Embed Size (px)
Citation preview

5455
J. Dairy Sci. 96 :5455–5464http://dx.doi.org/ 10.3168/jds.2012-6497 © American Dairy Science Association®, 2013 .
ABSTRACT
The protein and fat content of Dutch bulk milk has been monitored since the 1950s and has increased con-siderably, by 11 and 20%, respectively, whereas milk yield has more than doubled. The change in protein and fat content of milk is advantageous for the dairy industry, as these are the 2 most economically valu-able constituents of milk. Increases in protein and fat content of milk have allowed increases in the yield of various products such as cheese and butter. However, for cheese and other applications where casein micelles play a crucial role in structure and stability, it is not only casein content, but also the properties of the ca-sein micelles that determine processability. Of particu-lar importance herein is the salt partition in milk, but it is unknown whether increased protein content has affected the milk salts and their distribution between casein micelles and milk serum. It was, therefore, the objective of this research to determine the salt compo-sition and protein content for individual cow milk and bulk milk over a period of 1 yr and to compare these data to results obtained during the 1930s, 1950s, and 1960s in the last century. Calcium, magnesium, sodium, potassium, and phosphorus content were determined by inductively coupled plasma atomic emission spectrom-etry and inorganic phosphate, citrate, chloride, and sulfate content by anion-exchange chromatography in bulk milk and milk ultracentrifugate. In addition, ionic calcium and ionic magnesium concentration were de-termined by the Donnan membrane technique. We con-cluded that historical increase in milk yield and protein content in milk have resulted in correlated changes in casein content and the micellar salt fraction of milk. In addition, the essential nutrients, calcium, magnesium, and phosphorus in milk have increased the past 75 yr; therefore, the nutritional value of milk has improved.
Key words: milk protein , casein , calcium phosphate , magnesium
INTRODUCTION
Accurate knowledge of the distribution and total concentration of milk salts is relevant throughout the dairy chain. In nutrition science, great interest exists in the salt content and composition of milk and other dairy food products because they contribute substan-tial amounts of essential nutrients to the Western diet (i.e., 52–75% of calcium, 30–45% of phosphorus, 19% of potassium, and 16–21% of magnesium; Guéguen and Pointillart, 2000; Huth et al., 2006; Cashman, 2011). Furthermore, milk salt composition is important for the technological properties of milk. The partition of salts, especially the distribution of calcium phosphate between the casein micelle and serum phase, has a large influence on the structure and stability of casein micelles (Holt, 1985; Lucey and Horne, 2009; Dalgleish and Corredig, 2012). The salt partition can be altered by changes in physicochemical conditions, such as heating, cooling, and acidification (de la Fuente, 1998; Gauche-ron, 2005) and can, therefore, have major consequences for several dairy processes in which casein micelles are involved, such as acid coagulation of yogurt products and stability of concentrated milk during heating and evaporation (Hardy et al., 1984; Nieuwenhuijse et al., 1988). In addition, colloidal calcium phosphate and free calcium play an essential role during rennet coagulation in the cheese-making process (Lucey and Fox, 1993).
The major fraction of salts in milk is composed of the cations calcium, magnesium, potassium, and sodium and the anions citrate, phosphate, and chloride (Pyne, 1962; Holt, 1985). They can be either dissolved as free ions or ion pairs in milk serum or dispersed in colloidal calcium phosphate nanoclusters bound to caseins (de Kruif et al., 2012). Calcium phosphate nanoclusters are in dynamic equilibrium with milk serum (Holt et al., 1989; Little and Holt, 2004). On average, 70% of calcium, 50% of inorganic phosphate, 30% of magne-sium, and 10% of citrate in milk are located in the
Protein, casein, and micellar salts in milk: Current content and historical perspectives E. Bijl ,*† H. J. F. van Valenberg ,*1 T. Huppertz ,‡ and A. C. M. van Hooijdonk * * Dairy Science and Technology Group, and † Animal Breeding and Genomics Centre, Wageningen University, PO Box 17, 6700 AA, Wageningen, the Netherlands ‡ NIZO Food Research, PO Box 20, 6710 BA, Ede, the Netherlands
Received December 18, 2012. Accepted May 23, 2013. 1 Corresponding author: [email protected]

5456 BIJL ET AL.
Journal of Dairy Science Vol. 96 No. 9, 2013
casein micelle (Holt, 2004) and are of vital importance for casein micelle stability (de Kruif and Holt, 2003; Walstra et al., 2005; Farrell et al., 2006). Because of the close relationship between micellar salts and casein, calcium phosphate in milk varies in proportion to the casein content of milk (Holt and Jenness, 1984, Lucey and Horne, 2009; Holt, 2011).
It is clearly relevant for many disciplines within the field of dairy science and for the dairy industry to have an accurate understanding of the casein content and salt composition of the milk used on a daily ba-sis. However, the detailed salt composition and casein content is currently not monitored on a regular basis. Although it is recognized that the salt composition in milk of individual cows is influenced by breed, season, stage of lactation, diet, and mastitis within the time frame of a lactation period (Gaucheron, 2005), until now insufficient data have been available to determine variation over a longer time frame of decades. Dur-ing the past 50 yr, several trends between casein, salt fractions, and several other factors have been observed using individual milk samples, bulk milk, mineral-depleted milk, and even interspecies analysis. White and Davies (1958) examined the bulk milk of 1 herd of Ayrshire cows during 1 yr as well as individual milk samples of cows at different stages of lactation. The analysis of differences in milk composition between cows showed multiple direct and inverse correlations between different salt fractions, pH, lactose, and stage of lactation. Correlations between lactose, sodium, and potassium were also observed in milk from 8 individual Friesian cows that were followed during the first 90 d of their lactation (Tsioulpas et al., 2007a). In addition, correlations between calcium in serum and citrate in serum were found after analysis of bulk milk from 5 creameries in Scotland during 1 yr (Holt and Muir, 1979). Mineral depletion of bulk milk and 3 individual cow milk samples showed a strong correlation between colloidal calcium and colloidal phosphate (Holt, 1982) and were later also found between species (Holt and Jenness, 1984).
The protein and fat content of Dutch bulk milk has been monitored yearly since the 1950s and it can be seen that both have increased considerably (Figure 1). Also milk yield per cow has approximately doubled and the average milk protein yield in the Netherlands has increased from 148 kg in 1960 to 331 kg in 2010 per lactation per cow (CRV, 2012). These changes are the result of changes in management, especially feed com-position, and breeding strategies (Heck et al., 2009). Breeding goals in most countries consist of milk yield and milk composition. Selection might result in corre-lated changes in other traits. For example, selection for a higher fat content resulted in more saturated and less
unsaturated FA (Stoop et al., 2008). Similarly, selection for higher protein content can alter milk protein com-position (Schopen et al., 2009). Breeding and payment schemes for the dairy industry have been aimed at increasing the protein content or protein yield of milk (Boland et al., 2001; Schopen et al., 2009). The change in protein and fat content of milk is advantageous for the dairy industry, as these are the 2 most economically valuable constituents of milk. Increases in protein and fat content of milk have allowed increases in the yield of various products derived from milk, including cheese, butter, as well as milk protein- and milk fat-based in-gredients. However, for the applications listed above, particularly those where casein micelles play a crucial role in structure and stability, it is not only casein content, but also the properties of the casein micelles that determine processability. Of particular importance herein is the mineral balance in milk, but it is unknown whether increased protein content has affected the milk salts and their distribution between casein micelles and milk serum. These changes could influence the struc-ture and stability of casein micelles as well as processes in which casein micelles play a crucial role, such as rennet coagulation, acid coagulation, and concentration of milk. Besides that, changes in salt composition might have an effect on the nutritional value of milk.
The objective of this research was, therefore, to de-termine salt composition and protein content for indi-vidual cow milk and bulk milk over a period of 1 yr and to place these recent data in a historical perspective, using results from milk salt analysis performed during the 1930s, 1950s, and 1960s of the last century. This was done by creating 2 data sets containing informa-
Figure 1. Historical trend for fat (�) and protein (�) content (g/100 g of milk) of Dutch bovine raw milk from 1945 to 2010 (CRV, 2012). Data for 1937 are from Ter Horst (1963).
Journal of Dairy Science Vol. 96 No. 9, 2013
MILK PROTEIN CONTENT AND SALT COMPOSITION 5457
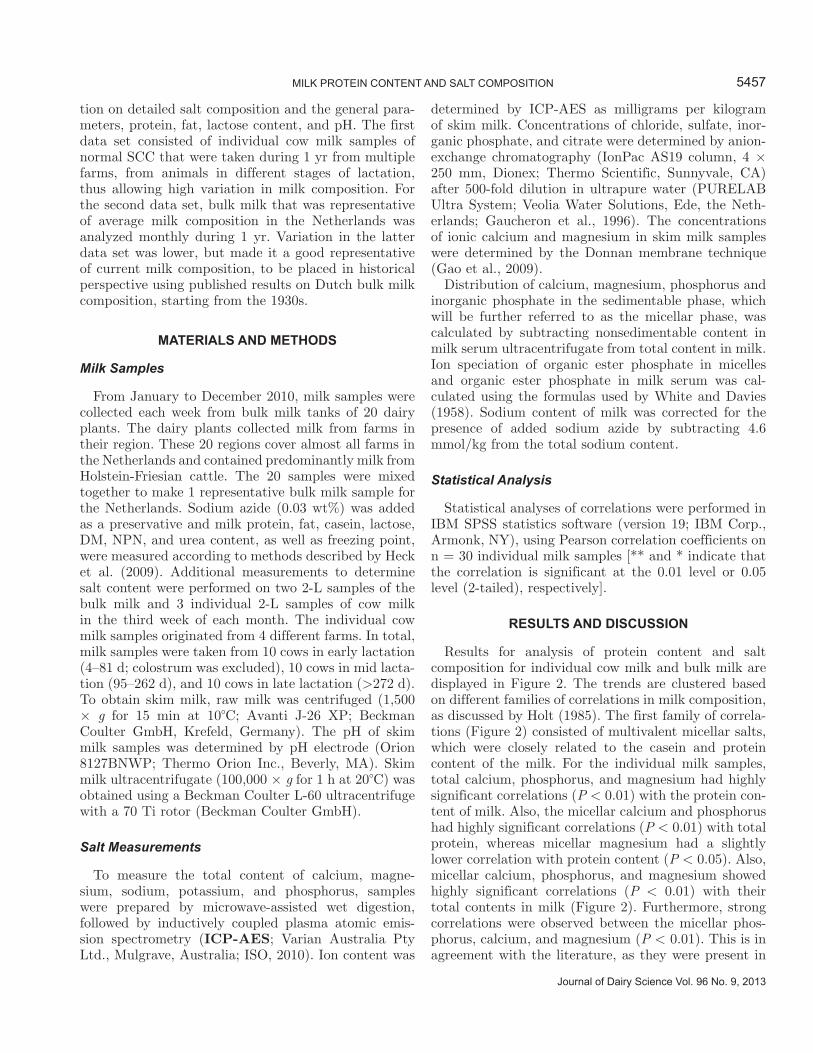
tion on detailed salt composition and the general para- meters, protein, fat, lactose content, and pH. The first data set consisted of individual cow milk samples of normal SCC that were taken during 1 yr from multiple farms, from animals in different stages of lactation, thus allowing high variation in milk composition. For the second data set, bulk milk that was representative of average milk composition in the Netherlands was analyzed monthly during 1 yr. Variation in the latter data set was lower, but made it a good representative of current milk composition, to be placed in historical perspective using published results on Dutch bulk milk composition, starting from the 1930s.
MATERIALS AND METHODS
Milk Samples
From January to December 2010, milk samples were collected each week from bulk milk tanks of 20 dairy plants. The dairy plants collected milk from farms in their region. These 20 regions cover almost all farms in the Netherlands and contained predominantly milk from Holstein-Friesian cattle. The 20 samples were mixed together to make 1 representative bulk milk sample for the Netherlands. Sodium azide (0.03 wt%) was added as a preservative and milk protein, fat, casein, lactose, DM, NPN, and urea content, as well as freezing point, were measured according to methods described by Heck et al. (2009). Additional measurements to determine salt content were performed on two 2-L samples of the bulk milk and 3 individual 2-L samples of cow milk in the third week of each month. The individual cow milk samples originated from 4 different farms. In total, milk samples were taken from 10 cows in early lactation (4–81 d; colostrum was excluded), 10 cows in mid lacta-tion (95–262 d), and 10 cows in late lactation (>272 d). To obtain skim milk, raw milk was centrifuged (1,500 × g for 15 min at 10°C; Avanti J-26 XP; Beckman Coulter GmbH, Krefeld, Germany). The pH of skim milk samples was determined by pH electrode (Orion 8127BNWP; Thermo Orion Inc., Beverly, MA). Skim milk ultracentrifugate (100,000 × g for 1 h at 20°C) was obtained using a Beckman Coulter L-60 ultracentrifuge with a 70 Ti rotor (Beckman Coulter GmbH).
Salt Measurements
To measure the total content of calcium, magne-sium, sodium, potassium, and phosphorus, samples were prepared by microwave-assisted wet digestion, followed by inductively coupled plasma atomic emis-sion spectrometry (ICP-AES; Varian Australia Pty Ltd., Mulgrave, Australia; ISO, 2010). Ion content was
determined by ICP-AES as milligrams per kilogram of skim milk. Concentrations of chloride, sulfate, inor-ganic phosphate, and citrate were determined by anion-exchange chromatography (IonPac AS19 column, 4 × 250 mm, Dionex; Thermo Scientific, Sunnyvale, CA) after 500-fold dilution in ultrapure water (PURELAB Ultra System; Veolia Water Solutions, Ede, the Neth-erlands; Gaucheron et al., 1996). The concentrations of ionic calcium and magnesium in skim milk samples were determined by the Donnan membrane technique (Gao et al., 2009).
Distribution of calcium, magnesium, phosphorus and inorganic phosphate in the sedimentable phase, which will be further referred to as the micellar phase, was calculated by subtracting nonsedimentable content in milk serum ultracentrifugate from total content in milk. Ion speciation of organic ester phosphate in micelles and organic ester phosphate in milk serum was cal-culated using the formulas used by White and Davies (1958). Sodium content of milk was corrected for the presence of added sodium azide by subtracting 4.6 mmol/kg from the total sodium content.
Statistical Analysis
Statistical analyses of correlations were performed in IBM SPSS statistics software (version 19; IBM Corp., Armonk, NY), using Pearson correlation coefficients on n = 30 individual milk samples [** and * indicate that the correlation is significant at the 0.01 level or 0.05 level (2-tailed), respectively].
RESULTS AND DISCUSSION
Results for analysis of protein content and salt composition for individual cow milk and bulk milk are displayed in Figure 2. The trends are clustered based on different families of correlations in milk composition, as discussed by Holt (1985). The first family of correla-tions (Figure 2) consisted of multivalent micellar salts, which were closely related to the casein and protein content of the milk. For the individual milk samples, total calcium, phosphorus, and magnesium had highly significant correlations (P < 0.01) with the protein con-tent of milk. Also, the micellar calcium and phosphorus had highly significant correlations (P < 0.01) with total protein, whereas micellar magnesium had a slightly lower correlation with protein content (P < 0.05). Also, micellar calcium, phosphorus, and magnesium showed highly significant correlations (P < 0.01) with their total contents in milk (Figure 2). Furthermore, strong correlations were observed between the micellar phos-phorus, calcium, and magnesium (P < 0.01). This is in agreement with the literature, as they were present in

5458 BIJL ET AL.
Journal of Dairy Science Vol. 96 No. 9, 2013
Figure 2. Trends for micellar multivalent salts and protein for individual cow milk (×) and bulk milk (�). r indicates the Pearson correla-tion for individual cow milk data; ** and * indicate that the correlation is significant at the 0.01 level and 0.05 level (2-tailed), respectively.

Journal of Dairy Science Vol. 96 No. 9, 2013
MILK PROTEIN CONTENT AND SALT COMPOSITION 5459
the colloidal calcium phosphate (CCP) nanoclusters in casein micelles at a fixed ratio (Holt, 1982).
The second family of correlations (Figure 3) con-sisted of lactose, chloride, sodium, and potassium; these constituents are involved in maintaining the osmotic pressure of milk, which is always closely related to the osmotic pressure of blood. The correlations of lactose content with chloride and sodium (P < 0.01) have been observed before (Rook and Wood, 1958; White and Davies, 1958). Sodium and potassium and sodium and chloride were highly correlated (P < 0.01). This strong correlation was mainly due to the increase in sodium compared with potassium for 3 cows that were at the end of their lactation period. This phenomenon was also observed by White and Davies (1958) and can be explained by the opening of tight junctions at the end of lactation, when milk secretion rate decreases (Nguyen and Neville, 1998).
The third cluster of correlations (Figure 4) contained information on nonsedimentable multivalent ions, pH, and free ions in solution. Nonsedimentable calcium and nonsedimentable magnesium were highly correlated with nonsedimentable citrate (P < 0.01), and non-sedimentable calcium and nonsedimentable phosphorus were also highly correlated (P < 0.01), but showed a wider distribution. This was also observed by Holt and Muir (1979) and can be explained by the higher affinity of calcium to form complexes with citrate in milk, as
the logarithm of association constants (pKassoc) of the calcium-citrate (CaCit−) complex is 5.2, which is over 100 times higher than the pKassoc of 3.0 of the CaHPO4 complex formed between calcium and inorganic phos-phate (Holt et al., 1981). For the second groups of cor-relations, free calcium and free magnesium were highly correlated with their nonsedimentable counterparts and with each other (P < 0.01). Finally, pH and free calcium and nonsedimentable phosphorus were highly correlated (P < 0.01) because 3 cows at the beginning of their lactation (4, 5, and 6 d) had a milk pH below 6.6. This was also observed by Tsioulpas et al. (2007a) for cows up to 15 d in lactation, as well as by White and Davies (1958).
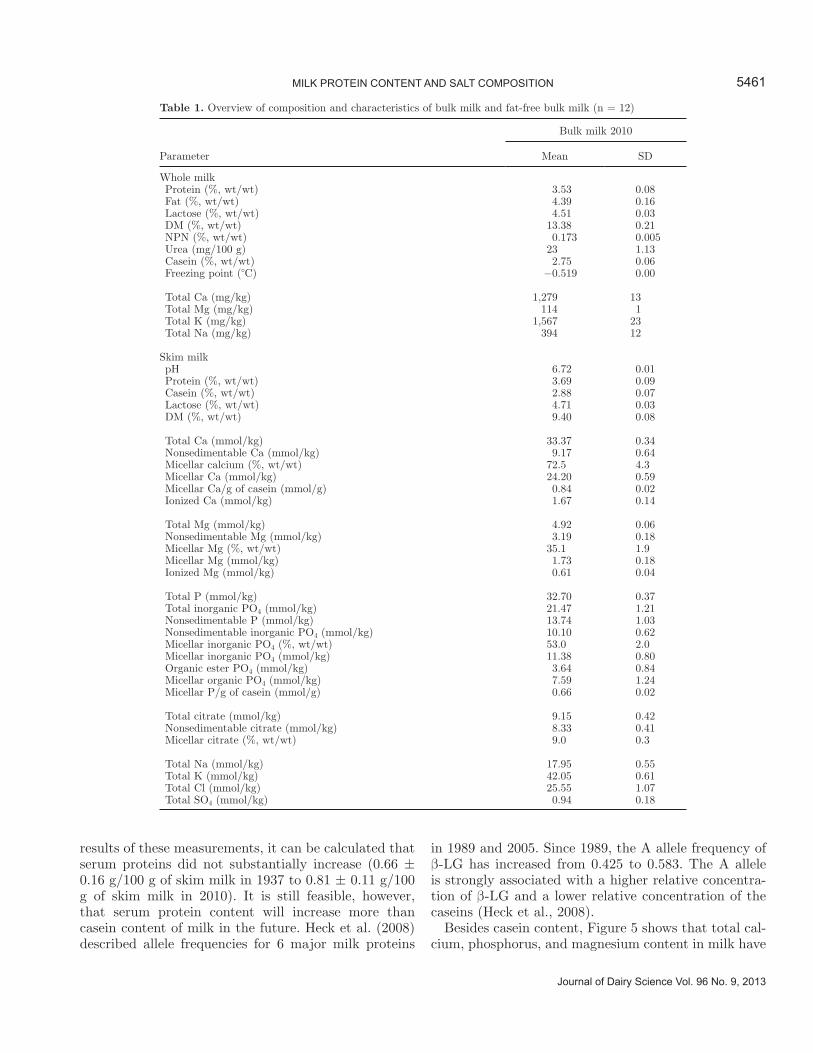
The obtained correlations confirm that the results de-scribed earlier, obtained from individual milk samples, bulk milk, mineral-depleted milk, or interspecies analy-sis, are equally valid for our data set of individual cow milk. When comparing individual milk to bulk milk, it can be seen that data points for bulk milk are in the middle of the individual milk distribution and show low variation, as was expected. The detailed composition of bulk milk is given in Table 1. An important aspect of this list is the content of ionic calcium and magnesium in milk, because these are 2 of the most important fac-tors for stability of milk (Lewis, 2011). The value of ionic calcium in bulk milk was 1.67 ± 0.14 mmol/kg. This result is in agreement with the value of 1.90 ±
Figure 3. Trends for lactose, sodium, potassium, and chloride for individual cow milk (×) and bulk milk (�). r indicates the Pearson cor-relation for individual cow milk data; ** and * indicate that the correlation is significant at the 0.01 level and 0.05 level (2-tailed), respectively.

5460 BIJL ET AL.
Journal of Dairy Science Vol. 96 No. 9, 2013
0.4 mmol of free calcium/kg of skim milk reported by Tsioulpas et al. (2007b), who averaged results from 234 individual milk samples. The content of ionic magne-sium in milk was measured for the first time in bulk milk and was 0.61 ± 0.04 mmol/kg.
The detailed information of bulk milk was also placed in a historical perspective. From the historical trend displayed in Figure 5, it can be seen that the casein content of milk in the Netherlands has increased around
9% from 2.64 ± 0.13 to 2.88 ± 0.07 g/100 g of skim milk since 1937. The increase in casein is in the same order of magnitude as the 11% increase of protein con-tent of bulk milk in Figure 1, which increased from 3.30 ± 0.1 to 3.69 ± 0.09 g/100 g of skim milk. Current and historical analysis all have used the Kjeldahl method to determine casein nitrogen and a conversion factor of 6.38 was used for all data. Therefore, the comparison to historic measurements should be reliable. Using the
Figure 4. Trends for nonsedimentable multivalent ions, free Ca, free Mg, and pH in milk serum for individual cow milk (×) and bulk milk (�). r indicates the Pearson correlation for individual cow milk data; ** and * indicate that the correlation is significant at the 0.01 level and 0.05 level (2-tailed), respectively.
Journal of Dairy Science Vol. 96 No. 9, 2013
MILK PROTEIN CONTENT AND SALT COMPOSITION 5461
results of these measurements, it can be calculated that serum proteins did not substantially increase (0.66 ± 0.16 g/100 g of skim milk in 1937 to 0.81 ± 0.11 g/100 g of skim milk in 2010). It is still feasible, however, that serum protein content will increase more than casein content of milk in the future. Heck et al. (2008) described allele frequencies for 6 major milk proteins
in 1989 and 2005. Since 1989, the A allele frequency of β-LG has increased from 0.425 to 0.583. The A allele is strongly associated with a higher relative concentra-tion of β-LG and a lower relative concentration of the caseins (Heck et al., 2008).
Besides casein content, Figure 5 shows that total cal-cium, phosphorus, and magnesium content in milk have
Table 1. Overview of composition and characteristics of bulk milk and fat-free bulk milk (n = 12)
Parameter
Bulk milk 2010
Mean SD
Whole milk Protein (%, wt/wt) 3.53 0.08 Fat (%, wt/wt) 4.39 0.16 Lactose (%, wt/wt) 4.51 0.03 DM (%, wt/wt) 13.38 0.21 NPN (%, wt/wt) 0.173 0.005 Urea (mg/100 g) 23 1.13 Casein (%, wt/wt) 2.75 0.06 Freezing point (°C) −0.519 0.00
Total Ca (mg/kg) 1,279 13 Total Mg (mg/kg) 114 1 Total K (mg/kg) 1,567 23 Total Na (mg/kg) 394 12
Skim milk pH 6.72 0.01 Protein (%, wt/wt) 3.69 0.09 Casein (%, wt/wt) 2.88 0.07 Lactose (%, wt/wt) 4.71 0.03 DM (%, wt/wt) 9.40 0.08
Total Ca (mmol/kg) 33.37 0.34 Nonsedimentable Ca (mmol/kg) 9.17 0.64 Micellar calcium (%, wt/wt) 72.5 4.3 Micellar Ca (mmol/kg) 24.20 0.59 Micellar Ca/g of casein (mmol/g) 0.84 0.02 Ionized Ca (mmol/kg) 1.67 0.14
Total Mg (mmol/kg) 4.92 0.06 Nonsedimentable Mg (mmol/kg) 3.19 0.18 Micellar Mg (%, wt/wt) 35.1 1.9 Micellar Mg (mmol/kg) 1.73 0.18 Ionized Mg (mmol/kg) 0.61 0.04
Total P (mmol/kg) 32.70 0.37 Total inorganic PO4 (mmol/kg) 21.47 1.21 Nonsedimentable P (mmol/kg) 13.74 1.03 Nonsedimentable inorganic PO4 (mmol/kg) 10.10 0.62 Micellar inorganic PO4 (%, wt/wt) 53.0 2.0 Micellar inorganic PO4 (mmol/kg) 11.38 0.80 Organic ester PO4 (mmol/kg) 3.64 0.84 Micellar organic PO4 (mmol/kg) 7.59 1.24 Micellar P/g of casein (mmol/g) 0.66 0.02
Total citrate (mmol/kg) 9.15 0.42 Nonsedimentable citrate (mmol/kg) 8.33 0.41 Micellar citrate (%, wt/wt) 9.0 0.3
Total Na (mmol/kg) 17.95 0.55 Total K (mmol/kg) 42.05 0.61 Total Cl (mmol/kg) 25.55 1.07 Total SO4 (mmol/kg) 0.94 0.18

5462 BIJL ET AL.
Journal of Dairy Science Vol. 96 No. 9, 2013
increased as well (by 12.4, 9.6, and 7.2%, respectively). The increase in calcium is larger than the increase in magnesium; therefore, this is most likely caused by an increase in the micellar salt fraction, as 72.5% of calcium, 53% of inorganic phosphate, and 35.1% of
magnesium was present in the micellar phase (Table 1). In addition, nonsedimentable calcium did not in-crease. This is in agreement with the fact that milk serum is supersaturated with calcium phosphate. Thus, any increase in calcium, magnesium, and phosphorus
Figure 5. Historical trend for casein, lactose, Ca, Mg, nonsedimentable Ca ( ), nonsedimentable Mg (�), micellar Ca, P, K (�), and Na ( ) content in Dutch bulk skim milk. Values for casein, lactose, Ca, and P were obtained from Ter Horst (1963), who used bulk milk from all cooperative dairies in the province of Friesland in the period 1934 to 1937. In addition, values for casein, lactose, and different fractions of Ca and Mg were obtained from Mulder et al. (1956), who determined the composition of Dutch bulk milk in the period 1953 to 1956 based on milk composition of 10 individual cows during lactation. Values for Ca, K, and Na were obtained from Eisses and de Ruig (1966); results were aver-aged for bulk milk from dairy plants of 4 different regions in the Netherlands in the period 1962 to 1965. The error bars represent the standard deviation of the mean.

Journal of Dairy Science Vol. 96 No. 9, 2013
MILK PROTEIN CONTENT AND SALT COMPOSITION 5463
was mainly caused by the increase in casein content. The strong positive correlation between casein content and micellar calcium has also been found for interspe-cies analyses (Holt and Jenness, 1984). Unfortunately, insufficient historical data are available on different phosphate fractions in milk serum ultracentrifugate to make a reliable comparison. However, it may be expect-ed that the increase in total phosphorus was mainly caused by an increase in micellar inorganic phosphate and micellar organic phosphate. Using data on casein, total calcium, and nonsedimentable calcium, it can be calculated that the content of micellar calcium per gram of casein has not substantially increased in Dutch bulk milk (0.77 ± 0.06 in 1954 to 0.84 ± 0.02 in 2010).
On further examination of milk serum, it can be seen that lactose, potassium, and sodium content of Dutch bulk milk, which are almost completely present in the serum phase of milk, have not significantly increased over the years (Figure 5). The rather stable concen-trations can be explained by the fact that they are the main determinants of osmolality in milk, together with chloride. Variation in osmolality of blood is low in healthy cows to maintain homeostasis. As osmotic pres-sure in blood and in milk are closely related (Wheelock et al., 1965; Bjerg et al., 2005), as outlined previously, it is logical that variation in determinants of osmolality of milk is low as well over time.
The historical trends in Figure 5 were made using data of Dutch bulk milk, but even when we compare current values in Table 1 to the results of White and Davies (1958), which were obtained from a different breed (Ayrshire) at 1 farm in the United Kingdom more than 50 yr ago, no significant differences exist in the nonsedimentable calcium, nonsedimentable magne-sium, nonsedimentable phosphate fractions, and micel-lar calcium per gram of casein. This suggests that our findings are applicable not only for the Netherlands, but also for other countries.
CONCLUSIONS
Casein content and the related micellar fractions of calcium, phosphorus, and magnesium have increased significantly the past 75 yr, whereas the salt content of serum and the salt composition of casein micelles have remained almost constant. Therefore, it can be concluded that historical increase in milk yield and protein content in milk have resulted in correlated changes in casein content and the micellar salt fraction of milk. Furthermore, correlations observed for protein and micellar salt composition between individual cows over short time periods have also been consistent over more than 7 decades. Finally, the essential nutrients, calcium, magnesium, and phosphorus in milk have
increased; therefore, the nutritional value of milk has improved. All the observed changes are related to CCP nanoclusters in milk. As CCP nanoclusters have great structural importance, it will be interesting to moni-tor the future trend to gain better insights into how the lactating mammary gland is coping with increased production of caseins, and if structure of casein micelles is changing as a result of this increased production.
ACKNOWLEDGMENTS
This study is part of the Milk Genomics Initiative and the project “Melk op maat,” funded by Wageningen University (Wageningen, the Netherlands), the Dutch Dairy Association (NZO; Zoetermeer, the Netherlands), cattle cooperative CRV (Arnhem, the Netherlands), the Dutch Technology Foundation STW (Utrecht, the Netherlands), the Ministry of Economic Affairs (Den Haag, the Netherlands), and the provinces of Gelder-land (Arnhem, the Netherlands) and Overijssel (Zwolle, the Netherlands). The authors thank the farmers of the herds for their generous help in collecting the milk samples, Peter Nobels and Arie van den Berg from the Chemical Biological Laboratory of the Wageningen University Soil Centre for their technical assistance with ICP-AES measurements, and Ardy Beurskens of the sub-department of Environmental Technology at Wageningen University for his technical assistance with ion chromatography. We also thank Gao Ran and Banu Dal of the Dairy Science and Technology group at Wageningen University for their help with preliminary experiments on analysis of salt composition of indi-vidual milk samples and Henk Bovenhuis of the Animal Breeding and Genetics group at Wageningen University for his contribution to the introduction and discussion on the importance of this research in the area of animal breeding and genetics.
REFERENCESBjerg, M., M. D. Rasmussen, and M. O. Nielsen. 2005. Changes in
freezing point of blood and milk during dehydration and rehydra-tion in lactating cows. J. Dairy Sci. 88:3174–3185.
Boland, M., A. MacGibbon, and J. Hill. 2001. Designer milks for the new millennium. Livest. Prod. Sci. 72:99–109.
Cashman, K. D. 2011. Milk salts | Macroelements, nutritional signifi-cance. Pages 925–932 in Encyclopedia of Dairy Sciences. 2nd ed. Academic Press, San Diego, CA.
CRV. 2012. Year statistics 1945–2010. The Royal Dutch Cattle Syndi-cate (CRV), Arnhem, the Netherlands.
Dalgleish, D. G., and M. Corredig. 2012. The structure of the casein micelle of milk and its changes during processing. Annu. Rev. Food Sci. Technol. 3:449–467.
De Kruif, C. G., and C. Holt. 2003. Casein micelle structure, function and interactions. Pages 233–276 in Advanced Dairy Chemistry. Vol. 1. P. F. Fox and P. L. H. McSweeney, ed. Kluwer Academic/Plenum, New York, NY.
de Kruif, C. G., T. Huppertz, V. S. Urban, and A. V. Petukhov. 2012. Casein micelles and their internal structure. Adv. Colloid Interface Sci. 171–172:36–52.

5464 BIJL ET AL.
Journal of Dairy Science Vol. 96 No. 9, 2013
de la Fuente, M. A. 1998. Changes in the mineral balance of milk submitted to technological treatments. Trends Food Sci. Technol. 9:281–288.
Eisses, J., and W. G. de Ruig. 1966. The calcium content of bulk milk samples from all parts of the Netherlands. Neth. Milk Dairy J. 20:243–255.
Farrell, H. M., Jr., E. L. Malin, E. M. Brown, and P. X. Qi. 2006. Casein micelle structure: What can be learned from milk synthesis and structural biology? Curr. Opin. Colloid Interface Sci. 11:135–147.
Gao, R., E. J. M. Temminghoff, H. P. van Leeuwen, H. J. F. van Valenberg, M. D. Eisner, and M. A. J. S. van Boekel. 2009. Simul-taneous determination of free calcium, magnesium, sodium and potassium ion concentrations in simulated milk ultrafiltrate and reconstituted skim milk using the Donnan membrane technique. Int. Dairy J. 19:431–436.
Gaucheron, F. 2005. The minerals of milk. Reprod. Nutr. Dev. 45:473–483.
Gaucheron, F., Y. Le Graet, M. Piot, and E. Boyaval. 1996. Determi-nation of anions of milk by ion chromatography. Lait 76:433–443.
Guéguen, L., and A. Pointillart. 2000. The bioavailability of dietary calcium. J. Am. Coll. Nutr. 19:119S–136S.
Hardy, E. E., D. D. Muir, A. W. M. Sweetsur, and I. G. West. 1984. Changes of calcium-phosphate partition and heat-stability dur-ing manufacture of sterilized concentrated milk. J. Dairy Sci. 67:1666–1673.
Heck, J. M. L., C. Olieman, A. Schennink, H. J. F. van Valenberg, M. H. P. W. Visker, R. C. R. Meuldijk, and A. C. M. van Hooijdonk. 2008. Estimation of variation in concentration, phosphorylation and genetic polymorphism of milk proteins using capillary zone electrophoresis. Int. Dairy J. 18:548–555.
Heck, J. M. L., H. J. F. van Valenberg, J. Dijkstra, and A. C. M. van Hooijdonk. 2009. Seasonal variation in the Dutch bovine raw milk composition. J. Dairy Sci. 92:4745–4755.
Holt, C. 1982. Inorganic constituents of milk. III. The colloidal calcium phosphate of cow’s milk. J. Dairy Res. 49:29–38.
Holt, C. 1985. The milk salts. Pages 143–181 in Developments in Dairy Chemistry. Vol. 3. P. F. Fox, ed. Elsevier Applied Science Publish-ers, London, UK and New York, NY.
Holt, C. 2004. An equilibrium thermodynamic model of the sequestra-tion of calcium phosphate by casein micelles and its application to the calculation of the partition of salts in milk. Eur. Biophys. J. 33:421–434.
Holt, C. 2011. Milk salts | Interaction with caseins. Pages 917–924 in Encyclopedia of Dairy Sciences. 2nd ed. Academic Press, San Diego, CA.
Holt, C., D. G. Dalgleish, and R. Jenness. 1981. Calculation of the ion equilibria in milk diffusate and comparison with experiment. Anal. Biochem. 113:154–163.
Holt, C., and R. Jenness. 1984. Interrelationships of constituents and partition of salts in milk samples from 8 species. Comp. Biochem. Physiol. A 77:275–282.
Holt, C., and D. D. Muir. 1979. Inorganic constituents of milk. 1. Cor-relation of soluble calcium with citrate in bovine milk. J. Dairy Res. 46:433–439.
Holt, C., M. J. J. M. van Kemenade, L. S. Nelson Jr., L. Sawyer, J. E. Harries, R. T. Bailey, and D. W. L. Hukins. 1989. Composi-tion and structure of micellar calcium phosphate. J. Dairy Res. 56:411–416.
Huth, P. J., D. B. DiRienzo, and G. D. Miller. 2006. Major scientific advances with dairy foods in nutrition and health. J. Dairy Sci. 89:1207–1221.
ISO (International Organization for Standardization). 2010. Milk and milk products—Determination of calcium, copper, iron, magne-sium, manganese, phosphorus, potassium, sodium and zinc con-tents—Inductively coupled plasma atomic emission spectrometric method (ICP-AES). ISO/CD 15151. ISO, Geneva, Switzerland.
Lewis, M. J. 2011. The measurement and significance of ionic calcium in milk—A review. Int. J. Dairy Technol. 64:1–13.
Little, E. M., and C. Holt. 2004. An equilibrium thermodynamic mod-el of the sequestration of calcium phosphate by casein phosphopep-tides. Eur. Biophys. J. 33:435–447.
Lucey, J. A., and P. F. Fox. 1993. Importance of calcium and phosphate in cheese manufacture: A review. J. Dairy Sci. 76:1714–1724.
Lucey, J. A., and D. S. Horne. 2009. Milk salts: Technological signifi-cance. Pages 351–390 in Advanced Dairy Chemistry: Volume 3: Lactose, Water, Salts and Minor Constituents. Springer-Verlag, New York, NY.
Mulder, H., A. J. van der Have, and C. J. Schipper. 1956. The Com-position of Netherlands Milk. Agricultural University Wageningen, Wageningen, the Netherlands.
Nguyen, D. A. D., and M. C. Neville. 1998. Tight junction regula-tion in the mammary gland. J. Mammary Gland Biol. Neoplasia 3:233–246.
Nieuwenhuijse, J. A., W. Timmermans, and P. Walstra. 1988. Calcium and phosphate partitions during the manufacture of sterilized con-centrated milk and their relations to the heat stability. Neth. Milk Dairy J. 42:387–421.
Pyne, G. T. 1962. Some aspects of physical chemistry of salts of milk. J. Dairy Res. 29:101–130.
Rook, J. A. F., and M. Wood. 1958. Interrelationships of the concen-trations of sodium, potassium, lactose and water in milk. Nature 181:1284–1285.
Schopen, G. C. B., J. M. L. Heck, H. Bovenhuis, M. Visker, H. J. F. van Valenberg, and J. A. M. van Arendonk. 2009. Genetic param-eters for major milk proteins in Dutch Holstein-Friesians. J. Dairy Sci. 92:1182–1191.
Stoop, W. M., J. A. M. van Arendonk, J. M. L. Heck, H. J. F. van Valenberg, and H. Bovenhuis. 2008. Genetic parameters for major milk fatty acids and milk production traits of Dutch Holstein-Friesians. J. Dairy Sci. 91:385–394.
Ter Horst, M. G. 1963. Influence of pasture and housing periods on the composition of bulk milk. Neth. Milk Dairy J. 17:162–175.
Tsioulpas, A., A. S. Grandison, and M. J. Lewis. 2007a. Changes in physical properties of bovine milk from the colostrum period to early lactation. J. Dairy Sci. 90:5012–5017.
Tsioulpas, A., M. J. Lewis, and A. S. Grandison. 2007b. Effect of minerals on casein micelle stability of cows’ milk. J. Dairy Res. 74:167–173.
Walstra, P., J. T. M. Wouters, and T. J. Geurts. 2005. Dairy Science and Technology. 2nd ed. (Food Science and Technology). CRC/Taylor & Francis, Boca Raton, FL.
Wheelock, J. V., J. A. F. Rook, and F. H. Dodd. 1965. The relation-ship in the cow between osmotic pressure of milk and of blood. J. Dairy Res. 32:79–88.
White, J. C. D., and D. T. Davies. 1958. The relation between the chemical composition of milk and the stability of the caseinate complex: I. General introduction, description of samples, methods and chemical composition of samples. J. Dairy Res. 25:236–255.