Embed Size (px)
Citation preview
Anesthesiology, V 118 • No 6 1307 June 2013
ABSTRACT
Background: The impact of intraoperative ventilation on postoperative pulmonary complications is not defined. The authors aimed at determining the effectiveness of protective mechanical ventilation during open abdominal surgery on a modified Clinical Pulmonary Infection Score as primary outcome and postoperative pulmonary function.Methods: Prospective randomized, open-label, clinical trial performed in 56 patients scheduled to undergo elective open abdominal surgery lasting more than 2 h. Patients were assigned by envelopes to mechanical ventilation with tidal volume of 9 ml/kg ideal body weight and zero-positive end-expiratory pressure (standard ventilation strategy) or tidal
volumes of 7 ml/kg ideal body weight, 10 cm H2O positive end-expiratory pressure, and recruitment maneuvers (pro-tective ventilation strategy). Modified Clinical Pulmonary Infection Score, gas exchange, and pulmonary functional tests were measured preoperatively, as well as at days 1, 3, and 5 after surgery.Results: Patients ventilated protectively showed better pul-monary functional tests up to day 5, fewer alterations on chest x-ray up to day 3 and higher arterial oxygenation in air at days 1, 3, and 5 (mmHg; mean ± SD): 77.1 ± 13.0 versus 64.9 ± 11.3 (P = 0.0006), 80.5 ± 10.1 versus 69.7 ± 9.3 (P = 0.0002), and 82.1 ± 10.7 versus 78.5 ± 21.7 (P = 0.44) respectively. The modified Clinical Pulmonary Infection Score was lower in the protective ventilation strategy at days 1 and 3. The percentage of patients in hospital at day 28 after surgery was not different between groups (7 vs. 15% respectively, P = 0.42).Conclusion: A protective ventilation strategy during abdominal surgery lasting more than 2 h improved respira-tory function and reduced the modified Clinical Pulmonary Infection Score without affecting length of hospital stay.
What We Already Know about This Topic
• Theuseoflargetidalvolumesduringmechanicalventilationofthelungscaninjurethelungsofcriticallyillpatients
What This Article Tells Us That Is New
• A prospective, randomized, open-label trial of protectiveventilation in56patientsundergoingmore than2hofopenabdominalsurgeryshowedthatlowertidalvolumes,positiveend-expiratory pressure, and recruitment maneuvers led tosignificantlyimprovedpulmonaryfunctiontestresultsupto5daysafter surgery, fewerchest x-ray findingsand improvedClinicalPulmonaryInfectionScores
Protective Ventilation during Abdominal Surgery
Severgnini et al.
June
10.1097/ALN.0b013e31829102de
6
◆ ThisarticleisaccompaniedbyanEditorialView.Pleasesee:Vidal MeloMF, EikermannM: Protect the lungs during ab-dominalsurgery: Itmaychange thepostoperativeoutcome.Anesthesiology2013;118:1254–7.
Anjana
2013
Copyright © 2013, the American Society of Anesthesiologists, Inc. Lippincott Williams & Wilkins. Anesthesiology 2013; 118:1307-21
Anesthesiology
2013
118
1307
21
PERIOPERATIVE MEDICINE
* Medical Doctor, §§ Professor, Department of Ambient, Health and Safety, University of Insubria, Varese, Italy. † Department of Anesthesia, Azienda Ospedaliera Fondazione Macchi—Ospedale di Circolo, Varese, Italy. ‡ Associate Professor, Department of Sur-gical Sciences, University of Insubria. § Research Assistant, Depart-ment of Clinical and Biological Sciences, University of Insubria. || Department of Emergency and Intensive Care CTO-M Adelaide Hospital, Turin, Italy. # Professor, Department of Anesthesiology and Intensive Care Therapy, University Hospital Carl Gustav Carus, Dresden University of Technology, Dresden, Germany. ** Profes-sor, Department of Intensive Care Medicine—Academic Medical Center Univerisity of Amsterdam, Amsterdam, The Netherlands. †† Professor, Department of Critical Care and Anesthesiology, CHU Montpellier Hopital Saint Eloi, Montpellier Cedex, France. ‡‡ Assistant Professor, Department of Anesthesiology and Critical Care, University Hospital of Clermont-Ferrand, Clermont-Ferrand, France. |||| Professor, Department of Surgical Sciences and Inte-grated Diagnostics, University of Genoa, Genoa, Italy.
Received from the Department of Science and High Technology, University of Insubria—Servizio di Anestesia Rianimazione, Osped-ale di Circolo, Varese, Italy. Submitted for publication April 5, 2012. Accepted for publication December 19, 2012. Support was provided solely from institutional and/or departmental sources.
Address correspondence to Dr. Severgnini: Department of Ambi-ent, Health and Safety, University of Insubria—Servizio di Anestesia Rianimazione, Ospedale di Circolo, viale Borri 57, 21100, Varese, Italy. [email protected]. Information on purchasing reprints may be found at www.anesthesiology.org or on the mast-head page at the beginning of this issue. Anesthesiology’s articles are made freely accessible to all readers, for personal use only, 6 months from the cover date of the issue.
Protective Mechanical Ventilation during General Anesthesia for Open Abdominal Surgery Improves Postoperative Pulmonary Function
PaoloSevergnini,M.D.,*GabrieleSelmo,M.D.,*ChristianLanza,M.D.,*AlessandroChiesa,M.D.,*AliceFrigerio,M.D.,*AlessandroBacuzzi,M.D.,*GianlorenzoDionigi,M.D.,Ph.D.,‡RaffaeleNovario,P.H.,§CesareGregoretti,M.D.,||MarceloGamadeAbreu,M.D.,Ph.D.,#MarcusJ.Schultz,M.D.,Ph.D.,**SamirJaber,M.D.,Ph.D.,††EmmanuelFutier,M.D.,‡‡MaurizioChiaranda,M.D.,Ph.D.,§§PaoloPelosi,M.D.,||||
Anesthesiology 2013; 118:1307-21 1308 Severgnini et al.
Protective Ventilation during Abdominal Surgery
P OSTOPERATIVE pulmonary complications, espe-cially postoperative respiratory failure, are important
causes of perioperative morbidity and mortality.1–4 Induc-tion of general anesthesia promotes a reduction in lung vol-ume and atelectasis formation associated with a deterioration of both gas exchange and respiratory mechanics.5,6 There is unequivocal evidence from both experimental and clinical studies that mechanical ventilation in critically ill patients has the potential to aggravate or even initiate lung injury. Two retrospective studies7,8 and one randomized controlled trial9 suggested that lower tidal volumes are beneficial in patients who need long-term mechanical ventilation but do not suffer from lung injury.
Mechanical ventilation is mandatory in patients under-going general anesthesia. Higher tidal volumes may over-distend noninjured lungs, in particular, nondependent lung tissue. During surgical procedures, both phenomena may stress the noninjured lung, triggering local inflammation and local coagulation.10,11 Retrospective and prospective studies have shown possible beneficial effects of lower tidal volumes in patients who are on short-term mechanical ventilation because of surgery.12,13 However, the beneficial effects of short-term intraoperative mechanical ventilation with lower tidal volumes on pulmonary integrity remains undefined.14,15 In addition, zero-positive end-expiratory pressure (ZEEP) or low levels of positive end-expiratory pressure (PEEP) may promote atelectasis, resulting in repetitive collapse/reopening of dependent lung tissue. The role of PEEP and low tidal volume (the so-called protective lung strategy) during the intraoperative period in preventing lung damage and post-operative pulmonary complications is not clearly defined.16,17 Indeed, recently an experimental study suggested that such strategy might even lead to increased inflammation and lung injury in normal lungs.18 Despite these pathophysiological considerations, the use of PEEP in the operating room is con-troversial. Recently, an observational study conducted in 28 centers in France revealed that most patients undergoing gen-eral surgery were ventilated without PEEP.19 Notably, the use of recruitment maneuvers (RMs) to open the lungs has also been found to improve the effectiveness of PEEP with regard to gas exchange during general anesthesia.20–22 However, to date, there is no clear evidence of an additional benefit of RMs for routine anesthesia.
The current study compared a lung-protective mechani-cal ventilation strategy combining the use of lower tidal vol-ume (Vt), higher PEEP levels, and intraoperative RMs, with a conventional standard mechanical ventilation (higher tidal volume, ZEEP without intraoperative RMs) during abdomi-nal nonlaparoscopic surgery lasting more than 2 h.1
We hypothesized that in patients with normal lungs scheduled for general anesthesia, a protective ventilation strategy might prevent lung function modifications and lung morphological alterations.
The aim was to determine in this patient population the effect of an intraoperative protective ventilation strategy on
modifying chest x-ray images, oxygenation, and pulmonary functional tests.
Materials and MethodsStudy DesignThis unfunded, prospective, randomized, open-label, clinical trial was registered at ClinicalTrials.gov (ID NCT00426790). This trial was designed to demonstrate a superiority of treat-ment in protective group compared to the standard group.
The medical ethics committee of the Ospedale di Circolo e Fondazione Macchi, Varese, Italy, approved the trial pro-tocol, and informed consent was obtained from all patients before inclusion. The trial was not overseen by an indepen-dent safety board monitoring due to its design as a pilot physiological study.
Inclusion and Exclusion CriteriaPatients scheduled for elective nonlaparoscopic abdominal surgery under general anesthesia from May 2006 to May 2008 were selected through the clinical anesthesia service of our regional university hospital—Azienda Ospedaliera Ospedale di Circolo e Fondazione Macchi of Varese, Italy.
Patients were eligible for participation if they met the fol-lowing criteria: nonlaparoscopic abdominal surgery under general anesthesia expected to last more than 2 h and age more than 18 yr. Exclusion criteria were as follows: body mass index more than 40 kg/m2, laparoscopic surgery, need for surgery in emergency, previous lung surgery (any), persis-tent hemodynamic instability, intractable shock considered unsuitable for the study by the patient’s managing physician, history of chronic obstructive pulmonary disease, repeated systemic corticosteroid therapy for acute exacerbations of chronic obstructive pulmonary disease, asthma or sleep disorders, recent immunosuppressive medication defined as need of chemotherapy or radiation therapy, less than 2 months after chemotherapy or radiation therapy, severe car-diac disease defined as New York Heart Association class III or IV, or acute coronary syndrome, or persistent ventricular tachyarrhythmias, pregnancy (excluded by laboratory analy-sis), acute lung injury or acute respiratory distress syndrome, expecting to require prolonged postoperative mechanical ventilation, any neuromuscular disease, contraindications to position an epidural catheter because of major clotting dis-orders,23–25 or sign of infection at the site of the procedure.26
Standard ProceduresA central venous line was inserted in all patients, and a conservative fluids infusion (12–15 ml⋅kg−1⋅h−1) was administered during the study period to assure hemodynamic stability. Before they were given general anesthesia, patients underwent epidural anesthesia at the T8-T12 level whenever not contraindicated. After surgery the patients received a continuous infusion of ropivacaine 0.2% at 4–6 ml/h and morphine 0.1–0.15 mg for at least 48 h (AmbIT PCA; Summit Medical Products, Inc., Sandy, UT) with the possibility of
Anesthesiology 2013; 118:1307-21 1309 Severgnini et al.
PERIOPERATIVE MEDICINE
having patient-controlled bolus volume of 4–6 mg/h. The catheter was scheduled to be removed on the fourth day after surgery. Removal of the epidural catheter was planned at least 12 h after the last dose of low–molecular weight heparin (Enoxaparine sodium 4,000 U/die in a single subcutaneous administration) and 4 h before the next administration.
In other patients analgesia was provided by subcutane-ous continuous infusion through an elastomeric infusion system with morphine (0.3–0.4 mg/kg in 24 h) and ketoro-lac (1.0–1.5 mg/kg in 24 h) according to creatinine serum level. In only one patient analgesia was performed by a con-tinuous intravenous infusion of ketorolac (60 mg in 24 h) and tramadol (300 mg in 24 h); rescue dose was provided by subcutaneous morphine (5–10 mg). All patients were preoxygenated with FIO2 0.8 before tracheal intubation, and maintained at 0.4 during the entire anesthesia procedure, irrespective of study group, and received a routine anesthesia according to protocol, including intravenous fentanyl (1–3 μ/kg), propofol (2–3 mg/kg) at induction; thereafter, anes-thesia was maintained with propofol (5–10 mg⋅kg−1⋅h−1) or sevoflurane (inspiratory concentration between 1.5 and 2%); analgesia was provided with continuous remifentanil infusion (0.05–0.3 μ⋅kg−1⋅min−1) or fentanyl (1–3 μ/kg) as required. Patients were intubated after they were admin-istered rocuronium bromide (0.8 mg/kg); rocuronium was administered every 40 min, and the last administration was at least 1 h before the end of surgical suture. Routine intraoperative monitoring was performed using a dedicated monitor (IntelliVue Mp70; Philips Electronics, Eindhoven, The Netherlands) and included noninvasive blood pressure, pulse oximetry, end-tidal fractions of carbon dioxide, and electrocardiogram.
According to the standard of care in our institution all patients underwent conventional physiotherapy27 (early mobilization, stimulation of cough, and incentive spirom-etry), control of pain to achieve a Visual Analogue Scales (VAS) below 3, antibiotic prophylaxis, and antithrombotic treatment as required in the postoperative period.
Ventilation ProtocolConcealed randomization was conducted to ensure a fair comparison between groups: to select patients for treat-ment we generated a randomization list by Random Alloca-tion Software (Windows software, version 1.0, May 2004, Saghaei, licensee BioMed Central Ltd.) (allocation ratio 1:1) and inserted the group-identification paper in envelopes, which were then sealed and clouded to not reveal allocations.
The ventilation protocol consisted of volume-controlled mechanical ventilation (Datex Ohmeda S/5 Avance; GE Healthcare, Helsinki, Finland) at an inspired oxygen fraction of 0.40, inspiratory to expiratory ratio of 1:2, and a respira-tory rate adjusted to normocapnia (end-tidal carbon dioxide partial pressure between 30 and 40 mmHg). The compliance value was calculated with the plateau pressure measured dur-ing the normal ventilation setting, with an inspiratory pause
set at 40% of the inspiratory time. Patients were randomly assigned to mechanical ventilation with either a tidal volume of 9 ml/kg ideal body weight (IBW) and ZEEP (the stan-dard ventilation strategy) or 7 ml/kg IBW and 10 cm H2O PEEP with RMs (the protective ventilation strategy). IBW was calculated according to a predefined formula: 50 + 0.91 (height [cm] −152.4) for men and 45.5 + 0.91 (height [cm] −152.4) for women.28 RMs, as part of the protective strat-egy, were performed directly after induction of anesthesia, after any disconnection from the mechanical ventilator and directly before extubation, in hemodynamic stable situation as judged by the attending physician. Briefly, RMs were per-formed in volume-controlled ventilation as follows: the limit of peak inspiratory pressure was initially set at 45 cm H2O, the tidal volume at 7 ml/kg IBW, and respiratory rate at 6 breaths/min, PEEP at 10 cm H2O, and the inspiratory to expiratory ratio at 3:1; then the tidal volume was increased in steps of 4 ml/kg IBW until plateau pressure reached 30 cm H2O and three breaths were allowed. Finally, the respiratory rate, the inspiratory to expiratory ratio, inspiratory pause, and tidal volume were set back at values preceding the RM, whereas the PEEP was maintained at 10 cm H2O.
We defined a remarkable reduction in systolic arterial pressure when less than 90 mmHG and ensured that a mean arterial pressure less than 60 mmHg was not accepted.
Anesthesiologists were allowed to change the ventilation protocol at any point on the surgeon’s request, or if there was any concern about patient safety.
Clinical and Laboratory VariablesDuring mechanical ventilation, airway pressures, tidal vol-ume, and the respiratory rate were measured by means of the facilities of the ventilator. The compliance of the respiratory system was calculated as VT/(plateau pressure of the respira-tory system − PEEP).
Before and after surgery, pulmonary functional tests were performed at the bedside by using a spirometer (FERRARIS PiKo-6 FEV1/FEV6 METER; Pulmonary Data Services, Inc., Louisville, KY) while the patient was in a seated, comfortable position. A clip was placed over the nose and the patient breathed through the mouth into a tube connected to the spirometer. First the patient breathed in deeply, and then exhaled as quickly and forcefully as possible into the tube. The patient repeated this test three times and the best of the three results was considered to be the measure of lung function. The forced vital capacity and the forced expiratory vital capacity in 1 s were measured whereas the ratio between the forced vital capacity and the forced expiratory vital capacity in 1 s (forced expiratory vital capacity in 1 s/forced vital capacity) was calculated by the internal algorithm of the spirometer. We also calculated the predicted values of pulmonary functional tests according to Quanjer et al.29
Arterial blood gas analysis (Copenhagen abl 700 series; Radiometer, Brønshøj, Denmark) and peripheral oxygen sat-uration were measured in sitting position in room air, after
Anesthesiology 2013; 118:1307-21 1310 Severgnini et al.
Protective Ventilation during Abdominal Surgery
10 min of adaptation. After surgery, if the patient was using a Venturi oxygen mask (Breathing Solutions, Castelbolognese, Italy). the mask was removed. If peripheral oxygen satura-tion dropped below 88% during the 10 min of adaptation, the maneuver was stopped and arterial blood gas analysis immediately obtained.
Pain ScorePre- and postoperative dyspnea, cough, presence of secre-tions, abdominal and thoracic pain were measured by means of specifically targeted VAS. VAS was obtained by an attend-ing physician not involved in the study. Patients were asked to report their level of comfort by pointing to a horizontal line, 100 mm in length, anchored by word descriptor at each end, after answering one of the following questions: “How is your sensation of dyspnea?”, “How severe was your cough today?”, “How is your level of pain?”30,31 The VAS (in millimeters) was determined by measuring from the left-hand end of the line to the point that the patient or the physician marked.
Chest RadiographyPre- and postoperative (day 1 and day 3) chest x-ray, per-formed at the bedside, was examined in a blinded way by an independent specialist in radiology, who was not involved in the study. Pathological chest x-ray was defined as the pres-ence of at least one of the following: atelectasis, pleural effu-sions, or other chest radiological alterations.
Modified Clinical Pulmonary Infection ScoreThe modified Clinical Pulmonary Infection Score (mCPIS) was calculated by a modified original score as described by Pelosi et al.32 Patients were also compared before and after surgery for the following parameters: the Glasgow Coma Scale for nervous central system, the mean arterial pressure or administration of vasopressors required for cardiovascu-lar system, the serum aspartate transaminase, alanine trans-aminase, and bilirubin for liver, the prothrombin time and platelets for coagulation, and the serum creatinine for renal system.33
Intraoperative ObservationsDuring the intraoperative period (after induction of anesthe-sia, during the surgery, and before extubation) the follow-ing data were collected: airway pressures, arterial pressure, compliance of the respiratory system, peripheral oxygen saturation, and end-tidal fractions of carbon dioxide. Intra-operative fluids requirement and erythrocytes administra-tion were recorded, as well as blood losses and urine output. Intraoperative complications were recorded during anesthe-sia, and defined as follows: peripheral oxygen saturation less than 90% and/or end-tidal fractions of carbon dioxide more than 45 mmHg for more than 1 min, need to change the ventilation setting (tidal volume and/or respiratory rate), heart rate more than 100 beats/min or less than 60 beats/min, systolic arterial pressure more than 150 mmHg or less
than 90 mmHg, need for vasoactive drugs. During RMs, noninvasive blood pressure measurements were performed by setting the monitor in continuous mode.
Pre- and Postoperative ObservationsPreoperatively the following measurements were obtained: peripheral oxygen saturation and arterial blood gas analysis in air, pulmonary functional tests, tympanic temperature, VAS for abdominal and thoracic pain, dyspnea, cough, pres-ence of secretions, laboratory tests for organ function, chest x-ray, and the mCPIS.
The same measurements were performed on postopera-tive days 1, 3, and 5 whereas the chest x-ray and the mCPIS were calculated only on postoperative days 1 and 3. Pulmo-nary complications were defined with Celli score34 calcu-lated postoperatively on days 1, 3, and 5.
Pulmonary complications were defined as the develop-ment of three or more of six new findings: cough, increased secretions, dyspnea, chest pain, temperature greater than 38°C, and pulse rate more than 100 beats/min.34 Surgical complications were recorded and patients were followed up until hospital discharge or death. Wound infection was defined according to Horan et al.35 criteria: infection within 30 days after the operative procedure with at least purulent drainage from the superficial incision, organisms isolated from an aseptically obtained culture of fluid or tissue from the superficial incision, with pain or tenderness, localized swelling, redness or heat.
Primary and Secondary EndpointsOur hypothesis was that intraoperative lung-protective ven-tilation could protect against postoperative pulmonary and extrapulmonary complications. The primary endpoints were the changes in mCPIS in the postoperative period. The sec-ondary endpoints were the changes in arterial oxygenation and peripheral oxygen saturation in air, the pulmonary func-tional tests, and the rate of complications during recruit-ment, anesthesia, as well as in the postoperative period.
Statistical AnalysisThe sample size was based on data previously published in the literature on oxygenation and chest x-ray alterations postoperatively, according to Hedenstierna and Edmark5 and Choi et al.,10 but a formal a priori sample size calculation was not conducted.
The normality of the distribution was tested with the D’Agostino-Pearson test. Data are given as mean ± SD or median and interquartile range (25–75%), as appropriate. Comparisons of normally distributed variables were performed with paired or unpaired t tests as appropriate, whereas the Mann–Whitney and the Wilcoxon tests were used for other variables. Comparisons of two or more proportions were conducted with the chi-square test; the Fisher exact test was used for small frequencies. The major outcome variables were tested with two-way repeated measures ANOVA (group
Anesthesiology 2013; 118:1307-21 1311 Severgnini et al.
PERIOPERATIVE MEDICINE
effects), and pair-wise comparisons of each time point with baseline, adjusted according to Bonferroni correction, were conducted.
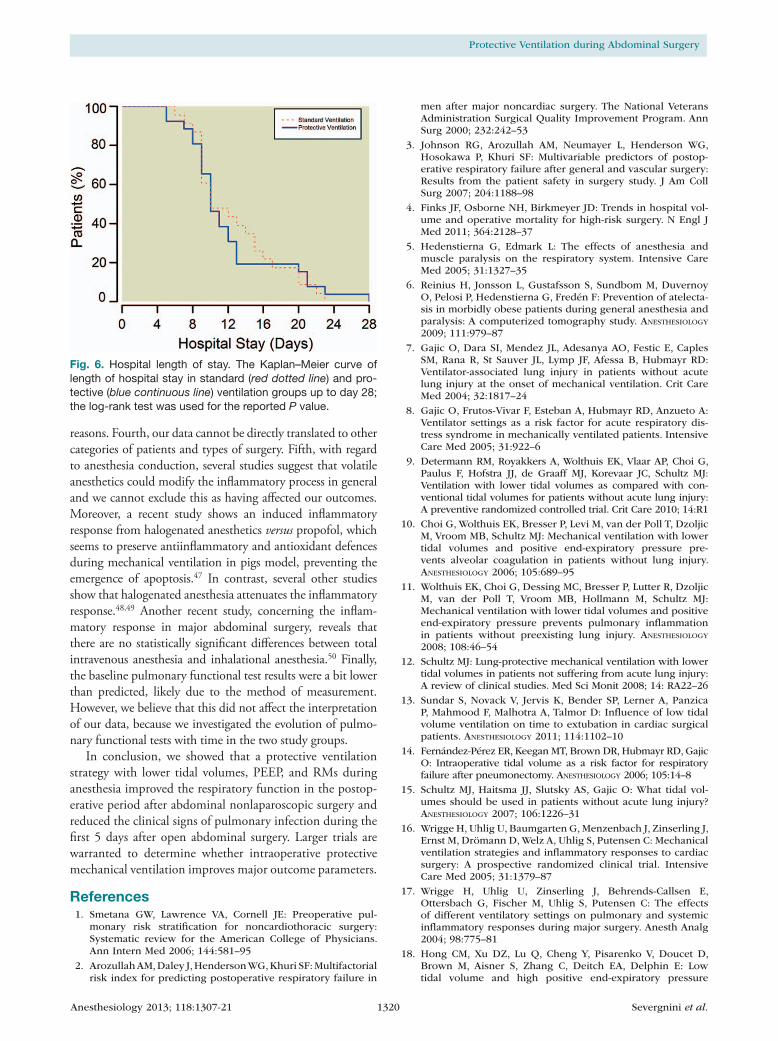
The Kaplan–Meier curve was used to analyze the length of hospital stay in groups; the log-rank test was used for the reported P value.
All tests were two-tailed and statistical significance was accepted at P value less than 0.05.
All statistical analyses were performed with MedCalc® Version 9.3.7.0 (MedCalc Software bvba, Mariakerke, Bel-gium). The statistical analysis was performed independently of the team of the clinicians involved in the study, by a spe-cialist in physics and biomedical statistics (Dr. Novario).
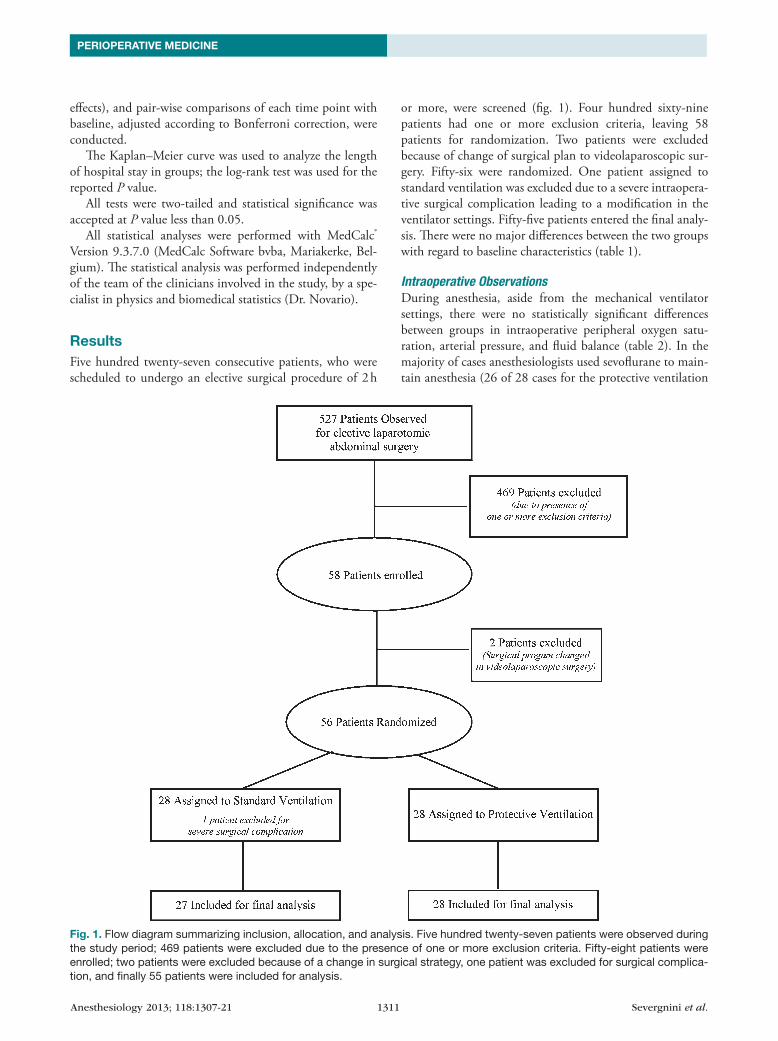
ResultsFive hundred twenty-seven consecutive patients, who were scheduled to undergo an elective surgical procedure of 2 h
or more, were screened (fig. 1). Four hundred sixty-nine patients had one or more exclusion criteria, leaving 58 patients for randomization. Two patients were excluded because of change of surgical plan to videolaparoscopic sur-gery. Fifty-six were randomized. One patient assigned to standard ventilation was excluded due to a severe intraopera-tive surgical complication leading to a modification in the ventilator settings. Fifty-five patients entered the final analy-sis. There were no major differences between the two groups with regard to baseline characteristics (table 1).
Intraoperative ObservationsDuring anesthesia, aside from the mechanical ventilator settings, there were no statistically significant differences between groups in intraoperative peripheral oxygen satu-ration, arterial pressure, and fluid balance (table 2). In the majority of cases anesthesiologists used sevoflurane to main-tain anesthesia (26 of 28 cases for the protective ventilation
Fig. 1. Flow diagram summarizing inclusion, allocation, and analysis. Five hundred twenty-seven patients were observed during the study period; 469 patients were excluded due to the presence of one or more exclusion criteria. Fifty-eight patients were enrolled; two patients were excluded because of a change in surgical strategy, one patient was excluded for surgical complica-tion, and finally 55 patients were included for analysis.
Anesthesiology 2013; 118:1307-21 1312 Severgnini et al.
Protective Ventilation during Abdominal Surgery
group and 26 of 27 cases for the standard ventilation group; P = 1.0). Tidal volume, PEEP, plateau pressure, and mean airway pressure of the respiratory system were higher in the protective group compared with the standard ventilation strategy group. The respiratory rate was slightly lower in the standard ventilation strategy group, whereas the end-tidal carbon dioxide partial pressure was slightly higher in the protective ventilation strategy group.
Overall intraoperative complications, including those during RMs, were comparable between the two study groups (table 3). During RMs in eight patients systolic arterial pres-sure decreased less than 90 mmHg for more than 3 min, whereas two patients showed a heart rate less than 60 beats/min. No other complications were observed during RMs.
End-tidal carbon dioxide partial pressure was never less than 25 mmHg during RMs.
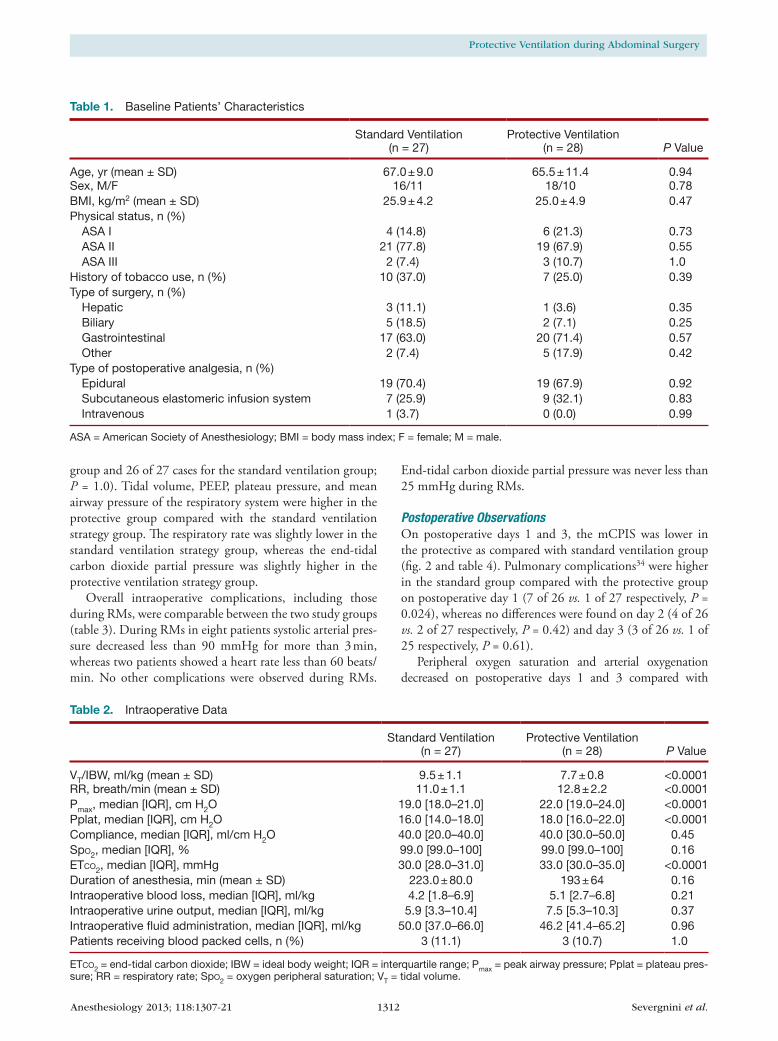
Postoperative ObservationsOn postoperative days 1 and 3, the mCPIS was lower in the protective as compared with standard ventilation group (fig. 2 and table 4). Pulmonary complications34 were higher in the standard group compared with the protective group on postoperative day 1 (7 of 26 vs. 1 of 27 respectively, P = 0.024), whereas no differences were found on day 2 (4 of 26 vs. 2 of 27 respectively, P = 0.42) and day 3 (3 of 26 vs. 1 of 25 respectively, P = 0.61).
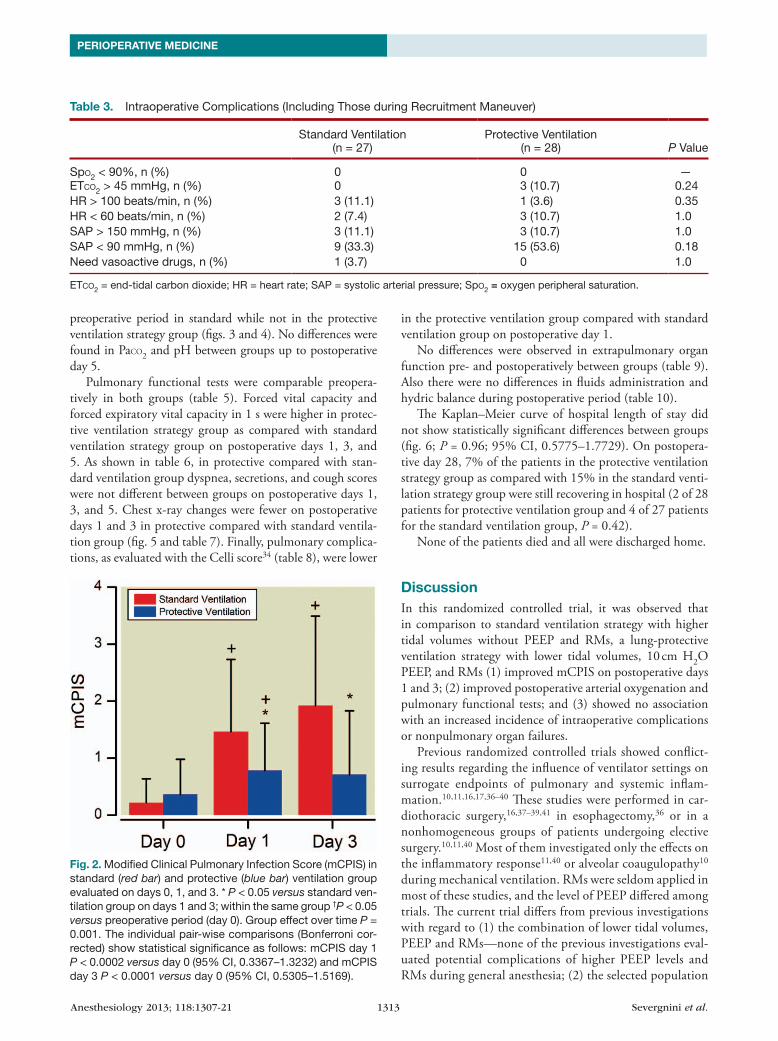
Peripheral oxygen saturation and arterial oxygenation decreased on postoperative days 1 and 3 compared with
Table 1. Baseline Patients’ Characteristics
Standard Ventilation (n = 27)
Protective Ventilation (n = 28) P Value
Age, yr (mean ± SD) 67.0 ± 9.0 65.5 ± 11.4 0.94Sex, M/F 16/11 18/10 0.78BMI, kg/m2 (mean ± SD) 25.9 ± 4.2 25.0 ± 4.9 0.47Physical status, n (%) ASA I 4 (14.8) 6 (21.3) 0.73 ASA II 21 (77.8) 19 (67.9) 0.55 ASA III 2 (7.4) 3 (10.7) 1.0History of tobacco use, n (%) 10 (37.0) 7 (25.0) 0.39Type of surgery, n (%) Hepatic 3 (11.1) 1 (3.6) 0.35 Biliary 5 (18.5) 2 (7.1) 0.25 Gastrointestinal 17 (63.0) 20 (71.4) 0.57 Other 2 (7.4) 5 (17.9) 0.42Type of postoperative analgesia, n (%) Epidural 19 (70.4) 19 (67.9) 0.92 Subcutaneous elastomeric infusion system 7 (25.9) 9 (32.1) 0.83 Intravenous 1 (3.7) 0 (0.0) 0.99
ASA = American Society of Anesthesiology; BMI = body mass index; F = female; M = male.
Table 2. Intraoperative Data
Standard Ventilation (n = 27)
Protective Ventilation (n = 28) P Value
VT/IBW, ml/kg (mean ± SD) 9.5 ± 1.1 7.7 ± 0.8 <0.0001RR, breath/min (mean ± SD) 11.0 ± 1.1 12.8 ± 2.2 <0.0001Pmax, median [IQR], cm H2O 19.0 [18.0–21.0] 22.0 [19.0–24.0] <0.0001Pplat, median [IQR], cm H2O 16.0 [14.0–18.0] 18.0 [16.0–22.0] <0.0001Compliance, median [IQR], ml/cm H2O 40.0 [20.0–40.0] 40.0 [30.0–50.0] 0.45SpO2, median [IQR], % 99.0 [99.0–100] 99.0 [99.0–100] 0.16ETCO2, median [IQR], mmHg 30.0 [28.0–31.0] 33.0 [30.0–35.0] <0.0001Duration of anesthesia, min (mean ± SD) 223.0 ± 80.0 193 ± 64 0.16Intraoperative blood loss, median [IQR], ml/kg 4.2 [1.8–6.9] 5.1 [2.7–6.8] 0.21Intraoperative urine output, median [IQR], ml/kg 5.9 [3.3–10.4] 7.5 [5.3–10.3] 0.37Intraoperative fluid administration, median [IQR], ml/kg 50.0 [37.0–66.0] 46.2 [41.4–65.2] 0.96Patients receiving blood packed cells, n (%) 3 (11.1) 3 (10.7) 1.0
ETCO2 = end-tidal carbon dioxide; IBW = ideal body weight; IQR = interquartile range; Pmax = peak airway pressure; Pplat = plateau pres-sure; RR = respiratory rate; SpO2 = oxygen peripheral saturation; VT = tidal volume.
Anesthesiology 2013; 118:1307-21 1313 Severgnini et al.
PERIOPERATIVE MEDICINE
preoperative period in standard while not in the protective ventilation strategy group (figs. 3 and 4). No differences were found in PaCO2 and pH between groups up to postoperative day 5.
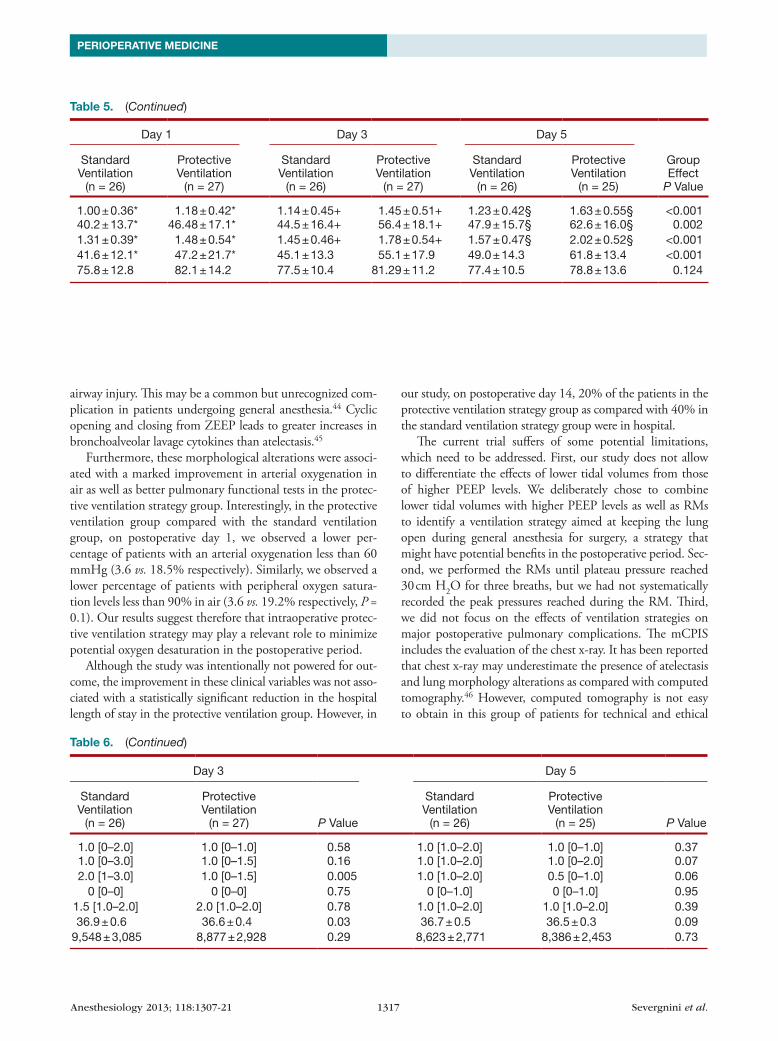
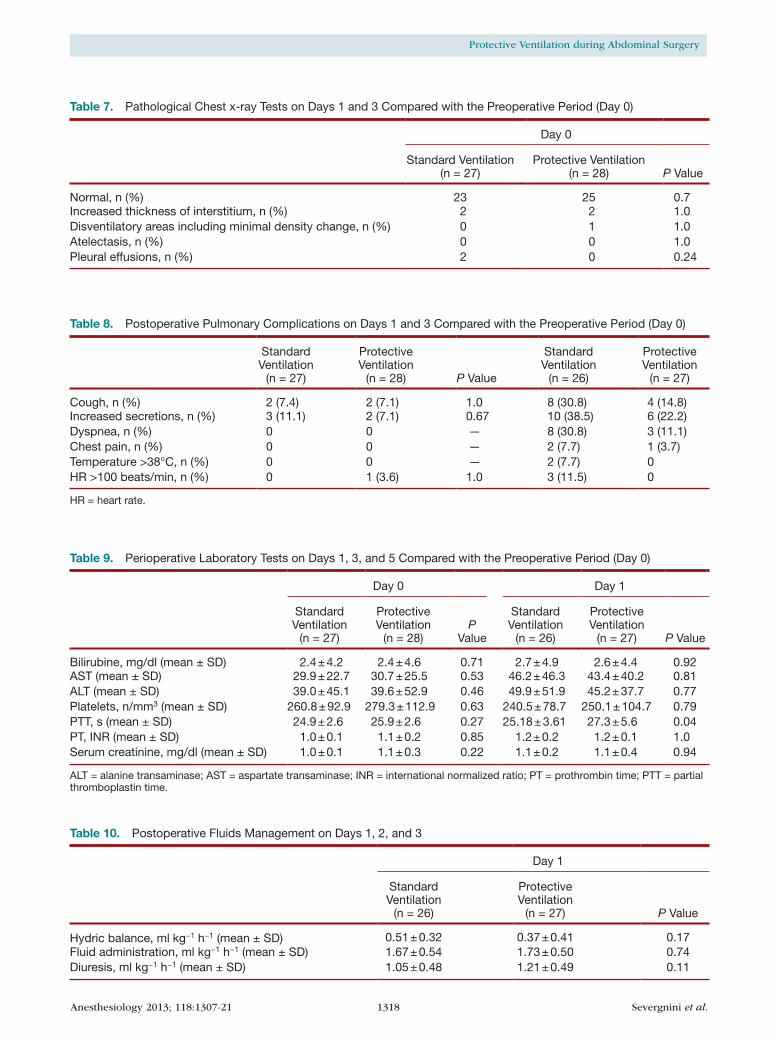
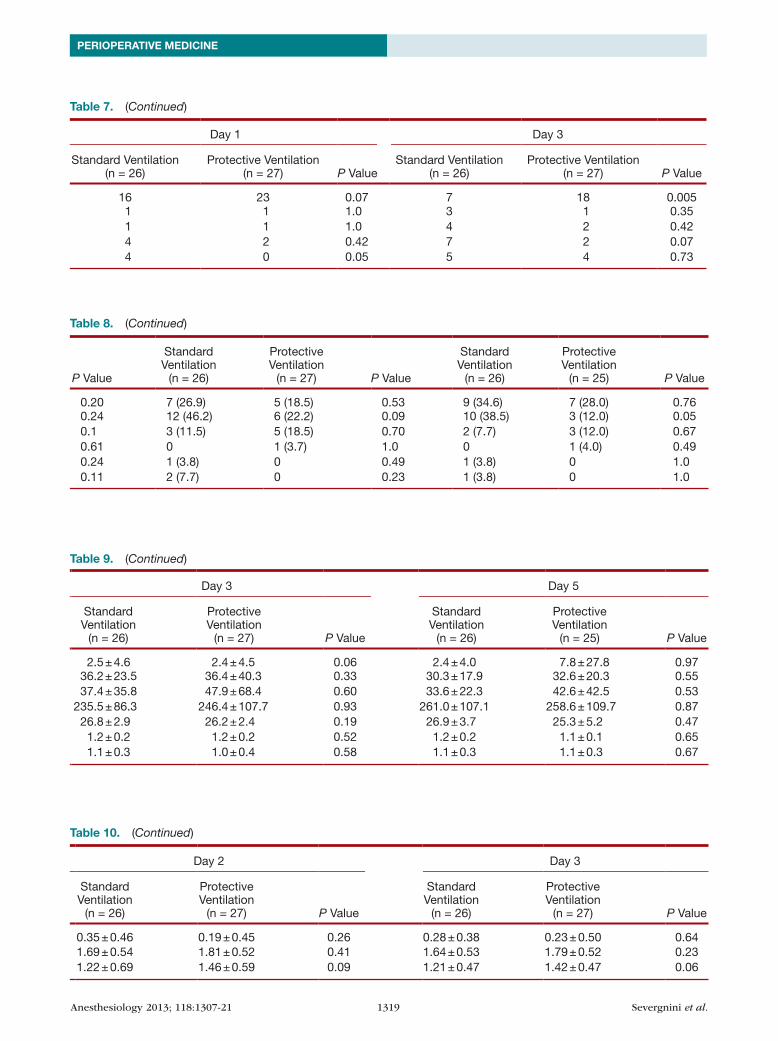
Pulmonary functional tests were comparable preopera-tively in both groups (table 5). Forced vital capacity and forced expiratory vital capacity in 1 s were higher in protec-tive ventilation strategy group as compared with standard ventilation strategy group on postoperative days 1, 3, and 5. As shown in table 6, in protective compared with stan-dard ventilation group dyspnea, secretions, and cough scores were not different between groups on postoperative days 1, 3, and 5. Chest x-ray changes were fewer on postoperative days 1 and 3 in protective compared with standard ventila-tion group (fig. 5 and table 7). Finally, pulmonary complica-tions, as evaluated with the Celli score34 (table 8), were lower
in the protective ventilation group compared with standard ventilation group on postoperative day 1.
No differences were observed in extrapulmonary organ function pre- and postoperatively between groups (table 9). Also there were no differences in fluids administration and hydric balance during postoperative period (table 10).
The Kaplan–Meier curve of hospital length of stay did not show statistically significant differences between groups (fig. 6; P = 0.96; 95% CI, 0.5775–1.7729). On postopera-tive day 28, 7% of the patients in the protective ventilation strategy group as compared with 15% in the standard venti-lation strategy group were still recovering in hospital (2 of 28 patients for protective ventilation group and 4 of 27 patients for the standard ventilation group, P = 0.42).
None of the patients died and all were discharged home.
DiscussionIn this randomized controlled trial, it was observed that in comparison to standard ventilation strategy with higher tidal volumes without PEEP and RMs, a lung-protective ventilation strategy with lower tidal volumes, 10 cm H2O PEEP, and RMs (1) improved mCPIS on postoperative days 1 and 3; (2) improved postoperative arterial oxygenation and pulmonary functional tests; and (3) showed no association with an increased incidence of intraoperative complications or nonpulmonary organ failures.
Previous randomized controlled trials showed conflict-ing results regarding the influence of ventilator settings on surrogate endpoints of pulmonary and systemic inflam-mation.10,11,16,17,36–40 These studies were performed in car-diothoracic surgery,16,37–39,41 in esophagectomy,36 or in a nonhomogeneous groups of patients undergoing elective surgery.10,11,40 Most of them investigated only the effects on the inflammatory response11,40 or alveolar coaugulopathy10 during mechanical ventilation. RMs were seldom applied in most of these studies, and the level of PEEP differed among trials. The current trial differs from previous investigations with regard to (1) the combination of lower tidal volumes, PEEP and RMs—none of the previous investigations eval-uated potential complications of higher PEEP levels and RMs during general anesthesia; (2) the selected population
Table 3. Intraoperative Complications (Including Those during Recruitment Maneuver)
Standard Ventilation (n = 27)
Protective Ventilation (n = 28) P Value
SpO2 < 90%, n (%) 0 0 —ETCO2 > 45 mmHg, n (%) 0 3 (10.7) 0.24HR > 100 beats/min, n (%) 3 (11.1) 1 (3.6) 0.35HR < 60 beats/min, n (%) 2 (7.4) 3 (10.7) 1.0SAP > 150 mmHg, n (%) 3 (11.1) 3 (10.7) 1.0SAP < 90 mmHg, n (%) 9 (33.3) 15 (53.6) 0.18Need vasoactive drugs, n (%) 1 (3.7) 0 1.0
ETCO2 = end-tidal carbon dioxide; HR = heart rate; SAP = systolic arterial pressure; SpO2 = oxygen peripheral saturation.
Fig. 2. Modified Clinical Pulmonary Infection Score (mCPIS) in standard (red bar) and protective (blue bar) ventilation group evaluated on days 0, 1, and 3. * P < 0.05 versus standard ven-tilation group on days 1 and 3; within the same group †P < 0.05 versus preoperative period (day 0). Group effect over time P = 0.001. The individual pair-wise comparisons (Bonferroni cor-rected) show statistical significance as follows: mCPIS day 1 P < 0.0002 versus day 0 (95% CI, 0.3367–1.3232) and mCPIS day 3 P < 0.0001 versus day 0 (95% CI, 0.5305–1.5169).
Anesthesiology 2013; 118:1307-21 1314 Severgnini et al.
Protective Ventilation during Abdominal Surgery
Fig. 3. Peripheral oxygen saturation (SpO2) evaluated on post-operative days 1, 3, and 5 compared with the preoperative period (day 0) in standard (red bar) and protective (blue bar) ventilation strategy groups. * P < 0.05 versus standard venti-lation group on days 1, 3, and 5, respectively; within the same group + P <0.05 versus preoperative period (day 0). Group effect over time P < 0.001. The individual pair-wise com-parisons (Bonferroni corrected) show statistical significance as follows: SpO2 day 1, P < 0.0001 versus day 0 (95% CI, −3.7065 to −1.1086); SpO2 day 3, P < 0.0715 versus day 0 (95% CI, −2.5362 to 0.06174); SpO2 day 5, P = 1.0 versus day 0 (95% CI, −1.5850 to 1.0254).
Fig. 4. Arterial oxygen pressure (PaO2) evaluated on postoper-ative days 1, 3, and 5 compared with the preoperative period (day 0) in standard (red bar) and protective (blue bar) ventila-tion strategy groups. * P < 0.05 versus standard ventilation group on days 1, 3, and 5, respectively; within the same group + P < 0.05 versus preoperative period (day 0). Group effect over time P < 0.001. The individual pair-wise comparisons (Bonferroni corrected) show statistical significance as follows: PaO2 on day 1 P < 0.0001 versus on day 0 (95% CI, 21.8521 to −9.3786); PaO2 on day 3 P < 0.0001 versus on day 0 (95% CI, 17.7832 to −5.3096); PaO2 on day 5 P < 0.046 versus on day 0 (95% CI, 12.6022 to −0.06890).
Table 4. Criteria and Detail Score for Modified Clinical Pulmonary Infection Score on Days 1 and 3 Compared with Preoperative Period (Day 0)
Components
Day 0 Day 1 Day 3
Standard Ventilation (n = 27)
Protective Ventilation (n = 28) P Value
Standard Ventilation (n = 26)
Protective Ventilation (n = 27) P Value
Standard Ventilation (n = 26)
Protective Ventilation (n = 27) P Value
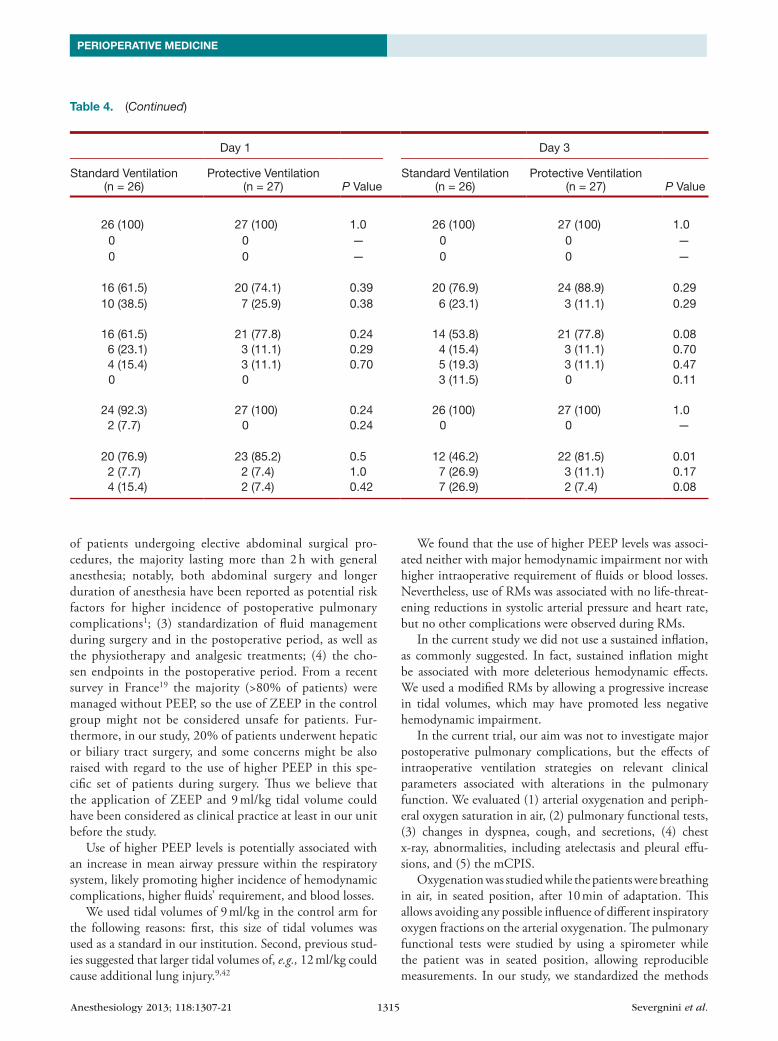
Temperature, °C, n (%) ≥36.1 and ≤38.4 27 (100) 28 (100) 1.0 26 (100) 27 (100) 1.0 26 (100) 27 (100) 1.0 ≥38.5 and ≤38.9 0 0 — 0 0 — 0 0 — ≥39.0 and ≤36.0 0 0 — 0 0 — 0 0 —Blood leukocytes, n (%) ≥4000 and ≤11.000 26 (96.3) 25 (89.3) 0.61 16 (61.5) 20 (74.1) 0.39 20 (76.9) 24 (88.9) 0.29 < 4000 and >11.000 1 (3.7) 3 (10.7) 0.31 10 (38.5) 7 (25.9) 0.38 6 (23.1) 3 (11.1) 0.29Tracheal secretions, n (%) Few 24 (88.9) 26 (92.8) 0.67 16 (61.5) 21 (77.8) 0.24 14 (53.8) 21 (77.8) 0.08 Moderate 3 (11.1) 1 (3.6) 0.35 6 (23.1) 3 (11.1) 0.29 4 (15.4) 3 (11.1) 0.70 Large 0 1 (3.6) 1.0 4 (15.4) 3 (11.1) 0.70 5 (19.3) 3 (11.1) 0.47 Purulent 0 0 — 0 0 3 (11.5) 0 0.11PaO2/FIO2 ratio, mmHg, n (%) >240 or presence of ARDS 27 (100) 28 (100) 1.0 24 (92.3) 27 (100) 0.24 26 (100) 27 (100) 1.0 ≤240 and absence of ARDS 0 0 — 2 (7.7) 0 0.24 0 0 —Chest x-ray, n (%) No infiltrate 25 (92.6) 25 (89.3) 1.0 20 (76.9) 23 (85.2) 0.5 12 (46.2) 22 (81.5) 0.01 Patchy or diffuse infiltrate 2 (7.4) 3 (10.7) 1 2 (7.7) 2 (7.4) 1.0 7 (26.9) 3 (11.1) 0.17 Localized infiltrate 0 0 — 4 (15.4) 2 (7.4) 0.42 7 (26.9) 2 (7.4) 0.08
ARDS = acute respiratory distress symdrome; FIO2 = oxygen inspiratory fraction; PaO2 = oxygen arterial pressure.
Anesthesiology 2013; 118:1307-21 1315 Severgnini et al.
PERIOPERATIVE MEDICINE
of patients undergoing elective abdominal surgical pro-cedures, the majority lasting more than 2 h with general anesthesia; notably, both abdominal surgery and longer duration of anesthesia have been reported as potential risk factors for higher incidence of postoperative pulmonary complications1; (3) standardization of fluid management during surgery and in the postoperative period, as well as the physiotherapy and analgesic treatments; (4) the cho-sen endpoints in the postoperative period. From a recent survey in France19 the majority (>80% of patients) were managed without PEEP, so the use of ZEEP in the control group might not be considered unsafe for patients. Fur-thermore, in our study, 20% of patients underwent hepatic or biliary tract surgery, and some concerns might be also raised with regard to the use of higher PEEP in this spe-cific set of patients during surgery. Thus we believe that the application of ZEEP and 9 ml/kg tidal volume could have been considered as clinical practice at least in our unit before the study.
Use of higher PEEP levels is potentially associated with an increase in mean airway pressure within the respiratory system, likely promoting higher incidence of hemodynamic complications, higher fluids’ requirement, and blood losses.
We used tidal volumes of 9 ml/kg in the control arm for the following reasons: first, this size of tidal volumes was used as a standard in our institution. Second, previous stud-ies suggested that larger tidal volumes of, e.g., 12 ml/kg could cause additional lung injury.9,42
We found that the use of higher PEEP levels was associ-ated neither with major hemodynamic impairment nor with higher intraoperative requirement of fluids or blood losses. Nevertheless, use of RMs was associated with no life-threat-ening reductions in systolic arterial pressure and heart rate, but no other complications were observed during RMs.
In the current study we did not use a sustained inflation, as commonly suggested. In fact, sustained inflation might be associated with more deleterious hemodynamic effects. We used a modified RMs by allowing a progressive increase in tidal volumes, which may have promoted less negative hemodynamic impairment.
In the current trial, our aim was not to investigate major postoperative pulmonary complications, but the effects of intraoperative ventilation strategies on relevant clinical parameters associated with alterations in the pulmonary function. We evaluated (1) arterial oxygenation and periph-eral oxygen saturation in air, (2) pulmonary functional tests, (3) changes in dyspnea, cough, and secretions, (4) chest x-ray, abnormalities, including atelectasis and pleural effu-sions, and (5) the mCPIS.
Oxygenation was studied while the patients were breathing in air, in seated position, after 10 min of adaptation. This allows avoiding any possible influence of different inspiratory oxygen fractions on the arterial oxygenation. The pulmonary functional tests were studied by using a spirometer while the patient was in seated position, allowing reproducible measurements. In our study, we standardized the methods
Table 4. Criteria and Detail Score for Modified Clinical Pulmonary Infection Score on Days 1 and 3 Compared with Preoperative Period (Day 0)
Components
Day 0 Day 1 Day 3
Standard Ventilation (n = 27)
Protective Ventilation (n = 28) P Value
Standard Ventilation (n = 26)
Protective Ventilation (n = 27) P Value
Standard Ventilation (n = 26)
Protective Ventilation (n = 27) P Value
Temperature, °C, n (%) ≥36.1 and ≤38.4 27 (100) 28 (100) 1.0 26 (100) 27 (100) 1.0 26 (100) 27 (100) 1.0 ≥38.5 and ≤38.9 0 0 — 0 0 — 0 0 — ≥39.0 and ≤36.0 0 0 — 0 0 — 0 0 —Blood leukocytes, n (%) ≥4000 and ≤11.000 26 (96.3) 25 (89.3) 0.61 16 (61.5) 20 (74.1) 0.39 20 (76.9) 24 (88.9) 0.29 < 4000 and >11.000 1 (3.7) 3 (10.7) 0.31 10 (38.5) 7 (25.9) 0.38 6 (23.1) 3 (11.1) 0.29Tracheal secretions, n (%) Few 24 (88.9) 26 (92.8) 0.67 16 (61.5) 21 (77.8) 0.24 14 (53.8) 21 (77.8) 0.08 Moderate 3 (11.1) 1 (3.6) 0.35 6 (23.1) 3 (11.1) 0.29 4 (15.4) 3 (11.1) 0.70 Large 0 1 (3.6) 1.0 4 (15.4) 3 (11.1) 0.70 5 (19.3) 3 (11.1) 0.47 Purulent 0 0 — 0 0 3 (11.5) 0 0.11PaO2/FIO2 ratio, mmHg, n (%) >240 or presence of ARDS 27 (100) 28 (100) 1.0 24 (92.3) 27 (100) 0.24 26 (100) 27 (100) 1.0 ≤240 and absence of ARDS 0 0 — 2 (7.7) 0 0.24 0 0 —Chest x-ray, n (%) No infiltrate 25 (92.6) 25 (89.3) 1.0 20 (76.9) 23 (85.2) 0.5 12 (46.2) 22 (81.5) 0.01 Patchy or diffuse infiltrate 2 (7.4) 3 (10.7) 1 2 (7.7) 2 (7.4) 1.0 7 (26.9) 3 (11.1) 0.17 Localized infiltrate 0 0 — 4 (15.4) 2 (7.4) 0.42 7 (26.9) 2 (7.4) 0.08
ARDS = acute respiratory distress symdrome; FIO2 = oxygen inspiratory fraction; PaO2 = oxygen arterial pressure.
Table 4. (Continued)
Anesthesiology 2013; 118:1307-21 1316 Severgnini et al.
Protective Ventilation during Abdominal Surgery
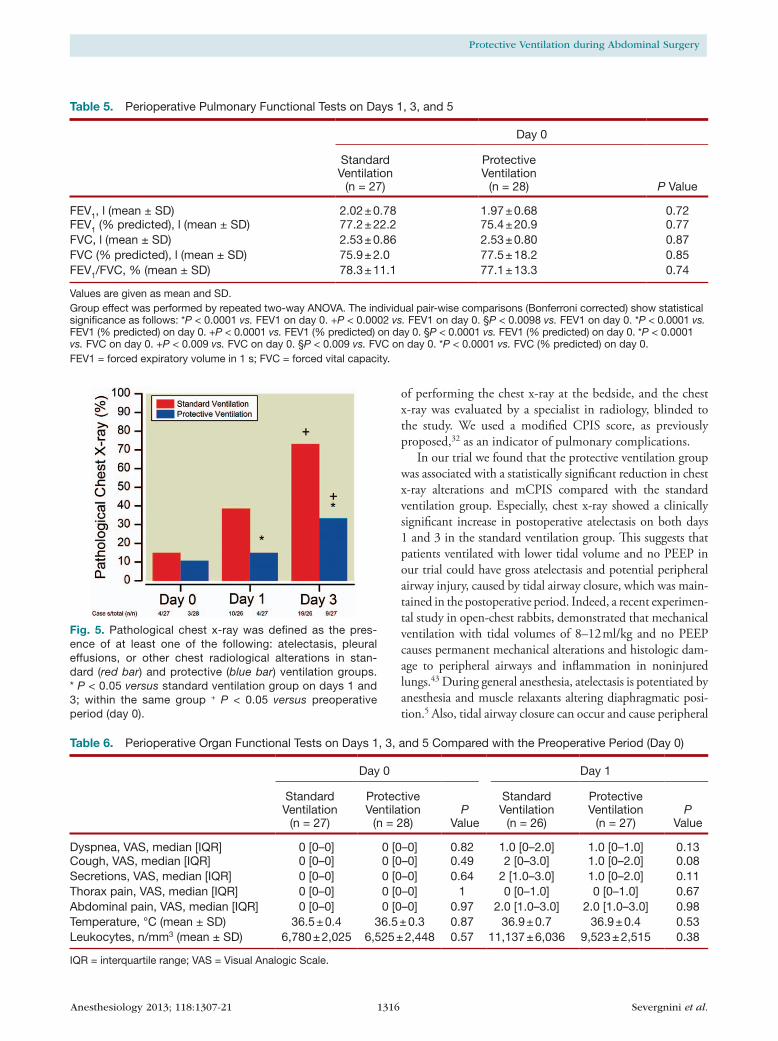
of performing the chest x-ray at the bedside, and the chest x-ray was evaluated by a specialist in radiology, blinded to the study. We used a modified CPIS score, as previously proposed,32 as an indicator of pulmonary complications.
In our trial we found that the protective ventilation group was associated with a statistically significant reduction in chest x-ray alterations and mCPIS compared with the standard ventilation group. Especially, chest x-ray showed a clinically significant increase in postoperative atelectasis on both days 1 and 3 in the standard ventilation group. This suggests that patients ventilated with lower tidal volume and no PEEP in our trial could have gross atelectasis and potential peripheral airway injury, caused by tidal airway closure, which was main-tained in the postoperative period. Indeed, a recent experimen-tal study in open-chest rabbits, demonstrated that mechanical ventilation with tidal volumes of 8–12 ml/kg and no PEEP causes permanent mechanical alterations and histologic dam-age to peripheral airways and inflammation in noninjured lungs.43 During general anesthesia, atelectasis is potentiated by anesthesia and muscle relaxants altering diaphragmatic posi-tion.5 Also, tidal airway closure can occur and cause peripheral
Fig. 5. Pathological chest x-ray was defined as the pres-ence of at least one of the following: atelectasis, pleural effusions, or other chest radiological alterations in stan-dard (red bar) and protective (blue bar) ventilation groups. * P < 0.05 versus standard ventilation group on days 1 and 3; within the same group + P < 0.05 versus preoperative period (day 0).
Table 5. Perioperative Pulmonary Functional Tests on Days 1, 3, and 5
Day 0 Day 1 Day 3 Day 5
Group Effect
P Value
Standard Ventilation
(n = 27)
Protective Ventilation
(n = 28) P Value
Standard Ventilation
(n = 26)
Protective Ventilation
(n = 27)
Standard Ventilation
(n = 26)
Protective Ventilation
(n = 27)
Standard Ventilation
(n = 26)
Protective Ventilation
(n = 25)
FEV1, l (mean ± SD) 2.02 ± 0.78 1.97 ± 0.68 0.72 1.00 ± 0.36* 1.18 ± 0.42* 1.14 ± 0.45+ 1.45 ± 0.51+ 1.23 ± 0.42§ 1.63 ± 0.55§ <0.001FEV1 (% predicted), l (mean ± SD) 77.2 ± 22.2 75.4 ± 20.9 0.77 40.2 ± 13.7* 46.48 ± 17.1* 44.5 ± 16.4+ 56.4 ± 18.1+ 47.9 ± 15.7§ 62.6 ± 16.0§ 0.002FVC, l (mean ± SD) 2.53 ± 0.86 2.53 ± 0.80 0.87 1.31 ± 0.39* 1.48 ± 0.54* 1.45 ± 0.46+ 1.78 ± 0.54+ 1.57 ± 0.47§ 2.02 ± 0.52§ <0.001FVC (% predicted), l (mean ± SD) 75.9 ± 2.0 77.5 ± 18.2 0.85 41.6 ± 12.1* 47.2 ± 21.7* 45.1 ± 13.3 55.1 ± 17.9 49.0 ± 14.3 61.8 ± 13.4 <0.001FEV1/FVC, % (mean ± SD) 78.3 ± 11.1 77.1 ± 13.3 0.74 75.8 ± 12.8 82.1 ± 14.2 77.5 ± 10.4 81.29 ± 11.2 77.4 ± 10.5 78.8 ± 13.6 0.124
Values are given as mean and SD.Group effect was performed by repeated two-way ANOVA. The individual pair-wise comparisons (Bonferroni corrected) show statistical significance as follows: *P < 0.0001 vs. FEV1 on day 0. +P < 0.0002 vs. FEV1 on day 0. §P < 0.0098 vs. FEV1 on day 0. *P < 0.0001 vs. FEV1 (% predicted) on day 0. +P < 0.0001 vs. FEV1 (% predicted) on day 0. §P < 0.0001 vs. FEV1 (% predicted) on day 0. *P < 0.0001 vs. FVC on day 0. +P < 0.009 vs. FVC on day 0. §P < 0.009 vs. FVC on day 0. *P < 0.0001 vs. FVC (% predicted) on day 0.FEV1 = forced expiratory volume in 1 s; FVC = forced vital capacity.
Table 6. Perioperative Organ Functional Tests on Days 1, 3, and 5 Compared with the Preoperative Period (Day 0)
Day 0 Day 1 Day 3 Day 5
Standard Ventilation
(n = 27)
Protective Ventilation
(n = 28)P
Value
Standard Ventilation
(n = 26)
Protective Ventilation
(n = 27)P
Value
Standard Ventilation
(n = 26)
Protective Ventilation
(n = 27) P Value
Standard Ventilation
(n = 26)
Protective Ventilation
(n = 25) P Value
Dyspnea, VAS, median [IQR] 0 [0–0] 0 [0–0] 0.82 1.0 [0–2.0] 1.0 [0–1.0] 0.13 1.0 [0–2.0] 1.0 [0–1.0] 0.58 1.0 [1.0–2.0] 1.0 [0–1.0] 0.37Cough, VAS, median [IQR] 0 [0–0] 0 [0–0] 0.49 2 [0–3.0] 1.0 [0–2.0] 0.08 1.0 [0–3.0] 1.0 [0–1.5] 0.16 1.0 [1.0–2.0] 1.0 [0–2.0] 0.07Secretions, VAS, median [IQR] 0 [0–0] 0 [0–0] 0.64 2 [1.0–3.0] 1.0 [0–2.0] 0.11 2.0 [1–3.0] 1.0 [0–1.5] 0.005 1.0 [1.0–2.0] 0.5 [0–1.0] 0.06Thorax pain, VAS, median [IQR] 0 [0–0] 0 [0–0] 1 0 [0–1.0] 0 [0–1.0] 0.67 0 [0–0] 0 [0–0] 0.75 0 [0–1.0] 0 [0–1.0] 0.95Abdominal pain, VAS, median [IQR] 0 [0–0] 0 [0–0] 0.97 2.0 [1.0–3.0] 2.0 [1.0–3.0] 0.98 1.5 [1.0–2.0] 2.0 [1.0–2.0] 0.78 1.0 [1.0–2.0] 1.0 [1.0–2.0] 0.39Temperature, °C (mean ± SD) 36.5 ± 0.4 36.5 ± 0.3 0.87 36.9 ± 0.7 36.9 ± 0.4 0.53 36.9 ± 0.6 36.6 ± 0.4 0.03 36.7 ± 0.5 36.5 ± 0.3 0.09Leukocytes, n/mm3 (mean ± SD) 6,780 ± 2,025 6,525 ± 2,448 0.57 11,137 ± 6,036 9,523 ± 2,515 0.38 9,548 ± 3,085 8,877 ± 2,928 0.29 8,623 ± 2,771 8,386 ± 2,453 0.73
IQR = interquartile range; VAS = Visual Analogic Scale.
Anesthesiology 2013; 118:1307-21 1317 Severgnini et al.
PERIOPERATIVE MEDICINE
airway injury. This may be a common but unrecognized com-plication in patients undergoing general anesthesia.44 Cyclic opening and closing from ZEEP leads to greater increases in bronchoalveolar lavage cytokines than atelectasis.45
Furthermore, these morphological alterations were associ-ated with a marked improvement in arterial oxygenation in air as well as better pulmonary functional tests in the protec-tive ventilation strategy group. Interestingly, in the protective ventilation group compared with the standard ventilation group, on postoperative day 1, we observed a lower per-centage of patients with an arterial oxygenation less than 60 mmHg (3.6 vs. 18.5% respectively). Similarly, we observed a lower percentage of patients with peripheral oxygen satura-tion levels less than 90% in air (3.6 vs. 19.2% respectively, P = 0.1). Our results suggest therefore that intraoperative protec-tive ventilation strategy may play a relevant role to minimize potential oxygen desaturation in the postoperative period.
Although the study was intentionally not powered for out-come, the improvement in these clinical variables was not asso-ciated with a statistically significant reduction in the hospital length of stay in the protective ventilation group. However, in
our study, on postoperative day 14, 20% of the patients in the protective ventilation strategy group as compared with 40% in the standard ventilation strategy group were in hospital.
The current trial suffers of some potential limitations, which need to be addressed. First, our study does not allow to differentiate the effects of lower tidal volumes from those of higher PEEP levels. We deliberately chose to combine lower tidal volumes with higher PEEP levels as well as RMs to identify a ventilation strategy aimed at keeping the lung open during general anesthesia for surgery, a strategy that might have potential benefits in the postoperative period. Sec-ond, we performed the RMs until plateau pressure reached 30 cm H2O for three breaths, but we had not systematically recorded the peak pressures reached during the RM. Third, we did not focus on the effects of ventilation strategies on major postoperative pulmonary complications. The mCPIS includes the evaluation of the chest x-ray. It has been reported that chest x-ray may underestimate the presence of atelectasis and lung morphology alterations as compared with computed tomography.46 However, computed tomography is not easy to obtain in this group of patients for technical and ethical
Table 5. Perioperative Pulmonary Functional Tests on Days 1, 3, and 5
Day 0 Day 1 Day 3 Day 5
Group Effect
P Value
Standard Ventilation
(n = 27)
Protective Ventilation
(n = 28) P Value
Standard Ventilation
(n = 26)
Protective Ventilation
(n = 27)
Standard Ventilation
(n = 26)
Protective Ventilation
(n = 27)
Standard Ventilation
(n = 26)
Protective Ventilation
(n = 25)
FEV1, l (mean ± SD) 2.02 ± 0.78 1.97 ± 0.68 0.72 1.00 ± 0.36* 1.18 ± 0.42* 1.14 ± 0.45+ 1.45 ± 0.51+ 1.23 ± 0.42§ 1.63 ± 0.55§ <0.001FEV1 (% predicted), l (mean ± SD) 77.2 ± 22.2 75.4 ± 20.9 0.77 40.2 ± 13.7* 46.48 ± 17.1* 44.5 ± 16.4+ 56.4 ± 18.1+ 47.9 ± 15.7§ 62.6 ± 16.0§ 0.002FVC, l (mean ± SD) 2.53 ± 0.86 2.53 ± 0.80 0.87 1.31 ± 0.39* 1.48 ± 0.54* 1.45 ± 0.46+ 1.78 ± 0.54+ 1.57 ± 0.47§ 2.02 ± 0.52§ <0.001FVC (% predicted), l (mean ± SD) 75.9 ± 2.0 77.5 ± 18.2 0.85 41.6 ± 12.1* 47.2 ± 21.7* 45.1 ± 13.3 55.1 ± 17.9 49.0 ± 14.3 61.8 ± 13.4 <0.001FEV1/FVC, % (mean ± SD) 78.3 ± 11.1 77.1 ± 13.3 0.74 75.8 ± 12.8 82.1 ± 14.2 77.5 ± 10.4 81.29 ± 11.2 77.4 ± 10.5 78.8 ± 13.6 0.124
Values are given as mean and SD.Group effect was performed by repeated two-way ANOVA. The individual pair-wise comparisons (Bonferroni corrected) show statistical significance as follows: *P < 0.0001 vs. FEV1 on day 0. +P < 0.0002 vs. FEV1 on day 0. §P < 0.0098 vs. FEV1 on day 0. *P < 0.0001 vs. FEV1 (% predicted) on day 0. +P < 0.0001 vs. FEV1 (% predicted) on day 0. §P < 0.0001 vs. FEV1 (% predicted) on day 0. *P < 0.0001 vs. FVC on day 0. +P < 0.009 vs. FVC on day 0. §P < 0.009 vs. FVC on day 0. *P < 0.0001 vs. FVC (% predicted) on day 0.FEV1 = forced expiratory volume in 1 s; FVC = forced vital capacity.
Table 6. Perioperative Organ Functional Tests on Days 1, 3, and 5 Compared with the Preoperative Period (Day 0)
Day 0 Day 1 Day 3 Day 5
Standard Ventilation
(n = 27)
Protective Ventilation
(n = 28)P
Value
Standard Ventilation
(n = 26)
Protective Ventilation
(n = 27)P
Value
Standard Ventilation
(n = 26)
Protective Ventilation
(n = 27) P Value
Standard Ventilation
(n = 26)
Protective Ventilation
(n = 25) P Value
Dyspnea, VAS, median [IQR] 0 [0–0] 0 [0–0] 0.82 1.0 [0–2.0] 1.0 [0–1.0] 0.13 1.0 [0–2.0] 1.0 [0–1.0] 0.58 1.0 [1.0–2.0] 1.0 [0–1.0] 0.37Cough, VAS, median [IQR] 0 [0–0] 0 [0–0] 0.49 2 [0–3.0] 1.0 [0–2.0] 0.08 1.0 [0–3.0] 1.0 [0–1.5] 0.16 1.0 [1.0–2.0] 1.0 [0–2.0] 0.07Secretions, VAS, median [IQR] 0 [0–0] 0 [0–0] 0.64 2 [1.0–3.0] 1.0 [0–2.0] 0.11 2.0 [1–3.0] 1.0 [0–1.5] 0.005 1.0 [1.0–2.0] 0.5 [0–1.0] 0.06Thorax pain, VAS, median [IQR] 0 [0–0] 0 [0–0] 1 0 [0–1.0] 0 [0–1.0] 0.67 0 [0–0] 0 [0–0] 0.75 0 [0–1.0] 0 [0–1.0] 0.95Abdominal pain, VAS, median [IQR] 0 [0–0] 0 [0–0] 0.97 2.0 [1.0–3.0] 2.0 [1.0–3.0] 0.98 1.5 [1.0–2.0] 2.0 [1.0–2.0] 0.78 1.0 [1.0–2.0] 1.0 [1.0–2.0] 0.39Temperature, °C (mean ± SD) 36.5 ± 0.4 36.5 ± 0.3 0.87 36.9 ± 0.7 36.9 ± 0.4 0.53 36.9 ± 0.6 36.6 ± 0.4 0.03 36.7 ± 0.5 36.5 ± 0.3 0.09Leukocytes, n/mm3 (mean ± SD) 6,780 ± 2,025 6,525 ± 2,448 0.57 11,137 ± 6,036 9,523 ± 2,515 0.38 9,548 ± 3,085 8,877 ± 2,928 0.29 8,623 ± 2,771 8,386 ± 2,453 0.73
IQR = interquartile range; VAS = Visual Analogic Scale.
Table 5. (Continued)
Table 6. (Continued)
Anesthesiology 2013; 118:1307-21 1318 Severgnini et al.
Protective Ventilation during Abdominal Surgery
Table 8. Postoperative Pulmonary Complications on Days 1 and 3 Compared with the Preoperative Period (Day 0)
Standard Ventilation
(n = 27)
Protective Ventilation
(n = 28) P Value
Standard Ventilation
(n = 26)
Protective Ventilation
(n = 27) P Value
Standard Ventilation
(n = 26)
Protective Ventilation
(n = 27) P Value
Standard Ventilation
(n = 26)
Protective Ventilation
(n = 25) P Value
Cough, n (%) 2 (7.4) 2 (7.1) 1.0 8 (30.8) 4 (14.8) 0.20 7 (26.9) 5 (18.5) 0.53 9 (34.6) 7 (28.0) 0.76Increased secretions, n (%) 3 (11.1) 2 (7.1) 0.67 10 (38.5) 6 (22.2) 0.24 12 (46.2) 6 (22.2) 0.09 10 (38.5) 3 (12.0) 0.05Dyspnea, n (%) 0 0 — 8 (30.8) 3 (11.1) 0.1 3 (11.5) 5 (18.5) 0.70 2 (7.7) 3 (12.0) 0.67Chest pain, n (%) 0 0 — 2 (7.7) 1 (3.7) 0.61 0 1 (3.7) 1.0 0 1 (4.0) 0.49Temperature >38°C, n (%) 0 0 — 2 (7.7) 0 0.24 1 (3.8) 0 0.49 1 (3.8) 0 1.0HR >100 beats/min, n (%) 0 1 (3.6) 1.0 3 (11.5) 0 0.11 2 (7.7) 0 0.23 1 (3.8) 0 1.0
HR = heart rate.
Table 9. Perioperative Laboratory Tests on Days 1, 3, and 5 Compared with the Preoperative Period (Day 0)
Day 0 Day 1 Day 3 Day 5
Standard Ventilation
(n = 27)
Protective Ventilation
(n = 28)P
Value
Standard Ventilation
(n = 26)
Protective Ventilation
(n = 27) P Value
Standard Ventilation
(n = 26)
Protective Ventilation
(n = 27) P Value
Standard Ventilation
(n = 26)
Protective Ventilation
(n = 25) P Value
Bilirubine, mg/dl (mean ± SD) 2.4 ± 4.2 2.4 ± 4.6 0.71 2.7 ± 4.9 2.6 ± 4.4 0.92 2.5 ± 4.6 2.4 ± 4.5 0.06 2.4 ± 4.0 7.8 ± 27.8 0.97AST (mean ± SD) 29.9 ± 22.7 30.7 ± 25.5 0.53 46.2 ± 46.3 43.4 ± 40.2 0.81 36.2 ± 23.5 36.4 ± 40.3 0.33 30.3 ± 17.9 32.6 ± 20.3 0.55ALT (mean ± SD) 39.0 ± 45.1 39.6 ± 52.9 0.46 49.9 ± 51.9 45.2 ± 37.7 0.77 37.4 ± 35.8 47.9 ± 68.4 0.60 33.6 ± 22.3 42.6 ± 42.5 0.53Platelets, n/mm3 (mean ± SD) 260.8 ± 92.9 279.3 ± 112.9 0.63 240.5 ± 78.7 250.1 ± 104.7 0.79 235.5 ± 86.3 246.4 ± 107.7 0.93 261.0 ± 107.1 258.6 ± 109.7 0.87PTT, s (mean ± SD) 24.9 ± 2.6 25.9 ± 2.6 0.27 25.18 ± 3.61 27.3 ± 5.6 0.04 26.8 ± 2.9 26.2 ± 2.4 0.19 26.9 ± 3.7 25.3 ± 5.2 0.47PT, INR (mean ± SD) 1.0 ± 0.1 1.1 ± 0.2 0.85 1.2 ± 0.2 1.2 ± 0.1 1.0 1.2 ± 0.2 1.2 ± 0.2 0.52 1.2 ± 0.2 1.1 ± 0.1 0.65Serum creatinine, mg/dl (mean ± SD) 1.0 ± 0.1 1.1 ± 0.3 0.22 1.1 ± 0.2 1.1 ± 0.4 0.94 1.1 ± 0.3 1.0 ± 0.4 0.58 1.1 ± 0.3 1.1 ± 0.3 0.67
ALT = alanine transaminase; AST = aspartate transaminase; INR = international normalized ratio; PT = prothrombin time; PTT = partial thromboplastin time.
Table 10. Postoperative Fluids Management on Days 1, 2, and 3
Day 1 Day 2 Day 3
Standard Ventilation
(n = 26)
Protective Ventilation
(n = 27) P Value
Standard Ventilation
(n = 26)
Protective Ventilation
(n = 27) P Value
Standard Ventilation
(n = 26)
Protective Ventilation
(n = 27) P Value
Hydric balance, ml⋅kg−1⋅h−1 (mean ± SD) 0.51 ± 0.32 0.37 ± 0.41 0.17 0.35 ± 0.46 0.19 ± 0.45 0.26 0.28 ± 0.38 0.23 ± 0.50 0.64Fluid administration, ml kg−1 h−1 (mean ± SD) 1.67 ± 0.54 1.73 ± 0.50 0.74 1.69 ± 0.54 1.81 ± 0.52 0.41 1.64 ± 0.53 1.79 ± 0.52 0.23Diuresis, ml kg−1 h−1 (mean ± SD) 1.05 ± 0.48 1.21 ± 0.49 0.11 1.22 ± 0.69 1.46 ± 0.59 0.09 1.21 ± 0.47 1.42 ± 0.47 0.06
Table 7. Pathological Chest x-ray Tests on Days 1 and 3 Compared with the Preoperative Period (Day 0)
Day 0 Day 1 Day 3
Standard Ventilation (n = 27)
Protective Ventilation (n = 28) P Value
Standard Ventilation (n = 26)
Protective Ventilation (n = 27) P Value
Standard Ventilation (n = 26)
Protective Ventilation (n = 27) P Value
Normal, n (%) 23 25 0.7 16 23 0.07 7 18 0.005Increased thickness of interstitium, n (%) 2 2 1.0 1 1 1.0 3 1 0.35Disventilatory areas including minimal density change, n (%) 0 1 1.0 1 1 1.0 4 2 0.42Atelectasis, n (%) 0 0 1.0 4 2 0.42 7 2 0.07Pleural effusions, n (%) 2 0 0.24 4 0 0.05 5 4 0.73
Anesthesiology 2013; 118:1307-21 1319 Severgnini et al.
PERIOPERATIVE MEDICINE
Table 8. Postoperative Pulmonary Complications on Days 1 and 3 Compared with the Preoperative Period (Day 0)
Standard Ventilation
(n = 27)
Protective Ventilation
(n = 28) P Value
Standard Ventilation
(n = 26)
Protective Ventilation
(n = 27) P Value
Standard Ventilation
(n = 26)
Protective Ventilation
(n = 27) P Value
Standard Ventilation
(n = 26)
Protective Ventilation
(n = 25) P Value
Cough, n (%) 2 (7.4) 2 (7.1) 1.0 8 (30.8) 4 (14.8) 0.20 7 (26.9) 5 (18.5) 0.53 9 (34.6) 7 (28.0) 0.76Increased secretions, n (%) 3 (11.1) 2 (7.1) 0.67 10 (38.5) 6 (22.2) 0.24 12 (46.2) 6 (22.2) 0.09 10 (38.5) 3 (12.0) 0.05Dyspnea, n (%) 0 0 — 8 (30.8) 3 (11.1) 0.1 3 (11.5) 5 (18.5) 0.70 2 (7.7) 3 (12.0) 0.67Chest pain, n (%) 0 0 — 2 (7.7) 1 (3.7) 0.61 0 1 (3.7) 1.0 0 1 (4.0) 0.49Temperature >38°C, n (%) 0 0 — 2 (7.7) 0 0.24 1 (3.8) 0 0.49 1 (3.8) 0 1.0HR >100 beats/min, n (%) 0 1 (3.6) 1.0 3 (11.5) 0 0.11 2 (7.7) 0 0.23 1 (3.8) 0 1.0
HR = heart rate.
Table 9. Perioperative Laboratory Tests on Days 1, 3, and 5 Compared with the Preoperative Period (Day 0)
Day 0 Day 1 Day 3 Day 5
Standard Ventilation
(n = 27)
Protective Ventilation
(n = 28)P
Value
Standard Ventilation
(n = 26)
Protective Ventilation
(n = 27) P Value
Standard Ventilation
(n = 26)
Protective Ventilation
(n = 27) P Value
Standard Ventilation
(n = 26)
Protective Ventilation
(n = 25) P Value
Bilirubine, mg/dl (mean ± SD) 2.4 ± 4.2 2.4 ± 4.6 0.71 2.7 ± 4.9 2.6 ± 4.4 0.92 2.5 ± 4.6 2.4 ± 4.5 0.06 2.4 ± 4.0 7.8 ± 27.8 0.97AST (mean ± SD) 29.9 ± 22.7 30.7 ± 25.5 0.53 46.2 ± 46.3 43.4 ± 40.2 0.81 36.2 ± 23.5 36.4 ± 40.3 0.33 30.3 ± 17.9 32.6 ± 20.3 0.55ALT (mean ± SD) 39.0 ± 45.1 39.6 ± 52.9 0.46 49.9 ± 51.9 45.2 ± 37.7 0.77 37.4 ± 35.8 47.9 ± 68.4 0.60 33.6 ± 22.3 42.6 ± 42.5 0.53Platelets, n/mm3 (mean ± SD) 260.8 ± 92.9 279.3 ± 112.9 0.63 240.5 ± 78.7 250.1 ± 104.7 0.79 235.5 ± 86.3 246.4 ± 107.7 0.93 261.0 ± 107.1 258.6 ± 109.7 0.87PTT, s (mean ± SD) 24.9 ± 2.6 25.9 ± 2.6 0.27 25.18 ± 3.61 27.3 ± 5.6 0.04 26.8 ± 2.9 26.2 ± 2.4 0.19 26.9 ± 3.7 25.3 ± 5.2 0.47PT, INR (mean ± SD) 1.0 ± 0.1 1.1 ± 0.2 0.85 1.2 ± 0.2 1.2 ± 0.1 1.0 1.2 ± 0.2 1.2 ± 0.2 0.52 1.2 ± 0.2 1.1 ± 0.1 0.65Serum creatinine, mg/dl (mean ± SD) 1.0 ± 0.1 1.1 ± 0.3 0.22 1.1 ± 0.2 1.1 ± 0.4 0.94 1.1 ± 0.3 1.0 ± 0.4 0.58 1.1 ± 0.3 1.1 ± 0.3 0.67
ALT = alanine transaminase; AST = aspartate transaminase; INR = international normalized ratio; PT = prothrombin time; PTT = partial thromboplastin time.
Table 10. Postoperative Fluids Management on Days 1, 2, and 3
Day 1 Day 2 Day 3
Standard Ventilation
(n = 26)
Protective Ventilation
(n = 27) P Value
Standard Ventilation
(n = 26)
Protective Ventilation
(n = 27) P Value
Standard Ventilation
(n = 26)
Protective Ventilation
(n = 27) P Value
Hydric balance, ml⋅kg−1⋅h−1 (mean ± SD) 0.51 ± 0.32 0.37 ± 0.41 0.17 0.35 ± 0.46 0.19 ± 0.45 0.26 0.28 ± 0.38 0.23 ± 0.50 0.64Fluid administration, ml kg−1 h−1 (mean ± SD) 1.67 ± 0.54 1.73 ± 0.50 0.74 1.69 ± 0.54 1.81 ± 0.52 0.41 1.64 ± 0.53 1.79 ± 0.52 0.23Diuresis, ml kg−1 h−1 (mean ± SD) 1.05 ± 0.48 1.21 ± 0.49 0.11 1.22 ± 0.69 1.46 ± 0.59 0.09 1.21 ± 0.47 1.42 ± 0.47 0.06
Table 7. Pathological Chest x-ray Tests on Days 1 and 3 Compared with the Preoperative Period (Day 0)
Day 0 Day 1 Day 3
Standard Ventilation (n = 27)
Protective Ventilation (n = 28) P Value
Standard Ventilation (n = 26)
Protective Ventilation (n = 27) P Value
Standard Ventilation (n = 26)
Protective Ventilation (n = 27) P Value
Normal, n (%) 23 25 0.7 16 23 0.07 7 18 0.005Increased thickness of interstitium, n (%) 2 2 1.0 1 1 1.0 3 1 0.35Disventilatory areas including minimal density change, n (%) 0 1 1.0 1 1 1.0 4 2 0.42Atelectasis, n (%) 0 0 1.0 4 2 0.42 7 2 0.07Pleural effusions, n (%) 2 0 0.24 4 0 0.05 5 4 0.73
Table 7. (Continued)
Table 8. (Continued)
Table 9. (Continued)
Table 10. (Continued)
Anesthesiology 2013; 118:1307-21 1320 Severgnini et al.
Protective Ventilation during Abdominal Surgery
reasons. Fourth, our data cannot be directly translated to other categories of patients and types of surgery. Fifth, with regard to anesthesia conduction, several studies suggest that volatile anesthetics could modify the inflammatory process in general and we cannot exclude this as having affected our outcomes. Moreover, a recent study shows an induced inflammatory response from halogenated anesthetics versus propofol, which seems to preserve antiinflammatory and antioxidant defences during mechanical ventilation in pigs model, preventing the emergence of apoptosis.47 In contrast, several other studies show that halogenated anesthesia attenuates the inflammatory response.48,49 Another recent study, concerning the inflam-matory response in major abdominal surgery, reveals that there are no statistically significant differences between total intravenous anesthesia and inhalational anesthesia.50 Finally, the baseline pulmonary functional test results were a bit lower than predicted, likely due to the method of measurement. However, we believe that this did not affect the interpretation of our data, because we investigated the evolution of pulmo-nary functional tests with time in the two study groups.
In conclusion, we showed that a protective ventilation strategy with lower tidal volumes, PEEP, and RMs during anesthesia improved the respiratory function in the postop-erative period after abdominal nonlaparoscopic surgery and reduced the clinical signs of pulmonary infection during the first 5 days after open abdominal surgery. Larger trials are warranted to determine whether intraoperative protective mechanical ventilation improves major outcome parameters.
References 1. Smetana GW, Lawrence VA, Cornell JE: Preoperative pul-
monary risk stratification for noncardiothoracic surgery: Systematic review for the American College of Physicians. Ann Intern Med 2006; 144:581–95
2. Arozullah AM, Daley J, Henderson WG, Khuri SF: Multifactorial risk index for predicting postoperative respiratory failure in
men after major noncardiac surgery. The National Veterans Administration Surgical Quality Improvement Program. Ann Surg 2000; 232:242–53
3. Johnson RG, Arozullah AM, Neumayer L, Henderson WG, Hosokawa P, Khuri SF: Multivariable predictors of postop-erative respiratory failure after general and vascular surgery: Results from the patient safety in surgery study. J Am Coll Surg 2007; 204:1188–98
4. Finks JF, Osborne NH, Birkmeyer JD: Trends in hospital vol-ume and operative mortality for high-risk surgery. N Engl J Med 2011; 364:2128–37
5. Hedenstierna G, Edmark L: The effects of anesthesia and muscle paralysis on the respiratory system. Intensive Care Med 2005; 31:1327–35
6. Reinius H, Jonsson L, Gustafsson S, Sundbom M, Duvernoy O, Pelosi P, Hedenstierna G, Fredén F: Prevention of atelecta-sis in morbidly obese patients during general anesthesia and paralysis: A computerized tomography study. Anesthesiology 2009; 111:979–87
7. Gajic O, Dara SI, Mendez JL, Adesanya AO, Festic E, Caples SM, Rana R, St Sauver JL, Lymp JF, Afessa B, Hubmayr RD: Ventilator-associated lung injury in patients without acute lung injury at the onset of mechanical ventilation. Crit Care Med 2004; 32:1817–24
8. Gajic O, Frutos-Vivar F, Esteban A, Hubmayr RD, Anzueto A: Ventilator settings as a risk factor for acute respiratory dis-tress syndrome in mechanically ventilated patients. Intensive Care Med 2005; 31:922–6
9. Determann RM, Royakkers A, Wolthuis EK, Vlaar AP, Choi G, Paulus F, Hofstra JJ, de Graaff MJ, Korevaar JC, Schultz MJ: Ventilation with lower tidal volumes as compared with con-ventional tidal volumes for patients without acute lung injury: A preventive randomized controlled trial. Crit Care 2010; 14:R1
10. Choi G, Wolthuis EK, Bresser P, Levi M, van der Poll T, Dzoljic M, Vroom MB, Schultz MJ: Mechanical ventilation with lower tidal volumes and positive end-expiratory pressure pre-vents alveolar coagulation in patients without lung injury. Anesthesiology 2006; 105:689–95
11. Wolthuis EK, Choi G, Dessing MC, Bresser P, Lutter R, Dzoljic M, van der Poll T, Vroom MB, Hollmann M, Schultz MJ: Mechanical ventilation with lower tidal volumes and positive end-expiratory pressure prevents pulmonary inflammation in patients without preexisting lung injury. Anesthesiology 2008; 108:46–54
12. Schultz MJ: Lung-protective mechanical ventilation with lower tidal volumes in patients not suffering from acute lung injury: A review of clinical studies. Med Sci Monit 2008; 14: RA22–26
13. Sundar S, Novack V, Jervis K, Bender SP, Lerner A, Panzica P, Mahmood F, Malhotra A, Talmor D: Influence of low tidal volume ventilation on time to extubation in cardiac surgical patients. Anesthesiology 2011; 114:1102–10
14. Fernández-Pérez ER, Keegan MT, Brown DR, Hubmayr RD, Gajic O: Intraoperative tidal volume as a risk factor for respiratory failure after pneumonectomy. Anesthesiology 2006; 105:14–8
15. Schultz MJ, Haitsma JJ, Slutsky AS, Gajic O: What tidal vol-umes should be used in patients without acute lung injury? Anesthesiology 2007; 106:1226–31
16. Wrigge H, Uhlig U, Baumgarten G, Menzenbach J, Zinserling J, Ernst M, Drömann D, Welz A, Uhlig S, Putensen C: Mechanical ventilation strategies and inflammatory responses to cardiac surgery: A prospective randomized clinical trial. Intensive Care Med 2005; 31:1379–87
17. Wrigge H, Uhlig U, Zinserling J, Behrends-Callsen E, Ottersbach G, Fischer M, Uhlig S, Putensen C: The effects of different ventilatory settings on pulmonary and systemic inflammatory responses during major surgery. Anesth Analg 2004; 98:775–81
18. Hong CM, Xu DZ, Lu Q, Cheng Y, Pisarenko V, Doucet D, Brown M, Aisner S, Zhang C, Deitch EA, Delphin E: Low tidal volume and high positive end-expiratory pressure
Fig. 6. Hospital length of stay. The Kaplan–Meier curve of length of hospital stay in standard (red dotted line) and pro-tective (blue continuous line) ventilation groups up to day 28; the log-rank test was used for the reported P value.
Anesthesiology 2013; 118:1307-21 1321 Severgnini et al.
PERIOPERATIVE MEDICINE
mechanical ventilation results in increased inflammation and ventilator-associated lung injury in normal lungs. Anesth Analg 2010; 110:1652–60
19. Jaber S, Coisel Y, Chanques G, Futier E, Constantin JM, Michelet P, Beaussier M, Lefrant JY, Allaouchiche B, Capdevila X, Marret E: A multicentre observational study of intra-oper-ative ventilatory management during general anaesthesia: Tidal volumes and relation to body weight. Anaesthesia 2012; 67:999–1008
20. Rothen HU, Sporre B, Engberg G, Wegenius G, Reber A, Hedenstierna G: Prevention of atelectasis during general anaesthesia. Lancet 1995; 345:1387–91
21. Girgis K, Hamed H, Khater Y, Kacmarek RM: A decremental PEEP trial identifies the PEEP level that maintains oxygen-ation after lung recruitment. Respir Care 2006; 51:1132–9
22. Maisch S, Reissmann H, Fuellekrug B, Weismann D, Rutkowski T, Tusman G, Bohm SH: Compliance and dead space fraction indicate an optimal level of positive end-expi-ratory pressure after recruitment in anesthetized patients. Anesth Analg 2008; 106:175–81
23. Kaplan R: ASRA consensus statements for anticoagulated patients. American Society of Regional Anesthesia. Reg Anesth Pain Med 1999; 24:477–8
24. Horlocker TT, Wedel DJ, Benzon H, Brown DL, Enneking FK, Heit JA, Mulroy MF, Rosenquist RW, Rowlingson J, Tryba M, Yuan CS: Regional anesthesia in the anticoagulated patient: Defining the risks (the second ASRA Consensus Conference on Neuraxial Anesthesia and Anticoagulation). Reg Anesth Pain Med 2003; 28:172–97
25. Krombach JW, Dagtekin O, Kampe S: Regional anesthesia and anticoagulation. Curr Opin Anaesthesiol 2004; 17:427–33
26. Horlocker TT, Wedel DJ: Infectious complications of regional anesthesia. Best Pract Res Clin Anaesthesiol 2008; 22:451–75
27. Lawrence VA, Cornell JE, Smetana GW; American College of Physicians: Strategies to reduce postoperative pulmonary complications after noncardiothoracic surgery: Systematic review for the American College of Physicians. Ann Intern Med 2006; 144:596–608
28. Ventilation with lower tidal volumes as compared with tradi-tional tidal volumes for acute lung injury and the acute respi-ratory distress syndrome. The Acute Respiratory Distress Syndrome Network. N Engl J Med 2000; 342:1301–8
29. Quanjer PH, Tammeling GJ, Cotes JE, Pedersen OF, Peslin R, Yernault JC: Lung volumes and forced ventilatory flows. Report Working Party Standardization of Lung Function Tests, European Community for Steel and Coal. Official Statement of the European Respiratory Society. Eur Respir J Suppl 1993; 16:5–40
30. Gastpar H, Criscuolo D, Dieterich HA: Efficacy and tolerabil-ity of glaucine as an antitussive agent. Curr Med Res Opin 1984; 9:21–7
31. Vernon M, Kline Leidy N, Nacson A, Nelsen L: Measuring cough severity: Development and pilot testing of a new seven-item cough severity patient-reported outcome mea-sure. Ther Adv Respir Dis 2010; 4:199–208
32. Pelosi P, Barassi A, Severgnini P, Gomiero B, Finazzi S, Merlini G, d’Eril GM, Chiaranda M, Niederman MS: Prognostic role of clinical and laboratory criteria to identify early ventilator-associated pneumonia in brain injury. Chest 2008; 134:101–8
33. Vincent JL, de Mendonça A, Cantraine F, Moreno R, Takala J, Suter PM, Sprung CL, Colardyn F, Blecher S: Use of the SOFA score to assess the incidence of organ dysfunction/failure in intensive care units: Results of a multicenter, prospective study. Working group on “sepsis-related problems” of the European Society of Intensive Care Medicine. Crit Care Med 1998; 26:1793–800
34. Celli BR, Rodriguez KS, Snider GL: A controlled trial of intermit-tent positive pressure breathing, incentive spirometry, and deep breathing exercises in preventing pulmonary complications after abdominal surgery. Am Rev Respir Dis 1984; 130:12–5
35. Horan TC, Gaynes RP, Martone WJ, Jarvis WR, Emori TG: CDC definitions of nosocomial surgical site infections, 1992: A modification of CDC definitions of surgical wound infec-tions. Infect Control Hosp Epidemiol 1992; 13:606–8
36. Michelet P, D’Journo XB, Roch A, Doddoli C, Marin V, Papazian L, Decamps I, Bregeon F, Thomas P, Auffray JP: Protective ventilation influences systemic inflamma-tion after esophagectomy: A randomized controlled study. Anesthesiology 2006; 105:911–9
37. Koner O, Celebi S, Balci H, Cetin G, Karaoglu K, Cakar N: Effects of protective and conventional mechanical ventilation on pulmonary function and systemic cytokine release after cardiopulmonary bypass. Intensive Care Med 2004; 30:620–6
38. Reis Miranda D, Gommers D, Struijs A, Dekker R, Mekel J, Feelders R, Lachmann B, Bogers AJ: Ventilation according to the open lung concept attenuates pulmonary inflammatory response in cardiac surgery. Eur J Cardiothorac Surg 2005; 28:889–95
39. Zupancich E, Paparella D, Turani F, Munch C, Rossi A, Massaccesi S, Ranieri VM: Mechanical ventilation affects inflammatory mediators in patients undergoing cardiopul-monary bypass for cardiac surgery: A randomized clinical trial. J Thorac Cardiovasc Surg 2005; 130:378–83
40. Wrigge H, Zinserling J, Stüber F, von Spiegel T, Hering R, Wetegrove S, Hoeft A, Putensen C: Effects of mechanical ventilation on release of cytokines into systemic circulation in patients with normal pulmonary function. Anesthesiology 2000; 93:1413–7
41. Reis Miranda D, Struijs A, Koetsier P, van Thiel R, Schepp R, Hop W, Klein J, Lachmann B, Bogers AJ, Gommers D: Open lung ventilation improves functional residual capacity after extubation in cardiac surgery. Crit Care Med 2005; 33:2253–8
42. Treschan TA, Kaisers W, Schaefer MS, Bastin B, Schmalz U, Wania V, Eisenberger CF, Saleh A, Weiss M, Schmitz A, Kienbaum P, Sessler DI, Pannen B, Beiderlinden M: Ventilation with low tidal volumes during upper abdominal surgery does not improve postoperative lung function. Br J Anaesth 2012; 109:263–71
43. D’Angelo E, Pecchiari M, Gentile G: Dependence of lung injury on surface tension during low-volume ventilation in normal open-chest rabbits. J Appl Physiol 2007; 102:174–82
44. Hedenstierna G: Alveolar collapse and closure of airways: Regular effects of anaesthesia. Clin Physiol Funct Imaging 2003; 23:123–9
45. Duggan M, McNamara PJ, Engelberts D, Pace-Asciak C, Babyn P, Post M, Kavanagh BP: Oxygen attenuates atelec-tasis-induced injury in the in vivo rat lung. Anesthesiology 2005; 103:522–31
46. Gregoretti C, Pelosi P: A physiologically oriented approach to the perioperative period: The role of the anaesthesiologist. Best Pract Res Clin Anaesthesiol 2010; 24:vii–viii
47. Kalimeris K, Christodoulaki K, Karakitsos P, Batistatou A, Lekka M, Bai M, Kitsiouli E, Nakos G, Kostopanagiotou G: Influence of propofol and volatile anaesthetics on the inflam-matory response in the ventilated lung. Acta Anaesthesiol Scand 2011; 55:740–8
48. Schilling T, Kozian A, Kretzschmar M, Huth C, Welte T, Bühling F, Hedenstierna G, Hachenberg T: Effects of propofol and des-flurane anaesthesia on the alveolar inflammatory response to one-lung ventilation. Br J Anaesth 2007; 99:368–75
49. Lee JJ, Kim GH, Kim JA, Yang M, Ahn HJ, Sim WS, Park KJ, Jun BH: Comparison of pulmonary morbidity using sevoflu-rane or propofol-remifentanil anesthesia in an Ivor Lewis operation. J Cardiothorac Vasc Anesth 2012; 26:857–62
50. Kvarnström AL, Sarbinowski RT, Bengtson JP, Jacobsson LM, Bengtsson AL: Complement activation and interleukin response in major abdominal surgery. Scand J Immunol 2012; 75:510–6