Embed Size (px)
Citation preview
Bioprocess Engineering 9 (1993) 47-59 Bi0pr0cess Engineering �9 Springer-Verlag 1993
Protection of biofilms against toxic shocks by the adsorption and desorption capacity of carriers in anaerobic fluidized bed reactors
S. Petrozzi, O. M. Kut and I. J. Dunn, Z/irich, Switzerland
Abstract. The aim of this study was to select a support medium for an anaerobic biofilm fluidized bed reactor (AFBR) for waste water treatment. Six materials, shale, pumice, porous glass, quartz sand, activated carbon and anthracite were used as carriers for the biofilm. The reactors were operated in parallel for several months with vapour condensate from a sulfite cellulose process as feed. The criteria used for the evaluation were: a) Reproducibility of the reactor performance, b) performance of the different carriers under various loading rates, c) stability against toxic shock loadings using 2,4,6-trichlorophenol (TCP) as toxicant, d) recovery capacity after intoxication and starvation, e) adsorption/desorption behavior of the carriers.
A comparison between four runs showed good reproducibility of the steady state removal rates. The performance of the reactors and the stability of the degradation rates were tested for a range of loading conditions. Unbuffered, buffered and pH controlled condi- tions were compared. The pumice carrier was best with respect to the degradation rate achieved per carrier mass. The response of the reactors to massive TCP step loadings was tested. Loadings less than 1.5 kgTCP/m3d resulted in initially normal gas production rates for all the systems, except the activated carbon, whose gas production was partially inhibited from the start. After increasing the load to 1.5 kg TCP/mad the gas production rates of all the other reactors fell abruptly to zero. Restarting after 2 months, all reactors showed methanogenic activity without requiring new inoculum.
Adsorption and desorption experiments with TCP showed that only the anthracite and activated carbon adsorbed appreciable amounts. The activated carbon had the greatest adsorption capacity but did not release the TCP by desorption, as did the anthracite.
A bicomponent (pumice and anthracite) carrier mixture was compared in biological experiments with pumice and anthracite carrier alone, with and without TCP loading. The pumice and the carrier-mix performed equally well under non-toxic.loading condi- tions. With TCP toxic loading, the performance of the anthracite was superior. The anthracite carrier could be regenerated, owing mainly to its capacity for desorption.
1. Introduction
Anaerobic treatment is recognized as a viable option for several types of industrial wastewaters [1, 2]. Relatively newly developed systems, such as the upflow anaerobic filter, the downflow anaerobic filter, the expanded bed reactor, and the fluidized bed reactor, have been estab-
lished for the degradation of the soluble organic fraction of industrial waste water. The selection of the support material is one of the most significant parameters in anaerobic processes in fluidized bed reactors. Sand is the most frequently used carrier in ftuidized bed reactors, because it is cheap and readily available. The proper choice of carrier seems to be more important for an anaerobic reactor than for an aerobic reactor [3], but the parameters to select support materials are not well estab- lished. In the literature various aspects have been investig- ated by Huysman et al. [4], Stonach et al. [5], Kuroda et al. [6], Gorris et al. [7], and Albagnac [8]. In general, the attachment of microorganisms to a surface is prob- ably influenced by a number of factors. These include physico-chemical surface properties of the carrier material such as porosity [9], surface energy [10], and hydro- phobicity [11]. Experience in the authors ' laboratory has shown that surface roughness was more impor tan t than internal surface area [12]. The apparently different be- havior reported by Mol et al. [13], using the same types of carrier with two different wastewaters, indicates that the wastewater type is also crucial.
Despite its significant advantages, such as lower en- ergy requirements, methane gas production, low produc- tion of biological sludge, and the possibility of month-long interruption with short restart time, the application of anaerobic processes still involves uncertainties. The insta- bility against toxicity is a possible indication. To improve the operation with toxic organic shock loads several authors reported benefits associated with the direct addi- tion of powdered activated carbon [14, 15, 16], or granu- lar activated carbon to fluidized bed reactors [17, 18, 19, 20]. In these studies it was postulated that partial re- generation of the carbon by microorganisms prolongs the adsorption capacity of the carbon, according to a hypoth- esis involving extracellular enzymatic degradation within the carbon pores [21]. Based on considerations that 95% of the total surface area in activated carbon involves pores that are not large enough for the common enzymes, Zhang et al. [22] concluded that the mechanisms of the re-

48
generation was a simple combination of biodegradation and carbon adsorption.
The best performance might be obtained by com- bining the advantages of a carrier which allows adsorp- tion and desorption, with a carrier whose roughness promotes biofilm formation. The goal of this work was to investigate the importance of adsorption/desorption pro- cesses on anaerobic fluidized bed performance especially under toxic loading conditions. The carriers without bio- film were characterized by their adsorptive capacities of the toxicant, 2,4,6-trichlorophenol (TCP).
2. Materials and methods
2.1 Fluidized bed reactors
Laboratory-scale anaerobic fluidized bed reactors (AFBR) were used in parallel to investigate the per- formance of various carriers, whose activity was measured by degradation rates and gas production rates of vapor condensate wastewater and a similar synthetic wastewa- ter. The reactors consisted of standard glass parts fitted together with tapered joints as shown in Fig. 1. The reactor columns were approximately 0.8 1 volume, with a height of 34 cm and an internal diameter of 3 cm. In later work, phase IV, the volumes were 0.88 1 and the heights were 60 cm. The conical upper settling zones were spe- cially built and had a diameter of 10 cm. Each reactor contained initially 70 ml settled volume of support mater- ial. The upflow velocity rate through the column was adjusted to achieve an expansion between 200 and 250% (100% = height �9 of the settled carrier). Circulation and fluidization flow rates were maintained with a peristaltic pump using Marprene tubing, The feed was introduced into the system on the suction side of the recycle pump,
Bioprocess Engineering 9 (1993)
using a multi-channel peristaltic pump. The reactor was fed continuously, and the effluent exited through an over- flow. The reactor temperature was maintained at 37 ~ by passing the recycled liquid through a heat exchanger. Gases were collected via an outlet at the top of the reactor and measured in a wet gas meter.
2.2 Wastewater
The wastewater was vapor condensate from a sulfite cellulose process (Cellulose Attisholz AG, Switzerland). This waste contained primarily methanol, furfural and acetic acid with an average composition as follows: meth- anol, 0.1 g/l; 2-furaldehyd (furfural), 0.6-0.65 g/l; acetic acid, 1-1.5 g/l; COD, 4.5-7.0 g O2/1; pH 3.0. The v a p o r condensate at pH 3 was stored at ambient temperature until usage. Before feeding, the pH was adjusted to 7.0 with 30% NaOH, was cooled to 0.5 ~ and gassed with nitrogen. It was previously observed that uncooled feed at pH 7 and room temperature was degraded biologically during storage. Because of fluctuations in concentration of the supplied wastewater, the experiments with the bicom- ponent support media were carried out with a synthetic wastewater containing 2.5 g/1 acetic acid; 0.6 g/1 2-fural- dehyd (furfural) and 0.3 g/1 methanol; (COD 4,2 g O2/1 ).
The real and the synthetic waste waters were supple- mented by addition of ammonium and phospate salts, trace elements, and resazurine (as a redox potential indi- cator). Also a NaH2POg/Na2HPO 4 buffer (pH 7.1) was added during startup [23].
2.3 Carrier materials
Six materials were selected as carriers in the AFBR's. A particle size of less than 0.5 mm has proven to be suitable. A range from 0.2 to 0.3 mm diameter was achieved by sieving. To remove air from the pores, the activated carbon and anthracite were heated to 100 ~ in water for 30 min. before being put in the reactor. The carrier mater- ials with size and densities, were as follows: Porous-glass, Siran (Schott), 0.4-0.6 mm, 1.8 g/cm3; quartz sand, natu- ral crushed, 0.2-0.3mm, 2.6g/cm3; pumice, Typ 1, 0.2-0.3 mm, 1.65 g/cm3; activated carbon, Chemviron F 100, 0.2-0.3 mm, 1.4 g/cm 3, spec. surface area 56.4 mZ/g (without pores > 3000 A); Chemviron F 200 (Phase IV), 0.8-1 mm, 1.4 g/cm3; anthracite, Hydroanthrazit H 300, 0.2-0.3 mm, 1.05g/cm 3, spec. surface area 25.5 mZ/g; shale, 0.2-0.3 mm, 1.87 g/cm 3.
Fig. 1. Photo of the fluidized bed reactors
2.4 Analytical methods
Chemical oxygen demand (COD) and total gas produc- tion were used for the evaluation of the reactor's degrada- tion performance. Influent and effluent samples were cen- trifuged at 5000 rpm for 10 min, and COD analyses were

S. Petrozzi et al.: Protection of biofilms against toxic shocks
made using a commercial colorimetric test system (Nanocolor| Gas production was measured by a volu- metric gas meter (Wohlgroth). pH measurements and control were made using a new-type gel electrode [24]. Routine quantitative analysis of 2,4,6-trichlorophenol was carried out photometrically with a modified 4-aminoanti- pyrine test [25] at 2 = 505 nm. The method was rapid, reproducible and provided a limit of detection of 0.2 mg/1, using a 1 cm disposable cell. The analysis method was verified by using high pressure liquid chromatography (Waters HPLC), with the UV absorbance detector set at 2 = 280 nm. The samples were filtered through 0.45 #m
Gelman Acrodisc filters. The injected volume was 25 #1. A Hypersil Green analytical column was used, with a mobile phase consisting of 70% methanol (1% acetic acid) and 30% water (1% acetic acid). The flow rate of the mobile phase was 1.5 ml/min. The results of the photometrically analyses from aqueous solution agreed reasonably well with the HPLC results. The photometric method was not specific for 2,4,6-trichlorophenol in the presence of phenol or dichlorphenols, whose molar extinction coefficients are much higher (10 times). Since the extinction values were lower in the effluent, it was assumed that only small amounts of dechlorinated product could be present.
The measurement error using the photometric method was estimated to be + 7%, which gives for the balancing a _ 14% error in the difference calculation.
2.5 Batch adsorption experiments with TCP
The intrinsic relative adsorption capacities of the carriers were thought to be important as a basis for comparing the performance of the carriers with biofilm attached under toxic loading. To determine the adsorption capacities of the bare activated carbon (Chemviron F 200) and of the anthracite (Hydroanthrazit H 300) the Freundlich-iso- therms were measured. A 100 ml Erlenmeyer, containing a weighted amount of the activated carbon or anthracite was filled with a 2,4,6-trichlorophenol solution of known concentration and was placed in a shaker for mixing. The weights of the carrier were varied so that a suitable range of solute concentration was covered. The Erlenmeyer flasks, sealed with glass stoppers, were placed in a shaker, at 45 ~ and pH 7, for mixing times that varied from 24 h to 72 h. After the shaking period, the samples were centri- fuged at 5000 rpm for 10 min before analysis. The TCP in the supernatant was measured.
2.6 Continuous adsorption experiments with TCP
Dynamic adsorption and desorption measurements for all bare support materials were also carried out in the fluid- ized bed reactors. For glass, pumice, sand and shale the fluidized bed reactors were fed with a 2,4,6-trichloro- phenol solution (cone. 0.2 g/l) at a flow rate of 8.8 ml/min.
49
The adsorption behavior of activated carbon and anthra- cite in the fluidized bed reactor was investigated by feed- ing the reactor with a 2,4,6-trichlorophenol solution (conc. 0.42 g/l) at a flow rate of 17.1 ml/min. The effluent samples were centrifuged in order to separate the solid particles from water prior to analysis.
Although it has been shown that oxygen has a strong influence on the adsorptive capacity of activated carbon 1-26], no control over the amount of oxygen was provided.
After breakthrough of TCP was achieved, the feed solution was switched to deionized water to observe the desorption of TCP.
2 . 7 Repeated batch TCP desorption experiments
Samples of anthracite (1 g) and activated carbon (1 g) were contacted for 72 h with 500 ml of an aqueous 2,4,6-tri- chlorophenol solution (initial concentration = 0.6g/l). The adsorbed TCP amounts were obtained from the liquid phase analysis by difference: Anthracite 60 mg TCP/g carrier and activated carbon 270 mgTCP/g carrier. The adsorbent was separated from the solution by vacuum filtration through a membrane filter. Desorption was measured by contacting the solids with portions of 50 ml water, which corresponded to the daily amount of water during the continuous experiments, and the contacting vessel was shaken for 24 h at 35 ~ After 24 h, the solids were repeatedly separated seven times and contacted with fresh water. The desorbed amounts of TCP were determined by analysis of the supernatant (Fig. 7).
2.8 TCP content of the anthracite carrier
Representative samples of the anthracite carrier from the reactor were analysed for TCP content by ethanol ex- traction. Carrier samples were taken as a mixture from the top, middle and bottom of the reactor. It was assumed that no adsorption profile existed in the reactor. The samples were shaken for 24 h at 35 ~ and after 24 h, the TCP content of the supernatant was determined by spec- trophotometric analysis.
3. Results and discussion
3.1 TCP adsorption on activated carbon and anthracite (batch experiments)
The adsorptive capacities of the bare carriers were correl- ated empirically by the Freundlich-type isotherms, ac- cording to Eq (1). The results with TCP on bare activated carbon and on anthracite are shown in Fig. 2. The adsorp- tion capacity of activated carbon was more than five times higher than that of anthracite:
x/m = kc" (1)

50 Bioprocess Engineering 9 (1993)
1: g/g
F
0.1
.E
0.01-
�9 Carbon o Anthracite
7
10 mg 2,4,6-TCP/[ 1000 Concentration c
Fig. 2. Freundlich-adsorption isotherms for TCP on activated carbon (0.8-1 mm) and on anthracite (0.2-0.315 mm)
400
mg/[
300-
200 .c_ O_ fJ
100'
o /
�9 /
~, , . , ,~ O Anthracite
o , . ,
0 400 800 1200 1600min2000 Time
Fig. 4. Breakthrough curves for TCP in a fluidized bed reactor containing activated carbon or anthracite without biofilm. Feed concentration = 0.42 g/l; Flow rate = 17.1 ml/min; HRT = 47 min
Here x is the mass of adsorbate removed by the carrier, m is the mass of the carrier, k, n are constants and c is the adsorbate concentration remaining in solution. Plotting log x/m against c the model parameters k and n were obtained.
The x/m values at c = 100 mgTCP/1 were 0.3 g TCP/g carrier for the activated carbon and 0.05 g TCP/g carrier for the anthracite.
3.2 Adsorption breakthrough of TCP(continuous experiments)
T h e b r e a k t h r o u g h curves for the ba re glass, pumice , s and
a n d shale ca r r i e r s a re s h o w n in Fig. 3. B r e a k t h r o u g h
o c c u r r e d re la t ive ly soon , a n d its s t a r t ing t ime d id n o t
a p p e a r to be s ign i f ican t ly affected b y the m a t e r i a l o f the
carriers. The breakthrough curves for anthracite and activated
carbon are shown in Fig. 4. The faster increase of the 2,4,6-
trichlorophenol in the anthracite-containing reactor re- flects the lower adsorption capacity of the anthracite.
The total amount of 2,4,6-trichlorophenol adsorbed in the reactors can be obtained by integrating the area between the influent concentration line and the break- through curve. The amount removed was found to be as follows [in mg adsorbed TCP per g carrier]: Porous-glass, 3.9; quartz sand, 1.7; pumice, 4.7; shale, 2.7; activated carbon (Chemviron F 200), 200; anthracite (Hydro- anthrazit H 300), 70.
3.3 Desorption of TCP (continuous experiments)
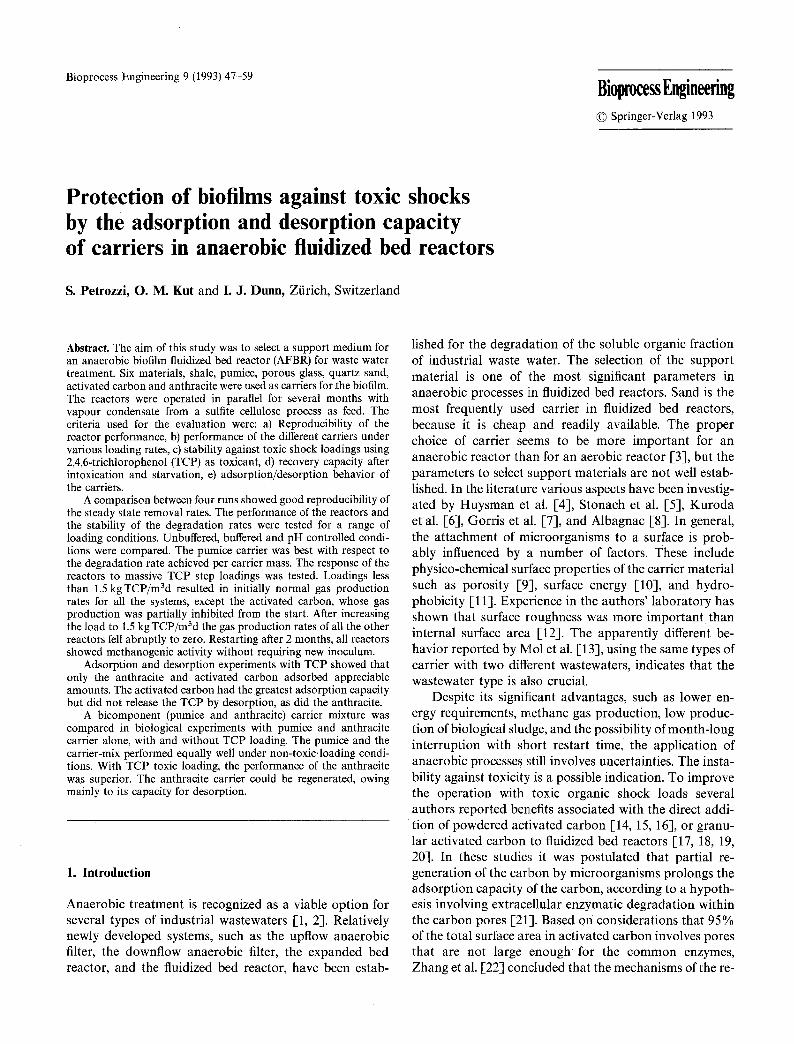
The elution curves in the AFBR's obtained from these experiments are shown in Figs. 5 and 6. The reactor volume used to calculate the elution was 0.8 1. The desorp- tion of 2,4,6-trichlorophenol from the carriers resulted in an effluent concentration higher than that due to dilution only. The difference in area between the calculated dilu-
200.
1 5 0
~ 100
I J~ = Pumice
o__J/ . . . . . . . �9 , Sha[ 1 0 50 100 150 200min250
Time
Fig. 3. Breakthrough curves for TCP in a fluidized bed reactor containing glass, sand, pumice, or shale without biofilm. Feed concentration = 0.2 g/l; Flow rate = 8.8 ml/min; HRT = 1.5 h
200 [ ~ Grass
mg/I ~ ~ Sand
150 \~, ~ Pumice ~ A Shale
,oo_ \\ h-
O/ . . . . . . . . 270 420 570 720 min 870
Time
Fig. 5. Elutions of adsorbed TCP with water from a fluidized bed reactor containing bare glass, sand, pumice, or shale. Flow rate = 8.8 ml/min

S. Petrozzi et al.: Protection of biofilms against toxic shocks
tion curve and the measured effluent curves represents the amount of TCP desorbed from the carriers. All materials except anthracite showed a negligible amount of TCP desorption. In Fig. 6 after one day (1440 min), the effluent of the activated carbon carrier contained essentially no TCP, whereas the desorption rate of the anthracite was still 0.2 mg/min. The integration of the data of Fig. 6
400 O Anthracite
mg/ l [ ] Carbon
300 ODitution (calculated',
2o0 c . I
1 0 0 ~
01 _ w . . , =~ . . . . .~J, . 0 500 1000 min 1500
Time
Fig. 6. Elutions of adsorbed TCP with water from a fluidized bed reactor containing bare activated carbon or anthracite. Flow rate = 17.1 ml/min
8 �84
mg O.. o 6 "6
~ - 4 o
" o
"5 2 D
�9 Anthracite �9 Activated carbon
1 2 3 4 5 6 d 7 Time
Fig. 7. Desorbed mass of TCP extracted with water during the repeated batch contacting experiments
51
showed that of the 3600 mg TCP total adsorbed amount, 283 m g T C P was desorbed after switching to water.
3.4. Desorption of TCP with various solvents (batch experiments)
During the 7-day desorption experiment with water, very little TCP was desorbed from the activated carbon. As shown in Fig. 7, after day 3 no TCP was detected in the extraction samples. The anthracite, on the other hand, lost approximately 20 mg or 30% by desorption.
Similar, single, batch TCP desorption experiments were conducted with various solvents as given in Table 1. The contact times varied between 48 and 72 h, and the solvent-carrier mass ratio was 50: 1. Comparing the effectiveness of the solvents for TCP removal, it is seen that all are more effective than water, but much smaller amounts were desorbed from the activated carbon.
4 Biological test program
4.1 Phase I." Comparison of six carriers under non-toxic conditions
Experiments were carried out with parallel anaerobic fluidized biofilm reactors, as used in previous work [12] to study the influence of the carrier on the performance of the reactors. These results are compared with investigations run for over 4 years (Table 2a and 2b). The reactors were inoculated with a mixture consisting of liquid from a methane fermentation digester and biomass from a pre- vious anaerobic biofilm reactor treating the same waste- water. The inoculum volume was 240 ml, or approxim- ately one quarter of the reactor volume. All reactors were operated at the same organic and hydraulic loadings, and at a temperature of 37 ~ The organic loading was gra- dually increased over a period of 1-2 months until an active biomass was established. The later startup times with adapted organisms were shorter. Steady state opera- tion was characterized by constant gas production and constant C O D degradation rates. The comparison in Table 2.b among four startup-operations (1987, 1989, 1990 and 1992) showed good reproducibility of the re- moval efficiencies achieved at steady state. The average
Table 1. Batch elution of 2,4,6-TCP from an- thracite (Hydroanthrazit H 300) and activa- ted carbon (Chemviron F 200)
Solvent (for elution)
Ethanol Acetone Diethyl ether Water
% Recovery 2,4,6-TCP adsorbed (TCP) Anthracite Carbon Anthracite Activated carbon
90 15 65 mg/g carrier 295 mg/g carrier 85 25 65 mg/g carrier 290 mg/g carrier 85 25 60 mg/g carrier 290 mg/g carrier 15 0.5 65 mg/g carrier 270 mg/g carrier

52
Table 2a. Reactor operating conditions
Startup 1987 1989 1990 1992 Year
Vol. Reactor 2.0 0.8 0.8 0.8 (L) Vol. Carrier 180 70 70 70 (mL) HRT 6 12 12 12 (h) Loading 12 9.5-11 11-13.5 11-12 (kg COD/m3d)
Bioprocess Engineering 9 (1993)
the pumice system had the max imum efficiency in terms of degradat ion rate per carrier mass. For this reason, this carrier was selected for use in the combined carrier experi- ment, described later.
4.2 Phase H." Res&tance to toxicants
Addit ional experiments were conducted to test the resist- ance of the reactor systems to additions of TCP, as toxicant, to the wastewater. T C P was selected because it is found in cellulose bleaching wastes. The T C P feed concen-
Table 2b. Comparison of rates during startup-periods.
Degradation rate Gas Rate Degradation rate (kg COD/m3d) (ma/mad) (kg COD/kg Carrier d)
Carrier 1987 1989 1990 1992 1987 1989 1990 1992 1987 1989 1990 1992
Glass Pumice Quartz sand Activated carbon (Chemviron V 100) Anthracite (Hydroanthra- zit H 300) Shale
5.1 6.5 2.81 3.5 0.1 0.16 6.5 7.3 6.6 2.94 4.7 2.83 0.13 0.18 0.13
4.8 6.0 5.5 2.9 3.8 3.9 0.05 0.~8 0.055 6.5 6.3 3.8 2.8 0.17 0.21
5.2 5.0 5.3 2.5 2.2 2.24 0.12 0.i4 0.14
8.4 5.3 0.14
3 ,
kg
m3d
2. 03 c
.2o 13-
1.
0 5 10 15 20 25 Time
30 35 40 d 45
Fig. 8. Loading profile for the TCP toxicity experiment in the fluidized bed reactors
8- m 3 m3 i
"(3 s 4 o .
',D
2
0 5 10 15 20 25 30 35 40d45 Time
Sand
,L Glass
�9 Pumice
�9 Anthracite
�9 Carbon
Fig. 9. Response of fluidized bed reactors to TCP. Loading = 18 kg COD/mad; HRT = 8h
loading was 10-13 kg C O D / m 3 d with a residence time of 12h.
The performance of the reactors and the stability of the degradat ion rates were tested for a range of loading conditions, under unbuffered, buffered and pH controlled conditions. The results, presented in Table 3, show that
trat ion was increased stepwise, as shown in Fig. 8, in terms of the T C P loading. The response to the toxicity was measured by the gas product ion rate (m3/m3d). The data in Fig. 9 show a considerable initial resistance of the methanogenic bacteria to toxic overloading. Fo r all re- actors, loadings of less than 1 kg T C P / m a d showed a

S. Petrozzi et al.: Protection of biofilms against toxic shocks 53
Table 3. Summary of maximum rate (1989).
Carrier Load (max.) Degradation Degradation rate [kg COD/ rate (kg COD/ m 3 d] (kg COD/m ~ d) kg Carrier d)
Period 1 unbuffered Glass 12.9 8.5 0.17 Pumice 12.9 9.0 0.18 Quartz sand 31.2 21.0 0.17 Activated 8.6 5.0 0.13 carbon (Chemviron F 100) Anthracite 8.6 5.0 0.11 Hydro- anthrazit (H 300)
Period 2 well buffered Glass 21.3 12.5 0.25 Pumice 42.5 17.5 0.35 Quartz sand 42.5 25 0.2 Activated 21.3 5.5 0.15 carbon (Chemviron F 100) Anthracite 21.3 8.0 0,18 Hydro- anthrazit (H 300)
Period 3 pH- controlled Quartz sand 36 25 0.2 Pumice 36 25 0.5
2.0
m 3 HRT=15h L :5 .6 L:11
mSd L=3.Skg COD/m3d ~'~ > <
1.5. j ~ c �9 Anthracite �9 s ., Grass f f *5 = ----o-- Pumice . . . . ,. ~ I I
t [ I I U b U L U I I I t ! "u - bana / // �9 o 1.0. ~- -- Carbon
o 0.5.
0 3 7 15 18 23 28 3 8 d 4 2 Time
Fig. 10. Gas production during the recovery period, restarted two months after the toxic loading
more or less normal gas production. After feeding an almost saturated solution of 0.7 g TCP/1 at day 23, the gas production ceased suddenly in all reactors, with the ex- ception of the activated carbon system. Progressive inhibi-
tion of the gas production in the activated carbon reactor started earlier but never stopped completely.
4.3 Phase III: Recovery after intoxication
Following the inhibition experiments, the reactors were shut down. They were kept in the waste water solution without feeding for 2 months. After this period the re- actors were restarted and fed with fresh vapor condensate. All reactors showed methanogenic activity without new inoculum (Fig. 10), except the anthracite reactor. To pro- mote faster recovery the reactors were reinoculated after 18 days. With higher loading after 38 days, they gave an increased gas production rate.
5. The two-component support medium (Phase IV)
After the selection of the two "best" carriers, 3 laboratory- scale (0.88 1) fluidized bed reactors were used in parallel experiments, with the objective of exploiting the combined advantages of anthracite's adsorption/desorption charac- teristics and the excellent biological degradation per- formance of the pumice carrier. One reactor contained a bicomponent carrier (40% anthracite and 60%. pumice by volume), and for reference, two reactors contained pumice and anthracite only.
During startup each reactor was fed with a buffered vapor condensate from a sulfite cellulose process. The COD concentrations of the feed varied from 3 kg/m 3 to 6 kg/m3. Because of the adapted inoculum, a loading of 11 kgCOD/m3d with an HRT of 12 h was held constant from the beginning until the reactors had reached a steady state. The hydraulic loading was adjusted to provide a bed expansion of 250%. The pH of the reactors during the startup fluctuated between 6.8 and 6.5.
The organic removal efficiencies and gas production rates achieved by each of the three systems after a startup of 1 month were as follows: Pumice, degradation rate 6.6 [kg COD/m3d] and gas rate 2.83 [ma/m3d]; mixture (40% anthracite/60% pumice), degradation rate 6.5 [kg COD/m3d] and gas rate 2.61 [m3/mad]; anthracite, de- gradation rate 5.3 [kg COD/mad] and gas rate 2.24 [m3/m3d]. These results are in good agreement with previous results (Table 2.b). To avoid fluctuations in the concentration, the toxic loading experiments were carried out with a synthetic wastewater, which had approximately the same composition as the real vapor condensate waste- water used in the previous biological experiments. The removal performances were measured by COD degrada- tion rates and gas rates.
In order to compare the stability under toxic loading for the three carrier systems, TCP was added to the feed in stepwise increasing amounts as shown in Fig. 11. The first experiments involved all three carrier systems toxic load-

54
1.5 kg m3d
~1.0
13- O
0.5
Tax I
0 o lb
Tox 11
Tax nI
2'0 3'0 40 d s.0 Times of Loading
Fig. 11. Loading profiles for the three TCP toxicity experiment in the anthracite fluidized bed reactor
Bioprocess Engineering 9 (1993)
6
m 3
m3 d
g 4
Q.
o 2
�9 Mix Tox I �9 �9 Pumice
---D-- Anthracite
2 4 6 8 10 12 d 14 Time
Fig. 13. Response of the reactor gas production rates during period Tax I and the following zero toxic loading period
300 mg/[
250
200 2 ~0150
,1::
n
~ o o
50 �84
0 0
Anthracite fox I �9 �9 Mix
= Pumice
2 4 6 8 10 12 d 14 Time
Fig. 12. Response of the reactor effluent concentrations during period Tax I and the following zero toxic loading period
6 iTox I
41#I I
�9 Mix
�9 Pumice
,,~ 2-
0 0 10 20 3'0 4'0 d 50
Time
Fig. 14. Recovery of the gas production for the mixed carrier and pumice carrier reactors after the period Tax I
ing (Tax I). In later experiments the stepwise toxic loading to only the anthracite carrier was repeated, and referred to toxic loading II and toxic loading III. The responses of the reactors for the period I are given in Fig. 12 for the effluent TCP concentration and in Fig. 13 for the gas the produc- tion rates. The maximum toxic loading was started at day 6, (Fig. 11) which caused a dramatic decrease of the gas rates for the pumice and for the two-component carrier systems. The anthracite system gas rate remained essen- tially constant. The TCP toxic loading was stopped at the end of day 7. In Fig. 12 it is seen that the reactor TCP concentrations were lowest for the anthracite, while the pumice had the highest concentrations and the carrier mixture had an intermediate concentration. These con- centration profiles are a result of the dynamic loading effects, the degradation, and the adsorption/desorption rates. It will be shown later that there was actually TCP
biodegradation. The recovery of the pumice and carrier- mix without further TCP toxic loading is shown in Fig. 14, during which the gradual increase of the gas production over 44 days is apparent, similar to the startup in Fig. 10.
During the toxification loading period II, which started at day 14, only the anthracite carrier was used. The anthracite reactor exhibited influences of toxicity at lower loading rates than in toxic period I, resulting in a rapid decrease in the gas rates after day 18 (Fig. 15). After stopping the TCP toxic loading at day 19, the recovery began soon thereafter and proceeded more rapidly than had that of the two other carrier systems (compare Fig. 14), reaching a rate close to the original after 23 days.
On day 40 the toxic loading period III began, during which the TCP concentration was increased stepwise until day 47. During the first days, the gas rates increased until the toxic effects were apparent on day 47 (Fig. 15). At this

S. Petrozzi et al.: Protection of biofilms against toxic shocks 55
5 m3 t m 3 d Tox I Tox I f
=o3
o & ~ 2
0
Tox ]TI- t
�9 , �9 , �9 , �9 , . ,
10 20 30 40 d 50 Time
Fig. 15. Response of the anthracite reactor gas production rate to the three toxic loading periods
70- mg/g ~ 60-
~ 50-
a_ 40- 0 I - -
-~ 3o-
20- " D
< ~
10-
Tox I Tox T[ Tox Ill
. , �9 , �9 , . , , ,
10 20 30 40 d 50 Time
Fig. 17. Total specific adsorbed amounts of TCP (measured) on the anthracite carrier during the three toxic loading periods
250
mg/ t
200-
~ 150-
. c . _
n 100- 0
I . - -
50 -
Tox I Tox ]I Tox Ill
, - , �9 , �9 ,
10 20 30 40 d 50
Time
Fig. 16. Response of the anthracite reactor effluent concentration to the three toxic loading periods
point the toxic loading was stopped, and the gas rates dropped approximately 30% and began to recover on day 52.
The effluent (and reactor) TCP concentrations for the three toxification loading periods are given in Fig. 16. Comparing these three periods, it is seen that the influence of adsorption initially reduced the concentrations but that the anthracite became saturated after repeated loadings with short desorption intervals. This explains why the effluent values were almost twice as high in the third period as they were for the first period, although the toxic loadings for the first and third periods were much the same. Also the TCP concentrations during toxification periods increased from the first to the third periods, apparently the result of slow desorption.
Samples of the anthracite carrier were taken during the continuous 55-day operation period for analysis of the
TCP content. The results are found in Fig. 17, expressed on a weight ratio basis. From this data it is seen that the TCP content of the carrier decreased during the periods of zero TCP toxic loading and low reactor concentration. Thus the dynamic patterns of adsorption and desorption are clearly visible in Fig. 17. The adsorption data in Fig. 4 and the desorption data in Fig. 6 indicates a response time of approximately one day. Some detail of the dynamic behaviour cannot be seen in Fig. 17 because of the infre- quent sampling.
The question of which concentration is most import- ant in determining the toxicity, the TCP concentration in the liquid or that on the carrier, cannot be definitely answered at the moment. However, Figs. 16 and 17 may give an indication that the carrier TCP is most important. It is seen in Fig. 15, that the gas production fell almost to zero after the second toxic loading, while after the third toxic loading it recovered after declining only about 30%, inspite of the fact that the liquid TCP concentration was highest after this period, but highest TCP carrier concen- tration was measured during toxic loading II.
The TCP removal from the liquid occurred by two mechanisms: It was consumed by biological degradation, and it was taken up by adsorption of the carrier and by possible adsorption by the biomass. Bishop et al. [27] and Bayley et al. [-28], pointed out, that the colonization Of the carbon surface by microorganisms may result in a signific- ant change of the physical properties of the carrier. Ac- cording to Fahmy [29], only traces of phenolic com- pounds could be detected in the biomass from fluidized bed reactors fed with pulp bleaching effluent.
Scanning electron micrographs of the fixed biofilm (Fig. 18 to 21) revealed that after the 2 month startup operation, only a poor biofilm was developed on the anthracite and pumice carriers. Attachment was spotty with large areas of bare carrier. Qualitative visible inspec-

56 Bioprocess Engineering 9 (1993)
Fig. 18. Electron micrographs of the anthracite carrier Fig. 20. Electron micrographs of the pumice carrier
Fig. 19. Electron micrographs of the anthracite carrier. Same carrier Fig. 21. Electron micrographs of the pumice carrier. Same carrier as as in Fig. 18, at higher magnification in Fig. 20, at higher magnification

S. Petrozzi et aL: Protection of biofilms against toxic shocks
tion showed that substantially more biofilm was present on the anthracite carrier. Therefore the TCP adsorption by biomass might reasonably be neglected in the evalu- ation of the quantitative removal of TCP. In parallel, continuous, biological experiments without TCP the pumice system exhibited a 1.26 times higher biological activity than the anthracite carrier system, as measured by the gas production rates. Adsorption played no role in these experiments. It was therefore assumed that the biological consumption rate of TCP by the biomass on the anthracite carrier would be also less by the Same factor. Both systems were then loaded with TCP, and their total consumption rates were measured. It was known from adsorption experiments (Fig. 3) tha t pumice adsorb- ed very little TCP. Therefore all of the TCP consumption of the pumice was attributed to biological degradation, and the biological rate on anthracite was corrected by dividing by 1.26. The difference between the total consumption rates and the corrected biological rates in Fig. 22 gave the TCP adsorption rate. These values were used to calculate the mass of the additionally adsorbed TCP on the carrier. Assuming the biological rates to be the same for each period, these values could then be calculated for each day of the toxic loading time-period to give the additional adsorbed TCP, as shown in Fig. 23. It is seen that the largest amount of TCP per day was adsorbed during the first period, Tox I. Summing the additional TCP amount over the days of the toxic loading period, gave the total additional adsorbed amount during each period. Plotting these values, related to the carrier mass, together with the measured values gave the results in Fig. 24, where the bars indicate the total additionally adsorbed amounts at the end of each period. The meas- ured values were obtained by extraction. The height of the bars correspond approximately to the difference be- tween the measured starting and final values for each toxic
57
15 �9 l T o x I
mg/g carrier. [ ] Tox 1[ [ ] Tox Il l
10
[ 3 . .
~ 5
~ oil. 1 2 3 4 5 6 d 7
Loading times
Fig. 23. Daily additional adsorbed amounts of TCP (calculated) during the periods Tox I, Tox II, and Tox III
70 mg/g carrier
~60-
-~ 50-
I - . -
<
Tox I )-
(
30-
20-
10-
O( 0
Tox IT J
,, ', Tax nT
---O--- Measured I Calculated
10 20 " 3'0 " 4b d 50 Time
Fig. 24. Comparison of measured and calculated total adsorbed amounts of TCP for the periods Tox I, Tox II, and Tox III
1.4- kg
m3d
1.o
.c E 0.6-
o.a I - - -
0.2
Anthracite (biol. + adsorption)
= Pumice (biol. corrected)
0 �9 , - , �9 , �9 , - , �9 , �9 , �9
1 2 3 4 5 6 7 d 8 Time
Fig. 22. Degradation rates used for calculation of the biological degradation of the anthracite carrier system from the period Tox I
loading period. An explanation for the discrepancy in toxic period III, is that adaptation could have increased the biodegradation rate of TCP. The agreement seems generally to support the method of calculation, in spite of the simplifying assumptions.
6. Concluding discussion
A comparison was made of the performance of anaerobic fluidized beds treating vapor condensate with different carrier materials obtained from several startup operations over several years and with different inoculum sources. From these results it can be concluded that the repro- ducibility in terms of gas production rates and COD degradation rates was good.

58
All carriers (except activated carbon) showed the same initial stability against toxic loading, using 2,4,6 trichloro- phenol. The activated carbon system showed a progress- ive inhibition of the gas production but always main- tained some gas production.
After an extended period of starvation and intoxifica- tion all systems showed methanogenic activity, and the ability to recovery was not significantly affected by the support material.
Adsorption/desorption behavior for T C P obtained with bare carriers showed a very low adsorption capacity for glass, pumice, shale, sand and a high adsorption capacity for activated carbon and for anthracite. The important difference between activated carbon and an- thracite was that activated carbon adsorbed T C P irre- versibly, while the TCP from the anthracite was at least partly desorbed.
Parallel biological experiments were conducted to compare the performance of pumice, anthracite, and a mixture of both carriers. The pumice and the carrier-mix performed equally well under non-toxic loading condi- tions. With the first TCP toxic loading, the resistance to toxicity of the anthracite was superior, and it maintained its gas production at a constant value. The activity of both the pumice and the mixture fell to zero. Apparently the adsorptive capacity of the anthracite in the mixture was not sufficient to protect the culture with the loads used. The recovery of the reactors after the toxic loading period indicated that the activity of the carrier-mix was higher and increased faster than that of the pumice alone.
Further T C P toxic loading experiments with the an- thracite carrier demonstrated that this carrier was best, with respect to its ability to recover, due to its desorptive properties. The regeneration (removal of TCP) of the anthracite carrier was found to occur by desorption. Although, a partial role of biodegradation in the regenera- tion cannot be ruled out.
F rom these experiments it can be concluded that an adsorptive carrier can indeed offer protection to toxic loading and that a carrier's ability to desorb the toxic material serves to regenerate the carrier.
It can be concluded that a carrier with the ability to reversibly adsorb and desorb a particular toxic substance would regenerate itself, as did the anthracite carrier in the present work, and therefore be useful for a biofilm process which is subject to shock loadings of the same substance.
It is, of course, not possible to generalize these results to predict the performance of AFBR's, under all condi- tions. Thus the choice of carrier would depend on the nature of the toxic substances expected in the wastewater stream and on the wastewater composition.
Acknowledgments
For the cartoon, we like to thank Mr. E. Ryf.
Bioprocess Engineering 9 (1993)
(Bio)/Regeneration
References
1. Henze, M.; Harremoes, P.: Anaerobic treatment of wastewater in fixed film reactors- a literature review. Water Sci. Technol. 15 (1983) 8/9, 1/101
2. Hickey, R. F.; Goodwin S.: Anaerobic processes. J. Water Pollut. Control Fed. 61 (1989) 814/821
3. Yoda, M.; Shin, S. W.; Watanabe, A.; Kitigawa, W.; Miyaji, Y.: Anaerobic fluidized bed treatment with a steady-state biofilm. Water Sei. Technol. 19 (1987) 7/8, 287/298
4. Huysman, P.; van Meenen, P.; van Assche, P.; and Verstraete, W.: Factors affecting the colonisation of non porous and porous packing materials in model upflow methane reactors. Bio- technol. Lett. 5 (1983) 643/647
5. Stonach, S. M.; Diaz-Baez, M. C.; Rudd, T.; Lester, J. N.: Factors affecting biomass attachment during startup and operation of anaerobic fluidized beds. Biotechnol. Bioeng. 30 (1987) 611/620
6. Kuroda, M.; Yuzawa, M.; Sakakibara, Y.; Okamura, M.: Methanogenic bacteria adhered to solid support (film formation
�9 kinetic). Water Res. 22 (1988) 653/656 7. Gorris, L. G. M.; van Deursen, J. M. A.; van der Drift, C.; Vogels,
G. D.: Biofilm development in laboratory methanogenic fluid- ized bed reactors. Biotechnol. Bioeng. 33 (1989) 687/693
8. Albagnac, G.: Biomass retention in advanced anaerobic re- actors. Water Sci. Technol. 22 (1990) 1/2, 17/23
9. Murray, W. D.; van den Berg, L.: Effect of support material on the development of microbial fixed films converting acetic acid to methane. J. Appl. Bacteriol. 51 (1981) 257/267
10. Rouxhet, P. G.; Mozes, N.: Physical chemistry of the interface between attached microorganisms and their support. Water Sci. Technol. 22 (1990) 1/2, 1/16
11. Mozes, N.; Leonard, A. J.; Rouxet, P. G.: On the relations between the elemental surface composition of yeasts and bac- teria and their charge and hydrophobicity. Biochim. Biophys. Acta 945 (1988) 324/334
12. Petrozzi, S.; Dunn, I. J.; Heinzle, E.; Kut, O. M.: Carrier influence in anaerobic biofilm fluidized beds for treating vapor condensate from the sulfite cellulose process. Can. J. Chem. Eng. 69 (1991) 527/53
13. Mol, N.; Heinzle, E., Petrozzi, S.; Kut, O. M.; Dunn, I. J.: Carrier influence for the treatment of industrial wastewaters in an- aerobic biofilm fluidized bed reactors. Recent Advances in Biotechnology. Ed. F. Vardar-Sukan and S. S. Sukan. Kluwer Academic Publishers. The Netherlands. (1992) 419/424
14. ScarameUi, A. B.; Di Giano, F.: Upgrading the activated sludge system by addition of powdered activated carbon. Water Sewage Works 120 (1970) 90/98

S. Petrozzi et al.: Protection of biofilms against toxic shocks 59
15. Robertaccio, F. L.: Powdered activated carbon addition to biological reactors. Ph.D. thesis, Univ. of Delaware (1976)
16. Adams, A. D.: Improving activated sludge treatment with pow- dered activated carbon. Eng. Bull. Purdue Univ. Eng. Ext. Ser. 142 (1973) 1, 1/11
17. Kim, B. R.; Cognata, M. B.: PAC Addition as a means of regenerating GAC in a GAC ttuidized bed reactor. Water Res. 24 (1990) 103/109
18. Kim, B. R.; Chian, E. S. K.; Cross, W. H.; Cheng, S.-S.: Adsorp- tion, desorption, and bioregeneration in an anaerobic, granular activated carbon reactor for the removal of phenols. J. Water Pollut. Control Fed. 58 (1986) 35/41
19. Kim, B. R.; Matz, M. J.; Lipari, F.: Treatment of a metal-cutting fluids waste-water using an anaerobic GAC fluidized-bed reactor. J. Water Pollut. Control Fed. 61 (1989) 1430/1435
20. Suidan, M. T.; Strubler, C. E.; Kao, S. W.; Pfeffer, J. T. P.: Traetment of coal gasification wastewater with anaerobic filter technology. J. Wat. Pollut. Control Fed. 55 (1983) 1263/1270
21. Perotti, A. E.; Rodman, C. A.: Factors involved with biological regeneration of activated carbon. AICHE Symposium Series 70 (1974) 144, 316/325
22. Zhang, X.; Wang, Z., Gu, X.: Simple combination of biodegrada- tion and carbon adsorption - the mechanism of the biological activated carbon process. Water Res. 25 (1991) 165/172
23. Petrozzi, S.; Mol, N.; Dunn, I. J.: Determining specific biomass activity in anaerobic wastewater treatment processes. Bio- process Eng. 8 (1992) 55/60
24. Monzambe, K. M.; Navaeu, H. P.; Nyns, E.-J.; Bogaert, N.; B/ihler, H.: Problematics and stability of on-line pH measure-
ments in anaerobic environments: the jellied combined elec- trode. Biotechnol. Bioeng. 31 (1988) 659/665
25. Ettinger, M. B.; Ruchhof, C. C.; Lishka, R. J.: Sensitive 4-amino- antipyrine method for phenolic compounds. Anal. Chem. 23 (1951) 1783/1788
26. Vidic, R. D.; Suidan, M. T.: Role of dissolved oxygen on the adsorptive capacity of activated carbon for synthetic and natu- ral organic matter. Environ. Sci. Technol. 25 (1991) 1612/1618
27. Bishop, D. F.; O'Farrel, T. P., Stamberg, J.: Physical-chemical treatment of municipal wastewater. J. Water Pollut. Control Fed. 44 (1972) 361/371
28. Bayley, R. W.; Thomas E. V.; Cooper, P. F2 Some problems associated with treatment of sewage by non-biological processes. Progr. Water Technol. 1 (1972) 119/132
29. Fahmy, M. K.: Treatment of sulphite pulp bleaching effluents in anaerobic/aerobic fluidized biofilm reactors. Diss. ETH 9730 (1992)
Received June 19, 1992
S. Petrozzi Dr. O. M. Kut Dr. I. J. Dunn (corresponding author) Biological Reaction Engineering Group Chemical Engineering Department ETH 8092 Ztirich Switzerland