Embed Size (px)
Citation preview
Protection Motivation Theory: Understanding the Determinants of Individual Security Behavior
Robert E. Crossler
Dissertation submitted to the faculty of the Virginia Polytechnic Institute and State University in partial fulfillment of the requirements for the degree of
Doctor of Philosophy
In General Business, Accounting and Information Systems
France Bélanger (Chair) Robert M. Brown
Weiguo Fan Janine S. Hiller Steven D. Sheetz
March 19, 2009 Blacksburg, VA
Keywords: information security, protection motivation theory, behavior, partial-least squares, instrument development
Copyright 2009, Robert E. Crossler
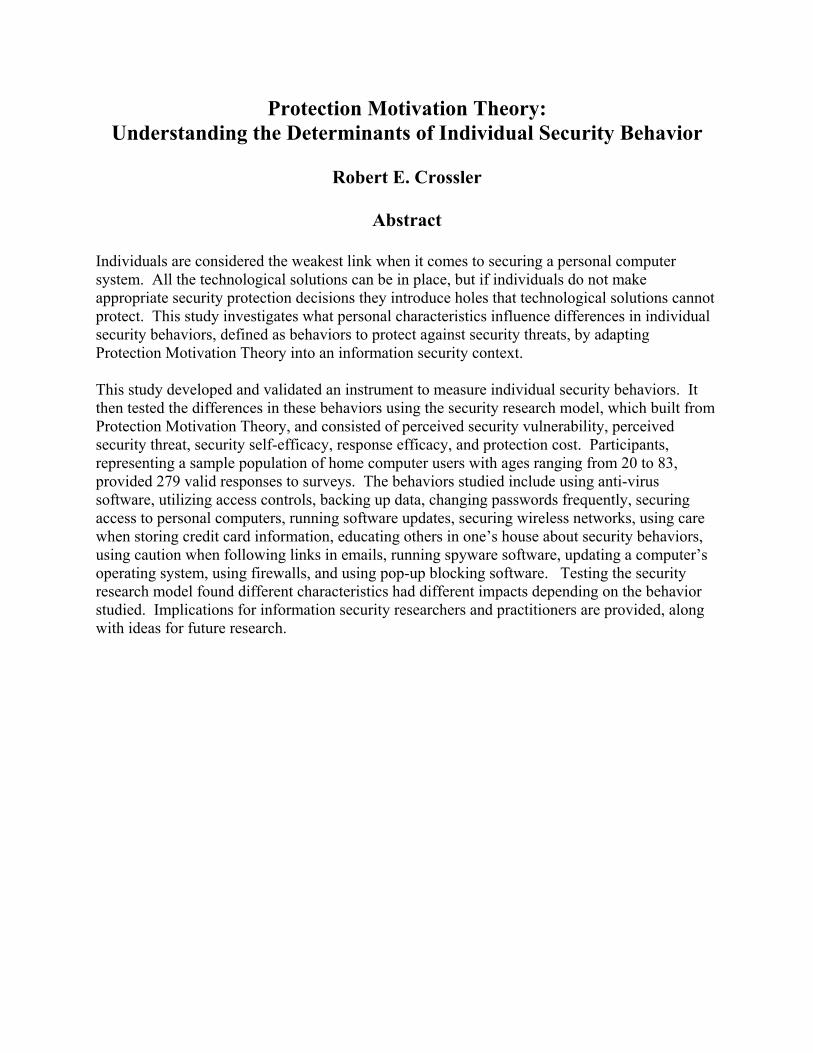
Protection Motivation Theory: Understanding the Determinants of Individual Security Behavior
Robert E. Crossler
Abstract
Individuals are considered the weakest link when it comes to securing a personal computer system. All the technological solutions can be in place, but if individuals do not make appropriate security protection decisions they introduce holes that technological solutions cannot protect. This study investigates what personal characteristics influence differences in individual security behaviors, defined as behaviors to protect against security threats, by adapting Protection Motivation Theory into an information security context. This study developed and validated an instrument to measure individual security behaviors. It then tested the differences in these behaviors using the security research model, which built from Protection Motivation Theory, and consisted of perceived security vulnerability, perceived security threat, security self-efficacy, response efficacy, and protection cost. Participants, representing a sample population of home computer users with ages ranging from 20 to 83, provided 279 valid responses to surveys. The behaviors studied include using anti-virus software, utilizing access controls, backing up data, changing passwords frequently, securing access to personal computers, running software updates, securing wireless networks, using care when storing credit card information, educating others in one’s house about security behaviors, using caution when following links in emails, running spyware software, updating a computer’s operating system, using firewalls, and using pop-up blocking software. Testing the security research model found different characteristics had different impacts depending on the behavior studied. Implications for information security researchers and practitioners are provided, along with ideas for future research.

iii
Dedication
This dissertation is dedicated to my loving wife, Crystal, and my two wonderful boys, David and Aidan, who encouraged me and supported me through the arduous task of pursuing my Ph.D. Crystal, your unconditional love, patience, and understanding as I have enjoyed the highs of success and lows of failure have provided a balance that has enabled me to persevere through this process. David and Aidan, your infectious laughter and desire to roughhouse and play with Daddy regardless of my state of mind and are a continuous reminder that there are more important things in life than the work that is forever in front of me. I love all of you very much and look forward to the journey, wherever life may take us.

iv
Acknowledgments
The completion of this dissertation would have not have been possible without the contribution and support of many individuals who supported me in many ways throughout my time in the Ph.D. program. First, I would like to acknowledge God and thank Him for opening many doors throughout this process and guiding my path. Many things came together throughout this process, which on my own would not have been possible. I would like to express my extreme gratitude to Dr. France Bélanger, who I have had the opportunity to work with throughout my entire time at Virginia Tech. She has been a fantastic mentor and friend who taught me a lot, not only about research, but also about academia and the importance of enjoying life outside of academia. As I proceed in my academic career, I hope that I am able to be at least half the mentor and teacher to future researchers as she has been for me. I would also like to express my thanks to the rest of my dissertation committee for their help and guidance throughout the process: Dr. Robert Brown, Dr. Patrick Fan, Dr. Janine Hiller, and Dr. Steve Sheetz. I am grateful for their valuable feedback and suggestions. I would like to thank my fellow doctoral students, especially James Long and Lasse Mertins for your friendship and support. You have become my friends for life, and I look forward to seeing where we all go from here. I would like to thank my friends from The Bridge Foursquare Church in Christiansburg for all of their support and prayer. Gathering together with my Life Group every other week was a highlight of this season of my life. Joey Lyons, you are a special friend who was always there for me catch a late night “guy” movie with or share the burdens I was facing. Pastors Paul Sheldon and Nick Gough, you have been great encouragers in getting me to stretch myself into what God had for my life. I appreciate the time you have invested in me. I would like to thank Phyllis Neece, Arnita Perfater, and Kathy Caldwell for their administrative assistance. Finally, I would like to thank the Accounting and Information Systems Department for their financial support over the last four years.
v
Table of Contents
Chapter One: Introduction .............................................................................................................. 1 Purpose of the Study ................................................................................................................... 4
Research Question .................................................................................................................. 5 Research Framework .................................................................................................................. 5 Detailed Research Model ............................................................................................................ 7 Individual Security Behaviors ..................................................................................................... 8 Independent Variables ................................................................................................................ 9
Perceived Security Vulnerability ............................................................................................ 9 Perceived Security Threat ..................................................................................................... 10 Security Self-Efficacy ........................................................................................................... 10 Response Efficacy ................................................................................................................. 11 Prevention Cost ..................................................................................................................... 11
Research Model ........................................................................................................................ 12 Expected Contributions ............................................................................................................. 13 Overview of the Dissertation .................................................................................................... 14
Chapter Two: Background ............................................................................................................ 15 Outcome Oriented IS Security Research .................................................................................. 15
Risk ....................................................................................................................................... 15 Improved Approaches to Security ........................................................................................ 16 Technological Solutions........................................................................................................ 19
Behavioral IS Security Research .............................................................................................. 20 Individual Security Behavior ................................................................................................ 22 General Deterrence Theory ................................................................................................... 29
Protection Motivation Theory ................................................................................................... 33 Alignment with the GDT Framework ................................................................................... 35
Behavioral Security Research Model ........................................................................................ 37 Security Threat Appraisal ..................................................................................................... 37 Security Coping Appraisal .................................................................................................... 39 Prevention Cost ..................................................................................................................... 41 Security Research Model ...................................................................................................... 42 Interaction Effects ................................................................................................................. 43
Chapter Three: Methodology ........................................................................................................ 46 Instrument Development ........................................................................................................... 46
Pretest .................................................................................................................................... 48 Technical Validation ............................................................................................................. 53 Grouping of Behaviors .......................................................................................................... 57 Pre-Test and Pilot Study ....................................................................................................... 58 Full Scale Survey .................................................................................................................. 59
Data Analysis ............................................................................................................................ 60 Nature of constructs .............................................................................................................. 60 Hypothesis Testing................................................................................................................ 65
Chapter Four: Data Analysis ......................................................................................................... 67 Descriptive Analysis ................................................................................................................. 67 Measurement Model ................................................................................................................. 71

vi
Structural Model ....................................................................................................................... 73 Chapter Five: Discussion .............................................................................................................. 86
Significant Findings .................................................................................................................. 86 File Loss ................................................................................................................................ 87 Identity Theft ........................................................................................................................ 94 Computer Slow Down........................................................................................................... 98
Threat Comparisons ................................................................................................................ 105 Implications and Future Research ........................................................................................... 106
Impacts on Security Research ............................................................................................. 106 Impacts for Security Practitioners ....................................................................................... 110
Chapter Six: Conclusion ............................................................................................................. 112 Contributions........................................................................................................................... 112 Limitations .............................................................................................................................. 114
Perceived Security Vulnerability ........................................................................................ 114 Sample Demographics ........................................................................................................ 115 Social Desirability Bias....................................................................................................... 115 Common Method Bias ........................................................................................................ 116
Concluding Comments............................................................................................................ 117 References ................................................................................................................................... 119 Appendix A – Initial ISB Instrument .......................................................................................... 141 Appendix B – Analysis of ISB Instrument ................................................................................. 144
Reliability ................................................................................................................................ 149 Item Quality ............................................................................................................................ 151 Rating Scale Analysis ............................................................................................................. 151 Testing the ISB Instrument ..................................................................................................... 151
Appendix C – Final ISB Instrument ........................................................................................... 153 Appendix D – Squared Pair-Wise Correlations and Average Variance Extracted ..................... 156 Appendix E – Item Loading ........................................................................................................ 160 Appendix F – List of Acronyms ................................................................................................. 169
vii
List of Tables
Table
Number Table
Description Page
Number1.1 Security Risk Analysis Matrix 4 2.1 Previous Empirical Behavioral Security Research 22 2.2 Protection Mechanisms for Computer Threats 23 2.3 Significant General Deterrence Theory Variables 31 3.1 Initial Item Framework 50 3.2 Mapping of Behaviors and Threats 52 3.3 Construct Types 61 3.4 PLS Considerations 66 4.1 Sample Sources 68 4.2 Categorical Variable Summary Demographics 70 4.3 Continuous Variable Summary Demographics 70 4.4 Summary of Study Reflective Variables 71 4.5 Construct Reliability 72 5.1 Summarized File Loss Protection Findings – Initial Model 87 5.2 Summarized File Loss Protection Findings – Extended Model 91 5.3 Summarized Identity Theft Protection Findings – Initial Model 94 5.4 Summarized Identity Theft Protection Findings – Extended Model 96 5.5 Summarized Computer Slow Down Protection Findings – Initial Model 99 5.6 Summarized Computer Slow Down Protection Findings – Extended Model 102 5.7 Behavioral Security Theories 109 B.1 Dimensionality of Scale 146 B.2 Parallel Analysis 147 B.3 Item Loading on Rasch Model 150 D.1 File Loss Anti-Virus Squared Pair-Wise Correlation and AVE 156 D.2 File Loss Access Control Squared Pair-Wise Correlation and AVE 156 D.3 File Loss Backup Squared Pair-Wise Correlation and AVE 156 D.4 File Loss Password Change Squared Pair-Wise Correlation and AVE 156 D.5 File Loss Secure Access Squared Pair-Wise Correlation and AVE 156 D.6 File Loss Software Updates Squared Pair-Wise Correlation and AVE 157 D.7 File Loss Wireless Network Squared Pair-Wise Correlation and AVE 157 D.8 ID Theft Credit Cards Squared Pair-Wise Correlation and AVE 157 D.9 ID Theft Education Squared Pair-Wise Correlation and AVE 157
D.10 ID Theft Links Squared Pair-Wise Correlation and AVE 157 D.11 ID Theft Spyware Squared Pair-Wise Correlation and AVE 157 D.12 ID Theft Wireless Squared Pair-Wise Correlation and AVE 158 D.13 Slow Down Anti-Virus Squared Pair-Wise Correlation and AVE 158 D.14 Slow Down Auto Update Squared Pair-Wise Correlation and AVE 158 D.15 Slow Down Firewall Squared Pair-Wise Correlation and AVE 158 D.16 Slow Down Popup Squared Pair-Wise Correlation and AVE 158
viii
List of Tables (Continued)
Table Number
Table Description
Page Number
D.17 Slow Down Software Updates Squared Pair-Wise Correlation and AVE 159 D.18 Slow Down Spyware Squared Pair-Wise Correlation and AVE 159 E.1 File Loss Anti-Virus Item Loading 160 E.2 File Loss Access Control Item Loading 160 E.3 File Loss Backup Item Loading 161 E.4 File Loss Password Change Item Loading 161 E.5 File Loss Software Update Item Loading 162 E.6 File Loss Secure Access Item Loading 162 E.7 File Loss Wireless Item Loading 163 E.8 ID Theft Credit Cards Item Loading 163 E.9 ID Theft Educate Item Loading 164 E.10 ID Theft Links Item Loading 164 E.11 ID Theft Spyware Item Loading 165 E.12 ID Theft Wireless Item Loading 165 E.13 Slow Down Anti-Virus Item Loading 166 E.14 Slow Down Auto Update Item Loading 166 E.15 Slow Down Firewall Item Loading 167 E.16 Slow Down Pop Up Item Loading 167 E.17 Slow Down Software Updates Item Loading 168 E.18 Slow Down Spyware Item Loading 168
ix
List of Figures
Figure
Number Figure
Description Page
Number 1.1 Research Model 13 2.1 The Security Action Cycle 30 2.2 General Deterrence Theory – Guiding Framework 33 2.3 Protection Motivation Theory 34 2.4 Behavioral Security Research Model 44 2.5 Extended Behavioral Security Research Model 45 3.1 Methodology Followed 48 3.2 Research Model 63 3.3 Multi-Dimensional Reflective Constructs 64 3.4 Multi-Dimensional Formative Constructs 64 3.5 Formative Constructs 65 4.1 Significant Paths for File Loss Initial Model 75 4.2 Significant Paths for ID Theft Initial Model 76 4.3 Significant Paths for Slow Down Initial Model 78 4.4 Significant Paths for File Loss Threat Extended Model 80 4.5 Significant Paths for ID Theft Threat Extended Model 82 4.6 Significant Paths for Slow Down Threat Extended Model 84 B.1 Initial Distribution of Scaled ISB Items (5-point scale) 145 B.2 Final Distribution of Scaled ISB Measures (3-point scale) 145 B.3 Scree Plot of ISB Data 147 B.4 Parallel Scree Plot of ISB Data 148
1
Chapter One: Introduction Prior to the emergence of the Internet, computers had no direct access to other computers.
In such an environment, there was little concern for the security of information. As computers
began to plug into the Internet, which connected computers from all over the world, a door was
opened that allowed for vast sharing of information. With information easily flowing over this
network and the lack of a security conscious design, the Internet allowed some people to use this
resource to steal and destroy for opportunistic gain or for fun. As security of information
became a concern, mechanisms were added on top of the existing Internet to provide for
protection of information. This piece-meal approach to providing security on the Internet has
created an environment where information security professionals must continually work to keep
information safe (Whitman et al. 2009).
Businesses lose a significant amount of money each year due to security attacks. One
survey of United States companies, conducted by the Computer Security Institute (CSI) with the
support of the Federal Bureau of Investigation (FBI), found that companies lost an average of
$345,000 due to security breaches and computer crime during 2006 (Richardson 2007).
However, it is likely that such losses are even greater as it is often difficult to quantify security
losses (Richardson 2007) and many companies do not have a way to measure the cost of security
breaches beyond direct revenue losses (Deloitte 2006). To address the losses from security
breaches, 98% of companies worldwide continue to significantly increase their security budgets
(Deloitte 2007). Increased funding is often included as part of the overall IT budget, indicating
companies view information security as an IT function, which is contrary to the fact that
information security is as much a people problem as it is a technological problem (Deloitte 2005;
Deloitte 2006; Deloitte 2007).
2
One approach used to address the security issues posed by people within an organization
is to increase the awareness and training of employees. When utilizing training and awareness
programs, it is important to train people on the security mechanisms they can use to protect
information as well as to make them aware of potential threats to computer systems (Whitman
2003). However, corporations do very little to provide training to their employees. One author
noted that “while the industry talks a good game about teaching users how to be good stewards
of company network resources, they don’t put real dollars behind the proposition” (Richardson
2007). Other studies support this claim by Richardson, finding that companies view training and
awareness as important aspects of their security plan, but do not have adequate funding or
programs to properly educate and train their employees (Deloitte 2005; 2006; 2007).
The issue of security takes on a new level of concern when extending the performance of
individuals beyond the corporate setting into a home environment. In a corporate setting, there
are employees available to perform part of the security task, but in a home environment, it is
completely up to the individual to take all of the steps to secure their home computers and
network. Failing to secure home computers and networks properly can result in financial losses
and time loss for individuals, dealing with such things as identity theft, lost or corrupted files,
and stolen laptops. Improperly secured home computers can result in additional issues for
corporations when the stolen access to an individual’s computer is used to mount attacks against
the corporation, which can lead to a number of issues such as financial losses and increased
down time on network machines due to denial of service attacks (Whitman et al. 2009).
One of the more costly issues that individuals face online is identity theft, which has
become a serious problem facing many people. A recent study
(http://www.privacyrights.org/ar/idtheftsurveys.htm) by the Javelin Strategy and Research group,
3
a research group focusing on consumer security and privacy, found that 8.4 million Americans
were victims of identity theft during 2007, decreasing from 9.3 million in 2005. Such decreases
are encouraging, but a large number of identity thefts still occur. The victims of identity theft in
2007 lost $49.3 billion for an average loss per victim of over $5,000. These losses go beyond a
financial impact to consumers; it also creates a cost for businesses that have to return money they
made on products sold due to stolen credit cards and other forms of stolen information. In order
to fight the vast number of thefts due to identity theft, it is necessary to educate consumers on the
steps they need to take.
It is surprising that little education or training takes place, considering that corporations
view education as an important step in their efforts to fight security attacks. It is also surprising
that there are few, if any studies, trying to understand the human component of a secure
information system as end users are an integral component in securing information systems. It
has also been noted that there is a dearth of research on the socio-organizational perspective of
security within the IS research community (Dhillon et al. 2000; 2001). An understanding of
factors that influence people to perform behaviors to protect against security threats seems a
necessary precursor to a successful training program. However, very little empirical research
exists upon which to make such assessments (Cannoy et al. 2006). This raises the following
question: What differences in individuals influence their effectiveness at performing security
behaviors?
The goal of this dissertation is to begin to address this question by 1) proposing a
research model to explain what motivates people to perform individual security behaviors and 2)
developing a way to measure individual security behaviors. This research builds upon an
existing theory to propose a new theory, which suggests that, an individual’s perceptions of
4
threat severity and vulnerability, along with their ability to respond to threats, explains their
performance of security behaviors. As part of the research process, a validated instrument to
measure individual security behaviors is developed following the recommendations of Straub
(1989).
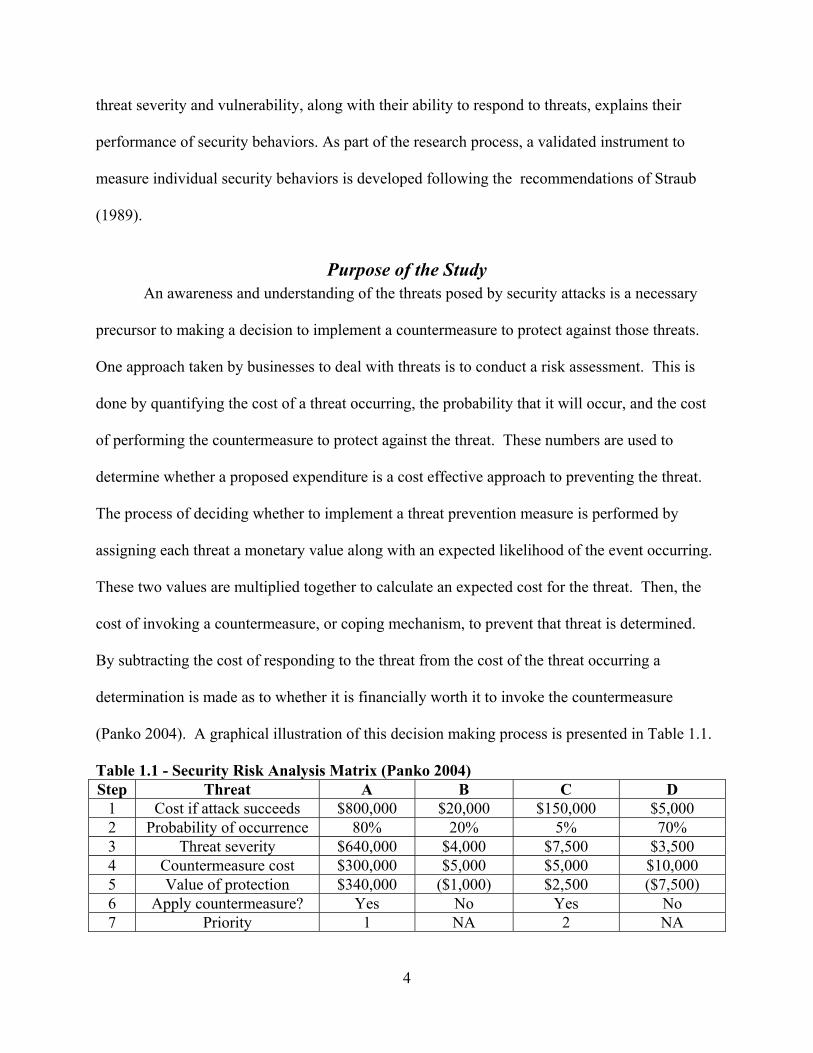
Purpose of the Study An awareness and understanding of the threats posed by security attacks is a necessary
precursor to making a decision to implement a countermeasure to protect against those threats.
One approach taken by businesses to deal with threats is to conduct a risk assessment. This is
done by quantifying the cost of a threat occurring, the probability that it will occur, and the cost
of performing the countermeasure to protect against the threat. These numbers are used to
determine whether a proposed expenditure is a cost effective approach to preventing the threat.
The process of deciding whether to implement a threat prevention measure is performed by
assigning each threat a monetary value along with an expected likelihood of the event occurring.
These two values are multiplied together to calculate an expected cost for the threat. Then, the
cost of invoking a countermeasure, or coping mechanism, to prevent that threat is determined.
By subtracting the cost of responding to the threat from the cost of the threat occurring a
determination is made as to whether it is financially worth it to invoke the countermeasure
(Panko 2004). A graphical illustration of this decision making process is presented in Table 1.1.
Table 1.1 - Security Risk Analysis Matrix (Panko 2004) Step Threat A B C D
1 Cost if attack succeeds $800,000 $20,000 $150,000 $5,000 2 Probability of occurrence 80% 20% 5% 70% 3 Threat severity $640,000 $4,000 $7,500 $3,500 4 Countermeasure cost $300,000 $5,000 $5,000 $10,000 5 Value of protection $340,000 ($1,000) $2,500 ($7,500) 6 Apply countermeasure? Yes No Yes No 7 Priority 1 NA 2 NA
5
An underlying assumption of the risk analysis presented in Table 1.1 is that the threat is
known, which allows for an assessment can be made. A similar argument can be made for users
of computer systems. Once the threats are known they mentally perform some sort of an
assessment about whether they should perform a countermeasure to protect against the threat,
and they need to believe that the countermeasure will be an effective tool to fight against the
threat and that they have the capabilities to perform the countermeasure.
Research Question
Moving from the way that corporations assess and make decisions about security risk to
understanding the way individuals assess and make decisions about security risks is a sizable
jump, filled with many unknowns and assumptions. However, understanding the process that
individuals go through in making decisions about performing security countermeasures is
important due to the increasing cost of dealing with a successful security attack. This leads to
the purpose of this study, which is to address the following research question:
RQ: What determines the security behaviors of individuals?
This research proceeds to answer this question in four stages. First, a framework to build
a new behavioral research model upon is built by relying on existing IS security literature.
Second, an instrument for measuring the security behaviors of individuals is created. Then, the
newly proposed behavioral security research model is tested, utilizing the newly designed
instrument, which serves as the dependent variable in the model. Finally, the results and
implications for future research are considered.
Research Framework One theory generally been relied upon to explain IS misuse within an organization is
General Deterrence Theory (GDT), which was adapted from the criminal justice field and has
6
been used within IS research to show that security countermeasures can act as a deterrent by
increasing the perceptions of the severity and certainty of punishment for misusing information
systems (Straub 1990). GDT uses three variables to explain IS misuse within an organization;
severity of punishment, certainty of punishment, and rival explanations, which has been
operationalized in many different ways including IS specific codes of ethics (Harrington 1996),
preventative measures (Kankanhalli et al. 2003), and ethics training (Workman et al. 2007), to
name a few. One limitation to GDT is that it only applies within a corporate setting. When
expanding the explanation of preventing IS misuse through punishment to a home environment,
the theory no longer holds, as there is no one to punish individual users. However, if the
definition of GDT is adapted from punishment to threats then the theory provides a framework,
upon which a new theory can emerge. This adaptation is possible because a punishment is a
threat to the individual that the company will implement an undesired action, similar to a threat
in the home environment where an unknown attacker will impose an undesired action.
By changing GDT and substituting threats of security attacks rather than punishment for
IS misuse, a framework emerges that propounds the view that severity and vulnerability to
threats along with rival explanations determines the security behavior of individuals. This
framework provides a theoretical approach that is no longer specific just to organizations where
punishment is possible, but to any person who is dealing with security threats. Additionally, it
provides a foundation for drawing upon theories from outside disciplines in order to deal with
explaining IS security behavior, which was suggested as an approach to understanding the
complexities of security by a panel on IS security at the 2007 Americas Conference on
Information Systems (AMCIS) (Choobineh et al. 2007).
7
Detailed Research Model Building on the framework adapted from GDT, this study relies on an adaptation of the
Protection Motivation Theory (PMT), which models behavioral intentions to change health
behaviors (Floyd et al. 2000; Rogers 1975). PMT incorporates threat appraisals, the perceived
effectiveness of a response, an individual’s ability to perform that response, and cost analyses
into its design. PMT was created to determine what stimuli variables raise fear in a person and
the cognitive process necessary to adopt a behavior that will protect him from the outcome of the
fear (Rogers 1975). PMT has been applied successfully to health related issues, injury
prevention, political issues, environmental concerns, protecting others, online privacy, and home
wireless security (Floyd et al. 2000; Woon et al. 2005; Youn 2005). This suggests that the theory
would apply to a broad range of threats that an individual can effectively respond to by
performing a given response. Over the course of the last two decades, PMT has proven to be a
reliable theory. A meta-analysis of the research conducted using PMT, consisting of 65 studies
with approximately 30,000 subjects, representing over 20 health issues, showed that all variables
of the theory exerted at least moderate effects in determining adoption of adaptive behaviors
(Floyd et al. 2000). As information security is as much about technical solutions as it is about
getting people to respond to threats with a given action (Panko 2004), and computer security is
often referred to as computer health (Kearns 2006; Lacy et al. 2006), it should be expected that
this theory will display similar effects when applied to the information security setting.
The premise of PMT is that individuals go through a coping assessment process to
determine whether they should perform some behavior that will influence their health. Sources of
information from personal experience or an outside source influences this coping assessment.
The individual then performs a threat appraisal, where he determines how severe a given threat is
and how vulnerable he thinks he is to that threat. This threat appraisal combines with the
8
individual’s coping appraisal, where he determines how well he thinks he can perform the coping
mechanism and how effective he thinks the coping mechanism is at providing protection from
the threat. By adapting this approach from threats to a person’s health to threats to a person’s
computer system the result is individual security behavior as a dependent variable of interest.
Individual Security Behaviors Prior to testing a research model that explains the security behaviors of individuals, it is
important to understand what composes individual security behaviors and how to measure this
construct. A number of IS studies note that there is a lack of research about individual behaviors
towards security (Cannoy et al. 2006; Dhillon et al. 2000; 2001). The majority of studies that
exist utilize a dichotomous variable to measure security behaviors; none utilizes a validated
measure. However, the use of consistent validated measures will ensure the instrument
possesses reliability and longitudinal validity (Straub 1989). Using validated measures also
allows future researchers to build upon one another’s work in an effort to provide a greater
understanding of the studied phenomenon. To ensure the dependent variable in this study is
reliable and valid and that future researchers can build on findings from this study, this research
follows the process that Straub describes to construct a validated measure for individual security
behaviors. This process consists of reviewing existing literature to create a foundation of
existing suggested security behaviors, followed by a series of interviews with information
security experts to provide further insight into appropriate behaviors. The developed instrument
is validated on a sample population to ensure that it possesses acceptable levels of reliability and
validity.
9
Independent Variables Factors that influence individual security behaviors are tested by adapting constructs
from PMT. The particular adaptations of the PMT variables to the behavioral security research
model are based on how the variables were used in PMT research and how they fit within the
security context. This section briefly describes the threat appraisal measures (perceived security
vulnerability and perceived threat appraisal) and the coping appraisal measures (security self-
efficacy, response efficacy, and prevention cost). Chapter Two provides a more detailed
explanation of these measures.
Perceived Security Vulnerability
Protection Motivation Theory research regularly employs a measure called threat
vulnerability; defined as the probability that a person believes he or she will experience health
related consequences due to performing an unhealthy behavior (Maddux et al. 1983; Rogers
1975). In the context of protecting against security threats, perceived security vulnerability is the
probability that a person will experience a computer attack due to a failure to perform a security
countermeasure. Perceived security vulnerability, as illustrated in Table 1.1, is one of the
processes that businesses utilize to assess the perceived risk of a security threat. Additionally, IS
research has investigated the effect that perceived risk has on individual behavior. Perceived risk
is conceptualized as uncertainty and consequences (Conchar et al. 2004; Dowling et al. 1994; Jia
et al. 1999; Nicolaou et al. 2006; Pavlou et al. 2004). One view of a person’s vulnerability to a
threat is the certainty with which they perceive that the threatening event will occur. Adapting
this PMT measure to explain IS research is fitting, therefore, as it aligns with existing measures
used in previous research.
10
Perceived Security Threat
Another measure used as part of PMT research is threat severity; defined as the severity
of health related consequences that a person believes occur due to performing an unhealthy
behavior (Maddux et al. 1983; Rogers 1975). Adapting this to the context of dealing with
security threats means that perceived security threat is how severe a person believes the
consequences are when a security threat manifests itself into a successful attack. Similar to the
Perceived Security Vulnerability discussion above, this is part of the process businesses use in
assessing the risk of a security threat. This is also similar to the consequences aspect of
perceived risk, as discussed above. The decisions people make when it comes to taking security
countermeasures is in direct relation to how severe they believe the consequences are should the
threat materialize. Similar to the applicability of adapting threat vulnerability to the IS research
field, adapting threat severity is fitting as it also aligns with existing measures used in previous
research.
Security Self-Efficacy
PMT also utilizes a measure for self-efficacy or a person’s confidence in his ability to
perform some sort of coping mechanism to change an unhealthy behavior (Maddux et al. 1983).
Adapting this to the context of dealing with security threats means that it is the confidence that a
person has that he can perform a security countermeasure to prevent a threat from manifesting
into a successful attack. For the purpose of this study, this construct is referred to as security
self-efficacy. IS research regularly relies on self-efficacy to explain individuals’ performance at
using computers (Burkhardt et al. 1990; Carlson et al. 1992; Compeau et al. 1999; Compeau et
al. 1995a; Delcourt et al. 1993; Fagan et al. 2003; Fenech 1998; Gist et al. 1989; Johnson et al.
2000; Lee et al. 2003; Stephens 2005). One particular approach proposed the concept of
11
computer self-efficacy and validated an instrument to measure the confidence that a person has
in using a computer application (Compeau et al. 1995b). Another study provided an analysis of
the research using computer self-efficacy and found that it was appropriate and necessary to
adapt the computer self-efficacy construct to be context specific (Marakas et al. 2007). Thus,
adapting the self-efficacy construct from PMT research to the security self-efficacy construct
used in this study is also appropriate and necessary.
Response Efficacy
Response efficacy is another measure that is a part of PMT. PMT research defines this
measure as the perceived effectiveness of a coping mechanism at changing an unhealthy
behavior (Maddux et al. 1983; Rogers 1975). Adapting this to the context of dealing with
security threats means that it is the confidence that a person has that performing a security
countermeasure will prevent a threatening security event from manifesting itself into a successful
attack. This definition is essentially the same as the outcome expectations, which is “a person’s
estimate that a given behavior will lead to certain outcomes” (Bandura 1977). Outcome
expectations is a measure that has regularly been used in IS research to explain user performance
or acceptance of technology (Chung et al. 2002; Compeau et al. 1999; Compeau et al. 1995b;
Lam et al. 2006; Venkatesh et al. 2003). Given that in this study response efficacy is being used
to explain a person’s performance at performing security behaviors, it is appropriate to apply it in
an IS research study.
Prevention Cost
Protection Motivation Theory research utilizes a response cost measure to capture the
cost that individuals perceive in performing a different health behavior (Floyd et al. 2000;
Rogers 1975). In PMT research, this could have consisted of a reward for continuing unhealthy
12
behavior or a cost for performing a new behavior. However, in a computer security setting, only
the cost for performing a new behavior conceptually makes sense. Response cost influencing the
performance of a new behavior is consistent with IS research, which has found that cost
influences the use or adoption of new technology (Ghorab 1997; Reardon et al. 2007; Wu et al.
2005). However, response cost could be inferred to mean the cost of responding to an attack,
therefore this measure is referred to as prevention cost in the study, which reflects the cost of
preventing a threat from manifesting into a successful attack.
Research Model A recent panel on IS security at the 2007 Americas Conference on Information Systems
(AMCIS) suggested that, in order to deal with the increased challenges of IS security, new
theories from reference disciplines needed to be examined (Choobineh et al. 2007). Such a
suggestion is consistent with a study that reviewed security research in the top IS journals over a
ten-year period and found very little theoretically founded, empirical research in the realm of IS
security (Cannoy et al. 2006). A more expansive review of the literature, as presented in Chapter
Two of this dissertation, found results consistent with the study by Cannoy and her colleagues.
Following the suggestions of Choobineh and his colleagues, a theory from a reference discipline
was referred to in order to help explain the security behaviors of individuals. The present study
utilizes a framework provided by existing IS literature to justify the adaptation of a theory from a
reference discipline. Drawing from existing IS literature to borrow a theory from another
discipline ensures that findings from previous IS research can readily be combined with findings
from this study, which is necessary in order to enable future research to expand upon the findings
of this study. Figure 1.1 presents the research model developed and tested as part of this study
and is described more in depth in Chapter Two.
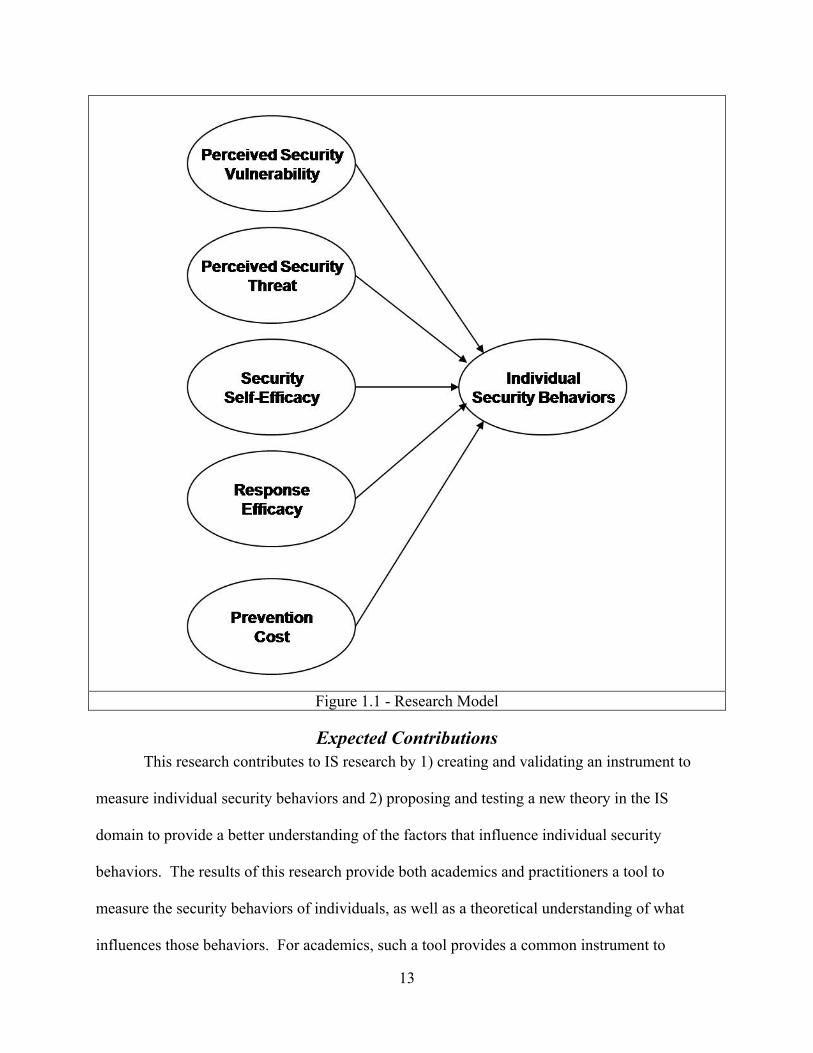
13
Figure 1.1 - Research Model
Expected Contributions This research contributes to IS research by 1) creating and validating an instrument to
measure individual security behaviors and 2) proposing and testing a new theory in the IS
domain to provide a better understanding of the factors that influence individual security
behaviors. The results of this research provide both academics and practitioners a tool to
measure the security behaviors of individuals, as well as a theoretical understanding of what
influences those behaviors. For academics, such a tool provides a common instrument to
14
measure individual security behaviors consistently. By using a common, validated method of
measuring individual security behavior, future studies can build upon one another using this
measure as a constant base. For practitioners, such a tool will be useful for assessing how
thorough a person is at protecting his or her computer from security attacks. It also allows for a
follow-up measure to be performed, determining how successful different training and education
endeavors are. The theoretical understanding of what influences security behaviors also provides
useful insights for academics and practitioners alike. For academics, it provides one more piece
of the puzzle to build upon and combine with other theories to provide further understanding of
what determines an individual’s security behaviors. For practitioners, it provides insight into
improving training and education programs to better influence the outcome they are after –
improved individual security behaviors.
Overview of the Dissertation The remainder of this dissertation is organized as follows: Chapter Two contains a review
of the literature with main sections on outcome oriented IS security research, behavioral IS
security research, protection motivation theory, and the behavioral security research model;
Chapter Three describes the research design and methodology; Chapter Four provides a detailed
analysis of the data collected; Chapter Five discusses the research results and implications; and
Chapter Six provides a conclusion, which includes contributions, limitations of the study, and
recommendations for future research.
15
Chapter Two: Background This research uses a multi-phased and multi-theoretical perspective, extending an existing
information systems theory, General Deterrence Theory, by adapting a theory from the field of
social psychology, Protection Motivation Theory. In addition, this research builds a newly
validated instrument for measuring the security behaviors of individuals. This approach is used
to address the research question presented in Chapter One; what determines the security
behaviors of individuals? This chapter is organized as follows: first, a discussion of outcome
oriented research in IS security is presented; then behavioral IS security research is discussed;
this is followed by a presentation of a guiding framework for advancing behavioral research in IS
security; the final section adapts a theory from the field of social psychology by building upon
existing IS research.
Outcome Oriented IS Security Research Much of the existing work in security research revolves around investigation of the ends
as opposed to the mean, meaning that research has been focusing more on developing better
technological solutions to providing security as opposed to understanding the individuals who
utilize the technology (Dhillon et al. 2001). Some of the technological solutions that have been
researched deal with risk analysis, improved approaches to implementing better security, as well
as specific tools for increasing the security capabilities of computers.
Risk
Risk is one component regularly studied in IS security research. One approach looks at
cultural differences to understand the differences in people’s risk perceptions based on their
worldview, which provides management with a better way to manage risk given different
cultural settings (Tsohou et al. 2006). Another approach to risk deals with a cost/benefit analysis
16
prior to implementing given security countermeasures. The cost/benefit analysis considers the
cost of a risk occurring versus the cost of investing in a countermeasure to deal with the risk. If
the cost of investing in the countermeasure is less than the cost of the risk occurring, then there is
enough benefit to justify the expenditure. Such an approach uses mathematical formulas to
provide a subjective way of determining which security countermeasures should be invested in
(Karabacak et al. 2005). Further research illustrates the risk that management faces in the new
era of Internet based computing and provides methods that management can take to mitigate
these risks (Farahmand et al. 2005). Risk is an important component to understand when
considering the security of systems in a number of other contexts including accounting
information systems (Abu-Musa 2006), justifying information systems (Baskerville 1991),
justifying the economics of information security (Cavusoglu et al. 2004), setting security goals
(Koskosas et al. 2003), developing information systems (Maguire 2002), making management
decisions (Straub et al. 1998), and analyzing threats to information security (Whitman 2003).
Improved Approaches to Security
Several authors have suggested ways in which improved approaches to security can
decrease the number or severity of attacks. One such paper introduces the Process-Oriented
Security Model (POSeM), which relies on business process descriptions to create necessary
security safeguards (Rohrig et al. 2004). An evaluation of POSeM is provided in an e-commerce
setting. Another paper provides a framework for applying multiple high-level security models to
meet the diverse set of requirements in an e-commerce environment (Essmayr et al. 2004). The
Information Governance Security Framework is proposed to provide a holistic perspective to
governing security, which, the authors claim, will minimize risk and cultivate a greater level of
information security culture (Veiga et al. 2007). Another study provides a framework that
17
suggests that sharing security information along with investments in security technology work as
complements to one another in ensuring a secure computing environment (Gal-Or et al. 2005).
Many other models and frameworks have been proposed to increase the security of a system
including policy (Rees et al. 2003; Siponen et al. 2006b) and standards setting (Backhouse et al.
2006; Ma et al. 2005; Myler et al. 2006; Siponen 2002), information assurance (Ezingeard et al.
2005), cyberterrorism protection (Foltz 2004), outsourcing (Karyda et al. 2006), security goal
setting (Koskosas et al. 2003), risk assessment (Misra et al. 2007; Sun et al. 2006; Willison et al.
2006), access control (Miller et al. 1996; Pan et al. 2006; Zhang et al. 2003), design frameworks
(Siponen 2005; Siponen et al. 2006a; Tak et al. 2004), and information systems security
management (Trcek 2003; Zuccato 2007).
In addition to the proposed models and frameworks for increasing the security of
systems, other studies provide discussions on how better approaches to security can be
implemented, either to comply with legal regulations and security best practices or to deal with
the changing complexity of information technology. One study proposed a new way of encoding
personal micro-data in such a way that no individual person’s information would be at risk, but
that would allow for the sharing of information between people that legally have the right to
access that information (Garfinkel et al. 2007). Encoding personal micro-data this way helps to
ensure that medical institutions are following the law and provide an extra layer of privacy
protection to individuals. A number of other studies explore better approaches to security in
such areas as risk management and assessment (Anderson 2007; Bernard 2007; Magklaras et al.
2002; Theoharidou et al. 2005; Tsoumas et al. 2004; Yeh et al. 2007), complying with health
regulations (Dantu et al. 2007; Thomas et al. 2007), deployment of information systems and
technologies (Doherty et al. 2006), recommendations for tighter security systems (Issac et al.
18
2007), ethical and legal impacts of spyware (Sipior et al. 2005), managing user relationships
(Vroblefski et al. 2007), and user authentications (Warkentin et al. 2004).
Another theme in security research is trust. One paper proposes a solution that will
address trust issues in a wireless Internet setting, which should increase usage of wireless
networks (Stewart et al. 2006). Other work has been done that proposes key components of a
trust model that ensure a sense of security in a mobile computing environment (Misra et al.
2004). Following this approach, another paper proposes an expanded trust model for distributed
systems that is rigorous enough to hold as technology changes (Hoffman et al. 2006).
Furthermore, one author argues that biometrics increase people’s trust over traditional security
measures and online transactions should utilize this technology to effectively lower the cost and
risk associated with online transactions (Kleist 2007). However, Kleist argues that the
acceptance of biometrics for a solution such as this is constrained by a lack of standardization
amongst biometric manufacturers and the use of proprietary algorithms, limiting the
interconnectivity of this type of technology. Additionally, use of biometrics faces social
challenges to get individuals to adopt the technology (Chandra et al. 2005). There exist several
other papers detailing the importance of trust in ensuring a secure computer system (Eigeles
2005; Koskosas et al. 2003; Neumann 2006; Viega et al. 2001).
Contrary to the above findings that suggest trust impacts security, other papers suggest
that how secure an individual thinks a system is influences their trust of the online-based system
(Shalhoub 2006; Wakefield et al. 2006). Such a suggestion supports the argument that trust and
security are related, but the nature of that relationship in an online environment is not fully
understood. Based on these different findings of trust it may be argued that the relationship
between security and trust is not a one-way relationship but a reciprocal relationship. As trust
19
increases so does a person’s perception of the security of a system, and likewise as a system has
proven to be secure the trust a person places in that system increases.
Security has also been shown to be an issue when it comes to knowledge sharing. One
set of papers argues that knowledge management models need security integrated into them
(Jennex et al. 2007; Randeree 2006). Jennex and his colleague illustrate how two existing
security models can be applied to the knowledge management context and provide two case
studies illustrating how risk management can be applied to knowledge management governance.
Similarly, another paper proposes a knowledge-sharing security model that combines preexisting
models to create a way in which business partners can proactively monitor the shared knowledge
assets within their shared value chain (Soper et al. 2007). Additionally, a couple of approaches
to communicating knowledge within and across organizational boundaries via semantic mapping
have been provided (Lee et al. 2005; Muthaiyah et al. 2007). The purpose of the semantic
mapping is to provide a solution to the communication of security policies between organizations
that arises due to the heterogeneous nature of policies across organizations. Another study relies
on simulation to show that in order to properly secure knowledge, not only does the proper
technology need to be relied upon, but the proper social environment for reporting issues needs
to be in place (Sveen et al. 2007). Further discussions about the importance of security to
knowledge management are also provided (Belsis et al. 2005; Gal-Or et al. 2005; Metaxiotis et
al. 2003).
Technological Solutions
Technological solutions are an important aspect to securing information systems. One
study proposes a better way to provide digital rights management (DRM) for protecting digital
information (Abie et al. 2004), by proposing a set of criteria that a DRM solution should consist
20
of and describe how they created an implementation that fits most of the criteria. Another study
proposes a better way to watermark digital images, protecting the images from theft and
defacement (Hsieh et al. 2004). Expanding the technological protection of security on networks
even further, another paper provides a new way of performing detection intrusion on networked
systems (Li et al. 2007), by addressing the weaknesses in current intrusion detection systems that
prevent people from regularly relying on them to enhance their network’s security. Further, it
has been argued that the development of security tools has not taken advantage of the well-
developed stream of research in human-computer interaction (HCI). By doing so it is suggested
that the use of security tools can be significantly increased (Johnston et al. 2003). Many other
technological solutions to security issues have been provided over the years including secure
signatures (Backes et al. 2005; Clarke et al. 2007; Ding et al. 2006), audit services (Baldwin et
al. 2005), firewalls (Byrne 2006), intrusion detection systems (Cavusoglu et al. 2005; Li et al.
2005; Williams et al. 2007; Ye et al. 2006), user authentication (Furnell et al. 2004; Itakura et al.
2005), cryptographic solutions (Galindo et al. 2005), countermeasures to security attacks
(Gürgens et al. 2005), mobile phone security (Lee et al. 2006), usage control (Pretschner et al.
2006), network vulnerability assessment (Shahriari et al. 2007), and securing multi-agent
systems (Viia et al. 2007).
Behavioral IS Security Research As noted by Dhillon and Backhouse (2000; 2001), an understanding of the socio-
organizational perspective is lacking in current IS security research. This observation is
supported by another study in which several IS managers were interviewed about what they
value in managing IS security, which suggested that, in order to maintain IS security, it was
important to consider organizational principles and values instead of just technology (Dhillon et
21
al. 2006). Similarly, in a review of security research in the top IS journals from 1996 to 2005, it
was found that research in this area is very fragmented with very few papers testing research
hypotheses and no framework emerging to explain security research (Cannoy et al. 2006).
Cannoy and her colleagues also show that there has been no consistency in the variables used to
explain security and that very few studies include major constructs and their relationships, but
focus only on narrow topics or clarifying the details of a technical system. Along these same
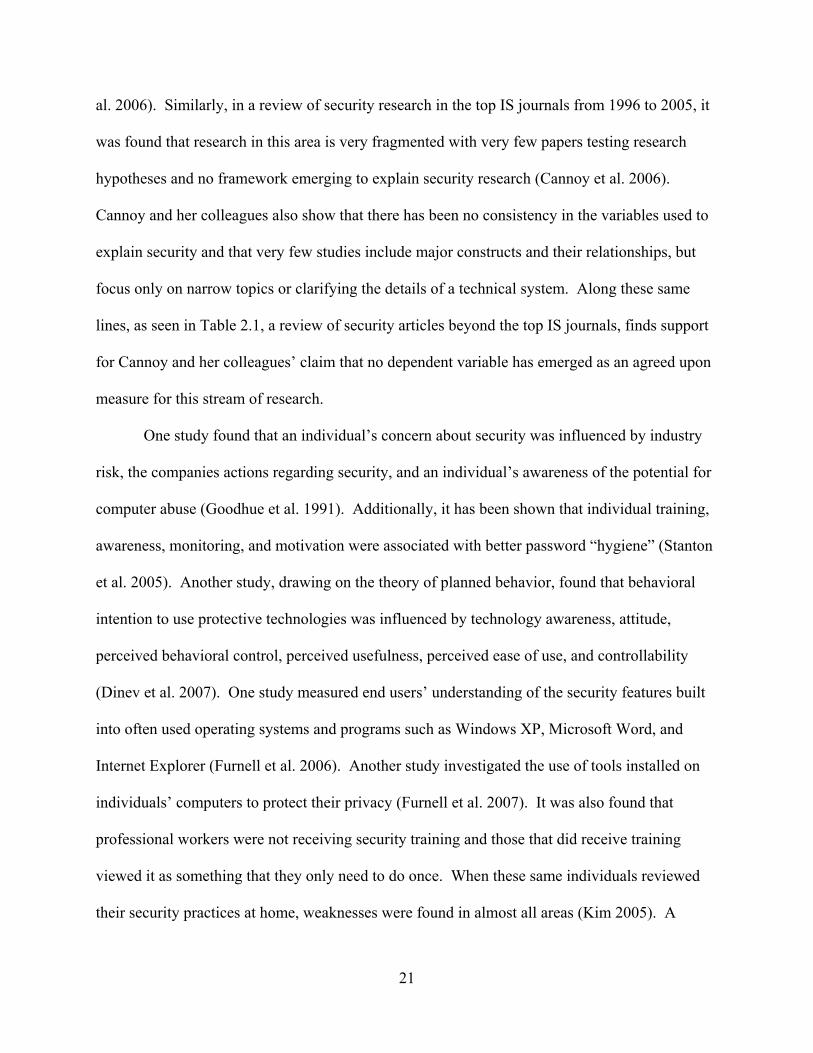
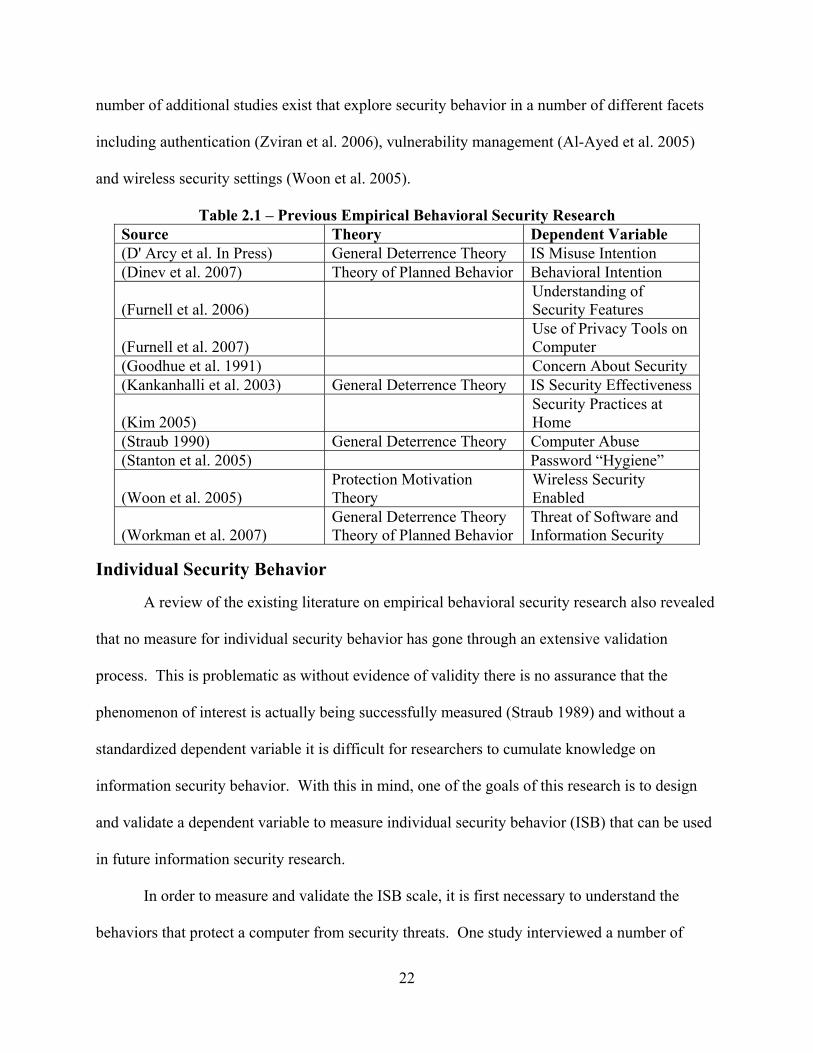
lines, as seen in Table 2.1, a review of security articles beyond the top IS journals, finds support
for Cannoy and her colleagues’ claim that no dependent variable has emerged as an agreed upon
measure for this stream of research.
One study found that an individual’s concern about security was influenced by industry
risk, the companies actions regarding security, and an individual’s awareness of the potential for
computer abuse (Goodhue et al. 1991). Additionally, it has been shown that individual training,
awareness, monitoring, and motivation were associated with better password “hygiene” (Stanton
et al. 2005). Another study, drawing on the theory of planned behavior, found that behavioral
intention to use protective technologies was influenced by technology awareness, attitude,
perceived behavioral control, perceived usefulness, perceived ease of use, and controllability
(Dinev et al. 2007). One study measured end users’ understanding of the security features built
into often used operating systems and programs such as Windows XP, Microsoft Word, and
Internet Explorer (Furnell et al. 2006). Another study investigated the use of tools installed on
individuals’ computers to protect their privacy (Furnell et al. 2007). It was also found that
professional workers were not receiving security training and those that did receive training
viewed it as something that they only need to do once. When these same individuals reviewed
their security practices at home, weaknesses were found in almost all areas (Kim 2005). A
22
number of additional studies exist that explore security behavior in a number of different facets
including authentication (Zviran et al. 2006), vulnerability management (Al-Ayed et al. 2005)
and wireless security settings (Woon et al. 2005).
Table 2.1 – Previous Empirical Behavioral Security Research Source Theory Dependent Variable (D' Arcy et al. In Press) General Deterrence Theory IS Misuse Intention (Dinev et al. 2007) Theory of Planned Behavior Behavioral Intention
(Furnell et al. 2006) Understanding of Security Features
(Furnell et al. 2007) Use of Privacy Tools on Computer
(Goodhue et al. 1991) Concern About Security (Kankanhalli et al. 2003) General Deterrence Theory IS Security Effectiveness
(Kim 2005) Security Practices at Home
(Straub 1990) General Deterrence Theory Computer Abuse (Stanton et al. 2005) Password “Hygiene”
(Woon et al. 2005) Protection Motivation Theory
Wireless Security Enabled
(Workman et al. 2007) General Deterrence Theory Theory of Planned Behavior
Threat of Software and Information Security
Individual Security Behavior
A review of the existing literature on empirical behavioral security research also revealed
that no measure for individual security behavior has gone through an extensive validation
process. This is problematic as without evidence of validity there is no assurance that the
phenomenon of interest is actually being successfully measured (Straub 1989) and without a
standardized dependent variable it is difficult for researchers to cumulate knowledge on
information security behavior. With this in mind, one of the goals of this research is to design
and validate a dependent variable to measure individual security behavior (ISB) that can be used
in future information security research.
In order to measure and validate the ISB scale, it is first necessary to understand the
behaviors that protect a computer from security threats. One study interviewed a number of
23
security experts to uncover the threats that they faced most often as well as the mechanisms used
to protect against these threats (Whitman 2004). As discussed above, research into the protection
mechanisms used to secure a system regularly occurs in IS research. Additionally, a number of
research groups seek to better understand the steps companies take to protect themselves from
security threats (Deloitte 2007; Richardson 2007). Generally, this research is performed to
provide a big picture understanding of what companies are doing and to provide opportunities for
industry-wide improvement in securing computer systems.
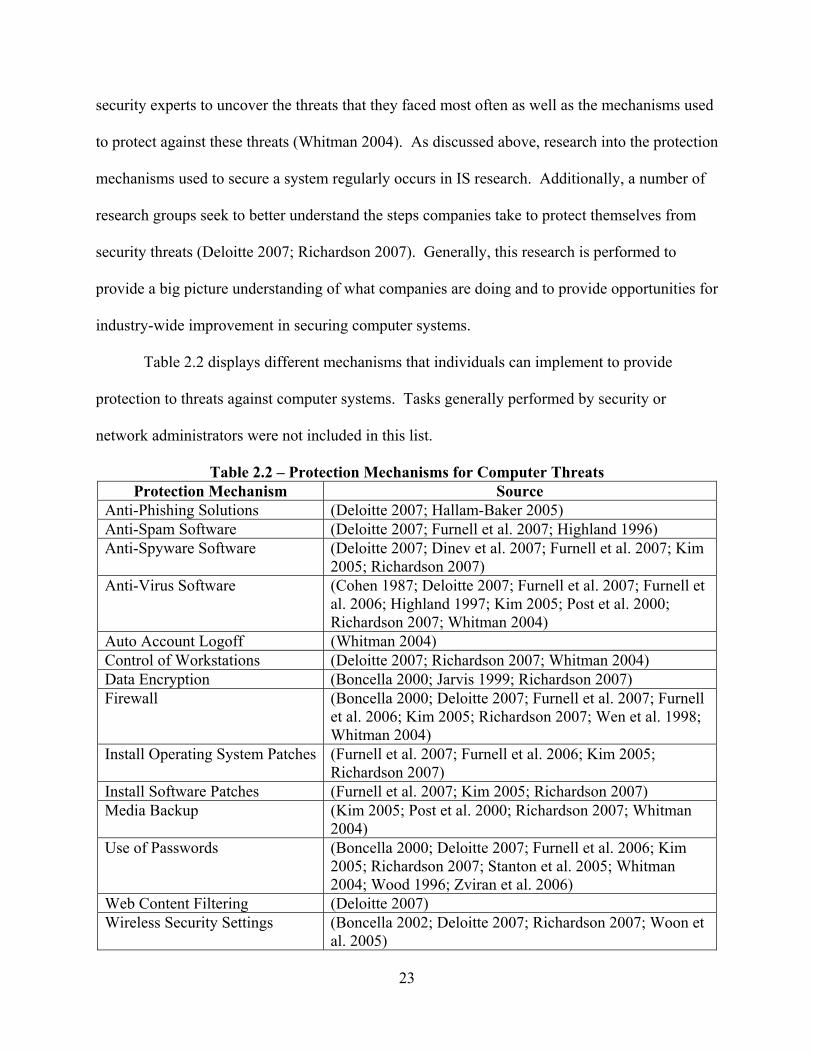
Table 2.2 displays different mechanisms that individuals can implement to provide
protection to threats against computer systems. Tasks generally performed by security or
network administrators were not included in this list.
Table 2.2 – Protection Mechanisms for Computer Threats Protection Mechanism Source
Anti-Phishing Solutions (Deloitte 2007; Hallam-Baker 2005) Anti-Spam Software (Deloitte 2007; Furnell et al. 2007; Highland 1996) Anti-Spyware Software (Deloitte 2007; Dinev et al. 2007; Furnell et al. 2007; Kim
2005; Richardson 2007) Anti-Virus Software (Cohen 1987; Deloitte 2007; Furnell et al. 2007; Furnell et
al. 2006; Highland 1997; Kim 2005; Post et al. 2000; Richardson 2007; Whitman 2004)
Auto Account Logoff (Whitman 2004) Control of Workstations (Deloitte 2007; Richardson 2007; Whitman 2004) Data Encryption (Boncella 2000; Jarvis 1999; Richardson 2007) Firewall (Boncella 2000; Deloitte 2007; Furnell et al. 2007; Furnell
et al. 2006; Kim 2005; Richardson 2007; Wen et al. 1998; Whitman 2004)
Install Operating System Patches (Furnell et al. 2007; Furnell et al. 2006; Kim 2005; Richardson 2007)
Install Software Patches (Furnell et al. 2007; Kim 2005; Richardson 2007) Media Backup (Kim 2005; Post et al. 2000; Richardson 2007; Whitman
2004) Use of Passwords (Boncella 2000; Deloitte 2007; Furnell et al. 2006; Kim
2005; Richardson 2007; Stanton et al. 2005; Whitman 2004; Wood 1996; Zviran et al. 2006)
Web Content Filtering (Deloitte 2007) Wireless Security Settings (Boncella 2002; Deloitte 2007; Richardson 2007; Woon et
al. 2005)
24
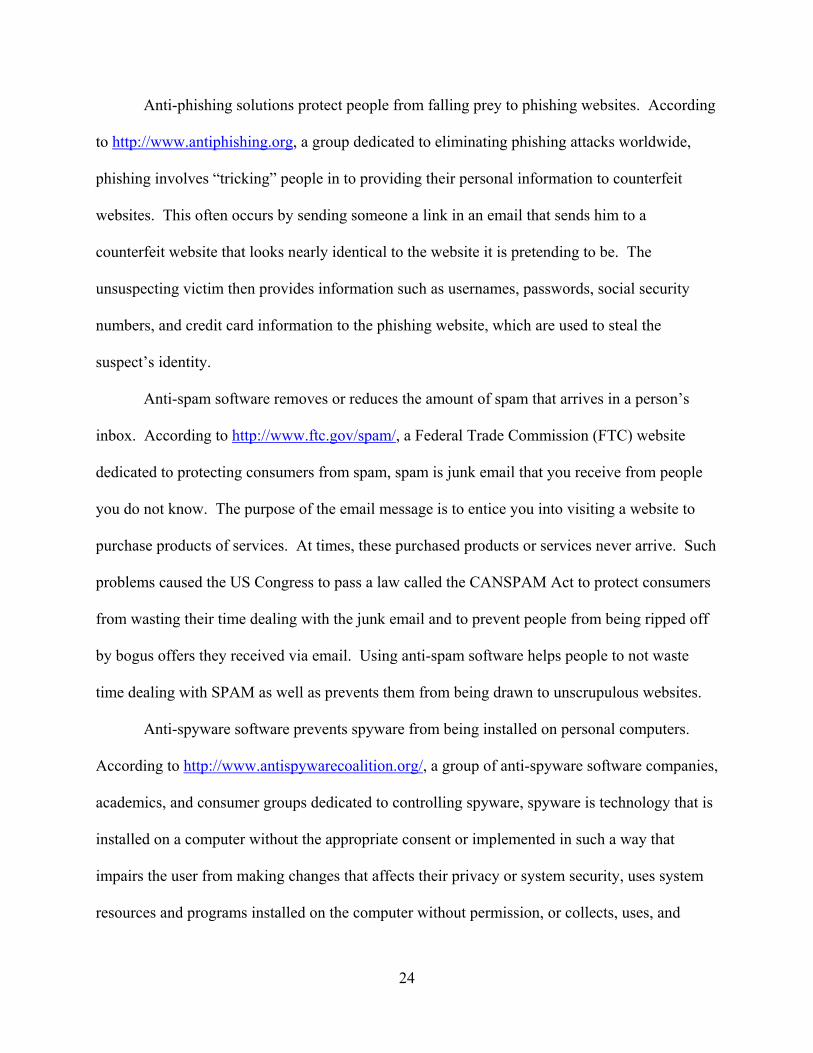
Anti-phishing solutions protect people from falling prey to phishing websites. According
to http://www.antiphishing.org, a group dedicated to eliminating phishing attacks worldwide,
phishing involves “tricking” people in to providing their personal information to counterfeit
websites. This often occurs by sending someone a link in an email that sends him to a
counterfeit website that looks nearly identical to the website it is pretending to be. The
unsuspecting victim then provides information such as usernames, passwords, social security
numbers, and credit card information to the phishing website, which are used to steal the
suspect’s identity.
Anti-spam software removes or reduces the amount of spam that arrives in a person’s
inbox. According to http://www.ftc.gov/spam/, a Federal Trade Commission (FTC) website
dedicated to protecting consumers from spam, spam is junk email that you receive from people
you do not know. The purpose of the email message is to entice you into visiting a website to
purchase products of services. At times, these purchased products or services never arrive. Such
problems caused the US Congress to pass a law called the CANSPAM Act to protect consumers
from wasting their time dealing with the junk email and to prevent people from being ripped off
by bogus offers they received via email. Using anti-spam software helps people to not waste
time dealing with SPAM as well as prevents them from being drawn to unscrupulous websites.
Anti-spyware software prevents spyware from being installed on personal computers.
According to http://www.antispywarecoalition.org/, a group of anti-spyware software companies,
academics, and consumer groups dedicated to controlling spyware, spyware is technology that is
installed on a computer without the appropriate consent or implemented in such a way that
impairs the user from making changes that affects their privacy or system security, uses system
resources and programs installed on the computer without permission, or collects, uses, and
25
distributes sensitive or personal information. When spyware is successfully installed on a
computer it can cause problems for the user of the computer by tracking what they do on their
computer and then using this information to market items directly to them, or in the worst case
steal their identity. Utilizing anti-spyware software helps prevent such technology from being
installed on a personal computer.
Anti-virus software is software that prevents viruses from infecting files on a personal
computer. A virus is “a program that can 'infect' other programs by modifying them to include a
possibly evolved copy of the virus. With the infection property, a virus can spread throughout a
computer system or network using the authorizations of every user using it to infect their
programs. Every program that gets infected may also act as a virus and thus the infection grows”
(Cohen 1987). Once computers get viruses the virus can not only spread, but can also delete
files, cause hard drives to crash, or open holes for people to gain unauthorized access to the
system. Running anti-virus software helps prevent viruses from ever infecting a computer.
Auto account logoff serves the purpose of automatically logging a user off their personal
computer account after a predetermined amount of inactivity. The purpose of this is it requires
that a user re-establish their credentials to use system resources, preventing someone from using
a workstation that someone has logged onto, but stepped away from. Using an auto account
logoff feature helps prevent this threat.
Keeping physical control of workstations helps prevent unauthorized people from
accessing them. This includes keeping workstations physically secured in a room with a lock
when no one is present. When it comes to keeping physical control of laptops there are
additional precautions needed. Laptop computers should remain physically with someone,
physically secured to an immovable object such as a desk, or secured in a room with a lock when
26
no one is present. Once a person has physical control of a computer it becomes much easier for
them to access the information on it as a number of other security safeguards have been
bypassed. Additionally, with physical access to a computer a person can use brute force attacks
and eventually crack even the strongest passwords.
Data encryption is necessary to ensure that data stored on a computer or sent over the
network remains confidential. According to http://www.us-cert.gov/, a Computer Emergency
Response Team of the United States government that is tasked with coordinating defenses and
responses to cyber attacks across the country, it is important to use encryption when using a
laptop computer or when the data that you have on a computer is not sufficiently protected by the
built in security mechanisms of the operating system on the computer used. Additionally,
whenever sending personal information over the network, which is an open system that any one
has access to, it is important to use encryption to ensure that only the people that are supposed to
can view the personal information. Such encryption is generally built into web transactions,
especially when credit card numbers are involved. Secure Socket Layers (SSL) is the technology
utilized for online transactions and should always be present when making online purchases.
The purpose of a firewall is to guard the information that enters and leaves a personal
computer or network. Firewalls come in two different types, hardware and software. Software
firewalls are installed on the computer utilizing it, while hardware firewalls are separate devices
that sit between a network or personal computer and the Internet connection. According to
http://www.us-cert.gov/, firewalls are necessary to ensure that only information that is supposed
to enter and leave a personal computer or network does. By having a firewall sit at the gate
between a personal computer or network and the Internet it is possible to prevent people with
malicious intent from gaining access to a computer and taking information from it that may be

27
stored there. It is important to use at least a software firewall, but if a person’s budgets allows
for the additional cost of a hardware firewall the additional layer of protection provides added
defense against outside attackers.
Installing operating systems patches is an important way to ensure that bugs identified by
the operating system vendor are fixed. Fixing these bugs is an important step to ensure that
outside intruders do not exploit vulnerabilities introduced by these bugs. Oftentimes bugs in
operating systems can open up ways for unauthorized people to gain complete access to a system
from a remote location. According to http://www.us-cert.gov/, keeping the operating system
patched is one way to remove these vulnerabilities.
Installing software patches addresses similar problem as installing operating systems
patches. When programs are released they often have bugs that result in unintended
vulnerabilities that outside attackers can exploit. These vulnerabilities can be fixed by installing
patches released by software vendors (http://www.us-cert.gov/).
Backing up the important files and folders on a computer ensures they can be recovered if
anything happens to them. If a computer malfunctions or is destroyed by a malicious hacker, not
having backups of important files means that those files are lost forever (http://www.us-
cert.gov/). Backing up files to an online server also provides assurance that loss due to a natural
disaster such as a fire or a flood will not mean the loss of the important files.
Passwords are most often the means by which access is gained to personal computers and
other secure accounts that are accessed from personal computers. It is important not to share
passwords with other people as that allows them to have unauthorized access to systems.
Passwords should also be strong, that is they should not be common dictionary words, should be
at least eight characters long and made up of a combination of upper and lower case letters,
28
numbers and punctuation marks. Additionally, passwords should be changed on a regular basis
to prevent people who may have gained access from continuing to have access to your account
(http://www.us-cert.gov/). Following this approach ensures authorized people only access a
computer system.
Web content filtering helps prevent the release of private information to malicious
outsiders or through accidental release by detecting when such information is being sent over the
network (Deloitte 2007). In addition, some websites exist to infect computers with viruses and
spyware. Using web content filtering software can identify such unscrupulous websites.
Utilizing filtering software to prevent the loss of information or the installing of viruses and
spyware help keep a personal computer secure.
Wireless networks can be more prone to security breaches than wired networks (Deloitte
2007). Ensuring that the security settings of wireless networks are properly set helps mitigate
some of the risk posed by wireless networks. In order to ensure the security of a wireless
network it is necessary to restrict access to the network, encrypt connections to the network, and
protect the service set identifier (SSID) or network name (Woon et al. 2005). By following these
recommendations, it makes it more difficult for unauthorized people to access the wireless
network or steal information broadcast over it.
In summary, there exist many security protection mechanisms. Building upon the
mechanisms discussed above and following the instrument development procedures
recommended by Straub (1989) results in a way to measure how well individuals are performing
protection mechanisms that security professionals and researchers have agreed are necessary to
protect information security.
29
General Deterrence Theory
An examination of Table 2.2 reveals that General Deterrence Theory (GDT) has been the
most widely relied upon theory in behavioral IS security research. GDT originated in the
criminology domain to explain the behavior of criminals and anti-social personalities (Blumstein
1978; Pearson et al. 1985). The premise of GDT is that people with intent to commit illegal acts
can be dissuaded from committing these acts through the existence of severe disincentives and
punishments for committing the acts. Within the IS security literature, GDT has been adapted to
posit that security countermeasures can act as a deterrent by increasing the perceptions of the
severity and certainty of punishment for misusing information systems (Straub 1990). Inherent
in the foundation of GDT are the relationships illustrated in the Security Action Cycle (see
Figure 2.1), which shows how efforts at deterrence, prevention, detection, and remedies all
provide a deterrent effect towards future computer related criminal acts (Nance et al. 1988;
Straub et al. 1998). However, this theory has shown contradictory findings with some studies
supporting it (D' Arcy et al. In Press; Gopal et al. 1997; Kankanhalli et al. 2003; Straub 1990;
Workman et al. 2007) and others not (Harrington 1996; Lee et al. 2004).
30
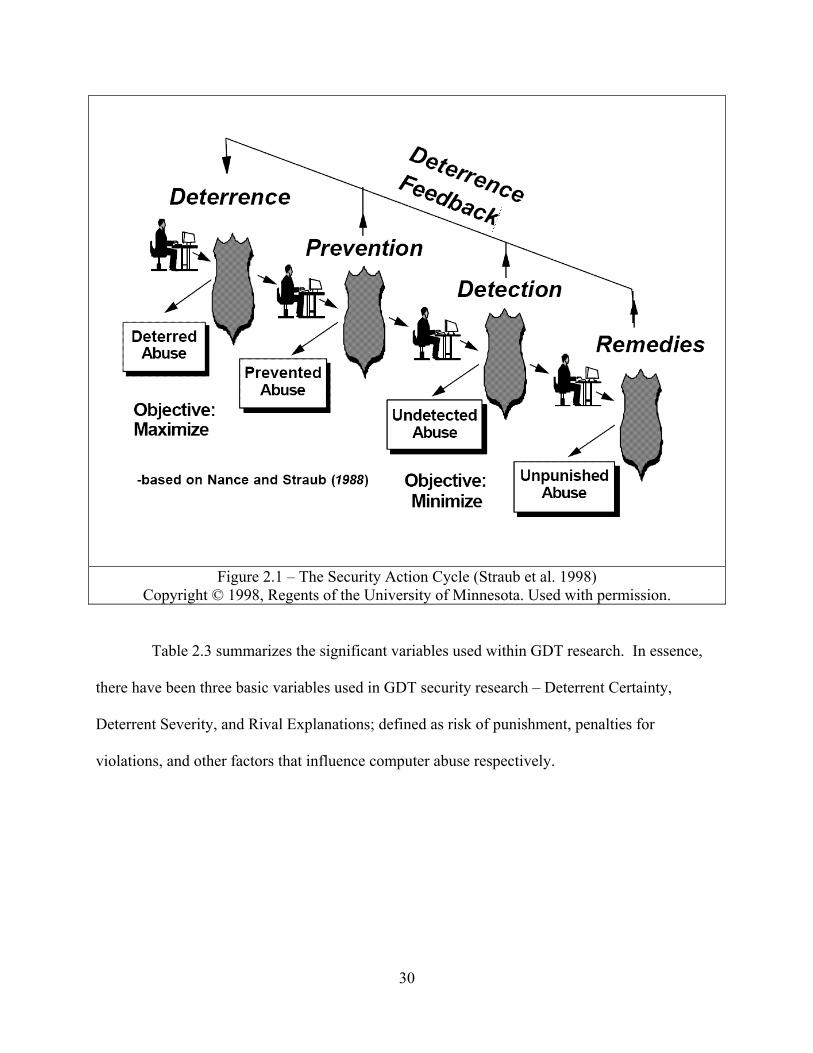
Figure 2.1 – The Security Action Cycle (Straub et al. 1998) Copyright © 1998, Regents of the University of Minnesota. Used with permission.
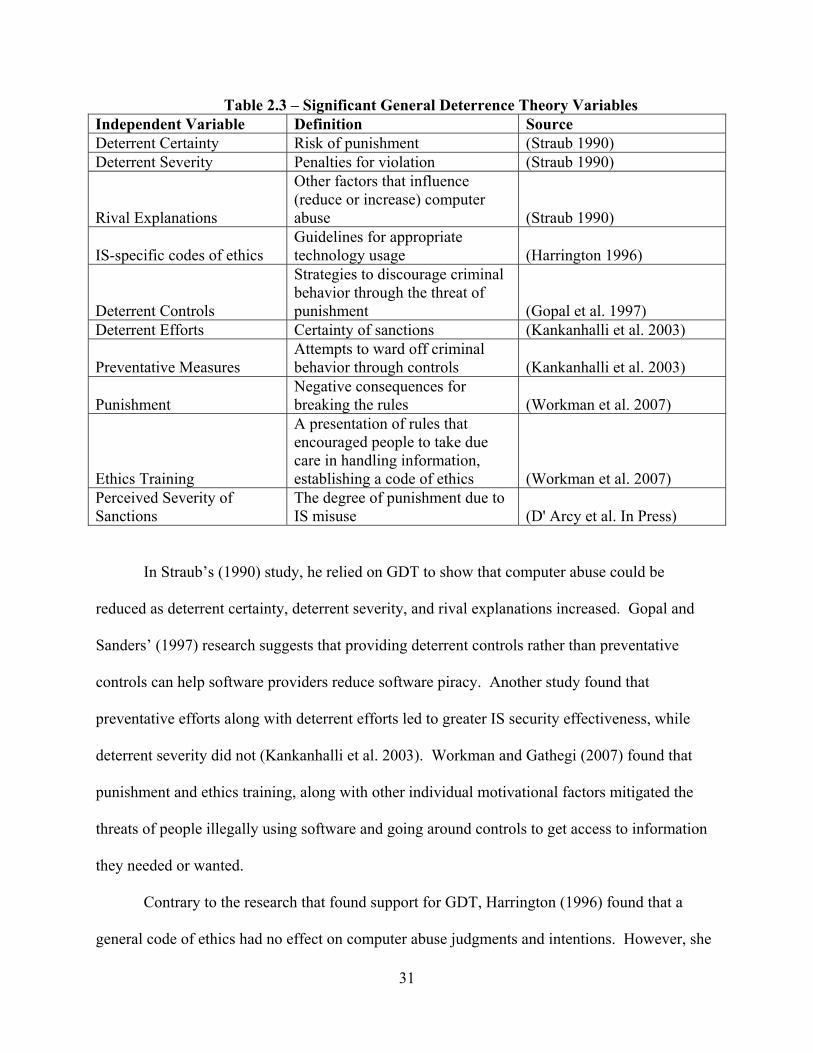
Table 2.3 summarizes the significant variables used within GDT research. In essence,
there have been three basic variables used in GDT security research – Deterrent Certainty,
Deterrent Severity, and Rival Explanations; defined as risk of punishment, penalties for
violations, and other factors that influence computer abuse respectively.
31
Table 2.3 – Significant General Deterrence Theory Variables Independent Variable Definition Source Deterrent Certainty Risk of punishment (Straub 1990) Deterrent Severity Penalties for violation (Straub 1990)
Rival Explanations
Other factors that influence (reduce or increase) computer abuse (Straub 1990)
IS-specific codes of ethics Guidelines for appropriate technology usage (Harrington 1996)
Deterrent Controls
Strategies to discourage criminal behavior through the threat of punishment (Gopal et al. 1997)
Deterrent Efforts Certainty of sanctions (Kankanhalli et al. 2003)
Preventative Measures Attempts to ward off criminal behavior through controls (Kankanhalli et al. 2003)
Punishment Negative consequences for breaking the rules (Workman et al. 2007)
Ethics Training
A presentation of rules that encouraged people to take due care in handling information, establishing a code of ethics (Workman et al. 2007)
Perceived Severity of Sanctions
The degree of punishment due to IS misuse (D' Arcy et al. In Press)
In Straub’s (1990) study, he relied on GDT to show that computer abuse could be
reduced as deterrent certainty, deterrent severity, and rival explanations increased. Gopal and
Sanders’ (1997) research suggests that providing deterrent controls rather than preventative
controls can help software providers reduce software piracy. Another study found that
preventative efforts along with deterrent efforts led to greater IS security effectiveness, while
deterrent severity did not (Kankanhalli et al. 2003). Workman and Gathegi (2007) found that
punishment and ethics training, along with other individual motivational factors mitigated the
threats of people illegally using software and going around controls to get access to information
they needed or wanted.
Contrary to the research that found support for GDT, Harrington (1996) found that a
general code of ethics had no effect on computer abuse judgments and intentions. However, she
32
did find that an IS-specific code of ethics had an effect on computer sabotage and intentions.
Conversely, in a study of Korean managers and MBA students, Lee et al. (2004) found that
security policies and systems did not impact computer abuse behaviors.
Noting the discrepancy in these findings, a further study expanded on GDT and found
that awareness of security policies, security education, training and awareness programs, and
computer monitoring led to increases in perceived certainty and severity of sanctions, with
perceived severity of sanctions being the only determinant to decreasing IS misuse intention (D'
Arcy et al. In Press). These findings provide support for GDT, but differ from the results found
in other papers (Kankanhalli et al. 2003). Although conflicting results exist about the
consistency of GDT at explaining how to deter computer abuse, it has shown more success than
failure. Therefore, this stream of research provides a good framework for expanding the
explanation of security behaviors beyond the corporate setting, by expanding beyond deterrents
to threats, such that the combination of threat severity, threat certainty, and rival explanations
influences the choices individuals make to perform security behaviors. Such an expansion on the
view of GDT falls in line with the Security Action Cycle that shows the effect that prevention,
detection, and remedies have on deterring computer abuse. Figure 2.2 illustrates the resulting
framework. The underlying question that remains unanswered is how individual differences lead
to better security behaviors. In addition, deterrent efforts have been shown to work in an
environment where sanctions can occur. Outside of an environment where sanctions can be
imposed, other individual differences need to be explored to explain security behaviors.
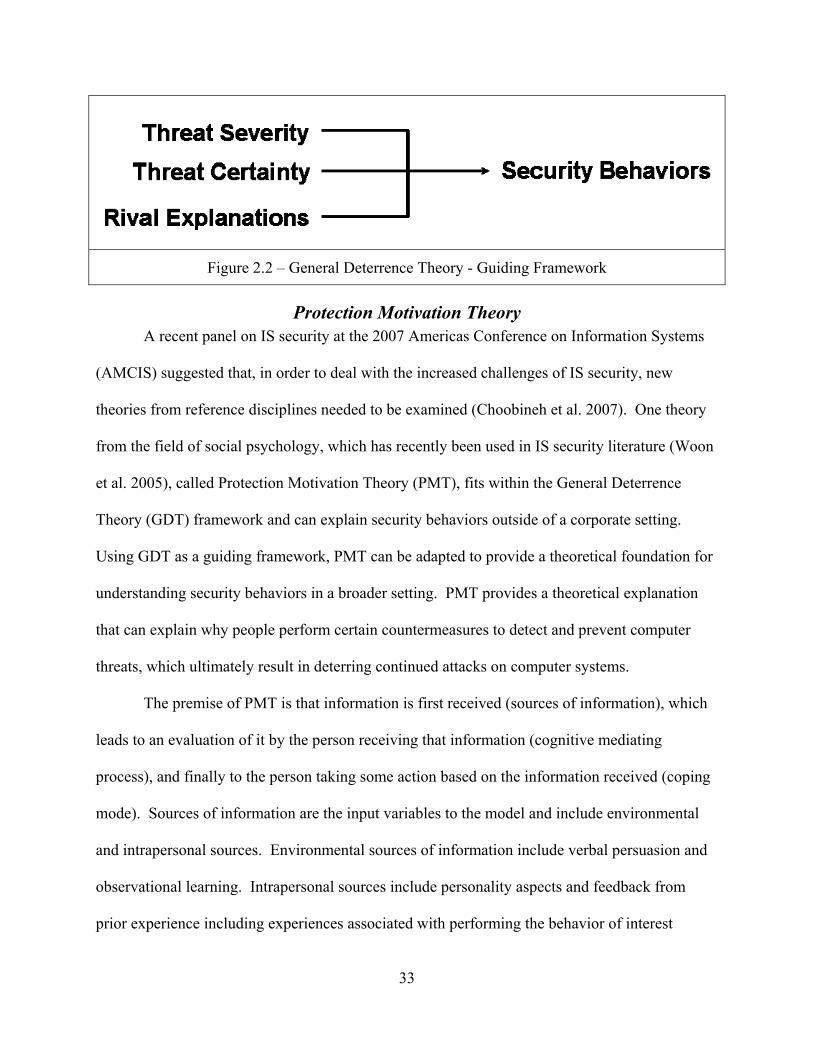
33
Figure 2.2 – General Deterrence Theory - Guiding Framework
Protection Motivation Theory A recent panel on IS security at the 2007 Americas Conference on Information Systems
(AMCIS) suggested that, in order to deal with the increased challenges of IS security, new
theories from reference disciplines needed to be examined (Choobineh et al. 2007). One theory
from the field of social psychology, which has recently been used in IS security literature (Woon
et al. 2005), called Protection Motivation Theory (PMT), fits within the General Deterrence
Theory (GDT) framework and can explain security behaviors outside of a corporate setting.
Using GDT as a guiding framework, PMT can be adapted to provide a theoretical foundation for
understanding security behaviors in a broader setting. PMT provides a theoretical explanation
that can explain why people perform certain countermeasures to detect and prevent computer
threats, which ultimately result in deterring continued attacks on computer systems.
The premise of PMT is that information is first received (sources of information), which
leads to an evaluation of it by the person receiving that information (cognitive mediating
process), and finally to the person taking some action based on the information received (coping
mode). Sources of information are the input variables to the model and include environmental
and intrapersonal sources. Environmental sources of information include verbal persuasion and
observational learning. Intrapersonal sources include personality aspects and feedback from
prior experience including experiences associated with performing the behavior of interest
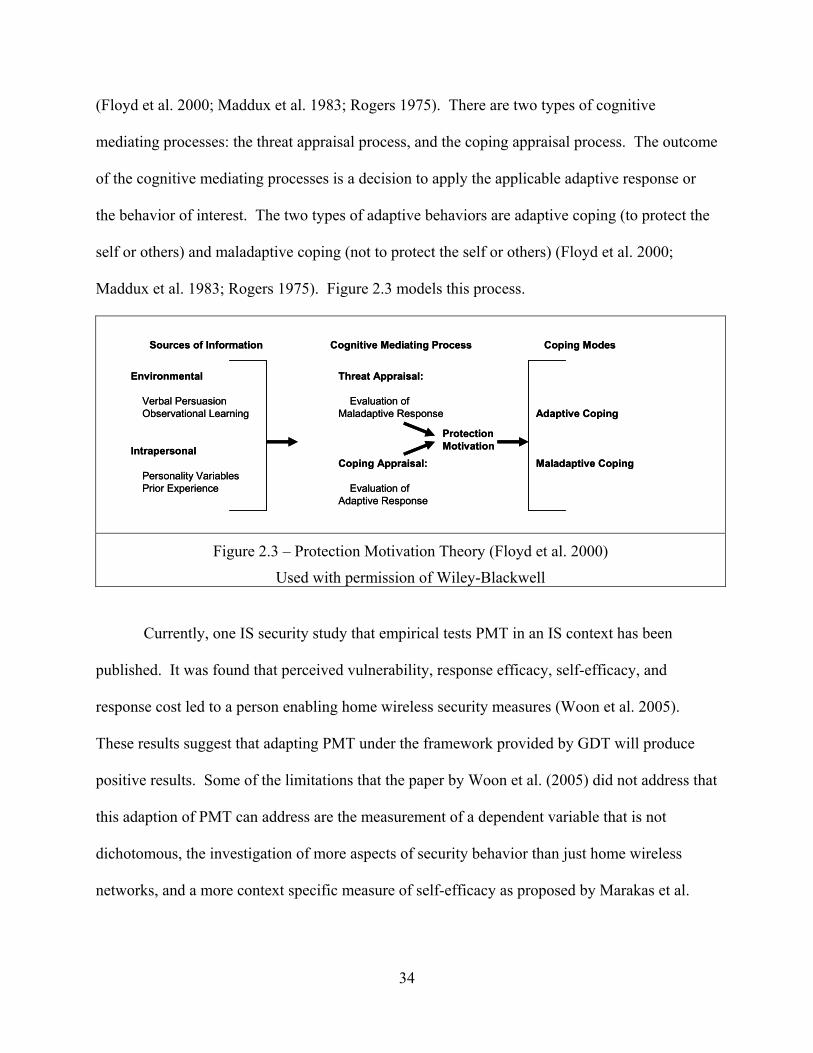
34
(Floyd et al. 2000; Maddux et al. 1983; Rogers 1975). There are two types of cognitive
mediating processes: the threat appraisal process, and the coping appraisal process. The outcome
of the cognitive mediating processes is a decision to apply the applicable adaptive response or
the behavior of interest. The two types of adaptive behaviors are adaptive coping (to protect the
self or others) and maladaptive coping (not to protect the self or others) (Floyd et al. 2000;
Maddux et al. 1983; Rogers 1975). Figure 2.3 models this process.
Sources of Information
Environmental
Verbal PersuasionObservational Learning
Intrapersonal
Personality VariablesPrior Experience
Threat Appraisal:
Evaluation of Maladaptive Response
Coping Appraisal:
Evaluation of Adaptive Response
Cognitive Mediating Process
Adaptive Coping
Maladaptive Coping
Coping Modes
ProtectionMotivation
Figure 2.3 – Protection Motivation Theory (Floyd et al. 2000)
Used with permission of Wiley-Blackwell
Currently, one IS security study that empirical tests PMT in an IS context has been
published. It was found that perceived vulnerability, response efficacy, self-efficacy, and
response cost led to a person enabling home wireless security measures (Woon et al. 2005).
These results suggest that adapting PMT under the framework provided by GDT will produce
positive results. Some of the limitations that the paper by Woon et al. (2005) did not address that
this adaption of PMT can address are the measurement of a dependent variable that is not
dichotomous, the investigation of more aspects of security behavior than just home wireless
networks, and a more context specific measure of self-efficacy as proposed by Marakas et al.
35
(2007). Recently, other studies that propose the use of PMT are appearing at IS conferences
(Crossler et al. 2006; Lee et al. 2007b; Wunnava et al. 2008).
Alignment with the GDT Framework
The outcome of interest provided by the GDT framework is security behaviors, which are
tasks people perform to protect themselves from the threats to their computer systems. When
considering the dependent variable that PMT posits, it is necessary to ensure this fits within the
framework provided by GDT. PMT posits that performance of coping methods occur for
protecting your own health or the health of others. Adapting this to the protection of a computer
system, an individual chooses to perform certain tasks to protect his computer from a given
threat. A review of previous research suggests that dependent variables, such as password
hygiene, use of protective technologies, and IS misuse, are all tasks an individual chooses to
perform. That is, all of these behaviors can either be adopted as a form of adaptive coping, while
some other behavior that is contrary to the end goal can be adopted, which is maladaptive
coping. A person’s security behavior comes down to whether he performs behaviors that lead to
a safer computing environment.
The GDT framework suggests that security behaviors are influenced by an interaction
between threat severity, threat certainty, and rival explanations. A discussion of these three
factors and how PMT lines up with the guiding framework of GDT follows.
Threat severity is an individual’s assessment of the severity of the consequences resulting
from a threatening security event. One part of the cognitive mediating process of PMT is the
severity of the threat (Maddux et al. 1983; Rogers 1975). The conceptualization provided by
PMT lines up nicely with the framework provided by GDT.
36
Threat vulnerability is an individual’s assessment of the probability of a threatening
security event occurring. One part of the cognitive mediating process of PMT is the probability
of the event occurring (Maddux et al. 1983; Rogers 1975). The conceptualization of threat
vulnerability provided by PMT also lines up nicely with the framework provided by GDT. The
combination of these two constructs, threat severity and threat vulnerability, have been referred
to as the threat appraisal process, a multi-construct factor that determines a person’s motivation
to perform a coping response (Floyd et al. 2000).
Rival explanations are other factors that influence security behaviors. The definition of
rival explanations is very broad and many potential factors could fit within this category. As
such, rival explanations provide the greatest opportunity for expanding on the understanding of
decisions to perform security behaviors. PMT posits that, in addition to the threat appraisal
process described above, a coping appraisal process occurs that combines with the threat
appraisal process to determine a person’s motivation to perform a coping response (Floyd et al.
2000). This coping appraisal process is composed of response efficacy and self-efficacy.
Response efficacy refers to how effective a person thinks a response is at reducing or eliminating
the effects of a threatening event (Maddux et al. 1983; Rogers 1975). Self-efficacy refers to a
person’s confidence in their ability to perform the coping action (Maddux et al. 1983).
Additionally, both the threat appraisal and coping appraisal process include cost factors.
In the threat appraisal process, the costs are rewards, either intrinsic or extrinsic, for continuing a
maladaptive response. The coping appraisal process refers to response costs for performing an
adaptive behavior (Floyd et al. 2000; Rogers 1975). However, prior literature conceptualizes
cost factors as their own constructs (Neuwirth et al. 2000; Sheeran et al. 1996) or leaves them out
altogether (Beck 1984). In the case of security behaviors there does not appear to be any rewards
37
for not performing a behavior so response cost encompasses the cost factors. However, response
cost implies that a person is responding to a given attack, therefore, this study uses the construct
prevention cost to convey that it is the cost of preventing a threat from manifesting itself into an
attack. Prevention cost is the perceived opportunity costs – time, cognitive effort, financial – of
adopting the recommend behavior to prevent or mitigate the threatening security event.
Behavioral Security Research Model
Security Threat Appraisal
The threat appraisal is comprised of the threat perception (severity and vulnerability) of
continuing with the maladaptive response. In the case of this study, threat appraisal is called
security threat appraisal and is defined as an individual’s assessment about the level of danger
posed by a security threat.
Security threat appraisal is similar to perceived risk, which is conceptualized as
uncertainty and consequences (Conchar et al. 2004; Dowling et al. 1994; Jia et al. 1999;
Nicolaou et al. 2006; Pavlou et al. 2004). These conceptualizations are similar in that both
capture uncertainty and consequences, but security threat appraisals refers to uncertainty as
vulnerability and captures how vulnerable a person thinks he is to a given threat. This study
conceptualizes security threat appraisal as being comprised of perceived security vulnerability
and perceived security threat. Perceived security vulnerability is an individual’s assessment of
the probability of a threatening security event occurring. Perceived security threat is an
individual’s assessment of the severity of the consequences resulting from a threatening security
event.
PMT posits that threat appraisal is one determinant that impacts whether a person adopts
a given behavioral response (Floyd et al. 2000). A number of studies suggest that as a person’s
38
perception of risk increases he is less likely to participate in risky activities or is more likely to
take steps to protect himself from risks (Jarvenpaa et al. 2000; Keil et al. 2000; Lee et al. 2007a;
Nicolaou et al. 2006; Pavlou 2003; Pavlou et al. 2004; Sitkin et al. 1992; Youn 2005). When
investigating people’s willingness to share private information on a government website, the
perceived risk of anti-terrorism measures by the government led to a lower likelihood to share
information. However, perceived risk in the Internet environment did not show the same effects
(Lee et al. 2007a). Another study looking just at perceived risk found that as perceived risk
increases a person’s intention to enter into electronic transactions decreases (Pavlou et al. 2004).
Further confirming this research is another study which found that increases in perceived risk led
to a lower likelihood of people using inter-organizational data exchanges (Nicolaou et al. 2006).
In a study investigating the online privacy behaviors of teenagers on the Internet, risk appraisal
(susceptibility and severity of perceived risk) led to a lower willingness to provide information to
websites. People that were less likely to provide information to websites were also more likely
to practice other coping behaviors to protect their personal information, such as provide false
information or provide incomplete information (Youn 2005). The difference between the study
of privacy behavior and the use of electronic transactions and data exchanges is that practicing
privacy behaviors is a task that limits risk, whereas the other two examples are entering into a
transaction that puts an individual more at risk. In addition, results from research utilizing GDT
have shown that deterrent certainty and severity impact IS misuse (Straub 1990) which is a
behavior that limits or reduces risk (that of being punished). In this study, the performance of
behaviors that are done to protect an individual from security risks are being investigated;
therefore, I hypothesize that increases in security threat appraisal will lead to increases in
security behavior.
39
H1: Higher levels of perceived security vulnerabilities will lead to higher levels of
individual security behavior.
H2: Higher levels of perceived security threats will lead to higher levels of individual
security behavior.
Security Coping Appraisal
The coping appraisal process consists of the individual’s confidence that a coping
response will reduce or mitigate a security threat (response efficacy) and that he believes he can
perform the given response (self-efficacy). In this study, coping appraisal is called security
coping appraisal and is defined as an individual’s assessment of his ability to cope with and avert
the potential loss or damage resulting from the threatening security event. This study
conceptualizes the security coping appraisal as being comprised of response efficacy and security
self-efficacy. Response efficacy is an individual’s confidence that a recommended behavior
will prevent or mitigate the threatening security event. Security self-efficacy is an individual’s
confidence in his/her own ability to perform the recommended behavior to prevent or mitigate
the threatening security event.
Security Self-Efficacy
PMT posits that coping appraisal is one determinant that impacts whether a person adopts
a given behavioral response (Floyd et al. 2000). An experimental study showed that as a
person’s coping appraisal increased his willingness to perform the coping behavior also
increased (Neuwirth et al. 2000). PMT research has found similar results. As noted above, one
of the components of coping appraisal is self-efficacy. Self-efficacy was initially conceptualized
by Bandura (1977) and defined as “the conviction that one can successfully execute the behavior
required to produce outcomes” (Bandura 1977). Since its initial conceptualization, a number of
40
studies have applied the concept of self-efficacy to explain individual’s performance at using
computers (Burkhardt et al. 1990; Carlson et al. 1992; Compeau et al. 1999; Compeau et al.
1995a; Delcourt et al. 1993; Fagan et al. 2003; Fenech 1998; Gist et al. 1989; Johnson et al.
2000; Lee et al. 2003; Stephens 2005). Rather than simply use self-efficacy to test usage of
computer systems, one study validated and tested an instrument called computer self-efficacy,
which found that computer self-efficacy influenced the expectations of individuals on the
outcome of using computers (Compeau et al. 1995b). However, there exists conflicting results
with those of Compeau and Higgins. In one study that combined the technology adoption
literature, computer self-efficacy was shown to not be a significant determinant in the proposed
model (Venkatesh et al. 2003). That study used the original measures for computer self-efficacy
that were proposed by Compeau and Higgins (1995b), and did not adapt it to the study’s context.
Noting the discrepancy in findings with computer self-efficacy in the Venkatesh et al. study and
others (Bolt et al. 2001; Venkatesh et al. 1996), Marakas et al. (2007) conducted an analysis of
the research done with this construct. They found that when computer self-efficacy is adapted to
the setting being studied it shows to be a good predictor of performance. However, in the studies
when computer self-efficacy is not adapted to setting, then it is not a significant predictor of
performance. Marakas et al. justified these findings by going back to the work of Bandura
(2001), the person that originally conceptualized self-efficacy to show that it needs to be context
specific.
As this study is about security, it is necessary and appropriate to adapt the instrument to
security and rename the construct security self-efficacy. Similar to prior research, it is expected
that increases in security self-efficacy will lead to increases in security behavior.
41
H3: Higher levels of security self-efficacy will lead to higher levels of individual
security behavior.
Response Efficacy
By definition, response efficacy is measuring the same thing as outcome expectations.
Response efficacy is the confidence a person has that a given response will mitigate or reduce a
threat; outcome expectations is defined as “a person’s estimate that a given behavior will lead to
certain outcomes” (Bandura 1977). IS research has shown that outcome expectations influence
individual performance or acceptance of technology (Chung et al. 2002; Compeau et al. 1999;
Compeau et al. 1995b; Lam et al. 2006; Venkatesh et al. 2003). One study of end users found
that along with computer self-efficacy, outcome expectations led to usage of technology
(Compeau et al. 1999). Additionally, in a study that combined the variables from a number of
different acceptance models it was shown that outcome expectations led to intention to use a
technology (Venkatesh et al. 2003). As response efficacy is by definition the same thing as
outcome expectations and IS research has shown that outcome expectations lead to a higher
likelihood to use a technology, it is expected that as response efficacy increases the security
behavior of individuals will also increase.
H4: Higher levels of response efficacy will lead to higher levels of individual security
behavior.
Prevention Cost
PMT posits that as the response cost goes up the likelihood of performing the adaptive
coping response goes down. Such a suggestion is in line with other security research that says a
security countermeasure will not occur when the cost of responding to a security threat is greater
than the damage of the resulting threat (Lee et al. 2002). This follows from security
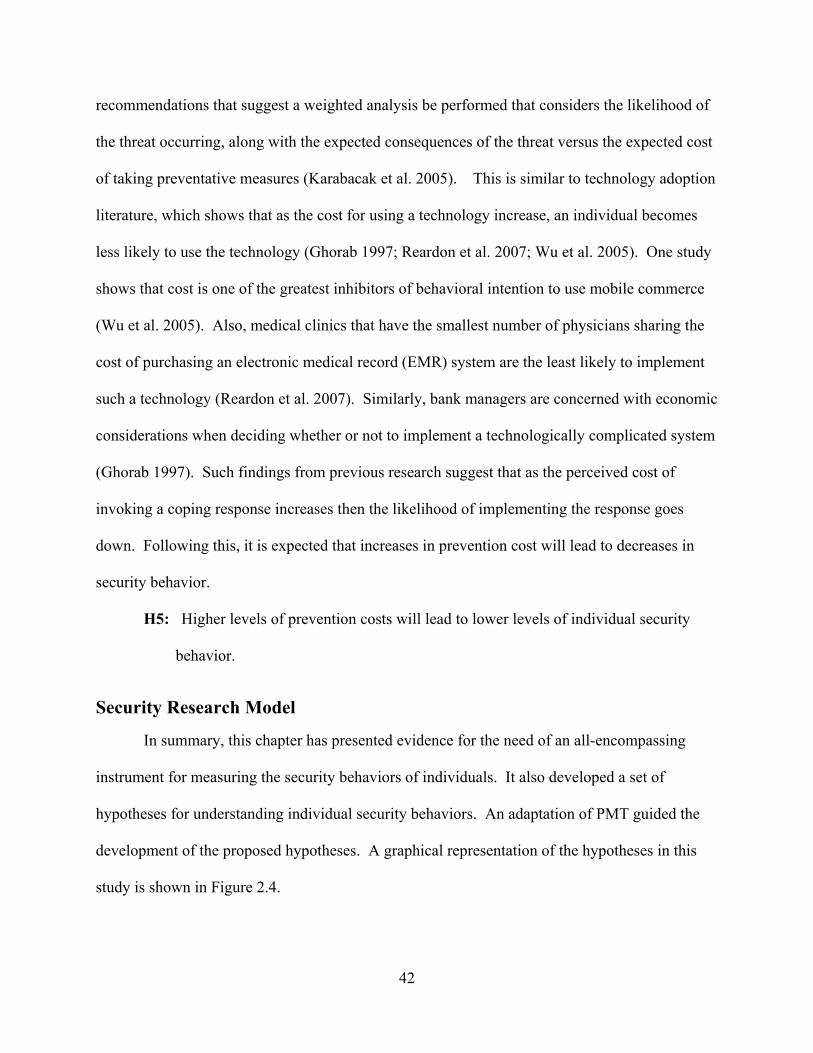
42
recommendations that suggest a weighted analysis be performed that considers the likelihood of
the threat occurring, along with the expected consequences of the threat versus the expected cost
of taking preventative measures (Karabacak et al. 2005). This is similar to technology adoption
literature, which shows that as the cost for using a technology increase, an individual becomes
less likely to use the technology (Ghorab 1997; Reardon et al. 2007; Wu et al. 2005). One study
shows that cost is one of the greatest inhibitors of behavioral intention to use mobile commerce
(Wu et al. 2005). Also, medical clinics that have the smallest number of physicians sharing the
cost of purchasing an electronic medical record (EMR) system are the least likely to implement
such a technology (Reardon et al. 2007). Similarly, bank managers are concerned with economic
considerations when deciding whether or not to implement a technologically complicated system
(Ghorab 1997). Such findings from previous research suggest that as the perceived cost of
invoking a coping response increases then the likelihood of implementing the response goes
down. Following this, it is expected that increases in prevention cost will lead to decreases in
security behavior.
H5: Higher levels of prevention costs will lead to lower levels of individual security
behavior.
Security Research Model
In summary, this chapter has presented evidence for the need of an all-encompassing
instrument for measuring the security behaviors of individuals. It also developed a set of
hypotheses for understanding individual security behaviors. An adaptation of PMT guided the
development of the proposed hypotheses. A graphical representation of the hypotheses in this
study is shown in Figure 2.4.
43
Interaction Effects
Protection Motivation Theory research has found inconsistent interaction effects to occur.
The most consistent of these interactions has been between vulnerability, severity, self-efficacy,
and response efficacy (Neuwirth et al. 2000). Such an approach is fitting for the information
security context, as an individual’s assessment of their ability to utilize a security protection
behavior will not occur unless they feel that it is a threat that affects them. Therefore, this
research tests the model presented in Figure 2.5.
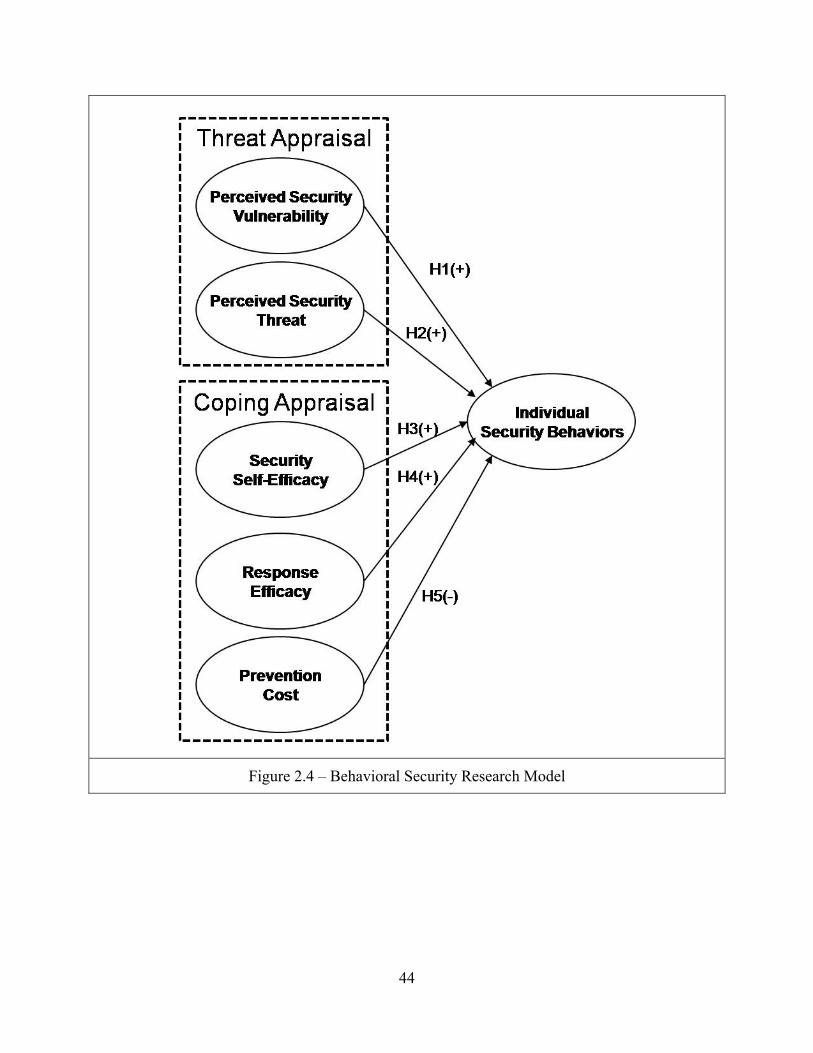
44
Figure 2.4 – Behavioral Security Research Model
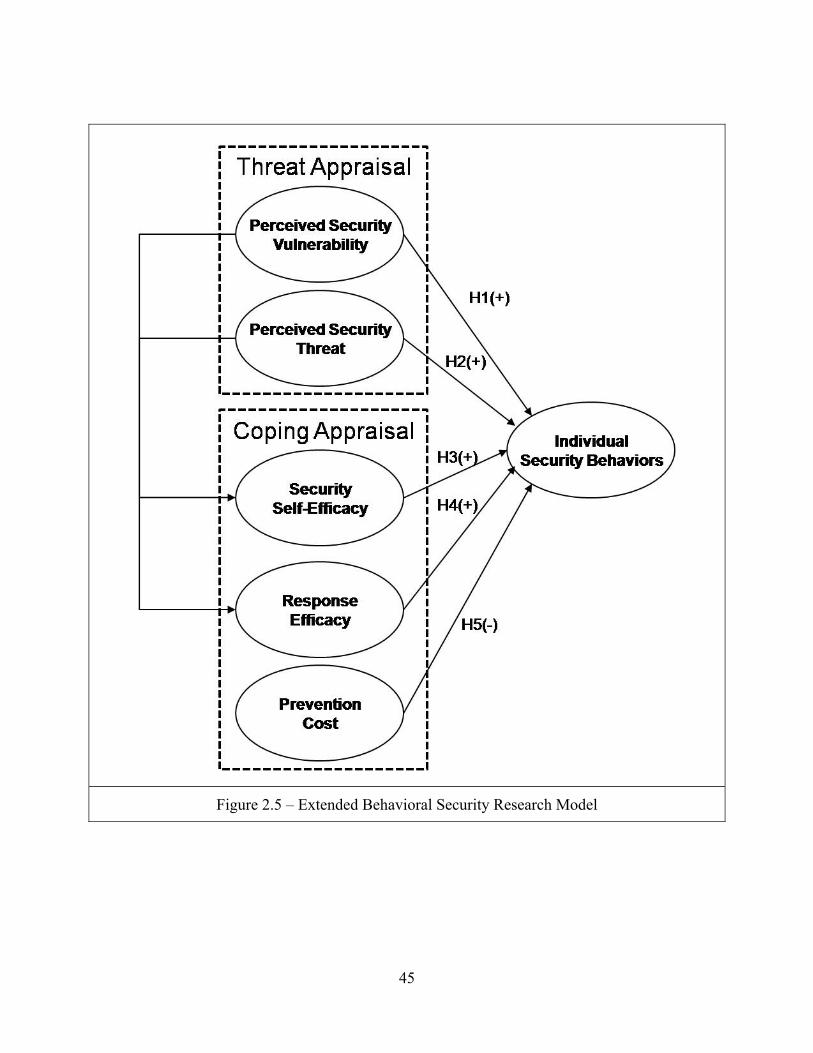
45
Figure 2.5 – Extended Behavioral Security Research Model
46
Chapter Three: Methodology This study seeks to explain why individuals perform certain security behaviors. In order
to accomplish this, it is necessary to understand what those behaviors are, and appropriately
measure them. Once this is accomplished, I must measure antecedents that provide explanatory
power in understanding this behavior. This chapter describes how individual security behavior
were measured and how the following hypotheses, originally developed in Chapter Two, were
tested.
H1: Higher levels of perceived security vulnerabilities will lead to higher levels of
security behavior.
H2: Higher levels of perceived security threats will lead to higher levels of security
behavior.
H3: Higher levels of security self-efficacy will lead to higher levels of security behavior.
H4: Higher levels of response efficacy will lead to higher levels of security behavior.
H5: Higher levels of prevention costs will lead to lower levels of security behavior.
The organization of this chapter follows. The first section discusses the process of
instrument development. Then the validation process for the developed instrument is presented.
Finally, a discussion of the methodology of data collection is presented, followed by the pre-test
and pilot test results and the methods of data analysis.
Instrument Development To measure the variables of interest in this study, two things need to occur. First, a
method for measuring individual security behaviors (ISB) must be determined. ISB is the
dependent variable in the study. The second process that needs to occur is the measurement of
47
the independent variables hypothesized to affect ISB. This section discusses the appropriate
process for both sets of variables.
The variables in this study could be successfully measured in a number of ways. One
approach would be to observe the security of individuals directly, followed by a series of
questions about the reasons why they perform the behaviors that they do. Although this
approach would gain reliable information and understanding of an individual’s actual behavior, it
would be very time consuming to collect. An alternative to this approach would be to install
some sort of a device on an individual’s computer to measure how frequently he performs certain
behaviors, and then follow up with a series of questions asking him to answer questions about
the independent variables. This would be useful, but limited, since there are some behaviors that
cannot be measured on an individual’s computer, as the behaviors are not directly associated
with tasks done on the computer (i.e. writing passwords down, educating others in the household,
securing the computer properly, etc.). Interviewing people to ask them directly about their
security behaviors is another possible approach, which would provide very rich information, but
would provide a limited number of subjects for analysis. Creating and administering a survey is
another approach that would allow for the collection of a significant amount of data from a
variety of individuals. This also carries with it some concerns, most notably social desirability
bias or a desire by individuals to respond in a way that makes them look good to others (Whitley
2002). In other words, some individuals may report what they think the researcher wants them to
report or what they think the correct answer is as opposed to what their actual behavior is.
After weighing the pros and cons of each of the potential approaches to data collection, a
survey approach was selected. However, as no validated scale exists to measure ISB and the
proposed independent variables in this context, the first step is to identify the items and proper
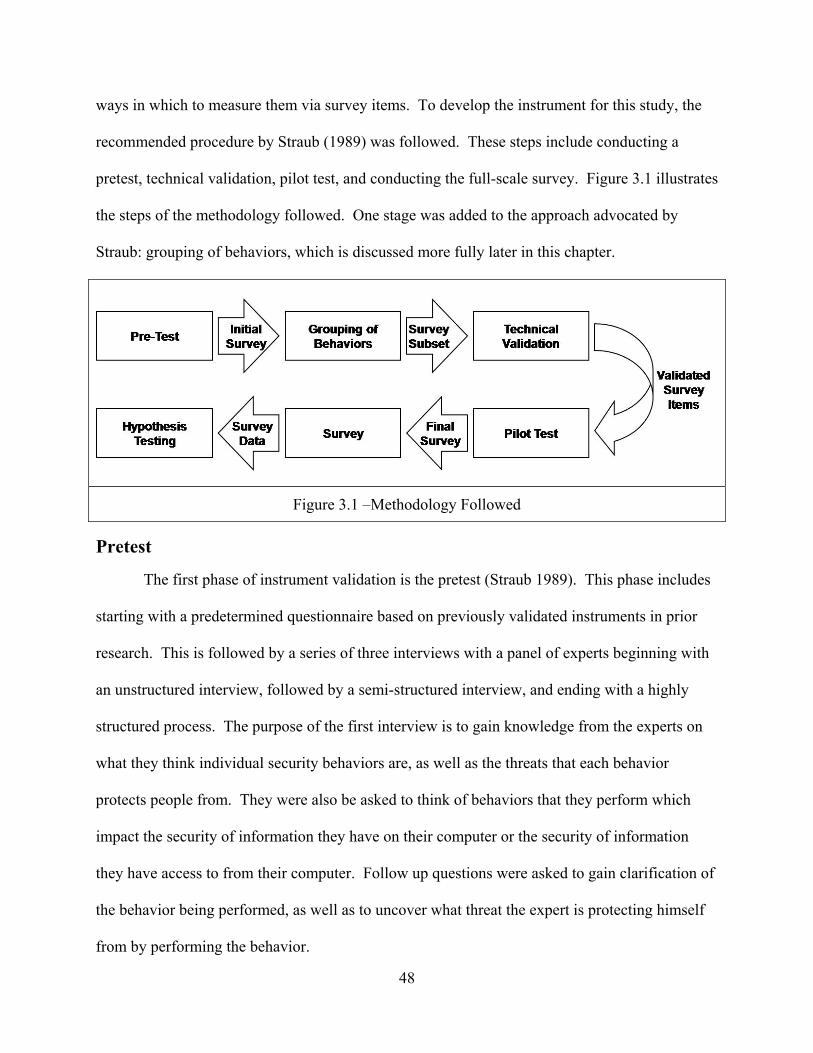
48
ways in which to measure them via survey items. To develop the instrument for this study, the
recommended procedure by Straub (1989) was followed. These steps include conducting a
pretest, technical validation, pilot test, and conducting the full-scale survey. Figure 3.1 illustrates
the steps of the methodology followed. One stage was added to the approach advocated by
Straub: grouping of behaviors, which is discussed more fully later in this chapter.
Figure 3.1 –Methodology Followed
Pretest
The first phase of instrument validation is the pretest (Straub 1989). This phase includes
starting with a predetermined questionnaire based on previously validated instruments in prior
research. This is followed by a series of three interviews with a panel of experts beginning with
an unstructured interview, followed by a semi-structured interview, and ending with a highly
structured process. The purpose of the first interview is to gain knowledge from the experts on
what they think individual security behaviors are, as well as the threats that each behavior
protects people from. They were also be asked to think of behaviors that they perform which
impact the security of information they have on their computer or the security of information
they have access to from their computer. Follow up questions were asked to gain clarification of
the behavior being performed, as well as to uncover what threat the expert is protecting himself
from by performing the behavior.
49
As discussed in Chapter Two, no validated instrument for measuring ISB currently exists.
However, a number of behaviors have been identified as necessary to protect the security of
computer systems. In order to develop an instrument to measure ISB it is necessary to start with
expert interviews, comparing what the experts have to say with the predetermined list of
behaviors to protect computer systems (the specific process of expert interviews is discussed
later in this paper). However, previously validated measures do exist for the independent
variables. PMT research regularly measures response cost (Neuwirth et al. 2000; Sheeran et al.
1996); however, previous research does not define the costs of performing security behaviors.
Therefore, it is necessary to utilize the expert opinions to determine what these costs are. A scale
to measure the remaining four independent variables has been developed and validated. This
scale is the Risk Behavior Diagnosis (RBD) Scale, and encompasses severity of threat,
susceptibility to threat, self-efficacy, and response efficacy (Witte 1996). Additionally, much
work has been done in IS research on self-efficacy, developing this construct with validated
measures (Compeau et al. 1995b; Marakas et al. 2007). Relying on the previously validated
instruments results in a framework for questions to measure the items in this context (see Table
3.1). The specific way these questions were asked resulted from the pretest with experts.
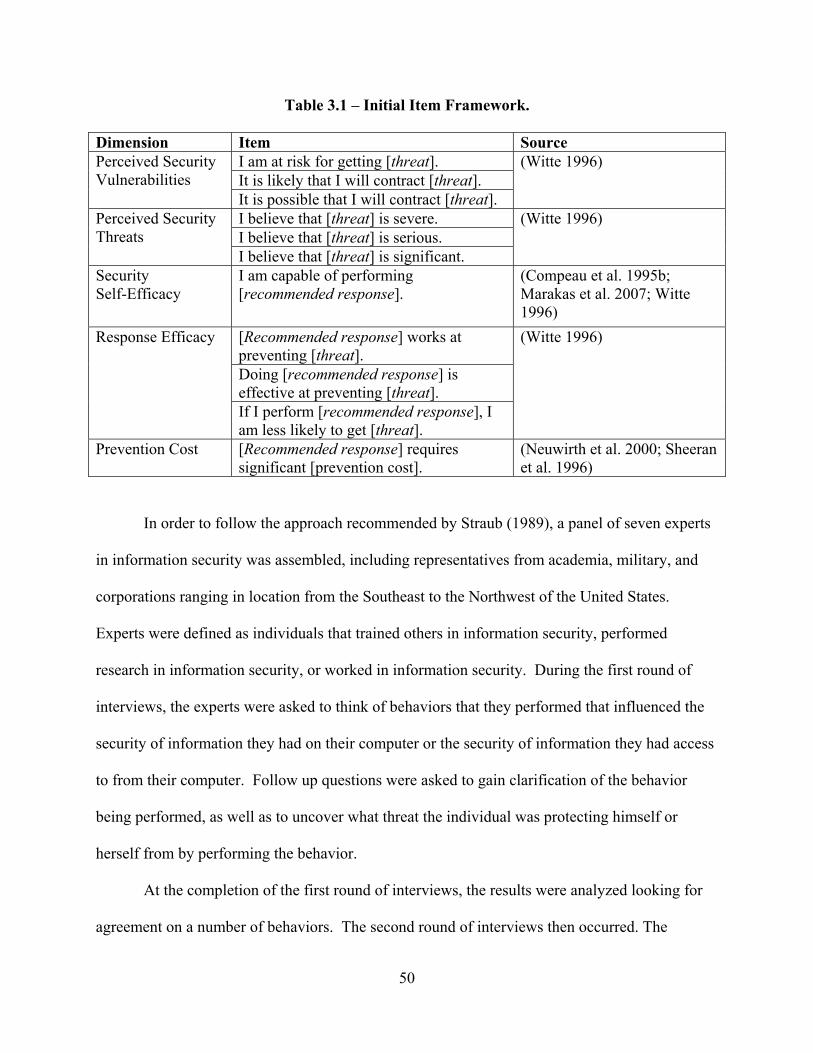
50
Table 3.1 – Initial Item Framework.
Dimension Item Source Perceived Security Vulnerabilities
I am at risk for getting [threat]. (Witte 1996) It is likely that I will contract [threat]. It is possible that I will contract [threat].
Perceived Security Threats
I believe that [threat] is severe. (Witte 1996) I believe that [threat] is serious. I believe that [threat] is significant.
Security Self-Efficacy
I am capable of performing [recommended response].
(Compeau et al. 1995b; Marakas et al. 2007; Witte 1996)
Response Efficacy [Recommended response] works at preventing [threat].
(Witte 1996)
Doing [recommended response] is effective at preventing [threat]. If I perform [recommended response], I am less likely to get [threat].
Prevention Cost [Recommended response] requires significant [prevention cost].
(Neuwirth et al. 2000; Sheeran et al. 1996)
In order to follow the approach recommended by Straub (1989), a panel of seven experts
in information security was assembled, including representatives from academia, military, and
corporations ranging in location from the Southeast to the Northwest of the United States.
Experts were defined as individuals that trained others in information security, performed
research in information security, or worked in information security. During the first round of
interviews, the experts were asked to think of behaviors that they performed that influenced the
security of information they had on their computer or the security of information they had access
to from their computer. Follow up questions were asked to gain clarification of the behavior
being performed, as well as to uncover what threat the individual was protecting himself or
herself from by performing the behavior.
At the completion of the first round of interviews, the results were analyzed looking for
agreement on a number of behaviors. The second round of interviews then occurred. The
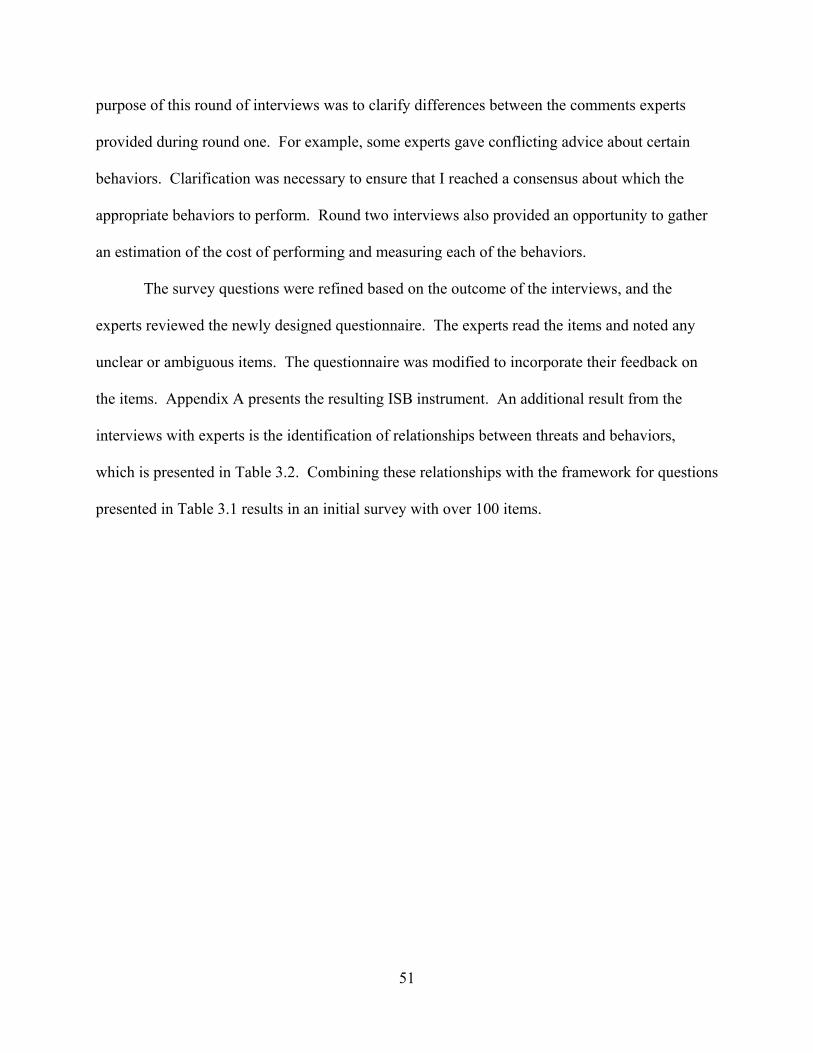
51
purpose of this round of interviews was to clarify differences between the comments experts
provided during round one. For example, some experts gave conflicting advice about certain
behaviors. Clarification was necessary to ensure that I reached a consensus about which the
appropriate behaviors to perform. Round two interviews also provided an opportunity to gather
an estimation of the cost of performing and measuring each of the behaviors.
The survey questions were refined based on the outcome of the interviews, and the
experts reviewed the newly designed questionnaire. The experts read the items and noted any
unclear or ambiguous items. The questionnaire was modified to incorporate their feedback on
the items. Appendix A presents the resulting ISB instrument. An additional result from the
interviews with experts is the identification of relationships between threats and behaviors,
which is presented in Table 3.2. Combining these relationships with the framework for questions
presented in Table 3.1 results in an initial survey with over 100 items.
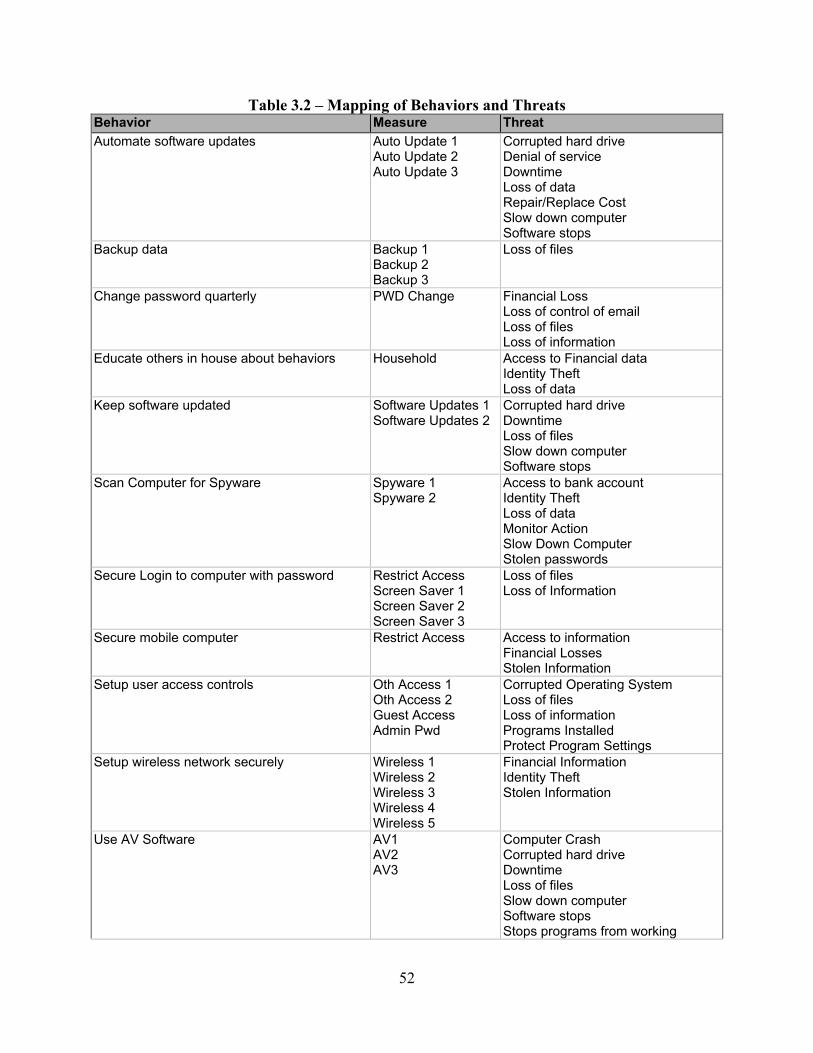
52
Table 3.2 – Mapping of Behaviors and Threats Behavior Measure Threat Automate software updates Auto Update 1
Auto Update 2 Auto Update 3
Corrupted hard drive Denial of service Downtime Loss of data Repair/Replace Cost Slow down computer Software stops
Backup data Backup 1 Backup 2 Backup 3
Loss of files
Change password quarterly PWD Change Financial Loss Loss of control of email Loss of files Loss of information
Educate others in house about behaviors
Household Access to Financial data Identity Theft Loss of data
Keep software updated Software Updates 1 Software Updates 2
Corrupted hard drive Downtime Loss of files Slow down computer Software stops
Scan Computer for Spyware Spyware 1 Spyware 2
Access to bank account Identity Theft Loss of data Monitor Action Slow Down Computer Stolen passwords
Secure Login to computer with password Restrict Access Screen Saver 1 Screen Saver 2 Screen Saver 3
Loss of files Loss of Information
Secure mobile computer Restrict Access Access to information Financial Losses Stolen Information
Setup user access controls Oth Access 1 Oth Access 2 Guest Access Admin Pwd
Corrupted Operating System Loss of files Loss of information Programs Installed Protect Program Settings
Setup wireless network securely Wireless 1 Wireless 2 Wireless 3 Wireless 4 Wireless 5
Financial Information Identity Theft Stolen Information
Use AV Software AV1 AV2 AV3
Computer Crash Corrupted hard drive Downtime Loss of files Slow down computer Software stops Stops programs from working
53
Behavior Measure Threat Use caution when following links in email Links 1
Links 2 Identity Theft
Use caution when opening attachments Attachments Financial Information Corrupted hard drive Loss of files/data Software stops
Use caution when storing credit card info online
CC Identity Theft
Use Firewall Firewall 1 Firewall 2
Computer Crash Corrupted hard drive Financial Losses Loss of data Slow down computer Software stops Stealing software
Use popup blocker Popup 1 Popup 2
Loss of data Slow down computer Stolen privacy
Use software to manage passwords PWD Store Loss of network account Punitive actions
Technical Validation
The purpose of technical validation is to ensure that the developed items display adequate
reliability and validity. The ISB instrument, being the only new instrument for this survey, is the
only instrument that went through the technical validation process. The reliability and validity of
the other items were analyzed during the pilot test phase. During this phase of instrument
development, the questionnaire was adjusted to ensure it performs as expected. In order to
perform the technical validation, it was first necessary to administer the developed scale to a
population. Approximately 300 students from undergraduate and graduate level business classes
were recruited to assist in the validation of the developed instrument. Participants were told that
their responses would remain anonymous.
The scales were analyzed using the Rasch Rating Scale Model (RSM) (Wright et al.
1982). The Rasch model relies on a single-parameter item response model to depict measures of
latent traits and characteristics of items on a single continuum (Osterlind 2006). Relying on
RSM instead of classical test theory is appropriate in this study as RSM allows for items in one
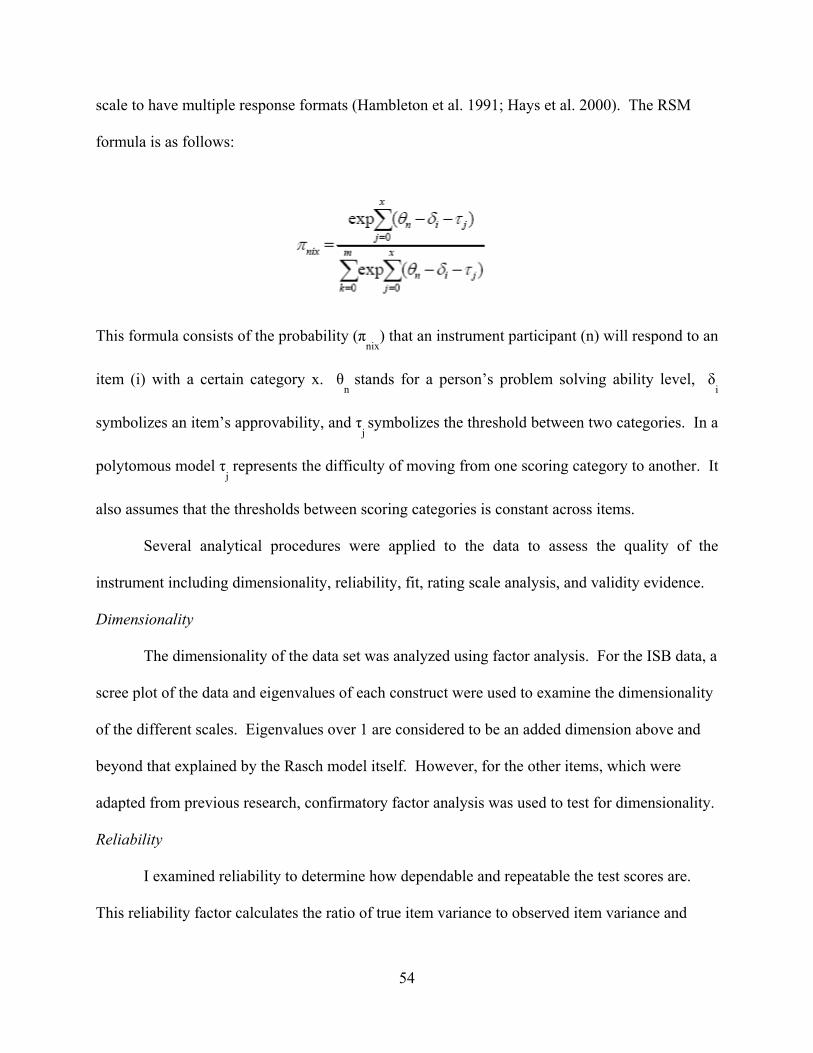
54
scale to have multiple response formats (Hambleton et al. 1991; Hays et al. 2000). The RSM
formula is as follows:
This formula consists of the probability (πnix
) that an instrument participant (n) will respond to an
item (i) with a certain category x. θn
stands for a person’s problem solving ability level, δi
symbolizes an item’s approvability, and τj symbolizes the threshold between two categories. In a
polytomous model τj represents the difficulty of moving from one scoring category to another. It
also assumes that the thresholds between scoring categories is constant across items.
Several analytical procedures were applied to the data to assess the quality of the
instrument including dimensionality, reliability, fit, rating scale analysis, and validity evidence.
Dimensionality
The dimensionality of the data set was analyzed using factor analysis. For the ISB data, a
scree plot of the data and eigenvalues of each construct were used to examine the dimensionality
of the different scales. Eigenvalues over 1 are considered to be an added dimension above and
beyond that explained by the Rasch model itself. However, for the other items, which were
adapted from previous research, confirmatory factor analysis was used to test for dimensionality.
Reliability
I examined reliability to determine how dependable and repeatable the test scores are.
This reliability factor calculates the ratio of true item variance to observed item variance and
55
shows how consistent measurements are for individuals or groups of a population (Osterlind
2006). Reliability is provided as output from WINSTEPS version 3.63.2. As this is an initial
creation of an instrument and high stakes decisions are not being made with it, reliability of
greater than .7 are considered adequate.
Fit Analysis
An advantage of IRT is the ability to determine how appropriate the Rasch model is for
the data. This includes testing the assumptions of the model, determining the accuracy of the
model’s predictions, assessing the overall fit of the model to the data, and assessing the fit of the
individual components of the measurement context to the model (Wolfe 2007). Model
assumptions were analyzed as part of the dimensionality analysis. The initial assumption of the
model is that the model is unidimensional. Following this, other fit measures can be analyzed by
investigating whether or not participants responded to items as predicted by the model. If not,
certain items are flagged for substantive analysis. Following Hambleton (1985) the fit of latent
trait models to the collected data was evaluated by determining whether the model assumptions
are satisfied and the precision of model predictions.
I analyzed the fit between the Rasch model and the responses using the unweighted mean
square statistic and the weighted mean square statistic. By using both the weighted and the
unweighted mean square statistic, both unexpected responses for mismatched pairs and equally
weighted items were captured. In this analysis, a bootstrap procedure is used to flag items for
further analysis (Wolfe in press). This bootstrap procedure was conducted utilizing the
following five-step procedure (Wolfe 2008): (1) Item and person parameters for the Rasch model
were calculated for the original dataset using WINSTEPS version 3.63.2; (2) Simulated item
response data that conform to the Rasch model were bootstrapped from the original calculations
56
in step 1; (3) Item and person fit statistics were calculated for each dataset in step 2; (4) Extreme
indexes at 2.5%, 5%, 95%, and 97.5% were calculated based on the statistics calculated in step 3;
and (5) Item and person fit statistics from the original dataset were compared to the extreme
indexes calculated in step 4. This final step determined whether any of the original data has fit
that is more extreme than the bootstrapped critical values.
Biserial point measure correlation was used to analyze inter-item correlation. The
biserial point measure correlation takes into account item difficulty in assessing the cohesiveness
between items, where the standard point measure correlation does not. Items with biserial point
measure correlations greater than .3 indicate a minimum level of cohesiveness or that each item
is measuring the same thing.
Rating Scale Analysis
The rating scale analysis is used to determine whether the instrument works as it was
intended. When an instrument is administered, it is done so using a scale with a certain number
of responses available for the respondent (e.g. 7, 5, 3-point scales). This analysis determines
whether or not the respondents answered using the intended scale or if some other scale would
have been more appropriate. This is accomplished by looking at the thresholds of when one
response becomes more likely than another response. As this study includes items on several
different scales, it was necessary to perform the rating scale analysis on different groups of
items. In doing so the criteria proposed by Linnacre (2002) was used to evaluate each rating
scale. Linnacre’s evaluation criteria includes 8 items and is as follows: (1) Each category needs
at least 10 observations; (2) Each item’s distribution should be unimodal which ensures that
people use the rating scale the same way; (3) Average measures should increase across
categories; (4) The outfit mean square statistic should be less than 2.0 for each category; (5)
57
Category thresholds should increase with the categories; (6) Ratings should imply measures and
measures should imply ratings; (7) Thresholds should increase by at least 1.4 logits from one
category to the next; and (8) Thresholds should not increase by more than 5.0 logits from one
category to the next.
Validity
To ensure validity from these results, I tested the three criteria which Messick (1989)
introduced as important when analyzing instruments. These three types of validity are
substantive validity, structural validity, and generalizability. Substantive validity was ensured by
the underlying theory that developed the measures as well as the fit analysis that was discussed
above. Structural validity was ensured through the dimensionality analysis. Generalizability
was ensured through an analysis of the person reliability.
Grouping of Behaviors
As noted above, the resulting questionnaire was greater than 100 items, which is too large
for a survey. Therefore, it was necessary to reduce the number of items measured in the final
data collection effort. This was accomplished by examining the mapping of behaviors that the
group of experts recommended with the threats that each of these behaviors protect individuals
from as displayed in Table 3.2. The resulting analysis revealed that in order for each of the
behaviors in the ISB instrument to have a relevant threat that it protects people from that three
threats needed to be included – Identity Theft, File and Information Loss, and Computer
Slowdown. To facilitate a shorter survey instrument, three surveys were administered, one for
each threat identified.
58
Pre-Test and Pilot Study
Each of the resulting three survey instruments from the grouping of behaviors were
reviewed by four Ph.D. students to identify unclear wording and the approximate amount of time
each survey will take to complete. Respondents reported that it took approximately 8 to 12
minutes to complete and that a few of the items required clarification. Modifications were made
to the items identified during the Pre-Test.
The pilot study was conducted by recruiting three sections of the same graduate level
business class and administering each section a different version of the survey. Ninety students
completed surveys; 34 completed the identity theft survey, 24 completed the file and information
loss survey, and 32 completed the computer slowdown survey. SmartPLS Version 2.0.M3 was
used to analyze the reliability and validity of the items. It is necessary to use Partial Least
Squares (PLS) to perform this process as the research model is composed of reflective and
formative constructs. To test the reliability and validity of the items in the pilot study, a PLS
algorithm was conducted for each behavior to threat mapping. The majority of constructs
demonstrated acceptable reliability greater than .7 with the following exceptions – Threat
Perception File and Information Loss (.658), Response Efficacy Identity Theft Secure Wireless
Network (.627), Prevention Cost File and Information Loss Password Change (.593), Prevention
Cost File and Information Loss Secure Access (.641), and Prevention Cost Identity Theft
Following Links in Email (.694). Of these items, prevention cost makes up three of the five
items with low reliability. Prevention cost is a formative construct so VIF values were examined
to test for multicollinearity. With VIF values of less than 3.3, all three scales do not display
multicollinearity, suggesting they are appropriate as designed (Petter et al. 2007). The remaining
two scales are close to the .7 threshold, and with the different population set to be used for final
data collection, it is expected that these items will prove to be reliable as designed.
59
Validity analysis revealed that the majority of items loaded as expected. Only one of
three items for the Threat Perception Identity Theft scale loaded together. These two items were
reworded to clarify the meaning of the questions. One of the three Response Efficacy Identity
Theft Spyware items did not load (.363) with the other two items. The wording on this item was
evaluated and it appeared to accurately capture the construct of interested, therefore no changes
were made at this time. None of the Prevention Cost Computer Slowdown Firewall items loaded
together. The VIF value for the items measuring the formative construct prevention cost
construct were evaluated and did not show multicollinearity, suggesting that the items to measure
this construct are appropriately worded. Appendix B contains the validation of the ISB
instrument.
Full Scale Survey
After the survey was adjusted based on the results of the pilot test, a large-scale survey
was conducted. It is suggested that the use of PLS requires a sample size of 10 times either the
number of structural paths to a particular construct in a model or 10 times the number of
formative indicators to a particular construct (Chin 2000). The security self-efficacy construct
has the greatest number of formative indicators at seven, suggesting it is necessary to have at
least a sample size of 70. However, it is also necessary to conduct a power analysis to ensure
that a large enough sample size is used. A power analysis based on previous PMT research
(Floyd et al. 2000), which found a medium effect size of .15, an alpha of .05, and power of .80,
suggests that 97 responses are necessary to ensure enough power (Cohen 1992). Therefore, the
goal for data collection was at least 100 subjects per survey from the population of people that
use computers. This was conducted by using paper and web-based surveys. Paper-based
surveys were used for manual data collection at events, while web-based surveys were used to
60
collect data from people within a business. Both event data collection and solicitations from
businesses were used to ensure a large enough population for data analysis.
Data Analysis
Nature of constructs
When hypothesizing theoretical models, not only is it important to test the hypotheses in
the model, but it is also important to define and test the nature of the constructs in the model.
Models can be composed of any combination of reflective, formative, and multi-dimensional
constructs (Petter et al. 2007). Petter et al. define the above constructs accordingly: Reflective
constructs are observed measures that are affected by underlying latent construct. Formative
constructs are a composite of multiple measures where changes in the formative measures cause
changes in the underlying construct. Multi-dimensional constructs are constructs with more than
one dimension, with each dimension representing some portion of the overall latent construct
and with each dimension, itself being either reflective or latent. A summary of these types of
constructs along with the criteria for determining them are provide in Table 3.3.
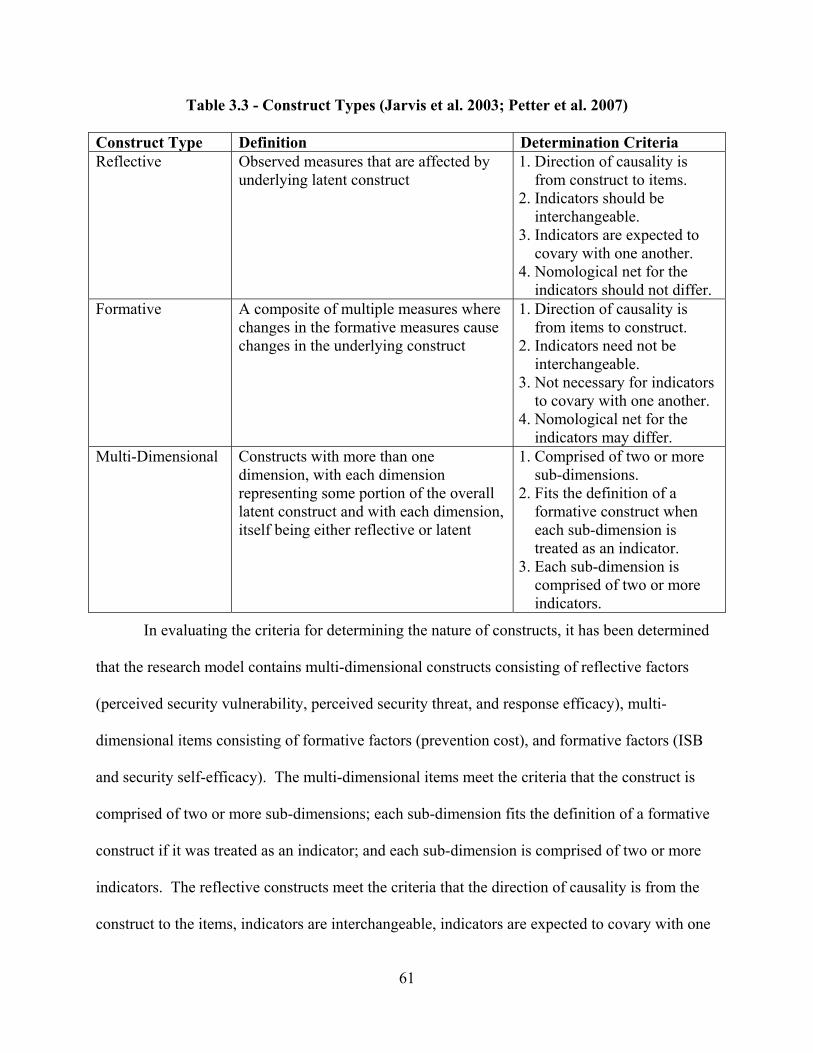
61
Table 3.3 - Construct Types (Jarvis et al. 2003; Petter et al. 2007)
Construct Type Definition Determination Criteria Reflective Observed measures that are affected by
underlying latent construct 1. Direction of causality is
from construct to items. 2. Indicators should be
interchangeable. 3. Indicators are expected to
covary with one another. 4. Nomological net for the
indicators should not differ. Formative A composite of multiple measures where
changes in the formative measures cause changes in the underlying construct
1. Direction of causality is from items to construct.
2. Indicators need not be interchangeable.
3. Not necessary for indicators to covary with one another.
4. Nomological net for the indicators may differ.
Multi-Dimensional Constructs with more than one dimension, with each dimension representing some portion of the overall latent construct and with each dimension, itself being either reflective or latent
1. Comprised of two or more sub-dimensions.
2. Fits the definition of a formative construct when each sub-dimension is treated as an indicator.
3. Each sub-dimension is comprised of two or more indicators.
In evaluating the criteria for determining the nature of constructs, it has been determined
that the research model contains multi-dimensional constructs consisting of reflective factors
(perceived security vulnerability, perceived security threat, and response efficacy), multi-
dimensional items consisting of formative factors (prevention cost), and formative factors (ISB
and security self-efficacy). The multi-dimensional items meet the criteria that the construct is
comprised of two or more sub-dimensions; each sub-dimension fits the definition of a formative
construct if it was treated as an indicator; and each sub-dimension is comprised of two or more
indicators. The reflective constructs meet the criteria that the direction of causality is from the
construct to the items, indicators are interchangeable, indicators are expected to covary with one
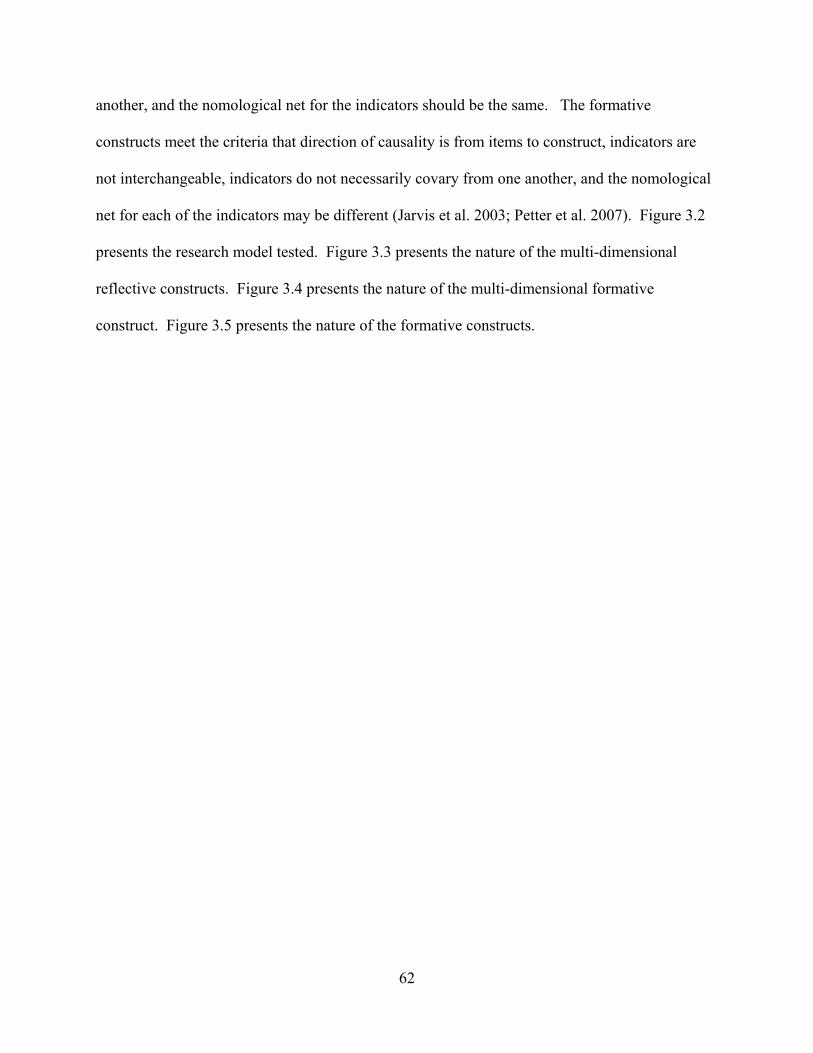
62
another, and the nomological net for the indicators should be the same. The formative
constructs meet the criteria that direction of causality is from items to construct, indicators are
not interchangeable, indicators do not necessarily covary from one another, and the nomological
net for each of the indicators may be different (Jarvis et al. 2003; Petter et al. 2007). Figure 3.2
presents the research model tested. Figure 3.3 presents the nature of the multi-dimensional
reflective constructs. Figure 3.4 presents the nature of the multi-dimensional formative
construct. Figure 3.5 presents the nature of the formative constructs.
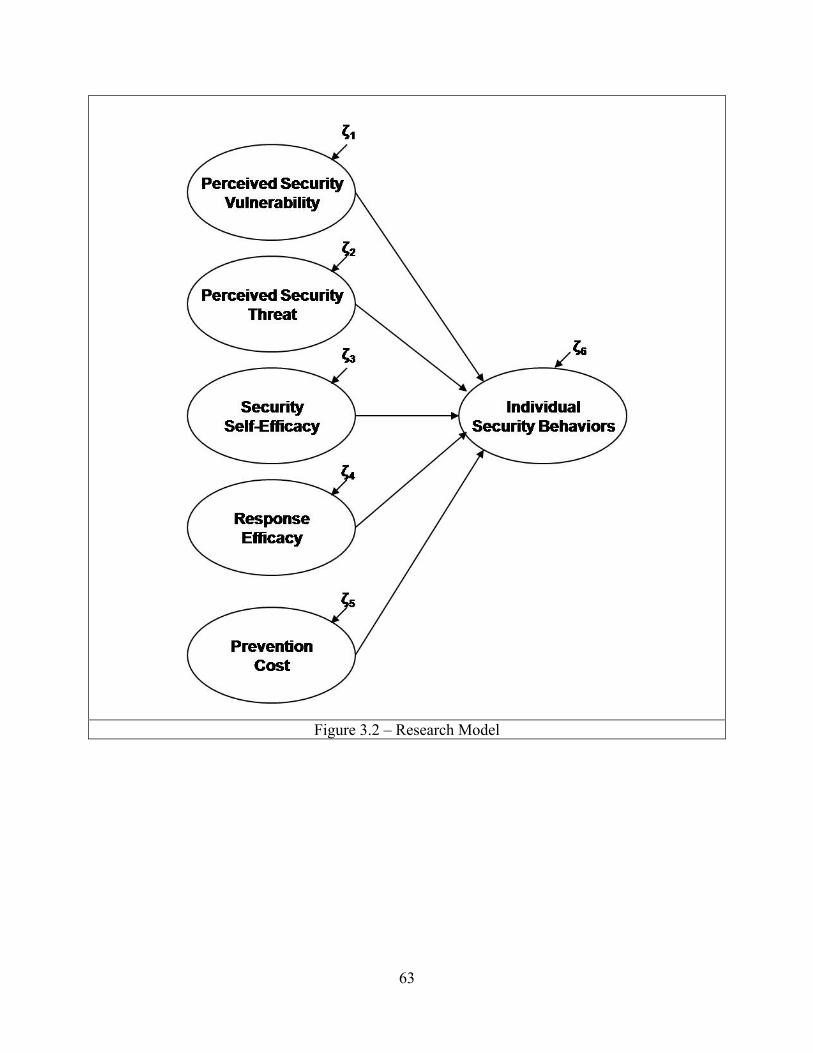
63
Figure 3.2 – Research Model
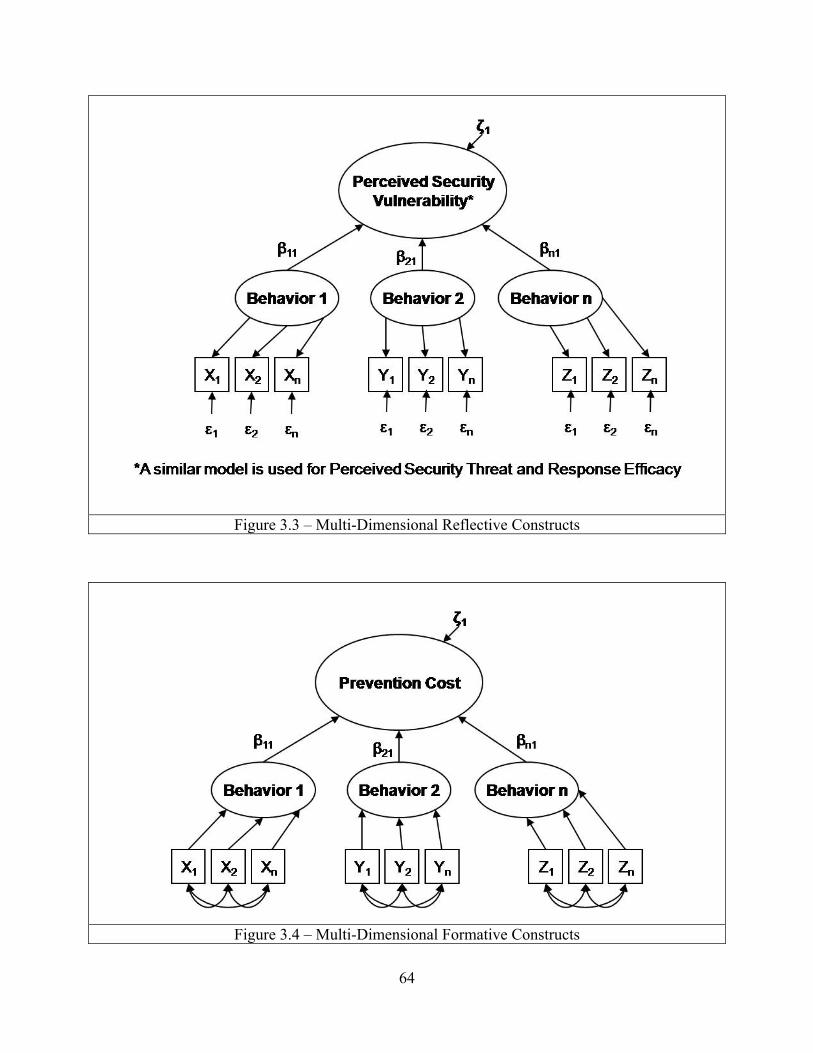
64
Figure 3.3 – Multi-Dimensional Reflective Constructs
Figure 3.4 – Multi-Dimensional Formative Constructs
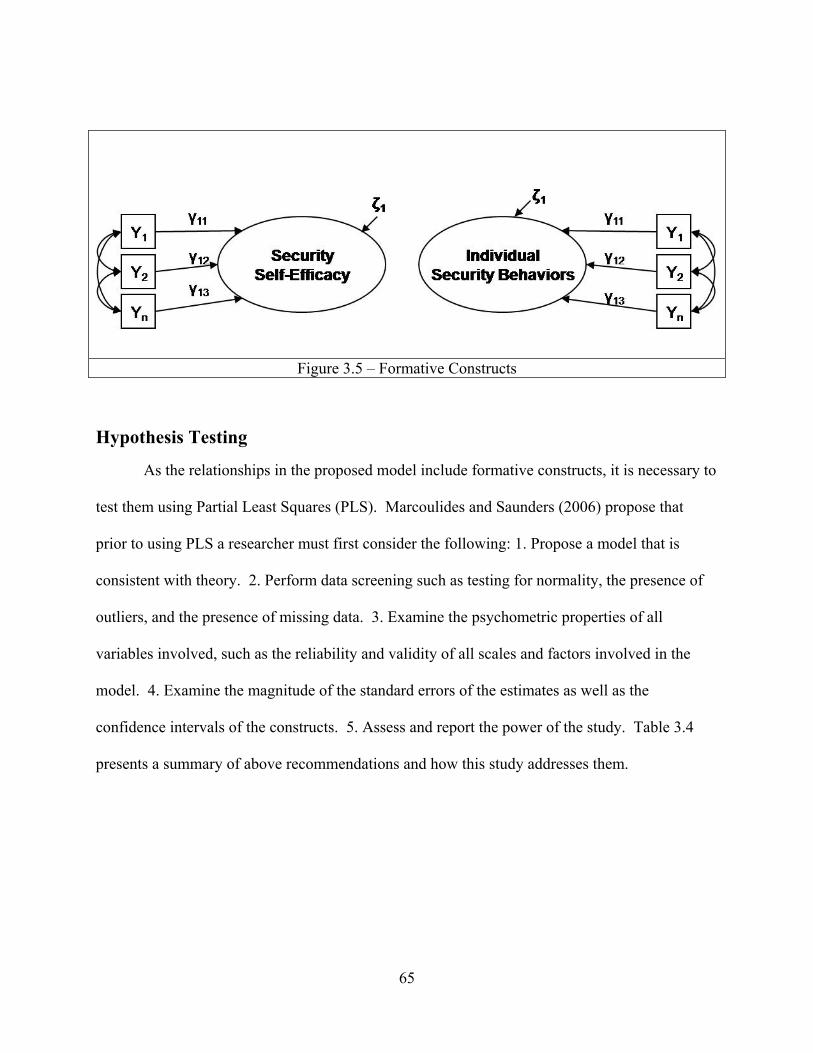
65
Figure 3.5 – Formative Constructs
Hypothesis Testing
As the relationships in the proposed model include formative constructs, it is necessary to
test them using Partial Least Squares (PLS). Marcoulides and Saunders (2006) propose that
prior to using PLS a researcher must first consider the following: 1. Propose a model that is
consistent with theory. 2. Perform data screening such as testing for normality, the presence of
outliers, and the presence of missing data. 3. Examine the psychometric properties of all
variables involved, such as the reliability and validity of all scales and factors involved in the
model. 4. Examine the magnitude of the standard errors of the estimates as well as the
confidence intervals of the constructs. 5. Assess and report the power of the study. Table 3.4
presents a summary of above recommendations and how this study addresses them.
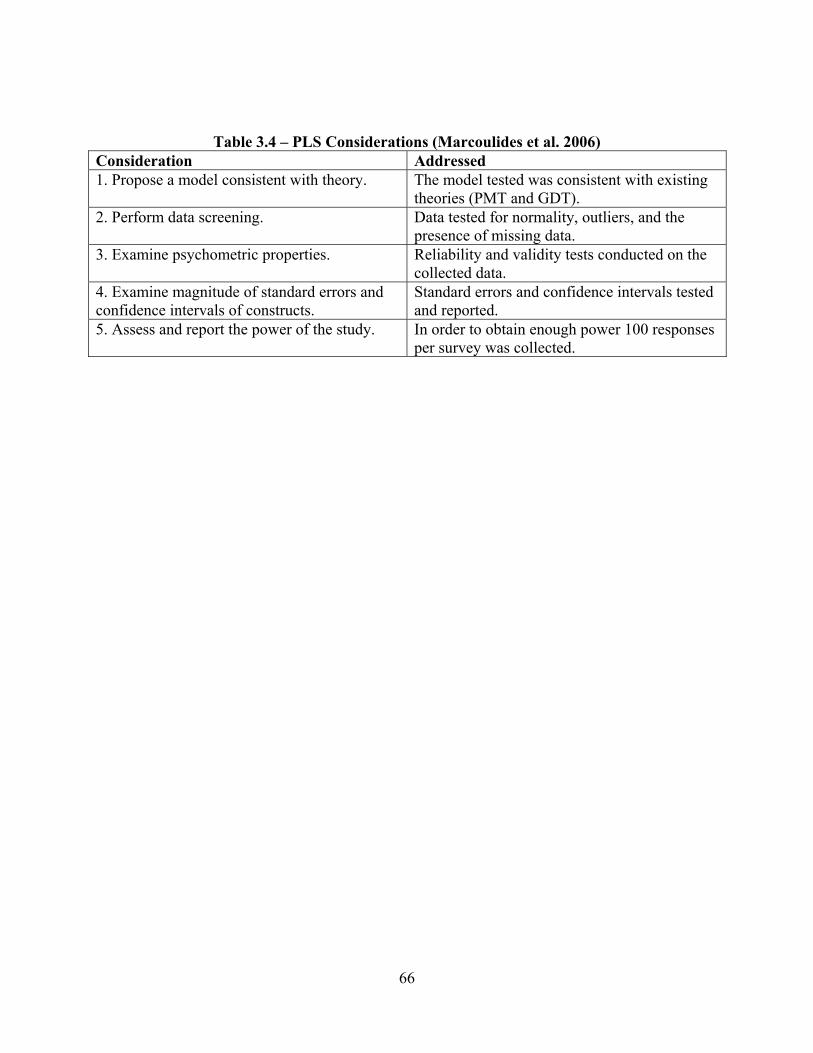
66
Table 3.4 – PLS Considerations (Marcoulides et al. 2006) Consideration Addressed 1. Propose a model consistent with theory. The model tested was consistent with existing
theories (PMT and GDT). 2. Perform data screening. Data tested for normality, outliers, and the
presence of missing data. 3. Examine psychometric properties. Reliability and validity tests conducted on the
collected data. 4. Examine magnitude of standard errors and confidence intervals of constructs.
Standard errors and confidence intervals tested and reported.
5. Assess and report the power of the study. In order to obtain enough power 100 responses per survey was collected.
67
Chapter Four: Data Analysis The survey instrument used for this research was created through the process of expert
interviews and by adapting scales and items from existing literature. This chapter presents a
detailed description of the data analysis for this study. Chapter Five discusses the results found
in this chapter and the implications they have for academics and practitioners, along with
avenues for future research. Chapter Six concludes the dissertation with a discussion of the
limitations, and a summary of the contributions of this study.
This chapter is organized as follows. The first section provides a descriptive analysis of
the data. Reliability, convergent and discriminant validity are presented in the measurement
model. This is followed by PLS regressions, which are used to test the research model and
hypotheses. The structural model is tested through estimates of the path coefficient, which
indicate the strength of the relationships between the independent and dependent variables, and
the r-squared values, which represent the variance in the dependent variable that is explained by
the independent variables. Taken as a whole, the path coefficients and the r-squared values
indicate how well the data support the proposed model. Finally, the extended model, which
includes an interaction between the threat appraisal and coping appraisal, is presented.
Descriptive Analysis Online and paper-based versions of the survey were administered to participants. Different
sources completed each version of the survey. The paper version of the survey was administered to
attendees of a soccer tournament in Virginia, USA. Distribution of the online version of the survey
occurred in a number of ways. Initially, data was collected by emailing a number of contacts of the
researcher a request to participate in the survey and then forward on the request. Collection of
additional data occurred through the distribution of a request to participate in the survey to
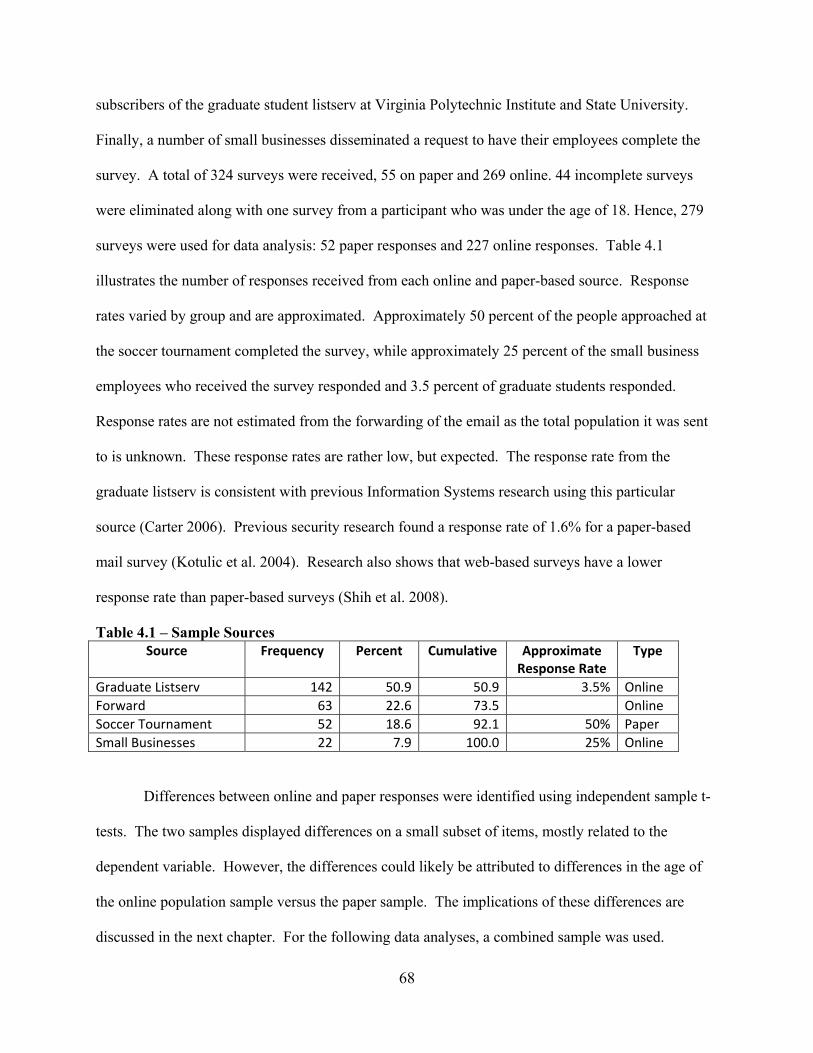
68
subscribers of the graduate student listserv at Virginia Polytechnic Institute and State University.
Finally, a number of small businesses disseminated a request to have their employees complete the
survey. A total of 324 surveys were received, 55 on paper and 269 online. 44 incomplete surveys
were eliminated along with one survey from a participant who was under the age of 18. Hence, 279
surveys were used for data analysis: 52 paper responses and 227 online responses. Table 4.1
illustrates the number of responses received from each online and paper-based source. Response
rates varied by group and are approximated. Approximately 50 percent of the people approached at
the soccer tournament completed the survey, while approximately 25 percent of the small business
employees who received the survey responded and 3.5 percent of graduate students responded.
Response rates are not estimated from the forwarding of the email as the total population it was sent
to is unknown. These response rates are rather low, but expected. The response rate from the
graduate listserv is consistent with previous Information Systems research using this particular
source (Carter 2006). Previous security research found a response rate of 1.6% for a paper-based
mail survey (Kotulic et al. 2004). Research also shows that web-based surveys have a lower
response rate than paper-based surveys (Shih et al. 2008).
Table 4.1 – Sample Sources Source Frequency Percent Cumulative Approximate
Response Rate Type
Graduate Listserv 142 50.9 50.9 3.5% Online Forward 63 22.6 73.5 Online Soccer Tournament 52 18.6 92.1 50% Paper Small Businesses 22 7.9 100.0 25% Online
Differences between online and paper responses were identified using independent sample t-
tests. The two samples displayed differences on a small subset of items, mostly related to the
dependent variable. However, the differences could likely be attributed to differences in the age of
the online population sample versus the paper sample. The implications of these differences are
discussed in the next chapter. For the following data analyses, a combined sample was used.
69
After combining the samples, the data were tested for outliers and normality. Outliers can
significantly alter the outcome of analysis. Outliers can occur due to errors of data entry, missing
values, unintended sampling, and non-normal distribution (Cohen 1969). Outliers were identified by
proofreading the data for obvious data entry errors. This was followed by checking the data for
missing values and then running statistical tests. A response was considered an outlier if it was more
than three standard deviations away from the expected value of the variable (Cohen 1969). For the
majority of models tested, all cases were within the suggested range. However, the dataset for two of
the behaviors related to the threat of a computer slowing down had one data point removed (auto
update and pop ups) and two of the data points from the dataset measuring the use of spyware
software to address the identification theft threat were removed. As previously mentioned, 44
incomplete surveys were eliminated along with one survey that represented unintended sampling,
resulting in a sample of 279 responses.
Table 4.2 and 4.3 display the summary demographics. Over half of the respondents are
female (55.3%). The majority of respondents are Caucasian (85.6%). Almost all of the respondents
hold a college degree or higher (90.2%). The income is well distributed with no group containing
more than 35% and no group containing less than 20%. The average age of respondents was 35.30
with a minimum age of 20 and a maximum age of 83. Respondents have been using computers for
an average of 16.67 years with a minimum of two years and a maximum of 53. The average number
of hours respondents spend on the Internet is 27.73 ranging from one hour to 100 hours. The average
number of hours respondents spend on their computer is 35.62 ranging from one hour to 110 hours
per week.
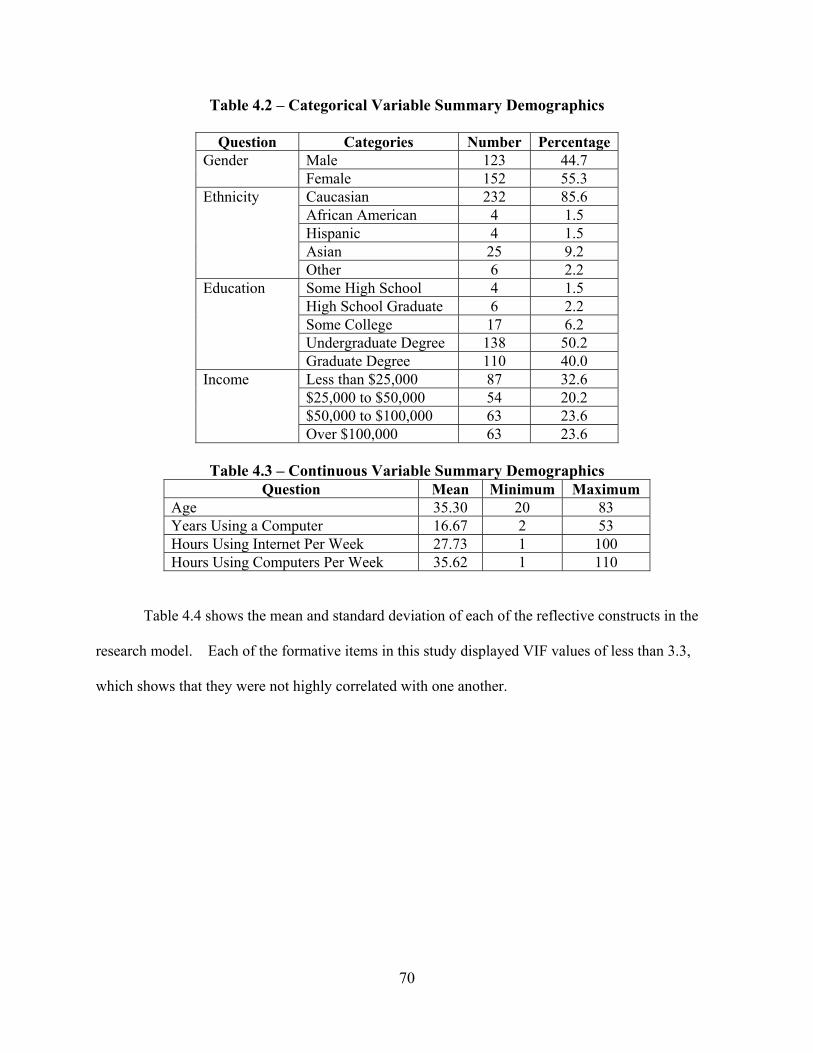
70
Table 4.2 – Categorical Variable Summary Demographics
Question Categories Number Percentage Gender Male 123 44.7
Female 152 55.3 Ethnicity Caucasian 232 85.6
African American 4 1.5 Hispanic 4 1.5 Asian 25 9.2 Other 6 2.2
Education Some High School 4 1.5 High School Graduate 6 2.2 Some College 17 6.2 Undergraduate Degree 138 50.2 Graduate Degree 110 40.0
Income Less than $25,000 87 32.6 $25,000 to $50,000 54 20.2 $50,000 to $100,000 63 23.6 Over $100,000 63 23.6
Table 4.3 – Continuous Variable Summary Demographics
Question Mean Minimum Maximum Age 35.30 20 83 Years Using a Computer 16.67 2 53 Hours Using Internet Per Week 27.73 1 100 Hours Using Computers Per Week 35.62 1 110
Table 4.4 shows the mean and standard deviation of each of the reflective constructs in the
research model. Each of the formative items in this study displayed VIF values of less than 3.3,
which shows that they were not highly correlated with one another.
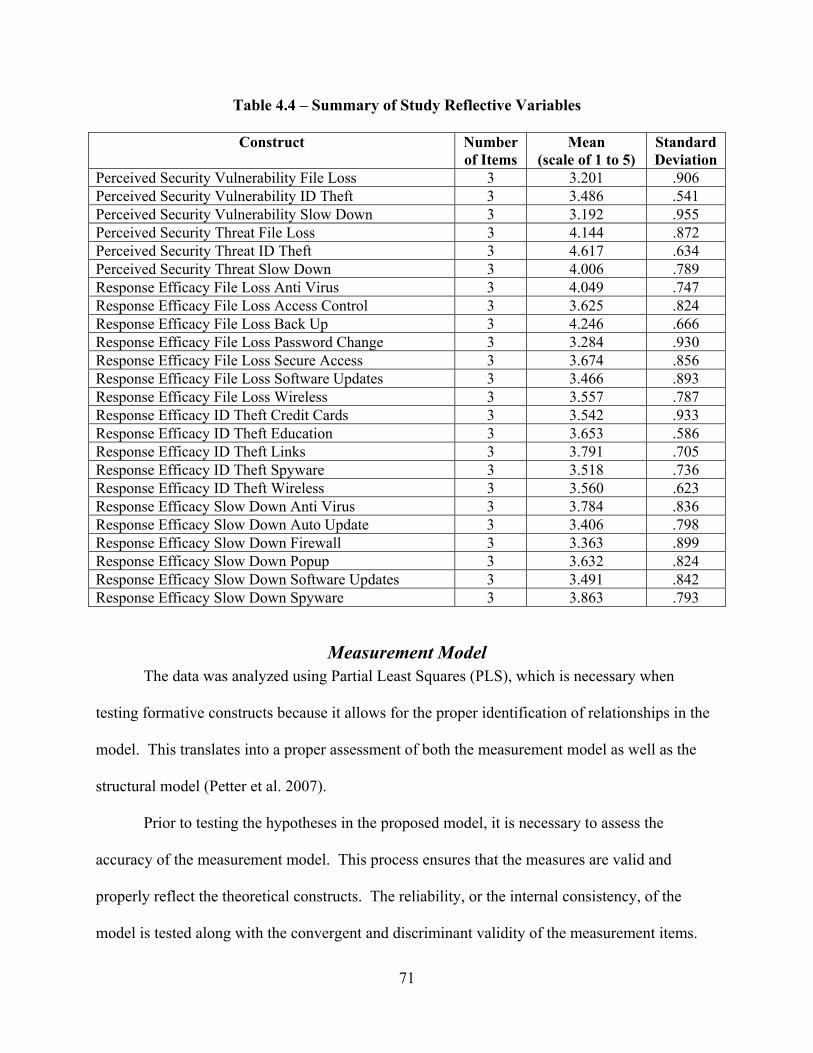
71
Table 4.4 – Summary of Study Reflective Variables
Construct Number of Items
Mean (scale of 1 to 5)
Standard Deviation
Perceived Security Vulnerability File Loss 3 3.201 .906 Perceived Security Vulnerability ID Theft 3 3.486 .541 Perceived Security Vulnerability Slow Down 3 3.192 .955 Perceived Security Threat File Loss 3 4.144 .872 Perceived Security Threat ID Theft 3 4.617 .634 Perceived Security Threat Slow Down 3 4.006 .789 Response Efficacy File Loss Anti Virus 3 4.049 .747 Response Efficacy File Loss Access Control 3 3.625 .824 Response Efficacy File Loss Back Up 3 4.246 .666 Response Efficacy File Loss Password Change 3 3.284 .930 Response Efficacy File Loss Secure Access 3 3.674 .856 Response Efficacy File Loss Software Updates 3 3.466 .893 Response Efficacy File Loss Wireless 3 3.557 .787 Response Efficacy ID Theft Credit Cards 3 3.542 .933 Response Efficacy ID Theft Education 3 3.653 .586 Response Efficacy ID Theft Links 3 3.791 .705 Response Efficacy ID Theft Spyware 3 3.518 .736 Response Efficacy ID Theft Wireless 3 3.560 .623 Response Efficacy Slow Down Anti Virus 3 3.784 .836 Response Efficacy Slow Down Auto Update 3 3.406 .798 Response Efficacy Slow Down Firewall 3 3.363 .899 Response Efficacy Slow Down Popup 3 3.632 .824 Response Efficacy Slow Down Software Updates 3 3.491 .842 Response Efficacy Slow Down Spyware 3 3.863 .793
Measurement Model The data was analyzed using Partial Least Squares (PLS), which is necessary when
testing formative constructs because it allows for the proper identification of relationships in the
model. This translates into a proper assessment of both the measurement model as well as the
structural model (Petter et al. 2007).
Prior to testing the hypotheses in the proposed model, it is necessary to assess the
accuracy of the measurement model. This process ensures that the measures are valid and
properly reflect the theoretical constructs. The reliability, or the internal consistency, of the
model is tested along with the convergent and discriminant validity of the measurement items.
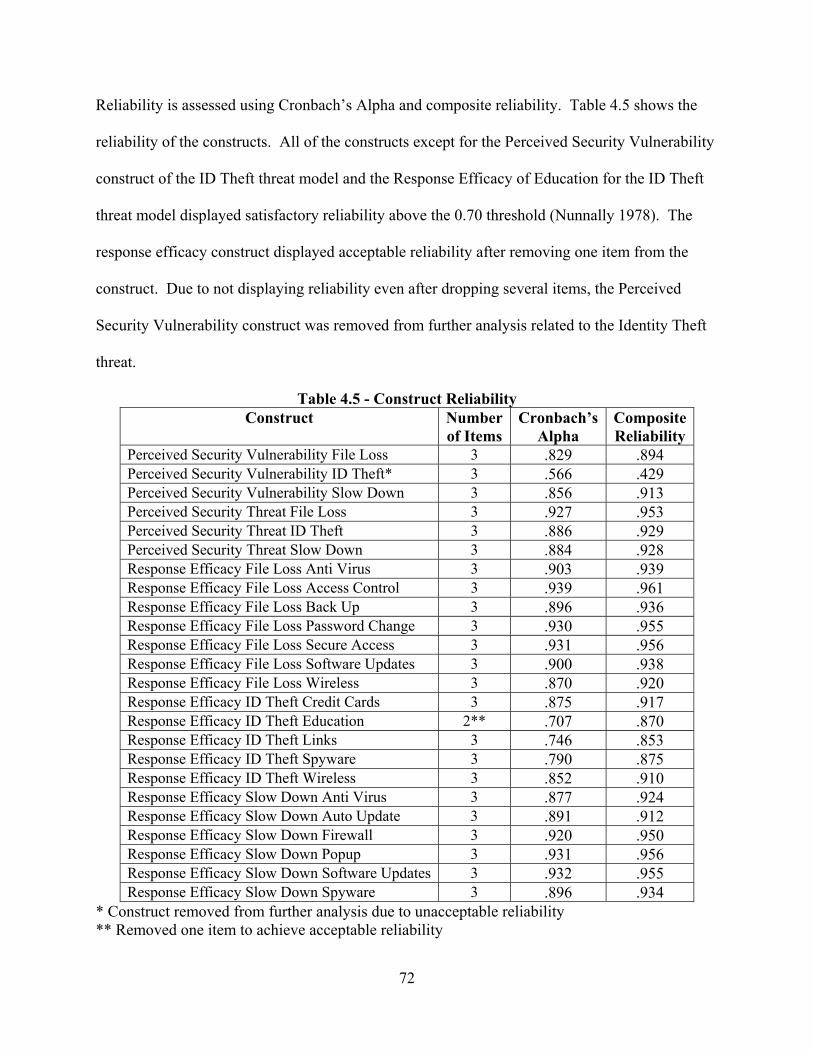
72
Reliability is assessed using Cronbach’s Alpha and composite reliability. Table 4.5 shows the
reliability of the constructs. All of the constructs except for the Perceived Security Vulnerability
construct of the ID Theft threat model and the Response Efficacy of Education for the ID Theft
threat model displayed satisfactory reliability above the 0.70 threshold (Nunnally 1978). The
response efficacy construct displayed acceptable reliability after removing one item from the
construct. Due to not displaying reliability even after dropping several items, the Perceived
Security Vulnerability construct was removed from further analysis related to the Identity Theft
threat.
Table 4.5 - Construct Reliability Construct Number
of ItemsCronbach’s
Alpha Composite Reliability
Perceived Security Vulnerability File Loss 3 .829 .894 Perceived Security Vulnerability ID Theft* 3 .566 .429 Perceived Security Vulnerability Slow Down 3 .856 .913 Perceived Security Threat File Loss 3 .927 .953 Perceived Security Threat ID Theft 3 .886 .929 Perceived Security Threat Slow Down 3 .884 .928 Response Efficacy File Loss Anti Virus 3 .903 .939 Response Efficacy File Loss Access Control 3 .939 .961 Response Efficacy File Loss Back Up 3 .896 .936 Response Efficacy File Loss Password Change 3 .930 .955 Response Efficacy File Loss Secure Access 3 .931 .956 Response Efficacy File Loss Software Updates 3 .900 .938 Response Efficacy File Loss Wireless 3 .870 .920 Response Efficacy ID Theft Credit Cards 3 .875 .917 Response Efficacy ID Theft Education 2** .707 .870 Response Efficacy ID Theft Links 3 .746 .853 Response Efficacy ID Theft Spyware 3 .790 .875 Response Efficacy ID Theft Wireless 3 .852 .910 Response Efficacy Slow Down Anti Virus 3 .877 .924 Response Efficacy Slow Down Auto Update 3 .891 .912 Response Efficacy Slow Down Firewall 3 .920 .950 Response Efficacy Slow Down Popup 3 .931 .956 Response Efficacy Slow Down Software Updates 3 .932 .955 Response Efficacy Slow Down Spyware 3 .896 .934
* Construct removed from further analysis due to unacceptable reliability ** Removed one item to achieve acceptable reliability
73
Convergent and discriminant validity were assessed by examining whether items
intended to measure one construct were more highly correlated with themselves or with other
constructs. Items that loaded the most strongly on their own constructs were considered to have
convergent validity. Convergent validity was additionally tested by calculating the Average
Variance Extracted (AVE) for each construct, which is the amount of variance that a latent
variable component captures from its indicators in relation to the amount due to measurement
error. The AVE value for all constructs were above the recommended threshold of 0.50 (Fornell
et al. 1981), indicating good convergent validity of the items in each construct.
Discriminant validity was tested by assessing whether the AVE from a construct was
greater than the variance shared with other constructs in the model (Chin 1998). Appendix D
displays the squared pair-wise correlation of the latent construct correlations along with the
AVE. The diagonal of the correlation matrix presents the AVEs. Satisfactory discriminant
validity is indicated for all models, as the AVE is greater than the squared pair-wise correlation
of the latent variables.
Discriminant validity was additionally assessed using the cross-loading method (Chin
1998). As seen in Appendix E, the items loaded higher in their own columns than in the column
for other constructs. Furthermore, when evaluating the items across rows, the items loaded most
strongly on their intended constructs. Therefore, the measurements satisfy the criteria
recommended by Chin (1998).
Structural Model
Based on the acceptable analysis of the measurement model, testing of the structural
model and proposed hypotheses can ensue. The structural model was tested using SmartPLS to
estimate the path coefficients, which calculates the strength of the relationships between
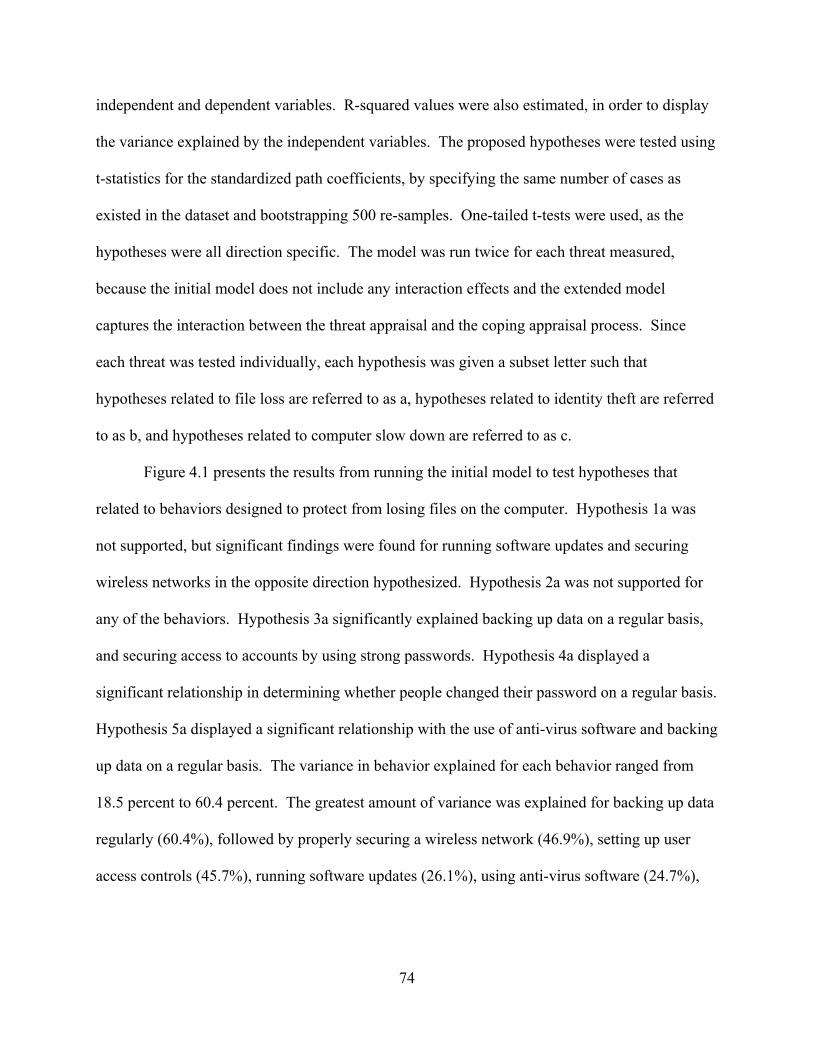
74
independent and dependent variables. R-squared values were also estimated, in order to display
the variance explained by the independent variables. The proposed hypotheses were tested using
t-statistics for the standardized path coefficients, by specifying the same number of cases as
existed in the dataset and bootstrapping 500 re-samples. One-tailed t-tests were used, as the
hypotheses were all direction specific. The model was run twice for each threat measured,
because the initial model does not include any interaction effects and the extended model
captures the interaction between the threat appraisal and the coping appraisal process. Since
each threat was tested individually, each hypothesis was given a subset letter such that
hypotheses related to file loss are referred to as a, hypotheses related to identity theft are referred
to as b, and hypotheses related to computer slow down are referred to as c.
Figure 4.1 presents the results from running the initial model to test hypotheses that
related to behaviors designed to protect from losing files on the computer. Hypothesis 1a was
not supported, but significant findings were found for running software updates and securing
wireless networks in the opposite direction hypothesized. Hypothesis 2a was not supported for
any of the behaviors. Hypothesis 3a significantly explained backing up data on a regular basis,
and securing access to accounts by using strong passwords. Hypothesis 4a displayed a
significant relationship in determining whether people changed their password on a regular basis.
Hypothesis 5a displayed a significant relationship with the use of anti-virus software and backing
up data on a regular basis. The variance in behavior explained for each behavior ranged from
18.5 percent to 60.4 percent. The greatest amount of variance was explained for backing up data
regularly (60.4%), followed by properly securing a wireless network (46.9%), setting up user
access controls (45.7%), running software updates (26.1%), using anti-virus software (24.7%),
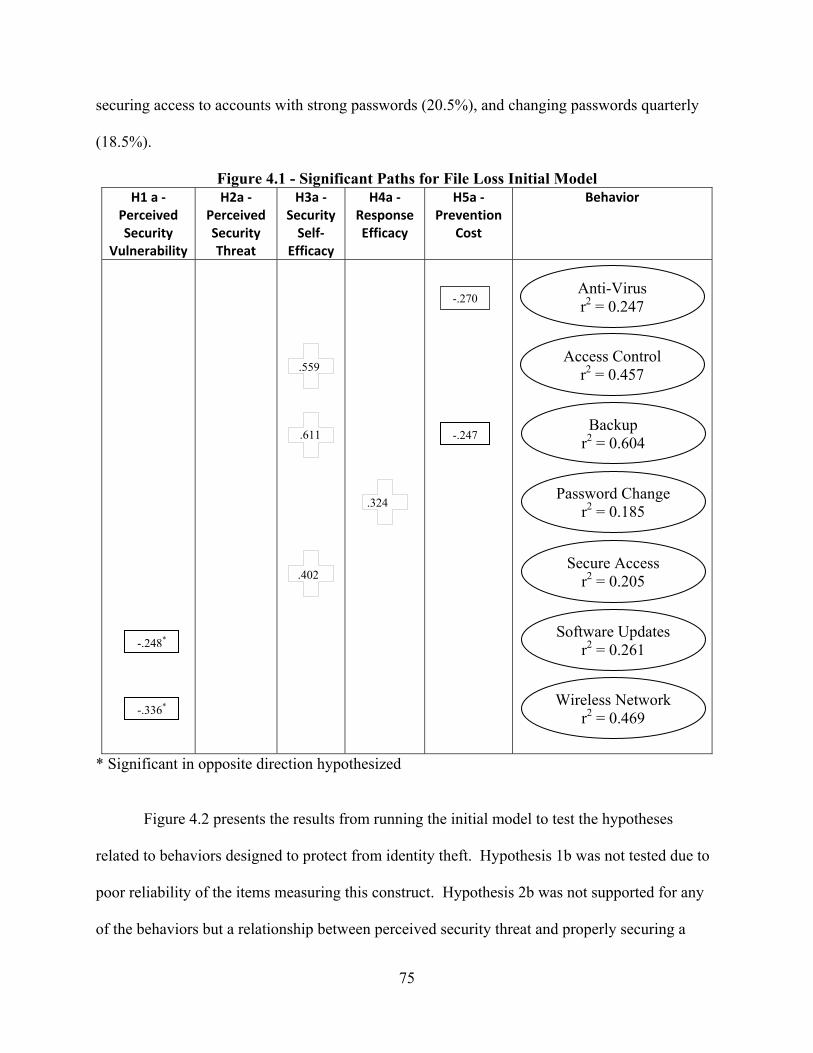
75
securing access to accounts with strong passwords (20.5%), and changing passwords quarterly
(18.5%).
Figure 4.1 - Significant Paths for File Loss Initial Model H1 a ‐
Perceived Security
Vulnerability
H2a ‐ Perceived Security Threat
H3a ‐ Security Self‐
Efficacy
H4a ‐ Response Efficacy
H5a ‐ Prevention
Cost
Behavior
* Significant in opposite direction hypothesized
Figure 4.2 presents the results from running the initial model to test the hypotheses
related to behaviors designed to protect from identity theft. Hypothesis 1b was not tested due to
poor reliability of the items measuring this construct. Hypothesis 2b was not supported for any
of the behaviors but a relationship between perceived security threat and properly securing a
Anti-Virus r2 = 0.247 -.270
.559
.324
.611 -.247
.402
Access Control r2 = 0.457
Backup r2 = 0.604
Password Change r2 = 0.185
Secure Access r2 = 0.205
Software Updates r2 = 0.261
Wireless Network r2 = 0.469
-.248*
-.336*
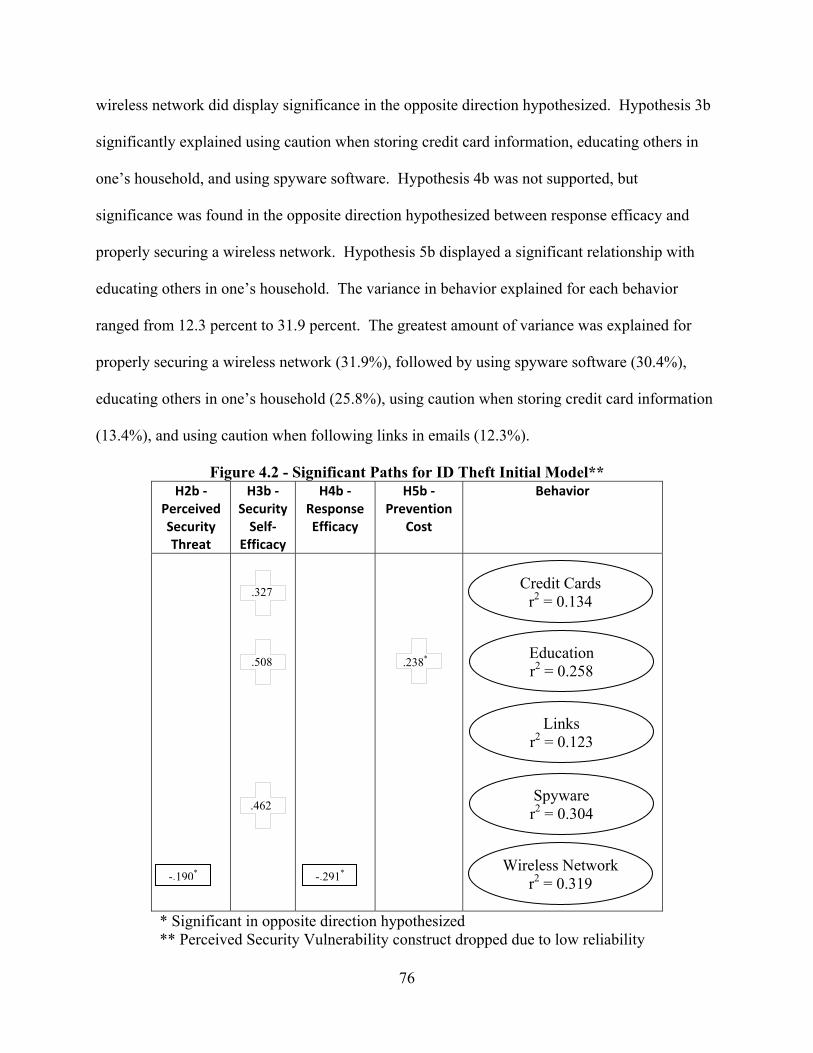
76
wireless network did display significance in the opposite direction hypothesized. Hypothesis 3b
significantly explained using caution when storing credit card information, educating others in
one’s household, and using spyware software. Hypothesis 4b was not supported, but
significance was found in the opposite direction hypothesized between response efficacy and
properly securing a wireless network. Hypothesis 5b displayed a significant relationship with
educating others in one’s household. The variance in behavior explained for each behavior
ranged from 12.3 percent to 31.9 percent. The greatest amount of variance was explained for
properly securing a wireless network (31.9%), followed by using spyware software (30.4%),
educating others in one’s household (25.8%), using caution when storing credit card information
(13.4%), and using caution when following links in emails (12.3%).
Figure 4.2 - Significant Paths for ID Theft Initial Model** H2b ‐
Perceived Security Threat
H3b ‐ Security Self‐
Efficacy
H4b ‐ Response Efficacy
H5b ‐ Prevention
Cost
Behavior
* Significant in opposite direction hypothesized ** Perceived Security Vulnerability construct dropped due to low reliability
.327
.462
Credit Cards r2 = 0.134
Education r2 = 0.258 .508 .238*
Links r2 = 0.123
Spyware r2 = 0.304
Wireless Network r2 = 0.319 -.190* -.291*
77
Figure 4.3 presents the results from running the initial model to test the hypotheses
related to behaviors designed to protect from having computers slow down. Hypothesis 1c was
not supported, but significant findings were found for running software updates in the opposite
direction hypothesized. Hypothesis 2c was not supported for any of the behaviors. Hypothesis
3c significantly explained using anti-virus software, using pop-up blocking software, running
software updates, and using spyware software. Hypothesis 4c displayed a significant
relationship in determining whether people ran automatic updates for Windows and ran other
software updates regularly. Hypothesis 5c displayed a significant relationship with the use of
anti-virus software, the use of a firewall and the use of spyware software. The variance in
behavior explained for each behavior ranged from 24.5 percent to 30.4 percent. The greatest
amount of variance was explained for using pop-up blocking software (30.4%), followed by
using spyware software (30.2%), running automatic updates (26.5%), running software updates
(25.3%), using anti-virus software (25.3), and using a firewall (24.5%).
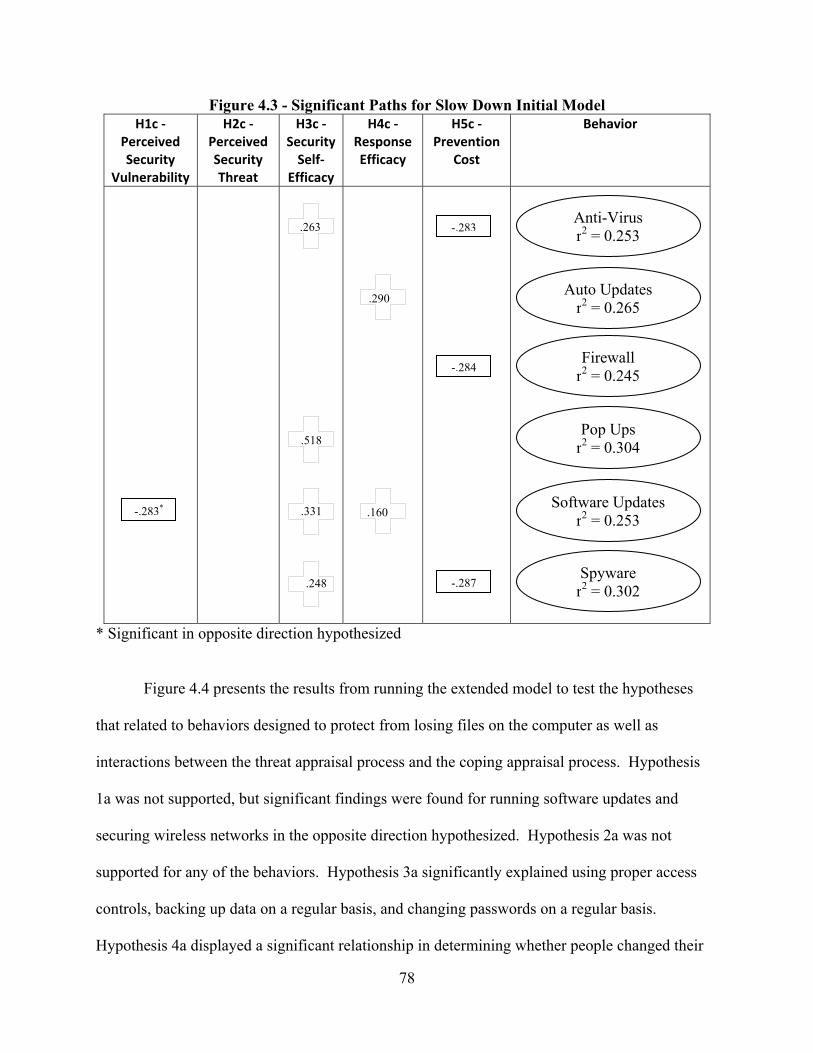
78
Figure 4.3 - Significant Paths for Slow Down Initial Model H1c ‐
Perceived Security
Vulnerability
H2c ‐ Perceived Security Threat
H3c ‐ Security Self‐
Efficacy
H4c ‐ Response Efficacy
H5c ‐ Prevention
Cost
Behavior
* Significant in opposite direction hypothesized
Figure 4.4 presents the results from running the extended model to test the hypotheses
that related to behaviors designed to protect from losing files on the computer as well as
interactions between the threat appraisal process and the coping appraisal process. Hypothesis
1a was not supported, but significant findings were found for running software updates and
securing wireless networks in the opposite direction hypothesized. Hypothesis 2a was not
supported for any of the behaviors. Hypothesis 3a significantly explained using proper access
controls, backing up data on a regular basis, and changing passwords on a regular basis.
Hypothesis 4a displayed a significant relationship in determining whether people changed their
.518
.160.331
.263 Anti-Virus r2 = 0.253
Auto Updates r2 = 0.265
.290
Firewall r2 = 0.245
Pop Ups r2 = 0.304
Software Updates r2 = 0.253
Spyware r2 = 0.302 .248
-.283*
-.283
-.284
-.287
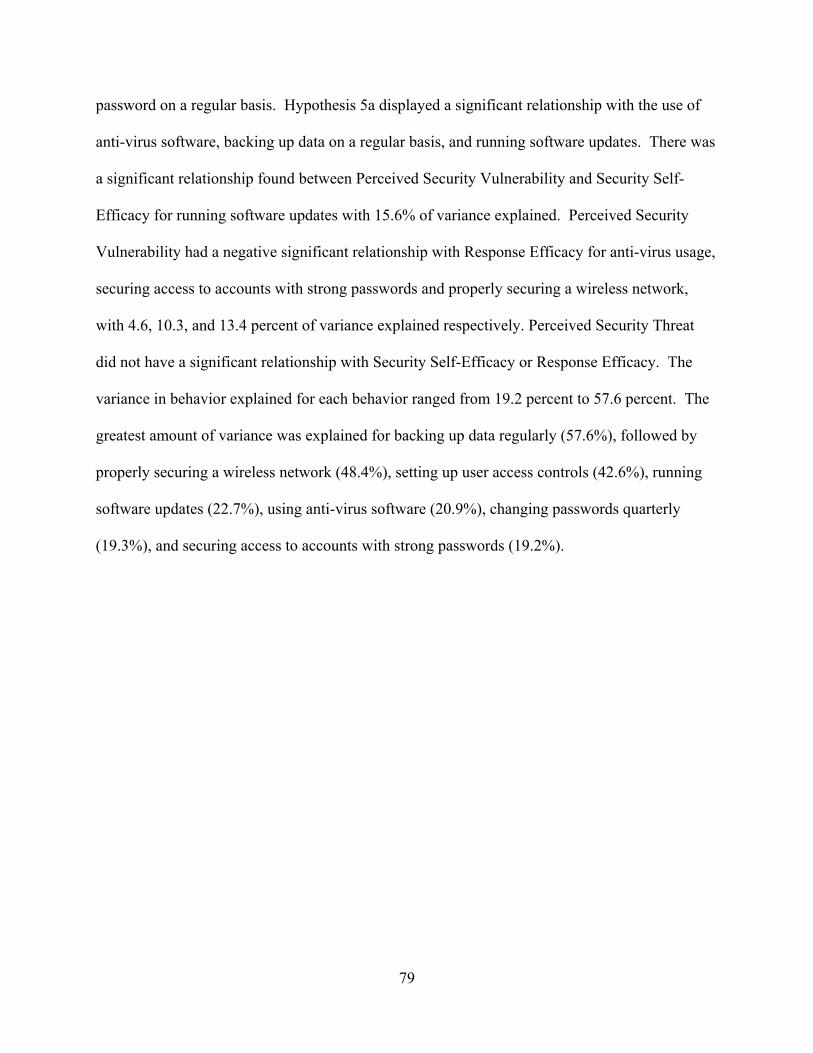
79
password on a regular basis. Hypothesis 5a displayed a significant relationship with the use of
anti-virus software, backing up data on a regular basis, and running software updates. There was
a significant relationship found between Perceived Security Vulnerability and Security Self-
Efficacy for running software updates with 15.6% of variance explained. Perceived Security
Vulnerability had a negative significant relationship with Response Efficacy for anti-virus usage,
securing access to accounts with strong passwords and properly securing a wireless network,
with 4.6, 10.3, and 13.4 percent of variance explained respectively. Perceived Security Threat
did not have a significant relationship with Security Self-Efficacy or Response Efficacy. The
variance in behavior explained for each behavior ranged from 19.2 percent to 57.6 percent. The
greatest amount of variance was explained for backing up data regularly (57.6%), followed by
properly securing a wireless network (48.4%), setting up user access controls (42.6%), running
software updates (22.7%), using anti-virus software (20.9%), changing passwords quarterly
(19.3%), and securing access to accounts with strong passwords (19.2%).
80
Figure 4.4 - Significant Paths for File Loss Threat Extended Model H1a ‐
Perceived Security
Vulnerability
H2a ‐ Perceived Security Threat
H3a ‐ Security Self‐
Efficacy
H4a ‐ Response Efficacy
H5a ‐ Prevention
Cost
Behavior
Vulnerability Security
Self‐Efficacy
Vulnerability Response Efficacy
Severity Security
Self‐Efficacy
Severity Response Efficacy
* Significant in opposite direction hypothesized
r2 = 0.103
.596
.360
.597
Anti-Virus r2 = 0.209
Access Control r2 = 0.426
Backup r2 = 0.576
Password Change r2 = 0.193
Secure Access r2 = 0.192
Software Updates r2 = 0.227
Wireless Network r2 = 0.484
r2 = 0.046
.597
r2 = 0.156
r2 = 0.134
-.227*
-.397*
-.263
-.255
-.233 -.270
-.212
-.317
-.367
81
Figure 4.5 presents the results from running the extended model to test the hypotheses
related to behaviors designed to protect from identity theft as well as interactions between the
threat appraisal process and the coping appraisal process. Hypothesis 1b was not tested due to
poor reliability of the items measuring this construct. Hypothesis 2b was not supported for any
of the behaviors. Hypothesis 3b significantly explained using caution when storing credit card
information, educating others in one’s household, and using spyware software. Hypothesis 4b
was not supported, but significance was found in the opposite direction hypothesized between
Response Efficacy and properly securing a wireless network. Hypothesis 5b displayed a
significant relationship with educating others in one’s household. There were no relationships
found between the coping appraisal process and the threat appraisal process. The variance in
behavior explained for each behavior ranged from 9.8 percent to 31.2 percent. The greatest
amount of variance was explained for properly securing a wireless network (31.2%), followed by
using spyware software (30.1%), educating others in one’s household (24.9%), using caution
when storing credit card information (13.4%), and using caution when following links in emails
(9.8%).
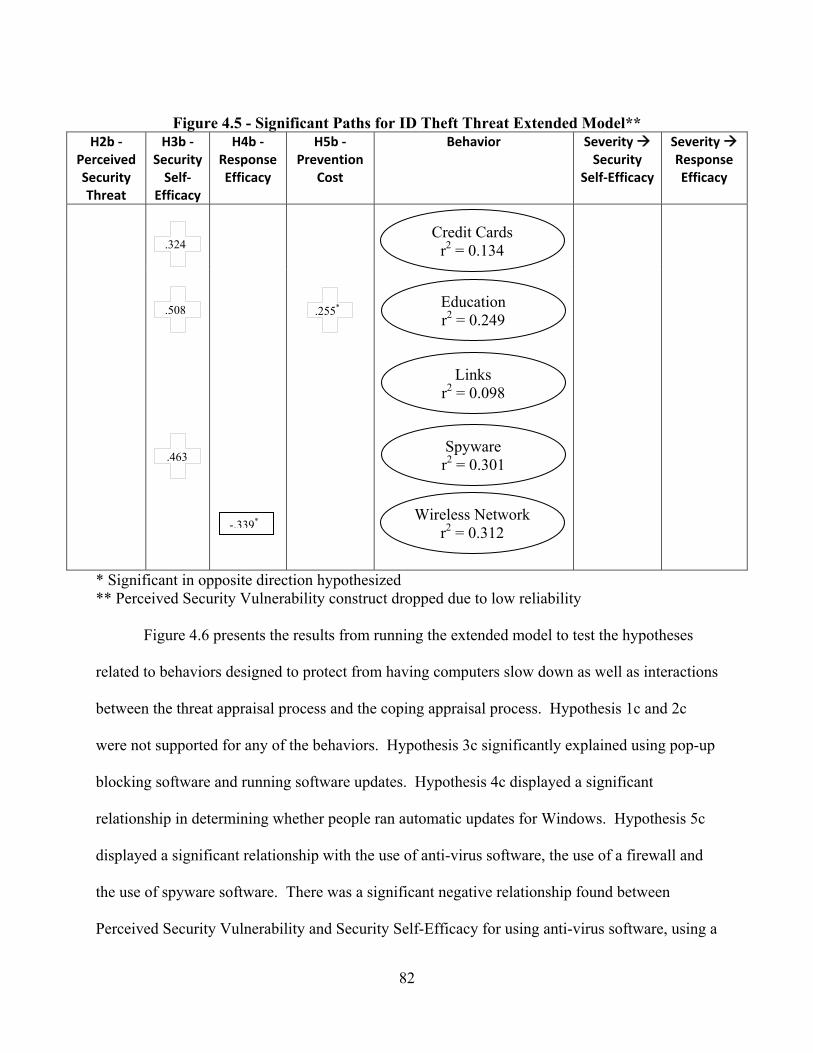
82
Figure 4.5 - Significant Paths for ID Theft Threat Extended Model**
H2b ‐ Perceived Security Threat
H3b ‐ Security Self‐
Efficacy
H4b ‐ Response Efficacy
H5b ‐ Prevention
Cost
Behavior Severity Security
Self‐Efficacy
Severity Response Efficacy
* Significant in opposite direction hypothesized ** Perceived Security Vulnerability construct dropped due to low reliability
Figure 4.6 presents the results from running the extended model to test the hypotheses
related to behaviors designed to protect from having computers slow down as well as interactions
between the threat appraisal process and the coping appraisal process. Hypothesis 1c and 2c
were not supported for any of the behaviors. Hypothesis 3c significantly explained using pop-up
blocking software and running software updates. Hypothesis 4c displayed a significant
relationship in determining whether people ran automatic updates for Windows. Hypothesis 5c
displayed a significant relationship with the use of anti-virus software, the use of a firewall and
the use of spyware software. There was a significant negative relationship found between
Perceived Security Vulnerability and Security Self-Efficacy for using anti-virus software, using a
.463
.255*
Credit Cards r2 = 0.134
Education r2 = 0.249
Links r2 = 0.098
Spyware r2 = 0.301
Wireless Network r2 = 0.312
.324
.508
-.339*
83
firewall, running software updates, and using spyware software with 16.5, 16.1, 16.7, and 12.8
percent of variance explained respectively. Perceived Security Vulnerability had a negative
significant relationship with Response Efficacy for running auto updates and using pop-up
blocking software with 9.3 and 5.2 percent of variance explained respectively. Perceived
Security Threat had a positive significant relationship with Security Self-Efficacy for using a
firewall, using pop-up blocking software, and running software updates with 16.1, 16.4, and 16.7
percent of the variance explained respectively. Perceived Security Threat did not influence
Response Efficacy for any of the behaviors. The variance in behavior explained for each
behavior ranged from 16.6 percent to 29.2 percent. The greatest amount of variance was
explained for using pop-up blocking software (29.2%), followed by using spyware software
(27.6%), running automatic updates (25.3%), running software updates (21.8%), using a firewall
(19.9), and using anti-virus software (16.6%).
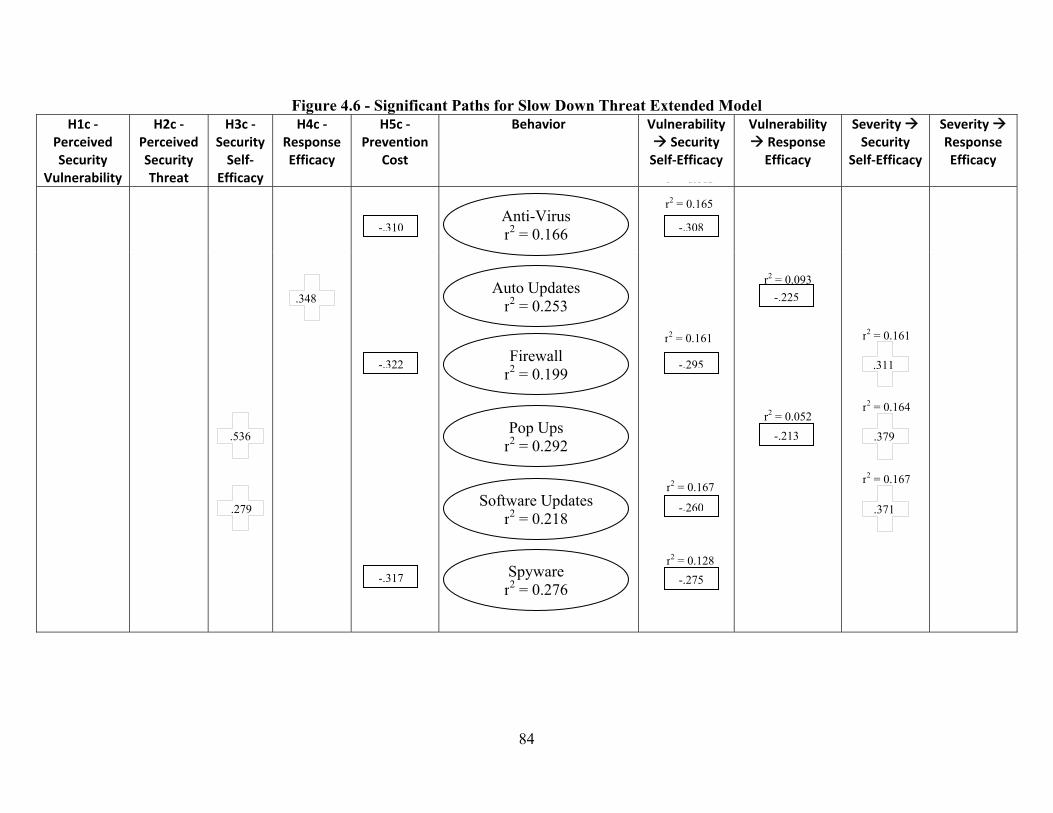
84
r2 = 0.093
r2 = 0.161 r2 = 0.161
r2 = 0.052r2 = 0.164
r2 = 0.128
r2 = 0.167r2 = 0.167
r2 = 0.165
Figure 4.6 - Significant Paths for Slow Down Threat Extended Model H1c ‐
Perceived Security
Vulnerability
H2c ‐ Perceived Security Threat
H3c ‐ Security Self‐
Efficacy
H4c ‐ Response Efficacy
H5c ‐ Prevention
Cost
Behavior Vulnerability Security
Self‐Efficacy
Vulnerability Response Efficacy
Severity Security
Self‐Efficacy
Severity Response Efficacy
r2 = 0.165
.536 .379
.311
.279 .371
Anti-Virus r2 = 0.166
Auto Updates r2 = 0.253
Firewall r2 = 0.199
Pop Ups r2 = 0.292
Software Updates r2 = 0.218
Spyware r2 = 0.276
.348
-.310
-.322
-.317
-.308
-.295
-.260
-.275
-.225
-.213

85
In summary, figures 4.1 through 4.6 shows that different hypotheses are supported for
different behaviors and the specific threat it addresses. The results and implications of these
findings are discussed more fully in the next chapter.
86
Chapter Five: Discussion This chapter provides a discussion of the results presented in Chapter Four, the
implications of these findings and ideas for future research. This study empirically investigated
how well Protection Motivation Theory (PMT) explained individual security behaviors. Five
determinants were hypothesized to have an effect on individual security behaviors. The
determinants were perceived security vulnerability, perceived security threat, security self-
efficacy, response efficacy, and protection costs. No study to date has used PMT to explore such
a plethora of information security behaviors. As illustrated in the previous chapter, the
determinants proposed to have an effect on individual security behaviors differed greatly
depending on the behavior studied.
This chapter first discusses the findings and implications for each threat individually,
which includes losing files on a computer, identity theft, and having the computer slow down.
Then, a discussion of similarities and differences between the findings for the three threats
occurs. This chapter concludes with a discussion of the overall implications of this research
coupled with ideas for future research.
Significant Findings As identified in Chapter One, the goal of this study was to understand what determined
the security behaviors of individuals. This study found that the determinants of individual
security behaviors vary depending on the behavior studied. In this section, each threat is
explored individually to see how the threat appraisal process coupled with the coping appraisal
process affects individual security behaviors.
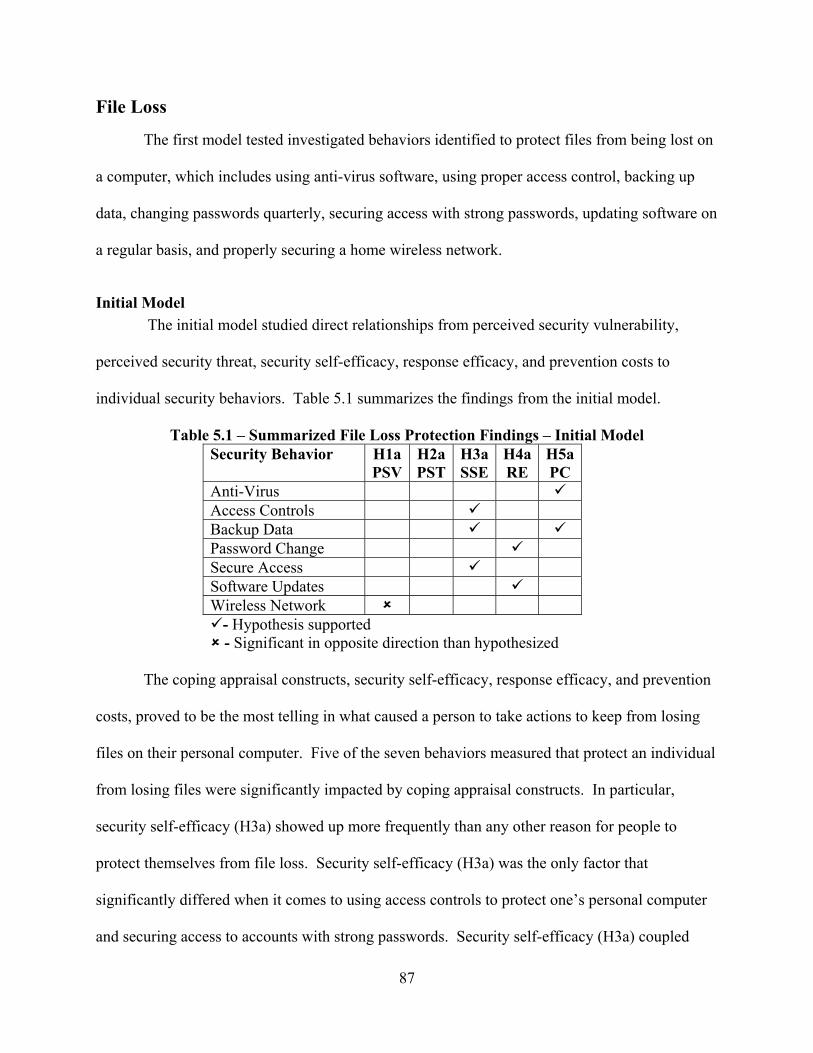
87
File Loss
The first model tested investigated behaviors identified to protect files from being lost on
a computer, which includes using anti-virus software, using proper access control, backing up
data, changing passwords quarterly, securing access with strong passwords, updating software on
a regular basis, and properly securing a home wireless network.
Initial Model The initial model studied direct relationships from perceived security vulnerability,
perceived security threat, security self-efficacy, response efficacy, and prevention costs to
individual security behaviors. Table 5.1 summarizes the findings from the initial model.
Table 5.1 – Summarized File Loss Protection Findings – Initial Model Security Behavior H1a
PSVH2aPST
H3aSSE
H4aRE
H5a PC
Anti-Virus Access Controls Backup Data Password Change Secure Access Software Updates Wireless Network
- Hypothesis supported - Significant in opposite direction than hypothesized
The coping appraisal constructs, security self-efficacy, response efficacy, and prevention
costs, proved to be the most telling in what caused a person to take actions to keep from losing
files on their personal computer. Five of the seven behaviors measured that protect an individual
from losing files were significantly impacted by coping appraisal constructs. In particular,
security self-efficacy (H3a) showed up more frequently than any other reason for people to
protect themselves from file loss. Security self-efficacy (H3a) was the only factor that
significantly differed when it comes to using access controls to protect one’s personal computer
and securing access to accounts with strong passwords. Security self-efficacy (H3a) coupled
88
with protection costs (H5a) significantly affected whether people backup the data on their
personal computer. This suggests that as people gain confidence in their ability to secure their
computer the likelihood that they will backup their data, setup proper access controls, and use
strong passwords to secure their accounts should increase. In addition, people who perceive the
cost of backing up their data as low are more likely to perform this behavior. Kim (2005) found
that people who received security training were twice as likely to backup their data. This
suggests that when people receive training on security the likelihood they are backing up their
data should increase. Future research could use an experiment to determine whether the increase
in data backup is due to changes in security self-efficacy and prevention cost or some other
factors.
Response efficacy (H4a) displayed significance only for changing passwords quarterly.
This suggests that individuals who are confident that changing their password will protect them
from losing files actually perform this behavior. Other research has found that training,
awareness, monitoring, and rewards resulted in a greater likelihood to change passwords
regularly (Stanton et al. 2005). These findings suggest that combining training on the
effectiveness of changing passwords regularly to protect from losing files with a monitoring and
reward system to encourage the changing of passwords will result in an increase in frequent
password changes. Part of this process should be coupled with other research findings that
people should be allowed to use the same password for multiple systems (Kim 2005).
Companies can improve the number of employees changing their passwords regularly through
the implementation of training systems targeted at the effectiveness of password changes at
protecting files from being lost, monitoring people to ensure passwords are changed regularly,
89
rewarding those who regularly change passwords, and allowing people to use the same password
for multiple systems.
Prevention costs (H5a) affected anti-virus software usage such that those who perceived
the cost of using anti-virus software as low were more likely to use it. Previous research found
that 25 percent of respondents either did not use anti-virus software or did not update it (Kim
2005). Of those that did have anti-virus software installed on their computer, the majority did so
because it came pre-installed with the purchase of their personal computer, thus making the
financial cost near zero. Further research found that 85 to 93 percent of respondents use anti-
virus software (Furnell et al. 2007; Furnell et al. 2006). However, only 63 percent of individuals
reported to be updating their anti-virus software regularly (Furnell et al. 2007). The findings
related to anti-virus usage suggest that it is important for anti-virus software to come pre-
packaged with computers or setup before it ends up in users’ hands and that automatic updates be
turned on. Using these technological solutions will lower the perceived cost of using anti-virus
software and result in protecting people from viruses, even if they do not know they have the
software turned on. Researchers should be aware that, with the nearly universal automation of
anti-virus software, users might not know they are using the software and their responses to
questions about the use of this software could be unintentionally wrong. Training that makes
people aware that they are using anti-virus software could help address this lack of knowledge
issue and result in more accurate survey responses.
Perceived security vulnerability (H1a) is the only threat appraisal construct that
significantly affects individual security behaviors performed to protect from file loss. However,
for the two behaviors (running software updates and securing wireless networks) where
significance is found, it is in the opposite direction than hypothesized. This suggests that people
90
who feel that they are vulnerable to losing files on their computer are less likely to keep the
software updated on their computer or secure their home wireless network. These findings are
contrary to the findings by Woon et al. (2005), who found all the constructs except perceived
vulnerability significantly impacted home wireless security. The dependent variable in this study
and the study by Woon and his colleagues is different, as is the nature of the threat measured.
This study investigated the single threat of files being lost or stolen. While Woon and his
colleagues investigated multiple threats including identity theft, having files stolen, lost network
bandwidth, and hacker attacks. Even with these differences, it is interesting to note that there is
no similarity in findings. This implies that although people are not using a secure wireless
network to protect from losing files, they may be doing so to protect from one of a number of
threats that Woon and his colleagues propose. In other words, people are not securing their
wireless network properly in order to protect from the threat of files being lost or stolen. Further
research is necessary to determine the true relationship between which threat people are actually
concerned about protecting themselves from when they secure their wireless network.
Extended Model The extended model, summarized in Table 5.2, introduces a relationship from perceived
security vulnerability and threat to security self-efficacy and response efficacy. In this extended
model, the threat appraisal constructs show up as significant indicators to the coping appraisal
constructs.
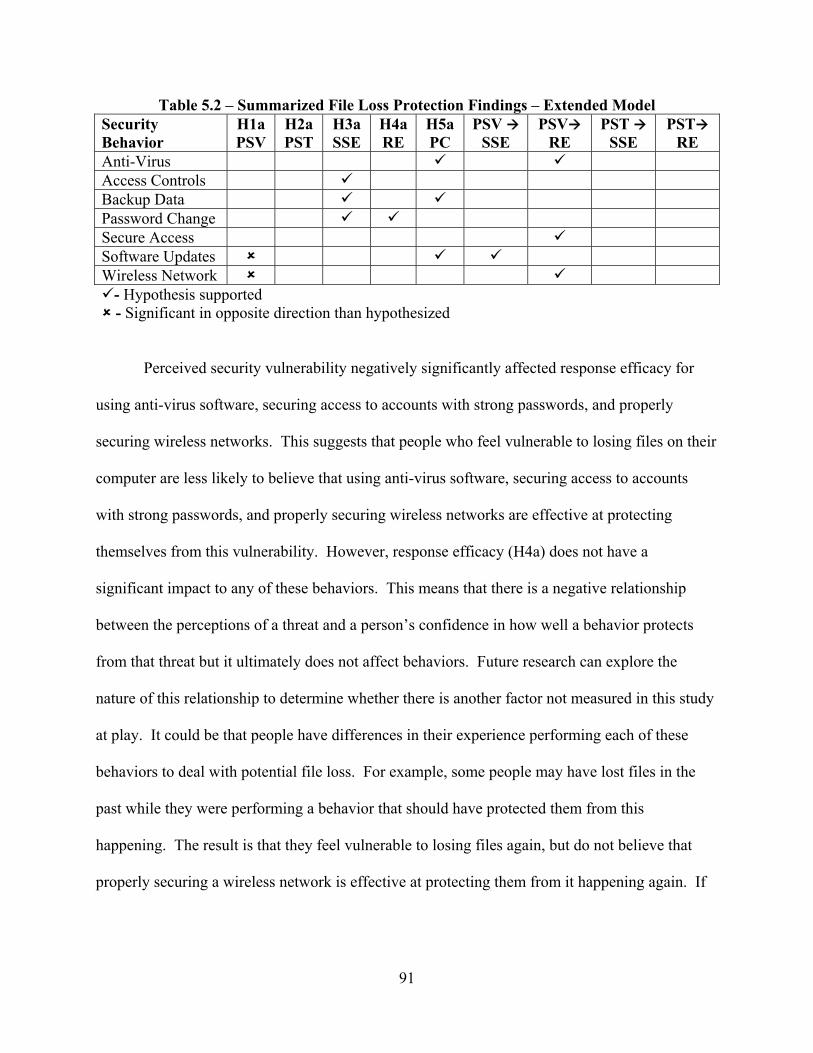
91
Table 5.2 – Summarized File Loss Protection Findings – Extended Model Security Behavior
H1a PSV
H2a PST
H3a SSE
H4aRE
H5a PC
PSV SSE
PSVRE
PST SSE
PST RE
Anti-Virus Access Controls Backup Data Password Change Secure Access Software Updates Wireless Network
- Hypothesis supported - Significant in opposite direction than hypothesized
Perceived security vulnerability negatively significantly affected response efficacy for
using anti-virus software, securing access to accounts with strong passwords, and properly
securing wireless networks. This suggests that people who feel vulnerable to losing files on their
computer are less likely to believe that using anti-virus software, securing access to accounts
with strong passwords, and properly securing wireless networks are effective at protecting
themselves from this vulnerability. However, response efficacy (H4a) does not have a
significant impact to any of these behaviors. This means that there is a negative relationship
between the perceptions of a threat and a person’s confidence in how well a behavior protects
from that threat but it ultimately does not affect behaviors. Future research can explore the
nature of this relationship to determine whether there is another factor not measured in this study
at play. It could be that people have differences in their experience performing each of these
behaviors to deal with potential file loss. For example, some people may have lost files in the
past while they were performing a behavior that should have protected them from this
happening. The result is that they feel vulnerable to losing files again, but do not believe that
properly securing a wireless network is effective at protecting them from it happening again. If
92
they are securing their wireless network, they are doing it for a reason not captured in this
particular model.
The introduction of the threat appraisal constructs as antecedents to the coping appraisal
constructs results in more characteristics having a direct impact on behaviors. This could be
happening because perceived security vulnerability and threat better explain differences in
security self-efficacy and response efficacy than differences in individual security behaviors.
When the variance explained by the threat appraisal constructs is lower in explaining differences
in individual security behaviors, then other coping appraisal constructs are able to explain more
of the variance in individual security behaviors. Backing up data, changing passwords quarterly,
and running software updates now have significant relationships with two determining factors.
Identical to the initial model, security self-efficacy (H3a) and prevention costs (H5a) affected
backing up data, providing additional evidence that people with confidence in their ability to
perform security tasks coupled with a view that backup data is a low cost behavior are more
likely to backup their data regularly. Security self-efficacy (H3a) and response efficacy (H4a)
affect changing passwords quarterly. This implies that in order for people to change their
passwords quarterly they need to have confidence in their ability to perform security tasks and
believe that changing their password quarterly will protect them from file loss. Perceived
security vulnerability (H1a) and prevention costs (H5a) affect the frequency of running software
updates, such that people who feel vulnerable to file loss and view the costs of running software
updates as high are less likely to run software updates. In addition, perceived security
vulnerability negatively affects security self-efficacy (H3a), which does not have a direct effect
on running software updates. This implies that those who feel less vulnerable to losing files have
greater confidence in their ability to perform security tasks. However, it is not their confidence
93
in performing security tasks that causes them to run software updates, but that not feeling
vulnerable and believing the cost of running software updates is low are the determining factors
of whether someone runs software updates. This begs the question as to why those that feel less
vulnerable to file loss are more likely to perform software updates. Future research can explore
whether this relationship is cyclical, in the sense that experience running software updates leads
to feeling less vulnerable to file loss and, based on that experience, the individual continues to
run software updates.
Although the majority of hypotheses related to behaviors that protect from file loss are
not supported, the amount of variance explained in the difference of the behaviors for some
models is relatively high. Backing up data, properly securing a wireless network, and using
appropriate user access control all have more than 40 percent of their variance explained in both
models while backing up data has over 60 percent of its variance explained in the initial model.
This suggests that although not all of the paths are significant, the model still does a good job of
explaining the differences in behaviors. Even the behaviors with lower variance explained such
as changing passwords quarterly and securing access to accounts with strong passwords have
over 18 percent of variance explained. These findings demonstrate that the model that explains
behaviors related to protecting from losing files is more parsimonious than the models tested.
This allows researchers and practitioners to have confidence that, as they influence the few
factors that affect individual security behaviors that protect from file loss, they will make a
significant difference in improving behaviors, especially those behaviors with over 40 percent of
their variance explained.
In summary, many of the hypothesized relationships did not explain the differences in
why people perform different behaviors to protect themselves from losing files. However, of
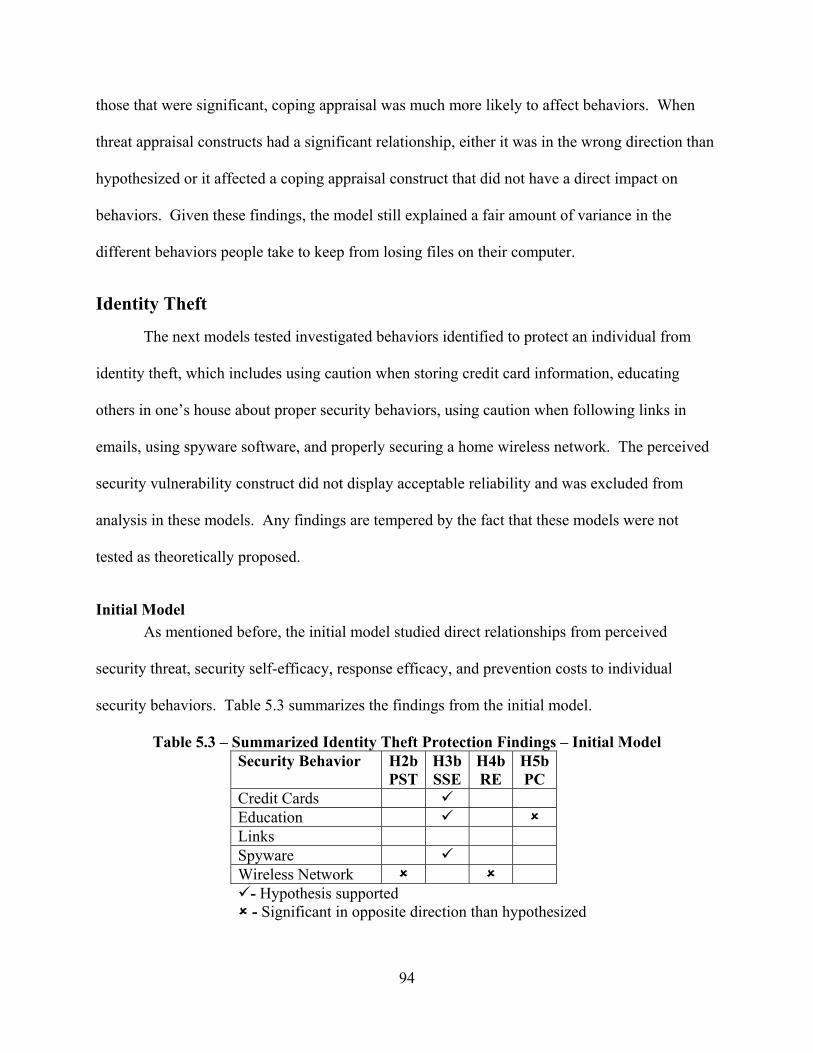
94
those that were significant, coping appraisal was much more likely to affect behaviors. When
threat appraisal constructs had a significant relationship, either it was in the wrong direction than
hypothesized or it affected a coping appraisal construct that did not have a direct impact on
behaviors. Given these findings, the model still explained a fair amount of variance in the
different behaviors people take to keep from losing files on their computer.
Identity Theft
The next models tested investigated behaviors identified to protect an individual from
identity theft, which includes using caution when storing credit card information, educating
others in one’s house about proper security behaviors, using caution when following links in
emails, using spyware software, and properly securing a home wireless network. The perceived
security vulnerability construct did not display acceptable reliability and was excluded from
analysis in these models. Any findings are tempered by the fact that these models were not
tested as theoretically proposed.
Initial Model As mentioned before, the initial model studied direct relationships from perceived
security threat, security self-efficacy, response efficacy, and prevention costs to individual
security behaviors. Table 5.3 summarizes the findings from the initial model.
Table 5.3 – Summarized Identity Theft Protection Findings – Initial Model Security Behavior H2b
PSTH3bSSE
H4bRE
H5bPC
Credit Cards Education Links Spyware Wireless Network - Hypothesis supported
- Significant in opposite direction than hypothesized
95
Behaviors that protect people from identify theft are best explained by the coping
appraisal constructs. The initial model found that four of the five behaviors to protect from this
threat were explained by coping appraisal constructs. Security self-efficacy (H3b) significantly
affected using caution when storing credit cards, educating others in one’s household about
security behaviors and using software to protect from spyware. That is people who felt confident
in their ability to perform security tasks were more likely to practice these behaviors to protect
themselves from identity theft. Previous research on the use of spyware found that perceived
behavioral control, attitude, and technology awareness affected a person’s intention to use
spyware software (Dinev et al. 2007). Dinev and her colleagues found that self-efficacy did not
affect perceived behavioral control. An interesting expansion on this research would be to
replace the reflective measure of self-efficacy used by Dinev and her colleagues with a formative
measure of security self-efficacy as used in this study to see if it better explains differences in
perceived behavioral control.
In addition to security self-efficacy (H3b), prevention costs (H5b) significantly affected
educating others in one’s house in the opposite direction hypothesized. This would suggest that
people who view the cost of educating others in their household as high would be more likely to
do so. This may be an experience issue for people, as people who are educating others in their
house realize the cost of it, but it is important enough for them to do so anyway. The
implementation of training programs for people, especially parents, about the importance of
educating others in their house about appropriate security behaviors could result in the increase
of the education of others.
Only one of these behaviors, properly securing wireless networks, was explained by a
threat appraisal construct. However, contrary to findings by Woon et al. (2005), properly
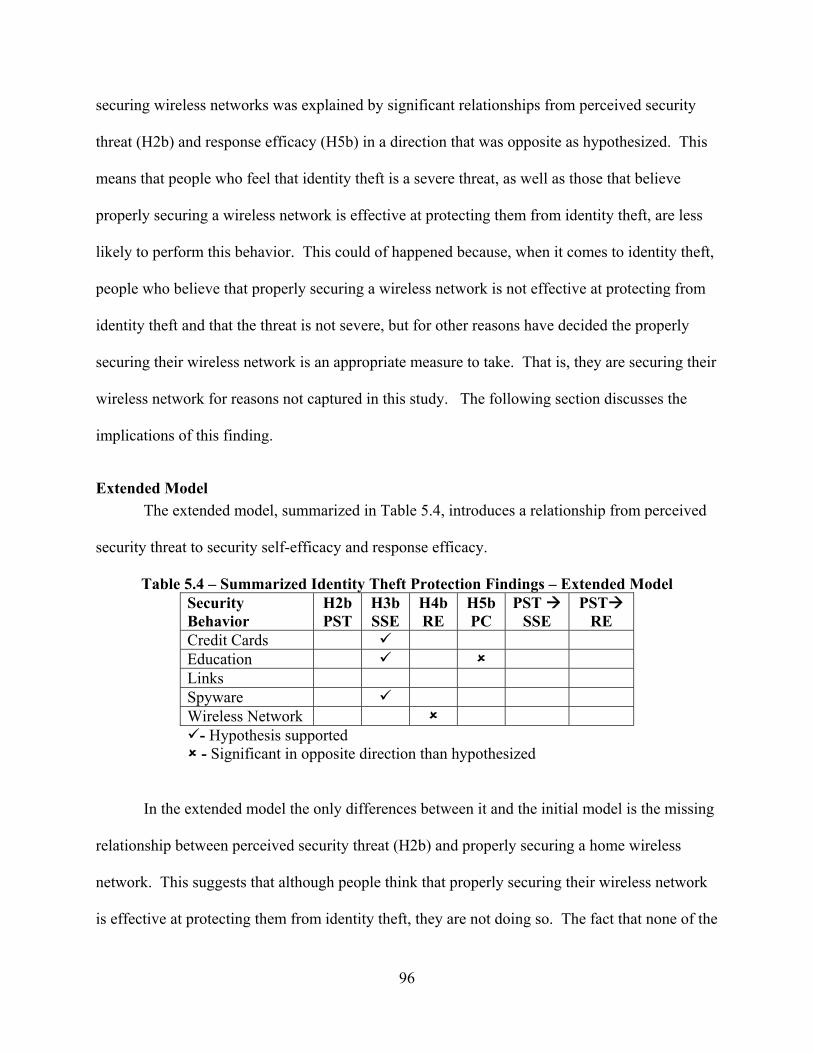
96
securing wireless networks was explained by significant relationships from perceived security
threat (H2b) and response efficacy (H5b) in a direction that was opposite as hypothesized. This
means that people who feel that identity theft is a severe threat, as well as those that believe
properly securing a wireless network is effective at protecting them from identity theft, are less
likely to perform this behavior. This could of happened because, when it comes to identity theft,
people who believe that properly securing a wireless network is not effective at protecting from
identity theft and that the threat is not severe, but for other reasons have decided the properly
securing their wireless network is an appropriate measure to take. That is, they are securing their
wireless network for reasons not captured in this study. The following section discusses the
implications of this finding.
Extended Model The extended model, summarized in Table 5.4, introduces a relationship from perceived
security threat to security self-efficacy and response efficacy.
Table 5.4 – Summarized Identity Theft Protection Findings – Extended Model Security Behavior
H2b PST
H3b SSE
H4b RE
H5b PC
PST SSE
PST RE
Credit Cards Education Links Spyware Wireless Network
- Hypothesis supported - Significant in opposite direction than hypothesized
In the extended model the only differences between it and the initial model is the missing
relationship between perceived security threat (H2b) and properly securing a home wireless
network. This suggests that although people think that properly securing their wireless network
is effective at protecting them from identity theft, they are not doing so. The fact that none of the
97
other relationships are significant suggests that people are not terribly concerned with identity
theft and are not performing those behaviors that they know will protect them. It could also be
this study does now capture what people are doing to protect themselves from identity theft. One
marketing study suggests that the best way to protect from identity theft is to freeze credit reports
through reporting bureaus (Eisenstein 2008). This suggests that people may be taking a broader
view of identity theft than just as it relates to their personal computer and are taking measures to
protect themselves from any form of identity theft. Further investigation in this area is necessary
before making any definitive conclusions, especially considering that perceived security
vulnerability was not included in the model testing.
Although very few of the hypotheses related to behaviors that protect from identity theft
are supported, a fair amount of variance in the performance of different behaviors is explained.
The amount of variance explained ranges from 12.3 percent to 31.9 percent for the initial model
and 9.8 percent to 31.2 percent in the extended model. Properly securing a wireless network had
the greatest amount of variance explained in both models. This is interesting, considering the
relationships that affect properly securing a wireless network are in the opposite direction
hypothesized. This suggests that these findings are robust in explaining why people properly
secure their wireless network. With the hypotheses related to this behavior being supported in
the opposite direction hypothesized, it could be that people are securing the wireless network for
reasons other than to protect from identity theft, but their feelings are strong enough that securing
a wireless network is not effective at protecting them from identity theft that it explains
differences anyway. Such findings suggest that an avenue for future research is to understand
what causes people to properly secure their wireless network. Not surprisingly, using caution
when clicking on links had the lowest variance explained in both models. Using caution when
98
clicking on links also did not have any hypotheses supported. This suggests that this model is
not appropriate to explain differences in this behavior. It could also indicate that people are
knowledgeable enough about this behavior that they are all taking proper measures and thus
there is no variance in behavior.
In summary, this model does not do a very good job of explaining the differences in why
people protect themselves from identity theft. Compared to the other models, this model could
have the least number of supported hypotheses because it deals with something that is social in
nature, while the other two threats deal with more technical related threats. It is possible that
people’s behavior when it comes to social threats are influenced differently than more
technically related threats whose losses are more readily and easily observable. It should be kept
in mind that perceived security vulnerability was not tested in these models and including it
could have influenced the findings. Without having this variable, the findings from this model
should be used cautiously, if at all.
Computer Slow Down
The final model tested investigated behaviors identified to prevent a person’s computer
from slowing down, which includes using anti-virus software, automating Windows updates,
using a software firewall, using pop-up blocking software, updating software on a regular basis,
and using spyware software.
Initial Model Similar to before, the initial model studied direct relationships from perceived security
vulnerability, perceived security threat, security self-efficacy, response efficacy, and prevention
costs to individual security behaviors. Table 5.5 summarizes the findings from the initial model.
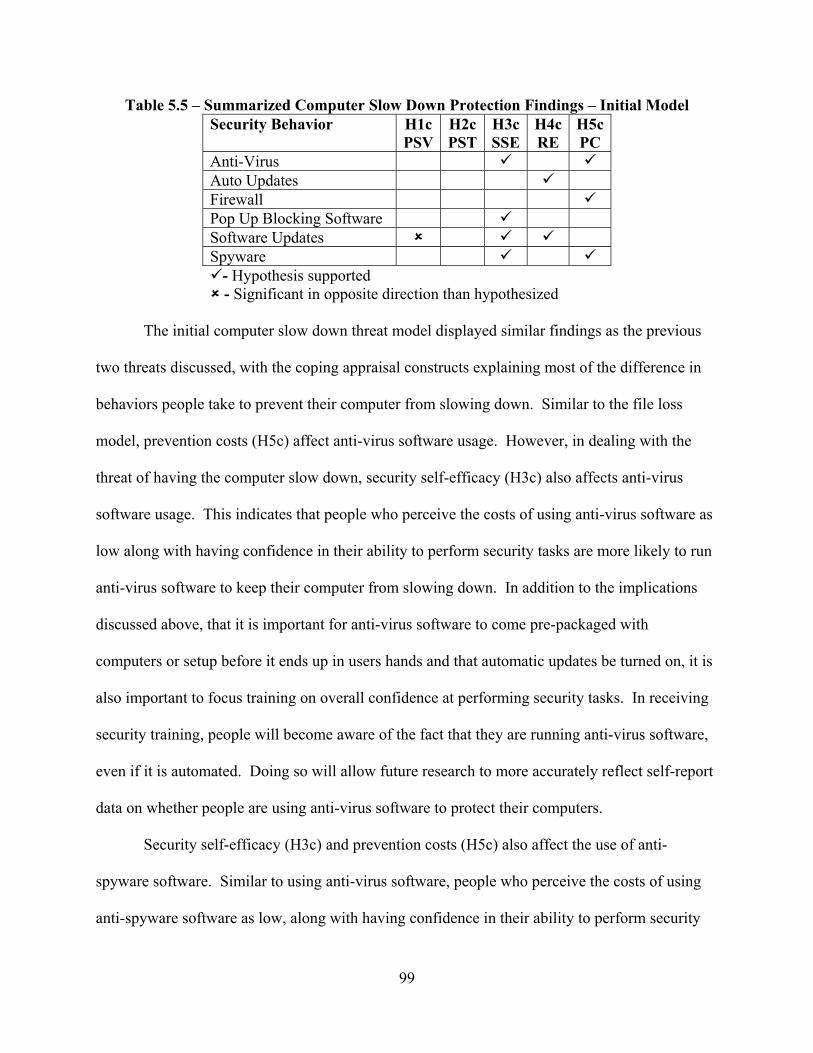
99
Table 5.5 – Summarized Computer Slow Down Protection Findings – Initial Model
The initial computer slow down threat model displayed similar findings as the previous
two threats discussed, with the coping appraisal constructs explaining most of the difference in
behaviors people take to prevent their computer from slowing down. Similar to the file loss
model, prevention costs (H5c) affect anti-virus software usage. However, in dealing with the
threat of having the computer slow down, security self-efficacy (H3c) also affects anti-virus
software usage. This indicates that people who perceive the costs of using anti-virus software as
low along with having confidence in their ability to perform security tasks are more likely to run
anti-virus software to keep their computer from slowing down. In addition to the implications
discussed above, that it is important for anti-virus software to come pre-packaged with
computers or setup before it ends up in users hands and that automatic updates be turned on, it is
also important to focus training on overall confidence at performing security tasks. In receiving
security training, people will become aware of the fact that they are running anti-virus software,
even if it is automated. Doing so will allow future research to more accurately reflect self-report
data on whether people are using anti-virus software to protect their computers.
Security self-efficacy (H3c) and prevention costs (H5c) also affect the use of anti-
spyware software. Similar to using anti-virus software, people who perceive the costs of using
anti-spyware software as low, along with having confidence in their ability to perform security
Security Behavior H1cPSV
H2cPST
H3cSSE
H4cRE
H5c PC
Anti-Virus Auto Updates Firewall Pop Up Blocking Software Software Updates Spyware
- Hypothesis supported - Significant in opposite direction than hypothesized
100
tasks, are more likely to run anti-spyware software to keep their computer from slowing down.
Previous studies find different results in the number of people who use anti-spyware software
with one study finding that less than 30 percent of respondents use anti-spyware software (Kim
2005) and another finding that 77 percent of respondents use anti-spyware software (Furnell et
al. 2007). This difference could be attributed to the time that passed between these two studies.
As spyware has become a bigger threat (Deloitte 2007), more people have become aware of the
need to do something about it. Therefore, continuing to educate people about how to perform
security tasks, including how to use anti-spyware software, will result in significant improvement
in this behavior. In particular, education in this area will increase people’s confidence at
performing security tasks, increase their knowledge about the what anti-spyware software does
as well as how to use it, and decrease their perception of the costs associated with running anti-
spyware software.
Security self-efficacy (H3c), prevention cost (H5c), and perceived security vulnerability
(H1c) affect the running of software updates; with perceived security vulnerability affecting the
running of software updates in a direction opposite than hypothesized. This indicates that people
that feel the most vulnerable to having their computer slow down are less likely to run software
updates. However, people with confidence in their ability to perform security tasks and a belief
that downloading software updates prevents their computer from slowing down are more likely
to do so. These relationships change in the extended model, thus discussion of the implications
of these results occurs in the next section.
Security self-efficacy (H3c) also affects the use of pop-up blocking software to protect
from having computers slow down. This suggests that people who are confident in their ability
to perform security tasks are more likely to use pop-up blocking software. Similar to other
101
behaviors that protect from having computers slow down, training programs designed to improve
confidence when performing security tasks will result in more people using pop-up blocking
software.
Response efficacy (H4c) affects the running of automatic updates for the Windows
operating system. In other words, a person is more likely to run automatic updates if they are
confident that doing so protects them from having their computer slow down. Previous research
found that more than half of respondents did not update their operating system, let alone use
automatic updates (Kim 2005). A more recent study found that 70 percent of respondents ran
automatic updates (Furnell et al. 2006), but a further study found that only 40 percent of
respondents did so regularly (Furnell et al. 2007). The study by Kim (2005) found that of those
that had received security training nearly one-third did not regularly update their operating
system. This suggests that the training provided did not adequately inform people about the
effectiveness that running automatic updates had on preventing the computer from slowing
down. An increase in the frequency of operating system updates should result by informing
people how automatic updates prevents their computer from slowing down during training
programs.
Prevention costs (H5c) affect the use of firewall software. People who perceive the costs
of using firewall software as low are more likely to run anti-virus software to keep their
computer from slowing down. Previous studies found that approximately half of respondents did
not use firewall software (Furnell et al. 2006; Kim 2005), with over 20 percent not aware of the
firewall feature within Windows XP (Furnell et al. 2006). These findings suggest that educating
people about how to configure and setup firewall software on their computer will result in
significant improvements in this behavior. In particular, education in this area will increase
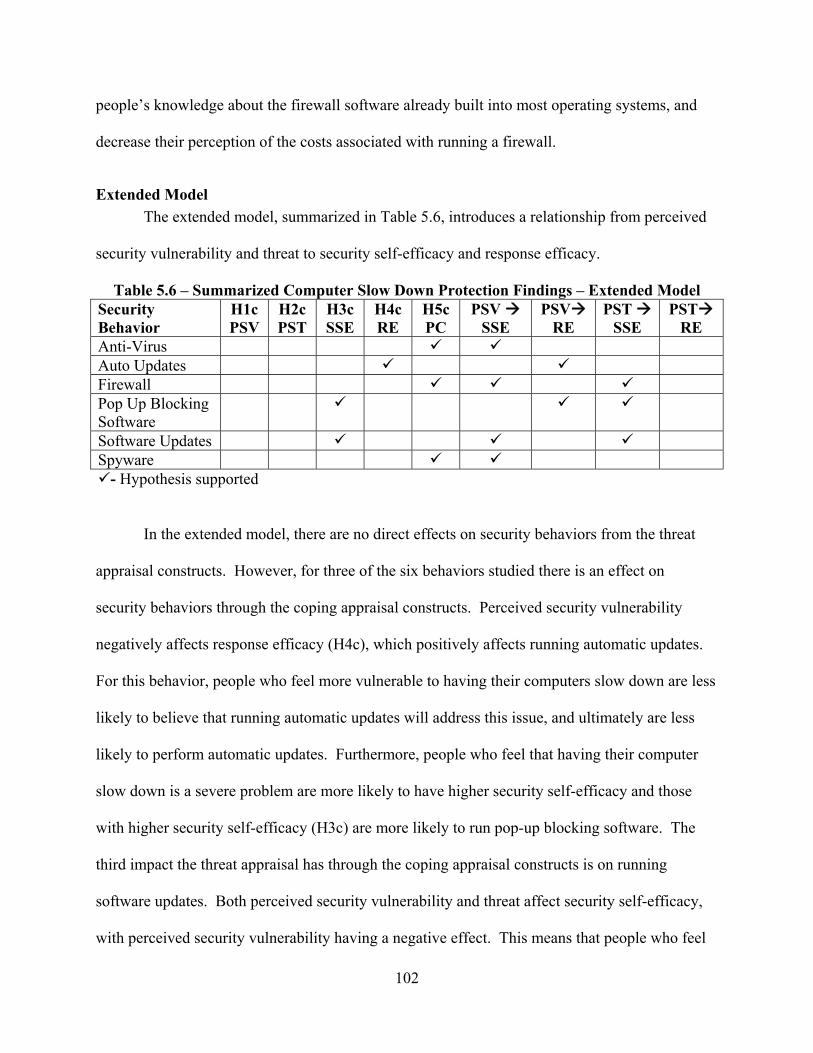
102
people’s knowledge about the firewall software already built into most operating systems, and
decrease their perception of the costs associated with running a firewall.
Extended Model The extended model, summarized in Table 5.6, introduces a relationship from perceived
security vulnerability and threat to security self-efficacy and response efficacy.
Table 5.6 – Summarized Computer Slow Down Protection Findings – Extended Model Security Behavior
H1c PSV
H2c PST
H3c SSE
H4c RE
H5c PC
PSV SSE
PSV RE
PST SSE
PST RE
Anti-Virus Auto Updates Firewall Pop Up Blocking Software
Software Updates Spyware
- Hypothesis supported
In the extended model, there are no direct effects on security behaviors from the threat
appraisal constructs. However, for three of the six behaviors studied there is an effect on
security behaviors through the coping appraisal constructs. Perceived security vulnerability
negatively affects response efficacy (H4c), which positively affects running automatic updates.
For this behavior, people who feel more vulnerable to having their computers slow down are less
likely to believe that running automatic updates will address this issue, and ultimately are less
likely to perform automatic updates. Furthermore, people who feel that having their computer
slow down is a severe problem are more likely to have higher security self-efficacy and those
with higher security self-efficacy (H3c) are more likely to run pop-up blocking software. The
third impact the threat appraisal has through the coping appraisal constructs is on running
software updates. Both perceived security vulnerability and threat affect security self-efficacy,
with perceived security vulnerability having a negative effect. This means that people who feel
103
vulnerable to having their computer slow down have less confidence in their ability to perform
security tasks, while people that feel that their computer slowing down is a severe problem have
more confidence in their ability to perform security tasks. This is interesting as security self-
efficacy (H3c) is the only characteristic that has a significant impact on individual’s updating of
software regularly. These findings inform the development of information security programs
aimed at protecting computers from slowing down. In order to reduce this threat, people need to
be running software updates regularly. Since security self-efficacy directly affects running
software updates, programs that target this characteristic should yield greater results in individual
behavior. These findings suggest that targeting training on increasing people’s threat perception
of their computer slowing down and decreasing how vulnerable they feel to this threat will affect
their confidence in performing security tasks. By adding training that focuses on the perceived
vulnerability and severity of having computers slow down, further impact can be had on security
self-efficacy.
Other relationships exist between the threat appraisal constructs and the coping appraisal
constructs, but not in a way that led directly to behaviors. For example, only prevention costs
(H5c) affect running anti-virus software and spyware software, but perceived security
vulnerability negatively affects security self-efficacy for these behaviors. Similar findings exist
for using a software firewall with perceived security threat negatively affecting security self-
efficacy. Additionally, the impact security self-efficacy (H3c) had on behaviors fell from four
behaviors impacted to two when using the extended model. These findings suggest the
relationship between perceived security threat and security self-efficacy confounded the initial
findings and suggests that security self-efficacy may not influence behaviors related to protecting
computers from slowing down as much as the initial findings indicated. Further studies that
104
investigate antecedents to security self-efficacy should include perceived security vulnerability
so the true relationship between these constructs can be understood.
The models that explain behaviors that protect computers from slowing down have the
most consistently supported hypotheses. However, the majority of the proposed hypotheses were
not supported and the variance explained in the dependent variables was not as high as it was for
the model that explained behaviors that protected people from losing files. In the initial model,
all the behaviors had over 24 percent of their variance explained with using spyware software
and using pop-up blocking software having the most at over 30 percent of the variance
explained. In the extended model none of the behaviors had over 30 percent of their variance
explained with the use of pop-up blocking software dropping to 29.2 percent, spyware software
usage dropping to 27.6 percent and anti-virus software usage dropping to 16.6 percent of
variance explained. This suggests that the initial model does a better job of explaining the
variance in behaviors, but using the extended model may do a better job of explaining the true
nature of the characteristics that influence these security behaviors. The variance explained in
these models suggests that the theory used is parsimonious and caution should be used not to use
overly complicated models as future research tries to further understand differences in individual
security behaviors that protect from having computers slow down.
In summary, consistent with the previous models studied, coping appraisal constructs
affected performing behaviors to protect one’s computer from slowing down more often than
threat appraisal constructs. In this particular model, the threat appraisal regularly interacted with
the coping appraisal to influence security behaviors. Although the hypotheses were more
consistently supported, the overall variance explained by the models was less than the models
dealing with the threat of losing files.
105
Threat Comparisons Each of the three models discussed above dealt with findings related to a different threat.
This section discusses security behaviors as a whole and compares the above-discussed models
to one another. Although each threat used a different sample, analyzing these models as a whole
can provide a number of insights.
Certain independent variables more regularly affect individual security behaviors for all
of the models studied. In particular, security self-efficacy (H3) affected behaviors the most
frequently, followed by response efficacy (H4), prevention cost (H5), perceived security
vulnerability (H1) and perceived security threat respectively (H2). When these last two
constructs did directly influence security behaviors, they were in the opposite direction as
hypothesized. When testing the hypotheses with the extended model, perceived security
vulnerability (H1) only affected two of the behaviors related to not losing files (running software
updates and properly securing wireless networks). Other than that, neither perceived security
vulnerability (H1) nor perceived security threat (H2) influenced behaviors in the extended
models.
The most consistent finding throughout all three threats was that the coping appraisal
process consistently outperformed the threat appraisal process in explaining differences in
individuals’ behaviors. There were differences between models on how the threat appraisal
interacted with the coping appraisal process to explain behaviors. The models that included
behaviors that protect people from identity theft did not show any interaction between the threat
appraisal and the coping appraisal constructs. This could have been due to perceived security
vulnerability not being included in this model, as perceived security vulnerability more
frequently led to differences in security self-efficacy and response efficacy. In the model that
included behaviors that protected people from losing computer files, the interaction between
106
threat appraisal and coping appraisal never led to a direct effect on behaviors. However, when it
comes to protecting computers from slowing down there were three out of six behaviors that did
show the threat appraisal constructs having a significant impact through the coping appraisal
constructs. Perceived security threat only affected security self-efficacy and never response
efficacy.
In summary, no consistent set of characteristics explained the behaviors studied. In
general, there was consistency in the coping appraisal having the greatest impact on behaviors.
The threat appraisal process more consistently affected the coping appraisal process than security
behaviors. When the threat appraisal did influence security behaviors, it was in the opposite
direction hypothesized. The next section discusses the implications of these findings.
Implications and Future Research Investigation of differences in individual security behaviors was conducted by asking
users of personal computers questions regarding their use of computers at home. This approach
was utilized in order to understand how people acted in an environment where they were
responsible for making their own security decisions. This section describes the implications of
the findings presented above, as well as directions for future research.
Impacts on Security Research
The above findings show a lack of consistency in what causes an individual to protect
himself from a given threat with any of a number of responses. These findings have implications
for both academics and practitioners. From an academic perspective, it illustrates that there may
be different models that explain differences in individual security behaviors. However, the
tested model explains a significant amount of the variance in performance for some behaviors,
even with very few of the hypotheses supported. As researchers begin to investigate what
107
causes people to perform certain security behaviors, it is important that they concentrate on a
certain behavior that addresses a certain threat and use the findings in this study as a foundation
for what characteristics to include in their research model.
One of the most consistent findings was the positive impact that security self-efficacy has
on individual security behaviors. Computer self-efficacy is a regularly studied construct within
the information systems field (Marakas et al. 2007) and these findings confirm the influence that
this characteristic has on individual security behaviors. As research in the realm of information
security moves forward, one avenue of research should be to explore what individual
characteristics explain differences in people’s security self-efficacy. To begin with, researchers
could look at antecedents to computer self-efficacy found in previous research to determine if
they apply within an information security setting. Researchers could then develop and test
further theoretical explanations for what determines differences in security self-efficacy.
There was little direct impact found on individual security behaviors from the threat
appraisal constructs. Namely, perceived security vulnerability and perceived security threat
rarely influenced individual security behaviors directly. When they did, the relationships were in
the opposite direction hypothesized, meaning people who thought that they were vulnerable to a
given threat, or that a given threat was severe, were less likely to perform a behavior to protect
them from that threat. This is a very important finding for security researchers as it indicates that
when people recognize they are vulnerable to a given threat, or that it is severe, they are less
likely to be doing something about it. These findings are contrary to findings in the social
psychology literature where increases in the threat appraisal process led to a greater likelihood to
perform a recommended behavior (Floyd et al. 2000; Neuwirth et al. 2000). It is possible that
this occurred due to the influence that perceived security vulnerability and threat had on the
108
coping appraisal process, suggesting that the threat appraisal constructs are antecedents to the
coping appraisal constructs and not directly related to the performance of security behaviors.
Future research could explore this further, either experimentally or through a qualitative study.
Experimentally, researchers could set up a study that manipulates the threat appraisal constructs
and test the impact that changes have on the coping appraisal constructs compared to the
individual security behaviors. Qualitatively, researchers could interview computer users to ferret
out the reasons why people who feel vulnerable to a given threat are not performing the
necessary behaviors to protect from it. If people are not performing the behaviors because they
do not feel like they can perform the task or that the behavior will address the threat, it will
confirm the findings in this study. It may also be that people who are less knowledgeable about
a threat perceive the threat to be higher, but are less likely to act on to protect themselves. As
further understandings of people’s behavior are uncovered qualitatively, follow up studies can be
conducted to empirically test the newly uncovered relationships between individual
characteristics and behaviors.
This study only investigated three threats necessitating protection by performing
individual security behaviors. Future research needs to explore the relationships between
additional threats and behaviors not investigated in this study, which will provide further insight
into why people are performing other security behaviors and from what threat they are seeking
protection. One example in particular is using anti-spyware software, which also protects from
having one’s actions monitored. Different individual characteristics than found in this study may
explain differences in the use of anti-spyware software when looking at the threat of direct
invasion of one’s privacy.
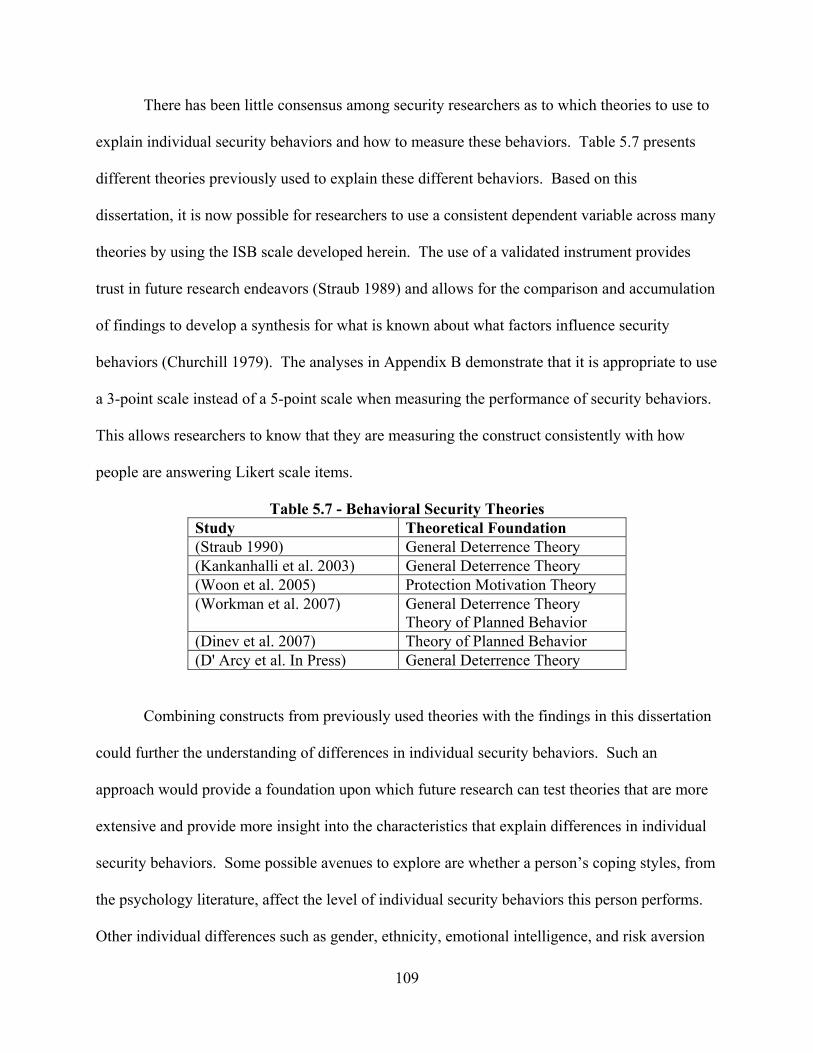
109
There has been little consensus among security researchers as to which theories to use to
explain individual security behaviors and how to measure these behaviors. Table 5.7 presents
different theories previously used to explain these different behaviors. Based on this
dissertation, it is now possible for researchers to use a consistent dependent variable across many
theories by using the ISB scale developed herein. The use of a validated instrument provides
trust in future research endeavors (Straub 1989) and allows for the comparison and accumulation
of findings to develop a synthesis for what is known about what factors influence security
behaviors (Churchill 1979). The analyses in Appendix B demonstrate that it is appropriate to use
a 3-point scale instead of a 5-point scale when measuring the performance of security behaviors.
This allows researchers to know that they are measuring the construct consistently with how
people are answering Likert scale items.
Table 5.7 - Behavioral Security Theories Study Theoretical Foundation (Straub 1990) General Deterrence Theory (Kankanhalli et al. 2003) General Deterrence Theory (Woon et al. 2005) Protection Motivation Theory (Workman et al. 2007) General Deterrence Theory
Theory of Planned Behavior (Dinev et al. 2007) Theory of Planned Behavior (D' Arcy et al. In Press) General Deterrence Theory
Combining constructs from previously used theories with the findings in this dissertation
could further the understanding of differences in individual security behaviors. Such an
approach would provide a foundation upon which future research can test theories that are more
extensive and provide more insight into the characteristics that explain differences in individual
security behaviors. Some possible avenues to explore are whether a person’s coping styles, from
the psychology literature, affect the level of individual security behaviors this person performs.
Other individual differences such as gender, ethnicity, emotional intelligence, and risk aversion
110
could be influencing the perceptions of security threats and the resulting behaviors. Another
interesting concept to explore would be the potential feedback loop that might exist between
individual security behaviors and individual differences. For example, the results of poor
security behaviors might have dire consequences (such as loss of crucial data) that will affect a
person’s coping reactions, leading to different individual security behaviors in the future.
Another use of the ISB instrument is in providing evidence of the effectiveness of
security training and awareness programs often used to increase individuals’ performance of
security tasks (Crossler et al. 2006; Deloitte 2007; Richardson 2007; Schultz 2004). Utilizing a
validated instrument to measure changes in security behaviors before and after training in an
experimental setting would provide trust in the effectiveness of different training and awareness
programs. Some training programs may be effective on certain aspects of individual security
behaviors while other training programs may be effective on other behaviors. For example,
setting up a secured wireless network is a onetime process and then the network will remain
secure, while using a strong password and changing it regularly requires constant efforts by
individuals. Research might show that these two aspects of individual security behaviors require
different types of training to improve individuals’ behaviors at those tasks.
Impacts for Security Practitioners
For security practitioners, these findings provide insight that can help address security
training and awareness programs. Given the multiple threats and behaviors presented in this
study, practitioners can tailor training and awareness programs to address factors shown to have
a direct impact on the behavior of interest. For example, if training and awareness programs
were designed to address getting people to run software updates then it would be important to
address the prevention costs that people perceive as preventing them from running these updates.
111
This may include showing people ways to automate the process to cut down on the time involved
in performing this task or the increased knowledge provided through training may cut down on
the cognitive costs people perceive that it takes to run software updates. This training approach
would be effective whether it was addressing the threat of computers slowing down or file loss.
However, when dealing with increasing individuals’ usage of spyware software the threat that
one is concerned with being protected from makes a difference on which individual
characteristic should be addressed. When addressing the concern of identity theft it is important
to tailor programs towards an individual’s confidence using security protection tools. In
addressing the threat of having computers slow down, it is more important to address the
perception of prevention costs, as prevention cost is the singular characteristic that influences
usage of spyware software to prevent computers from slowing down.
This study also provides an instrument to measure individual security behaviors. This
instrument provides security practitioners with a tool to assess the effectiveness of their
employees at performing these behaviors. By analyzing the data collected with the ISB
instrument, managers will be able to determine the areas that their employees are succeeding at
and those that need improvement. By administering this instrument on a regular basis, they will
also be able to determine whether improvements in security behavior occur over time. For
example, information security departments could perform a random sampling of individuals’
security performance. Then they could assess the areas that need improvement and develop
ways to provide additional training in these areas or implement technological solutions that
would force people to perform appropriate security behaviors. The instrument could then be
randomly administered a second time to determine whether changes in performance have been
found.
112
Chapter Six: Conclusion
This dissertation investigated the behaviors of individuals that influence the security
decisions they make. Specifically, this research used Protection Motivation Theory (PMT) as a
theoretical underpinning to explore the effect perceived security vulnerability, perceived security
threat, security self-efficacy, response efficacy, and prevention costs have on individual security
behaviors. The findings indicate that no consistent characteristic explains differences in all the
security behaviors an individual performs. However, the information security community gains
insights from this study about what affects each behavior individually.
Contributions This research makes significant contributions, beyond those discussed in Chapter Five, to
information security researchers and information security professionals. The research question
investigated in this dissertation is of interest to social researchers who want to understand human
behavior related to information security. In addition, it is of interest to information security
professionals who are concerned with the everyday issue of keeping their systems secure.
Investigating what determines differences in individual security behaviors with home computer
users removes the impact of rules and policies from a corporation, leaving a true picture of a
person’s intent for performing security behaviors.
For information security researchers, this study shows how the developed security
research model explains a plethora of individual security behaviors, which begins to fill the gap
in information security research at the individual level. Although the model used in this research
was not entirely supported, a number of insights were provided to the determinants of the
different behaviors studied. Future research can use these findings as a starting point for what
affects a given behavior and expand on that to further understand what causes differences in that
113
particular phenomenon. The model used should not be taken as the end all theory of individual
security behaviors, but should be combined with other theories, such as the Theory of Planned
Behavior, General Deterrence Theory, and Perceived Behavioral Control to continue to further
understand the differences in these behaviors. The model used in this study could be used in any
area where the performance of a behavior or use of a technology is necessary to protect from a
threat. A few examples of these areas are information privacy, physical security protection, and
home security. Further enabling the expansion of research into individual security behaviors is
the development of an instrument to measure individual security behaviors. Providing this as a
consistent dependent variable allows researchers to build upon one another’s work while
exploring the same underlying behavior, ultimately resulting in a broader understanding of what
determines individual security behaviors.
For information security professionals this research provides insight into what causes
different security behaviors. Information security professionals are concerned with protecting
the corporation’s information and assets from threats. The human factor is believed to be the
“weakest link” in securing a computer system (Deloitte 2007). The insight provided in this study
gives information security professionals the ability to tailor training and awareness programs to
address the underlying reasons why people do not perform security tasks. For example, security
self-efficacy emerged as the most frequent determinant of individual security behaviors.
However, focusing training and awareness strictly at improving security self-efficacy will not
result in changes for all the behaviors necessary to protect from security threats. One behavior in
particular where training would need to focus on something other than security self-efficacy is
the use of firewall software. The only determinant to firewall software usage was prevention
114
costs. Therefore, training to improve firewall software usage needs to focus on lowering the
perceived cost of using this software.
Information security professionals can also utilize the findings in this research to improve
their assessment of their security awareness and training programs. This is necessary as 32
percent of companies do not assess the effectiveness of their security awareness and training
programs (Richardson 2008). The ISB instrument developed in this research provides security
professionals a tool to assess the effectiveness of their training and awareness programs.
Utilizing this measurement instrument before and after training programs will quantitatively
demonstrate how effective the training was.
Limitations When conducting research on a social phenomenon, such as individual security
behaviors, decisions have to be made that cause limitations on the study. This study used a
combination of previously validated instruments and extensively designed and validated new
instruments based on insights from security experts. The instruments were pre-tested, pilot
tested, and subjected to reliability and validity measures. Statistical analyses on the data led to
the elimination of outliers and incomplete responses. However, there still exist limitations to this
study that are discussed in this section.
Perceived Security Vulnerability
This research included perceived security vulnerability as one of its theoretical
constructs. For two of the three models studied, this construct displayed acceptable levels of
reliability. However, the perceived security vulnerability of identity theft construct failed to
display acceptable reliability. This construct did display acceptable reliability during the pilot
test, so it was surprising that the full-scale survey did not display acceptable reliability. Further
115
investigation is needed to ensure that the items used to measure the perceived security
vulnerability of identity theft construct measure the underlying concept in a way consistent with
how people are responding to it. This model could then be retested to see what difference having
a reliable perceived security vulnerability measure makes.
Sample Demographics
This study measured a number of demographics about the respondents, including gender,
ethnicity, education, income, age, years using a computer, and hours of computer and Internet
usage per week. Data was collected from a convenience sample, leading to some of the
demographics being not representative of the population studied. In particular, ethnicity and
education were not representative of the population at large. The sample used in this study was
mostly Caucasian (85.6%) and over 90% of the population held at least an undergraduate degree.
This suggests that these findings apply to educated Caucasians and caution should be used when
trying to apply these findings to other groups of people. Future research should utilize a
stratified random sample consisting of people with different ethnic and educational backgrounds.
Social Desirability Bias
One of the limitations inherent with self-reported data is social desirability bias or the
tendency for respondents to complete surveys in a way that makes themselves look good to
others (Whitley 2002). Additionally, researchers in security have found that it is difficult to get
good response rates from research that is as sensitive as security behaviors (Kotulic et al. 2004).
In order to address these concerns, it is recommended that respondents are assured that their
results are anonymous and to use a web-based data collection effort (Whitley 2002). Following
these recommendations, the majority of data was collected utilizing online survey instruments.
The results presented in this study are from those that chose to respond to the collection
116
mechanisms used. There is likely a certain characteristic about those who chose not to respond
that is lost using this approach. It is possible that those who are overly concerned about
information security did not respond to the survey as they are predisposed not to share that
information. Therefore, these findings are likely not representative of those that are overly
security conscious.
One limitation of using online-based data collection efforts is the likelihood that those
people who are not Internet savvy may not have completed this survey at all. Future research
could try to collect data using both paper-based approaches and Internet based approaches to see
if there is a significant difference in the types of people who responded. This study did collect
some paper-based data but the number of people who responded using paper surveys was not
large enough to make significant claims about these differences.
Common Method Bias
Common Method Bias is a primary cause of measurement error that arises when
researchers use the same method, such as surveys, to measure correlation between variables
(Podsakoff et al. 2003). This bias is one of most frequently cited concerns with information
systems research (Malhotra et al. 2006; Straub et al. 2004). Common Method Bias can be
minimized by assuring respondents that their responses will be anonymous, that there is no
correct or incorrect answer, and that the questions should be answered as honestly as possible
(Dinev et al. 2006; Podsakoff et al. 2003). I followed these guidelines, assuring respondents that
their response would be anonymous, that there was no correct answer, and that they should
respond honestly. After data collection, I tested for the effects of Common Methods Bias using
Harman’s single factor test (Harman 1967), which is the most widely used method of testing for
Common Method Bias in a single-method research study (Malhotra et al. 2006). The premise of
117
this test is that if one factor explains the majority of the variance than there is strong evidence
that Common Method Bias is present. A Harman’s single factor test was run for the data used in
each of the three threat models in this study by running an exploratory factor analysis and
examining the unrotated factor solution to determine the number of factors necessary to account
for the variance in the data. The results show that the data for the file loss threat model loaded
on 14 factors accounting for 79% of variance explained, the data for the identity theft threat
model loaded on nine factors accounting for 70% of variance explained, the data for the
computer slow down threat model loaded on 11 factors accounting for 80% of variance
explained. These results lead me to the conclusion that Common Method Bias did not overly
affect responses in this study.
Concluding Comments In conclusion, this research developed and tested the use of a newly developed security
research model, guided by Protection Motivation Theory, as an empirical way to explain the
differences in individual security behaviors. Although this theoretical model did not consistently
explain the differences in the number of behaviors studied, it did provide insight into what causes
these differences. The findings in this dissertation also illustrate the importance of knowing the
threats faced along with the possible behaviors to protect from these threats. Implications of
these findings were discussed along with avenues for future research.
The study of differences in individual security behaviors is becoming an active area of
exploration for information security researchers. The findings of this research provide a
platform, upon which many avenues of research can be explored. This includes the study of a
number of different behaviors, suggestions for different research methodologies, and a tool to
measure individual security behaviors. Future research in information security will be more
118
fruitful if researchers begin building upon one another’s work and allow for cumulative
knowledge gain, rather than continue to explore this phenomenon in an inconsistent manner. A
few ideas that emerged from this study that would be particularly telling areas of future research
are expanding on the use of security self-efficacy in explaining individual security behaviors,
experimentally testing how well training and awareness programs increase individual security
behaviors, and using qualitative research to uncover further individual characteristics that lead to
security behavior choices.
119
References Abie, H., Spilling, P., and Foyn, B. "A distributed digital rights management model for secure
information-distribution systems," International Journal of Information Security (3:2)
2004, p 113.
Abu-Musa, A.A. "Perceived Security Threats of Computerized Accounting Information Systems
in the Egyptian Banking Industry," Journal of Information Systems (20:1) 2006, p 187.
Al-Ayed, A., Furnell, S.M., Zhao, D., and Dowland, P.S. "An automated framework for
managing security vulnerabilities," Information Management & Computer Security
(13:2/3) 2005, p 156.
Anderson, K. "Convergence: A holistic approach to risk management," Network Security
(2007:4) 2007, p 4.
Backes, M., Pfitzmann, B., and Waidner, M. "Reactively secure signature schemes,"
International Journal of Information Security (4:4) 2005, p 242.
Backhouse, J., Hsu, C.W., and Silva, L. "Circuits of power in creating de jure standards: shaping
an international information systems security standard," MIS Quarterly (30) 2006, pp
413-438.
Baldwin, A., and Shiu, S. "Enabling shared audit data," International Journal of Information
Security (4:4) 2005, p 263.
Bandura, A. "Self-efficacy: Toward a Unifying Theory of Behavioral Change," Psychological
Review (84:2), February 1977 1977, pp 191-215.
Bandura, A. "Guide for constructing self-efficacy scales," in: Self-efficacy Beliefs of Adolescents,
2001, pp. 7-37.
120
Baskerville, R. "Risk analysis: an interpretive feasibility tool in justifying information systems
security," European Journal of Information Systems (1:2) 1991, pp 121-130.
Beck, K.H. "The effects of risk probability, outcome severity, efficacy of protection and access
to protection on decision making: A further test of protection motivation theory," Social
Behavior and Personality (12:2) 1984, pp 121-125.
Belsis, P., Kokolakis, S., and Kiountouzis, E. "Information systems security from a knowledge
management perspective," Information Management & Computer Security (13:2/3) 2005,
p 189.
Bernard, R. "Information Lifecycle Security Risk Assessment: A tool for closing security gaps,"
Computers & Security (26:1) 2007, p 26.
Blumstein, A. "Introduction," in: Deterrence and Incapacitation: Estimating the Effects of
Criminal Sanctions on Crime Rates, A. Blumstein, J. Cohen and D. Nagin (eds.),
National Academy of Sciences, 1978.
Bolt, M.A., Killough, L.N., and Koh, H.C. "Testing the interaction effects of task complexity in
computer training using the social cognitive model," Decision Sciences (32:1) 2001, pp
1-20.
Boncella, R.J. "Web Security for e-Commerce," Communications of the Association for
Information Systems (4) 2000.
Boncella, R.J. "Wireless Security: An Overview," Communications of the Association for
Information Systems (9) 2002, pp 269-282.
Burkhardt, M.E., and Brass, D.J. "Changing Patterns Of Patterns Of Change: The Effects Of A
C," Administrative Science Quarterly (35:1) 1990, p 104.
121
Byrne, P. "Application firewalls in a defence-in-depth design," Network Security (2006:9) 2006,
p 9.
Cannoy, S., Palvia, P.C., and Schilhavy, R. "A Research Framework for Information Systems
Security," Journal of Information Privacy & Security (2:2) 2006, p 3.
Carlson, R.D., and Grabowski, B.L. "The Effects of Computer Self-Efficacy on Direction-
Following Behavior in Computer Assisted Instruction," Journal of Computer-Based
Instruction) 1992.
Carter, L. "Political Participation in a Digital Age: An Integrated Perspective on the Impacts of
the Internet on Voter Turnout," in: Accounting and Information Systems Department,
Virginia Tech, Blacksburg, VA, 2006.
Cavusoglu, H., Cavusoglu, H., and Raghunathan, S. "Economics of IT Security Management:
Four Improvements to Current Security Practices," Communications of the Association
for Information Systems (14) 2004, p 1.
Cavusoglu, H., Mishra, B., and Raghunathan, S. "The Value of Intrusion Detection Systems in
Information Technology Security Architecture," Information Systems Research (16:1)
2005, pp 28-46.
Chandra, A., and Calderon, T. "Challenges and constraints to the diffusion of biometrics in
information systems," Association for Computing Machinery. Communications of the
ACM (48:12) 2005, p 101.
Chin, W. "Partial least squares for IS researchers: an overview and presentation of recent
advances using the PLS approach," International Conference on Information Systems,
AIS, Brisbane, Australia, 2000.
122
Chin, W.W. "The partial least squares approach to structural equation modeling," in: Modern
Methods for Business Research, G.A. Marcoulides (ed.), Lawrence Erlbaum, Mahway,
New Jersey, 1998, pp. 295-336.
Choobineh, J., Dhillon, G., Grimaila, M.R., and Rees, J. "Management of Information Security:
Challenges and Research Directions," Communications of the Association for
Information Systems (20) 2007, pp 958-971.
Chung, S.H., Schwager, P.H., and Turner, D.E. "An empirical of students' computer self-
efficacy: Differences among four academic disciplines at a large university," The Journal
of Computer Information Systems (42:4) 2002, p 1.
Churchill, G.A. "A paradigm for developing better measures of marketing constructs," Journal of
Marketing Research (16:1) 1979, pp 64-73.
Clarke, N.L., and Mekala, A.R. "The application of signature recognition to transparent
handwriting verification for mobile devices," Information Management & Computer
Security (15:3) 2007, p 214.
Cohen, F. "Computer viruses : Theory and experiments," Computers & Security (6:1) 1987, pp
22-35.
Cohen, J. Statistical Power Analysis for the Behavioral Sciences Academic Press, NY, 1969.
Cohen, J. "A Power Primer," Psychological Bulletin (112:1) 1992, p 155.
Compeau, D., Higgins, C.A., and Huff, S. "Social cognitive theory and individual reactions to
computing technology: A longitudinal study," MIS Quarterly (23:2) 1999, p 145.
Compeau, D.R., and Higgins, C.A. "Application of social cognitive theory to training for
computer skills," Information Systems Research (6:2) 1995a, pp 118-143.
123
Compeau, D.R., and Higgins, C.A. "Computer self-efficacy: Development of a measure and
initial test," MIS Quarterly (19:2) 1995b, p 189.
Conchar, M.P., Zinkhan, G.M., Peters, C., and Olavarrieta, S. "An Integrated Framework for the
Conceptualization of Consumers' Perceived-Risk Processing," Journal of the Academy of
Marketing Science (32:4) 2004, p 418.
Crossler, R.E., Belanger, F., and Fan, W. "Determinants of Information Security End User
Behavior," in: 2006 Annualy Internation Workshop (WISA 2006) of the AIS Special
Interest Group on Netowrk and Internet Security (SIG-SEC), Milwaukee, WI, 2006.
D' Arcy, J., Hovav, A., and Galletta, D. "USER AWARENESS OF SECURITY
COUNTERMEASURES AND ITS IMPACT ON INFORMATION SYSTEMS
MISUSE: A DETERRENCE APPROACH," Information Systems Research) In Press.
Dantu, R., Oosterwijk, H., Kolan, P., and Husna, H. "Securing medical networks," Network
Security (2007:6) 2007, p 13.
Delcourt, M.A.B., and Kinzie, M.B. "Computer Technologies in Teacher Education: The
Measurement of Attitudes and Self-Efficacy," Journal of Research and Development in
Education (27:1) 1993, pp 35-41.
Deloitte "2005 Global Security Study," 2005.
Deloitte "2006 Global Security Study: A global perspective on security for life sciences," 2006.
Deloitte "2007 Global Security Survey: The Shifting Security Paradigm," 2007.
Dhillon, G., and Backhouse, J. "Information System Security Management in the New
Millenium," Communications of the ACM (43:7), July 2000 2000, p 4.
Dhillon, G., and Backhouse, J. "Current Directions in IS Security Research: Towards Socio-
Organizational Perspectives," Information Systems Journal (11:2) 2001, pp 127-153.
124
Dhillon, G., and Torkzadeh, G. "Value-focused assessment of information system security in
organizations," Information Systems Journal (16:3) 2006, p 293.
Dinev, T., and Hart, P. "An Extended Privacy Calculus Model for E-Commerce Transactions,"
Information Systems Research (17:1) 2006, p 61.
Dinev, T., and Hu, Q. "The Centrality of Awareness in the Formation of User Behavioral
Intention toward Protective Information Technologies *," Journal of the Association for
Information Systems (8:7) 2007, p 386.
Ding, J., Schmidt, D., and Yin, Z. "Cryptanalysis of the new TTS scheme in CHES 2004,"
International Journal of Information Security (5:4) 2006, p 231.
Doherty, N.F., and Fulford, H. "Aligning the information security policy with the strategic
information systems plan," Computers & Security (25:1) 2006, p 55.
Dowling, G.R., and Staelin, R. "A Model of Perceived Risk and Intended Risk-Handling
Activity," The Journal of Consumer Research (21:1) 1994, pp 119-134.
Eigeles, D. "Intelligent authentication, authorization, and administration (I3A)," Information
Management & Computer Security (13:5) 2005, p 419.
Eisenstein, E.M. "Identity theft: An exploratory study with implications for marketers," Journal
of Business Research (61) 2008, p 1160.
Essmayr, W., Probst, S., and Weippl, E. "Role-Based Access Controls: Status, Dissemination,
and Prospects for Generic Security Mechanisms," Electronic Commerce Research (4:1-2)
2004, p 127.
Ezingeard, J.-N., McFadzean, E., and Birchall, D. "A MODEL OF INFORMATION
ASSURANCE BENEFITS," Information Systems Management (22:2) 2005, p 20.
125
Fagan, M.H., Neill, S., and Wooldridge, B.R. "AN EMPIRICAL INVESTIGATION INTO THE
RELATIONSHIP BETWEEN COMPUTER SELF-EFFICACY, ANXIETY,
EXPERIENCE, SUPPORT AND USAGE," The Journal of Computer Information
Systems (44:2) 2003, p 95.
Farahmand, F., Navathe, S.B., Sharp, G.P., and Enslow, P.H. "A Management Perspective on
Risk of Security Threats to Information Systems," Information Technology and
Management (6:2-3) 2005, p 203.
Fenech, T. "Using perceived ease of use and perceived usefulness to predict acceptance of the
World Wide Web," Computer Networks and ISDN Systems (30:1-7) 1998, pp 629-630.
Floyd, D.L., Prentice-Dunn, S., and Rogers, R.W. "A meta-analysis of research on protection
motivation theory," Journal of Applied Social Psychology (30:2) 2000, pp 407-429.
Foltz, C.B. "Cyberterrorism, computer crime, and reality," Information Management &
Computer Security (12:2/3) 2004, p 154.
Fornell, C., and Larcker, D. "Evaluating Structural Equation Models with Unobservable
Variables and Measurement Error," Journal of Marketing Research) 1981, pp 39-50.
Furnell, S.M., Bryant, P., and Phippen, A.D. "Assessing the security perceptions of personal
Internet users," Computers & Security (26:5) 2007, p 410.
Furnell, S.M., Jusoh, A., and Katsabas, D. "The challenges of understanding and using security:
A survey of end-users," Computers & Security (25:1) 2006, p 27.
Furnell, S.M., Papadopoulos, I., and Dowland, P. "A long-term trial of alternative user
authentication technologies," Information Management & Computer Security (12:2/3)
2004, p 178.
126
Gal-Or, E., and Ghose, A. "The Economic Incentives for Sharing Security Information,"
Information Systems Research (16:2) 2005, p 186.
Galindo, D., Martín, S., Morillo, P., and Villar, J.L. "Fujisaki-Okamoto hybrid encryption
revisited," International Journal of Information Security (4:4) 2005, p 228.
Garfinkel, R., Gopal, R., and Thompson, S. "Releasing Individually Identifiable Microdata with
Privacy Protection Against Stochastic Threat: An Application to Health Information,"
Information Systems Research (18:1) 2007, p 23.
Ghorab, K.E. "The impact of technology acceptance consideration on system usage, and adopted
level of technological sophistication: An empirical investigation," International Journal
of Information Management (17:4) 1997, p 249.
Gist, M.E., Schwoerer, C., and Rosen, B. "Effects of alternative training methods on self-
efficacy and performance in computer software training," Journal of Applied Psychology
(74:6) 1989, pp 884-891.
Goodhue, D.L., and Straub, D.W. "Security Concerns of System Users: A Study of Perceptions
of the Adequacy of Security," Information & Management (20:1) 1991, p 13.
Gopal, R.D., and Sanders, G.L. "Preventive and deterrent controls for software piracy," Journal
of Management Information Systems (13:4) 1997, p 29.
Gürgens, S., Rudolph, C., and Vogt, H. "On the security of fair non-repudiation protocols,"
International Journal of Information Security (4:4) 2005, p 253.
Hallam-Baker, P. "Prevention strategies for the next wave of cyber crime," Network Security
(2005:10) 2005, p 12.
Hambleton, R.K. Item response theory: Principles and applications. Kluwer–Nijhoff, Boston,
1985.
127
Hambleton, R.K., Swaminathan, H., and Rogers, H.J. Fundamentals of Item Response Theory
Sage Publications, 1991.
Harman, H. "Modern Factor Analysis, Revised," University of Chicago Press, Chicago. MR (37)
1967, p 4909.
Harrington, S.J. "The effect of codes of ethics and personal denial of responsibility on computer
abuse judgments and intentions," MIS Quarterly (20:3) 1996, p 257.
Hays, R.D., Morales, L.S., and Reise, S.P. "Item response theory and health outcomes
measurement in the 21st century," Med Care (38:9) 2000, pp 28–42.
Highland, H.J. "Ready for spamming?," Computers & Security (15:1) 1996, p 4.
Highland, H.J. "Virus scanners for multiple OSes," Computers & Security (16:3) 1997, p 182.
Hoffman, L.J., Lawson-Jenkins, K., and Blum, J. "Trust beyond security," Association for
Computing Machinery. Communications of the ACM (49:7) 2006, p 94.
Hsieh, M.-S., and Tseng, D.-C. "Perceptual Digital Watermarking for Image Authentication in
Electronic Commerce," Electronic Commerce Research (4:1-2) 2004, p 157.
Issac, B., and Mohammed, L.A. "War Driving and WLAN Security Issues-Attacks, Security
Design and Remedies," Information Systems Management (24:4) 2007, p 289.
Itakura, Y., and Tsujii, S. "Proposal on a multifactor biometric authentication method based on
cryptosystem keys containing biometric signatures," International Journal of Information
Security (4:4) 2005, p 288.
Jarvenpaa, S.L., Tractinsky, N., and Vitale, M. "Consumer trust in an Internet store," Information
Technology and Management (1:1-2) 2000, p 45.
128
Jarvis, C.B., Mackenzie, S.B., and Podsakoff, P.M. "A critical review of construct indicators and
measurement model misspecification in marketing and consumer research," Journal of
Consumer Research (30:2) 2003, pp 199-218.
Jarvis, N. "E-commerce and encryption: Barriers to growth," Computers & Security (18:5) 1999,
p 429.
Jennex, M.E., and Zyngier, S. "Security as a contributor to knowledge management success,"
Information Systems Frontiers (9:5) 2007, p 493.
Jia, J., Dyer, J.S., and Butler, J.C. "Measure of perceived risk," Management Science (45:4)
1999, p 519.
Johnson, R.D., and Marakas, G.M. "Research Report: The Role of Behavioral Modeling in
Computer Skills Acquisition: Toward Refinementof the Model," Information Systems
Research (11:4) 2000, p 403.
Johnston, J., Eloff, J.H.P., and Labuschagne, L. "Security and human computer interfaces,"
Computers & Security (22:8) 2003, p 675.
Kankanhalli, A., Teo, H.-H., Tan, B.C.Y., and Wei, K.-K. "An integrative study of information
systems security effectiveness," International Journal of Information Management (23:2)
2003, p 139.
Karabacak, B., and Sogukpinar, I. "ISRAM: information security risk analysis method,"
Computers & Security (24:2) 2005, p 147.
Karyda, M., Mitrou, E., and Quirchmayr, G. "A framework for outsourcing IS/IT security
services," Information Management & Computer Security (14:5) 2006, p 402.
Kearns, D. "Is your Active Directory properly provisioned for network access control?," in:
Network World, 2006.
129
Keil, M., Tan, B.C.Y., Wei, K.-K., Saarinen, T., Tuunainen, V., and Wassenaar, A. "A cross-
cultural study on escalation of commitment behavior in software projects," MIS
Quarterly (24:2) 2000, p 299.
Kim, E.B. "Information Security Awareness Status of Full Time Employees," The Business
Review, Cambridge (3:2) 2005, p 219.
Kleist, V.F. "Building Technologically Based Online Trust: Can the Biometrics Industry Deliver
the Online Trust Silver Bullet?," Information Systems Management (24:4) 2007, p 319.
Koskosas, I.V., and Paul, R.J. "A socio-organizational approach to information systems security
risks," International Journal of Risk Assessment and Management (4:2,3) 2003, p 232.
Kotadia, M. "Microsoft security guru: Jot down your passwords," in: CNET News, 2005.
Kotulic, A.G., and Clark, J.G. "Why there aren't more information security research studies,"
Information & Management (41:5) 2004, p 597.
Lacy, S., and Greene, J. "McAfee and Symantec Confront Microsoft," in: Business Week Online,
2006.
Lam, J.C.Y., and Lee, M.K.O. "Digital Inclusiveness - Longitudinal Study of Internet Adoption
by Older Adults," Journal of Management Information Systems (22:4) 2006, p 177.
Lee, J., and Rao, H.R. "Perceived risks, counter-beliefs, and intentions to use anti-/counter-
terrorism websites: An exploratory study of government-citizens online interactions in a
turbulent environment*," Decision Support Systems (43:4) 2007a, p 1431.
Lee, J., Shambhu, J.U., Rao, H.R., and Sharman, R. "Secure knowledge management and the
semantic web," Association for Computing Machinery. Communications of the ACM
(48:12) 2005, p 48.
130
Lee, S., and Park, S. "IMPROVING ACCESSIBILITY AND SECURITY FOR MOBILE
PHONE SHOPPING," The Journal of Computer Information Systems (46:3) 2006, p 124.
Lee, S.M., Lee, S.-G., and Yoo, S. "An integrative model of computer abuse based on social
control and general deterrence theories," Information & Management (41:6) 2004, p 707.
Lee, W., Fan, W., Miller, M., Stolfo, S.J., and Zadok, E. "Toward cost-sensitive modeling for
intrusion detection and response," Intrusion Detection (10) 2002, pp 5-22.
Lee, Y., Kozar, K.A., and Larsen, K.R.T. "The Technology Acceptance Model: Past, Present,
and Future," Communications of the Association for Information Systems (12) 2003, pp
752-780.
Lee, Y., Lee, J.-Y., and Liu, Y. "Protection Motivation Theory in Information System Adoption:
A Case of Anti-Plagiarism System," 13th Annual Americas Conference on Information
Systems, Keystone, CO, 2007b.
Li, X., and Ye, N. "A supervised clustering algorithm for computer intrusion detection,"
Knowledge and Information Systems (8:4) 2005, p 498.
Li, Y., and Guo, L. "An active learning based TCM-KNN algorithm for supervised network
intrusion detection," Computers & Security (26:7/8) 2007, p 459.
Linacre, J.M. "Optimizing rating scale category effectiveness," Journal of Applied Measurement
(3) 2002, pp 85-106.
Ma, Q., and Pearson, J.M. "ISO 17799: "Best Practices" in Information Security Management?,"
Communications of the Association for Information Systems (15) 2005, p 1.
Maddux, J.E., and Rogers, R.W. "Protection motivation and self-efficacy: A revised theory of
fear appeals and attitude change," Journal of Experimental Social Psychology (19:5)
1983, pp 469-479.
131
Magklaras, G.B., and Furnell, S.M. "Insider threat prediction tool: Evaluating the probability of
IT misuse," Computers & Security (21:1) 2002, p 62.
Maguire, S. "Identifying risks during information system development: Managing the process,"
Information Management & Computer Security (10:2/3) 2002, p 126.
Malhotra, N., Kim, S., and Patil, A. "Common Method Variance in IS Research: A Comparison
of Alternative Approaches and a Reanalysis of Past Research," Management Science
(52:12) 2006, p 1865.
Marakas, G.M., Johnson, R.D., and Clay, P.F. "The Evolving Nature of the Computer Self-
Efficacy Construct: An Empirical Investigation of Measurement Construction, Validity,
Reliability and Stability Over Time," Journal of the Association for Information Systems
(8:1) 2007, p 15.
Marcoulides, G.A., and Saunders, C. "PLS: A Silver Bullet?," MIS Quarterly (30:2) 2006, p 1.
Messick, S. in R. Linn, ed., Educational measurement (pg. 13-103), (3rd ed.) American Council
on Education and Macmillan Publishing Company. , New York, 1989.
Metaxiotis, K., Ergazakis, K., Samouilidis, E., and Psarras, J. "Decision support through
knowledge management: the role of the artificial intelligence," Information Management
& Computer Security (11:5) 2003, p 216.
Miller, J., and Resnick, P. "PICS: Internet Access Control Without Censorship,"
Communications of the ACM (39:10) 1996, pp 87-93.
Misra, S.C., Kumar, V., and Kumar, U. "A strategic modeling technique for information security
risk assessment," Information Management & Computer Security (15:1) 2007, p 64.
Misra, S.K., and Wickamasinghe, N. "Security of a Mobile Transaction: A Trust Model,"
Electronic Commerce Research (4:4) 2004, p 359.
132
Muthaiyah, S., and Kerschberg, L. "Virtual organization security policies: An ontology-based
integration approach," Information Systems Frontiers (9:5) 2007, p 505.
Myler, E., and Broadbent, G. "ISO 17799: Standard for Security," Information Management
Journal (40:6) 2006, p 43.
Nance, W.D., and Straub, D.W. "An Investigation into the Use and Usefulness of Security
Software in Detecting Computer Abuse," 9th International Conference on Information
Systems (ICIS), Management Information Systems Research Center, Curtis L. Carlson
School of Management, University of Minnesota, Minneapolis, MN, 1988, pp. 283-294.
Neumann, P.G. "Trustworthy systems revisited," Association for Computing Machinery.
Communications of the ACM (49:2) 2006, p 152.
Neuwirth, K., Dunwoody, S., and Griffin, R.J. "Protection Motivation and Risk
Communication," Risk Analysis (20:5) 2000, pp 721-734.
Nicolaou, A.I., and McKnight, D.H. "Perceived Information Quality in Data Exchanges: Effects
on Risk, Trust, and Intention to Use," Information Systems Research (17:4) 2006, p 332.
Nunnally, J. Psychometric Theory McGraw Hill, New York, 1978.
Osterlind, S.J. Modern Measurement: Theory, Principles, and Applications of Mental Appraisal
Pearson Prentice Hall, Upper Saddle River, New Jersey, 2006.
Pan, L., Zhang, C.N., and Yang, C. "A ROLE-BASED MULTILEVEL SECURITY ACCESS
CONTROL MODEL," The Journal of Computer Information Systems (46:3) 2006, p 1.
Panko, R.R. Corporate Computer and Network Security Prentice Hall, Upper Saddle River, New
Jersey, 2004, p. 522.
133
Pavlou, P.A. "Consumer Acceptance of Electronic Commerce: Integrating Trust and Risk with
the Technology Acceptance Model," International Journal of Electronic Commerce (7:3)
2003, pp 101-134.
Pavlou, P.A., and Gefen, D. "Building Effective Online Marketplaces with Institution-Based
Trust," Information Systems Research (15:1) 2004, p 37.
Pearson, F.S., and Weiner, N.A. "Toward an Integration of Criminological Theories," The
Journal of Criminal Law and Criminology (1973-) (76:1) 1985, pp 116-150.
Petter, S., Straub, D., and Rai, A. "Specifying Formative Constructs in Information Systems
Research," MIS Quarterly (31:4) 2007, p 623.
Podsakoff, P., MacKenzie, S., Lee, J., and Podsakoff, N. "Common Method Biases in Behavioral
Research: A Critical Review of the Literature and Recommended Remedies," Journal of
Applied Psychology (88:5) 2003, pp 879-903.
Post, G., and Kagan, A. "Management tradeoffs in anti-virus strategies," Information &
Management (37:1) 2000, p 13.
Pretschner, A., Hilty, M., and Basin, D. "Distributed usage control," Association for Computing
Machinery. Communications of the ACM (49:9) 2006, p 39.
Ranalli, H.T. "Options for Secure Personal Password Management," in: SANS Institute, 2003.
Randeree, E. "Knowledge management: securing the future," Journal of Knowledge
Management (10:4) 2006, p 145.
Reardon, J.L., and Davidson, E. "An organizational learning perspective on the assimilation of
electronic medical records among small physician practices," European Journal of
Information Systems (16:6) 2007, p 681.
134
Rees, J., Bandyopadhyay, S., and Spafford, E.H. "PFIRES: A policy framework for information
security," Association for Computing Machinery. Communications of the ACM (46:7)
2003, p 101.
Richardson, R. "2007 CSI Computer Crime and Security Survey," Computer Security Institute.
Richardson, R. "2008 CSI Computer Crime and Security Survey," Computer Security Institute.
Rogers, R.W. "A protection motivation theory of fear appeals and attitude change," Journal of
Psychology: Interdisciplinary and Applied (91:1) 1975, pp 93-114.
Rohrig, S., and Knorr, K. "Security Analysis of Electronic Business Processes," Electronic
Commerce Research (4:1-2) 2004, p 59.
Schultz, E. "Security training and awareness - fitting a square peg in a round hole," Computers &
Security (23:1) 2004, p 1.
Shahriari, H.R., and Jalili, R. "Vulnerability Take Grant (VTG): An efficient approach to analyze
network vulnerabilities," Computers & Security (26:5) 2007, p 349.
Shalhoub, Z.K. "Trust, privacy, and security in electronic business: the case of the GCC
countries," Information Management & Computer Security (14:3) 2006, p 270.
Sheeran, P., and Orbell, S. "How confidently can we infer health beliefs from questionnaire
responses?," Psychology & Health (11:2) 1996, pp 273-290.
Shih, T., and Fan, X. "Comparing Response Rates from Web and Mail Surveys: A Meta-
Analysis," Field Methods (20:3) 2008, p 249.
Sipior, J.C., Ward, B.T., and Roselli, G.R. "The Ethical and Legal Concerns of Spyware,"
Information Systems Management (22:2) 2005, p 39.
135
Siponen, M. "Towards maturity of information security maturity criteria: Six lessons learned
from software maturity criteria," Information Management & Computer Security (10:5)
2002, p 210.
Siponen, M. "An analysis of the traditional IS security approaches: implications for research and
practice," European Journal of Information Systems (14:3) 2005, p 303.
Siponen, M., Baskerville, R., and Heikka, J. "A Design Theory for Secure Information Systems
Design Methods," Journal of the Association for Information Systems (7:11) 2006a, p
725.
Siponen, M., and Iivari, J. "Six Design Theories for IS Security Policies and Guidelines,"
Journal of the Association for Information Systems (7:7) 2006b, p 445.
Sitkin, S.B., and Pablo, A.L. "Reconceptualizing the Determinants of Risk Behavior," Academy
of Management. The Academy of Management Review (17:1) 1992, p 9.
Soper, D.S., Demirkan, H., and Goul, M. "An interorganizational knowledge-sharing security
model with breach propagation detection," Information Systems Frontiers (9:5) 2007, p
469.
Stanton, J.M., Stam, K.R., Mastrangelo, P., and Jolton, J. "Analysis of end user security
behaviors," Computers & Security (24:2) 2005, p 124.
Stephens, P. "A DECISION SUPPORT SYSTEM FOR COMPUTER LITERACY TRAINING
AT UNIVERSITIES," The Journal of Computer Information Systems (46:2) 2005, p 33.
Stewart, N., Spencer, J., and Melby, N. "Developing Trust in M-commerce: A Vendor and
Certificate Authority Model," Journal of Information Privacy & Security (2:2) 2006, p
51.
136
Straub, D., Boudreau, M., and Gefen, D. "Validation guidelines for IS positivist research,"
Communications of the Association for Information Systems (13:24) 2004, pp 380-427.
Straub, D.W. "Validating Instruments in MIS Research," MIS Quarterly (13:2) 1989, pp 147-
169.
Straub, D.W. "Effective IS Security: An Empirical Study," Information Systems Research (1:3)
1990, pp 255-276.
Straub, D.W., and Welke, R.J. "Coping with systems risk: Security planning models for
management decision making," MIS Quarterly (22:4) 1998, p 441.
Sun, L., Srivastava, R.P., and Mock, T.J. "An Information Systems Security Risk Assessment
Model Under the Dempster-Shafer Theory of Belief Functions," Journal of Management
Information Systems (22:4) 2006, p 109.
Sveen, F.O., Rich, E., and Jager, M. "Overcoming organizational challenges to secure knowledge
management," Information Systems Frontiers (9:5) 2007, p 481.
Tak, S.W., and Park, E.K. "A Software Framework for Non-Repudiation Service based on
Adaptive~Secure Methodology in Electronic Commerce," Information Systems Frontiers
(6:1) 2004, p 47.
Theoharidou, M., Kokolakis, S., Karyda, M., and Kiountouzis, E. "The insider threat to
information systems and the effectiveness of ISO17799," Computers & Security (24:6)
2005, p 472.
Thomas, G., and Botha, R.A. "Secure Mobile Device Use in Healthcare Guidance from HIPAA
and ISO17799," Information Systems Management (24:4) 2007, p 333.
Trcek, D. "An integral framework for information systems security management," Computers &
Security (22:4) 2003, p 337.
137
Tsohou, A., Karyda, M., Kokolakis, S., and Kiountouzis, E. "Formulating information systems
risk management strategies through cultural theory," Information Management &
Computer Security (14:3) 2006, p 198.
Tsoumas, V., and Tryfonas, T. "From risk analysis to effective security management: towards an
automated approach," Information Management & Computer Security (12:1) 2004, p 91.
Veiga, A.D., and Eloff, J.H.P. "An Information Security Governance Framework," Information
Systems Management (24:4) 2007, p 361.
Venkatesh, V., and Davis, F.D. "A model of the antecedents of perceived ease of use:
Development and test," Decision Sciences (27:3) 1996, p 451.
Venkatesh, V., Morris, M., Davis, G., and Davis, F. "User acceptance of information technology:
Toward a unified view," MIS Quarterly (27:3) 2003, pp 425-478.
Viega, J., Kohno, T., and Potter, B. "Trust (and mistrust) in secure applications,"
Communications of the ACM (44:2) 2001, pp 31-36.
Viia, X., Schuster, A., and Riera, A. "Security for a Multi-Agent System based on JADE,"
Computers & Security (26:5) 2007, p 391.
Vroblefski, M., Chen, A., Shao, B., and Swinarski, M. "Managing user relationships in
hierarchies for information system security," Decision Support Systems (43:2) 2007, p
408.
Wakefield, R.L., and Whitten, D. "Examining User Perceptions of Third-Party Organization
Credibility and Trust in an E-Retailer," Journal of Organizational and End User
Computing (18:2) 2006, p 1.
138
Warkentin, M., Davis, K., and Bekkering, E. "Introducing the Check-Off Password System
(COPS): An Advancement in User Authentication Methods and Information Security*,"
Journal of Organizational and End User Computing (16:3) 2004, p 41.
Wen, H.J., and Tarn, J.-H.M. "Internet security: a case study of firewall selection," Information
Management & Computer Security (6:4) 1998, p 178.
Whitley, B.E. Principles of research in behavioral science McGraw-Hill New York, NY, 2002.
Whitman, M.E. "Enemy at the gate: Threats to information security," Association for Computing
Machinery. Communications of the ACM (46:8) 2003, p 91.
Whitman, M.E. "In defense of the realm: understanding the threats to information security,"
International Journal of Information Management (24:1) 2004, p 43.
Whitman, M.E., and Mattord, H.J. Principles of Information Security, (3rd ed.) Course
Technology, Boston, MA, 2009, p. 598.
Williams, P.D., and Spafford, E.H. "CuPIDS: An exploration of highly focused, co-processor-
based information system protection," Computer Networks (51:5) 2007, p 1284.
Willison, R., and Backhouse, J. "Opportunities for computer crime: considering systems risk
from a criminological perspective," European Journal of Information Systems (15:4)
2006, p 403.
Witte, K. "Predicting Risk Behaviors: Development and Validation of a Diagnostic Scale,"
Journal of Health Communication (1:4) 1996, pp 317-342.
Wolfe, E. "EDRE 6794 Course Presentation," Virginia Tech, 2007.
Wolfe, E.W. "A Bootstrap Approach to Evaluating Person and Item Fit to the Rasch Model,"
International Objective Measurement Workshop, New York, NY, 2008.
139
Wolfe, E.W. "RBF.sas (Rasch Bootstrap Fit): A SAS macro for estimating critical values for
Rasch model fit statistics," Applied Psychological Measurement) in press.
Wood, C.C. "Constructing difficult-to-guess passwords," Information Management & Computer
Security (4:1) 1996, p 43.
Woon, I.M.Y., Tan, G.W., and Low, R.T. "A Protection Motivation Theory Approach to Home
Wireless Security," Twenty-Sixth International Conference on Information Systems
(ICIS), 2005, pp. 367-380.
Workman, M., and Gathegi, J. "Punishment and ethics deterrents: A study of insider security
contravention," Journal of the American Society for Information Science and Technology
(58:2) 2007, p 212.
Wright, B.D., and Masters, G.N. Rating Scale Analysis: Rasch Measurement MESA Press,
Chicago, IL, 1982.
Wu, J.-H., and Wang, S.-C. "What drives mobile commerce? An empirical evaluation of the
revised technology acceptance model," Information & Management (42:5) 2005, p 719.
Wunnava, S., and Ellis, S. "Disaster Recovery Planning: A PMT-Based Conceptual Model
(Research-In-Progress)," Southern Association for Information Systems Conference,
Richmond, VA, 2008.
Ye, N., Farley, T., and Lakshminarasimhan, D. "An attack-norm separation approach for
detecting cyber attacks," Information Systems Frontiers (8:3) 2006, p 163.
Yeh, Q.-J., and Chang, A.J.-T. "Threats and countermeasures for information system security: A
cross-industry study," Information & Management (44:5) 2007, p 480.
140
Youn, S. "Teenagers' Perceptions of Online Privacy and Coping Behaviors: A Risk-Benefit
Appraisal Approach," Journal of Broadcasting & Electronic Media (49:1) 2005, pp 86-
110.
Zhang, C.N., and Yang, C. "Integrating object oriented role-based access control model with
mandatory access control principles," The Journal of Computer Information Systems
(43:3) 2003, p 40.
Zuccato, A. "Holistic security management framework applied in electronic commerce,"
Computers & Security (26:3) 2007, p 256.
Zviran, M., and Erlich, Z. "Identification and Authentication: Technology and Implementation
Issues," The Communications of the Association for Information Systems (17) 2006.
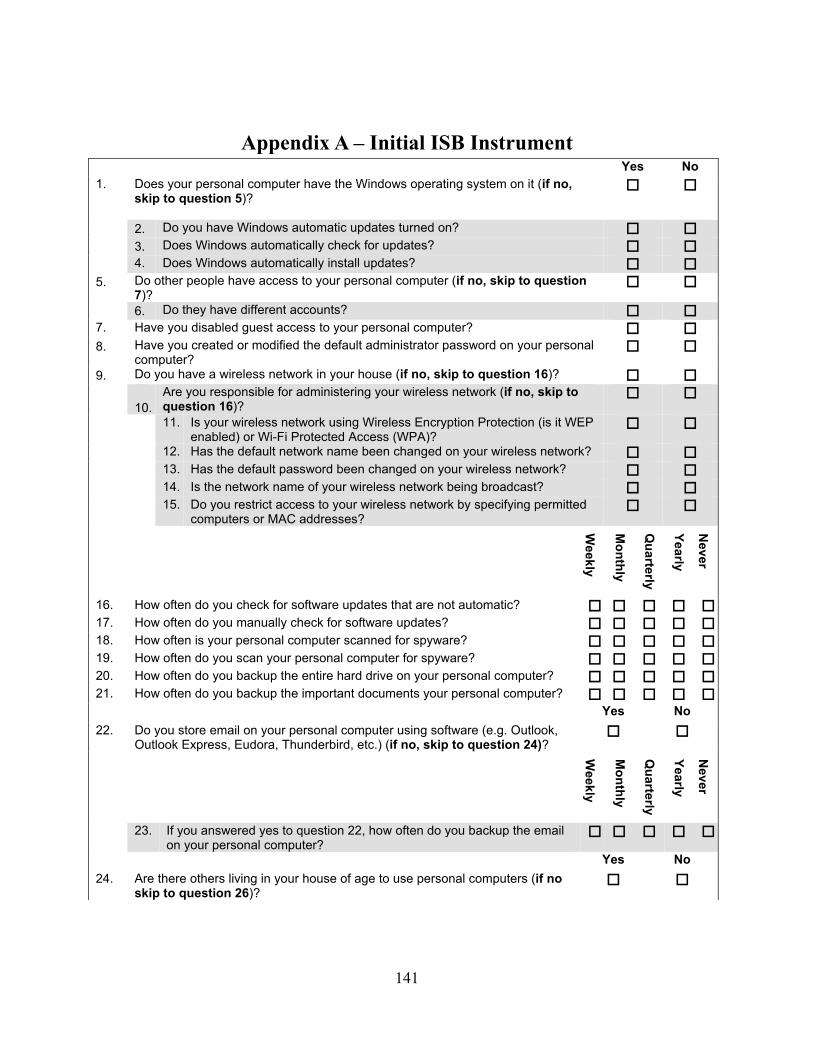
141
Appendix A – Initial ISB Instrument Yes No 1. Does your personal computer have the Windows operating system on it (if no,
skip to question 5)?
2. Do you have Windows automatic updates turned on? 3. Does Windows automatically check for updates? 4. Does Windows automatically install updates? 5. Do other people have access to your personal computer (if no, skip to question
7)?
6. Do they have different accounts? 7. Have you disabled guest access to your personal computer? 8. Have you created or modified the default administrator password on your personal
computer?
9. Do you have a wireless network in your house (if no, skip to question 16)?
10. Are you responsible for administering your wireless network (if no, skip to question 16)?
11. Is your wireless network using Wireless Encryption Protection (is it WEP enabled) or Wi-Fi Protected Access (WPA)?
12. Has the default network name been changed on your wireless network? 13. Has the default password been changed on your wireless network? 14. Is the network name of your wireless network being broadcast? 15. Do you restrict access to your wireless network by specifying permitted
computers or MAC addresses?
Weekly
Monthly
Quarterly
Yearly
Never
16. How often do you check for software updates that are not automatic? 17. How often do you manually check for software updates? 18. How often is your personal computer scanned for spyware? 19. How often do you scan your personal computer for spyware? 20. How often do you backup the entire hard drive on your personal computer? 21. How often do you backup the important documents your personal computer? Yes No 22. Do you store email on your personal computer using software (e.g. Outlook,
Outlook Express, Eudora, Thunderbird, etc.) (if no, skip to question 24)?
Weekly
Monthly
Quarterly
Yearly
Never
23. If you answered yes to question 22, how often do you backup the email on your personal computer?
Yes No 24. Are there others living in your house of age to use personal computers (if no
skip to question 26)?
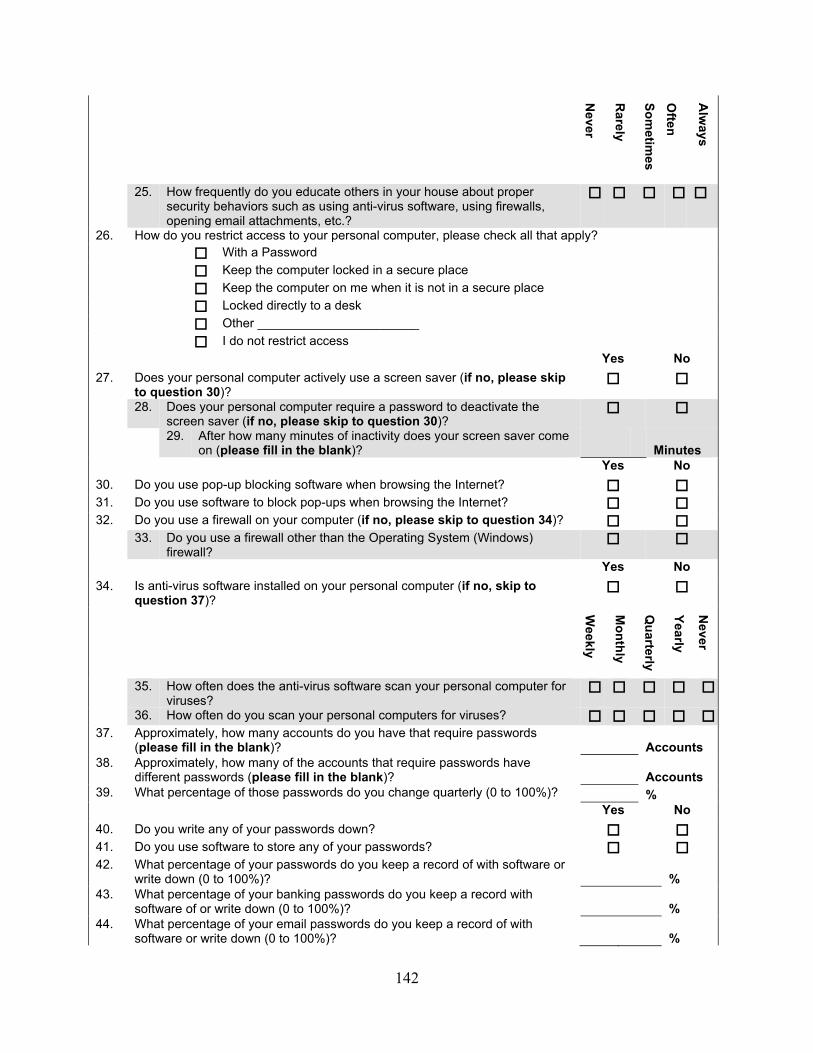
142
Never
Rarely
Sometim
es O
ften
Alw
ays
25. How frequently do you educate others in your house about proper security behaviors such as using anti-virus software, using firewalls, opening email attachments, etc.?
26. How do you restrict access to your personal computer, please check all that apply? With a Password Keep the computer locked in a secure place Keep the computer on me when it is not in a secure place Locked directly to a desk Other _______________________ I do not restrict access
Yes No 27. Does your personal computer actively use a screen saver (if no, please skip
to question 30)?
28. Does your personal computer require a password to deactivate the screen saver (if no, please skip to question 30)?
29. After how many minutes of inactivity does your screen saver come on (please fill in the blank)?
Minutes
Yes No 30. Do you use pop-up blocking software when browsing the Internet? 31. Do you use software to block pop-ups when browsing the Internet? 32. Do you use a firewall on your computer (if no, please skip to question 34)? 33. Do you use a firewall other than the Operating System (Windows)
firewall?
Yes No 34. Is anti-virus software installed on your personal computer (if no, skip to
question 37)?
Weekly
Monthly
Quarterly
Yearly
Never
35. How often does the anti-virus software scan your personal computer for viruses?
36. How often do you scan your personal computers for viruses? 37. Approximately, how many accounts do you have that require passwords
(please fill in the blank)?
Accounts 38. Approximately, how many of the accounts that require passwords have
different passwords (please fill in the blank)?
Accounts 39. What percentage of those passwords do you change quarterly (0 to 100%)? % Yes No 40. Do you write any of your passwords down? 41. Do you use software to store any of your passwords? 42. What percentage of your passwords do you keep a record of with software or
write down (0 to 100%)?
% 43. What percentage of your banking passwords do you keep a record with
software of or write down (0 to 100%)?
% 44. What percentage of your email passwords do you keep a record of with
software or write down (0 to 100%)?
%
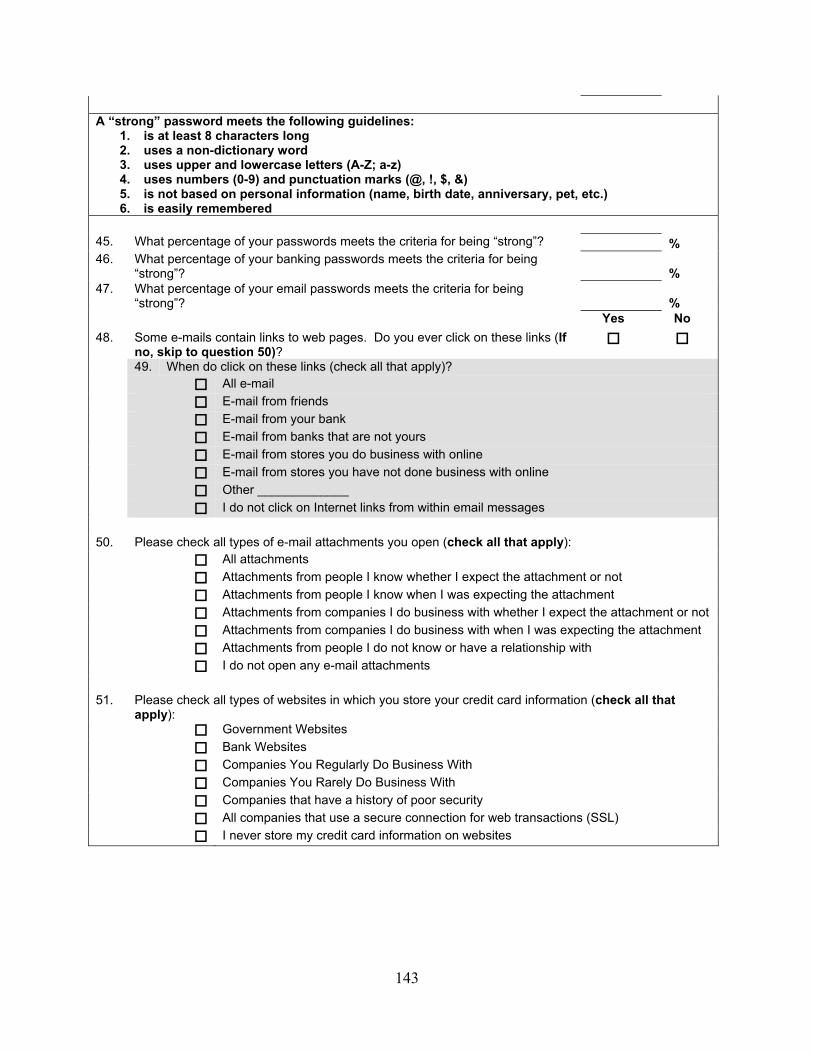
143
A “strong” password meets the following guidelines:
1. is at least 8 characters long 2. uses a non-dictionary word 3. uses upper and lowercase letters (A-Z; a-z) 4. uses numbers (0-9) and punctuation marks (@, !, $, &) 5. is not based on personal information (name, birth date, anniversary, pet, etc.) 6. is easily remembered
45. What percentage of your passwords meets the criteria for being “strong”? % 46. What percentage of your banking passwords meets the criteria for being
“strong”?
% 47. What percentage of your email passwords meets the criteria for being
“strong”?
% Yes No 48. Some e-mails contain links to web pages. Do you ever click on these links (If
no, skip to question 50)?
49. When do click on these links (check all that apply)? All e-mail E-mail from friends E-mail from your bank E-mail from banks that are not yours E-mail from stores you do business with online E-mail from stores you have not done business with online Other _____________ I do not click on Internet links from within email messages
50. Please check all types of e-mail attachments you open (check all that apply):
All attachments Attachments from people I know whether I expect the attachment or not Attachments from people I know when I was expecting the attachment Attachments from companies I do business with whether I expect the attachment or not Attachments from companies I do business with when I was expecting the attachment Attachments from people I do not know or have a relationship with I do not open any e-mail attachments
51. Please check all types of websites in which you store your credit card information (check all that
apply): Government Websites Bank Websites Companies You Regularly Do Business With Companies You Rarely Do Business With Companies that have a history of poor security All companies that use a secure connection for web transactions (SSL) I never store my credit card information on websites
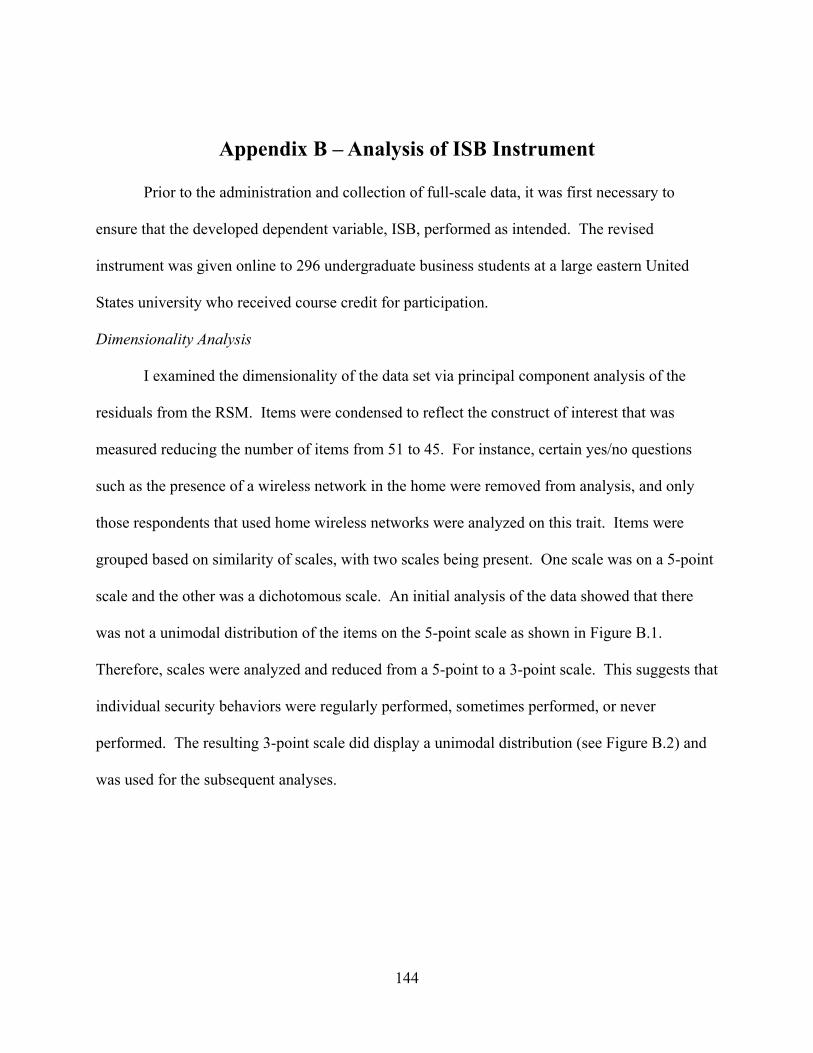
144
Appendix B – Analysis of ISB Instrument Prior to the administration and collection of full-scale data, it was first necessary to
ensure that the developed dependent variable, ISB, performed as intended. The revised
instrument was given online to 296 undergraduate business students at a large eastern United
States university who received course credit for participation.
Dimensionality Analysis
I examined the dimensionality of the data set via principal component analysis of the
residuals from the RSM. Items were condensed to reflect the construct of interest that was
measured reducing the number of items from 51 to 45. For instance, certain yes/no questions
such as the presence of a wireless network in the home were removed from analysis, and only
those respondents that used home wireless networks were analyzed on this trait. Items were
grouped based on similarity of scales, with two scales being present. One scale was on a 5-point
scale and the other was a dichotomous scale. An initial analysis of the data showed that there
was not a unimodal distribution of the items on the 5-point scale as shown in Figure B.1.
Therefore, scales were analyzed and reduced from a 5-point to a 3-point scale. This suggests that
individual security behaviors were regularly performed, sometimes performed, or never
performed. The resulting 3-point scale did display a unimodal distribution (see Figure B.2) and
was used for the subsequent analyses.
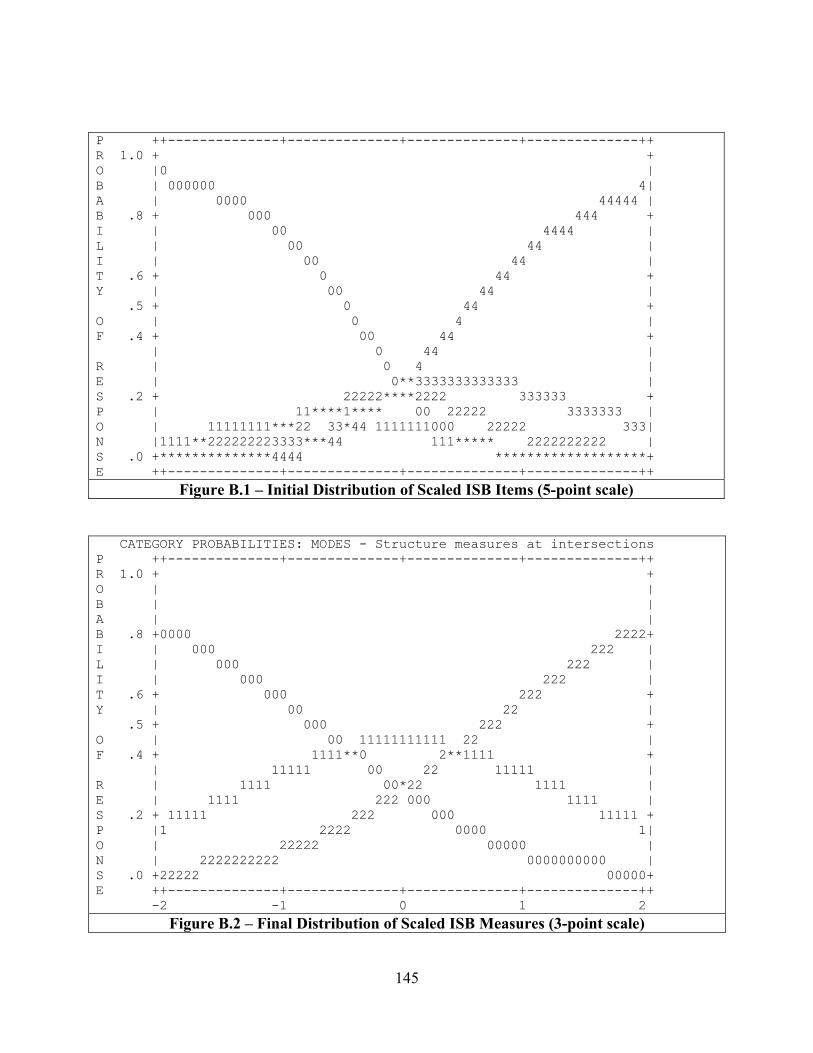
145
P ++--------------+--------------+--------------+--------------++ R 1.0 + + O |0 | B | 000000 4| A | 0000 44444 | B .8 + 000 444 + I | 00 4444 | L | 00 44 | I | 00 44 | T .6 + 0 44 + Y | 00 44 | .5 + 0 44 + O | 0 4 | F .4 + 00 44 + | 0 44 | R | 0 4 | E | 0**3333333333333 | S .2 + 22222****2222 333333 + P | 11****1**** 00 22222 3333333 | O | 11111111***22 33*44 1111111000 22222 333| N |1111**222222223333***44 111***** 2222222222 | S .0 +**************4444 *******************+ E ++--------------+--------------+--------------+--------------++
Figure B.1 – Initial Distribution of Scaled ISB Items (5-point scale)
CATEGORY PROBABILITIES: MODES - Structure measures at intersections P ++--------------+--------------+--------------+--------------++ R 1.0 + + O | | B | | A | | B .8 +0000 2222+ I | 000 222 | L | 000 222 | I | 000 222 | T .6 + 000 222 + Y | 00 22 | .5 + 000 222 + O | 00 11111111111 22 | F .4 + 1111**0 2**1111 + | 11111 00 22 11111 | R | 1111 00*22 1111 | E | 1111 222 000 1111 | S .2 + 11111 222 000 11111 + P |1 2222 0000 1| O | 22222 00000 | N | 2222222222 0000000000 | S .0 +22222 00000+ E ++--------------+--------------+--------------+--------------++ -2 -1 0 1 2
Figure B.2 – Final Distribution of Scaled ISB Measures (3-point scale)
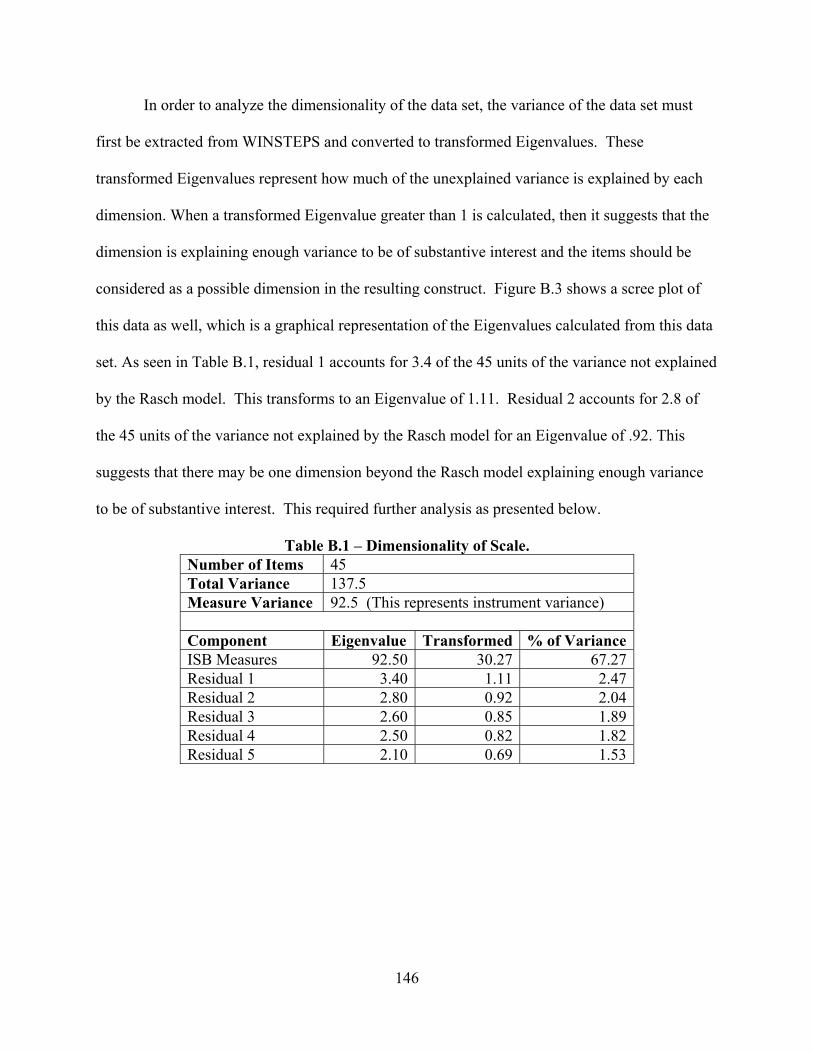
146
In order to analyze the dimensionality of the data set, the variance of the data set must
first be extracted from WINSTEPS and converted to transformed Eigenvalues. These
transformed Eigenvalues represent how much of the unexplained variance is explained by each
dimension. When a transformed Eigenvalue greater than 1 is calculated, then it suggests that the
dimension is explaining enough variance to be of substantive interest and the items should be
considered as a possible dimension in the resulting construct. Figure B.3 shows a scree plot of
this data as well, which is a graphical representation of the Eigenvalues calculated from this data
set. As seen in Table B.1, residual 1 accounts for 3.4 of the 45 units of the variance not explained
by the Rasch model. This transforms to an Eigenvalue of 1.11. Residual 2 accounts for 2.8 of
the 45 units of the variance not explained by the Rasch model for an Eigenvalue of .92. This
suggests that there may be one dimension beyond the Rasch model explaining enough variance
to be of substantive interest. This required further analysis as presented below.
Table B.1 – Dimensionality of Scale. Number of Items 45 Total Variance 137.5 Measure Variance 92.5 (This represents instrument variance) Component Eigenvalue Transformed % of Variance ISB Measures 92.50 30.27 67.27 Residual 1 3.40 1.11 2.47 Residual 2 2.80 0.92 2.04 Residual 3 2.60 0.85 1.89 Residual 4 2.50 0.82 1.82 Residual 5 2.10 0.69 1.53
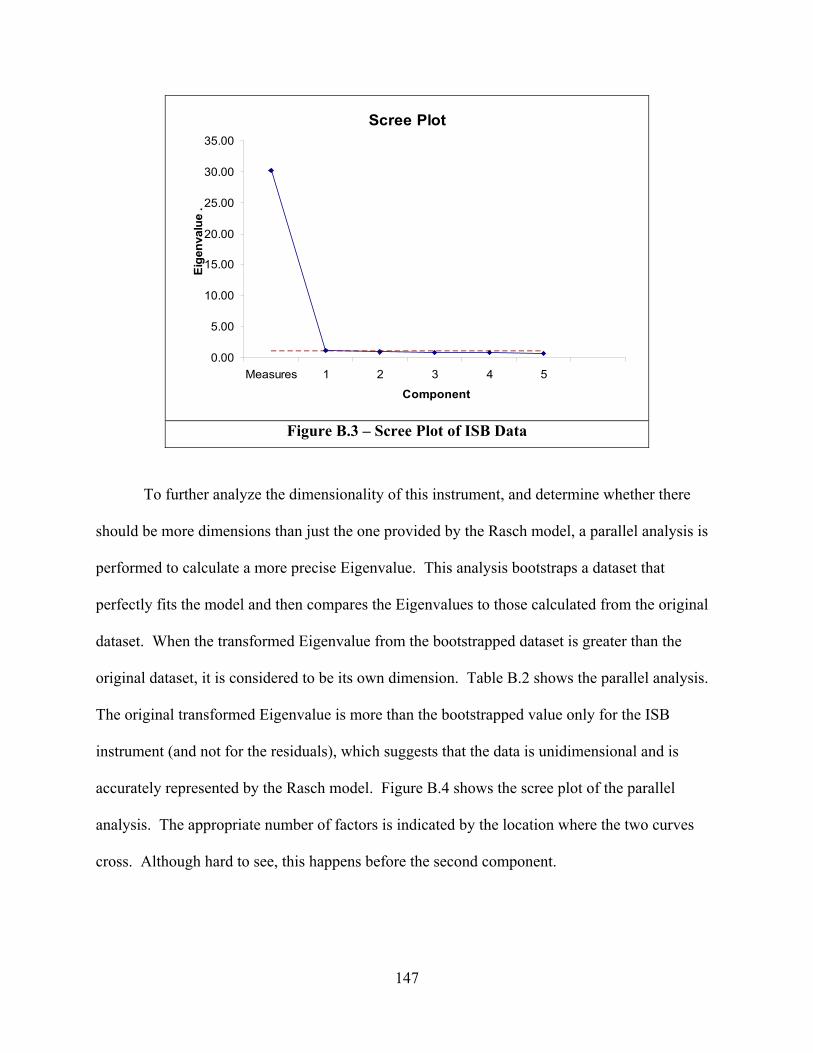
147
Scree Plot
0.00
5.00
10.00
15.00
20.00
25.00
30.00
35.00
Measures 1 2 3 4 5
Component
Eige
nval
ue .
Figure B.3 – Scree Plot of ISB Data
To further analyze the dimensionality of this instrument, and determine whether there
should be more dimensions than just the one provided by the Rasch model, a parallel analysis is
performed to calculate a more precise Eigenvalue. This analysis bootstraps a dataset that
perfectly fits the model and then compares the Eigenvalues to those calculated from the original
dataset. When the transformed Eigenvalue from the bootstrapped dataset is greater than the
original dataset, it is considered to be its own dimension. Table B.2 shows the parallel analysis.
The original transformed Eigenvalue is more than the bootstrapped value only for the ISB
instrument (and not for the residuals), which suggests that the data is unidimensional and is
accurately represented by the Rasch model. Figure B.4 shows the scree plot of the parallel
analysis. The appropriate number of factors is indicated by the location where the two curves
cross. Although hard to see, this happens before the second component.
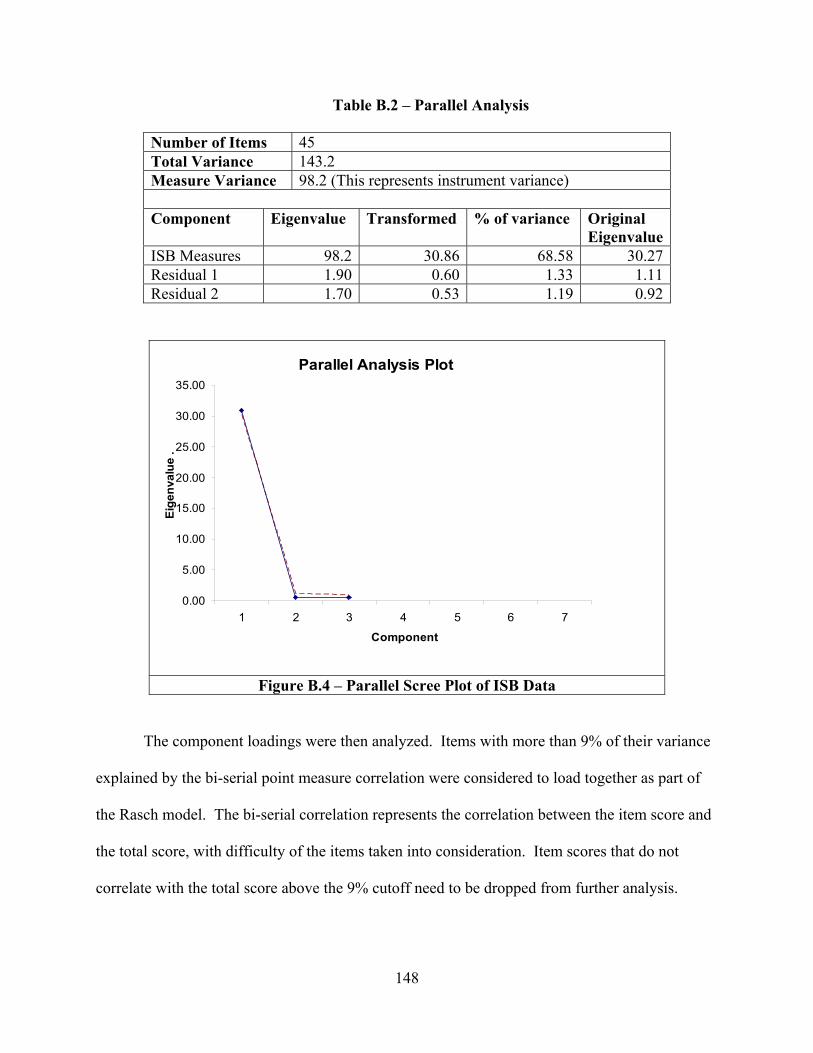
148
Table B.2 – Parallel Analysis
Number of Items 45 Total Variance 143.2 Measure Variance 98.2 (This represents instrument variance) Component Eigenvalue Transformed % of variance Original
EigenvalueISB Measures 98.2 30.86 68.58 30.27Residual 1 1.90 0.60 1.33 1.11Residual 2 1.70 0.53 1.19 0.92
Parallel Analysis Plot
0.00
5.00
10.00
15.00
20.00
25.00
30.00
35.00
1 2 3 4 5 6 7
Component
Eige
nval
ue .
Figure B.4 – Parallel Scree Plot of ISB Data
The component loadings were then analyzed. Items with more than 9% of their variance
explained by the bi-serial point measure correlation were considered to load together as part of
the Rasch model. The bi-serial correlation represents the correlation between the item score and
the total score, with difficulty of the items taken into consideration. Item scores that do not
correlate with the total score above the 9% cutoff need to be dropped from further analysis.
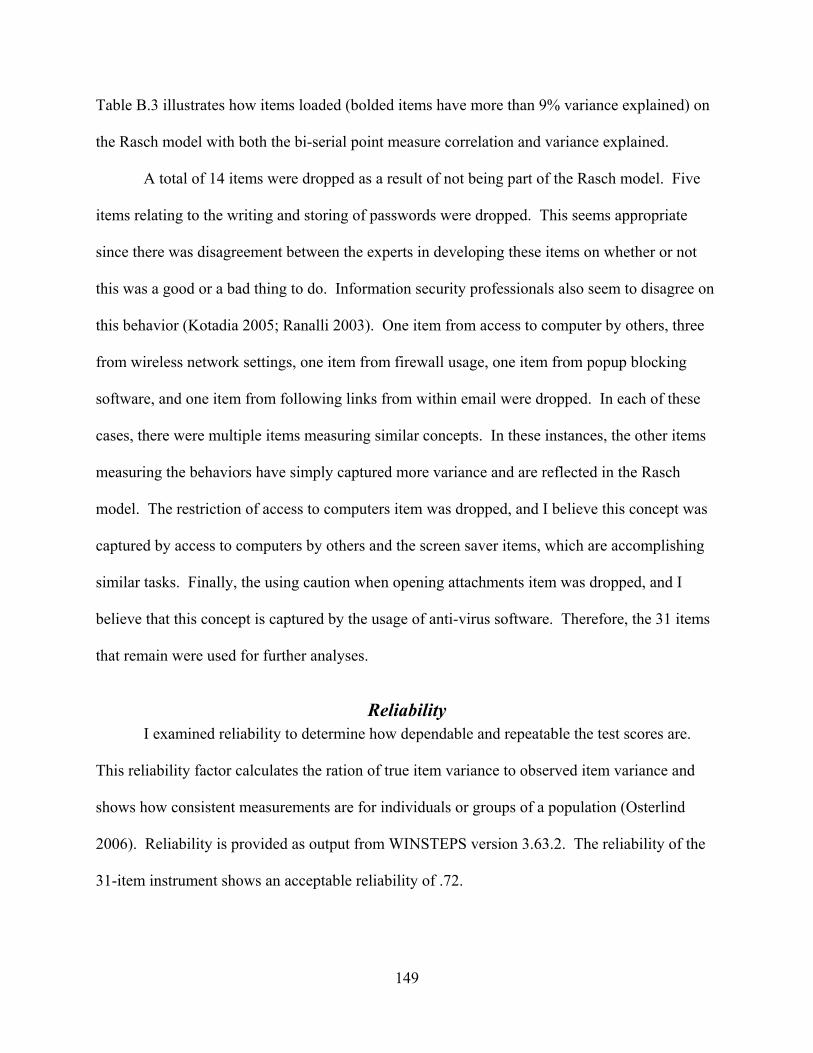
149
Table B.3 illustrates how items loaded (bolded items have more than 9% variance explained) on
the Rasch model with both the bi-serial point measure correlation and variance explained.
A total of 14 items were dropped as a result of not being part of the Rasch model. Five
items relating to the writing and storing of passwords were dropped. This seems appropriate
since there was disagreement between the experts in developing these items on whether or not
this was a good or a bad thing to do. Information security professionals also seem to disagree on
this behavior (Kotadia 2005; Ranalli 2003). One item from access to computer by others, three
from wireless network settings, one item from firewall usage, one item from popup blocking
software, and one item from following links from within email were dropped. In each of these
cases, there were multiple items measuring similar concepts. In these instances, the other items
measuring the behaviors have simply captured more variance and are reflected in the Rasch
model. The restriction of access to computers item was dropped, and I believe this concept was
captured by access to computers by others and the screen saver items, which are accomplishing
similar tasks. Finally, the using caution when opening attachments item was dropped, and I
believe that this concept is captured by the usage of anti-virus software. Therefore, the 31 items
that remain were used for further analyses.
Reliability I examined reliability to determine how dependable and repeatable the test scores are.
This reliability factor calculates the ration of true item variance to observed item variance and
shows how consistent measurements are for individuals or groups of a population (Osterlind
2006). Reliability is provided as output from WINSTEPS version 3.63.2. The reliability of the
31-item instrument shows an acceptable reliability of .72.
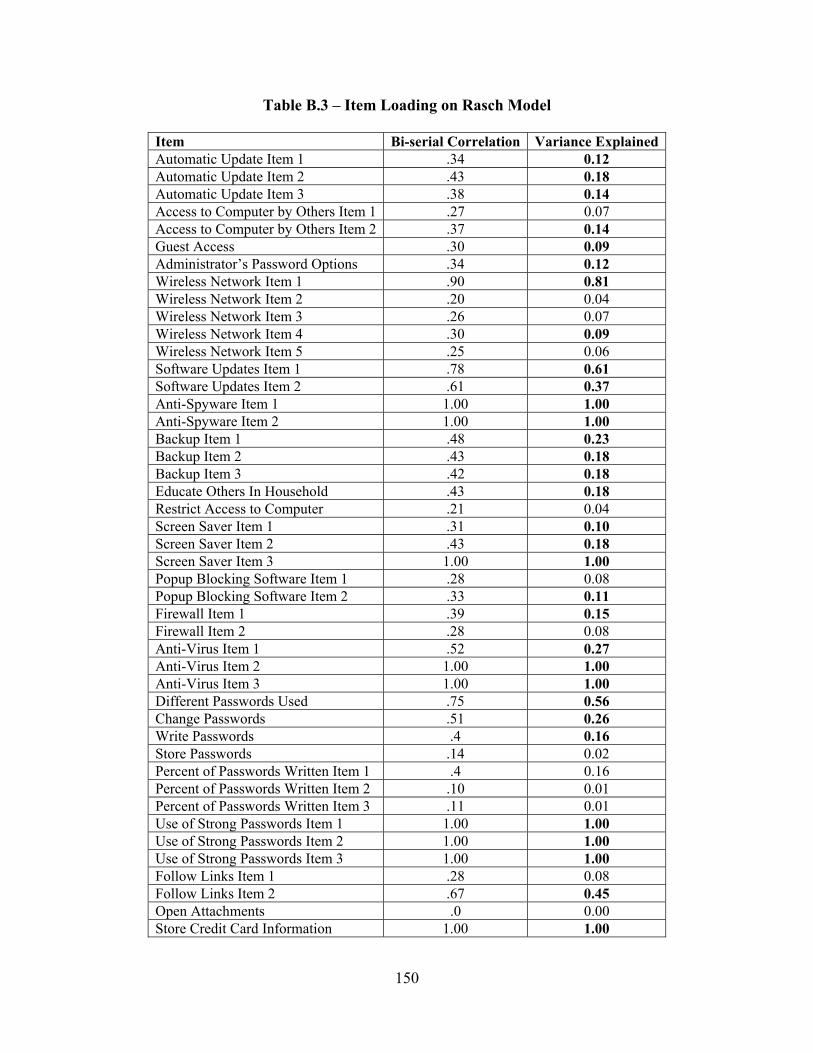
150
Table B.3 – Item Loading on Rasch Model
Item Bi-serial Correlation Variance ExplainedAutomatic Update Item 1 .34 0.12 Automatic Update Item 2 .43 0.18 Automatic Update Item 3 .38 0.14 Access to Computer by Others Item 1 .27 0.07 Access to Computer by Others Item 2 .37 0.14 Guest Access .30 0.09 Administrator’s Password Options .34 0.12 Wireless Network Item 1 .90 0.81 Wireless Network Item 2 .20 0.04 Wireless Network Item 3 .26 0.07 Wireless Network Item 4 .30 0.09 Wireless Network Item 5 .25 0.06 Software Updates Item 1 .78 0.61 Software Updates Item 2 .61 0.37 Anti-Spyware Item 1 1.00 1.00 Anti-Spyware Item 2 1.00 1.00 Backup Item 1 .48 0.23 Backup Item 2 .43 0.18 Backup Item 3 .42 0.18 Educate Others In Household .43 0.18 Restrict Access to Computer .21 0.04 Screen Saver Item 1 .31 0.10 Screen Saver Item 2 .43 0.18 Screen Saver Item 3 1.00 1.00 Popup Blocking Software Item 1 .28 0.08 Popup Blocking Software Item 2 .33 0.11 Firewall Item 1 .39 0.15 Firewall Item 2 .28 0.08 Anti-Virus Item 1 .52 0.27 Anti-Virus Item 2 1.00 1.00 Anti-Virus Item 3 1.00 1.00 Different Passwords Used .75 0.56 Change Passwords .51 0.26 Write Passwords .4 0.16 Store Passwords .14 0.02 Percent of Passwords Written Item 1 .4 0.16 Percent of Passwords Written Item 2 .10 0.01 Percent of Passwords Written Item 3 .11 0.01 Use of Strong Passwords Item 1 1.00 1.00 Use of Strong Passwords Item 2 1.00 1.00 Use of Strong Passwords Item 3 1.00 1.00 Follow Links Item 1 .28 0.08 Follow Links Item 2 .67 0.45 Open Attachments .0 0.00 Store Credit Card Information 1.00 1.00
151
Item Quality One advantage of using RSM is the ability to determine how appropriate the model is for
the data. This includes testing the assumptions of the model, determining the accuracy of the
model’s predictions, assessing the overall fit of the model to the data, and assessing the fit of the
individual components of the measurement context to the model (Wolfe 2007). Model
assumptions were analyzed as part of the dimensionality analysis. The initial assumption of the
model is that the model is unidimensional. Following this, other fit measures can be analyzed by
investigating whether or not participants responded to items as predicted. If not, then certain
items were flagged for substantive analysis. Following Hambleton (1985), the fit of latent trait
models to the collected data was evaluated. The main criteria for this are whether the model
assumptions are satisfied and the precision of model predictions, or how well the model predicts
(or fits) the responses. All analyses show acceptable level of fit, confirming the structural
validity of the ISB instrument.
Rating Scale Analysis The rating scale analysis is used to determine whether or not the instrument works as
intended. When an instrument is administered, a certain set of responses are available for the
respondent. This analysis determines whether or not respondents answered using the intended
scale, or if some other scale would have been more appropriate. In general, the analysis suggests
that the ISB scale is working as intended.
Testing the ISB Instrument While the development of the ISB instrument followed a set of rigorous procedures, the
instrument is not considered valid until a test of the instrument is performed using its finalized
form, which can be found in Appendix C. For this final test, I collected data using paper surveys
of the final instrument from 90 graduate business students at a large American university. A

152
rating scale analysis performed on the collected data revealed that all eight of Linacre’s (2002)
suggested criteria were met (see Appendix D for details on the criteria), including the
requirement that thresholds between categories increased by at least 1.4 logits. These results
confirm that respondents answered using the ISB scale as presented.
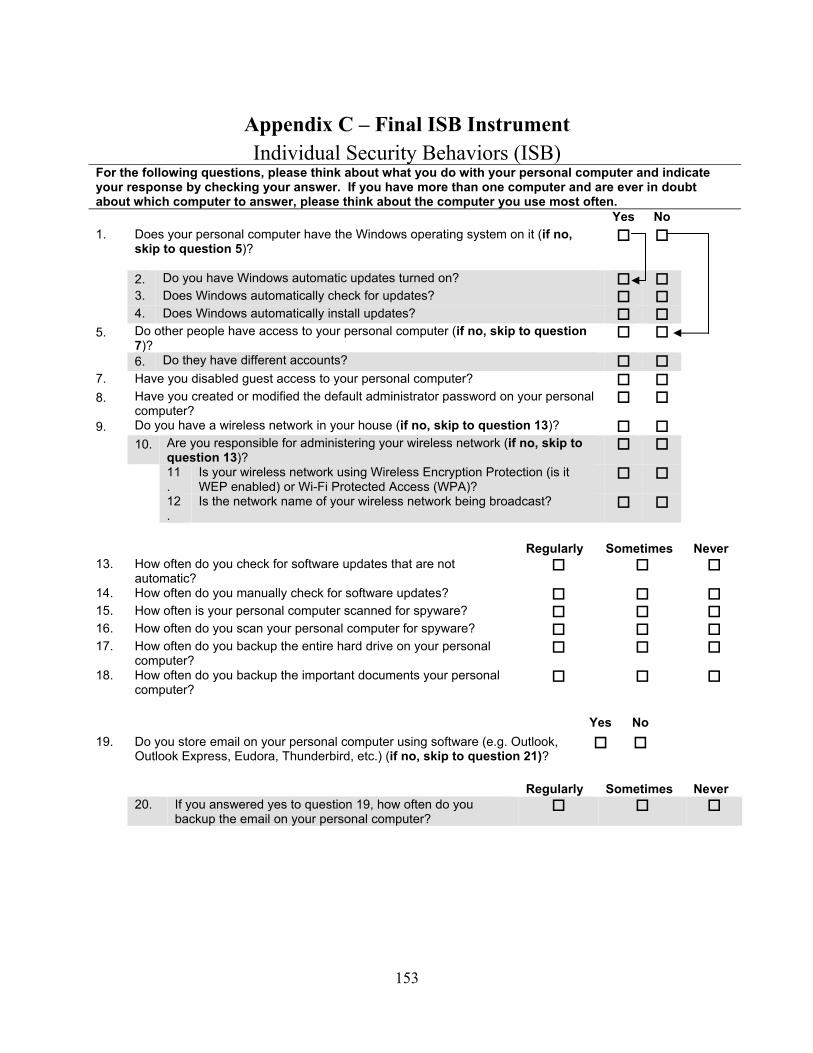
153
Appendix C – Final ISB Instrument Individual Security Behaviors (ISB)
For the following questions, please think about what you do with your personal computer and indicate your response by checking your answer. If you have more than one computer and are ever in doubt about which computer to answer, please think about the computer you use most often. Yes No 1. Does your personal computer have the Windows operating system on it (if no,
skip to question 5)?
2. Do you have Windows automatic updates turned on? 3. Does Windows automatically check for updates? 4. Does Windows automatically install updates? 5. Do other people have access to your personal computer (if no, skip to question
7)?
6. Do they have different accounts? 7. Have you disabled guest access to your personal computer? 8. Have you created or modified the default administrator password on your personal
computer?
9. Do you have a wireless network in your house (if no, skip to question 13)? 10. Are you responsible for administering your wireless network (if no, skip to
question 13)?
11.
Is your wireless network using Wireless Encryption Protection (is it WEP enabled) or Wi-Fi Protected Access (WPA)?
12.
Is the network name of your wireless network being broadcast?
Regularly Sometimes Never 13. How often do you check for software updates that are not
automatic?
14. How often do you manually check for software updates? 15. How often is your personal computer scanned for spyware? 16. How often do you scan your personal computer for spyware? 17. How often do you backup the entire hard drive on your personal
computer?
18. How often do you backup the important documents your personal computer?
Yes No 19. Do you store email on your personal computer using software (e.g. Outlook,
Outlook Express, Eudora, Thunderbird, etc.) (if no, skip to question 21)?
Regularly Sometimes Never 20. If you answered yes to question 19, how often do you
backup the email on your personal computer?
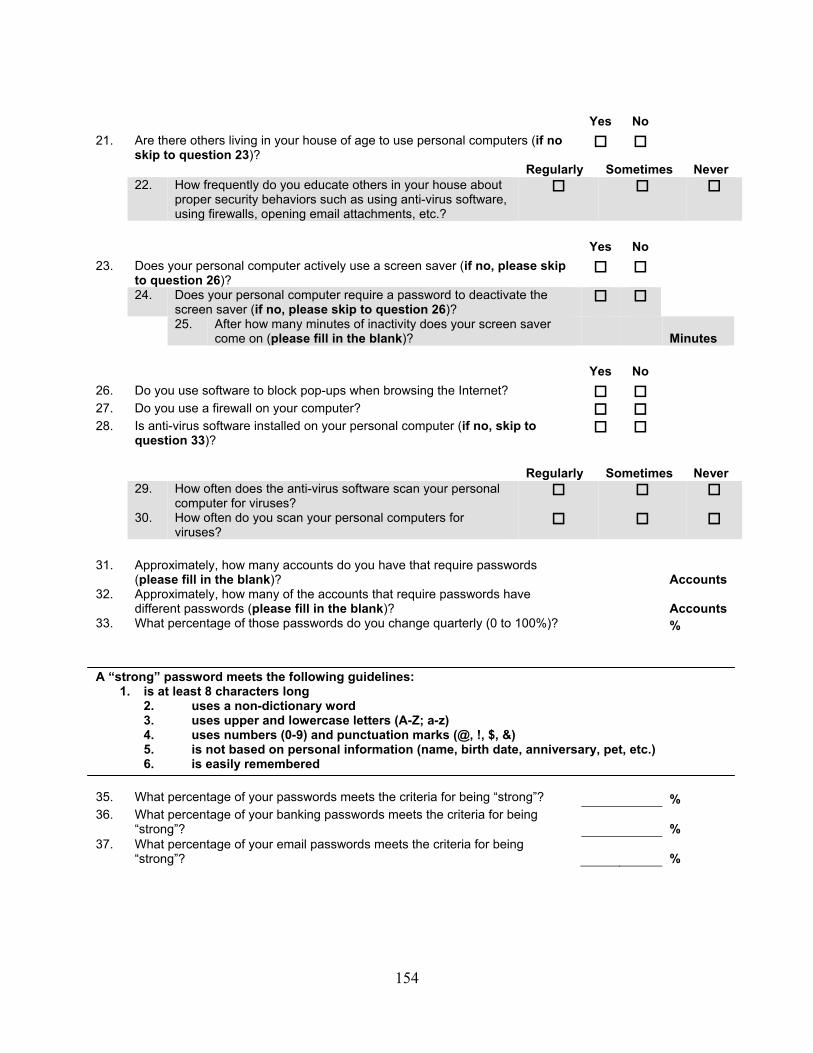
154
Yes No 21. Are there others living in your house of age to use personal computers (if no
skip to question 23)?
Regularly Sometimes Never 22. How frequently do you educate others in your house about
proper security behaviors such as using anti-virus software, using firewalls, opening email attachments, etc.?
Yes No 23. Does your personal computer actively use a screen saver (if no, please skip
to question 26)?
24. Does your personal computer require a password to deactivate the screen saver (if no, please skip to question 26)?
25. After how many minutes of inactivity does your screen saver come on (please fill in the blank)?
Minutes
Yes No 26. Do you use software to block pop-ups when browsing the Internet? 27. Do you use a firewall on your computer? 28. Is anti-virus software installed on your personal computer (if no, skip to
question 33)?
Regularly Sometimes Never 29. How often does the anti-virus software scan your personal
computer for viruses?
30. How often do you scan your personal computers for viruses?
31. Approximately, how many accounts do you have that require passwords
(please fill in the blank)?
Accounts 32. Approximately, how many of the accounts that require passwords have
different passwords (please fill in the blank)?
Accounts 33. What percentage of those passwords do you change quarterly (0 to 100%)? %
A “strong” password meets the following guidelines:
1. is at least 8 characters long 2. uses a non-dictionary word 3. uses upper and lowercase letters (A-Z; a-z) 4. uses numbers (0-9) and punctuation marks (@, !, $, &) 5. is not based on personal information (name, birth date, anniversary, pet, etc.) 6. is easily remembered
35. What percentage of your passwords meets the criteria for being “strong”? % 36. What percentage of your banking passwords meets the criteria for being
“strong”?
% 37. What percentage of your email passwords meets the criteria for being
“strong”?
%
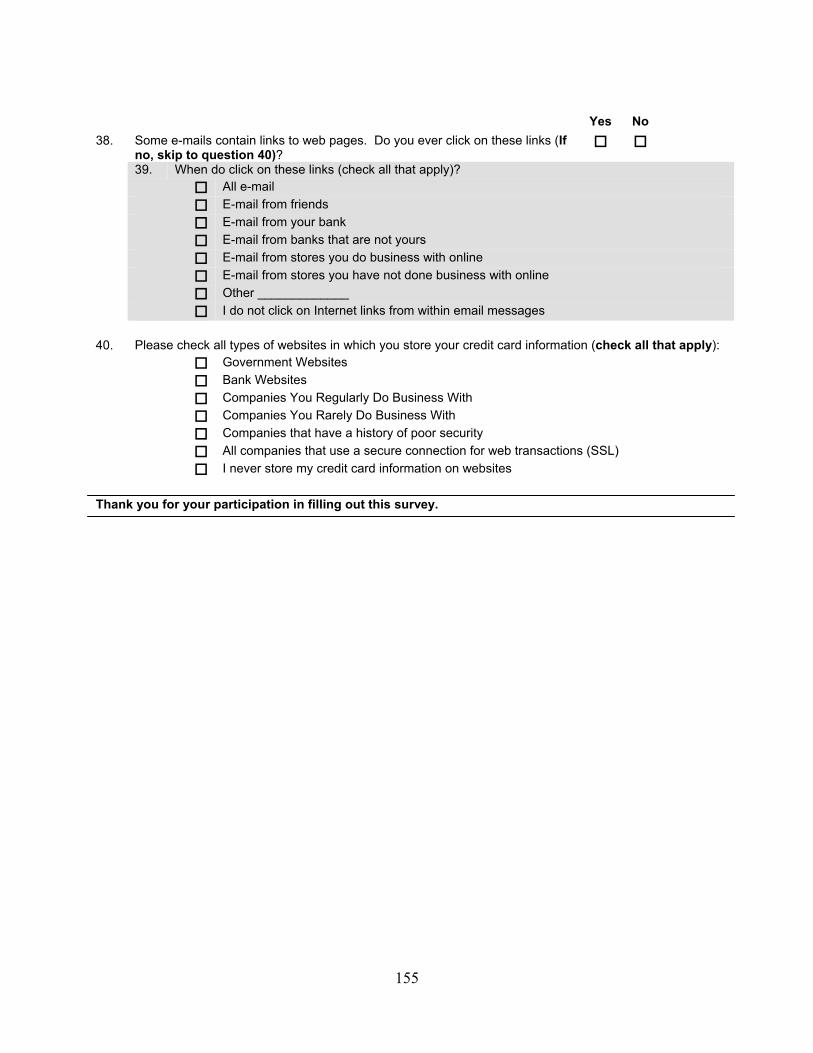
155
Yes No 38. Some e-mails contain links to web pages. Do you ever click on these links (If
no, skip to question 40)?
39. When do click on these links (check all that apply)? All e-mail E-mail from friends E-mail from your bank E-mail from banks that are not yours E-mail from stores you do business with online E-mail from stores you have not done business with online Other _____________ I do not click on Internet links from within email messages
40. Please check all types of websites in which you store your credit card information (check all that apply):
Government Websites Bank Websites Companies You Regularly Do Business With Companies You Rarely Do Business With Companies that have a history of poor security All companies that use a secure connection for web transactions (SSL) I never store my credit card information on websites
Thank you for your participation in filling out this survey.
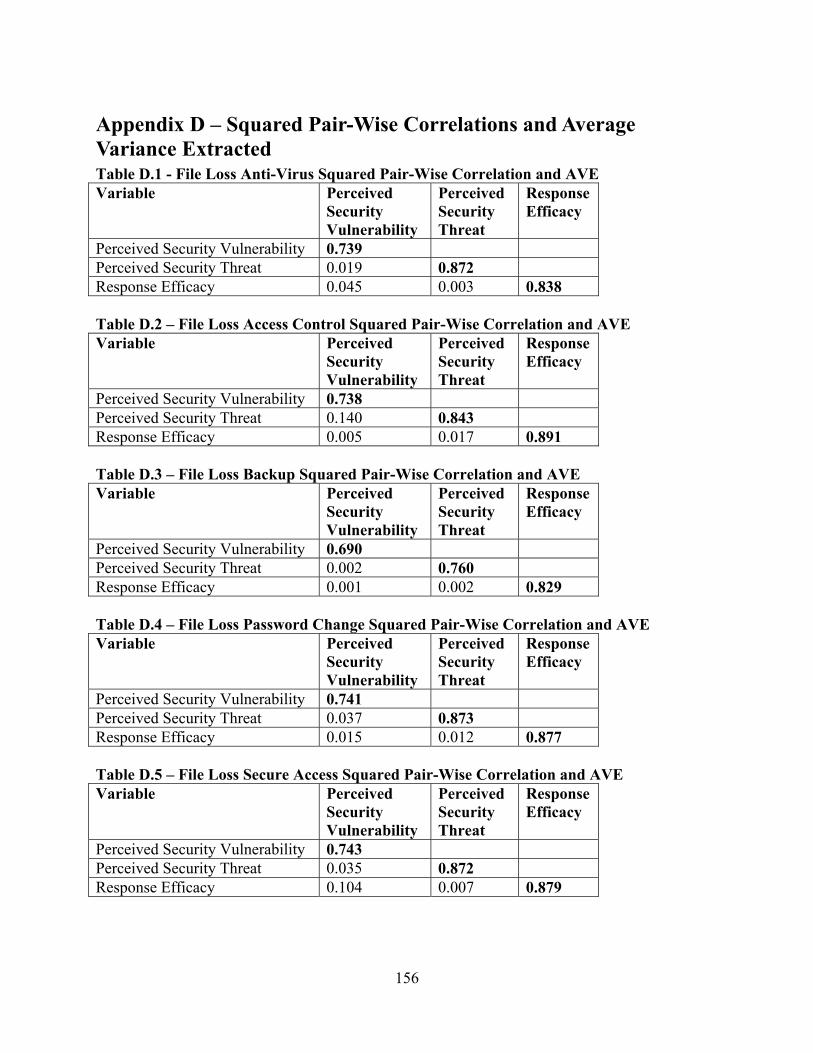
156
Appendix D – Squared Pair-Wise Correlations and Average Variance Extracted Table D.1 - File Loss Anti-Virus Squared Pair-Wise Correlation and AVE Variable Perceived
Security Vulnerability
Perceived Security Threat
Response Efficacy
Perceived Security Vulnerability 0.739 Perceived Security Threat 0.019 0.872 Response Efficacy 0.045 0.003 0.838 Table D.2 – File Loss Access Control Squared Pair-Wise Correlation and AVE Variable Perceived
Security Vulnerability
Perceived Security Threat
Response Efficacy
Perceived Security Vulnerability 0.738 Perceived Security Threat 0.140 0.843 Response Efficacy 0.005 0.017 0.891 Table D.3 – File Loss Backup Squared Pair-Wise Correlation and AVE Variable Perceived
Security Vulnerability
Perceived Security Threat
Response Efficacy
Perceived Security Vulnerability 0.690 Perceived Security Threat 0.002 0.760 Response Efficacy 0.001 0.002 0.829 Table D.4 – File Loss Password Change Squared Pair-Wise Correlation and AVE Variable Perceived
Security Vulnerability
Perceived Security Threat
Response Efficacy
Perceived Security Vulnerability 0.741 Perceived Security Threat 0.037 0.873 Response Efficacy 0.015 0.012 0.877 Table D.5 – File Loss Secure Access Squared Pair-Wise Correlation and AVE Variable Perceived
Security Vulnerability
Perceived Security Threat
Response Efficacy
Perceived Security Vulnerability 0.743 Perceived Security Threat 0.035 0.872 Response Efficacy 0.104 0.007 0.879
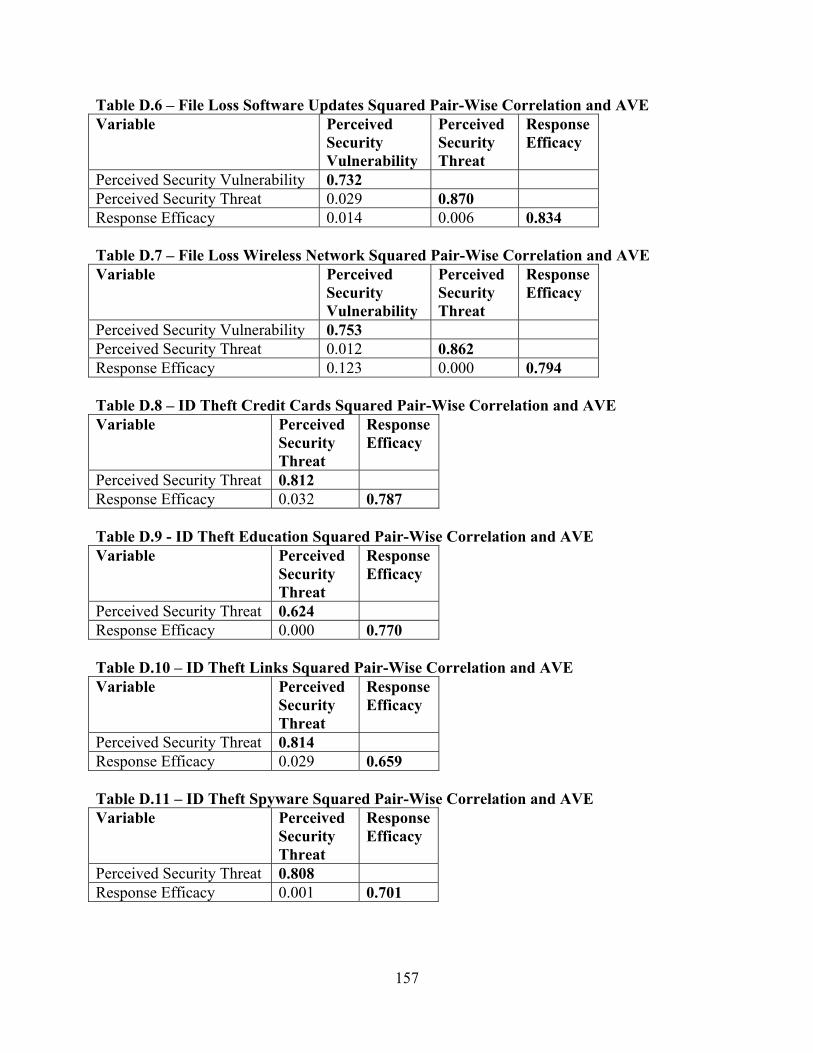
157
Table D.6 – File Loss Software Updates Squared Pair-Wise Correlation and AVE Variable Perceived
Security Vulnerability
Perceived Security Threat
Response Efficacy
Perceived Security Vulnerability 0.732 Perceived Security Threat 0.029 0.870 Response Efficacy 0.014 0.006 0.834 Table D.7 – File Loss Wireless Network Squared Pair-Wise Correlation and AVE Variable Perceived
Security Vulnerability
Perceived Security Threat
Response Efficacy
Perceived Security Vulnerability 0.753 Perceived Security Threat 0.012 0.862 Response Efficacy 0.123 0.000 0.794 Table D.8 – ID Theft Credit Cards Squared Pair-Wise Correlation and AVE Variable Perceived
Security Threat
Response Efficacy
Perceived Security Threat 0.812 Response Efficacy 0.032 0.787 Table D.9 - ID Theft Education Squared Pair-Wise Correlation and AVE Variable Perceived
Security Threat
Response Efficacy
Perceived Security Threat 0.624 Response Efficacy 0.000 0.770 Table D.10 – ID Theft Links Squared Pair-Wise Correlation and AVE Variable Perceived
Security Threat
Response Efficacy
Perceived Security Threat 0.814 Response Efficacy 0.029 0.659 Table D.11 – ID Theft Spyware Squared Pair-Wise Correlation and AVE Variable Perceived
Security Threat
Response Efficacy
Perceived Security Threat 0.808 Response Efficacy 0.001 0.701
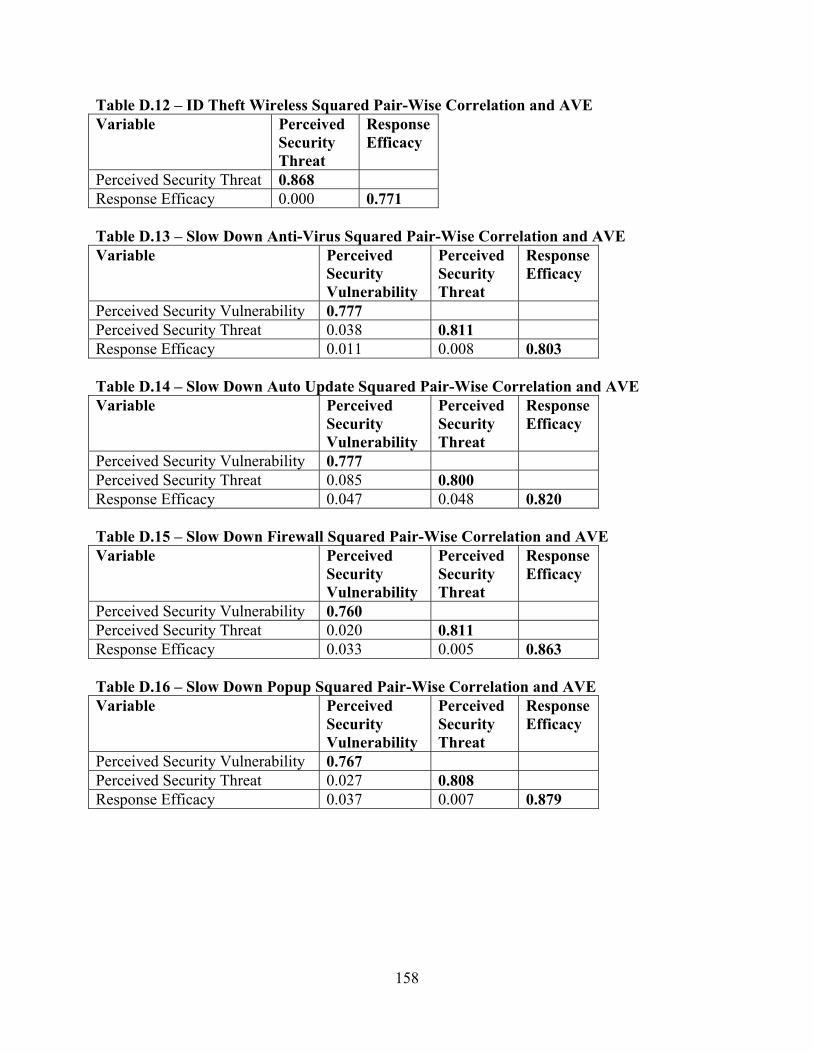
158
Table D.12 – ID Theft Wireless Squared Pair-Wise Correlation and AVE Variable Perceived
Security Threat
Response Efficacy
Perceived Security Threat 0.868 Response Efficacy 0.000 0.771 Table D.13 – Slow Down Anti-Virus Squared Pair-Wise Correlation and AVE Variable Perceived
Security Vulnerability
Perceived Security Threat
Response Efficacy
Perceived Security Vulnerability 0.777 Perceived Security Threat 0.038 0.811 Response Efficacy 0.011 0.008 0.803 Table D.14 – Slow Down Auto Update Squared Pair-Wise Correlation and AVE Variable Perceived
Security Vulnerability
Perceived Security Threat
Response Efficacy
Perceived Security Vulnerability 0.777 Perceived Security Threat 0.085 0.800 Response Efficacy 0.047 0.048 0.820 Table D.15 – Slow Down Firewall Squared Pair-Wise Correlation and AVE Variable Perceived
Security Vulnerability
Perceived Security Threat
Response Efficacy
Perceived Security Vulnerability 0.760 Perceived Security Threat 0.020 0.811 Response Efficacy 0.033 0.005 0.863 Table D.16 – Slow Down Popup Squared Pair-Wise Correlation and AVE Variable Perceived
Security Vulnerability
Perceived Security Threat
Response Efficacy
Perceived Security Vulnerability 0.767 Perceived Security Threat 0.027 0.808 Response Efficacy 0.037 0.007 0.879
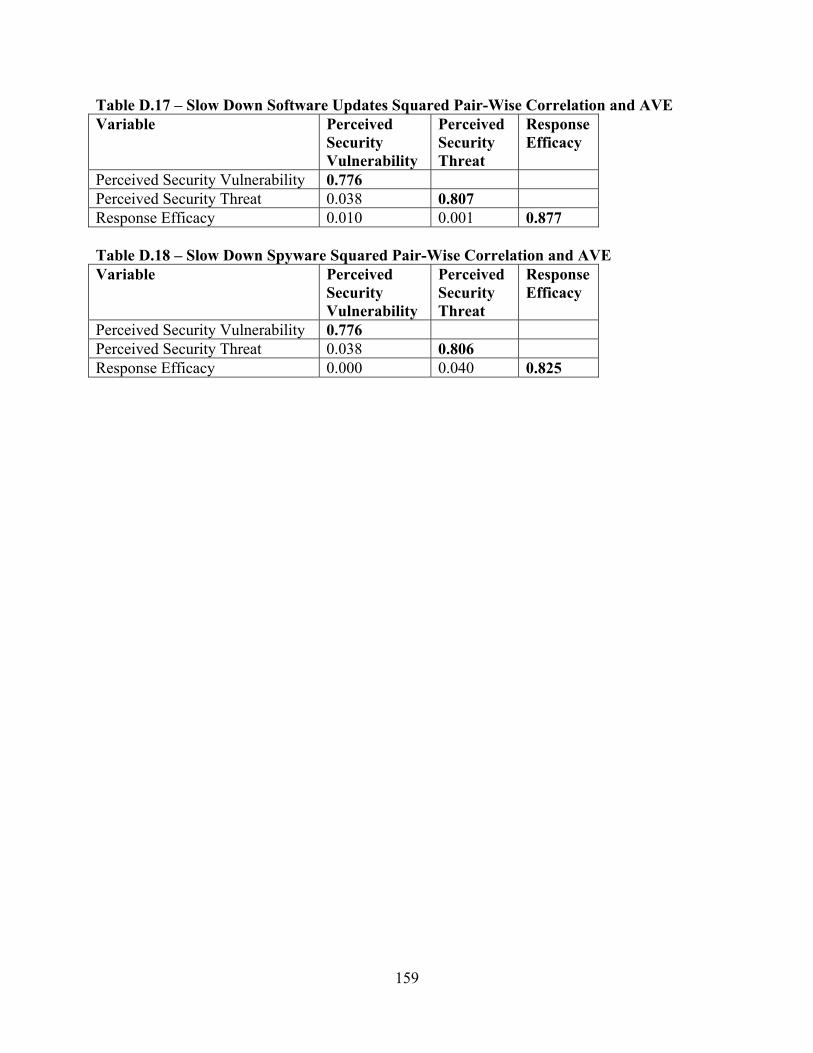
159
Table D.17 – Slow Down Software Updates Squared Pair-Wise Correlation and AVE Variable Perceived
Security Vulnerability
Perceived Security Threat
Response Efficacy
Perceived Security Vulnerability 0.776 Perceived Security Threat 0.038 0.807 Response Efficacy 0.010 0.001 0.877 Table D.18 – Slow Down Spyware Squared Pair-Wise Correlation and AVE Variable Perceived
Security Vulnerability
Perceived Security Threat
Response Efficacy
Perceived Security Vulnerability 0.776 Perceived Security Threat 0.038 0.806 Response Efficacy 0.000 0.040 0.825
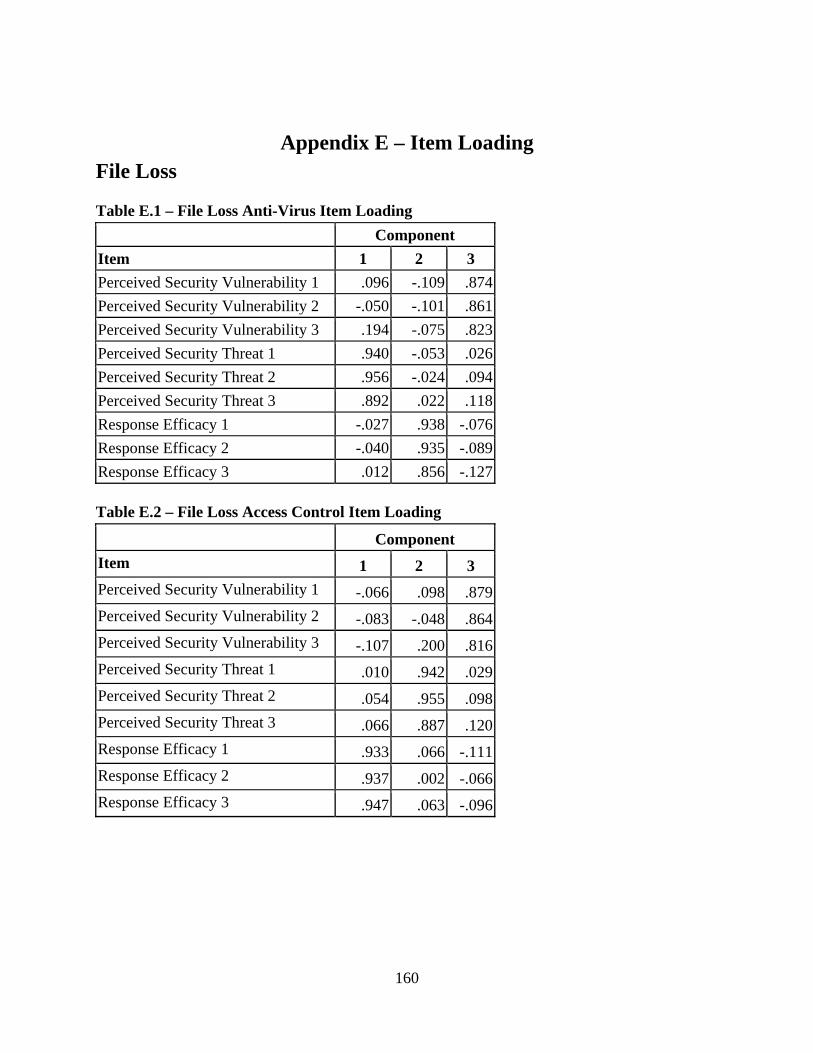
160
Appendix E – Item Loading File Loss Table E.1 – File Loss Anti-Virus Item Loading Component Item 1 2 3 Perceived Security Vulnerability 1 .096 -.109 .874Perceived Security Vulnerability 2 -.050 -.101 .861Perceived Security Vulnerability 3 .194 -.075 .823Perceived Security Threat 1 .940 -.053 .026Perceived Security Threat 2 .956 -.024 .094Perceived Security Threat 3 .892 .022 .118Response Efficacy 1 -.027 .938 -.076Response Efficacy 2 -.040 .935 -.089Response Efficacy 3 .012 .856 -.127 Table E.2 – File Loss Access Control Item Loading Component Item 1 2 3 Perceived Security Vulnerability 1 -.066 .098 .879Perceived Security Vulnerability 2 -.083 -.048 .864Perceived Security Vulnerability 3 -.107 .200 .816Perceived Security Threat 1 .010 .942 .029Perceived Security Threat 2 .054 .955 .098Perceived Security Threat 3 .066 .887 .120Response Efficacy 1 .933 .066 -.111Response Efficacy 2 .937 .002 -.066Response Efficacy 3 .947 .063 -.096
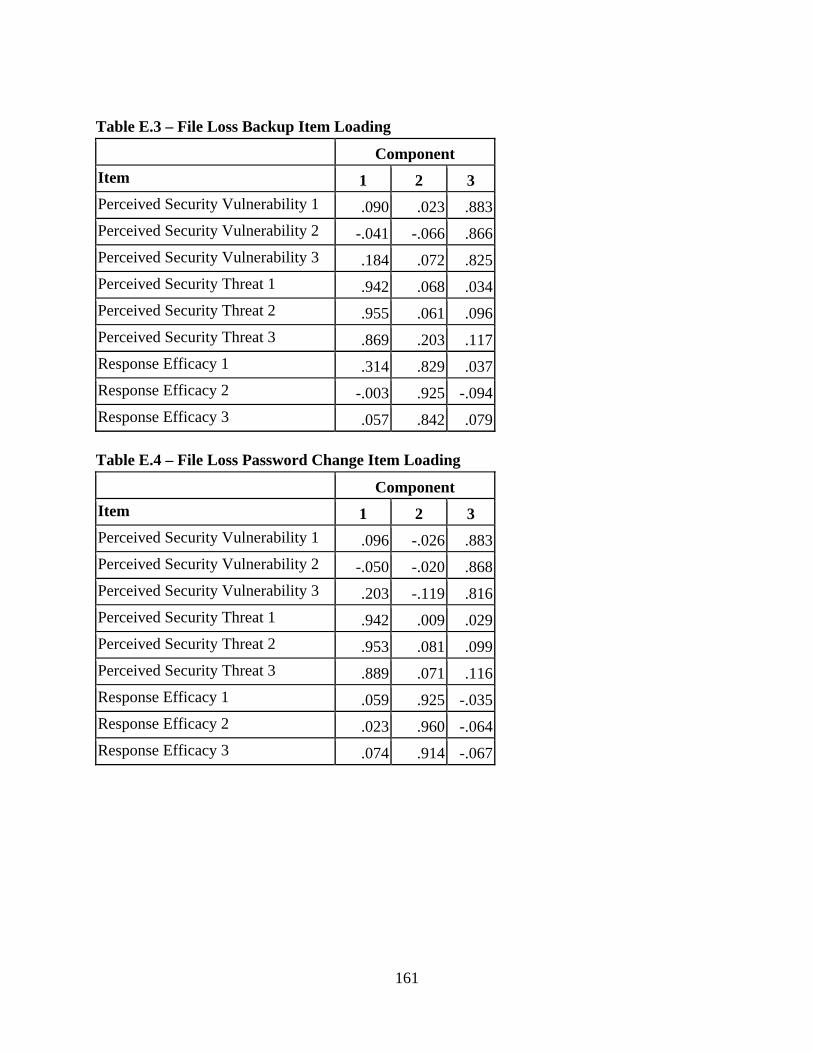
161
Table E.3 – File Loss Backup Item Loading Component Item 1 2 3 Perceived Security Vulnerability 1 .090 .023 .883Perceived Security Vulnerability 2 -.041 -.066 .866Perceived Security Vulnerability 3 .184 .072 .825Perceived Security Threat 1 .942 .068 .034Perceived Security Threat 2 .955 .061 .096Perceived Security Threat 3 .869 .203 .117Response Efficacy 1 .314 .829 .037Response Efficacy 2 -.003 .925 -.094Response Efficacy 3 .057 .842 .079 Table E.4 – File Loss Password Change Item Loading Component Item 1 2 3 Perceived Security Vulnerability 1 .096 -.026 .883Perceived Security Vulnerability 2 -.050 -.020 .868Perceived Security Vulnerability 3 .203 -.119 .816Perceived Security Threat 1 .942 .009 .029Perceived Security Threat 2 .953 .081 .099Perceived Security Threat 3 .889 .071 .116Response Efficacy 1 .059 .925 -.035Response Efficacy 2 .023 .960 -.064Response Efficacy 3 .074 .914 -.067
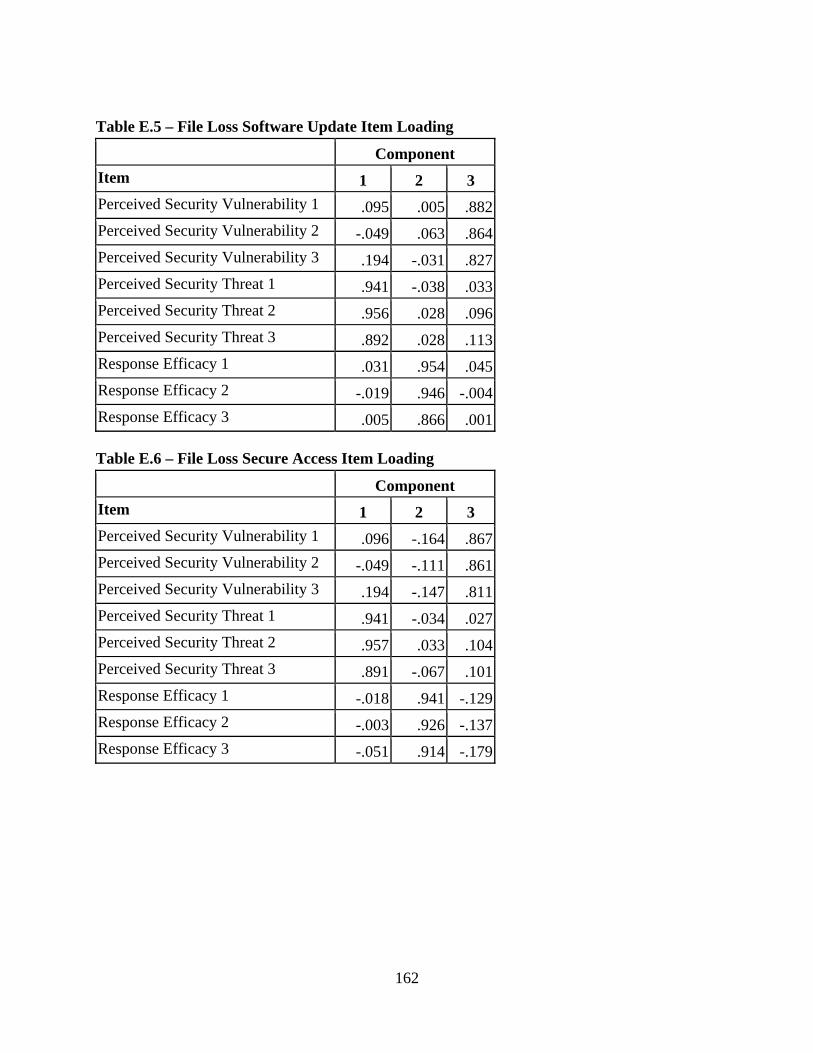
162
Table E.5 – File Loss Software Update Item Loading Component Item 1 2 3 Perceived Security Vulnerability 1 .095 .005 .882Perceived Security Vulnerability 2 -.049 .063 .864Perceived Security Vulnerability 3 .194 -.031 .827Perceived Security Threat 1 .941 -.038 .033Perceived Security Threat 2 .956 .028 .096Perceived Security Threat 3 .892 .028 .113Response Efficacy 1 .031 .954 .045Response Efficacy 2 -.019 .946 -.004Response Efficacy 3 .005 .866 .001 Table E.6 – File Loss Secure Access Item Loading Component Item 1 2 3 Perceived Security Vulnerability 1 .096 -.164 .867Perceived Security Vulnerability 2 -.049 -.111 .861Perceived Security Vulnerability 3 .194 -.147 .811Perceived Security Threat 1 .941 -.034 .027Perceived Security Threat 2 .957 .033 .104Perceived Security Threat 3 .891 -.067 .101Response Efficacy 1 -.018 .941 -.129Response Efficacy 2 -.003 .926 -.137Response Efficacy 3 -.051 .914 -.179
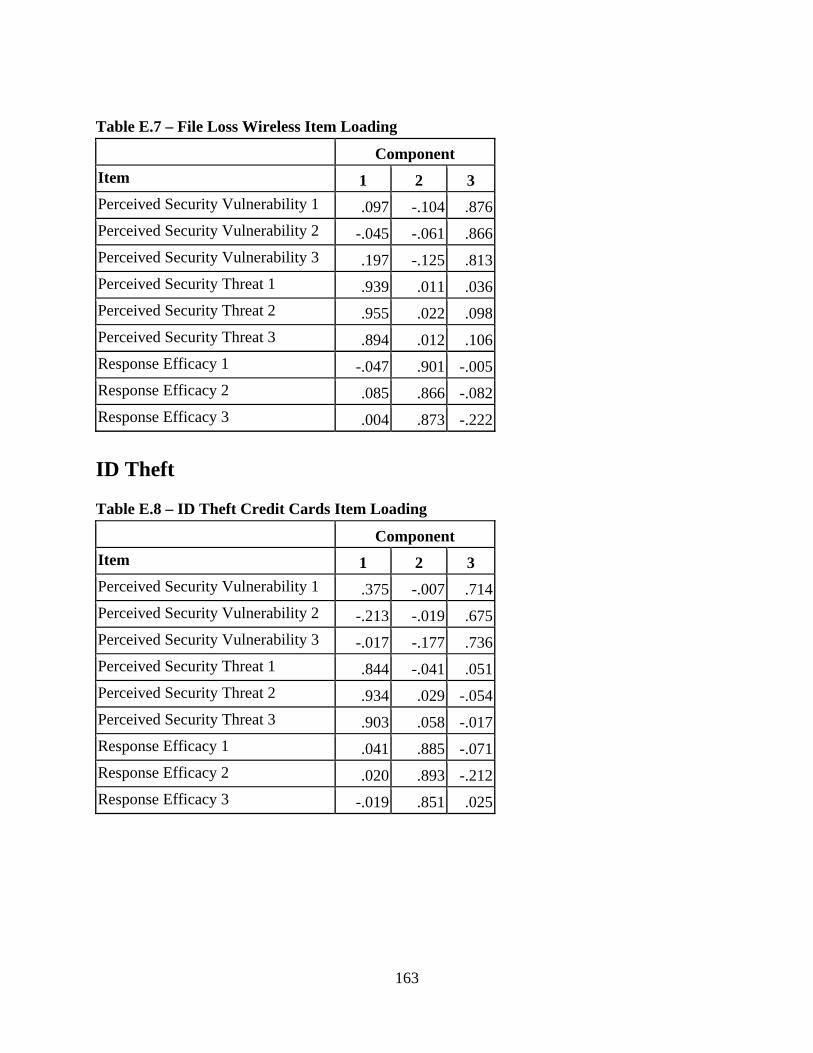
163
Table E.7 – File Loss Wireless Item Loading Component Item 1 2 3 Perceived Security Vulnerability 1 .097 -.104 .876Perceived Security Vulnerability 2 -.045 -.061 .866Perceived Security Vulnerability 3 .197 -.125 .813Perceived Security Threat 1 .939 .011 .036Perceived Security Threat 2 .955 .022 .098Perceived Security Threat 3 .894 .012 .106Response Efficacy 1 -.047 .901 -.005Response Efficacy 2 .085 .866 -.082Response Efficacy 3 .004 .873 -.222
ID Theft Table E.8 – ID Theft Credit Cards Item Loading Component Item 1 2 3 Perceived Security Vulnerability 1 .375 -.007 .714Perceived Security Vulnerability 2 -.213 -.019 .675Perceived Security Vulnerability 3 -.017 -.177 .736Perceived Security Threat 1 .844 -.041 .051Perceived Security Threat 2 .934 .029 -.054Perceived Security Threat 3 .903 .058 -.017Response Efficacy 1 .041 .885 -.071Response Efficacy 2 .020 .893 -.212Response Efficacy 3 -.019 .851 .025

164
Table E.9 – ID Theft Educate Item Loading Component Item 1 2 3 Perceived Security Vulnerability 1 .372 .138 .732Perceived Security Vulnerability 2 -.220 .006 .615Perceived Security Vulnerability 3 -.023 -.098 .761Perceived Security Threat 1 .841 .022 .057Perceived Security Threat 2 .934 .018 -.063Perceived Security Threat 3 .904 -.020 -.036Response Efficacy 1 .018 .817 -.033Response Efficacy 2 -.096 .845 -.203Response Efficacy 3 .084 .619 .209 Table E.10 – ID Theft Links Item Loading Component Item 1 2 3 Perceived Security Vulnerability 1 .365 .024 .722Perceived Security Vulnerability 2 -.225 -.008 .650Perceived Security Vulnerability 3 -.004 -.155 .754Perceived Security Threat 1 .831 .108 .074Perceived Security Threat 2 .935 .053 -.058Perceived Security Threat 3 .903 .078 -.026Response Efficacy 1 .031 .881 .013Response Efficacy 2 .021 .831 -.206Response Efficacy 3 .151 .707 .009
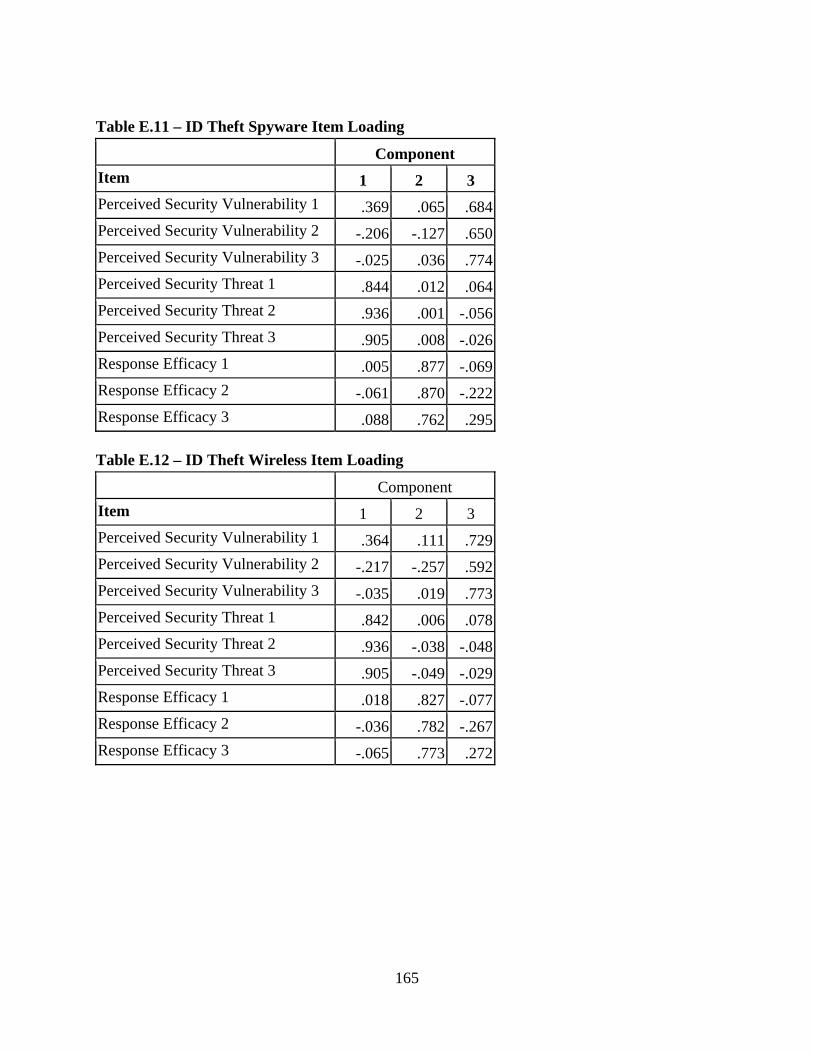
165
Table E.11 – ID Theft Spyware Item Loading Component Item 1 2 3 Perceived Security Vulnerability 1 .369 .065 .684Perceived Security Vulnerability 2 -.206 -.127 .650Perceived Security Vulnerability 3 -.025 .036 .774Perceived Security Threat 1 .844 .012 .064Perceived Security Threat 2 .936 .001 -.056Perceived Security Threat 3 .905 .008 -.026Response Efficacy 1 .005 .877 -.069Response Efficacy 2 -.061 .870 -.222Response Efficacy 3 .088 .762 .295 Table E.12 – ID Theft Wireless Item Loading Component Item 1 2 3 Perceived Security Vulnerability 1 .364 .111 .729Perceived Security Vulnerability 2 -.217 -.257 .592Perceived Security Vulnerability 3 -.035 .019 .773Perceived Security Threat 1 .842 .006 .078Perceived Security Threat 2 .936 -.038 -.048Perceived Security Threat 3 .905 -.049 -.029Response Efficacy 1 .018 .827 -.077Response Efficacy 2 -.036 .782 -.267Response Efficacy 3 -.065 .773 .272
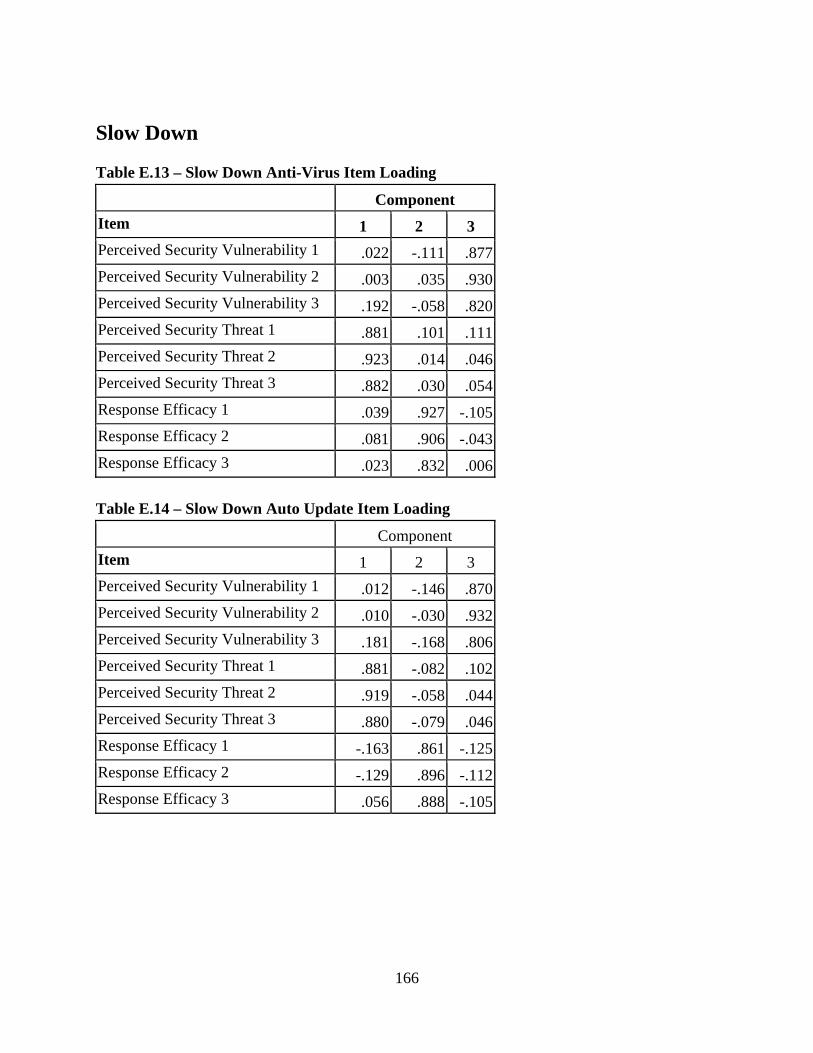
166
Slow Down Table E.13 – Slow Down Anti-Virus Item Loading Component Item 1 2 3 Perceived Security Vulnerability 1 .022 -.111 .877Perceived Security Vulnerability 2 .003 .035 .930Perceived Security Vulnerability 3 .192 -.058 .820Perceived Security Threat 1 .881 .101 .111Perceived Security Threat 2 .923 .014 .046Perceived Security Threat 3 .882 .030 .054Response Efficacy 1 .039 .927 -.105Response Efficacy 2 .081 .906 -.043Response Efficacy 3 .023 .832 .006 Table E.14 – Slow Down Auto Update Item Loading Component Item 1 2 3 Perceived Security Vulnerability 1 .012 -.146 .870Perceived Security Vulnerability 2 .010 -.030 .932Perceived Security Vulnerability 3 .181 -.168 .806Perceived Security Threat 1 .881 -.082 .102Perceived Security Threat 2 .919 -.058 .044Perceived Security Threat 3 .880 -.079 .046Response Efficacy 1 -.163 .861 -.125Response Efficacy 2 -.129 .896 -.112Response Efficacy 3 .056 .888 -.105

167
Table E.15 – Slow Down Firewall Item Loading Component Item 1 2 3 Perceived Security Vulnerability 1 -.090 .001 .871Perceived Security Vulnerability 2 -.053 -.005 .924Perceived Security Vulnerability 3 -.068 .176 .813Perceived Security Threat 1 -.055 .895 .126Perceived Security Threat 2 -.011 .928 .005Perceived Security Threat 3 .016 .880 .043Response Efficacy 1 .943 .007 -.065Response Efficacy 2 .933 -.069 -.053Response Efficacy 3 .909 .013 -.102 Table E.16 – Slow Down Pop Up Item Loading Component Item 1 2 3 Perceived Security Vulnerability 1 .017 -.003 .886Perceived Security Vulnerability 2 -.142 .001 .915Perceived Security Vulnerability 3 -.132 .188 .801Perceived Security Threat 1 .034 .892 .132Perceived Security Threat 2 .036 .928 .006Perceived Security Threat 3 .056 .880 .041Response Efficacy 1 .939 .097 -.114Response Efficacy 2 .921 -.021 -.079Response Efficacy 3 .920 .058 -.065
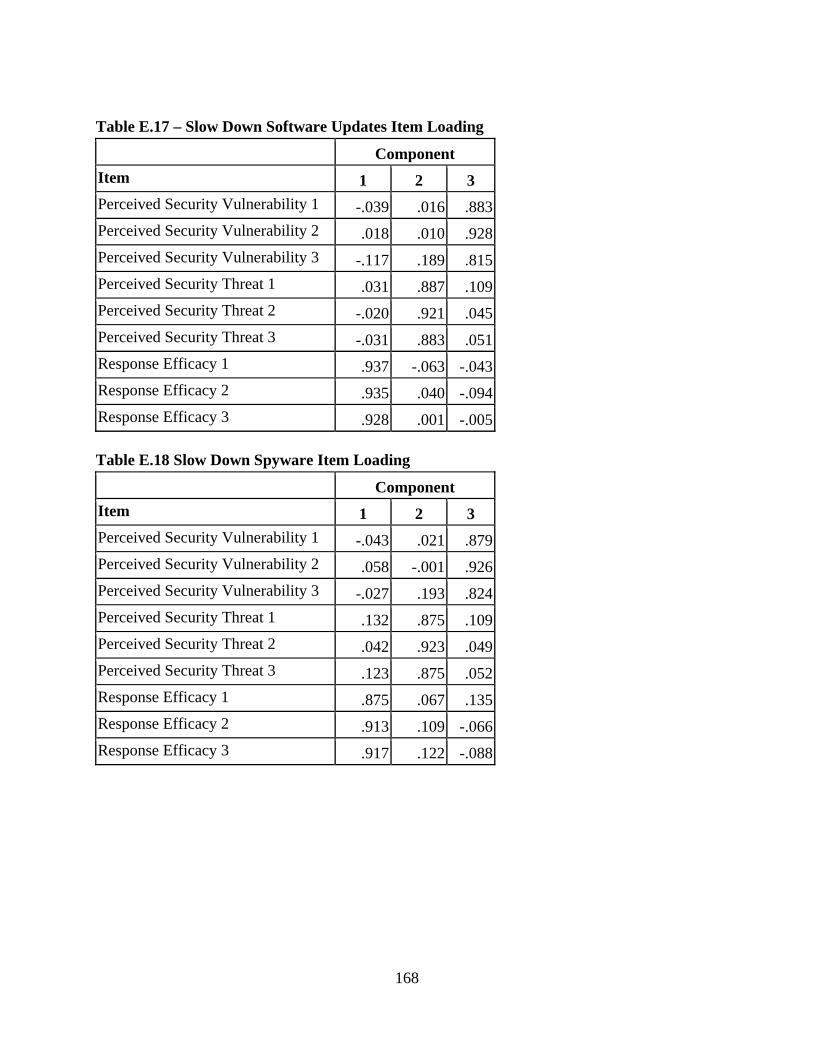
168
Table E.17 – Slow Down Software Updates Item Loading Component Item 1 2 3 Perceived Security Vulnerability 1 -.039 .016 .883Perceived Security Vulnerability 2 .018 .010 .928Perceived Security Vulnerability 3 -.117 .189 .815Perceived Security Threat 1 .031 .887 .109Perceived Security Threat 2 -.020 .921 .045Perceived Security Threat 3 -.031 .883 .051Response Efficacy 1 .937 -.063 -.043Response Efficacy 2 .935 .040 -.094Response Efficacy 3 .928 .001 -.005 Table E.18 Slow Down Spyware Item Loading Component Item 1 2 3 Perceived Security Vulnerability 1 -.043 .021 .879Perceived Security Vulnerability 2 .058 -.001 .926Perceived Security Vulnerability 3 -.027 .193 .824Perceived Security Threat 1 .132 .875 .109Perceived Security Threat 2 .042 .923 .049Perceived Security Threat 3 .123 .875 .052Response Efficacy 1 .875 .067 .135Response Efficacy 2 .913 .109 -.066Response Efficacy 3 .917 .122 -.088
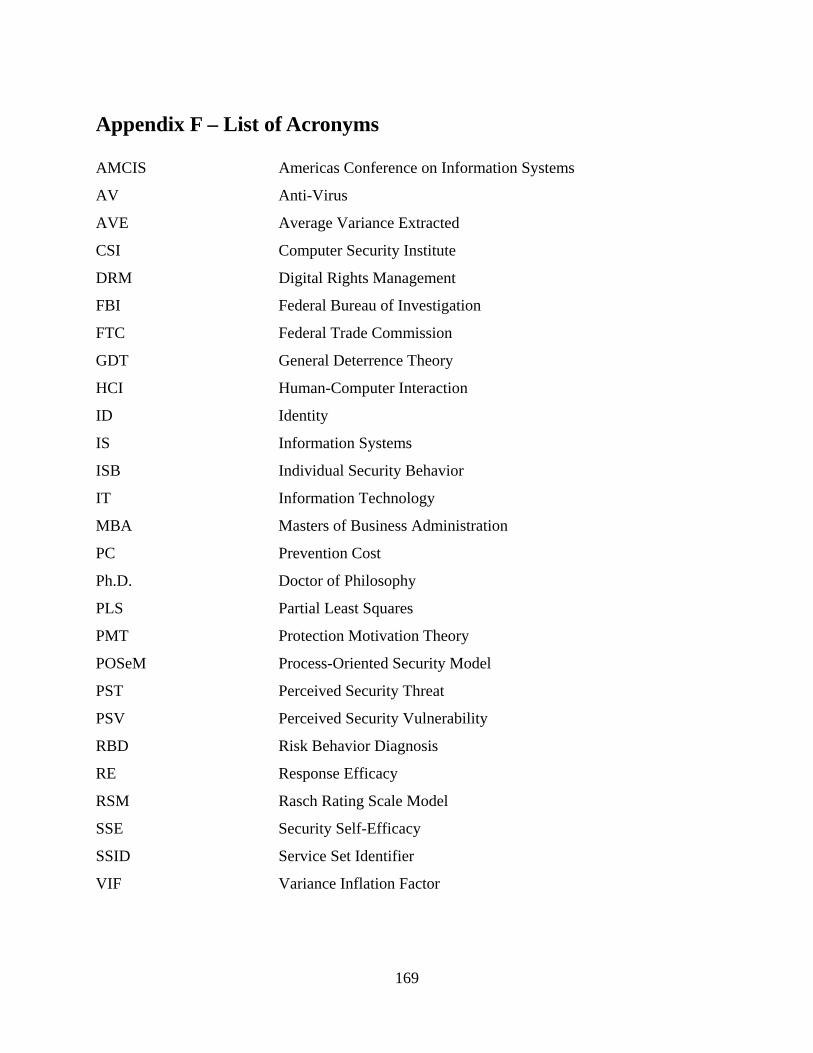
169
Appendix F – List of Acronyms AMCIS Americas Conference on Information Systems
AV Anti-Virus
AVE Average Variance Extracted
CSI Computer Security Institute
DRM Digital Rights Management
FBI Federal Bureau of Investigation
FTC Federal Trade Commission
GDT General Deterrence Theory
HCI Human-Computer Interaction
ID Identity
IS Information Systems
ISB Individual Security Behavior
IT Information Technology
MBA Masters of Business Administration
PC Prevention Cost
Ph.D. Doctor of Philosophy
PLS Partial Least Squares
PMT Protection Motivation Theory
POSeM Process-Oriented Security Model
PST Perceived Security Threat
PSV Perceived Security Vulnerability
RBD Risk Behavior Diagnosis
RE Response Efficacy
RSM Rasch Rating Scale Model
SSE Security Self-Efficacy
SSID Service Set Identifier
VIF Variance Inflation Factor