Embed Size (px)
Citation preview

MARINE ECOLOGY PROGRESS SERIESMar Ecol Prog Ser
Vol. 397: 341–354, 2009doi: 10.3354/meps08300
Published December 17
INTRODUCTION
New Zealand is closely surrounded by extensive vol-canic underwater topographic features ranging fromthe 10 000 m deep Kermadec Trench in the north to the4000 m high Macquarie Ridge in the South, and fromthe Lord Howe Rise and Challenger Plateau in thewest to the Louisville Seamount chain in the east.The Food and Agriculture Organization of the UnitedNations (FAO) lists such features, particularly sub-merged edges and slopes; summits and flanks of
seamounts, guyots, banks, knolls and hills; canyons,trenches and hydrothermal vents as features thatpotentially support species, groups or communitieswhich are ‘considered sensitive and potentially vulner-able to deep sea fisheries in the high seas, and whichmay contribute to forming vulnerable marine ecosys-tems (VMEs)’ (FAO 2008, p. 16).
UN General Assembly Resolution 61/105 (UNGA2006) requires that such areas on the high seas shouldbe closed to bottom fisheries unless adequate manage-ment measures have been put in place to prevent
© Inter-Research 2009 · www.int-res.com*Email: [email protected]
Protection measures implemented by New Zealandfor vulnerable marine ecosystems in the South
Pacific Ocean
Andrew J. Penney1,*, Steven J. Parker2, James H. Brown1
1Ministry of Fisheries, PO Box 1020, Wellington, New Zealand2National Institute of Water and Atmospheric Research, PO Box 893 Nelson, New Zealand
ABSTRACT: Interim measures for bottom fisheries adopted by the South Pacific Regional FisheriesManagement Organization (SPRFMO) require participants to limit bottom fishing to currently fishedareas and prevent significant adverse impacts on vulnerable marine ecosystems (VMEs). The NewZealand bottom trawl footprint consists of two hundred 20 min latitude × 20 min longitude blockstrawled over the period 2002–2006 within which New Zealand flagged vessels reported 11 425 tows,primarily targeting orange roughy Hoplostethus atlanticus. Past effort and seabed impact levels dif-fer substantially between these blocks, ranging from lightly (<3 tows block–1) to heavily trawled(>50 tows block–1), with a maximum of 1417 tows in the most heavily trawled block. Effort data wereused to stratify the bottom trawl footprint into 3 effort tiers as the basis for a management approachtailored to levels of past impact: (1) adequate and representative spatial closure of areas likely to sup-port VMEs, with emphasis on less impacted areas; (2) a move-on rule in areas where likelihood ofencounter with a VME is unknown; and (3) constraining fishing effort to remaining open areas mostimpacted by past fishing. Sixty-two lightly trawled blocks were closed to prevent impact in theseareas; 69 moderately trawled blocks were subjected to a move-on rule; and 69 heavily trawled blockswere designated as open to fishing. A further 20 blocks were closed to provide representative protec-tion within the moderately and heavily trawled tiers. In the absence of seabed biodiversity data, bio-logically important physical factors, primarily depth range and topography, were used to selectinterim precautionary closures and to evaluate representativity of closed in comparison with openareas. Geospatial analyses are presented on the distribution and representivity of seabed depthwithin open, move-on and closed blocks in each fishing area in comparison with the overall SPRFMOArea.
KEY WORDS: Vulnerable marine ecosystems · Deep-sea coral · Trawling impacts · Spatial fisheriesmanagement · SPRFMO
Resale or republication not permitted without written consent of the publisher
Contribution to the Theme Section ‘Conservation and management of deep-sea corals and coral reefs’ OPENPEN ACCESSCCESS
Mar Ecol Prog Ser 397: 341–354, 2009
significant adverse impacts on VMEs. Participantsnegotiating the South Pacific Regional Fisheries Man-agement Organisation (SPRFMO) accordingly adoptedinterim measures for high seas bottom fisheries in 2007(SPRFMO 2007a)1, including limiting bottom fishing toareas where such fishing is currently occurring and, inareas where VMEs are known or likely to occur, imple-menting measures ‘to prevent significant adverse im-pacts on vulnerable marine ecosystems and the long-term sustainability of deep sea fish stocks’ (SPRFMO2007a, Bottom Fisheries Interim Measure 3). Vesselsencountering evidence of VMEs are required to imple-ment a move-on rule and cease fishing operationswithin 5 nautical miles (n miles) of that site. NewZealand is implementing these measures through aseries of sequential steps. Some of these requirementswere already satisfied by existing management sys-tems for New Zealand fisheries (e.g. vessel monitoringsystems, VMS), while others have required enhance-ment of existing systems (e.g. increased observer cov-erage). Requirements to limit bottom fishery impactsto currently fished areas, and to prevent significantadverse impacts in these areas, are being implementedusing a combination of precautionary closures, openareas and areas where the SPRFMO move-on rule isimplemented.
New Zealand’s implementation of the SPRFMO in-terim measures began with full observer coverage forbottom trawling in 2007, followed by conservation andmanagement measures that came into effect in May2008 for the 2008 high seas bottom trawling season, im-plemented as conditions on the high seas fishing per-mits required by New Zealand flagged vessels fishingthe high seas. Here we describe the process wherebythese measures were developed, present the informa-tion used to design these measures and evaluate therepresentativity of closed and move-on areas, in termsof biologically important physical factors, in comparisonwith areas left open to fishing. There is an emerging lit-erature on the design of effective deep-water closuresfor the representative protection of deep-sea biodiver-sity (e.g. Davies et al. 2008, Rogers et al. 2008, Abdullaet al. 2009, Clark & Rowden 2009, Williams et al. 2009),and we explain to what extent the guiding principlesemanating from this work have been applied to the de-sign of interim protection measures, and what furtherinformation or work is required for these principles tobe more rigorously applied in the design of future long-term spatial protection measures.
MAPPING THE NEW ZEALAND BOTTOM TRAWLFOOTPRINT
In terms of the Benthic Assessment Frameworkadopted by SPRFMO in 2007, currently fished areasare defined as the bottom fishing ‘footprint’, consistingof 20 min latitude × 20 min longitude blocks withinwhich at least 1 trawl occurred over 2002–2006(SPRFMO 2007b). The New Zealand high seas bottomtrawling footprint was mapped using catch and effortdata reported to the New Zealand Ministry of Fisherieson compulsory catch and effort returns which report alltrawl tow start and end positions in latitude/longitudeto the nearest minute. The resultant bottom trawl foot-print consists of two hundred 20 min latitude × 20 minlongitude blocks comprising 5 distinct fishing areas:Lord Howe Rise, Challenger Plateau, West NorfolkRidge, Three Kings Ridge and Louisville Ridge (Fig. 1).
From 2002 to 2006, 11 145 bottom trawls were re-ported by New Zealand vessels in these fishing areasand levels of past fishing effort differed substantiallybetween individual 20 × 20 min trawl footprint blocks.A total of 62 blocks were classified as lightly trawled,with a combined total of 92 tows at <3 tows per blockand an effective average of zero tows per year. At theother end of the scale, half the remaining blocks(69 blocks) had 10 533 tows, with >50 tows (average 10tows yr–1) per block and a maximum total of 1417 towsreported over 2002–2006 in the most heavily trawledblock (on the Challenger Plateau). Within this area,comprising a heavily trawled one-third of the totalfootprint, 95% of the trawling effort occurred, 97%(8957 tonnes [t]) of the New Zealand high seas orangeroughy Hoplostethus atlanticus catch was made, muchof the trawling was conducted on shallower featuresand seabed impacts will have been most concentrated(MFish 2008). Between these effort extremes, the re-maining one-third of the footprint (69 blocks) had 5% ofthe effort (559 tows) and 3% (265 t) of the orangeroughy catch. Within these moderately trawled blocks,most trawls were conducted on flatter areas adjacent toshallower features, and seabed impacts would havebeen relatively low.
PREVENTION OF SIGNIFICANT ADVERSEIMPACTS ON VMEs
In terms of the SPRFMO interim measures for bottomfisheries, participants are required to close areaswhere VMEs are ‘known or likely to occur’, unless ade-quate management measures have been implementedto prevent ‘significant adverse impacts’ on VMEs insuch areas. Significant adverse impacts remain unde-fined but, following UNGA Resolution 61/105 (UNGA
342
1The SPRFMO Area is under negotiation, but for the purposesof the interim measures and the present study it is the highseas area south of the Equator, north of the CCAMLR Con-vention area, east of the SIOFA Convention Area and west ofthe areas of fisheries jurisdictions of South American States.

Penney et al.: New Zealand VME protection measures 343
Fig. 1. Geographic distribution of open, move-on and closed New Zealand bottom trawl footprint blocks in (a) the Lord HoweRise, Challenger Plateau, West Norfolk Ridge and Three Kings Ridge fishing areas; and (b) the Northern and Central LouisvilleRidge areas (southern Louisville footprint blocks not shown). Dark grey shading shows the trawlable seabed area <2000 m depth
Mar Ecol Prog Ser 397: 341–354, 2009
2007), concerns focus on impacts on underwater topo-graphic features which support VMEs, particularlyseamounts and biogenic habitat-forming cold-watercorals and sponge fields. In areas where presence ofVMEs is unknown, participants are required to imple-ment the 5 n mile move-on rule. The specific definitionof ‘evidence of a VME’ developed by New Zealand totrigger this move-on rule is described in detail byParker et al. (2009, this Theme Section).
Specific management and mitigation measures tomeet the requirements of these interim measures weredeveloped in consultation with industry, environmentalnon-governmental organizations and government de-partments concerned with environmental conservation.Expectedly, competing objectives or requirements wereexpressed by participants in these consultations: (1) toprotect all features known or likely to support vulnerablemarine species from any significant adverse impactsfrom bottom fishing operations; and (2) to provide accessto adequate and suitable target areas to provide for aviable and sustainable deep-water trawl fishery.
The management approach has taken attempts tobalance these competing objectives. Recognising thedifficulty of defining ‘significant adverse impacts’,New Zealand has implemented measures whichinstead attempt to provide for ‘adequate and represen-tative protection’ from trawling impacts. While thisrequires functional definitions of ‘adequate’ and‘representative’ to be adopted, there has re-cently been substantial international develop-ment of approaches, guidelines and best prac-tice in defining these concepts as they pertain todesigning spatial protection measures formarine ecosystems (see Davies et al. 2008,Rogers et al. 2008, Abdulla et al. 2009, Clark& Rowden 2009, Williams et al. 2009). Anapproach based on implementing spatial pro-tection measures representative of the bio- andgeodiversity of the area also inevitably requiresthat such measures need to be designed andimplemented at an ecosystem, biotype or biomelevel (sensu Williams et al. 2009), and not at anindividual feature or organism level.
Three-tier management approach
The combination of the 3 competing require-ments to close or adequately protect areasknown or likely to contain VMEs, to implementa move-on rule in areas where likelihood ofencounters with evidence of a VME is unknownand to provide for suitable target areas for aviable and sustainable deep-water trawl fisheryessentially dictates a 3-tiered approach to im-
plementation of management measures. New Zea-land’s approach has been to specifically tailor manage-ment measures to incorporate known or likely bio- andgeodiversity of the fished areas, as well as levels ofpast effort and impact. The 3-tier effort stratification ofthe New Zealand bottom trawl footprint intentionallyfacilitates such an approach.
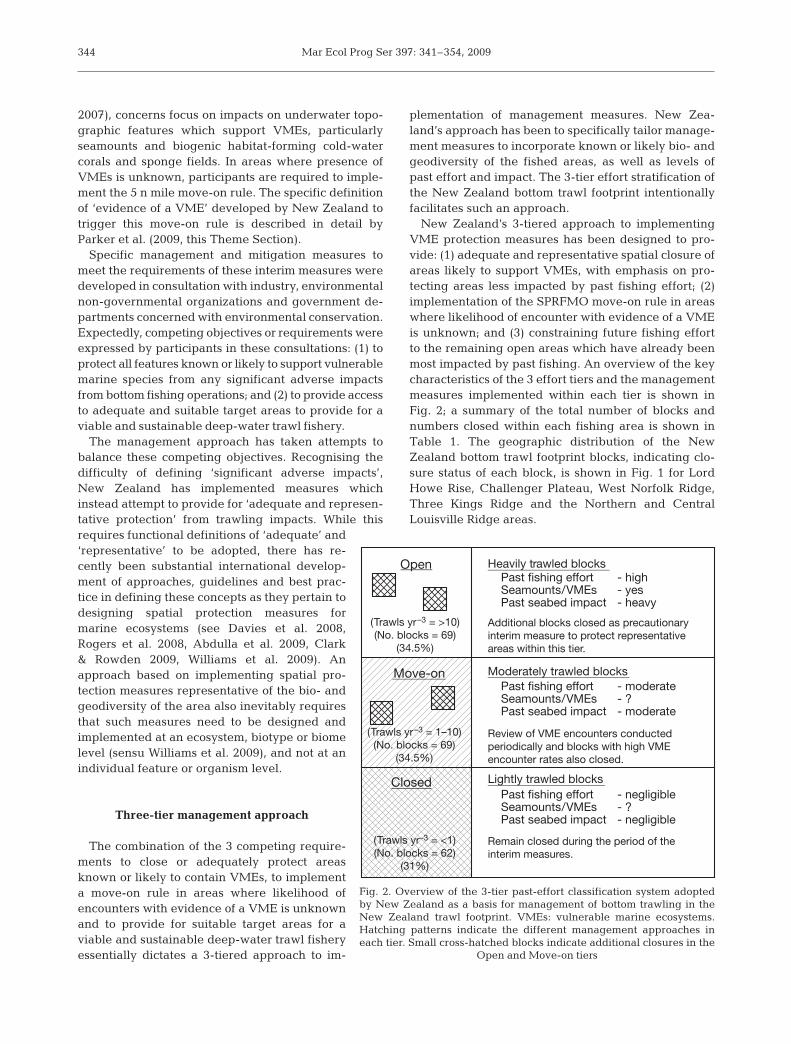
New Zealand’s 3-tiered approach to implementingVME protection measures has been designed to pro-vide: (1) adequate and representative spatial closure ofareas likely to support VMEs, with emphasis on pro-tecting areas less impacted by past fishing effort; (2)implementation of the SPRFMO move-on rule in areaswhere likelihood of encounter with evidence of a VMEis unknown; and (3) constraining future fishing effortto the remaining open areas which have already beenmost impacted by past fishing. An overview of the keycharacteristics of the 3 effort tiers and the managementmeasures implemented within each tier is shown inFig. 2; a summary of the total number of blocks andnumbers closed within each fishing area is shown inTable 1. The geographic distribution of the NewZealand bottom trawl footprint blocks, indicating clo-sure status of each block, is shown in Fig. 1 for LordHowe Rise, Challenger Plateau, West Norfolk Ridge,Three Kings Ridge and the Northern and CentralLouisville Ridge areas.
344
Open
Move-on
Closed
(Trawls yr–3 = >10)(No. blocks = 69)
(34.5%)
(Trawls yr–3 = <1)(No. blocks = 62)
(31%)
(Trawls yr–3 = 1–10)(No. blocks = 69)
(34.5%)
Heavily trawled blocksPast fishing effort - highSeamounts/VMEs - yesPast seabed impact - heavy
Past fishing effort - moderateSeamounts/VMEs - ?Past seabed impact - moderate
Past fishing effort - negligibleSeamounts/VMEs - ?Past seabed impact - negligible
Additional blocks closed as precautionary interim measure to protect representative areas within this tier.
Moderately trawled blocks
Review of VME encounters conducted periodically and blocks with high VME encounter rates also closed.
Lightly trawled blocks
Remain closed during the period of the interim measures.
Fig. 2. Overview of the 3-tier past-effort classification system adoptedby New Zealand as a basis for management of bottom trawling in theNew Zealand trawl footprint. VMEs: vulnerable marine ecosystems.Hatching patterns indicate the different management approaches ineach tier. Small cross-hatched blocks indicate additional closures in the
Open and Move-on tiers

Penney et al.: New Zealand VME protection measures
Tier 1: lightly trawled blocks
The 62 lightly trawled blocks have been closed tofurther fishing. This reduces the area available forfuture fishing more closely to the actual area fishedhistorically and protects these lightly trawled areasfrom further impact. A similar approach to benthicprotection has been adopted in other regions, such asthe open areas approach by the US National MarineFisheries Service (NMFS) for benthic habitat protec-tion in the Aleutian Islands/Bering Sea groundfishtrawl fishery (NMFS 2008). An important purpose ofthat fishery management plan is to constrain fishingeffort to seabed areas already impacted by past fish-ing, and prevent effort from expanding onto adjacentuntrawled or lightly trawled areas (as recommendedby Davies et al. 2007). The approach taken by NMFShas been to close any area with ≤1 trawl 100 km–2
during 1998–2005 to further fishing, and any areawith >1 trawl being designated the open area for fish-ing. For comparison, the 20 × 20 min blocks compris-ing the New Zealand bottom trawl footprint average1087 km2 in area, ranging from 1243 km2 in the northto 898 km2 in the south of the footprint, and blockswith <4 trawls during 2002–2006 being closed.
Tier 2: moderately trawled blocks
Much of the fishing effort in the 69 moderatelytrawled (3 to 50 tows) blocks has comprised exploratoryfishing in areas adjacent to targeted seamount fea-tures. These tend to be flatter, mud-dominated areasand it is largely unknown, but certainly less likely (in
terms of habitat suitability), that VMEs occur in theseblocks. The move on rule has therefore been applied inthese blocks using the rapid VME Identification Proto-col described in Parker et al. (2009). Vessels bringingup evidence of a VME (as defined in that protocol) arerequired to move 5 n miles away from the positionwhere hauling of the gear commenced for any particu-lar tow, and not fish within 5 n miles of that position forthe remainder of that fishing trip. Evidence of VMEs intrawl bycatches in each tow is gathered by scientificobservers under the 100% observer coverage require-ments for high seas bottom trawling. These observersadditionally collect comprehensive benthic bycatchdata, quantified and identified to the lowest possibletaxon, from every tow in all areas. Data generated bytrawls encountering evidence of a VME will be period-ically reviewed, together with observer data ondetailed benthic bycatch, to ascertain to what extentthis evidence of a VME indicates actual existence ofVMEs. Additional closures will be considered if consis-tent and significant evidence indicates existence ofVMEs in particular areas (as recommended by Rogerset al. 2008, see Parker et al. 2009 for details).
Tier 3: heavily trawled blocks
One of the explicit objectives of the New Zealandmanagement approach is to provide for some level offuture bottom fishing activity. Of the past fishing effort,95% has occurred in the 69 heavily trawled (>50 tows)blocks, much of it targeting certain specific seamountfeatures. These heavily trawled blocks also produced97% of the catch during 2002–2006. Given the existingevidence of the substantial impact of bottom trawlingon fragile deep-water corals, it is likely that manyVMEs in heavily targeted fishing positions in theseareas have already been significantly impacted. Thishas led authors such as Davies et al. (2007) to concludethat, if fishing is to continue in the deep sea, the mostimmediately effective measure would be to allow fish-ing to continue in areas where benthic damage hasalready occurred, but to close other areas to newfishing to protect benthic habitats and fish stocks. Thishas been the approach taken to benthic habitat pro-tection in the Aleutian Islands/Bering Sea groundfishtrawl fishery (NMFS 2008), and was the main principleunderpinning the establishment of the SPRFMO bot-tom fishing footprint.
Most of these heavily fished blocks have thereforebeen designated as open fishing areas. The move-onrule has not been applied in these blocks, partly toaddress the concern that such move-on provisionsresult in steady expansion of fishing effort onto adja-cent, previously less impacted areas, and partly to
345
Table 1. Summary of block closures in New Zealand based onthe 3-tier stratification, including the total number of 20 minlatitude × 20 min longitude blocks in each fishing area, thenumber closed in the lightly fished tier and the number addi-tionally closed in the moderately (9 blocks closed) and heavily
trawled (11 blocks closed) tiers
Fishing area Total no. of Lightly Additional blocks trawled closures:
closed moderate & blocks heavy areas
Lord Howe North 22 8 2Lord Howe South 23 12 2Challenger Plateau 58 9 6West Norfolk Ridge 17 6 2Three Kings Ridge 10 4 1Louisville North 24 7 3Louisville Central 26 6 2Louisville South 16 6 2Other areas 4 4 0
Total 200 62 20

Mar Ecol Prog Ser 397: 341–354, 2009
focus fishing on already heavily targeted features.Instead, adequate representative protection of VMEsacross the spatial scale of each of the distinct fishingareas is being implemented through the closure of thelightly trawled tier, implementation of the move-onrule (with the possibility of further closures if exis-tence of VMEs is demonstrated), plus additional pre-cautionary closures in the moderately and heavilytrawled tiers.
Additional block closures
To address concerns that closures implemented onlyin the lightly trawled tier would not be adequately rep-resentative of seabed features and geodiversity of theopen areas, additional representative protection wasimplemented in the heavily and moderately trawledtiers in the form of an additional 20 block closures(10% of the total footprint blocks), 9 in the moderatelytrawled and 11 in the heavily trawled areas. The 20additional block closures were specifically selected tobe representative of the open areas in terms of depthrange and topography, using high-resolution bathyme-try provided by industry for the purpose of the consul-tations.
The resulting distribution of closures across fishingareas is summarised in Table 1 and shown in Fig. 1.The lightly trawled block closures are distributedacross all fishing areas in inverse proportion to thelevel of past fishing effort in each area. A smaller pro-portion of the blocks have remained lightly trawled inheavily trawled areas such as the Challenger Plateau,so a smaller proportion of blocks in that area (16%)have been closed. In contrast, a high proportion ofblocks have been lightly trawled and closed in morelightly trawled areas such as the West Norfolk Ridge(35% closed), Three Kings Ridge (40% closed) andLord Howe Rise (44% closed). Lightly trawled blockclosures along the Louisville Ridge range from 23% ofblocks for the most heavily trawled central area to38% of blocks in the more lightly trawled southernarea.
Additional closures in the moderately and heavilytrawled tiers were intentionally distributed in propor-tion to the number of heavily trawled blocks in eacharea to ensure proportional protection by these addi-tional closures between fishing areas. The largestnumber of additional closures was therefore made inthe Challenger Plateau (6 blocks), decreasing to 1additional closure in the Three Kings Ridge area. Overthe entire bottom trawl footprint, 31% of the blockswere closed due to being lightly trawled; with addi-tional closures this brings the total proportion closed to41% (82 of the 200 blocks).
EVALUATING REPRESENTATIVITY OF SPATIALCLOSURES
Adequate and representative spatial closures havebeen recognized as probably the most effective long-term VME protection measure by the SPRFMO Sci-ence Working Group (SPRFMO 2007c) and the FAOTechnical Consultation on International Guidelines forthe Management of Deep-sea Fisheries in the HighSeas (FAO 2008). Recent IUCN recommendations onprotection of seamounts and deep-sea VMEs recom-mend a minimum closure of 30 to 40% of such areas(Rogers et al. 2008), although some estimates suggestthat a precautionary approach may require 50 to 90%of the total habitat to be protected (Clark 1996, Laucket al. 1998). One of the main questions that aroseduring consultations and risk assessment of the 3-tiermanagement approach and proposed closures waswhether proposed closed areas were representative ofthe open areas in terms of likelihood of supportingVMEs, and whether these closures would be sufficientto constitute adequate and representative protectionacross the spatial scale of the bottom trawl footprint orthe SPRFMO Area (MFish 2008).
Given adequate time and funding to conduct thenecessary seabed biodiversity surveys, spatial protec-tion measures should be designed around protectionof areas demonstrated to be highly biodiverse; thisapproach has been strongly advocated in the design ofinshore marine protected areas (MPAs). In deep-waterareas, protection of the Darwin Mounds northwest ofScotland after demonstration that these mounds werecolonised by a diverse community of corals, suspensionfeeders and infauna (Van Gaever et al. 2004) is cited asan example of the approach which should be adopted(Davies et al. 2007). However, data on seabed biodiver-sity are lacking for most deep-sea benthic areas, andare unlikely to be collected except for a few seamountsystems, so an alternate approach is required. Initially,bathymetric information was used to define, identifyand delineate geomorphic units or characteristic sea-bed features, such as seamounts; spatial protectionproposals were then stratified by these units (e.g. Har-ris 2007). The prevalence of this approach is reflectedin the FAO Guidelines for Management of Deep-seaFisheries (FAO 2008), which specifically define VMEsin terms of seabed features likely to support vulnerablespecies.
However, Williams et al. (2009) have demonstratedthat reliance on geodiversity alone results in falseassumptions of homogeneity within geomorphic units,unless other factors of biological importance are takeninto consideration. They found that the most importantof these factors are depth, feature size and topographiccomplexity, which strongly influence biodiversity
346

Penney et al.: New Zealand VME protection measures
within a feature class. Noting the general paucity ofhigh-seas biodiversity data, a series of workshops todevelop guidelines for the design of MPA networks forseamounts and the Abyssal Nodule Province in thePacific high seas (Clark et al. 2009) distilled habitatsuitability classification approaches (such as Hirzel etal. 2002, Clark et al. 2006) and recommendationsregarding key factors to include when evaluating geo-morphic features as surrogates for seabed biodiversity(e.g. Williams et al. 2009) into recommendations forstratification of deep-sea spatial closures to representkey biologically important factors of importance tocold-water corals.
The following 4 main recommended key factorswere used to stratify and evaluate representativity ofthe spatial closures within the New Zealand bottomtrawl footprint.
Stratification by biogeographic zone
At the highest level, spatial closures should reflectoceanographic conditions of water masses in largeocean areas, such as the Southwest Pacific Ocean.Fishing areas in the Tasman Sea and the SouthwestPacific Ocean occupy, at most, 2 different biogeo-graphic zones. The requirement of stratifying repre-sentative benthic protection measures by biogeo-graphic zone (Clark et al. 2009) is therefore auto-matically dealt with by stratifying closures betweenthe fishing areas, with the Lord Howe Rise, ChallengerPlateau, West Norfolk Ridge and Three Kings Ridgefishing areas in the Tasman Sea, and the LouisvilleRidge in the Southwest Pacific Ocean.
Stratification by proximity and/or connectivity
The distance between underwater topographic fea-tures and the relationship of seamount direction to cur-rent flow affect the abilities of fauna to disperse andcolonize adjacent seamounts. The separation distanceindicating a separate feature has been proposed as 100to 200 km and Clark et al. (2009) recommend 2 ranges:close (<100 km separation) and distant (>100 km sepa-ration) as appropriate strata for precautionary conser-vation in the central Pacific region. Under the NewZealand approach, stratification of spatial closures torepresent the various fishing areas also addresses therecommendation to stratify spatial closures by proxim-ity and/or connectivity. The Tasman Sea fishing areasare about 150 × 300 km in size, with separationbetween them ranging from about 50 to 250 km. The 3areas along the Louisville Ridge are about 120 kmwide, and are separated by a similar distance.
Stratification by depth range
After geomorphology (feature types), depth has beenfound to be a major determinant of species composi-tion, particularly on deep-sea seamount features withhigh elevation (Clark & Rowden 2009, Williams et al.2009). Elevation above the abyssal plain (which typi-cally lies at ~4000 m deep in the South Pacific Ocean)is also a relative measure of seamount size. The follow-ing depth strata were adopted for the purposes of eval-uating the New Zealand bottom trawl closures, modi-fied slightly from those recommended by Clark et al.(2009) to divide strata at 2000 m, the current maximumtrawlable depth:
(1) 0 to 200 m: this stratum covers the protrusion of aseabed feature into the photic zone.
(2) 201 to 800 m: this stratum covers the depth rangeof the scattering layer, composed of vertically migrat-ing animals, and the impact of these on the fauna thatexists on seamount summits. The upper limit, 800 m, isthe upper bathyal split proposed by Zezina (1997).
(3) 801 to 2000 m: this stratum covers part of the 800to 3500 m depth band recognized in the Global OpenOceans and Deep-sea habitats (GOODs) bioregionalclassification (Vierros et al. 2008) as the lower bathyalbiogeographic zone, as assigned by Zezina (1997)based on a global evaluation of brachiopods. The lowerbathyal zone has been divided at 2000 m, the currentmaximum trawlable depth, for the purpose of designingrepresentative closures in the bottom trawl footprint.
(4) >2000 m: this is the stratum below current trawl-ing technology, and currently beyond impact by deep-water trawling.
Stratification by topography
Seabed topography is an indicator of seabed geol-ogy, and therefore of substratum suitability for sup-porting VME species, and provides the primary basisfor geomorphological classification of specific seabedfeature classes (such as seamounts, canyons or ridges).The FAO (2008) specifically recognizes the followingas being features that potentially support species,groups or communities which may contribute to form-ing VMEs: submerged edges and slopes; summits andflanks of seamounts, guyots, banks, knolls, and hills;and canyons, trenches and hydrothermal vents.
Representativity of spatial closures by depth
Representativity of the New Zealand interim spatialclosures by depth and topography were evaluatedusing bathymetric data. Additional block closures were
347

Mar Ecol Prog Ser 397: 341–354, 2009
selected to be representative of topography and depthrange of open areas within each fishing area, based onhigh-resolution industry bathymetric data of trawledareas. Representativity of closed areas in relation tothe SPRFMO Area was evaluated using the 2008global 1 min resolution gridded bathymetry availablefrom the General Bathymetric Chart of the Oceans(GEBCO, www.gebco.net). Data were extracted for theSPRFMO Area (0° to 60° S, 120° E to 70° W) and re-gridded at 3 min resolution using MapInfo VerticalMapper®. Simple rectangular gridding (which aver-ages nearby depths at the new grid resolution) wasused to avoid introducing any further gridding arte-facts. These regridded depth data were contouredusing MapInfo® to produce closed contour regions atintervals of 200 m from which areas by depth could becalculated, and split into regions which fall within theSPRFMO Area and those which fall into Exclusive Eco-nomic Zones (EEZs) adjacent to the SPRFMO Area.
Histograms of the resulting 200 m depth frequencydistributions are shown in Fig. 3 for EEZs and theSPRFMO Area. The seabed in the SPRFMO Area pri-marily covers the depth range 2800 to 5600 m, with astrong mode at the depth of the abyssal plain from4000 to 4600 m. Many South Pacific countries haveextensive deep areas within their EEZs, and EEZseabed depths cover a wider range than the SPRFMOArea, extending from the shore out to the 10 000 mdeep Kermadec Trench within the New Zealand EEZ.Notably, most of the South Pacific seabed at depths<3200 m lies within EEZs, with a high proportion of thetrawlable depths <2000 m lying on continental shelvesand slopes within EEZs.
Table 2 provides a summary of the calculated areawithin each of the depth protection strata recom-mended by Clark et al. (2009), and the depth bound-aries of these strata are indicated in Fig. 3. MostEEZ and SPRFMO areas lie below trawlable depth,but there are substantial differences between theSPRFMO Area and EEZs in the trawlable depth ranges.Less than 1% of the SPRFMO Area is <2000 m deep,whereas 23% of EEZs are shallower than 2000 m.Across the whole South Pacific, almost 100% of the 0 to200 m depth range lies within EEZs, as does 98% of the200 to 800 m range and 90% of the 800 to 2000 m range.Overall, 94% of the trawlable depth range of 0 to2000 m lies within EEZs and coastal states clearly havean important role to play in protecting VMEs on seabedareas at trawlable depths within their EEZs.
The distribution of areas <2000 m deep within theSPRFMO Area is mapped in Fig. 4. Areas of trawlabledepth are isolated and largely confined to the LordHowe Rise, Challenger Plateau and West NorfolkRidge, and the scattered seamount chains forming theLouisville, Foundation, Salas y Gómez and NazcaRidges. Fig. 1 shows the distribution of depths <2000 min relation to the New Zealand bottom trawl footprint.Although the bottom trawl footprint only covers 0.4%of the total SPRFMO Area, it covers all of the Area from0 to 200 m depth, 90% of the Area from 200 to 800 mand 22% of the Area from 800 to 2000 m (Table 3). Intotal, footprint areas <2000 m deep cover 28% of theSPRFMO Area <2000 m deep. There is therefore aclear obligation for SPRFMO participants to protectVMEs that may occur in the high proportion oftrawlable depth areas that occur within the bottom
trawl footprint.To compare depth ranges within
closed, move-on and open footprintblocks, the distribution of depth rangeswithin each footprint block wasevaluated using the original 1 minGEBCO gridded bathymetry data,which provides ~400 evenly spaceddepth grid points for each footprintblock. Assuming each point within ablock represents an equal area of thefootprint block concerned, the surfaceareas of each 200 m depth rangewithin each footprint block were cal-culated and compared with the depthdistributions in the SPRFMO Area.
The extent to which New Zealandhas protected representative depthranges within the spatial closures isdetailed in Table 3, which sum-marises the proportion of the footprintwithin each depth range which has
348
0
2
4
6
8
10
12
0 400 800 1200 1600 2000 2400 2800 3200 3600 4000 4400 4800 5200 5600 6000
Depth range (m)
Su
rface a
rea (%
)
EEZ areasSPRFMO AreaDepth stratum boundaries
Fig. 3. Depth frequency distributions (200 m depth ranges) of the seabed inthe proposed South Pacific Regional Fisheries Management Organisation(SPRFMO) Area and in directly adjacent exclusive economic zones (EEZs), show-ing boundaries of the depth strata used for evaluating representativity of closed
areas by depth

Penney et al.: New Zealand VME protection measures
been closed, made subject to a move-on rule or leftopen. All of the 0 to 200 m depth range has been closed.A total of 84% of the 200 to 800 m depth range and 63%of the 800 to 2000 m depth range have been closed ormade subject to a move-on rule. In addition, the entiredepth range deeper than 2000 m is effectively closed asa result of being beyond trawlable depths. These deepareas within the footprint have nonetheless beenexplicitly closed, as a result of falling within lightlytrawled blocks. Overall, 68% of the 0 to 2000 m depthrange and 71% of the total depth range within the foot-print has been protected in some way, either by closureor by implementation of move-on provisions.
The percentage of each fishing area/depth stratumwhich has been protected either by precautionary clo-sures or by implementation of a move-on rule is sum-marised in Fig. 5, which shows the percentage of eachstratum protected within each fishing area in relationto recommended levels of 30% (Rogers et al. 2008) and
50% (Clark 1996, Lauck et al. 1998). The fishing areasdiffer in depth range, with plateau areas like the LordHowe Rise and Challenger Plateau having narrowerdepth ranges than the ridge and seamount chain sys-tems. Much of the footprint on these plateaus lieswithin the actively targeted and heavily fished trawldepth range of 400 to 1600 m (MFish 2008). Depths onthe West Norfolk Ridge span the widest range, includ-ing most of the high seas area shallower than 200 mand some areas deeper than 2000 m adjacent to theridge itself. Most of the seabed in the Three Kings andLouisville Ridge areas lies below 2000 m, with limitedareas of trawlable depth, particularly along the Louis-ville seamount chain.
Across the entire footprint, more than half of each200 m depth range has either been closed or made sub-ject to a move-on provision, the least being 58% of the
349
Table 2. Estimated total sea surface area within various depthranges in the South Pacific Regional Fisheries ManagementOrganisation (SPRFMO) Area and within the exclusive
economic zones (EEZs) of adjacent countries
Depth EEZs SPRFMOrange (m) Area (km2) Area (%) Area (km2) Area (%)
0–200 3 109 166 7.6 552 0.001200–800 1 770 889 4.3 43 101 0.1800–2000 4 392 874 10.8 497 305 0.9>2000 31 453 950 77.2 53 309 911 99.0
Total 40 740 704 100 53 850 868 100
0 3000km
10° S
30°
50°
120°E 140° 120° 100° 80°
>2000 m
<2000 m
Depth ranges
SPRFMO Area
140°160° 160°W180°
Fig. 4. Map of the proposed South Pacific Regional Fisheries Management Organisation (SPRFMO) Area showing the proportionof the SPRFMO Area deeper than 2000 m (99% of the SPRFMO Area, light grey) and shallower than 2000 m (1% of the SPRFMOArea, black). Areas within national exclusive economic zones are white. Trawlable areas (<2000 m depth) are largely confined tothe South Tasman Rise, Lord Howe Rise, Challenger Plateau and the West Norfolk, Three Kings, Louisville, Foundation, Salas
y Gomez and Nazca Ridges
Table 3. Proportion of the New Zealand bottom trawl footprintcovering various depth strata within the South Pacific Re-gional Fisheries Management Organisation (SPRFMO) Area,showing relative proportions of closed, move-on and open
areas within each stratum
Depth SPRFMO Bottom trawl footprint (%) Footprintrange area Closed Move-on Open total (m) (km2) (%)
0–200 552 100.0 0.0 0.0 100.0200–800 43 101 35.5 40.0 14.6 90.0800–2000 497 305 9.0 4.9 8.2 22.0>2000 53 309 911 0.1 0.0 0.0 0.1
Total 53 850 868 0.2 0.1 0.1 0.4

Mar Ecol Prog Ser 397: 341–354, 2009
1000 to 1200 m depth range. However, the proportionof protected area by 200 m depth range differsbetween fishing areas depending on intensity of pastfishing effort in each area. Only 27% of the main tar-geted depth range of 800 to 1400 m on the ChallengerPlateau has been protected, including <20% of the1000 to 1200 m depth range, and 37% of the 600 to800 m depth range on the Lord Howe Rise and 41% ofthe 800 to 1200 m depth range on the Louisville Ridgehave been protected. This is a direct consequence ofthe higher levels of past (2002–2006) fishing effort inthese areas and the management decision to leavesuch areas open to focus future trawling effort on thosehistorically most impacted areas.
Representativity of spatial closures by topography
Seamounts
Given the emphasis in the UNGA Resolution 61/105(UNGA 2007), the SPRFMO interim measures and theFAO Deepwater Guidelines (FAO 2008) on protectionof seamounts as features likely to support VMEs, anevaluation of the representativity of footprint closuresin protecting topographic features was conductedusing available data on distribution of seamounts inthe South Pacific Ocean. Two data sets were used, theKitchingman & Lai (2004) database of predictedseamounts and the Allain et al. (2008) database of val-idated seamounts occurring within the SPRFMO Area.
Of the total 4126 Kitchingman & Lai(2004) seamounts occurring in the SouthPacific Ocean (0 to 60° S, 120° E to 70° W),2541 (62%) occur within the EEZs ofcountries bordering the SPRFMO Area,and 1585 (38%) occur within theSPRFMO Area. This is a consequenceof the volcanic nature of the region, theresult of which is that many SouthPacific countries, particularly small Pa-cific island countries, have numerousseamounts within their EEZs. CoastalStates therefore have an important roleto play in protecting VMEs in the SouthPacific region. (In recognition of thisobligation, New Zealand implementeda Seamounts Management Strategy in2001 [Brodie & Clark 2004], followed byclosure of Benthic Protection Areas in2007; www.fish.govt.nz/en-nz/environ-mental/). The combination of thesemeasures now protects 32% of the NewZealand EEZ, 28% of underwater topo-graphic features, 52% of known large-
scale (>1000 m height) seamounts and 88% of activegeothermal vents.
Within the SPRFMO Area itself, Allain et al. (2008)have validated the existence and positions of 1450 sea-mount features. Of these, 97% lie outside the NewZealand bottom trawl footprint, 42 lie within the foot-print and 18 (1.2%) lie within the open footprint blocks.Therefore, 57% of the known seamounts occurringwithin the trawl footprint are protected either byclosures or move-on provisions.
General seabed topography
In addition to the GEBCO 1 min bathymetric griddata, higher resolution (30 arc-second) data are avail-able from Geoscience Australia (www.ga.gov.au) forthe Tasman Sea region. These 2 data sets were used togenerate highest available resolution bathymetric gridmaps of the individual fishing areas using MapInfoVertical Mapper®. Three-dimensional digital terrainsurfaces draped with the New Zealand bottom trawlfootprint were generated for each fishing area to facil-itate visual comparison of topography of the closed,move-on and open blocks in each area. Cross-sectionalprofiles across the various fishing areas were thenused to evaluate the extent to which closed areas, andareas outside the bottom trawl footprint, are represen-tative, in terms of depth range and seabed topography,of the areas left open to bottom trawling. We present of2 of the areas here as examples, Three Kings and West
350
0
0
10
20
30
20
40
60
80
100
0 200 400 600 800 1000 1200 1400 1600 1800 2000 8800
Depth stratum (m)
Are
a p
rote
cte
d (%
)
Traw
l to
ws
(%)
Lord HoweChallengerWest NorfolkThree KingsLouisville
OverallTrawl tows
Fig. 5. Percent of each fishing area by 200 m depth stratum in the New Zealandbottom trawl footprint that has been protected, either by precautionary closureor by move-on provisions, in relation to recommended protection levels (horizon-tal dotted lines) of 30% (Rogers et al. 2008) and 50% (Clark 1996, Lauck et al.1998). The solid line shows the percent protected by 200 m depth range acrossthe entire footprint. The dashed line shows the distribution of fishing effort by
200 m depth stratum

Penney et al.: New Zealand VME protection measures
Norfolk Ridges, to illustrate the process which wasconducted for all areas (see MFish 2008).
Three Kings Ridge
The Three Kings Ridge fishing area lies along thewestern edge of the Fiji Basin and is surrounded by alarge number of relatively isolated, steep, high-profileseamounts (Fig. 6). Most of the high-profile and likelyhigh-biodiversity features in this area lie outside thefootprint, and have remained untrawled, as has muchof the ridge feature itself. Along the ridge area withinthe footprint, only one block remains open to fishing.The combination of closed, move-on and outside-footprint surrounding areas protect most of the shal-lower, high-profile areas in the northern part of thisarea. The one additional block closure plus one move-on block afford complete protection of the southernpart of this area, including the shallowest feature.
West Norfolk Ridge
The West Norfolk Ridge is a complex, rugged andhigh-profile area of hills, steep flanks and canyons,dominated by 2 parallel ridge features running roughlynorth–south (Fig. 7). The shallowest and highest pro-file of these in the northeast of the area is a primary tar-get area for bottom long-line vessels targeting blue-nose Hyperoglyphe antarctica and wreckfish (mainlyPolyprion americanus with some P. oxygeneios) onsteep rocky features along this ridge. This ridge areahas remained relatively untrawled and one additionalblock closure has resulted in most of the eastern ridge
being closed to trawling. Trawling has focused on fea-tures in the southeast and central parts of the area. Thetopography and depth range of the open blocks arewell represented by the eastern ridge closure, themove-on blocks covering the shallowest part of thecentral area and the additional block closure on thecentral canyon between the ridges. To the west, thesouthwest block closure protects a particularly steepflank area. Together with the move-on blocks, theentire high profile western flank is currently protected.
DISCUSSION
The mitigation measures to prevent significantadverse impacts from bottom trawling in the NewZealand bottom trawl footprint are a combination ofclosure of all lightly trawled blocks, application of themove-on rule in moderately trawled blocks, plus addi-tional precautionary closures of representative blocksin the moderately and heavily trawled areas, with thepotential future closure of further blocks found to con-tain significant evidence of VMEs. Advantages of thisapproach are that representative trawled areas andunimpacted areas are closed to provide protection tolikely VMEs from the outset, rather than relying on amove-on rule and subsequent analyses before closingareas. The clear definition of open and closed areasprovides certainty to industry and facilitates compli-ance. The approach also supports data collection asinformation on fishing impacts and regeneration ratescan be monitored. The combination of limited foot-print, representative precautionary closures and themove-on rule are intended to constitute adequateprotection measures during the interim period.
351
Fig. 6. Three-dimensional seabed topography in the Three Kings Ridge fishing area showing the distribution of open, move-onand closed bottom trawl footprint blocks (20 min latitude × 20 min longitude) and ridge/seamount features outside the footprint.
*: additional representative closures of moderately and heavily trawled blocks

Mar Ecol Prog Ser 397: 341–354, 2009
Comparing the approach taken by New Zealand tomeasures implemented by other RFMOs, the approachtaken by the North East Atlantic Fisheries Commission(NEAFC) to protect VMEs in the Mid-Atlantic Ridge issimilar. The NEAFC recognizes that detailed infor-mation on species composition, habitat association,seabed geology and bathymetry are not available, andconsiders that some areas have already been substan-tially impacted by fishing (NEAFC 2008, PECMAS2008). However, whereas the NEAFC closures are tar-geted at specific seamounts and areas where corals areknown from surveys, the New Zealand approach isbroader, using available information on fishing inten-sity, connectivity, depth zones, biogeographic zonesand topography to design representative spatial pro-tection measures across the full extent of the fishingfootprint, as recommended by Williams et al. (2009). Tothe extent that the FAO provides a method for designa-tion of VMEs, the New Zealand approach complies in amore explicit manner than the NEAFC closure scheme.The New Zealand approach has also implemented farmore conservative encounter rules (Parker et al. 2009)in comparison with the NEAFC and the NorthwestAtlantic Fisheries Organization thresholds of 1000 kgof sponge or 100 kg of coral per set.
However, these are only intended to be interim mea-sures, to try and provide adequate and representativeprotection to areas likely to support VMEs during theperiod of the interim measures. In the long term, effec-tive protection of benthic VMEs in the Pacific Oceanhigh seas will probably require the establishment of aseries of international spatial closures designed to pro-tect adequate and representative areas of habitats andecosystems. There is evidence in the Atlantic Ocean
that community composition can vary substantiallyamong features and that communities may not bewidely distributed, which would weaken the represen-tative approach taken by New Zealand and theNEAFC (Hall-Spencer et al. 2007, Watling 2007, ICES2008). However, the broad biodiversity distributionaldata needed to make more informed protection deci-sions is not available in the North Atlantic and distrib-utional data from the South Pacific is even moresparse.
In this context, the recommendations of Williams etal. (2009), regarding the need to adopt an approachwhich integrates high-resolution data on seabed geo-morphology, depth and topographic complexity withlimited survey data on seabed biodiversity to jointlydefine patterns in biodiversity and abiotic variables,are particularly relevant. Such approaches offer theadvantage of providing a classification that preservesthe information of both data sets, maximizing thepotential for predicting patterns in biodiversity fromabiotic variables. Integration of survey biodiversitydata, observer benthic bycatch information and biolog-ically important physical data forms the foundation ofhabitat suitability and niche-factor analysis models(Hirzel et al. 2002), which have already been used topredict habitat suitability for cold-water corals withinthe New Zealand EEZ (Clark et al. 2006, Clark & Row-den 2009), in the South Pacific Ocean (Allain et al.2008) and in the Northern Hemisphere (Davies et al.2008). Over the next few years, New Zealand will beevaluating such approaches to develop internationalrecommendations for permanent representative spa-tial closures to protect VMEs and low productivityresources in the South Pacific Ocean.
352
Fig. 7. Three-dimensional seabed topography in the West Norfolk Ridge fishing area showing the distribution of open, move-onand closed bottom trawl footprint blocks (20 min latitude × 20 min longitude) and ridge areas outside the footprint. *:additional
representative closures of moderately and heavily trawled blocks

Penney et al.: New Zealand VME protection measures
Acknowledgements. We thank M. Clark for helpful discus-sions and for reviewing the project. J. Willing and B. Sims arethanked for their guidance and assistance regarding interna-tional fisheries policies and obligations. The paper benefitedfrom the constructive criticism of reviewers.
LITERATURE CITED
Abdulla A, Gomei M, Hyrenbach D, Notarbartolo-di-SciaraG, Agardy T (2009) Challenges facing a network of repre-sentative marine protected areas in the Mediterranean:prioritizing the protection of underrepresented habitats.ICES J Mar Sci 66:22–28
Allain VJA Kerandel, Clark M (2008) Potential seamountlocation in the South Pacific RFMO Area: prerequisite forfisheries management and conservation in the high seas.SPRFMO-V-SWG-05, Secretariat of the Pacific Commu-nity, Noumea
Brodie S, Clark MR 2004. The New Zealand seamount man-agement strategy—steps towards conserving offshoremarine habitat, In: Beumer, JP, A Grant, DC Smith (eds),Aquatic protected areas: What works best and how do weknow? Proceedings of the World Congress on Aquatic Pro-tected Areas, Cairns, 14–17 August 2002. Australian Soci-ety for Fish Biology, Hobart, p 664–673
Clark CW (1996) Marine reserves and the precautionarymanagement of fisheries. Ecol Appl 6:369–370
Clark MR, Rowden AA (2009) Effect of deepwater trawling onthe macro-invertebrate assemblages of seamounts on theChatham Rise, New Zealand. Deep-Sea Res I 56:1540–1554
Clark MR, Tittensor D, Rogers AD, Brewin P and others (2006)Seamounts, deep-sea corals and fisheries: vulnerability ofdeep-sea corals to fishing on seamounts beyond areas ofnational jurisdiction. UNEP-WCMC, Cambridge
Clark MR, Watling L, Smith C, Rowden AA, Guinotte J,Ardron J (2009) Seamount classification: steps towardsglobal MPA network design. Submission and presentationto Convention on Biological Diversity: expert workshop onscientific and technical guidance on the use of biogeo-graphic classification systems and identification of marineareas beyond national jurisdiction in need of protection.Ottawa, Canada, Sep–Oct 2009
Davies AJ, Roberts JM, Hall-Spencer J (2007) Preservingdeep-sea natural heritage: emerging issues in offshoreconservation and management. Biol Conserv 138:299–312
Davies AJ, Wisshak M, Orr JC, Roberts JM (2008) Predictingsuitable habitat for the cold-water coral Lophelia pertusa(Scleractinia). Deep-Sea Res I 55:1048–1062
FAO (Food and Agricultural Organisation of the UnitedNations) (2008) International guidelines for the manage-ment of deep-sea fisheries in the high seas. Annex 1 of theReport of the Technical Consultation on InternationalGuidelines for the Management of Deep-sea Fisheries inthe High Seas. 4–8 February and 25–29 August 2008.FAO Fisheries and Aquaculture Report No. 881, FAO,Rome, p 52
Hall-Spencer J, Rogers A, Davies J, Foggo A (2007) Deep-seacoral distribution on seamounts, oceanic islands, and con-tinental slopes in the Northeast Atlantic. Bull Mar Sci81(Suppl 1):135–146
Harris PT (2007) Application of geophysical information to thedesign of a representative system of marine protectedareas in southeastern Australia. In: Todd BJ, Greene HG(eds) Mapping the seafloor for habitat characterization.Special Paper 47, Geological Association of Canada, St.John’s, NL, p 463–481
Hirzel AH, Hausser J, Chessel D, Perrin N (2002) Ecological-niche factor analysis: How to compute habitat-suitabilitymaps without absence data? Ecology 83:2027–2036
ICES (2008) Report of the ICES-NAFO Joint Working Groupon Deep Water Ecology (WGDEC). 10–14 Mar 2008,Copenhagen, Denmark. ICES CM 2008/ACOM:45, ICES,Copenhagen
Kitchingman A, Lai S (2004) Inferences on potential seamountlocations from mid-resolution bathymetric data. In: MoratoT, Pauly D (eds) Seamounts: biodiversity and fisheries.UBC Fisheries Centre, Vancouver, BC, p 261
Lauck T, Clark CW, Mangel M, Munro GR (1998) Implement-ing the precautionary principle in fisheries managementthrough marine reserves. Ecol Appl 8:S72–S78
MFish (Ministry of Fisheries) (2008) Bottom fishing activitiesby New Zealand vessels fishing in the high seas in theSPRFMO Area during 2008 and 2009. SPRFMO BottomFishery Impact Assessment, New Zealand Ministry ofFisheries, Wellingtion
NEAFC (North East Atlantic Fisheries Commission) (2008)Report of the 27th annual meeting of the North EastAtlantic Fisheries Commission, 10–14 November 2008,Vol I. North East Atlantic Fisheries Commission, Lon-don, available at www.neafc.org/system/files/%252Fhome/neafc/drupal2_files/27neafc_annual_2008_vol1_main-report.pdf
NMFS (National Marine Fisheries Service) (2008) Environ-mental assessment / regulatory impact review / final reg-ulatory flexibility analysis for Amendment 89 to the fisherymanagement plan for groundfish of the Bering Sea andAleutian Islands Management Area and regulatoryamendments for Bering Sea habitat conservation. EA-RIR-FRFA Report, National Marine Fisheries Service,
Parker SJ, Penney AJ, Clark MR (2009) Detection criteria formanaging trawl impacts to vulnerable marine ecosystemsin high seas fisheries of the South Pacific Ocean. Mar EcolProg Ser 397:309–317
PECMAS (2008) Permanent Committee on Management andScience — report of the Meeting 17–18 June 2008, Annex2. North East Atlantic Fisheries Commission, London,available at www.neafc.org/system/files/%252Fhome/neafc/drupal2_files/annex2+from+june_08.pdf
Rogers AD, Clark MR, Hall-Spencer JM, Gjerde KM (2008)The science behind the guidelines: a scientific guide to theFAO draft international guidelines (December 2007) forthe management of deep-sea fisheries in high seas andexamples of how the guidelines may be practically imple-mented. IUCN, Switzerland
SPRFMO (South Pacific Regional Fisheries ManagementOrganisation) (2007a) SPRFMO III Report—Annex F:interim measures adopted by participants in negotiationsto establish South Pacific regional fisheries managementorganisation. SPRFMO III, 30 Apr to 4 May 2007, Reñaca,Chile. South Pacific Regional Fishery Management Orga-nisation, Wellington
SPRFMO (2007b) SPRFMO IV Report—Annex C: benthicassessment framework. SPRFMO IV, 4–7 Sep 2007,Noumea, New Caledonia. South Pacific Regional FisheryManagement Organisation, Wellington
SPRFMO (2007c) Report of the Fourth Meeting of theSPRFMO Science Working Group. SPRFMO IV, Noumea,New Caledonia, 4–7 Sep 2007. South Pacific RegionalFishery Management Organisation, Wellington
UNGA (United Nations General Assembly) (2007) Resolution61/105. Sustainable fisheries, including through the 1995Agreement for the Implementation of the Provisions of theUnited Nations Convention on the Law of the Sea of 10
353
Mar Ecol Prog Ser 397: 341–354, 2009
December 1982 relating to the Conservation and Manage-ment of Straddling Fish Stocks and Highly Migratory FishStocks, and related instruments. UNGA A/RES/61/105,available at www.un.org/Depts/los/general_assembly/general_assembly_resolutions.htm
Van Gaever S, Vanreusel A, Hughes JA, Bett B, KiriakoulakisK (2004) The macro- and micro-scale patchiness ofmeiobenthos associated with the Darwin Mounds (north-east Atlantic). J Mar Biol Assoc UK 84:547–556
Vierros M, Cresswell I, Escobar Briones E, Rice J, Ardron J(Eds) (2008) Global Open Oceans and Deep-sea habitats
(GOODs) bioregional classification, p 82Watling L (2007) A review of the genus Iridogorgia (Octoco-
rallia: Chrysogorgiidae) and its relatives, chiefly fromthe North Atlantic Ocean. J Mar Biol Assoc UK 87:393–402
Williams A, Bax NJ, Kloser RJ, Althaus F, Barker B, Keith G(2009) Australia’s deep-water reserve network: implica-tions of false homogeneity for classifying abiotic surro-gates of biodiversity. ICES J Mar Sci 66:214–224
Zezina O (1997) Biogeography of the bathyal zone. Adv MarBiol 32:389–426
354
Submitted: February 27, 2009; Accepted: September 4, 2009 Proofs received from author(s): November 20, 2009