Embed Size (px)
Citation preview

AUGUST 22, 2005 REV B
Aquifer Guardians in Urban Areas Phone 210 320-6298 PO Box 15618 Fax 210 657-2206 San Antonio, Texas 78212
Protecting the Edwards Aquifer
Vulnerability, contamination, effects of development, and inadequacy of engineered controls
The Blue Hole at San Antonio Springs

2
Table of Contents Table of Contents 2
Protecting the Edwards Aquifer 3
A. Introduction ..................................................................................... 3
B. Vulnerable Karst Creates a Sensitive Environment....................... 4
C. Contamination................................................................................. 5
D. Sprawling Development and its Effects on the Aquifer.................. 7
E. Engineered Structural Controls .................................................... 14
F. Texas Chapter 245 Limitations..................................................... 17
G. Monitoring Will Not Protect Water ................................................ 17
References 18
Acknowledgements 20
Note: See AGUA’s companion report, Reforms for Aquifer Protection, which contains recommendations for City of San Antonio codes, ordinances, and policies.

3
Protecting the Edwards Aquifer A. Introduction The Edwards Aquifer is one of our most valuable, irreplaceable, and endangered public treasures. It is the sole-source of drinking water for more than 1.5 million residents and more than two dozen communities. Clean and abundant flows from the Aquifer are essential to the economic activity that sustains our communities. The Aquifer and its contributing watersheds are also home for more than fifty unique species of plants and animals. Many of these species are threatened with extinction and new species continue to be discovered. Despite immeasurable natural, spiritual, economic, aesthetic, and recreational values and benefits, human development now threatens the basic integrity of the Edwards Aquifer Ecosystem. Hill Country watersheds that feed the Aquifer are increasingly desirable areas for development, largely without restriction or regulation. Without immediate and decisive action by the Edwards Aquifer Authority, expanding water demands and suburban sprawl will irreversibly pollute and deplete this uniquely valuable water source. This report presents specific scientific information about the geology of the Edwards Aquifer and the threats of development. It also describes the effects of development on Aquifer recharge. Technical information in this report is based on field research in the Central Texas region. Results here are consistent with those of nationwide investigations on impervious cover effects. The report also presents real-world, experience-based information as to why engineered controls cannot substitute for effective development controls.
Texas Blind Salamander – an endangered species living in the Edwards Aquifer -

4
B. Vulnerable Karst Creates a Sensitive Environment The Edwards Aquifer sits within the Edwards limestone of the Texas hill country. This limestone was deposited in an ocean lagoon more than 100 million years ago and is 400 to almost 700 feet thick. The limestone is crossed by the Balcones fault zone, which has resulted in blocks of limestone shifting toward the southeast. Narrow zones of shattered rock separate these blocks. Over thousands of years, these Balcones zone faults exposed the Edwards limestone to water flow. Moving water dissolved limestone minerals and opened ever-larger holes, channels and caverns. These relatively large openings allow the aquifer to recharge quickly. The cavernous nature of the aquifer also allows rapid water movement within the aquifer. For
example, water in the Edwards aquifer moves at a rate of thousands of feet per day; compared to velocities of a few feet per year in other aquifers. This rapid movement and the relatively large size of the flow openings provide none of the filtration, adsorption, and slow water flow that protect many aquifers from contamination. All of the water that recharges the Edwards
Aquifer originates as rainfall on the transition, contributing or recharge zones. The contributing zone consists of watersheds upstream of where the Edwards limestone is exposed. These watersheds funnel runoff into streams that carry it directly to the relatively large and rapidly infiltrating openings in their beds and
Inside the Edwards Aquifer

5
banks. Any activity within these watersheds that taints or contaminates runoff will contaminate water within the Aquifer. Within the recharge zone, the aquifer is fed both from streams and from direct infiltration through karst
limestone openings. These openings may be visible at the surface or hidden beneath thin soil coverings. Because there is little opportunity to capture released pollutants, and because of the hidden location and orientation of the subsurface conduits, the aquifer is even more vulnerable to pollution from activities on the recharge zone. Once contaminating pollutants are in the aquifer, they flow with the water through complex, unknown, and largely unknowable routes of the karst openings. There is little opportunity to drill effective wells to recover pollutants once they enter the aquifer.
C. Contamination Chlorinated solvents,1 toxic metals,2 and pesticides3 are regularly detected in the Edwards Aquifer in Bexar County. Specific sources of many of these contaminants are unknown; but these man-made, carcinogenic, and toxic chemicals are
1 Sources of data: Edwards Aquifer Authority, San Antonio Water System, U.S. Geological Survey, BexarMet Water District, Texas Commission on Environmental Quality, Kelly AFB. Solvents detected are: Trichloroethylene, tetrachloroethylene, 1,2 dichloroethylene, 1,1,2,2 tetrachloroethane, vinyl chloride, dichlorobenzene, dichloroethane, chlorobenzene, trichloroethane, 1,1,1 trchloroethane, 1,1,2 trichloroethane, methylene chloride, dichloromethane 2 Lead, mercury, arsenic 3 atrazine, diazinon
Stormwater entering Hills and Dales Cave
San Antonio Express-News, April 21, 2004

6
found in the Aquifer as a result of storm runoff, leaks, spills, and dumping. The presence of these chemicals in the Edwards Aquifer demonstrates its vulnerability to pollution. In most wells, contaminants are below levels established to protect human health. In a few wells, however, health-based concentration standards have been exceeded, requiring drinking water wells to be closed. In the AY-68-28-313 well near Stone Oak, the pesticides ethoprop, diazinon and lindane have been detected.4 In addition, nitrates were measured at levels of up to 4.4 mg/L, as compared to the Maximum Contaminant Level of 10 mg/L. At 10 mg/L, significant health effects occur. Not surprisingly, Lorence Creek, which originates in Stone Oak, contains much higher pesticide concentrations than a similar creek draining an undeveloped watershed in Uvalde County.5 As Figure 1 shows, the concentration of diazinon is far greater in Lorence Creek. Ethoprop and diazinon were also detected in nearby Panther Springs Creek.
4 Edwards Aquifer Authority Hydrogeologic Data Report for 2002, June, 2003. Pesticides were detected in Bexar County well AY-68-28-313, at 0.077 µg/L for ethoprop, 0.01 µg/L for lindane, and 0.014 µg/L for diazinon. There is no established Maximum Contaminant Level for Diazinon. 5 Quality of Stormwater Runoff from an Urbanizing Watershed and a Rangeland Watershed in the Edwards Aquifer Recharge Zone, Bexar and Uvalde Counties, Texas, 1996–98, U.S. Geological Survey, 1999.
Figure 1. Pesticide concentrations in stormwater runoff Comparing an urbanized watershed (Lorence Creek in Bexar County) to an undeveloped
watershed (Frio River tributary in Uvalde County)

7
Chlorinated solvents appear in numerous wells in Bexar County (see figure 2). These man-made substances are there for only one reason, we put them there. Even though the central portion of Bexar County has been developed much longer than the northern portion of the county, most solvents have been found toward the north, near and on the recharge zone, the most vulnerable portion of the aquifer. Some argue that the aquifer is so large that any contamination will be well diluted and therefore protections are not needed. Karst pathways within the
aquifer, however, prevent complete mixing and dilution. While segments of the aquifer in undeveloped areas would remain pristine, other segments will degrade rapidly with sprawling development. These may be the very segments that we rely on for our water.
D. Sprawling Development and its Effects on the Aquifer Sprawling development can be seen on the Edwards Aquifer recharge and contributing zones. In an undeveloped watershed, most rainfall is either caught by plants and trees, or soaks into the soil. Rainfall that
Figure 2. Bexar County Public Supply Wells Containing Chlorinated Solvents
1982-1996
Salado Creek

8
soaks into the soil is used by the plants for their growth or evaporates back into the air. A small but critical fraction, however, moves deeper into the soil. This deeper-moving water either recharges groundwater, or emerges as a spring or seep. These small springs and seeps provide clear, clean water flow into streams and rivers long after the rain has ended. When a watershed is developed, however, the intimate relationship between rainfall, soils, vegetation, and streams is interrupted. Rainfall encounters the impervious surfaces of buildings, parking lots, and roads rather than plants and soil. It is quickly drained from these surfaces through concrete storm sewers, to creeks or rivers. As it flows into the streams, runoff carries chemicals from parking lots, roadways, buildings, and landscaped areas. The land and stream channels erode, trying to carry a much larger flow. Once the rain is over, streams quickly dry up because the seeps and springs are no longer feeding their flow. Any plants or animals that depended upon a wet stream channel and clean water can no longer survive.
The best way to measure the effects of development in a watershed is to look at the amount of impervious cover. Impervious cover includes rooftops, sidewalks, concrete-lined drainage channels, parking lots, residential streets, and roadways—anything that prevents the water from going directly into the soil. The amount of impervious cover will show us just how much urban use there is, how much pollution will be generated, the increases in storm runoff and the decrease in stream baseflow.
Large recharge zone development – The Shops at La Cantera

9
1) Storm Runoff Pollution
With higher impervious cover, more pollutants are generated and carried into stormwater runoff. A study6 conducted in Bexar County shows that higher impervious cover levels generally lead to higher mass yields of lead and higher concentrations of fecal coliform, toxic metals, pesticides and other contaminants. The study compared stormwater runoff from commercial developments near DeZavala and IH-10 to stormwater runoff from Shavano Park, Stone Oak, and Government Canyon. As Figure 3 shows, mass yields for lead were far higher in the watersheds with high impervious cover levels.
Figure 4 shows estimated pollution increases in storm runoff as impervious cover increases due to development. These relationships are based on data from storm runoff monitoring in Central Texas and are consistent with results from many similar studies around the United States. The figures show that with even modest levels of imperviousness, pollutant loads increase by 5 to 12 times that of an undeveloped site.
6 Stormwater Runoff for Selected Watersheds in the Edwards Aquifer Recharge Zone, Bexar County, Texas, 1996-98. U.S. Geological Survey, March, 1998.
Commercial, 50% impervious, no detention
Commercial, 45-65% impervious, with detention
Stone Oak, 40-50% impervious
Shavano Park, <5% impervious
Government Canyon State Natural Area, <2% impervious
Figure 3. Annual mass yields for total lead by watershed, Bexar County, Texas, 1997.

10
Figure 1. Increasing Stormflow and Pollutant Loadswith Increasing Impervious Cover
0
5
10
15
20
25
30
35
0 0.05 0.1 0.15 0.2 0.25 0.3 0.35 0.4 0.45 0.5
Impervious Cover
Rat
io to
Flo
w o
r Lo
ad a
t 5%
Impe
rvio
us C
over Stormflow
TSS (Sand Filter)
COD (Sand Filter)TN (Sand Filter)
Example: Curve indicates that Chemical Oxygen Demand loads at 35% IC will be 15
times higher than background loads.
2) Stream Bank Erosion
With larger impervious areas, more water reaches waterways faster and with greater erosive force. The resulting scour widens and deepens channels, abrades aquatic and streamside vegetation, and creates shifting sediment bars. An estimated 80% of the total suspended solids pollution generated from urbanization comes from channel banks downstream from the developed watershed. Engineered water quality controls treating runoff from a developed area do nothing to remove this additional sediment pollution. Sediments and adsorbed pollutants introduced by this runoff suffocate and contaminate stream ecosystems, and eliminate the natural pool and riffle sequences critical to fish and wildlife. Enlarging channels destroy tree root support and eventually these large trees fall and die. Figure 5 illustrates the effect of impervious cover on the size of stream channels.
Erosion has undermined this fence next to a recharge zone creek
Figure 4. Increasing storm flow and pollutant loads with increasing impervious cover

11
3) Decreased Base Flow in Streams Decreases Aquifer Recharge
Baseflow is water in creeks and rivers between storm runoff events. It provides most of the Edwards Aquifer recharge in the Barton Springs Zone and likely in the San Antonio Edwards as well. Baseflow loss translates directly, therefore, into a reduction in available aquifer water. The loss of baseflow also radically alters the natural character of the stream and reduces the viability of wetlands and aquatic habitat.
0%
10%
20%
30%
40%
50%
60%
70%
80%
90%
0% 5% 10% 15% 20% 25% 30% 35% 40% 45% 50% 55% 60% 65% 70% 75% 80% 85% 90%
Impervious Cover
Pct.
Tot
al A
nnua
l Pre
cipi
tatio
n C
onve
rted
Baseflow
Stormflow
Figure 6. Percent of Precipitation Converted to Stormflow and Baseflow versus Impervious Cover
0
1
2
3
4
5
6
7
8
9
10
11
12
0 0.1 0.2 0.3 0.4 0.5 0.6 0.7 0.8Impervious Cover
Enla
rgem
ent R
atio
Alluvial Channel
Rock-Bottomed Channel
Rock-Controlled Channel
Source: Raymond Chan & Associates, Technical Procedures for the Watershed Erosion Assessments , September, 1997.
Figure 5. Stream enlargement ratio versus impervious cover

12
Figure 6 shows how baseflow drops and storm runoff increases as imperviousness increases. Impervious surfaces covering about 30% of a site reduce baseflow volumes by one half. At 60% imperviousness, virtually 100% of the baseflow is eliminated. Even if we were to eliminate 100% of the pollutant loads in storm runoff, development still diminishes baseflow volumes, which in turn diminishes the amount of aquifer water available.
4) Wastewater Pollution
Traditionally regulations to protect water quality focus on storm runoff pollution and wastewater that is handled separately. Existing wastewater regulations however, do not prevent water pollution from three sources:
a. Central Sewer Lines. Sewer lines leak, as indicated by the vastly larger quantities of water that arrive at wastewater treatment plants during wet soil conditions. In the thin soils of the recharge and contributing zones, sewer lines are often constructed into trenches cut directly and deeply into the limestone. Any leaking sewer water readily moves into openings in the underlying limestone.
b. Septic Systems. Properly constructed septic systems remove most sewage pollution during normal conditions. During wet soil conditions, however, wastewater from even well-constructed systems moves through soil and into underlying groundwater. If the septic system is improperly constructed, wastewater can move directly into the underlying Edwards. High fecal coliform counts and nitrogen indicate this type of contamination.
c. Recycled Wastewater Systems. San Antonio Water Systems (SAWS) recently studied utilization of recycled water for recharge zone golf course irrigation and quarry operations. Leachate from study areas irrigated with recycled water showed greater nitrate concentrations. Elevated nitrate concentrations have been detected in a western Comal County well and are of concern because of potential health effects. Of additional concern is the group of pollutants called “emerging contaminants” (pharmaceuticals, hormones, steroids, antibiotics, etc.). Although these substances are found in wastewater, the SAWS study did not test for them. While recycled water systems might be appropriate for many areas, they have serious limitations in the Edwards recharge and contributing zones. Thin, rocky soils means that there is relatively no storage or natural treatment of wastewater in many areas where it is applied. Such systems create the potential for polluted runoff to flow into streams, rivers, and recharge features. Note that the Texas Commission on Environmental

13
Quality prohibits wastewater discharge into streams and rivers contributing Edwards Aquifer recharge.
d. Spills. Wastewater spills occur when sewer manholes leak, lift stations overflow, or effluent treatment or storage basins are flooded or mismanaged, sometimes dumping thousands of gallons of untreated or partially treated wastewater into streams. Wastewater thus becomes part of the aquifer recharge. These types of spills are a regular occurrence in any wastewater system and will be increasingly more frequent with sprawling development over the Aquifer recharge and contributing zones.
5) Pesticides and Fertilizers from Lawns and Golf Courses
Suburban lawns and golf courses are typically maintained with pesticides, herbicides and fertilizers. The U.S. Environmental Protection Agency7 found that application rates of these chemicals to suburban lawns is much higher than to agricultural land; and as much as 95% of the chemicals is leached to ground or surface water. The transport, sale and storage of these chemicals also create a continual risk of release and water contamination.
7 Guidance Specifying Management Measures for Sources of Nonpoint Pollution in Coastal Waters, EPA 840-B-92-002, January 1993.
Raw sewage spilling from a sanitary sewer

14
6) Hazardous Material Spills
Existing data show that hazardous materials have already entered the Edwards Aquifer. Significant spills include the 800-gallon Ram Texaco gasoline spill in northern Bexar County, the 3,000-gallon Dyno-Nobel diesel spill near New Braunfels, and the Texas Industrial Services tetrachloroethene (PCE) spill in Uvalde. PCE from the Texas Industrial Systems spill has traveled more than 3 miles from the site, resulting in the closure of a City of Uvalde public supply well and several private supply wells. Ram Texaco is located over the Trinity Aquifer close to the Edwards recharge zone. A number of private Trinity Aquifer wells required temporary closure and installation of treatment systems as a result of that spill. As development and human activity proliferate across the recharge and contributing zones, the number of spills will inevitably increase.
E. Engineered Structural Controls People often argue that we don’t need impervious cover limits because engineered water quality controls can protect the Aquifer. Engineered water quality controls can remove some of the pollutants associated with urban development. These engineered systems, however, can never replace the water quality benefits of undeveloped land, open space, park areas, and low impervious cover development for two significant reasons.
1) Engineered Controls Don’t Solve All the Problems
Engineered water quality controls are designed primarily to remove pollutants from storm runoff. There are some engineered designs that claim to remove 100% of the pollution from development. Engineers have also proposed piping all the storm water runoff from a site downstream of aquifer recharging areas, to sewage wastewater treatment facilities, or into elaborate treatment systems constructed on site.
Express-News story about Dyno-Nobel diesel spill
15
The problem with each of these proposals is that, even if engineered systems operated perfectly, pollutant loads are only one of the problems that results from development run-off. If these systems take 100% of the storm runoff from the creeks, there will be no stream or river base flow, and a reduction in aquifer recharge. If they remove 100% of the pollutants from storm runoff, but continue to discharge the same runoff volume into the creeks, they have done nothing to address stream bank erosion, and the 80% of total suspended solids pollution that occurs downstream from a developed site. National water quality experts8 have concluded that, for various reasons, engineered controls make no significant difference in the relationship between impervious area increases and degrading stream quality.
2) Engineered Controls Fail
When San Antonio Water System performed its initial inspections of 233 water quality basins, over half (55%) of them were non-compliant. Engineered controls have high failure rates and consequently provide little protection for our aquifer. Statistics indicate that these systems are highly unreliable and cannot be relied upon over long time periods. Humans have drunk from the aquifer for tens of thousands of years, and will continue to do so as long as the water remains relatively
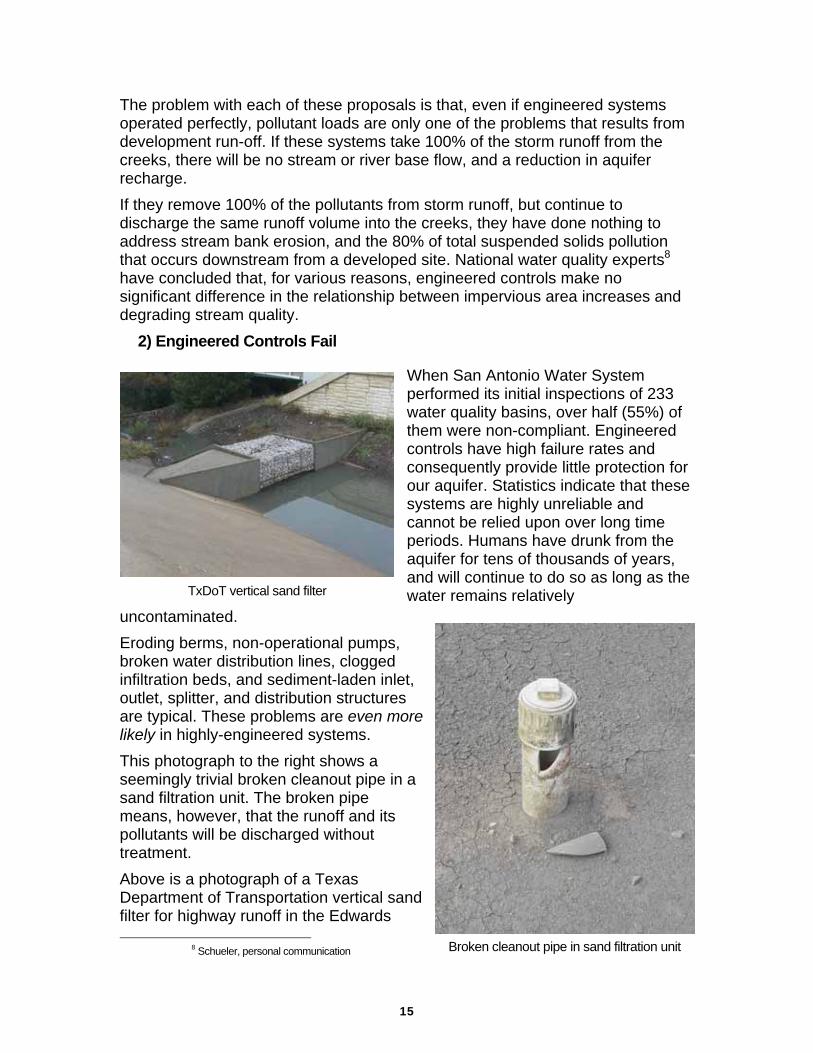
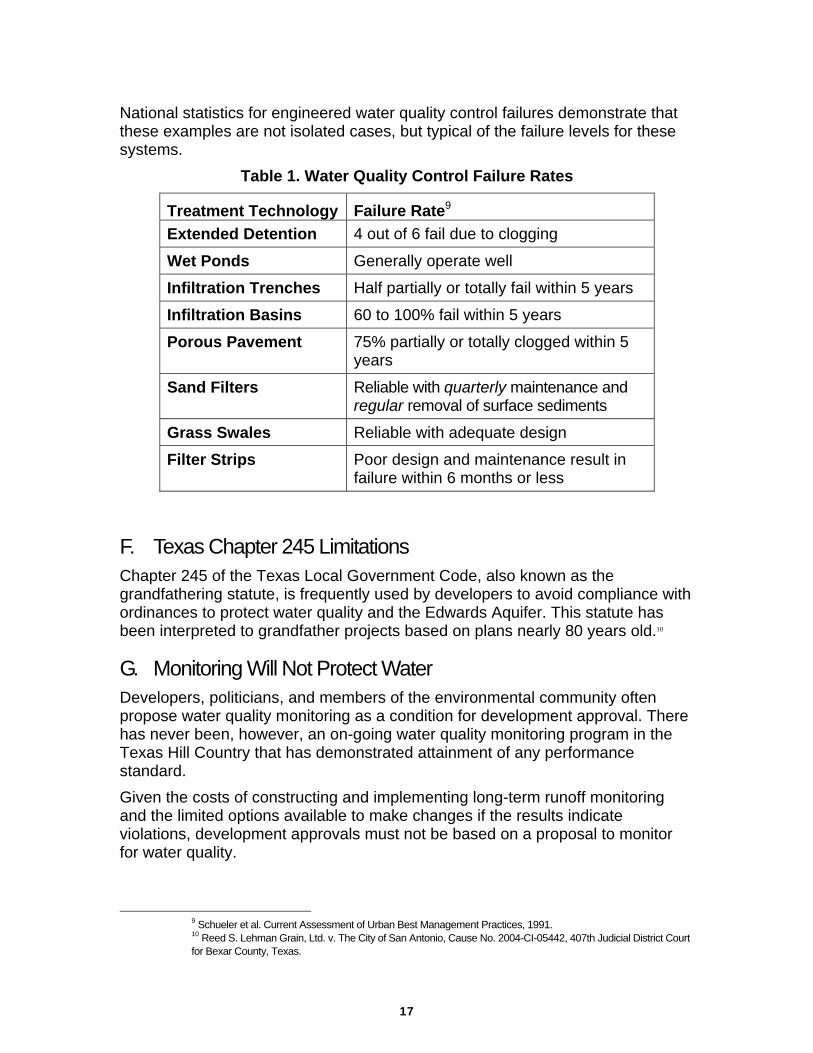
uncontaminated. Eroding berms, non-operational pumps, broken water distribution lines, clogged infiltration beds, and sediment-laden inlet, outlet, splitter, and distribution structures are typical. These problems are even more likely in highly-engineered systems. This photograph to the right shows a seemingly trivial broken cleanout pipe in a sand filtration unit. The broken pipe means, however, that the runoff and its pollutants will be discharged without treatment. Above is a photograph of a Texas Department of Transportation vertical sand filter for highway runoff in the Edwards
8 Schueler, personal communication
TxDoT vertical sand filter
Broken cleanout pipe in sand filtration unit

16
recharge zone. Monitoring data for this type of water quality control confirms what is evident from the picture: there is little pollution removal happening from one side of the filter to the other.
The photograph to the left shows that the sand filtration basin for a Sam’s Club was clearly overloaded with sediment during construction. While finishing the concrete floors, however, chemicals from the finishing process were released into the filtration basin. In
addition, someone removed a plug (photograph below) that would have kept these chemicals from flowing out of the basin and into a creek connected to known Edwards recharge features.
The site investigators photographed the foaming plume of chemicals (photograph to left) in the creek for several hundred feet until they became light-headed from breathing the chemicals.
17
National statistics for engineered water quality control failures demonstrate that these examples are not isolated cases, but typical of the failure levels for these systems.
Table 1. Water Quality Control Failure Rates
Treatment Technology Failure Rate9 Extended Detention 4 out of 6 fail due to clogging
Wet Ponds Generally operate well
Infiltration Trenches Half partially or totally fail within 5 years
Infiltration Basins 60 to 100% fail within 5 years
Porous Pavement 75% partially or totally clogged within 5 years
Sand Filters Reliable with quarterly maintenance and regular removal of surface sediments
Grass Swales Reliable with adequate design
Filter Strips Poor design and maintenance result in failure within 6 months or less
F. Texas Chapter 245 Limitations Chapter 245 of the Texas Local Government Code, also known as the grandfathering statute, is frequently used by developers to avoid compliance with ordinances to protect water quality and the Edwards Aquifer. This statute has been interpreted to grandfather projects based on plans nearly 80 years old.10
G. Monitoring Will Not Protect Water Developers, politicians, and members of the environmental community often propose water quality monitoring as a condition for development approval. There has never been, however, an on-going water quality monitoring program in the Texas Hill Country that has demonstrated attainment of any performance standard. Given the costs of constructing and implementing long-term runoff monitoring and the limited options available to make changes if the results indicate violations, development approvals must not be based on a proposal to monitor for water quality.
9 Schueler et al. Current Assessment of Urban Best Management Practices, 1991. 10 Reed S. Lehman Grain, Ltd. v. The City of San Antonio, Cause No. 2004-CI-05442, 407th Judicial District Court for Bexar County, Texas.

18
References Barrett, Michael E. and Randall J. Charbeneau. A Parsimonious Model for Simulation of Flow and Transport in a Karst Aquifer. Center for Research in Water Resources, November 1996. Barrett, Michael E., Ann M. Quenzer, and David R. Maidment. “Water Quality and Quantity Inputs for the Urban Creeks: Future Needs Assessment.” Center for Research in Water Resources, The University of Texas at Austin, January 1998. Center for Watershed Protection. “Section 1: Is Impervious Cover Still Important? A Review of Recent Urban Stream Research.” Part One of an on-line article. http://www.cwp.org/Impacts_Part1.PDF, October 2002. Center for Watershed Protection. Better Site Design: A Handbook for Changing Development Rules in Your Community. 1998. Center for Watershed Protection. Site Planning for Urban Stream Protection. 1995. Center for Watershed Protection. Better Site Design: A Handbook for Changing Development Rules in Your Community. 1998. City of Olympia, Washington. Impervious Surface Reduction Study. 1995. Edwards Underground Water District (EUWD), 1986, Report of Chemical Analysis, Well Water, WW4, Old Reliable Batteries Site, by Raba-Kistner Consultants, Inc. Ging, P.B.; Quality of Stormwater Runoff from an Urbanizing Watershed and a Rangeland Watershed in the Edwards Aquifer Recharge Zone, Bexar, and Uvalde Counties, Texas, 1996–98., U.S. Geological Survey, 1999. Hauwert, N.M., and Vickers, S., 1994; Barton Springs/Edwards Aquifer Hydrogeology and Water Quality, Barton Springs/Edwards Aquifer Conservation District (TWDB Grant Contract No. 93-483-346), September 1994. May, Christopher W. Assessment of Cumulative Effects of Urbanization on Small Streams in the Puget Sound Lowland Ecoregion: Implications for Salmonid Resource Management. Doctoral Dissertation. University of Washington, 1996. Ockerman, D.J., Petri, B.L., and Slattery, R.N.; Stormwater Runoff for Selected Watersheds in the Edwards Aquifer Recharge Zone, Bexar County, Texas, 1996-98., U.S. Geological Survey, March, 1998. Raymond Chan & Associates. “Technical Procedures for the Watershed Erosion Assessments,” September 1997. Raymond Chan & Associates and Aquafor Beech Limited. “Lower Walnut Creek Erosion Management Facility Study,” January 1999.

19
Raymond Chan & Associates, Aquafor Beech Limited, and Crespo Consulting Services. “Regulatory Approaches for Managing Stream Erosion.” Project No. 485-617-2000. February 1997. Rice, G., 1998; Compilation of data: Edwards Aquifer Public Supply Wells Found to Contain Chlorinated Solvents, Bexar County, 1982 – 1996. Ross, Lauren. Inventory of Stormwater Management Practices: Regulations. Draft report for the City of Austin, 1998. Sandoval, M.N., 1989; A Proposal for a Study of Tetrachloroethylene in the Uvalde, Texas Water Supply and Cancer Rates for Residents of Uvalde County, University of Texas Health Science Center at Houston, School of Public Health, May 1989. Schindel, G. et. al., Edwards Aquifer Authority Hydrogeologic Data Report for 2002, Edwards Aquifer Authority, June, 2003. Schueler, Thomas R. Site Planning for Urban Stream Protection. The Center for Watershed Protection, December 1995. Schueler, Thomas R. “The Importance of Imperviousness.” Watershed Protection Techniques. Vol. 1, No. 3, pp. 100-111, Fall 1994. Slade, Raymond, Michael Dorsey, and Sheree Stewart. Hydrology and Water Quality of the Edwards Aquifer Associated with Barton Springs in the Austin Area, Texas. U. S. Geological Survey Water-Resources Investigations Report 86-4036, 1986. U. S. Geological Survey, 2000, Water Quality in South-Central Texas, National Water-Quality Assessment Program (NAWQA), USGS Circular 1212.

20
Acknowledgements Much of this report was written by Lauren Ross, Ph. D., P. E. and the Greater Edwards Aquifer Alliance. Parts of this report were written by George Rice, Groundwater Hydrologist.
Photographs Gregg A. Eckhardt – San Antonio Springs, faults of Edwards Aquifer,
Salado Creek, Shops at La Cantera. Lauren A. Ross, PhD., P.E. – Eroded creek, Sams Club, spray irrigation,
leaking sewer, cleanout pipe, TxDoT filter, Edwards Aquifer Authority – Inside the aquifer, Blind Salamander, Hills &
Dales cave San Antonio Express-News – EAA well is contaminated, diesel spill in
recharge zone
Figures George Rice – figure 2 Lauren A. Ross, PhD., P.E. – figures 4, 5, & 6, table 1 U. S. Geological Survey – figure 3


![[PPT]Vulernability map of the Edwards Aquifer - University of … · Web viewVulnerability map of the Edwards Aquifer Aquifer DRASTIC INDEX 84 - 90 90 - 978 97 - 104 104 – 111 111](https://img.pdfslide.us/doc/110x75/5aebf7d37f8b9ab24d8f7734/pptvulernability-map-of-the-edwards-aquifer-university-of-viewvulnerability.jpg)