Embed Size (px)
DESCRIPTION
Bio-chemistry
Citation preview
[1] molecular weight determination by ESI and MALDI 1
[1] Molecular Weight Determination of Peptides andProteins by ESI and MALDI
By KERSTIN STRUPAT
Abstract
Several topics are covered, namely, general aspects important for massdetermination of peptides and proteins, sample preparation for both ESIand MALDI, and various mass analyzers coupled to these ionizationtechniques. Finally, the discussion is carried out on peptide and proteinmass analysis as related to accuracy and precision of mass determinationfor both ESI–MS and MALDI–MS.
Introduction
The techniques of electrospray/ionization (ESI) and matrix‐assistedlaser desorption/ionization (MALDI) have revolutionized biological massspectrometry (MS). All state‐of‐the‐art biochemistry and biology labora-tories possess at least one of these ionization techniques and, in general,have access to both of them. Parallel to and motivated by the developmentof these techniques, a diminution of chromatographic separation techni-ques and purification techniques has taken place, and the success of ESIand MALDI in biochemistry and biology is also due to the possibility ofdirect or indirect coupling of the ionization techniques to appropriateseparation and purification techniques. Both ionization techniques areapplicable to peptides and proteins (Yates, 1998), DNA and RNA (Gross,2000), glycoconjugates, and synthetic polymers (Nielen, 1999).
Considerable information can be derived from mass spectra ofbiological samples such as peptides and proteins. Besides the determina-tion of the molecular massM of a given compound (often named molecularweight Mr, which is not quite correct because no weight or force, respec-tively, is measured by MS) and the identification of proteins by accuratemass determination of their proteolytic fragments, mass spectrometry iscapable of providing structural information (i.e., sequences) for peptides.The elucidation of post‐translational modifications of peptides or proteinsis an important branch of mass spectrometry. In combination with chroma-tography, known compounds can be determined quantitatively. Togetherwith enzymatic degradation, the carbohydrate content of a glycoprotein
METHODS IN ENZYMOLOGY, VOL. 405 0076-6879/05 $35.00Copyright 2005, Elsevier Inc. All rights reserved. DOI: 10.1016/S0076-6879(05)05001-9
2 mass spectrometry: modified proteins and glycoconjugates [1]
can be evaluated at least semiquantitatively. Furthermore, the quaternarystructure of protein complexes, the interaction between proteins and li-gands (Rogniaux et al., 1999) or metal ions (Strupat et al., 2000), as well asprotein folding (Yao, 2005) can be studied by mass spectrometry.
In the rapidly expanding field of proteomics, high quality mass data—namely accurate mass determination—represent the key to unambiguousprotein identification by peptide mass mapping and to determination ofposttranslational modifications of proteins harvested from cells grownunder different conditions (Stults, 2005). The accuracy of mass determina-tion in peptide mass analysis obtained by ESI–MS and MALDI–MS hasincreased from less than 5 � 10�4 or 500 ppm (0.5 u at 1000 u) 10 years agoto 0.5 – 2 � 10�6 or 0.5 – 2 ppm (0.0005 – 0.002 u at 1000 u) at present(Senko, 2004). The striking advantage of an improved mass accuracy is thedramatic reduction of false hits in database interrogation for protein iden-tity (Clauser et al., 1999; Jensen et al., 1996; Shevchenko et al., 1996). It hasto be noted, however, that such a high accuracy of mass determination istypically not achievable for analyte molecules of higher masses, such asproteins. This is due to both practical and fundamental reasons (seefollowing paragraphs).
This paper is divided into several parts for ease of understanding. First,general aspects important for the understanding of the context are ex-plained. This rather theoretical part is followed by an explanation ofpractical features, such as preparative steps and mass analyzers coupledto the ionization techniques, and, more importantly, results in a discussionof peptide and protein mass analysis with respect to accuracy and precisionof mass determination for both ESI–MS and MALDI–MS. The perfor-mance of a Fourier transform ion cyclotron resonance (FTICR) massanalyzer with its ultra‐high mass resolving power is discussed in a separatechapter.
Some General Aspects Important for Mass Determination of Peptidesand Proteins
Isotopic Distribution of Peptide and Protein Signals
When discussing the topic of mass determination of biological mole-cules, one main aspect that should be kept in mind is the naturally occur-ring isotope distribution. It is necessary to distinguish between nominalmass, monoisotopic mass, and the average mass of a molecule (Yergeyet al., 1983). The nominal mass of a molecule is calculated by using the mostabundant isotope without regard of mass defect/excess (i.e., H ¼ 1, C ¼ 12,N ¼ 14, O ¼ 16, etc.). The monoisotopic mass (MMONO) of a molecule
[1] molecular weight determination by ESI and MALDI 3
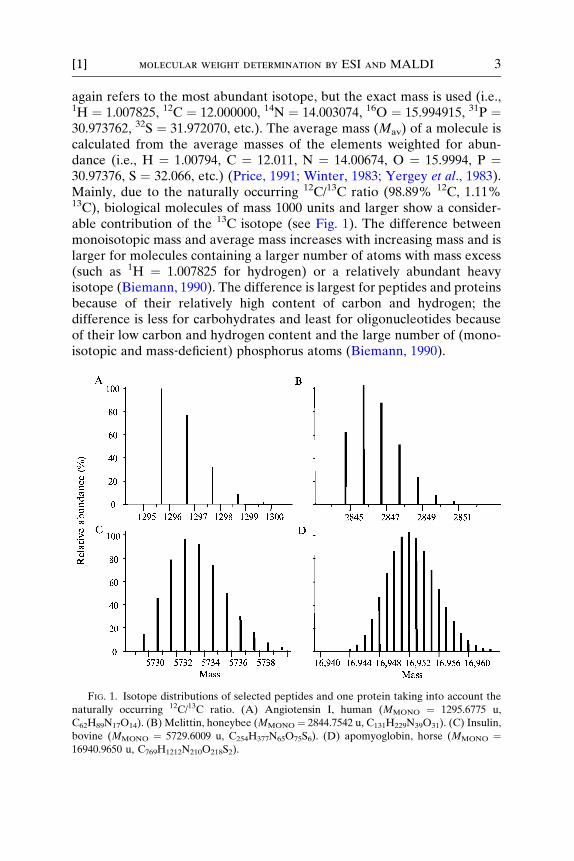
again refers to the most abundant isotope, but the exact mass is used (i.e.,1H ¼ 1.007825, 12C ¼ 12.000000, 14N ¼ 14.003074, 16O ¼ 15.994915, 31P ¼30.973762, 32S ¼ 31.972070, etc.). The average mass (Mav) of a molecule iscalculated from the average masses of the elements weighted for abun-dance (i.e., H ¼ 1.00794, C ¼ 12.011, N ¼ 14.00674, O ¼ 15.9994, P ¼30.97376, S ¼ 32.066, etc.) (Price, 1991; Winter, 1983; Yergey et al., 1983).Mainly, due to the naturally occurring 12C/13C ratio (98.89% 12C, 1.11%13C), biological molecules of mass 1000 units and larger show a consider-able contribution of the 13C isotope (see Fig. 1). The difference betweenmonoisotopic mass and average mass increases with increasing mass and islarger for molecules containing a larger number of atoms with mass excess(such as 1H ¼ 1.007825 for hydrogen) or a relatively abundant heavyisotope (Biemann, 1990). The difference is largest for peptides and proteinsbecause of their relatively high content of carbon and hydrogen; thedifference is less for carbohydrates and least for oligonucleotides becauseof their low carbon and hydrogen content and the large number of (mono-isotopic and mass‐deficient) phosphorus atoms (Biemann, 1990).
FIG. 1. Isotope distributions of selected peptides and one protein taking into account the
naturally occurring 12C/13C ratio. (A) Angiotensin I, human (MMONO ¼ 1295.6775 u,
C62H89N17O14). (B) Melittin, honeybee (MMONO ¼ 2844.7542 u, C131H229N39O31). (C) Insulin,
bovine (MMONO ¼ 5729.6009 u, C254H377N65O75S6). (D) apomyoglobin, horse (MMONO ¼16940.9650 u, C769H1212N210O218S2).
4 mass spectrometry: modified proteins and glycoconjugates [1]
In the mass range below 1500 u the monoisotopic mass of peptides is themost abundant mass with an asymmetry to larger masses. The isotopedistribution loses its asymmetry with increasing mass. Particularly for pro-teins, the isotope distribution follows a Gaussian distribution (bell‐shapedcurve). For proteins above �15 ku, the abundance of the monoisotopicpeak is negligible; for example, the monoisotopic peak of apomyoglobin(horse), a protein of mass 16951.49 u (average mass), is of low abundance(0.03%) and occurs at 16940.97 u, about 10.5 u beyond the averagemolecular mass of apomyoglobin. Figure 1 gives the isotope distributionsof angiotensin I, melittin, insulin, and apomyoglobin. Sum formulae andorganisms are given together with monoisotopic masses and average(molecular)masses, respectively, in the legend for Fig. 1. For apomyoglobin,(see Fig. 1D), the monoisotopic mass cannot be shown due to its lowabundance.
Precision and Accuracy of Mass Determination
Precision of mass determination describes to what extent a mass mea-surement of a given compound can be reproduced. The precision is ex-pressed by a statistic distribution (mean variation) of several independentmass determinations of a given analyte molecule; the average value ofthese independent mass measurements is given together with its standarddeviation (�n). The accuracy of mass determination describes the accuracyof the measurement (i.e., the accuracy of mass determination expresses thedeviation between the measured mass and the theoretical mass of thecompound under investigation).
Both accuracy and precision are important characteristics of a massspectrometric technique and account for its reliability. Achieving both highprecision and high accuracy of mass determination are necessary to satisfythe demands on biological mass spectrometry, such as in protein identifica-tion by peptide mass mapping (Yates, 1998). Put simply, a high precision ofmass determination allows reliance on a limited number of mass spectra ofthe same peptide map (high reproducibility of determined mass means asmall standard deviation of measurement), while a high mass accuracy ofmass determination results in a high probability of unambiguous identifica-tion of a protein by database interrogation using the masses of the peptidemass map. The higher the accuracy of mass determination of peptides in apeptide map, the fewer peptide masses are necessary for this approach.
Precision and accuracy of mass determination of peptides (1 to 5 ku)using ESI and MALDI with state‐of‐the‐art mass analyzers are in the lowparts per million range. For example, insulin �‐chain (3494.651 u) wasmeasured by Edmondson and Russell with a precision of 7.3 ppm
[1] molecular weight determination by ESI and MALDI 5
(0.026 u) and an accuracy of ‐2.6 ppm (‐0.009 u) using MALDI–MS andapplying an internal mass calibration (see the following paragraphs)(Edmondson and Russell, 1996; Russell and Edmondson, 1997). The sameauthors describe how accurate mass measurement can aid correct assign-ment of proteolytic fragments while also taking into account patterns ofisotope distributions: Patterns can be uncommon compared to simple pep-tides of the same size, such as if a prosthetic group is bound to the peptide.Russell and Edmondson (1997) report of MALDI mass spectra obtainedfor a proteolytic digestion of cytochrome c with its covalently bound hemegroup. The heme‐containing tryptic fragment of cytochrome c (Cys14 –Lys22, m/z 1633.620) can clearly be assigned by the relative abundances ofthe resolved isotopes and, therefore, distinguished from another potentiallyoccurring fragment (Ile9 – Lys22, m/z 1633.820). The prosthetic groupcontains iron, and the observed (uncommon) isotope distribution is dueto the iron‐containing heme group (Edmondson and Russell, 1996; Russelland Edmondson, 1997).
A frequently discussed challenge for peptide mass analyses is to distin-guish, for example, between Lys and Gln in a tryptic fragment of typicalmass (1000–5000 u) or in a small protein only from the determination of itsabsolute molecular mass (and not by acetylating the compounds and de-ducing the number of Lys by the mass differences of 42 u). Because Lys andGln differ by 0.0364 u, an accuracy of 36.4 ppm at mass 1000 u is required,whereas an accuracy of 3.6 ppm is required at mass 10,000 u. There aremany other examples for amino acid mass coincidences requiring highaccuracy of mass determination to distinguish different amino acid compo-sitions just from peptide mass.
Mass Resolution and Resolving Power
A peak width definition as well as a 10% valley definition exist (Price,1991). The peak width definition considers a single peak in a mass spectrummade up of singly charged ions at mass m. The resolution R is expressed asm/�m, where �m is the width of the peak at a height that is a specificfraction of the maximum peak height. A common standard is the definitionof resolution R based upon �m being full width at half maximum(FWHM). Considering a signal at mass m ¼ 1000 u and a peak width ofthis signal of �m ¼ 0.5 u FWHM, mass resolution is R ¼ m/�m ¼ 2000.The 10% valley definition considers two peaks of equal height in a massspectrum at mass m and (m – �m) that are separated by a valley that at itslowest point is just 10% of the height of either peak. The resolution is thenR ¼ m/�m. It is usually a function of m, and therefore m/�m should begiven for a number of different values of m (Price, 1991).
6 mass spectrometry: modified proteins and glycoconjugates [1]
The ability of a mass analyzer to distinguish between ions differingslightly in mass‐to‐charge ratio is expressed by its resolving power. Theresolving power is characterized by the peak width (in mass units) for atleast two points on the peak (50% and 5% of the maximum peak height)(Price, 1991). High resolving power of a mass analyzer is neither a neces-sary prerequisite for accurate mass determination nor a sufficient onebecause accurate mass determination depends also on well‐defined calibra-tion standards of known mass, correct calibration procedures (see thefollowing paragraphs), and precise (i.e., reproducible) signal peak shapes.However, high mass resolution helps to obtain high mass accuracy if thelatter conditions are optimized and adapted to the analytical problem. As arough guideline, if mass resolution is R ¼ 10,000 at mass 1000 u, that is thepeak width �m ¼ 0.1 u FWHM, the achievable accuracy of mass determi-nation is about or better than one‐tenth of the peak width �m. This meansthat the mass of an ion at mass 1000 u can be determined with an accuracyof at least 0.01 u at 1000 u (10 ppm).
Calibration of Mass Spectra
The calibration of mass spectra can be performed internally or exter-nally (i.e., the calibration peptides or proteins can either be withinthe sample containing the analyte, or the calibration compound and theanalyte can be measured separately from each other using the same instru-ment configuration and voltages). It should be noted that a given masscalibration is only valid for the mass range covered by the standards.
In general, high precision of mass determination is achievable for bothMALDI and ESI because triggering of electronics, stability of powersupplies (AC and DC voltages), and other such factors are reliable (pre-cise). The achievable mass accuracy, therefore, depends strongly on thequality of standards used for mass calibration. In the mass range below 30ku a number of homogeneous peptides and proteins of known mass existthat can be used for mass calibration. Table I gives an overview of com-monly used standard peptides and proteins. The average mass of a peptideor protein is abbreviated by Mav, while the monoisotopic mass of a com-pound is abbreviated by MMONO.
Due to a typically occurring sample heterogeneity of proteins increas-ing with mass (a fundamental problem) and a heterogeneity induced byimpurities and/or by the ionization technique itself (a practical problem),the accuracy of mass determination is limited at high mass range. Anintrinsic protein heterogeneity typical for large proteins (posttranslationalmodifications such as phosphorylation and glycosylation) and sample im-purities also in the standards (such as sodium and potassium) do not allow
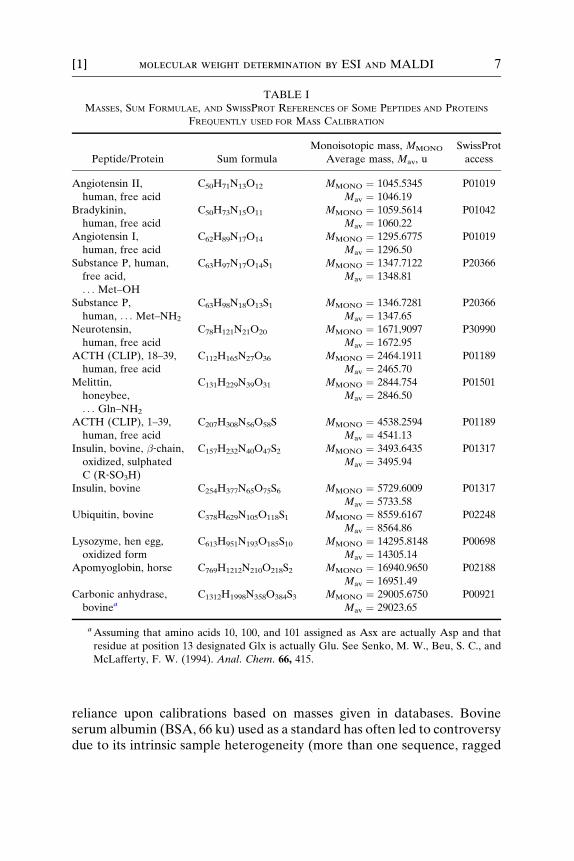
TABLE I
MASSES, SUM FORMULAE, AND SWISSPROT REFERENCES OF SOME PEPTIDES AND PROTEINS
FREQUENTLY USED FOR MASS CALIBRATION
Peptide/Protein Sum formula
Monoisotopic mass, MMONO
Average mass, Mav, u
SwissProt
access
Angiotensin II,
human, free acid
C50H71N13O12 MMONO ¼ 1045.5345 P01019
Mav ¼ 1046.19
Bradykinin,
human, free acid
C50H73N15O11 MMONO ¼ 1059.5614 P01042
Mav ¼ 1060.22
Angiotensin I,
human, free acid
C62H89N17O14 MMONO ¼ 1295.6775 P01019
Mav ¼ 1296.50
Substance P, human,
free acid,
. . . Met–OH
C63H97N17O14S1 MMONO ¼ 1347.7122 P20366
Mav ¼ 1348.81
Substance P,
human, . . . Met–NH2
C63H98N18O13S1 MMONO ¼ 1346.7281 P20366
Mav ¼ 1347.65
Neurotensin,
human, free acid
C78H121N21O20 MMONO ¼ 1671,9097 P30990
Mav ¼ 1672.95
ACTH (CLIP), 18–39,
human, free acid
C112H165N27O36 MMONO ¼ 2464.1911 P01189
Mav ¼ 2465.70
Melittin,
honeybee,
. . . Gln–NH2
C131H229N39O31 MMONO ¼ 2844.754 P01501
Mav ¼ 2846.50
ACTH (CLIP), 1–39,
human, free acid
C207H308N56O58S MMONO ¼ 4538.2594 P01189
Mav ¼ 4541.13
Insulin, bovine, �‐chain,oxidized, sulphated
C (R‐SO3H)
C157H232N40O47S2 MMONO ¼ 3493.6435 P01317
Mav ¼ 3495.94
Insulin, bovine C254H377N65O75S6 MMONO ¼ 5729.6009 P01317
Mav ¼ 5733.58
Ubiquitin, bovine C378H629N105O118S1 MMONO ¼ 8559.6167 P02248
Mav ¼ 8564.86
Lysozyme, hen egg,
oxidized form
C613H951N193O185S10 MMONO ¼ 14295.8148 P00698
Mav ¼ 14305.14
Apomyoglobin, horse C769H1212N210O218S2 MMONO ¼ 16940.9650 P02188
Mav ¼ 16951.49
Carbonic anhydrase,
bovineaC1312H1998N358O384S3 MMONO ¼ 29005.6750 P00921
Mav ¼ 29023.65
aAssuming that amino acids 10, 100, and 101 assigned as Asx are actually Asp and that
residue at position 13 designated Glx is actually Glu. See Senko, M. W., Beu, S. C., and
McLafferty, F. W. (1994). Anal. Chem. 66, 415.
[1] molecular weight determination by ESI and MALDI 7
reliance upon calibrations based on masses given in databases. Bovineserum albumin (BSA, 66 ku) used as a standard has often led to controversydue to its intrinsic sample heterogeneity (more than one sequence, ragged
8 mass spectrometry: modified proteins and glycoconjugates [1]
ends) and its high affinity for cations, both causing an inaccurate massdetermination.
Nevertheless, peptides and proteins used for mass calibration should beused in a highly purified form to produce clean, well‐resolved peaks in themass spectrum and should be freshly prepared to obtain optimal results. Ifavailable, recombinant proteins are recommended for mass calibration ofproteins; however, it should be remembered that such proteins are stillsensitive to oxidation and other modifications as well as proteolysis duringstorage in solution. The content of alkali cations or inorganic anions canalso vary among suppliers and vials. Both modifications and adduct forma-tion result in moving of the peak centroid and peak height, respectively.Especially in ESI mass analysis, a minor amount of salts and detergents canweaken protein ion intensities by adduct formation and can degrade spec-tra quality. Independent of these arguments, the question remains whetherthe protein under investigation behaves in the same way as the calibrationprotein with respect to both adduct formation and decay induced by theionization technique (for the latter, see upcoming text).
Although it is preferable to use peptides or proteins to calibrate peptideor protein signals to obtain high mass accuracy, mixtures of inorganicsalts, such as CsI/NaI, can be used as calibration compounds in ESI. Signalsfrom these calibration compounds are not affected by the effects previ-ously discussed and allow for determination of a precise peak centroidbecause these salts are monoisotopic. It should be noted, however, thatthe use of inorganic salts often leads to source contamination, especiallyin ESI under flow rates in the microliters per minute range, and internalmass calibration is not recommended due to the cation formation alreadydiscussed.
Factors Affecting Mass Resolution and Mass Accuracy
Besides the problem of intrinsic mass heterogeneity, a signal heteroge-neity can be induced by the ionization technique itself (a practical prob-lem): adduct ion formation (e.g., cations, solvents, or matrix moleculesgetting attached to the analyte molecule) or small neutral loss (loss ofH2O or NH3) from the calibration compound or from the compound ofinterest are the most important factors that can deteriorate mass calibra-tion in MALDI–MS and ESI–MS. Adduct ion formation and small neutralloss can cause severe problems if mass resolution is insufficient andaccurate signal assignment is no longer possible. The former leads to ashift of the peak centroid toward higher masses, while the latter leadstoward lower masses. In addition, adduct ion formation and small neutralloss can cause particularly severe problems when the calibration compound
[1] molecular weight determination by ESI and MALDI 9
and the compound of interest behave differently in adduct ion formation ordecay.
In this context, explaining sample purification seems to be appropriatebecause purified calibration standards and analyte molecules are requiredfor best results. Typically, sample cleanup procedures are required prior tomass analysis to obtain high mass accuracy. Samples must be freed fromsodium and potassium as much as possible; often—in protein identificationby peptide mass mapping—sample cleanup is essential to get rid of deter-gents and other biochemical additives that were required for proteolyticdegradation in steps prior to mass analysis. MALDI–MS is known to bemore tolerant toward common impurities than ESI–MS using flow rates inthe microliters per minute range. In comparison to ESI, nanoelectrosprayis significantly more tolerant toward common contaminants than ESI dueto the formation of smaller, more highly charged droplets undergoingfissions at earlier stages (Juraschek et al., 1999). For both the MALDI–MS and ESI–MS techniques, sample cleanup procedures were established,including cation or anion exchange procedures and purification using re-versed phase surfaces, which are on a microliter scale and are easy to use(Gobom et al., 1999; Kussmann et al., 1997).
Several other parameters can influence the achievable mass resolutionof a given system; these parameters include sample preparation, purity ofthe ion source, density of ions (e.g., in the mass separating device, such asan ion trap or FTICR), and other such factors. The detection system canalso limit mass resolution; for example, the postacceleration of large massions onto a conversion dynode followed by a secondary electron multiplierproduces a variety of (nonresolved) secondary ions as well as electrons, andmass dispersion leads to a significant peak broadening (Spengler et al.,1990). Multichannel plate detectors (MCP) are therefore typically usedfor both ESI and MALDI mass analysis (Baldwin, 2005), and the conver-sion dynode approach appears superior only for very high m/z valuesproduced by MALDI.
ESI–MS
In this section, the results and discussion are based mainly on quadru-pole mass filters and orthogonal acceleration TOF (oa‐TOF) mass analy-zers for electrospray/ionization–mass spectrometry (ESI–MS) applications.
ESI: Sample Preparation
The general idea of an ESI sample preparation is to dissolve the analytemolecules (peptides or proteins) in a 1/1 (v/v) water/methanol or water/acetonitrile mixture, typically containing 0.5–1% acetic or formic acid
10 mass spectrometry: modified proteins and glycoconjugates [1]
(denaturing conditions). As a rough rule, the sample concentration is in the10�6 M range (1 pmol/�l). The sample is continuously injected into anelectric field via a metal capillary (Fenn et al., 1989) (atmospheric pressureESI) with flow rates of 1–5 �l per minute or via a metal‐coated glasscapillary (Wilm and Mann, 1994, 1996) (nanoelectrospray source) withflow rates in the low nanoliters per minute range. The electric fieldgenerates a mist of highly charged droplets containing analyte molecules.The droplets move down a potential gradient �U and a pressure gra-dient �p—which both finally liberate analyte molecules from solventmolecules—toward the mass analyzer (Kebarle, 2000).
While the preparation conditions just described are appropriate forthe determination of molecular masses of single peptide or proteinchains, ESI–MS is being used more for the mass analysis of noncovalentlybound complexes, such as multimeric proteins or protein/ligand complexes(Strupat et al., 2000). To guarantee a complex in solution, mild solventconditions must be chosen. Typically, the multimeric protein or protein/ligand complex is dissolved in an aqueous, buffered solution adjusted toappropriate pH‐values (native conditions). Many noncovalently boundcomplexes are dissolved in and measured directly from aqueous solutionscontaining, for example, 5–25 mM NH4Ac with pH values between 5 and 8.5,depending on the analyte molecules under investigation (Loo, 1997; Smithet al., 1997; Strupat et al., 2000; Yao, 2005).
Mass Analyzers
The continuity of the spray in electrospray/ionization enables a scanningdevice, such as the quadrupole mass filter, to be conveniently used as a massanalyzer (Fenn et al., 1989).Quadrupolemass filters (scanning filters) coupledtoESI sources, therefore, were the workhorses for ESI formany years in bothoff‐line and on‐line couplings (liquid chromatography [LC] or capillary elec-trophoresis [EC]–ESI–MS) approaches (Fenn et al., 1989; Voyksner, 1997).
Triple quadrupole instruments offer the opportunity to obtain tandemMS (MS/MS) data; the first quadrupole serves as precursor ion selector,followed by a collision cell (hexapole in rf‐only mode) in which collision‐induced dissociation (CID) between analyte molecules and Argon (low‐energy collision) are performed. The collision cell is followed by anotherquadrupole mass filter that separates the fragment ions by them/z ratio. Thecoupling of ESI sources to other scanning devices, such as ion traps (vanBerkel et al., 1990) andmagnetic sectors (Meng et al., 1990a,b), which are alsoable to perform MS/MS measurements, is described in the literature.
The coupling of ESI sources to (pulsed) time‐of‐flight (TOF) analyzersin so‐called orthogonal acceleration TOF setups (oa‐TOF) is routinely
[1] molecular weight determination by ESI and MALDI 11
used after the introduction of the oa‐TOF by the groups of Guilhaus(Dawson and Guilhaus, 1989) and Dodonow (Dodonow, 1991). A recentlypublished review by Guilhaus et al. reports on the principle instrumenta-tion and different applications of the oa‐TOF instrument (Guilhaus et al.,2000). The main advantages of an oa‐TOF over a quadrupole are thehigher mass resolution, a higher achievable mass range, and a highersensitivity (Guilhaus et al., 2000). The higher sensitivity is achieved bythe orthogonal accelerator, which is a highly efficient device for samplingions from an ion beam into a TOF mass analyzer. A higher mass range is ofinterest because proteins or noncovalent complexes measured under nativeconditions (see previous paragraphs) require a high mass‐to‐charge rangeof the mass analyzer. The excellent performance of the oa‐TOF massanalyzer for very high masses (noncovalent complexes) was first realizedby the Manitoba group (Chernushevich et al., 1999; Werner, 2005) and byRobinson et al. (Rostom and Robinson, 1999; Yao, 2005).
A further development of the oa‐TOF instrumentation was made bythe introduction of a hybrid instrument (quadrupole‐TOF combinations,Q‐TOF or qQ‐TOF (Chernushevich et al., 1999) that enabled MS/MSapplications (Werner, 2005). ESI‐produced ions are transferred to an ana-lytical quadrupole, where a specific precursor ion is selected. The selectedion can be fragmented in the succeeding collision cell. Mass analysis of thefragment ions is performed in the adjacent oa‐TOF.
Appearance of ESI–MS
ESI–MS generates highly charged ion species of peptides or proteins.An ESI mass spectrum is characterized by a number of signals that eachdiffer by one charge. Such a distribution of charge states is typicallyproduced by multiple protonation (positive ion mode) or deprotonation(negative ion mode) of the species, but cation formation is also known tooccur. An ion signal of a species of mass M produced by n‐fold protonation(mass of a proton mH) has the mass M þ n � mH; this signal is assigned as(M þ n H)nþ or Mnþ (positive ion mode, n 2 N) in the mass spectrum.Note that the signal occurs at mass‐to‐charge ratios m/z ¼ (M þ n � mH)/n,(n 2 N). Depending on the purity of the sample, undesired though typicallyless pronounced, sodium and potassium adduct ions, such as (M þ nH þmNa)(mþn)þ (n þ m > 0, n 2 Z, m 2 N), also appear. An ion signal of ann‐fold deprotonated species (of mass M) possesses a mass M – n � mH,which is assigned as (M – n H)n� orMn� in the mass spectrum (negative ionmode).
Dissolving peptides and proteins under denaturing conditions (organicsolvent plus water containing acid), as already described, results in a more
12 mass spectrometry: modified proteins and glycoconjugates [1]
or less pronounced unfolding of the analyte molecule in solution. Thedegree of unfolding depends on the features of the individual analyte;unfolding is typically limited for proteins with intramolecular bonds (disul-fide bonds). Acetic or formic acid in the solvent ensures protonation ofbasic amino acids, and unfolding of the analyte molecule by organic solventincreases the number of achievable basic amino acids. As a rough rule, thenumber of basic amino acids determines the number of charges observed inpositive ESI–MS.
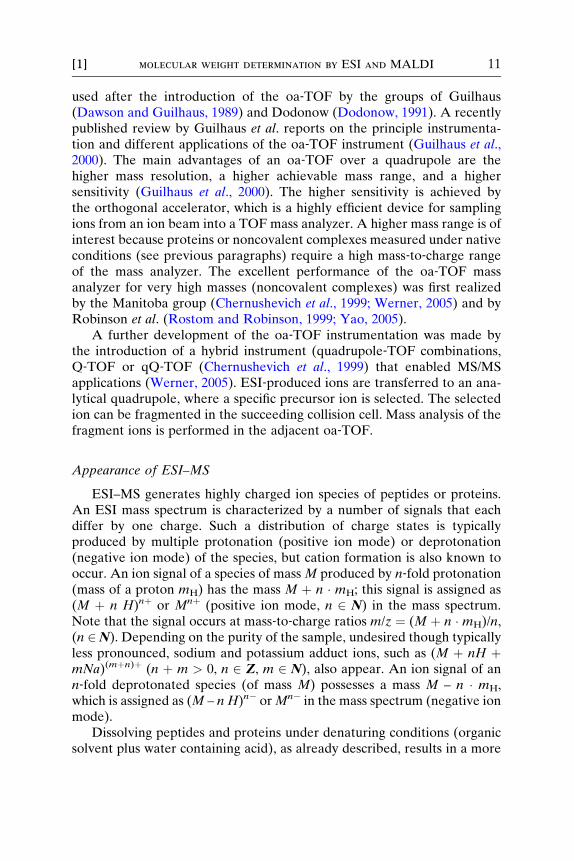
Peptides are typically observed with two to five protons, (M þ 2H)2þ,. . . , (M þ 5H)5þ, in the mass spectrum depending on the mass of thepeptide and the number of its basic residues. The m/z ratios are typicallybetween m/z ¼ 300 and m/z ¼ 1500. ESI–MS data of an equimolar mixtureof angiotensin I, substance P, and neurotensin (1 pmol/�l each peptide, allpeptides of human source) are shown in Fig. 2. The triply charged species(M þ 3H)3þ are observed predominantly for these three peptides; angio-tensin I is also observed as fourfold‐charged species (m/z ¼ 325). Thecharge state information observed for the three peptides, therefore, is inagreement with the number of basic amino acids plus one charge for theN terminus. Angiotensin I has four likely protonation sites, while substanceP and neurotensin have three potential protonation sites (i.e., the sum ofbasic amino acid residues (Lys, Arg, His) plus one protonation site at theamino terminus). Data shown in Fig. 2 were obtained using an ESI–oa‐TOF mass analyzer (Mariner, Applied Biosystems, Framingham, MA,www .appliedb iosystem s.com) equipped with a nanoelec trospray sou rce.Typically, a mass resolution of R ¼ 6000 FWHM for each peptide isobserved as shown in the insets of Fig. 2. If the triply charged species ofangiotensin I and neurotensin are used for calibration of the mass scale 300�m/z � 1000, then the mass of substance P is determined with an accuracyof �10 ppm or 10�5 (Fig. 2, internal calibration). Using the calibratedmass spectrum for further mass analysis in subsequent spectra (externalcalibration), the accuracy of mass determination is still better than 100ppm. For peptides, common mass analyzers enable the resolution of thecorresponding isotope distribution (Fig. 2). To resolve adjacent isotopes isof particular interest because it allows the assignment of the charge state ofan ion only by the spacing between adjacent signals. The spacing betweenthe monoisotopic peak and the peak including one 13C isotope equals to(charge state)�1. In the example shown in Fig. 2, the spacing betweenadjacent signals of angiotensin equals to m=z ¼ 0:�3; this corresponds to acharge state of 3. Knowing the charge state of a given peptide signal (seethe following paragraphs) enables the determination of the monoisotopicmass of a peptide MMONO.
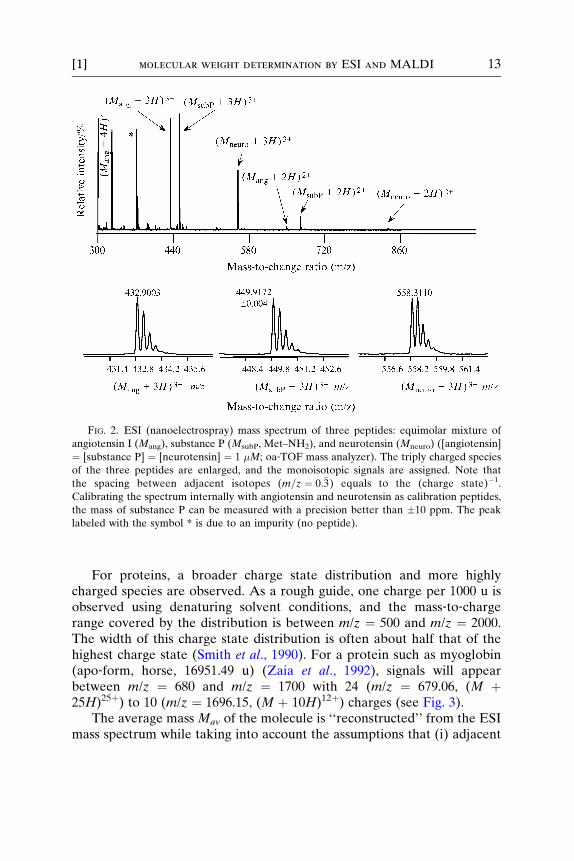
FIG. 2. ESI (nanoelectrospray) mass spectrum of three peptides: equimolar mixture of
angiotensin I (Mang), substance P (MsubP, Met–NH2), and neurotensin (Mneuro) ([angiotensin]
¼ [substance P] ¼ [neurotensin] ¼ 1 �M; oa‐TOF mass analyzer). The triply charged species
of the three peptides are enlarged, and the monoisotopic signals are assigned. Note that
the spacing between adjacent isotopes (m=z ¼ 0:�3) equals to the (charge state)�1.
Calibrating the spectrum internally with angiotensin and neurotensin as calibration peptides,
the mass of substance P can be measured with a precision better than �10 ppm. The peak
labeled with the symbol * is due to an impurity (no peptide).
[1] molecular weight determination by ESI and MALDI 13
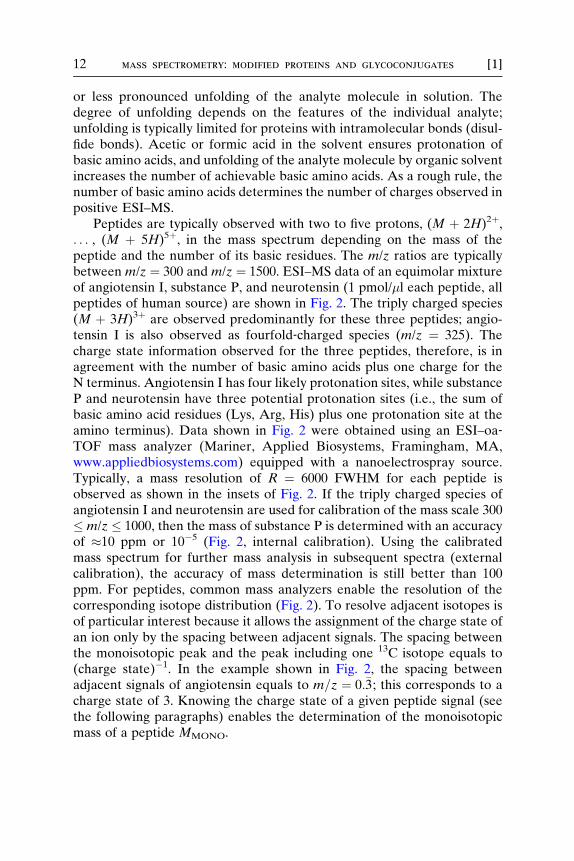
For proteins, a broader charge state distribution and more highlycharged species are observed. As a rough guide, one charge per 1000 u isobserved using denaturing solvent conditions, and the mass‐to‐chargerange covered by the distribution is between m/z ¼ 500 and m/z ¼ 2000.The width of this charge state distribution is often about half that of thehighest charge state (Smith et al., 1990). For a protein such as myoglobin(apo‐form, horse, 16951.49 u) (Zaia et al., 1992), signals will appearbetween m/z ¼ 680 and m/z ¼ 1700 with 24 (m/z ¼ 679.06, (M þ25H)25þ) to 10 (m/z ¼ 1696.15, (M þ 10H)12þ) charges (see Fig. 3).
The average mass Mav of the molecule is ‘‘reconstructed’’ from the ESImass spectrum while taking into account the assumptions that (i) adjacent
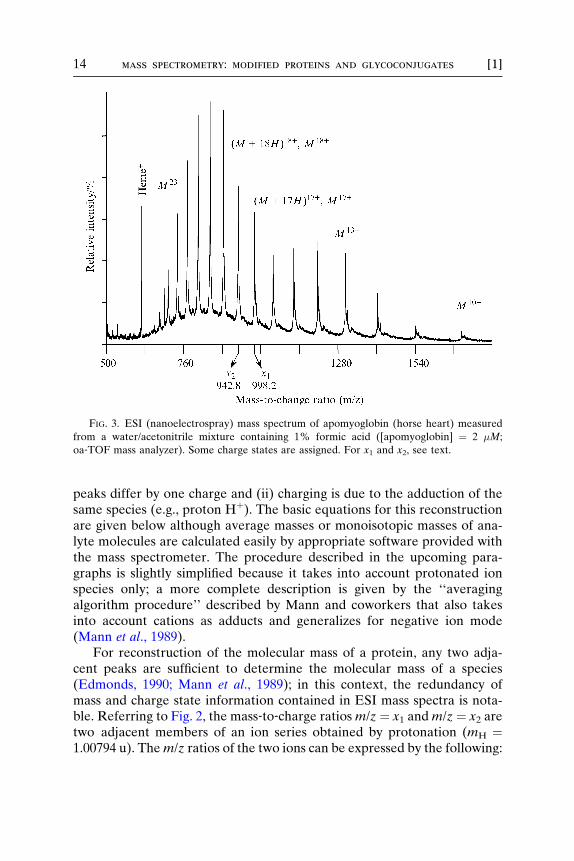
FIG. 3. ESI (nanoelectrospray) mass spectrum of apomyoglobin (horse heart) measured
from a water/acetonitrile mixture containing 1% formic acid ([apomyoglobin] ¼ 2 �M;
oa‐TOF mass analyzer). Some charge states are assigned. For x1 and x2, see text.
14 mass spectrometry: modified proteins and glycoconjugates [1]
peaks differ by one charge and (ii) charging is due to the adduction of thesame species (e.g., proton Hþ). The basic equations for this reconstructionare given below although average masses or monoisotopic masses of ana-lyte molecules are calculated easily by appropriate software provided withthe mass spectrometer. The procedure described in the upcoming para-graphs is slightly simplified because it takes into account protonated ionspecies only; a more complete description is given by the ‘‘averagingalgorithm procedure’’ described by Mann and coworkers that also takesinto account cations as adducts and generalizes for negative ion mode(Mann et al., 1989).
For reconstruction of the molecular mass of a protein, any two adja-cent peaks are sufficient to determine the molecular mass of a species(Edmonds, 1990; Mann et al., 1989); in this context, the redundancy ofmass and charge state information contained in ESI mass spectra is nota-ble. Referring to Fig. 2, the mass‐to‐charge ratiosm/z¼ x1 andm/z¼ x2 aretwo adjacent members of an ion series obtained by protonation (mH ¼1.00794 u). Them/z ratios of the two ions can be expressed by the following:
[1] molecular weight determination by ESI and MALDI 15
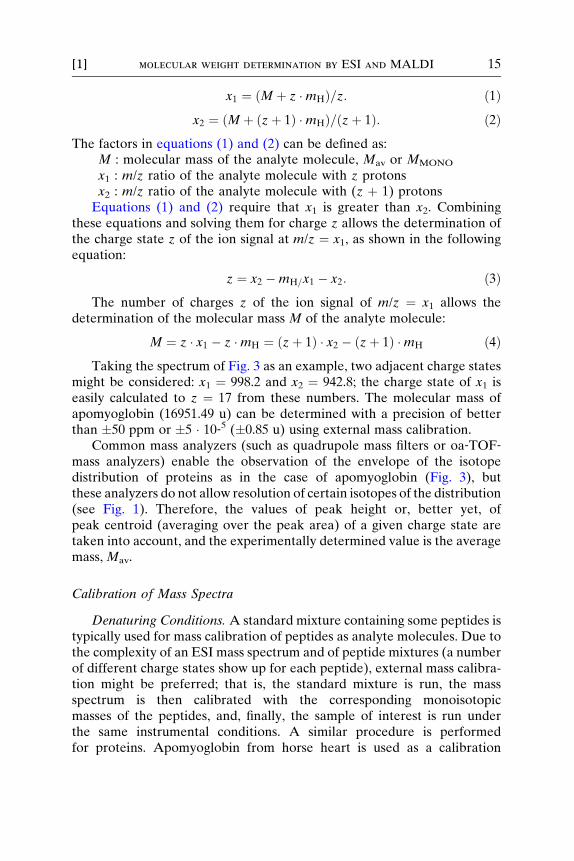
x1 ¼ ðM þ z �mHÞ=z: ð1Þx2 ¼ ðM þ ðzþ 1Þ �mHÞ=ðzþ 1Þ: ð2Þ
The factors in equations (1) and (2) can be defined as:
M : molecular mass of the analyte molecule, Mav or MMONOx1 : m/z ratio of the analyte molecule with z protonsx2 : m/z ratio of the analyte molecule with (z þ 1) protons
Equations (1) and (2) require that x1 is greater than x2. Combiningthese equations and solving them for charge z allows the determination ofthe charge state z of the ion signal at m/z ¼ x1, as shown in the followingequation:
z ¼ x2 �mH=x1 � x2: ð3ÞThe number of charges z of the ion signal of m/z ¼ x1 allows the
determination of the molecular mass M of the analyte molecule:
M ¼ z � x1 � z �mH ¼ ðzþ 1Þ � x2 � ðzþ 1Þ �mH ð4ÞTaking the spectrum of Fig. 3 as an example, two adjacent charge states
might be considered: x1 ¼ 998.2 and x2 ¼ 942.8; the charge state of x1 iseasily calculated to z ¼ 17 from these numbers. The molecular mass ofapomyoglobin (16951.49 u) can be determined with a precision of betterthan �50 ppm or �5 � 10‐5 (�0.85 u) using external mass calibration.
Common mass analyzers (such as quadrupole mass filters or oa‐TOF‐mass analyzers) enable the observation of the envelope of the isotopedistribution of proteins as in the case of apomyoglobin (Fig. 3), butthese analyzers do not allow resolution of certain isotopes of the distribution(see Fig. 1). Therefore, the values of peak height or, better yet, ofpeak centroid (averaging over the peak area) of a given charge state aretaken into account, and the experimentally determined value is the averagemass, Mav.
Calibration of Mass Spectra
Denaturing Conditions. A standard mixture containing some peptides istypically used for mass calibration of peptides as analyte molecules. Due tothe complexity of an ESI mass spectrum and of peptide mixtures (a numberof different charge states show up for each peptide), external mass calibra-tion might be preferred; that is, the standard mixture is run, the massspectrum is then calibrated with the corresponding monoisotopicmasses of the peptides, and, finally, the sample of interest is run underthe same instrumental conditions. A similar procedure is performedfor proteins. Apomyoglobin from horse heart is used as a calibration
16 mass spectrometry: modified proteins and glycoconjugates [1]
protein in many applications because it is well‐defined (one amino acidsequence, no heterogeneity due to posttranslational modifications) andbecause it results in a wide charge state distribution (see Fig. 3). Bourelland colleagues report a mass determination accuracy of less than or equalto 200 ppm for purified antibody fragments of 100 ku that are engineered ina recombinant manner using a triple quadrupole mass analyzer andperforming peak height measurement (Bourell et al., 1994). Such an accu-racy will reflect whether correct translation and proper posttranslationalmodification of the proteins are achieved (Bourell et al., 1994).
Native Conditions. For the analysis of noncovalently bound multimericproteins or protein‐ligand complexes, samples are dissolved in aqueous,buffered solutions (see previous paragraphs) with the aim of preservingthe (native) solution state of the complex. If compounds are massanalyzed under these conditions, mass calibration is typically a little moretedious because charge state distributions are narrower and shifted to high-erm/z values and because well‐defined standards that give intense signals athigh m/z‐ values are rare. In addition, the quality of ion signals may bedegraded with respect to mass resolution due to unresolved solvent and/orbuffer molecules (e.g., acetate, ammonia, water) attached to the protonatedion species (Potier et al., 1997; Rogniaux et al., 1999). Lysozyme (14305.14 u,chicken egg white), when dissolved in pure water and measured from a5 �M solution, produces nicely resolved peaks and a relatively wide chargestate distribution from z¼ 4 to z¼ 11, which covers the mass range between1300 < m/z < 3600. It is, therefore, a reasonable calibration protein formedium‐sized proteins measured under native conditions.
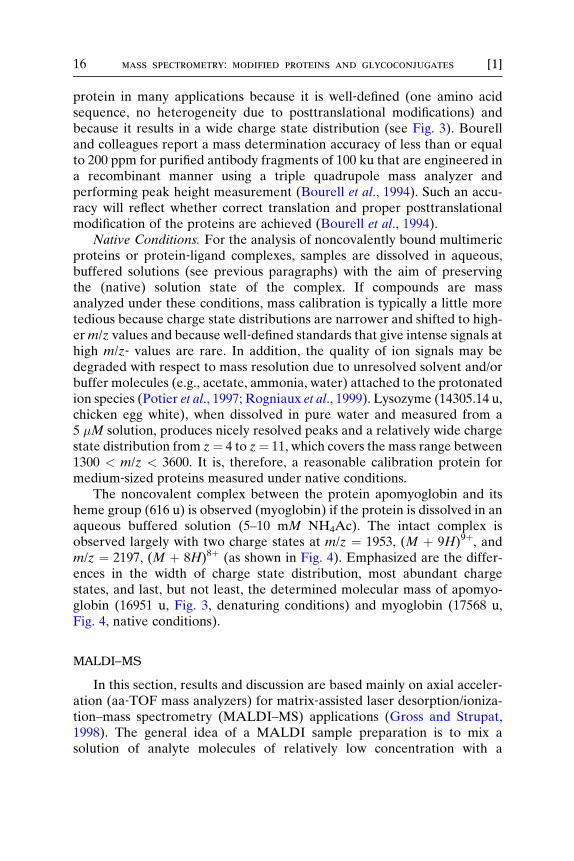
The noncovalent complex between the protein apomyoglobin and itsheme group (616 u) is observed (myoglobin) if the protein is dissolved in anaqueous buffered solution (5–10 mM NH4Ac). The intact complex isobserved largely with two charge states at m/z ¼ 1953, (M þ 9H)9þ, andm/z ¼ 2197, (M þ 8H)8þ (as shown in Fig. 4). Emphasized are the differ-ences in the width of charge state distribution, most abundant chargestates, and last, but not least, the determined molecular mass of apomyo-globin (16951 u, Fig. 3, denaturing conditions) and myoglobin (17568 u,Fig. 4, native conditions).
MALDI–MS
In this section, results and discussion are based mainly on axial acceler-ation (aa‐TOF mass analyzers) for matrix‐assisted laser desorption/ioniza-tion–mass spectrometry (MALDI–MS) applications (Gross and Strupat,1998). The general idea of a MALDI sample preparation is to mix asolution of analyte molecules of relatively low concentration with a
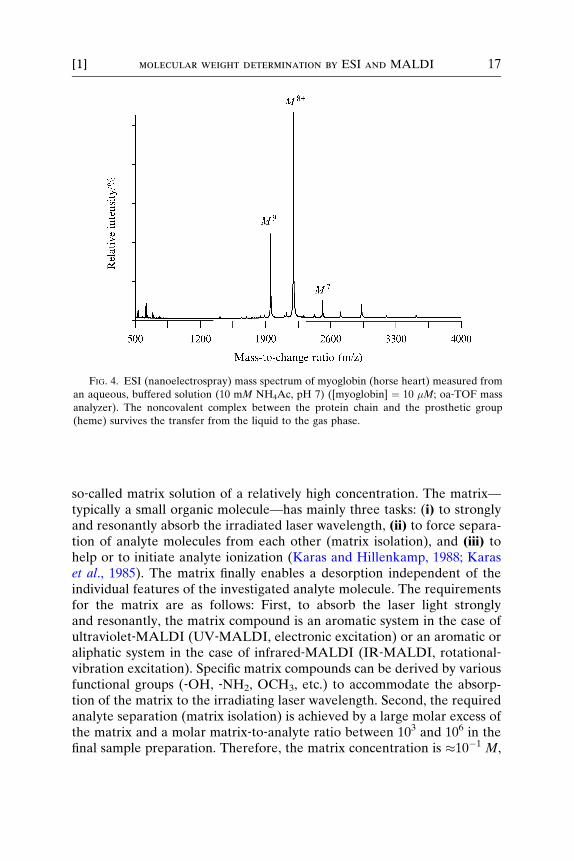
FIG. 4. ESI (nanoelectrospray) mass spectrum of myoglobin (horse heart) measured from
an aqueous, buffered solution (10 mM NH4Ac, pH 7) ([myoglobin] ¼ 10 �M; oa‐TOF mass
analyzer). The noncovalent complex between the protein chain and the prosthetic group
(heme) survives the transfer from the liquid to the gas phase.
[1] molecular weight determination by ESI and MALDI 17
so‐called matrix solution of a relatively high concentration. The matrix—typically a small organic molecule—has mainly three tasks: (i) to stronglyand resonantly absorb the irradiated laser wavelength, (ii) to force separa-tion of analyte molecules from each other (matrix isolation), and (iii) tohelp or to initiate analyte ionization (Karas and Hillenkamp, 1988; Karaset al., 1985). The matrix finally enables a desorption independent of theindividual features of the investigated analyte molecule. The requirementsfor the matrix are as follows: First, to absorb the laser light stronglyand resonantly, the matrix compound is an aromatic system in the case ofultraviolet‐MALDI (UV‐MALDI, electronic excitation) or an aromatic oraliphatic system in the case of infrared‐MALDI (IR‐MALDI, rotational‐vibration excitation). Specific matrix compounds can be derived by variousfunctional groups (‐OH, ‐NH2, OCH3, etc.) to accommodate the absorp-tion of the matrix to the irradiating laser wavelength. Second, the requiredanalyte separation (matrix isolation) is achieved by a large molar excess ofthe matrix and a molar matrix‐to‐analyte ratio between 103 and 106 in thefinal sample preparation. Therefore, the matrix concentration is �10�1 M,
18 mass spectrometry: modified proteins and glycoconjugates [1]
while the analyte concentration is in the range between 10�5 M and 10�7
M, depending on the size of the analyte molecule and its purity. In otherwords, a peptide or protein concentration of 0.1 g/l (10�4 M for mass 1000 uand 10�6 M for mass 100,000 u) is sufficient for a successful MALDI massanalysis. Third, it is assumed that the choice of the matrix plays an impor-tant role in analyte ionization, and a proton transfer from the electronicallyexcited matrix compound to the analyte molecules in the expanding plumemight be responsible for ionization; however, a model taking into accountthe different physical properties of UV– and IR–MALDI has yet to beexplored (Ehring et al., 1992; Karas et al., 2000; Zenobi and Knochenmuss,1999).
MALDI Sample Preparation
Two different main sample preparation techniques should be distin-guished and can lead to very different sample morphologies, which influ-ence the achievable precision and accuracy of mass determination. The fastevaporation or thin layer preparation introduced by Vorm et al. (Vorm andMann, 1994; Vorm et al., 1994) results in a very homogeneous samplemorphology. This preparation technique is suited to matrix compoundsthat are almost water insoluble, such as �‐cyano‐4‐hydroxy cinnamic acid(ACCA) (Beavis et al., 1992). The MALDI sample is prepared by firstproducing a thin matrix layer on the target and afterward spotting theanalyte solution on top of this matrix layer. For this purpose, a saturatedmatrix solution dissolved in acetone is spread over the target; the solventevaporates quickly, leaving a thin, dry matrix layer behind. The analytesolution (preferentially in a slightly acidic solution containing 0.1% tri-fluoroacetic acid or TFA) is added on top of the matrix layer that is notdissolved completely by the solvent. Whether this results in analyte incor-poration into the ACCA matrix crystals or the analyte molecules are onlyattached to the matrix surface is still debated (Horneffer et al., 1999). Thethin layer preparation technique using the ACCA matrix is preferentiallyused for peptide mass mapping with the aim of protein identification. TheACCA matrix is not a matrix of choice for high mass compounds, such asproteins analyzed in a reflector TOF, because the ACCA matrix tends toinduce a considerable amount of metastable fragmentation of analytemolecules (Karas et al., 1995).
The dried droplet preparation is best suited for water‐soluble matrixcompounds, such as 2,5‐dihydroxybenzoic acid (2,5‐DHB), or is best suitedfor mixtures with 2‐hydroxy‐5‐methoxy benzoic acid (DHBs) (Karas et al.,1993), 3‐hydroxy picolinic acid (both UV–MALDI), or succinic acid(IR–MALDI) and results in a more heterogeneous sample morphology.
[1] molecular weight determination by ESI and MALDI 19
The MALDI sample is prepared by mixing analyte and matrix solutiondirectly on the target and air‐drying the sample. The cocrystallization ofmatrix and analyte results in matrix crystals with dimensions of the 100‐�mrange or larger. Crystals can tower into the acceleration region of the ionsource, which limits precision of mass determination, if mass spectra aretaken from different spots. Typically a dried droplet preparation leads to amore or less pronounced hot spot phenomenon (i.e., signal intensitycan differ quite dramatically within one given sample preparation). Thisis especially pronounced for the 3‐high‐performance addressing (HPA)matrix.
Several helpful hints about sample preparation, including sample puri-fication steps on a microliter scale prior to matrix incubation and on‐targetreactions such as dithiothreitol (DTT)‐reduction, are described in theliterature (Gobom et al., 1999; Kussmann et al., 1997).
Last, but not least, some comment about the liquid IR matrix glycerolseems appropriate. Glycerol acts as an IR matrix due to its three hydroxylgroups and can be used at a laser wavelength of 3 �m as well as of 10.6 �m(Berkenkamp et al., 1997; Menzel et al., 1999). Glycerol has the advantageof also being a liquid in a vacuum, and no cocrystallization with the analytemolecules occurs. The laser beam irradiates the liquid sample and alwaysfinds a ‘‘healed’’ surface from which analyte molecules can be desorbed. Inpractice, the observed ions—singly to more highly charged monomeric ionsor singly charged oligomers of the analyte molecules—depend on themolar matrix‐to‐analyte ratio chosen (Berlenpamp, 2000; Berkenkampet al., 1997; Menzel et al., 1999). Molar matrix‐to‐analyte ratios are between104 and 107. The lower the molar glycerol excess, the more pronounced arethe oligomeric states (most likely gas‐phase induced) and the less pro-nounced become doubly or triply charged ions of the analyte molecule.
Mass Analyzers. The laser‐pulsed MALDI source is most suitable forTOF mass analyzers. Therefore, TOF mass analyzers in an axial accelera-tion (aa‐TOF) geometry were the first to be employed in this ionizationtechnique (Hillenkamp et al., 1991). Peptide mass mapping is straightfor-ward and the ease of interpretation of MALDI mass spectra (seeappearance of mass spectra) often avoids the need to couple to the chro-matographic separation of peptides prior to mass analysis.
A state‐of‐the‐art MALDI–TOF instrument is equipped with both alinear port (ion source, field‐free drift region, and detector are in a linearrow) and a reflector port (which divides the field‐free drift region by anelectrostatic mirror that compensates for energy deficits of ions of thesame m/z ratio) and, most importantly, with the possibility for delayedion extraction in the MALDI source. In particular, the introduction ofdelayed ion extraction has improved the quality of MALDI mass spectra
20 mass spectrometry: modified proteins and glycoconjugates [1]
significantly in terms of mass resolution R (Brown and Lennon, 1995; Colbyet al., 1994; Vestal et al., 1995; Whittal and Li, 1995). Basically, delayed ionextraction (DE–MALDI) compensates for the initial velocity distribution(Beavis and Chait, 1991) of MALDI‐produced ions (Juhasz et al., 1997).
Mass resolution of more than R ¼ 10,000 is achievable for peptidesin the mass range up to 5000 u (Vestal et al., 1995), and DE–MALDI‐produced ions of a peptide mass map can be determined with an accuracyof 10 to 50 ppm (0.01 u to 0.05 u in 1000 u) or better. Such a high massaccuracy dramatically increases the specificity of database interrogation,and identification of proteins can be achieved unambiguously if at least fivepeptide masses are determined with better than 50 ppm accuracy (Clauseret al., 1999; Jensen et al. 1996; Shevchenko et al., 1996).
In contrast to the first conclusions made after the introduction of thetechnique—that MALDI‐produced ions would be extremely stable andthat no fragment ions would be observed—postsource decay (PSD) analy-sis allows investigation and identification of structural fragment ionsof peptides up to 3000 u that result from decay taking place in the field‐free drift region of the mass spectrometer after leaving the ion source(Kaufmann et al., 1996; Spengler et al., 1992). The complexity of PSDspectra, the relatively low abundance of fragment ions, and, most impor-tantly, the limited mass accuracy still make PSD‐based peptide sequencingfor protein identification difficult, at least for high‐throughput analysis(Spengler, 1997).
A MALDI source has been coupled to an oa‐TOF arrangement(Krutchinsky et al., 1998) and to a qQ‐TOF setup (Krutchinsky, 1998;Loboda, 1999). The oa‐TOF geometry substantially decouples the desorp-tion process of MALDI (ions with large initial velocity distribution) fromthe subsequent mass analysis in the TOF. This facilitates mass calibrationfor both MS and MS/MS applications. MALDI‐produced ions are cooled inthe collisional damping interface (q) and transferred to the analyticalquadrupole (Q), which is operated to transmit the ions to the oa‐TOF(peptide mass map) or a precursor ion is selected that is fragmented inthe succeeding collision cell (MS/MS) (Werner, 2005). Details on thedesign and performance of the qQ‐TOF equipped with a MALDI‐sourcehave been published by Loboda et al. (2000). The power of this instrumen-tation and its promising impact on proteomics by MALDI‐produced ionswere described recently by Shevchenko et al. (2000). With high massresolution R (R ¼ 10000 FWHM) and high mass accuracy (10 ppm) ofboth, MS and MS/MS spectra are provided by this approach to peptidemass analysis (Shevchenko et al., 2000).
MALDI sources have also been coupled to other mass analyzers, suchas ion traps (Doroshenko et al., 1992; Qin et al., 1996), magnetic sectors
[1] molecular weight determination by ESI and MALDI 21
(Hill et al., 1991), and double‐focusing instruments (combined with anoa‐TOF) (Bateman et al., 1995), allowing the performance of MS andMS/MS applications.
Appearance of MALDI Mass Spectra
When accumulating spectra in the positive ion mode, single protonationof peptide and protein species is the most frequent mechanism. The mostabundant ion signal is, therefore, assigned as (M þ H)þ or Mþ. Dependingon sample purity, less pronounced sodium and potassium adduct ions (M þNa)þ or (M � H þ Na þ K)þ occur and broaden the signal to the highermass side. This becomes a severe problem with increasing mass of theprotein, because cation adducts cannot be resolved any more from theprotonated species.
The singly charged (protonated) ion species Mþ is accompanied by lessintense doubly and more highly charged ions (Mnþ) and some still lessabundant singly or more highly charged (most likely) gas phase‐inducedoligomers (mMnþ) of the species. The fact that MALDI produces predom-inantly singly charged ions significantly facilitates mass spectra interpreta-tion compared to what is possible with ESI if more than one species ispresent in the sample. Even in the analysis of mixtures, signalscorresponding to the same analyte molecule are easy to assign, makingMALDI mass analysis most straightforward for peptide mass mapping(Clauser et al., 1999; Jensen et al., 1996; Shevchenko et al., 1996).
In peptide mass analysis and positive ion mode, signals correspondingto singly charged protonated species (M þ H)þ are almost the only signalsobtained. The information in Fig. 5 shows the same peptide mixture asshown in Fig. 2, but the data in Fig. 5 result from using an ACCA matrixprepared as a thin layer analyzed by MALDI–MS; angiotensin I, substanceP, and neurotensin are added on top of the dried matrix layer. Each peptidehas a concentration of 1 �M. Interestingly, only singly charged speciesappear in the mass spectrum (as protonated species and, although lessabundant, as sodium and potassium attached species) together with matrixsignals. Signals corresponding to dimers (2Mþ) and doubly charged species(M2þ) are not observed. This finding is very typical for the mass analysis ofpeptides by MALDI–MS.
With increasing mass, more highly charged signals, such as (M þ 2H)2þ
or (Mþ 3H)3þ, and singly or doubly charged oligomers, such as (2MþH)þ
or (3M þ 2H)2þ, may show up in the mass spectrum. To provide anexample of a medium‐sized protein, Fig. 6 shows apomyoglobin (3 �M)prepared with DHBs matrix (Bahr et al., 1997). The inset shows the singlycharged ion species; a peak width at half maximum of �m ¼ 9.6 u is
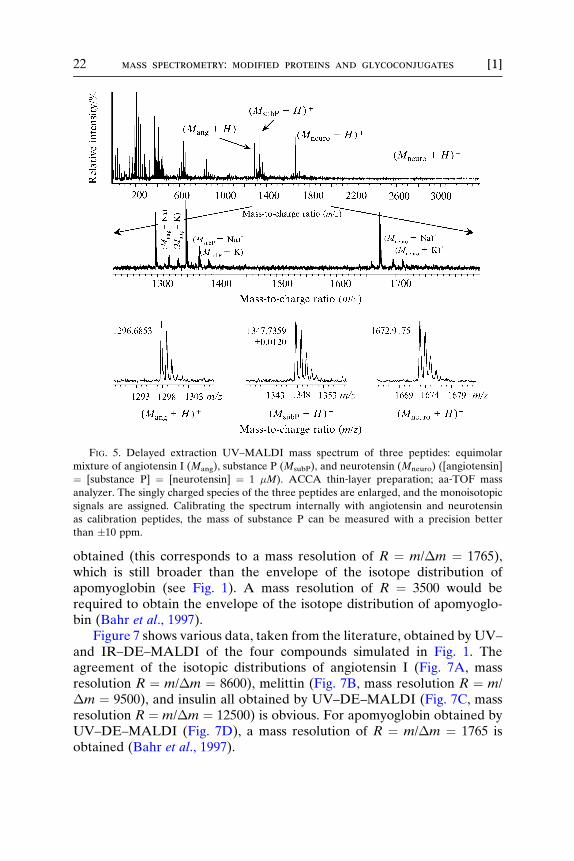
FIG. 5. Delayed extraction UV–MALDI mass spectrum of three peptides: equimolar
mixture of angiotensin I (Mang), substance P (MsubP), and neurotensin (Mneuro) ([angiotensin]
¼ [substance P] ¼ [neurotensin] ¼ 1 �M). ACCA thin‐layer preparation; aa‐TOF mass
analyzer. The singly charged species of the three peptides are enlarged, and the monoisotopic
signals are assigned. Calibrating the spectrum internally with angiotensin and neurotensin
as calibration peptides, the mass of substance P can be measured with a precision better
than �10 ppm.
22 mass spectrometry: modified proteins and glycoconjugates [1]
obtained (this corresponds to a mass resolution of R ¼ m/�m ¼ 1765),which is still broader than the envelope of the isotope distribution ofapomyoglobin (see Fig. 1). A mass resolution of R ¼ 3500 would berequired to obtain the envelope of the isotope distribution of apomyoglo-bin (Bahr et al., 1997).
Figure 7 shows various data, taken from the literature, obtained by UV–and IR–DE–MALDI of the four compounds simulated in Fig. 1. Theagreement of the isotopic distributions of angiotensin I (Fig. 7A, massresolution R ¼ m/�m ¼ 8600), melittin (Fig. 7B, mass resolution R ¼ m/�m ¼ 9500), and insulin all obtained by UV–DE–MALDI (Fig. 7C, massresolution R ¼ m/�m ¼ 12500) is obvious. For apomyoglobin obtained byUV–DE–MALDI (Fig. 7D), a mass resolution of R ¼ m/�m ¼ 1765 isobtained (Bahr et al., 1997).
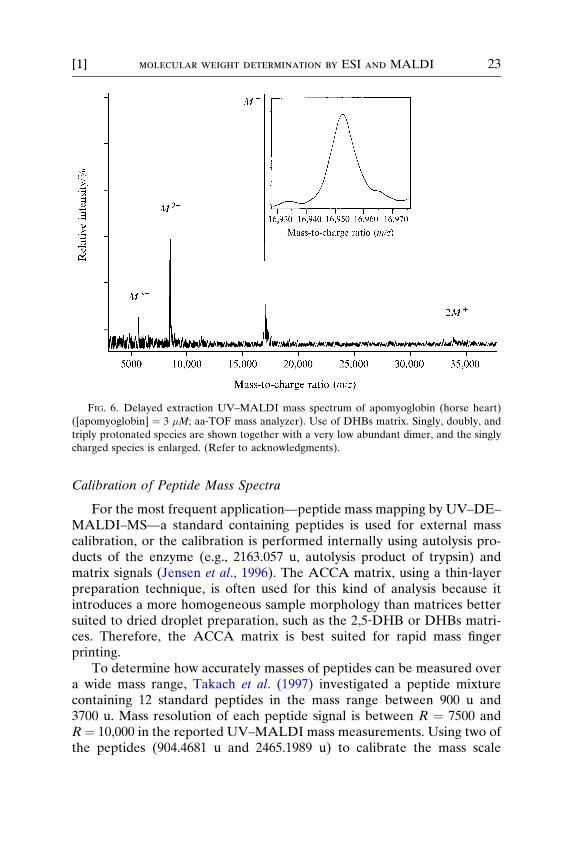
FIG. 6. Delayed extraction UV–MALDI mass spectrum of apomyoglobin (horse heart)
([apomyoglobin] ¼ 3 �M; aa‐TOF mass analyzer). Use of DHBs matrix. Singly, doubly, and
triply protonated species are shown together with a very low abundant dimer, and the singly
charged species is enlarged. (Refer to acknowledgments).
[1] molecular weight determination by ESI and MALDI 23
Calibration of Peptide Mass Spectra
For the most frequent application—peptide mass mapping by UV–DE–MALDI–MS—a standard containing peptides is used for external masscalibration, or the calibration is performed internally using autolysis pro-ducts of the enzyme (e.g., 2163.057 u, autolysis product of trypsin) andmatrix signals (Jensen et al., 1996). The ACCA matrix, using a thin‐layerpreparation technique, is often used for this kind of analysis because itintroduces a more homogeneous sample morphology than matrices bettersuited to dried droplet preparation, such as the 2,5‐DHB or DHBs matri-ces. Therefore, the ACCA matrix is best suited for rapid mass fingerprinting.
To determine how accurately masses of peptides can be measured overa wide mass range, Takach et al. (1997) investigated a peptide mixturecontaining 12 standard peptides in the mass range between 900 u and3700 u. Mass resolution of each peptide signal is between R ¼ 7500 andR ¼ 10,000 in the reported UV–MALDI mass measurements. Using two ofthe peptides (904.4681 u and 2465.1989 u) to calibrate the mass scale
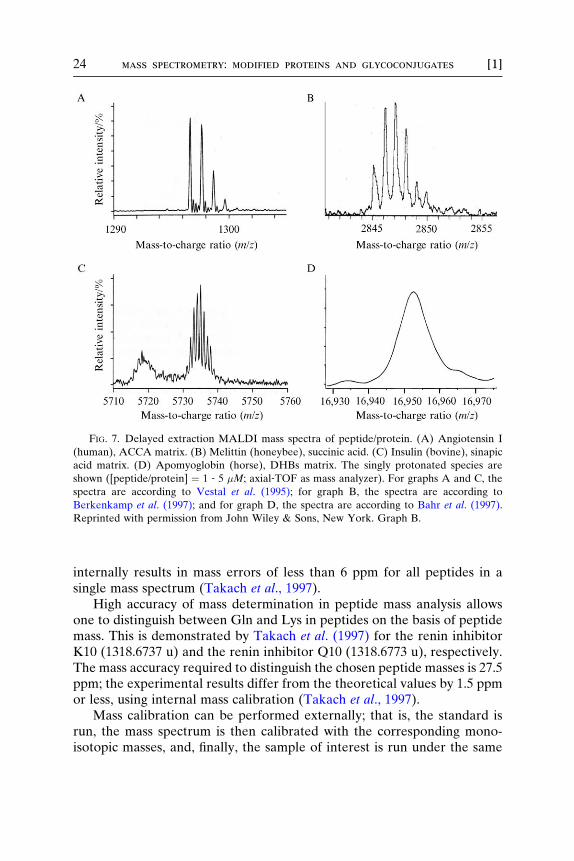
FIG. 7. Delayed extraction MALDI mass spectra of peptide/protein. (A) Angiotensin I
(human), ACCA matrix. (B) Melittin (honeybee), succinic acid. (C) Insulin (bovine), sinapic
acid matrix. (D) Apomyoglobin (horse), DHBs matrix. The singly protonated species are
shown ([peptide/protein] ¼ 1 ‐ 5 �M; axial‐TOF as mass analyzer). For graphs A and C, the
spectra are according to Vestal et al. (1995); for graph B, the spectra are according to
Berkenkamp et al. (1997); and for graph D, the spectra are according to Bahr et al. (1997).
Reprinted with permission from John Wiley & Sons, New York. Graph B.
24 mass spectrometry: modified proteins and glycoconjugates [1]
internally results in mass errors of less than 6 ppm for all peptides in asingle mass spectrum (Takach et al., 1997).
High accuracy of mass determination in peptide mass analysis allowsone to distinguish between Gln and Lys in peptides on the basis of peptidemass. Thi s is demonst rated by Takach et al. (1997) for the renin inhibit orK10 (1318.6737 u) and the renin inhibitor Q10 (1318.6773 u), respectively.The mass accuracy required to distinguish the chosen peptide masses is 27.5ppm; the experimental results differ from the theoretical values by 1.5 ppmor less, using internal mass calibration (Takach et al., 1997).
Mass calibration can be performed externally; that is, the standard isrun, the mass spectrum is then calibrated with the corresponding mono-isotopic masses, and, finally, the sample of interest is run under the same
[1] molecular weight determination by ESI and MALDI 25
instrumental conditions. Consequences and limitations with respect tomass accuracy resulting from external mass calibration of MALDI dataare mainly due to the heterogeneity of sample preparation both from spot‐to‐spot and from preparation‐to‐preparation. Russell and Edmondson dis-cuss the influence of mass resolution and peak shapes on accurate massassignment in the mass analysis of peptides; they have obtained an accuracybetter than 5 ppm for internal and 10 to 15 ppm for external mass calibra-tion in the mass range between 1 and 4 ku while achieving a mass resolu-tion of R ¼ 10,000 ‐ 15,000 in the mass range of peptides (Edmondson andRussell, 1996; Russell and Edmondson, 1997).
Calibration of Protein Mass Spectra
In protein mass analysis, precision and accuracy of mass determinationdrops to values of 100 to 1000 ppm when using static ion extraction. Beavisand Chait reported results of UV–MALDI mass analysis of proteins in themass range up to 30 ku and determined the mass of bovine pancreatictrypsinogen to 23980.3 � 2.6 u, which is equal to a precision of 110 ppm andan accuracy of ‐29 ppm; the mass of protease subtilisin Carlsberg (Bacillussubtilis) was measured to (27288.2 � 1.7 u), which is equal to a precision of62 ppm and an accuracy of ‐7.3 ppm (Beavis and Chait, 1990). However,both the accuracy and precision drop down for proteins with increasingmass due to their intrinsic heterogeneity and their decay and adductformation. For monoclonal antibodies (150 ku), Siegel et al. (1991) demon-strated that a precision between 100 and 700 ppm is achievable usingnicotinic acid as UV–MALDI matrix.
Due to the introduction of delayed ion extraction and the higher massresolution thereby obtained, precision of mass determination of proteinsabove 20 ku has been increased to �50 ppm for successive measurementsfrom a given spot and is still �200 ppm for several spots in between onepreparation of a DHBs matrix rim, as shown by Bahr et al. (1997). Theaccuracy of mass determination is in the 100 ppm range for proteinsexceeding 25,000 u. The best conditions were explored for weak extractionfield strengths and long delay times (Bahr et al., 1997). By far the bestresults with respect to matrix choice were obtained using a DHBs matrix;the strength of this matrix for high mass compounds is due to the factthat it does not transfer much energy into the analyte molecules (asthe ACCA matrix does, for example) and therefore prevents orreduces decay of analyte molecules in the field‐free drift region of themass analyzer. The softness of the DHBs matrix (Karas et al., 1993)compensates for the heterogeneous sample morphology obtained usingthis type of matrix. Bahr et al. (1997) investigated �‐amylase (from
26 mass spectrometry: modified proteins and glycoconjugates [1]
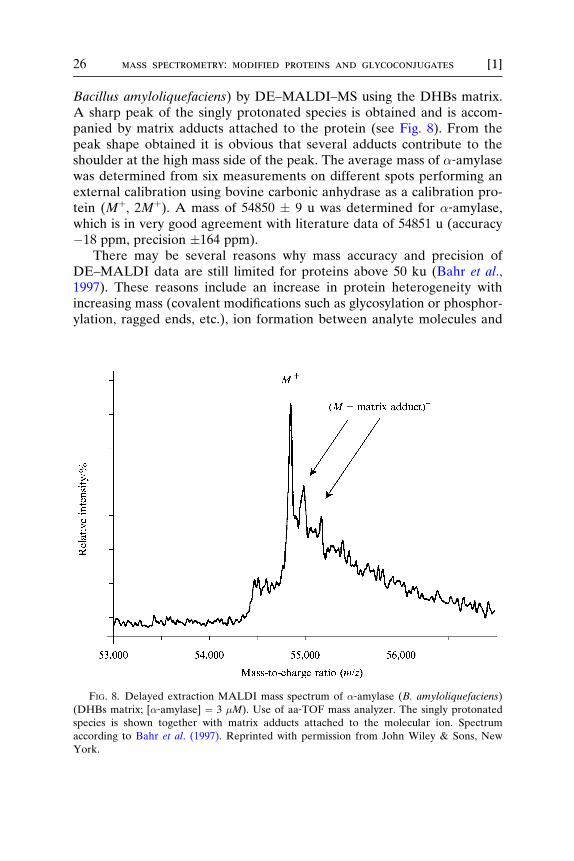
Bacillus amyloliquefaciens) by DE–MALDI–MS using the DHBs matrix.A sharp peak of the singly protonated species is obtained and is accom-panied by matrix adducts attached to the protein (see Fig. 8). From thepeak shape obtained it is obvious that several adducts contribute to theshoulder at the high mass side of the peak. The average mass of �‐amylasewas determined from six measurements on different spots performing anexternal calibration using bovine carbonic anhydrase as a calibration pro-tein (Mþ, 2Mþ). A mass of 54850 � 9 u was determined for �‐amylase,which is in very good agreement with literature data of 54851 u (accuracy�18 ppm, precision �164 ppm).
There may be several reasons why mass accuracy and precision ofDE–MALDI data are still limited for proteins above 50 ku (Bahr et al.,1997). These reasons include an increase in protein heterogeneity withincreasing mass (covalent modifications such as glycosylation or phosphor-ylation, ragged ends, etc.), ion formation between analyte molecules and
FIG. 8. Delayed extraction MALDI mass spectrum of �‐amylase (B. amyloliquefaciens)
(DHBs matrix; [�‐amylase] ¼ 3 �M). Use of aa‐TOF mass analyzer. The singly protonated
species is shown together with matrix adducts attached to the molecular ion. Spectrum
according to Bahr et al. (1997). Reprinted with permission from John Wiley & Sons, New
York.
[1] molecular weight determination by ESI and MALDI 27
matrix molecules (matrix adducts), and an increasing contribution of theinitial energy and energy distribution with increasing analyte mass (Bahret al., 1997).
Calibration of Mass Spectra Using IR–MALDI
In static extraction using a reflectron TOF mass analyzer, the precisionof mass determination of IR–MALDI is typically 400 to 700 ppm formolecular masses up to 150 ku using solid matrices, while the precision isa little better, at 200 to 500 ppm, using the liquid matrix glycerol. Using solidmatrices precision is mainly limited by the need for frequent changes ofdesorption location, as is typical for IR–MALDI. Precision in IR–MALDIis, therefore, one order of magnitude worse for analyte molecules below 30kDa using static extraction compared to UV–MALDI, while it is betterby a factor of 2 for larger analyte molecules. This finding might beexplained by the typically better mass resolution of IR–MALDI ion signalscompared to UV–MALDI ion signals of high mass compounds, which isa consequence of the lower yield of metastable fragmentation in IR–MALDI compared to UV–MALDI. For proteins up to 40 ku, mass accu-racy is about 100 to 500 ppm, while it is limited to 1000 to 5000 ppm foranalytes exceeding 40 ku (Berkenkamp et al., 1997).
Mass calibration of high mass compounds in IR–MALDI can be per-formed conveniently by using lysozyme (chicken egg white) desorbed fromglycerol matrix. Depending on the mass range of interest, slightly differentmolar lysozyme‐glycerol ratios are prepared, resulting in more or lesspronounced oligomeric signals of lysozyme of the type (nM þ H)þ up to200,000 u. This performance of IR–MALDI using a glycerol matrix permitscalibration of higher mass ranges; however, high accuracy of mass determi-nation is still desirable: lysozyme was used to calibrate two differentchondroitinase enzymes that digest a polysaccharide part of the eye’sproteoglycan. The molecular masses of these two enzymes were calculatedfrom their c‐DNA‐derived sequences; chondroitinase I has a molecularmass of 112,508 u, while chondroitinase II has a molecular mass of111,713 u. IR–MALDI determined the molecular masses with an accuracyof ‐1600 ppm (‐185 u) using static ion extraction (Berlenpamp, 2000;Kelleher et al., 1997).
Using delayed extraction, the achievable accuracy of mass determina-tion of a mixture of peptides was tested for succinic acid matrix (2.94 �m)(Berkenkamp et al., 1997), glycerol matrix (2.94 �m) (Berkenkamp et al.,1997), and fumaric acid (10.6 �m) (Menzel et al., 1999). All three matricesresulted in an accuracy of 10 ppm or better using internal mass calibration.With this respect, accuracy of mass determination of peptides achieved by
28 mass spectrometry: modified proteins and glycoconjugates [1]
IR–MALDI–MS is in excellent agreement with values obtained by UV–MALDI–MS and ESI–MS.
FTICR Mass Analyzers Coupled to ESI and MALDI
The underlying physical principle of mass determination by a FTICRmass analyzer is the relationship between the cyclotron frequency (nc) ofan ion in a magnetic field of the magnetic field induction (B) and the mass‐to‐charge ratio (m/z) of the ion: nc / (m/z)�1 (Marshall and Grosshans,1991). The accuracy of mass determination by FTICR mass analyzers ispotentially ultra‐high because frequencies can be measured more accurate-ly than any other physical property. Mass calibration is performed by thedetermination of the cyclotron frequency of a calibration peptide or pro-tein. The cyclotron frequency of the analyte compound under investigationis compared to that of the calibration molecule. As a rough guide, massaccuracy performing an external mass calibration is about 10 ppm or better(Li et al., 1994), while applying mass calibration is better by a factor of 3(Wu et al., 1995). The masses of the most abundant isotopes of the twochondroitinases (112,508 u and 111,713 u) mentioned earlier could bedetermined with an accuracy of �3 u (�2.6 ppm, external mass calibration)by Kelleher et al. (1997).
Although ESI is the more frequently used ionization technique em-ployed with FTICR mass analyzers, MALDI can also be applied with thiskind of mass analyzer. The challenge to couple MALDI‐produced ions toFTICR mass analyzers lies in the relatively broad mass‐independent veloc-ity distribution of MALDI ions (Beavis and Chait, 1991). The kineticenergy dependent on velocity distribution makes an efficient trappingof ions in the FTICR cell more difficult (Hettich and Buchanan, 1991;Li et al., 1996).
The striking feature of FTICR mass analyzers is their ultra‐high massresolution (R > 105 at 1000 u). The mass resolution increases with theapplied magnetic field induction B, which motivates the performance ofexperiments with higher and higher values of B. The high mass resolutionachievable with FTICR mass analyzers allows the determination of thecharge state of high molecular compounds, such as proteins, directly fromone single charge state: the distance between isotopic signals is now alsoresolved for larger compounds (compare to Fig. 2 and Fig. 3), and adjacention signals differing by one mass unit (1 u) have a distance of (chargestate)�1.
This feature greatly simplifies the mass assignment of an ion in ESI(Beu et al., 1993; Senko et al., 1996; Speir et al., 1995). Figure 9 shows the
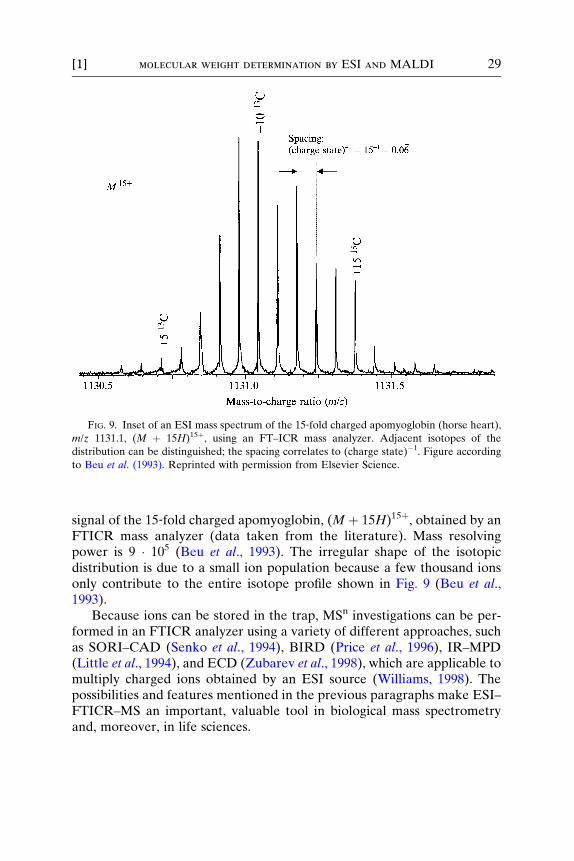
FIG. 9. Inset of an ESI mass spectrum of the 15‐fold charged apomyoglobin (horse heart),
m/z 1131.1, (M þ 15H)15þ, using an FT–ICR mass analyzer. Adjacent isotopes of the
distribution can be distinguished; the spacing correlates to (charge state)�1. Figure according
to Beu et al. (1993). Reprinted with permission from Elsevier Science.
[1] molecular weight determination by ESI and MALDI 29
signal of the 15‐fold charged apomyoglobin, (M þ 15H)15þ, obtained by anFTICR mass analyzer (data taken from the literature). Mass resolvingpower is 9 � 105 (Beu et al., 1993). The irregular shape of the isotopicdistribution is due to a small ion population because a few thousand ionsonly contribute to the entire isotope profile shown in Fig. 9 (Beu et al.,1993).
Because ions can be stored in the trap, MSn investigations can be per-formed in an FTICR analyzer using a variety of different approaches, suchas SORI–CAD (Senko et al., 1994), BIRD (Price et al., 1996), IR–MPD(Little et al., 1994), and ECD (Zubarev et al., 1998), which are applicable tomultiply charged ions obtained by an ESI source (Williams, 1998). Thepossibilities and features mentioned in the previous paragraphs make ESI–FTICR–MS an important, valuable tool in biological mass spectrometryand, moreover, in life sciences.
30 mass spectrometry: modified proteins and glycoconjugates [1]
Addendum
Mass Analyzers
A variety of different analyzers or combinations of analyzers (hybridinstruments) have been applied very successfully for both ESI andMALDI ionization techniques, and most of them are commercially avail-able. These include quadrupole time‐of‐flight instruments available withexchangeable ion sources, making them applicable to a large spectrumof analytical questions (Chernushevich et al., 2001). The TOF–TOF in-strument equipped with a MALDI source and a collision cell for highenergy collisions allows the identification of up to 10,000 proteins per day(Medzihradszky et al., 2000). Another approach to identifying proteins viaa sequencing of specific peptides of MALDI‐induced PSD products isopened by the LIFT technology realized on an aa‐reflectron TOF; PSD‐spectra can be accumulated much faster because all fragment ions arefound for one given reflectron potential (La Rotta, 2001). In addition, ahybrid instrument that is a combination of a linear ion trap followed by aFTICR mass spectrometer has also been introduced. The LTQ–FT iscapable of detecting fragment ions in the linear trap (low mass resolutionand accuracy) of a given precursor, while (in parallel) the correspondingprecursor is detected with high mass resolution and ultra‐high mass accu-racy (0.5–2 ppm) (Olsen and Mann, 2004). The future will show how theseanalyzers will answer the variety of analytical questions in life sciences withrespect to factors such as speed, sensitivity, dynamic range, and massaccuracy.
MALDI Sample Preparation
When addressing the question whether analyte molecules should beincorporated into the solid matrix to enable a successful desorption/ioniza-tion event of analyte molecules by MALDI, it should be mentioned thatresults indicate the necessity of a chemisorption of analyte molecules (i.e.,only partly incorporated) into the matrix surface to enable MALDI. Aphysisorption (a simple deposition of analyte molecules onto the matrixsurface) is not sufficient (Gluckmann, 2001; Horneffer, 2001).
Acknowledgments
ESI mass spectra of the peptide mixture, of apomyoglobin and myoglobin, were
accumulated using a Mariner instrument (oa‐TOF) equipped with a nanoelectrospray source.
The instrument was kindly given to chapter author Kerstin Strupat for research work; this
support by Applied Biosystems is highly appreciated. Strupat wants to thank Dr. Jonathan
[1] molecular weight determination by ESI and MALDI 31
Butler (Laboratory of Molecular Biology, Cambridge, United Kingdom) for proofreading the
manuscript and helping with the English language. The MALDI mass spectrum of
apomyoglobin (Fig. 6) was kindly donated by Dr. Ute Bahr and Dr. Michael Karas from
the University of Frankfurt, Germany. Dr. Michael Mormann (Institute for Medical Physics
and Biophysics, Biomedical Analytics, University of Munster) is also thanked for the
discussion about FTICR instrumentation.
References
Bahr, U., Stahl‐Zeng, J., Gleitsmann, E., and Karas, M. (1997). Delayed extraction time‐of‐flight MALDI mass spectrometry of proteins above 25,000 Da. J. Mass Spectrom. 32,
1111–1116.
Baldwin, M. L. (2005). Mass spectrometers for the analysis of biomolecules. Methods in
Enzymology 405, 172–187.
Bateman, R. H., Green, M. R., Scott, G., and Clayton, E. (1995). A combined magnetic
sector‐time‐of‐flight mass spectrometer for structural determination studies by tandem
mass spectrometry. Rapid Commun. Mass Spectrom. 9, 1227–1233.Beavis, R. C., and Chait, B. T. (1990). High‐accuracy molecular mass determination of
proteins using matrix‐assisted laser desorption mass spectrometry. Anal. Chem. 62,
1836–1840.
Beavis, R. C., and Chait, B. T. (1991). Velocity distributions of intact high mass polypeptide
molecule ions produced by matrix assisted laser desorption. Chem. Phys. Letters 181,
479–484.
Beavis, R. C., Chaudhary, T., and Chait, B. T. (1992). A‐Cyano‐4‐hydroxycinnamic acid as a
matrix for matrix‐assisted laser desorption mass spectrometry. Org. Mass Spectrom. 27,
156–158.
Berkenkamp, S., Menzel, C., Karas, M., and Hillenkamp, F. (1997). Performance of infrared
matrix‐assisted laser desorption/ionization mass spectrometry with lasers emitting in the
3 mm wavelength range. Rapid Commun. Mass Spectrom. 11, 1399–1406.
Berlenpamp (2000). Dissertation. University of Munster, Germany.
Beu, S. C., Senko, M. W., Quinn, J. P., Wampler, F. M., III, and McLafferty, F. W. (1993).
Fourier‐transform electrospray instrumentation for tandem high‐resolution mass spec-
trometry of large molecules. J. Am. Soc. Mass Spectrom. 4, 557–565.
Biemann, K. (1990). In ‘‘Methods in Enzymology’’ (J. McCloskey, ed.). Academic Press, New
York.
Bourell, J. H., Clauser, K. P., Kelley, R., Carter, P., and Stults, J. T. (1994). Electrospray
ionization mass spectrometry of recombinantly engineered antibody fragments. Anal.
Chem. 66, 2088–2095.
Brown, R. S., and Lennon, J. J. (1995). Mass resolution improvement by incorporation of
pulsed ion extraction in a matrix‐assisted laser desorption/ionization linear time‐of‐flightmass spectrometer. Anal. Chem. 67, 1998–2003.
Chernushevich, I. V., Ens, W., and Standing, K. G. (1999). Orthogonal injection TOFMS for
analyzing biomolecules. Anal. Chem. 71, 452A–461A.
Chernushevich, I. V., Loboda, A. V., and Thomson, B. A. (2001). An introduction to
quadrupole‐time‐of‐flight mass spectrometry. J. Mass Spectrom. 36, 849–865.
Clauser, K. R., Baker, P., and Burlingame, A. L. (1999). Role of accurate mass measurement
(�10 ppm) in protein identification strategies employing MS or MS/MS and database
searching. Anal. Chem. 71, 2871–2882.
32 mass spectrometry: modified proteins and glycoconjugates [1]
Colby, S. M., King, T. B., and Reilly, J. P. (1994). Improving the resolution of matrix‐assistedlaser desorption/ionization time‐of‐flight mass spectrometry by exploiting the correlation
between ion position and velocity. Rapid Commun. Mass Spectrom. 8, 865–868.
Dawson, J. H. J., and Guilhaus, M. (1989). Orthogonal‐acceleration time‐of‐flight mass
spectrometer. Rapid Commun. Mass Spectrom. 3, 155–159.Dodonow, J. H. J., Chernushevich, I. V., and Laiko, V. V. (1991). Proceed. 12th Intern. Mass
Spectrom. Conf., p. 153.
Doroshenko, V. M., Cornish, T. J., and Cotter, R. J. (1992). Matrix‐assisted laser desorption/
ionization inside a quadrupole ion‐trap detector cell. Rapid Commun. Mass Spectrom. 6,753–757.
Edmonds, C. G., and Smith, R. D. (1990). Methods in Enzymology. Academic Press, New
York.
Edmondson, R. D., and Russell, D. H. (1996). Evaluation of matrix‐assisted laser desorption
ionization‐time‐of‐flight mass measurement accuracy by using delayed extraction. J. Am.
Soc. Mass Spectrom. 7, 995–1001.
Ehring, H., Karas, M., and Hillenkamp, F. (1992). Role of photoionization and photochemis-
try in ionization processes of organic molecules and relevance for matrix‐assisted laser
desorption ionization mass spectrometry. Org. Mass Spectrom. 27, 472–480.
Fenn, J. B., Mann, M., Meng, C. K., Wong, S. F., and Whitehouse, C. M. (1989). Electrospray
ionization for mass spectrometry of large biomolecules. Science 246, 64–71.Gluckmann, M., Pfenninger, A., Karas, M., Horneffer, V., Hillenkamp, F., and Strupat, K.
(2001). Poster presentation, part 1. Proceed. 34th Ann. Meeting German Mass Spectrom.
Conf., p. 70. Leipzig, Germany.
Gobom, J., Nordhoff, E., Mirgorodskaya, E., Ekman, R., and Roepstorff, P. (1999). Sample
purification and preparation technique based on nano‐scale reversed‐phase columns for
the sensitive analysis of complex peptide mixtures by matrix‐assisted laser desorption/
ionization mass spectrometry. J. Mass Spectrom. 34, 105–116.
Gross, J., and Strupat, K. (1998). Matrix‐assisted laser desorption/ionization‐mass spectrome-
try applied to biological macromolecules. TrAC 17, 470–484.
Gross, J., and Hillenkamp, F. (2000). In ‘‘Encyclopedia of Analytical Chemistry’’ (R. A.
Meyers, ed.), pp. 225–275. John Wiley & Sons. In press.
Guilhaus, M., Selby, S., and Mlynski, V. (2000). Orthogonal acceleration time‐of‐flight mass
spectrometry. Mass Spectrom. Rev. 19, 65–107.
Hettich, R. L., and Buchanan, M. V. (1991). Matrix‐assisted laser desorption Fourier
transform mass spectrometry for the structural examination of modified nucleic acid
constituents. Inter. J. Mass Spectrom. Ion Proc. 111, 365–380.
Hill, J. A., Annan, R. S., and Biemann, K. (1991). Matrix‐assisted laser desorption ionization
with a magnetic mass spectrometer. Rapid Commun. Mass Spectrom. 5, 395–399.
Hillenkamp, F., Karas, M., Beavis, R. C., and Chait, B. T. (1991). Matrix‐assisted laser
desorption/ionization mass spectrometry of biopolymers. Anal. Chem. 63, 1193A–1203A.
Horneffer, V., Dreisewerd, K., Ludemann, H. C., Hillenkamp, F., Lage, M., and Strupat, K.
(1999). Is the incorporation of analytes into matrix crystals a prerequisite for matrix‐assisted laser desorption/ionization mass spectrometry? A study of five positional isomers
of dihydroxybenzoic acid. Intern. J. Mass Spectrom. 185/186/187, 859–870.
Horneffer, V., Hillenkamp, F., Strupat, K., Gluckmann, M., Pfenninger, A., and Karas, M.
(2001). Poster, part 2, presented at conference. Proceed. 34th Ann. Meet. German Mass
Spectrom. Conf., p. 72. Leipzig, Germany.
Jensen, O. N., Podtelejnikov, A., and Mann, M. (1996). Delayed extraction improves
specificity in database searches by matrix‐assisted laser desorption/ionization peptide
maps. Rapid Commun. Mass Spectrom. 10, 1371–1378.
[1] molecular weight determination by ESI and MALDI 33
Juhasz, P., Vestal, M. L., and Martin, S. A. (1997). On the initial velocity of ions generated by
matrix‐assisted laser desorption ionization and its effect on the calibration of delayed
extraction time‐of‐flight mass spectra. J. Am. Soc. Mass Spectrom. 8, 209–217.
Juraschek, R., Dulcks, T., and Karas, M. (1999). Nanoelectrospray—more than just a
minimized‐flow electrospray ionization source. J. Am. Soc. Mass Spectrom. 10, 300–308.Karas, M., Bachmann, D., and Hillenkamp, F. (1985). Influence of the wavelength in high‐
irradiance ultraviolet laser desorption mass spectrometry of organic molecules. Anal.
Chem. 57, 2935–2939.
Karas, M., Bahr, U., Strupat, K., Hillenkamp, F., Tsarbopoulos, A., and Pramanik, B. N.
(1995). Matrix dependence of metastable fragmentation of glycoproteins in MALDI TOF
mass spectrometry. Anal. Chem. 67, 675–679.
Karas, M., Ehring, H., Nordhoff, E., Stahl, B., Strupat, K., Hillenkamp, F., Grehl, M., and
Krebs, B. (1993). Matrix‐assisted laser desorption/ionization mass spectrometry with
additives to 2,5‐dihydroxybenzoic acid. Org. Mass Spectrom. 28, 1476–1481.
Karas, M., Gluckmann, M., and Schafer, J. (2000). Ionization in matrix‐assisted laser
desorption/ionization: Singly charged molecular ions are the lucky survivors. J. Mass
Spectrom. 35, 1–12.Karas, M., and Hillenkamp, F. (1988). Laser desorption ionization of proteins with molecular
masses exceeding 10,000 daltons. Anal. Chem. 60, 2299–2301.
Kaufmann, R., Chaurand, P., Kirsch, D., and Spengler, B. (1996). Post‐source decay and
delayed extraction in matrix‐assisted laser desorption/ionization‐reflectron time‐of‐flightmass spectrometry. Are there trade‐offs? Rapid Commun. Mass Spectrom. 10, 1199–2208.
Kebarle, P. (2000). A brief overview of the present status of the mechanisms involved in
electrospray mass spectrometry. J. Mass Spectrom. 35, 804–817.Kelleher, N. L., Senko,M.W., Siegel,M.M., andMcLafferty, F.W. (1997).Unit resolutionmass
spectra of 112 kDa molecules with 3 Da accuracy. J. Amer. Soc. Mass Spectrom. 8, 380–383.
Krutchinsky, A. N., Loboda, A. V., Spicer, V. L., Dworschak, R., Ens, W., and Standing, K. G.
(1998). Orthogonal injection of matrix‐assisted laser desorption/ionization ions into a
time‐of‐flight spectrometer through a collisional damping interfacet. Rapid Commun.
Mass Spectrom. 12, 508–518.
Krutchinsky, A. N., Loboda, A. V., Bromirski, M., Standing, K. G., and Ens, W. (1998). Proc.
46th ASMS Conf. p. 794. Orlando, FL.
Kussmann, M., Nordhoff, E., Rahbek‐Nielsen, H., Haebel, S., Rossel‐Larsen, M., Jakobsen,
L., Gobom, J., Mirgorodskaya, E., Kroll‐Kristensen, A., Palm, L., and Roepstorff, P.
(1997). Matrix‐assisted laser desorption/ionization mass spectrometry sample preparation
techniques designed for various peptide and protein analytes. J. Mass Spectrom. 32,
593–601.
La Rotta, A., Holle, A., and Hillenkamp, F. (2001). Proc. 49th ASMS Conf., p. 1240. Chicago,
IL.
Li, Y., Hunter, R. L., and McIver, R. T., Jr. (1996). Ultrahigh‐resolution Fourier transform
mass spectrometry of biomolecules abovem/z 5000. Inter. J. Mass Spectrom. Ion Proc. 157/
158, 175–188.Li, Y., Hunter, R. L., and McIver, R. T., Jr. (1994). High‐accuracy molecular mass
determination for peptides and proteins by Fourier transform mass spectrometry. Anal.
Chem. 66, 2077–2083.
Little, D. P., Speir, J. P., Senko, M. W., O’Connor, P. B., and McLafferty, F. W. (1994).
Infrared multiphoton dissociation of large multiply charged ions for biomolecule
sequencing. Anal. Chem. 66, 2809–2815.
Loboda, A. V., Krutchinsky, A. N., Bromirski, M., Ens, W., and Standing, K. G. (2000). A
tandem quadrupole/time‐of‐flight mass spectrometer with a matrix‐assisted laser
34 mass spectrometry: modified proteins and glycoconjugates [1]
desorption/ionization source, design and performance. Rapid Commun. Mass Spectrom.
14, 1047–1057.Loboda, A. V., Krutchinsky, A. N., Spicer, V. L., Ens, W., and Standing, K. G. (1999). Proc.
47th ASMS Conf., p. 1956, Dallas, TX.
Loo, J. A. (1997). Studying noncovalent protein complexes by electrospray ionization mass
spectrometry. Mass Spectrom. Rev 16, 1–23.
Mann, M., Meng, C. K., and Fenn, J. B. (1989). Interpreting mass spectra of multiply charged
ions. Anal. Chem. 61, 1702–1708.
Marshall, A. G., and Grosshans, P. B. (1991). Fourier transform ion cyclotron resonance mass
spectrometry: The teenage years. Anal. Chem. 63, 215A–229A.
Medzihradszky, K. F., Campbell, J. M., Baldwin, M. A., Falick, A. M., Juhasz, P., Vestal,
M. L., and Burlingame, A. L. (2000). The characteristics of peptide collision‐induceddissociation using a high‐performance MALDI–TOF/TOF tandem mass spectrometer.
Anal. Chem. 72, 552–558.
Meng, C. K., McEwen, C. N., and Larsen, B. S. (1990a). Electrospray ionization on a high‐performance magnetic‐sector mass spectrometer. Rapid Commun. Mass Spectrom. 4,
147–150.
Meng, C. K., McEwen, C. N., and Larsen, B. S. (1990b). Peptide sequencing with electrospray
ionization on a magnetic sector mass spectrometer. Rapid Comm. Mass Spectrom. 4,
151–155.
Menzel, C., Berkenkamp, S., and Hillenkamp, F. (1999). Infrared matrix‐assisted laser
desorption/ionization mass spectrometry with a transversely excited atmospheric pressure
carbon dioxide laser at 10.6 mm wavelength with static and delayed ion extraction. Rapid
Commun. Mass Spectrom. 13, 26–32.Nielen, M. W. F. (1999). MALDI time‐of‐flight mass spectrometry of synthetic polymers.
Mass Spectrom. Rev. 18, 309–344.
Olsen, J. V., and Mann, M. (2004). Improved peptide identification in proteomics by two
consecutive stages of mass spectrometric fragmentation. Proc. Natl. Acad. Sci. USA 101,13417–13422.
Potier, N., Barth, P., Tritsch, D., Biellmann, J. F., and Van Dorsselaer, A. (1997). Study of
noncovalent enzyme‐inhibitor complexes of aldose reductase by electrospray mass
spectrometry. Eur. J. Biochem. 243, 274–282.
Price, P. (1991). Standard definitions of terms relating to mass spectrometry. A report from
the committee on measurements and standards of the american society for mass
spectrometry. J. Amer. Soc. Mass Spectro. 2, 336–348.Price, W. D., Schnier, P. D., and Williams, E. R. (1996). Tandem mass spectrometry of large
biomolecule ions by blackbody infrared radiative dissociation. Anal. Chem. 68, 859–866.
Qin, J., Ruud, J., and Chait, B. T. (1996). A practical ion trap mass spectrometer for the
analysis of peptides by matrix‐assisted laser desorption/ionization. Anal. Chem. 68,1784–1791.
Rogniaux, H., van Dorsselaer, A., Barth, P., Biellmann, J. F., Barbanton, J., van Zandt, M.,
Chevrier, B., Howard, E., Mitschler, A., Potier, N., Urzhumtseva, L., Moras, D., and
Podjarny, A. (1999). Binding of aldose reductase inhibitors: Correlation of crystallographic
and mass spectrometric studies. J. Am. Soc. Mass Spectrom. 10, 635–647.
Rostom, A. A., and Robinson, C. V. (1999). Disassembly of intact multiprotein complexes in
the gas phase. Curr. Opin. Struct. Biol. 9, 135–141.Russell, D. H., and Edmondson, R. D. (1997). High‐resolution mass spectrometry and
accurate mass measurements with emphasis on the characterization of peptides and
proteins by matrix‐assisted laser desorption/ionization time‐of‐flight mass spectrometry.
J. Mass Spectrom. 32, 263–276.
[1] molecular weight determination by ESI and MALDI 35
Senko, M., Zabrouskov, V., Lange, O., Wieghaus, A., and Horning, S. (2004). LC/MS with
external calibration mass accuracies approaching 100 ppb. Proc. 52nd ASMS Conf. Mass
Spectrom. Allied Top, p. 735. Nashville, TN.
Senko, M. W., Hendrickson, C. L., Pasa‐Tolic, L., Marto, J. A., White, F. M., Guan, S., and
Marshall, A. G. (1996). Electrospray ionization Fourier transform ion cyclotron resonance
at 9.4 T. Rapid Comm. Mass Spectrom. 10, 1824–1828.
Senko, M. W., Speir, J. P., and McLafferty, F. W. (1994). Collisional activation of large
multiply charged ions using Fourier transform mass spectrometry. Anal. Chem. 66,
2801–2808.
Shevchenko, A., Jensen, O. N., Podtelejnikov, A. V., Sagliocco, F., Wilm, M., Vorm, O.,
Mortensen, P., Boucherie, H., and Mann, M. (1996). Linking genome and proteome by
mass spectrometry: Large‐scale identification of yeast proteins from two dimensional gels.
Proc. Natl. Acad. Sci. USA 93, 14440–14445.Shevchenko, A., Loboda, A., Shevchenko, A., Ens, W., and Standing, K. G. (2000). MALDI
quadrupole time‐of‐flight mass spectrometry: A powerful tool for proteomic research.
Anal. Chem. 72, 2132–2141.
Siegel, M. M., Hollander, IJ., Hamann, P. R., James, J. P., Hinman, L., Smith, B. J.,
Farnsworth, A. P., Phipps, A., King, D. J., and Karas, M. (1991). Matrix‐assisted UV‐laserdesorption/ionization mass spectrometric analysis of monoclonal antibodies for the
determination of carbohydrate, conjugated chelator and conjugated drug content. Anal.
Chem. 63, 2470–2481.
Smith, R. D., Bruce, J. E., Wu, Q., and Lei, Q. P. (1997). New mass spectrometric methods for
the study of noncovalent associations of biopolymers. Chem. Soc. Rev. 26, 191–202.
Smith, R. D., Loo, J. A., Edmonds, C. G., Barinaga, C. J., and Udseth, H. R. (1990). New
developments in biochemical mass spectrometry: Electrospray ionization. Anal. Chem. 62,
882–899.
Speir, J. P., Senko, M. W., Little, D. P., Loo, J. A., and McLafferty, F. W. (1995). High‐resolution tandem mass spectra of 37–67 kDa proteins. J. Mass Spectrom. 30, 39–42.
Spengler, B. (1997). Post‐source decay analysis in matrix‐assisted laser desorption/ionization
mass spectrometry of biomolecules. J. Mass Spectrom. 32, 1019–1036.
Spengler, B., Kirsch, D., Kaufmann, R., and Jaeger, E. (1992). Peptide sequencing by matrix‐assisted laser‐desorption mass spectrometry. Rapid Commun. Mass Spectrom. 6, 105–108.
Spengler, B., Kirsch, D., Kaufmann, R., Karas, M., Hillenkamp, F., and Giessmann, U. (1990).
The detection of large molecules in matrix‐assisted UV‐laser desorption. Rapid Commun.
Mass Spectrom. 4, 301–305.Strupat, K., Rogniaux, H., van Dorsselaer, A., Roth, J., and Vogl, T. (2000). Calcium‐induced
noncovalently linked tetramers of MRP8 and MRP14 are confirmed by electrospray
ionization‐mass analysis. J. Am. Soc. Mass Spectrom. 11, 780–788.
Stults, J. T., and Arnott, D. (2005). Proteomics. Meth. Enzym. 402, 245–289.Takach, E. J., Hines, W. M., Patterson, D. H., Juhasz, P., Falick, A. M., Vestal, M. L., and
Martin, S. A. (1997). Accurate mass measurements using MALDI–TOF with delayed
extraction. J. Protein Chem. 16, 363–369.van Berkel, G. J., Glish, G. L., and McLuckey, S. A. (1990). Electrospray ionization combined
with ion trap mass spectrometry. Anal. Chem. 62, 1284–1295.
Vestal, M. L., Juhasz, P., and Martin, S. A. (1995). Delayed extraction matrix‐assisted laser
desorption time‐of‐flight mass spectrometry. Rapid Commun. Mass Spectrom. 9,1044–1050.
Vorm, O., and Mann, M. (1994). Improved mass accuracy in matrix‐assisted laser desorption/
ionization time‐of‐flight mass spectrometry of peptides. J. Amer. Soc. Mass Spectrom. 5,
955–958.
36 mass spectrometry: modified proteins and glycoconjugates [2]
Vorm, O., Roepstorff, P., and Mann, M. (1994). Improved resolution and very high sensitivity
in MALDI–TOF of matrix surfaces made by fast evaporation. Anal. Chem. 66, 3281–3287.Voyksner, R. D. (1997). ESI–MS In ‘‘Electrospray ionization mass spectrometry’’ (R. B. Cole,
ed.). John Wiley & Sons, New York.
Werner, E., and Standing, K. G. (2005). Hybrid quadrupole/time‐of‐flight mass spectrometers
for analysis of biomolecules. Meth. Enzym. 405. In press.
Whittal, R. M., and Li, L. (1995). High‐resolution matrix‐assisted laser desorption/ionization
in a linear time‐of‐flight mass spectrometer. Anal. Chem. 67, 1950–1954.
Williams, E. R. (1998). Tandem FTMS of large biomolecules. Anal. Chem. 70, 179A–185A.
Wilm, M., and Mann, M. (1996). Analytical properties of the nanoelectrospray ion source.
Anal. Chem. 68, 1–8.
Wilm, M. S., and Mann, M. (1994). Electrospray and Taylor‐Cone theory, Dole’s beam of
macromolecules at last? Intern. J. Mass Spectrom. Ion Proc. 136, 167–180.Winter, M. (1983). WebElements.
Wu, J., Fannin, S. T., Franklin, M. A., Molinski, T. F., and Lebrilla, C. B. (1995). Exact mass
determination for elemental analysis of ions produced by matrix‐assisted laser desorption.
Anal. Chem. 67, 3788–3792.Yao, Z., Tito, P., and Robinson, C. V. (2005). Site‐specific hydrogen exchange of
proteins: Insights into the structures of amyloidogenic intermediates. Meth. Enzym. 405.
In press.
Yates, J. R., 3rd. (1998). Mass spectrometry and the age of the proteome. J. Mass Spectrom.
33, 1–19.
Yergey, J., Heller, D., Hansen, G., Cotter, R. J., and Fenselau, C. (1983). Isotopic distributions
in mass spectra of large molecules. Anal. Chem. 55, 353–356.Zaia, J., Annan, R. S., and Biemann, K. (1992). The correct molecular weight of myoglobin, a
common calibrant for mass spectrometry. Rapid Commun. Mass Spectrom. 6, 32–36.
Zenobi, R., and Knochenmuss, R. (1999). Ion formation in MALDI mass spectrometry. Mass
Spectrom. Rev. 17, 337–366.Zubarev, R. A., Kelleher, N. L., and McLafferty, F. W. (1998). Electron capture dissociation
of multiply charged protein cations. A nonergodic process. J. Amer. Chem. Soc. 120,
3265–3266.
[2] Batch Introduction Techniques
By CONNIE R. JIMENEZ
Abstract
Mass spectrometry (MS) is widely used as a rapid tool for peptideprofiling and protein identification. However, the success of the methodis compromised by dirty and contaminated samples. Moreover, analysisfrom a small sample volume with a relative high concentration is usuallyrequired. In this chapter, different microscale sample preparation methodsare discussed for off‐line, matrix‐assisted laser desorption/ionization(MALDI) and nanoelectrospray ionization (nanoESI) MS analysis.
METHODS IN ENZYMOLOGY, VOL. 405 0076-6879/05 $35.00Copyright 2005, Elsevier Inc. All rights reserved. DOI: 10.1016/S0076-6879(05)05002-0