Embed Size (px)
Citation preview
Principal Funds, Inc.
Class A SharesClass C SharesClass J SharesClass P Shares
Class Institutional SharesClass R-1 SharesClass R-2 SharesClass R-3 SharesClass R-4 SharesClass R-5 SharesClass R-6 Shares
ProspectusMarch 1, 2015


Principal Funds, Inc.
Supplement dated March 23, 2015to the Statutory Prospectus dated March 1, 2015
(as supplemented on March 13, 2015)
This supplement updates information currently in the Statutory Prospectus. Please retain this supplement for future reference.
Fund Summary for Principal LifeTime 2060 Fund
In the Annual Fund Operating Expenses Table, add a new footnote (1) to the line for Distribution and/or Service (12b-1) Fees that states as follows:
(1) Expense information in the table has been restated to reflect current fees. Effective December 30, 2013, the Distribution and/or Service (12b-1) Fees for Class J shares were reduced.
Renumber the succeeding footnotes accordingly.
Add the following title to the table providing information "For the periods ended December 31, 2014" that appears after the bar chart: Average Annual Total Returns.
FV822S-01

1
Principal Funds, Inc.
Supplement dated March 13, 2015to the Statutory Prospectus dated March 1, 2015
This supplement updates information currently in the Statutory Prospectus. Please retain this supplement for future reference.
Fund Summary for High Yield Fund I
Effective on December 31, 2015, delete the reference to Ann H. Benjamin from Neuberger Berman Fixed Income LLC in the list titled “Sub-Advisors and Portfolio Managers” under the “Management” heading.
MANAGEMENT OF THE FUNDS
Effective on December 31, 2015, delete the reference to Ann H. Benjamin from the Neuberger Berman Fixed Income LLC portfolio managers in “The Sub-Advisors” sub-section.
FV822S-0

PRINCIPAL FUNDS, INC. (“PFI”)
Class A SharesClass C SharesClass J SharesClass P Shares
Class Institutional SharesClass R-1 SharesClass R-2 SharesClass R-3 SharesClass R-4 SharesClass R-5 SharesClass R-6 Shares
The date of this Prospectus is March 1, 2015.
The ticker symbols for series and share classes are on the next page.
The Securities and Exchange Commission has not approved or disapproved these securities or passed upon theadequacy of this prospectus. Any representation to the contrary is a criminal offense.
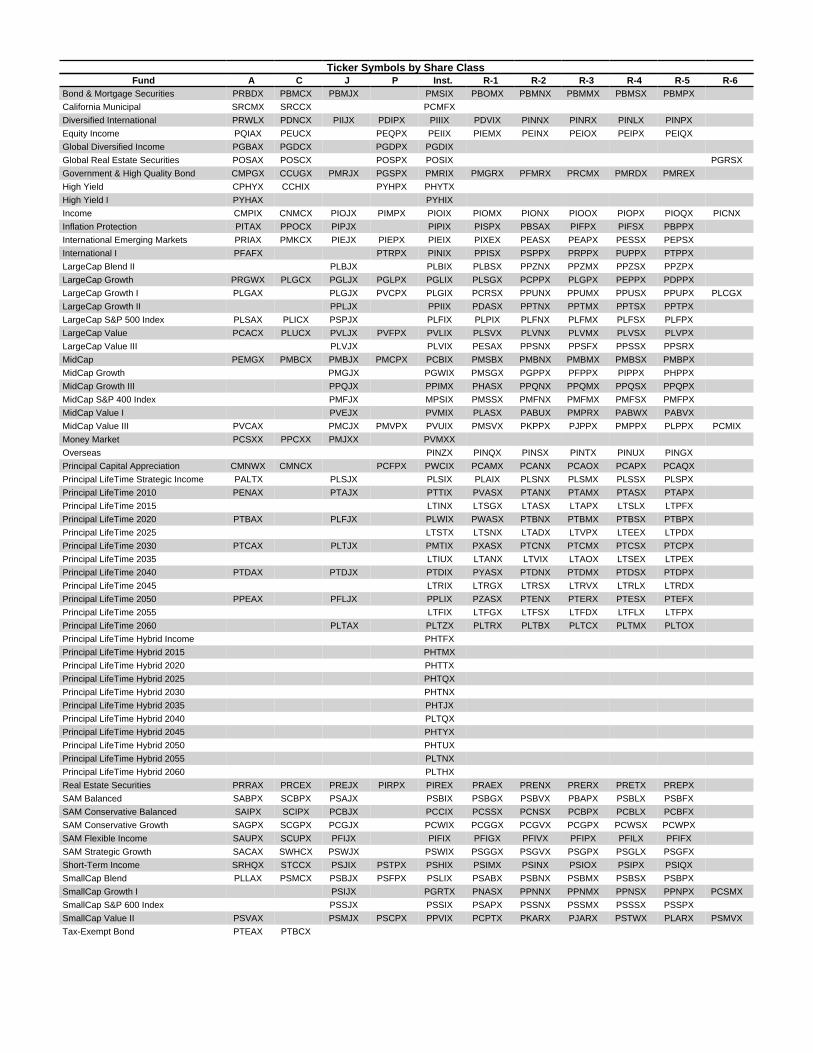
Ticker Symbols by Share ClassFund A C J P Inst. R-1 R-2 R-3 R-4 R-5 R-6
Bond & Mortgage Securities PRBDX PBMCX PBMJX PMSIX PBOMX PBMNX PBMMX PBMSX PBMPXCalifornia Municipal SRCMX SRCCX PCMFXDiversified International PRWLX PDNCX PIIJX PDIPX PIIIX PDVIX PINNX PINRX PINLX PINPXEquity Income PQIAX PEUCX PEQPX PEIIX PIEMX PEINX PEIOX PEIPX PEIQXGlobal Diversified Income PGBAX PGDCX PGDPX PGDIXGlobal Real Estate Securities POSAX POSCX POSPX POSIX PGRSXGovernment & High Quality Bond CMPGX CCUGX PMRJX PGSPX PMRIX PMGRX PFMRX PRCMX PMRDX PMREXHigh Yield CPHYX CCHIX PYHPX PHYTXHigh Yield I PYHAX PYHIXIncome CMPIX CNMCX PIOJX PIMPX PIOIX PIOMX PIONX PIOOX PIOPX PIOQX PICNXInflation Protection PITAX PPOCX PIPJX PIPIX PISPX PBSAX PIFPX PIFSX PBPPXInternational Emerging Markets PRIAX PMKCX PIEJX PIEPX PIEIX PIXEX PEASX PEAPX PESSX PEPSXInternational I PFAFX PTRPX PINIX PPISX PSPPX PRPPX PUPPX PTPPXLargeCap Blend II PLBJX PLBIX PLBSX PPZNX PPZMX PPZSX PPZPXLargeCap Growth PRGWX PLGCX PGLJX PGLPX PGLIX PLSGX PCPPX PLGPX PEPPX PDPPXLargeCap Growth I PLGAX PLGJX PVCPX PLGIX PCRSX PPUNX PPUMX PPUSX PPUPX PLCGXLargeCap Growth II PPLJX PPIIX PDASX PPTNX PPTMX PPTSX PPTPXLargeCap S&P 500 Index PLSAX PLICX PSPJX PLFIX PLPIX PLFNX PLFMX PLFSX PLFPXLargeCap Value PCACX PLUCX PVLJX PVFPX PVLIX PLSVX PLVNX PLVMX PLVSX PLVPXLargeCap Value III PLVJX PLVIX PESAX PPSNX PPSFX PPSSX PPSRXMidCap PEMGX PMBCX PMBJX PMCPX PCBIX PMSBX PMBNX PMBMX PMBSX PMBPXMidCap Growth PMGJX PGWIX PMSGX PGPPX PFPPX PIPPX PHPPXMidCap Growth III PPQJX PPIMX PHASX PPQNX PPQMX PPQSX PPQPXMidCap S&P 400 Index PMFJX MPSIX PMSSX PMFNX PMFMX PMFSX PMFPXMidCap Value I PVEJX PVMIX PLASX PABUX PMPRX PABWX PABVXMidCap Value III PVCAX PMCJX PMVPX PVUIX PMSVX PKPPX PJPPX PMPPX PLPPX PCMIXMoney Market PCSXX PPCXX PMJXX PVMXXOverseas PINZX PINQX PINSX PINTX PINUX PINGXPrincipal Capital Appreciation CMNWX CMNCX PCFPX PWCIX PCAMX PCANX PCAOX PCAPX PCAQXPrincipal LifeTime Strategic Income PALTX PLSJX PLSIX PLAIX PLSNX PLSMX PLSSX PLSPXPrincipal LifeTime 2010 PENAX PTAJX PTTIX PVASX PTANX PTAMX PTASX PTAPXPrincipal LifeTime 2015 LTINX LTSGX LTASX LTAPX LTSLX LTPFXPrincipal LifeTime 2020 PTBAX PLFJX PLWIX PWASX PTBNX PTBMX PTBSX PTBPXPrincipal LifeTime 2025 LTSTX LTSNX LTADX LTVPX LTEEX LTPDXPrincipal LifeTime 2030 PTCAX PLTJX PMTIX PXASX PTCNX PTCMX PTCSX PTCPXPrincipal LifeTime 2035 LTIUX LTANX LTVIX LTAOX LTSEX LTPEXPrincipal LifeTime 2040 PTDAX PTDJX PTDIX PYASX PTDNX PTDMX PTDSX PTDPXPrincipal LifeTime 2045 LTRIX LTRGX LTRSX LTRVX LTRLX LTRDXPrincipal LifeTime 2050 PPEAX PFLJX PPLIX PZASX PTENX PTERX PTESX PTEFXPrincipal LifeTime 2055 LTFIX LTFGX LTFSX LTFDX LTFLX LTFPXPrincipal LifeTime 2060 PLTAX PLTZX PLTRX PLTBX PLTCX PLTMX PLTOXPrincipal LifeTime Hybrid Income PHTFXPrincipal LifeTime Hybrid 2015 PHTMXPrincipal LifeTime Hybrid 2020 PHTTXPrincipal LifeTime Hybrid 2025 PHTQXPrincipal LifeTime Hybrid 2030 PHTNXPrincipal LifeTime Hybrid 2035 PHTJXPrincipal LifeTime Hybrid 2040 PLTQXPrincipal LifeTime Hybrid 2045 PHTYXPrincipal LifeTime Hybrid 2050 PHTUXPrincipal LifeTime Hybrid 2055 PLTNXPrincipal LifeTime Hybrid 2060 PLTHXReal Estate Securities PRRAX PRCEX PREJX PIRPX PIREX PRAEX PRENX PRERX PRETX PREPXSAM Balanced SABPX SCBPX PSAJX PSBIX PSBGX PSBVX PBAPX PSBLX PSBFXSAM Conservative Balanced SAIPX SCIPX PCBJX PCCIX PCSSX PCNSX PCBPX PCBLX PCBFXSAM Conservative Growth SAGPX SCGPX PCGJX PCWIX PCGGX PCGVX PCGPX PCWSX PCWPXSAM Flexible Income SAUPX SCUPX PFIJX PIFIX PFIGX PFIVX PFIPX PFILX PFIFXSAM Strategic Growth SACAX SWHCX PSWJX PSWIX PSGGX PSGVX PSGPX PSGLX PSGFXShort-Term Income SRHQX STCCX PSJIX PSTPX PSHIX PSIMX PSINX PSIOX PSIPX PSIQXSmallCap Blend PLLAX PSMCX PSBJX PSFPX PSLIX PSABX PSBNX PSBMX PSBSX PSBPXSmallCap Growth I PSIJX PGRTX PNASX PPNNX PPNMX PPNSX PPNPX PCSMXSmallCap S&P 600 Index PSSJX PSSIX PSAPX PSSNX PSSMX PSSSX PSSPXSmallCap Value II PSVAX PSMJX PSCPX PPVIX PCPTX PKARX PJARX PSTWX PLARX PSMVXTax-Exempt Bond PTEAX PTBCX
3
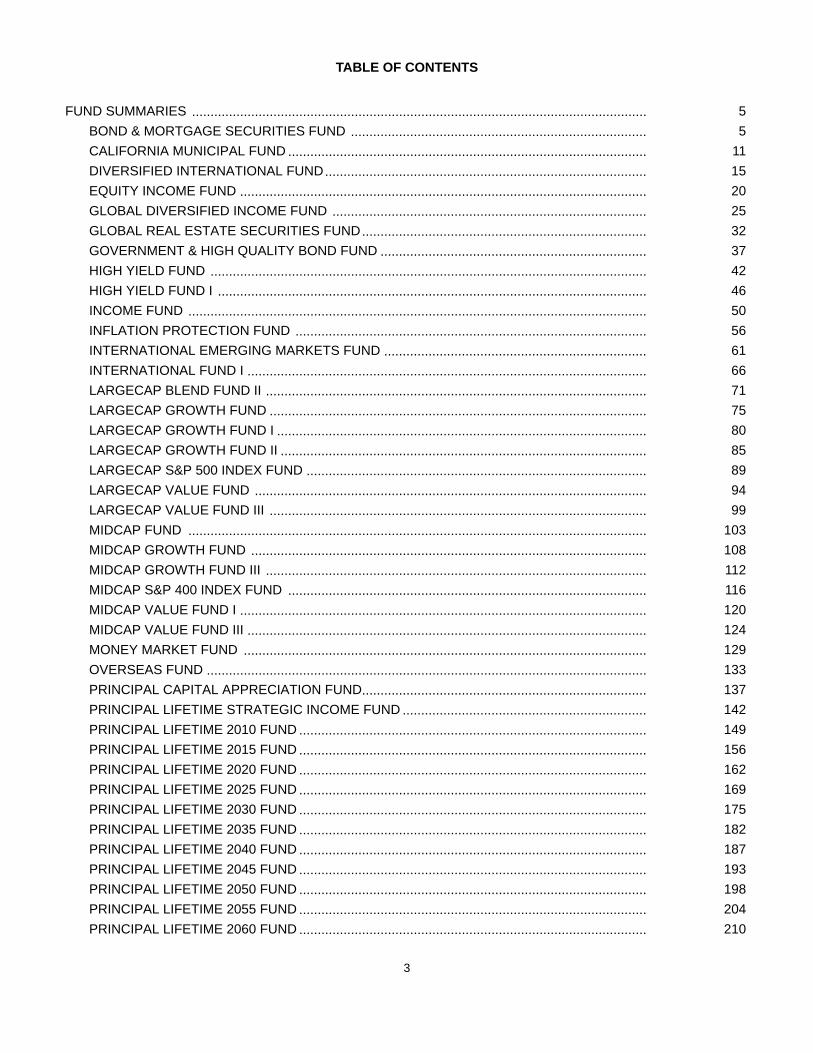
TABLE OF CONTENTS
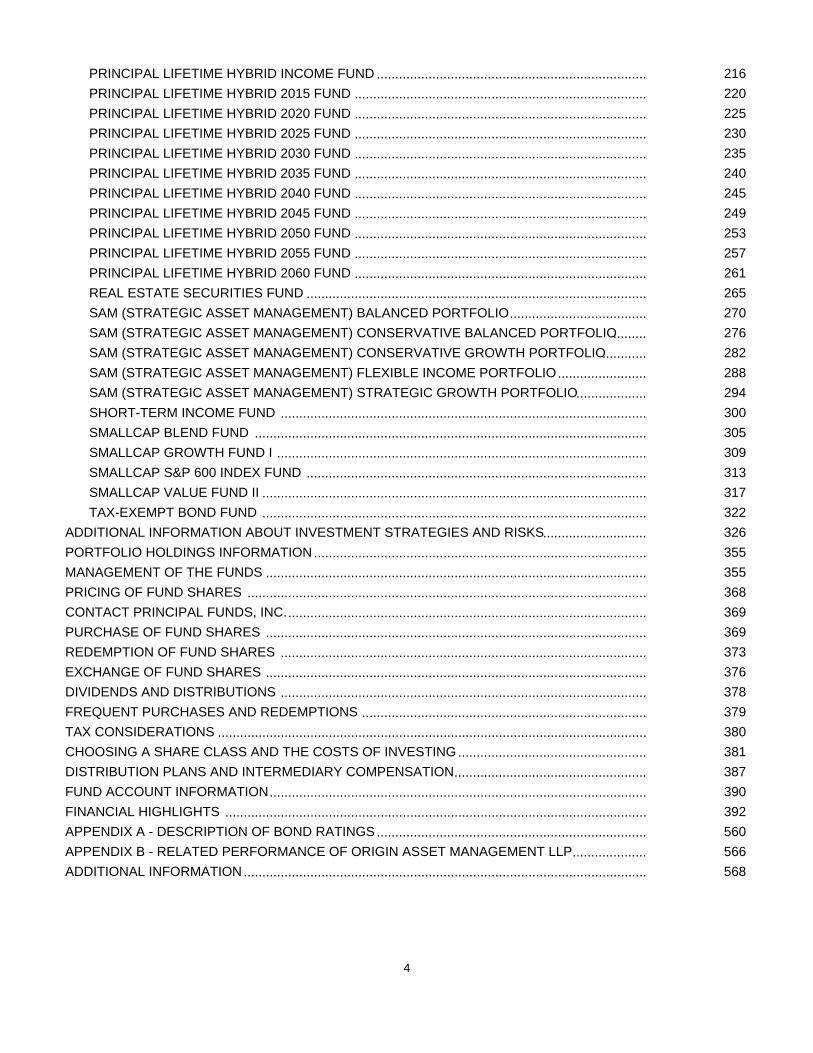
FUND SUMMARIES ...........................................................................................................................BOND & MORTGAGE SECURITIES FUND ................................................................................CALIFORNIA MUNICIPAL FUND .................................................................................................DIVERSIFIED INTERNATIONAL FUND.......................................................................................EQUITY INCOME FUND ..............................................................................................................GLOBAL DIVERSIFIED INCOME FUND .....................................................................................GLOBAL REAL ESTATE SECURITIES FUND.............................................................................GOVERNMENT & HIGH QUALITY BOND FUND ........................................................................HIGH YIELD FUND ......................................................................................................................HIGH YIELD FUND I ....................................................................................................................INCOME FUND ............................................................................................................................INFLATION PROTECTION FUND ...............................................................................................INTERNATIONAL EMERGING MARKETS FUND .......................................................................INTERNATIONAL FUND I ............................................................................................................LARGECAP BLEND FUND II .......................................................................................................LARGECAP GROWTH FUND ......................................................................................................LARGECAP GROWTH FUND I ....................................................................................................LARGECAP GROWTH FUND II ...................................................................................................LARGECAP S&P 500 INDEX FUND ............................................................................................LARGECAP VALUE FUND ..........................................................................................................LARGECAP VALUE FUND III ......................................................................................................MIDCAP FUND ............................................................................................................................MIDCAP GROWTH FUND ...........................................................................................................MIDCAP GROWTH FUND III .......................................................................................................MIDCAP S&P 400 INDEX FUND .................................................................................................MIDCAP VALUE FUND I ..............................................................................................................MIDCAP VALUE FUND III ............................................................................................................MONEY MARKET FUND .............................................................................................................OVERSEAS FUND .......................................................................................................................PRINCIPAL CAPITAL APPRECIATION FUND.............................................................................PRINCIPAL LIFETIME STRATEGIC INCOME FUND ..................................................................PRINCIPAL LIFETIME 2010 FUND ..............................................................................................PRINCIPAL LIFETIME 2015 FUND ..............................................................................................PRINCIPAL LIFETIME 2020 FUND ..............................................................................................PRINCIPAL LIFETIME 2025 FUND ..............................................................................................PRINCIPAL LIFETIME 2030 FUND ..............................................................................................PRINCIPAL LIFETIME 2035 FUND ..............................................................................................PRINCIPAL LIFETIME 2040 FUND ..............................................................................................PRINCIPAL LIFETIME 2045 FUND ..............................................................................................PRINCIPAL LIFETIME 2050 FUND ..............................................................................................PRINCIPAL LIFETIME 2055 FUND ..............................................................................................PRINCIPAL LIFETIME 2060 FUND ..............................................................................................
55
11152025323742465056616671758085899499
103108112116120124129133137142149156162169175182187193198204210
4
PRINCIPAL LIFETIME HYBRID INCOME FUND .........................................................................PRINCIPAL LIFETIME HYBRID 2015 FUND ...............................................................................PRINCIPAL LIFETIME HYBRID 2020 FUND ...............................................................................PRINCIPAL LIFETIME HYBRID 2025 FUND ...............................................................................PRINCIPAL LIFETIME HYBRID 2030 FUND ...............................................................................PRINCIPAL LIFETIME HYBRID 2035 FUND ...............................................................................PRINCIPAL LIFETIME HYBRID 2040 FUND ...............................................................................PRINCIPAL LIFETIME HYBRID 2045 FUND ...............................................................................PRINCIPAL LIFETIME HYBRID 2050 FUND ...............................................................................PRINCIPAL LIFETIME HYBRID 2055 FUND ...............................................................................PRINCIPAL LIFETIME HYBRID 2060 FUND ...............................................................................REAL ESTATE SECURITIES FUND ............................................................................................SAM (STRATEGIC ASSET MANAGEMENT) BALANCED PORTFOLIO.....................................SAM (STRATEGIC ASSET MANAGEMENT) CONSERVATIVE BALANCED PORTFOLIO.........SAM (STRATEGIC ASSET MANAGEMENT) CONSERVATIVE GROWTH PORTFOLIO............SAM (STRATEGIC ASSET MANAGEMENT) FLEXIBLE INCOME PORTFOLIO........................SAM (STRATEGIC ASSET MANAGEMENT) STRATEGIC GROWTH PORTFOLIO...................SHORT-TERM INCOME FUND ...................................................................................................SMALLCAP BLEND FUND ..........................................................................................................SMALLCAP GROWTH FUND I ....................................................................................................SMALLCAP S&P 600 INDEX FUND ............................................................................................SMALLCAP VALUE FUND II ........................................................................................................TAX-EXEMPT BOND FUND ........................................................................................................
ADDITIONAL INFORMATION ABOUT INVESTMENT STRATEGIES AND RISKS............................PORTFOLIO HOLDINGS INFORMATION..........................................................................................MANAGEMENT OF THE FUNDS .......................................................................................................PRICING OF FUND SHARES ............................................................................................................CONTACT PRINCIPAL FUNDS, INC..................................................................................................PURCHASE OF FUND SHARES .......................................................................................................REDEMPTION OF FUND SHARES ...................................................................................................EXCHANGE OF FUND SHARES .......................................................................................................DIVIDENDS AND DISTRIBUTIONS ...................................................................................................FREQUENT PURCHASES AND REDEMPTIONS .............................................................................TAX CONSIDERATIONS ....................................................................................................................CHOOSING A SHARE CLASS AND THE COSTS OF INVESTING...................................................DISTRIBUTION PLANS AND INTERMEDIARY COMPENSATION....................................................FUND ACCOUNT INFORMATION......................................................................................................FINANCIAL HIGHLIGHTS ..................................................................................................................APPENDIX A - DESCRIPTION OF BOND RATINGS.........................................................................APPENDIX B - RELATED PERFORMANCE OF ORIGIN ASSET MANAGEMENT LLP....................ADDITIONAL INFORMATION.............................................................................................................
216220225230235240245249253257261265270276282288294300305309313317322326355355368369369373376378379380381387390392560566568
5
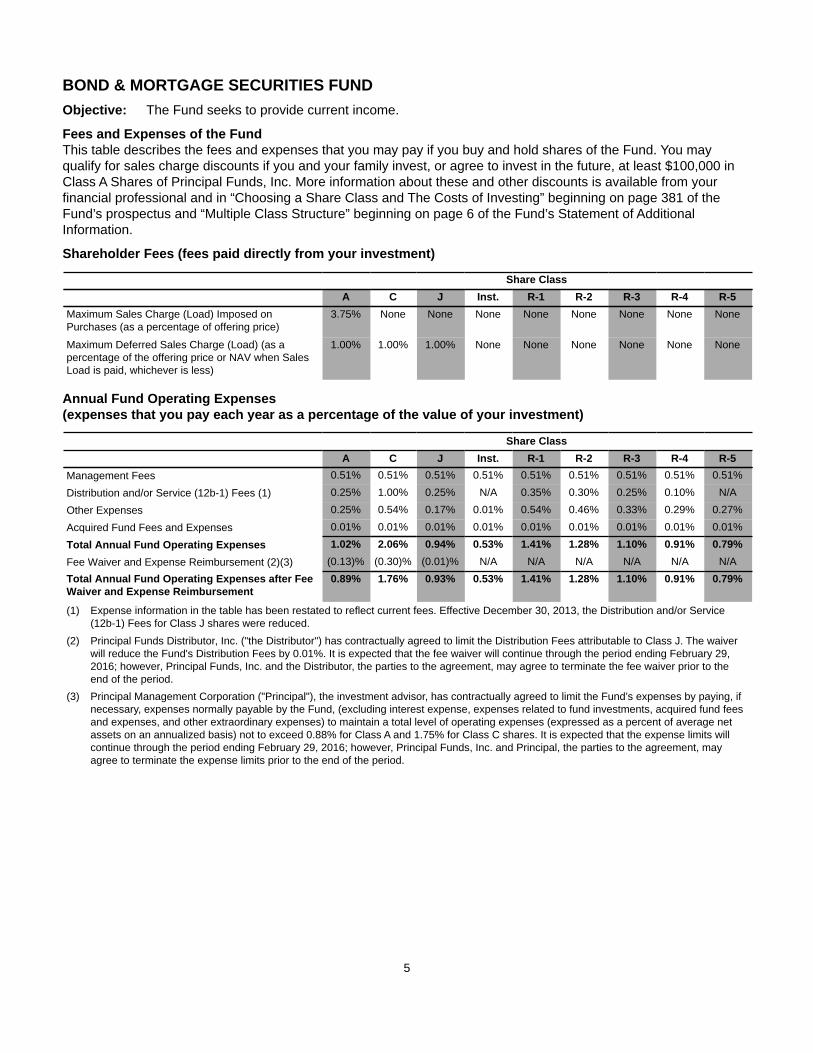
BOND & MORTGAGE SECURITIES FUNDObjective: The Fund seeks to provide current income.
Fees and Expenses of the FundThis table describes the fees and expenses that you may pay if you buy and hold shares of the Fund. You may qualify for sales charge discounts if you and your family invest, or agree to invest in the future, at least $100,000 in Class A Shares of Principal Funds, Inc. More information about these and other discounts is available from your financial professional and in “Choosing a Share Class and The Costs of Investing” beginning on page 381 of the Fund’s prospectus and “Multiple Class Structure” beginning on page 6 of the Fund’s Statement of Additional Information.
Shareholder Fees (fees paid directly from your investment)
Share ClassA C J Inst. R-1 R-2 R-3 R-4 R-5
Maximum Sales Charge (Load) Imposed onPurchases (as a percentage of offering price)
3.75% None None None None None None None None
Maximum Deferred Sales Charge (Load) (as apercentage of the offering price or NAV when SalesLoad is paid, whichever is less)
1.00% 1.00% 1.00% None None None None None None
Annual Fund Operating Expenses (expenses that you pay each year as a percentage of the value of your investment)
Share ClassA C J Inst. R-1 R-2 R-3 R-4 R-5
Management Fees 0.51% 0.51% 0.51% 0.51% 0.51% 0.51% 0.51% 0.51% 0.51%
Distribution and/or Service (12b-1) Fees (1) 0.25% 1.00% 0.25% N/A 0.35% 0.30% 0.25% 0.10% N/A
Other Expenses 0.25% 0.54% 0.17% 0.01% 0.54% 0.46% 0.33% 0.29% 0.27%
Acquired Fund Fees and Expenses 0.01% 0.01% 0.01% 0.01% 0.01% 0.01% 0.01% 0.01% 0.01%
Total Annual Fund Operating Expenses 1.02% 2.06% 0.94% 0.53% 1.41% 1.28% 1.10% 0.91% 0.79%Fee Waiver and Expense Reimbursement (2)(3) (0.13)% (0.30)% (0.01)% N/A N/A N/A N/A N/A N/ATotal Annual Fund Operating Expenses after FeeWaiver and Expense Reimbursement
0.89% 1.76% 0.93% 0.53% 1.41% 1.28% 1.10% 0.91% 0.79%
(1) Expense information in the table has been restated to reflect current fees. Effective December 30, 2013, the Distribution and/or Service (12b-1) Fees for Class J shares were reduced.
(2) Principal Funds Distributor, Inc. ("the Distributor") has contractually agreed to limit the Distribution Fees attributable to Class J. The waiver will reduce the Fund's Distribution Fees by 0.01%. It is expected that the fee waiver will continue through the period ending February 29, 2016; however, Principal Funds, Inc. and the Distributor, the parties to the agreement, may agree to terminate the fee waiver prior to the end of the period.
(3) Principal Management Corporation ("Principal"), the investment advisor, has contractually agreed to limit the Fund’s expenses by paying, if necessary, expenses normally payable by the Fund, (excluding interest expense, expenses related to fund investments, acquired fund fees and expenses, and other extraordinary expenses) to maintain a total level of operating expenses (expressed as a percent of average net assets on an annualized basis) not to exceed 0.88% for Class A and 1.75% for Class C shares. It is expected that the expense limits will continue through the period ending February 29, 2016; however, Principal Funds, Inc. and Principal, the parties to the agreement, may agree to terminate the expense limits prior to the end of the period.
6
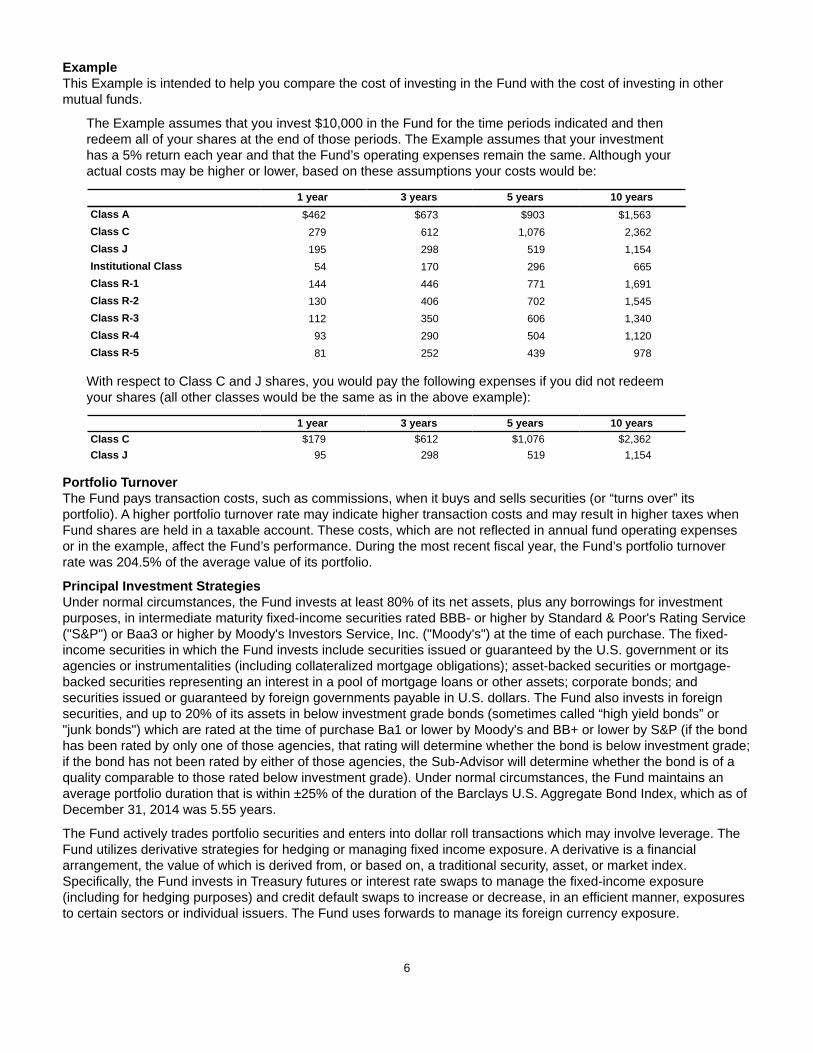
ExampleThis Example is intended to help you compare the cost of investing in the Fund with the cost of investing in other mutual funds.
The Example assumes that you invest $10,000 in the Fund for the time periods indicated and then redeem all of your shares at the end of those periods. The Example assumes that your investment has a 5% return each year and that the Fund’s operating expenses remain the same. Although your actual costs may be higher or lower, based on these assumptions your costs would be:
1 year 3 years 5 years 10 yearsClass A $462 $673 $903 $1,563Class C 279 612 1,076 2,362Class J 195 298 519 1,154Institutional Class 54 170 296 665Class R-1 144 446 771 1,691Class R-2 130 406 702 1,545Class R-3 112 350 606 1,340Class R-4 93 290 504 1,120Class R-5 81 252 439 978
With respect to Class C and J shares, you would pay the following expenses if you did not redeem your shares (all other classes would be the same as in the above example):
1 year 3 years 5 years 10 yearsClass C $179 $612 $1,076 $2,362Class J 95 298 519 1,154
Portfolio TurnoverThe Fund pays transaction costs, such as commissions, when it buys and sells securities (or “turns over” its portfolio). A higher portfolio turnover rate may indicate higher transaction costs and may result in higher taxes when Fund shares are held in a taxable account. These costs, which are not reflected in annual fund operating expenses or in the example, affect the Fund’s performance. During the most recent fiscal year, the Fund’s portfolio turnover rate was 204.5% of the average value of its portfolio.
Principal Investment StrategiesUnder normal circumstances, the Fund invests at least 80% of its net assets, plus any borrowings for investment purposes, in intermediate maturity fixed-income securities rated BBB- or higher by Standard & Poor's Rating Service ("S&P") or Baa3 or higher by Moody's Investors Service, Inc. ("Moody's") at the time of each purchase. The fixed-income securities in which the Fund invests include securities issued or guaranteed by the U.S. government or its agencies or instrumentalities (including collateralized mortgage obligations); asset-backed securities or mortgage-backed securities representing an interest in a pool of mortgage loans or other assets; corporate bonds; and securities issued or guaranteed by foreign governments payable in U.S. dollars. The Fund also invests in foreign securities, and up to 20% of its assets in below investment grade bonds (sometimes called “high yield bonds” or "junk bonds") which are rated at the time of purchase Ba1 or lower by Moody's and BB+ or lower by S&P (if the bond has been rated by only one of those agencies, that rating will determine whether the bond is below investment grade; if the bond has not been rated by either of those agencies, the Sub-Advisor will determine whether the bond is of a quality comparable to those rated below investment grade). Under normal circumstances, the Fund maintains an average portfolio duration that is within ±25% of the duration of the Barclays U.S. Aggregate Bond Index, which as of December 31, 2014 was 5.55 years.
The Fund actively trades portfolio securities and enters into dollar roll transactions which may involve leverage. The Fund utilizes derivative strategies for hedging or managing fixed income exposure. A derivative is a financial arrangement, the value of which is derived from, or based on, a traditional security, asset, or market index. Specifically, the Fund invests in Treasury futures or interest rate swaps to manage the fixed-income exposure (including for hedging purposes) and credit default swaps to increase or decrease, in an efficient manner, exposures to certain sectors or individual issuers. The Fund uses forwards to manage its foreign currency exposure.
7
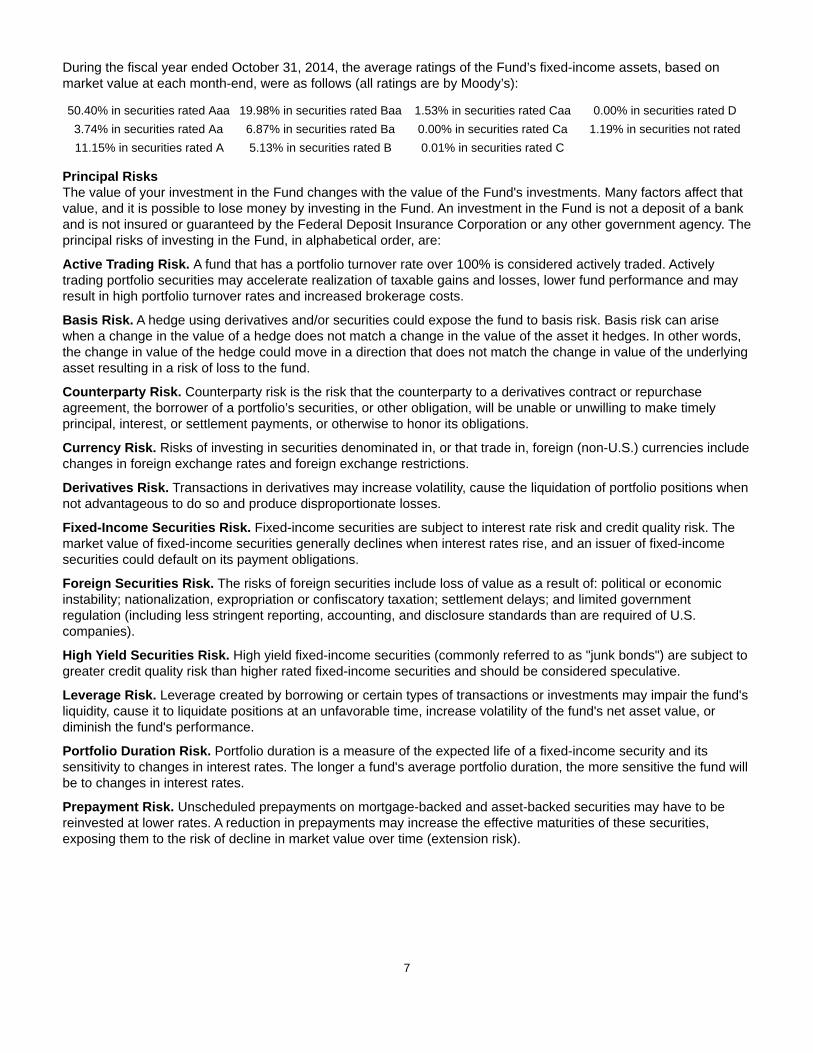
During the fiscal year ended October 31, 2014, the average ratings of the Fund’s fixed-income assets, based on market value at each month-end, were as follows (all ratings are by Moody’s):
50.40% in securities rated Aaa 19.98% in securities rated Baa 1.53% in securities rated Caa 0.00% in securities rated D3.74% in securities rated Aa 6.87% in securities rated Ba 0.00% in securities rated Ca 1.19% in securities not rated11.15% in securities rated A 5.13% in securities rated B 0.01% in securities rated C
Principal RisksThe value of your investment in the Fund changes with the value of the Fund's investments. Many factors affect that value, and it is possible to lose money by investing in the Fund. An investment in the Fund is not a deposit of a bank and is not insured or guaranteed by the Federal Deposit Insurance Corporation or any other government agency. The principal risks of investing in the Fund, in alphabetical order, are:
Active Trading Risk. A fund that has a portfolio turnover rate over 100% is considered actively traded. Actively trading portfolio securities may accelerate realization of taxable gains and losses, lower fund performance and may result in high portfolio turnover rates and increased brokerage costs.
Basis Risk. A hedge using derivatives and/or securities could expose the fund to basis risk. Basis risk can arise when a change in the value of a hedge does not match a change in the value of the asset it hedges. In other words, the change in value of the hedge could move in a direction that does not match the change in value of the underlying asset resulting in a risk of loss to the fund.
Counterparty Risk. Counterparty risk is the risk that the counterparty to a derivatives contract or repurchase agreement, the borrower of a portfolio’s securities, or other obligation, will be unable or unwilling to make timely principal, interest, or settlement payments, or otherwise to honor its obligations.
Currency Risk. Risks of investing in securities denominated in, or that trade in, foreign (non-U.S.) currencies include changes in foreign exchange rates and foreign exchange restrictions.
Derivatives Risk. Transactions in derivatives may increase volatility, cause the liquidation of portfolio positions when not advantageous to do so and produce disproportionate losses.
Fixed-Income Securities Risk. Fixed-income securities are subject to interest rate risk and credit quality risk. The market value of fixed-income securities generally declines when interest rates rise, and an issuer of fixed-income securities could default on its payment obligations.
Foreign Securities Risk. The risks of foreign securities include loss of value as a result of: political or economic instability; nationalization, expropriation or confiscatory taxation; settlement delays; and limited government regulation (including less stringent reporting, accounting, and disclosure standards than are required of U.S. companies).
High Yield Securities Risk. High yield fixed-income securities (commonly referred to as "junk bonds") are subject to greater credit quality risk than higher rated fixed-income securities and should be considered speculative.
Leverage Risk. Leverage created by borrowing or certain types of transactions or investments may impair the fund's liquidity, cause it to liquidate positions at an unfavorable time, increase volatility of the fund's net asset value, or diminish the fund's performance.
Portfolio Duration Risk. Portfolio duration is a measure of the expected life of a fixed-income security and its sensitivity to changes in interest rates. The longer a fund's average portfolio duration, the more sensitive the fund will be to changes in interest rates.
Prepayment Risk. Unscheduled prepayments on mortgage-backed and asset-backed securities may have to be reinvested at lower rates. A reduction in prepayments may increase the effective maturities of these securities, exposing them to the risk of decline in market value over time (extension risk).

8
Real Estate Securities Risk. Real estate securities are subject to the risks associated with direct ownership of real estate, including declines in value, adverse economic conditions, increases in expenses, regulatory changes and environmental problems. Investing in securities of companies in the real estate industry, subjects a fund to the special risks associated with the real estate market including factors such as loss to casualty or condemnation, changes in real estate values, property taxes, interest rates, cash flow of underlying real estate assets, occupancy rates, government regulations affecting zoning, land use and rents, and the management skill and creditworthiness of the issuer.
Risk of Being an Underlying Fund. A fund is subject to the risk of being an underlying fund to the extent that a fund of funds invests in the fund. An underlying fund of a fund of funds may experience relatively large redemptions or investments as the fund of funds periodically reallocates or rebalances its assets. These transactions may cause the underlying fund to sell portfolio securities to meet such redemptions, or to invest cash from such investments, at times it would not otherwise do so, and may as a result increase transaction costs and adversely affect underlying fund performance.
U.S. Government Securities Risk. Yields available from U.S. government securities are generally lower than yields from many other fixed-income securities.
U.S. Government Sponsored Securities Risk. Securities issued by U.S. government-sponsored or -chartered enterprises such as the Federal Home Loan Mortgage Corporation, the Federal National Mortgage Association, and the Federal Home Loan Banks are not issued or guaranteed by the U.S. Treasury.
PerformanceThe following information provides some indication of the risks of investing in the Fund. Past performance (before and after taxes) is not necessarily an indication of how the Fund will perform in the future. You may get updated performance information by calling 1-800-222-5852 or online at:• For Classes A, C, and J - www.principalfunds.com.• For Classes Institutional, R-1, R-2, R-3, R-4, and R-5 - www.principal.com.
The bar chart shows the investment returns of the Fund’s Class A shares for each full calendar year of operations for 10 years (or, if shorter, the life of the Fund). The table shows, for each share class of the Fund and for the last one, five, and ten calendar year periods (or, if shorter, the life of the Fund), how the Fund’s average annual total returns compare with those of one or more broad measures of market performance.
For periods prior to the inception date of Class A shares (June 28, 2005) and Class C shares (January 16, 2007), performance shown in the bar chart and the table for these classes is based on the performance of the Fund's Class R-3 shares, adjusted to reflect the respective fees and expenses of each class. The adjustments result in performance for such periods that is no higher than the historical performance of the Class R-3 shares, which were first sold on December 6, 2000.
9
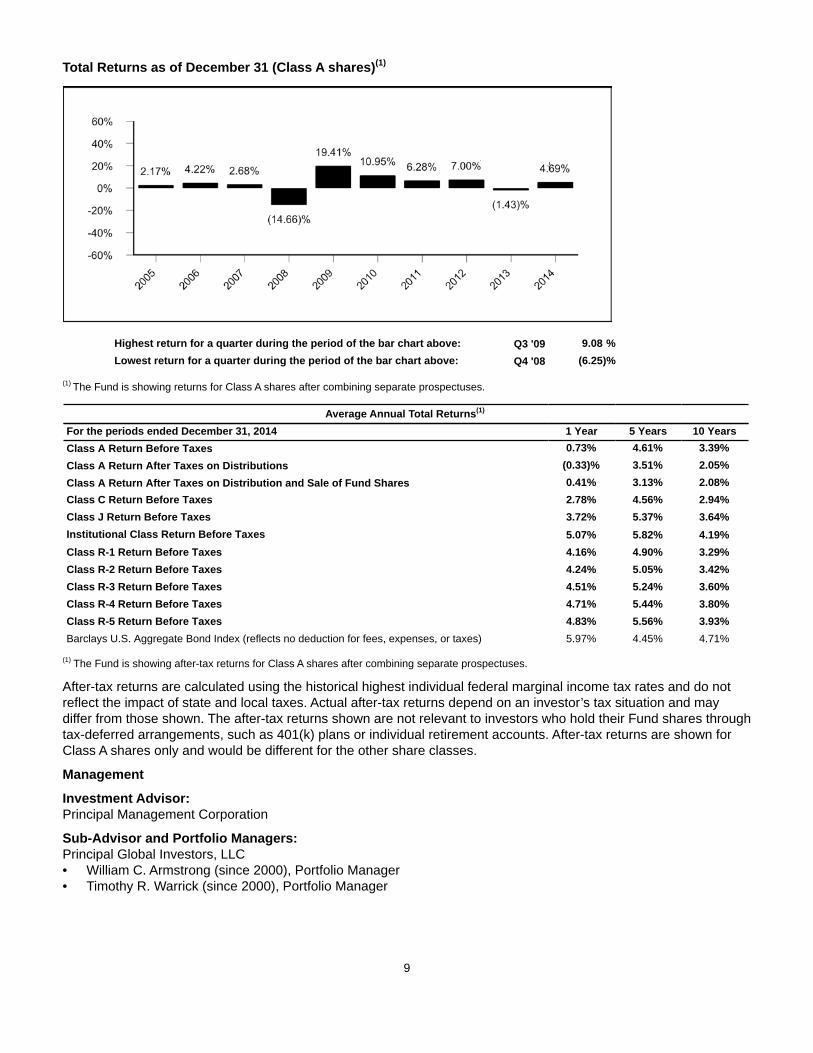
Total Returns as of December 31 (Class A shares)(1)
Highest return for a quarter during the period of the bar chart above: Q3 '09 9.08 %Lowest return for a quarter during the period of the bar chart above: Q4 '08 (6.25)%
(1) The Fund is showing returns for Class A shares after combining separate prospectuses.
Average Annual Total Returns(1)
For the periods ended December 31, 2014 1 Year 5 Years 10 YearsClass A Return Before Taxes 0.73% 4.61% 3.39%Class A Return After Taxes on Distributions (0.33)% 3.51% 2.05%Class A Return After Taxes on Distribution and Sale of Fund Shares 0.41% 3.13% 2.08%Class C Return Before Taxes 2.78% 4.56% 2.94%Class J Return Before Taxes 3.72% 5.37% 3.64%Institutional Class Return Before Taxes 5.07% 5.82% 4.19%Class R-1 Return Before Taxes 4.16% 4.90% 3.29%Class R-2 Return Before Taxes 4.24% 5.05% 3.42%Class R-3 Return Before Taxes 4.51% 5.24% 3.60%Class R-4 Return Before Taxes 4.71% 5.44% 3.80%Class R-5 Return Before Taxes 4.83% 5.56% 3.93%Barclays U.S. Aggregate Bond Index (reflects no deduction for fees, expenses, or taxes) 5.97% 4.45% 4.71%
(1) The Fund is showing after-tax returns for Class A shares after combining separate prospectuses.
After-tax returns are calculated using the historical highest individual federal marginal income tax rates and do not reflect the impact of state and local taxes. Actual after-tax returns depend on an investor’s tax situation and may differ from those shown. The after-tax returns shown are not relevant to investors who hold their Fund shares through tax-deferred arrangements, such as 401(k) plans or individual retirement accounts. After-tax returns are shown for Class A shares only and would be different for the other share classes.
Management
Investment Advisor: Principal Management Corporation
Sub-Advisor and Portfolio Managers: Principal Global Investors, LLC• William C. Armstrong (since 2000), Portfolio Manager• Timothy R. Warrick (since 2000), Portfolio Manager

10
Purchase and Sale of Fund Shares
Share Class Investment TypePurchase Minimum
Per FundA, C, and J Initial Investment $1,000(1)
A, C, and J Initial Investment for accounts with an Automatic Investment Plan (AIP) $100A, C, and J Subsequent Investments $100(1)(2)
Institutional, R-1, R-2, R-3, R-4, andR-5
There are no minimum initial or subsequent investment requirements foreligible purchasers.
N/A
(1) Some exceptions apply; see "Purchase of Fund Shares - Minimum Investments" for more information.(2) For accounts with an AIP, the subsequent automatic investments must total $1,200 annually if the initial $1,000 minimum has not been met.
You may purchase or redeem shares on any business day (normally any day when the New York Stock Exchange is open for regular trading), through your plan, intermediary, or Financial Professional; by sending a written request to Principal Funds at P.O. Box 8024, Boston, MA 02266-8024 (regular mail) or 30 Dan Road, Canton, MA 02021-2809 (overnight mail); calling us at 1-800-222-5852; or accessing our website (www.principalfunds.com).
Tax InformationThe Fund’s distributions you receive are generally subject to federal income tax as ordinary income or capital gain and may also be subject to state and local taxes, unless you are tax-exempt or your account is tax-deferred in which case your distributions would be taxed when withdrawn from the tax-deferred account.
Payments to Broker-Dealers and Other Financial IntermediariesIf you purchase the Fund through a broker-dealer or other financial intermediary (such as a bank, insurance company, investment adviser, etc.), the Fund and its related companies may pay the intermediary for the sale of Fund shares and related services. These payments may create a conflict of interest by influencing the broker-dealer or other intermediary and your salesperson to recommend the Fund over another investment, or to recommend one share class of the Fund over another share class. Ask your salesperson or visit your financial intermediary's website for more information.
11
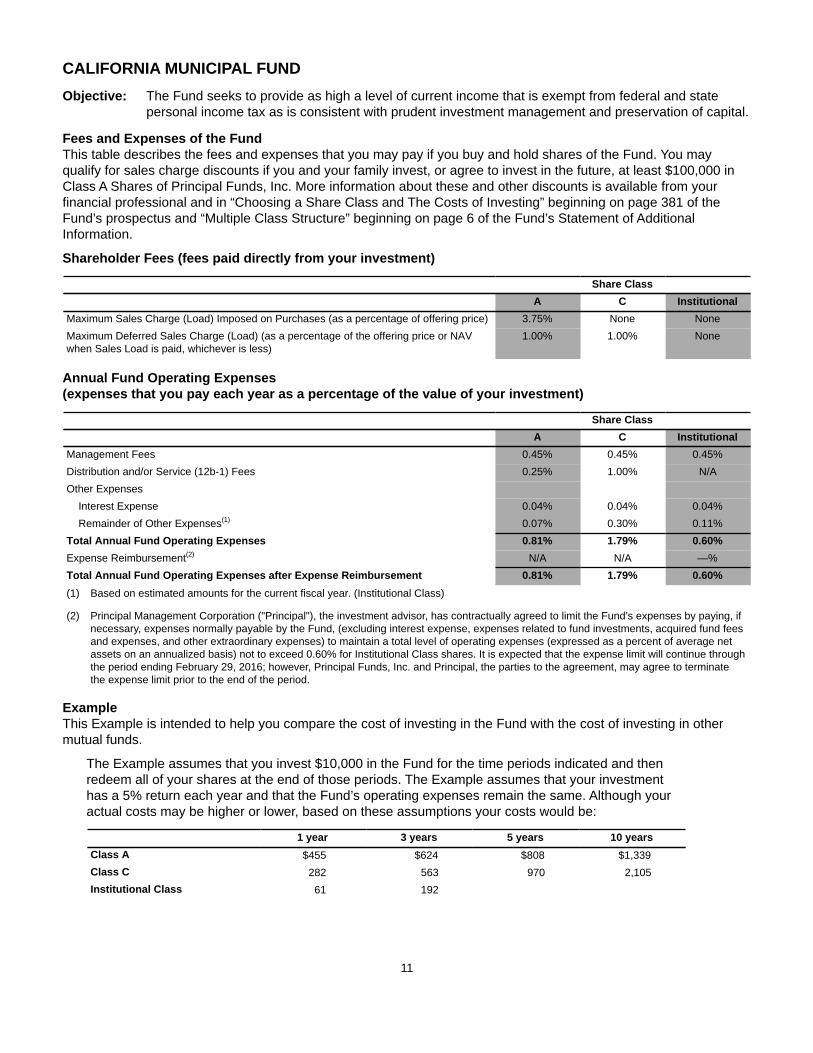
CALIFORNIA MUNICIPAL FUNDObjective: The Fund seeks to provide as high a level of current income that is exempt from federal and state
personal income tax as is consistent with prudent investment management and preservation of capital.
Fees and Expenses of the FundThis table describes the fees and expenses that you may pay if you buy and hold shares of the Fund. You may qualify for sales charge discounts if you and your family invest, or agree to invest in the future, at least $100,000 in Class A Shares of Principal Funds, Inc. More information about these and other discounts is available from your financial professional and in “Choosing a Share Class and The Costs of Investing” beginning on page 381 of the Fund’s prospectus and “Multiple Class Structure” beginning on page 6 of the Fund’s Statement of Additional Information.
Shareholder Fees (fees paid directly from your investment)
Share ClassA C Institutional
Maximum Sales Charge (Load) Imposed on Purchases (as a percentage of offering price) 3.75% None NoneMaximum Deferred Sales Charge (Load) (as a percentage of the offering price or NAVwhen Sales Load is paid, whichever is less)
1.00% 1.00% None
Annual Fund Operating Expenses (expenses that you pay each year as a percentage of the value of your investment)
Share ClassA C Institutional
Management Fees 0.45% 0.45% 0.45%Distribution and/or Service (12b-1) Fees 0.25% 1.00% N/AOther Expenses
Interest Expense 0.04% 0.04% 0.04%Remainder of Other Expenses(1) 0.07% 0.30% 0.11%
Total Annual Fund Operating Expenses 0.81% 1.79% 0.60%Expense Reimbursement(2) N/A N/A —%Total Annual Fund Operating Expenses after Expense Reimbursement 0.81% 1.79% 0.60%(1) Based on estimated amounts for the current fiscal year. (Institutional Class)
(2) Principal Management Corporation ("Principal"), the investment advisor, has contractually agreed to limit the Fund’s expenses by paying, if necessary, expenses normally payable by the Fund, (excluding interest expense, expenses related to fund investments, acquired fund fees and expenses, and other extraordinary expenses) to maintain a total level of operating expenses (expressed as a percent of average net assets on an annualized basis) not to exceed 0.60% for Institutional Class shares. It is expected that the expense limit will continue through the period ending February 29, 2016; however, Principal Funds, Inc. and Principal, the parties to the agreement, may agree to terminate the expense limit prior to the end of the period.
ExampleThis Example is intended to help you compare the cost of investing in the Fund with the cost of investing in other mutual funds.
The Example assumes that you invest $10,000 in the Fund for the time periods indicated and then redeem all of your shares at the end of those periods. The Example assumes that your investment has a 5% return each year and that the Fund’s operating expenses remain the same. Although your actual costs may be higher or lower, based on these assumptions your costs would be:
1 year 3 years 5 years 10 yearsClass A $455 $624 $808 $1,339Class C 282 563 970 2,105Institutional Class 61 192
12
With respect to Class C shares, you would pay the following expenses if you did not redeem your shares (all other classes would be the same as in the above example):
1 year 3 years 5 years 10 yearsClass C $182 $563 $970 $2,105
Portfolio TurnoverThe Fund pays transaction costs, such as commissions, when it buys and sells securities (or “turns over” its portfolio). A higher portfolio turnover rate may indicate higher transaction costs and may result in higher taxes when Fund shares are held in a taxable account. These costs, which are not reflected in annual fund operating expenses or in the example, affect the Fund’s performance. During the most recent fiscal year, the Fund’s portfolio turnover rate was 28.7% of the average value of its portfolio.
Principal Investment StrategiesUnder normal circumstances, the Fund invests at least 80% of its net assets, plus any borrowings for investment purposes, in California municipal obligations (securities issued by or on behalf of state or local governments and other public authorities) at the time of each purchase. Generally, these municipal obligations pay interest that is exempt from State personal income tax and federal income tax. These obligations may include bonds that generate interest payments that are subject to the alternative minimum tax. Under normal circumstances, the Fund maintains an average portfolio duration that is within ±50% of the duration of the Barclays California Municipal Bond Index, which as of December 31, 2014 was 4.71 years. The Fund may invest up to 20% of its assets in below investment grade bonds (sometimes called “high yield bonds” or "junk bonds") which are rated at the time of purchase Ba1 or lower by Moody's and BB+ or lower by S&P (if the bond has been rated by only one of those agencies, that rating will determine whether the bond is below investment grade; if the bond has not been rated by either of those agencies, the Sub-Advisor will determine whether the bond is of a quality comparable to those rated below investment grade). The Fund also invests in inverse floating rate obligations, which are generally more volatile than other types of municipal obligations and may involve leverage.
During the fiscal year ended October 31, 2014, the average ratings of the Fund’s fixed-income assets, based on market value at each month-end, were as follows (all ratings are by Moody’s):
4.31% in securities rated Aaa 8.43% in securities rated Baa 0.26% in securities rated Caa 0.00% in securities rated D50.27% in securities rated Aa 5.75% in securities rated Ba 0.00% in securities rated Ca 7.25% in securities not rated21.35% in securities rated A 2.38% in securities rated B 0.00% in securities rated C
Principal RisksThe value of your investment in the Fund changes with the value of the Fund's investments. Many factors affect that value, and it is possible to lose money by investing in the Fund. An investment in the Fund is not a deposit of a bank and is not insured or guaranteed by the Federal Deposit Insurance Corporation or any other government agency. The principal risks of investing in the Fund, in alphabetical order, are:
Counterparty Risk. Counterparty risk is the risk that the counterparty to a derivatives contract or repurchase agreement, the borrower of a portfolio’s securities, or other obligation, will be unable or unwilling to make timely principal, interest, or settlement payments, or otherwise to honor its obligations.
Fixed-Income Securities Risk. Fixed-income securities are subject to interest rate risk and credit quality risk. The market value of fixed-income securities generally declines when interest rates rise, and an issuer of fixed-income securities could default on its payment obligations.
Geographic Concentration Risk. A fund that invests significant portions of its assets in particular geographic areas (a particular state, such as California or Illinois, or a particular country or region) has greater exposure than other funds to economic conditions and developments in those areas.
High Yield Securities Risk. High yield fixed-income securities (commonly referred to as "junk bonds") are subject to greater credit quality risk than higher rated fixed-income securities and should be considered speculative.
Inverse Floating Rate Investments. Inverse floating rate investments are extremely sensitive to changes in interest rates and in some cases their market value may be extremely volatile.
13
Leverage Risk. Leverage created by borrowing or certain types of transactions or investments may impair the fund's liquidity, cause it to liquidate positions at an unfavorable time, increase volatility of the fund's net asset value, or diminish the fund's performance.
Municipal Securities Risk. Principal and interest payments on municipal securities may not be guaranteed by the issuing body and may be payable only from a particular source. That source may not perform as expected and payment obligations may not be made or made on time.
Portfolio Duration Risk. Portfolio duration is a measure of the expected life of a fixed-income security and its sensitivity to changes in interest rates. The longer a fund's average portfolio duration, the more sensitive the fund will be to changes in interest rates.
PerformanceThe following information provides some indication of the risks of investing in the Fund. Past performance (before and after taxes) is not necessarily an indication of how the Fund will perform in the future. You may get updated performance information by calling 1-800-222-5852 or online at:• For Classes A and C shares - www.principalfunds.com.• For Institutional Class shares - www.principal.com.
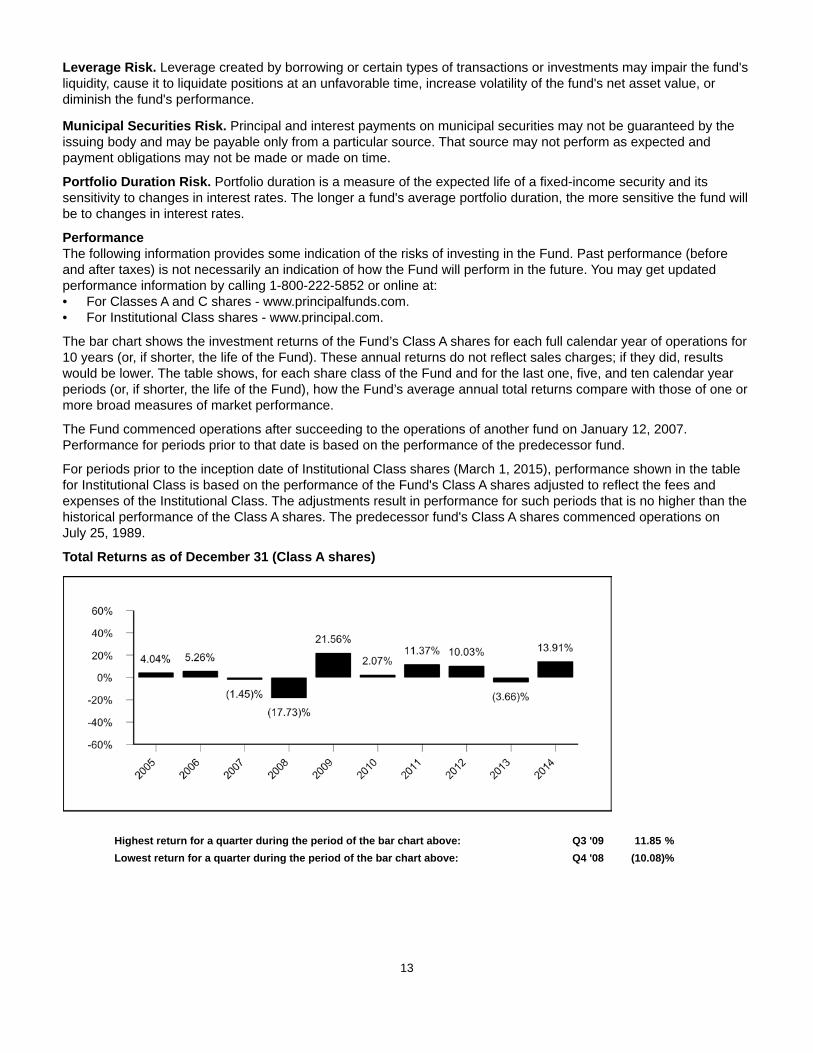
The bar chart shows the investment returns of the Fund’s Class A shares for each full calendar year of operations for 10 years (or, if shorter, the life of the Fund). These annual returns do not reflect sales charges; if they did, results would be lower. The table shows, for each share class of the Fund and for the last one, five, and ten calendar year periods (or, if shorter, the life of the Fund), how the Fund’s average annual total returns compare with those of one or more broad measures of market performance.
The Fund commenced operations after succeeding to the operations of another fund on January 12, 2007. Performance for periods prior to that date is based on the performance of the predecessor fund.
For periods prior to the inception date of Institutional Class shares (March 1, 2015), performance shown in the table for Institutional Class is based on the performance of the Fund's Class A shares adjusted to reflect the fees and expenses of the Institutional Class. The adjustments result in performance for such periods that is no higher than the historical performance of the Class A shares. The predecessor fund's Class A shares commenced operations on July 25, 1989.
Total Returns as of December 31 (Class A shares)
Highest return for a quarter during the period of the bar chart above: Q3 '09 11.85 %Lowest return for a quarter during the period of the bar chart above: Q4 '08 (10.08)%
14
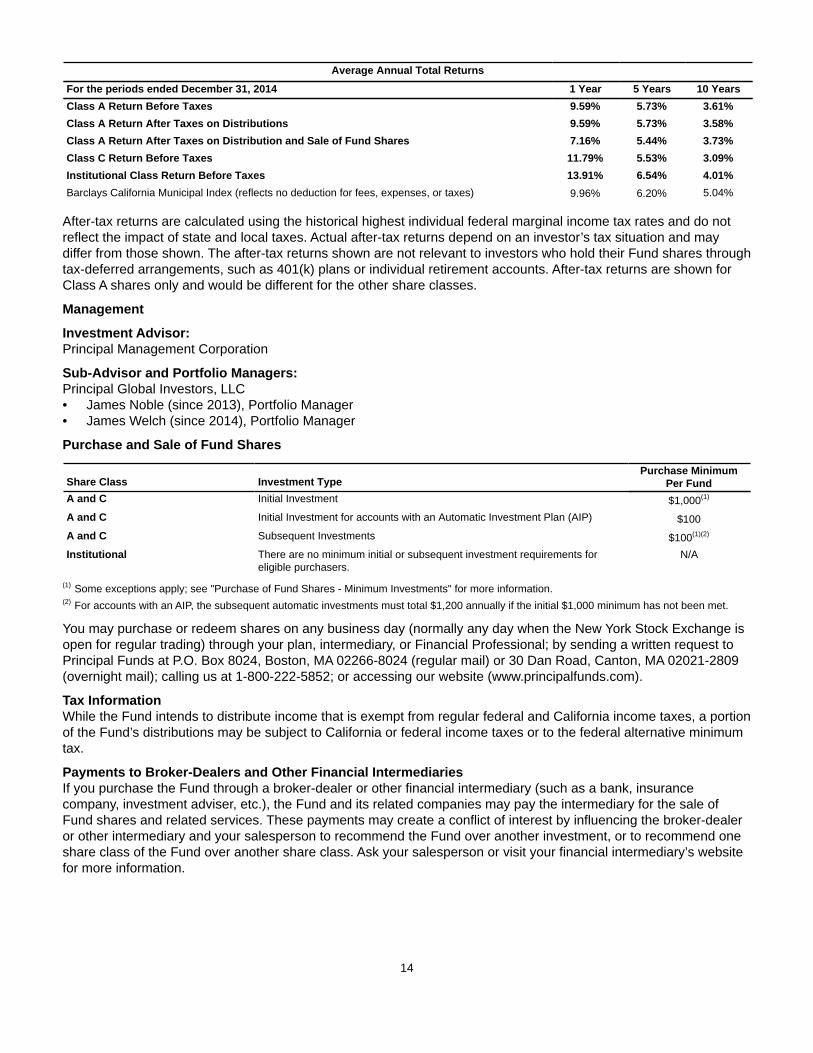
Average Annual Total Returns
For the periods ended December 31, 2014 1 Year 5 Years 10 YearsClass A Return Before Taxes 9.59% 5.73% 3.61%Class A Return After Taxes on Distributions 9.59% 5.73% 3.58%Class A Return After Taxes on Distribution and Sale of Fund Shares 7.16% 5.44% 3.73%Class C Return Before Taxes 11.79% 5.53% 3.09%Institutional Class Return Before Taxes 13.91% 6.54% 4.01%Barclays California Municipal Index (reflects no deduction for fees, expenses, or taxes) 9.96% 6.20% 5.04%
After-tax returns are calculated using the historical highest individual federal marginal income tax rates and do not reflect the impact of state and local taxes. Actual after-tax returns depend on an investor’s tax situation and may differ from those shown. The after-tax returns shown are not relevant to investors who hold their Fund shares through tax-deferred arrangements, such as 401(k) plans or individual retirement accounts. After-tax returns are shown for Class A shares only and would be different for the other share classes.
Management
Investment Advisor: Principal Management Corporation
Sub-Advisor and Portfolio Managers: Principal Global Investors, LLC• James Noble (since 2013), Portfolio Manager• James Welch (since 2014), Portfolio Manager
Purchase and Sale of Fund Shares
Share Class Investment TypePurchase Minimum
Per FundA and C Initial Investment $1,000(1)
A and C Initial Investment for accounts with an Automatic Investment Plan (AIP) $100A and C Subsequent Investments $100(1)(2)
Institutional There are no minimum initial or subsequent investment requirements foreligible purchasers.
N/A
(1) Some exceptions apply; see "Purchase of Fund Shares - Minimum Investments" for more information.(2) For accounts with an AIP, the subsequent automatic investments must total $1,200 annually if the initial $1,000 minimum has not been met.
You may purchase or redeem shares on any business day (normally any day when the New York Stock Exchange is open for regular trading) through your plan, intermediary, or Financial Professional; by sending a written request to Principal Funds at P.O. Box 8024, Boston, MA 02266-8024 (regular mail) or 30 Dan Road, Canton, MA 02021-2809 (overnight mail); calling us at 1-800-222-5852; or accessing our website (www.principalfunds.com).
Tax InformationWhile the Fund intends to distribute income that is exempt from regular federal and California income taxes, a portion of the Fund’s distributions may be subject to California or federal income taxes or to the federal alternative minimum tax.
Payments to Broker-Dealers and Other Financial IntermediariesIf you purchase the Fund through a broker-dealer or other financial intermediary (such as a bank, insurance company, investment adviser, etc.), the Fund and its related companies may pay the intermediary for the sale of Fund shares and related services. These payments may create a conflict of interest by influencing the broker-dealer or other intermediary and your salesperson to recommend the Fund over another investment, or to recommend one share class of the Fund over another share class. Ask your salesperson or visit your financial intermediary’s website for more information.
15
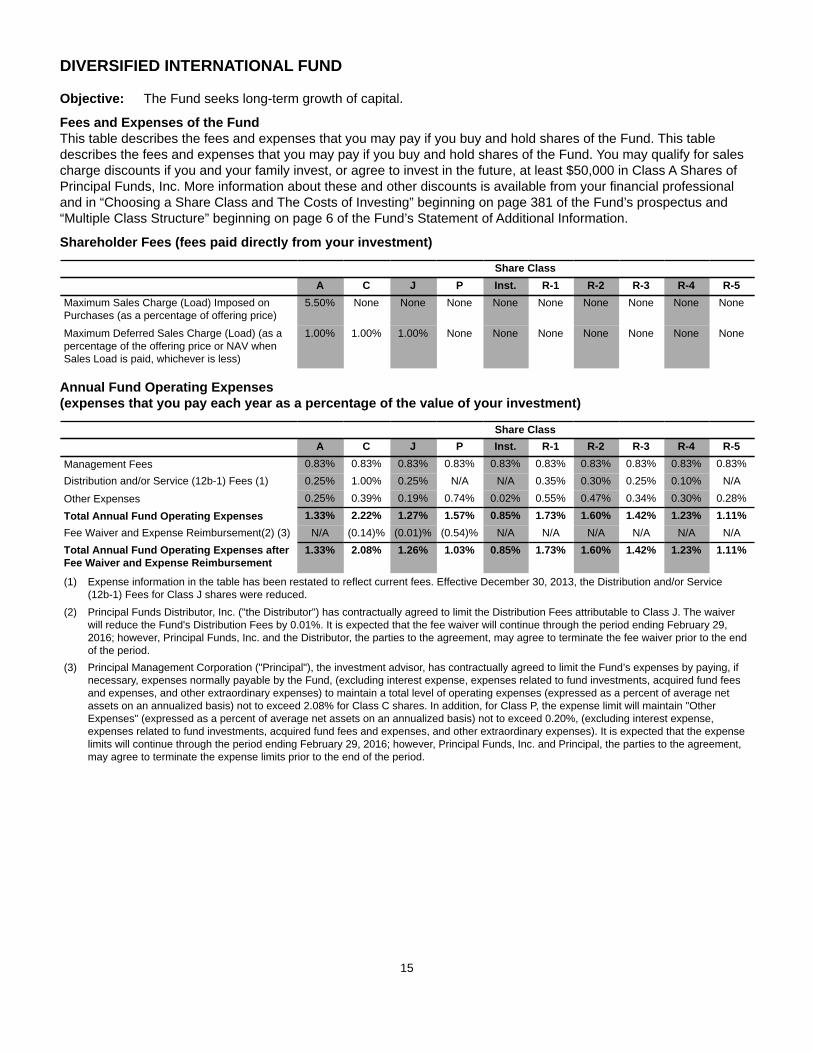
DIVERSIFIED INTERNATIONAL FUND
Objective: The Fund seeks long-term growth of capital.
Fees and Expenses of the FundThis table describes the fees and expenses that you may pay if you buy and hold shares of the Fund. This table describes the fees and expenses that you may pay if you buy and hold shares of the Fund. You may qualify for sales charge discounts if you and your family invest, or agree to invest in the future, at least $50,000 in Class A Shares of Principal Funds, Inc. More information about these and other discounts is available from your financial professional and in “Choosing a Share Class and The Costs of Investing” beginning on page 381 of the Fund’s prospectus and “Multiple Class Structure” beginning on page 6 of the Fund’s Statement of Additional Information.
Shareholder Fees (fees paid directly from your investment)
Share ClassA C J P Inst. R-1 R-2 R-3 R-4 R-5
Maximum Sales Charge (Load) Imposed onPurchases (as a percentage of offering price)
5.50% None None None None None None None None None
Maximum Deferred Sales Charge (Load) (as apercentage of the offering price or NAV whenSales Load is paid, whichever is less)
1.00% 1.00% 1.00% None None None None None None None
Annual Fund Operating Expenses (expenses that you pay each year as a percentage of the value of your investment)
Share ClassA C J P Inst. R-1 R-2 R-3 R-4 R-5
Management Fees 0.83% 0.83% 0.83% 0.83% 0.83% 0.83% 0.83% 0.83% 0.83% 0.83%Distribution and/or Service (12b-1) Fees (1) 0.25% 1.00% 0.25% N/A N/A 0.35% 0.30% 0.25% 0.10% N/A
Other Expenses 0.25% 0.39% 0.19% 0.74% 0.02% 0.55% 0.47% 0.34% 0.30% 0.28%
Total Annual Fund Operating Expenses 1.33% 2.22% 1.27% 1.57% 0.85% 1.73% 1.60% 1.42% 1.23% 1.11%Fee Waiver and Expense Reimbursement(2) (3) N/A (0.14)% (0.01)% (0.54)% N/A N/A N/A N/A N/A N/ATotal Annual Fund Operating Expenses afterFee Waiver and Expense Reimbursement
1.33% 2.08% 1.26% 1.03% 0.85% 1.73% 1.60% 1.42% 1.23% 1.11%
(1) Expense information in the table has been restated to reflect current fees. Effective December 30, 2013, the Distribution and/or Service (12b-1) Fees for Class J shares were reduced.
(2) Principal Funds Distributor, Inc. ("the Distributor") has contractually agreed to limit the Distribution Fees attributable to Class J. The waiver will reduce the Fund's Distribution Fees by 0.01%. It is expected that the fee waiver will continue through the period ending February 29, 2016; however, Principal Funds, Inc. and the Distributor, the parties to the agreement, may agree to terminate the fee waiver prior to the end of the period.
(3) Principal Management Corporation ("Principal"), the investment advisor, has contractually agreed to limit the Fund’s expenses by paying, if necessary, expenses normally payable by the Fund, (excluding interest expense, expenses related to fund investments, acquired fund fees and expenses, and other extraordinary expenses) to maintain a total level of operating expenses (expressed as a percent of average net assets on an annualized basis) not to exceed 2.08% for Class C shares. In addition, for Class P, the expense limit will maintain "Other Expenses" (expressed as a percent of average net assets on an annualized basis) not to exceed 0.20%, (excluding interest expense, expenses related to fund investments, acquired fund fees and expenses, and other extraordinary expenses). It is expected that the expense limits will continue through the period ending February 29, 2016; however, Principal Funds, Inc. and Principal, the parties to the agreement, may agree to terminate the expense limits prior to the end of the period.
16
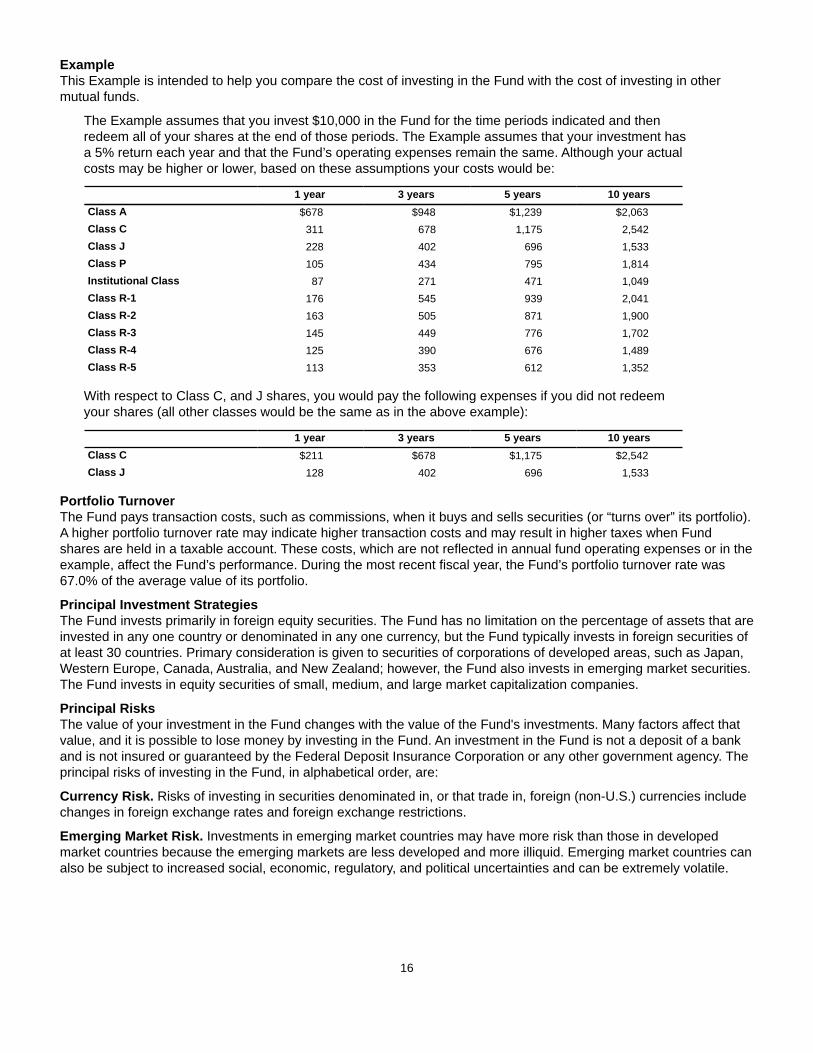
ExampleThis Example is intended to help you compare the cost of investing in the Fund with the cost of investing in other mutual funds.
The Example assumes that you invest $10,000 in the Fund for the time periods indicated and then redeem all of your shares at the end of those periods. The Example assumes that your investment has a 5% return each year and that the Fund’s operating expenses remain the same. Although your actual costs may be higher or lower, based on these assumptions your costs would be:
1 year 3 years 5 years 10 yearsClass A $678 $948 $1,239 $2,063Class C 311 678 1,175 2,542Class J 228 402 696 1,533Class P 105 434 795 1,814Institutional Class 87 271 471 1,049Class R-1 176 545 939 2,041Class R-2 163 505 871 1,900Class R-3 145 449 776 1,702Class R-4 125 390 676 1,489Class R-5 113 353 612 1,352
With respect to Class C, and J shares, you would pay the following expenses if you did not redeem your shares (all other classes would be the same as in the above example):
1 year 3 years 5 years 10 yearsClass C $211 $678 $1,175 $2,542Class J 128 402 696 1,533
Portfolio TurnoverThe Fund pays transaction costs, such as commissions, when it buys and sells securities (or “turns over” its portfolio). A higher portfolio turnover rate may indicate higher transaction costs and may result in higher taxes when Fund shares are held in a taxable account. These costs, which are not reflected in annual fund operating expenses or in the example, affect the Fund’s performance. During the most recent fiscal year, the Fund’s portfolio turnover rate was 67.0% of the average value of its portfolio.
Principal Investment StrategiesThe Fund invests primarily in foreign equity securities. The Fund has no limitation on the percentage of assets that are invested in any one country or denominated in any one currency, but the Fund typically invests in foreign securities of at least 30 countries. Primary consideration is given to securities of corporations of developed areas, such as Japan, Western Europe, Canada, Australia, and New Zealand; however, the Fund also invests in emerging market securities. The Fund invests in equity securities of small, medium, and large market capitalization companies.
Principal RisksThe value of your investment in the Fund changes with the value of the Fund's investments. Many factors affect that value, and it is possible to lose money by investing in the Fund. An investment in the Fund is not a deposit of a bank and is not insured or guaranteed by the Federal Deposit Insurance Corporation or any other government agency. The principal risks of investing in the Fund, in alphabetical order, are:
Currency Risk. Risks of investing in securities denominated in, or that trade in, foreign (non-U.S.) currencies include changes in foreign exchange rates and foreign exchange restrictions.
Emerging Market Risk. Investments in emerging market countries may have more risk than those in developed market countries because the emerging markets are less developed and more illiquid. Emerging market countries can also be subject to increased social, economic, regulatory, and political uncertainties and can be extremely volatile.
17
Equity Securities Risk. The value of equity securities could decline if the issuer's financial condition declines or in response to overall market and economic conditions. A fund's principal market segment(s), such as large cap, mid cap or small cap stocks, or growth or value stocks, may underperform other market segments or the equity markets as a whole. Investments in smaller companies and mid-size companies may involve greater risk and price volatility than investments in larger, more mature companies.
Foreign Securities Risk. The risks of foreign securities include loss of value as a result of: political or economic instability; nationalization, expropriation or confiscatory taxation; settlement delays; and limited government regulation (including less stringent reporting, accounting, and disclosure standards than are required of U.S. companies).
Risk of Being an Underlying Fund. A fund is subject to the risk of being an underlying fund to the extent that a fund of funds invests in the fund. An underlying fund of a fund of funds may experience relatively large redemptions or investments as the fund of funds periodically reallocates or rebalances its assets. These transactions may cause the underlying fund to sell portfolio securities to meet such redemptions, or to invest cash from such investments, at times it would not otherwise do so, and may as a result increase transaction costs and adversely affect underlying fund performance.
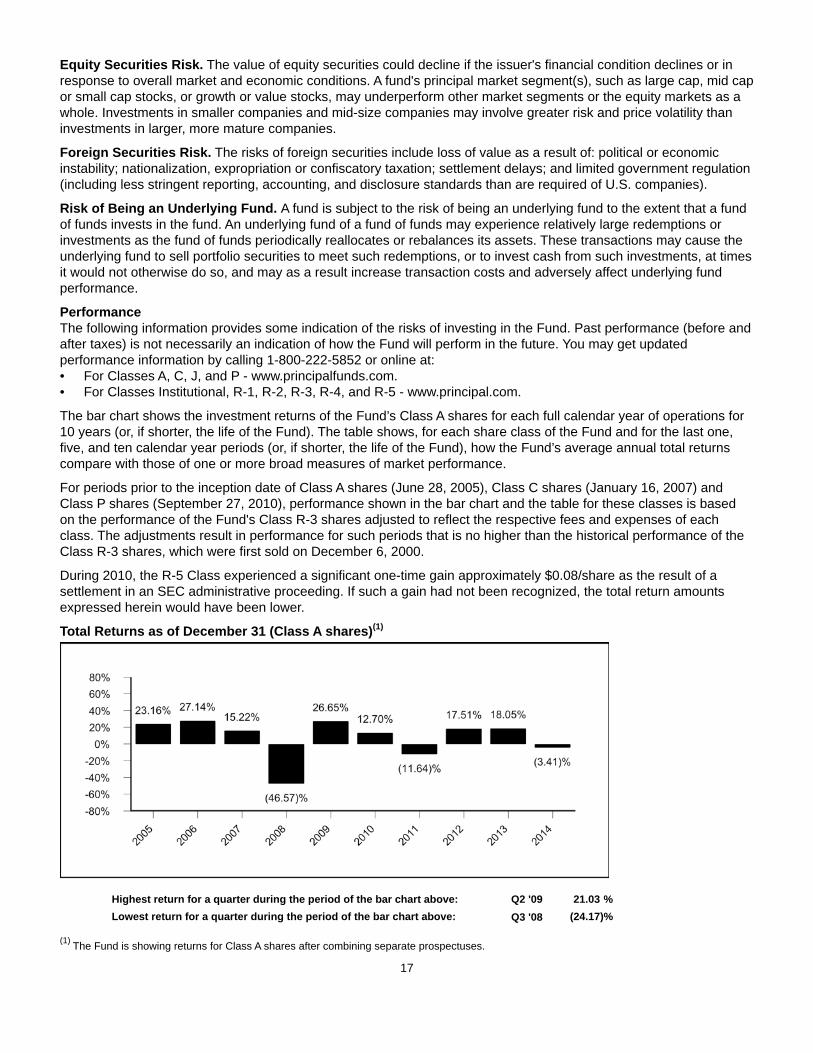
PerformanceThe following information provides some indication of the risks of investing in the Fund. Past performance (before and after taxes) is not necessarily an indication of how the Fund will perform in the future. You may get updated performance information by calling 1-800-222-5852 or online at:• For Classes A, C, J, and P - www.principalfunds.com.• For Classes Institutional, R-1, R-2, R-3, R-4, and R-5 - www.principal.com.
The bar chart shows the investment returns of the Fund’s Class A shares for each full calendar year of operations for 10 years (or, if shorter, the life of the Fund). The table shows, for each share class of the Fund and for the last one, five, and ten calendar year periods (or, if shorter, the life of the Fund), how the Fund’s average annual total returns compare with those of one or more broad measures of market performance.
For periods prior to the inception date of Class A shares (June 28, 2005), Class C shares (January 16, 2007) and Class P shares (September 27, 2010), performance shown in the bar chart and the table for these classes is based on the performance of the Fund's Class R-3 shares adjusted to reflect the respective fees and expenses of each class. The adjustments result in performance for such periods that is no higher than the historical performance of the Class R-3 shares, which were first sold on December 6, 2000.
During 2010, the R-5 Class experienced a significant one-time gain approximately $0.08/share as the result of a settlement in an SEC administrative proceeding. If such a gain had not been recognized, the total return amounts expressed herein would have been lower.
Total Returns as of December 31 (Class A shares)(1)
Highest return for a quarter during the period of the bar chart above: Q2 '09 21.03 %Lowest return for a quarter during the period of the bar chart above: Q3 '08 (24.17)%
(1) The Fund is showing returns for Class A shares after combining separate prospectuses.
18
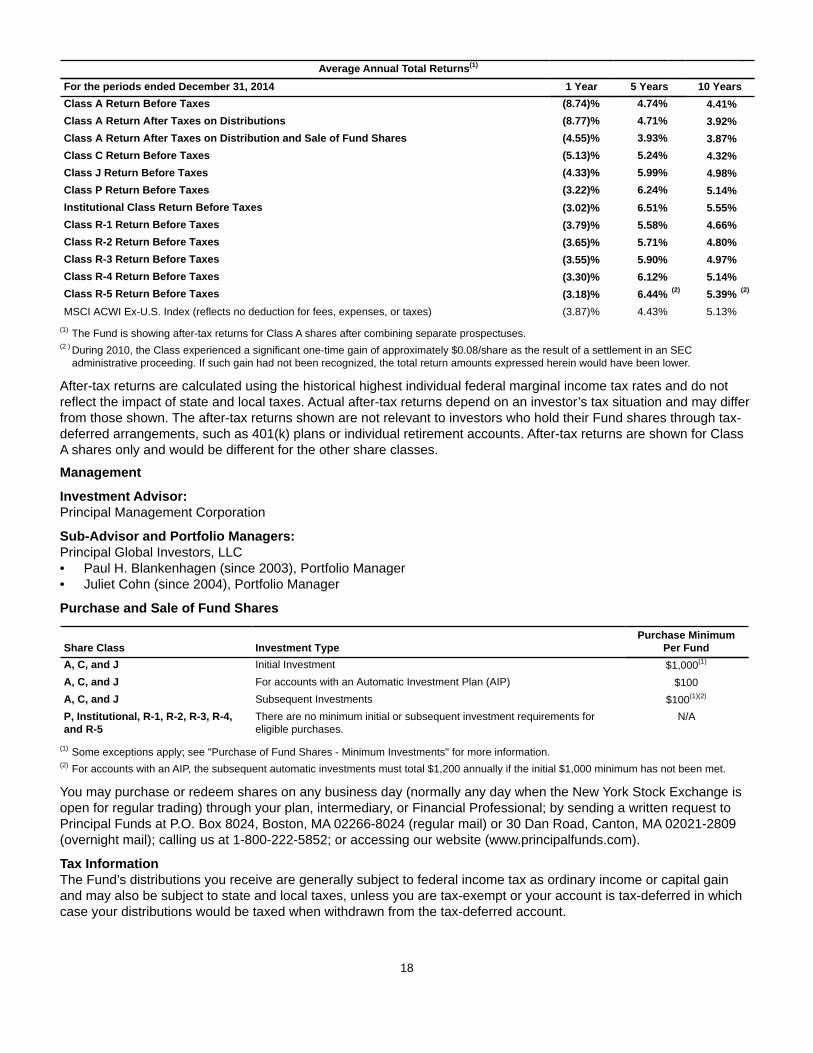
Average Annual Total Returns(1)
For the periods ended December 31, 2014 1 Year 5 Years 10 YearsClass A Return Before Taxes (8.74)% 4.74% 4.41%Class A Return After Taxes on Distributions (8.77)% 4.71% 3.92%Class A Return After Taxes on Distribution and Sale of Fund Shares (4.55)% 3.93% 3.87%Class C Return Before Taxes (5.13)% 5.24% 4.32%Class J Return Before Taxes (4.33)% 5.99% 4.98%Class P Return Before Taxes (3.22)% 6.24% 5.14%Institutional Class Return Before Taxes (3.02)% 6.51% 5.55%Class R-1 Return Before Taxes (3.79)% 5.58% 4.66%Class R-2 Return Before Taxes (3.65)% 5.71% 4.80%Class R-3 Return Before Taxes (3.55)% 5.90% 4.97%Class R-4 Return Before Taxes (3.30)% 6.12% 5.14%Class R-5 Return Before Taxes (3.18)% 6.44% (2) 5.39% (2)
MSCI ACWI Ex-U.S. Index (reflects no deduction for fees, expenses, or taxes) (3.87)% 4.43% 5.13%(1) The Fund is showing after-tax returns for Class A shares after combining separate prospectuses.(2 ) During 2010, the Class experienced a significant one-time gain of approximately $0.08/share as the result of a settlement in an SEC
administrative proceeding. If such gain had not been recognized, the total return amounts expressed herein would have been lower.
After-tax returns are calculated using the historical highest individual federal marginal income tax rates and do not reflect the impact of state and local taxes. Actual after-tax returns depend on an investor’s tax situation and may differ from those shown. The after-tax returns shown are not relevant to investors who hold their Fund shares through tax-deferred arrangements, such as 401(k) plans or individual retirement accounts. After-tax returns are shown for Class A shares only and would be different for the other share classes.
Management
Investment Advisor: Principal Management Corporation
Sub-Advisor and Portfolio Managers: Principal Global Investors, LLC• Paul H. Blankenhagen (since 2003), Portfolio Manager• Juliet Cohn (since 2004), Portfolio Manager
Purchase and Sale of Fund Shares
Share Class Investment TypePurchase Minimum
Per FundA, C, and J Initial Investment $1,000(1)
A, C, and J For accounts with an Automatic Investment Plan (AIP) $100A, C, and J Subsequent Investments $100(1)(2)
P, Institutional, R-1, R-2, R-3, R-4,and R-5
There are no minimum initial or subsequent investment requirements foreligible purchases.
N/A
(1) Some exceptions apply; see "Purchase of Fund Shares - Minimum Investments" for more information.(2) For accounts with an AIP, the subsequent automatic investments must total $1,200 annually if the initial $1,000 minimum has not been met.
You may purchase or redeem shares on any business day (normally any day when the New York Stock Exchange is open for regular trading) through your plan, intermediary, or Financial Professional; by sending a written request to Principal Funds at P.O. Box 8024, Boston, MA 02266-8024 (regular mail) or 30 Dan Road, Canton, MA 02021-2809 (overnight mail); calling us at 1-800-222-5852; or accessing our website (www.principalfunds.com).
Tax InformationThe Fund’s distributions you receive are generally subject to federal income tax as ordinary income or capital gain and may also be subject to state and local taxes, unless you are tax-exempt or your account is tax-deferred in which case your distributions would be taxed when withdrawn from the tax-deferred account.

19
Payments to Broker-Dealers and Other Financial IntermediariesIf you purchase the Fund through a broker-dealer or other financial intermediary (such as a bank, insurance company, investment adviser, etc.), the Fund and its related companies may pay the intermediary for the sale of Fund shares and related services. These payments may create a conflict of interest by influencing the broker-dealer or other intermediary and your salesperson to recommend the Fund over another investment, or to recommend one share class of the Fund over another share class. Ask your salesperson or visit your financial intermediary's website for more information.
20
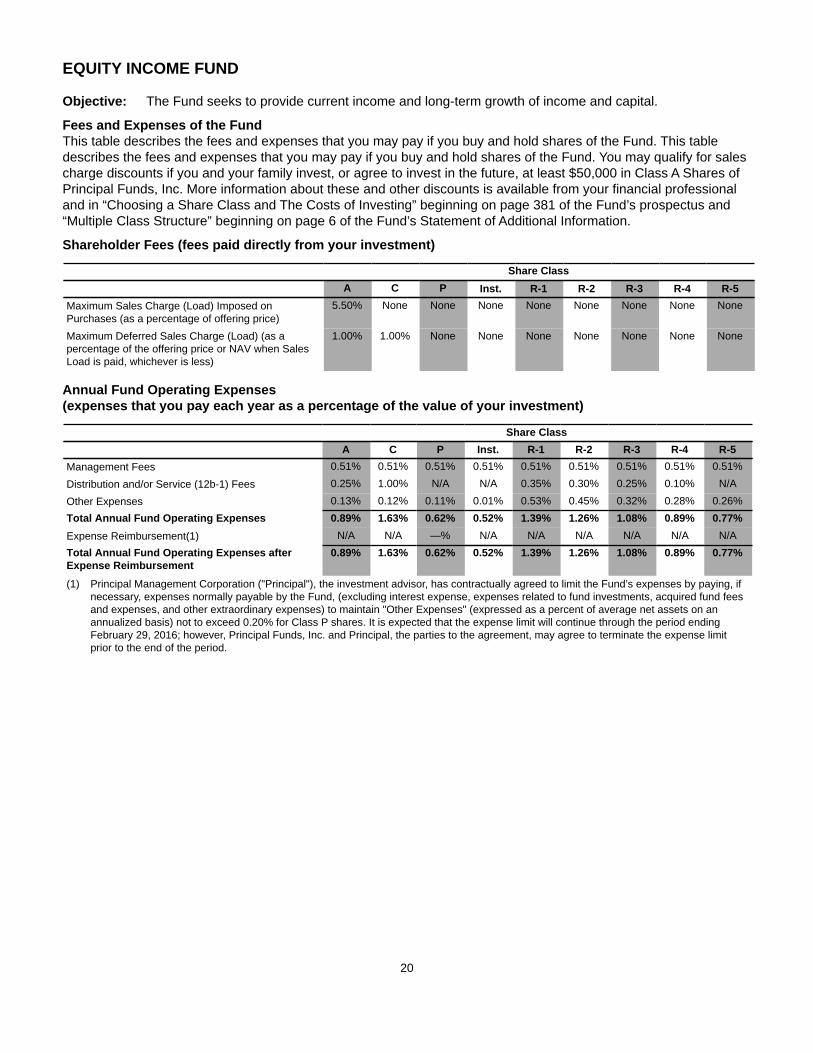
EQUITY INCOME FUND
Objective: The Fund seeks to provide current income and long-term growth of income and capital.
Fees and Expenses of the FundThis table describes the fees and expenses that you may pay if you buy and hold shares of the Fund. This table describes the fees and expenses that you may pay if you buy and hold shares of the Fund. You may qualify for sales charge discounts if you and your family invest, or agree to invest in the future, at least $50,000 in Class A Shares of Principal Funds, Inc. More information about these and other discounts is available from your financial professional and in “Choosing a Share Class and The Costs of Investing” beginning on page 381 of the Fund’s prospectus and “Multiple Class Structure” beginning on page 6 of the Fund’s Statement of Additional Information.
Shareholder Fees (fees paid directly from your investment)
Share ClassA C P Inst. R-1 R-2 R-3 R-4 R-5
Maximum Sales Charge (Load) Imposed onPurchases (as a percentage of offering price)
5.50% None None None None None None None None
Maximum Deferred Sales Charge (Load) (as apercentage of the offering price or NAV when SalesLoad is paid, whichever is less)
1.00% 1.00% None None None None None None None
Annual Fund Operating Expenses (expenses that you pay each year as a percentage of the value of your investment)
Share ClassA C P Inst. R-1 R-2 R-3 R-4 R-5
Management Fees 0.51% 0.51% 0.51% 0.51% 0.51% 0.51% 0.51% 0.51% 0.51%
Distribution and/or Service (12b-1) Fees 0.25% 1.00% N/A N/A 0.35% 0.30% 0.25% 0.10% N/A
Other Expenses 0.13% 0.12% 0.11% 0.01% 0.53% 0.45% 0.32% 0.28% 0.26%Total Annual Fund Operating Expenses 0.89% 1.63% 0.62% 0.52% 1.39% 1.26% 1.08% 0.89% 0.77%Expense Reimbursement(1) N/A N/A —% N/A N/A N/A N/A N/A N/ATotal Annual Fund Operating Expenses afterExpense Reimbursement
0.89% 1.63% 0.62% 0.52% 1.39% 1.26% 1.08% 0.89% 0.77%
(1) Principal Management Corporation ("Principal"), the investment advisor, has contractually agreed to limit the Fund’s expenses by paying, if necessary, expenses normally payable by the Fund, (excluding interest expense, expenses related to fund investments, acquired fund fees and expenses, and other extraordinary expenses) to maintain "Other Expenses" (expressed as a percent of average net assets on an annualized basis) not to exceed 0.20% for Class P shares. It is expected that the expense limit will continue through the period ending February 29, 2016; however, Principal Funds, Inc. and Principal, the parties to the agreement, may agree to terminate the expense limit prior to the end of the period.
21
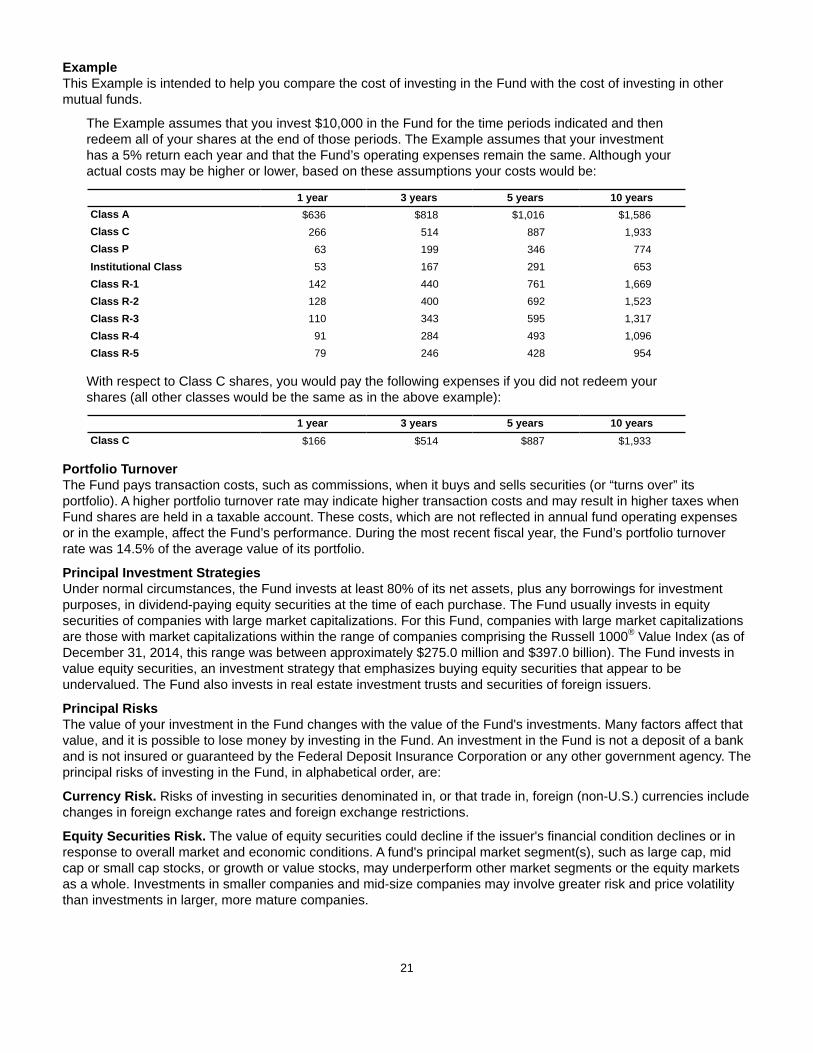
ExampleThis Example is intended to help you compare the cost of investing in the Fund with the cost of investing in other mutual funds.
The Example assumes that you invest $10,000 in the Fund for the time periods indicated and then redeem all of your shares at the end of those periods. The Example assumes that your investment has a 5% return each year and that the Fund’s operating expenses remain the same. Although your actual costs may be higher or lower, based on these assumptions your costs would be:
1 year 3 years 5 years 10 yearsClass A $636 $818 $1,016 $1,586Class C 266 514 887 1,933Class P 63 199 346 774Institutional Class 53 167 291 653Class R-1 142 440 761 1,669Class R-2 128 400 692 1,523Class R-3 110 343 595 1,317Class R-4 91 284 493 1,096Class R-5 79 246 428 954
With respect to Class C shares, you would pay the following expenses if you did not redeem your shares (all other classes would be the same as in the above example):
1 year 3 years 5 years 10 yearsClass C $166 $514 $887 $1,933
Portfolio TurnoverThe Fund pays transaction costs, such as commissions, when it buys and sells securities (or “turns over” its portfolio). A higher portfolio turnover rate may indicate higher transaction costs and may result in higher taxes when Fund shares are held in a taxable account. These costs, which are not reflected in annual fund operating expenses or in the example, affect the Fund’s performance. During the most recent fiscal year, the Fund’s portfolio turnover rate was 14.5% of the average value of its portfolio.
Principal Investment StrategiesUnder normal circumstances, the Fund invests at least 80% of its net assets, plus any borrowings for investment purposes, in dividend-paying equity securities at the time of each purchase. The Fund usually invests in equity securities of companies with large market capitalizations. For this Fund, companies with large market capitalizations are those with market capitalizations within the range of companies comprising the Russell 1000® Value Index (as of December 31, 2014, this range was between approximately $275.0 million and $397.0 billion). The Fund invests in value equity securities, an investment strategy that emphasizes buying equity securities that appear to be undervalued. The Fund also invests in real estate investment trusts and securities of foreign issuers.
Principal RisksThe value of your investment in the Fund changes with the value of the Fund's investments. Many factors affect that value, and it is possible to lose money by investing in the Fund. An investment in the Fund is not a deposit of a bank and is not insured or guaranteed by the Federal Deposit Insurance Corporation or any other government agency. The principal risks of investing in the Fund, in alphabetical order, are:
Currency Risk. Risks of investing in securities denominated in, or that trade in, foreign (non-U.S.) currencies include changes in foreign exchange rates and foreign exchange restrictions.
Equity Securities Risk. The value of equity securities could decline if the issuer's financial condition declines or in response to overall market and economic conditions. A fund's principal market segment(s), such as large cap, mid cap or small cap stocks, or growth or value stocks, may underperform other market segments or the equity markets as a whole. Investments in smaller companies and mid-size companies may involve greater risk and price volatility than investments in larger, more mature companies.
22
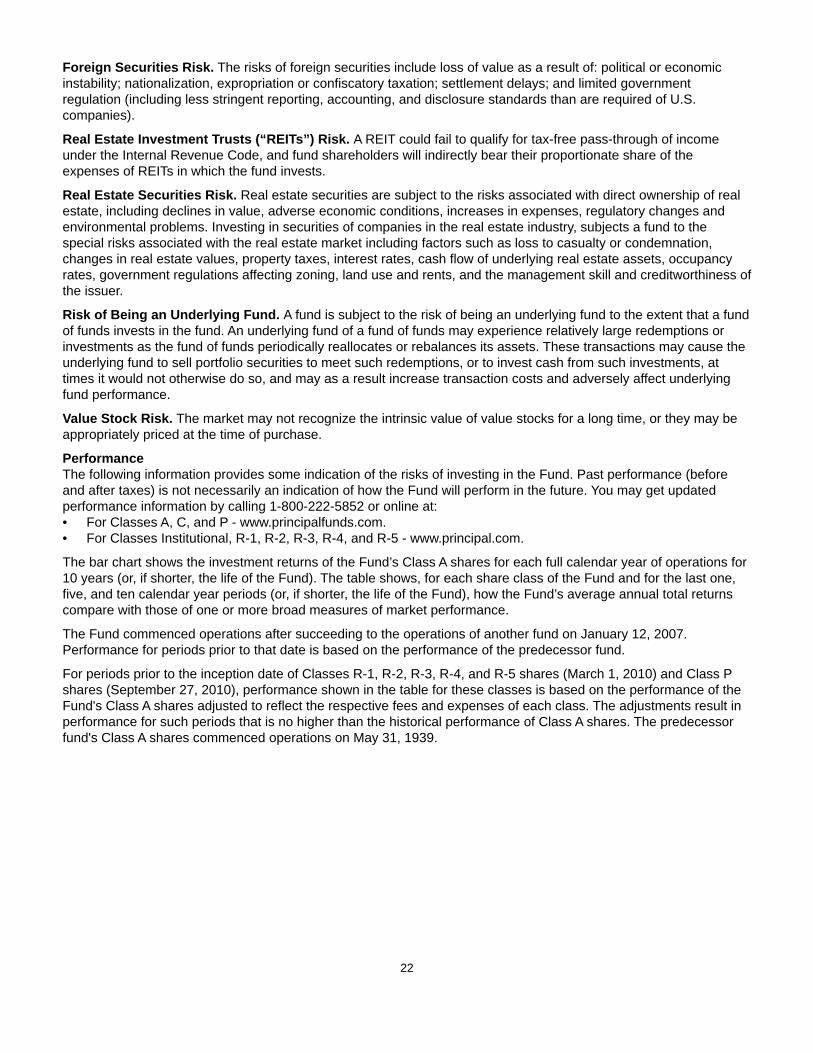
Foreign Securities Risk. The risks of foreign securities include loss of value as a result of: political or economic instability; nationalization, expropriation or confiscatory taxation; settlement delays; and limited government regulation (including less stringent reporting, accounting, and disclosure standards than are required of U.S. companies).
Real Estate Investment Trusts (“REITs”) Risk. A REIT could fail to qualify for tax-free pass-through of income under the Internal Revenue Code, and fund shareholders will indirectly bear their proportionate share of the expenses of REITs in which the fund invests.
Real Estate Securities Risk. Real estate securities are subject to the risks associated with direct ownership of real estate, including declines in value, adverse economic conditions, increases in expenses, regulatory changes and environmental problems. Investing in securities of companies in the real estate industry, subjects a fund to the special risks associated with the real estate market including factors such as loss to casualty or condemnation, changes in real estate values, property taxes, interest rates, cash flow of underlying real estate assets, occupancy rates, government regulations affecting zoning, land use and rents, and the management skill and creditworthiness of the issuer.
Risk of Being an Underlying Fund. A fund is subject to the risk of being an underlying fund to the extent that a fund of funds invests in the fund. An underlying fund of a fund of funds may experience relatively large redemptions or investments as the fund of funds periodically reallocates or rebalances its assets. These transactions may cause the underlying fund to sell portfolio securities to meet such redemptions, or to invest cash from such investments, at times it would not otherwise do so, and may as a result increase transaction costs and adversely affect underlying fund performance.
Value Stock Risk. The market may not recognize the intrinsic value of value stocks for a long time, or they may be appropriately priced at the time of purchase.
PerformanceThe following information provides some indication of the risks of investing in the Fund. Past performance (before and after taxes) is not necessarily an indication of how the Fund will perform in the future. You may get updated performance information by calling 1-800-222-5852 or online at:• For Classes A, C, and P - www.principalfunds.com.• For Classes Institutional, R-1, R-2, R-3, R-4, and R-5 - www.principal.com.
The bar chart shows the investment returns of the Fund’s Class A shares for each full calendar year of operations for 10 years (or, if shorter, the life of the Fund). The table shows, for each share class of the Fund and for the last one, five, and ten calendar year periods (or, if shorter, the life of the Fund), how the Fund’s average annual total returns compare with those of one or more broad measures of market performance.
The Fund commenced operations after succeeding to the operations of another fund on January 12, 2007. Performance for periods prior to that date is based on the performance of the predecessor fund.
For periods prior to the inception date of Classes R-1, R-2, R-3, R-4, and R-5 shares (March 1, 2010) and Class P shares (September 27, 2010), performance shown in the table for these classes is based on the performance of the Fund's Class A shares adjusted to reflect the respective fees and expenses of each class. The adjustments result in performance for such periods that is no higher than the historical performance of Class A shares. The predecessor fund's Class A shares commenced operations on May 31, 1939.
23
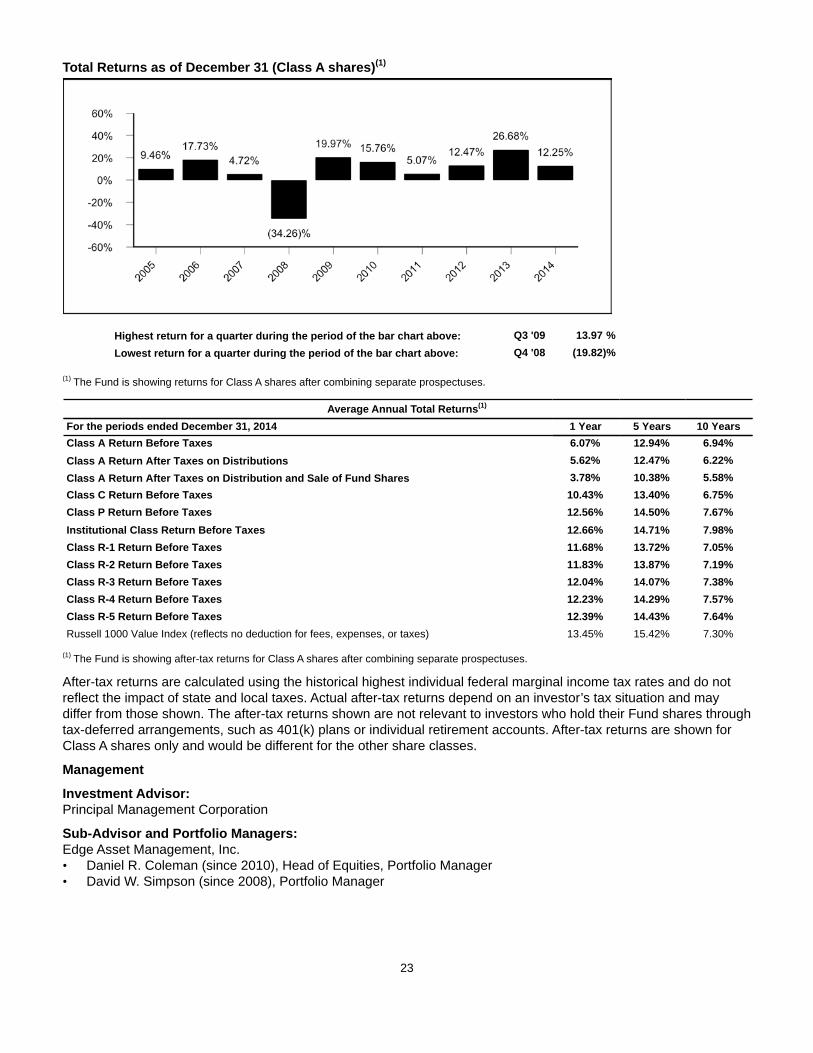
Total Returns as of December 31 (Class A shares)(1)
Highest return for a quarter during the period of the bar chart above: Q3 '09 13.97 %Lowest return for a quarter during the period of the bar chart above: Q4 '08 (19.82)%
(1) The Fund is showing returns for Class A shares after combining separate prospectuses.
Average Annual Total Returns(1)
For the periods ended December 31, 2014 1 Year 5 Years 10 YearsClass A Return Before Taxes 6.07% 12.94% 6.94%Class A Return After Taxes on Distributions 5.62% 12.47% 6.22%Class A Return After Taxes on Distribution and Sale of Fund Shares 3.78% 10.38% 5.58%Class C Return Before Taxes 10.43% 13.40% 6.75%Class P Return Before Taxes 12.56% 14.50% 7.67%Institutional Class Return Before Taxes 12.66% 14.71% 7.98%Class R-1 Return Before Taxes 11.68% 13.72% 7.05%Class R-2 Return Before Taxes 11.83% 13.87% 7.19%Class R-3 Return Before Taxes 12.04% 14.07% 7.38%Class R-4 Return Before Taxes 12.23% 14.29% 7.57%Class R-5 Return Before Taxes 12.39% 14.43% 7.64%Russell 1000 Value Index (reflects no deduction for fees, expenses, or taxes) 13.45% 15.42% 7.30%
(1) The Fund is showing after-tax returns for Class A shares after combining separate prospectuses.
After-tax returns are calculated using the historical highest individual federal marginal income tax rates and do not reflect the impact of state and local taxes. Actual after-tax returns depend on an investor’s tax situation and may differ from those shown. The after-tax returns shown are not relevant to investors who hold their Fund shares through tax-deferred arrangements, such as 401(k) plans or individual retirement accounts. After-tax returns are shown for Class A shares only and would be different for the other share classes.
Management
Investment Advisor: Principal Management Corporation
Sub-Advisor and Portfolio Managers: Edge Asset Management, Inc. • Daniel R. Coleman (since 2010), Head of Equities, Portfolio Manager• David W. Simpson (since 2008), Portfolio Manager
24
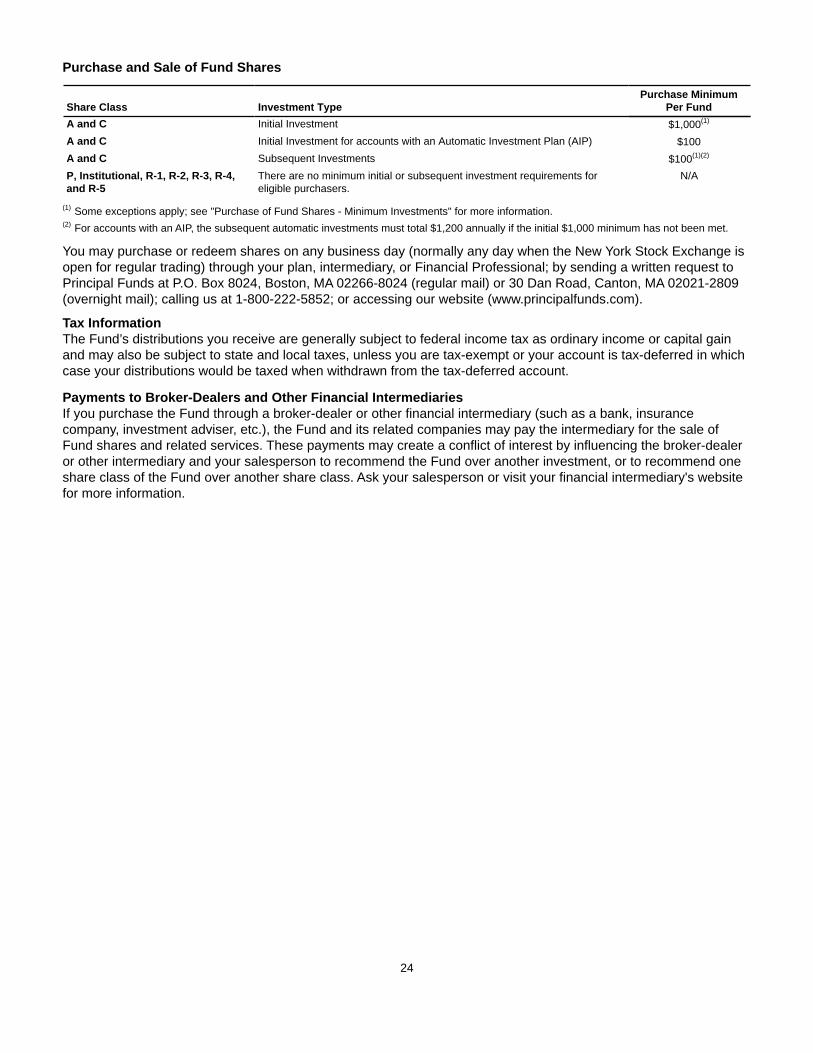
Purchase and Sale of Fund Shares
Share Class Investment TypePurchase Minimum
Per FundA and C Initial Investment $1,000(1)
A and C Initial Investment for accounts with an Automatic Investment Plan (AIP) $100A and C Subsequent Investments $100(1)(2)
P, Institutional, R-1, R-2, R-3, R-4,and R-5
There are no minimum initial or subsequent investment requirements foreligible purchasers.
N/A
(1) Some exceptions apply; see "Purchase of Fund Shares - Minimum Investments" for more information.(2) For accounts with an AIP, the subsequent automatic investments must total $1,200 annually if the initial $1,000 minimum has not been met.
You may purchase or redeem shares on any business day (normally any day when the New York Stock Exchange is open for regular trading) through your plan, intermediary, or Financial Professional; by sending a written request to Principal Funds at P.O. Box 8024, Boston, MA 02266-8024 (regular mail) or 30 Dan Road, Canton, MA 02021-2809 (overnight mail); calling us at 1-800-222-5852; or accessing our website (www.principalfunds.com).
Tax InformationThe Fund’s distributions you receive are generally subject to federal income tax as ordinary income or capital gain and may also be subject to state and local taxes, unless you are tax-exempt or your account is tax-deferred in which case your distributions would be taxed when withdrawn from the tax-deferred account.
Payments to Broker-Dealers and Other Financial IntermediariesIf you purchase the Fund through a broker-dealer or other financial intermediary (such as a bank, insurance company, investment adviser, etc.), the Fund and its related companies may pay the intermediary for the sale of Fund shares and related services. These payments may create a conflict of interest by influencing the broker-dealer or other intermediary and your salesperson to recommend the Fund over another investment, or to recommend one share class of the Fund over another share class. Ask your salesperson or visit your financial intermediary's website for more information.
25
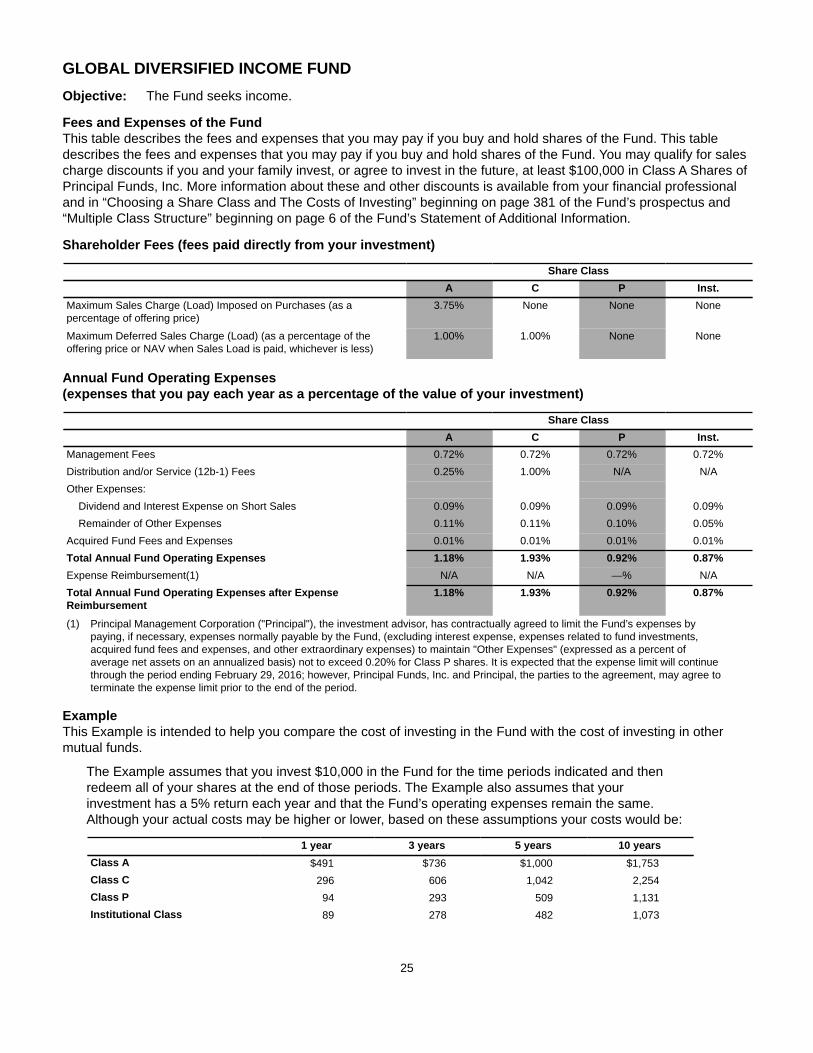
GLOBAL DIVERSIFIED INCOME FUNDObjective: The Fund seeks income.
Fees and Expenses of the FundThis table describes the fees and expenses that you may pay if you buy and hold shares of the Fund. This table describes the fees and expenses that you may pay if you buy and hold shares of the Fund. You may qualify for sales charge discounts if you and your family invest, or agree to invest in the future, at least $100,000 in Class A Shares of Principal Funds, Inc. More information about these and other discounts is available from your financial professional and in “Choosing a Share Class and The Costs of Investing” beginning on page 381 of the Fund’s prospectus and “Multiple Class Structure” beginning on page 6 of the Fund’s Statement of Additional Information.
Shareholder Fees (fees paid directly from your investment)
Share ClassA C P Inst.
Maximum Sales Charge (Load) Imposed on Purchases (as apercentage of offering price)
3.75% None None None
Maximum Deferred Sales Charge (Load) (as a percentage of theoffering price or NAV when Sales Load is paid, whichever is less)
1.00% 1.00% None None
Annual Fund Operating Expenses (expenses that you pay each year as a percentage of the value of your investment)
Share ClassA C P Inst.
Management Fees 0.72% 0.72% 0.72% 0.72%Distribution and/or Service (12b-1) Fees 0.25% 1.00% N/A N/AOther Expenses:
Dividend and Interest Expense on Short Sales 0.09% 0.09% 0.09% 0.09%Remainder of Other Expenses 0.11% 0.11% 0.10% 0.05%
Acquired Fund Fees and Expenses 0.01% 0.01% 0.01% 0.01%Total Annual Fund Operating Expenses 1.18% 1.93% 0.92% 0.87%Expense Reimbursement(1) N/A N/A —% N/ATotal Annual Fund Operating Expenses after ExpenseReimbursement
1.18% 1.93% 0.92% 0.87%
(1) Principal Management Corporation ("Principal"), the investment advisor, has contractually agreed to limit the Fund’s expenses by paying, if necessary, expenses normally payable by the Fund, (excluding interest expense, expenses related to fund investments, acquired fund fees and expenses, and other extraordinary expenses) to maintain "Other Expenses" (expressed as a percent of average net assets on an annualized basis) not to exceed 0.20% for Class P shares. It is expected that the expense limit will continue through the period ending February 29, 2016; however, Principal Funds, Inc. and Principal, the parties to the agreement, may agree to terminate the expense limit prior to the end of the period.
ExampleThis Example is intended to help you compare the cost of investing in the Fund with the cost of investing in other mutual funds.
The Example assumes that you invest $10,000 in the Fund for the time periods indicated and then redeem all of your shares at the end of those periods. The Example also assumes that your investment has a 5% return each year and that the Fund’s operating expenses remain the same. Although your actual costs may be higher or lower, based on these assumptions your costs would be:
1 year 3 years 5 years 10 yearsClass A $491 $736 $1,000 $1,753Class C 296 606 1,042 2,254Class P 94 293 509 1,131Institutional Class 89 278 482 1,073
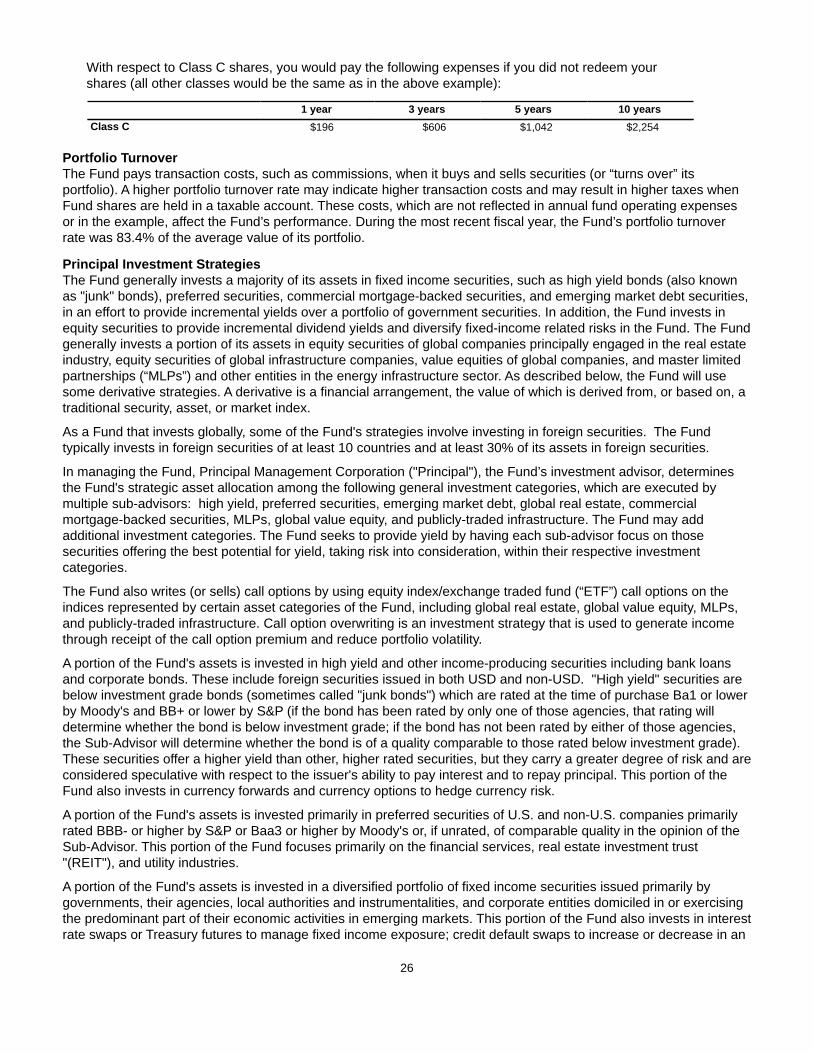
26
With respect to Class C shares, you would pay the following expenses if you did not redeem your shares (all other classes would be the same as in the above example):
1 year 3 years 5 years 10 yearsClass C $196 $606 $1,042 $2,254
Portfolio TurnoverThe Fund pays transaction costs, such as commissions, when it buys and sells securities (or “turns over” its portfolio). A higher portfolio turnover rate may indicate higher transaction costs and may result in higher taxes when Fund shares are held in a taxable account. These costs, which are not reflected in annual fund operating expenses or in the example, affect the Fund’s performance. During the most recent fiscal year, the Fund’s portfolio turnover rate was 83.4% of the average value of its portfolio.
Principal Investment StrategiesThe Fund generally invests a majority of its assets in fixed income securities, such as high yield bonds (also known as "junk" bonds), preferred securities, commercial mortgage-backed securities, and emerging market debt securities, in an effort to provide incremental yields over a portfolio of government securities. In addition, the Fund invests in equity securities to provide incremental dividend yields and diversify fixed-income related risks in the Fund. The Fund generally invests a portion of its assets in equity securities of global companies principally engaged in the real estate industry, equity securities of global infrastructure companies, value equities of global companies, and master limited partnerships (“MLPs”) and other entities in the energy infrastructure sector. As described below, the Fund will use some derivative strategies. A derivative is a financial arrangement, the value of which is derived from, or based on, a traditional security, asset, or market index.
As a Fund that invests globally, some of the Fund's strategies involve investing in foreign securities. The Fund typically invests in foreign securities of at least 10 countries and at least 30% of its assets in foreign securities.
In managing the Fund, Principal Management Corporation ("Principal"), the Fund’s investment advisor, determines the Fund's strategic asset allocation among the following general investment categories, which are executed by multiple sub-advisors: high yield, preferred securities, emerging market debt, global real estate, commercial mortgage-backed securities, MLPs, global value equity, and publicly-traded infrastructure. The Fund may add additional investment categories. The Fund seeks to provide yield by having each sub-advisor focus on those securities offering the best potential for yield, taking risk into consideration, within their respective investment categories.
The Fund also writes (or sells) call options by using equity index/exchange traded fund (“ETF”) call options on the indices represented by certain asset categories of the Fund, including global real estate, global value equity, MLPs, and publicly-traded infrastructure. Call option overwriting is an investment strategy that is used to generate income through receipt of the call option premium and reduce portfolio volatility.
A portion of the Fund's assets is invested in high yield and other income-producing securities including bank loans and corporate bonds. These include foreign securities issued in both USD and non-USD. "High yield" securities are below investment grade bonds (sometimes called "junk bonds") which are rated at the time of purchase Ba1 or lower by Moody's and BB+ or lower by S&P (if the bond has been rated by only one of those agencies, that rating will determine whether the bond is below investment grade; if the bond has not been rated by either of those agencies, the Sub-Advisor will determine whether the bond is of a quality comparable to those rated below investment grade). These securities offer a higher yield than other, higher rated securities, but they carry a greater degree of risk and are considered speculative with respect to the issuer's ability to pay interest and to repay principal. This portion of the Fund also invests in currency forwards and currency options to hedge currency risk.
A portion of the Fund's assets is invested primarily in preferred securities of U.S. and non-U.S. companies primarily rated BBB- or higher by S&P or Baa3 or higher by Moody's or, if unrated, of comparable quality in the opinion of the Sub-Advisor. This portion of the Fund focuses primarily on the financial services, real estate investment trust "(REIT"), and utility industries.
A portion of the Fund's assets is invested in a diversified portfolio of fixed income securities issued primarily by governments, their agencies, local authorities and instrumentalities, and corporate entities domiciled in or exercising the predominant part of their economic activities in emerging markets. This portion of the Fund also invests in interest rate swaps or Treasury futures to manage fixed income exposure; credit default swaps to increase or decrease in an
27
efficient manner exposures to certain sectors or individual issuers; total return swaps to increase or decrease in an efficient manner exposures to certain sectors; and currency forwards and currency options to hedge currency risk and express views on the direction of currency. Here, "emerging market country" means any country which is considered to be an emerging country by the international financial community (including the International Bank for Reconstruction and Development (also known as the World Bank) and MSCI Emerging Markets Index) and any country included in any J.P. Morgan Emerging Market Bond Index. These countries generally include every nation in the world except the U.S., Canada, Japan, Australia, and New Zealand, and most nations located in Western Europe.
A portion of the Fund's assets is invested in equity securities of global real estate companies. A real estate company has at least 50% of its assets, income or profits derived from products or services related to the real estate industry. Real estate companies include real estate investment trusts ("REITs"), REIT-like entities, and companies with substantial real estate holdings such as paper, lumber, hotel and entertainment companies as well as building supply manufacturers, mortgage lenders, and mortgage servicing companies.
A portion of the Fund’s assets is invested in commercial mortgage-backed securities, which are bonds that are secured by first mortgages on commercial real estate.
A portion of the Fund's assets is invested in MLPs and companies that are organized as corporations, limited liability companies or limited partnerships in the energy infrastructure sector. Energy infrastructure companies are engaged in the transportation, storage, processing, refining, marketing, exploration, production, or mining of any mineral or natural resource. This portion of the Fund invests primarily in the mid-stream energy infrastructure market, which is comprised mostly of the following: crude oil and refined products pipeline, storage, and terminal assets; natural gas gathering and transportation pipelines, processing, and storage facilities; propane distributors; energy commodity marine transportation (including liquefied natural gas transportation and processing); and other energy infrastructure assets. Most pipelines do not own the energy products they transport and, as a result, are not directly exposed to commodity price risk.
A portion of the Fund's assets is invested in a diversified portfolio of value equity securities of companies located or operating in the U.S. and foreign countries, including emerging markets. Investing in value equity securities, is an investment strategy that emphasizes buying equity securities that appear to be undervalued.
A portion of the Fund's assets is invested in publicly-listed infrastructure companies (domestic and foreign public utility, energy, and transportation companies). Publicly-listed infrastructure equity securities trade on an exchange and include companies involved to a significant extent in providing products, services or equipment for: transportation (including toll roads, airports, railways, and ports); the generation, transmission or distribution of electricity, gas or water (utilities); or telecommunications activities as well as in companies involved in the discovery, development, production, generation, transmission, refinement, measurement, trading, marketing or distribution of energy.
During the fiscal year ended October 31, 2014, the average ratings of the Fund’s fixed-income assets, based on market value at each month-end, were as follows (all ratings are by Moody’s):
0.71% in securities rated Aaa 19.02% in securities rated Baa 14.12% in securities rated Caa 0.21% in securities rated D1.11% in securities rated Aa 20.20% in securities rated Ba 0.13% in securities rated Ca 6.94% in securities not rated2.70% in securities rated A 34.86% in securities rated B 0.00% in securities rated C
Principal RisksThe value of your investment in the Fund changes with the value of the Fund's investments. Many factors affect that value, and it is possible to lose money by investing in the Fund. An investment in the Fund is not a deposit of a bank and is not insured or guaranteed by the Federal Deposit Insurance Corporation or any other government agency. The principal risks of investing in the Fund, in alphabetical order, are:
Asset Allocation Risk. A fund's selection and weighting of asset classes may cause it to underperform other funds with a similar investment objective.
Bank Loans Risk. Changes in economic conditions are likely to cause issuers of bank loans (also known as senior floating rate interests) to be unable to meet their obligations. In addition, the value of the collateral securing the loan may decline, causing a loan to be substantially unsecured. Underlying credit agreements governing the bank loans, reliance on market makers, priority of repayment and overall market volatility may harm the liquidity of loans.
28
Counterparty Risk. Counterparty risk is the risk that the counterparty to a derivatives contract or repurchase agreement, the borrower of a portfolio’s securities, or other obligation, will be unable or unwilling to make timely principal, interest, or settlement payments, or otherwise to honor its obligations.
Currency Risk. Risks of investing in securities denominated in, or that trade in, foreign (non-U.S.) currencies include changes in foreign exchange rates and foreign exchange restrictions.
Derivatives Risk. Transactions in derivatives may increase volatility, cause the liquidation of portfolio positions when not advantageous to do so and produce disproportionate losses.
Emerging Market Risk. Investments in emerging market countries may have more risk than those in developed market countries because the emerging markets are less developed and more illiquid. Emerging market countries can also be subject to increased social, economic, regulatory, and political uncertainties and can be extremely volatile.
Equity Index/Exchange-traded Fund (“ETF”) Call Option Risk. As the writer of an equity index/exchange-traded fund (“ETF”) call option, a fund forgoes, during the option’s life, the opportunity to profit from increases in the market value of the index on which the call option has been written above the sum of the premium and the strike price of the call, but has retained the risk of loss should the price of the underlying index decline (net of premiums received). In addition, a fund bears the risk that the index/ETF on which the call option has been written behaves differently than the underlying stocks in the portfolio which would limit the ability of the call option overwriting strategy to reduce portfolio volatility.
Equity Securities Risk. The value of equity securities could decline if the issuer's financial condition declines or in response to overall market and economic conditions. A fund's principal market segment(s), such as large cap, mid cap or small cap stocks, or growth or value stocks, may underperform other market segments or the equity markets as a whole. Investments in smaller companies and mid-size companies may involve greater risk and price volatility than investments in larger, more mature companies.
Fixed-Income Securities Risk. Fixed-income securities are subject to interest rate risk and credit quality risk. The market value of fixed-income securities generally declines when interest rates rise, and an issuer of fixed-income securities could default on its payment obligations.
Foreign Securities Risk. The risks of foreign securities include loss of value as a result of: political or economic instability; nationalization, expropriation or confiscatory taxation; settlement delays; and limited government regulation (including less stringent reporting, accounting, and disclosure standards than are required of U.S. companies).
High Yield Securities Risk. High yield fixed-income securities (commonly referred to as "junk bonds") are subject to greater credit quality risk than higher rated fixed-income securities and should be considered speculative.
Master Limited Partnership ("MLP") Risk. MLPs are publicly-traded limited partnership interests or units. An MLP that invests in a particular industry (e.g., oil and gas) will be harmed by detrimental economic events within that industry. As partnerships, MLPs may be subject to less regulation (and less protection for investors) under state laws than corporations. In addition, MLPs may be subject to state taxation in certain jurisdictions, which may reduce the amount of income an MLP pays to its investors.
Portfolio Duration Risk. Portfolio duration is a measure of the expected life of a fixed-income security and its sensitivity to changes in interest rates. The longer a fund's average portfolio duration, the more sensitive the fund will be to changes in interest rates.
Preferred Securities Risk. Preferred securities are securities with a lower priority claim on assets or earnings than bonds and other debt instruments in a company's capital structure, and therefore can be subject to greater credit and liquidation risk than more senior debt instruments. In addition, preferred securities are subject to other risks, such as limited or no voting rights, deferring or skipping distributions, interest rate risk, and redeeming the security prior to the stated maturity date.
Prepayment Risk. Unscheduled prepayments on mortgage-backed and asset-backed securities may have to be reinvested at lower rates. A reduction in prepayments may increase the effective maturities of these securities, exposing them to the risk of decline in market value over time (extension risk).
29
Real Estate Investment Trusts (“REITs”) Risk. A REIT could fail to qualify for tax-free pass-through of income under the Internal Revenue Code, and fund shareholders will indirectly bear their proportionate share of the expenses of REITs in which the fund invests.
Real Estate Securities Risk. Real estate securities are subject to the risks associated with direct ownership of real estate, including declines in value, adverse economic conditions, increases in expenses, regulatory changes and environmental problems. Investing in securities of companies in the real estate industry, subjects a fund to the special risks associated with the real estate market including factors such as loss to casualty or condemnation, changes in real estate values, property taxes, interest rates, cash flow of underlying real estate assets, occupancy rates, government regulations affecting zoning, land use and rents, and the management skill and creditworthiness of the issuer.
Risk of Being an Underlying Fund. A fund is subject to the risk of being an underlying fund to the extent that a fund of funds invests in the fund. An underlying fund of a fund of funds may experience relatively large redemptions or investments as the fund of funds periodically reallocates or rebalances its assets. These transactions may cause the underlying fund to sell portfolio securities to meet such redemptions, or to invest cash from such investments, at times it would not otherwise do so, and may as a result increase transaction costs and adversely affect underlying fund performance.
Value Stock Risk. The market may not recognize the intrinsic value of value stocks for a long time, or they may be appropriately priced at the time of purchase.
PerformanceThe following information provides some indication of the risks of investing in the Fund. Past performance (before and after taxes) is not necessarily an indication of how the Fund will perform in the future. You may get updated performance information by calling 1-800-222-5852 or online at:• For Classes A, C, and P - www.principalfunds.com.• For Institutional Class - www.principal.com.
The bar chart shows the investment returns of the Fund’s Class A shares for each full calendar year of operations for 10 years (or, if shorter, the life of the Fund). The table shows, for each class of shares of the Fund and for the last one, five, and ten calendar year periods (or, if shorter, the life of the Fund), how the Fund’s average annual total returns compare with those of one or more broad measures of market performance.
Life of Fund results are measured from the date the Fund's shares were first sold (December 15, 2008).
For periods prior to the inception date of Class P shares (September 27, 2010), performance shown in the table for Class P shares is based on the performance of the Fund's Institutional Class shares adjusted to reflect the fees and expenses of Class P shares. The adjustments result in performance for such periods that is no higher than the historical performance of the Institutional Class shares, which were first sold on December 15, 2008.
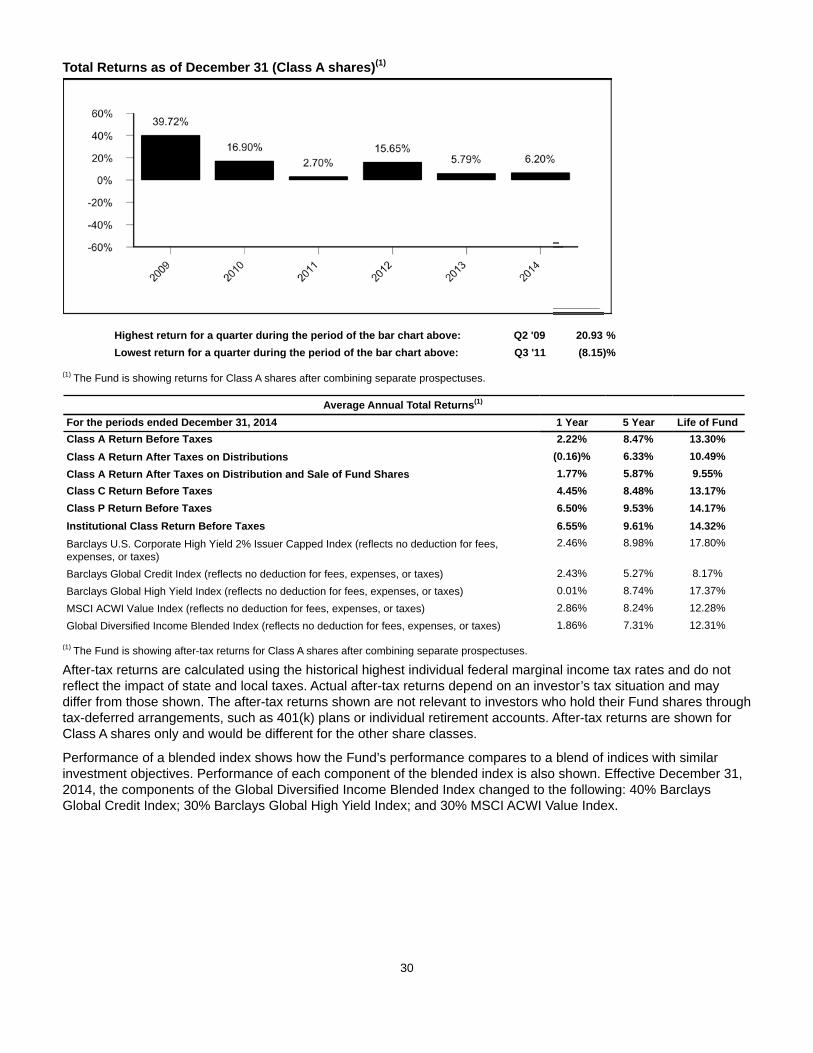
30
Total Returns as of December 31 (Class A shares)(1)
Highest return for a quarter during the period of the bar chart above: Q2 '09 20.93 %Lowest return for a quarter during the period of the bar chart above: Q3 '11 (8.15)%
(1) The Fund is showing returns for Class A shares after combining separate prospectuses.
Average Annual Total Returns(1)
For the periods ended December 31, 2014 1 Year 5 Year Life of FundClass A Return Before Taxes 2.22% 8.47% 13.30%Class A Return After Taxes on Distributions (0.16)% 6.33% 10.49%Class A Return After Taxes on Distribution and Sale of Fund Shares 1.77% 5.87% 9.55%Class C Return Before Taxes 4.45% 8.48% 13.17%Class P Return Before Taxes 6.50% 9.53% 14.17%Institutional Class Return Before Taxes 6.55% 9.61% 14.32%Barclays U.S. Corporate High Yield 2% Issuer Capped Index (reflects no deduction for fees,expenses, or taxes)
2.46% 8.98% 17.80%
Barclays Global Credit Index (reflects no deduction for fees, expenses, or taxes) 2.43% 5.27% 8.17%
Barclays Global High Yield Index (reflects no deduction for fees, expenses, or taxes) 0.01% 8.74% 17.37%
MSCI ACWI Value Index (reflects no deduction for fees, expenses, or taxes) 2.86% 8.24% 12.28%
Global Diversified Income Blended Index (reflects no deduction for fees, expenses, or taxes) 1.86% 7.31% 12.31%
(1) The Fund is showing after-tax returns for Class A shares after combining separate prospectuses.
After-tax returns are calculated using the historical highest individual federal marginal income tax rates and do not reflect the impact of state and local taxes. Actual after-tax returns depend on an investor’s tax situation and may differ from those shown. The after-tax returns shown are not relevant to investors who hold their Fund shares through tax-deferred arrangements, such as 401(k) plans or individual retirement accounts. After-tax returns are shown for Class A shares only and would be different for the other share classes.
Performance of a blended index shows how the Fund’s performance compares to a blend of indices with similar investment objectives. Performance of each component of the blended index is also shown. Effective December 31, 2014, the components of the Global Diversified Income Blended Index changed to the following: 40% Barclays Global Credit Index; 30% Barclays Global High Yield Index; and 30% MSCI ACWI Value Index.
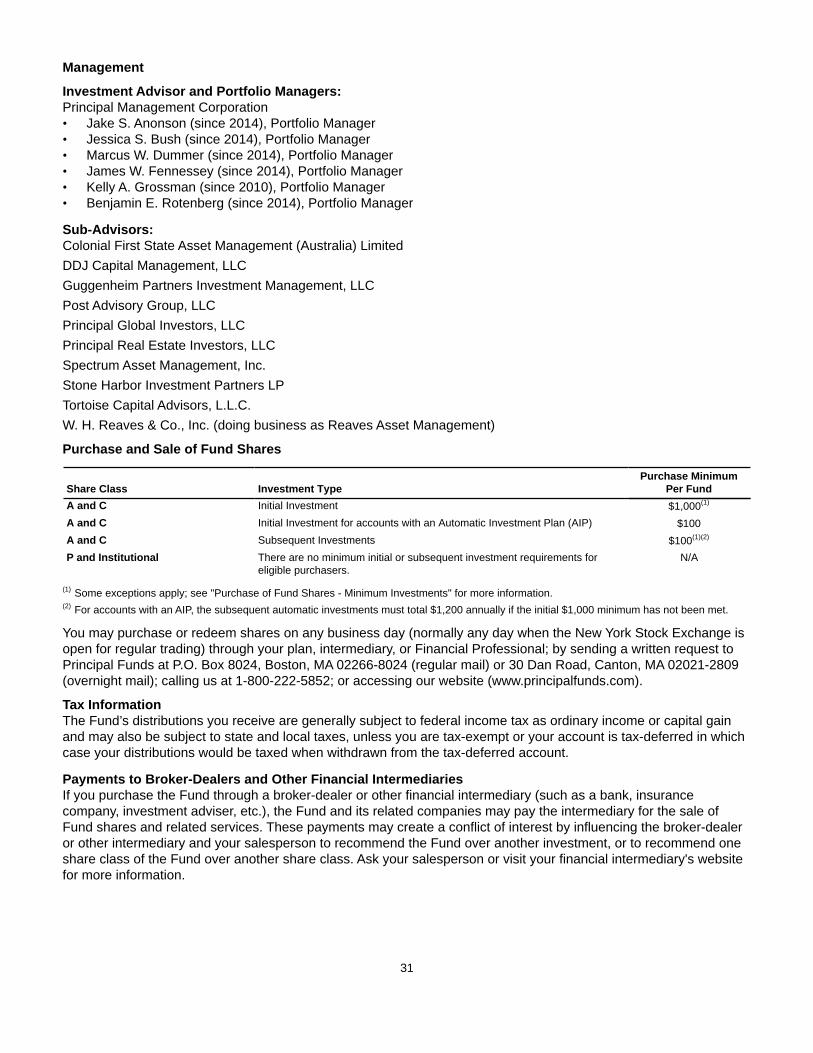
31
Management
Investment Advisor and Portfolio Managers:Principal Management Corporation• Jake S. Anonson (since 2014), Portfolio Manager• Jessica S. Bush (since 2014), Portfolio Manager• Marcus W. Dummer (since 2014), Portfolio Manager• James W. Fennessey (since 2014), Portfolio Manager• Kelly A. Grossman (since 2010), Portfolio Manager• Benjamin E. Rotenberg (since 2014), Portfolio Manager
Sub-Advisors: Colonial First State Asset Management (Australia) LimitedDDJ Capital Management, LLCGuggenheim Partners Investment Management, LLCPost Advisory Group, LLCPrincipal Global Investors, LLC Principal Real Estate Investors, LLCSpectrum Asset Management, Inc.Stone Harbor Investment Partners LPTortoise Capital Advisors, L.L.C.W. H. Reaves & Co., Inc. (doing business as Reaves Asset Management)
Purchase and Sale of Fund Shares
Share Class Investment TypePurchase Minimum
Per FundA and C Initial Investment $1,000(1)
A and C Initial Investment for accounts with an Automatic Investment Plan (AIP) $100A and C Subsequent Investments $100(1)(2)
P and Institutional There are no minimum initial or subsequent investment requirements foreligible purchasers.
N/A
(1) Some exceptions apply; see "Purchase of Fund Shares - Minimum Investments" for more information.(2) For accounts with an AIP, the subsequent automatic investments must total $1,200 annually if the initial $1,000 minimum has not been met.
You may purchase or redeem shares on any business day (normally any day when the New York Stock Exchange is open for regular trading) through your plan, intermediary, or Financial Professional; by sending a written request to Principal Funds at P.O. Box 8024, Boston, MA 02266-8024 (regular mail) or 30 Dan Road, Canton, MA 02021-2809 (overnight mail); calling us at 1-800-222-5852; or accessing our website (www.principalfunds.com).
Tax InformationThe Fund’s distributions you receive are generally subject to federal income tax as ordinary income or capital gain and may also be subject to state and local taxes, unless you are tax-exempt or your account is tax-deferred in which case your distributions would be taxed when withdrawn from the tax-deferred account.
Payments to Broker-Dealers and Other Financial IntermediariesIf you purchase the Fund through a broker-dealer or other financial intermediary (such as a bank, insurance company, investment adviser, etc.), the Fund and its related companies may pay the intermediary for the sale of Fund shares and related services. These payments may create a conflict of interest by influencing the broker-dealer or other intermediary and your salesperson to recommend the Fund over another investment, or to recommend one share class of the Fund over another share class. Ask your salesperson or visit your financial intermediary's website for more information.
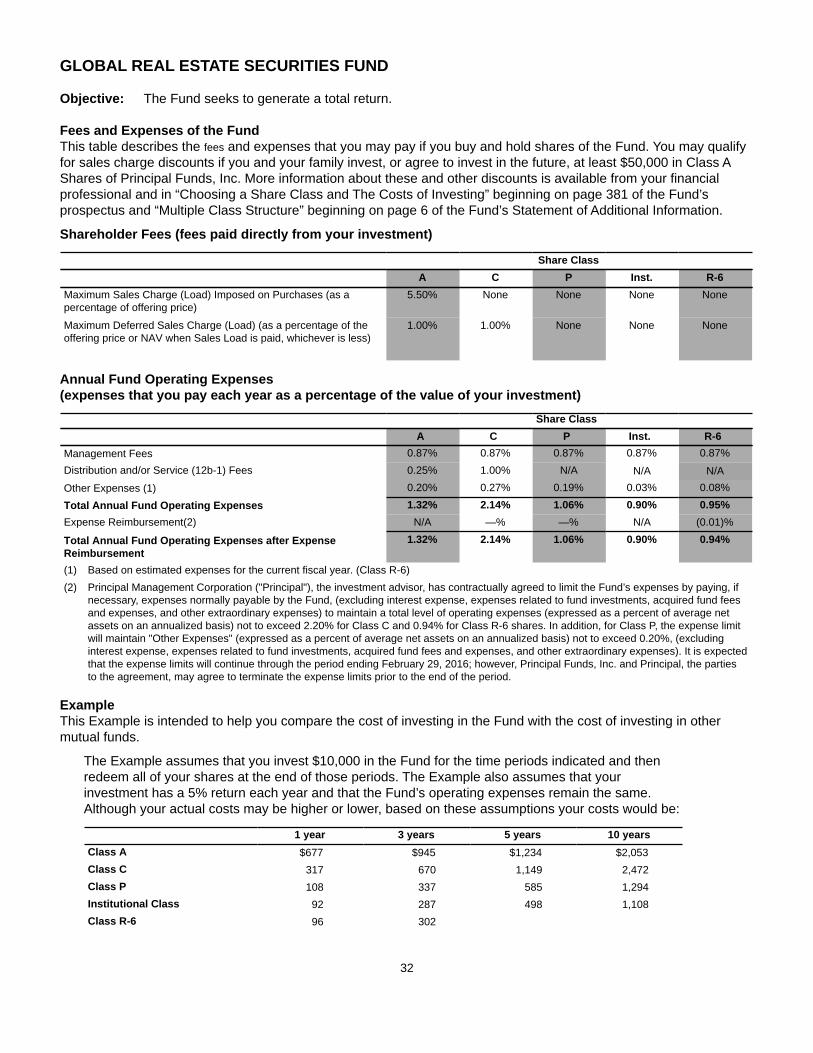
32
GLOBAL REAL ESTATE SECURITIES FUND
Objective: The Fund seeks to generate a total return.
Fees and Expenses of the FundThis table describes the fees and expenses that you may pay if you buy and hold shares of the Fund. You may qualify for sales charge discounts if you and your family invest, or agree to invest in the future, at least $50,000 in Class A Shares of Principal Funds, Inc. More information about these and other discounts is available from your financial professional and in “Choosing a Share Class and The Costs of Investing” beginning on page 381 of the Fund’s prospectus and “Multiple Class Structure” beginning on page 6 of the Fund’s Statement of Additional Information.
Shareholder Fees (fees paid directly from your investment)
Share ClassA C P Inst. R-6
Maximum Sales Charge (Load) Imposed on Purchases (as apercentage of offering price)
5.50% None None None None
Maximum Deferred Sales Charge (Load) (as a percentage of theoffering price or NAV when Sales Load is paid, whichever is less)
1.00% 1.00% None None None
Annual Fund Operating Expenses (expenses that you pay each year as a percentage of the value of your investment)
Share ClassA C P Inst. R-6
Management Fees 0.87% 0.87% 0.87% 0.87% 0.87%Distribution and/or Service (12b-1) Fees 0.25% 1.00% N/A N/A N/AOther Expenses (1) 0.20% 0.27% 0.19% 0.03% 0.08%
Total Annual Fund Operating Expenses 1.32% 2.14% 1.06% 0.90% 0.95%Expense Reimbursement(2) N/A —% —% N/A (0.01)%
Total Annual Fund Operating Expenses after ExpenseReimbursement
1.32% 2.14% 1.06% 0.90% 0.94%
(1) Based on estimated expenses for the current fiscal year. (Class R-6)(2) Principal Management Corporation ("Principal"), the investment advisor, has contractually agreed to limit the Fund’s expenses by paying, if
necessary, expenses normally payable by the Fund, (excluding interest expense, expenses related to fund investments, acquired fund fees and expenses, and other extraordinary expenses) to maintain a total level of operating expenses (expressed as a percent of average net assets on an annualized basis) not to exceed 2.20% for Class C and 0.94% for Class R-6 shares. In addition, for Class P, the expense limit will maintain "Other Expenses" (expressed as a percent of average net assets on an annualized basis) not to exceed 0.20%, (excluding interest expense, expenses related to fund investments, acquired fund fees and expenses, and other extraordinary expenses). It is expected that the expense limits will continue through the period ending February 29, 2016; however, Principal Funds, Inc. and Principal, the parties to the agreement, may agree to terminate the expense limits prior to the end of the period.
ExampleThis Example is intended to help you compare the cost of investing in the Fund with the cost of investing in other mutual funds.
The Example assumes that you invest $10,000 in the Fund for the time periods indicated and then redeem all of your shares at the end of those periods. The Example also assumes that your investment has a 5% return each year and that the Fund’s operating expenses remain the same. Although your actual costs may be higher or lower, based on these assumptions your costs would be:
1 year 3 years 5 years 10 yearsClass A $677 $945 $1,234 $2,053Class C 317 670 1,149 2,472Class P 108 337 585 1,294Institutional Class 92 287 498 1,108Class R-6 96 302
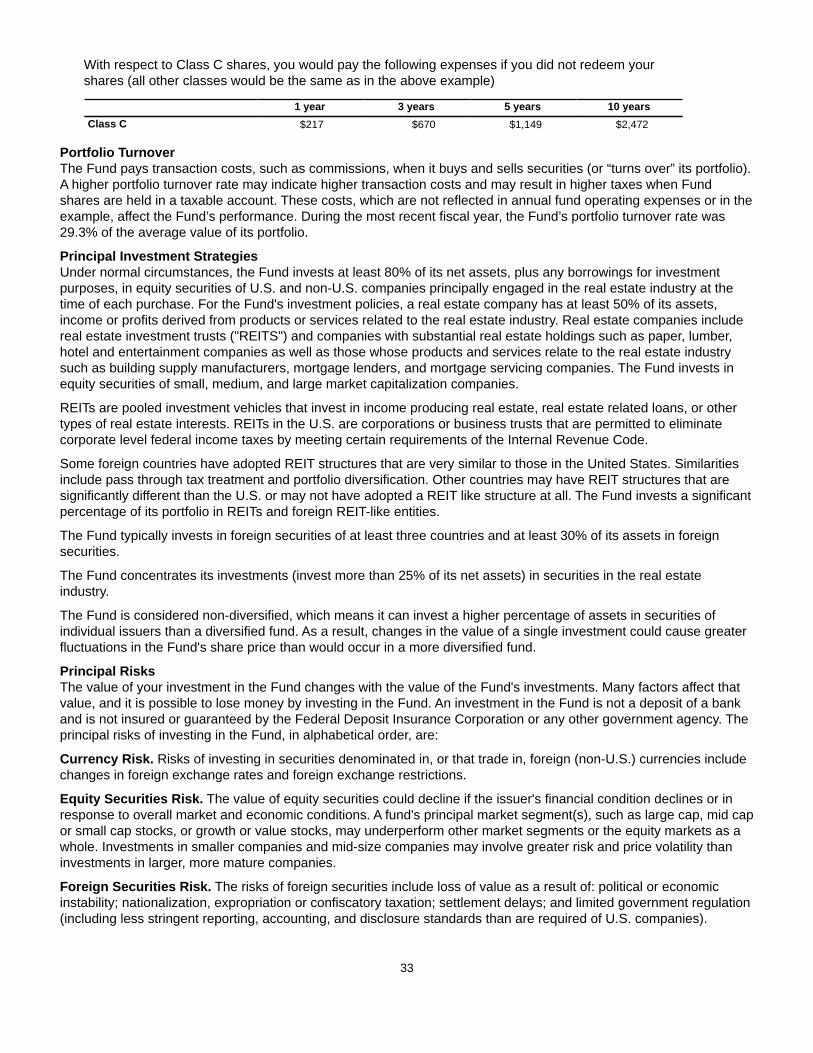
33
With respect to Class C shares, you would pay the following expenses if you did not redeem your shares (all other classes would be the same as in the above example)
1 year 3 years 5 years 10 yearsClass C $217 $670 $1,149 $2,472
Portfolio TurnoverThe Fund pays transaction costs, such as commissions, when it buys and sells securities (or “turns over” its portfolio). A higher portfolio turnover rate may indicate higher transaction costs and may result in higher taxes when Fund shares are held in a taxable account. These costs, which are not reflected in annual fund operating expenses or in the example, affect the Fund’s performance. During the most recent fiscal year, the Fund’s portfolio turnover rate was 29.3% of the average value of its portfolio.
Principal Investment StrategiesUnder normal circumstances, the Fund invests at least 80% of its net assets, plus any borrowings for investment purposes, in equity securities of U.S. and non-U.S. companies principally engaged in the real estate industry at the time of each purchase. For the Fund's investment policies, a real estate company has at least 50% of its assets, income or profits derived from products or services related to the real estate industry. Real estate companies include real estate investment trusts ("REITS") and companies with substantial real estate holdings such as paper, lumber, hotel and entertainment companies as well as those whose products and services relate to the real estate industry such as building supply manufacturers, mortgage lenders, and mortgage servicing companies. The Fund invests in equity securities of small, medium, and large market capitalization companies.
REITs are pooled investment vehicles that invest in income producing real estate, real estate related loans, or other types of real estate interests. REITs in the U.S. are corporations or business trusts that are permitted to eliminate corporate level federal income taxes by meeting certain requirements of the Internal Revenue Code.
Some foreign countries have adopted REIT structures that are very similar to those in the United States. Similarities include pass through tax treatment and portfolio diversification. Other countries may have REIT structures that are significantly different than the U.S. or may not have adopted a REIT like structure at all. The Fund invests a significant percentage of its portfolio in REITs and foreign REIT-like entities.
The Fund typically invests in foreign securities of at least three countries and at least 30% of its assets in foreign securities.
The Fund concentrates its investments (invest more than 25% of its net assets) in securities in the real estate industry.
The Fund is considered non-diversified, which means it can invest a higher percentage of assets in securities of individual issuers than a diversified fund. As a result, changes in the value of a single investment could cause greater fluctuations in the Fund's share price than would occur in a more diversified fund.
Principal RisksThe value of your investment in the Fund changes with the value of the Fund's investments. Many factors affect that value, and it is possible to lose money by investing in the Fund. An investment in the Fund is not a deposit of a bank and is not insured or guaranteed by the Federal Deposit Insurance Corporation or any other government agency. The principal risks of investing in the Fund, in alphabetical order, are:
Currency Risk. Risks of investing in securities denominated in, or that trade in, foreign (non-U.S.) currencies include changes in foreign exchange rates and foreign exchange restrictions.
Equity Securities Risk. The value of equity securities could decline if the issuer's financial condition declines or in response to overall market and economic conditions. A fund's principal market segment(s), such as large cap, mid cap or small cap stocks, or growth or value stocks, may underperform other market segments or the equity markets as a whole. Investments in smaller companies and mid-size companies may involve greater risk and price volatility than investments in larger, more mature companies.
Foreign Securities Risk. The risks of foreign securities include loss of value as a result of: political or economic instability; nationalization, expropriation or confiscatory taxation; settlement delays; and limited government regulation (including less stringent reporting, accounting, and disclosure standards than are required of U.S. companies).
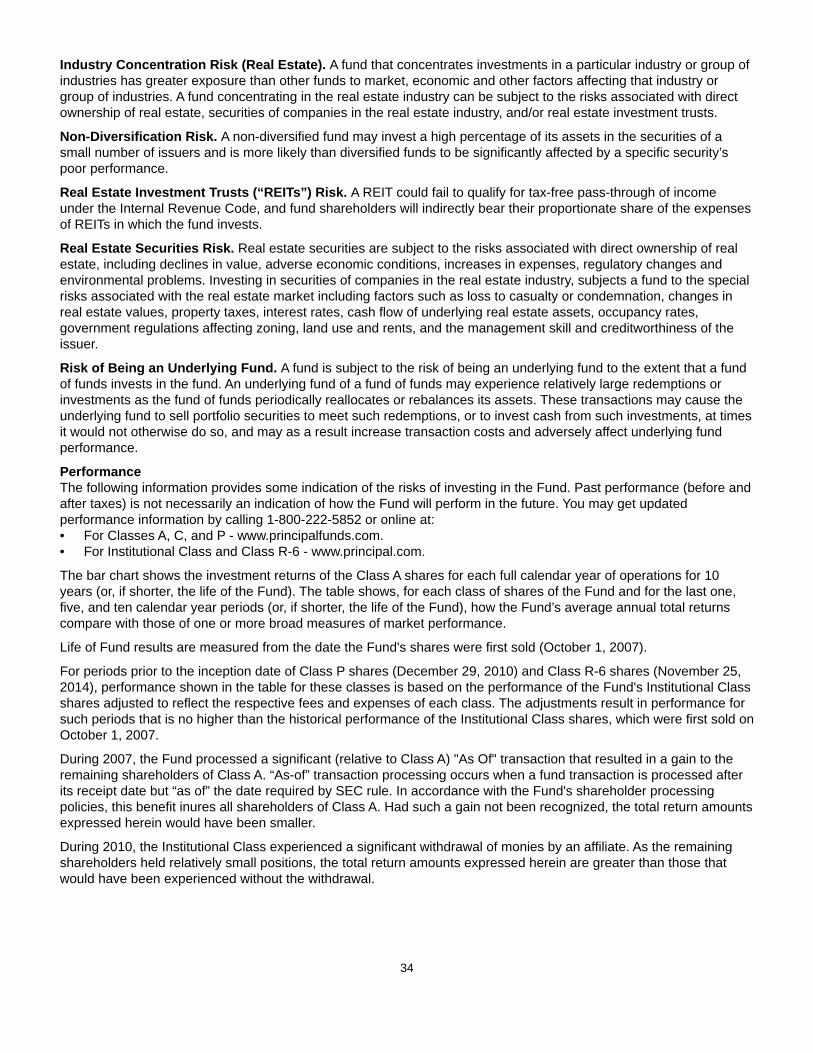
34
Industry Concentration Risk (Real Estate). A fund that concentrates investments in a particular industry or group of industries has greater exposure than other funds to market, economic and other factors affecting that industry or group of industries. A fund concentrating in the real estate industry can be subject to the risks associated with direct ownership of real estate, securities of companies in the real estate industry, and/or real estate investment trusts.
Non-Diversification Risk. A non-diversified fund may invest a high percentage of its assets in the securities of a small number of issuers and is more likely than diversified funds to be significantly affected by a specific security’s poor performance.
Real Estate Investment Trusts (“REITs”) Risk. A REIT could fail to qualify for tax-free pass-through of income under the Internal Revenue Code, and fund shareholders will indirectly bear their proportionate share of the expenses of REITs in which the fund invests.
Real Estate Securities Risk. Real estate securities are subject to the risks associated with direct ownership of real estate, including declines in value, adverse economic conditions, increases in expenses, regulatory changes and environmental problems. Investing in securities of companies in the real estate industry, subjects a fund to the special risks associated with the real estate market including factors such as loss to casualty or condemnation, changes in real estate values, property taxes, interest rates, cash flow of underlying real estate assets, occupancy rates, government regulations affecting zoning, land use and rents, and the management skill and creditworthiness of the issuer.
Risk of Being an Underlying Fund. A fund is subject to the risk of being an underlying fund to the extent that a fund of funds invests in the fund. An underlying fund of a fund of funds may experience relatively large redemptions or investments as the fund of funds periodically reallocates or rebalances its assets. These transactions may cause the underlying fund to sell portfolio securities to meet such redemptions, or to invest cash from such investments, at times it would not otherwise do so, and may as a result increase transaction costs and adversely affect underlying fund performance.
PerformanceThe following information provides some indication of the risks of investing in the Fund. Past performance (before and after taxes) is not necessarily an indication of how the Fund will perform in the future. You may get updated performance information by calling 1-800-222-5852 or online at:• For Classes A, C, and P - www.principalfunds.com.• For Institutional Class and Class R-6 - www.principal.com.
The bar chart shows the investment returns of the Class A shares for each full calendar year of operations for 10 years (or, if shorter, the life of the Fund). The table shows, for each class of shares of the Fund and for the last one, five, and ten calendar year periods (or, if shorter, the life of the Fund), how the Fund’s average annual total returns compare with those of one or more broad measures of market performance.
Life of Fund results are measured from the date the Fund's shares were first sold (October 1, 2007).
For periods prior to the inception date of Class P shares (December 29, 2010) and Class R-6 shares (November 25, 2014), performance shown in the table for these classes is based on the performance of the Fund's Institutional Class shares adjusted to reflect the respective fees and expenses of each class. The adjustments result in performance for such periods that is no higher than the historical performance of the Institutional Class shares, which were first sold on October 1, 2007.
During 2007, the Fund processed a significant (relative to Class A) "As Of" transaction that resulted in a gain to the remaining shareholders of Class A. “As-of” transaction processing occurs when a fund transaction is processed after its receipt date but “as of” the date required by SEC rule. In accordance with the Fund's shareholder processing policies, this benefit inures all shareholders of Class A. Had such a gain not been recognized, the total return amounts expressed herein would have been smaller.
During 2010, the Institutional Class experienced a significant withdrawal of monies by an affiliate. As the remaining shareholders held relatively small positions, the total return amounts expressed herein are greater than those that would have been experienced without the withdrawal.

35
Total Returns as of December 31 (Class A shares)(1)
Highest return for a quarter during the period of the bar chart above: Q2 '09 30.77 %Lowest return for a quarter during the period of the bar chart above: Q4 '08 (29.65)%
(1) The Fund is showing returns for Class A shares after combining separate prospectuses.
Average Annual Total Returns(1)
For the periods ended December 31, 2014 1 Year 5 Years Life of FundClass A Return Before Taxes 9.36% 11.36% 1.57% (2)
Class A Return After Taxes on Distributions 8.13% 9.63% 0.12%(2)
Class A Return After Taxes on Distribution and Sale of Fund Shares 5.46% 8.29% 0.59%(2)
Class C Return Before Taxes 13.94% 11.82% 1.48%Class P Return Before Taxes 16.13% 13.98%
(3)3.19%
(3)
Institutional Class Return Before Taxes 16.27% 14.16%(3)
3.37%(3)
Class R-6 Return Before Taxes 16.23% 14.14%(3)
3.34%(3)
FTSE EPRA/NAREIT Developed Index NR (reflects no deduction for fees, expenses or taxes) 15.02% 11.25% 1.05%FTSE EPRA/NAREIT Developed Index (reflects no deduction for fees, expenses, or taxes) 15.89% 12.03% 1.79%(1) The Fund is showing after-tax returns for Class A shares after combining separate prospectuses.(2) During 2007, the Fund processed a significant (relative to Class A) "As Of" transaction that resulted in a gain to the remaining shareholders of
Class A. “As-of” transaction processing occurs when a fund transaction is processed after its receipt date but “as of” the date required by SEC rule. In accordance with the Fund's shareholder processing policies, this benefit inures all shareholders of Class A. Had such a gain not been recognized, the total return amounts expressed herein would have been smaller.
(3) During 2010, the Institutional Class experienced a significant withdrawal of monies by an affiliate. As the remaining shareholders held relatively small positions, the total return amounts expressed herein are greater than those that would have been experienced without the withdrawal.
After-tax returns are calculated using the historical highest individual federal marginal income tax rates and do not reflect the impact of state and local taxes. Actual after-tax returns depend on an investor’s tax situation and may differ from those shown. The after-tax returns shown are not relevant to investors who hold their Fund shares through tax-deferred arrangements, such as 401(k) plans or individual retirement accounts. After-tax returns are shown for Class A shares only and would be different for the other share classes.
Effective December 31, 2014, the Fund’s primary benchmark changed from the FTSE EPRA/NAREIT Developed Index to the FTSE EPRA NAREIT Developed Index NR because the FTSE EPRA NAREIT Developed Index NR is net of tax and therefore more appropriate for investors in a taxable mutual fund.
Management
Investment Advisor:Principal Management Corporation
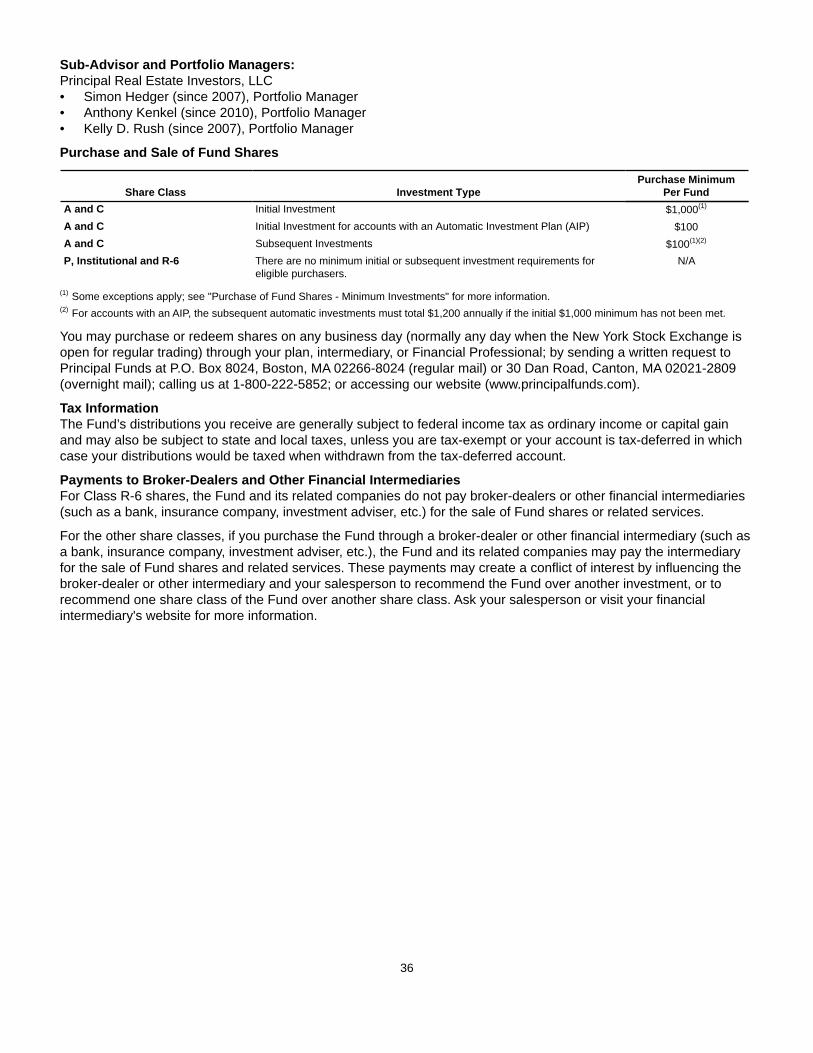
36
Sub-Advisor and Portfolio Managers:Principal Real Estate Investors, LLC• Simon Hedger (since 2007), Portfolio Manager• Anthony Kenkel (since 2010), Portfolio Manager• Kelly D. Rush (since 2007), Portfolio Manager
Purchase and Sale of Fund Shares
Share Class Investment TypePurchase Minimum
Per FundA and C Initial Investment $1,000(1)
A and C Initial Investment for accounts with an Automatic Investment Plan (AIP) $100A and C Subsequent Investments $100(1)(2)
P, Institutional and R-6 There are no minimum initial or subsequent investment requirements foreligible purchasers.
N/A
(1) Some exceptions apply; see "Purchase of Fund Shares - Minimum Investments" for more information.(2) For accounts with an AIP, the subsequent automatic investments must total $1,200 annually if the initial $1,000 minimum has not been met.
You may purchase or redeem shares on any business day (normally any day when the New York Stock Exchange is open for regular trading) through your plan, intermediary, or Financial Professional; by sending a written request to Principal Funds at P.O. Box 8024, Boston, MA 02266-8024 (regular mail) or 30 Dan Road, Canton, MA 02021-2809 (overnight mail); calling us at 1-800-222-5852; or accessing our website (www.principalfunds.com).
Tax InformationThe Fund’s distributions you receive are generally subject to federal income tax as ordinary income or capital gain and may also be subject to state and local taxes, unless you are tax-exempt or your account is tax-deferred in which case your distributions would be taxed when withdrawn from the tax-deferred account.
Payments to Broker-Dealers and Other Financial IntermediariesFor Class R-6 shares, the Fund and its related companies do not pay broker-dealers or other financial intermediaries (such as a bank, insurance company, investment adviser, etc.) for the sale of Fund shares or related services.
For the other share classes, if you purchase the Fund through a broker-dealer or other financial intermediary (such as a bank, insurance company, investment adviser, etc.), the Fund and its related companies may pay the intermediary for the sale of Fund shares and related services. These payments may create a conflict of interest by influencing the broker-dealer or other intermediary and your salesperson to recommend the Fund over another investment, or to recommend one share class of the Fund over another share class. Ask your salesperson or visit your financial intermediary's website for more information.
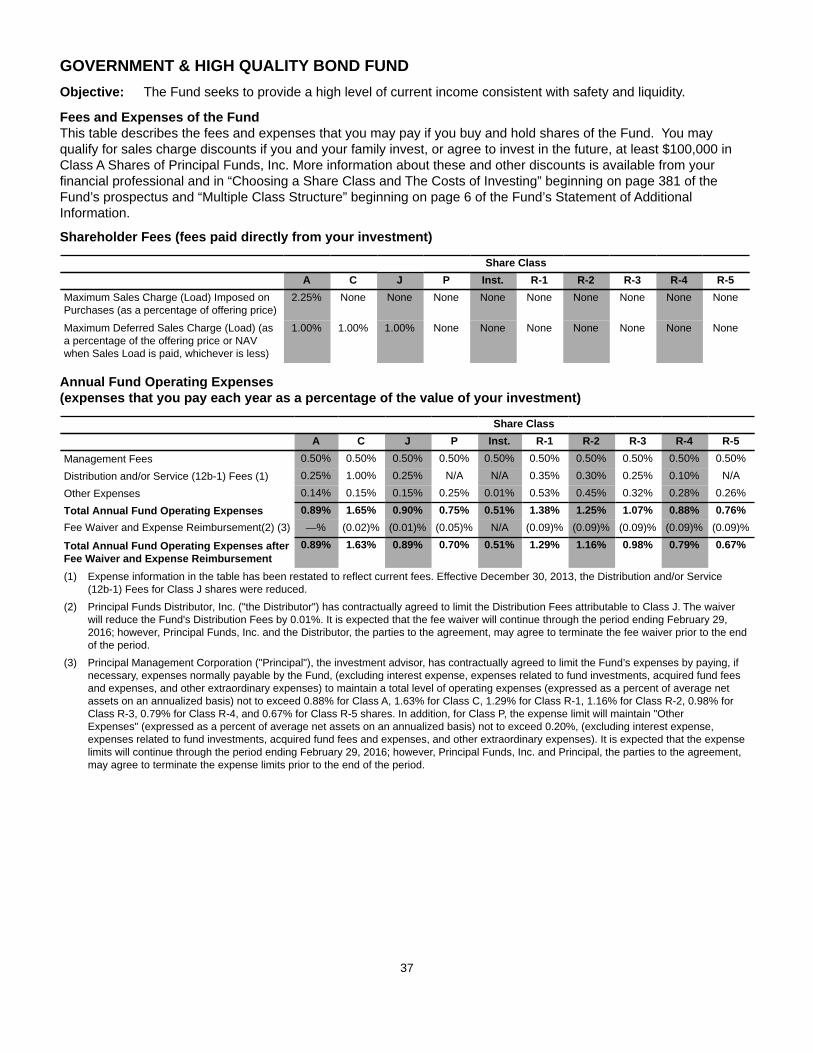
37
GOVERNMENT & HIGH QUALITY BOND FUNDObjective: The Fund seeks to provide a high level of current income consistent with safety and liquidity.
Fees and Expenses of the FundThis table describes the fees and expenses that you may pay if you buy and hold shares of the Fund. You may qualify for sales charge discounts if you and your family invest, or agree to invest in the future, at least $100,000 in Class A Shares of Principal Funds, Inc. More information about these and other discounts is available from your financial professional and in “Choosing a Share Class and The Costs of Investing” beginning on page 381 of the Fund’s prospectus and “Multiple Class Structure” beginning on page 6 of the Fund’s Statement of Additional Information.
Shareholder Fees (fees paid directly from your investment)
Share ClassA C J P Inst. R-1 R-2 R-3 R-4 R-5
Maximum Sales Charge (Load) Imposed onPurchases (as a percentage of offering price)
2.25% None None None None None None None None None
Maximum Deferred Sales Charge (Load) (asa percentage of the offering price or NAVwhen Sales Load is paid, whichever is less)
1.00% 1.00% 1.00% None None None None None None None
Annual Fund Operating Expenses (expenses that you pay each year as a percentage of the value of your investment)
Share ClassA C J P Inst. R-1 R-2 R-3 R-4 R-5
Management Fees 0.50% 0.50% 0.50% 0.50% 0.50% 0.50% 0.50% 0.50% 0.50% 0.50%
Distribution and/or Service (12b-1) Fees (1) 0.25% 1.00% 0.25% N/A N/A 0.35% 0.30% 0.25% 0.10% N/A
Other Expenses 0.14% 0.15% 0.15% 0.25% 0.01% 0.53% 0.45% 0.32% 0.28% 0.26%
Total Annual Fund Operating Expenses 0.89% 1.65% 0.90% 0.75% 0.51% 1.38% 1.25% 1.07% 0.88% 0.76%Fee Waiver and Expense Reimbursement(2) (3) —% (0.02)% (0.01)% (0.05)% N/A (0.09)% (0.09)% (0.09)% (0.09)% (0.09)%
Total Annual Fund Operating Expenses afterFee Waiver and Expense Reimbursement
0.89% 1.63% 0.89% 0.70% 0.51% 1.29% 1.16% 0.98% 0.79% 0.67%
(1) Expense information in the table has been restated to reflect current fees. Effective December 30, 2013, the Distribution and/or Service (12b-1) Fees for Class J shares were reduced.
(2) Principal Funds Distributor, Inc. ("the Distributor") has contractually agreed to limit the Distribution Fees attributable to Class J. The waiver will reduce the Fund's Distribution Fees by 0.01%. It is expected that the fee waiver will continue through the period ending February 29, 2016; however, Principal Funds, Inc. and the Distributor, the parties to the agreement, may agree to terminate the fee waiver prior to the end of the period.
(3) Principal Management Corporation ("Principal"), the investment advisor, has contractually agreed to limit the Fund’s expenses by paying, if necessary, expenses normally payable by the Fund, (excluding interest expense, expenses related to fund investments, acquired fund fees and expenses, and other extraordinary expenses) to maintain a total level of operating expenses (expressed as a percent of average net assets on an annualized basis) not to exceed 0.88% for Class A, 1.63% for Class C, 1.29% for Class R-1, 1.16% for Class R-2, 0.98% for Class R-3, 0.79% for Class R-4, and 0.67% for Class R-5 shares. In addition, for Class P, the expense limit will maintain "Other Expenses" (expressed as a percent of average net assets on an annualized basis) not to exceed 0.20%, (excluding interest expense, expenses related to fund investments, acquired fund fees and expenses, and other extraordinary expenses). It is expected that the expense limits will continue through the period ending February 29, 2016; however, Principal Funds, Inc. and Principal, the parties to the agreement, may agree to terminate the expense limits prior to the end of the period.
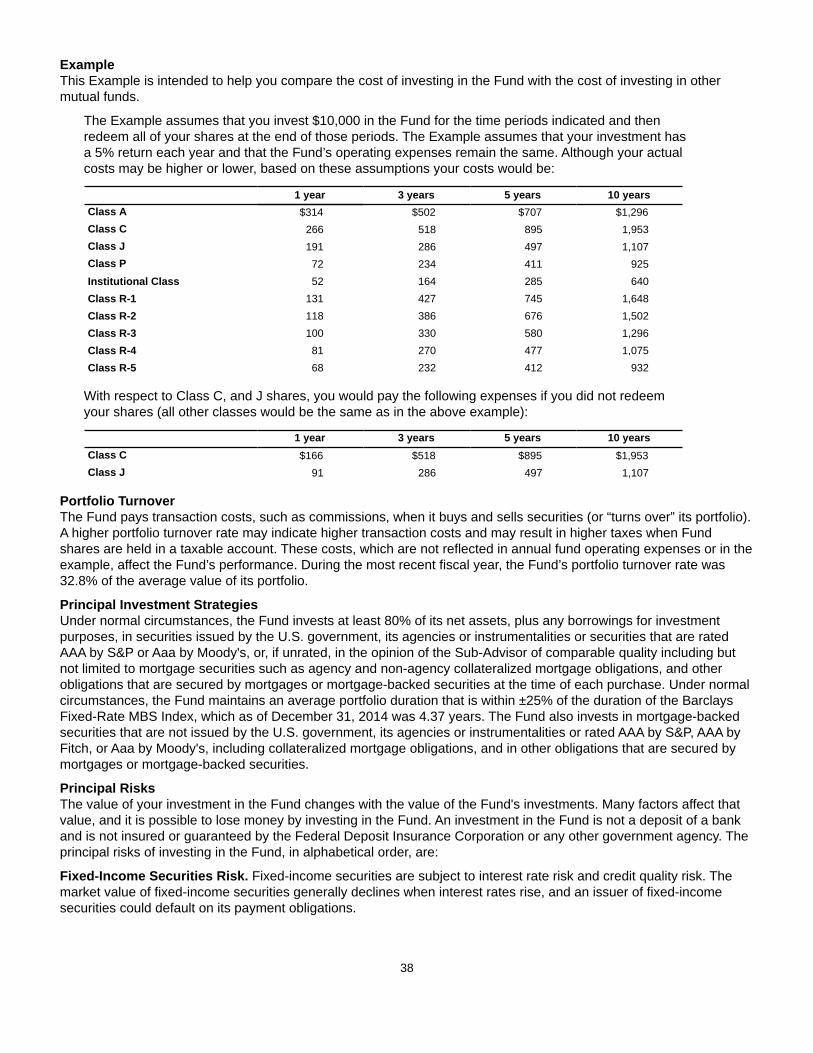
38
ExampleThis Example is intended to help you compare the cost of investing in the Fund with the cost of investing in other mutual funds.
The Example assumes that you invest $10,000 in the Fund for the time periods indicated and then redeem all of your shares at the end of those periods. The Example assumes that your investment has a 5% return each year and that the Fund’s operating expenses remain the same. Although your actual costs may be higher or lower, based on these assumptions your costs would be:
1 year 3 years 5 years 10 yearsClass A $314 $502 $707 $1,296Class C 266 518 895 1,953Class J 191 286 497 1,107Class P 72 234 411 925Institutional Class 52 164 285 640Class R-1 131 427 745 1,648Class R-2 118 386 676 1,502Class R-3 100 330 580 1,296Class R-4 81 270 477 1,075Class R-5 68 232 412 932
With respect to Class C, and J shares, you would pay the following expenses if you did not redeem your shares (all other classes would be the same as in the above example):
1 year 3 years 5 years 10 yearsClass C $166 $518 $895 $1,953Class J 91 286 497 1,107
Portfolio TurnoverThe Fund pays transaction costs, such as commissions, when it buys and sells securities (or “turns over” its portfolio). A higher portfolio turnover rate may indicate higher transaction costs and may result in higher taxes when Fund shares are held in a taxable account. These costs, which are not reflected in annual fund operating expenses or in the example, affect the Fund’s performance. During the most recent fiscal year, the Fund’s portfolio turnover rate was 32.8% of the average value of its portfolio.
Principal Investment StrategiesUnder normal circumstances, the Fund invests at least 80% of its net assets, plus any borrowings for investment purposes, in securities issued by the U.S. government, its agencies or instrumentalities or securities that are rated AAA by S&P or Aaa by Moody's, or, if unrated, in the opinion of the Sub-Advisor of comparable quality including but not limited to mortgage securities such as agency and non-agency collateralized mortgage obligations, and other obligations that are secured by mortgages or mortgage-backed securities at the time of each purchase. Under normal circumstances, the Fund maintains an average portfolio duration that is within ±25% of the duration of the Barclays Fixed-Rate MBS Index, which as of December 31, 2014 was 4.37 years. The Fund also invests in mortgage-backed securities that are not issued by the U.S. government, its agencies or instrumentalities or rated AAA by S&P, AAA by Fitch, or Aaa by Moody's, including collateralized mortgage obligations, and in other obligations that are secured by mortgages or mortgage-backed securities.
Principal RisksThe value of your investment in the Fund changes with the value of the Fund's investments. Many factors affect that value, and it is possible to lose money by investing in the Fund. An investment in the Fund is not a deposit of a bank and is not insured or guaranteed by the Federal Deposit Insurance Corporation or any other government agency. The principal risks of investing in the Fund, in alphabetical order, are:
Fixed-Income Securities Risk. Fixed-income securities are subject to interest rate risk and credit quality risk. The market value of fixed-income securities generally declines when interest rates rise, and an issuer of fixed-income securities could default on its payment obligations.
39
Portfolio Duration Risk. Portfolio duration is a measure of the expected life of a fixed-income security and its sensitivity to changes in interest rates. The longer a fund's average portfolio duration, the more sensitive the fund will be to changes in interest rates.
Prepayment Risk. Unscheduled prepayments on mortgage-backed and asset-backed securities may have to be reinvested at lower rates. A reduction in prepayments may increase the effective maturities of these securities, exposing them to the risk of decline in market value over time (extension risk).
Real Estate Securities Risk. Real estate securities are subject to the risks associated with direct ownership of real estate, including declines in value, adverse economic conditions, increases in expenses, regulatory changes and environmental problems. Investing in securities of companies in the real estate industry, subjects a fund to the special risks associated with the real estate market including factors such as loss to casualty or condemnation, changes in real estate values, property taxes, interest rates, cash flow of underlying real estate assets, occupancy rates, government regulations affecting zoning, land use and rents, and the management skill and creditworthiness of the issuer.
Risk of Being an Underlying Fund. A fund is subject to the risk of being an underlying fund to the extent that a fund of funds invests in the fund. An underlying fund of a fund of funds may experience relatively large redemptions or investments as the fund of funds periodically reallocates or rebalances its assets. These transactions may cause the underlying fund to sell portfolio securities to meet such redemptions, or to invest cash from such investments, at times it would not otherwise do so, and may as a result increase transaction costs and adversely affect underlying fund performance.
U.S. Government Securities Risk. Yields available from U.S. government securities are generally lower than yields from many other fixed-income securities.
U.S. Government Sponsored Securities Risk. Securities issued by U.S. government-sponsored or -chartered enterprises such as the Federal Home Loan Mortgage Corporation, the Federal National Mortgage Association, and the Federal Home Loan Banks are not issued or guaranteed by the U.S. Treasury.
PerformanceThe following information provides some indication of the risks of investing in the Fund. Past performance (before and after taxes) is not necessarily an indication of how the Fund will perform in the future. You may get updated performance information by calling 1-800-222-5852 or online at:• For Classes A, C, J, and P - www.principalfunds.com.• For Classes Institutional, R-1, R-2, R-3, R-4, and R-5 - www.principal.com.
The bar chart shows the investment returns of the Fund’s Class A shares for each full calendar year of operations for 10 years (or, if shorter, the life of the Fund). The table shows, for each share class of the Fund and for the last one, five, and ten calendar year periods (or, if shorter, the life of the Fund), how the Fund’s average annual total returns compare with those of one or more broad measures of market performance.
The Fund commenced operations after succeeding to the operations of another fund on January 12, 2007. Performance for periods prior to that date is based on the performance of the predecessor fund.
For periods prior to the inception date of Classes J, R-1, R-2, R-3, R-4, and R-5 shares (December 15, 2008) and Class P shares (September 27, 2010), performance shown in the table for these classes is based on the performance of the Fund's Class A shares adjusted to reflect the respective fees and expenses of each class. The adjustments result in performance for such periods that is no higher than the historical performance of Class A shares. The predecessor fund's Class A shares commenced operations on May 4, 1984.
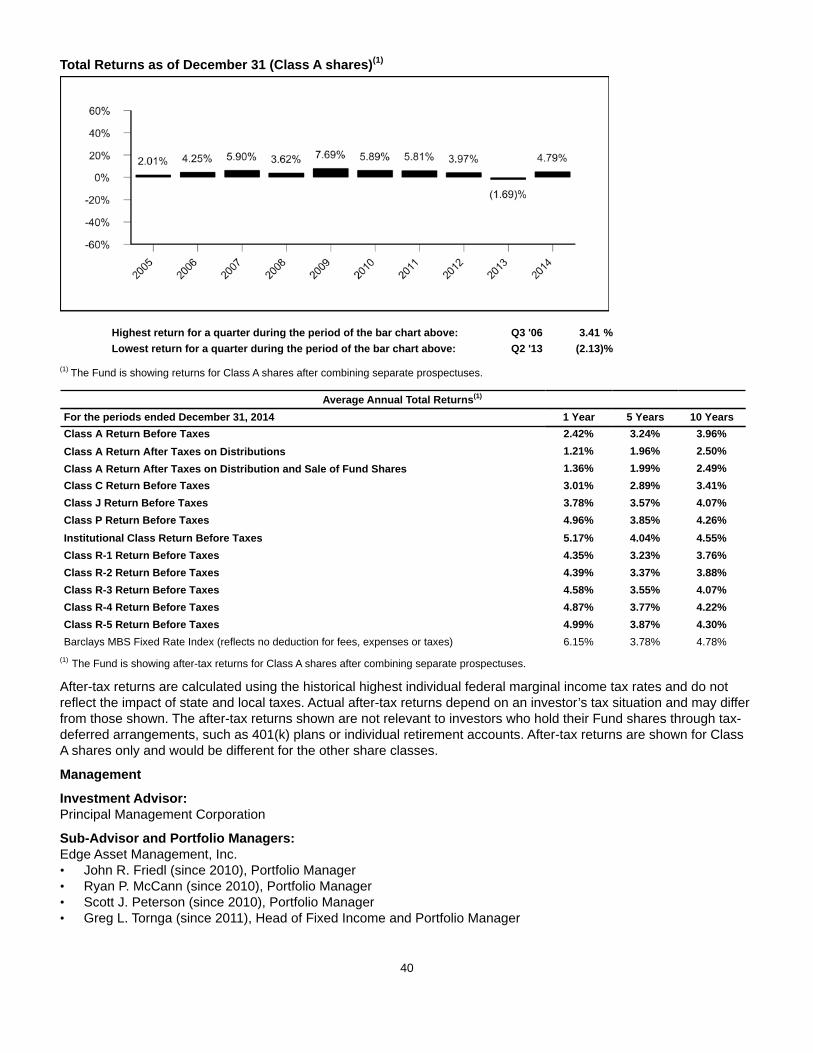
40
Total Returns as of December 31 (Class A shares)(1)
Highest return for a quarter during the period of the bar chart above: Q3 '06 3.41 %Lowest return for a quarter during the period of the bar chart above: Q2 '13 (2.13)%
(1) The Fund is showing returns for Class A shares after combining separate prospectuses.
Average Annual Total Returns(1)
For the periods ended December 31, 2014 1 Year 5 Years 10 YearsClass A Return Before Taxes 2.42% 3.24% 3.96%Class A Return After Taxes on Distributions 1.21% 1.96% 2.50%Class A Return After Taxes on Distribution and Sale of Fund Shares 1.36% 1.99% 2.49%Class C Return Before Taxes 3.01% 2.89% 3.41%Class J Return Before Taxes 3.78% 3.57% 4.07%Class P Return Before Taxes 4.96% 3.85% 4.26%Institutional Class Return Before Taxes 5.17% 4.04% 4.55%Class R-1 Return Before Taxes 4.35% 3.23% 3.76%Class R-2 Return Before Taxes 4.39% 3.37% 3.88%Class R-3 Return Before Taxes 4.58% 3.55% 4.07%Class R-4 Return Before Taxes 4.87% 3.77% 4.22%Class R-5 Return Before Taxes 4.99% 3.87% 4.30%Barclays MBS Fixed Rate Index (reflects no deduction for fees, expenses or taxes) 6.15% 3.78% 4.78%
(1) The Fund is showing after-tax returns for Class A shares after combining separate prospectuses.
After-tax returns are calculated using the historical highest individual federal marginal income tax rates and do not reflect the impact of state and local taxes. Actual after-tax returns depend on an investor’s tax situation and may differ from those shown. The after-tax returns shown are not relevant to investors who hold their Fund shares through tax-deferred arrangements, such as 401(k) plans or individual retirement accounts. After-tax returns are shown for Class A shares only and would be different for the other share classes.
Management
Investment Advisor: Principal Management Corporation
Sub-Advisor and Portfolio Managers: Edge Asset Management, Inc. • John R. Friedl (since 2010), Portfolio Manager• Ryan P. McCann (since 2010), Portfolio Manager• Scott J. Peterson (since 2010), Portfolio Manager• Greg L. Tornga (since 2011), Head of Fixed Income and Portfolio Manager

41
Purchase and Sale of Fund Shares
Share Class Investment TypePurchase Minimum
Per FundA, C, and J Initial Investment $1,000(1)
A, C, and J For accounts with an Automatic Investment Plan (AIP) $100A, C, and J Subsequent Investments $100(1)(2)
P, Institutional, R-1, R-2, R-3, R-4,and R-5
There are no minimum initial or subsequent investment requirements foreligible purchases.
N/A
(1) Some exceptions apply; see "Purchase of Fund Shares - Minimum Investments" for more information.(2) For accounts with an AIP, the subsequent automatic investments must total $1,200 annually if the initial $1,000 minimum has not been met.
You may purchase or redeem shares on any business day (normally any day when the New York Stock Exchange is open for regular trading) through your plan, intermediary, or Financial Professional; by sending a written request to Principal Funds at P.O. Box 8024, Boston, MA 02266-8024 (regular mail) or 30 Dan Road, Canton, MA 02021-2809 (overnight mail); calling us at 1-800-222-5852; or accessing our website (www.principalfunds.com).
Tax InformationThe Fund’s distributions you receive are generally subject to federal income tax as ordinary income or capital gain and may also be subject to state and local taxes, unless you are tax-exempt or your account is tax-deferred in which case your distributions would be taxed when withdrawn from the tax-deferred account.
Payments to Broker-Dealers and Other Financial IntermediariesIf you purchase the Fund through a broker-dealer or other financial intermediary (such as a bank, insurance company, investment adviser, etc.), the Fund and its related companies may pay the intermediary for the sale of Fund shares and related services. These payments may create a conflict of interest by influencing the broker-dealer or other intermediary and your salesperson to recommend the Fund over another investment, or to recommend one share class of the Fund over another share class. Ask your salesperson or visit your financial intermediary's website for more information.

42
HIGH YIELD FUND
Objective: The Fund seeks to provide a high level of current income.
Fees and Expenses of the FundThis table describes the fees and expenses that you may pay if you buy and hold shares of the Fund. You may qualify for sales charge discounts if you and your family invest, or agree to invest in the future, at least $100,000 in Class A Shares of Principal Funds, Inc. More information about these and other discounts is available from your financial professional and in “Choosing a Share Class and The Costs of Investing” beginning on page 381 of the Fund’s prospectus and “Multiple Class Structure” beginning on page 6 of the Fund’s Statement of Additional Information.
Shareholder Fees (fees paid directly from your investment)
Share ClassA C P Inst.
Maximum Sales Charge (Load) Imposed on Purchases (as apercentage of offering price)
3.75% None None None
Maximum Deferred Sales Charge (Load) (as a percentage of theoffering price or NAV when Sales Load is paid, whichever is less)
1.00% 1.00% None None
Annual Fund Operating Expenses (expenses that you pay each year as a percentage of the value of your investment)
Share ClassA C P Inst.
Management Fees 0.51% 0.51% 0.51% 0.51%Distribution and/or Service (12b-1) Fees 0.25% 1.00% N/A N/AOther Expenses 0.17% 0.11% 0.14% 0.08%Total Annual Fund Operating Expenses 0.93% 1.62% 0.65% 0.59%Expense Reimbursement(1) N/A N/A —% N/ATotal Annual Fund Operating Expenses after ExpenseReimbursement
0.93% 1.62% 0.65% 0.59%
(1) Principal Management Corporation ("Principal"), the investment advisor, has contractually agreed to limit the Fund’s expenses by paying, if necessary, expenses normally payable by the Fund, (excluding interest expense, expenses related to fund investments, acquired fund fees and expenses, and other extraordinary expenses) to maintain "Other Expenses" (expressed as a percent of average net assets on an annualized basis) not to exceed 0.20% for Class P shares. It is expected that the expense limit will continue through the period ending February 29, 2016; however, Principal Funds, Inc. and Principal, the parties to the agreement, may agree to terminate the expense limit prior to the end of the period.
ExampleThis Example is intended to help you compare the cost of investing in the Fund with the cost of investing in other mutual funds.
The Example assumes that you invest $10,000 in the Fund for the time periods indicated and then redeem all of your shares at the end of those periods. The Example assumes that your investment has a 5% return each year and that the Fund’s operating expenses remain the same. Although your actual costs may be higher or lower, based on these assumptions your costs would be:
1 year 3 years 5 years 10 yearsClass A $466 $660 $870 $1,475Class C 265 511 881 1,922Class P 66 208 362 810Institutional Class 60 189 329 738
43
With respect to Class C shares, you would pay the following expenses if you did not redeem your shares (all other classes would be the same as in the above example):
1 year 3 years 5 years 10 yearsClass C $165 $511 $881 $1,922
Portfolio TurnoverThe Fund pays transaction costs, such as commissions, when it buys and sells securities (or “turns over” its portfolio). A higher portfolio turnover rate may indicate higher transaction costs and may result in higher taxes when Fund shares are held in a taxable account. These costs, which are not reflected in annual fund operating expenses or in the example, affect the Fund’s performance. During the most recent fiscal year, the Fund’s portfolio turnover rate was 51.7% of the average value of its portfolio.
Principal Investment StrategiesUnder normal circumstances, the Fund invests at least 80% of its net assets, plus any borrowings for investment purposes, in below investment grade bonds (sometimes called “high yield bonds” or "junk bonds") which are rated at the time of each purchase Ba1 or lower by Moody's and BB+ or lower by S&P (if the bond has been rated by only one of those agencies, that rating will determine whether the bond is below investment grade; if the bond has not been rated by either of those agencies, the Sub-Advisor will determine whether the bond is of a quality comparable to those rated below investment grade). The Fund also invests in bank loans (also known as senior floating rate interests) and securities of foreign issuers, including those located in developing or emerging countries. Under normal circumstances, the Fund maintains an average portfolio duration that is within ±20% of the duration of the Barclays US High Yield 2% Issuer Capped Index, which as of December 31, 2014 was 4.39 years.
During the fiscal year ended October 31, 2014, the average ratings of the Fund’s fixed-income assets, based on market value at each month-end, were as follows (all ratings are by Moody’s):
0.00% in securities rated Aaa 5.77% in securities rated Baa 14.17% in securities rated Caa 0.06% in securities rated D0.00% in securities rated Aa 40.58% in securities rated Ba 0.00% in securities rated Ca 3.20% in securities not rated0.17% in securities rated A 36.05% in securities rated B 0.00% in securities rated C
Principal RisksThe value of your investment in the Fund changes with the value of the Fund's investments. Many factors affect that value, and it is possible to lose money by investing in the Fund. An investment in the Fund is not a deposit of a bank and is not insured or guaranteed by the Federal Deposit Insurance Corporation or any other government agency. The principal risks of investing in the Fund, in alphabetical order, are:
Bank Loans Risk. Changes in economic conditions are likely to cause issuers of bank loans (also known as senior floating rate interests) to be unable to meet their obligations. In addition, the value of the collateral securing the loan may decline, causing a loan to be substantially unsecured. Underlying credit agreements governing the bank loans, reliance on market makers, priority of repayment and overall market volatility may harm the liquidity of loans.
Currency Risk. Risks of investing in securities denominated in, or that trade in, foreign (non-U.S.) currencies include changes in foreign exchange rates and foreign exchange restrictions.
Emerging Market Risk. Investments in emerging market countries may have more risk than those in developed market countries because the emerging markets are less developed and more illiquid. Emerging market countries can also be subject to increased social, economic, regulatory, and political uncertainties and can be extremely volatile.
Fixed-Income Securities Risk. Fixed-income securities are subject to interest rate risk and credit quality risk. The market value of fixed-income securities generally declines when interest rates rise, and an issuer of fixed-income securities could default on its payment obligations.
Foreign Securities Risk. The risks of foreign securities include loss of value as a result of: political or economic instability; nationalization, expropriation or confiscatory taxation; settlement delays; and limited government regulation (including less stringent reporting, accounting, and disclosure standards than are required of U.S. companies).
High Yield Securities Risk. High yield fixed-income securities (commonly referred to as "junk bonds") are subject to greater credit quality risk than higher rated fixed-income securities and should be considered speculative.
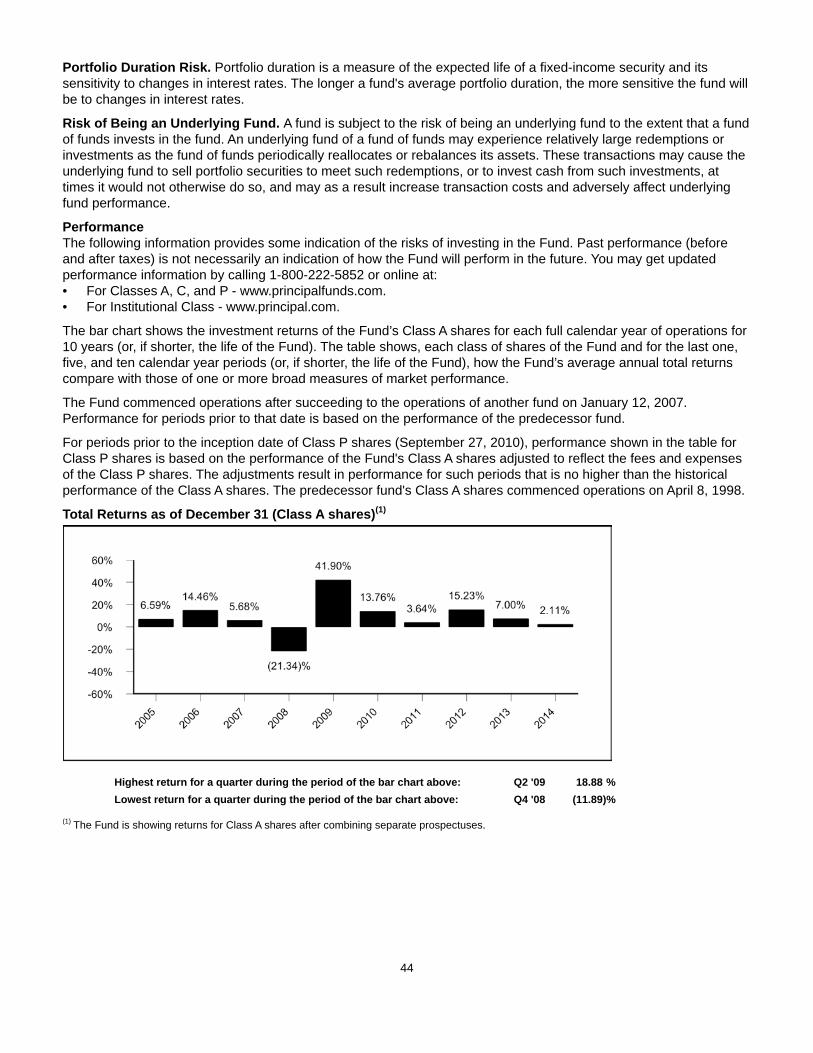
44
Portfolio Duration Risk. Portfolio duration is a measure of the expected life of a fixed-income security and its sensitivity to changes in interest rates. The longer a fund's average portfolio duration, the more sensitive the fund will be to changes in interest rates.
Risk of Being an Underlying Fund. A fund is subject to the risk of being an underlying fund to the extent that a fund of funds invests in the fund. An underlying fund of a fund of funds may experience relatively large redemptions or investments as the fund of funds periodically reallocates or rebalances its assets. These transactions may cause the underlying fund to sell portfolio securities to meet such redemptions, or to invest cash from such investments, at times it would not otherwise do so, and may as a result increase transaction costs and adversely affect underlying fund performance.
PerformanceThe following information provides some indication of the risks of investing in the Fund. Past performance (before and after taxes) is not necessarily an indication of how the Fund will perform in the future. You may get updated performance information by calling 1-800-222-5852 or online at:• For Classes A, C, and P - www.principalfunds.com.• For Institutional Class - www.principal.com.
The bar chart shows the investment returns of the Fund’s Class A shares for each full calendar year of operations for 10 years (or, if shorter, the life of the Fund). The table shows, each class of shares of the Fund and for the last one, five, and ten calendar year periods (or, if shorter, the life of the Fund), how the Fund’s average annual total returns compare with those of one or more broad measures of market performance.
The Fund commenced operations after succeeding to the operations of another fund on January 12, 2007. Performance for periods prior to that date is based on the performance of the predecessor fund.
For periods prior to the inception date of Class P shares (September 27, 2010), performance shown in the table for Class P shares is based on the performance of the Fund's Class A shares adjusted to reflect the fees and expenses of the Class P shares. The adjustments result in performance for such periods that is no higher than the historical performance of the Class A shares. The predecessor fund's Class A shares commenced operations on April 8, 1998.
Total Returns as of December 31 (Class A shares)(1)
Highest return for a quarter during the period of the bar chart above: Q2 '09 18.88 %Lowest return for a quarter during the period of the bar chart above: Q4 '08 (11.89)%
(1) The Fund is showing returns for Class A shares after combining separate prospectuses.
45
Average Annual Total Returns(1)
For the periods ended December 31, 2014 1 Year 5 Years 10 YearsClass A Return Before Taxes (1.69)% 7.40% 7.47%Class A Return After Taxes on Distributions (4.48)% 4.15% 4.31%Class A Return After Taxes on Distribution and Sale of Fund Shares (0.81)% 4.55% 4.63%Class C Return Before Taxes 0.32% 7.42% 7.08%Class P Return Before Taxes 2.40% 8.54% 8.04%Institutional Class Return Before Taxes 2.48% 8.59% 8.24%
Barclays U.S. Corporate High Yield 2% Issuer Capped Index (reflects no deduction for fees,expenses, or taxes)
2.46% 8.98% 7.73%
(1) The Fund is showing after-tax returns for Class A shares after combining separate prospectuses.
After-tax returns are calculated using the historical highest individual federal marginal income tax rates and do not reflect the impact of state and local taxes. Actual after-tax returns depend on an investor’s tax situation and may differ from those shown. The after-tax returns shown are not relevant to investors who hold their Fund shares through tax-deferred arrangements, such as 401(k) plans or individual retirement accounts. After-tax returns are shown for Class A shares only and would be different for the other share classes.
Management
Investment Advisor: Principal Management Corporation
Sub-Advisor and Portfolio Managers:Principal Global Investors, LLC• Mark P. Denkinger (since 2009), Portfolio Manager• Darrin E. Smith (since 2009), Portfolio Manager
Purchase and Sale of Fund Shares
Share Class Investment TypePurchase Minimum
Per FundA and C Initial Investment $1,000(1)
A and C For accounts with an Automatic Investment Plan (AIP) $100A and C Subsequent Investments $100(1)(2)
P and Institutional There are no minimum initial or subsequent investment requirements foreligible purchases.
N/A
(1) Some exceptions apply; see "Purchase of Fund Shares - Minimum Investments" for more information.(2) For accounts with an AIP, the subsequent automatic investments must total $1,200 annually if the initial $1,000 minimum has not been met.
You may purchase or redeem shares on any business day (normally any day when the New York Stock Exchange is open for regular trading), through your plan, intermediary, or Financial Professional; by sending a written request to Principal Funds at P.O. Box 8024, Boston, MA 02266-8024 (regular mail) or 30 Dan Road, Canton, MA 02021-2809)(overnight mail); calling us at 1-800-222-5852; or accessing our website (www.principalfunds.com).
Tax InformationThe Fund’s distributions you receive are generally subject to federal income tax as ordinary income or capital gain and may also be subject to state and local taxes, unless you are tax-exempt or your account is tax-deferred in which case your distributions would be taxed when withdrawn from the tax-deferred account.
Payments to Broker-Dealers and Other Financial IntermediariesIf you purchase the Fund through a broker-dealer or other financial intermediary (such as a bank, insurance company, investment adviser, etc.), the Fund and its related companies may pay the intermediary for the sale of Fund shares and related services. These payments may create a conflict of interest by influencing the broker-dealer or other intermediary and your salesperson to recommend the Fund over another investment, or to recommend one share class of the Fund over another share class. Ask your salesperson or visit your financial intermediary's website for more information.
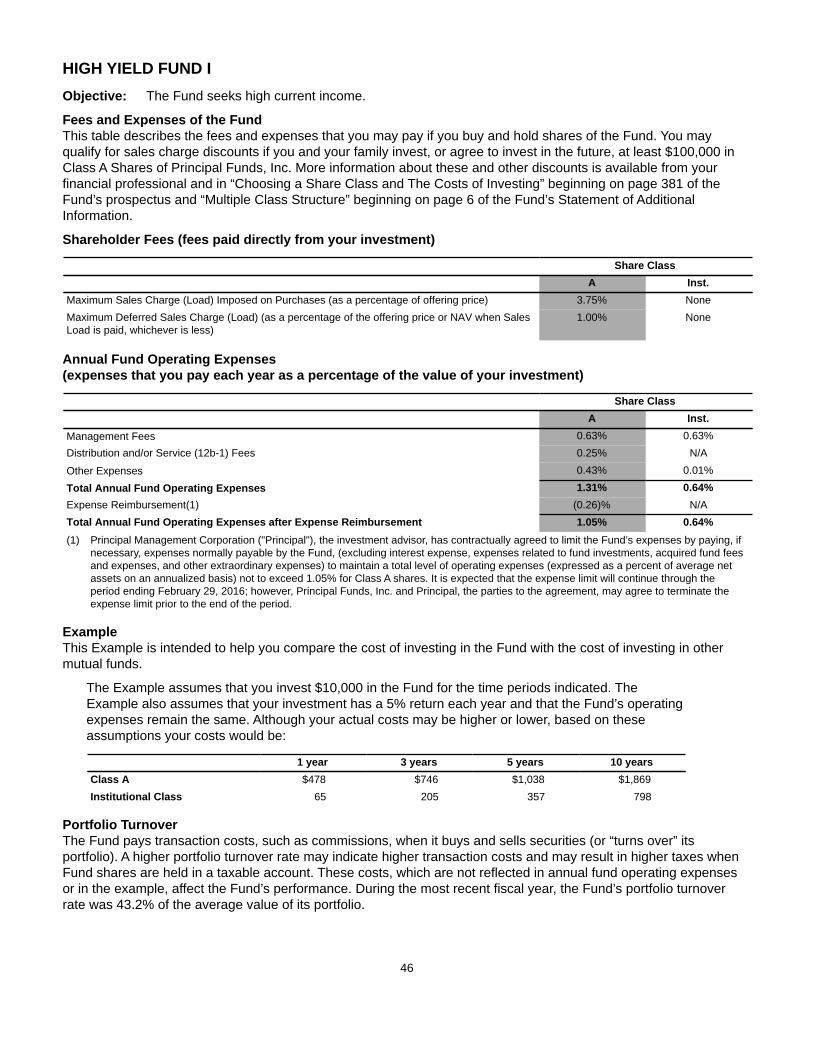
46
HIGH YIELD FUND IObjective: The Fund seeks high current income.
Fees and Expenses of the FundThis table describes the fees and expenses that you may pay if you buy and hold shares of the Fund. You may qualify for sales charge discounts if you and your family invest, or agree to invest in the future, at least $100,000 in Class A Shares of Principal Funds, Inc. More information about these and other discounts is available from your financial professional and in “Choosing a Share Class and The Costs of Investing” beginning on page 381 of the Fund’s prospectus and “Multiple Class Structure” beginning on page 6 of the Fund’s Statement of Additional Information.
Shareholder Fees (fees paid directly from your investment)
Share ClassA Inst.
Maximum Sales Charge (Load) Imposed on Purchases (as a percentage of offering price) 3.75% NoneMaximum Deferred Sales Charge (Load) (as a percentage of the offering price or NAV when SalesLoad is paid, whichever is less)
1.00% None
Annual Fund Operating Expenses (expenses that you pay each year as a percentage of the value of your investment)
Share ClassA Inst.
Management Fees 0.63% 0.63%Distribution and/or Service (12b-1) Fees 0.25% N/A
Other Expenses 0.43% 0.01%
Total Annual Fund Operating Expenses 1.31% 0.64%Expense Reimbursement(1) (0.26)% N/ATotal Annual Fund Operating Expenses after Expense Reimbursement 1.05% 0.64%(1) Principal Management Corporation ("Principal"), the investment advisor, has contractually agreed to limit the Fund’s expenses by paying, if
necessary, expenses normally payable by the Fund, (excluding interest expense, expenses related to fund investments, acquired fund fees and expenses, and other extraordinary expenses) to maintain a total level of operating expenses (expressed as a percent of average net assets on an annualized basis) not to exceed 1.05% for Class A shares. It is expected that the expense limit will continue through the period ending February 29, 2016; however, Principal Funds, Inc. and Principal, the parties to the agreement, may agree to terminate the expense limit prior to the end of the period.
ExampleThis Example is intended to help you compare the cost of investing in the Fund with the cost of investing in other mutual funds.
The Example assumes that you invest $10,000 in the Fund for the time periods indicated. The Example also assumes that your investment has a 5% return each year and that the Fund’s operating expenses remain the same. Although your actual costs may be higher or lower, based on these assumptions your costs would be:
1 year 3 years 5 years 10 yearsClass A $478 $746 $1,038 $1,869Institutional Class 65 205 357 798
Portfolio TurnoverThe Fund pays transaction costs, such as commissions, when it buys and sells securities (or “turns over” its portfolio). A higher portfolio turnover rate may indicate higher transaction costs and may result in higher taxes when Fund shares are held in a taxable account. These costs, which are not reflected in annual fund operating expenses or in the example, affect the Fund’s performance. During the most recent fiscal year, the Fund’s portfolio turnover rate was 43.2% of the average value of its portfolio.
47
Principal Investment StrategiesUnder normal circumstances, the Fund invests at least 80% of its net assets, plus any borrowings for investment purposes, in below investment grade bonds (sometimes called “high yield bonds” or "junk bonds") which are rated at the time of each purchase Ba1 or lower by Moody's and BB+ or lower by S&P (if the bond has been rated by only one of those agencies, that rating will determine whether the bond is below investment grade; if the bond has not been rated by either of those agencies, the Sub-Advisor will determine whether the bond is of a quality comparable to those rated below investment grade). The Fund also invests in bank loans (also known as senior floating rate interests) and securities of foreign issuers. Under normal circumstances, the Fund maintains an average portfolio duration that is within ±25% of the duration of the Barclays US High Yield 2% Issuer Capped Index, which as of December 31, 2014 was 4.39 years.
During the fiscal year ended October 31, 2014, the average ratings of the Fund’s fixed-income assets, based on market value at each month-end, were as follows (all ratings are by Moody’s):
0.00% in securities rated Aaa 6.25% in securities rated Baa 9.74% in securities rated Caa 0.02% in securities rated D0.00% in securities rated Aa 43.68% in securities rated Ba 0.01% in securities rated Ca 1.28% in securities not rated0.30% in securities rated A 38.72% in securities rated B 0.00% in securities rated C
Principal RisksThe value of your investment in the Fund changes with the value of the Fund's investments. Many factors affect that value, and it is possible to lose money by investing in the Fund. An investment in the Fund is not a deposit of a bank and is not insured or guaranteed by the Federal Deposit Insurance Corporation or any other government agency. The principal risks of investing in the Fund, in alphabetical order, are:
Bank Loans Risk. Changes in economic conditions are likely to cause issuers of bank loans (also known as senior floating rate interests) to be unable to meet their obligations. In addition, the value of the collateral securing the loan may decline, causing a loan to be substantially unsecured. Underlying credit agreements governing the bank loans, reliance on market makers, priority of repayment and overall market volatility may harm the liquidity of loans.
Currency Risk. Risks of investing in securities denominated in, or that trade in, foreign (non-U.S.) currencies include changes in foreign exchange rates and foreign exchange restrictions.
Fixed-Income Securities Risk. Fixed-income securities are subject to interest rate risk and credit quality risk. The market value of fixed-income securities generally declines when interest rates rise, and an issuer of fixed-income securities could default on its payment obligations.
Foreign Securities Risk. The risks of foreign securities include loss of value as a result of: political or economic instability; nationalization, expropriation or confiscatory taxation; settlement delays; and limited government regulation (including less stringent reporting, accounting, and disclosure standards than are required of U.S. companies).
High Yield Securities Risk. High yield fixed-income securities (commonly referred to as "junk bonds") are subject to greater credit quality risk than higher rated fixed-income securities and should be considered speculative.
Portfolio Duration Risk. Portfolio duration is a measure of the expected life of a fixed-income security and its sensitivity to changes in interest rates. The longer a fund's average portfolio duration, the more sensitive the fund will be to changes in interest rates.
Risk of Being an Underlying Fund. A fund is subject to the risk of being an underlying fund to the extent that a fund of funds invests in the fund. An underlying fund of a fund of funds may experience relatively large redemptions or investments as the fund of funds periodically reallocates or rebalances its assets. These transactions may cause the underlying fund to sell portfolio securities to meet such redemptions, or to invest cash from such investments, at times it would not otherwise do so, and may as a result increase transaction costs and adversely affect underlying fund performance.
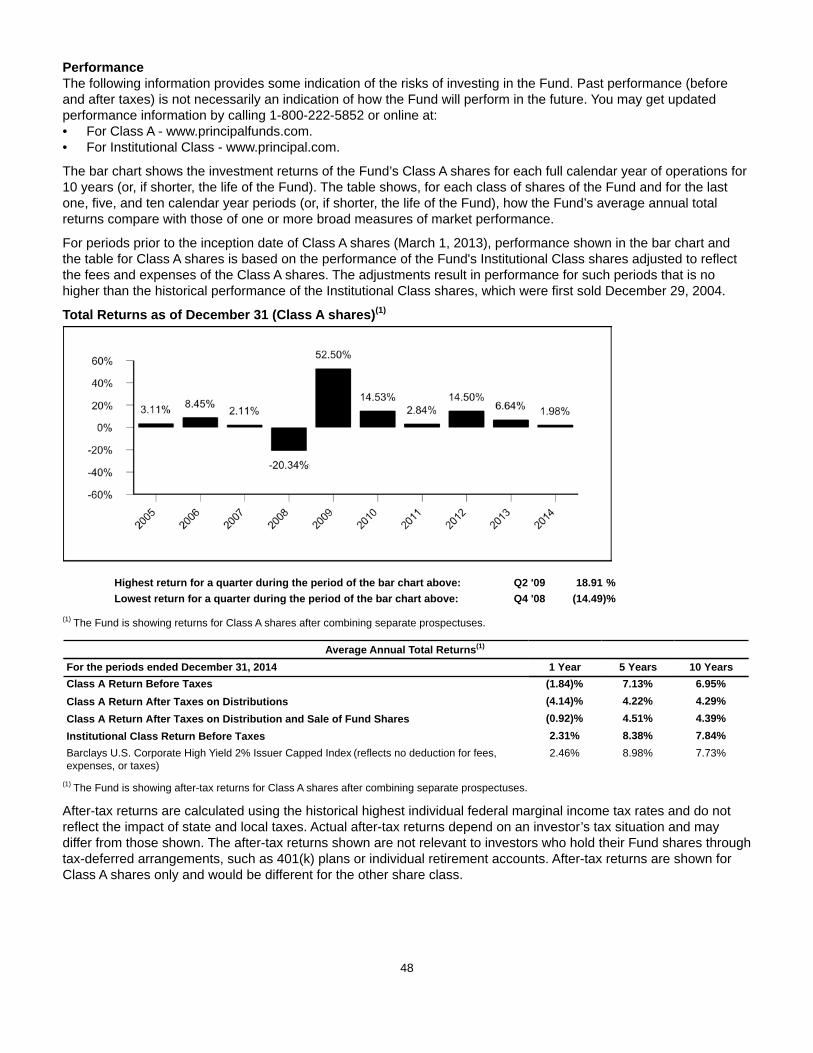
48
PerformanceThe following information provides some indication of the risks of investing in the Fund. Past performance (before and after taxes) is not necessarily an indication of how the Fund will perform in the future. You may get updated performance information by calling 1-800-222-5852 or online at:• For Class A - www.principalfunds.com.• For Institutional Class - www.principal.com.
The bar chart shows the investment returns of the Fund’s Class A shares for each full calendar year of operations for 10 years (or, if shorter, the life of the Fund). The table shows, for each class of shares of the Fund and for the last one, five, and ten calendar year periods (or, if shorter, the life of the Fund), how the Fund’s average annual total returns compare with those of one or more broad measures of market performance.
For periods prior to the inception date of Class A shares (March 1, 2013), performance shown in the bar chart and the table for Class A shares is based on the performance of the Fund's Institutional Class shares adjusted to reflect the fees and expenses of the Class A shares. The adjustments result in performance for such periods that is no higher than the historical performance of the Institutional Class shares, which were first sold December 29, 2004.
Total Returns as of December 31 (Class A shares)(1)
Highest return for a quarter during the period of the bar chart above: Q2 '09 18.91 %Lowest return for a quarter during the period of the bar chart above: Q4 '08 (14.49)%
(1) The Fund is showing returns for Class A shares after combining separate prospectuses.
Average Annual Total Returns(1)
For the periods ended December 31, 2014 1 Year 5 Years 10 YearsClass A Return Before Taxes (1.84)% 7.13% 6.95%Class A Return After Taxes on Distributions (4.14)% 4.22% 4.29%Class A Return After Taxes on Distribution and Sale of Fund Shares (0.92)% 4.51% 4.39%Institutional Class Return Before Taxes 2.31% 8.38% 7.84%Barclays U.S. Corporate High Yield 2% Issuer Capped Index (reflects no deduction for fees, expenses, or taxes)
2.46% 8.98% 7.73%
(1) The Fund is showing after-tax returns for Class A shares after combining separate prospectuses.
After-tax returns are calculated using the historical highest individual federal marginal income tax rates and do not reflect the impact of state and local taxes. Actual after-tax returns depend on an investor’s tax situation and may differ from those shown. The after-tax returns shown are not relevant to investors who hold their Fund shares through tax-deferred arrangements, such as 401(k) plans or individual retirement accounts. After-tax returns are shown for Class A shares only and would be different for the other share class.
49
Management
Investment Advisor: Principal Management Corporation
Sub-Advisors and Portfolio Managers: J.P. Morgan Investment Management Inc. • James Gibson (since 2007), Managing Director, Head High Yield Trader and Co-Portfolio Manager• William J. Morgan (since 2007), Managing Director, Senior Portfolio Manager and High Yield Team Leader• James P. Shanahan, Jr. (since 2007), Managing Director, Portfolio Manager
Neuberger Berman Fixed Income LLC• Ann H. Benjamin (since 2007), Managing Director• William (Russ) Covode (since 2011), Managing Director• Daniel Doyle (since 2014), Managing Director• Thomas P. O’Reilly (since 2007), Managing Director
Purchase and Sale of Fund Shares
Share Class Investment TypePurchase Minimum
Per FundA Initial Investment $1,000(1)
A For accounts with an Automatic Investment Plan (AIP) $100A Subsequent Investments $100(1)(2)
Institutional There are no minimum initial or subsequent investment requirements foreligible purchases.
N/A
(1) Some exceptions apply; see "Purchase of Fund Shares - Minimum Investments" for more information.(2) For accounts with an AIP, the subsequent automatic investments must total $1,200 annually if the initial $1,000 minimum has not been met.
You may purchase or redeem shares on any business day (normally any day when the New York Stock Exchange is open for regular trading), through your plan, intermediary, or Financial Professional; by sending a written request to Principal Funds at P.O. Box 8024, Boston, MA 02266-8024 (regular mail) or 30 Dan Road, Canton, MA 02021-2809)(overnight mail); calling us at 1-800-222-5852; or accessing our website (www.principalfunds.com).
Tax InformationThe Fund’s distributions you receive are generally subject to federal income tax as ordinary income or capital gain and may also be subject to state and local taxes, unless you are tax-exempt or your account is tax-deferred in which case your distributions would be taxed when withdrawn from the tax-deferred account.
Payments to Broker-Dealers and Other Financial IntermediariesIf you purchase the Fund through a broker-dealer or other financial intermediary (such as a bank, insurance company, investment adviser, etc.), the Fund and its related companies may pay the intermediary for the sale of Fund shares and related services. These payments may create a conflict of interest by influencing the broker-dealer or other intermediary and your salesperson to recommend the Fund over another investment, or to recommend one share class of the Fund over another share class. Ask your salesperson or visit your financial intermediary's website for more information.
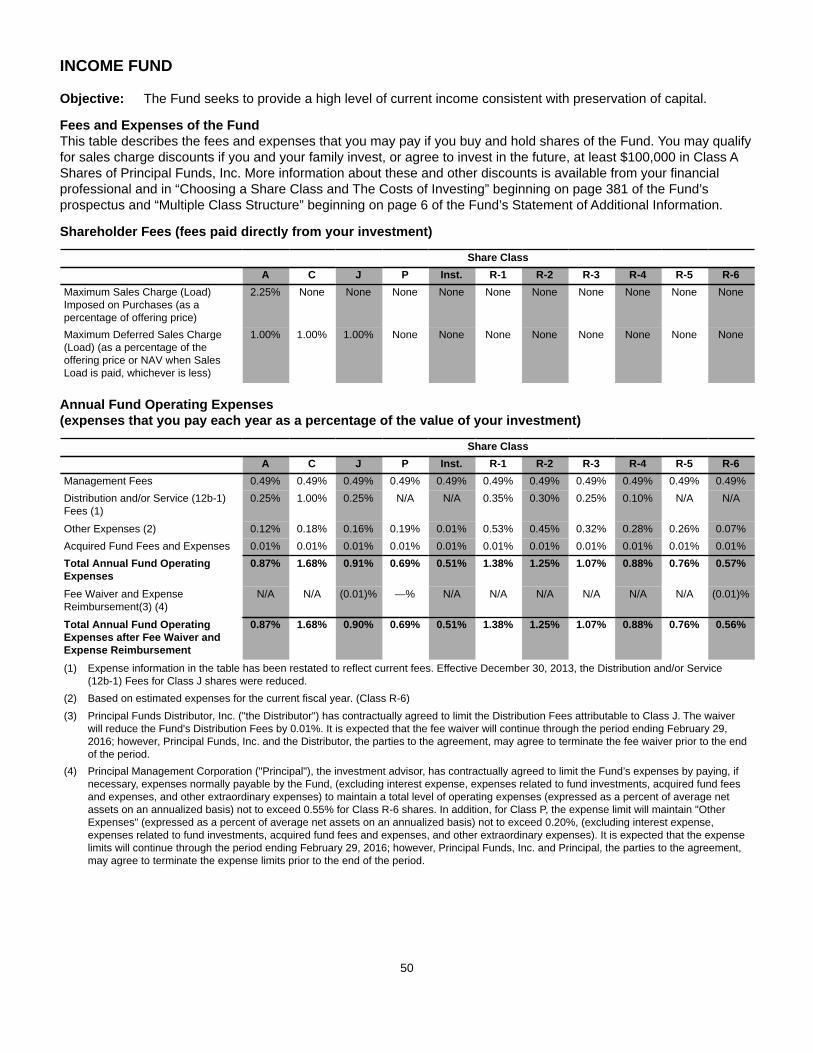
50
INCOME FUND
Objective: The Fund seeks to provide a high level of current income consistent with preservation of capital.
Fees and Expenses of the FundThis table describes the fees and expenses that you may pay if you buy and hold shares of the Fund. You may qualify for sales charge discounts if you and your family invest, or agree to invest in the future, at least $100,000 in Class A Shares of Principal Funds, Inc. More information about these and other discounts is available from your financial professional and in “Choosing a Share Class and The Costs of Investing” beginning on page 381 of the Fund’s prospectus and “Multiple Class Structure” beginning on page 6 of the Fund’s Statement of Additional Information.
Shareholder Fees (fees paid directly from your investment)
Share ClassA C J P Inst. R-1 R-2 R-3 R-4 R-5 R-6
Maximum Sales Charge (Load)Imposed on Purchases (as apercentage of offering price)
2.25% None None None None None None None None None None
Maximum Deferred Sales Charge(Load) (as a percentage of theoffering price or NAV when SalesLoad is paid, whichever is less)
1.00% 1.00% 1.00% None None None None None None None None
Annual Fund Operating Expenses (expenses that you pay each year as a percentage of the value of your investment)
Share ClassA C J P Inst. R-1 R-2 R-3 R-4 R-5 R-6
Management Fees 0.49% 0.49% 0.49% 0.49% 0.49% 0.49% 0.49% 0.49% 0.49% 0.49% 0.49%Distribution and/or Service (12b-1)Fees (1)
0.25% 1.00% 0.25% N/A N/A 0.35% 0.30% 0.25% 0.10% N/A N/A
Other Expenses (2) 0.12% 0.18% 0.16% 0.19% 0.01% 0.53% 0.45% 0.32% 0.28% 0.26% 0.07%Acquired Fund Fees and Expenses 0.01% 0.01% 0.01% 0.01% 0.01% 0.01% 0.01% 0.01% 0.01% 0.01% 0.01%Total Annual Fund OperatingExpenses
0.87% 1.68% 0.91% 0.69% 0.51% 1.38% 1.25% 1.07% 0.88% 0.76% 0.57%
Fee Waiver and ExpenseReimbursement(3) (4)
N/A N/A (0.01)% —% N/A N/A N/A N/A N/A N/A (0.01)%
Total Annual Fund OperatingExpenses after Fee Waiver andExpense Reimbursement
0.87% 1.68% 0.90% 0.69% 0.51% 1.38% 1.25% 1.07% 0.88% 0.76% 0.56%
(1) Expense information in the table has been restated to reflect current fees. Effective December 30, 2013, the Distribution and/or Service (12b-1) Fees for Class J shares were reduced.
(2) Based on estimated expenses for the current fiscal year. (Class R-6)(3) Principal Funds Distributor, Inc. ("the Distributor") has contractually agreed to limit the Distribution Fees attributable to Class J. The waiver
will reduce the Fund's Distribution Fees by 0.01%. It is expected that the fee waiver will continue through the period ending February 29, 2016; however, Principal Funds, Inc. and the Distributor, the parties to the agreement, may agree to terminate the fee waiver prior to the end of the period.
(4) Principal Management Corporation ("Principal"), the investment advisor, has contractually agreed to limit the Fund’s expenses by paying, if necessary, expenses normally payable by the Fund, (excluding interest expense, expenses related to fund investments, acquired fund fees and expenses, and other extraordinary expenses) to maintain a total level of operating expenses (expressed as a percent of average net assets on an annualized basis) not to exceed 0.55% for Class R-6 shares. In addition, for Class P, the expense limit will maintain "Other Expenses" (expressed as a percent of average net assets on an annualized basis) not to exceed 0.20%, (excluding interest expense, expenses related to fund investments, acquired fund fees and expenses, and other extraordinary expenses). It is expected that the expense limits will continue through the period ending February 29, 2016; however, Principal Funds, Inc. and Principal, the parties to the agreement, may agree to terminate the expense limits prior to the end of the period.
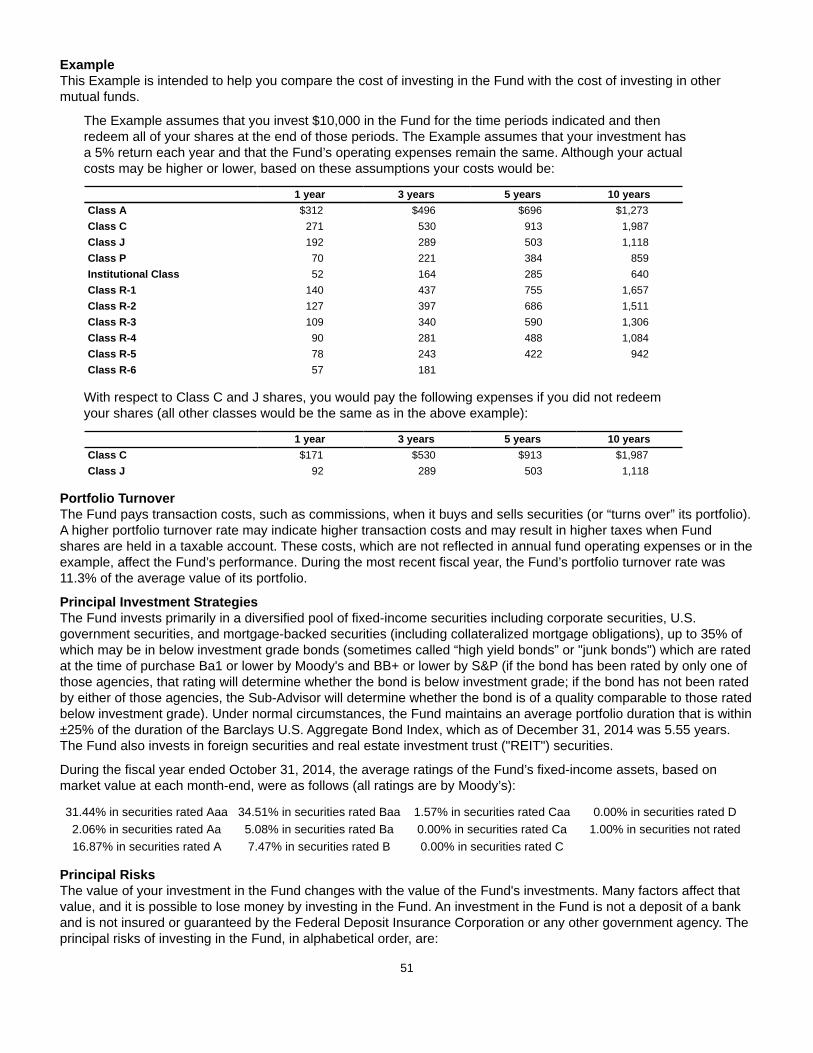
51
ExampleThis Example is intended to help you compare the cost of investing in the Fund with the cost of investing in other mutual funds.
The Example assumes that you invest $10,000 in the Fund for the time periods indicated and then redeem all of your shares at the end of those periods. The Example assumes that your investment has a 5% return each year and that the Fund’s operating expenses remain the same. Although your actual costs may be higher or lower, based on these assumptions your costs would be:
1 year 3 years 5 years 10 yearsClass A $312 $496 $696 $1,273Class C 271 530 913 1,987Class J 192 289 503 1,118Class P 70 221 384 859Institutional Class 52 164 285 640Class R-1 140 437 755 1,657Class R-2 127 397 686 1,511Class R-3 109 340 590 1,306Class R-4 90 281 488 1,084Class R-5 78 243 422 942Class R-6 57 181
With respect to Class C and J shares, you would pay the following expenses if you did not redeem your shares (all other classes would be the same as in the above example):
1 year 3 years 5 years 10 yearsClass C $171 $530 $913 $1,987Class J 92 289 503 1,118
Portfolio TurnoverThe Fund pays transaction costs, such as commissions, when it buys and sells securities (or “turns over” its portfolio). A higher portfolio turnover rate may indicate higher transaction costs and may result in higher taxes when Fund shares are held in a taxable account. These costs, which are not reflected in annual fund operating expenses or in the example, affect the Fund’s performance. During the most recent fiscal year, the Fund’s portfolio turnover rate was 11.3% of the average value of its portfolio.
Principal Investment StrategiesThe Fund invests primarily in a diversified pool of fixed-income securities including corporate securities, U.S. government securities, and mortgage-backed securities (including collateralized mortgage obligations), up to 35% of which may be in below investment grade bonds (sometimes called “high yield bonds” or "junk bonds") which are rated at the time of purchase Ba1 or lower by Moody's and BB+ or lower by S&P (if the bond has been rated by only one of those agencies, that rating will determine whether the bond is below investment grade; if the bond has not been rated by either of those agencies, the Sub-Advisor will determine whether the bond is of a quality comparable to those rated below investment grade). Under normal circumstances, the Fund maintains an average portfolio duration that is within ±25% of the duration of the Barclays U.S. Aggregate Bond Index, which as of December 31, 2014 was 5.55 years. The Fund also invests in foreign securities and real estate investment trust ("REIT") securities.
During the fiscal year ended October 31, 2014, the average ratings of the Fund’s fixed-income assets, based on market value at each month-end, were as follows (all ratings are by Moody’s):
31.44% in securities rated Aaa 34.51% in securities rated Baa 1.57% in securities rated Caa 0.00% in securities rated D2.06% in securities rated Aa 5.08% in securities rated Ba 0.00% in securities rated Ca 1.00% in securities not rated16.87% in securities rated A 7.47% in securities rated B 0.00% in securities rated C
Principal RisksThe value of your investment in the Fund changes with the value of the Fund's investments. Many factors affect that value, and it is possible to lose money by investing in the Fund. An investment in the Fund is not a deposit of a bank and is not insured or guaranteed by the Federal Deposit Insurance Corporation or any other government agency. The principal risks of investing in the Fund, in alphabetical order, are:
52
Currency Risk. Risks of investing in securities denominated in, or that trade in, foreign (non-U.S.) currencies include changes in foreign exchange rates and foreign exchange restrictions.
Fixed-Income Securities Risk. Fixed-income securities are subject to interest rate risk and credit quality risk. The market value of fixed-income securities generally declines when interest rates rise, and an issuer of fixed-income securities could default on its payment obligations.
Foreign Securities Risk. The risks of foreign securities include loss of value as a result of: political or economic instability; nationalization, expropriation or confiscatory taxation; settlement delays; and limited government regulation (including less stringent reporting, accounting, and disclosure standards than are required of U.S. companies).
High Yield Securities Risk. High yield fixed-income securities (commonly referred to as "junk bonds") are subject to greater credit quality risk than higher rated fixed-income securities and should be considered speculative.
Portfolio Duration Risk. Portfolio duration is a measure of the expected life of a fixed-income security and its sensitivity to changes in interest rates. The longer a fund's average portfolio duration, the more sensitive the fund will be to changes in interest rates.
Prepayment Risk. Unscheduled prepayments on mortgage-backed and asset-backed securities may have to be reinvested at lower rates. A reduction in prepayments may increase the effective maturities of these securities, exposing them to the risk of decline in market value over time (extension risk).
Real Estate Investment Trusts (“REITs”) Risk. A REIT could fail to qualify for tax-free pass-through of income under the Internal Revenue Code, and fund shareholders will indirectly bear their proportionate share of the expenses of REITs in which the fund invests.
Real Estate Securities Risk. Real estate securities are subject to the risks associated with direct ownership of real estate, including declines in value, adverse economic conditions, increases in expenses, regulatory changes and environmental problems. Investing in securities of companies in the real estate industry, subjects a fund to the special risks associated with the real estate market including factors such as loss to casualty or condemnation, changes in real estate values, property taxes, interest rates, cash flow of underlying real estate assets, occupancy rates, government regulations affecting zoning, land use and rents, and the management skill and creditworthiness of the issuer.
Risk of Being an Underlying Fund. A fund is subject to the risk of being an underlying fund to the extent that a fund of funds invests in the fund. An underlying fund of a fund of funds may experience relatively large redemptions or investments as the fund of funds periodically reallocates or rebalances its assets. These transactions may cause the underlying fund to sell portfolio securities to meet such redemptions, or to invest cash from such investments, at times it would not otherwise do so, and may as a result increase transaction costs and adversely affect underlying fund performance.
U.S. Government Securities Risk. Yields available from U.S. government securities are generally lower than yields from many other fixed-income securities.
U.S. Government Sponsored Securities Risk. Securities issued by U.S. government-sponsored or -chartered enterprises such as the Federal Home Loan Mortgage Corporation, the Federal National Mortgage Association, and the Federal Home Loan Banks are not issued or guaranteed by the U.S. Treasury.
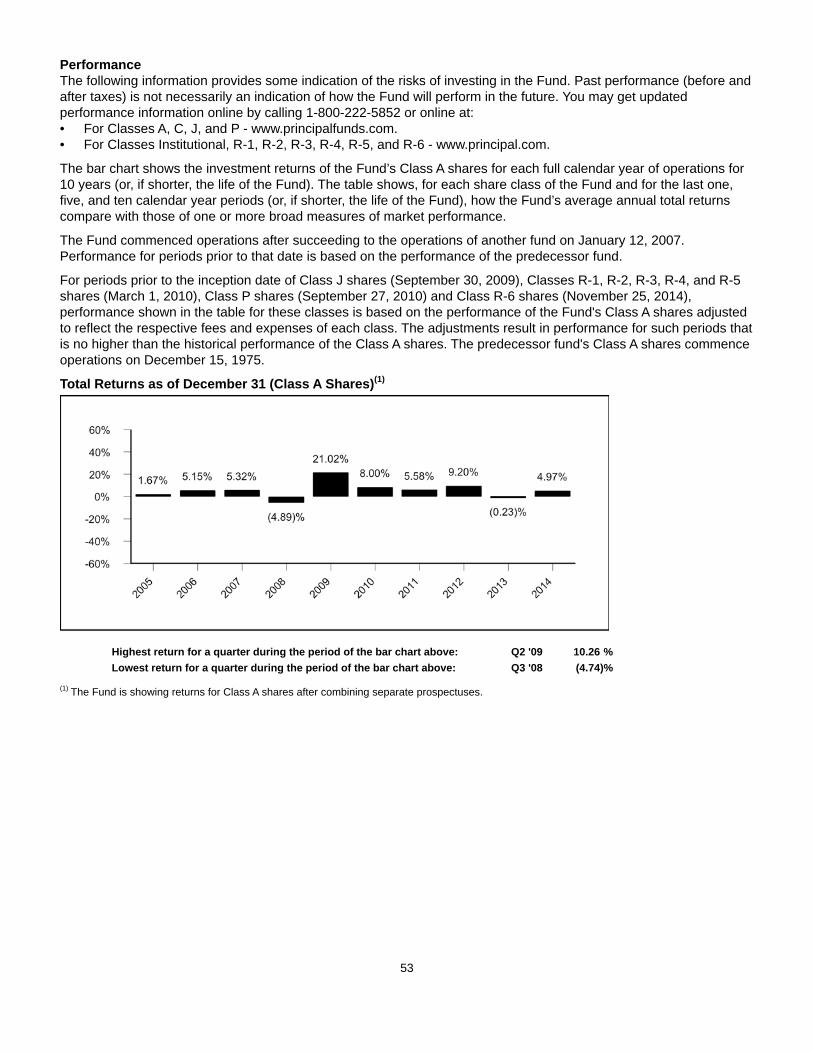
53
PerformanceThe following information provides some indication of the risks of investing in the Fund. Past performance (before and after taxes) is not necessarily an indication of how the Fund will perform in the future. You may get updated performance information online by calling 1-800-222-5852 or online at:• For Classes A, C, J, and P - www.principalfunds.com.• For Classes Institutional, R-1, R-2, R-3, R-4, R-5, and R-6 - www.principal.com.
The bar chart shows the investment returns of the Fund’s Class A shares for each full calendar year of operations for 10 years (or, if shorter, the life of the Fund). The table shows, for each share class of the Fund and for the last one, five, and ten calendar year periods (or, if shorter, the life of the Fund), how the Fund’s average annual total returns compare with those of one or more broad measures of market performance.
The Fund commenced operations after succeeding to the operations of another fund on January 12, 2007. Performance for periods prior to that date is based on the performance of the predecessor fund.
For periods prior to the inception date of Class J shares (September 30, 2009), Classes R-1, R-2, R-3, R-4, and R-5 shares (March 1, 2010), Class P shares (September 27, 2010) and Class R-6 shares (November 25, 2014), performance shown in the table for these classes is based on the performance of the Fund's Class A shares adjusted to reflect the respective fees and expenses of each class. The adjustments result in performance for such periods that is no higher than the historical performance of the Class A shares. The predecessor fund's Class A shares commence operations on December 15, 1975.
Total Returns as of December 31 (Class A Shares)(1)
Highest return for a quarter during the period of the bar chart above: Q2 '09 10.26 %Lowest return for a quarter during the period of the bar chart above: Q3 '08 (4.74)%
(1) The Fund is showing returns for Class A shares after combining separate prospectuses.
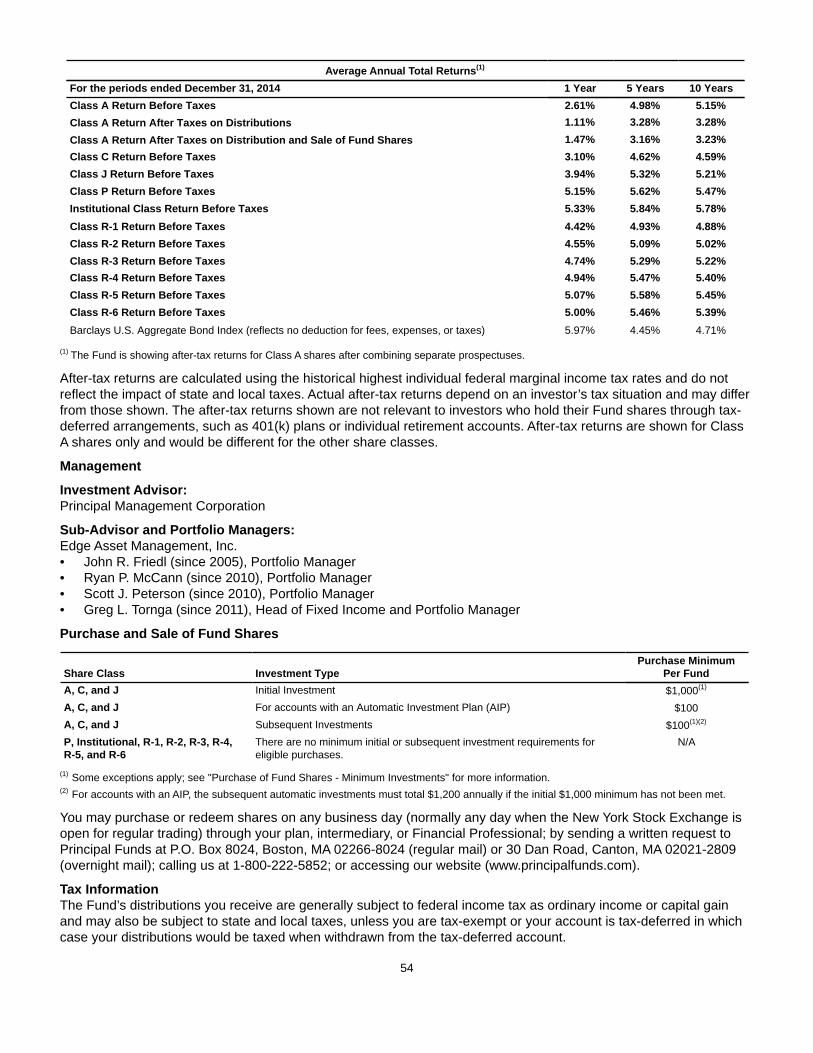
54
Average Annual Total Returns(1)
For the periods ended December 31, 2014 1 Year 5 Years 10 YearsClass A Return Before Taxes 2.61% 4.98% 5.15%Class A Return After Taxes on Distributions 1.11% 3.28% 3.28%Class A Return After Taxes on Distribution and Sale of Fund Shares 1.47% 3.16% 3.23%Class C Return Before Taxes 3.10% 4.62% 4.59%Class J Return Before Taxes 3.94% 5.32% 5.21%Class P Return Before Taxes 5.15% 5.62% 5.47%Institutional Class Return Before Taxes 5.33% 5.84% 5.78%Class R-1 Return Before Taxes 4.42% 4.93% 4.88%Class R-2 Return Before Taxes 4.55% 5.09% 5.02%Class R-3 Return Before Taxes 4.74% 5.29% 5.22%Class R-4 Return Before Taxes 4.94% 5.47% 5.40%Class R-5 Return Before Taxes 5.07% 5.58% 5.45%Class R-6 Return Before Taxes 5.00% 5.46% 5.39%Barclays U.S. Aggregate Bond Index (reflects no deduction for fees, expenses, or taxes) 5.97% 4.45% 4.71%
(1) The Fund is showing after-tax returns for Class A shares after combining separate prospectuses.
After-tax returns are calculated using the historical highest individual federal marginal income tax rates and do not reflect the impact of state and local taxes. Actual after-tax returns depend on an investor’s tax situation and may differ from those shown. The after-tax returns shown are not relevant to investors who hold their Fund shares through tax-deferred arrangements, such as 401(k) plans or individual retirement accounts. After-tax returns are shown for Class A shares only and would be different for the other share classes.
Management
Investment Advisor: Principal Management Corporation
Sub-Advisor and Portfolio Managers: Edge Asset Management, Inc.• John R. Friedl (since 2005), Portfolio Manager• Ryan P. McCann (since 2010), Portfolio Manager• Scott J. Peterson (since 2010), Portfolio Manager• Greg L. Tornga (since 2011), Head of Fixed Income and Portfolio Manager
Purchase and Sale of Fund Shares
Share Class Investment TypePurchase Minimum
Per FundA, C, and J Initial Investment $1,000(1)
A, C, and J For accounts with an Automatic Investment Plan (AIP) $100A, C, and J Subsequent Investments $100(1)(2)
P, Institutional, R-1, R-2, R-3, R-4,R-5, and R-6
There are no minimum initial or subsequent investment requirements foreligible purchases.
N/A
(1) Some exceptions apply; see "Purchase of Fund Shares - Minimum Investments" for more information.(2) For accounts with an AIP, the subsequent automatic investments must total $1,200 annually if the initial $1,000 minimum has not been met.
You may purchase or redeem shares on any business day (normally any day when the New York Stock Exchange is open for regular trading) through your plan, intermediary, or Financial Professional; by sending a written request to Principal Funds at P.O. Box 8024, Boston, MA 02266-8024 (regular mail) or 30 Dan Road, Canton, MA 02021-2809 (overnight mail); calling us at 1-800-222-5852; or accessing our website (www.principalfunds.com).
Tax InformationThe Fund’s distributions you receive are generally subject to federal income tax as ordinary income or capital gain and may also be subject to state and local taxes, unless you are tax-exempt or your account is tax-deferred in which case your distributions would be taxed when withdrawn from the tax-deferred account.

55
Payments to Broker-Dealers and Other Financial IntermediariesFor Class R-6 shares, the Fund and its related companies do not pay broker-dealers or other financial intermediaries (such as a bank, insurance company, investment adviser, etc.) for the sale of Fund shares or related services.
For the other share classes, if you purchase the Fund through a broker-dealer or other financial intermediary (such as a bank, insurance company, investment adviser, etc.), the Fund and its related companies may pay the intermediary for the sale of Fund shares and related services. These payments may create a conflict of interest by influencing the broker-dealer or other intermediary and your salesperson to recommend the Fund over another investment, or to recommend one share class of the Fund over another share class. Ask your salesperson or visit your financial intermediary's website for more information.
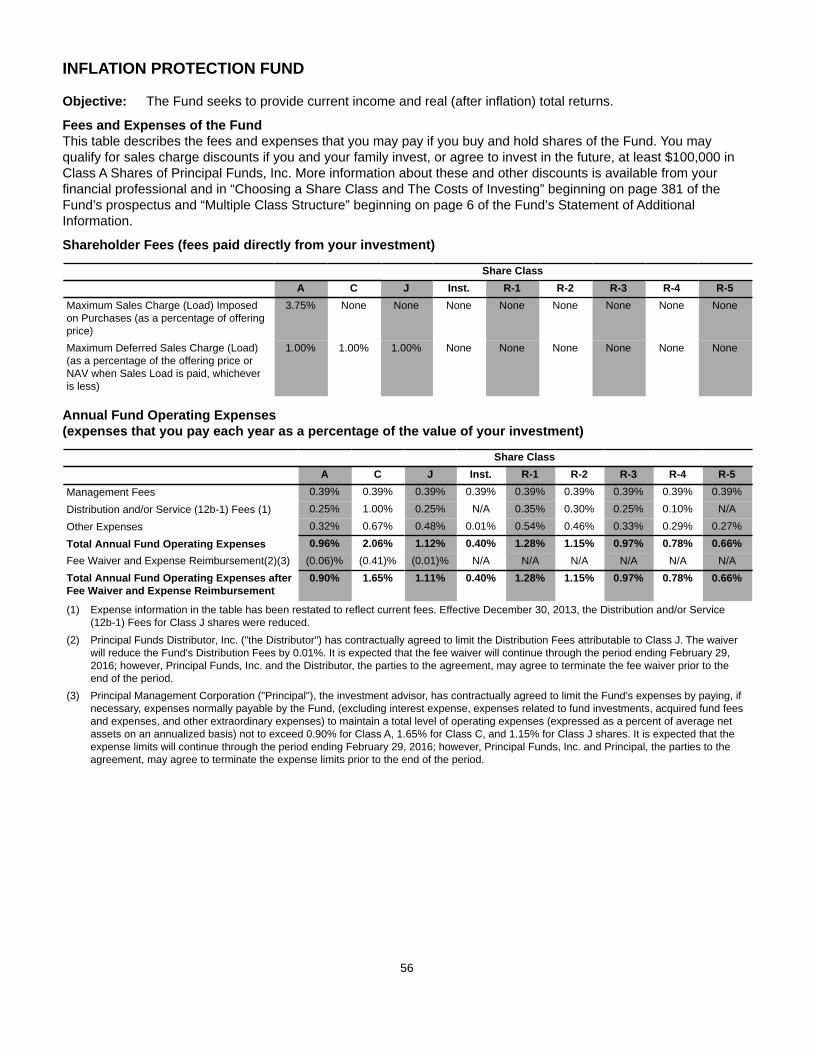
56
INFLATION PROTECTION FUND
Objective: The Fund seeks to provide current income and real (after inflation) total returns.
Fees and Expenses of the FundThis table describes the fees and expenses that you may pay if you buy and hold shares of the Fund. You may qualify for sales charge discounts if you and your family invest, or agree to invest in the future, at least $100,000 in Class A Shares of Principal Funds, Inc. More information about these and other discounts is available from your financial professional and in “Choosing a Share Class and The Costs of Investing” beginning on page 381 of the Fund’s prospectus and “Multiple Class Structure” beginning on page 6 of the Fund’s Statement of Additional Information.
Shareholder Fees (fees paid directly from your investment)
Share ClassA C J Inst. R-1 R-2 R-3 R-4 R-5
Maximum Sales Charge (Load) Imposedon Purchases (as a percentage of offeringprice)
3.75% None None None None None None None None
Maximum Deferred Sales Charge (Load)(as a percentage of the offering price orNAV when Sales Load is paid, whicheveris less)
1.00% 1.00% 1.00% None None None None None None
Annual Fund Operating Expenses (expenses that you pay each year as a percentage of the value of your investment)
Share ClassA C J Inst. R-1 R-2 R-3 R-4 R-5
Management Fees 0.39% 0.39% 0.39% 0.39% 0.39% 0.39% 0.39% 0.39% 0.39%
Distribution and/or Service (12b-1) Fees (1) 0.25% 1.00% 0.25% N/A 0.35% 0.30% 0.25% 0.10% N/A
Other Expenses 0.32% 0.67% 0.48% 0.01% 0.54% 0.46% 0.33% 0.29% 0.27%
Total Annual Fund Operating Expenses 0.96% 2.06% 1.12% 0.40% 1.28% 1.15% 0.97% 0.78% 0.66%Fee Waiver and Expense Reimbursement(2)(3) (0.06)% (0.41)% (0.01)% N/A N/A N/A N/A N/A N/ATotal Annual Fund Operating Expenses afterFee Waiver and Expense Reimbursement
0.90% 1.65% 1.11% 0.40% 1.28% 1.15% 0.97% 0.78% 0.66%
(1) Expense information in the table has been restated to reflect current fees. Effective December 30, 2013, the Distribution and/or Service (12b-1) Fees for Class J shares were reduced.
(2) Principal Funds Distributor, Inc. ("the Distributor") has contractually agreed to limit the Distribution Fees attributable to Class J. The waiver will reduce the Fund's Distribution Fees by 0.01%. It is expected that the fee waiver will continue through the period ending February 29, 2016; however, Principal Funds, Inc. and the Distributor, the parties to the agreement, may agree to terminate the fee waiver prior to the end of the period.
(3) Principal Management Corporation ("Principal"), the investment advisor, has contractually agreed to limit the Fund’s expenses by paying, if necessary, expenses normally payable by the Fund, (excluding interest expense, expenses related to fund investments, acquired fund fees and expenses, and other extraordinary expenses) to maintain a total level of operating expenses (expressed as a percent of average net assets on an annualized basis) not to exceed 0.90% for Class A, 1.65% for Class C, and 1.15% for Class J shares. It is expected that the expense limits will continue through the period ending February 29, 2016; however, Principal Funds, Inc. and Principal, the parties to the agreement, may agree to terminate the expense limits prior to the end of the period.
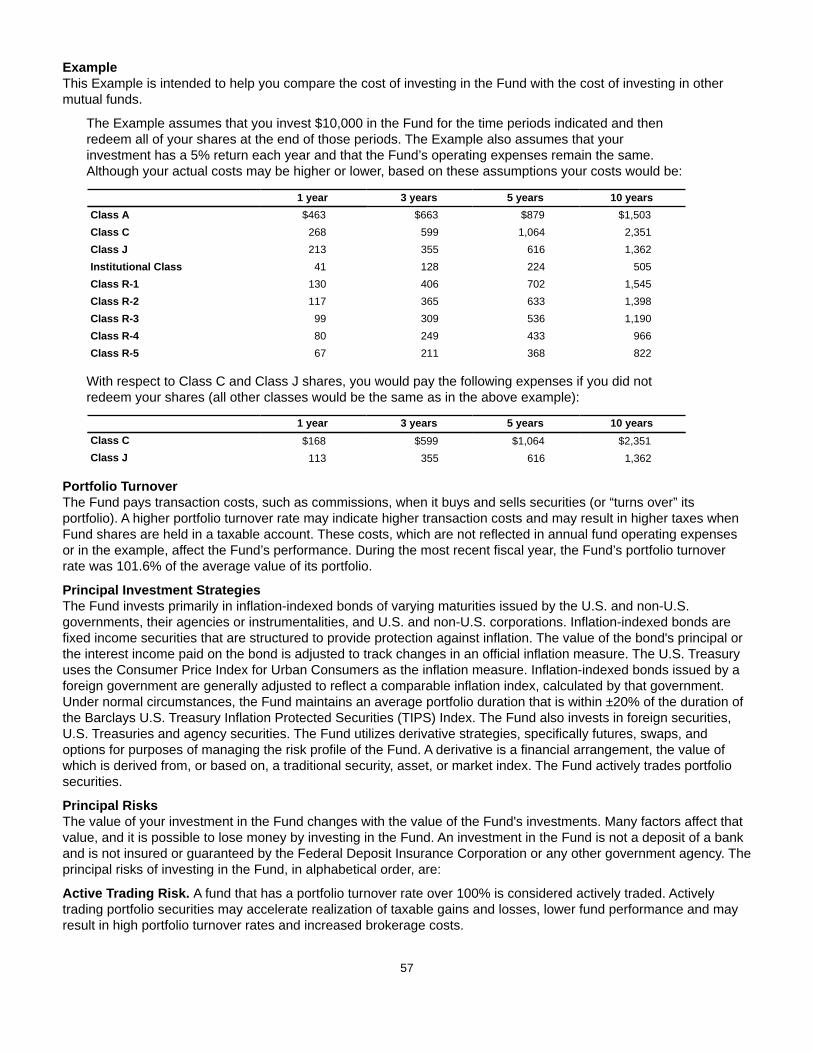
57
ExampleThis Example is intended to help you compare the cost of investing in the Fund with the cost of investing in other mutual funds.
The Example assumes that you invest $10,000 in the Fund for the time periods indicated and then redeem all of your shares at the end of those periods. The Example also assumes that your investment has a 5% return each year and that the Fund’s operating expenses remain the same. Although your actual costs may be higher or lower, based on these assumptions your costs would be:
1 year 3 years 5 years 10 yearsClass A $463 $663 $879 $1,503Class C 268 599 1,064 2,351Class J 213 355 616 1,362Institutional Class 41 128 224 505Class R-1 130 406 702 1,545Class R-2 117 365 633 1,398Class R-3 99 309 536 1,190Class R-4 80 249 433 966Class R-5 67 211 368 822
With respect to Class C and Class J shares, you would pay the following expenses if you did not redeem your shares (all other classes would be the same as in the above example):
1 year 3 years 5 years 10 yearsClass C $168 $599 $1,064 $2,351Class J 113 355 616 1,362
Portfolio TurnoverThe Fund pays transaction costs, such as commissions, when it buys and sells securities (or “turns over” its portfolio). A higher portfolio turnover rate may indicate higher transaction costs and may result in higher taxes when Fund shares are held in a taxable account. These costs, which are not reflected in annual fund operating expenses or in the example, affect the Fund’s performance. During the most recent fiscal year, the Fund’s portfolio turnover rate was 101.6% of the average value of its portfolio.
Principal Investment StrategiesThe Fund invests primarily in inflation-indexed bonds of varying maturities issued by the U.S. and non-U.S. governments, their agencies or instrumentalities, and U.S. and non-U.S. corporations. Inflation-indexed bonds are fixed income securities that are structured to provide protection against inflation. The value of the bond's principal or the interest income paid on the bond is adjusted to track changes in an official inflation measure. The U.S. Treasury uses the Consumer Price Index for Urban Consumers as the inflation measure. Inflation-indexed bonds issued by a foreign government are generally adjusted to reflect a comparable inflation index, calculated by that government. Under normal circumstances, the Fund maintains an average portfolio duration that is within ±20% of the duration of the Barclays U.S. Treasury Inflation Protected Securities (TIPS) Index. The Fund also invests in foreign securities, U.S. Treasuries and agency securities. The Fund utilizes derivative strategies, specifically futures, swaps, and options for purposes of managing the risk profile of the Fund. A derivative is a financial arrangement, the value of which is derived from, or based on, a traditional security, asset, or market index. The Fund actively trades portfolio securities.
Principal RisksThe value of your investment in the Fund changes with the value of the Fund's investments. Many factors affect that value, and it is possible to lose money by investing in the Fund. An investment in the Fund is not a deposit of a bank and is not insured or guaranteed by the Federal Deposit Insurance Corporation or any other government agency. The principal risks of investing in the Fund, in alphabetical order, are:
Active Trading Risk. A fund that has a portfolio turnover rate over 100% is considered actively traded. Actively trading portfolio securities may accelerate realization of taxable gains and losses, lower fund performance and may result in high portfolio turnover rates and increased brokerage costs.

58
Counterparty Risk. Counterparty risk is the risk that the counterparty to a derivatives contract or repurchase agreement, the borrower of a portfolio’s securities, or other obligation, will be unable or unwilling to make timely principal, interest, or settlement payments, or otherwise to honor its obligations.
Currency Risk. Risks of investing in securities denominated in, or that trade in, foreign (non-U.S.) currencies include changes in foreign exchange rates and foreign exchange restrictions.
Derivatives Risk. Transactions in derivatives may increase volatility, cause the liquidation of portfolio positions when not advantageous to do so and produce disproportionate losses.
Fixed-Income Securities Risk. Fixed-income securities are subject to interest rate risk and credit quality risk. The market value of fixed-income securities generally declines when interest rates rise, and an issuer of fixed-income securities could default on its payment obligations.
Foreign Securities Risk. The risks of foreign securities include loss of value as a result of: political or economic instability; nationalization, expropriation or confiscatory taxation; settlement delays; and limited government regulation (including less stringent reporting, accounting, and disclosure standards than are required of U.S. companies).
Portfolio Duration Risk. Portfolio duration is a measure of the expected life of a fixed-income security and its sensitivity to changes in interest rates. The longer a fund's average portfolio duration, the more sensitive the fund will be to changes in interest rates.
Risk of Being an Underlying Fund. A fund is subject to the risk of being an underlying fund to the extent that a fund of funds invests in the fund. An underlying fund of a fund of funds may experience relatively large redemptions or investments as the fund of funds periodically reallocates or rebalances its assets. These transactions may cause the underlying fund to sell portfolio securities to meet such redemptions, or to invest cash from such investments, at times it would not otherwise do so, and may as a result increase transaction costs and adversely affect underlying fund performance.
U.S. Government Securities Risk. Yields available from U.S. government securities are generally lower than yields from many other fixed-income securities.
U.S. Government Sponsored Securities Risk. Securities issued by U.S. government-sponsored or -chartered enterprises such as the Federal Home Loan Mortgage Corporation, the Federal National Mortgage Association, and the Federal Home Loan Banks are not issued or guaranteed by the U.S. Treasury.
PerformanceThe following information provides some indication of the risks of investing in the Fund. Past performance (before and after taxes) is not necessarily an indication of how the Fund will perform in the future. You may get updated performance information by calling 1-800-222-5852 or online at:• For Classes A, C, and J - www.principalfunds.com.• For Classes Institutional, R-1, R-2, R-3, R-4, and R-5 - www.principal.com.
The bar chart shows the investment returns of the Fund’s Class A shares for each full calendar year of operations for 10 years (or, if shorter, the life of the Fund). The table shows, for each share class of the Fund and for the last one, five, and ten calendar year periods (or, if shorter, the life of the Fund), how the Fund’s average annual total returns compare with those of one or more broad measures of market performance.
For periods prior to the inception date of Class A shares (June 28, 2005) and Class C shares (January 16, 2007), performance shown in the bar chart and the table for these classes is based on the performance of the Fund's Institutional Class shares adjusted to reflect the respective fees and expenses of each class. The adjustments result in performance for such periods that is no higher than the historical performance of the Fund's Institutional Class shares, which were first sold December 29, 2004.
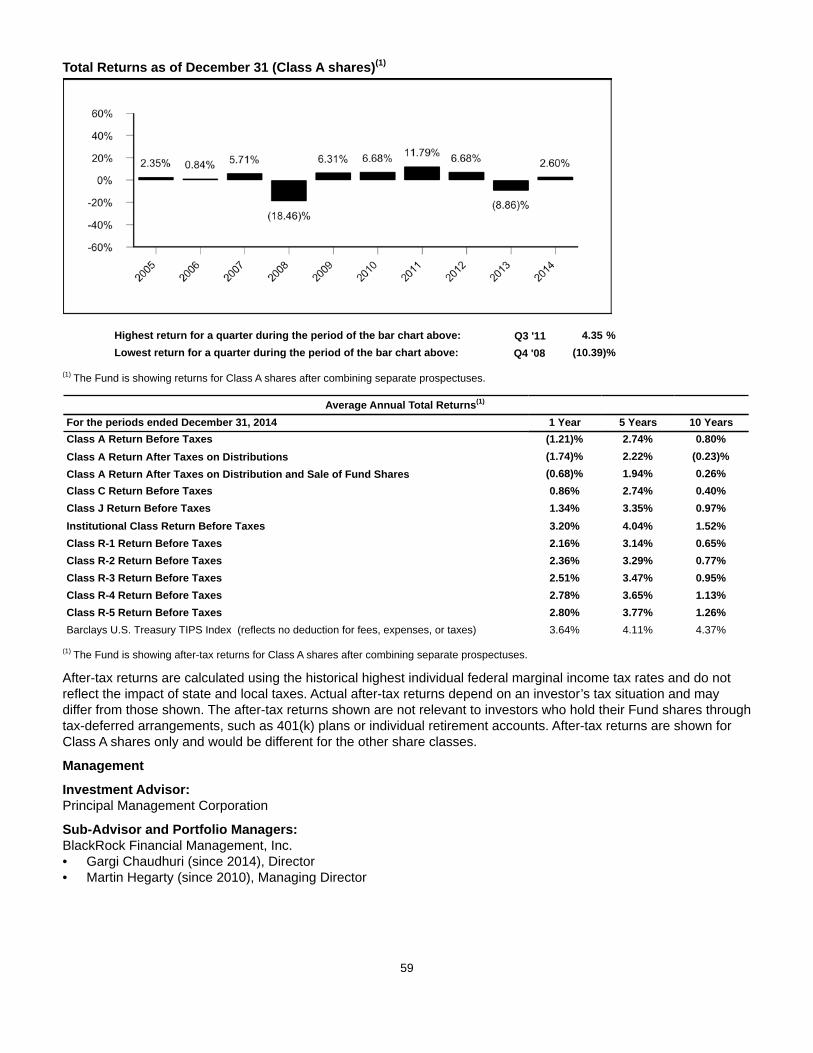
59
Total Returns as of December 31 (Class A shares)(1)
Highest return for a quarter during the period of the bar chart above: Q3 '11 4.35 %Lowest return for a quarter during the period of the bar chart above: Q4 '08 (10.39)%
(1) The Fund is showing returns for Class A shares after combining separate prospectuses.
Average Annual Total Returns(1)
For the periods ended December 31, 2014 1 Year 5 Years 10 YearsClass A Return Before Taxes (1.21)% 2.74% 0.80%Class A Return After Taxes on Distributions (1.74)% 2.22% (0.23)%Class A Return After Taxes on Distribution and Sale of Fund Shares (0.68)% 1.94% 0.26%Class C Return Before Taxes 0.86% 2.74% 0.40%Class J Return Before Taxes 1.34% 3.35% 0.97%Institutional Class Return Before Taxes 3.20% 4.04% 1.52%Class R-1 Return Before Taxes 2.16% 3.14% 0.65%Class R-2 Return Before Taxes 2.36% 3.29% 0.77%Class R-3 Return Before Taxes 2.51% 3.47% 0.95%Class R-4 Return Before Taxes 2.78% 3.65% 1.13%Class R-5 Return Before Taxes 2.80% 3.77% 1.26%Barclays U.S. Treasury TIPS Index (reflects no deduction for fees, expenses, or taxes) 3.64% 4.11% 4.37%
(1) The Fund is showing after-tax returns for Class A shares after combining separate prospectuses.
After-tax returns are calculated using the historical highest individual federal marginal income tax rates and do not reflect the impact of state and local taxes. Actual after-tax returns depend on an investor’s tax situation and may differ from those shown. The after-tax returns shown are not relevant to investors who hold their Fund shares through tax-deferred arrangements, such as 401(k) plans or individual retirement accounts. After-tax returns are shown for Class A shares only and would be different for the other share classes.
Management
Investment Advisor:Principal Management Corporation
Sub-Advisor and Portfolio Managers: BlackRock Financial Management, Inc. • Gargi Chaudhuri (since 2014), Director• Martin Hegarty (since 2010), Managing Director

60
Purchase and Sale of Fund Shares
Share Class Investment TypePurchase Minimum
Per FundA, C, and J Initial Investment $1,000(1)
A, C, and J For accounts with an Automatic Investment Plan (AIP) $100A, C, and J Subsequent Investments $100(1)
Institutional, R-1, R-2, R-3, R-4, andR-5
There are no minimum initial or subsequent investment requirements foreligible purchases.
N/A
(1) Some exceptions apply; see "Purchase of Fund Shares - Minimum Investments" for more information.(2) For accounts with an AIP, the subsequent automatic investments must total $1,200 annually if the initial $1,000 minimum has not been met.
You may purchase or redeem shares on any business day (normally any day when the New York Stock Exchange is open for regular trading) through your plan, intermediary, or Financial Professional; by sending a written request to Principal Funds at P.O. Box 8024, Boston, MA 02266-8024 (regular mail) or 30 Dan Road, Canton, MA 02021-2809 (overnight mail); calling us at 1-800-222-5852; or accessing our website (www.principalfunds.com).
Tax InformationThe Fund’s distributions you receive are generally subject to federal income tax as ordinary income or capital gain and may also be subject to state and local taxes, unless you are tax-exempt or your account is tax-deferred in which case your distributions would be taxed when withdrawn from the tax-deferred account.
Payments to Broker-Dealers and Other Financial IntermediariesIf you purchase the Fund through a broker-dealer or other financial intermediary (such as a bank, insurance company, investment adviser, etc.), the Fund and its related companies may pay the intermediary for the sale of Fund shares and related services. These payments may create a conflict of interest by influencing the broker-dealer or other intermediary and your salesperson to recommend the Fund over another investment, or to recommend one share class of the Fund over another share class. Ask your salesperson or visit your financial intermediary's website for more information.
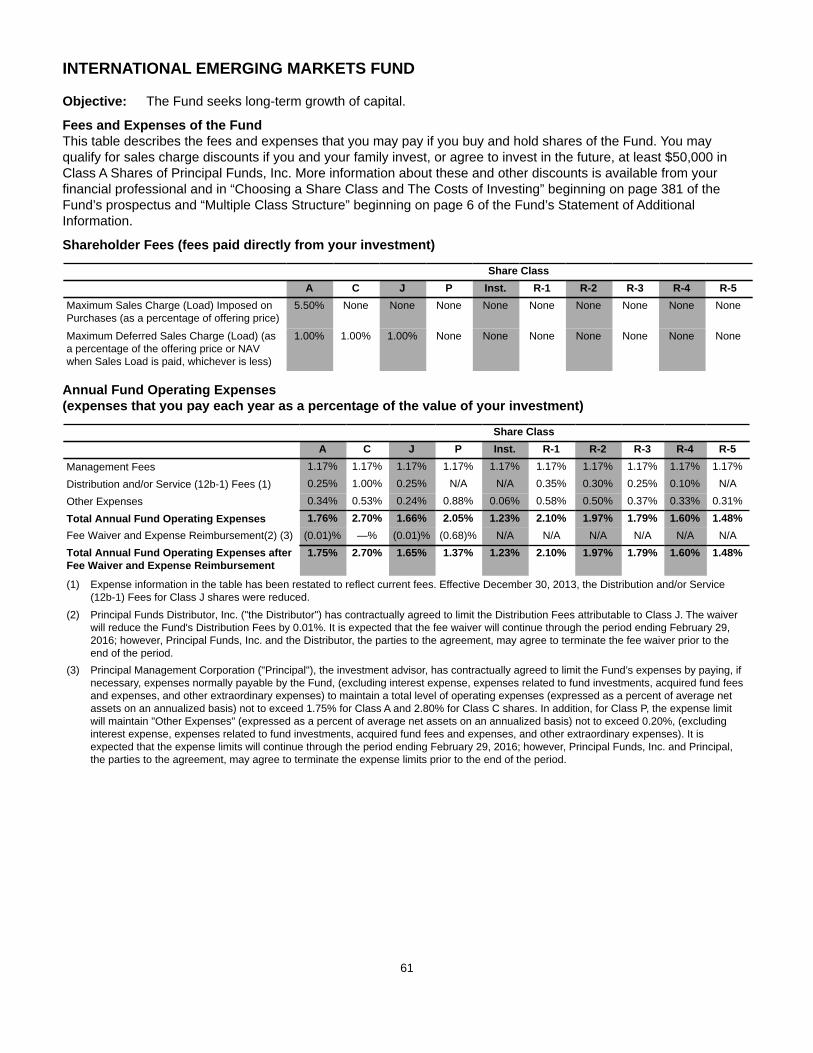
61
INTERNATIONAL EMERGING MARKETS FUND
Objective: The Fund seeks long-term growth of capital.
Fees and Expenses of the FundThis table describes the fees and expenses that you may pay if you buy and hold shares of the Fund. You may qualify for sales charge discounts if you and your family invest, or agree to invest in the future, at least $50,000 in Class A Shares of Principal Funds, Inc. More information about these and other discounts is available from your financial professional and in “Choosing a Share Class and The Costs of Investing” beginning on page 381 of the Fund’s prospectus and “Multiple Class Structure” beginning on page 6 of the Fund’s Statement of Additional Information.
Shareholder Fees (fees paid directly from your investment)
Share ClassA C J P Inst. R-1 R-2 R-3 R-4 R-5
Maximum Sales Charge (Load) Imposed onPurchases (as a percentage of offering price)
5.50% None None None None None None None None None
Maximum Deferred Sales Charge (Load) (asa percentage of the offering price or NAVwhen Sales Load is paid, whichever is less)
1.00% 1.00% 1.00% None None None None None None None
Annual Fund Operating Expenses (expenses that you pay each year as a percentage of the value of your investment)
Share ClassA C J P Inst. R-1 R-2 R-3 R-4 R-5
Management Fees 1.17% 1.17% 1.17% 1.17% 1.17% 1.17% 1.17% 1.17% 1.17% 1.17%
Distribution and/or Service (12b-1) Fees (1) 0.25% 1.00% 0.25% N/A N/A 0.35% 0.30% 0.25% 0.10% N/A
Other Expenses 0.34% 0.53% 0.24% 0.88% 0.06% 0.58% 0.50% 0.37% 0.33% 0.31%
Total Annual Fund Operating Expenses 1.76% 2.70% 1.66% 2.05% 1.23% 2.10% 1.97% 1.79% 1.60% 1.48%Fee Waiver and Expense Reimbursement(2) (3) (0.01)% —% (0.01)% (0.68)% N/A N/A N/A N/A N/A N/ATotal Annual Fund Operating Expenses afterFee Waiver and Expense Reimbursement
1.75% 2.70% 1.65% 1.37% 1.23% 2.10% 1.97% 1.79% 1.60% 1.48%
(1) Expense information in the table has been restated to reflect current fees. Effective December 30, 2013, the Distribution and/or Service (12b-1) Fees for Class J shares were reduced.
(2) Principal Funds Distributor, Inc. ("the Distributor") has contractually agreed to limit the Distribution Fees attributable to Class J. The waiver will reduce the Fund's Distribution Fees by 0.01%. It is expected that the fee waiver will continue through the period ending February 29, 2016; however, Principal Funds, Inc. and the Distributor, the parties to the agreement, may agree to terminate the fee waiver prior to the end of the period.
(3) Principal Management Corporation ("Principal"), the investment advisor, has contractually agreed to limit the Fund’s expenses by paying, if necessary, expenses normally payable by the Fund, (excluding interest expense, expenses related to fund investments, acquired fund fees and expenses, and other extraordinary expenses) to maintain a total level of operating expenses (expressed as a percent of average net assets on an annualized basis) not to exceed 1.75% for Class A and 2.80% for Class C shares. In addition, for Class P, the expense limit will maintain "Other Expenses" (expressed as a percent of average net assets on an annualized basis) not to exceed 0.20%, (excluding interest expense, expenses related to fund investments, acquired fund fees and expenses, and other extraordinary expenses). It is expected that the expense limits will continue through the period ending February 29, 2016; however, Principal Funds, Inc. and Principal, the parties to the agreement, may agree to terminate the expense limits prior to the end of the period.
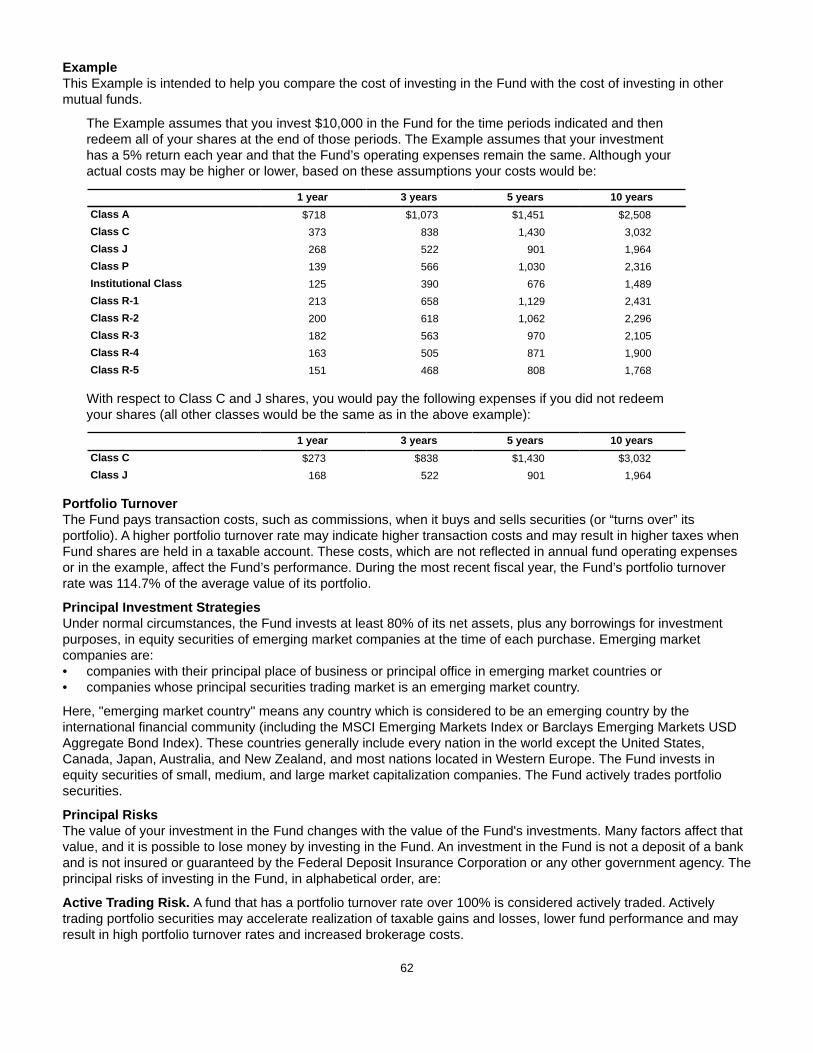
62
ExampleThis Example is intended to help you compare the cost of investing in the Fund with the cost of investing in other mutual funds.
The Example assumes that you invest $10,000 in the Fund for the time periods indicated and then redeem all of your shares at the end of those periods. The Example assumes that your investment has a 5% return each year and that the Fund’s operating expenses remain the same. Although your actual costs may be higher or lower, based on these assumptions your costs would be:
1 year 3 years 5 years 10 yearsClass A $718 $1,073 $1,451 $2,508Class C 373 838 1,430 3,032Class J 268 522 901 1,964Class P 139 566 1,030 2,316Institutional Class 125 390 676 1,489Class R-1 213 658 1,129 2,431Class R-2 200 618 1,062 2,296Class R-3 182 563 970 2,105Class R-4 163 505 871 1,900Class R-5 151 468 808 1,768
With respect to Class C and J shares, you would pay the following expenses if you did not redeem your shares (all other classes would be the same as in the above example):
1 year 3 years 5 years 10 yearsClass C $273 $838 $1,430 $3,032Class J 168 522 901 1,964
Portfolio TurnoverThe Fund pays transaction costs, such as commissions, when it buys and sells securities (or “turns over” its portfolio). A higher portfolio turnover rate may indicate higher transaction costs and may result in higher taxes when Fund shares are held in a taxable account. These costs, which are not reflected in annual fund operating expenses or in the example, affect the Fund’s performance. During the most recent fiscal year, the Fund’s portfolio turnover rate was 114.7% of the average value of its portfolio.
Principal Investment StrategiesUnder normal circumstances, the Fund invests at least 80% of its net assets, plus any borrowings for investment purposes, in equity securities of emerging market companies at the time of each purchase. Emerging market companies are:• companies with their principal place of business or principal office in emerging market countries or• companies whose principal securities trading market is an emerging market country.
Here, "emerging market country" means any country which is considered to be an emerging country by the international financial community (including the MSCI Emerging Markets Index or Barclays Emerging Markets USD Aggregate Bond Index). These countries generally include every nation in the world except the United States, Canada, Japan, Australia, and New Zealand, and most nations located in Western Europe. The Fund invests in equity securities of small, medium, and large market capitalization companies. The Fund actively trades portfolio securities.
Principal RisksThe value of your investment in the Fund changes with the value of the Fund's investments. Many factors affect that value, and it is possible to lose money by investing in the Fund. An investment in the Fund is not a deposit of a bank and is not insured or guaranteed by the Federal Deposit Insurance Corporation or any other government agency. The principal risks of investing in the Fund, in alphabetical order, are:
Active Trading Risk. A fund that has a portfolio turnover rate over 100% is considered actively traded. Actively trading portfolio securities may accelerate realization of taxable gains and losses, lower fund performance and may result in high portfolio turnover rates and increased brokerage costs.
63
Currency Risk. Risks of investing in securities denominated in, or that trade in, foreign (non-U.S.) currencies include changes in foreign exchange rates and foreign exchange restrictions.
Emerging Market Risk. Investments in emerging market countries may have more risk than those in developed market countries because the emerging markets are less developed and more illiquid. Emerging market countries can also be subject to increased social, economic, regulatory, and political uncertainties and can be extremely volatile.
Equity Securities Risk. The value of equity securities could decline if the issuer's financial condition declines or in response to overall market and economic conditions. A fund's principal market segment(s), such as large cap, mid cap or small cap stocks, or growth or value stocks, may underperform other market segments or the equity markets as a whole. Investments in smaller companies and mid-size companies may involve greater risk and price volatility than investments in larger, more mature companies.
Foreign Securities Risk. The risks of foreign securities include loss of value as a result of: political or economic instability; nationalization, expropriation or confiscatory taxation; settlement delays; and limited government regulation (including less stringent reporting, accounting, and disclosure standards than are required of U.S. companies).
Risk of Being an Underlying Fund. A fund is subject to the risk of being an underlying fund to the extent that a fund of funds invests in the fund. An underlying fund of a fund of funds may experience relatively large redemptions or investments as the fund of funds periodically reallocates or rebalances its assets. These transactions may cause the underlying fund to sell portfolio securities to meet such redemptions, or to invest cash from such investments, at times it would not otherwise do so, and may as a result increase transaction costs and adversely affect underlying fund performance.
PerformanceThe following information provides some indication of the risks of investing in the Fund. Past performance (before and after taxes) is not necessarily an indication of how the Fund will perform in the future. You may get updated performance information by calling 1-800-222-5852 or online at:• For Classes A, C, J, and P - www.principalfunds.com.• For Classes Institutional, R-1, R-2, R-3, R-4, and R-5 - www.principal.com.
The bar chart shows the investment returns of the Fund’s Class A shares for each full calendar year of operations for 10 years (or, if shorter, the life of the Fund). The table shows, for each share class of the Fund and for the last one, five, and ten calendar year periods (or, if shorter, the life of the Fund), how the Fund’s average annual total returns compare with those of one or more broad measures of market performance.
For periods prior to the inception date of Class A shares (June 28, 2005), Class C shares (January 16, 2007) and Class P shares (September 27, 2010), performance shown in the bar chart and the table for these classes is based on the performance of the Fund’s Class R-3 shares adjusted to reflect the respective fees and expenses of each class. The adjustments result in performance for such periods that is no higher than the historical performance of the Fund's Class R-3 shares, which were first sold December 6, 2000.

64
Total Returns as of December 31 (Class A shares)(1)
Highest return for a quarter during the period of the bar chart above: Q2 '09 28.76 %Lowest return for a quarter during the period of the bar chart above: Q3 '08 (29.21)%
(1) The Fund is showing returns for Class A shares after combining separate prospectuses.
Average Annual Total Returns(1)
For the periods ended December 31, 2014 1 Year 5 Years 10 YearsClass A Return Before Taxes (9.52)% (0.07)% 6.96%Class A Return After Taxes on Distributions (9.70)% 0.02% 6.12%Class A Return After Taxes on Distribution and Sale of Fund Shares (5.11)% 0.19% 5.71%Class C Return Before Taxes (6.12)% 0.11% 6.63%Class J Return Before Taxes (5.09)% 1.16% 7.61%Class P Return Before Taxes (3.89)% 1.44% 7.81%Institutional Class Return Before Taxes (3.77)% 1.62% 8.21%Class R-1 Return Before Taxes (4.57)% 0.75% 7.28%Class R-2 Return Before Taxes (4.48)% 0.88% 7.42%Class R-3 Return Before Taxes (4.32)% 1.06% 7.61%Class R-4 Return Before Taxes (4.11)% 1.26% 7.82%Class R-5 Return Before Taxes (3.99)% 1.39% 7.94%MSCI Emerging Markets NDTR D Index (reflects no deduction for fees, expenses, or taxes) (2.19)% 1.78% 8.43%
(1) The Fund is showing after-tax returns for Class A shares after combining separate prospectuses.
After-tax returns are calculated using the historical highest individual federal marginal income tax rates and do not reflect the impact of state and local taxes. Actual after-tax returns depend on an investor’s tax situation and may differ from those shown. The after-tax returns shown are not relevant to investors who hold their Fund shares through tax-deferred arrangements, such as 401(k) plans or individual retirement accounts. After-tax returns are shown for Class A shares only and would be different for the other share classes.
Management
Investment Advisor: Principal Management Corporation
Sub-Advisor and Portfolio Managers: Principal Global Investors, LLC • Mihail Dobrinov (since 2007), Portfolio Manager• Alan Wang (since 2014), Portfolio Manager• Mohammed Zaidi (since 2012), Portfolio Manager

65
Purchase and Sale of Fund Shares
Share Class Investment TypePurchase Minimum
Per FundA, C, and J Initial Investment $1,000(1)
A, C, and J For accounts with an Automatic Investment Plan (AIP) $100A, C, and J Subsequent Investments $100(1)(2)
P, Institutional, R-1, R-2, R-3, R-4,and R-5
There are no minimum initial or subsequent investment requirements foreligible purchases.
N/A
(1) Some exceptions apply; see "Purchase of Fund Shares - Minimum Investments" for more information.(2) For accounts with an AIP, the subsequent automatic investments must total $1,200 annually if the initial $1,000 minimum has not been met.
You may purchase or redeem shares on any business day (normally any day when the New York Stock Exchange is open for regular trading) through your plan, intermediary, or Financial Professional; by sending a written request to Principal Funds at P.O. Box 8024, Boston, MA 02266-8024 (regular mail) or 30 Dan Road, Canton, MA 02021-2809 (overnight mail); calling us at 1-800-222-5852; or accessing our website (www.principalfunds.com).
Tax InformationThe Fund’s distributions you receive are generally subject to federal income tax as ordinary income or capital gain and may also be subject to state and local taxes, unless you are tax-exempt or your account is tax-deferred in which case your distributions would be taxed when withdrawn from the tax-deferred account.
Payments to Broker-Dealers and Other Financial IntermediariesIf you purchase the Fund through a broker-dealer or other financial intermediary (such as a bank, insurance company, investment adviser, etc.), the Fund and its related companies may pay the intermediary for the sale of Fund shares and related services. These payments may create a conflict of interest by influencing the broker-dealer or other intermediary and your salesperson to recommend the Fund over another investment, or to recommend one share class of the Fund over another share class. Ask your salesperson or visit your financial intermediary's website for more information.
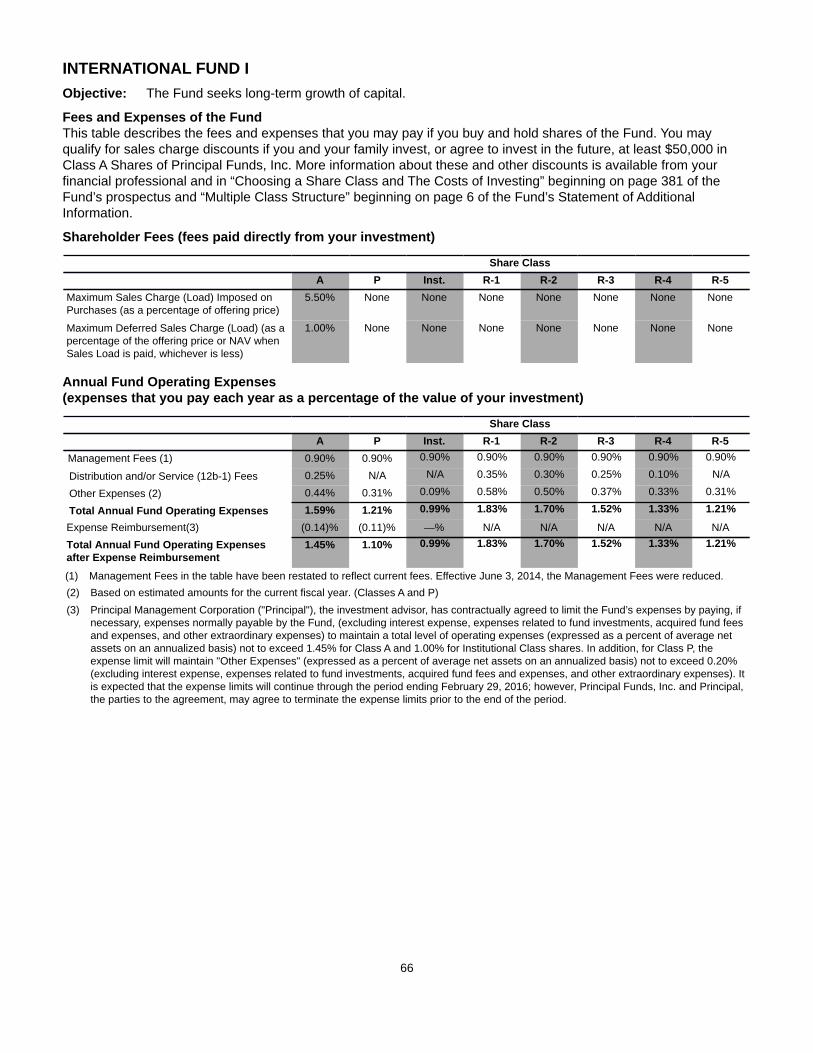
66
INTERNATIONAL FUND IObjective: The Fund seeks long-term growth of capital.
Fees and Expenses of the FundThis table describes the fees and expenses that you may pay if you buy and hold shares of the Fund. You may qualify for sales charge discounts if you and your family invest, or agree to invest in the future, at least $50,000 in Class A Shares of Principal Funds, Inc. More information about these and other discounts is available from your financial professional and in “Choosing a Share Class and The Costs of Investing” beginning on page 381 of the Fund’s prospectus and “Multiple Class Structure” beginning on page 6 of the Fund’s Statement of Additional Information.
Shareholder Fees (fees paid directly from your investment)
Share ClassA P Inst. R-1 R-2 R-3 R-4 R-5
Maximum Sales Charge (Load) Imposed onPurchases (as a percentage of offering price)
5.50% None None None None None None None
Maximum Deferred Sales Charge (Load) (as apercentage of the offering price or NAV whenSales Load is paid, whichever is less)
1.00% None None None None None None None
Annual Fund Operating Expenses (expenses that you pay each year as a percentage of the value of your investment)
Share ClassA P Inst. R-1 R-2 R-3 R-4 R-5
Management Fees (1) 0.90% 0.90% 0.90% 0.90% 0.90% 0.90% 0.90% 0.90%
Distribution and/or Service (12b-1) Fees 0.25% N/A N/A 0.35% 0.30% 0.25% 0.10% N/A
Other Expenses (2) 0.44% 0.31% 0.09% 0.58% 0.50% 0.37% 0.33% 0.31%
Total Annual Fund Operating Expenses 1.59% 1.21% 0.99% 1.83% 1.70% 1.52% 1.33% 1.21%
Expense Reimbursement(3) (0.14)% (0.11)% —% N/A N/A N/A N/A N/ATotal Annual Fund Operating Expensesafter Expense Reimbursement
1.45% 1.10% 0.99% 1.83% 1.70% 1.52% 1.33% 1.21%
(1) Management Fees in the table have been restated to reflect current fees. Effective June 3, 2014, the Management Fees were reduced.(2) Based on estimated amounts for the current fiscal year. (Classes A and P)(3) Principal Management Corporation ("Principal"), the investment advisor, has contractually agreed to limit the Fund’s expenses by paying, if
necessary, expenses normally payable by the Fund, (excluding interest expense, expenses related to fund investments, acquired fund fees and expenses, and other extraordinary expenses) to maintain a total level of operating expenses (expressed as a percent of average net assets on an annualized basis) not to exceed 1.45% for Class A and 1.00% for Institutional Class shares. In addition, for Class P, the expense limit will maintain "Other Expenses" (expressed as a percent of average net assets on an annualized basis) not to exceed 0.20% (excluding interest expense, expenses related to fund investments, acquired fund fees and expenses, and other extraordinary expenses). It is expected that the expense limits will continue through the period ending February 29, 2016; however, Principal Funds, Inc. and Principal, the parties to the agreement, may agree to terminate the expense limits prior to the end of the period.

67
ExampleThis Example is intended to help you compare the cost of investing in the Fund with the cost of investing in other mutual funds.
The Example assumes that you invest $10,000 in the Fund for the time periods indicated. The Example also assumes that your investment has a 5% return each year and that the Fund’s operating expenses remain the same. Although your actual costs may be higher or lower, based on these assumptions your costs would be:
1 year 3 years 5 years 10 yearsClass A $689 $1,009Class P 112 371Institutional Class 101 315 $547 $1,213Class R-1 186 576 990 2,148Class R-2 173 536 923 2,009Class R-3 155 480 829 1,813Class R-4 135 421 729 1,601Class R-5 123 384 665 1,466
Portfolio TurnoverThe Fund pays transaction costs, such as commissions, when it buys and sells securities (or “turns over” its portfolio). A higher portfolio turnover rate may indicate higher transaction costs and may result in higher taxes when Fund shares are held in a taxable account. These costs, which are not reflected in annual fund operating expenses or in the example, affect the Fund’s performance. During the most recent fiscal year, the Fund’s portfolio turnover rate was 128.4% of the average value of its portfolio.
Principal Investment StrategiesThe Fund invests primarily in foreign equity securities. Usually, the Fund's investments are diversified across many different countries and regions, including countries with emerging markets. The Fund typically invests in foreign securities of at least ten countries. The Fund invests in equity securities of small, medium, and large market capitalization companies.
The Fund invests in value equity securities, an investment strategy that emphasizes buying equity securities that appear to be undervalued. The Fund also invests in growth equity securities; growth orientation emphasizes buying equity securities of companies whose potential for growth of capital and earnings is expected to be above average. The Fund actively trades portfolio securities.
Principal RisksThe value of your investment in the Fund changes with the value of the Fund's investments. Many factors affect that value, and it is possible to lose money by investing in the Fund. An investment in the Fund is not a deposit of a bank and is not insured or guaranteed by the Federal Deposit Insurance Corporation or any other government agency. The principal risks of investing in the Fund, in alphabetical order, are:
Active Trading Risk. A fund that has a portfolio turnover rate over 100% is considered actively traded. Actively trading portfolio securities may accelerate realization of taxable gains and losses, lower fund performance and may result in high portfolio turnover rates and increased brokerage costs.
Currency Risk. Risks of investing in securities denominated in, or that trade in, foreign (non-U.S.) currencies include changes in foreign exchange rates and foreign exchange restrictions.
Emerging Market Risk. Investments in emerging market countries may have more risk than those in developed market countries because the emerging markets are less developed and more illiquid. Emerging market countries can also be subject to increased social, economic, regulatory, and political uncertainties and can be extremely volatile.
Equity Securities Risk. The value of equity securities could decline if the issuer's financial condition declines or in response to overall market and economic conditions. A fund's principal market segment(s), such as large cap, mid cap or small cap stocks, or growth or value stocks, may underperform other market segments or the equity markets as a whole. Investments in smaller companies and mid-size companies may involve greater risk and price volatility than investments in larger, more mature companies.
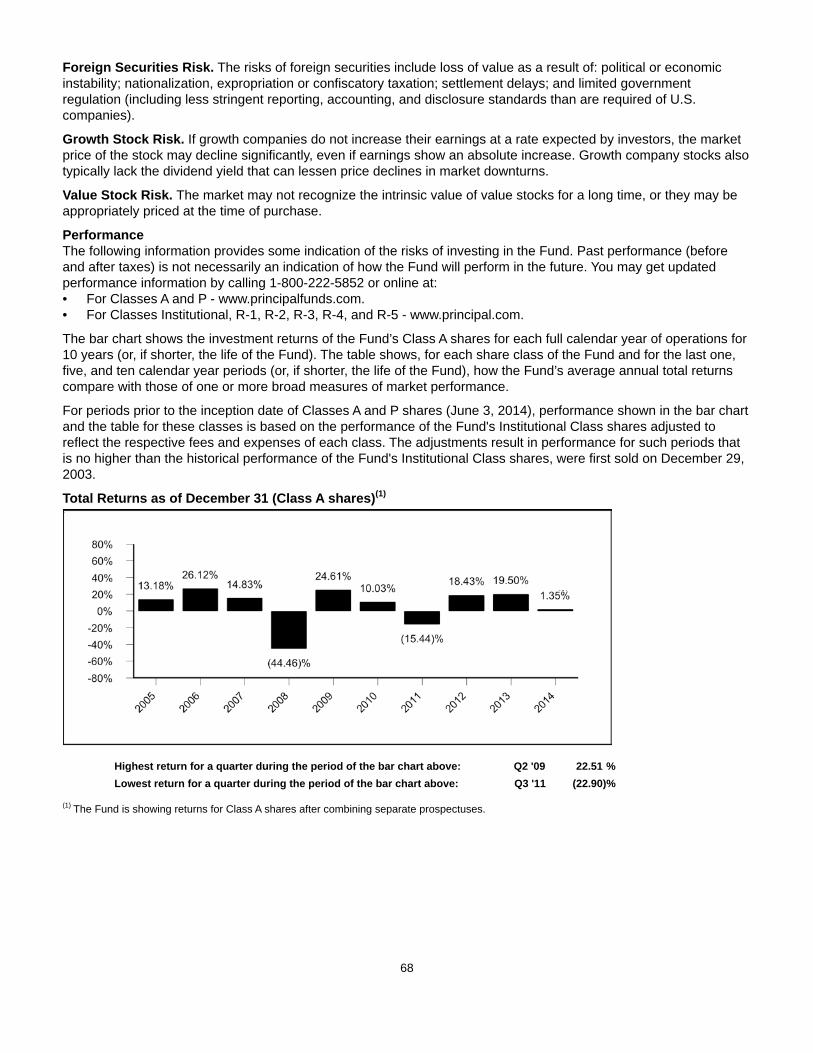
68
Foreign Securities Risk. The risks of foreign securities include loss of value as a result of: political or economic instability; nationalization, expropriation or confiscatory taxation; settlement delays; and limited government regulation (including less stringent reporting, accounting, and disclosure standards than are required of U.S. companies).
Growth Stock Risk. If growth companies do not increase their earnings at a rate expected by investors, the market price of the stock may decline significantly, even if earnings show an absolute increase. Growth company stocks also typically lack the dividend yield that can lessen price declines in market downturns.
Value Stock Risk. The market may not recognize the intrinsic value of value stocks for a long time, or they may be appropriately priced at the time of purchase.
PerformanceThe following information provides some indication of the risks of investing in the Fund. Past performance (before and after taxes) is not necessarily an indication of how the Fund will perform in the future. You may get updated performance information by calling 1-800-222-5852 or online at:• For Classes A and P - www.principalfunds.com.• For Classes Institutional, R-1, R-2, R-3, R-4, and R-5 - www.principal.com.
The bar chart shows the investment returns of the Fund’s Class A shares for each full calendar year of operations for 10 years (or, if shorter, the life of the Fund). The table shows, for each share class of the Fund and for the last one, five, and ten calendar year periods (or, if shorter, the life of the Fund), how the Fund’s average annual total returns compare with those of one or more broad measures of market performance.
For periods prior to the inception date of Classes A and P shares (June 3, 2014), performance shown in the bar chart and the table for these classes is based on the performance of the Fund's Institutional Class shares adjusted to reflect the respective fees and expenses of each class. The adjustments result in performance for such periods that is no higher than the historical performance of the Fund's Institutional Class shares, were first sold on December 29, 2003.
Total Returns as of December 31 (Class A shares)(1)
Highest return for a quarter during the period of the bar chart above: Q2 '09 22.51 %Lowest return for a quarter during the period of the bar chart above: Q3 '11 (22.90)%
(1) The Fund is showing returns for Class A shares after combining separate prospectuses.
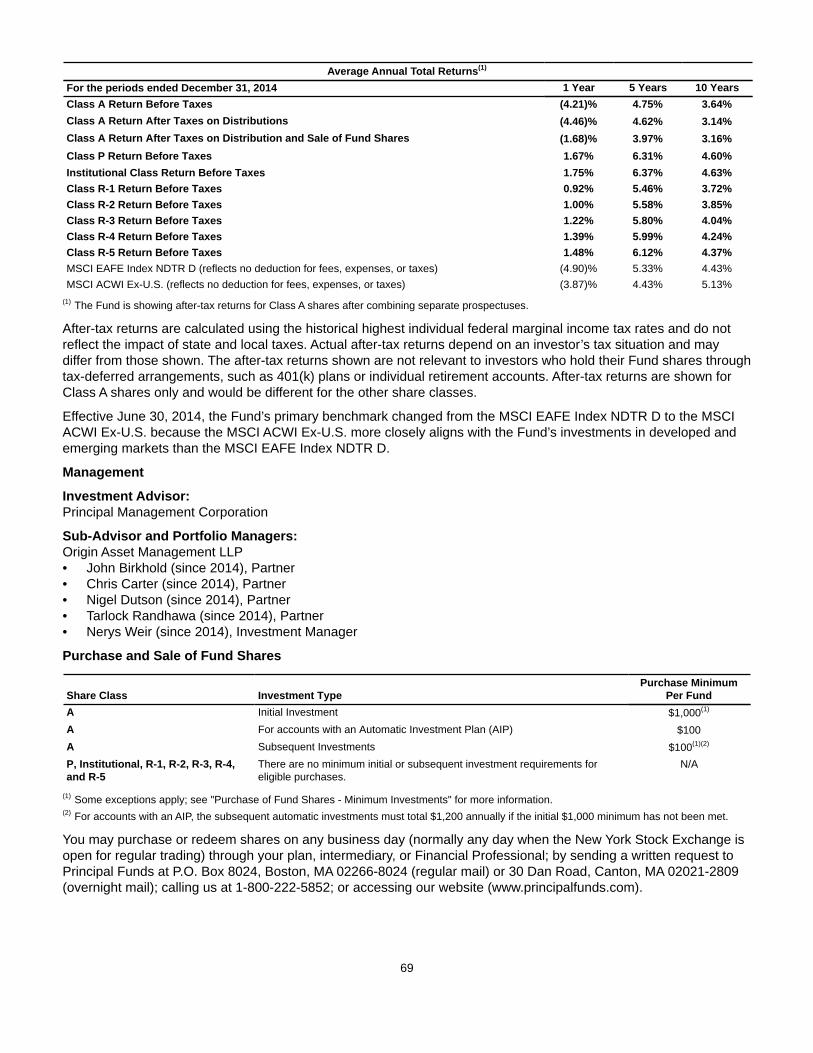
69
Average Annual Total Returns(1)
For the periods ended December 31, 2014 1 Year 5 Years 10 YearsClass A Return Before Taxes (4.21)% 4.75% 3.64%Class A Return After Taxes on Distributions (4.46)% 4.62% 3.14%Class A Return After Taxes on Distribution and Sale of Fund Shares (1.68)% 3.97% 3.16%Class P Return Before Taxes 1.67% 6.31% 4.60%Institutional Class Return Before Taxes 1.75% 6.37% 4.63%Class R-1 Return Before Taxes 0.92% 5.46% 3.72%Class R-2 Return Before Taxes 1.00% 5.58% 3.85%Class R-3 Return Before Taxes 1.22% 5.80% 4.04%Class R-4 Return Before Taxes 1.39% 5.99% 4.24%Class R-5 Return Before Taxes 1.48% 6.12% 4.37%MSCI EAFE Index NDTR D (reflects no deduction for fees, expenses, or taxes) (4.90)% 5.33% 4.43%MSCI ACWI Ex-U.S. (reflects no deduction for fees, expenses, or taxes) (3.87)% 4.43% 5.13%
(1) The Fund is showing after-tax returns for Class A shares after combining separate prospectuses.
After-tax returns are calculated using the historical highest individual federal marginal income tax rates and do not reflect the impact of state and local taxes. Actual after-tax returns depend on an investor’s tax situation and may differ from those shown. The after-tax returns shown are not relevant to investors who hold their Fund shares through tax-deferred arrangements, such as 401(k) plans or individual retirement accounts. After-tax returns are shown for Class A shares only and would be different for the other share classes.
Effective June 30, 2014, the Fund’s primary benchmark changed from the MSCI EAFE Index NDTR D to the MSCI ACWI Ex-U.S. because the MSCI ACWI Ex-U.S. more closely aligns with the Fund’s investments in developed and emerging markets than the MSCI EAFE Index NDTR D.
Management
Investment Advisor: Principal Management Corporation
Sub-Advisor and Portfolio Managers: Origin Asset Management LLP• John Birkhold (since 2014), Partner• Chris Carter (since 2014), Partner• Nigel Dutson (since 2014), Partner• Tarlock Randhawa (since 2014), Partner• Nerys Weir (since 2014), Investment Manager
Purchase and Sale of Fund Shares
Share Class Investment TypePurchase Minimum
Per FundA Initial Investment $1,000(1)
A For accounts with an Automatic Investment Plan (AIP) $100A Subsequent Investments $100(1)(2)
P, Institutional, R-1, R-2, R-3, R-4,and R-5
There are no minimum initial or subsequent investment requirements foreligible purchases.
N/A
(1) Some exceptions apply; see "Purchase of Fund Shares - Minimum Investments" for more information.(2) For accounts with an AIP, the subsequent automatic investments must total $1,200 annually if the initial $1,000 minimum has not been met.
You may purchase or redeem shares on any business day (normally any day when the New York Stock Exchange is open for regular trading) through your plan, intermediary, or Financial Professional; by sending a written request to Principal Funds at P.O. Box 8024, Boston, MA 02266-8024 (regular mail) or 30 Dan Road, Canton, MA 02021-2809 (overnight mail); calling us at 1-800-222-5852; or accessing our website (www.principalfunds.com).

70
Tax InformationThe Fund’s distributions you receive are generally subject to federal income tax as ordinary income or capital gain and may also be subject to state and local taxes, unless you are tax-exempt or your account is tax-deferred in which case your distributions would be taxed when withdrawn from the tax-deferred account.
Payments to Broker-Dealers and Other Financial IntermediariesIf you purchase the Fund through a broker-dealer or other financial intermediary (such as a bank, insurance company, investment adviser, etc.), the Fund and its related companies may pay the intermediary for the sale of Fund shares and related services. These payments may create a conflict of interest by influencing the broker-dealer or other intermediary and your salesperson to recommend the Fund over another investment, or to recommend one share class of the Fund over another share class. Ask your salesperson or visit your financial intermediary's website for more information.
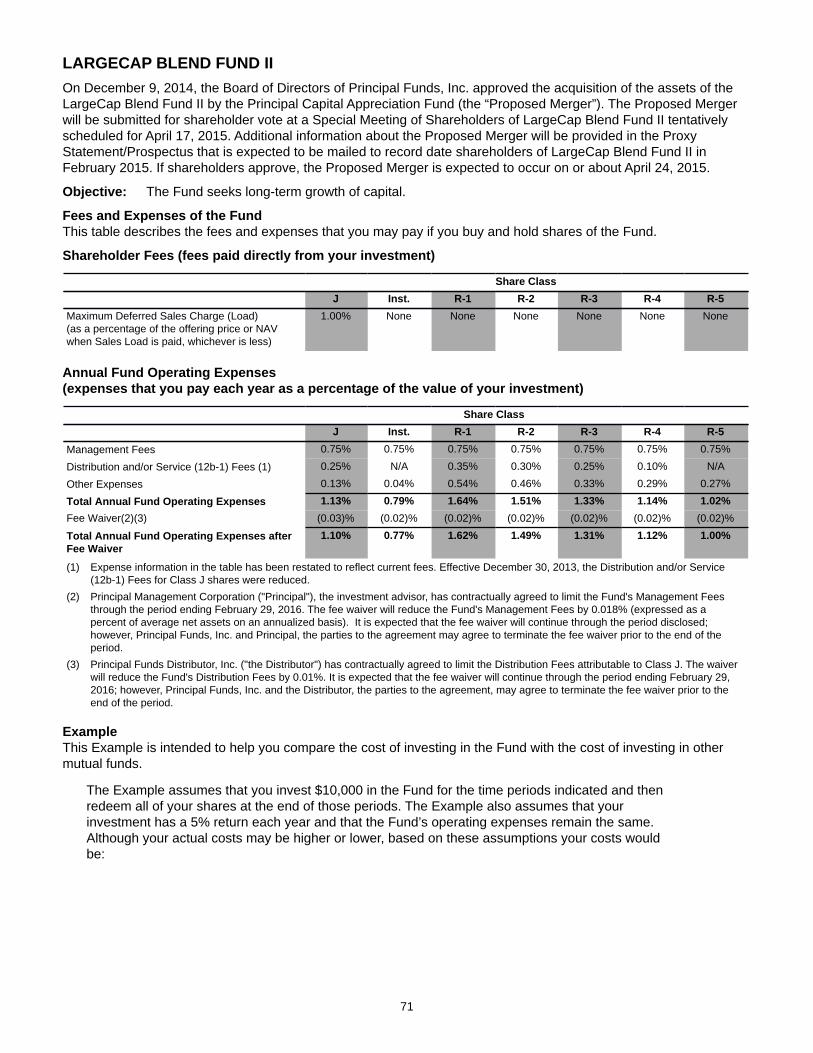
71
LARGECAP BLEND FUND IIOn December 9, 2014, the Board of Directors of Principal Funds, Inc. approved the acquisition of the assets of the LargeCap Blend Fund II by the Principal Capital Appreciation Fund (the “Proposed Merger”). The Proposed Merger will be submitted for shareholder vote at a Special Meeting of Shareholders of LargeCap Blend Fund II tentatively scheduled for April 17, 2015. Additional information about the Proposed Merger will be provided in the Proxy Statement/Prospectus that is expected to be mailed to record date shareholders of LargeCap Blend Fund II in February 2015. If shareholders approve, the Proposed Merger is expected to occur on or about April 24, 2015.
Objective: The Fund seeks long-term growth of capital.
Fees and Expenses of the FundThis table describes the fees and expenses that you may pay if you buy and hold shares of the Fund.
Shareholder Fees (fees paid directly from your investment)
Share ClassJ Inst. R-1 R-2 R-3 R-4 R-5
Maximum Deferred Sales Charge (Load)(as a percentage of the offering price or NAVwhen Sales Load is paid, whichever is less)
1.00% None None None None None None
Annual Fund Operating Expenses (expenses that you pay each year as a percentage of the value of your investment)
Share ClassJ Inst. R-1 R-2 R-3 R-4 R-5
Management Fees 0.75% 0.75% 0.75% 0.75% 0.75% 0.75% 0.75%
Distribution and/or Service (12b-1) Fees (1) 0.25% N/A 0.35% 0.30% 0.25% 0.10% N/A
Other Expenses 0.13% 0.04% 0.54% 0.46% 0.33% 0.29% 0.27%
Total Annual Fund Operating Expenses 1.13% 0.79% 1.64% 1.51% 1.33% 1.14% 1.02%Fee Waiver(2)(3) (0.03)% (0.02)% (0.02)% (0.02)% (0.02)% (0.02)% (0.02)%
Total Annual Fund Operating Expenses afterFee Waiver
1.10% 0.77% 1.62% 1.49% 1.31% 1.12% 1.00%
(1) Expense information in the table has been restated to reflect current fees. Effective December 30, 2013, the Distribution and/or Service (12b-1) Fees for Class J shares were reduced.
(2) Principal Management Corporation ("Principal"), the investment advisor, has contractually agreed to limit the Fund's Management Fees through the period ending February 29, 2016. The fee waiver will reduce the Fund's Management Fees by 0.018% (expressed as a percent of average net assets on an annualized basis). It is expected that the fee waiver will continue through the period disclosed; however, Principal Funds, Inc. and Principal, the parties to the agreement may agree to terminate the fee waiver prior to the end of the period.
(3) Principal Funds Distributor, Inc. ("the Distributor") has contractually agreed to limit the Distribution Fees attributable to Class J. The waiver will reduce the Fund's Distribution Fees by 0.01%. It is expected that the fee waiver will continue through the period ending February 29, 2016; however, Principal Funds, Inc. and the Distributor, the parties to the agreement, may agree to terminate the fee waiver prior to the end of the period.
ExampleThis Example is intended to help you compare the cost of investing in the Fund with the cost of investing in other mutual funds.
The Example assumes that you invest $10,000 in the Fund for the time periods indicated and then redeem all of your shares at the end of those periods. The Example also assumes that your investment has a 5% return each year and that the Fund’s operating expenses remain the same. Although your actual costs may be higher or lower, based on these assumptions your costs would be:
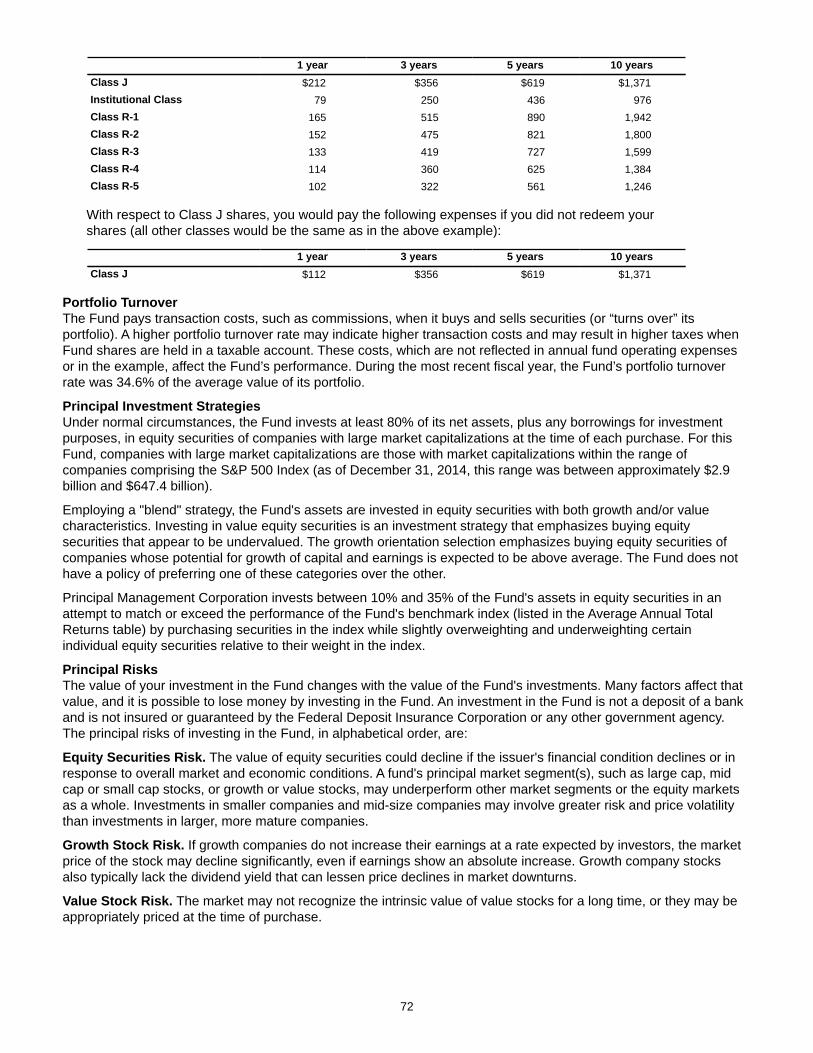
72
1 year 3 years 5 years 10 yearsClass J $212 $356 $619 $1,371Institutional Class 79 250 436 976Class R-1 165 515 890 1,942Class R-2 152 475 821 1,800Class R-3 133 419 727 1,599Class R-4 114 360 625 1,384Class R-5 102 322 561 1,246
With respect to Class J shares, you would pay the following expenses if you did not redeem your shares (all other classes would be the same as in the above example):
1 year 3 years 5 years 10 yearsClass J $112 $356 $619 $1,371
Portfolio TurnoverThe Fund pays transaction costs, such as commissions, when it buys and sells securities (or “turns over” its portfolio). A higher portfolio turnover rate may indicate higher transaction costs and may result in higher taxes when Fund shares are held in a taxable account. These costs, which are not reflected in annual fund operating expenses or in the example, affect the Fund’s performance. During the most recent fiscal year, the Fund’s portfolio turnover rate was 34.6% of the average value of its portfolio.
Principal Investment StrategiesUnder normal circumstances, the Fund invests at least 80% of its net assets, plus any borrowings for investment purposes, in equity securities of companies with large market capitalizations at the time of each purchase. For this Fund, companies with large market capitalizations are those with market capitalizations within the range of companies comprising the S&P 500 Index (as of December 31, 2014, this range was between approximately $2.9 billion and $647.4 billion).
Employing a "blend" strategy, the Fund's assets are invested in equity securities with both growth and/or value characteristics. Investing in value equity securities is an investment strategy that emphasizes buying equity securities that appear to be undervalued. The growth orientation selection emphasizes buying equity securities of companies whose potential for growth of capital and earnings is expected to be above average. The Fund does not have a policy of preferring one of these categories over the other.
Principal Management Corporation invests between 10% and 35% of the Fund's assets in equity securities in an attempt to match or exceed the performance of the Fund's benchmark index (listed in the Average Annual Total Returns table) by purchasing securities in the index while slightly overweighting and underweighting certain individual equity securities relative to their weight in the index.
Principal RisksThe value of your investment in the Fund changes with the value of the Fund's investments. Many factors affect that value, and it is possible to lose money by investing in the Fund. An investment in the Fund is not a deposit of a bank and is not insured or guaranteed by the Federal Deposit Insurance Corporation or any other government agency. The principal risks of investing in the Fund, in alphabetical order, are:
Equity Securities Risk. The value of equity securities could decline if the issuer's financial condition declines or in response to overall market and economic conditions. A fund's principal market segment(s), such as large cap, mid cap or small cap stocks, or growth or value stocks, may underperform other market segments or the equity markets as a whole. Investments in smaller companies and mid-size companies may involve greater risk and price volatility than investments in larger, more mature companies.
Growth Stock Risk. If growth companies do not increase their earnings at a rate expected by investors, the market price of the stock may decline significantly, even if earnings show an absolute increase. Growth company stocks also typically lack the dividend yield that can lessen price declines in market downturns.
Value Stock Risk. The market may not recognize the intrinsic value of value stocks for a long time, or they may be appropriately priced at the time of purchase.
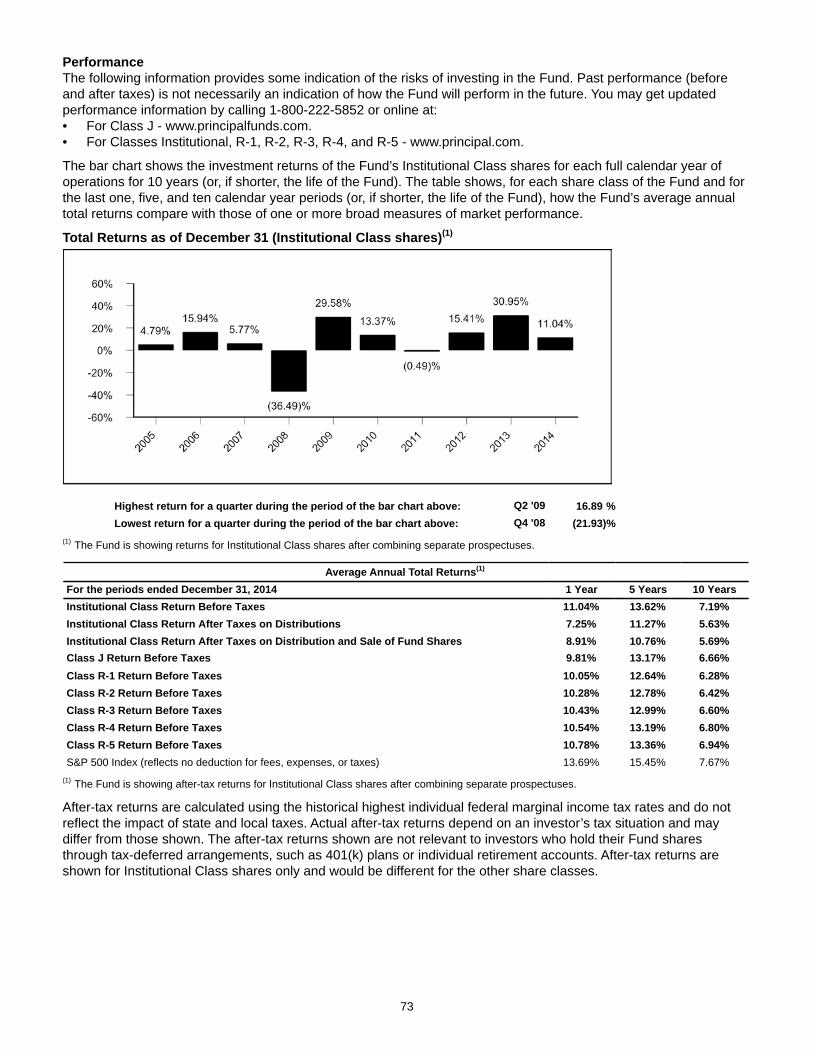
73
PerformanceThe following information provides some indication of the risks of investing in the Fund. Past performance (before and after taxes) is not necessarily an indication of how the Fund will perform in the future. You may get updated performance information by calling 1-800-222-5852 or online at:• For Class J - www.principalfunds.com.• For Classes Institutional, R-1, R-2, R-3, R-4, and R-5 - www.principal.com.
The bar chart shows the investment returns of the Fund’s Institutional Class shares for each full calendar year of operations for 10 years (or, if shorter, the life of the Fund). The table shows, for each share class of the Fund and for the last one, five, and ten calendar year periods (or, if shorter, the life of the Fund), how the Fund’s average annual total returns compare with those of one or more broad measures of market performance.
Total Returns as of December 31 (Institutional Class shares)(1)
Highest return for a quarter during the period of the bar chart above: Q2 '09 16.89 %Lowest return for a quarter during the period of the bar chart above: Q4 '08 (21.93)%
(1) The Fund is showing returns for Institutional Class shares after combining separate prospectuses.
Average Annual Total Returns(1)
For the periods ended December 31, 2014 1 Year 5 Years 10 YearsInstitutional Class Return Before Taxes 11.04% 13.62% 7.19%Institutional Class Return After Taxes on Distributions 7.25% 11.27% 5.63%Institutional Class Return After Taxes on Distribution and Sale of Fund Shares 8.91% 10.76% 5.69%Class J Return Before Taxes 9.81% 13.17% 6.66%Class R-1 Return Before Taxes 10.05% 12.64% 6.28%Class R-2 Return Before Taxes 10.28% 12.78% 6.42%Class R-3 Return Before Taxes 10.43% 12.99% 6.60%Class R-4 Return Before Taxes 10.54% 13.19% 6.80%Class R-5 Return Before Taxes 10.78% 13.36% 6.94%S&P 500 Index (reflects no deduction for fees, expenses, or taxes) 13.69% 15.45% 7.67%
(1) The Fund is showing after-tax returns for Institutional Class shares after combining separate prospectuses.
After-tax returns are calculated using the historical highest individual federal marginal income tax rates and do not reflect the impact of state and local taxes. Actual after-tax returns depend on an investor’s tax situation and may differ from those shown. The after-tax returns shown are not relevant to investors who hold their Fund shares through tax-deferred arrangements, such as 401(k) plans or individual retirement accounts. After-tax returns are shown for Institutional Class shares only and would be different for the other share classes.

74
Management
Investment Advisor and Portfolio Managers: Principal Management Corporation• James W. Fennessey (since 2009), Portfolio Manager• Randy L. Welch (since 2009), Portfolio Manager
Sub-Advisors: ClearBridge Investments, LLCT. Rowe Price Associates, Inc.
Purchase and Sale of Fund Shares
Share Class Investment TypePurchase Minimum
Per FundJ Initial Investment $1,000(1)
J For accounts with an Automatic Investment Plan (AIP) $100J Subsequent Investments $100(1)(2)
Institutional, R-1, R-2, R-3, R-4, andR-5
There are no minimum initial or subsequent investment requirements foreligible purchases.
N/A
(1) Some exceptions apply; see "Purchase of Fund Shares - Minimum Investments" for more information.(2) For accounts with an AIP, the subsequent automatic investments must total $1,200 annually if the initial $1,000 minimum has not been met.
You may purchase or redeem shares on any business day (normally any day when the New York Stock Exchange is open for regular trading) through your plan, intermediary, or Financial Professional; by sending a written request to Principal Funds at P.O. Box 8024, Boston, MA 02266-8024 (regular mail) or 30 Dan Road, Canton, MA 02021-2809 (overnight mail); calling us at 1-800-222-5852; or accessing our website (www.principalfunds.com).
Tax InformationThe Fund’s distributions you receive are generally subject to federal income tax as ordinary income or capital gain and may also be subject to state and local taxes, unless you are tax-exempt or your account is tax-deferred in which case your distributions would be taxed when withdrawn from the tax-deferred account.
Payments to Broker-Dealers and Other Financial IntermediariesIf you purchase the Fund through a broker-dealer or other financial intermediary (such as a bank, insurance company, investment adviser, etc.), the Fund and its related companies may pay the intermediary for the sale of Fund shares and related services. These payments may create a conflict of interest by influencing the broker-dealer or other intermediary and your salesperson to recommend the Fund over another investment, or to recommend one share class of the Fund over another share class. Ask your salesperson or visit your financial intermediary's website for more information.
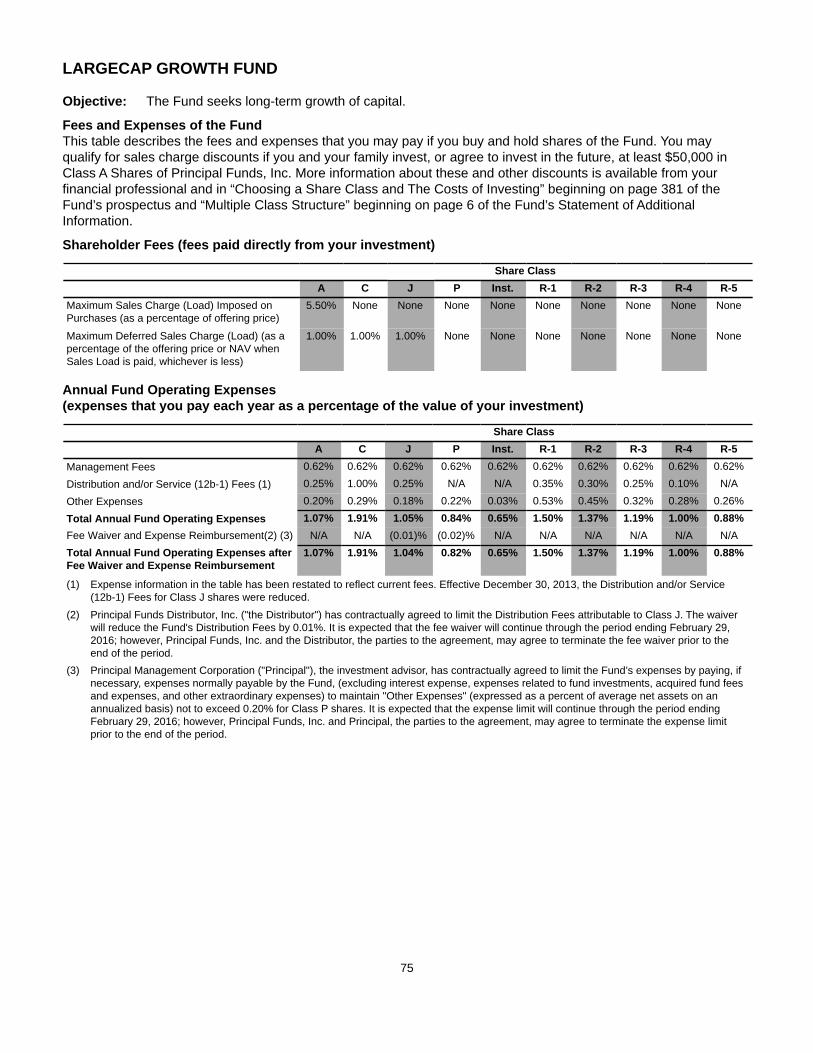
75
LARGECAP GROWTH FUND
Objective: The Fund seeks long-term growth of capital.
Fees and Expenses of the FundThis table describes the fees and expenses that you may pay if you buy and hold shares of the Fund. You may qualify for sales charge discounts if you and your family invest, or agree to invest in the future, at least $50,000 in Class A Shares of Principal Funds, Inc. More information about these and other discounts is available from your financial professional and in “Choosing a Share Class and The Costs of Investing” beginning on page 381 of the Fund’s prospectus and “Multiple Class Structure” beginning on page 6 of the Fund’s Statement of Additional Information.
Shareholder Fees (fees paid directly from your investment)
Share ClassA C J P Inst. R-1 R-2 R-3 R-4 R-5
Maximum Sales Charge (Load) Imposed onPurchases (as a percentage of offering price)
5.50% None None None None None None None None None
Maximum Deferred Sales Charge (Load) (as apercentage of the offering price or NAV whenSales Load is paid, whichever is less)
1.00% 1.00% 1.00% None None None None None None None
Annual Fund Operating Expenses (expenses that you pay each year as a percentage of the value of your investment)
Share ClassA C J P Inst. R-1 R-2 R-3 R-4 R-5
Management Fees 0.62% 0.62% 0.62% 0.62% 0.62% 0.62% 0.62% 0.62% 0.62% 0.62%
Distribution and/or Service (12b-1) Fees (1) 0.25% 1.00% 0.25% N/A N/A 0.35% 0.30% 0.25% 0.10% N/A
Other Expenses 0.20% 0.29% 0.18% 0.22% 0.03% 0.53% 0.45% 0.32% 0.28% 0.26%
Total Annual Fund Operating Expenses 1.07% 1.91% 1.05% 0.84% 0.65% 1.50% 1.37% 1.19% 1.00% 0.88%Fee Waiver and Expense Reimbursement(2) (3) N/A N/A (0.01)% (0.02)% N/A N/A N/A N/A N/A N/ATotal Annual Fund Operating Expenses afterFee Waiver and Expense Reimbursement
1.07% 1.91% 1.04% 0.82% 0.65% 1.50% 1.37% 1.19% 1.00% 0.88%
(1) Expense information in the table has been restated to reflect current fees. Effective December 30, 2013, the Distribution and/or Service (12b-1) Fees for Class J shares were reduced.
(2) Principal Funds Distributor, Inc. ("the Distributor") has contractually agreed to limit the Distribution Fees attributable to Class J. The waiver will reduce the Fund's Distribution Fees by 0.01%. It is expected that the fee waiver will continue through the period ending February 29, 2016; however, Principal Funds, Inc. and the Distributor, the parties to the agreement, may agree to terminate the fee waiver prior to the end of the period.
(3) Principal Management Corporation ("Principal"), the investment advisor, has contractually agreed to limit the Fund’s expenses by paying, if necessary, expenses normally payable by the Fund, (excluding interest expense, expenses related to fund investments, acquired fund fees and expenses, and other extraordinary expenses) to maintain "Other Expenses" (expressed as a percent of average net assets on an annualized basis) not to exceed 0.20% for Class P shares. It is expected that the expense limit will continue through the period ending February 29, 2016; however, Principal Funds, Inc. and Principal, the parties to the agreement, may agree to terminate the expense limit prior to the end of the period.
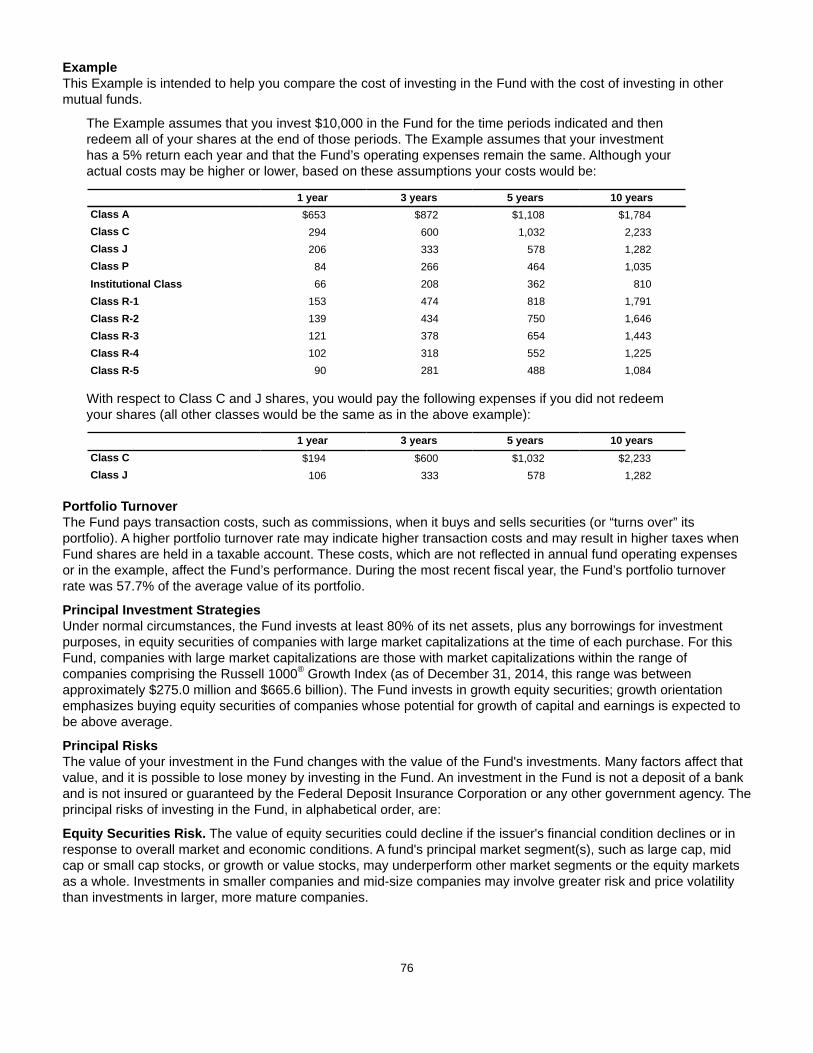
76
ExampleThis Example is intended to help you compare the cost of investing in the Fund with the cost of investing in other mutual funds.
The Example assumes that you invest $10,000 in the Fund for the time periods indicated and then redeem all of your shares at the end of those periods. The Example assumes that your investment has a 5% return each year and that the Fund’s operating expenses remain the same. Although your actual costs may be higher or lower, based on these assumptions your costs would be:
1 year 3 years 5 years 10 yearsClass A $653 $872 $1,108 $1,784Class C 294 600 1,032 2,233Class J 206 333 578 1,282Class P 84 266 464 1,035Institutional Class 66 208 362 810Class R-1 153 474 818 1,791Class R-2 139 434 750 1,646Class R-3 121 378 654 1,443Class R-4 102 318 552 1,225Class R-5 90 281 488 1,084
With respect to Class C and J shares, you would pay the following expenses if you did not redeem your shares (all other classes would be the same as in the above example):
1 year 3 years 5 years 10 yearsClass C $194 $600 $1,032 $2,233Class J 106 333 578 1,282
Portfolio TurnoverThe Fund pays transaction costs, such as commissions, when it buys and sells securities (or “turns over” its portfolio). A higher portfolio turnover rate may indicate higher transaction costs and may result in higher taxes when Fund shares are held in a taxable account. These costs, which are not reflected in annual fund operating expenses or in the example, affect the Fund’s performance. During the most recent fiscal year, the Fund’s portfolio turnover rate was 57.7% of the average value of its portfolio.
Principal Investment StrategiesUnder normal circumstances, the Fund invests at least 80% of its net assets, plus any borrowings for investment purposes, in equity securities of companies with large market capitalizations at the time of each purchase. For this Fund, companies with large market capitalizations are those with market capitalizations within the range of companies comprising the Russell 1000® Growth Index (as of December 31, 2014, this range was between approximately $275.0 million and $665.6 billion). The Fund invests in growth equity securities; growth orientation emphasizes buying equity securities of companies whose potential for growth of capital and earnings is expected to be above average.
Principal RisksThe value of your investment in the Fund changes with the value of the Fund's investments. Many factors affect that value, and it is possible to lose money by investing in the Fund. An investment in the Fund is not a deposit of a bank and is not insured or guaranteed by the Federal Deposit Insurance Corporation or any other government agency. The principal risks of investing in the Fund, in alphabetical order, are:
Equity Securities Risk. The value of equity securities could decline if the issuer's financial condition declines or in response to overall market and economic conditions. A fund's principal market segment(s), such as large cap, mid cap or small cap stocks, or growth or value stocks, may underperform other market segments or the equity markets as a whole. Investments in smaller companies and mid-size companies may involve greater risk and price volatility than investments in larger, more mature companies.
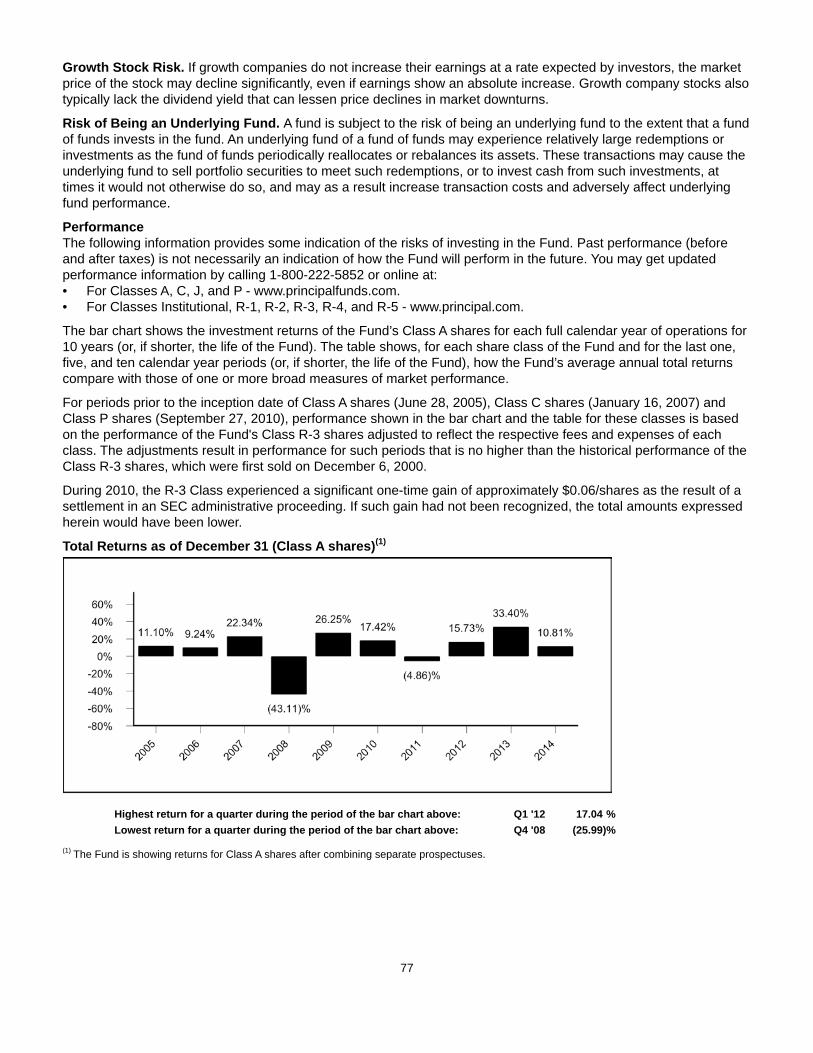
77
Growth Stock Risk. If growth companies do not increase their earnings at a rate expected by investors, the market price of the stock may decline significantly, even if earnings show an absolute increase. Growth company stocks also typically lack the dividend yield that can lessen price declines in market downturns.
Risk of Being an Underlying Fund. A fund is subject to the risk of being an underlying fund to the extent that a fund of funds invests in the fund. An underlying fund of a fund of funds may experience relatively large redemptions or investments as the fund of funds periodically reallocates or rebalances its assets. These transactions may cause the underlying fund to sell portfolio securities to meet such redemptions, or to invest cash from such investments, at times it would not otherwise do so, and may as a result increase transaction costs and adversely affect underlying fund performance.
PerformanceThe following information provides some indication of the risks of investing in the Fund. Past performance (before and after taxes) is not necessarily an indication of how the Fund will perform in the future. You may get updated performance information by calling 1-800-222-5852 or online at:• For Classes A, C, J, and P - www.principalfunds.com.• For Classes Institutional, R-1, R-2, R-3, R-4, and R-5 - www.principal.com.
The bar chart shows the investment returns of the Fund’s Class A shares for each full calendar year of operations for 10 years (or, if shorter, the life of the Fund). The table shows, for each share class of the Fund and for the last one, five, and ten calendar year periods (or, if shorter, the life of the Fund), how the Fund’s average annual total returns compare with those of one or more broad measures of market performance.
For periods prior to the inception date of Class A shares (June 28, 2005), Class C shares (January 16, 2007) and Class P shares (September 27, 2010), performance shown in the bar chart and the table for these classes is based on the performance of the Fund's Class R-3 shares adjusted to reflect the respective fees and expenses of each class. The adjustments result in performance for such periods that is no higher than the historical performance of the Class R-3 shares, which were first sold on December 6, 2000.
During 2010, the R-3 Class experienced a significant one-time gain of approximately $0.06/shares as the result of a settlement in an SEC administrative proceeding. If such gain had not been recognized, the total amounts expressed herein would have been lower.
Total Returns as of December 31 (Class A shares)(1)
Highest return for a quarter during the period of the bar chart above: Q1 '12 17.04 %Lowest return for a quarter during the period of the bar chart above: Q4 '08 (25.99)%
(1) The Fund is showing returns for Class A shares after combining separate prospectuses.
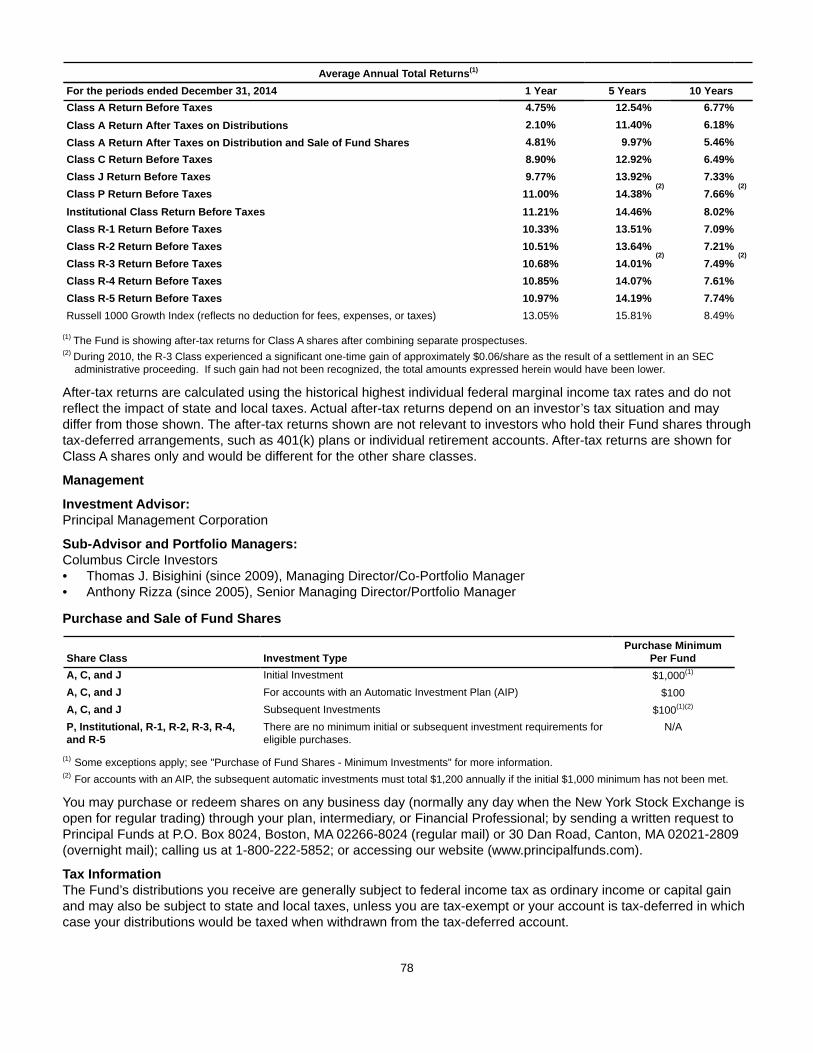
78
Average Annual Total Returns(1)
For the periods ended December 31, 2014 1 Year 5 Years 10 YearsClass A Return Before Taxes 4.75% 12.54% 6.77%Class A Return After Taxes on Distributions 2.10% 11.40% 6.18%Class A Return After Taxes on Distribution and Sale of Fund Shares 4.81% 9.97% 5.46%Class C Return Before Taxes 8.90% 12.92% 6.49%Class J Return Before Taxes 9.77% 13.92% 7.33%Class P Return Before Taxes 11.00% 14.38%
(2)7.66%
(2)
Institutional Class Return Before Taxes 11.21% 14.46% 8.02%Class R-1 Return Before Taxes 10.33% 13.51% 7.09%Class R-2 Return Before Taxes 10.51% 13.64% 7.21%Class R-3 Return Before Taxes 10.68% 14.01%
(2)7.49%
(2)
Class R-4 Return Before Taxes 10.85% 14.07% 7.61%Class R-5 Return Before Taxes 10.97% 14.19% 7.74%Russell 1000 Growth Index (reflects no deduction for fees, expenses, or taxes) 13.05% 15.81% 8.49%
(1) The Fund is showing after-tax returns for Class A shares after combining separate prospectuses.(2) During 2010, the R-3 Class experienced a significant one-time gain of approximately $0.06/share as the result of a settlement in an SEC
administrative proceeding. If such gain had not been recognized, the total amounts expressed herein would have been lower.
After-tax returns are calculated using the historical highest individual federal marginal income tax rates and do not reflect the impact of state and local taxes. Actual after-tax returns depend on an investor’s tax situation and may differ from those shown. The after-tax returns shown are not relevant to investors who hold their Fund shares through tax-deferred arrangements, such as 401(k) plans or individual retirement accounts. After-tax returns are shown for Class A shares only and would be different for the other share classes.
Management
Investment Advisor: Principal Management Corporation
Sub-Advisor and Portfolio Managers: Columbus Circle Investors • Thomas J. Bisighini (since 2009), Managing Director/Co-Portfolio Manager• Anthony Rizza (since 2005), Senior Managing Director/Portfolio Manager
Purchase and Sale of Fund Shares
Share Class Investment TypePurchase Minimum
Per FundA, C, and J Initial Investment $1,000(1)
A, C, and J For accounts with an Automatic Investment Plan (AIP) $100A, C, and J Subsequent Investments $100(1)(2)
P, Institutional, R-1, R-2, R-3, R-4,and R-5
There are no minimum initial or subsequent investment requirements foreligible purchases.
N/A
(1) Some exceptions apply; see "Purchase of Fund Shares - Minimum Investments" for more information.(2) For accounts with an AIP, the subsequent automatic investments must total $1,200 annually if the initial $1,000 minimum has not been met.
You may purchase or redeem shares on any business day (normally any day when the New York Stock Exchange is open for regular trading) through your plan, intermediary, or Financial Professional; by sending a written request to Principal Funds at P.O. Box 8024, Boston, MA 02266-8024 (regular mail) or 30 Dan Road, Canton, MA 02021-2809 (overnight mail); calling us at 1-800-222-5852; or accessing our website (www.principalfunds.com).
Tax InformationThe Fund’s distributions you receive are generally subject to federal income tax as ordinary income or capital gain and may also be subject to state and local taxes, unless you are tax-exempt or your account is tax-deferred in which case your distributions would be taxed when withdrawn from the tax-deferred account.

79
Payments to Broker-Dealers and Other Financial IntermediariesIf you purchase the Fund through a broker-dealer or other financial intermediary (such as a bank, insurance company, investment adviser, etc.), the Fund and its related companies may pay the intermediary for the sale of Fund shares and related services. These payments may create a conflict of interest by influencing the broker-dealer or other intermediary and your salesperson to recommend the Fund over another investment, or to recommend one share class of the Fund over another share class. Ask your salesperson or visit your financial intermediary's website for more information.
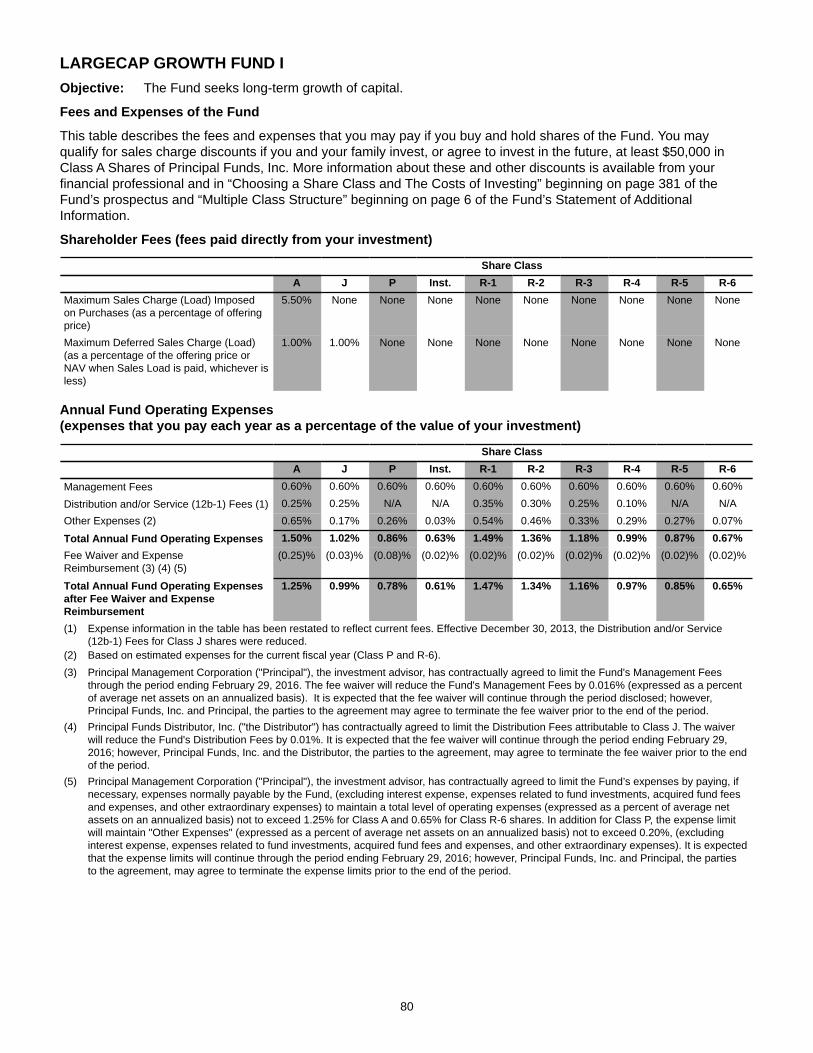
80
LARGECAP GROWTH FUND IObjective: The Fund seeks long-term growth of capital.
Fees and Expenses of the Fund
This table describes the fees and expenses that you may pay if you buy and hold shares of the Fund. You may qualify for sales charge discounts if you and your family invest, or agree to invest in the future, at least $50,000 in Class A Shares of Principal Funds, Inc. More information about these and other discounts is available from your financial professional and in “Choosing a Share Class and The Costs of Investing” beginning on page 381 of the Fund’s prospectus and “Multiple Class Structure” beginning on page 6 of the Fund’s Statement of Additional Information.
Shareholder Fees (fees paid directly from your investment)
Share ClassA J P Inst. R-1 R-2 R-3 R-4 R-5 R-6
Maximum Sales Charge (Load) Imposedon Purchases (as a percentage of offeringprice)
5.50% None None None None None None None None None
Maximum Deferred Sales Charge (Load)(as a percentage of the offering price orNAV when Sales Load is paid, whichever isless)
1.00% 1.00% None None None None None None None None
Annual Fund Operating Expenses (expenses that you pay each year as a percentage of the value of your investment)
Share ClassA J P Inst. R-1 R-2 R-3 R-4 R-5 R-6
Management Fees 0.60% 0.60% 0.60% 0.60% 0.60% 0.60% 0.60% 0.60% 0.60% 0.60%
Distribution and/or Service (12b-1) Fees (1) 0.25% 0.25% N/A N/A 0.35% 0.30% 0.25% 0.10% N/A N/AOther Expenses (2) 0.65% 0.17% 0.26% 0.03% 0.54% 0.46% 0.33% 0.29% 0.27% 0.07%
Total Annual Fund Operating Expenses 1.50% 1.02% 0.86% 0.63% 1.49% 1.36% 1.18% 0.99% 0.87% 0.67%Fee Waiver and ExpenseReimbursement (3) (4) (5)
(0.25)% (0.03)% (0.08)% (0.02)% (0.02)% (0.02)% (0.02)% (0.02)% (0.02)% (0.02)%
Total Annual Fund Operating Expensesafter Fee Waiver and ExpenseReimbursement
1.25% 0.99% 0.78% 0.61% 1.47% 1.34% 1.16% 0.97% 0.85% 0.65%
(1) Expense information in the table has been restated to reflect current fees. Effective December 30, 2013, the Distribution and/or Service (12b-1) Fees for Class J shares were reduced.
(2) Based on estimated expenses for the current fiscal year (Class P and R-6).(3) Principal Management Corporation ("Principal"), the investment advisor, has contractually agreed to limit the Fund's Management Fees
through the period ending February 29, 2016. The fee waiver will reduce the Fund's Management Fees by 0.016% (expressed as a percent of average net assets on an annualized basis). It is expected that the fee waiver will continue through the period disclosed; however, Principal Funds, Inc. and Principal, the parties to the agreement may agree to terminate the fee waiver prior to the end of the period.
(4) Principal Funds Distributor, Inc. ("the Distributor") has contractually agreed to limit the Distribution Fees attributable to Class J. The waiver will reduce the Fund's Distribution Fees by 0.01%. It is expected that the fee waiver will continue through the period ending February 29, 2016; however, Principal Funds, Inc. and the Distributor, the parties to the agreement, may agree to terminate the fee waiver prior to the end of the period.
(5) Principal Management Corporation ("Principal"), the investment advisor, has contractually agreed to limit the Fund’s expenses by paying, if necessary, expenses normally payable by the Fund, (excluding interest expense, expenses related to fund investments, acquired fund fees and expenses, and other extraordinary expenses) to maintain a total level of operating expenses (expressed as a percent of average net assets on an annualized basis) not to exceed 1.25% for Class A and 0.65% for Class R-6 shares. In addition for Class P, the expense limit will maintain "Other Expenses" (expressed as a percent of average net assets on an annualized basis) not to exceed 0.20%, (excluding interest expense, expenses related to fund investments, acquired fund fees and expenses, and other extraordinary expenses). It is expected that the expense limits will continue through the period ending February 29, 2016; however, Principal Funds, Inc. and Principal, the parties to the agreement, may agree to terminate the expense limits prior to the end of the period.

81
ExampleThis Example is intended to help you compare the cost of investing in the Fund with the cost of investing in other mutual funds.
The Example assumes that you invest $10,000 in the Fund for the time periods indicated and then redeem all of your shares at the end of those periods. The Example also assumes that your investment has a 5% return each year and that the Fund’s operating expenses remain the same. Although your actual costs may be higher or lower, based on these assumptions your costs would be:
1 year 3 years 5 years 10 years
Class A $670 $971 $1,297 $2,218Class J 201 321 560 1,245Class P 80 265
Institutional Class 62 199 349 784Class R-1 150 469 811 1,777Class R-2 136 428 742 1,633Class R-3 118 372 647 1,430Class R-4 99 313 545 1,211Class R-5 87 275 480 1,070Class R-6 66 212
With respect to Class J shares, you would pay the following expenses if you did not redeem your shares (all other classes would be the same as in the above example):
1 year 3 years 5 years 10 yearsClass J $101 $321 $560 $1,245
Portfolio TurnoverThe Fund pays transaction costs, such as commissions, when it buys and sells securities (or “turns over” its portfolio). A higher portfolio turnover rate may indicate higher transaction costs and may result in higher taxes when Fund shares are held in a taxable account. These costs, which are not reflected in annual fund operating expenses or in the example, affect the Fund’s performance. During the most recent fiscal year, the Fund’s portfolio turnover rate was 38.4% of the average value of its portfolio.
Principal Investment StrategiesUnder normal circumstances, the Fund invests at least 80% of its net assets, plus any borrowings for investment purposes, in equity securities of companies with large market capitalizations at the time of each purchase. For this Fund, companies with large market capitalizations are those with market capitalizations within the range of companies comprising the Russell 1000® Growth Index (as of December 31, 2014, this range was between approximately $275.0 million and $665.6 billion). The Fund invests in growth equity securities; growth orientation emphasizes buying equity securities of companies whose potential for growth of capital and earnings is expected to be above average.
Principal Management Corporation invests between 10% and 35% of the Fund's assets in equity securities in an attempt to match or exceed the performance of the Fund's benchmark index (listed in the Average Annual Total Returns table) by purchasing securities in the index while slightly overweighting and underweighting certain individual equity securities relative to their weight in the index.
Principal RisksThe value of your investment in the Fund changes with the value of the Fund's investments. Many factors affect that value, and it is possible to lose money by investing in the Fund. An investment in the Fund is not a deposit of a bank and is not insured or guaranteed by the Federal Deposit Insurance Corporation or any other government agency. The principal risks of investing in the Fund, in alphabetical order, are:
Equity Securities Risk. The value of equity securities could decline if the issuer's financial condition declines or in response to overall market and economic conditions. A fund's principal market segment(s), such as large cap, mid cap or small cap stocks, or growth or value stocks, may underperform other market segments or the equity markets as a whole. Investments in smaller companies and mid-size companies may involve greater risk and price volatility than investments in larger, more mature companies.
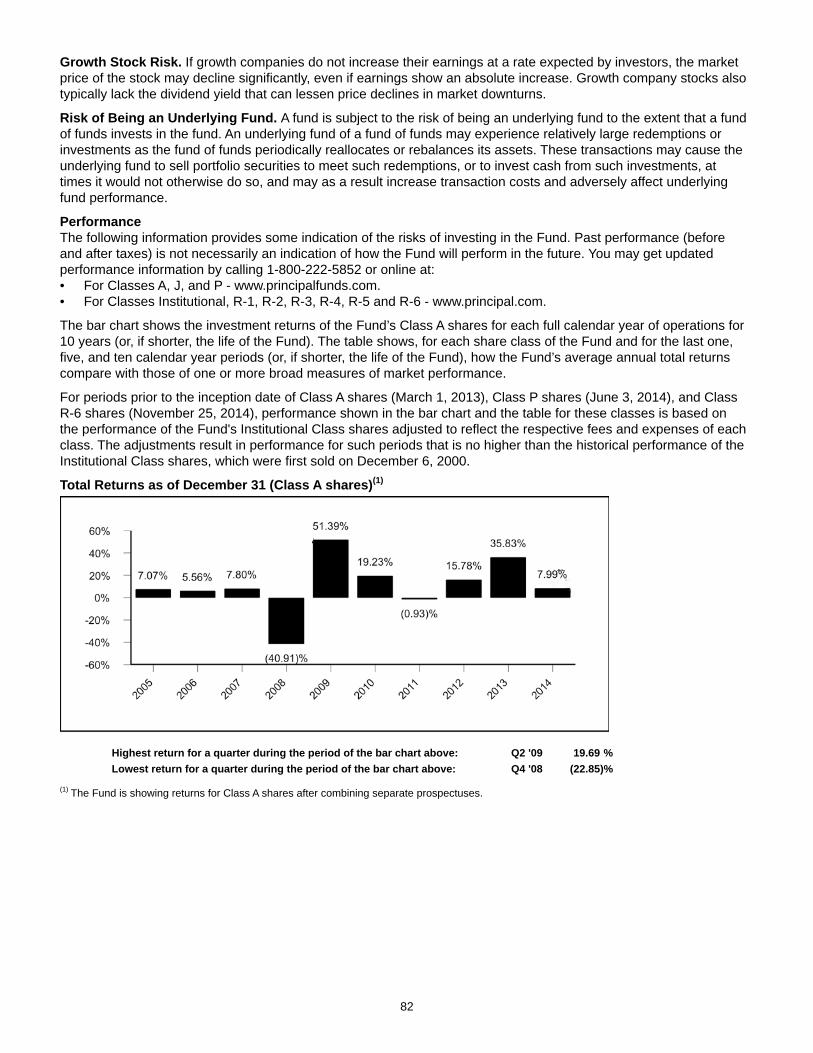
82
Growth Stock Risk. If growth companies do not increase their earnings at a rate expected by investors, the market price of the stock may decline significantly, even if earnings show an absolute increase. Growth company stocks also typically lack the dividend yield that can lessen price declines in market downturns.
Risk of Being an Underlying Fund. A fund is subject to the risk of being an underlying fund to the extent that a fund of funds invests in the fund. An underlying fund of a fund of funds may experience relatively large redemptions or investments as the fund of funds periodically reallocates or rebalances its assets. These transactions may cause the underlying fund to sell portfolio securities to meet such redemptions, or to invest cash from such investments, at times it would not otherwise do so, and may as a result increase transaction costs and adversely affect underlying fund performance.
PerformanceThe following information provides some indication of the risks of investing in the Fund. Past performance (before and after taxes) is not necessarily an indication of how the Fund will perform in the future. You may get updated performance information by calling 1-800-222-5852 or online at: • For Classes A, J, and P - www.principalfunds.com.• For Classes Institutional, R-1, R-2, R-3, R-4, R-5 and R-6 - www.principal.com.
The bar chart shows the investment returns of the Fund’s Class A shares for each full calendar year of operations for 10 years (or, if shorter, the life of the Fund). The table shows, for each share class of the Fund and for the last one, five, and ten calendar year periods (or, if shorter, the life of the Fund), how the Fund’s average annual total returns compare with those of one or more broad measures of market performance.
For periods prior to the inception date of Class A shares (March 1, 2013), Class P shares (June 3, 2014), and Class R-6 shares (November 25, 2014), performance shown in the bar chart and the table for these classes is based on the performance of the Fund's Institutional Class shares adjusted to reflect the respective fees and expenses of each class. The adjustments result in performance for such periods that is no higher than the historical performance of the Institutional Class shares, which were first sold on December 6, 2000.
Total Returns as of December 31 (Class A shares)(1)
Highest return for a quarter during the period of the bar chart above: Q2 '09 19.69 %Lowest return for a quarter during the period of the bar chart above: Q4 '08 (22.85)%
(1) The Fund is showing returns for Class A shares after combining separate prospectuses.
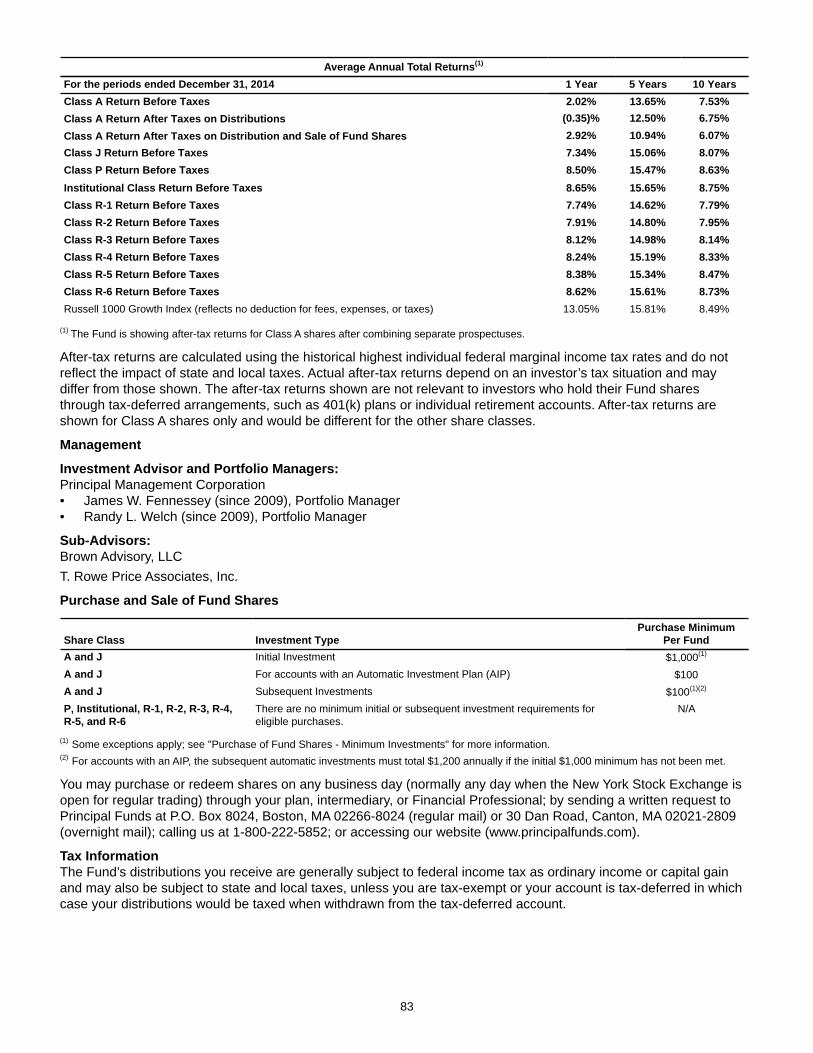
83
Average Annual Total Returns(1)
For the periods ended December 31, 2014 1 Year 5 Years 10 YearsClass A Return Before Taxes 2.02% 13.65% 7.53%Class A Return After Taxes on Distributions (0.35)% 12.50% 6.75%Class A Return After Taxes on Distribution and Sale of Fund Shares 2.92% 10.94% 6.07%Class J Return Before Taxes 7.34% 15.06% 8.07%Class P Return Before Taxes 8.50% 15.47% 8.63%Institutional Class Return Before Taxes 8.65% 15.65% 8.75%Class R-1 Return Before Taxes 7.74% 14.62% 7.79%Class R-2 Return Before Taxes 7.91% 14.80% 7.95%Class R-3 Return Before Taxes 8.12% 14.98% 8.14%Class R-4 Return Before Taxes 8.24% 15.19% 8.33%Class R-5 Return Before Taxes 8.38% 15.34% 8.47%Class R-6 Return Before Taxes 8.62% 15.61% 8.73%Russell 1000 Growth Index (reflects no deduction for fees, expenses, or taxes) 13.05% 15.81% 8.49%
(1) The Fund is showing after-tax returns for Class A shares after combining separate prospectuses.
After-tax returns are calculated using the historical highest individual federal marginal income tax rates and do not reflect the impact of state and local taxes. Actual after-tax returns depend on an investor’s tax situation and may differ from those shown. The after-tax returns shown are not relevant to investors who hold their Fund shares through tax-deferred arrangements, such as 401(k) plans or individual retirement accounts. After-tax returns are shown for Class A shares only and would be different for the other share classes.
Management
Investment Advisor and Portfolio Managers: Principal Management Corporation• James W. Fennessey (since 2009), Portfolio Manager• Randy L. Welch (since 2009), Portfolio Manager
Sub-Advisors: Brown Advisory, LLCT. Rowe Price Associates, Inc.
Purchase and Sale of Fund Shares
Share Class Investment TypePurchase Minimum
Per FundA and J Initial Investment $1,000(1)
A and J For accounts with an Automatic Investment Plan (AIP) $100A and J Subsequent Investments $100(1)(2)
P, Institutional, R-1, R-2, R-3, R-4,R-5, and R-6
There are no minimum initial or subsequent investment requirements foreligible purchases.
N/A
(1) Some exceptions apply; see "Purchase of Fund Shares - Minimum Investments" for more information.(2) For accounts with an AIP, the subsequent automatic investments must total $1,200 annually if the initial $1,000 minimum has not been met.
You may purchase or redeem shares on any business day (normally any day when the New York Stock Exchange is open for regular trading) through your plan, intermediary, or Financial Professional; by sending a written request to Principal Funds at P.O. Box 8024, Boston, MA 02266-8024 (regular mail) or 30 Dan Road, Canton, MA 02021-2809 (overnight mail); calling us at 1-800-222-5852; or accessing our website (www.principalfunds.com).
Tax InformationThe Fund’s distributions you receive are generally subject to federal income tax as ordinary income or capital gain and may also be subject to state and local taxes, unless you are tax-exempt or your account is tax-deferred in which case your distributions would be taxed when withdrawn from the tax-deferred account.

84
Payments to Broker-Dealers and Other Financial IntermediariesFor Class R-6 shares, the Fund and its related companies do not pay broker-dealers or other financial intermediaries (such as a bank, insurance company, investment adviser, etc.) for the sale of Fund shares or related services.
For the other share classes, if you purchase the Fund through a broker-dealer or other financial intermediary (such as a bank, insurance company, investment adviser, etc.), the Fund and its related companies may pay the intermediary for the sale of Fund shares and related services. These payments may create a conflict of interest by influencing the broker-dealer or other intermediary and your salesperson to recommend the Fund over another investment, or to recommend one share class of the Fund over another share class. Ask your salesperson or visit your financial intermediary's website for more information.
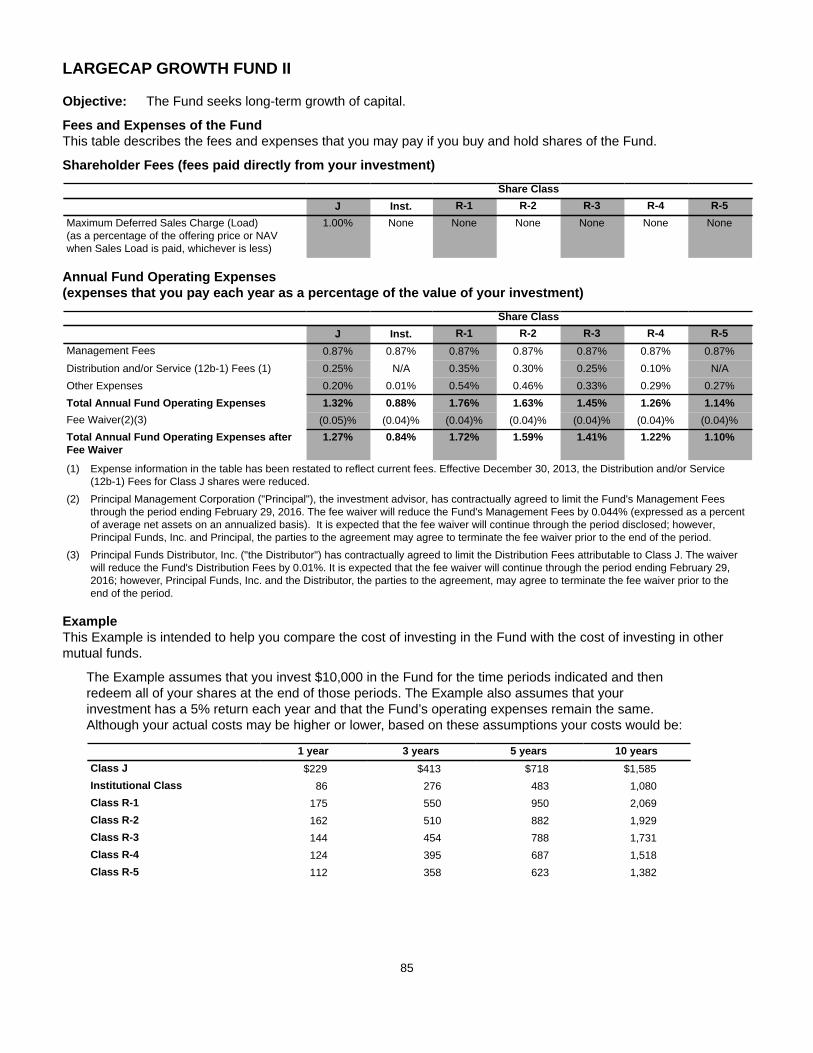
85
LARGECAP GROWTH FUND II
Objective: The Fund seeks long-term growth of capital.
Fees and Expenses of the FundThis table describes the fees and expenses that you may pay if you buy and hold shares of the Fund.
Shareholder Fees (fees paid directly from your investment)
Share ClassJ Inst. R-1 R-2 R-3 R-4 R-5
Maximum Deferred Sales Charge (Load)(as a percentage of the offering price or NAVwhen Sales Load is paid, whichever is less)
1.00% None None None None None None
Annual Fund Operating Expenses (expenses that you pay each year as a percentage of the value of your investment)
Share ClassJ Inst. R-1 R-2 R-3 R-4 R-5
Management Fees 0.87% 0.87% 0.87% 0.87% 0.87% 0.87% 0.87%Distribution and/or Service (12b-1) Fees (1) 0.25% N/A 0.35% 0.30% 0.25% 0.10% N/AOther Expenses 0.20% 0.01% 0.54% 0.46% 0.33% 0.29% 0.27%Total Annual Fund Operating Expenses 1.32% 0.88% 1.76% 1.63% 1.45% 1.26% 1.14%Fee Waiver(2)(3) (0.05)% (0.04)% (0.04)% (0.04)% (0.04)% (0.04)% (0.04)%Total Annual Fund Operating Expenses afterFee Waiver
1.27% 0.84% 1.72% 1.59% 1.41% 1.22% 1.10%
(1) Expense information in the table has been restated to reflect current fees. Effective December 30, 2013, the Distribution and/or Service (12b-1) Fees for Class J shares were reduced.
(2) Principal Management Corporation ("Principal"), the investment advisor, has contractually agreed to limit the Fund's Management Fees through the period ending February 29, 2016. The fee waiver will reduce the Fund's Management Fees by 0.044% (expressed as a percent of average net assets on an annualized basis). It is expected that the fee waiver will continue through the period disclosed; however, Principal Funds, Inc. and Principal, the parties to the agreement may agree to terminate the fee waiver prior to the end of the period.
(3) Principal Funds Distributor, Inc. ("the Distributor") has contractually agreed to limit the Distribution Fees attributable to Class J. The waiver will reduce the Fund's Distribution Fees by 0.01%. It is expected that the fee waiver will continue through the period ending February 29, 2016; however, Principal Funds, Inc. and the Distributor, the parties to the agreement, may agree to terminate the fee waiver prior to the end of the period.
ExampleThis Example is intended to help you compare the cost of investing in the Fund with the cost of investing in other mutual funds.
The Example assumes that you invest $10,000 in the Fund for the time periods indicated and then redeem all of your shares at the end of those periods. The Example also assumes that your investment has a 5% return each year and that the Fund’s operating expenses remain the same. Although your actual costs may be higher or lower, based on these assumptions your costs would be:
1 year 3 years 5 years 10 yearsClass J $229 $413 $718 $1,585Institutional Class 86 276 483 1,080Class R-1 175 550 950 2,069Class R-2 162 510 882 1,929Class R-3 144 454 788 1,731Class R-4 124 395 687 1,518Class R-5 112 358 623 1,382
86
With respect to Class J shares, you would pay the following expenses if you did not redeem your shares (all other classes would be the same as in the above example):
1 year 3 years 5 years 10 yearsClass J $129 $413 $718 $1,585
Portfolio TurnoverThe Fund pays transaction costs, such as commissions, when it buys and sells securities (or “turns over” its portfolio). A higher portfolio turnover rate may indicate higher transaction costs and may result in higher taxes when Fund shares are held in a taxable account. These costs, which are not reflected in annual fund operating expenses or in the example, affect the Fund’s performance. During the most recent fiscal year, the Fund’s portfolio turnover rate was 83.6% of the average value of its portfolio.
Principal Investment StrategiesUnder normal circumstances, the Fund invests at least 80% of its net assets, plus any borrowings for investment purposes, in equity securities of companies with large market capitalizations at the time of each purchase. For this Fund, companies with large market capitalizations are those with market capitalizations within the range of companies comprising the Russell 1000® Growth Index (as of December 31, 2014, the range was between approximately $275.0 million and $665.6 billion). The Fund invests in growth equity securities; growth orientation emphasizes buying equity securities of companies whose potential for growth of capital and earnings is expected to be above average.
Principal Management Corporation invests between 10% and 35% of the Fund's assets in equity securities in an attempt to match or exceed the performance of the Fund's benchmark index (listed in the Average Annual Total Returns table) by purchasing securities in the index while slightly overweighting and underweighting certain individual equity securities relative to their weight in the index.
Principal RisksThe value of your investment in the Fund changes with the value of the Fund's investments. Many factors affect that value, and it is possible to lose money by investing in the Fund. An investment in the Fund is not a deposit of a bank and is not insured or guaranteed by the Federal Deposit Insurance Corporation or any other government agency. The principal risks of investing in the Fund, in alphabetical order, are:
Equity Securities Risk. The value of equity securities could decline if the issuer's financial condition declines or in response to overall market and economic conditions. A fund's principal market segment(s), such as large cap, mid cap or small cap stocks, or growth or value stocks, may underperform other market segments or the equity markets as a whole. Investments in smaller companies and mid-size companies may involve greater risk and price volatility than investments in larger, more mature companies.
Growth Stock Risk. If growth companies do not increase their earnings at a rate expected by investors, the market price of the stock may decline significantly, even if earnings show an absolute increase. Growth company stocks also typically lack the dividend yield that can lessen price declines in market downturns.
Risk of Being an Underlying Fund. A fund is subject to the risk of being an underlying fund to the extent that a fund of funds invests in the fund. An underlying fund of a fund of funds may experience relatively large redemptions or investments as the fund of funds periodically reallocates or rebalances its assets. These transactions may cause the underlying fund to sell portfolio securities to meet such redemptions, or to invest cash from such investments, at times it would not otherwise do so, and may as a result increase transaction costs and adversely affect underlying fund performance.
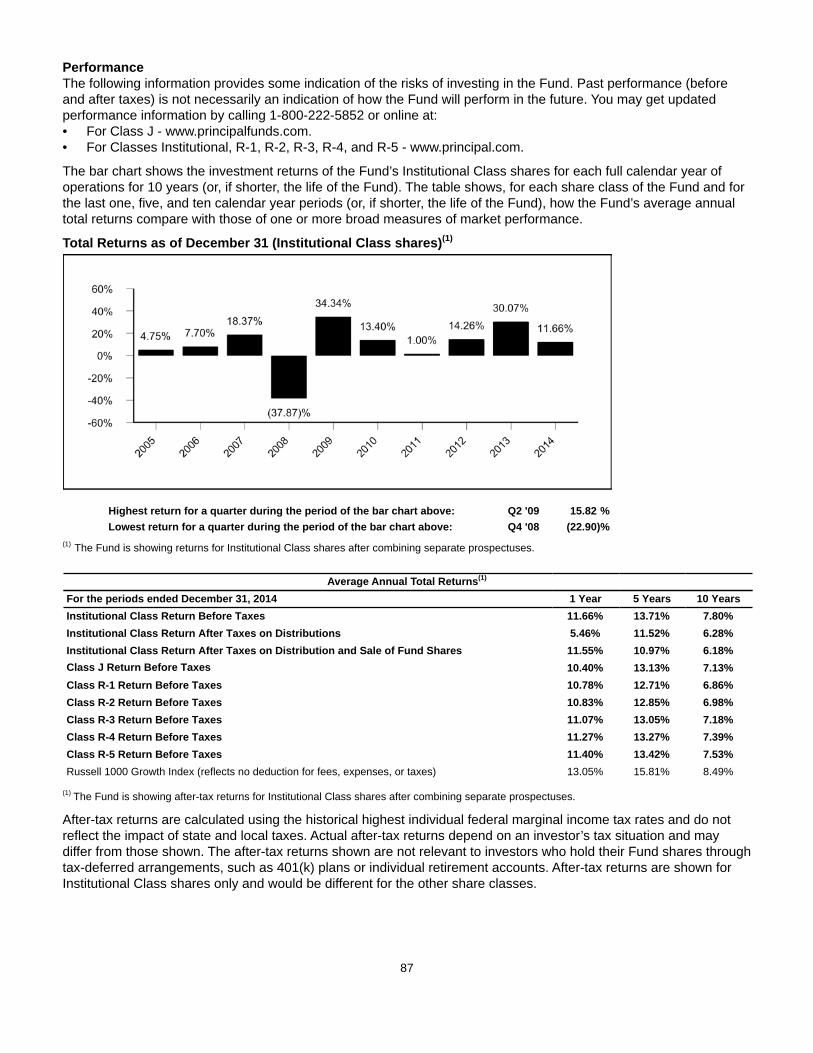
87
PerformanceThe following information provides some indication of the risks of investing in the Fund. Past performance (before and after taxes) is not necessarily an indication of how the Fund will perform in the future. You may get updated performance information by calling 1-800-222-5852 or online at:• For Class J - www.principalfunds.com.• For Classes Institutional, R-1, R-2, R-3, R-4, and R-5 - www.principal.com.
The bar chart shows the investment returns of the Fund’s Institutional Class shares for each full calendar year of operations for 10 years (or, if shorter, the life of the Fund). The table shows, for each share class of the Fund and for the last one, five, and ten calendar year periods (or, if shorter, the life of the Fund), how the Fund’s average annual total returns compare with those of one or more broad measures of market performance.
Total Returns as of December 31 (Institutional Class shares)(1)
Highest return for a quarter during the period of the bar chart above: Q2 '09 15.82 %Lowest return for a quarter during the period of the bar chart above: Q4 '08 (22.90)%
(1) The Fund is showing returns for Institutional Class shares after combining separate prospectuses.
Average Annual Total Returns(1)
For the periods ended December 31, 2014 1 Year 5 Years 10 YearsInstitutional Class Return Before Taxes 11.66% 13.71% 7.80%Institutional Class Return After Taxes on Distributions 5.46% 11.52% 6.28%Institutional Class Return After Taxes on Distribution and Sale of Fund Shares 11.55% 10.97% 6.18%Class J Return Before Taxes 10.40% 13.13% 7.13%Class R-1 Return Before Taxes 10.78% 12.71% 6.86%Class R-2 Return Before Taxes 10.83% 12.85% 6.98%Class R-3 Return Before Taxes 11.07% 13.05% 7.18%Class R-4 Return Before Taxes 11.27% 13.27% 7.39%Class R-5 Return Before Taxes 11.40% 13.42% 7.53%Russell 1000 Growth Index (reflects no deduction for fees, expenses, or taxes) 13.05% 15.81% 8.49%
(1) The Fund is showing after-tax returns for Institutional Class shares after combining separate prospectuses.
After-tax returns are calculated using the historical highest individual federal marginal income tax rates and do not reflect the impact of state and local taxes. Actual after-tax returns depend on an investor’s tax situation and may differ from those shown. The after-tax returns shown are not relevant to investors who hold their Fund shares through tax-deferred arrangements, such as 401(k) plans or individual retirement accounts. After-tax returns are shown for Institutional Class shares only and would be different for the other share classes.
88
Management
Investment Advisor and Portfolio Managers: Principal Management Corporation• James W. Fennessey (since 2009), Portfolio Manager• Randy L. Welch (since 2009), Portfolio Manager
Sub-Advisors: American Century Investment Management, Inc. Sawgrass Asset Management, LLC
Purchase and Sale of Fund Shares
Share Class Investment TypePurchase Minimum
Per FundJ Initial Investment $1,000(1)
J Initial Investment for accounts with an Automatic Investment Plan (AIP) $100J Subsequent Investments $100(1)(2)
Institutional, R-1, R-2, R-3, R-4, andR-5
There are no minimum initial or subsequent investment requirements foreligible purchasers.
N/A
(1) Some exceptions apply; see "Purchase of Fund Shares - Minimum Investments" for more information.(2) For accounts with an AIP, the subsequent automatic investments must total $1,200 annually if the initial $1,000 minimum has not been met.
You may purchase or redeem shares on any business day (normally any day when the New York Stock Exchange is open for regular trading), through your plan, intermediary, or Financial Professional; by sending a written request to Principal Funds at P.O. Box 8024, Boston, MA 02266-8024 (regular mail) or 30 Dan Road, Canton, MA 02021-2809 (overnight mail); calling us at 1-800-222-5852; or accessing our website (www.principalfunds.com).
Tax InformationThe Fund’s distributions you receive are generally subject to federal income tax as ordinary income or capital gain and may also be subject to state and local taxes, unless you are tax-exempt or your account is tax-deferred in which case your distributions would be taxed when withdrawn from the tax-deferred account.
Payments to Broker-Dealers and Other Financial IntermediariesIf you purchase the Fund through a broker-dealer or other financial intermediary (such as a bank, insurance company, investment adviser, etc.), the Fund and its related companies may pay the intermediary for the sale of Fund shares and related services. These payments may create a conflict of interest by influencing the broker-dealer or other intermediary and your salesperson to recommend the Fund over another investment, or to recommend one share class of the Fund over another share class. Ask your salesperson or visit your financial intermediary's website for more information.
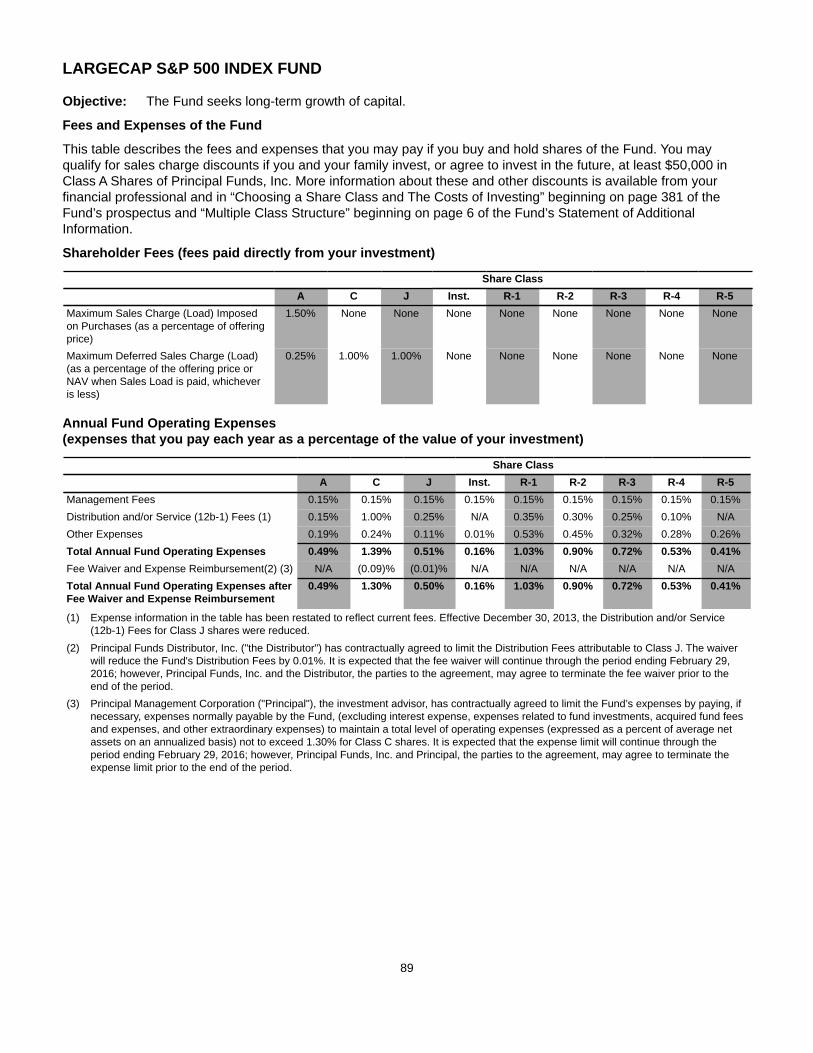
89
LARGECAP S&P 500 INDEX FUND
Objective: The Fund seeks long-term growth of capital.
Fees and Expenses of the Fund
This table describes the fees and expenses that you may pay if you buy and hold shares of the Fund. You may qualify for sales charge discounts if you and your family invest, or agree to invest in the future, at least $50,000 in Class A Shares of Principal Funds, Inc. More information about these and other discounts is available from your financial professional and in “Choosing a Share Class and The Costs of Investing” beginning on page 381 of the Fund’s prospectus and “Multiple Class Structure” beginning on page 6 of the Fund’s Statement of Additional Information.
Shareholder Fees (fees paid directly from your investment)
Share ClassA C J Inst. R-1 R-2 R-3 R-4 R-5
Maximum Sales Charge (Load) Imposedon Purchases (as a percentage of offeringprice)
1.50% None None None None None None None None
Maximum Deferred Sales Charge (Load)(as a percentage of the offering price orNAV when Sales Load is paid, whicheveris less)
0.25% 1.00% 1.00% None None None None None None
Annual Fund Operating Expenses (expenses that you pay each year as a percentage of the value of your investment)
Share ClassA C J Inst. R-1 R-2 R-3 R-4 R-5
Management Fees 0.15% 0.15% 0.15% 0.15% 0.15% 0.15% 0.15% 0.15% 0.15%Distribution and/or Service (12b-1) Fees (1) 0.15% 1.00% 0.25% N/A 0.35% 0.30% 0.25% 0.10% N/AOther Expenses 0.19% 0.24% 0.11% 0.01% 0.53% 0.45% 0.32% 0.28% 0.26%Total Annual Fund Operating Expenses 0.49% 1.39% 0.51% 0.16% 1.03% 0.90% 0.72% 0.53% 0.41%Fee Waiver and Expense Reimbursement(2) (3) N/A (0.09)% (0.01)% N/A N/A N/A N/A N/A N/ATotal Annual Fund Operating Expenses afterFee Waiver and Expense Reimbursement
0.49% 1.30% 0.50% 0.16% 1.03% 0.90% 0.72% 0.53% 0.41%
(1) Expense information in the table has been restated to reflect current fees. Effective December 30, 2013, the Distribution and/or Service (12b-1) Fees for Class J shares were reduced.
(2) Principal Funds Distributor, Inc. ("the Distributor") has contractually agreed to limit the Distribution Fees attributable to Class J. The waiver will reduce the Fund's Distribution Fees by 0.01%. It is expected that the fee waiver will continue through the period ending February 29, 2016; however, Principal Funds, Inc. and the Distributor, the parties to the agreement, may agree to terminate the fee waiver prior to the end of the period.
(3) Principal Management Corporation ("Principal"), the investment advisor, has contractually agreed to limit the Fund’s expenses by paying, if necessary, expenses normally payable by the Fund, (excluding interest expense, expenses related to fund investments, acquired fund fees and expenses, and other extraordinary expenses) to maintain a total level of operating expenses (expressed as a percent of average net assets on an annualized basis) not to exceed 1.30% for Class C shares. It is expected that the expense limit will continue through the period ending February 29, 2016; however, Principal Funds, Inc. and Principal, the parties to the agreement, may agree to terminate the expense limit prior to the end of the period.
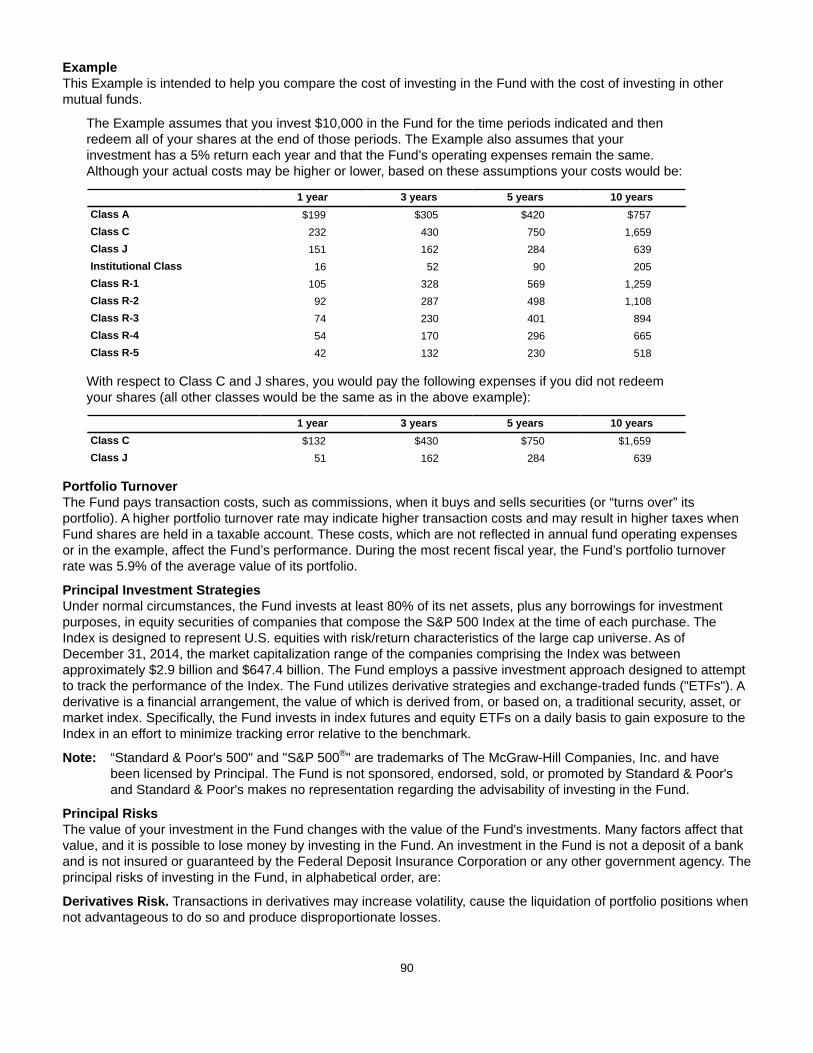
90
ExampleThis Example is intended to help you compare the cost of investing in the Fund with the cost of investing in other mutual funds.
The Example assumes that you invest $10,000 in the Fund for the time periods indicated and then redeem all of your shares at the end of those periods. The Example also assumes that your investment has a 5% return each year and that the Fund’s operating expenses remain the same. Although your actual costs may be higher or lower, based on these assumptions your costs would be:
1 year 3 years 5 years 10 yearsClass A $199 $305 $420 $757Class C 232 430 750 1,659Class J 151 162 284 639Institutional Class 16 52 90 205Class R-1 105 328 569 1,259Class R-2 92 287 498 1,108Class R-3 74 230 401 894Class R-4 54 170 296 665Class R-5 42 132 230 518
With respect to Class C and J shares, you would pay the following expenses if you did not redeem your shares (all other classes would be the same as in the above example):
1 year 3 years 5 years 10 yearsClass C $132 $430 $750 $1,659Class J 51 162 284 639
Portfolio TurnoverThe Fund pays transaction costs, such as commissions, when it buys and sells securities (or “turns over” its portfolio). A higher portfolio turnover rate may indicate higher transaction costs and may result in higher taxes when Fund shares are held in a taxable account. These costs, which are not reflected in annual fund operating expenses or in the example, affect the Fund’s performance. During the most recent fiscal year, the Fund’s portfolio turnover rate was 5.9% of the average value of its portfolio.
Principal Investment StrategiesUnder normal circumstances, the Fund invests at least 80% of its net assets, plus any borrowings for investment purposes, in equity securities of companies that compose the S&P 500 Index at the time of each purchase. The Index is designed to represent U.S. equities with risk/return characteristics of the large cap universe. As of December 31, 2014, the market capitalization range of the companies comprising the Index was between approximately $2.9 billion and $647.4 billion. The Fund employs a passive investment approach designed to attempt to track the performance of the Index. The Fund utilizes derivative strategies and exchange-traded funds ("ETFs"). A derivative is a financial arrangement, the value of which is derived from, or based on, a traditional security, asset, or market index. Specifically, the Fund invests in index futures and equity ETFs on a daily basis to gain exposure to the Index in an effort to minimize tracking error relative to the benchmark.
Note: “Standard & Poor's 500" and "S&P 500®" are trademarks of The McGraw-Hill Companies, Inc. and have been licensed by Principal. The Fund is not sponsored, endorsed, sold, or promoted by Standard & Poor's and Standard & Poor's makes no representation regarding the advisability of investing in the Fund.
Principal RisksThe value of your investment in the Fund changes with the value of the Fund's investments. Many factors affect that value, and it is possible to lose money by investing in the Fund. An investment in the Fund is not a deposit of a bank and is not insured or guaranteed by the Federal Deposit Insurance Corporation or any other government agency. The principal risks of investing in the Fund, in alphabetical order, are:
Derivatives Risk. Transactions in derivatives may increase volatility, cause the liquidation of portfolio positions when not advantageous to do so and produce disproportionate losses.
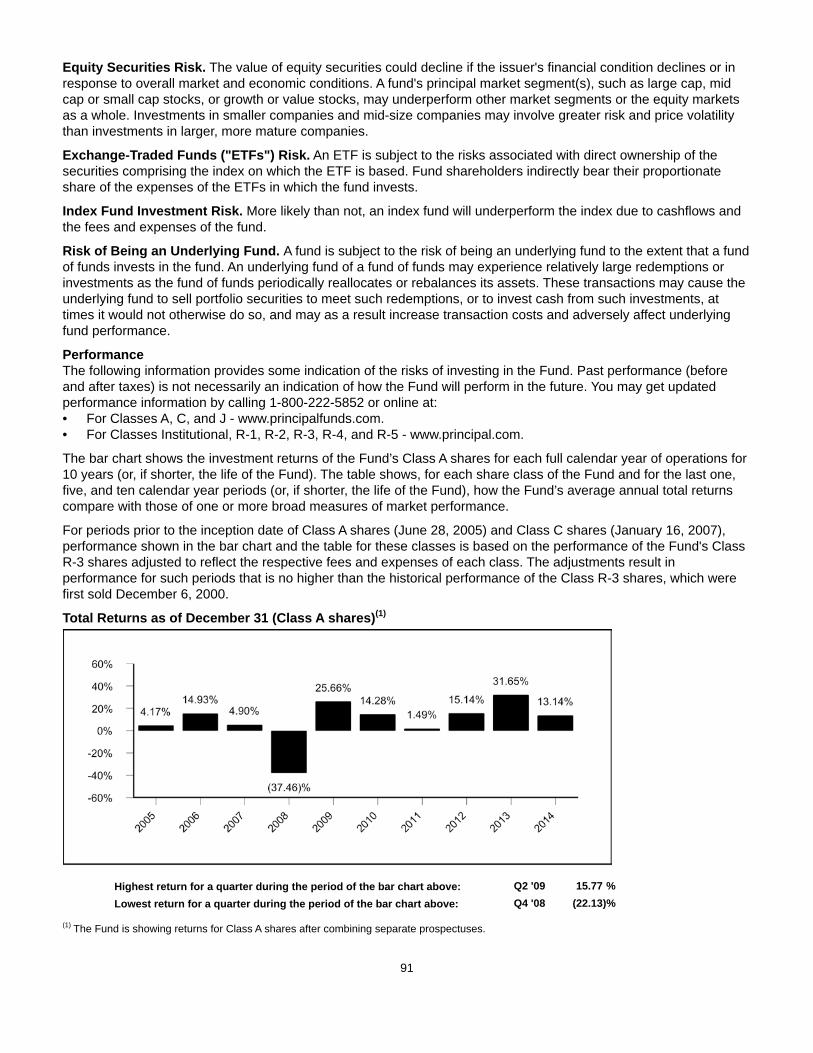
91
Equity Securities Risk. The value of equity securities could decline if the issuer's financial condition declines or in response to overall market and economic conditions. A fund's principal market segment(s), such as large cap, mid cap or small cap stocks, or growth or value stocks, may underperform other market segments or the equity markets as a whole. Investments in smaller companies and mid-size companies may involve greater risk and price volatility than investments in larger, more mature companies.
Exchange-Traded Funds ("ETFs") Risk. An ETF is subject to the risks associated with direct ownership of the securities comprising the index on which the ETF is based. Fund shareholders indirectly bear their proportionate share of the expenses of the ETFs in which the fund invests.
Index Fund Investment Risk. More likely than not, an index fund will underperform the index due to cashflows and the fees and expenses of the fund.
Risk of Being an Underlying Fund. A fund is subject to the risk of being an underlying fund to the extent that a fund of funds invests in the fund. An underlying fund of a fund of funds may experience relatively large redemptions or investments as the fund of funds periodically reallocates or rebalances its assets. These transactions may cause the underlying fund to sell portfolio securities to meet such redemptions, or to invest cash from such investments, at times it would not otherwise do so, and may as a result increase transaction costs and adversely affect underlying fund performance.
PerformanceThe following information provides some indication of the risks of investing in the Fund. Past performance (before and after taxes) is not necessarily an indication of how the Fund will perform in the future. You may get updated performance information by calling 1-800-222-5852 or online at:• For Classes A, C, and J - www.principalfunds.com.• For Classes Institutional, R-1, R-2, R-3, R-4, and R-5 - www.principal.com.
The bar chart shows the investment returns of the Fund’s Class A shares for each full calendar year of operations for 10 years (or, if shorter, the life of the Fund). The table shows, for each share class of the Fund and for the last one, five, and ten calendar year periods (or, if shorter, the life of the Fund), how the Fund’s average annual total returns compare with those of one or more broad measures of market performance.
For periods prior to the inception date of Class A shares (June 28, 2005) and Class C shares (January 16, 2007), performance shown in the bar chart and the table for these classes is based on the performance of the Fund's Class R-3 shares adjusted to reflect the respective fees and expenses of each class. The adjustments result in performance for such periods that is no higher than the historical performance of the Class R-3 shares, which were first sold December 6, 2000.
Total Returns as of December 31 (Class A shares)(1)
Highest return for a quarter during the period of the bar chart above: Q2 '09 15.77 %Lowest return for a quarter during the period of the bar chart above: Q4 '08 (22.13)%
(1) The Fund is showing returns for Class A shares after combining separate prospectuses.
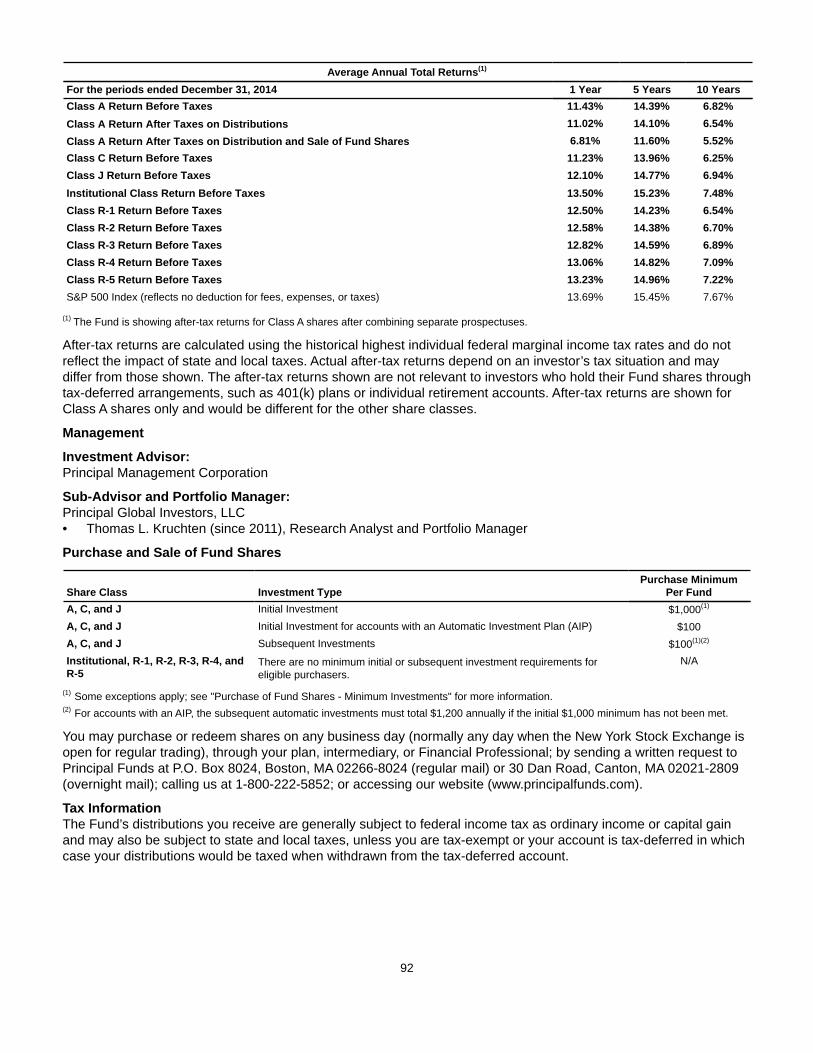
92
Average Annual Total Returns(1)
For the periods ended December 31, 2014 1 Year 5 Years 10 YearsClass A Return Before Taxes 11.43% 14.39% 6.82%Class A Return After Taxes on Distributions 11.02% 14.10% 6.54%Class A Return After Taxes on Distribution and Sale of Fund Shares 6.81% 11.60% 5.52%Class C Return Before Taxes 11.23% 13.96% 6.25%Class J Return Before Taxes 12.10% 14.77% 6.94%Institutional Class Return Before Taxes 13.50% 15.23% 7.48%Class R-1 Return Before Taxes 12.50% 14.23% 6.54%Class R-2 Return Before Taxes 12.58% 14.38% 6.70%Class R-3 Return Before Taxes 12.82% 14.59% 6.89%Class R-4 Return Before Taxes 13.06% 14.82% 7.09%Class R-5 Return Before Taxes 13.23% 14.96% 7.22%S&P 500 Index (reflects no deduction for fees, expenses, or taxes) 13.69% 15.45% 7.67%
(1) The Fund is showing after-tax returns for Class A shares after combining separate prospectuses.
After-tax returns are calculated using the historical highest individual federal marginal income tax rates and do not reflect the impact of state and local taxes. Actual after-tax returns depend on an investor’s tax situation and may differ from those shown. The after-tax returns shown are not relevant to investors who hold their Fund shares through tax-deferred arrangements, such as 401(k) plans or individual retirement accounts. After-tax returns are shown for Class A shares only and would be different for the other share classes.
Management
Investment Advisor: Principal Management Corporation
Sub-Advisor and Portfolio Manager:Principal Global Investors, LLC• Thomas L. Kruchten (since 2011), Research Analyst and Portfolio Manager
Purchase and Sale of Fund Shares
Share Class Investment TypePurchase Minimum
Per FundA, C, and J Initial Investment $1,000(1)
A, C, and J Initial Investment for accounts with an Automatic Investment Plan (AIP) $100A, C, and J Subsequent Investments $100(1)(2)
Institutional, R-1, R-2, R-3, R-4, andR-5
There are no minimum initial or subsequent investment requirements foreligible purchasers.
N/A
(1) Some exceptions apply; see "Purchase of Fund Shares - Minimum Investments" for more information.(2) For accounts with an AIP, the subsequent automatic investments must total $1,200 annually if the initial $1,000 minimum has not been met.
You may purchase or redeem shares on any business day (normally any day when the New York Stock Exchange is open for regular trading), through your plan, intermediary, or Financial Professional; by sending a written request to Principal Funds at P.O. Box 8024, Boston, MA 02266-8024 (regular mail) or 30 Dan Road, Canton, MA 02021-2809 (overnight mail); calling us at 1-800-222-5852; or accessing our website (www.principalfunds.com).
Tax InformationThe Fund’s distributions you receive are generally subject to federal income tax as ordinary income or capital gain and may also be subject to state and local taxes, unless you are tax-exempt or your account is tax-deferred in which case your distributions would be taxed when withdrawn from the tax-deferred account.

93
Payments to Broker-Dealers and Other Financial IntermediariesIf you purchase the Fund through a broker-dealer or other financial intermediary (such as a bank, insurance company, investment adviser, etc.), the Fund and its related companies may pay the intermediary for the sale of Fund shares and related services. These payments may create a conflict of interest by influencing the broker-dealer or other intermediary and your salesperson to recommend the Fund over another investment, or to recommend one share class of the Fund over another share class. Ask your salesperson or visit your financial intermediary's website for more information.

94
LARGECAP VALUE FUND
Objective: The Fund seeks long-term growth of capital.
Fees and Expenses of the FundThis table describes the fees and expenses that you may pay if you buy and hold shares of the Fund. You may qualify for sales charge discounts if you and your family invest, or agree to invest in the future, at least $50,000 in Class A Shares of Principal Funds, Inc. More information about these and other discounts is available from your financial professional and in “Choosing a Share Class and The Costs of Investing” beginning on page 381 of the Fund’s prospectus and “Multiple Class Structure” beginning on page 6 of the Fund’s Statement of Additional Information.
Shareholder Fees (fees paid directly from your investment)
Share ClassA C J P Inst. R-1 R-2 R-3 R-4 R-5
Maximum Sales Charge (Load) Imposed onPurchases (as a percentage of offering price)
5.50% None None None None None None None None None
Maximum Deferred Sales Charge (Load) (asa percentage of the offering price or NAVwhen Sales Load is paid, whichever is less)
1.00% 1.00% 1.00% None None None None None None None
Annual Fund Operating Expenses (expenses that you pay each year as a percentage of the value of your investment)
Share ClassA C J P Inst. R-1 R-2 R-3 R-4 R-5
Management Fees 0.41% 0.41% 0.41% 0.41% 0.41% 0.41% 0.41% 0.41% 0.41% 0.41%Distribution and/or Service (12b-1) Fees (1) 0.25% 1.00% 0.25% N/A N/A 0.35% 0.30% 0.25% 0.10% N/AOther Expenses (2) 0.19% 0.46% 0.18% 0.26% —% 0.53% 0.45% 0.32% 0.28% 0.26%Total Annual Fund Operating Expenses 0.85% 1.87% 0.84% 0.67% 0.41% 1.29% 1.16% 0.98% 0.79% 0.67%Fee Waiver and Expense Reimbursement(3)(4)
N/A (0.17)% (0.01)% (0.06)% N/A N/A N/A N/A N/A N/A
Total Annual Fund Operating Expensesafter Fee Waiver and ExpenseReimbursement
0.85% 1.70% 0.83% 0.61% 0.41% 1.29% 1.16% 0.98% 0.79% 0.67%
(1) Expense information in the table has been restated to reflect current fees. Effective December 30, 2013, the Distribution and/or Service (12b-1) Fees for Class J shares were reduced.
(2) Based on estimated amounts for the current fiscal year. (Class P)
(3) Principal Funds Distributor, Inc. ("the Distributor") has contractually agreed to limit the Distribution Fees attributable to Class J. The waiver will reduce the Fund's Distribution Fees by 0.01%. It is expected that the fee waiver will continue through the period ending February 29, 2016; however, Principal Funds, Inc. and the Distributor, the parties to the agreement, may agree to terminate the fee waiver prior to the end of the period.
(4) Principal Management Corporation ("Principal"), the investment advisor, has contractually agreed to limit the Fund’s expenses by paying, if necessary, expenses normally payable by the Fund, (excluding interest expense, expenses related to fund investments, acquired fund fees and expenses, and other extraordinary expenses) to maintain a total level of operating expenses (expressed as a percent of average net assets on an annualized basis) not to exceed 1.70% for Class C shares. In addition for Class P, the expense limit will maintain "Other Expenses" (expressed as a percent of average net assets on an annualized basis) not to exceed 0.20%, (excluding interest expense, expenses related to fund investments, acquired fund fees and expenses, and other extraordinary expenses). It is expected that the expense limits will continue through the period ending February 29, 2016; however, Principal Funds, Inc. and Principal, the parties to the agreement, may agree to terminate the expense limits prior to the end of the period.
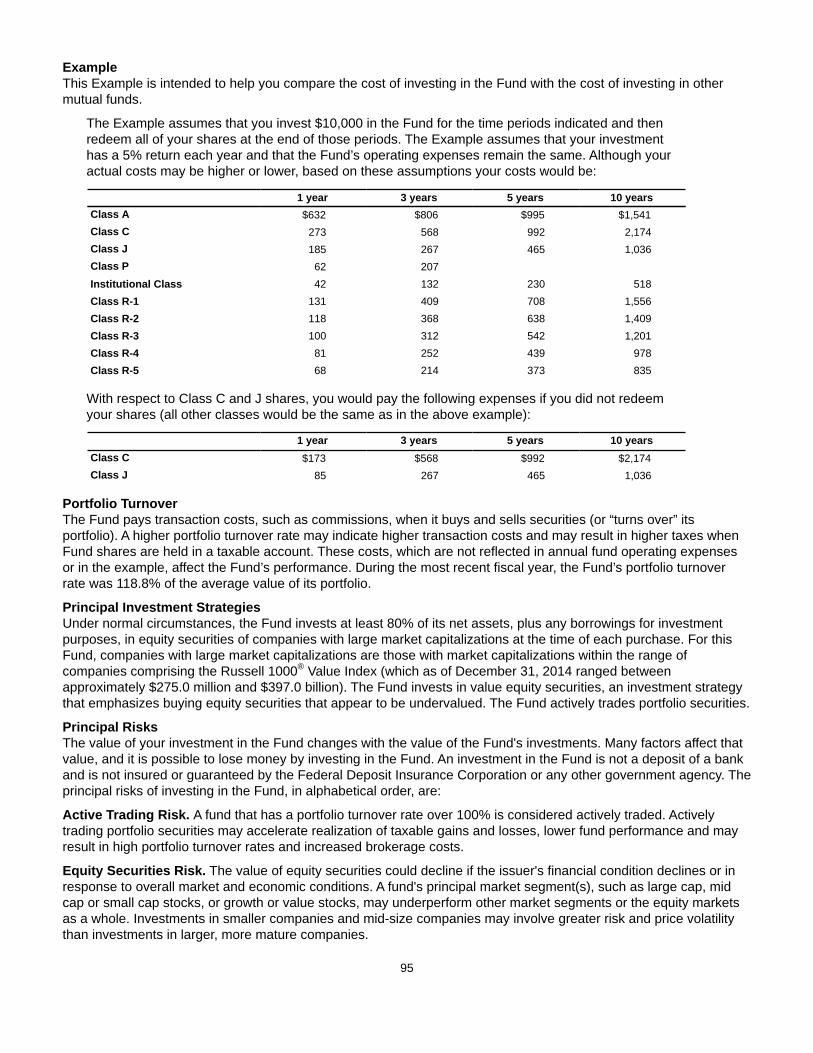
95
ExampleThis Example is intended to help you compare the cost of investing in the Fund with the cost of investing in other mutual funds.
The Example assumes that you invest $10,000 in the Fund for the time periods indicated and then redeem all of your shares at the end of those periods. The Example assumes that your investment has a 5% return each year and that the Fund’s operating expenses remain the same. Although your actual costs may be higher or lower, based on these assumptions your costs would be:
1 year 3 years 5 years 10 yearsClass A $632 $806 $995 $1,541Class C 273 568 992 2,174Class J 185 267 465 1,036Class P 62 207Institutional Class 42 132 230 518Class R-1 131 409 708 1,556Class R-2 118 368 638 1,409Class R-3 100 312 542 1,201Class R-4 81 252 439 978Class R-5 68 214 373 835
With respect to Class C and J shares, you would pay the following expenses if you did not redeem your shares (all other classes would be the same as in the above example):
1 year 3 years 5 years 10 yearsClass C $173 $568 $992 $2,174Class J 85 267 465 1,036
Portfolio TurnoverThe Fund pays transaction costs, such as commissions, when it buys and sells securities (or “turns over” its portfolio). A higher portfolio turnover rate may indicate higher transaction costs and may result in higher taxes when Fund shares are held in a taxable account. These costs, which are not reflected in annual fund operating expenses or in the example, affect the Fund’s performance. During the most recent fiscal year, the Fund’s portfolio turnover rate was 118.8% of the average value of its portfolio.
Principal Investment StrategiesUnder normal circumstances, the Fund invests at least 80% of its net assets, plus any borrowings for investment purposes, in equity securities of companies with large market capitalizations at the time of each purchase. For this Fund, companies with large market capitalizations are those with market capitalizations within the range of companies comprising the Russell 1000® Value Index (which as of December 31, 2014 ranged between approximately $275.0 million and $397.0 billion). The Fund invests in value equity securities, an investment strategy that emphasizes buying equity securities that appear to be undervalued. The Fund actively trades portfolio securities.
Principal RisksThe value of your investment in the Fund changes with the value of the Fund's investments. Many factors affect that value, and it is possible to lose money by investing in the Fund. An investment in the Fund is not a deposit of a bank and is not insured or guaranteed by the Federal Deposit Insurance Corporation or any other government agency. The principal risks of investing in the Fund, in alphabetical order, are:
Active Trading Risk. A fund that has a portfolio turnover rate over 100% is considered actively traded. Actively trading portfolio securities may accelerate realization of taxable gains and losses, lower fund performance and may result in high portfolio turnover rates and increased brokerage costs.
Equity Securities Risk. The value of equity securities could decline if the issuer's financial condition declines or in response to overall market and economic conditions. A fund's principal market segment(s), such as large cap, mid cap or small cap stocks, or growth or value stocks, may underperform other market segments or the equity markets as a whole. Investments in smaller companies and mid-size companies may involve greater risk and price volatility than investments in larger, more mature companies.
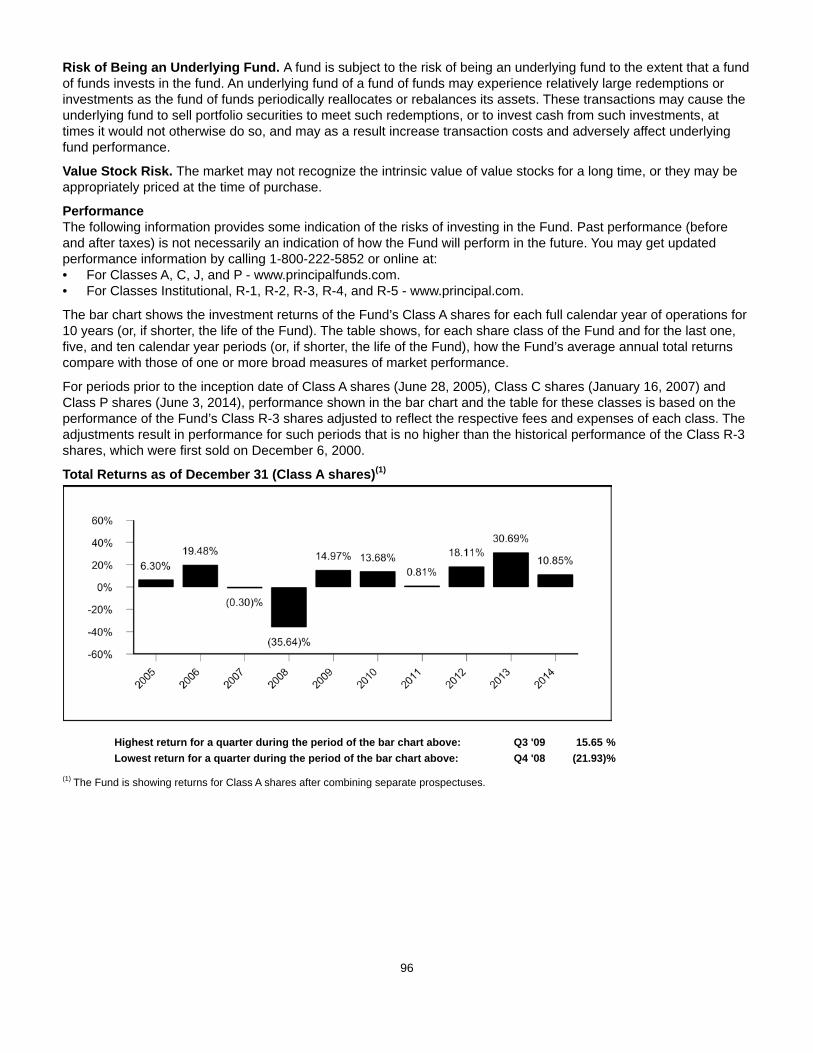
96
Risk of Being an Underlying Fund. A fund is subject to the risk of being an underlying fund to the extent that a fund of funds invests in the fund. An underlying fund of a fund of funds may experience relatively large redemptions or investments as the fund of funds periodically reallocates or rebalances its assets. These transactions may cause the underlying fund to sell portfolio securities to meet such redemptions, or to invest cash from such investments, at times it would not otherwise do so, and may as a result increase transaction costs and adversely affect underlying fund performance.
Value Stock Risk. The market may not recognize the intrinsic value of value stocks for a long time, or they may be appropriately priced at the time of purchase.
PerformanceThe following information provides some indication of the risks of investing in the Fund. Past performance (before and after taxes) is not necessarily an indication of how the Fund will perform in the future. You may get updated performance information by calling 1-800-222-5852 or online at:• For Classes A, C, J, and P - www.principalfunds.com.• For Classes Institutional, R-1, R-2, R-3, R-4, and R-5 - www.principal.com.
The bar chart shows the investment returns of the Fund’s Class A shares for each full calendar year of operations for 10 years (or, if shorter, the life of the Fund). The table shows, for each share class of the Fund and for the last one, five, and ten calendar year periods (or, if shorter, the life of the Fund), how the Fund’s average annual total returns compare with those of one or more broad measures of market performance.
For periods prior to the inception date of Class A shares (June 28, 2005), Class C shares (January 16, 2007) and Class P shares (June 3, 2014), performance shown in the bar chart and the table for these classes is based on the performance of the Fund’s Class R-3 shares adjusted to reflect the respective fees and expenses of each class. The adjustments result in performance for such periods that is no higher than the historical performance of the Class R-3 shares, which were first sold on December 6, 2000.
Total Returns as of December 31 (Class A shares)(1)
Highest return for a quarter during the period of the bar chart above: Q3 '09 15.65 %Lowest return for a quarter during the period of the bar chart above: Q4 '08 (21.93)%
(1) The Fund is showing returns for Class A shares after combining separate prospectuses.
97
Average Annual Total Returns(1)
For the periods ended December 31, 2014 1 Year 5 Years 10 YearsClass A Return Before Taxes 4.76% 13.14% 5.67%Class A Return After Taxes on Distributions 1.24% 11.68% 4.60%Class A Return After Taxes on Distribution and Sale of Fund Shares 4.04% 10.22% 4.41%Class C Return Before Taxes 8.92% 13.52% 5.48%Class J Return Before Taxes 9.92% 14.41% 6.16%Class P Return Before Taxes 10.96% 14.41% 6.24%Institutional Class Return Before Taxes 11.32% 14.98% 6.82%Class R-1 Return Before Taxes 10.40% 14.02% 5.89%Class R-2 Return Before Taxes 10.56% 14.15% 6.04%Class R-3 Return Before Taxes 10.71% 14.35% 6.21%Class R-4 Return Before Taxes 10.99% 14.56% 6.42%Class R-5 Return Before Taxes 11.01% 14.69% 6.54%Russell 1000 Value Index (reflects no deduction for fees, expenses, or taxes) 13.45% 15.42% 7.30%
(1) The Fund is showing after-tax returns for Class A shares after combining separate prospectuses.
After-tax returns are calculated using the historical highest individual federal marginal income tax rates and do not reflect the impact of state and local taxes. Actual after-tax returns depend on an investor’s tax situation and may differ from those shown. The after-tax returns shown are not relevant to investors who hold their Fund shares through tax-deferred arrangements, such as 401(k) plans or individual retirement accounts. After-tax returns are shown for Class A shares only and would be different for the other share classes.
Management
Investment Advisor: Principal Management Corporation
Sub-Advisor and Portfolio Managers:Principal Global Investors, LLC• Joel Fortney (since 2014), Portfolio Manager• Arild Holm (since 2007), Portfolio Manager • Jeffrey A. Schwarte (since 2010), Portfolio Manager
Purchase and Sale of Fund Shares
Share Class Investment TypePurchase Minimum
Per FundA, C, and J Initial Investment $1,000(1)
A, C, and J Initial Investment for accounts with an Automatic Investment Plan (AIP) $100A, C, and J Subsequent Investments $100(1)(2)
P, Institutional, R-1, R-2, R-3, R-4,and R-5
There are no minimum initial or subsequent investment requirements foreligible purchasers.
N/A
(1) Some exceptions apply; see "Purchase of Fund Shares - Minimum Investments" for more information.(2) For accounts with an AIP, the subsequent automatic investments must total $1,200 annually if the initial $1,000 minimum has not been met.
You may purchase or redeem shares on any business day (normally any day when the New York Stock Exchange is open for regular trading), through your plan, intermediary, or Financial Professional; by sending a written request to Principal Funds at P.O. Box 8024, Boston, MA 02266-8024 (regular mail) or 30 Dan Road, Canton, MA 02021-2809 (overnight mail); calling us at 1-800-222-5852; or accessing our website (www.principalfunds.com).
Tax InformationThe Fund’s distributions you receive are generally subject to federal income tax as ordinary income or capital gain and may also be subject to state and local taxes, unless you are tax-exempt or your account is tax-deferred in which case your distributions would be taxed when withdrawn from the tax-deferred account.

98
Payments to Broker-Dealers and Other Financial IntermediariesIf you purchase the Fund through a broker-dealer or other financial intermediary (such as a bank, insurance company, investment adviser, etc.), the Fund and its related companies may pay the intermediary for the sale of Fund shares and related services. These payments may create a conflict of interest by influencing the broker-dealer or other intermediary and your salesperson to recommend the Fund over another investment, or to recommend one share class of the Fund over another share class. Ask your salesperson or visit your financial intermediary's website for more information.

99
LARGECAP VALUE FUND III
Objective: The Fund seeks long-term growth of capital.
Fees and Expenses of the FundThis table describes the fees and expenses that you may pay if you buy and hold shares of the Fund.
Shareholder Fees (fees paid directly from your investment)
Share ClassJ Inst. R-1 R-2 R-3 R-4 R-5
Maximum Deferred Sales Charge (Load)(as a percentage of the offering price or NAVwhen Sales Load is paid, whichever is less)
1.00% None None None None None None
Annual Fund Operating Expenses (expenses that you pay each year as a percentage of the value of your investment)
Share ClassJ Inst. R-1 R-2 R-3 R-4 R-5
Management Fees 0.76% 0.76% 0.76% 0.76% 0.76% 0.76% 0.76%Distribution and/or Service (12b-1) Fees (1) 0.25% N/A 0.35% 0.30% 0.25% 0.10% N/AOther Expenses 0.16% 0.01% 0.53% 0.45% 0.32% 0.28% 0.26%Total Annual Fund Operating Expenses 1.17% 0.77% 1.64% 1.51% 1.33% 1.14% 1.02%Fee Waiver(2)(3) (0.02)% (0.01)% (0.01)% (0.01)% (0.01)% (0.01)% (0.01)%Total Annual Fund Operating Expenses afterFee Waiver
1.15% 0.76% 1.63% 1.50% 1.32% 1.13% 1.01%
(1) Expense information in the table has been restated to reflect current fees. Effective December 30, 2013, the Distribution and/or Service (12b-1) Fees for Class J shares were reduced.
(2) Principal Management Corporation ("Principal"), the investment advisor, has contractually agreed to limit the Fund's Management Fees through the period ending February 29, 2016. The fee waiver will reduce the Fund's Management Fees by 0.012% (expressed as a percent of average net assets on an annualized basis). It is expected that the fee waiver will continue through the period disclosed; however, Principal Funds, Inc. and Principal, the parties to the agreement may agree to terminate the fee waiver prior to the end of the period.
(3) Principal Funds Distributor, Inc. ("the Distributor") has contractually agreed to limit the Distribution Fees attributable to Class J. The waiver will reduce the Fund's Distribution Fees by 0.01%. It is expected that the fee waiver will continue through the period ending February 29, 2016; however, Principal Funds, Inc. and the Distributor, the parties to the agreement, may agree to terminate the fee waiver prior to the end of the period.
ExampleThis Example is intended to help you compare the cost of investing in the Fund with the cost of investing in other mutual funds.
The Example assumes that you invest $10,000 in the Fund for the time periods indicated and then redeem all of your shares at the end of those periods. The Example also assumes that your investment has a 5% return each year and that the Fund’s operating expenses remain the same. Although your actual costs may be higher or lower, based on these assumptions your costs would be:
1 year 3 years 5 years 10 yearsClass J $217 $369 $641 $1,418Institutional Class 78 245 427 953Class R-1 166 516 891 1,943Class R-2 153 476 823 1,801Class R-3 134 420 728 1,600Class R-4 115 361 626 1,385Class R-5 103 324 562 1,247
100
With respect to Class J shares, you would pay the following expenses if you did not redeem your shares (all other classes would be the same as in the above example):
1 year 3 years 5 years 10 yearsClass J $117 $369 $641 $1,418
Portfolio TurnoverThe Fund pays transaction costs, such as commissions, when it buys and sells securities (or “turns over” its portfolio). A higher portfolio turnover rate may indicate higher transaction costs and may result in higher taxes when Fund shares are held in a taxable account. These costs, which are not reflected in annual fund operating expenses or in the example, affect the Fund’s performance. During the most recent fiscal year, the Fund’s portfolio turnover rate was 41.3% of the average value of its portfolio.
Principal Investment StrategiesUnder normal circumstances, the Fund invests at least 80% of its net assets, plus any borrowings for investment purposes, in companies with large market capitalizations at the time of each purchase. For this Fund, companies with large market capitalizations are those with market capitalizations within the range of companies comprising the Russell 1000® Value Index (as of December 31, 2014, the range of the index was between approximately $275.0 million and $397.0 billion). The Fund invests in value equity securities, an investment strategy that emphasizes buying equity securities that appear to be undervalued.
Principal Management Corporation invests between 10% and 35% of the Fund's assets in equity securities in an attempt to match or exceed the performance of the Fund's benchmark index (listed in the Average Annual Total Returns table) by purchasing securities in the index while slightly overweighting and underweighting certain individual equity securities relative to their weight in the index.
Principal RisksThe value of your investment in the Fund changes with the value of the Fund's investments. Many factors affect that value, and it is possible to lose money by investing in the Fund. An investment in the Fund is not a deposit of a bank and is not insured or guaranteed by the Federal Deposit Insurance Corporation or any other government agency. The principal risks of investing in the Fund, in alphabetical order, are:
Equity Securities Risk. The value of equity securities could decline if the issuer's financial condition declines or in response to overall market and economic conditions. A fund's principal market segment(s), such as large cap, mid cap or small cap stocks, or growth or value stocks, may underperform other market segments or the equity markets as a whole. Investments in smaller companies and mid-size companies may involve greater risk and price volatility than investments in larger, more mature companies.
Risk of Being an Underlying Fund. A fund is subject to the risk of being an underlying fund to the extent that a fund of funds invests in the fund. An underlying fund of a fund of funds may experience relatively large redemptions or investments as the fund of funds periodically reallocates or rebalances its assets. These transactions may cause the underlying fund to sell portfolio securities to meet such redemptions, or to invest cash from such investments, at times it would not otherwise do so, and may as a result increase transaction costs and adversely affect underlying fund performance.
Value Stock Risk. The market may not recognize the intrinsic value of value stocks for a long time, or they may be appropriately priced at the time of purchase.
PerformanceThe following information provides some indication of the risks of investing in the Fund. Past performance (before and after taxes) is not necessarily an indication of how the Fund will perform in the future. You may get updated performance information by calling 1-800-222-5852 or online at: • For Class J - www.principalfunds.com.• For Classes Institutional, R-1, R-2, R-3, R-4, and R-5 - www.principal.com.
The bar chart shows the investment returns of the Fund’s Institutional Class shares for each full calendar year of operations for 10 years (or, if shorter, the life of the Fund). The table shows, for each share class of the Fund and for the last one, five, and ten calendar year periods (or, if shorter, the life of the Fund), how the Fund’s average annual total returns compare with those of one or more broad measures of market performance.
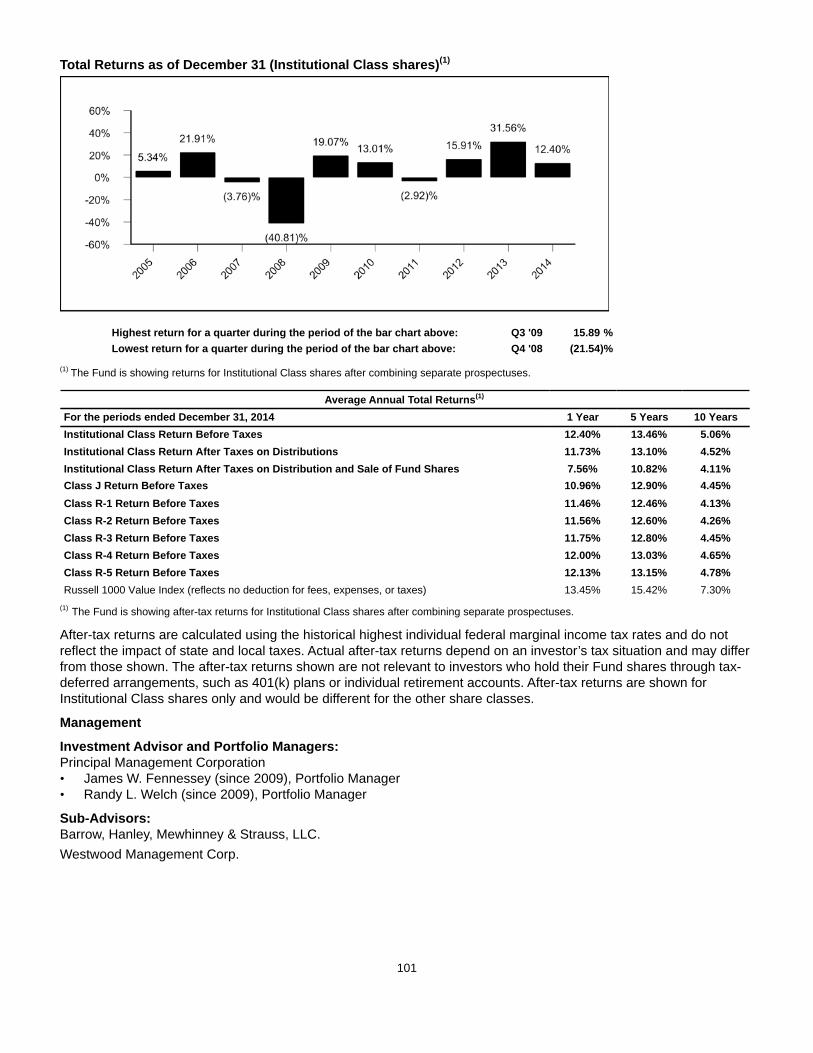
101
Total Returns as of December 31 (Institutional Class shares)(1)
Highest return for a quarter during the period of the bar chart above: Q3 '09 15.89 %Lowest return for a quarter during the period of the bar chart above: Q4 '08 (21.54)%
(1) The Fund is showing returns for Institutional Class shares after combining separate prospectuses.
Average Annual Total Returns(1)
For the periods ended December 31, 2014 1 Year 5 Years 10 YearsInstitutional Class Return Before Taxes 12.40% 13.46% 5.06%Institutional Class Return After Taxes on Distributions 11.73% 13.10% 4.52%Institutional Class Return After Taxes on Distribution and Sale of Fund Shares 7.56% 10.82% 4.11%Class J Return Before Taxes 10.96% 12.90% 4.45%Class R-1 Return Before Taxes 11.46% 12.46% 4.13%Class R-2 Return Before Taxes 11.56% 12.60% 4.26%Class R-3 Return Before Taxes 11.75% 12.80% 4.45%Class R-4 Return Before Taxes 12.00% 13.03% 4.65%Class R-5 Return Before Taxes 12.13% 13.15% 4.78%Russell 1000 Value Index (reflects no deduction for fees, expenses, or taxes) 13.45% 15.42% 7.30%
(1) The Fund is showing after-tax returns for Institutional Class shares after combining separate prospectuses.
After-tax returns are calculated using the historical highest individual federal marginal income tax rates and do not reflect the impact of state and local taxes. Actual after-tax returns depend on an investor’s tax situation and may differ from those shown. The after-tax returns shown are not relevant to investors who hold their Fund shares through tax-deferred arrangements, such as 401(k) plans or individual retirement accounts. After-tax returns are shown for Institutional Class shares only and would be different for the other share classes.
Management
Investment Advisor and Portfolio Managers: Principal Management Corporation• James W. Fennessey (since 2009), Portfolio Manager• Randy L. Welch (since 2009), Portfolio Manager
Sub-Advisors: Barrow, Hanley, Mewhinney & Strauss, LLC.Westwood Management Corp.
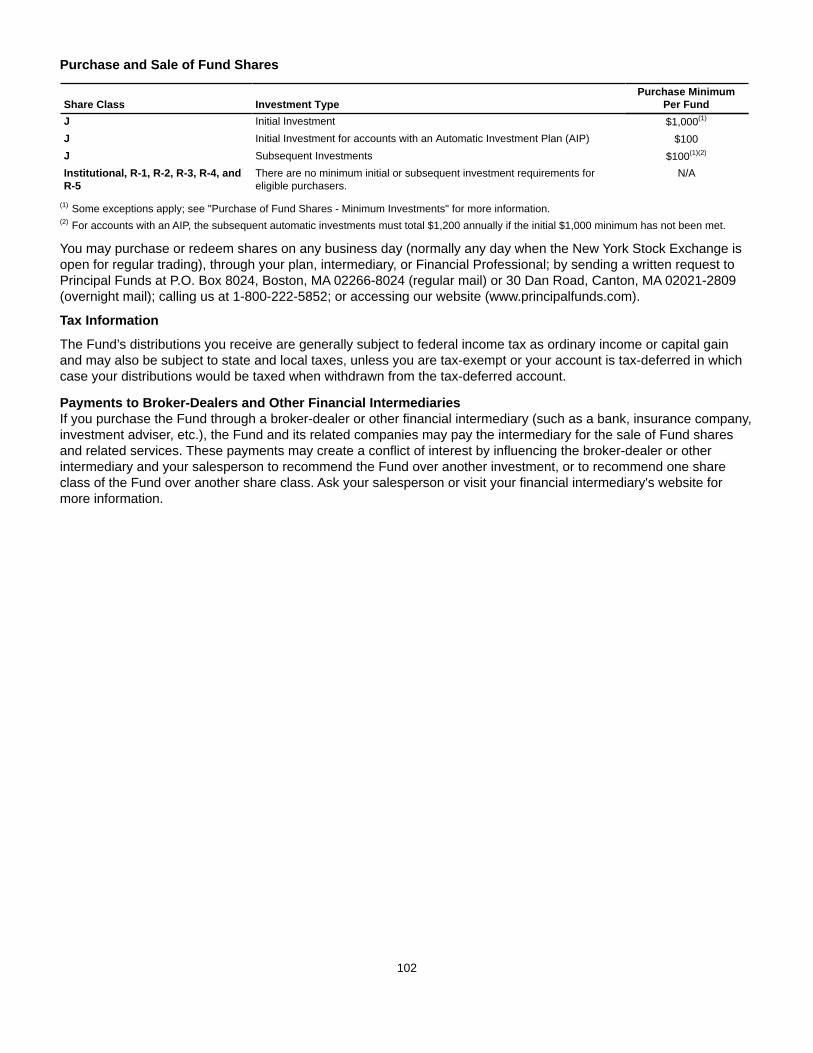
102
Purchase and Sale of Fund Shares
Share Class Investment TypePurchase Minimum
Per FundJ Initial Investment $1,000(1)
J Initial Investment for accounts with an Automatic Investment Plan (AIP) $100J Subsequent Investments $100(1)(2)
Institutional, R-1, R-2, R-3, R-4, andR-5
There are no minimum initial or subsequent investment requirements foreligible purchasers.
N/A
(1) Some exceptions apply; see "Purchase of Fund Shares - Minimum Investments" for more information.(2) For accounts with an AIP, the subsequent automatic investments must total $1,200 annually if the initial $1,000 minimum has not been met.
You may purchase or redeem shares on any business day (normally any day when the New York Stock Exchange is open for regular trading), through your plan, intermediary, or Financial Professional; by sending a written request to Principal Funds at P.O. Box 8024, Boston, MA 02266-8024 (regular mail) or 30 Dan Road, Canton, MA 02021-2809 (overnight mail); calling us at 1-800-222-5852; or accessing our website (www.principalfunds.com).
Tax Information
The Fund’s distributions you receive are generally subject to federal income tax as ordinary income or capital gain and may also be subject to state and local taxes, unless you are tax-exempt or your account is tax-deferred in which case your distributions would be taxed when withdrawn from the tax-deferred account.
Payments to Broker-Dealers and Other Financial IntermediariesIf you purchase the Fund through a broker-dealer or other financial intermediary (such as a bank, insurance company, investment adviser, etc.), the Fund and its related companies may pay the intermediary for the sale of Fund shares and related services. These payments may create a conflict of interest by influencing the broker-dealer or other intermediary and your salesperson to recommend the Fund over another investment, or to recommend one share class of the Fund over another share class. Ask your salesperson or visit your financial intermediary's website for more information.
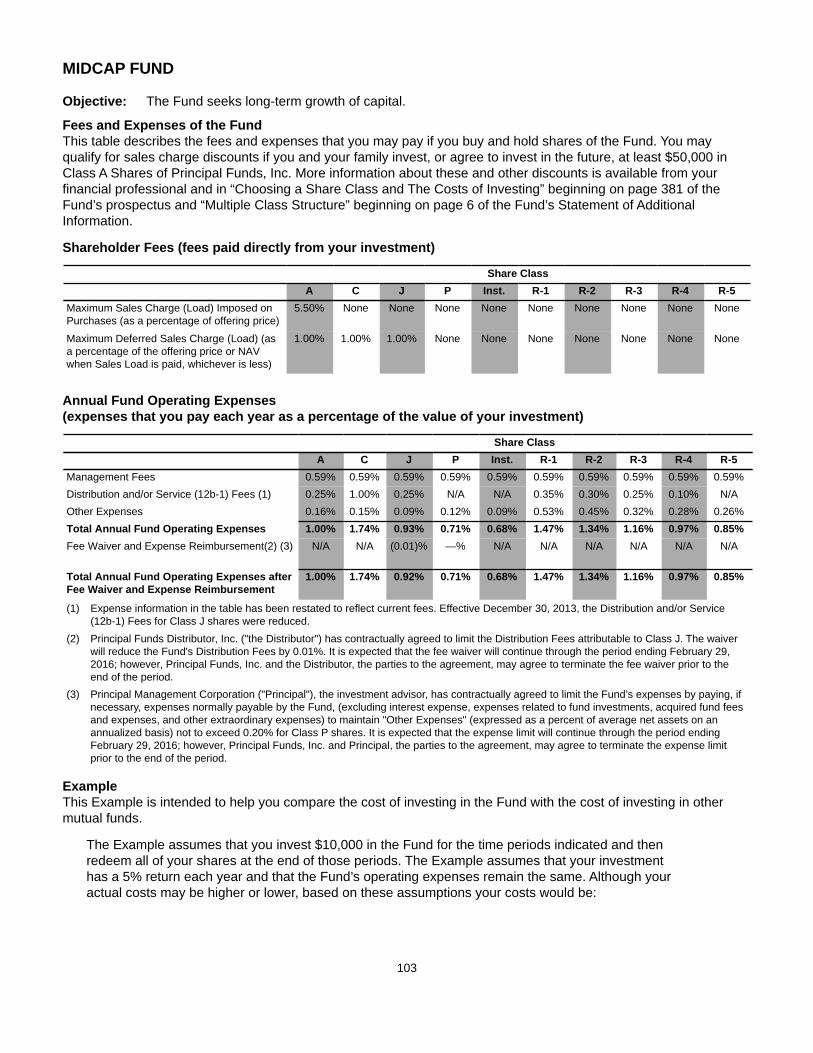
103
MIDCAP FUND
Objective: The Fund seeks long-term growth of capital.
Fees and Expenses of the FundThis table describes the fees and expenses that you may pay if you buy and hold shares of the Fund. You may qualify for sales charge discounts if you and your family invest, or agree to invest in the future, at least $50,000 in Class A Shares of Principal Funds, Inc. More information about these and other discounts is available from your financial professional and in “Choosing a Share Class and The Costs of Investing” beginning on page 381 of the Fund’s prospectus and “Multiple Class Structure” beginning on page 6 of the Fund’s Statement of Additional Information.
Shareholder Fees (fees paid directly from your investment)
Share ClassA C J P Inst. R-1 R-2 R-3 R-4 R-5
Maximum Sales Charge (Load) Imposed onPurchases (as a percentage of offering price)
5.50% None None None None None None None None None
Maximum Deferred Sales Charge (Load) (asa percentage of the offering price or NAVwhen Sales Load is paid, whichever is less)
1.00% 1.00% 1.00% None None None None None None None
Annual Fund Operating Expenses (expenses that you pay each year as a percentage of the value of your investment)
Share ClassA C J P Inst. R-1 R-2 R-3 R-4 R-5
Management Fees 0.59% 0.59% 0.59% 0.59% 0.59% 0.59% 0.59% 0.59% 0.59% 0.59%Distribution and/or Service (12b-1) Fees (1) 0.25% 1.00% 0.25% N/A N/A 0.35% 0.30% 0.25% 0.10% N/AOther Expenses 0.16% 0.15% 0.09% 0.12% 0.09% 0.53% 0.45% 0.32% 0.28% 0.26%Total Annual Fund Operating Expenses 1.00% 1.74% 0.93% 0.71% 0.68% 1.47% 1.34% 1.16% 0.97% 0.85%Fee Waiver and Expense Reimbursement(2) (3) N/A N/A (0.01)% —% N/A N/A N/A N/A N/A N/A
Total Annual Fund Operating Expenses afterFee Waiver and Expense Reimbursement
1.00% 1.74% 0.92% 0.71% 0.68% 1.47% 1.34% 1.16% 0.97% 0.85%
(1) Expense information in the table has been restated to reflect current fees. Effective December 30, 2013, the Distribution and/or Service (12b-1) Fees for Class J shares were reduced.
(2) Principal Funds Distributor, Inc. ("the Distributor") has contractually agreed to limit the Distribution Fees attributable to Class J. The waiver will reduce the Fund's Distribution Fees by 0.01%. It is expected that the fee waiver will continue through the period ending February 29, 2016; however, Principal Funds, Inc. and the Distributor, the parties to the agreement, may agree to terminate the fee waiver prior to the end of the period.
(3) Principal Management Corporation ("Principal"), the investment advisor, has contractually agreed to limit the Fund’s expenses by paying, if necessary, expenses normally payable by the Fund, (excluding interest expense, expenses related to fund investments, acquired fund fees and expenses, and other extraordinary expenses) to maintain "Other Expenses" (expressed as a percent of average net assets on an annualized basis) not to exceed 0.20% for Class P shares. It is expected that the expense limit will continue through the period ending February 29, 2016; however, Principal Funds, Inc. and Principal, the parties to the agreement, may agree to terminate the expense limit prior to the end of the period.
ExampleThis Example is intended to help you compare the cost of investing in the Fund with the cost of investing in other mutual funds.
The Example assumes that you invest $10,000 in the Fund for the time periods indicated and then redeem all of your shares at the end of those periods. The Example assumes that your investment has a 5% return each year and that the Fund’s operating expenses remain the same. Although your actual costs may be higher or lower, based on these assumptions your costs would be:
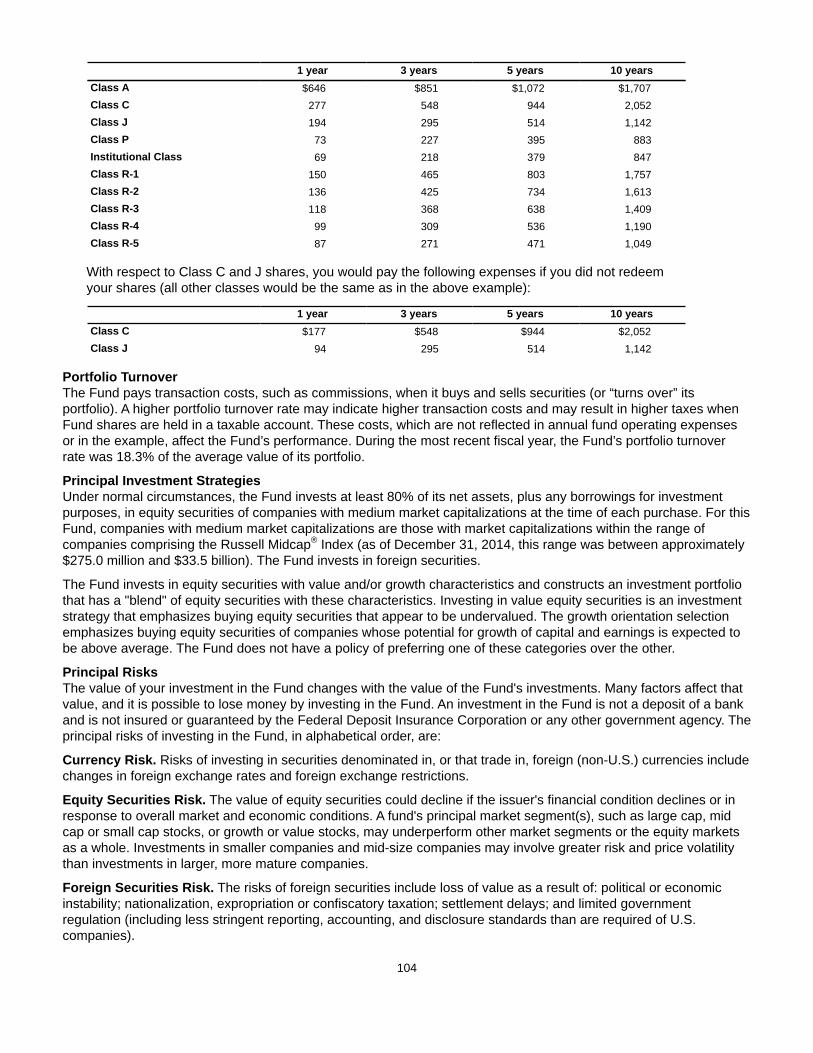
104
1 year 3 years 5 years 10 yearsClass A $646 $851 $1,072 $1,707Class C 277 548 944 2,052Class J 194 295 514 1,142Class P 73 227 395 883Institutional Class 69 218 379 847Class R-1 150 465 803 1,757Class R-2 136 425 734 1,613Class R-3 118 368 638 1,409Class R-4 99 309 536 1,190Class R-5 87 271 471 1,049
With respect to Class C and J shares, you would pay the following expenses if you did not redeem your shares (all other classes would be the same as in the above example):
1 year 3 years 5 years 10 yearsClass C $177 $548 $944 $2,052Class J 94 295 514 1,142
Portfolio TurnoverThe Fund pays transaction costs, such as commissions, when it buys and sells securities (or “turns over” its portfolio). A higher portfolio turnover rate may indicate higher transaction costs and may result in higher taxes when Fund shares are held in a taxable account. These costs, which are not reflected in annual fund operating expenses or in the example, affect the Fund’s performance. During the most recent fiscal year, the Fund’s portfolio turnover rate was 18.3% of the average value of its portfolio.
Principal Investment StrategiesUnder normal circumstances, the Fund invests at least 80% of its net assets, plus any borrowings for investment purposes, in equity securities of companies with medium market capitalizations at the time of each purchase. For this Fund, companies with medium market capitalizations are those with market capitalizations within the range of companies comprising the Russell Midcap® Index (as of December 31, 2014, this range was between approximately $275.0 million and $33.5 billion). The Fund invests in foreign securities.
The Fund invests in equity securities with value and/or growth characteristics and constructs an investment portfolio that has a "blend" of equity securities with these characteristics. Investing in value equity securities is an investment strategy that emphasizes buying equity securities that appear to be undervalued. The growth orientation selection emphasizes buying equity securities of companies whose potential for growth of capital and earnings is expected to be above average. The Fund does not have a policy of preferring one of these categories over the other.
Principal RisksThe value of your investment in the Fund changes with the value of the Fund's investments. Many factors affect that value, and it is possible to lose money by investing in the Fund. An investment in the Fund is not a deposit of a bank and is not insured or guaranteed by the Federal Deposit Insurance Corporation or any other government agency. The principal risks of investing in the Fund, in alphabetical order, are:
Currency Risk. Risks of investing in securities denominated in, or that trade in, foreign (non-U.S.) currencies include changes in foreign exchange rates and foreign exchange restrictions.
Equity Securities Risk. The value of equity securities could decline if the issuer's financial condition declines or in response to overall market and economic conditions. A fund's principal market segment(s), such as large cap, mid cap or small cap stocks, or growth or value stocks, may underperform other market segments or the equity markets as a whole. Investments in smaller companies and mid-size companies may involve greater risk and price volatility than investments in larger, more mature companies.
Foreign Securities Risk. The risks of foreign securities include loss of value as a result of: political or economic instability; nationalization, expropriation or confiscatory taxation; settlement delays; and limited government regulation (including less stringent reporting, accounting, and disclosure standards than are required of U.S. companies).
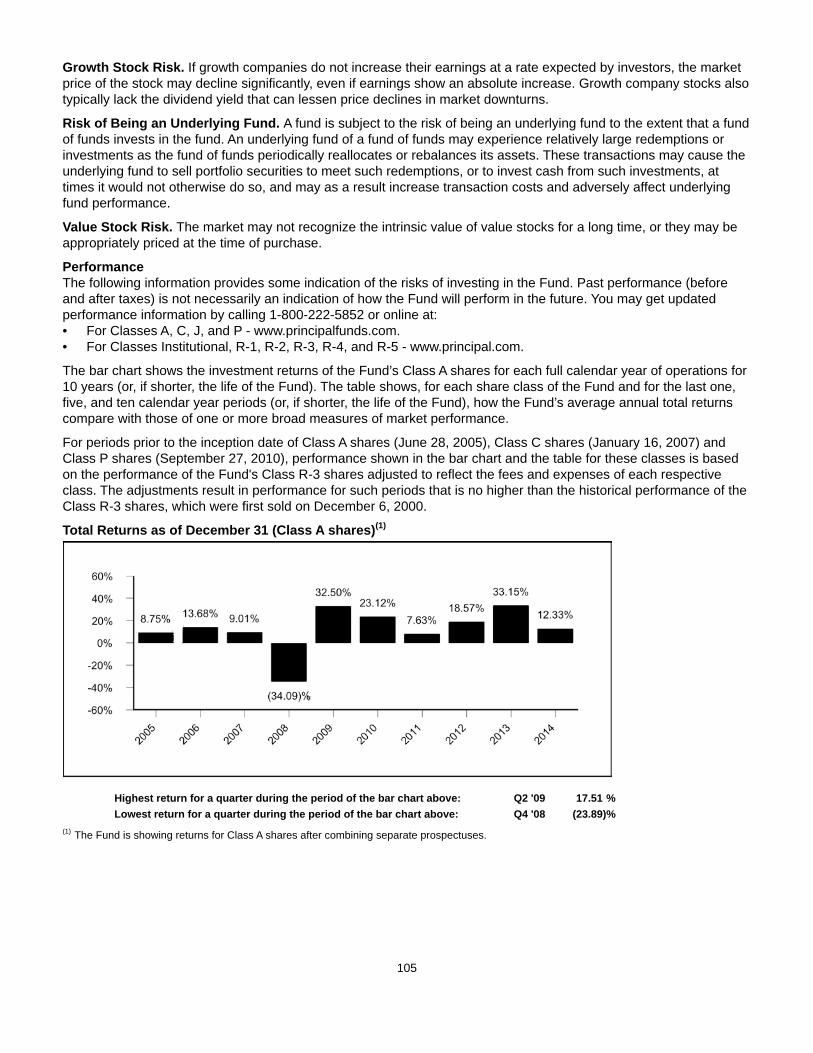
105
Growth Stock Risk. If growth companies do not increase their earnings at a rate expected by investors, the market price of the stock may decline significantly, even if earnings show an absolute increase. Growth company stocks also typically lack the dividend yield that can lessen price declines in market downturns.
Risk of Being an Underlying Fund. A fund is subject to the risk of being an underlying fund to the extent that a fund of funds invests in the fund. An underlying fund of a fund of funds may experience relatively large redemptions or investments as the fund of funds periodically reallocates or rebalances its assets. These transactions may cause the underlying fund to sell portfolio securities to meet such redemptions, or to invest cash from such investments, at times it would not otherwise do so, and may as a result increase transaction costs and adversely affect underlying fund performance.
Value Stock Risk. The market may not recognize the intrinsic value of value stocks for a long time, or they may be appropriately priced at the time of purchase.
PerformanceThe following information provides some indication of the risks of investing in the Fund. Past performance (before and after taxes) is not necessarily an indication of how the Fund will perform in the future. You may get updated performance information by calling 1-800-222-5852 or online at:• For Classes A, C, J, and P - www.principalfunds.com.• For Classes Institutional, R-1, R-2, R-3, R-4, and R-5 - www.principal.com.
The bar chart shows the investment returns of the Fund’s Class A shares for each full calendar year of operations for 10 years (or, if shorter, the life of the Fund). The table shows, for each share class of the Fund and for the last one, five, and ten calendar year periods (or, if shorter, the life of the Fund), how the Fund’s average annual total returns compare with those of one or more broad measures of market performance.
For periods prior to the inception date of Class A shares (June 28, 2005), Class C shares (January 16, 2007) and Class P shares (September 27, 2010), performance shown in the bar chart and the table for these classes is based on the performance of the Fund's Class R-3 shares adjusted to reflect the fees and expenses of each respective class. The adjustments result in performance for such periods that is no higher than the historical performance of the Class R-3 shares, which were first sold on December 6, 2000.
Total Returns as of December 31 (Class A shares)(1)
Highest return for a quarter during the period of the bar chart above: Q2 '09 17.51 %Lowest return for a quarter during the period of the bar chart above: Q4 '08 (23.89)%
(1) The Fund is showing returns for Class A shares after combining separate prospectuses.
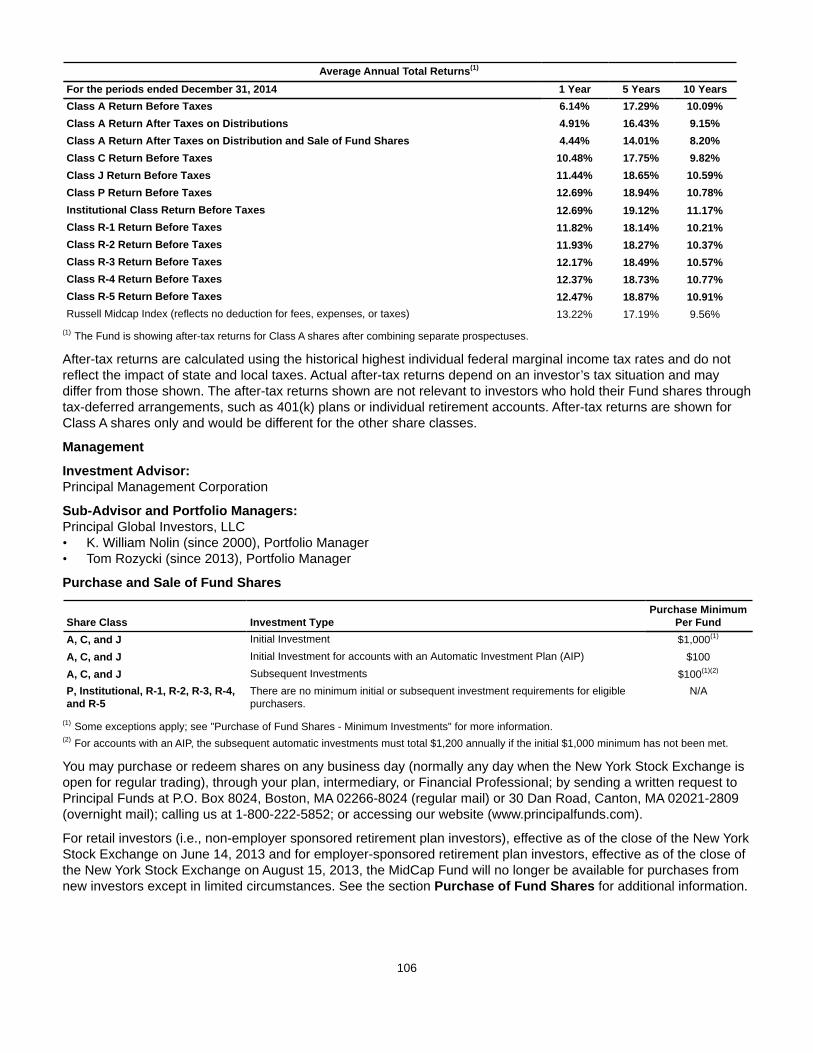
106
Average Annual Total Returns(1)
For the periods ended December 31, 2014 1 Year 5 Years 10 YearsClass A Return Before Taxes 6.14% 17.29% 10.09%Class A Return After Taxes on Distributions 4.91% 16.43% 9.15%Class A Return After Taxes on Distribution and Sale of Fund Shares 4.44% 14.01% 8.20%Class C Return Before Taxes 10.48% 17.75% 9.82%Class J Return Before Taxes 11.44% 18.65% 10.59%Class P Return Before Taxes 12.69% 18.94% 10.78%Institutional Class Return Before Taxes 12.69% 19.12% 11.17%Class R-1 Return Before Taxes 11.82% 18.14% 10.21%Class R-2 Return Before Taxes 11.93% 18.27% 10.37%Class R-3 Return Before Taxes 12.17% 18.49% 10.57%Class R-4 Return Before Taxes 12.37% 18.73% 10.77%Class R-5 Return Before Taxes 12.47% 18.87% 10.91%Russell Midcap Index (reflects no deduction for fees, expenses, or taxes) 13.22% 17.19% 9.56%
(1) The Fund is showing after-tax returns for Class A shares after combining separate prospectuses.
After-tax returns are calculated using the historical highest individual federal marginal income tax rates and do not reflect the impact of state and local taxes. Actual after-tax returns depend on an investor’s tax situation and may differ from those shown. The after-tax returns shown are not relevant to investors who hold their Fund shares through tax-deferred arrangements, such as 401(k) plans or individual retirement accounts. After-tax returns are shown for Class A shares only and would be different for the other share classes.
Management
Investment Advisor: Principal Management Corporation
Sub-Advisor and Portfolio Managers:Principal Global Investors, LLC• K. William Nolin (since 2000), Portfolio Manager• Tom Rozycki (since 2013), Portfolio Manager
Purchase and Sale of Fund Shares
Share Class Investment TypePurchase Minimum
Per FundA, C, and J Initial Investment $1,000(1)
A, C, and J Initial Investment for accounts with an Automatic Investment Plan (AIP) $100A, C, and J Subsequent Investments $100(1)(2)
P, Institutional, R-1, R-2, R-3, R-4,and R-5
There are no minimum initial or subsequent investment requirements for eligiblepurchasers.
N/A
(1) Some exceptions apply; see "Purchase of Fund Shares - Minimum Investments" for more information.(2) For accounts with an AIP, the subsequent automatic investments must total $1,200 annually if the initial $1,000 minimum has not been met.
You may purchase or redeem shares on any business day (normally any day when the New York Stock Exchange is open for regular trading), through your plan, intermediary, or Financial Professional; by sending a written request to Principal Funds at P.O. Box 8024, Boston, MA 02266-8024 (regular mail) or 30 Dan Road, Canton, MA 02021-2809 (overnight mail); calling us at 1-800-222-5852; or accessing our website (www.principalfunds.com).
For retail investors (i.e., non-employer sponsored retirement plan investors), effective as of the close of the New York Stock Exchange on June 14, 2013 and for employer-sponsored retirement plan investors, effective as of the close of the New York Stock Exchange on August 15, 2013, the MidCap Fund will no longer be available for purchases from new investors except in limited circumstances. See the section Purchase of Fund Shares for additional information.

107
Tax InformationThe Fund’s distributions you receive are generally subject to federal income tax as ordinary income or capital gain and may also be subject to state and local taxes, unless you are tax-exempt or your account is tax-deferred in which case your distributions would be taxed when withdrawn from the tax-deferred account.
Payments to Broker-Dealers and Other Financial IntermediariesIf you purchase the Fund through a broker-dealer or other financial intermediary (such as a bank, insurance company, investment adviser, etc.), the Fund and its related companies may pay the intermediary for the sale of Fund shares and related services. These payments may create a conflict of interest by influencing the broker-dealer or other intermediary and your salesperson to recommend the Fund over another investment, or to recommend one share class of the Fund over another share class. Ask your salesperson or visit your financial intermediary's website for more information.

108
MIDCAP GROWTH FUND
Objective: The Fund seeks long-term growth of capital.
Fees and Expenses of the FundThis table describes the fees and expenses that you may pay if you buy and hold shares of the Fund.
Shareholder Fees (fees paid directly from your investment)
Share ClassJ Inst. R-1 R-2 R-3 R-4 R-5
Maximum Deferred Sales Charge (Load)(as a percentage of the offering price or NAVwhen Sales Load is paid, whichever is less)
1.00% None None None None None None
Annual Fund Operating Expenses (expenses that you pay each year as a percentage of the value of your investment)
Share ClassJ Inst. R-1 R-2 R-3 R-4 R-5
Management Fees 0.65% 0.65% 0.65% 0.65% 0.65% 0.65% 0.65%Distribution and/or Service (12b-1) Fees (1) 0.25% N/A 0.35% 0.30% 0.25% 0.10% N/AOther Expenses 0.31% 0.13% 0.56% 0.48% 0.35% 0.31% 0.29%Total Annual Fund Operating Expenses 1.21% 0.78% 1.56% 1.43% 1.25% 1.06% 0.94%Fee Waiver and Expense Reimbursement(2)(3) (0.01)% (0.03)% N/A N/A N/A N/A N/ATotal Annual Fund Operating Expenses afterFee Waiver and Expense Reimbursement
1.20% 0.75% 1.56% 1.43% 1.25% 1.06% 0.94%
(1) Expense information in the table has been restated to reflect current fees. Effective December 30, 2013, the Distribution and/or Service (12b-1) Fees for Class J shares were reduced.
(2) Principal Funds Distributor, Inc. ("the Distributor") has contractually agreed to limit the Distribution Fees attributable to Class J. The waiver will reduce the Fund's Distribution Fees by 0.01%. It is expected that the fee waiver will continue through the period ending February 29, 2016; however, Principal Funds, Inc. and the Distributor, the parties to the agreement, may agree to terminate the fee waiver prior to the end of the period.
(3) Principal Management Corporation ("Principal"), the investment advisor, has contractually agreed to limit the Fund’s expenses by paying, if necessary, expenses normally payable by the Fund, (excluding interest expense, expenses related to fund investments, acquired fund fees and expenses, and other extraordinary expenses) to maintain a total level of operating expenses (expressed as a percent of average net assets on an annualized basis) not to exceed 0.75% for Institutional Class shares. It is expected that the expense limit will continue through the period ending February 29, 2016; however, Principal Funds, Inc. and Principal, the parties to the agreement, may agree to terminate the expense limit prior to the end of the period.
ExampleThis Example is intended to help you compare the cost of investing in the Fund with the cost of investing in other mutual funds.
The Example assumes that you invest $10,000 in the Fund for the time periods indicated and then redeem all of your shares at the end of those periods. The Example also assumes that your investment has a 5% return each year and that the Fund’s operating expenses remain the same. Although your actual costs may be higher or lower, based on these assumptions your costs would be:
1 year 3 years 5 years 10 yearsClass J $222 $383 $664 $1,465Institutional Class 77 246 430 963Class R-1 159 493 850 1,856Class R-2 146 452 782 1,713Class R-3 127 397 686 1,511Class R-4 108 337 585 1,294Class R-5 96 300 520 1,155
109
With respect to Class J shares, you would pay the following expenses if you did not redeem your shares (all other classes would be the same as in the above example):
1 year 3 years 5 years 10 yearsClass J $122 $383 $664 $1,465
Portfolio TurnoverThe Fund pays transaction costs, such as commissions, when it buys and sells securities (or “turns over” its portfolio). A higher portfolio turnover rate may indicate higher transaction costs and may result in higher taxes when Fund shares are held in a taxable account. These costs, which are not reflected in annual fund operating expenses or in the example, affect the Fund’s performance. During the most recent fiscal year, the Fund’s portfolio turnover rate was 184.6% of the average value of its portfolio.
Principal Investment StrategiesUnder normal circumstances, the Fund invests at least 80% of its net assets, plus any borrowings for investment purposes, in equity securities of companies with medium market capitalizations at the time of each purchase. For this Fund, companies with medium market capitalizations are those with market capitalizations within the range of companies comprising the Russell Midcap® Growth Index (as of December 31, 2014, this range was between approximately $275.0 million and $33.5 billion). The Fund invests in growth equity securities; growth orientation emphasizes buying equity securities of companies whose potential for growth of capital and earnings is expected to be above average. The Fund actively trades portfolio securities.
Principal RisksThe value of your investment in the Fund changes with the value of the Fund's investments. Many factors affect that value, and it is possible to lose money by investing in the Fund. An investment in the Fund is not a deposit of a bank and is not insured or guaranteed by the Federal Deposit Insurance Corporation or any other government agency. The principal risks of investing in the Fund, in alphabetical order, are:
Active Trading Risk. A fund that has a portfolio turnover rate over 100% is considered actively traded. Actively trading portfolio securities may accelerate realization of taxable gains and losses, lower fund performance and may result in high portfolio turnover rates and increased brokerage costs.
Equity Securities Risk. The value of equity securities could decline if the issuer's financial condition declines or in response to overall market and economic conditions. A fund's principal market segment(s), such as large cap, mid cap or small cap stocks, or growth or value stocks, may underperform other market segments or the equity markets as a whole. Investments in smaller companies and mid-size companies may involve greater risk and price volatility than investments in larger, more mature companies.
Growth Stock Risk. If growth companies do not increase their earnings at a rate expected by investors, the market price of the stock may decline significantly, even if earnings show an absolute increase. Growth company stocks also typically lack the dividend yield that can lessen price declines in market downturns.
PerformanceThe following information provides some indication of the risks of investing in the Fund. Past performance (before and after taxes) is not necessarily an indication of how the Fund will perform in the future. You may get updated performance information by calling 1-800-222-5852 or online at: • For Class J - www.principalfunds.com.• For Classes Institutional, R-1, R-2, R-3, R-4, and R-5 - www.principal.com.
The bar chart shows the investment returns of the Fund’s Institutional Class shares for each full calendar year of operations for 10 years (or, if shorter, the life of the Fund). The table shows, for each share class of the Fund and for the last one, five, and ten calendar year periods (or, if shorter, the life of the Fund), how the Fund’s average annual total returns compare with those of one or more broad measures of market performance.
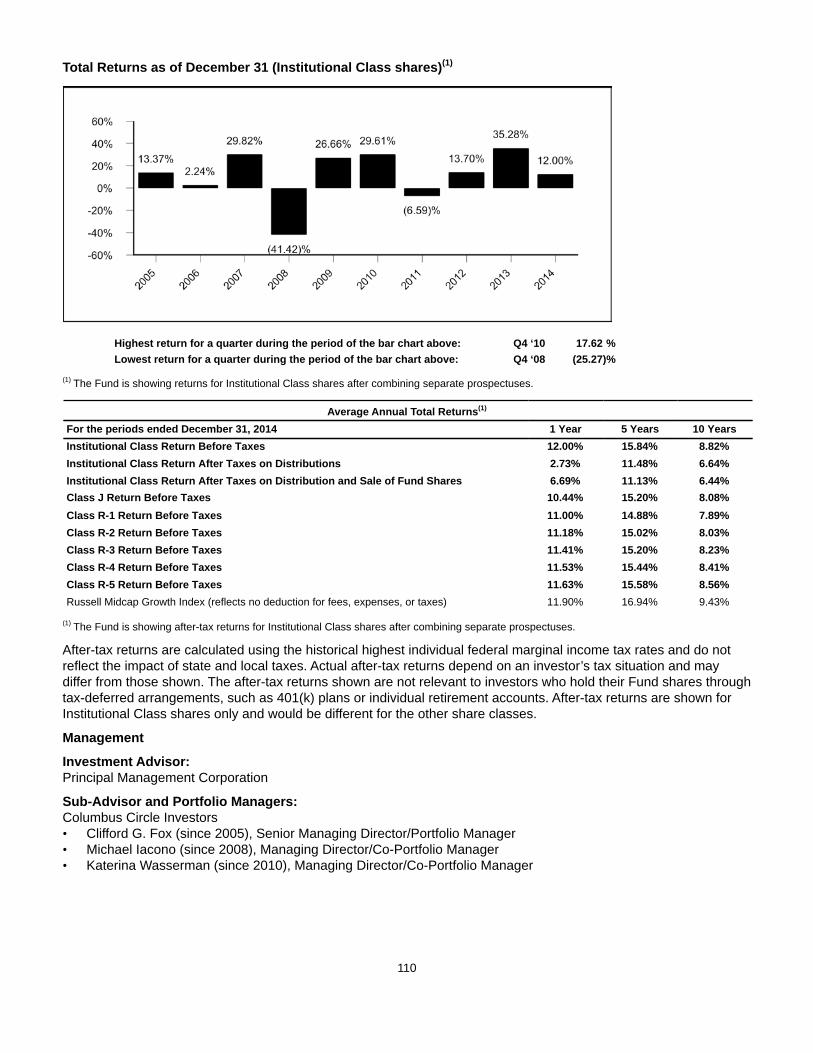
110
Total Returns as of December 31 (Institutional Class shares)(1)
Highest return for a quarter during the period of the bar chart above: Q4 ‘10 17.62 %Lowest return for a quarter during the period of the bar chart above: Q4 ‘08 (25.27)%
(1) The Fund is showing returns for Institutional Class shares after combining separate prospectuses.
Average Annual Total Returns(1)
For the periods ended December 31, 2014 1 Year 5 Years 10 YearsInstitutional Class Return Before Taxes 12.00% 15.84% 8.82%Institutional Class Return After Taxes on Distributions 2.73% 11.48% 6.64%Institutional Class Return After Taxes on Distribution and Sale of Fund Shares 6.69% 11.13% 6.44%Class J Return Before Taxes 10.44% 15.20% 8.08%Class R-1 Return Before Taxes 11.00% 14.88% 7.89%Class R-2 Return Before Taxes 11.18% 15.02% 8.03%Class R-3 Return Before Taxes 11.41% 15.20% 8.23%Class R-4 Return Before Taxes 11.53% 15.44% 8.41%Class R-5 Return Before Taxes 11.63% 15.58% 8.56%Russell Midcap Growth Index (reflects no deduction for fees, expenses, or taxes) 11.90% 16.94% 9.43%
(1) The Fund is showing after-tax returns for Institutional Class shares after combining separate prospectuses.
After-tax returns are calculated using the historical highest individual federal marginal income tax rates and do not reflect the impact of state and local taxes. Actual after-tax returns depend on an investor’s tax situation and may differ from those shown. The after-tax returns shown are not relevant to investors who hold their Fund shares through tax-deferred arrangements, such as 401(k) plans or individual retirement accounts. After-tax returns are shown for Institutional Class shares only and would be different for the other share classes.
Management
Investment Advisor: Principal Management Corporation
Sub-Advisor and Portfolio Managers: Columbus Circle Investors • Clifford G. Fox (since 2005), Senior Managing Director/Portfolio Manager• Michael Iacono (since 2008), Managing Director/Co-Portfolio Manager • Katerina Wasserman (since 2010), Managing Director/Co-Portfolio Manager
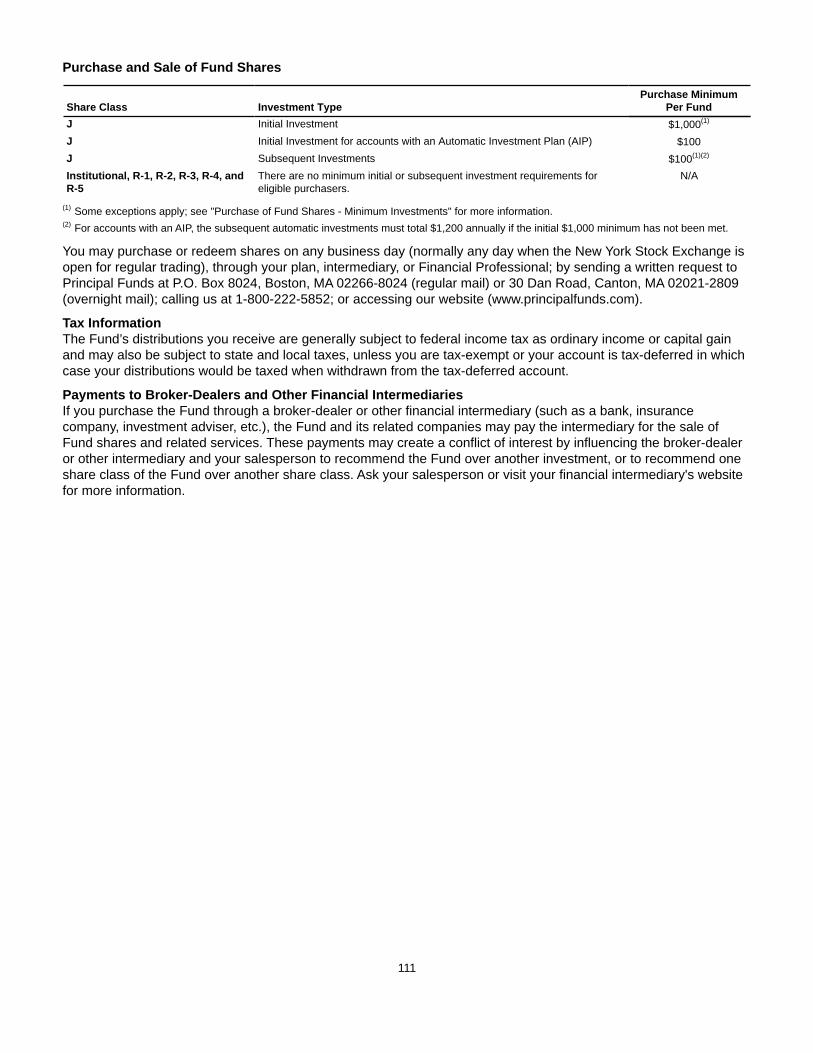
111
Purchase and Sale of Fund Shares
Share Class Investment TypePurchase Minimum
Per FundJ Initial Investment $1,000(1)
J Initial Investment for accounts with an Automatic Investment Plan (AIP) $100J Subsequent Investments $100(1)(2)
Institutional, R-1, R-2, R-3, R-4, andR-5
There are no minimum initial or subsequent investment requirements foreligible purchasers.
N/A
(1) Some exceptions apply; see "Purchase of Fund Shares - Minimum Investments" for more information.(2) For accounts with an AIP, the subsequent automatic investments must total $1,200 annually if the initial $1,000 minimum has not been met.
You may purchase or redeem shares on any business day (normally any day when the New York Stock Exchange is open for regular trading), through your plan, intermediary, or Financial Professional; by sending a written request to Principal Funds at P.O. Box 8024, Boston, MA 02266-8024 (regular mail) or 30 Dan Road, Canton, MA 02021-2809 (overnight mail); calling us at 1-800-222-5852; or accessing our website (www.principalfunds.com).
Tax InformationThe Fund’s distributions you receive are generally subject to federal income tax as ordinary income or capital gain and may also be subject to state and local taxes, unless you are tax-exempt or your account is tax-deferred in which case your distributions would be taxed when withdrawn from the tax-deferred account.
Payments to Broker-Dealers and Other Financial IntermediariesIf you purchase the Fund through a broker-dealer or other financial intermediary (such as a bank, insurance company, investment adviser, etc.), the Fund and its related companies may pay the intermediary for the sale of Fund shares and related services. These payments may create a conflict of interest by influencing the broker-dealer or other intermediary and your salesperson to recommend the Fund over another investment, or to recommend one share class of the Fund over another share class. Ask your salesperson or visit your financial intermediary's website for more information.
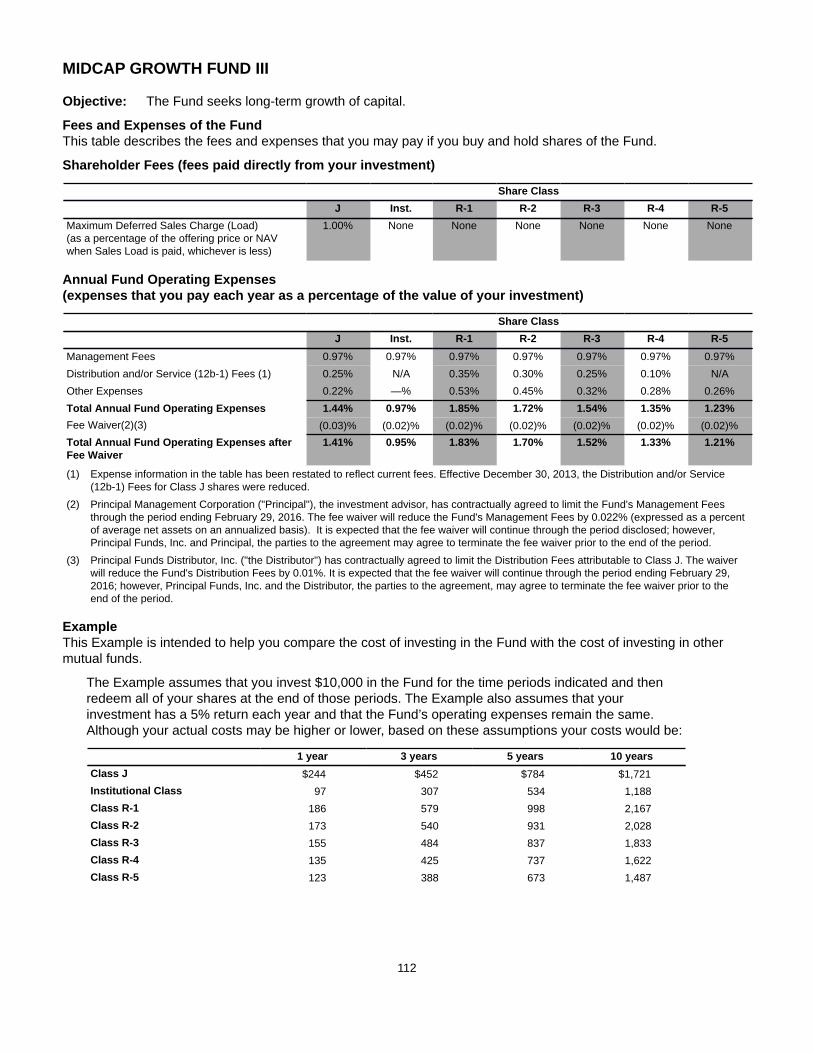
112
MIDCAP GROWTH FUND III
Objective: The Fund seeks long-term growth of capital.
Fees and Expenses of the FundThis table describes the fees and expenses that you may pay if you buy and hold shares of the Fund.
Shareholder Fees (fees paid directly from your investment)
Share ClassJ Inst. R-1 R-2 R-3 R-4 R-5
Maximum Deferred Sales Charge (Load)(as a percentage of the offering price or NAVwhen Sales Load is paid, whichever is less)
1.00% None None None None None None
Annual Fund Operating Expenses (expenses that you pay each year as a percentage of the value of your investment)
Share ClassJ Inst. R-1 R-2 R-3 R-4 R-5
Management Fees 0.97% 0.97% 0.97% 0.97% 0.97% 0.97% 0.97%Distribution and/or Service (12b-1) Fees (1) 0.25% N/A 0.35% 0.30% 0.25% 0.10% N/AOther Expenses 0.22% —% 0.53% 0.45% 0.32% 0.28% 0.26%Total Annual Fund Operating Expenses 1.44% 0.97% 1.85% 1.72% 1.54% 1.35% 1.23%Fee Waiver(2)(3) (0.03)% (0.02)% (0.02)% (0.02)% (0.02)% (0.02)% (0.02)%Total Annual Fund Operating Expenses afterFee Waiver
1.41% 0.95% 1.83% 1.70% 1.52% 1.33% 1.21%
(1) Expense information in the table has been restated to reflect current fees. Effective December 30, 2013, the Distribution and/or Service (12b-1) Fees for Class J shares were reduced.
(2) Principal Management Corporation ("Principal"), the investment advisor, has contractually agreed to limit the Fund's Management Fees through the period ending February 29, 2016. The fee waiver will reduce the Fund's Management Fees by 0.022% (expressed as a percent of average net assets on an annualized basis). It is expected that the fee waiver will continue through the period disclosed; however, Principal Funds, Inc. and Principal, the parties to the agreement may agree to terminate the fee waiver prior to the end of the period.
(3) Principal Funds Distributor, Inc. ("the Distributor") has contractually agreed to limit the Distribution Fees attributable to Class J. The waiver will reduce the Fund's Distribution Fees by 0.01%. It is expected that the fee waiver will continue through the period ending February 29, 2016; however, Principal Funds, Inc. and the Distributor, the parties to the agreement, may agree to terminate the fee waiver prior to the end of the period.
ExampleThis Example is intended to help you compare the cost of investing in the Fund with the cost of investing in other mutual funds.
The Example assumes that you invest $10,000 in the Fund for the time periods indicated and then redeem all of your shares at the end of those periods. The Example also assumes that your investment has a 5% return each year and that the Fund’s operating expenses remain the same. Although your actual costs may be higher or lower, based on these assumptions your costs would be:
1 year 3 years 5 years 10 yearsClass J $244 $452 $784 $1,721Institutional Class 97 307 534 1,188Class R-1 186 579 998 2,167Class R-2 173 540 931 2,028Class R-3 155 484 837 1,833Class R-4 135 425 737 1,622Class R-5 123 388 673 1,487
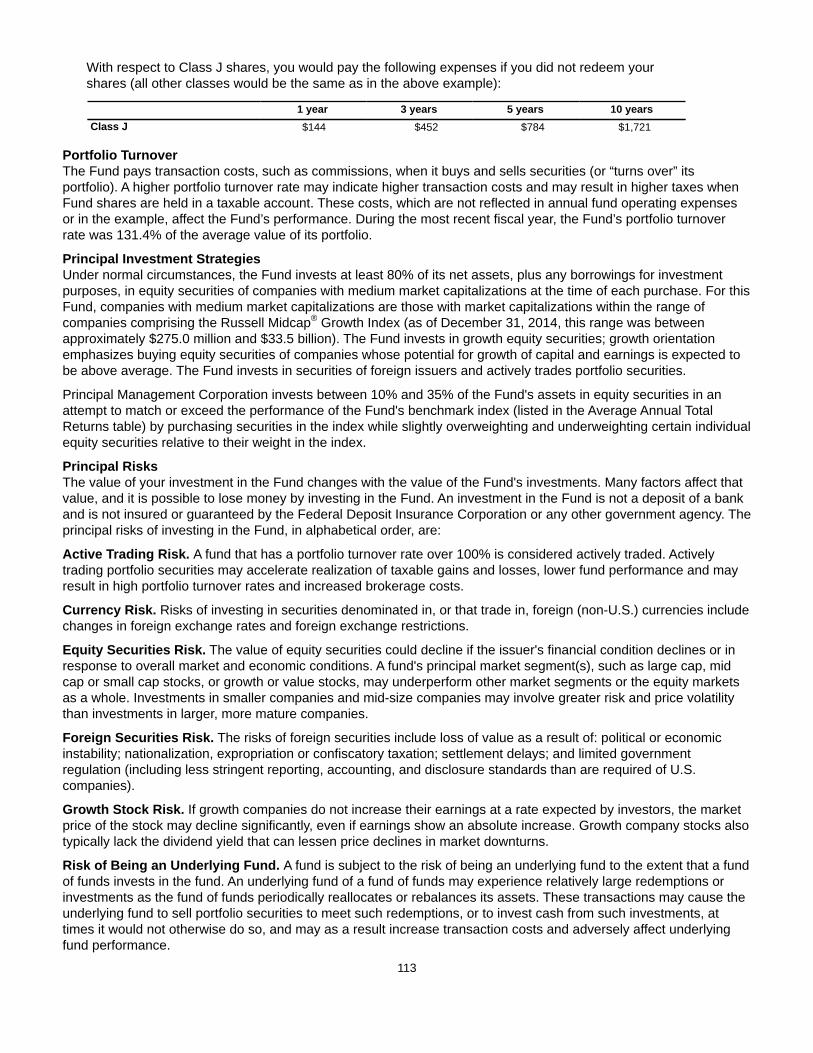
113
With respect to Class J shares, you would pay the following expenses if you did not redeem your shares (all other classes would be the same as in the above example):
1 year 3 years 5 years 10 yearsClass J $144 $452 $784 $1,721
Portfolio TurnoverThe Fund pays transaction costs, such as commissions, when it buys and sells securities (or “turns over” its portfolio). A higher portfolio turnover rate may indicate higher transaction costs and may result in higher taxes when Fund shares are held in a taxable account. These costs, which are not reflected in annual fund operating expenses or in the example, affect the Fund’s performance. During the most recent fiscal year, the Fund’s portfolio turnover rate was 131.4% of the average value of its portfolio.
Principal Investment StrategiesUnder normal circumstances, the Fund invests at least 80% of its net assets, plus any borrowings for investment purposes, in equity securities of companies with medium market capitalizations at the time of each purchase. For this Fund, companies with medium market capitalizations are those with market capitalizations within the range of companies comprising the Russell Midcap® Growth Index (as of December 31, 2014, this range was between approximately $275.0 million and $33.5 billion). The Fund invests in growth equity securities; growth orientation emphasizes buying equity securities of companies whose potential for growth of capital and earnings is expected to be above average. The Fund invests in securities of foreign issuers and actively trades portfolio securities.
Principal Management Corporation invests between 10% and 35% of the Fund's assets in equity securities in an attempt to match or exceed the performance of the Fund's benchmark index (listed in the Average Annual Total Returns table) by purchasing securities in the index while slightly overweighting and underweighting certain individual equity securities relative to their weight in the index.
Principal RisksThe value of your investment in the Fund changes with the value of the Fund's investments. Many factors affect that value, and it is possible to lose money by investing in the Fund. An investment in the Fund is not a deposit of a bank and is not insured or guaranteed by the Federal Deposit Insurance Corporation or any other government agency. The principal risks of investing in the Fund, in alphabetical order, are:
Active Trading Risk. A fund that has a portfolio turnover rate over 100% is considered actively traded. Actively trading portfolio securities may accelerate realization of taxable gains and losses, lower fund performance and may result in high portfolio turnover rates and increased brokerage costs.
Currency Risk. Risks of investing in securities denominated in, or that trade in, foreign (non-U.S.) currencies include changes in foreign exchange rates and foreign exchange restrictions.
Equity Securities Risk. The value of equity securities could decline if the issuer's financial condition declines or in response to overall market and economic conditions. A fund's principal market segment(s), such as large cap, mid cap or small cap stocks, or growth or value stocks, may underperform other market segments or the equity markets as a whole. Investments in smaller companies and mid-size companies may involve greater risk and price volatility than investments in larger, more mature companies.
Foreign Securities Risk. The risks of foreign securities include loss of value as a result of: political or economic instability; nationalization, expropriation or confiscatory taxation; settlement delays; and limited government regulation (including less stringent reporting, accounting, and disclosure standards than are required of U.S. companies).
Growth Stock Risk. If growth companies do not increase their earnings at a rate expected by investors, the market price of the stock may decline significantly, even if earnings show an absolute increase. Growth company stocks also typically lack the dividend yield that can lessen price declines in market downturns.
Risk of Being an Underlying Fund. A fund is subject to the risk of being an underlying fund to the extent that a fund of funds invests in the fund. An underlying fund of a fund of funds may experience relatively large redemptions or investments as the fund of funds periodically reallocates or rebalances its assets. These transactions may cause the underlying fund to sell portfolio securities to meet such redemptions, or to invest cash from such investments, at times it would not otherwise do so, and may as a result increase transaction costs and adversely affect underlying fund performance.
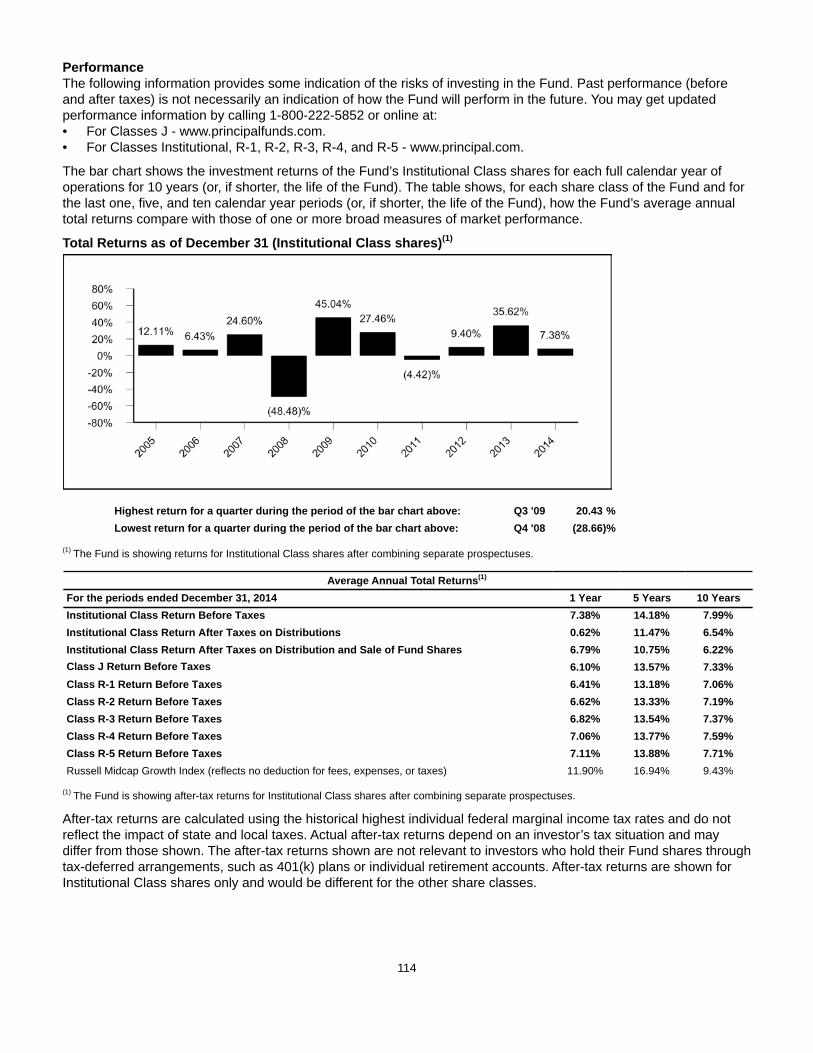
114
PerformanceThe following information provides some indication of the risks of investing in the Fund. Past performance (before and after taxes) is not necessarily an indication of how the Fund will perform in the future. You may get updated performance information by calling 1-800-222-5852 or online at:• For Classes J - www.principalfunds.com.• For Classes Institutional, R-1, R-2, R-3, R-4, and R-5 - www.principal.com.
The bar chart shows the investment returns of the Fund’s Institutional Class shares for each full calendar year of operations for 10 years (or, if shorter, the life of the Fund). The table shows, for each share class of the Fund and for the last one, five, and ten calendar year periods (or, if shorter, the life of the Fund), how the Fund’s average annual total returns compare with those of one or more broad measures of market performance.
Total Returns as of December 31 (Institutional Class shares)(1)
Highest return for a quarter during the period of the bar chart above: Q3 '09 20.43 %Lowest return for a quarter during the period of the bar chart above: Q4 '08 (28.66)%
(1) The Fund is showing returns for Institutional Class shares after combining separate prospectuses.
Average Annual Total Returns(1)
For the periods ended December 31, 2014 1 Year 5 Years 10 YearsInstitutional Class Return Before Taxes 7.38% 14.18% 7.99%Institutional Class Return After Taxes on Distributions 0.62% 11.47% 6.54%Institutional Class Return After Taxes on Distribution and Sale of Fund Shares 6.79% 10.75% 6.22%Class J Return Before Taxes 6.10% 13.57% 7.33%Class R-1 Return Before Taxes 6.41% 13.18% 7.06%Class R-2 Return Before Taxes 6.62% 13.33% 7.19%Class R-3 Return Before Taxes 6.82% 13.54% 7.37%Class R-4 Return Before Taxes 7.06% 13.77% 7.59%Class R-5 Return Before Taxes 7.11% 13.88% 7.71%Russell Midcap Growth Index (reflects no deduction for fees, expenses, or taxes) 11.90% 16.94% 9.43%
(1) The Fund is showing after-tax returns for Institutional Class shares after combining separate prospectuses.
After-tax returns are calculated using the historical highest individual federal marginal income tax rates and do not reflect the impact of state and local taxes. Actual after-tax returns depend on an investor’s tax situation and may differ from those shown. The after-tax returns shown are not relevant to investors who hold their Fund shares through tax-deferred arrangements, such as 401(k) plans or individual retirement accounts. After-tax returns are shown for Institutional Class shares only and would be different for the other share classes.
115
Management
Investment Advisor and Portfolio Managers: Principal Management Corporation• James W. Fennessey (since 2009), Portfolio Manager• Randy L. Welch (since 2009), Portfolio Manager
Sub-Advisors: Robert W. Baird & Co. Incorporated William Blair & Company, L.L.C.
Purchase and Sale of Fund Shares
Share Class Investment TypePurchase Minimum
Per FundJ Initial Investment $1,000(1)
J For accounts with an Automatic Investment Plan (AIP) $100J Subsequent Investments $100(1)(2)
Institutional, R-1, R-2, R-3, R-4, andR-5
There are no minimum initial or subsequent investment requirements foreligible purchases.
N/A
(1) Some exceptions apply; see "Purchase of Fund Shares - Minimum Investments" for more information.(2) For accounts with an AIP, the subsequent automatic investments must total $1,200 annually if the initial $1,000 minimum has not been met.
You may purchase or redeem shares on any business day (normally any day when the New York Stock Exchange is open for regular trading) through your plan, intermediary, or Financial Professional; by sending a written request to Principal Funds at P.O. Box 8024, Boston, MA 02266-8024 (regular mail) or 30 Dan Road, Canton, MA 02021-2809 (overnight mail); calling us at 1-800-222-5852; or accessing our website (www.principalfunds.com).
Tax InformationThe Fund’s distributions you receive are generally subject to federal income tax as ordinary income or capital gain and may also be subject to state and local taxes, unless you are tax-exempt or your account is tax-deferred in which case your distributions would be taxed when withdrawn from the tax-deferred account.
Payments to Broker-Dealers and Other Financial IntermediariesIf you purchase the Fund through a broker-dealer or other financial intermediary (such as a bank, insurance company, investment adviser, etc.), the Fund and its related companies may pay the intermediary for the sale of Fund shares and related services. These payments may create a conflict of interest by influencing the broker-dealer or other intermediary and your salesperson to recommend the Fund over another investment, or to recommend one share class of the Fund over another share class. Ask your salesperson or visit your financial intermediary's website for more information.
116
MIDCAP S&P 400 INDEX FUNDObjective: The Fund seeks long-term growth of capital.
Fees and Expenses of the FundThis table describes the fees and expenses that you may pay if you buy and hold shares of the Fund.
Shareholder Fees (fees paid directly from your investment)
Share ClassJ Inst. R-1 R-2 R-3 R-4 R-5
Maximum Deferred Sales Charge (Load)(as a percentage of the offering price or NAVwhen Sales Load is paid, whichever is less)
1.00% None None None None None None
Annual Fund Operating Expenses (expenses that you pay each year as a percentage of the value of your investment)
Share ClassJ Inst. R-1 R-2 R-3 R-4 R-5
Management Fees 0.15% 0.15% 0.15% 0.15% 0.15% 0.15% 0.15%
Distribution and/or Service (12b-1) Fees (1) 0.25% N/A 0.35% 0.30% 0.25% 0.10% N/A
Other Expenses 0.21% 0.05% 0.54% 0.46% 0.33% 0.29% 0.27%
Total Annual Fund Operating Expenses 0.61% 0.20% 1.04% 0.91% 0.73% 0.54% 0.42%Fee Waiver and Expense Reimbursement(2)(3) (0.01)% —% N/A N/A N/A N/A N/A
Total Annual Fund Operating Expenses afterFee Waiver and Expense Reimbursement
0.60% 0.20% 1.04% 0.91% 0.73% 0.54% 0.42%
(1) Expense information in the table has been restated to reflect current fees. Effective December 30, 2013, the Distribution and/or Service (12b-1) Fees for Class J shares were reduced.
(2) Principal Funds Distributor, Inc. ("the Distributor") has contractually agreed to limit the Distribution Fees attributable to Class J. The waiver will reduce the Fund's Distribution Fees by 0.01%. It is expected that the fee waiver will continue through the period ending February 29, 2016; however, Principal Funds, Inc. and the Distributor, the parties to the agreement, may agree to terminate the fee waiver prior to the end of the period.
(3) Principal Management Corporation ("Principal"), the investment advisor, has contractually agreed to limit the Fund’s expenses by paying, if necessary, expenses normally payable by the Fund, (excluding interest expense, expenses related to fund investments, acquired fund fees and expenses, and other extraordinary expenses) to maintain a total level of operating expenses (expressed as a percent of average net assets on an annualized basis) not to exceed 0.25% for Institutional Class shares. It is expected that the expense limit will continue through the period ending February 29, 2016; however, Principal Funds, Inc. and Principal, the parties to the agreement, may agree to terminate the expense limit prior to the end of the period.
ExampleThis Example is intended to help you compare the cost of investing in the Fund with the cost of investing in other mutual funds.
The Example assumes that you invest $10,000 in the Fund for the time periods indicated and then redeem all of your shares at the end of those periods. The Example also assumes that your investment has a 5% return each year and that the Fund’s operating expenses remain the same. Although your actual costs may be higher or lower, based on these assumptions your costs would be:
1 year 3 years 5 years 10 yearsClass J $161 $194 $339 $761Institutional Class 20 64 113 255Class R-1 106 331 574 1,271Class R-2 93 290 504 1,120Class R-3 75 233 406 906Class R-4 55 173 302 677Class R-5 43 135 235 530
117
With respect to Class J shares, you would pay the following expenses if you did not redeem your shares (all other classes would be the same as in the above example):
1 year 3 years 5 years 10 yearsClass J $61 $194 $339 $761
Portfolio TurnoverThe Fund pays transaction costs, such as commissions, when it buys and sells securities (or “turns over” its portfolio). A higher portfolio turnover rate may indicate higher transaction costs and may result in higher taxes when Fund shares are held in a taxable account. These costs, which are not reflected in annual fund operating expenses or in the example, affect the Fund’s performance. During the most recent fiscal year, the Fund’s portfolio turnover rate was 13.9% of the average value of its portfolio.
Principal Investment StrategiesUnder normal circumstances, the Fund invests at least 80% of its net assets, plus any borrowings for investment purposes, in equity securities of companies that compose the Standard & Poor's ("S&P") MidCap 400 Index at the time of each purchase. The Index is designed to represent U.S. equities with risk/return characteristics of the mid cap universe. As of December 31, 2014, the market capitalization range of the companies comprising the Index was between approximately $924.9 million and $13.9 billion. The Fund employs a passive investment approach designed to attempt to track the performance of the Index. The Fund utilizes derivative strategies and exchange-traded funds ("ETFs"). A derivative is a financial arrangement, the value of which is derived from, or based on, a traditional security, asset, or market index. Specifically, the Fund invests in index futures and equity ETFs on a daily basis to gain exposure to the Index in an effort to minimize tracking error relative to the benchmark.
Note: “Standard & Poor's MidCap 400" and "S&P MidCap 400" are trademarks of The McGraw-Hill Companies, Inc. and have been licensed by Principal. The Fund is not sponsored, endorsed, sold or promoted by Standard & Poor's and Standard & Poor's makes no representation regarding the advisability of investing in the Fund.
Principal RisksThe value of your investment in the Fund changes with the value of the Fund's investments. Many factors affect that value, and it is possible to lose money by investing in the Fund. An investment in the Fund is not a deposit of a bank and is not insured or guaranteed by the Federal Deposit Insurance Corporation or any other government agency. The principal risks of investing in the Fund, in alphabetical order, are:
Derivatives Risk. Transactions in derivatives may increase volatility, cause the liquidation of portfolio positions when not advantageous to do so and produce disproportionate losses.
Equity Securities Risk. The value of equity securities could decline if the issuer's financial condition declines or in response to overall market and economic conditions. A fund's principal market segment(s), such as large cap, mid cap or small cap stocks, or growth or value stocks, may underperform other market segments or the equity markets as a whole. Investments in smaller companies and mid-size companies may involve greater risk and price volatility than investments in larger, more mature companies.
Exchange-Traded Funds ("ETFs") Risk. An ETF is subject to the risks associated with direct ownership of the securities comprising the index on which the ETF is based. Fund shareholders indirectly bear their proportionate share of the expenses of the ETFs in which the fund invests.
Index Fund Investment Risk. More likely than not, an index fund will underperform the index due to cashflows and the fees and expenses of the fund.
Risk of Being an Underlying Fund. A fund is subject to the risk of being an underlying fund to the extent that a fund of funds invests in the fund. An underlying fund of a fund of funds may experience relatively large redemptions or investments as the fund of funds periodically reallocates or rebalances its assets. These transactions may cause the underlying fund to sell portfolio securities to meet such redemptions, or to invest cash from such investments, at times it would not otherwise do so, and may as a result increase transaction costs and adversely affect underlying fund performance.

118
PerformanceThe following information provides some indication of the risks of investing in the Fund. Past performance (before and after taxes) is not necessarily an indication of how the Fund will perform in the future. You may get updated performance information by calling 1-800-222-5852 or online at:• For Class J - www.principalfunds.com.• For Classes Institutional, R-1, R-2, R-3, R-4, and R-5 - www.principal.com.
The bar chart shows the investment returns of the Fund’s Institutional Class shares for each full calendar year of operations for 10 years (or, if shorter, the life of the Fund). The table shows, for each share class of the Fund and for the last one, five, and ten calendar year periods (or, if shorter, the life of the Fund), how the Fund’s average annual total returns compare with those of one or more broad measures of market performance.
Total Returns as of December 31 (Institutional Class shares)(1)
Highest return for a quarter during the period of the bar chart above: Q3 '09 19.87 %Lowest return for a quarter during the period of the bar chart above: Q4 '08 (25.73)%
(1) The Fund is showing returns for Institutional Class shares after combining separate prospectuses.
Average Annual Total Returns(1)
For the periods ended December 31, 2014 1 Year 5 Years 10 YearsInstitutional Class Return Before Taxes 9.51% 16.27% 9.47%Institutional Class Return After Taxes on Distributions 7.96% 15.28% 8.53%Institutional Class Return After Taxes on Distribution and Sale of Fund Shares 6.51% 13.13% 7.67%Class J Return Before Taxes 8.09% 15.72% 8.83%Class R-1 Return Before Taxes 8.61% 15.29% 8.54%Class R-2 Return Before Taxes 8.70% 15.45% 8.68%Class R-3 Return Before Taxes 8.94% 15.65% 8.88%Class R-4 Return Before Taxes 9.16% 15.88% 9.09%Class R-5 Return Before Taxes 9.29% 16.02% 9.22%S&P Midcap 400 Index (reflects no deduction for fees, expenses, or taxes) 9.77% 16.54% 9.71%
(1) The Fund is showing after-tax returns for Institutional Class shares after combining separate prospectuses.
After-tax returns are calculated using the historical highest individual federal marginal income tax rates and do not reflect the impact of state and local taxes. Actual after-tax returns depend on an investor’s tax situation and may differ from those shown. The after-tax returns shown are not relevant to investors who hold their Fund shares through tax-deferred arrangements, such as 401(k) plans or individual retirement accounts. After-tax returns are shown for Institutional Class shares only and would be different for the other share classes.
119
Management
Investment Advisor: Principal Management Corporation
Sub-Advisor and Portfolio Manager: Principal Global Investors, LLC• Thomas L. Kruchten (since 2011), Research Analyst and Portfolio Manager
Purchase and Sale of Fund Shares
Share Class Investment TypePurchase Minimum
Per FundJ Initial Investment $1,000(1)
J For accounts with an Automatic Investment Plan (AIP) $100J Subsequent Investments $100(1)(2)
Institutional, R-1, R-2, R-3, R-4, andR-5
There are no minimum initial or subsequent investment requirements foreligible purchases.
N/A
(1) Some exceptions apply; see "Purchase of Fund Shares - Minimum Investments" for more information.(2) For accounts with an AIP, the subsequent automatic investments must total $1,200 annually if the initial $1,000 minimum has not been met.
You may purchase or redeem shares on any business day (normally any day when the New York Stock Exchange is open for regular trading) through your plan, intermediary, or Financial Professional; by sending a written request to Principal Funds at P.O. Box 8024, Boston, MA 02266-8024 (regular mail) or 30 Dan Road, Canton, MA 02021-2809 (overnight mail); calling us at 1-800-222-5852; or accessing our website (www.principalfunds.com).
Tax InformationThe Fund’s distributions you receive are generally subject to federal income tax as ordinary income or capital gain and may also be subject to state and local taxes, unless you are tax-exempt or your account is tax-deferred in which case your distributions would be taxed when withdrawn from the tax-deferred account.
Payments to Broker-Dealers and Other Financial IntermediariesIf you purchase the Fund through a broker-dealer or other financial intermediary (such as a bank, insurance company, investment adviser, etc.), the Fund and its related companies may pay the intermediary for the sale of Fund shares and related services. These payments may create a conflict of interest by influencing the broker-dealer or other intermediary and your salesperson to recommend the Fund over another investment, or to recommend one share class of the Fund over another share class. Ask your salesperson or visit your financial intermediary's website for more information.
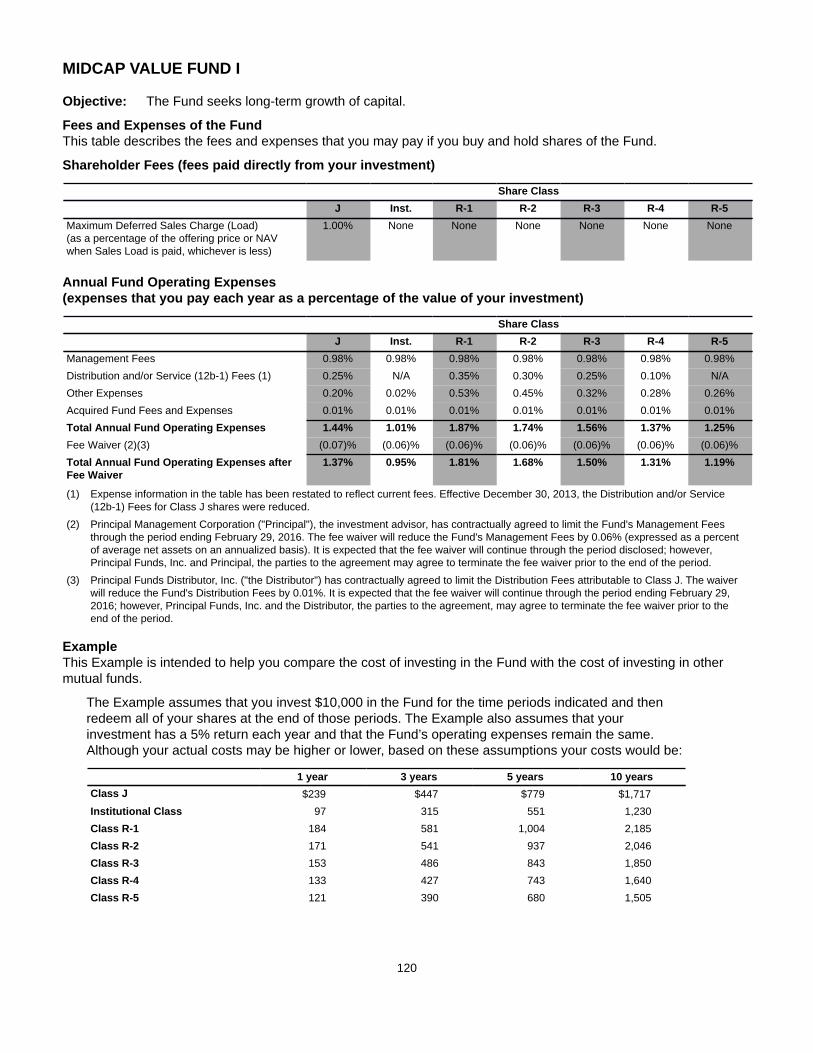
120
MIDCAP VALUE FUND I
Objective: The Fund seeks long-term growth of capital.
Fees and Expenses of the FundThis table describes the fees and expenses that you may pay if you buy and hold shares of the Fund.
Shareholder Fees (fees paid directly from your investment)
Share ClassJ Inst. R-1 R-2 R-3 R-4 R-5
Maximum Deferred Sales Charge (Load)(as a percentage of the offering price or NAVwhen Sales Load is paid, whichever is less)
1.00% None None None None None None
Annual Fund Operating Expenses (expenses that you pay each year as a percentage of the value of your investment)
Share ClassJ Inst. R-1 R-2 R-3 R-4 R-5
Management Fees 0.98% 0.98% 0.98% 0.98% 0.98% 0.98% 0.98%Distribution and/or Service (12b-1) Fees (1) 0.25% N/A 0.35% 0.30% 0.25% 0.10% N/AOther Expenses 0.20% 0.02% 0.53% 0.45% 0.32% 0.28% 0.26%Acquired Fund Fees and Expenses 0.01% 0.01% 0.01% 0.01% 0.01% 0.01% 0.01%Total Annual Fund Operating Expenses 1.44% 1.01% 1.87% 1.74% 1.56% 1.37% 1.25%Fee Waiver (2)(3) (0.07)% (0.06)% (0.06)% (0.06)% (0.06)% (0.06)% (0.06)%Total Annual Fund Operating Expenses afterFee Waiver
1.37% 0.95% 1.81% 1.68% 1.50% 1.31% 1.19%
(1) Expense information in the table has been restated to reflect current fees. Effective December 30, 2013, the Distribution and/or Service (12b-1) Fees for Class J shares were reduced.
(2) Principal Management Corporation ("Principal"), the investment advisor, has contractually agreed to limit the Fund's Management Fees through the period ending February 29, 2016. The fee waiver will reduce the Fund's Management Fees by 0.06% (expressed as a percent of average net assets on an annualized basis). It is expected that the fee waiver will continue through the period disclosed; however, Principal Funds, Inc. and Principal, the parties to the agreement may agree to terminate the fee waiver prior to the end of the period.
(3) Principal Funds Distributor, Inc. ("the Distributor") has contractually agreed to limit the Distribution Fees attributable to Class J. The waiver will reduce the Fund's Distribution Fees by 0.01%. It is expected that the fee waiver will continue through the period ending February 29, 2016; however, Principal Funds, Inc. and the Distributor, the parties to the agreement, may agree to terminate the fee waiver prior to the end of the period.
ExampleThis Example is intended to help you compare the cost of investing in the Fund with the cost of investing in other mutual funds.
The Example assumes that you invest $10,000 in the Fund for the time periods indicated and then redeem all of your shares at the end of those periods. The Example also assumes that your investment has a 5% return each year and that the Fund’s operating expenses remain the same. Although your actual costs may be higher or lower, based on these assumptions your costs would be:
1 year 3 years 5 years 10 yearsClass J $239 $447 $779 $1,717Institutional Class 97 315 551 1,230Class R-1 184 581 1,004 2,185Class R-2 171 541 937 2,046Class R-3 153 486 843 1,850Class R-4 133 427 743 1,640Class R-5 121 390 680 1,505
121
With respect to Class J shares, you would pay the following expenses if you did not redeem your shares (all other classes would be the same as in the above example):
1 year 3 years 5 years 10 yearsClass J $139 $447 $779 $1,717
Portfolio TurnoverThe Fund pays transaction costs, such as commissions, when it buys and sells securities (or “turns over” its portfolio). A higher portfolio turnover rate may indicate higher transaction costs and may result in higher taxes when Fund shares are held in a taxable account. These costs, which are not reflected in annual fund operating expenses or in the example, affect the Fund’s performance. During the most recent fiscal year, the Fund’s portfolio turnover rate was 85.3% of the average value of its portfolio.
Principal Investment StrategiesUnder normal circumstances, the Fund invests at least 80% of its net assets, plus any borrowings for investment purposes, in a diversified portfolio of equity securities of companies with medium market capitalizations at the time of each purchase. For this Fund, companies with medium market capitalizations are those with market capitalizations within the range of companies comprising the Russell Midcap® Value Index (as of December 31, 2014, the range was between approximately $275.0 million and $33.5 billion). The Fund invests in value equity securities, an investment strategy that emphasizes buying equity securities that appear to be undervalued. The Fund also invests in real estate investment trusts.
Principal Management Corporation invests between 10% and 35% of the Fund's assets in equity securities in an attempt to match or exceed the performance of the Fund's benchmark index (listed in the Average Annual Total Returns table) by purchasing securities in the index while slightly overweighting and underweighting certain individual equity securities relative to their weight in the index.
Principal RisksThe value of your investment in the Fund changes with the value of the Fund's investments. Many factors affect that value, and it is possible to lose money by investing in the Fund. An investment in the Fund is not a deposit of a bank and is not insured or guaranteed by the Federal Deposit Insurance Corporation or any other government agency. The principal risks of investing in the Fund, in alphabetical order, are:
Equity Securities Risk. The value of equity securities could decline if the issuer's financial condition declines or in response to overall market and economic conditions. A fund's principal market segment(s), such as large cap, mid cap or small cap stocks, or growth or value stocks, may underperform other market segments or the equity markets as a whole. Investments in smaller companies and mid-size companies may involve greater risk and price volatility than investments in larger, more mature companies.
Real Estate Investment Trusts (“REITs”) Risk. A REIT could fail to qualify for tax-free pass-through of income under the Internal Revenue Code, and fund shareholders will indirectly bear their proportionate share of the expenses of REITs in which the fund invests.
Real Estate Securities Risk. Real estate securities are subject to the risks associated with direct ownership of real estate, including declines in value, adverse economic conditions, increases in expenses, regulatory changes and environmental problems. Investing in securities of companies in the real estate industry, subjects a fund to the special risks associated with the real estate market including factors such as loss to casualty or condemnation, changes in real estate values, property taxes, interest rates, cash flow of underlying real estate assets, occupancy rates, government regulations affecting zoning, land use and rents, and the management skill and creditworthiness of the issuer.
Value Stock Risk. The market may not recognize the intrinsic value of value stocks for a long time, or they may be appropriately priced at the time of purchase.
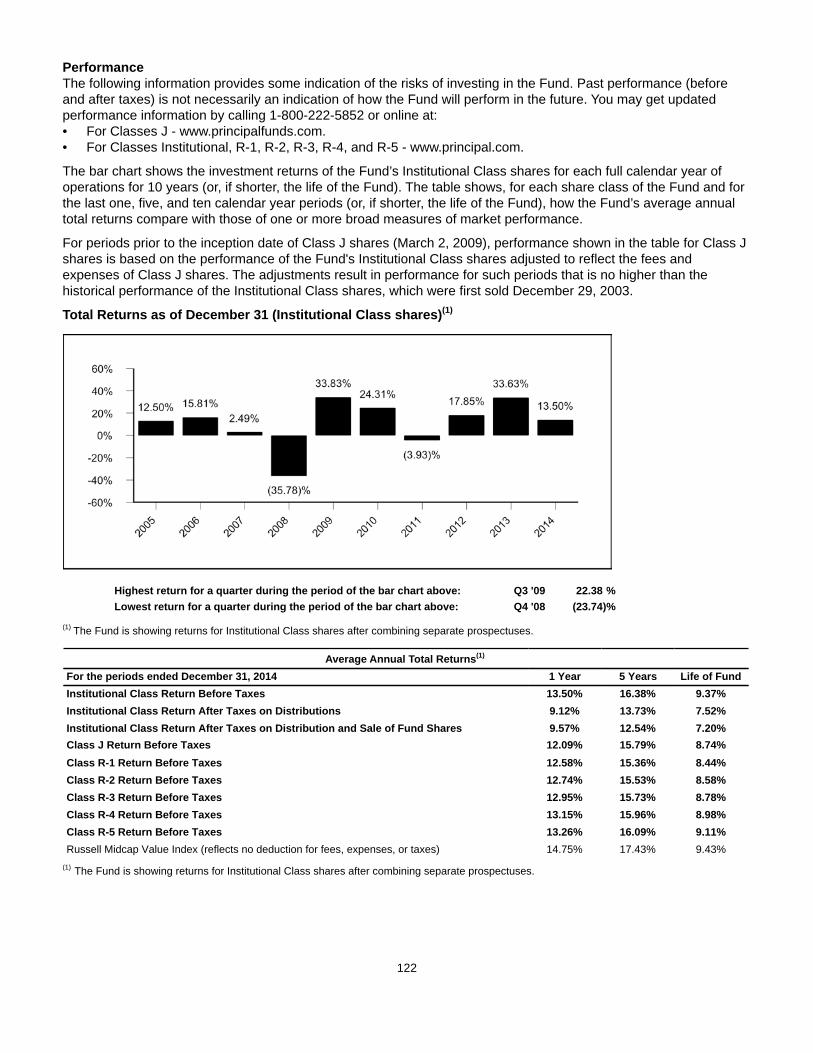
122
PerformanceThe following information provides some indication of the risks of investing in the Fund. Past performance (before and after taxes) is not necessarily an indication of how the Fund will perform in the future. You may get updated performance information by calling 1-800-222-5852 or online at: • For Classes J - www.principalfunds.com.• For Classes Institutional, R-1, R-2, R-3, R-4, and R-5 - www.principal.com.
The bar chart shows the investment returns of the Fund’s Institutional Class shares for each full calendar year of operations for 10 years (or, if shorter, the life of the Fund). The table shows, for each share class of the Fund and for the last one, five, and ten calendar year periods (or, if shorter, the life of the Fund), how the Fund’s average annual total returns compare with those of one or more broad measures of market performance.
For periods prior to the inception date of Class J shares (March 2, 2009), performance shown in the table for Class J shares is based on the performance of the Fund's Institutional Class shares adjusted to reflect the fees and expenses of Class J shares. The adjustments result in performance for such periods that is no higher than the historical performance of the Institutional Class shares, which were first sold December 29, 2003.
Total Returns as of December 31 (Institutional Class shares)(1)
Highest return for a quarter during the period of the bar chart above: Q3 '09 22.38 %Lowest return for a quarter during the period of the bar chart above: Q4 '08 (23.74)%
(1) The Fund is showing returns for Institutional Class shares after combining separate prospectuses.
Average Annual Total Returns(1)
For the periods ended December 31, 2014 1 Year 5 Years Life of FundInstitutional Class Return Before Taxes 13.50% 16.38% 9.37%Institutional Class Return After Taxes on Distributions 9.12% 13.73% 7.52%Institutional Class Return After Taxes on Distribution and Sale of Fund Shares 9.57% 12.54% 7.20%Class J Return Before Taxes 12.09% 15.79% 8.74%Class R-1 Return Before Taxes 12.58% 15.36% 8.44%Class R-2 Return Before Taxes 12.74% 15.53% 8.58%Class R-3 Return Before Taxes 12.95% 15.73% 8.78%Class R-4 Return Before Taxes 13.15% 15.96% 8.98%Class R-5 Return Before Taxes 13.26% 16.09% 9.11%Russell Midcap Value Index (reflects no deduction for fees, expenses, or taxes) 14.75% 17.43% 9.43%
(1) The Fund is showing returns for Institutional Class shares after combining separate prospectuses.
123
After-tax returns are calculated using the historical highest individual federal marginal income tax rates and do not reflect the impact of state and local taxes. Actual after-tax returns depend on an investor’s tax situation and may differ from those shown. The after-tax returns shown are not relevant to investors who hold their Fund shares through tax-deferred arrangements, such as 401(k) plans or individual retirement accounts. After-tax returns are shown for Institutional Class shares only and would be different for the other share classes.
Management
Investment Advisor and Portfolio Managers: Principal Management Corporation• James W. Fennessey (since 2009), Portfolio Manager• Randy L. Welch (since 2009), Portfolio Manager
Sub-Advisors: Goldman Sachs Asset Management, L.P.Los Angeles Capital Management and Equity Research, Inc.
Purchase and Sale of Fund Shares
Share Class Investment TypePurchase Minimum
Per FundJ Initial Investment $1,000(1)
J For accounts with an Automatic Investment Plan (AIP) $100J Subsequent Investments $100(1)(2)
Institutional, R-1, R-2, R-3, R-4, andR-5
There are no minimum initial or subsequent investment requirements foreligible purchases.
N/A
(1) Some exceptions apply; see "Purchase of Fund Shares - Minimum Investments" for more information.(2) For accounts with an AIP, the subsequent automatic investments must total $1,200 annually if the initial $1,000 minimum has not been met.
You may purchase or redeem shares on any business day (normally any day when the New York Stock Exchange is open for regular trading) through your plan, intermediary, or Financial Professional; by sending a written request to Principal Funds at P.O. Box 8024, Boston, MA 02266-8024 (regular mail) or 30 Dan Road, Canton, MA 02021-2809 (overnight mail); calling us at 1-800-222-5852; or accessing our website (www.principalfunds.com).
Tax InformationThe Fund’s distributions you receive are generally subject to federal income tax as ordinary income or capital gain and may also be subject to state and local taxes, unless you are tax-exempt or your account is tax-deferred in which case your distributions would be taxed when withdrawn from the tax-deferred account.
Payments to Broker-Dealers and Other Financial IntermediariesIf you purchase the Fund through a broker-dealer or other financial intermediary (such as a bank, insurance company, investment adviser, etc.), the Fund and its related companies may pay the intermediary for the sale of Fund shares and related services. These payments may create a conflict of interest by influencing the broker-dealer or other intermediary and your salesperson to recommend the Fund over another investment, or to recommend one share class of the Fund over another share class. Ask your salesperson or visit your financial intermediary's website for more information.
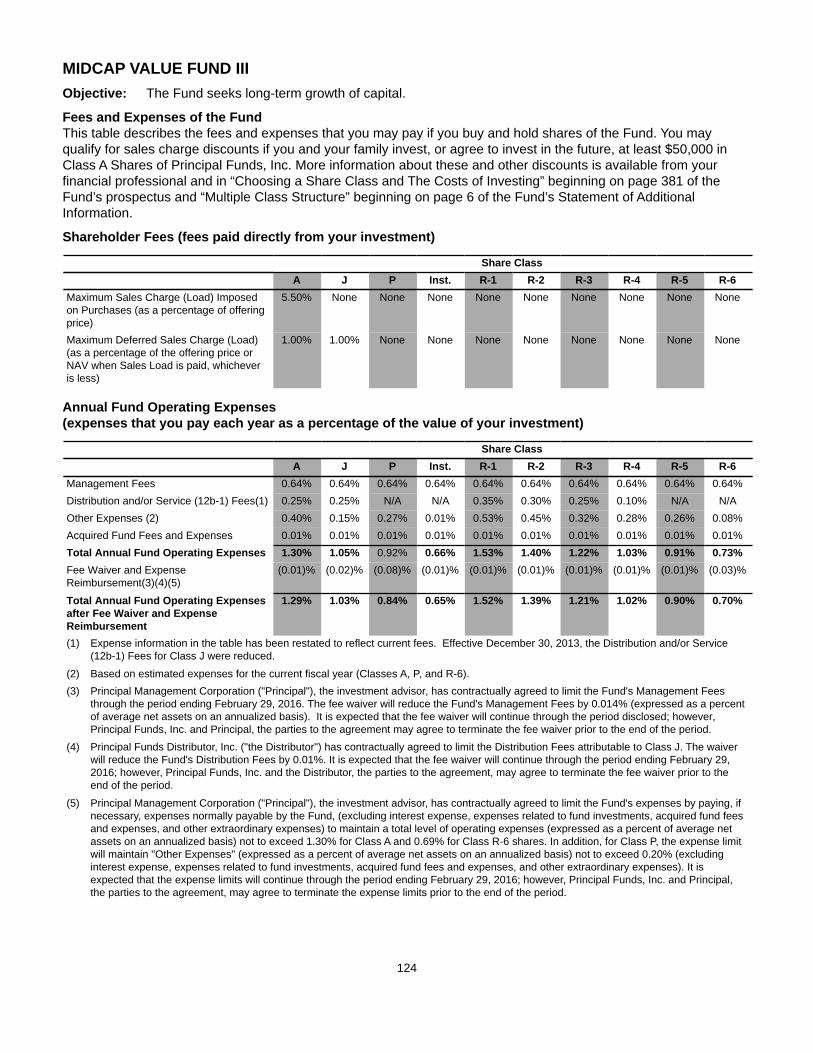
124
MIDCAP VALUE FUND IIIObjective: The Fund seeks long-term growth of capital.
Fees and Expenses of the FundThis table describes the fees and expenses that you may pay if you buy and hold shares of the Fund. You may qualify for sales charge discounts if you and your family invest, or agree to invest in the future, at least $50,000 in Class A Shares of Principal Funds, Inc. More information about these and other discounts is available from your financial professional and in “Choosing a Share Class and The Costs of Investing” beginning on page 381 of the Fund’s prospectus and “Multiple Class Structure” beginning on page 6 of the Fund’s Statement of Additional Information.
Shareholder Fees (fees paid directly from your investment)
Share ClassA J P Inst. R-1 R-2 R-3 R-4 R-5 R-6
Maximum Sales Charge (Load) Imposedon Purchases (as a percentage of offeringprice)
5.50% None None None None None None None None None
Maximum Deferred Sales Charge (Load)(as a percentage of the offering price orNAV when Sales Load is paid, whicheveris less)
1.00% 1.00% None None None None None None None None
Annual Fund Operating Expenses (expenses that you pay each year as a percentage of the value of your investment)
Share ClassA J P Inst. R-1 R-2 R-3 R-4 R-5 R-6
Management Fees 0.64% 0.64% 0.64% 0.64% 0.64% 0.64% 0.64% 0.64% 0.64% 0.64%Distribution and/or Service (12b-1) Fees(1) 0.25% 0.25% N/A N/A 0.35% 0.30% 0.25% 0.10% N/A N/AOther Expenses (2) 0.40% 0.15% 0.27% 0.01% 0.53% 0.45% 0.32% 0.28% 0.26% 0.08%Acquired Fund Fees and Expenses 0.01% 0.01% 0.01% 0.01% 0.01% 0.01% 0.01% 0.01% 0.01% 0.01%Total Annual Fund Operating Expenses 1.30% 1.05% 0.92% 0.66% 1.53% 1.40% 1.22% 1.03% 0.91% 0.73%Fee Waiver and ExpenseReimbursement(3)(4)(5)
(0.01)% (0.02)% (0.08)% (0.01)% (0.01)% (0.01)% (0.01)% (0.01)% (0.01)% (0.03)%
Total Annual Fund Operating Expensesafter Fee Waiver and ExpenseReimbursement
1.29% 1.03% 0.84% 0.65% 1.52% 1.39% 1.21% 1.02% 0.90% 0.70%
(1) Expense information in the table has been restated to reflect current fees. Effective December 30, 2013, the Distribution and/or Service (12b-1) Fees for Class J were reduced.
(2) Based on estimated expenses for the current fiscal year (Classes A, P, and R-6).(3) Principal Management Corporation ("Principal"), the investment advisor, has contractually agreed to limit the Fund's Management Fees
through the period ending February 29, 2016. The fee waiver will reduce the Fund's Management Fees by 0.014% (expressed as a percent of average net assets on an annualized basis). It is expected that the fee waiver will continue through the period disclosed; however, Principal Funds, Inc. and Principal, the parties to the agreement may agree to terminate the fee waiver prior to the end of the period.
(4) Principal Funds Distributor, Inc. ("the Distributor") has contractually agreed to limit the Distribution Fees attributable to Class J. The waiver will reduce the Fund's Distribution Fees by 0.01%. It is expected that the fee waiver will continue through the period ending February 29, 2016; however, Principal Funds, Inc. and the Distributor, the parties to the agreement, may agree to terminate the fee waiver prior to the end of the period.
(5) Principal Management Corporation ("Principal"), the investment advisor, has contractually agreed to limit the Fund's expenses by paying, if necessary, expenses normally payable by the Fund, (excluding interest expense, expenses related to fund investments, acquired fund fees and expenses, and other extraordinary expenses) to maintain a total level of operating expenses (expressed as a percent of average net assets on an annualized basis) not to exceed 1.30% for Class A and 0.69% for Class R-6 shares. In addition, for Class P, the expense limit will maintain "Other Expenses" (expressed as a percent of average net assets on an annualized basis) not to exceed 0.20% (excluding interest expense, expenses related to fund investments, acquired fund fees and expenses, and other extraordinary expenses). It is expected that the expense limits will continue through the period ending February 29, 2016; however, Principal Funds, Inc. and Principal, the parties to the agreement, may agree to terminate the expense limits prior to the end of the period.
125
ExampleThis Example is intended to help you compare the cost of investing in the Fund with the cost of investing in other mutual funds.
The Example assumes that you invest $10,000 in the Fund for the time periods indicated and then redeem all of your shares at the end of those periods. The Example also assumes that your investment has a 5% return each year and that the Fund’s operating expenses remain the same. Although your actual costs may be higher or lower, based on these assumptions your costs would be:
1 year 3 years 5 years 10 yearsClass A $674 $938Class J 205 332 $577 $1,280Class P 86 284Institutional Class 66 210 367 821Class R-1 155 482 833 1,823Class R-2 142 442 765 1,679Class R-3 123 386 669 1,476Class R-4 104 327 567 1,258Class R-5 92 289 503 1,118Class R-6 72 230
With respect to Class J shares, you would pay the following expenses if you did not redeem your shares (all other classes would be the same as in the above example):
1 year 3 years 5 years 10 yearsClass J $105 $332 $577 $1,280
Portfolio TurnoverThe Fund pays transaction costs, such as commissions, when it buys and sells securities (or “turns over” its portfolio). A higher portfolio turnover rate may indicate higher transaction costs and may result in higher taxes when Fund shares are held in a taxable account. These costs, which are not reflected in annual fund operating expenses or in the example, affect the Fund’s performance. During the most recent fiscal year, the Fund’s portfolio turnover rate was 70.2% of the average value of its portfolio.
Principal Investment StrategiesUnder normal circumstances, the Fund invests at least 80% of its net assets, plus any borrowings for investment purposes, in equity securities of companies with medium market capitalizations at the time of each purchase. For this Fund, companies with medium market capitalizations are those with market capitalizations within the range of companies comprising the Russell Midcap® Value Index (as of December 31, 2014, this range was between approximately $275.0 million and $33.5 billion). The Fund invests in value equity securities, an investment strategy that emphasizes buying equity securities that appear to be undervalued. The Fund invests in real estate investment trusts.
Principal Management Corporation invests between 10% and 35% of the Fund's assets in equity securities in an attempt to match or exceed the performance of the Fund's benchmark index (listed in the Average Annual Total Returns table) by purchasing securities in the index while slightly overweighting and underweighting certain individual equity securities relative to their weight in the index.
Principal RisksThe value of your investment in the Fund changes with the value of the Fund's investments. Many factors affect that value, and it is possible to lose money by investing in the Fund. An investment in the Fund is not a deposit of a bank and is not insured or guaranteed by the Federal Deposit Insurance Corporation or any other government agency. The principal risks of investing in the Fund, in alphabetical order, are:
Equity Securities Risk. The value of equity securities could decline if the issuer's financial condition declines or in response to overall market and economic conditions. A fund's principal market segment(s), such as large cap, mid cap or small cap stocks, or growth or value stocks, may underperform other market segments or the equity markets as a whole. Investments in smaller companies and mid-size companies may involve greater risk and price volatility than investments in larger, more mature companies.
126
Real Estate Investment Trusts (“REITs”) Risk. A REIT could fail to qualify for tax-free pass-through of income under the Internal Revenue Code, and fund shareholders will indirectly bear their proportionate share of the expenses of REITs in which the fund invests.
Real Estate Securities Risk. Real estate securities are subject to the risks associated with direct ownership of real estate, including declines in value, adverse economic conditions, increases in expenses, regulatory changes and environmental problems. Investing in securities of companies in the real estate industry, subjects a fund to the special risks associated with the real estate market including factors such as loss to casualty or condemnation, changes in real estate values, property taxes, interest rates, cash flow of underlying real estate assets, occupancy rates, government regulations affecting zoning, land use and rents, and the management skill and creditworthiness of the issuer.
Risk of Being an Underlying Fund. A fund is subject to the risk of being an underlying fund to the extent that a fund of funds invests in the fund. An underlying fund of a fund of funds may experience relatively large redemptions or investments as the fund of funds periodically reallocates or rebalances its assets. These transactions may cause the underlying fund to sell portfolio securities to meet such redemptions, or to invest cash from such investments, at times it would not otherwise do so, and may as a result increase transaction costs and adversely affect underlying fund performance.
Value Stock Risk. The market may not recognize the intrinsic value of value stocks for a long time, or they may be appropriately priced at the time of purchase.
PerformanceThe following information provides some indication of the risks of investing in the Fund. Past performance (before and after taxes) is not necessarily an indication of how the Fund will perform in the future. You may get updated performance information by calling 1-800-222-5852 or online at:• For Classes A, J, and P - www.principalfunds.com.• For Classes Institutional, R-1, R-2, R-3, R-4, R-5, and R-6 - www.principal.com.
The bar chart shows the investment returns of the Fund’s Class A shares for each full calendar year of operations for 10 years (or, if shorter, the life of the Fund). The table shows, for each share class of the Fund and for the last one, five, and ten calendar year periods (or, if shorter, the life of the Fund), how the Fund’s average annual total returns compare with those of one or more broad measures of market performance.
For periods prior to the inception date of Classes A and P shares (June 3, 2014) and Class R-6 shares (November 25, 2014), performance shown in the bar chart and the table for these classes is based on the performance of the Fund's Class R-3 shares adjusted to reflect the respective fees and expenses of each class. The adjustments result in performance for such periods that is no higher than the historical performance of the Class R-3 shares, which were first sold on December 6, 2000.
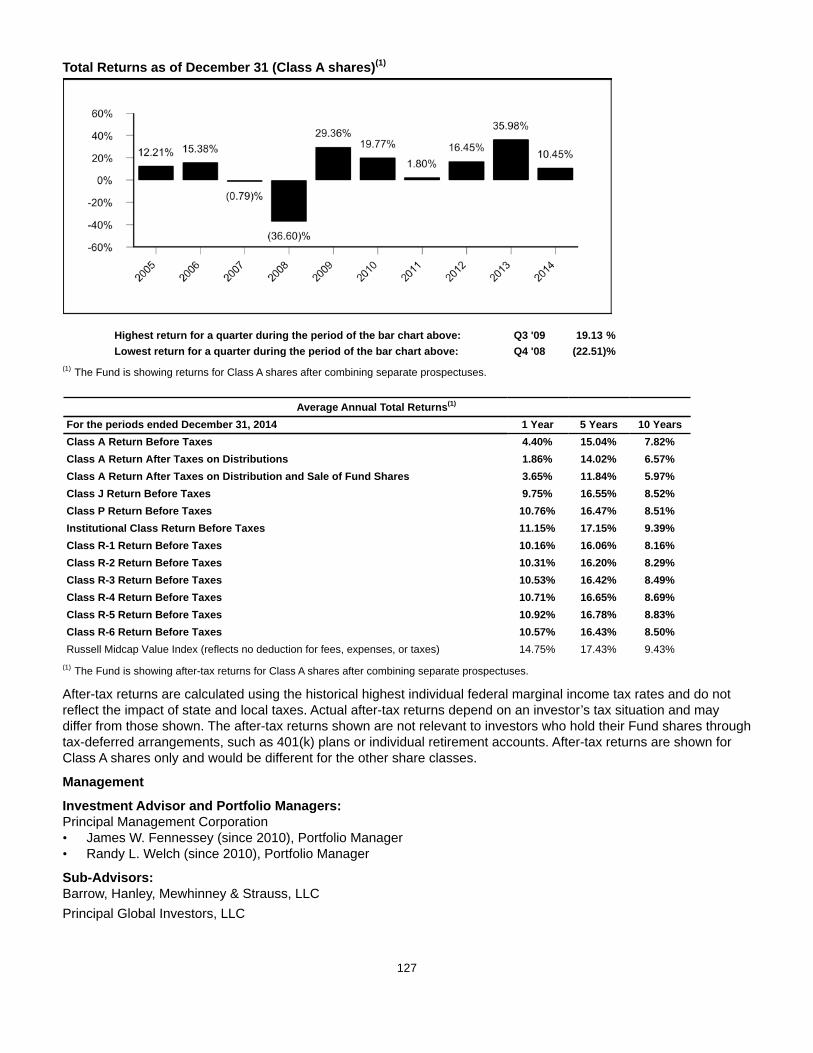
127
Total Returns as of December 31 (Class A shares)(1)
Highest return for a quarter during the period of the bar chart above: Q3 '09 19.13 %Lowest return for a quarter during the period of the bar chart above: Q4 '08 (22.51)%
(1) The Fund is showing returns for Class A shares after combining separate prospectuses.
Average Annual Total Returns(1)
For the periods ended December 31, 2014 1 Year 5 Years 10 YearsClass A Return Before Taxes 4.40% 15.04% 7.82%Class A Return After Taxes on Distributions 1.86% 14.02% 6.57%Class A Return After Taxes on Distribution and Sale of Fund Shares 3.65% 11.84% 5.97%Class J Return Before Taxes 9.75% 16.55% 8.52%Class P Return Before Taxes 10.76% 16.47% 8.51%Institutional Class Return Before Taxes 11.15% 17.15% 9.39%Class R-1 Return Before Taxes 10.16% 16.06% 8.16%Class R-2 Return Before Taxes 10.31% 16.20% 8.29%Class R-3 Return Before Taxes 10.53% 16.42% 8.49%Class R-4 Return Before Taxes 10.71% 16.65% 8.69%Class R-5 Return Before Taxes 10.92% 16.78% 8.83%Class R-6 Return Before Taxes 10.57% 16.43% 8.50%Russell Midcap Value Index (reflects no deduction for fees, expenses, or taxes) 14.75% 17.43% 9.43%
(1) The Fund is showing after-tax returns for Class A shares after combining separate prospectuses.
After-tax returns are calculated using the historical highest individual federal marginal income tax rates and do not reflect the impact of state and local taxes. Actual after-tax returns depend on an investor’s tax situation and may differ from those shown. The after-tax returns shown are not relevant to investors who hold their Fund shares through tax-deferred arrangements, such as 401(k) plans or individual retirement accounts. After-tax returns are shown for Class A shares only and would be different for the other share classes.
Management
Investment Advisor and Portfolio Managers: Principal Management Corporation• James W. Fennessey (since 2010), Portfolio Manager• Randy L. Welch (since 2010), Portfolio Manager
Sub-Advisors:Barrow, Hanley, Mewhinney & Strauss, LLC Principal Global Investors, LLC
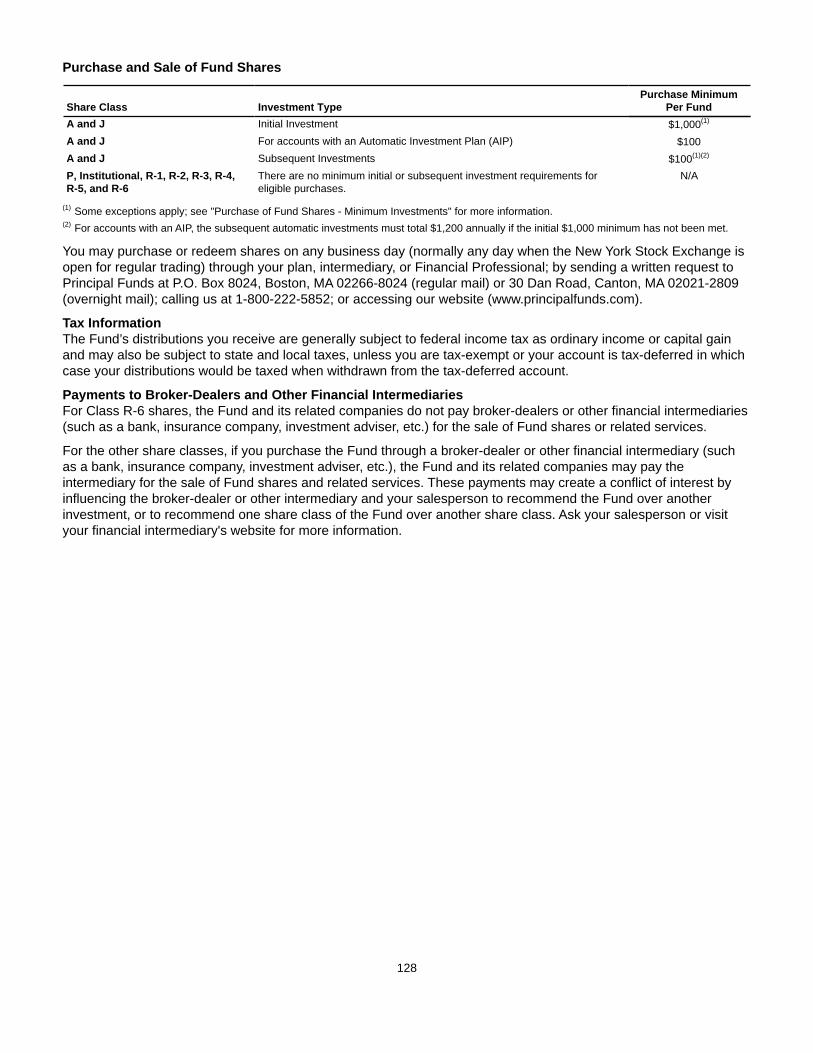
128
Purchase and Sale of Fund Shares
Share Class Investment TypePurchase Minimum
Per FundA and J Initial Investment $1,000(1)
A and J For accounts with an Automatic Investment Plan (AIP) $100A and J Subsequent Investments $100(1)(2)
P, Institutional, R-1, R-2, R-3, R-4,R-5, and R-6
There are no minimum initial or subsequent investment requirements foreligible purchases.
N/A
(1) Some exceptions apply; see "Purchase of Fund Shares - Minimum Investments" for more information.(2) For accounts with an AIP, the subsequent automatic investments must total $1,200 annually if the initial $1,000 minimum has not been met.
You may purchase or redeem shares on any business day (normally any day when the New York Stock Exchange is open for regular trading) through your plan, intermediary, or Financial Professional; by sending a written request to Principal Funds at P.O. Box 8024, Boston, MA 02266-8024 (regular mail) or 30 Dan Road, Canton, MA 02021-2809 (overnight mail); calling us at 1-800-222-5852; or accessing our website (www.principalfunds.com).
Tax InformationThe Fund’s distributions you receive are generally subject to federal income tax as ordinary income or capital gain and may also be subject to state and local taxes, unless you are tax-exempt or your account is tax-deferred in which case your distributions would be taxed when withdrawn from the tax-deferred account.
Payments to Broker-Dealers and Other Financial IntermediariesFor Class R-6 shares, the Fund and its related companies do not pay broker-dealers or other financial intermediaries (such as a bank, insurance company, investment adviser, etc.) for the sale of Fund shares or related services.
For the other share classes, if you purchase the Fund through a broker-dealer or other financial intermediary (such as a bank, insurance company, investment adviser, etc.), the Fund and its related companies may pay the intermediary for the sale of Fund shares and related services. These payments may create a conflict of interest by influencing the broker-dealer or other intermediary and your salesperson to recommend the Fund over another investment, or to recommend one share class of the Fund over another share class. Ask your salesperson or visit your financial intermediary's website for more information.
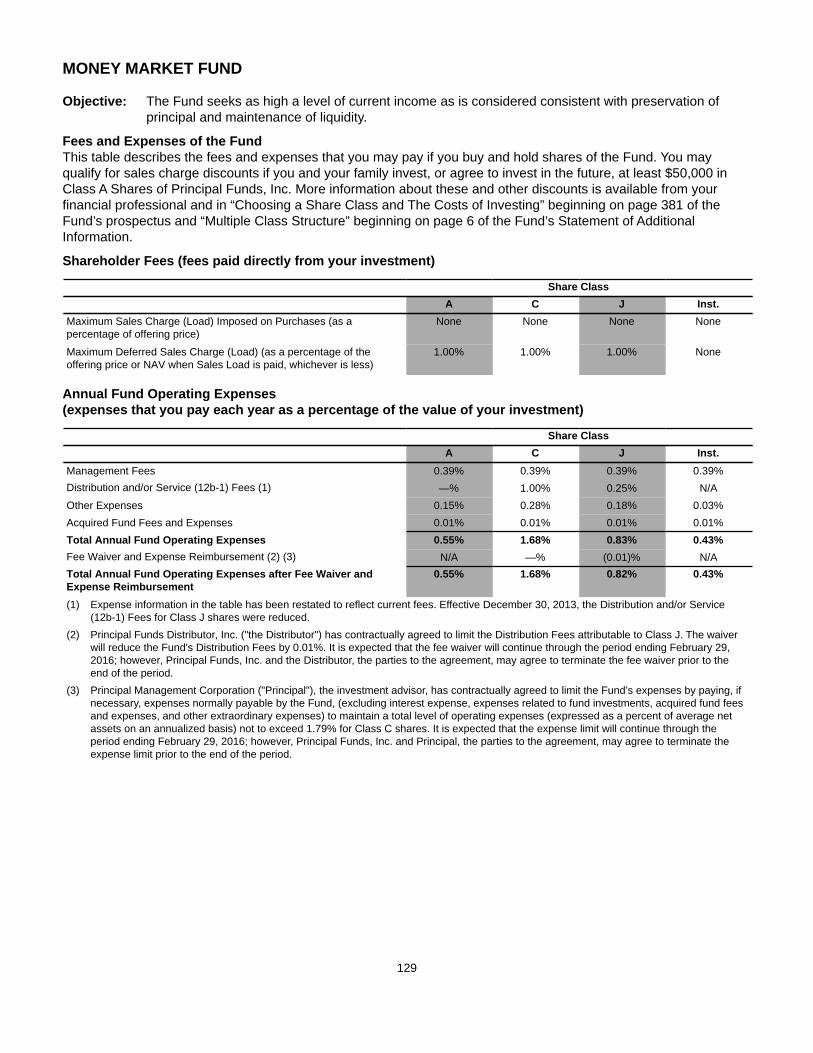
129
MONEY MARKET FUND
Objective: The Fund seeks as high a level of current income as is considered consistent with preservation of principal and maintenance of liquidity.
Fees and Expenses of the FundThis table describes the fees and expenses that you may pay if you buy and hold shares of the Fund. You may qualify for sales charge discounts if you and your family invest, or agree to invest in the future, at least $50,000 in Class A Shares of Principal Funds, Inc. More information about these and other discounts is available from your financial professional and in “Choosing a Share Class and The Costs of Investing” beginning on page 381 of the Fund’s prospectus and “Multiple Class Structure” beginning on page 6 of the Fund’s Statement of Additional Information.
Shareholder Fees (fees paid directly from your investment)
Share ClassA C J Inst.
Maximum Sales Charge (Load) Imposed on Purchases (as apercentage of offering price)
None None None None
Maximum Deferred Sales Charge (Load) (as a percentage of theoffering price or NAV when Sales Load is paid, whichever is less)
1.00% 1.00% 1.00% None
Annual Fund Operating Expenses (expenses that you pay each year as a percentage of the value of your investment)
Share ClassA C J Inst.
Management Fees 0.39% 0.39% 0.39% 0.39%Distribution and/or Service (12b-1) Fees (1) —% 1.00% 0.25% N/AOther Expenses 0.15% 0.28% 0.18% 0.03%Acquired Fund Fees and Expenses 0.01% 0.01% 0.01% 0.01%Total Annual Fund Operating Expenses 0.55% 1.68% 0.83% 0.43%Fee Waiver and Expense Reimbursement (2) (3) N/A —% (0.01)% N/ATotal Annual Fund Operating Expenses after Fee Waiver andExpense Reimbursement
0.55% 1.68% 0.82% 0.43%
(1) Expense information in the table has been restated to reflect current fees. Effective December 30, 2013, the Distribution and/or Service (12b-1) Fees for Class J shares were reduced.
(2) Principal Funds Distributor, Inc. ("the Distributor") has contractually agreed to limit the Distribution Fees attributable to Class J. The waiver will reduce the Fund's Distribution Fees by 0.01%. It is expected that the fee waiver will continue through the period ending February 29, 2016; however, Principal Funds, Inc. and the Distributor, the parties to the agreement, may agree to terminate the fee waiver prior to the end of the period.
(3) Principal Management Corporation ("Principal"), the investment advisor, has contractually agreed to limit the Fund’s expenses by paying, if necessary, expenses normally payable by the Fund, (excluding interest expense, expenses related to fund investments, acquired fund fees and expenses, and other extraordinary expenses) to maintain a total level of operating expenses (expressed as a percent of average net assets on an annualized basis) not to exceed 1.79% for Class C shares. It is expected that the expense limit will continue through the period ending February 29, 2016; however, Principal Funds, Inc. and Principal, the parties to the agreement, may agree to terminate the expense limit prior to the end of the period.

130
ExampleThis Example is intended to help you compare the cost of investing in the Fund with the cost of investing in other mutual funds.
The Example assumes that you invest $10,000 in the Fund for the time periods indicated and then redeem all of your shares at the end of those periods. The Example also assumes that your investment has a 5% return each year and that the Fund’s operating expenses remain the same. Although your actual costs may be higher or lower, based on these assumptions your costs would be:
1 year 3 years 5 years 10 yearsClass A $56 $176 $307 $689Class C 271 530 913 1,987Class J 184 264 459 1,024Institutional Class 44 138 241 542
With respect to Class C and J shares, you would pay the following expenses if you did not redeem your shares (all other classes would be the same as in the above example):
1 year 3 years 5 years 10 yearsClass C $171 $530 $913 $1,987Class J 84 264 459 1,024
Principal Investment StrategiesThe Fund seeks to maintain a stable net asset value of $1.00 per share by investing its assets in a portfolio of high quality, short-term money market instruments such as those issued by banks, corporations (U.S. and non-U.S.), municipalities and the U.S. government. Such instruments include certificates of deposit, bankers acceptances, commercial paper, treasury bills, bonds, and shares of other money market funds. The Fund maintains a dollar weighted average portfolio maturity of 60 days or less. As with all mutual funds, the value of the Fund's assets may rise or fall.
Principal RisksAn investment in the Fund is not a deposit of a bank and is not insured or guaranteed by the Federal Deposit Insurance Corporation or any other government agency. Although the Fund seeks to preserve the value of an investment at $1.00 per share, it is possible to lose money by investing in the Fund. The principal risks of investing in the Fund, in alphabetical order, are:
Fixed-Income Securities Risk. Fixed-income securities are subject to interest rate risk and credit quality risk. The market value of fixed-income securities generally declines when interest rates rise, and an issuer of fixed-income securities could default on its payment obligations.
Foreign Securities Risk. The risks of foreign securities include loss of value as a result of: political or economic instability; nationalization, expropriation or confiscatory taxation; settlement delays; and limited government regulation (including less stringent reporting, accounting, and disclosure standards than are required of U.S. companies).
Investment Company Securities Risk. Fund shareholders bear indirectly their proportionate share of the expenses of other investment companies in which the fund invests.
U.S. Government Securities Risk. Yields available from U.S. government securities are generally lower than yields from many other fixed-income securities.
U.S. Government Sponsored Securities Risk. Securities issued by U.S. government-sponsored or -chartered enterprises such as the Federal Home Loan Mortgage Corporation, the Federal National Mortgage Association, and the Federal Home Loan Banks are not issued or guaranteed by the U.S. Treasury.
PerformanceThe following information provides some indication of the risks of investing in the Fund. Past performance (before and after taxes) is not necessarily an indication of how the Fund will perform in the future. You may get updated performance information by calling 1-800-222-5852 or online at:• For Classes A, C, and J - www.principalfunds.com.
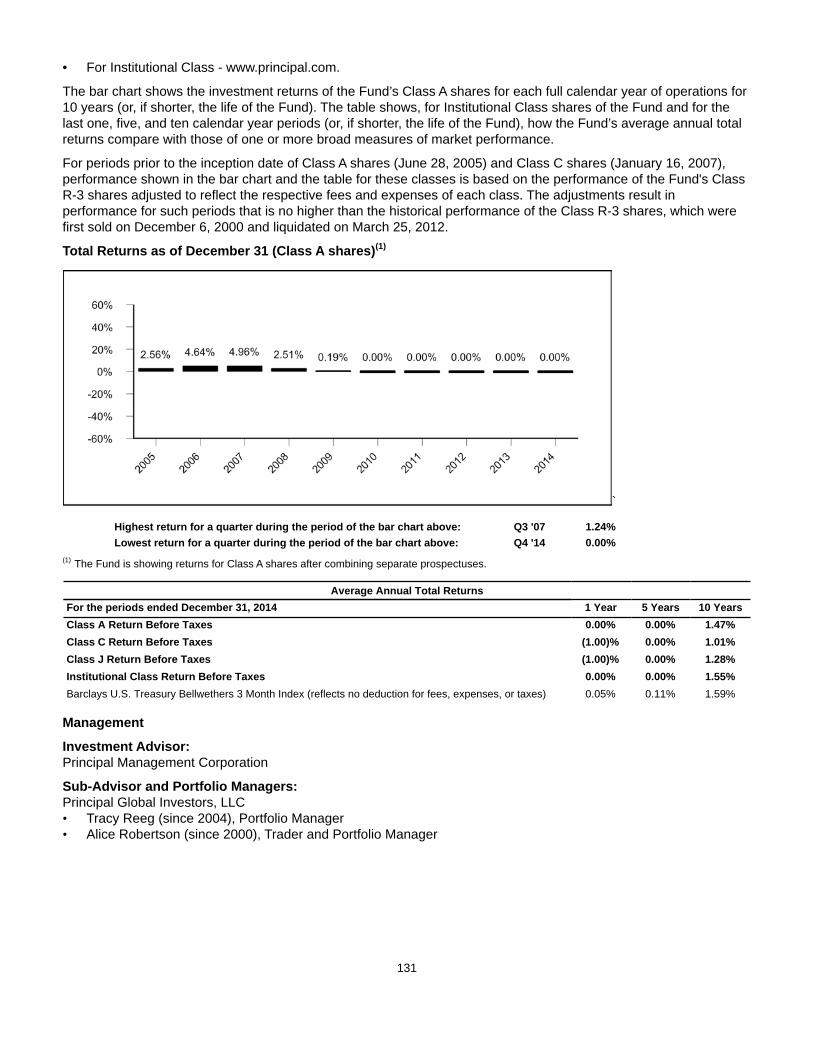
131
• For Institutional Class - www.principal.com.
The bar chart shows the investment returns of the Fund’s Class A shares for each full calendar year of operations for 10 years (or, if shorter, the life of the Fund). The table shows, for Institutional Class shares of the Fund and for the last one, five, and ten calendar year periods (or, if shorter, the life of the Fund), how the Fund’s average annual total returns compare with those of one or more broad measures of market performance.
For periods prior to the inception date of Class A shares (June 28, 2005) and Class C shares (January 16, 2007), performance shown in the bar chart and the table for these classes is based on the performance of the Fund's Class R-3 shares adjusted to reflect the respective fees and expenses of each class. The adjustments result in performance for such periods that is no higher than the historical performance of the Class R-3 shares, which were first sold on December 6, 2000 and liquidated on March 25, 2012.
Total Returns as of December 31 (Class A shares)(1)
`
Highest return for a quarter during the period of the bar chart above: Q3 '07 1.24%Lowest return for a quarter during the period of the bar chart above: Q4 '14 0.00%
(1) The Fund is showing returns for Class A shares after combining separate prospectuses.
Average Annual Total ReturnsFor the periods ended December 31, 2014 1 Year 5 Years 10 YearsClass A Return Before Taxes 0.00% 0.00% 1.47%Class C Return Before Taxes (1.00)% 0.00% 1.01%Class J Return Before Taxes (1.00)% 0.00% 1.28%Institutional Class Return Before Taxes 0.00% 0.00% 1.55%Barclays U.S. Treasury Bellwethers 3 Month Index (reflects no deduction for fees, expenses, or taxes) 0.05% 0.11% 1.59%
Management
Investment Advisor: Principal Management Corporation
Sub-Advisor and Portfolio Managers: Principal Global Investors, LLC • Tracy Reeg (since 2004), Portfolio Manager• Alice Robertson (since 2000), Trader and Portfolio Manager

132
Purchase and Sale of Fund Shares
Share Class Investment TypePurchase Minimum
Per FundA, C, and J Initial Investment $1,000(1)
A, C, and J Initial Investment for accounts with an Automatic Investment Plan (AIP) $100A, C, and J Subsequent Investments $100(1)(2)
Institutional There are no minimum initial or subsequent investment requirements foreligible purchasers.
N/A
(1) Some exceptions apply; see "Purchase of Fund Shares - Minimum Investments" for more information.(2) For accounts with an AIP, the subsequent automatic investments must total $1,200 annually if the initial $1,000 minimum has not been met.
You may purchase or redeem shares on any business day (normally any day when the New York Stock Exchange is open for regular trading), through your plan, intermediary, or Financial Professional; by sending a written request to Principal Funds at P.O. Box 8024, Boston, MA 02266-8024 (regular mail) or 30 Dan Road, Canton, MA 02021-2809 (overnight mail); calling us at 1-800-222-5852; or accessing our website (www.principalfunds.com).
Tax InformationThe Fund’s distributions you receive are generally subject to federal income tax as ordinary income or capital gain and may also be subject to state and local taxes, unless you are tax-exempt or your account is tax-deferred in which case your distributions would be taxed when withdrawn from the tax-deferred account.
Payments to Broker-Dealers and Other Financial IntermediariesIf you purchase the Fund through a broker-dealer or other financial intermediary (such as a bank, insurance company, investment adviser, etc.), the Fund and its related companies may pay the intermediary for the sale of Fund shares and related services. These payments may create a conflict of interest by influencing the broker-dealer or other intermediary and your salesperson to recommend the Fund over another investment, or to recommend one share class of the Fund over another share class. Ask your salesperson or visit your financial intermediary's website for more information.
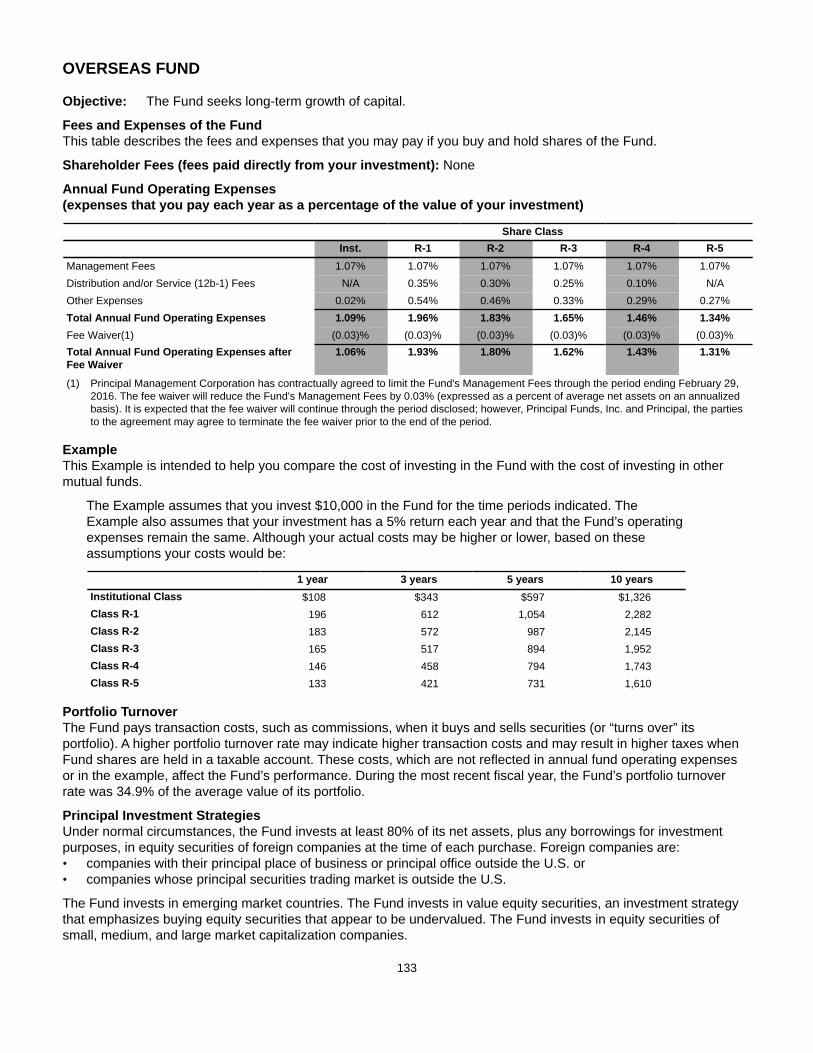
133
OVERSEAS FUND
Objective: The Fund seeks long-term growth of capital.
Fees and Expenses of the FundThis table describes the fees and expenses that you may pay if you buy and hold shares of the Fund.
Shareholder Fees (fees paid directly from your investment): None
Annual Fund Operating Expenses (expenses that you pay each year as a percentage of the value of your investment)
Share ClassInst. R-1 R-2 R-3 R-4 R-5
Management Fees 1.07% 1.07% 1.07% 1.07% 1.07% 1.07%Distribution and/or Service (12b-1) Fees N/A 0.35% 0.30% 0.25% 0.10% N/AOther Expenses 0.02% 0.54% 0.46% 0.33% 0.29% 0.27%Total Annual Fund Operating Expenses 1.09% 1.96% 1.83% 1.65% 1.46% 1.34%Fee Waiver(1) (0.03)% (0.03)% (0.03)% (0.03)% (0.03)% (0.03)%Total Annual Fund Operating Expenses afterFee Waiver
1.06% 1.93% 1.80% 1.62% 1.43% 1.31%
(1) Principal Management Corporation has contractually agreed to limit the Fund's Management Fees through the period ending February 29, 2016. The fee waiver will reduce the Fund's Management Fees by 0.03% (expressed as a percent of average net assets on an annualized basis). It is expected that the fee waiver will continue through the period disclosed; however, Principal Funds, Inc. and Principal, the parties to the agreement may agree to terminate the fee waiver prior to the end of the period.
ExampleThis Example is intended to help you compare the cost of investing in the Fund with the cost of investing in other mutual funds.
The Example assumes that you invest $10,000 in the Fund for the time periods indicated. The Example also assumes that your investment has a 5% return each year and that the Fund’s operating expenses remain the same. Although your actual costs may be higher or lower, based on these assumptions your costs would be:
1 year 3 years 5 years 10 yearsInstitutional Class $108 $343 $597 $1,326Class R-1 196 612 1,054 2,282Class R-2 183 572 987 2,145Class R-3 165 517 894 1,952Class R-4 146 458 794 1,743Class R-5 133 421 731 1,610
Portfolio TurnoverThe Fund pays transaction costs, such as commissions, when it buys and sells securities (or “turns over” its portfolio). A higher portfolio turnover rate may indicate higher transaction costs and may result in higher taxes when Fund shares are held in a taxable account. These costs, which are not reflected in annual fund operating expenses or in the example, affect the Fund’s performance. During the most recent fiscal year, the Fund’s portfolio turnover rate was 34.9% of the average value of its portfolio.
Principal Investment StrategiesUnder normal circumstances, the Fund invests at least 80% of its net assets, plus any borrowings for investment purposes, in equity securities of foreign companies at the time of each purchase. Foreign companies are:• companies with their principal place of business or principal office outside the U.S. or• companies whose principal securities trading market is outside the U.S.
The Fund invests in emerging market countries. The Fund invests in value equity securities, an investment strategy that emphasizes buying equity securities that appear to be undervalued. The Fund invests in equity securities of small, medium, and large market capitalization companies.
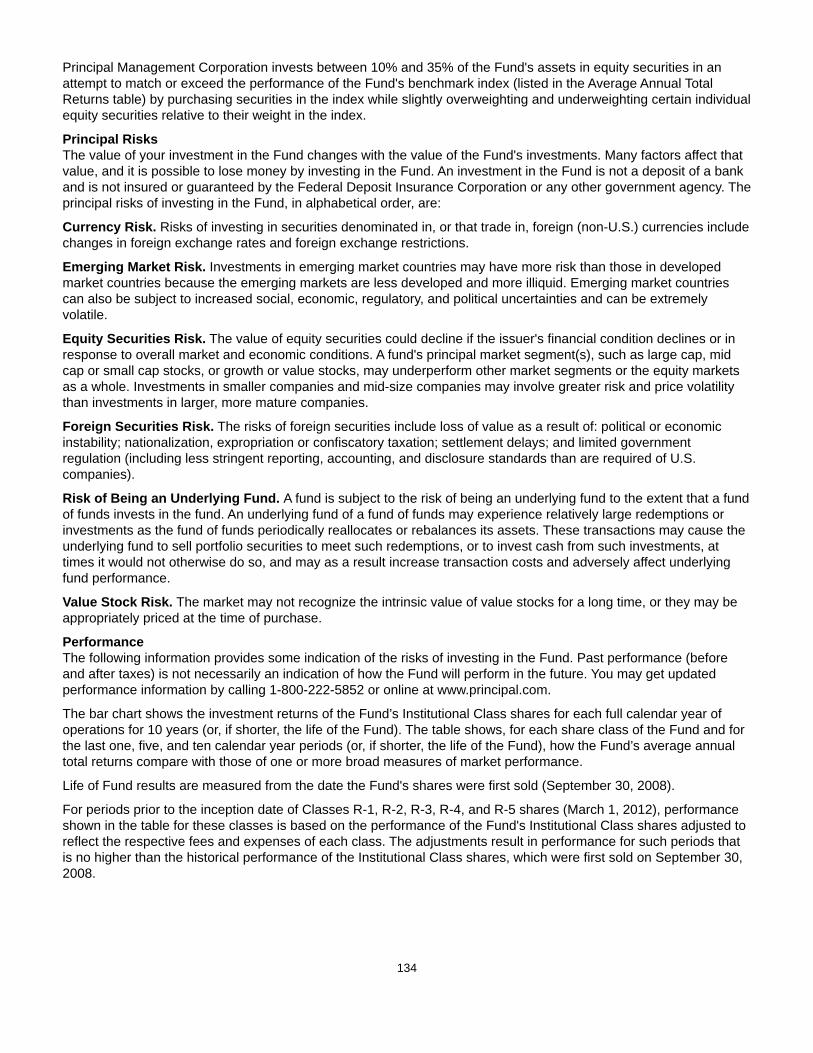
134
Principal Management Corporation invests between 10% and 35% of the Fund's assets in equity securities in an attempt to match or exceed the performance of the Fund's benchmark index (listed in the Average Annual Total Returns table) by purchasing securities in the index while slightly overweighting and underweighting certain individual equity securities relative to their weight in the index.
Principal RisksThe value of your investment in the Fund changes with the value of the Fund's investments. Many factors affect that value, and it is possible to lose money by investing in the Fund. An investment in the Fund is not a deposit of a bank and is not insured or guaranteed by the Federal Deposit Insurance Corporation or any other government agency. The principal risks of investing in the Fund, in alphabetical order, are:
Currency Risk. Risks of investing in securities denominated in, or that trade in, foreign (non-U.S.) currencies include changes in foreign exchange rates and foreign exchange restrictions.
Emerging Market Risk. Investments in emerging market countries may have more risk than those in developed market countries because the emerging markets are less developed and more illiquid. Emerging market countries can also be subject to increased social, economic, regulatory, and political uncertainties and can be extremely volatile.
Equity Securities Risk. The value of equity securities could decline if the issuer's financial condition declines or in response to overall market and economic conditions. A fund's principal market segment(s), such as large cap, mid cap or small cap stocks, or growth or value stocks, may underperform other market segments or the equity markets as a whole. Investments in smaller companies and mid-size companies may involve greater risk and price volatility than investments in larger, more mature companies.
Foreign Securities Risk. The risks of foreign securities include loss of value as a result of: political or economic instability; nationalization, expropriation or confiscatory taxation; settlement delays; and limited government regulation (including less stringent reporting, accounting, and disclosure standards than are required of U.S. companies).
Risk of Being an Underlying Fund. A fund is subject to the risk of being an underlying fund to the extent that a fund of funds invests in the fund. An underlying fund of a fund of funds may experience relatively large redemptions or investments as the fund of funds periodically reallocates or rebalances its assets. These transactions may cause the underlying fund to sell portfolio securities to meet such redemptions, or to invest cash from such investments, at times it would not otherwise do so, and may as a result increase transaction costs and adversely affect underlying fund performance.
Value Stock Risk. The market may not recognize the intrinsic value of value stocks for a long time, or they may be appropriately priced at the time of purchase.
PerformanceThe following information provides some indication of the risks of investing in the Fund. Past performance (before and after taxes) is not necessarily an indication of how the Fund will perform in the future. You may get updated performance information by calling 1-800-222-5852 or online at www.principal.com.
The bar chart shows the investment returns of the Fund’s Institutional Class shares for each full calendar year of operations for 10 years (or, if shorter, the life of the Fund). The table shows, for each share class of the Fund and for the last one, five, and ten calendar year periods (or, if shorter, the life of the Fund), how the Fund’s average annual total returns compare with those of one or more broad measures of market performance.
Life of Fund results are measured from the date the Fund's shares were first sold (September 30, 2008).
For periods prior to the inception date of Classes R-1, R-2, R-3, R-4, and R-5 shares (March 1, 2012), performance shown in the table for these classes is based on the performance of the Fund's Institutional Class shares adjusted to reflect the respective fees and expenses of each class. The adjustments result in performance for such periods that is no higher than the historical performance of the Institutional Class shares, which were first sold on September 30, 2008.
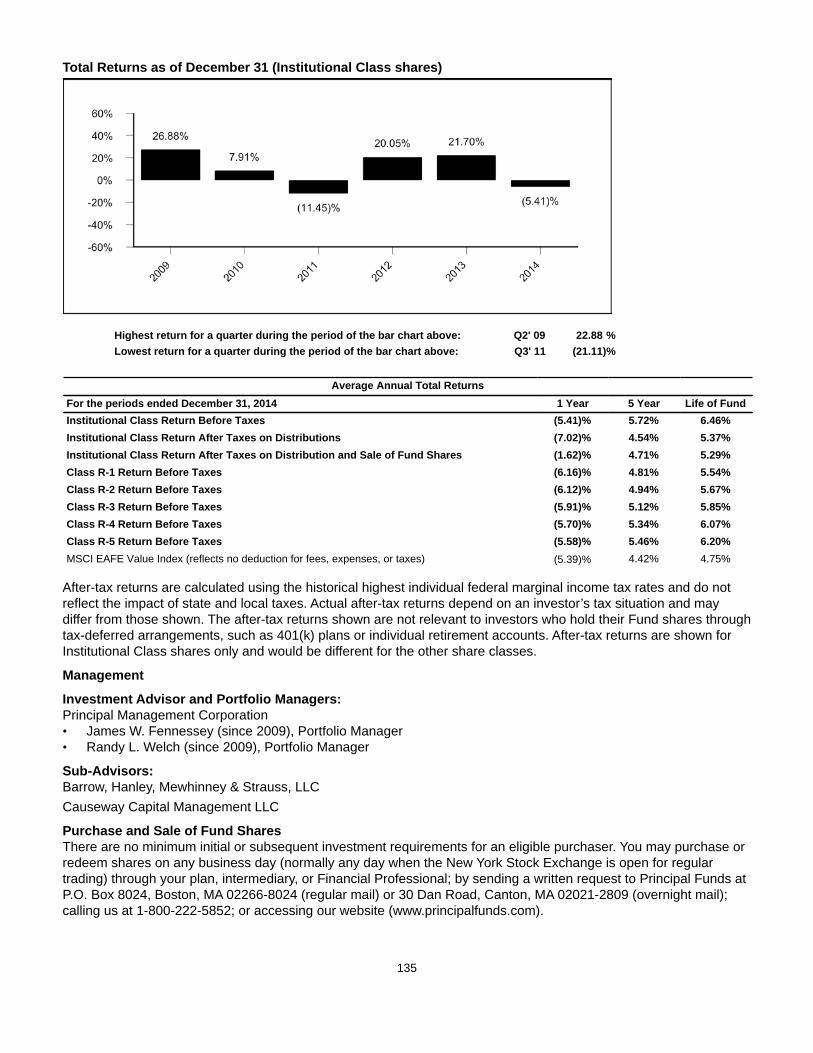
135
Total Returns as of December 31 (Institutional Class shares)
Highest return for a quarter during the period of the bar chart above: Q2' 09 22.88 %Lowest return for a quarter during the period of the bar chart above: Q3' 11 (21.11)%
Average Annual Total ReturnsFor the periods ended December 31, 2014 1 Year 5 Year Life of FundInstitutional Class Return Before Taxes (5.41)% 5.72% 6.46%Institutional Class Return After Taxes on Distributions (7.02)% 4.54% 5.37%Institutional Class Return After Taxes on Distribution and Sale of Fund Shares (1.62)% 4.71% 5.29%Class R-1 Return Before Taxes (6.16)% 4.81% 5.54%Class R-2 Return Before Taxes (6.12)% 4.94% 5.67%Class R-3 Return Before Taxes (5.91)% 5.12% 5.85%Class R-4 Return Before Taxes (5.70)% 5.34% 6.07%Class R-5 Return Before Taxes (5.58)% 5.46% 6.20%MSCI EAFE Value Index (reflects no deduction for fees, expenses, or taxes) (5.39)% 4.42% 4.75%
After-tax returns are calculated using the historical highest individual federal marginal income tax rates and do not reflect the impact of state and local taxes. Actual after-tax returns depend on an investor’s tax situation and may differ from those shown. The after-tax returns shown are not relevant to investors who hold their Fund shares through tax-deferred arrangements, such as 401(k) plans or individual retirement accounts. After-tax returns are shown for Institutional Class shares only and would be different for the other share classes.
Management
Investment Advisor and Portfolio Managers: Principal Management Corporation• James W. Fennessey (since 2009), Portfolio Manager• Randy L. Welch (since 2009), Portfolio Manager
Sub-Advisors: Barrow, Hanley, Mewhinney & Strauss, LLC Causeway Capital Management LLC
Purchase and Sale of Fund SharesThere are no minimum initial or subsequent investment requirements for an eligible purchaser. You may purchase or redeem shares on any business day (normally any day when the New York Stock Exchange is open for regular trading) through your plan, intermediary, or Financial Professional; by sending a written request to Principal Funds at P.O. Box 8024, Boston, MA 02266-8024 (regular mail) or 30 Dan Road, Canton, MA 02021-2809 (overnight mail); calling us at 1-800-222-5852; or accessing our website (www.principalfunds.com).

136
Tax InformationThe Fund’s distributions you receive are generally subject to federal income tax as ordinary income or capital gain and may also be subject to state and local taxes, unless you are tax-exempt or your account is tax-deferred in which case your distributions would be taxed when withdrawn from the tax-deferred account.
Payments to Broker-Dealers and Other Financial IntermediariesIf you purchase the Fund through a broker-dealer or other financial intermediary (such as a bank, insurance company, investment adviser, etc.), the Fund and its related companies may pay the intermediary for the sale of Fund shares and related services. These payments may create a conflict of interest by influencing the broker-dealer or other intermediary and your salesperson to recommend the Fund over another investment, or to recommend one share class of the Fund over another share class. Ask your salesperson or visit your financial intermediary's website for more information.
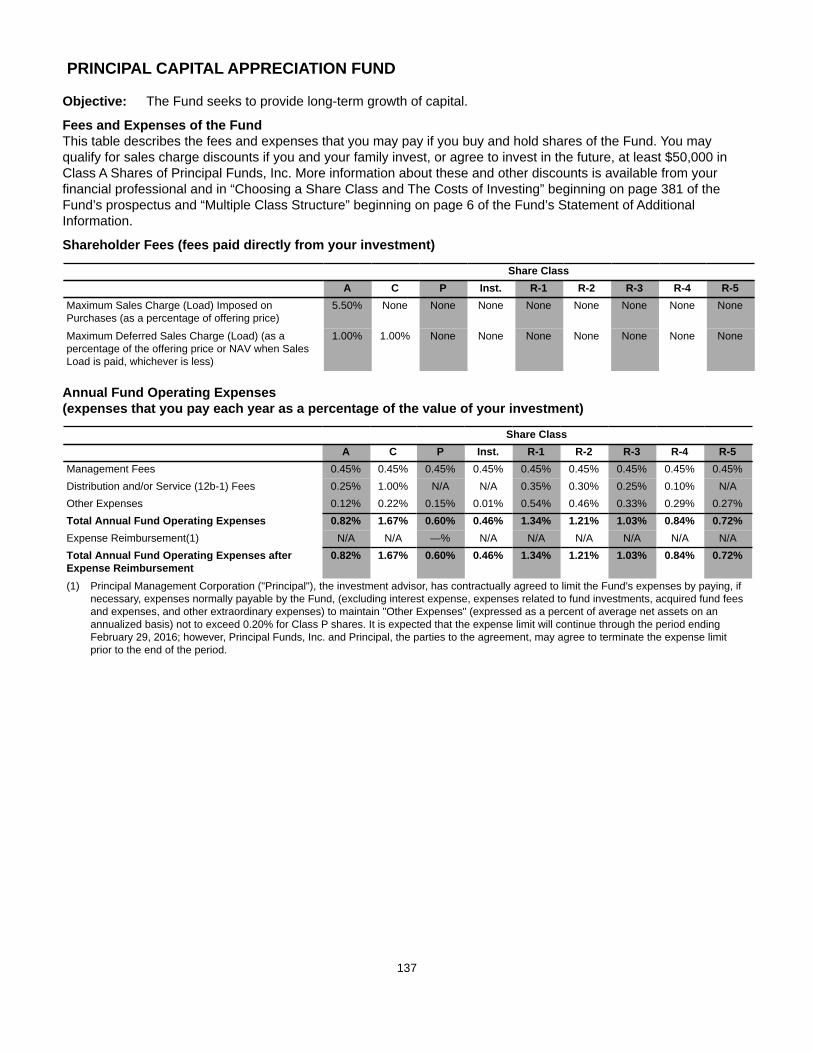
137
PRINCIPAL CAPITAL APPRECIATION FUND
Objective: The Fund seeks to provide long-term growth of capital.
Fees and Expenses of the FundThis table describes the fees and expenses that you may pay if you buy and hold shares of the Fund. You may qualify for sales charge discounts if you and your family invest, or agree to invest in the future, at least $50,000 in Class A Shares of Principal Funds, Inc. More information about these and other discounts is available from your financial professional and in “Choosing a Share Class and The Costs of Investing” beginning on page 381 of the Fund’s prospectus and “Multiple Class Structure” beginning on page 6 of the Fund’s Statement of Additional Information.
Shareholder Fees (fees paid directly from your investment)
Share ClassA C P Inst. R-1 R-2 R-3 R-4 R-5
Maximum Sales Charge (Load) Imposed onPurchases (as a percentage of offering price)
5.50% None None None None None None None None
Maximum Deferred Sales Charge (Load) (as apercentage of the offering price or NAV when SalesLoad is paid, whichever is less)
1.00% 1.00% None None None None None None None
Annual Fund Operating Expenses (expenses that you pay each year as a percentage of the value of your investment)
Share ClassA C P Inst. R-1 R-2 R-3 R-4 R-5
Management Fees 0.45% 0.45% 0.45% 0.45% 0.45% 0.45% 0.45% 0.45% 0.45%Distribution and/or Service (12b-1) Fees 0.25% 1.00% N/A N/A 0.35% 0.30% 0.25% 0.10% N/AOther Expenses 0.12% 0.22% 0.15% 0.01% 0.54% 0.46% 0.33% 0.29% 0.27%Total Annual Fund Operating Expenses 0.82% 1.67% 0.60% 0.46% 1.34% 1.21% 1.03% 0.84% 0.72%Expense Reimbursement(1) N/A N/A —% N/A N/A N/A N/A N/A N/ATotal Annual Fund Operating Expenses afterExpense Reimbursement
0.82% 1.67% 0.60% 0.46% 1.34% 1.21% 1.03% 0.84% 0.72%
(1) Principal Management Corporation ("Principal"), the investment advisor, has contractually agreed to limit the Fund’s expenses by paying, if necessary, expenses normally payable by the Fund, (excluding interest expense, expenses related to fund investments, acquired fund fees and expenses, and other extraordinary expenses) to maintain "Other Expenses" (expressed as a percent of average net assets on an annualized basis) not to exceed 0.20% for Class P shares. It is expected that the expense limit will continue through the period ending February 29, 2016; however, Principal Funds, Inc. and Principal, the parties to the agreement, may agree to terminate the expense limit prior to the end of the period.
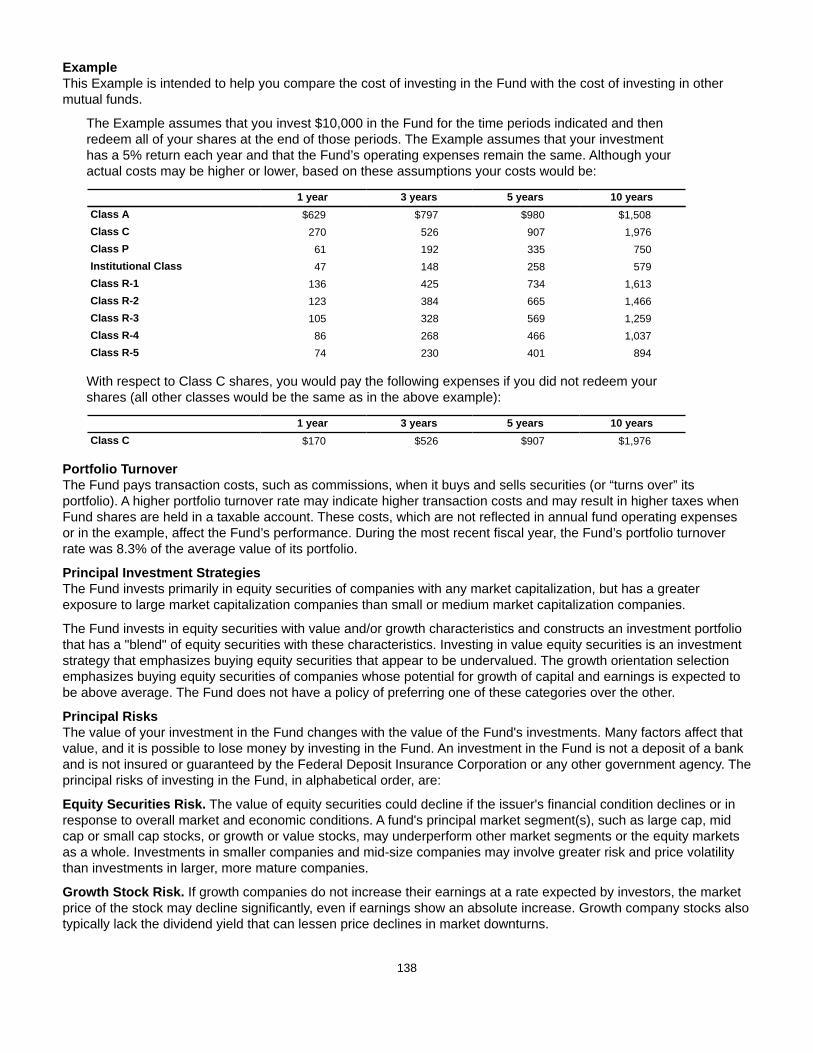
138
ExampleThis Example is intended to help you compare the cost of investing in the Fund with the cost of investing in other mutual funds.
The Example assumes that you invest $10,000 in the Fund for the time periods indicated and then redeem all of your shares at the end of those periods. The Example assumes that your investment has a 5% return each year and that the Fund’s operating expenses remain the same. Although your actual costs may be higher or lower, based on these assumptions your costs would be:
1 year 3 years 5 years 10 yearsClass A $629 $797 $980 $1,508Class C 270 526 907 1,976Class P 61 192 335 750Institutional Class 47 148 258 579Class R-1 136 425 734 1,613Class R-2 123 384 665 1,466Class R-3 105 328 569 1,259Class R-4 86 268 466 1,037Class R-5 74 230 401 894
With respect to Class C shares, you would pay the following expenses if you did not redeem your shares (all other classes would be the same as in the above example):
1 year 3 years 5 years 10 yearsClass C $170 $526 $907 $1,976
Portfolio TurnoverThe Fund pays transaction costs, such as commissions, when it buys and sells securities (or “turns over” its portfolio). A higher portfolio turnover rate may indicate higher transaction costs and may result in higher taxes when Fund shares are held in a taxable account. These costs, which are not reflected in annual fund operating expenses or in the example, affect the Fund’s performance. During the most recent fiscal year, the Fund’s portfolio turnover rate was 8.3% of the average value of its portfolio.
Principal Investment StrategiesThe Fund invests primarily in equity securities of companies with any market capitalization, but has a greater exposure to large market capitalization companies than small or medium market capitalization companies.
The Fund invests in equity securities with value and/or growth characteristics and constructs an investment portfolio that has a "blend" of equity securities with these characteristics. Investing in value equity securities is an investment strategy that emphasizes buying equity securities that appear to be undervalued. The growth orientation selection emphasizes buying equity securities of companies whose potential for growth of capital and earnings is expected to be above average. The Fund does not have a policy of preferring one of these categories over the other.
Principal RisksThe value of your investment in the Fund changes with the value of the Fund's investments. Many factors affect that value, and it is possible to lose money by investing in the Fund. An investment in the Fund is not a deposit of a bank and is not insured or guaranteed by the Federal Deposit Insurance Corporation or any other government agency. The principal risks of investing in the Fund, in alphabetical order, are:
Equity Securities Risk. The value of equity securities could decline if the issuer's financial condition declines or in response to overall market and economic conditions. A fund's principal market segment(s), such as large cap, mid cap or small cap stocks, or growth or value stocks, may underperform other market segments or the equity markets as a whole. Investments in smaller companies and mid-size companies may involve greater risk and price volatility than investments in larger, more mature companies.
Growth Stock Risk. If growth companies do not increase their earnings at a rate expected by investors, the market price of the stock may decline significantly, even if earnings show an absolute increase. Growth company stocks also typically lack the dividend yield that can lessen price declines in market downturns.
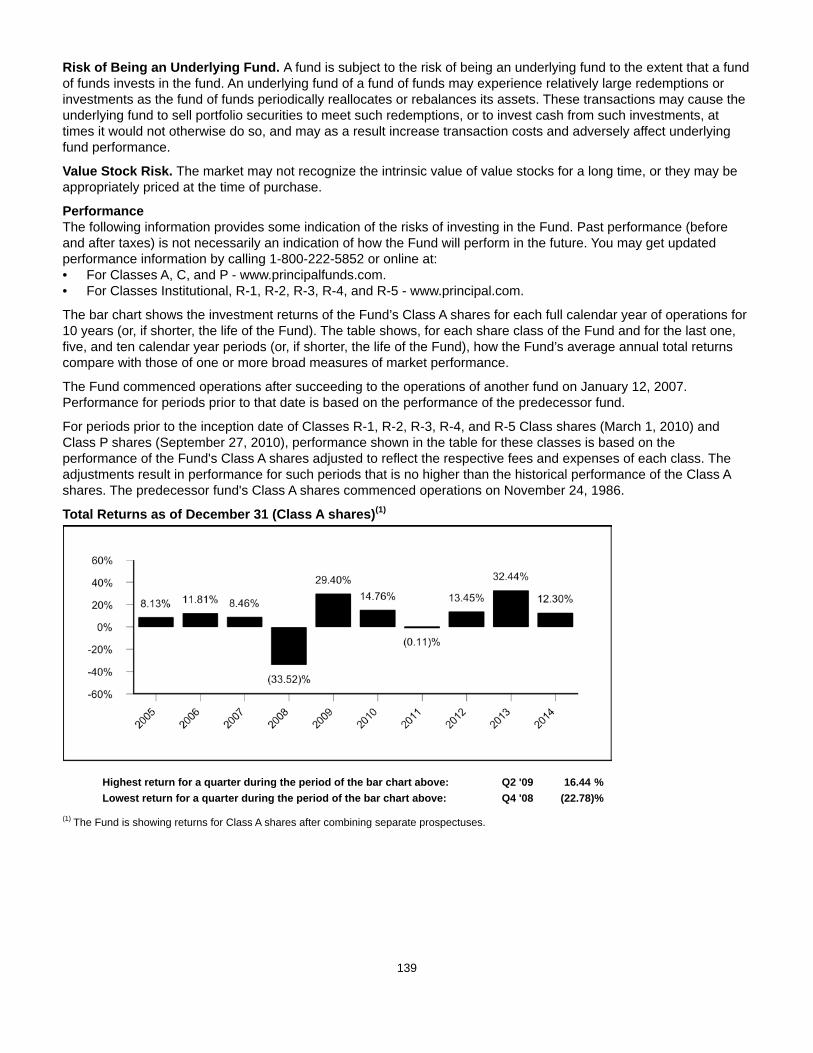
139
Risk of Being an Underlying Fund. A fund is subject to the risk of being an underlying fund to the extent that a fund of funds invests in the fund. An underlying fund of a fund of funds may experience relatively large redemptions or investments as the fund of funds periodically reallocates or rebalances its assets. These transactions may cause the underlying fund to sell portfolio securities to meet such redemptions, or to invest cash from such investments, at times it would not otherwise do so, and may as a result increase transaction costs and adversely affect underlying fund performance.
Value Stock Risk. The market may not recognize the intrinsic value of value stocks for a long time, or they may be appropriately priced at the time of purchase.
PerformanceThe following information provides some indication of the risks of investing in the Fund. Past performance (before and after taxes) is not necessarily an indication of how the Fund will perform in the future. You may get updated performance information by calling 1-800-222-5852 or online at: • For Classes A, C, and P - www.principalfunds.com.• For Classes Institutional, R-1, R-2, R-3, R-4, and R-5 - www.principal.com.
The bar chart shows the investment returns of the Fund’s Class A shares for each full calendar year of operations for 10 years (or, if shorter, the life of the Fund). The table shows, for each share class of the Fund and for the last one, five, and ten calendar year periods (or, if shorter, the life of the Fund), how the Fund’s average annual total returns compare with those of one or more broad measures of market performance.
The Fund commenced operations after succeeding to the operations of another fund on January 12, 2007. Performance for periods prior to that date is based on the performance of the predecessor fund.
For periods prior to the inception date of Classes R-1, R-2, R-3, R-4, and R-5 Class shares (March 1, 2010) and Class P shares (September 27, 2010), performance shown in the table for these classes is based on the performance of the Fund's Class A shares adjusted to reflect the respective fees and expenses of each class. The adjustments result in performance for such periods that is no higher than the historical performance of the Class A shares. The predecessor fund's Class A shares commenced operations on November 24, 1986.
Total Returns as of December 31 (Class A shares)(1)
Highest return for a quarter during the period of the bar chart above: Q2 '09 16.44 %Lowest return for a quarter during the period of the bar chart above: Q4 '08 (22.78)%
(1) The Fund is showing returns for Class A shares after combining separate prospectuses.

140
Average Annual Total Returns(1)
For the periods ended December 31, 2014 1 Year 5 Years 10 YearsClass A Return Before Taxes 6.12% 12.82% 7.50%Class A Return After Taxes on Distributions 4.93% 12.13% 6.86%Class A Return After Taxes on Distribution and Sale of Fund Shares 4.41% 10.27% 6.08%Class C Return Before Taxes 10.32% 13.12% 7.15%Class P Return Before Taxes 12.55% 14.33% 8.22%Institutional Class Return Before Taxes 12.70% 14.59% 8.55%Class R-1 Return Before Taxes 11.72% 13.59% 7.58%Class R-2 Return Before Taxes 11.86% 13.74% 7.72%Class R-3 Return Before Taxes 12.07% 13.94% 7.91%Class R-4 Return Before Taxes 12.27% 14.15% 8.11%Class R-5 Return Before Taxes 12.42% 14.29% 8.20%Russell 3000 Index (reflects no deduction for fees, expenses, or taxes) 12.56% 15.63% 7.94%
(1) The Fund is showing after-tax returns for Class A shares after combining separate prospectuses.
After-tax returns are calculated using the historical highest individual federal marginal income tax rates and do not reflect the impact of state and local taxes. Actual after-tax returns depend on an investor’s tax situation and may differ from those shown. The after-tax returns shown are not relevant to investors who hold their Fund shares through tax-deferred arrangements, such as 401(k) plans or individual retirement accounts. After-tax returns are shown for Class A shares only and would be different for the other share classes.
Management
Investment Advisor: Principal Management Corporation
Sub-Advisor and Portfolio Managers:Edge Asset Management, Inc. • Daniel R. Coleman (since 2010), Head of Equities, Portfolio Manager• Philip M. Foreman (since 2002), Portfolio Manager
Purchase and Sale of Fund Shares
Share Class Investment TypePurchase Minimum
Per FundA and C Initial Investment $1,000(1)
A and C Initial Investment for accounts with an Automatic Investment Plan (AIP) $100A and C Subsequent Investments $100(1)(2)
P, Institutional, R-1, R-2, R-3, R-4,and R-5
There are no minimum initial or subsequent investment requirements foreligible purchasers.
N/A
(1) Some exceptions apply; see "Purchase of Fund Shares - Minimum Investments" for more information.(2) For accounts with an AIP, the subsequent automatic investments must total $1,200 annually if the initial $1,000 minimum has not been met.
You may purchase or redeem shares on any business day (normally any day when the New York Stock Exchange is open for regular trading), through your plan, intermediary, or Financial Professional; by sending a written request to Principal Funds at P.O. Box 8024, Boston, MA 02266-8024 (regular mail) or 30 Dan Road, Canton, MA 02021-2809 (overnight mail); calling us at 1-800-222-5852; or accessing our website (www.principalfunds.com).
Tax InformationThe Fund’s distributions you receive are generally subject to federal income tax as ordinary income or capital gain and may also be subject to state and local taxes, unless you are tax-exempt or your account is tax-deferred in which case your distributions would be taxed when withdrawn from the tax-deferred account.

141
Payments to Broker-Dealers and Other Financial IntermediariesIf you purchase the Fund through a broker-dealer or other financial intermediary (such as a bank, insurance company, investment adviser, etc.), the Fund and its related companies may pay the intermediary for the sale of Fund shares and related services. These payments may create a conflict of interest by influencing the broker-dealer or other intermediary and your salesperson to recommend the Fund over another investment, or to recommend one share class of the Fund over another share class. Ask your salesperson or visit your financial intermediary's website for more information.
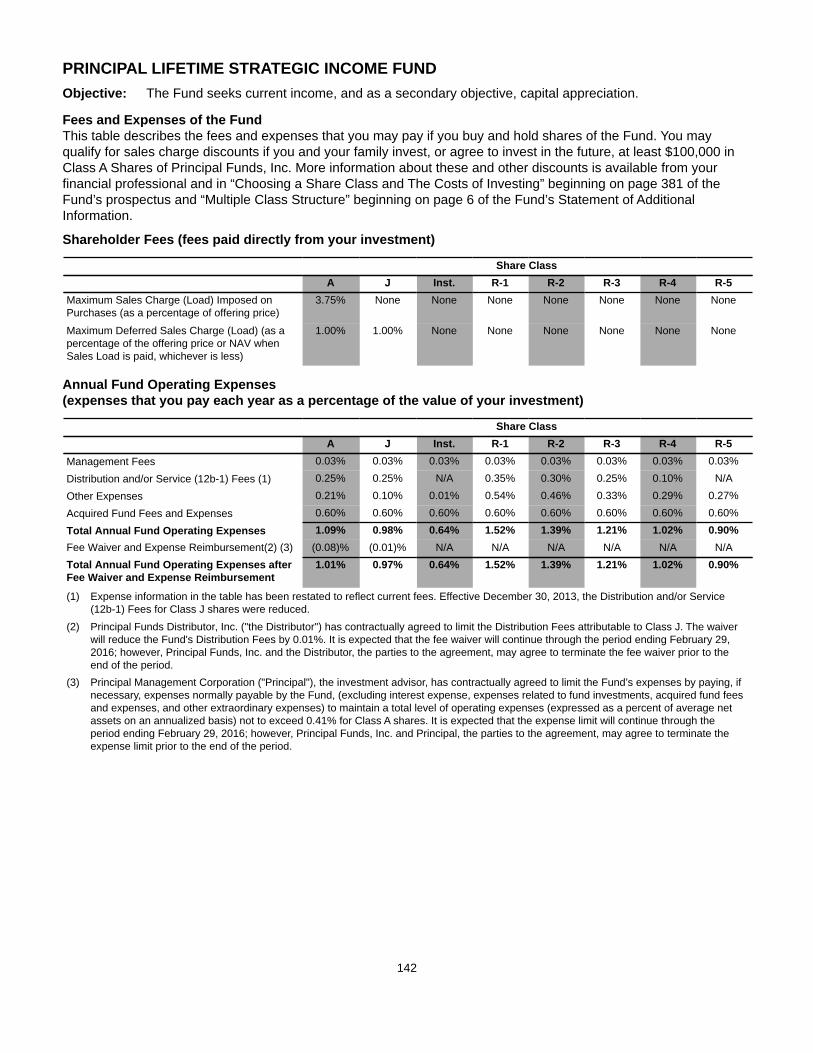
142
PRINCIPAL LIFETIME STRATEGIC INCOME FUNDObjective: The Fund seeks current income, and as a secondary objective, capital appreciation.
Fees and Expenses of the FundThis table describes the fees and expenses that you may pay if you buy and hold shares of the Fund. You may qualify for sales charge discounts if you and your family invest, or agree to invest in the future, at least $100,000 in Class A Shares of Principal Funds, Inc. More information about these and other discounts is available from your financial professional and in “Choosing a Share Class and The Costs of Investing” beginning on page 381 of the Fund’s prospectus and “Multiple Class Structure” beginning on page 6 of the Fund’s Statement of Additional Information.
Shareholder Fees (fees paid directly from your investment)
Share ClassA J Inst. R-1 R-2 R-3 R-4 R-5
Maximum Sales Charge (Load) Imposed onPurchases (as a percentage of offering price)
3.75% None None None None None None None
Maximum Deferred Sales Charge (Load) (as apercentage of the offering price or NAV whenSales Load is paid, whichever is less)
1.00% 1.00% None None None None None None
Annual Fund Operating Expenses (expenses that you pay each year as a percentage of the value of your investment)
Share ClassA J Inst. R-1 R-2 R-3 R-4 R-5
Management Fees 0.03% 0.03% 0.03% 0.03% 0.03% 0.03% 0.03% 0.03%
Distribution and/or Service (12b-1) Fees (1) 0.25% 0.25% N/A 0.35% 0.30% 0.25% 0.10% N/A
Other Expenses 0.21% 0.10% 0.01% 0.54% 0.46% 0.33% 0.29% 0.27%
Acquired Fund Fees and Expenses 0.60% 0.60% 0.60% 0.60% 0.60% 0.60% 0.60% 0.60%
Total Annual Fund Operating Expenses 1.09% 0.98% 0.64% 1.52% 1.39% 1.21% 1.02% 0.90%Fee Waiver and Expense Reimbursement(2) (3) (0.08)% (0.01)% N/A N/A N/A N/A N/A N/ATotal Annual Fund Operating Expenses afterFee Waiver and Expense Reimbursement
1.01% 0.97% 0.64% 1.52% 1.39% 1.21% 1.02% 0.90%
(1) Expense information in the table has been restated to reflect current fees. Effective December 30, 2013, the Distribution and/or Service (12b-1) Fees for Class J shares were reduced.
(2) Principal Funds Distributor, Inc. ("the Distributor") has contractually agreed to limit the Distribution Fees attributable to Class J. The waiver will reduce the Fund's Distribution Fees by 0.01%. It is expected that the fee waiver will continue through the period ending February 29, 2016; however, Principal Funds, Inc. and the Distributor, the parties to the agreement, may agree to terminate the fee waiver prior to the end of the period.
(3) Principal Management Corporation ("Principal"), the investment advisor, has contractually agreed to limit the Fund’s expenses by paying, if necessary, expenses normally payable by the Fund, (excluding interest expense, expenses related to fund investments, acquired fund fees and expenses, and other extraordinary expenses) to maintain a total level of operating expenses (expressed as a percent of average net assets on an annualized basis) not to exceed 0.41% for Class A shares. It is expected that the expense limit will continue through the period ending February 29, 2016; however, Principal Funds, Inc. and Principal, the parties to the agreement, may agree to terminate the expense limit prior to the end of the period.
143
ExampleThis Example is intended to help you compare the cost of investing in the Fund with the cost of investing in other mutual funds.
The Example assumes that you invest $10,000 in the Fund for the time periods indicated and then redeem all of your shares at the end of those periods. The Example assumes that your investment has a 5% return each year and that the Fund’s operating expenses remain the same. Although your actual costs may be higher or lower, based on these assumptions your costs would be:
1 year 3 years 5 years 10 yearsClass A $474 $700 $945 $1,646Class J 199 311 541 1,200Institutional Class 65 205 357 798Class R-1 155 480 829 1,813Class R-2 142 440 761 1,669Class R-3 123 384 665 1,466Class R-4 104 325 563 1,248Class R-5 92 287 498 1,108
With respect to Class J shares, you would pay the following expenses if you did not redeem your shares (all other classes would be the same as in the above example):
1 year 3 years 5 years 10 yearsClass J $99 $311 $541 $1,200
Portfolio TurnoverAs a fund of funds, the Fund does not pay transaction costs, such as commissions, when it buys and sells shares of underlying funds (or “turns over” its portfolio). An underlying fund does pay transaction costs when it buys and sells portfolio securities, and a higher portfolio turnover may indicate higher transaction costs. These costs, which are not reflected in annual fund operating expenses or in the examples, affect the performance of the underlying fund and the Fund. During its most recent fiscal year, the Fund's portfolio turnover rate was 26.8% of the average value of its portfolio.
Principal Investment StrategiesThe Fund invests according to an asset allocation strategy designed for investors primarily seeking current income and secondarily capital appreciation. The Fund's asset allocation is designed for investors who are approximately 15 years beyond the normal retirement age of 65. The Fund is a fund of funds that invests in PFI Institutional Class shares. Its underlying funds consist of domestic and foreign equity funds, fixed-income funds, real asset funds, and other funds that aim to offer diversification beyond traditional equity and fixed-income securities. The Fund is managed by Principal Management Corporation (“Principal”); Principal has hired a sub-advisor, Principal Global Investors, LLC (“PGI”), to assist in managing the Fund.
Principal, with assistance from PGI, develops, implements and monitors the Fund's strategic or long-term asset class targets and target ranges, is also responsible for an active rebalancing strategy designed to identify asset classes that appear attractive over the short term and sets the percentage of Fund assets to be allocated to a particular asset class. Principal selects the underlying funds for each asset class and the target weights for each underlying fund. Principal, with assistance from PGI, may shift asset class targets in response to normal evaluative processes, the shortening time horizon of the Fund or changes in market forces or Fund circumstances. Principal may add, remove, or substitute underlying funds at any time.
In selecting underlying funds and target weights, Principal considers both quantitative measures (e.g., past performance, expected levels of risk and returns, expense levels, diversification and style consistency) and qualitative factors (e.g., organizational stability, investment experience, investment and risk management processes, and information, trading, and compliance systems). There are no minimum or maximum percentages of assets that the Fund must invest in a specific asset class or underlying fund.
The underlying funds invest in growth and value stocks of large market capitalization companies, fixed-income securities (including high yield or “junk” bonds), domestic and foreign securities, securities denominated in foreign currencies, investment companies (including index funds), real estate securities, derivatives, mortgage-backed
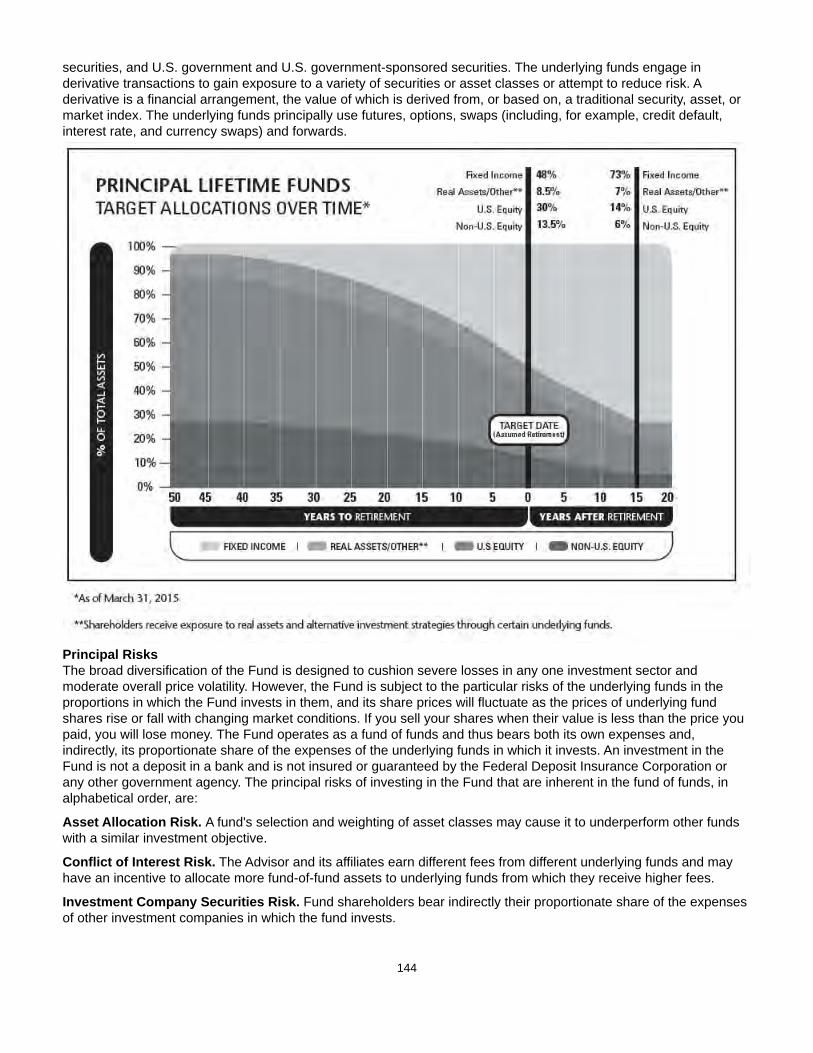
144
securities, and U.S. government and U.S. government-sponsored securities. The underlying funds engage in derivative transactions to gain exposure to a variety of securities or asset classes or attempt to reduce risk. A derivative is a financial arrangement, the value of which is derived from, or based on, a traditional security, asset, or market index. The underlying funds principally use futures, options, swaps (including, for example, credit default, interest rate, and currency swaps) and forwards.
Principal RisksThe broad diversification of the Fund is designed to cushion severe losses in any one investment sector and moderate overall price volatility. However, the Fund is subject to the particular risks of the underlying funds in the proportions in which the Fund invests in them, and its share prices will fluctuate as the prices of underlying fund shares rise or fall with changing market conditions. If you sell your shares when their value is less than the price you paid, you will lose money. The Fund operates as a fund of funds and thus bears both its own expenses and, indirectly, its proportionate share of the expenses of the underlying funds in which it invests. An investment in the Fund is not a deposit in a bank and is not insured or guaranteed by the Federal Deposit Insurance Corporation or any other government agency. The principal risks of investing in the Fund that are inherent in the fund of funds, in alphabetical order, are:
Asset Allocation Risk. A fund's selection and weighting of asset classes may cause it to underperform other funds with a similar investment objective.
Conflict of Interest Risk. The Advisor and its affiliates earn different fees from different underlying funds and may have an incentive to allocate more fund-of-fund assets to underlying funds from which they receive higher fees.
Investment Company Securities Risk. Fund shareholders bear indirectly their proportionate share of the expenses of other investment companies in which the fund invests.
145
Target Date Fund Risk. A target date fund should not be selected based solely on age or retirement date because there is no guarantee that this fund will provide adequate income at or through retirement.
The principal risks of investing in the Fund that are inherent in the underlying funds, in alphabetical order, are:
Counterparty Risk. Counterparty risk is the risk that the counterparty to a derivatives contract or repurchase agreement, the borrower of a portfolio’s securities, or other obligation, will be unable or unwilling to make timely principal, interest, or settlement payments, or otherwise to honor its obligations.
Currency Risk. Risks of investing in securities denominated in, or that trade in, foreign (non-U.S.) currencies include changes in foreign exchange rates and foreign exchange restrictions.
Derivatives Risk. Transactions in derivatives may increase volatility, cause the liquidation of portfolio positions when not advantageous to do so and produce disproportionate losses.
Equity Securities Risk. The value of equity securities could decline if the issuer's financial condition declines or in response to overall market and economic conditions. A fund's principal market segment(s), such as large cap, mid cap or small cap stocks, or growth or value stocks, may underperform other market segments or the equity markets as a whole. Investments in smaller companies and mid-size companies may involve greater risk and price volatility than investments in larger, more mature companies.
Fixed-Income Securities Risk. Fixed-income securities are subject to interest rate risk and credit quality risk. The market value of fixed-income securities generally declines when interest rates rise, and an issuer of fixed-income securities could default on its payment obligations.
Foreign Securities Risk. The risks of foreign securities include loss of value as a result of: political or economic instability; nationalization, expropriation or confiscatory taxation; settlement delays; and limited government regulation (including less stringent reporting, accounting, and disclosure standards than are required of U.S. companies).
Growth Stock Risk. If growth companies do not increase their earnings at a rate expected by investors, the market price of the stock may decline significantly, even if earnings show an absolute increase. Growth company stocks also typically lack the dividend yield that can lessen price declines in market downturns.
High Yield Securities Risk. High yield fixed-income securities (commonly referred to as "junk bonds") are subject to greater credit quality risk than higher rated fixed-income securities and should be considered speculative.
Index Fund Investment Risk. More likely than not, an index fund will underperform the index due to cashflows and the fees and expenses of the fund.
Investment Company Securities Risk. Fund shareholders bear indirectly their proportionate share of the expenses of other investment companies in which the fund invests.
Portfolio Duration Risk. Portfolio duration is a measure of the expected life of a fixed-income security and its sensitivity to changes in interest rates. The longer a fund's average portfolio duration, the more sensitive the fund will be to changes in interest rates.
Prepayment Risk. Unscheduled prepayments on mortgage-backed and asset-backed securities may have to be reinvested at lower rates. A reduction in prepayments may increase the effective maturities of these securities, exposing them to the risk of decline in market value over time (extension risk).
Real Estate Securities Risk. Real estate securities are subject to the risks associated with direct ownership of real estate, including declines in value, adverse economic conditions, increases in expenses, regulatory changes and environmental problems. Investing in securities of companies in the real estate industry, subjects a fund to the special risks associated with the real estate market including factors such as loss to casualty or condemnation, changes in real estate values, property taxes, interest rates, cash flow of underlying real estate assets, occupancy rates, government regulations affecting zoning, land use and rents, and the management skill and creditworthiness of the issuer.
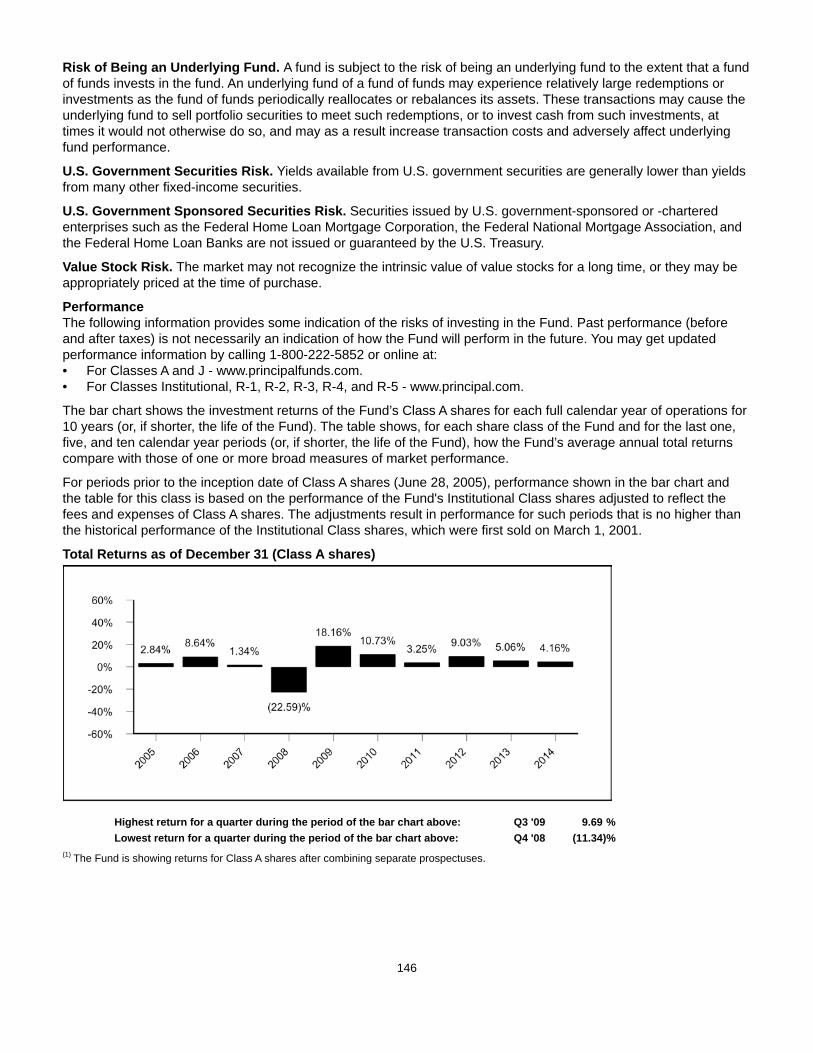
146
Risk of Being an Underlying Fund. A fund is subject to the risk of being an underlying fund to the extent that a fund of funds invests in the fund. An underlying fund of a fund of funds may experience relatively large redemptions or investments as the fund of funds periodically reallocates or rebalances its assets. These transactions may cause the underlying fund to sell portfolio securities to meet such redemptions, or to invest cash from such investments, at times it would not otherwise do so, and may as a result increase transaction costs and adversely affect underlying fund performance.
U.S. Government Securities Risk. Yields available from U.S. government securities are generally lower than yields from many other fixed-income securities.
U.S. Government Sponsored Securities Risk. Securities issued by U.S. government-sponsored or -chartered enterprises such as the Federal Home Loan Mortgage Corporation, the Federal National Mortgage Association, and the Federal Home Loan Banks are not issued or guaranteed by the U.S. Treasury.
Value Stock Risk. The market may not recognize the intrinsic value of value stocks for a long time, or they may be appropriately priced at the time of purchase.
PerformanceThe following information provides some indication of the risks of investing in the Fund. Past performance (before and after taxes) is not necessarily an indication of how the Fund will perform in the future. You may get updated performance information by calling 1-800-222-5852 or online at:• For Classes A and J - www.principalfunds.com.• For Classes Institutional, R-1, R-2, R-3, R-4, and R-5 - www.principal.com.
The bar chart shows the investment returns of the Fund’s Class A shares for each full calendar year of operations for 10 years (or, if shorter, the life of the Fund). The table shows, for each share class of the Fund and for the last one, five, and ten calendar year periods (or, if shorter, the life of the Fund), how the Fund’s average annual total returns compare with those of one or more broad measures of market performance.
For periods prior to the inception date of Class A shares (June 28, 2005), performance shown in the bar chart and the table for this class is based on the performance of the Fund's Institutional Class shares adjusted to reflect the fees and expenses of Class A shares. The adjustments result in performance for such periods that is no higher than the historical performance of the Institutional Class shares, which were first sold on March 1, 2001.
Total Returns as of December 31 (Class A shares)
Highest return for a quarter during the period of the bar chart above: Q3 '09 9.69 %Lowest return for a quarter during the period of the bar chart above: Q4 '08 (11.34)%
(1) The Fund is showing returns for Class A shares after combining separate prospectuses.

147
Average Annual Total Returns(1)
For the periods ended December 31, 2014 1 Year 5 Years 10 YearsClass A Return Before Taxes 0.25% 5.59% 3.12%Class A Return After Taxes on Distributions (0.42)% 4.78% 2.06%Class A Return After Taxes on Distribution and Sale of Fund Shares 0.22% 4.06% 2.05%Class J Return Before Taxes 3.19% 6.40% 3.50%Institutional Class Return Before Taxes 4.59% 6.80% 3.99%Class R-1 Return Before Taxes 3.66% 5.88% 3.08%Class R-2 Return Before Taxes 3.77% 6.02% 3.22%Class R-3 Return Before Taxes 3.98% 6.20% 3.40%Class R-4 Return Before Taxes 4.10% 6.38% 3.60%Class R-5 Return Before Taxes 4.25% 6.52% 3.73%S&P Target Date Retirement Income Index (reflects no deduction for fees, expenses, or taxes) 4.86% 6.33% 4.63%
(1) The Fund is showing after-tax returns for Class A shares after combining separate prospectuses.
After-tax returns are calculated using the historical highest individual federal marginal income tax rates and do not reflect the impact of state and local taxes. Actual after-tax returns depend on an investor’s tax situation and may differ from those shown. The after-tax returns shown are not relevant to investors who hold their Fund shares through tax-deferred arrangements, such as 401(k) plans or individual retirement accounts. After-tax returns are shown for Class A shares only and would be different for the other share classes.
Management
Investment Advisor and Portfolio Managers: Principal Management Corporation• James W. Fennessey (since 2007), Portfolio Manager• Jeffrey R. Tyler (since 2011), Portfolio Manager• Randy L. Welch (since 2007), Portfolio Manager
Sub-Advisor and Portfolio Manager:Principal Global Investors, LLC • Matthew Annenberg (since 2013), Managing Director, Asset Allocation
Purchase and Sale of Fund Shares
Share Class Investment TypePurchase Minimum
Per FundA and J Initial Investment $1,000(1)
A and J Initial Investment for accounts with an Automatic Investment Plan (AIP) $100A and J Subsequent Investments $100(1)(2)
Institutional, R-1, R-2, R-3, R-4, andR-5
There are no minimum initial or subsequent investment requirements foreligible purchasers.
N/A
(1) Some exceptions apply; see "Purchase of Fund Shares - Minimum Investments" for more information.(2) For accounts with an AIP, the subsequent automatic investments must total $1,200 annually if the initial $1,000 minimum has not been met.
You may purchase or redeem shares on any business day (normally any day when the New York Stock Exchange is open for regular trading), through your plan, intermediary, or Financial Professional; by sending a written request to Principal Funds at P.O. Box 8024, Boston, MA 02266-8024 (regular mail) or 30 Dan Road, Canton, MA 02021-2809 (overnight mail); calling us at 1-800-222-5852; or accessing our website (www.principalfunds.com).
Tax InformationThe Fund’s distributions you receive are generally subject to federal income tax as ordinary income or capital gain and may also be subject to state and local taxes, unless you are tax-exempt or your account is tax-deferred in which case your distributions would be taxed when withdrawn from the tax-deferred account.

148
Payments to Broker-Dealers and Other Financial IntermediariesIf you purchase the Fund through a broker-dealer or other financial intermediary (such as a bank, insurance company, investment adviser, etc.), the Fund and its related companies may pay the intermediary for the sale of Fund shares and related services. These payments may create a conflict of interest by influencing the broker-dealer or other intermediary and your salesperson to recommend the Fund over another investment, or to recommend one share class of the Fund over another share class. Ask your salesperson or visit your financial intermediary's website for more information.
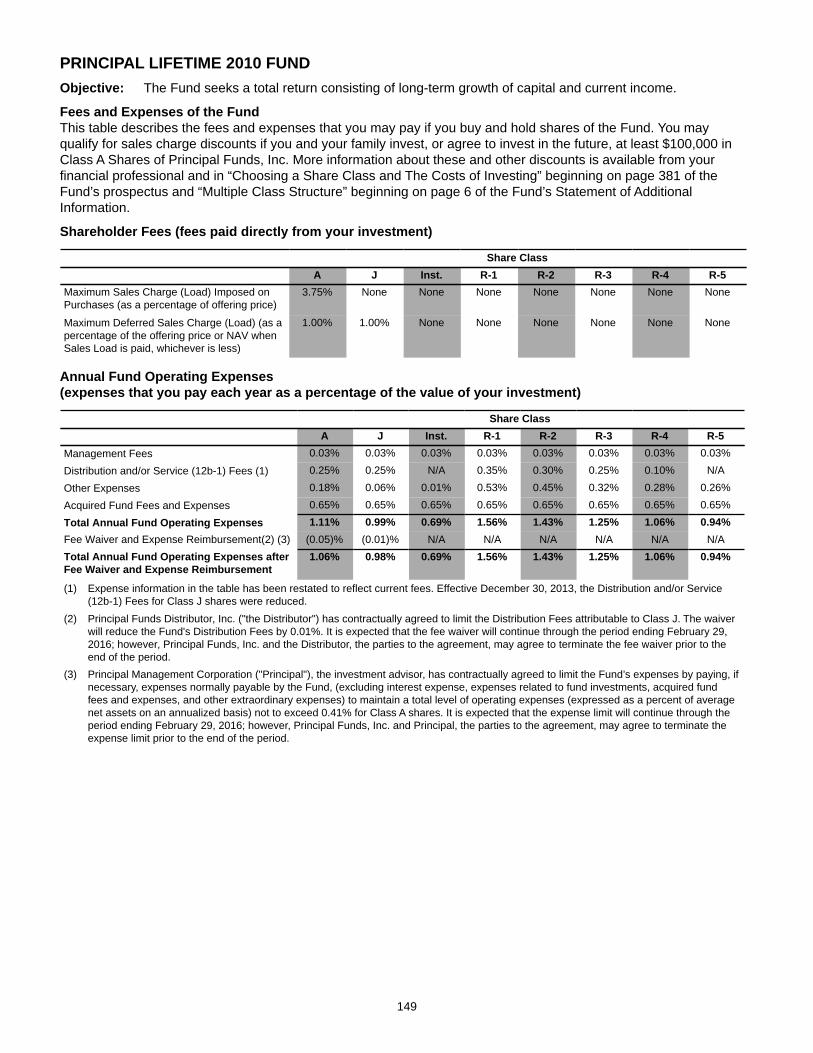
149
PRINCIPAL LIFETIME 2010 FUNDObjective: The Fund seeks a total return consisting of long-term growth of capital and current income.
Fees and Expenses of the FundThis table describes the fees and expenses that you may pay if you buy and hold shares of the Fund. You may qualify for sales charge discounts if you and your family invest, or agree to invest in the future, at least $100,000 in Class A Shares of Principal Funds, Inc. More information about these and other discounts is available from your financial professional and in “Choosing a Share Class and The Costs of Investing” beginning on page 381 of the Fund’s prospectus and “Multiple Class Structure” beginning on page 6 of the Fund’s Statement of Additional Information.
Shareholder Fees (fees paid directly from your investment)
Share ClassA J Inst. R-1 R-2 R-3 R-4 R-5
Maximum Sales Charge (Load) Imposed onPurchases (as a percentage of offering price)
3.75% None None None None None None None
Maximum Deferred Sales Charge (Load) (as apercentage of the offering price or NAV whenSales Load is paid, whichever is less)
1.00% 1.00% None None None None None None
Annual Fund Operating Expenses (expenses that you pay each year as a percentage of the value of your investment)
Share ClassA J Inst. R-1 R-2 R-3 R-4 R-5
Management Fees 0.03% 0.03% 0.03% 0.03% 0.03% 0.03% 0.03% 0.03%
Distribution and/or Service (12b-1) Fees (1) 0.25% 0.25% N/A 0.35% 0.30% 0.25% 0.10% N/A
Other Expenses 0.18% 0.06% 0.01% 0.53% 0.45% 0.32% 0.28% 0.26%
Acquired Fund Fees and Expenses 0.65% 0.65% 0.65% 0.65% 0.65% 0.65% 0.65% 0.65%
Total Annual Fund Operating Expenses 1.11% 0.99% 0.69% 1.56% 1.43% 1.25% 1.06% 0.94%Fee Waiver and Expense Reimbursement(2) (3) (0.05)% (0.01)% N/A N/A N/A N/A N/A N/ATotal Annual Fund Operating Expenses afterFee Waiver and Expense Reimbursement
1.06% 0.98% 0.69% 1.56% 1.43% 1.25% 1.06% 0.94%
(1) Expense information in the table has been restated to reflect current fees. Effective December 30, 2013, the Distribution and/or Service (12b-1) Fees for Class J shares were reduced.
(2) Principal Funds Distributor, Inc. ("the Distributor") has contractually agreed to limit the Distribution Fees attributable to Class J. The waiver will reduce the Fund's Distribution Fees by 0.01%. It is expected that the fee waiver will continue through the period ending February 29, 2016; however, Principal Funds, Inc. and the Distributor, the parties to the agreement, may agree to terminate the fee waiver prior to the end of the period.
(3) Principal Management Corporation ("Principal"), the investment advisor, has contractually agreed to limit the Fund’s expenses by paying, if necessary, expenses normally payable by the Fund, (excluding interest expense, expenses related to fund investments, acquired fund fees and expenses, and other extraordinary expenses) to maintain a total level of operating expenses (expressed as a percent of average net assets on an annualized basis) not to exceed 0.41% for Class A shares. It is expected that the expense limit will continue through the period ending February 29, 2016; however, Principal Funds, Inc. and Principal, the parties to the agreement, may agree to terminate the expense limit prior to the end of the period.
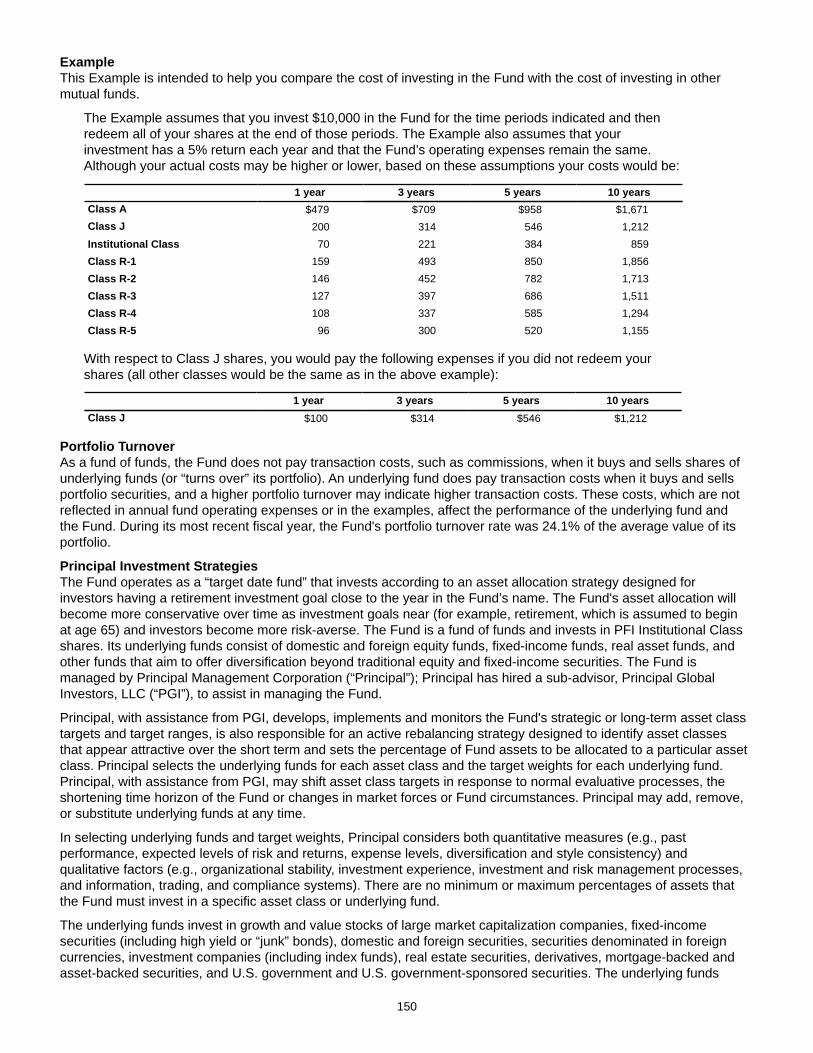
150
ExampleThis Example is intended to help you compare the cost of investing in the Fund with the cost of investing in other mutual funds.
The Example assumes that you invest $10,000 in the Fund for the time periods indicated and then redeem all of your shares at the end of those periods. The Example also assumes that your investment has a 5% return each year and that the Fund’s operating expenses remain the same. Although your actual costs may be higher or lower, based on these assumptions your costs would be:
1 year 3 years 5 years 10 yearsClass A $479 $709 $958 $1,671Class J 200 314 546 1,212Institutional Class 70 221 384 859Class R-1 159 493 850 1,856Class R-2 146 452 782 1,713Class R-3 127 397 686 1,511Class R-4 108 337 585 1,294Class R-5 96 300 520 1,155
With respect to Class J shares, you would pay the following expenses if you did not redeem your shares (all other classes would be the same as in the above example):
1 year 3 years 5 years 10 yearsClass J $100 $314 $546 $1,212
Portfolio TurnoverAs a fund of funds, the Fund does not pay transaction costs, such as commissions, when it buys and sells shares of underlying funds (or “turns over” its portfolio). An underlying fund does pay transaction costs when it buys and sells portfolio securities, and a higher portfolio turnover may indicate higher transaction costs. These costs, which are not reflected in annual fund operating expenses or in the examples, affect the performance of the underlying fund and the Fund. During its most recent fiscal year, the Fund's portfolio turnover rate was 24.1% of the average value of its portfolio.
Principal Investment StrategiesThe Fund operates as a “target date fund” that invests according to an asset allocation strategy designed for investors having a retirement investment goal close to the year in the Fund’s name. The Fund's asset allocation will become more conservative over time as investment goals near (for example, retirement, which is assumed to begin at age 65) and investors become more risk-averse. The Fund is a fund of funds and invests in PFI Institutional Class shares. Its underlying funds consist of domestic and foreign equity funds, fixed-income funds, real asset funds, and other funds that aim to offer diversification beyond traditional equity and fixed-income securities. The Fund is managed by Principal Management Corporation (“Principal”); Principal has hired a sub-advisor, Principal Global Investors, LLC (“PGI”), to assist in managing the Fund.
Principal, with assistance from PGI, develops, implements and monitors the Fund's strategic or long-term asset class targets and target ranges, is also responsible for an active rebalancing strategy designed to identify asset classes that appear attractive over the short term and sets the percentage of Fund assets to be allocated to a particular asset class. Principal selects the underlying funds for each asset class and the target weights for each underlying fund. Principal, with assistance from PGI, may shift asset class targets in response to normal evaluative processes, the shortening time horizon of the Fund or changes in market forces or Fund circumstances. Principal may add, remove, or substitute underlying funds at any time.
In selecting underlying funds and target weights, Principal considers both quantitative measures (e.g., past performance, expected levels of risk and returns, expense levels, diversification and style consistency) and qualitative factors (e.g., organizational stability, investment experience, investment and risk management processes, and information, trading, and compliance systems). There are no minimum or maximum percentages of assets that the Fund must invest in a specific asset class or underlying fund.
The underlying funds invest in growth and value stocks of large market capitalization companies, fixed-income securities (including high yield or “junk” bonds), domestic and foreign securities, securities denominated in foreign currencies, investment companies (including index funds), real estate securities, derivatives, mortgage-backed and asset-backed securities, and U.S. government and U.S. government-sponsored securities. The underlying funds
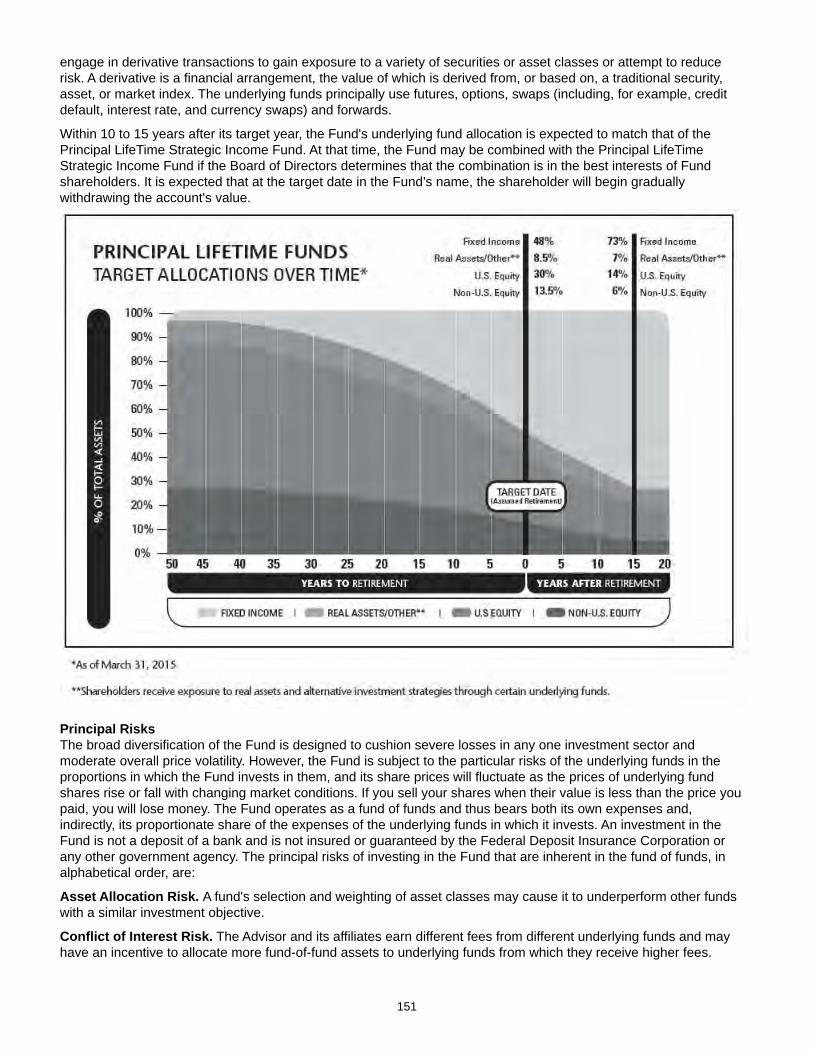
151
engage in derivative transactions to gain exposure to a variety of securities or asset classes or attempt to reduce risk. A derivative is a financial arrangement, the value of which is derived from, or based on, a traditional security, asset, or market index. The underlying funds principally use futures, options, swaps (including, for example, credit default, interest rate, and currency swaps) and forwards.
Within 10 to 15 years after its target year, the Fund's underlying fund allocation is expected to match that of the Principal LifeTime Strategic Income Fund. At that time, the Fund may be combined with the Principal LifeTime Strategic Income Fund if the Board of Directors determines that the combination is in the best interests of Fund shareholders. It is expected that at the target date in the Fund’s name, the shareholder will begin gradually withdrawing the account's value.
Principal RisksThe broad diversification of the Fund is designed to cushion severe losses in any one investment sector and moderate overall price volatility. However, the Fund is subject to the particular risks of the underlying funds in the proportions in which the Fund invests in them, and its share prices will fluctuate as the prices of underlying fund shares rise or fall with changing market conditions. If you sell your shares when their value is less than the price you paid, you will lose money. The Fund operates as a fund of funds and thus bears both its own expenses and, indirectly, its proportionate share of the expenses of the underlying funds in which it invests. An investment in the Fund is not a deposit of a bank and is not insured or guaranteed by the Federal Deposit Insurance Corporation or any other government agency. The principal risks of investing in the Fund that are inherent in the fund of funds, in alphabetical order, are:
Asset Allocation Risk. A fund's selection and weighting of asset classes may cause it to underperform other funds with a similar investment objective.
Conflict of Interest Risk. The Advisor and its affiliates earn different fees from different underlying funds and may have an incentive to allocate more fund-of-fund assets to underlying funds from which they receive higher fees.
152
Emerging Market Risk. Investments in emerging market countries may have more risk than those in developed market countries because the emerging markets are less developed and more illiquid. Emerging market countries can also be subject to increased social, economic, regulatory, and political uncertainties and can be extremely volatile.
Investment Company Securities Risk. Fund shareholders bear indirectly their proportionate share of the expenses of other investment companies in which the fund invests.
Target Date Fund Risk. A target date fund should not be selected based solely on age or retirement date because there is no guarantee that this fund will provide adequate income at or through retirement.
The principal risks of investing in the Fund that are inherent in the underlying funds, in alphabetical order, are:
Counterparty Risk. Counterparty risk is the risk that the counterparty to a derivatives contract or repurchase agreement, the borrower of a portfolio’s securities, or other obligation, will be unable or unwilling to make timely principal, interest, or settlement payments, or otherwise to honor its obligations.
Currency Risk. Risks of investing in securities denominated in, or that trade in, foreign (non-U.S.) currencies include changes in foreign exchange rates and foreign exchange restrictions.
Derivatives Risk. Transactions in derivatives may increase volatility, cause the liquidation of portfolio positions when not advantageous to do so and produce disproportionate losses.
Equity Securities Risk. The value of equity securities could decline if the issuer's financial condition declines or in response to overall market and economic conditions. A fund's principal market segment(s), such as large cap, mid cap or small cap stocks, or growth or value stocks, may underperform other market segments or the equity markets as a whole. Investments in smaller companies and mid-size companies may involve greater risk and price volatility than investments in larger, more mature companies.
Fixed-Income Securities Risk. Fixed-income securities are subject to interest rate risk and credit quality risk. The market value of fixed-income securities generally declines when interest rates rise, and an issuer of fixed-income securities could default on its payment obligations.
Foreign Securities Risk. The risks of foreign securities include loss of value as a result of: political or economic instability; nationalization, expropriation or confiscatory taxation; settlement delays; and limited government regulation (including less stringent reporting, accounting, and disclosure standards than are required of U.S. companies).
Growth Stock Risk. If growth companies do not increase their earnings at a rate expected by investors, the market price of the stock may decline significantly, even if earnings show an absolute increase. Growth company stocks also typically lack the dividend yield that can lessen price declines in market downturns.
High Yield Securities Risk. High yield fixed-income securities (commonly referred to as "junk bonds") are subject to greater credit quality risk than higher rated fixed-income securities and should be considered speculative.
Index Fund Investment Risk. More likely than not, an index fund will underperform the index due to cashflows and the fees and expenses of the fund.
Investment Company Securities Risk. Fund shareholders bear indirectly their proportionate share of the expenses of other investment companies in which the fund invests.
Portfolio Duration Risk. Portfolio duration is a measure of the expected life of a fixed-income security and its sensitivity to changes in interest rates. The longer a fund's average portfolio duration, the more sensitive the fund will be to changes in interest rates.
Prepayment Risk. Unscheduled prepayments on mortgage-backed and asset-backed securities may have to be reinvested at lower rates. A reduction in prepayments may increase the effective maturities of these securities, exposing them to the risk of decline in market value over time (extension risk).
Real Estate Securities Risk. Real estate securities are subject to the risks associated with direct ownership of real estate, including declines in value, adverse economic conditions, increases in expenses, regulatory changes and environmental problems. Investing in securities of companies in the real estate industry, subjects a fund to the special risks associated with the real estate market including factors such as loss to casualty or condemnation, changes in real estate values, property taxes, interest rates, cash flow of underlying real estate assets, occupancy rates, government regulations affecting zoning, land use and rents, and the management skill and creditworthiness of the issuer.
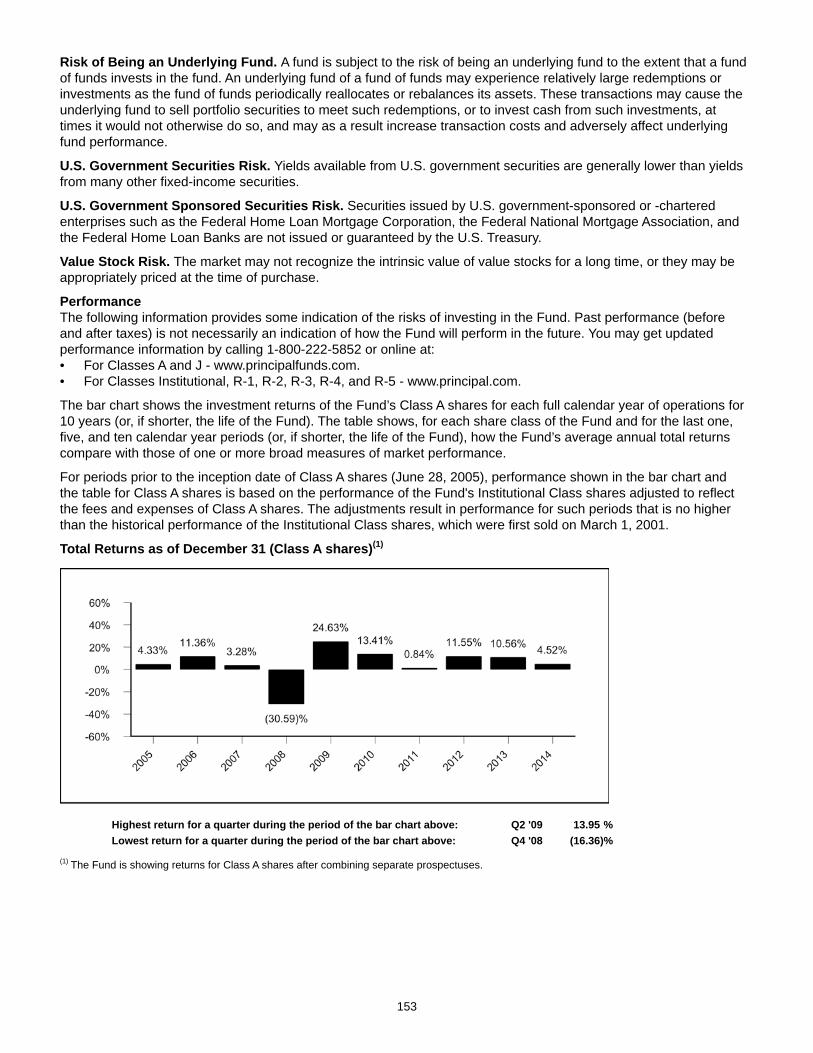
153
Risk of Being an Underlying Fund. A fund is subject to the risk of being an underlying fund to the extent that a fund of funds invests in the fund. An underlying fund of a fund of funds may experience relatively large redemptions or investments as the fund of funds periodically reallocates or rebalances its assets. These transactions may cause the underlying fund to sell portfolio securities to meet such redemptions, or to invest cash from such investments, at times it would not otherwise do so, and may as a result increase transaction costs and adversely affect underlying fund performance.
U.S. Government Securities Risk. Yields available from U.S. government securities are generally lower than yields from many other fixed-income securities.
U.S. Government Sponsored Securities Risk. Securities issued by U.S. government-sponsored or -chartered enterprises such as the Federal Home Loan Mortgage Corporation, the Federal National Mortgage Association, and the Federal Home Loan Banks are not issued or guaranteed by the U.S. Treasury.
Value Stock Risk. The market may not recognize the intrinsic value of value stocks for a long time, or they may be appropriately priced at the time of purchase.
PerformanceThe following information provides some indication of the risks of investing in the Fund. Past performance (before and after taxes) is not necessarily an indication of how the Fund will perform in the future. You may get updated performance information by calling 1-800-222-5852 or online at: • For Classes A and J - www.principalfunds.com.• For Classes Institutional, R-1, R-2, R-3, R-4, and R-5 - www.principal.com.
The bar chart shows the investment returns of the Fund’s Class A shares for each full calendar year of operations for 10 years (or, if shorter, the life of the Fund). The table shows, for each share class of the Fund and for the last one, five, and ten calendar year periods (or, if shorter, the life of the Fund), how the Fund’s average annual total returns compare with those of one or more broad measures of market performance.
For periods prior to the inception date of Class A shares (June 28, 2005), performance shown in the bar chart and the table for Class A shares is based on the performance of the Fund's Institutional Class shares adjusted to reflect the fees and expenses of Class A shares. The adjustments result in performance for such periods that is no higher than the historical performance of the Institutional Class shares, which were first sold on March 1, 2001.
Total Returns as of December 31 (Class A shares)(1)
Highest return for a quarter during the period of the bar chart above: Q2 '09 13.95 %Lowest return for a quarter during the period of the bar chart above: Q4 '08 (16.36)%
(1) The Fund is showing returns for Class A shares after combining separate prospectuses.
154
Average Annual Total Returns(1)
For the periods ended December 31, 2014 1 Year 5 Years 10 YearsClass A Return Before Taxes 0.62% 7.26% 3.95%Class A Return After Taxes on Distributions (0.03)% 6.59% 3.08%Class A Return After Taxes on Distribution and Sale of Fund Shares 0.48% 5.47% 2.83%Class J Return Before Taxes 3.58% 8.11% 4.38%Institutional Class Return Before Taxes 4.94% 8.49% 4.84%Class R-1 Return Before Taxes 3.97% 7.53% 3.91%Class R-2 Return Before Taxes 4.10% 7.66% 4.05%Class R-3 Return Before Taxes 4.27% 7.87% 4.23%Class R-4 Return Before Taxes 4.49% 8.08% 4.44%Class R-5 Return Before Taxes 4.61% 8.19% 4.56%S&P Target Date 2010 Index (reflects no deduction for fees, expenses, or taxes) 5.07% 7.28% 5.10%
(1) The Fund is showing after-tax returns for Class A shares after combining separate prospectuses.
After-tax returns are calculated using the historical highest individual federal marginal income tax rates and do not reflect the impact of state and local taxes. Actual after-tax returns depend on an investor’s tax situation and may differ from those shown. The after-tax returns shown are not relevant to investors who hold their Fund shares through tax-deferred arrangements, such as 401(k) plans or individual retirement accounts. After-tax returns are shown for Class A shares only and would be different for the other share classes.
Management
Investment Advisor and Portfolio Managers: Principal Management Corporation• James W. Fennessey (since 2007), Portfolio Manager• Jeffrey R. Tyler (since 2011), Portfolio Manager• Randy L. Welch (since 2007), Portfolio Manager
Sub-Advisor and Portfolio Manager:Principal Global Investors, LLC • Matthew Annenberg (since 2013), Managing Director, Asset Allocation
Purchase and Sale of Fund Shares
Share Class Investment TypePurchase Minimum
Per FundA and J Initial Investment $1,000(1)
A and J Initial Investment for accounts with an Automatic Investment Plan (AIP) $100A and J Subsequent Investments $100(1)(2)
Institutional, R-1, R-2, R-3, R-4, andR-5
There are no minimum initial or subsequent investment requirements foreligible purchasers.
N/A
(1) Some exceptions apply; see "Purchase of Fund Shares - Minimum Investments" for more information.(2) For accounts with an AIP, the subsequent automatic investments must total $1,200 annually if the initial $1,000 minimum has not been met.
You may purchase or redeem shares on any business day (normally any day when the New York Stock Exchange is open for regular trading), through your plan, intermediary, or Financial Professional; by sending a written request to Principal Funds at P.O. Box 8024, Boston, MA 02266-8024 (regular mail) or 30 Dan Road, Canton, MA 02021-2809 (overnight mail); calling us at 1-800-222-5852; or accessing our website (www.principalfunds.com).
Tax InformationThe Fund’s distributions you receive are generally subject to federal income tax as ordinary income or capital gain and may also be subject to state and local taxes, unless you are tax-exempt or your account is tax-deferred in which case your distributions would be taxed when withdrawn from the tax-deferred account.

155
Payments to Broker-Dealers and Other Financial IntermediariesIf you purchase the Fund through a broker-dealer or other financial intermediary (such as a bank, insurance company, investment adviser, etc.), the Fund and its related companies may pay the intermediary for the sale of Fund shares and related services. These payments may create a conflict of interest by influencing the broker-dealer or other intermediary and your salesperson to recommend the Fund over another investment, or to recommend one share class of the Fund over another share class. Ask your salesperson or visit your financial intermediary's website for more information.

156
PRINCIPAL LIFETIME 2015 FUNDObjective: The Fund seeks a total return consisting of long-term growth of capital and current income.
Fees and Expenses of the FundThis table describes the fees and expenses that you may pay if you buy and hold shares of the Fund.
Shareholder Fees (fees paid directly from your investment): None
Annual Fund Operating Expenses (expenses that you pay each year as a percentage of the value of your investment)
Share ClassInst. R-1 R-2 R-3 R-4 R-5
Management Fees 0.03% 0.03% 0.03% 0.03% 0.03% 0.03%Distribution and/or Service (12b-1) Fees N/A 0.35% 0.30% 0.25% 0.10% N/AOther Expenses 0.01% 0.53% 0.45% 0.32% 0.28% 0.26%Acquired Fund Fees and Expenses 0.66% 0.66% 0.66% 0.66% 0.66% 0.66%Total Annual Fund Operating Expenses 0.70% 1.57% 1.44% 1.26% 1.07% 0.95%
ExampleThis Example is intended to help you compare the cost of investing in the Fund with the cost of investing in other mutual funds.
The Example assumes that you invest $10,000 in the Fund for the time periods indicated. The Example also assumes that your investment has a 5% return each year and that the Fund’s operating expenses remain the same. Although your actual costs may be higher or lower, based on these assumptions your costs would be:
1 year 3 years 5 years 10 yearsInstitutional Class $72 $224 $390 $871Class R-1 160 496 855 1,867Class R-2 147 456 787 1,724Class R-3 128 400 692 1,523Class R-4 109 340 590 1,306Class R-5 97 303 525 1,166
Portfolio TurnoverAs a fund of funds, the Fund does not pay transaction costs, such as commissions, when it buys and sells shares of underlying funds (or “turns over” its portfolio). An underlying fund does pay transaction costs when it buys and sells portfolio securities, and a higher portfolio turnover may indicate higher transaction costs. These costs, which are not reflected in annual fund operating expenses or in the examples, affect the performance of the underlying fund and the Fund. During its most recent fiscal year, the Fund's portfolio turnover rate was 24.6% of the average value of its portfolio.
Principal Investment StrategiesThe Fund operates as a “target date fund” that invests according to an asset allocation strategy designed for investors having a retirement investment goal close to the year in the Fund’s name. The Fund's asset allocation will become more conservative over time as investment goals near (for example, retirement, which is assumed to begin at age 65) and investors become more risk-averse. The Fund is a fund of funds and invests in PFI Institutional Class shares. Its underlying funds consist of domestic and foreign equity funds, fixed-income funds, real asset funds, and other funds that aim to offer diversification beyond traditional equity and fixed-income securities. The Fund is managed by Principal Management Corporation (“Principal”); Principal has hired a sub-advisor, Principal Global Investors, LLC (“PGI”), to assist in managing the Fund.
Principal, with assistance from PGI, develops, implements and monitors the Fund's strategic or long-term asset class targets and target ranges, is also responsible for an active rebalancing strategy designed to identify asset classes that appear attractive over the short term and sets the percentage of Fund assets to be allocated to a particular asset class. Principal selects the underlying funds for each asset class and the target weights for each underlying fund.
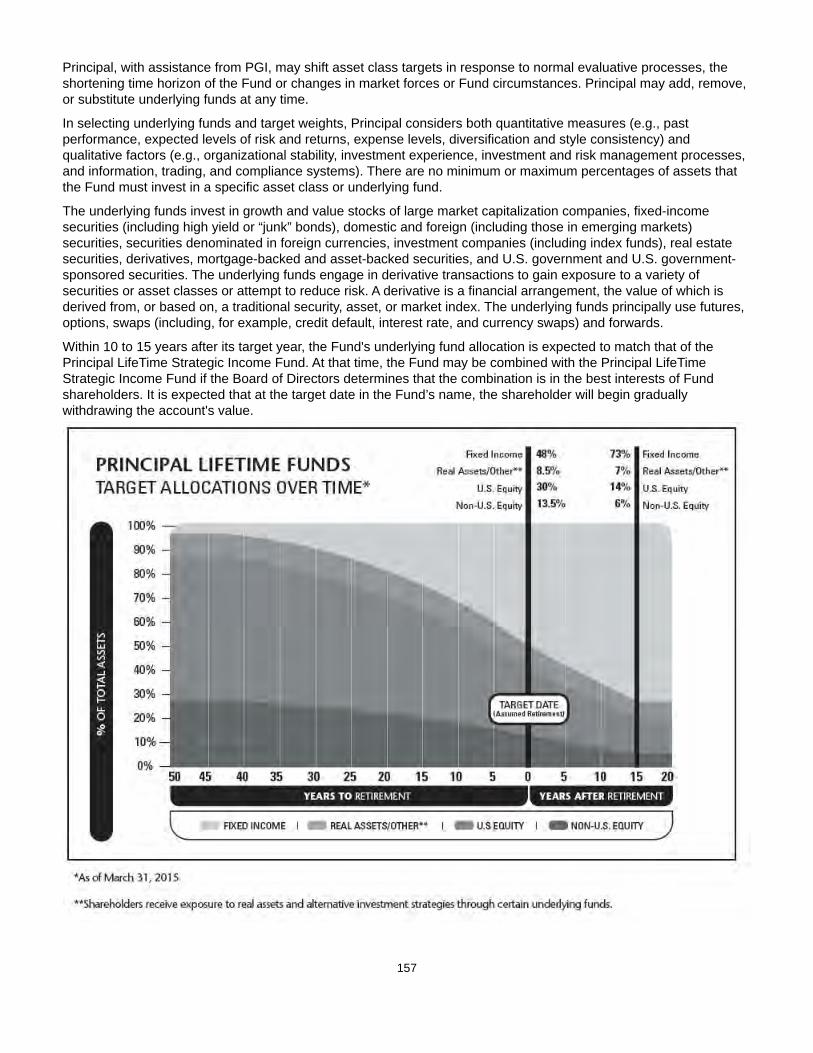
157
Principal, with assistance from PGI, may shift asset class targets in response to normal evaluative processes, the shortening time horizon of the Fund or changes in market forces or Fund circumstances. Principal may add, remove, or substitute underlying funds at any time.
In selecting underlying funds and target weights, Principal considers both quantitative measures (e.g., past performance, expected levels of risk and returns, expense levels, diversification and style consistency) and qualitative factors (e.g., organizational stability, investment experience, investment and risk management processes, and information, trading, and compliance systems). There are no minimum or maximum percentages of assets that the Fund must invest in a specific asset class or underlying fund.
The underlying funds invest in growth and value stocks of large market capitalization companies, fixed-income securities (including high yield or “junk” bonds), domestic and foreign (including those in emerging markets) securities, securities denominated in foreign currencies, investment companies (including index funds), real estate securities, derivatives, mortgage-backed and asset-backed securities, and U.S. government and U.S. government-sponsored securities. The underlying funds engage in derivative transactions to gain exposure to a variety of securities or asset classes or attempt to reduce risk. A derivative is a financial arrangement, the value of which is derived from, or based on, a traditional security, asset, or market index. The underlying funds principally use futures, options, swaps (including, for example, credit default, interest rate, and currency swaps) and forwards.
Within 10 to 15 years after its target year, the Fund's underlying fund allocation is expected to match that of the Principal LifeTime Strategic Income Fund. At that time, the Fund may be combined with the Principal LifeTime Strategic Income Fund if the Board of Directors determines that the combination is in the best interests of Fund shareholders. It is expected that at the target date in the Fund’s name, the shareholder will begin gradually withdrawing the account's value.

158
Principal RisksThe broad diversification of the Fund is designed to cushion severe losses in any one investment sector and moderate overall price volatility. However, the Fund is subject to the particular risks of the underlying funds in the proportions in which the Fund invests in them, and its share prices will fluctuate as the prices of underlying fund shares rise or fall with changing market conditions. If you sell your shares when their value is less than the price you paid, you will lose money. The Fund operates as a fund of funds and thus bears both its own expenses and, indirectly, its proportionate share of the expenses of the underlying funds in which it invests. An investment in the Fund is not a deposit of a bank and is not insured or guaranteed by the Federal Deposit Insurance Corporation or any other government agency. The principal risks of investing in the Fund that are inherent in the fund of funds, in alphabetical order, are:
Asset Allocation Risk. A fund's selection and weighting of asset classes may cause it to underperform other funds with a similar investment objective.
Conflict of Interest Risk. The Advisor and its affiliates earn different fees from different underlying funds and may have an incentive to allocate more fund-of-fund assets to underlying funds from which they receive higher fees.
Investment Company Securities Risk. Fund shareholders bear indirectly their proportionate share of the expenses of other investment companies in which the fund invests.
Target Date Fund Risk. A target date fund should not be selected based solely on age or retirement date because there is no guarantee that this fund will provide adequate income at or through retirement.
The principal risks of investing in the Fund that are inherent in the underlying funds, in alphabetical order, are:
Counterparty Risk. Counterparty risk is the risk that the counterparty to a derivatives contract or repurchase agreement, the borrower of a portfolio’s securities, or other obligation, will be unable or unwilling to make timely principal, interest, or settlement payments, or otherwise to honor its obligations.
Currency Risk. Risks of investing in securities denominated in, or that trade in, foreign (non-U.S.) currencies include changes in foreign exchange rates and foreign exchange restrictions.
Derivatives Risk. Transactions in derivatives may increase volatility, cause the liquidation of portfolio positions when not advantageous to do so and produce disproportionate losses.
Emerging Market Risk. Investments in emerging market countries may have more risk than those in developed market countries because the emerging markets are less developed and more illiquid. Emerging market countries can also be subject to increased social, economic, regulatory, and political uncertainties and can be extremely volatile.
Equity Securities Risk. The value of equity securities could decline if the issuer's financial condition declines or in response to overall market and economic conditions. A fund's principal market segment(s), such as large cap, mid cap or small cap stocks, or growth or value stocks, may underperform other market segments or the equity markets as a whole. Investments in smaller companies and mid-size companies may involve greater risk and price volatility than investments in larger, more mature companies.
Fixed-Income Securities Risk. Fixed-income securities are subject to interest rate risk and credit quality risk. The market value of fixed-income securities generally declines when interest rates rise, and an issuer of fixed-income securities could default on its payment obligations.
Foreign Securities Risk. The risks of foreign securities include loss of value as a result of: political or economic instability; nationalization, expropriation or confiscatory taxation; settlement delays; and limited government regulation (including less stringent reporting, accounting, and disclosure standards than are required of U.S. companies).
Growth Stock Risk. If growth companies do not increase their earnings at a rate expected by investors, the market price of the stock may decline significantly, even if earnings show an absolute increase. Growth company stocks also typically lack the dividend yield that can lessen price declines in market downturns.
High Yield Securities Risk. High yield fixed-income securities (commonly referred to as "junk bonds") are subject to greater credit quality risk than higher rated fixed-income securities and should be considered speculative.
159
Index Fund Investment Risk. More likely than not, an index fund will underperform the index due to cashflows and the fees and expenses of the fund.
Investment Company Securities Risk. Fund shareholders bear indirectly their proportionate share of the expenses of other investment companies in which the fund invests.
Portfolio Duration Risk. Portfolio duration is a measure of the expected life of a fixed-income security and its sensitivity to changes in interest rates. The longer a fund's average portfolio duration, the more sensitive the fund will be to changes in interest rates.
Prepayment Risk. Unscheduled prepayments on mortgage-backed and asset-backed securities may have to be reinvested at lower rates. A reduction in prepayments may increase the effective maturities of these securities, exposing them to the risk of decline in market value over time (extension risk).
Real Estate Securities Risk. Real estate securities are subject to the risks associated with direct ownership of real estate, including declines in value, adverse economic conditions, increases in expenses, regulatory changes and environmental problems. Investing in securities of companies in the real estate industry, subjects a fund to the special risks associated with the real estate market including factors such as loss to casualty or condemnation, changes in real estate values, property taxes, interest rates, cash flow of underlying real estate assets, occupancy rates, government regulations affecting zoning, land use and rents, and the management skill and creditworthiness of the issuer.
Risk of Being an Underlying Fund. A fund is subject to the risk of being an underlying fund to the extent that a fund of funds invests in the fund. An underlying fund of a fund of funds may experience relatively large redemptions or investments as the fund of funds periodically reallocates or rebalances its assets. These transactions may cause the underlying fund to sell portfolio securities to meet such redemptions, or to invest cash from such investments, at times it would not otherwise do so, and may as a result increase transaction costs and adversely affect underlying fund performance.
U.S. Government Securities Risk. Yields available from U.S. government securities are generally lower than yields from many other fixed-income securities.
U.S. Government Sponsored Securities Risk. Securities issued by U.S. government-sponsored or -chartered enterprises such as the Federal Home Loan Mortgage Corporation, the Federal National Mortgage Association, and the Federal Home Loan Banks are not issued or guaranteed by the U.S. Treasury.
Value Stock Risk. The market may not recognize the intrinsic value of value stocks for a long time, or they may be appropriately priced at the time of purchase.
PerformanceThe following information provides some indication of the risks of investing in the Fund. Past performance (before and after taxes) is not necessarily an indication of how the Fund will perform in the future. You may get updated performance information by calling 1-800-222-5852 or online at www.principal.com.
The bar chart shows the investment returns of the Fund’s Institutional Class shares for each full calendar year of operations for 10 years (or, if shorter, the life of the Fund). The table shows, for each share class of the Fund and for the last one, five, and ten calendar year periods (or, if shorter, the life of the Fund), how the Fund’s average annual total returns compare with those of one or more broad measures of market performance.
Life of Fund results are measured from the date the Fund's shares were first sold (February 29, 2008).
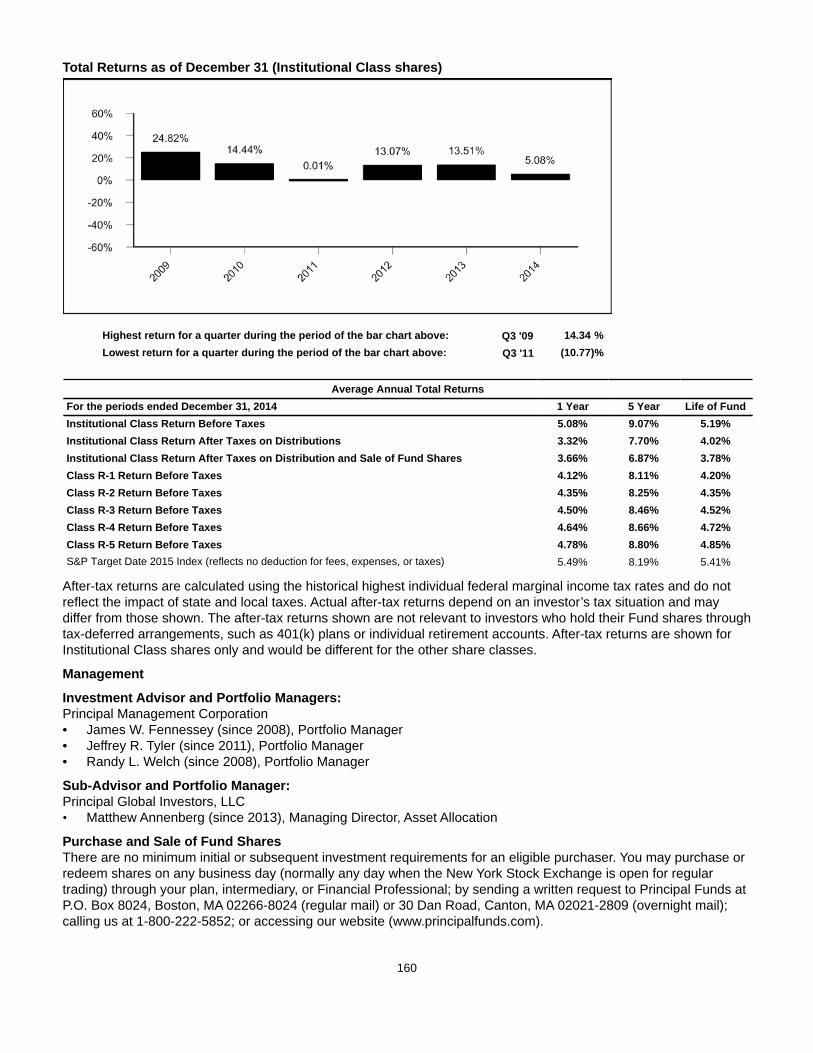
160
Total Returns as of December 31 (Institutional Class shares)
Highest return for a quarter during the period of the bar chart above: Q3 '09 14.34 %Lowest return for a quarter during the period of the bar chart above: Q3 '11 (10.77)%
Average Annual Total ReturnsFor the periods ended December 31, 2014 1 Year 5 Year Life of FundInstitutional Class Return Before Taxes 5.08% 9.07% 5.19%Institutional Class Return After Taxes on Distributions 3.32% 7.70% 4.02%Institutional Class Return After Taxes on Distribution and Sale of Fund Shares 3.66% 6.87% 3.78%Class R-1 Return Before Taxes 4.12% 8.11% 4.20%Class R-2 Return Before Taxes 4.35% 8.25% 4.35%Class R-3 Return Before Taxes 4.50% 8.46% 4.52%Class R-4 Return Before Taxes 4.64% 8.66% 4.72%Class R-5 Return Before Taxes 4.78% 8.80% 4.85%S&P Target Date 2015 Index (reflects no deduction for fees, expenses, or taxes) 5.49% 8.19% 5.41%
After-tax returns are calculated using the historical highest individual federal marginal income tax rates and do not reflect the impact of state and local taxes. Actual after-tax returns depend on an investor’s tax situation and may differ from those shown. The after-tax returns shown are not relevant to investors who hold their Fund shares through tax-deferred arrangements, such as 401(k) plans or individual retirement accounts. After-tax returns are shown for Institutional Class shares only and would be different for the other share classes.
Management
Investment Advisor and Portfolio Managers: Principal Management Corporation• James W. Fennessey (since 2008), Portfolio Manager• Jeffrey R. Tyler (since 2011), Portfolio Manager• Randy L. Welch (since 2008), Portfolio Manager
Sub-Advisor and Portfolio Manager:Principal Global Investors, LLC • Matthew Annenberg (since 2013), Managing Director, Asset Allocation
Purchase and Sale of Fund SharesThere are no minimum initial or subsequent investment requirements for an eligible purchaser. You may purchase or redeem shares on any business day (normally any day when the New York Stock Exchange is open for regular trading) through your plan, intermediary, or Financial Professional; by sending a written request to Principal Funds at P.O. Box 8024, Boston, MA 02266-8024 (regular mail) or 30 Dan Road, Canton, MA 02021-2809 (overnight mail); calling us at 1-800-222-5852; or accessing our website (www.principalfunds.com).

161
Tax InformationThe Fund’s distributions you receive are generally subject to federal income tax as ordinary income or capital gain and may also be subject to state and local taxes, unless you are tax-exempt or your account is tax-deferred in which case your distributions would be taxed when withdrawn from the tax-deferred account.
Payments to Broker-Dealers and Other Financial IntermediariesIf you purchase the Fund through a broker-dealer or other financial intermediary (such as a bank, insurance company, investment adviser, etc.), the Fund and its related companies may pay the intermediary for the sale of Fund shares and related services. These payments may create a conflict of interest by influencing the broker-dealer or other intermediary and your salesperson to recommend the Fund over another investment, or to recommend one share class of the Fund over another share class. Ask your salesperson or visit your financial intermediary's website for more information.
162
PRINCIPAL LIFETIME 2020 FUNDObjective: The Fund seeks a total return consisting of long-term growth of capital and current income.
Fees and Expenses of the FundThis table describes the fees and expenses that you may pay if you buy and hold shares of the Fund. You may qualify for sales charge discounts if you and your family invest, or agree to invest in the future, at least $50,000 in Class A Shares of Principal Funds, Inc. More information about these and other discounts is available from your financial professional and in “Choosing a Share Class and The Costs of Investing” beginning on page 381 of the Fund’s prospectus and “Multiple Class Structure” beginning on page 6 of the Fund’s Statement of Additional Information.
Shareholder Fees (fees paid directly from your investment)
Share ClassA J Inst. R-1 R-2 R-3 R-4 R-5
Maximum Sales Charge (Load) Imposed onPurchases (as a percentage of offering price)
5.50% None None None None None None None
Maximum Deferred Sales Charge (Load) (as apercentage of the offering price or NAV whenSales Load is paid, whichever is less)
1.00% 1.00% None None None None None None
Annual Fund Operating Expenses (expenses that you pay each year as a percentage of the value of your investment)
Share ClassA J Inst. R-1 R-2 R-3 R-4 R-5
Management Fees 0.03% 0.03% 0.03% 0.03% 0.03% 0.03% 0.03% 0.03%
Distribution and/or Service (12b-1) Fees(1) 0.25% 0.25% N/A 0.35% 0.30% 0.25% 0.10% N/A
Other Expenses 0.15% 0.06% 0.01% 0.53% 0.45% 0.32% 0.28% 0.26%
Acquired Fund Fees and Expenses 0.69% 0.69% 0.69% 0.69% 0.69% 0.69% 0.69% 0.69%
Total Annual Fund Operating Expenses 1.12% 1.03% 0.73% 1.60% 1.47% 1.29% 1.10% 0.98%Fee Waiver and Expense Reimbursement(2) (3) (0.02)% (0.01)% N/A N/A N/A N/A N/A N/ATotal Annual Fund Operating Expenses afterFee Waiver and Expense Reimbursement
1.10% 1.02% 0.73% 1.60% 1.47% 1.29% 1.10% 0.98%
(1) Expense information in the table has been restated to reflect current fees. Effective December 30, 2013, the Distribution and/or Service (12b-1) Fees for Class J shares were reduced.
(2) Principal Funds Distributor, Inc. ("the Distributor") has contractually agreed to limit the Distribution Fees attributable to Class J. The waiver will reduce the Fund's Distribution Fees by 0.01%. It is expected that the fee waiver will continue through the period ending February 29, 2016; however, Principal Funds, Inc. and the Distributor, the parties to the agreement, may agree to terminate the fee waiver prior to the end of the period.
(3) Principal Management Corporation ("Principal"), the investment advisor, has contractually agreed to limit the Fund’s expenses by paying, if necessary, expenses normally payable by the Fund, (excluding interest expense, expenses related to fund investments, acquired fund fees and expenses, and other extraordinary expenses) to maintain a total level of operating expenses (expressed as a percent of average net assets on an annualized basis) not to exceed 0.41% for Class A shares. It is expected that the expense limit will continue through the period ending February 29, 2016; however, Principal Funds, Inc. and Principal, the parties to the agreement, may agree to terminate the expense limit prior to the end of the period.

163
ExampleThis Example is intended to help you compare the cost of investing in the Fund with the cost of investing in other mutual funds.
The Example assumes that you invest $10,000 in the Fund for the time periods indicated and then redeem all of your shares at the end of those periods. The Example assumes that your investment has a 5% return each year and that the Fund’s operating expenses remain the same. Although your actual costs may be higher or lower, based on these assumptions your costs would be:
1 year 3 years 5 years 10 yearsClass A $656 $884 $1,131 $1,836Class J 204 327 567 1,258Institutional Class 75 233 406 906Class R-1 163 505 871 1,900Class R-2 150 465 803 1,757Class R-3 131 409 708 1,556Class R-4 112 350 606 1,340Class R-5 100 312 542 1,201
With respect to Class J shares, you would pay the following expenses if you did not redeem your shares (all other classes would be the same as in the above example):
1 year 3 years 5 years 10 yearsClass J $104 $327 $567 $1,258
Portfolio TurnoverAs a fund of funds, the Fund does not pay transaction costs, such as commissions, when it buys and sells shares of underlying funds (or “turns over” its portfolio). An underlying fund does pay transaction costs when it buys and sells portfolio securities, and a higher portfolio turnover may indicate higher transaction costs. These costs, which are not reflected in annual fund operating expenses or in the examples, affect the performance of the underlying fund and the Fund. During its most recent fiscal year, the Fund's portfolio turnover rate was 18.6% of the average value of its portfolio.
Principal Investment StrategiesThe Fund operates as a “target date fund” that invests according to an asset allocation strategy designed for investors having a retirement investment goal close to the year in the Fund’s name. The Fund's asset allocation will become more conservative over time as investment goals near (for example, retirement, which is assumed to begin at age 65) and investors become more risk-averse. The Fund is a fund of funds and invests in PFI Institutional Class shares. Its underlying funds consist of domestic and foreign equity funds, fixed-income funds, real asset funds, and other funds that aim to offer diversification beyond traditional equity and fixed-income securities. The Fund is managed by Principal Management Corporation (“Principal”); Principal has hired a sub-advisor, Principal Global Investors, LLC (“PGI”), to assist in managing the Fund.
Principal, with assistance from PGI, develops, implements and monitors the Fund's strategic or long-term asset class targets and target ranges, is also responsible for an active rebalancing strategy designed to identify asset classes that appear attractive over the short term and sets the percentage of Fund assets to be allocated to a particular asset class. Principal selects the underlying funds for each asset class and the target weights for each underlying fund. Principal, with assistance from PGI, may shift asset class targets in response to normal evaluative processes, the shortening time horizon of the Fund or changes in market forces or Fund circumstances. Principal may add, remove, or substitute underlying funds at any time.
In selecting underlying funds and target weights, Principal considers both quantitative measures (e.g., past performance, expected levels of risk and returns, expense levels, diversification and style consistency) and qualitative factors (e.g., organizational stability, investment experience, investment and risk management processes, and information, trading, and compliance systems). There are no minimum or maximum percentages of assets that the Fund must invest in a specific asset class or underlying fund.

164
The underlying funds invest in growth and value stocks of small, medium, and large market capitalization companies, fixed-income securities (including high yield or “junk” bonds), domestic and foreign (including those in emerging markets) securities, securities denominated in foreign currencies, investment companies (including index funds), real estate securities, derivatives, and U.S. government and U.S. government-sponsored securities. The underlying funds engage in derivative transactions to gain exposure to a variety of securities or asset classes or attempt to reduce risk. A derivative is a financial arrangement, the value of which is derived from, or based on, a traditional security, asset, or market index. The underlying funds principally use futures, options, swaps (including, for example, credit default, interest rate, and currency swaps) and forwards.
Within 10 to 15 years after its target year, the Fund's underlying fund allocation is expected to match that of the Principal LifeTime Strategic Income Fund. At that time, the Fund may be combined with the Principal LifeTime Strategic Income Fund if the Board of Directors determines that the combination is in the best interests of Fund shareholders. It is expected that at the target date in the Fund’s name, the shareholder will begin gradually withdrawing the account's value.
Principal RisksThe broad diversification of the Fund is designed to cushion severe losses in any one investment sector and moderate overall price volatility. However, the Fund is subject to the particular risks of the underlying funds in the proportions in which the Fund invests in them, and its share prices will fluctuate as the prices of underlying fund shares rise or fall with changing market conditions. If you sell your shares when their value is less than the price you paid, you will lose money. The Fund operates as a fund of funds and thus bears both its own expenses and, indirectly, its proportionate share of the expenses of the underlying funds in which it invests. An investment in the Fund is not a deposit of a bank and is not insured or guaranteed by the Federal Deposit Insurance Corporation or any other government agency. The principal risks of investing in the Fund that are inherent in the fund of funds, in alphabetical order, are:

165
Asset Allocation Risk. A fund's selection and weighting of asset classes may cause it to underperform other funds with a similar investment objective.
Conflict of Interest Risk. The Advisor and its affiliates earn different fees from different underlying funds and may have an incentive to allocate more fund-of-fund assets to underlying funds from which they receive higher fees.
Investment Company Securities Risk. Fund shareholders bear indirectly their proportionate share of the expenses of other investment companies in which the fund invests.
Target Date Fund Risk. A target date fund should not be selected based solely on age or retirement date because there is no guarantee that this fund will provide adequate income at or through retirement.
The principal risks of investing in the Fund that are inherent in the underlying funds, in alphabetical order, are:
Counterparty Risk. Counterparty risk is the risk that the counterparty to a derivatives contract or repurchase agreement, the borrower of a portfolio’s securities, or other obligation, will be unable or unwilling to make timely principal, interest, or settlement payments, or otherwise to honor its obligations.
Currency Risk. Risks of investing in securities denominated in, or that trade in, foreign (non-U.S.) currencies include changes in foreign exchange rates and foreign exchange restrictions.
Derivatives Risk. Transactions in derivatives may increase volatility, cause the liquidation of portfolio positions when not advantageous to do so and produce disproportionate losses.
Emerging Market Risk. Investments in emerging market countries may have more risk than those in developed market countries because the emerging markets are less developed and more illiquid. Emerging market countries can also be subject to increased social, economic, regulatory, and political uncertainties and can be extremely volatile.
Equity Securities Risk. The value of equity securities could decline if the issuer's financial condition declines or in response to overall market and economic conditions. A fund's principal market segment(s), such as large cap, mid cap or small cap stocks, or growth or value stocks, may underperform other market segments or the equity markets as a whole. Investments in smaller companies and mid-size companies may involve greater risk and price volatility than investments in larger, more mature companies.
Fixed-Income Securities Risk. Fixed-income securities are subject to interest rate risk and credit quality risk. The market value of fixed-income securities generally declines when interest rates rise, and an issuer of fixed-income securities could default on its payment obligations.
Foreign Securities Risk. The risks of foreign securities include loss of value as a result of: political or economic instability; nationalization, expropriation or confiscatory taxation; settlement delays; and limited government regulation (including less stringent reporting, accounting, and disclosure standards than are required of U.S. companies).
Growth Stock Risk. If growth companies do not increase their earnings at a rate expected by investors, the market price of the stock may decline significantly, even if earnings show an absolute increase. Growth company stocks also typically lack the dividend yield that can lessen price declines in market downturns.
High Yield Securities Risk. High yield fixed-income securities (commonly referred to as "junk bonds") are subject to greater credit quality risk than higher rated fixed-income securities and should be considered speculative.
Index Fund Investment Risk. More likely than not, an index fund will underperform the index due to cashflows and the fees and expenses of the fund.
Investment Company Securities Risk. Fund shareholders bear indirectly their proportionate share of the expenses of other investment companies in which the fund invests.
Portfolio Duration Risk. Portfolio duration is a measure of the expected life of a fixed-income security and its sensitivity to changes in interest rates. The longer a fund's average portfolio duration, the more sensitive the fund will be to changes in interest rates.
Real Estate Securities Risk. Real estate securities are subject to the risks associated with direct ownership of real estate, including declines in value, adverse economic conditions, increases in expenses, regulatory changes and environmental problems. Investing in securities of companies in the real estate industry, subjects a fund to the

166
special risks associated with the real estate market including factors such as loss to casualty or condemnation, changes in real estate values, property taxes, interest rates, cash flow of underlying real estate assets, occupancy rates, government regulations affecting zoning, land use and rents, and the management skill and creditworthiness of the issuer.
Risk of Being an Underlying Fund. A fund is subject to the risk of being an underlying fund to the extent that a fund of funds invests in the fund. An underlying fund of a fund of funds may experience relatively large redemptions or investments as the fund of funds periodically reallocates or rebalances its assets. These transactions may cause the underlying fund to sell portfolio securities to meet such redemptions, or to invest cash from such investments, at times it would not otherwise do so, and may as a result increase transaction costs and adversely affect underlying fund performance.
U.S. Government Securities Risk. Yields available from U.S. government securities are generally lower than yields from many other fixed-income securities.
U.S. Government Sponsored Securities Risk. Securities issued by U.S. government-sponsored or -chartered enterprises such as the Federal Home Loan Mortgage Corporation, the Federal National Mortgage Association, and the Federal Home Loan Banks are not issued or guaranteed by the U.S. Treasury.
Value Stock Risk. The market may not recognize the intrinsic value of value stocks for a long time, or they may be appropriately priced at the time of purchase.
PerformanceThe following information provides some indication of the risks of investing in the Fund. Past performance (before and after taxes) is not necessarily an indication of how the Fund will perform in the future. You may get updated performance information by calling 1-800-222-5852 or online at: • For Classes A and J - www.principalfunds.com.• For Classes Institutional, R-1, R-2, R-3, R-4, and R-5 - www.principal.com.
The bar chart shows the investment returns of the Fund’s Class A shares for each full calendar year of operations for 10 years (or, if shorter, the life of the Fund). The table shows, for each share class of the Fund and for the last one, five, and ten calendar year periods (or, if shorter, the life of the Fund), how the Fund’s average annual total returns compare with those of one or more broad measures of market performance.
For periods prior to the inception date of Class A shares (June 28, 2005), performance shown in the bar chart and the table for this class is based on the performance of the Fund's Institutional Class shares adjusted to reflect the fees and expenses of Class A shares. The adjustments result in performance for such periods that is no higher than the historical performance of the Institutional Class shares, which were first sold on March 1, 2001.
Total Returns as of December 31 (Class A shares)(1)
Highest return for a quarter during the period of the bar chart above: Q2 '09 15.99 %Lowest return for a quarter during the period of the bar chart above: Q4 '08 (18.46)%
(1) The Fund is showing returns for Class A shares after combining separate prospectuses.
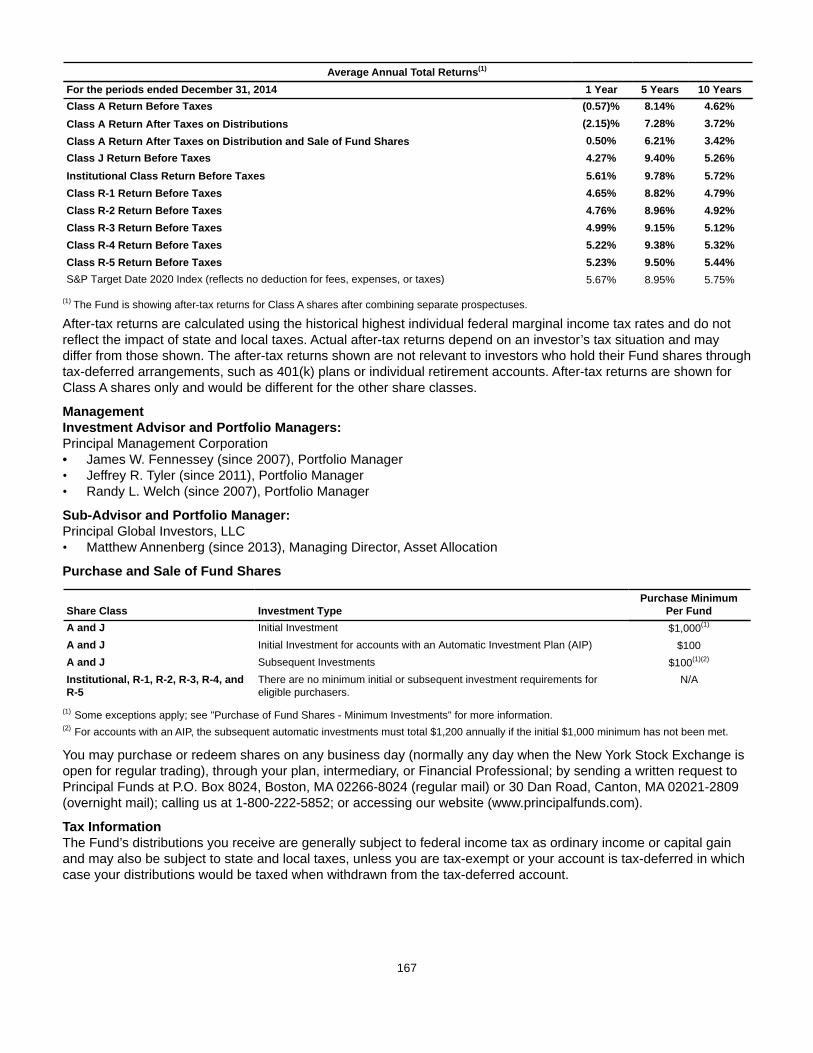
167
Average Annual Total Returns(1)
For the periods ended December 31, 2014 1 Year 5 Years 10 YearsClass A Return Before Taxes (0.57)% 8.14% 4.62%Class A Return After Taxes on Distributions (2.15)% 7.28% 3.72%Class A Return After Taxes on Distribution and Sale of Fund Shares 0.50% 6.21% 3.42%Class J Return Before Taxes 4.27% 9.40% 5.26%Institutional Class Return Before Taxes 5.61% 9.78% 5.72%Class R-1 Return Before Taxes 4.65% 8.82% 4.79%Class R-2 Return Before Taxes 4.76% 8.96% 4.92%Class R-3 Return Before Taxes 4.99% 9.15% 5.12%Class R-4 Return Before Taxes 5.22% 9.38% 5.32%Class R-5 Return Before Taxes 5.23% 9.50% 5.44%S&P Target Date 2020 Index (reflects no deduction for fees, expenses, or taxes) 5.67% 8.95% 5.75%
(1) The Fund is showing after-tax returns for Class A shares after combining separate prospectuses.
After-tax returns are calculated using the historical highest individual federal marginal income tax rates and do not reflect the impact of state and local taxes. Actual after-tax returns depend on an investor’s tax situation and may differ from those shown. The after-tax returns shown are not relevant to investors who hold their Fund shares through tax-deferred arrangements, such as 401(k) plans or individual retirement accounts. After-tax returns are shown for Class A shares only and would be different for the other share classes.
ManagementInvestment Advisor and Portfolio Managers: Principal Management Corporation• James W. Fennessey (since 2007), Portfolio Manager• Jeffrey R. Tyler (since 2011), Portfolio Manager• Randy L. Welch (since 2007), Portfolio Manager
Sub-Advisor and Portfolio Manager:Principal Global Investors, LLC • Matthew Annenberg (since 2013), Managing Director, Asset Allocation
Purchase and Sale of Fund Shares
Share Class Investment TypePurchase Minimum
Per FundA and J Initial Investment $1,000(1)
A and J Initial Investment for accounts with an Automatic Investment Plan (AIP) $100A and J Subsequent Investments $100(1)(2)
Institutional, R-1, R-2, R-3, R-4, andR-5
There are no minimum initial or subsequent investment requirements foreligible purchasers.
N/A
(1) Some exceptions apply; see "Purchase of Fund Shares - Minimum Investments" for more information.(2) For accounts with an AIP, the subsequent automatic investments must total $1,200 annually if the initial $1,000 minimum has not been met.
You may purchase or redeem shares on any business day (normally any day when the New York Stock Exchange is open for regular trading), through your plan, intermediary, or Financial Professional; by sending a written request to Principal Funds at P.O. Box 8024, Boston, MA 02266-8024 (regular mail) or 30 Dan Road, Canton, MA 02021-2809 (overnight mail); calling us at 1-800-222-5852; or accessing our website (www.principalfunds.com).
Tax InformationThe Fund’s distributions you receive are generally subject to federal income tax as ordinary income or capital gain and may also be subject to state and local taxes, unless you are tax-exempt or your account is tax-deferred in which case your distributions would be taxed when withdrawn from the tax-deferred account.

168
Payments to Broker-Dealers and Other Financial IntermediariesIf you purchase the Fund through a broker-dealer or other financial intermediary (such as a bank, insurance company, investment adviser, etc.), the Fund and its related companies may pay the intermediary for the sale of Fund shares and related services. These payments may create a conflict of interest by influencing the broker-dealer or other intermediary and your salesperson to recommend the Fund over another investment, or to recommend one share class of the Fund over another share class. Ask your salesperson or visit your financial intermediary's website for more information.
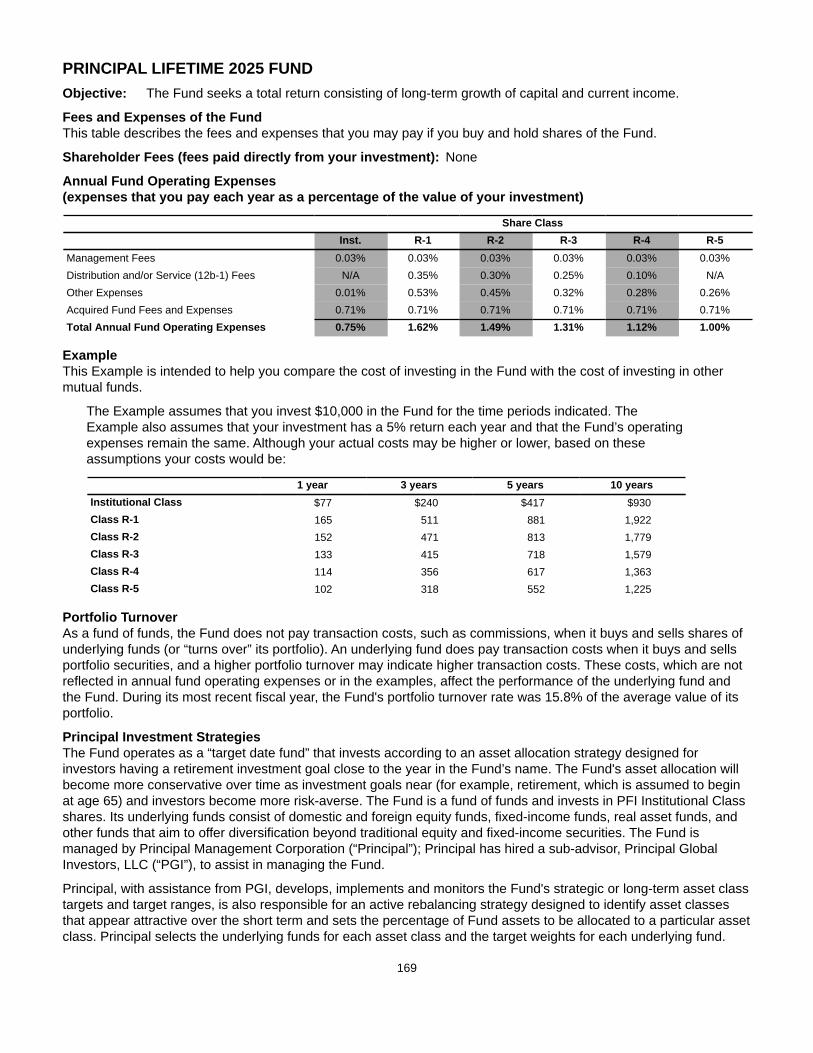
169
PRINCIPAL LIFETIME 2025 FUNDObjective: The Fund seeks a total return consisting of long-term growth of capital and current income.
Fees and Expenses of the FundThis table describes the fees and expenses that you may pay if you buy and hold shares of the Fund.
Shareholder Fees (fees paid directly from your investment): None
Annual Fund Operating Expenses (expenses that you pay each year as a percentage of the value of your investment)
Share ClassInst. R-1 R-2 R-3 R-4 R-5
Management Fees 0.03% 0.03% 0.03% 0.03% 0.03% 0.03%Distribution and/or Service (12b-1) Fees N/A 0.35% 0.30% 0.25% 0.10% N/AOther Expenses 0.01% 0.53% 0.45% 0.32% 0.28% 0.26%Acquired Fund Fees and Expenses 0.71% 0.71% 0.71% 0.71% 0.71% 0.71%Total Annual Fund Operating Expenses 0.75% 1.62% 1.49% 1.31% 1.12% 1.00%
ExampleThis Example is intended to help you compare the cost of investing in the Fund with the cost of investing in other mutual funds.
The Example assumes that you invest $10,000 in the Fund for the time periods indicated. The Example also assumes that your investment has a 5% return each year and that the Fund’s operating expenses remain the same. Although your actual costs may be higher or lower, based on these assumptions your costs would be:
1 year 3 years 5 years 10 yearsInstitutional Class $77 $240 $417 $930Class R-1 165 511 881 1,922Class R-2 152 471 813 1,779Class R-3 133 415 718 1,579Class R-4 114 356 617 1,363Class R-5 102 318 552 1,225
Portfolio TurnoverAs a fund of funds, the Fund does not pay transaction costs, such as commissions, when it buys and sells shares of underlying funds (or “turns over” its portfolio). An underlying fund does pay transaction costs when it buys and sells portfolio securities, and a higher portfolio turnover may indicate higher transaction costs. These costs, which are not reflected in annual fund operating expenses or in the examples, affect the performance of the underlying fund and the Fund. During its most recent fiscal year, the Fund's portfolio turnover rate was 15.8% of the average value of its portfolio.
Principal Investment StrategiesThe Fund operates as a “target date fund” that invests according to an asset allocation strategy designed for investors having a retirement investment goal close to the year in the Fund’s name. The Fund's asset allocation will become more conservative over time as investment goals near (for example, retirement, which is assumed to begin at age 65) and investors become more risk-averse. The Fund is a fund of funds and invests in PFI Institutional Class shares. Its underlying funds consist of domestic and foreign equity funds, fixed-income funds, real asset funds, and other funds that aim to offer diversification beyond traditional equity and fixed-income securities. The Fund is managed by Principal Management Corporation (“Principal”); Principal has hired a sub-advisor, Principal Global Investors, LLC (“PGI”), to assist in managing the Fund.
Principal, with assistance from PGI, develops, implements and monitors the Fund's strategic or long-term asset class targets and target ranges, is also responsible for an active rebalancing strategy designed to identify asset classes that appear attractive over the short term and sets the percentage of Fund assets to be allocated to a particular asset class. Principal selects the underlying funds for each asset class and the target weights for each underlying fund.

170
Principal, with assistance from PGI, may shift asset class targets in response to normal evaluative processes, the shortening time horizon of the Fund or changes in market forces or Fund circumstances. Principal may add, remove, or substitute underlying funds at any time.
In selecting underlying funds and target weights, Principal considers both quantitative measures (e.g., past performance, expected levels of risk and returns, expense levels, diversification and style consistency) and qualitative factors (e.g., organizational stability, investment experience, investment and risk management processes, and information, trading, and compliance systems). There are no minimum or maximum percentages of assets that the Fund must invest in a specific asset class or underlying fund.
The underlying funds invest in growth and value stocks of small, medium, and large market capitalization companies, fixed-income securities (including high yield or “junk” bonds), domestic and foreign (including those in emerging markets) securities, securities denominated in foreign currencies, investment companies (including index funds), real estate securities, derivatives, and U.S. government and U.S. government-sponsored securities. The underlying funds engage in derivative transactions to gain exposure to a variety of securities or asset classes or attempt to reduce risk. A derivative is a financial arrangement, the value of which is derived from, or based on, a traditional security, asset, or market index. The underlying funds principally use futures, options, swaps (including, for example, credit default, interest rate, and currency swaps) and forwards.
Within 10 to 15 years after its target year, the Fund's underlying fund allocation is expected to match that of the Principal LifeTime Strategic Income Fund. At that time, the Fund may be combined with the Principal LifeTime Strategic Income Fund if the Board of Directors determines that the combination is in the best interests of Fund shareholders. It is expected that at the target date in the Fund’s name, the shareholder will begin gradually withdrawing the account's value.

171
Principal RisksThe broad diversification of the Fund is designed to cushion severe losses in any one investment sector and moderate overall price volatility. However, the Fund is subject to the particular risks of the underlying funds in the proportions in which the Fund invests in them, and its share prices will fluctuate as the prices of underlying fund shares rise or fall with changing market conditions. If you sell your shares when their value is less than the price you paid, you will lose money. The Fund operates as a fund of funds and thus bears both its own expenses and, indirectly, its proportionate share of the expenses of the underlying funds in which it invests. An investment in the Fund is not a deposit of a bank and is not insured or guaranteed by the Federal Deposit Insurance Corporation or any other government agency. The principal risks of investing in the Fund that are inherent in the fund of funds, in alphabetical order, are:
Asset Allocation Risk. A fund's selection and weighting of asset classes may cause it to underperform other funds with a similar investment objective.
Conflict of Interest Risk. The Advisor and its affiliates earn different fees from different underlying funds and may have an incentive to allocate more fund-of-fund assets to underlying funds from which they receive higher fees.
Investment Company Securities Risk. Fund shareholders bear indirectly their proportionate share of the expenses of other investment companies in which the fund invests.
Target Date Fund Risk. A target date fund should not be selected based solely on age or retirement date because there is no guarantee that this fund will provide adequate income at or through retirement.
The principal risks of investing in the Fund that are inherent in the underlying funds, in alphabetical order, are:
Counterparty Risk. Counterparty risk is the risk that the counterparty to a derivatives contract or repurchase agreement, the borrower of a portfolio’s securities, or other obligation, will be unable or unwilling to make timely principal, interest, or settlement payments, or otherwise to honor its obligations.
Currency Risk. Risks of investing in securities denominated in, or that trade in, foreign (non-U.S.) currencies include changes in foreign exchange rates and foreign exchange restrictions.
Derivatives Risk. Transactions in derivatives may increase volatility, cause the liquidation of portfolio positions when not advantageous to do so and produce disproportionate losses.
Emerging Market Risk. Investments in emerging market countries may have more risk than those in developed market countries because the emerging markets are less developed and more illiquid. Emerging market countries can also be subject to increased social, economic, regulatory, and political uncertainties and can be extremely volatile.
Equity Securities Risk. The value of equity securities could decline if the issuer's financial condition declines or in response to overall market and economic conditions. A fund's principal market segment(s), such as large cap, mid cap or small cap stocks, or growth or value stocks, may underperform other market segments or the equity markets as a whole. Investments in smaller companies and mid-size companies may involve greater risk and price volatility than investments in larger, more mature companies.
Fixed-Income Securities Risk. Fixed-income securities are subject to interest rate risk and credit quality risk. The market value of fixed-income securities generally declines when interest rates rise, and an issuer of fixed-income securities could default on its payment obligations.
Foreign Securities Risk. The risks of foreign securities include loss of value as a result of: political or economic instability; nationalization, expropriation or confiscatory taxation; settlement delays; and limited government regulation (including less stringent reporting, accounting, and disclosure standards than are required of U.S. companies).
Growth Stock Risk. If growth companies do not increase their earnings at a rate expected by investors, the market price of the stock may decline significantly, even if earnings show an absolute increase. Growth company stocks also typically lack the dividend yield that can lessen price declines in market downturns.
High Yield Securities Risk. High yield fixed-income securities (commonly referred to as "junk bonds") are subject to greater credit quality risk than higher rated fixed-income securities and should be considered speculative.
172
Index Fund Investment Risk. More likely than not, an index fund will underperform the index due to cashflows and the fees and expenses of the fund.
Investment Company Securities Risk. Fund shareholders bear indirectly their proportionate share of the expenses of other investment companies in which the fund invests.
Portfolio Duration Risk. Portfolio duration is a measure of the expected life of a fixed-income security and its sensitivity to changes in interest rates. The longer a fund's average portfolio duration, the more sensitive the fund will be to changes in interest rates.
Real Estate Securities Risk. Real estate securities are subject to the risks associated with direct ownership of real estate, including declines in value, adverse economic conditions, increases in expenses, regulatory changes and environmental problems. Investing in securities of companies in the real estate industry, subjects a fund to the special risks associated with the real estate market including factors such as loss to casualty or condemnation, changes in real estate values, property taxes, interest rates, cash flow of underlying real estate assets, occupancy rates, government regulations affecting zoning, land use and rents, and the management skill and creditworthiness of the issuer.
Risk of Being an Underlying Fund. A fund is subject to the risk of being an underlying fund to the extent that a fund of funds invests in the fund. An underlying fund of a fund of funds may experience relatively large redemptions or investments as the fund of funds periodically reallocates or rebalances its assets. These transactions may cause the underlying fund to sell portfolio securities to meet such redemptions, or to invest cash from such investments, at times it would not otherwise do so, and may as a result increase transaction costs and adversely affect underlying fund performance.
U.S. Government Securities Risk. Yields available from U.S. government securities are generally lower than yields from many other fixed-income securities.
U.S. Government Sponsored Securities Risk. Securities issued by U.S. government-sponsored or -chartered enterprises such as the Federal Home Loan Mortgage Corporation, the Federal National Mortgage Association, and the Federal Home Loan Banks are not issued or guaranteed by the U.S. Treasury.
Value Stock Risk. The market may not recognize the intrinsic value of value stocks for a long time, or they may be appropriately priced at the time of purchase.
PerformanceThe following information provides some indication of the risks of investing in the Fund. Past performance (before and after taxes) is not necessarily an indication of how the Fund will perform in the future. You may get updated performance information by calling 1-800-222-5852 or online at www.principal.com.
The bar chart shows the investment returns of the Fund’s Institutional Class shares for each full calendar year of operations for 10 years (or, if shorter, the life of the Fund). The table shows, for each share class of the Fund and for the last one, five, and ten calendar year periods (or, if shorter, the life of the Fund), how the Fund’s average annual total returns compare with those of one or more broad measures of market performance.
Life of Fund results are measured from the date the Fund's shares were first sold (February 29, 2008).

173
Total Returns as of December 31 (Institutional Class shares)
Highest return for a quarter during the period of the bar chart above: Q2 '09 15.65 %Lowest return for a quarter during the period of the bar chart above: Q3 '11 (13.65)%
Average Annual Total ReturnsFor the periods ended December 31, 2014 1 Year 5 Year Life of FundInstitutional Class Return Before Taxes 5.87% 10.14% 5.56%Institutional Class Return After Taxes on Distributions 3.99% 8.86% 4.49%Institutional Class Return After Taxes on Distribution and Sale of Fund Shares 4.20% 7.79% 4.13%Class R-1 Return Before Taxes 4.93% 9.18% 4.64%Class R-2 Return Before Taxes 5.06% 9.31% 4.77%Class R-3 Return Before Taxes 5.22% 9.53% 4.94%Class R-4 Return Before Taxes 5.44% 9.73% 5.16%Class R-5 Return Before Taxes 5.54% 9.87% 5.28%S&P Target Date 2025 Index (reflects no deduction for fees, expenses, or taxes) 5.56% 9.55% 5.91%
After-tax returns are calculated using the historical highest individual federal marginal income tax rates and do not reflect the impact of state and local taxes. Actual after-tax returns depend on an investor’s tax situation and may differ from those shown. The after-tax returns shown are not relevant to investors who hold their Fund shares through tax-deferred arrangements, such as 401(k) plans or individual retirement accounts. After-tax returns are shown for Institutional Class shares only and would be different for the other share classes.
Management
Investment Advisor and Portfolio Managers: Principal Management Corporation• James W. Fennessey (since 2008), Portfolio Manager• Jeffrey R. Tyler (since 2011), Portfolio Manager• Randy L. Welch (since 2008), Portfolio Manager
Sub-Advisor and Portfolio Manager:Principal Global Investors, LLC • Matthew Annenberg (since 2013), Managing Director, Asset Allocation
Purchase and Sale of Fund SharesThere are no minimum initial or subsequent investment requirements for an eligible purchaser. You may purchase or redeem shares on any business day (normally any day when the New York Stock Exchange is open for regular trading) through your plan, intermediary, or Financial Professional; by sending a written request to Principal Funds at P.O. Box 8024, Boston, MA 02266-8024 (regular mail) or 30 Dan Road, Canton, MA 02021-2809 (overnight mail); calling us at 1-800-222-5852; or accessing our website (www.principalfunds.com).

174
Tax InformationThe Fund’s distributions you receive are generally subject to federal income tax as ordinary income or capital gain and may also be subject to state and local taxes, unless you are tax-exempt or your account is tax-deferred in which case your distributions would be taxed when withdrawn from the tax-deferred account.
Payments to Broker-Dealers and Other Financial IntermediariesIf you purchase the Fund through a broker-dealer or other financial intermediary (such as a bank, insurance company, investment adviser, etc.), the Fund and its related companies may pay the intermediary for the sale of Fund shares and related services. These payments may create a conflict of interest by influencing the broker-dealer or other intermediary and your salesperson to recommend the Fund over another investment, or to recommend one share class of the Fund over another share class. Ask your salesperson or visit your financial intermediary's website for more information.

175
PRINCIPAL LIFETIME 2030 FUNDObjective: The Fund seeks a total return consisting of long-term growth of capital and current income.
Fees and Expenses of the FundThis table describes the fees and expenses that you may pay if you buy and hold shares of the Fund. You may qualify for sales charge discounts if you and your family invest, or agree to invest in the future, at least $50,000 in Class A Shares of Principal Funds, Inc. More information about these and other discounts is available from your financial professional and in “Choosing a Share Class and The Costs of Investing” beginning on page 381 of the Fund’s prospectus and “Multiple Class Structure” beginning on page 6 of the Fund’s Statement of Additional Information.
Shareholder Fees (fees paid directly from your investment)
Share ClassA J Inst. R-1 R-2 R-3 R-4 R-5
Maximum Sales Charge (Load) Imposed onPurchases (as a percentage of offering price)
5.50% None None None None None None None
Maximum Deferred Sales Charge (Load) (as apercentage of the offering price or NAV whenSales Load is paid, whichever is less)
1.00% 1.00% None None None None None None
Annual Fund Operating Expenses (expenses that you pay each year as a percentage of the value of your investment)
Share ClassA J Inst. R-1 R-2 R-3 R-4 R-5
Management Fees 0.03% 0.03% 0.03% 0.03% 0.03% 0.03% 0.03% 0.03%
Distribution and/or Service (12b-1) Fees(1) 0.25% 0.25% N/A 0.35% 0.30% 0.25% 0.10% N/A
Other Expenses 0.16% 0.07% 0.01% 0.53% 0.45% 0.32% 0.28% 0.26%
Acquired Fund Fees and Expenses 0.73% 0.73% 0.73% 0.73% 0.73% 0.73% 0.73% 0.73%
Total Annual Fund Operating Expenses 1.17% 1.08% 0.77% 1.64% 1.51% 1.33% 1.14% 1.02%Fee Waiver and Expense Reimbursement(2) (3) (0.03)% (0.01)% N/A N/A N/A N/A N/A N/A
Total Annual Fund Operating Expenses afterFee Waiver and Expense Reimbursement
1.14% 1.07% 0.77% 1.64% 1.51% 1.33% 1.14% 1.02%
(1) Expense information in the table has been restated to reflect current fees. Effective December 30, 2013, the Distribution and/or Service (12b-1) Fees for Class J shares were reduced.
(2) Principal Funds Distributor, Inc. ("the Distributor") has contractually agreed to limit the Distribution Fees attributable to Class J. The waiver will reduce the Fund's Distribution Fees by 0.01%. It is expected that the fee waiver will continue through the period ending February 29, 2016; however, Principal Funds, Inc. and the Distributor, the parties to the agreement, may agree to terminate the fee waiver prior to the end of the period.
(3) Principal Management Corporation ("Principal"), the investment advisor, has contractually agreed to limit the Fund’s expenses by paying, if necessary, expenses normally payable by the Fund, (excluding interest expense, expenses related to fund investments, acquired fund fees and expenses, and other extraordinary expenses) to maintain a total level of operating expenses (expressed as a percent of average net assets on an annualized basis) not to exceed 0.41% for Class A shares. It is expected that the expense limit will continue through the period ending February 29, 2016; however, Principal Funds, Inc. and Principal, the parties to the agreement, may agree to terminate the expense limit prior to the end of the period.

176
ExampleThis Example is intended to help you compare the cost of investing in the Fund with the cost of investing in other mutual funds.
The Example assumes that you invest $10,000 in the Fund for the time periods indicated and then redeem all of your shares at the end of those periods. The Example assumes that your investment has a 5% return each year and that the Fund’s operating expenses remain the same. Although your actual costs may be higher or lower, based on these assumptions your costs would be:
1 year 3 years 5 years 10 yearsClass A $660 $898 $1,155 $1,889Class J 209 342 594 1,316Institutional Class 79 246 428 954Class R-1 167 517 892 1,944Class R-2 154 477 824 1,802Class R-3 135 421 729 1,601Class R-4 116 362 628 1,386Class R-5 104 325 563 1,248
With respect to Class J shares, you would pay the following expenses if you did not redeem your shares (all other classes would be the same as in the above example):
1 year 3 years 5 years 10 yearsClass J $109 $342 $594 $1,316
Portfolio TurnoverAs a fund of funds, the Fund does not pay transaction costs, such as commissions, when it buys and sells shares of underlying funds (or “turns over” its portfolio). An underlying fund does pay transaction costs when it buys and sells portfolio securities, and a higher portfolio turnover may indicate higher transaction costs. These costs, which are not reflected in annual fund operating expenses or in the examples, affect the performance of the underlying fund and the Fund. During its most recent fiscal year, the Fund's portfolio turnover rate was 15.3% of the average value of its portfolio.
Principal Investment StrategiesThe Fund operates as a “target date fund” that invests according to an asset allocation strategy designed for investors having a retirement investment goal close to the year in the Fund’s name. The Fund's asset allocation will become more conservative over time as investment goals near (for example, retirement, which is assumed to begin at age 65) and investors become more risk-averse. The Fund is a fund of funds and invests in PFI Institutional Class shares. Its underlying funds consist of domestic and foreign equity funds, fixed-income funds, real asset funds, and other funds that aim to offer diversification beyond traditional equity and fixed-income securities. The Fund is managed by Principal Management Corporation (“Principal”); Principal has hired a sub-advisor, Principal Global Investors, LLC (“PGI”), to assist in managing the Fund.
Principal, with assistance from PGI, develops, implements and monitors the Fund's strategic or long-term asset class targets and target ranges, is also responsible for an active rebalancing strategy designed to identify asset classes that appear attractive over the short term and sets the percentage of Fund assets to be allocated to a particular asset class. Principal selects the underlying funds for each asset class and the target weights for each underlying fund. Principal, with assistance from PGI, may shift asset class targets in response to normal evaluative processes, the shortening time horizon of the Fund or changes in market forces or Fund circumstances. Principal may add, remove, or substitute underlying funds at any time.
In selecting underlying funds and target weights, Principal considers both quantitative measures (e.g., past performance, expected levels of risk and returns, expense levels, diversification and style consistency) and qualitative factors (e.g., organizational stability, investment experience, investment and risk management processes, and information, trading, and compliance systems). There are no minimum or maximum percentages of assets that the Fund must invest in a specific asset class or underlying fund.
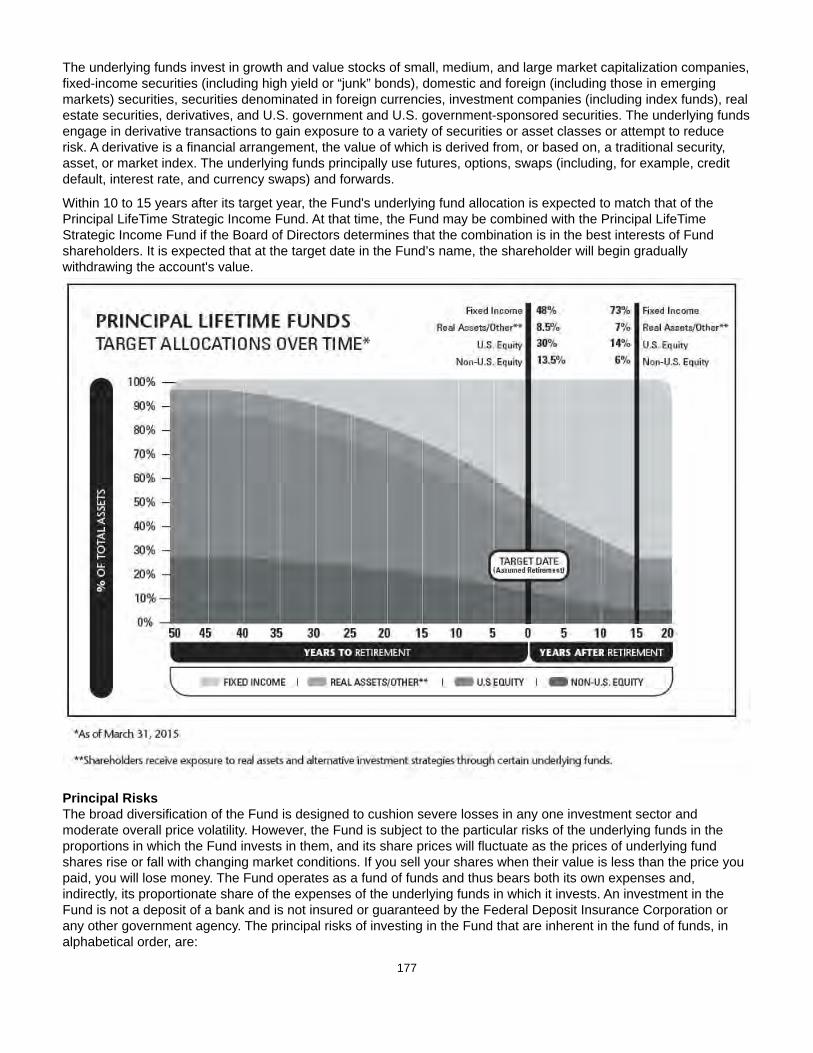
177
The underlying funds invest in growth and value stocks of small, medium, and large market capitalization companies, fixed-income securities (including high yield or “junk” bonds), domestic and foreign (including those in emerging markets) securities, securities denominated in foreign currencies, investment companies (including index funds), real estate securities, derivatives, and U.S. government and U.S. government-sponsored securities. The underlying funds engage in derivative transactions to gain exposure to a variety of securities or asset classes or attempt to reduce risk. A derivative is a financial arrangement, the value of which is derived from, or based on, a traditional security, asset, or market index. The underlying funds principally use futures, options, swaps (including, for example, credit default, interest rate, and currency swaps) and forwards.
Within 10 to 15 years after its target year, the Fund's underlying fund allocation is expected to match that of the Principal LifeTime Strategic Income Fund. At that time, the Fund may be combined with the Principal LifeTime Strategic Income Fund if the Board of Directors determines that the combination is in the best interests of Fund shareholders. It is expected that at the target date in the Fund’s name, the shareholder will begin gradually withdrawing the account's value.
Principal RisksThe broad diversification of the Fund is designed to cushion severe losses in any one investment sector and moderate overall price volatility. However, the Fund is subject to the particular risks of the underlying funds in the proportions in which the Fund invests in them, and its share prices will fluctuate as the prices of underlying fund shares rise or fall with changing market conditions. If you sell your shares when their value is less than the price you paid, you will lose money. The Fund operates as a fund of funds and thus bears both its own expenses and, indirectly, its proportionate share of the expenses of the underlying funds in which it invests. An investment in the Fund is not a deposit of a bank and is not insured or guaranteed by the Federal Deposit Insurance Corporation or any other government agency. The principal risks of investing in the Fund that are inherent in the fund of funds, in alphabetical order, are:
178
Asset Allocation Risk. A fund's selection and weighting of asset classes may cause it to underperform other funds with a similar investment objective.
Conflict of Interest Risk. The Advisor and its affiliates earn different fees from different underlying funds and may have an incentive to allocate more fund-of-fund assets to underlying funds from which they receive higher fees.
Investment Company Securities Risk. Fund shareholders bear indirectly their proportionate share of the expenses of other investment companies in which the fund invests.
Target Date Fund Risk. A target date fund should not be selected based solely on age or retirement date because there is no guarantee that this fund will provide adequate income at or through retirement.
The principal risks of investing in the Fund that are inherent in the underlying funds, in alphabetical order, are:
Counterparty Risk. Counterparty risk is the risk that the counterparty to a derivatives contract or repurchase agreement, the borrower of a portfolio’s securities, or other obligation, will be unable or unwilling to make timely principal, interest, or settlement payments, or otherwise to honor its obligations.
Currency Risk. Risks of investing in securities denominated in, or that trade in, foreign (non-U.S.) currencies include changes in foreign exchange rates and foreign exchange restrictions.
Derivatives Risk. Transactions in derivatives may increase volatility, cause the liquidation of portfolio positions when not advantageous to do so and produce disproportionate losses.
Emerging Market Risk. Investments in emerging market countries may have more risk than those in developed market countries because the emerging markets are less developed and more illiquid. Emerging market countries can also be subject to increased social, economic, regulatory, and political uncertainties and can be extremely volatile.
Equity Securities Risk. The value of equity securities could decline if the issuer's financial condition declines or in response to overall market and economic conditions. A fund's principal market segment(s), such as large cap, mid cap or small cap stocks, or growth or value stocks, may underperform other market segments or the equity markets as a whole. Investments in smaller companies and mid-size companies may involve greater risk and price volatility than investments in larger, more mature companies.
Fixed-Income Securities Risk. Fixed-income securities are subject to interest rate risk and credit quality risk. The market value of fixed-income securities generally declines when interest rates rise, and an issuer of fixed-income securities could default on its payment obligations.
Foreign Securities Risk. The risks of foreign securities include loss of value as a result of: political or economic instability; nationalization, expropriation or confiscatory taxation; settlement delays; and limited government regulation (including less stringent reporting, accounting, and disclosure standards than are required of U.S. companies).
Growth Stock Risk. If growth companies do not increase their earnings at a rate expected by investors, the market price of the stock may decline significantly, even if earnings show an absolute increase. Growth company stocks also typically lack the dividend yield that can lessen price declines in market downturns.
High Yield Securities Risk. High yield fixed-income securities (commonly referred to as "junk bonds") are subject to greater credit quality risk than higher rated fixed-income securities and should be considered speculative.
Index Fund Investment Risk. More likely than not, an index fund will underperform the index due to cashflows and the fees and expenses of the fund.
Investment Company Securities Risk. Fund shareholders bear indirectly their proportionate share of the expenses of other investment companies in which the fund invests.
Portfolio Duration Risk. Portfolio duration is a measure of the expected life of a fixed-income security and its sensitivity to changes in interest rates. The longer a fund's average portfolio duration, the more sensitive the fund will be to changes in interest rates.
Real Estate Securities Risk. Real estate securities are subject to the risks associated with direct ownership of real estate, including declines in value, adverse economic conditions, increases in expenses, regulatory changes and environmental problems. Investing in securities of companies in the real estate industry, subjects a fund to the
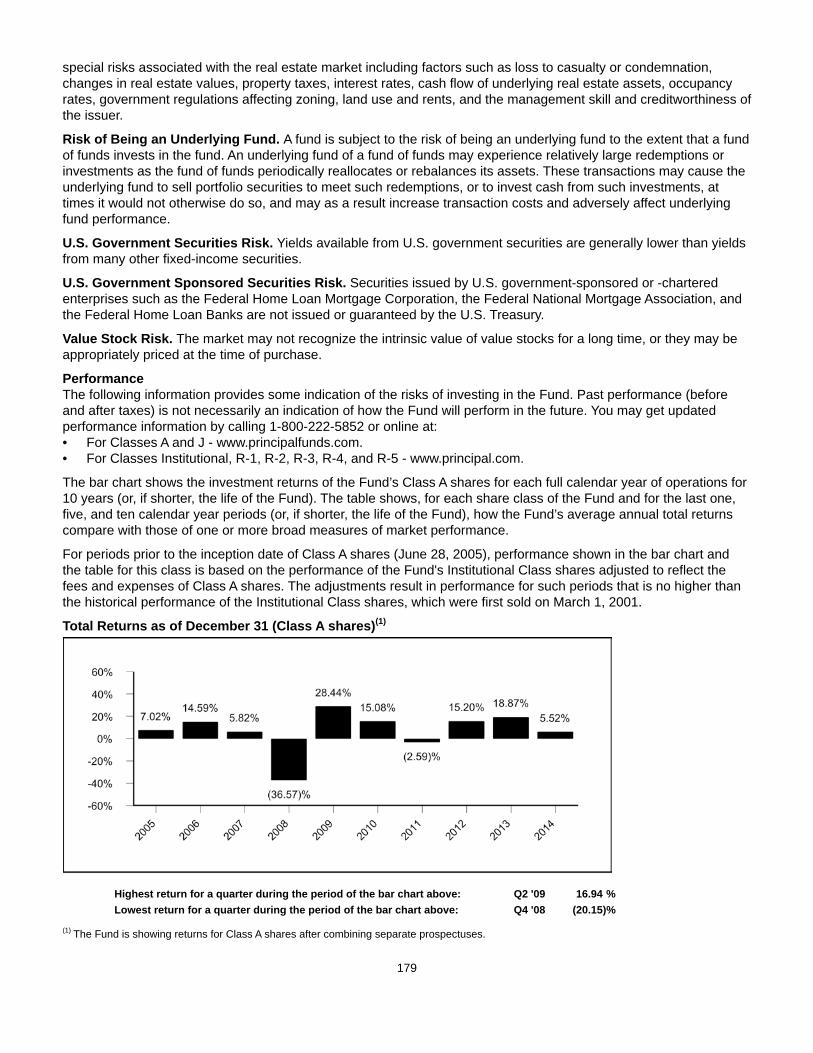
179
special risks associated with the real estate market including factors such as loss to casualty or condemnation, changes in real estate values, property taxes, interest rates, cash flow of underlying real estate assets, occupancy rates, government regulations affecting zoning, land use and rents, and the management skill and creditworthiness of the issuer.
Risk of Being an Underlying Fund. A fund is subject to the risk of being an underlying fund to the extent that a fund of funds invests in the fund. An underlying fund of a fund of funds may experience relatively large redemptions or investments as the fund of funds periodically reallocates or rebalances its assets. These transactions may cause the underlying fund to sell portfolio securities to meet such redemptions, or to invest cash from such investments, at times it would not otherwise do so, and may as a result increase transaction costs and adversely affect underlying fund performance.
U.S. Government Securities Risk. Yields available from U.S. government securities are generally lower than yields from many other fixed-income securities.
U.S. Government Sponsored Securities Risk. Securities issued by U.S. government-sponsored or -chartered enterprises such as the Federal Home Loan Mortgage Corporation, the Federal National Mortgage Association, and the Federal Home Loan Banks are not issued or guaranteed by the U.S. Treasury.
Value Stock Risk. The market may not recognize the intrinsic value of value stocks for a long time, or they may be appropriately priced at the time of purchase.
PerformanceThe following information provides some indication of the risks of investing in the Fund. Past performance (before and after taxes) is not necessarily an indication of how the Fund will perform in the future. You may get updated performance information by calling 1-800-222-5852 or online at: • For Classes A and J - www.principalfunds.com.• For Classes Institutional, R-1, R-2, R-3, R-4, and R-5 - www.principal.com.
The bar chart shows the investment returns of the Fund’s Class A shares for each full calendar year of operations for 10 years (or, if shorter, the life of the Fund). The table shows, for each share class of the Fund and for the last one, five, and ten calendar year periods (or, if shorter, the life of the Fund), how the Fund’s average annual total returns compare with those of one or more broad measures of market performance.
For periods prior to the inception date of Class A shares (June 28, 2005), performance shown in the bar chart and the table for this class is based on the performance of the Fund's Institutional Class shares adjusted to reflect the fees and expenses of Class A shares. The adjustments result in performance for such periods that is no higher than the historical performance of the Institutional Class shares, which were first sold on March 1, 2001.
Total Returns as of December 31 (Class A shares)(1)
Highest return for a quarter during the period of the bar chart above: Q2 '09 16.94 %Lowest return for a quarter during the period of the bar chart above: Q4 '08 (20.15)%
(1) The Fund is showing returns for Class A shares after combining separate prospectuses.
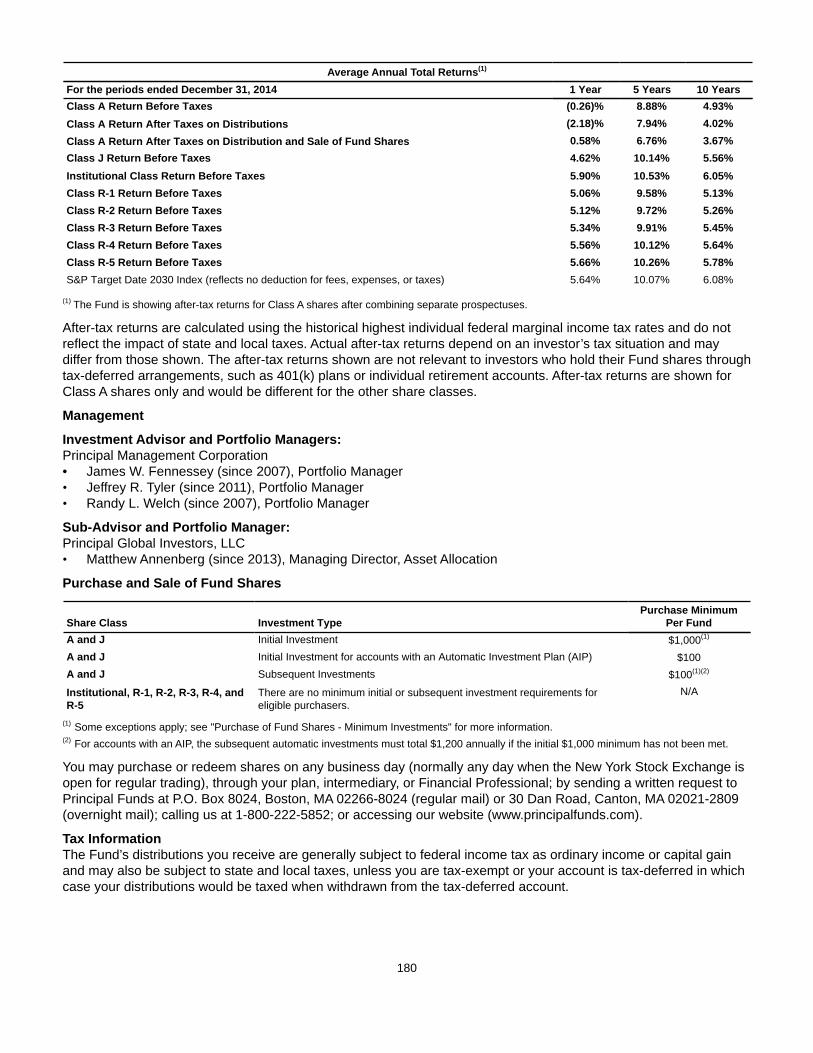
180
Average Annual Total Returns(1)
For the periods ended December 31, 2014 1 Year 5 Years 10 YearsClass A Return Before Taxes (0.26)% 8.88% 4.93%Class A Return After Taxes on Distributions (2.18)% 7.94% 4.02%Class A Return After Taxes on Distribution and Sale of Fund Shares 0.58% 6.76% 3.67%Class J Return Before Taxes 4.62% 10.14% 5.56%Institutional Class Return Before Taxes 5.90% 10.53% 6.05%Class R-1 Return Before Taxes 5.06% 9.58% 5.13%Class R-2 Return Before Taxes 5.12% 9.72% 5.26%Class R-3 Return Before Taxes 5.34% 9.91% 5.45%Class R-4 Return Before Taxes 5.56% 10.12% 5.64%Class R-5 Return Before Taxes 5.66% 10.26% 5.78%S&P Target Date 2030 Index (reflects no deduction for fees, expenses, or taxes) 5.64% 10.07% 6.08%
(1) The Fund is showing after-tax returns for Class A shares after combining separate prospectuses.
After-tax returns are calculated using the historical highest individual federal marginal income tax rates and do not reflect the impact of state and local taxes. Actual after-tax returns depend on an investor’s tax situation and may differ from those shown. The after-tax returns shown are not relevant to investors who hold their Fund shares through tax-deferred arrangements, such as 401(k) plans or individual retirement accounts. After-tax returns are shown for Class A shares only and would be different for the other share classes.
Management
Investment Advisor and Portfolio Managers: Principal Management Corporation• James W. Fennessey (since 2007), Portfolio Manager• Jeffrey R. Tyler (since 2011), Portfolio Manager• Randy L. Welch (since 2007), Portfolio Manager
Sub-Advisor and Portfolio Manager:Principal Global Investors, LLC • Matthew Annenberg (since 2013), Managing Director, Asset Allocation
Purchase and Sale of Fund Shares
Share Class Investment TypePurchase Minimum
Per FundA and J Initial Investment $1,000(1)
A and J Initial Investment for accounts with an Automatic Investment Plan (AIP) $100A and J Subsequent Investments $100(1)(2)
Institutional, R-1, R-2, R-3, R-4, andR-5
There are no minimum initial or subsequent investment requirements foreligible purchasers.
N/A
(1) Some exceptions apply; see "Purchase of Fund Shares - Minimum Investments" for more information.(2) For accounts with an AIP, the subsequent automatic investments must total $1,200 annually if the initial $1,000 minimum has not been met.
You may purchase or redeem shares on any business day (normally any day when the New York Stock Exchange is open for regular trading), through your plan, intermediary, or Financial Professional; by sending a written request to Principal Funds at P.O. Box 8024, Boston, MA 02266-8024 (regular mail) or 30 Dan Road, Canton, MA 02021-2809 (overnight mail); calling us at 1-800-222-5852; or accessing our website (www.principalfunds.com).
Tax InformationThe Fund’s distributions you receive are generally subject to federal income tax as ordinary income or capital gain and may also be subject to state and local taxes, unless you are tax-exempt or your account is tax-deferred in which case your distributions would be taxed when withdrawn from the tax-deferred account.

181
Payments to Broker-Dealers and Other Financial IntermediariesIf you purchase the Fund through a broker-dealer or other financial intermediary (such as a bank, insurance company, investment adviser, etc.), the Fund and its related companies may pay the intermediary for the sale of Fund shares and related services. These payments may create a conflict of interest by influencing the broker-dealer or other intermediary and your salesperson to recommend the Fund over another investment, or to recommend one share class of the Fund over another share class. Ask your salesperson or visit your financial intermediary's website for more information.
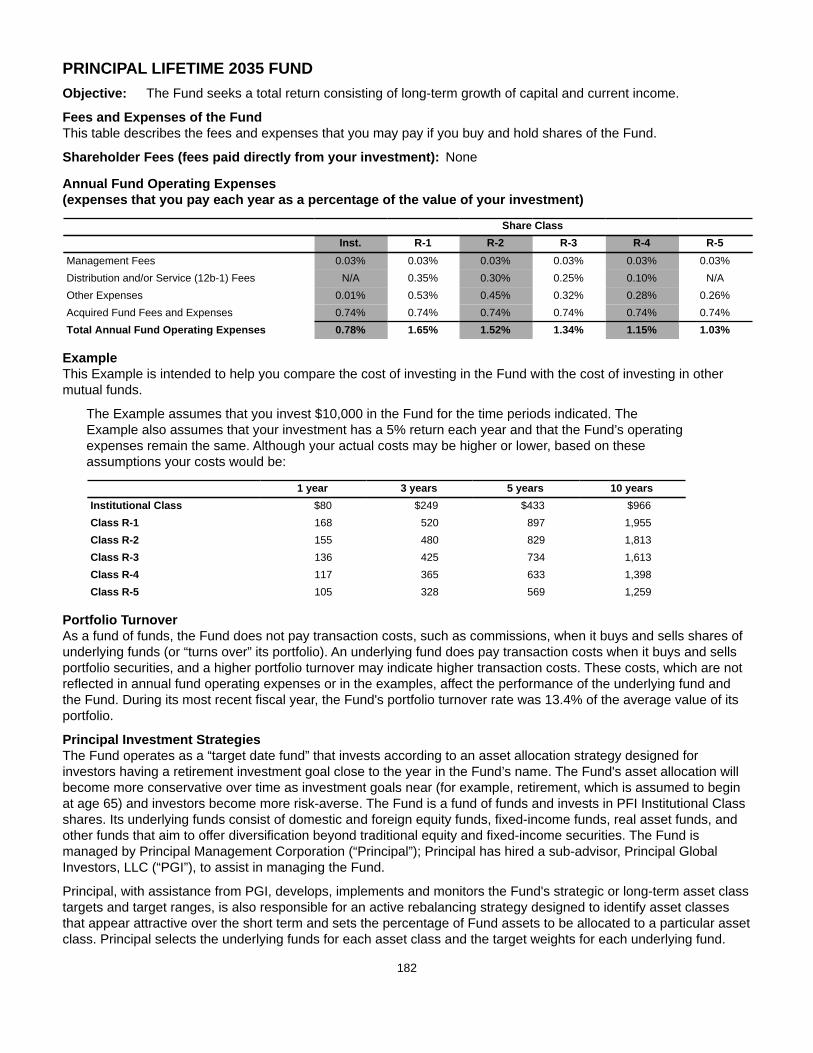
182
PRINCIPAL LIFETIME 2035 FUNDObjective: The Fund seeks a total return consisting of long-term growth of capital and current income.
Fees and Expenses of the FundThis table describes the fees and expenses that you may pay if you buy and hold shares of the Fund.
Shareholder Fees (fees paid directly from your investment): None
Annual Fund Operating Expenses (expenses that you pay each year as a percentage of the value of your investment)
Share ClassInst. R-1 R-2 R-3 R-4 R-5
Management Fees 0.03% 0.03% 0.03% 0.03% 0.03% 0.03%Distribution and/or Service (12b-1) Fees N/A 0.35% 0.30% 0.25% 0.10% N/AOther Expenses 0.01% 0.53% 0.45% 0.32% 0.28% 0.26%Acquired Fund Fees and Expenses 0.74% 0.74% 0.74% 0.74% 0.74% 0.74%Total Annual Fund Operating Expenses 0.78% 1.65% 1.52% 1.34% 1.15% 1.03%
ExampleThis Example is intended to help you compare the cost of investing in the Fund with the cost of investing in other mutual funds.
The Example assumes that you invest $10,000 in the Fund for the time periods indicated. The Example also assumes that your investment has a 5% return each year and that the Fund’s operating expenses remain the same. Although your actual costs may be higher or lower, based on these assumptions your costs would be:
1 year 3 years 5 years 10 yearsInstitutional Class $80 $249 $433 $966Class R-1 168 520 897 1,955Class R-2 155 480 829 1,813Class R-3 136 425 734 1,613Class R-4 117 365 633 1,398Class R-5 105 328 569 1,259
Portfolio TurnoverAs a fund of funds, the Fund does not pay transaction costs, such as commissions, when it buys and sells shares of underlying funds (or “turns over” its portfolio). An underlying fund does pay transaction costs when it buys and sells portfolio securities, and a higher portfolio turnover may indicate higher transaction costs. These costs, which are not reflected in annual fund operating expenses or in the examples, affect the performance of the underlying fund and the Fund. During its most recent fiscal year, the Fund's portfolio turnover rate was 13.4% of the average value of its portfolio.
Principal Investment StrategiesThe Fund operates as a “target date fund” that invests according to an asset allocation strategy designed for investors having a retirement investment goal close to the year in the Fund’s name. The Fund's asset allocation will become more conservative over time as investment goals near (for example, retirement, which is assumed to begin at age 65) and investors become more risk-averse. The Fund is a fund of funds and invests in PFI Institutional Class shares. Its underlying funds consist of domestic and foreign equity funds, fixed-income funds, real asset funds, and other funds that aim to offer diversification beyond traditional equity and fixed-income securities. The Fund is managed by Principal Management Corporation (“Principal”); Principal has hired a sub-advisor, Principal Global Investors, LLC (“PGI”), to assist in managing the Fund.
Principal, with assistance from PGI, develops, implements and monitors the Fund's strategic or long-term asset class targets and target ranges, is also responsible for an active rebalancing strategy designed to identify asset classes that appear attractive over the short term and sets the percentage of Fund assets to be allocated to a particular asset class. Principal selects the underlying funds for each asset class and the target weights for each underlying fund.
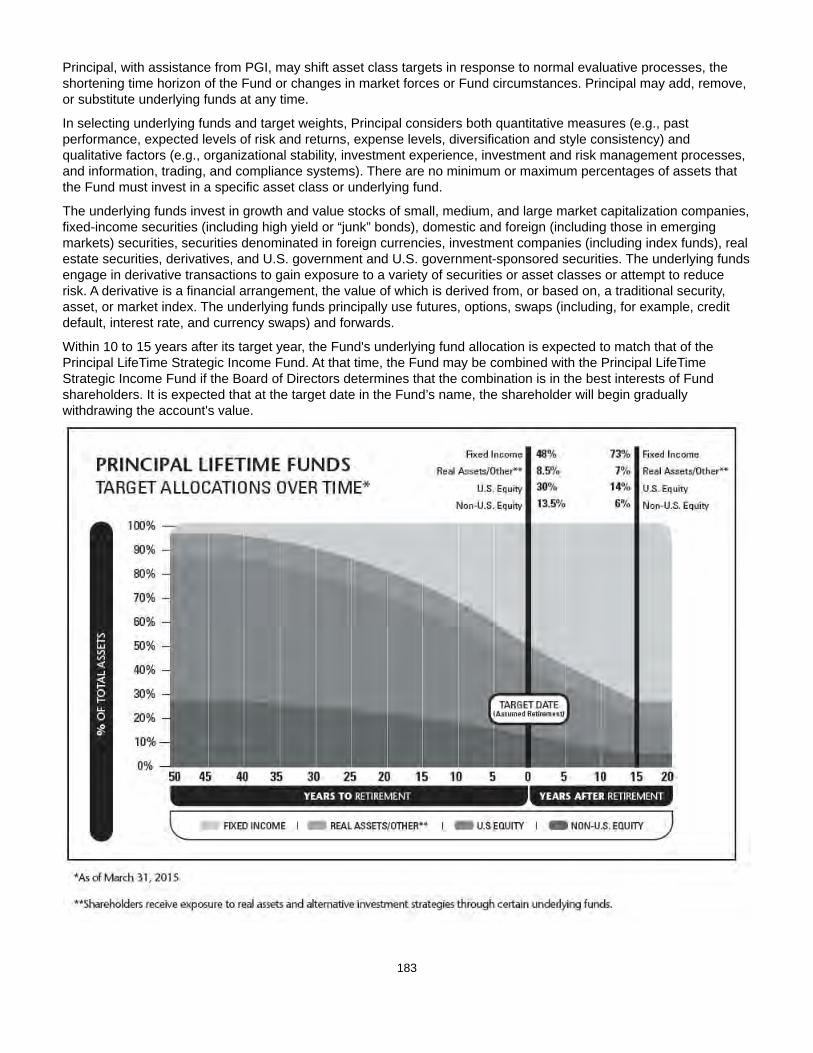
183
Principal, with assistance from PGI, may shift asset class targets in response to normal evaluative processes, the shortening time horizon of the Fund or changes in market forces or Fund circumstances. Principal may add, remove, or substitute underlying funds at any time.
In selecting underlying funds and target weights, Principal considers both quantitative measures (e.g., past performance, expected levels of risk and returns, expense levels, diversification and style consistency) and qualitative factors (e.g., organizational stability, investment experience, investment and risk management processes, and information, trading, and compliance systems). There are no minimum or maximum percentages of assets that the Fund must invest in a specific asset class or underlying fund.
The underlying funds invest in growth and value stocks of small, medium, and large market capitalization companies, fixed-income securities (including high yield or “junk” bonds), domestic and foreign (including those in emerging markets) securities, securities denominated in foreign currencies, investment companies (including index funds), real estate securities, derivatives, and U.S. government and U.S. government-sponsored securities. The underlying funds engage in derivative transactions to gain exposure to a variety of securities or asset classes or attempt to reduce risk. A derivative is a financial arrangement, the value of which is derived from, or based on, a traditional security, asset, or market index. The underlying funds principally use futures, options, swaps (including, for example, credit default, interest rate, and currency swaps) and forwards.
Within 10 to 15 years after its target year, the Fund's underlying fund allocation is expected to match that of the Principal LifeTime Strategic Income Fund. At that time, the Fund may be combined with the Principal LifeTime Strategic Income Fund if the Board of Directors determines that the combination is in the best interests of Fund shareholders. It is expected that at the target date in the Fund’s name, the shareholder will begin gradually withdrawing the account's value.

184
Principal RisksThe broad diversification of the Fund is designed to cushion severe losses in any one investment sector and moderate overall price volatility. However, the Fund is subject to the particular risks of the underlying funds in the proportions in which the Fund invests in them, and its share prices will fluctuate as the prices of underlying fund shares rise or fall with changing market conditions. If you sell your shares when their value is less than the price you paid, you will lose money. The Fund operates as a fund of funds and thus bears both its own expenses and, indirectly, its proportionate share of the expenses of the underlying funds in which it invests. An investment in the Fund is not a deposit of a bank and is not insured or guaranteed by the Federal Deposit Insurance Corporation or any other government agency. The principal risks of investing in the Fund that are inherent in the fund of funds, in alphabetical order, are:
Asset Allocation Risk. A fund's selection and weighting of asset classes may cause it to underperform other funds with a similar investment objective.
Conflict of Interest Risk. The Advisor and its affiliates earn different fees from different underlying funds and may have an incentive to allocate more fund-of-fund assets to underlying funds from which they receive higher fees.
Investment Company Securities Risk. Fund shareholders bear indirectly their proportionate share of the expenses of other investment companies in which the fund invests.
Target Date Fund Risk. A target date fund should not be selected based solely on age or retirement date because there is no guarantee that this fund will provide adequate income at or through retirement.
The principal risks of investing in the Fund that are inherent in the underlying funds, in alphabetical order, are:
Currency Risk. Risks of investing in securities denominated in, or that trade in, foreign (non-U.S.) currencies include changes in foreign exchange rates and foreign exchange restrictions.
Derivatives Risk. Transactions in derivatives may increase volatility, cause the liquidation of portfolio positions when not advantageous to do so and produce disproportionate losses.
Emerging Market Risk. Investments in emerging market countries may have more risk than those in developed market countries because the emerging markets are less developed and more illiquid. Emerging market countries can also be subject to increased social, economic, regulatory, and political uncertainties and can be extremely volatile.
Equity Securities Risk. The value of equity securities could decline if the issuer's financial condition declines or in response to overall market and economic conditions. A fund's principal market segment(s), such as large cap, mid cap or small cap stocks, or growth or value stocks, may underperform other market segments or the equity markets as a whole. Investments in smaller companies and mid-size companies may involve greater risk and price volatility than investments in larger, more mature companies.
Fixed-Income Securities Risk. Fixed-income securities are subject to interest rate risk and credit quality risk. The market value of fixed-income securities generally declines when interest rates rise, and an issuer of fixed-income securities could default on its payment obligations.
Foreign Securities Risk. The risks of foreign securities include loss of value as a result of: political or economic instability; nationalization, expropriation or confiscatory taxation; settlement delays; and limited government regulation (including less stringent reporting, accounting, and disclosure standards than are required of U.S. companies).
Growth Stock Risk. If growth companies do not increase their earnings at a rate expected by investors, the market price of the stock may decline significantly, even if earnings show an absolute increase. Growth company stocks also typically lack the dividend yield that can lessen price declines in market downturns.
Index Fund Investment Risk. More likely than not, an index fund will underperform the index due to cashflows and the fees and expenses of the fund.
Investment Company Securities Risk. Fund shareholders bear indirectly their proportionate share of the expenses of other investment companies in which the fund invests.
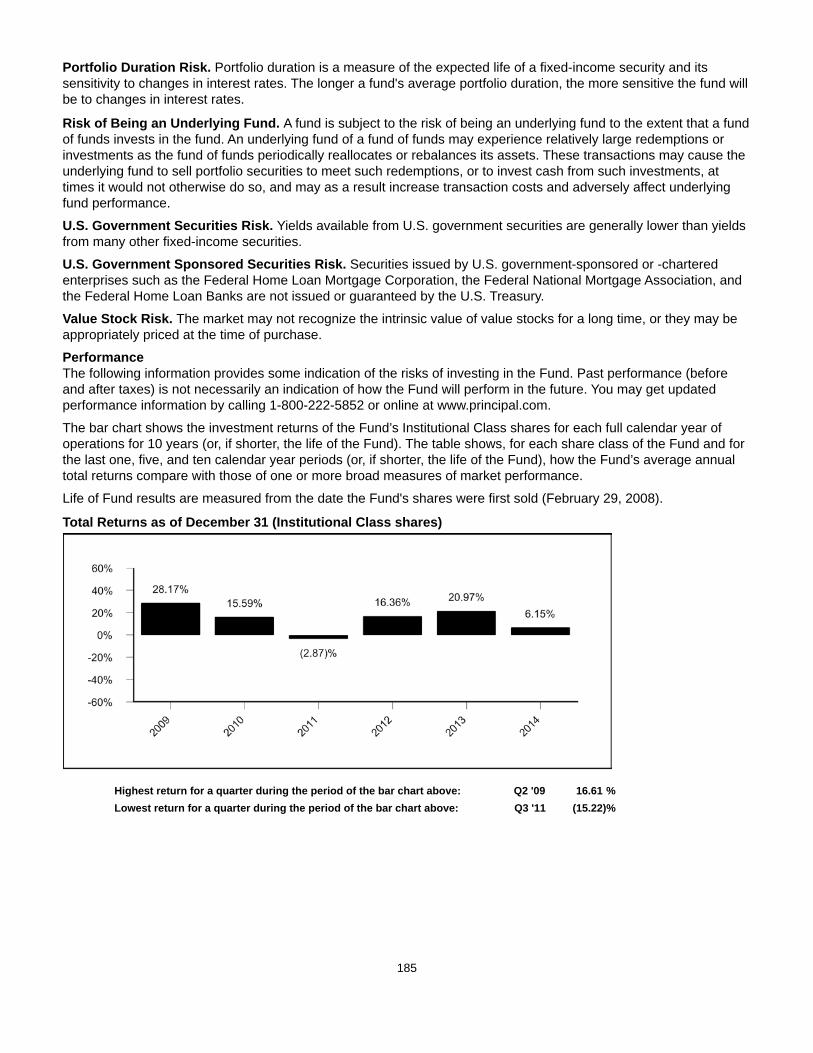
185
Portfolio Duration Risk. Portfolio duration is a measure of the expected life of a fixed-income security and its sensitivity to changes in interest rates. The longer a fund's average portfolio duration, the more sensitive the fund will be to changes in interest rates.
Risk of Being an Underlying Fund. A fund is subject to the risk of being an underlying fund to the extent that a fund of funds invests in the fund. An underlying fund of a fund of funds may experience relatively large redemptions or investments as the fund of funds periodically reallocates or rebalances its assets. These transactions may cause the underlying fund to sell portfolio securities to meet such redemptions, or to invest cash from such investments, at times it would not otherwise do so, and may as a result increase transaction costs and adversely affect underlying fund performance.
U.S. Government Securities Risk. Yields available from U.S. government securities are generally lower than yields from many other fixed-income securities.
U.S. Government Sponsored Securities Risk. Securities issued by U.S. government-sponsored or -chartered enterprises such as the Federal Home Loan Mortgage Corporation, the Federal National Mortgage Association, and the Federal Home Loan Banks are not issued or guaranteed by the U.S. Treasury.
Value Stock Risk. The market may not recognize the intrinsic value of value stocks for a long time, or they may be appropriately priced at the time of purchase.
PerformanceThe following information provides some indication of the risks of investing in the Fund. Past performance (before and after taxes) is not necessarily an indication of how the Fund will perform in the future. You may get updated performance information by calling 1-800-222-5852 or online at www.principal.com.
The bar chart shows the investment returns of the Fund’s Institutional Class shares for each full calendar year of operations for 10 years (or, if shorter, the life of the Fund). The table shows, for each share class of the Fund and for the last one, five, and ten calendar year periods (or, if shorter, the life of the Fund), how the Fund’s average annual total returns compare with those of one or more broad measures of market performance.
Life of Fund results are measured from the date the Fund's shares were first sold (February 29, 2008).
Total Returns as of December 31 (Institutional Class shares)
Highest return for a quarter during the period of the bar chart above: Q2 '09 16.61 %Lowest return for a quarter during the period of the bar chart above: Q3 '11 (15.22)%
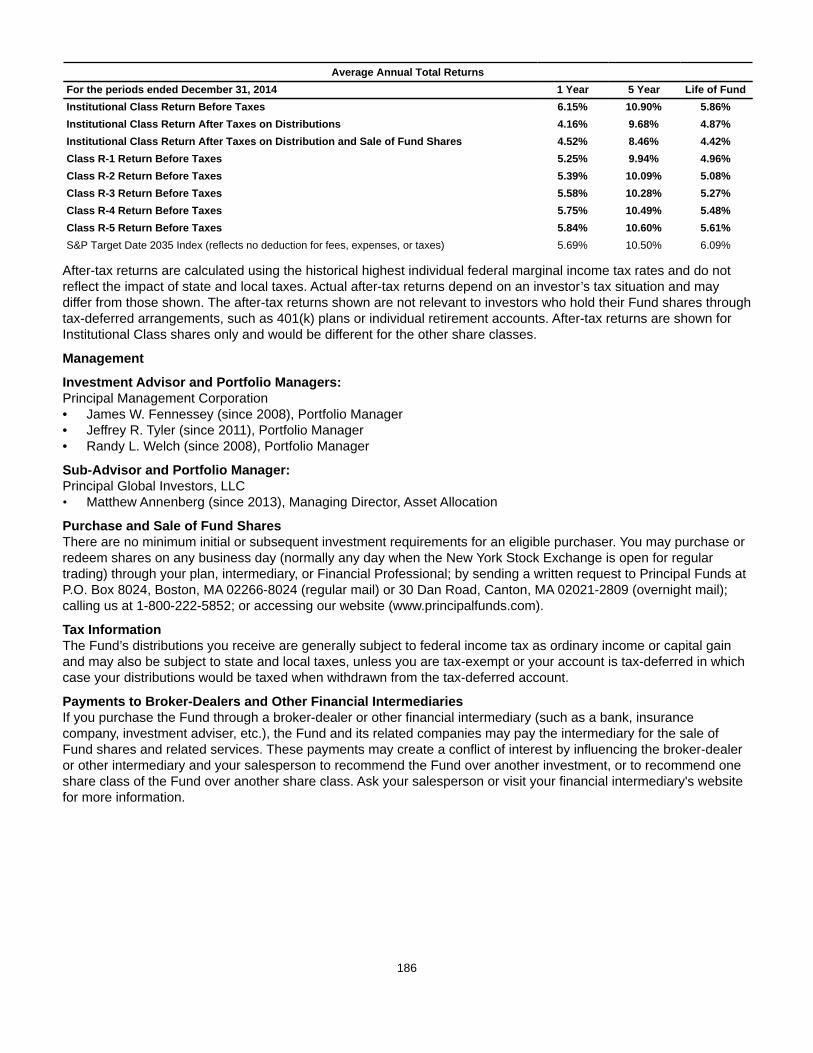
186
Average Annual Total ReturnsFor the periods ended December 31, 2014 1 Year 5 Year Life of FundInstitutional Class Return Before Taxes 6.15% 10.90% 5.86%Institutional Class Return After Taxes on Distributions 4.16% 9.68% 4.87%Institutional Class Return After Taxes on Distribution and Sale of Fund Shares 4.52% 8.46% 4.42%Class R-1 Return Before Taxes 5.25% 9.94% 4.96%Class R-2 Return Before Taxes 5.39% 10.09% 5.08%Class R-3 Return Before Taxes 5.58% 10.28% 5.27%Class R-4 Return Before Taxes 5.75% 10.49% 5.48%Class R-5 Return Before Taxes 5.84% 10.60% 5.61%S&P Target Date 2035 Index (reflects no deduction for fees, expenses, or taxes) 5.69% 10.50% 6.09%
After-tax returns are calculated using the historical highest individual federal marginal income tax rates and do not reflect the impact of state and local taxes. Actual after-tax returns depend on an investor’s tax situation and may differ from those shown. The after-tax returns shown are not relevant to investors who hold their Fund shares through tax-deferred arrangements, such as 401(k) plans or individual retirement accounts. After-tax returns are shown for Institutional Class shares only and would be different for the other share classes.
Management
Investment Advisor and Portfolio Managers: Principal Management Corporation• James W. Fennessey (since 2008), Portfolio Manager• Jeffrey R. Tyler (since 2011), Portfolio Manager• Randy L. Welch (since 2008), Portfolio Manager
Sub-Advisor and Portfolio Manager:Principal Global Investors, LLC • Matthew Annenberg (since 2013), Managing Director, Asset Allocation
Purchase and Sale of Fund SharesThere are no minimum initial or subsequent investment requirements for an eligible purchaser. You may purchase or redeem shares on any business day (normally any day when the New York Stock Exchange is open for regular trading) through your plan, intermediary, or Financial Professional; by sending a written request to Principal Funds at P.O. Box 8024, Boston, MA 02266-8024 (regular mail) or 30 Dan Road, Canton, MA 02021-2809 (overnight mail); calling us at 1-800-222-5852; or accessing our website (www.principalfunds.com).
Tax InformationThe Fund’s distributions you receive are generally subject to federal income tax as ordinary income or capital gain and may also be subject to state and local taxes, unless you are tax-exempt or your account is tax-deferred in which case your distributions would be taxed when withdrawn from the tax-deferred account.
Payments to Broker-Dealers and Other Financial IntermediariesIf you purchase the Fund through a broker-dealer or other financial intermediary (such as a bank, insurance company, investment adviser, etc.), the Fund and its related companies may pay the intermediary for the sale of Fund shares and related services. These payments may create a conflict of interest by influencing the broker-dealer or other intermediary and your salesperson to recommend the Fund over another investment, or to recommend one share class of the Fund over another share class. Ask your salesperson or visit your financial intermediary's website for more information.

187
PRINCIPAL LIFETIME 2040 FUNDObjective: The Fund seeks a total return consisting of long-term growth of capital and current income.
Fees and Expenses of the FundThis table describes the fees and expenses that you may pay if you buy and hold shares of the Fund. You may qualify for sales charge discounts if you and your family invest, or agree to invest in the future, at least $50,000 in Class A Shares of Principal Funds, Inc. More information about these and other discounts is available from your financial professional and in “Choosing a Share Class and The Costs of Investing” beginning on page 381 of the Fund’s prospectus and “Multiple Class Structure” beginning on page 6 of the Fund’s Statement of Additional Information.
Shareholder Fees (fees paid directly from your investment)
Share ClassA J Inst. R-1 R-2 R-3 R-4 R-5
Maximum Sales Charge (Load) Imposed onPurchases (as a percentage of offering price)
5.50% None None None None None None None
Maximum Deferred Sales Charge (Load) (as apercentage of the offering price or NAV whenSales Load is paid, whichever is less)
1.00% 1.00% None None None None None None
Annual Fund Operating Expenses (expenses that you pay each year as a percentage of the value of your investment)
Share ClassA J Inst. R-1 R-2 R-3 R-4 R-5
Management Fees 0.03% 0.03% 0.03% 0.03% 0.03% 0.03% 0.03% 0.03%Distribution and/or Service (12b-1) Fees (1) 0.25% 0.25% N/A 0.35% 0.30% 0.25% 0.10% N/AOther Expenses 0.20% 0.11% 0.01% 0.53% 0.45% 0.32% 0.28% 0.26%Acquired Fund Fees and Expenses 0.75% 0.75% 0.75% 0.75% 0.75% 0.75% 0.75% 0.75%Total Annual Fund Operating Expenses 1.23% 1.14% 0.79% 1.66% 1.53% 1.35% 1.16% 1.04%Fee Waiver and Expense Reimbursement(2) (3) (0.07)% (0.01)% N/A N/A N/A N/A N/A N/ATotal Annual Fund Operating Expenses afterFee Waiver and Expense Reimbursement
1.16% 1.13% 0.79% 1.66% 1.53% 1.35% 1.16% 1.04%
(1) Expense information in the table has been restated to reflect current fees. Effective December 30, 2013, the Distribution and/or Service (12b-1) Fees for Class J shares were reduced.
(2) Principal Funds Distributor, Inc. ("the Distributor") has contractually agreed to limit the Distribution Fees attributable to Class J. The waiver will reduce the Fund's Distribution Fees by 0.01%. It is expected that the fee waiver will continue through the period ending February 29, 2016; however, Principal Funds, Inc. and the Distributor, the parties to the agreement, may agree to terminate the fee waiver prior to the end of the period.
(3) Principal Management Corporation ("Principal"), the investment advisor, has contractually agreed to limit the Fund’s expenses by paying, if necessary, expenses normally payable by the Fund, (excluding interest expense, expenses related to fund investments, acquired fund fees and expenses, and other extraordinary expenses) to maintain a total level of operating expenses (expressed as a percent of average net assets on an annualized basis) not to exceed 0.41% for Class A shares. It is expected that the expense limit will continue through the period ending February 29, 2016; however, Principal Funds, Inc. and Principal, the parties to the agreement, may agree to terminate the expense limit prior to the end of the period.
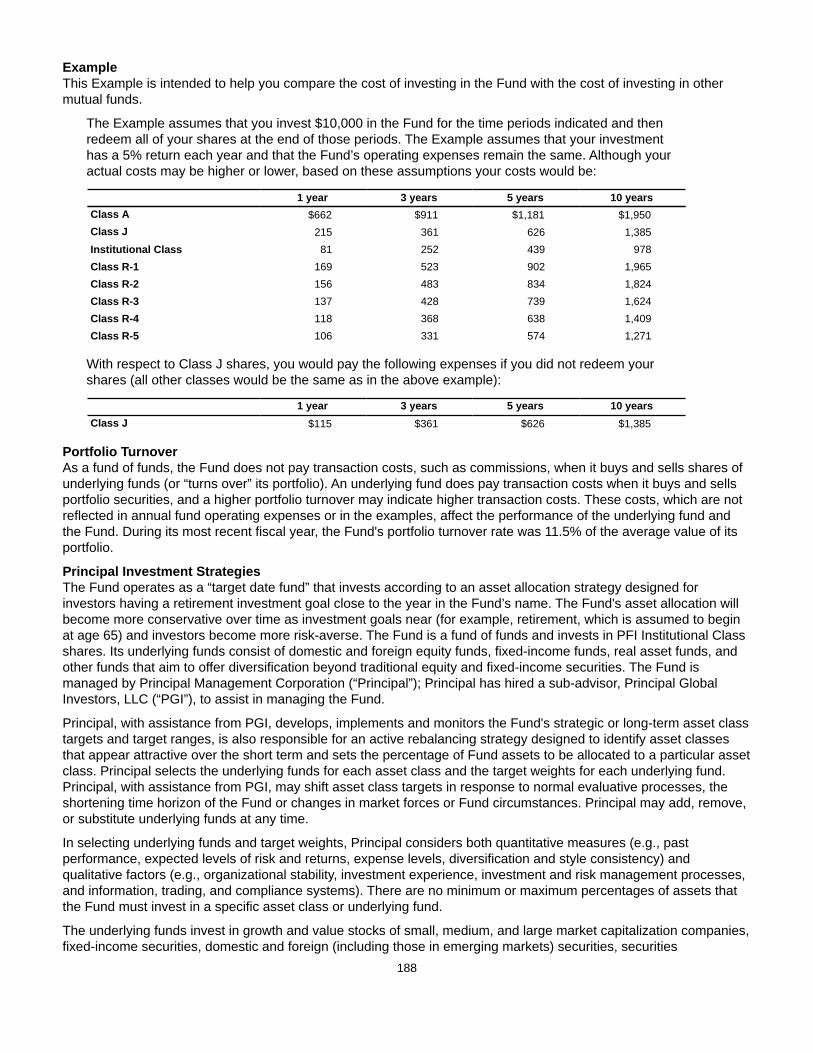
188
ExampleThis Example is intended to help you compare the cost of investing in the Fund with the cost of investing in other mutual funds.
The Example assumes that you invest $10,000 in the Fund for the time periods indicated and then redeem all of your shares at the end of those periods. The Example assumes that your investment has a 5% return each year and that the Fund’s operating expenses remain the same. Although your actual costs may be higher or lower, based on these assumptions your costs would be:
1 year 3 years 5 years 10 yearsClass A $662 $911 $1,181 $1,950Class J 215 361 626 1,385Institutional Class 81 252 439 978Class R-1 169 523 902 1,965Class R-2 156 483 834 1,824Class R-3 137 428 739 1,624Class R-4 118 368 638 1,409Class R-5 106 331 574 1,271
With respect to Class J shares, you would pay the following expenses if you did not redeem your shares (all other classes would be the same as in the above example):
1 year 3 years 5 years 10 yearsClass J $115 $361 $626 $1,385
Portfolio TurnoverAs a fund of funds, the Fund does not pay transaction costs, such as commissions, when it buys and sells shares of underlying funds (or “turns over” its portfolio). An underlying fund does pay transaction costs when it buys and sells portfolio securities, and a higher portfolio turnover may indicate higher transaction costs. These costs, which are not reflected in annual fund operating expenses or in the examples, affect the performance of the underlying fund and the Fund. During its most recent fiscal year, the Fund's portfolio turnover rate was 11.5% of the average value of its portfolio.
Principal Investment StrategiesThe Fund operates as a “target date fund” that invests according to an asset allocation strategy designed for investors having a retirement investment goal close to the year in the Fund’s name. The Fund's asset allocation will become more conservative over time as investment goals near (for example, retirement, which is assumed to begin at age 65) and investors become more risk-averse. The Fund is a fund of funds and invests in PFI Institutional Class shares. Its underlying funds consist of domestic and foreign equity funds, fixed-income funds, real asset funds, and other funds that aim to offer diversification beyond traditional equity and fixed-income securities. The Fund is managed by Principal Management Corporation (“Principal”); Principal has hired a sub-advisor, Principal Global Investors, LLC (“PGI”), to assist in managing the Fund.
Principal, with assistance from PGI, develops, implements and monitors the Fund's strategic or long-term asset class targets and target ranges, is also responsible for an active rebalancing strategy designed to identify asset classes that appear attractive over the short term and sets the percentage of Fund assets to be allocated to a particular asset class. Principal selects the underlying funds for each asset class and the target weights for each underlying fund. Principal, with assistance from PGI, may shift asset class targets in response to normal evaluative processes, the shortening time horizon of the Fund or changes in market forces or Fund circumstances. Principal may add, remove, or substitute underlying funds at any time.
In selecting underlying funds and target weights, Principal considers both quantitative measures (e.g., past performance, expected levels of risk and returns, expense levels, diversification and style consistency) and qualitative factors (e.g., organizational stability, investment experience, investment and risk management processes, and information, trading, and compliance systems). There are no minimum or maximum percentages of assets that the Fund must invest in a specific asset class or underlying fund.
The underlying funds invest in growth and value stocks of small, medium, and large market capitalization companies, fixed-income securities, domestic and foreign (including those in emerging markets) securities, securities
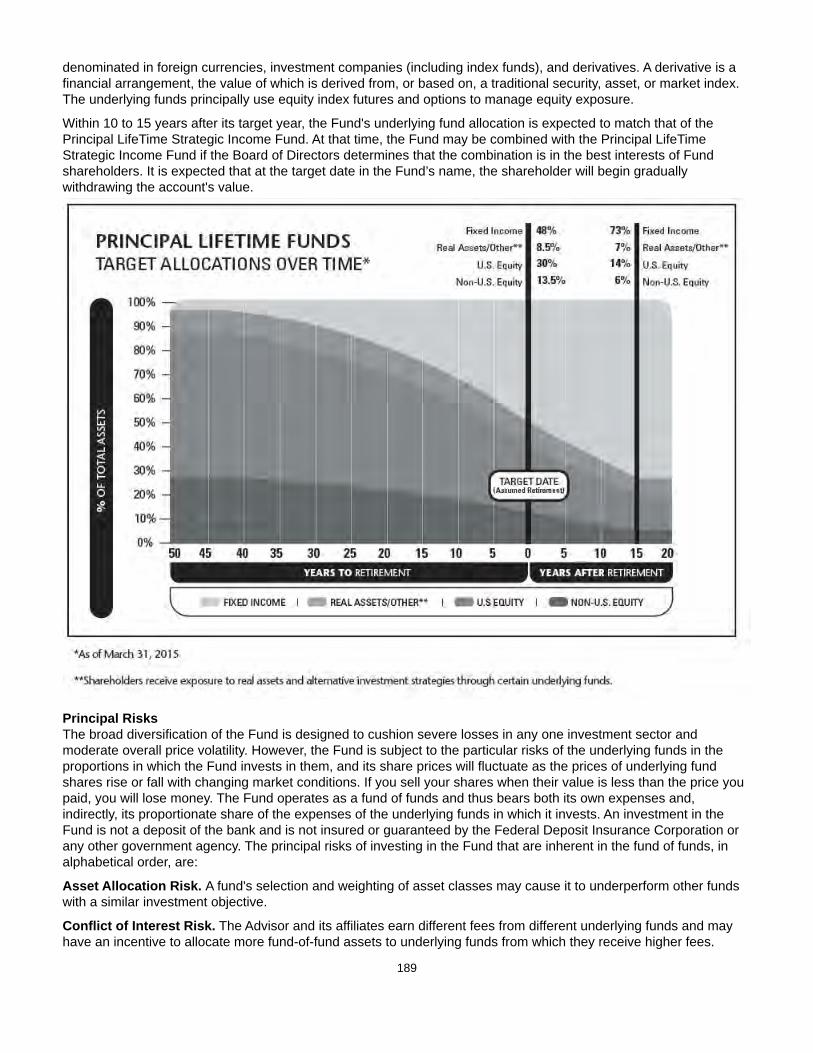
189
denominated in foreign currencies, investment companies (including index funds), and derivatives. A derivative is a financial arrangement, the value of which is derived from, or based on, a traditional security, asset, or market index. The underlying funds principally use equity index futures and options to manage equity exposure.
Within 10 to 15 years after its target year, the Fund's underlying fund allocation is expected to match that of the Principal LifeTime Strategic Income Fund. At that time, the Fund may be combined with the Principal LifeTime Strategic Income Fund if the Board of Directors determines that the combination is in the best interests of Fund shareholders. It is expected that at the target date in the Fund’s name, the shareholder will begin gradually withdrawing the account's value.
Principal RisksThe broad diversification of the Fund is designed to cushion severe losses in any one investment sector and moderate overall price volatility. However, the Fund is subject to the particular risks of the underlying funds in the proportions in which the Fund invests in them, and its share prices will fluctuate as the prices of underlying fund shares rise or fall with changing market conditions. If you sell your shares when their value is less than the price you paid, you will lose money. The Fund operates as a fund of funds and thus bears both its own expenses and, indirectly, its proportionate share of the expenses of the underlying funds in which it invests. An investment in the Fund is not a deposit of the bank and is not insured or guaranteed by the Federal Deposit Insurance Corporation or any other government agency. The principal risks of investing in the Fund that are inherent in the fund of funds, in alphabetical order, are:
Asset Allocation Risk. A fund's selection and weighting of asset classes may cause it to underperform other funds with a similar investment objective.
Conflict of Interest Risk. The Advisor and its affiliates earn different fees from different underlying funds and may have an incentive to allocate more fund-of-fund assets to underlying funds from which they receive higher fees.
190
Investment Company Securities Risk. Fund shareholders bear indirectly their proportionate share of the expenses of other investment companies in which the fund invests.
Target Date Fund Risk. A target date fund should not be selected based solely on age or retirement date because there is no guarantee that this fund will provide adequate income at or through retirement.
The principal risks of investing in the Fund that are inherent in the underlying funds, in alphabetical order, are:
Currency Risk. Risks of investing in securities denominated in, or that trade in, foreign (non-U.S.) currencies include changes in foreign exchange rates and foreign exchange restrictions.
Derivatives Risk. Transactions in derivatives may increase volatility, cause the liquidation of portfolio positions when not advantageous to do so and produce disproportionate losses.
Emerging Market Risk. Investments in emerging market countries may have more risk than those in developed market countries because the emerging markets are less developed and more illiquid. Emerging market countries can also be subject to increased social, economic, regulatory, and political uncertainties and can be extremely volatile.
Equity Securities Risk. The value of equity securities could decline if the issuer's financial condition declines or in response to overall market and economic conditions. A fund's principal market segment(s), such as large cap, mid cap or small cap stocks, or growth or value stocks, may underperform other market segments or the equity markets as a whole. Investments in smaller companies and mid-size companies may involve greater risk and price volatility than investments in larger, more mature companies.
Fixed-Income Securities Risk. Fixed-income securities are subject to interest rate risk and credit quality risk. The market value of fixed-income securities generally declines when interest rates rise, and an issuer of fixed-income securities could default on its payment obligations.
Foreign Securities Risk. The risks of foreign securities include loss of value as a result of: political or economic instability; nationalization, expropriation or confiscatory taxation; settlement delays; and limited government regulation (including less stringent reporting, accounting, and disclosure standards than are required of U.S. companies).
Growth Stock Risk. If growth companies do not increase their earnings at a rate expected by investors, the market price of the stock may decline significantly, even if earnings show an absolute increase. Growth company stocks also typically lack the dividend yield that can lessen price declines in market downturns.
Index Fund Investment Risk. More likely than not, an index fund will underperform the index due to cashflows and the fees and expenses of the fund.
Investment Company Securities Risk. Fund shareholders bear indirectly their proportionate share of the expenses of other investment companies in which the fund invests.
Portfolio Duration Risk. Portfolio duration is a measure of the expected life of a fixed-income security and its sensitivity to changes in interest rates. The longer a fund's average portfolio duration, the more sensitive the fund will be to changes in interest rates.
Risk of Being an Underlying Fund. A fund is subject to the risk of being an underlying fund to the extent that a fund of funds invests in the fund. An underlying fund of a fund of funds may experience relatively large redemptions or investments as the fund of funds periodically reallocates or rebalances its assets. These transactions may cause the underlying fund to sell portfolio securities to meet such redemptions, or to invest cash from such investments, at times it would not otherwise do so, and may as a result increase transaction costs and adversely affect underlying fund performance.
Value Stock Risk. The market may not recognize the intrinsic value of value stocks for a long time, or they may be appropriately priced at the time of purchase.
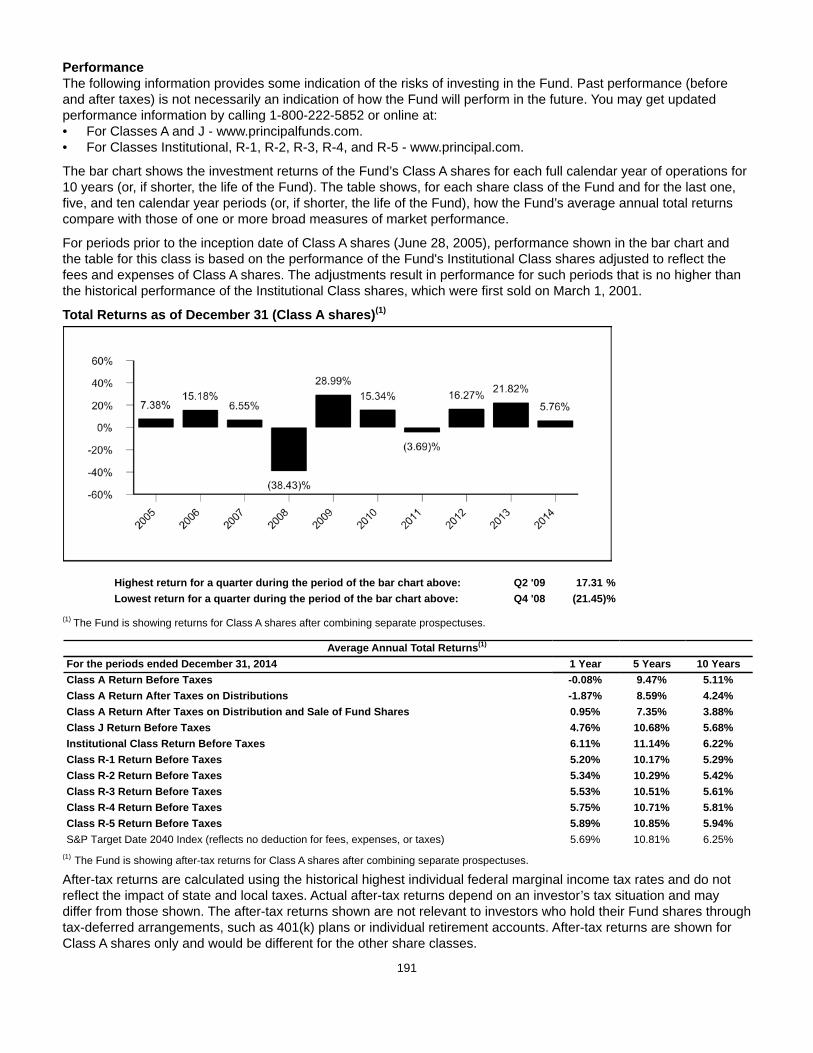
191
PerformanceThe following information provides some indication of the risks of investing in the Fund. Past performance (before and after taxes) is not necessarily an indication of how the Fund will perform in the future. You may get updated performance information by calling 1-800-222-5852 or online at: • For Classes A and J - www.principalfunds.com.• For Classes Institutional, R-1, R-2, R-3, R-4, and R-5 - www.principal.com.
The bar chart shows the investment returns of the Fund’s Class A shares for each full calendar year of operations for 10 years (or, if shorter, the life of the Fund). The table shows, for each share class of the Fund and for the last one, five, and ten calendar year periods (or, if shorter, the life of the Fund), how the Fund’s average annual total returns compare with those of one or more broad measures of market performance.
For periods prior to the inception date of Class A shares (June 28, 2005), performance shown in the bar chart and the table for this class is based on the performance of the Fund's Institutional Class shares adjusted to reflect the fees and expenses of Class A shares. The adjustments result in performance for such periods that is no higher than the historical performance of the Institutional Class shares, which were first sold on March 1, 2001.
Total Returns as of December 31 (Class A shares)(1)
Highest return for a quarter during the period of the bar chart above: Q2 '09 17.31 %Lowest return for a quarter during the period of the bar chart above: Q4 '08 (21.45)%
(1) The Fund is showing returns for Class A shares after combining separate prospectuses.
Average Annual Total Returns(1)
For the periods ended December 31, 2014 1 Year 5 Years 10 YearsClass A Return Before Taxes -0.08% 9.47% 5.11%Class A Return After Taxes on Distributions -1.87% 8.59% 4.24%Class A Return After Taxes on Distribution and Sale of Fund Shares 0.95% 7.35% 3.88%Class J Return Before Taxes 4.76% 10.68% 5.68%Institutional Class Return Before Taxes 6.11% 11.14% 6.22%Class R-1 Return Before Taxes 5.20% 10.17% 5.29%Class R-2 Return Before Taxes 5.34% 10.29% 5.42%Class R-3 Return Before Taxes 5.53% 10.51% 5.61%Class R-4 Return Before Taxes 5.75% 10.71% 5.81%Class R-5 Return Before Taxes 5.89% 10.85% 5.94%S&P Target Date 2040 Index (reflects no deduction for fees, expenses, or taxes) 5.69% 10.81% 6.25%
(1) The Fund is showing after-tax returns for Class A shares after combining separate prospectuses.
After-tax returns are calculated using the historical highest individual federal marginal income tax rates and do not reflect the impact of state and local taxes. Actual after-tax returns depend on an investor’s tax situation and may differ from those shown. The after-tax returns shown are not relevant to investors who hold their Fund shares through tax-deferred arrangements, such as 401(k) plans or individual retirement accounts. After-tax returns are shown for Class A shares only and would be different for the other share classes.

192
Management
Investment Advisor and Portfolio Managers: Principal Management Corporation• James W. Fennessey (since 2007), Portfolio Manager• Jeffrey R. Tyler (since 2011), Portfolio Manager• Randy L. Welch (since 2007), Portfolio Manager
Sub-Advisor and Portfolio Manager:Principal Global Investors, LLC • Matthew Annenberg (since 2013), Managing Director, Asset Allocation
Purchase and Sale of Fund Shares
Share Class Investment TypePurchase Minimum
Per FundA and J Initial Investment $1,000(1)
A and J Initial Investment for accounts with an Automatic Investment Plan (AIP) $100A and J Subsequent Investments $100(1)(2)
Institutional, R-1, R-2, R-3, R-4, andR-5
There are no minimum initial or subsequent investment requirements foreligible purchasers.
N/A
(1) Some exceptions apply; see "Purchase of Fund Shares - Minimum Investments" for more information.(2) For accounts with an AIP, the subsequent automatic investments must total $1,200 annually if the initial $1,000 minimum has not been met.
You may purchase or redeem shares on any business day (normally any day when the New York Stock Exchange is open for regular trading), through your plan, intermediary, or Financial Professional; by sending a written request to Principal Funds at P.O. Box 8024, Boston, MA 02266-8024 (regular mail) or 30 Dan Road, Canton, MA 02021-2809 (overnight mail); calling us at 1-800-222-5852; or accessing our website (www.principalfunds.com).
Tax InformationThe Fund’s distributions you receive are generally subject to federal income tax as ordinary income or capital gain and may also be subject to state and local taxes, unless you are tax-exempt or your account is tax-deferred in which case your distributions would be taxed when withdrawn from the tax-deferred account.
Payments to Broker-Dealers and Other Financial IntermediariesIf you purchase the Fund through a broker-dealer or other financial intermediary (such as a bank, insurance company, investment adviser, etc.), the Fund and its related companies may pay the intermediary for the sale of Fund shares and related services. These payments may create a conflict of interest by influencing the broker-dealer or other intermediary and your salesperson to recommend the Fund over another investment, or to recommend one share class of the Fund over another share class. Ask your salesperson or visit your financial intermediary's website for more information.
193
PRINCIPAL LIFETIME 2045 FUND
Objective: The Fund seeks a total return consisting of long-term growth of capital and current income.
Fees and Expenses of the FundThis table describes the fees and expenses that you may pay if you buy and hold shares of the Fund.
Shareholder Fees (fees paid directly from your investment): None
Annual Fund Operating Expenses (expenses that you pay each year as a percentage of the value of your investment)
Share ClassInst. R-1 R-2 R-3 R-4 R-5
Management Fees 0.03% 0.03% 0.03% 0.03% 0.03% 0.03%Distribution and/or Service (12b-1) Fees N/A 0.35% 0.30% 0.25% 0.10% N/AOther Expenses 0.01% 0.54% 0.46% 0.33% 0.29% 0.27%Acquired Fund Fees and Expenses 0.76% 0.76% 0.76% 0.76% 0.76% 0.76%Total Annual Fund Operating Expenses 0.80% 1.68% 1.55% 1.37% 1.18% 1.06%
ExampleThis Example is intended to help you compare the cost of investing in the Fund with the cost of investing in other mutual funds.
The Example assumes that you invest $10,000 in the Fund for the time periods indicated. The Example also assumes that your investment has a 5% return each year and that the Fund’s operating expenses remain the same. Although your actual costs may be higher or lower, based on these assumptions your costs would be:
1 year 3 years 5 years 10 yearsInstitutional Class $82 $255 $444 $990Class R-1 171 530 913 1,987Class R-2 158 490 845 1,845Class R-3 139 434 750 1,646Class R-4 120 375 649 1,432Class R-5 108 337 585 1,294
Portfolio TurnoverAs a fund of funds, the Fund does not pay transaction costs, such as commissions, when it buys and sells shares of underlying funds (or “turns over” its portfolio). An underlying fund does pay transaction costs when it buys and sells portfolio securities, and a higher portfolio turnover may indicate higher transaction costs. These costs, which are not reflected in annual fund operating expenses or in the examples, affect the performance of the underlying fund and the Fund. During its most recent fiscal year, the Fund's portfolio turnover rate was 8.7% of the average value of its portfolio.
Principal Investment StrategiesThe Fund operates as a “target date fund” that invests according to an asset allocation strategy designed for investors having a retirement investment goal close to the year in the Fund’s name. The Fund's asset allocation will become more conservative over time as investment goals near (for example, retirement, which is assumed to begin at age 65) and investors become more risk-averse. The Fund is a fund of funds and invests in PFI Institutional Class shares. Its underlying funds consist of domestic and foreign equity funds, fixed-income funds, real asset funds, and other funds that aim to offer diversification beyond traditional equity and fixed-income securities. The Fund is managed by Principal Management Corporation (“Principal”); Principal has hired a sub-advisor, Principal Global Investors, LLC (“PGI”), to assist in managing the Fund.
Principal, with assistance from PGI, develops, implements and monitors the Fund's strategic or long-term asset class targets and target ranges, is also responsible for an active rebalancing strategy designed to identify asset classes that appear attractive over the short term and sets the percentage of Fund assets to be allocated to a particular asset class. Principal selects the underlying funds for each asset class and the target weights for each underlying fund.
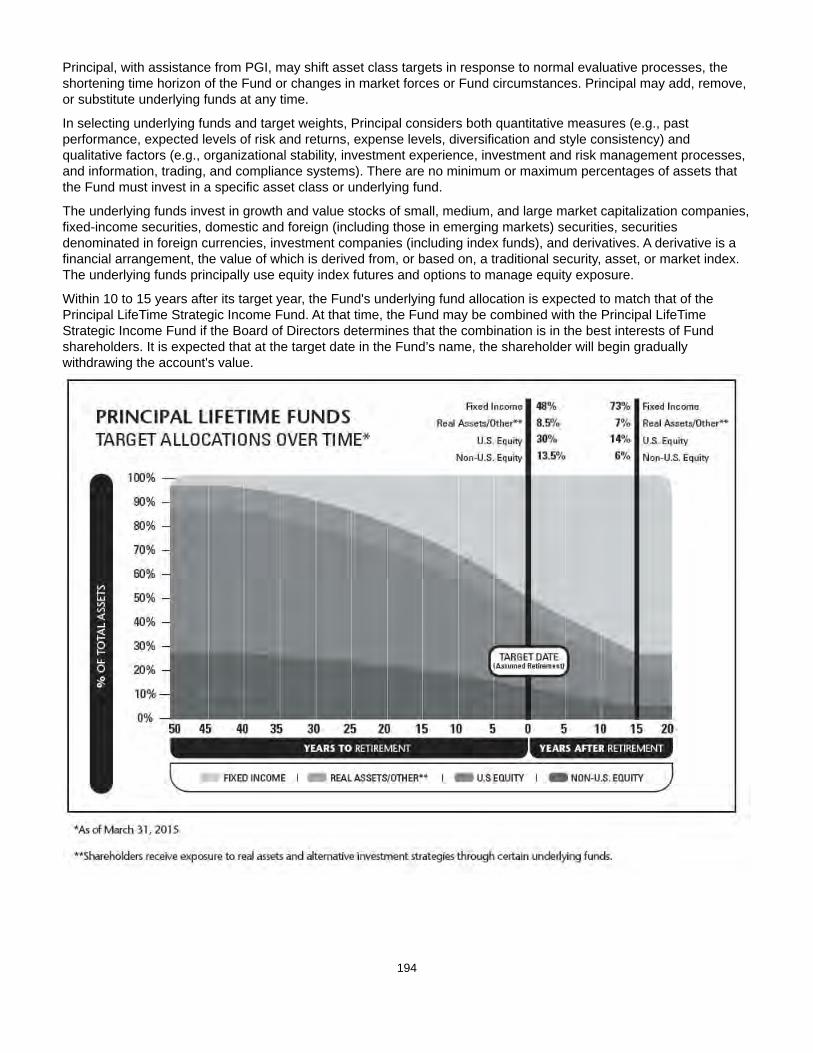
194
Principal, with assistance from PGI, may shift asset class targets in response to normal evaluative processes, the shortening time horizon of the Fund or changes in market forces or Fund circumstances. Principal may add, remove, or substitute underlying funds at any time.
In selecting underlying funds and target weights, Principal considers both quantitative measures (e.g., past performance, expected levels of risk and returns, expense levels, diversification and style consistency) and qualitative factors (e.g., organizational stability, investment experience, investment and risk management processes, and information, trading, and compliance systems). There are no minimum or maximum percentages of assets that the Fund must invest in a specific asset class or underlying fund.
The underlying funds invest in growth and value stocks of small, medium, and large market capitalization companies, fixed-income securities, domestic and foreign (including those in emerging markets) securities, securities denominated in foreign currencies, investment companies (including index funds), and derivatives. A derivative is a financial arrangement, the value of which is derived from, or based on, a traditional security, asset, or market index. The underlying funds principally use equity index futures and options to manage equity exposure.
Within 10 to 15 years after its target year, the Fund's underlying fund allocation is expected to match that of the Principal LifeTime Strategic Income Fund. At that time, the Fund may be combined with the Principal LifeTime Strategic Income Fund if the Board of Directors determines that the combination is in the best interests of Fund shareholders. It is expected that at the target date in the Fund’s name, the shareholder will begin gradually withdrawing the account's value.
195
Principal RisksThe broad diversification of the Fund is designed to cushion severe losses in any one investment sector and moderate overall price volatility. However, the Fund is subject to the particular risks of the underlying funds in the proportions in which the Fund invests in them, and its share prices will fluctuate as the prices of underlying fund shares rise or fall with changing market conditions. If you sell your shares when their value is less than the price you paid, you will lose money. The Fund operates as a fund of funds and thus bears both its own expenses and, indirectly, its proportionate share of the expenses of the underlying funds in which it invests. An investment in the Fund is not a deposit of a bank and is not insured or guaranteed by the Federal Deposit Insurance Corporation or any other government agency. The principal risks of investing in the Fund that are inherent in the fund of funds, in alphabetical order, are:
Asset Allocation Risk. A fund's selection and weighting of asset classes may cause it to underperform other funds with a similar investment objective.
Conflict of Interest Risk. The Advisor and its affiliates earn different fees from different underlying funds and may have an incentive to allocate more fund-of-fund assets to underlying funds from which they receive higher fees.
Investment Company Securities Risk. Fund shareholders bear indirectly their proportionate share of the expenses of other investment companies in which the fund invests.
Target Date Fund Risk. A target date fund should not be selected based solely on age or retirement date because there is no guarantee that this fund will provide adequate income at or through retirement.
The principal risks of investing in the Fund that are inherent in the underlying funds, in alphabetical order, are:
Currency Risk. Risks of investing in securities denominated in, or that trade in, foreign (non-U.S.) currencies include changes in foreign exchange rates and foreign exchange restrictions.
Derivatives Risk. Transactions in derivatives may increase volatility, cause the liquidation of portfolio positions when not advantageous to do so and produce disproportionate losses.
Emerging Market Risk. Investments in emerging market countries may have more risk than those in developed market countries because the emerging markets are less developed and more illiquid. Emerging market countries can also be subject to increased social, economic, regulatory, and political uncertainties and can be extremely volatile.
Equity Securities Risk. The value of equity securities could decline if the issuer's financial condition declines or in response to overall market and economic conditions. A fund's principal market segment(s), such as large cap, mid cap or small cap stocks, or growth or value stocks, may underperform other market segments or the equity markets as a whole. Investments in smaller companies and mid-size companies may involve greater risk and price volatility than investments in larger, more mature companies.
Fixed-Income Securities Risk. Fixed-income securities are subject to interest rate risk and credit quality risk. The market value of fixed-income securities generally declines when interest rates rise, and an issuer of fixed-income securities could default on its payment obligations.
Foreign Securities Risk. The risks of foreign securities include loss of value as a result of: political or economic instability; nationalization, expropriation or confiscatory taxation; settlement delays; and limited government regulation (including less stringent reporting, accounting, and disclosure standards than are required of U.S. companies).
Growth Stock Risk. If growth companies do not increase their earnings at a rate expected by investors, the market price of the stock may decline significantly, even if earnings show an absolute increase. Growth company stocks also typically lack the dividend yield that can lessen price declines in market downturns.
Index Fund Investment Risk. More likely than not, an index fund will underperform the index due to cashflows and the fees and expenses of the fund.
Investment Company Securities Risk. Fund shareholders bear indirectly their proportionate share of the expenses of other investment companies in which the fund invests.
Portfolio Duration Risk. Portfolio duration is a measure of the expected life of a fixed-income security and its sensitivity to changes in interest rates. The longer a fund's average portfolio duration, the more sensitive the fund will be to changes in interest rates.

196
Risk of Being an Underlying Fund. A fund is subject to the risk of being an underlying fund to the extent that a fund of funds invests in the fund. An underlying fund of a fund of funds may experience relatively large redemptions or investments as the fund of funds periodically reallocates or rebalances its assets. These transactions may cause the underlying fund to sell portfolio securities to meet such redemptions, or to invest cash from such investments, at times it would not otherwise do so, and may as a result increase transaction costs and adversely affect underlying fund performance.
Value Stock Risk. The market may not recognize the intrinsic value of value stocks for a long time, or they may be appropriately priced at the time of purchase.
PerformanceThe following information provides some indication of the risks of investing in the Fund. Past performance (before and after taxes) is not necessarily an indication of how the Fund will perform in the future. You may get updated performance information by calling 1-800-222-5852 or online at www.principal.com.
The bar chart shows the investment returns of the Fund’s Institutional Class shares for each full calendar year of operations for 10 years (or, if shorter, the life of the Fund). The table shows, for each share class of the Fund and for the last one, five, and ten calendar year periods (or, if shorter, the life of the Fund), how the Fund’s average annual total returns compare with those of one or more broad measures of market performance.
Life of Fund results are measured from the date the Fund's shares were first sold (February 29, 2008).
Total Returns as of December 31 (Institutional Class shares)
Highest return for a quarter during the period of the bar chart above: Q2 '09 17.31 %Lowest return for a quarter during the period of the bar chart above: Q3 '11 (16.15)%

197
Average Annual Total ReturnsFor the periods ended December 31, 2014 1 Year 5 Year Life of FundInstitutional Class Return Before Taxes 6.35% 11.33% 6.01%Institutional Class Return After Taxes on Distributions 4.38% 10.11% 5.04%Institutional Class Return After Taxes on Distribution and Sale of Fund Shares 4.65% 8.77% 4.53%Class R-1 Return Before Taxes 5.39% 10.36% 5.05%Class R-2 Return Before Taxes 5.49% 10.49% 5.19%Class R-3 Return Before Taxes 5.74% 10.70% 5.36%Class R-4 Return Before Taxes 5.91% 10.92% 5.57%Class R-5 Return Before Taxes 6.01% 11.05% 5.71%S&P Target Date 2045 Index (reflects no deduction for fees, expenses, or taxes) 5.67% 11.04% 6.12%
After-tax returns are calculated using the historical highest individual federal marginal income tax rates and do not reflect the impact of state and local taxes. Actual after-tax returns depend on an investor’s tax situation and may differ from those shown. The after-tax returns shown are not relevant to investors who hold their Fund shares through tax-deferred arrangements, such as 401(k) plans or individual retirement accounts. After-tax returns are shown for Institutional Class shares only and would be different for the other share classes.
Management
Investment Advisor and Portfolio Managers: Principal Management Corporation• James W. Fennessey (since 2008), Portfolio Manager• Jeffrey R. Tyler (since 2011), Portfolio Manager• Randy L. Welch (since 2008), Portfolio Manager
Sub-Advisor and Portfolio Manager:Principal Global Investors, LLC • Matthew Annenberg (since 2013), Managing Director, Asset Allocation
Purchase and Sale of Fund SharesThere are no minimum initial or subsequent investment requirements for an eligible purchaser. You may purchase or redeem shares on any business day (normally any day when the New York Stock Exchange is open for regular trading) through your plan, intermediary, or Financial Professional; by sending a written request to Principal Funds at P.O. Box 8024, Boston, MA 02266-8024 (regular mail) or 30 Dan Road, Canton, MA 02021-2809 (overnight mail); calling us at 1-800-222-5852; or accessing our website (www.principalfunds.com).
Tax InformationThe Fund’s distributions you receive are generally subject to federal income tax as ordinary income or capital gain and may also be subject to state and local taxes, unless you are tax-exempt or your account is tax-deferred in which case your distributions would be taxed when withdrawn from the tax-deferred account.
Payments to Broker-Dealers and Other Financial IntermediariesIf you purchase the Fund through a broker-dealer or other financial intermediary (such as a bank, insurance company, investment adviser, etc.), the Fund and its related companies may pay the intermediary for the sale of Fund shares and related services. These payments may create a conflict of interest by influencing the broker-dealer or other intermediary and your salesperson to recommend the Fund over another investment, or to recommend one share class of the Fund over another share class. Ask your salesperson or visit your financial intermediary's website for more information.
198
PRINCIPAL LIFETIME 2050 FUNDObjective: The Fund seeks a total return consisting of long-term growth of capital and current income.
Fees and Expenses of the FundThis table describes the fees and expenses that you may pay if you buy and hold shares of the Fund. You may qualify for sales charge discounts if you and your family invest, or agree to invest in the future, at least $50,000 in Class A Shares of Principal Funds, Inc. More information about these and other discounts is available from your financial professional and in “Choosing a Share Class and The Costs of Investing” beginning on page 381 of the Fund’s prospectus and “Multiple Class Structure” beginning on page 6 of the Fund’s Statement of Additional Information.
Shareholder Fees (fees paid directly from your investment)
Share ClassA J Inst. R-1 R-2 R-3 R-4 R-5
Maximum Sales Charge (Load) Imposed onPurchases (as a percentage of offering price)
5.50% None None None None None None None
Maximum Deferred Sales Charge (Load) (as apercentage of the offering price or NAV whenSales Load is paid, whichever is less)
1.00% 1.00% None None None None None None
Annual Fund Operating Expenses (expenses that you pay each year as a percentage of the value of your investment)
Share ClassA J Inst. R-1 R-2 R-3 R-4 R-5
Management Fees 0.03% 0.03% 0.03% 0.03% 0.03% 0.03% 0.03% 0.03%
Distribution and/or Service (12b-1) Fees (1) 0.25% 0.25% N/A 0.35% 0.30% 0.25% 0.10% N/A
Other Expenses 0.24% 0.22% 0.01% 0.53% 0.45% 0.32% 0.28% 0.26%
Acquired Fund Fees and Expenses 0.76% 0.76% 0.76% 0.76% 0.76% 0.76% 0.76% 0.76%
Total Annual Fund Operating Expenses 1.28% 1.26% 0.80% 1.67% 1.54% 1.36% 1.17% 1.05%Fee Waiver and Expense Reimbursement(2) (3) (0.11)% (0.01)% N/A N/A N/A N/A N/A N/ATotal Annual Fund Operating Expenses afterFee Waiver and Expense Reimbursement
1.17% 1.25% 0.80% 1.67% 1.54% 1.36% 1.17% 1.05%
(1) Expense information in the table has been restated to reflect current fees. Effective December 30, 2013, the Distribution and/or Service (12b-1) Fees for Class J shares were reduced.
(2) Principal Funds Distributor, Inc. ("the Distributor") has contractually agreed to limit the Distribution Fees attributable to Class J. The waiver will reduce the Fund's Distribution Fees by 0.01%. It is expected that the fee waiver will continue through the period ending February 29, 2016; however, Principal Funds, Inc. and the Distributor, the parties to the agreement, may agree to terminate the fee waiver prior to the end of the period.
(3) Principal Management Corporation ("Principal"), the investment advisor, has contractually agreed to limit the Fund’s expenses by paying, if necessary, expenses normally payable by the Fund, (excluding interest expense, expenses related to fund investments, acquired fund fees and expenses, and other extraordinary expenses) to maintain a total level of operating expenses (expressed as a percent of average net assets on an annualized basis) not to exceed 0.41% for Class A shares. It is expected that the expense limit will continue through the period ending February 29, 2016; however, Principal Funds, Inc. and Principal, the parties to the agreement, may agree to terminate the expense limit prior to the end of the period.
ExampleThis Example is intended to help you compare the cost of investing in the Fund with the cost of investing in other mutual funds.
The Example assumes that you invest $10,000 in the Fund for the time periods indicated and then redeem all of your shares at the end of those periods. The Example assumes that your investment has a 5% return each year and that the Fund’s operating expenses remain the same. Although your actual costs may be higher or lower, based on these assumptions your costs would be:
199
1 year 3 years 5 years 10 yearsClass A $663 $922 $1,202 $2,000Class J 227 398 690 1,522Institutional Class 82 255 444 990Class R-1 170 526 907 1,976Class R-2 157 486 839 1,834Class R-3 138 431 745 1,635Class R-4 119 372 644 1,420Class R-5 107 334 579 1,283
With respect to Class J shares, you would pay the following expenses if you did not redeem your shares (all other classes would be the same as in the above example):
1 year 3 years 5 years 10 yearsClass J $127 $398 $690 $1,522
Portfolio TurnoverAs a fund of funds, the Fund does not pay transaction costs, such as commissions, when it buys and sells shares of underlying funds (or “turns over” its portfolio). An underlying fund does pay transaction costs when it buys and sells portfolio securities, and a higher portfolio turnover may indicate higher transaction costs. These costs, which are not reflected in annual fund operating expenses or in the examples, affect the performance of the underlying fund and the Fund. During its most recent fiscal year, the Fund's portfolio turnover rate was 9.9% of the average value of its portfolio.
Principal Investment StrategiesThe Fund operates as a “target date fund” that invests according to an asset allocation strategy designed for investors having a retirement investment goal close to the year in the Fund’s name. The Fund's asset allocation will become more conservative over time as investment goals near (for example, retirement, which is assumed to begin at age 65) and investors become more risk-averse. The Fund is a fund of funds and invests in PFI Institutional Class shares. Its underlying funds consist of domestic and foreign equity funds, fixed-income funds, real asset funds, and other funds that aim to offer diversification beyond traditional equity and fixed-income securities. The Fund is managed by Principal Management Corporation (“Principal”); Principal has hired a sub-advisor, Principal Global Investors, LLC (“PGI”), to assist in managing the Fund.
Principal, with assistance from PGI, develops, implements and monitors the Fund's strategic or long-term asset class targets and target ranges, is also responsible for an active rebalancing strategy designed to identify asset classes that appear attractive over the short term and sets the percentage of Fund assets to be allocated to a particular asset class. Principal selects the underlying funds for each asset class and the target weights for each underlying fund.
Principal, with assistance from PGI, may shift asset class targets in response to normal evaluative processes, the shortening time horizon of the Fund or changes in market forces or Fund circumstances. Principal may add, remove, or substitute underlying funds at any time.
In selecting underlying funds and target weights, Principal considers both quantitative measures (e.g., past performance, expected levels of risk and returns, expense levels, diversification and style consistency) and qualitative factors (e.g., organizational stability, investment experience, investment and risk management processes, and information, trading, and compliance systems). There are no minimum or maximum percentages of assets that the Fund must invest in a specific asset class or underlying fund.
The underlying funds invest in growth and value stocks of small, medium, and large market capitalization companies, fixed-income securities, domestic and foreign (including those in emerging markets) securities, securities denominated in foreign currencies, investment companies (including index funds), and derivatives. A derivative is a financial arrangement, the value of which is derived from, or based on, a traditional security, asset, or market index. The underlying funds principally use equity index futures and options to manage equity exposure.

200
Within 10 to 15 years after its target year, the Fund's underlying fund allocation is expected to match that of the Principal LifeTime Strategic Income Fund. At that time, the Fund may be combined with the Principal LifeTime Strategic Income Fund if the Board of Directors determines that the combination is in the best interests of Fund shareholders. It is expected that at the target date in the Fund’s name, the shareholder will begin gradually withdrawing the account's value.
Principal RisksThe broad diversification of the Fund is designed to cushion severe losses in any one investment sector and moderate overall price volatility. However, the Fund is subject to the particular risks of the underlying funds in the proportions in which the Fund invests in them, and its share prices will fluctuate as the prices of underlying fund shares rise or fall with changing market conditions. If you sell your shares when their value is less than the price you paid, you will lose money. The Fund operates as a fund of funds and thus bears both its own expenses and, indirectly, its proportionate share of the expenses of the underlying funds in which it invests. An investment in the Fund is not a deposit of a bank and is not insured or guaranteed by the Federal Deposit Insurance Corporation or any other government agency. The principal risks of investing in the Fund that are inherent in the fund of funds, in alphabetical order, are:
Asset Allocation Risk. A fund's selection and weighting of asset classes may cause it to underperform other funds with a similar investment objective.
Conflict of Interest Risk. The Advisor and its affiliates earn different fees from different underlying funds and may have an incentive to allocate more fund-of-fund assets to underlying funds from which they receive higher fees.
Investment Company Securities Risk. Fund shareholders bear indirectly their proportionate share of the expenses of other investment companies in which the fund invests.
201
Target Date Fund Risk. A target date fund should not be selected based solely on age or retirement date because there is no guarantee that this fund will provide adequate income at or through retirement.
The principal risks of investing in the Fund that are inherent in the underlying funds, in alphabetical order, are:
Currency Risk. Risks of investing in securities denominated in, or that trade in, foreign (non-U.S.) currencies include changes in foreign exchange rates and foreign exchange restrictions.
Derivatives Risk. Transactions in derivatives may increase volatility, cause the liquidation of portfolio positions when not advantageous to do so and produce disproportionate losses.
Emerging Market Risk. Investments in emerging market countries may have more risk than those in developed market countries because the emerging markets are less developed and more illiquid. Emerging market countries can also be subject to increased social, economic, regulatory, and political uncertainties and can be extremely volatile.
Equity Securities Risk. The value of equity securities could decline if the issuer's financial condition declines or in response to overall market and economic conditions. A fund's principal market segment(s), such as large cap, mid cap or small cap stocks, or growth or value stocks, may underperform other market segments or the equity markets as a whole. Investments in smaller companies and mid-size companies may involve greater risk and price volatility than investments in larger, more mature companies.
Fixed-Income Securities Risk. Fixed-income securities are subject to interest rate risk and credit quality risk. The market value of fixed-income securities generally declines when interest rates rise, and an issuer of fixed-income securities could default on its payment obligations.
Foreign Securities Risk. The risks of foreign securities include loss of value as a result of: political or economic instability; nationalization, expropriation or confiscatory taxation; settlement delays; and limited government regulation (including less stringent reporting, accounting, and disclosure standards than are required of U.S. companies).
Growth Stock Risk. If growth companies do not increase their earnings at a rate expected by investors, the market price of the stock may decline significantly, even if earnings show an absolute increase. Growth company stocks also typically lack the dividend yield that can lessen price declines in market downturns.
Index Fund Investment Risk. More likely than not, an index fund will underperform the index due to cashflows and the fees and expenses of the fund.
Investment Company Securities Risk. Fund shareholders bear indirectly their proportionate share of the expenses of other investment companies in which the fund invests.
Portfolio Duration Risk. Portfolio duration is a measure of the expected life of a fixed-income security and its sensitivity to changes in interest rates. The longer a fund's average portfolio duration, the more sensitive the fund will be to changes in interest rates.
Risk of Being an Underlying Fund. A fund is subject to the risk of being an underlying fund to the extent that a fund of funds invests in the fund. An underlying fund of a fund of funds may experience relatively large redemptions or investments as the fund of funds periodically reallocates or rebalances its assets. These transactions may cause the underlying fund to sell portfolio securities to meet such redemptions, or to invest cash from such investments, at times it would not otherwise do so, and may as a result increase transaction costs and adversely affect underlying fund performance.
Value Stock Risk. The market may not recognize the intrinsic value of value stocks for a long time, or they may be appropriately priced at the time of purchase.
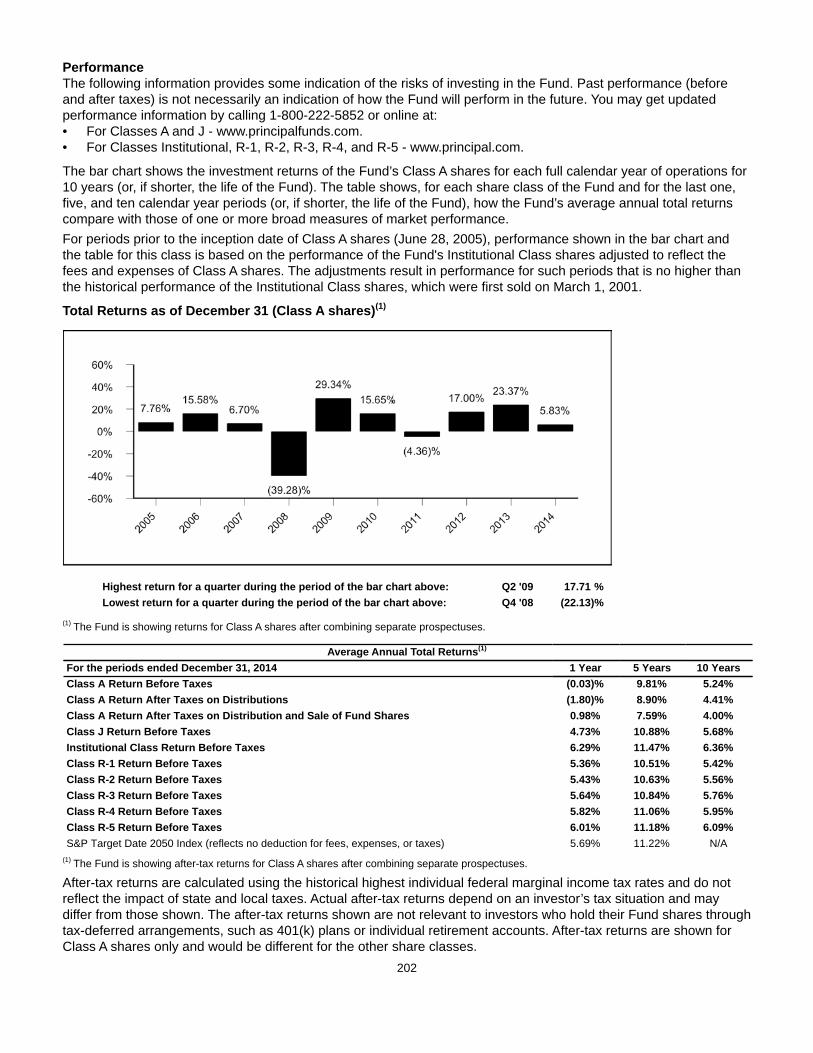
202
PerformanceThe following information provides some indication of the risks of investing in the Fund. Past performance (before and after taxes) is not necessarily an indication of how the Fund will perform in the future. You may get updated performance information by calling 1-800-222-5852 or online at: • For Classes A and J - www.principalfunds.com.• For Classes Institutional, R-1, R-2, R-3, R-4, and R-5 - www.principal.com.
The bar chart shows the investment returns of the Fund’s Class A shares for each full calendar year of operations for 10 years (or, if shorter, the life of the Fund). The table shows, for each share class of the Fund and for the last one, five, and ten calendar year periods (or, if shorter, the life of the Fund), how the Fund’s average annual total returns compare with those of one or more broad measures of market performance. For periods prior to the inception date of Class A shares (June 28, 2005), performance shown in the bar chart and the table for this class is based on the performance of the Fund's Institutional Class shares adjusted to reflect the fees and expenses of Class A shares. The adjustments result in performance for such periods that is no higher than the historical performance of the Institutional Class shares, which were first sold on March 1, 2001.
Total Returns as of December 31 (Class A shares)(1)
Highest return for a quarter during the period of the bar chart above: Q2 '09 17.71 %Lowest return for a quarter during the period of the bar chart above: Q4 '08 (22.13)%
(1) The Fund is showing returns for Class A shares after combining separate prospectuses.
Average Annual Total Returns(1)
For the periods ended December 31, 2014 1 Year 5 Years 10 YearsClass A Return Before Taxes (0.03)% 9.81% 5.24%Class A Return After Taxes on Distributions (1.80)% 8.90% 4.41%Class A Return After Taxes on Distribution and Sale of Fund Shares 0.98% 7.59% 4.00%Class J Return Before Taxes 4.73% 10.88% 5.68%Institutional Class Return Before Taxes 6.29% 11.47% 6.36%Class R-1 Return Before Taxes 5.36% 10.51% 5.42%Class R-2 Return Before Taxes 5.43% 10.63% 5.56%Class R-3 Return Before Taxes 5.64% 10.84% 5.76%Class R-4 Return Before Taxes 5.82% 11.06% 5.95%Class R-5 Return Before Taxes 6.01% 11.18% 6.09%S&P Target Date 2050 Index (reflects no deduction for fees, expenses, or taxes) 5.69% 11.22% N/A
(1) The Fund is showing after-tax returns for Class A shares after combining separate prospectuses.
After-tax returns are calculated using the historical highest individual federal marginal income tax rates and do not reflect the impact of state and local taxes. Actual after-tax returns depend on an investor’s tax situation and may differ from those shown. The after-tax returns shown are not relevant to investors who hold their Fund shares through tax-deferred arrangements, such as 401(k) plans or individual retirement accounts. After-tax returns are shown for Class A shares only and would be different for the other share classes.
203
Management
Investment Advisor and Portfolio Managers: Principal Management Corporation• James W. Fennessey (since 2007), Portfolio Manager• Jeffrey R. Tyler (since 2011), Portfolio Manager• Randy L. Welch (since 2007), Portfolio Manager
Sub-Advisor and Portfolio Manager:Principal Global Investors, LLC • Matthew Annenberg (since 2013), Managing Director, Asset Allocation
Purchase and Sale of Fund Shares
Share Class Investment TypePurchase Minimum
Per FundA and J Initial Investment $1,000(1)
A and J Initial Investment for accounts with an Automatic Investment Plan (AIP) $100A and J Subsequent Investments $100(1)(2)
Institutional, R-1, R-2, R-3, R-4, and R-5 There are no minimum initial or subsequent investment requirements foreligible purchasers.
N/A
(1) Some exceptions apply; see "Purchase of Fund Shares - Minimum Investments" for more information.(2) For accounts with an AIP, the subsequent automatic investments must total $1,200 annually if the initial $1,000 minimum has not been met.
You may purchase or redeem shares on any business day (normally any day when the New York Stock Exchange is open for regular trading), through your plan, intermediary, or Financial Professional; by sending a written request to Principal Funds at P.O. Box 8024, Boston, MA 02266-8024 (regular mail) or 30 Dan Road, Canton, MA 02021-2809 (overnight mail); calling us at 1-800-222-5852; or accessing our website (www.principalfunds.com).
Tax InformationThe Fund’s distributions you receive are generally subject to federal income tax as ordinary income or capital gain and may also be subject to state and local taxes, unless you are tax-exempt or your account is tax-deferred in which case your distributions would be taxed when withdrawn from the tax-deferred account.
Payments to Broker-Dealers and Other Financial IntermediariesIf you purchase the Fund through a broker-dealer or other financial intermediary (such as a bank, insurance company, investment adviser, etc.), the Fund and its related companies may pay the intermediary for the sale of Fund shares and related services. These payments may create a conflict of interest by influencing the broker-dealer or other intermediary and your salesperson to recommend the Fund over another investment, or to recommend one share class of the Fund over another share class. Ask your salesperson or visit your financial intermediary's website for more information.
204
PRINCIPAL LIFETIME 2055 FUNDObjective: The Fund seeks a total return consisting of long-term growth of capital and current income.
Fees and Expenses of the FundThis table describes the fees and expenses that you may pay if you buy and hold shares of the Fund.
Shareholder Fees (fees paid directly from your investment): None
Annual Fund Operating Expenses (expenses that you pay each year as a percentage of the value of your investment)
Share ClassInst. R-1 R-2 R-3 R-4 R-5
Management Fees 0.03% 0.03% 0.03% 0.03% 0.03% 0.03%Distribution and/or Service (12b-1) Fees N/A 0.35% 0.30% 0.25% 0.10% N/AOther Expenses 0.04% 0.55% 0.47% 0.34% 0.30% 0.28%Acquired Fund Fees and Expenses 0.76% 0.76% 0.76% 0.76% 0.76% 0.76%Total Annual Fund Operating Expenses 0.83% 1.69% 1.56% 1.38% 1.19% 1.07%Expense Reimbursement(1) N/A —% —% —% —% —%
Total Annual Fund Operating Expenses afterExpense Reimbursement
0.83% 1.69% 1.56% 1.38% 1.19% 1.07%
(1) Principal Management Corporation ("Principal"), the investment advisor, has contractually agreed to limit the Fund’s expenses by paying, if necessary, expenses normally payable by the Fund, (excluding interest expense, expenses related to fund investments, acquired fund fees and expenses, and other extraordinary expenses) to maintain a total level of operating expenses (expressed as a percent of average net assets on an annualized basis) not to exceed 0.96% for Class R-1, 0.83% for Class R-2, 0.65% for Class R-3, 0.46% for Class R-4, and 0.34% for Class R-5 shares. It is expected that the expense limits will continue through the period ending February 29, 2016; however, Principal Funds, Inc. and Principal, the parties to the agreement, may agree to terminate the expense limits prior to the end of the period.
ExampleThis Example is intended to help you compare the cost of investing in the Fund with the cost of investing in other mutual funds.
The Example assumes that you invest $10,000 in the Fund for the time periods indicated. The Example also assumes that your investment has a 5% return each year and that the Fund’s operating expenses remain the same. Although your actual costs may be higher or lower, based on these assumptions your costs would be:
1 year 3 years 5 years 10 yearsInstitutional Class $85 $265 $460 $1,025Class R-1 172 533 918 1,998Class R-2 159 493 850 1,856Class R-3 140 437 755 1,657Class R-4 121 378 654 1,443Class R-5 109 340 590 1,306
Portfolio TurnoverAs a fund of funds, the Fund does not pay transaction costs, such as commissions, when it buys and sells shares of underlying funds (or “turns over” its portfolio). An underlying fund does pay transaction costs when it buys and sells portfolio securities, and a higher portfolio turnover may indicate higher transaction costs. These costs, which are not reflected in annual fund operating expenses or in the examples, affect the performance of the underlying fund and the Fund. During its most recent fiscal year, the Fund's portfolio turnover rate was 8.6% of the average value of its portfolio.
205
Principal Investment StrategiesThe Fund operates as a “target date fund” that invests according to an asset allocation strategy designed for investors having a retirement investment goal close to the year in the Fund’s name. The Fund's asset allocation will become more conservative over time as investment goals near (for example, retirement, which is assumed to begin at age 65) and investors become more risk-averse. The Fund is a fund of funds and invests in PFI Institutional Class shares. Its underlying funds consist of domestic and foreign equity funds, fixed-income funds, real asset funds, and other funds that aim to offer diversification beyond traditional equity and fixed-income securities. The Fund is managed by Principal Management Corporation (“Principal”); Principal has hired a sub-advisor, Principal Global Investors, LLC (“PGI”), to assist in managing the Fund.
Principal, with assistance from PGI, develops, implements and monitors the Fund's strategic or long-term asset class targets and target ranges, is also responsible for an active rebalancing strategy designed to identify asset classes that appear attractive over the short term and sets the percentage of Fund assets to be allocated to a particular asset class. Principal selects the underlying funds for each asset class and the target weights for each underlying fund. Principal, with assistance from PGI, may shift asset class targets in response to normal evaluative processes, the shortening time horizon of the Fund or changes in market forces or Fund circumstances. Principal may add, remove, or substitute underlying funds at any time.
In selecting underlying funds and target weights, Principal considers both quantitative measures (e.g., past performance, expected levels of risk and returns, expense levels, diversification and style consistency) and qualitative factors (e.g., organizational stability, investment experience, investment and risk management processes, and information, trading, and compliance systems). There are no minimum or maximum percentages of assets that the Fund must invest in a specific asset class or underlying fund.
The underlying funds invest in growth and value stocks of small, medium, and large market capitalization companies, fixed-income securities, domestic and foreign (including those in emerging markets) securities, securities denominated in foreign currencies, investment companies (including index funds), and derivatives. A derivative is a financial arrangement, the value of which is derived from, or based on, a traditional security, asset, or market index. The underlying funds principally use equity index futures and options to manage equity exposure.
Within 10 to 15 years after its target year, the Fund's underlying fund allocation is expected to match that of the Principal LifeTime Strategic Income Fund. At that time, the Fund may be combined with the Principal LifeTime Strategic Income Fund if the Board of Directors determines that the combination is in the best interests of Fund shareholders. It is expected that at the target date in the Fund’s name, the shareholder will begin gradually withdrawing the account's value.

206
Principal Risks. The broad diversification of the Fund is designed to cushion severe losses in any one investment sector and moderate overall price volatility. However, the Fund is subject to the particular risks of the underlying funds in the proportions in which the Fund invests in them, and its share prices will fluctuate as the prices of underlying fund shares rise or fall with changing market conditions. If you sell your shares when their value is less than the price you paid, you will lose money. The Fund operates as a fund of funds and thus bears both its own expenses and, indirectly, its proportionate share of the expenses of the underlying funds in which it invests. An investment in the Fund is not a deposit of a bank and is not insured or guaranteed by the Federal Deposit Insurance Corporation or any other government agency. The principal risks of investing in the Fund that are inherent in the fund of funds, in alphabetical order, are:
Asset Allocation Risk. A fund's selection and weighting of asset classes may cause it to underperform other funds with a similar investment objective.
Conflict of Interest Risk. The Advisor and its affiliates earn different fees from different underlying funds and may have an incentive to allocate more fund-of-fund assets to underlying funds from which they receive higher fees.
Investment Company Securities Risk. Fund shareholders bear indirectly their proportionate share of the expenses of other investment companies in which the fund invests.
Target Date Fund Risk. A target date fund should not be selected based solely on age or retirement date because there is no guarantee that this fund will provide adequate income at or through retirement.
The principal risks of investing in the Fund that are inherent in the underlying funds, in alphabetical order, are:
Currency Risk. Risks of investing in securities denominated in, or that trade in, foreign (non-U.S.) currencies include changes in foreign exchange rates and foreign exchange restrictions.
207
Derivatives Risk. Transactions in derivatives may increase volatility, cause the liquidation of portfolio positions when not advantageous to do so and produce disproportionate losses.
Emerging Market Risk. Investments in emerging market countries may have more risk than those in developed market countries because the emerging markets are less developed and more illiquid. Emerging market countries can also be subject to increased social, economic, regulatory, and political uncertainties and can be extremely volatile.
Equity Securities Risk. The value of equity securities could decline if the issuer's financial condition declines or in response to overall market and economic conditions. A fund's principal market segment(s), such as large cap, mid cap or small cap stocks, or growth or value stocks, may underperform other market segments or the equity markets as a whole. Investments in smaller companies and mid-size companies may involve greater risk and price volatility than investments in larger, more mature companies.
Fixed-Income Securities Risk. Fixed-income securities are subject to interest rate risk and credit quality risk. The market value of fixed-income securities generally declines when interest rates rise, and an issuer of fixed-income securities could default on its payment obligations.
Foreign Securities Risk. The risks of foreign securities include loss of value as a result of: political or economic instability; nationalization, expropriation or confiscatory taxation; settlement delays; and limited government regulation (including less stringent reporting, accounting, and disclosure standards than are required of U.S. companies).
Growth Stock Risk. If growth companies do not increase their earnings at a rate expected by investors, the market price of the stock may decline significantly, even if earnings show an absolute increase. Growth company stocks also typically lack the dividend yield that can lessen price declines in market downturns.
Index Fund Investment Risk. More likely than not, an index fund will underperform the index due to cashflows and the fees and expenses of the fund.
Investment Company Securities Risk. Fund shareholders bear indirectly their proportionate share of the expenses of other investment companies in which the fund invests.
Portfolio Duration Risk. Portfolio duration is a measure of the expected life of a fixed-income security and its sensitivity to changes in interest rates. The longer a fund's average portfolio duration, the more sensitive the fund will be to changes in interest rates.
Risk of Being an Underlying Fund. A fund is subject to the risk of being an underlying fund to the extent that a fund of funds invests in the fund. An underlying fund of a fund of funds may experience relatively large redemptions or investments as the fund of funds periodically reallocates or rebalances its assets. These transactions may cause the underlying fund to sell portfolio securities to meet such redemptions, or to invest cash from such investments, at times it would not otherwise do so, and may as a result increase transaction costs and adversely affect underlying fund performance.
Value Stock Risk. The market may not recognize the intrinsic value of value stocks for a long time, or they may be appropriately priced at the time of purchase.
PerformanceThe following information provides some indication of the risks of investing in the Fund. Past performance (before and after taxes) is not necessarily an indication of how the Fund will perform in the future. You may get updated performance information by calling 1-800-222-5852 or online at www.principal.com.
The bar chart shows the investment returns of the Fund’s Institutional Class shares for each full calendar year of operations for 10 years (or, if shorter, the life of the Fund). The table shows, for each share class of the Fund and for the last one, five, and ten calendar year periods (or, if shorter, the life of the Fund), how the Fund’s average annual total returns compare with those of one or more broad measures of market performance.
Life of Fund results are measured from the date the Fund's shares were first sold (February 29, 2008).
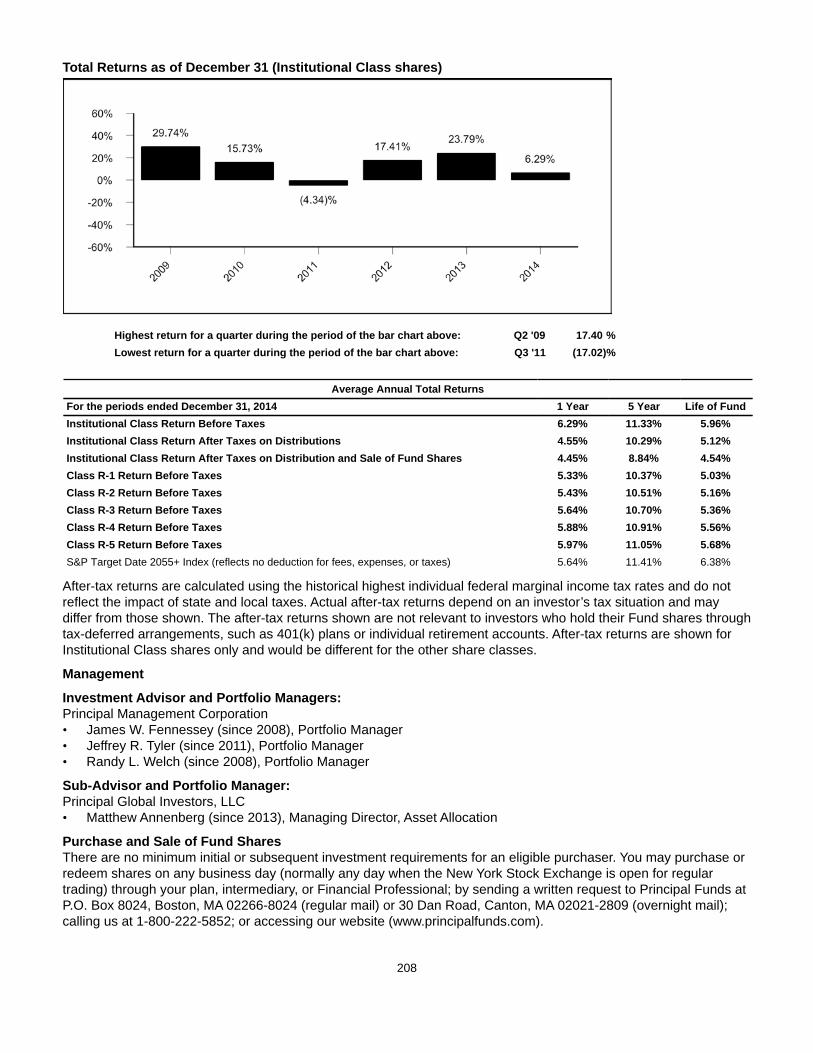
208
Total Returns as of December 31 (Institutional Class shares)
Highest return for a quarter during the period of the bar chart above: Q2 '09 17.40 %Lowest return for a quarter during the period of the bar chart above: Q3 '11 (17.02)%
Average Annual Total ReturnsFor the periods ended December 31, 2014 1 Year 5 Year Life of FundInstitutional Class Return Before Taxes 6.29% 11.33% 5.96%Institutional Class Return After Taxes on Distributions 4.55% 10.29% 5.12%Institutional Class Return After Taxes on Distribution and Sale of Fund Shares 4.45% 8.84% 4.54%Class R-1 Return Before Taxes 5.33% 10.37% 5.03%Class R-2 Return Before Taxes 5.43% 10.51% 5.16%Class R-3 Return Before Taxes 5.64% 10.70% 5.36%Class R-4 Return Before Taxes 5.88% 10.91% 5.56%Class R-5 Return Before Taxes 5.97% 11.05% 5.68%S&P Target Date 2055+ Index (reflects no deduction for fees, expenses, or taxes) 5.64% 11.41% 6.38%
After-tax returns are calculated using the historical highest individual federal marginal income tax rates and do not reflect the impact of state and local taxes. Actual after-tax returns depend on an investor’s tax situation and may differ from those shown. The after-tax returns shown are not relevant to investors who hold their Fund shares through tax-deferred arrangements, such as 401(k) plans or individual retirement accounts. After-tax returns are shown for Institutional Class shares only and would be different for the other share classes.
Management
Investment Advisor and Portfolio Managers: Principal Management Corporation• James W. Fennessey (since 2008), Portfolio Manager• Jeffrey R. Tyler (since 2011), Portfolio Manager• Randy L. Welch (since 2008), Portfolio Manager
Sub-Advisor and Portfolio Manager:Principal Global Investors, LLC • Matthew Annenberg (since 2013), Managing Director, Asset Allocation
Purchase and Sale of Fund SharesThere are no minimum initial or subsequent investment requirements for an eligible purchaser. You may purchase or redeem shares on any business day (normally any day when the New York Stock Exchange is open for regular trading) through your plan, intermediary, or Financial Professional; by sending a written request to Principal Funds at P.O. Box 8024, Boston, MA 02266-8024 (regular mail) or 30 Dan Road, Canton, MA 02021-2809 (overnight mail); calling us at 1-800-222-5852; or accessing our website (www.principalfunds.com).

209
Tax InformationThe Fund’s distributions you receive are generally subject to federal income tax as ordinary income or capital gain and may also be subject to state and local taxes, unless you are tax-exempt or your account is tax-deferred in which case your distributions would be taxed when withdrawn from the tax-deferred account.
Payments to Broker-Dealers and Other Financial IntermediariesIf you purchase the Fund through a broker-dealer or other financial intermediary (such as a bank, insurance company, investment adviser, etc.), the Fund and its related companies may pay the intermediary for the sale of Fund shares and related services. These payments may create a conflict of interest by influencing the broker-dealer or other intermediary and your salesperson to recommend the Fund over another investment, or to recommend one share class of the Fund over another share class. Ask your salesperson or visit your financial intermediary's website for more information.
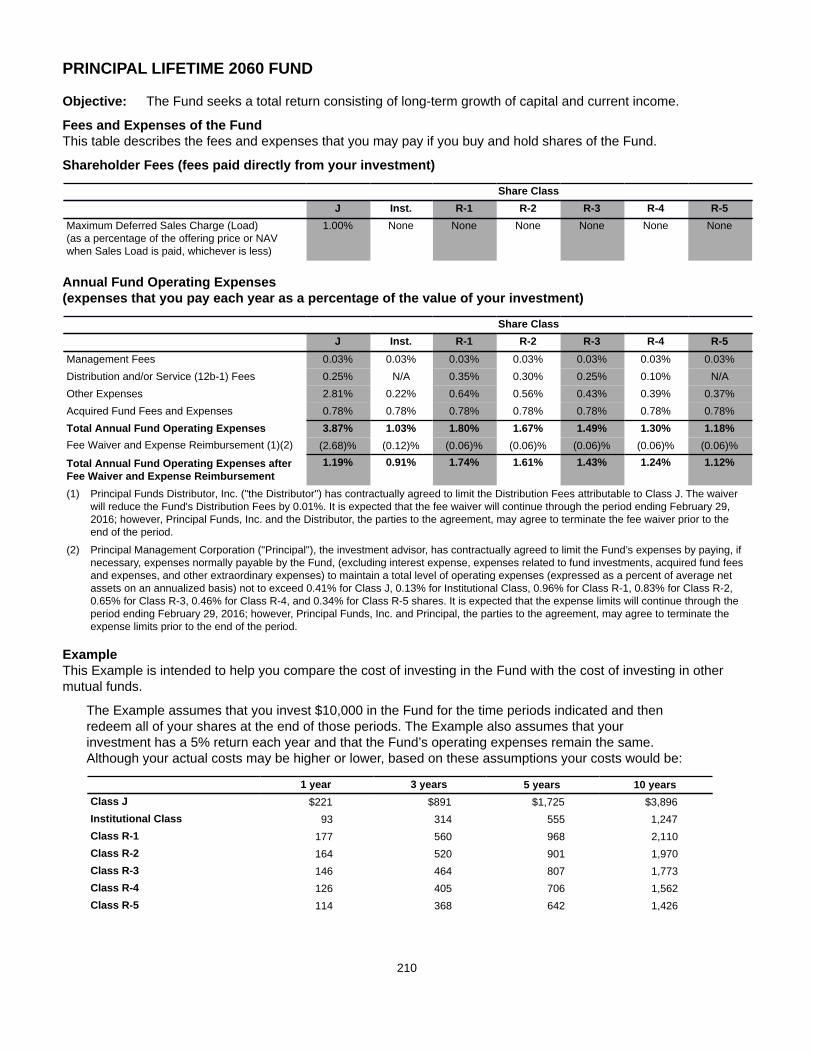
210
PRINCIPAL LIFETIME 2060 FUND
Objective: The Fund seeks a total return consisting of long-term growth of capital and current income.
Fees and Expenses of the FundThis table describes the fees and expenses that you may pay if you buy and hold shares of the Fund.
Shareholder Fees (fees paid directly from your investment)
Share ClassJ Inst. R-1 R-2 R-3 R-4 R-5
Maximum Deferred Sales Charge (Load)(as a percentage of the offering price or NAVwhen Sales Load is paid, whichever is less)
1.00% None None None None None None
Annual Fund Operating Expenses(expenses that you pay each year as a percentage of the value of your investment)
Share ClassJ Inst. R-1 R-2 R-3 R-4 R-5
Management Fees 0.03% 0.03% 0.03% 0.03% 0.03% 0.03% 0.03%Distribution and/or Service (12b-1) Fees 0.25% N/A 0.35% 0.30% 0.25% 0.10% N/AOther Expenses 2.81% 0.22% 0.64% 0.56% 0.43% 0.39% 0.37%Acquired Fund Fees and Expenses 0.78% 0.78% 0.78% 0.78% 0.78% 0.78% 0.78%Total Annual Fund Operating Expenses 3.87% 1.03% 1.80% 1.67% 1.49% 1.30% 1.18%Fee Waiver and Expense Reimbursement (1)(2) (2.68)% (0.12)% (0.06)% (0.06)% (0.06)% (0.06)% (0.06)%
Total Annual Fund Operating Expenses afterFee Waiver and Expense Reimbursement
1.19% 0.91% 1.74% 1.61% 1.43% 1.24% 1.12%
(1) Principal Funds Distributor, Inc. ("the Distributor") has contractually agreed to limit the Distribution Fees attributable to Class J. The waiver will reduce the Fund's Distribution Fees by 0.01%. It is expected that the fee waiver will continue through the period ending February 29, 2016; however, Principal Funds, Inc. and the Distributor, the parties to the agreement, may agree to terminate the fee waiver prior to the end of the period.
(2) Principal Management Corporation ("Principal"), the investment advisor, has contractually agreed to limit the Fund’s expenses by paying, if necessary, expenses normally payable by the Fund, (excluding interest expense, expenses related to fund investments, acquired fund fees and expenses, and other extraordinary expenses) to maintain a total level of operating expenses (expressed as a percent of average net assets on an annualized basis) not to exceed 0.41% for Class J, 0.13% for Institutional Class, 0.96% for Class R-1, 0.83% for Class R-2, 0.65% for Class R-3, 0.46% for Class R-4, and 0.34% for Class R-5 shares. It is expected that the expense limits will continue through the period ending February 29, 2016; however, Principal Funds, Inc. and Principal, the parties to the agreement, may agree to terminate the expense limits prior to the end of the period.
ExampleThis Example is intended to help you compare the cost of investing in the Fund with the cost of investing in other mutual funds.
The Example assumes that you invest $10,000 in the Fund for the time periods indicated and then redeem all of your shares at the end of those periods. The Example also assumes that your investment has a 5% return each year and that the Fund’s operating expenses remain the same. Although your actual costs may be higher or lower, based on these assumptions your costs would be:
1 year 3 years 5 years 10 yearsClass J $221 $891 $1,725 $3,896Institutional Class 93 314 555 1,247Class R-1 177 560 968 2,110Class R-2 164 520 901 1,970Class R-3 146 464 807 1,773Class R-4 126 405 706 1,562Class R-5 114 368 642 1,426
211
With respect to Class J shares, you would pay the following expenses if you did not redeem your shares (all other classes would be the same as in the above example):
1 year 3 years 5 years 10 yearsClass J $121 $891 $1,725 $3,896
Portfolio TurnoverAs a fund of funds, the Fund does not pay transaction costs, such as commissions, when it buys and sells shares of underlying funds (or “turns over” its portfolio). An underlying fund does pay transaction costs when it buys and sells portfolio securities, and a higher portfolio turnover may indicate higher transaction costs. These costs, which are not reflected in annual fund operating expenses or in the examples, affect the performance of the underlying fund and the Fund. During its most recent fiscal year, the Fund's portfolio turnover rate was 16.2% of the average value of its portfolio.
Principal Investment StrategiesThe Fund operates as a “target date fund” that invests according to an asset allocation strategy designed for investors having a retirement investment goal close to the year in the Fund’s name. The Fund's asset allocation will become more conservative over time as investment goals near (for example, retirement, which is assumed to begin at age 65) and investors become more risk-averse. The Fund is a fund of funds and invests in PFI Institutional Class shares. Its underlying funds consist of domestic and foreign equity funds, fixed-income funds, real asset funds, and other funds that aim to offer diversification beyond traditional equity and fixed-income securities. The Fund is managed by Principal Management Corporation (“Principal”); Principal has hired a sub-advisor, Principal Global Investors, LLC (“PGI”), to assist in managing the Fund.
Principal, with assistance from PGI, develops, implements and monitors the Fund's strategic or long-term asset class targets and target ranges, is also responsible for an active rebalancing strategy designed to identify asset classes that appear attractive over the short term and sets the percentage of Fund assets to be allocated to a particular asset class. Principal selects the underlying funds for each asset class and the target weights for each underlying fund. Principal, with assistance from PGI, may shift asset class targets in response to normal evaluative processes, the shortening time horizon of the Fund or changes in market forces or Fund circumstances. Principal may add, remove, or substitute underlying funds at any time.
In selecting underlying funds and target weights, Principal considers both quantitative measures (e.g., past performance, expected levels of risk and returns, expense levels, diversification and style consistency) and qualitative factors (e.g., organizational stability, investment experience, investment and risk management processes, and information, trading, and compliance systems). There are no minimum or maximum percentages of assets that the Fund must invest in a specific asset class or underlying fund.
The underlying funds invest in growth and value stocks of small, medium, and large market capitalization companies, fixed-income securities, domestic and foreign (including those in emerging markets) securities, securities denominated in foreign currencies, investment companies (including index funds), and derivatives. A derivative is a financial arrangement, the value of which is derived from, or based on, a traditional security, asset, or market index. The underlying funds principally use equity index futures and options to manage equity exposure.
Within 10 to 15 years after its target year, the Fund's underlying fund allocation is expected to match that of the Principal LifeTime Strategic Income Fund. At that time, the Fund may be combined with the Principal LifeTime Strategic Income Fund if the Board of Directors determines that the combination is in the best interests of Fund shareholders. It is expected that at the target date in the Fund’s name, the shareholder will begin gradually withdrawing the account's value.
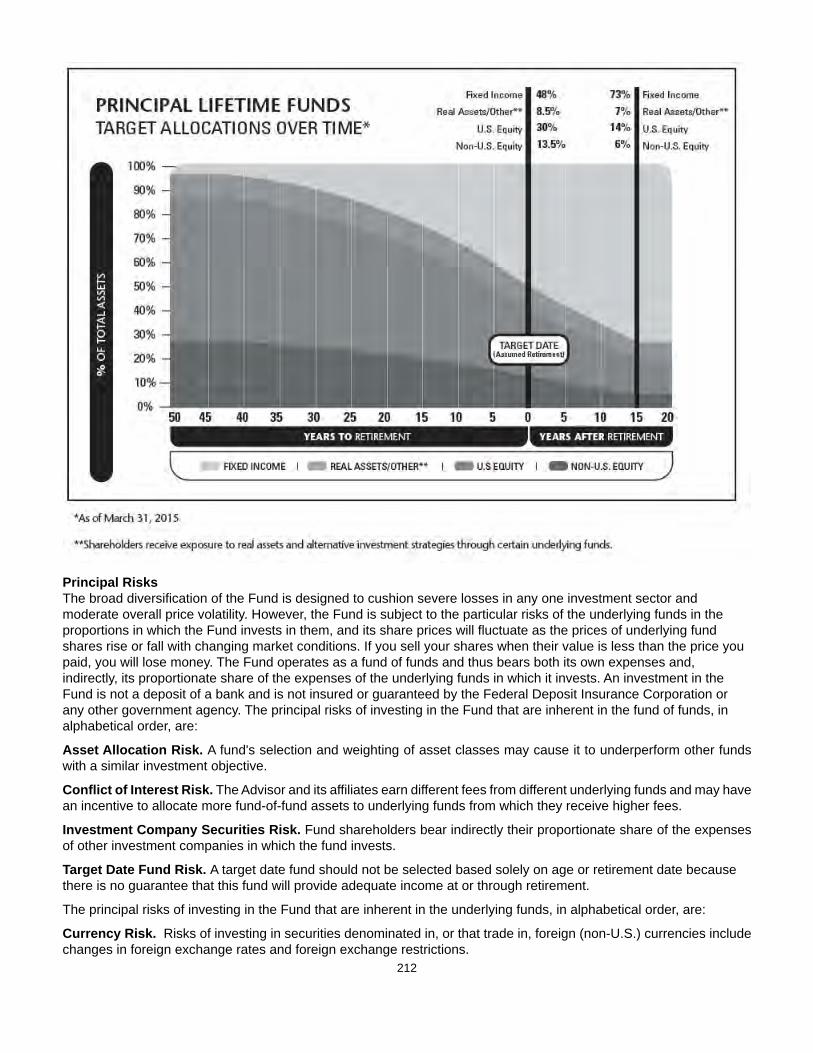
212
Principal RisksThe broad diversification of the Fund is designed to cushion severe losses in any one investment sector and moderate overall price volatility. However, the Fund is subject to the particular risks of the underlying funds in the proportions in which the Fund invests in them, and its share prices will fluctuate as the prices of underlying fund shares rise or fall with changing market conditions. If you sell your shares when their value is less than the price you paid, you will lose money. The Fund operates as a fund of funds and thus bears both its own expenses and, indirectly, its proportionate share of the expenses of the underlying funds in which it invests. An investment in the Fund is not a deposit of a bank and is not insured or guaranteed by the Federal Deposit Insurance Corporation or any other government agency. The principal risks of investing in the Fund that are inherent in the fund of funds, in alphabetical order, are:
Asset Allocation Risk. A fund's selection and weighting of asset classes may cause it to underperform other funds with a similar investment objective.
Conflict of Interest Risk. The Advisor and its affiliates earn different fees from different underlying funds and may have an incentive to allocate more fund-of-fund assets to underlying funds from which they receive higher fees.
Investment Company Securities Risk. Fund shareholders bear indirectly their proportionate share of the expenses of other investment companies in which the fund invests.
Target Date Fund Risk. A target date fund should not be selected based solely on age or retirement date because there is no guarantee that this fund will provide adequate income at or through retirement.
The principal risks of investing in the Fund that are inherent in the underlying funds, in alphabetical order, are:
Currency Risk. Risks of investing in securities denominated in, or that trade in, foreign (non-U.S.) currencies include changes in foreign exchange rates and foreign exchange restrictions.
213
Derivatives Risk. Transactions in derivatives may increase volatility, cause the liquidation of portfolio positions when not advantageous to do so and produce disproportionate losses.
Emerging Market Risk. Investments in emerging market countries may have more risk than those in developed market countries because the emerging markets are less developed and more illiquid. Emerging market countries can also be subject to increased social, economic, regulatory, and political uncertainties and can be extremely volatile.
Equity Securities Risk. The value of equity securities could decline if the issuer's financial condition declines or in response to overall market and economic conditions. A fund's principal market segment(s), such as large cap, mid cap or small cap stocks, or growth or value stocks, may underperform other market segments or the equity markets as a whole. Investments in smaller companies and mid-size companies may involve greater risk and price volatility than investments in larger, more mature companies.
Fixed-Income Securities Risk. Fixed-income securities are subject to interest rate risk and credit quality risk. The market value of fixed-income securities generally declines when interest rates rise, and an issuer of fixed-income securities could default on its payment obligations.
Foreign Securities Risk. The risks of foreign securities include loss of value as a result of: political or economic instability; nationalization, expropriation or confiscatory taxation; settlement delays; and limited government regulation (including less stringent reporting, accounting, and disclosure standards than are required of U.S. companies).
Growth Stock Risk. If growth companies do not increase their earnings at a rate expected by investors, the market price of the stock may decline significantly, even if earnings show an absolute increase. Growth company stocks also typically lack the dividend yield that can lessen price declines in market downturns.
Index Fund Investment Risk. More likely than not, an index fund will underperform the index due to cashflows and the fees and expenses of the fund.
Investment Company Securities Risk. Fund shareholders bear indirectly their proportionate share of the expenses of other investment companies in which the fund invests.
Portfolio Duration Risk. Portfolio duration is a measure of the expected life of a fixed-income security and its sensitivity to changes in interest rates. The longer a fund's average portfolio duration, the more sensitive the fund will be to changes in interest rates. Risk of Being an Underlying Fund. A fund is subject to the risk of being an underlying fund to the extent that a fund of funds invests in the fund. An underlying fund of a fund of funds may experience relatively large redemptions or investments as the fund of funds periodically reallocates or rebalances its assets. These transactions may cause the underlying fund to sell portfolio securities to meet such redemptions, or to invest cash from such investments, at times it would not otherwise do so, and may as a result increase transaction costs and adversely affect underlying fund performance.
Value Stock Risk. The market may not recognize the intrinsic value of value stocks for a long time, or they may be appropriately priced at the time of purchase.
PerformanceThe following information provides some indication of the risks of investing in the Fund. Past performance (before and after taxes) is not necessarily an indication of how the Fund will perform in the future. You may get updated performance information by calling 1-800-222-5852 or online at www.principal.com.
The bar chart shows the investment returns of the Fund’s Institutional Class shares for each full calendar year of operations for 10 years (or, if shorter, the life of the Fund). The table shows, for each share class of the Fund and for the last one, five, and ten calendar year periods (or, if shorter, the life of the Fund), how the Fund’s average annual total returns compare with those of one or more broad measures of market performance.
Life of Fund results are measured from the date the Fund's shares were first sold (March 1, 2013).
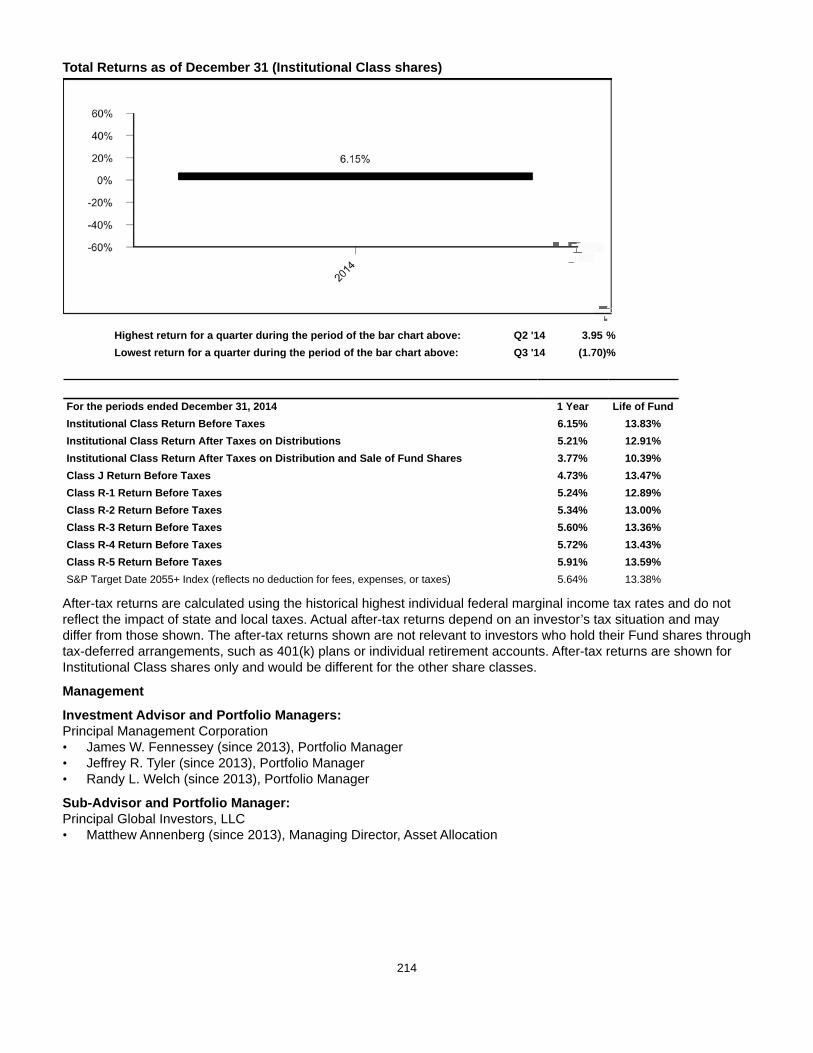
214
Total Returns as of December 31 (Institutional Class shares)
Highest return for a quarter during the period of the bar chart above: Q2 '14 3.95 %Lowest return for a quarter during the period of the bar chart above: Q3 '14 (1.70)%
For the periods ended December 31, 2014 1 Year Life of FundInstitutional Class Return Before Taxes 6.15% 13.83%Institutional Class Return After Taxes on Distributions 5.21% 12.91%Institutional Class Return After Taxes on Distribution and Sale of Fund Shares 3.77% 10.39%Class J Return Before Taxes 4.73% 13.47%Class R-1 Return Before Taxes 5.24% 12.89%Class R-2 Return Before Taxes 5.34% 13.00%Class R-3 Return Before Taxes 5.60% 13.36%Class R-4 Return Before Taxes 5.72% 13.43%Class R-5 Return Before Taxes 5.91% 13.59%S&P Target Date 2055+ Index (reflects no deduction for fees, expenses, or taxes) 5.64% 13.38%
After-tax returns are calculated using the historical highest individual federal marginal income tax rates and do not reflect the impact of state and local taxes. Actual after-tax returns depend on an investor’s tax situation and may differ from those shown. The after-tax returns shown are not relevant to investors who hold their Fund shares through tax-deferred arrangements, such as 401(k) plans or individual retirement accounts. After-tax returns are shown for Institutional Class shares only and would be different for the other share classes.
Management
Investment Advisor and Portfolio Managers: Principal Management Corporation• James W. Fennessey (since 2013), Portfolio Manager• Jeffrey R. Tyler (since 2013), Portfolio Manager• Randy L. Welch (since 2013), Portfolio Manager
Sub-Advisor and Portfolio Manager:Principal Global Investors, LLC • Matthew Annenberg (since 2013), Managing Director, Asset Allocation
215
Purchase and Sale of Fund Shares
Share Class Investment TypePurchase Minimum
Per FundJ Initial Investment $1,000(1)
J Initial Investment for accounts with an Automatic Investment Plan (AIP) $100J Subsequent Investments $100(1)(2)
Institutional, R-1, R-2, R-3, R-4,and R-5
There are no minimum initial or subsequent investment requirements for eligiblepurchasers.
N/A
(1) Some exceptions apply; see "Purchase of Fund Shares - Minimum Investments" for more information.(2) For accounts with an AIP, the subsequent automatic investments must total $1,200 annually if the initial $1,000 minimum has not been met.
You may purchase or redeem shares on any business day (normally any day when the New York Stock Exchange is open for regular trading), through your plan, intermediary, or Financial Professional; by sending a written request to Principal Funds at P.O. Box 8024, Boston, MA 02266-8024 (regular mail) or 30 Dan Road, Canton, MA 02021-2809 (overnight mail); calling us at 1-800-222-5852; or accessing our website (www.principalfunds.com).
Tax InformationThe Fund’s distributions you receive are generally subject to federal income tax as ordinary income or capital gain and may also be subject to state and local taxes, unless you are tax-exempt or your account is tax-deferred in which case your distributions would be taxed when withdrawn from the tax-deferred account.
Payments to Broker-Dealers and Other Financial IntermediariesIf you purchase the Fund through a broker-dealer or other financial intermediary (such as a bank, insurance company, investment adviser, etc.), the Fund and its related companies may pay the intermediary for the sale of Fund shares and related services. These payments may create a conflict of interest by influencing the broker-dealer or other intermediary and your salesperson to recommend the Fund over another investment, or to recommend one share class of the Fund over another share class. Ask your salesperson or visit your financial intermediary's website for more information.
216
PRINCIPAL LIFETIME HYBRID INCOME FUNDObjective: The Fund seeks current income, and as a secondary objective, capital appreciation.
Fees and Expenses of the FundThis table describes the fees and expenses that you may pay if you buy and hold shares of the Fund.
Shareholder Fees (fees paid directly from your investment): None
Annual Fund Operating Expenses (expenses that you pay each year as a percentage of the value of your investment)
Share ClassInst.
Management Fees 0.01%Distribution and/or Service (12b-1) Fees N/AOther Expenses (1) 0.24%Acquired Fund Fees and Expenses (1) 0.37%Total Annual Fund Operating Expenses 0.62%Expense Reimbursement (2) (0.19)%Total Annual Fund Operating Expenses After Expense Reimbursement 0.43%
(1) Based on estimated amounts for the current fiscal year.(2) Principal Management Corporation ("Principal"), the investment advisor, has contractually agreed to limit the Fund’s expenses by paying, if
necessary, expenses normally payable by the Fund, (excluding interest expense, expenses related to fund investments, acquired fund fees and expenses, and other extraordinary expenses) to maintain a total level of operating expenses (expressed as a percent of average net assets on an annualized basis) not to exceed 0.06% for Institutional shares. It is expected that the expense limit will continue through the period ending February 29, 2016; however, Principal Funds, Inc. and Principal, the parties to the agreement, may agree to terminate the expense limit prior to the end of the period.
ExampleThis Example is intended to help you compare the cost of investing in the Fund with the cost of investing in other mutual funds.
The Example assumes that you invest $10,000 in the Fund for the time periods indicated. The Example also assumes that your investment has a 5% return each year and that the Fund’s operating expenses remain the same. Although your actual costs may be higher or lower, based on these assumptions your costs would be:
1 year 3 yearsInstitutional Class $44 $176
Portfolio TurnoverAs a fund of funds, the Fund does not pay transaction costs, such as commissions, when it buys and sells shares of underlying funds (or “turns over” its portfolio). An underlying fund does pay transaction costs when it buys and sells portfolio securities, and a higher portfolio turnover may indicate higher transaction costs. These costs, which are not reflected in annual fund operating expenses or in the examples, affect the performance of the underlying fund and the Fund. This is a new fund and does not yet have a portfolio turnover rate to disclose.
Principal Investment StrategiesThe Fund invests according to an asset allocation strategy designed for investors primarily seeking current income and secondarily capital appreciation. The Fund's asset allocation is designed for investors who are approximately 15 years beyond the normal retirement age of 65. The Fund is a fund of funds that invests in Institutional Class shares of Principal Funds, Inc. (“PFI”), with a majority of the Fund's assets invested in index funds. Its underlying funds consist of domestic and foreign equity funds, fixed-income funds, real asset funds, and other funds that aim to offer diversification beyond traditional equity and fixed-income securities. The Fund is managed by Principal Management Corporation (“Principal”).
Principal develops, implements and monitors the Fund's strategic or long-term asset class targets and target ranges, is responsible for an active rebalancing strategy designed to identify asset classes that appear attractive over the short term, and sets the percentage of Fund assets to be allocated to a particular asset class. Principal selects the underlying funds for each asset class and the target weights for each underlying fund and may shift asset class
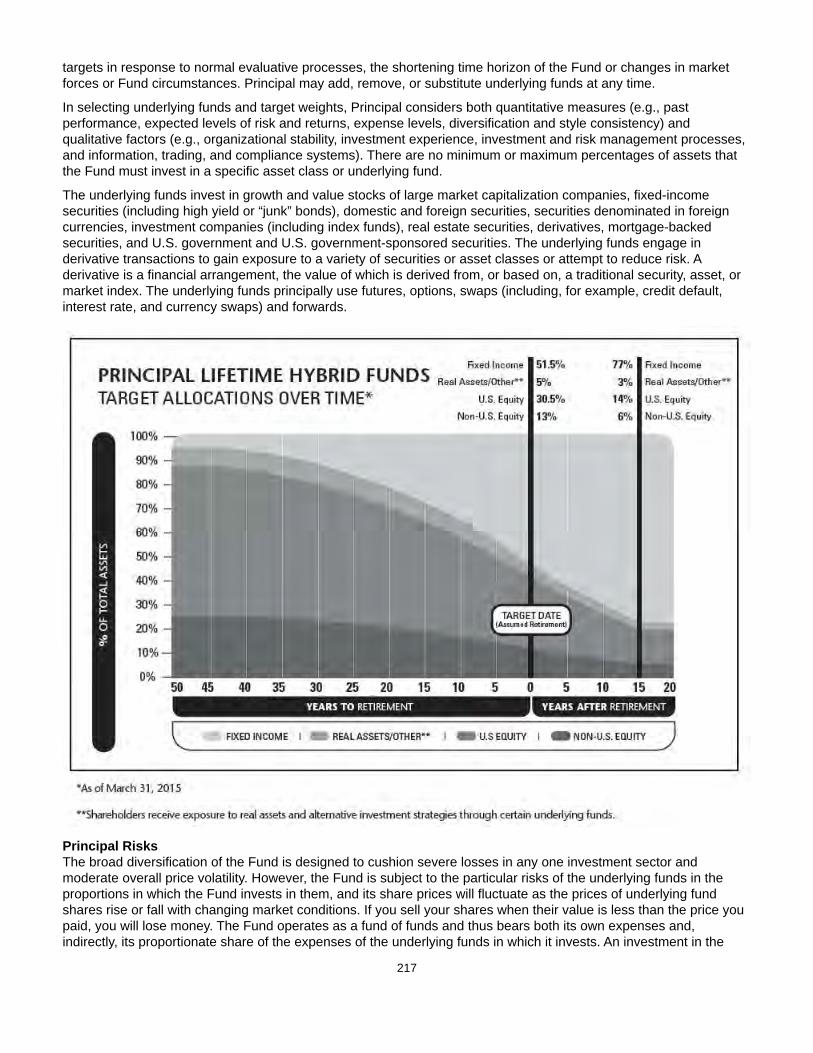
217
targets in response to normal evaluative processes, the shortening time horizon of the Fund or changes in market forces or Fund circumstances. Principal may add, remove, or substitute underlying funds at any time.
In selecting underlying funds and target weights, Principal considers both quantitative measures (e.g., past performance, expected levels of risk and returns, expense levels, diversification and style consistency) and qualitative factors (e.g., organizational stability, investment experience, investment and risk management processes, and information, trading, and compliance systems). There are no minimum or maximum percentages of assets that the Fund must invest in a specific asset class or underlying fund.
The underlying funds invest in growth and value stocks of large market capitalization companies, fixed-income securities (including high yield or “junk” bonds), domestic and foreign securities, securities denominated in foreign currencies, investment companies (including index funds), real estate securities, derivatives, mortgage-backed securities, and U.S. government and U.S. government-sponsored securities. The underlying funds engage in derivative transactions to gain exposure to a variety of securities or asset classes or attempt to reduce risk. A derivative is a financial arrangement, the value of which is derived from, or based on, a traditional security, asset, or market index. The underlying funds principally use futures, options, swaps (including, for example, credit default, interest rate, and currency swaps) and forwards.
Principal RisksThe broad diversification of the Fund is designed to cushion severe losses in any one investment sector and moderate overall price volatility. However, the Fund is subject to the particular risks of the underlying funds in the proportions in which the Fund invests in them, and its share prices will fluctuate as the prices of underlying fund shares rise or fall with changing market conditions. If you sell your shares when their value is less than the price you paid, you will lose money. The Fund operates as a fund of funds and thus bears both its own expenses and, indirectly, its proportionate share of the expenses of the underlying funds in which it invests. An investment in the
218
Fund is not a deposit in a bank and is not insured or guaranteed by the Federal Deposit Insurance Corporation or any other government agency. The principal risks of investing in the Fund that are inherent in the fund of funds, in alphabetical order, are:
Asset Allocation Risk. A fund's selection and weighting of asset classes may cause it to underperform other funds with a similar investment objective.
Conflict of Interest Risk. The Advisor and its affiliates earn different fees from different underlying funds and may have an incentive to allocate more fund-of-fund assets to underlying funds from which they receive higher fees.
Investment Company Securities Risk. Fund shareholders bear indirectly their proportionate share of the expenses of other investment companies in which the fund invests.
Target Date Fund Risk. A target date fund should not be selected based solely on age or retirement date because there is no guarantee that this fund will provide adequate income at or through retirement.
The principal risks of investing in the Fund that are inherent in the underlying funds, in alphabetical order, are:
Counterparty Risk. Counterparty risk is the risk that the counterparty to a derivatives contract or repurchase agreement, the borrower of a portfolio’s securities, or other obligation, will be unable or unwilling to make timely principal, interest, or settlement payments, or otherwise to honor its obligations.
Currency Risk. Risks of investing in securities denominated in, or that trade in, foreign (non-U.S.) currencies include changes in foreign exchange rates and foreign exchange restrictions.
Derivatives Risk. Transactions in derivatives may increase volatility, cause the liquidation of portfolio positions when not advantageous to do so and produce disproportionate losses.
Equity Securities Risk. The value of equity securities could decline if the issuer's financial condition declines or in response to overall market and economic conditions. A fund's principal market segment(s), such as large cap, mid cap or small cap stocks, or growth or value stocks, may underperform other market segments or the equity markets as a whole. Investments in smaller companies and mid-size companies may involve greater risk and price volatility than investments in larger, more mature companies.
Fixed-Income Securities Risk. Fixed-income securities are subject to interest rate risk and credit quality risk. The market value of fixed-income securities generally declines when interest rates rise, and an issuer of fixed-income securities could default on its payment obligations.
Foreign Securities Risk. The risks of foreign securities include loss of value as a result of: political or economic instability; nationalization, expropriation or confiscatory taxation; settlement delays; and limited government regulation (including less stringent reporting, accounting, and disclosure standards than are required of U.S. companies).
Growth Stock Risk. If growth companies do not increase their earnings at a rate expected by investors, the market price of the stock may decline significantly, even if earnings show an absolute increase. Growth company stocks also typically lack the dividend yield that can lessen price declines in market downturns.
High Yield Securities Risk. High yield fixed-income securities (commonly referred to as "junk bonds") are subject to greater credit quality risk than higher rated fixed-income securities and should be considered speculative.
Index Fund Investment Risk. More likely than not, an index fund will underperform the index due to cashflows and the fees and expenses of the fund.
Investment Company Securities Risk. Fund shareholders bear indirectly their proportionate share of the expenses of other investment companies in which the fund invests.
Portfolio Duration Risk. Portfolio duration is a measure of the expected life of a fixed-income security and its sensitivity to changes in interest rates. The longer a fund's average portfolio duration, the more sensitive the fund will be to changes in interest rates.
Prepayment Risk. Unscheduled prepayments on mortgage-backed and asset-backed securities may have to be reinvested at lower rates. A reduction in prepayments may increase the effective maturities of these securities, exposing them to the risk of decline in market value over time (extension risk).
219
Real Estate Securities Risk. Real estate securities are subject to the risks associated with direct ownership of real estate, including declines in value, adverse economic conditions, increases in expenses, regulatory changes and environmental problems. Investing in securities of companies in the real estate industry, subjects a fund to the special risks associated with the real estate market including factors such as loss to casualty or condemnation, changes in real estate values, property taxes, interest rates, cash flow of underlying real estate assets, occupancy rates, government regulations affecting zoning, land use and rents, and the management skill and creditworthiness of the issuer.
Risk of Being an Underlying Fund. A fund is subject to the risk of being an underlying fund to the extent that a fund of funds invests in the fund. An underlying fund of a fund of funds may experience relatively large redemptions or investments as the fund of funds periodically reallocates or rebalances its assets. These transactions may cause the underlying fund to sell portfolio securities to meet such redemptions, or to invest cash from such investments, at times it would not otherwise do so, and may as a result increase transaction costs and adversely affect underlying fund performance.
U.S. Government Securities Risk. Yields available from U.S. government securities are generally lower than yields from many other fixed-income securities.
U.S. Government Sponsored Securities Risk. Securities issued by U.S. government-sponsored or -chartered enterprises such as the Federal Home Loan Mortgage Corporation, the Federal National Mortgage Association, and the Federal Home Loan Banks are not issued or guaranteed by the U.S. Treasury.
Value Stock Risk. The market may not recognize the intrinsic value of value stocks for a long time, or they may be appropriately priced at the time of purchase.
PerformanceNo performance information is shown below because the Fund has not yet had a calendar year of performance. The Fund's performance is benchmarked against the S&P Target Date Retirement Income Index. Performance information provides an indication of the risks of investing in the Fund. Past performance (before and after taxes) is not necessarily an indication of how the Fund will perform in the future. You may get updated performance information by calling 1-800-222-5852 or online at www.principal.com.
Management
Investment Advisor and Portfolio Managers: Principal Management Corporation• James W. Fennessey (since 2014), Portfolio Manager• Jeffrey R. Tyler (since 2014), Portfolio Manager• Randy L. Welch (since 2014), Portfolio Manager
Purchase and Sale of Fund SharesThere are no minimum initial or subsequent investment requirements for an eligible purchaser. You may purchase or redeem shares on any business day (normally any day when the New York Stock Exchange is open for regular trading) through your plan, intermediary, or Financial Professional; by sending a written request to Principal Funds at P.O. Box 8024, Boston, MA 02266-8024 (regular mail) or 30 Dan Road, Canton, MA 02021-2809 (overnight mail); calling us at 1-800-222-5852; or accessing our website (www.principalfunds.com).
Tax InformationThe Fund’s distributions you receive are generally subject to federal income tax as ordinary income or capital gain and may also be subject to state and local taxes, unless you are tax-exempt or your account is tax-deferred in which case your distributions would be taxed when withdrawn from the tax-deferred account.
Payments to Broker-Dealers and Other Financial IntermediariesIf you purchase the Fund through a broker-dealer or other financial intermediary (such as a bank, insurance company, investment adviser, etc.), the Fund and its related companies may pay the intermediary for the sale of Fund shares and related services. These payments may create a conflict of interest by influencing the broker-dealer or other intermediary and your salesperson to recommend the Fund over another investment, or to recommend one share class of the Fund over another share class. Ask your salesperson or visit your financial intermediary's website for more information.
220
PRINCIPAL LIFETIME HYBRID 2015 FUNDObjective: The Fund seeks a total return consisting of long-term growth of capital and current income.
Fees and Expenses of the FundThis table describes the fees and expenses that you may pay if you buy and hold shares of the Fund.
Shareholder Fees (fees paid directly from your investment): None
Annual Fund Operating Expenses (expenses that you pay each year as a percentage of the value of your investment)
Share ClassInst.
Management Fees 0.01%Distribution and/or Service (12b-1) Fees N/AOther Expenses (1) 0.12%Acquired Fund Fees and Expenses (1) 0.38%Total Annual Fund Operating Expenses 0.51%Expense Reimbursement (2) (0.07)%Total Annual Fund Operating Expenses After Expense Reimbursement 0.44%
(1) Based on estimated amounts for the current fiscal year.(2) Principal Management Corporation ("Principal"), the investment advisor, has contractually agreed to limit the Fund’s expenses by paying, if
necessary, expenses normally payable by the Fund, (excluding interest expense, expenses related to fund investments, acquired fund fees and expenses, and other extraordinary expenses) to maintain a total level of operating expenses (expressed as a percent of average net assets on an annualized basis) not to exceed 0.06% for Institutional shares. It is expected that the expense limit will continue through the period ending February 29, 2016; however, Principal Funds, Inc. and Principal, the parties to the agreement, may agree to terminate the expense limit prior to the end of the period.
ExampleThis Example is intended to help you compare the cost of investing in the Fund with the cost of investing in other mutual funds.
The Example assumes that you invest $10,000 in the Fund for the time periods indicated. The Example also assumes that your investment has a 5% return each year and that the Fund’s operating expenses remain the same. Although your actual costs may be higher or lower, based on these assumptions your costs would be:
1 year 3 yearsInstitutional Class $45 $155
Portfolio TurnoverAs a fund of funds, the Fund does not pay transaction costs, such as commissions, when it buys and sells shares of underlying funds (or “turns over” its portfolio). An underlying fund does pay transaction costs when it buys and sells portfolio securities, and a higher portfolio turnover may indicate higher transaction costs. These costs, which are not reflected in annual fund operating expenses or in the examples, affect the performance of the underlying fund and the Fund. This is a new fund and does not yet have a portfolio turnover rate to disclose.
Principal Investment StrategiesThe Fund operates as a “target date fund” that invests according to an asset allocation strategy designed for investors having a retirement investment goal close to the year in the Fund’s name. The Fund's asset allocation will become more conservative over time as investment goals near (for example, retirement, which is assumed to begin at age 65) and investors become more risk-averse. The Fund is a fund of funds that invests in Institutional Class shares of Principal Funds, Inc. (“PFI”), with a majority of the Fund's assets invested in index funds. Its underlying funds consist of domestic and foreign equity funds, fixed-income funds, real asset funds, and other funds that aim to offer diversification beyond traditional equity and fixed-income securities. The Fund is managed by Principal Management Corporation (“Principal”).
Principal develops, implements and monitors the Fund's strategic or long-term asset class targets and target ranges, is responsible for an active rebalancing strategy designed to identify asset classes that appear attractive over the short term, and sets the percentage of Fund assets to be allocated to a particular asset class. Principal selects the
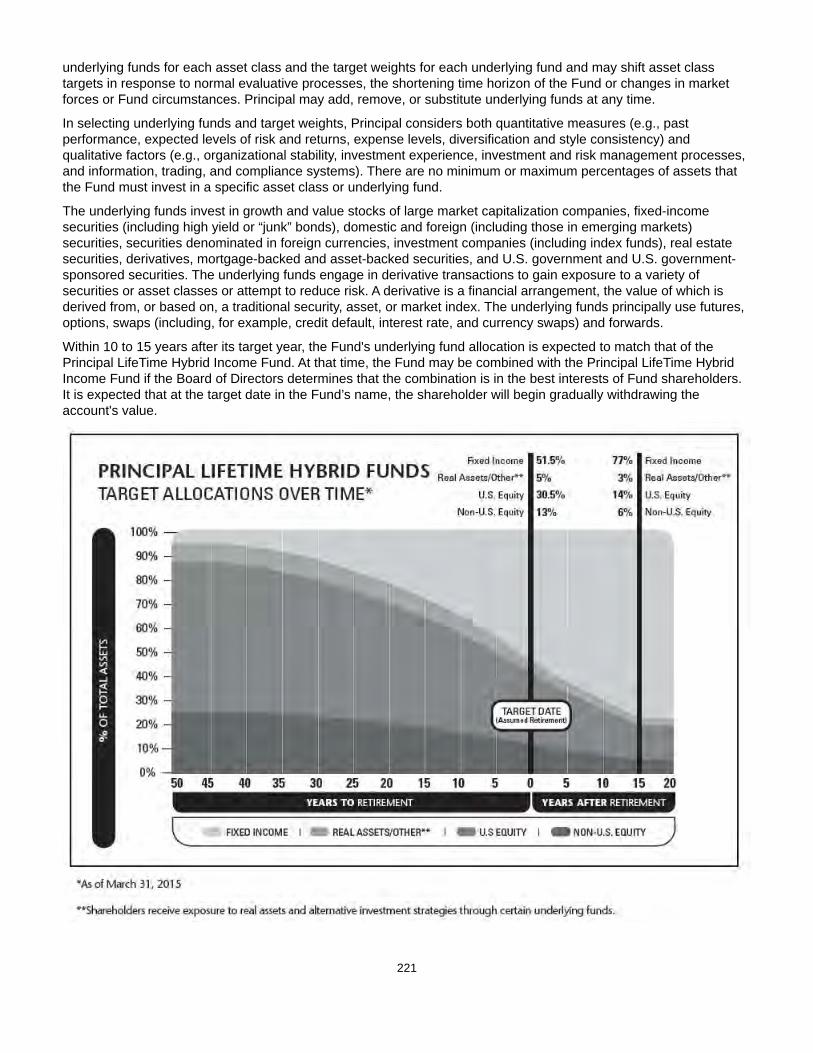
221
underlying funds for each asset class and the target weights for each underlying fund and may shift asset class targets in response to normal evaluative processes, the shortening time horizon of the Fund or changes in market forces or Fund circumstances. Principal may add, remove, or substitute underlying funds at any time.
In selecting underlying funds and target weights, Principal considers both quantitative measures (e.g., past performance, expected levels of risk and returns, expense levels, diversification and style consistency) and qualitative factors (e.g., organizational stability, investment experience, investment and risk management processes, and information, trading, and compliance systems). There are no minimum or maximum percentages of assets that the Fund must invest in a specific asset class or underlying fund.
The underlying funds invest in growth and value stocks of large market capitalization companies, fixed-income securities (including high yield or “junk” bonds), domestic and foreign (including those in emerging markets) securities, securities denominated in foreign currencies, investment companies (including index funds), real estate securities, derivatives, mortgage-backed and asset-backed securities, and U.S. government and U.S. government-sponsored securities. The underlying funds engage in derivative transactions to gain exposure to a variety of securities or asset classes or attempt to reduce risk. A derivative is a financial arrangement, the value of which is derived from, or based on, a traditional security, asset, or market index. The underlying funds principally use futures, options, swaps (including, for example, credit default, interest rate, and currency swaps) and forwards.
Within 10 to 15 years after its target year, the Fund's underlying fund allocation is expected to match that of the Principal LifeTime Hybrid Income Fund. At that time, the Fund may be combined with the Principal LifeTime Hybrid Income Fund if the Board of Directors determines that the combination is in the best interests of Fund shareholders. It is expected that at the target date in the Fund’s name, the shareholder will begin gradually withdrawing the account's value.

222
Principal RisksThe broad diversification of the Fund is designed to cushion severe losses in any one investment sector and moderate overall price volatility. However, the Fund is subject to the particular risks of the underlying funds in the proportions in which the Fund invests in them, and its share prices will fluctuate as the prices of underlying fund shares rise or fall with changing market conditions. If you sell your shares when their value is less than the price you paid, you will lose money. The Fund operates as a fund of funds and thus bears both its own expenses and, indirectly, its proportionate share of the expenses of the underlying funds in which it invests. An investment in the Fund is not a deposit of a bank and is not insured or guaranteed by the Federal Deposit Insurance Corporation or any other government agency. The principal risks of investing in the Fund that are inherent in the fund of funds, in alphabetical order, are:
Asset Allocation Risk. A fund's selection and weighting of asset classes may cause it to underperform other funds with a similar investment objective.
Conflict of Interest Risk. The Advisor and its affiliates earn different fees from different underlying funds and may have an incentive to allocate more fund-of-fund assets to underlying funds from which they receive higher fees.
Investment Company Securities Risk. Fund shareholders bear indirectly their proportionate share of the expenses of other investment companies in which the fund invests.
Target Date Fund Risk. A target date fund should not be selected based solely on age or retirement date because there is no guarantee that this fund will provide adequate income at or through retirement.
The principal risks of investing in the Fund that are inherent in the underlying funds, in alphabetical order, are:
Counterparty Risk. Counterparty risk is the risk that the counterparty to a derivatives contract or repurchase agreement, the borrower of a portfolio’s securities, or other obligation, will be unable or unwilling to make timely principal, interest, or settlement payments, or otherwise to honor its obligations.
Currency Risk. Risks of investing in securities denominated in, or that trade in, foreign (non-U.S.) currencies include changes in foreign exchange rates and foreign exchange restrictions.
Derivatives Risk. Transactions in derivatives may increase volatility, cause the liquidation of portfolio positions when not advantageous to do so and produce disproportionate losses.
Emerging Market Risk. Investments in emerging market countries may have more risk than those in developed market countries because the emerging markets are less developed and more illiquid. Emerging market countries can also be subject to increased social, economic, regulatory, and political uncertainties and can be extremely volatile.
Equity Securities Risk. The value of equity securities could decline if the issuer's financial condition declines or in response to overall market and economic conditions. A fund's principal market segment(s), such as large cap, mid cap or small cap stocks, or growth or value stocks, may underperform other market segments or the equity markets as a whole. Investments in smaller companies and mid-size companies may involve greater risk and price volatility than investments in larger, more mature companies.
Fixed-Income Securities Risk. Fixed-income securities are subject to interest rate risk and credit quality risk. The market value of fixed-income securities generally declines when interest rates rise, and an issuer of fixed-income securities could default on its payment obligations.
Foreign Securities Risk. The risks of foreign securities include loss of value as a result of: political or economic instability; nationalization, expropriation or confiscatory taxation; settlement delays; and limited government regulation (including less stringent reporting, accounting, and disclosure standards than are required of U.S. companies).
Growth Stock Risk. If growth companies do not increase their earnings at a rate expected by investors, the market price of the stock may decline significantly, even if earnings show an absolute increase. Growth company stocks also typically lack the dividend yield that can lessen price declines in market downturns.
High Yield Securities Risk. High yield fixed-income securities (commonly referred to as "junk bonds") are subject to greater credit quality risk than higher rated fixed-income securities and should be considered speculative.
223
Index Fund Investment Risk. More likely than not, an index fund will underperform the index due to cashflows and the fees and expenses of the fund.
Investment Company Securities Risk. Fund shareholders bear indirectly their proportionate share of the expenses of other investment companies in which the fund invests.
Portfolio Duration Risk. Portfolio duration is a measure of the expected life of a fixed-income security and its sensitivity to changes in interest rates. The longer a fund's average portfolio duration, the more sensitive the fund will be to changes in interest rates.
Prepayment Risk. Unscheduled prepayments on mortgage-backed and asset-backed securities may have to be reinvested at lower rates. A reduction in prepayments may increase the effective maturities of these securities, exposing them to the risk of decline in market value over time (extension risk).
Real Estate Securities Risk. Real estate securities are subject to the risks associated with direct ownership of real estate, including declines in value, adverse economic conditions, increases in expenses, regulatory changes and environmental problems. Investing in securities of companies in the real estate industry, subjects a fund to the special risks associated with the real estate market including factors such as loss to casualty or condemnation, changes in real estate values, property taxes, interest rates, cash flow of underlying real estate assets, occupancy rates, government regulations affecting zoning, land use and rents, and the management skill and creditworthiness of the issuer.
Risk of Being an Underlying Fund. A fund is subject to the risk of being an underlying fund to the extent that a fund of funds invests in the fund. An underlying fund of a fund of funds may experience relatively large redemptions or investments as the fund of funds periodically reallocates or rebalances its assets. These transactions may cause the underlying fund to sell portfolio securities to meet such redemptions, or to invest cash from such investments, at times it would not otherwise do so, and may as a result increase transaction costs and adversely affect underlying fund performance.
U.S. Government Securities Risk. Yields available from U.S. government securities are generally lower than yields from many other fixed-income securities.
U.S. Government Sponsored Securities Risk. Securities issued by U.S. government-sponsored or -chartered enterprises such as the Federal Home Loan Mortgage Corporation, the Federal National Mortgage Association, and the Federal Home Loan Banks are not issued or guaranteed by the U.S. Treasury.
Value Stock Risk. The market may not recognize the intrinsic value of value stocks for a long time, or they may be appropriately priced at the time of purchase.
PerformanceNo performance information is shown below because the Fund has not yet had a calendar year of performance. The Fund's performance is benchmarked against the S&P Target Date 2015 Index. Performance information provides an indication of the risks of investing in the Fund. Past performance (before and after taxes) is not necessarily an indication of how the Fund will perform in the future. You may get updated performance information by calling 1-800-222-5852 or online at www.principal.com.
Management
Investment Advisor and Portfolio Managers: Principal Management Corporation• James W. Fennessey (since 2014), Portfolio Manager• Jeffrey R. Tyler (since 2014), Portfolio Manager• Randy L. Welch (since 2014), Portfolio Manager
Purchase and Sale of Fund SharesThere are no minimum initial or subsequent investment requirements for an eligible purchaser. You may purchase or redeem shares on any business day (normally any day when the New York Stock Exchange is open for regular trading) through your plan, intermediary, or Financial Professional; by sending a written request to Principal Funds at P.O. Box 8024, Boston, MA 02266-8024 (regular mail) or 30 Dan Road, Canton, MA 02021-2809 (overnight mail); calling us at 1-800-222-5852; or accessing our website (www.principalfunds.com).

224
Tax InformationThe Fund’s distributions you receive are generally subject to federal income tax as ordinary income or capital gain and may also be subject to state and local taxes, unless you are tax-exempt or your account is tax-deferred in which case your distributions would be taxed when withdrawn from the tax-deferred account.
Payments to Broker-Dealers and Other Financial IntermediariesIf you purchase the Fund through a broker-dealer or other financial intermediary (such as a bank, insurance company, investment adviser, etc.), the Fund and its related companies may pay the intermediary for the sale of Fund shares and related services. These payments may create a conflict of interest by influencing the broker-dealer or other intermediary and your salesperson to recommend the Fund over another investment, or to recommend one share class of the Fund over another share class. Ask your salesperson or visit your financial intermediary's website for more information.

225
PRINCIPAL LIFETIME HYBRID 2020 FUNDObjective: The Fund seeks a total return consisting of long-term growth of capital and current income.
Fees and Expenses of the FundThis table describes the fees and expenses that you may pay if you buy and hold shares of the Fund.
Shareholder Fees (fees paid directly from your investment): None
Annual Fund Operating Expenses (expenses that you pay each year as a percentage of the value of your investment)
Share ClassInst.
Management Fees 0.01%Distribution and/or Service (12b-1) Fees N/AOther Expenses (1) 0.12%Acquired Fund Fees and Expenses (1) 0.40%Total Annual Fund Operating Expenses 0.53%Expense Reimbursement (2) (0.07)%Total Annual Fund Operating Expenses After Expense Reimbursement 0.46%
(1) Based on estimated amounts for the current fiscal year.(2) Principal Management Corporation ("Principal"), the investment advisor, has contractually agreed to limit the Fund’s expenses by paying, if
necessary, expenses normally payable by the Fund, (excluding interest expense, expenses related to fund investments, acquired fund fees and expenses, and other extraordinary expenses) to maintain a total level of operating expenses (expressed as a percent of average net assets on an annualized basis) not to exceed 0.06% for Institutional shares. It is expected that the expense limit will continue through the period ending February 29, 2016; however, Principal Funds, Inc. and Principal, the parties to the agreement, may agree to terminate the expense limit prior to the end of the period.
ExampleThis Example is intended to help you compare the cost of investing in the Fund with the cost of investing in other mutual funds.
The Example assumes that you invest $10,000 in the Fund for the time periods indicated. The Example also assumes that your investment has a 5% return each year and that the Fund’s operating expenses remain the same. Although your actual costs may be higher or lower, based on these assumptions your costs would be:
1 year 3 yearsInstitutional Class $47 $162
Portfolio TurnoverAs a fund of funds, the Fund does not pay transaction costs, such as commissions, when it buys and sells shares of underlying funds (or “turns over” its portfolio). An underlying fund does pay transaction costs when it buys and sells portfolio securities, and a higher portfolio turnover may indicate higher transaction costs. These costs, which are not reflected in annual fund operating expenses or in the examples, affect the performance of the underlying fund and the Fund. This is a new fund and does not yet have a portfolio turnover rate to disclose.
Principal Investment StrategiesThe Fund operates as a “target date fund” that invests according to an asset allocation strategy designed for investors having a retirement investment goal close to the year in the Fund’s name. The Fund's asset allocation will become more conservative over time as investment goals near (for example, retirement, which is assumed to begin at age 65) and investors become more risk-averse. The Fund is a fund of funds that invests in Institutional Class shares of Principal Funds, Inc. (“PFI”), with a majority of the Fund's assets invested in index funds. Its underlying funds consist of domestic and foreign equity funds, fixed-income funds, real asset funds, and other funds that aim to offer diversification beyond traditional equity and fixed-income securities. The Fund is managed by Principal Management Corporation (“Principal”).
Principal develops, implements and monitors the Fund's strategic or long-term asset class targets and target ranges, is responsible for an active rebalancing strategy designed to identify asset classes that appear attractive over the short term, and sets the percentage of Fund assets to be allocated to a particular asset class. Principal selects the

226
underlying funds for each asset class and the target weights for each underlying fund and may shift asset class targets in response to normal evaluative processes, the shortening time horizon of the Fund or changes in market forces or Fund circumstances. Principal may add, remove, or substitute underlying funds at any time.
In selecting underlying funds and target weights, Principal considers both quantitative measures (e.g., past performance, expected levels of risk and returns, expense levels, diversification and style consistency) and qualitative factors (e.g., organizational stability, investment experience, investment and risk management processes, and information, trading, and compliance systems). There are no minimum or maximum percentages of assets that the Fund must invest in a specific asset class or underlying fund.
The underlying funds invest in growth and value stocks of small, medium, and large market capitalization companies, fixed-income securities (including high yield or “junk” bonds), domestic and foreign (including those in emerging markets) securities, securities denominated in foreign currencies, investment companies (including index funds), real estate securities, derivatives, and U.S. government and U.S. government-sponsored securities. The underlying funds engage in derivative transactions to gain exposure to a variety of securities or asset classes or attempt to reduce risk. A derivative is a financial arrangement, the value of which is derived from, or based on, a traditional security, asset, or market index. The underlying funds principally use futures, options, swaps (including, for example, credit default, interest rate, and currency swaps) and forwards.
Within 10 to 15 years after its target year, the Fund's underlying fund allocation is expected to match that of the Principal LifeTime Hybrid Income Fund. At that time, the Fund may be combined with the Principal LifeTime Hybrid Income Fund if the Board of Directors determines that the combination is in the best interests of Fund shareholders. It is expected that at the target date in the Fund’s name, the shareholder will begin gradually withdrawing the account's value.
227
Principal RisksThe broad diversification of the Fund is designed to cushion severe losses in any one investment sector and moderate overall price volatility. However, the Fund is subject to the particular risks of the underlying funds in the proportions in which the Fund invests in them, and its share prices will fluctuate as the prices of underlying fund shares rise or fall with changing market conditions. If you sell your shares when their value is less than the price you paid, you will lose money. The Fund operates as a fund of funds and thus bears both its own expenses and, indirectly, its proportionate share of the expenses of the underlying funds in which it invests. An investment in the Fund is not a deposit of a bank and is not insured or guaranteed by the Federal Deposit Insurance Corporation or any other government agency. The principal risks of investing in the Fund that are inherent in the fund of funds, in alphabetical order, are:
Asset Allocation Risk. A fund's selection and weighting of asset classes may cause it to underperform other funds with a similar investment objective.
Conflict of Interest Risk. The Advisor and its affiliates earn different fees from different underlying funds and may have an incentive to allocate more fund-of-fund assets to underlying funds from which they receive higher fees.
Investment Company Securities Risk. Fund shareholders bear indirectly their proportionate share of the expenses of other investment companies in which the fund invests.
Target Date Fund Risk. A target date fund should not be selected based solely on age or retirement date because there is no guarantee that this fund will provide adequate income at or through retirement.
The principal risks of investing in the Fund that are inherent in the underlying funds, in alphabetical order, are:
Counterparty Risk. Counterparty risk is the risk that the counterparty to a derivatives contract or repurchase agreement, the borrower of a portfolio’s securities, or other obligation, will be unable or unwilling to make timely principal, interest, or settlement payments, or otherwise to honor its obligations.
Currency Risk. Risks of investing in securities denominated in, or that trade in, foreign (non-U.S.) currencies include changes in foreign exchange rates and foreign exchange restrictions.
Derivatives Risk. Transactions in derivatives may increase volatility, cause the liquidation of portfolio positions when not advantageous to do so and produce disproportionate losses.
Emerging Market Risk. Investments in emerging market countries may have more risk than those in developed market countries because the emerging markets are less developed and more illiquid. Emerging market countries can also be subject to increased social, economic, regulatory, and political uncertainties and can be extremely volatile.
Equity Securities Risk. The value of equity securities could decline if the issuer's financial condition declines or in response to overall market and economic conditions. A fund's principal market segment(s), such as large cap, mid cap or small cap stocks, or growth or value stocks, may underperform other market segments or the equity markets as a whole. Investments in smaller companies and mid-size companies may involve greater risk and price volatility than investments in larger, more mature companies.
Fixed-Income Securities Risk. Fixed-income securities are subject to interest rate risk and credit quality risk. The market value of fixed-income securities generally declines when interest rates rise, and an issuer of fixed-income securities could default on its payment obligations.
Foreign Securities Risk. The risks of foreign securities include loss of value as a result of: political or economic instability; nationalization, expropriation or confiscatory taxation; settlement delays; and limited government regulation (including less stringent reporting, accounting, and disclosure standards than are required of U.S. companies).
Growth Stock Risk. If growth companies do not increase their earnings at a rate expected by investors, the market price of the stock may decline significantly, even if earnings show an absolute increase. Growth company stocks also typically lack the dividend yield that can lessen price declines in market downturns.
High Yield Securities Risk. High yield fixed-income securities (commonly referred to as "junk bonds") are subject to greater credit quality risk than higher rated fixed-income securities and should be considered speculative.

228
Index Fund Investment Risk. More likely than not, an index fund will underperform the index due to cashflows and the fees and expenses of the fund.
Investment Company Securities Risk. Fund shareholders bear indirectly their proportionate share of the expenses of other investment companies in which the fund invests.
Portfolio Duration Risk. Portfolio duration is a measure of the expected life of a fixed-income security and its sensitivity to changes in interest rates. The longer a fund's average portfolio duration, the more sensitive the fund will be to changes in interest rates.
Real Estate Securities Risk. Real estate securities are subject to the risks associated with direct ownership of real estate, including declines in value, adverse economic conditions, increases in expenses, regulatory changes and environmental problems. Investing in securities of companies in the real estate industry, subjects a fund to the special risks associated with the real estate market including factors such as loss to casualty or condemnation, changes in real estate values, property taxes, interest rates, cash flow of underlying real estate assets, occupancy rates, government regulations affecting zoning, land use and rents, and the management skill and creditworthiness of the issuer.
Risk of Being an Underlying Fund. A fund is subject to the risk of being an underlying fund to the extent that a fund of funds invests in the fund. An underlying fund of a fund of funds may experience relatively large redemptions or investments as the fund of funds periodically reallocates or rebalances its assets. These transactions may cause the underlying fund to sell portfolio securities to meet such redemptions, or to invest cash from such investments, at times it would not otherwise do so, and may as a result increase transaction costs and adversely affect underlying fund performance.
U.S. Government Securities Risk. Yields available from U.S. government securities are generally lower than yields from many other fixed-income securities.
U.S. Government Sponsored Securities Risk. Securities issued by U.S. government-sponsored or -chartered enterprises such as the Federal Home Loan Mortgage Corporation, the Federal National Mortgage Association, and the Federal Home Loan Banks are not issued or guaranteed by the U.S. Treasury.
Value Stock Risk. The market may not recognize the intrinsic value of value stocks for a long time, or they may be appropriately priced at the time of purchase.
PerformanceNo performance information is shown below because the Fund has not yet had a calendar year of performance. The Fund's performance is benchmarked against the S&P Target Date 2020 Index. Performance information provides an indication of the risks of investing in the Fund. Past performance (before and after taxes) is not necessarily an indication of how the Fund will perform in the future. You may get updated performance information by calling 1-800-222-5852 or online at www.principal.com.
Management
Investment Advisor and Portfolio Managers: Principal Management Corporation• James W. Fennessey (since 2014), Portfolio Manager• Jeffrey R. Tyler (since 2014), Portfolio Manager• Randy L. Welch (since 2014), Portfolio Manager
Purchase and Sale of Fund SharesThere are no minimum initial or subsequent investment requirements for an eligible purchaser. You may purchase or redeem shares on any business day (normally any day when the New York Stock Exchange is open for regular trading) through your plan, intermediary, or Financial Professional; by sending a written request to Principal Funds at P.O. Box 8024, Boston, MA 02266-8024 (regular mail) or 30 Dan Road, Canton, MA 02021-2809 (overnight mail); calling us at 1-800-222-5852; or accessing our website (www.principalfunds.com).
Tax InformationThe Fund’s distributions you receive are generally subject to federal income tax as ordinary income or capital gain and may also be subject to state and local taxes, unless you are tax-exempt or your account is tax-deferred in which case your distributions would be taxed when withdrawn from the tax-deferred account.

229
Payments to Broker-Dealers and Other Financial IntermediariesIf you purchase the Fund through a broker-dealer or other financial intermediary (such as a bank, insurance company, investment adviser, etc.), the Fund and its related companies may pay the intermediary for the sale of Fund shares and related services. These payments may create a conflict of interest by influencing the broker-dealer or other intermediary and your salesperson to recommend the Fund over another investment, or to recommend one share class of the Fund over another share class. Ask your salesperson or visit your financial intermediary's website for more information.

230
PRINCIPAL LIFETIME HYBRID 2025 FUNDObjective: The Fund seeks a total return consisting of long-term growth of capital and current income.
Fees and Expenses of the FundThis table describes the fees and expenses that you may pay if you buy and hold shares of the Fund.
Shareholder Fees (fees paid directly from your investment): None
Annual Fund Operating Expenses (expenses that you pay each year as a percentage of the value of your investment)
Share ClassInst.
Management Fees 0.01%Distribution and/or Service (12b-1) Fees N/AOther Expenses (1) 0.04%Acquired Fund Fees and Expenses (1) 0.41%Total Annual Fund Operating Expenses 0.46%Expense Reimbursement (2) —%Total Annual Fund Operating Expenses After Expense Reimbursement 0.46%
(1) Based on estimated amounts for the current fiscal year.(2) Principal Management Corporation ("Principal"), the investment advisor, has contractually agreed to limit the Fund’s expenses by paying, if
necessary, expenses normally payable by the Fund, (excluding interest expense, expenses related to fund investments, acquired fund fees and expenses, and other extraordinary expenses) to maintain a total level of operating expenses (expressed as a percent of average net assets on an annualized basis) not to exceed 0.06% for Institutional shares. It is expected that the expense limit will continue through the period ending February 29, 2016; however, Principal Funds, Inc. and Principal, the parties to the agreement, may agree to terminate the expense limit prior to the end of the period.
ExampleThis Example is intended to help you compare the cost of investing in the Fund with the cost of investing in other mutual funds.
The Example assumes that you invest $10,000 in the Fund for the time periods indicated. The Example also assumes that your investment has a 5% return each year and that the Fund’s operating expenses remain the same. Although your actual costs may be higher or lower, based on these assumptions your costs would be:
1 year 3 yearsInstitutional Class $47 $148
Portfolio TurnoverAs a fund of funds, the Fund does not pay transaction costs, such as commissions, when it buys and sells shares of underlying funds (or “turns over” its portfolio). An underlying fund does pay transaction costs when it buys and sells portfolio securities, and a higher portfolio turnover may indicate higher transaction costs. These costs, which are not reflected in annual fund operating expenses or in the examples, affect the performance of the underlying fund and the Fund. This is a new fund and does not yet have a portfolio turnover rate to disclose.
Principal Investment StrategiesThe Fund operates as a “target date fund” that invests according to an asset allocation strategy designed for investors having a retirement investment goal close to the year in the Fund’s name. The Fund's asset allocation will become more conservative over time as investment goals near (for example, retirement, which is assumed to begin at age 65) and investors become more risk-averse. The Fund is a fund of funds that invests in Institutional Class shares of Principal Funds, Inc. (“PFI”), with a majority of the Fund's assets invested in index funds. Its underlying funds consist of domestic and foreign equity funds, fixed-income funds, real asset funds, and other funds that aim to offer diversification beyond traditional equity and fixed-income securities. The Fund is managed by Principal Management Corporation (“Principal”).
Principal develops, implements and monitors the Fund's strategic or long-term asset class targets and target ranges, is responsible for an active rebalancing strategy designed to identify asset classes that appear attractive over the short term, and sets the percentage of Fund assets to be allocated to a particular asset class. Principal selects the

231
underlying funds for each asset class and the target weights for each underlying fund and may shift asset class targets in response to normal evaluative processes, the shortening time horizon of the Fund or changes in market forces or Fund circumstances. Principal may add, remove, or substitute underlying funds at any time.
In selecting underlying funds and target weights, Principal considers both quantitative measures (e.g., past performance, expected levels of risk and returns, expense levels, diversification and style consistency) and qualitative factors (e.g., organizational stability, investment experience, investment and risk management processes, and information, trading, and compliance systems). There are no minimum or maximum percentages of assets that the Fund must invest in a specific asset class or underlying fund.
The underlying funds invest in growth and value stocks of small, medium, and large market capitalization companies, fixed-income securities (including high yield or “junk” bonds), domestic and foreign (including those in emerging markets) securities, securities denominated in foreign currencies, investment companies (including index funds), real estate securities, derivatives, and U.S. government and U.S. government-sponsored securities. The underlying funds engage in derivative transactions to gain exposure to a variety of securities or asset classes or attempt to reduce risk. A derivative is a financial arrangement, the value of which is derived from, or based on, a traditional security, asset, or market index. The underlying funds principally use futures, options, swaps (including, for example, credit default, interest rate, and currency swaps) and forwards.
Within 10 to 15 years after its target year, the Fund's underlying fund allocation is expected to match that of the Principal LifeTime Hybrid Income Fund. At that time, the Fund may be combined with the Principal LifeTime Hybrid Income Fund if the Board of Directors determines that the combination is in the best interests of Fund shareholders. It is expected that at the target date in the Fund’s name, the shareholder will begin gradually withdrawing the account's value.

232
Principal RisksThe broad diversification of the Fund is designed to cushion severe losses in any one investment sector and moderate overall price volatility. However, the Fund is subject to the particular risks of the underlying funds in the proportions in which the Fund invests in them, and its share prices will fluctuate as the prices of underlying fund shares rise or fall with changing market conditions. If you sell your shares when their value is less than the price you paid, you will lose money. The Fund operates as a fund of funds and thus bears both its own expenses and, indirectly, its proportionate share of the expenses of the underlying funds in which it invests. An investment in the Fund is not a deposit of a bank and is not insured or guaranteed by the Federal Deposit Insurance Corporation or any other government agency. The principal risks of investing in the Fund that are inherent in the fund of funds, in alphabetical order, are:
Asset Allocation Risk. A fund's selection and weighting of asset classes may cause it to underperform other funds with a similar investment objective.
Conflict of Interest Risk. The Advisor and its affiliates earn different fees from different underlying funds and may have an incentive to allocate more fund-of-fund assets to underlying funds from which they receive higher fees.
Investment Company Securities Risk. Fund shareholders bear indirectly their proportionate share of the expenses of other investment companies in which the fund invests.
Target Date Fund Risk. A target date fund should not be selected based solely on age or retirement date because there is no guarantee that this fund will provide adequate income at or through retirement.
The principal risks of investing in the Fund that are inherent in the underlying funds, in alphabetical order, are:
Counterparty Risk. Counterparty risk is the risk that the counterparty to a derivatives contract or repurchase agreement, the borrower of a portfolio’s securities, or other obligation, will be unable or unwilling to make timely principal, interest, or settlement payments, or otherwise to honor its obligations.
Currency Risk. Risks of investing in securities denominated in, or that trade in, foreign (non-U.S.) currencies include changes in foreign exchange rates and foreign exchange restrictions.
Derivatives Risk. Transactions in derivatives may increase volatility, cause the liquidation of portfolio positions when not advantageous to do so and produce disproportionate losses.
Emerging Market Risk. Investments in emerging market countries may have more risk than those in developed market countries because the emerging markets are less developed and more illiquid. Emerging market countries can also be subject to increased social, economic, regulatory, and political uncertainties and can be extremely volatile.
Equity Securities Risk. The value of equity securities could decline if the issuer's financial condition declines or in response to overall market and economic conditions. A fund's principal market segment(s), such as large cap, mid cap or small cap stocks, or growth or value stocks, may underperform other market segments or the equity markets as a whole. Investments in smaller companies and mid-size companies may involve greater risk and price volatility than investments in larger, more mature companies.
Fixed-Income Securities Risk. Fixed-income securities are subject to interest rate risk and credit quality risk. The market value of fixed-income securities generally declines when interest rates rise, and an issuer of fixed-income securities could default on its payment obligations.
Foreign Securities Risk. The risks of foreign securities include loss of value as a result of: political or economic instability; nationalization, expropriation or confiscatory taxation; settlement delays; and limited government regulation (including less stringent reporting, accounting, and disclosure standards than are required of U.S. companies).
Growth Stock Risk. If growth companies do not increase their earnings at a rate expected by investors, the market price of the stock may decline significantly, even if earnings show an absolute increase. Growth company stocks also typically lack the dividend yield that can lessen price declines in market downturns.
High Yield Securities Risk. High yield fixed-income securities (commonly referred to as "junk bonds") are subject to greater credit quality risk than higher rated fixed-income securities and should be considered speculative.

233
Index Fund Investment Risk. More likely than not, an index fund will underperform the index due to cashflows and the fees and expenses of the fund.
Investment Company Securities Risk. Fund shareholders bear indirectly their proportionate share of the expenses of other investment companies in which the fund invests.
Portfolio Duration Risk. Portfolio duration is a measure of the expected life of a fixed-income security and its sensitivity to changes in interest rates. The longer a fund's average portfolio duration, the more sensitive the fund will be to changes in interest rates.
Real Estate Securities Risk. Real estate securities are subject to the risks associated with direct ownership of real estate, including declines in value, adverse economic conditions, increases in expenses, regulatory changes and environmental problems. Investing in securities of companies in the real estate industry, subjects a fund to the special risks associated with the real estate market including factors such as loss to casualty or condemnation, changes in real estate values, property taxes, interest rates, cash flow of underlying real estate assets, occupancy rates, government regulations affecting zoning, land use and rents, and the management skill and creditworthiness of the issuer.
Risk of Being an Underlying Fund. A fund is subject to the risk of being an underlying fund to the extent that a fund of funds invests in the fund. An underlying fund of a fund of funds may experience relatively large redemptions or investments as the fund of funds periodically reallocates or rebalances its assets. These transactions may cause the underlying fund to sell portfolio securities to meet such redemptions, or to invest cash from such investments, at times it would not otherwise do so, and may as a result increase transaction costs and adversely affect underlying fund performance.
U.S. Government Securities Risk. Yields available from U.S. government securities are generally lower than yields from many other fixed-income securities.
U.S. Government Sponsored Securities Risk. Securities issued by U.S. government-sponsored or -chartered enterprises such as the Federal Home Loan Mortgage Corporation, the Federal National Mortgage Association, and the Federal Home Loan Banks are not issued or guaranteed by the U.S. Treasury.
Value Stock Risk. The market may not recognize the intrinsic value of value stocks for a long time, or they may be appropriately priced at the time of purchase.
PerformanceNo performance information is shown below because the Fund has not yet had a calendar year of performance. The Fund's performance is benchmarked against the S&P Target Date 2025 Index. Performance information provides an indication of the risks of investing in the Fund. Past performance (before and after taxes) is not necessarily an indication of how the Fund will perform in the future. You may get updated performance information by calling 1-800-222-5852 or online at www.principal.com.
Management
Investment Advisor and Portfolio Managers: Principal Management Corporation• James W. Fennessey (since 2014), Portfolio Manager• Jeffrey R. Tyler (since 2014), Portfolio Manager• Randy L. Welch (since 2014), Portfolio Manager
Purchase and Sale of Fund SharesThere are no minimum initial or subsequent investment requirements for an eligible purchaser. You may purchase or redeem shares on any business day (normally any day when the New York Stock Exchange is open for regular trading) through your plan, intermediary, or Financial Professional; by sending a written request to Principal Funds at P.O. Box 8024, Boston, MA 02266-8024 (regular mail) or 30 Dan Road, Canton, MA 02021-2809 (overnight mail); calling us at 1-800-222-5852; or accessing our website (www.principalfunds.com).
Tax InformationThe Fund’s distributions you receive are generally subject to federal income tax as ordinary income or capital gain and may also be subject to state and local taxes, unless you are tax-exempt or your account is tax-deferred in which case your distributions would be taxed when withdrawn from the tax-deferred account.

234
Payments to Broker-Dealers and Other Financial IntermediariesIf you purchase the Fund through a broker-dealer or other financial intermediary (such as a bank, insurance company, investment adviser, etc.), the Fund and its related companies may pay the intermediary for the sale of Fund shares and related services. These payments may create a conflict of interest by influencing the broker-dealer or other intermediary and your salesperson to recommend the Fund over another investment, or to recommend one share class of the Fund over another share class. Ask your salesperson or visit your financial intermediary's website for more information.

235
PRINCIPAL LIFETIME HYBRID 2030 FUNDObjective: The Fund seeks a total return consisting of long-term growth of capital and current income.
Fees and Expenses of the FundThis table describes the fees and expenses that you may pay if you buy and hold shares of the Fund.
Shareholder Fees (fees paid directly from your investment): None
Annual Fund Operating Expenses (expenses that you pay each year as a percentage of the value of your investment)
Share ClassInst.
Management Fees 0.01%Distribution and/or Service (12b-1) Fees N/AOther Expenses (1) 0.04%Acquired Fund Fees and Expenses (1) 0.42%Total Annual Fund Operating Expenses 0.47%Expense Reimbursement (2) —%Total Annual Fund Operating Expenses After Expense Reimbursement 0.47%
(1) Based on estimated amounts for the current fiscal year.(2) Principal Management Corporation ("Principal"), the investment advisor, has contractually agreed to limit the Fund’s expenses by paying, if
necessary, expenses normally payable by the Fund, (excluding interest expense, expenses related to fund investments, acquired fund fees and expenses, and other extraordinary expenses) to maintain a total level of operating expenses (expressed as a percent of average net assets on an annualized basis) not to exceed 0.06% for Institutional shares. It is expected that the expense limit will continue through the period ending February 29, 2016; however, Principal Funds, Inc. and Principal, the parties to the agreement, may agree to terminate the expense limit prior to the end of the period.
ExampleThis Example is intended to help you compare the cost of investing in the Fund with the cost of investing in other mutual funds.
The Example assumes that you invest $10,000 in the Fund for the time periods indicated. The Example also assumes that your investment has a 5% return each year and that the Fund’s operating expenses remain the same. Although your actual costs may be higher or lower, based on these assumptions your costs would be:
1 year 3 yearsInstitutional Class $48 $151
Portfolio TurnoverAs a fund of funds, the Fund does not pay transaction costs, such as commissions, when it buys and sells shares of underlying funds (or “turns over” its portfolio). An underlying fund does pay transaction costs when it buys and sells portfolio securities, and a higher portfolio turnover may indicate higher transaction costs. These costs, which are not reflected in annual fund operating expenses or in the examples, affect the performance of the underlying fund and the Fund. This is a new fund and does not yet have a portfolio turnover rate to disclose.
Principal Investment StrategiesThe Fund operates as a “target date fund” that invests according to an asset allocation strategy designed for investors having a retirement investment goal close to the year in the Fund’s name. The Fund's asset allocation will become more conservative over time as investment goals near (for example, retirement, which is assumed to begin at age 65) and investors become more risk-averse. The Fund is a fund of funds that invests in Institutional Class shares of Principal Funds, Inc. (“PFI”), with a majority of the Fund's assets invested in index funds. Its underlying funds consist of domestic and foreign equity funds, fixed-income funds, real asset funds, and other funds that aim to offer diversification beyond traditional equity and fixed-income securities. The Fund is managed by Principal Management Corporation (“Principal”).
Principal develops, implements and monitors the Fund's strategic or long-term asset class targets and target ranges, is responsible for an active rebalancing strategy designed to identify asset classes that appear attractive over the short term, and sets the percentage of Fund assets to be allocated to a particular asset class. Principal selects the
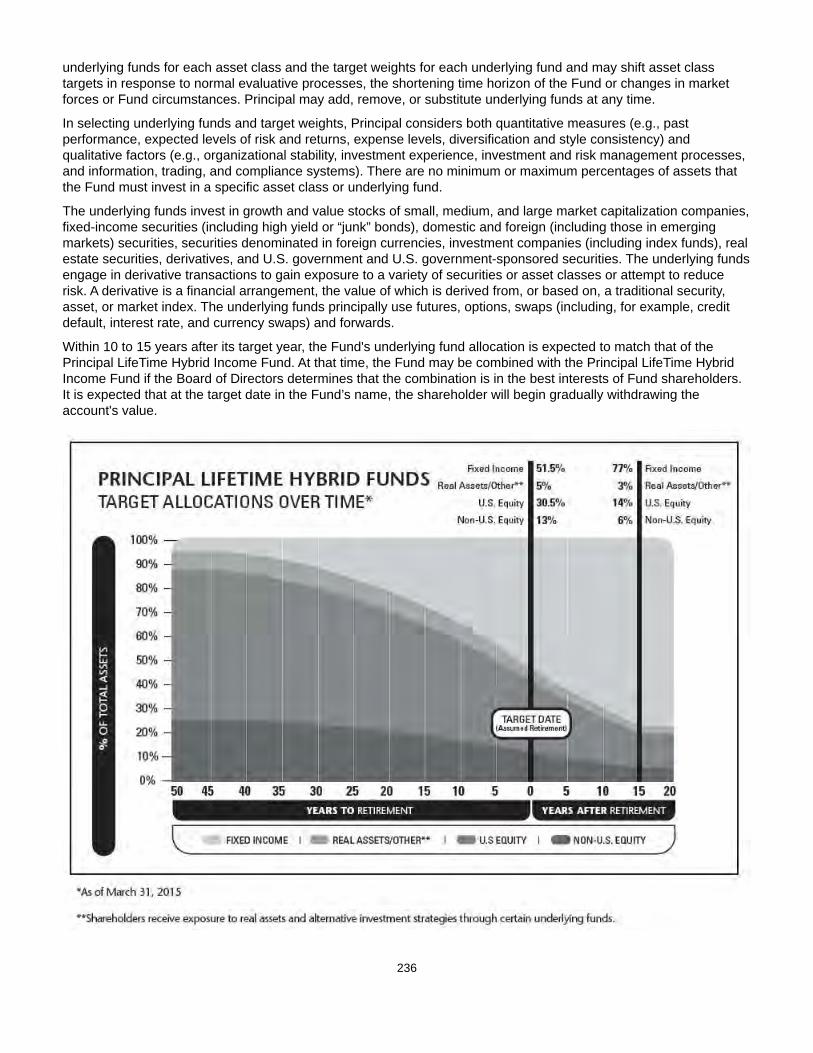
236
underlying funds for each asset class and the target weights for each underlying fund and may shift asset class targets in response to normal evaluative processes, the shortening time horizon of the Fund or changes in market forces or Fund circumstances. Principal may add, remove, or substitute underlying funds at any time.
In selecting underlying funds and target weights, Principal considers both quantitative measures (e.g., past performance, expected levels of risk and returns, expense levels, diversification and style consistency) and qualitative factors (e.g., organizational stability, investment experience, investment and risk management processes, and information, trading, and compliance systems). There are no minimum or maximum percentages of assets that the Fund must invest in a specific asset class or underlying fund.
The underlying funds invest in growth and value stocks of small, medium, and large market capitalization companies, fixed-income securities (including high yield or “junk” bonds), domestic and foreign (including those in emerging markets) securities, securities denominated in foreign currencies, investment companies (including index funds), real estate securities, derivatives, and U.S. government and U.S. government-sponsored securities. The underlying funds engage in derivative transactions to gain exposure to a variety of securities or asset classes or attempt to reduce risk. A derivative is a financial arrangement, the value of which is derived from, or based on, a traditional security, asset, or market index. The underlying funds principally use futures, options, swaps (including, for example, credit default, interest rate, and currency swaps) and forwards.
Within 10 to 15 years after its target year, the Fund's underlying fund allocation is expected to match that of the Principal LifeTime Hybrid Income Fund. At that time, the Fund may be combined with the Principal LifeTime Hybrid Income Fund if the Board of Directors determines that the combination is in the best interests of Fund shareholders. It is expected that at the target date in the Fund’s name, the shareholder will begin gradually withdrawing the account's value.

237
Principal RisksThe broad diversification of the Fund is designed to cushion severe losses in any one investment sector and moderate overall price volatility. However, the Fund is subject to the particular risks of the underlying funds in the proportions in which the Fund invests in them, and its share prices will fluctuate as the prices of underlying fund shares rise or fall with changing market conditions. If you sell your shares when their value is less than the price you paid, you will lose money. The Fund operates as a fund of funds and thus bears both its own expenses and, indirectly, its proportionate share of the expenses of the underlying funds in which it invests. An investment in the Fund is not a deposit of a bank and is not insured or guaranteed by the Federal Deposit Insurance Corporation or any other government agency. The principal risks of investing in the Fund that are inherent in the fund of funds, in alphabetical order, are:
Asset Allocation Risk. A fund's selection and weighting of asset classes may cause it to underperform other funds with a similar investment objective.
Conflict of Interest Risk. The Advisor and its affiliates earn different fees from different underlying funds and may have an incentive to allocate more fund-of-fund assets to underlying funds from which they receive higher fees.
Investment Company Securities Risk. Fund shareholders bear indirectly their proportionate share of the expenses of other investment companies in which the fund invests.
Target Date Fund Risk. A target date fund should not be selected based solely on age or retirement date because there is no guarantee that this fund will provide adequate income at or through retirement.
The principal risks of investing in the Fund that are inherent in the underlying funds, in alphabetical order, are:
Counterparty Risk. Counterparty risk is the risk that the counterparty to a derivatives contract or repurchase agreement, the borrower of a portfolio’s securities, or other obligation, will be unable or unwilling to make timely principal, interest, or settlement payments, or otherwise to honor its obligations.
Currency Risk. Risks of investing in securities denominated in, or that trade in, foreign (non-U.S.) currencies include changes in foreign exchange rates and foreign exchange restrictions.
Derivatives Risk. Transactions in derivatives may increase volatility, cause the liquidation of portfolio positions when not advantageous to do so and produce disproportionate losses.
Emerging Market Risk. Investments in emerging market countries may have more risk than those in developed market countries because the emerging markets are less developed and more illiquid. Emerging market countries can also be subject to increased social, economic, regulatory, and political uncertainties and can be extremely volatile.
Equity Securities Risk. The value of equity securities could decline if the issuer's financial condition declines or in response to overall market and economic conditions. A fund's principal market segment(s), such as large cap, mid cap or small cap stocks, or growth or value stocks, may underperform other market segments or the equity markets as a whole. Investments in smaller companies and mid-size companies may involve greater risk and price volatility than investments in larger, more mature companies.
Fixed-Income Securities Risk. Fixed-income securities are subject to interest rate risk and credit quality risk. The market value of fixed-income securities generally declines when interest rates rise, and an issuer of fixed-income securities could default on its payment obligations.
Foreign Securities Risk. The risks of foreign securities include loss of value as a result of: political or economic instability; nationalization, expropriation or confiscatory taxation; settlement delays; and limited government regulation (including less stringent reporting, accounting, and disclosure standards than are required of U.S. companies).
Growth Stock Risk. If growth companies do not increase their earnings at a rate expected by investors, the market price of the stock may decline significantly, even if earnings show an absolute increase. Growth company stocks also typically lack the dividend yield that can lessen price declines in market downturns.
High Yield Securities Risk. High yield fixed-income securities (commonly referred to as "junk bonds") are subject to greater credit quality risk than higher rated fixed-income securities and should be considered speculative.

238
Index Fund Investment Risk. More likely than not, an index fund will underperform the index due to cashflows and the fees and expenses of the fund.
Investment Company Securities Risk. Fund shareholders bear indirectly their proportionate share of the expenses of other investment companies in which the fund invests.
Portfolio Duration Risk. Portfolio duration is a measure of the expected life of a fixed-income security and its sensitivity to changes in interest rates. The longer a fund's average portfolio duration, the more sensitive the fund will be to changes in interest rates.
Real Estate Securities Risk. Real estate securities are subject to the risks associated with direct ownership of real estate, including declines in value, adverse economic conditions, increases in expenses, regulatory changes and environmental problems. Investing in securities of companies in the real estate industry, subjects a fund to the special risks associated with the real estate market including factors such as loss to casualty or condemnation, changes in real estate values, property taxes, interest rates, cash flow of underlying real estate assets, occupancy rates, government regulations affecting zoning, land use and rents, and the management skill and creditworthiness of the issuer.
Risk of Being an Underlying Fund. A fund is subject to the risk of being an underlying fund to the extent that a fund of funds invests in the fund. An underlying fund of a fund of funds may experience relatively large redemptions or investments as the fund of funds periodically reallocates or rebalances its assets. These transactions may cause the underlying fund to sell portfolio securities to meet such redemptions, or to invest cash from such investments, at times it would not otherwise do so, and may as a result increase transaction costs and adversely affect underlying fund performance.
U.S. Government Securities Risk. Yields available from U.S. government securities are generally lower than yields from many other fixed-income securities.
U.S. Government Sponsored Securities Risk. Securities issued by U.S. government-sponsored or -chartered enterprises such as the Federal Home Loan Mortgage Corporation, the Federal National Mortgage Association, and the Federal Home Loan Banks are not issued or guaranteed by the U.S. Treasury.
Value Stock Risk. The market may not recognize the intrinsic value of value stocks for a long time, or they may be appropriately priced at the time of purchase.
PerformanceNo performance information is shown below because the Fund has not yet had a calendar year of performance. The Fund's performance is benchmarked against the S&P Target Date 2030 Index. Performance information provides an indication of the risks of investing in the Fund. Past performance (before and after taxes) is not necessarily an indication of how the Fund will perform in the future. You may get updated performance information by calling 1-800-222-5852 or online at www.principal.com.
Management
Investment Advisor and Portfolio Managers: Principal Management Corporation• James W. Fennessey (since 2014), Portfolio Manager• Jeffrey R. Tyler (since 2014), Portfolio Manager• Randy L. Welch (since 2014), Portfolio Manager
Purchase and Sale of Fund SharesThere are no minimum initial or subsequent investment requirements for an eligible purchaser. You may purchase or redeem shares on any business day (normally any day when the New York Stock Exchange is open for regular trading) through your plan, intermediary, or Financial Professional; by sending a written request to Principal Funds at P.O. Box 8024, Boston, MA 02266-8024 (regular mail) or 30 Dan Road, Canton, MA 02021-2809 (overnight mail); calling us at 1-800-222-5852; or accessing our website (www.principalfunds.com).
Tax InformationThe Fund’s distributions you receive are generally subject to federal income tax as ordinary income or capital gain and may also be subject to state and local taxes, unless you are tax-exempt or your account is tax-deferred in which case your distributions would be taxed when withdrawn from the tax-deferred account.

239
Payments to Broker-Dealers and Other Financial IntermediariesIf you purchase the Fund through a broker-dealer or other financial intermediary (such as a bank, insurance company, investment adviser, etc.), the Fund and its related companies may pay the intermediary for the sale of Fund shares and related services. These payments may create a conflict of interest by influencing the broker-dealer or other intermediary and your salesperson to recommend the Fund over another investment, or to recommend one share class of the Fund over another share class. Ask your salesperson or visit your financial intermediary's website for more information.

240
PRINCIPAL LIFETIME HYBRID 2035 FUNDObjective: The Fund seeks a total return consisting of long-term growth of capital and current income.
Fees and Expenses of the FundThis table describes the fees and expenses that you may pay if you buy and hold shares of the Fund.
Shareholder Fees (fees paid directly from your investment): None
Annual Fund Operating Expenses (expenses that you pay each year as a percentage of the value of your investment)
Share ClassInst.
Management Fees 0.01%Distribution and/or Service (12b-1) Fees N/AOther Expenses (1) 0.05%Acquired Fund Fees and Expenses (1) 0.43%Total Annual Fund Operating Expenses 0.49%Expense Reimbursement (2) —%Total Annual Fund Operating Expenses After Expense Reimbursement 0.49%
(1) Based on estimated amounts for the current fiscal year.(2) Principal Management Corporation ("Principal"), the investment advisor, has contractually agreed to limit the Fund’s expenses by paying, if
necessary, expenses normally payable by the Fund, (excluding interest expense, expenses related to fund investments, acquired fund fees and expenses, and other extraordinary expenses) to maintain a total level of operating expenses (expressed as a percent of average net assets on an annualized basis) not to exceed 0.06% for Institutional shares. It is expected that the expense limit will continue through the period ending February 29, 2016; however, Principal Funds, Inc. and Principal, the parties to the agreement, may agree to terminate the expense limit prior to the end of the period.
ExampleThis Example is intended to help you compare the cost of investing in the Fund with the cost of investing in other mutual funds.
The Example assumes that you invest $10,000 in the Fund for the time periods indicated. The Example also assumes that your investment has a 5% return each year and that the Fund’s operating expenses remain the same. Although your actual costs may be higher or lower, based on these assumptions your costs would be:
1 year 3 yearsInstitutional Class $50 $157
Portfolio TurnoverAs a fund of funds, the Fund does not pay transaction costs, such as commissions, when it buys and sells shares of underlying funds (or “turns over” its portfolio). An underlying fund does pay transaction costs when it buys and sells portfolio securities, and a higher portfolio turnover may indicate higher transaction costs. These costs, which are not reflected in annual fund operating expenses or in the examples, affect the performance of the underlying fund and the Fund. This is a new fund and does not yet have a portfolio turnover rate to disclose.
Principal Investment StrategiesThe Fund operates as a “target date fund” that invests according to an asset allocation strategy designed for investors having a retirement investment goal close to the year in the Fund’s name. The Fund's asset allocation will become more conservative over time as investment goals near (for example, retirement, which is assumed to begin at age 65) and investors become more risk-averse. The Fund is a fund of funds that invests in Institutional Class shares of Principal Funds, Inc. (“PFI”), with a majority of the Fund's assets invested in index funds. Its underlying funds consist of domestic and foreign equity funds, fixed-income funds, real asset funds, and other funds that aim to offer diversification beyond traditional equity and fixed-income securities. The Fund is managed by Principal Management Corporation (“Principal”).
Principal develops, implements and monitors the Fund's strategic or long-term asset class targets and target ranges, is responsible for an active rebalancing strategy designed to identify asset classes that appear attractive over the short term, and sets the percentage of Fund assets to be allocated to a particular asset class. Principal selects the

241
underlying funds for each asset class and the target weights for each underlying fund and may shift asset class targets in response to normal evaluative processes, the shortening time horizon of the Fund or changes in market forces or Fund circumstances. Principal may add, remove, or substitute underlying funds at any time.
In selecting underlying funds and target weights, Principal considers both quantitative measures (e.g., past performance, expected levels of risk and returns, expense levels, diversification and style consistency) and qualitative factors (e.g., organizational stability, investment experience, investment and risk management processes, and information, trading, and compliance systems). There are no minimum or maximum percentages of assets that the Fund must invest in a specific asset class or underlying fund.
The underlying funds invest in growth and value stocks of small, medium, and large market capitalization companies, fixed-income securities, domestic and foreign (including those in emerging markets) securities, securities denominated in foreign currencies, investment companies (including index funds), real estate securities, derivatives, and U.S. government and U.S. government-sponsored securities. The underlying funds engage in derivative transactions to gain exposure to a variety of securities or asset classes or attempt to reduce risk. A derivative is a financial arrangement, the value of which is derived from, or based on, a traditional security, asset, or market index. The underlying funds principally use equity index futures and options to manage equity exposure.
Within 10 to 15 years after its target year, the Fund's underlying fund allocation is expected to match that of the Principal LifeTime Hybrid Income Fund. At that time, the Fund may be combined with the Principal LifeTime Hybrid Income Fund if the Board of Directors determines that the combination is in the best interests of Fund shareholders. It is expected that at the target date in the Fund’s name, the shareholder will begin gradually withdrawing the account's value.
242
Principal RisksThe broad diversification of the Fund is designed to cushion severe losses in any one investment sector and moderate overall price volatility. However, the Fund is subject to the particular risks of the underlying funds in the proportions in which the Fund invests in them, and its share prices will fluctuate as the prices of underlying fund shares rise or fall with changing market conditions. If you sell your shares when their value is less than the price you paid, you will lose money. The Fund operates as a fund of funds and thus bears both its own expenses and, indirectly, its proportionate share of the expenses of the underlying funds in which it invests. An investment in the Fund is not a deposit of a bank and is not insured or guaranteed by the Federal Deposit Insurance Corporation or any other government agency. The principal risks of investing in the Fund that are inherent in the fund of funds, in alphabetical order, are:
Asset Allocation Risk. A fund's selection and weighting of asset classes may cause it to underperform other funds with a similar investment objective.
Conflict of Interest Risk. The Advisor and its affiliates earn different fees from different underlying funds and may have an incentive to allocate more fund-of-fund assets to underlying funds from which they receive higher fees.
Investment Company Securities Risk. Fund shareholders bear indirectly their proportionate share of the expenses of other investment companies in which the fund invests.
Target Date Fund Risk. A target date fund should not be selected based solely on age or retirement date because there is no guarantee that this fund will provide adequate income at or through retirement.
The principal risks of investing in the Fund that are inherent in the underlying funds, in alphabetical order, are:
Currency Risk. Risks of investing in securities denominated in, or that trade in, foreign (non-U.S.) currencies include changes in foreign exchange rates and foreign exchange restrictions.
Derivatives Risk. Transactions in derivatives may increase volatility, cause the liquidation of portfolio positions when not advantageous to do so and produce disproportionate losses.
Emerging Market Risk. Investments in emerging market countries may have more risk than those in developed market countries because the emerging markets are less developed and more illiquid. Emerging market countries can also be subject to increased social, economic, regulatory, and political uncertainties and can be extremely volatile.
Equity Securities Risk. The value of equity securities could decline if the issuer's financial condition declines or in response to overall market and economic conditions. A fund's principal market segment(s), such as large cap, mid cap or small cap stocks, or growth or value stocks, may underperform other market segments or the equity markets as a whole. Investments in smaller companies and mid-size companies may involve greater risk and price volatility than investments in larger, more mature companies.
Fixed-Income Securities Risk. Fixed-income securities are subject to interest rate risk and credit quality risk. The market value of fixed-income securities generally declines when interest rates rise, and an issuer of fixed-income securities could default on its payment obligations.
Foreign Securities Risk. The risks of foreign securities include loss of value as a result of: political or economic instability; nationalization, expropriation or confiscatory taxation; settlement delays; and limited government regulation (including less stringent reporting, accounting, and disclosure standards than are required of U.S. companies).
Growth Stock Risk. If growth companies do not increase their earnings at a rate expected by investors, the market price of the stock may decline significantly, even if earnings show an absolute increase. Growth company stocks also typically lack the dividend yield that can lessen price declines in market downturns.
Index Fund Investment Risk. More likely than not, an index fund will underperform the index due to cashflows and the fees and expenses of the fund.
Investment Company Securities Risk. Fund shareholders bear indirectly their proportionate share of the expenses of other investment companies in which the fund invests.
243
Portfolio Duration Risk. Portfolio duration is a measure of the expected life of a fixed-income security and its sensitivity to changes in interest rates. The longer a fund's average portfolio duration, the more sensitive the fund will be to changes in interest rates.
Real Estate Securities Risk. Real estate securities are subject to the risks associated with direct ownership of real estate, including declines in value, adverse economic conditions, increases in expenses, regulatory changes and environmental problems. Investing in securities of companies in the real estate industry, subjects a fund to the special risks associated with the real estate market including factors such as loss to casualty or condemnation, changes in real estate values, property taxes, interest rates, cash flow of underlying real estate assets, occupancy rates, government regulations affecting zoning, land use and rents, and the management skill and creditworthiness of the issuer.
Risk of Being an Underlying Fund. A fund is subject to the risk of being an underlying fund to the extent that a fund of funds invests in the fund. An underlying fund of a fund of funds may experience relatively large redemptions or investments as the fund of funds periodically reallocates or rebalances its assets. These transactions may cause the underlying fund to sell portfolio securities to meet such redemptions, or to invest cash from such investments, at times it would not otherwise do so, and may as a result increase transaction costs and adversely affect underlying fund performance.
U.S. Government Securities Risk. Yields available from U.S. government securities are generally lower than yields from many other fixed-income securities.
U.S. Government Sponsored Securities Risk. Securities issued by U.S. government-sponsored or -chartered enterprises such as the Federal Home Loan Mortgage Corporation, the Federal National Mortgage Association, and the Federal Home Loan Banks are not issued or guaranteed by the U.S. Treasury.
Value Stock Risk. The market may not recognize the intrinsic value of value stocks for a long time, or they may be appropriately priced at the time of purchase.
PerformanceNo performance information is shown below because the Fund has not yet had a calendar year of performance. The Fund's performance is benchmarked against the S&P Target Date 2035 Index. Performance information provides an indication of the risks of investing in the Fund. Past performance (before and after taxes) is not necessarily an indication of how the Fund will perform in the future. You may get updated performance information by calling 1-800-222-5852 or online at www.principal.com.
Management
Investment Advisor and Portfolio Managers: Principal Management Corporation• James W. Fennessey (since 2014), Portfolio Manager• Jeffrey R. Tyler (since 2014), Portfolio Manager• Randy L. Welch (since 2014), Portfolio Manager
Purchase and Sale of Fund SharesThere are no minimum initial or subsequent investment requirements for an eligible purchaser. You may purchase or redeem shares on any business day (normally any day when the New York Stock Exchange is open for regular trading) through your plan, intermediary, or Financial Professional; by sending a written request to Principal Funds at P.O. Box 8024, Boston, MA 02266-8024 (regular mail) or 30 Dan Road, Canton, MA 02021-2809 (overnight mail); calling us at 1-800-222-5852; or accessing our website (www.principalfunds.com).
Tax InformationThe Fund’s distributions you receive are generally subject to federal income tax as ordinary income or capital gain and may also be subject to state and local taxes, unless you are tax-exempt or your account is tax-deferred in which case your distributions would be taxed when withdrawn from the tax-deferred account.

244
Payments to Broker-Dealers and Other Financial IntermediariesIf you purchase the Fund through a broker-dealer or other financial intermediary (such as a bank, insurance company, investment adviser, etc.), the Fund and its related companies may pay the intermediary for the sale of Fund shares and related services. These payments may create a conflict of interest by influencing the broker-dealer or other intermediary and your salesperson to recommend the Fund over another investment, or to recommend one share class of the Fund over another share class. Ask your salesperson or visit your financial intermediary's website for more information.

245
PRINCIPAL LIFETIME HYBRID 2040 FUNDObjective: The Fund seeks a total return consisting of long-term growth of capital and current income.
Fees and Expenses of the FundThis table describes the fees and expenses that you may pay if you buy and hold shares of the Fund.
Shareholder Fees (fees paid directly from your investment): None
Annual Fund Operating Expenses (expenses that you pay each year as a percentage of the value of your investment)
Share ClassInst.
Management Fees 0.01%Distribution and/or Service (12b-1) Fees N/AOther Expenses (1) 0.05%Acquired Fund Fees and Expenses (1) 0.43%Total Annual Fund Operating Expenses 0.49%Expense Reimbursement (2) —%Total Annual Fund Operating Expenses After Expense Reimbursement 0.49%
(1) Based on estimated amounts for the current fiscal year.(2) Principal Management Corporation ("Principal"), the investment advisor, has contractually agreed to limit the Fund’s expenses by paying, if
necessary, expenses normally payable by the Fund, (excluding interest expense, expenses related to fund investments, acquired fund fees and expenses, and other extraordinary expenses) to maintain a total level of operating expenses (expressed as a percent of average net assets on an annualized basis) not to exceed 0.06% for Institutional shares. It is expected that the expense limit will continue through the period ending February 29, 2016; however, Principal Funds, Inc. and Principal, the parties to the agreement, may agree to terminate the expense limit prior to the end of the period.
ExampleThis Example is intended to help you compare the cost of investing in the Fund with the cost of investing in other mutual funds.
The Example assumes that you invest $10,000 in the Fund for the time periods indicated. The Example also assumes that your investment has a 5% return each year and that the Fund’s operating expenses remain the same. Although your actual costs may be higher or lower, based on these assumptions your costs would be:
1 year 3 yearsInstitutional Class $50 $157
Portfolio TurnoverAs a fund of funds, the Fund does not pay transaction costs, such as commissions, when it buys and sells shares of underlying funds (or “turns over” its portfolio). An underlying fund does pay transaction costs when it buys and sells portfolio securities, and a higher portfolio turnover may indicate higher transaction costs. These costs, which are not reflected in annual fund operating expenses or in the examples, affect the performance of the underlying fund and the Fund. This is a new fund and does not yet have a portfolio turnover rate to disclose.
Principal Investment StrategiesThe Fund operates as a “target date fund” that invests according to an asset allocation strategy designed for investors having a retirement investment goal close to the year in the Fund’s name. The Fund's asset allocation will become more conservative over time as investment goals near (for example, retirement, which is assumed to begin at age 65) and investors become more risk-averse. The Fund is a fund of funds that invests in Institutional Class shares of Principal Funds, Inc. (“PFI”), with a majority of the Fund's assets invested in index funds. Its underlying funds consist of domestic and foreign equity funds, fixed-income funds, real asset funds, and other funds that aim to offer diversification beyond traditional equity and fixed-income securities. The Fund is managed by Principal Management Corporation (“Principal”).
Principal develops, implements and monitors the Fund's strategic or long-term asset class targets and target ranges, is responsible for an active rebalancing strategy designed to identify asset classes that appear attractive over the short term, and sets the percentage of Fund assets to be allocated to a particular asset class. Principal selects the
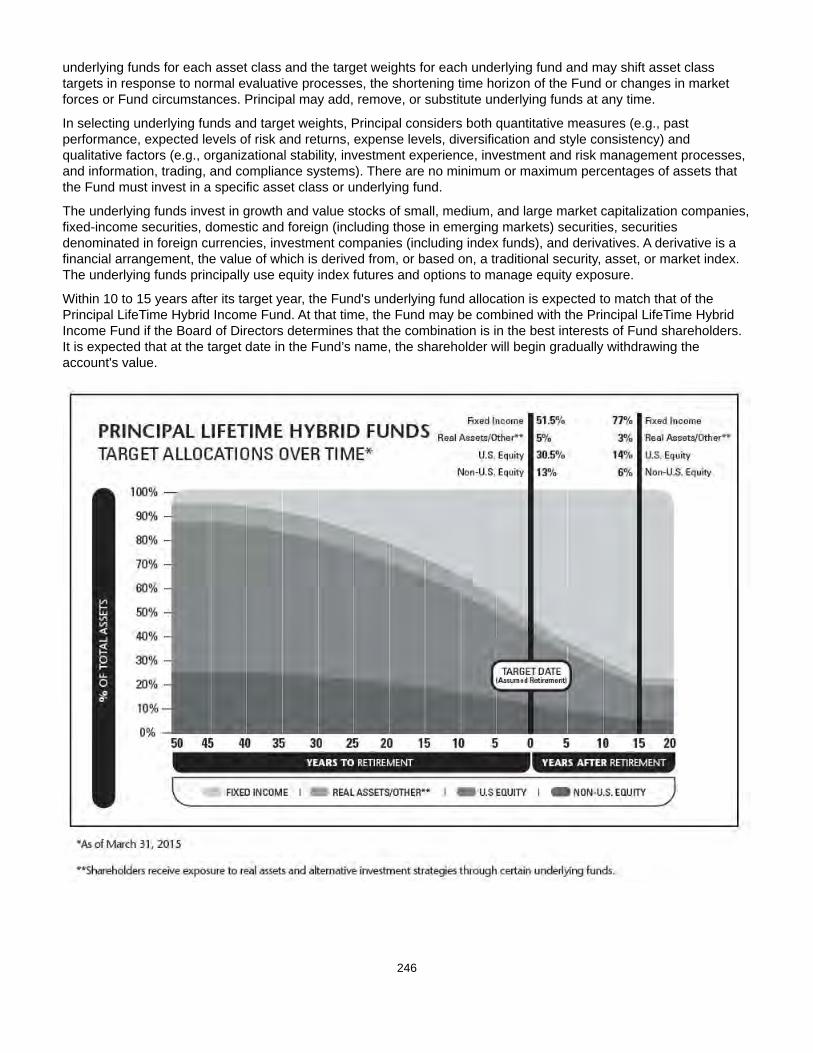
246
underlying funds for each asset class and the target weights for each underlying fund and may shift asset class targets in response to normal evaluative processes, the shortening time horizon of the Fund or changes in market forces or Fund circumstances. Principal may add, remove, or substitute underlying funds at any time.
In selecting underlying funds and target weights, Principal considers both quantitative measures (e.g., past performance, expected levels of risk and returns, expense levels, diversification and style consistency) and qualitative factors (e.g., organizational stability, investment experience, investment and risk management processes, and information, trading, and compliance systems). There are no minimum or maximum percentages of assets that the Fund must invest in a specific asset class or underlying fund.
The underlying funds invest in growth and value stocks of small, medium, and large market capitalization companies, fixed-income securities, domestic and foreign (including those in emerging markets) securities, securities denominated in foreign currencies, investment companies (including index funds), and derivatives. A derivative is a financial arrangement, the value of which is derived from, or based on, a traditional security, asset, or market index. The underlying funds principally use equity index futures and options to manage equity exposure.
Within 10 to 15 years after its target year, the Fund's underlying fund allocation is expected to match that of the Principal LifeTime Hybrid Income Fund. At that time, the Fund may be combined with the Principal LifeTime Hybrid Income Fund if the Board of Directors determines that the combination is in the best interests of Fund shareholders. It is expected that at the target date in the Fund’s name, the shareholder will begin gradually withdrawing the account's value.

247
Principal RisksThe broad diversification of the Fund is designed to cushion severe losses in any one investment sector and moderate overall price volatility. However, the Fund is subject to the particular risks of the underlying funds in the proportions in which the Fund invests in them, and its share prices will fluctuate as the prices of underlying fund shares rise or fall with changing market conditions. If you sell your shares when their value is less than the price you paid, you will lose money. The Fund operates as a fund of funds and thus bears both its own expenses and, indirectly, its proportionate share of the expenses of the underlying funds in which it invests. An investment in the Fund is not a deposit of the bank and is not insured or guaranteed by the Federal Deposit Insurance Corporation or any other government agency. The principal risks of investing in the Fund that are inherent in the fund of funds, in alphabetical order, are:
Asset Allocation Risk. A fund's selection and weighting of asset classes may cause it to underperform other funds with a similar investment objective.
Conflict of Interest Risk. The Advisor and its affiliates earn different fees from different underlying funds and may have an incentive to allocate more fund-of-fund assets to underlying funds from which they receive higher fees.
Investment Company Securities Risk. Fund shareholders bear indirectly their proportionate share of the expenses of other investment companies in which the fund invests.
Target Date Fund Risk. A target date fund should not be selected based solely on age or retirement date because there is no guarantee that this fund will provide adequate income at or through retirement.
The principal risks of investing in the Fund that are inherent in the underlying funds, in alphabetical order, are:
Currency Risk. Risks of investing in securities denominated in, or that trade in, foreign (non-U.S.) currencies include changes in foreign exchange rates and foreign exchange restrictions.
Derivatives Risk. Transactions in derivatives may increase volatility, cause the liquidation of portfolio positions when not advantageous to do so and produce disproportionate losses.
Emerging Market Risk. Investments in emerging market countries may have more risk than those in developed market countries because the emerging markets are less developed and more illiquid. Emerging market countries can also be subject to increased social, economic, regulatory, and political uncertainties and can be extremely volatile.
Equity Securities Risk. The value of equity securities could decline if the issuer's financial condition declines or in response to overall market and economic conditions. A fund's principal market segment(s), such as large cap, mid cap or small cap stocks, or growth or value stocks, may underperform other market segments or the equity markets as a whole. Investments in smaller companies and mid-size companies may involve greater risk and price volatility than investments in larger, more mature companies.
Fixed-Income Securities Risk. Fixed-income securities are subject to interest rate risk and credit quality risk. The market value of fixed-income securities generally declines when interest rates rise, and an issuer of fixed-income securities could default on its payment obligations.
Foreign Securities Risk. The risks of foreign securities include loss of value as a result of: political or economic instability; nationalization, expropriation or confiscatory taxation; settlement delays; and limited government regulation (including less stringent reporting, accounting, and disclosure standards than are required of U.S. companies).
Growth Stock Risk. If growth companies do not increase their earnings at a rate expected by investors, the market price of the stock may decline significantly, even if earnings show an absolute increase. Growth company stocks also typically lack the dividend yield that can lessen price declines in market downturns.
Index Fund Investment Risk. More likely than not, an index fund will underperform the index due to cashflows and the fees and expenses of the fund.
Investment Company Securities Risk. Fund shareholders bear indirectly their proportionate share of the expenses of other investment companies in which the fund invests.
248
Portfolio Duration Risk. Portfolio duration is a measure of the expected life of a fixed-income security and its sensitivity to changes in interest rates. The longer a fund's average portfolio duration, the more sensitive the fund will be to changes in interest rates.
Real Estate Securities Risk. Real estate securities are subject to the risks associated with direct ownership of real estate, including declines in value, adverse economic conditions, increases in expenses, regulatory changes and environmental problems. Investing in securities of companies in the real estate industry, subjects a fund to the special risks associated with the real estate market including factors such as loss to casualty or condemnation, changes in real estate values, property taxes, interest rates, cash flow of underlying real estate assets, occupancy rates, government regulations affecting zoning, land use and rents, and the management skill and creditworthiness of the issuer.
Risk of Being an Underlying Fund. A fund is subject to the risk of being an underlying fund to the extent that a fund of funds invests in the fund. An underlying fund of a fund of funds may experience relatively large redemptions or investments as the fund of funds periodically reallocates or rebalances its assets. These transactions may cause the underlying fund to sell portfolio securities to meet such redemptions, or to invest cash from such investments, at times it would not otherwise do so, and may as a result increase transaction costs and adversely affect underlying fund performance.
Value Stock Risk. The market may not recognize the intrinsic value of value stocks for a long time, or they may be appropriately priced at the time of purchase.
PerformanceNo performance information is shown below because the Fund has not yet had a calendar year of performance. The Fund's performance is benchmarked against the S&P Target Date 2040 Index. Performance information provides an indication of the risks of investing in the Fund. Past performance (before and after taxes) is not necessarily an indication of how the Fund will perform in the future. You may get updated performance information by calling 1-800-222-5852 or online at www.principal.com.
Management
Investment Advisor and Portfolio Managers: Principal Management Corporation• James W. Fennessey (since 2014), Portfolio Manager• Jeffrey R. Tyler (since 2014), Portfolio Manager• Randy L. Welch (since 2014), Portfolio Manager
Purchase and Sale of Fund SharesThere are no minimum initial or subsequent investment requirements for an eligible purchaser. You may purchase or redeem shares on any business day (normally any day when the New York Stock Exchange is open for regular trading) through your plan, intermediary, or Financial Professional; by sending a written request to Principal Funds at P.O. Box 8024, Boston, MA 02266-8024 (regular mail) or 30 Dan Road, Canton, MA 02021-2809 (overnight mail); calling us at 1-800-222-5852; or accessing our website (www.principalfunds.com).
Tax InformationThe Fund’s distributions you receive are generally subject to federal income tax as ordinary income or capital gain and may also be subject to state and local taxes, unless you are tax-exempt or your account is tax-deferred in which case your distributions would be taxed when withdrawn from the tax-deferred account.
Payments to Broker-Dealers and Other Financial IntermediariesIf you purchase the Fund through a broker-dealer or other financial intermediary (such as a bank, insurance company, investment adviser, etc.), the Fund and its related companies may pay the intermediary for the sale of Fund shares and related services. These payments may create a conflict of interest by influencing the broker-dealer or other intermediary and your salesperson to recommend the Fund over another investment, or to recommend one share class of the Fund over another share class. Ask your salesperson or visit your financial intermediary's website for more information.

249
PRINCIPAL LIFETIME HYBRID 2045 FUND
Objective: The Fund seeks a total return consisting of long-term growth of capital and current income.
Fees and Expenses of the FundThis table describes the fees and expenses that you may pay if you buy and hold shares of the Fund.
Shareholder Fees (fees paid directly from your investment): None
Annual Fund Operating Expenses (expenses that you pay each year as a percentage of the value of your investment)
Share ClassInst.
Management Fees 0.01%Distribution and/or Service (12b-1) Fees N/AOther Expenses (1) 0.08%Acquired Fund Fees and Expenses (1) 0.44%Total Annual Fund Operating Expenses 0.53%Expense Reimbursement (2) (0.03)%Total Annual Fund Operating Expenses After Expense Reimbursement 0.50%
(1) Based on estimated amounts for the current fiscal year.(2) Principal Management Corporation ("Principal"), the investment advisor, has contractually agreed to limit the Fund’s expenses by paying, if
necessary, expenses normally payable by the Fund, (excluding interest expense, expenses related to fund investments, acquired fund fees and expenses, and other extraordinary expenses) to maintain a total level of operating expenses (expressed as a percent of average net assets on an annualized basis) not to exceed 0.06% for Institutional shares. It is expected that the expense limit will continue through the period ending February 29, 2016; however, Principal Funds, Inc. and Principal, the parties to the agreement, may agree to terminate the expense limit prior to the end of the period.
ExampleThis Example is intended to help you compare the cost of investing in the Fund with the cost of investing in other mutual funds.
The Example assumes that you invest $10,000 in the Fund for the time periods indicated. The Example also assumes that your investment has a 5% return each year and that the Fund’s operating expenses remain the same. Although your actual costs may be higher or lower, based on these assumptions your costs would be:
1 year 3 yearsInstitutional Class $51 $166
Portfolio TurnoverAs a fund of funds, the Fund does not pay transaction costs, such as commissions, when it buys and sells shares of underlying funds (or “turns over” its portfolio). An underlying fund does pay transaction costs when it buys and sells portfolio securities, and a higher portfolio turnover may indicate higher transaction costs. These costs, which are not reflected in annual fund operating expenses or in the examples, affect the performance of the underlying fund and the Fund. This is a new fund and does not yet have a portfolio turnover rate to disclose.
Principal Investment StrategiesThe Fund operates as a “target date fund” that invests according to an asset allocation strategy designed for investors having a retirement investment goal close to the year in the Fund’s name. The Fund's asset allocation will become more conservative over time as investment goals near (for example, retirement, which is assumed to begin at age 65) and investors become more risk-averse. The Fund is a fund of funds that invests in Institutional Class shares of Principal Funds, Inc. (“PFI”), with a majority of the Fund's assets invested in index funds. Its underlying funds consist of domestic and foreign equity funds, fixed-income funds, real asset funds, and other funds that aim to offer diversification beyond traditional equity and fixed-income securities. The Fund is managed by Principal Management Corporation (“Principal”).
Principal develops, implements and monitors the Fund's strategic or long-term asset class targets and target ranges, is responsible for an active rebalancing strategy designed to identify asset classes that appear attractive over the short term, and sets the percentage of Fund assets to be allocated to a particular asset class. Principal selects the

250
underlying funds for each asset class and the target weights for each underlying fund and may shift asset class targets in response to normal evaluative processes, the shortening time horizon of the Fund or changes in market forces or Fund circumstances. Principal may add, remove, or substitute underlying funds at any time.
In selecting underlying funds and target weights, Principal considers both quantitative measures (e.g., past performance, expected levels of risk and returns, expense levels, diversification and style consistency) and qualitative factors (e.g., organizational stability, investment experience, investment and risk management processes, and information, trading, and compliance systems). There are no minimum or maximum percentages of assets that the Fund must invest in a specific asset class or underlying fund.
The underlying funds invest in growth and value stocks of small, medium, and large market capitalization companies, fixed-income securities, domestic and foreign (including those in emerging markets) securities, securities denominated in foreign currencies, investment companies (including index funds), and derivatives. A derivative is a financial arrangement, the value of which is derived from, or based on, a traditional security, asset, or market index. The underlying funds principally use equity index futures and options to manage equity exposure.
Within 10 to 15 years after its target year, the Fund's underlying fund allocation is expected to match that of the Principal LifeTime Hybrid Income Fund. At that time, the Fund may be combined with the Principal LifeTime Hybrid Income Fund if the Board of Directors determines that the combination is in the best interests of Fund shareholders. It is expected that at the target date in the Fund’s name, the shareholder will begin gradually withdrawing the account's value.

251
Principal RisksThe broad diversification of the Fund is designed to cushion severe losses in any one investment sector and moderate overall price volatility. However, the Fund is subject to the particular risks of the underlying funds in the proportions in which the Fund invests in them, and its share prices will fluctuate as the prices of underlying fund shares rise or fall with changing market conditions. If you sell your shares when their value is less than the price you paid, you will lose money. The Fund operates as a fund of funds and thus bears both its own expenses and, indirectly, its proportionate share of the expenses of the underlying funds in which it invests. An investment in the Fund is not a deposit of a bank and is not insured or guaranteed by the Federal Deposit Insurance Corporation or any other government agency. The principal risks of investing in the Fund that are inherent in the fund of funds, in alphabetical order, are:
Asset Allocation Risk. A fund's selection and weighting of asset classes may cause it to underperform other funds with a similar investment objective.
Conflict of Interest Risk. The Advisor and its affiliates earn different fees from different underlying funds and may have an incentive to allocate more fund-of-fund assets to underlying funds from which they receive higher fees.
Investment Company Securities Risk. Fund shareholders bear indirectly their proportionate share of the expenses of other investment companies in which the fund invests.
Target Date Fund Risk. A target date fund should not be selected based solely on age or retirement date because there is no guarantee that this fund will provide adequate income at or through retirement.
The principal risks of investing in the Fund that are inherent in the underlying funds, in alphabetical order, are:
Currency Risk. Risks of investing in securities denominated in, or that trade in, foreign (non-U.S.) currencies include changes in foreign exchange rates and foreign exchange restrictions.
Derivatives Risk. Transactions in derivatives may increase volatility, cause the liquidation of portfolio positions when not advantageous to do so and produce disproportionate losses.
Emerging Market Risk. Investments in emerging market countries may have more risk than those in developed market countries because the emerging markets are less developed and more illiquid. Emerging market countries can also be subject to increased social, economic, regulatory, and political uncertainties and can be extremely volatile.
Equity Securities Risk. The value of equity securities could decline if the issuer's financial condition declines or in response to overall market and economic conditions. A fund's principal market segment(s), such as large cap, mid cap or small cap stocks, or growth or value stocks, may underperform other market segments or the equity markets as a whole. Investments in smaller companies and mid-size companies may involve greater risk and price volatility than investments in larger, more mature companies.
Fixed-Income Securities Risk. Fixed-income securities are subject to interest rate risk and credit quality risk. The market value of fixed-income securities generally declines when interest rates rise, and an issuer of fixed-income securities could default on its payment obligations.
Foreign Securities Risk. The risks of foreign securities include loss of value as a result of: political or economic instability; nationalization, expropriation or confiscatory taxation; settlement delays; and limited government regulation (including less stringent reporting, accounting, and disclosure standards than are required of U.S. companies).
Growth Stock Risk. If growth companies do not increase their earnings at a rate expected by investors, the market price of the stock may decline significantly, even if earnings show an absolute increase. Growth company stocks also typically lack the dividend yield that can lessen price declines in market downturns.
Index Fund Investment Risk. More likely than not, an index fund will underperform the index due to cashflows and the fees and expenses of the fund.
Investment Company Securities Risk. Fund shareholders bear indirectly their proportionate share of the expenses of other investment companies in which the fund invests.

252
Portfolio Duration Risk. Portfolio duration is a measure of the expected life of a fixed-income security and its sensitivity to changes in interest rates. The longer a fund's average portfolio duration, the more sensitive the fund will be to changes in interest rates.
Real Estate Securities Risk. Real estate securities are subject to the risks associated with direct ownership of real estate, including declines in value, adverse economic conditions, increases in expenses, regulatory changes and environmental problems. Investing in securities of companies in the real estate industry, subjects a fund to the special risks associated with the real estate market including factors such as loss to casualty or condemnation, changes in real estate values, property taxes, interest rates, cash flow of underlying real estate assets, occupancy rates, government regulations affecting zoning, land use and rents, and the management skill and creditworthiness of the issuer.
Risk of Being an Underlying Fund. A fund is subject to the risk of being an underlying fund to the extent that a fund of funds invests in the fund. An underlying fund of a fund of funds may experience relatively large redemptions or investments as the fund of funds periodically reallocates or rebalances its assets. These transactions may cause the underlying fund to sell portfolio securities to meet such redemptions, or to invest cash from such investments, at times it would not otherwise do so, and may as a result increase transaction costs and adversely affect underlying fund performance.
Value Stock Risk. The market may not recognize the intrinsic value of value stocks for a long time, or they may be appropriately priced at the time of purchase.
PerformanceNo performance information is shown below because the Fund has not yet had a calendar year of performance. The Fund's performance is benchmarked against the S&P Target Date 2045 Index. Performance information provides an indication of the risks of investing in the Fund. Past performance (before and after taxes) is not necessarily an indication of how the Fund will perform in the future. You may get updated performance information by calling 1-800-222-5852 or online at www.principal.com.
Management
Investment Advisor and Portfolio Managers: Principal Management Corporation• James W. Fennessey (since 2014), Portfolio Manager• Jeffrey R. Tyler (since 2014), Portfolio Manager• Randy L. Welch (since 2014), Portfolio Manager
Purchase and Sale of Fund SharesThere are no minimum initial or subsequent investment requirements for an eligible purchaser. You may purchase or redeem shares on any business day (normally any day when the New York Stock Exchange is open for regular trading) through your plan, intermediary, or Financial Professional; by sending a written request to Principal Funds at P.O. Box 8024, Boston, MA 02266-8024 (regular mail) or 30 Dan Road, Canton, MA 02021-2809 (overnight mail); calling us at 1-800-222-5852; or accessing our website (www.principalfunds.com).
Tax InformationThe Fund’s distributions you receive are generally subject to federal income tax as ordinary income or capital gain and may also be subject to state and local taxes, unless you are tax-exempt or your account is tax-deferred in which case your distributions would be taxed when withdrawn from the tax-deferred account.
Payments to Broker-Dealers and Other Financial IntermediariesIf you purchase the Fund through a broker-dealer or other financial intermediary (such as a bank, insurance company, investment adviser, etc.), the Fund and its related companies may pay the intermediary for the sale of Fund shares and related services. These payments may create a conflict of interest by influencing the broker-dealer or other intermediary and your salesperson to recommend the Fund over another investment, or to recommend one share class of the Fund over another share class. Ask your salesperson or visit your financial intermediary's website for more information.

253
PRINCIPAL LIFETIME HYBRID 2050 FUNDObjective: The Fund seeks a total return consisting of long-term growth of capital and current income.
Fees and Expenses of the FundThis table describes the fees and expenses that you may pay if you buy and hold shares of the Fund.
Shareholder Fees (fees paid directly from your investment): None
Annual Fund Operating Expenses (expenses that you pay each year as a percentage of the value of your investment)
Share ClassInst.
Management Fees 0.01%Distribution and/or Service (12b-1) Fees N/AOther Expenses (1) 0.08%Acquired Fund Fees and Expenses (1) 0.44%Total Annual Fund Operating Expenses 0.53%Expense Reimbursement (2) (0.03)%Total Annual Fund Operating Expenses After Expense Reimbursement 0.50%
(1) Based on estimated amounts for the current fiscal year.(2) Principal Management Corporation ("Principal"), the investment advisor, has contractually agreed to limit the Fund’s expenses by paying, if
necessary, expenses normally payable by the Fund, (excluding interest expense, expenses related to fund investments, acquired fund fees and expenses, and other extraordinary expenses) to maintain a total level of operating expenses (expressed as a percent of average net assets on an annualized basis) not to exceed 0.06% for Institutional shares. It is expected that the expense limit will continue through the period ending February 29, 2016; however, Principal Funds, Inc. and Principal, the parties to the agreement, may agree to terminate the expense limit prior to the end of the period.
ExampleThis Example is intended to help you compare the cost of investing in the Fund with the cost of investing in other mutual funds.
The Example assumes that you invest $10,000 in the Fund for the time periods indicated. The Example also assumes that your investment has a 5% return each year and that the Fund’s operating expenses remain the same. Although your actual costs may be higher or lower, based on these assumptions your costs would be:
1 year 3 yearsInstitutional Class $51 $166
Portfolio TurnoverAs a fund of funds, the Fund does not pay transaction costs, such as commissions, when it buys and sells shares of underlying funds (or “turns over” its portfolio). An underlying fund does pay transaction costs when it buys and sells portfolio securities, and a higher portfolio turnover may indicate higher transaction costs. These costs, which are not reflected in annual fund operating expenses or in the examples, affect the performance of the underlying fund and the Fund. This is a new fund and does not yet have a portfolio turnover rate to disclose.
Principal Investment StrategiesThe Fund operates as a “target date fund” that invests according to an asset allocation strategy designed for investors having a retirement investment goal close to the year in the Fund’s name. The Fund's asset allocation will become more conservative over time as investment goals near (for example, retirement, which is assumed to begin at age 65) and investors become more risk-averse. The Fund is a fund of funds that invests in Institutional Class shares of Principal Funds, Inc. (“PFI”), with a majority of the Fund's assets invested in index funds. Its underlying funds consist of domestic and foreign equity funds, fixed-income funds, real asset funds, and other funds that aim to offer diversification beyond traditional equity and fixed-income securities. The Fund is managed by Principal Management Corporation (“Principal”).
Principal develops, implements and monitors the Fund's strategic or long-term asset class targets and target ranges, is responsible for an active rebalancing strategy designed to identify asset classes that appear attractive over the short term, and sets the percentage of Fund assets to be allocated to a particular asset class. Principal selects the

254
underlying funds for each asset class and the target weights for each underlying fund and may shift asset class targets in response to normal evaluative processes, the shortening time horizon of the Fund or changes in market forces or Fund circumstances. Principal may add, remove, or substitute underlying funds at any time.
In selecting underlying funds and target weights, Principal considers both quantitative measures (e.g., past performance, expected levels of risk and returns, expense levels, diversification and style consistency) and qualitative factors (e.g., organizational stability, investment experience, investment and risk management processes, and information, trading, and compliance systems). There are no minimum or maximum percentages of assets that the Fund must invest in a specific asset class or underlying fund.
The underlying funds invest in growth and value stocks of small, medium, and large market capitalization companies, fixed-income securities, domestic and foreign (including those in emerging markets) securities, securities denominated in foreign currencies, investment companies (including index funds), and derivatives. A derivative is a financial arrangement, the value of which is derived from, or based on, a traditional security, asset, or market index. The underlying funds principally use equity index futures and options to manage equity exposure.
Within 10 to 15 years after its target year, the Fund's underlying fund allocation is expected to match that of the Principal LifeTime Hybrid Income Fund. At that time, the Fund may be combined with the Principal LifeTime Hybrid Income Fund if the Board of Directors determines that the combination is in the best interests of Fund shareholders. It is expected that at the target date in the Fund’s name, the shareholder will begin gradually withdrawing the account's value.

255
Principal RisksThe broad diversification of the Fund is designed to cushion severe losses in any one investment sector and moderate overall price volatility. However, the Fund is subject to the particular risks of the underlying funds in the proportions in which the Fund invests in them, and its share prices will fluctuate as the prices of underlying fund shares rise or fall with changing market conditions. If you sell your shares when their value is less than the price you paid, you will lose money. The Fund operates as a fund of funds and thus bears both its own expenses and, indirectly, its proportionate share of the expenses of the underlying funds in which it invests. An investment in the Fund is not a deposit of a bank and is not insured or guaranteed by the Federal Deposit Insurance Corporation or any other government agency. The principal risks of investing in the Fund that are inherent in the fund of funds, in alphabetical order, are:
Asset Allocation Risk. A fund's selection and weighting of asset classes may cause it to underperform other funds with a similar investment objective.
Conflict of Interest Risk. The Advisor and its affiliates earn different fees from different underlying funds and may have an incentive to allocate more fund-of-fund assets to underlying funds from which they receive higher fees.
Investment Company Securities Risk. Fund shareholders bear indirectly their proportionate share of the expenses of other investment companies in which the fund invests.
Target Date Fund Risk. A target date fund should not be selected based solely on age or retirement date because there is no guarantee that this fund will provide adequate income at or through retirement.
The principal risks of investing in the Fund that are inherent in the underlying funds, in alphabetical order, are:
Currency Risk. Risks of investing in securities denominated in, or that trade in, foreign (non-U.S.) currencies include changes in foreign exchange rates and foreign exchange restrictions.
Derivatives Risk. Transactions in derivatives may increase volatility, cause the liquidation of portfolio positions when not advantageous to do so and produce disproportionate losses.
Emerging Market Risk. Investments in emerging market countries may have more risk than those in developed market countries because the emerging markets are less developed and more illiquid. Emerging market countries can also be subject to increased social, economic, regulatory, and political uncertainties and can be extremely volatile.
Equity Securities Risk. The value of equity securities could decline if the issuer's financial condition declines or in response to overall market and economic conditions. A fund's principal market segment(s), such as large cap, mid cap or small cap stocks, or growth or value stocks, may underperform other market segments or the equity markets as a whole. Investments in smaller companies and mid-size companies may involve greater risk and price volatility than investments in larger, more mature companies.
Fixed-Income Securities Risk. Fixed-income securities are subject to interest rate risk and credit quality risk. The market value of fixed-income securities generally declines when interest rates rise, and an issuer of fixed-income securities could default on its payment obligations.
Foreign Securities Risk. The risks of foreign securities include loss of value as a result of: political or economic instability; nationalization, expropriation or confiscatory taxation; settlement delays; and limited government regulation (including less stringent reporting, accounting, and disclosure standards than are required of U.S. companies).
Growth Stock Risk. If growth companies do not increase their earnings at a rate expected by investors, the market price of the stock may decline significantly, even if earnings show an absolute increase. Growth company stocks also typically lack the dividend yield that can lessen price declines in market downturns.
Index Fund Investment Risk. More likely than not, an index fund will underperform the index due to cashflows and the fees and expenses of the fund.
Investment Company Securities Risk. Fund shareholders bear indirectly their proportionate share of the expenses of other investment companies in which the fund invests.

256
Portfolio Duration Risk. Portfolio duration is a measure of the expected life of a fixed-income security and its sensitivity to changes in interest rates. The longer a fund's average portfolio duration, the more sensitive the fund will be to changes in interest rates.
Risk of Being an Underlying Fund. A fund is subject to the risk of being an underlying fund to the extent that a fund of funds invests in the fund. An underlying fund of a fund of funds may experience relatively large redemptions or investments as the fund of funds periodically reallocates or rebalances its assets. These transactions may cause the underlying fund to sell portfolio securities to meet such redemptions, or to invest cash from such investments, at times it would not otherwise do so, and may as a result increase transaction costs and adversely affect underlying fund performance.
Value Stock Risk. The market may not recognize the intrinsic value of value stocks for a long time, or they may be appropriately priced at the time of purchase.
PerformanceNo performance information is shown below because the Fund has not yet had a calendar year of performance. The Fund's performance is benchmarked against the S&P Target Date 2050 Index. Performance information provides an indication of the risks of investing in the Fund. Past performance (before and after taxes) is not necessarily an indication of how the Fund will perform in the future. You may get updated performance information by calling 1-800-222-5852 or online at www.principal.com.
Management
Investment Advisor and Portfolio Managers: Principal Management Corporation• James W. Fennessey (since 2014), Portfolio Manager• Jeffrey R. Tyler (since 2014), Portfolio Manager• Randy L. Welch (since 2014), Portfolio Manager
Purchase and Sale of Fund SharesThere are no minimum initial or subsequent investment requirements for an eligible purchaser. You may purchase or redeem shares on any business day (normally any day when the New York Stock Exchange is open for regular trading) through your plan, intermediary, or Financial Professional; by sending a written request to Principal Funds at P.O. Box 8024, Boston, MA 02266-8024 (regular mail) or 30 Dan Road, Canton, MA 02021-2809 (overnight mail); calling us at 1-800-222-5852; or accessing our website (www.principalfunds.com).
Tax InformationThe Fund’s distributions you receive are generally subject to federal income tax as ordinary income or capital gain and may also be subject to state and local taxes, unless you are tax-exempt or your account is tax-deferred in which case your distributions would be taxed when withdrawn from the tax-deferred account.
Payments to Broker-Dealers and Other Financial IntermediariesIf you purchase the Fund through a broker-dealer or other financial intermediary (such as a bank, insurance company, investment adviser, etc.), the Fund and its related companies may pay the intermediary for the sale of Fund shares and related services. These payments may create a conflict of interest by influencing the broker-dealer or other intermediary and your salesperson to recommend the Fund over another investment, or to recommend one share class of the Fund over another share class. Ask your salesperson or visit your financial intermediary's website for more information.

257
PRINCIPAL LIFETIME HYBRID 2055 FUNDObjective: The Fund seeks a total return consisting of long-term growth of capital and current income.
Fees and Expenses of the FundThis table describes the fees and expenses that you may pay if you buy and hold shares of the Fund.
Shareholder Fees (fees paid directly from your investment): None
Annual Fund Operating Expenses (expenses that you pay each year as a percentage of the value of your investment)
Share ClassInst.
Management Fees 0.01%Distribution and/or Service (12b-1) Fees N/AOther Expenses (1) 0.12%Acquired Fund Fees and Expenses (1) 0.44%Total Annual Fund Operating Expenses 0.57%Expense Reimbursement (2) (0.07)%Total Annual Fund Operating Expenses After Expense Reimbursement 0.50%
(1) Based on estimated amounts for the current fiscal year.(2) Principal Management Corporation ("Principal"), the investment advisor, has contractually agreed to limit the Fund’s expenses by paying, if
necessary, expenses normally payable by the Fund, (excluding interest expense, expenses related to fund investments, acquired fund fees and expenses, and other extraordinary expenses) to maintain a total level of operating expenses (expressed as a percent of average net assets on an annualized basis) not to exceed 0.06% for Institutional shares. It is expected that the expense limit will continue through the period ending February 29, 2016; however, Principal Funds, Inc. and Principal, the parties to the agreement, may agree to terminate the expense limit prior to the end of the period.
ExampleThis Example is intended to help you compare the cost of investing in the Fund with the cost of investing in other mutual funds.
The Example assumes that you invest $10,000 in the Fund for the time periods indicated. The Example also assumes that your investment has a 5% return each year and that the Fund’s operating expenses remain the same. Although your actual costs may be higher or lower, based on these assumptions your costs would be:
1 year 3 yearsInstitutional Class $51 $174
Portfolio TurnoverAs a fund of funds, the Fund does not pay transaction costs, such as commissions, when it buys and sells shares of underlying funds (or “turns over” its portfolio). An underlying fund does pay transaction costs when it buys and sells portfolio securities, and a higher portfolio turnover may indicate higher transaction costs. These costs, which are not reflected in annual fund operating expenses or in the examples, affect the performance of the underlying fund and the Fund. This is a new fund and does not yet have a portfolio turnover rate to disclose.
Principal Investment StrategiesThe Fund operates as a “target date fund” that invests according to an asset allocation strategy designed for investors having a retirement investment goal close to the year in the Fund’s name. The Fund's asset allocation will become more conservative over time as investment goals near (for example, retirement, which is assumed to begin at age 65) and investors become more risk-averse. The Fund is a fund of funds that invests in Institutional Class shares of Principal Funds, Inc. (“PFI”), with a majority of the Fund's assets invested in index funds. Its underlying funds consist of domestic and foreign equity funds, fixed-income funds, real asset funds, and other funds that aim to offer diversification beyond traditional equity and fixed-income securities. The Fund is managed by Principal Management Corporation (“Principal”).
Principal develops, implements and monitors the Fund's strategic or long-term asset class targets and target ranges, is responsible for an active rebalancing strategy designed to identify asset classes that appear attractive over the short term, and sets the percentage of Fund assets to be allocated to a particular asset class. Principal selects the

258
underlying funds for each asset class and the target weights for each underlying fund and may shift asset class targets in response to normal evaluative processes, the shortening time horizon of the Fund or changes in market forces or Fund circumstances. Principal may add, remove, or substitute underlying funds at any time.
In selecting underlying funds and target weights, Principal considers both quantitative measures (e.g., past performance, expected levels of risk and returns, expense levels, diversification and style consistency) and qualitative factors (e.g., organizational stability, investment experience, investment and risk management processes, and information, trading, and compliance systems). There are no minimum or maximum percentages of assets that the Fund must invest in a specific asset class or underlying fund.
The underlying funds invest in growth and value stocks of small, medium, and large market capitalization companies, fixed-income securities, domestic and foreign (including those in emerging markets) securities, securities denominated in foreign currencies, investment companies (including index funds), and derivatives. A derivative is a financial arrangement, the value of which is derived from, or based on, a traditional security, asset, or market index. The underlying funds principally use equity index futures and options to manage equity exposure.
Within 10 to 15 years after its target year, the Fund's underlying fund allocation is expected to match that of the Principal LifeTime Hybrid Income Fund. At that time, the Fund may be combined with the Principal LifeTime Hybrid Income Fund if the Board of Directors determines that the combination is in the best interests of Fund shareholders. It is expected that at the target date in the Fund’s name, the shareholder will begin gradually withdrawing the account's value.

259
Principal RisksThe broad diversification of the Fund is designed to cushion severe losses in any one investment sector and moderate overall price volatility. However, the Fund is subject to the particular risks of the underlying funds in the proportions in which the Fund invests in them, and its share prices will fluctuate as the prices of underlying fund shares rise or fall with changing market conditions. If you sell your shares when their value is less than the price you paid, you will lose money. The Fund operates as a fund of funds and thus bears both its own expenses and, indirectly, its proportionate share of the expenses of the underlying funds in which it invests. An investment in the Fund is not a deposit of a bank and is not insured or guaranteed by the Federal Deposit Insurance Corporation or any other government agency. The principal risks of investing in the Fund that are inherent in the fund of funds, in alphabetical order, are:
Asset Allocation Risk. A fund's selection and weighting of asset classes may cause it to underperform other funds with a similar investment objective.
Conflict of Interest Risk. The Advisor and its affiliates earn different fees from different underlying funds and may have an incentive to allocate more fund-of-fund assets to underlying funds from which they receive higher fees.
Investment Company Securities Risk. Fund shareholders bear indirectly their proportionate share of the expenses of other investment companies in which the fund invests.
Target Date Fund Risk. A target date fund should not be selected based solely on age or retirement date because there is no guarantee that this fund will provide adequate income at or through retirement.
The principal risks of investing in the Fund that are inherent in the underlying funds, in alphabetical order, are:
Currency Risk. Risks of investing in securities denominated in, or that trade in, foreign (non-U.S.) currencies include changes in foreign exchange rates and foreign exchange restrictions.
Derivatives Risk. Transactions in derivatives may increase volatility, cause the liquidation of portfolio positions when not advantageous to do so and produce disproportionate losses.
Emerging Market Risk. Investments in emerging market countries may have more risk than those in developed market countries because the emerging markets are less developed and more illiquid. Emerging market countries can also be subject to increased social, economic, regulatory, and political uncertainties and can be extremely volatile.
Equity Securities Risk. The value of equity securities could decline if the issuer's financial condition declines or in response to overall market and economic conditions. A fund's principal market segment(s), such as large cap, mid cap or small cap stocks, or growth or value stocks, may underperform other market segments or the equity markets as a whole. Investments in smaller companies and mid-size companies may involve greater risk and price volatility than investments in larger, more mature companies.
Fixed-Income Securities Risk. Fixed-income securities are subject to interest rate risk and credit quality risk. The market value of fixed-income securities generally declines when interest rates rise, and an issuer of fixed-income securities could default on its payment obligations.
Foreign Securities Risk. The risks of foreign securities include loss of value as a result of: political or economic instability; nationalization, expropriation or confiscatory taxation; settlement delays; and limited government regulation (including less stringent reporting, accounting, and disclosure standards than are required of U.S. companies).
Growth Stock Risk. If growth companies do not increase their earnings at a rate expected by investors, the market price of the stock may decline significantly, even if earnings show an absolute increase. Growth company stocks also typically lack the dividend yield that can lessen price declines in market downturns.
Index Fund Investment Risk. More likely than not, an index fund will underperform the index due to cashflows and the fees and expenses of the fund.
Investment Company Securities Risk. Fund shareholders bear indirectly their proportionate share of the expenses of other investment companies in which the fund invests.

260
Portfolio Duration Risk. Portfolio duration is a measure of the expected life of a fixed-income security and its sensitivity to changes in interest rates. The longer a fund's average portfolio duration, the more sensitive the fund will be to changes in interest rates.
Risk of Being an Underlying Fund. A fund is subject to the risk of being an underlying fund to the extent that a fund of funds invests in the fund. An underlying fund of a fund of funds may experience relatively large redemptions or investments as the fund of funds periodically reallocates or rebalances its assets. These transactions may cause the underlying fund to sell portfolio securities to meet such redemptions, or to invest cash from such investments, at times it would not otherwise do so, and may as a result increase transaction costs and adversely affect underlying fund performance.
Value Stock Risk. The market may not recognize the intrinsic value of value stocks for a long time, or they may be appropriately priced at the time of purchase.
PerformanceNo performance information is shown below because the Fund has not yet had a calendar year of performance. The Fund's performance is benchmarked against the S&P Target Date 2055+ Index. Performance information provides an indication of the risks of investing in the Fund. Past performance (before and after taxes) is not necessarily an indication of how the Fund will perform in the future. You may get updated performance information by calling 1-800-222-5852 or online at www.principal.com.
Management
Investment Advisor and Portfolio Managers: Principal Management Corporation• James W. Fennessey (since 2014), Portfolio Manager• Jeffrey R. Tyler (since 2014), Portfolio Manager• Randy L. Welch (since 2014), Portfolio Manager
Purchase and Sale of Fund SharesThere are no minimum initial or subsequent investment requirements for an eligible purchaser. You may purchase or redeem shares on any business day (normally any day when the New York Stock Exchange is open for regular trading) through your plan, intermediary, or Financial Professional; by sending a written request to Principal Funds at P.O. Box 8024, Boston, MA 02266-8024 (regular mail) or 30 Dan Road, Canton, MA 02021-2809 (overnight mail); calling us at 1-800-222-5852; or accessing our website (www.principalfunds.com).
Tax InformationThe Fund’s distributions you receive are generally subject to federal income tax as ordinary income or capital gain and may also be subject to state and local taxes, unless you are tax-exempt or your account is tax-deferred in which case your distributions would be taxed when withdrawn from the tax-deferred account.
Payments to Broker-Dealers and Other Financial IntermediariesIf you purchase the Fund through a broker-dealer or other financial intermediary (such as a bank, insurance company, investment adviser, etc.), the Fund and its related companies may pay the intermediary for the sale of Fund shares and related services. These payments may create a conflict of interest by influencing the broker-dealer or other intermediary and your salesperson to recommend the Fund over another investment, or to recommend one share class of the Fund over another share class. Ask your salesperson or visit your financial intermediary's website for more information.

261
PRINCIPAL LIFETIME HYBRID 2060 FUNDObjective: The Fund seeks a total return consisting of long-term growth of capital and current income.
Fees and Expenses of the FundThis table describes the fees and expenses that you may pay if you buy and hold shares of the Fund.
Shareholder Fees (fees paid directly from your investment): None
Annual Fund Operating Expenses (expenses that you pay each year as a percentage of the value of your investment)
Share ClassInst.
Management Fees 0.01%Distribution and/or Service (12b-1) Fees N/AOther Expenses (1) 0.12%Acquired Fund Fees and Expenses (1) 0.44%Total Annual Fund Operating Expenses 0.57%Expense Reimbursement (2) (0.07)%Total Annual Fund Operating Expenses After Expense Reimbursement 0.50%
(1) Based on estimated amounts for the current fiscal year.(2) Principal Management Corporation ("Principal"), the investment advisor, has contractually agreed to limit the Fund’s expenses by paying, if
necessary, expenses normally payable by the Fund, (excluding interest expense, expenses related to fund investments, acquired fund fees and expenses, and other extraordinary expenses) to maintain a total level of operating expenses (expressed as a percent of average net assets on an annualized basis) not to exceed 0.06% for Institutional shares. It is expected that the expense limit will continue through the period ending February 29, 2016; however, Principal Funds, Inc. and Principal, the parties to the agreement, may agree to terminate the expense limit prior to the end of the period.
ExampleThis Example is intended to help you compare the cost of investing in the Fund with the cost of investing in other mutual funds.
The Example assumes that you invest $10,000 in the Fund for the time periods indicated. The Example also assumes that your investment has a 5% return each year and that the Fund’s operating expenses remain the same. Although your actual costs may be higher or lower, based on these assumptions your costs would be:
1 year 3 yearsInstitutional Class $51 $174
Portfolio TurnoverAs a fund of funds, the Fund does not pay transaction costs, such as commissions, when it buys and sells shares of underlying funds (or “turns over” its portfolio). An underlying fund does pay transaction costs when it buys and sells portfolio securities, and a higher portfolio turnover may indicate higher transaction costs. These costs, which are not reflected in annual fund operating expenses or in the examples, affect the performance of the underlying fund and the Fund. This is a new fund and does not yet have a portfolio turnover rate to disclose.
Principal Investment StrategiesThe Fund operates as a “target date fund” that invests according to an asset allocation strategy designed for investors having a retirement investment goal close to the year in the Fund’s name. The Fund's asset allocation will become more conservative over time as investment goals near (for example, retirement, which is assumed to begin at age 65) and investors become more risk-averse. The Fund is a fund of funds that invests in Institutional Class shares of Principal Funds, Inc. (“PFI”), with a majority of the Fund's assets invested in index funds. Its underlying funds consist of domestic and foreign equity funds, fixed-income funds, real asset funds, and other funds that aim to offer diversification beyond traditional equity and fixed-income securities. The Fund is managed by Principal Management Corporation (“Principal”).
Principal develops, implements and monitors the Fund's strategic or long-term asset class targets and target ranges, is responsible for an active rebalancing strategy designed to identify asset classes that appear attractive over the short term, and sets the percentage of Fund assets to be allocated to a particular asset class. Principal selects the

262
underlying funds for each asset class and the target weights for each underlying fund and may shift asset class targets in response to normal evaluative processes, the shortening time horizon of the Fund or changes in market forces or Fund circumstances. Principal may add, remove, or substitute underlying funds at any time.
In selecting underlying funds and target weights, Principal considers both quantitative measures (e.g., past performance, expected levels of risk and returns, expense levels, diversification and style consistency) and qualitative factors (e.g., organizational stability, investment experience, investment and risk management processes, and information, trading, and compliance systems). There are no minimum or maximum percentages of assets that the Fund must invest in a specific asset class or underlying fund.
The underlying funds invest in growth and value stocks of small, medium, and large market capitalization companies, fixed-income securities, domestic and foreign (including those in emerging markets) securities, securities denominated in foreign currencies, investment companies (including index funds), and derivatives. A derivative is a financial arrangement, the value of which is derived from, or based on, a traditional security, asset, or market index. The underlying funds principally use equity index futures and options to manage equity exposure.
Within 10 to 15 years after its target year, the Fund's underlying fund allocation is expected to match that of the Principal LifeTime Hybrid Income Fund. At that time, the Fund may be combined with the Principal LifeTime Hybrid Income Fund if the Board of Directors determines that the combination is in the best interests of Fund shareholders. It is expected that at the target date in the Fund’s name, the shareholder will begin gradually withdrawing the account's value.
263
Principal RisksThe broad diversification of the Fund is designed to cushion severe losses in any one investment sector and moderate overall price volatility. However, the Fund is subject to the particular risks of the underlying funds in the proportions in which the Fund invests in them, and its share prices will fluctuate as the prices of underlying fund shares rise or fall with changing market conditions. If you sell your shares when their value is less than the price you paid, you will lose money. The Fund operates as a fund of funds and thus bears both its own expenses and, indirectly, its proportionate share of the expenses of the underlying funds in which it invests. An investment in the Fund is not a deposit of a bank and is not insured or guaranteed by the Federal Deposit Insurance Corporation or any other government agency. The principal risks of investing in the Fund that are inherent in the fund of funds, in alphabetical order, are:
Asset Allocation Risk. A fund's selection and weighting of asset classes may cause it to underperform other funds with a similar investment objective.
Conflict of Interest Risk. The Advisor and its affiliates earn different fees from different underlying funds and may have an incentive to allocate more fund-of-fund assets to underlying funds from which they receive higher fees.
Investment Company Securities Risk. Fund shareholders bear indirectly their proportionate share of the expenses of other investment companies in which the fund invests.
Target Date Fund Risk. A target date fund should not be selected based solely on age or retirement date because there is no guarantee that this fund will provide adequate income at or through retirement.
The principal risks of investing in the Fund that are inherent in the underlying funds, in alphabetical order, are:
Currency Risk. Risks of investing in securities denominated in, or that trade in, foreign (non-U.S.) currencies include changes in foreign exchange rates and foreign exchange restrictions.
Derivatives Risk. Transactions in derivatives may increase volatility, cause the liquidation of portfolio positions when not advantageous to do so and produce disproportionate losses.
Emerging Market Risk. Investments in emerging market countries may have more risk than those in developed market countries because the emerging markets are less developed and more illiquid. Emerging market countries can also be subject to increased social, economic, regulatory, and political uncertainties and can be extremely volatile.
Equity Securities Risk. The value of equity securities could decline if the issuer's financial condition declines or in response to overall market and economic conditions. A fund's principal market segment(s), such as large cap, mid cap or small cap stocks, or growth or value stocks, may underperform other market segments or the equity markets as a whole. Investments in smaller companies and mid-size companies may involve greater risk and price volatility than investments in larger, more mature companies.
Fixed-Income Securities Risk. Fixed-income securities are subject to interest rate risk and credit quality risk. The market value of fixed-income securities generally declines when interest rates rise, and an issuer of fixed-income securities could default on its payment obligations.
Foreign Securities Risk. The risks of foreign securities include loss of value as a result of: political or economic instability; nationalization, expropriation or confiscatory taxation; settlement delays; and limited government regulation (including less stringent reporting, accounting, and disclosure standards than are required of U.S. companies).
Growth Stock Risk. If growth companies do not increase their earnings at a rate expected by investors, the market price of the stock may decline significantly, even if earnings show an absolute increase. Growth company stocks also typically lack the dividend yield that can lessen price declines in market downturns.
Index Fund Investment Risk. More likely than not, an index fund will underperform the index due to cashflows and the fees and expenses of the fund.
Investment Company Securities Risk. Fund shareholders bear indirectly their proportionate share of the expenses of other investment companies in which the fund invests.
264
Portfolio Duration Risk. Portfolio duration is a measure of the expected life of a fixed-income security and its sensitivity to changes in interest rates. The longer a fund's average portfolio duration, the more sensitive the fund will be to changes in interest rates.
Risk of Being an Underlying Fund. A fund is subject to the risk of being an underlying fund to the extent that a fund of funds invests in the fund. An underlying fund of a fund of funds may experience relatively large redemptions or investments as the fund of funds periodically reallocates or rebalances its assets. These transactions may cause the underlying fund to sell portfolio securities to meet such redemptions, or to invest cash from such investments, at times it would not otherwise do so, and may as a result increase transaction costs and adversely affect underlying fund performance.
Value Stock Risk. The market may not recognize the intrinsic value of value stocks for a long time, or they may be appropriately priced at the time of purchase.
PerformanceNo performance information is shown below because the Fund has not yet had a calendar year of performance. The Fund's performance is benchmarked against the S&P Target Date 2055+ Index. Performance information provides an indication of the risks of investing in the Fund. Past performance (before and after taxes) is not necessarily an indication of how the Fund will perform in the future. You may get updated performance information by calling 1-800-222-5852 or online at www.principal.com.
Management
Investment Advisor and Portfolio Managers: Principal Management Corporation• James W. Fennessey (since 2014), Portfolio Manager• Jeffrey R. Tyler (since 2014), Portfolio Manager• Randy L. Welch (since 2014), Portfolio Manager
Purchase and Sale of Fund SharesThere are no minimum initial or subsequent investment requirements for an eligible purchaser. You may purchase or redeem shares on any business day (normally any day when the New York Stock Exchange is open for regular trading) through your plan, intermediary, or Financial Professional; by sending a written request to Principal Funds at P.O. Box 8024, Boston, MA 02266-8024 (regular mail) or 30 Dan Road, Canton, MA 02021-2809 (overnight mail); calling us at 1-800-222-5852; or accessing our website (www.principalfunds.com).
Tax InformationThe Fund’s distributions you receive are generally subject to federal income tax as ordinary income or capital gain and may also be subject to state and local taxes, unless you are tax-exempt or your account is tax-deferred in which case your distributions would be taxed when withdrawn from the tax-deferred account.
Payments to Broker-Dealers and Other Financial IntermediariesIf you purchase the Fund through a broker-dealer or other financial intermediary (such as a bank, insurance company, investment adviser, etc.), the Fund and its related companies may pay the intermediary for the sale of Fund shares and related services. These payments may create a conflict of interest by influencing the broker-dealer or other intermediary and your salesperson to recommend the Fund over another investment, or to recommend one share class of the Fund over another share class. Ask your salesperson or visit your financial intermediary's website for more information.

265
REAL ESTATE SECURITIES FUND
Objective: The Fund seeks to generate a total return.
Fees and Expenses of the FundThis table describes the fees and expenses that you may pay if you buy and hold shares of the Fund. You may qualify for sales charge discounts if you and your family invest, or agree to invest in the future, at least $50,000 in Class A Shares of Principal Funds, Inc. More information about these and other discounts is available from your financial professional and in “Choosing a Share Class and The Costs of Investing” beginning on page 381 of the Fund’s prospectus and “Multiple Class Structure” beginning on page 6 of the Fund’s Statement of Additional Information.
Shareholder Fees (fees paid directly from your investment)
Share ClassA C J P Inst. R-1 R-2 R-3 R-4 R-5
Maximum Sales Charge (Load) Imposed onPurchases (as a percentage of offering price)
5.50% None None None None None None None None None
Maximum Deferred Sales Charge (Load) (as apercentage of the offering price or NAV whenSales Load is paid, whichever is less)
1.00% 1.00% 1.00% None None None None None None None
Annual Fund Operating Expenses (expenses that you pay each year as a percentage of the value of your investment)
Share ClassA C J P Inst. R-1 R-2 R-3 R-4 R-5
Management Fees 0.83% 0.83% 0.83% 0.83% 0.83% 0.83% 0.83% 0.83% 0.83% 0.83%
Distribution and/or Service (12b-1) Fees (1) 0.25% 1.00% 0.25% N/A N/A 0.35% 0.30% 0.25% 0.10% N/A
Other Expenses 0.22% 0.26% 0.20% 0.17% 0.07% 0.53% 0.45% 0.32% 0.28% 0.26%
Total Annual Fund Operating Expenses 1.30% 2.09% 1.28% 1.00% 0.90% 1.71% 1.58% 1.40% 1.21% 1.09%Fee Waiver and Expense Reimbursement(2) (3) N/A —% (0.01)% —% N/A N/A N/A N/A N/A N/ATotal Annual Fund Operating Expenses afterFee Waiver and Expense Reimbursement
1.30% 2.09% 1.27% 1.00% 0.90% 1.71% 1.58% 1.40% 1.21% 1.09%
(1) Expense information in the table has been restated to reflect current fees. Effective December 30, 2013, the Distribution and/or Service (12b-1) Fees for Class J shares were reduced.
(2) Principal Funds Distributor, Inc. ("the Distributor") has contractually agreed to limit the Distribution Fees attributable to Class J. The waiver will reduce the Fund's Distribution Fees by 0.01%. It is expected that the fee waiver will continue through the period ending February 29, 2016; however, Principal Funds, Inc. and the Distributor, the parties to the agreement, may agree to terminate the fee waiver prior to the end of the period.
(3) Principal Management Corporation ("Principal"), the investment advisor, has contractually agreed to limit the Fund’s expenses by paying, if necessary, expenses normally payable by the Fund, (excluding interest expense, expenses related to fund investments, acquired fund fees and expenses, and other extraordinary expenses) to maintain a total level of operating expenses (expressed as a percent of average net assets on an annualized basis) not to exceed 2.20% for Class C shares. In addition, for Class P, the expense limit will maintain "Other Expenses" (expressed as a percent of average net assets on an annualized basis) not to exceed 0.20%, (excluding interest expense, expenses related to fund investments, acquired fund fees and expenses, and other extraordinary expenses). It is expected that the expense limits will continue through the period ending February 29, 2016; however, Principal Funds, Inc. and Principal, the parties to the agreement, may agree to terminate the expense limits prior to the end of the period.
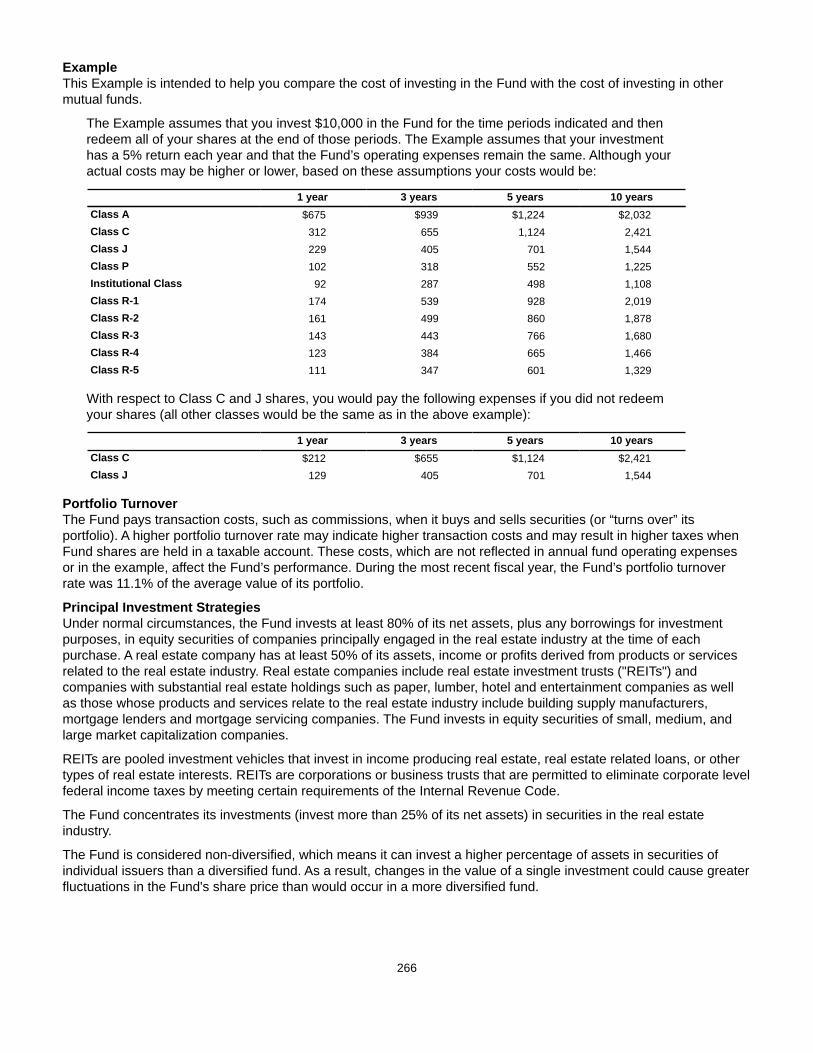
266
ExampleThis Example is intended to help you compare the cost of investing in the Fund with the cost of investing in other mutual funds.
The Example assumes that you invest $10,000 in the Fund for the time periods indicated and then redeem all of your shares at the end of those periods. The Example assumes that your investment has a 5% return each year and that the Fund’s operating expenses remain the same. Although your actual costs may be higher or lower, based on these assumptions your costs would be:
1 year 3 years 5 years 10 yearsClass A $675 $939 $1,224 $2,032Class C 312 655 1,124 2,421Class J 229 405 701 1,544Class P 102 318 552 1,225Institutional Class 92 287 498 1,108Class R-1 174 539 928 2,019Class R-2 161 499 860 1,878Class R-3 143 443 766 1,680Class R-4 123 384 665 1,466Class R-5 111 347 601 1,329
With respect to Class C and J shares, you would pay the following expenses if you did not redeem your shares (all other classes would be the same as in the above example):
1 year 3 years 5 years 10 yearsClass C $212 $655 $1,124 $2,421Class J 129 405 701 1,544
Portfolio TurnoverThe Fund pays transaction costs, such as commissions, when it buys and sells securities (or “turns over” its portfolio). A higher portfolio turnover rate may indicate higher transaction costs and may result in higher taxes when Fund shares are held in a taxable account. These costs, which are not reflected in annual fund operating expenses or in the example, affect the Fund’s performance. During the most recent fiscal year, the Fund’s portfolio turnover rate was 11.1% of the average value of its portfolio.
Principal Investment StrategiesUnder normal circumstances, the Fund invests at least 80% of its net assets, plus any borrowings for investment purposes, in equity securities of companies principally engaged in the real estate industry at the time of each purchase. A real estate company has at least 50% of its assets, income or profits derived from products or services related to the real estate industry. Real estate companies include real estate investment trusts ("REITs") and companies with substantial real estate holdings such as paper, lumber, hotel and entertainment companies as well as those whose products and services relate to the real estate industry include building supply manufacturers, mortgage lenders and mortgage servicing companies. The Fund invests in equity securities of small, medium, and large market capitalization companies.
REITs are pooled investment vehicles that invest in income producing real estate, real estate related loans, or other types of real estate interests. REITs are corporations or business trusts that are permitted to eliminate corporate level federal income taxes by meeting certain requirements of the Internal Revenue Code.
The Fund concentrates its investments (invest more than 25% of its net assets) in securities in the real estate industry.
The Fund is considered non-diversified, which means it can invest a higher percentage of assets in securities of individual issuers than a diversified fund. As a result, changes in the value of a single investment could cause greater fluctuations in the Fund's share price than would occur in a more diversified fund.
267
Principal RisksThe value of your investment in the Fund changes with the value of the Fund's investments. Many factors affect that value, and it is possible to lose money by investing in the Fund. An investment in the Fund is not a deposit of a bank and is not insured or guaranteed by the Federal Deposit Insurance Corporation or any other government agency. The principal risks of investing in the Fund, in alphabetical order, are:
Equity Securities Risk. The value of equity securities could decline if the issuer's financial condition declines or in response to overall market and economic conditions. A fund's principal market segment(s), such as large cap, mid cap or small cap stocks, or growth or value stocks, may underperform other market segments or the equity markets as a whole. Investments in smaller companies and mid-size companies may involve greater risk and price volatility than investments in larger, more mature companies.
Industry Concentration Risk (Real Estate). A fund that concentrates investments in a particular industry or group of industries has greater exposure than other funds to market, economic and other factors affecting that industry or group of industries. A fund concentrating in the real estate industry can be subject to the risks associated with direct ownership of real estate, securities of companies in the real estate industry, and/or real estate investment trusts.
Non-Diversification Risk. A non-diversified fund may invest a high percentage of its assets in the securities of a small number of issuers and is more likely than diversified funds to be significantly affected by a specific security’s poor performance.
Real Estate Investment Trusts (“REITs”) Risk. A REIT could fail to qualify for tax-free pass-through of income under the Internal Revenue Code, and fund shareholders will indirectly bear their proportionate share of the expenses of REITs in which the fund invests.
Real Estate Securities Risk. Real estate securities are subject to the risks associated with direct ownership of real estate, including declines in value, adverse economic conditions, increases in expenses, regulatory changes and environmental problems. Investing in securities of companies in the real estate industry, subjects a fund to the special risks associated with the real estate market including factors such as loss to casualty or condemnation, changes in real estate values, property taxes, interest rates, cash flow of underlying real estate assets, occupancy rates, government regulations affecting zoning, land use and rents, and the management skill and creditworthiness of the issuer.
PerformanceThe following information provides some indication of the risks of investing in the Fund. Past performance (before and after taxes) is not necessarily an indication of how the Fund will perform in the future. You may get updated performance information by calling 1-800-222-5852 or online at:• For Classes A, C, J, and P - www.principalfunds.com.• For Classes Institutional, R-1, R-2, R-3, R-4, and R-5 - www.principal.com.
The bar chart shows the investment returns of the Fund’s Class A shares for each full calendar year of operations for 10 years (or, if shorter, the life of the Fund). The table shows, for each share class of the Fund and for the last one, five, and ten calendar year periods (or, if shorter, the life of the Fund), how the Fund’s average annual total returns compare with those of one or more broad measures of market performance.
For periods prior to the inception date of Class A shares (June 28, 2005), Class C shares (January 16, 2007) and Class P shares (September 27, 2010), performance shown in the bar chart and the table for these classes is based on the performance of the Fund's R-3 Class shares adjusted to reflect the respective fees and expenses of each class. The adjustments result in performance for such periods that is no higher than the historical performance of the R-3 Class shares, which were first sold on December 6, 2000.
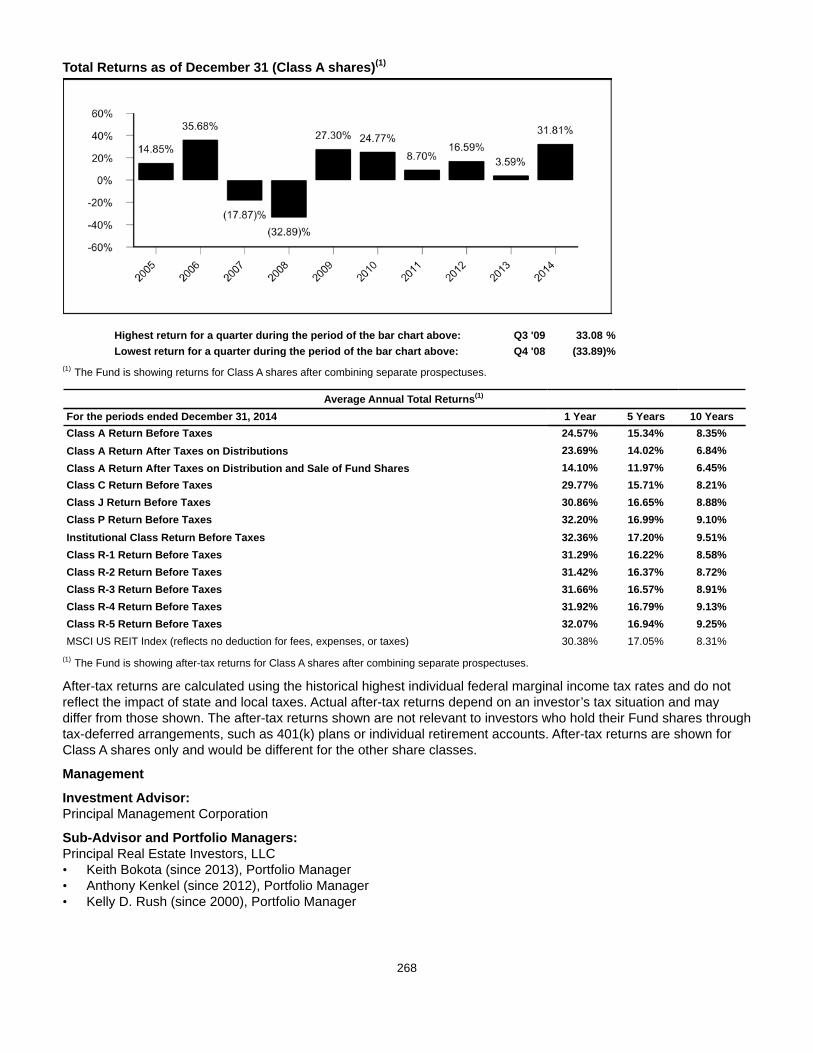
268
Total Returns as of December 31 (Class A shares)(1)
Highest return for a quarter during the period of the bar chart above: Q3 '09 33.08 %Lowest return for a quarter during the period of the bar chart above: Q4 '08 (33.89)%
(1) The Fund is showing returns for Class A shares after combining separate prospectuses.
Average Annual Total Returns(1)
For the periods ended December 31, 2014 1 Year 5 Years 10 YearsClass A Return Before Taxes 24.57% 15.34% 8.35%Class A Return After Taxes on Distributions 23.69% 14.02% 6.84%Class A Return After Taxes on Distribution and Sale of Fund Shares 14.10% 11.97% 6.45%Class C Return Before Taxes 29.77% 15.71% 8.21%Class J Return Before Taxes 30.86% 16.65% 8.88%Class P Return Before Taxes 32.20% 16.99% 9.10%Institutional Class Return Before Taxes 32.36% 17.20% 9.51%Class R-1 Return Before Taxes 31.29% 16.22% 8.58%Class R-2 Return Before Taxes 31.42% 16.37% 8.72%Class R-3 Return Before Taxes 31.66% 16.57% 8.91%Class R-4 Return Before Taxes 31.92% 16.79% 9.13%Class R-5 Return Before Taxes 32.07% 16.94% 9.25%MSCI US REIT Index (reflects no deduction for fees, expenses, or taxes) 30.38% 17.05% 8.31%
(1) The Fund is showing after-tax returns for Class A shares after combining separate prospectuses.
After-tax returns are calculated using the historical highest individual federal marginal income tax rates and do not reflect the impact of state and local taxes. Actual after-tax returns depend on an investor’s tax situation and may differ from those shown. The after-tax returns shown are not relevant to investors who hold their Fund shares through tax-deferred arrangements, such as 401(k) plans or individual retirement accounts. After-tax returns are shown for Class A shares only and would be different for the other share classes.
Management
Investment Advisor: Principal Management Corporation
Sub-Advisor and Portfolio Managers: Principal Real Estate Investors, LLC • Keith Bokota (since 2013), Portfolio Manager • Anthony Kenkel (since 2012), Portfolio Manager• Kelly D. Rush (since 2000), Portfolio Manager

269
Purchase and Sale of Fund Shares
Share Class Investment TypePurchase Minimum
Per FundA, C, and J Initial Investment $1,000(1)
A, C, and J For accounts with an Automatic Investment Plan (AIP) $100A, C, and J Subsequent Investments $100(1)(2)
P, Institutional, R-1, R-2, R-3, R-4,and R-5
There are no minimum initial or subsequent investment requirements foreligible purchases.
N/A
(1) Some exceptions apply; see "Purchase of Fund Shares - Minimum Investments" for more information.(2) For accounts with an AIP, the subsequent automatic investments must total $1,200 annually if the initial $1,000 minimum has not been met.
You may purchase or redeem shares on any business day (normally any day when the New York Stock Exchange is open for regular trading) through your plan, intermediary, or Financial Professional; by sending a written request to Principal Funds at P.O. Box 8024, Boston, MA 02266-8024 (regular mail) or 30 Dan Road, Canton, MA 02021-2809 (overnight mail); calling us at 1-800-222-5852; or accessing our website (www.principalfunds.com).
Tax InformationThe Fund’s distributions you receive are generally subject to federal income tax as ordinary income or capital gain and may also be subject to state and local taxes, unless you are tax-exempt or your account is tax-deferred in which case your distributions would be taxed when withdrawn from the tax-deferred account.
Payments to Broker-Dealers and Other Financial IntermediariesIf you purchase the Fund through a broker-dealer or other financial intermediary (such as a bank, insurance company, investment adviser, etc.), the Fund and its related companies may pay the intermediary for the sale of Fund shares and related services. These payments may create a conflict of interest by influencing the broker-dealer or other intermediary and your salesperson to recommend the Fund over another investment, or to recommend one share class of the Fund over another share class. Ask your salesperson or visit your financial intermediary's website for more information.
270
SAM (STRATEGIC ASSET MANAGEMENT) BALANCED PORTFOLIO
Objective: The Portfolio seeks to provide as high a level of total return (consisting of reinvested income and capital appreciation) as is consistent with reasonable risk.
Fees and Expenses of the FundThis table describes the fees and expenses that you may pay if you buy and hold shares of the Fund. You may qualify for sales charge discounts if you and your family invest, or agree to invest in the future, at least $50,000 in Class A Shares of Principal Funds, Inc. More information about these and other discounts is available from your financial professional and in “Choosing a Share Class and The Costs of Investing” beginning on page 381 of the Fund’s prospectus and “Multiple Class Structure” beginning on page 6 of the Fund’s Statement of Additional Information.
Shareholder Fees (fees paid directly from your investment)
Share ClassA C J Inst. R-1 R-2 R-3 R-4 R-5
Maximum Sales Charge (Load) Imposed onPurchases (as a percentage of offering price)
5.50% None None None None None None None None
Maximum Deferred Sales Charge (Load) (as apercentage of the offering price or NAV when SalesLoad is paid, whichever is less)
1.00% 1.00% 1.00% None None None None None None
Annual Fund Operating Expenses (expenses that you pay each year as a percentage of the value of your investment)
Share ClassA C J Inst. R-1 R-2 R-3 R-4 R-5
Management Fees 0.31% 0.31% 0.31% 0.31% 0.31% 0.31% 0.31% 0.31% 0.31%
Distribution and/or Service (12b-1) Fees (1) 0.25% 1.00% 0.25% N/A 0.35% 0.30% 0.25% 0.10% N/A
Other Expenses 0.09% 0.09% 0.06% —% 0.53% 0.45% 0.32% 0.28% 0.26%
Acquired Fund Fees and Expenses 0.68% 0.68% 0.68% 0.68% 0.68% 0.68% 0.68% 0.68% 0.68%
Total Annual Fund Operating Expenses 1.33% 2.08% 1.30% 0.99% 1.87% 1.74% 1.56% 1.37% 1.25%Fee Waiver (2) N/A N/A (0.01)% N/A N/A N/A N/A N/A N/ATotal Annual Fund Operating Expenses after FeeWaiver
1.33% 2.08% 1.29% 0.99% 1.87% 1.74% 1.56% 1.37% 1.25%
(1) Expense information in the table has been restated to reflect current fees. Effective December 30, 2013, the Distribution and/or Service (12b-1) Fees for Class J shares were reduced.
(2) Principal Funds Distributor, Inc. ("the Distributor") has contractually agreed to limit the Distribution Fees attributable to Class J. The waiver will reduce the Fund's Distribution Fees by 0.01%. It is expected that the fee waiver will continue through the period ending February 29, 2016; however, Principal Funds, Inc. and the Distributor, the parties to the agreement, may agree to terminate the fee waiver prior to the end of the period.
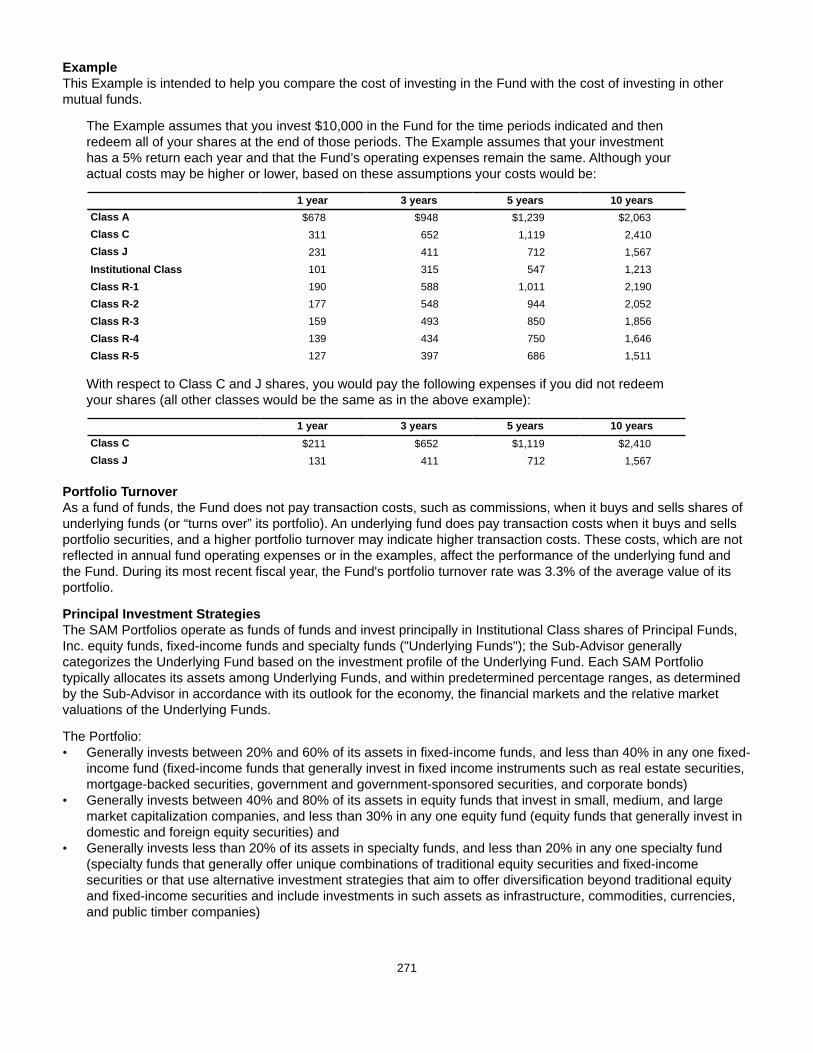
271
ExampleThis Example is intended to help you compare the cost of investing in the Fund with the cost of investing in other mutual funds.
The Example assumes that you invest $10,000 in the Fund for the time periods indicated and then redeem all of your shares at the end of those periods. The Example assumes that your investment has a 5% return each year and that the Fund’s operating expenses remain the same. Although your actual costs may be higher or lower, based on these assumptions your costs would be:
1 year 3 years 5 years 10 yearsClass A $678 $948 $1,239 $2,063Class C 311 652 1,119 2,410Class J 231 411 712 1,567Institutional Class 101 315 547 1,213Class R-1 190 588 1,011 2,190Class R-2 177 548 944 2,052Class R-3 159 493 850 1,856Class R-4 139 434 750 1,646Class R-5 127 397 686 1,511
With respect to Class C and J shares, you would pay the following expenses if you did not redeem your shares (all other classes would be the same as in the above example):
1 year 3 years 5 years 10 yearsClass C $211 $652 $1,119 $2,410Class J 131 411 712 1,567
Portfolio TurnoverAs a fund of funds, the Fund does not pay transaction costs, such as commissions, when it buys and sells shares of underlying funds (or “turns over” its portfolio). An underlying fund does pay transaction costs when it buys and sells portfolio securities, and a higher portfolio turnover may indicate higher transaction costs. These costs, which are not reflected in annual fund operating expenses or in the examples, affect the performance of the underlying fund and the Fund. During its most recent fiscal year, the Fund's portfolio turnover rate was 3.3% of the average value of its portfolio.
Principal Investment StrategiesThe SAM Portfolios operate as funds of funds and invest principally in Institutional Class shares of Principal Funds, Inc. equity funds, fixed-income funds and specialty funds ("Underlying Funds"); the Sub-Advisor generally categorizes the Underlying Fund based on the investment profile of the Underlying Fund. Each SAM Portfolio typically allocates its assets among Underlying Funds, and within predetermined percentage ranges, as determined by the Sub-Advisor in accordance with its outlook for the economy, the financial markets and the relative market valuations of the Underlying Funds.
The Portfolio:• Generally invests between 20% and 60% of its assets in fixed-income funds, and less than 40% in any one fixed-
income fund (fixed-income funds that generally invest in fixed income instruments such as real estate securities, mortgage-backed securities, government and government-sponsored securities, and corporate bonds)
• Generally invests between 40% and 80% of its assets in equity funds that invest in small, medium, and large market capitalization companies, and less than 30% in any one equity fund (equity funds that generally invest in domestic and foreign equity securities) and
• Generally invests less than 20% of its assets in specialty funds, and less than 20% in any one specialty fund (specialty funds that generally offer unique combinations of traditional equity securities and fixed-income securities or that use alternative investment strategies that aim to offer diversification beyond traditional equity and fixed-income securities and include investments in such assets as infrastructure, commodities, currencies, and public timber companies)
272
The Portfolio may temporarily exceed the applicable percentage ranges for short periods, and the Sub-Advisor may alter the percentage ranges when it deems appropriate.
Principal RisksThe broad diversification of the Portfolio is designed to cushion severe losses in any one investment sector and moderate overall price volatility. However, the Portfolio is subject to the particular risks of the Underlying Funds in which it invests, and its share prices and performance will fluctuate with the shares prices and performance of the Underlying Funds. The Portfolio operates as a fund of funds and thus bears both its own expenses and, indirectly, its proportionate share of the expenses of the underlying funds in which it invests. An investment in the Portfolio is not a deposit of a bank and is not insured or guaranteed by the Federal Deposit Insurance Corporation or any other government agency. If you sell your shares when their value is less than the price you paid, you will lose money.
The principal risks of investing in the Portfolio that are inherent in the fund of funds, in alphabetical order, are:
Asset Allocation Risk. A fund's selection and weighting of asset classes may cause it to underperform other funds with a similar investment objective.
Conflict of Interest Risk. The Advisor and its affiliates earn different fees from different underlying funds and may have an incentive to allocate more fund-of-fund assets to underlying funds from which they receive higher fees.
Investment Company Securities Risk. Fund shareholders bear indirectly their proportionate share of the expenses of other investment companies in which the fund invests.
The principal risks of investing in the Portfolio that are inherent in the underlying funds, in alphabetical order, are:
Currency Risk. Risks of investing in securities denominated in, or that trade in, foreign (non-U.S.) currencies include changes in foreign exchange rates and foreign exchange restrictions.
Equity Securities Risk. The value of equity securities could decline if the issuer's financial condition declines or in response to overall market and economic conditions. A fund's principal market segment(s), such as large cap, mid cap or small cap stocks, or growth or value stocks, may underperform other market segments or the equity markets as a whole. Investments in smaller companies and mid-size companies may involve greater risk and price volatility than investments in larger, more mature companies.
Fixed-Income Securities Risk. Fixed-income securities are subject to interest rate risk and credit quality risk. The market value of fixed-income securities generally declines when interest rates rise, and an issuer of fixed-income securities could default on its payment obligations.
Foreign Securities Risk. The risks of foreign securities include loss of value as a result of: political or economic instability; nationalization, expropriation or confiscatory taxation; settlement delays; and limited government regulation (including less stringent reporting, accounting, and disclosure standards than are required of U.S. companies).
Growth Stock Risk. If growth companies do not increase their earnings at a rate expected by investors, the market price of the stock may decline significantly, even if earnings show an absolute increase. Growth company stocks also typically lack the dividend yield that can lessen price declines in market downturns.
Investment Company Securities Risk. Fund shareholders bear indirectly their proportionate share of the expenses of other investment companies in which the fund invests.
Portfolio Duration Risk. Portfolio duration is a measure of the expected life of a fixed-income security and its sensitivity to changes in interest rates. The longer a fund's average portfolio duration, the more sensitive the fund will be to changes in interest rates.
Prepayment Risk. Unscheduled prepayments on mortgage-backed and asset-backed securities may have to be reinvested at lower rates. A reduction in prepayments may increase the effective maturities of these securities, exposing them to the risk of decline in market value over time (extension risk).
273
Real Estate Securities Risk. Real estate securities are subject to the risks associated with direct ownership of real estate, including declines in value, adverse economic conditions, increases in expenses, regulatory changes and environmental problems. Investing in securities of companies in the real estate industry, subjects a fund to the special risks associated with the real estate market including factors such as loss to casualty or condemnation, changes in real estate values, property taxes, interest rates, cash flow of underlying real estate assets, occupancy rates, government regulations affecting zoning, land use and rents, and the management skill and creditworthiness of the issuer.
Risk of Being an Underlying Fund. A fund is subject to the risk of being an underlying fund to the extent that a fund of funds invests in the fund. An underlying fund of a fund of funds may experience relatively large redemptions or investments as the fund of funds periodically reallocates or rebalances its assets. These transactions may cause the underlying fund to sell portfolio securities to meet such redemptions, or to invest cash from such investments, at times it would not otherwise do so, and may as a result increase transaction costs and adversely affect underlying fund performance.
U.S. Government Securities Risk. Yields available from U.S. government securities are generally lower than yields from many other fixed-income securities.
U.S. Government Sponsored Securities Risk. Securities issued by U.S. government-sponsored or -chartered enterprises such as the Federal Home Loan Mortgage Corporation, the Federal National Mortgage Association, and the Federal Home Loan Banks are not issued or guaranteed by the U.S. Treasury.
Value Stock Risk. The market may not recognize the intrinsic value of value stocks for a long time, or they may be appropriately priced at the time of purchase.
PerformanceThe following information provides some indication of the risks of investing in the Fund. Past performance (before and after taxes) is not necessarily an indication of how the Fund will perform in the future. You may get updated performance information by calling 1-800-222-5852 or online at:• For Classes A, C, and J - www.principalfunds.com.• For Classes Institutional, R-1, R-2, R-3, R-4, and R-5 - www.principal.com.
The bar chart shows the investment returns of the Fund’s Class A shares for each full calendar year of operations for 10 years (or, if shorter, the life of the Fund). The table shows, for each share class of the Fund and for the last one, five, and ten calendar year periods (or, if shorter, the life of the Fund), how the Fund’s average annual total returns compare with those of one or more broad measures of market performance.
The Portfolio commenced operations after succeeding to the operations of another fund on January 12, 2007. Performance for periods prior to that date is based on the performance of the predecessor fund.
For periods prior to the inception date of Classes J, Institutional, R-1, R-2, R-3, R-4 and R-5 shares (January 16, 2007), performance shown in the table for these classes is based on the performance of the Portfolio's Class A shares, adjusted to reflect the respective fees and expenses of each class. The adjustments result in performance for such periods that is no higher than the historical performance of the Class A shares. The predecessor fund's Class A shares commenced operations on July 25, 1996.
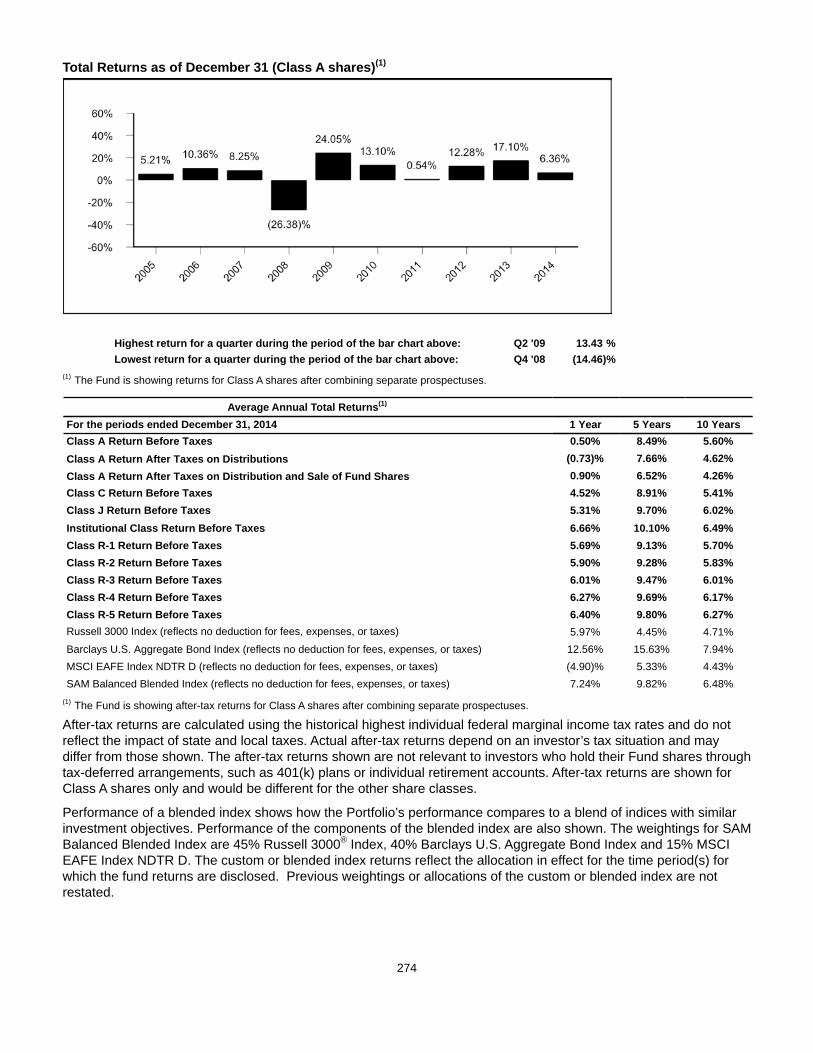
274
Total Returns as of December 31 (Class A shares)(1)
Highest return for a quarter during the period of the bar chart above: Q2 '09 13.43 %Lowest return for a quarter during the period of the bar chart above: Q4 '08 (14.46)%
(1) The Fund is showing returns for Class A shares after combining separate prospectuses.
Average Annual Total Returns(1)
For the periods ended December 31, 2014 1 Year 5 Years 10 YearsClass A Return Before Taxes 0.50% 8.49% 5.60%Class A Return After Taxes on Distributions (0.73)% 7.66% 4.62%Class A Return After Taxes on Distribution and Sale of Fund Shares 0.90% 6.52% 4.26%Class C Return Before Taxes 4.52% 8.91% 5.41%Class J Return Before Taxes 5.31% 9.70% 6.02%Institutional Class Return Before Taxes 6.66% 10.10% 6.49%Class R-1 Return Before Taxes 5.69% 9.13% 5.70%Class R-2 Return Before Taxes 5.90% 9.28% 5.83%Class R-3 Return Before Taxes 6.01% 9.47% 6.01%Class R-4 Return Before Taxes 6.27% 9.69% 6.17%Class R-5 Return Before Taxes 6.40% 9.80% 6.27%Russell 3000 Index (reflects no deduction for fees, expenses, or taxes) 5.97% 4.45% 4.71%Barclays U.S. Aggregate Bond Index (reflects no deduction for fees, expenses, or taxes) 12.56% 15.63% 7.94%MSCI EAFE Index NDTR D (reflects no deduction for fees, expenses, or taxes) (4.90)% 5.33% 4.43%SAM Balanced Blended Index (reflects no deduction for fees, expenses, or taxes) 7.24% 9.82% 6.48%
(1) The Fund is showing after-tax returns for Class A shares after combining separate prospectuses.
After-tax returns are calculated using the historical highest individual federal marginal income tax rates and do not reflect the impact of state and local taxes. Actual after-tax returns depend on an investor’s tax situation and may differ from those shown. The after-tax returns shown are not relevant to investors who hold their Fund shares through tax-deferred arrangements, such as 401(k) plans or individual retirement accounts. After-tax returns are shown for Class A shares only and would be different for the other share classes.
Performance of a blended index shows how the Portfolio’s performance compares to a blend of indices with similar investment objectives. Performance of the components of the blended index are also shown. The weightings for SAM Balanced Blended Index are 45% Russell 3000® Index, 40% Barclays U.S. Aggregate Bond Index and 15% MSCI EAFE Index NDTR D. The custom or blended index returns reflect the allocation in effect for the time period(s) for which the fund returns are disclosed. Previous weightings or allocations of the custom or blended index are not restated.

275
Management
Investment Advisor: Principal Management Corporation
Sub-Advisor and Portfolio Managers: Edge Asset Management, Inc. • Charles D. Averill (since 2010), Portfolio Manager• Jill R. Cuniff (since 2010), President and Portfolio Manager• Todd A. Jablonski (since 2010), Portfolio Manager
Purchase and Sale of Fund Shares
Share Class Investment TypePurchase Minimum
Per FundA, C, and J Initial Investment $1,000(1)
A, C, and J For accounts with an Automatic Investment Plan (AIP) $100A, C, and J Subsequent Investments $100(1)(2)
Institutional, R-1, R-2, R-3, R-4, andR-5
There are no minimum initial or subsequent investment requirements foreligible purchases.
N/A
(1) Some exceptions apply; see "Purchase of Fund Shares - Minimum Investments" for more information.(2) For accounts with an AIP, the subsequent automatic investments must total $1,200 annually if the initial $1,000 minimum has not been met.
You may purchase or redeem shares on any business day (normally any day when the New York Stock Exchange is open for regular trading) through your plan, intermediary, or Financial Professional; by sending a written request to Principal Funds at P.O. Box 8024, Boston, MA 02266-8024 (regular mail) or 30 Dan Road, Canton, MA 02021-2809 (overnight mail); calling us at 1-800-222-5852; or accessing our website (www.principalfunds.com).
Tax InformationThe Fund’s distributions you receive are generally subject to federal income tax as ordinary income or capital gain and may also be subject to state and local taxes, unless you are tax-exempt or your account is tax-deferred in which case your distributions would be taxed when withdrawn from the tax-deferred account.
Payments to Broker-Dealers and Other Financial IntermediariesIf you purchase the Fund through a broker-dealer or other financial intermediary (such as a bank, insurance company, investment adviser, etc.), the Fund and its related companies may pay the intermediary for the sale of Fund shares and related services. These payments may create a conflict of interest by influencing the broker-dealer or other intermediary and your salesperson to recommend the Fund over another investment, or to recommend one share class of the Fund over another share class. Ask your salesperson or visit your financial intermediary's website for more information.
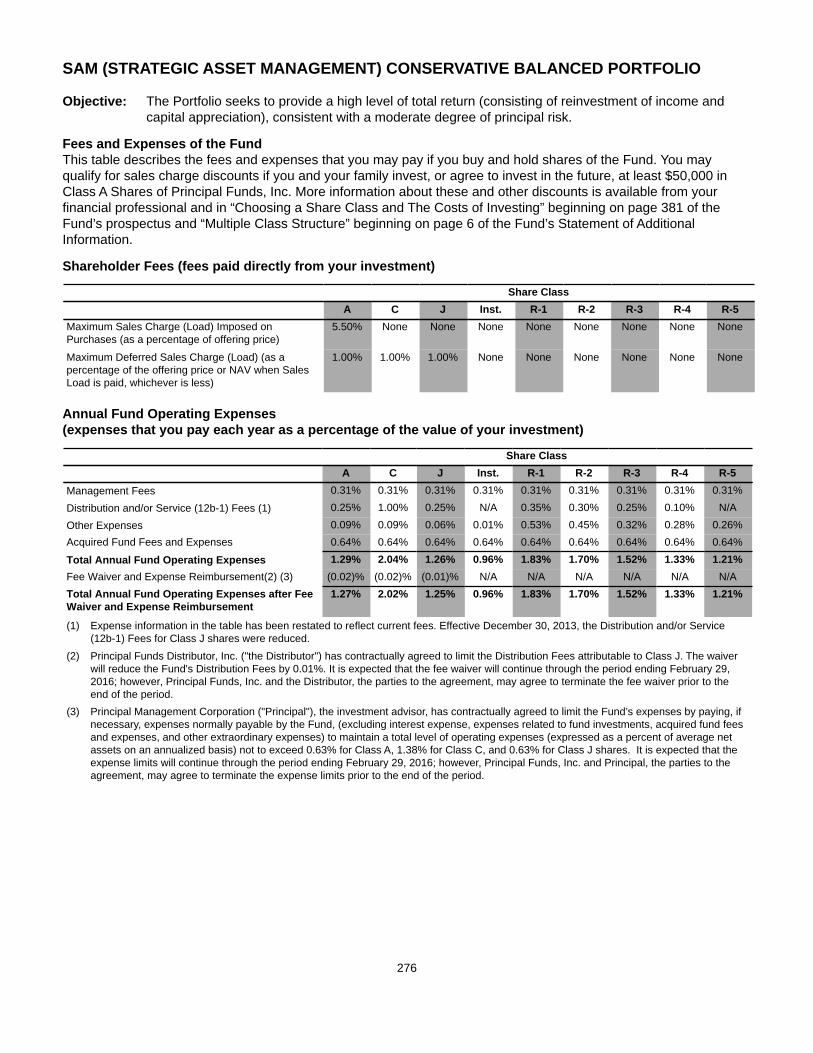
276
SAM (STRATEGIC ASSET MANAGEMENT) CONSERVATIVE BALANCED PORTFOLIO
Objective: The Portfolio seeks to provide a high level of total return (consisting of reinvestment of income and capital appreciation), consistent with a moderate degree of principal risk.
Fees and Expenses of the FundThis table describes the fees and expenses that you may pay if you buy and hold shares of the Fund. You may qualify for sales charge discounts if you and your family invest, or agree to invest in the future, at least $50,000 in Class A Shares of Principal Funds, Inc. More information about these and other discounts is available from your financial professional and in “Choosing a Share Class and The Costs of Investing” beginning on page 381 of the Fund’s prospectus and “Multiple Class Structure” beginning on page 6 of the Fund’s Statement of Additional Information.
Shareholder Fees (fees paid directly from your investment)
Share ClassA C J Inst. R-1 R-2 R-3 R-4 R-5
Maximum Sales Charge (Load) Imposed onPurchases (as a percentage of offering price)
5.50% None None None None None None None None
Maximum Deferred Sales Charge (Load) (as apercentage of the offering price or NAV when SalesLoad is paid, whichever is less)
1.00% 1.00% 1.00% None None None None None None
Annual Fund Operating Expenses (expenses that you pay each year as a percentage of the value of your investment)
Share ClassA C J Inst. R-1 R-2 R-3 R-4 R-5
Management Fees 0.31% 0.31% 0.31% 0.31% 0.31% 0.31% 0.31% 0.31% 0.31%
Distribution and/or Service (12b-1) Fees (1) 0.25% 1.00% 0.25% N/A 0.35% 0.30% 0.25% 0.10% N/A
Other Expenses 0.09% 0.09% 0.06% 0.01% 0.53% 0.45% 0.32% 0.28% 0.26%Acquired Fund Fees and Expenses 0.64% 0.64% 0.64% 0.64% 0.64% 0.64% 0.64% 0.64% 0.64%
Total Annual Fund Operating Expenses 1.29% 2.04% 1.26% 0.96% 1.83% 1.70% 1.52% 1.33% 1.21%Fee Waiver and Expense Reimbursement(2) (3) (0.02)% (0.02)% (0.01)% N/A N/A N/A N/A N/A N/ATotal Annual Fund Operating Expenses after FeeWaiver and Expense Reimbursement
1.27% 2.02% 1.25% 0.96% 1.83% 1.70% 1.52% 1.33% 1.21%
(1) Expense information in the table has been restated to reflect current fees. Effective December 30, 2013, the Distribution and/or Service (12b-1) Fees for Class J shares were reduced.
(2) Principal Funds Distributor, Inc. ("the Distributor") has contractually agreed to limit the Distribution Fees attributable to Class J. The waiver will reduce the Fund's Distribution Fees by 0.01%. It is expected that the fee waiver will continue through the period ending February 29, 2016; however, Principal Funds, Inc. and the Distributor, the parties to the agreement, may agree to terminate the fee waiver prior to the end of the period.
(3) Principal Management Corporation ("Principal"), the investment advisor, has contractually agreed to limit the Fund’s expenses by paying, if necessary, expenses normally payable by the Fund, (excluding interest expense, expenses related to fund investments, acquired fund fees and expenses, and other extraordinary expenses) to maintain a total level of operating expenses (expressed as a percent of average net assets on an annualized basis) not to exceed 0.63% for Class A, 1.38% for Class C, and 0.63% for Class J shares. It is expected that the expense limits will continue through the period ending February 29, 2016; however, Principal Funds, Inc. and Principal, the parties to the agreement, may agree to terminate the expense limits prior to the end of the period.
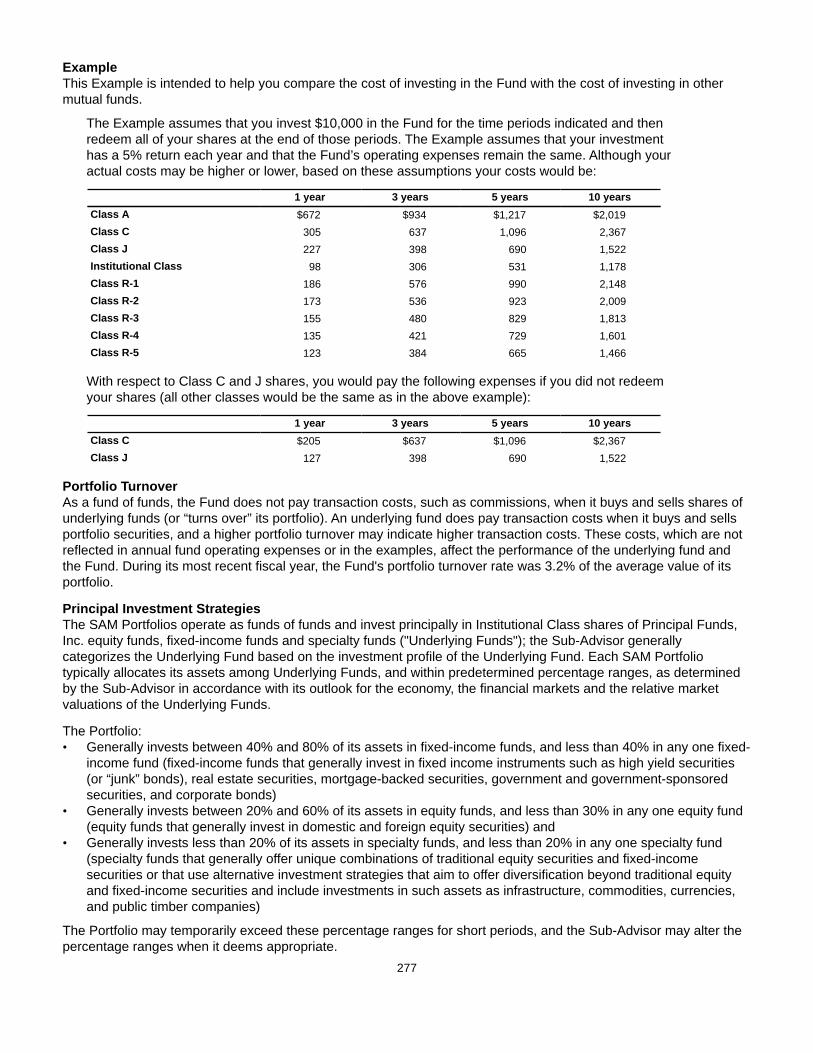
277
ExampleThis Example is intended to help you compare the cost of investing in the Fund with the cost of investing in other mutual funds.
The Example assumes that you invest $10,000 in the Fund for the time periods indicated and then redeem all of your shares at the end of those periods. The Example assumes that your investment has a 5% return each year and that the Fund’s operating expenses remain the same. Although your actual costs may be higher or lower, based on these assumptions your costs would be:
1 year 3 years 5 years 10 yearsClass A $672 $934 $1,217 $2,019Class C 305 637 1,096 2,367Class J 227 398 690 1,522Institutional Class 98 306 531 1,178Class R-1 186 576 990 2,148Class R-2 173 536 923 2,009Class R-3 155 480 829 1,813Class R-4 135 421 729 1,601Class R-5 123 384 665 1,466
With respect to Class C and J shares, you would pay the following expenses if you did not redeem your shares (all other classes would be the same as in the above example):
1 year 3 years 5 years 10 yearsClass C $205 $637 $1,096 $2,367Class J 127 398 690 1,522
Portfolio TurnoverAs a fund of funds, the Fund does not pay transaction costs, such as commissions, when it buys and sells shares of underlying funds (or “turns over” its portfolio). An underlying fund does pay transaction costs when it buys and sells portfolio securities, and a higher portfolio turnover may indicate higher transaction costs. These costs, which are not reflected in annual fund operating expenses or in the examples, affect the performance of the underlying fund and the Fund. During its most recent fiscal year, the Fund's portfolio turnover rate was 3.2% of the average value of its portfolio.
Principal Investment StrategiesThe SAM Portfolios operate as funds of funds and invest principally in Institutional Class shares of Principal Funds, Inc. equity funds, fixed-income funds and specialty funds ("Underlying Funds"); the Sub-Advisor generally categorizes the Underlying Fund based on the investment profile of the Underlying Fund. Each SAM Portfolio typically allocates its assets among Underlying Funds, and within predetermined percentage ranges, as determined by the Sub-Advisor in accordance with its outlook for the economy, the financial markets and the relative market valuations of the Underlying Funds.
The Portfolio:• Generally invests between 40% and 80% of its assets in fixed-income funds, and less than 40% in any one fixed-
income fund (fixed-income funds that generally invest in fixed income instruments such as high yield securities (or “junk” bonds), real estate securities, mortgage-backed securities, government and government-sponsored securities, and corporate bonds)
• Generally invests between 20% and 60% of its assets in equity funds, and less than 30% in any one equity fund (equity funds that generally invest in domestic and foreign equity securities) and
• Generally invests less than 20% of its assets in specialty funds, and less than 20% in any one specialty fund (specialty funds that generally offer unique combinations of traditional equity securities and fixed-income securities or that use alternative investment strategies that aim to offer diversification beyond traditional equity and fixed-income securities and include investments in such assets as infrastructure, commodities, currencies, and public timber companies)
The Portfolio may temporarily exceed these percentage ranges for short periods, and the Sub-Advisor may alter the percentage ranges when it deems appropriate.
278
Principal RisksThe broad diversification of the Portfolio is designed to cushion severe losses in any one investment sector and moderate overall price volatility. However, the Portfolio is subject to the particular risks of the Underlying Funds in which it invests, and its share prices and performance will fluctuate with the shares prices and performance of the Underlying Funds. The Portfolio operates as a fund of funds and thus bears both its own expenses and, indirectly, its proportionate share of the expenses of the underlying funds in which it invests. An investment in the Portfolio is not a deposit of a bank and is not insured or guaranteed by the Federal Deposit Insurance Corporation or any other government agency. If you sell your shares when their value is less than the price you paid, you will lose money.
The principal risks of investing in the Portfolio that are inherent in the fund of funds, in alphabetical order, are:
Asset Allocation Risk. A fund's selection and weighting of asset classes may cause it to underperform other funds with a similar investment objective.
Conflict of Interest Risk. The Advisor and its affiliates earn different fees from different underlying funds and may have an incentive to allocate more fund-of-fund assets to underlying funds from which they receive higher fees.
Investment Company Securities Risk. Fund shareholders bear indirectly their proportionate share of the expenses of other investment companies in which the fund invests.
The principal risks of investing in the Portfolio that are inherent in the underlying funds, in alphabetical order, are:
Currency Risk. Risks of investing in securities denominated in, or that trade in, foreign (non-U.S.) currencies include changes in foreign exchange rates and foreign exchange restrictions.
Equity Securities Risk. The value of equity securities could decline if the issuer's financial condition declines or in response to overall market and economic conditions. A fund's principal market segment(s), such as large cap, mid cap or small cap stocks, or growth or value stocks, may underperform other market segments or the equity markets as a whole. Investments in smaller companies and mid-size companies may involve greater risk and price volatility than investments in larger, more mature companies.
Fixed-Income Securities Risk. Fixed-income securities are subject to interest rate risk and credit quality risk. The market value of fixed-income securities generally declines when interest rates rise, and an issuer of fixed-income securities could default on its payment obligations.
Foreign Securities Risk. The risks of foreign securities include loss of value as a result of: political or economic instability; nationalization, expropriation or confiscatory taxation; settlement delays; and limited government regulation (including less stringent reporting, accounting, and disclosure standards than are required of U.S. companies).
Growth Stock Risk. If growth companies do not increase their earnings at a rate expected by investors, the market price of the stock may decline significantly, even if earnings show an absolute increase. Growth company stocks also typically lack the dividend yield that can lessen price declines in market downturns.
High Yield Securities Risk. High yield fixed-income securities (commonly referred to as "junk bonds") are subject to greater credit quality risk than higher rated fixed-income securities and should be considered speculative.
Investment Company Securities Risk. Fund shareholders bear indirectly their proportionate share of the expenses of other investment companies in which the fund invests.
Portfolio Duration Risk. Portfolio duration is a measure of the expected life of a fixed-income security and its sensitivity to changes in interest rates. The longer a fund's average portfolio duration, the more sensitive the fund will be to changes in interest rates.
Prepayment Risk. Unscheduled prepayments on mortgage-backed and asset-backed securities may have to be reinvested at lower rates. A reduction in prepayments may increase the effective maturities of these securities, exposing them to the risk of decline in market value over time (extension risk).

279
Real Estate Securities Risk. Real estate securities are subject to the risks associated with direct ownership of real estate, including declines in value, adverse economic conditions, increases in expenses, regulatory changes and environmental problems. Investing in securities of companies in the real estate industry, subjects a fund to the special risks associated with the real estate market including factors such as loss to casualty or condemnation, changes in real estate values, property taxes, interest rates, cash flow of underlying real estate assets, occupancy rates, government regulations affecting zoning, land use and rents, and the management skill and creditworthiness of the issuer.
Risk of Being an Underlying Fund. A fund is subject to the risk of being an underlying fund to the extent that a fund of funds invests in the fund. An underlying fund of a fund of funds may experience relatively large redemptions or investments as the fund of funds periodically reallocates or rebalances its assets. These transactions may cause the underlying fund to sell portfolio securities to meet such redemptions, or to invest cash from such investments, at times it would not otherwise do so, and may as a result increase transaction costs and adversely affect underlying fund performance.
U.S. Government Securities Risk. Yields available from U.S. government securities are generally lower than yields from many other fixed-income securities.
U.S. Government Sponsored Securities Risk. Securities issued by U.S. government-sponsored or -chartered enterprises such as the Federal Home Loan Mortgage Corporation, the Federal National Mortgage Association, and the Federal Home Loan Banks are not issued or guaranteed by the U.S. Treasury.
Value Stock Risk. The market may not recognize the intrinsic value of value stocks for a long time, or they may be appropriately priced at the time of purchase.
PerformanceThe following information provides some indication of the risks of investing in the Fund. Past performance (before and after taxes) is not necessarily an indication of how the Fund will perform in the future. You may get updated performance information by calling 1-800-222-5852 or online at:• For Classes A, C, and J - www.principalfunds.com.• For Classes Institutional, R-1, R-2, R-3, R-4, and R-5 - www.principal.com.
The bar chart shows the investment returns of the Fund’s Class A shares for each full calendar year of operations for 10 years (or, if shorter, the life of the Fund). The table shows, for each share class of the Fund and for the last one, five, and ten calendar year periods (or, if shorter, the life of the Fund), how the Fund’s average annual total returns compare with those of one or more broad measures of market performance.
The Portfolio commenced operations after succeeding to the operations of another fund on January 12, 2007. Performance for periods prior to that date is based on the performance of the predecessor fund.
For periods prior to the inception date of Classes J, Institutional, R-1, R-2, R-3, R-4 and R-5 shares (January 16, 2007), performance shown in the table for these classes is based on the performance of the Portfolio's Class A shares, adjusted to reflect the respective fees and expenses of each class. The adjustments result in performance for such periods that is no higher than the historical performance of the Class A shares. The predecessor fund's Class A shares commenced operations on July 25, 1996.
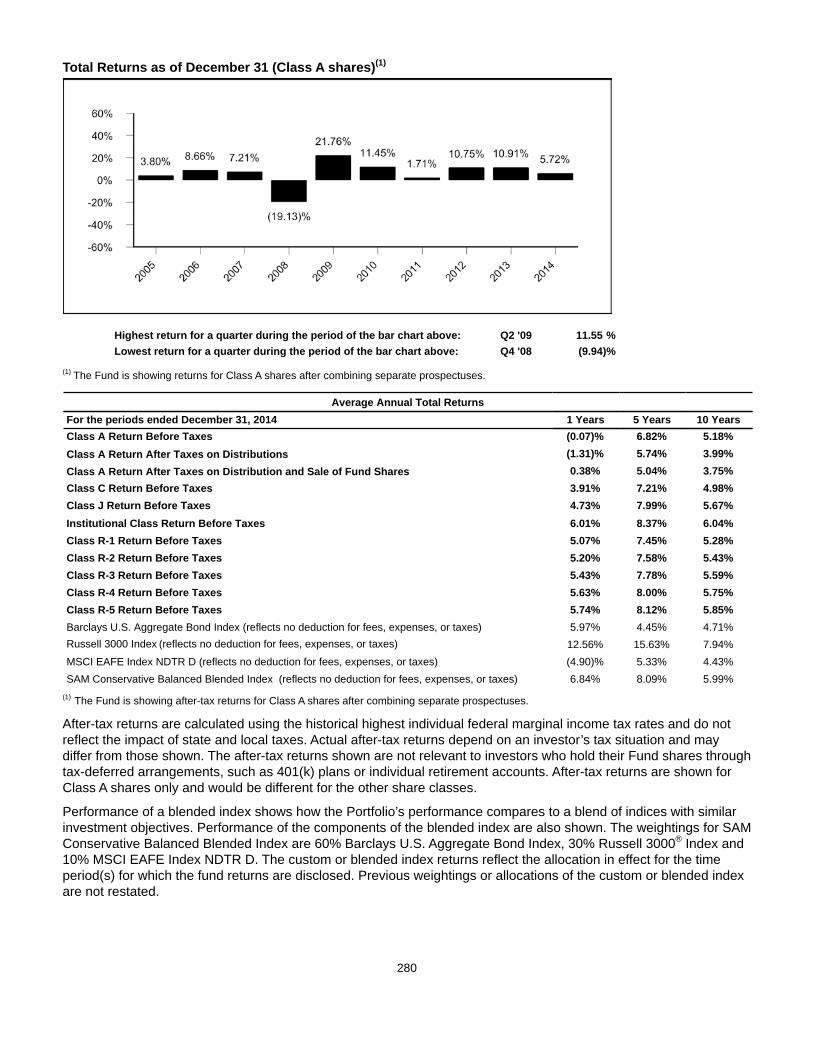
280
Total Returns as of December 31 (Class A shares)(1)
Highest return for a quarter during the period of the bar chart above: Q2 '09 11.55 %Lowest return for a quarter during the period of the bar chart above: Q4 '08 (9.94)%
(1) The Fund is showing returns for Class A shares after combining separate prospectuses.
Average Annual Total ReturnsFor the periods ended December 31, 2014 1 Years 5 Years 10 YearsClass A Return Before Taxes (0.07)% 6.82% 5.18%Class A Return After Taxes on Distributions (1.31)% 5.74% 3.99%Class A Return After Taxes on Distribution and Sale of Fund Shares 0.38% 5.04% 3.75%Class C Return Before Taxes 3.91% 7.21% 4.98%Class J Return Before Taxes 4.73% 7.99% 5.67%Institutional Class Return Before Taxes 6.01% 8.37% 6.04%Class R-1 Return Before Taxes 5.07% 7.45% 5.28%Class R-2 Return Before Taxes 5.20% 7.58% 5.43%Class R-3 Return Before Taxes 5.43% 7.78% 5.59%Class R-4 Return Before Taxes 5.63% 8.00% 5.75%Class R-5 Return Before Taxes 5.74% 8.12% 5.85%Barclays U.S. Aggregate Bond Index (reflects no deduction for fees, expenses, or taxes) 5.97% 4.45% 4.71%Russell 3000 Index (reflects no deduction for fees, expenses, or taxes) 12.56% 15.63% 7.94%MSCI EAFE Index NDTR D (reflects no deduction for fees, expenses, or taxes) (4.90)% 5.33% 4.43%SAM Conservative Balanced Blended Index (reflects no deduction for fees, expenses, or taxes) 6.84% 8.09% 5.99%
(1) The Fund is showing after-tax returns for Class A shares after combining separate prospectuses.
After-tax returns are calculated using the historical highest individual federal marginal income tax rates and do not reflect the impact of state and local taxes. Actual after-tax returns depend on an investor’s tax situation and may differ from those shown. The after-tax returns shown are not relevant to investors who hold their Fund shares through tax-deferred arrangements, such as 401(k) plans or individual retirement accounts. After-tax returns are shown for Class A shares only and would be different for the other share classes.
Performance of a blended index shows how the Portfolio’s performance compares to a blend of indices with similar investment objectives. Performance of the components of the blended index are also shown. The weightings for SAM Conservative Balanced Blended Index are 60% Barclays U.S. Aggregate Bond Index, 30% Russell 3000® Index and 10% MSCI EAFE Index NDTR D. The custom or blended index returns reflect the allocation in effect for the time period(s) for which the fund returns are disclosed. Previous weightings or allocations of the custom or blended index are not restated.
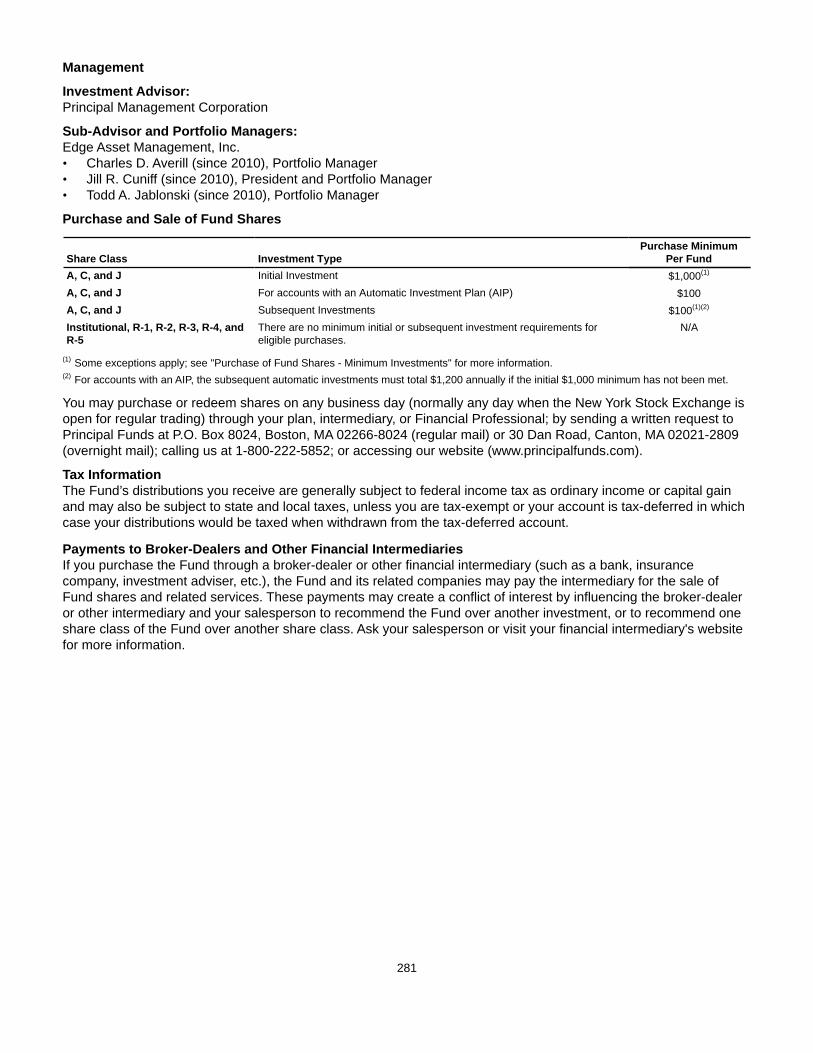
281
Management
Investment Advisor: Principal Management Corporation
Sub-Advisor and Portfolio Managers: Edge Asset Management, Inc. • Charles D. Averill (since 2010), Portfolio Manager• Jill R. Cuniff (since 2010), President and Portfolio Manager• Todd A. Jablonski (since 2010), Portfolio Manager
Purchase and Sale of Fund Shares
Share Class Investment TypePurchase Minimum
Per FundA, C, and J Initial Investment $1,000(1)
A, C, and J For accounts with an Automatic Investment Plan (AIP) $100A, C, and J Subsequent Investments $100(1)(2)
Institutional, R-1, R-2, R-3, R-4, andR-5
There are no minimum initial or subsequent investment requirements foreligible purchases.
N/A
(1) Some exceptions apply; see "Purchase of Fund Shares - Minimum Investments" for more information.(2) For accounts with an AIP, the subsequent automatic investments must total $1,200 annually if the initial $1,000 minimum has not been met.
You may purchase or redeem shares on any business day (normally any day when the New York Stock Exchange is open for regular trading) through your plan, intermediary, or Financial Professional; by sending a written request to Principal Funds at P.O. Box 8024, Boston, MA 02266-8024 (regular mail) or 30 Dan Road, Canton, MA 02021-2809 (overnight mail); calling us at 1-800-222-5852; or accessing our website (www.principalfunds.com).
Tax InformationThe Fund’s distributions you receive are generally subject to federal income tax as ordinary income or capital gain and may also be subject to state and local taxes, unless you are tax-exempt or your account is tax-deferred in which case your distributions would be taxed when withdrawn from the tax-deferred account.
Payments to Broker-Dealers and Other Financial IntermediariesIf you purchase the Fund through a broker-dealer or other financial intermediary (such as a bank, insurance company, investment adviser, etc.), the Fund and its related companies may pay the intermediary for the sale of Fund shares and related services. These payments may create a conflict of interest by influencing the broker-dealer or other intermediary and your salesperson to recommend the Fund over another investment, or to recommend one share class of the Fund over another share class. Ask your salesperson or visit your financial intermediary's website for more information.
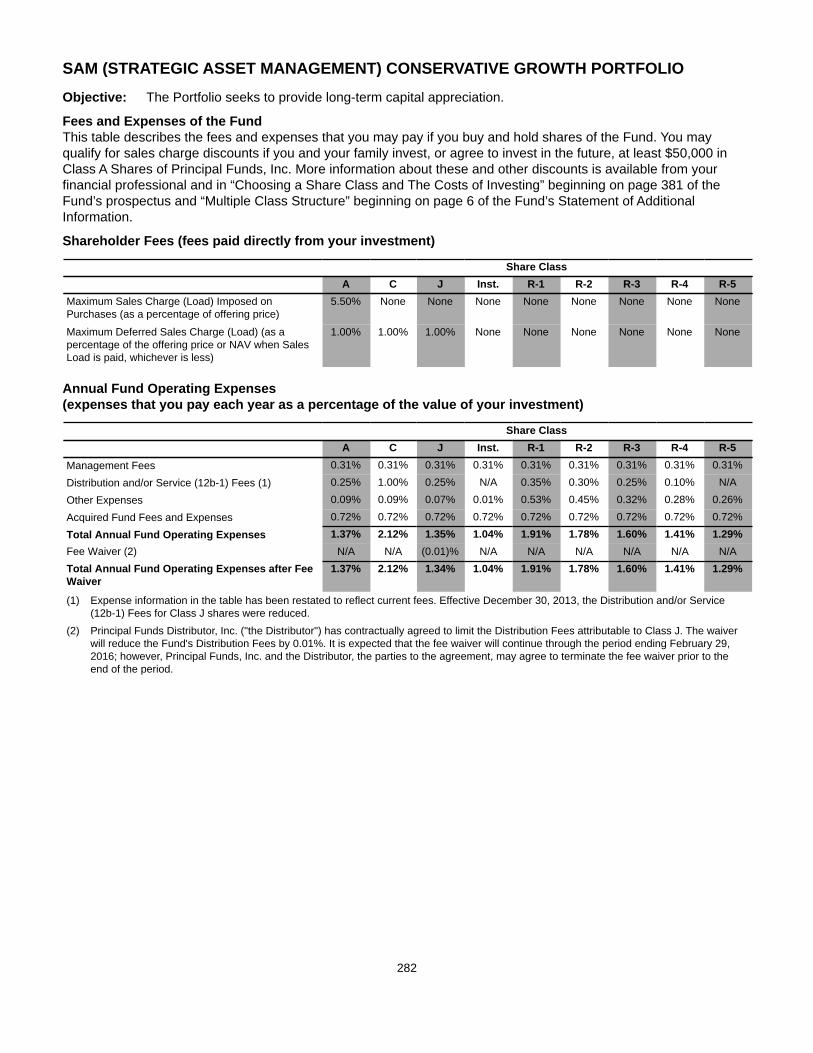
282
SAM (STRATEGIC ASSET MANAGEMENT) CONSERVATIVE GROWTH PORTFOLIO
Objective: The Portfolio seeks to provide long-term capital appreciation.
Fees and Expenses of the FundThis table describes the fees and expenses that you may pay if you buy and hold shares of the Fund. You may qualify for sales charge discounts if you and your family invest, or agree to invest in the future, at least $50,000 in Class A Shares of Principal Funds, Inc. More information about these and other discounts is available from your financial professional and in “Choosing a Share Class and The Costs of Investing” beginning on page 381 of the Fund’s prospectus and “Multiple Class Structure” beginning on page 6 of the Fund’s Statement of Additional Information.
Shareholder Fees (fees paid directly from your investment)
Share ClassA C J Inst. R-1 R-2 R-3 R-4 R-5
Maximum Sales Charge (Load) Imposed onPurchases (as a percentage of offering price)
5.50% None None None None None None None None
Maximum Deferred Sales Charge (Load) (as apercentage of the offering price or NAV when SalesLoad is paid, whichever is less)
1.00% 1.00% 1.00% None None None None None None
Annual Fund Operating Expenses (expenses that you pay each year as a percentage of the value of your investment)
Share ClassA C J Inst. R-1 R-2 R-3 R-4 R-5
Management Fees 0.31% 0.31% 0.31% 0.31% 0.31% 0.31% 0.31% 0.31% 0.31%
Distribution and/or Service (12b-1) Fees (1) 0.25% 1.00% 0.25% N/A 0.35% 0.30% 0.25% 0.10% N/A
Other Expenses 0.09% 0.09% 0.07% 0.01% 0.53% 0.45% 0.32% 0.28% 0.26%
Acquired Fund Fees and Expenses 0.72% 0.72% 0.72% 0.72% 0.72% 0.72% 0.72% 0.72% 0.72%
Total Annual Fund Operating Expenses 1.37% 2.12% 1.35% 1.04% 1.91% 1.78% 1.60% 1.41% 1.29%Fee Waiver (2) N/A N/A (0.01)% N/A N/A N/A N/A N/A N/ATotal Annual Fund Operating Expenses after FeeWaiver
1.37% 2.12% 1.34% 1.04% 1.91% 1.78% 1.60% 1.41% 1.29%
(1) Expense information in the table has been restated to reflect current fees. Effective December 30, 2013, the Distribution and/or Service (12b-1) Fees for Class J shares were reduced.
(2) Principal Funds Distributor, Inc. ("the Distributor") has contractually agreed to limit the Distribution Fees attributable to Class J. The waiver will reduce the Fund's Distribution Fees by 0.01%. It is expected that the fee waiver will continue through the period ending February 29, 2016; however, Principal Funds, Inc. and the Distributor, the parties to the agreement, may agree to terminate the fee waiver prior to the end of the period.
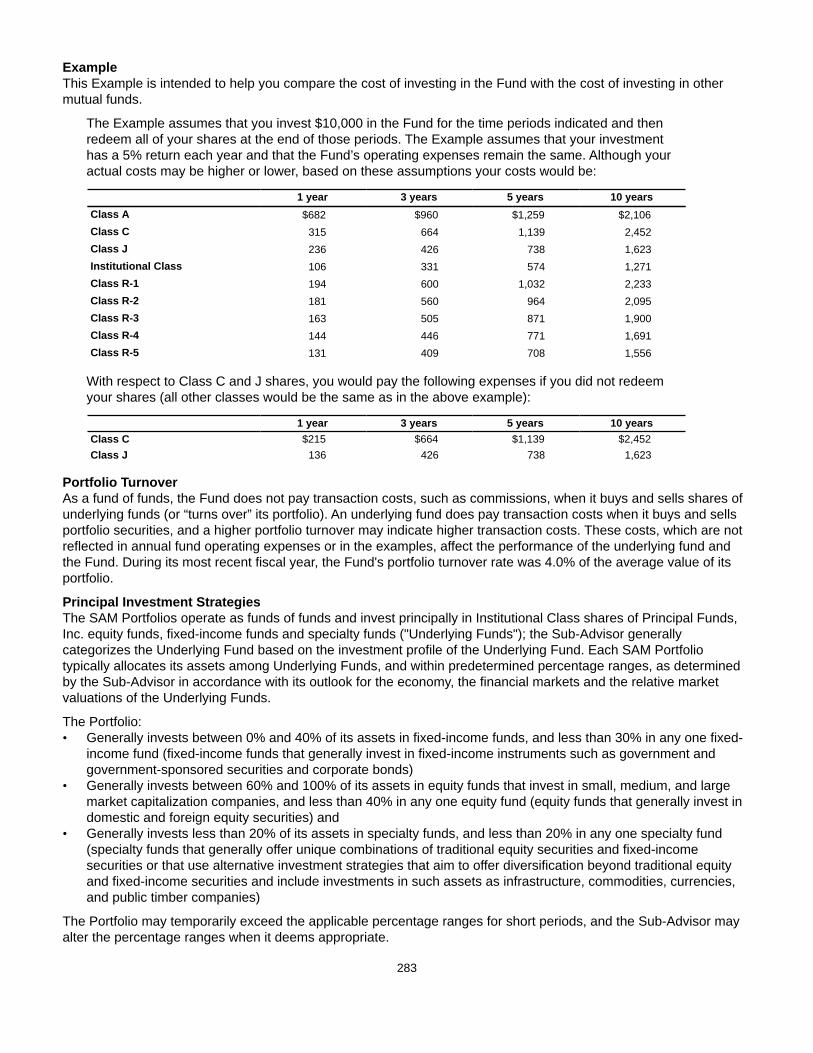
283
ExampleThis Example is intended to help you compare the cost of investing in the Fund with the cost of investing in other mutual funds.
The Example assumes that you invest $10,000 in the Fund for the time periods indicated and then redeem all of your shares at the end of those periods. The Example assumes that your investment has a 5% return each year and that the Fund’s operating expenses remain the same. Although your actual costs may be higher or lower, based on these assumptions your costs would be:
1 year 3 years 5 years 10 yearsClass A $682 $960 $1,259 $2,106Class C 315 664 1,139 2,452Class J 236 426 738 1,623Institutional Class 106 331 574 1,271Class R-1 194 600 1,032 2,233Class R-2 181 560 964 2,095Class R-3 163 505 871 1,900Class R-4 144 446 771 1,691Class R-5 131 409 708 1,556
With respect to Class C and J shares, you would pay the following expenses if you did not redeem your shares (all other classes would be the same as in the above example):
1 year 3 years 5 years 10 yearsClass C $215 $664 $1,139 $2,452Class J 136 426 738 1,623
Portfolio TurnoverAs a fund of funds, the Fund does not pay transaction costs, such as commissions, when it buys and sells shares of underlying funds (or “turns over” its portfolio). An underlying fund does pay transaction costs when it buys and sells portfolio securities, and a higher portfolio turnover may indicate higher transaction costs. These costs, which are not reflected in annual fund operating expenses or in the examples, affect the performance of the underlying fund and the Fund. During its most recent fiscal year, the Fund's portfolio turnover rate was 4.0% of the average value of its portfolio.
Principal Investment StrategiesThe SAM Portfolios operate as funds of funds and invest principally in Institutional Class shares of Principal Funds, Inc. equity funds, fixed-income funds and specialty funds ("Underlying Funds"); the Sub-Advisor generally categorizes the Underlying Fund based on the investment profile of the Underlying Fund. Each SAM Portfolio typically allocates its assets among Underlying Funds, and within predetermined percentage ranges, as determined by the Sub-Advisor in accordance with its outlook for the economy, the financial markets and the relative market valuations of the Underlying Funds.
The Portfolio:• Generally invests between 0% and 40% of its assets in fixed-income funds, and less than 30% in any one fixed-
income fund (fixed-income funds that generally invest in fixed-income instruments such as government and government-sponsored securities and corporate bonds)
• Generally invests between 60% and 100% of its assets in equity funds that invest in small, medium, and large market capitalization companies, and less than 40% in any one equity fund (equity funds that generally invest in domestic and foreign equity securities) and
• Generally invests less than 20% of its assets in specialty funds, and less than 20% in any one specialty fund (specialty funds that generally offer unique combinations of traditional equity securities and fixed-income securities or that use alternative investment strategies that aim to offer diversification beyond traditional equity and fixed-income securities and include investments in such assets as infrastructure, commodities, currencies, and public timber companies)
The Portfolio may temporarily exceed the applicable percentage ranges for short periods, and the Sub-Advisor may alter the percentage ranges when it deems appropriate.
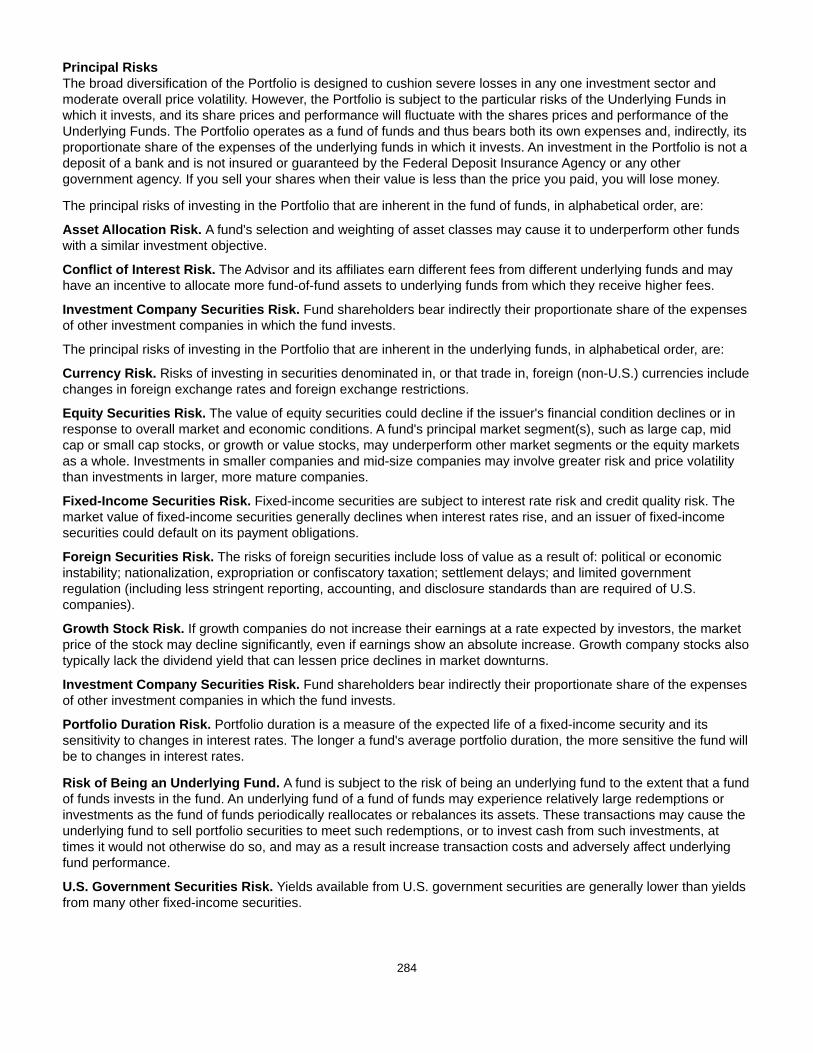
284
Principal RisksThe broad diversification of the Portfolio is designed to cushion severe losses in any one investment sector and moderate overall price volatility. However, the Portfolio is subject to the particular risks of the Underlying Funds in which it invests, and its share prices and performance will fluctuate with the shares prices and performance of the Underlying Funds. The Portfolio operates as a fund of funds and thus bears both its own expenses and, indirectly, its proportionate share of the expenses of the underlying funds in which it invests. An investment in the Portfolio is not a deposit of a bank and is not insured or guaranteed by the Federal Deposit Insurance Agency or any other government agency. If you sell your shares when their value is less than the price you paid, you will lose money.
The principal risks of investing in the Portfolio that are inherent in the fund of funds, in alphabetical order, are:
Asset Allocation Risk. A fund's selection and weighting of asset classes may cause it to underperform other funds with a similar investment objective.
Conflict of Interest Risk. The Advisor and its affiliates earn different fees from different underlying funds and may have an incentive to allocate more fund-of-fund assets to underlying funds from which they receive higher fees.
Investment Company Securities Risk. Fund shareholders bear indirectly their proportionate share of the expenses of other investment companies in which the fund invests.
The principal risks of investing in the Portfolio that are inherent in the underlying funds, in alphabetical order, are:
Currency Risk. Risks of investing in securities denominated in, or that trade in, foreign (non-U.S.) currencies include changes in foreign exchange rates and foreign exchange restrictions.
Equity Securities Risk. The value of equity securities could decline if the issuer's financial condition declines or in response to overall market and economic conditions. A fund's principal market segment(s), such as large cap, mid cap or small cap stocks, or growth or value stocks, may underperform other market segments or the equity markets as a whole. Investments in smaller companies and mid-size companies may involve greater risk and price volatility than investments in larger, more mature companies.
Fixed-Income Securities Risk. Fixed-income securities are subject to interest rate risk and credit quality risk. The market value of fixed-income securities generally declines when interest rates rise, and an issuer of fixed-income securities could default on its payment obligations.
Foreign Securities Risk. The risks of foreign securities include loss of value as a result of: political or economic instability; nationalization, expropriation or confiscatory taxation; settlement delays; and limited government regulation (including less stringent reporting, accounting, and disclosure standards than are required of U.S. companies).
Growth Stock Risk. If growth companies do not increase their earnings at a rate expected by investors, the market price of the stock may decline significantly, even if earnings show an absolute increase. Growth company stocks also typically lack the dividend yield that can lessen price declines in market downturns.
Investment Company Securities Risk. Fund shareholders bear indirectly their proportionate share of the expenses of other investment companies in which the fund invests.
Portfolio Duration Risk. Portfolio duration is a measure of the expected life of a fixed-income security and its sensitivity to changes in interest rates. The longer a fund's average portfolio duration, the more sensitive the fund will be to changes in interest rates.
Risk of Being an Underlying Fund. A fund is subject to the risk of being an underlying fund to the extent that a fund of funds invests in the fund. An underlying fund of a fund of funds may experience relatively large redemptions or investments as the fund of funds periodically reallocates or rebalances its assets. These transactions may cause the underlying fund to sell portfolio securities to meet such redemptions, or to invest cash from such investments, at times it would not otherwise do so, and may as a result increase transaction costs and adversely affect underlying fund performance.
U.S. Government Securities Risk. Yields available from U.S. government securities are generally lower than yields from many other fixed-income securities.
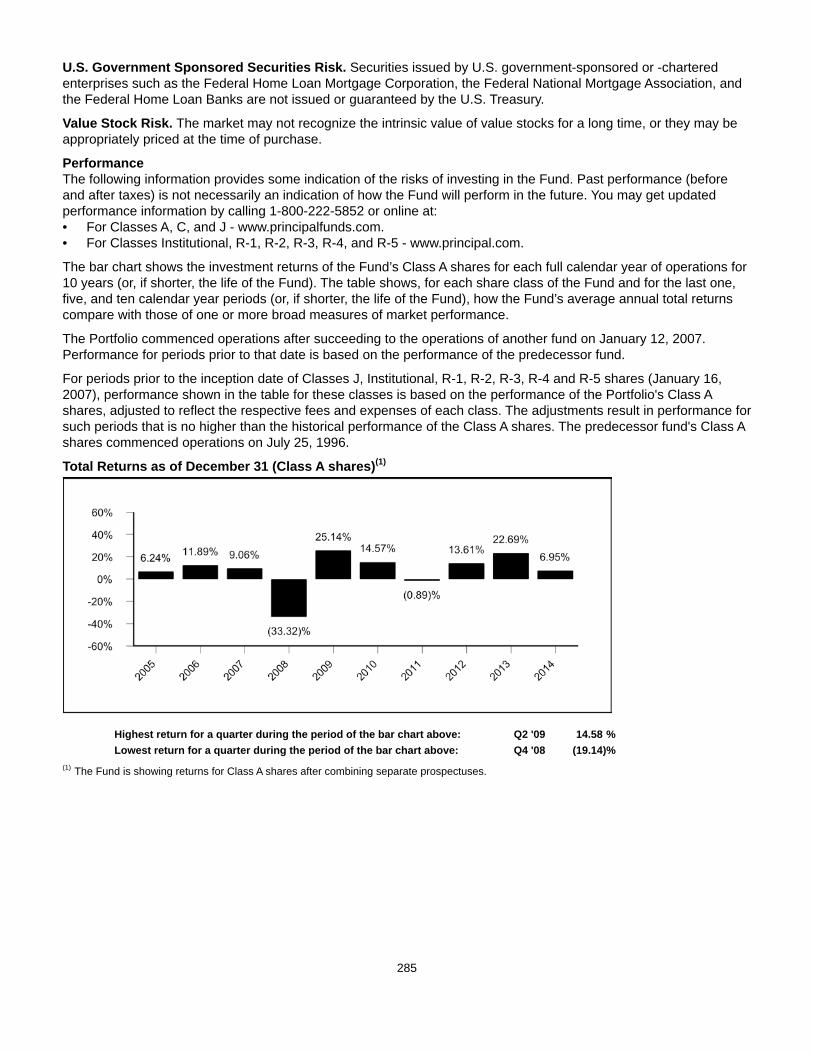
285
U.S. Government Sponsored Securities Risk. Securities issued by U.S. government-sponsored or -chartered enterprises such as the Federal Home Loan Mortgage Corporation, the Federal National Mortgage Association, and the Federal Home Loan Banks are not issued or guaranteed by the U.S. Treasury.
Value Stock Risk. The market may not recognize the intrinsic value of value stocks for a long time, or they may be appropriately priced at the time of purchase.
PerformanceThe following information provides some indication of the risks of investing in the Fund. Past performance (before and after taxes) is not necessarily an indication of how the Fund will perform in the future. You may get updated performance information by calling 1-800-222-5852 or online at:• For Classes A, C, and J - www.principalfunds.com.• For Classes Institutional, R-1, R-2, R-3, R-4, and R-5 - www.principal.com.
The bar chart shows the investment returns of the Fund’s Class A shares for each full calendar year of operations for 10 years (or, if shorter, the life of the Fund). The table shows, for each share class of the Fund and for the last one, five, and ten calendar year periods (or, if shorter, the life of the Fund), how the Fund’s average annual total returns compare with those of one or more broad measures of market performance.
The Portfolio commenced operations after succeeding to the operations of another fund on January 12, 2007. Performance for periods prior to that date is based on the performance of the predecessor fund.
For periods prior to the inception date of Classes J, Institutional, R-1, R-2, R-3, R-4 and R-5 shares (January 16, 2007), performance shown in the table for these classes is based on the performance of the Portfolio's Class A shares, adjusted to reflect the respective fees and expenses of each class. The adjustments result in performance for such periods that is no higher than the historical performance of the Class A shares. The predecessor fund's Class A shares commenced operations on July 25, 1996.
Total Returns as of December 31 (Class A shares)(1)
Highest return for a quarter during the period of the bar chart above: Q2 '09 14.58 %Lowest return for a quarter during the period of the bar chart above: Q4 '08 (19.14)%
(1) The Fund is showing returns for Class A shares after combining separate prospectuses.
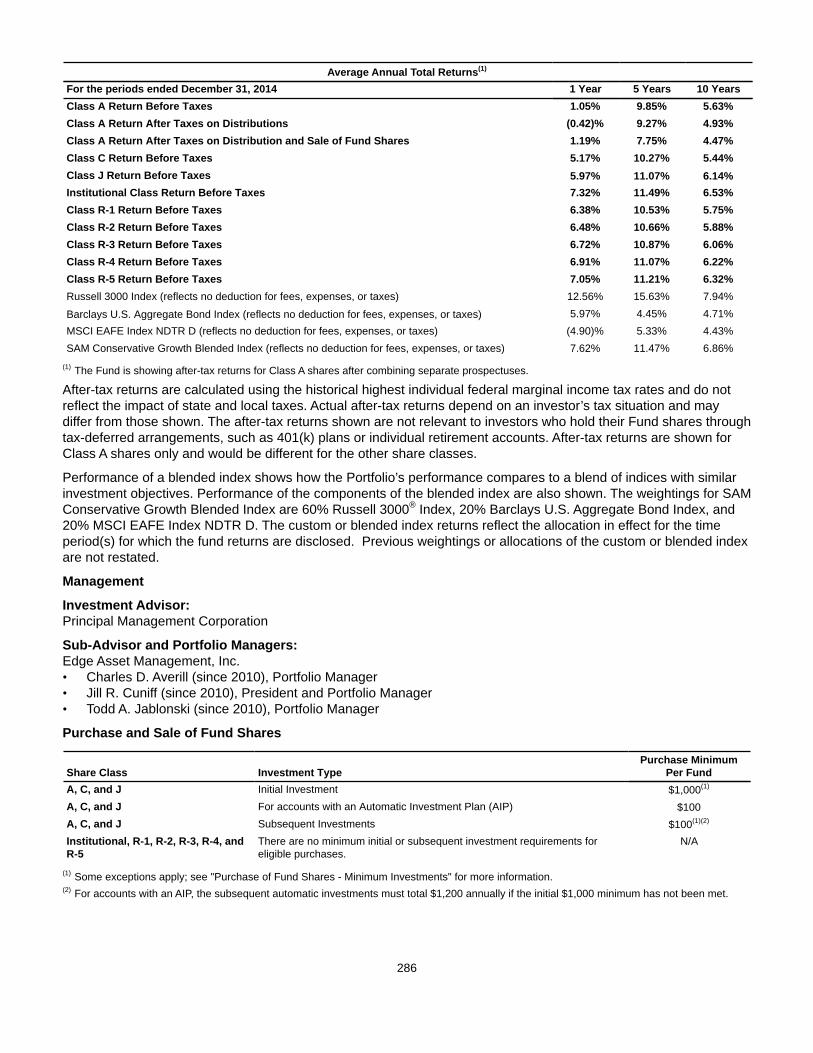
286
Average Annual Total Returns(1)
For the periods ended December 31, 2014 1 Year 5 Years 10 YearsClass A Return Before Taxes 1.05% 9.85% 5.63%Class A Return After Taxes on Distributions (0.42)% 9.27% 4.93%Class A Return After Taxes on Distribution and Sale of Fund Shares 1.19% 7.75% 4.47%Class C Return Before Taxes 5.17% 10.27% 5.44%Class J Return Before Taxes 5.97% 11.07% 6.14%Institutional Class Return Before Taxes 7.32% 11.49% 6.53%Class R-1 Return Before Taxes 6.38% 10.53% 5.75%Class R-2 Return Before Taxes 6.48% 10.66% 5.88%Class R-3 Return Before Taxes 6.72% 10.87% 6.06%Class R-4 Return Before Taxes 6.91% 11.07% 6.22%Class R-5 Return Before Taxes 7.05% 11.21% 6.32%Russell 3000 Index (reflects no deduction for fees, expenses, or taxes) 12.56% 15.63% 7.94%
Barclays U.S. Aggregate Bond Index (reflects no deduction for fees, expenses, or taxes) 5.97% 4.45% 4.71%MSCI EAFE Index NDTR D (reflects no deduction for fees, expenses, or taxes) (4.90)% 5.33% 4.43%SAM Conservative Growth Blended Index (reflects no deduction for fees, expenses, or taxes) 7.62% 11.47% 6.86%
(1) The Fund is showing after-tax returns for Class A shares after combining separate prospectuses.
After-tax returns are calculated using the historical highest individual federal marginal income tax rates and do not reflect the impact of state and local taxes. Actual after-tax returns depend on an investor’s tax situation and may differ from those shown. The after-tax returns shown are not relevant to investors who hold their Fund shares through tax-deferred arrangements, such as 401(k) plans or individual retirement accounts. After-tax returns are shown for Class A shares only and would be different for the other share classes.
Performance of a blended index shows how the Portfolio’s performance compares to a blend of indices with similar investment objectives. Performance of the components of the blended index are also shown. The weightings for SAM Conservative Growth Blended Index are 60% Russell 3000® Index, 20% Barclays U.S. Aggregate Bond Index, and 20% MSCI EAFE Index NDTR D. The custom or blended index returns reflect the allocation in effect for the time period(s) for which the fund returns are disclosed. Previous weightings or allocations of the custom or blended index are not restated.
Management
Investment Advisor: Principal Management Corporation
Sub-Advisor and Portfolio Managers: Edge Asset Management, Inc. • Charles D. Averill (since 2010), Portfolio Manager• Jill R. Cuniff (since 2010), President and Portfolio Manager• Todd A. Jablonski (since 2010), Portfolio Manager
Purchase and Sale of Fund Shares
Share Class Investment TypePurchase Minimum
Per FundA, C, and J Initial Investment $1,000(1)
A, C, and J For accounts with an Automatic Investment Plan (AIP) $100A, C, and J Subsequent Investments $100(1)(2)
Institutional, R-1, R-2, R-3, R-4, andR-5
There are no minimum initial or subsequent investment requirements foreligible purchases.
N/A
(1) Some exceptions apply; see "Purchase of Fund Shares - Minimum Investments" for more information.(2) For accounts with an AIP, the subsequent automatic investments must total $1,200 annually if the initial $1,000 minimum has not been met.

287
You may purchase or redeem shares on any business day (normally any day when the New York Stock Exchange is open for regular trading) through your plan, intermediary, or Financial Professional; by sending a written request to Principal Funds at P.O. Box 8024, Boston, MA 02266-8024 (regular mail) or 30 Dan Road, Canton, MA 02021-2809 (overnight mail); calling us at 1-800-222-5852; or accessing our website (www.principalfunds.com).
Tax InformationThe Fund’s distributions you receive are generally subject to federal income tax as ordinary income or capital gain and may also be subject to state and local taxes, unless you are tax-exempt or your account is tax-deferred in which case your distributions would be taxed when withdrawn from the tax-deferred account.
Payments to Broker-Dealers and Other Financial IntermediariesIf you purchase the Fund through a broker-dealer or other financial intermediary (such as a bank, insurance company, investment adviser, etc.), the Fund and its related companies may pay the intermediary for the sale of Fund shares and related services. These payments may create a conflict of interest by influencing the broker-dealer or other intermediary and your salesperson to recommend the Fund over another investment, or to recommend one share class of the Fund over another share class. Ask your salesperson or visit your financial intermediary's website for more information.
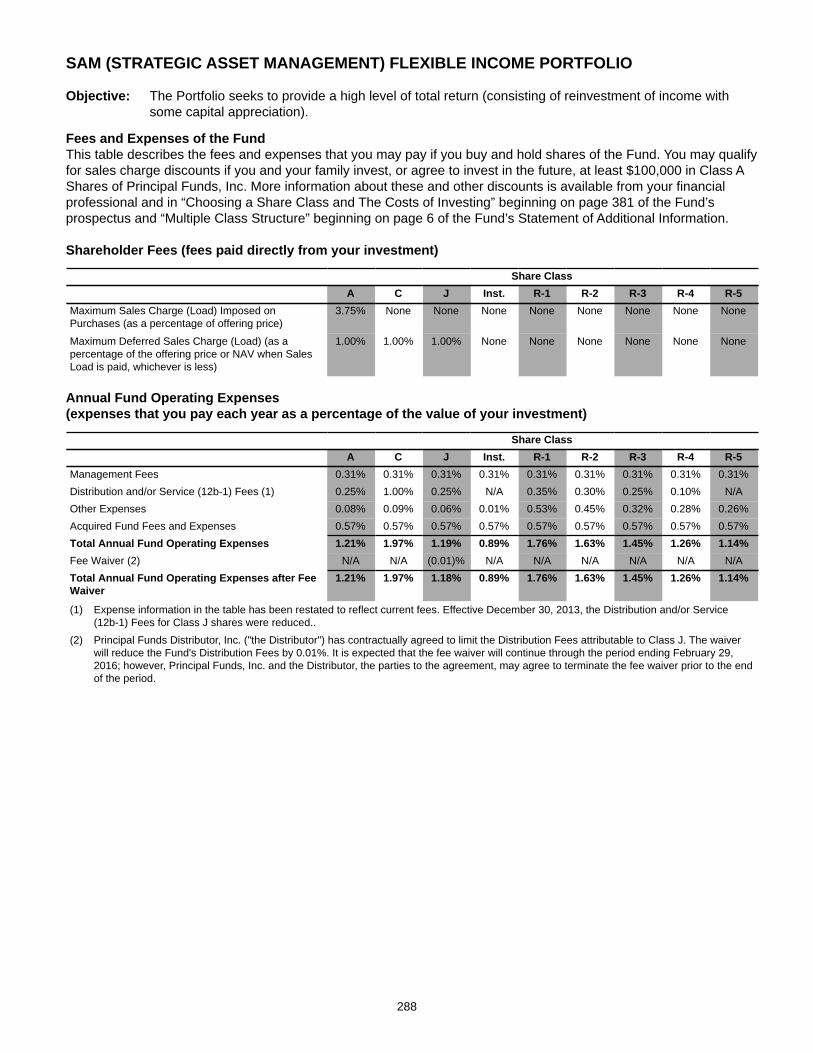
288
SAM (STRATEGIC ASSET MANAGEMENT) FLEXIBLE INCOME PORTFOLIO
Objective: The Portfolio seeks to provide a high level of total return (consisting of reinvestment of income with some capital appreciation).
Fees and Expenses of the FundThis table describes the fees and expenses that you may pay if you buy and hold shares of the Fund. You may qualify for sales charge discounts if you and your family invest, or agree to invest in the future, at least $100,000 in Class A Shares of Principal Funds, Inc. More information about these and other discounts is available from your financial professional and in “Choosing a Share Class and The Costs of Investing” beginning on page 381 of the Fund’s prospectus and “Multiple Class Structure” beginning on page 6 of the Fund’s Statement of Additional Information.
Shareholder Fees (fees paid directly from your investment)
Share ClassA C J Inst. R-1 R-2 R-3 R-4 R-5
Maximum Sales Charge (Load) Imposed onPurchases (as a percentage of offering price)
3.75% None None None None None None None None
Maximum Deferred Sales Charge (Load) (as apercentage of the offering price or NAV when SalesLoad is paid, whichever is less)
1.00% 1.00% 1.00% None None None None None None
Annual Fund Operating Expenses (expenses that you pay each year as a percentage of the value of your investment)
Share ClassA C J Inst. R-1 R-2 R-3 R-4 R-5
Management Fees 0.31% 0.31% 0.31% 0.31% 0.31% 0.31% 0.31% 0.31% 0.31%Distribution and/or Service (12b-1) Fees (1) 0.25% 1.00% 0.25% N/A 0.35% 0.30% 0.25% 0.10% N/AOther Expenses 0.08% 0.09% 0.06% 0.01% 0.53% 0.45% 0.32% 0.28% 0.26%Acquired Fund Fees and Expenses 0.57% 0.57% 0.57% 0.57% 0.57% 0.57% 0.57% 0.57% 0.57%Total Annual Fund Operating Expenses 1.21% 1.97% 1.19% 0.89% 1.76% 1.63% 1.45% 1.26% 1.14%Fee Waiver (2) N/A N/A (0.01)% N/A N/A N/A N/A N/A N/ATotal Annual Fund Operating Expenses after FeeWaiver
1.21% 1.97% 1.18% 0.89% 1.76% 1.63% 1.45% 1.26% 1.14%
(1) Expense information in the table has been restated to reflect current fees. Effective December 30, 2013, the Distribution and/or Service (12b-1) Fees for Class J shares were reduced..
(2) Principal Funds Distributor, Inc. ("the Distributor") has contractually agreed to limit the Distribution Fees attributable to Class J. The waiver will reduce the Fund's Distribution Fees by 0.01%. It is expected that the fee waiver will continue through the period ending February 29, 2016; however, Principal Funds, Inc. and the Distributor, the parties to the agreement, may agree to terminate the fee waiver prior to the end of the period.
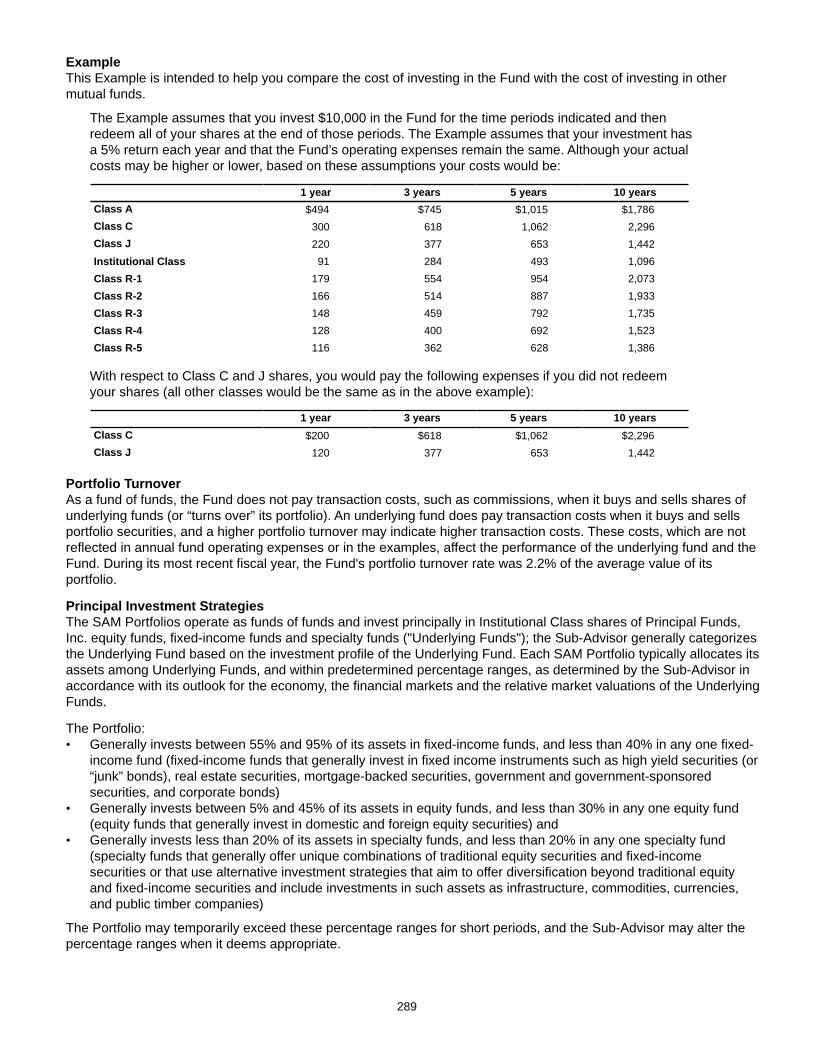
289
ExampleThis Example is intended to help you compare the cost of investing in the Fund with the cost of investing in other mutual funds.
The Example assumes that you invest $10,000 in the Fund for the time periods indicated and then redeem all of your shares at the end of those periods. The Example assumes that your investment has a 5% return each year and that the Fund’s operating expenses remain the same. Although your actual costs may be higher or lower, based on these assumptions your costs would be:
1 year 3 years 5 years 10 yearsClass A $494 $745 $1,015 $1,786Class C 300 618 1,062 2,296Class J 220 377 653 1,442Institutional Class 91 284 493 1,096Class R-1 179 554 954 2,073Class R-2 166 514 887 1,933Class R-3 148 459 792 1,735Class R-4 128 400 692 1,523Class R-5 116 362 628 1,386
With respect to Class C and J shares, you would pay the following expenses if you did not redeem your shares (all other classes would be the same as in the above example):
1 year 3 years 5 years 10 yearsClass C $200 $618 $1,062 $2,296Class J 120 377 653 1,442
Portfolio TurnoverAs a fund of funds, the Fund does not pay transaction costs, such as commissions, when it buys and sells shares of underlying funds (or “turns over” its portfolio). An underlying fund does pay transaction costs when it buys and sells portfolio securities, and a higher portfolio turnover may indicate higher transaction costs. These costs, which are not reflected in annual fund operating expenses or in the examples, affect the performance of the underlying fund and the Fund. During its most recent fiscal year, the Fund's portfolio turnover rate was 2.2% of the average value of its portfolio.
Principal Investment StrategiesThe SAM Portfolios operate as funds of funds and invest principally in Institutional Class shares of Principal Funds, Inc. equity funds, fixed-income funds and specialty funds ("Underlying Funds"); the Sub-Advisor generally categorizes the Underlying Fund based on the investment profile of the Underlying Fund. Each SAM Portfolio typically allocates its assets among Underlying Funds, and within predetermined percentage ranges, as determined by the Sub-Advisor in accordance with its outlook for the economy, the financial markets and the relative market valuations of the Underlying Funds.
The Portfolio:• Generally invests between 55% and 95% of its assets in fixed-income funds, and less than 40% in any one fixed-
income fund (fixed-income funds that generally invest in fixed income instruments such as high yield securities (or “junk” bonds), real estate securities, mortgage-backed securities, government and government-sponsored securities, and corporate bonds)
• Generally invests between 5% and 45% of its assets in equity funds, and less than 30% in any one equity fund (equity funds that generally invest in domestic and foreign equity securities) and
• Generally invests less than 20% of its assets in specialty funds, and less than 20% in any one specialty fund (specialty funds that generally offer unique combinations of traditional equity securities and fixed-income securities or that use alternative investment strategies that aim to offer diversification beyond traditional equity and fixed-income securities and include investments in such assets as infrastructure, commodities, currencies, and public timber companies)
The Portfolio may temporarily exceed these percentage ranges for short periods, and the Sub-Advisor may alter the percentage ranges when it deems appropriate.
290
Principal RisksThe broad diversification of the Portfolio is designed to cushion severe losses in any one investment sector and moderate overall price volatility. However, the Portfolio is subject to the particular risks of the Underlying Funds in which it invests, and its share prices and performance will fluctuate with the shares prices and performance of the Underlying Funds. The Portfolio operates as a fund of funds and thus bears both its own expenses and, indirectly, its proportionate share of the expenses of the underlying funds in which it invests. An investment in the Portfolio is not a deposit of a bank and is not insured or guaranteed by the Federal Deposit Insurance Corporation or any other government agency. If you sell your shares when their value is less than the price you paid, you will lose money.
The principal risks of investing in the Portfolio that are inherent in the fund of funds, in alphabetical order, are:
Asset Allocation Risk. A fund's selection and weighting of asset classes may cause it to underperform other funds with a similar investment objective.
Conflict of Interest Risk. The Advisor and its affiliates earn different fees from different underlying funds and may have an incentive to allocate more fund-of-fund assets to underlying funds from which they receive higher fees.
Investment Company Securities Risk. Fund shareholders bear indirectly their proportionate share of the expenses of other investment companies in which the fund invests.
The principal risks of investing in the Portfolio that are inherent in the underlying funds, in alphabetical order, are:
Currency Risk. Risks of investing in securities denominated in, or that trade in, foreign (non-U.S.) currencies include changes in foreign exchange rates and foreign exchange restrictions.
Equity Securities Risk. The value of equity securities could decline if the issuer's financial condition declines or in response to overall market and economic conditions. A fund's principal market segment(s), such as large cap, mid cap or small cap stocks, or growth or value stocks, may underperform other market segments or the equity markets as a whole. Investments in smaller companies and mid-size companies may involve greater risk and price volatility than investments in larger, more mature companies.
Fixed-Income Securities Risk. Fixed-income securities are subject to interest rate risk and credit quality risk. The market value of fixed-income securities generally declines when interest rates rise, and an issuer of fixed-income securities could default on its payment obligations.
Foreign Securities Risk. The risks of foreign securities include loss of value as a result of: political or economic instability; nationalization, expropriation or confiscatory taxation; settlement delays; and limited government regulation (including less stringent reporting, accounting, and disclosure standards than are required of U.S. companies).
Growth Stock Risk. If growth companies do not increase their earnings at a rate expected by investors, the market price of the stock may decline significantly, even if earnings show an absolute increase. Growth company stocks also typically lack the dividend yield that can lessen price declines in market downturns.
High Yield Securities Risk. High yield fixed-income securities (commonly referred to as "junk bonds") are subject to greater credit quality risk than higher rated fixed-income securities and should be considered speculative.
Investment Company Securities Risk. Fund shareholders bear indirectly their proportionate share of the expenses of other investment companies in which the fund invests.
Portfolio Duration Risk. Portfolio duration is a measure of the expected life of a fixed-income security and its sensitivity to changes in interest rates. The longer a fund's average portfolio duration, the more sensitive the fund will be to changes in interest rates.
Prepayment Risk. Unscheduled prepayments on mortgage-backed and asset-backed securities may have to be reinvested at lower rates. A reduction in prepayments may increase the effective maturities of these securities, exposing them to the risk of decline in market value over time (extension risk).
Real Estate Securities Risk. Real estate securities are subject to the risks associated with direct ownership of real estate, including declines in value, adverse economic conditions, increases in expenses, regulatory changes and environmental problems. Investing in securities of companies in the real estate industry, subjects a fund to the special risks associated with the real estate market including factors such as loss to casualty or condemnation, changes in real estate values, property taxes, interest rates, cash flow of underlying real estate assets, occupancy rates, government regulations affecting zoning, land use and rents, and the management skill and creditworthiness of the issuer.
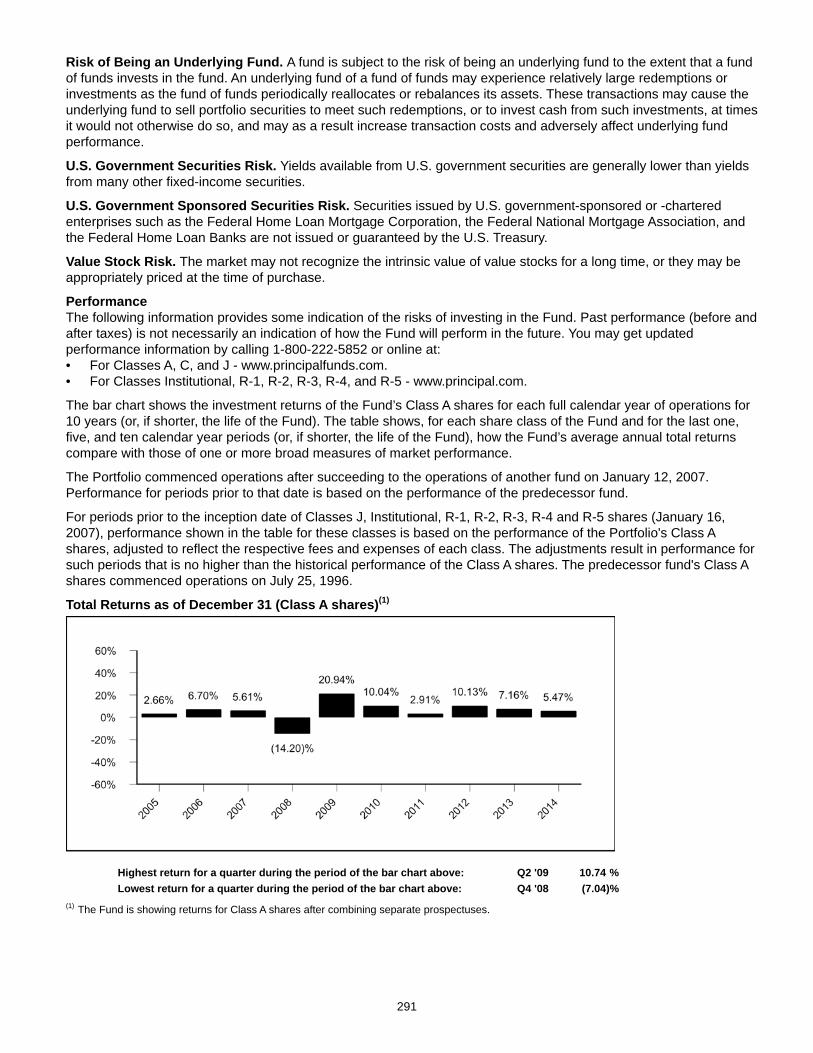
291
Risk of Being an Underlying Fund. A fund is subject to the risk of being an underlying fund to the extent that a fund of funds invests in the fund. An underlying fund of a fund of funds may experience relatively large redemptions or investments as the fund of funds periodically reallocates or rebalances its assets. These transactions may cause the underlying fund to sell portfolio securities to meet such redemptions, or to invest cash from such investments, at times it would not otherwise do so, and may as a result increase transaction costs and adversely affect underlying fund performance.
U.S. Government Securities Risk. Yields available from U.S. government securities are generally lower than yields from many other fixed-income securities.
U.S. Government Sponsored Securities Risk. Securities issued by U.S. government-sponsored or -chartered enterprises such as the Federal Home Loan Mortgage Corporation, the Federal National Mortgage Association, and the Federal Home Loan Banks are not issued or guaranteed by the U.S. Treasury.
Value Stock Risk. The market may not recognize the intrinsic value of value stocks for a long time, or they may be appropriately priced at the time of purchase.
PerformanceThe following information provides some indication of the risks of investing in the Fund. Past performance (before and after taxes) is not necessarily an indication of how the Fund will perform in the future. You may get updated performance information by calling 1-800-222-5852 or online at:• For Classes A, C, and J - www.principalfunds.com.• For Classes Institutional, R-1, R-2, R-3, R-4, and R-5 - www.principal.com.
The bar chart shows the investment returns of the Fund’s Class A shares for each full calendar year of operations for 10 years (or, if shorter, the life of the Fund). The table shows, for each share class of the Fund and for the last one, five, and ten calendar year periods (or, if shorter, the life of the Fund), how the Fund’s average annual total returns compare with those of one or more broad measures of market performance.
The Portfolio commenced operations after succeeding to the operations of another fund on January 12, 2007. Performance for periods prior to that date is based on the performance of the predecessor fund.
For periods prior to the inception date of Classes J, Institutional, R-1, R-2, R-3, R-4 and R-5 shares (January 16, 2007), performance shown in the table for these classes is based on the performance of the Portfolio's Class A shares, adjusted to reflect the respective fees and expenses of each class. The adjustments result in performance for such periods that is no higher than the historical performance of the Class A shares. The predecessor fund's Class A shares commenced operations on July 25, 1996.
Total Returns as of December 31 (Class A shares)(1)
Highest return for a quarter during the period of the bar chart above: Q2 '09 10.74 %Lowest return for a quarter during the period of the bar chart above: Q4 '08 (7.04)%
(1) The Fund is showing returns for Class A shares after combining separate prospectuses.

292
Average Annual Total Returns(1)
For the periods ended December 31, 2014 1 Year 5 Years 10 YearsClass A Return Before Taxes 1.48% 6.30% 5.00%Class A Return After Taxes on Distributions 0.15% 5.03% 3.62%Class A Return After Taxes on Distribution and Sale of Fund Shares 1.14% 4.52% 3.47%Class C Return Before Taxes 3.73% 6.31% 4.61%Class J Return Before Taxes 4.54% 7.07% 5.29%Institutional Class Return Before Taxes 5.90% 7.46% 5.68%Class R-1 Return Before Taxes 4.92% 6.54% 4.91%Class R-2 Return Before Taxes 5.11% 6.67% 5.06%Class R-3 Return Before Taxes 5.24% 6.87% 5.22%Class R-4 Return Before Taxes 5.42% 7.08% 5.37%Class R-5 Return Before Taxes 5.65% 7.21% 5.48%Barclays U.S. Aggregate Bond Index (reflects no deduction for fees, expenses, or taxes) 5.97% 4.45% 4.71%Russell 3000 Index (reflects no deduction for fees, expenses, or taxes) 12.56% 15.63% 7.94%MSCI EAFE Index NDTR D (reflects no deduction for fees, expenses, or taxes) (4.90)% 5.33% 4.43%SAM Flexible Income Blended Index (reflects no deduction for fees, expenses, or taxes) 6.75% 6.88% 5.59%
(1) The Fund is showing after-tax returns for Class A shares after combining separate prospectuses.
After-tax returns are calculated using the historical highest individual federal marginal income tax rates and do not reflect the impact of state and local taxes. Actual after-tax returns depend on an investor’s tax situation and may differ from those shown. The after-tax returns shown are not relevant to investors who hold their Fund shares through tax-deferred arrangements, such as 401(k) plans or individual retirement accounts. After-tax returns are shown for Class A shares only and would be different for the other share classes.
Performance of a blended index shows how the Portfolio’s performance compares to a blend of indices with similar investment objectives. Performance of the components of the blended index are also shown. The weightings for SAM Flexible Income Blended Index are 75% Barclays U.S. Aggregate Bond Index, 20% Russell 3000® Index and 5% MSCI EAFE Index NDTR D. The custom or blended index returns reflect the allocation in effect for the time period(s) for which the fund returns are disclosed. Previous weightings or allocations of the custom or blended index are not restated.
Management
Investment Advisor:Principal Management Corporation
Sub-Advisor and Portfolio Managers: Edge Asset Management, Inc. • Charles D. Averill (since 2010), Portfolio Manager• Jill R. Cuniff (since 2010), President and Portfolio Manager• Todd A. Jablonski (since 2010), Portfolio Manager
Purchase and Sale of Fund Shares
Share Class Investment TypePurchase Minimum
Per FundA, C, and J Initial Investment $1,000(1)
A, C, and J For accounts with an Automatic Investment Plan (AIP) $100A, C, and J Subsequent Investments $100(1)(2)
Institutional, R-1, R-2, R-3, R-4, andR-5
There are no minimum initial or subsequent investment requirements foreligible purchases.
N/A
(1) Some exceptions apply; see "Purchase of Fund Shares - Minimum Investments" for more information.(2) For accounts with an AIP, the subsequent automatic investments must total $1,200 annually if the initial $1,000 minimum has not been met.
You may purchase or redeem shares on any business day (normally any day when the New York Stock Exchange is open for regular trading) through your plan, intermediary, or Financial Professional; by sending a written request to Principal Funds at P.O. Box 8024, Boston, MA 02266-8024 (regular mail) or 30 Dan Road, Canton, MA 02021-2809 (overnight mail); calling us at 1-800-222-5852; or accessing our website (www.principalfunds.com).

293
Tax InformationThe Fund’s distributions you receive are generally subject to federal income tax as ordinary income or capital gain and may also be subject to state and local taxes, unless you are tax-exempt or your account is tax-deferred in which case your distributions would be taxed when withdrawn from the tax-deferred account.
Payments to Broker-Dealers and Other Financial IntermediariesIf you purchase the Fund through a broker-dealer or other financial intermediary (such as a bank, insurance company, investment adviser, etc.), the Fund and its related companies may pay the intermediary for the sale of Fund shares and related services. These payments may create a conflict of interest by influencing the broker-dealer or other intermediary and your salesperson to recommend the Fund over another investment, or to recommend one share class of the Fund over another share class. Ask your salesperson or visit your financial intermediary's website for more information.

294
SAM (STRATEGIC ASSET MANAGEMENT) STRATEGIC GROWTH PORTFOLIO
Objective: The Portfolio seeks to provide long-term capital appreciation.
Fees and Expenses of the FundThis table describes the fees and expenses that you may pay if you buy and hold shares of the Fund. You may qualify for sales charge discounts if you and your family invest, or agree to invest in the future, at least $50,000 in Class A Shares of Principal Funds, Inc. More information about these and other discounts is available from your financial professional and in “Choosing a Share Class and The Costs of Investing” beginning on page 381 of the Fund’s prospectus and “Multiple Class Structure” beginning on page 6 of the Fund’s Statement of Additional Information.
Shareholder Fees (fees paid directly from your investment)
Share ClassA C J Inst. R-1 R-2 R-3 R-4 R-5
Maximum Sales Charge (Load) Imposed onPurchases (as a percentage of offering price)
5.50% None None None None None None None None
Maximum Deferred Sales Charge (Load) (as apercentage of the offering price or NAV when SalesLoad is paid, whichever is less)
1.00% 1.00% 1.00% None None None None None None
Annual Fund Operating Expenses (expenses that you pay each year as a percentage of the value of your investment)
Share ClassA C J Inst. R-1 R-2 R-3 R-4 R-5
Management Fees 0.31% 0.31% 0.31% 0.31% 0.31% 0.31% 0.31% 0.31% 0.31%
Distribution and/or Service (12b-1) Fees (1) 0.25% 1.00% 0.25% N/A 0.35% 0.30% 0.25% 0.10% N/A
Other Expenses 0.11% 0.11% 0.08% 0.01% 0.53% 0.45% 0.32% 0.28% 0.26%
Acquired Fund Fees and Expenses 0.66% 0.66% 0.66% 0.66% 0.66% 0.66% 0.66% 0.66% 0.66%
Total Annual Fund Operating Expenses 1.33% 2.08% 1.30% 0.98% 1.85% 1.72% 1.54% 1.35% 1.23%Fee Waiver (2) N/A N/A (0.01)% N/A N/A N/A N/A N/A N/ATotal Annual Fund Operating Expenses after FeeWaiver
1.33% 2.08% 1.29% 0.98% 1.85% 1.72% 1.54% 1.35% 1.23%
(1) Expense information in the table has been restated to reflect current fees. Effective December 30, 2013, the Distribution and/or Service (12b-1) Fees for Class J shares were reduced.
(2) Principal Funds Distributor, Inc. ("the Distributor") has contractually agreed to limit the Distribution Fees attributable to Class J. The waiver will reduce the Fund's Distribution Fees by 0.01%. It is expected that the fee waiver will continue through the period ending February 29, 2016; however, Principal Funds, Inc. and the Distributor, the parties to the agreement, may agree to terminate the fee waiver prior to the end of the period.

295
ExampleThis Example is intended to help you compare the cost of investing in the Fund with the cost of investing in other mutual funds.
The Example assumes that you invest $10,000 in the Fund for the time periods indicated and then redeem all of your shares at the end of those periods. The Example assumes that your investment has a 5% return each year and that the Fund’s operating expenses remain the same. Although your actual costs may be higher or lower, based on these assumptions your costs would be:
1 year 3 years 5 years 10 yearsClass A $678 $948 $1,239 $2,063Class C 311 652 1,119 2,410Class J 231 411 712 1,567Institutional Class 100 312 542 1,201Class R-1 188 582 1,001 2,169Class R-2 175 542 933 2,030Class R-3 157 486 839 1,834Class R-4 137 428 739 1,624Class R-5 125 390 676 1,489
With respect to Class C and J shares, you would pay the following expenses if you did not redeem your shares (all other classes would be the same as in the above example):
1 year 3 years 5 years 10 yearsClass C $211 $652 $1,119 $2,410Class J 131 411 712 1,567
Portfolio TurnoverAs a fund of funds, the Fund does not pay transaction costs, such as commissions, when it buys and sells shares of underlying funds (or “turns over” its portfolio). An underlying fund does pay transaction costs when it buys and sells portfolio securities, and a higher portfolio turnover may indicate higher transaction costs. These costs, which are not reflected in annual fund operating expenses or in the examples, affect the performance of the underlying fund and the Fund. During its most recent fiscal year, the Fund's portfolio turnover rate was 5.9% of the average value of its portfolio.
Principal Investment StrategiesThe SAM Portfolios operate as funds of funds and invest principally in Institutional Class shares of Principal Funds, Inc. equity funds, fixed-income funds and specialty funds ("Underlying Funds"); the Sub-Advisor generally categorizes the Underlying Fund based on the investment profile of the Underlying Fund. Each SAM Portfolio typically allocates its assets among Underlying Funds, and within predetermined percentage ranges, as determined by the Sub-Advisor in accordance with its outlook for the economy, the financial markets and the relative market valuations of the Underlying Funds.
The Portfolio:• Generally invests between 75% and 100% of its assets in equity funds that invest in small, medium, and large
market capitalization companies, and less than 50% in any one equity fund (equity funds that generally invest in domestic and foreign equity securities) and
• Generally invests less than 20% of its assets in specialty funds, and less than 20% in any one specialty fund (specialty funds that generally offer unique combinations of traditional equity securities and fixed-income securities or that use alternative investment strategies that aim to offer diversification beyond traditional equity and fixed-income securities and include investments in such assets as infrastructure, commodities, currencies, and public timber companies)
The Portfolio may temporarily exceed the applicable percentage ranges for short periods, and the Sub-Advisor may alter the percentage ranges when it deems appropriate.
296
Principal RisksThe broad diversification of the Portfolio is designed to cushion severe losses in any one investment sector and moderate overall price volatility. However, the Portfolio is subject to the particular risks of the Underlying Funds in which it invests, and its share prices and performance will fluctuate with the shares prices and performance of the Underlying Funds. The Portfolio operates as a fund of funds and thus bears both its own expenses and, indirectly, its proportionate share of the expenses of the underlying funds in which it invests. An investment in the Portfolio is not a deposit of a bank and is not insured or guaranteed by the Federal Deposit Insurance Corporation or any other government agency. If you sell your shares when their value is less than the price you paid, you will lose money.
The principal risks of investing in the Portfolio that are inherent in the fund of funds, in alphabetical order, are:
Asset Allocation Risk. A fund's selection and weighting of asset classes may cause it to underperform other funds with a similar investment objective.
Conflict of Interest Risk. The Advisor and its affiliates earn different fees from different underlying funds and may have an incentive to allocate more fund-of-fund assets to underlying funds from which they receive higher fees.
Investment Company Securities Risk. Fund shareholders bear indirectly their proportionate share of the expenses of other investment companies in which the fund invests.
The principal risks of investing in the Portfolio that are inherent in the underlying funds, in alphabetical order, are:
Currency Risk. Risks of investing in securities denominated in, or that trade in, foreign (non-U.S.) currencies include changes in foreign exchange rates and foreign exchange restrictions.
Equity Securities Risk. The value of equity securities could decline if the issuer's financial condition declines or in response to overall market and economic conditions. A fund's principal market segment(s), such as large cap, mid cap or small cap stocks, or growth or value stocks, may underperform other market segments or the equity markets as a whole. Investments in smaller companies and mid-size companies may involve greater risk and price volatility than investments in larger, more mature companies.
Foreign Securities Risk. The risks of foreign securities include loss of value as a result of: political or economic instability; nationalization, expropriation or confiscatory taxation; settlement delays; and limited government regulation (including less stringent reporting, accounting, and disclosure standards than are required of U.S. companies).
Growth Stock Risk. If growth companies do not increase their earnings at a rate expected by investors, the market price of the stock may decline significantly, even if earnings show an absolute increase. Growth company stocks also typically lack the dividend yield that can lessen price declines in market downturns.
Investment Company Securities Risk. Fund shareholders bear indirectly their proportionate share of the expenses of other investment companies in which the fund invests.
Risk of Being an Underlying Fund. A fund is subject to the risk of being an underlying fund to the extent that a fund of funds invests in the fund. An underlying fund of a fund of funds may experience relatively large redemptions or investments as the fund of funds periodically reallocates or rebalances its assets. These transactions may cause the underlying fund to sell portfolio securities to meet such redemptions, or to invest cash from such investments, at times it would not otherwise do so, and may as a result increase transaction costs and adversely affect underlying fund performance.
Value Stock Risk. The market may not recognize the intrinsic value of value stocks for a long time, or they may be appropriately priced at the time of purchase.
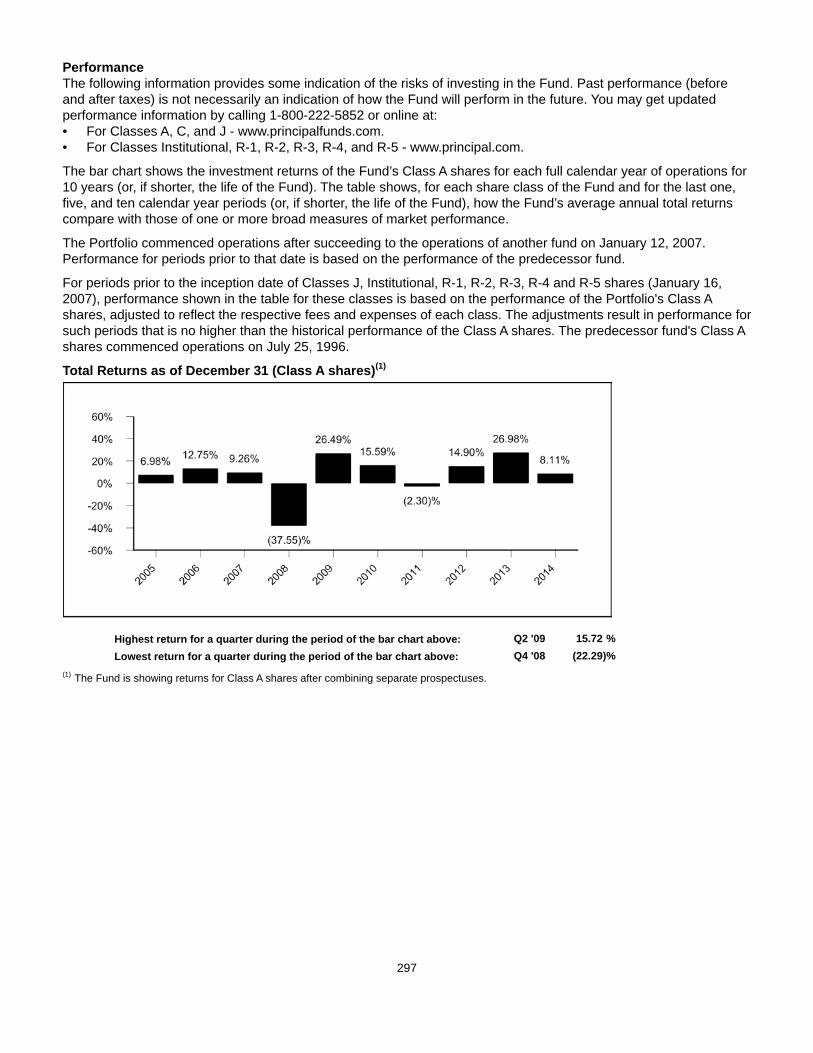
297
PerformanceThe following information provides some indication of the risks of investing in the Fund. Past performance (before and after taxes) is not necessarily an indication of how the Fund will perform in the future. You may get updated performance information by calling 1-800-222-5852 or online at:• For Classes A, C, and J - www.principalfunds.com.• For Classes Institutional, R-1, R-2, R-3, R-4, and R-5 - www.principal.com.
The bar chart shows the investment returns of the Fund’s Class A shares for each full calendar year of operations for 10 years (or, if shorter, the life of the Fund). The table shows, for each share class of the Fund and for the last one, five, and ten calendar year periods (or, if shorter, the life of the Fund), how the Fund’s average annual total returns compare with those of one or more broad measures of market performance.
The Portfolio commenced operations after succeeding to the operations of another fund on January 12, 2007. Performance for periods prior to that date is based on the performance of the predecessor fund.
For periods prior to the inception date of Classes J, Institutional, R-1, R-2, R-3, R-4 and R-5 shares (January 16, 2007), performance shown in the table for these classes is based on the performance of the Portfolio's Class A shares, adjusted to reflect the respective fees and expenses of each class. The adjustments result in performance for such periods that is no higher than the historical performance of the Class A shares. The predecessor fund's Class A shares commenced operations on July 25, 1996.
Total Returns as of December 31 (Class A shares)(1)
Highest return for a quarter during the period of the bar chart above: Q2 '09 15.72 %Lowest return for a quarter during the period of the bar chart above: Q4 '08 (22.29)%
(1) The Fund is showing returns for Class A shares after combining separate prospectuses.
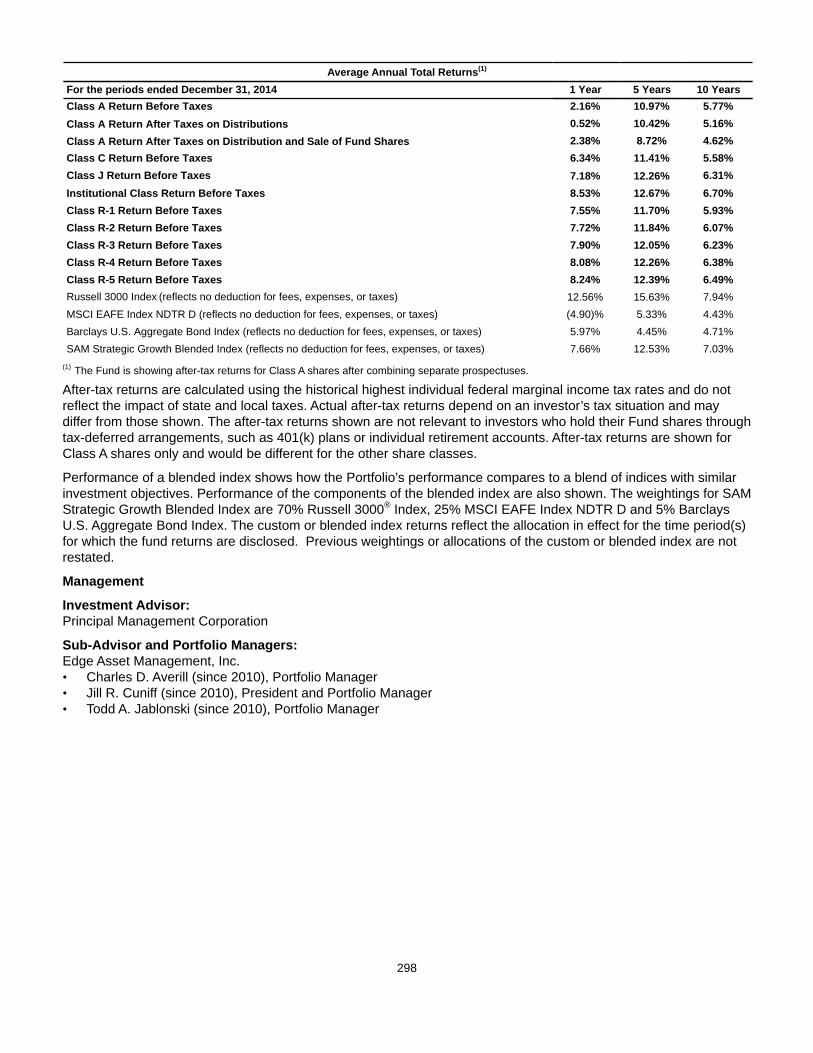
298
Average Annual Total Returns(1)
For the periods ended December 31, 2014 1 Year 5 Years 10 YearsClass A Return Before Taxes 2.16% 10.97% 5.77%Class A Return After Taxes on Distributions 0.52% 10.42% 5.16%Class A Return After Taxes on Distribution and Sale of Fund Shares 2.38% 8.72% 4.62%Class C Return Before Taxes 6.34% 11.41% 5.58%Class J Return Before Taxes 7.18% 12.26% 6.31%Institutional Class Return Before Taxes 8.53% 12.67% 6.70%Class R-1 Return Before Taxes 7.55% 11.70% 5.93%Class R-2 Return Before Taxes 7.72% 11.84% 6.07%Class R-3 Return Before Taxes 7.90% 12.05% 6.23%Class R-4 Return Before Taxes 8.08% 12.26% 6.38%Class R-5 Return Before Taxes 8.24% 12.39% 6.49%Russell 3000 Index (reflects no deduction for fees, expenses, or taxes) 12.56% 15.63% 7.94%MSCI EAFE Index NDTR D (reflects no deduction for fees, expenses, or taxes) (4.90)% 5.33% 4.43%Barclays U.S. Aggregate Bond Index (reflects no deduction for fees, expenses, or taxes) 5.97% 4.45% 4.71%SAM Strategic Growth Blended Index (reflects no deduction for fees, expenses, or taxes) 7.66% 12.53% 7.03%
(1) The Fund is showing after-tax returns for Class A shares after combining separate prospectuses.
After-tax returns are calculated using the historical highest individual federal marginal income tax rates and do not reflect the impact of state and local taxes. Actual after-tax returns depend on an investor’s tax situation and may differ from those shown. The after-tax returns shown are not relevant to investors who hold their Fund shares through tax-deferred arrangements, such as 401(k) plans or individual retirement accounts. After-tax returns are shown for Class A shares only and would be different for the other share classes.
Performance of a blended index shows how the Portfolio’s performance compares to a blend of indices with similar investment objectives. Performance of the components of the blended index are also shown. The weightings for SAM Strategic Growth Blended Index are 70% Russell 3000® Index, 25% MSCI EAFE Index NDTR D and 5% Barclays U.S. Aggregate Bond Index. The custom or blended index returns reflect the allocation in effect for the time period(s) for which the fund returns are disclosed. Previous weightings or allocations of the custom or blended index are not restated.
Management
Investment Advisor: Principal Management Corporation
Sub-Advisor and Portfolio Managers: Edge Asset Management, Inc. • Charles D. Averill (since 2010), Portfolio Manager• Jill R. Cuniff (since 2010), President and Portfolio Manager• Todd A. Jablonski (since 2010), Portfolio Manager
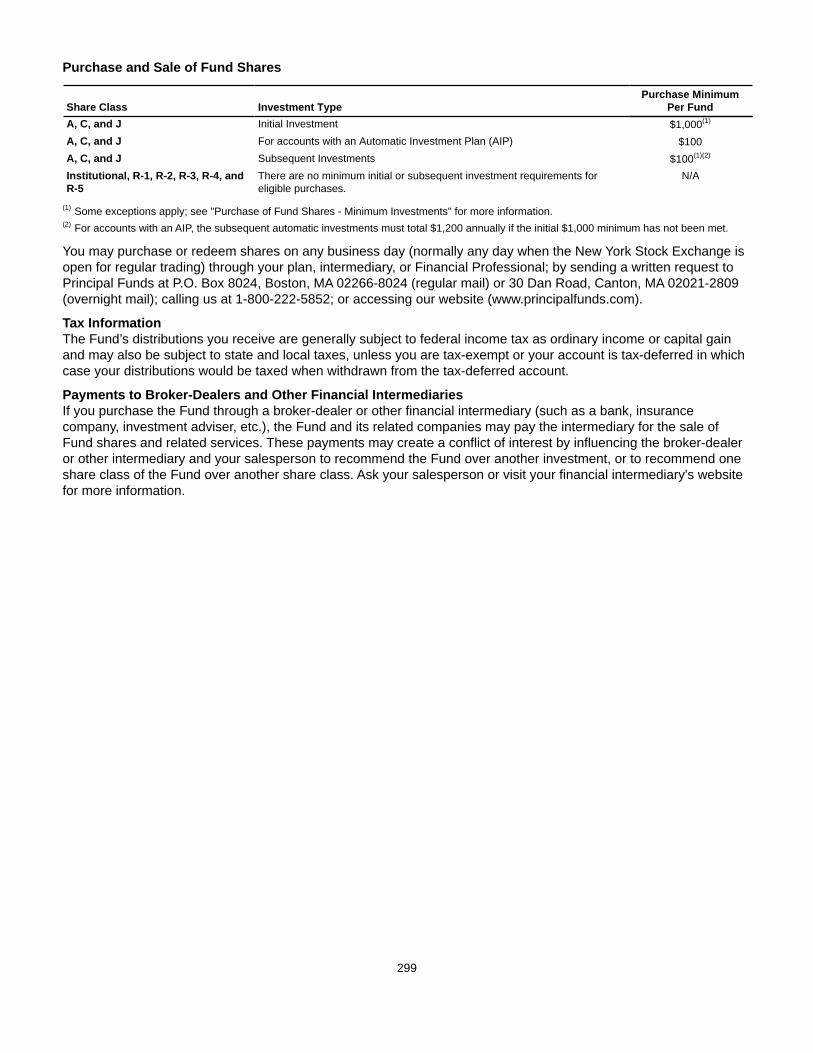
299
Purchase and Sale of Fund Shares
Share Class Investment TypePurchase Minimum
Per FundA, C, and J Initial Investment $1,000(1)
A, C, and J For accounts with an Automatic Investment Plan (AIP) $100A, C, and J Subsequent Investments $100(1)(2)
Institutional, R-1, R-2, R-3, R-4, andR-5
There are no minimum initial or subsequent investment requirements foreligible purchases.
N/A
(1) Some exceptions apply; see "Purchase of Fund Shares - Minimum Investments" for more information.(2) For accounts with an AIP, the subsequent automatic investments must total $1,200 annually if the initial $1,000 minimum has not been met.
You may purchase or redeem shares on any business day (normally any day when the New York Stock Exchange is open for regular trading) through your plan, intermediary, or Financial Professional; by sending a written request to Principal Funds at P.O. Box 8024, Boston, MA 02266-8024 (regular mail) or 30 Dan Road, Canton, MA 02021-2809 (overnight mail); calling us at 1-800-222-5852; or accessing our website (www.principalfunds.com).
Tax InformationThe Fund’s distributions you receive are generally subject to federal income tax as ordinary income or capital gain and may also be subject to state and local taxes, unless you are tax-exempt or your account is tax-deferred in which case your distributions would be taxed when withdrawn from the tax-deferred account.
Payments to Broker-Dealers and Other Financial IntermediariesIf you purchase the Fund through a broker-dealer or other financial intermediary (such as a bank, insurance company, investment adviser, etc.), the Fund and its related companies may pay the intermediary for the sale of Fund shares and related services. These payments may create a conflict of interest by influencing the broker-dealer or other intermediary and your salesperson to recommend the Fund over another investment, or to recommend one share class of the Fund over another share class. Ask your salesperson or visit your financial intermediary's website for more information.
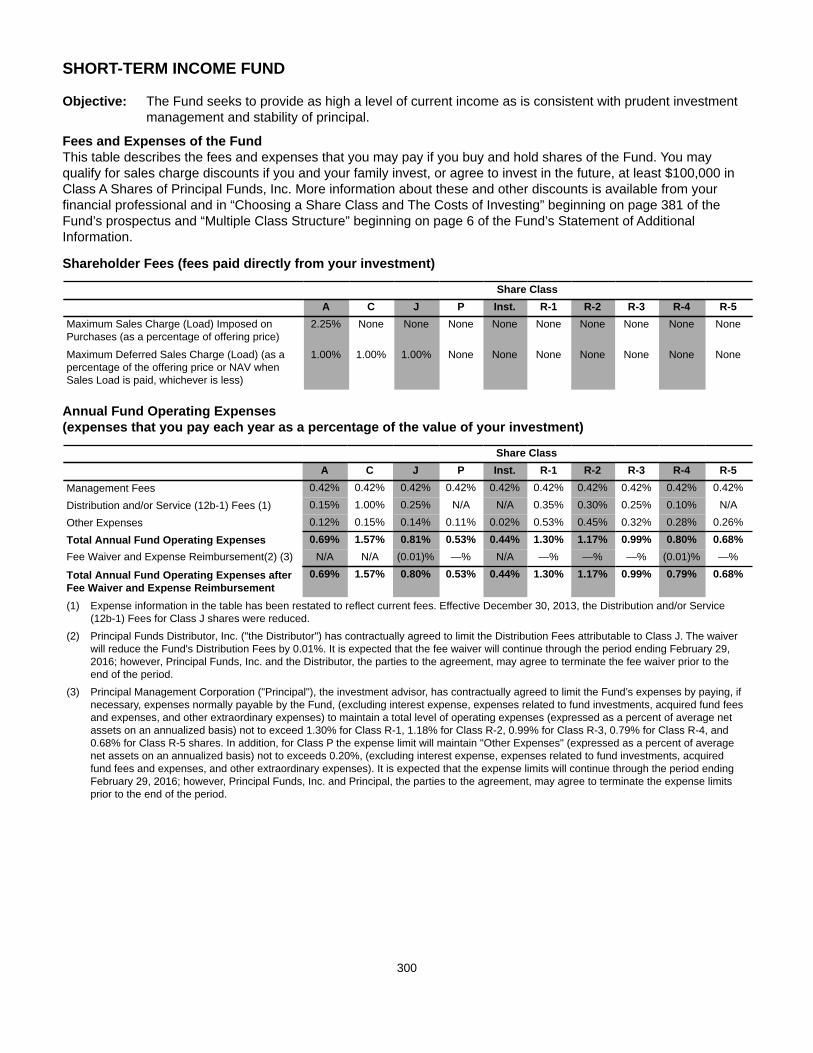
300
SHORT-TERM INCOME FUND
Objective: The Fund seeks to provide as high a level of current income as is consistent with prudent investment management and stability of principal.
Fees and Expenses of the FundThis table describes the fees and expenses that you may pay if you buy and hold shares of the Fund. You may qualify for sales charge discounts if you and your family invest, or agree to invest in the future, at least $100,000 in Class A Shares of Principal Funds, Inc. More information about these and other discounts is available from your financial professional and in “Choosing a Share Class and The Costs of Investing” beginning on page 381 of the Fund’s prospectus and “Multiple Class Structure” beginning on page 6 of the Fund’s Statement of Additional Information.
Shareholder Fees (fees paid directly from your investment)
Share ClassA C J P Inst. R-1 R-2 R-3 R-4 R-5
Maximum Sales Charge (Load) Imposed onPurchases (as a percentage of offering price)
2.25% None None None None None None None None None
Maximum Deferred Sales Charge (Load) (as apercentage of the offering price or NAV whenSales Load is paid, whichever is less)
1.00% 1.00% 1.00% None None None None None None None
Annual Fund Operating Expenses (expenses that you pay each year as a percentage of the value of your investment)
Share ClassA C J P Inst. R-1 R-2 R-3 R-4 R-5
Management Fees 0.42% 0.42% 0.42% 0.42% 0.42% 0.42% 0.42% 0.42% 0.42% 0.42%
Distribution and/or Service (12b-1) Fees (1) 0.15% 1.00% 0.25% N/A N/A 0.35% 0.30% 0.25% 0.10% N/A
Other Expenses 0.12% 0.15% 0.14% 0.11% 0.02% 0.53% 0.45% 0.32% 0.28% 0.26%
Total Annual Fund Operating Expenses 0.69% 1.57% 0.81% 0.53% 0.44% 1.30% 1.17% 0.99% 0.80% 0.68%Fee Waiver and Expense Reimbursement(2) (3) N/A N/A (0.01)% —% N/A —% —% —% (0.01)% —%
Total Annual Fund Operating Expenses afterFee Waiver and Expense Reimbursement
0.69% 1.57% 0.80% 0.53% 0.44% 1.30% 1.17% 0.99% 0.79% 0.68%
(1) Expense information in the table has been restated to reflect current fees. Effective December 30, 2013, the Distribution and/or Service (12b-1) Fees for Class J shares were reduced.
(2) Principal Funds Distributor, Inc. ("the Distributor") has contractually agreed to limit the Distribution Fees attributable to Class J. The waiver will reduce the Fund's Distribution Fees by 0.01%. It is expected that the fee waiver will continue through the period ending February 29, 2016; however, Principal Funds, Inc. and the Distributor, the parties to the agreement, may agree to terminate the fee waiver prior to the end of the period.
(3) Principal Management Corporation ("Principal"), the investment advisor, has contractually agreed to limit the Fund’s expenses by paying, if necessary, expenses normally payable by the Fund, (excluding interest expense, expenses related to fund investments, acquired fund fees and expenses, and other extraordinary expenses) to maintain a total level of operating expenses (expressed as a percent of average net assets on an annualized basis) not to exceed 1.30% for Class R-1, 1.18% for Class R-2, 0.99% for Class R-3, 0.79% for Class R-4, and 0.68% for Class R-5 shares. In addition, for Class P the expense limit will maintain "Other Expenses" (expressed as a percent of average net assets on an annualized basis) not to exceeds 0.20%, (excluding interest expense, expenses related to fund investments, acquired fund fees and expenses, and other extraordinary expenses). It is expected that the expense limits will continue through the period ending February 29, 2016; however, Principal Funds, Inc. and Principal, the parties to the agreement, may agree to terminate the expense limits prior to the end of the period.
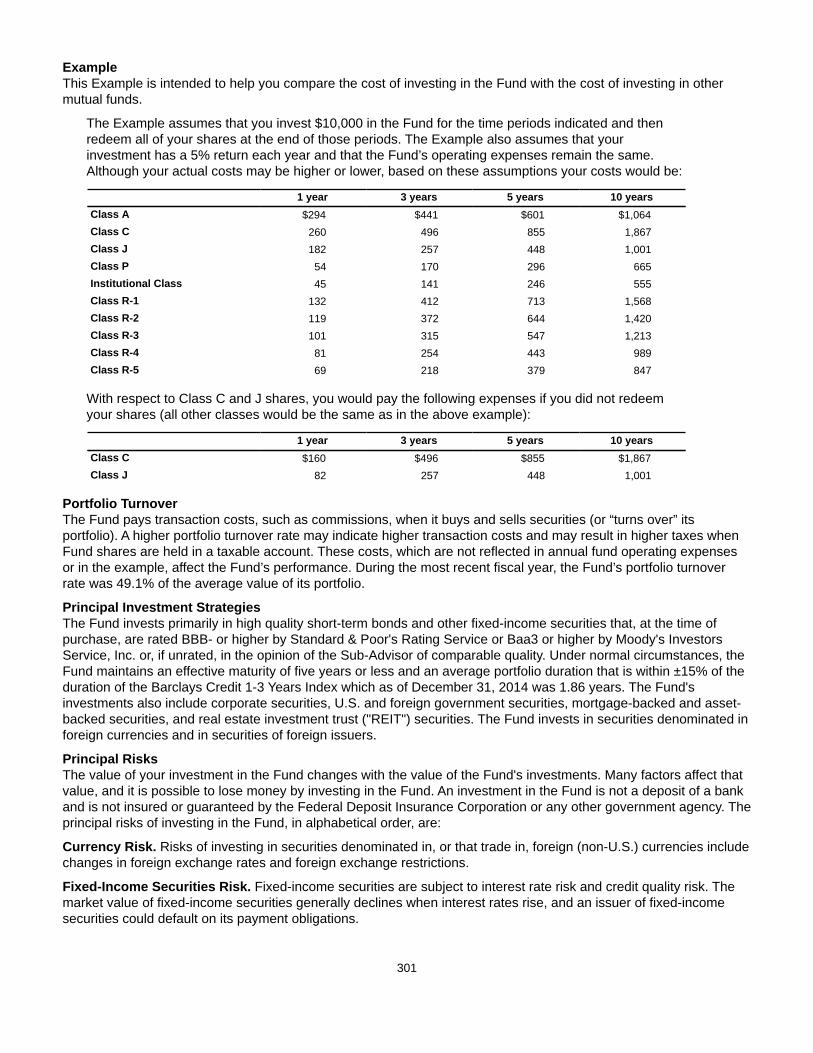
301
ExampleThis Example is intended to help you compare the cost of investing in the Fund with the cost of investing in other mutual funds.
The Example assumes that you invest $10,000 in the Fund for the time periods indicated and then redeem all of your shares at the end of those periods. The Example also assumes that your investment has a 5% return each year and that the Fund’s operating expenses remain the same. Although your actual costs may be higher or lower, based on these assumptions your costs would be:
1 year 3 years 5 years 10 yearsClass A $294 $441 $601 $1,064Class C 260 496 855 1,867Class J 182 257 448 1,001Class P 54 170 296 665Institutional Class 45 141 246 555Class R-1 132 412 713 1,568Class R-2 119 372 644 1,420Class R-3 101 315 547 1,213Class R-4 81 254 443 989Class R-5 69 218 379 847
With respect to Class C and J shares, you would pay the following expenses if you did not redeem your shares (all other classes would be the same as in the above example):
1 year 3 years 5 years 10 yearsClass C $160 $496 $855 $1,867Class J 82 257 448 1,001
Portfolio TurnoverThe Fund pays transaction costs, such as commissions, when it buys and sells securities (or “turns over” its portfolio). A higher portfolio turnover rate may indicate higher transaction costs and may result in higher taxes when Fund shares are held in a taxable account. These costs, which are not reflected in annual fund operating expenses or in the example, affect the Fund’s performance. During the most recent fiscal year, the Fund’s portfolio turnover rate was 49.1% of the average value of its portfolio.
Principal Investment StrategiesThe Fund invests primarily in high quality short-term bonds and other fixed-income securities that, at the time of purchase, are rated BBB- or higher by Standard & Poor's Rating Service or Baa3 or higher by Moody's Investors Service, Inc. or, if unrated, in the opinion of the Sub-Advisor of comparable quality. Under normal circumstances, the Fund maintains an effective maturity of five years or less and an average portfolio duration that is within ±15% of the duration of the Barclays Credit 1-3 Years Index which as of December 31, 2014 was 1.86 years. The Fund's investments also include corporate securities, U.S. and foreign government securities, mortgage-backed and asset-backed securities, and real estate investment trust ("REIT") securities. The Fund invests in securities denominated in foreign currencies and in securities of foreign issuers.
Principal RisksThe value of your investment in the Fund changes with the value of the Fund's investments. Many factors affect that value, and it is possible to lose money by investing in the Fund. An investment in the Fund is not a deposit of a bank and is not insured or guaranteed by the Federal Deposit Insurance Corporation or any other government agency. The principal risks of investing in the Fund, in alphabetical order, are:
Currency Risk. Risks of investing in securities denominated in, or that trade in, foreign (non-U.S.) currencies include changes in foreign exchange rates and foreign exchange restrictions.
Fixed-Income Securities Risk. Fixed-income securities are subject to interest rate risk and credit quality risk. The market value of fixed-income securities generally declines when interest rates rise, and an issuer of fixed-income securities could default on its payment obligations.
302
Foreign Securities Risk. The risks of foreign securities include loss of value as a result of: political or economic instability; nationalization, expropriation or confiscatory taxation; settlement delays; and limited government regulation (including less stringent reporting, accounting, and disclosure standards than are required of U.S. companies).
Portfolio Duration Risk. Portfolio duration is a measure of the expected life of a fixed-income security and its sensitivity to changes in interest rates. The longer a fund's average portfolio duration, the more sensitive the fund will be to changes in interest rates.
Prepayment Risk. Unscheduled prepayments on mortgage-backed and asset-backed securities may have to be reinvested at lower rates. A reduction in prepayments may increase the effective maturities of these securities, exposing them to the risk of decline in market value over time (extension risk).
Real Estate Investment Trusts (“REITs”) Risk. A REIT could fail to qualify for tax-free pass-through of income under the Internal Revenue Code, and fund shareholders will indirectly bear their proportionate share of the expenses of REITs in which the fund invests.
Real Estate Securities Risk. Real estate securities are subject to the risks associated with direct ownership of real estate, including declines in value, adverse economic conditions, increases in expenses, regulatory changes and environmental problems. Investing in securities of companies in the real estate industry, subjects a fund to the special risks associated with the real estate market including factors such as loss to casualty or condemnation, changes in real estate values, property taxes, interest rates, cash flow of underlying real estate assets, occupancy rates, government regulations affecting zoning, land use and rents, and the management skill and creditworthiness of the issuer.
Risk of Being an Underlying Fund. A fund is subject to the risk of being an underlying fund to the extent that a fund of funds invests in the fund. An underlying fund of a fund of funds may experience relatively large redemptions or investments as the fund of funds periodically reallocates or rebalances its assets. These transactions may cause the underlying fund to sell portfolio securities to meet such redemptions, or to invest cash from such investments, at times it would not otherwise do so, and may as a result increase transaction costs and adversely affect underlying fund performance.
U.S. Government Securities Risk. Yields available from U.S. government securities are generally lower than yields from many other fixed-income securities.
U.S. Government Sponsored Securities Risk. Securities issued by U.S. government-sponsored or -chartered enterprises such as the Federal Home Loan Mortgage Corporation, the Federal National Mortgage Association, and the Federal Home Loan Banks are not issued or guaranteed by the U.S. Treasury.
PerformanceThe following information provides some indication of the risks of investing in the Fund. Past performance (before and after taxes) is not necessarily an indication of how the Fund will perform in the future. You may get updated performance information by calling 1-800-222-5852 or online at:• For Classes A, C, J, and P - www.principalfunds.com.• For Classes Institutional, R-1, R-2, R-3, R-4, and R-5 - www.principal.com.
The bar chart shows the investment returns of the Fund's Class A shares for each full calendar year of operations for 10 years (or, if shorter, the life of the Fund). The table shows, for each share class of the Fund and for the last one, five, and ten calendar year periods (or, if shorter, the life of the Fund), how the Fund's average annual total returns compare with those of one or more broad measures of market performance.
The Fund commenced operations after succeeding to the operations of another fund on January 12, 2007. Performance for periods prior to that date is based on the performance of the predecessor fund.
For periods prior to the inception date of Classes J, R-1, R-2, R-3, R-4, and R-5 shares (July 12, 2010) and Class P shares (September 27, 2010), performance shown in the table for these classes is based on the performance of the Class A shares adjusted to reflect the respective fees and expenses of each class. The adjustments result in performance for such periods that is no higher than the historical performance of Class A shares. The predecessor fund's Class A shares commenced operations on November 1, 1993.
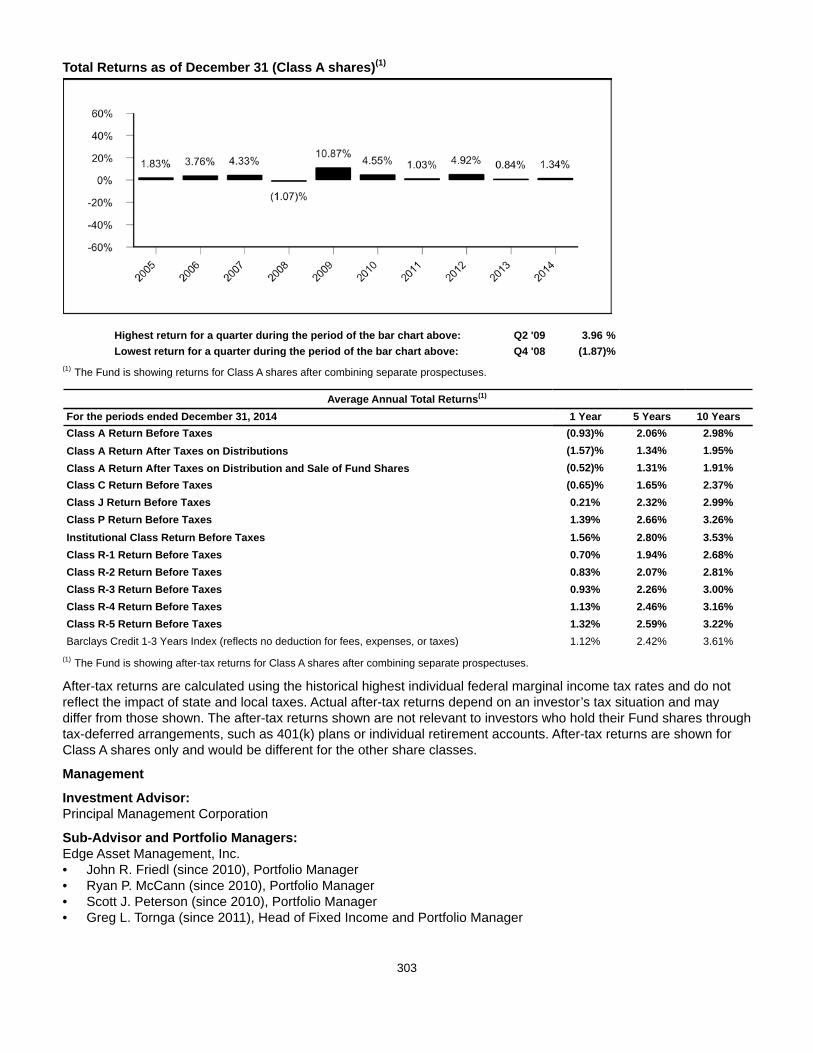
303
Total Returns as of December 31 (Class A shares)(1)
Highest return for a quarter during the period of the bar chart above: Q2 '09 3.96 %Lowest return for a quarter during the period of the bar chart above: Q4 '08 (1.87)%
(1) The Fund is showing returns for Class A shares after combining separate prospectuses.
Average Annual Total Returns(1)
For the periods ended December 31, 2014 1 Year 5 Years 10 YearsClass A Return Before Taxes (0.93)% 2.06% 2.98%Class A Return After Taxes on Distributions (1.57)% 1.34% 1.95%Class A Return After Taxes on Distribution and Sale of Fund Shares (0.52)% 1.31% 1.91%Class C Return Before Taxes (0.65)% 1.65% 2.37%Class J Return Before Taxes 0.21% 2.32% 2.99%Class P Return Before Taxes 1.39% 2.66% 3.26%Institutional Class Return Before Taxes 1.56% 2.80% 3.53%Class R-1 Return Before Taxes 0.70% 1.94% 2.68%Class R-2 Return Before Taxes 0.83% 2.07% 2.81%Class R-3 Return Before Taxes 0.93% 2.26% 3.00%Class R-4 Return Before Taxes 1.13% 2.46% 3.16%Class R-5 Return Before Taxes 1.32% 2.59% 3.22%Barclays Credit 1-3 Years Index (reflects no deduction for fees, expenses, or taxes) 1.12% 2.42% 3.61%
(1) The Fund is showing after-tax returns for Class A shares after combining separate prospectuses.
After-tax returns are calculated using the historical highest individual federal marginal income tax rates and do not reflect the impact of state and local taxes. Actual after-tax returns depend on an investor’s tax situation and may differ from those shown. The after-tax returns shown are not relevant to investors who hold their Fund shares through tax-deferred arrangements, such as 401(k) plans or individual retirement accounts. After-tax returns are shown for Class A shares only and would be different for the other share classes.
Management
Investment Advisor: Principal Management Corporation
Sub-Advisor and Portfolio Managers: Edge Asset Management, Inc.• John R. Friedl (since 2010), Portfolio Manager• Ryan P. McCann (since 2010), Portfolio Manager• Scott J. Peterson (since 2010), Portfolio Manager• Greg L. Tornga (since 2011), Head of Fixed Income and Portfolio Manager

304
Purchase and Sale of Fund Shares
Share Class Investment TypePurchase Minimum
Per FundA, C, and J Initial Investment $1,000(1)
A, C, and J For accounts with an Automatic Investment Plan (AIP) $100A, C, and J Subsequent Investments $100(1)(2)
P, Institutional, R-1, R-2, R-3, R-4,and R-5
There are no minimum initial or subsequent investment requirements foreligible purchases.
N/A
(1) Some exceptions apply; see "Purchase of Fund Shares - Minimum Investments" for more information.(2) For accounts with an AIP, the subsequent automatic investments must total $1,200 annually if the initial $1,000 minimum has not been met.
You may purchase or redeem shares on any business day (normally any day when the New York Stock Exchange is open for regular trading) through your plan, intermediary, or Financial Professional; by sending a written request to Principal Funds at P.O. Box 8024, Boston, MA 02266-8024 (regular mail) or 30 Dan Road, Canton, MA 02021-2809 (overnight mail); calling us at 1-800-222-5852; or accessing our website (www.principalfunds.com).
Tax InformationThe Fund’s distributions you receive are generally subject to federal income tax as ordinary income or capital gain and may also be subject to state and local taxes, unless you are tax-exempt or your account is tax-deferred in which case your distributions would be taxed when withdrawn from the tax-deferred account.
Payments to Broker-Dealers and Other Financial IntermediariesIf you purchase the Fund through a broker-dealer or other financial intermediary (such as a bank, insurance company, investment adviser, etc.), the Fund and its related companies may pay the intermediary for the sale of Fund shares and related services. These payments may create a conflict of interest by influencing the broker-dealer or other intermediary and your salesperson to recommend the Fund over another investment, or to recommend one share class of the Fund over another share class. Ask your salesperson or visit your financial intermediary's website for more information.
305
SMALLCAP BLEND FUND
Objective: The Fund seeks long-term growth of capital.
Fees and Expenses of the FundThis table describes the fees and expenses that you may pay if you buy and hold shares of the Fund. You may qualify for sales charge discounts if you and your family invest, or agree to invest in the future, at least $50,000 in Class A Shares of Principal Funds, Inc. More information about these and other discounts is available from your financial professional and in “Choosing a Share Class and The Costs of Investing” beginning on page 381 of the Fund’s prospectus and “Multiple Class Structure” beginning on page 6 of the Fund’s Statement of Additional Information.
Shareholder Fees (fees paid directly from your investment)
Share ClassA C J P Inst. R-1 R-2 R-3 R-4 R-5
Maximum Sales Charge (Load) Imposed onPurchases (as a percentage of offering price)
5.50% None None None None None None None None None
Maximum Deferred Sales Charge (Load) (as apercentage of the offering price or NAV whenSales Load is paid, whichever is less)
1.00% 1.00% 1.00% None None None None None None None
Annual Fund Operating Expenses (expenses that you pay each year as a percentage of the value of your investment)
Share ClassA C J P Inst. R-1 R-2 R-3 R-4 R-5
Management Fees 0.75% 0.75% 0.75% 0.75% 0.75% 0.75% 0.75% 0.75% 0.75% 0.75%Distribution and/or Service (12b-1) Fees (1) 0.25% 1.00% 0.25% N/A N/A 0.35% 0.30% 0.25% 0.10% N/AOther Expenses (2) 0.23% 0.33% 0.14% 0.27% 0.04% 0.54% 0.46% 0.33% 0.29% 0.27%Acquired Fund Fees and Expenses 0.02% 0.02% 0.02% 0.02% 0.02% 0.02% 0.02% 0.02% 0.02% 0.02%Total Annual Fund Operating Expenses 1.25% 2.10% 1.16% 1.04% 0.81% 1.66% 1.53% 1.35% 1.16% 1.04%Fee Waiver and Expense Reimbursement(3) (4) —% —% (0.01)% (0.07)% —% N/A N/A N/A N/A N/ATotal Annual Fund Operating Expenses afterFee Waiver and Expense Reimbursement
1.25% 2.10% 1.15% 0.97% 0.81% 1.66% 1.53% 1.35% 1.16% 1.04%
(1) Expense information in the table has been restated to reflect current fees. Effective December 30, 2013, the Distribution and/or Service (12b-1) Fees for Class J shares were reduced.
(2) Based on estimated amounts for the current fiscal year (Class P).(3) Principal Funds Distributor, Inc. ("the Distributor") has contractually agreed to limit the Distribution Fees attributable to Class J. The waiver
will reduce the Fund's Distribution Fees by 0.01%. It is expected that the fee waiver will continue through the period ending February 29, 2016; however, Principal Funds, Inc. and the Distributor, the parties to the agreement, may agree to terminate the fee waiver prior to the end of the period.
(4) Principal Management Corporation ("Principal"), the investment advisor, has contractually agreed to limit the Fund’s expenses by paying, if necessary, expenses normally payable by the Fund, (excluding interest expense, expenses related to fund investments, acquired fund fees and expenses, and other extraordinary expenses) to maintain a total level of operating expenses (expressed as a percent of average net assets on an annualized basis) not to exceed 1.35% for Class A, 2.08% for Class C, and 0.80% for Institutional Class shares. In addition for Class P, the expense limit will maintain "Other Expenses" (expressed as a percent of average net assets on an annualized basis) not to exceed 0.20%, (excluding interest expense, expenses related to fund investments, acquired fund fees and expenses, and other extraordinary expenses). It is expected that the expense limits will continue through the period ending February 29, 2016; however, Principal Funds, Inc. and Principal, the parties to the agreement, may agree to terminate the expense limits prior to the end of the period.
Example
This Example is intended to help you compare the cost of investing in the Fund with the cost of investing in other mutual funds.
The Example assumes that you invest $10,000 in the Fund for the time periods indicated and then redeem all of your shares at the end of those periods. The Example assumes that your investment has a 5% return each year and that the Fund’s operating expenses remain the same. Although your actual costs may be higher or lower, based on these assumptions your costs would be:
306
1 year 3 years 5 years 10 yearsClass A $670 $925 $1,199 $1,978Class C 313 658 1,129 2,431Class J 217 367 637 1,408Class P 99 323Institutional Class 83 259 450 1,002Class R-1 169 523 902 1,965Class R-2 156 483 834 1,824Class R-3 137 428 739 1,624Class R-4 118 368 638 1,409Class R-5 106 331 574 1,271
With respect to Class C and J shares, you would pay the following expenses if you did not redeem your shares (all other classes would be the same as in the above example):
1 year 3 years 5 years 10 yearsClass C $213 $658 $1,129 $2,431Class J 117 367 637 1,408
Portfolio TurnoverThe Fund pays transaction costs, such as commissions, when it buys and sells securities (or “turns over” its portfolio). A higher portfolio turnover rate may indicate higher transaction costs and may result in higher taxes when Fund shares are held in a taxable account. These costs, which are not reflected in annual fund operating expenses or in the example, affect the Fund’s performance. During the most recent fiscal year, the Fund’s portfolio turnover rate was 67.6% of the average value of its portfolio.
Principal Investment StrategiesUnder normal circumstances, the Fund invests at least 80% of its net assets, plus any borrowings for investment purposes, in equity securities of companies with small market capitalizations at the time of each purchase. For this Fund, companies with small market capitalizations are those with market capitalizations within the range of companies comprising the Russell 2000® Index (as of December 31, 2014, this range was between approximately $19.0 million and $7.3 billion).
The Fund invests in equity securities with value and/or growth characteristics and constructs an investment portfolio that has a "blend" of equity securities with these characteristics. Investing in value equity securities is an investment strategy that emphasizes buying equity securities that appear to be undervalued. The growth orientation selection emphasizes buying equity securities of companies whose potential for growth of capital and earnings is expected to be above average. The Fund does not have a policy of preferring one of these categories over the other.
Principal RisksThe value of your investment in the Fund changes with the value of the Fund's investments. Many factors affect that value, and it is possible to lose money by investing in the Fund. An investment in the Fund is not a deposit of a bank and is not insured or guaranteed by the Federal Deposit Insurance Corporation or any other government agency. The principal risks of investing in the Fund, in alphabetical order, are:
Equity Securities Risk. The value of equity securities could decline if the issuer's financial condition declines or in response to overall market and economic conditions. A fund's principal market segment(s), such as large cap, mid cap or small cap stocks, or growth or value stocks, may underperform other market segments or the equity markets as a whole. Investments in smaller companies and mid-size companies may involve greater risk and price volatility than investments in larger, more mature companies.
Growth Stock Risk. If growth companies do not increase their earnings at a rate expected by investors, the market price of the stock may decline significantly, even if earnings show an absolute increase. Growth company stocks also typically lack the dividend yield that can lessen price declines in market downturns.
Value Stock Risk. The market may not recognize the intrinsic value of value stocks for a long time, or they may be appropriately priced at the time of purchase.
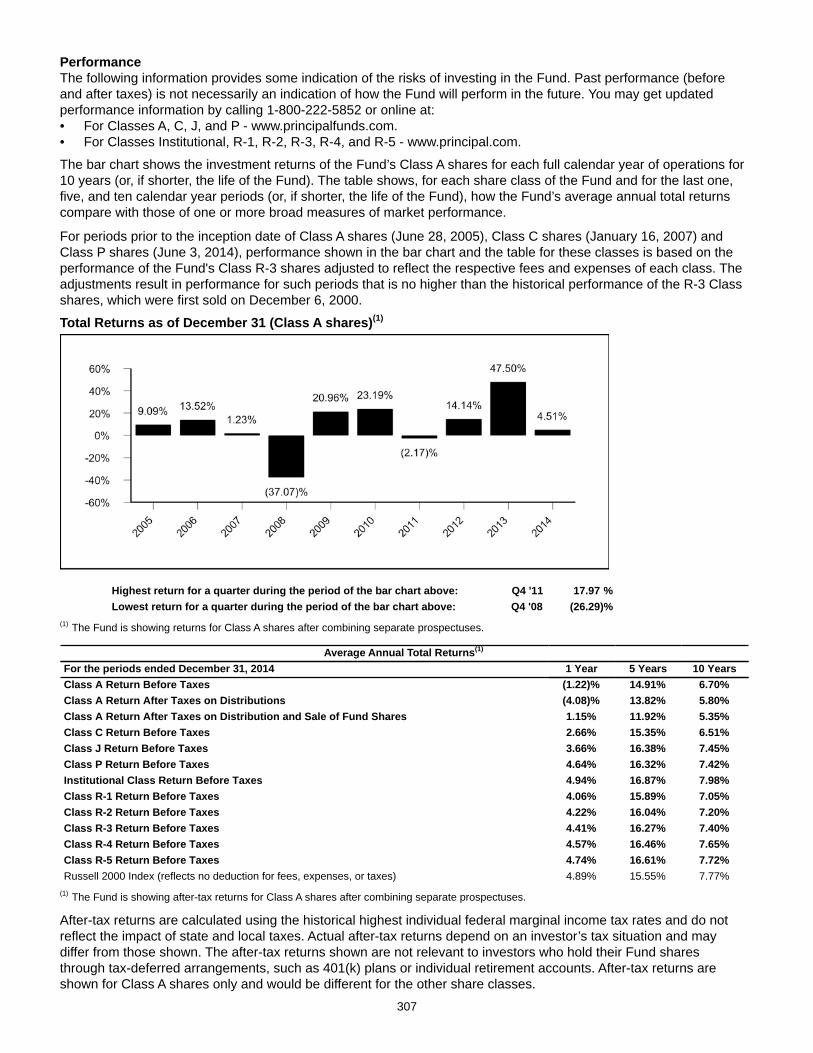
307
PerformanceThe following information provides some indication of the risks of investing in the Fund. Past performance (before and after taxes) is not necessarily an indication of how the Fund will perform in the future. You may get updated performance information by calling 1-800-222-5852 or online at:• For Classes A, C, J, and P - www.principalfunds.com.• For Classes Institutional, R-1, R-2, R-3, R-4, and R-5 - www.principal.com.
The bar chart shows the investment returns of the Fund’s Class A shares for each full calendar year of operations for 10 years (or, if shorter, the life of the Fund). The table shows, for each share class of the Fund and for the last one, five, and ten calendar year periods (or, if shorter, the life of the Fund), how the Fund’s average annual total returns compare with those of one or more broad measures of market performance.
For periods prior to the inception date of Class A shares (June 28, 2005), Class C shares (January 16, 2007) and Class P shares (June 3, 2014), performance shown in the bar chart and the table for these classes is based on the performance of the Fund's Class R-3 shares adjusted to reflect the respective fees and expenses of each class. The adjustments result in performance for such periods that is no higher than the historical performance of the R-3 Class shares, which were first sold on December 6, 2000.
Total Returns as of December 31 (Class A shares)(1)
Highest return for a quarter during the period of the bar chart above: Q4 '11 17.97 %Lowest return for a quarter during the period of the bar chart above: Q4 '08 (26.29)%
(1) The Fund is showing returns for Class A shares after combining separate prospectuses.
Average Annual Total Returns(1)
For the periods ended December 31, 2014 1 Year 5 Years 10 YearsClass A Return Before Taxes (1.22)% 14.91% 6.70%Class A Return After Taxes on Distributions (4.08)% 13.82% 5.80%Class A Return After Taxes on Distribution and Sale of Fund Shares 1.15% 11.92% 5.35%Class C Return Before Taxes 2.66% 15.35% 6.51%Class J Return Before Taxes 3.66% 16.38% 7.45%Class P Return Before Taxes 4.64% 16.32% 7.42%Institutional Class Return Before Taxes 4.94% 16.87% 7.98%Class R-1 Return Before Taxes 4.06% 15.89% 7.05%Class R-2 Return Before Taxes 4.22% 16.04% 7.20%Class R-3 Return Before Taxes 4.41% 16.27% 7.40%Class R-4 Return Before Taxes 4.57% 16.46% 7.65%Class R-5 Return Before Taxes 4.74% 16.61% 7.72%Russell 2000 Index (reflects no deduction for fees, expenses, or taxes) 4.89% 15.55% 7.77%
(1) The Fund is showing after-tax returns for Class A shares after combining separate prospectuses.
After-tax returns are calculated using the historical highest individual federal marginal income tax rates and do not reflect the impact of state and local taxes. Actual after-tax returns depend on an investor’s tax situation and may differ from those shown. The after-tax returns shown are not relevant to investors who hold their Fund shares through tax-deferred arrangements, such as 401(k) plans or individual retirement accounts. After-tax returns are shown for Class A shares only and would be different for the other share classes.
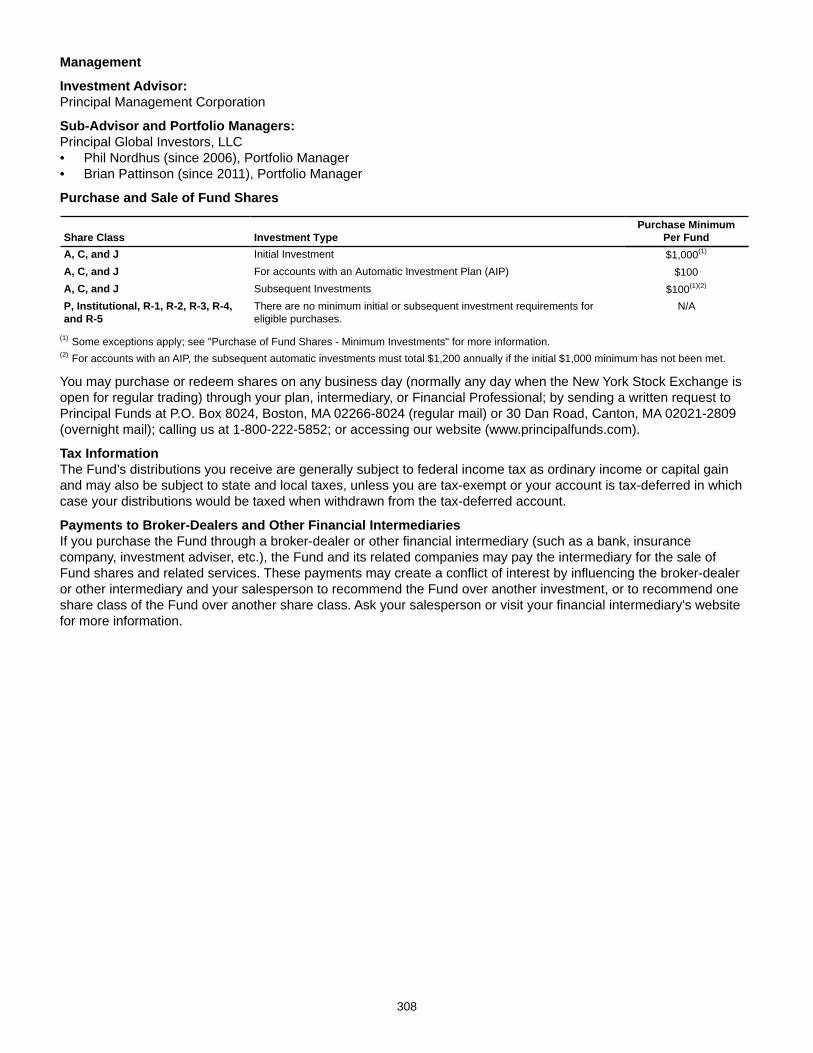
308
Management
Investment Advisor:Principal Management Corporation
Sub-Advisor and Portfolio Managers: Principal Global Investors, LLC• Phil Nordhus (since 2006), Portfolio Manager• Brian Pattinson (since 2011), Portfolio Manager
Purchase and Sale of Fund Shares
Share Class Investment TypePurchase Minimum
Per FundA, C, and J Initial Investment $1,000(1)
A, C, and J For accounts with an Automatic Investment Plan (AIP) $100A, C, and J Subsequent Investments $100(1)(2)
P, Institutional, R-1, R-2, R-3, R-4,and R-5
There are no minimum initial or subsequent investment requirements foreligible purchases.
N/A
(1) Some exceptions apply; see "Purchase of Fund Shares - Minimum Investments" for more information.(2) For accounts with an AIP, the subsequent automatic investments must total $1,200 annually if the initial $1,000 minimum has not been met.
You may purchase or redeem shares on any business day (normally any day when the New York Stock Exchange is open for regular trading) through your plan, intermediary, or Financial Professional; by sending a written request to Principal Funds at P.O. Box 8024, Boston, MA 02266-8024 (regular mail) or 30 Dan Road, Canton, MA 02021-2809 (overnight mail); calling us at 1-800-222-5852; or accessing our website (www.principalfunds.com).
Tax InformationThe Fund’s distributions you receive are generally subject to federal income tax as ordinary income or capital gain and may also be subject to state and local taxes, unless you are tax-exempt or your account is tax-deferred in which case your distributions would be taxed when withdrawn from the tax-deferred account.
Payments to Broker-Dealers and Other Financial IntermediariesIf you purchase the Fund through a broker-dealer or other financial intermediary (such as a bank, insurance company, investment adviser, etc.), the Fund and its related companies may pay the intermediary for the sale of Fund shares and related services. These payments may create a conflict of interest by influencing the broker-dealer or other intermediary and your salesperson to recommend the Fund over another investment, or to recommend one share class of the Fund over another share class. Ask your salesperson or visit your financial intermediary's website for more information.
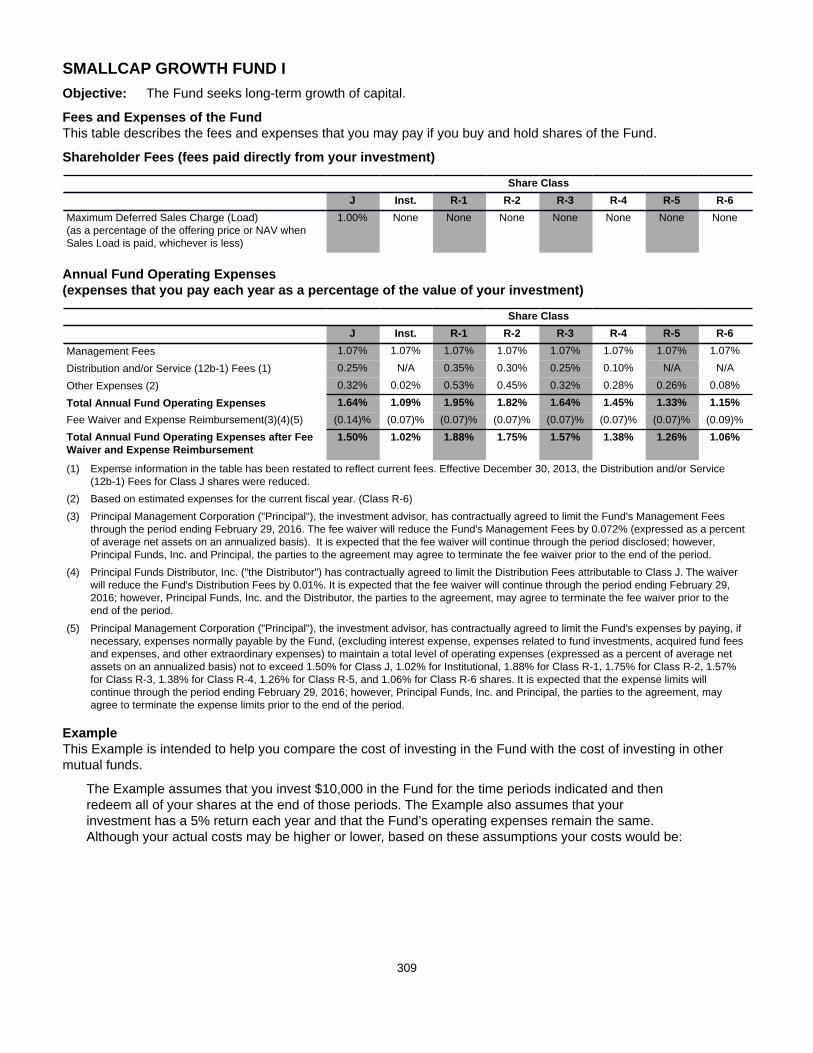
309
SMALLCAP GROWTH FUND IObjective: The Fund seeks long-term growth of capital.
Fees and Expenses of the FundThis table describes the fees and expenses that you may pay if you buy and hold shares of the Fund.
Shareholder Fees (fees paid directly from your investment)
Share ClassJ Inst. R-1 R-2 R-3 R-4 R-5 R-6
Maximum Deferred Sales Charge (Load)(as a percentage of the offering price or NAV whenSales Load is paid, whichever is less)
1.00% None None None None None None None
Annual Fund Operating Expenses (expenses that you pay each year as a percentage of the value of your investment)
Share ClassJ Inst. R-1 R-2 R-3 R-4 R-5 R-6
Management Fees 1.07% 1.07% 1.07% 1.07% 1.07% 1.07% 1.07% 1.07%
Distribution and/or Service (12b-1) Fees (1) 0.25% N/A 0.35% 0.30% 0.25% 0.10% N/A N/A
Other Expenses (2) 0.32% 0.02% 0.53% 0.45% 0.32% 0.28% 0.26% 0.08%
Total Annual Fund Operating Expenses 1.64% 1.09% 1.95% 1.82% 1.64% 1.45% 1.33% 1.15%Fee Waiver and Expense Reimbursement(3)(4)(5) (0.14)% (0.07)% (0.07)% (0.07)% (0.07)% (0.07)% (0.07)% (0.09)%Total Annual Fund Operating Expenses after FeeWaiver and Expense Reimbursement
1.50% 1.02% 1.88% 1.75% 1.57% 1.38% 1.26% 1.06%
(1) Expense information in the table has been restated to reflect current fees. Effective December 30, 2013, the Distribution and/or Service (12b-1) Fees for Class J shares were reduced.
(2) Based on estimated expenses for the current fiscal year. (Class R-6)(3) Principal Management Corporation ("Principal"), the investment advisor, has contractually agreed to limit the Fund's Management Fees
through the period ending February 29, 2016. The fee waiver will reduce the Fund's Management Fees by 0.072% (expressed as a percent of average net assets on an annualized basis). It is expected that the fee waiver will continue through the period disclosed; however, Principal Funds, Inc. and Principal, the parties to the agreement may agree to terminate the fee waiver prior to the end of the period.
(4) Principal Funds Distributor, Inc. ("the Distributor") has contractually agreed to limit the Distribution Fees attributable to Class J. The waiver will reduce the Fund's Distribution Fees by 0.01%. It is expected that the fee waiver will continue through the period ending February 29, 2016; however, Principal Funds, Inc. and the Distributor, the parties to the agreement, may agree to terminate the fee waiver prior to the end of the period.
(5) Principal Management Corporation ("Principal"), the investment advisor, has contractually agreed to limit the Fund’s expenses by paying, if necessary, expenses normally payable by the Fund, (excluding interest expense, expenses related to fund investments, acquired fund fees and expenses, and other extraordinary expenses) to maintain a total level of operating expenses (expressed as a percent of average net assets on an annualized basis) not to exceed 1.50% for Class J, 1.02% for Institutional, 1.88% for Class R-1, 1.75% for Class R-2, 1.57% for Class R-3, 1.38% for Class R-4, 1.26% for Class R-5, and 1.06% for Class R-6 shares. It is expected that the expense limits will continue through the period ending February 29, 2016; however, Principal Funds, Inc. and Principal, the parties to the agreement, may agree to terminate the expense limits prior to the end of the period.
ExampleThis Example is intended to help you compare the cost of investing in the Fund with the cost of investing in other mutual funds.
The Example assumes that you invest $10,000 in the Fund for the time periods indicated and then redeem all of your shares at the end of those periods. The Example also assumes that your investment has a 5% return each year and that the Fund’s operating expenses remain the same. Although your actual costs may be higher or lower, based on these assumptions your costs would be:

310
1 year 3 years 5 years 10 yearsClass J $253 $501 $876 $1,930Institutional Class 104 338 593 1,321Class R-1 191 604 1,045 2,268Class R-2 178 565 978 2,131Class R-3 160 509 884 1,937Class R-4 140 451 784 1,728Class R-5 128 413 721 1,594Class R-6 108 355
With respect to Class J shares, you would pay the following expenses if you did not redeem your shares (all other classes would be the same as in the above example):
1 year 3 years 5 years 10 yearsClass J $153 $501 $876 $1,930
Portfolio TurnoverThe Fund pays transaction costs, such as commissions, when it buys and sells securities (or “turns over” its portfolio). A higher portfolio turnover rate may indicate higher transaction costs and may result in higher taxes when Fund shares are held in a taxable account. These costs, which are not reflected in annual fund operating expenses or in the example, affect the Fund’s performance. During the most recent fiscal year, the Fund’s portfolio turnover rate was 66.1% of the average value of its portfolio.
Principal Investment StrategiesUnder normal circumstances, the Fund invests at least 80% of its net assets, plus any borrowings for investment purposes, in equity securities of companies with small market capitalizations at the time of each purchase. For this Fund, companies with small market capitalizations are those with market capitalizations equal to or smaller than the greater of: 1) $6.0 billion or 2) the highest market capitalization of the companies comprising the Russell 2000® Growth Index (as of December 31, 2014, the range was between approximately $31.0 million and $7.3 billion). The Fund invests in growth equity securities; growth orientation emphasizes buying equity securities of companies whose potential for growth of capital and earnings is expected to be above average.
Principal Management Corporation invests between 10% and 35% of the Fund's assets in equity securities in an attempt to match or exceed the performance of the Fund's benchmark index (listed in the Average Annual Total Returns table) by purchasing securities in the index while slightly overweighting and underweighting certain individual equity securities relative to their weight in the index.
Principal RisksThe value of your investment in the Fund changes with the value of the Fund's investments. Many factors affect that value, and it is possible to lose money by investing in the Fund. An investment in the Fund is not a deposit of a bank and is not insured or guaranteed by the Federal Deposit Insurance Corporation or any other government agency. The principal risks of investing in the Fund, in alphabetical order, are:
Equity Securities Risk. The value of equity securities could decline if the issuer's financial condition declines or in response to overall market and economic conditions. A fund's principal market segment(s), such as large cap, mid cap or small cap stocks, or growth or value stocks, may underperform other market segments or the equity markets as a whole. Investments in smaller companies and mid-size companies may involve greater risk and price volatility than investments in larger, more mature companies.
Growth Stock Risk. If growth companies do not increase their earnings at a rate expected by investors, the market price of the stock may decline significantly, even if earnings show an absolute increase. Growth company stocks also typically lack the dividend yield that can lessen price declines in market downturns.
Risk of Being an Underlying Fund. A fund is subject to the risk of being an underlying fund to the extent that a fund of funds invests in the fund. An underlying fund of a fund of funds may experience relatively large redemptions or investments as the fund of funds periodically reallocates or rebalances its assets. These transactions may cause the underlying fund to sell portfolio securities to meet such redemptions, or to invest cash from such investments, at times it would not otherwise do so, and may as a result increase transaction costs and adversely affect underlying fund performance.
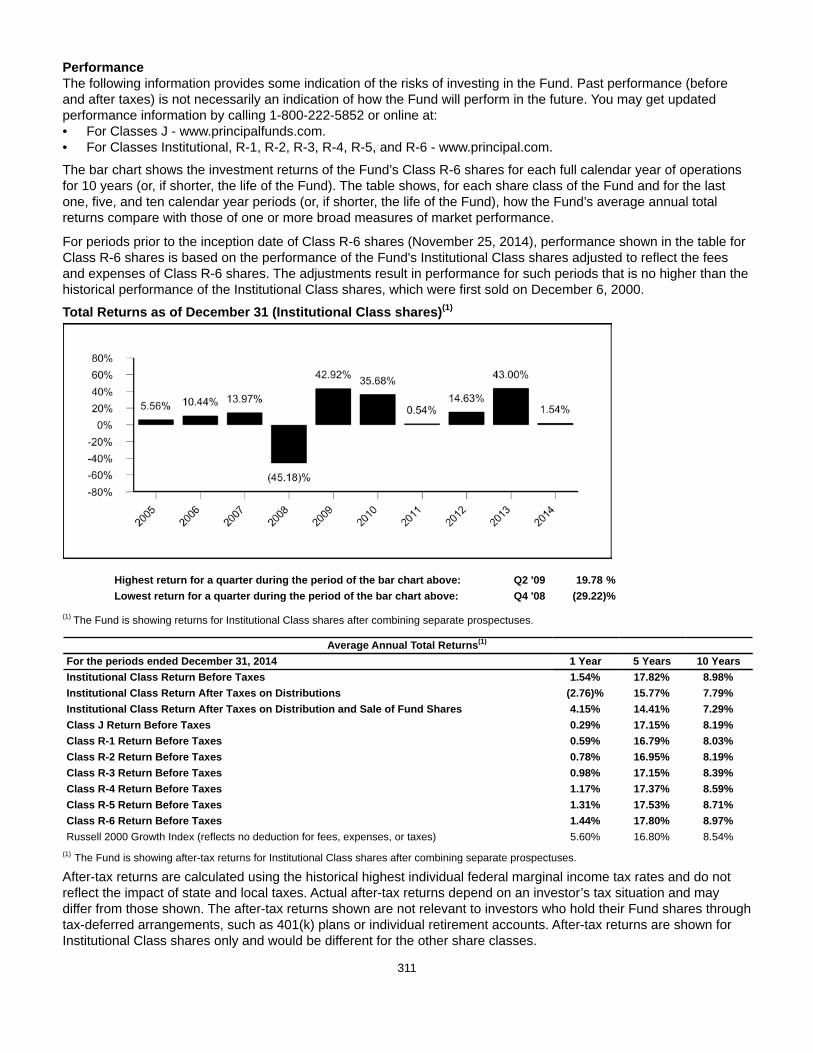
311
PerformanceThe following information provides some indication of the risks of investing in the Fund. Past performance (before and after taxes) is not necessarily an indication of how the Fund will perform in the future. You may get updated performance information by calling 1-800-222-5852 or online at: • For Classes J - www.principalfunds.com.• For Classes Institutional, R-1, R-2, R-3, R-4, R-5, and R-6 - www.principal.com.
The bar chart shows the investment returns of the Fund’s Class R-6 shares for each full calendar year of operations for 10 years (or, if shorter, the life of the Fund). The table shows, for each share class of the Fund and for the last one, five, and ten calendar year periods (or, if shorter, the life of the Fund), how the Fund’s average annual total returns compare with those of one or more broad measures of market performance.
For periods prior to the inception date of Class R-6 shares (November 25, 2014), performance shown in the table for Class R-6 shares is based on the performance of the Fund's Institutional Class shares adjusted to reflect the fees and expenses of Class R-6 shares. The adjustments result in performance for such periods that is no higher than the historical performance of the Institutional Class shares, which were first sold on December 6, 2000.
Total Returns as of December 31 (Institutional Class shares)(1)
Highest return for a quarter during the period of the bar chart above: Q2 '09 19.78 %Lowest return for a quarter during the period of the bar chart above: Q4 '08 (29.22)%
(1) The Fund is showing returns for Institutional Class shares after combining separate prospectuses.
Average Annual Total Returns(1)
For the periods ended December 31, 2014 1 Year 5 Years 10 YearsInstitutional Class Return Before Taxes 1.54% 17.82% 8.98%Institutional Class Return After Taxes on Distributions (2.76)% 15.77% 7.79%Institutional Class Return After Taxes on Distribution and Sale of Fund Shares 4.15% 14.41% 7.29%Class J Return Before Taxes 0.29% 17.15% 8.19%Class R-1 Return Before Taxes 0.59% 16.79% 8.03%Class R-2 Return Before Taxes 0.78% 16.95% 8.19%Class R-3 Return Before Taxes 0.98% 17.15% 8.39%Class R-4 Return Before Taxes 1.17% 17.37% 8.59%Class R-5 Return Before Taxes 1.31% 17.53% 8.71%Class R-6 Return Before Taxes 1.44% 17.80% 8.97%Russell 2000 Growth Index (reflects no deduction for fees, expenses, or taxes) 5.60% 16.80% 8.54%
(1) The Fund is showing after-tax returns for Institutional Class shares after combining separate prospectuses.
After-tax returns are calculated using the historical highest individual federal marginal income tax rates and do not reflect the impact of state and local taxes. Actual after-tax returns depend on an investor’s tax situation and may differ from those shown. The after-tax returns shown are not relevant to investors who hold their Fund shares through tax-deferred arrangements, such as 401(k) plans or individual retirement accounts. After-tax returns are shown for Institutional Class shares only and would be different for the other share classes.
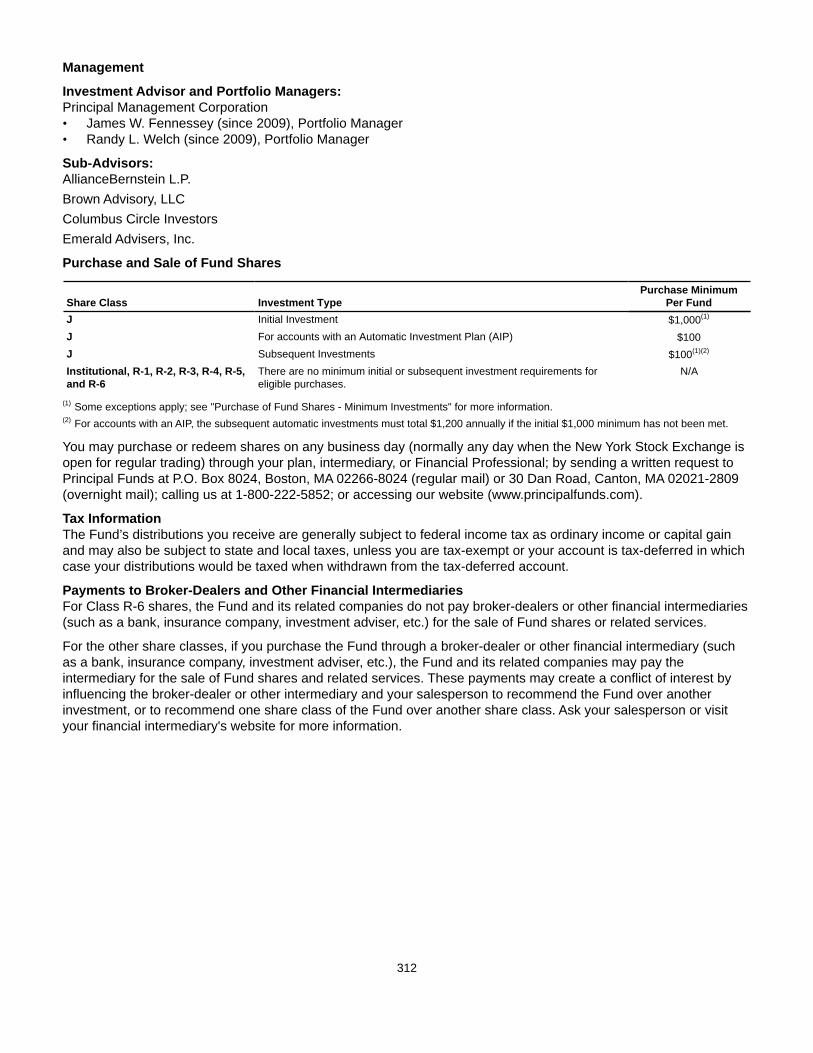
312
Management
Investment Advisor and Portfolio Managers: Principal Management Corporation• James W. Fennessey (since 2009), Portfolio Manager• Randy L. Welch (since 2009), Portfolio Manager
Sub-Advisors: AllianceBernstein L.P. Brown Advisory, LLCColumbus Circle Investors Emerald Advisers, Inc.
Purchase and Sale of Fund Shares
Share Class Investment TypePurchase Minimum
Per FundJ Initial Investment $1,000(1)
J For accounts with an Automatic Investment Plan (AIP) $100J Subsequent Investments $100(1)(2)
Institutional, R-1, R-2, R-3, R-4, R-5,and R-6
There are no minimum initial or subsequent investment requirements foreligible purchases.
N/A
(1) Some exceptions apply; see "Purchase of Fund Shares - Minimum Investments" for more information.(2) For accounts with an AIP, the subsequent automatic investments must total $1,200 annually if the initial $1,000 minimum has not been met.
You may purchase or redeem shares on any business day (normally any day when the New York Stock Exchange is open for regular trading) through your plan, intermediary, or Financial Professional; by sending a written request to Principal Funds at P.O. Box 8024, Boston, MA 02266-8024 (regular mail) or 30 Dan Road, Canton, MA 02021-2809 (overnight mail); calling us at 1-800-222-5852; or accessing our website (www.principalfunds.com).
Tax InformationThe Fund’s distributions you receive are generally subject to federal income tax as ordinary income or capital gain and may also be subject to state and local taxes, unless you are tax-exempt or your account is tax-deferred in which case your distributions would be taxed when withdrawn from the tax-deferred account.
Payments to Broker-Dealers and Other Financial IntermediariesFor Class R-6 shares, the Fund and its related companies do not pay broker-dealers or other financial intermediaries (such as a bank, insurance company, investment adviser, etc.) for the sale of Fund shares or related services.
For the other share classes, if you purchase the Fund through a broker-dealer or other financial intermediary (such as a bank, insurance company, investment adviser, etc.), the Fund and its related companies may pay the intermediary for the sale of Fund shares and related services. These payments may create a conflict of interest by influencing the broker-dealer or other intermediary and your salesperson to recommend the Fund over another investment, or to recommend one share class of the Fund over another share class. Ask your salesperson or visit your financial intermediary's website for more information.
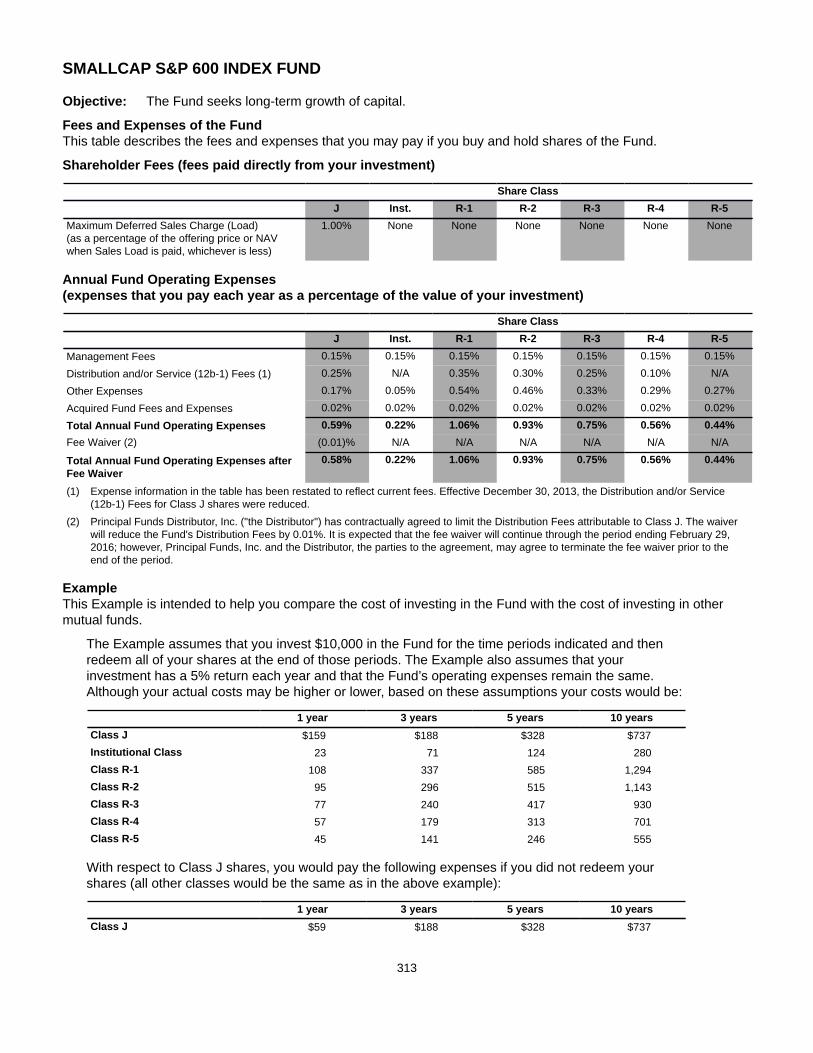
313
SMALLCAP S&P 600 INDEX FUND
Objective: The Fund seeks long-term growth of capital.
Fees and Expenses of the FundThis table describes the fees and expenses that you may pay if you buy and hold shares of the Fund.
Shareholder Fees (fees paid directly from your investment)
Share ClassJ Inst. R-1 R-2 R-3 R-4 R-5
Maximum Deferred Sales Charge (Load)(as a percentage of the offering price or NAVwhen Sales Load is paid, whichever is less)
1.00% None None None None None None
Annual Fund Operating Expenses (expenses that you pay each year as a percentage of the value of your investment)
Share ClassJ Inst. R-1 R-2 R-3 R-4 R-5
Management Fees 0.15% 0.15% 0.15% 0.15% 0.15% 0.15% 0.15%
Distribution and/or Service (12b-1) Fees (1) 0.25% N/A 0.35% 0.30% 0.25% 0.10% N/A
Other Expenses 0.17% 0.05% 0.54% 0.46% 0.33% 0.29% 0.27%
Acquired Fund Fees and Expenses 0.02% 0.02% 0.02% 0.02% 0.02% 0.02% 0.02%
Total Annual Fund Operating Expenses 0.59% 0.22% 1.06% 0.93% 0.75% 0.56% 0.44%Fee Waiver (2) (0.01)% N/A N/A N/A N/A N/A N/A
Total Annual Fund Operating Expenses afterFee Waiver
0.58% 0.22% 1.06% 0.93% 0.75% 0.56% 0.44%
(1) Expense information in the table has been restated to reflect current fees. Effective December 30, 2013, the Distribution and/or Service (12b-1) Fees for Class J shares were reduced.
(2) Principal Funds Distributor, Inc. ("the Distributor") has contractually agreed to limit the Distribution Fees attributable to Class J. The waiver will reduce the Fund's Distribution Fees by 0.01%. It is expected that the fee waiver will continue through the period ending February 29, 2016; however, Principal Funds, Inc. and the Distributor, the parties to the agreement, may agree to terminate the fee waiver prior to the end of the period.
ExampleThis Example is intended to help you compare the cost of investing in the Fund with the cost of investing in other mutual funds.
The Example assumes that you invest $10,000 in the Fund for the time periods indicated and then redeem all of your shares at the end of those periods. The Example also assumes that your investment has a 5% return each year and that the Fund’s operating expenses remain the same. Although your actual costs may be higher or lower, based on these assumptions your costs would be:
1 year 3 years 5 years 10 yearsClass J $159 $188 $328 $737Institutional Class 23 71 124 280Class R-1 108 337 585 1,294Class R-2 95 296 515 1,143Class R-3 77 240 417 930Class R-4 57 179 313 701Class R-5 45 141 246 555
With respect to Class J shares, you would pay the following expenses if you did not redeem your shares (all other classes would be the same as in the above example):
1 year 3 years 5 years 10 yearsClass J $59 $188 $328 $737
314
Portfolio TurnoverThe Fund pays transaction costs, such as commissions, when it buys and sells securities (or “turns over” its portfolio). A higher portfolio turnover rate may indicate higher transaction costs and may result in higher taxes when Fund shares are held in a taxable account. These costs, which are not reflected in annual fund operating expenses or in the example, affect the Fund’s performance. During the most recent fiscal year, the Fund’s portfolio turnover rate was 19.0% of the average value of its portfolio.
Principal Investment StrategiesUnder normal circumstances, the Fund invests at least 80% of its net assets, plus any borrowings for investment purposes, in equity securities of companies that compose the Standard & Poor's ("S&P") SmallCap 600 Index at the time of each purchase. The Index is designed to represent U.S. equities with risk/return characteristics of the small cap universe. As of December 31, 2014, the market capitalization range of the companies comprising the Index was between approximately $90.5 million and $4.8 billion. The Fund employs a passive investment approach designed to attempt to track the performance of the Index. The Fund utilizes derivative strategies and exchange-traded funds ("ETFs"). A derivative is a financial arrangement, the value of which is derived from, or based on, a traditional security, asset, or market index. Specifically, the Fund invests in index futures and equity ETFs on a daily basis to gain exposure to the Index in an effort to minimize tracking error relative to the benchmark.
Note: "Standard & Poor's SmallCap 600" and "S&P SmallCap 600" are trademarks of The McGraw-Hill Companies, Inc. and have been licensed by Principal. The Fund is not sponsored, endorsed, sold or promoted by Standard & Poor's and Standard & Poor's makes no representation regarding the advisability of investing in the Fund.
Principal RisksThe value of your investment in the Fund changes with the value of the Fund's investments. Many factors affect that value, and it is possible to lose money by investing in the Fund. An investment in the Fund is not a deposit of a bank and is not insured or guaranteed by the Federal Deposit Insurance Corporation or any other government agency. The principal risks of investing in the Fund, in alphabetical order, are:
Derivatives Risk. Transactions in derivatives may increase volatility, cause the liquidation of portfolio positions when not advantageous to do so and produce disproportionate losses.
Equity Securities Risk. The value of equity securities could decline if the issuer's financial condition declines or in response to overall market and economic conditions. A fund's principal market segment(s), such as large cap, mid cap or small cap stocks, or growth or value stocks, may underperform other market segments or the equity markets as a whole. Investments in smaller companies and mid-size companies may involve greater risk and price volatility than investments in larger, more mature companies.
Exchange-Traded Funds ("ETFs") Risk. An ETF is subject to the risks associated with direct ownership of the securities comprising the index on which the ETF is based. Fund shareholders indirectly bear their proportionate share of the expenses of the ETFs in which the fund invests.
Index Fund Investment Risk. More likely than not, an index fund will underperform the index due to cashflows and the fees and expenses of the fund.
Risk of Being an Underlying Fund. A fund is subject to the risk of being an underlying fund to the extent that a fund of funds invests in the fund. An underlying fund of a fund of funds may experience relatively large redemptions or investments as the fund of funds periodically reallocates or rebalances its assets. These transactions may cause the underlying fund to sell portfolio securities to meet such redemptions, or to invest cash from such investments, at times it would not otherwise do so, and may as a result increase transaction costs and adversely affect underlying fund performance.

315
PerformanceThe following information provides some indication of the risks of investing in the Fund. Past performance (before and after taxes) is not necessarily an indication of how the Fund will perform in the future. You may get updated performance information by calling 1-800-222-5852 or online at:• For Classes J - www.principalfunds.com.• For Classes Institutional, R-1, R-2, R-3, R-4, and R-5 - www.principal.com.
The bar chart shows the investment returns of the Fund’s Institutional Class shares for each full calendar year of operations for 10 years (or, if shorter, the life of the Fund). The table shows, for each share class of the Fund and for the last one, five, and ten calendar year periods (or, if shorter, the life of the Fund), how the Fund’s average annual total returns compare with those of one or more broad measures of market performance.
Total Returns as of December 31 (Institutional Class shares)(1)
Highest return for a quarter during the period of the bar chart above: Q2 '09 20.85 %Lowest return for a quarter during the period of the bar chart above: Q4 '08 (25.21)%
(1) The Fund is showing returns for Institutional Class shares after combining separate prospectuses.
Average Annual Total Returns(1)
For the periods ended December 31, 2014 1 Year 5 Years 10 YearsInstitutional Class Return Before Taxes 5.52% 16.94% 8.81%Institutional Class Return After Taxes on Distributions 3.45% 16.19% 7.92%Institutional Class Return After Taxes on Distribution and Sale of Fund Shares 4.50% 13.70% 7.07%Class J Return Before Taxes 4.20% 16.42% 8.17%Class R-1 Return Before Taxes 4.66% 15.97% 7.89%Class R-2 Return Before Taxes 4.81% 16.12% 8.03%Class R-3 Return Before Taxes 4.96% 16.33% 8.22%Class R-4 Return Before Taxes 5.19% 16.57% 8.43%Class R-5 Return Before Taxes 5.30% 16.70% 8.56%S&P SmallCap 600 Index (reflects no deduction for fees, expenses, or taxes) 5.76% 17.27% 9.02%
(1) The Fund is showing after-tax returns for Institutional Class shares after combining separate prospectuses.
After-tax returns are calculated using the historical highest individual federal marginal income tax rates and do not reflect the impact of state and local taxes. Actual after-tax returns depend on an investor’s tax situation and may differ from those shown. The after-tax returns shown are not relevant to investors who hold their Fund shares through tax-deferred arrangements, such as 401(k) plans or individual retirement accounts. After-tax returns are shown for Institutional Class shares only and would be different for the other share classes.

316
Management
Investment Advisor: Principal Management Corporation
Sub-Advisor and Portfolio Manager: Principal Global Investors, LLC • Thomas L. Kruchten (since 2011), Research Analyst and Portfolio Manager
Purchase and Sale of Fund Shares
Share Class Investment TypePurchase Minimum
Per FundJ Initial Investment $1,000(1)
J For accounts with an Automatic Investment Plan (AIP) $100J Subsequent Investments $100(1)(2)
Institutional, R-1, R-2, R-3, R-4, andR-5
There are no minimum initial or subsequent investment requirements foreligible purchases.
N/A
(1) Some exceptions apply; see "Purchase of Fund Shares - Minimum Investments" for more information.(2) For accounts with an AIP, the subsequent automatic investments must total $1,200 annually if the initial $1,000 minimum has not been met.
You may purchase or redeem shares on any business day (normally any day when the New York Stock Exchange is open for regular trading) through your plan, intermediary, or Financial Professional; by sending a written request to Principal Funds at P.O. Box 8024, Boston, MA 02266-8024 (regular mail) or 30 Dan Road, Canton, MA 02021-2809 (overnight mail); calling us at 1-800-222-5852; or accessing our website (www.principalfunds.com).
Tax InformationThe Fund’s distributions you receive are generally subject to federal income tax as ordinary income or capital gain and may also be subject to state and local taxes, unless you are tax-exempt or your account is tax-deferred in which case your distributions would be taxed when withdrawn from the tax-deferred account.
Payments to Broker-Dealers and Other Financial IntermediariesIf you purchase the Fund through a broker-dealer or other financial intermediary (such as a bank, insurance company, investment adviser, etc.), the Fund and its related companies may pay the intermediary for the sale of Fund shares and related services. These payments may create a conflict of interest by influencing the broker-dealer or other intermediary and your salesperson to recommend the Fund over another investment, or to recommend one share class of the Fund over another share class. Ask your salesperson or visit your financial intermediary's website for more information.
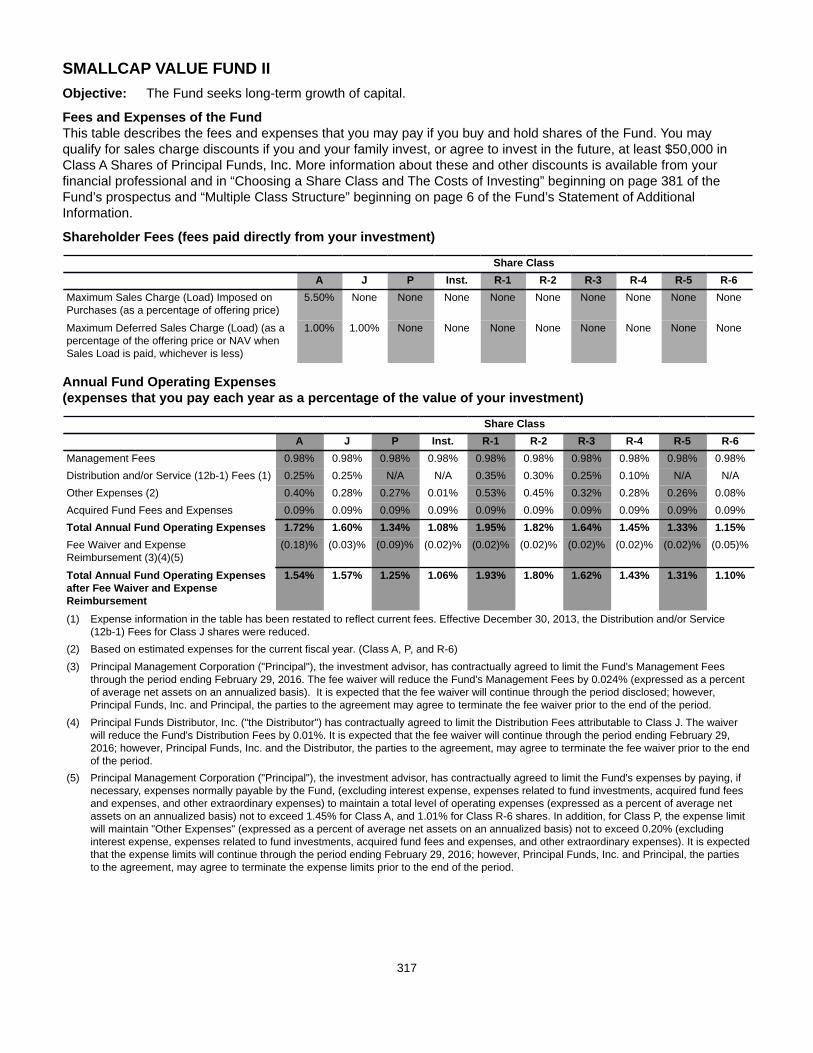
317
SMALLCAP VALUE FUND IIObjective: The Fund seeks long-term growth of capital.
Fees and Expenses of the FundThis table describes the fees and expenses that you may pay if you buy and hold shares of the Fund. You may qualify for sales charge discounts if you and your family invest, or agree to invest in the future, at least $50,000 in Class A Shares of Principal Funds, Inc. More information about these and other discounts is available from your financial professional and in “Choosing a Share Class and The Costs of Investing” beginning on page 381 of the Fund’s prospectus and “Multiple Class Structure” beginning on page 6 of the Fund’s Statement of Additional Information.
Shareholder Fees (fees paid directly from your investment)
Share ClassA J P Inst. R-1 R-2 R-3 R-4 R-5 R-6
Maximum Sales Charge (Load) Imposed onPurchases (as a percentage of offering price)
5.50% None None None None None None None None None
Maximum Deferred Sales Charge (Load) (as apercentage of the offering price or NAV whenSales Load is paid, whichever is less)
1.00% 1.00% None None None None None None None None
Annual Fund Operating Expenses (expenses that you pay each year as a percentage of the value of your investment)
Share ClassA J P Inst. R-1 R-2 R-3 R-4 R-5 R-6
Management Fees 0.98% 0.98% 0.98% 0.98% 0.98% 0.98% 0.98% 0.98% 0.98% 0.98%Distribution and/or Service (12b-1) Fees (1) 0.25% 0.25% N/A N/A 0.35% 0.30% 0.25% 0.10% N/A N/AOther Expenses (2) 0.40% 0.28% 0.27% 0.01% 0.53% 0.45% 0.32% 0.28% 0.26% 0.08%Acquired Fund Fees and Expenses 0.09% 0.09% 0.09% 0.09% 0.09% 0.09% 0.09% 0.09% 0.09% 0.09%Total Annual Fund Operating Expenses 1.72% 1.60% 1.34% 1.08% 1.95% 1.82% 1.64% 1.45% 1.33% 1.15%Fee Waiver and ExpenseReimbursement (3)(4)(5)
(0.18)% (0.03)% (0.09)% (0.02)% (0.02)% (0.02)% (0.02)% (0.02)% (0.02)% (0.05)%
Total Annual Fund Operating Expensesafter Fee Waiver and ExpenseReimbursement
1.54% 1.57% 1.25% 1.06% 1.93% 1.80% 1.62% 1.43% 1.31% 1.10%
(1) Expense information in the table has been restated to reflect current fees. Effective December 30, 2013, the Distribution and/or Service (12b-1) Fees for Class J shares were reduced.
(2) Based on estimated expenses for the current fiscal year. (Class A, P, and R-6)(3) Principal Management Corporation ("Principal"), the investment advisor, has contractually agreed to limit the Fund's Management Fees
through the period ending February 29, 2016. The fee waiver will reduce the Fund's Management Fees by 0.024% (expressed as a percent of average net assets on an annualized basis). It is expected that the fee waiver will continue through the period disclosed; however, Principal Funds, Inc. and Principal, the parties to the agreement may agree to terminate the fee waiver prior to the end of the period.
(4) Principal Funds Distributor, Inc. ("the Distributor") has contractually agreed to limit the Distribution Fees attributable to Class J. The waiver will reduce the Fund's Distribution Fees by 0.01%. It is expected that the fee waiver will continue through the period ending February 29, 2016; however, Principal Funds, Inc. and the Distributor, the parties to the agreement, may agree to terminate the fee waiver prior to the end of the period.
(5) Principal Management Corporation ("Principal"), the investment advisor, has contractually agreed to limit the Fund's expenses by paying, if necessary, expenses normally payable by the Fund, (excluding interest expense, expenses related to fund investments, acquired fund fees and expenses, and other extraordinary expenses) to maintain a total level of operating expenses (expressed as a percent of average net assets on an annualized basis) not to exceed 1.45% for Class A, and 1.01% for Class R-6 shares. In addition, for Class P, the expense limit will maintain "Other Expenses" (expressed as a percent of average net assets on an annualized basis) not to exceed 0.20% (excluding interest expense, expenses related to fund investments, acquired fund fees and expenses, and other extraordinary expenses). It is expected that the expense limits will continue through the period ending February 29, 2016; however, Principal Funds, Inc. and Principal, the parties to the agreement, may agree to terminate the expense limits prior to the end of the period.
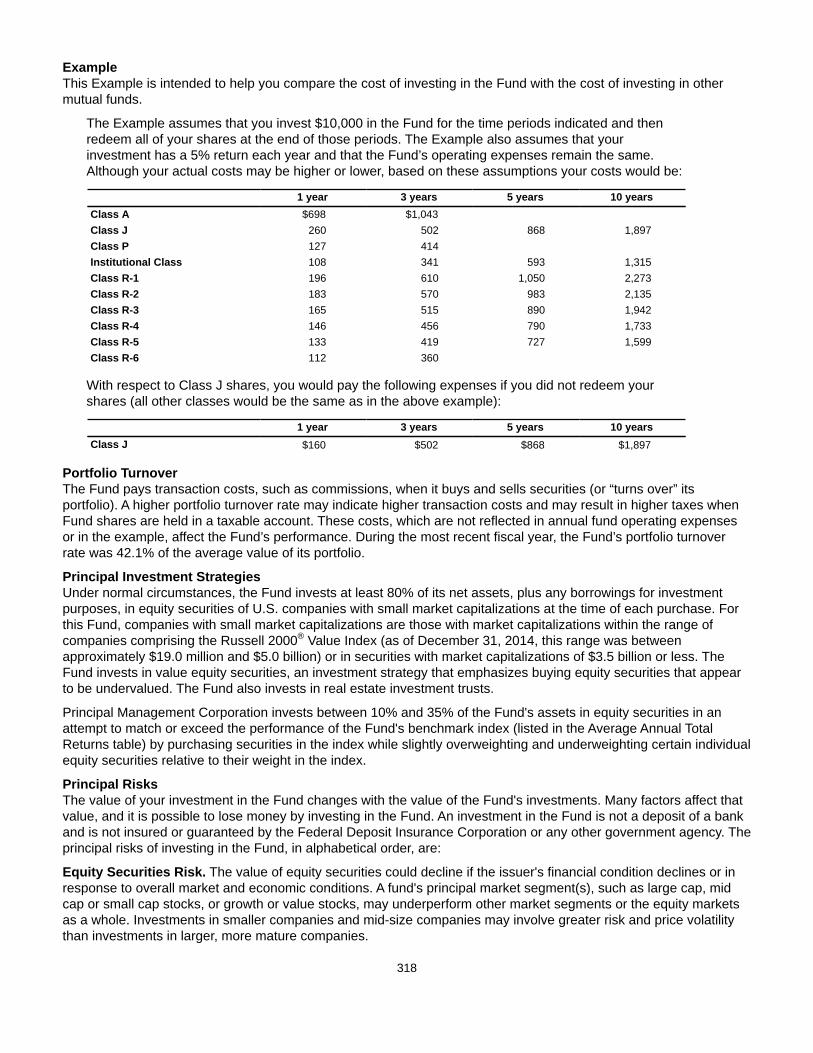
318
ExampleThis Example is intended to help you compare the cost of investing in the Fund with the cost of investing in other mutual funds.
The Example assumes that you invest $10,000 in the Fund for the time periods indicated and then redeem all of your shares at the end of those periods. The Example also assumes that your investment has a 5% return each year and that the Fund’s operating expenses remain the same. Although your actual costs may be higher or lower, based on these assumptions your costs would be:
1 year 3 years 5 years 10 yearsClass A $698 $1,043Class J 260 502 868 1,897Class P 127 414Institutional Class 108 341 593 1,315Class R-1 196 610 1,050 2,273Class R-2 183 570 983 2,135Class R-3 165 515 890 1,942Class R-4 146 456 790 1,733Class R-5 133 419 727 1,599Class R-6 112 360
With respect to Class J shares, you would pay the following expenses if you did not redeem your shares (all other classes would be the same as in the above example):
1 year 3 years 5 years 10 yearsClass J $160 $502 $868 $1,897
Portfolio TurnoverThe Fund pays transaction costs, such as commissions, when it buys and sells securities (or “turns over” its portfolio). A higher portfolio turnover rate may indicate higher transaction costs and may result in higher taxes when Fund shares are held in a taxable account. These costs, which are not reflected in annual fund operating expenses or in the example, affect the Fund’s performance. During the most recent fiscal year, the Fund’s portfolio turnover rate was 42.1% of the average value of its portfolio.
Principal Investment StrategiesUnder normal circumstances, the Fund invests at least 80% of its net assets, plus any borrowings for investment purposes, in equity securities of U.S. companies with small market capitalizations at the time of each purchase. For this Fund, companies with small market capitalizations are those with market capitalizations within the range of companies comprising the Russell 2000® Value Index (as of December 31, 2014, this range was between approximately $19.0 million and $5.0 billion) or in securities with market capitalizations of $3.5 billion or less. The Fund invests in value equity securities, an investment strategy that emphasizes buying equity securities that appear to be undervalued. The Fund also invests in real estate investment trusts.
Principal Management Corporation invests between 10% and 35% of the Fund's assets in equity securities in an attempt to match or exceed the performance of the Fund's benchmark index (listed in the Average Annual Total Returns table) by purchasing securities in the index while slightly overweighting and underweighting certain individual equity securities relative to their weight in the index.
Principal RisksThe value of your investment in the Fund changes with the value of the Fund's investments. Many factors affect that value, and it is possible to lose money by investing in the Fund. An investment in the Fund is not a deposit of a bank and is not insured or guaranteed by the Federal Deposit Insurance Corporation or any other government agency. The principal risks of investing in the Fund, in alphabetical order, are:
Equity Securities Risk. The value of equity securities could decline if the issuer's financial condition declines or in response to overall market and economic conditions. A fund's principal market segment(s), such as large cap, mid cap or small cap stocks, or growth or value stocks, may underperform other market segments or the equity markets as a whole. Investments in smaller companies and mid-size companies may involve greater risk and price volatility than investments in larger, more mature companies.
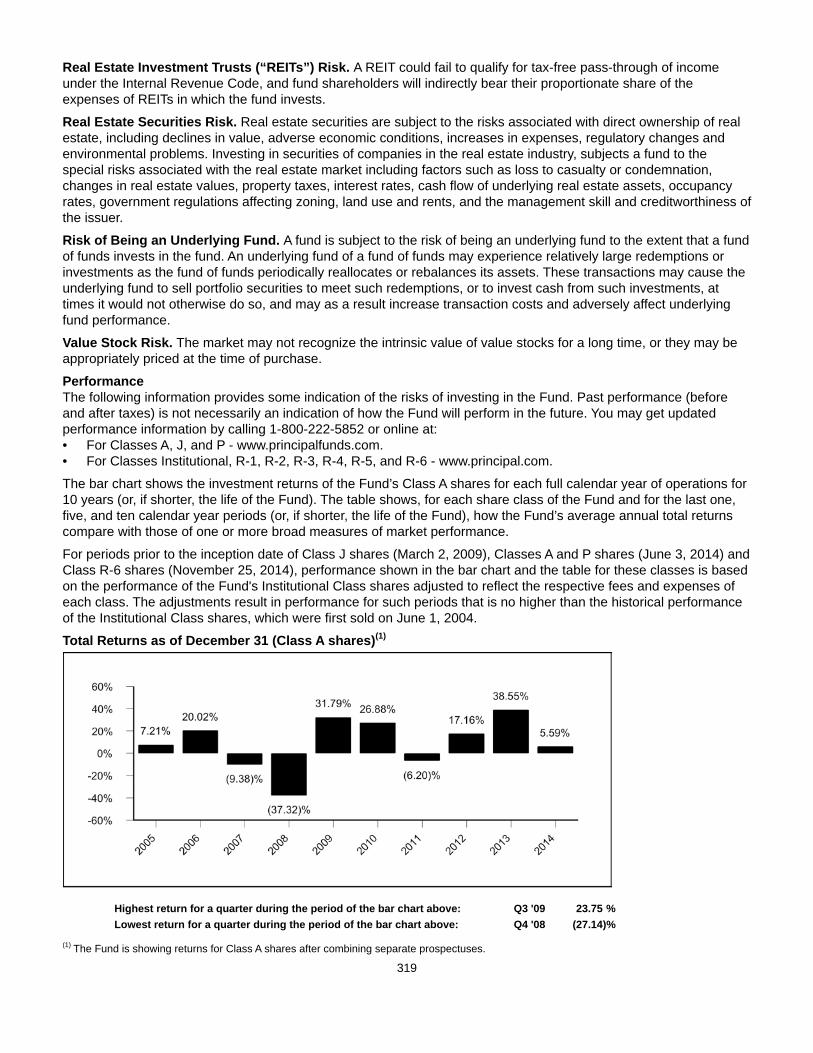
319
Real Estate Investment Trusts (“REITs”) Risk. A REIT could fail to qualify for tax-free pass-through of income under the Internal Revenue Code, and fund shareholders will indirectly bear their proportionate share of the expenses of REITs in which the fund invests.
Real Estate Securities Risk. Real estate securities are subject to the risks associated with direct ownership of real estate, including declines in value, adverse economic conditions, increases in expenses, regulatory changes and environmental problems. Investing in securities of companies in the real estate industry, subjects a fund to the special risks associated with the real estate market including factors such as loss to casualty or condemnation, changes in real estate values, property taxes, interest rates, cash flow of underlying real estate assets, occupancy rates, government regulations affecting zoning, land use and rents, and the management skill and creditworthiness of the issuer.
Risk of Being an Underlying Fund. A fund is subject to the risk of being an underlying fund to the extent that a fund of funds invests in the fund. An underlying fund of a fund of funds may experience relatively large redemptions or investments as the fund of funds periodically reallocates or rebalances its assets. These transactions may cause the underlying fund to sell portfolio securities to meet such redemptions, or to invest cash from such investments, at times it would not otherwise do so, and may as a result increase transaction costs and adversely affect underlying fund performance.
Value Stock Risk. The market may not recognize the intrinsic value of value stocks for a long time, or they may be appropriately priced at the time of purchase.
PerformanceThe following information provides some indication of the risks of investing in the Fund. Past performance (before and after taxes) is not necessarily an indication of how the Fund will perform in the future. You may get updated performance information by calling 1-800-222-5852 or online at:• For Classes A, J, and P - www.principalfunds.com.• For Classes Institutional, R-1, R-2, R-3, R-4, R-5, and R-6 - www.principal.com.
The bar chart shows the investment returns of the Fund’s Class A shares for each full calendar year of operations for 10 years (or, if shorter, the life of the Fund). The table shows, for each share class of the Fund and for the last one, five, and ten calendar year periods (or, if shorter, the life of the Fund), how the Fund’s average annual total returns compare with those of one or more broad measures of market performance.
For periods prior to the inception date of Class J shares (March 2, 2009), Classes A and P shares (June 3, 2014) and Class R-6 shares (November 25, 2014), performance shown in the bar chart and the table for these classes is based on the performance of the Fund's Institutional Class shares adjusted to reflect the respective fees and expenses of each class. The adjustments result in performance for such periods that is no higher than the historical performance of the Institutional Class shares, which were first sold on June 1, 2004.
Total Returns as of December 31 (Class A shares)(1)
Highest return for a quarter during the period of the bar chart above: Q3 '09 23.75 %Lowest return for a quarter during the period of the bar chart above: Q4 '08 (27.14)%
(1) The Fund is showing returns for Class A shares after combining separate prospectuses.

320
Average Annual Total Returns(1)
For the periods ended December 31, 2014 1 Year 5 Years 10 YearsClass A Return Before Taxes (0.24)% 14.03% 6.39%Class A Return After Taxes on Distributions (4.98)% 12.50% 4.79%Class A Return After Taxes on Distribution and Sale of Fund Shares (0.21)% 10.73% 4.64%Class J Return Before Taxes 4.58% 15.07% 6.63%Class P Return Before Taxes 5.87% 15.65% 7.29%Institutional Class Return Before Taxes 6.07% 15.86% 7.47%Class R-1 Return Before Taxes 5.11% 14.83% 6.53%Class R-2 Return Before Taxes 5.23% 14.98% 6.67%Class R-3 Return Before Taxes 5.49% 15.19% 6.86%Class R-4 Return Before Taxes 5.69% 15.42% 7.07%Class R-5 Return Before Taxes 5.82% 15.54% 7.19%Class R-6 Return Before Taxes 5.86% 15.68% 7.32%Russell 2000 Value Index (reflects no deduction for fees, expenses, or taxes) 4.22% 14.26% 6.89%
(1) The Fund is showing after-tax returns for Class A shares after combining separate prospectuses.
After-tax returns are calculated using the historical highest individual federal marginal income tax rates and do not reflect the impact of state and local taxes. Actual after-tax returns depend on an investor’s tax situation and may differ from those shown. The after-tax returns shown are not relevant to investors who hold their Fund shares through tax-deferred arrangements, such as 401(k) plans or individual retirement accounts. After-tax returns are shown for Class A shares only and would be different for the other share classes.
Management
Investment Advisor and Portfolio Managers: Principal Management Corporation• James W. Fennessey (since 2009), Portfolio Manager• Randy L. Welch (since 2009), Portfolio Manager
Sub-Advisors: Dimensional Fund Advisors LPLos Angeles Capital Management and Equity Research, Inc.Vaughan Nelson Investment Management, LP
Purchase and Sale of Fund Shares
Share Class Investment TypePurchase Minimum
Per FundA and J Initial Investment $1,000(1)
A and J For accounts with an Automatic Investment Plan (AIP) $100A and J Subsequent Investments $100(1)(2)
P, Institutional, R-1, R-2, R-3, R-4,R-5, and R-6
There are no minimum initial or subsequent investment requirements foreligible purchases.
N/A
(1) Some exceptions apply; see "Purchase of Fund Shares - Minimum Investments" for more information.(2) For accounts with an AIP, the subsequent automatic investments must total $1,200 annually if the initial $1,000 minimum has not been met.
You may purchase or redeem shares on any business day (normally any day when the New York Stock Exchange is open for regular trading) through your plan, intermediary, or Financial Professional; by sending a written request to Principal Funds at P.O. Box 8024, Boston, MA 02266-8024 (regular mail) or 30 Dan Road, Canton, MA 02021-2809 (overnight mail); calling us at 1-800-222-5852; or accessing our website (www.principalfunds.com).
Tax InformationThe Fund’s distributions you receive are generally subject to federal income tax as ordinary income or capital gain and may also be subject to state and local taxes, unless you are tax-exempt or your account is tax-deferred in which case your distributions would be taxed when withdrawn from the tax-deferred account.

321
Payments to Broker-Dealers and Other Financial IntermediariesFor Class R-6 shares, the Fund and its related companies do not pay broker-dealers or other financial intermediaries (such as a bank, insurance company, investment adviser, etc.) for the sale of Fund shares or related services.
For the other share classes, if you purchase the Fund through a broker-dealer or other financial intermediary (such as a bank, insurance company, investment adviser, etc.), the Fund and its related companies may pay the intermediary for the sale of Fund shares and related services. These payments may create a conflict of interest by influencing the broker-dealer or other intermediary and your salesperson to recommend the Fund over another investment, or to recommend one share class of the Fund over another share class. Ask your salesperson or visit your financial intermediary's website for more information.
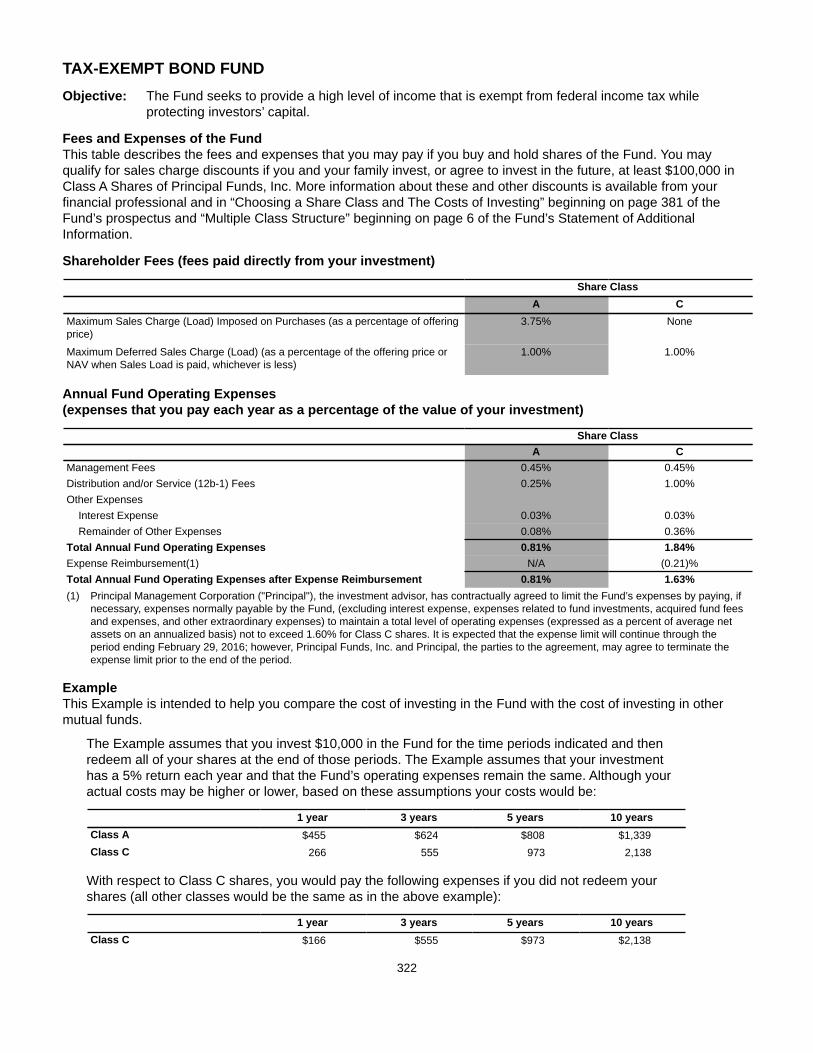
322
TAX-EXEMPT BOND FUNDObjective: The Fund seeks to provide a high level of income that is exempt from federal income tax while
protecting investors’ capital.
Fees and Expenses of the FundThis table describes the fees and expenses that you may pay if you buy and hold shares of the Fund. You may qualify for sales charge discounts if you and your family invest, or agree to invest in the future, at least $100,000 in Class A Shares of Principal Funds, Inc. More information about these and other discounts is available from your financial professional and in “Choosing a Share Class and The Costs of Investing” beginning on page 381 of the Fund’s prospectus and “Multiple Class Structure” beginning on page 6 of the Fund’s Statement of Additional Information.
Shareholder Fees (fees paid directly from your investment)
Share ClassA C
Maximum Sales Charge (Load) Imposed on Purchases (as a percentage of offeringprice)
3.75% None
Maximum Deferred Sales Charge (Load) (as a percentage of the offering price orNAV when Sales Load is paid, whichever is less)
1.00% 1.00%
Annual Fund Operating Expenses (expenses that you pay each year as a percentage of the value of your investment)
Share ClassA C
Management Fees 0.45% 0.45%Distribution and/or Service (12b-1) Fees 0.25% 1.00%Other Expenses
Interest Expense 0.03% 0.03%Remainder of Other Expenses 0.08% 0.36%
Total Annual Fund Operating Expenses 0.81% 1.84%Expense Reimbursement(1) N/A (0.21)%Total Annual Fund Operating Expenses after Expense Reimbursement 0.81% 1.63%(1) Principal Management Corporation ("Principal"), the investment advisor, has contractually agreed to limit the Fund’s expenses by paying, if
necessary, expenses normally payable by the Fund, (excluding interest expense, expenses related to fund investments, acquired fund fees and expenses, and other extraordinary expenses) to maintain a total level of operating expenses (expressed as a percent of average net assets on an annualized basis) not to exceed 1.60% for Class C shares. It is expected that the expense limit will continue through the period ending February 29, 2016; however, Principal Funds, Inc. and Principal, the parties to the agreement, may agree to terminate the expense limit prior to the end of the period.
ExampleThis Example is intended to help you compare the cost of investing in the Fund with the cost of investing in other mutual funds.
The Example assumes that you invest $10,000 in the Fund for the time periods indicated and then redeem all of your shares at the end of those periods. The Example assumes that your investment has a 5% return each year and that the Fund’s operating expenses remain the same. Although your actual costs may be higher or lower, based on these assumptions your costs would be:
1 year 3 years 5 years 10 yearsClass A $455 $624 $808 $1,339Class C 266 555 973 2,138
With respect to Class C shares, you would pay the following expenses if you did not redeem your shares (all other classes would be the same as in the above example):
1 year 3 years 5 years 10 yearsClass C $166 $555 $973 $2,138

323
Portfolio TurnoverThe Fund pays transaction costs, such as commissions, when it buys and sells securities (or “turns over” its portfolio). A higher portfolio turnover rate may indicate higher transaction costs and may result in higher taxes when Fund shares are held in a taxable account. These costs, which are not reflected in annual fund operating expenses or in the example, affect the Fund’s performance. During the most recent fiscal year, the Fund’s portfolio turnover rate was 22.3% of the average value of its portfolio.
Principal Investment StrategiesUnder normal circumstances, the Fund invests at least 80% of its net assets, plus any borrowings for investment purposes, in tax-exempt bonds (securities issued by or on behalf of state or local governments and other public authorities) at the time of each purchase. Many of these are from California and Illinois. Generally, municipal obligations pay interest that is exempt from federal income tax. The Fund also invests in inverse floating rate obligations, which are generally more volatile than other types of municipal obligations and may involve leverage. The Fund may invest up to 20% of its assets in below investment grade bonds (sometimes called “high yield bonds” or "junk bonds") which are rated at the time of purchase Ba1 or lower by Moody's and BB+ or lower by S&P (if the bond has been rated by only one of those agencies, that rating will determine whether the bond is below investment grade; if the bond has not been rated by either of those agencies, the Sub-Advisor will determine whether the bond is of a quality comparable to those rated below investment grade). Under normal circumstances, the Fund maintains an average portfolio duration that is within ±50% of the duration of the Barclays Municipal Bond Index, which as of December 31, 2014 was 4.69 years.
During the fiscal year ended October 31, 2014, the average ratings of the Fund’s fixed-income assets, based on market value at each month-end, were as follows (all ratings are by Moody’s):
11.87% in securities rated Aaa 9.20% in securities rated Baa 0.08% in securities rated Caa 0.00% in securities rated D45.10% in securities rated Aa 4.38% in securities rated Ba 0.00% in securities rated Ca 7.46% in securities not rated19.42% in securities rated A 2.49% in securities rated B 0.00% in securities rated C
Principal RisksThe value of your investment in the Fund changes with the value of the Fund's investments. Many factors affect that value, and it is possible to lose money by investing in the Fund. An investment in the Fund is not a deposit of a bank and is not insured or guaranteed by the Federal Deposit Insurance Corporation or any other government agency. The principal risks of investing in the Fund, in alphabetical order, are:
Counterparty Risk. Counterparty risk is the risk that the counterparty to a derivatives contract or repurchase agreement, the borrower of a portfolio’s securities, or other obligation, will be unable or unwilling to make timely principal, interest, or settlement payments, or otherwise to honor its obligations.
Fixed-Income Securities Risk. Fixed-income securities are subject to interest rate risk and credit quality risk. The market value of fixed-income securities generally declines when interest rates rise, and an issuer of fixed-income securities could default on its payment obligations.
Geographic Concentration Risk. A fund that invests significant portions of its assets in particular geographic areas (a particular state, such as California or Illinois, or a particular country or region) has greater exposure than other funds to economic conditions and developments in those areas.
High Yield Securities Risk. High yield fixed-income securities (commonly referred to as "junk bonds") are subject to greater credit quality risk than higher rated fixed-income securities and should be considered speculative.
Inverse Floating Rate Investments. Inverse floating rate investments are extremely sensitive to changes in interest rates and in some cases their market value may be extremely volatile.
Leverage Risk. Leverage created by borrowing or certain types of transactions or investments may impair the fund's liquidity, cause it to liquidate positions at an unfavorable time, increase volatility of the fund's net asset value, or diminish the fund's performance.
Municipal Securities Risk. Principal and interest payments on municipal securities may not be guaranteed by the issuing body and may be payable only from a particular source. That source may not perform as expected and payment obligations may not be made or made on time.
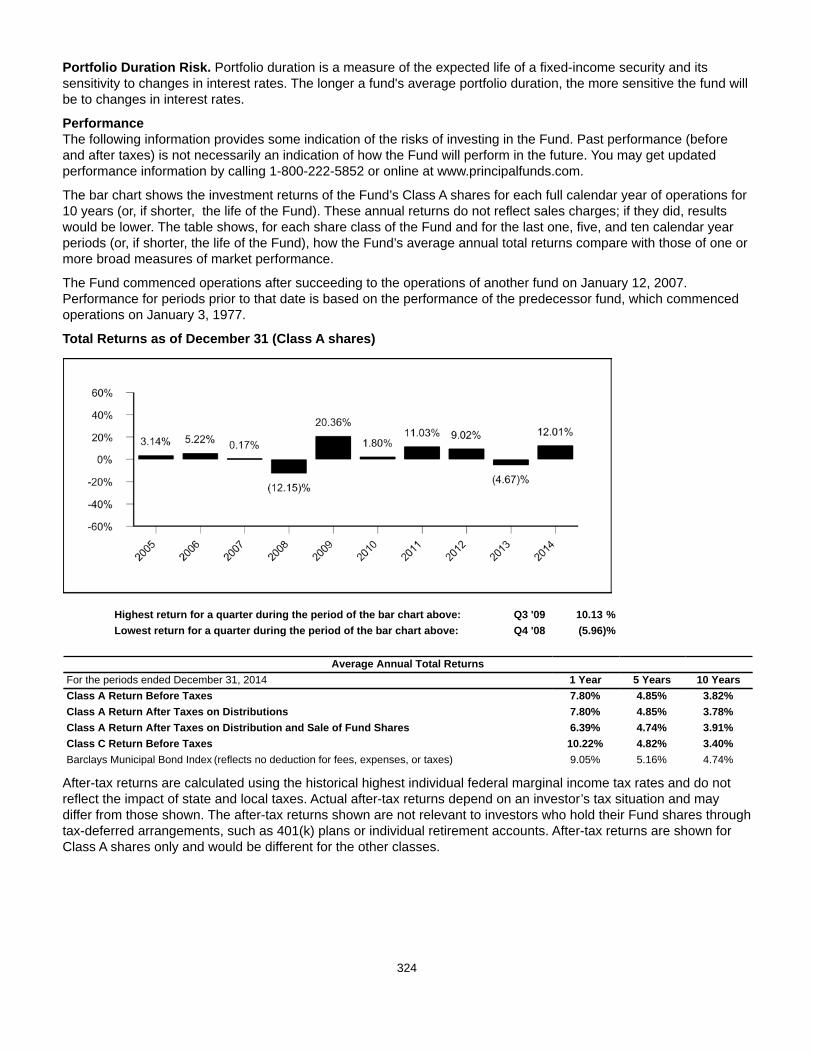
324
Portfolio Duration Risk. Portfolio duration is a measure of the expected life of a fixed-income security and its sensitivity to changes in interest rates. The longer a fund's average portfolio duration, the more sensitive the fund will be to changes in interest rates.
PerformanceThe following information provides some indication of the risks of investing in the Fund. Past performance (before and after taxes) is not necessarily an indication of how the Fund will perform in the future. You may get updated performance information by calling 1-800-222-5852 or online at www.principalfunds.com.
The bar chart shows the investment returns of the Fund’s Class A shares for each full calendar year of operations for 10 years (or, if shorter, the life of the Fund). These annual returns do not reflect sales charges; if they did, results would be lower. The table shows, for each share class of the Fund and for the last one, five, and ten calendar year periods (or, if shorter, the life of the Fund), how the Fund’s average annual total returns compare with those of one or more broad measures of market performance.
The Fund commenced operations after succeeding to the operations of another fund on January 12, 2007. Performance for periods prior to that date is based on the performance of the predecessor fund, which commenced operations on January 3, 1977.
Total Returns as of December 31 (Class A shares)
Highest return for a quarter during the period of the bar chart above: Q3 '09 10.13 %Lowest return for a quarter during the period of the bar chart above: Q4 '08 (5.96)%
Average Annual Total ReturnsFor the periods ended December 31, 2014 1 Year 5 Years 10 YearsClass A Return Before Taxes 7.80% 4.85% 3.82%Class A Return After Taxes on Distributions 7.80% 4.85% 3.78%Class A Return After Taxes on Distribution and Sale of Fund Shares 6.39% 4.74% 3.91%Class C Return Before Taxes 10.22% 4.82% 3.40%Barclays Municipal Bond Index (reflects no deduction for fees, expenses, or taxes) 9.05% 5.16% 4.74%
After-tax returns are calculated using the historical highest individual federal marginal income tax rates and do not reflect the impact of state and local taxes. Actual after-tax returns depend on an investor’s tax situation and may differ from those shown. The after-tax returns shown are not relevant to investors who hold their Fund shares through tax-deferred arrangements, such as 401(k) plans or individual retirement accounts. After-tax returns are shown for Class A shares only and would be different for the other classes.
325
Management
Investment Advisor: Principal Management Corporation
Sub-Advisor and Portfolio Managers: Principal Global Investors, LLC• James Noble (since 2013), Portfolio Manager• James Welch (since 2014), Portfolio Manager
Purchase and Sale of Fund Shares
Share Class Investment TypePurchase Minimum
Per FundA and C Initial Investment $1,000(1)
A and C For accounts with an Automatic Investment Plan (AIP) $100A and C Subsequent Investments $100(1)(2)
(1) Some exceptions apply; see "Purchase of Fund Shares - Minimum Investments" for more information.(2) For accounts with an AIP, the subsequent automatic investments must total $1,200 annually if the initial $1,000 minimum has not been met.
You may purchase or redeem shares on any business day (normally any day when the New York Stock Exchange is open for regular trading) through your plan, intermediary, or Financial Professional; by sending a written request to Principal Funds at P.O. Box 8024, Boston, MA 02266-8024 (regular mail) or 30 Dan Road, Canton, MA 02021-2809 (overnight mail); calling us at 1-800-222-5852; or accessing our website (www.principalfunds.com).
Tax InformationWhile the Fund intends to distribute income that is exempt from regular federal and possibly some state income taxes, a portion of the Fund’s distributions may be subject to federal income taxes or to the federal alternative minimum tax. A portion of the Fund’s distributions likely will be subject to state income taxes depending on the state’s rules.
Payments to Broker-Dealers and Other Financial IntermediariesIf you purchase the Fund through a broker-dealer or other financial intermediary (such as a bank, insurance company, investment adviser, etc.), the Fund and its related companies may pay the intermediary for the sale of Fund shares and related services. These payments may create a conflict of interest by influencing the broker-dealer or other intermediary and your salesperson to recommend the Fund over another investment, or to recommend one share class of the Fund over another share class. Ask your salesperson or visit your financial intermediary’s website for more information.
326
ADDITIONAL INFORMATION ABOUT INVESTMENT STRATEGIES AND RISKS
Each Fund’s investment objective is described in the summary section for each Fund. The summary section also describes each Fund’s principal investment strategies, including the types of securities in which each Fund invests, and the principal risks of investing in each Fund. The principal investment strategies are not the only investment strategies available to each Fund, but they are the ones each Fund primarily uses to achieve its investment objective.
The Board of Directors may change each Fund's objective or the investment strategies without a shareholder vote if it determines such a change is in the best interests of the Fund. If there is a material change to a Fund's investment objective or investment strategies, you should consider whether the Fund remains an appropriate investment for you. There is no guarantee that each Fund will meet its objective.
The investment strategies identified in this section provide specific information about each Fund, but there are some general principles that Principal Management Corporation (“Principal”) and/or the sub-advisors apply in making investment decisions. When making decisions about whether to buy or sell equity securities, Principal and/or the sub-advisors may consider, among other things, a company’s strength in fundamentals, its potential for earnings growth over time, its ability to navigate certain macroeconomic environments, the current price of its securities relative to their perceived worth and relative to others in its industry, and analysis from computer models. When making decisions about whether to buy or sell fixed-income investments, Principal and/or the sub-advisors may consider, among other things, the strength of certain sectors of the fixed-income market relative to others, interest rates, the macroeconomic backdrop, the balance between supply and demand for certain asset classes, other general market conditions, and the credit quality of individual issuers.
Each Fund is designed to be a portion of an investor's portfolio. No Fund is intended to be a complete investment program. Investors should consider the risks of a Fund before making an investment and be prepared to maintain the investment during periods of adverse market conditions. It is possible to lose money by investing in each Fund.
The following table lists each Fund and identifies whether the strategies and risks discussed in this section (listed in alphabetical order) are principal, non-principal, or not applicable for each Fund. The risks described below for the Funds that operate as fund of funds - Principal LifeTime Funds, Principal LifeTime Hybrid Funds and the Strategic Asset Management ("SAM") Portfolios - are risks at both the fund of funds level and underlying funds level. These Funds are also subject to the risks of the underlying funds in which they invest. A Fund is subject to Risk of Being an Underlying Fund to the extent that a fund of funds invests in the Fund. The Statement of Additional Information ("SAI") contains additional information about investment strategies and their related risks.
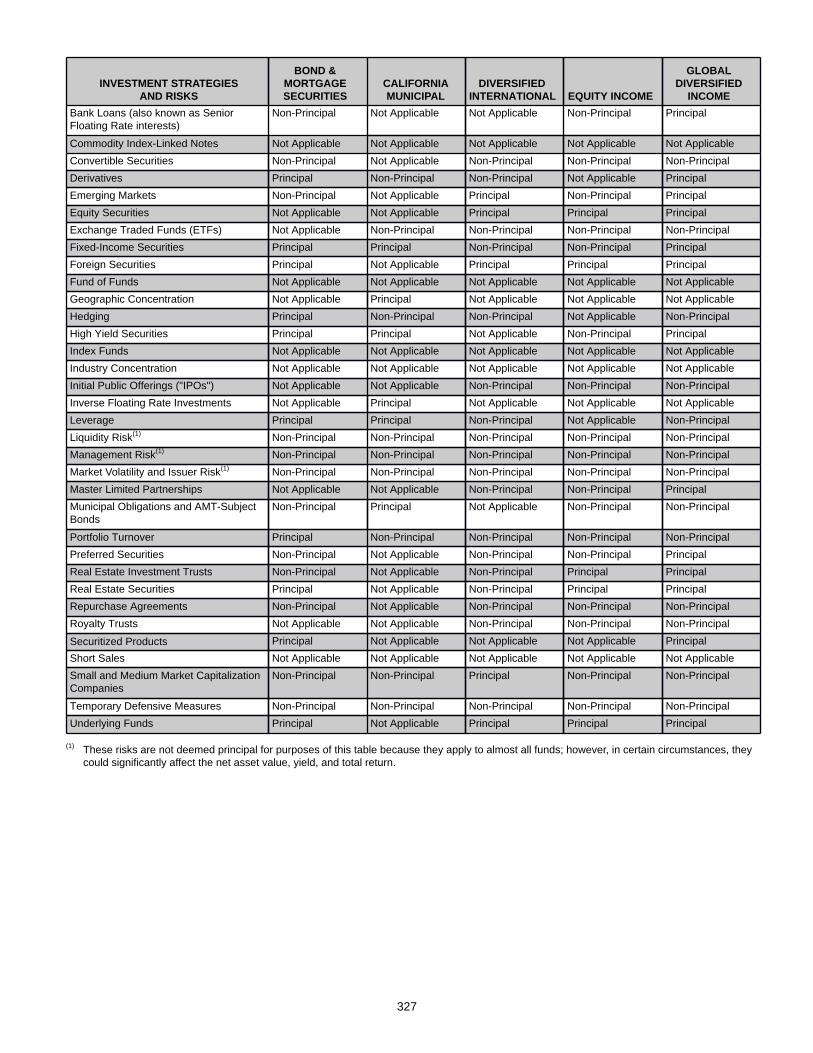
327
INVESTMENT STRATEGIESAND RISKS
BOND &MORTGAGESECURITIES
CALIFORNIAMUNICIPAL
DIVERSIFIEDINTERNATIONAL EQUITY INCOME
GLOBALDIVERSIFIED
INCOMEBank Loans (also known as SeniorFloating Rate interests)
Non-Principal Not Applicable Not Applicable Non-Principal Principal
Commodity Index-Linked Notes Not Applicable Not Applicable Not Applicable Not Applicable Not ApplicableConvertible Securities Non-Principal Not Applicable Non-Principal Non-Principal Non-PrincipalDerivatives Principal Non-Principal Non-Principal Not Applicable PrincipalEmerging Markets Non-Principal Not Applicable Principal Non-Principal PrincipalEquity Securities Not Applicable Not Applicable Principal Principal PrincipalExchange Traded Funds (ETFs) Not Applicable Non-Principal Non-Principal Non-Principal Non-PrincipalFixed-Income Securities Principal Principal Non-Principal Non-Principal PrincipalForeign Securities Principal Not Applicable Principal Principal PrincipalFund of Funds Not Applicable Not Applicable Not Applicable Not Applicable Not ApplicableGeographic Concentration Not Applicable Principal Not Applicable Not Applicable Not ApplicableHedging Principal Non-Principal Non-Principal Not Applicable Non-PrincipalHigh Yield Securities Principal Principal Not Applicable Non-Principal PrincipalIndex Funds Not Applicable Not Applicable Not Applicable Not Applicable Not ApplicableIndustry Concentration Not Applicable Not Applicable Not Applicable Not Applicable Not ApplicableInitial Public Offerings ("IPOs") Not Applicable Not Applicable Non-Principal Non-Principal Non-PrincipalInverse Floating Rate Investments Not Applicable Principal Not Applicable Not Applicable Not ApplicableLeverage Principal Principal Non-Principal Not Applicable Non-PrincipalLiquidity Risk(1) Non-Principal Non-Principal Non-Principal Non-Principal Non-PrincipalManagement Risk(1) Non-Principal Non-Principal Non-Principal Non-Principal Non-PrincipalMarket Volatility and Issuer Risk(1) Non-Principal Non-Principal Non-Principal Non-Principal Non-PrincipalMaster Limited Partnerships Not Applicable Not Applicable Non-Principal Non-Principal PrincipalMunicipal Obligations and AMT-SubjectBonds
Non-Principal Principal Not Applicable Non-Principal Non-Principal
Portfolio Turnover Principal Non-Principal Non-Principal Non-Principal Non-PrincipalPreferred Securities Non-Principal Not Applicable Non-Principal Non-Principal PrincipalReal Estate Investment Trusts Non-Principal Not Applicable Non-Principal Principal PrincipalReal Estate Securities Principal Not Applicable Non-Principal Principal PrincipalRepurchase Agreements Non-Principal Not Applicable Non-Principal Non-Principal Non-PrincipalRoyalty Trusts Not Applicable Not Applicable Non-Principal Non-Principal Non-Principal
Securitized Products Principal Not Applicable Not Applicable Not Applicable PrincipalShort Sales Not Applicable Not Applicable Not Applicable Not Applicable Not ApplicableSmall and Medium Market CapitalizationCompanies
Non-Principal Non-Principal Principal Non-Principal Non-Principal
Temporary Defensive Measures Non-Principal Non-Principal Non-Principal Non-Principal Non-PrincipalUnderlying Funds Principal Not Applicable Principal Principal Principal
(1) These risks are not deemed principal for purposes of this table because they apply to almost all funds; however, in certain circumstances, they could significantly affect the net asset value, yield, and total return.
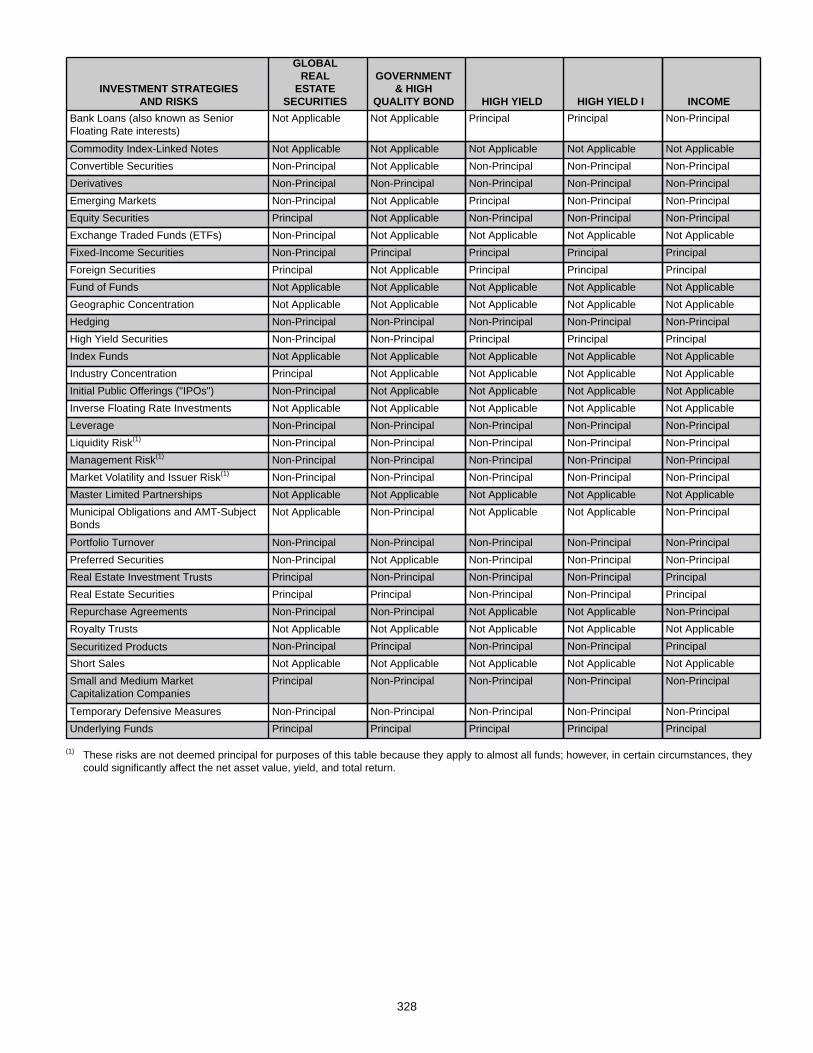
328
INVESTMENT STRATEGIESAND RISKS
GLOBALREAL
ESTATE SECURITIES
GOVERNMENT& HIGH
QUALITY BOND HIGH YIELD HIGH YIELD I INCOMEBank Loans (also known as SeniorFloating Rate interests)
Not Applicable Not Applicable Principal Principal Non-Principal
Commodity Index-Linked Notes Not Applicable Not Applicable Not Applicable Not Applicable Not ApplicableConvertible Securities Non-Principal Not Applicable Non-Principal Non-Principal Non-PrincipalDerivatives Non-Principal Non-Principal Non-Principal Non-Principal Non-PrincipalEmerging Markets Non-Principal Not Applicable Principal Non-Principal Non-PrincipalEquity Securities Principal Not Applicable Non-Principal Non-Principal Non-PrincipalExchange Traded Funds (ETFs) Non-Principal Not Applicable Not Applicable Not Applicable Not ApplicableFixed-Income Securities Non-Principal Principal Principal Principal PrincipalForeign Securities Principal Not Applicable Principal Principal PrincipalFund of Funds Not Applicable Not Applicable Not Applicable Not Applicable Not ApplicableGeographic Concentration Not Applicable Not Applicable Not Applicable Not Applicable Not ApplicableHedging Non-Principal Non-Principal Non-Principal Non-Principal Non-PrincipalHigh Yield Securities Non-Principal Non-Principal Principal Principal PrincipalIndex Funds Not Applicable Not Applicable Not Applicable Not Applicable Not ApplicableIndustry Concentration Principal Not Applicable Not Applicable Not Applicable Not ApplicableInitial Public Offerings ("IPOs") Non-Principal Not Applicable Not Applicable Not Applicable Not ApplicableInverse Floating Rate Investments Not Applicable Not Applicable Not Applicable Not Applicable Not ApplicableLeverage Non-Principal Non-Principal Non-Principal Non-Principal Non-PrincipalLiquidity Risk(1) Non-Principal Non-Principal Non-Principal Non-Principal Non-PrincipalManagement Risk(1) Non-Principal Non-Principal Non-Principal Non-Principal Non-PrincipalMarket Volatility and Issuer Risk(1) Non-Principal Non-Principal Non-Principal Non-Principal Non-PrincipalMaster Limited Partnerships Not Applicable Not Applicable Not Applicable Not Applicable Not ApplicableMunicipal Obligations and AMT-SubjectBonds
Not Applicable Non-Principal Not Applicable Not Applicable Non-Principal
Portfolio Turnover Non-Principal Non-Principal Non-Principal Non-Principal Non-PrincipalPreferred Securities Non-Principal Not Applicable Non-Principal Non-Principal Non-PrincipalReal Estate Investment Trusts Principal Non-Principal Non-Principal Non-Principal PrincipalReal Estate Securities Principal Principal Non-Principal Non-Principal PrincipalRepurchase Agreements Non-Principal Non-Principal Not Applicable Not Applicable Non-PrincipalRoyalty Trusts Not Applicable Not Applicable Not Applicable Not Applicable Not Applicable
Securitized Products Non-Principal Principal Non-Principal Non-Principal PrincipalShort Sales Not Applicable Not Applicable Not Applicable Not Applicable Not ApplicableSmall and Medium MarketCapitalization Companies
Principal Non-Principal Non-Principal Non-Principal Non-Principal
Temporary Defensive Measures Non-Principal Non-Principal Non-Principal Non-Principal Non-PrincipalUnderlying Funds Principal Principal Principal Principal Principal
(1) These risks are not deemed principal for purposes of this table because they apply to almost all funds; however, in certain circumstances, they could significantly affect the net asset value, yield, and total return.
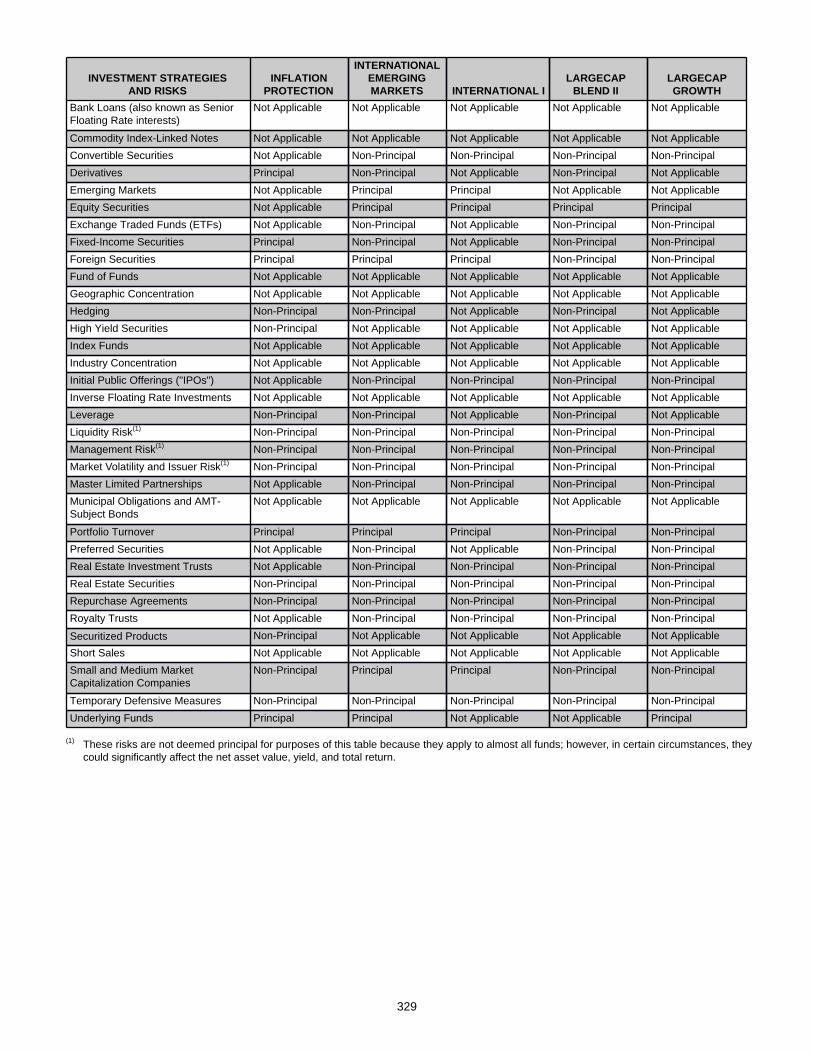
329
INVESTMENT STRATEGIESAND RISKS
INFLATIONPROTECTION
INTERNATIONALEMERGINGMARKETS INTERNATIONAL I
LARGECAPBLEND II
LARGECAPGROWTH
Bank Loans (also known as SeniorFloating Rate interests)
Not Applicable Not Applicable Not Applicable Not Applicable Not Applicable
Commodity Index-Linked Notes Not Applicable Not Applicable Not Applicable Not Applicable Not ApplicableConvertible Securities Not Applicable Non-Principal Non-Principal Non-Principal Non-PrincipalDerivatives Principal Non-Principal Not Applicable Non-Principal Not ApplicableEmerging Markets Not Applicable Principal Principal Not Applicable Not ApplicableEquity Securities Not Applicable Principal Principal Principal PrincipalExchange Traded Funds (ETFs) Not Applicable Non-Principal Not Applicable Non-Principal Non-PrincipalFixed-Income Securities Principal Non-Principal Not Applicable Non-Principal Non-PrincipalForeign Securities Principal Principal Principal Non-Principal Non-PrincipalFund of Funds Not Applicable Not Applicable Not Applicable Not Applicable Not ApplicableGeographic Concentration Not Applicable Not Applicable Not Applicable Not Applicable Not ApplicableHedging Non-Principal Non-Principal Not Applicable Non-Principal Not ApplicableHigh Yield Securities Non-Principal Not Applicable Not Applicable Not Applicable Not ApplicableIndex Funds Not Applicable Not Applicable Not Applicable Not Applicable Not ApplicableIndustry Concentration Not Applicable Not Applicable Not Applicable Not Applicable Not ApplicableInitial Public Offerings ("IPOs") Not Applicable Non-Principal Non-Principal Non-Principal Non-PrincipalInverse Floating Rate Investments Not Applicable Not Applicable Not Applicable Not Applicable Not ApplicableLeverage Non-Principal Non-Principal Not Applicable Non-Principal Not ApplicableLiquidity Risk(1) Non-Principal Non-Principal Non-Principal Non-Principal Non-PrincipalManagement Risk(1) Non-Principal Non-Principal Non-Principal Non-Principal Non-PrincipalMarket Volatility and Issuer Risk(1) Non-Principal Non-Principal Non-Principal Non-Principal Non-PrincipalMaster Limited Partnerships Not Applicable Non-Principal Non-Principal Non-Principal Non-PrincipalMunicipal Obligations and AMT-Subject Bonds
Not Applicable Not Applicable Not Applicable Not Applicable Not Applicable
Portfolio Turnover Principal Principal Principal Non-Principal Non-PrincipalPreferred Securities Not Applicable Non-Principal Not Applicable Non-Principal Non-PrincipalReal Estate Investment Trusts Not Applicable Non-Principal Non-Principal Non-Principal Non-PrincipalReal Estate Securities Non-Principal Non-Principal Non-Principal Non-Principal Non-PrincipalRepurchase Agreements Non-Principal Non-Principal Non-Principal Non-Principal Non-PrincipalRoyalty Trusts Not Applicable Non-Principal Non-Principal Non-Principal Non-Principal
Securitized Products Non-Principal Not Applicable Not Applicable Not Applicable Not ApplicableShort Sales Not Applicable Not Applicable Not Applicable Not Applicable Not ApplicableSmall and Medium MarketCapitalization Companies
Non-Principal Principal Principal Non-Principal Non-Principal
Temporary Defensive Measures Non-Principal Non-Principal Non-Principal Non-Principal Non-PrincipalUnderlying Funds Principal Principal Not Applicable Not Applicable Principal
(1) These risks are not deemed principal for purposes of this table because they apply to almost all funds; however, in certain circumstances, they could significantly affect the net asset value, yield, and total return.
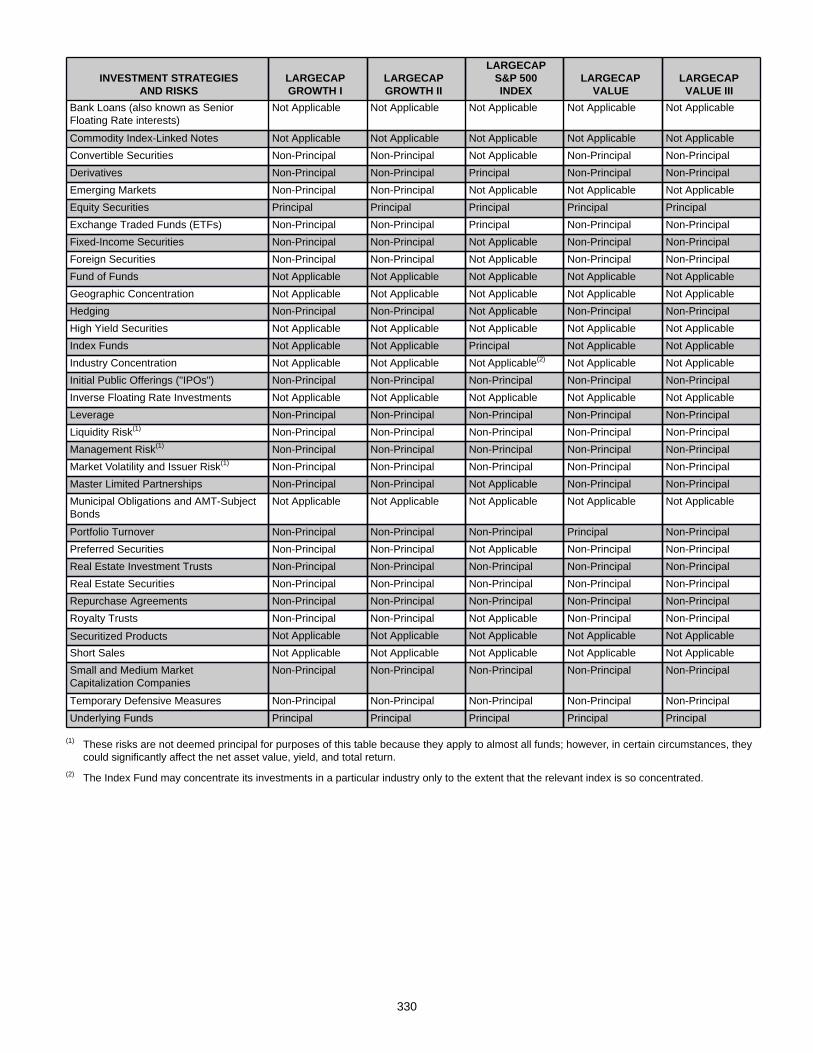
330
INVESTMENT STRATEGIESAND RISKS
LARGECAPGROWTH I
LARGECAPGROWTH II
LARGECAPS&P 500 INDEX
LARGECAPVALUE
LARGECAPVALUE III
Bank Loans (also known as SeniorFloating Rate interests)
Not Applicable Not Applicable Not Applicable Not Applicable Not Applicable
Commodity Index-Linked Notes Not Applicable Not Applicable Not Applicable Not Applicable Not ApplicableConvertible Securities Non-Principal Non-Principal Not Applicable Non-Principal Non-PrincipalDerivatives Non-Principal Non-Principal Principal Non-Principal Non-PrincipalEmerging Markets Non-Principal Non-Principal Not Applicable Not Applicable Not ApplicableEquity Securities Principal Principal Principal Principal PrincipalExchange Traded Funds (ETFs) Non-Principal Non-Principal Principal Non-Principal Non-PrincipalFixed-Income Securities Non-Principal Non-Principal Not Applicable Non-Principal Non-PrincipalForeign Securities Non-Principal Non-Principal Not Applicable Non-Principal Non-PrincipalFund of Funds Not Applicable Not Applicable Not Applicable Not Applicable Not ApplicableGeographic Concentration Not Applicable Not Applicable Not Applicable Not Applicable Not ApplicableHedging Non-Principal Non-Principal Not Applicable Non-Principal Non-PrincipalHigh Yield Securities Not Applicable Not Applicable Not Applicable Not Applicable Not ApplicableIndex Funds Not Applicable Not Applicable Principal Not Applicable Not ApplicableIndustry Concentration Not Applicable Not Applicable Not Applicable(2) Not Applicable Not ApplicableInitial Public Offerings ("IPOs") Non-Principal Non-Principal Non-Principal Non-Principal Non-PrincipalInverse Floating Rate Investments Not Applicable Not Applicable Not Applicable Not Applicable Not ApplicableLeverage Non-Principal Non-Principal Non-Principal Non-Principal Non-PrincipalLiquidity Risk(1) Non-Principal Non-Principal Non-Principal Non-Principal Non-PrincipalManagement Risk(1) Non-Principal Non-Principal Non-Principal Non-Principal Non-PrincipalMarket Volatility and Issuer Risk(1) Non-Principal Non-Principal Non-Principal Non-Principal Non-PrincipalMaster Limited Partnerships Non-Principal Non-Principal Not Applicable Non-Principal Non-PrincipalMunicipal Obligations and AMT-SubjectBonds
Not Applicable Not Applicable Not Applicable Not Applicable Not Applicable
Portfolio Turnover Non-Principal Non-Principal Non-Principal Principal Non-PrincipalPreferred Securities Non-Principal Non-Principal Not Applicable Non-Principal Non-PrincipalReal Estate Investment Trusts Non-Principal Non-Principal Non-Principal Non-Principal Non-PrincipalReal Estate Securities Non-Principal Non-Principal Non-Principal Non-Principal Non-PrincipalRepurchase Agreements Non-Principal Non-Principal Non-Principal Non-Principal Non-PrincipalRoyalty Trusts Non-Principal Non-Principal Not Applicable Non-Principal Non-Principal
Securitized Products Not Applicable Not Applicable Not Applicable Not Applicable Not ApplicableShort Sales Not Applicable Not Applicable Not Applicable Not Applicable Not ApplicableSmall and Medium MarketCapitalization Companies
Non-Principal Non-Principal Non-Principal Non-Principal Non-Principal
Temporary Defensive Measures Non-Principal Non-Principal Non-Principal Non-Principal Non-PrincipalUnderlying Funds Principal Principal Principal Principal Principal
(1) These risks are not deemed principal for purposes of this table because they apply to almost all funds; however, in certain circumstances, they could significantly affect the net asset value, yield, and total return.
(2) The Index Fund may concentrate its investments in a particular industry only to the extent that the relevant index is so concentrated.
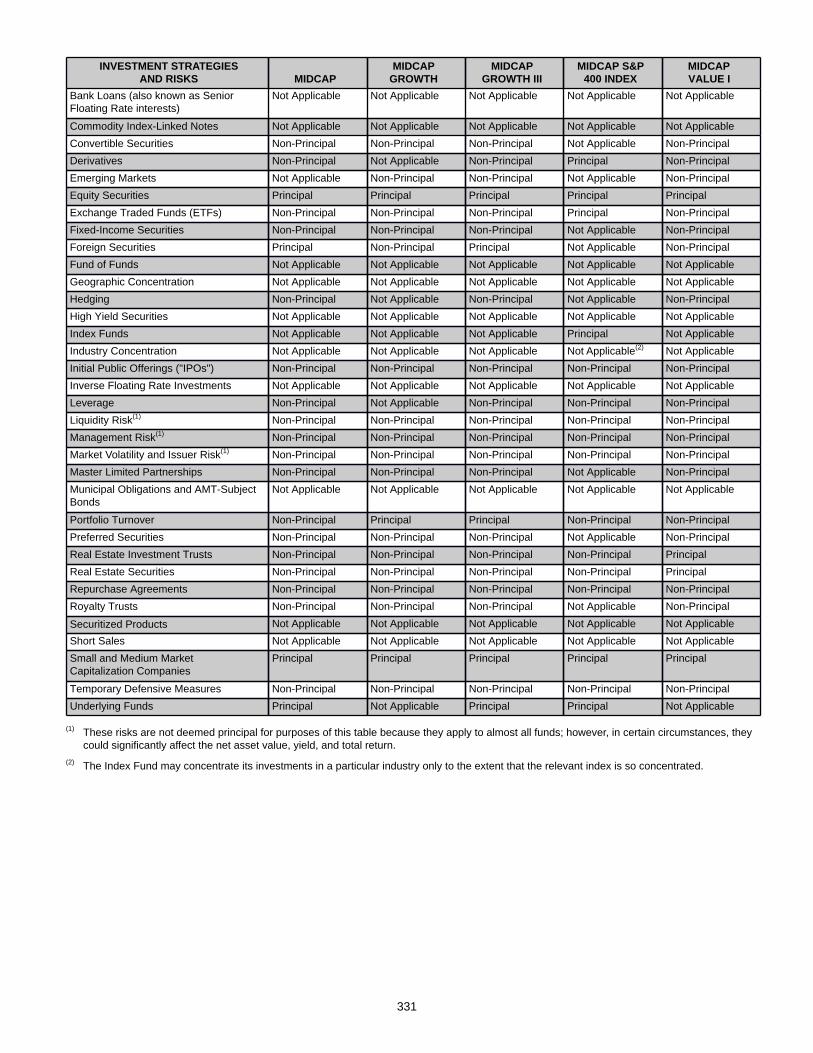
331
INVESTMENT STRATEGIESAND RISKS MIDCAP
MIDCAPGROWTH
MIDCAPGROWTH III
MIDCAP S&P400 INDEX
MIDCAPVALUE I
Bank Loans (also known as SeniorFloating Rate interests)
Not Applicable Not Applicable Not Applicable Not Applicable Not Applicable
Commodity Index-Linked Notes Not Applicable Not Applicable Not Applicable Not Applicable Not ApplicableConvertible Securities Non-Principal Non-Principal Non-Principal Not Applicable Non-PrincipalDerivatives Non-Principal Not Applicable Non-Principal Principal Non-PrincipalEmerging Markets Not Applicable Non-Principal Non-Principal Not Applicable Non-PrincipalEquity Securities Principal Principal Principal Principal PrincipalExchange Traded Funds (ETFs) Non-Principal Non-Principal Non-Principal Principal Non-PrincipalFixed-Income Securities Non-Principal Non-Principal Non-Principal Not Applicable Non-PrincipalForeign Securities Principal Non-Principal Principal Not Applicable Non-PrincipalFund of Funds Not Applicable Not Applicable Not Applicable Not Applicable Not ApplicableGeographic Concentration Not Applicable Not Applicable Not Applicable Not Applicable Not ApplicableHedging Non-Principal Not Applicable Non-Principal Not Applicable Non-PrincipalHigh Yield Securities Not Applicable Not Applicable Not Applicable Not Applicable Not ApplicableIndex Funds Not Applicable Not Applicable Not Applicable Principal Not ApplicableIndustry Concentration Not Applicable Not Applicable Not Applicable Not Applicable(2) Not ApplicableInitial Public Offerings ("IPOs") Non-Principal Non-Principal Non-Principal Non-Principal Non-PrincipalInverse Floating Rate Investments Not Applicable Not Applicable Not Applicable Not Applicable Not ApplicableLeverage Non-Principal Not Applicable Non-Principal Non-Principal Non-PrincipalLiquidity Risk(1) Non-Principal Non-Principal Non-Principal Non-Principal Non-PrincipalManagement Risk(1) Non-Principal Non-Principal Non-Principal Non-Principal Non-PrincipalMarket Volatility and Issuer Risk(1) Non-Principal Non-Principal Non-Principal Non-Principal Non-PrincipalMaster Limited Partnerships Non-Principal Non-Principal Non-Principal Not Applicable Non-PrincipalMunicipal Obligations and AMT-SubjectBonds
Not Applicable Not Applicable Not Applicable Not Applicable Not Applicable
Portfolio Turnover Non-Principal Principal Principal Non-Principal Non-PrincipalPreferred Securities Non-Principal Non-Principal Non-Principal Not Applicable Non-PrincipalReal Estate Investment Trusts Non-Principal Non-Principal Non-Principal Non-Principal PrincipalReal Estate Securities Non-Principal Non-Principal Non-Principal Non-Principal PrincipalRepurchase Agreements Non-Principal Non-Principal Non-Principal Non-Principal Non-PrincipalRoyalty Trusts Non-Principal Non-Principal Non-Principal Not Applicable Non-Principal
Securitized Products Not Applicable Not Applicable Not Applicable Not Applicable Not ApplicableShort Sales Not Applicable Not Applicable Not Applicable Not Applicable Not ApplicableSmall and Medium MarketCapitalization Companies
Principal Principal Principal Principal Principal
Temporary Defensive Measures Non-Principal Non-Principal Non-Principal Non-Principal Non-PrincipalUnderlying Funds Principal Not Applicable Principal Principal Not Applicable
(1) These risks are not deemed principal for purposes of this table because they apply to almost all funds; however, in certain circumstances, they could significantly affect the net asset value, yield, and total return.
(2) The Index Fund may concentrate its investments in a particular industry only to the extent that the relevant index is so concentrated.
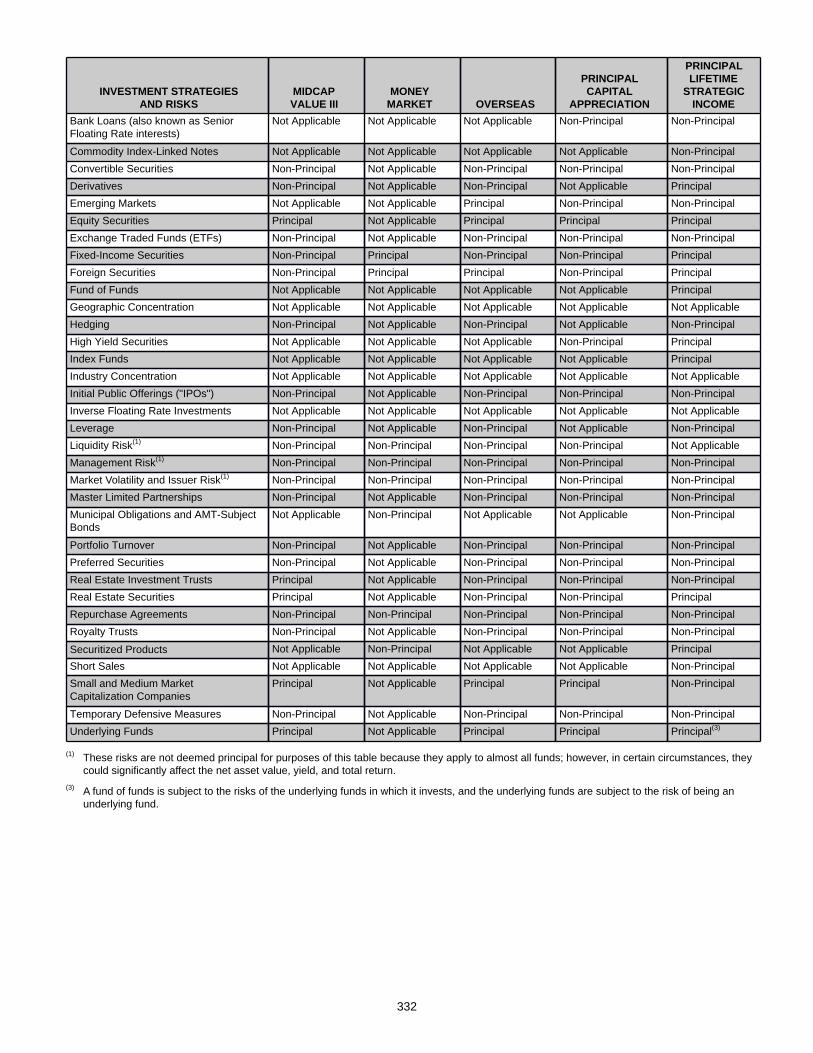
332
INVESTMENT STRATEGIESAND RISKS
MIDCAPVALUE III
MONEYMARKET OVERSEAS
PRINCIPALCAPITAL
APPRECIATION
PRINCIPALLIFETIME
STRATEGICINCOME
Bank Loans (also known as SeniorFloating Rate interests)
Not Applicable Not Applicable Not Applicable Non-Principal Non-Principal
Commodity Index-Linked Notes Not Applicable Not Applicable Not Applicable Not Applicable Non-PrincipalConvertible Securities Non-Principal Not Applicable Non-Principal Non-Principal Non-PrincipalDerivatives Non-Principal Not Applicable Non-Principal Not Applicable PrincipalEmerging Markets Not Applicable Not Applicable Principal Non-Principal Non-PrincipalEquity Securities Principal Not Applicable Principal Principal PrincipalExchange Traded Funds (ETFs) Non-Principal Not Applicable Non-Principal Non-Principal Non-PrincipalFixed-Income Securities Non-Principal Principal Non-Principal Non-Principal PrincipalForeign Securities Non-Principal Principal Principal Non-Principal PrincipalFund of Funds Not Applicable Not Applicable Not Applicable Not Applicable PrincipalGeographic Concentration Not Applicable Not Applicable Not Applicable Not Applicable Not ApplicableHedging Non-Principal Not Applicable Non-Principal Not Applicable Non-PrincipalHigh Yield Securities Not Applicable Not Applicable Not Applicable Non-Principal PrincipalIndex Funds Not Applicable Not Applicable Not Applicable Not Applicable PrincipalIndustry Concentration Not Applicable Not Applicable Not Applicable Not Applicable Not ApplicableInitial Public Offerings ("IPOs") Non-Principal Not Applicable Non-Principal Non-Principal Non-PrincipalInverse Floating Rate Investments Not Applicable Not Applicable Not Applicable Not Applicable Not ApplicableLeverage Non-Principal Not Applicable Non-Principal Not Applicable Non-PrincipalLiquidity Risk(1) Non-Principal Non-Principal Non-Principal Non-Principal Not ApplicableManagement Risk(1) Non-Principal Non-Principal Non-Principal Non-Principal Non-PrincipalMarket Volatility and Issuer Risk(1) Non-Principal Non-Principal Non-Principal Non-Principal Non-PrincipalMaster Limited Partnerships Non-Principal Not Applicable Non-Principal Non-Principal Non-PrincipalMunicipal Obligations and AMT-SubjectBonds
Not Applicable Non-Principal Not Applicable Not Applicable Non-Principal
Portfolio Turnover Non-Principal Not Applicable Non-Principal Non-Principal Non-PrincipalPreferred Securities Non-Principal Not Applicable Non-Principal Non-Principal Non-PrincipalReal Estate Investment Trusts Principal Not Applicable Non-Principal Non-Principal Non-PrincipalReal Estate Securities Principal Not Applicable Non-Principal Non-Principal PrincipalRepurchase Agreements Non-Principal Non-Principal Non-Principal Non-Principal Non-PrincipalRoyalty Trusts Non-Principal Not Applicable Non-Principal Non-Principal Non-Principal
Securitized Products Not Applicable Non-Principal Not Applicable Not Applicable PrincipalShort Sales Not Applicable Not Applicable Not Applicable Not Applicable Non-PrincipalSmall and Medium MarketCapitalization Companies
Principal Not Applicable Principal Principal Non-Principal
Temporary Defensive Measures Non-Principal Not Applicable Non-Principal Non-Principal Non-PrincipalUnderlying Funds Principal Not Applicable Principal Principal Principal(3)
(1) These risks are not deemed principal for purposes of this table because they apply to almost all funds; however, in certain circumstances, they could significantly affect the net asset value, yield, and total return.
(3) A fund of funds is subject to the risks of the underlying funds in which it invests, and the underlying funds are subject to the risk of being an underlying fund.
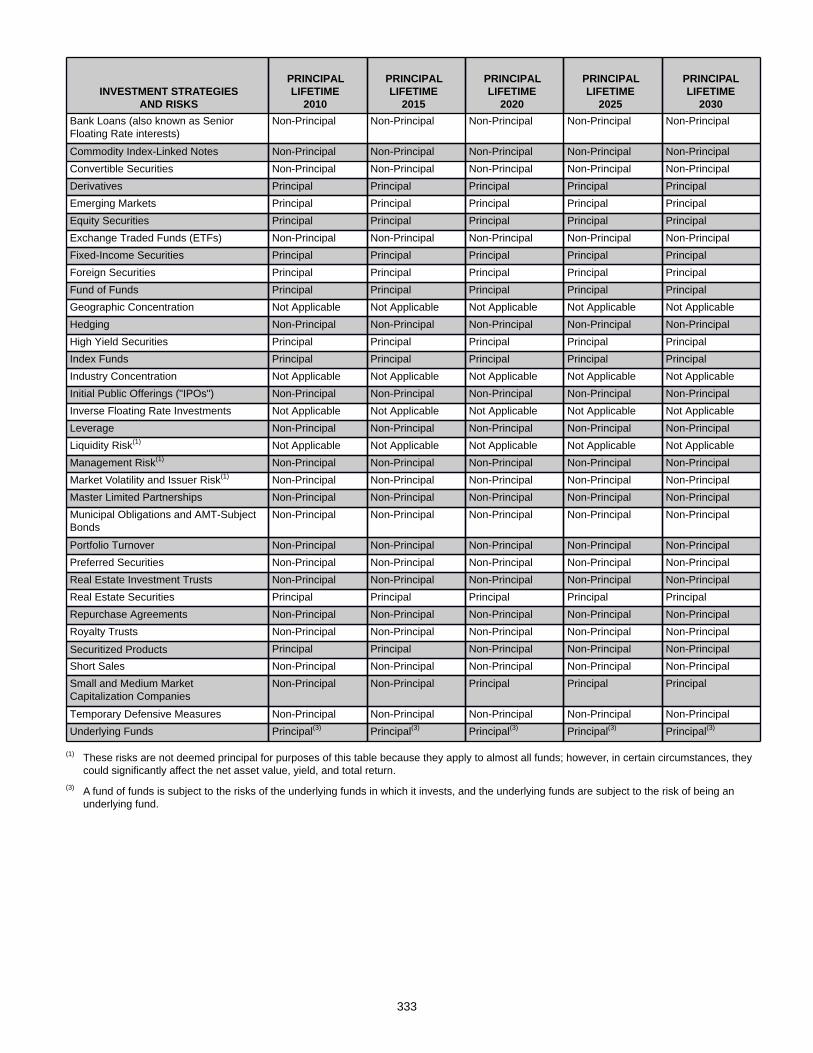
333
INVESTMENT STRATEGIESAND RISKS
PRINCIPALLIFETIME
2010
PRINCIPALLIFETIME
2015
PRINCIPALLIFETIME
2020
PRINCIPALLIFETIME
2025
PRINCIPAL LIFETIME
2030Bank Loans (also known as SeniorFloating Rate interests)
Non-Principal Non-Principal Non-Principal Non-Principal Non-Principal
Commodity Index-Linked Notes Non-Principal Non-Principal Non-Principal Non-Principal Non-PrincipalConvertible Securities Non-Principal Non-Principal Non-Principal Non-Principal Non-PrincipalDerivatives Principal Principal Principal Principal PrincipalEmerging Markets Principal Principal Principal Principal PrincipalEquity Securities Principal Principal Principal Principal PrincipalExchange Traded Funds (ETFs) Non-Principal Non-Principal Non-Principal Non-Principal Non-PrincipalFixed-Income Securities Principal Principal Principal Principal PrincipalForeign Securities Principal Principal Principal Principal PrincipalFund of Funds Principal Principal Principal Principal PrincipalGeographic Concentration Not Applicable Not Applicable Not Applicable Not Applicable Not ApplicableHedging Non-Principal Non-Principal Non-Principal Non-Principal Non-PrincipalHigh Yield Securities Principal Principal Principal Principal PrincipalIndex Funds Principal Principal Principal Principal PrincipalIndustry Concentration Not Applicable Not Applicable Not Applicable Not Applicable Not ApplicableInitial Public Offerings ("IPOs") Non-Principal Non-Principal Non-Principal Non-Principal Non-PrincipalInverse Floating Rate Investments Not Applicable Not Applicable Not Applicable Not Applicable Not ApplicableLeverage Non-Principal Non-Principal Non-Principal Non-Principal Non-PrincipalLiquidity Risk(1) Not Applicable Not Applicable Not Applicable Not Applicable Not ApplicableManagement Risk(1) Non-Principal Non-Principal Non-Principal Non-Principal Non-PrincipalMarket Volatility and Issuer Risk(1) Non-Principal Non-Principal Non-Principal Non-Principal Non-PrincipalMaster Limited Partnerships Non-Principal Non-Principal Non-Principal Non-Principal Non-PrincipalMunicipal Obligations and AMT-SubjectBonds
Non-Principal Non-Principal Non-Principal Non-Principal Non-Principal
Portfolio Turnover Non-Principal Non-Principal Non-Principal Non-Principal Non-PrincipalPreferred Securities Non-Principal Non-Principal Non-Principal Non-Principal Non-PrincipalReal Estate Investment Trusts Non-Principal Non-Principal Non-Principal Non-Principal Non-PrincipalReal Estate Securities Principal Principal Principal Principal PrincipalRepurchase Agreements Non-Principal Non-Principal Non-Principal Non-Principal Non-PrincipalRoyalty Trusts Non-Principal Non-Principal Non-Principal Non-Principal Non-Principal
Securitized Products Principal Principal Non-Principal Non-Principal Non-PrincipalShort Sales Non-Principal Non-Principal Non-Principal Non-Principal Non-PrincipalSmall and Medium MarketCapitalization Companies
Non-Principal Non-Principal Principal Principal Principal
Temporary Defensive Measures Non-Principal Non-Principal Non-Principal Non-Principal Non-PrincipalUnderlying Funds Principal(3) Principal(3) Principal(3) Principal(3) Principal(3)
(1) These risks are not deemed principal for purposes of this table because they apply to almost all funds; however, in certain circumstances, they could significantly affect the net asset value, yield, and total return.
(3) A fund of funds is subject to the risks of the underlying funds in which it invests, and the underlying funds are subject to the risk of being an underlying fund.
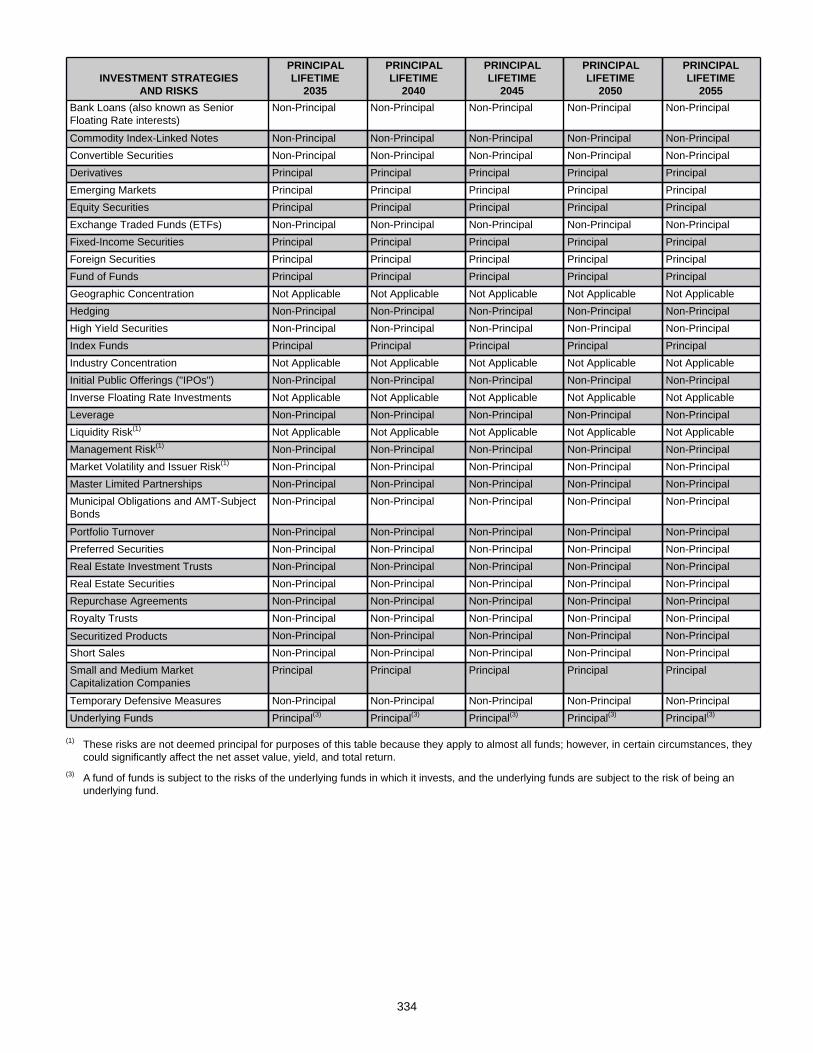
334
INVESTMENT STRATEGIESAND RISKS
PRINCIPALLIFETIME
2035
PRINCIPALLIFETIME
2040
PRINCIPALLIFETIME
2045
PRINCIPALLIFETIME
2050
PRINCIPAL LIFETIME
2055Bank Loans (also known as SeniorFloating Rate interests)
Non-Principal Non-Principal Non-Principal Non-Principal Non-Principal
Commodity Index-Linked Notes Non-Principal Non-Principal Non-Principal Non-Principal Non-PrincipalConvertible Securities Non-Principal Non-Principal Non-Principal Non-Principal Non-PrincipalDerivatives Principal Principal Principal Principal PrincipalEmerging Markets Principal Principal Principal Principal PrincipalEquity Securities Principal Principal Principal Principal PrincipalExchange Traded Funds (ETFs) Non-Principal Non-Principal Non-Principal Non-Principal Non-PrincipalFixed-Income Securities Principal Principal Principal Principal PrincipalForeign Securities Principal Principal Principal Principal PrincipalFund of Funds Principal Principal Principal Principal PrincipalGeographic Concentration Not Applicable Not Applicable Not Applicable Not Applicable Not ApplicableHedging Non-Principal Non-Principal Non-Principal Non-Principal Non-PrincipalHigh Yield Securities Non-Principal Non-Principal Non-Principal Non-Principal Non-PrincipalIndex Funds Principal Principal Principal Principal PrincipalIndustry Concentration Not Applicable Not Applicable Not Applicable Not Applicable Not ApplicableInitial Public Offerings ("IPOs") Non-Principal Non-Principal Non-Principal Non-Principal Non-PrincipalInverse Floating Rate Investments Not Applicable Not Applicable Not Applicable Not Applicable Not ApplicableLeverage Non-Principal Non-Principal Non-Principal Non-Principal Non-PrincipalLiquidity Risk(1) Not Applicable Not Applicable Not Applicable Not Applicable Not ApplicableManagement Risk(1) Non-Principal Non-Principal Non-Principal Non-Principal Non-PrincipalMarket Volatility and Issuer Risk(1) Non-Principal Non-Principal Non-Principal Non-Principal Non-PrincipalMaster Limited Partnerships Non-Principal Non-Principal Non-Principal Non-Principal Non-PrincipalMunicipal Obligations and AMT-SubjectBonds
Non-Principal Non-Principal Non-Principal Non-Principal Non-Principal
Portfolio Turnover Non-Principal Non-Principal Non-Principal Non-Principal Non-PrincipalPreferred Securities Non-Principal Non-Principal Non-Principal Non-Principal Non-PrincipalReal Estate Investment Trusts Non-Principal Non-Principal Non-Principal Non-Principal Non-PrincipalReal Estate Securities Non-Principal Non-Principal Non-Principal Non-Principal Non-PrincipalRepurchase Agreements Non-Principal Non-Principal Non-Principal Non-Principal Non-PrincipalRoyalty Trusts Non-Principal Non-Principal Non-Principal Non-Principal Non-Principal
Securitized Products Non-Principal Non-Principal Non-Principal Non-Principal Non-PrincipalShort Sales Non-Principal Non-Principal Non-Principal Non-Principal Non-PrincipalSmall and Medium MarketCapitalization Companies
Principal Principal Principal Principal Principal
Temporary Defensive Measures Non-Principal Non-Principal Non-Principal Non-Principal Non-PrincipalUnderlying Funds Principal(3) Principal(3) Principal(3) Principal(3) Principal(3)
(1) These risks are not deemed principal for purposes of this table because they apply to almost all funds; however, in certain circumstances, they could significantly affect the net asset value, yield, and total return.
(3) A fund of funds is subject to the risks of the underlying funds in which it invests, and the underlying funds are subject to the risk of being an underlying fund.
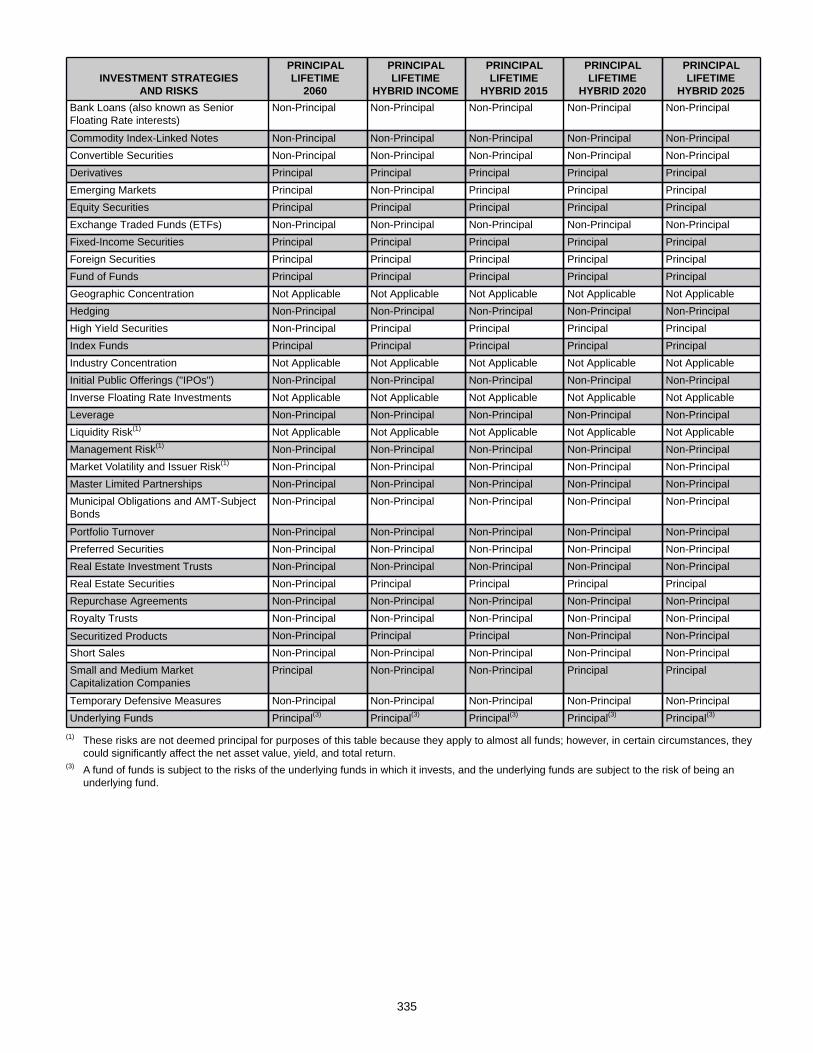
335
INVESTMENT STRATEGIESAND RISKS
PRINCIPALLIFETIME
2060
PRINCIPALLIFETIME
HYBRID INCOME
PRINCIPALLIFETIME
HYBRID 2015
PRINCIPALLIFETIME
HYBRID 2020
PRINCIPALLIFETIME
HYBRID 2025Bank Loans (also known as SeniorFloating Rate interests)
Non-Principal Non-Principal Non-Principal Non-Principal Non-Principal
Commodity Index-Linked Notes Non-Principal Non-Principal Non-Principal Non-Principal Non-PrincipalConvertible Securities Non-Principal Non-Principal Non-Principal Non-Principal Non-PrincipalDerivatives Principal Principal Principal Principal PrincipalEmerging Markets Principal Non-Principal Principal Principal PrincipalEquity Securities Principal Principal Principal Principal PrincipalExchange Traded Funds (ETFs) Non-Principal Non-Principal Non-Principal Non-Principal Non-PrincipalFixed-Income Securities Principal Principal Principal Principal PrincipalForeign Securities Principal Principal Principal Principal PrincipalFund of Funds Principal Principal Principal Principal PrincipalGeographic Concentration Not Applicable Not Applicable Not Applicable Not Applicable Not ApplicableHedging Non-Principal Non-Principal Non-Principal Non-Principal Non-PrincipalHigh Yield Securities Non-Principal Principal Principal Principal PrincipalIndex Funds Principal Principal Principal Principal PrincipalIndustry Concentration Not Applicable Not Applicable Not Applicable Not Applicable Not ApplicableInitial Public Offerings ("IPOs") Non-Principal Non-Principal Non-Principal Non-Principal Non-PrincipalInverse Floating Rate Investments Not Applicable Not Applicable Not Applicable Not Applicable Not ApplicableLeverage Non-Principal Non-Principal Non-Principal Non-Principal Non-PrincipalLiquidity Risk(1) Not Applicable Not Applicable Not Applicable Not Applicable Not ApplicableManagement Risk(1) Non-Principal Non-Principal Non-Principal Non-Principal Non-PrincipalMarket Volatility and Issuer Risk(1) Non-Principal Non-Principal Non-Principal Non-Principal Non-PrincipalMaster Limited Partnerships Non-Principal Non-Principal Non-Principal Non-Principal Non-PrincipalMunicipal Obligations and AMT-SubjectBonds
Non-Principal Non-Principal Non-Principal Non-Principal Non-Principal
Portfolio Turnover Non-Principal Non-Principal Non-Principal Non-Principal Non-PrincipalPreferred Securities Non-Principal Non-Principal Non-Principal Non-Principal Non-PrincipalReal Estate Investment Trusts Non-Principal Non-Principal Non-Principal Non-Principal Non-PrincipalReal Estate Securities Non-Principal Principal Principal Principal PrincipalRepurchase Agreements Non-Principal Non-Principal Non-Principal Non-Principal Non-PrincipalRoyalty Trusts Non-Principal Non-Principal Non-Principal Non-Principal Non-Principal
Securitized Products Non-Principal Principal Principal Non-Principal Non-PrincipalShort Sales Non-Principal Non-Principal Non-Principal Non-Principal Non-PrincipalSmall and Medium MarketCapitalization Companies
Principal Non-Principal Non-Principal Principal Principal
Temporary Defensive Measures Non-Principal Non-Principal Non-Principal Non-Principal Non-PrincipalUnderlying Funds Principal(3) Principal(3) Principal(3) Principal(3) Principal(3)
(1) These risks are not deemed principal for purposes of this table because they apply to almost all funds; however, in certain circumstances, they could significantly affect the net asset value, yield, and total return.
(3) A fund of funds is subject to the risks of the underlying funds in which it invests, and the underlying funds are subject to the risk of being an underlying fund.

336
INVESTMENT STRATEGIESAND RISKS
PRINCIPALLIFETIME
HYBRID 2030
PRINCIPALLIFETIME
HYBRID 2035
PRINCIPALLIFETIME
HYBRID 2040
PRINCIPALLIFETIME
HYBRID 2045
PRINCIPALLIFETIME
HYBRID 2050Bank Loans (also known as SeniorFloating Rate interests)
Non-Principal Non-Principal Non-Principal Non-Principal Non-Principal
Commodity Index-Linked Notes Non-Principal Non-Principal Non-Principal Non-Principal Non-PrincipalConvertible Securities Non-Principal Non-Principal Non-Principal Non-Principal Non-PrincipalDerivatives Principal Principal Principal Principal PrincipalEmerging Markets Principal Principal Principal Principal PrincipalEquity Securities Principal Principal Principal Principal PrincipalExchange Traded Funds (ETFs) Non-Principal Non-Principal Non-Principal Non-Principal Non-PrincipalFixed-Income Securities Principal Principal Principal Principal PrincipalForeign Securities Principal Principal Principal Principal PrincipalFund of Funds Principal Principal Principal Principal PrincipalGeographic Concentration Not Applicable Not Applicable Not Applicable Not Applicable Not ApplicableHedging Non-Principal Non-Principal Non-Principal Non-Principal Non-PrincipalHigh Yield Securities Principal Non-Principal Non-Principal Non-Principal Non-PrincipalIndex Funds Principal Principal Principal Principal PrincipalIndustry Concentration Not Applicable Not Applicable Not Applicable Not Applicable Not ApplicableInitial Public Offerings ("IPOs") Non-Principal Non-Principal Non-Principal Non-Principal Non-PrincipalInverse Floating Rate Investments Not Applicable Not Applicable Not Applicable Not Applicable Not ApplicableLeverage Non-Principal Non-Principal Non-Principal Non-Principal Non-PrincipalLiquidity Risk(1) Not Applicable Not Applicable Not Applicable Not Applicable Not ApplicableManagement Risk(1) Non-Principal Non-Principal Non-Principal Non-Principal Non-PrincipalMarket Volatility and Issuer Risk(1) Non-Principal Non-Principal Non-Principal Non-Principal Non-PrincipalMaster Limited Partnerships Non-Principal Non-Principal Non-Principal Non-Principal Non-PrincipalMunicipal Obligations and AMT-SubjectBonds
Non-Principal Non-Principal Non-Principal Non-Principal Non-Principal
Portfolio Turnover Non-Principal Non-Principal Non-Principal Non-Principal Non-PrincipalPreferred Securities Non-Principal Non-Principal Non-Principal Non-Principal Non-PrincipalReal Estate Investment Trusts Non-Principal Non-Principal Non-Principal Non-Principal Non-PrincipalReal Estate Securities Principal Principal Principal Principal Non-PrincipalRepurchase Agreements Non-Principal Non-Principal Non-Principal Non-Principal Non-PrincipalRoyalty Trusts Non-Principal Non-Principal Non-Principal Non-Principal Non-Principal
Securitized Products Non-Principal Non-Principal Non-Principal Non-Principal Non-PrincipalShort Sales Non-Principal Non-Principal Non-Principal Non-Principal Non-PrincipalSmall and Medium MarketCapitalization Companies
Principal Principal Principal Principal Principal
Temporary Defensive Measures Non-Principal Non-Principal Non-Principal Non-Principal Non-PrincipalUnderlying Funds Principal(3) Principal(3) Principal(3) Principal(3) Principal(3)
(1) These risks are not deemed principal for purposes of this table because they apply to almost all funds; however, in certain circumstances, they could significantly affect the net asset value, yield, and total return.
(3) A fund of funds is subject to the risks of the underlying funds in which it invests, and the underlying funds are subject to the risk of being an underlying fund.
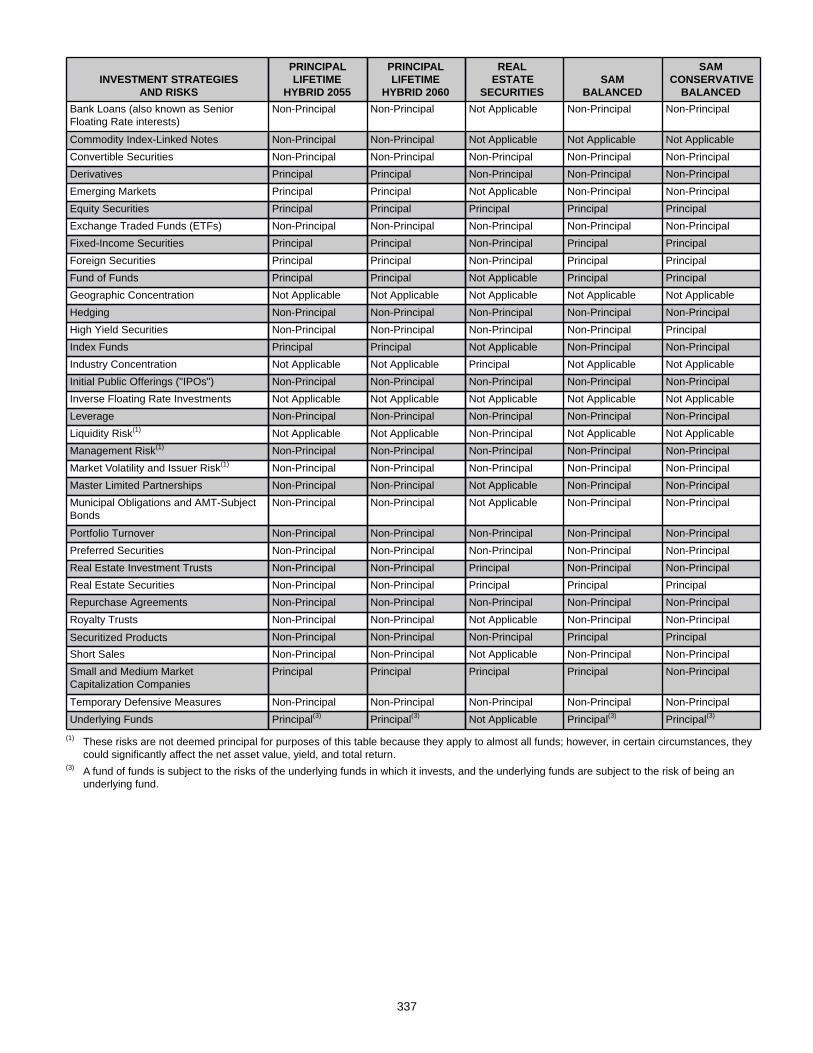
337
INVESTMENT STRATEGIESAND RISKS
PRINCIPALLIFETIME
HYBRID 2055
PRINCIPAL LIFETIME
HYBRID 2060
REALESTATE
SECURITIESSAM
BALANCED
SAMCONSERVATIVE
BALANCEDBank Loans (also known as SeniorFloating Rate interests)
Non-Principal Non-Principal Not Applicable Non-Principal Non-Principal
Commodity Index-Linked Notes Non-Principal Non-Principal Not Applicable Not Applicable Not ApplicableConvertible Securities Non-Principal Non-Principal Non-Principal Non-Principal Non-PrincipalDerivatives Principal Principal Non-Principal Non-Principal Non-PrincipalEmerging Markets Principal Principal Not Applicable Non-Principal Non-PrincipalEquity Securities Principal Principal Principal Principal PrincipalExchange Traded Funds (ETFs) Non-Principal Non-Principal Non-Principal Non-Principal Non-PrincipalFixed-Income Securities Principal Principal Non-Principal Principal PrincipalForeign Securities Principal Principal Non-Principal Principal PrincipalFund of Funds Principal Principal Not Applicable Principal PrincipalGeographic Concentration Not Applicable Not Applicable Not Applicable Not Applicable Not ApplicableHedging Non-Principal Non-Principal Non-Principal Non-Principal Non-PrincipalHigh Yield Securities Non-Principal Non-Principal Non-Principal Non-Principal PrincipalIndex Funds Principal Principal Not Applicable Non-Principal Non-PrincipalIndustry Concentration Not Applicable Not Applicable Principal Not Applicable Not ApplicableInitial Public Offerings ("IPOs") Non-Principal Non-Principal Non-Principal Non-Principal Non-PrincipalInverse Floating Rate Investments Not Applicable Not Applicable Not Applicable Not Applicable Not ApplicableLeverage Non-Principal Non-Principal Non-Principal Non-Principal Non-PrincipalLiquidity Risk(1) Not Applicable Not Applicable Non-Principal Not Applicable Not ApplicableManagement Risk(1) Non-Principal Non-Principal Non-Principal Non-Principal Non-PrincipalMarket Volatility and Issuer Risk(1) Non-Principal Non-Principal Non-Principal Non-Principal Non-PrincipalMaster Limited Partnerships Non-Principal Non-Principal Not Applicable Non-Principal Non-PrincipalMunicipal Obligations and AMT-SubjectBonds
Non-Principal Non-Principal Not Applicable Non-Principal Non-Principal
Portfolio Turnover Non-Principal Non-Principal Non-Principal Non-Principal Non-PrincipalPreferred Securities Non-Principal Non-Principal Non-Principal Non-Principal Non-PrincipalReal Estate Investment Trusts Non-Principal Non-Principal Principal Non-Principal Non-PrincipalReal Estate Securities Non-Principal Non-Principal Principal Principal PrincipalRepurchase Agreements Non-Principal Non-Principal Non-Principal Non-Principal Non-PrincipalRoyalty Trusts Non-Principal Non-Principal Not Applicable Non-Principal Non-Principal
Securitized Products Non-Principal Non-Principal Non-Principal Principal PrincipalShort Sales Non-Principal Non-Principal Not Applicable Non-Principal Non-PrincipalSmall and Medium MarketCapitalization Companies
Principal Principal Principal Principal Non-Principal
Temporary Defensive Measures Non-Principal Non-Principal Non-Principal Non-Principal Non-PrincipalUnderlying Funds Principal(3) Principal(3) Not Applicable Principal(3) Principal(3)
(1) These risks are not deemed principal for purposes of this table because they apply to almost all funds; however, in certain circumstances, they could significantly affect the net asset value, yield, and total return.
(3) A fund of funds is subject to the risks of the underlying funds in which it invests, and the underlying funds are subject to the risk of being an underlying fund.
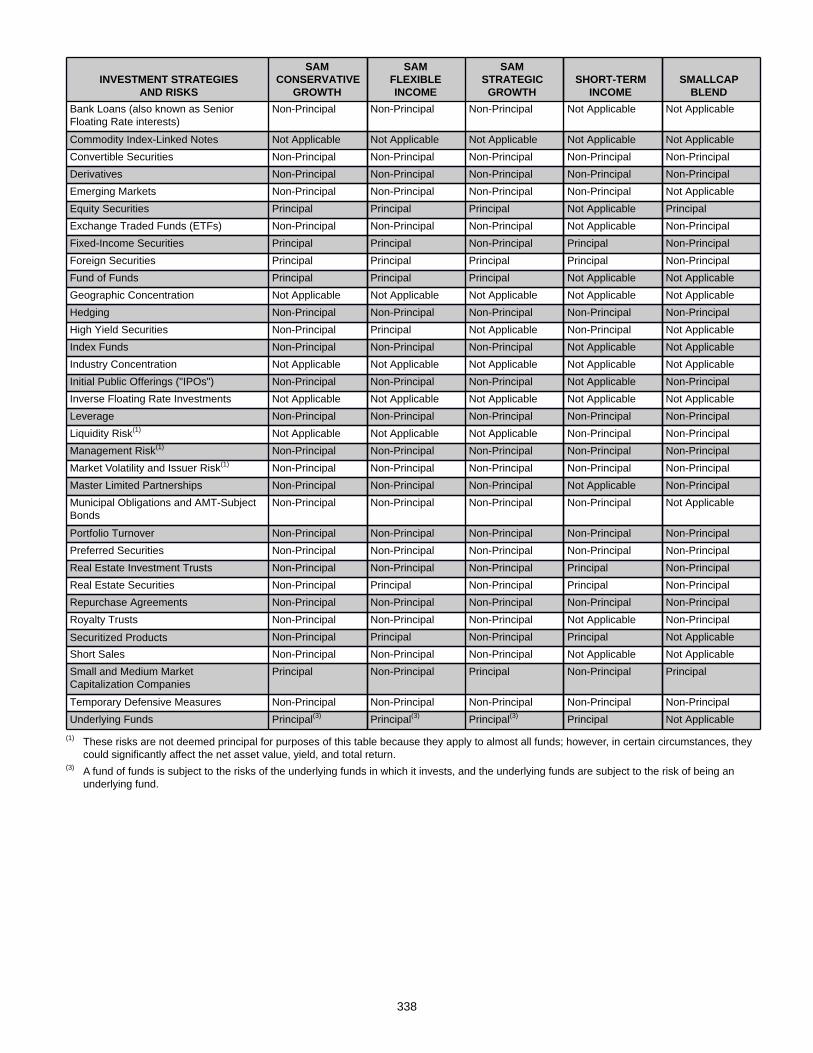
338
INVESTMENT STRATEGIESAND RISKS
SAMCONSERVATIVE
GROWTH
SAMFLEXIBLE INCOME
SAMSTRATEGIC
GROWTHSHORT-TERM
INCOMESMALLCAP
BLENDBank Loans (also known as SeniorFloating Rate interests)
Non-Principal Non-Principal Non-Principal Not Applicable Not Applicable
Commodity Index-Linked Notes Not Applicable Not Applicable Not Applicable Not Applicable Not ApplicableConvertible Securities Non-Principal Non-Principal Non-Principal Non-Principal Non-PrincipalDerivatives Non-Principal Non-Principal Non-Principal Non-Principal Non-PrincipalEmerging Markets Non-Principal Non-Principal Non-Principal Non-Principal Not ApplicableEquity Securities Principal Principal Principal Not Applicable PrincipalExchange Traded Funds (ETFs) Non-Principal Non-Principal Non-Principal Not Applicable Non-PrincipalFixed-Income Securities Principal Principal Non-Principal Principal Non-PrincipalForeign Securities Principal Principal Principal Principal Non-PrincipalFund of Funds Principal Principal Principal Not Applicable Not ApplicableGeographic Concentration Not Applicable Not Applicable Not Applicable Not Applicable Not ApplicableHedging Non-Principal Non-Principal Non-Principal Non-Principal Non-PrincipalHigh Yield Securities Non-Principal Principal Not Applicable Non-Principal Not ApplicableIndex Funds Non-Principal Non-Principal Non-Principal Not Applicable Not ApplicableIndustry Concentration Not Applicable Not Applicable Not Applicable Not Applicable Not ApplicableInitial Public Offerings ("IPOs") Non-Principal Non-Principal Non-Principal Not Applicable Non-PrincipalInverse Floating Rate Investments Not Applicable Not Applicable Not Applicable Not Applicable Not ApplicableLeverage Non-Principal Non-Principal Non-Principal Non-Principal Non-PrincipalLiquidity Risk(1) Not Applicable Not Applicable Not Applicable Non-Principal Non-PrincipalManagement Risk(1) Non-Principal Non-Principal Non-Principal Non-Principal Non-PrincipalMarket Volatility and Issuer Risk(1) Non-Principal Non-Principal Non-Principal Non-Principal Non-PrincipalMaster Limited Partnerships Non-Principal Non-Principal Non-Principal Not Applicable Non-PrincipalMunicipal Obligations and AMT-SubjectBonds
Non-Principal Non-Principal Non-Principal Non-Principal Not Applicable
Portfolio Turnover Non-Principal Non-Principal Non-Principal Non-Principal Non-PrincipalPreferred Securities Non-Principal Non-Principal Non-Principal Non-Principal Non-PrincipalReal Estate Investment Trusts Non-Principal Non-Principal Non-Principal Principal Non-PrincipalReal Estate Securities Non-Principal Principal Non-Principal Principal Non-PrincipalRepurchase Agreements Non-Principal Non-Principal Non-Principal Non-Principal Non-PrincipalRoyalty Trusts Non-Principal Non-Principal Non-Principal Not Applicable Non-Principal
Securitized Products Non-Principal Principal Non-Principal Principal Not ApplicableShort Sales Non-Principal Non-Principal Non-Principal Not Applicable Not ApplicableSmall and Medium MarketCapitalization Companies
Principal Non-Principal Principal Non-Principal Principal
Temporary Defensive Measures Non-Principal Non-Principal Non-Principal Non-Principal Non-PrincipalUnderlying Funds Principal(3) Principal(3) Principal(3) Principal Not Applicable
(1) These risks are not deemed principal for purposes of this table because they apply to almost all funds; however, in certain circumstances, they could significantly affect the net asset value, yield, and total return.
(3) A fund of funds is subject to the risks of the underlying funds in which it invests, and the underlying funds are subject to the risk of being an underlying fund.
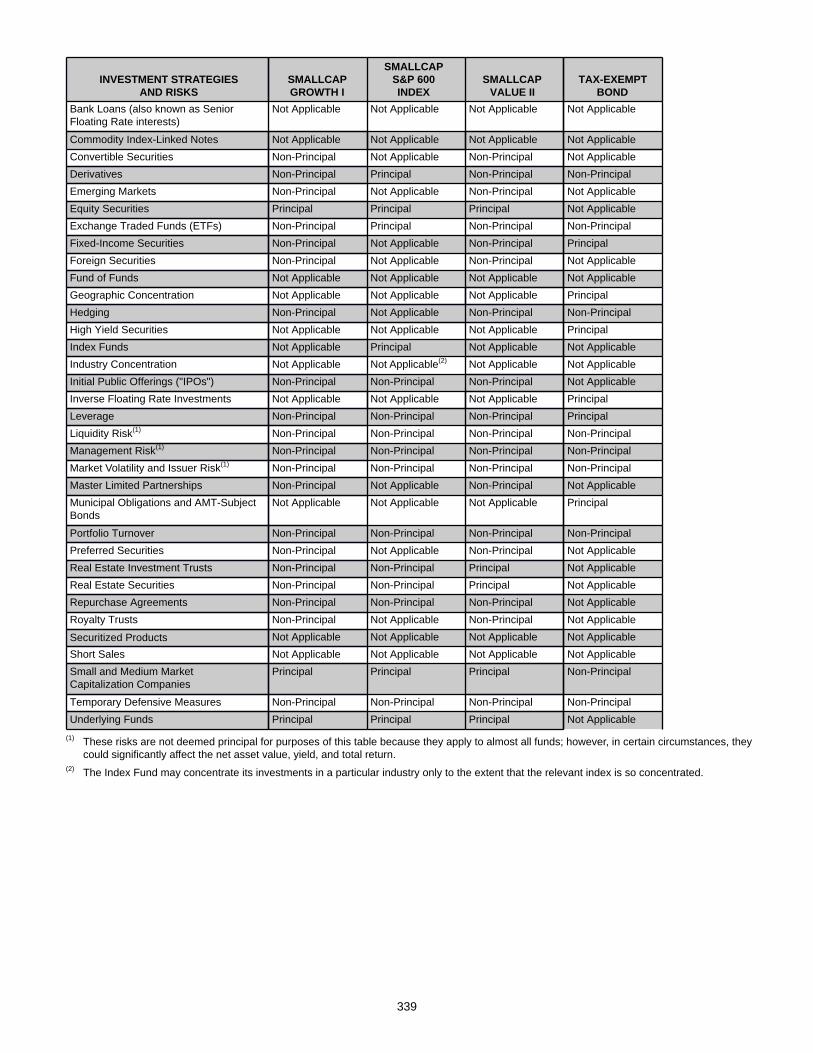
339
INVESTMENT STRATEGIESAND RISKS
SMALLCAPGROWTH I
SMALLCAPS&P 600INDEX
SMALLCAPVALUE II
TAX-EXEMPTBOND
Bank Loans (also known as SeniorFloating Rate interests)
Not Applicable Not Applicable Not Applicable Not Applicable
Commodity Index-Linked Notes Not Applicable Not Applicable Not Applicable Not ApplicableConvertible Securities Non-Principal Not Applicable Non-Principal Not ApplicableDerivatives Non-Principal Principal Non-Principal Non-PrincipalEmerging Markets Non-Principal Not Applicable Non-Principal Not ApplicableEquity Securities Principal Principal Principal Not ApplicableExchange Traded Funds (ETFs) Non-Principal Principal Non-Principal Non-PrincipalFixed-Income Securities Non-Principal Not Applicable Non-Principal PrincipalForeign Securities Non-Principal Not Applicable Non-Principal Not ApplicableFund of Funds Not Applicable Not Applicable Not Applicable Not ApplicableGeographic Concentration Not Applicable Not Applicable Not Applicable PrincipalHedging Non-Principal Not Applicable Non-Principal Non-PrincipalHigh Yield Securities Not Applicable Not Applicable Not Applicable PrincipalIndex Funds Not Applicable Principal Not Applicable Not ApplicableIndustry Concentration Not Applicable Not Applicable(2) Not Applicable Not ApplicableInitial Public Offerings ("IPOs") Non-Principal Non-Principal Non-Principal Not ApplicableInverse Floating Rate Investments Not Applicable Not Applicable Not Applicable PrincipalLeverage Non-Principal Non-Principal Non-Principal PrincipalLiquidity Risk(1) Non-Principal Non-Principal Non-Principal Non-PrincipalManagement Risk(1) Non-Principal Non-Principal Non-Principal Non-PrincipalMarket Volatility and Issuer Risk(1) Non-Principal Non-Principal Non-Principal Non-PrincipalMaster Limited Partnerships Non-Principal Not Applicable Non-Principal Not ApplicableMunicipal Obligations and AMT-SubjectBonds
Not Applicable Not Applicable Not Applicable Principal
Portfolio Turnover Non-Principal Non-Principal Non-Principal Non-PrincipalPreferred Securities Non-Principal Not Applicable Non-Principal Not ApplicableReal Estate Investment Trusts Non-Principal Non-Principal Principal Not ApplicableReal Estate Securities Non-Principal Non-Principal Principal Not ApplicableRepurchase Agreements Non-Principal Non-Principal Non-Principal Not ApplicableRoyalty Trusts Non-Principal Not Applicable Non-Principal Not Applicable
Securitized Products Not Applicable Not Applicable Not Applicable Not ApplicableShort Sales Not Applicable Not Applicable Not Applicable Not ApplicableSmall and Medium MarketCapitalization Companies
Principal Principal Principal Non-Principal
Temporary Defensive Measures Non-Principal Non-Principal Non-Principal Non-PrincipalUnderlying Funds Principal Principal Principal Not Applicable
(1) These risks are not deemed principal for purposes of this table because they apply to almost all funds; however, in certain circumstances, they could significantly affect the net asset value, yield, and total return.
(2) The Index Fund may concentrate its investments in a particular industry only to the extent that the relevant index is so concentrated.
340
Bank Loans (also known as Senior Floating Rate Interests)Bank loans typically hold the most senior position in the capital structure of a business entity (the "Borrower"), are typically secured by specific collateral, and have a claim on the assets and/or stock of the Borrower that is senior to that held by unsecured subordinated debtholders and stockholders of the Borrower. The proceeds of bank loans primarily are used to finance leveraged buyouts, recapitalizations, mergers, acquisitions, stock repurchases, dividends, and, to a lesser extent, to finance internal growth and for other corporate purposes. Bank loans are typically structured and administered by a financial institution that acts as the agent of the lenders participating in the bank loan. Most bank loans that will be purchased by the fund are rated below-investment-grade (sometimes called "junk") or will be comparable if unrated, which means they are more likely to default than investment-grade loans. A default could lead to non-payment of income which would result in a reduction of income to the fund, and there can be no assurance that the liquidation of any collateral would satisfy the Borrower's obligation in the event of non-payment of scheduled interest or principal payments or that such collateral could be readily liquidated. Most bank loans are not traded on any national securities exchange. Bank loans generally have less liquidity than investment-grade bonds and there may be less public information available about them.
The primary and secondary market for bank loans may be subject to irregular trading activity, wide bid/ask spreads and extended trade settlement periods, which may cause the fund to be unable to realize full value and thus cause a material decline in the fund's net asset value.
Bank loans pay interest at rates which are periodically reset by reference to a base lending rate plus a spread. These base lending rates are generally the prime rate offered by a designated U.S. bank or the London InterBank Offered Rate (LIBOR) or the prime rate offered by one or more major U.S. banks.
Bank loans generally are subject to mandatory and/or optional prepayment. Because of these mandatory prepayment conditions and because there may be significant economic incentives for the borrower to repay, prepayments of senior floating rate interests may occur.
Commodity Index-Linked NotesCommodities are assets that have tangible properties, such as oil, coal, natural gas, agricultural products, industrial metals, livestock, and precious metals. The value of commodities may be affected by overall market movements and other factors affecting the value of a particular industry or commodity, such as weather, disease, embargoes, or political and regulatory developments. Funds may seek exposure to commodity markets through investments in commodity index-linked notes, which are derivative debt instruments issued by U.S. and foreign banks, brokerage firms, insurance companies and other corporations with principal and/or coupon payments linked to the performance of commodity indices. These notes expose the fund to movements in commodity prices. They are also subject to credit, counterparty, and interest rate risk. Commodity index-linked notes are often leveraged, increasing the volatility of each note's market value relative to changes in the underlying commodity index. At the maturity of the note, the fund may receive more or less principal than it originally invested. The fund may also receive interest payments on the note that are less than the stated coupon interest payments.
Convertible SecuritiesConvertible securities are usually fixed-income securities that a fund has the right to exchange for equity securities at a specified conversion price. Convertible securities could also include corporate bonds, notes, or preferred stocks of U.S. or foreign issuers. The option allows the fund to realize additional returns if the market price of the equity securities exceeds the conversion price. For example, the fund may hold fixed-income securities that are convertible into shares of common stock at a conversion price of $10 per share. If the market value of the shares of common stock reached $12, the fund could realize an additional $2 per share by converting its fixed-income securities.
Convertible securities have lower yields than comparable fixed-income securities. In addition, at the time a convertible security is issued the conversion price exceeds the market value of the underlying equity securities. Thus, convertible securities may provide lower returns than non-convertible fixed-income securities or equity securities depending upon changes in the price of the underlying equity securities. However, convertible securities permit the fund to realize some of the potential appreciation of the underlying equity securities with less risk of losing its initial investment.
Depending on the features of the convertible security, the fund will treat a convertible security as either a fixed-income or equity security for purposes of investment policies and limitations because of the unique characteristics of convertible securities. Funds that invest in convertible securities may invest in convertible securities that are below investment grade. Many convertible securities are relatively illiquid.
341
DerivativesA fund may invest in certain derivative strategies to earn income, manage or adjust the risk profile of the fund, replace more direct investments, or obtain exposure to certain markets. Generally, a derivative is a financial arrangement, the value of which is derived from, or based on, a traditional security, asset, or market index. Certain derivative securities are described more accurately as index/structured securities. Index/structured securities are derivative securities whose value or performance is linked to other equity securities (such as depositary receipts), currencies, interest rates, indices, or other financial indicators (reference indices).
There are many different types of derivatives and many different ways to use them. Futures, forward contracts, and options are commonly used for traditional hedging purposes to attempt to protect a fund from loss due to changing interest rates, securities prices, asset values, or currency exchange rates and as a low-cost method of gaining exposure to a particular market without investing directly in those securities or assets. A fund may enter into put or call options, futures contracts, options on futures contracts, over-the-counter swap contracts (e.g., interest rate swaps, total return swaps and credit default swaps), currency futures contracts and options, options on currencies, and forward currency contracts or currency swaps for both hedging and non-hedging purposes. A fund also may use foreign currency options and foreign currency forward and swap contracts to increase exposure to a foreign currency or to shift exposure to foreign currency fluctuations from one country to another. A forward currency contract involves a privately negotiated obligation to purchase or sell a specific currency at a future date at a price set in the contract. A fund will not hedge currency exposure to an extent greater than the approximate aggregate market value of the securities held or to be purchased by the fund (denominated or generally quoted or currently convertible into the currency). A fund may enter into forward commitment agreements, which call for the fund to purchase or sell a security on a future date at a fixed price. A fund may also enter into contracts to sell its investments either on demand or at a specific interval.
Generally, a fund may not invest in a derivative security unless the reference index or the instrument to which it relates is an eligible investment for the fund or the reference currency relates to an eligible investment for the fund.
The return on a derivative security may increase or decrease, depending upon changes in the reference index or instrument to which it relates. If a fund's Sub-Advisor hedges market conditions incorrectly or employs a strategy that does not correlate well with the fund's investment, these techniques could result in a loss. These techniques may increase the volatility of a fund and may involve a small investment of cash relative to the magnitude of the risk assumed.
The risks associated with derivative investments include:• the risk that the underlying security, currency, interest rate, market index, or other financial asset will not move in
the direction Principal Management Corporation (“Principal”) and/or Sub-Advisor anticipated;• the possibility that there may be no liquid secondary market which may make it difficult or impossible to close out
a position when desired;• the risk that adverse price movements in an instrument can result in a loss substantially greater than a fund's
initial investment;• the possibility that the counterparty may fail to perform its obligations; and• the inability to close out certain hedged positions to avoid adverse tax consequences.
Swap agreements involve the risk that the party with whom the fund has entered into the swap will default on its obligation to pay the fund and the risk that the fund will not be able to meet its obligations to pay the other party to the agreement.
A fund may enter into credit default swap agreements as a "buyer" or "seller" of credit protection. Credit default swap agreements involve special risks because they may be difficult to value, are highly susceptible to liquidity and credit risk, and generally pay a return to the party that has paid the premium only in the event of an actual default by the issuer of the underlying obligation (as opposed to a credit downgrade or other indication of financial difficulty). Credit default swaps can increase credit risk because the fund has exposure to both the issuer of the referenced obligation and the counterparty to the credit default swap.
342
Forward, swap, and futures contracts are subject to special risk considerations. The primary risks associated with the use of these contracts are (a) the imperfect correlation between the change in market value of the instruments held by the fund and the price of the forward or futures contract; (b) possible lack of a liquid secondary market for a forward, swap, or futures contract and the resulting inability to close a forward, swap, or futures contract when desired; (c) losses caused by unanticipated market movements, which are potentially unlimited; (d) the sub-advisor’s inability to predict correctly the direction of securities prices, interest rates, currency exchange rates, asset values, and other economic factors; (e) the possibility that the counterparty will default in the performance of its obligations; and (f) if the fund has insufficient cash, it may have to sell securities from its portfolio to meet daily variation margin requirements, and the fund may have to sell securities at a time when it may be disadvantageous to do so.
For currency contracts, there is also a risk of government action through exchange controls that would restrict the ability of the fund to deliver or receive currency.
Some of the risks associated with options include imperfect correlation, counterparty risk, difference in trading hours for the options markets and the markets for the underlying securities (rate movements can take place in the underlying markets that cannot be reflected in the options markets), and an insufficient liquid secondary market for particular options.
Emerging MarketsPrincipal Management Corporation ("Principal") defines emerging market securities as those issued by:• companies with their principal place of business or principal office in emerging market countries or• companies whose principal securities trading market is an emerging market country.Usually, the term "emerging market country" means any country that is considered to be an emerging country by the international financial community (including the MSCI Emerging Markets Index or Barclays Emerging Markets USD Aggregate Bond). These countries generally include every nation in the world except the U.S., Canada, Japan, Australia, New Zealand, and most nations located in Western Europe.
Investments in companies of emerging (also called "developing") countries are subject to higher risks than investments in companies in more developed countries. These risks include:• increased social, political, and economic instability; • a smaller market for these securities and low or nonexistent volume of trading that results in a lack of liquidity and
in greater price volatility;• lack of publicly available information, including reports of payments of dividends or interest on outstanding
securities;• foreign government policies that may restrict opportunities, including restrictions on investment in issuers or
industries deemed sensitive to national interests;• relatively new capital market structure or market-oriented economy;• the possibility that recent favorable economic developments may be slowed or reversed by unanticipated political
or social events in these countries;• restrictions that may make it difficult or impossible for the fund to vote proxies, exercise shareholder rights, pursue
legal remedies, and obtain judgments in foreign courts; and• possible losses through the holding of securities in domestic and foreign custodial banks and depositories.
In addition, many developing countries have experienced substantial and, in some periods, extremely high rates of inflation for many years. Inflation and rapid fluctuations in inflation rates have had and may continue to have negative effects on the economies, currencies, interest rates, and securities markets of those countries.
Repatriation of investment income, capital, and proceeds of sales by foreign investors may require governmental registration and/or approval in some developing countries. A fund could be adversely affected by delays in or a refusal to grant any required governmental registration or approval for repatriation.
Further, the economies of developing countries generally are heavily dependent upon international trade and, accordingly, have been and may continue to be adversely affected by trade barriers, exchange controls, managed adjustments in relative currency values and other protectionist measures imposed or negotiated by the countries with which they trade.

343
Equity SecuritiesEquity securities include common stocks, convertible securities, depositary receipts, rights (a right is an offering of common stock to investors who currently own shares which entitle them to buy subsequent issues at a discount from the offering price), and warrants (a warrant grants its owner the right to purchase securities from the issuer at a specified price, normally higher than the current market price). Common stocks, the most familiar type, represent an equity (ownership) interest in a corporation. The value of a company's stock may fall as a result of factors directly relating to that company, such as decisions made by its management or lower demand for the company's products or services. A stock's value may also fall because of factors affecting not just the company, but also companies in the same industry or in a number of different industries, such as increases in production costs. The value of a company's stock may also be affected by changes in financial markets that are relatively unrelated to the company or its industry, such as changes in interest rates or currency exchange rates. In addition, a company's stock generally pays dividends only after the company invests in its own business and makes required payments to holders of its bonds and other debt. For this reason, the value of a company's stock will usually react more strongly than its bonds and other debt to actual or perceived changes in the company's financial condition or prospects. Some funds focus their investments on certain market capitalization ranges. Market capitalization is defined as total current market value of a company's outstanding equity securities. The market capitalization of companies in the fund’s portfolios and their related indexes will change over time and, the fund will not automatically sell a security just because it falls outside of the market capitalization range of its index(es). Stocks of smaller companies may be more vulnerable to adverse developments than those of larger companies.
Exchange Traded Funds ("ETFs")Generally, ETFs invest in a portfolio of stocks, bonds or other assets. Often ETFs are a type of index or actively managed fund bought and sold on a securities exchange. An ETF trades like common stock. Shares in an index ETF represent an interest in a fixed portfolio of securities designed to track a particular market index. A fund could purchase shares issued by an ETF to gain exposure to a portion of the U.S. or a foreign market while awaiting purchase of underlying securities or for other reasons. The risks of owning an ETF generally reflect the risks of owning the underlying securities or other assets they are designed to track, although ETFs have management fees that increase their costs. Fund shareholders indirectly bear their proportionate share of the expenses of the ETFs in which the fund invests.
Fixed-Income SecuritiesFixed-income securities include bonds and other debt instruments that are used by issuers to borrow money from investors (some examples include corporate bonds, convertible securities, mortgage-backed securities, U.S. government securities and asset-backed securities). The issuer generally pays the investor a fixed, variable, or floating rate of interest. The amount borrowed must be repaid at maturity. Some debt securities, such as zero coupon bonds, do not pay current interest, but are sold at a discount from their face values.• Interest Rate Changes: Fixed-income securities are sensitive to changes in interest rates. In general, fixed-
income security prices rise when interest rates fall and fall when interest rates rise. If interest rates fall, issuers of callable bonds may call (repay) securities with high interest rates before their maturity dates; this is known as call risk. In this case, a fund would likely reinvest the proceeds from these securities at lower interest rates, resulting in a decline in the fund's income. Floating rate securities generally are less sensitive to interest rate changes but may decline in value if their interest rates do not rise as much, or as quickly, as interest rates in general. Conversely, floating rate securities will not generally increase in value if interest rates decline. Average duration is a mathematical calculation of the average life of a bond (or bonds in a bond fund) that serves as a useful measure of its price risk. Duration is an estimate of how much the value of the bonds held by a fund will fluctuate in response to a change in interest rates. For example, if a fund has an average duration of 4 years and interest rates rise by 1%, the value of the bonds held by the fund will decline by approximately 4%, and if the interest rates decline by 1%, the value of the bonds held by the fund will increase by approximately 4%. Longer term bonds and zero coupon bonds are generally more sensitive to interest rate changes. Duration, which measures price sensitivity to interest rate changes, is not necessarily equal to average maturity.
• Credit Risk: Fixed-income security prices are also affected by the credit quality of the issuer. Investment-grade debt securities are medium and high quality securities. Some bonds, such as lower grade or "junk" bonds, may have speculative characteristics and may be particularly sensitive to economic conditions and the financial condition of the issuers. Credit risk refers to the possibility that the issuer of the security will not be able to make principal and interest payments when due.
344
Foreign SecuritiesPrincipal defines foreign securities as those issued by:• companies with their principal place of business or principal office outside the U.S. or• companies whose principal securities trading market is outside the U.S.
Foreign companies may not be subject to the same uniform accounting, auditing, and financial reporting practices as are required of U.S. companies. In addition, there may be less publicly available information about a foreign company than about a U.S. company. Securities of many foreign companies are less liquid and more volatile than securities of comparable U.S. companies. Commissions on foreign securities exchanges may be generally higher than those on U.S. exchanges.
Foreign markets also have different clearance and settlement procedures than those in U.S. markets. In certain markets, there have been times when settlements have been unable to keep pace with the volume of securities transactions, making it difficult to conduct these transactions. Delays in settlement could result in temporary periods when a portion of fund assets is not invested and earning no return. If a fund is unable to make intended security purchases due to settlement problems, the fund may miss attractive investment opportunities. In addition, a fund may incur a loss as a result of a decline in the value of its portfolio if it is unable to sell a security.
With respect to certain foreign countries, there is the possibility of expropriation or confiscatory taxation, political or social instability, or diplomatic developments that could affect a fund's investments in those countries. In addition, a fund may also suffer losses due to nationalization, expropriation, or differing accounting practices and treatments. Investments in foreign securities are subject to laws of the foreign country that may limit the amount and types of foreign investments. Changes of governments or of economic or monetary policies, in the U.S. or abroad, changes in dealings between nations, currency convertibility or exchange rates could result in investment losses for a fund. Finally, even though certain currencies may be convertible into U.S. dollars, the conversion rates may be artificial relative to the actual market values and may be unfavorable to fund investors. To protect against future uncertainties in foreign currency exchange rates, the funds are authorized to enter into certain foreign currency exchange transactions.
Foreign securities are often traded with less frequency and volume, and therefore may have greater price volatility, than is the case with many U.S. securities. Brokerage commissions, custodial services, and other costs relating to investment in foreign countries are generally more expensive than in the U.S. Though the fund intends to acquire the securities of foreign issuers where there are public trading markets, economic or political turmoil in a country in which a fund has a significant portion of its assets or deterioration of the relationship between the U.S. and a foreign country may reduce the liquidity of a fund's portfolio. The fund may have difficulty meeting a large number of redemption requests. Furthermore, there may be difficulties in obtaining or enforcing judgments against foreign issuers.
A fund may choose to invest in a foreign company by purchasing depositary receipts. Depositary receipts are certificates of ownership of shares in a foreign-based issuer held by a bank or other financial institution. They are alternatives to purchasing the underlying security but are subject to the foreign securities risks to which they relate.
Fund of FundsThe performance and risks of each Principal LifeTime Fund, Principal LifeTime Hybrid Fund and Strategic Asset Management ("SAM") Portfolio (singly, “a fund of funds” and collectively, “the funds of funds”) directly correspond to the performance and risks of the underlying funds in which the Fund or Portfolio invests. By investing in many underlying funds, the funds of funds have partial exposure to the risks of many different areas of the market. The more a fund of funds allocates to stock funds, the greater the expected risk.
As of October 31, 2014, the Principal LifeTime Funds’, Principal LifeTime Hybrid Funds', and SAM Portfolios’ assets were allocated among the underlying funds as identified in the following tables.
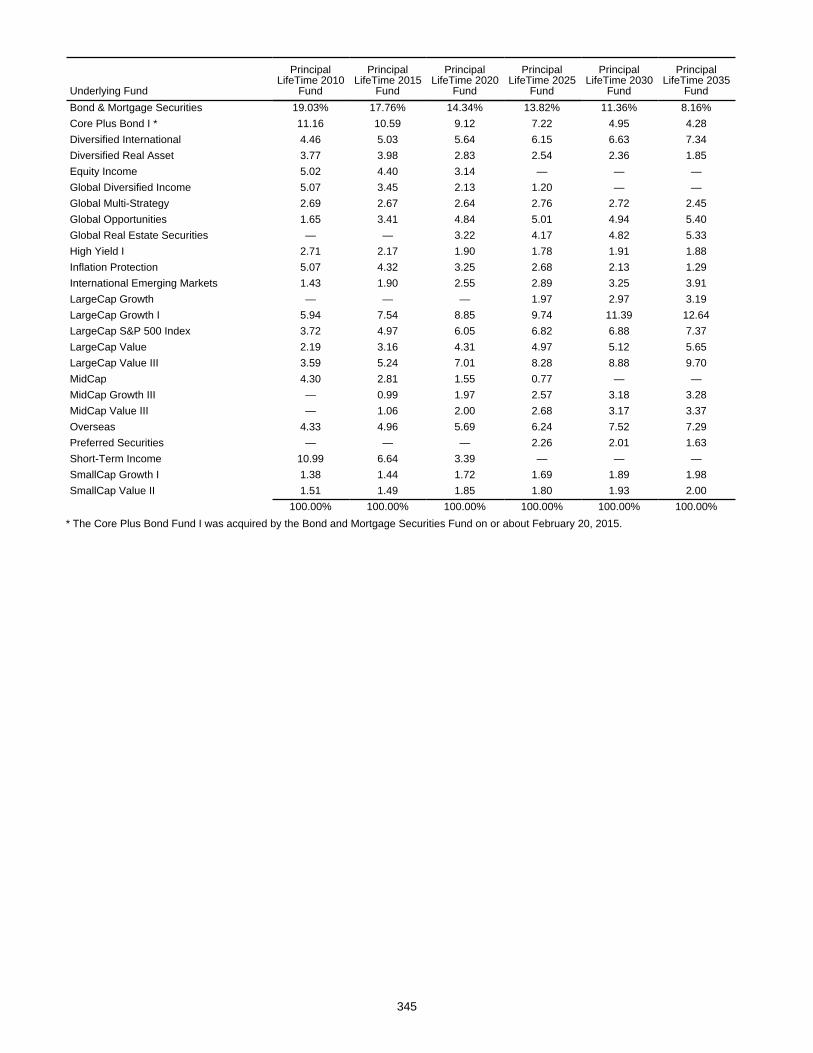
345
Underlying Fund
PrincipalLifeTime 2010
Fund
PrincipalLifeTime 2015
Fund
PrincipalLifeTime 2020
Fund
PrincipalLifeTime 2025
Fund
PrincipalLifeTime 2030
Fund
PrincipalLifeTime 2035
FundBond & Mortgage Securities 19.03% 17.76% 14.34% 13.82% 11.36% 8.16%Core Plus Bond I * 11.16 10.59 9.12 7.22 4.95 4.28Diversified International 4.46 5.03 5.64 6.15 6.63 7.34Diversified Real Asset 3.77 3.98 2.83 2.54 2.36 1.85Equity Income 5.02 4.40 3.14 — — —Global Diversified Income 5.07 3.45 2.13 1.20 — —Global Multi-Strategy 2.69 2.67 2.64 2.76 2.72 2.45Global Opportunities 1.65 3.41 4.84 5.01 4.94 5.40Global Real Estate Securities — — 3.22 4.17 4.82 5.33High Yield I 2.71 2.17 1.90 1.78 1.91 1.88Inflation Protection 5.07 4.32 3.25 2.68 2.13 1.29International Emerging Markets 1.43 1.90 2.55 2.89 3.25 3.91LargeCap Growth — — — 1.97 2.97 3.19LargeCap Growth I 5.94 7.54 8.85 9.74 11.39 12.64LargeCap S&P 500 Index 3.72 4.97 6.05 6.82 6.88 7.37LargeCap Value 2.19 3.16 4.31 4.97 5.12 5.65LargeCap Value III 3.59 5.24 7.01 8.28 8.88 9.70MidCap 4.30 2.81 1.55 0.77 — —MidCap Growth III — 0.99 1.97 2.57 3.18 3.28MidCap Value III — 1.06 2.00 2.68 3.17 3.37Overseas 4.33 4.96 5.69 6.24 7.52 7.29Preferred Securities — — — 2.26 2.01 1.63Short-Term Income 10.99 6.64 3.39 — — —SmallCap Growth I 1.38 1.44 1.72 1.69 1.89 1.98SmallCap Value II 1.51 1.49 1.85 1.80 1.93 2.00
100.00% 100.00% 100.00% 100.00% 100.00% 100.00%* The Core Plus Bond Fund I was acquired by the Bond and Mortgage Securities Fund on or about February 20, 2015.
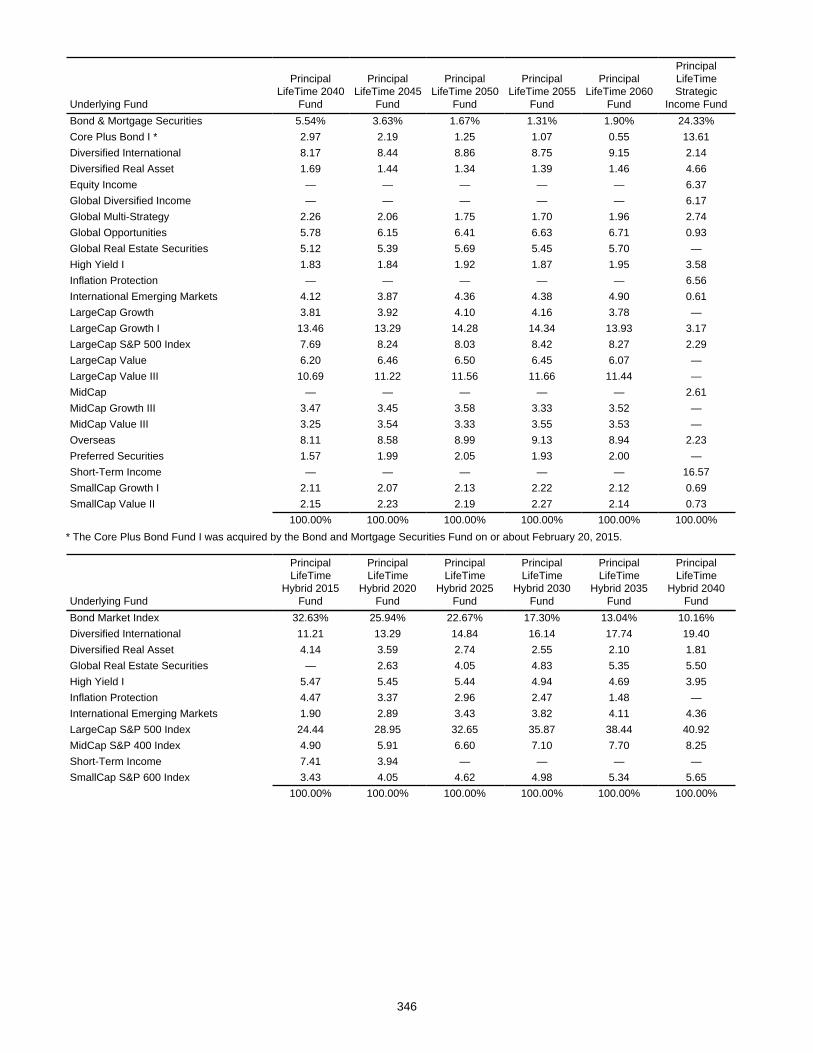
346
Underlying Fund
PrincipalLifeTime 2040
Fund
PrincipalLifeTime 2045
Fund
PrincipalLifeTime 2050
Fund
PrincipalLifeTime 2055
Fund
PrincipalLifeTime 2060
Fund
PrincipalLifeTimeStrategic
Income FundBond & Mortgage Securities 5.54% 3.63% 1.67% 1.31% 1.90% 24.33%Core Plus Bond I * 2.97 2.19 1.25 1.07 0.55 13.61Diversified International 8.17 8.44 8.86 8.75 9.15 2.14Diversified Real Asset 1.69 1.44 1.34 1.39 1.46 4.66Equity Income — — — — — 6.37Global Diversified Income — — — — — 6.17Global Multi-Strategy 2.26 2.06 1.75 1.70 1.96 2.74Global Opportunities 5.78 6.15 6.41 6.63 6.71 0.93Global Real Estate Securities 5.12 5.39 5.69 5.45 5.70 —High Yield I 1.83 1.84 1.92 1.87 1.95 3.58Inflation Protection — — — — — 6.56International Emerging Markets 4.12 3.87 4.36 4.38 4.90 0.61LargeCap Growth 3.81 3.92 4.10 4.16 3.78 —LargeCap Growth I 13.46 13.29 14.28 14.34 13.93 3.17LargeCap S&P 500 Index 7.69 8.24 8.03 8.42 8.27 2.29LargeCap Value 6.20 6.46 6.50 6.45 6.07 —LargeCap Value III 10.69 11.22 11.56 11.66 11.44 —MidCap — — — — — 2.61MidCap Growth III 3.47 3.45 3.58 3.33 3.52 —MidCap Value III 3.25 3.54 3.33 3.55 3.53 —Overseas 8.11 8.58 8.99 9.13 8.94 2.23Preferred Securities 1.57 1.99 2.05 1.93 2.00 —Short-Term Income — — — — — 16.57SmallCap Growth I 2.11 2.07 2.13 2.22 2.12 0.69SmallCap Value II 2.15 2.23 2.19 2.27 2.14 0.73
100.00% 100.00% 100.00% 100.00% 100.00% 100.00%* The Core Plus Bond Fund I was acquired by the Bond and Mortgage Securities Fund on or about February 20, 2015.
Underlying Fund
PrincipalLifeTime
Hybrid 2015Fund
PrincipalLifeTime
Hybrid 2020Fund
PrincipalLifeTime
Hybrid 2025Fund
PrincipalLifeTime
Hybrid 2030Fund
PrincipalLifeTime
Hybrid 2035Fund
PrincipalLifeTime
Hybrid 2040Fund
Bond Market Index 32.63% 25.94% 22.67% 17.30% 13.04% 10.16%Diversified International 11.21 13.29 14.84 16.14 17.74 19.40Diversified Real Asset 4.14 3.59 2.74 2.55 2.10 1.81Global Real Estate Securities — 2.63 4.05 4.83 5.35 5.50High Yield I 5.47 5.45 5.44 4.94 4.69 3.95Inflation Protection 4.47 3.37 2.96 2.47 1.48 —International Emerging Markets 1.90 2.89 3.43 3.82 4.11 4.36LargeCap S&P 500 Index 24.44 28.95 32.65 35.87 38.44 40.92MidCap S&P 400 Index 4.90 5.91 6.60 7.10 7.70 8.25Short-Term Income 7.41 3.94 — — — —SmallCap S&P 600 Index 3.43 4.05 4.62 4.98 5.34 5.65
100.00% 100.00% 100.00% 100.00% 100.00% 100.00%
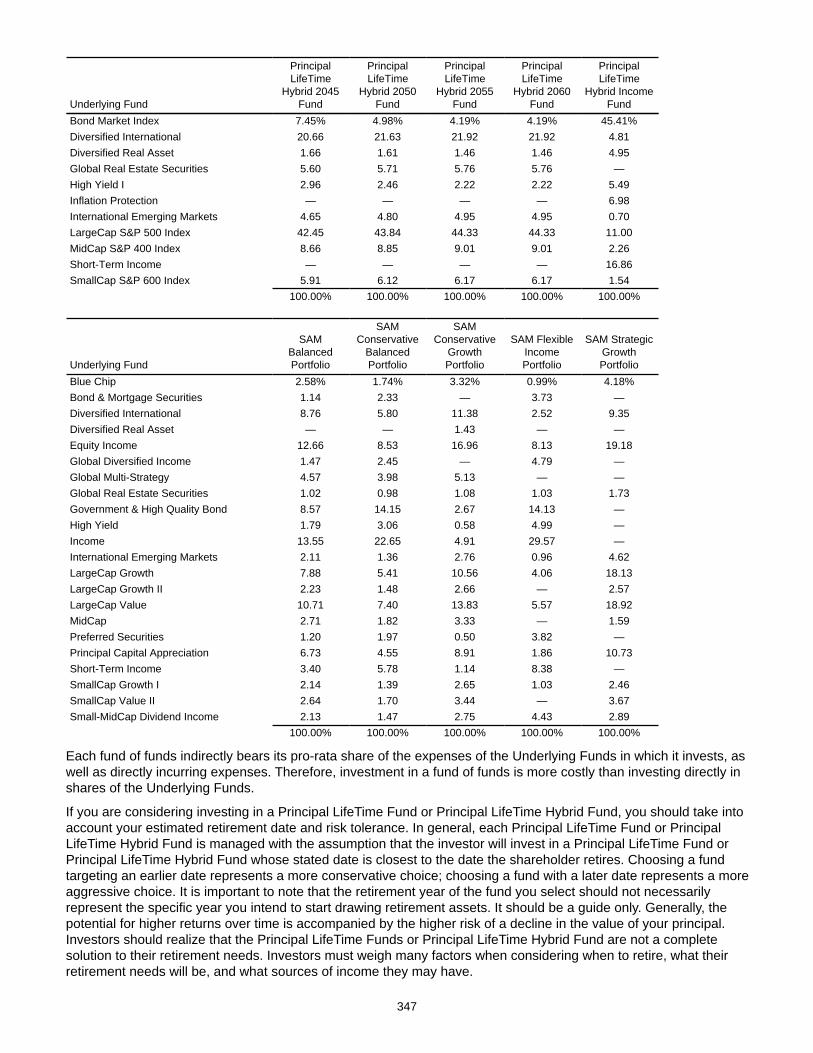
347
Underlying Fund
PrincipalLifeTime
Hybrid 2045Fund
PrincipalLifeTime
Hybrid 2050Fund
PrincipalLifeTime
Hybrid 2055Fund
PrincipalLifeTime
Hybrid 2060Fund
PrincipalLifeTime
Hybrid IncomeFund
Bond Market Index 7.45% 4.98% 4.19% 4.19% 45.41%Diversified International 20.66 21.63 21.92 21.92 4.81Diversified Real Asset 1.66 1.61 1.46 1.46 4.95Global Real Estate Securities 5.60 5.71 5.76 5.76 —High Yield I 2.96 2.46 2.22 2.22 5.49Inflation Protection — — — — 6.98International Emerging Markets 4.65 4.80 4.95 4.95 0.70LargeCap S&P 500 Index 42.45 43.84 44.33 44.33 11.00MidCap S&P 400 Index 8.66 8.85 9.01 9.01 2.26Short-Term Income — — — — 16.86SmallCap S&P 600 Index 5.91 6.12 6.17 6.17 1.54
100.00% 100.00% 100.00% 100.00% 100.00%
Underlying Fund
SAMBalancedPortfolio
SAMConservative
BalancedPortfolio
SAMConservative
GrowthPortfolio
SAM FlexibleIncomePortfolio
SAM StrategicGrowthPortfolio
Blue Chip 2.58% 1.74% 3.32% 0.99% 4.18%Bond & Mortgage Securities 1.14 2.33 — 3.73 —Diversified International 8.76 5.80 11.38 2.52 9.35Diversified Real Asset — — 1.43 — —Equity Income 12.66 8.53 16.96 8.13 19.18Global Diversified Income 1.47 2.45 — 4.79 —Global Multi-Strategy 4.57 3.98 5.13 — —Global Real Estate Securities 1.02 0.98 1.08 1.03 1.73Government & High Quality Bond 8.57 14.15 2.67 14.13 —High Yield 1.79 3.06 0.58 4.99 —Income 13.55 22.65 4.91 29.57 —International Emerging Markets 2.11 1.36 2.76 0.96 4.62LargeCap Growth 7.88 5.41 10.56 4.06 18.13LargeCap Growth II 2.23 1.48 2.66 — 2.57LargeCap Value 10.71 7.40 13.83 5.57 18.92MidCap 2.71 1.82 3.33 — 1.59Preferred Securities 1.20 1.97 0.50 3.82 —Principal Capital Appreciation 6.73 4.55 8.91 1.86 10.73Short-Term Income 3.40 5.78 1.14 8.38 —SmallCap Growth I 2.14 1.39 2.65 1.03 2.46SmallCap Value II 2.64 1.70 3.44 — 3.67Small-MidCap Dividend Income 2.13 1.47 2.75 4.43 2.89
100.00% 100.00% 100.00% 100.00% 100.00%
Each fund of funds indirectly bears its pro-rata share of the expenses of the Underlying Funds in which it invests, as well as directly incurring expenses. Therefore, investment in a fund of funds is more costly than investing directly in shares of the Underlying Funds.
If you are considering investing in a Principal LifeTime Fund or Principal LifeTime Hybrid Fund, you should take into account your estimated retirement date and risk tolerance. In general, each Principal LifeTime Fund or Principal LifeTime Hybrid Fund is managed with the assumption that the investor will invest in a Principal LifeTime Fund or Principal LifeTime Hybrid Fund whose stated date is closest to the date the shareholder retires. Choosing a fund targeting an earlier date represents a more conservative choice; choosing a fund with a later date represents a more aggressive choice. It is important to note that the retirement year of the fund you select should not necessarily represent the specific year you intend to start drawing retirement assets. It should be a guide only. Generally, the potential for higher returns over time is accompanied by the higher risk of a decline in the value of your principal. Investors should realize that the Principal LifeTime Funds or Principal LifeTime Hybrid Fund are not a complete solution to their retirement needs. Investors must weigh many factors when considering when to retire, what their retirement needs will be, and what sources of income they may have.
348
There are five Strategic Asset Management ("SAM") Portfolios: Flexible Income, Conservative Balanced, Balanced, Conservative Growth and Strategic Growth. The SAM Portfolios offer long-term investors different asset allocation strategies having different levels of potential investment risk and reward. The SAM Portfolios share the same risks but often with different levels of exposure. In general, relative to the other Portfolios:• the Balanced Portfolio should offer investors the potential for a medium level of income and a medium level of
capital growth, while exposing them to a medium level of principal risk,• the Conservative Balanced Portfolio should offer investors the potential for a medium to high level of income and
a medium to low level of capital growth, while exposing them to a medium to low level of principal risk,• the Conservative Growth Portfolio should offer investors the potential for a low to medium level of income and a
medium to high level of capital growth, while exposing them to a medium to high level of principal risk,• the Flexible Income Portfolio should offer investors the potential for a high level of income and a low level of
capital growth, while exposing them to a low level of principal risk, and• the Strategic Growth Portfolio should offer investors the potential for a high level of capital growth, and a
corresponding level of principal risk.Funds of funds can be subject to payment in kind liquidity risk: If an underlying fund pays a redemption request by the fund wholly or partly by a distribution-in-kind of portfolio securities rather than in cash, the fund may hold such portfolio securities until its sub-advisor determines that it is appropriate to dispose of them.
Geographic ConcentrationPotential investors should consider the possibility of greater risk arising from the geographic concentration (a particular state, such as California or Illinois, or a particular country or region) of their investments, as well as the current and past financial condition of municipal issuers in the case of a municipal fund. In addition to factors affecting the state or regional economy, certain constitutional amendments, legislative measures, executive orders, administrative regulations, court decisions, and voter initiatives could result in certain adverse consequences affecting municipal obligations. See the SAI for a more detailed description of these risks.
HedgingHedging is a strategy that can be used to limit or offset investment risk. The success of a fund’s hedging strategy will be subject to the Sub-Adviser’s ability to correctly assess the degree of correlation between the performance of the instruments used in the hedging strategy and the performance of the investments in the portfolio being hedged. Since the characteristics of many securities change as markets change or time passes, the success of a fund’s hedging strategy will also be subject to the Sub-Adviser’s ability to continually recalculate, readjust, and execute hedges in an efficient and timely manner. For a variety of reasons, the Sub-Adviser may not seek to establish a perfect correlation between such hedging instruments and the portfolio holdings being hedged. Such imperfect correlation may prevent a fund from achieving the intended hedge or expose a fund to risk of loss. In addition, it is not possible to hedge fully or perfectly against any risk, and hedging entails its own costs.
High Yield SecuritiesBelow investment grade bonds, which are rated at the time of purchase Ba1 or lower by Moody's and BB+ or lower by S&P (if the bond has been rated by only one of those agencies, that rating will determine if the bond is below investment grade; if the bond has not been rated by either of those agencies, the Sub-Advisor will determine whether the bond is of a quality comparable to those rated below investment grade), are sometimes referred to as high yield or "junk bonds" and are considered speculative. Such securities could be in default at time of purchase. Each of the Principal LifeTime Funds, Principal LifeTime Hybrid Funds and Strategic Asset Management Portfolios may invest in underlying funds that may invest in such securities.
Investment in high yield bonds involves special risks in addition to the risks associated with investment in highly rated debt securities. High yield bonds may be regarded as predominantly speculative with respect to the issuer's continuing ability to meet principal and interest payments. Moreover, under certain circumstances, such securities may be less liquid than higher rated debt securities.
Analysis of the creditworthiness of issuers of high yield securities may be more complex than for issuers of higher quality debt securities. The ability of a fund to achieve its investment objective may, to the extent of its investment in high yield bonds, be more dependent on such credit analysis than would be the case if the fund were investing in higher quality bonds.
High yield bonds may be more susceptible to real or perceived adverse economic and competitive industry conditions than higher-grade bonds. The prices of high yield bonds have been found to be less sensitive to interest rate changes than more highly rated investments, but more sensitive to adverse economic downturns or individual corporate developments. If the issuer of high yield bonds defaults, a fund may incur additional expenses to seek recovery. To
349
the extent that such high yield issuers undergo a corporate restructuring, such high yield securities may become exchanged for or converted into reorganized equity of the underlying issuer. High yield bonds oftentimes include complex legal covenants that impose various degrees of restriction on the issuer’s ability to take certain actions, such as distribute cash to equity holders, incur additional indebtedness, and dispose of assets. To the extent that a bond indenture or loan agreement does not contain sufficiently protective covenants or otherwise permits the issuer to take certain actions to the detriment of the holder of the fixed-income security, the underlying value of such fixed-income security may decline.
The secondary market on which high yield bonds are traded may be less liquid than the market for higher-grade bonds. Less liquidity in the secondary trading market could adversely affect the price at which a fund could sell a high yield bond and could adversely affect and cause large fluctuations in the daily price of the fund's shares. Adverse publicity and investor perceptions, whether or not based on fundamental analysis, may decrease the value and liquidity of high yield bonds, especially in a thinly traded market.
The use of credit ratings for evaluating high yield bonds also involves certain risks. For example, credit ratings evaluate the safety of principal and interest payments, not the market value risk of high yield bonds. Also, credit rating agencies may fail to change credit ratings in a timely manner to reflect subsequent events. If a credit rating agency changes the rating of a portfolio security held by a fund, the fund may retain the security if Principal or Sub-Advisor thinks it is in the best interest of shareholders.
Index FundsIndex funds generally attempt to mirror the investment performance of the index by allocating the fund's assets in approximately the same weightings as the index. However, it is unlikely that the fund's performance will perfectly correlate with the index performance for a variety of reasons. The correlation between fund performance and index performance may be affected by the fund's expenses, changes in securities markets, changes in the composition of the index and the timing of purchases and sales of fund shares. Because of the difficulty and expense of executing relatively small securities trades, index funds may not always be invested in the less heavily weighted securities and may at times be weighted differently than the index.
Industry ConcentrationA fund that concentrates its investments (invests more than 25% of its net assets) in a particular industry (or group of industries) is more exposed to the overall condition of the particular industry than a fund that invests in a wider variety of industries. A particular industry could be affected by economic, business, supply-and-demand, political, or regulatory factors. Companies within the same industry could react similarly to such factors. As a result, a fund’s concentration in a particular industry would increase the possibility that the fund’s performance will be affected by such factors.
Initial Public Offerings ("IPOs") An IPO is a company's first offering of stock to the public. IPO risk is that the market value of IPO shares will fluctuate considerably due to factors such as the absence of a prior public market, unseasoned trading, the small number of shares available for trading, and limited information about the issuer. The purchase of IPO shares may involve high transaction costs. IPO shares are subject to market risk and liquidity risk. In addition, the market for IPO shares can be speculative and/or inactive for extended periods. The limited number of shares available for trading in some IPOs may make it more difficult for a fund to buy or sell significant amounts of shares without an unfavorable impact on prevailing prices. Investors in IPO shares can be affected by substantial dilution in the value of their shares by sales of additional shares and by concentration of control in existing management and principal shareholders.
When a fund's asset base is small, a significant portion of the fund's performance could be attributable to investments in IPOs because such investments would have a magnified impact on the fund. As the fund's assets grow, the effect of the fund's investments in IPOs on the fund's performance probably will decline, which could reduce the fund's performance. Because of the price volatility of IPO shares, a fund may choose to hold IPO shares for a very short period. This may increase the turnover of the fund's portfolio and lead to increased expenses to the fund, such as commissions and transaction costs. By selling IPO shares, the fund may realize taxable gains it will subsequently distribute to shareholders.
Inverse Floating Rate InvestmentsInverse floating rate investments are variable rate debt instruments that pay interest at rates that move in the opposite direction of prevailing interest rates. Inverse floating rate investments tend to underperform the market for fixed rate bonds in a rising interest rate environment. Inverse floating rate investments have varying degrees of liquidity. Inverse floating rate investments in which these funds may invest may include derivative instruments, such as residual interest bonds or tender option bonds. Such instruments are typically created by a special purpose trust that holds long-term fixed rate bonds and sells two classes of beneficial interests: short-term floating rate interests, which are sold to third
350
party investors, and the inverse floating residual interests, which are purchased by these funds. These funds generally invest in inverse floating rate investments that include embedded leverage, thus exposing these funds to greater risks and increased costs. The market value of a "leveraged" inverse floating rate investment generally will fluctuate in response to changes in market rates of interest to a greater extent than the value of an unleveraged investment. A fund making such an investment will segregate on its books liquid securities having a value equal to the market value of the bonds underlying the "leveraged" inverse floating rate investment.
LeverageIf a fund makes investments in futures contracts, forward contracts, swaps and other derivative instruments, these instruments provide the economic effect of financial leverage by creating additional investment exposure, as well as the potential for greater loss. If a fund uses leverage through activities such as borrowing, entering into short sales, purchasing securities on margin or on a “when-issued” basis or purchasing derivative instruments in an effort to increase its returns, the fund has the risk of magnified capital losses that occur when losses affect an asset base, enlarged by borrowings or the creation of liabilities, that exceeds the net assets of the fund. The net asset value of a fund employing leverage will be more volatile and sensitive to market movements. Leverage may involve the creation of a liability that requires the fund to pay interest. Leveraging may cause a fund to liquidate portfolio positions to satisfy its obligations or to meet segregation requirements when it may not be advantageous to do so. To the extent that a fund is not able to close out a leveraged position because of market illiquidity, a fund’s liquidity may be impaired to the extent that it has a substantial portion of liquid assets segregated or earmarked to cover obligations.
Liquidity RiskA fund is exposed to liquidity risk when trading volume, lack of a market maker, or legal restrictions impair the fund's ability to sell particular securities or close derivative positions at an advantageous price. Funds with principal investment strategies that involve securities of companies with smaller market capitalizations, foreign securities, derivatives, high yield bonds and bank loans or securities with substantial market and/or credit risk tend to have the greatest exposure to liquidity risk.
Management RiskIf Principal's and/or a Sub-Advisor's investment strategies do not perform as expected, the fund could underperform other funds with similar investment objectives or lose money.• Active Management: The performance of a fund that is actively managed will reflect in part the ability of Principal
and/or Sub-Advisor(s) to make investment decisions that are suited to achieving the fund's investment objective. Actively managed funds are prepared to invest in securities, sectors, or industries differently from the benchmark.
• Passive Management: Index funds use a passive, or indexing, investment approach. Pure index funds do not attempt to manage market volatility, use defensive strategies or reduce the effect of any long-term periods of poor stock or bond performance. Index funds attempt to replicate their relevant target index by investing primarily in the securities held by the index in approximately the same proportion of the weightings in the index. However, because of the difficulty of executing some relatively small securities trades, such funds may not always be invested in the less heavily weighted securities held by the index. An index fund's ability to match the performance of their relevant index may be affected by many factors, such as fund expenses, the timing of cash flows into and out of the fund, changes in securities markets, and changes in the composition of the index. Some index funds may invest in index futures and/or exchange traded funds on a daily basis to gain exposure to the Index in an effort to minimize tracking error relative to the benchmark.
Market Volatility and Issuer RiskThe value of a fund's portfolio securities may go down in response to overall stock or bond market movements. Markets tend to move in cycles, with periods of rising prices and periods of falling prices. Stocks tend to go up and down in value more than bonds. If the fund's investments are concentrated in certain sectors, its performance could be worse than the overall market. The value of an individual security or particular type of security can be more volatile than the market as a whole and can perform differently from the value of the market as a whole. The value of a security may decline for reasons directly related to the issuer, such as management performance, financial leverage, and reduced demand for the issuer’s goods or services. It is possible to lose money when investing in a fund.
Master Limited Partnerships Master limited partnerships ("MLPs") tend to pay relatively higher distributions than other types of companies. The amount of cash that each individual MLP can distribute to its partners will depend on the amount of cash it generates from operations, which will vary from quarter to quarter depending on factors affecting the market generally and on factors affecting the particular business lines of the MLP. Available cash will also depend on the MLPs' level of operating costs (including incentive distributions to the general partner), level of capital expenditures, debt service requirements, acquisition costs (if any), fluctuations in working capital needs and other factors. The benefit derived from investment in MLPs depends largely on the MLPs being treated as partnerships for federal income tax purposes.
351
As a partnership, an MLP has no federal income tax liability at the entity level. If, as a result of a change in current law or a change in an MLP's business, an MLP was treated as a corporation for federal income tax purposes, the MLP would be obligated to pay federal income tax on its income at the corporate tax rate. If an MLP was classified as a corporation for federal income tax purposes, the amount of cash available for distribution would be reduced and the distributions received might be taxed entirely as dividend income.
An MLP that invests in a particular industry (e.g., oil and gas) will be harmed by detrimental economic events within that industry. For example, the business of certain MLPs is affected by supply and demand for energy commodities because such MLPs derive revenue and income based upon the volume of the underlying commodity produced, transported, processed, distributed, and/or marketed. Many MLPs are also subject to various federal, state and local environmental laws and health and safety laws as well as laws and regulations specific to their particular activities.
Municipal Obligations and AMT-Subject BondsThe term “municipal obligations” generally is understood to include debt obligations issued by municipalities to obtain funds for various public purposes. The two principal classifications of municipal bonds are "general obligation" and "revenue" bonds. General obligation bonds are secured by the issuer's pledge of its full faith and credit, with either limited or unlimited taxing power for the payment of principal and interest. Revenue bonds are not supported by the issuer's full taxing authority. Generally, they are payable only from the revenues of a particular facility, a class of facilities, or the proceeds of another specific revenue source.
"AMT-subject bonds" are municipal obligations issued to finance certain "private activities," such as bonds used to finance airports, housing projects, student loan programs, and water and sewer projects. Interest on AMT-subject bonds is an item of tax preference for purposes of the federal individual alternative minimum tax ("AMT") and will also give rise to corporate alternative minimum taxes. See "Tax Considerations" for a discussion of the tax consequences of investing in the fund.
Current federal income tax laws limit the types and volume of bonds qualifying for the federal income tax exemption of interest, which may have an effect upon the ability of the fund to purchase sufficient amounts of tax-exempt securities.
Portfolio Turnover"Portfolio Turnover" is the term used in the industry for measuring the amount of trading that occurs in a fund's portfolio during the year. For example, a 100% turnover rate means that on average every security in the portfolio has been replaced once during the year. Funds that engage in active trading may have high portfolio turnover rates. Funds with high turnover rates (more than 100%) often have higher transaction costs (which are paid by the fund) and may lower the fund's performance. Please consider all the factors when you compare the turnover rates of different funds. You should also be aware that the "total return" line in the Financial Highlights section reflects portfolio turnover costs.
High portfolio turnover can result in a lower capital gain distribution due to higher transaction costs added to the basis of the assets or can result in lower ordinary income distributions to shareholders when the transaction costs cannot be added to the basis of assets. Both events reduce fund performance.
No turnover rate can be calculated for the Money Market Fund because of the short maturities of the securities in which it invests.
Preferred SecuritiesPreferred securities generally pay fixed rate dividends and/or interest (though some are adjustable rate) and typically have "preference" over common stock in payment priority and the liquidation of a company's assets - preference means that a company must pay on its preferred securities before paying on its common stock, and the claims of preferred securities holders are typically ahead of common stockholders' claims on assets in a corporate liquidation. Holders of preferred securities usually have no right to vote for corporate directors or on other matters. The market value of preferred securities is sensitive to changes in interest rates as they are typically fixed income securities - the fixed-income payments are expected to be the primary source of long-term investment return. While some preferred securities are issued with a final maturity date, others are perpetual in nature. In certain instances, a final maturity date may be extended and/or the final payment of principal may be deferred at the issuer’s option for a specified time without triggering an event of default for the issuer. In addition, an issuer of preferred securities may have the right to redeem the securities before their stated maturity date. For instance, for certain types of preferred securities, a redemption may be triggered by a change in federal income tax or securities laws. As with call provisions, a redemption by the issuer may reduce the return of the security held by the fund. Preferred securities may be subject to provisions that allow an issuer, under certain circumstances to skip (indefinitely) or defer (possibly up to 10 years) distributions. If a fund owns a preferred security that is deferring its distribution, the fund may be required to report income for tax purposes while it is not receiving any income.
352
Preferred securities are typically issued by corporations, generally in the form of interest or dividend bearing instruments, or by an affiliated business trust of a corporation, generally in the form of beneficial interests in subordinated debentures or similarly structured securities. The preferred securities market is generally divided into the $25 par “retail” and the $1,000 par “institutional” segments. The $25 par segment includes securities that are listed on the New York Stock Exchange (exchange traded), which trade and are quoted with accrued dividend or interest income, and which are often callable at par value five years after their original issuance date. The institutional segment includes $1,000 par value securities that are not exchange-listed (over the counter), which trade and are quoted on a “clean” price, i.e., without accrued dividend or interest income, and which often have a minimum of 10 years of call protection from the date of their original issuance. Preferred securities can also be issued by real estate investment trusts and involve risks similar to those associated with investing in real estate investment trust companies.
Real Estate Investment TrustsReal estate investment trust securities ("REITs") involve certain unique risks in addition to those risks associated with investing in the real estate industry in general (such as possible declines in the value of real estate, lack of availability of mortgage funds, or extended vacancies of property). REITs are characterized as: equity REITs, which primarily own property and generate revenue from rental income; mortgage REITs, which invest in real estate mortgages; and hybrid REITs, which combine the characteristics of both equity and mortgage REITs. Equity REITs may be affected by changes in the value of the underlying property owned by the REITs, while mortgage REITs may be affected by the quality of any credit extended. REITs are dependent upon management skills, are not diversified, and are subject to heavy cash flow dependency, risks of default by borrowers, and self-liquidation. As an investor in a REIT, the fund will be subject to the REIT’s expenses, including management fees, and will remain subject to the fund's advisory fees with respect to the assets so invested. REITs are also subject to the possibilities of failing to qualify for the special tax treatment accorded REITs under the Internal Revenue Code, and failing to maintain their exemptions from registration under the 1940 Act.
Investment in REITs involves risks similar to those associated with investing in small market capitalization companies. REITs may have limited financial resources, may trade less frequently and in a limited volume, and may be subject to more abrupt or erratic price movements than larger company securities.
Real Estate SecuritiesInvesting in securities of companies in the real estate industry subjects a fund to the special risks associated with the real estate market and the real estate industry in general. Generally, companies in the real estate industry are considered to be those that have principal activity involving the development, ownership, construction, management or sale of real estate; have significant real estate holdings, such as hospitality companies, healthcare facilities, supermarkets, mining, lumber and/or paper companies; and/or provide products or services related to the real estate industry, such as financial institutions that make and/or service mortgage loans and manufacturers or distributors of building supplies. Securities of companies in the real estate industry are sensitive to factors such as loss to casualty or condemnation, changes in real estate values, property taxes, interest rates, cash flow of underlying real estate assets, occupancy rates, government regulations affecting zoning, land use and rents, and the management skill and creditworthiness of the issuer. Companies in the real estate industry may also be subject to liabilities under environmental and hazardous waste laws.
Repurchase AgreementsRepurchase agreements typically involve the purchase of debt securities from a financial institution such as a bank, savings and loan association, or broker-dealer. A repurchase agreement provides that the fund sells back to the seller and that the seller repurchases the underlying securities at a specified price on a specific date. Repurchase agreements may be viewed as loans by a fund collateralized by the underlying securities. This arrangement results in a fixed rate of return that is not subject to market fluctuation while the fund holds the security. In the event of a default or bankruptcy by a selling financial institution, the affected fund bears a risk of loss. To minimize such risks, the fund enters into repurchase agreements only with parties a Sub-Advisor deems creditworthy (those that are large, well-capitalized, and well-established financial institutions). In addition, the value of the securities collateralizing the repurchase agreement is, and during the entire term of the repurchase agreement remains, at least equal to the repurchase price, including accrued interest.
353
Royalty TrustsA royalty trust generally acquires an interest in natural resource or chemical companies and distributes the income it receives to its investors. A sustained decline in demand for natural resource and related products could adversely affect royalty trust revenues and cash flows. Such a decline could result from a recession or other adverse economic conditions, an increase in the market price of the underlying commodity, higher taxes or other regulatory actions that increase costs, or a shift in consumer demand. Rising interest rates could harm the performance and limit the capital appreciation of royalty trusts because of the increased availability of alternative investments at more competitive yields. Fund shareholders will indirectly bear their proportionate share of the royalty trusts' expenses.
Securitized ProductsSecuritized products are fixed income instruments that represent interest in underlying pools of collateral or assets. The value of the securitized product is derived from the performance, value, and cash flows of the underlying asset(s). The fund’s investments in securitized products are subject to risks similar to traditional fixed income securities, such as credit, interest rate, liquidity, prepayment, extension, and default risk, as well as additional risks associated with the nature of the assets and the servicing of those assets. Prepayment risk may make it difficult to calculate the average life of a fund’s investment in securitized products. Securitized products are generally issued as pass-through certificates, which represent the right to receive principal and interest payments collected on the underlying pool of assets, which are passed through to the security holder. Therefore, repayment depends on the cash flows generated by the underlying pool of assets. The securities may be rated as investment-grade or below-investment-grade.
• Mortgage-backed securities (“MBS”) represent an interest in a pool of underlying mortgage loans secured by real property. Mortgage-backed securities are sensitive to changes in interest rates, but may respond to these changes differently from other fixed income securities due to the possibility of prepayment of the underlying mortgage loans. If interest rates fall and the underlying loans are prepaid faster than expected, the fund may have to reinvest the prepaid principal in lower yielding securities, thus reducing the fund’s income. Conversely, rising interest rates tend to discourage refinancings and the underlying loans are prepaid more slowly than expected, reducing a fund’s potential to reinvest the principal in higher yielding securities and extending the duration of the underlying loans. In addition, when market conditions result in an increase in default rates on the underlying loans and the foreclosure values of the underlying real estate is less than the outstanding amount due on the underlying loan, collection of the full amount of accrued interest and principal on these investments may be doubtful. The risk of such defaults is generally higher in the case of underlying mortgage pools that include sub-prime mortgages (mortgages granted to borrowers whose credit histories would not support conventional mortgages).
• Commercial mortgage-backed securities (“CMBS”) represent an interest in a pool of underlying commercial mortgage loans secured by real property such as retail, office, hotel, multi-family, and industrial properties. Certain CMBS are issued in several classes with different levels of yield and credit protection, and the CMBS class in which a fund invests usually influences the interest rate, credit, and prepayment risks.
• Asset-backed securities (“ABS”) are backed by non-mortgage assets such as company receivables, truck and auto loans, student loans, leases and credit card receivables. Asset-backed securities entail credit risk. They also may present a risk that, in the event of default, the liquidation value of the underlying assets may be inadequate to pay any unpaid interest or principal.
Short SalesA fund enters into a short sale by selling a security it has borrowed (typically from a broker or other institution). If the market price of a security increases after a fund borrows the security, the fund will suffer a (potentially unlimited) loss when it replaces the borrowed security at the higher price. In certain cases, purchasing a security to cover a short position can itself cause the price of the security to rise further, thereby exacerbating the loss. In addition, a fund may not always be able to borrow the security at a particular time or at an acceptable price. Before a fund replaces a borrowed security, it is required to designate on its books cash or liquid assets as collateral to cover the fund’s short position, marking the collateral to market daily. This obligation limits a fund’s investment flexibility, as well as its ability to meet redemption requests or other current obligations. The fund may also take a short position in a derivative instrument, such as a future, forward or swap. A short position in a derivative instrument involves the risk of a theoretically unlimited increase in the value of the underlying instrument. Short sales also involve transaction and other costs that will reduce potential fund gains and increase potential fund losses.
354
Small and Medium Market Capitalization CompaniesFunds may invest in securities of companies with small- or mid-sized market capitalizations. Market capitalization is defined as total current market value of a company's outstanding common stock. Investments in companies with smaller market capitalizations may involve greater risks and price volatility (wide, rapid fluctuations) than investments in larger, more mature companies. Small companies may be less significant within their industries and may be at a competitive disadvantage relative to their larger competitors. While smaller companies may be subject to these additional risks, they may also realize more substantial growth than larger or more established companies.
Smaller companies may be less mature than larger companies. At this earlier stage of development, the companies may have limited product lines, reduced market liquidity for their shares, limited financial resources, or less depth in management than larger or more established companies. Unseasoned issuers are companies with a record of less than three years continuous operation, including the operation of predecessors and parents. Unseasoned issuers by their nature have only a limited operating history that can be used for evaluating the company's growth prospects. As a result, these securities may place a greater emphasis on current or planned product lines and the reputation and experience of the company's management and less emphasis on fundamental valuation factors than would be the case for more mature growth companies.
Temporary Defensive MeasuresFrom time to time, as part of its investment strategy, funds may invest without limit in cash and cash equivalents for temporary defensive purposes in response to adverse market, economic, or political conditions. To the extent that a fund is in a defensive position, it may lose the benefit of upswings and limit its ability to meet its investment objective. For this purpose, cash equivalents include: bank notes, bank certificates of deposit, bankers' acceptances, repurchase agreements, commercial paper, and commercial paper master notes, which are floating rate debt instruments without a fixed maturity. In addition, the fund may purchase U.S. government securities, preferred stocks, and debt securities, whether or not convertible into or carrying rights for common stock.
There is no limit on the extent to which a fund may take temporary defensive measures. In taking such measures, a fund may fail to achieve its investment objective.
The Money Market Fund may invest in high-quality money market securities at any time.
Underlying FundsAn underlying fund to a fund of funds may experience relatively large redemptions or purchases as the fund of funds periodically reallocates or rebalances its assets. These transactions may accelerate the realization of taxable income if sales of portfolio securities result in gains and could increase transaction costs. In addition, when a fund of funds reallocates or redeems significant assets away from an underlying fund, the loss of assets to the underlying fund could result in increased expense ratios for that fund.
Principal is the advisor to the Principal LifeTime Funds, Principal LifeTime Hybrid Funds, Real Estate Allocation Fund, SAM Portfolios, PVC Diversified Balanced Account, PVC Diversified Balanced Managed Volatility Account, PVC Diversified Growth Account, PVC Diversified Growth Managed Volatility Account, PVC Diversified Income Account, and each of the underlying funds. Principal Global Investors, LLC ("PGI") is Sub-Advisor to the Principal LifeTime Funds, Principal Real Estate Investors, LLC ("Principal-REI") is sub-advisor to the Real Estate Allocation Fund, and Edge Asset Management, Inc. ("Edge") is the Sub-Advisor to the SAM Portfolios. PGI, Principal-REI or Edge also serves as Sub-Advisor to some or all of the underlying funds. Principal, PGI, Principal-REI, and Edge are committed to minimizing the potential impact of underlying fund risk on underlying funds to the extent consistent with pursuing the investment objectives of the fund of funds that it manages. Each may face conflicts of interest in fulfilling its responsibilities to all such funds.

355
As of October 31, 2014, PFI SAM Portfolios, PFI Principal LifeTime Funds, PFI Principal LifeTime Hybrid Funds, PFI Real Estate Allocation Fund*, PVC SAM Portfolios, PVC Principal LifeTime Accounts, PVC Diversified Balanced Account, PVC Diversified Balanced Managed Volatility Account, PVC Diversified Growth Account, PVC Diversified Growth Managed Volatility Account, and PVC Diversified Income Account owned the following percentages, in the aggregate, of the outstanding shares of the underlying funds listed below:
Fund
Total Percentageof OutstandingShares Owned
Bond & Mortgage Securities Fund 84.53%Diversified International Fund 54.63%Equity Income Fund 38.16%Global Diversified Income Fund 6.02%Global Real Estate Securities Fund 55.69%Government & High Quality Bond Fund 62.14%High Yield Fund 7.99%High Yield Fund I 32.00%Income Fund 63.92%Inflation Protection Fund 59.68%International Emerging Markets Fund 61.05%LargeCap Growth Fund 59.26%LargeCap Growth Fund I 38.94%LargeCap Growth Fund II 26.71%LargeCap S&P 500 Index Fund 44.16%LargeCap Value Fund 85.77%LargeCap Value Fund III 80.80%MidCap Fund 6.21%MidCap Growth Fund III 49.29%MidCap S&P 400 Index Fund 17.60%MidCap Value Fund III 73.10%Overseas Fund 75.71%Principal Capital Appreciation Fund 42.67%Short-Term Income Fund 43.34%SmallCap Growth Fund I 44.75%SmallCap S&P 600 Index Fund 18.73%SmallCap Value Fund II 59.43%
* The Real Estate Allocation Fund did not exist prior to October 31, 2014.
PORTFOLIO HOLDINGS INFORMATION
A description of the Fund's policies and procedures with respect to disclosure of the Fund's portfolio securities is available in the Fund's Statement of Additional Information.
MANAGEMENT OF THE FUNDS
The ManagerPrincipal Management Corporation (“Principal”) serves as the manager for the Fund. Through the Management Agreement with the Fund, Principal provides investment advisory services and certain corporate administrative services for the Fund.
Principal is an indirect subsidiary of Principal Financial Group, Inc. and has managed mutual funds since 1969. Principal’s address is 655 9th Street, Des Moines, IA 50392.
Principal provides investment advisory services with respect to 10-35% of the assets of the following Funds:LargeCap Blend Fund II, LargeCap Growth Fund I, LargeCap Growth Fund II, LargeCap Value Fund III, MidCap Growth Fund III, MidCap Value Fund I, MidCap Value Fund III, Overseas Fund, SmallCap Growth Fund I, and SmallCap Value Fund II. The remaining assets in each of these Funds will be managed by the sub-advisor(s) named in the prospectus.
Principal provides these investment advisory services through a portfolio manager who functions as a co-employee of Principal and Principal Global Investors, LLC ("PGI") under an investment service agreement. Through the agreement, the portfolio manager has access to PGI's equity management processes, systems, staff, proprietary
356
quantitative model, portfolio construction disciplines, experienced portfolio management, and quantitative research staff. This portfolio manager also has access to PGI's trading staff and trade execution capabilities along with PGI's order management system, pre- and post-trade compliance system, portfolio accounting system and performance attribution and risk management system.
Principal provides a substantial part of the investment advisory services to each of the Principal LifeTime Funds directly, while engaging PGI as a sub-advisor to assist in providing those investment advisory services. The portfolio managers Principal has appointed for each Principal LifeTime Fund are James W. Fennessey, Jeffrey R. Tyler, and Randy L. Welch. The portfolio manager PGI has appointed for each Principal LifeTime Fund is Matthew D. Annenberg. Messrs. Fennessey, Tyler, Welch, and Annenberg work as a team, sharing day-to-day management of the Principal LifeTime Funds; however, Mr. Tyler has ultimate decision making authority.
Principal provides investment advisory services to each of the Principal LifeTime Hybrid Funds directly. The portfolio managers Principal has appointed for each Principal LifeTime Hybrid Fund are James W. Fennessey, Jeffrey R. Tyler, and Randy L. Welch. Fennessey, Tyler and Welch work as a team, sharing day-to-day management of the Principal LifeTime Hybrid Funds; however, Mr. Tyler has ultimate decision making authority. Additional information about the portfolio managers follows. The SAI provides additional information about each portfolio manager’s compensation, other accounts managed by the portfolio manager, and the portfolio manager’s ownership of securities in the Fund.
James W. Fennessey joined the Principal Financial Group in 2000. He is the Head of the Manager Research Team that is responsible for analyzing, interpreting, and coordinating investment performance data and evaluation of the investment managers under the due diligence program that monitors investment managers used by the Principal Funds and is a member of the Principal Funds Investment Committee. Mr. Fennessey earned a B.S. in Business Administration, with an emphasis in Finance, and a minor in Economics from Truman State University. He has earned the right to use the Chartered Financial Analyst designation.
Jeffrey R. Tyler joined Principal in 2011. Prior to that, Mr. Tyler was the Chief Investment Officer at EXOS Partners. From 1988-2009, Mr. Tyler was Senior Vice President, Senior Portfolio Manager, and Manager of Taxable Fixed Income for American Century. He earned a B.A. in Business Economics and Accounting from the University of California, Santa Barbara and a Master of Management in Finance and Economics from the J.L. Kellogg Graduate School of Management, Northwestern University. Mr. Tyler has earned the right to use the Chartered Financial Analyst designation.
Randy L. Welch joined the Principal Financial Group in 1989 and oversees the functions of the Investment Services group, which includes investment manager research, investment consulting, performance analysis, and investment communication. He is also responsible for the due diligence program that monitors investment managers used by the Principal Funds. Mr. Welch is an affiliate member of the Chartered Financial Analysts (CFA) Institute. Mr. Welch earned a B.A. in Business/Finance from Grand View College and an M.B.A. from Drake University.
Cash Management ProgramThe following Funds have adopted a special cash management program, which is executed by Principal: International Fund I, LargeCap Blend Fund II, LargeCap Growth Fund I, LargeCap Growth Fund II, LargeCap Value Fund III, MidCap Growth Fund III, MidCap Value Fund I, MidCap Value Fund III, Overseas Fund, SmallCap Growth Fund I, and SmallCap Value Fund II.
Each Fund in the cash management program has cash available in its portfolio to meet redemption requests and to pay expenses. Additionally, each Fund receives cash when shareholders purchase shares. Each Fund invests its cash in money market investments and in stock index futures contracts reflecting the Fund's market capitalization to gain exposure to the market. Stock index futures provide returns similar to those of common stocks. Principal believes that, over the long term, this strategy will enhance the investment performance of the Funds.
The Sub-AdvisorsPrincipal has signed contracts with various Sub-Advisors. Under the sub-advisory agreements, the Sub-Advisor agrees to assume the obligations of Principal to provide investment advisory services to the portion of the assets of a specific Fund allocated to it by Principal. For these services, Principal pays the Sub-Advisor a fee.
357
Principal or the Sub-Advisor provides the Directors of the Fund with a recommended investment program. The program must be consistent with the Fund's investment objective and policies. Within the scope of the approved investment program, the Sub-Advisor advises the Fund on its investment policy and determines which securities are bought or sold, and in what amounts.
Some of the Sub-Advisors may enter into co-employee agreements, investment service agreements, dual employee agreements, or other similar agreements with advisers with which they are affiliated. Through the agreements, the Sub-Advisor’s portfolio manager usually is accorded access to the portfolio management processes, systems, staff, proprietary quantitative model, portfolio construction disciplines, experienced portfolio management, and quantitative research staff of the affiliated investment advisory firm. Likewise, through the agreements, the portfolio manager usually has access to the trading staff and trade execution capabilities along with the order management system, pre- and post-trade compliance system, portfolio accounting system and performance attribution and risk management system of the affiliated investment advisory firm.
Several of the Funds have multiple Sub-Advisors. For those Funds (except the Global Diversified Income Fund), a team at Principal, consisting of James Fennessey and Randy Welch, determines the portion of the Fund's assets each Sub-Advisor will manage and may, from time-to-time, reallocate Fund assets between the Sub- Advisors. The decision to do so may be based on a variety of factors, including but not limited to: the investment capacity of each Sub-Advisor, portfolio diversification, volume of net cash flows, fund liquidity, investment performance, investment strategies, changes in each Sub-Advisor's firm or investment professionals or changes in the number of Sub-Advisors. Ordinarily, reallocations of Fund assets among Sub-Advisors occur as a Sub-Advisor liquidates assets in the normal course of portfolio management or with net new cash flows; however, at times existing Fund assets may be reallocated among Sub-Advisors. This team shares equally in the day-to-day portfolio management responsibility and agrees on allocation decisions.
The Global Diversified Income Fund has multiple Sub-Advisors and a team at Principal, consisting of Jake S. Anonson, Jessica S. Bush, Marcus W. Dummer, James W. Fennessey, Kelly A. Grossman, and Benjamin E. Rotenberg, determines the portion of the Fund’s assets each Sub-Advisor will manage and may reallocate Fund assets among the Sub-Advisors from time-to-time. This team shares day-to-day portfolio management, sharing authority, with no limitation on the authority of one portfolio manager in relation to another. The decision to reallocate Fund assets between the Sub-Advisors may be based on a variety of factors, including but not limited to: the investment capacity of each Sub-Advisor, portfolio diversification, volume of net cash flows, fund liquidity, investment performance, investment strategies, changes in each Sub-Advisor's firm or investment professionals or changes in the number of Sub-Advisors. Ordinarily, reallocations of Fund assets among Sub-Advisors occur as a Sub-Advisor liquidates assets in the normal course of portfolio management or with net new cash flows; however, at times existing Fund assets may be reallocated among Sub-Advisors.
Jake S. Anonson joined the Principal Financial Group in 2012. He worked at Miles Capital from 2010 - 2012. Before that, Mr. Anonson worked at Principal Financial Group. Mr. Anonson is a Senior Portfolio Strategist for Principal and a member of the Principal Funds Investment Committee. He is responsible for conducting research, assessing risk, and making relative value recommendations relating to the equity component of the Principal Portfolio Construction StrategiesSM (Global Diversified Income Fund, Diversified Real Asset Fund, and Global Multi-Strategy Fund). Mr. Anonson earned a B.A. and B.S. from the University of Northern Iowa and an M.B.A. from Iowa State University. Mr. Anonson has earned the right to use the Chartered Financial Analyst designation.
Jessica S. Bush joined the Principal Financial Group in 2006. Ms. Bush is an Investment Strategist for Principal and a member of the Principal Funds Investment Committee. She is responsible for the manager selection, oversight, and asset allocation decisions for the Principal Portfolio Construction StrategiesSM (Global Diversified Income Fund, Diversified Real Asset Fund, and Global Multi-Strategy Fund). Previously, Ms. Bush was a Senior Research Analyst responsible for analyzing, interpreting, and coordinating investment performance data and evaluation of the investment managers under the due diligence program that monitors investment managers used by the Principal Funds. Ms. Bush earned a B.A. in Business Administration from the University of Michigan. She has earned the right to use the Chartered Financial Analyst designation.
Marcus W. Dummer joined the Principal Financial Group in 2003. Mr. Dummer is a Senior Portfolio Strategist for Principal and a member of the Principal Funds Investment Committee. He is responsible for conducting research, assessing risk, and making relative value recommendations relating to the fixed income component of the Principal Portfolio Construction StrategiesSM (Global Diversified Income Fund, Diversified Real Asset Fund, and Global Multi-Strategy Fund). Mr. Dummer earned a bachelor’s degree in Finance and an M.B.A. from the University of Utah.
358
Kelly A. Grossman joined the Principal Financial Group in 1991. She is a Senior Product Manager at Principal and a member of the Principal Funds Investment Committee. Before that, she was a Managing Director within the Capital Markets and Structured Products Group at Principal Global Investors. Ms. Grossman earned a B.A. in Mathematics and Computer Science from the University of Northern Iowa. She is a fellow of the Society of Actuaries and a member of the American Academy of Actuaries.
Benjamin E. Rotenberg joined the Principal Financial Group in 2014. Before that, he served as Managing Director with Cliffwater LLC. Mr. Rotenberg is a Senior Portfolio Strategist for Principal and a member of the Principal Funds Investment Committee. In this role, he is responsible for risk assessment within the alternative strategies as well as supporting the portfolio decision-making process for the Principal Portfolio Construction StrategiesSM (Global Diversified Income Fund, Diversified Real Asset Fund, and Global Multi-Strategy Fund). He earned a bachelor’s degree in International Relations and Russian from Pomona College. Mr. Rotenberg has earned the right to use the Chartered Financial Analyst designation.
The Fund summaries identified the portfolio managers and the funds they manage. Additional information about the portfolio managers follows. The SAI provides additional information about each portfolio manager’s compensation, other accounts managed by the portfolio manager, and the portfolio manager’s ownership of securities in the Fund.
Sub-Advisor: AllianceBernstein L.P. (“AllianceBernstein”), 1345 Avenue of the Americas, New York, NY 10105, was founded in 1971 as an independent investment advisor registered with the SEC.
AllianceBernstein is the sub-advisor for a portion of the assets of the SmallCap Growth Fund I.
Sub-Advisor: American Century Investment Management, Inc. (“American Century”), American Century Tower, 4500 Main Street, Kansas City, MO 64111, was founded in 1958.
American Century is the sub-advisor for a portion of the assets of the LargeCap Growth Fund II.
Sub-Advisor: Barrow, Hanley, Mewhinney & Strauss, LLC (“BHMS”), 2200 Ross Avenue, 31st Floor, Dallas, Texas 75201, is an investment advisory firm that was founded in 1979.
BHMS is the sub-advisor for a portion of the assets of the LargeCap Value Fund III, a portion of the assets of the MidCap Value Fund III, and a portion of the assets of the Overseas Fund.
Sub-Advisor: BlackRock Financial Management, Inc. (“BlackRock”), 55 East 52nd Street, New York, New York 10055, is a registered investment adviser organized in 1994. BlackRock and its affiliates manage investment company and other portfolio assets.
BlackRock is the sub-advisor for the Inflation Protection Fund.
The Inflation Protection Fund is managed by a team of financial professionals at BlackRock. The portfolio managers are jointly and primarily responsible for the day-to-day management of the Fund.
Gargi Chaudhuri has been with BlackRock since 2010. Ms. Chaudhuri earned a B.A. in Accounting from Ohio Wesleyan University.
Martin Hegarty has been with BlackRock since 2010. He earned a B.S. in Economics from Rhodes University, South Africa.
Sub-Advisor: Brown Advisory, LLC (“Brown”), 901 South Bond Street, Suite 400, Baltimore, Maryland 21231, is a registered investment adviser that works with institutions, corporations, nonprofits, families and individuals.
Brown is the sub-advisor for a portion of the assets of the LargeCap Growth Fund I and a portion of the assets of the SmallCap Growth Fund I.
Sub-Advisor: Causeway Capital Management LLC (“Causeway”), 11111 Santa Monica Boulevard, 15th Floor, Los Angeles, CA 90025, is a registered investment adviser founded in 2001.
Causeway is the sub-advisor for a portion of the assets of the Overseas Fund.
359
Sub-Advisor: ClearBridge Investments, LLC (“ClearBridge”), 620 8th Avenue, New York, NY 10018, formed in 2005, is a registered investment advisor offering a variety of products and services to institutions and individuals.
ClearBridge is the sub-advisor for a portion of the assets of the LargeCap Blend Fund II.
Sub-Advisor: Colonial First State Asset Management (Australia) Limited (“Colonial First State”), Level 3, Darling Park Tower 1, 201 Sussex Street, Sydney NSW 2000, is a global asset manager, which has experience across a range of asset classes and specialist investment sectors. Colonial First State manages investments on behalf of institutional investors, pension funds, wholesale distributors and platforms, financial advisers and their clients.
Colonial First State is one of the sub-advisors for the publicly-listed infrastructure portion of the Global Diversified Income Fund.
Sub-Advisor: Columbus Circle Investors (“CCI”), Metro Center, One Station Place, Stamford, CT 06902, founded in 1975, manages growth-oriented portfolios in Large Cap, Mid Cap, SMID, and Small Cap categories for domestic equities. CCI specializes in the management of discretionary accounts for a variety of organizations. CCI also offers advisory services for mutual funds and high net worth individuals.
CCI is the sub-advisor for the LargeCap Growth Fund, the MidCap Growth Fund and a portion of the assets of the SmallCap Growth Fund I.
For the LargeCap Growth Fund, Anthony Rizza is the lead Portfolio Manager, and Thomas J. Bisighini, as Co-Portfolio Manager, has responsibility for research and supports Mr. Rizza on the day-to-day management of the Fund.
For the MidCap Growth Fund, Clifford G. Fox is the lead Portfolio Manager and Michael Iacono and Katerina Wasserman are Co-Portfolio Managers. Mr. Fox has the final decision making authority, but Mr. Iacono and Ms. Wasserman have the authority to execute trades in Mr. Fox’s absence.
Thomas J. Bisighini has been with CCI since 2004. He earned a B.S. from Bentley College and an M.B.A. in Finance from Fordham University. Mr. Bisighini has earned the right to use the Chartered Financial Analyst designation.
Clifford G. Fox has been with CCI since 1992. He earned an M.B.A. from the Stern School of Business, New York University and a B.S. in Economics from the Wharton School, University of Pennsylvania. Mr. Fox has earned the right to use the Chartered Financial Analyst designation.
Michael Iacono has been with CCI since 1997. He earned a B.S. in Accounting from Boston College. Mr. Iacono is a CPA and has earned the right to use the Chartered Financial Analyst designation.
Anthony Rizza has been with CCI since 1991. He earned a B.S. in Business from the University of Connecticut. Mr. Rizza has earned the right to use the Chartered Financial Analyst designation.
Katerina Wasserman has been with CCI since 2000. She earned a B.S. in Biochemistry from the State University of New York at Stony Brook and a Master’s of Public Administration from the Robert F. Wagner Graduate School at New York University.
Sub-Advisor: DDJ Capital Management, LLC (“DDJ”), 130 Turner Street, Building 3, Suite 600, Waltham, MA 02453, is an SEC registered investment advisor. DDJ was formed in 1996 and presently manages opportunistic high yield, core high yield, senior loan, and strategic income strategies for U.S. and international institutional investors.
DDJ is one of the sub-advisors for the high yield portion of the Global Diversified Income Fund.
360
Sub-Advisor: Dimensional Fund Advisors LP (“Dimensional”), 6300 Bee Cave Road, Building One, Austin, TX 78746, is a registered investment advisor organized in 1981.
Dimensional is the sub-advisor for a portion of the assets of the SmallCap Value Fund II.
Sub-Advisor: Edge Asset Management, Inc. (“Edge”), 601 Union Street, Suite 2200, Seattle, WA 98101-1377, has been in the business of investment management since 1944.
Edge is the sub-advisor for the Equity Income Fund, the Government & High Quality Bond Fund, the Income Fund, the Principal Capital Appreciation Fund, the Short-Term Income Fund, the SAM Balanced Portfolio, the SAM Conservative Balanced Portfolio, the SAM Conservative Growth Portfolio, the SAM Flexible Income Portfolio, and the SAM Strategic Growth Portfolio.
The portfolio managers operate as a team, sharing authority, with no limitation on the authority of one portfolio manager in relation to another.
Charles D. Averill has been with Edge since 1990 and previously was a Senior Quantitative Analyst. He earned a bachelor’s degree in Economics from Reed College and an M.A. in Economics from Princeton University. Mr. Averill has earned the right to use the Chartered Financial Analyst designation.
Daniel R. Coleman joined Edge in 2001 and has held various investment management roles on the equity team, including Portfolio Manager and some senior management roles. He earned a bachelor's degree in Finance from the University of Washington and an M.B.A. from New York University.
Jill R. Cuniff became President of Edge in 2009 and became Portfolio Manager in 2010. She earned a bachelor’s degree in Business Finance from Montana State University.
Philip M. Foreman has been with Edge since 2002. He earned a bachelor’s degree in Economics from the University of Washington and an M.B.A. from the University of Puget Sound. Mr. Foreman has earned the right to use the Chartered Financial Analyst designation.
John R. Friedl has been with Edge since 1998. He earned a B.A. in Communications and History from the University of Washington and a master's degree in Finance from Seattle University. Mr. Friedl has earned the right to use the Chartered Financial Analyst designation.
Todd A. Jablonski has been with Edge since 2010. He earned a bachelor’s degree in Economics from the University of Virginia and an M.B.A. with an emphasis in Quantitative Finance from New York University's Stern School of Business. Mr. Jablonski has earned the right to use the Chartered Financial Analyst designation.
Ryan P. McCann has been a Portfolio Manager for Edge since 2010. He earned a B.A. in Business Administration from Washington State University. Mr. McCann has earned the right to use the Chartered Financial Analyst designation.
Scott J. Peterson has been with Edge since 2002. He earned a bachelor’s degree in Mathematics from Brigham Young University and an M.B.A. from New York University’s Stern School of Business. Mr. Peterson has earned the right to use the Chartered Financial Analyst designation.
David W. Simpson has been with Edge since 2003. He earned a bachelor's degree from the University of Illinois and an M.B.A. in Finance from the University of Wisconsin. Mr. Simpson has earned the right to use the Chartered Financial Analyst designation.
Greg L. Tornga joined Edge in 2011. Previously, Mr. Tornga worked at Payden & Rygel Investment Management in Los Angeles. He earned a bachelor’s degree from the University of Michigan and an M.B.A. from the Argyros School of Business at Chapman University. Mr. Tornga has earned the right to use the Chartered Financial Analyst designation.
Sub-Advisor: Emerald Advisers, Inc. (“Emerald”), 3175 Oregon Pike, Leola, PA 17540, was incorporated in 1991 and manages institutional separate account and mutual fund investment portfolios for corporations, public and private pension funds, and for individual retail investors.
Emerald is the sub-advisor for a portion of the assets of the SmallCap Growth Fund I.
361
Sub-Advisor: Goldman Sachs Asset Management, L.P. (“GSAM”), 200 West Street, New York, NY 10282, has been registered as an investment adviser with the SEC since 1990.
GSAM is the sub-advisor for a portion of the assets of the MidCap Value Fund I.
Sub-Advisor: Guggenheim Partners Investment Management, LLC ("Guggenheim"), 100 Wilshire Boulevard, Suite 500 Santa Monica CA 90401, is an SEC registered investment adviser that provides investment advisory services to institutional clients including public pensions, corporate pensions, foundations, insurance companies and family offices.
Guggenheim is the sub-advisor for the call option overwriting portion of the Global Diversified Income Fund and one of the sub-advisors for the high yield portion of the Global Diversified Income Fund.
Sub-Advisor: J.P. Morgan Investment Management Inc. (“J.P. Morgan”), 270 Park Avenue, New York, NY 10017, is an SEC registered investment advisor.
J.P. Morgan is the sub-advisor for a portion of the assets of the High Yield Fund I.
For the portion of the assets allocated to this firm, the portfolio managers operate as a team, sharing authority and responsibility for research and the day-to-day management of the portfolio with no limitation on the authority of one portfolio manager in relation to another.
James E. Gibson has been with J.P. Morgan since 2005. He earned a B.S. in Finance from the University of Cincinnati College of Business Administration.
William J. Morgan has been with J.P. Morgan since 2005. He earned a B.A. in History from Kenyon College and an M.B.A. from Xavier University.
James P. Shanahan, Jr. has been with J.P. Morgan since 2005. He earned a B.A. from Xavier University and a J.D. from the University of Cincinnati College of Law.
Sub-Advisor: Los Angeles Capital Management and Equity Research, Inc. ("Los Angeles Capital"), 11150 Santa Monica Boulevard, Suite 200, Los Angeles, CA 90025, founded in 2002, is a registered investment adviser offering risk-controlled, active equity management services to a broad range of institutional investors.
Los Angeles Capital is the sub-advisor for a portion of the assets of the MidCap Value Fund I and a portion of the assets of the SmallCap Value Fund II.
Sub-Advisor: Neuberger Berman Fixed Income LLC (“Neuberger Berman”), 190 South LaSalle Street, Chicago, IL 60603, is an investment adviser registered with the SEC.
Neuberger Berman is the sub-advisor for a portion of the assets of the High Yield Fund I.
For the portion of the assets allocated to this firm, the portfolio managers operate as a team, sharing authority and responsibility for research and the day-to-day management of the portfolio with no limitation on the authority of one portfolio manager in relation to another.
Ann H. Benjamin has been with Neuberger Berman (and its predecessors) since 1997. She earned a B.A. in Economics from Chatham College and a master’s degree in Finance from Carnegie Mellon University.
William (Russ) Covode has been with Neuberger Berman since 2006. He earned a B.A. in Economics from Colorado College and an M.B.A. from the University of Chicago.
Daniel Doyle has been with Neuberger Berman since 2012. Before that, Mr. Doyle was Managing Director at SunTrust Robinson Humphrey. He earned a B.S. from Northern Illinois University and an M.B.A. from the University of Chicago. He has earned the right to use the Chartered Financial Analyst designation.
362
Thomas P. O’Reilly has been with Neuberger Berman (and its predecessors) since 1997. He earned a B.S. in Finance from Indiana University and an M.B.A. from Loyola University. He has earned the right to use the Chartered Financial Analyst designation.
Sub-Advisor: Origin Asset Management LLP ("Origin"), One Carey Lane, London, EC2V 8AE, UK manages global equity securities for institutional clients.
Origin is the sub-advisor for the International Fund I.
The portfolio managers operate as a team, sharing authority and responsibility for research and the day-to-day management of the portfolio with no limitation on the authority of one portfolio manager in relation to another.
John Birkhold has been with Origin since 2009. He earned a B.S. and M.E. in Systems Engineering from the University of Virginia and an M.B.A. in Finance from the University of Chicago.
Chris Carter has been with Origin since 2005. Mr. Carter is a graduate of Gonville & Caius College, University of Cambridge, with an M.A. Honours Degree in Economics and Philosophy.
Nigel Dutson has been with Origin since 2005. Mr. Dutson is a graduate of Surrey University with a B.Sc. Joint Honours Degree in Mathematics & Economics.
Tarlock Randhawa has been with Origin since 2005. Mr. Randhawa is a graduate of Brunel University with a B.Sc. Joint Honours Degree in Mathematics & Management.
Nerys Weir has been with Origin since 2008. Ms. Weir is a graduate of Leicester University with a B.A. Honours Degree in Ancient History and Archaeology.
Sub-Advisor: Post Advisory Group, LLC (“Post”), 1620 26th Street, Suite 6500N, Santa Monica, CA 90404, founded in 1992, is a global investment manager specializing in high yield securities with a multi-strategy, value-oriented investment approach.
Post is one of the sub-advisors for the high yield portion of the Global Diversified Income Fund.
Sub-Advisor: Principal Global Investors, LLC (“PGI”), 801 Grand Avenue, Des Moines, IA 50392, manages equity and fixed-income investments, primarily for institutional investors. PGI's other primary asset management office is in New York, with asset management offices of affiliate advisors in several non-U.S. locations including London, Sydney and Singapore.
PGI is the sub-advisor for the Bond & Mortgage Securities Fund, the California Municipal Fund, the Diversified International Fund, the High Yield Fund, the International Emerging Markets Fund, the LargeCap S&P 500 Index Fund, the LargeCap Value Fund, the MidCap Fund, the MidCap S&P 400 Index Fund, the Money Market Fund, the Principal LifeTime 2010 Fund, the Principal LifeTime 2015 Fund, the Principal LifeTime 2020 Fund, the Principal LifeTime 2025 Fund, the Principal LifeTime 2030 Fund, the Principal LifeTime 2035 Fund, the Principal LifeTime 2040 Fund, the Principal LifeTime 2045 Fund, the Principal LifeTime 2050 Fund, the Principal LifeTime 2055 Fund, the Principal LifeTime 2060 Fund, the Principal LifeTime Strategic Income Fund, the SmallCap Blend Fund, the SmallCap S&P 600 Index Fund, the Tax-Exempt Bond Fund, the global value equity portion of the Global Diversified Income Fund, and a portion of the assets of the MidCap Value Fund III.As reflected in the fund summaries, the day-to-day portfolio management, for some funds, is shared by multiple portfolio managers. In each such case, except the MidCap Fund and where noted in the Management of the Funds section describing the management of the Principal LifeTime Funds, the portfolio managers operate as a team, sharing authority and responsibility for research and the day-to-day management of the portfolio with no limitation on the authority of one portfolio manager in relation to another. For the MidCap Fund, Mr. Nolin and Mr. Rozycki work as a team, sharing day-to-day management of the Fund; however, Mr. Nolin has ultimate decision making authority. Mr. Rozycki may execute trades in Mr. Nolin's absence.Matthew D. Annenberg has been with PGI since 2012. Prior to PGI, he was Managing Director at K2 Advisors and at ABM AMRO Bank. He earned a bachelor's degree in Finance from Harvard College. Mr. Annenberg has earned the right to use the Chartered Financial Analyst designation.

363
William C. Armstrong has been with PGI since 1992. He earned a bachelor’s degree from Kearney State College and an M.B.A. from the University of Iowa. Mr. Armstrong has earned the right to use the Chartered Financial Analyst designation.
Paul H. Blankenhagen has been with PGI since 1992. He earned a bachelor’s degree in Finance from Iowa State University and a master’s degree from Drake University. Mr. Blankenhagen has earned the right to use the Chartered Financial Analyst designation.
Juliet Cohn has been with PGI since 2003. As a co-employee of PGI and Principal Global Investors (Europe) Limited (“PGI Europe”), Ms. Cohn manages Principal Fund assets as an employee of PGI. She earned a bachelor's degree in Mathematics from Trinity College, Cambridge, England.
Mark P. Denkinger has been with PGI since 1990. He earned a bachelor’s degree in Finance and an M.B.A. with a Finance emphasis from the University of Iowa. Mr. Denkinger has earned the right to use the Chartered Financial Analyst designation.
Mihail Dobrinov has been with PGI since 1995. He earned an M.B.A. in Finance from the University of Iowa and a law degree from Sofia University, Bulgaria. Mr. Dobrinov has earned the right to use the Chartered Financial Analyst designation.
Joel Fortney has been with PGI since 2001. He earned a bachelor's degree in Finance from the University of Iowa and an M.B.A. from University of Chicago Booth School of Business. Mr. Fortney has earned the right to use the Chartered Financial Analyst designation.
Arild Holm has been with PGI since 2002. He earned a bachelor’s degree in Management Sciences from the University of Manchester Institute of Science and Technology (England) and an M.B.A. in Finance from the University of Colorado. Mr. Holm has earned the right to use the Chartered Financial Analyst designation.
Thomas L. Kruchten has been with PGI since 2005. He earned a B.A. in Finance from the University of Northern Iowa. Mr. Kruchten has earned the right to use the Chartered Financial Analyst designation and is a member of the CFA Society of Iowa.
James Noble has been with PGI since 2010. He earned a bachelor’s degree in Finance and an M.B.A. from Hofstra University.
K. William Nolin has been with PGI since 1993. He earned a bachelor’s degree in Finance from the University of Iowa and an M.B.A. from the Yale School of Management. Mr. Nolin has earned the right to use the Chartered Financial Analyst designation.
Phil Nordhus has been with PGI since 1990. He earned a bachelor’s degree in Economics from Kansas State University and an M.B.A. from Drake University. Mr. Nordhus has earned the right to use the Chartered Financial Analyst designation.
Brian W. Pattinson has been with PGI since 1994. He earned a bachelor's degree and an M.B.A. in Finance from the University of Iowa. Mr. Pattinson has earned the right to use the Chartered Financial Analyst designation.
Tracy Reeg has been with PGI since 1993. She earned a bachelor’s degree in Finance from the University of Northern Iowa.
Alice Robertson has been with the Principal Financial Group since 1990. She earned a bachelor’s degree in Economics from Northwestern University and a master’s degree in Finance and Marketing from DePaul University.
Tom Rozycki has been with PGI since 2001. He earned a bachelor’s degree in Finance from Drake University. Mr. Rozycki has earned the right to use the Chartered Financial Analyst designation.
Jeffrey A. Schwarte has been with PGI since 1993. He earned a bachelor’s degree in Accounting from the University of Northern Iowa. Mr. Schwarte is a CPA and has earned the right to use the Chartered Financial Analyst designation.
Darrin E. Smith has been with PGI since 2007. He earned a bachelor’s degree in Economics from Iowa State University and an M.B.A. from Drake University. Mr. Smith has earned the right to use the Chartered Financial Analyst designation.
364
Alan Wang returned to PGI in 2012, where he formerly worked from 2003 to 2008. As a co-employee of PGI and Principal Global Investors (Hong Kong) Limited, Mr. Wang manages Principal Fund assets as an employee of PGI. Previously, he was with Ping An of China Asset Management (Hong Kong) and BlackRock Asia. He earned a bachelor’s degree in Economics and International Finance from Renmin University of China and an M.B.A. from the University of Iowa. Mr. Wang has earned the right to use the Chartered Financial Analyst designation.
Timothy R. Warrick has been with PGI since 1990. He earned a bachelor’s degree in Accounting and Economics from Simpson College and an M.B.A. in Finance from Drake University. Mr. Warrick has earned the right to use the Chartered Financial Analyst designation.
James Welch has been with PGI since 2014. Previously, he was a Senior Portfolio Manager at Castleton Partners, and prior to that, at Standish Mellon Asset Management. He earned a bachelor's degree in Economics from the Pennsylvania State University.
Mohammed Zaidi returned to PGI in 2012, where he formerly worked from 2001 to 2006. As a co-employee of PGI and Principal Global Investors (Singapore) Limited, Mr. Zaidi manages Principal Fund assets as an employee of PGI. Previously, he was with Martin Currie Investment Management and Scottish Widows Investment Partnership. He earned a bachelor’s degree in Economics from the Wharton School of the University of Pennsylvania and an M.B.A. from Massachusetts Institute of Technology, Sloan School of Management.
Sub-Advisor: Principal Real Estate Investors, LLC (“Principal - REI”), 801 Grand Avenue, Des Moines, IA 50392, was founded in 2000 and manages commercial real estate across the spectrum of public and private equity and debt investments, primarily for institutional investors.
Principal - REI is the sub-advisor for the Global Real Estate Securities Fund, the Real Estate Securities Fund, and the global real estate portion of the Global Diversified Income Fund.
The portfolio managers operate as a team, sharing authority and responsibility for research and the day-to-day management of the portfolio with no limitation on the authority of one portfolio manager in relation to another.Keith Bokota has been with Principal - REI since 2007. He earned a bachelor’s degree in Finance and International Business from Georgetown University. Mr. Bokota has earned the right to use the Chartered Financial Analyst designation.
Simon Hedger has been with Principal - REI since 2003. As a co-employee of Principal - REI and PGI Europe, Mr. Hedger manages Principal Fund assets as an employee of Principal - REI. He earned an M.B.A. from the University of New England and is an associate member of both the Royal Institute of Chartered Surveyors and of the Australian Property Institute. He is a U.K. qualified chartered surveyor (ARICS).
Anthony Kenkel has been with Principal - REI since 2005. He earned a bachelor’s degree in Finance from Drake University and an M.B.A. from the University of Chicago Graduate School of Business. Mr. Kenkel has earned the right to use the Chartered Financial Analyst and Financial Risk Manager designations.
Kelly D. Rush has been with Principal - REI since 2000 and the predecessor firms since 1987. He earned a B.A. in Finance and an M.B.A. in Business Administration from the University of Iowa. Mr. Rush has earned the right to use the Chartered Financial Analyst designation.
Sub-Advisor: Robert W. Baird & Co. Incorporated (“Baird”), 777 East Wisconsin Avenue, Milwaukee, Wisconsin 53202, was founded in 1919. Baird provides investment management services for individuals and institutional clients including pension and profit sharing plans.
Baird is the sub-advisor for a portion of the assets of the MidCap Growth Fund III.
Sub-Advisor: Sawgrass Asset Management, LLC (“Sawgrass”), 1579 The Greens Way, Suite 20, Jacksonville Beach, Florida 32250 is a registered investment advisor founded in 1998 that provides active growth equity and fixed income investment management services to institutional investors.
Sawgrass is the sub-advisor for a portion of the assets of LargeCap Growth Fund II.
365
Sub-Advisor: Spectrum Asset Management, Inc. (“Spectrum”), 2 High Ridge Park, Stamford, CT 06905, founded in 1987, manages portfolios of preferred securities for corporate, pension fund, insurance and endowment clients, open-end and closed-end mutual funds, and separately managed account programs for high net worth individual investors as well as providing volatility mitigation solutions for some client portfolios.
Spectrum is the sub-advisor for the preferred securities portion of the Global Diversified Income Fund.
Sub-Advisor: Stone Harbor Investment Partners LP (“Stone Harbor”), 31 West 52nd Street, 16th Floor, New York, New York 10019, was established in 2006 and provides investment advisory services to clients located throughout the world.
Stone Harbor is the sub-advisor for the emerging market debt and European high yield asset portions of the Global Diversified Income Fund.
Sub-Advisor: T. Rowe Price Associates, Inc. (“T. Rowe Price”), 100 East Pratt Street, Baltimore, MD 21202, has over 75 years of investment management experience.
T. Rowe Price is the sub-advisor for a portion of the assets of the LargeCap Blend Fund II and a portion of the assets of the LargeCap Growth Fund I.
Sub-Advisor: Tortoise Capital Advisors, L.L.C. ("Tortoise"), 11550 Ash Street, Suite 300, Leawood, Kansas 66211, formed in October 2002, specializes in listed energy investments.
Tortoise is the sub-advisor for the master limited partnership portion of the Global Diversified Income Fund.
Sub-Advisor: Vaughan Nelson Investment Management, LP (“Vaughan Nelson”), 600 Travis Street, Suite 6300, Houston, Texas 77002, was founded in 1970.
Vaughan Nelson is the sub-advisor for a portion of the assets of the SmallCap Value Fund II.
Sub-Advisor: W. H. Reaves & Co., Inc. (doing business as Reaves Asset Management), 10 Exchange Place, 18th Floor, Jersey City, NJ 07302, was founded in 1961 as an institutional research firm and is an SEC registered adviser.
Reaves Asset Management is one of the sub-advisors for the publicly-listed infrastructure portion of the Global Diversified Income Fund.
Sub-Advisor: Westwood Management Corp. (“Westwood”), 200 Crescent Court, Suite 1200, Dallas, Texas 75201, was formed in 1983.
Westwood is the sub-advisor for a portion of the assets of the LargeCap Value Fund III.
Sub-Advisor: William Blair & Company, L.L.C. (“William Blair”), 222 West Adams Street, Chicago, Illinois 60606, has been an investment advisor since 1947, and provides investment management services to mutual funds, corporate pension plans, endowments and foundations and individual accounts.
William Blair is the sub-advisor for a portion of the assets of the MidCap Growth Fund III.
366
Fees Paid to PrincipalEach Fund pays Principal a fee for its services, which includes the fee Principal pays to the Sub-Advisor.
The management fee schedules for the Funds that have not completed a full fiscal year are as follows:
Management Fee Schedule (as a percentageof the average daily net assets)
Fund All AssetsPrincipal LifeTime Hybrid 2015 0.01%Principal LifeTime Hybrid 2020 0.01%Principal LifeTime Hybrid 2025 0.01%Principal LifeTime Hybrid 2030 0.01%Principal LifeTime Hybrid 2035 0.01%Principal LifeTime Hybrid 2040 0.01%Principal LifeTime Hybrid 2045 0.01%Principal LifeTime Hybrid 2050 0.01%Principal LifeTime Hybrid 2055 0.01%Principal LifeTime Hybrid 2060 0.01%Principal LifeTime Hybrid Income 0.01%
The fee each Fund paid (as a percentage of the average daily net assets) for the fiscal year ended October 31, 2014 was:
Bond & Mortgage Securities Fund 0.51% Overseas Fund 1.07%California Municipal Fund 0.45% Principal Capital Appreciation Fund 0.45%Diversified International Fund 0.83% Principal LifeTime 2010 Fund 0.03%Equity Income Fund 0.51% Principal LifeTime 2015 Fund 0.03%Global Diversified Income Fund 0.72% Principal LifeTime 2020 Fund 0.03%Global Real Estate Securities Fund 0.87% Principal LifeTime 2025 Fund 0.03%Government & High Quality Bond Fund 0.50% Principal LifeTime 2030 Fund 0.03%High Yield Fund 0.51% Principal LifeTime 2035 Fund 0.03%High Yield Fund I 0.63% Principal LifeTime 2040 Fund 0.03%Income Fund 0.49% Principal LifeTime 2045 Fund 0.03%Inflation Protection Fund 0.39% Principal LifeTime 2050 Fund 0.03%International Emerging Markets Fund 1.17% Principal LifeTime 2055 Fund 0.03%International Fund I (1) 0.90% Principal LifeTime 2060 Fund 0.03%LargeCap Blend Fund II 0.75% Principal LifeTime Strategic Income Fund 0.03%LargeCap Growth Fund 0.62% Real Estate Securities Fund 0.83%LargeCap Growth Fund I 0.60% SAM Balanced Portfolio 0.31%LargeCap Growth Fund II 0.87% SAM Conservative Balanced Portfolio 0.31%LargeCap S&P 500 Index Fund 0.15% SAM Conservative Growth Portfolio 0.31%LargeCap Value Fund 0.41% SAM Flexible Income Portfolio 0.31%LargeCap Value Fund III 0.76% SAM Strategic Growth Portfolio 0.31%MidCap Fund 0.59% Short-Term Income Fund 0.42%MidCap Growth Fund 0.65% SmallCap Blend Fund 0.75%MidCap Growth Fund III 0.97% SmallCap Growth Fund I 1.07%MidCap S&P 400 Index Fund 0.15% SmallCap S&P 600 Index Fund 0.15%MidCap Value Fund I 0.98% SmallCap Value Fund II 0.98%MidCap Value Fund III 0.64% Tax-Exempt Bond Fund 0.45%Money Market Fund 0.39%
(1) Management fees have been restated to reflect current fees. Effective June 3, 2014, the Management Fees were reduced.
367
Availability of the discussions regarding the the basis for the Board of Directors approval of various management and sub-advisory agreements is as follows:
Annual Reportto Shareholders
for the period endingOctober 31, 2014
FundManagementAgreement
Sub-AdvisoryAgreement
Principal LifeTime Hybrid Funds X N/A
All Other Funds X X
Voluntary WaiversBond and Mortgage Securities FundPrincipal has voluntarily agreed to limit the Fund’s expenses attributable to Class J shares by paying, if necessary, expenses normally payable by the Fund, (excluding interest expense, expenses related to fund investments, acquired fund fees and expenses, and other extraordinary expenses). The expense limit will maintain a total level of operating expenses (expressed as a percent of average net assets on an annualized basis) not to exceed 0.99%. The expense limit may be terminated at any time.
Money Market FundPrincipal has voluntarily agreed to limit the Fund's expenses to the extent necessary to maintain a 0% yield. The voluntary expense limit may be terminated at any time.
Short-Term Income FundPrincipal has voluntarily agreed to limit the Fund’s expenses attributable to Class J shares by paying, if necessary, expenses normally payable by the Fund, (excluding interest expense, expenses related to fund investments, acquired fund fees and expenses, and other extraordinary expenses). The expense limit will maintain a total level of operating expenses (expressed as a percent of average net assets on an annualized basis) not to exceed 1.00%. The expense limit may be terminated at any time.
Manager of ManagersThe Fund operates as a Manager of Managers. Under the conditions of an order previously received from the SEC (the "unaffiliated order"), the Fund and Principal may enter into and materially amend agreements with Sub-Advisors, other than those affiliated with Principal, without obtaining shareholder approval. Principal may, without obtaining shareholder approval:• hire one or more Sub-Advisors; • change Sub-Advisors; and • reallocate management fees between itself and Sub-Advisors.
The SEC has granted an amended exemptive order that expands the relief of the unaffiliated order to allow Principal to enter into and materially amend agreements with wholly-owned affiliated sub-advisors (affiliated sub-advisors which are at least 95% owned, directly or indirectly, by Principal or an affiliated person of Principal) (the "wholly-owned order").
Further, the Fund has applied to the SEC for another amended exemptive order, which if granted would allow Principal to also enter into and materially amend agreements with majority-owned affiliated sub-advisors (affiliated sub-advisors which are at least 50% owned, directly or indirectly, by Principal or an affiliated person of Principal) (the "majority-owned order"). There is no assurance, however, that the SEC will grant the majority-owned order.
Principal has ultimate responsibility for the investment performance of each Fund that utilizes a Sub-Advisor due to its responsibility to oversee Sub-Advisors and recommend their hiring, termination, and replacement. No Fund will rely on the unaffiliated order, the wholly-owned order, the majority-owned order, or any future order until it receives approval from its shareholders (or, in the case of a new Fund, the Fund’s sole initial shareholder before the Fund is available to the other purchasers).
The shareholders of the following Funds have approved reliance on the majority-owned order, should the SEC grant that relief in the future, and the wholly-owned order: Principal LifeTime Hybrid Funds. The remaining Funds have approved the Fund's reliance on the unaffiliated order.
368
PRICING OF FUND SHARESEach Fund’s shares are bought and sold at the current share price. The share price of each class of each Fund is calculated each day the New York Stock Exchange (“NYSE”) is open (share prices are not calculated on the days on which the NYSE is closed for trading, generally New Year’s Day, Martin Luther King, Jr. Day, Washington’s Birthday/ Presidents’ Day, Good Friday, Memorial Day, Independence Day, Labor Day, Thanksgiving Day, and Christmas). The share price is determined as of the close of business of the NYSE (normally 3:00 p.m. Central Time). When an order to buy or sell shares is received, the share price used to fill the order is the next price we calculate after we receive the order (in proper form) at our transaction processing center in Canton, Massachusetts. To process your transaction (purchase, redemption, or exchange) on the day we receive it, we must receive the order (with complete information):• on a day that the NYSE is open and • before the close of trading on the NYSE (normally 3 p.m. Central Time).
Orders received after the close of the NYSE or on days that the NYSE is not open will be processed on the next day that the NYSE is open for normal trading.
If we receive an application or purchase request for a new mutual fund account or subsequent purchase into an existing account that is accompanied by a check and the application or purchase request does not contain complete information, we may hold the application (and check) for up to two business days while we attempt to obtain the necessary information. If we receive the necessary information within two business days, we will process the order using the next share price calculated. If we do not receive the information within two business days, we will return the application and check to you.
For all Funds, except the Money Market Fund, the share price is calculated by: • taking the current market value of the total assets of the Fund• subtracting liabilities of the Fund • dividing the remainder proportionately into the classes of the Fund• subtracting the liability of each class • dividing the remainder by the total number of shares outstanding for that class.
With respect to the Principal LifeTime Funds, Principal LifeTime Hybrid Funds and SAM Portfolios, which invest in other registered investment company funds, each Fund's NAV is calculated based on the NAV of such other registered investment company funds in which the Fund invests.
The securities of the Money Market Fund are valued at amortized cost. The calculation procedure is described in the Statement of Additional Information.Notes:• If market quotations are not readily available for a security owned by a Fund, its fair value is determined using a
policy adopted by the Directors. Fair valuation pricing is subjective and creates the possibility that the fair value determined for a security may differ materially from the value that could be realized upon the sale of the security.
• A Fund’s securities may be traded on foreign securities markets that generally complete trading at various times during the day before the close of the NYSE. Foreign securities and currencies are converted to U.S. dollars using the exchange rate in effect at the close of the NYSE. Securities traded outside of the Western Hemisphere are valued using a fair value policy adopted by the Fund. These fair valuation procedures are intended to discourage shareholders from investing in the Fund for the purpose of engaging in market timing or arbitrage transactions.
• The trading of foreign securities generally or in a particular country or countries may not take place on all days the NYSE is open, or may trade on days the NYSE is closed. Thus, the value of the foreign securities held by the Fund may change on days when shareholders are unable to purchase or redeem shares.
• Certain securities issued by companies in emerging market countries may have more than one quoted valuation at any point in time. These may be referred to as local price and premium price. The premium price is often a negotiated price that may not consistently represent a price at which a specific transaction can be effected. The Fund has a policy to value such securities at a price at which the Sub-Advisor expects the securities may be sold.
369
CONTACT PRINCIPAL FUNDS, INC.
Contact information for Principal Funds, Inc. (“Principal Funds”) is as follows:
Mailing Addresses:
Regular Mail Overnight MailPrincipal Funds Principal FundsP.O. Box 8024 30 Dan RoadBoston, MA 02266-8024 Canton, MA 02021-2809
You may speak with a Client Relations Specialist by calling 1-800-222-5852, between 7:00 a.m. and 7:00 p.m. Central Time on any day that the NYSE is open.
To obtain Automated Clearing House ("ACH") or wire instructions, please contact a Client Relations Specialist.
For additional information about Principal Funds, Inc., go to www.principalfunds.com.
PURCHASE OF FUND SHARES
Principal Funds, Inc. offers funds in multiple share classes: A, C, J, P, Institutional, R-1, R-2, R-3, R-4, R-5, R-6, and S. Funds available in multiple share classes have the same investments, but differing expenses. Classes A, C, J, P, Institutional, R-1, R-2, R-3, R-4, R-5, and R-6 shares are available in this prospectus.
The Fund reserves the right to refuse or cancel any purchase orders, including those by exchange, for any reason. For example, the Fund does not intend to permit market timing because short-term or other excessive trading into and out of the Funds may harm performance by disrupting portfolio management strategies and by increasing expenses. Accordingly, the Fund may reject any purchase orders from market timers or investors that, in Principal’s opinion, may be disruptive to the Fund. For these purposes, Principal may consider an investor’s trading history in the Fund or other Funds sponsored by Principal Life and accounts under common ownership or control.
Principal may recommend to the Board, and the Board may elect, to close certain funds or share classes to new investors or to close certain funds or share classes to new and existing investors.
Principal Funds will not issue certificates for shares.
No salesperson, broker-dealer or other person is authorized to give information or make representations about a Fund other than those contained in this Prospectus. Information or representations not contained in this prospectus may not be relied upon as having been provided or made by Principal Funds, a Fund, Principal, any Sub-Advisor, or PFD.
Procedures for Opening an Account and Making an Investment
Classes A and C SharesShares of the Funds are generally purchased through Financial Professionals. Financial Professionals may establish shareholder accounts according to their procedures or they may establish shareholder accounts directly with the Fund by visiting our website to obtain the appropriate forms.
Your Financial Professional can help you buy shares of the Funds by mail, through bank wire, direct deposit, or Automatic Investment Plan (“AIP”). No wires are accepted on days when the NYSE is closed or when the Federal Reserve is closed (because the bank that would receive your wire is closed). An investment in the Fund may be held in various types of accounts, including individual, joint ownership, trust, and business accounts. The Fund also offers a range of custodial accounts for those who wish to invest for retirement and/or education expenses. Prospective shareholders should consult with their Financial Professional before making decisions about the account and type of investment that are appropriate for them.
370
Class J SharesClass J shares are currently available through registered representatives of:• Princor who are also employees of Principal Life distribution channels used to directly market certain products
and services of the companies of the Principal Financial Group as well as provide retirement plan services and education on topics such as investing and retirement. These Princor registered representatives are with Principal Connection (part of Principal Bank) and Worksite Solutions (part of the Retirement & Investor Services and US Insurance Solutions Distribution area), and
• Selected broker-dealers that have entered into a selling agreement to offer Class J shares.
Class J shares are also available through an online IRA rollover tool on www.principal.com.
For more information about Class J shares of the Funds, please call Principal Connection at 1-800-243-4380, extension 704.
Classes Institutional, P, R-1, R-2, R-3, R-4, R-5, and R-6 SharesShares may be purchased from Principal Funds Distributor, Inc. (“PFD” or “the Distributor”). The Distributor is an affiliate of Principal Life Insurance Company and with it are subsidiaries of Principal Financial Group, Inc. and members of the Principal Financial Group. There are no sales charges on Institutional, P, R-1, R-2, R-3, R-4, R-5, and R-6 Class shares of the Fund.
Shareholder accounts for the Fund are maintained under an open account system. Under this system, an account is opened and maintained for each investor (generally an omnibus account, plan level account, or institutional investor). Each investment is confirmed by sending the investor a statement of account showing the current purchase or sale and the total number of shares owned. The statement of account is treated by the Fund as evidence of ownership of Fund shares. Contact your Financial Professional for additional information on how to buy shares.
Verification of IdentityTo help the government fight the funding of terrorism and money laundering activities, Federal law requires financial institutions to obtain, verify, and record information that identifies each person who opens an account. When you open an account, we (or your Financial Professional) may ask for your name, address, date of birth, and other information that will allow us (or your Financial Professional) to verify your identity. We (or your Financial Professional) may also ask to see your driver’s license or other identifying documents.
If concerns arise with verification of your identity, no transactions, other than redemptions, will be permitted while we attempt to reconcile the concerns. If we are unable to verify your identity on a timely basis, we may close your account or take such other action as we deem appropriate.
Principal Funds will not establish accounts with foreign addresses. If an existing shareholder with a U.S. address moves to a foreign location and updates the address on the shareholder’s account, we are unable to process any purchases or exchanges on that account. Principal Funds will not establish accounts that are for the benefit of a business/organization that is illegal under Federal and/or state law (such as a marijuana clinic) or a person who owns or receives income from such an entity or whose source of funds is illegal.
Eligible PurchasersYou must be an eligible purchaser for a particular share class to buy shares of a Fund available in that share class. Principal reserves the right to broaden or limit the designation of eligible purchasers. Not all of the Funds are offered in every state. Please check with your financial advisor or our home office for state availability.
Class C Shares - Money Market FundClass C shares of the Money Market Fund may be purchased only by exchange from other Fund accounts in the same share class or by reinvestment of distributions made on such shares. Class C shares are not available to retirement plans qualified under IRC section 401(a) that are not already investing in Class C shares of other Funds of the Principal Funds, but are available to new participants in plans that currently invest in Class C shares of the Fund.
Classes P, Institutional, R-1, R-2, R-3, R-4, R-5, and R-6 SharesSome eligible purchasers (as listed below) purchase shares through plans or other arrangements; such plans or arrangements may impose fees in addition to those charged by the Funds. The services or share classes available to you may vary depending upon how you wish to purchase shares of the Fund. Each investor's financial considerations are different. You should speak with your financial professional to help you decide which share class is best for you.
371
Eligible purchasers of Classes P, Institutional, R-1, R-2, R-3, R-4, R-5, and R-6 shares currently include but are not limited to:
Eligible purchasers currently include,but are not limited to: P Institutional R-1 R-2 R-3 R-4 R-5 R-6retirement and pension plans to whichPrincipal Life Insurance Company(“Principal Life”) provides recordkeepingservices
X X X X X X X
separate accounts of Principal Life X X X X X XPrincipal Life or any of its subsidiaries oraffiliates
X X X X X X X
any fund distributed by PFD if the fundseeks to achieve its investment objectiveby investing primarily in shares of mutualfunds
X X X X X X
clients of Principal Global Investors, LLC X X X X X X X Xcertain employer sponsored retirementplans with plan level omnibus accounts
X X X X X X X
certain pension plans and employeebenefit plans
X X X X X X X
certain retirement account investmentvehicles administered by foreign ordomestic pension plans
X X X X X X X
an investor who buys shares through anomnibus account with certainintermediaries, such as a broker-dealer,bank, or other financial institution,pursuant to a written agreement betweenthe intermediary and PFD or its affiliate
X X X X X X
certain retirement plan clients that have anorganization, approved by Principal Life,for purposes of providing planrecordkeeping services
X X X X X X X
investors investing at least $1,000,000 perfund
X
sponsors, recordkeepers, oradministrators of wrap account or mutualfund asset allocation programs orparticipants in those programs (suchaccounts and programs must trade in anomnibus relationship)
X
sponsors, recordkeepers, oradministrators of wrap account, mutualfund asset allocation, or fee-basedprograms or participants in thoseprograms;
X
certain institutional investors that providerecordkeeping for retirement plans orother employee benefit plans
X
institutional clients that Principal Life hasapproved for purposes of providing planrecordkeeping
X
institutional investors investing for theirown account, including banks, trustcompanies, financial intermediaries,corporations, endowments andfoundations
X
collective trust funds, fund of funds orother pooled investment vehicles, andentities acting for the account of a publicentity
X X
372
Eligible purchasers currently include,but are not limited to: P Institutional R-1 R-2 R-3 R-4 R-5 R-6clients of a private banking divisionpursuant to a written agreement betweenthe bank and PFD or its affiliate
X
the portfolio manager of any adviser to thefund
X
certain institutional investors with specialarrangements (for example, insurancecompanies, employee benefit plans,retirement plans, and Section 529 Plans,among others)
X
MidCap FundFor retail investors (i.e., non-employer sponsored retirement plan investors), effective as of the close of theNew York Stock Exchange on June 14, 2013 and for employer-sponsored retirement plan investors, effective as ofthe close of the New York Stock Exchange on August 15, 2013, the MidCap Fund will no longer be available forpurchases from new investors except in limited circumstances.• Shareholders, including those in omnibus accounts, who own shares of the MidCap Fund as of June 14, 2013
(for retail investors, i.e., non-employer sponsored retirement plan investors) or August 15, 2013 (for employer sponsored retirement plan investors), may continue to make purchases, exchanges, and dividend or capital gains reinvestment in existing accounts.
• Registered Investment Advisor (RIA) and bank trust firms that have an investment allocation to the MidCap Fund in a fee-based, wrap or advisory account, may continue to add new clients, purchase shares, and exchange into the MidCap Fund. The MidCap Fund will not be available to new RIA and bank trust firms.
• Shareholders through accounts at private banks may continue to purchase shares and exchange into the MidCap Fund. Private banks that have an investment allocation to the MidCap Fund may add new clients. The MidCap Fund will not be available to private bank or private bank platforms not already investing in the MidCap Fund.
• Shareholders in broker/dealer wrap or fee-based programs that have an investment allocation to the MidCap Fund may continue to purchase shares and exchange into the MidCap Fund. Existing broker/dealer wrap or fee-based programs may add new participants.
• Shareholders in certain types of retirement plans (including 401(k)s, SEPs, SIMPLEs, 403(b)s, etc.) may continue to purchase shares and exchange into the MidCap Fund. New participants in these plans may elect to purchase shares of the MidCap Fund.
• Retirement plans in transition as of the closure date will have until August 15, 2013, to fund any new accounts.• Investors who open a new IRA transfer or rollover account by the close of business on June 14, 2013, will have
until August 15, 2013, to fund these accounts.• Shareholders within brokerage accounts may continue to purchase shares of the MidCap Fund; however, new
brokerage accounts will not be permitted to begin investing in the MidCap Fund after June 14, 2013.• 529 plans that include the MidCap Fund within their investment options may continue to purchase shares and
exchange into the MidCap Fund.• Funds of funds, such as the Strategic Asset Management (SAM) Portfolios and Principal LifeTime Funds, may
continue to invest in the MidCap Fund.
Minimum InvestmentsClasses A, C, and J SharesPrincipal Funds has a minimum initial investment amount of $1,000 and a minimum subsequent investment amount of $100. Initial and subsequent investment minimums apply on a per-fund basis for each Fund or Portfolio in which a shareholder invests.
Shareholders must meet the minimum initial investment amount of $1,000 unless an AIP is established. With an AIP, the minimum initial investment is $100. Accounts or automatic payroll deduction plans established with an AIP that do not meet the minimum initial investment must maintain subsequent automatic investments that total at least $1,200 annually.

373
Minimum initial and subsequent investments may be waived on accounts set up for: certain employee benefit plans; retirement plans qualified under Internal Revenue Code Section 401(a); payroll deduction plans submitting contributions in an electronic format devised and/or approved by the Fund; and purchases through an omnibus account with a broker-dealer, investment advisor, or other financial institution.
Classes Institutional, P, R-1, R-2, R-3, R-4, R-5, and R-6 SharesThere are no minimum initial or subsequent investment requirements for an eligible purchaser.
PaymentClasses A, C and J Shares Payments are to be made via personal or financial institution check (for example, a bank or cashier's check). We consider your purchase of Fund shares by check to be your authorization to make an automated clearing house (“ACH”) debit entry to your account. We reserve the right to refuse any payment that we feel presents a fraud or money laundering risk. Examples of the types of payments we will not accept are cash, starter checks, money orders, travelers' checks, credit card checks, and foreign checks.
The Funds may, in their discretion and under certain limited circumstances, accept securities as payment for Fund shares at the applicable net asset value (“‘NAV”). For federal income tax purposes, a purchase of shares with securities will be treated as a sale or exchange of such securities on which the investor will generally realize a taxable gain or loss. Each Fund will value securities used to purchase its shares using the same method the Fund uses to value its portfolio securities as described in this prospectus.
You may reinvest your redemption proceeds, dividend payment or capital gain distribution without an initial sales charge or contingent deferred sales charge, in the same share class of any other Fund of Principal Funds within 60 days of the date of the redemption. To purchase the shares without a sales charge (initial or contingent deferred) as described in this section, the shareholder must notify Principal Funds at the time of reinvestment that the shareholder is reinvesting proceeds within 60 days of the date of redemption. The original redemption will be considered a sale for federal (and state) income tax purposes even if the proceeds are reinvested within 60 days. If a loss is realized on the sale, the reinvestment may be subject to the “wash sale” rules resulting in the postponement of the recognition of the loss for tax purposes.
Your Financial Professional can help you make a Direct Deposit from your paycheck (if your employer approves) or from a government allotment. Direct Deposit allows you to deposit automatically all or part of your paycheck (or government allotment) to your Principal Funds account(s). You can request a Direct Deposit Authorization Form to give to your employer or the governmental agency (either of which may charge a fee for this service). Shares will be purchased on the day the ACH notification is received by the transfer agent’s bank. On days when the NYSE is closed, but the bank receiving the ACH notification is open, your purchase will be priced at the next calculated share price.
Your Financial Professional can help you establish an Automatic Investment Plan ("AIP"). You may make regular monthly investments with automatic deductions from your bank or other financial institution account. You select the day of the month the deduction is to be made (if none is selected, the investment will be made on the 15th of the month). If that date is a non-trading day, we will process the deduction on the next trading day. If the next trading day falls in the next month or year, we will process the deduction on the day before your selected day.
Classes Institutional, P, R-1, R-2, R-3, R-4, R-5, and R-6 SharesPayments are generally to be made through your plan or intermediary. We reserve the right to refuse any payment that we feel presents a fraud or money laundering risk. Examples of the types of payments we will not accept are cash, starter checks, money orders, travelers' checks, credit card checks, and foreign checks.
REDEMPTION OF FUND SHARESYou may redeem any class of shares of the Fund upon request. There is no charge for the redemption. The Fund Board of Directors has determined that it is not necessary to impose a fee upon the redemption of fund shares, because the Fund has adopted transfer restrictions as described in “Exchange of Fund Shares.”
Principal Funds generally sends the sale proceeds on the next business day (a day when the NYSE is open for normal business) after the sell order is received. Under unusual circumstances, Principal Funds may suspend redemptions, or postpone payment for up to seven days, as permitted by federal securities law. Shares purchased by check may be sold only after the check has cleared your bank, which may take up to seven calendar days.
374
Shares are redeemed at the NAV per share next computed after the request is received by the Fund in proper and complete form. The amount you receive will be reduced by any applicable CDSC except as noted below; see Choosing a Share Class and the Costs of Investing, One-Time Fee - Contingent Deferred Sales Charge ("CDSC"), CDSC Waiver for Classes A, C, and J Shares.
Classes A, C, and J SharesYou will be charged a $10 wire fee if you have the sale proceeds wired to your bank. It may take additional business days for your financial institution to post this payment to your account at that financial institution. At your request, the check will be sent overnight (a $15 overnight fee will be deducted from your account unless other arrangements are made).
Distributions from IRA, SEP, SIMPLE, 403(b), and SAR-SEP accounts may be taken as:• lump sum of the entire interest in the account,• partial interest in the account, or• periodic payments of either a fixed amount or an amount based on certain life expectancy calculations.
Tax penalties may apply to distributions before the participant reaches age 59 ½.
Selling shares may create a gain or a loss for federal (and state) income tax purposes. You should maintain accurate records for use in preparing your income tax returns.
Generally, sales proceeds are:• payable to all owners on the account (as shown in the account registration) and• mailed to the address on the account (if not changed within last 15 days) or sent by wire or ACH to previously
authorized U.S. bank account.
For other payment arrangements, please call Principal Funds. You should also call Principal Funds for special instructions that may apply to sales from accounts:• when an owner has died• for certain employee benefit plans; or• owned by corporations, partnerships, agents, or fiduciaries.
Except as described above, you may redeem shares of the Funds in any of the following ways:
By MailTo sell shares by mail, you must:• Send a letter or our distribution form which is signed by an owner of the account, • Specify the account number, and• Specify the number of shares or the dollar amount to be sold.
If you send a letter rather than our distribution form, the letter must be in a form acceptable to the Fund.
By Telephone, in amounts of $100,000 or lessTo sell shares by telephone:• The request may be made by a shareholder or by the shareholder’s Financial Professional.• The combined amount requested from all funds to which the redemption request relates is $100,000 or less.• The address on the account must not have been changed within the last 15 days and telephone privileges must
apply to the account from which the shares are being sold.• If previously authorized, wire or ACH can be sent to a shareholder’s U.S. bank account.• If our phone lines are busy, you may need to send in a written sell order.• Telephone redemption privileges are NOT available for Principal Funds 403(b) plans and certain employer
sponsored benefit plans.

375
Classes A, C, and J Shares - Systematic Withdrawal PlansYou may set up a systematic withdrawal plan on a monthly, quarterly, semiannual, or annual basis to sell enough shares to provide a fixed amount of money ($100 minimum amount; the required minimum is waived to the extent necessary to meet the required minimum distribution as defined by the Internal Revenue Code).You can set up a systematic withdrawal plan by:• completing the applicable section of the application,• sending us your written instructions,• completing a Systematic Withdrawal Plan Request form, or• calling us if you have telephone privileges on the account (telephone privileges may not be available for all types
of accounts).
Your systematic withdrawal plan continues until:• you instruct us to stop or• your Fund account balance is zero.
When you set up the withdrawal plan, you select which day you want the sale made (if none is selected, the sale will be made on the 15th of the month). If the selected date is not a trading day, the sale will take place on the preceding trading day (if that day falls in the month or year before your selected date, the transaction will take place on the next trading day after your selected date). If telephone privileges apply to the account, you may change the date or amount by telephoning us. Sales made under your systematic withdrawal plan will reduce and may eventually exhaust your account. The Fund from which the systematic withdrawal is made makes no recommendation as to either the number of shares or the fixed amount that you withdraw.
Class A shares of Money Market Fund: Sell shares by checkwriting • Checkwriting must be elected on initial application or by written request to Principal Funds. Such election
continues in effect until the Fund receives written notice revoking or changing the election.• The Fund can only sell shares after your check making the Fund investment has cleared your bank.• Checks must be written for at least $250. The Fund reserves the right to increase the minimum check amount.• The rules of the bank on which the checks are drawn concerning checking accounts apply.• If the account does not have sufficient funds to cover the check, it is marked “Insufficient Funds” and returned
(the Fund may revoke checkwriting on accounts on which “Insufficient Funds” checks are drawn).• Accounts may not be closed by withdrawal check (accounts continue to earn dividends until checks clear and the
exact value of the account is not known until the check is received by the bank).• Checkwriting is available only for non-qualified accounts.• Neither the Fund, the bank nor Principal shall incur any liability for honoring the checks, selling shares to pay
checks, or for returning checks unpaid.• Checkwriting may be converted to a point-of-purchase debit from your account. This only applies if such service
is available at the business with which you are doing business.
Classes Institutional, P, R-1, R-2, R-3, R-4, R-5, and R-6 SharesYou may redeem shares of the Funds in any of the following ways:
Through an Employer Sponsored Retirement Plan Administrator or Record-KeeperIf you own Fund shares in an eligible retirement or employee benefit plan, you must sell your shares through the plan’s administrator or record-keeper.
Through your Financial ProfessionalIf your Fund shares are held for you in nominee form, you must sell those shares through your intermediary or dealer.
By mailTo sell shares by mail, you must:• Send a letter or our distribution form which is signed by an owner of the account, • Specify the account number, and• Specify the number of shares or the dollar amount to be sold.
If you send a letter rather than our distribution form, the letter must be in a form acceptable to the Fund.
376
By telephoneTo sell shares by telephone:• Telephone privileges must apply to the account from which the shares are sold.• A shareholder or the shareholder’s Financial Professional may request to sell shares by telephone.• A maximum amount (listed below) of redemption requests will be permitted per day per account, as the
combined amount from all funds, provided the proceeds are to be sent to a previously authorized U.S. bank account:
$10,000,000 for Class Institutional.$100,000 for Class P.$500,000 for Classes R-1, R-2, R-3, R-4, R-5, and R-6.
• A maximum of $500,000 ($100,000 for Class P) of redemption requests will be permitted per day, as the combined amount from all funds, provided the proceeds are to be sent by check through the mail to the address on the account and such address must not have changed within the last 15 days.
• If our telephone lines are busy, you may need to send in a written sell order.
Distributions in KindPayment for shares of the Funds tendered for redemption is ordinarily made by check. However, the Funds may determine that it would be detrimental to the remaining shareholders of a Fund to make payment of a redemption order wholly or partly in cash. Under certain circumstances, therefore, each of the Funds may pay the redemption proceeds in whole or in part by a distribution of “in kind” of securities from the Fund’s portfolio in lieu of cash. If a Fund pays the redemption proceeds in kind, the redeeming shareholder might incur brokerage or other costs in selling the securities for cash. Each Fund will value securities used to pay redemptions in kind using the same method the Fund uses to value its portfolio securities as described in this prospectus.
EXCHANGE OF FUND SHARESAn exchange between Funds is a redemption of shares of one Fund and a concurrent purchase of shares in another Fund with the redemption proceeds. To prevent excessive exchanges, and under other circumstances where the Fund Board of Directors or Principal believes it is in the best interests of the Fund, the Fund reserves the right to revise or terminate this exchange privilege, limit the amount or further limit the number of exchanges, reject any exchange or close an account.
Classes A, C, and J SharesYour shares in the Funds (except Money Market) may be exchanged without a sales charge or CDSC for the same class of any other Principal Funds. However, the original purchase date of the shares from which an exchange is made is used to determine if newly acquired shares are subject to a CDSC when they are sold. The Fund reserves the right to revise or terminate the exchange privilege at any time.
You may exchange shares by: • sending a written request to Principal Funds,• using our website, or• calling us, if you have telephone privileges on the account.
Exchanges from Money Market FundClass A shares of Money Market Fund may be exchanged into: • Class A shares of other Funds.
• If Money Market Fund shares were acquired by direct purchase, a sales charge will be imposed on the exchange into other Class A shares.
• If Money Market Fund shares were acquired by (1) exchange from other Funds, (2) conversion of Class B shares, or (3) reinvestment of dividends earned on Class A shares that were acquired through exchange, no sales charge will be imposed on the exchange into other Class A shares.
• Class C shares of other Funds - subject to the applicable CDSC.
377
Automatic Exchange ElectionThis election authorizes an exchange from one fund of Principal Funds to another fund of Principal Funds on a monthly, quarterly, semiannual or annual basis. You can set up an automatic exchange by:• completing the Automatic Exchange Election section of the application,• calling us if telephone privileges apply to the account from which the exchange is to be made,• sending us your written instructions, or• completing an Automatic Exchange Election form.
Your automatic exchange continues until: • you instruct us to stop (by calling us if telephone privileges apply to the account or sending us your written
instructions) or• your Fund account balance of the account from which shares are redeemed is zero.
You may specify the day of the exchange (if none is selected, the exchange will be made on the 15th of the month). If the selected day is not a trading day, the sale will take place on the preceding trading day (if that day falls in the month or year before your selected date, the transaction will take place on the next trading day after your selected date). If telephone privileges apply to the account, you may change the date or amount by telephoning us.
General• An exchange by any joint owner is binding on all joint owners.• If you do not have an existing account in the Fund to which the exchange is being made, a new account is
established. The new account has the same owner(s), dividend and capital gain options and dealer of record as the account from which the shares are being exchanged.
• All exchanges are subject to the minimum investment and eligibility requirements of the Fund being acquired.• You may acquire shares of a Fund only if its shares are legally offered in your state of residence.
When money is exchanged or transferred from one account registration or tax identification number to another, the account holder is relinquishing his or her rights to the money. Therefore, exchanges and transfers can only be accepted by telephone if the exchange (transfer) is between:• accounts with identical ownership, • an account with a single owner to one with joint ownership if the owner of the single owner account is also an
owner of the account with joint ownership,• a single owner to a Uniform Transfers to Minors Act ("UTMA") account if the owner of the single owner account is
also the custodian on the UTMA account, or• a single or jointly owned account to an IRA account to fund the yearly IRA contribution of the owner (or one of the
owners in the case of a jointly owned account).
The exchange is treated as a sale of shares for federal (and state) income tax purposes and may result in a capital gain or loss.
Fund shares used to fund an employee benefit plan may be exchanged only for shares of other Funds available to employee benefit plans. Such an exchange must be made by following the procedures provided in the employee benefit plan and the written service agreement.
Class P SharesA shareholder, including a beneficial owner of shares held in nominee name may exchange Fund shares under certain circumstances. You may exchange your Fund shares, without charge, for shares of any other Fund of the Principal Funds available in Class P; however, an intermediary may impose restrictions on exchanges.
Classes Institutional, R-1, R-2, R-3, R-4, R-5, and R-6 SharesA shareholder, including a beneficial owner of shares held in nominee name or a participant in a participant-directed employee benefit plan, may exchange Fund shares under certain circumstances. In addition to any restrictions an intermediary or an employee benefit plan imposes, Fund shares may be exchanged, without charge, for shares of any other Fund of the Principal Funds, provided that:• the shareholder has not exchanged shares of the Fund within 30 days preceding the exchange, unless the
shareholder is exchanging into the Money Market Fund,• the share class of such other Fund is available through the plan, and• the share class of such other Fund is available in the shareholder’s state of residence.
378
All exchanges completed on the same day are considered a single exchange for purposes of this exchange limitation. In addition, the Fund will reject an order to purchase shares of any Fund, except shares of the Money Market Fund, if the shareholder redeemed shares from that Fund within the preceding 30-day period. The 30-day exchange or purchase restriction does not apply to exchanges or purchases made on a scheduled basis such as scheduled periodic portfolio rebalancing transactions or to transactions by Fund managers of the SAM Portfolios, Principal LifeTime Funds, Principal LifeTime Hybrid Funds, Real Estate Allocation Fund or other fund-of-funds in shares of the underlying Funds.If Fund shares are purchased through an intermediary that is unable or unwilling to impose the 30-day exchange or repurchase restrictions described above, Fund management may waive these restrictions based on:• Exchange and repurchase limitations that the intermediary is able to impose if, in management’s judgment, such
limitations are reasonably likely to prevent excessive trading in Fund shares; or• The implementation of other transaction monitoring management believes is reasonably likely to identify and
prevent excessive trading in Fund shares.DIVIDENDS AND DISTRIBUTIONS
Dividends are based on estimates of income, expenses, and shareholder activity for the Fund. Actual income, expenses, and shareholder activity may differ from estimates; consequently, differences, if any, will be included in the calculation of subsequent dividends. The Funds pay their net investment income to record date shareholders; this record date is the business day before the payment date. The payment schedule is as follows:• The Bond & Mortgage Securities, California Municipal, Government & High Quality Bond, High Yield, High
Yield I, Income, Short-Term Income, and Tax-Exempt Bond Funds declare dividends of their daily net investment income each day their shares are priced. The Funds pay out their accumulated declared dividends monthly.
• The Money Market Fund declares dividends of all its daily net investment income each day its shares are priced. On the 20th day of each month (or the previous business day), the Fund will distribute its accumulated declared dividends. You may ask to have your dividends paid to you in cash. If you do not request cash payment, your dividend will be applied to purchase additional shares of the Fund monthly.
• The Global Diversified Income Fund and SAM Flexible Income Portfolio pay their net investment income monthly.• The Equity Income, Global Real Estate Securities, Inflation Protection, and Real Estate Securities Funds and the
SAM Conservative Balanced, and SAM Balanced Portfolios each pay their net investment income quarterly in March, June, September, and December.
• The other Funds pay their net investment income annually in December.
For more details on the payment schedule, go to: www.principalfunds.com/investor/funds/tax-center/div-capgain- dist.htm.
Net realized capital gains, if any, are distributed annually in December. Payments are made to shareholders of record on the business day before the payable date. Capital gains may be taxable at different rates, depending on the length of time that the Fund holds its assets.
The Money Market Fund does not seek to realize any capital gains or losses. If capital gains or losses were to occur, they could result in an increase or decrease in dividends.
Dividend and capital gains distributions will be reinvested, without a sales charge, in shares of the Fund from which the distribution is paid; however, for Classes A, C, J and P shares, you may authorize (on your application or at a later time) the distribution to be:• invested in shares of another of the Principal Funds without a sales charge (distributions of a Fund may be
directed only to one receiving Fund); or• paid in cash, if the amount is $10 or more.
Generally, for federal income tax purposes, Fund distributions are taxable as ordinary income, except that any distributions of long-term capital gains will be taxed as such, regardless of how long Fund shares have been held. Special tax rules apply to Fund distributions to Individual Retirement Accounts and other retirement plans. A tax advisor should be consulted to determine the suitability of the Fund as an investment by such a plan and the tax treatment of distributions by the Fund. A tax advisor can also provide information on the potential impact of possible foreign, state, and local taxes. A Fund’s investments in foreign securities may be subject to foreign withholding taxes. In that case, the Fund’s yield on those securities would be decreased.
379
To the extent that distributions the Fund pays are derived from a source other than net income (such as a return of capital), a notice will be included in your quarterly statement pursuant to Section 19(a) of the Investment Company Act of 1940, as amended, and Rule 19a-1 disclosing the source of such distributions. Furthermore, such notices shall be posted monthly on our website at www.principalfunds.com/investor/funds/tax-center/div-capgain-dist.htm. You may request a copy of all such notices, free of charge, by telephoning 1-800-222-5852. The amounts and sources of distributions included in such notices are estimates only and you should not rely upon them for purposes of reporting income taxes. The Fund will send shareholders a Form 1099-DIV for the calendar year that will tell shareholders how to report these distributions for federal income tax purposes.
A Fund’s payment of income dividends and capital gains has the effect of reducing the share price by the amount of the payment. Distributions from a Fund, whether received in cash or reinvested in additional shares, may be subject to federal (and state) income tax. For these reasons, buying shares of a Fund shortly before it makes a distribution may be disadvantageous to you.
FREQUENT PURCHASES AND REDEMPTIONSThe Funds are not designed for, and do not knowingly accommodate, frequent purchases and redemptions of fund shares. If you intend to trade frequently and/or use market timing investment strategies, you should not purchase these Funds.
Frequent purchases and redemptions pose a risk to the Funds because they may:• Disrupt the management of the Funds by:
• forcing the Funds to hold short-term (liquid) assets rather than investing for long-term growth, which results in lost investment opportunities for the Funds and
• causing unplanned portfolio turnover; • Hurt the portfolio performance of the Funds; and • Increase expenses of the Funds due to:
• increased broker-dealer commissions and • increased recordkeeping and related costs.
Certain Funds may be at greater risk of harm due to frequent purchases and redemptions. For example, those Funds that invest in foreign securities may appeal to investors attempting to take advantage of time-zone arbitrage. The Funds have adopted procedures to “fair value” foreign securities owned by the Funds each day to discourage these market timing transactions in shares of the Funds.
The Board of Directors of the Fund has also adopted policies and procedures with respect to frequent purchases and redemptions of shares of the Funds. The Funds monitor shareholder trading activity to identify and take action against abuses. When we do identify abusive trading, we will apply our policies and procedures in a fair and uniform manner. While our policies and procedures are designed to identify and protect against abusive trading practices, there can be no certainty that we will identify and prevent abusive trading in all instances. If we are not able to identify such excessive trading practices, the Funds and their shareholders may be harmed. The harm of undetected excessive trading in shares of the underlying funds in which the funds of funds (for example, PFI Real Estate Allocation Fund, Principal LifeTime Funds/Accounts, Principal LifeTime Hybrid Funds, Strategic Asset Management Portfolios, PVC Diversified Balanced Account, PVC Diversified Balanced Managed Volatility Account, PVC Diversified Growth Account, PVC Diversified Growth Managed Volatility Account, and PVC Diversified Income Account) invest could flow through to the funds of funds as they would for any fund shareholder.
If we, or a Fund, deem abusive trading practices to be occurring, we will take action that may include, but is not limited to:• Rejecting exchange instructions from the shareholder or other person authorized by the shareholder to direct
exchanges;• Restricting submission of exchange requests by, for example, allowing exchange requests to be submitted by
1st class U.S. mail only and disallowing requests made by facsimile, overnight courier, telephone or via the internet;
• Limiting the number of exchanges during a year; and• Taking such other action as directed by the Fund.
380
The Funds have reserved the right to accept or reject, without prior written notice, any exchange requests. In some instances, an exchange may be completed before a determination of abusive trading. In those instances, we will reverse the exchange and return the account holdings to the positions held before the exchange. We will give the shareholder written notice in this instance.
Classes Institutional, R-1, R-2, R-3, R-4, R-5, and R-6 SharesIn addition to taking any of the foregoing actions, if we, or a Fund, deem abusive trading practices to be occurring, we may require a holding period of a minimum of 30 days before permitting exchanges among the Funds where there is evidence of at least one round-trip exchange (exchange or redemption of shares that were purchased within 30 days of the exchange/redemption).
The Funds have adopted an exchange frequency restriction for these classes, described above in “Exchange of Fund Shares” to limit excessive trading in fund shares.
TAX CONSIDERATIONSIt is a policy of the Funds to make distributions of substantially all of their respective investment income and any net realized capital gains. Shareholders are responsible for federal income tax (and any other taxes, including state and local income taxes, if applicable) on dividends and capital gains distributions whether such dividends or distributions are paid in cash or are reinvested in additional shares. Special tax rules apply to distributions from IRAs and other retirement accounts. You should consult a tax advisor to determine the suitability of the Fund as an investment by such a plan and the tax treatment of Fund distributions.Generally, dividends paid by the Funds from interest, dividends, or net short-term capital gains will be taxed as ordinary income. Distributions properly designated by the Fund as deriving from net gains on securities held for more than one year are taxable as such (generally at a 15% tax rate for individuals and taxable trusts, some individuals and taxable trusts will be subject to a 20% tax rate), regardless of how long you have held your shares. Distributions of investment income properly designated by the Fund as derived from “qualified dividend income” will be taxed at the rates applicable to long-term capital gains. Some high-income individuals and taxable trusts will be subject to a Medicare 3.8% tax on unearned net investment income.
Because of tax law requirements, you must provide the Fund with an accurate and certified taxpayer identification number (for individuals, generally a Social Security number) to avoid “back-up” withholding, which is imposed at a rate of 28%. The Fund is required in certain cases to withhold and remit to the U.S. Treasury 28% of ordinary income dividends and capital gain dividends, and the proceeds of redemption of shares, paid to any shareholder who has provided either an incorrect tax identification number or no number at all, who is subject to backup withholding by the Internal Revenue Service for failure to report the receipt of interest or dividend income properly, or who has failed to certify to the Fund that it is not subject to backup withholding or that it is a corporation or other "exempt recipient."
A shareholder recognizes gain or loss on the sale or redemption of shares of the Fund in an amount equal to the difference between the proceeds of the sales or redemption and the shareholder's adjusted tax basis in the shares. All or a portion of any loss so recognized may be disallowed if the shareholder purchases other shares of the Fund within 30 days before or after the sale or redemption. In general, any gain or loss arising from (or treated as arising from) the sale or redemption of shares of the Fund is considered capital gain or loss (long-term capital gain or loss if the shares were held for longer than one year). However, any capital loss arising from the sales or redemption of shares held for six months or less is disallowed to the extent of the amount of exempt-interest dividends received on such shares and (to the extent not disallowed) is treated as a long-term capital loss to the extent of the amount of capital gain dividends received on such shares. Capital losses in any year are deductible only to the extent of capital gains plus, in the case of a noncorporate taxpayer, $3,000 of ordinary income under current rules.
If a shareholder incurs a sales charge in acquiring shares of the Fund, disposes of such shares less than 91 days after they are acquired, and subsequently acquires shares of the Fund or another fund at a reduced sales charge pursuant to a right to reinvest at such reduced sales charge acquired in connection with the acquisition of the shares disposed of, then the sales charge on the shares disposed of (to the extent of the reduction in the sales charge on the shares subsequently acquired) shall not be taken into account in determining gain or loss on the shares disposed of but shall be treated as incurred on the acquisition of the shares subsequently acquired.

381
Any gain resulting from the redemption or exchange, of your shares will generally also be subject to tax. For shares acquired after January 1, 2012, you will need to select a cost basis method to be used to calculate your reported gains and losses prior to or at the time of any redemption or exchange. If you do not select a method, the Funds’ default method of average cost will be applied to the transactions. The cost basis method used on your account could significantly affect your taxes due and should be carefully considered. You should consult your tax advisor for more information on your own tax situation, including possible foreign, state, and local taxes.
Investments by a Fund in certain debt instruments or derivatives may cause the Fund to recognize taxable income in excess of the cash generated by such instruments. As a result, the Fund could be required at times to liquidate other investments to satisfy its distribution requirements under the Internal Revenue Code. The Fund’s use of derivatives will also affect the amount, timing, and character of the Fund’s distributions.
Early in each calendar year, each Fund will notify you of the amount and tax status of distributions paid to you for the preceding year.
A dividend or distribution made shortly after the purchase of shares of a Fund by a shareholder, although in effect a return of capital to that shareholder, would be taxable to that shareholder as described above, subject to a holding period requirement for dividends designated as qualified dividend income.
The information contained in this prospectus is not a complete description of the federal, state, local, or foreign tax consequences of investing in the Fund. You should consult your tax advisor before investing in the Fund.
Funds Investing in Securities Generating Tax-Exempt IncomeDistributions designated as “exempt-interest dividends” by Funds investing in securities generating tax-exempt income are generally not subject to federal income tax. However, if you receive Social Security or railroad retirement benefits, you should consult your tax advisor to determine what effect, if any, an investment in such Fund may have on the federal taxation of your benefits. Some Funds invests in “AMT-subject bonds,” which are municipal obligations issued to finance certain “private activities,” such as bonds used to finance airports, housing projects, student loan programs, and water and sewer projects. Interest on AMT-subject bonds is an item of tax preference for purposes of the federal individual alternative minimum tax (“AMT”) and will also give rise to corporate alternative minimum taxes. A portion of such Fund’s distributions may, therefore, be subject to federal income taxes or to the federal alternative minimum tax. Some Funds may invest a portion of their assets in securities that generate income that is not exempt from federal (or state and local) income tax. Income exempt from federal tax may be subject to state and local income tax. In addition, any capital gains distributed by such Fund will be taxable as described in this section. A portion of the dividends paid by such Fund may be exempt from California State personal income tax, but not from California State franchise tax or California State corporate income tax. Corporate taxpayers should consult their tax advisor concerning the California state tax treatment of investments in such Funds.
CHOOSING A SHARE CLASS AND THE COSTS OF INVESTING
Before you invest, you should understand the characteristics of each share class so you can be sure to choose the class that is right for you. Fund and share class selections must be made at the time of purchase.
Classes differ regarding the costs associated with buying, redeeming, and holding shares. Which class is best for you depends upon:• the dollar amount you are investing, • the amount of time you plan to hold the investment, • any plans to make additional investments in the Principal Funds, and• eligibility to purchase the class.
The following sections describe the fees and expenses you may pay if you invest in a Fund. You may pay both one-time fees and ongoing fees. Fees and expenses are important because they lower your earnings. Before investing, you should be sure you understand the nature of different costs. Your Financial Professional can help you with this process and can help you choose the share class and Fund or Funds that are appropriate for you based upon your investment objective, risk tolerance and other factors. Financial Professionals may receive different compensation depending upon which class of shares you purchase.
382
Fees and Expenses of the FundsClasses A, C, J and P SharesThere is no sales charge on shares of the Funds purchased with reinvested dividends or other distributions. You may obtain more information about sales charge reductions and waivers through a link on our website, from the SAI, or from your Financial Professional.
In some cases, the initial sales charge or contingent deferred sales charge may be waived or reduced. To receive a waiver or reduction in the initial sales charge or contingent deferred sales charge, you or your Financial Professional must let the Fund know at the time you purchase or redeem shares that you qualify for such a waiver or reduction. It may be necessary for you to provide information and records, such as account statements, to determine your eligibility. If your Financial Professional or you do not let the Fund know that you are eligible for a waiver or reduction, it is possible you will not receive a sales charge discount to which you are otherwise entitled.
Class C SharesClass C shares may not be suitable for large investments. Due to the higher expenses associated with Class C shares, it may be more advantageous for investors currently purchasing, intending to purchase, or with existing assets in amounts that may qualify for a reduced sales charge on Class A shares, including through Rights of Accumulation and/or Statement of Intent, to purchase Class A shares. Class C shares have higher annual expenses than Class A shares because they are subject to higher distribution fees.
The Fund seeks to prevent investments in Class C shares by shareholders with at least $1 million of investments in Principal Funds eligible for inclusion pursuant to Rights of Accumulation. If you are making an initial purchase of Principal Funds of $1,000,000 or more and have selected Class C shares, the purchase will be of Class A shares of the Fund(s) you have selected. If you are making subsequent purchases into your existing Principal Funds Class C share accounts and the combined value of the subsequent investment and your existing Class A, Class B, Class C, and Class J share accounts combined for Rights of Accumulation purposes exceeds $1,000,000, the subsequent investment will be applied to purchase Class A shares of the Fund(s) you have selected.
Classes Institutional, R-1, R-2, R-3, R-4, R-5, and R-6 SharesFund shares are sold without a front-end sales charge and do not have a contingent deferred sales charge. There is no sales charge on Fund shares purchased with reinvested dividends or other distributions.
One-Time Fee - Initial Sales Charge
Class A SharesThe offering price for Class A shares is the NAV next calculated after receipt of an investor’s order in proper form by the Fund or its servicing agent, plus any applicable initial sales charge as shown in the table below. The right-hand column in the table indicates what portion of the sales charge is paid to Financial Professionals and their brokerage firms (“dealers”) for selling Class A shares. For more information regarding compensation paid to dealers, see “Distribution Plans and Intermediary Compensation.”
CLASS A SALES CHARGES(1)
Bond & Mortgage Securities, California Municipal, Global Diversified Income, High Yield, High Yield I, Inflation Protection, PrincipalLifeTime 2010, Principal LifeTime Strategic Income, Tax-Exempt Bond Funds, and SAM Flexible Income Portfolio
Class A Sales Charge as % of
Amount of PurchaseOffering
PriceAmountInvested
Dealer Allowance as of %of Offering Price
Less than $100,000 3.75% 3.90% 3.00%$100,000 but less than $250,000 2.75% 2.83% 2.25%$250,000 but less than $500,000 1.50% 1.52% 1.00%$500,000 or more 0.00% 0.00% 0.00%(2)
Government & High Quality Bond, Income, and Short-Term Income FundsClass A Sales Charge as % of
Amount of PurchaseOffering
PriceAmountInvested
Dealer Allowance as of %of Offering Price
Less than $100,000 2.25% 2.30% 2.00%$100,000 but less than $250,000 1.75% 1.78% 1.50%$250,000 but less than $500,000 1.25% 1.27% 1.00%$500,000 or more 0.00% 0.00% 0.00%(2)

383
LargeCap S&P 500 Index FundClass A Sales Charge as % of
Amount of PurchaseOffering
PriceAmountInvested
Dealer Allowance as of %of Offering Price
Less than $50,000 1.50% 1.52% 1.25%$50,000 but less than $100,000 1.25% 1.27% 1.00%$100,000 but less than $250,000 1.00% 1.01% 0.75%$250,000 but less than $500,000 0.75% 0.76% 0.50%$500,000 but less than $1,000,000 0.50% 0.50% 0.25%$1,000,000 or more 0.00% 0.00% 0.25%
All other Funds (except Money Market Fund(4)
Class A Sales Charge as % of
Amount of PurchaseOffering
PriceAmountInvested
Dealer Allowance as of %of Offering Price
Less than $50,000 5.50% 5.82% 4.75%$50,000 but less than $100,000 4.75% 4.99% 4.00%$100,000 but less than $250,000 3.75% 3.90% 3.00%$250,000 but less than $500,000 3.00% 3.09% 2.50%$500,000 but less than $1,000,000 2.00% 2.04% 1.75%$1,000,000 or more 0.00% 0.00% 0.00%(3)
(1) Because of rounding in the calculation of the offering price, the actual maximum front-end sales charge paid by an investor may be higher or lower than the percentages noted above.
(2) The Distributor may pay authorized dealers commissions on purchases of Class A shares over $500,000 calculated as follows: 1.00% on purchases between $500,000 and $4,999,999, 0.50% on purchases between $5 million and $49,999,999, and 0.25% on purchases of $50 million or more. The commission rate is determined based on the cumulative investments over the life of the account combined with the investments in existing Class A, C, and J shares.
(3) The Distributor may pay authorized dealers commissions on purchases of Class A shares over $1 million calculated as follows: 1.00% on purchases between $1,000,000 and $4,999,999, 0.50% on purchases between $5 million and $49,999,999, and 0.25% on purchases of $50 million or more. The commission rate is determined based on the cumulative investments over the life of the account combined with the investments in existing Class A, C, and J shares.
(4) There is no sales charge on purchases of Class A shares of the Money Market Fund.
Initial Sales Charge Waiver or Reduction
Class A shares of the Funds may be purchased without a sales charge or at a reduced sales charge.
Initial Sales Charge Waiver
• No initial sales charge will apply to purchases of Fund shares if the purchase is of sufficient size as disclosed in the preceding “Class A Sales Charges” table.
• No initial sales charge will apply to shares purchased with the proceeds of redemptions of Class A shares of the Funds (other than the Money Market Fund, unless such shares were obtained by exchange of shares of a Fund that imposes an initial sales charge), or was waived in connection with a Required Minimum Distribution, involuntary redemption or due to the death of the shareholder, within 60 days of redemption.
• A Fund’s Class A shares may be purchased without an initial sales charge by the following individuals, groups, and/or entities:• current and former Directors of Principal Funds, member companies of the Principal Financial Group, and
their active or retired employees, officers, directors, brokers, or agents (for the life of the account). This also includes their immediate family members (spouse, domestic partner, children (regardless of age), and parents) and trusts created by or primarily for the benefit of these individuals;
• Premier Credit Union when the shares are owned directly with Principal Funds;• non-ERISA clients of Principal Global Investors LLC; • any employee or registered representative (and their immediate family members and employees) of an
authorized broker-dealer or company that has entered into a selling agreement with the Distributor;
384
• clients investing in Class A shares through a “wrap account” offered through broker-dealers, investment advisors, and other financial institutions that have entered into an agreement with the Distributor which includes a requirement that such shares be sold for the benefit of clients participating in a “wrap account” or similar program under which clients pay a fee to the broker-dealer, investment advisor, or financial institution;
• non-qualified plans administered by a member company of the Principal Financial Group pursuant to a written service agreement;
• any investor who buys Class A shares through an omnibus account held by certain financial intermediaries, such as a bank, broker-dealer, or other financial institution, with special arrangements and that does not accept or charge the initial sales charge;
• individuals who were eligible to purchase shares without payment of a sales charge of a predecessor fund (a fund previously included in the WM Group of Funds) before the date the successor fund commenced operations and who own the shares directly with Principal Funds;
• clients of registered investment advisors that have entered into arrangements with the Distributor providing for the shares to be used in particular investment products made available to such clients and for which such registered investment advisors may charge a separate fee;
• financial intermediaries who have entered into an agreement with the Distributor to offer shares to self-directed investment brokerage accounts that may or may not charge a transaction fee to its customers;
• any investor whose account is held directly with Principal Funds and Principal Funds treated such account, as of May 11, 2012, as qualifying for an initial sales charge waiver based on the February 29, 2012 Prospectus for Class A Shares;
• retirement plans or benefit plans, or participants in such plans, where the plan’s investments in the Fund are part of an omnibus account (pursuant to a written agreement) or by other retirement plans or benefit plans with a total value of at least $500,000 or participants in such plans. For clarification, such plans do not include individual retirement arrangements under IRC Section 408, such as Simplified Employee Pensions (SEP), SIMPLE IRAs or other IRAs; and
• Shareholders who acquired Class A shares of Principal Capital Appreciation Fund through that fund's acquisition of Class J shares of the LargeCap Blend Fund II.
Initial Sales Charge Reduction
(1) Rights of Accumulation. The sales charge varies with the size of your purchase. Purchases made by you, your spouse or domestic partner, your children (including children of your spouse or domestic partner) age 25 or under, and/or a trust created by or primarily for the benefit of such persons (together “a Qualified Purchaser”) will be combined along with the value of existing Class A, C, and J shares of Principal Funds owned by such persons, to determine the applicable sales charge. Class A shares of the Money Market Fund are not included in the calculation unless they were acquired in exchange from other Principal Fund shares. If the total amount being invested in the Principal Funds is near a sales charge breakpoint, you should consider increasing the amount invested to take advantage of a lower sales charge.
(2) Statement of Intent (SOI). Qualified Purchasers may obtain reduced sales charges by signing an SOI. The SOI is a nonbinding obligation on the Qualified Purchaser to purchase the full amount indicated in the SOI. Purchases made by you, your spouse or domestic partner, or the children of you, your spouse or domestic partner up to and including the age of 25 and/or a trust created by or primarily for the benefit of such persons (together “a Qualified Purchaser”) will be combined along with the value of existing Class A, C, and J shares of Principal Funds owned by such persons. Purchases of Class A shares of Money Market Fund are not included. The sales charge is based on the total amount to be invested in a 13 month period. If the intended investment is not made (or shares are sold during the 13 month period), sufficient shares will be sold to pay the additional sales charge due. An SOI is not available for 401(a) plan purchases.
(3) The maximum sales charge that applies to purchases of Class A shares by qualified plans administered by Expertplan, Inc. that were previously converted from B share plans is the sales charge that applies to purchases of at least $250,000 but less than $500,000 as described in the sales charge tables; the regular sales charge applies to purchases of $500,000 or more in such accounts and to all purchases of the Global Diversified Income Fund, LargeCap S&P 500 Index Fund, and Short-Term Income Fund shares.
(4) The maximum sales charge for all purchases made in an account that is included in a SIMPLE IRA, SEP, SAR-SEP, non-qualified deferred compensation, or payroll deduction plan established before March 1, 2002 with
385
Principal Management Corporation as the Funds’ transfer agent, is the sales charge that applies to purchases of at least $100,000 but less than $250,000 as described in the sales charge tables; the regular sales charge applies to purchases of $250,000 or more in such accounts and to all purchases of the Global Diversified Income Fund, LargeCap S&P 500 Index Fund, and Short-Term Income Fund. The reduced sales charge applies to purchases made by or on behalf of participants to such plans who became participants on or before July 28, 2007.
Class C SharesPurchases of Class C shares are not subject to a front-end sales load. The offering price for Class C shares is the NAV next calculated after receipt of an investor’s order in proper form by the Fund or its servicing agent, with no initial sales charge. The Distributor currently pays authorized dealers commissions of up to 1.00% of the amount invested in Class C shares.
Classes Institutional, J, P, R-1, R-2, R-3, R-4, R-5, and R-6 SharesPurchases of these classes of shares are not subject to a front-end sales load. The offering price for such shares is the NAV next calculated after receipt of an investor’s order in proper form by the Fund or its servicing agent, with no initial sales charge.
One-Time Fee - Contingent Deferred Sales Charge ("CDSC")If you sell (redeem) shares and the CDSC is imposed, it will reduce the amount of sales proceeds.
The CDSC is based on the lesser of the market value at the time of redemption or the initial purchase price of the shares sold. The CDSC does not apply to shares purchased with reinvested dividends or other distributions. The CDSC is not charged on exchanges. However, the original purchase date of the shares from which an exchange is made determines if the newly acquired shares are subject to the CDSC when they are sold.
If you sell some but not all of the shares in your account, the shares not subject to a CDSC will be sold first. Other shares will be sold in the order purchased (first in, first out). The CDSC does not apply to shares redeemed according to a systematic withdrawal plan limited to no more than 1.00% per month (measured cumulatively for non-monthly plans) of the value of the Fund account at the time, and beginning on the date, the systematic withdrawal plan is established.
Class A SharesClass A shares purchased in amounts that are of sufficient size to qualify for a 0.00% sales charge, as disclosed in the “Class A Sales Charges” table, are generally subject to a CDSC of 1.00% (0.25% for the LargeCap S&P 500 Index Fund) if the shares are redeemed during the first 12 months after purchase, unless the dealer, at its discretion, has waived the commission. The Distributor may pay authorized dealers commissions up to 1.00% of the price of such purchases.
There is no CDSC on Class A shares of the Money Market Fund that are directly purchased by the shareholder. Class A shares of the Money Market Fund that are obtained through an exchange of another Fund's shares are generally subject to a CDSC of 1.00% on certain redemptions made within 12 months following purchases of Fund shares that are of sufficient size to qualify for a 0.00% sales charge as disclosed in the “Class A Sales Charges” table.
The CDSC generally applicable to redemptions of Class A shares made within 12 months after purchase will not be imposed on redemptions of shares purchased through an omnibus account with certain financial intermediaries, such as a bank or other financial institution, where no sales charge payments were advanced for purchases made through these entities.
Class C SharesEach initial and subsequent purchase of Class C shares is subject to a CDSC of 1.00% for a period of 12 months from the date of purchase. Shares will be redeemed first from shares purchased through reinvested dividends and capital gain distributions, which are not subject to the CDSC, and then in order of purchase. Within 60 calendar days after the sale of Class C shares, you may reinvest any amount of the sale proceeds in Class C shares and those shares purchased will not be subject to the 12-month CDSC.
386
Class J SharesIf you sell your Class J shares within 18 months of purchase, a contingent deferred sales charge (CDSC) may be imposed on the shares sold. The CDSC, if any, is determined by multiplying by 1.00% the lesser of the market value at the time of redemption or the initial purchase price of the shares sold. Within 60 calendar days after the sale of J shares, you may reinvest the amount of the sale proceeds into any Principal Funds Class J shares fund; shares purchased by redemption proceeds are not subject to the eighteen-month CDSC.
Classes Institutional, P, R-1, R-2, R-3, R-4, R-5, and R-6 SharesThese share classes are not subject to a CDSC.
CDSC Waiver For Classes A, C, and J shares, the CDSC is waived on shares: • redeemed within 90 days after an account is re-registered due to a shareholder's death;• redeemed to pay surrender fees;• redeemed to pay retirement plan fees;• redeemed involuntarily from accounts with small balances;• redeemed due to the shareholder's disability (as defined by the Internal Revenue Code) provided the shares
were purchased before the disability; • redeemed from retirement plans to satisfy minimum distribution rules under the Internal Revenue Code;• redeemed from a retirement plan to assure the plan complies with the Internal Revenue Code;• redeemed from retirement plans qualified under Section 401(a) of the Internal Revenue Code due to the plan
participant's death, disability, retirement, or separation from service after attaining age 55;• redeemed from retirement plans to satisfy excess contribution rules under the Internal Revenue Code; or• redeemed using a systematic withdrawal plan (up to 1% per month (measured cumulatively with respect to non-
monthly plans) of the value of the fund account at the time, and beginning on the date, the systematic withdrawal plan begins). (The free withdrawal privilege not used in a calendar year is not added to the free withdrawal privileges for any following year.)
For Class J shares, the CDSC also is waived on shares:
• redeemed that were purchased pursuant to the Small Amount Force Out program (SAFO); or• of the Money Market Fund redeemed within 30 days of the initial purchase if the redemption proceeds are
transferred to another Principal IRA, defined as either a fixed or variable annuity issued by Principal Life Insurance Company to fund an IRA, a Principal Bank IRA product, or a WRAP account IRA sponsored by Princor Financial Services Corporation.
Ongoing FeesThe ongoing fees are the operating expenses of a Fund, which are described in the “Annual Fund Operating Expenses” table included in the Summary for each Fund. These expenses reduce the value of each share you own. Because they are ongoing, they increase the cost of investing in the Funds.
Each Principal LifeTime Fund and SAM Portfolio, as a shareholder in the underlying fund, bears its pro rata share of the operating expenses incurred by each underlying fund. The investment return of each Principal LifeTime Fund and SAM Portfolio is net of the underlying funds’ operating expenses.
Each of the Funds pays ongoing fees to Principal and others who provide services to the Fund. These fees include:• Management Fee (all Classes) – Through the Management Agreement with the Fund, Principal has agreed to
provide investment advisory services and corporate administrative services to the Fund.• Distribution Fee (Classes A, C, J, R-1, R-2, R-3, and R-4) - Each Fund has adopted a distribution plan under
Rule 12b-1 of the Investment Company Act of 1940 for its Classes A (except the Money Market Fund), C, J, R-1, R-2, R-3 and R-4 shares. Under the plan, the foregoing classes of each Fund pay a distribution fee based on the average daily NAV of the Fund. These fees pay distribution and other expenses for the sale of Fund shares and for services provided to shareholders. Because they are ongoing fees, over time, these fees may exceed other types of sales charges.
• Other Expenses (all Classes) - A portion of expenses that are allocated to all classes of the Fund. Other expenses include interest expense and expenses related to fund investments. Additional examples of other expenses include:• Transfer Agent Fee (Classes A, C, J, P, Institutional, R-1, R-2, R-3, R-4, R-5, and R-6) - Principal
Shareholder Services, Inc. (“PSS”) has entered into a Transfer Agency Agreement with the Fund under which
387
PSS provides transfer agent services to these classes. Except for Classes J (for which services are provided at a rate that includes a profit), R-1, R-2, R-3, R-4, R-5, and R-6, these services are currently provided at cost. The Fund does not pay for these services for Classes R-1, R-2, R-3, R-4, R-5, and R-6.
• Certain Operating Expenses (Classes A, C, J, P, Institutional, and R-6) - expenses of registering and qualifying shares for sale, the cost of producing and distributing reports and prospectuses to shareholders of these classes, the cost of shareholder meetings held solely for shareholders of these classes, and other operating expenses of the Fund.
• Service Fee (Classes R-1, R-2, R-3, R-4, and R-5) - Principal has entered into a Service Agreement with the Fund under which Principal performs personal services.
• Administrative Services Fee (Classes R-1, R-2, R-3, R-4, and R-5) - Principal has entered into an Administrative Services Agreement with Principal Funds under which Principal provides shareholder and administrative services for retirement plans and other beneficial owners of Fund shares.
• Acquired Fund Fees and Expenses (all Classes) – fees and expenses charged by other investment companies in which a Fund invests a portion of its assets.
DISTRIBUTION PLANS AND INTERMEDIARY COMPENSATION
Distribution and/or Service (12b-1) FeesPrincipal Funds Distributor, Inc. ("PFD" or the "Distributor") is the distributor for the shares of Principal Funds, Inc. PFD is an affiliate of Principal Life Insurance Company and with it is a subsidiary of Principal Financial Group, Inc. and member of the Principal Financial Group®.
Principal Funds has adopted a distribution plan pursuant to Rule 12b-1 under the Investment Company Act for each of the Classes A, C, J, R-1, R-2, R-3, and R-4 shares of Principal Funds. Under the 12b-1 Plans, except as noted below, each Fund makes payments from its assets attributable to the particular share class to the Fund's Distributor for distribution-related expenses and for providing services to shareholders of that share class. Payments under the 12b-1 plans are made by the Funds to the Distributor pursuant to the 12b-1 plans regardless of the expenses incurred by the Distributor. When the Distributor receives Rule 12b-1 fees, it may pay some or all of them to intermediaries whose customers are shareholders of the funds for sales support services and for providing services to shareholders of that share class. Intermediaries may include, among others, broker-dealers, registered investment advisors, banks, trust companies, pension plan consultants, retirement plan administrators, and insurance companies. Because Rule 12b-1 fees are paid out of Fund assets and are ongoing fees, over time they will increase the cost of your investment in the Funds and may cost you more than other types of sales charges.The maximum annual Rule 12b-1 fee for distribution related expenses and/or for providing services to shareholders under each 12b-1 plan (as a percentage of average daily net assets) is:
Share Class Maximum Annualized Rate 12b-1 FeeA(1) 0.25% (0.15% for LargeCap S&P 500 Index and Short-Term Income Funds)C 1.00%J 0.25%R-1 0.35%R-2 0.30%R-3 0.25%R-4 0.10%
(1) Class A shares of the Money Market Fund are not subject to Rule 12b-1 fees.
The Distributor generally uses Rule 12b-1 fees to finance any activity that is primarily intended to result in the sale of shares and for providing services to shareholders of the share class, and the activities vary depending on the share class. In addition to shareholder services, examples of such sales or distribution related expenses include, but are not limited to: • Compensation to salespeople and selected dealers, including ongoing commissions payments.• Printing of prospectuses and statements of additional information and reports for other than existing
shareholders, and preparing and conducting sales seminars.
Examples of services to shareholders include furnishing information as to the status of shareholder accounts, responding to telephone and written inquiries of shareholders, and assisting shareholders with tax information.
388
Payments under the 12b-1 plans will not automatically terminate for funds that are closed to new investors or to additional purchases by existing shareholders. The fund Board will determine whether to terminate, modify, or leave unchanged the 12b-1 plans when the Board directs the implementation of the closure of a fund.
Classes A and C SharesGenerally, to receive 12b-1 fees from the Distributor, dealers or other intermediaries must be the dealer of record for shares with average daily net assets of at least $100,000. Generally, Class A shares must be held for three months before these fees are paid. In the case of Class C shares, generally these fees are not paid until such shares have been held for twelve months.
Class J SharesEffective December 30, 2013, Principal Funds Distributor, Inc. ("the Distributor") has contractually agreed to limit the Distribution Fees attributable to Class J. This waiver is in place through February 29, 2016 and will reduce the Fund's Distribution Fees by 0.01%. It is expected that the fee waiver will continue through the period disclosed; however, Principal Funds, Inc. and the Distributor, the parties to the agreement, may agree to terminate the fee waiver prior to the end of the period.
Government & High Quality Bond FundThe Distributor has voluntarily agreed to limit the Fund's Distribution and/or Service (12b-1) Fees normally payable by the Fund. The limit will maintain the level of Distribution and/or Service (12b-1) Fees (expressed as a percent of average net assets on an annualized basis) not to exceed 0.15% for Class A shares. The voluntary expense limit may be terminated at any time.
Money Market FundThe Distributor has voluntarily agreed to limit the Fund’s Distribution and/or Service (12b-1) Fees normally payable by the Fund. The expense limit will maintain a level of Distribution and/or Service (12b-1) Fees (expressed as a percent of average net assets on an annualized basis) not to exceed 0.00% for Class C shares. The expense limit may be terminated at any time.
Commissions, Finder’s Fees, and Ongoing Payments
See "Choosing a Share Class and The Costs of Investing" for more details.
Class A SharesAll or a portion of the initial sales charge that you pay may be paid by the Distributor to intermediaries selling Class A shares. The Distributor may pay these intermediaries a commission of up to 1.00% on purchases of $1,000,000 or more (or $500,000 or more depending on the Fund purchased), excluding purchases by qualified retirement plans in omnibus accounts which are not subject to initial sales charges.
In lieu of commissions, the Distributor may pay intermediaries a finder’s fee on initial investment by qualified retirement plans in omnibus accounts which are not subject to initial sales charges, provided the selling intermediary notifies the Distributor within 90 days of the initial investment that the transaction is eligible for the payment of a finder’s fee. The finder’s fee on such initial investments may be up to 1.00% on initial investments between $500,000 and $4,999,999, 0.50% on initial investments between $5 million and $49,999,999, 0.25% on initial investments of $50 million or more. Initial investments include transfers, rollovers and other lump sum purchases, excluding ongoing systematic investments, made within 90 days of the initial funding of the account. The intermediary shall, upon request by the Distributor provided within 90 days of the triggering event, refund the finder’s fee to the Distributor to the extent shares are redeemed within 12 months of the initial investment or trading restrictions are placed on the account in accordance with the Funds' frequent trading policy.
Classes A, J, R-1, R-2, R-3, and R-4 Shares Additionally, the Distributor generally makes ongoing 12b-1 fee payments to your intermediary at a rate that varies by class, as noted above under “Distribution and/or Service (12b-1) Fees."
Class C SharesThe Distributor will pay, at the time of your purchase, a commission to your intermediary equal to 1.00% of your investment. Additionally, the Distributor generally makes ongoing 12b-1 fee payments to your intermediary as noted above under “Distribution and/or Service (12b-1) Fees."

389
Additional Payments to IntermediariesShares of the Fund are sold primarily through intermediaries, such as brokers, dealers, investment advisors, banks, trust companies, pension plan consultants, retirement plan administrators, and insurance companies.
Classes A, C, J, and P SharesIn addition to payments pursuant to 12b-1 plans, sales charges, commissions and finder’s fees, including compensation for referrals, Principal or its affiliates enter into agreements with some intermediaries pursuant to which the intermediaries receive payments for providing services relating to Fund shares. Examples of such services are administrative, networking, recordkeeping, sub-transfer agency and shareholder services. In some situations, the Fund will reimburse Principal or its affiliates for making such payments; in others, the Fund may make such additional payments directly to intermediaries.
Principal or its affiliates may also pay, without reimbursement from the Fund, compensation from their own resources to certain intermediaries that support the distribution of shares of the Fund or provide services to Fund shareholders.
Such additional payments may vary, but generally do not exceed: (a) 0.25% of the current year's sales of Fund shares by that intermediary and/or (b) 0.25% of average net asset value of Fund shares held by clients of such intermediary.
The Distributor and its affiliates may pay a bonus or other consideration or incentive to intermediaries if an employee covered under an employer sponsored benefit program purchases a product from an affiliate of Distributor with the assistance of a registered representative of an affiliate of Distributor, if the intermediary sold the funding vehicle the employer sponsored benefit program utilizes or if the intermediary subsequently became the broker of record with regard to the employer sponsored benefit program.
The Distributor and/or its affiliates provide services to and/or funding vehicles for retirement plans and employer sponsored benefit programs. The Distributor and its affiliates may pay a bonus or other consideration or incentive to intermediaries if a participant in such a retirement plan establishes a rollover individual retirement account with the assistance of a registered representative of an affiliate of Distributor, if the intermediary sold the funding vehicle the retirement plan utilizes or if the intermediary subsequently became the broker of record with regard to the retirement plan.
Classes Institutional, R-1, R-2, R-3, R-4, and R-5 SharesIn addition to payments pursuant to 12b-1 plans, Principal or its affiliates enter into agreements with some intermediaries pursuant to which the intermediaries receive payments for providing services relating to Fund shares. Examples of such services are administrative, networking, recordkeeping, sub-transfer agency and/or shareholder services. For Class R-1, R-2, R-3, R-4, and R-5 shares, such compensation is generally paid out of the Service Fees and Administrative Service Fees that are disclosed in this prospectus as Other Expenses. For Institutional Class shares, in some situations the Fund will reimburse Principal or its affiliates for making such payments; in others, the Fund may make such payments directly to the intermediaries.
Principal or its affiliates may also pay, without reimbursement from the Fund, compensation from their own resources to certain intermediaries that support the distribution of shares of the Fund or provide services to Fund shareholders.
For Institutional Class shares, such payments may vary, but generally do not exceed: (a) 0.10% of the current year’s sales of Fund shares by that intermediary or (b) 0.10% of the average net asset value of Fund shares held by clients of such intermediary.
Principal Life Insurance Company is one such intermediary that provides services relating to Fund shares held in retirement plans, and it is typically paid some or all of the Service Fees and Administrative Service Fees pertaining to such plans, and it also receives compensation paid by Principal from its own resources.
Classes A, C, J, P, Institutional, R-1, R-2, R-3, R-4, and R-5 SharesThe intermediary may pay to its Financial Professionals some or all of the amounts the Distributor and its affiliates pay to the intermediary.
The amounts paid to intermediaries vary by share class and by Fund.
390
In some cases, the Distributor and its affiliates will provide payments or reimbursements in connection with the costs of conferences, educational seminars, training and marketing efforts related to the Funds. Such activities may be sponsored by intermediaries or the Distributor. The costs associated with such activities may include travel, lodging, entertainment, and meals. In some cases, the Distributor will also provide payment or reimbursement for expenses associated with transactions ("ticket") charges and general marketing expenses.
For more information, see the Statement of Additional Information (SAI).
The payments described in this prospectus may create a conflict of interest by influencing your Financial Professional or your intermediary to recommend the Fund over another investment, or to recommend one share class of the Fund over another share class. Ask your Financial Professional or visit your intermediary's website for more information about the total amounts paid to them by Principal and its affiliates, and by sponsors of other mutual funds your Financial Professional may recommend to you.
Your intermediary may charge you additional fees other than those disclosed in this prospectus. Ask your Financial Professional about any fees and commissions they charge.
Class R-6 SharesDistributor and its affiliates do not pay compensation to intermediaries for distribution or other services for Class R-6 shares. For more information, see the Statement of Additional Information (SAI).
FUND ACCOUNT INFORMATION
StatementsYou will receive quarterly statements for the Funds you own, or if you purchase through a third party intermediary, on a periodic basis established by such intermediary. Such statements provide the number and value of shares you own, transactions during the period, dividends declared or paid, and other information. The year-end statement includes information for all transactions that took place during the year. Please review your statement as soon as you receive it. Keep your statements, as you may need them for tax reporting purposes.
Generally, each time you buy, sell, or exchange shares in Principal Funds, you will receive a confirmation shortly thereafter. It summarizes all the key information - what you bought or sold, the amount of the transaction, and other important information.
Certain purchases and sales are only included on your quarterly statement. These include accounts:• when the only activity during the quarter are:
• purchases of shares from reinvested dividends and/or capital gains,• purchases under an Automatic Investment Plan, • sales under a Systematic Withdrawal Plan, or• purchases or sales under an Automatic Exchange Election
• used to fund certain individual retirement or individual pension plans; or• established under a payroll deduction plan.
If you need information about your account(s) at other times, you may call us or access your account on the internet.
Orders Placed by IntermediariesPrincipal Funds may have an agreement with your intermediary, such as a broker-dealer, third party administrator, or trust company, that permits the intermediary to accept orders on behalf of the Fund until 3 p.m. Central Time. The agreement may include authorization for your intermediary to designate other intermediaries (“sub-designees”) to accept orders on behalf of the Fund on the same terms that apply to the intermediary. In such cases, if your intermediary or a sub-designee receives your order in correct form by 3 p.m. Central Time, transmits it to the Fund, and pays for it in accordance with the agreement, the Fund will price the order at the next net asset value per share it computes after your intermediary or sub-designee received your order.
The time at which the Fund prices orders and the time until which the Fund or your intermediary or sub-designee will accept orders may change in the case of an emergency or if the NYSE closes at a time other than 3 p.m. Central Time.

391
Transactions through Financial Institutions/ProfessionalsFinancial institutions and dealers may charge their customers a processing or service fee in connection with the purchase or redemption of Fund shares. The amount and applicability of such a fee is determined and disclosed to its customers by each individual financial institution or dealer. Processing or service fees typically are fixed, nominal dollar amounts and are in addition to the sales and other charges described in this prospectus and the SAI.
Your financial institution or dealer will provide you with specific information about any processing or service fees you will be charged.
Telephone and Internet InstructionsThe Funds reserve the right to refuse telephone and/or internet instructions. You are liable for a loss resulting from a fraudulent telephone or internet instruction that we reasonably believe is genuine. We use reasonable procedures to assure instructions are genuine. If the procedures are not followed, we may be liable for loss due to unauthorized or fraudulent transactions. The procedures include: recording all telephone instructions, requiring the use of a password (Personal Identification Number) for internet instructions, requesting personal identification information, and sending written confirmation to the shareholder’s address of record.
If you elect telephone privileges, instructions regarding your account(s) may be given to us via the telephone or internet. Your instructions:• may be given by calling us;• may be given via our website for certain transactions (for security purposes you need a user name and password
to use any of the internet services, including viewing your account information on-line. If you don’t have a user name or password, you may obtain one at our website); or
• may be given to your Financial Professional (a person employed by or affiliated with broker/dealer firms) who will in turn contact us with your instructions.
Instructions received from one owner are binding on all owners. In the case of an account owned by a corporation or trust, instructions received from an authorized person are binding on the corporation/trust unless we have a written notification requiring that more than one authorized person execute written instructions.
Signature GuaranteesCertain transactions require that your signature be guaranteed. If required, the signature(s) must be guaranteed by a commercial bank, trust company, credit union, savings and loan, national securities exchange member, or brokerage firm that participates in a Medallion program recognized by the Securities Transfer Association. A signature guaranteed by a notary public or savings bank is not acceptable. Signature guarantees are required in any of the following circumstances:
• if you sell more than $100,000 (in the aggregate) from the Funds (Classes A, C and J).• if you sell more than $500,000 (in the aggregate) from the Funds (Classes Institutional, P, R-1, R-2, R-3, R-4,
R-5, and R-6).• if you sell more than $10,000,000 if you have the proceeds sent electronically to a previously authorized U.S.
bank account (Class Institutional).• if a sales proceeds check is payable to a party other than the account shareholder(s), or, for Classes A, C, J, and
P, Principal Life, Principal Bank, a retirement plan trustee or custodian that has agreed in writing to accept a transfer of assets from the Fund or Princor Financial Services Corporation payable through Pershing.
• to change ownership of an account.• to add telephone transaction services and/or wire or ACH redemption privileges to an existing account if there is
not a common owner between the bank account and mutual fund account.• to change bank account information designated under an existing telephone withdrawal plan if there is not a
common owner between the bank account and mutual fund account.• to wire or ACH to a shareholder’s U.S. bank account not previously authorized or when the request does not
include a voided check or deposit slip indicating a common owner between the bank account and mutual fund account.
• to exchange or transfer among accounts with different ownership.• to have a sales proceeds check mailed to an address other than the address on the account or to the address on
the account if it has been changed within the preceding 15 days.

392
Reservation of RightsPrincipal Funds reserves the right to amend or terminate the special plans described in this prospectus. Shareholders will be notified of any such action to the extent required by law.
Such plans include, for example, automatic investment, systematic withdrawal, waiver of Fund minimums for certain accounts and waiver or reduction of the sales charge or contingent deferred sales charge for certain purchasers.
Classes A, C, and J Shares - Minimum Account BalanceEach Fund has a minimum required account balance of $1000. The Fund reserves the right to redeem all shares in your account if the value of your account falls below $1000. The Fund will mail the redemption proceeds to you. An involuntary redemption of a small account will not be triggered by market conditions alone. The Fund will notify you before involuntarily redeeming your account. You will have 30 days to make an additional investment of an amount that brings your account up to the required minimum. The Funds reserve the right to increase the required minimum.
HouseholdingTo avoid sending duplicate copies of materials to households, mailings for accounts held by members of your household may be combined so that only one copy of each prospectus, annual and semiannual reports will be mailed. In addition, your account information may be included with other householded accounts on the same quarterly and annual statements. The consolidation of these mailings, called householding, benefits Principal Funds and our shareholders through reduced printing and mailing expenses. If you prefer to receive multiple copies of these materials, you may write or call Principal Funds. Householding will be stopped within thirty (30) days after we receive your request.
Multiple TranslationsThis prospectus may be translated into other languages. In the event of any inconsistencies or ambiguity as to the meaning of any word or phrase in a translation, the English text will prevail.
Financial StatementsShareholders will receive annual financial statements for the Funds, audited by the Funds’ independent registered public accounting firm. Shareholders will also receive a semiannual financial statement that is unaudited.FINANCIAL HIGHLIGHTS
The following financial highlights tables are intended to help you understand the Fund's financial performance for the periods shown. Certain information reflects returns for a single Fund share. The total returns in each table represent the rate that an investor would have earned or lost each period on an investment in the Fund (assuming reinvestment of all distributions). This information has been audited by Ernst & Young LLP, Independent Registered Public Accounting Firm, whose report, along with each Fund's financial statements, is included in Principal Funds, Inc. Annual Report to Shareholders for the fiscal year ended October 31, 2014, which is available upon request, and incorporated by reference into the SAI.
To request a free copy of the latest annual or semiannual report for the Fund, you may telephone 1-800-222-5852.

393
This page left blank intentionally.
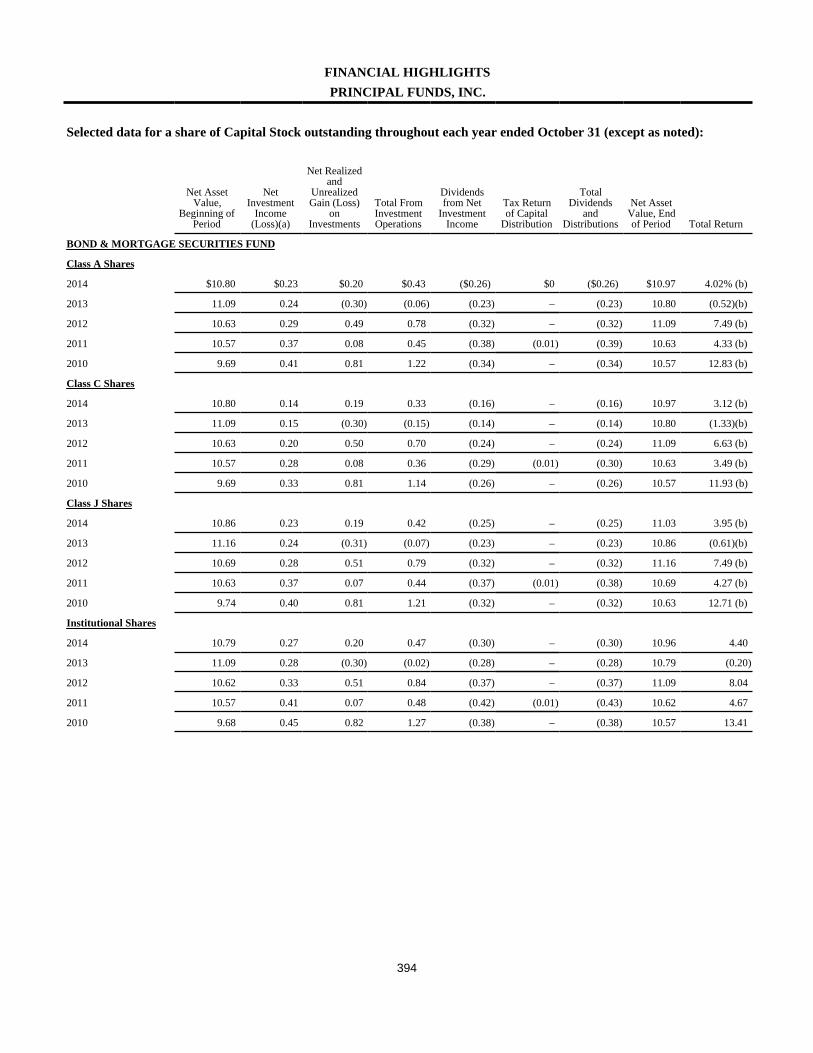
394
FINANCIAL HIGHLIGHTSPRINCIPAL FUNDS, INC.
Selected data for a share of Capital Stock outstanding throughout each year ended October 31 (except as noted):
Net AssetValue,
Beginning ofPeriod
NetInvestment
Income(Loss)(a)
Net Realizedand
UnrealizedGain (Loss)
onInvestments
Total FromInvestmentOperations
Dividendsfrom Net
InvestmentIncome
Tax Returnof Capital
Distribution
TotalDividends
andDistributions
Net AssetValue, Endof Period Total Return
BOND & MORTGAGE SECURITIES FUND
Class A Shares
2014 $10.80 $0.23 $0.20 $0.43 ($0.26) $0 ($0.26) $10.97 4.02% (b)
2013 11.09 0.24 (0.30) (0.06) (0.23) – (0.23) 10.80 (0.52)(b)
2012 10.63 0.29 0.49 0.78 (0.32) – (0.32) 11.09 7.49 (b)
2011 10.57 0.37 0.08 0.45 (0.38) (0.01) (0.39) 10.63 4.33 (b)
2010 9.69 0.41 0.81 1.22 (0.34) – (0.34) 10.57 12.83 (b)
Class C Shares
2014 10.80 0.14 0.19 0.33 (0.16) – (0.16) 10.97 3.12 (b)
2013 11.09 0.15 (0.30) (0.15) (0.14) – (0.14) 10.80 (1.33)(b)
2012 10.63 0.20 0.50 0.70 (0.24) – (0.24) 11.09 6.63 (b)
2011 10.57 0.28 0.08 0.36 (0.29) (0.01) (0.30) 10.63 3.49 (b)
2010 9.69 0.33 0.81 1.14 (0.26) – (0.26) 10.57 11.93 (b)
Class J Shares
2014 10.86 0.23 0.19 0.42 (0.25) – (0.25) 11.03 3.95 (b)
2013 11.16 0.24 (0.31) (0.07) (0.23) – (0.23) 10.86 (0.61)(b)
2012 10.69 0.28 0.51 0.79 (0.32) – (0.32) 11.16 7.49 (b)
2011 10.63 0.37 0.07 0.44 (0.37) (0.01) (0.38) 10.69 4.27 (b)
2010 9.74 0.40 0.81 1.21 (0.32) – (0.32) 10.63 12.71 (b)
Institutional Shares
2014 10.79 0.27 0.20 0.47 (0.30) – (0.30) 10.96 4.40
2013 11.09 0.28 (0.30) (0.02) (0.28) – (0.28) 10.79 (0.20)
2012 10.62 0.33 0.51 0.84 (0.37) – (0.37) 11.09 8.04
2011 10.57 0.41 0.07 0.48 (0.42) (0.01) (0.43) 10.62 4.67
2010 9.68 0.45 0.82 1.27 (0.38) – (0.38) 10.57 13.41
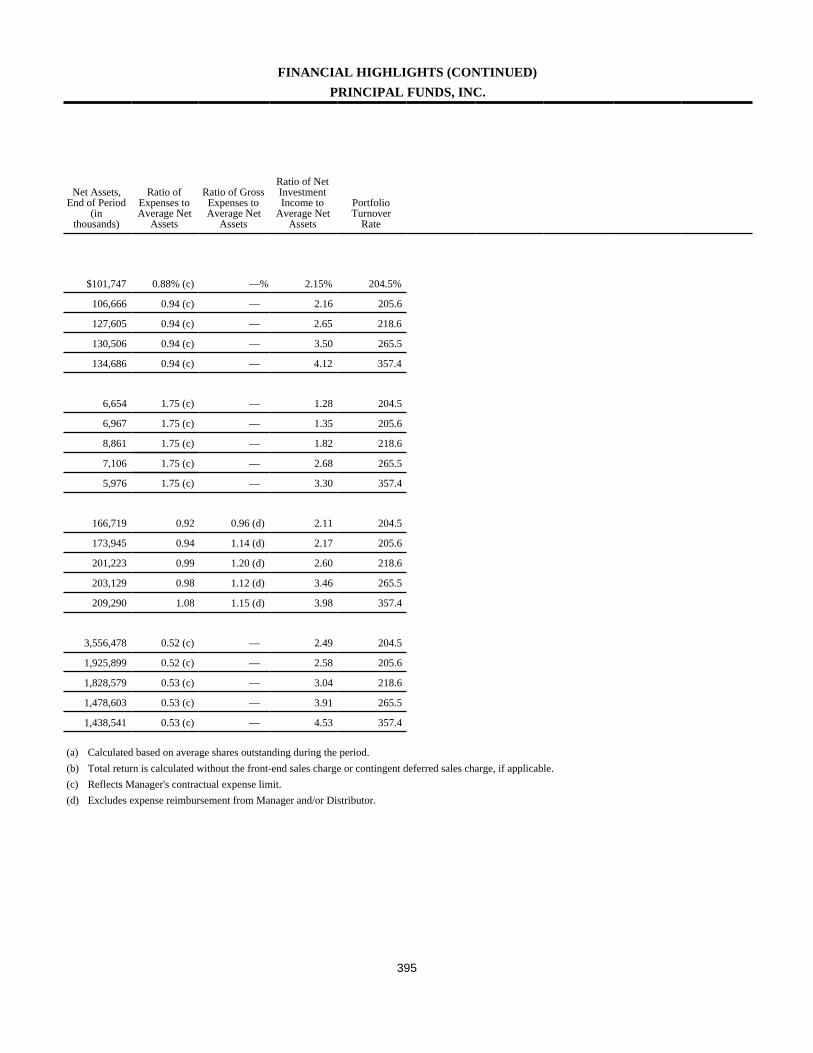
395
FINANCIAL HIGHLIGHTS (CONTINUED)PRINCIPAL FUNDS, INC.
Net Assets,End of Period
(inthousands)
Ratio ofExpenses toAverage Net
Assets
Ratio of GrossExpenses toAverage Net
Assets
Ratio of NetInvestmentIncome to
Average NetAssets
PortfolioTurnover
Rate
$101,747 0.88% (c) —% 2.15% 204.5%
106,666 0.94 (c) — 2.16 205.6
127,605 0.94 (c) — 2.65 218.6
130,506 0.94 (c) — 3.50 265.5
134,686 0.94 (c) — 4.12 357.4
6,654 1.75 (c) — 1.28 204.5
6,967 1.75 (c) — 1.35 205.6
8,861 1.75 (c) — 1.82 218.6
7,106 1.75 (c) — 2.68 265.5
5,976 1.75 (c) — 3.30 357.4
166,719 0.92 0.96 (d) 2.11 204.5
173,945 0.94 1.14 (d) 2.17 205.6
201,223 0.99 1.20 (d) 2.60 218.6
203,129 0.98 1.12 (d) 3.46 265.5
209,290 1.08 1.15 (d) 3.98 357.4
3,556,478 0.52 (c) — 2.49 204.5
1,925,899 0.52 (c) — 2.58 205.6
1,828,579 0.53 (c) — 3.04 218.6
1,478,603 0.53 (c) — 3.91 265.5
1,438,541 0.53 (c) — 4.53 357.4
(a) Calculated based on average shares outstanding during the period.(b) Total return is calculated without the front-end sales charge or contingent deferred sales charge, if applicable.(c) Reflects Manager's contractual expense limit.(d) Excludes expense reimbursement from Manager and/or Distributor.
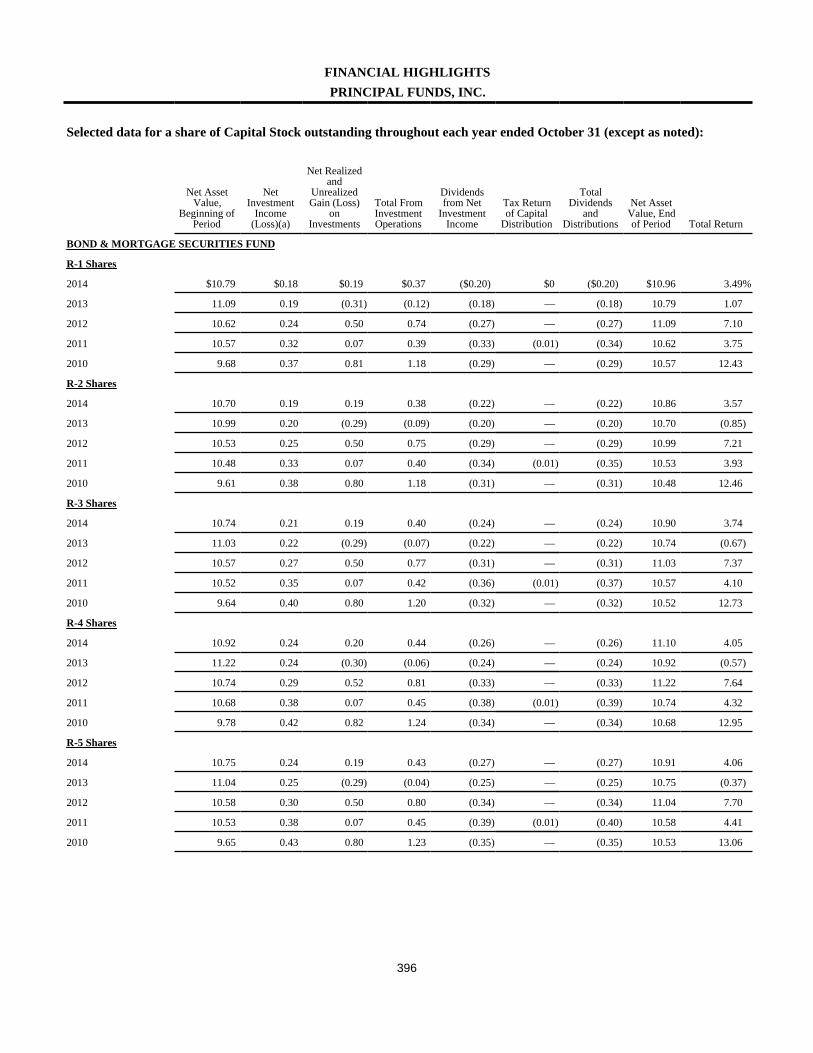
396
FINANCIAL HIGHLIGHTSPRINCIPAL FUNDS, INC.
Selected data for a share of Capital Stock outstanding throughout each year ended October 31 (except as noted):
Net AssetValue,
Beginning ofPeriod
NetInvestment
Income(Loss)(a)
Net Realizedand
UnrealizedGain (Loss)
onInvestments
Total FromInvestmentOperations
Dividendsfrom Net
InvestmentIncome
Tax Returnof Capital
Distribution
TotalDividends
andDistributions
Net AssetValue, Endof Period Total Return
BOND & MORTGAGE SECURITIES FUND
R-1 Shares
2014 $10.79 $0.18 $0.19 $0.37 ($0.20) $0 ($0.20) $10.96 3.49%
2013 11.09 0.19 (0.31) (0.12) (0.18) — (0.18) 10.79 1.07
2012 10.62 0.24 0.50 0.74 (0.27) — (0.27) 11.09 7.10
2011 10.57 0.32 0.07 0.39 (0.33) (0.01) (0.34) 10.62 3.75
2010 9.68 0.37 0.81 1.18 (0.29) — (0.29) 10.57 12.43
R-2 Shares
2014 10.70 0.19 0.19 0.38 (0.22) — (0.22) 10.86 3.57
2013 10.99 0.20 (0.29) (0.09) (0.20) — (0.20) 10.70 (0.85)
2012 10.53 0.25 0.50 0.75 (0.29) — (0.29) 10.99 7.21
2011 10.48 0.33 0.07 0.40 (0.34) (0.01) (0.35) 10.53 3.93
2010 9.61 0.38 0.80 1.18 (0.31) — (0.31) 10.48 12.46
R-3 Shares
2014 10.74 0.21 0.19 0.40 (0.24) — (0.24) 10.90 3.74
2013 11.03 0.22 (0.29) (0.07) (0.22) — (0.22) 10.74 (0.67)
2012 10.57 0.27 0.50 0.77 (0.31) — (0.31) 11.03 7.37
2011 10.52 0.35 0.07 0.42 (0.36) (0.01) (0.37) 10.57 4.10
2010 9.64 0.40 0.80 1.20 (0.32) — (0.32) 10.52 12.73
R-4 Shares
2014 10.92 0.24 0.20 0.44 (0.26) — (0.26) 11.10 4.05
2013 11.22 0.24 (0.30) (0.06) (0.24) — (0.24) 10.92 (0.57)
2012 10.74 0.29 0.52 0.81 (0.33) — (0.33) 11.22 7.64
2011 10.68 0.38 0.07 0.45 (0.38) (0.01) (0.39) 10.74 4.32
2010 9.78 0.42 0.82 1.24 (0.34) — (0.34) 10.68 12.95
R-5 Shares
2014 10.75 0.24 0.19 0.43 (0.27) — (0.27) 10.91 4.06
2013 11.04 0.25 (0.29) (0.04) (0.25) — (0.25) 10.75 (0.37)
2012 10.58 0.30 0.50 0.80 (0.34) — (0.34) 11.04 7.70
2011 10.53 0.38 0.07 0.45 (0.39) (0.01) (0.40) 10.58 4.41
2010 9.65 0.43 0.80 1.23 (0.35) — (0.35) 10.53 13.06

397
FINANCIAL HIGHLIGHTS (CONTINUED)PRINCIPAL FUNDS, INC.
Net Assets,End of Period
(inthousands)
Ratio ofExpenses toAverage Net
Assets
Ratio of GrossExpenses toAverage Net
Assets
Ratio of NetInvestmentIncome to
Average NetAssets
PortfolioTurnover
Rate
$4,667 1.40% – 1.64% 204.5%
5,969 1.40 – 1.71 205.6
11,645 1.41 – 2.18 218.6
11,158 1.41 – 3.03 265.5
10,669 1.41 – 3.66 357.4
10,799 1.27 – 1.71 204.5
14,978 1.27 – 1.83 205.6
19,392 1.28 – 2.32 218.6
20,576 1.28 – 3.18 265.5
28,778 1.28 – 3.78 357.4
27,332 1.09 – 1.95 204.5
32,743 1.09 – 2.01 205.6
38,896 1.10 – 2.50 218.6
41,063 1.10 – 3.34 265.5
41,586 1.10 – 3.97 357.4
27,091 0.90 – 2.14 204.5
30,315 0.90 – 2.20 205.6
37,187 0.91 – 2.67 218.6
32,495 0.91 – 3.53 265.5
36,175 0.91 – 4.14 357.4
46,871 0.78 – 2.26 204.5
44,281 0.78 – 2.32 205.6
70,930 0.79 – 2.79 218.6
63,753 0.79 – 3.66 265.5
59,861 0.79 – 4.26 357.4
(a) Calculated based on average shares outstanding during the period.(b) Total return is calculated without the front-end sales charge or contingent deferred sales charge, if applicable.(c) Reflects Manager's contractual expense limit.(d) Excludes expense reimbursement from Manager and/or Distributor.
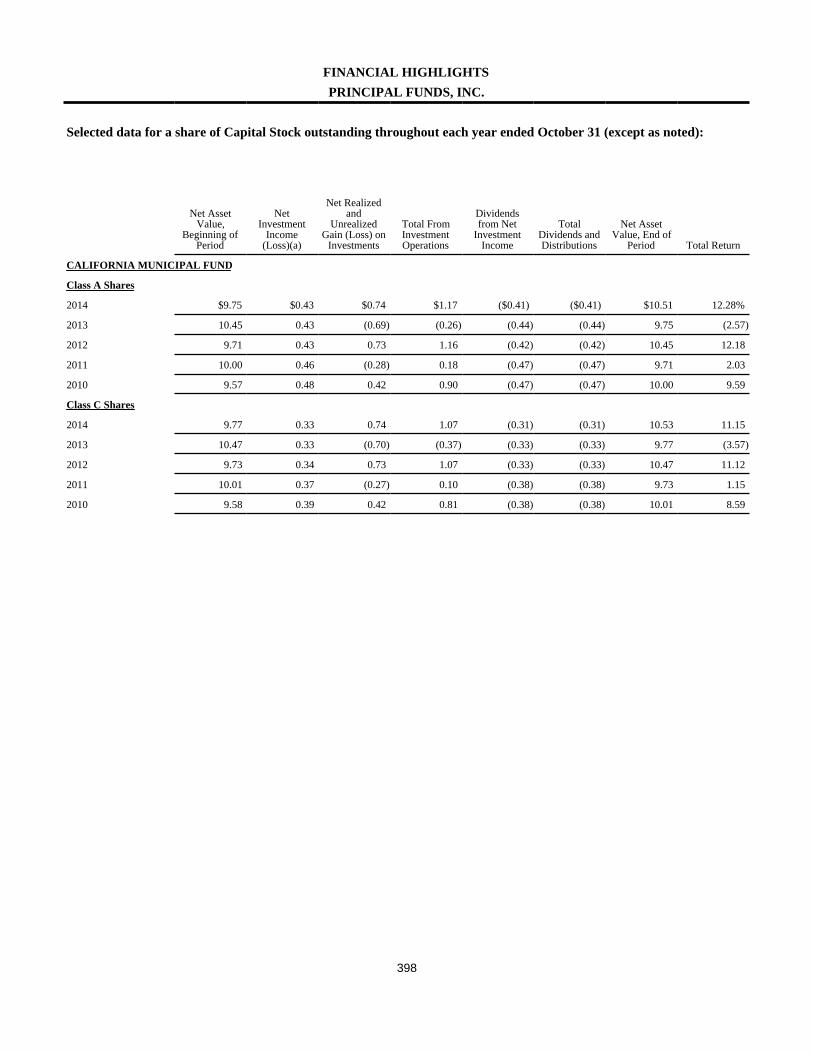
398
FINANCIAL HIGHLIGHTSPRINCIPAL FUNDS, INC.
Selected data for a share of Capital Stock outstanding throughout each year ended October 31 (except as noted):
Net AssetValue,
Beginning ofPeriod
NetInvestment
Income(Loss)(a)
Net Realizedand
UnrealizedGain (Loss) on
Investments
Total FromInvestmentOperations
Dividendsfrom Net
InvestmentIncome
TotalDividends andDistributions
Net AssetValue, End of
Period Total Return
CALIFORNIA MUNICIPAL FUND
Class A Shares
2014 $9.75 $0.43 $0.74 $1.17 ($0.41) ($0.41) $10.51 12.28%
2013 10.45 0.43 (0.69) (0.26) (0.44) (0.44) 9.75 (2.57)
2012 9.71 0.43 0.73 1.16 (0.42) (0.42) 10.45 12.18
2011 10.00 0.46 (0.28) 0.18 (0.47) (0.47) 9.71 2.03
2010 9.57 0.48 0.42 0.90 (0.47) (0.47) 10.00 9.59
Class C Shares
2014 9.77 0.33 0.74 1.07 (0.31) (0.31) 10.53 11.15
2013 10.47 0.33 (0.70) (0.37) (0.33) (0.33) 9.77 (3.57)
2012 9.73 0.34 0.73 1.07 (0.33) (0.33) 10.47 11.12
2011 10.01 0.37 (0.27) 0.10 (0.38) (0.38) 9.73 1.15
2010 9.58 0.39 0.42 0.81 (0.38) (0.38) 10.01 8.59
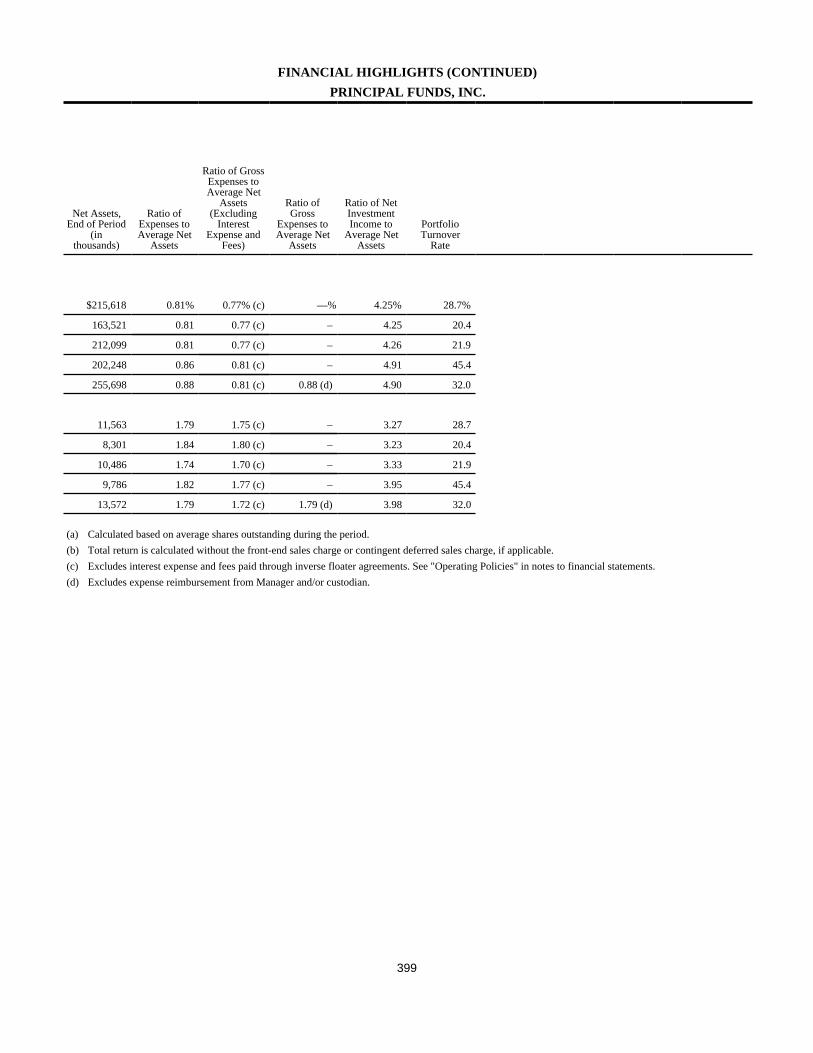
399
FINANCIAL HIGHLIGHTS (CONTINUED)PRINCIPAL FUNDS, INC.
Net Assets,End of Period
(inthousands)
Ratio ofExpenses toAverage Net
Assets
Ratio of GrossExpenses toAverage Net
Assets(Excluding
InterestExpense and
Fees)
Ratio ofGross
Expenses toAverage Net
Assets
Ratio of NetInvestmentIncome to
Average NetAssets
PortfolioTurnover
Rate
$215,618 0.81% 0.77% (c) —% 4.25% 28.7%
163,521 0.81 0.77 (c) – 4.25 20.4
212,099 0.81 0.77 (c) – 4.26 21.9
202,248 0.86 0.81 (c) – 4.91 45.4
255,698 0.88 0.81 (c) 0.88 (d) 4.90 32.0
11,563 1.79 1.75 (c) – 3.27 28.7
8,301 1.84 1.80 (c) – 3.23 20.4
10,486 1.74 1.70 (c) – 3.33 21.9
9,786 1.82 1.77 (c) – 3.95 45.4
13,572 1.79 1.72 (c) 1.79 (d) 3.98 32.0
(a) Calculated based on average shares outstanding during the period.(b) Total return is calculated without the front-end sales charge or contingent deferred sales charge, if applicable.(c) Excludes interest expense and fees paid through inverse floater agreements. See "Operating Policies" in notes to financial statements.(d) Excludes expense reimbursement from Manager and/or custodian.
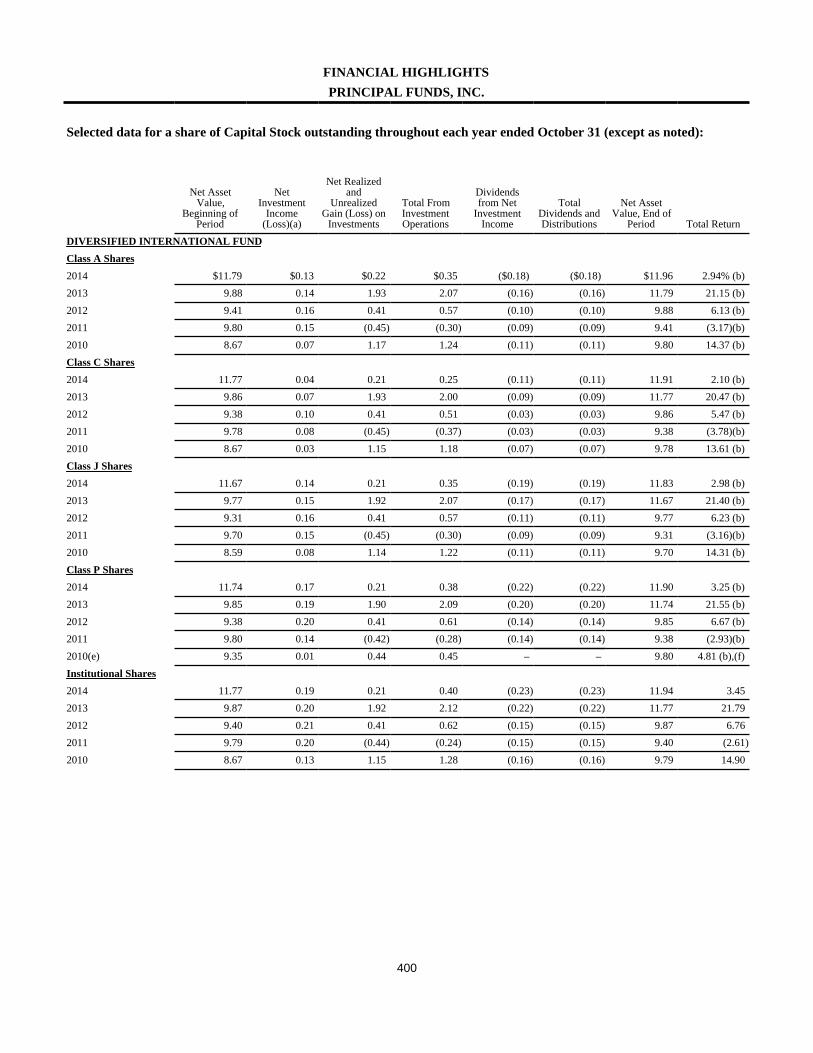
400
FINANCIAL HIGHLIGHTSPRINCIPAL FUNDS, INC.
Selected data for a share of Capital Stock outstanding throughout each year ended October 31 (except as noted):
Net AssetValue,
Beginning ofPeriod
NetInvestment
Income(Loss)(a)
Net Realizedand
UnrealizedGain (Loss) on
Investments
Total FromInvestmentOperations
Dividendsfrom Net
InvestmentIncome
TotalDividends andDistributions
Net AssetValue, End of
Period Total ReturnDIVERSIFIED INTERNATIONAL FUNDClass A Shares2014 $11.79 $0.13 $0.22 $0.35 ($0.18) ($0.18) $11.96 2.94% (b)2013 9.88 0.14 1.93 2.07 (0.16) (0.16) 11.79 21.15 (b)2012 9.41 0.16 0.41 0.57 (0.10) (0.10) 9.88 6.13 (b)2011 9.80 0.15 (0.45) (0.30) (0.09) (0.09) 9.41 (3.17)(b)2010 8.67 0.07 1.17 1.24 (0.11) (0.11) 9.80 14.37 (b)Class C Shares2014 11.77 0.04 0.21 0.25 (0.11) (0.11) 11.91 2.10 (b)2013 9.86 0.07 1.93 2.00 (0.09) (0.09) 11.77 20.47 (b)2012 9.38 0.10 0.41 0.51 (0.03) (0.03) 9.86 5.47 (b)2011 9.78 0.08 (0.45) (0.37) (0.03) (0.03) 9.38 (3.78)(b)2010 8.67 0.03 1.15 1.18 (0.07) (0.07) 9.78 13.61 (b)Class J Shares2014 11.67 0.14 0.21 0.35 (0.19) (0.19) 11.83 2.98 (b)2013 9.77 0.15 1.92 2.07 (0.17) (0.17) 11.67 21.40 (b)2012 9.31 0.16 0.41 0.57 (0.11) (0.11) 9.77 6.23 (b)2011 9.70 0.15 (0.45) (0.30) (0.09) (0.09) 9.31 (3.16)(b)2010 8.59 0.08 1.14 1.22 (0.11) (0.11) 9.70 14.31 (b)Class P Shares2014 11.74 0.17 0.21 0.38 (0.22) (0.22) 11.90 3.25 (b)2013 9.85 0.19 1.90 2.09 (0.20) (0.20) 11.74 21.55 (b)2012 9.38 0.20 0.41 0.61 (0.14) (0.14) 9.85 6.67 (b)2011 9.80 0.14 (0.42) (0.28) (0.14) (0.14) 9.38 (2.93)(b)2010(e) 9.35 0.01 0.44 0.45 – – 9.80 4.81 (b),(f)Institutional Shares2014 11.77 0.19 0.21 0.40 (0.23) (0.23) 11.94 3.452013 9.87 0.20 1.92 2.12 (0.22) (0.22) 11.77 21.792012 9.40 0.21 0.41 0.62 (0.15) (0.15) 9.87 6.762011 9.79 0.20 (0.44) (0.24) (0.15) (0.15) 9.40 (2.61)2010 8.67 0.13 1.15 1.28 (0.16) (0.16) 9.79 14.90
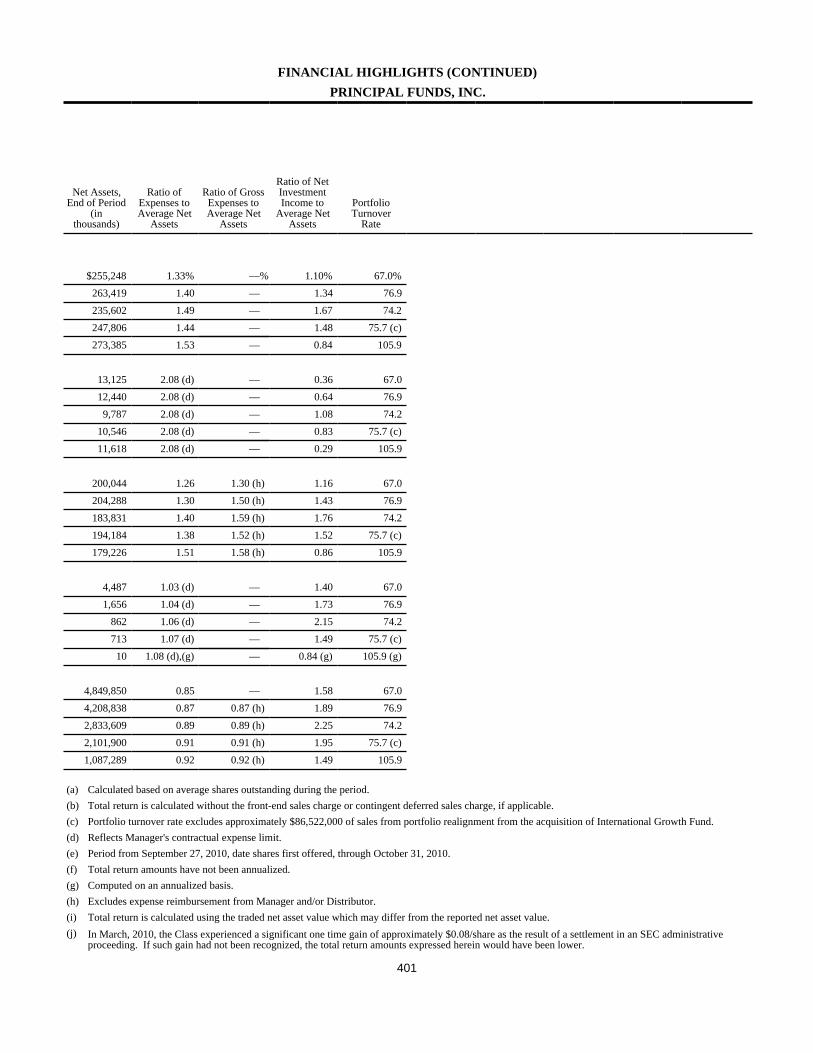
401
FINANCIAL HIGHLIGHTS (CONTINUED)PRINCIPAL FUNDS, INC.
Net Assets,End of Period
(inthousands)
Ratio ofExpenses toAverage Net
Assets
Ratio of GrossExpenses toAverage Net
Assets
Ratio of NetInvestmentIncome to
Average NetAssets
PortfolioTurnover
Rate
$255,248 1.33% —% 1.10% 67.0%263,419 1.40 — 1.34 76.9235,602 1.49 — 1.67 74.2247,806 1.44 — 1.48 75.7 (c)273,385 1.53 — 0.84 105.9
13,125 2.08 (d) — 0.36 67.012,440 2.08 (d) — 0.64 76.9
9,787 2.08 (d) — 1.08 74.210,546 2.08 (d) — 0.83 75.7 (c)11,618 2.08 (d) — 0.29 105.9
200,044 1.26 1.30 (h) 1.16 67.0204,288 1.30 1.50 (h) 1.43 76.9183,831 1.40 1.59 (h) 1.76 74.2194,184 1.38 1.52 (h) 1.52 75.7 (c)179,226 1.51 1.58 (h) 0.86 105.9
4,487 1.03 (d) — 1.40 67.01,656 1.04 (d) — 1.73 76.9
862 1.06 (d) — 2.15 74.2713 1.07 (d) — 1.49 75.7 (c)10 1.08 (d),(g) — 0.84 (g) 105.9 (g)
4,849,850 0.85 — 1.58 67.04,208,838 0.87 0.87 (h) 1.89 76.92,833,609 0.89 0.89 (h) 2.25 74.22,101,900 0.91 0.91 (h) 1.95 75.7 (c)1,087,289 0.92 0.92 (h) 1.49 105.9
(a) Calculated based on average shares outstanding during the period.(b) Total return is calculated without the front-end sales charge or contingent deferred sales charge, if applicable.(c) Portfolio turnover rate excludes approximately $86,522,000 of sales from portfolio realignment from the acquisition of International Growth Fund.(d) Reflects Manager's contractual expense limit.(e) Period from September 27, 2010, date shares first offered, through October 31, 2010.(f) Total return amounts have not been annualized.(g) Computed on an annualized basis.(h) Excludes expense reimbursement from Manager and/or Distributor.(i) Total return is calculated using the traded net asset value which may differ from the reported net asset value.(j) In March, 2010, the Class experienced a significant one time gain of approximately $0.08/share as the result of a settlement in an SEC administrative
proceeding. If such gain had not been recognized, the total return amounts expressed herein would have been lower.
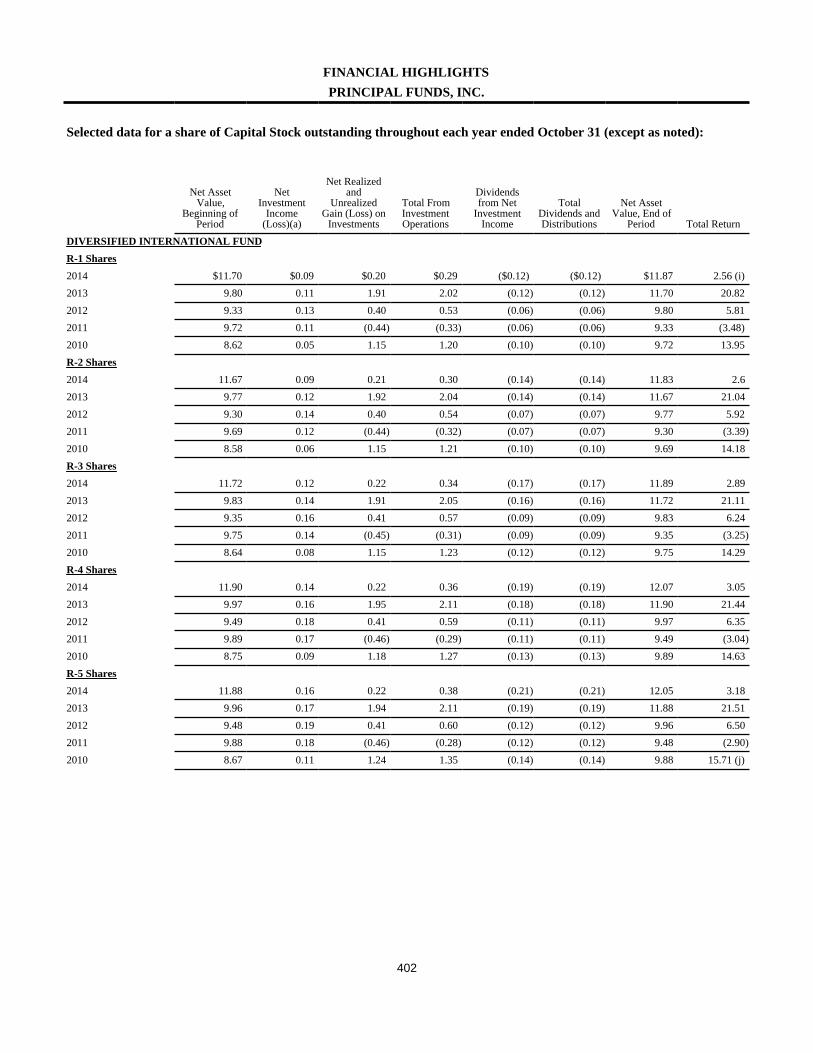
402
FINANCIAL HIGHLIGHTSPRINCIPAL FUNDS, INC.
Selected data for a share of Capital Stock outstanding throughout each year ended October 31 (except as noted):
Net AssetValue,
Beginning ofPeriod
NetInvestment
Income(Loss)(a)
Net Realizedand
UnrealizedGain (Loss) on
Investments
Total FromInvestmentOperations
Dividendsfrom Net
InvestmentIncome
TotalDividends andDistributions
Net AssetValue, End of
Period Total ReturnDIVERSIFIED INTERNATIONAL FUNDR-1 Shares2014 $11.70 $0.09 $0.20 $0.29 ($0.12) ($0.12) $11.87 2.56 (i)2013 9.80 0.11 1.91 2.02 (0.12) (0.12) 11.70 20.822012 9.33 0.13 0.40 0.53 (0.06) (0.06) 9.80 5.812011 9.72 0.11 (0.44) (0.33) (0.06) (0.06) 9.33 (3.48)2010 8.62 0.05 1.15 1.20 (0.10) (0.10) 9.72 13.95R-2 Shares2014 11.67 0.09 0.21 0.30 (0.14) (0.14) 11.83 2.62013 9.77 0.12 1.92 2.04 (0.14) (0.14) 11.67 21.042012 9.30 0.14 0.40 0.54 (0.07) (0.07) 9.77 5.922011 9.69 0.12 (0.44) (0.32) (0.07) (0.07) 9.30 (3.39)2010 8.58 0.06 1.15 1.21 (0.10) (0.10) 9.69 14.18R-3 Shares2014 11.72 0.12 0.22 0.34 (0.17) (0.17) 11.89 2.892013 9.83 0.14 1.91 2.05 (0.16) (0.16) 11.72 21.112012 9.35 0.16 0.41 0.57 (0.09) (0.09) 9.83 6.242011 9.75 0.14 (0.45) (0.31) (0.09) (0.09) 9.35 (3.25)2010 8.64 0.08 1.15 1.23 (0.12) (0.12) 9.75 14.29R-4 Shares2014 11.90 0.14 0.22 0.36 (0.19) (0.19) 12.07 3.052013 9.97 0.16 1.95 2.11 (0.18) (0.18) 11.90 21.442012 9.49 0.18 0.41 0.59 (0.11) (0.11) 9.97 6.352011 9.89 0.17 (0.46) (0.29) (0.11) (0.11) 9.49 (3.04)2010 8.75 0.09 1.18 1.27 (0.13) (0.13) 9.89 14.63R-5 Shares2014 11.88 0.16 0.22 0.38 (0.21) (0.21) 12.05 3.182013 9.96 0.17 1.94 2.11 (0.19) (0.19) 11.88 21.512012 9.48 0.19 0.41 0.60 (0.12) (0.12) 9.96 6.502011 9.88 0.18 (0.46) (0.28) (0.12) (0.12) 9.48 (2.90)2010 8.67 0.11 1.24 1.35 (0.14) (0.14) 9.88 15.71 (j)
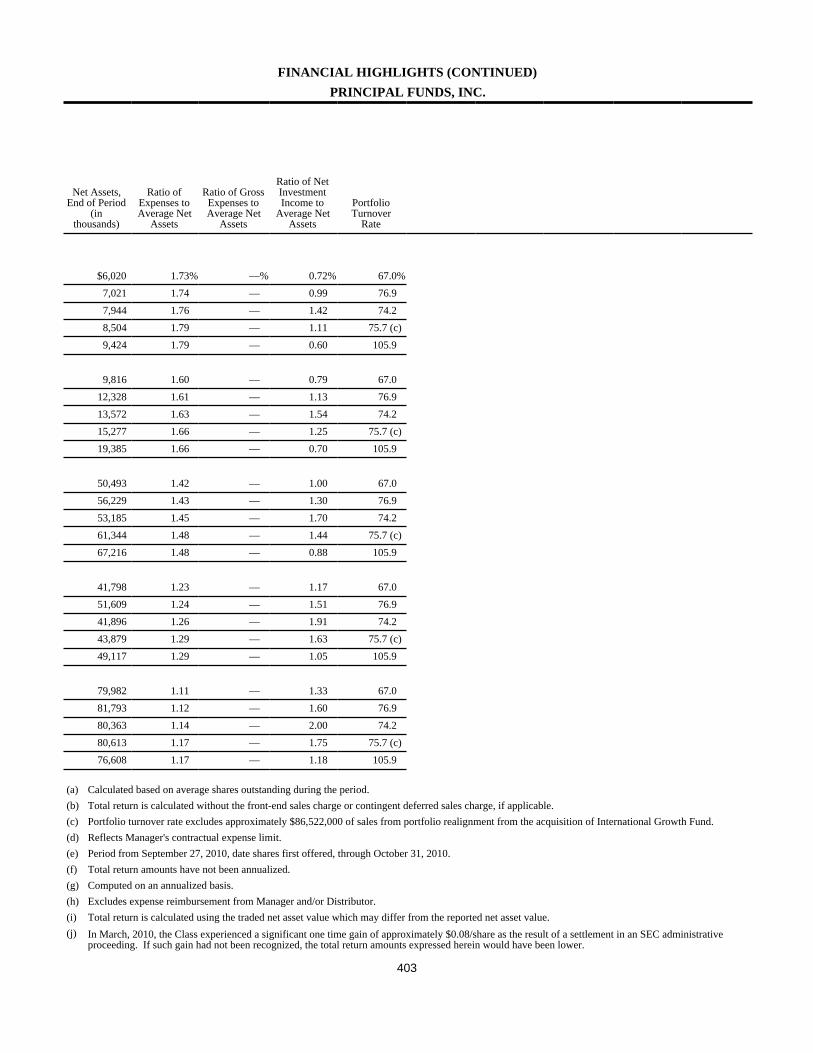
403
FINANCIAL HIGHLIGHTS (CONTINUED)PRINCIPAL FUNDS, INC.
Net Assets,End of Period
(inthousands)
Ratio ofExpenses toAverage Net
Assets
Ratio of GrossExpenses toAverage Net
Assets
Ratio of NetInvestmentIncome to
Average NetAssets
PortfolioTurnover
Rate
$6,020 1.73% —% 0.72% 67.0%7,021 1.74 — 0.99 76.97,944 1.76 — 1.42 74.28,504 1.79 — 1.11 75.7 (c)9,424 1.79 — 0.60 105.9
9,816 1.60 — 0.79 67.012,328 1.61 — 1.13 76.913,572 1.63 — 1.54 74.215,277 1.66 — 1.25 75.7 (c)19,385 1.66 — 0.70 105.9
50,493 1.42 — 1.00 67.056,229 1.43 — 1.30 76.953,185 1.45 — 1.70 74.261,344 1.48 — 1.44 75.7 (c)67,216 1.48 — 0.88 105.9
41,798 1.23 — 1.17 67.051,609 1.24 — 1.51 76.941,896 1.26 — 1.91 74.243,879 1.29 — 1.63 75.7 (c)49,117 1.29 — 1.05 105.9
79,982 1.11 — 1.33 67.081,793 1.12 — 1.60 76.980,363 1.14 — 2.00 74.280,613 1.17 — 1.75 75.7 (c)76,608 1.17 — 1.18 105.9
(a) Calculated based on average shares outstanding during the period.(b) Total return is calculated without the front-end sales charge or contingent deferred sales charge, if applicable.(c) Portfolio turnover rate excludes approximately $86,522,000 of sales from portfolio realignment from the acquisition of International Growth Fund.(d) Reflects Manager's contractual expense limit.(e) Period from September 27, 2010, date shares first offered, through October 31, 2010.(f) Total return amounts have not been annualized.(g) Computed on an annualized basis.(h) Excludes expense reimbursement from Manager and/or Distributor.(i) Total return is calculated using the traded net asset value which may differ from the reported net asset value.(j) In March, 2010, the Class experienced a significant one time gain of approximately $0.08/share as the result of a settlement in an SEC administrative
proceeding. If such gain had not been recognized, the total return amounts expressed herein would have been lower.
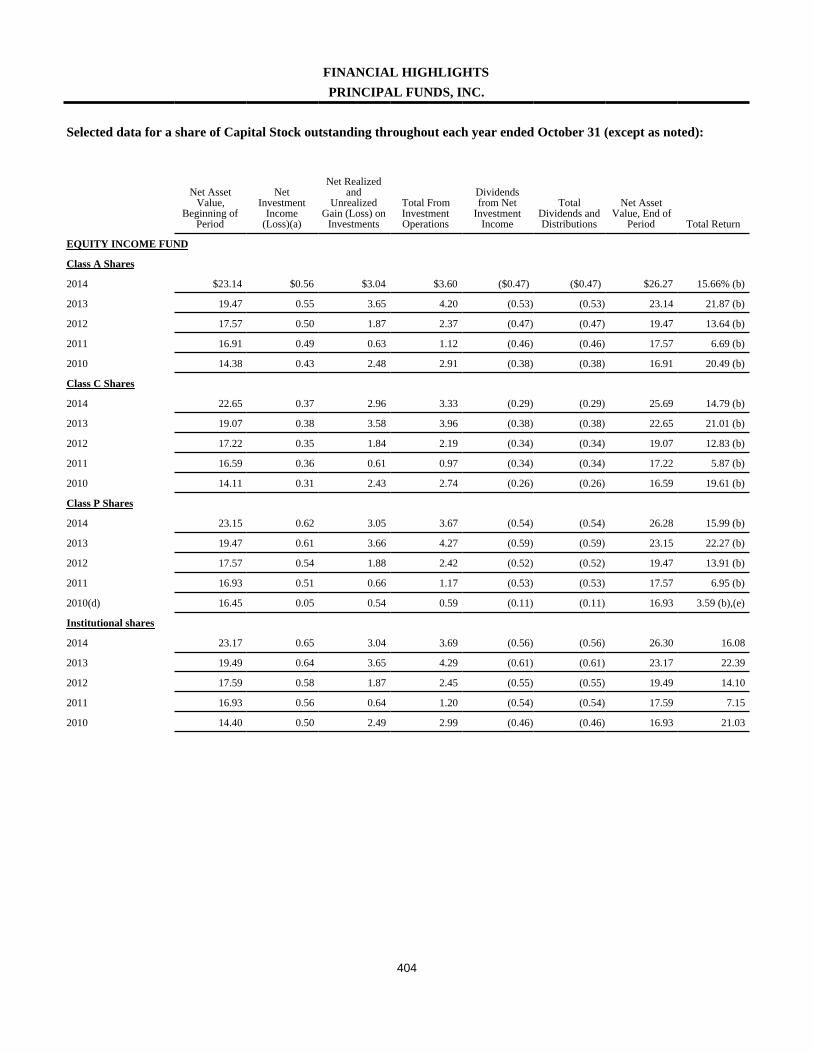
404
FINANCIAL HIGHLIGHTSPRINCIPAL FUNDS, INC.
Selected data for a share of Capital Stock outstanding throughout each year ended October 31 (except as noted):
Net AssetValue,
Beginning ofPeriod
NetInvestment
Income(Loss)(a)
Net Realizedand
UnrealizedGain (Loss) on
Investments
Total FromInvestmentOperations
Dividendsfrom Net
InvestmentIncome
TotalDividends andDistributions
Net AssetValue, End of
Period Total Return
EQUITY INCOME FUND
Class A Shares
2014 $23.14 $0.56 $3.04 $3.60 ($0.47) ($0.47) $26.27 15.66% (b)
2013 19.47 0.55 3.65 4.20 (0.53) (0.53) 23.14 21.87 (b)
2012 17.57 0.50 1.87 2.37 (0.47) (0.47) 19.47 13.64 (b)
2011 16.91 0.49 0.63 1.12 (0.46) (0.46) 17.57 6.69 (b)
2010 14.38 0.43 2.48 2.91 (0.38) (0.38) 16.91 20.49 (b)
Class C Shares
2014 22.65 0.37 2.96 3.33 (0.29) (0.29) 25.69 14.79 (b)
2013 19.07 0.38 3.58 3.96 (0.38) (0.38) 22.65 21.01 (b)
2012 17.22 0.35 1.84 2.19 (0.34) (0.34) 19.07 12.83 (b)
2011 16.59 0.36 0.61 0.97 (0.34) (0.34) 17.22 5.87 (b)
2010 14.11 0.31 2.43 2.74 (0.26) (0.26) 16.59 19.61 (b)
Class P Shares
2014 23.15 0.62 3.05 3.67 (0.54) (0.54) 26.28 15.99 (b)
2013 19.47 0.61 3.66 4.27 (0.59) (0.59) 23.15 22.27 (b)
2012 17.57 0.54 1.88 2.42 (0.52) (0.52) 19.47 13.91 (b)
2011 16.93 0.51 0.66 1.17 (0.53) (0.53) 17.57 6.95 (b)
2010(d) 16.45 0.05 0.54 0.59 (0.11) (0.11) 16.93 3.59 (b),(e)
Institutional shares
2014 23.17 0.65 3.04 3.69 (0.56) (0.56) 26.30 16.08
2013 19.49 0.64 3.65 4.29 (0.61) (0.61) 23.17 22.39
2012 17.59 0.58 1.87 2.45 (0.55) (0.55) 19.49 14.10
2011 16.93 0.56 0.64 1.20 (0.54) (0.54) 17.59 7.15
2010 14.40 0.50 2.49 2.99 (0.46) (0.46) 16.93 21.03
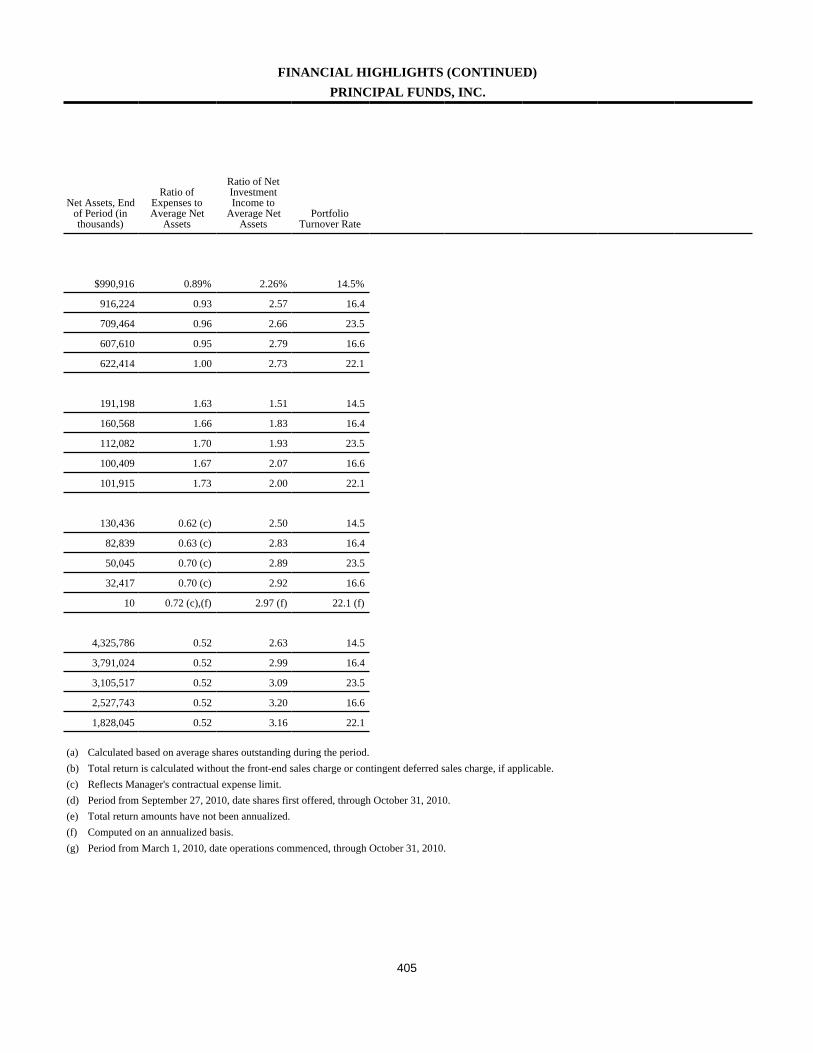
405
FINANCIAL HIGHLIGHTS (CONTINUED)PRINCIPAL FUNDS, INC.
Net Assets, Endof Period (inthousands)
Ratio ofExpenses toAverage Net
Assets
Ratio of NetInvestmentIncome to
Average NetAssets
PortfolioTurnover Rate
$990,916 0.89% 2.26% 14.5%
916,224 0.93 2.57 16.4
709,464 0.96 2.66 23.5
607,610 0.95 2.79 16.6
622,414 1.00 2.73 22.1
191,198 1.63 1.51 14.5
160,568 1.66 1.83 16.4
112,082 1.70 1.93 23.5
100,409 1.67 2.07 16.6
101,915 1.73 2.00 22.1
130,436 0.62 (c) 2.50 14.5
82,839 0.63 (c) 2.83 16.4
50,045 0.70 (c) 2.89 23.5
32,417 0.70 (c) 2.92 16.6
10 0.72 (c),(f) 2.97 (f) 22.1 (f)
4,325,786 0.52 2.63 14.5
3,791,024 0.52 2.99 16.4
3,105,517 0.52 3.09 23.5
2,527,743 0.52 3.20 16.6
1,828,045 0.52 3.16 22.1
(a) Calculated based on average shares outstanding during the period.(b) Total return is calculated without the front-end sales charge or contingent deferred sales charge, if applicable.(c) Reflects Manager's contractual expense limit.(d) Period from September 27, 2010, date shares first offered, through October 31, 2010.(e) Total return amounts have not been annualized.(f) Computed on an annualized basis.(g) Period from March 1, 2010, date operations commenced, through October 31, 2010.
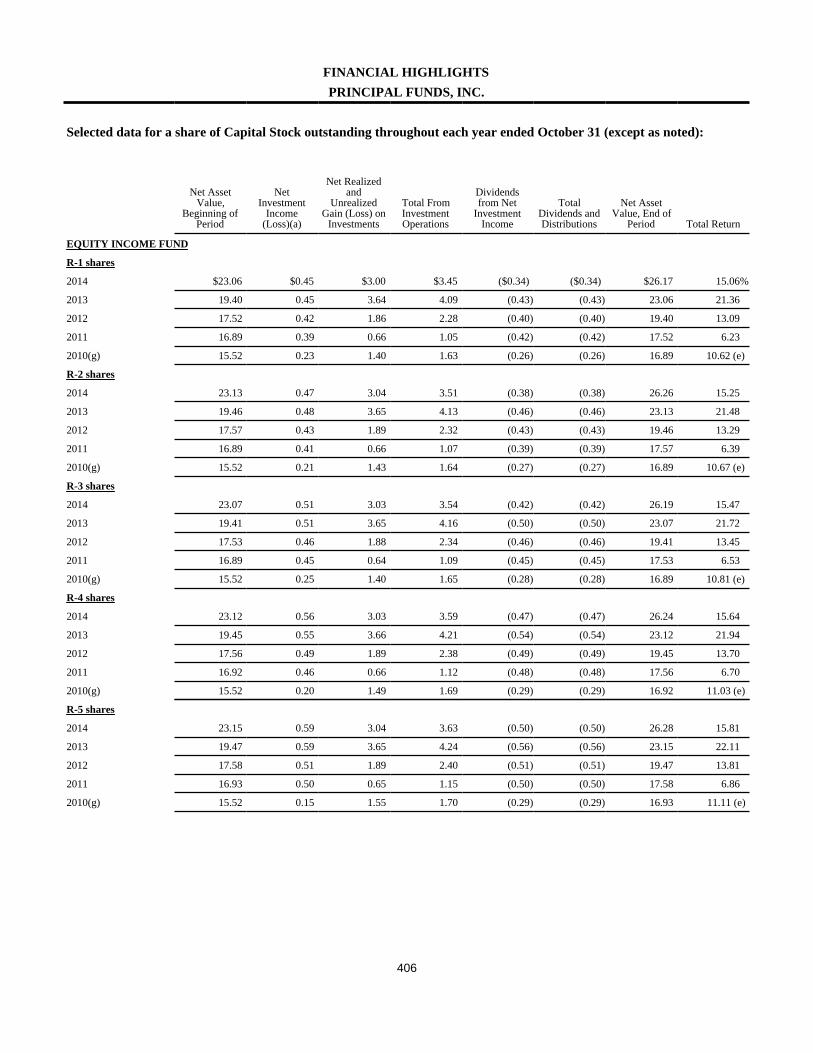
406
FINANCIAL HIGHLIGHTSPRINCIPAL FUNDS, INC.
Selected data for a share of Capital Stock outstanding throughout each year ended October 31 (except as noted):
Net AssetValue,
Beginning ofPeriod
NetInvestment
Income(Loss)(a)
Net Realizedand
UnrealizedGain (Loss) on
Investments
Total FromInvestmentOperations
Dividendsfrom Net
InvestmentIncome
TotalDividends andDistributions
Net AssetValue, End of
Period Total Return
EQUITY INCOME FUND
R-1 shares
2014 $23.06 $0.45 $3.00 $3.45 ($0.34) ($0.34) $26.17 15.06%
2013 19.40 0.45 3.64 4.09 (0.43) (0.43) 23.06 21.36
2012 17.52 0.42 1.86 2.28 (0.40) (0.40) 19.40 13.09
2011 16.89 0.39 0.66 1.05 (0.42) (0.42) 17.52 6.23
2010(g) 15.52 0.23 1.40 1.63 (0.26) (0.26) 16.89 10.62 (e)
R-2 shares
2014 23.13 0.47 3.04 3.51 (0.38) (0.38) 26.26 15.25
2013 19.46 0.48 3.65 4.13 (0.46) (0.46) 23.13 21.48
2012 17.57 0.43 1.89 2.32 (0.43) (0.43) 19.46 13.29
2011 16.89 0.41 0.66 1.07 (0.39) (0.39) 17.57 6.39
2010(g) 15.52 0.21 1.43 1.64 (0.27) (0.27) 16.89 10.67 (e)
R-3 shares
2014 23.07 0.51 3.03 3.54 (0.42) (0.42) 26.19 15.47
2013 19.41 0.51 3.65 4.16 (0.50) (0.50) 23.07 21.72
2012 17.53 0.46 1.88 2.34 (0.46) (0.46) 19.41 13.45
2011 16.89 0.45 0.64 1.09 (0.45) (0.45) 17.53 6.53
2010(g) 15.52 0.25 1.40 1.65 (0.28) (0.28) 16.89 10.81 (e)
R-4 shares
2014 23.12 0.56 3.03 3.59 (0.47) (0.47) 26.24 15.64
2013 19.45 0.55 3.66 4.21 (0.54) (0.54) 23.12 21.94
2012 17.56 0.49 1.89 2.38 (0.49) (0.49) 19.45 13.70
2011 16.92 0.46 0.66 1.12 (0.48) (0.48) 17.56 6.70
2010(g) 15.52 0.20 1.49 1.69 (0.29) (0.29) 16.92 11.03 (e)
R-5 shares
2014 23.15 0.59 3.04 3.63 (0.50) (0.50) 26.28 15.81
2013 19.47 0.59 3.65 4.24 (0.56) (0.56) 23.15 22.11
2012 17.58 0.51 1.89 2.40 (0.51) (0.51) 19.47 13.81
2011 16.93 0.50 0.65 1.15 (0.50) (0.50) 17.58 6.86
2010(g) 15.52 0.15 1.55 1.70 (0.29) (0.29) 16.93 11.11 (e)
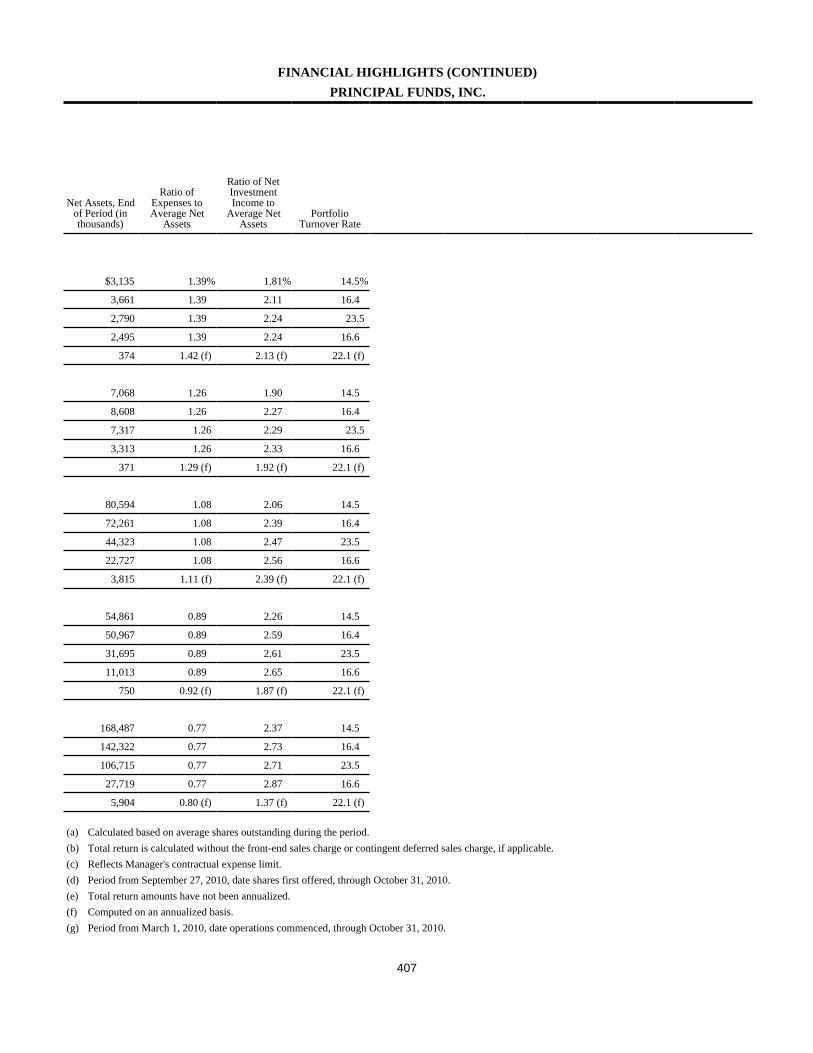
407
FINANCIAL HIGHLIGHTS (CONTINUED)PRINCIPAL FUNDS, INC.
Net Assets, Endof Period (inthousands)
Ratio ofExpenses toAverage Net
Assets
Ratio of NetInvestmentIncome to
Average NetAssets
PortfolioTurnover Rate
$3,135 1.39% 1.81% 14.5%
3,661 1.39 2.11 16.4
2,790 1.39 2.24 23.5
2,495 1.39 2.24 16.6
374 1.42 (f) 2.13 (f) 22.1 (f)
7,068 1.26 1.90 14.5
8,608 1.26 2.27 16.4
7,317 1.26 2.29 23.5
3,313 1.26 2.33 16.6
371 1.29 (f) 1.92 (f) 22.1 (f)
80,594 1.08 2.06 14.5
72,261 1.08 2.39 16.4
44,323 1.08 2.47 23.5
22,727 1.08 2.56 16.6
3,815 1.11 (f) 2.39 (f) 22.1 (f)
54,861 0.89 2.26 14.5
50,967 0.89 2.59 16.4
31,695 0.89 2.61 23.5
11,013 0.89 2.65 16.6
750 0.92 (f) 1.87 (f) 22.1 (f)
168,487 0.77 2.37 14.5
142,322 0.77 2.73 16.4
106,715 0.77 2.71 23.5
27,719 0.77 2.87 16.6
5,904 0.80 (f) 1.37 (f) 22.1 (f)
(a) Calculated based on average shares outstanding during the period.(b) Total return is calculated without the front-end sales charge or contingent deferred sales charge, if applicable.(c) Reflects Manager's contractual expense limit.(d) Period from September 27, 2010, date shares first offered, through October 31, 2010.(e) Total return amounts have not been annualized.(f) Computed on an annualized basis.(g) Period from March 1, 2010, date operations commenced, through October 31, 2010.
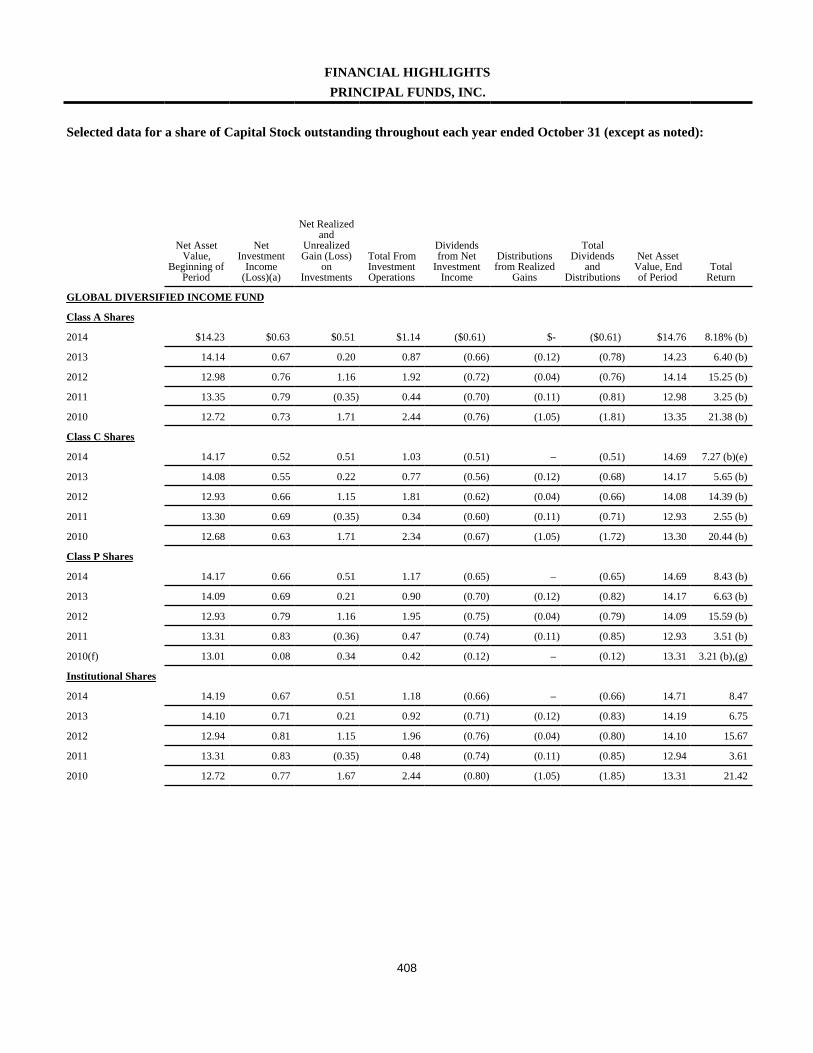
408
FINANCIAL HIGHLIGHTSPRINCIPAL FUNDS, INC.
Selected data for a share of Capital Stock outstanding throughout each year ended October 31 (except as noted):
Net AssetValue,
Beginning ofPeriod
NetInvestment
Income(Loss)(a)
Net Realizedand
UnrealizedGain (Loss)
onInvestments
Total FromInvestmentOperations
Dividendsfrom Net
InvestmentIncome
Distributionsfrom Realized
Gains
TotalDividends
andDistributions
Net AssetValue, Endof Period
TotalReturn
GLOBAL DIVERSIFIED INCOME FUND
Class A Shares
2014 $14.23 $0.63 $0.51 $1.14 ($0.61) $- ($0.61) $14.76 8.18% (b)
2013 14.14 0.67 0.20 0.87 (0.66) (0.12) (0.78) 14.23 6.40 (b)
2012 12.98 0.76 1.16 1.92 (0.72) (0.04) (0.76) 14.14 15.25 (b)
2011 13.35 0.79 (0.35) 0.44 (0.70) (0.11) (0.81) 12.98 3.25 (b)
2010 12.72 0.73 1.71 2.44 (0.76) (1.05) (1.81) 13.35 21.38 (b)
Class C Shares
2014 14.17 0.52 0.51 1.03 (0.51) – (0.51) 14.69 7.27 (b)(e)
2013 14.08 0.55 0.22 0.77 (0.56) (0.12) (0.68) 14.17 5.65 (b)
2012 12.93 0.66 1.15 1.81 (0.62) (0.04) (0.66) 14.08 14.39 (b)
2011 13.30 0.69 (0.35) 0.34 (0.60) (0.11) (0.71) 12.93 2.55 (b)
2010 12.68 0.63 1.71 2.34 (0.67) (1.05) (1.72) 13.30 20.44 (b)
Class P Shares
2014 14.17 0.66 0.51 1.17 (0.65) – (0.65) 14.69 8.43 (b)
2013 14.09 0.69 0.21 0.90 (0.70) (0.12) (0.82) 14.17 6.63 (b)
2012 12.93 0.79 1.16 1.95 (0.75) (0.04) (0.79) 14.09 15.59 (b)
2011 13.31 0.83 (0.36) 0.47 (0.74) (0.11) (0.85) 12.93 3.51 (b)
2010(f) 13.01 0.08 0.34 0.42 (0.12) – (0.12) 13.31 3.21 (b),(g)
Institutional Shares
2014 14.19 0.67 0.51 1.18 (0.66) – (0.66) 14.71 8.47
2013 14.10 0.71 0.21 0.92 (0.71) (0.12) (0.83) 14.19 6.75
2012 12.94 0.81 1.15 1.96 (0.76) (0.04) (0.80) 14.10 15.67
2011 13.31 0.83 (0.35) 0.48 (0.74) (0.11) (0.85) 12.94 3.61
2010 12.72 0.77 1.67 2.44 (0.80) (1.05) (1.85) 13.31 21.42
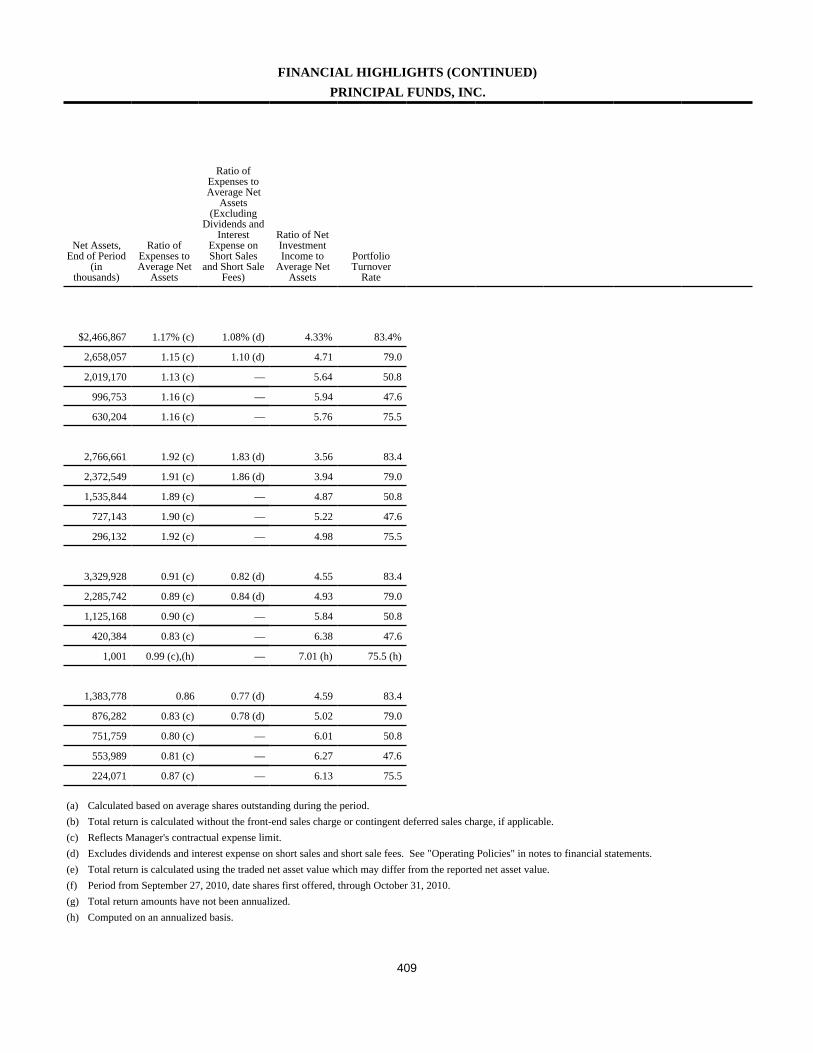
409
FINANCIAL HIGHLIGHTS (CONTINUED)PRINCIPAL FUNDS, INC.
Net Assets,End of Period
(inthousands)
Ratio ofExpenses toAverage Net
Assets
Ratio ofExpenses toAverage Net
Assets(Excluding
Dividends andInterest
Expense onShort Sales
and Short SaleFees)
Ratio of NetInvestmentIncome to
Average NetAssets
PortfolioTurnover
Rate
$2,466,867 1.17% (c) 1.08% (d) 4.33% 83.4%
2,658,057 1.15 (c) 1.10 (d) 4.71 79.0
2,019,170 1.13 (c) — 5.64 50.8
996,753 1.16 (c) — 5.94 47.6
630,204 1.16 (c) — 5.76 75.5
2,766,661 1.92 (c) 1.83 (d) 3.56 83.4
2,372,549 1.91 (c) 1.86 (d) 3.94 79.0
1,535,844 1.89 (c) — 4.87 50.8
727,143 1.90 (c) — 5.22 47.6
296,132 1.92 (c) — 4.98 75.5
3,329,928 0.91 (c) 0.82 (d) 4.55 83.4
2,285,742 0.89 (c) 0.84 (d) 4.93 79.0
1,125,168 0.90 (c) — 5.84 50.8
420,384 0.83 (c) — 6.38 47.6
1,001 0.99 (c),(h) — 7.01 (h) 75.5 (h)
1,383,778 0.86 0.77 (d) 4.59 83.4
876,282 0.83 (c) 0.78 (d) 5.02 79.0
751,759 0.80 (c) — 6.01 50.8
553,989 0.81 (c) — 6.27 47.6
224,071 0.87 (c) — 6.13 75.5
(a) Calculated based on average shares outstanding during the period.(b) Total return is calculated without the front-end sales charge or contingent deferred sales charge, if applicable.(c) Reflects Manager's contractual expense limit.(d) Excludes dividends and interest expense on short sales and short sale fees. See "Operating Policies" in notes to financial statements.(e) Total return is calculated using the traded net asset value which may differ from the reported net asset value.(f) Period from September 27, 2010, date shares first offered, through October 31, 2010.(g) Total return amounts have not been annualized.(h) Computed on an annualized basis.
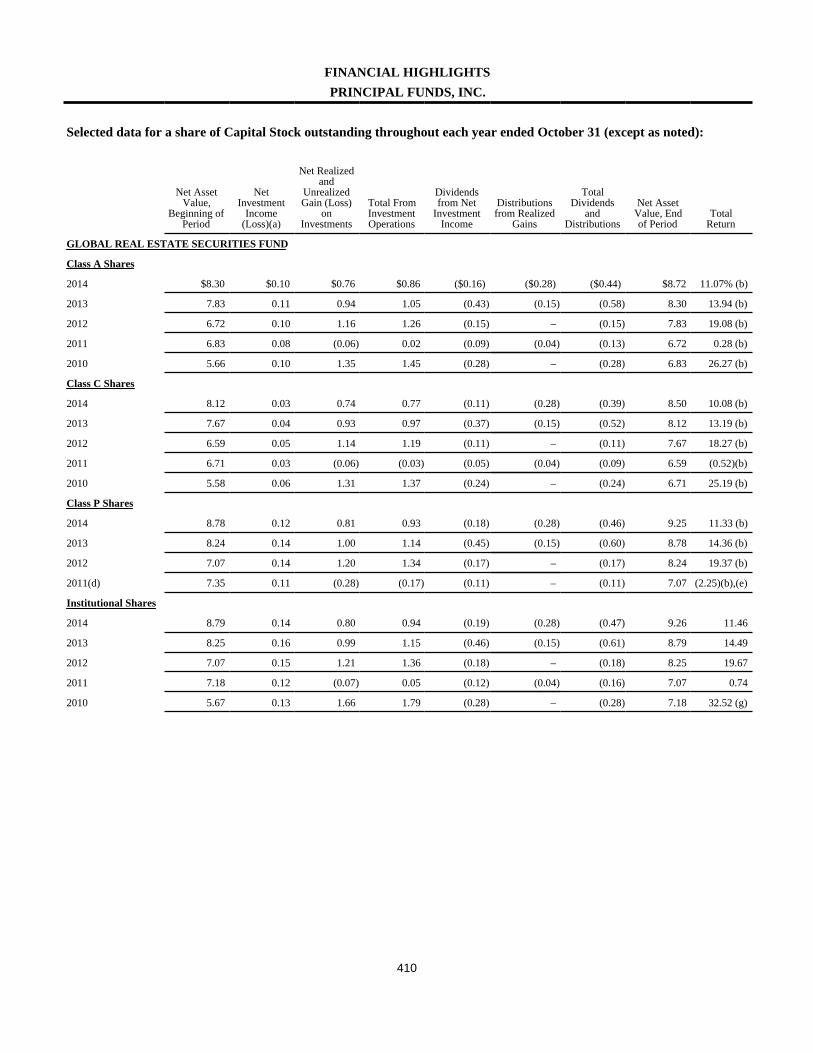
410
FINANCIAL HIGHLIGHTSPRINCIPAL FUNDS, INC.
Selected data for a share of Capital Stock outstanding throughout each year ended October 31 (except as noted):
Net AssetValue,
Beginning ofPeriod
NetInvestment
Income(Loss)(a)
Net Realizedand
UnrealizedGain (Loss)
onInvestments
Total FromInvestmentOperations
Dividendsfrom Net
InvestmentIncome
Distributionsfrom Realized
Gains
TotalDividends
andDistributions
Net AssetValue, Endof Period
TotalReturn
GLOBAL REAL ESTATE SECURITIES FUND
Class A Shares
2014 $8.30 $0.10 $0.76 $0.86 ($0.16) ($0.28) ($0.44) $8.72 11.07% (b)
2013 7.83 0.11 0.94 1.05 (0.43) (0.15) (0.58) 8.30 13.94 (b)
2012 6.72 0.10 1.16 1.26 (0.15) – (0.15) 7.83 19.08 (b)
2011 6.83 0.08 (0.06) 0.02 (0.09) (0.04) (0.13) 6.72 0.28 (b)
2010 5.66 0.10 1.35 1.45 (0.28) – (0.28) 6.83 26.27 (b)
Class C Shares
2014 8.12 0.03 0.74 0.77 (0.11) (0.28) (0.39) 8.50 10.08 (b)
2013 7.67 0.04 0.93 0.97 (0.37) (0.15) (0.52) 8.12 13.19 (b)
2012 6.59 0.05 1.14 1.19 (0.11) – (0.11) 7.67 18.27 (b)
2011 6.71 0.03 (0.06) (0.03) (0.05) (0.04) (0.09) 6.59 (0.52)(b)
2010 5.58 0.06 1.31 1.37 (0.24) – (0.24) 6.71 25.19 (b)
Class P Shares
2014 8.78 0.12 0.81 0.93 (0.18) (0.28) (0.46) 9.25 11.33 (b)
2013 8.24 0.14 1.00 1.14 (0.45) (0.15) (0.60) 8.78 14.36 (b)
2012 7.07 0.14 1.20 1.34 (0.17) – (0.17) 8.24 19.37 (b)
2011(d) 7.35 0.11 (0.28) (0.17) (0.11) – (0.11) 7.07 (2.25)(b),(e)
Institutional Shares
2014 8.79 0.14 0.80 0.94 (0.19) (0.28) (0.47) 9.26 11.46
2013 8.25 0.16 0.99 1.15 (0.46) (0.15) (0.61) 8.79 14.49
2012 7.07 0.15 1.21 1.36 (0.18) – (0.18) 8.25 19.67
2011 7.18 0.12 (0.07) 0.05 (0.12) (0.04) (0.16) 7.07 0.74
2010 5.67 0.13 1.66 1.79 (0.28) – (0.28) 7.18 32.52 (g)
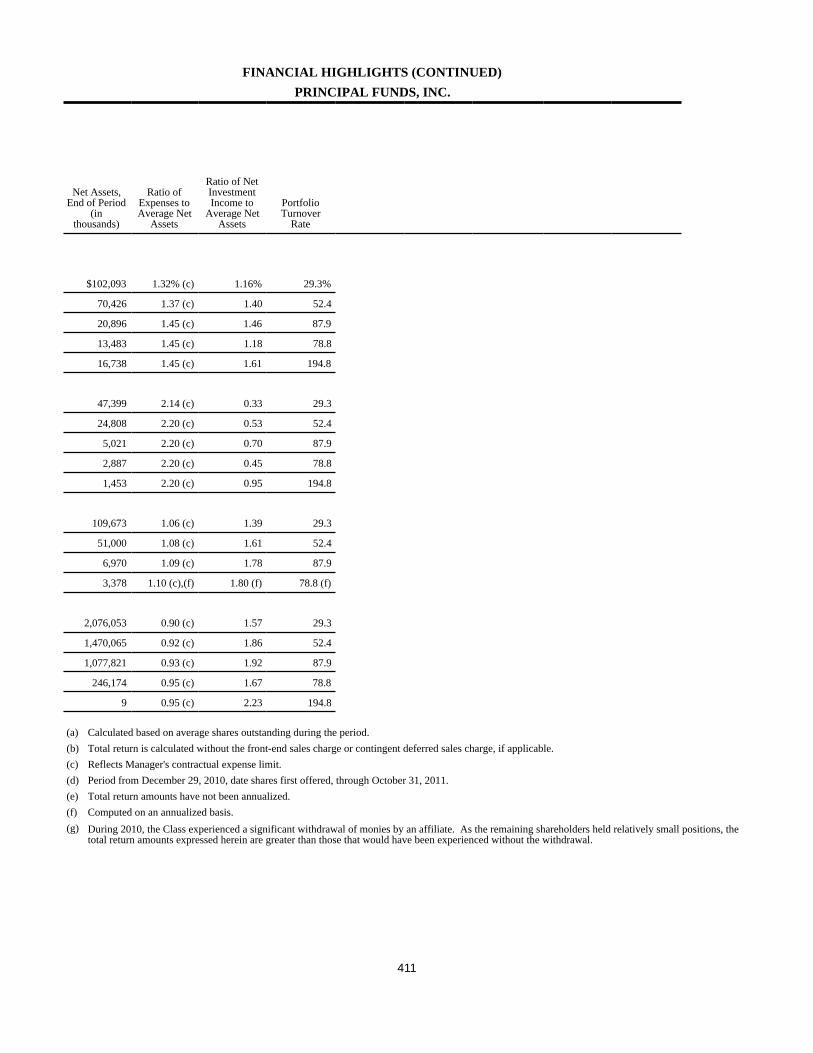
411
FINANCIAL HIGHLIGHTS (CONTINUED)PRINCIPAL FUNDS, INC.
Net Assets,End of Period
(inthousands)
Ratio ofExpenses toAverage Net
Assets
Ratio of NetInvestmentIncome to
Average NetAssets
PortfolioTurnover
Rate
$102,093 1.32% (c) 1.16% 29.3%
70,426 1.37 (c) 1.40 52.4
20,896 1.45 (c) 1.46 87.9
13,483 1.45 (c) 1.18 78.8
16,738 1.45 (c) 1.61 194.8
47,399 2.14 (c) 0.33 29.3
24,808 2.20 (c) 0.53 52.4
5,021 2.20 (c) 0.70 87.9
2,887 2.20 (c) 0.45 78.8
1,453 2.20 (c) 0.95 194.8
109,673 1.06 (c) 1.39 29.3
51,000 1.08 (c) 1.61 52.4
6,970 1.09 (c) 1.78 87.9
3,378 1.10 (c),(f) 1.80 (f) 78.8 (f)
2,076,053 0.90 (c) 1.57 29.3
1,470,065 0.92 (c) 1.86 52.4
1,077,821 0.93 (c) 1.92 87.9
246,174 0.95 (c) 1.67 78.8
9 0.95 (c) 2.23 194.8
(a) Calculated based on average shares outstanding during the period.(b) Total return is calculated without the front-end sales charge or contingent deferred sales charge, if applicable.(c) Reflects Manager's contractual expense limit.(d) Period from December 29, 2010, date shares first offered, through October 31, 2011.(e) Total return amounts have not been annualized.(f) Computed on an annualized basis.(g) During 2010, the Class experienced a significant withdrawal of monies by an affiliate. As the remaining shareholders held relatively small positions, the
total return amounts expressed herein are greater than those that would have been experienced without the withdrawal.
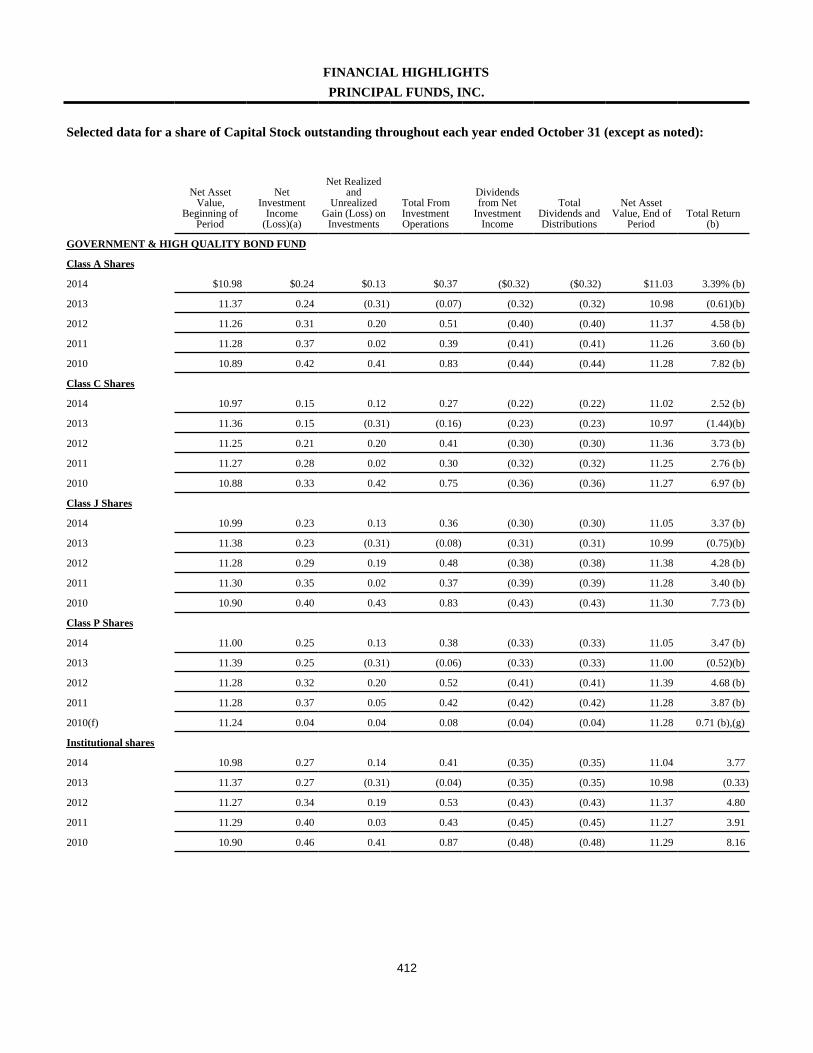
412
FINANCIAL HIGHLIGHTSPRINCIPAL FUNDS, INC.
Selected data for a share of Capital Stock outstanding throughout each year ended October 31 (except as noted):
Net AssetValue,
Beginning ofPeriod
NetInvestment
Income(Loss)(a)
Net Realizedand
UnrealizedGain (Loss) on
Investments
Total FromInvestmentOperations
Dividendsfrom Net
InvestmentIncome
TotalDividends andDistributions
Net AssetValue, End of
PeriodTotal Return
(b)
GOVERNMENT & HIGH QUALITY BOND FUND
Class A Shares
2014 $10.98 $0.24 $0.13 $0.37 ($0.32) ($0.32) $11.03 3.39% (b)
2013 11.37 0.24 (0.31) (0.07) (0.32) (0.32) 10.98 (0.61)(b)
2012 11.26 0.31 0.20 0.51 (0.40) (0.40) 11.37 4.58 (b)
2011 11.28 0.37 0.02 0.39 (0.41) (0.41) 11.26 3.60 (b)
2010 10.89 0.42 0.41 0.83 (0.44) (0.44) 11.28 7.82 (b)
Class C Shares
2014 10.97 0.15 0.12 0.27 (0.22) (0.22) 11.02 2.52 (b)
2013 11.36 0.15 (0.31) (0.16) (0.23) (0.23) 10.97 (1.44)(b)
2012 11.25 0.21 0.20 0.41 (0.30) (0.30) 11.36 3.73 (b)
2011 11.27 0.28 0.02 0.30 (0.32) (0.32) 11.25 2.76 (b)
2010 10.88 0.33 0.42 0.75 (0.36) (0.36) 11.27 6.97 (b)
Class J Shares
2014 10.99 0.23 0.13 0.36 (0.30) (0.30) 11.05 3.37 (b)
2013 11.38 0.23 (0.31) (0.08) (0.31) (0.31) 10.99 (0.75)(b)
2012 11.28 0.29 0.19 0.48 (0.38) (0.38) 11.38 4.28 (b)
2011 11.30 0.35 0.02 0.37 (0.39) (0.39) 11.28 3.40 (b)
2010 10.90 0.40 0.43 0.83 (0.43) (0.43) 11.30 7.73 (b)
Class P Shares
2014 11.00 0.25 0.13 0.38 (0.33) (0.33) 11.05 3.47 (b)
2013 11.39 0.25 (0.31) (0.06) (0.33) (0.33) 11.00 (0.52)(b)
2012 11.28 0.32 0.20 0.52 (0.41) (0.41) 11.39 4.68 (b)
2011 11.28 0.37 0.05 0.42 (0.42) (0.42) 11.28 3.87 (b)
2010(f) 11.24 0.04 0.04 0.08 (0.04) (0.04) 11.28 0.71 (b),(g)
Institutional shares
2014 10.98 0.27 0.14 0.41 (0.35) (0.35) 11.04 3.77
2013 11.37 0.27 (0.31) (0.04) (0.35) (0.35) 10.98 (0.33)
2012 11.27 0.34 0.19 0.53 (0.43) (0.43) 11.37 4.80
2011 11.29 0.40 0.03 0.43 (0.45) (0.45) 11.27 3.91
2010 10.90 0.46 0.41 0.87 (0.48) (0.48) 11.29 8.16
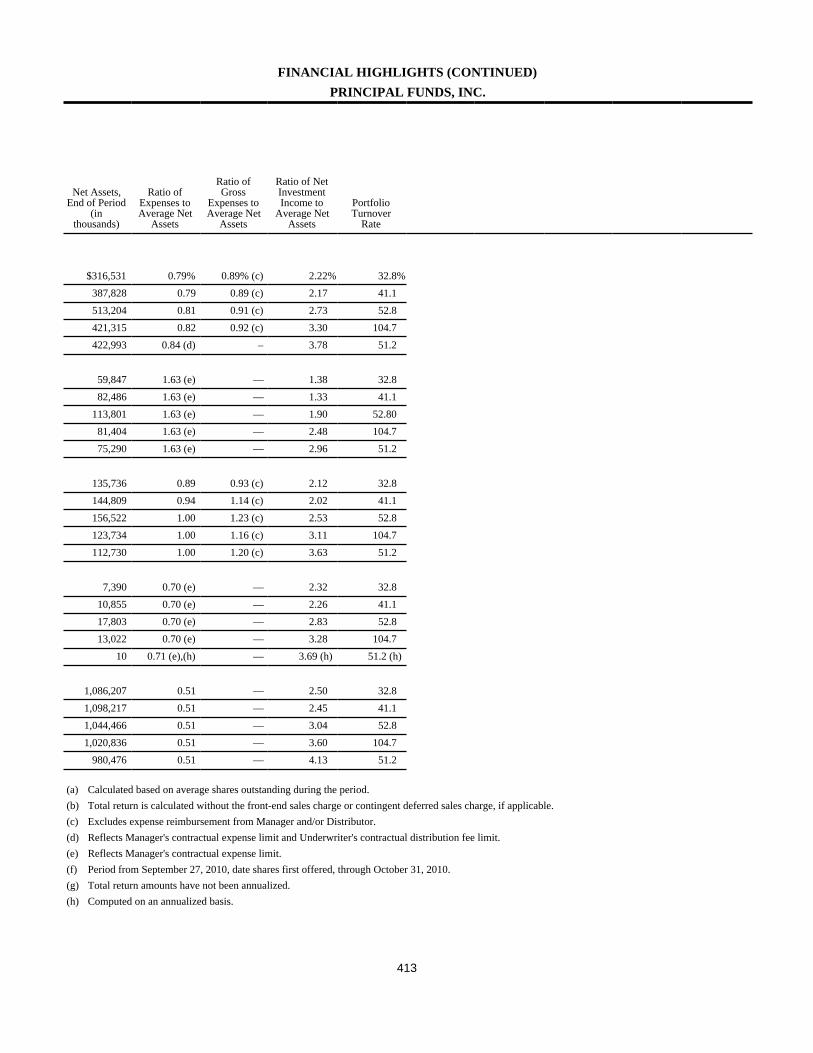
413
FINANCIAL HIGHLIGHTS (CONTINUED)PRINCIPAL FUNDS, INC.
Net Assets,End of Period
(inthousands)
Ratio ofExpenses toAverage Net
Assets
Ratio ofGross
Expenses toAverage Net
Assets
Ratio of NetInvestmentIncome to
Average NetAssets
PortfolioTurnover
Rate
$316,531 0.79% 0.89% (c) 2.22% 32.8%387,828 0.79 0.89 (c) 2.17 41.1513,204 0.81 0.91 (c) 2.73 52.8421,315 0.82 0.92 (c) 3.30 104.7422,993 0.84 (d) – 3.78 51.2
59,847 1.63 (e) — 1.38 32.882,486 1.63 (e) — 1.33 41.1
113,801 1.63 (e) — 1.90 52.8081,404 1.63 (e) — 2.48 104.775,290 1.63 (e) — 2.96 51.2
135,736 0.89 0.93 (c) 2.12 32.8144,809 0.94 1.14 (c) 2.02 41.1156,522 1.00 1.23 (c) 2.53 52.8123,734 1.00 1.16 (c) 3.11 104.7112,730 1.00 1.20 (c) 3.63 51.2
7,390 0.70 (e) — 2.32 32.810,855 0.70 (e) — 2.26 41.117,803 0.70 (e) — 2.83 52.813,022 0.70 (e) — 3.28 104.7
10 0.71 (e),(h) — 3.69 (h) 51.2 (h)
1,086,207 0.51 — 2.50 32.81,098,217 0.51 — 2.45 41.11,044,466 0.51 — 3.04 52.81,020,836 0.51 — 3.60 104.7
980,476 0.51 — 4.13 51.2
(a) Calculated based on average shares outstanding during the period.(b) Total return is calculated without the front-end sales charge or contingent deferred sales charge, if applicable.(c) Excludes expense reimbursement from Manager and/or Distributor.(d) Reflects Manager's contractual expense limit and Underwriter's contractual distribution fee limit.(e) Reflects Manager's contractual expense limit.(f) Period from September 27, 2010, date shares first offered, through October 31, 2010.(g) Total return amounts have not been annualized.(h) Computed on an annualized basis.
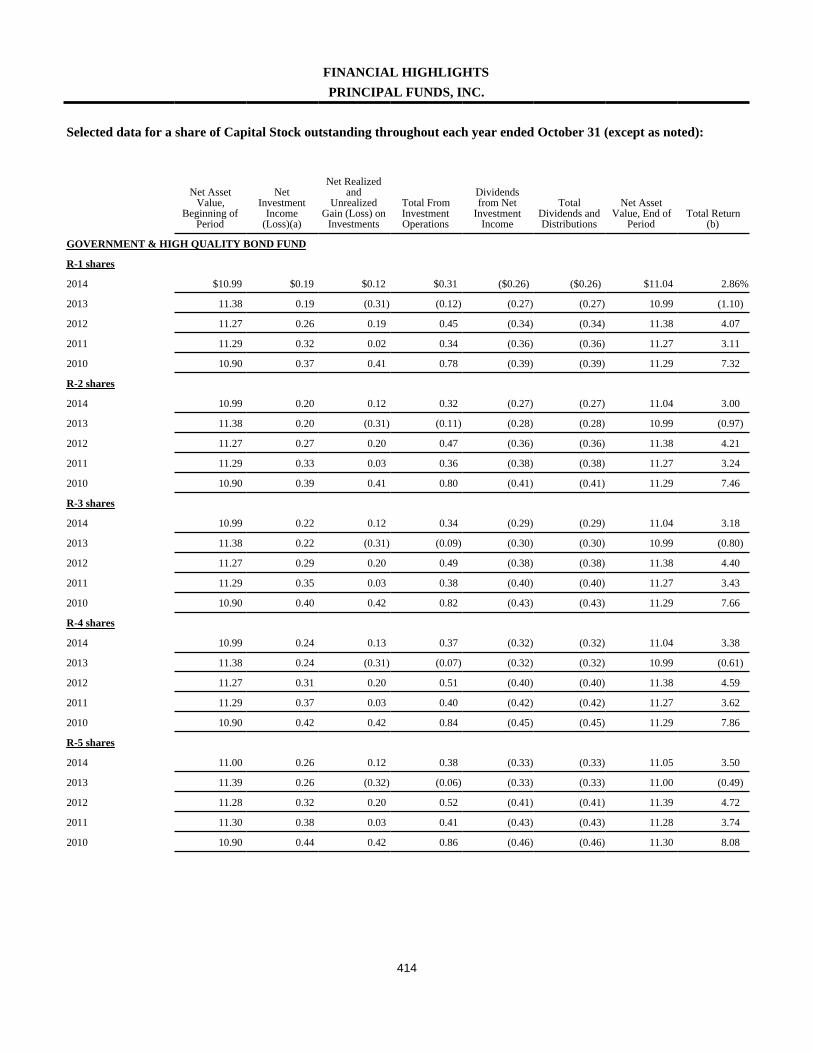
414
FINANCIAL HIGHLIGHTSPRINCIPAL FUNDS, INC.
Selected data for a share of Capital Stock outstanding throughout each year ended October 31 (except as noted):
Net AssetValue,
Beginning ofPeriod
NetInvestment
Income(Loss)(a)
Net Realizedand
UnrealizedGain (Loss) on
Investments
Total FromInvestmentOperations
Dividendsfrom Net
InvestmentIncome
TotalDividends andDistributions
Net AssetValue, End of
PeriodTotal Return
(b)
GOVERNMENT & HIGH QUALITY BOND FUND
R-1 shares
2014 $10.99 $0.19 $0.12 $0.31 ($0.26) ($0.26) $11.04 2.86%
2013 11.38 0.19 (0.31) (0.12) (0.27) (0.27) 10.99 (1.10)
2012 11.27 0.26 0.19 0.45 (0.34) (0.34) 11.38 4.07
2011 11.29 0.32 0.02 0.34 (0.36) (0.36) 11.27 3.11
2010 10.90 0.37 0.41 0.78 (0.39) (0.39) 11.29 7.32
R-2 shares
2014 10.99 0.20 0.12 0.32 (0.27) (0.27) 11.04 3.00
2013 11.38 0.20 (0.31) (0.11) (0.28) (0.28) 10.99 (0.97)
2012 11.27 0.27 0.20 0.47 (0.36) (0.36) 11.38 4.21
2011 11.29 0.33 0.03 0.36 (0.38) (0.38) 11.27 3.24
2010 10.90 0.39 0.41 0.80 (0.41) (0.41) 11.29 7.46
R-3 shares
2014 10.99 0.22 0.12 0.34 (0.29) (0.29) 11.04 3.18
2013 11.38 0.22 (0.31) (0.09) (0.30) (0.30) 10.99 (0.80)
2012 11.27 0.29 0.20 0.49 (0.38) (0.38) 11.38 4.40
2011 11.29 0.35 0.03 0.38 (0.40) (0.40) 11.27 3.43
2010 10.90 0.40 0.42 0.82 (0.43) (0.43) 11.29 7.66
R-4 shares
2014 10.99 0.24 0.13 0.37 (0.32) (0.32) 11.04 3.38
2013 11.38 0.24 (0.31) (0.07) (0.32) (0.32) 10.99 (0.61)
2012 11.27 0.31 0.20 0.51 (0.40) (0.40) 11.38 4.59
2011 11.29 0.37 0.03 0.40 (0.42) (0.42) 11.27 3.62
2010 10.90 0.42 0.42 0.84 (0.45) (0.45) 11.29 7.86
R-5 shares
2014 11.00 0.26 0.12 0.38 (0.33) (0.33) 11.05 3.50
2013 11.39 0.26 (0.32) (0.06) (0.33) (0.33) 11.00 (0.49)
2012 11.28 0.32 0.20 0.52 (0.41) (0.41) 11.39 4.72
2011 11.30 0.38 0.03 0.41 (0.43) (0.43) 11.28 3.74
2010 10.90 0.44 0.42 0.86 (0.46) (0.46) 11.30 8.08
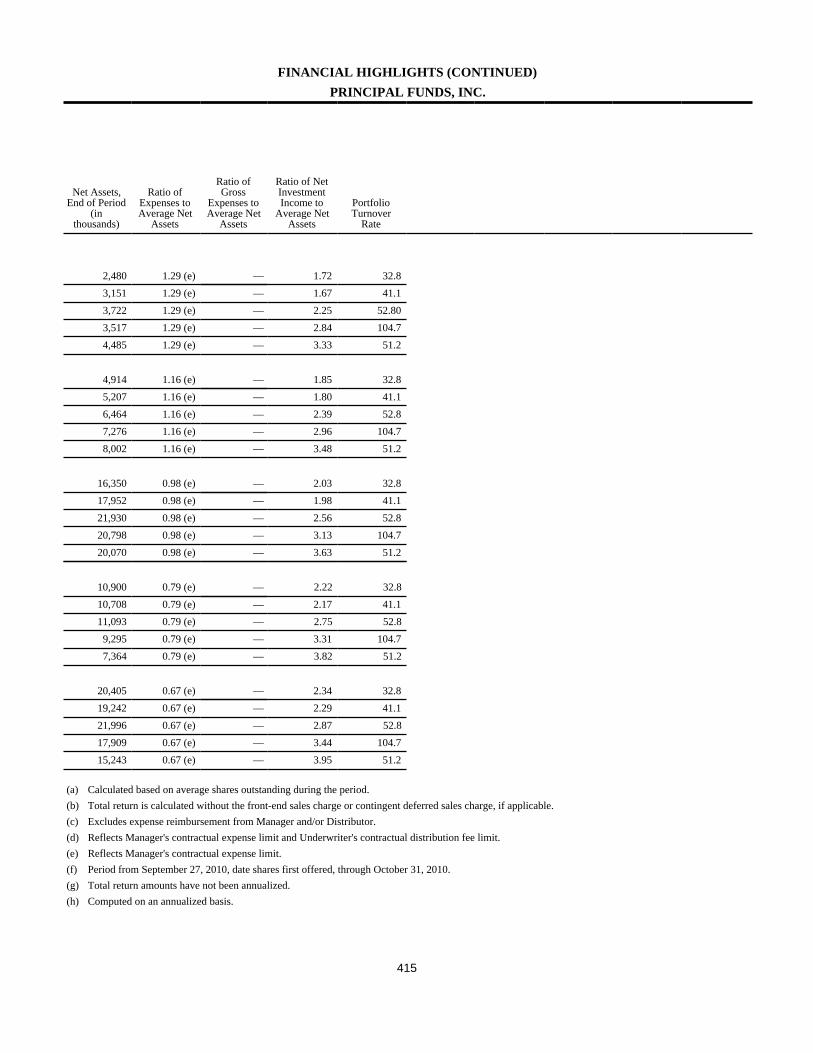
415
FINANCIAL HIGHLIGHTS (CONTINUED)PRINCIPAL FUNDS, INC.
Net Assets,End of Period
(inthousands)
Ratio ofExpenses toAverage Net
Assets
Ratio ofGross
Expenses toAverage Net
Assets
Ratio of NetInvestmentIncome to
Average NetAssets
PortfolioTurnover
Rate
2,480 1.29 (e) — 1.72 32.83,151 1.29 (e) — 1.67 41.13,722 1.29 (e) — 2.25 52.803,517 1.29 (e) — 2.84 104.74,485 1.29 (e) — 3.33 51.2
4,914 1.16 (e) — 1.85 32.85,207 1.16 (e) — 1.80 41.16,464 1.16 (e) — 2.39 52.87,276 1.16 (e) — 2.96 104.78,002 1.16 (e) — 3.48 51.2
16,350 0.98 (e) — 2.03 32.817,952 0.98 (e) — 1.98 41.121,930 0.98 (e) — 2.56 52.820,798 0.98 (e) — 3.13 104.720,070 0.98 (e) — 3.63 51.2
10,900 0.79 (e) — 2.22 32.810,708 0.79 (e) — 2.17 41.111,093 0.79 (e) — 2.75 52.8
9,295 0.79 (e) — 3.31 104.77,364 0.79 (e) — 3.82 51.2
20,405 0.67 (e) — 2.34 32.819,242 0.67 (e) — 2.29 41.121,996 0.67 (e) — 2.87 52.817,909 0.67 (e) — 3.44 104.715,243 0.67 (e) — 3.95 51.2
(a) Calculated based on average shares outstanding during the period.(b) Total return is calculated without the front-end sales charge or contingent deferred sales charge, if applicable.(c) Excludes expense reimbursement from Manager and/or Distributor.(d) Reflects Manager's contractual expense limit and Underwriter's contractual distribution fee limit.(e) Reflects Manager's contractual expense limit.(f) Period from September 27, 2010, date shares first offered, through October 31, 2010.(g) Total return amounts have not been annualized.(h) Computed on an annualized basis.
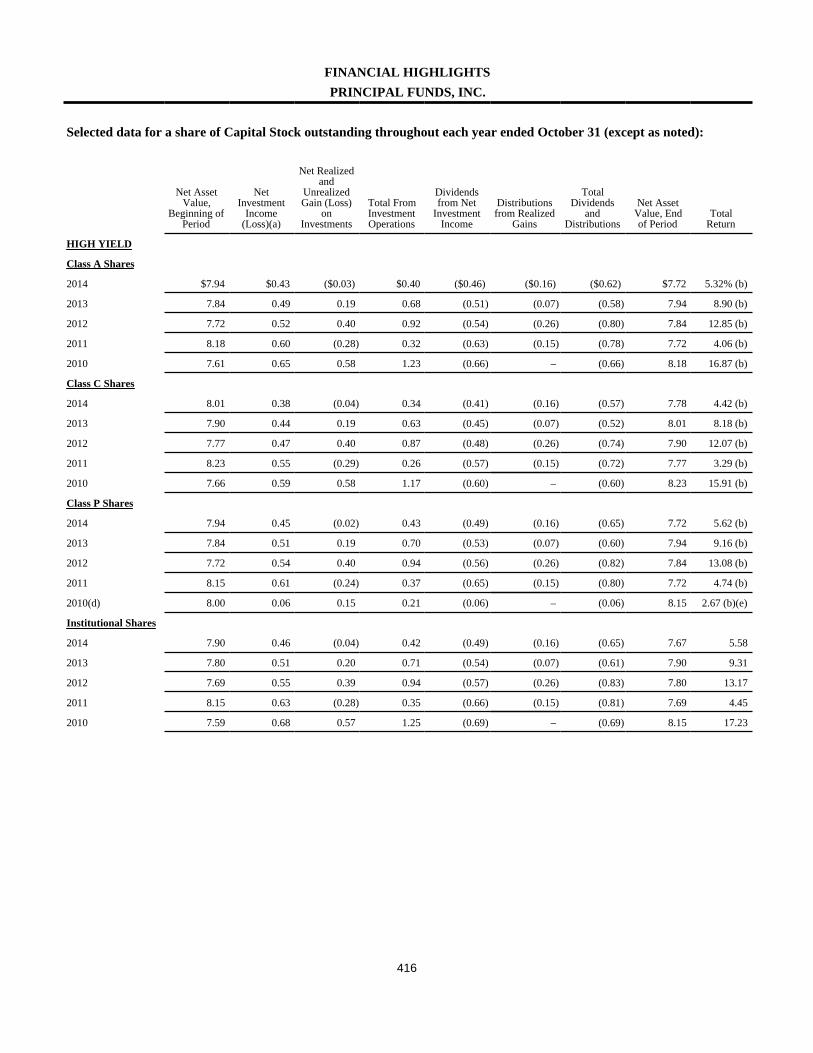
416
FINANCIAL HIGHLIGHTSPRINCIPAL FUNDS, INC.
Selected data for a share of Capital Stock outstanding throughout each year ended October 31 (except as noted):
Net AssetValue,
Beginning ofPeriod
NetInvestment
Income(Loss)(a)
Net Realizedand
UnrealizedGain (Loss)
onInvestments
Total FromInvestmentOperations
Dividendsfrom Net
InvestmentIncome
Distributionsfrom Realized
Gains
TotalDividends
andDistributions
Net AssetValue, Endof Period
TotalReturn
HIGH YIELD
Class A Shares
2014 $7.94 $0.43 ($0.03) $0.40 ($0.46) ($0.16) ($0.62) $7.72 5.32% (b)
2013 7.84 0.49 0.19 0.68 (0.51) (0.07) (0.58) 7.94 8.90 (b)
2012 7.72 0.52 0.40 0.92 (0.54) (0.26) (0.80) 7.84 12.85 (b)
2011 8.18 0.60 (0.28) 0.32 (0.63) (0.15) (0.78) 7.72 4.06 (b)
2010 7.61 0.65 0.58 1.23 (0.66) – (0.66) 8.18 16.87 (b)
Class C Shares
2014 8.01 0.38 (0.04) 0.34 (0.41) (0.16) (0.57) 7.78 4.42 (b)
2013 7.90 0.44 0.19 0.63 (0.45) (0.07) (0.52) 8.01 8.18 (b)
2012 7.77 0.47 0.40 0.87 (0.48) (0.26) (0.74) 7.90 12.07 (b)
2011 8.23 0.55 (0.29) 0.26 (0.57) (0.15) (0.72) 7.77 3.29 (b)
2010 7.66 0.59 0.58 1.17 (0.60) – (0.60) 8.23 15.91 (b)
Class P Shares
2014 7.94 0.45 (0.02) 0.43 (0.49) (0.16) (0.65) 7.72 5.62 (b)
2013 7.84 0.51 0.19 0.70 (0.53) (0.07) (0.60) 7.94 9.16 (b)
2012 7.72 0.54 0.40 0.94 (0.56) (0.26) (0.82) 7.84 13.08 (b)
2011 8.15 0.61 (0.24) 0.37 (0.65) (0.15) (0.80) 7.72 4.74 (b)
2010(d) 8.00 0.06 0.15 0.21 (0.06) – (0.06) 8.15 2.67 (b)(e)
Institutional Shares
2014 7.90 0.46 (0.04) 0.42 (0.49) (0.16) (0.65) 7.67 5.58
2013 7.80 0.51 0.20 0.71 (0.54) (0.07) (0.61) 7.90 9.31
2012 7.69 0.55 0.39 0.94 (0.57) (0.26) (0.83) 7.80 13.17
2011 8.15 0.63 (0.28) 0.35 (0.66) (0.15) (0.81) 7.69 4.45
2010 7.59 0.68 0.57 1.25 (0.69) – (0.69) 8.15 17.23
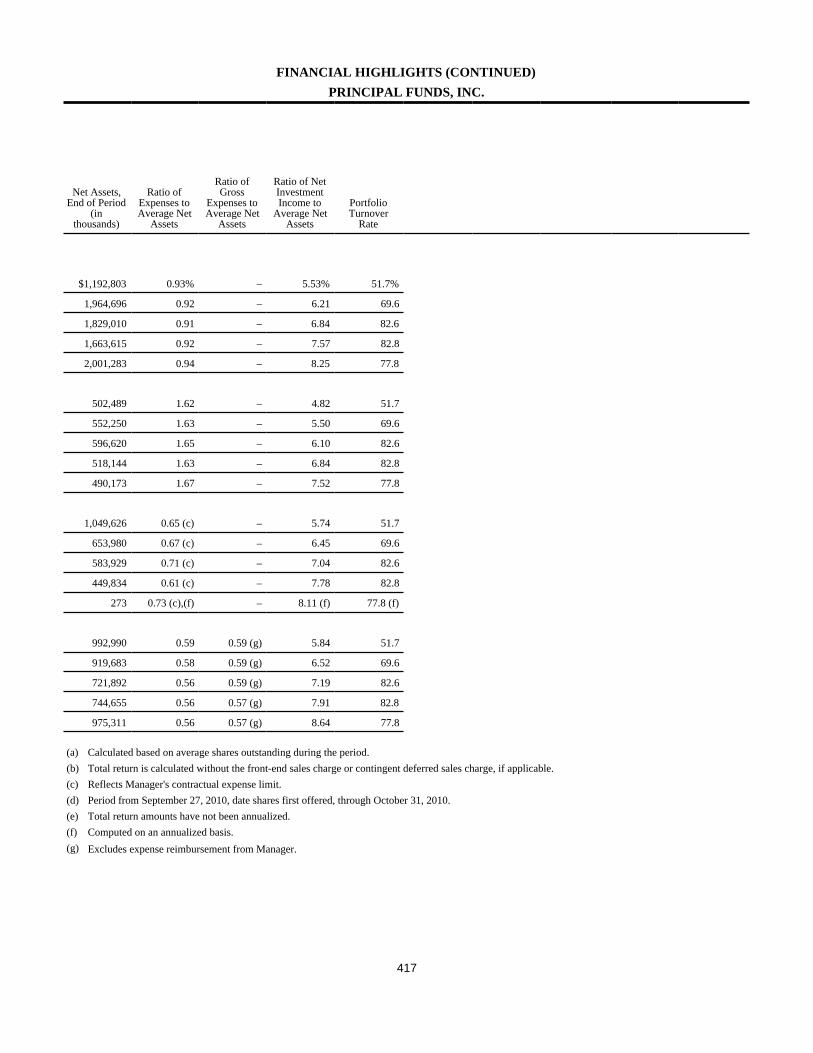
417
FINANCIAL HIGHLIGHTS (CONTINUED)PRINCIPAL FUNDS, INC.
Net Assets,End of Period
(inthousands)
Ratio ofExpenses toAverage Net
Assets
Ratio ofGross
Expenses toAverage Net
Assets
Ratio of NetInvestmentIncome to
Average NetAssets
PortfolioTurnover
Rate
$1,192,803 0.93% – 5.53% 51.7%
1,964,696 0.92 – 6.21 69.6
1,829,010 0.91 – 6.84 82.6
1,663,615 0.92 – 7.57 82.8
2,001,283 0.94 – 8.25 77.8
502,489 1.62 – 4.82 51.7
552,250 1.63 – 5.50 69.6
596,620 1.65 – 6.10 82.6
518,144 1.63 – 6.84 82.8
490,173 1.67 – 7.52 77.8
1,049,626 0.65 (c) – 5.74 51.7
653,980 0.67 (c) – 6.45 69.6
583,929 0.71 (c) – 7.04 82.6
449,834 0.61 (c) – 7.78 82.8
273 0.73 (c),(f) – 8.11 (f) 77.8 (f)
992,990 0.59 0.59 (g) 5.84 51.7
919,683 0.58 0.59 (g) 6.52 69.6
721,892 0.56 0.59 (g) 7.19 82.6
744,655 0.56 0.57 (g) 7.91 82.8
975,311 0.56 0.57 (g) 8.64 77.8
(a) Calculated based on average shares outstanding during the period.(b) Total return is calculated without the front-end sales charge or contingent deferred sales charge, if applicable.(c) Reflects Manager's contractual expense limit.(d) Period from September 27, 2010, date shares first offered, through October 31, 2010.(e) Total return amounts have not been annualized.(f) Computed on an annualized basis.(g) Excludes expense reimbursement from Manager.

418
FINANCIAL HIGHLIGHTSPRINCIPAL FUNDS, INC.
Selected data for a share of Capital Stock outstanding throughout each year ended October 31 (except as noted):
Net AssetValue,
Beginning ofPeriod
NetInvestment
Income(Loss)(a)
Net Realizedand
UnrealizedGain (Loss)
onInvestments
Total FromInvestmentOperations
Dividendsfrom Net
InvestmentIncome
Distributionsfrom Realized
Gains
TotalDividends
andDistributions
Net AssetValue, Endof Period
TotalReturn
HIGH YIELD I
Class A Shares
2014 $10.76 $0.54 ($0.06) $0.48 ($0.54) ($0.21) ($0.75) $10.49 4.56% (b)
2013(d) 10.70 0.36 0.07 0.43 (0.37) – (0.37) 10.76 4.11 (b)(e)
Institutional Shares
2014 10.76 0.58 (0.06) 0.52 (0.58) (0.21) (0.79) 10.49 4.99
2013 11.37 0.65 0.27 0.92 (1.22) (0.31) (1.53) 10.76 8.72
2012 11.05 0.73 0.54 1.27 (0.73) (0.22) (0.95) 11.37 12.65
2011 11.64 0.83 (0.42) 0.41 (0.85) (0.15) (1.00) 11.05 3.87
2010 10.67 0.94 1.00 1.94 (0.97) – (0.97) 11.64 19.54

419
FINANCIAL HIGHLIGHTS (CONTINUED)PRINCIPAL FUNDS, INC.
Net Assets,End of Period(in thousands)
Ratio ofExpenses toAverage Net
Assets
Ratio of NetInvestmentIncome to
Average NetAssets
PortfolioTurnover
Rate
$2,661 1.05% (c) 5.09% 43.2%
33,001 1.05 (c),(f) 5.07 (f) 67.0 (f)
1,789,770 0.64 5.44 43.2
1,495,205 0.65 6.00 67.0
1,189,513 0.65 6.75 75.0
1,633,132 0.65 7.50 67.4
1,276,786 0.65 8.77 100.0
(a) Calculated based on average shares outstanding during the period.(b) Total return is calculated without the front-end sales charge or contingent deferred sales charge, if applicable.(c) Reflects Manager's contractual expense limit.(d) Period from March 1, 2013, date shares first offered, through October 31, 2013.(e) Total return amounts have not been annualized.(f) Computed on an annualized basis.
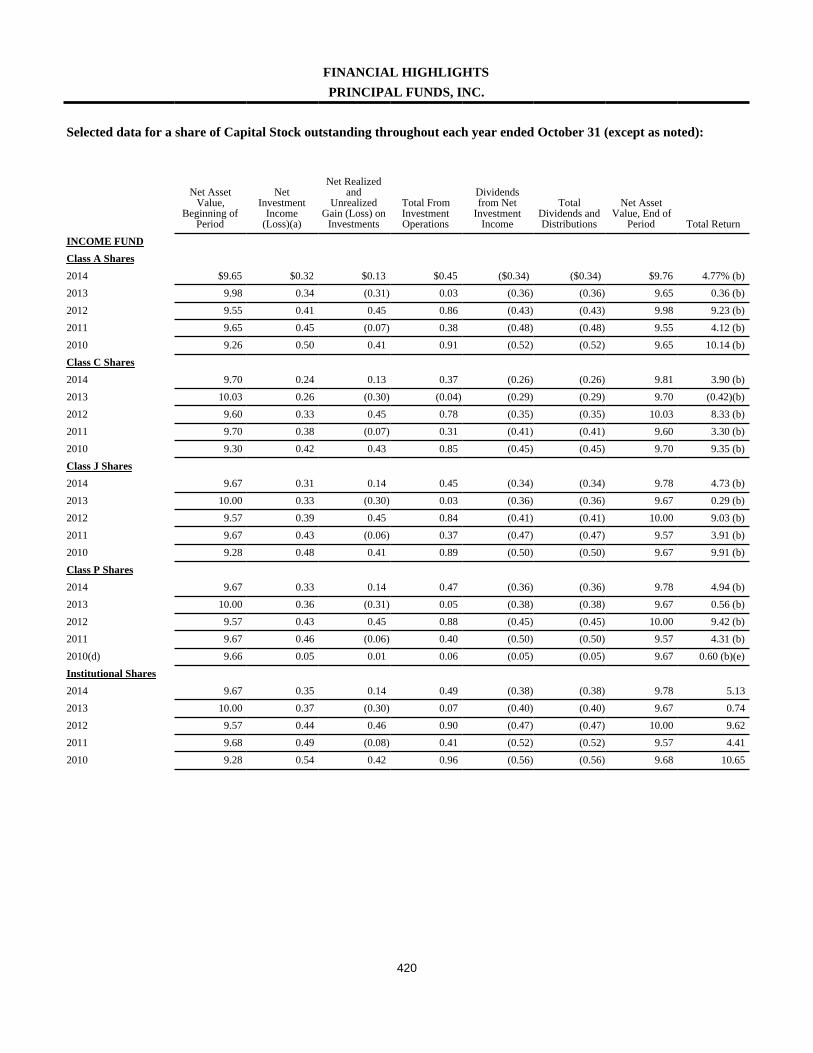
420
FINANCIAL HIGHLIGHTSPRINCIPAL FUNDS, INC.
Selected data for a share of Capital Stock outstanding throughout each year ended October 31 (except as noted):
Net AssetValue,
Beginning ofPeriod
NetInvestment
Income(Loss)(a)
Net Realizedand
UnrealizedGain (Loss) on
Investments
Total FromInvestmentOperations
Dividendsfrom Net
InvestmentIncome
TotalDividends andDistributions
Net AssetValue, End of
Period Total ReturnINCOME FUNDClass A Shares2014 $9.65 $0.32 $0.13 $0.45 ($0.34) ($0.34) $9.76 4.77% (b)2013 9.98 0.34 (0.31) 0.03 (0.36) (0.36) 9.65 0.36 (b)2012 9.55 0.41 0.45 0.86 (0.43) (0.43) 9.98 9.23 (b)2011 9.65 0.45 (0.07) 0.38 (0.48) (0.48) 9.55 4.12 (b)2010 9.26 0.50 0.41 0.91 (0.52) (0.52) 9.65 10.14 (b)Class C Shares2014 9.70 0.24 0.13 0.37 (0.26) (0.26) 9.81 3.90 (b)2013 10.03 0.26 (0.30) (0.04) (0.29) (0.29) 9.70 (0.42)(b)2012 9.60 0.33 0.45 0.78 (0.35) (0.35) 10.03 8.33 (b)2011 9.70 0.38 (0.07) 0.31 (0.41) (0.41) 9.60 3.30 (b)2010 9.30 0.42 0.43 0.85 (0.45) (0.45) 9.70 9.35 (b)Class J Shares2014 9.67 0.31 0.14 0.45 (0.34) (0.34) 9.78 4.73 (b)2013 10.00 0.33 (0.30) 0.03 (0.36) (0.36) 9.67 0.29 (b)2012 9.57 0.39 0.45 0.84 (0.41) (0.41) 10.00 9.03 (b)2011 9.67 0.43 (0.06) 0.37 (0.47) (0.47) 9.57 3.91 (b)2010 9.28 0.48 0.41 0.89 (0.50) (0.50) 9.67 9.91 (b)Class P Shares2014 9.67 0.33 0.14 0.47 (0.36) (0.36) 9.78 4.94 (b)2013 10.00 0.36 (0.31) 0.05 (0.38) (0.38) 9.67 0.56 (b)2012 9.57 0.43 0.45 0.88 (0.45) (0.45) 10.00 9.42 (b)2011 9.67 0.46 (0.06) 0.40 (0.50) (0.50) 9.57 4.31 (b)2010(d) 9.66 0.05 0.01 0.06 (0.05) (0.05) 9.67 0.60 (b)(e)Institutional Shares2014 9.67 0.35 0.14 0.49 (0.38) (0.38) 9.78 5.132013 10.00 0.37 (0.30) 0.07 (0.40) (0.40) 9.67 0.742012 9.57 0.44 0.46 0.90 (0.47) (0.47) 10.00 9.622011 9.68 0.49 (0.08) 0.41 (0.52) (0.52) 9.57 4.412010 9.28 0.54 0.42 0.96 (0.56) (0.56) 9.68 10.65

421
FINANCIAL HIGHLIGHTS (CONTINUED)PRINCIPAL FUNDS, INC.
Net Assets,End of Period
(inthousands)
Ratio ofExpenses toAverage Net
Assets
Ratio of GrossExpenses toAverage Net
Assets
Ratio of NetInvestmentIncome to
Average NetAssets
PortfolioTurnover
Rate
$272,809 0.86% —% 3.26% 11.3%293,396 0.89 — 3.43 20.7338,977 0.90 — 4.20 14.1268,621 0.90 — 4.75 16.9268,103 0.91 (c) — 5.28 13.1
65,027 1.67 — 2.45 11.373,328 1.67 — 2.65 20.786,409 1.68 — 3.41 14.163,548 1.68 — 3.98 16.959,080 1.69 (c) — 4.50 13.1
93,304 0.89 0.93 (g) 3.23 11.388,170 0.96 1.16 (g) 3.36 20.790,263 1.06 1.25 (g) 4.02 14.158,259 1.10 1.29 (g) 4.54 16.936,124 1.10 1.75 (g) 5.02 13.1
25,010 0.68 (c) — 3.40 11.312,960 0.69 (c) — 3.63 20.715,196 0.70 (c) — 4.37 14.1
9,474 0.70 (c) — 4.83 16.930 0.71 (c),(f) — 5.07 (f) 13.1 (f)
2,288,675 0.50 — 3.61 11.31,907,327 0.50 — 3.82 20.71,763,464 0.51 — 4.56 14.11,157,481 0.52 — 5.13 16.9
930,550 0.52 — 5.69 13.1
(a) Calculated based on average shares outstanding during the period.(b) Total return is calculated without the front-end sales charge or contingent deferred sales charge, if applicable.(c) Reflects Manager's contractual expense limit.(d) Period from September 27, 2010, date shares first offered, through October 31, 2010.(e) Total return amounts have not been annualized.(f) Computed on an annualized basis.(g) Excludes expense reimbursement from Manager and/or Distributor.(h) Period from March 1, 2010, date operations commenced, through October 31, 2010.
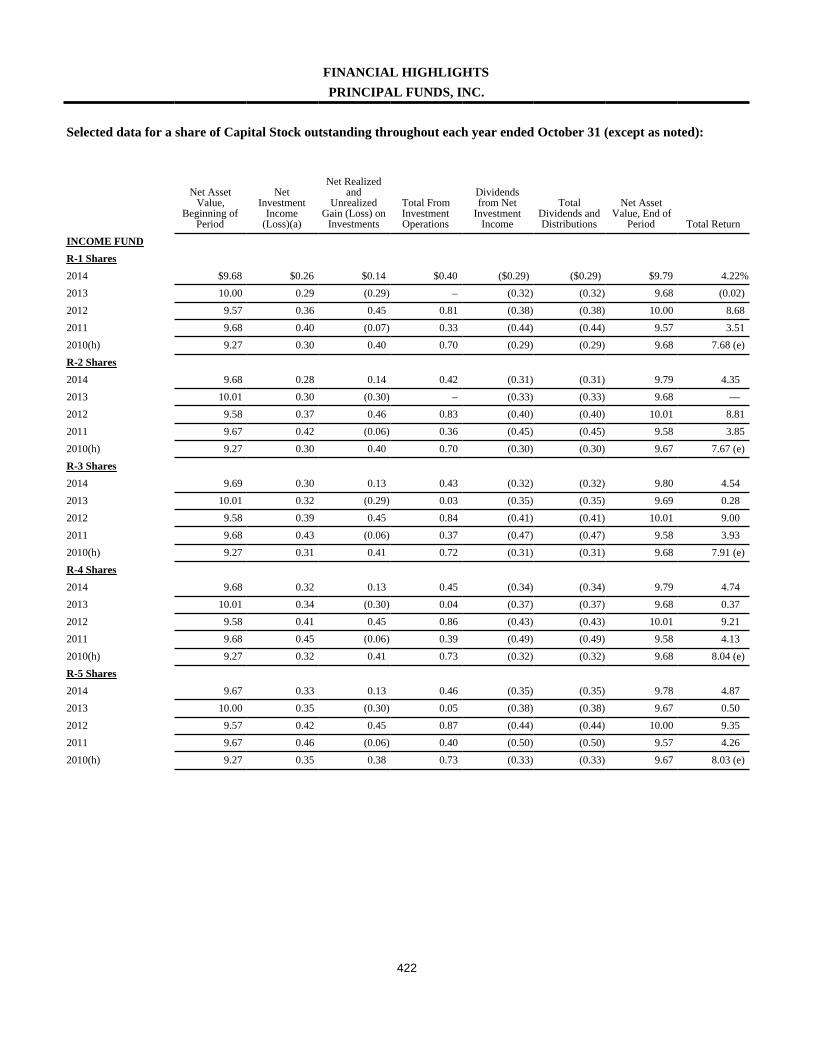
422
FINANCIAL HIGHLIGHTSPRINCIPAL FUNDS, INC.
Selected data for a share of Capital Stock outstanding throughout each year ended October 31 (except as noted):
Net AssetValue,
Beginning ofPeriod
NetInvestment
Income(Loss)(a)
Net Realizedand
UnrealizedGain (Loss) on
Investments
Total FromInvestmentOperations
Dividendsfrom Net
InvestmentIncome
TotalDividends andDistributions
Net AssetValue, End of
Period Total ReturnINCOME FUNDR-1 Shares2014 $9.68 $0.26 $0.14 $0.40 ($0.29) ($0.29) $9.79 4.22%2013 10.00 0.29 (0.29) – (0.32) (0.32) 9.68 (0.02)2012 9.57 0.36 0.45 0.81 (0.38) (0.38) 10.00 8.682011 9.68 0.40 (0.07) 0.33 (0.44) (0.44) 9.57 3.512010(h) 9.27 0.30 0.40 0.70 (0.29) (0.29) 9.68 7.68 (e)R-2 Shares2014 9.68 0.28 0.14 0.42 (0.31) (0.31) 9.79 4.352013 10.01 0.30 (0.30) – (0.33) (0.33) 9.68 —2012 9.58 0.37 0.46 0.83 (0.40) (0.40) 10.01 8.812011 9.67 0.42 (0.06) 0.36 (0.45) (0.45) 9.58 3.852010(h) 9.27 0.30 0.40 0.70 (0.30) (0.30) 9.67 7.67 (e)R-3 Shares2014 9.69 0.30 0.13 0.43 (0.32) (0.32) 9.80 4.542013 10.01 0.32 (0.29) 0.03 (0.35) (0.35) 9.69 0.282012 9.58 0.39 0.45 0.84 (0.41) (0.41) 10.01 9.002011 9.68 0.43 (0.06) 0.37 (0.47) (0.47) 9.58 3.932010(h) 9.27 0.31 0.41 0.72 (0.31) (0.31) 9.68 7.91 (e)R-4 Shares2014 9.68 0.32 0.13 0.45 (0.34) (0.34) 9.79 4.742013 10.01 0.34 (0.30) 0.04 (0.37) (0.37) 9.68 0.372012 9.58 0.41 0.45 0.86 (0.43) (0.43) 10.01 9.212011 9.68 0.45 (0.06) 0.39 (0.49) (0.49) 9.58 4.132010(h) 9.27 0.32 0.41 0.73 (0.32) (0.32) 9.68 8.04 (e)R-5 Shares2014 9.67 0.33 0.13 0.46 (0.35) (0.35) 9.78 4.872013 10.00 0.35 (0.30) 0.05 (0.38) (0.38) 9.67 0.502012 9.57 0.42 0.45 0.87 (0.44) (0.44) 10.00 9.352011 9.67 0.46 (0.06) 0.40 (0.50) (0.50) 9.57 4.262010(h) 9.27 0.35 0.38 0.73 (0.33) (0.33) 9.67 8.03 (e)
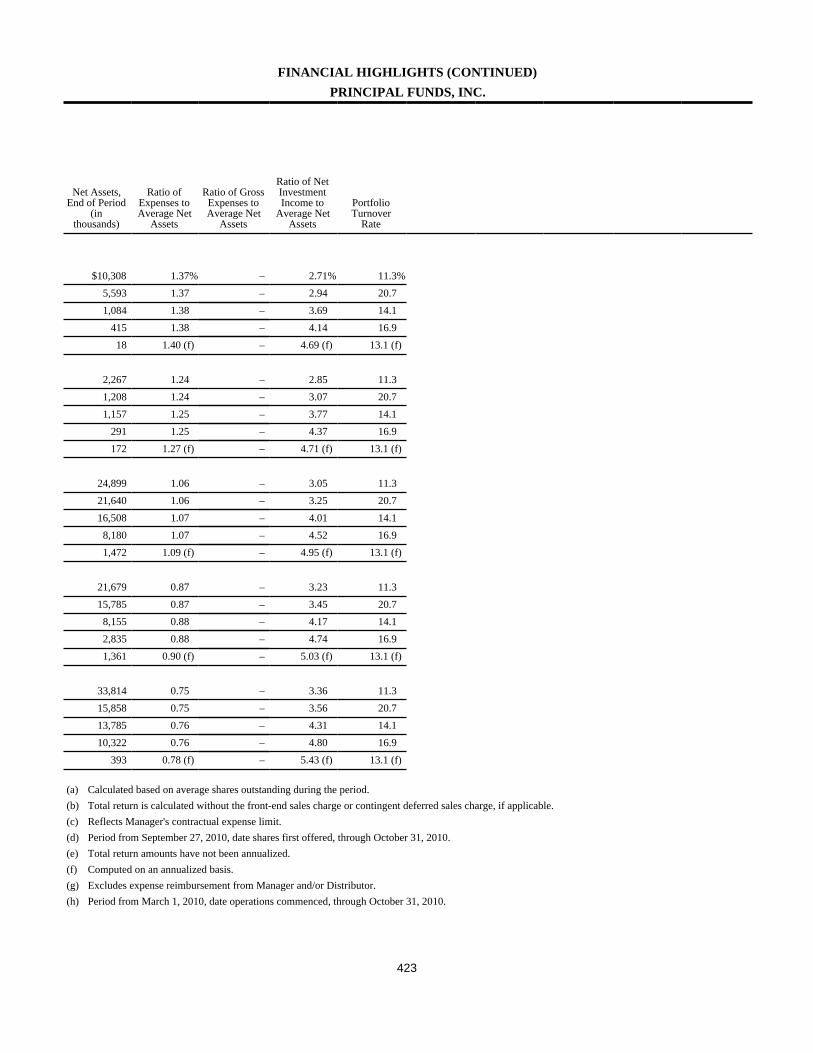
423
FINANCIAL HIGHLIGHTS (CONTINUED)PRINCIPAL FUNDS, INC.
Net Assets,End of Period
(inthousands)
Ratio ofExpenses toAverage Net
Assets
Ratio of GrossExpenses toAverage Net
Assets
Ratio of NetInvestmentIncome to
Average NetAssets
PortfolioTurnover
Rate
$10,308 1.37% – 2.71% 11.3%5,593 1.37 – 2.94 20.71,084 1.38 – 3.69 14.1
415 1.38 – 4.14 16.918 1.40 (f) – 4.69 (f) 13.1 (f)
2,267 1.24 – 2.85 11.31,208 1.24 – 3.07 20.71,157 1.25 – 3.77 14.1
291 1.25 – 4.37 16.9172 1.27 (f) – 4.71 (f) 13.1 (f)
24,899 1.06 – 3.05 11.321,640 1.06 – 3.25 20.716,508 1.07 – 4.01 14.1
8,180 1.07 – 4.52 16.91,472 1.09 (f) – 4.95 (f) 13.1 (f)
21,679 0.87 – 3.23 11.315,785 0.87 – 3.45 20.7
8,155 0.88 – 4.17 14.12,835 0.88 – 4.74 16.91,361 0.90 (f) – 5.03 (f) 13.1 (f)
33,814 0.75 – 3.36 11.315,858 0.75 – 3.56 20.713,785 0.76 – 4.31 14.110,322 0.76 – 4.80 16.9
393 0.78 (f) – 5.43 (f) 13.1 (f)
(a) Calculated based on average shares outstanding during the period.(b) Total return is calculated without the front-end sales charge or contingent deferred sales charge, if applicable.(c) Reflects Manager's contractual expense limit.(d) Period from September 27, 2010, date shares first offered, through October 31, 2010.(e) Total return amounts have not been annualized.(f) Computed on an annualized basis.(g) Excludes expense reimbursement from Manager and/or Distributor.(h) Period from March 1, 2010, date operations commenced, through October 31, 2010.
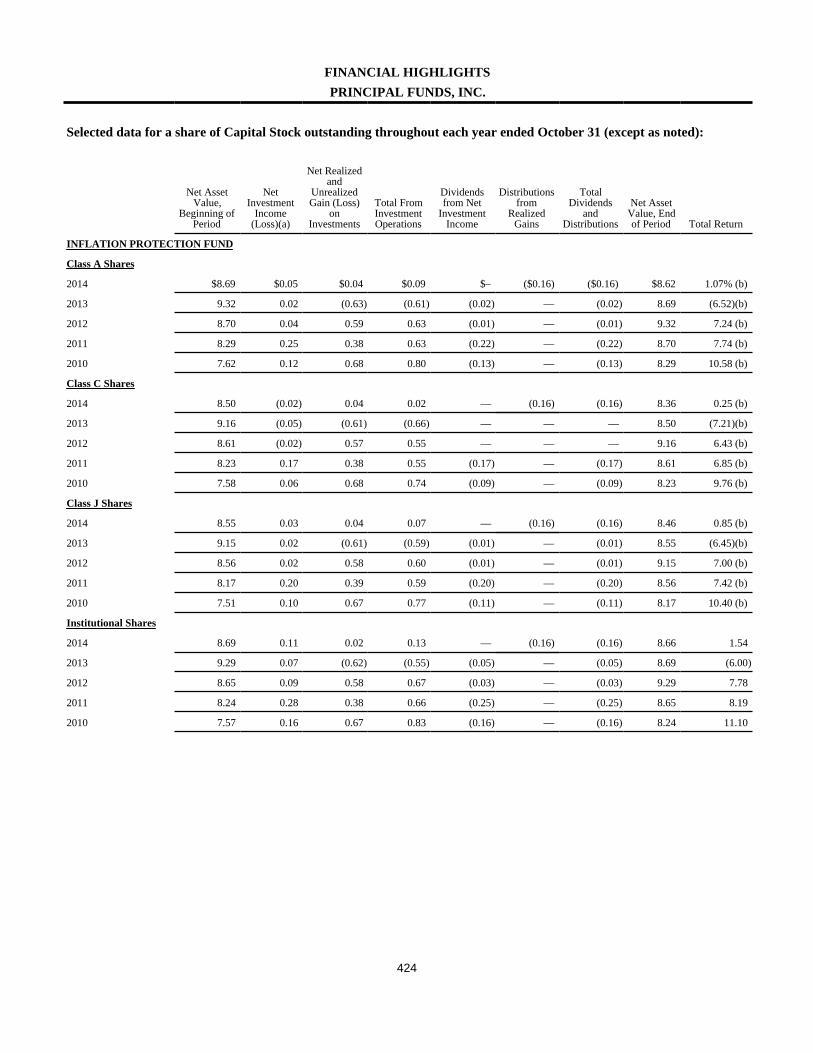
424
FINANCIAL HIGHLIGHTSPRINCIPAL FUNDS, INC.
Selected data for a share of Capital Stock outstanding throughout each year ended October 31 (except as noted):
Net AssetValue,
Beginning ofPeriod
NetInvestment
Income(Loss)(a)
Net Realizedand
UnrealizedGain (Loss)
onInvestments
Total FromInvestmentOperations
Dividendsfrom Net
InvestmentIncome
Distributionsfrom
RealizedGains
TotalDividends
andDistributions
Net AssetValue, Endof Period Total Return
INFLATION PROTECTION FUND
Class A Shares
2014 $8.69 $0.05 $0.04 $0.09 $– ($0.16) ($0.16) $8.62 1.07% (b)
2013 9.32 0.02 (0.63) (0.61) (0.02) — (0.02) 8.69 (6.52)(b)
2012 8.70 0.04 0.59 0.63 (0.01) — (0.01) 9.32 7.24 (b)
2011 8.29 0.25 0.38 0.63 (0.22) — (0.22) 8.70 7.74 (b)
2010 7.62 0.12 0.68 0.80 (0.13) — (0.13) 8.29 10.58 (b)
Class C Shares
2014 8.50 (0.02) 0.04 0.02 — (0.16) (0.16) 8.36 0.25 (b)
2013 9.16 (0.05) (0.61) (0.66) — — — 8.50 (7.21)(b)
2012 8.61 (0.02) 0.57 0.55 — — — 9.16 6.43 (b)
2011 8.23 0.17 0.38 0.55 (0.17) — (0.17) 8.61 6.85 (b)
2010 7.58 0.06 0.68 0.74 (0.09) — (0.09) 8.23 9.76 (b)
Class J Shares
2014 8.55 0.03 0.04 0.07 — (0.16) (0.16) 8.46 0.85 (b)
2013 9.15 0.02 (0.61) (0.59) (0.01) — (0.01) 8.55 (6.45)(b)
2012 8.56 0.02 0.58 0.60 (0.01) — (0.01) 9.15 7.00 (b)
2011 8.17 0.20 0.39 0.59 (0.20) — (0.20) 8.56 7.42 (b)
2010 7.51 0.10 0.67 0.77 (0.11) — (0.11) 8.17 10.40 (b)
Institutional Shares
2014 8.69 0.11 0.02 0.13 — (0.16) (0.16) 8.66 1.54
2013 9.29 0.07 (0.62) (0.55) (0.05) — (0.05) 8.69 (6.00)
2012 8.65 0.09 0.58 0.67 (0.03) — (0.03) 9.29 7.78
2011 8.24 0.28 0.38 0.66 (0.25) — (0.25) 8.65 8.19
2010 7.57 0.16 0.67 0.83 (0.16) — (0.16) 8.24 11.10
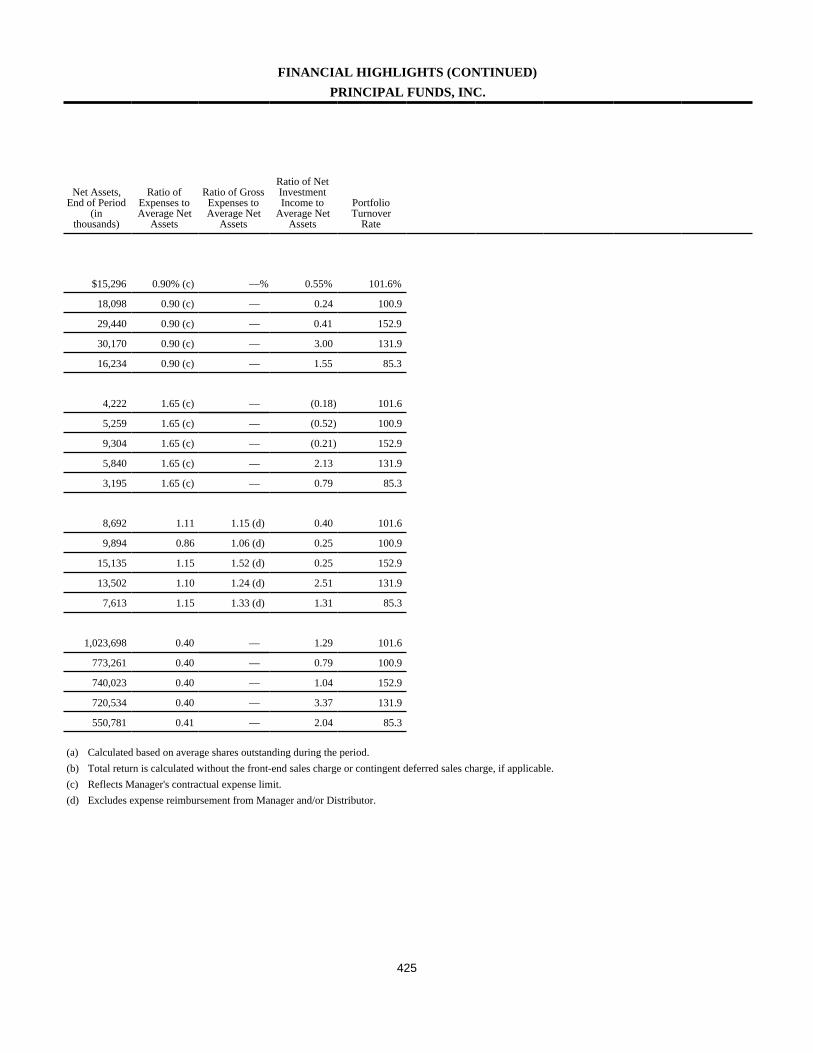
425
FINANCIAL HIGHLIGHTS (CONTINUED)PRINCIPAL FUNDS, INC.
Net Assets,End of Period
(inthousands)
Ratio ofExpenses toAverage Net
Assets
Ratio of GrossExpenses toAverage Net
Assets
Ratio of NetInvestmentIncome to
Average NetAssets
PortfolioTurnover
Rate
$15,296 0.90% (c) —% 0.55% 101.6%
18,098 0.90 (c) — 0.24 100.9
29,440 0.90 (c) — 0.41 152.9
30,170 0.90 (c) — 3.00 131.9
16,234 0.90 (c) — 1.55 85.3
4,222 1.65 (c) — (0.18) 101.6
5,259 1.65 (c) — (0.52) 100.9
9,304 1.65 (c) — (0.21) 152.9
5,840 1.65 (c) — 2.13 131.9
3,195 1.65 (c) — 0.79 85.3
8,692 1.11 1.15 (d) 0.40 101.6
9,894 0.86 1.06 (d) 0.25 100.9
15,135 1.15 1.52 (d) 0.25 152.9
13,502 1.10 1.24 (d) 2.51 131.9
7,613 1.15 1.33 (d) 1.31 85.3
1,023,698 0.40 — 1.29 101.6
773,261 0.40 — 0.79 100.9
740,023 0.40 — 1.04 152.9
720,534 0.40 — 3.37 131.9
550,781 0.41 — 2.04 85.3
(a) Calculated based on average shares outstanding during the period.(b) Total return is calculated without the front-end sales charge or contingent deferred sales charge, if applicable.(c) Reflects Manager's contractual expense limit.(d) Excludes expense reimbursement from Manager and/or Distributor.
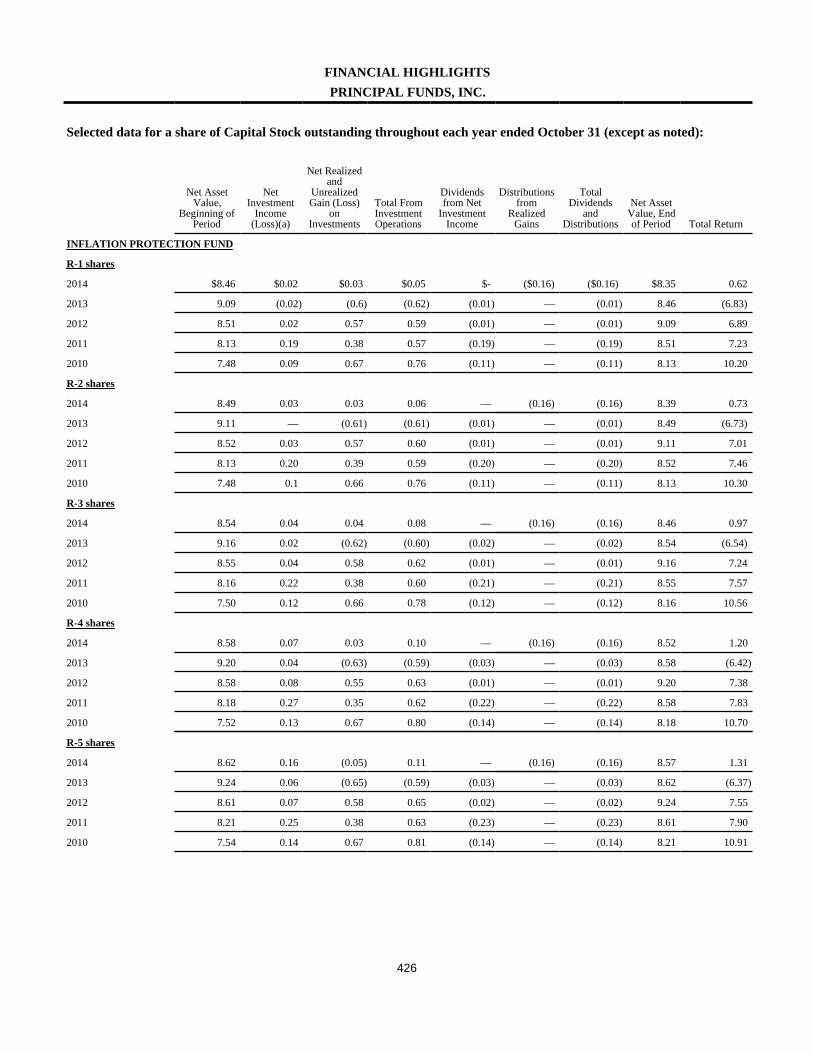
426
FINANCIAL HIGHLIGHTSPRINCIPAL FUNDS, INC.
Selected data for a share of Capital Stock outstanding throughout each year ended October 31 (except as noted):
Net AssetValue,
Beginning ofPeriod
NetInvestment
Income(Loss)(a)
Net Realizedand
UnrealizedGain (Loss)
onInvestments
Total FromInvestmentOperations
Dividendsfrom Net
InvestmentIncome
Distributionsfrom
RealizedGains
TotalDividends
andDistributions
Net AssetValue, Endof Period Total Return
INFLATION PROTECTION FUND
R-1 shares
2014 $8.46 $0.02 $0.03 $0.05 $- ($0.16) ($0.16) $8.35 0.62
2013 9.09 (0.02) (0.6) (0.62) (0.01) — (0.01) 8.46 (6.83)
2012 8.51 0.02 0.57 0.59 (0.01) — (0.01) 9.09 6.89
2011 8.13 0.19 0.38 0.57 (0.19) — (0.19) 8.51 7.23
2010 7.48 0.09 0.67 0.76 (0.11) — (0.11) 8.13 10.20
R-2 shares
2014 8.49 0.03 0.03 0.06 — (0.16) (0.16) 8.39 0.73
2013 9.11 — (0.61) (0.61) (0.01) — (0.01) 8.49 (6.73)
2012 8.52 0.03 0.57 0.60 (0.01) — (0.01) 9.11 7.01
2011 8.13 0.20 0.39 0.59 (0.20) — (0.20) 8.52 7.46
2010 7.48 0.1 0.66 0.76 (0.11) — (0.11) 8.13 10.30
R-3 shares
2014 8.54 0.04 0.04 0.08 — (0.16) (0.16) 8.46 0.97
2013 9.16 0.02 (0.62) (0.60) (0.02) — (0.02) 8.54 (6.54)
2012 8.55 0.04 0.58 0.62 (0.01) — (0.01) 9.16 7.24
2011 8.16 0.22 0.38 0.60 (0.21) — (0.21) 8.55 7.57
2010 7.50 0.12 0.66 0.78 (0.12) — (0.12) 8.16 10.56
R-4 shares
2014 8.58 0.07 0.03 0.10 — (0.16) (0.16) 8.52 1.20
2013 9.20 0.04 (0.63) (0.59) (0.03) — (0.03) 8.58 (6.42)
2012 8.58 0.08 0.55 0.63 (0.01) — (0.01) 9.20 7.38
2011 8.18 0.27 0.35 0.62 (0.22) — (0.22) 8.58 7.83
2010 7.52 0.13 0.67 0.80 (0.14) — (0.14) 8.18 10.70
R-5 shares
2014 8.62 0.16 (0.05) 0.11 — (0.16) (0.16) 8.57 1.31
2013 9.24 0.06 (0.65) (0.59) (0.03) — (0.03) 8.62 (6.37)
2012 8.61 0.07 0.58 0.65 (0.02) — (0.02) 9.24 7.55
2011 8.21 0.25 0.38 0.63 (0.23) — (0.23) 8.61 7.90
2010 7.54 0.14 0.67 0.81 (0.14) — (0.14) 8.21 10.91
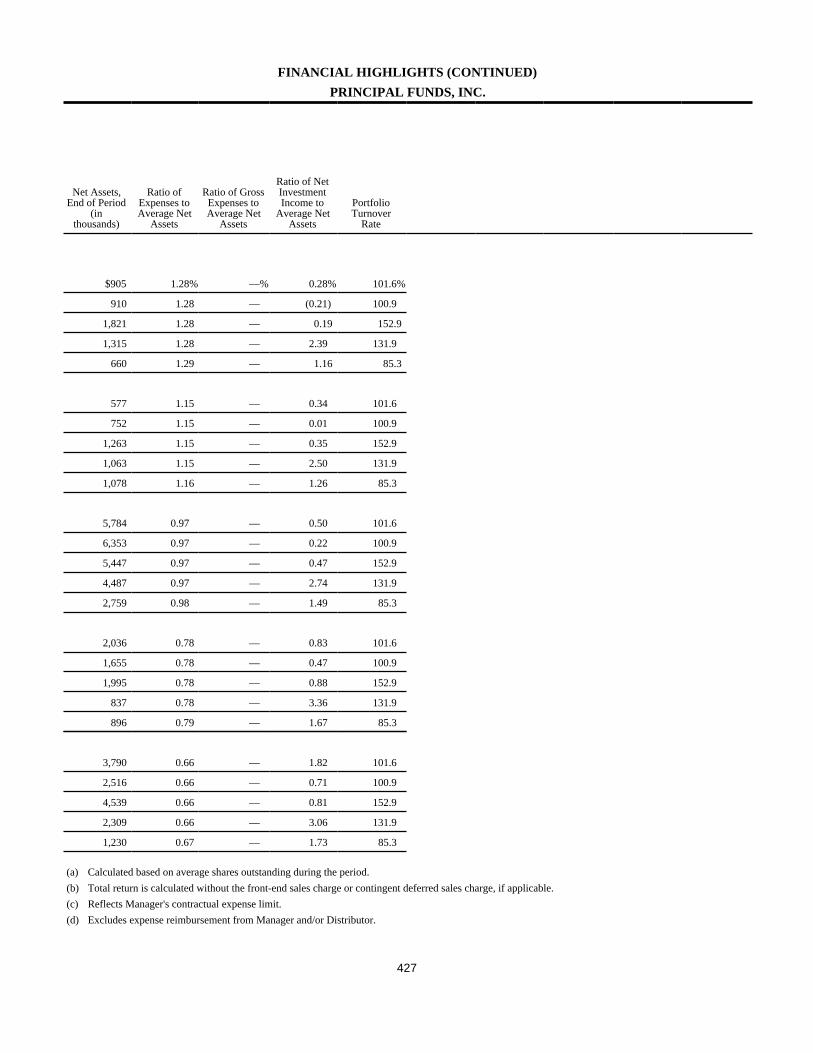
427
FINANCIAL HIGHLIGHTS (CONTINUED)PRINCIPAL FUNDS, INC.
Net Assets,End of Period
(inthousands)
Ratio ofExpenses toAverage Net
Assets
Ratio of GrossExpenses toAverage Net
Assets
Ratio of NetInvestmentIncome to
Average NetAssets
PortfolioTurnover
Rate
$905 1.28% —% 0.28% 101.6%
910 1.28 — (0.21) 100.9
1,821 1.28 — 0.19 152.9
1,315 1.28 — 2.39 131.9
660 1.29 — 1.16 85.3
577 1.15 — 0.34 101.6
752 1.15 — 0.01 100.9
1,263 1.15 — 0.35 152.9
1,063 1.15 — 2.50 131.9
1,078 1.16 — 1.26 85.3
5,784 0.97 — 0.50 101.6
6,353 0.97 — 0.22 100.9
5,447 0.97 — 0.47 152.9
4,487 0.97 — 2.74 131.9
2,759 0.98 — 1.49 85.3
2,036 0.78 — 0.83 101.6
1,655 0.78 — 0.47 100.9
1,995 0.78 — 0.88 152.9
837 0.78 — 3.36 131.9
896 0.79 — 1.67 85.3
3,790 0.66 — 1.82 101.6
2,516 0.66 — 0.71 100.9
4,539 0.66 — 0.81 152.9
2,309 0.66 — 3.06 131.9
1,230 0.67 — 1.73 85.3
(a) Calculated based on average shares outstanding during the period.(b) Total return is calculated without the front-end sales charge or contingent deferred sales charge, if applicable.(c) Reflects Manager's contractual expense limit.(d) Excludes expense reimbursement from Manager and/or Distributor.
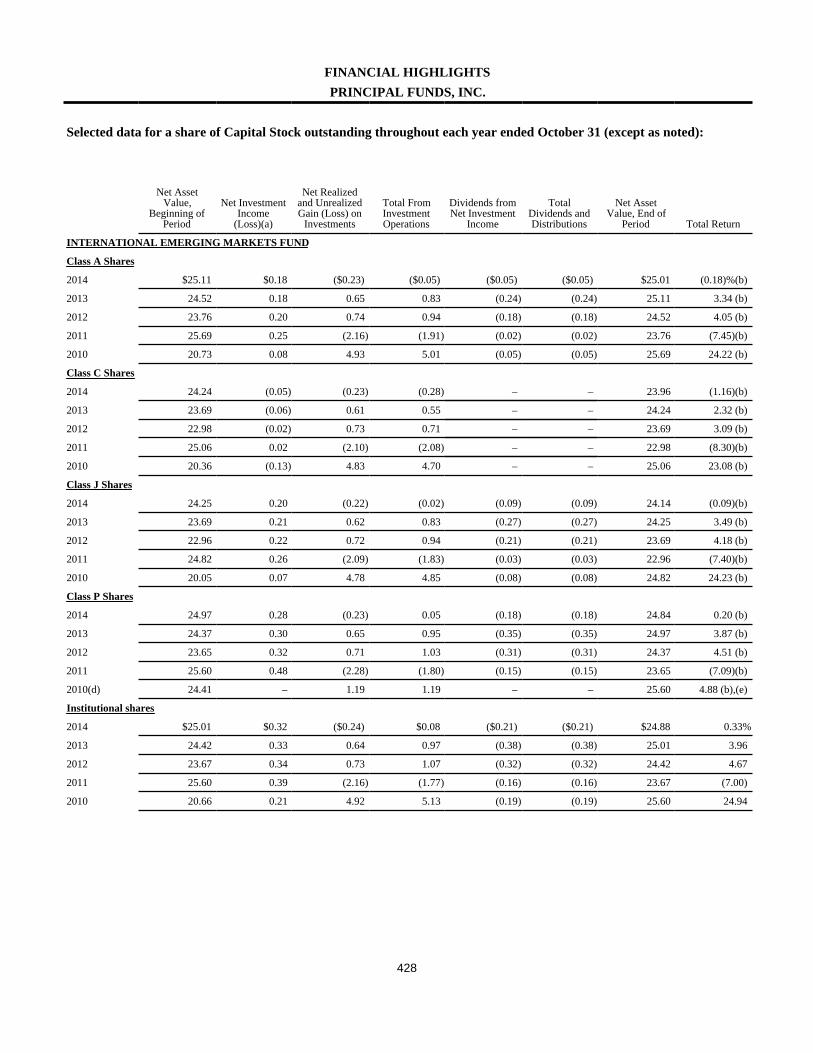
428
FINANCIAL HIGHLIGHTSPRINCIPAL FUNDS, INC.
Selected data for a share of Capital Stock outstanding throughout each year ended October 31 (except as noted):
Net AssetValue,
Beginning ofPeriod
Net InvestmentIncome
(Loss)(a)
Net Realizedand UnrealizedGain (Loss) on
Investments
Total FromInvestmentOperations
Dividends fromNet Investment
Income
TotalDividends andDistributions
Net AssetValue, End of
Period Total Return
INTERNATIONAL EMERGING MARKETS FUND
Class A Shares
2014 $25.11 $0.18 ($0.23) ($0.05) ($0.05) ($0.05) $25.01 (0.18)%(b)
2013 24.52 0.18 0.65 0.83 (0.24) (0.24) 25.11 3.34 (b)
2012 23.76 0.20 0.74 0.94 (0.18) (0.18) 24.52 4.05 (b)
2011 25.69 0.25 (2.16) (1.91) (0.02) (0.02) 23.76 (7.45)(b)
2010 20.73 0.08 4.93 5.01 (0.05) (0.05) 25.69 24.22 (b)
Class C Shares
2014 24.24 (0.05) (0.23) (0.28) – – 23.96 (1.16)(b)
2013 23.69 (0.06) 0.61 0.55 – – 24.24 2.32 (b)
2012 22.98 (0.02) 0.73 0.71 – – 23.69 3.09 (b)
2011 25.06 0.02 (2.10) (2.08) – – 22.98 (8.30)(b)
2010 20.36 (0.13) 4.83 4.70 – – 25.06 23.08 (b)
Class J Shares
2014 24.25 0.20 (0.22) (0.02) (0.09) (0.09) 24.14 (0.09)(b)
2013 23.69 0.21 0.62 0.83 (0.27) (0.27) 24.25 3.49 (b)
2012 22.96 0.22 0.72 0.94 (0.21) (0.21) 23.69 4.18 (b)
2011 24.82 0.26 (2.09) (1.83) (0.03) (0.03) 22.96 (7.40)(b)
2010 20.05 0.07 4.78 4.85 (0.08) (0.08) 24.82 24.23 (b)
Class P Shares
2014 24.97 0.28 (0.23) 0.05 (0.18) (0.18) 24.84 0.20 (b)
2013 24.37 0.30 0.65 0.95 (0.35) (0.35) 24.97 3.87 (b)
2012 23.65 0.32 0.71 1.03 (0.31) (0.31) 24.37 4.51 (b)
2011 25.60 0.48 (2.28) (1.80) (0.15) (0.15) 23.65 (7.09)(b)
2010(d) 24.41 – 1.19 1.19 – – 25.60 4.88 (b),(e)
Institutional shares
2014 $25.01 $0.32 ($0.24) $0.08 ($0.21) ($0.21) $24.88 0.33%
2013 24.42 0.33 0.64 0.97 (0.38) (0.38) 25.01 3.96
2012 23.67 0.34 0.73 1.07 (0.32) (0.32) 24.42 4.67
2011 25.60 0.39 (2.16) (1.77) (0.16) (0.16) 23.67 (7.00)
2010 20.66 0.21 4.92 5.13 (0.19) (0.19) 25.60 24.94
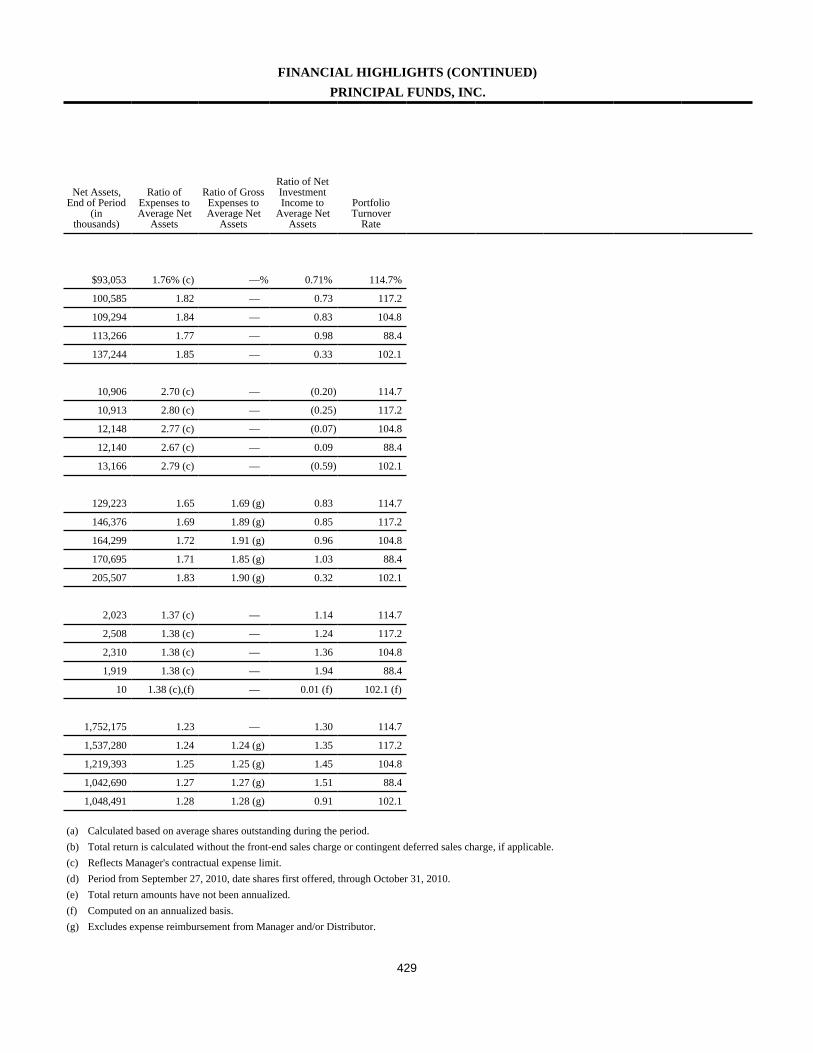
429
FINANCIAL HIGHLIGHTS (CONTINUED)PRINCIPAL FUNDS, INC.
Net Assets,End of Period
(inthousands)
Ratio ofExpenses toAverage Net
Assets
Ratio of GrossExpenses toAverage Net
Assets
Ratio of NetInvestmentIncome to
Average NetAssets
PortfolioTurnover
Rate
$93,053 1.76% (c) —% 0.71% 114.7%
100,585 1.82 — 0.73 117.2
109,294 1.84 — 0.83 104.8
113,266 1.77 — 0.98 88.4
137,244 1.85 — 0.33 102.1
10,906 2.70 (c) — (0.20) 114.7
10,913 2.80 (c) — (0.25) 117.2
12,148 2.77 (c) — (0.07) 104.8
12,140 2.67 (c) — 0.09 88.4
13,166 2.79 (c) — (0.59) 102.1
129,223 1.65 1.69 (g) 0.83 114.7
146,376 1.69 1.89 (g) 0.85 117.2
164,299 1.72 1.91 (g) 0.96 104.8
170,695 1.71 1.85 (g) 1.03 88.4
205,507 1.83 1.90 (g) 0.32 102.1
2,023 1.37 (c) — 1.14 114.7
2,508 1.38 (c) — 1.24 117.2
2,310 1.38 (c) — 1.36 104.8
1,919 1.38 (c) — 1.94 88.4
10 1.38 (c),(f) — 0.01 (f) 102.1 (f)
1,752,175 1.23 — 1.30 114.7
1,537,280 1.24 1.24 (g) 1.35 117.2
1,219,393 1.25 1.25 (g) 1.45 104.8
1,042,690 1.27 1.27 (g) 1.51 88.4
1,048,491 1.28 1.28 (g) 0.91 102.1
(a) Calculated based on average shares outstanding during the period.(b) Total return is calculated without the front-end sales charge or contingent deferred sales charge, if applicable.(c) Reflects Manager's contractual expense limit.(d) Period from September 27, 2010, date shares first offered, through October 31, 2010.(e) Total return amounts have not been annualized.(f) Computed on an annualized basis.(g) Excludes expense reimbursement from Manager and/or Distributor.
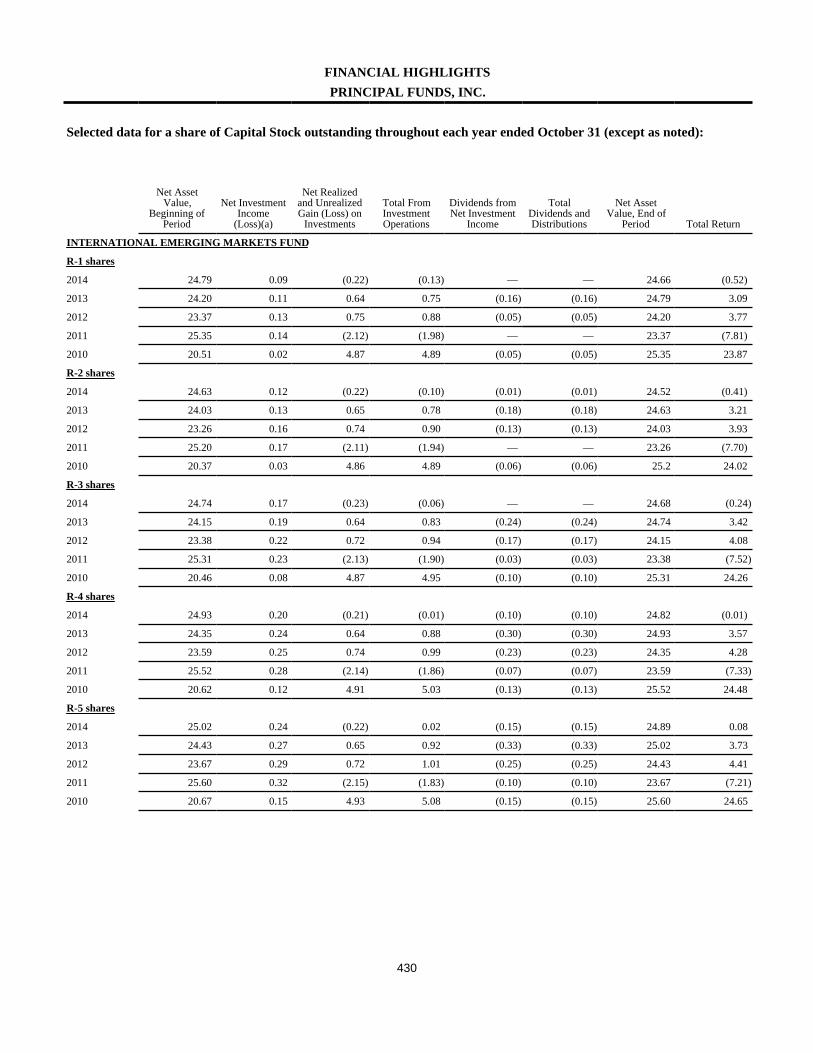
430
FINANCIAL HIGHLIGHTSPRINCIPAL FUNDS, INC.
Selected data for a share of Capital Stock outstanding throughout each year ended October 31 (except as noted):
Net AssetValue,
Beginning ofPeriod
Net InvestmentIncome
(Loss)(a)
Net Realizedand UnrealizedGain (Loss) on
Investments
Total FromInvestmentOperations
Dividends fromNet Investment
Income
TotalDividends andDistributions
Net AssetValue, End of
Period Total Return
INTERNATIONAL EMERGING MARKETS FUND
R-1 shares
2014 24.79 0.09 (0.22) (0.13) — — 24.66 (0.52)
2013 24.20 0.11 0.64 0.75 (0.16) (0.16) 24.79 3.09
2012 23.37 0.13 0.75 0.88 (0.05) (0.05) 24.20 3.77
2011 25.35 0.14 (2.12) (1.98) — — 23.37 (7.81)
2010 20.51 0.02 4.87 4.89 (0.05) (0.05) 25.35 23.87
R-2 shares
2014 24.63 0.12 (0.22) (0.10) (0.01) (0.01) 24.52 (0.41)
2013 24.03 0.13 0.65 0.78 (0.18) (0.18) 24.63 3.21
2012 23.26 0.16 0.74 0.90 (0.13) (0.13) 24.03 3.93
2011 25.20 0.17 (2.11) (1.94) — — 23.26 (7.70)
2010 20.37 0.03 4.86 4.89 (0.06) (0.06) 25.2 24.02
R-3 shares
2014 24.74 0.17 (0.23) (0.06) — — 24.68 (0.24)
2013 24.15 0.19 0.64 0.83 (0.24) (0.24) 24.74 3.42
2012 23.38 0.22 0.72 0.94 (0.17) (0.17) 24.15 4.08
2011 25.31 0.23 (2.13) (1.90) (0.03) (0.03) 23.38 (7.52)
2010 20.46 0.08 4.87 4.95 (0.10) (0.10) 25.31 24.26
R-4 shares
2014 24.93 0.20 (0.21) (0.01) (0.10) (0.10) 24.82 (0.01)
2013 24.35 0.24 0.64 0.88 (0.30) (0.30) 24.93 3.57
2012 23.59 0.25 0.74 0.99 (0.23) (0.23) 24.35 4.28
2011 25.52 0.28 (2.14) (1.86) (0.07) (0.07) 23.59 (7.33)
2010 20.62 0.12 4.91 5.03 (0.13) (0.13) 25.52 24.48
R-5 shares
2014 25.02 0.24 (0.22) 0.02 (0.15) (0.15) 24.89 0.08
2013 24.43 0.27 0.65 0.92 (0.33) (0.33) 25.02 3.73
2012 23.67 0.29 0.72 1.01 (0.25) (0.25) 24.43 4.41
2011 25.60 0.32 (2.15) (1.83) (0.10) (0.10) 23.67 (7.21)
2010 20.67 0.15 4.93 5.08 (0.15) (0.15) 25.60 24.65

431
FINANCIAL HIGHLIGHTS (CONTINUED)PRINCIPAL FUNDS, INC.
Net Assets,End of Period
(inthousands)
Ratio ofExpenses toAverage Net
Assets
Ratio of GrossExpenses toAverage Net
Assets
Ratio of NetInvestmentIncome to
Average NetAssets
PortfolioTurnover
Rate
$3,490 2.10% —% 0.38% 114.7%
4,467 2.11 — 0.43 117.2
5,362 2.11 — 0.56 104.8
6,019 2.13 — 0.56 88.4
10,335 2.14 — 0.07 102.1
5,878 1.97 — 0.50 114.7
6,610 1.98 — 0.53 117.2
9,010 1.98 — 0.69 104.8
10,638 2.00 — 0.67 88.4
13,900 2.01 — 0.15 102.1
14,835 1.79 — 0.68 114.7
19,344 1.80 — 0.77 117.2
37,931 1.80 — 0.94 104.8
32,869 1.82 — 0.89 88.4
42,741 1.83 — 0.38 102.1
14,415 1.60 — 0.84 114.7
20,951 1.61 — 0.98 117.2
21,453 1.61 — 1.05 104.8
24,222 1.63 — 1.08 88.4
31,507 1.64 — 0.54 102.1
29,903 1.48 — 0.97 114.7
33,812 1.49 — 1.08 117.2
37,421 1.49 — 1.21 104.8
33,187 1.51 — 1.25 88.4
37,391 1.52 — 0.65 102.1
(a) Calculated based on average shares outstanding during the period.(b) Total return is calculated without the front-end sales charge or contingent deferred sales charge, if applicable.(c) Reflects Manager's contractual expense limit.(d) Period from September 27, 2010, date shares first offered, through October 31, 2010.(e) Total return amounts have not been annualized.(f) Computed on an annualized basis.(g) Excludes expense reimbursement from Manager and/or Distributor.
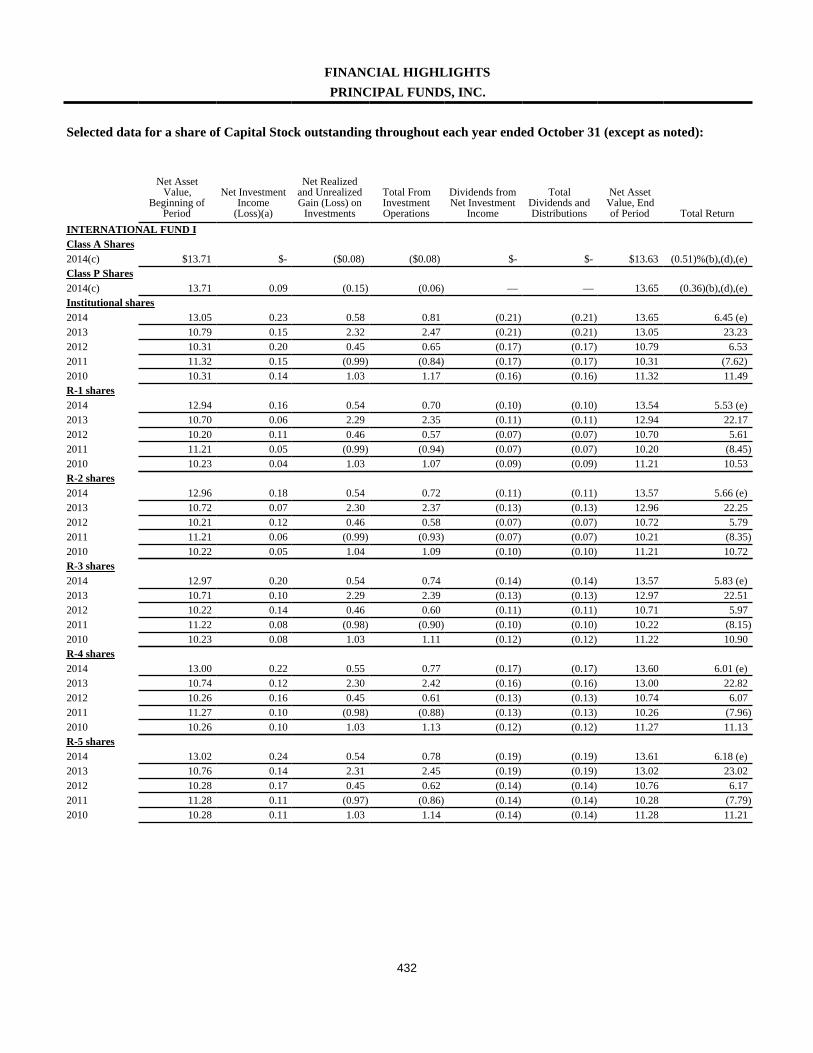
432
FINANCIAL HIGHLIGHTSPRINCIPAL FUNDS, INC.
Selected data for a share of Capital Stock outstanding throughout each year ended October 31 (except as noted):
Net AssetValue,
Beginning ofPeriod
Net InvestmentIncome
(Loss)(a)
Net Realizedand UnrealizedGain (Loss) on
Investments
Total FromInvestmentOperations
Dividends fromNet Investment
Income
TotalDividends andDistributions
Net AssetValue, Endof Period Total Return
INTERNATIONAL FUND IClass A Shares2014(c) $13.71 $- ($0.08) ($0.08) $- $- $13.63 (0.51)%(b),(d),(e)Class P Shares2014(c) 13.71 0.09 (0.15) (0.06) — — 13.65 (0.36)(b),(d),(e)Institutional shares2014 13.05 0.23 0.58 0.81 (0.21) (0.21) 13.65 6.45 (e)2013 10.79 0.15 2.32 2.47 (0.21) (0.21) 13.05 23.232012 10.31 0.20 0.45 0.65 (0.17) (0.17) 10.79 6.532011 11.32 0.15 (0.99) (0.84) (0.17) (0.17) 10.31 (7.62)2010 10.31 0.14 1.03 1.17 (0.16) (0.16) 11.32 11.49R-1 shares2014 12.94 0.16 0.54 0.70 (0.10) (0.10) 13.54 5.53 (e)2013 10.70 0.06 2.29 2.35 (0.11) (0.11) 12.94 22.172012 10.20 0.11 0.46 0.57 (0.07) (0.07) 10.70 5.612011 11.21 0.05 (0.99) (0.94) (0.07) (0.07) 10.20 (8.45)2010 10.23 0.04 1.03 1.07 (0.09) (0.09) 11.21 10.53R-2 shares2014 12.96 0.18 0.54 0.72 (0.11) (0.11) 13.57 5.66 (e)2013 10.72 0.07 2.30 2.37 (0.13) (0.13) 12.96 22.252012 10.21 0.12 0.46 0.58 (0.07) (0.07) 10.72 5.792011 11.21 0.06 (0.99) (0.93) (0.07) (0.07) 10.21 (8.35)2010 10.22 0.05 1.04 1.09 (0.10) (0.10) 11.21 10.72R-3 shares2014 12.97 0.20 0.54 0.74 (0.14) (0.14) 13.57 5.83 (e)2013 10.71 0.10 2.29 2.39 (0.13) (0.13) 12.97 22.512012 10.22 0.14 0.46 0.60 (0.11) (0.11) 10.71 5.972011 11.22 0.08 (0.98) (0.90) (0.10) (0.10) 10.22 (8.15)2010 10.23 0.08 1.03 1.11 (0.12) (0.12) 11.22 10.90R-4 shares2014 13.00 0.22 0.55 0.77 (0.17) (0.17) 13.60 6.01 (e)2013 10.74 0.12 2.30 2.42 (0.16) (0.16) 13.00 22.822012 10.26 0.16 0.45 0.61 (0.13) (0.13) 10.74 6.072011 11.27 0.10 (0.98) (0.88) (0.13) (0.13) 10.26 (7.96)2010 10.26 0.10 1.03 1.13 (0.12) (0.12) 11.27 11.13R-5 shares2014 13.02 0.24 0.54 0.78 (0.19) (0.19) 13.61 6.18 (e)2013 10.76 0.14 2.31 2.45 (0.19) (0.19) 13.02 23.022012 10.28 0.17 0.45 0.62 (0.14) (0.14) 10.76 6.172011 11.28 0.11 (0.97) (0.86) (0.14) (0.14) 10.28 (7.79)2010 10.28 0.11 1.03 1.14 (0.14) (0.14) 11.28 11.21
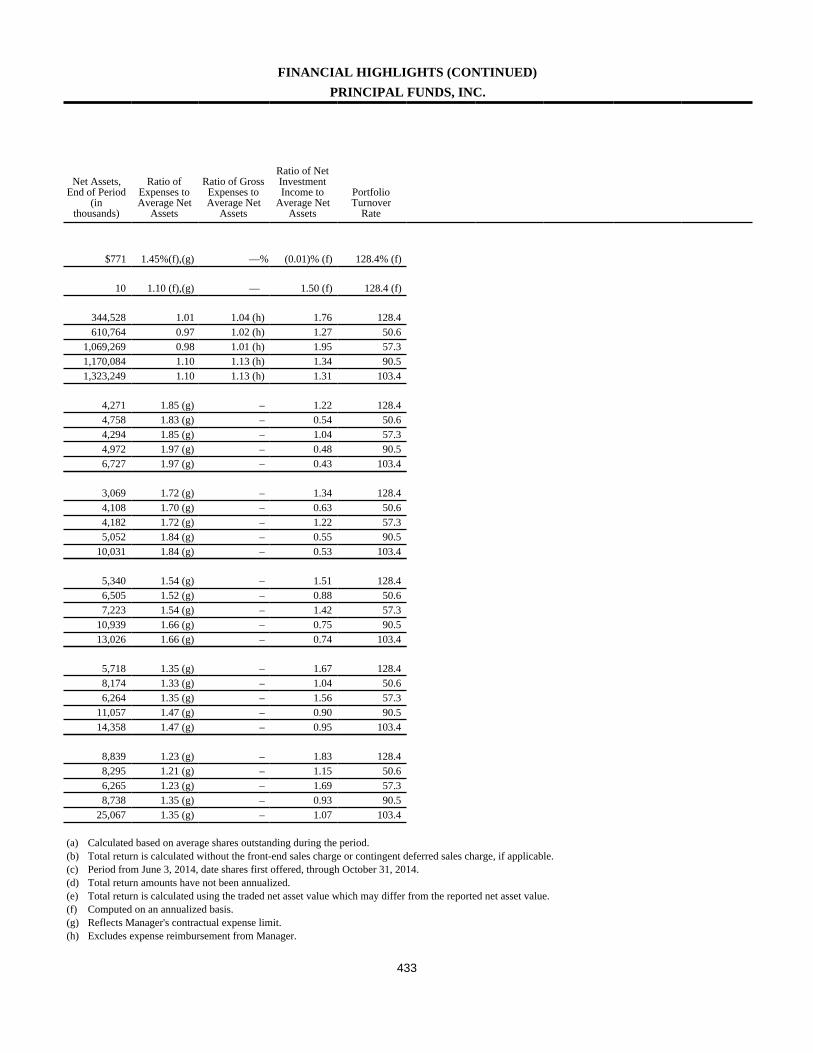
433
FINANCIAL HIGHLIGHTS (CONTINUED)PRINCIPAL FUNDS, INC.
Net Assets,End of Period
(inthousands)
Ratio ofExpenses toAverage Net
Assets
Ratio of GrossExpenses toAverage Net
Assets
Ratio of NetInvestmentIncome to
Average NetAssets
PortfolioTurnover
Rate
$771 1.45%(f),(g) —% (0.01)% (f) 128.4% (f)
10 1.10 (f),(g) — 1.50 (f) 128.4 (f)
344,528 1.01 1.04 (h) 1.76 128.4610,764 0.97 1.02 (h) 1.27 50.6
1,069,269 0.98 1.01 (h) 1.95 57.31,170,084 1.10 1.13 (h) 1.34 90.51,323,249 1.10 1.13 (h) 1.31 103.4
4,271 1.85 (g) – 1.22 128.44,758 1.83 (g) – 0.54 50.64,294 1.85 (g) – 1.04 57.34,972 1.97 (g) – 0.48 90.56,727 1.97 (g) – 0.43 103.4
3,069 1.72 (g) – 1.34 128.44,108 1.70 (g) – 0.63 50.64,182 1.72 (g) – 1.22 57.35,052 1.84 (g) – 0.55 90.5
10,031 1.84 (g) – 0.53 103.4
5,340 1.54 (g) – 1.51 128.46,505 1.52 (g) – 0.88 50.67,223 1.54 (g) – 1.42 57.3
10,939 1.66 (g) – 0.75 90.513,026 1.66 (g) – 0.74 103.4
5,718 1.35 (g) – 1.67 128.48,174 1.33 (g) – 1.04 50.66,264 1.35 (g) – 1.56 57.3
11,057 1.47 (g) – 0.90 90.514,358 1.47 (g) – 0.95 103.4
8,839 1.23 (g) – 1.83 128.48,295 1.21 (g) – 1.15 50.66,265 1.23 (g) – 1.69 57.38,738 1.35 (g) – 0.93 90.5
25,067 1.35 (g) – 1.07 103.4
(a) Calculated based on average shares outstanding during the period.(b) Total return is calculated without the front-end sales charge or contingent deferred sales charge, if applicable.(c) Period from June 3, 2014, date shares first offered, through October 31, 2014.(d) Total return amounts have not been annualized.(e) Total return is calculated using the traded net asset value which may differ from the reported net asset value.(f) Computed on an annualized basis.(g) Reflects Manager's contractual expense limit.(h) Excludes expense reimbursement from Manager.
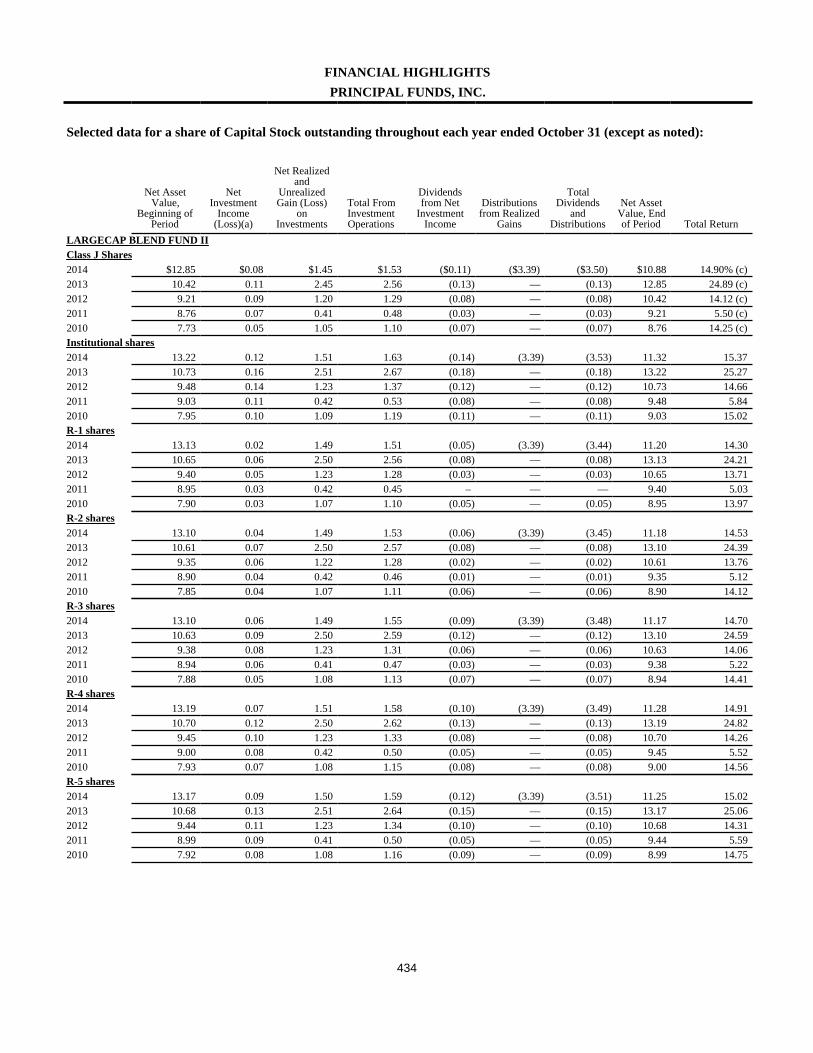
434
FINANCIAL HIGHLIGHTSPRINCIPAL FUNDS, INC.
Selected data for a share of Capital Stock outstanding throughout each year ended October 31 (except as noted):
Net AssetValue,
Beginning ofPeriod
NetInvestment
Income(Loss)(a)
Net Realizedand
UnrealizedGain (Loss)
onInvestments
Total FromInvestmentOperations
Dividendsfrom Net
InvestmentIncome
Distributionsfrom Realized
Gains
TotalDividends
andDistributions
Net AssetValue, Endof Period Total Return
LARGECAP BLEND FUND IIClass J Shares2014 $12.85 $0.08 $1.45 $1.53 ($0.11) ($3.39) ($3.50) $10.88 14.90% (c)2013 10.42 0.11 2.45 2.56 (0.13) — (0.13) 12.85 24.89 (c)2012 9.21 0.09 1.20 1.29 (0.08) — (0.08) 10.42 14.12 (c)2011 8.76 0.07 0.41 0.48 (0.03) — (0.03) 9.21 5.50 (c)2010 7.73 0.05 1.05 1.10 (0.07) — (0.07) 8.76 14.25 (c)Institutional shares2014 13.22 0.12 1.51 1.63 (0.14) (3.39) (3.53) 11.32 15.372013 10.73 0.16 2.51 2.67 (0.18) — (0.18) 13.22 25.272012 9.48 0.14 1.23 1.37 (0.12) — (0.12) 10.73 14.662011 9.03 0.11 0.42 0.53 (0.08) — (0.08) 9.48 5.842010 7.95 0.10 1.09 1.19 (0.11) — (0.11) 9.03 15.02R-1 shares2014 13.13 0.02 1.49 1.51 (0.05) (3.39) (3.44) 11.20 14.302013 10.65 0.06 2.50 2.56 (0.08) — (0.08) 13.13 24.212012 9.40 0.05 1.23 1.28 (0.03) — (0.03) 10.65 13.712011 8.95 0.03 0.42 0.45 – — — 9.40 5.032010 7.90 0.03 1.07 1.10 (0.05) — (0.05) 8.95 13.97R-2 shares2014 13.10 0.04 1.49 1.53 (0.06) (3.39) (3.45) 11.18 14.532013 10.61 0.07 2.50 2.57 (0.08) — (0.08) 13.10 24.392012 9.35 0.06 1.22 1.28 (0.02) — (0.02) 10.61 13.762011 8.90 0.04 0.42 0.46 (0.01) — (0.01) 9.35 5.122010 7.85 0.04 1.07 1.11 (0.06) — (0.06) 8.90 14.12R-3 shares2014 13.10 0.06 1.49 1.55 (0.09) (3.39) (3.48) 11.17 14.702013 10.63 0.09 2.50 2.59 (0.12) — (0.12) 13.10 24.592012 9.38 0.08 1.23 1.31 (0.06) — (0.06) 10.63 14.062011 8.94 0.06 0.41 0.47 (0.03) — (0.03) 9.38 5.222010 7.88 0.05 1.08 1.13 (0.07) — (0.07) 8.94 14.41R-4 shares2014 13.19 0.07 1.51 1.58 (0.10) (3.39) (3.49) 11.28 14.912013 10.70 0.12 2.50 2.62 (0.13) — (0.13) 13.19 24.822012 9.45 0.10 1.23 1.33 (0.08) — (0.08) 10.70 14.262011 9.00 0.08 0.42 0.50 (0.05) — (0.05) 9.45 5.522010 7.93 0.07 1.08 1.15 (0.08) — (0.08) 9.00 14.56R-5 shares2014 13.17 0.09 1.50 1.59 (0.12) (3.39) (3.51) 11.25 15.022013 10.68 0.13 2.51 2.64 (0.15) — (0.15) 13.17 25.062012 9.44 0.11 1.23 1.34 (0.10) — (0.10) 10.68 14.312011 8.99 0.09 0.41 0.50 (0.05) — (0.05) 9.44 5.592010 7.92 0.08 1.08 1.16 (0.09) — (0.09) 8.99 14.75
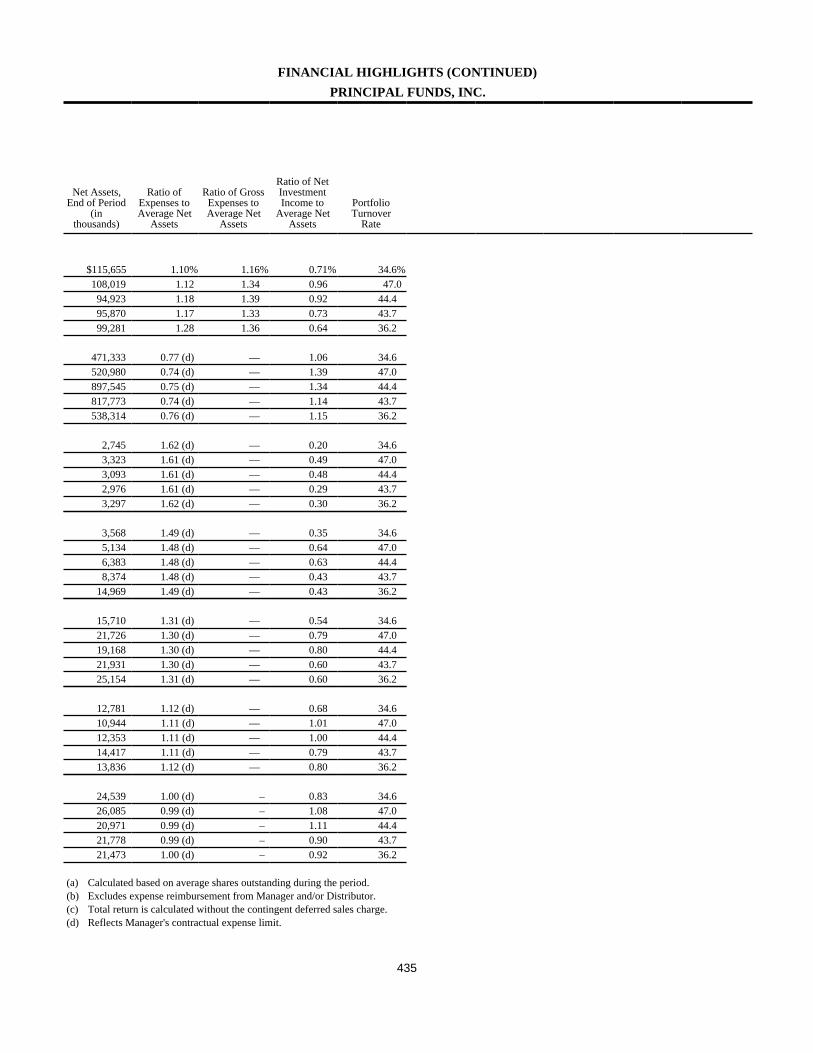
435
FINANCIAL HIGHLIGHTS (CONTINUED)PRINCIPAL FUNDS, INC.
Net Assets,End of Period
(inthousands)
Ratio ofExpenses toAverage Net
Assets
Ratio of GrossExpenses toAverage Net
Assets
Ratio of NetInvestmentIncome to
Average NetAssets
PortfolioTurnover
Rate
$115,655 1.10% 1.16% 0.71% 34.6%108,019 1.12 1.34 0.96 47.094,923 1.18 1.39 0.92 44.495,870 1.17 1.33 0.73 43.799,281 1.28 1.36 0.64 36.2
471,333 0.77 (d) — 1.06 34.6520,980 0.74 (d) — 1.39 47.0897,545 0.75 (d) — 1.34 44.4817,773 0.74 (d) — 1.14 43.7538,314 0.76 (d) — 1.15 36.2
2,745 1.62 (d) — 0.20 34.63,323 1.61 (d) — 0.49 47.03,093 1.61 (d) — 0.48 44.42,976 1.61 (d) — 0.29 43.73,297 1.62 (d) — 0.30 36.2
3,568 1.49 (d) — 0.35 34.65,134 1.48 (d) — 0.64 47.06,383 1.48 (d) — 0.63 44.48,374 1.48 (d) — 0.43 43.7
14,969 1.49 (d) — 0.43 36.2
15,710 1.31 (d) — 0.54 34.621,726 1.30 (d) — 0.79 47.019,168 1.30 (d) — 0.80 44.421,931 1.30 (d) — 0.60 43.725,154 1.31 (d) — 0.60 36.2
12,781 1.12 (d) — 0.68 34.610,944 1.11 (d) — 1.01 47.012,353 1.11 (d) — 1.00 44.414,417 1.11 (d) — 0.79 43.713,836 1.12 (d) — 0.80 36.2
24,539 1.00 (d) – 0.83 34.626,085 0.99 (d) – 1.08 47.020,971 0.99 (d) – 1.11 44.421,778 0.99 (d) – 0.90 43.721,473 1.00 (d) – 0.92 36.2
(a) Calculated based on average shares outstanding during the period.(b) Excludes expense reimbursement from Manager and/or Distributor.(c) Total return is calculated without the contingent deferred sales charge.(d) Reflects Manager's contractual expense limit.
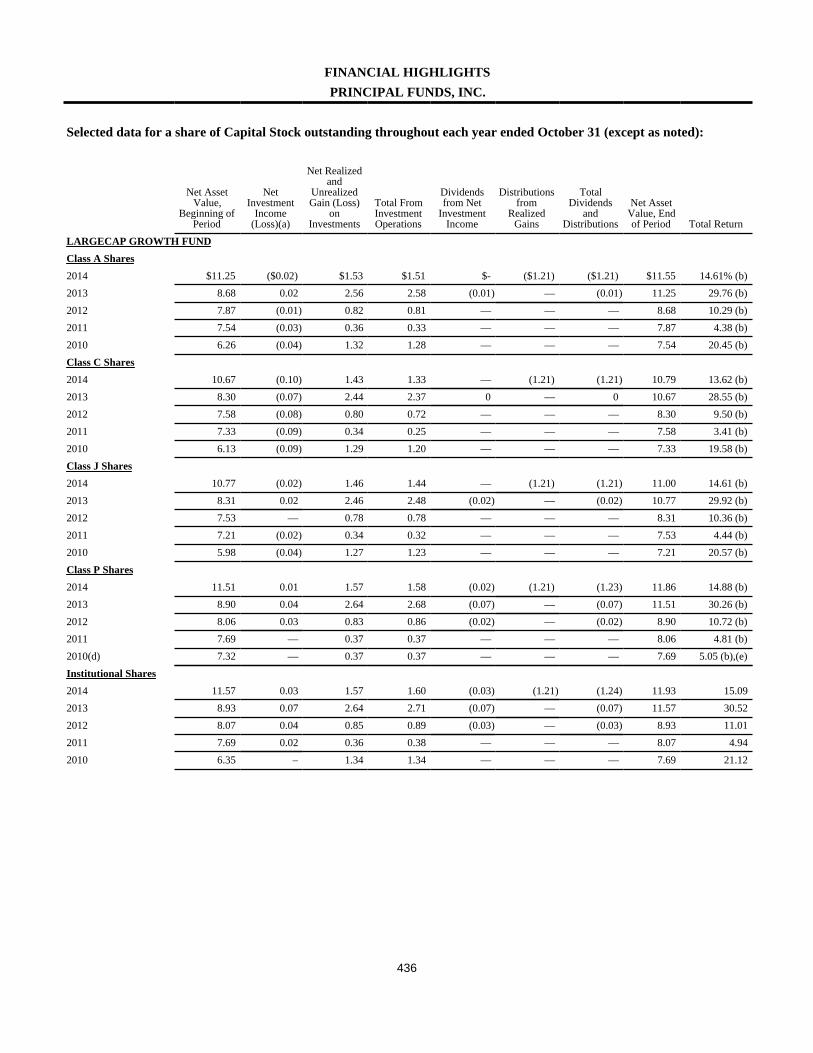
436
FINANCIAL HIGHLIGHTSPRINCIPAL FUNDS, INC.
Selected data for a share of Capital Stock outstanding throughout each year ended October 31 (except as noted):
Net AssetValue,
Beginning ofPeriod
NetInvestment
Income(Loss)(a)
Net Realizedand
UnrealizedGain (Loss)
onInvestments
Total FromInvestmentOperations
Dividendsfrom Net
InvestmentIncome
Distributionsfrom
RealizedGains
TotalDividends
andDistributions
Net AssetValue, Endof Period Total Return
LARGECAP GROWTH FUNDClass A Shares2014 $11.25 ($0.02) $1.53 $1.51 $- ($1.21) ($1.21) $11.55 14.61% (b)2013 8.68 0.02 2.56 2.58 (0.01) — (0.01) 11.25 29.76 (b)2012 7.87 (0.01) 0.82 0.81 — — — 8.68 10.29 (b)2011 7.54 (0.03) 0.36 0.33 — — — 7.87 4.38 (b)2010 6.26 (0.04) 1.32 1.28 — — — 7.54 20.45 (b)Class C Shares2014 10.67 (0.10) 1.43 1.33 — (1.21) (1.21) 10.79 13.62 (b)2013 8.30 (0.07) 2.44 2.37 0 — 0 10.67 28.55 (b)2012 7.58 (0.08) 0.80 0.72 — — — 8.30 9.50 (b)2011 7.33 (0.09) 0.34 0.25 — — — 7.58 3.41 (b)2010 6.13 (0.09) 1.29 1.20 — — — 7.33 19.58 (b)Class J Shares2014 10.77 (0.02) 1.46 1.44 — (1.21) (1.21) 11.00 14.61 (b)2013 8.31 0.02 2.46 2.48 (0.02) — (0.02) 10.77 29.92 (b)2012 7.53 — 0.78 0.78 — — — 8.31 10.36 (b)2011 7.21 (0.02) 0.34 0.32 — — — 7.53 4.44 (b)2010 5.98 (0.04) 1.27 1.23 — — — 7.21 20.57 (b)Class P Shares2014 11.51 0.01 1.57 1.58 (0.02) (1.21) (1.23) 11.86 14.88 (b)2013 8.90 0.04 2.64 2.68 (0.07) — (0.07) 11.51 30.26 (b)2012 8.06 0.03 0.83 0.86 (0.02) — (0.02) 8.90 10.72 (b)2011 7.69 — 0.37 0.37 — — — 8.06 4.81 (b)2010(d) 7.32 — 0.37 0.37 — — — 7.69 5.05 (b),(e)Institutional Shares2014 11.57 0.03 1.57 1.60 (0.03) (1.21) (1.24) 11.93 15.092013 8.93 0.07 2.64 2.71 (0.07) — (0.07) 11.57 30.522012 8.07 0.04 0.85 0.89 (0.03) — (0.03) 8.93 11.012011 7.69 0.02 0.36 0.38 — — — 8.07 4.942010 6.35 – 1.34 1.34 — — — 7.69 21.12
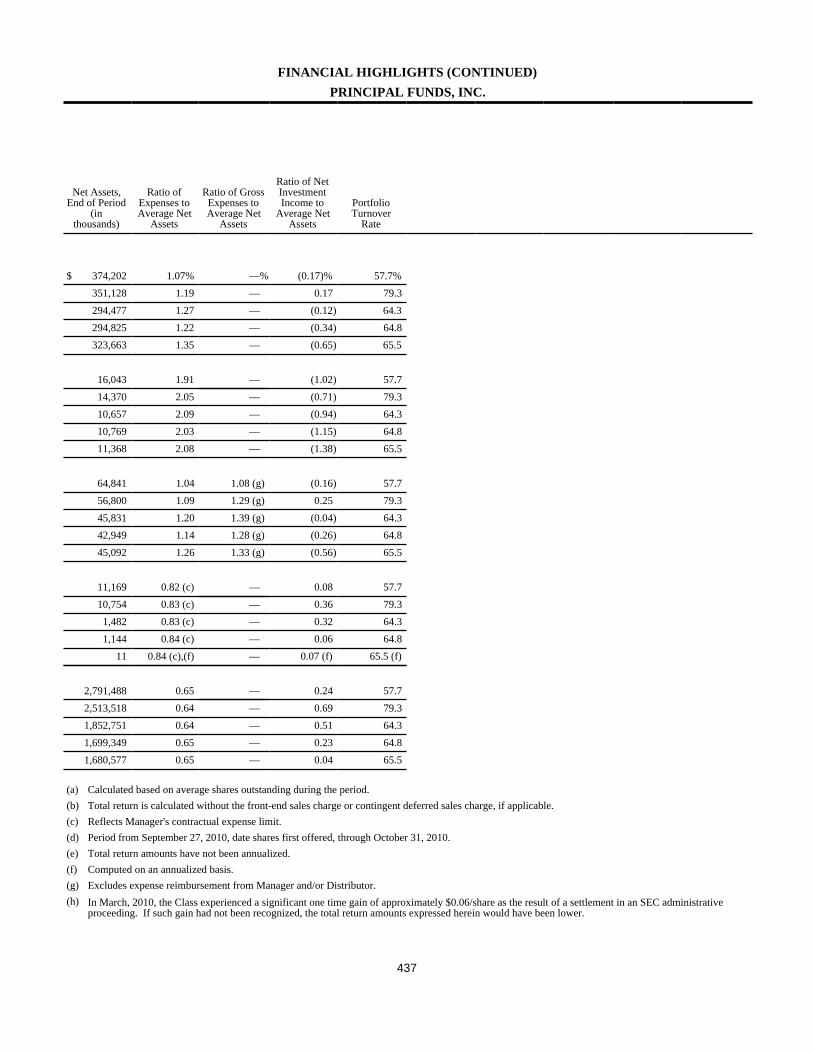
437
FINANCIAL HIGHLIGHTS (CONTINUED)PRINCIPAL FUNDS, INC.
Net Assets,End of Period
(inthousands)
Ratio ofExpenses toAverage Net
Assets
Ratio of GrossExpenses toAverage Net
Assets
Ratio of NetInvestmentIncome to
Average NetAssets
PortfolioTurnover
Rate
$ 374,202 1.07% —% (0.17)% 57.7%351,128 1.19 — 0.17 79.3294,477 1.27 — (0.12) 64.3294,825 1.22 — (0.34) 64.8323,663 1.35 — (0.65) 65.5
16,043 1.91 — (1.02) 57.714,370 2.05 — (0.71) 79.310,657 2.09 — (0.94) 64.310,769 2.03 — (1.15) 64.811,368 2.08 — (1.38) 65.5
64,841 1.04 1.08 (g) (0.16) 57.756,800 1.09 1.29 (g) 0.25 79.345,831 1.20 1.39 (g) (0.04) 64.342,949 1.14 1.28 (g) (0.26) 64.845,092 1.26 1.33 (g) (0.56) 65.5
11,169 0.82 (c) — 0.08 57.710,754 0.83 (c) — 0.36 79.3
1,482 0.83 (c) — 0.32 64.31,144 0.84 (c) — 0.06 64.8
11 0.84 (c),(f) — 0.07 (f) 65.5 (f)
2,791,488 0.65 — 0.24 57.72,513,518 0.64 — 0.69 79.31,852,751 0.64 — 0.51 64.31,699,349 0.65 — 0.23 64.81,680,577 0.65 — 0.04 65.5
(a) Calculated based on average shares outstanding during the period.(b) Total return is calculated without the front-end sales charge or contingent deferred sales charge, if applicable.(c) Reflects Manager's contractual expense limit.(d) Period from September 27, 2010, date shares first offered, through October 31, 2010.(e) Total return amounts have not been annualized.(f) Computed on an annualized basis.(g) Excludes expense reimbursement from Manager and/or Distributor.(h) In March, 2010, the Class experienced a significant one time gain of approximately $0.06/share as the result of a settlement in an SEC administrative
proceeding. If such gain had not been recognized, the total return amounts expressed herein would have been lower.
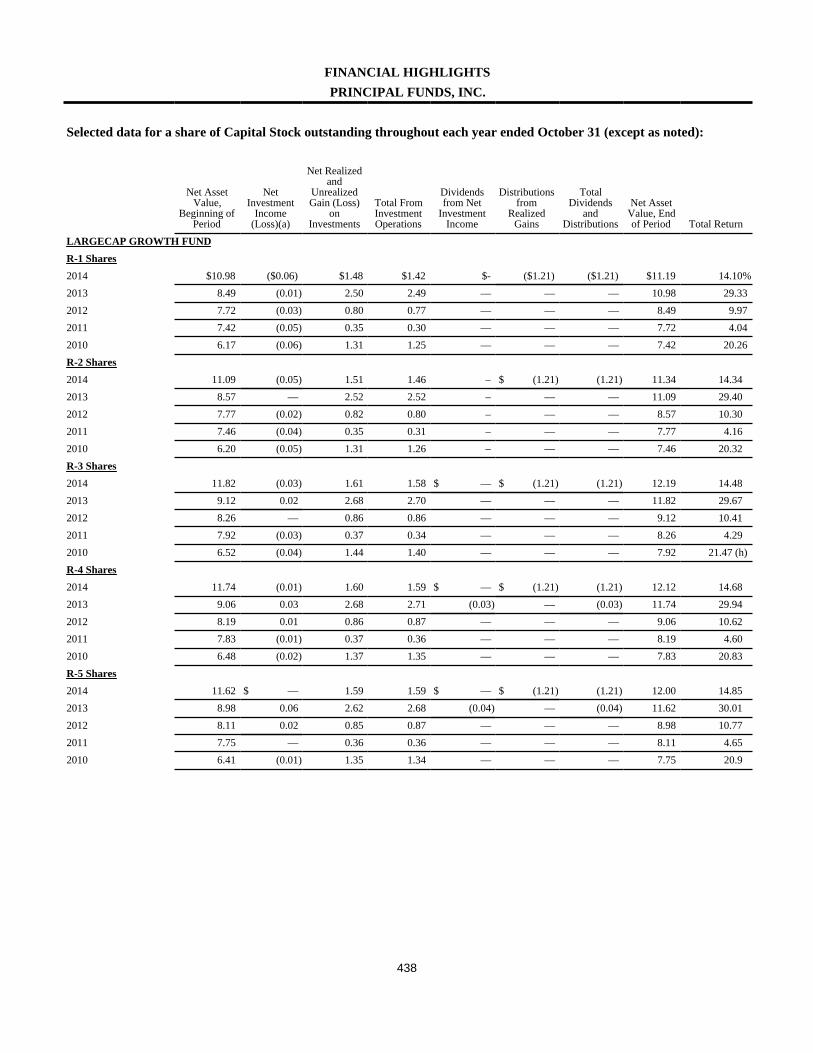
438
FINANCIAL HIGHLIGHTSPRINCIPAL FUNDS, INC.
Selected data for a share of Capital Stock outstanding throughout each year ended October 31 (except as noted):
Net AssetValue,
Beginning ofPeriod
NetInvestment
Income(Loss)(a)
Net Realizedand
UnrealizedGain (Loss)
onInvestments
Total FromInvestmentOperations
Dividendsfrom Net
InvestmentIncome
Distributionsfrom
RealizedGains
TotalDividends
andDistributions
Net AssetValue, Endof Period Total Return
LARGECAP GROWTH FUNDR-1 Shares2014 $10.98 ($0.06) $1.48 $1.42 $- ($1.21) ($1.21) $11.19 14.10%2013 8.49 (0.01) 2.50 2.49 — — — 10.98 29.332012 7.72 (0.03) 0.80 0.77 — — — 8.49 9.972011 7.42 (0.05) 0.35 0.30 — — — 7.72 4.042010 6.17 (0.06) 1.31 1.25 — — — 7.42 20.26R-2 Shares2014 11.09 (0.05) 1.51 1.46 – $ (1.21) (1.21) 11.34 14.342013 8.57 — 2.52 2.52 – — — 11.09 29.402012 7.77 (0.02) 0.82 0.80 – — — 8.57 10.302011 7.46 (0.04) 0.35 0.31 – — — 7.77 4.162010 6.20 (0.05) 1.31 1.26 – — — 7.46 20.32R-3 Shares2014 11.82 (0.03) 1.61 1.58 $ — $ (1.21) (1.21) 12.19 14.482013 9.12 0.02 2.68 2.70 — — — 11.82 29.672012 8.26 — 0.86 0.86 — — — 9.12 10.412011 7.92 (0.03) 0.37 0.34 — — — 8.26 4.292010 6.52 (0.04) 1.44 1.40 — — — 7.92 21.47 (h)R-4 Shares2014 11.74 (0.01) 1.60 1.59 $ — $ (1.21) (1.21) 12.12 14.682013 9.06 0.03 2.68 2.71 (0.03) — (0.03) 11.74 29.942012 8.19 0.01 0.86 0.87 — — — 9.06 10.622011 7.83 (0.01) 0.37 0.36 — — — 8.19 4.602010 6.48 (0.02) 1.37 1.35 — — — 7.83 20.83R-5 Shares2014 11.62 $ — 1.59 1.59 $ — $ (1.21) (1.21) 12.00 14.852013 8.98 0.06 2.62 2.68 (0.04) — (0.04) 11.62 30.012012 8.11 0.02 0.85 0.87 — — — 8.98 10.772011 7.75 — 0.36 0.36 — — — 8.11 4.652010 6.41 (0.01) 1.35 1.34 — — — 7.75 20.9
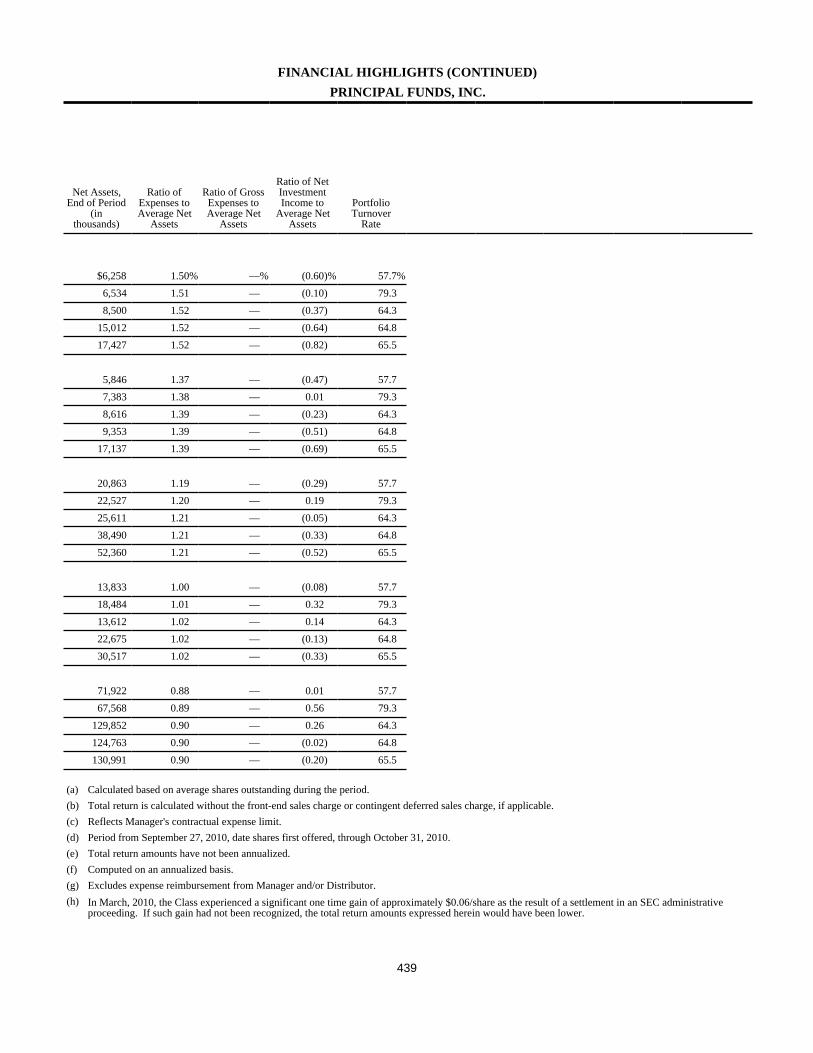
439
FINANCIAL HIGHLIGHTS (CONTINUED)PRINCIPAL FUNDS, INC.
Net Assets,End of Period
(inthousands)
Ratio ofExpenses toAverage Net
Assets
Ratio of GrossExpenses toAverage Net
Assets
Ratio of NetInvestmentIncome to
Average NetAssets
PortfolioTurnover
Rate
$6,258 1.50% —% (0.60)% 57.7%6,534 1.51 — (0.10) 79.38,500 1.52 — (0.37) 64.3
15,012 1.52 — (0.64) 64.817,427 1.52 — (0.82) 65.5
5,846 1.37 — (0.47) 57.77,383 1.38 — 0.01 79.38,616 1.39 — (0.23) 64.39,353 1.39 — (0.51) 64.8
17,137 1.39 — (0.69) 65.5
20,863 1.19 — (0.29) 57.722,527 1.20 — 0.19 79.325,611 1.21 — (0.05) 64.338,490 1.21 — (0.33) 64.852,360 1.21 — (0.52) 65.5
13,833 1.00 — (0.08) 57.718,484 1.01 — 0.32 79.313,612 1.02 — 0.14 64.322,675 1.02 — (0.13) 64.830,517 1.02 — (0.33) 65.5
71,922 0.88 — 0.01 57.767,568 0.89 — 0.56 79.3
129,852 0.90 — 0.26 64.3124,763 0.90 — (0.02) 64.8130,991 0.90 — (0.20) 65.5
(a) Calculated based on average shares outstanding during the period.(b) Total return is calculated without the front-end sales charge or contingent deferred sales charge, if applicable.(c) Reflects Manager's contractual expense limit.(d) Period from September 27, 2010, date shares first offered, through October 31, 2010.(e) Total return amounts have not been annualized.(f) Computed on an annualized basis.(g) Excludes expense reimbursement from Manager and/or Distributor.(h) In March, 2010, the Class experienced a significant one time gain of approximately $0.06/share as the result of a settlement in an SEC administrative
proceeding. If such gain had not been recognized, the total return amounts expressed herein would have been lower.
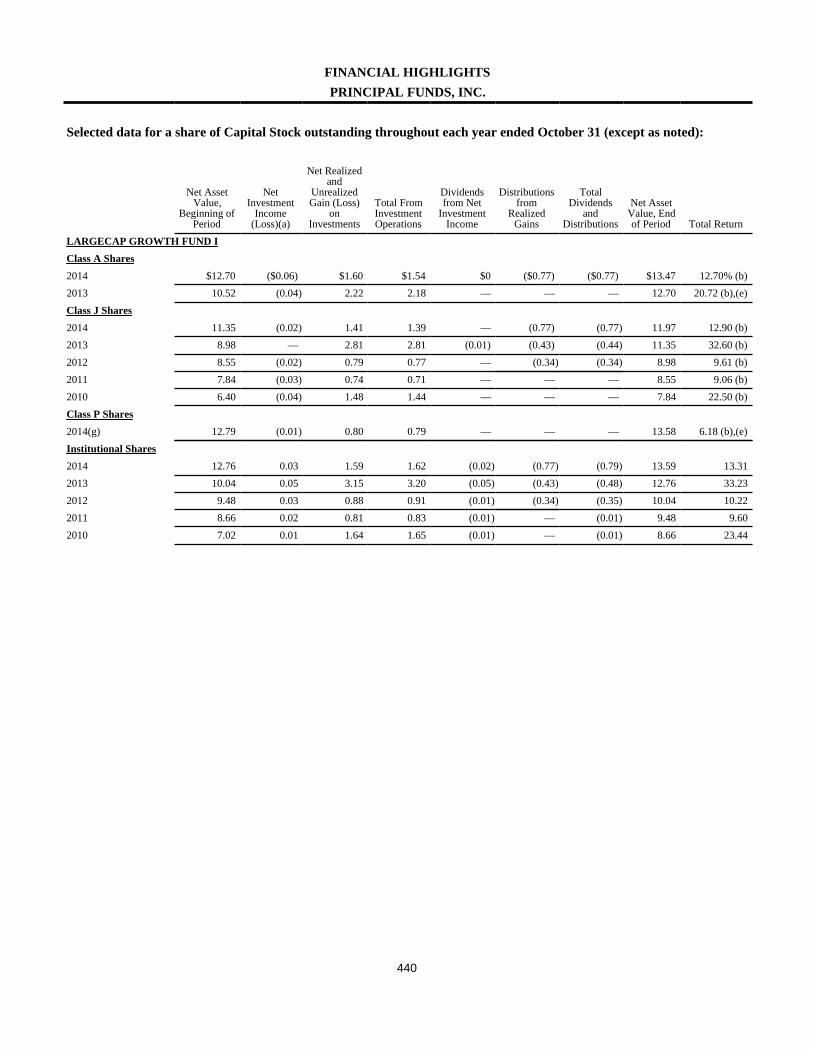
440
FINANCIAL HIGHLIGHTSPRINCIPAL FUNDS, INC.
Selected data for a share of Capital Stock outstanding throughout each year ended October 31 (except as noted):
Net AssetValue,
Beginning ofPeriod
NetInvestment
Income(Loss)(a)
Net Realizedand
UnrealizedGain (Loss)
onInvestments
Total FromInvestmentOperations
Dividendsfrom Net
InvestmentIncome
Distributionsfrom
RealizedGains
TotalDividends
andDistributions
Net AssetValue, Endof Period Total Return
LARGECAP GROWTH FUND IClass A Shares2014 $12.70 ($0.06) $1.60 $1.54 $0 ($0.77) ($0.77) $13.47 12.70% (b)2013 10.52 (0.04) 2.22 2.18 — — — 12.70 20.72 (b),(e)Class J Shares2014 11.35 (0.02) 1.41 1.39 — (0.77) (0.77) 11.97 12.90 (b)2013 8.98 — 2.81 2.81 (0.01) (0.43) (0.44) 11.35 32.60 (b)2012 8.55 (0.02) 0.79 0.77 — (0.34) (0.34) 8.98 9.61 (b)2011 7.84 (0.03) 0.74 0.71 — — — 8.55 9.06 (b)2010 6.40 (0.04) 1.48 1.44 — — — 7.84 22.50 (b)Class P Shares2014(g) 12.79 (0.01) 0.80 0.79 — — — 13.58 6.18 (b),(e)Institutional Shares2014 12.76 0.03 1.59 1.62 (0.02) (0.77) (0.79) 13.59 13.312013 10.04 0.05 3.15 3.20 (0.05) (0.43) (0.48) 12.76 33.232012 9.48 0.03 0.88 0.91 (0.01) (0.34) (0.35) 10.04 10.222011 8.66 0.02 0.81 0.83 (0.01) — (0.01) 9.48 9.602010 7.02 0.01 1.64 1.65 (0.01) — (0.01) 8.66 23.44
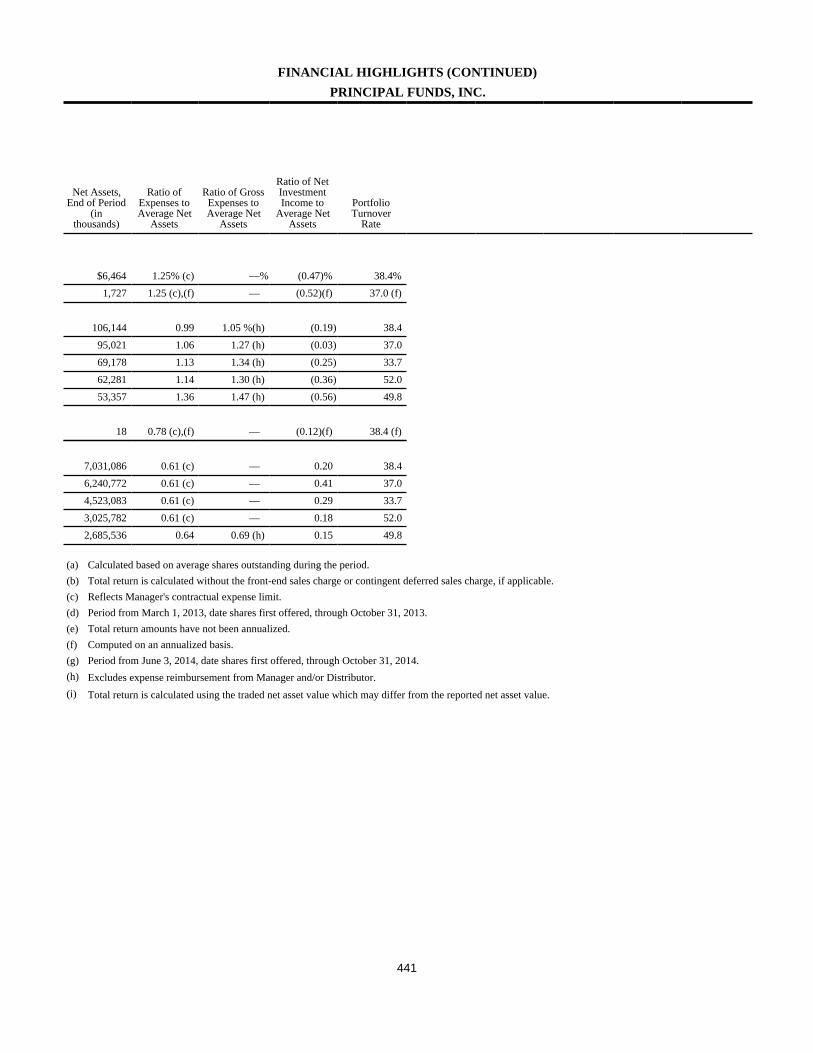
441
FINANCIAL HIGHLIGHTS (CONTINUED)PRINCIPAL FUNDS, INC.
Net Assets,End of Period
(inthousands)
Ratio ofExpenses toAverage Net
Assets
Ratio of GrossExpenses toAverage Net
Assets
Ratio of NetInvestmentIncome to
Average NetAssets
PortfolioTurnover
Rate
$6,464 1.25% (c) —% (0.47)% 38.4%1,727 1.25 (c),(f) — (0.52)(f) 37.0 (f)
106,144 0.99 1.05 %(h) (0.19) 38.495,021 1.06 1.27 (h) (0.03) 37.069,178 1.13 1.34 (h) (0.25) 33.762,281 1.14 1.30 (h) (0.36) 52.053,357 1.36 1.47 (h) (0.56) 49.8
18 0.78 (c),(f) — (0.12)(f) 38.4 (f)
7,031,086 0.61 (c) — 0.20 38.46,240,772 0.61 (c) — 0.41 37.04,523,083 0.61 (c) — 0.29 33.73,025,782 0.61 (c) — 0.18 52.02,685,536 0.64 0.69 (h) 0.15 49.8
(a) Calculated based on average shares outstanding during the period.(b) Total return is calculated without the front-end sales charge or contingent deferred sales charge, if applicable.(c) Reflects Manager's contractual expense limit.(d) Period from March 1, 2013, date shares first offered, through October 31, 2013.(e) Total return amounts have not been annualized.(f) Computed on an annualized basis.(g) Period from June 3, 2014, date shares first offered, through October 31, 2014.(h) Excludes expense reimbursement from Manager and/or Distributor.(i) Total return is calculated using the traded net asset value which may differ from the reported net asset value.
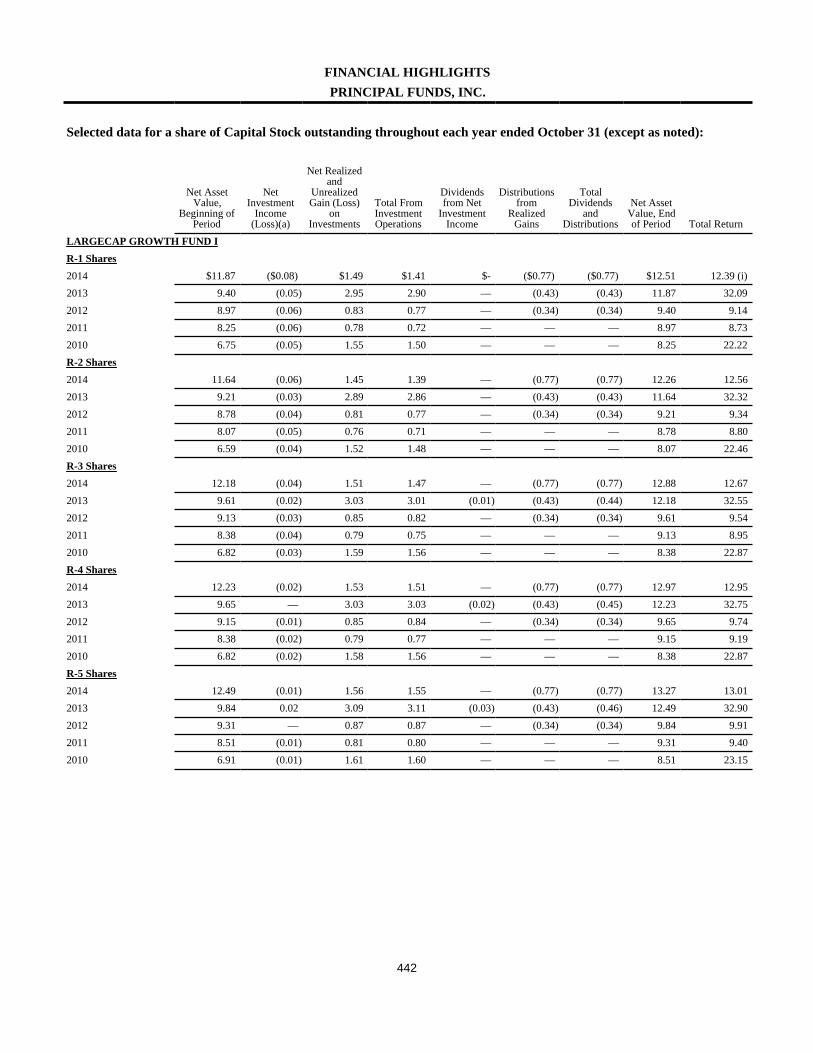
442
FINANCIAL HIGHLIGHTSPRINCIPAL FUNDS, INC.
Selected data for a share of Capital Stock outstanding throughout each year ended October 31 (except as noted):
Net AssetValue,
Beginning ofPeriod
NetInvestment
Income(Loss)(a)
Net Realizedand
UnrealizedGain (Loss)
onInvestments
Total FromInvestmentOperations
Dividendsfrom Net
InvestmentIncome
Distributionsfrom
RealizedGains
TotalDividends
andDistributions
Net AssetValue, Endof Period Total Return
LARGECAP GROWTH FUND IR-1 Shares2014 $11.87 ($0.08) $1.49 $1.41 $- ($0.77) ($0.77) $12.51 12.39 (i)2013 9.40 (0.05) 2.95 2.90 — (0.43) (0.43) 11.87 32.092012 8.97 (0.06) 0.83 0.77 — (0.34) (0.34) 9.40 9.142011 8.25 (0.06) 0.78 0.72 — — — 8.97 8.732010 6.75 (0.05) 1.55 1.50 — — — 8.25 22.22R-2 Shares2014 11.64 (0.06) 1.45 1.39 — (0.77) (0.77) 12.26 12.562013 9.21 (0.03) 2.89 2.86 — (0.43) (0.43) 11.64 32.322012 8.78 (0.04) 0.81 0.77 — (0.34) (0.34) 9.21 9.342011 8.07 (0.05) 0.76 0.71 — — — 8.78 8.802010 6.59 (0.04) 1.52 1.48 — — — 8.07 22.46R-3 Shares2014 12.18 (0.04) 1.51 1.47 — (0.77) (0.77) 12.88 12.672013 9.61 (0.02) 3.03 3.01 (0.01) (0.43) (0.44) 12.18 32.552012 9.13 (0.03) 0.85 0.82 — (0.34) (0.34) 9.61 9.542011 8.38 (0.04) 0.79 0.75 — — — 9.13 8.952010 6.82 (0.03) 1.59 1.56 — — — 8.38 22.87R-4 Shares2014 12.23 (0.02) 1.53 1.51 — (0.77) (0.77) 12.97 12.952013 9.65 — 3.03 3.03 (0.02) (0.43) (0.45) 12.23 32.752012 9.15 (0.01) 0.85 0.84 — (0.34) (0.34) 9.65 9.742011 8.38 (0.02) 0.79 0.77 — — — 9.15 9.192010 6.82 (0.02) 1.58 1.56 — — — 8.38 22.87R-5 Shares2014 12.49 (0.01) 1.56 1.55 — (0.77) (0.77) 13.27 13.012013 9.84 0.02 3.09 3.11 (0.03) (0.43) (0.46) 12.49 32.902012 9.31 — 0.87 0.87 — (0.34) (0.34) 9.84 9.912011 8.51 (0.01) 0.81 0.80 — — — 9.31 9.402010 6.91 (0.01) 1.61 1.60 — — — 8.51 23.15
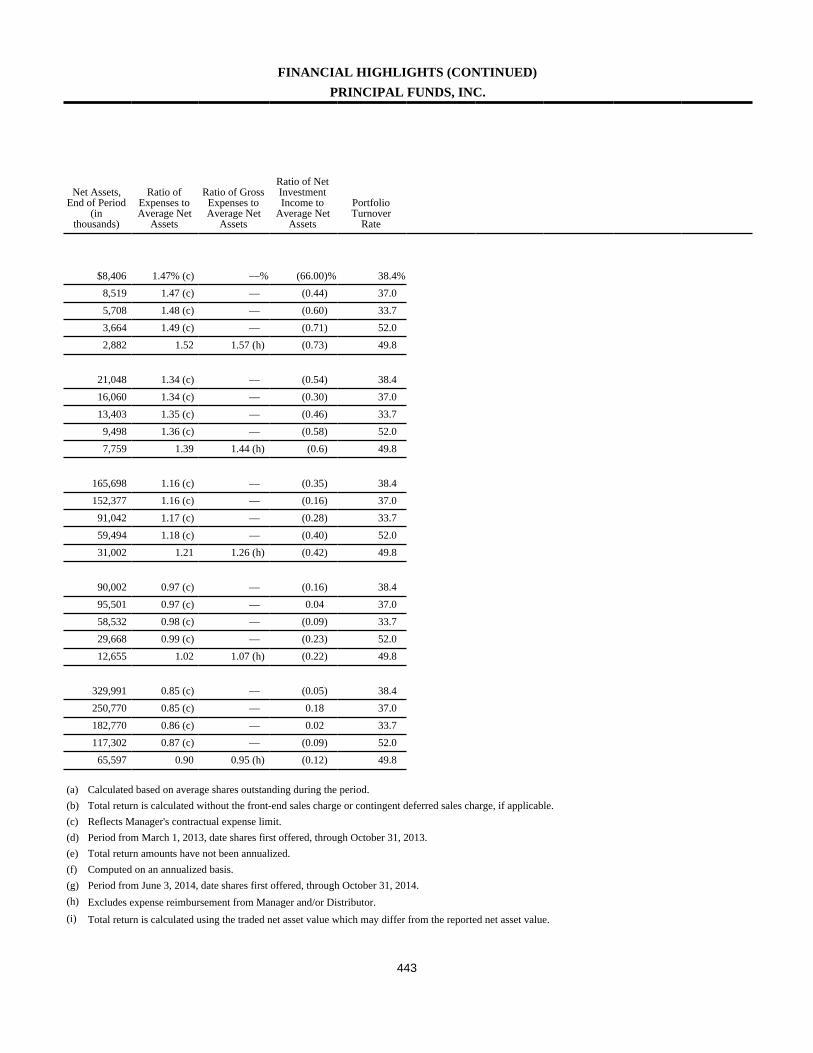
443
FINANCIAL HIGHLIGHTS (CONTINUED)PRINCIPAL FUNDS, INC.
Net Assets,End of Period
(inthousands)
Ratio ofExpenses toAverage Net
Assets
Ratio of GrossExpenses toAverage Net
Assets
Ratio of NetInvestmentIncome to
Average NetAssets
PortfolioTurnover
Rate
$8,406 1.47% (c) —% (66.00)% 38.4%8,519 1.47 (c) — (0.44) 37.05,708 1.48 (c) — (0.60) 33.73,664 1.49 (c) — (0.71) 52.02,882 1.52 1.57 (h) (0.73) 49.8
21,048 1.34 (c) — (0.54) 38.416,060 1.34 (c) — (0.30) 37.013,403 1.35 (c) — (0.46) 33.7
9,498 1.36 (c) — (0.58) 52.07,759 1.39 1.44 (h) (0.6) 49.8
165,698 1.16 (c) — (0.35) 38.4152,377 1.16 (c) — (0.16) 37.091,042 1.17 (c) — (0.28) 33.759,494 1.18 (c) — (0.40) 52.031,002 1.21 1.26 (h) (0.42) 49.8
90,002 0.97 (c) — (0.16) 38.495,501 0.97 (c) — 0.04 37.058,532 0.98 (c) — (0.09) 33.729,668 0.99 (c) — (0.23) 52.012,655 1.02 1.07 (h) (0.22) 49.8
329,991 0.85 (c) — (0.05) 38.4250,770 0.85 (c) — 0.18 37.0182,770 0.86 (c) — 0.02 33.7117,302 0.87 (c) — (0.09) 52.065,597 0.90 0.95 (h) (0.12) 49.8
(a) Calculated based on average shares outstanding during the period.(b) Total return is calculated without the front-end sales charge or contingent deferred sales charge, if applicable.(c) Reflects Manager's contractual expense limit.(d) Period from March 1, 2013, date shares first offered, through October 31, 2013.(e) Total return amounts have not been annualized.(f) Computed on an annualized basis.(g) Period from June 3, 2014, date shares first offered, through October 31, 2014.(h) Excludes expense reimbursement from Manager and/or Distributor.(i) Total return is calculated using the traded net asset value which may differ from the reported net asset value.
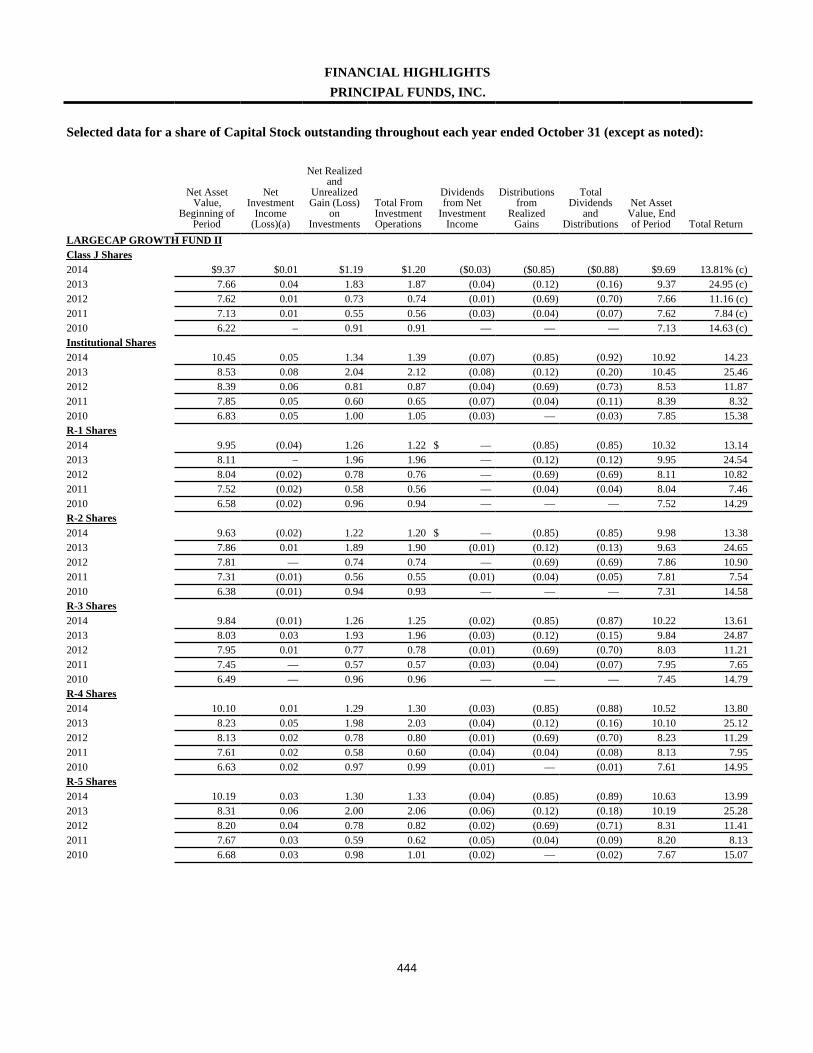
444
FINANCIAL HIGHLIGHTSPRINCIPAL FUNDS, INC.
Selected data for a share of Capital Stock outstanding throughout each year ended October 31 (except as noted):
Net AssetValue,
Beginning ofPeriod
NetInvestment
Income(Loss)(a)
Net Realizedand
UnrealizedGain (Loss)
onInvestments
Total FromInvestmentOperations
Dividendsfrom Net
InvestmentIncome
Distributionsfrom
RealizedGains
TotalDividends
andDistributions
Net AssetValue, Endof Period Total Return
LARGECAP GROWTH FUND IIClass J Shares2014 $9.37 $0.01 $1.19 $1.20 ($0.03) ($0.85) ($0.88) $9.69 13.81% (c)2013 7.66 0.04 1.83 1.87 (0.04) (0.12) (0.16) 9.37 24.95 (c)2012 7.62 0.01 0.73 0.74 (0.01) (0.69) (0.70) 7.66 11.16 (c)2011 7.13 0.01 0.55 0.56 (0.03) (0.04) (0.07) 7.62 7.84 (c)2010 6.22 – 0.91 0.91 — — — 7.13 14.63 (c)Institutional Shares2014 10.45 0.05 1.34 1.39 (0.07) (0.85) (0.92) 10.92 14.232013 8.53 0.08 2.04 2.12 (0.08) (0.12) (0.20) 10.45 25.462012 8.39 0.06 0.81 0.87 (0.04) (0.69) (0.73) 8.53 11.872011 7.85 0.05 0.60 0.65 (0.07) (0.04) (0.11) 8.39 8.322010 6.83 0.05 1.00 1.05 (0.03) — (0.03) 7.85 15.38R-1 Shares2014 9.95 (0.04) 1.26 1.22 $ — (0.85) (0.85) 10.32 13.142013 8.11 – 1.96 1.96 — (0.12) (0.12) 9.95 24.542012 8.04 (0.02) 0.78 0.76 — (0.69) (0.69) 8.11 10.822011 7.52 (0.02) 0.58 0.56 — (0.04) (0.04) 8.04 7.462010 6.58 (0.02) 0.96 0.94 — — — 7.52 14.29R-2 Shares2014 9.63 (0.02) 1.22 1.20 $ — (0.85) (0.85) 9.98 13.382013 7.86 0.01 1.89 1.90 (0.01) (0.12) (0.13) 9.63 24.652012 7.81 — 0.74 0.74 — (0.69) (0.69) 7.86 10.902011 7.31 (0.01) 0.56 0.55 (0.01) (0.04) (0.05) 7.81 7.542010 6.38 (0.01) 0.94 0.93 — — — 7.31 14.58R-3 Shares2014 9.84 (0.01) 1.26 1.25 (0.02) (0.85) (0.87) 10.22 13.612013 8.03 0.03 1.93 1.96 (0.03) (0.12) (0.15) 9.84 24.872012 7.95 0.01 0.77 0.78 (0.01) (0.69) (0.70) 8.03 11.212011 7.45 — 0.57 0.57 (0.03) (0.04) (0.07) 7.95 7.652010 6.49 — 0.96 0.96 — — — 7.45 14.79R-4 Shares2014 10.10 0.01 1.29 1.30 (0.03) (0.85) (0.88) 10.52 13.802013 8.23 0.05 1.98 2.03 (0.04) (0.12) (0.16) 10.10 25.122012 8.13 0.02 0.78 0.80 (0.01) (0.69) (0.70) 8.23 11.292011 7.61 0.02 0.58 0.60 (0.04) (0.04) (0.08) 8.13 7.952010 6.63 0.02 0.97 0.99 (0.01) — (0.01) 7.61 14.95R-5 Shares2014 10.19 0.03 1.30 1.33 (0.04) (0.85) (0.89) 10.63 13.992013 8.31 0.06 2.00 2.06 (0.06) (0.12) (0.18) 10.19 25.282012 8.20 0.04 0.78 0.82 (0.02) (0.69) (0.71) 8.31 11.412011 7.67 0.03 0.59 0.62 (0.05) (0.04) (0.09) 8.20 8.132010 6.68 0.03 0.98 1.01 (0.02) — (0.02) 7.67 15.07
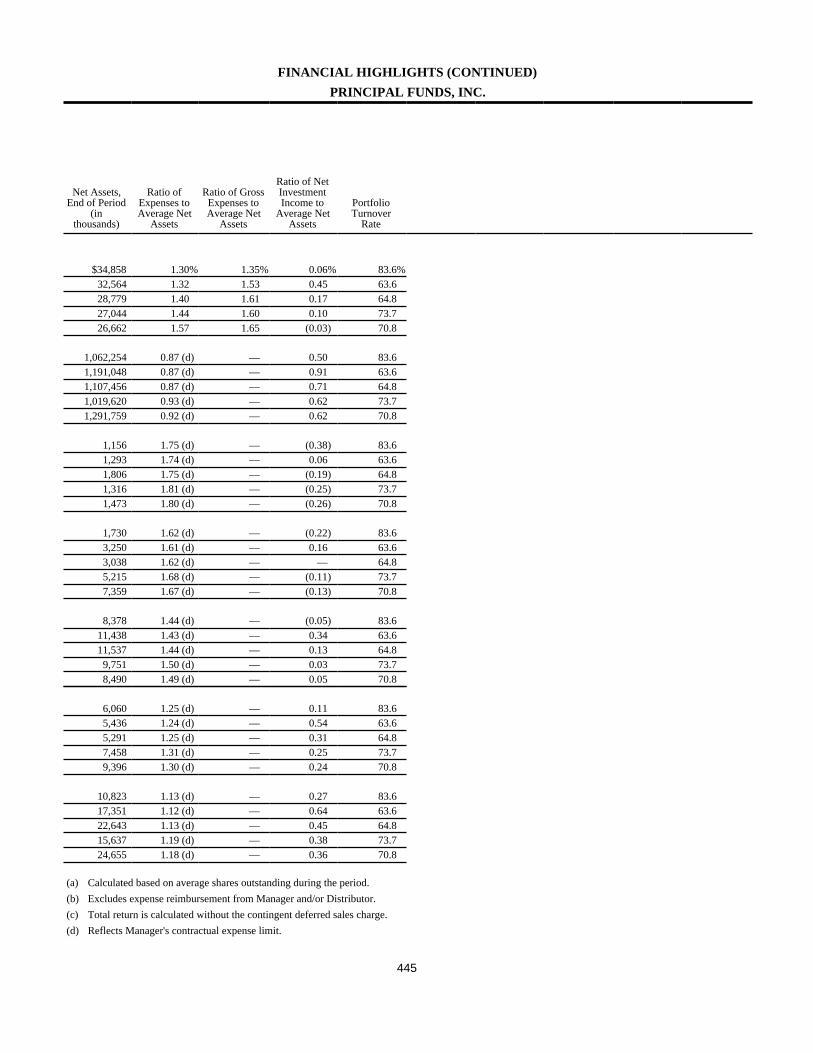
445
FINANCIAL HIGHLIGHTS (CONTINUED)PRINCIPAL FUNDS, INC.
Net Assets,End of Period
(inthousands)
Ratio ofExpenses toAverage Net
Assets
Ratio of GrossExpenses toAverage Net
Assets
Ratio of NetInvestmentIncome to
Average NetAssets
PortfolioTurnover
Rate
$34,858 1.30% 1.35% 0.06% 83.6%32,564 1.32 1.53 0.45 63.628,779 1.40 1.61 0.17 64.827,044 1.44 1.60 0.10 73.726,662 1.57 1.65 (0.03) 70.8
1,062,254 0.87 (d) — 0.50 83.61,191,048 0.87 (d) — 0.91 63.61,107,456 0.87 (d) — 0.71 64.81,019,620 0.93 (d) — 0.62 73.71,291,759 0.92 (d) — 0.62 70.8
1,156 1.75 (d) — (0.38) 83.61,293 1.74 (d) — 0.06 63.61,806 1.75 (d) — (0.19) 64.81,316 1.81 (d) — (0.25) 73.71,473 1.80 (d) — (0.26) 70.8
1,730 1.62 (d) — (0.22) 83.63,250 1.61 (d) — 0.16 63.63,038 1.62 (d) — — 64.85,215 1.68 (d) — (0.11) 73.77,359 1.67 (d) — (0.13) 70.8
8,378 1.44 (d) — (0.05) 83.611,438 1.43 (d) — 0.34 63.611,537 1.44 (d) — 0.13 64.8
9,751 1.50 (d) — 0.03 73.78,490 1.49 (d) — 0.05 70.8
6,060 1.25 (d) — 0.11 83.65,436 1.24 (d) — 0.54 63.65,291 1.25 (d) — 0.31 64.87,458 1.31 (d) — 0.25 73.79,396 1.30 (d) — 0.24 70.8
10,823 1.13 (d) — 0.27 83.617,351 1.12 (d) — 0.64 63.622,643 1.13 (d) — 0.45 64.815,637 1.19 (d) — 0.38 73.724,655 1.18 (d) — 0.36 70.8
(a) Calculated based on average shares outstanding during the period.(b) Excludes expense reimbursement from Manager and/or Distributor.(c) Total return is calculated without the contingent deferred sales charge.(d) Reflects Manager's contractual expense limit.
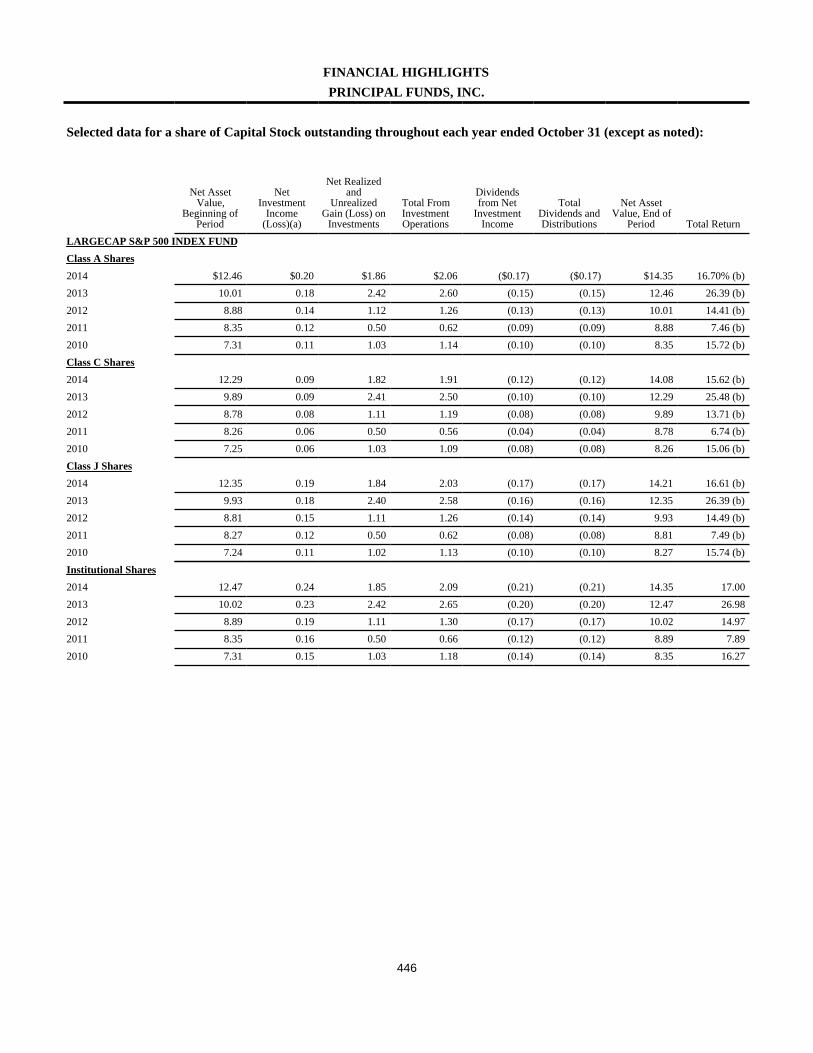
446
FINANCIAL HIGHLIGHTSPRINCIPAL FUNDS, INC.
Selected data for a share of Capital Stock outstanding throughout each year ended October 31 (except as noted):
Net AssetValue,
Beginning ofPeriod
NetInvestment
Income(Loss)(a)
Net Realizedand
UnrealizedGain (Loss) on
Investments
Total FromInvestmentOperations
Dividendsfrom Net
InvestmentIncome
TotalDividends andDistributions
Net AssetValue, End of
Period Total ReturnLARGECAP S&P 500 INDEX FUNDClass A Shares2014 $12.46 $0.20 $1.86 $2.06 ($0.17) ($0.17) $14.35 16.70% (b)2013 10.01 0.18 2.42 2.60 (0.15) (0.15) 12.46 26.39 (b)2012 8.88 0.14 1.12 1.26 (0.13) (0.13) 10.01 14.41 (b)2011 8.35 0.12 0.50 0.62 (0.09) (0.09) 8.88 7.46 (b)2010 7.31 0.11 1.03 1.14 (0.10) (0.10) 8.35 15.72 (b)Class C Shares2014 12.29 0.09 1.82 1.91 (0.12) (0.12) 14.08 15.62 (b)2013 9.89 0.09 2.41 2.50 (0.10) (0.10) 12.29 25.48 (b)2012 8.78 0.08 1.11 1.19 (0.08) (0.08) 9.89 13.71 (b)2011 8.26 0.06 0.50 0.56 (0.04) (0.04) 8.78 6.74 (b)2010 7.25 0.06 1.03 1.09 (0.08) (0.08) 8.26 15.06 (b)Class J Shares2014 12.35 0.19 1.84 2.03 (0.17) (0.17) 14.21 16.61 (b)2013 9.93 0.18 2.40 2.58 (0.16) (0.16) 12.35 26.39 (b)2012 8.81 0.15 1.11 1.26 (0.14) (0.14) 9.93 14.49 (b)2011 8.27 0.12 0.50 0.62 (0.08) (0.08) 8.81 7.49 (b)2010 7.24 0.11 1.02 1.13 (0.10) (0.10) 8.27 15.74 (b)Institutional Shares2014 12.47 0.24 1.85 2.09 (0.21) (0.21) 14.35 17.002013 10.02 0.23 2.42 2.65 (0.20) (0.20) 12.47 26.982012 8.89 0.19 1.11 1.30 (0.17) (0.17) 10.02 14.972011 8.35 0.16 0.50 0.66 (0.12) (0.12) 8.89 7.892010 7.31 0.15 1.03 1.18 (0.14) (0.14) 8.35 16.27
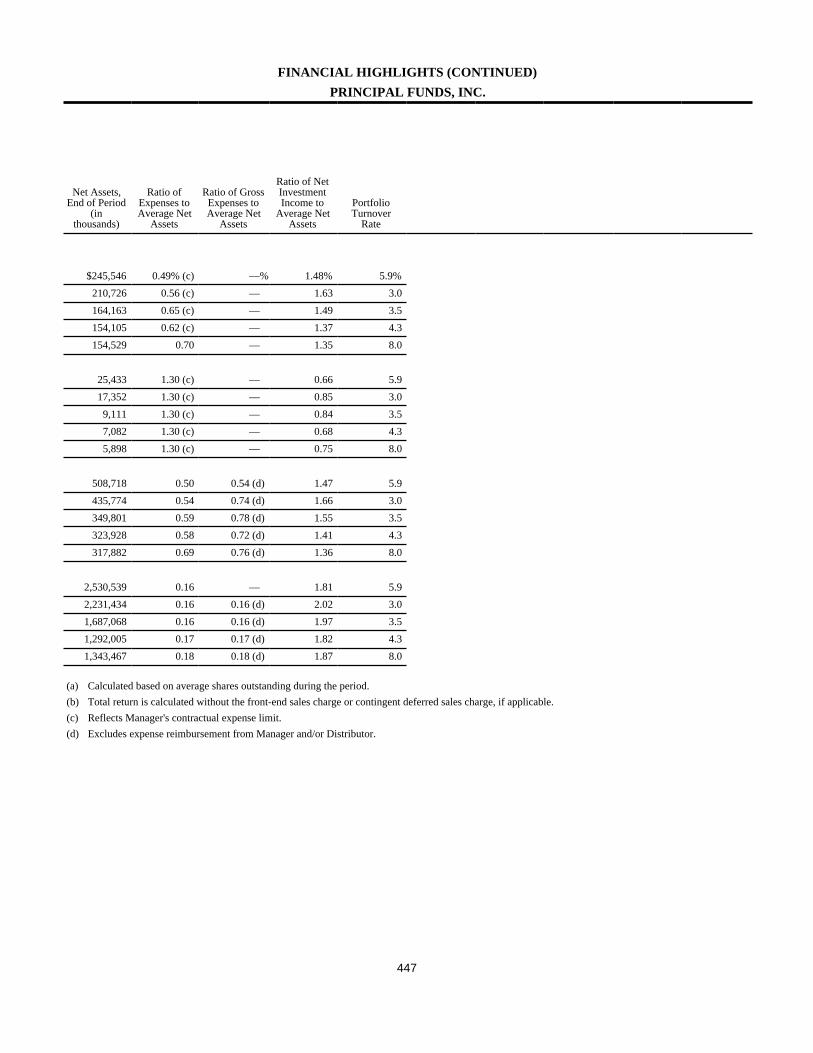
447
FINANCIAL HIGHLIGHTS (CONTINUED)PRINCIPAL FUNDS, INC.
Net Assets,End of Period
(inthousands)
Ratio ofExpenses toAverage Net
Assets
Ratio of GrossExpenses toAverage Net
Assets
Ratio of NetInvestmentIncome to
Average NetAssets
PortfolioTurnover
Rate
$245,546 0.49% (c) —% 1.48% 5.9%210,726 0.56 (c) — 1.63 3.0164,163 0.65 (c) — 1.49 3.5154,105 0.62 (c) — 1.37 4.3154,529 0.70 — 1.35 8.0
25,433 1.30 (c) — 0.66 5.917,352 1.30 (c) — 0.85 3.0
9,111 1.30 (c) — 0.84 3.57,082 1.30 (c) — 0.68 4.35,898 1.30 (c) — 0.75 8.0
508,718 0.50 0.54 (d) 1.47 5.9435,774 0.54 0.74 (d) 1.66 3.0349,801 0.59 0.78 (d) 1.55 3.5323,928 0.58 0.72 (d) 1.41 4.3317,882 0.69 0.76 (d) 1.36 8.0
2,530,539 0.16 — 1.81 5.92,231,434 0.16 0.16 (d) 2.02 3.01,687,068 0.16 0.16 (d) 1.97 3.51,292,005 0.17 0.17 (d) 1.82 4.31,343,467 0.18 0.18 (d) 1.87 8.0
(a) Calculated based on average shares outstanding during the period.(b) Total return is calculated without the front-end sales charge or contingent deferred sales charge, if applicable.(c) Reflects Manager's contractual expense limit.(d) Excludes expense reimbursement from Manager and/or Distributor.
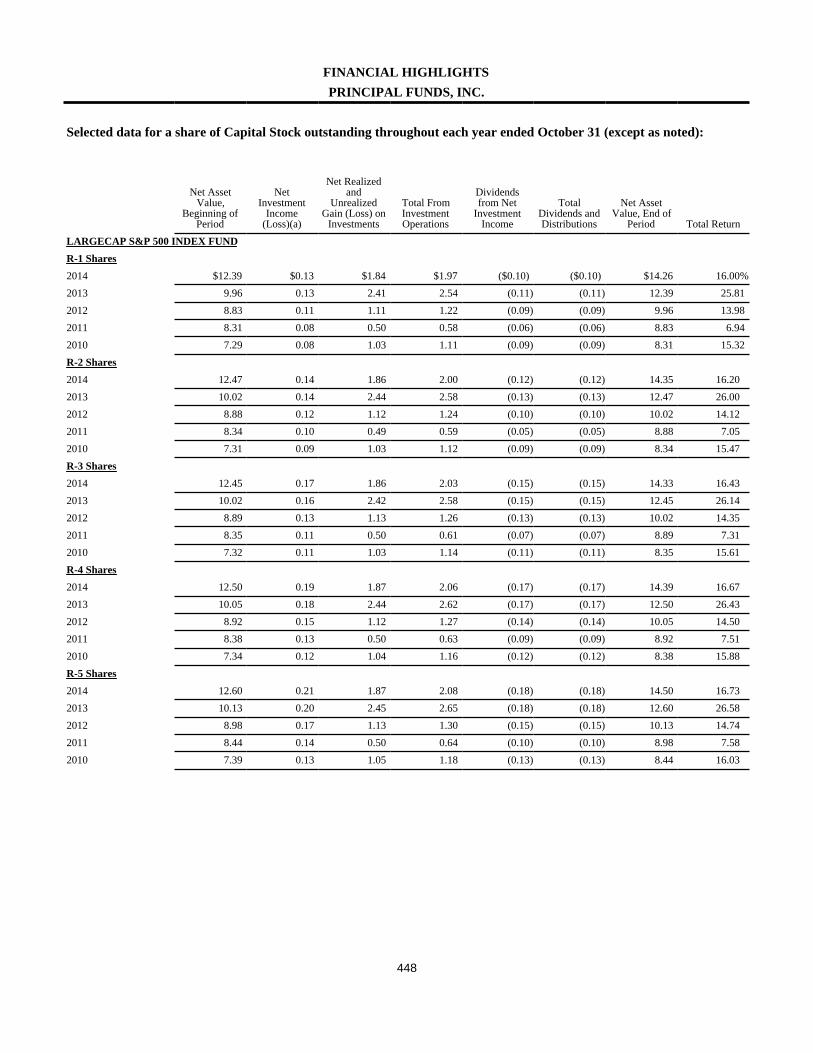
448
FINANCIAL HIGHLIGHTSPRINCIPAL FUNDS, INC.
Selected data for a share of Capital Stock outstanding throughout each year ended October 31 (except as noted):
Net AssetValue,
Beginning ofPeriod
NetInvestment
Income(Loss)(a)
Net Realizedand
UnrealizedGain (Loss) on
Investments
Total FromInvestmentOperations
Dividendsfrom Net
InvestmentIncome
TotalDividends andDistributions
Net AssetValue, End of
Period Total ReturnLARGECAP S&P 500 INDEX FUNDR-1 Shares2014 $12.39 $0.13 $1.84 $1.97 ($0.10) ($0.10) $14.26 16.00%2013 9.96 0.13 2.41 2.54 (0.11) (0.11) 12.39 25.812012 8.83 0.11 1.11 1.22 (0.09) (0.09) 9.96 13.982011 8.31 0.08 0.50 0.58 (0.06) (0.06) 8.83 6.942010 7.29 0.08 1.03 1.11 (0.09) (0.09) 8.31 15.32R-2 Shares2014 12.47 0.14 1.86 2.00 (0.12) (0.12) 14.35 16.202013 10.02 0.14 2.44 2.58 (0.13) (0.13) 12.47 26.002012 8.88 0.12 1.12 1.24 (0.10) (0.10) 10.02 14.122011 8.34 0.10 0.49 0.59 (0.05) (0.05) 8.88 7.052010 7.31 0.09 1.03 1.12 (0.09) (0.09) 8.34 15.47R-3 Shares2014 12.45 0.17 1.86 2.03 (0.15) (0.15) 14.33 16.432013 10.02 0.16 2.42 2.58 (0.15) (0.15) 12.45 26.142012 8.89 0.13 1.13 1.26 (0.13) (0.13) 10.02 14.352011 8.35 0.11 0.50 0.61 (0.07) (0.07) 8.89 7.312010 7.32 0.11 1.03 1.14 (0.11) (0.11) 8.35 15.61R-4 Shares2014 12.50 0.19 1.87 2.06 (0.17) (0.17) 14.39 16.672013 10.05 0.18 2.44 2.62 (0.17) (0.17) 12.50 26.432012 8.92 0.15 1.12 1.27 (0.14) (0.14) 10.05 14.502011 8.38 0.13 0.50 0.63 (0.09) (0.09) 8.92 7.512010 7.34 0.12 1.04 1.16 (0.12) (0.12) 8.38 15.88R-5 Shares2014 12.60 0.21 1.87 2.08 (0.18) (0.18) 14.50 16.732013 10.13 0.20 2.45 2.65 (0.18) (0.18) 12.60 26.582012 8.98 0.17 1.13 1.30 (0.15) (0.15) 10.13 14.742011 8.44 0.14 0.50 0.64 (0.10) (0.10) 8.98 7.582010 7.39 0.13 1.05 1.18 (0.13) (0.13) 8.44 16.03

449
FINANCIAL HIGHLIGHTS (CONTINUED)PRINCIPAL FUNDS, INC.
Net Assets,End of Period
(inthousands)
Ratio ofExpenses toAverage Net
Assets
Ratio of GrossExpenses toAverage Net
Assets
Ratio of NetInvestmentIncome to
Average NetAssets
PortfolioTurnover
Rate
$18,889 1.03% —% 0.95% 5.9%18,762 1.03 — 1.17 3.016,940 1.04 — 1.11 3.516,169 1.04 — 0.95 4.316,843 1.04 — 1.02 8.0
37,848 0.90 — 1.09 5.943,560 0.90 — 1.29 3.037,824 0.91 — 1.24 3.536,188 0.91 — 1.09 4.347,540 0.91 — 1.15 8.0
248,852 0.72 — 1.25 5.9219,693 0.72 — 1.47 3.0170,210 0.73 — 1.41 3.5127,726 0.73 — 1.26 4.3115,162 0.73 — 1.34 8.0
214,570 0.53 — 1.44 5.9179,047 0.53 — 1.64 3.0120,923 0.54 — 1.61 3.5120,723 0.54 — 1.45 4.3106,514 0.54 — 1.51 8.0
418,629 0.41 — 1.56 5.9354,869 0.41 — 1.77 3.0260,492 0.42 — 1.73 3.5224,128 0.42 — 1.57 4.3190,814 0.42 — 1.63 8.0
(a) Calculated based on average shares outstanding during the period.(b) Total return is calculated without the front-end sales charge or contingent deferred sales charge, if applicable.(c) Reflects Manager's contractual expense limit.(d) Excludes expense reimbursement from Manager and/or Distributor.
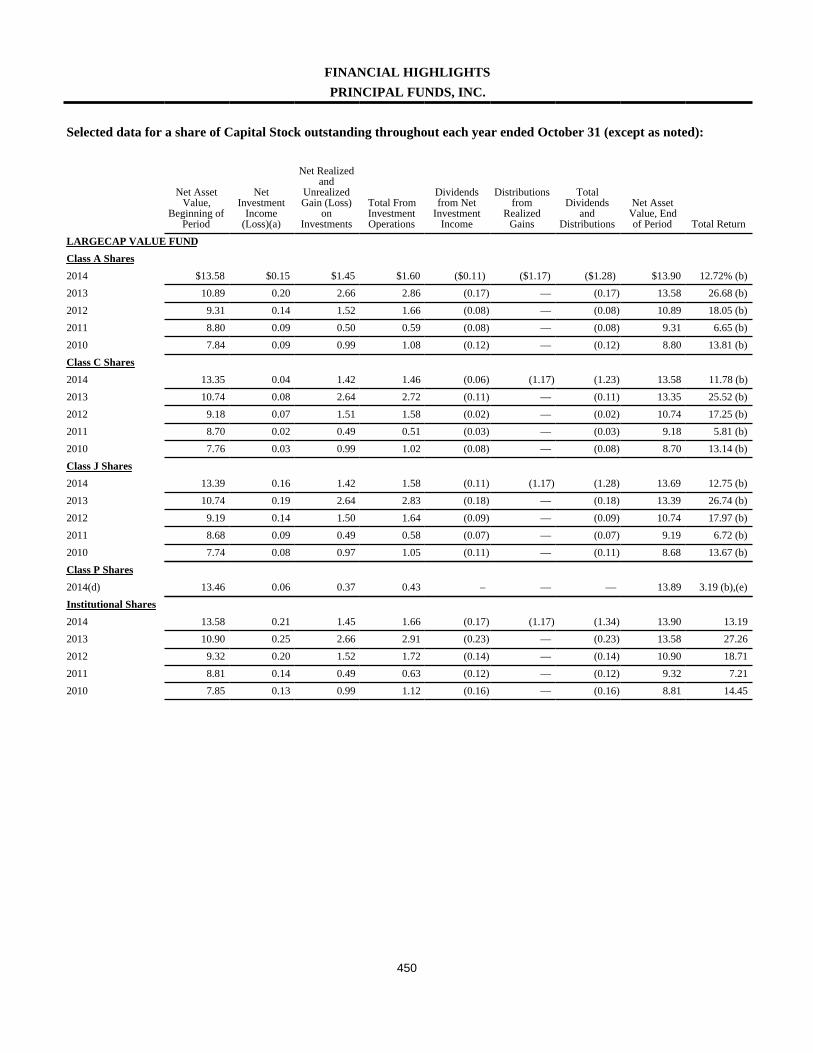
450
FINANCIAL HIGHLIGHTSPRINCIPAL FUNDS, INC.
Selected data for a share of Capital Stock outstanding throughout each year ended October 31 (except as noted):
Net AssetValue,
Beginning ofPeriod
NetInvestment
Income(Loss)(a)
Net Realizedand
UnrealizedGain (Loss)
onInvestments
Total FromInvestmentOperations
Dividendsfrom Net
InvestmentIncome
Distributionsfrom
RealizedGains
TotalDividends
andDistributions
Net AssetValue, Endof Period Total Return
LARGECAP VALUE FUNDClass A Shares2014 $13.58 $0.15 $1.45 $1.60 ($0.11) ($1.17) ($1.28) $13.90 12.72% (b)2013 10.89 0.20 2.66 2.86 (0.17) — (0.17) 13.58 26.68 (b)2012 9.31 0.14 1.52 1.66 (0.08) — (0.08) 10.89 18.05 (b)2011 8.80 0.09 0.50 0.59 (0.08) — (0.08) 9.31 6.65 (b)2010 7.84 0.09 0.99 1.08 (0.12) — (0.12) 8.80 13.81 (b)Class C Shares2014 13.35 0.04 1.42 1.46 (0.06) (1.17) (1.23) 13.58 11.78 (b)2013 10.74 0.08 2.64 2.72 (0.11) — (0.11) 13.35 25.52 (b)2012 9.18 0.07 1.51 1.58 (0.02) — (0.02) 10.74 17.25 (b)2011 8.70 0.02 0.49 0.51 (0.03) — (0.03) 9.18 5.81 (b)2010 7.76 0.03 0.99 1.02 (0.08) — (0.08) 8.70 13.14 (b)Class J Shares2014 13.39 0.16 1.42 1.58 (0.11) (1.17) (1.28) 13.69 12.75 (b)2013 10.74 0.19 2.64 2.83 (0.18) — (0.18) 13.39 26.74 (b)2012 9.19 0.14 1.50 1.64 (0.09) — (0.09) 10.74 17.97 (b)2011 8.68 0.09 0.49 0.58 (0.07) — (0.07) 9.19 6.72 (b)2010 7.74 0.08 0.97 1.05 (0.11) — (0.11) 8.68 13.67 (b)Class P Shares2014(d) 13.46 0.06 0.37 0.43 – — — 13.89 3.19 (b),(e)Institutional Shares2014 13.58 0.21 1.45 1.66 (0.17) (1.17) (1.34) 13.90 13.192013 10.90 0.25 2.66 2.91 (0.23) — (0.23) 13.58 27.262012 9.32 0.20 1.52 1.72 (0.14) — (0.14) 10.90 18.712011 8.81 0.14 0.49 0.63 (0.12) — (0.12) 9.32 7.212010 7.85 0.13 0.99 1.12 (0.16) — (0.16) 8.81 14.45
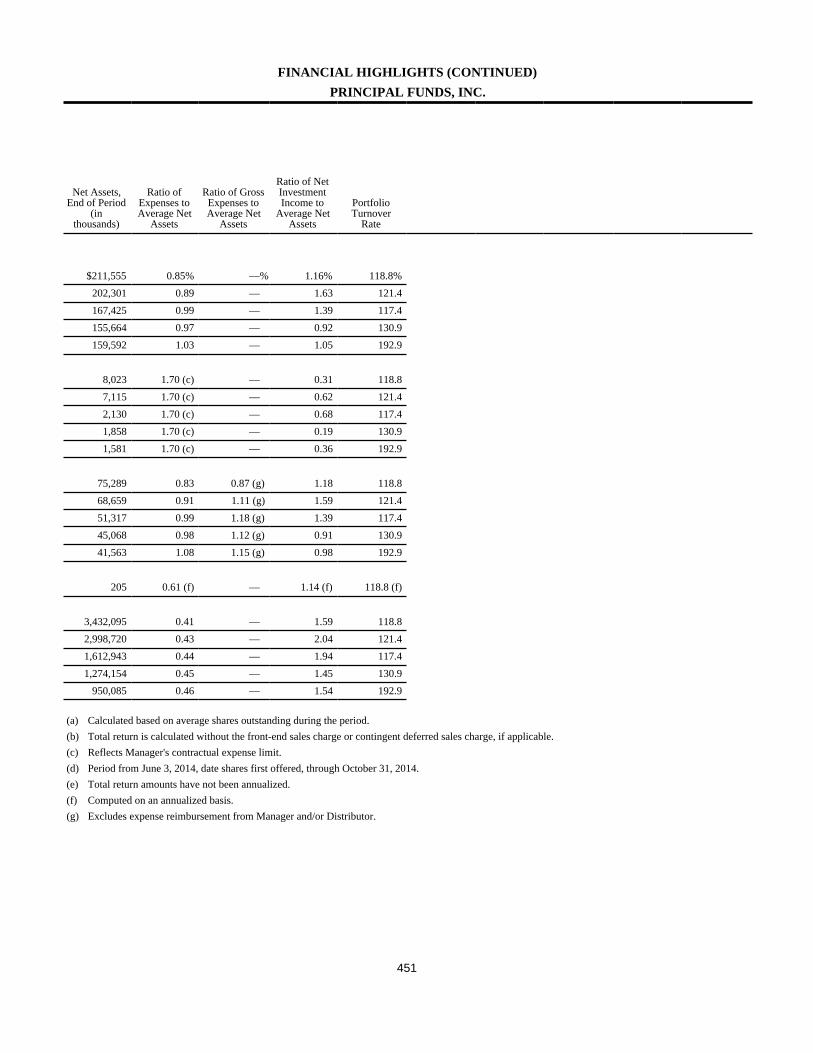
451
FINANCIAL HIGHLIGHTS (CONTINUED)PRINCIPAL FUNDS, INC.
Net Assets,End of Period
(inthousands)
Ratio ofExpenses toAverage Net
Assets
Ratio of GrossExpenses toAverage Net
Assets
Ratio of NetInvestmentIncome to
Average NetAssets
PortfolioTurnover
Rate
$211,555 0.85% —% 1.16% 118.8%202,301 0.89 — 1.63 121.4167,425 0.99 — 1.39 117.4155,664 0.97 — 0.92 130.9159,592 1.03 — 1.05 192.9
8,023 1.70 (c) — 0.31 118.87,115 1.70 (c) — 0.62 121.42,130 1.70 (c) — 0.68 117.41,858 1.70 (c) — 0.19 130.91,581 1.70 (c) — 0.36 192.9
75,289 0.83 0.87 (g) 1.18 118.868,659 0.91 1.11 (g) 1.59 121.451,317 0.99 1.18 (g) 1.39 117.445,068 0.98 1.12 (g) 0.91 130.941,563 1.08 1.15 (g) 0.98 192.9
205 0.61 (f) — 1.14 (f) 118.8 (f)
3,432,095 0.41 — 1.59 118.82,998,720 0.43 — 2.04 121.41,612,943 0.44 — 1.94 117.41,274,154 0.45 — 1.45 130.9
950,085 0.46 — 1.54 192.9
(a) Calculated based on average shares outstanding during the period.(b) Total return is calculated without the front-end sales charge or contingent deferred sales charge, if applicable.(c) Reflects Manager's contractual expense limit.(d) Period from June 3, 2014, date shares first offered, through October 31, 2014.(e) Total return amounts have not been annualized.(f) Computed on an annualized basis.(g) Excludes expense reimbursement from Manager and/or Distributor.

452
FINANCIAL HIGHLIGHTSPRINCIPAL FUNDS, INC.
Selected data for a share of Capital Stock outstanding throughout each year ended October 31 (except as noted):
Net AssetValue,
Beginning ofPeriod
NetInvestment
Income(Loss)(a)
Net Realizedand
UnrealizedGain (Loss)
onInvestments
Total FromInvestmentOperations
Dividendsfrom Net
InvestmentIncome
Distributionsfrom
RealizedGains
TotalDividends
andDistributions
Net AssetValue, Endof Period Total Return
LARGECAP VALUE FUNDR-1 Shares2014 $13.47 $0.09 $1.44 $1.53 ($0.07) ($1.17) ($1.24) $13.76 12.21%2013 10.80 0.15 2.65 2.80 (0.13) — (0.13) 13.47 26.242012 9.23 0.10 1.52 1.62 (0.05) — (0.05) 10.80 17.652011 8.72 0.05 0.50 0.55 (0.04) — (0.04) 9.23 6.322010 7.79 0.06 0.99 1.05 (0.12) — (0.12) 8.72 13.51R-2 Shares2014 13.52 0.11 1.45 1.56 (0.10) (1.17) (1.27) 13.81 12.392013 10.84 0.16 2.67 2.83 (0.15) — (0.15) 13.52 26.402012 9.25 0.12 1.52 1.64 (0.05) — (0.05) 10.84 17.832011 8.74 0.07 0.49 0.56 (0.05) — (0.05) 9.25 6.452010 7.80 0.07 0.98 1.05 (0.11) — (0.11) 8.74 13.56R-3 Shares2014 13.50 0.14 1.44 1.58 (0.11) (1.17) (1.28) 13.80 12.572013 10.83 0.18 2.67 2.85 (0.18) — (0.18) 13.50 26.672012 9.26 0.14 1.51 1.65 (0.08) — (0.08) 10.83 18.032011 8.72 0.08 0.49 0.57 (0.03) — (0.03) 9.26 6.592010 7.78 0.09 0.98 1.07 (0.13) — (0.13) 8.72 13.86R-4 Shares2014 13.47 0.16 1.44 1.60 (0.12) (1.17) (1.29) 13.78 12.802013 10.81 0.20 2.65 2.85 (0.19) — (0.19) 13.47 26.812012 9.24 0.16 1.51 1.67 (0.10) — (0.10) 10.81 18.262011 8.74 0.10 0.49 0.59 (0.09) — (0.09) 9.24 6.802010 7.79 0.10 0.99 1.09 (0.14) — (0.14) 8.74 14.09R-5 Shares2014 13.57 0.18 1.45 1.63 (0.13) (1.17) (1.30) 13.90 12.912013 10.91 0.22 2.66 2.88 (0.22) — (0.22) 13.57 26.892012 9.32 0.17 1.53 1.70 (0.11) — (0.11) 10.91 18.442011 8.81 0.11 0.51 0.62 (0.11) — (0.11) 9.32 6.992010 7.85 0.12 0.98 1.10 (0.14) — (0.14) 8.81 14.16
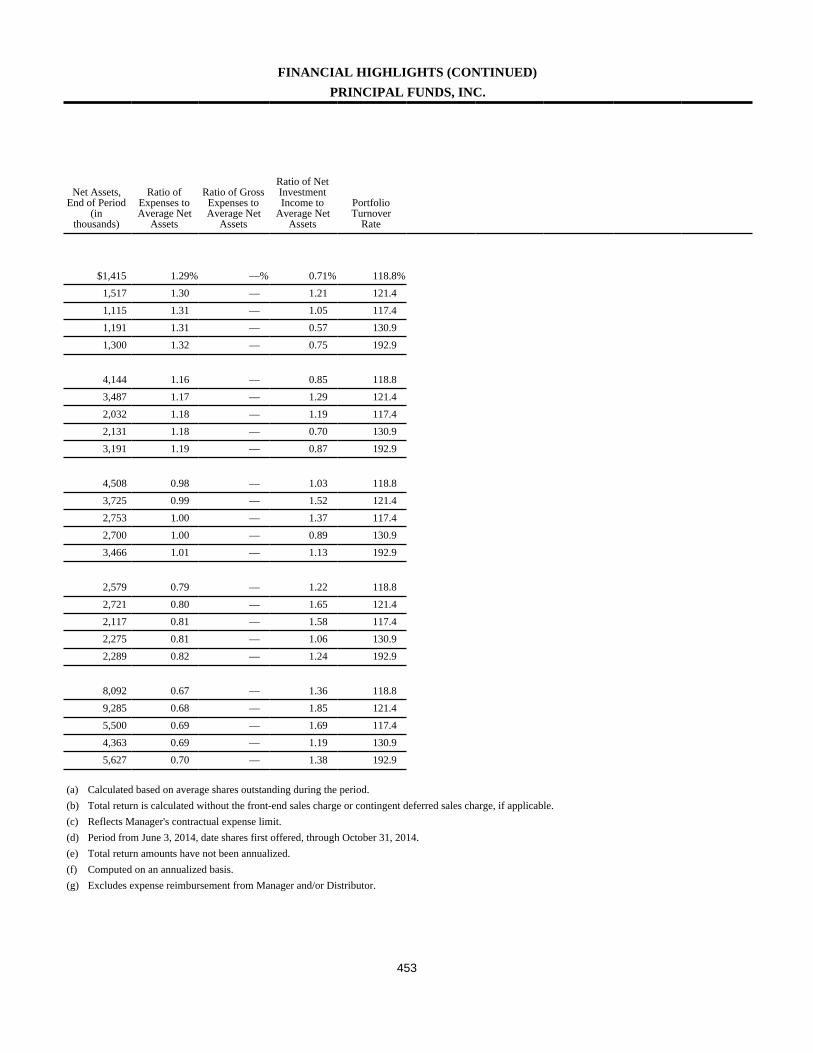
453
FINANCIAL HIGHLIGHTS (CONTINUED)PRINCIPAL FUNDS, INC.
Net Assets,End of Period
(inthousands)
Ratio ofExpenses toAverage Net
Assets
Ratio of GrossExpenses toAverage Net
Assets
Ratio of NetInvestmentIncome to
Average NetAssets
PortfolioTurnover
Rate
$1,415 1.29% —% 0.71% 118.8%1,517 1.30 — 1.21 121.41,115 1.31 — 1.05 117.41,191 1.31 — 0.57 130.91,300 1.32 — 0.75 192.9
4,144 1.16 — 0.85 118.83,487 1.17 — 1.29 121.42,032 1.18 — 1.19 117.42,131 1.18 — 0.70 130.93,191 1.19 — 0.87 192.9
4,508 0.98 — 1.03 118.83,725 0.99 — 1.52 121.42,753 1.00 — 1.37 117.42,700 1.00 — 0.89 130.93,466 1.01 — 1.13 192.9
2,579 0.79 — 1.22 118.82,721 0.80 — 1.65 121.42,117 0.81 — 1.58 117.42,275 0.81 — 1.06 130.92,289 0.82 — 1.24 192.9
8,092 0.67 — 1.36 118.89,285 0.68 — 1.85 121.45,500 0.69 — 1.69 117.44,363 0.69 — 1.19 130.95,627 0.70 — 1.38 192.9
(a) Calculated based on average shares outstanding during the period.(b) Total return is calculated without the front-end sales charge or contingent deferred sales charge, if applicable.(c) Reflects Manager's contractual expense limit.(d) Period from June 3, 2014, date shares first offered, through October 31, 2014.(e) Total return amounts have not been annualized.(f) Computed on an annualized basis.(g) Excludes expense reimbursement from Manager and/or Distributor.
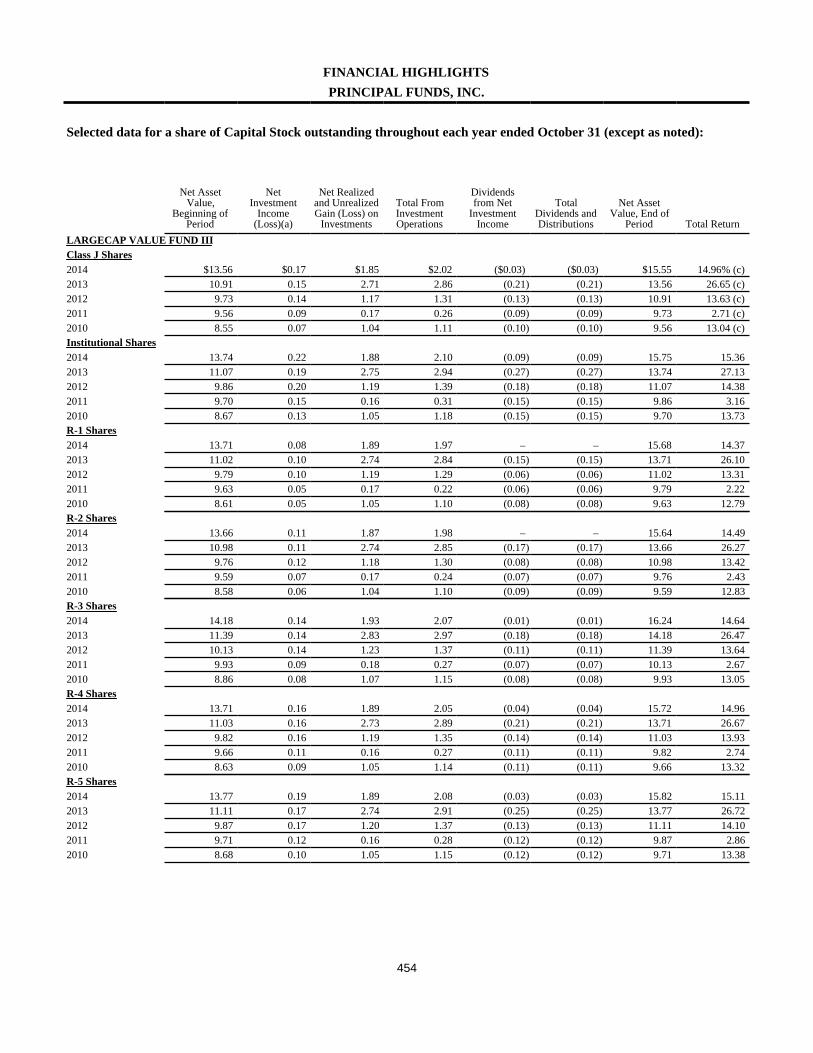
454
FINANCIAL HIGHLIGHTSPRINCIPAL FUNDS, INC.
Selected data for a share of Capital Stock outstanding throughout each year ended October 31 (except as noted):
Net AssetValue,
Beginning ofPeriod
NetInvestment
Income(Loss)(a)
Net Realizedand UnrealizedGain (Loss) on
Investments
Total FromInvestmentOperations
Dividendsfrom Net
InvestmentIncome
TotalDividends andDistributions
Net AssetValue, End of
Period Total ReturnLARGECAP VALUE FUND IIIClass J Shares2014 $13.56 $0.17 $1.85 $2.02 ($0.03) ($0.03) $15.55 14.96% (c)2013 10.91 0.15 2.71 2.86 (0.21) (0.21) 13.56 26.65 (c)2012 9.73 0.14 1.17 1.31 (0.13) (0.13) 10.91 13.63 (c)2011 9.56 0.09 0.17 0.26 (0.09) (0.09) 9.73 2.71 (c)2010 8.55 0.07 1.04 1.11 (0.10) (0.10) 9.56 13.04 (c)Institutional Shares2014 13.74 0.22 1.88 2.10 (0.09) (0.09) 15.75 15.362013 11.07 0.19 2.75 2.94 (0.27) (0.27) 13.74 27.132012 9.86 0.20 1.19 1.39 (0.18) (0.18) 11.07 14.382011 9.70 0.15 0.16 0.31 (0.15) (0.15) 9.86 3.162010 8.67 0.13 1.05 1.18 (0.15) (0.15) 9.70 13.73R-1 Shares2014 13.71 0.08 1.89 1.97 – – 15.68 14.372013 11.02 0.10 2.74 2.84 (0.15) (0.15) 13.71 26.102012 9.79 0.10 1.19 1.29 (0.06) (0.06) 11.02 13.312011 9.63 0.05 0.17 0.22 (0.06) (0.06) 9.79 2.222010 8.61 0.05 1.05 1.10 (0.08) (0.08) 9.63 12.79R-2 Shares2014 13.66 0.11 1.87 1.98 – – 15.64 14.492013 10.98 0.11 2.74 2.85 (0.17) (0.17) 13.66 26.272012 9.76 0.12 1.18 1.30 (0.08) (0.08) 10.98 13.422011 9.59 0.07 0.17 0.24 (0.07) (0.07) 9.76 2.432010 8.58 0.06 1.04 1.10 (0.09) (0.09) 9.59 12.83R-3 Shares2014 14.18 0.14 1.93 2.07 (0.01) (0.01) 16.24 14.642013 11.39 0.14 2.83 2.97 (0.18) (0.18) 14.18 26.472012 10.13 0.14 1.23 1.37 (0.11) (0.11) 11.39 13.642011 9.93 0.09 0.18 0.27 (0.07) (0.07) 10.13 2.672010 8.86 0.08 1.07 1.15 (0.08) (0.08) 9.93 13.05R-4 Shares2014 13.71 0.16 1.89 2.05 (0.04) (0.04) 15.72 14.962013 11.03 0.16 2.73 2.89 (0.21) (0.21) 13.71 26.672012 9.82 0.16 1.19 1.35 (0.14) (0.14) 11.03 13.932011 9.66 0.11 0.16 0.27 (0.11) (0.11) 9.82 2.742010 8.63 0.09 1.05 1.14 (0.11) (0.11) 9.66 13.32R-5 Shares2014 13.77 0.19 1.89 2.08 (0.03) (0.03) 15.82 15.112013 11.11 0.17 2.74 2.91 (0.25) (0.25) 13.77 26.722012 9.87 0.17 1.20 1.37 (0.13) (0.13) 11.11 14.102011 9.71 0.12 0.16 0.28 (0.12) (0.12) 9.87 2.862010 8.68 0.10 1.05 1.15 (0.12) (0.12) 9.71 13.38
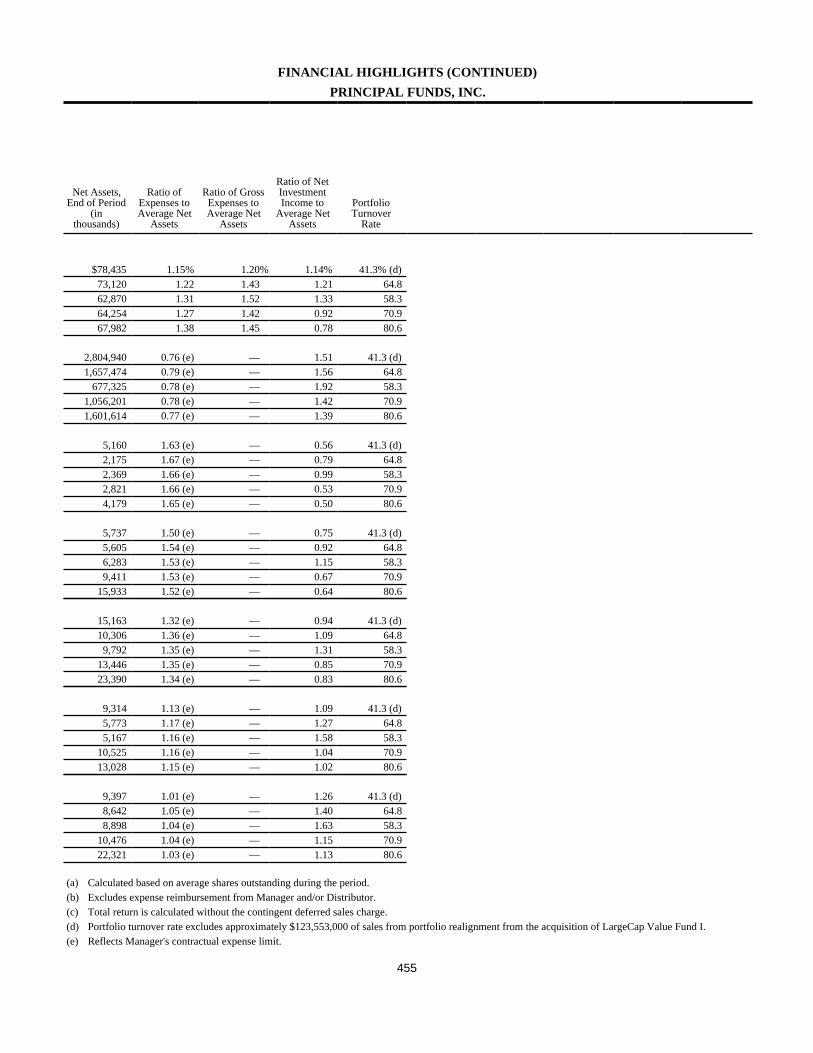
455
FINANCIAL HIGHLIGHTS (CONTINUED)PRINCIPAL FUNDS, INC.
Net Assets,End of Period
(inthousands)
Ratio ofExpenses toAverage Net
Assets
Ratio of GrossExpenses toAverage Net
Assets
Ratio of NetInvestmentIncome to
Average NetAssets
PortfolioTurnover
Rate
$78,435 1.15% 1.20% 1.14% 41.3% (d)73,120 1.22 1.43 1.21 64.862,870 1.31 1.52 1.33 58.364,254 1.27 1.42 0.92 70.967,982 1.38 1.45 0.78 80.6
2,804,940 0.76 (e) — 1.51 41.3 (d)1,657,474 0.79 (e) — 1.56 64.8
677,325 0.78 (e) — 1.92 58.31,056,201 0.78 (e) — 1.42 70.91,601,614 0.77 (e) — 1.39 80.6
5,160 1.63 (e) — 0.56 41.3 (d)2,175 1.67 (e) — 0.79 64.82,369 1.66 (e) — 0.99 58.32,821 1.66 (e) — 0.53 70.94,179 1.65 (e) — 0.50 80.6
5,737 1.50 (e) — 0.75 41.3 (d)5,605 1.54 (e) — 0.92 64.86,283 1.53 (e) — 1.15 58.39,411 1.53 (e) — 0.67 70.9
15,933 1.52 (e) — 0.64 80.6
15,163 1.32 (e) — 0.94 41.3 (d)10,306 1.36 (e) — 1.09 64.8
9,792 1.35 (e) — 1.31 58.313,446 1.35 (e) — 0.85 70.923,390 1.34 (e) — 0.83 80.6
9,314 1.13 (e) — 1.09 41.3 (d)5,773 1.17 (e) — 1.27 64.85,167 1.16 (e) — 1.58 58.3
10,525 1.16 (e) — 1.04 70.913,028 1.15 (e) — 1.02 80.6
9,397 1.01 (e) — 1.26 41.3 (d)8,642 1.05 (e) — 1.40 64.88,898 1.04 (e) — 1.63 58.3
10,476 1.04 (e) — 1.15 70.922,321 1.03 (e) — 1.13 80.6
(a) Calculated based on average shares outstanding during the period.(b) Excludes expense reimbursement from Manager and/or Distributor.(c) Total return is calculated without the contingent deferred sales charge.(d) Portfolio turnover rate excludes approximately $123,553,000 of sales from portfolio realignment from the acquisition of LargeCap Value Fund I.(e) Reflects Manager's contractual expense limit.
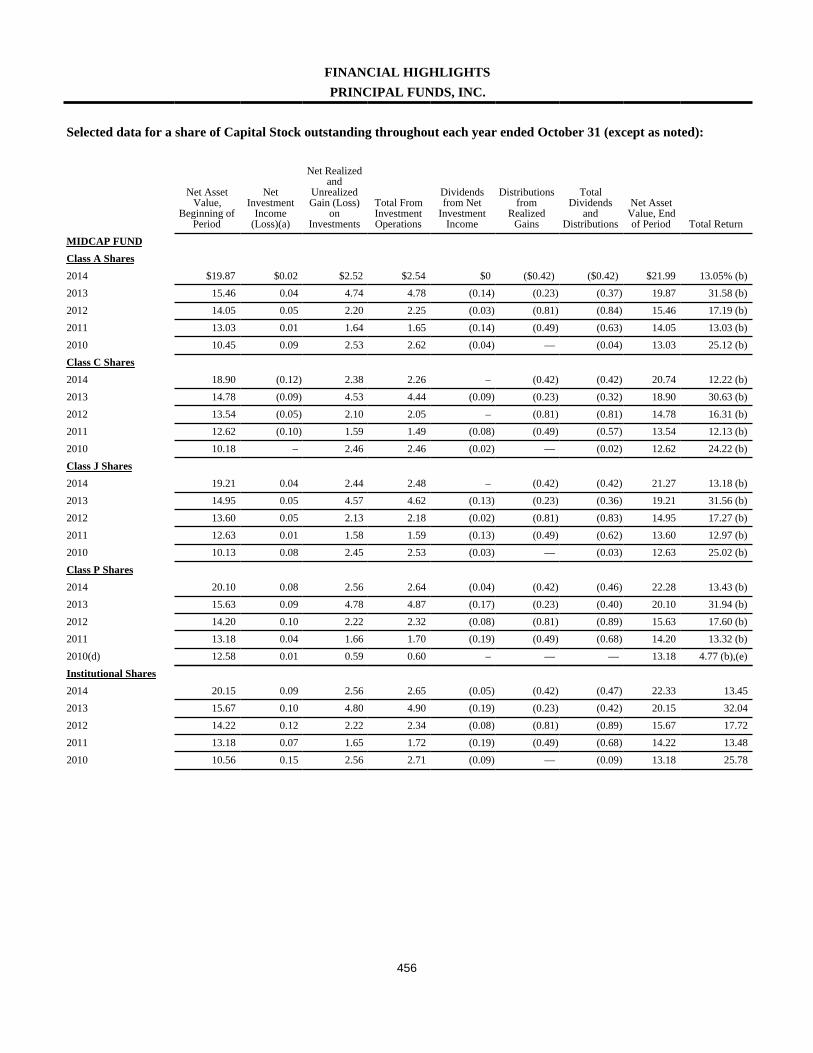
456
FINANCIAL HIGHLIGHTSPRINCIPAL FUNDS, INC.
Selected data for a share of Capital Stock outstanding throughout each year ended October 31 (except as noted):
Net AssetValue,
Beginning ofPeriod
NetInvestment
Income(Loss)(a)
Net Realizedand
UnrealizedGain (Loss)
onInvestments
Total FromInvestmentOperations
Dividendsfrom Net
InvestmentIncome
Distributionsfrom
RealizedGains
TotalDividends
andDistributions
Net AssetValue, Endof Period Total Return
MIDCAP FUNDClass A Shares2014 $19.87 $0.02 $2.52 $2.54 $0 ($0.42) ($0.42) $21.99 13.05% (b)2013 15.46 0.04 4.74 4.78 (0.14) (0.23) (0.37) 19.87 31.58 (b)2012 14.05 0.05 2.20 2.25 (0.03) (0.81) (0.84) 15.46 17.19 (b)2011 13.03 0.01 1.64 1.65 (0.14) (0.49) (0.63) 14.05 13.03 (b)2010 10.45 0.09 2.53 2.62 (0.04) — (0.04) 13.03 25.12 (b)Class C Shares2014 18.90 (0.12) 2.38 2.26 – (0.42) (0.42) 20.74 12.22 (b)2013 14.78 (0.09) 4.53 4.44 (0.09) (0.23) (0.32) 18.90 30.63 (b)2012 13.54 (0.05) 2.10 2.05 – (0.81) (0.81) 14.78 16.31 (b)2011 12.62 (0.10) 1.59 1.49 (0.08) (0.49) (0.57) 13.54 12.13 (b)2010 10.18 – 2.46 2.46 (0.02) — (0.02) 12.62 24.22 (b)Class J Shares2014 19.21 0.04 2.44 2.48 – (0.42) (0.42) 21.27 13.18 (b)2013 14.95 0.05 4.57 4.62 (0.13) (0.23) (0.36) 19.21 31.56 (b)2012 13.60 0.05 2.13 2.18 (0.02) (0.81) (0.83) 14.95 17.27 (b)2011 12.63 0.01 1.58 1.59 (0.13) (0.49) (0.62) 13.60 12.97 (b)2010 10.13 0.08 2.45 2.53 (0.03) — (0.03) 12.63 25.02 (b)Class P Shares2014 20.10 0.08 2.56 2.64 (0.04) (0.42) (0.46) 22.28 13.43 (b)2013 15.63 0.09 4.78 4.87 (0.17) (0.23) (0.40) 20.10 31.94 (b)2012 14.20 0.10 2.22 2.32 (0.08) (0.81) (0.89) 15.63 17.60 (b)2011 13.18 0.04 1.66 1.70 (0.19) (0.49) (0.68) 14.20 13.32 (b)2010(d) 12.58 0.01 0.59 0.60 – — — 13.18 4.77 (b),(e)Institutional Shares2014 20.15 0.09 2.56 2.65 (0.05) (0.42) (0.47) 22.33 13.452013 15.67 0.10 4.80 4.90 (0.19) (0.23) (0.42) 20.15 32.042012 14.22 0.12 2.22 2.34 (0.08) (0.81) (0.89) 15.67 17.722011 13.18 0.07 1.65 1.72 (0.19) (0.49) (0.68) 14.22 13.482010 10.56 0.15 2.56 2.71 (0.09) — (0.09) 13.18 25.78
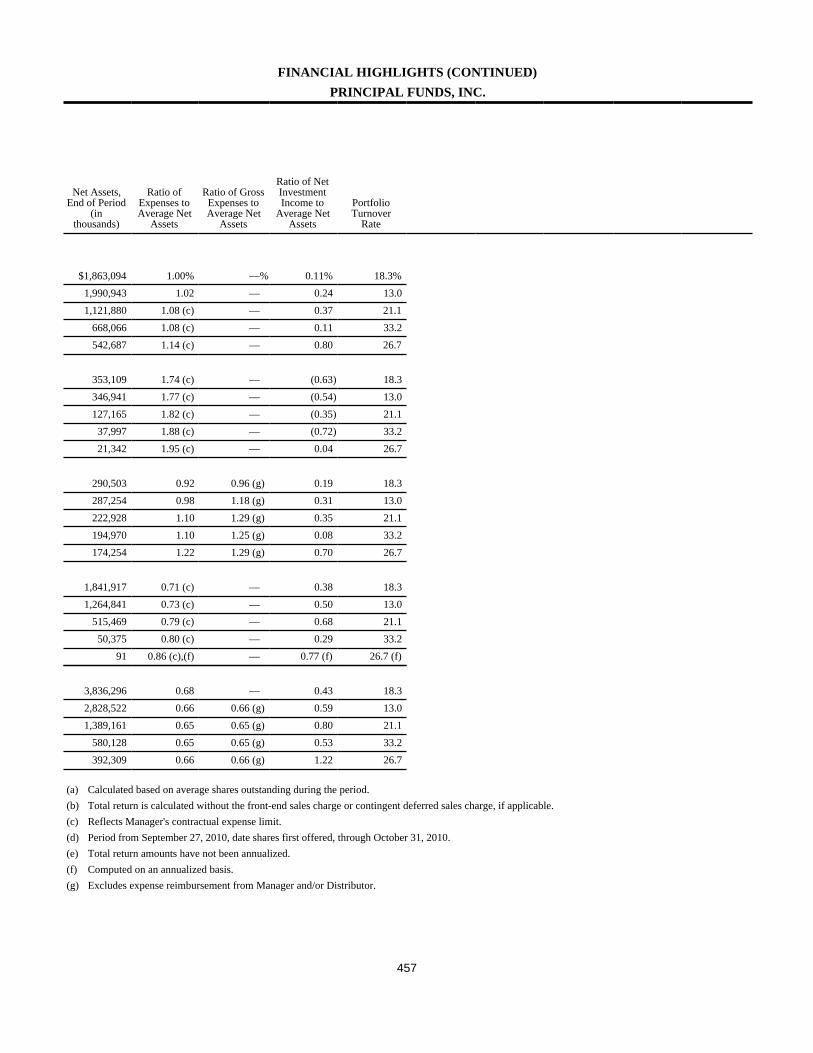
457
FINANCIAL HIGHLIGHTS (CONTINUED)PRINCIPAL FUNDS, INC.
Net Assets,End of Period
(inthousands)
Ratio ofExpenses toAverage Net
Assets
Ratio of GrossExpenses toAverage Net
Assets
Ratio of NetInvestmentIncome to
Average NetAssets
PortfolioTurnover
Rate
$1,863,094 1.00% —% 0.11% 18.3%1,990,943 1.02 — 0.24 13.01,121,880 1.08 (c) — 0.37 21.1
668,066 1.08 (c) — 0.11 33.2542,687 1.14 (c) — 0.80 26.7
353,109 1.74 (c) — (0.63) 18.3346,941 1.77 (c) — (0.54) 13.0127,165 1.82 (c) — (0.35) 21.137,997 1.88 (c) — (0.72) 33.221,342 1.95 (c) — 0.04 26.7
290,503 0.92 0.96 (g) 0.19 18.3287,254 0.98 1.18 (g) 0.31 13.0222,928 1.10 1.29 (g) 0.35 21.1194,970 1.10 1.25 (g) 0.08 33.2174,254 1.22 1.29 (g) 0.70 26.7
1,841,917 0.71 (c) — 0.38 18.31,264,841 0.73 (c) — 0.50 13.0
515,469 0.79 (c) — 0.68 21.150,375 0.80 (c) — 0.29 33.2
91 0.86 (c),(f) — 0.77 (f) 26.7 (f)
3,836,296 0.68 — 0.43 18.32,828,522 0.66 0.66 (g) 0.59 13.01,389,161 0.65 0.65 (g) 0.80 21.1
580,128 0.65 0.65 (g) 0.53 33.2392,309 0.66 0.66 (g) 1.22 26.7
(a) Calculated based on average shares outstanding during the period.(b) Total return is calculated without the front-end sales charge or contingent deferred sales charge, if applicable.(c) Reflects Manager's contractual expense limit.(d) Period from September 27, 2010, date shares first offered, through October 31, 2010.(e) Total return amounts have not been annualized.(f) Computed on an annualized basis.(g) Excludes expense reimbursement from Manager and/or Distributor.
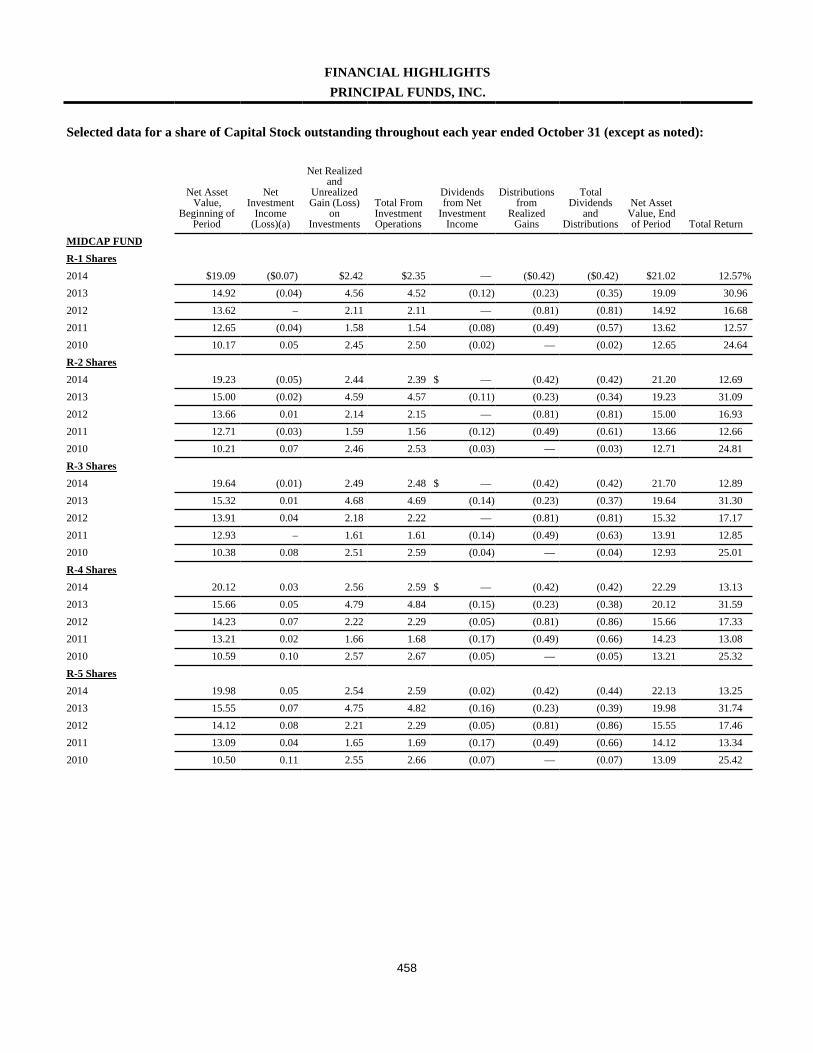
458
FINANCIAL HIGHLIGHTSPRINCIPAL FUNDS, INC.
Selected data for a share of Capital Stock outstanding throughout each year ended October 31 (except as noted):
Net AssetValue,
Beginning ofPeriod
NetInvestment
Income(Loss)(a)
Net Realizedand
UnrealizedGain (Loss)
onInvestments
Total FromInvestmentOperations
Dividendsfrom Net
InvestmentIncome
Distributionsfrom
RealizedGains
TotalDividends
andDistributions
Net AssetValue, Endof Period Total Return
MIDCAP FUNDR-1 Shares2014 $19.09 ($0.07) $2.42 $2.35 — ($0.42) ($0.42) $21.02 12.57%2013 14.92 (0.04) 4.56 4.52 (0.12) (0.23) (0.35) 19.09 30.962012 13.62 – 2.11 2.11 — (0.81) (0.81) 14.92 16.682011 12.65 (0.04) 1.58 1.54 (0.08) (0.49) (0.57) 13.62 12.572010 10.17 0.05 2.45 2.50 (0.02) — (0.02) 12.65 24.64R-2 Shares2014 19.23 (0.05) 2.44 2.39 $ — (0.42) (0.42) 21.20 12.692013 15.00 (0.02) 4.59 4.57 (0.11) (0.23) (0.34) 19.23 31.092012 13.66 0.01 2.14 2.15 — (0.81) (0.81) 15.00 16.932011 12.71 (0.03) 1.59 1.56 (0.12) (0.49) (0.61) 13.66 12.662010 10.21 0.07 2.46 2.53 (0.03) — (0.03) 12.71 24.81R-3 Shares2014 19.64 (0.01) 2.49 2.48 $ — (0.42) (0.42) 21.70 12.892013 15.32 0.01 4.68 4.69 (0.14) (0.23) (0.37) 19.64 31.302012 13.91 0.04 2.18 2.22 — (0.81) (0.81) 15.32 17.172011 12.93 – 1.61 1.61 (0.14) (0.49) (0.63) 13.91 12.852010 10.38 0.08 2.51 2.59 (0.04) — (0.04) 12.93 25.01R-4 Shares2014 20.12 0.03 2.56 2.59 $ — (0.42) (0.42) 22.29 13.132013 15.66 0.05 4.79 4.84 (0.15) (0.23) (0.38) 20.12 31.592012 14.23 0.07 2.22 2.29 (0.05) (0.81) (0.86) 15.66 17.332011 13.21 0.02 1.66 1.68 (0.17) (0.49) (0.66) 14.23 13.082010 10.59 0.10 2.57 2.67 (0.05) — (0.05) 13.21 25.32R-5 Shares2014 19.98 0.05 2.54 2.59 (0.02) (0.42) (0.44) 22.13 13.252013 15.55 0.07 4.75 4.82 (0.16) (0.23) (0.39) 19.98 31.742012 14.12 0.08 2.21 2.29 (0.05) (0.81) (0.86) 15.55 17.462011 13.09 0.04 1.65 1.69 (0.17) (0.49) (0.66) 14.12 13.342010 10.50 0.11 2.55 2.66 (0.07) — (0.07) 13.09 25.42
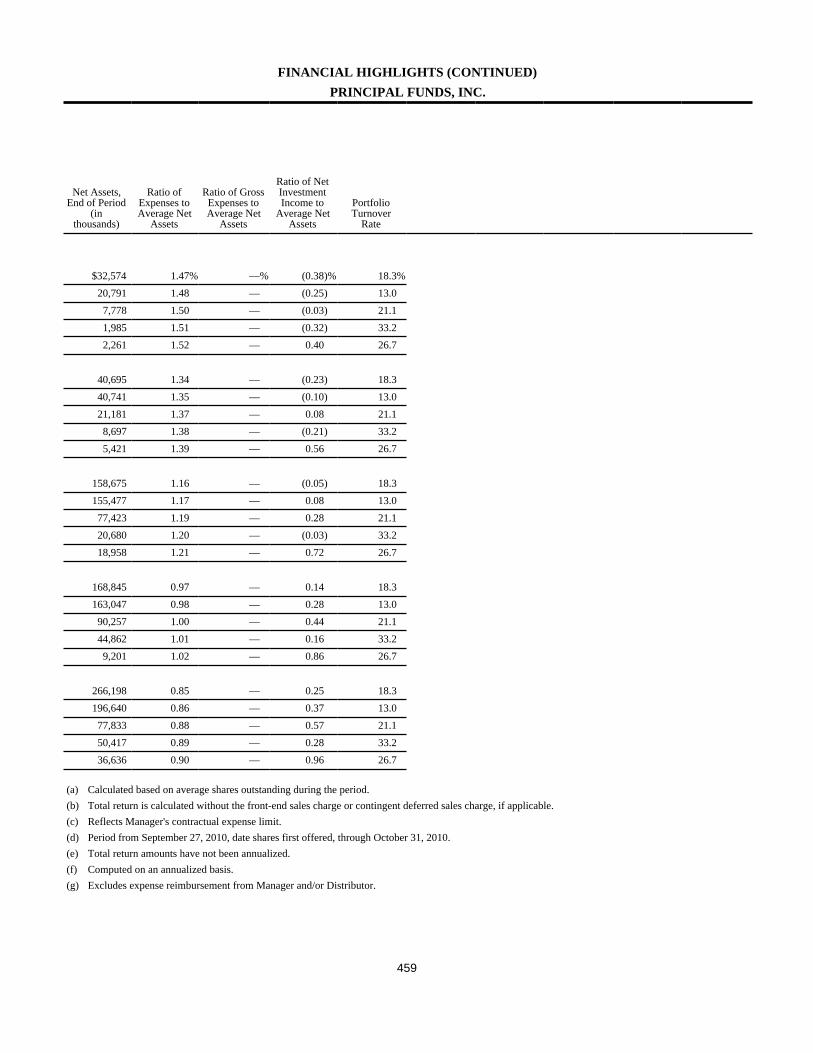
459
FINANCIAL HIGHLIGHTS (CONTINUED)PRINCIPAL FUNDS, INC.
Net Assets,End of Period
(inthousands)
Ratio ofExpenses toAverage Net
Assets
Ratio of GrossExpenses toAverage Net
Assets
Ratio of NetInvestmentIncome to
Average NetAssets
PortfolioTurnover
Rate
$32,574 1.47% —% (0.38)% 18.3%20,791 1.48 — (0.25) 13.0
7,778 1.50 — (0.03) 21.11,985 1.51 — (0.32) 33.22,261 1.52 — 0.40 26.7
40,695 1.34 — (0.23) 18.340,741 1.35 — (0.10) 13.021,181 1.37 — 0.08 21.1
8,697 1.38 — (0.21) 33.25,421 1.39 — 0.56 26.7
158,675 1.16 — (0.05) 18.3155,477 1.17 — 0.08 13.077,423 1.19 — 0.28 21.120,680 1.20 — (0.03) 33.218,958 1.21 — 0.72 26.7
168,845 0.97 — 0.14 18.3163,047 0.98 — 0.28 13.090,257 1.00 — 0.44 21.144,862 1.01 — 0.16 33.2
9,201 1.02 — 0.86 26.7
266,198 0.85 — 0.25 18.3196,640 0.86 — 0.37 13.077,833 0.88 — 0.57 21.150,417 0.89 — 0.28 33.236,636 0.90 — 0.96 26.7
(a) Calculated based on average shares outstanding during the period.(b) Total return is calculated without the front-end sales charge or contingent deferred sales charge, if applicable.(c) Reflects Manager's contractual expense limit.(d) Period from September 27, 2010, date shares first offered, through October 31, 2010.(e) Total return amounts have not been annualized.(f) Computed on an annualized basis.(g) Excludes expense reimbursement from Manager and/or Distributor.
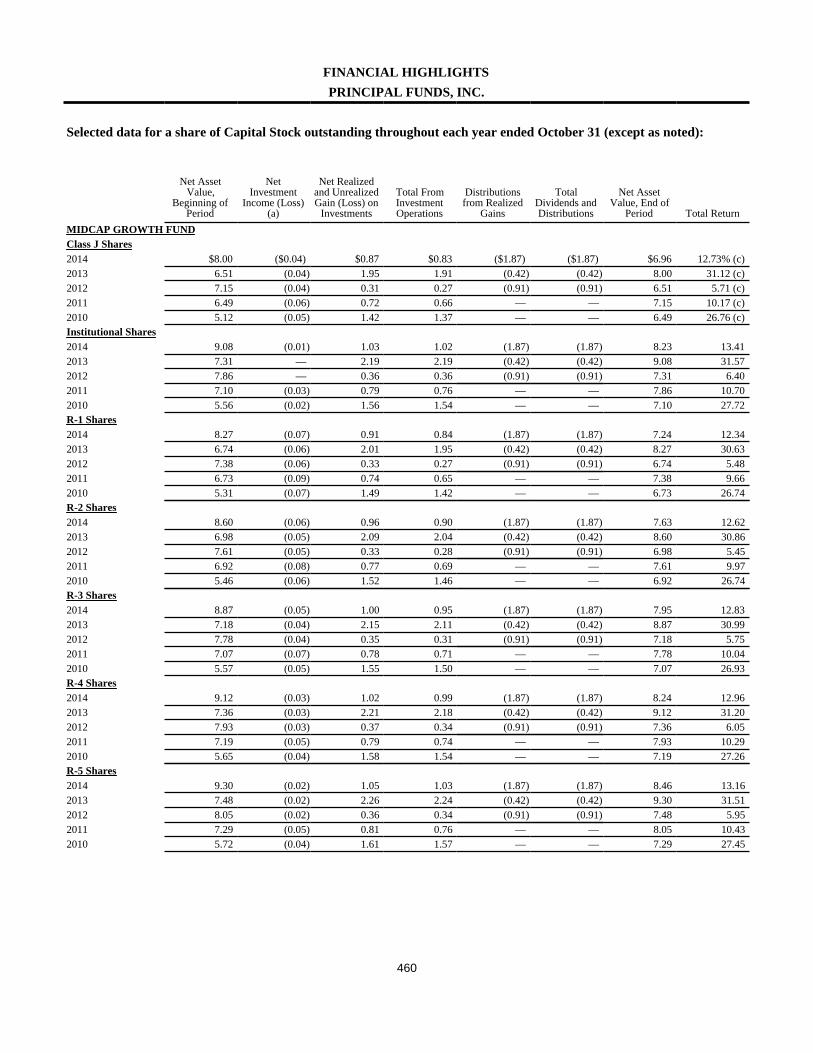
460
FINANCIAL HIGHLIGHTSPRINCIPAL FUNDS, INC.
Selected data for a share of Capital Stock outstanding throughout each year ended October 31 (except as noted):
Net AssetValue,
Beginning ofPeriod
NetInvestment
Income (Loss)(a)
Net Realizedand UnrealizedGain (Loss) on
Investments
Total FromInvestmentOperations
Distributionsfrom Realized
Gains
TotalDividends andDistributions
Net AssetValue, End of
Period Total ReturnMIDCAP GROWTH FUNDClass J Shares2014 $8.00 ($0.04) $0.87 $0.83 ($1.87) ($1.87) $6.96 12.73% (c)2013 6.51 (0.04) 1.95 1.91 (0.42) (0.42) 8.00 31.12 (c)2012 7.15 (0.04) 0.31 0.27 (0.91) (0.91) 6.51 5.71 (c)2011 6.49 (0.06) 0.72 0.66 — — 7.15 10.17 (c)2010 5.12 (0.05) 1.42 1.37 — — 6.49 26.76 (c)Institutional Shares2014 9.08 (0.01) 1.03 1.02 (1.87) (1.87) 8.23 13.412013 7.31 — 2.19 2.19 (0.42) (0.42) 9.08 31.572012 7.86 — 0.36 0.36 (0.91) (0.91) 7.31 6.402011 7.10 (0.03) 0.79 0.76 — — 7.86 10.702010 5.56 (0.02) 1.56 1.54 — — 7.10 27.72R-1 Shares2014 8.27 (0.07) 0.91 0.84 (1.87) (1.87) 7.24 12.342013 6.74 (0.06) 2.01 1.95 (0.42) (0.42) 8.27 30.632012 7.38 (0.06) 0.33 0.27 (0.91) (0.91) 6.74 5.482011 6.73 (0.09) 0.74 0.65 — — 7.38 9.662010 5.31 (0.07) 1.49 1.42 — — 6.73 26.74R-2 Shares2014 8.60 (0.06) 0.96 0.90 (1.87) (1.87) 7.63 12.622013 6.98 (0.05) 2.09 2.04 (0.42) (0.42) 8.60 30.862012 7.61 (0.05) 0.33 0.28 (0.91) (0.91) 6.98 5.452011 6.92 (0.08) 0.77 0.69 — — 7.61 9.972010 5.46 (0.06) 1.52 1.46 — — 6.92 26.74R-3 Shares2014 8.87 (0.05) 1.00 0.95 (1.87) (1.87) 7.95 12.832013 7.18 (0.04) 2.15 2.11 (0.42) (0.42) 8.87 30.992012 7.78 (0.04) 0.35 0.31 (0.91) (0.91) 7.18 5.752011 7.07 (0.07) 0.78 0.71 — — 7.78 10.042010 5.57 (0.05) 1.55 1.50 — — 7.07 26.93R-4 Shares2014 9.12 (0.03) 1.02 0.99 (1.87) (1.87) 8.24 12.962013 7.36 (0.03) 2.21 2.18 (0.42) (0.42) 9.12 31.202012 7.93 (0.03) 0.37 0.34 (0.91) (0.91) 7.36 6.052011 7.19 (0.05) 0.79 0.74 — — 7.93 10.292010 5.65 (0.04) 1.58 1.54 — — 7.19 27.26R-5 Shares2014 9.30 (0.02) 1.05 1.03 (1.87) (1.87) 8.46 13.162013 7.48 (0.02) 2.26 2.24 (0.42) (0.42) 9.30 31.512012 8.05 (0.02) 0.36 0.34 (0.91) (0.91) 7.48 5.952011 7.29 (0.05) 0.81 0.76 — — 8.05 10.432010 5.72 (0.04) 1.61 1.57 — — 7.29 27.45
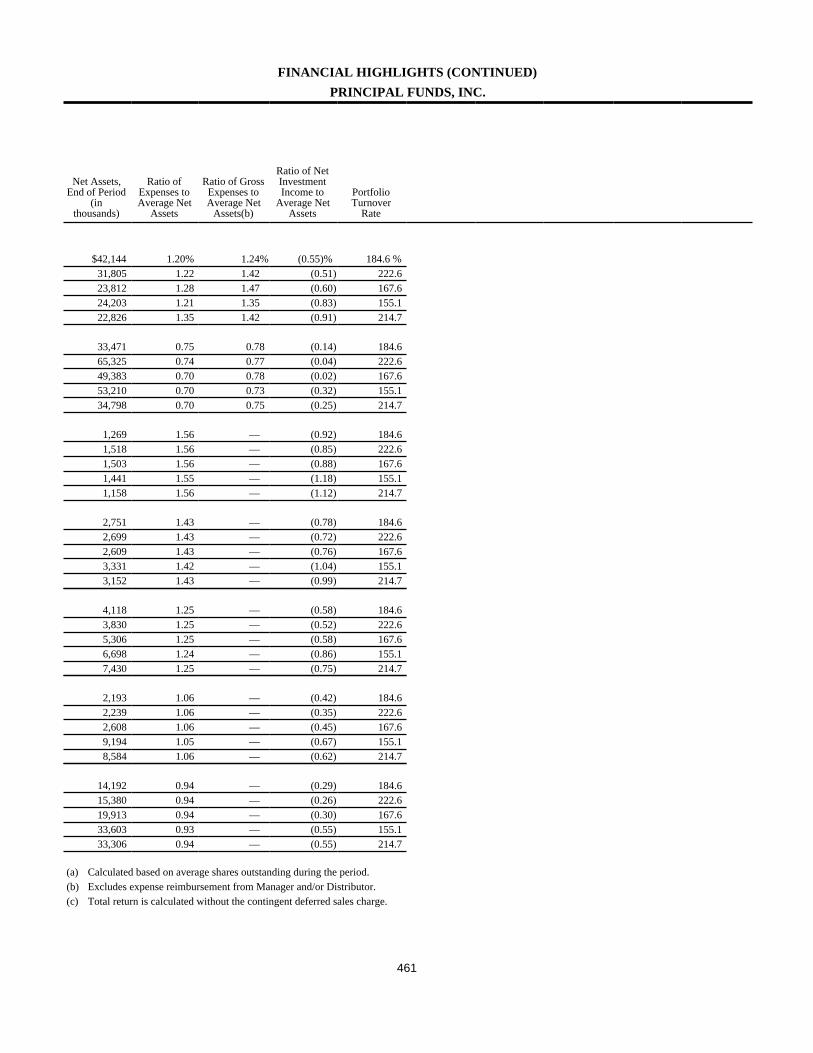
461
FINANCIAL HIGHLIGHTS (CONTINUED)PRINCIPAL FUNDS, INC.
Net Assets,End of Period
(inthousands)
Ratio ofExpenses toAverage Net
Assets
Ratio of GrossExpenses toAverage Net
Assets(b)
Ratio of NetInvestmentIncome to
Average NetAssets
PortfolioTurnover
Rate
$42,144 1.20% 1.24% (0.55)% 184.6 %31,805 1.22 1.42 (0.51) 222.623,812 1.28 1.47 (0.60) 167.624,203 1.21 1.35 (0.83) 155.122,826 1.35 1.42 (0.91) 214.7
33,471 0.75 0.78 (0.14) 184.665,325 0.74 0.77 (0.04) 222.649,383 0.70 0.78 (0.02) 167.653,210 0.70 0.73 (0.32) 155.134,798 0.70 0.75 (0.25) 214.7
1,269 1.56 — (0.92) 184.61,518 1.56 — (0.85) 222.61,503 1.56 — (0.88) 167.61,441 1.55 — (1.18) 155.11,158 1.56 — (1.12) 214.7
2,751 1.43 — (0.78) 184.62,699 1.43 — (0.72) 222.62,609 1.43 — (0.76) 167.63,331 1.42 — (1.04) 155.13,152 1.43 — (0.99) 214.7
4,118 1.25 — (0.58) 184.63,830 1.25 — (0.52) 222.65,306 1.25 — (0.58) 167.66,698 1.24 — (0.86) 155.17,430 1.25 — (0.75) 214.7
2,193 1.06 — (0.42) 184.62,239 1.06 — (0.35) 222.62,608 1.06 — (0.45) 167.69,194 1.05 — (0.67) 155.18,584 1.06 — (0.62) 214.7
14,192 0.94 — (0.29) 184.615,380 0.94 — (0.26) 222.619,913 0.94 — (0.30) 167.633,603 0.93 — (0.55) 155.133,306 0.94 — (0.55) 214.7
(a) Calculated based on average shares outstanding during the period.(b) Excludes expense reimbursement from Manager and/or Distributor.(c) Total return is calculated without the contingent deferred sales charge.
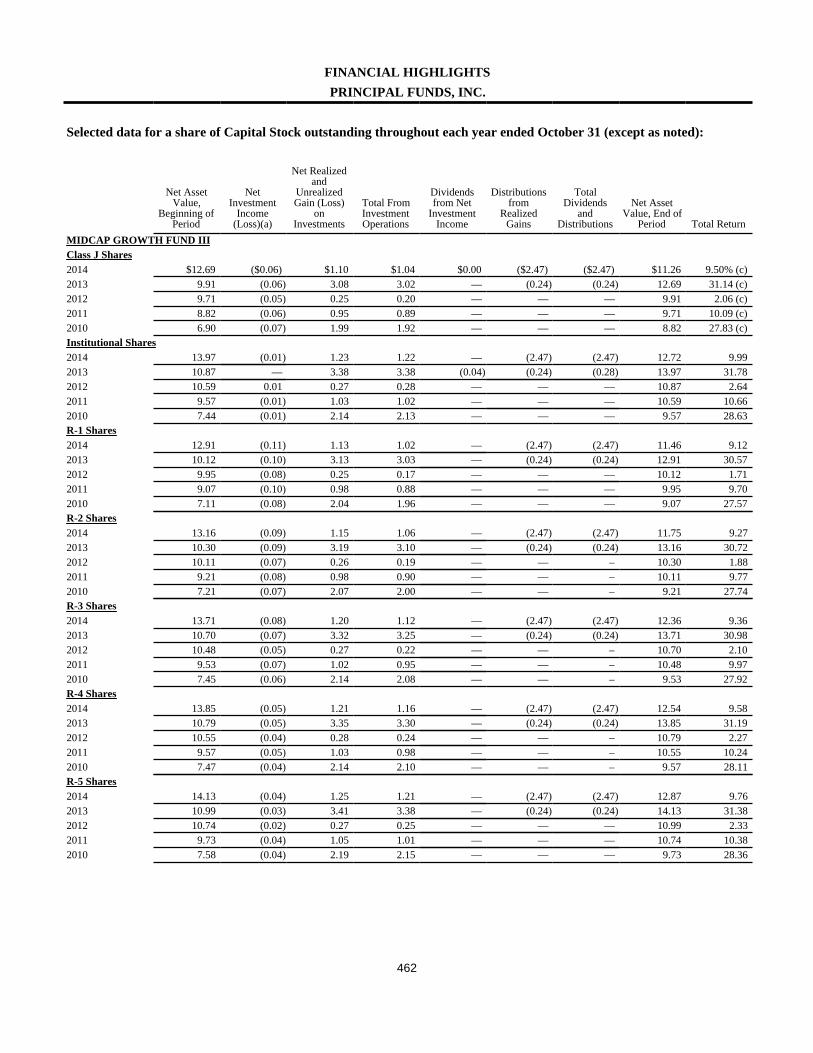
462
FINANCIAL HIGHLIGHTSPRINCIPAL FUNDS, INC.
Selected data for a share of Capital Stock outstanding throughout each year ended October 31 (except as noted):
Net AssetValue,
Beginning ofPeriod
NetInvestment
Income(Loss)(a)
Net Realizedand
UnrealizedGain (Loss)
onInvestments
Total FromInvestmentOperations
Dividendsfrom Net
InvestmentIncome
Distributionsfrom
RealizedGains
TotalDividends
andDistributions
Net AssetValue, End of
Period Total ReturnMIDCAP GROWTH FUND IIIClass J Shares2014 $12.69 ($0.06) $1.10 $1.04 $0.00 ($2.47) ($2.47) $11.26 9.50% (c)2013 9.91 (0.06) 3.08 3.02 — (0.24) (0.24) 12.69 31.14 (c)2012 9.71 (0.05) 0.25 0.20 — — — 9.91 2.06 (c)2011 8.82 (0.06) 0.95 0.89 — — — 9.71 10.09 (c)2010 6.90 (0.07) 1.99 1.92 — — — 8.82 27.83 (c)Institutional Shares2014 13.97 (0.01) 1.23 1.22 — (2.47) (2.47) 12.72 9.992013 10.87 — 3.38 3.38 (0.04) (0.24) (0.28) 13.97 31.782012 10.59 0.01 0.27 0.28 — — — 10.87 2.642011 9.57 (0.01) 1.03 1.02 — — — 10.59 10.662010 7.44 (0.01) 2.14 2.13 — — — 9.57 28.63R-1 Shares2014 12.91 (0.11) 1.13 1.02 — (2.47) (2.47) 11.46 9.122013 10.12 (0.10) 3.13 3.03 — (0.24) (0.24) 12.91 30.572012 9.95 (0.08) 0.25 0.17 — — — 10.12 1.712011 9.07 (0.10) 0.98 0.88 — — — 9.95 9.702010 7.11 (0.08) 2.04 1.96 — — — 9.07 27.57R-2 Shares2014 13.16 (0.09) 1.15 1.06 — (2.47) (2.47) 11.75 9.272013 10.30 (0.09) 3.19 3.10 — (0.24) (0.24) 13.16 30.722012 10.11 (0.07) 0.26 0.19 — — – 10.30 1.882011 9.21 (0.08) 0.98 0.90 — — – 10.11 9.772010 7.21 (0.07) 2.07 2.00 — — – 9.21 27.74R-3 Shares2014 13.71 (0.08) 1.20 1.12 — (2.47) (2.47) 12.36 9.362013 10.70 (0.07) 3.32 3.25 — (0.24) (0.24) 13.71 30.982012 10.48 (0.05) 0.27 0.22 — — – 10.70 2.102011 9.53 (0.07) 1.02 0.95 — — – 10.48 9.972010 7.45 (0.06) 2.14 2.08 — — – 9.53 27.92R-4 Shares2014 13.85 (0.05) 1.21 1.16 — (2.47) (2.47) 12.54 9.582013 10.79 (0.05) 3.35 3.30 — (0.24) (0.24) 13.85 31.192012 10.55 (0.04) 0.28 0.24 — — – 10.79 2.272011 9.57 (0.05) 1.03 0.98 — — – 10.55 10.242010 7.47 (0.04) 2.14 2.10 — — – 9.57 28.11R-5 Shares2014 14.13 (0.04) 1.25 1.21 — (2.47) (2.47) 12.87 9.762013 10.99 (0.03) 3.41 3.38 — (0.24) (0.24) 14.13 31.382012 10.74 (0.02) 0.27 0.25 — — — 10.99 2.332011 9.73 (0.04) 1.05 1.01 — — — 10.74 10.382010 7.58 (0.04) 2.19 2.15 — — — 9.73 28.36
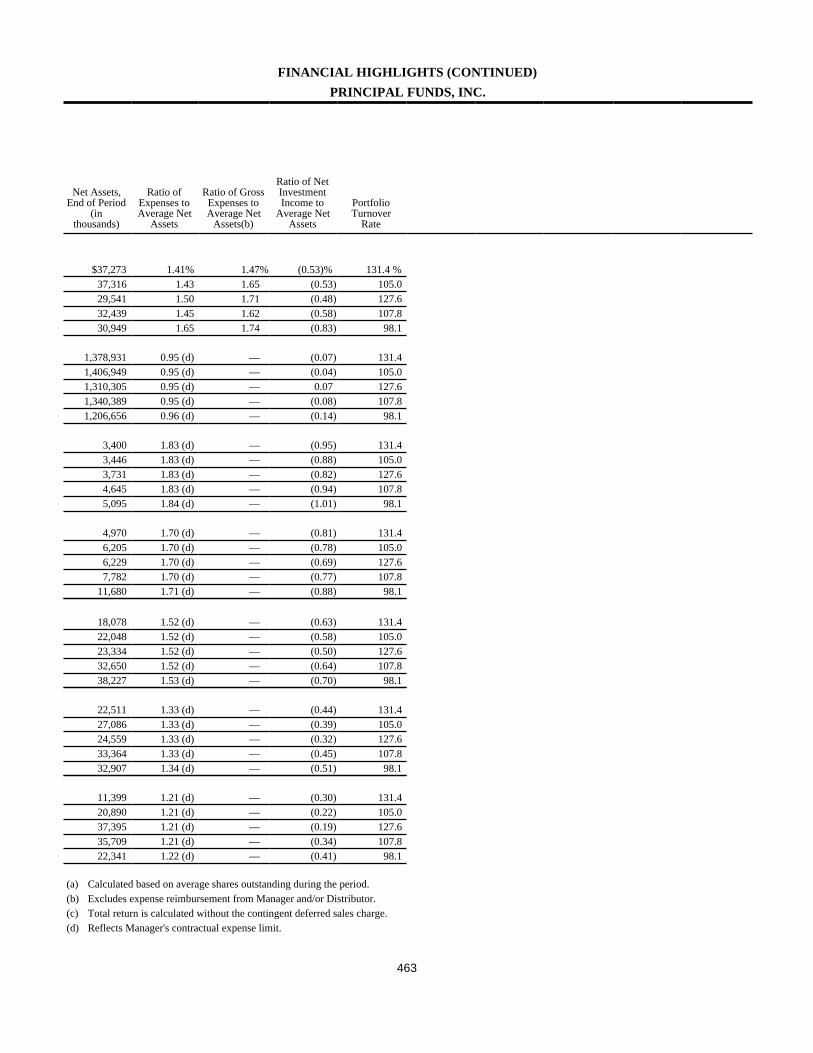
463
FINANCIAL HIGHLIGHTS (CONTINUED)PRINCIPAL FUNDS, INC.
Net Assets,End of Period
(inthousands)
Ratio ofExpenses toAverage Net
Assets
Ratio of GrossExpenses toAverage Net
Assets(b)
Ratio of NetInvestmentIncome to
Average NetAssets
PortfolioTurnover
Rate
$37,273 1.41% 1.47% (0.53)% 131.4 %37,316 1.43 1.65 (0.53) 105.029,541 1.50 1.71 (0.48) 127.632,439 1.45 1.62 (0.58) 107.830,949 1.65 1.74 (0.83) 98.1
1,378,931 0.95 (d) — (0.07) 131.41,406,949 0.95 (d) — (0.04) 105.01,310,305 0.95 (d) — 0.07 127.61,340,389 0.95 (d) — (0.08) 107.81,206,656 0.96 (d) — (0.14) 98.1
3,400 1.83 (d) — (0.95) 131.43,446 1.83 (d) — (0.88) 105.03,731 1.83 (d) — (0.82) 127.64,645 1.83 (d) — (0.94) 107.85,095 1.84 (d) — (1.01) 98.1
4,970 1.70 (d) — (0.81) 131.46,205 1.70 (d) — (0.78) 105.06,229 1.70 (d) — (0.69) 127.67,782 1.70 (d) — (0.77) 107.8
11,680 1.71 (d) — (0.88) 98.1
18,078 1.52 (d) — (0.63) 131.422,048 1.52 (d) — (0.58) 105.023,334 1.52 (d) — (0.50) 127.632,650 1.52 (d) — (0.64) 107.838,227 1.53 (d) — (0.70) 98.1
22,511 1.33 (d) — (0.44) 131.427,086 1.33 (d) — (0.39) 105.024,559 1.33 (d) — (0.32) 127.633,364 1.33 (d) — (0.45) 107.832,907 1.34 (d) — (0.51) 98.1
11,399 1.21 (d) — (0.30) 131.420,890 1.21 (d) — (0.22) 105.037,395 1.21 (d) — (0.19) 127.635,709 1.21 (d) — (0.34) 107.822,341 1.22 (d) — (0.41) 98.1
(a) Calculated based on average shares outstanding during the period.(b) Excludes expense reimbursement from Manager and/or Distributor.(c) Total return is calculated without the contingent deferred sales charge.(d) Reflects Manager's contractual expense limit.
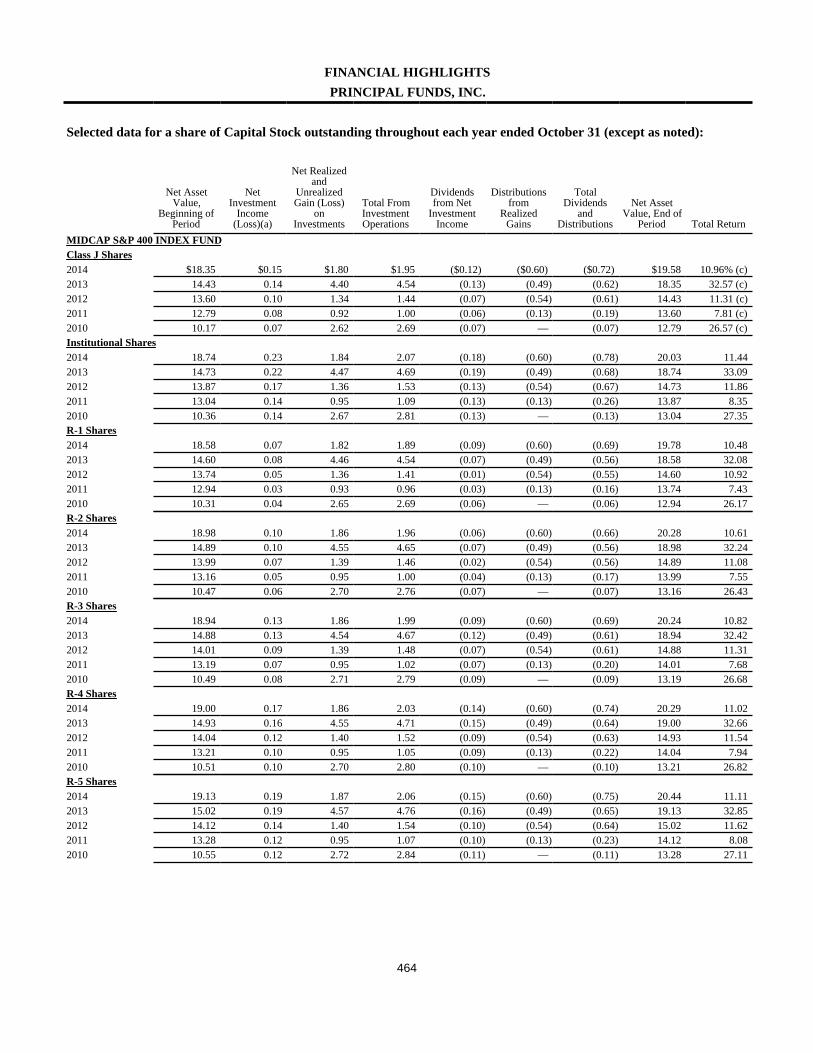
464
FINANCIAL HIGHLIGHTSPRINCIPAL FUNDS, INC.
Selected data for a share of Capital Stock outstanding throughout each year ended October 31 (except as noted):
Net AssetValue,
Beginning ofPeriod
NetInvestment
Income(Loss)(a)
Net Realizedand
UnrealizedGain (Loss)
onInvestments
Total FromInvestmentOperations
Dividendsfrom Net
InvestmentIncome
Distributionsfrom
RealizedGains
TotalDividends
andDistributions
Net AssetValue, End of
Period Total ReturnMIDCAP S&P 400 INDEX FUNDClass J Shares2014 $18.35 $0.15 $1.80 $1.95 ($0.12) ($0.60) ($0.72) $19.58 10.96% (c)2013 14.43 0.14 4.40 4.54 (0.13) (0.49) (0.62) 18.35 32.57 (c)2012 13.60 0.10 1.34 1.44 (0.07) (0.54) (0.61) 14.43 11.31 (c)2011 12.79 0.08 0.92 1.00 (0.06) (0.13) (0.19) 13.60 7.81 (c)2010 10.17 0.07 2.62 2.69 (0.07) — (0.07) 12.79 26.57 (c)Institutional Shares2014 18.74 0.23 1.84 2.07 (0.18) (0.60) (0.78) 20.03 11.442013 14.73 0.22 4.47 4.69 (0.19) (0.49) (0.68) 18.74 33.092012 13.87 0.17 1.36 1.53 (0.13) (0.54) (0.67) 14.73 11.862011 13.04 0.14 0.95 1.09 (0.13) (0.13) (0.26) 13.87 8.352010 10.36 0.14 2.67 2.81 (0.13) — (0.13) 13.04 27.35R-1 Shares2014 18.58 0.07 1.82 1.89 (0.09) (0.60) (0.69) 19.78 10.482013 14.60 0.08 4.46 4.54 (0.07) (0.49) (0.56) 18.58 32.082012 13.74 0.05 1.36 1.41 (0.01) (0.54) (0.55) 14.60 10.922011 12.94 0.03 0.93 0.96 (0.03) (0.13) (0.16) 13.74 7.432010 10.31 0.04 2.65 2.69 (0.06) — (0.06) 12.94 26.17R-2 Shares2014 18.98 0.10 1.86 1.96 (0.06) (0.60) (0.66) 20.28 10.612013 14.89 0.10 4.55 4.65 (0.07) (0.49) (0.56) 18.98 32.242012 13.99 0.07 1.39 1.46 (0.02) (0.54) (0.56) 14.89 11.082011 13.16 0.05 0.95 1.00 (0.04) (0.13) (0.17) 13.99 7.552010 10.47 0.06 2.70 2.76 (0.07) — (0.07) 13.16 26.43R-3 Shares2014 18.94 0.13 1.86 1.99 (0.09) (0.60) (0.69) 20.24 10.822013 14.88 0.13 4.54 4.67 (0.12) (0.49) (0.61) 18.94 32.422012 14.01 0.09 1.39 1.48 (0.07) (0.54) (0.61) 14.88 11.312011 13.19 0.07 0.95 1.02 (0.07) (0.13) (0.20) 14.01 7.682010 10.49 0.08 2.71 2.79 (0.09) — (0.09) 13.19 26.68R-4 Shares2014 19.00 0.17 1.86 2.03 (0.14) (0.60) (0.74) 20.29 11.022013 14.93 0.16 4.55 4.71 (0.15) (0.49) (0.64) 19.00 32.662012 14.04 0.12 1.40 1.52 (0.09) (0.54) (0.63) 14.93 11.542011 13.21 0.10 0.95 1.05 (0.09) (0.13) (0.22) 14.04 7.942010 10.51 0.10 2.70 2.80 (0.10) — (0.10) 13.21 26.82R-5 Shares2014 19.13 0.19 1.87 2.06 (0.15) (0.60) (0.75) 20.44 11.112013 15.02 0.19 4.57 4.76 (0.16) (0.49) (0.65) 19.13 32.852012 14.12 0.14 1.40 1.54 (0.10) (0.54) (0.64) 15.02 11.622011 13.28 0.12 0.95 1.07 (0.10) (0.13) (0.23) 14.12 8.082010 10.55 0.12 2.72 2.84 (0.11) — (0.11) 13.28 27.11
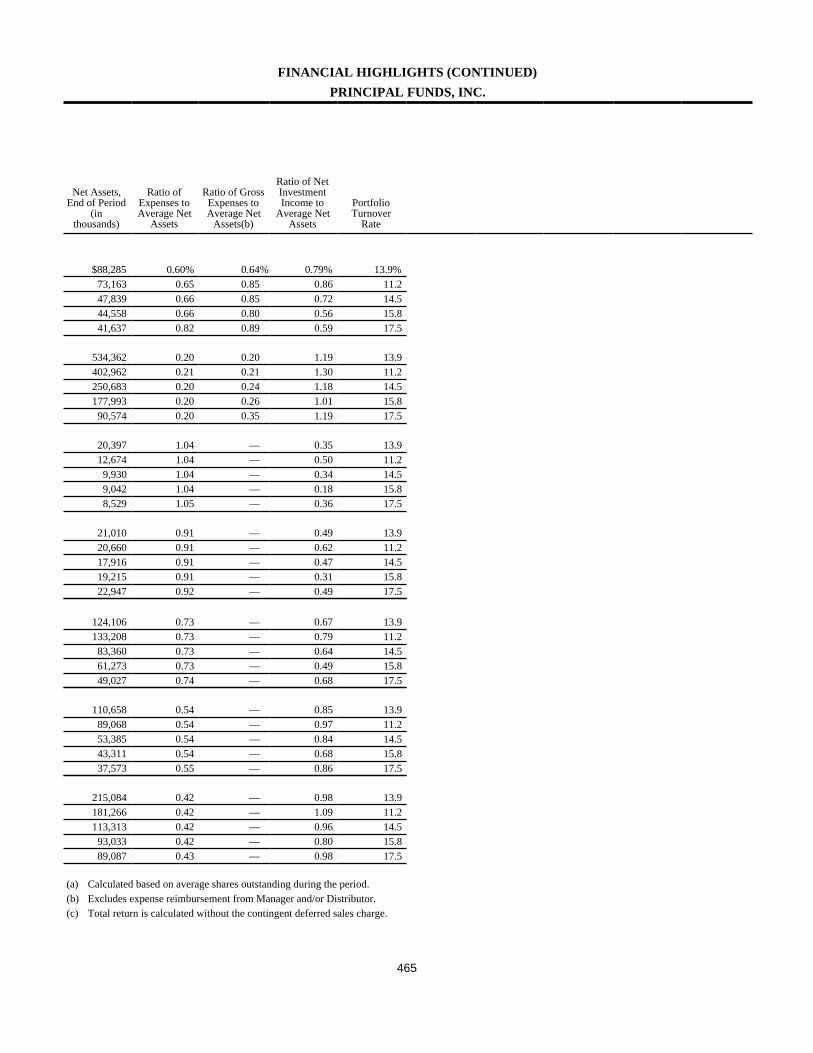
465
FINANCIAL HIGHLIGHTS (CONTINUED)PRINCIPAL FUNDS, INC.
Net Assets,End of Period
(inthousands)
Ratio ofExpenses toAverage Net
Assets
Ratio of GrossExpenses toAverage Net
Assets(b)
Ratio of NetInvestmentIncome to
Average NetAssets
PortfolioTurnover
Rate
$88,285 0.60% 0.64% 0.79% 13.9%73,163 0.65 0.85 0.86 11.247,839 0.66 0.85 0.72 14.544,558 0.66 0.80 0.56 15.841,637 0.82 0.89 0.59 17.5
534,362 0.20 0.20 1.19 13.9402,962 0.21 0.21 1.30 11.2250,683 0.20 0.24 1.18 14.5177,993 0.20 0.26 1.01 15.890,574 0.20 0.35 1.19 17.5
20,397 1.04 — 0.35 13.912,674 1.04 — 0.50 11.2
9,930 1.04 — 0.34 14.59,042 1.04 — 0.18 15.88,529 1.05 — 0.36 17.5
21,010 0.91 — 0.49 13.920,660 0.91 — 0.62 11.217,916 0.91 — 0.47 14.519,215 0.91 — 0.31 15.822,947 0.92 — 0.49 17.5
124,106 0.73 — 0.67 13.9133,208 0.73 — 0.79 11.283,360 0.73 — 0.64 14.561,273 0.73 — 0.49 15.849,027 0.74 — 0.68 17.5
110,658 0.54 — 0.85 13.989,068 0.54 — 0.97 11.253,385 0.54 — 0.84 14.543,311 0.54 — 0.68 15.837,573 0.55 — 0.86 17.5
215,084 0.42 — 0.98 13.9181,266 0.42 — 1.09 11.2113,313 0.42 — 0.96 14.593,033 0.42 — 0.80 15.889,087 0.43 — 0.98 17.5
(a) Calculated based on average shares outstanding during the period.(b) Excludes expense reimbursement from Manager and/or Distributor.(c) Total return is calculated without the contingent deferred sales charge.
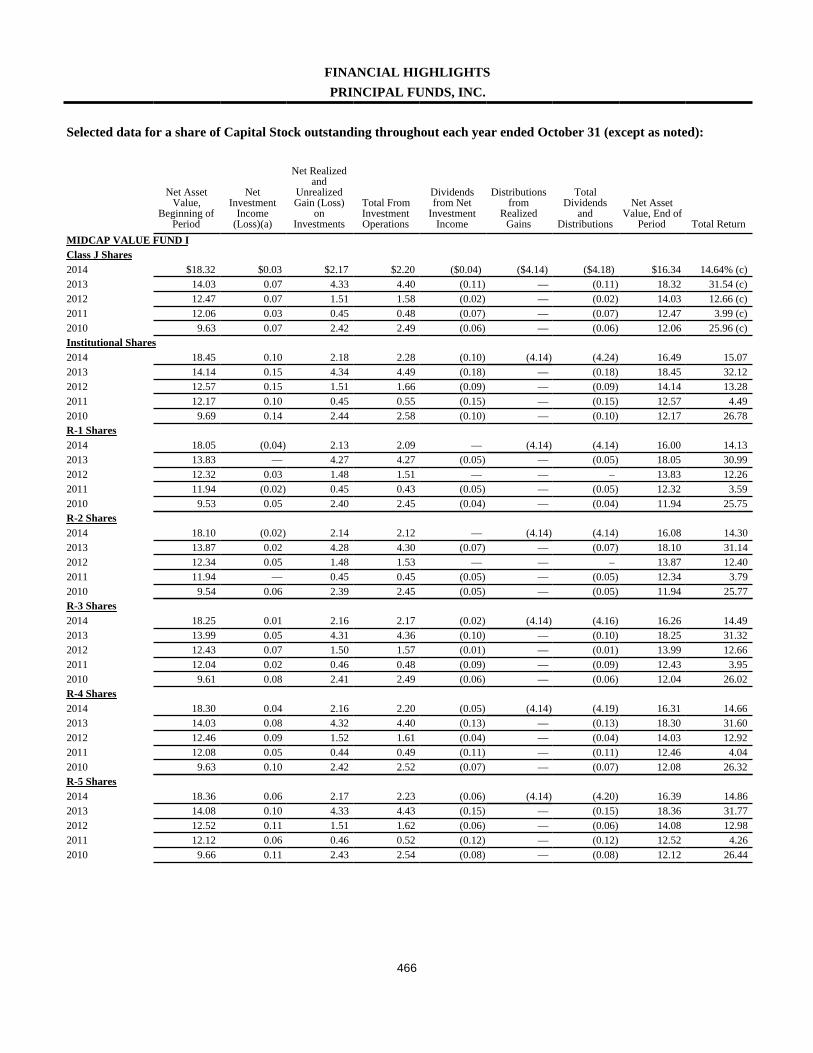
466
FINANCIAL HIGHLIGHTSPRINCIPAL FUNDS, INC.
Selected data for a share of Capital Stock outstanding throughout each year ended October 31 (except as noted):
Net AssetValue,
Beginning ofPeriod
NetInvestment
Income(Loss)(a)
Net Realizedand
UnrealizedGain (Loss)
onInvestments
Total FromInvestmentOperations
Dividendsfrom Net
InvestmentIncome
Distributionsfrom
RealizedGains
TotalDividends
andDistributions
Net AssetValue, End of
Period Total ReturnMIDCAP VALUE FUND IClass J Shares2014 $18.32 $0.03 $2.17 $2.20 ($0.04) ($4.14) ($4.18) $16.34 14.64% (c)2013 14.03 0.07 4.33 4.40 (0.11) — (0.11) 18.32 31.54 (c)2012 12.47 0.07 1.51 1.58 (0.02) — (0.02) 14.03 12.66 (c)2011 12.06 0.03 0.45 0.48 (0.07) — (0.07) 12.47 3.99 (c)2010 9.63 0.07 2.42 2.49 (0.06) — (0.06) 12.06 25.96 (c)Institutional Shares2014 18.45 0.10 2.18 2.28 (0.10) (4.14) (4.24) 16.49 15.072013 14.14 0.15 4.34 4.49 (0.18) — (0.18) 18.45 32.122012 12.57 0.15 1.51 1.66 (0.09) — (0.09) 14.14 13.282011 12.17 0.10 0.45 0.55 (0.15) — (0.15) 12.57 4.492010 9.69 0.14 2.44 2.58 (0.10) — (0.10) 12.17 26.78R-1 Shares2014 18.05 (0.04) 2.13 2.09 — (4.14) (4.14) 16.00 14.132013 13.83 — 4.27 4.27 (0.05) — (0.05) 18.05 30.992012 12.32 0.03 1.48 1.51 — — – 13.83 12.262011 11.94 (0.02) 0.45 0.43 (0.05) — (0.05) 12.32 3.592010 9.53 0.05 2.40 2.45 (0.04) — (0.04) 11.94 25.75R-2 Shares2014 18.10 (0.02) 2.14 2.12 — (4.14) (4.14) 16.08 14.302013 13.87 0.02 4.28 4.30 (0.07) — (0.07) 18.10 31.142012 12.34 0.05 1.48 1.53 — — – 13.87 12.402011 11.94 — 0.45 0.45 (0.05) — (0.05) 12.34 3.792010 9.54 0.06 2.39 2.45 (0.05) — (0.05) 11.94 25.77R-3 Shares2014 18.25 0.01 2.16 2.17 (0.02) (4.14) (4.16) 16.26 14.492013 13.99 0.05 4.31 4.36 (0.10) — (0.10) 18.25 31.322012 12.43 0.07 1.50 1.57 (0.01) — (0.01) 13.99 12.662011 12.04 0.02 0.46 0.48 (0.09) — (0.09) 12.43 3.952010 9.61 0.08 2.41 2.49 (0.06) — (0.06) 12.04 26.02R-4 Shares2014 18.30 0.04 2.16 2.20 (0.05) (4.14) (4.19) 16.31 14.662013 14.03 0.08 4.32 4.40 (0.13) — (0.13) 18.30 31.602012 12.46 0.09 1.52 1.61 (0.04) — (0.04) 14.03 12.922011 12.08 0.05 0.44 0.49 (0.11) — (0.11) 12.46 4.042010 9.63 0.10 2.42 2.52 (0.07) — (0.07) 12.08 26.32R-5 Shares2014 18.36 0.06 2.17 2.23 (0.06) (4.14) (4.20) 16.39 14.862013 14.08 0.10 4.33 4.43 (0.15) — (0.15) 18.36 31.772012 12.52 0.11 1.51 1.62 (0.06) — (0.06) 14.08 12.982011 12.12 0.06 0.46 0.52 (0.12) — (0.12) 12.52 4.262010 9.66 0.11 2.43 2.54 (0.08) — (0.08) 12.12 26.44
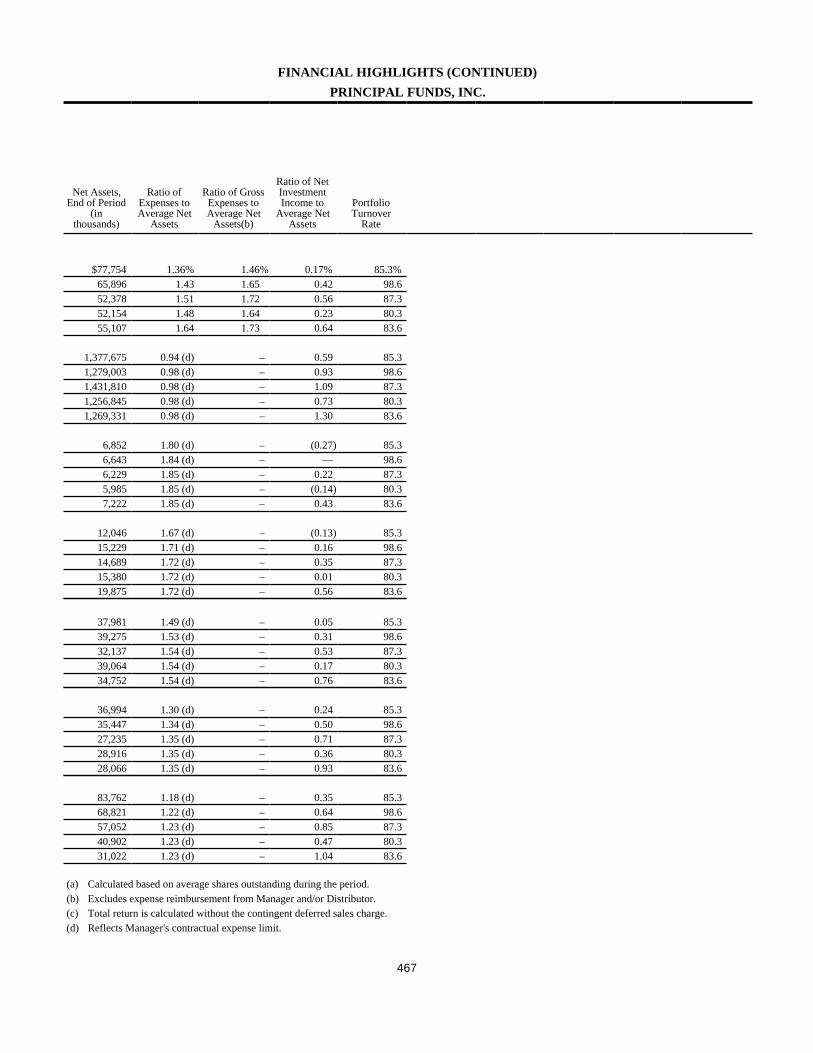
467
FINANCIAL HIGHLIGHTS (CONTINUED)PRINCIPAL FUNDS, INC.
Net Assets,End of Period
(inthousands)
Ratio ofExpenses toAverage Net
Assets
Ratio of GrossExpenses toAverage Net
Assets(b)
Ratio of NetInvestmentIncome to
Average NetAssets
PortfolioTurnover
Rate
$77,754 1.36% 1.46% 0.17% 85.3%65,896 1.43 1.65 0.42 98.652,378 1.51 1.72 0.56 87.352,154 1.48 1.64 0.23 80.355,107 1.64 1.73 0.64 83.6
1,377,675 0.94 (d) – 0.59 85.31,279,003 0.98 (d) – 0.93 98.61,431,810 0.98 (d) – 1.09 87.31,256,845 0.98 (d) – 0.73 80.31,269,331 0.98 (d) – 1.30 83.6
6,852 1.80 (d) – (0.27) 85.36,643 1.84 (d) – — 98.66,229 1.85 (d) – 0.22 87.35,985 1.85 (d) – (0.14) 80.37,222 1.85 (d) – 0.43 83.6
12,046 1.67 (d) – (0.13) 85.315,229 1.71 (d) – 0.16 98.614,689 1.72 (d) – 0.35 87.315,380 1.72 (d) – 0.01 80.319,875 1.72 (d) – 0.56 83.6
37,981 1.49 (d) – 0.05 85.339,275 1.53 (d) – 0.31 98.632,137 1.54 (d) – 0.53 87.339,064 1.54 (d) – 0.17 80.334,752 1.54 (d) – 0.76 83.6
36,994 1.30 (d) – 0.24 85.335,447 1.34 (d) – 0.50 98.627,235 1.35 (d) – 0.71 87.328,916 1.35 (d) – 0.36 80.328,066 1.35 (d) – 0.93 83.6
83,762 1.18 (d) – 0.35 85.368,821 1.22 (d) – 0.64 98.657,052 1.23 (d) – 0.85 87.340,902 1.23 (d) – 0.47 80.331,022 1.23 (d) – 1.04 83.6
(a) Calculated based on average shares outstanding during the period.(b) Excludes expense reimbursement from Manager and/or Distributor.(c) Total return is calculated without the contingent deferred sales charge.(d) Reflects Manager's contractual expense limit.
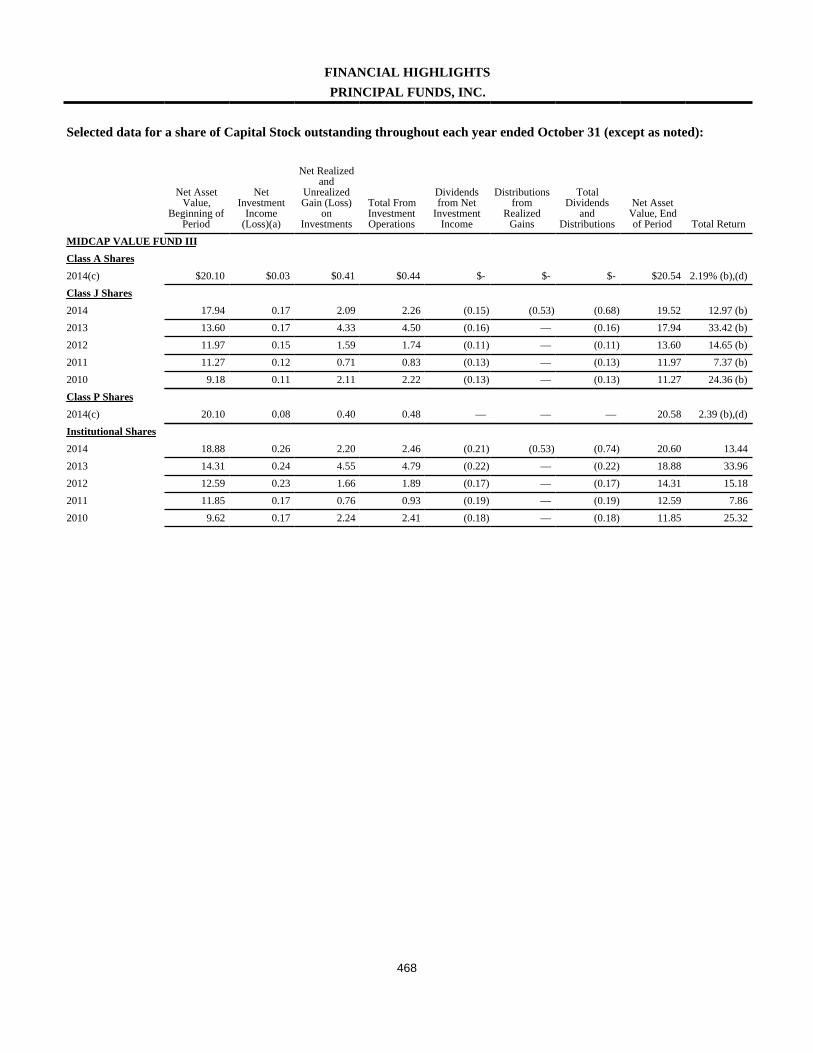
468
FINANCIAL HIGHLIGHTSPRINCIPAL FUNDS, INC.
Selected data for a share of Capital Stock outstanding throughout each year ended October 31 (except as noted):
Net AssetValue,
Beginning ofPeriod
NetInvestment
Income(Loss)(a)
Net Realizedand
UnrealizedGain (Loss)
onInvestments
Total FromInvestmentOperations
Dividendsfrom Net
InvestmentIncome
Distributionsfrom
RealizedGains
TotalDividends
andDistributions
Net AssetValue, Endof Period Total Return
MIDCAP VALUE FUND IIIClass A Shares2014(c) $20.10 $0.03 $0.41 $0.44 $- $- $- $20.54 2.19% (b),(d)Class J Shares2014 17.94 0.17 2.09 2.26 (0.15) (0.53) (0.68) 19.52 12.97 (b)2013 13.60 0.17 4.33 4.50 (0.16) — (0.16) 17.94 33.42 (b)2012 11.97 0.15 1.59 1.74 (0.11) — (0.11) 13.60 14.65 (b)2011 11.27 0.12 0.71 0.83 (0.13) — (0.13) 11.97 7.37 (b)2010 9.18 0.11 2.11 2.22 (0.13) — (0.13) 11.27 24.36 (b)Class P Shares2014(c) 20.10 0.08 0.40 0.48 — — — 20.58 2.39 (b),(d)Institutional Shares2014 18.88 0.26 2.20 2.46 (0.21) (0.53) (0.74) 20.60 13.442013 14.31 0.24 4.55 4.79 (0.22) — (0.22) 18.88 33.962012 12.59 0.23 1.66 1.89 (0.17) — (0.17) 14.31 15.182011 11.85 0.17 0.76 0.93 (0.19) — (0.19) 12.59 7.862010 9.62 0.17 2.24 2.41 (0.18) — (0.18) 11.85 25.32
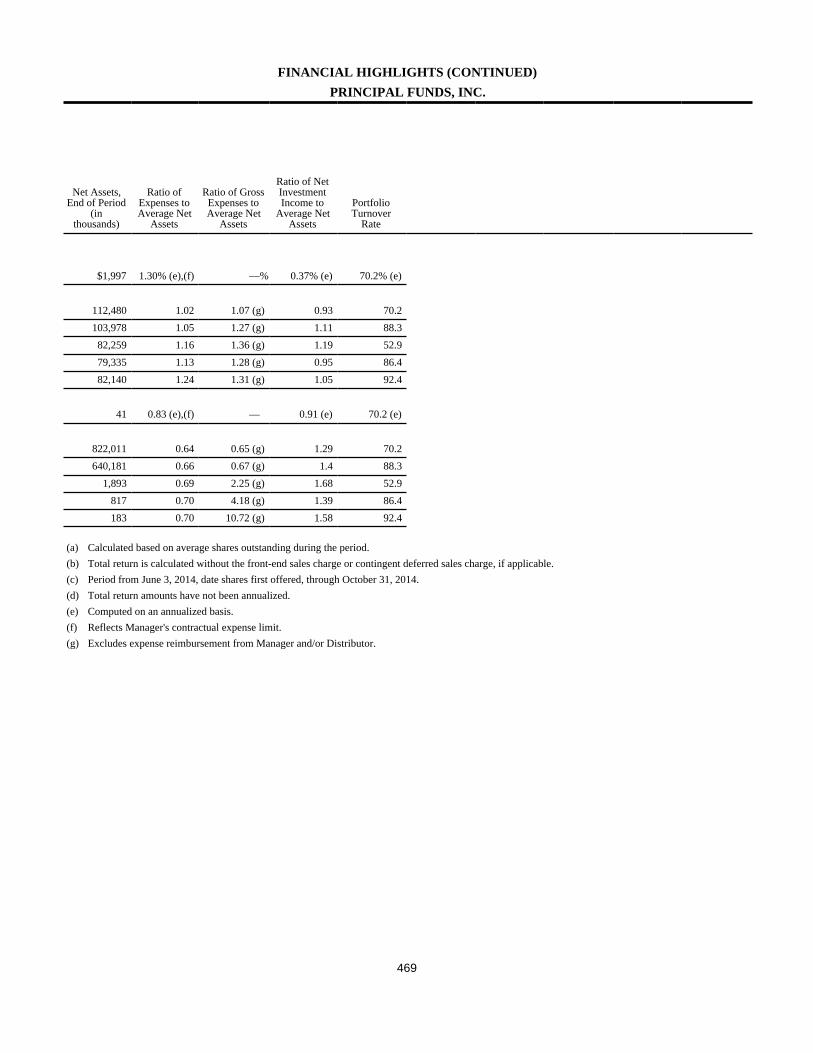
469
FINANCIAL HIGHLIGHTS (CONTINUED)PRINCIPAL FUNDS, INC.
Net Assets,End of Period
(inthousands)
Ratio ofExpenses toAverage Net
Assets
Ratio of GrossExpenses toAverage Net
Assets
Ratio of NetInvestmentIncome to
Average NetAssets
PortfolioTurnover
Rate
$1,997 1.30% (e),(f) —% 0.37% (e) 70.2% (e)
112,480 1.02 1.07 (g) 0.93 70.2103,978 1.05 1.27 (g) 1.11 88.382,259 1.16 1.36 (g) 1.19 52.979,335 1.13 1.28 (g) 0.95 86.482,140 1.24 1.31 (g) 1.05 92.4
41 0.83 (e),(f) — 0.91 (e) 70.2 (e)
822,011 0.64 0.65 (g) 1.29 70.2640,181 0.66 0.67 (g) 1.4 88.3
1,893 0.69 2.25 (g) 1.68 52.9817 0.70 4.18 (g) 1.39 86.4183 0.70 10.72 (g) 1.58 92.4
(a) Calculated based on average shares outstanding during the period.(b) Total return is calculated without the front-end sales charge or contingent deferred sales charge, if applicable.(c) Period from June 3, 2014, date shares first offered, through October 31, 2014.(d) Total return amounts have not been annualized.(e) Computed on an annualized basis.(f) Reflects Manager's contractual expense limit.(g) Excludes expense reimbursement from Manager and/or Distributor.
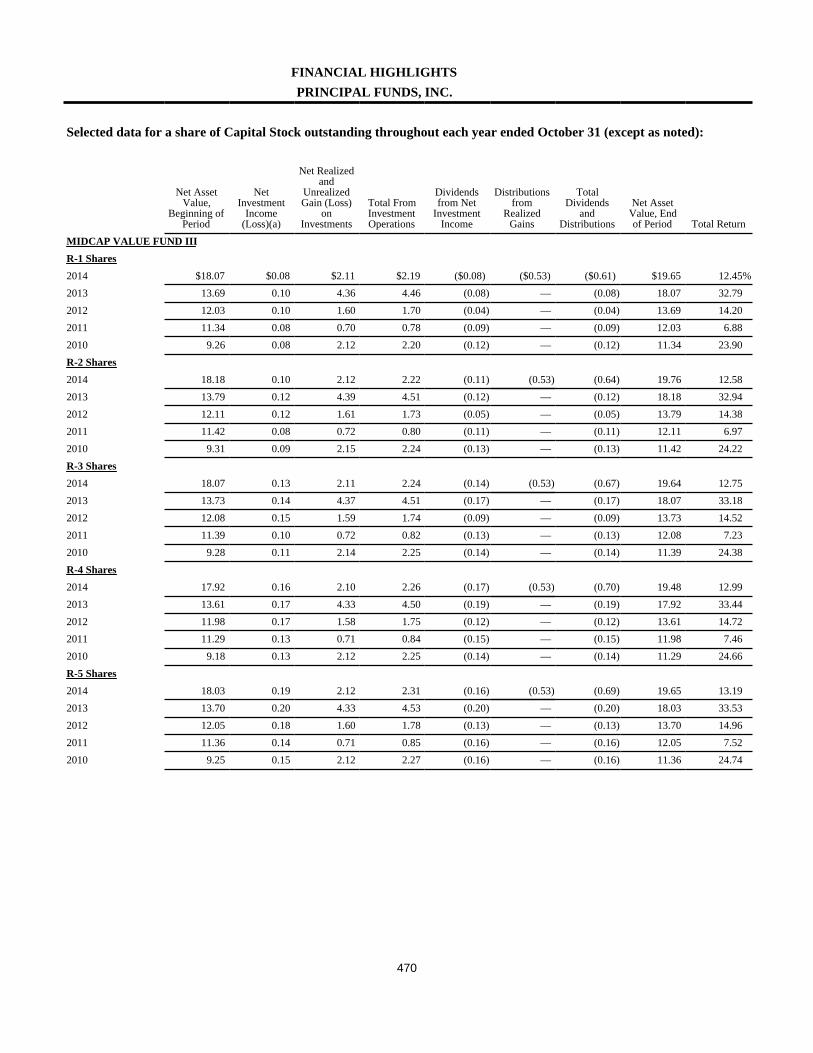
470
FINANCIAL HIGHLIGHTSPRINCIPAL FUNDS, INC.
Selected data for a share of Capital Stock outstanding throughout each year ended October 31 (except as noted):
Net AssetValue,
Beginning ofPeriod
NetInvestment
Income(Loss)(a)
Net Realizedand
UnrealizedGain (Loss)
onInvestments
Total FromInvestmentOperations
Dividendsfrom Net
InvestmentIncome
Distributionsfrom
RealizedGains
TotalDividends
andDistributions
Net AssetValue, Endof Period Total Return
MIDCAP VALUE FUND IIIR-1 Shares2014 $18.07 $0.08 $2.11 $2.19 ($0.08) ($0.53) ($0.61) $19.65 12.45%2013 13.69 0.10 4.36 4.46 (0.08) — (0.08) 18.07 32.792012 12.03 0.10 1.60 1.70 (0.04) — (0.04) 13.69 14.202011 11.34 0.08 0.70 0.78 (0.09) — (0.09) 12.03 6.882010 9.26 0.08 2.12 2.20 (0.12) — (0.12) 11.34 23.90R-2 Shares2014 18.18 0.10 2.12 2.22 (0.11) (0.53) (0.64) 19.76 12.582013 13.79 0.12 4.39 4.51 (0.12) — (0.12) 18.18 32.942012 12.11 0.12 1.61 1.73 (0.05) — (0.05) 13.79 14.382011 11.42 0.08 0.72 0.80 (0.11) — (0.11) 12.11 6.972010 9.31 0.09 2.15 2.24 (0.13) — (0.13) 11.42 24.22R-3 Shares2014 18.07 0.13 2.11 2.24 (0.14) (0.53) (0.67) 19.64 12.752013 13.73 0.14 4.37 4.51 (0.17) — (0.17) 18.07 33.182012 12.08 0.15 1.59 1.74 (0.09) — (0.09) 13.73 14.522011 11.39 0.10 0.72 0.82 (0.13) — (0.13) 12.08 7.232010 9.28 0.11 2.14 2.25 (0.14) — (0.14) 11.39 24.38R-4 Shares2014 17.92 0.16 2.10 2.26 (0.17) (0.53) (0.70) 19.48 12.992013 13.61 0.17 4.33 4.50 (0.19) — (0.19) 17.92 33.442012 11.98 0.17 1.58 1.75 (0.12) — (0.12) 13.61 14.722011 11.29 0.13 0.71 0.84 (0.15) — (0.15) 11.98 7.462010 9.18 0.13 2.12 2.25 (0.14) — (0.14) 11.29 24.66R-5 Shares2014 18.03 0.19 2.12 2.31 (0.16) (0.53) (0.69) 19.65 13.192013 13.70 0.20 4.33 4.53 (0.20) — (0.20) 18.03 33.532012 12.05 0.18 1.60 1.78 (0.13) — (0.13) 13.70 14.962011 11.36 0.14 0.71 0.85 (0.16) — (0.16) 12.05 7.522010 9.25 0.15 2.12 2.27 (0.16) — (0.16) 11.36 24.74
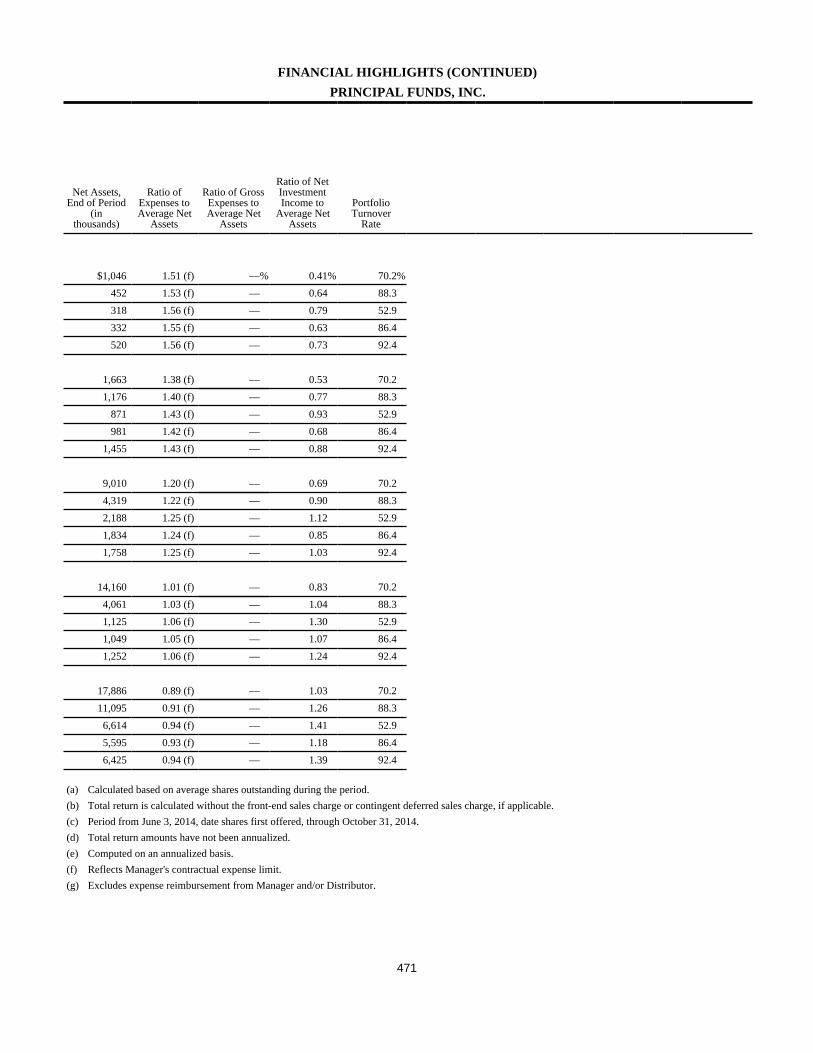
471
FINANCIAL HIGHLIGHTS (CONTINUED)PRINCIPAL FUNDS, INC.
Net Assets,End of Period
(inthousands)
Ratio ofExpenses toAverage Net
Assets
Ratio of GrossExpenses toAverage Net
Assets
Ratio of NetInvestmentIncome to
Average NetAssets
PortfolioTurnover
Rate
$1,046 1.51 (f) —% 0.41% 70.2%452 1.53 (f) — 0.64 88.3318 1.56 (f) — 0.79 52.9332 1.55 (f) — 0.63 86.4520 1.56 (f) — 0.73 92.4
1,663 1.38 (f) — 0.53 70.21,176 1.40 (f) — 0.77 88.3
871 1.43 (f) — 0.93 52.9981 1.42 (f) — 0.68 86.4
1,455 1.43 (f) — 0.88 92.4
9,010 1.20 (f) — 0.69 70.24,319 1.22 (f) — 0.90 88.32,188 1.25 (f) — 1.12 52.91,834 1.24 (f) — 0.85 86.41,758 1.25 (f) — 1.03 92.4
14,160 1.01 (f) — 0.83 70.24,061 1.03 (f) — 1.04 88.31,125 1.06 (f) — 1.30 52.91,049 1.05 (f) — 1.07 86.41,252 1.06 (f) — 1.24 92.4
17,886 0.89 (f) — 1.03 70.211,095 0.91 (f) — 1.26 88.3
6,614 0.94 (f) — 1.41 52.95,595 0.93 (f) — 1.18 86.46,425 0.94 (f) — 1.39 92.4
(a) Calculated based on average shares outstanding during the period.(b) Total return is calculated without the front-end sales charge or contingent deferred sales charge, if applicable.(c) Period from June 3, 2014, date shares first offered, through October 31, 2014.(d) Total return amounts have not been annualized.(e) Computed on an annualized basis.(f) Reflects Manager's contractual expense limit.(g) Excludes expense reimbursement from Manager and/or Distributor.

472
FINANCIAL HIGHLIGHTSPRINCIPAL FUNDS, INC.
Selected data for a share of Capital Stock outstanding throughout each year ended October 31 (except as noted):
Net Asset Value,Beginning of
PeriodNet Investment
Income (Loss)(a)
Total FromInvestmentOperations
Dividends fromNet Investment
IncomeTotal Dividends
and DistributionsNet Asset Value,
End of Period Total Return
MONEY MARKET FUND
Class A Shares
2014 $1.00 $- $- $- $- $1.00 0.00% (b)
2013 1.00 – – – – 1.00 0.00 (b)
2012 1.00 – – – – 1.00 0.00 (b)
2011 1.00 – – – – 1.00 0.00 (b)
2010 1.00 – – – – 1.00 0.00 (b)
Class C Shares
2014 1.00 – – – – 1.00 0.00 (b)
2013 1.00 – – – – 1.00 0.00 (b)
2012 1.00 – – – – 1.00 0.00 (b)
2011 1.00 – – – – 1.00 0.00 (b)
2010 1.00 – – – – 1.00 0.00 (b)
Class J Shares
2014 1.00 – – – – 1.00 0.00 (b)
2013 1.00 – – – – 1.00 0.00 (b)
2012 1.00 – – – – 1.00 0.00 (b)
2011 1.00 – – – – 1.00 0.00 (b)
2010 1.00 – – – – 1.00 0.00 (b)
Institutional Shares
2014 1.00 – – – – 1.00 0.00
2013 1.00 – – – – 1.00 0.00
2012 1.00 – – – – 1.00 0.00
2011 1.00 – – – – 1.00 0.00
2010 1.00 – – – – 1.00 0.00

473
FINANCIAL HIGHLIGHTS (CONTINUED)PRINCIPAL FUNDS, INC.
Net Assets, Endof Period (inthousands)
Ratio ofExpenses toAverage Net
Assets
Ratio of GrossExpenses toAverage Net
Assets
Ratio of NetInvestmentIncome to
Average NetAssets
$471,109 0.17% 0.54% (c) 0.00%
472,504 0.21 0.54 (c) 0.00
458,037 0.29 0.58 (c) 0.00
516,229 0.28 0.54 (c) 0.00
505,252 0.35 0.54 (c) 0.00
17,977 0.17 1.67 (d) 0.00
21,232 0.21 1.66 (d) 0.00
17,320 0.29 1.68 (d) 0.00
27,556 0.28 1.50 (d) 0.00
20,638 0.35 1.68 (d) 0.00
249,914 0.17 0.82 (d) 0.00
278,536 0.21 0.82 (d) 0.00
282,576 0.29 0.87 (d) 0.00
316,914 0.28 0.76 (d) 0.00
310,250 0.35 0.85 (d) 0.00
337,381 0.17 0.42 (d) 0.00
357,925 0.21 0.41 (d) 0.00
353,584 0.28 0.43 (d) 0.00
263,071 0.28 0.41 (d) 0.00
202,082 0.35 0.42 (d) 0.00
(a) Calculated based on average shares outstanding during the period.(b) Total return is calculated without the front-end sales charge or contingent deferred sales charge, if applicable.(c) Excludes expense reimbursement from Manager.(d) Excludes expense reimbursement from Manager and/or Distributor.
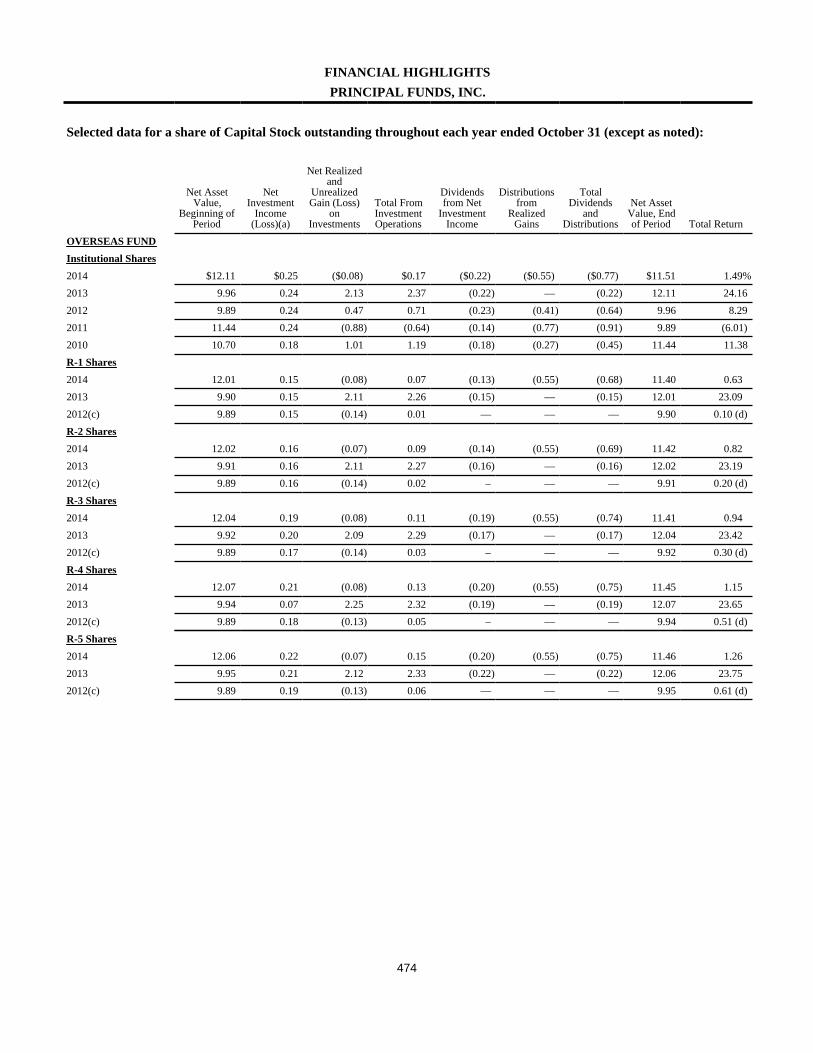
474
FINANCIAL HIGHLIGHTSPRINCIPAL FUNDS, INC.
Selected data for a share of Capital Stock outstanding throughout each year ended October 31 (except as noted):
Net AssetValue,
Beginning ofPeriod
NetInvestment
Income(Loss)(a)
Net Realizedand
UnrealizedGain (Loss)
onInvestments
Total FromInvestmentOperations
Dividendsfrom Net
InvestmentIncome
Distributionsfrom
RealizedGains
TotalDividends
andDistributions
Net AssetValue, Endof Period Total Return
OVERSEAS FUNDInstitutional Shares2014 $12.11 $0.25 ($0.08) $0.17 ($0.22) ($0.55) ($0.77) $11.51 1.49%2013 9.96 0.24 2.13 2.37 (0.22) — (0.22) 12.11 24.162012 9.89 0.24 0.47 0.71 (0.23) (0.41) (0.64) 9.96 8.292011 11.44 0.24 (0.88) (0.64) (0.14) (0.77) (0.91) 9.89 (6.01)2010 10.70 0.18 1.01 1.19 (0.18) (0.27) (0.45) 11.44 11.38R-1 Shares2014 12.01 0.15 (0.08) 0.07 (0.13) (0.55) (0.68) 11.40 0.632013 9.90 0.15 2.11 2.26 (0.15) — (0.15) 12.01 23.092012(c) 9.89 0.15 (0.14) 0.01 — — — 9.90 0.10 (d)R-2 Shares2014 12.02 0.16 (0.07) 0.09 (0.14) (0.55) (0.69) 11.42 0.822013 9.91 0.16 2.11 2.27 (0.16) — (0.16) 12.02 23.192012(c) 9.89 0.16 (0.14) 0.02 – — — 9.91 0.20 (d)R-3 Shares2014 12.04 0.19 (0.08) 0.11 (0.19) (0.55) (0.74) 11.41 0.942013 9.92 0.20 2.09 2.29 (0.17) — (0.17) 12.04 23.422012(c) 9.89 0.17 (0.14) 0.03 – — — 9.92 0.30 (d)R-4 Shares2014 12.07 0.21 (0.08) 0.13 (0.20) (0.55) (0.75) 11.45 1.152013 9.94 0.07 2.25 2.32 (0.19) — (0.19) 12.07 23.652012(c) 9.89 0.18 (0.13) 0.05 – — — 9.94 0.51 (d)R-5 Shares2014 12.06 0.22 (0.07) 0.15 (0.20) (0.55) (0.75) 11.46 1.262013 9.95 0.21 2.12 2.33 (0.22) — (0.22) 12.06 23.752012(c) 9.89 0.19 (0.13) 0.06 — — — 9.95 0.61 (d)
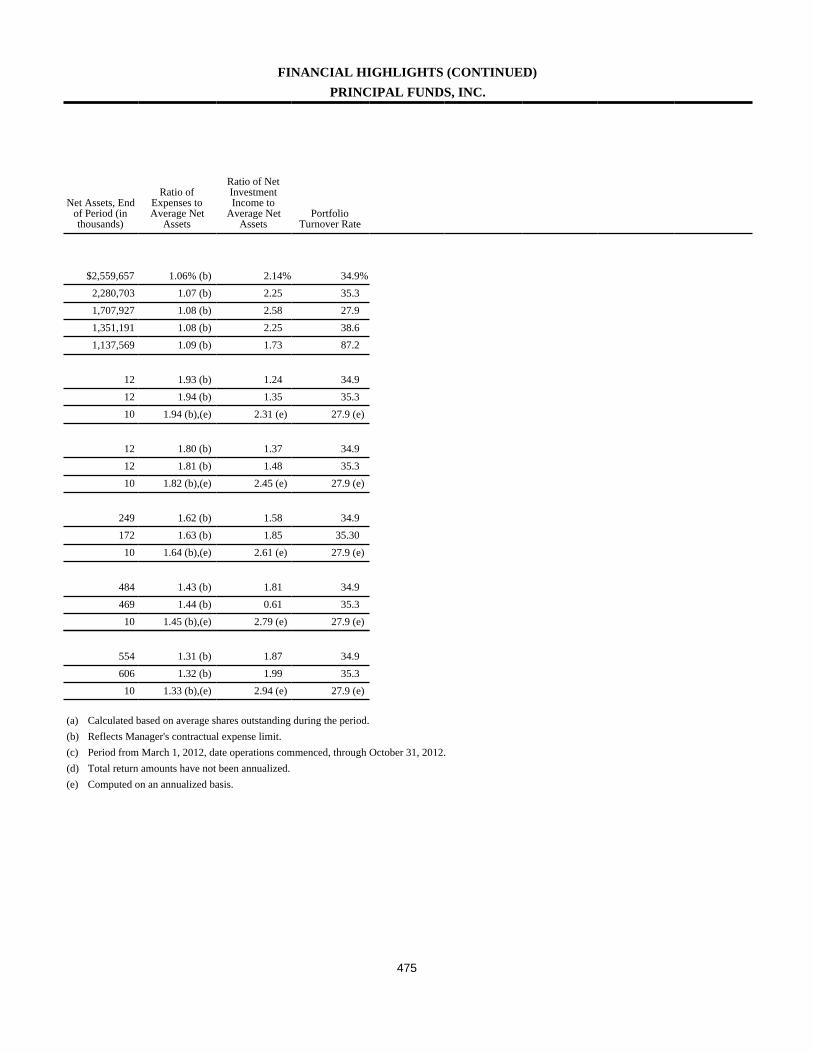
475
FINANCIAL HIGHLIGHTS (CONTINUED)PRINCIPAL FUNDS, INC.
Net Assets, Endof Period (inthousands)
Ratio ofExpenses toAverage Net
Assets
Ratio of NetInvestmentIncome to
Average NetAssets
PortfolioTurnover Rate
$2,559,657 1.06% (b) 2.14% 34.9%2,280,703 1.07 (b) 2.25 35.31,707,927 1.08 (b) 2.58 27.91,351,191 1.08 (b) 2.25 38.61,137,569 1.09 (b) 1.73 87.2
12 1.93 (b) 1.24 34.912 1.94 (b) 1.35 35.310 1.94 (b),(e) 2.31 (e) 27.9 (e)
12 1.80 (b) 1.37 34.912 1.81 (b) 1.48 35.310 1.82 (b),(e) 2.45 (e) 27.9 (e)
249 1.62 (b) 1.58 34.9172 1.63 (b) 1.85 35.3010 1.64 (b),(e) 2.61 (e) 27.9 (e)
484 1.43 (b) 1.81 34.9469 1.44 (b) 0.61 35.310 1.45 (b),(e) 2.79 (e) 27.9 (e)
554 1.31 (b) 1.87 34.9606 1.32 (b) 1.99 35.310 1.33 (b),(e) 2.94 (e) 27.9 (e)
(a) Calculated based on average shares outstanding during the period.(b) Reflects Manager's contractual expense limit.(c) Period from March 1, 2012, date operations commenced, through October 31, 2012.(d) Total return amounts have not been annualized.(e) Computed on an annualized basis.

476
FINANCIAL HIGHLIGHTSPRINCIPAL FUNDS, INC.
Selected data for a share of Capital Stock outstanding throughout each year ended October 31 (except as noted):
Net AssetValue,
Beginning ofPeriod
NetInvestment
Income(Loss)(a)
Net Realizedand
UnrealizedGain (Loss)
onInvestments
Total FromInvestmentOperations
Dividendsfrom Net
InvestmentIncome
Distributionsfrom
RealizedGains
TotalDividends
andDistributions
Net AssetValue, Endof Period Total Return
PRINCIPAL CAPITAL APPRECIATION FUND
Class A Shares
2014 $52.54 $0.50 $7.32 $7.82 ($0.41) ($1.15) ($1.56) $58.80 15.22% (b)
2013 41.72 0.57 11.27 11.84 (0.53) (0.49) (1.02) 52.54 28.98 (b)
2012 38.14 0.37 3.99 4.36 (0.30) (0.48) (0.78) 41.72 11.73 (b)
2011 37.16 0.30 2.19 2.49 (0.40) (1.11) (1.51) 38.14 6.73 (b)
2010 32.55 0.50 4.50 5.00 (0.17) (0.22) (0.39) 37.16 15.46 (b)
Class C Shares
2014 44.06 0.02 6.11 6.13 (0.16) (1.15) (1.31) 48.88 14.22 (b)
2013 35.19 0.14 9.49 9.63 (0.27) (0.49) (0.76) 44.06 27.89 (b)
2012 32.29 0.02 3.40 3.42 (0.04) (0.48) (0.52) 35.19 10.83 (b)
2011 31.73 (0.03) 1.86 1.83 (0.16) (1.11) (1.27) 32.29 5.77 (b)
2010 27.94 0.16 3.85 4.01 — (0.22) (0.22) 31.73 14.42 (b)
Class P Shares
2014 53.15 0.62 7.40 8.02 (0.53) (1.15) (1.68) 59.49 15.45 (b)
2013 42.23 0.67 11.40 12.07 (0.66) (0.49) (1.15) 53.15 29.27 (b)
2012 38.56 0.48 4.05 4.53 (0.38) (0.48) (0.86) 42.23 12.07 (b)
2011 37.62 0.38 2.22 2.60 (0.55) (1.11) (1.66) 38.56 6.95 (b)
2010(d) 35.97 0.02 1.63 1.65 — — — 37.62 4.59 (b),(e)
Institutional Shares
2014 53.31 0.71 7.41 8.12 (0.61) (1.15) (1.76) 59.67 15.62
2013 42.34 0.77 11.42 12.19 (0.73) (0.49) (1.22) 53.31 29.52
2012 38.63 0.56 4.05 4.61 (0.42) (0.48) (0.90) 42.34 12.28
2011 37.63 0.47 2.21 2.68 (0.57) (1.11) (1.68) 38.63 7.15
2010 32.93 0.67 4.56 5.23 (0.31) (0.22) (0.53) 37.63 16.02

477
FINANCIAL HIGHLIGHTS (CONTINUED)PRINCIPAL FUNDS, INC.
Net Assets, Endof Period (inthousands)
Ratio ofExpenses toAverage Net
Assets
Ratio of NetInvestmentIncome to
Average NetAssets
PortfolioTurnover Rate
$810,788 0.82% 0.91% 8.3%
734,098 0.90 1.22 14.3
591,255 0.97 0.92 8.2
578,850 0.94 0.77 12.7
409,697 1.04 1.43 15.3
42,658 1.67 (c) 0.05 8.3
35,400 1.73 (c) 0.36 14.3
24,958 1.82 (c) 0.06 8.2
23,009 1.82 (c) (0.10) 12.7
19,689 1.96 0.52 15.3
31,028 0.60 (c) 1.11 8.3
21,302 0.67 (c) 1.42 14.3
14,471 0.68 (c) 1.18 8.2
9,214 0.71 (c) 0.99 12.7
10 0.75 (c),(f) 0.59 (f) 15.3 (f)
1,507,343 0.46 1.27 8.3
1,357,704 0.48 1.63 14.3
1,053,972 0.50 1.38 8.2
907,061 0.52 1.19 12.7
578,458 0.58 1.89 15.3
(a) Calculated based on average shares outstanding during the period.(b) Total return is calculated without the front-end sales charge or contingent deferred sales charge, if applicable.(c) Reflects Manager's contractual expense limit.(d) Period from September 27, 2010, date shares first offered, through October 31, 2010.(e) Total return amounts have not been annualized.(f) Computed on an annualized basis.(g) Period from March 1, 2010, date operations commenced, through October 31, 2010.

478
FINANCIAL HIGHLIGHTSPRINCIPAL FUNDS, INC.
Selected data for a share of Capital Stock outstanding throughout each year ended October 31 (except as noted):
Net AssetValue,
Beginning ofPeriod
NetInvestment
Income(Loss)(a)
Net Realizedand
UnrealizedGain (Loss)
onInvestments
Total FromInvestmentOperations
Dividendsfrom Net
InvestmentIncome
Distributionsfrom
RealizedGains
TotalDividends
andDistributions
Net AssetValue, Endof Period Total Return
PRINCIPAL CAPITAL APPRECIATION FUNDR-1 Shares2014 $52.40 $0.22 $7.30 $7.52 ($0.09) ($1.15) ($1.24) $58.68 14.60%2013 41.64 0.38 11.24 11.62 (0.37) (0.49) (0.86) 52.40 28.392012 38.18 0.20 4.01 4.21 (0.27) (0.48) (0.75) 41.64 11.322011 37.42 0.08 2.24 2.32 (0.45) (1.11) (1.56) 38.18 6.222010(g) 35.15 0.05 2.22 2.27 — — — 37.42 6.46 (e)R-2 Shares2014 52.56 0.29 7.32 7.61 (0.23) (1.15) (1.38) 58.79 14.772013 41.78 0.41 11.30 11.71 (0.44) (0.49) (0.93) 52.56 28.562012 38.26 0.26 4.00 4.26 (0.26) (0.48) (0.74) 41.78 11.432011 37.44 0.14 2.25 2.39 (0.46) (1.11) (1.57) 38.26 6.412010(g) 35.15 0.53 1.76 2.29 — — — 37.44 6.51 (e)R-3 Shares2014 52.58 0.38 7.32 7.70 (0.35) (1.15) (1.50) 58.78 14.972013 41.85 0.46 11.33 11.79 (0.57) (0.49) (1.06) 52.58 28.792012 38.31 0.33 4.01 4.34 (0.32) (0.48) (0.80) 41.85 11.642011 37.49 0.21 2.25 2.46 (0.53) (1.11) (1.64) 38.31 6.592010(g) 35.15 0.02 2.32 2.34 — — — 37.49 6.66 (e)R-4 Shares2014 52.91 0.50 7.35 7.85 (0.44) (1.15) (1.59) 59.17 15.172013 42.05 0.58 11.37 11.95 (0.60) (0.49) (1.09) 52.91 29.052012 38.42 0.40 4.03 4.43 (0.32) (0.48) (0.80) 42.05 11.832011 37.53 0.31 2.23 2.54 (0.54) (1.11) (1.65) 38.42 6.802010(g) 35.15 0.11 2.27 2.38 — — — 37.53 6.77 (e)R-5 Shares2014 53.06 0.56 7.38 7.94 (0.51) (1.15) (1.66) 59.34 15.322013 42.15 0.64 11.39 12.03 (0.63) (0.49) (1.12) 53.06 29.202012 38.50 0.47 4.01 4.48 (0.35) (0.48) (0.83) 42.15 11.962011 37.57 0.37 2.22 2.59 (0.55) (1.11) (1.66) 38.50 6.912010(g) 35.15 0.15 2.27 2.42 — — — 37.57 6.88 (e)
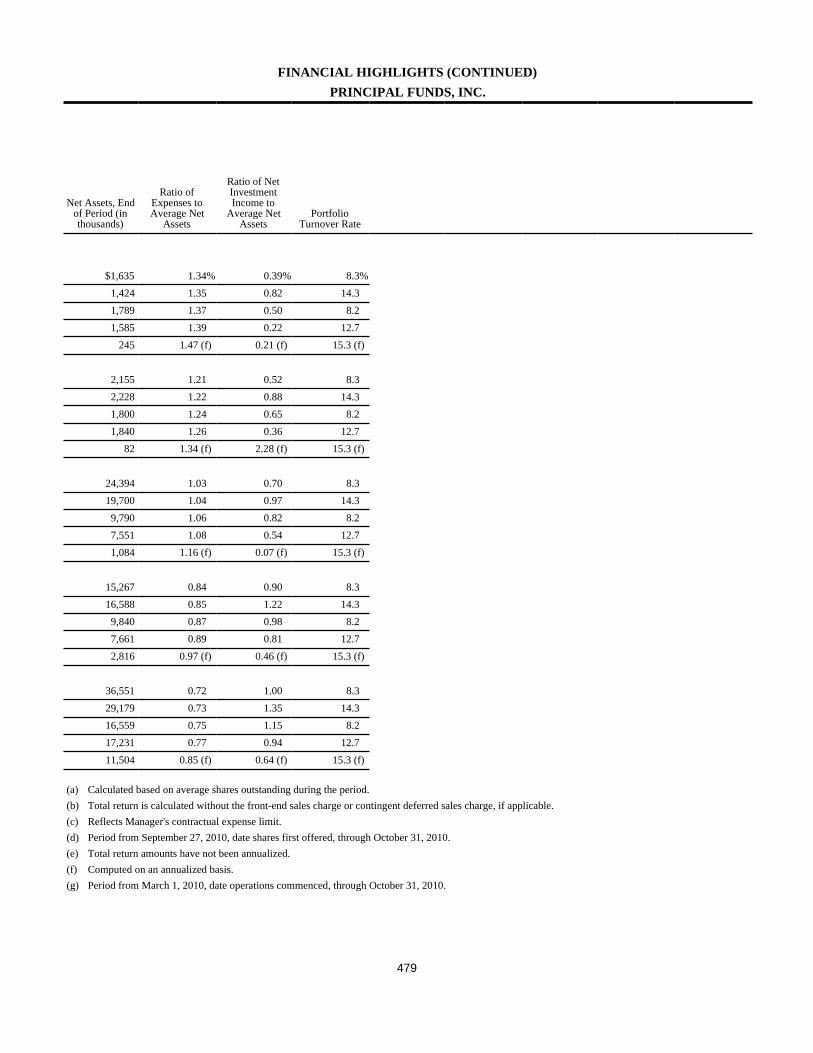
479
FINANCIAL HIGHLIGHTS (CONTINUED)PRINCIPAL FUNDS, INC.
Net Assets, Endof Period (inthousands)
Ratio ofExpenses toAverage Net
Assets
Ratio of NetInvestmentIncome to
Average NetAssets
PortfolioTurnover Rate
$1,635 1.34% 0.39% 8.3%1,424 1.35 0.82 14.31,789 1.37 0.50 8.21,585 1.39 0.22 12.7
245 1.47 (f) 0.21 (f) 15.3 (f)
2,155 1.21 0.52 8.32,228 1.22 0.88 14.31,800 1.24 0.65 8.21,840 1.26 0.36 12.7
82 1.34 (f) 2.28 (f) 15.3 (f)
24,394 1.03 0.70 8.319,700 1.04 0.97 14.39,790 1.06 0.82 8.27,551 1.08 0.54 12.71,084 1.16 (f) 0.07 (f) 15.3 (f)
15,267 0.84 0.90 8.316,588 0.85 1.22 14.39,840 0.87 0.98 8.27,661 0.89 0.81 12.72,816 0.97 (f) 0.46 (f) 15.3 (f)
36,551 0.72 1.00 8.329,179 0.73 1.35 14.316,559 0.75 1.15 8.217,231 0.77 0.94 12.711,504 0.85 (f) 0.64 (f) 15.3 (f)
(a) Calculated based on average shares outstanding during the period.(b) Total return is calculated without the front-end sales charge or contingent deferred sales charge, if applicable.(c) Reflects Manager's contractual expense limit.(d) Period from September 27, 2010, date shares first offered, through October 31, 2010.(e) Total return amounts have not been annualized.(f) Computed on an annualized basis.(g) Period from March 1, 2010, date operations commenced, through October 31, 2010.
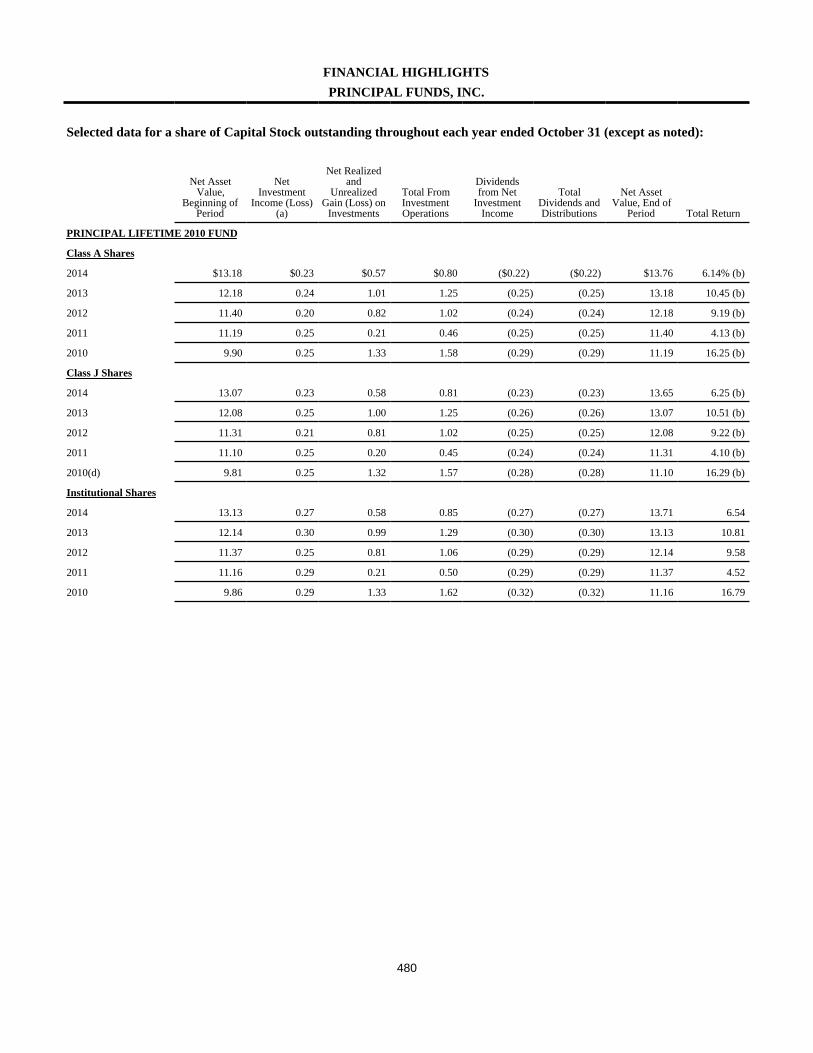
480
FINANCIAL HIGHLIGHTSPRINCIPAL FUNDS, INC.
Selected data for a share of Capital Stock outstanding throughout each year ended October 31 (except as noted):
Net AssetValue,
Beginning ofPeriod
NetInvestment
Income (Loss)(a)
Net Realizedand
UnrealizedGain (Loss) on
Investments
Total FromInvestmentOperations
Dividendsfrom Net
InvestmentIncome
TotalDividends andDistributions
Net AssetValue, End of
Period Total Return
PRINCIPAL LIFETIME 2010 FUND
Class A Shares
2014 $13.18 $0.23 $0.57 $0.80 ($0.22) ($0.22) $13.76 6.14% (b)
2013 12.18 0.24 1.01 1.25 (0.25) (0.25) 13.18 10.45 (b)
2012 11.40 0.20 0.82 1.02 (0.24) (0.24) 12.18 9.19 (b)
2011 11.19 0.25 0.21 0.46 (0.25) (0.25) 11.40 4.13 (b)
2010 9.90 0.25 1.33 1.58 (0.29) (0.29) 11.19 16.25 (b)
Class J Shares
2014 13.07 0.23 0.58 0.81 (0.23) (0.23) 13.65 6.25 (b)
2013 12.08 0.25 1.00 1.25 (0.26) (0.26) 13.07 10.51 (b)
2012 11.31 0.21 0.81 1.02 (0.25) (0.25) 12.08 9.22 (b)
2011 11.10 0.25 0.20 0.45 (0.24) (0.24) 11.31 4.10 (b)
2010(d) 9.81 0.25 1.32 1.57 (0.28) (0.28) 11.10 16.29 (b)
Institutional Shares
2014 13.13 0.27 0.58 0.85 (0.27) (0.27) 13.71 6.54
2013 12.14 0.30 0.99 1.29 (0.30) (0.30) 13.13 10.81
2012 11.37 0.25 0.81 1.06 (0.29) (0.29) 12.14 9.58
2011 11.16 0.29 0.21 0.50 (0.29) (0.29) 11.37 4.52
2010 9.86 0.29 1.33 1.62 (0.32) (0.32) 11.16 16.79
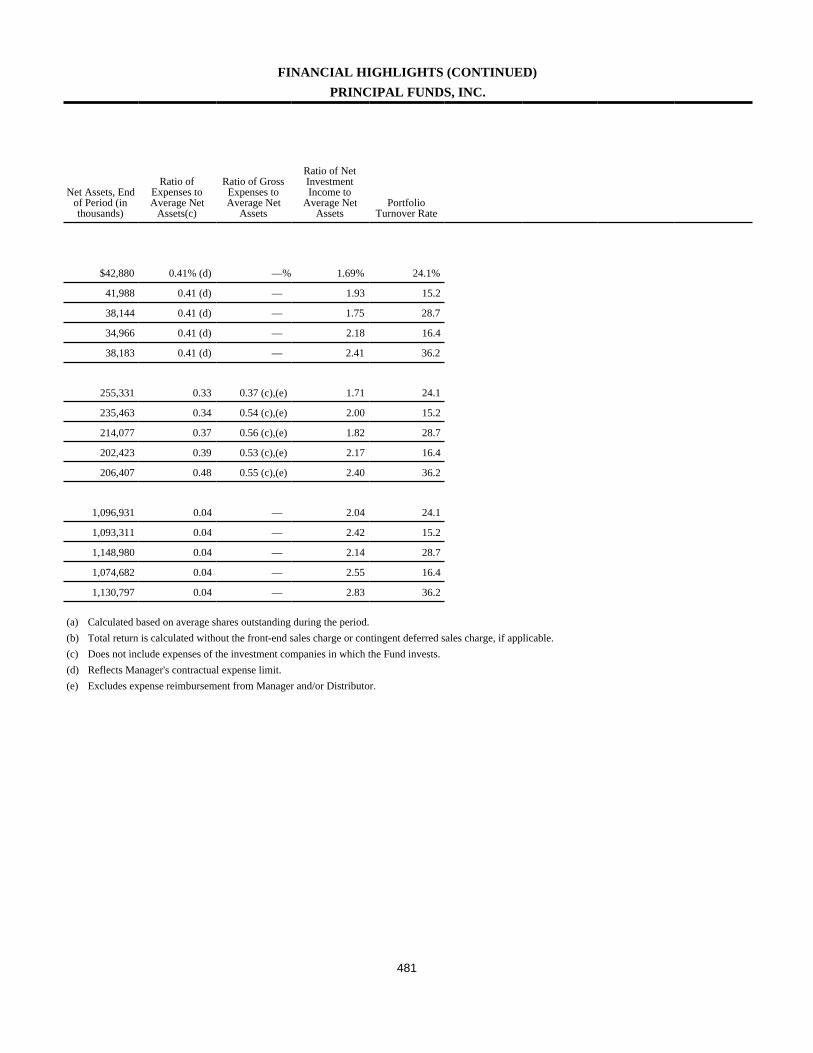
481
FINANCIAL HIGHLIGHTS (CONTINUED)PRINCIPAL FUNDS, INC.
Net Assets, Endof Period (inthousands)
Ratio ofExpenses toAverage Net
Assets(c)
Ratio of GrossExpenses toAverage Net
Assets
Ratio of NetInvestmentIncome to
Average NetAssets
PortfolioTurnover Rate
$42,880 0.41% (d) —% 1.69% 24.1%
41,988 0.41 (d) — 1.93 15.2
38,144 0.41 (d) — 1.75 28.7
34,966 0.41 (d) — 2.18 16.4
38,183 0.41 (d) — 2.41 36.2
255,331 0.33 0.37 (c),(e) 1.71 24.1
235,463 0.34 0.54 (c),(e) 2.00 15.2
214,077 0.37 0.56 (c),(e) 1.82 28.7
202,423 0.39 0.53 (c),(e) 2.17 16.4
206,407 0.48 0.55 (c),(e) 2.40 36.2
1,096,931 0.04 — 2.04 24.1
1,093,311 0.04 — 2.42 15.2
1,148,980 0.04 — 2.14 28.7
1,074,682 0.04 — 2.55 16.4
1,130,797 0.04 — 2.83 36.2
(a) Calculated based on average shares outstanding during the period.(b) Total return is calculated without the front-end sales charge or contingent deferred sales charge, if applicable.(c) Does not include expenses of the investment companies in which the Fund invests.(d) Reflects Manager's contractual expense limit.(e) Excludes expense reimbursement from Manager and/or Distributor.
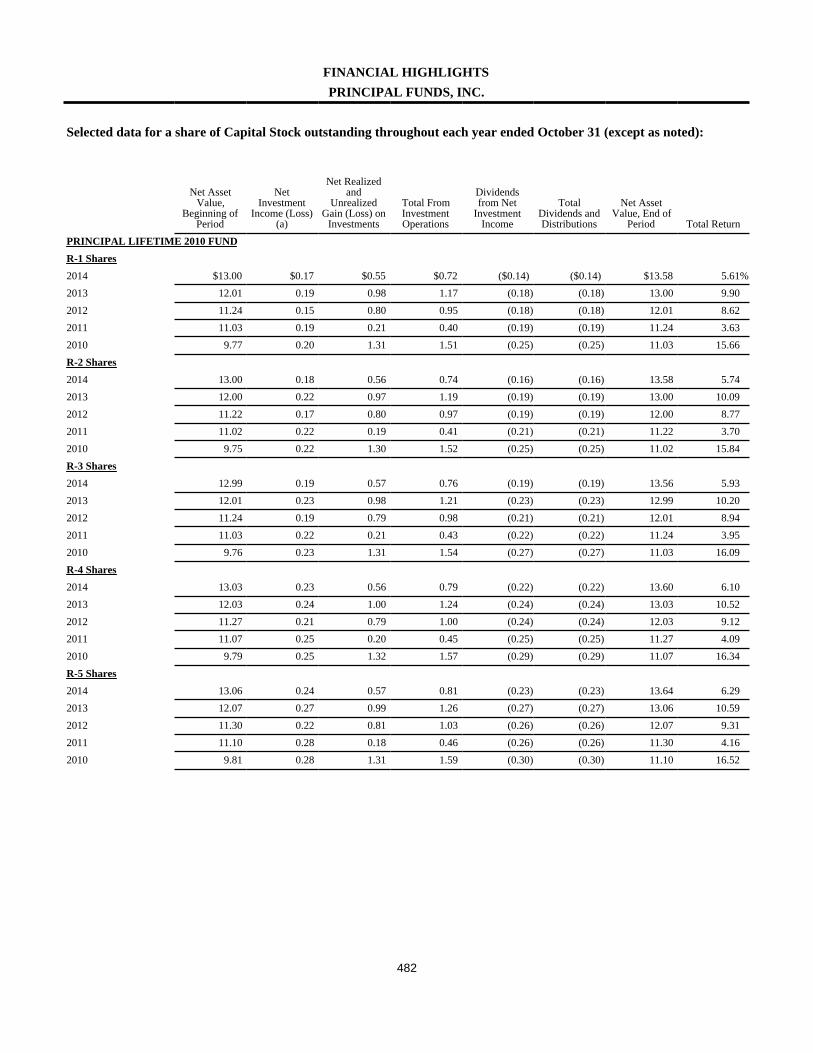
482
FINANCIAL HIGHLIGHTSPRINCIPAL FUNDS, INC.
Selected data for a share of Capital Stock outstanding throughout each year ended October 31 (except as noted):
Net AssetValue,
Beginning ofPeriod
NetInvestment
Income (Loss)(a)
Net Realizedand
UnrealizedGain (Loss) on
Investments
Total FromInvestmentOperations
Dividendsfrom Net
InvestmentIncome
TotalDividends andDistributions
Net AssetValue, End of
Period Total ReturnPRINCIPAL LIFETIME 2010 FUNDR-1 Shares2014 $13.00 $0.17 $0.55 $0.72 ($0.14) ($0.14) $13.58 5.61%2013 12.01 0.19 0.98 1.17 (0.18) (0.18) 13.00 9.902012 11.24 0.15 0.80 0.95 (0.18) (0.18) 12.01 8.622011 11.03 0.19 0.21 0.40 (0.19) (0.19) 11.24 3.632010 9.77 0.20 1.31 1.51 (0.25) (0.25) 11.03 15.66R-2 Shares2014 13.00 0.18 0.56 0.74 (0.16) (0.16) 13.58 5.742013 12.00 0.22 0.97 1.19 (0.19) (0.19) 13.00 10.092012 11.22 0.17 0.80 0.97 (0.19) (0.19) 12.00 8.772011 11.02 0.22 0.19 0.41 (0.21) (0.21) 11.22 3.702010 9.75 0.22 1.30 1.52 (0.25) (0.25) 11.02 15.84R-3 Shares2014 12.99 0.19 0.57 0.76 (0.19) (0.19) 13.56 5.932013 12.01 0.23 0.98 1.21 (0.23) (0.23) 12.99 10.202012 11.24 0.19 0.79 0.98 (0.21) (0.21) 12.01 8.942011 11.03 0.22 0.21 0.43 (0.22) (0.22) 11.24 3.952010 9.76 0.23 1.31 1.54 (0.27) (0.27) 11.03 16.09R-4 Shares2014 13.03 0.23 0.56 0.79 (0.22) (0.22) 13.60 6.102013 12.03 0.24 1.00 1.24 (0.24) (0.24) 13.03 10.522012 11.27 0.21 0.79 1.00 (0.24) (0.24) 12.03 9.122011 11.07 0.25 0.20 0.45 (0.25) (0.25) 11.27 4.092010 9.79 0.25 1.32 1.57 (0.29) (0.29) 11.07 16.34R-5 Shares2014 13.06 0.24 0.57 0.81 (0.23) (0.23) 13.64 6.292013 12.07 0.27 0.99 1.26 (0.27) (0.27) 13.06 10.592012 11.30 0.22 0.81 1.03 (0.26) (0.26) 12.07 9.312011 11.10 0.28 0.18 0.46 (0.26) (0.26) 11.30 4.162010 9.81 0.28 1.31 1.59 (0.30) (0.30) 11.10 16.52

483
FINANCIAL HIGHLIGHTS (CONTINUED)PRINCIPAL FUNDS, INC.
Net Assets, Endof Period (inthousands)
Ratio ofExpenses toAverage Net
Assets(c)
Ratio of GrossExpenses toAverage Net
Assets
Ratio of NetInvestmentIncome to
Average NetAssets
PortfolioTurnover Rate
$14,995 0.91% —% 1.27% 24.1%18,403 0.91 — 1.53 15.220,503 0.91 — 1.31 28.721,110 0.92 — 1.65 16.424,103 0.92 — 1.96 36.2
15,736 0.78 — 1.39 24.120,762 0.78 — 1.76 15.225,982 0.78 — 1.48 28.730,298 0.79 — 1.91 16.442,654 0.79 — 2.13 36.2
74,667 0.60 — 1.47 24.176,245 0.60 — 1.83 15.280,009 0.60 — 1.61 28.781,172 0.61 — 1.98 16.496,491 0.61 — 2.29 36.2
59,247 0.41 — 1.71 24.168,271 0.41 — 1.94 15.268,441 0.41 — 1.85 28.777,085 0.42 — 2.17 16.480,377 0.42 — 2.45 36.2
108,094 0.29 — 1.77 24.1113,248 0.29 — 2.16 15.2114,530 0.29 — 1.90 28.7115,406 0.30 — 2.44 16.4145,309 0.30 — 2.72 36.2
(a) Calculated based on average shares outstanding during the period.(b) Total return is calculated without the front-end sales charge or contingent deferred sales charge, if applicable.(c) Does not include expenses of the investment companies in which the Fund invests.(d) Reflects Manager's contractual expense limit.(e) Excludes expense reimbursement from Manager and/or Distributor.
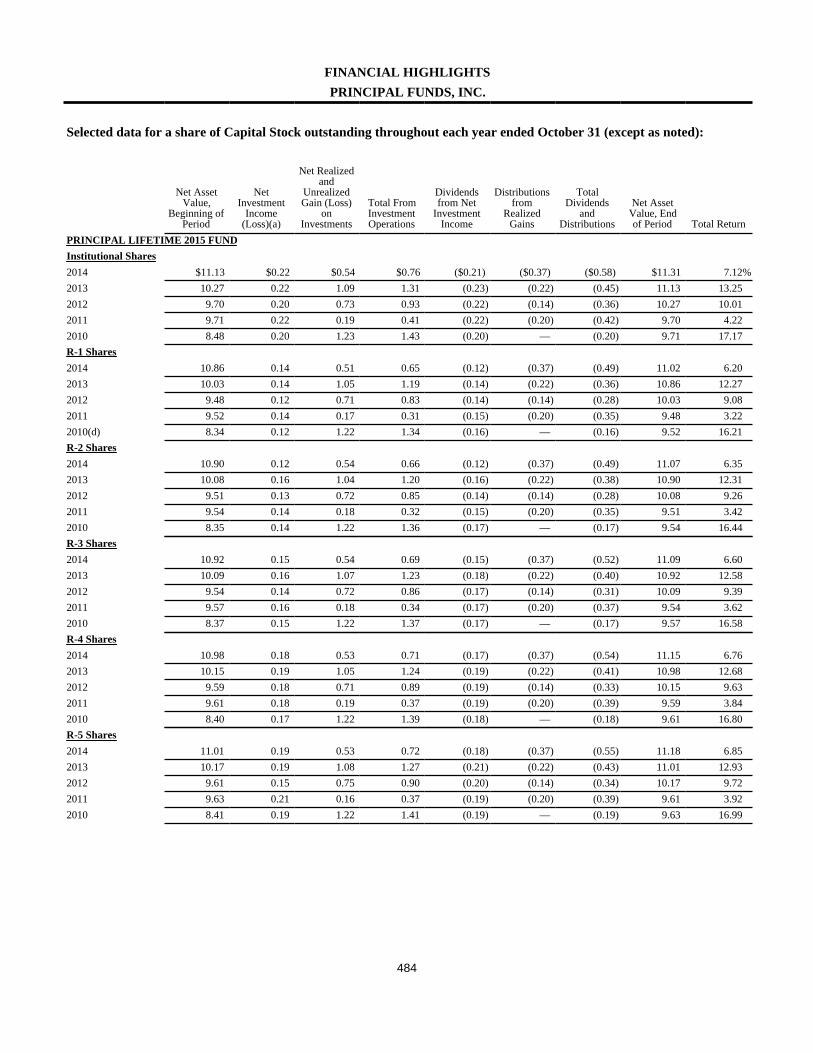
484
FINANCIAL HIGHLIGHTSPRINCIPAL FUNDS, INC.
Selected data for a share of Capital Stock outstanding throughout each year ended October 31 (except as noted):
Net AssetValue,
Beginning ofPeriod
NetInvestment
Income(Loss)(a)
Net Realizedand
UnrealizedGain (Loss)
onInvestments
Total FromInvestmentOperations
Dividendsfrom Net
InvestmentIncome
Distributionsfrom
RealizedGains
TotalDividends
andDistributions
Net AssetValue, Endof Period Total Return
PRINCIPAL LIFETIME 2015 FUNDInstitutional Shares2014 $11.13 $0.22 $0.54 $0.76 ($0.21) ($0.37) ($0.58) $11.31 7.12%2013 10.27 0.22 1.09 1.31 (0.23) (0.22) (0.45) 11.13 13.252012 9.70 0.20 0.73 0.93 (0.22) (0.14) (0.36) 10.27 10.012011 9.71 0.22 0.19 0.41 (0.22) (0.20) (0.42) 9.70 4.222010 8.48 0.20 1.23 1.43 (0.20) — (0.20) 9.71 17.17R-1 Shares2014 10.86 0.14 0.51 0.65 (0.12) (0.37) (0.49) 11.02 6.202013 10.03 0.14 1.05 1.19 (0.14) (0.22) (0.36) 10.86 12.272012 9.48 0.12 0.71 0.83 (0.14) (0.14) (0.28) 10.03 9.082011 9.52 0.14 0.17 0.31 (0.15) (0.20) (0.35) 9.48 3.222010(d) 8.34 0.12 1.22 1.34 (0.16) — (0.16) 9.52 16.21R-2 Shares2014 10.90 0.12 0.54 0.66 (0.12) (0.37) (0.49) 11.07 6.352013 10.08 0.16 1.04 1.20 (0.16) (0.22) (0.38) 10.90 12.312012 9.51 0.13 0.72 0.85 (0.14) (0.14) (0.28) 10.08 9.262011 9.54 0.14 0.18 0.32 (0.15) (0.20) (0.35) 9.51 3.422010 8.35 0.14 1.22 1.36 (0.17) — (0.17) 9.54 16.44R-3 Shares2014 10.92 0.15 0.54 0.69 (0.15) (0.37) (0.52) 11.09 6.602013 10.09 0.16 1.07 1.23 (0.18) (0.22) (0.40) 10.92 12.582012 9.54 0.14 0.72 0.86 (0.17) (0.14) (0.31) 10.09 9.392011 9.57 0.16 0.18 0.34 (0.17) (0.20) (0.37) 9.54 3.622010 8.37 0.15 1.22 1.37 (0.17) — (0.17) 9.57 16.58R-4 Shares2014 10.98 0.18 0.53 0.71 (0.17) (0.37) (0.54) 11.15 6.762013 10.15 0.19 1.05 1.24 (0.19) (0.22) (0.41) 10.98 12.682012 9.59 0.18 0.71 0.89 (0.19) (0.14) (0.33) 10.15 9.632011 9.61 0.18 0.19 0.37 (0.19) (0.20) (0.39) 9.59 3.842010 8.40 0.17 1.22 1.39 (0.18) — (0.18) 9.61 16.80R-5 Shares2014 11.01 0.19 0.53 0.72 (0.18) (0.37) (0.55) 11.18 6.852013 10.17 0.19 1.08 1.27 (0.21) (0.22) (0.43) 11.01 12.932012 9.61 0.15 0.75 0.90 (0.20) (0.14) (0.34) 10.17 9.722011 9.63 0.21 0.16 0.37 (0.19) (0.20) (0.39) 9.61 3.922010 8.41 0.19 1.22 1.41 (0.19) — (0.19) 9.63 16.99
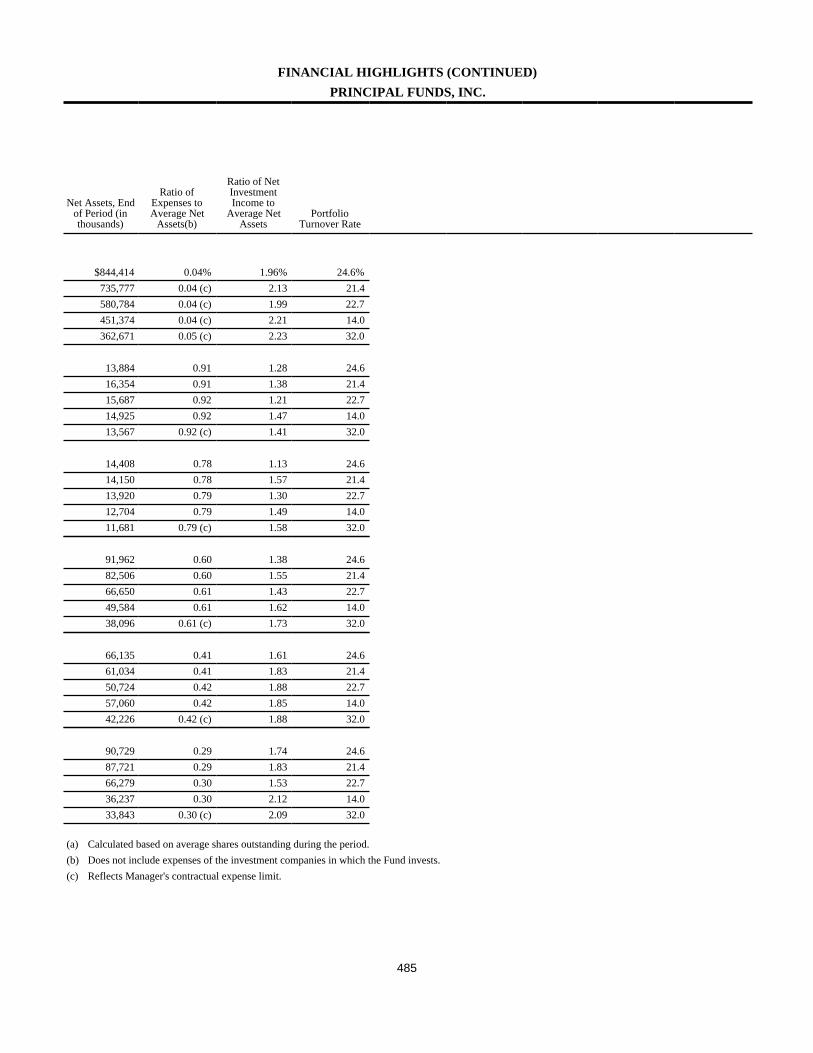
485
FINANCIAL HIGHLIGHTS (CONTINUED)PRINCIPAL FUNDS, INC.
Net Assets, Endof Period (inthousands)
Ratio ofExpenses toAverage Net
Assets(b)
Ratio of NetInvestmentIncome to
Average NetAssets
PortfolioTurnover Rate
$844,414 0.04% 1.96% 24.6%735,777 0.04 (c) 2.13 21.4580,784 0.04 (c) 1.99 22.7451,374 0.04 (c) 2.21 14.0362,671 0.05 (c) 2.23 32.0
13,884 0.91 1.28 24.616,354 0.91 1.38 21.415,687 0.92 1.21 22.714,925 0.92 1.47 14.013,567 0.92 (c) 1.41 32.0
14,408 0.78 1.13 24.614,150 0.78 1.57 21.413,920 0.79 1.30 22.712,704 0.79 1.49 14.011,681 0.79 (c) 1.58 32.0
91,962 0.60 1.38 24.682,506 0.60 1.55 21.466,650 0.61 1.43 22.749,584 0.61 1.62 14.038,096 0.61 (c) 1.73 32.0
66,135 0.41 1.61 24.661,034 0.41 1.83 21.450,724 0.42 1.88 22.757,060 0.42 1.85 14.042,226 0.42 (c) 1.88 32.0
90,729 0.29 1.74 24.687,721 0.29 1.83 21.466,279 0.30 1.53 22.736,237 0.30 2.12 14.033,843 0.30 (c) 2.09 32.0
(a) Calculated based on average shares outstanding during the period.(b) Does not include expenses of the investment companies in which the Fund invests.(c) Reflects Manager's contractual expense limit.

486
FINANCIAL HIGHLIGHTSPRINCIPAL FUNDS, INC.
Selected data for a share of Capital Stock outstanding throughout each year ended October 31 (except as noted):
Net AssetValue,
Beginning ofPeriod
NetInvestment
Income(Loss)(a)
Net Realizedand
UnrealizedGain (Loss)
onInvestments
Total FromInvestmentOperations
Dividendsfrom Net
InvestmentIncome
Distributionsfrom
RealizedGains
TotalDividends
andDistributions
Net AssetValue, Endof Period Total Return
PRINCIPAL LIFETIME 2020 FUND
Class A Shares
2014 $14.32 $0.23 $0.82 $1.05 ($0.23) ($0.15) ($0.38) $14.99 7.44% (b)
2013 12.66 0.24 1.67 1.91 (0.25) — (0.25) 14.32 15.35 (b)
2012 11.69 0.20 1.00 1.20 (0.23) — (0.23) 12.66 10.46 (b)
2011 11.52 0.21 0.18 0.39 (0.22) — (0.22) 11.69 3.39 (b)
2010 10.09 0.22 1.47 1.69 (0.26) — (0.26) 11.52 16.97 (b)
Class J Shares
2014 14.19 0.24 0.82 1.06 (0.24) (0.15) (0.39) 14.86 7.57 (b)
2013 12.55 0.24 1.66 1.90 (0.26) — (0.26) 14.19 15.38 (b)
2012 11.59 0.21 0.98 1.19 (0.23) — (0.23) 12.55 10.49 (b)
2011 11.41 0.21 0.18 0.39 (0.21) — (0.21) 11.59 3.45 (b)
2010(d) 9.99 0.21 1.46 1.67 (0.25) — (0.25) 11.41 16.92 (b)
Institutional Shares
2014 14.27 0.29 0.81 1.10 (0.28) (0.15) (0.43) 14.94 7.84
2013 12.61 0.30 1.66 1.96 (0.30) — (0.30) 14.27 15.82
2012 11.65 0.25 0.98 1.23 (0.27) — (0.27) 12.61 10.84
2011 11.48 0.26 0.17 0.43 (0.26) — (0.26) 11.65 3.76
2010 10.04 0.26 1.47 1.73 (0.29) — (0.29) 11.48 17.51

487
FINANCIAL HIGHLIGHTS (CONTINUED)PRINCIPAL FUNDS, INC.
Net Assets, Endof Period (inthousands)
Ratio ofExpenses toAverage Net
Assets(d)
Ratio of GrossExpenses toAverage Net
Assets
Ratio of NetInvestmentIncome to
Average NetAssets
PortfolioTurnover Rate
$128,189 0.41% (c) —% 1.60% 18.6%
118,277 0.41 (c) — 1.79 25.7
99,802 0.41 (c) — 1.67 21.9
85,340 0.41 (c) — 1.80 8.8
82,683 0.41 (c) — 2.02 32.0
879,358 0.33 0.37 (d),(e) 1.65 18.6
782,787 0.35 0.55 (d),(e) 1.84 25.7
655,845 0.37 0.56 (d),(e) 1.73 21.9
578,376 0.39 0.54 (d),(e) 1.80 8.8
552,609 0.49 0.55 (d),(e) 1.97 32.0
4,743,088 0.04 — 1.96 18.6
4,348,221 0.04 — 2.22 25.7
3,856,280 0.04 — 2.03 21.9
3,310,509 0.04 — 2.17 8.8
3,146,852 0.04 — 2.40 32.0
(a) Calculated based on average shares outstanding during the period.(b) Total return is calculated without the front-end sales charge or contingent deferred sales charge, if applicable.(c) Does not include expenses of the investment companies in which the Fund invests.(d) Reflects Manager's contractual expense limit.(e) Excludes expense reimbursement from Manager and/or Distributor.

488
FINANCIAL HIGHLIGHTSPRINCIPAL FUNDS, INC.
Selected data for a share of Capital Stock outstanding throughout each year ended October 31 (except as noted):
Net AssetValue,
Beginning ofPeriod
NetInvestment
Income(Loss)(a)
Net Realizedand
UnrealizedGain (Loss)
onInvestments
Total FromInvestmentOperations
Dividendsfrom Net
InvestmentIncome
Distributionsfrom
RealizedGains
TotalDividends
andDistributions
Net AssetValue, Endof Period Total Return
PRINCIPAL LIFETIME 2020 FUNDR-1 Shares2014 $14.12 $0.18 $0.78 $0.96 ($0.14) ($0.15) ($0.29) $14.79 6.91%2013 12.48 0.19 1.64 1.83 (0.19) — (0.19) 14.12 14.812012 11.53 0.14 0.98 1.12 (0.17) — (0.17) 12.48 9.842011 11.36 0.15 0.18 0.33 (0.16) — (0.16) 11.53 2.932010 9.96 0.16 1.46 1.62 (0.22) — (0.22) 11.36 16.43R-2 Shares2014 14.10 0.18 0.80 0.98 (0.17) (0.15) (0.32) 14.76 7.062013 12.47 0.20 1.63 1.83 (0.20) — (0.20) 14.10 14.872012 11.50 0.17 0.97 1.14 (0.17) — (0.17) 12.47 10.062011 11.33 0.18 0.17 0.35 (0.18) — (0.18) 11.50 3.052010 9.93 0.18 1.44 1.62 (0.22) — (0.22) 11.33 16.54R-3 Shares2014 14.12 0.20 0.81 1.01 (0.20) (0.15) (0.35) 14.78 7.272013 12.49 0.22 1.64 1.86 (0.23) — (0.23) 14.12 15.102012 11.54 0.18 0.97 1.15 (0.20) — (0.20) 12.49 10.192011 11.36 0.19 0.19 0.38 (0.20) — (0.20) 11.54 3.322010 9.96 0.20 1.44 1.64 (0.24) — (0.24) 11.36 16.70R-4 Shares2014 14.15 0.24 0.80 1.04 (0.23) (0.15) (0.38) 14.81 7.462013 12.51 0.23 1.66 1.89 (0.25) — (0.25) 14.15 15.322012 11.56 0.21 0.97 1.18 (0.23) — (0.23) 12.51 10.402011 11.39 0.21 0.18 0.39 (0.22) — (0.22) 11.56 3.442010 9.98 0.21 1.46 1.67 (0.26) — (0.26) 11.39 16.97R-5 Shares2014 14.20 0.24 0.81 1.05 (0.24) (0.15) (0.39) 14.86 7.552013 12.55 0.26 1.66 1.92 (0.27) — (0.27) 14.20 15.542012 11.60 0.22 0.97 1.19 (0.24) — (0.24) 12.55 10.502011 11.42 0.24 0.17 0.41 (0.23) — (0.23) 11.60 3.612010 10.00 0.24 1.45 1.69 (0.27) — (0.27) 11.42 17.14

489
FINANCIAL HIGHLIGHTS (CONTINUED)PRINCIPAL FUNDS, INC.
Net Assets, Endof Period (inthousands)
Ratio ofExpenses toAverage Net
Assets(d)
Ratio of GrossExpenses toAverage Net
Assets
Ratio of NetInvestmentIncome to
Average NetAssets
PortfolioTurnover Rate
$53,222 0.91% —% 1.21% 18.6%57,842 0.91 — 1.43 25.762,546 0.91 — 1.21 21.958,270 0.91 — 1.30 8.858,931 0.92 — 1.56 32.0
76,267 0.78 — 1.27 18.678,817 0.78 — 1.51 25.777,610 0.78 — 1.40 21.980,491 0.78 — 1.54 8.8
107,791 0.79 — 1.70 32.0
316,368 0.60 — 1.40 18.6291,200 0.60 — 1.64 25.7263,407 0.60 — 1.49 21.9227,897 0.60 — 1.58 8.8234,218 0.61 — 1.91 32.0
249,613 0.41 — 1.69 18.6263,543 0.41 — 1.74 25.7212,684 0.41 — 1.78 21.9227,971 0.41 — 1.77 8.8216,623 0.42 — 2.00 32.0
472,434 0.29 – 1.68 18.6439,570 0.29 — 1.98 25.7384,604 0.29 — 1.83 21.9341,102 0.29 — 2.05 8.8365,913 0.30 — 2.25 32.0
(a) Calculated based on average shares outstanding during the period.(b) Total return is calculated without the front-end sales charge or contingent deferred sales charge, if applicable.(c) Reflects Manager's contractual expense limit.(d) Does not include expenses of the investment companies in which the Fund invests.(e) Excludes expense reimbursement from Manager and/or Distributor.
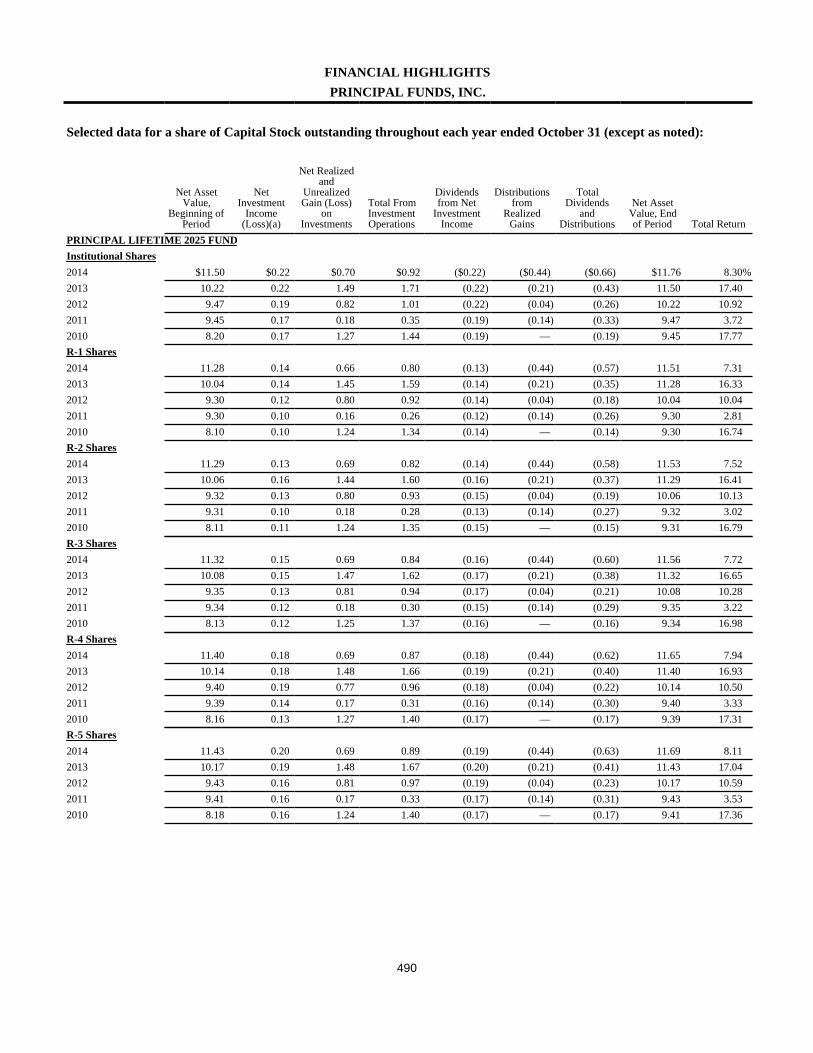
490
FINANCIAL HIGHLIGHTSPRINCIPAL FUNDS, INC.
Selected data for a share of Capital Stock outstanding throughout each year ended October 31 (except as noted):
Net AssetValue,
Beginning ofPeriod
NetInvestment
Income(Loss)(a)
Net Realizedand
UnrealizedGain (Loss)
onInvestments
Total FromInvestmentOperations
Dividendsfrom Net
InvestmentIncome
Distributionsfrom
RealizedGains
TotalDividends
andDistributions
Net AssetValue, Endof Period Total Return
PRINCIPAL LIFETIME 2025 FUNDInstitutional Shares2014 $11.50 $0.22 $0.70 $0.92 ($0.22) ($0.44) ($0.66) $11.76 8.30%2013 10.22 0.22 1.49 1.71 (0.22) (0.21) (0.43) 11.50 17.402012 9.47 0.19 0.82 1.01 (0.22) (0.04) (0.26) 10.22 10.922011 9.45 0.17 0.18 0.35 (0.19) (0.14) (0.33) 9.47 3.722010 8.20 0.17 1.27 1.44 (0.19) — (0.19) 9.45 17.77R-1 Shares2014 11.28 0.14 0.66 0.80 (0.13) (0.44) (0.57) 11.51 7.312013 10.04 0.14 1.45 1.59 (0.14) (0.21) (0.35) 11.28 16.332012 9.30 0.12 0.80 0.92 (0.14) (0.04) (0.18) 10.04 10.042011 9.30 0.10 0.16 0.26 (0.12) (0.14) (0.26) 9.30 2.812010 8.10 0.10 1.24 1.34 (0.14) — (0.14) 9.30 16.74R-2 Shares2014 11.29 0.13 0.69 0.82 (0.14) (0.44) (0.58) 11.53 7.522013 10.06 0.16 1.44 1.60 (0.16) (0.21) (0.37) 11.29 16.412012 9.32 0.13 0.80 0.93 (0.15) (0.04) (0.19) 10.06 10.132011 9.31 0.10 0.18 0.28 (0.13) (0.14) (0.27) 9.32 3.022010 8.11 0.11 1.24 1.35 (0.15) — (0.15) 9.31 16.79R-3 Shares2014 11.32 0.15 0.69 0.84 (0.16) (0.44) (0.60) 11.56 7.722013 10.08 0.15 1.47 1.62 (0.17) (0.21) (0.38) 11.32 16.652012 9.35 0.13 0.81 0.94 (0.17) (0.04) (0.21) 10.08 10.282011 9.34 0.12 0.18 0.30 (0.15) (0.14) (0.29) 9.35 3.222010 8.13 0.12 1.25 1.37 (0.16) — (0.16) 9.34 16.98R-4 Shares2014 11.40 0.18 0.69 0.87 (0.18) (0.44) (0.62) 11.65 7.942013 10.14 0.18 1.48 1.66 (0.19) (0.21) (0.40) 11.40 16.932012 9.40 0.19 0.77 0.96 (0.18) (0.04) (0.22) 10.14 10.502011 9.39 0.14 0.17 0.31 (0.16) (0.14) (0.30) 9.40 3.332010 8.16 0.13 1.27 1.40 (0.17) — (0.17) 9.39 17.31R-5 Shares2014 11.43 0.20 0.69 0.89 (0.19) (0.44) (0.63) 11.69 8.112013 10.17 0.19 1.48 1.67 (0.20) (0.21) (0.41) 11.43 17.042012 9.43 0.16 0.81 0.97 (0.19) (0.04) (0.23) 10.17 10.592011 9.41 0.16 0.17 0.33 (0.17) (0.14) (0.31) 9.43 3.532010 8.18 0.16 1.24 1.40 (0.17) — (0.17) 9.41 17.36
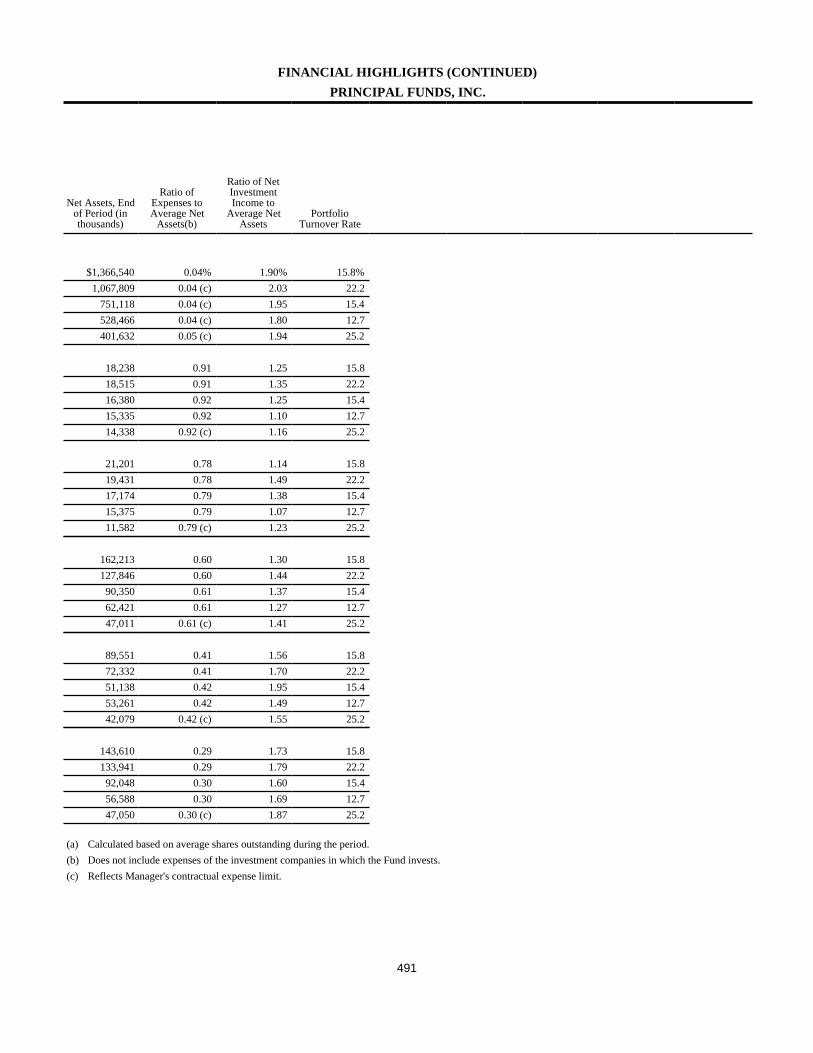
491
FINANCIAL HIGHLIGHTS (CONTINUED)PRINCIPAL FUNDS, INC.
Net Assets, Endof Period (inthousands)
Ratio ofExpenses toAverage Net
Assets(b)
Ratio of NetInvestmentIncome to
Average NetAssets
PortfolioTurnover Rate
$1,366,540 0.04% 1.90% 15.8%1,067,809 0.04 (c) 2.03 22.2
751,118 0.04 (c) 1.95 15.4528,466 0.04 (c) 1.80 12.7401,632 0.05 (c) 1.94 25.2
18,238 0.91 1.25 15.818,515 0.91 1.35 22.216,380 0.92 1.25 15.415,335 0.92 1.10 12.714,338 0.92 (c) 1.16 25.2
21,201 0.78 1.14 15.819,431 0.78 1.49 22.217,174 0.79 1.38 15.415,375 0.79 1.07 12.711,582 0.79 (c) 1.23 25.2
162,213 0.60 1.30 15.8127,846 0.60 1.44 22.2
90,350 0.61 1.37 15.462,421 0.61 1.27 12.747,011 0.61 (c) 1.41 25.2
89,551 0.41 1.56 15.872,332 0.41 1.70 22.251,138 0.42 1.95 15.453,261 0.42 1.49 12.742,079 0.42 (c) 1.55 25.2
143,610 0.29 1.73 15.8133,941 0.29 1.79 22.2
92,048 0.30 1.60 15.456,588 0.30 1.69 12.747,050 0.30 (c) 1.87 25.2
(a) Calculated based on average shares outstanding during the period.(b) Does not include expenses of the investment companies in which the Fund invests.(c) Reflects Manager's contractual expense limit.
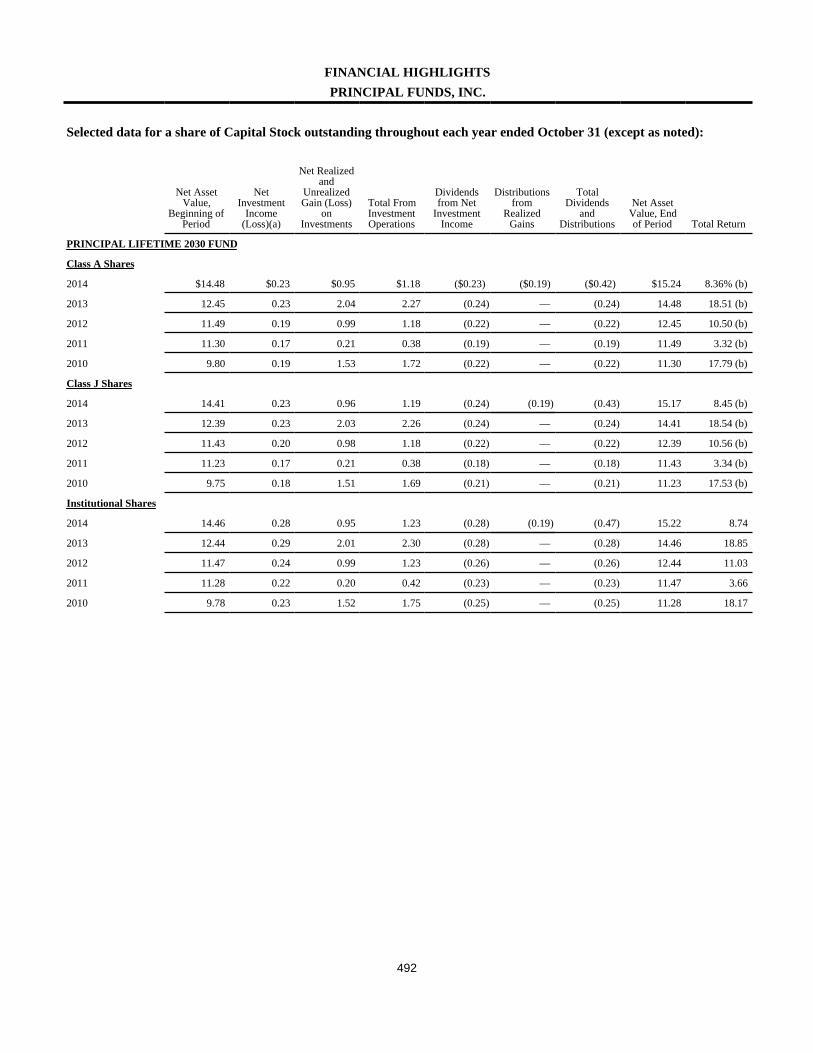
492
FINANCIAL HIGHLIGHTSPRINCIPAL FUNDS, INC.
Selected data for a share of Capital Stock outstanding throughout each year ended October 31 (except as noted):
Net AssetValue,
Beginning ofPeriod
NetInvestment
Income(Loss)(a)
Net Realizedand
UnrealizedGain (Loss)
onInvestments
Total FromInvestmentOperations
Dividendsfrom Net
InvestmentIncome
Distributionsfrom
RealizedGains
TotalDividends
andDistributions
Net AssetValue, Endof Period Total Return
PRINCIPAL LIFETIME 2030 FUND
Class A Shares
2014 $14.48 $0.23 $0.95 $1.18 ($0.23) ($0.19) ($0.42) $15.24 8.36% (b)
2013 12.45 0.23 2.04 2.27 (0.24) — (0.24) 14.48 18.51 (b)
2012 11.49 0.19 0.99 1.18 (0.22) — (0.22) 12.45 10.50 (b)
2011 11.30 0.17 0.21 0.38 (0.19) — (0.19) 11.49 3.32 (b)
2010 9.80 0.19 1.53 1.72 (0.22) — (0.22) 11.30 17.79 (b)
Class J Shares
2014 14.41 0.23 0.96 1.19 (0.24) (0.19) (0.43) 15.17 8.45 (b)
2013 12.39 0.23 2.03 2.26 (0.24) — (0.24) 14.41 18.54 (b)
2012 11.43 0.20 0.98 1.18 (0.22) — (0.22) 12.39 10.56 (b)
2011 11.23 0.17 0.21 0.38 (0.18) — (0.18) 11.43 3.34 (b)
2010 9.75 0.18 1.51 1.69 (0.21) — (0.21) 11.23 17.53 (b)
Institutional Shares
2014 14.46 0.28 0.95 1.23 (0.28) (0.19) (0.47) 15.22 8.74
2013 12.44 0.29 2.01 2.30 (0.28) — (0.28) 14.46 18.85
2012 11.47 0.24 0.99 1.23 (0.26) — (0.26) 12.44 11.03
2011 11.28 0.22 0.20 0.42 (0.23) — (0.23) 11.47 3.66
2010 9.78 0.23 1.52 1.75 (0.25) — (0.25) 11.28 18.17
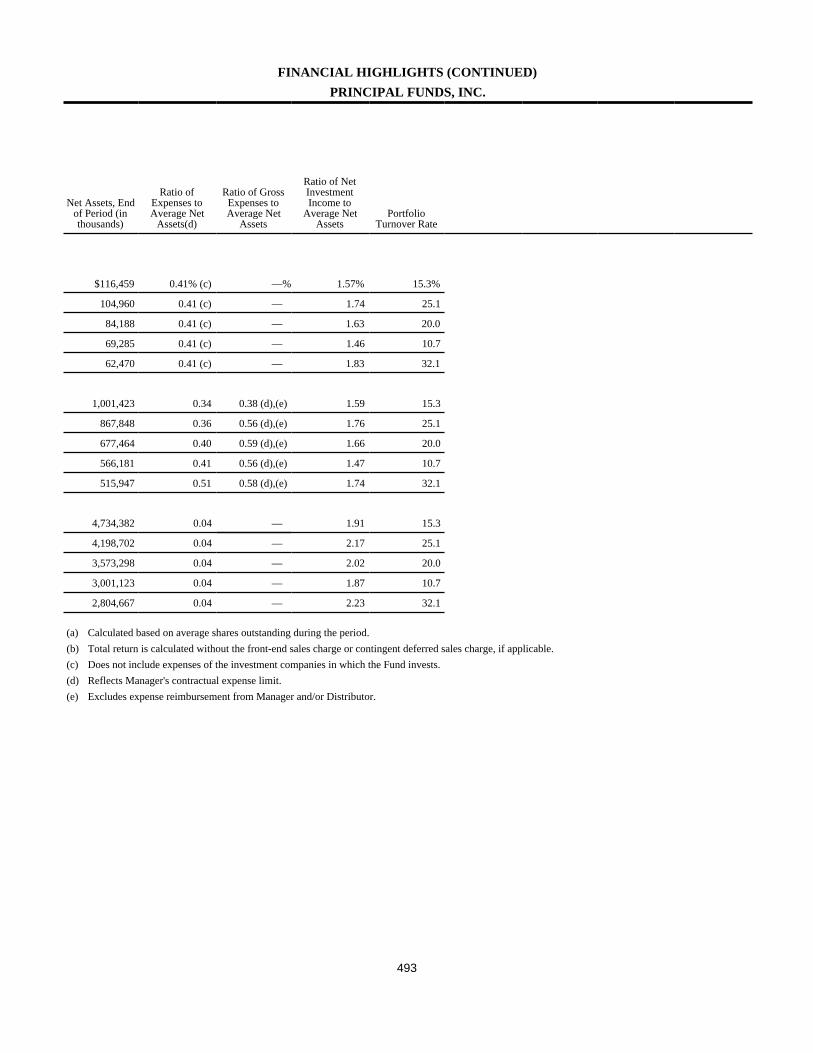
493
FINANCIAL HIGHLIGHTS (CONTINUED)PRINCIPAL FUNDS, INC.
Net Assets, Endof Period (inthousands)
Ratio ofExpenses toAverage Net
Assets(d)
Ratio of GrossExpenses toAverage Net
Assets
Ratio of NetInvestmentIncome to
Average NetAssets
PortfolioTurnover Rate
$116,459 0.41% (c) —% 1.57% 15.3%
104,960 0.41 (c) — 1.74 25.1
84,188 0.41 (c) — 1.63 20.0
69,285 0.41 (c) — 1.46 10.7
62,470 0.41 (c) — 1.83 32.1
1,001,423 0.34 0.38 (d),(e) 1.59 15.3
867,848 0.36 0.56 (d),(e) 1.76 25.1
677,464 0.40 0.59 (d),(e) 1.66 20.0
566,181 0.41 0.56 (d),(e) 1.47 10.7
515,947 0.51 0.58 (d),(e) 1.74 32.1
4,734,382 0.04 — 1.91 15.3
4,198,702 0.04 — 2.17 25.1
3,573,298 0.04 — 2.02 20.0
3,001,123 0.04 — 1.87 10.7
2,804,667 0.04 — 2.23 32.1
(a) Calculated based on average shares outstanding during the period.(b) Total return is calculated without the front-end sales charge or contingent deferred sales charge, if applicable.(c) Does not include expenses of the investment companies in which the Fund invests.(d) Reflects Manager's contractual expense limit.(e) Excludes expense reimbursement from Manager and/or Distributor.

494
FINANCIAL HIGHLIGHTSPRINCIPAL FUNDS, INC.
Selected data for a share of Capital Stock outstanding throughout each year ended October 31 (except as noted):
Net AssetValue,
Beginning ofPeriod
NetInvestment
Income(Loss)(a)
Net Realizedand
UnrealizedGain (Loss)
onInvestments
Total FromInvestmentOperations
Dividendsfrom Net
InvestmentIncome
Distributionsfrom
RealizedGains
TotalDividends
andDistributions
Net AssetValue, Endof Period Total Return
PRINCIPAL LIFETIME 2030 FUNDR-1 Shares2014 $14.31 $0.17 $0.93 $1.10 ($0.15) ($0.19) ($0.34) $15.07 7.82%2013 12.31 0.19 1.98 2.17 (0.17) — (0.17) 14.31 17.832012 11.35 0.14 0.98 1.12 (0.16) — (0.16) 12.31 10.012011 11.16 0.12 0.20 0.32 (0.13) — (0.13) 11.35 2.852010 9.70 0.14 1.50 1.64 (0.18) — (0.18) 11.16 17.11R-2 Shares2014 14.33 0.19 0.93 1.12 (0.18) (0.19) (0.37) 15.08 7.942013 12.33 0.21 1.97 2.18 (0.18) — (0.18) 14.33 17.932012 11.36 0.16 0.98 1.14 (0.17) — (0.17) 12.33 10.172011 11.17 0.14 0.19 0.33 (0.14) — (0.14) 11.36 2.942010 9.70 0.16 1.50 1.66 (0.19) — (0.19) 11.17 17.27R-3 Shares2014 14.38 0.20 0.95 1.15 (0.21) (0.19) (0.40) 15.13 8.142013 12.37 0.21 2.01 2.22 (0.21) — (0.21) 14.38 18.222012 11.41 0.18 0.97 1.15 (0.19) — (0.19) 12.37 10.312011 11.21 0.15 0.21 0.36 (0.16) — (0.16) 11.41 3.212010 9.74 0.18 1.49 1.67 (0.20) — (0.20) 11.21 17.40R-4 Shares2014 14.76 0.25 0.95 1.20 (0.23) (0.19) (0.42) 15.54 8.322013 12.68 0.23 2.08 2.31 (0.23) — (0.23) 14.76 18.502012 11.69 0.21 1.00 1.21 (0.22) — (0.22) 12.68 10.552011 11.49 0.18 0.20 0.38 (0.18) — (0.18) 11.69 3.332010 9.97 0.19 1.55 1.74 (0.22) — (0.22) 11.49 17.67R-5 Shares2014 14.43 0.24 0.96 1.20 (0.25) (0.19) (0.44) 15.19 8.502013 12.41 0.26 2.01 2.27 (0.25) — (0.25) 14.43 18.602012 11.45 0.22 0.97 1.19 (0.23) — (0.23) 12.41 10.652011 11.26 0.21 0.18 0.39 (0.20) — (0.20) 11.45 3.422010 9.77 0.21 1.51 1.72 (0.23) — (0.23) 11.26 17.85

495
FINANCIAL HIGHLIGHTS (CONTINUED)PRINCIPAL FUNDS, INC.
Net Assets, Endof Period (inthousands)
Ratio ofExpenses toAverage Net
Assets(d)
Ratio of GrossExpenses toAverage Net
Assets
Ratio of NetInvestmentIncome to
Average NetAssets
PortfolioTurnover Rate
$46,220 0.91% —% 1.17% 15.3%47,197 0.91 — 1.41 25.153,082 0.91 — 1.22 20.050,502 0.91 — 1.00 10.750,109 0.92 — 1.34 32.1
72,768 0.78 — 1.28 15.375,964 0.78 — 1.55 25.176,588 0.78 — 1.40 20.079,776 0.78 — 1.22 10.799,779 0.79 — 1.52 32.1
276,196 0.60 — 1.38 15.3263,892 0.60 — 1.59 25.1230,818 0.60 — 1.52 20.0208,383 0.60 — 1.30 10.7222,202 0.61 — 1.73 32.1
243,720 0.41 — 1.67 15.3246,295 0.41 — 1.69 25.1197,788 0.41 — 1.77 20.0199,240 0.41 — 1.50 10.7194,301 0.42 — 1.83 32.1
441,746 0.29 — 1.65 15.3416,542 0.29 — 1.93 25.1346,730 0.29 — 1.81 20.0305,169 0.29 — 1.78 10.7337,439 0.30 — 2.06 32.1
(a) Calculated based on average shares outstanding during the period.(b) Total return is calculated without the front-end sales charge or contingent deferred sales charge, if applicable.(c) Reflects Manager's contractual expense limit.(d) Does not include expenses of the investment companies in which the Fund invests.(e) Excludes expense reimbursement from Manager and/or Distributor.
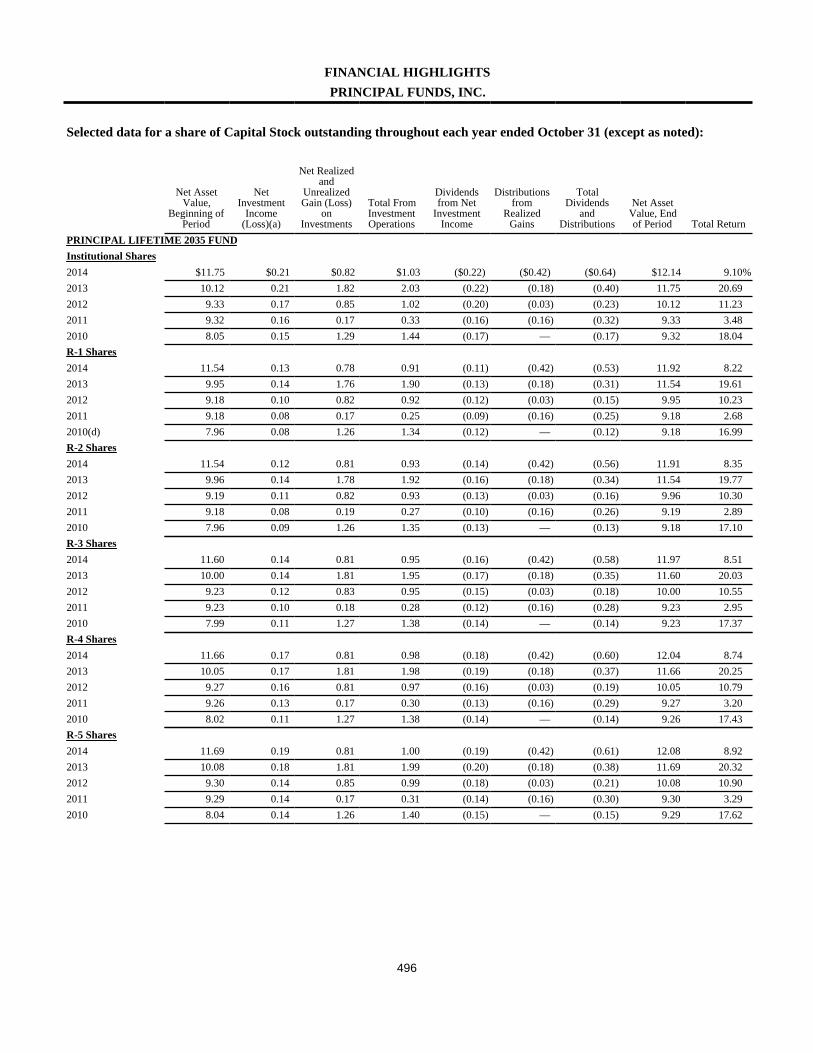
496
FINANCIAL HIGHLIGHTSPRINCIPAL FUNDS, INC.
Selected data for a share of Capital Stock outstanding throughout each year ended October 31 (except as noted):
Net AssetValue,
Beginning ofPeriod
NetInvestment
Income(Loss)(a)
Net Realizedand
UnrealizedGain (Loss)
onInvestments
Total FromInvestmentOperations
Dividendsfrom Net
InvestmentIncome
Distributionsfrom
RealizedGains
TotalDividends
andDistributions
Net AssetValue, Endof Period Total Return
PRINCIPAL LIFETIME 2035 FUNDInstitutional Shares2014 $11.75 $0.21 $0.82 $1.03 ($0.22) ($0.42) ($0.64) $12.14 9.10%2013 10.12 0.21 1.82 2.03 (0.22) (0.18) (0.40) 11.75 20.692012 9.33 0.17 0.85 1.02 (0.20) (0.03) (0.23) 10.12 11.232011 9.32 0.16 0.17 0.33 (0.16) (0.16) (0.32) 9.33 3.482010 8.05 0.15 1.29 1.44 (0.17) — (0.17) 9.32 18.04R-1 Shares2014 11.54 0.13 0.78 0.91 (0.11) (0.42) (0.53) 11.92 8.222013 9.95 0.14 1.76 1.90 (0.13) (0.18) (0.31) 11.54 19.612012 9.18 0.10 0.82 0.92 (0.12) (0.03) (0.15) 9.95 10.232011 9.18 0.08 0.17 0.25 (0.09) (0.16) (0.25) 9.18 2.682010(d) 7.96 0.08 1.26 1.34 (0.12) — (0.12) 9.18 16.99R-2 Shares2014 11.54 0.12 0.81 0.93 (0.14) (0.42) (0.56) 11.91 8.352013 9.96 0.14 1.78 1.92 (0.16) (0.18) (0.34) 11.54 19.772012 9.19 0.11 0.82 0.93 (0.13) (0.03) (0.16) 9.96 10.302011 9.18 0.08 0.19 0.27 (0.10) (0.16) (0.26) 9.19 2.892010 7.96 0.09 1.26 1.35 (0.13) — (0.13) 9.18 17.10R-3 Shares2014 11.60 0.14 0.81 0.95 (0.16) (0.42) (0.58) 11.97 8.512013 10.00 0.14 1.81 1.95 (0.17) (0.18) (0.35) 11.60 20.032012 9.23 0.12 0.83 0.95 (0.15) (0.03) (0.18) 10.00 10.552011 9.23 0.10 0.18 0.28 (0.12) (0.16) (0.28) 9.23 2.952010 7.99 0.11 1.27 1.38 (0.14) — (0.14) 9.23 17.37R-4 Shares2014 11.66 0.17 0.81 0.98 (0.18) (0.42) (0.60) 12.04 8.742013 10.05 0.17 1.81 1.98 (0.19) (0.18) (0.37) 11.66 20.252012 9.27 0.16 0.81 0.97 (0.16) (0.03) (0.19) 10.05 10.792011 9.26 0.13 0.17 0.30 (0.13) (0.16) (0.29) 9.27 3.202010 8.02 0.11 1.27 1.38 (0.14) — (0.14) 9.26 17.43R-5 Shares2014 11.69 0.19 0.81 1.00 (0.19) (0.42) (0.61) 12.08 8.922013 10.08 0.18 1.81 1.99 (0.20) (0.18) (0.38) 11.69 20.322012 9.30 0.14 0.85 0.99 (0.18) (0.03) (0.21) 10.08 10.902011 9.29 0.14 0.17 0.31 (0.14) (0.16) (0.30) 9.30 3.292010 8.04 0.14 1.26 1.40 (0.15) — (0.15) 9.29 17.62
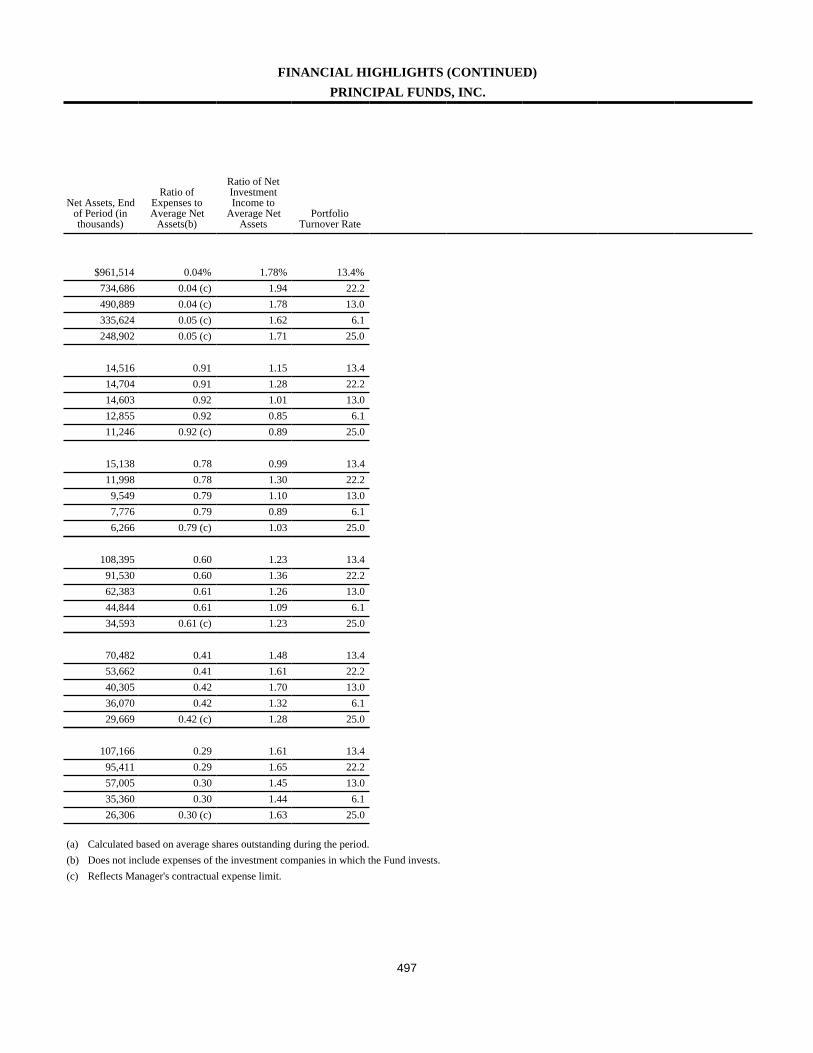
497
FINANCIAL HIGHLIGHTS (CONTINUED)PRINCIPAL FUNDS, INC.
Net Assets, Endof Period (inthousands)
Ratio ofExpenses toAverage Net
Assets(b)
Ratio of NetInvestmentIncome to
Average NetAssets
PortfolioTurnover Rate
$961,514 0.04% 1.78% 13.4%734,686 0.04 (c) 1.94 22.2490,889 0.04 (c) 1.78 13.0335,624 0.05 (c) 1.62 6.1248,902 0.05 (c) 1.71 25.0
14,516 0.91 1.15 13.414,704 0.91 1.28 22.214,603 0.92 1.01 13.012,855 0.92 0.85 6.111,246 0.92 (c) 0.89 25.0
15,138 0.78 0.99 13.411,998 0.78 1.30 22.29,549 0.79 1.10 13.07,776 0.79 0.89 6.16,266 0.79 (c) 1.03 25.0
108,395 0.60 1.23 13.491,530 0.60 1.36 22.262,383 0.61 1.26 13.044,844 0.61 1.09 6.134,593 0.61 (c) 1.23 25.0
70,482 0.41 1.48 13.453,662 0.41 1.61 22.240,305 0.42 1.70 13.036,070 0.42 1.32 6.129,669 0.42 (c) 1.28 25.0
107,166 0.29 1.61 13.495,411 0.29 1.65 22.257,005 0.30 1.45 13.035,360 0.30 1.44 6.126,306 0.30 (c) 1.63 25.0
(a) Calculated based on average shares outstanding during the period.(b) Does not include expenses of the investment companies in which the Fund invests.(c) Reflects Manager's contractual expense limit.

498
FINANCIAL HIGHLIGHTSPRINCIPAL FUNDS, INC.
Selected data for a share of Capital Stock outstanding throughout each year ended October 31 (except as noted):
Net AssetValue,
Beginning ofPeriod
NetInvestment
Income(Loss)(a)
Net Realizedand
UnrealizedGain (Loss)
onInvestments
Total FromInvestmentOperations
Dividendsfrom Net
InvestmentIncome
Distributionsfrom
RealizedGains
TotalDividends
andDistributions
Net AssetValue, Endof Period Total Return
PRINCIPAL LIFETIME 2040 FUND
Class A Shares
2014 $14.80 $0.21 $1.09 $1.30 ($0.23) ($0.37) ($0.60) $15.50 9.02% (b)
2013 12.42 0.22 2.39 2.61 (0.23) — (0.23) 14.80 21.35 (b)
2012 11.42 0.17 1.03 1.20 (0.20) — (0.20) 12.42 10.73 (b)
2011 11.23 0.15 0.20 0.35 (0.16) — (0.16) 11.42 3.08 (b)
2010 9.71 0.17 1.54 1.71 (0.19) — (0.19) 11.23 17.82 (b)
Class J Shares
2014 14.90 0.22 1.09 1.31 (0.23) (0.37) (0.60) 15.61 9.04 (b)
2013 12.50 0.22 2.41 2.63 (0.23) — (0.23) 14.90 21.35 (b)
2012 11.49 0.17 1.04 1.21 (0.20) — (0.20) 12.50 10.71 (b)
2011 11.29 0.15 0.20 0.35 (0.15) — (0.15) 11.49 3.03 (b)
2010(d) 9.76 0.15 1.56 1.71 (0.18) — (0.18) 11.29 17.64 (b)
Institutional Shares
2014 15.02 0.28 1.09 1.37 (0.28) (0.37) (0.65) 15.74 9.38
2013 12.59 0.28 2.42 2.70 (0.27) — (0.27) 15.02 21.87
2012 11.57 0.22 1.04 1.26 (0.24) — (0.24) 12.59 11.18
2011 11.37 0.20 0.20 0.40 (0.20) — (0.20) 11.57 3.46
2010 9.82 0.21 1.56 1.77 (0.22) — (0.22) 11.37 18.27

499
FINANCIAL HIGHLIGHTS (CONTINUED)PRINCIPAL FUNDS, INC.
Net Assets, Endof Period (inthousands)
Ratio ofExpenses toAverage Net
Assets(d)
Ratio of GrossExpenses toAverage Net
Assets
Ratio of NetInvestmentIncome to
Average NetAssets
PortfolioTurnover Rate
$82,944 0.41% (c) —% 1.43% 11.5%
69,974 0.41 (c) — 1.65 30.1
54,432 0.41 (c) — 1.44 12.5
44,108 0.41 (c) — 1.28 12.6
38,484 0.41 (c) — 1.62 31.4
569,314 0.38 0.42 (d),(e) 1.45 11.5
484,414 0.40 0.60 (d),(e) 1.63 30.1
361,253 0.45 0.64 (d),(e) 1.40 12.5
286,387 0.46 0.60 (d),(e) 1.23 12.6
246,236 0.56 0.63 (d),(e) 1.46 31.4
3,109,551 0.04 — 1.81 11.5
2,718,326 0.04 — 2.07 30.1
2,235,924 0.04 — 1.83 12.5
1,851,739 0.04 — 1.69 12.6
1,716,164 0.04 — 2.02 31.4
(a) Calculated based on average shares outstanding during the period.(b) Total return is calculated without the front-end sales charge or contingent deferred sales charge, if applicable.(c) Reflects Manager's contractual expense limit.(d) Does not include expenses of the investment companies in which the Fund invests.(e) Excludes expense reimbursement from Manager and/or Distributor.

500
FINANCIAL HIGHLIGHTSPRINCIPAL FUNDS, INC.
Selected data for a share of Capital Stock outstanding throughout each year ended October 31 (except as noted):
Net AssetValue,
Beginning ofPeriod
NetInvestment
Income(Loss)(a)
Net Realizedand
UnrealizedGain (Loss)
onInvestments
Total FromInvestmentOperations
Dividendsfrom Net
InvestmentIncome
Distributionsfrom
RealizedGains
TotalDividends
andDistributions
Net AssetValue, Endof Period Total Return
PRINCIPAL LIFETIME 2040 FUNDR-1 Shares2014 $14.83 $0.16 $1.06 $1.22 ($0.14) ($0.37) ($0.51) $15.54 8.43 %2013 12.44 0.17 2.38 2.55 (0.16) — (0.16) 14.83 20.712012 11.42 0.12 1.04 1.16 (0.14) — (0.14) 12.44 10.292011 11.24 0.10 0.18 0.28 (0.10) — (0.10) 11.42 2.512010 9.73 0.12 1.54 1.66 (0.15) — (0.15) 11.24 17.26R-2 Shares2014 14.84 0.18 1.06 1.24 (0.17) (0.37) (0.54) 15.54 8.582013 12.45 0.19 2.38 2.57 (0.18) — (0.18) 14.84 20.942012 11.43 0.14 1.03 1.17 (0.15) — (0.15) 12.45 10.362011 11.24 0.12 0.18 0.30 (0.11) — (0.11) 11.43 2.682010 9.73 0.14 1.53 1.67 (0.16) — (0.16) 11.24 17.33R-3 Shares2014 14.84 0.19 1.08 1.27 (0.20) (0.37) (0.57) 15.54 8.782013 12.45 0.20 2.39 2.59 (0.20) — (0.20) 14.84 21.112012 11.44 0.16 1.02 1.18 (0.17) — (0.17) 12.45 10.542011 11.24 0.13 0.20 0.33 (0.13) — (0.13) 11.44 2.942010 9.73 0.15 1.54 1.69 (0.18) — (0.18) 11.24 17.50R-4 Shares2014 14.87 0.24 1.06 1.30 (0.23) (0.37) (0.60) 15.57 8.972013 12.47 0.22 2.41 2.63 (0.23) — (0.23) 14.87 21.392012 11.46 0.18 1.03 1.21 (0.20) — (0.20) 12.47 10.762011 11.27 0.15 0.20 0.35 (0.16) — (0.16) 11.46 3.062010 9.74 0.17 1.55 1.72 (0.19) — (0.19) 11.27 17.87R-5 Shares2014 14.95 0.23 1.09 1.32 (0.24) (0.37) (0.61) 15.66 9.112013 12.54 0.25 2.40 2.65 (0.24) — (0.24) 14.95 21.502012 11.52 0.19 1.04 1.23 (0.21) — (0.21) 12.54 10.932011 11.32 0.20 0.17 0.37 (0.17) — (0.17) 11.52 3.242010 9.79 0.18 1.55 1.73 (0.20) — (0.20) 11.32 17.89
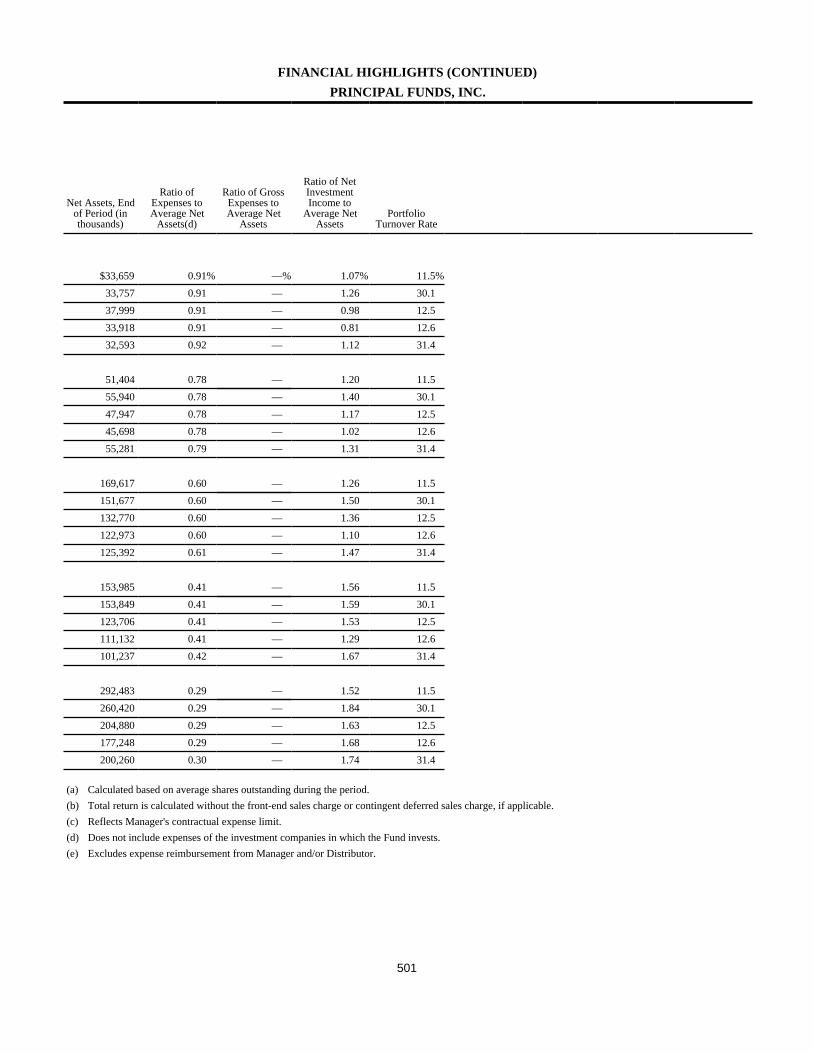
501
FINANCIAL HIGHLIGHTS (CONTINUED)PRINCIPAL FUNDS, INC.
Net Assets, Endof Period (inthousands)
Ratio ofExpenses toAverage Net
Assets(d)
Ratio of GrossExpenses toAverage Net
Assets
Ratio of NetInvestmentIncome to
Average NetAssets
PortfolioTurnover Rate
$33,659 0.91% —% 1.07% 11.5%33,757 0.91 — 1.26 30.137,999 0.91 — 0.98 12.533,918 0.91 — 0.81 12.632,593 0.92 — 1.12 31.4
51,404 0.78 — 1.20 11.555,940 0.78 — 1.40 30.147,947 0.78 — 1.17 12.545,698 0.78 — 1.02 12.655,281 0.79 — 1.31 31.4
169,617 0.60 — 1.26 11.5151,677 0.60 — 1.50 30.1132,770 0.60 — 1.36 12.5122,973 0.60 — 1.10 12.6125,392 0.61 — 1.47 31.4
153,985 0.41 — 1.56 11.5153,849 0.41 — 1.59 30.1123,706 0.41 — 1.53 12.5111,132 0.41 — 1.29 12.6101,237 0.42 — 1.67 31.4
292,483 0.29 — 1.52 11.5260,420 0.29 — 1.84 30.1204,880 0.29 — 1.63 12.5177,248 0.29 — 1.68 12.6200,260 0.30 — 1.74 31.4
(a) Calculated based on average shares outstanding during the period.(b) Total return is calculated without the front-end sales charge or contingent deferred sales charge, if applicable.(c) Reflects Manager's contractual expense limit.(d) Does not include expenses of the investment companies in which the Fund invests.(e) Excludes expense reimbursement from Manager and/or Distributor.
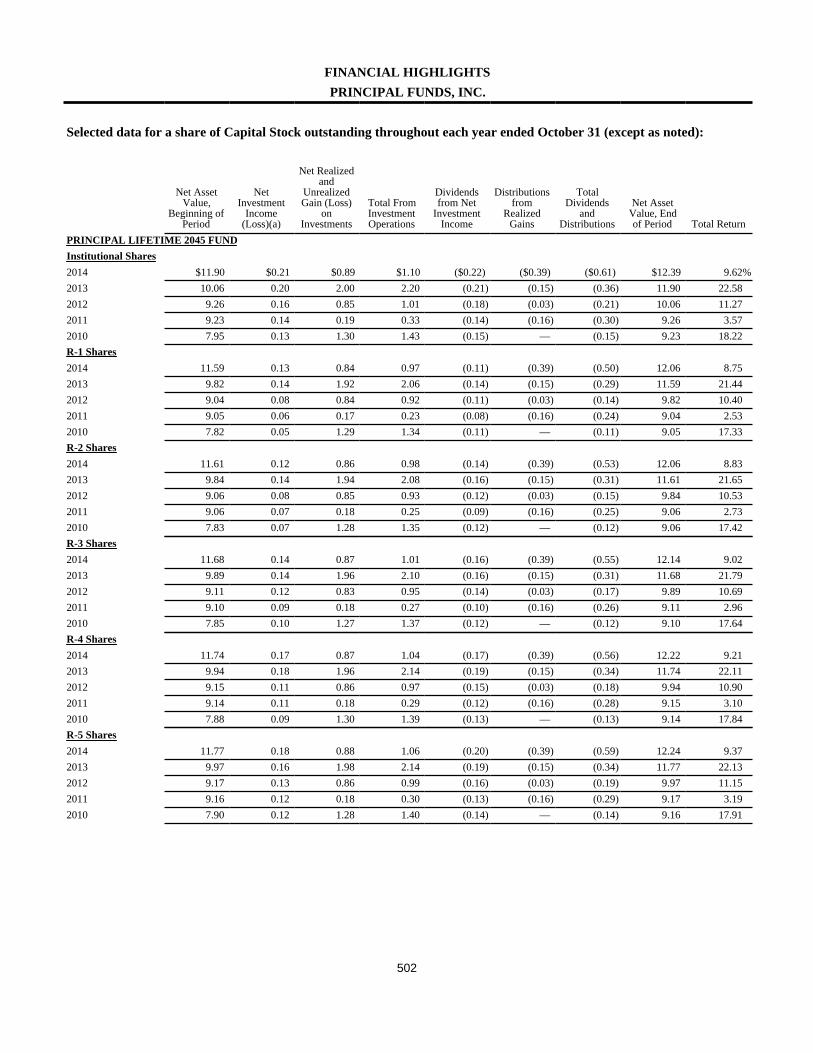
502
FINANCIAL HIGHLIGHTSPRINCIPAL FUNDS, INC.
Selected data for a share of Capital Stock outstanding throughout each year ended October 31 (except as noted):
Net AssetValue,
Beginning ofPeriod
NetInvestment
Income(Loss)(a)
Net Realizedand
UnrealizedGain (Loss)
onInvestments
Total FromInvestmentOperations
Dividendsfrom Net
InvestmentIncome
Distributionsfrom
RealizedGains
TotalDividends
andDistributions
Net AssetValue, Endof Period Total Return
PRINCIPAL LIFETIME 2045 FUNDInstitutional Shares2014 $11.90 $0.21 $0.89 $1.10 ($0.22) ($0.39) ($0.61) $12.39 9.62%2013 10.06 0.20 2.00 2.20 (0.21) (0.15) (0.36) 11.90 22.582012 9.26 0.16 0.85 1.01 (0.18) (0.03) (0.21) 10.06 11.272011 9.23 0.14 0.19 0.33 (0.14) (0.16) (0.30) 9.26 3.572010 7.95 0.13 1.30 1.43 (0.15) — (0.15) 9.23 18.22R-1 Shares2014 11.59 0.13 0.84 0.97 (0.11) (0.39) (0.50) 12.06 8.752013 9.82 0.14 1.92 2.06 (0.14) (0.15) (0.29) 11.59 21.442012 9.04 0.08 0.84 0.92 (0.11) (0.03) (0.14) 9.82 10.402011 9.05 0.06 0.17 0.23 (0.08) (0.16) (0.24) 9.04 2.532010 7.82 0.05 1.29 1.34 (0.11) — (0.11) 9.05 17.33R-2 Shares2014 11.61 0.12 0.86 0.98 (0.14) (0.39) (0.53) 12.06 8.832013 9.84 0.14 1.94 2.08 (0.16) (0.15) (0.31) 11.61 21.652012 9.06 0.08 0.85 0.93 (0.12) (0.03) (0.15) 9.84 10.532011 9.06 0.07 0.18 0.25 (0.09) (0.16) (0.25) 9.06 2.732010 7.83 0.07 1.28 1.35 (0.12) — (0.12) 9.06 17.42R-3 Shares2014 11.68 0.14 0.87 1.01 (0.16) (0.39) (0.55) 12.14 9.022013 9.89 0.14 1.96 2.10 (0.16) (0.15) (0.31) 11.68 21.792012 9.11 0.12 0.83 0.95 (0.14) (0.03) (0.17) 9.89 10.692011 9.10 0.09 0.18 0.27 (0.10) (0.16) (0.26) 9.11 2.962010 7.85 0.10 1.27 1.37 (0.12) — (0.12) 9.10 17.64R-4 Shares2014 11.74 0.17 0.87 1.04 (0.17) (0.39) (0.56) 12.22 9.212013 9.94 0.18 1.96 2.14 (0.19) (0.15) (0.34) 11.74 22.112012 9.15 0.11 0.86 0.97 (0.15) (0.03) (0.18) 9.94 10.902011 9.14 0.11 0.18 0.29 (0.12) (0.16) (0.28) 9.15 3.102010 7.88 0.09 1.30 1.39 (0.13) — (0.13) 9.14 17.84R-5 Shares2014 11.77 0.18 0.88 1.06 (0.20) (0.39) (0.59) 12.24 9.372013 9.97 0.16 1.98 2.14 (0.19) (0.15) (0.34) 11.77 22.132012 9.17 0.13 0.86 0.99 (0.16) (0.03) (0.19) 9.97 11.152011 9.16 0.12 0.18 0.30 (0.13) (0.16) (0.29) 9.17 3.192010 7.90 0.12 1.28 1.40 (0.14) — (0.14) 9.16 17.91

503
FINANCIAL HIGHLIGHTS (CONTINUED)PRINCIPAL FUNDS, INC.
Net Assets, Endof Period (inthousands)
Ratio ofExpenses toAverage Net
Assets(b)
Ratio of NetInvestmentIncome to
Average NetAssets
PortfolioTurnover Rate
$536,107 0.04% 1.71% 8.7%399,463 0.05 (c) 1.87 23.3244,484 0.05 (c) 1.63 8.1154,522 0.06 (c) 1.48 4.5105,004 0.08 (c) 1.50 23.8
9,350 0.92 1.11 8.79,201 0.92 1.28 23.39,027 0.92 0.85 8.17,195 0.92 (c) 0.70 4.55,821 0.93 (c) 0.65 23.8
11,165 0.79 1.01 8.79,204 0.79 1.29 23.36,674 0.79 0.89 8.14,130 0.79 (c) 0.71 4.52,780 0.80 (c) 0.79 23.8
56,544 0.61 1.19 8.746,505 0.61 1.35 23.330,592 0.61 1.32 8.128,181 0.61 (c) 0.96 4.520,005 0.62 (c) 1.16 23.8
37,009 0.42 1.43 8.727,277 0.42 1.68 23.329,088 0.42 1.20 8.116,819 0.42 (c) 1.17 4.512,730 0.43 (c) 1.08 23.8
87,269 0.30 1.51 8.769,834 0.30 1.52 23.328,899 0.30 1.36 8.117,728 0.30 (c) 1.26 4.511,045 0.31 (c) 1.45 23.8
(a) Calculated based on average shares outstanding during the period.(b) Does not include expenses of the investment companies in which the Fund invests.(c) Reflects Manager's contractual expense limit.
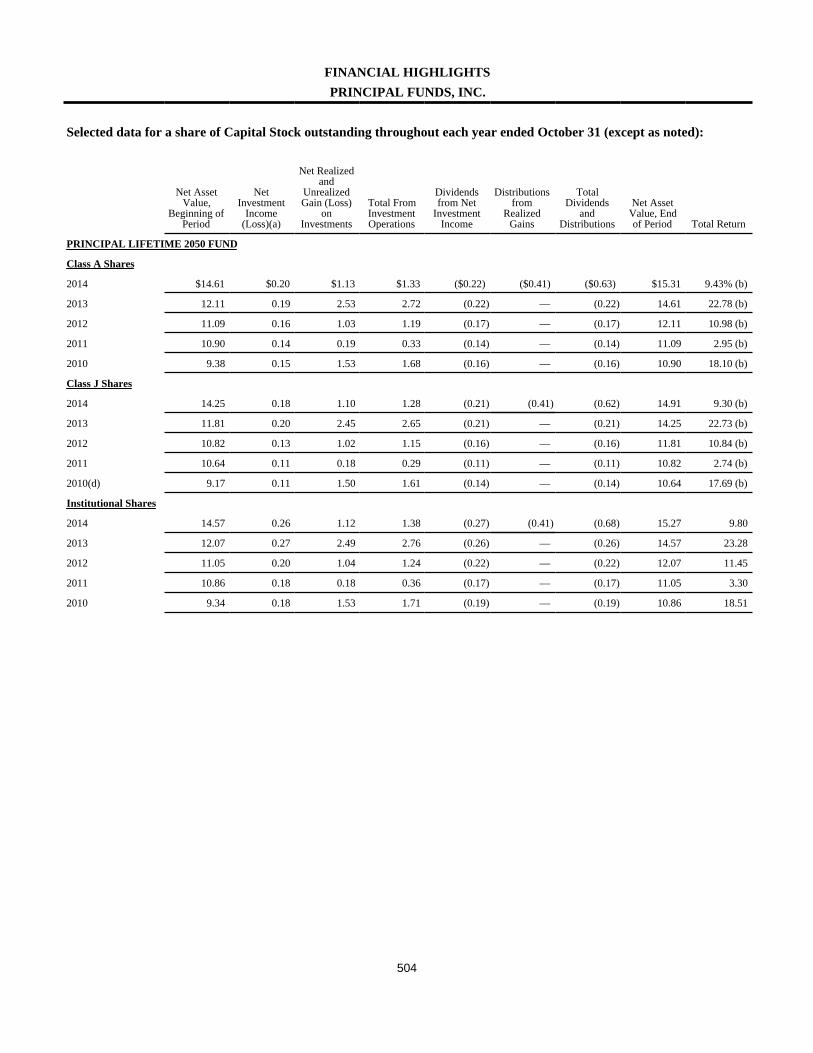
504
FINANCIAL HIGHLIGHTSPRINCIPAL FUNDS, INC.
Selected data for a share of Capital Stock outstanding throughout each year ended October 31 (except as noted):
Net AssetValue,
Beginning ofPeriod
NetInvestment
Income(Loss)(a)
Net Realizedand
UnrealizedGain (Loss)
onInvestments
Total FromInvestmentOperations
Dividendsfrom Net
InvestmentIncome
Distributionsfrom
RealizedGains
TotalDividends
andDistributions
Net AssetValue, Endof Period Total Return
PRINCIPAL LIFETIME 2050 FUND
Class A Shares
2014 $14.61 $0.20 $1.13 $1.33 ($0.22) ($0.41) ($0.63) $15.31 9.43% (b)
2013 12.11 0.19 2.53 2.72 (0.22) — (0.22) 14.61 22.78 (b)
2012 11.09 0.16 1.03 1.19 (0.17) — (0.17) 12.11 10.98 (b)
2011 10.90 0.14 0.19 0.33 (0.14) — (0.14) 11.09 2.95 (b)
2010 9.38 0.15 1.53 1.68 (0.16) — (0.16) 10.90 18.10 (b)
Class J Shares
2014 14.25 0.18 1.10 1.28 (0.21) (0.41) (0.62) 14.91 9.30 (b)
2013 11.81 0.20 2.45 2.65 (0.21) — (0.21) 14.25 22.73 (b)
2012 10.82 0.13 1.02 1.15 (0.16) — (0.16) 11.81 10.84 (b)
2011 10.64 0.11 0.18 0.29 (0.11) — (0.11) 10.82 2.74 (b)
2010(d) 9.17 0.11 1.50 1.61 (0.14) — (0.14) 10.64 17.69 (b)
Institutional Shares
2014 14.57 0.26 1.12 1.38 (0.27) (0.41) (0.68) 15.27 9.80
2013 12.07 0.27 2.49 2.76 (0.26) — (0.26) 14.57 23.28
2012 11.05 0.20 1.04 1.24 (0.22) — (0.22) 12.07 11.45
2011 10.86 0.18 0.18 0.36 (0.17) — (0.17) 11.05 3.30
2010 9.34 0.18 1.53 1.71 (0.19) — (0.19) 10.86 18.51
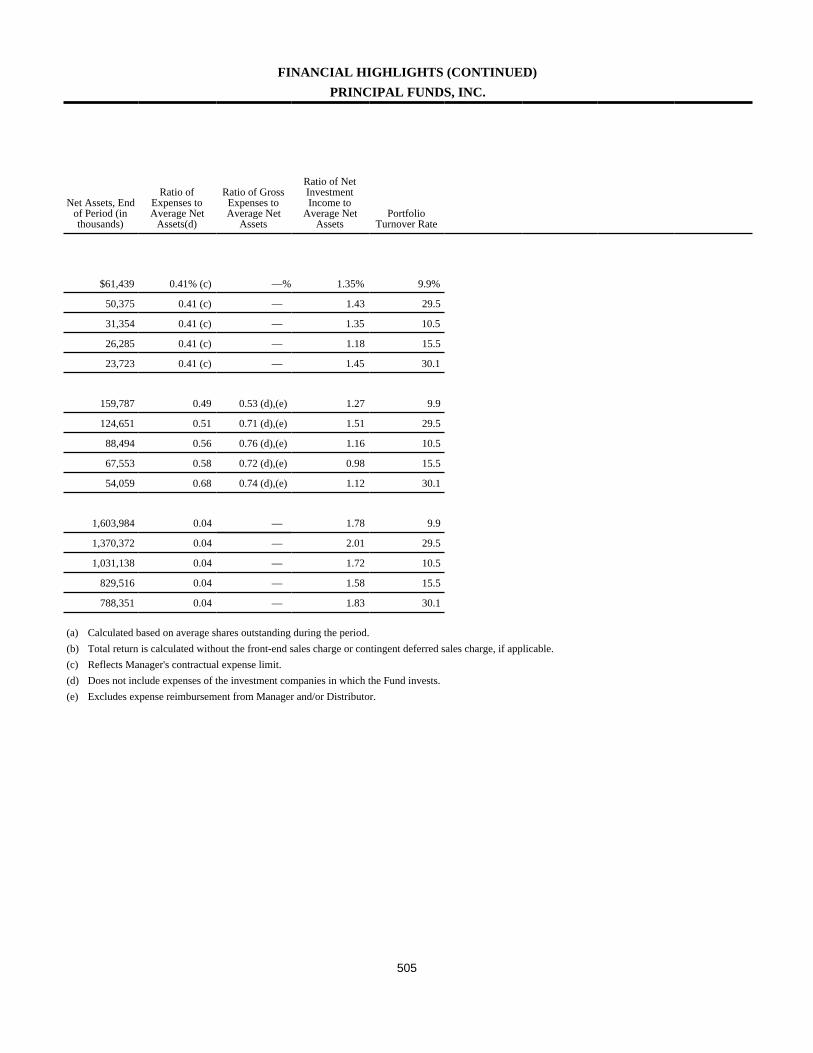
505
FINANCIAL HIGHLIGHTS (CONTINUED)PRINCIPAL FUNDS, INC.
Net Assets, Endof Period (inthousands)
Ratio ofExpenses toAverage Net
Assets(d)
Ratio of GrossExpenses toAverage Net
Assets
Ratio of NetInvestmentIncome to
Average NetAssets
PortfolioTurnover Rate
$61,439 0.41% (c) —% 1.35% 9.9%
50,375 0.41 (c) — 1.43 29.5
31,354 0.41 (c) — 1.35 10.5
26,285 0.41 (c) — 1.18 15.5
23,723 0.41 (c) — 1.45 30.1
159,787 0.49 0.53 (d),(e) 1.27 9.9
124,651 0.51 0.71 (d),(e) 1.51 29.5
88,494 0.56 0.76 (d),(e) 1.16 10.5
67,553 0.58 0.72 (d),(e) 0.98 15.5
54,059 0.68 0.74 (d),(e) 1.12 30.1
1,603,984 0.04 — 1.78 9.9
1,370,372 0.04 — 2.01 29.5
1,031,138 0.04 — 1.72 10.5
829,516 0.04 — 1.58 15.5
788,351 0.04 — 1.83 30.1
(a) Calculated based on average shares outstanding during the period.(b) Total return is calculated without the front-end sales charge or contingent deferred sales charge, if applicable.(c) Reflects Manager's contractual expense limit.(d) Does not include expenses of the investment companies in which the Fund invests.(e) Excludes expense reimbursement from Manager and/or Distributor.
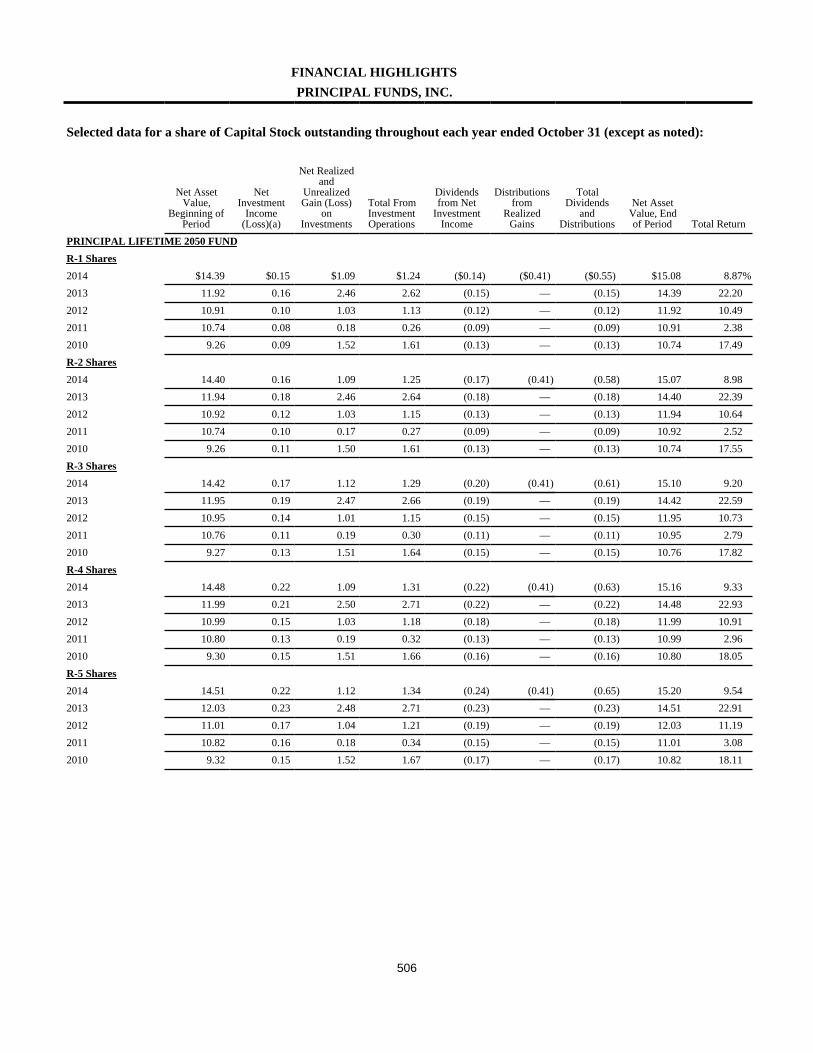
506
FINANCIAL HIGHLIGHTSPRINCIPAL FUNDS, INC.
Selected data for a share of Capital Stock outstanding throughout each year ended October 31 (except as noted):
Net AssetValue,
Beginning ofPeriod
NetInvestment
Income(Loss)(a)
Net Realizedand
UnrealizedGain (Loss)
onInvestments
Total FromInvestmentOperations
Dividendsfrom Net
InvestmentIncome
Distributionsfrom
RealizedGains
TotalDividends
andDistributions
Net AssetValue, Endof Period Total Return
PRINCIPAL LIFETIME 2050 FUNDR-1 Shares2014 $14.39 $0.15 $1.09 $1.24 ($0.14) ($0.41) ($0.55) $15.08 8.87%2013 11.92 0.16 2.46 2.62 (0.15) — (0.15) 14.39 22.202012 10.91 0.10 1.03 1.13 (0.12) — (0.12) 11.92 10.492011 10.74 0.08 0.18 0.26 (0.09) — (0.09) 10.91 2.382010 9.26 0.09 1.52 1.61 (0.13) — (0.13) 10.74 17.49R-2 Shares2014 14.40 0.16 1.09 1.25 (0.17) (0.41) (0.58) 15.07 8.982013 11.94 0.18 2.46 2.64 (0.18) — (0.18) 14.40 22.392012 10.92 0.12 1.03 1.15 (0.13) — (0.13) 11.94 10.642011 10.74 0.10 0.17 0.27 (0.09) — (0.09) 10.92 2.522010 9.26 0.11 1.50 1.61 (0.13) — (0.13) 10.74 17.55R-3 Shares2014 14.42 0.17 1.12 1.29 (0.20) (0.41) (0.61) 15.10 9.202013 11.95 0.19 2.47 2.66 (0.19) — (0.19) 14.42 22.592012 10.95 0.14 1.01 1.15 (0.15) — (0.15) 11.95 10.732011 10.76 0.11 0.19 0.30 (0.11) — (0.11) 10.95 2.792010 9.27 0.13 1.51 1.64 (0.15) — (0.15) 10.76 17.82R-4 Shares2014 14.48 0.22 1.09 1.31 (0.22) (0.41) (0.63) 15.16 9.332013 11.99 0.21 2.50 2.71 (0.22) — (0.22) 14.48 22.932012 10.99 0.15 1.03 1.18 (0.18) — (0.18) 11.99 10.912011 10.80 0.13 0.19 0.32 (0.13) — (0.13) 10.99 2.962010 9.30 0.15 1.51 1.66 (0.16) — (0.16) 10.80 18.05R-5 Shares2014 14.51 0.22 1.12 1.34 (0.24) (0.41) (0.65) 15.20 9.542013 12.03 0.23 2.48 2.71 (0.23) — (0.23) 14.51 22.912012 11.01 0.17 1.04 1.21 (0.19) — (0.19) 12.03 11.192011 10.82 0.16 0.18 0.34 (0.15) — (0.15) 11.01 3.082010 9.32 0.15 1.52 1.67 (0.17) — (0.17) 10.82 18.11

507
FINANCIAL HIGHLIGHTS (CONTINUED)PRINCIPAL FUNDS, INC.
Net Assets, Endof Period (inthousands)
Ratio ofExpenses toAverage Net
Assets(d)
Ratio of GrossExpenses toAverage Net
Assets
Ratio of NetInvestmentIncome to
Average NetAssets
PortfolioTurnover Rate
$18,098 0.91% —% 1.00% 9.9%16,286 0.91 — 1.19 29.517,885 0.91 — 0.84 10.514,614 0.92 — 0.67 15.513,401 0.92 — 0.90 30.1
31,670 0.78 — 1.09 9.929,353 0.78 — 1.35 29.521,922 0.78 — 1.04 10.520,121 0.79 — 0.90 15.524,165 0.79 — 1.13 30.1
78,959 0.60 — 1.19 9.968,416 0.60 — 1.43 29.552,457 0.60 — 1.26 10.546,829 0.61 — 0.94 15.542,918 0.61 — 1.30 30.1
73,607 0.41 — 1.53 9.969,616 0.41 — 1.60 29.557,975 0.41 — 1.30 10.545,442 0.42 — 1.15 15.539,183 0.42 — 1.50 30.1
163,844 0.29 — 1.47 9.9133,924 0.29 — 1.76 29.5
90,201 0.29 — 1.48 10.572,123 0.30 — 1.42 15.571,470 0.30 — 1.55 30.1
(a) Calculated based on average shares outstanding during the period.(b) Total return is calculated without the front-end sales charge or contingent deferred sales charge, if applicable.(c) Reflects Manager's contractual expense limit.(d) Does not include expenses of the investment companies in which the Fund invests.(e) Excludes expense reimbursement from Manager and/or Distributor.

508
FINANCIAL HIGHLIGHTSPRINCIPAL FUNDS, INC.
Selected data for a share of Capital Stock outstanding throughout each year ended October 31 (except as noted):
Net AssetValue,
Beginning ofPeriod
NetInvestment
Income(Loss)(a)
Net Realizedand
UnrealizedGain (Loss)
onInvestments
Total FromInvestmentOperations
Dividendsfrom Net
InvestmentIncome
Distributionsfrom
RealizedGains
TotalDividends
andDistributions
Net AssetValue, Endof Period Total Return
PRINCIPAL LIFETIME 2055 FUNDInstitutional Shares2014 $11.98 $0.19 $0.94 $1.13 ($0.21) ($0.34) ($0.55) $12.56 9.78%2013 10.02 0.19 2.09 2.28 (0.21) (0.11) (0.32) 11.98 23.322012 9.22 0.14 0.87 1.01 (0.17) (0.04) (0.21) 10.02 11.272011 9.21 0.13 0.14 0.27 (0.13) (0.13) (0.26) 9.22 2.972010 7.93 0.12 1.31 1.43 (0.15) — (0.15) 9.21 18.18R-1 Shares2014 11.66 0.11 0.89 1.00 (0.12) (0.34) (0.46) 12.20 8.872013 9.78 0.13 2.00 2.13 (0.14) (0.11) (0.25) 11.66 22.212012 9.01 0.07 0.85 0.92 (0.11) (0.04) (0.15) 9.78 10.362011 9.02 0.04 0.15 0.19 (0.07) (0.13) (0.20) 9.01 2.062010 7.80 0.06 1.27 1.33 (0.11) — (0.11) 9.02 17.22R-2 Shares2014 11.70 0.09 0.92 1.01 (0.14) (0.34) (0.48) 12.23 8.922013 9.81 0.13 2.03 2.16 (0.16) (0.11) (0.27) 11.70 22.472012 9.02 0.06 0.87 0.93 (0.10) (0.04) (0.14) 9.81 10.432011 9.05 0.07 0.13 0.20 (0.10) (0.13) (0.23) 9.02 2.162010 7.82 0.02 1.33 1.35 (0.12) — (0.12) 9.05 17.38R-3 Shares2014 11.77 0.12 0.92 1.04 (0.16) (0.34) (0.50) 12.31 9.182013 9.86 0.12 2.07 2.19 (0.17) (0.11) (0.28) 11.77 22.652012 9.08 0.08 0.87 0.95 (0.13) (0.04) (0.17) 9.86 10.692011 9.09 0.08 0.13 0.21 (0.09) (0.13) (0.22) 9.08 2.332010 7.85 0.09 1.28 1.37 (0.13) — (0.13) 9.09 17.54R-4 Shares2014 11.83 0.15 0.93 1.08 (0.18) (0.34) (0.52) 12.39 9.442013 9.91 0.15 2.06 2.21 (0.18) (0.11) (0.29) 11.83 22.842012 9.12 0.11 0.86 0.97 (0.14) (0.04) (0.18) 9.91 10.892011 9.12 0.09 0.15 0.24 (0.11) (0.13) (0.24) 9.12 2.612010 7.88 0.09 1.29 1.38 (0.14) — (0.14) 9.12 17.64R-5 Shares2014 11.86 0.16 0.93 1.09 (0.19) (0.34) (0.53) 12.42 9.542013 9.93 0.15 2.08 2.23 (0.19) (0.11) (0.30) 11.86 23.012012 9.15 0.10 0.87 0.97 (0.15) (0.04) (0.19) 9.93 10.912011 9.14 0.11 0.15 0.26 (0.12) (0.13) (0.25) 9.15 2.802010 7.89 0.11 1.28 1.39 (0.14) — (0.14) 9.14 17.82
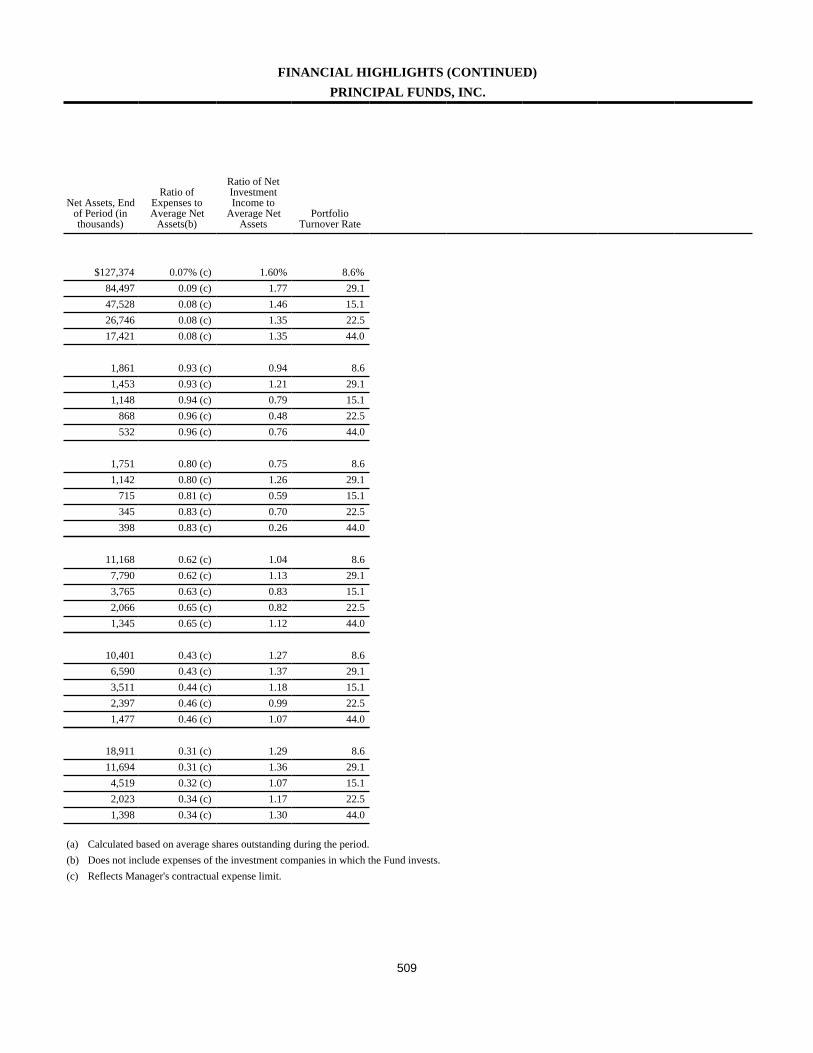
509
FINANCIAL HIGHLIGHTS (CONTINUED)PRINCIPAL FUNDS, INC.
Net Assets, Endof Period (inthousands)
Ratio ofExpenses toAverage Net
Assets(b)
Ratio of NetInvestmentIncome to
Average NetAssets
PortfolioTurnover Rate
$127,374 0.07% (c) 1.60% 8.6%84,497 0.09 (c) 1.77 29.147,528 0.08 (c) 1.46 15.126,746 0.08 (c) 1.35 22.517,421 0.08 (c) 1.35 44.0
1,861 0.93 (c) 0.94 8.61,453 0.93 (c) 1.21 29.11,148 0.94 (c) 0.79 15.1
868 0.96 (c) 0.48 22.5532 0.96 (c) 0.76 44.0
1,751 0.80 (c) 0.75 8.61,142 0.80 (c) 1.26 29.1
715 0.81 (c) 0.59 15.1345 0.83 (c) 0.70 22.5398 0.83 (c) 0.26 44.0
11,168 0.62 (c) 1.04 8.67,790 0.62 (c) 1.13 29.13,765 0.63 (c) 0.83 15.12,066 0.65 (c) 0.82 22.51,345 0.65 (c) 1.12 44.0
10,401 0.43 (c) 1.27 8.66,590 0.43 (c) 1.37 29.13,511 0.44 (c) 1.18 15.12,397 0.46 (c) 0.99 22.51,477 0.46 (c) 1.07 44.0
18,911 0.31 (c) 1.29 8.611,694 0.31 (c) 1.36 29.14,519 0.32 (c) 1.07 15.12,023 0.34 (c) 1.17 22.51,398 0.34 (c) 1.30 44.0
(a) Calculated based on average shares outstanding during the period.(b) Does not include expenses of the investment companies in which the Fund invests.(c) Reflects Manager's contractual expense limit.
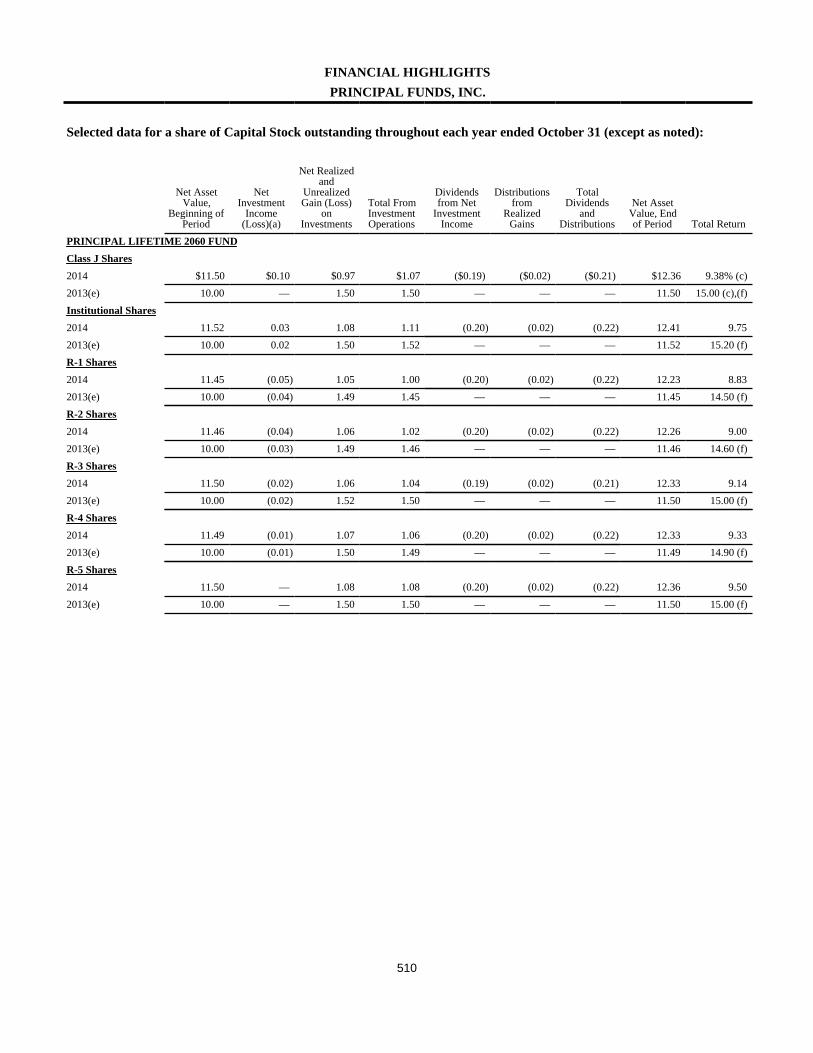
510
FINANCIAL HIGHLIGHTSPRINCIPAL FUNDS, INC.
Selected data for a share of Capital Stock outstanding throughout each year ended October 31 (except as noted):
Net AssetValue,
Beginning ofPeriod
NetInvestment
Income(Loss)(a)
Net Realizedand
UnrealizedGain (Loss)
onInvestments
Total FromInvestmentOperations
Dividendsfrom Net
InvestmentIncome
Distributionsfrom
RealizedGains
TotalDividends
andDistributions
Net AssetValue, Endof Period Total Return
PRINCIPAL LIFETIME 2060 FUNDClass J Shares2014 $11.50 $0.10 $0.97 $1.07 ($0.19) ($0.02) ($0.21) $12.36 9.38% (c)2013(e) 10.00 — 1.50 1.50 — — — 11.50 15.00 (c),(f)Institutional Shares2014 11.52 0.03 1.08 1.11 (0.20) (0.02) (0.22) 12.41 9.752013(e) 10.00 0.02 1.50 1.52 — — — 11.52 15.20 (f)R-1 Shares2014 11.45 (0.05) 1.05 1.00 (0.20) (0.02) (0.22) 12.23 8.832013(e) 10.00 (0.04) 1.49 1.45 — — — 11.45 14.50 (f)R-2 Shares2014 11.46 (0.04) 1.06 1.02 (0.20) (0.02) (0.22) 12.26 9.002013(e) 10.00 (0.03) 1.49 1.46 — — — 11.46 14.60 (f)R-3 Shares2014 11.50 (0.02) 1.06 1.04 (0.19) (0.02) (0.21) 12.33 9.142013(e) 10.00 (0.02) 1.52 1.50 — — — 11.50 15.00 (f)R-4 Shares2014 11.49 (0.01) 1.07 1.06 (0.20) (0.02) (0.22) 12.33 9.332013(e) 10.00 (0.01) 1.50 1.49 — — — 11.49 14.90 (f)R-5 Shares2014 11.50 — 1.08 1.08 (0.20) (0.02) (0.22) 12.36 9.502013(e) 10.00 — 1.50 1.50 — — — 11.50 15.00 (f)

511
FINANCIAL HIGHLIGHTS (CONTINUED)PRINCIPAL FUNDS, INC.
Net Assets,End of Period(in thousands)
Ratio ofExpenses toAverage Net
Assets(b)
Ratio of NetInvestmentIncome to
Average NetAssets
PortfolioTurnover Rate
$2,226 0.41% (d) 0.84% 16.2%662 0.41 (d),(g) (0.04)(g) 42.5 (g)
39,465 0.13 (d) 0.22 16.213 0.13 (d),(g) 0.25 (g) 42.5 (g)
193 0.96 (d) (0.43) 16.211 0.96 (d),(g) (0.59)(g) 42.5 (g)
254 0.83 (d) (0.33) 16.211 0.83 (d),(g) (0.46)(g) 42.5 (g)
2,073 0.65 (d) (0.17) 16.269 0.65 (d),(g) (0.26)(g) 42.5 (g)
1,670 0.46 (d) (0.07) 16.211 0.46 (d),(g) (0.10)(g) 42.5 (g)
2,756 0.34 (d) 0.03 16.212 0.34 (d),(g) 0.02 (g) 42.5 (g)
(a) Calculated based on average shares outstanding during the period.(b) Does not include expenses of the investment companies in which the Fund invests.(c) Total return is calculated without the contingent deferred sales charge.(d) Reflects Manager's contractual expense limit.(e) Period from March 1, 2013, date operations commenced, through October 31, 2013.(f) Total return amounts have not been annualized.(g) Computed on an annualized basis.

512
This page left blank intentionally.
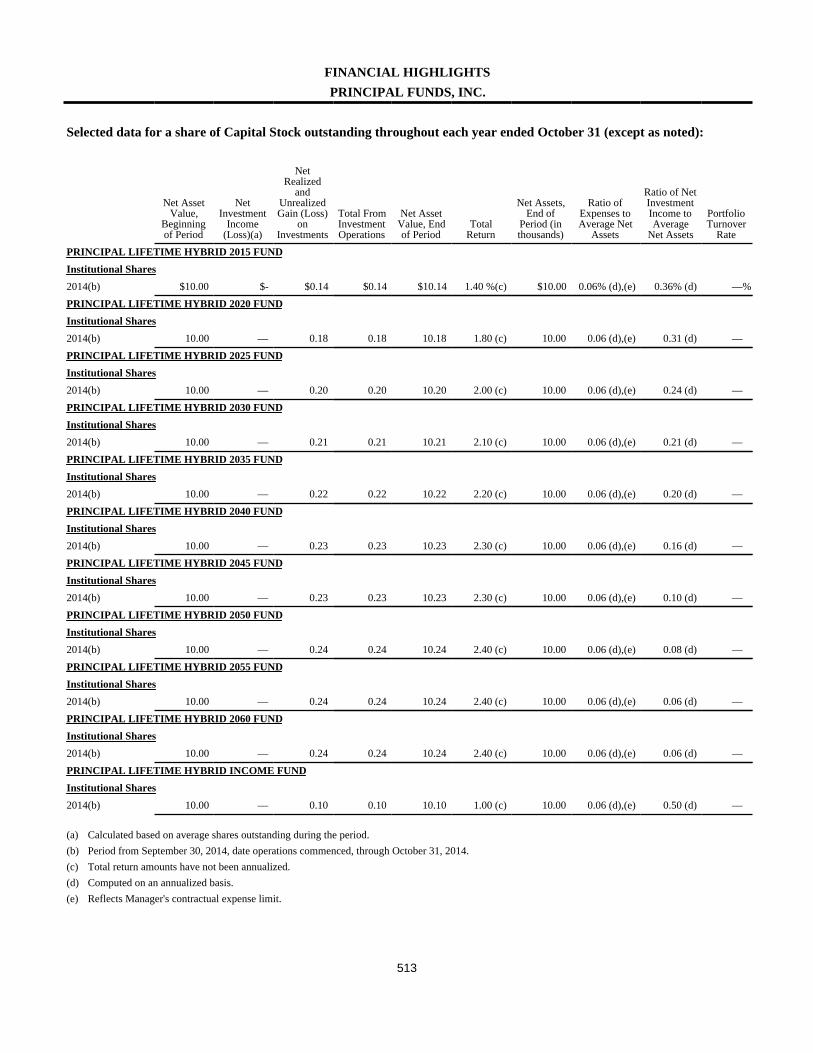
513
FINANCIAL HIGHLIGHTSPRINCIPAL FUNDS, INC.
Selected data for a share of Capital Stock outstanding throughout each year ended October 31 (except as noted):
Net AssetValue,
Beginningof Period
NetInvestment
Income(Loss)(a)
NetRealized
andUnrealizedGain (Loss)
onInvestments
Total FromInvestmentOperations
Net AssetValue, Endof Period
TotalReturn
Net Assets,End of
Period (inthousands)
Ratio ofExpenses toAverage Net
Assets
Ratio of NetInvestmentIncome toAverage
Net Assets
PortfolioTurnover
RatePRINCIPAL LIFETIME HYBRID 2015 FUNDInstitutional Shares2014(b) $10.00 $- $0.14 $0.14 $10.14 1.40 %(c) $10.00 0.06% (d),(e) 0.36% (d) —%PRINCIPAL LIFETIME HYBRID 2020 FUNDInstitutional Shares2014(b) 10.00 — 0.18 0.18 10.18 1.80 (c) 10.00 0.06 (d),(e) 0.31 (d) —PRINCIPAL LIFETIME HYBRID 2025 FUNDInstitutional Shares2014(b) 10.00 — 0.20 0.20 10.20 2.00 (c) 10.00 0.06 (d),(e) 0.24 (d) —PRINCIPAL LIFETIME HYBRID 2030 FUNDInstitutional Shares2014(b) 10.00 — 0.21 0.21 10.21 2.10 (c) 10.00 0.06 (d),(e) 0.21 (d) —PRINCIPAL LIFETIME HYBRID 2035 FUNDInstitutional Shares2014(b) 10.00 — 0.22 0.22 10.22 2.20 (c) 10.00 0.06 (d),(e) 0.20 (d) —PRINCIPAL LIFETIME HYBRID 2040 FUNDInstitutional Shares2014(b) 10.00 — 0.23 0.23 10.23 2.30 (c) 10.00 0.06 (d),(e) 0.16 (d) —PRINCIPAL LIFETIME HYBRID 2045 FUNDInstitutional Shares2014(b) 10.00 — 0.23 0.23 10.23 2.30 (c) 10.00 0.06 (d),(e) 0.10 (d) —PRINCIPAL LIFETIME HYBRID 2050 FUNDInstitutional Shares2014(b) 10.00 — 0.24 0.24 10.24 2.40 (c) 10.00 0.06 (d),(e) 0.08 (d) —PRINCIPAL LIFETIME HYBRID 2055 FUNDInstitutional Shares2014(b) 10.00 — 0.24 0.24 10.24 2.40 (c) 10.00 0.06 (d),(e) 0.06 (d) —PRINCIPAL LIFETIME HYBRID 2060 FUNDInstitutional Shares2014(b) 10.00 — 0.24 0.24 10.24 2.40 (c) 10.00 0.06 (d),(e) 0.06 (d) —PRINCIPAL LIFETIME HYBRID INCOME FUNDInstitutional Shares2014(b) 10.00 — 0.10 0.10 10.10 1.00 (c) 10.00 0.06 (d),(e) 0.50 (d) —
(a) Calculated based on average shares outstanding during the period.(b) Period from September 30, 2014, date operations commenced, through October 31, 2014.(c) Total return amounts have not been annualized.(d) Computed on an annualized basis.(e) Reflects Manager's contractual expense limit.
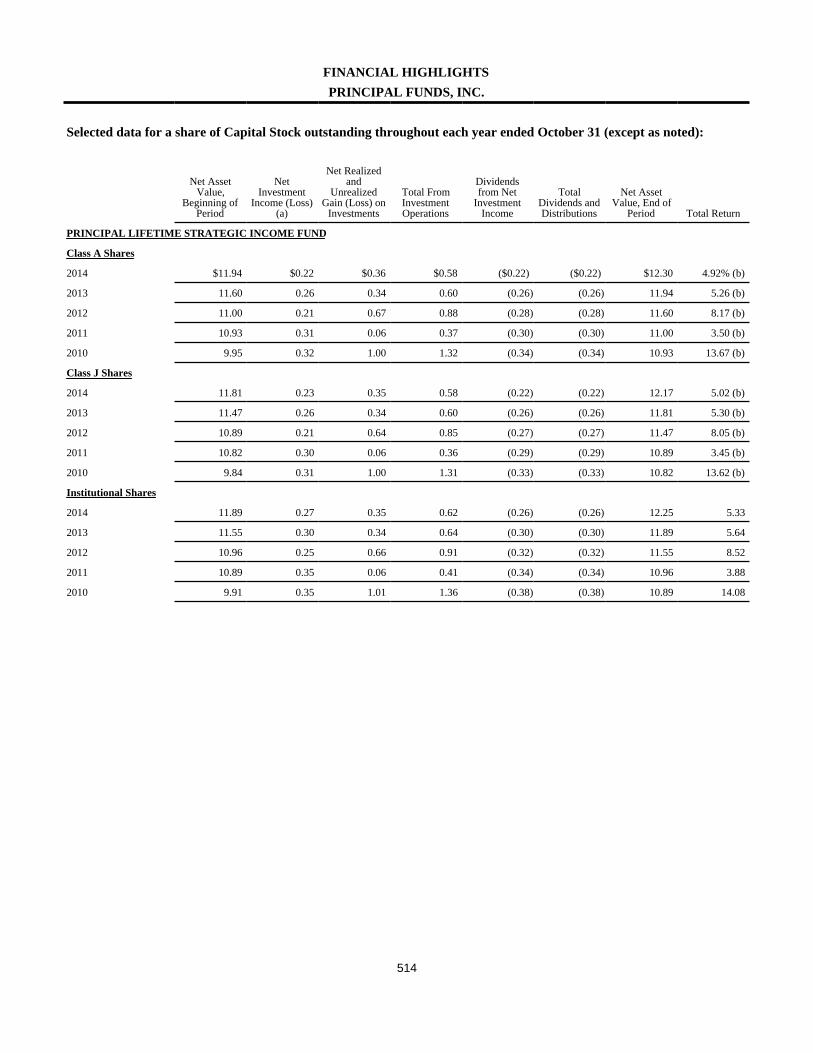
514
FINANCIAL HIGHLIGHTSPRINCIPAL FUNDS, INC.
Selected data for a share of Capital Stock outstanding throughout each year ended October 31 (except as noted):
Net AssetValue,
Beginning ofPeriod
NetInvestment
Income (Loss)(a)
Net Realizedand
UnrealizedGain (Loss) on
Investments
Total FromInvestmentOperations
Dividendsfrom Net
InvestmentIncome
TotalDividends andDistributions
Net AssetValue, End of
Period Total Return
PRINCIPAL LIFETIME STRATEGIC INCOME FUND
Class A Shares
2014 $11.94 $0.22 $0.36 $0.58 ($0.22) ($0.22) $12.30 4.92% (b)
2013 11.60 0.26 0.34 0.60 (0.26) (0.26) 11.94 5.26 (b)
2012 11.00 0.21 0.67 0.88 (0.28) (0.28) 11.60 8.17 (b)
2011 10.93 0.31 0.06 0.37 (0.30) (0.30) 11.00 3.50 (b)
2010 9.95 0.32 1.00 1.32 (0.34) (0.34) 10.93 13.67 (b)
Class J Shares
2014 11.81 0.23 0.35 0.58 (0.22) (0.22) 12.17 5.02 (b)
2013 11.47 0.26 0.34 0.60 (0.26) (0.26) 11.81 5.30 (b)
2012 10.89 0.21 0.64 0.85 (0.27) (0.27) 11.47 8.05 (b)
2011 10.82 0.30 0.06 0.36 (0.29) (0.29) 10.89 3.45 (b)
2010 9.84 0.31 1.00 1.31 (0.33) (0.33) 10.82 13.62 (b)
Institutional Shares
2014 11.89 0.27 0.35 0.62 (0.26) (0.26) 12.25 5.33
2013 11.55 0.30 0.34 0.64 (0.30) (0.30) 11.89 5.64
2012 10.96 0.25 0.66 0.91 (0.32) (0.32) 11.55 8.52
2011 10.89 0.35 0.06 0.41 (0.34) (0.34) 10.96 3.88
2010 9.91 0.35 1.01 1.36 (0.38) (0.38) 10.89 14.08
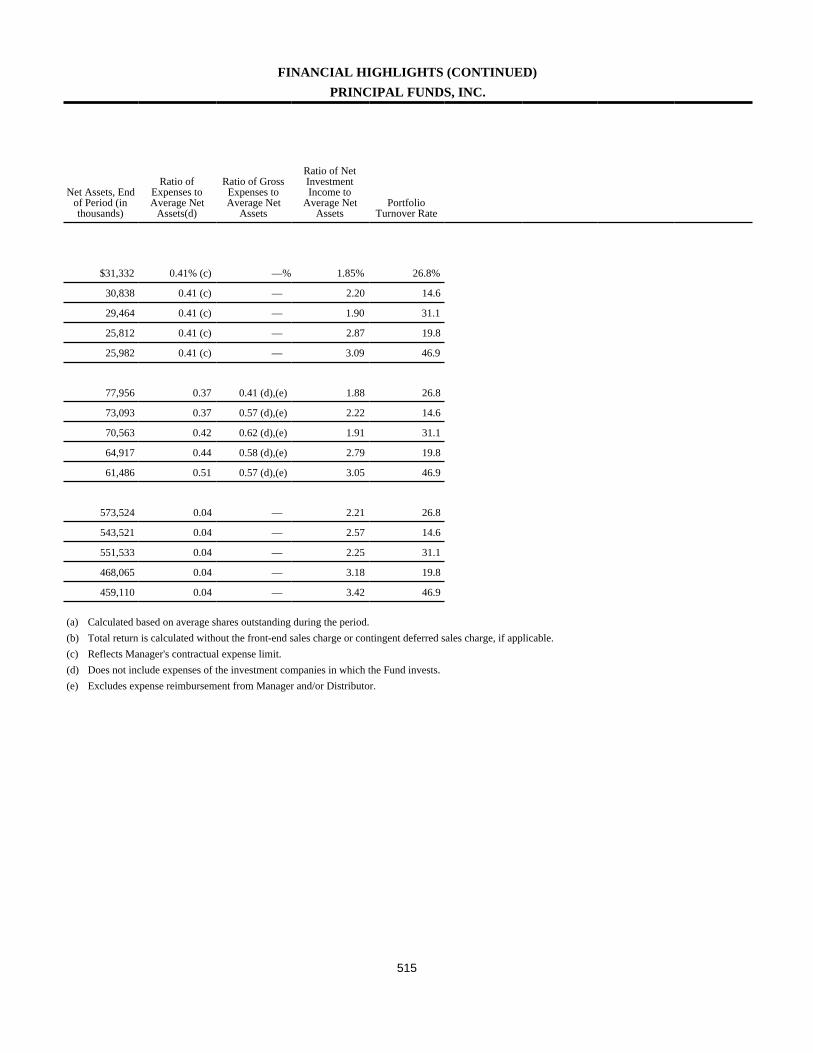
515
FINANCIAL HIGHLIGHTS (CONTINUED)PRINCIPAL FUNDS, INC.
Net Assets, Endof Period (inthousands)
Ratio ofExpenses toAverage Net
Assets(d)
Ratio of GrossExpenses toAverage Net
Assets
Ratio of NetInvestmentIncome to
Average NetAssets
PortfolioTurnover Rate
$31,332 0.41% (c) —% 1.85% 26.8%
30,838 0.41 (c) — 2.20 14.6
29,464 0.41 (c) — 1.90 31.1
25,812 0.41 (c) — 2.87 19.8
25,982 0.41 (c) — 3.09 46.9
77,956 0.37 0.41 (d),(e) 1.88 26.8
73,093 0.37 0.57 (d),(e) 2.22 14.6
70,563 0.42 0.62 (d),(e) 1.91 31.1
64,917 0.44 0.58 (d),(e) 2.79 19.8
61,486 0.51 0.57 (d),(e) 3.05 46.9
573,524 0.04 — 2.21 26.8
543,521 0.04 — 2.57 14.6
551,533 0.04 — 2.25 31.1
468,065 0.04 — 3.18 19.8
459,110 0.04 — 3.42 46.9
(a) Calculated based on average shares outstanding during the period.(b) Total return is calculated without the front-end sales charge or contingent deferred sales charge, if applicable.(c) Reflects Manager's contractual expense limit.(d) Does not include expenses of the investment companies in which the Fund invests.(e) Excludes expense reimbursement from Manager and/or Distributor.
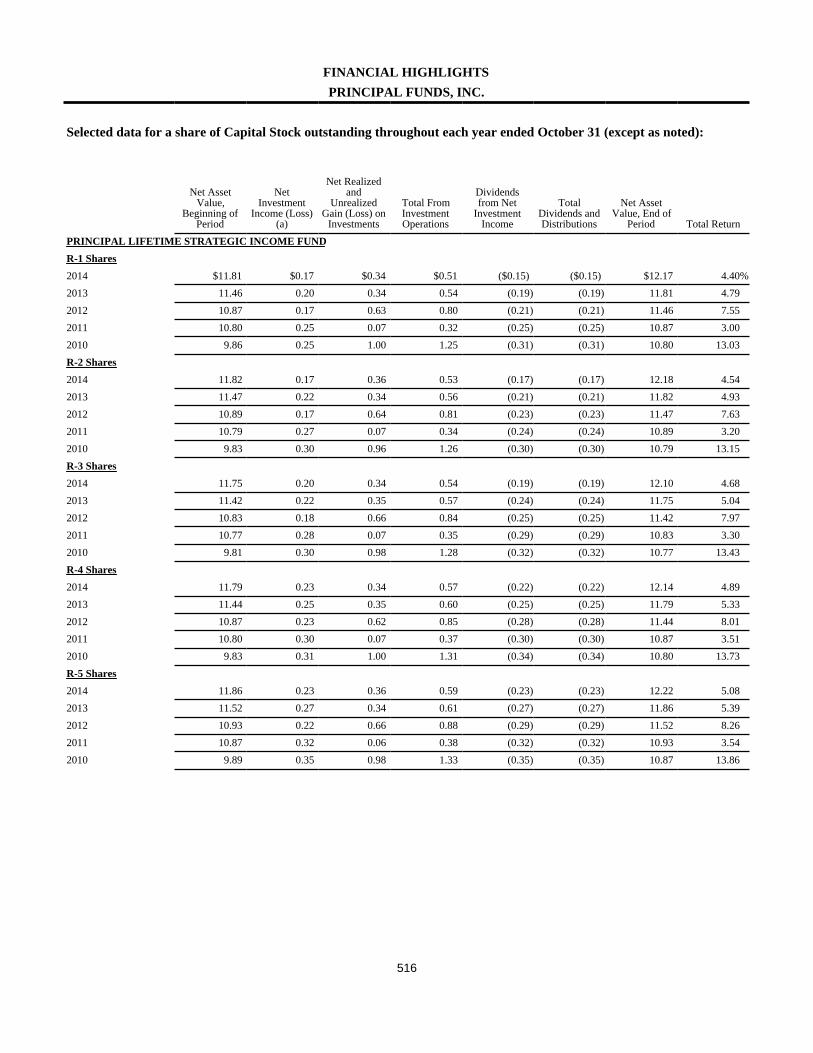
516
FINANCIAL HIGHLIGHTSPRINCIPAL FUNDS, INC.
Selected data for a share of Capital Stock outstanding throughout each year ended October 31 (except as noted):
Net AssetValue,
Beginning ofPeriod
NetInvestment
Income (Loss)(a)
Net Realizedand
UnrealizedGain (Loss) on
Investments
Total FromInvestmentOperations
Dividendsfrom Net
InvestmentIncome
TotalDividends andDistributions
Net AssetValue, End of
Period Total ReturnPRINCIPAL LIFETIME STRATEGIC INCOME FUNDR-1 Shares2014 $11.81 $0.17 $0.34 $0.51 ($0.15) ($0.15) $12.17 4.40%2013 11.46 0.20 0.34 0.54 (0.19) (0.19) 11.81 4.792012 10.87 0.17 0.63 0.80 (0.21) (0.21) 11.46 7.552011 10.80 0.25 0.07 0.32 (0.25) (0.25) 10.87 3.002010 9.86 0.25 1.00 1.25 (0.31) (0.31) 10.80 13.03R-2 Shares2014 11.82 0.17 0.36 0.53 (0.17) (0.17) 12.18 4.542013 11.47 0.22 0.34 0.56 (0.21) (0.21) 11.82 4.932012 10.89 0.17 0.64 0.81 (0.23) (0.23) 11.47 7.632011 10.79 0.27 0.07 0.34 (0.24) (0.24) 10.89 3.202010 9.83 0.30 0.96 1.26 (0.30) (0.30) 10.79 13.15R-3 Shares2014 11.75 0.20 0.34 0.54 (0.19) (0.19) 12.10 4.682013 11.42 0.22 0.35 0.57 (0.24) (0.24) 11.75 5.042012 10.83 0.18 0.66 0.84 (0.25) (0.25) 11.42 7.972011 10.77 0.28 0.07 0.35 (0.29) (0.29) 10.83 3.302010 9.81 0.30 0.98 1.28 (0.32) (0.32) 10.77 13.43R-4 Shares2014 11.79 0.23 0.34 0.57 (0.22) (0.22) 12.14 4.892013 11.44 0.25 0.35 0.60 (0.25) (0.25) 11.79 5.332012 10.87 0.23 0.62 0.85 (0.28) (0.28) 11.44 8.012011 10.80 0.30 0.07 0.37 (0.30) (0.30) 10.87 3.512010 9.83 0.31 1.00 1.31 (0.34) (0.34) 10.80 13.73R-5 Shares2014 11.86 0.23 0.36 0.59 (0.23) (0.23) 12.22 5.082013 11.52 0.27 0.34 0.61 (0.27) (0.27) 11.86 5.392012 10.93 0.22 0.66 0.88 (0.29) (0.29) 11.52 8.262011 10.87 0.32 0.06 0.38 (0.32) (0.32) 10.93 3.542010 9.89 0.35 0.98 1.33 (0.35) (0.35) 10.87 13.86
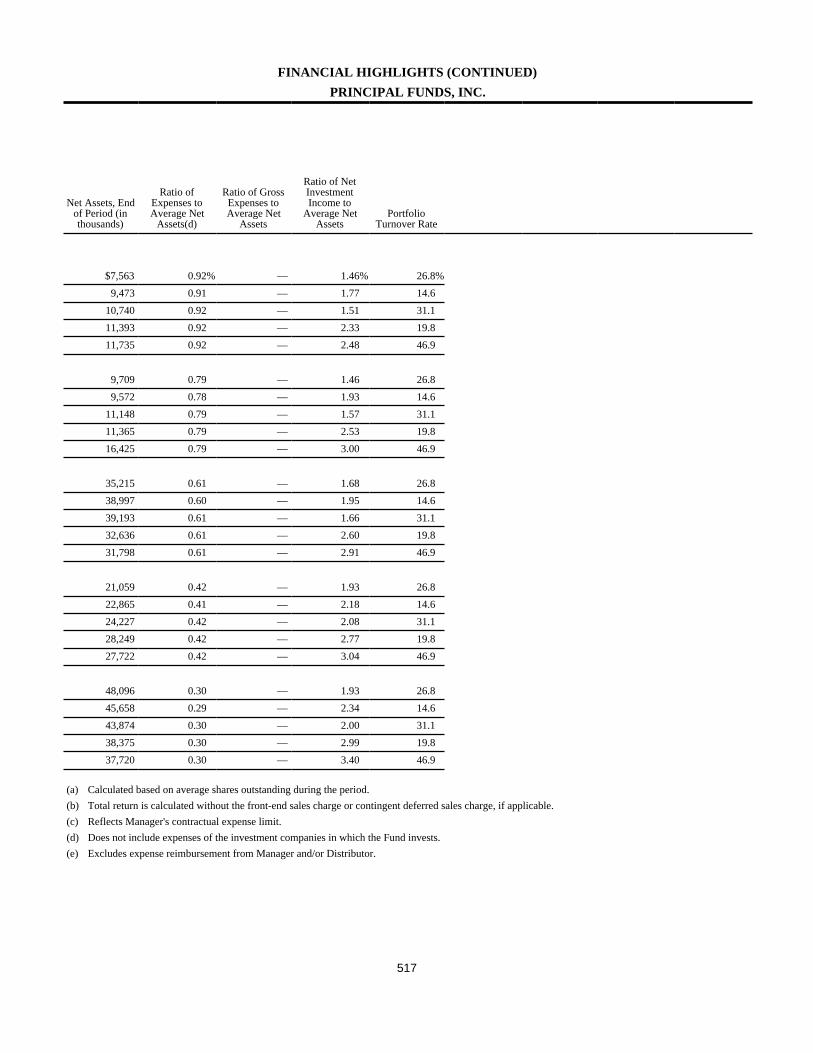
517
FINANCIAL HIGHLIGHTS (CONTINUED)PRINCIPAL FUNDS, INC.
Net Assets, Endof Period (inthousands)
Ratio ofExpenses toAverage Net
Assets(d)
Ratio of GrossExpenses toAverage Net
Assets
Ratio of NetInvestmentIncome to
Average NetAssets
PortfolioTurnover Rate
$7,563 0.92% — 1.46% 26.8%9,473 0.91 — 1.77 14.6
10,740 0.92 — 1.51 31.111,393 0.92 — 2.33 19.811,735 0.92 — 2.48 46.9
9,709 0.79 — 1.46 26.89,572 0.78 — 1.93 14.6
11,148 0.79 — 1.57 31.111,365 0.79 — 2.53 19.816,425 0.79 — 3.00 46.9
35,215 0.61 — 1.68 26.838,997 0.60 — 1.95 14.639,193 0.61 — 1.66 31.132,636 0.61 — 2.60 19.831,798 0.61 — 2.91 46.9
21,059 0.42 — 1.93 26.822,865 0.41 — 2.18 14.624,227 0.42 — 2.08 31.128,249 0.42 — 2.77 19.827,722 0.42 — 3.04 46.9
48,096 0.30 — 1.93 26.845,658 0.29 — 2.34 14.643,874 0.30 — 2.00 31.138,375 0.30 — 2.99 19.837,720 0.30 — 3.40 46.9
(a) Calculated based on average shares outstanding during the period.(b) Total return is calculated without the front-end sales charge or contingent deferred sales charge, if applicable.(c) Reflects Manager's contractual expense limit.(d) Does not include expenses of the investment companies in which the Fund invests.(e) Excludes expense reimbursement from Manager and/or Distributor.
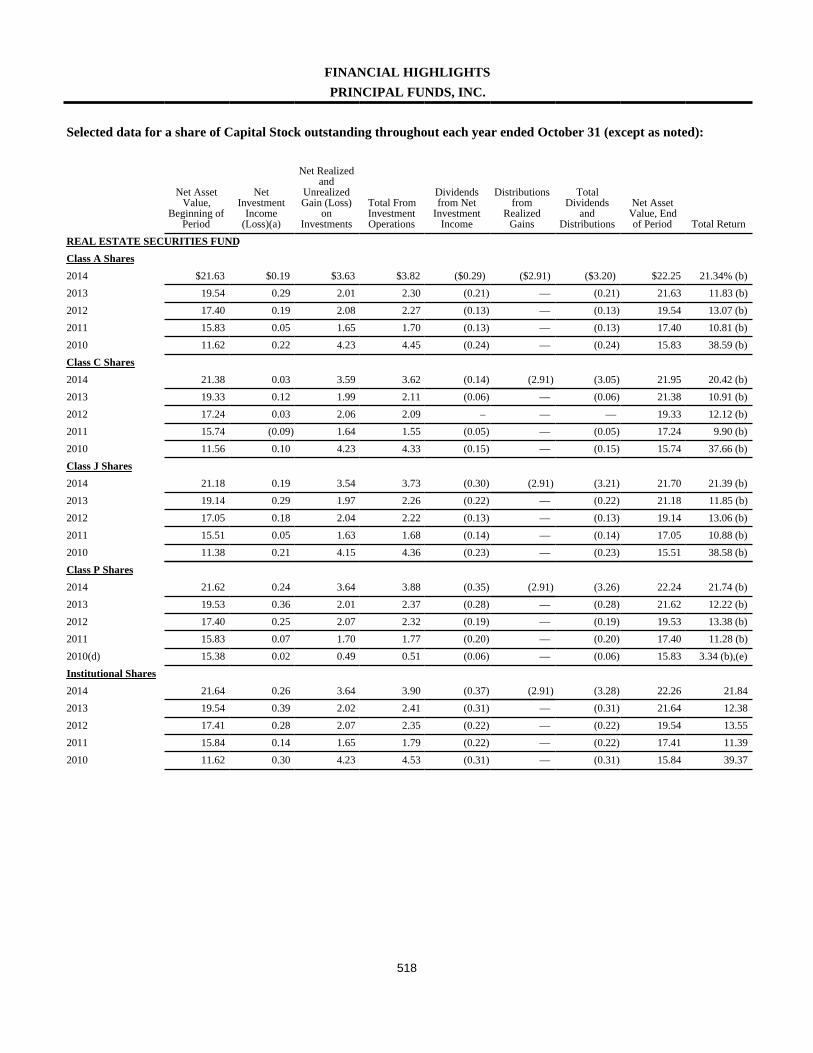
518
FINANCIAL HIGHLIGHTSPRINCIPAL FUNDS, INC.
Selected data for a share of Capital Stock outstanding throughout each year ended October 31 (except as noted):
Net AssetValue,
Beginning ofPeriod
NetInvestment
Income(Loss)(a)
Net Realizedand
UnrealizedGain (Loss)
onInvestments
Total FromInvestmentOperations
Dividendsfrom Net
InvestmentIncome
Distributionsfrom
RealizedGains
TotalDividends
andDistributions
Net AssetValue, Endof Period Total Return
REAL ESTATE SECURITIES FUNDClass A Shares2014 $21.63 $0.19 $3.63 $3.82 ($0.29) ($2.91) ($3.20) $22.25 21.34% (b)2013 19.54 0.29 2.01 2.30 (0.21) — (0.21) 21.63 11.83 (b)2012 17.40 0.19 2.08 2.27 (0.13) — (0.13) 19.54 13.07 (b)2011 15.83 0.05 1.65 1.70 (0.13) — (0.13) 17.40 10.81 (b)2010 11.62 0.22 4.23 4.45 (0.24) — (0.24) 15.83 38.59 (b)Class C Shares2014 21.38 0.03 3.59 3.62 (0.14) (2.91) (3.05) 21.95 20.42 (b)2013 19.33 0.12 1.99 2.11 (0.06) — (0.06) 21.38 10.91 (b)2012 17.24 0.03 2.06 2.09 – — — 19.33 12.12 (b)2011 15.74 (0.09) 1.64 1.55 (0.05) — (0.05) 17.24 9.90 (b)2010 11.56 0.10 4.23 4.33 (0.15) — (0.15) 15.74 37.66 (b)Class J Shares2014 21.18 0.19 3.54 3.73 (0.30) (2.91) (3.21) 21.70 21.39 (b)2013 19.14 0.29 1.97 2.26 (0.22) — (0.22) 21.18 11.85 (b)2012 17.05 0.18 2.04 2.22 (0.13) — (0.13) 19.14 13.06 (b)2011 15.51 0.05 1.63 1.68 (0.14) — (0.14) 17.05 10.88 (b)2010 11.38 0.21 4.15 4.36 (0.23) — (0.23) 15.51 38.58 (b)Class P Shares2014 21.62 0.24 3.64 3.88 (0.35) (2.91) (3.26) 22.24 21.74 (b)2013 19.53 0.36 2.01 2.37 (0.28) — (0.28) 21.62 12.22 (b)2012 17.40 0.25 2.07 2.32 (0.19) — (0.19) 19.53 13.38 (b)2011 15.83 0.07 1.70 1.77 (0.20) — (0.20) 17.40 11.28 (b)2010(d) 15.38 0.02 0.49 0.51 (0.06) — (0.06) 15.83 3.34 (b),(e)Institutional Shares2014 21.64 0.26 3.64 3.90 (0.37) (2.91) (3.28) 22.26 21.842013 19.54 0.39 2.02 2.41 (0.31) — (0.31) 21.64 12.382012 17.41 0.28 2.07 2.35 (0.22) — (0.22) 19.54 13.552011 15.84 0.14 1.65 1.79 (0.22) — (0.22) 17.41 11.392010 11.62 0.30 4.23 4.53 (0.31) — (0.31) 15.84 39.37
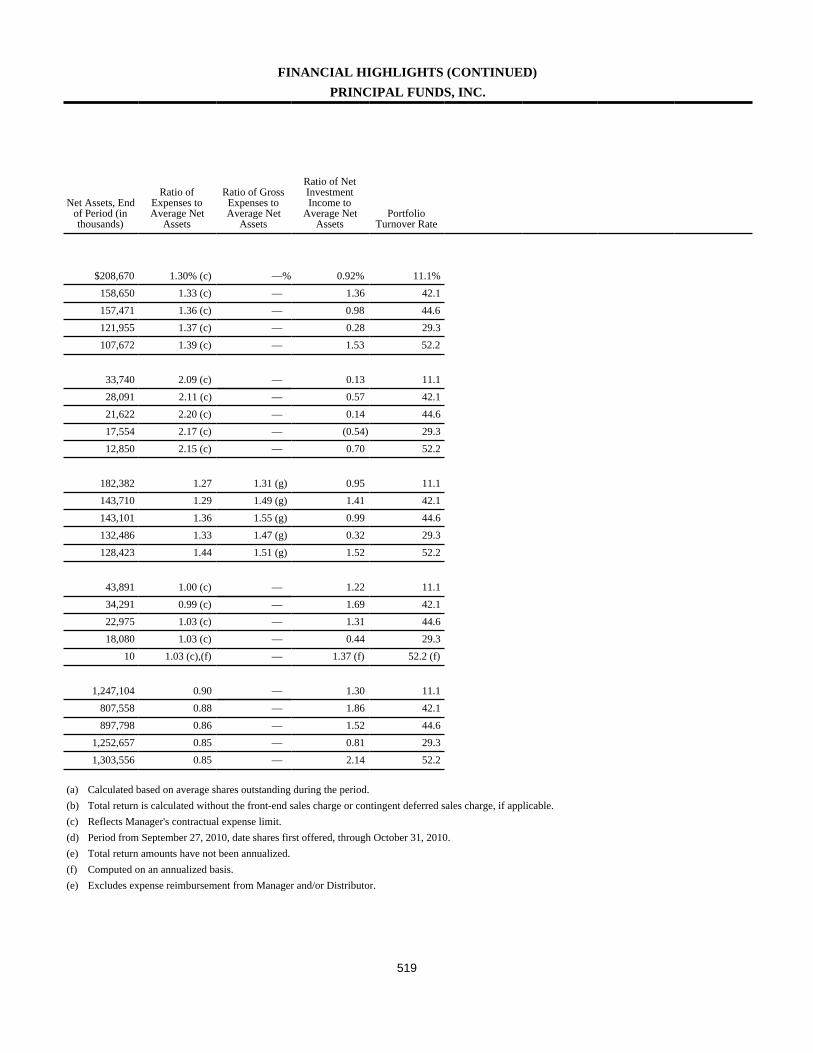
519
FINANCIAL HIGHLIGHTS (CONTINUED)PRINCIPAL FUNDS, INC.
Net Assets, Endof Period (inthousands)
Ratio ofExpenses toAverage Net
Assets
Ratio of GrossExpenses toAverage Net
Assets
Ratio of NetInvestmentIncome to
Average NetAssets
PortfolioTurnover Rate
$208,670 1.30% (c) —% 0.92% 11.1%158,650 1.33 (c) — 1.36 42.1157,471 1.36 (c) — 0.98 44.6121,955 1.37 (c) — 0.28 29.3107,672 1.39 (c) — 1.53 52.2
33,740 2.09 (c) — 0.13 11.128,091 2.11 (c) — 0.57 42.121,622 2.20 (c) — 0.14 44.617,554 2.17 (c) — (0.54) 29.312,850 2.15 (c) — 0.70 52.2
182,382 1.27 1.31 (g) 0.95 11.1143,710 1.29 1.49 (g) 1.41 42.1143,101 1.36 1.55 (g) 0.99 44.6132,486 1.33 1.47 (g) 0.32 29.3128,423 1.44 1.51 (g) 1.52 52.2
43,891 1.00 (c) — 1.22 11.134,291 0.99 (c) — 1.69 42.122,975 1.03 (c) — 1.31 44.618,080 1.03 (c) — 0.44 29.3
10 1.03 (c),(f) — 1.37 (f) 52.2 (f)
1,247,104 0.90 — 1.30 11.1807,558 0.88 — 1.86 42.1897,798 0.86 — 1.52 44.6
1,252,657 0.85 — 0.81 29.31,303,556 0.85 — 2.14 52.2
(a) Calculated based on average shares outstanding during the period.(b) Total return is calculated without the front-end sales charge or contingent deferred sales charge, if applicable.(c) Reflects Manager's contractual expense limit.(d) Period from September 27, 2010, date shares first offered, through October 31, 2010.(e) Total return amounts have not been annualized.(f) Computed on an annualized basis.(e) Excludes expense reimbursement from Manager and/or Distributor.

520
FINANCIAL HIGHLIGHTSPRINCIPAL FUNDS, INC.
Selected data for a share of Capital Stock outstanding throughout each year ended October 31 (except as noted):
Net AssetValue,
Beginning ofPeriod
NetInvestment
Income(Loss)(a)
Net Realizedand
UnrealizedGain (Loss)
onInvestments
Total FromInvestmentOperations
Dividendsfrom Net
InvestmentIncome
Distributionsfrom
RealizedGains
TotalDividends
andDistributions
Net AssetValue, Endof Period Total Return
REAL ESTATE SECURITIES FUNDR-1 Shares2014 $21.43 $0.10 $3.60 $3.70 ($0.21) ($2.91) ($3.12) $22.01 20.87%2013 19.36 0.21 1.99 2.20 (0.13) — (0.13) 21.43 11.392012 17.25 0.12 2.06 2.18 (0.07) — (0.07) 19.36 12.632011 15.70 (0.01) 1.64 1.63 (0.08) — (0.08) 17.25 10.442010 11.52 0.17 4.20 4.37 (0.19) — (0.19) 15.70 38.22R-2 Shares2014 20.88 0.12 3.49 3.61 (0.24) (2.91) (3.15) 21.34 21.042013 18.87 0.23 1.94 2.17 (0.16) — (0.16) 20.88 11.542012 16.82 0.14 2.01 2.15 (0.10) — (0.10) 18.87 12.762011 15.31 0.01 1.60 1.61 (0.10) — (0.10) 16.82 10.562010 11.24 0.19 4.09 4.28 (0.21) — (0.21) 15.31 38.36R-3 Shares2014 21.25 0.16 3.56 3.72 (0.27) (2.91) (3.18) 21.79 21.262013 19.20 0.27 1.98 2.25 (0.20) — (0.20) 21.25 11.752012 17.11 0.17 2.05 2.22 (0.13) — (0.13) 19.20 12.972011 15.57 0.04 1.63 1.67 (0.13) — (0.13) 17.11 10.772010 11.42 0.22 4.17 4.39 (0.24) — (0.24) 15.57 38.69R-4 Shares2014 21.08 0.20 3.52 3.72 (0.31) (2.91) (3.22) 21.58 21.482013 19.05 0.30 1.97 2.27 (0.24) — (0.24) 21.08 11.972012 16.98 0.21 2.02 2.23 (0.16) — (0.16) 19.05 13.162011 15.45 0.07 1.62 1.69 (0.16) — (0.16) 16.98 11.022010 11.34 0.24 4.13 4.37 (0.26) — (0.26) 15.45 38.89R-5 Shares2014 21.11 0.22 3.53 3.75 (0.33) (2.91) (3.24) 21.62 21.632013 19.08 0.33 1.96 2.29 (0.26) — (0.26) 21.11 12.082012 17.00 0.23 2.03 2.26 (0.18) — (0.18) 19.08 13.332011 15.48 0.09 1.61 1.70 (0.18) — (0.18) 17.00 11.072010 11.36 0.26 4.14 4.40 (0.28) — (0.28) 15.48 39.05

521
FINANCIAL HIGHLIGHTS (CONTINUED)PRINCIPAL FUNDS, INC.
Net Assets, Endof Period (inthousands)
Ratio ofExpenses toAverage Net
Assets
Ratio of GrossExpenses toAverage Net
Assets
Ratio of NetInvestmentIncome to
Average NetAssets
PortfolioTurnover Rate
$7,138 1.71% —% 0.52% 11.1%6,737 1.71 — 1.00 42.17,692 1.71 — 0.62 44.66,951 1.71 — (0.05) 29.36,794 1.71 — 1.22 52.2
17,507 1.58 — 0.64 11.114,360 1.58 — 1.12 42.115,354 1.58 — 0.76 44.613,043 1.58 — 0.08 29.314,881 1.58 — 1.38 52.2
56,032 1.40 — 0.83 11.147,905 1.40 — 1.30 42.148,924 1.40 — 0.94 44.639,405 1.40 — 0.25 29.339,463 1.40 — 1.58 52.2
67,466 1.21 — 1.01 11.148,216 1.21 — 1.47 42.140,509 1.21 — 1.13 44.632,332 1.21 — 0.42 29.323,587 1.21 — 1.73 52.2
167,195 1.09 — 1.11 11.1105,831 1.09 — 1.61 42.1107,275 1.09 — 1.26 44.6
95,630 1.09 — 0.53 29.359,168 1.09 — 1.91 52.2
(a) Calculated based on average shares outstanding during the period.(b) Total return is calculated without the front-end sales charge or contingent deferred sales charge, if applicable.(c) Reflects Manager's contractual expense limit.(d) Period from September 27, 2010, date shares first offered, through October 31, 2010.(e) Total return amounts have not been annualized.(f) Computed on an annualized basis.(e) Excludes expense reimbursement from Manager and/or Distributor.
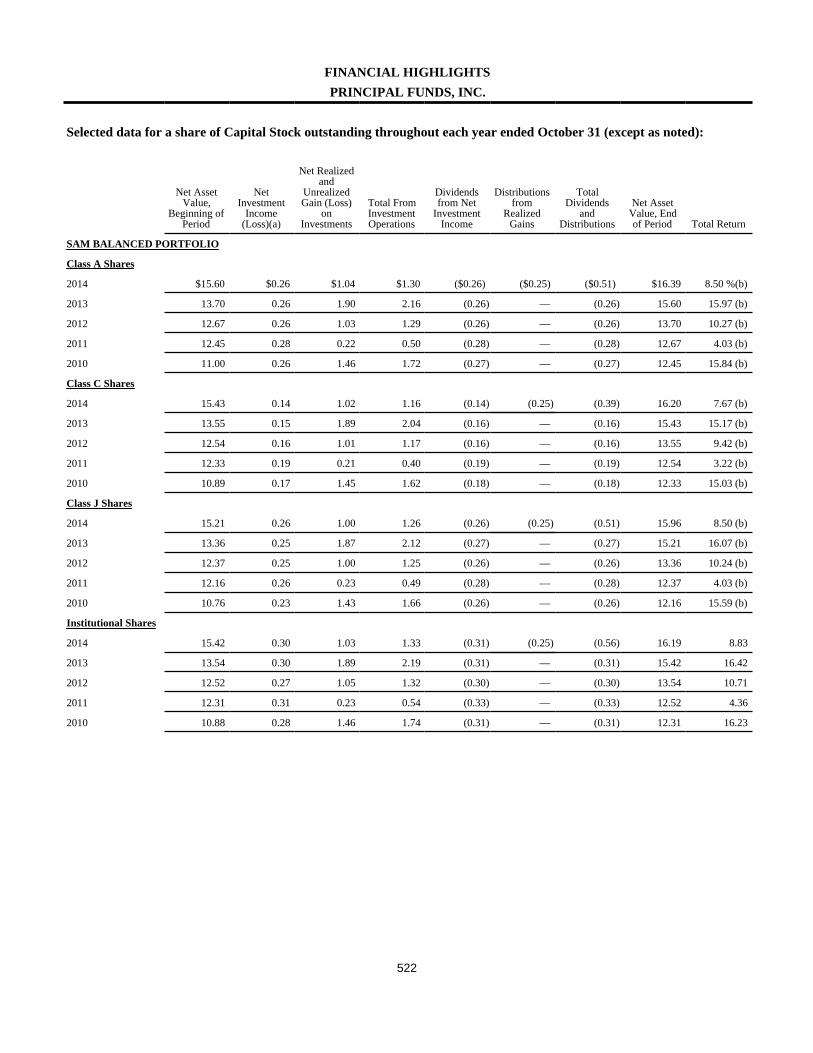
522
FINANCIAL HIGHLIGHTSPRINCIPAL FUNDS, INC.
Selected data for a share of Capital Stock outstanding throughout each year ended October 31 (except as noted):
Net AssetValue,
Beginning ofPeriod
NetInvestment
Income(Loss)(a)
Net Realizedand
UnrealizedGain (Loss)
onInvestments
Total FromInvestmentOperations
Dividendsfrom Net
InvestmentIncome
Distributionsfrom
RealizedGains
TotalDividends
andDistributions
Net AssetValue, Endof Period Total Return
SAM BALANCED PORTFOLIO
Class A Shares
2014 $15.60 $0.26 $1.04 $1.30 ($0.26) ($0.25) ($0.51) $16.39 8.50 %(b)
2013 13.70 0.26 1.90 2.16 (0.26) — (0.26) 15.60 15.97 (b)
2012 12.67 0.26 1.03 1.29 (0.26) — (0.26) 13.70 10.27 (b)
2011 12.45 0.28 0.22 0.50 (0.28) — (0.28) 12.67 4.03 (b)
2010 11.00 0.26 1.46 1.72 (0.27) — (0.27) 12.45 15.84 (b)
Class C Shares
2014 15.43 0.14 1.02 1.16 (0.14) (0.25) (0.39) 16.20 7.67 (b)
2013 13.55 0.15 1.89 2.04 (0.16) — (0.16) 15.43 15.17 (b)
2012 12.54 0.16 1.01 1.17 (0.16) — (0.16) 13.55 9.42 (b)
2011 12.33 0.19 0.21 0.40 (0.19) — (0.19) 12.54 3.22 (b)
2010 10.89 0.17 1.45 1.62 (0.18) — (0.18) 12.33 15.03 (b)
Class J Shares
2014 15.21 0.26 1.00 1.26 (0.26) (0.25) (0.51) 15.96 8.50 (b)
2013 13.36 0.25 1.87 2.12 (0.27) — (0.27) 15.21 16.07 (b)
2012 12.37 0.25 1.00 1.25 (0.26) — (0.26) 13.36 10.24 (b)
2011 12.16 0.26 0.23 0.49 (0.28) — (0.28) 12.37 4.03 (b)
2010 10.76 0.23 1.43 1.66 (0.26) — (0.26) 12.16 15.59 (b)
Institutional Shares
2014 15.42 0.30 1.03 1.33 (0.31) (0.25) (0.56) 16.19 8.83
2013 13.54 0.30 1.89 2.19 (0.31) — (0.31) 15.42 16.42
2012 12.52 0.27 1.05 1.32 (0.30) — (0.30) 13.54 10.71
2011 12.31 0.31 0.23 0.54 (0.33) — (0.33) 12.52 4.36
2010 10.88 0.28 1.46 1.74 (0.31) — (0.31) 12.31 16.23

523
FINANCIAL HIGHLIGHTS (CONTINUED)PRINCIPAL FUNDS, INC.
Net Assets, Endof Period (inthousands)
Ratio ofExpenses toAverage Net
Assets(c)
Ratio of GrossExpenses toAverage Net
Assets
Ratio of NetInvestmentIncome to
Average NetAssets
PortfolioTurnover Rate
$2,083,846 0.65% —% 1.63% 3.3%
1,923,276 0.68 — 1.78 16.9
1,675,088 0.71 — 1.94 9.6
1,580,189 0.70 — 2.19 29.6
1,627,536 0.71 — 2.21 13.2
732,362 1.40 — 0.88 3.3
654,170 1.41 — 1.03 16.9
554,609 1.45 — 1.21 9.6
541,446 1.43 — 1.46 29.6
576,580 1.45 — 1.47 13.2
981,860 0.61 0.65 (c),(d) 1.66 3.3
864,184 0.63 0.83 (c),(d) 1.78 16.9
675,382 0.68 0.88 (c),(d) 1.92 9.6
514,475 0.73 0.87 (c),(d) 2.11 29.6
396,058 0.85 0.92 (c),(d) 1.98 13.2
787,845 0.31 — 1.91 3.3
719,100 0.33 0.33 (c),(d) 2.11 16.9
612,372 0.35 0.35 (c),(d) 2.06 9.6
227,083 0.36 0.36 (c),(d) 2.44 29.6
122,317 0.38 0.38 (c),(d) 2.43 13.2
(a) Calculated based on average shares outstanding during the period.(b) Total return is calculated without the front-end sales charge or contingent deferred sales charge, if applicable.(c) Does not include expenses of the investment companies in which the Portfolio invests.(d) Excludes expense reimbursement from Manager and/or Distributor.
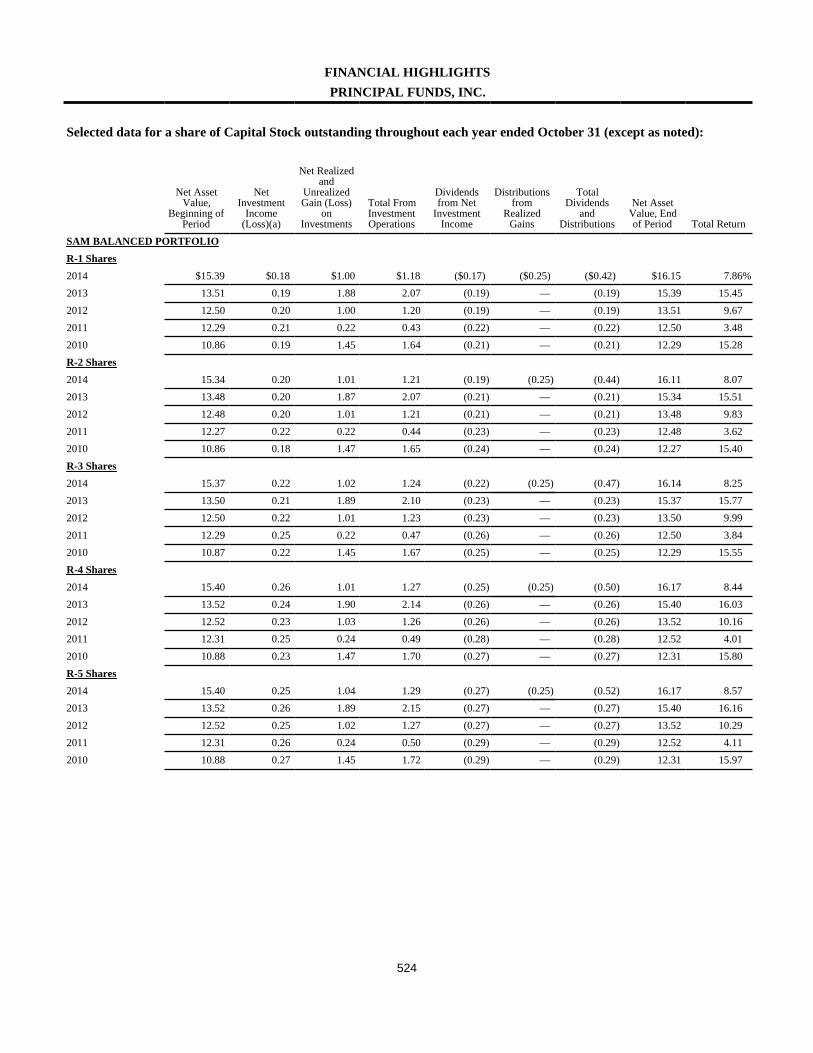
524
FINANCIAL HIGHLIGHTSPRINCIPAL FUNDS, INC.
Selected data for a share of Capital Stock outstanding throughout each year ended October 31 (except as noted):
Net AssetValue,
Beginning ofPeriod
NetInvestment
Income(Loss)(a)
Net Realizedand
UnrealizedGain (Loss)
onInvestments
Total FromInvestmentOperations
Dividendsfrom Net
InvestmentIncome
Distributionsfrom
RealizedGains
TotalDividends
andDistributions
Net AssetValue, Endof Period Total Return
SAM BALANCED PORTFOLIOR-1 Shares2014 $15.39 $0.18 $1.00 $1.18 ($0.17) ($0.25) ($0.42) $16.15 7.86%2013 13.51 0.19 1.88 2.07 (0.19) — (0.19) 15.39 15.452012 12.50 0.20 1.00 1.20 (0.19) — (0.19) 13.51 9.672011 12.29 0.21 0.22 0.43 (0.22) — (0.22) 12.50 3.482010 10.86 0.19 1.45 1.64 (0.21) — (0.21) 12.29 15.28R-2 Shares2014 15.34 0.20 1.01 1.21 (0.19) (0.25) (0.44) 16.11 8.072013 13.48 0.20 1.87 2.07 (0.21) — (0.21) 15.34 15.512012 12.48 0.20 1.01 1.21 (0.21) — (0.21) 13.48 9.832011 12.27 0.22 0.22 0.44 (0.23) — (0.23) 12.48 3.622010 10.86 0.18 1.47 1.65 (0.24) — (0.24) 12.27 15.40R-3 Shares2014 15.37 0.22 1.02 1.24 (0.22) (0.25) (0.47) 16.14 8.252013 13.50 0.21 1.89 2.10 (0.23) — (0.23) 15.37 15.772012 12.50 0.22 1.01 1.23 (0.23) — (0.23) 13.50 9.992011 12.29 0.25 0.22 0.47 (0.26) — (0.26) 12.50 3.842010 10.87 0.22 1.45 1.67 (0.25) — (0.25) 12.29 15.55R-4 Shares2014 15.40 0.26 1.01 1.27 (0.25) (0.25) (0.50) 16.17 8.442013 13.52 0.24 1.90 2.14 (0.26) — (0.26) 15.40 16.032012 12.52 0.23 1.03 1.26 (0.26) — (0.26) 13.52 10.162011 12.31 0.25 0.24 0.49 (0.28) — (0.28) 12.52 4.012010 10.88 0.23 1.47 1.70 (0.27) — (0.27) 12.31 15.80R-5 Shares2014 15.40 0.25 1.04 1.29 (0.27) (0.25) (0.52) 16.17 8.572013 13.52 0.26 1.89 2.15 (0.27) — (0.27) 15.40 16.162012 12.52 0.25 1.02 1.27 (0.27) — (0.27) 13.52 10.292011 12.31 0.26 0.24 0.50 (0.29) — (0.29) 12.52 4.112010 10.88 0.27 1.45 1.72 (0.29) — (0.29) 12.31 15.97
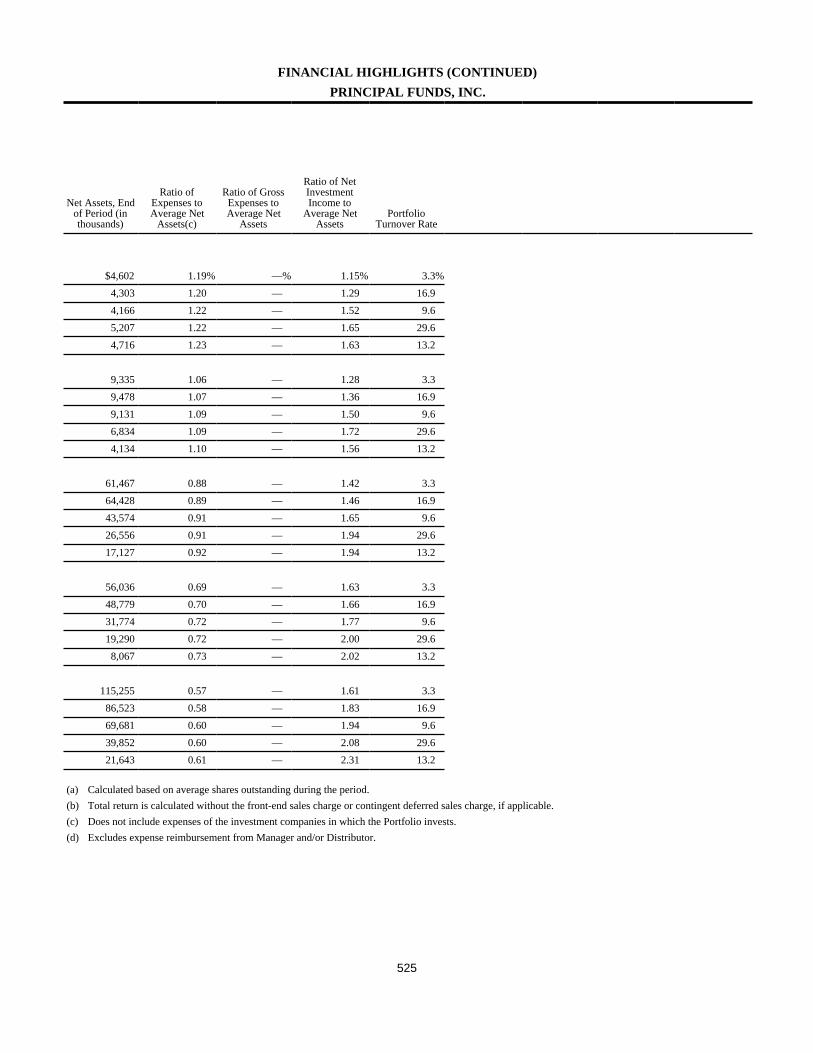
525
FINANCIAL HIGHLIGHTS (CONTINUED)PRINCIPAL FUNDS, INC.
Net Assets, Endof Period (inthousands)
Ratio ofExpenses toAverage Net
Assets(c)
Ratio of GrossExpenses toAverage Net
Assets
Ratio of NetInvestmentIncome to
Average NetAssets
PortfolioTurnover Rate
$4,602 1.19% —% 1.15% 3.3%4,303 1.20 — 1.29 16.94,166 1.22 — 1.52 9.65,207 1.22 — 1.65 29.64,716 1.23 — 1.63 13.2
9,335 1.06 — 1.28 3.39,478 1.07 — 1.36 16.99,131 1.09 — 1.50 9.66,834 1.09 — 1.72 29.64,134 1.10 — 1.56 13.2
61,467 0.88 — 1.42 3.364,428 0.89 — 1.46 16.943,574 0.91 — 1.65 9.626,556 0.91 — 1.94 29.617,127 0.92 — 1.94 13.2
56,036 0.69 — 1.63 3.348,779 0.70 — 1.66 16.931,774 0.72 — 1.77 9.619,290 0.72 — 2.00 29.68,067 0.73 — 2.02 13.2
115,255 0.57 — 1.61 3.386,523 0.58 — 1.83 16.969,681 0.60 — 1.94 9.639,852 0.60 — 2.08 29.621,643 0.61 — 2.31 13.2
(a) Calculated based on average shares outstanding during the period.(b) Total return is calculated without the front-end sales charge or contingent deferred sales charge, if applicable.(c) Does not include expenses of the investment companies in which the Portfolio invests.(d) Excludes expense reimbursement from Manager and/or Distributor.
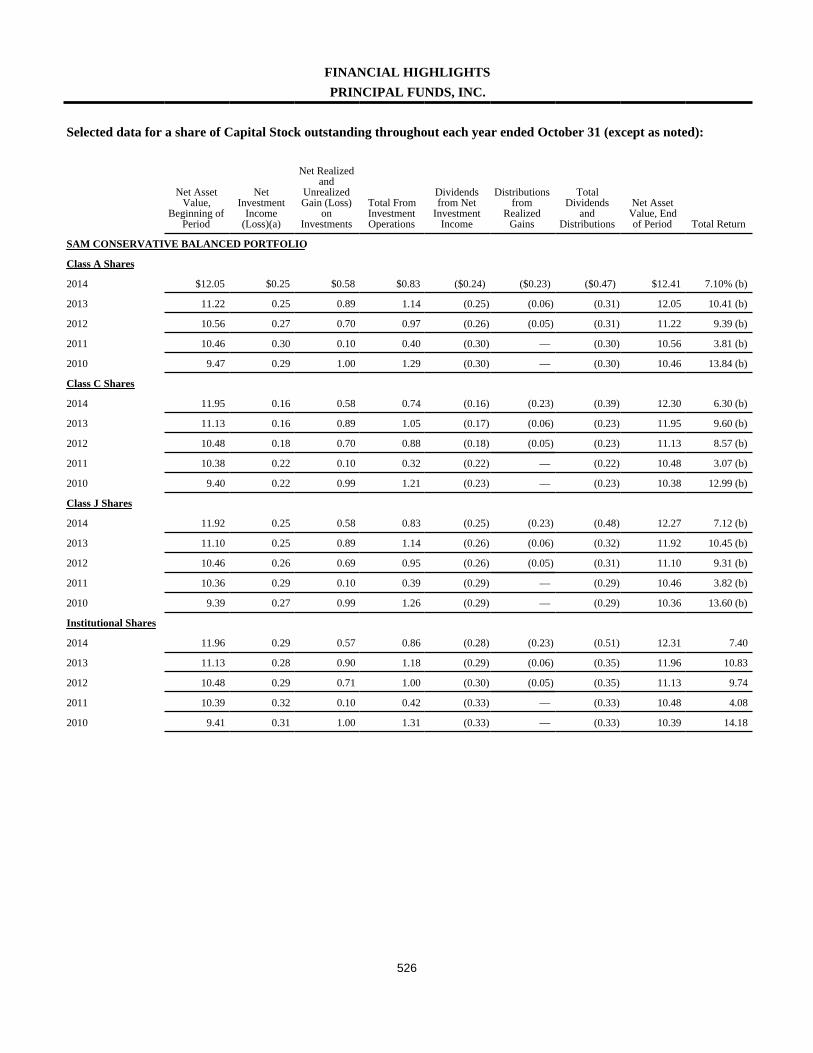
526
FINANCIAL HIGHLIGHTSPRINCIPAL FUNDS, INC.
Selected data for a share of Capital Stock outstanding throughout each year ended October 31 (except as noted):
Net AssetValue,
Beginning ofPeriod
NetInvestment
Income(Loss)(a)
Net Realizedand
UnrealizedGain (Loss)
onInvestments
Total FromInvestmentOperations
Dividendsfrom Net
InvestmentIncome
Distributionsfrom
RealizedGains
TotalDividends
andDistributions
Net AssetValue, Endof Period Total Return
SAM CONSERVATIVE BALANCED PORTFOLIO
Class A Shares
2014 $12.05 $0.25 $0.58 $0.83 ($0.24) ($0.23) ($0.47) $12.41 7.10% (b)
2013 11.22 0.25 0.89 1.14 (0.25) (0.06) (0.31) 12.05 10.41 (b)
2012 10.56 0.27 0.70 0.97 (0.26) (0.05) (0.31) 11.22 9.39 (b)
2011 10.46 0.30 0.10 0.40 (0.30) — (0.30) 10.56 3.81 (b)
2010 9.47 0.29 1.00 1.29 (0.30) — (0.30) 10.46 13.84 (b)
Class C Shares
2014 11.95 0.16 0.58 0.74 (0.16) (0.23) (0.39) 12.30 6.30 (b)
2013 11.13 0.16 0.89 1.05 (0.17) (0.06) (0.23) 11.95 9.60 (b)
2012 10.48 0.18 0.70 0.88 (0.18) (0.05) (0.23) 11.13 8.57 (b)
2011 10.38 0.22 0.10 0.32 (0.22) — (0.22) 10.48 3.07 (b)
2010 9.40 0.22 0.99 1.21 (0.23) — (0.23) 10.38 12.99 (b)
Class J Shares
2014 11.92 0.25 0.58 0.83 (0.25) (0.23) (0.48) 12.27 7.12 (b)
2013 11.10 0.25 0.89 1.14 (0.26) (0.06) (0.32) 11.92 10.45 (b)
2012 10.46 0.26 0.69 0.95 (0.26) (0.05) (0.31) 11.10 9.31 (b)
2011 10.36 0.29 0.10 0.39 (0.29) — (0.29) 10.46 3.82 (b)
2010 9.39 0.27 0.99 1.26 (0.29) — (0.29) 10.36 13.60 (b)
Institutional Shares
2014 11.96 0.29 0.57 0.86 (0.28) (0.23) (0.51) 12.31 7.40
2013 11.13 0.28 0.90 1.18 (0.29) (0.06) (0.35) 11.96 10.83
2012 10.48 0.29 0.71 1.00 (0.30) (0.05) (0.35) 11.13 9.74
2011 10.39 0.32 0.10 0.42 (0.33) — (0.33) 10.48 4.08
2010 9.41 0.31 1.00 1.31 (0.33) — (0.33) 10.39 14.18
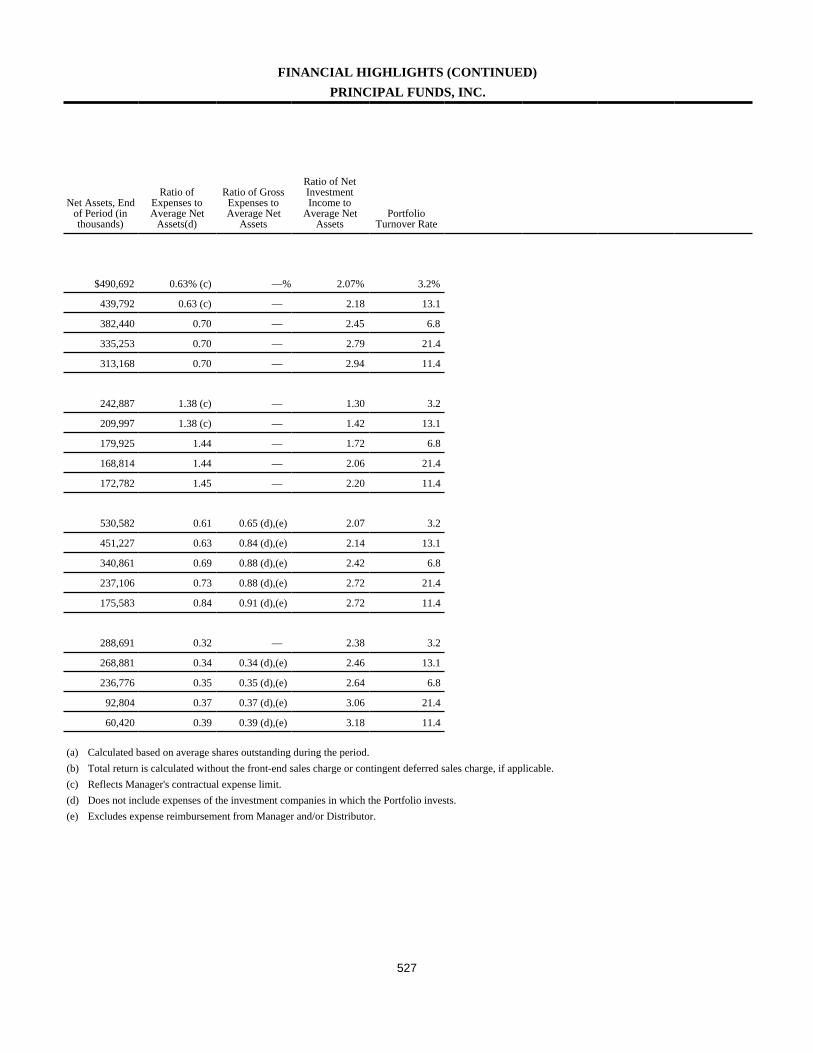
527
FINANCIAL HIGHLIGHTS (CONTINUED)PRINCIPAL FUNDS, INC.
Net Assets, Endof Period (inthousands)
Ratio ofExpenses toAverage Net
Assets(d)
Ratio of GrossExpenses toAverage Net
Assets
Ratio of NetInvestmentIncome to
Average NetAssets
PortfolioTurnover Rate
$490,692 0.63% (c) —% 2.07% 3.2%
439,792 0.63 (c) — 2.18 13.1
382,440 0.70 — 2.45 6.8
335,253 0.70 — 2.79 21.4
313,168 0.70 — 2.94 11.4
242,887 1.38 (c) — 1.30 3.2
209,997 1.38 (c) — 1.42 13.1
179,925 1.44 — 1.72 6.8
168,814 1.44 — 2.06 21.4
172,782 1.45 — 2.20 11.4
530,582 0.61 0.65 (d),(e) 2.07 3.2
451,227 0.63 0.84 (d),(e) 2.14 13.1
340,861 0.69 0.88 (d),(e) 2.42 6.8
237,106 0.73 0.88 (d),(e) 2.72 21.4
175,583 0.84 0.91 (d),(e) 2.72 11.4
288,691 0.32 — 2.38 3.2
268,881 0.34 0.34 (d),(e) 2.46 13.1
236,776 0.35 0.35 (d),(e) 2.64 6.8
92,804 0.37 0.37 (d),(e) 3.06 21.4
60,420 0.39 0.39 (d),(e) 3.18 11.4
(a) Calculated based on average shares outstanding during the period.(b) Total return is calculated without the front-end sales charge or contingent deferred sales charge, if applicable.(c) Reflects Manager's contractual expense limit.(d) Does not include expenses of the investment companies in which the Portfolio invests.(e) Excludes expense reimbursement from Manager and/or Distributor.
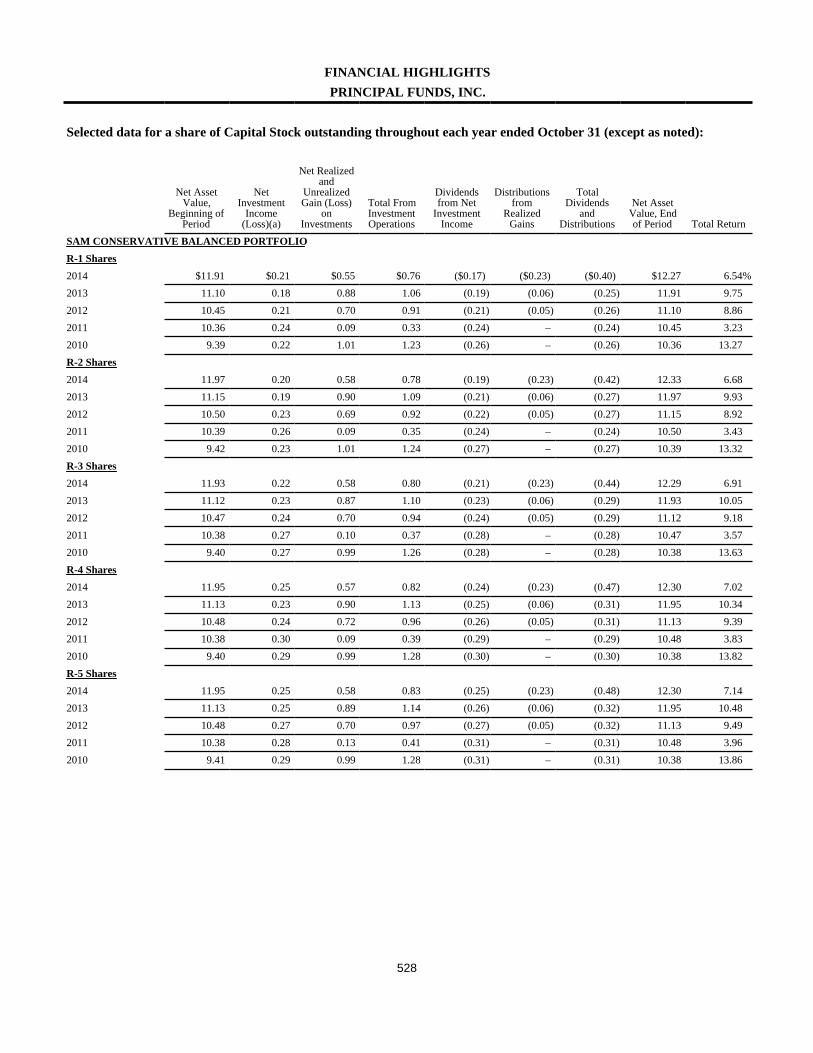
528
FINANCIAL HIGHLIGHTSPRINCIPAL FUNDS, INC.
Selected data for a share of Capital Stock outstanding throughout each year ended October 31 (except as noted):
Net AssetValue,
Beginning ofPeriod
NetInvestment
Income(Loss)(a)
Net Realizedand
UnrealizedGain (Loss)
onInvestments
Total FromInvestmentOperations
Dividendsfrom Net
InvestmentIncome
Distributionsfrom
RealizedGains
TotalDividends
andDistributions
Net AssetValue, Endof Period Total Return
SAM CONSERVATIVE BALANCED PORTFOLIOR-1 Shares2014 $11.91 $0.21 $0.55 $0.76 ($0.17) ($0.23) ($0.40) $12.27 6.54%2013 11.10 0.18 0.88 1.06 (0.19) (0.06) (0.25) 11.91 9.752012 10.45 0.21 0.70 0.91 (0.21) (0.05) (0.26) 11.10 8.862011 10.36 0.24 0.09 0.33 (0.24) – (0.24) 10.45 3.232010 9.39 0.22 1.01 1.23 (0.26) – (0.26) 10.36 13.27R-2 Shares2014 11.97 0.20 0.58 0.78 (0.19) (0.23) (0.42) 12.33 6.682013 11.15 0.19 0.90 1.09 (0.21) (0.06) (0.27) 11.97 9.932012 10.50 0.23 0.69 0.92 (0.22) (0.05) (0.27) 11.15 8.922011 10.39 0.26 0.09 0.35 (0.24) – (0.24) 10.50 3.432010 9.42 0.23 1.01 1.24 (0.27) – (0.27) 10.39 13.32R-3 Shares2014 11.93 0.22 0.58 0.80 (0.21) (0.23) (0.44) 12.29 6.912013 11.12 0.23 0.87 1.10 (0.23) (0.06) (0.29) 11.93 10.052012 10.47 0.24 0.70 0.94 (0.24) (0.05) (0.29) 11.12 9.182011 10.38 0.27 0.10 0.37 (0.28) – (0.28) 10.47 3.572010 9.40 0.27 0.99 1.26 (0.28) – (0.28) 10.38 13.63R-4 Shares2014 11.95 0.25 0.57 0.82 (0.24) (0.23) (0.47) 12.30 7.022013 11.13 0.23 0.90 1.13 (0.25) (0.06) (0.31) 11.95 10.342012 10.48 0.24 0.72 0.96 (0.26) (0.05) (0.31) 11.13 9.392011 10.38 0.30 0.09 0.39 (0.29) – (0.29) 10.48 3.832010 9.40 0.29 0.99 1.28 (0.30) – (0.30) 10.38 13.82R-5 Shares2014 11.95 0.25 0.58 0.83 (0.25) (0.23) (0.48) 12.30 7.142013 11.13 0.25 0.89 1.14 (0.26) (0.06) (0.32) 11.95 10.482012 10.48 0.27 0.70 0.97 (0.27) (0.05) (0.32) 11.13 9.492011 10.38 0.28 0.13 0.41 (0.31) – (0.31) 10.48 3.962010 9.41 0.29 0.99 1.28 (0.31) – (0.31) 10.38 13.86

529
FINANCIAL HIGHLIGHTS (CONTINUED)PRINCIPAL FUNDS, INC.
Net Assets, Endof Period (inthousands)
Ratio ofExpenses toAverage Net
Assets(d)
Ratio of GrossExpenses toAverage Net
Assets
Ratio of NetInvestmentIncome to
Average NetAssets
PortfolioTurnover Rate
$2,823 1.19% —% 1.75% 3.2%4,436 1.20 — 1.60 13.13,753 1.22 — 1.94 6.83,256 1.22 — 2.24 21.42,580 1.23 — 2.25 11.4
2,756 1.06 — 1.67 3.23,019 1.07 — 1.64 13.12,532 1.09 — 2.17 6.83,083 1.09 — 2.43 21.44,251 1.10 — 2.29 11.4
21,180 0.88 — 1.82 3.220,157 0.89 — 2.04 13.122,210 0.91 — 2.20 6.815,468 0.91 — 2.52 21.48,726 0.92 — 2.69 11.4
20,811 0.69 — 2.06 3.217,604 0.70 — 1.99 13.111,581 0.72 — 2.26 6.84,674 0.72 — 2.81 21.44,294 0.73 — 2.90 11.4
36,356 0.57 — 2.08 3.229,141 0.58 — 2.14 13.118,477 0.60 — 2.46 6.811,243 0.60 — 2.67 21.44,233 0.61 — 2.98 11.4
(a) Calculated based on average shares outstanding during the period.(b) Total return is calculated without the front-end sales charge or contingent deferred sales charge, if applicable.(c) Reflects Manager's contractual expense limit.(d) Does not include expenses of the investment companies in which the Portfolio invests.(e) Excludes expense reimbursement from Manager and/or Distributor.
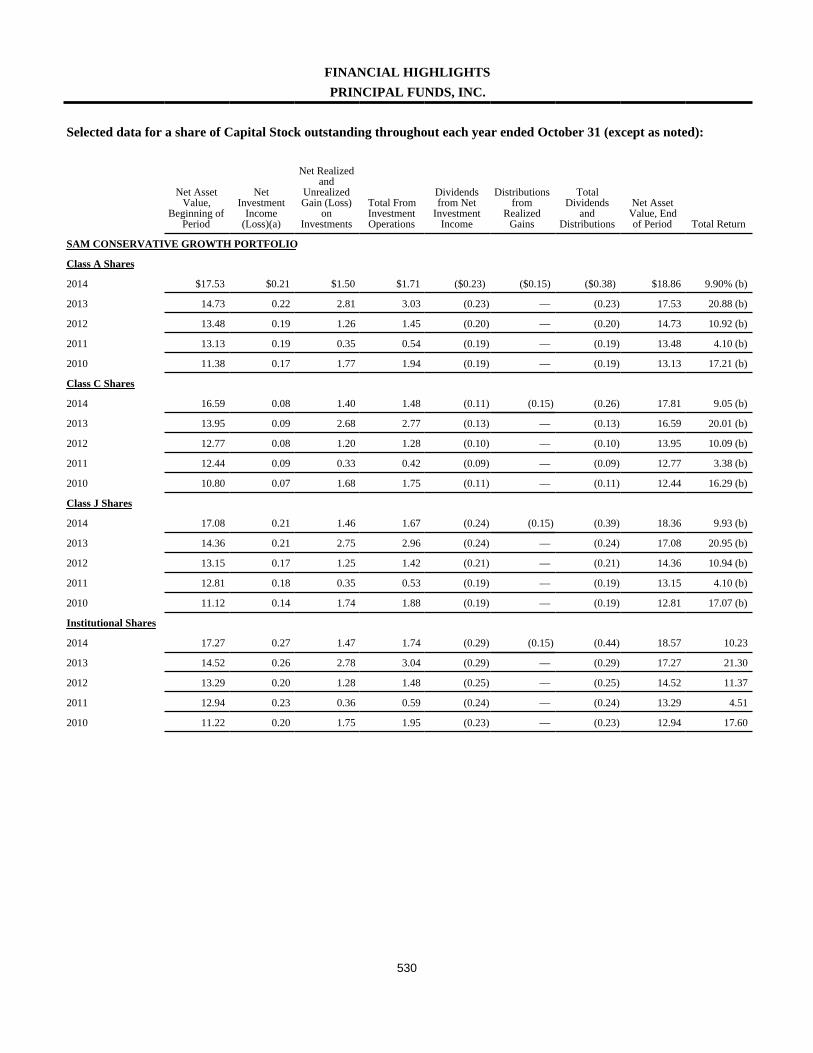
530
FINANCIAL HIGHLIGHTSPRINCIPAL FUNDS, INC.
Selected data for a share of Capital Stock outstanding throughout each year ended October 31 (except as noted):
Net AssetValue,
Beginning ofPeriod
NetInvestment
Income(Loss)(a)
Net Realizedand
UnrealizedGain (Loss)
onInvestments
Total FromInvestmentOperations
Dividendsfrom Net
InvestmentIncome
Distributionsfrom
RealizedGains
TotalDividends
andDistributions
Net AssetValue, Endof Period Total Return
SAM CONSERVATIVE GROWTH PORTFOLIO
Class A Shares
2014 $17.53 $0.21 $1.50 $1.71 ($0.23) ($0.15) ($0.38) $18.86 9.90% (b)
2013 14.73 0.22 2.81 3.03 (0.23) — (0.23) 17.53 20.88 (b)
2012 13.48 0.19 1.26 1.45 (0.20) — (0.20) 14.73 10.92 (b)
2011 13.13 0.19 0.35 0.54 (0.19) — (0.19) 13.48 4.10 (b)
2010 11.38 0.17 1.77 1.94 (0.19) — (0.19) 13.13 17.21 (b)
Class C Shares
2014 16.59 0.08 1.40 1.48 (0.11) (0.15) (0.26) 17.81 9.05 (b)
2013 13.95 0.09 2.68 2.77 (0.13) — (0.13) 16.59 20.01 (b)
2012 12.77 0.08 1.20 1.28 (0.10) — (0.10) 13.95 10.09 (b)
2011 12.44 0.09 0.33 0.42 (0.09) — (0.09) 12.77 3.38 (b)
2010 10.80 0.07 1.68 1.75 (0.11) — (0.11) 12.44 16.29 (b)
Class J Shares
2014 17.08 0.21 1.46 1.67 (0.24) (0.15) (0.39) 18.36 9.93 (b)
2013 14.36 0.21 2.75 2.96 (0.24) — (0.24) 17.08 20.95 (b)
2012 13.15 0.17 1.25 1.42 (0.21) — (0.21) 14.36 10.94 (b)
2011 12.81 0.18 0.35 0.53 (0.19) — (0.19) 13.15 4.10 (b)
2010 11.12 0.14 1.74 1.88 (0.19) — (0.19) 12.81 17.07 (b)
Institutional Shares
2014 17.27 0.27 1.47 1.74 (0.29) (0.15) (0.44) 18.57 10.23
2013 14.52 0.26 2.78 3.04 (0.29) — (0.29) 17.27 21.30
2012 13.29 0.20 1.28 1.48 (0.25) — (0.25) 14.52 11.37
2011 12.94 0.23 0.36 0.59 (0.24) — (0.24) 13.29 4.51
2010 11.22 0.20 1.75 1.95 (0.23) — (0.23) 12.94 17.60

531
FINANCIAL HIGHLIGHTS (CONTINUED)PRINCIPAL FUNDS, INC.
Net Assets, Endof Period (inthousands)
Ratio ofExpenses toAverage Net
Assets(c)
Ratio of GrossExpenses toAverage Net
Assets
Ratio of NetInvestmentIncome to
Average NetAssets
PortfolioTurnover Rate
$1,493,034 0.65% —% 1.17% 4.0%
1,372,490 0.68 — 1.35 20.2
1,174,694 0.72 — 1.32 13.1
1,124,629 0.71 — 1.42 31.9
1,178,547 0.72 — 1.37 15.4
551,460 1.40 — 0.44 4.0
510,553 1.43 — 0.61 20.2
443,838 1.47 — 0.59 13.1
447,955 1.46 — 0.68 31.9
493,019 1.48 — 0.64 15.4
496,391 0.62 0.66 (c),(d) 1.19 4.0
422,288 0.65 0.85 (c),(d) 1.33 20.2
313,149 0.70 0.90 (c),(d) 1.26 13.1
234,693 0.74 0.88 (c),(d) 1.33 31.9
181,273 0.85 0.92 (c),(d) 1.16 15.4
526,264 0.32 — 1.52 4.0
487,967 0.33 0.33 (c),(d) 1.67 20.2
401,459 0.34 0.34 (c),(d) 1.40 13.1
146,347 0.35 0.35 (c),(d) 1.68 31.9
94,846 0.38 0.38 (c),(d) 1.63 15.4
(a) Calculated based on average shares outstanding during the period.(b) Total return is calculated without the front-end sales charge or contingent deferred sales charge, if applicable.(c) Does not include expenses of the investment companies in which the Portfolio invests.(d) Excludes expense reimbursement from Manager and/or Distributor.
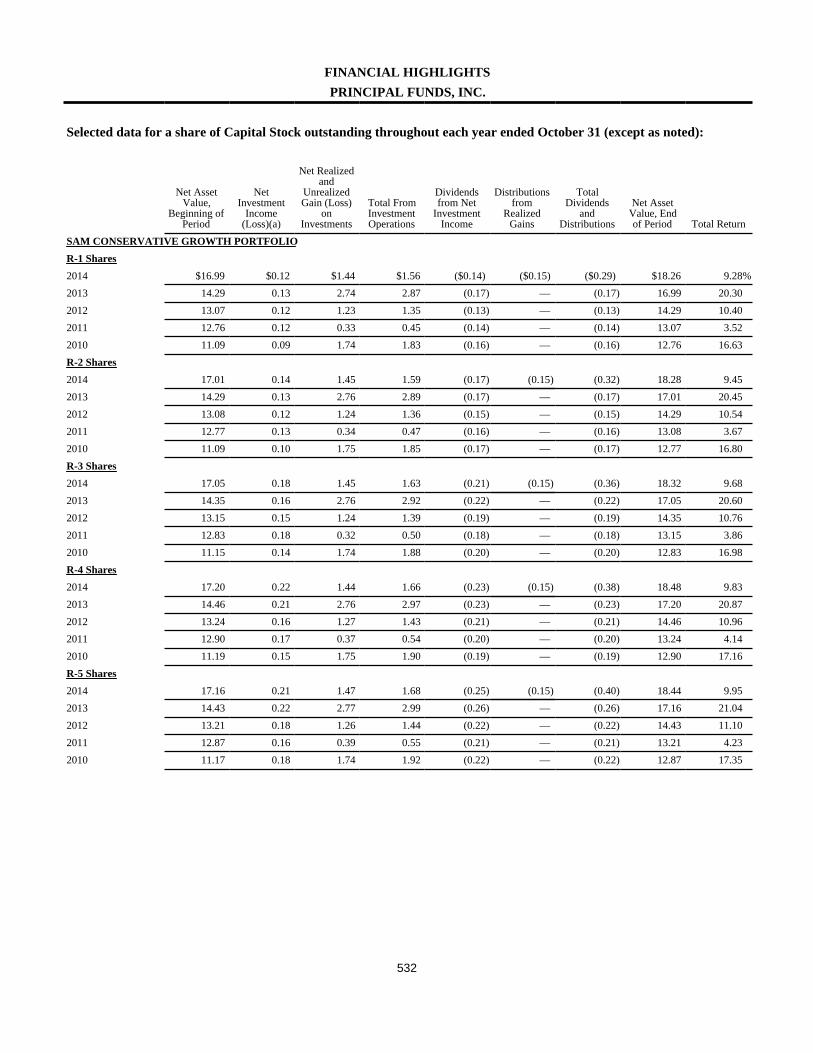
532
FINANCIAL HIGHLIGHTSPRINCIPAL FUNDS, INC.
Selected data for a share of Capital Stock outstanding throughout each year ended October 31 (except as noted):
Net AssetValue,
Beginning ofPeriod
NetInvestment
Income(Loss)(a)
Net Realizedand
UnrealizedGain (Loss)
onInvestments
Total FromInvestmentOperations
Dividendsfrom Net
InvestmentIncome
Distributionsfrom
RealizedGains
TotalDividends
andDistributions
Net AssetValue, Endof Period Total Return
SAM CONSERVATIVE GROWTH PORTFOLIOR-1 Shares2014 $16.99 $0.12 $1.44 $1.56 ($0.14) ($0.15) ($0.29) $18.26 9.28%2013 14.29 0.13 2.74 2.87 (0.17) — (0.17) 16.99 20.302012 13.07 0.12 1.23 1.35 (0.13) — (0.13) 14.29 10.402011 12.76 0.12 0.33 0.45 (0.14) — (0.14) 13.07 3.522010 11.09 0.09 1.74 1.83 (0.16) — (0.16) 12.76 16.63R-2 Shares2014 17.01 0.14 1.45 1.59 (0.17) (0.15) (0.32) 18.28 9.452013 14.29 0.13 2.76 2.89 (0.17) — (0.17) 17.01 20.452012 13.08 0.12 1.24 1.36 (0.15) — (0.15) 14.29 10.542011 12.77 0.13 0.34 0.47 (0.16) — (0.16) 13.08 3.672010 11.09 0.10 1.75 1.85 (0.17) — (0.17) 12.77 16.80R-3 Shares2014 17.05 0.18 1.45 1.63 (0.21) (0.15) (0.36) 18.32 9.682013 14.35 0.16 2.76 2.92 (0.22) — (0.22) 17.05 20.602012 13.15 0.15 1.24 1.39 (0.19) — (0.19) 14.35 10.762011 12.83 0.18 0.32 0.50 (0.18) — (0.18) 13.15 3.862010 11.15 0.14 1.74 1.88 (0.20) — (0.20) 12.83 16.98R-4 Shares2014 17.20 0.22 1.44 1.66 (0.23) (0.15) (0.38) 18.48 9.832013 14.46 0.21 2.76 2.97 (0.23) — (0.23) 17.20 20.872012 13.24 0.16 1.27 1.43 (0.21) — (0.21) 14.46 10.962011 12.90 0.17 0.37 0.54 (0.20) — (0.20) 13.24 4.142010 11.19 0.15 1.75 1.90 (0.19) — (0.19) 12.90 17.16R-5 Shares2014 17.16 0.21 1.47 1.68 (0.25) (0.15) (0.40) 18.44 9.952013 14.43 0.22 2.77 2.99 (0.26) — (0.26) 17.16 21.042012 13.21 0.18 1.26 1.44 (0.22) — (0.22) 14.43 11.102011 12.87 0.16 0.39 0.55 (0.21) — (0.21) 13.21 4.232010 11.17 0.18 1.74 1.92 (0.22) — (0.22) 12.87 17.35

533
FINANCIAL HIGHLIGHTS (CONTINUED)PRINCIPAL FUNDS, INC.
Net Assets, Endof Period (inthousands)
Ratio ofExpenses toAverage Net
Assets(c)
Ratio of GrossExpenses toAverage Net
Assets
Ratio of NetInvestmentIncome to
Average NetAssets
PortfolioTurnover Rate
$4,246 1.19% —% 0.68% 4.0%4,190 1.20 — 0.83 20.23,657 1.21 — 0.86 13.13,541 1.22 — 0.92 31.93,766 1.23 — 0.75 15.4
8,556 1.06 — 0.77 4.08,384 1.07 — 0.82 20.25,916 1.08 — 0.90 13.15,411 1.09 — 0.99 31.95,194 1.10 — 0.82 15.4
26,537 0.88 — 1.02 4.026,667 0.89 — 1.01 20.217,863 0.90 — 1.06 13.112,199 0.91 — 1.36 31.910,094 0.92 — 1.14 15.4
24,177 0.69 — 1.21 4.021,406 0.70 — 1.31 20.215,442 0.71 — 1.15 13.110,662 0.72 — 1.29 31.97,704 0.73 — 1.23 15.4
84,381 0.57 — 1.17 4.067,284 0.58 — 1.37 20.247,638 0.59 — 1.32 13.131,447 0.60 — 1.18 31.912,668 0.61 — 1.47 15.4
(a) Calculated based on average shares outstanding during the period.(b) Total return is calculated without the front-end sales charge or contingent deferred sales charge, if applicable.(c) Does not include expenses of the investment companies in which the Portfolio invests.(d) Excludes expense reimbursement from Manager and/or Distributor.
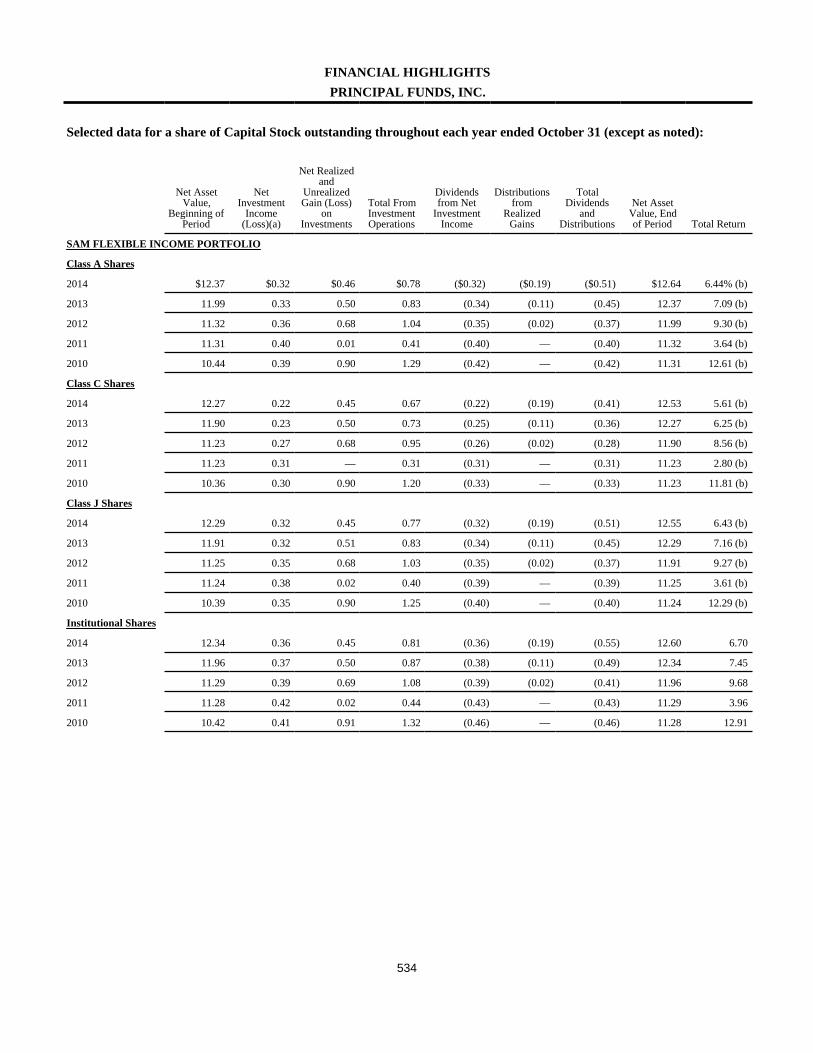
534
FINANCIAL HIGHLIGHTSPRINCIPAL FUNDS, INC.
Selected data for a share of Capital Stock outstanding throughout each year ended October 31 (except as noted):
Net AssetValue,
Beginning ofPeriod
NetInvestment
Income(Loss)(a)
Net Realizedand
UnrealizedGain (Loss)
onInvestments
Total FromInvestmentOperations
Dividendsfrom Net
InvestmentIncome
Distributionsfrom
RealizedGains
TotalDividends
andDistributions
Net AssetValue, Endof Period Total Return
SAM FLEXIBLE INCOME PORTFOLIO
Class A Shares
2014 $12.37 $0.32 $0.46 $0.78 ($0.32) ($0.19) ($0.51) $12.64 6.44% (b)
2013 11.99 0.33 0.50 0.83 (0.34) (0.11) (0.45) 12.37 7.09 (b)
2012 11.32 0.36 0.68 1.04 (0.35) (0.02) (0.37) 11.99 9.30 (b)
2011 11.31 0.40 0.01 0.41 (0.40) — (0.40) 11.32 3.64 (b)
2010 10.44 0.39 0.90 1.29 (0.42) — (0.42) 11.31 12.61 (b)
Class C Shares
2014 12.27 0.22 0.45 0.67 (0.22) (0.19) (0.41) 12.53 5.61 (b)
2013 11.90 0.23 0.50 0.73 (0.25) (0.11) (0.36) 12.27 6.25 (b)
2012 11.23 0.27 0.68 0.95 (0.26) (0.02) (0.28) 11.90 8.56 (b)
2011 11.23 0.31 — 0.31 (0.31) — (0.31) 11.23 2.80 (b)
2010 10.36 0.30 0.90 1.20 (0.33) — (0.33) 11.23 11.81 (b)
Class J Shares
2014 12.29 0.32 0.45 0.77 (0.32) (0.19) (0.51) 12.55 6.43 (b)
2013 11.91 0.32 0.51 0.83 (0.34) (0.11) (0.45) 12.29 7.16 (b)
2012 11.25 0.35 0.68 1.03 (0.35) (0.02) (0.37) 11.91 9.27 (b)
2011 11.24 0.38 0.02 0.40 (0.39) — (0.39) 11.25 3.61 (b)
2010 10.39 0.35 0.90 1.25 (0.40) — (0.40) 11.24 12.29 (b)
Institutional Shares
2014 12.34 0.36 0.45 0.81 (0.36) (0.19) (0.55) 12.60 6.70
2013 11.96 0.37 0.50 0.87 (0.38) (0.11) (0.49) 12.34 7.45
2012 11.29 0.39 0.69 1.08 (0.39) (0.02) (0.41) 11.96 9.68
2011 11.28 0.42 0.02 0.44 (0.43) — (0.43) 11.29 3.96
2010 10.42 0.41 0.91 1.32 (0.46) — (0.46) 11.28 12.91

535
FINANCIAL HIGHLIGHTS (CONTINUED)PRINCIPAL FUNDS, INC.
Net Assets, Endof Period (inthousands)
Ratio ofExpenses toAverage Net
Assets(c)
Ratio of GrossExpenses toAverage Net
Assets
Ratio of NetInvestmentIncome to
Average NetAssets
PortfolioTurnover Rate
$793,238 0.64% —% 2.57% 2.2%
718,931 0.66 — 2.71 10.5
612,795 0.69 — 3.08 5.5
521,730 0.69 — 3.48 19.6
461,662 0.70 — 3.56 9.5
311,494 1.40 — 1.79 2.2
259,444 1.42 — 1.95 10.5
224,627 1.44 — 2.33 5.5
188,596 1.44 — 2.74 19.6
193,584 1.45 — 2.81 9.5
723,517 0.61 0.65 (c),(d) 2.57 2.2
589,349 0.64 0.84 (c),(d) 2.69 10.5
423,411 0.69 0.89 (c),(d) 3.05 5.5
272,865 0.75 0.89 (c),(d) 3.37 19.6
151,199 0.90 0.98 (c),(d) 3.25 9.5
180,049 0.32 — 2.89 2.2
174,501 0.34 0.34 (c),(d) 3.05 10.5
168,309 0.36 0.36 (c),(d) 3.30 5.5
58,782 0.39 0.39 (c),(d) 3.71 19.6
37,271 0.40 0.43 (c),(d) 3.79 9.5
(a) Calculated based on average shares outstanding during the period.(b) Total return is calculated without the front-end sales charge or contingent deferred sales charge, if applicable.(c) Does not include expenses of the investment companies in which the Portfolio invests.(d) Excludes expense reimbursement from Manager and/or Distributor.
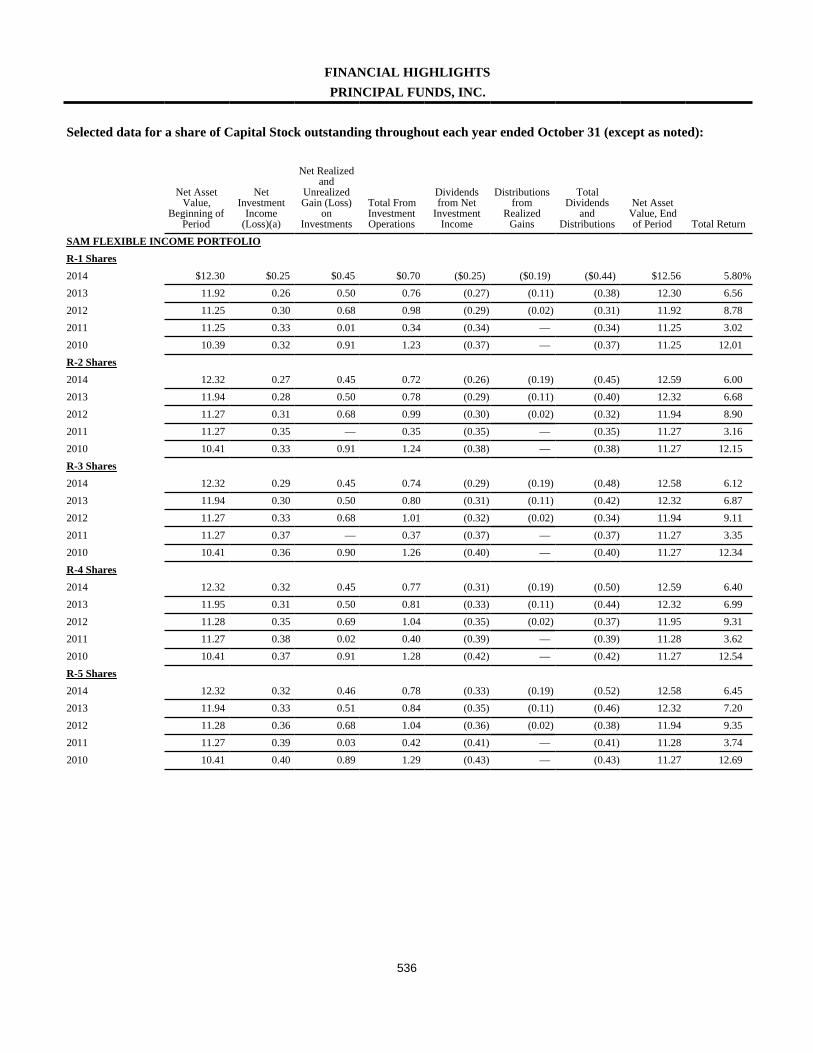
536
FINANCIAL HIGHLIGHTSPRINCIPAL FUNDS, INC.
Selected data for a share of Capital Stock outstanding throughout each year ended October 31 (except as noted):
Net AssetValue,
Beginning ofPeriod
NetInvestment
Income(Loss)(a)
Net Realizedand
UnrealizedGain (Loss)
onInvestments
Total FromInvestmentOperations
Dividendsfrom Net
InvestmentIncome
Distributionsfrom
RealizedGains
TotalDividends
andDistributions
Net AssetValue, Endof Period Total Return
SAM FLEXIBLE INCOME PORTFOLIOR-1 Shares2014 $12.30 $0.25 $0.45 $0.70 ($0.25) ($0.19) ($0.44) $12.56 5.80%2013 11.92 0.26 0.50 0.76 (0.27) (0.11) (0.38) 12.30 6.562012 11.25 0.30 0.68 0.98 (0.29) (0.02) (0.31) 11.92 8.782011 11.25 0.33 0.01 0.34 (0.34) — (0.34) 11.25 3.022010 10.39 0.32 0.91 1.23 (0.37) — (0.37) 11.25 12.01R-2 Shares2014 12.32 0.27 0.45 0.72 (0.26) (0.19) (0.45) 12.59 6.002013 11.94 0.28 0.50 0.78 (0.29) (0.11) (0.40) 12.32 6.682012 11.27 0.31 0.68 0.99 (0.30) (0.02) (0.32) 11.94 8.902011 11.27 0.35 — 0.35 (0.35) — (0.35) 11.27 3.162010 10.41 0.33 0.91 1.24 (0.38) — (0.38) 11.27 12.15R-3 Shares2014 12.32 0.29 0.45 0.74 (0.29) (0.19) (0.48) 12.58 6.122013 11.94 0.30 0.50 0.80 (0.31) (0.11) (0.42) 12.32 6.872012 11.27 0.33 0.68 1.01 (0.32) (0.02) (0.34) 11.94 9.112011 11.27 0.37 — 0.37 (0.37) — (0.37) 11.27 3.352010 10.41 0.36 0.90 1.26 (0.40) — (0.40) 11.27 12.34R-4 Shares2014 12.32 0.32 0.45 0.77 (0.31) (0.19) (0.50) 12.59 6.402013 11.95 0.31 0.50 0.81 (0.33) (0.11) (0.44) 12.32 6.992012 11.28 0.35 0.69 1.04 (0.35) (0.02) (0.37) 11.95 9.312011 11.27 0.38 0.02 0.40 (0.39) — (0.39) 11.28 3.622010 10.41 0.37 0.91 1.28 (0.42) — (0.42) 11.27 12.54R-5 Shares2014 12.32 0.32 0.46 0.78 (0.33) (0.19) (0.52) 12.58 6.452013 11.94 0.33 0.51 0.84 (0.35) (0.11) (0.46) 12.32 7.202012 11.28 0.36 0.68 1.04 (0.36) (0.02) (0.38) 11.94 9.352011 11.27 0.39 0.03 0.42 (0.41) — (0.41) 11.28 3.742010 10.41 0.40 0.89 1.29 (0.43) — (0.43) 11.27 12.69

537
FINANCIAL HIGHLIGHTS (CONTINUED)PRINCIPAL FUNDS, INC.
Net Assets, Endof Period (inthousands)
Ratio ofExpenses toAverage Net
Assets(c)
Ratio of GrossExpenses toAverage Net
Assets
Ratio of NetInvestmentIncome to
Average NetAssets
PortfolioTurnover Rate
$741 1.19% —% 2.05% 2.2%1,044 1.20 — 2.16 10.5
820 1.21 — 2.58 5.5801 1.22 — 2.95 19.6908 1.23 — 2.97 9.5
1,139 1.06 — 2.16 2.21,682 1.07 — 2.31 10.51,767 1.08 — 2.67 5.51,312 1.09 — 3.04 19.6
955 1.10 — 3.05 9.5
10,483 0.88 — 2.36 2.210,544 0.89 — 2.47 10.58,821 0.90 — 2.85 5.56,181 0.91 — 3.30 19.65,283 0.92 — 3.31 9.5
12,062 0.69 — 2.55 2.212,416 0.70 — 2.55 10.56,962 0.71 — 3.01 5.54,365 0.72 — 3.37 19.62,535 0.73 — 3.40 9.5
20,815 0.57 — 2.61 2.217,297 0.58 — 2.77 10.512,966 0.59 — 3.08 5.54,862 0.60 — 3.47 19.63,039 0.61 — 3.68 9.5
(a) Calculated based on average shares outstanding during the period.(b) Total return is calculated without the front-end sales charge or contingent deferred sales charge, if applicable.(c) Does not include expenses of the investment companies in which the Portfolio invests.(d) Excludes expense reimbursement from Manager and/or Distributor.
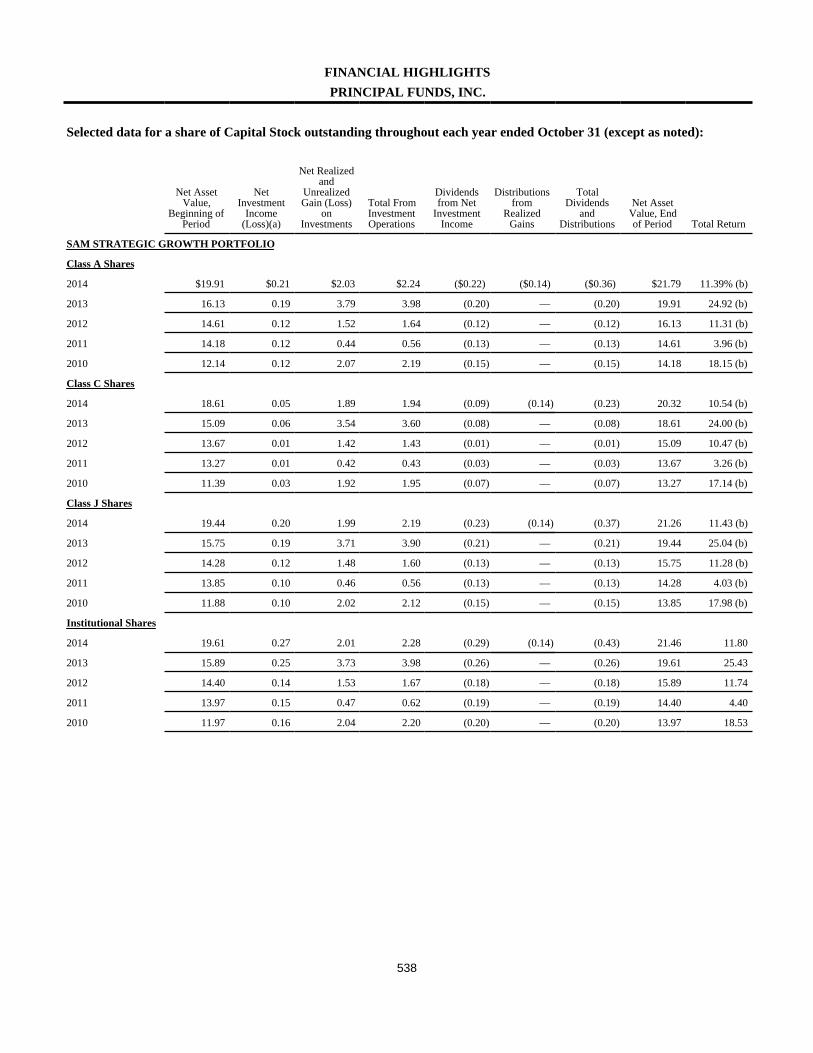
538
FINANCIAL HIGHLIGHTSPRINCIPAL FUNDS, INC.
Selected data for a share of Capital Stock outstanding throughout each year ended October 31 (except as noted):
Net AssetValue,
Beginning ofPeriod
NetInvestment
Income(Loss)(a)
Net Realizedand
UnrealizedGain (Loss)
onInvestments
Total FromInvestmentOperations
Dividendsfrom Net
InvestmentIncome
Distributionsfrom
RealizedGains
TotalDividends
andDistributions
Net AssetValue, Endof Period Total Return
SAM STRATEGIC GROWTH PORTFOLIO
Class A Shares
2014 $19.91 $0.21 $2.03 $2.24 ($0.22) ($0.14) ($0.36) $21.79 11.39% (b)
2013 16.13 0.19 3.79 3.98 (0.20) — (0.20) 19.91 24.92 (b)
2012 14.61 0.12 1.52 1.64 (0.12) — (0.12) 16.13 11.31 (b)
2011 14.18 0.12 0.44 0.56 (0.13) — (0.13) 14.61 3.96 (b)
2010 12.14 0.12 2.07 2.19 (0.15) — (0.15) 14.18 18.15 (b)
Class C Shares
2014 18.61 0.05 1.89 1.94 (0.09) (0.14) (0.23) 20.32 10.54 (b)
2013 15.09 0.06 3.54 3.60 (0.08) — (0.08) 18.61 24.00 (b)
2012 13.67 0.01 1.42 1.43 (0.01) — (0.01) 15.09 10.47 (b)
2011 13.27 0.01 0.42 0.43 (0.03) — (0.03) 13.67 3.26 (b)
2010 11.39 0.03 1.92 1.95 (0.07) — (0.07) 13.27 17.14 (b)
Class J Shares
2014 19.44 0.20 1.99 2.19 (0.23) (0.14) (0.37) 21.26 11.43 (b)
2013 15.75 0.19 3.71 3.90 (0.21) — (0.21) 19.44 25.04 (b)
2012 14.28 0.12 1.48 1.60 (0.13) — (0.13) 15.75 11.28 (b)
2011 13.85 0.10 0.46 0.56 (0.13) — (0.13) 14.28 4.03 (b)
2010 11.88 0.10 2.02 2.12 (0.15) — (0.15) 13.85 17.98 (b)
Institutional Shares
2014 19.61 0.27 2.01 2.28 (0.29) (0.14) (0.43) 21.46 11.80
2013 15.89 0.25 3.73 3.98 (0.26) — (0.26) 19.61 25.43
2012 14.40 0.14 1.53 1.67 (0.18) — (0.18) 15.89 11.74
2011 13.97 0.15 0.47 0.62 (0.19) — (0.19) 14.40 4.40
2010 11.97 0.16 2.04 2.20 (0.20) — (0.20) 13.97 18.53
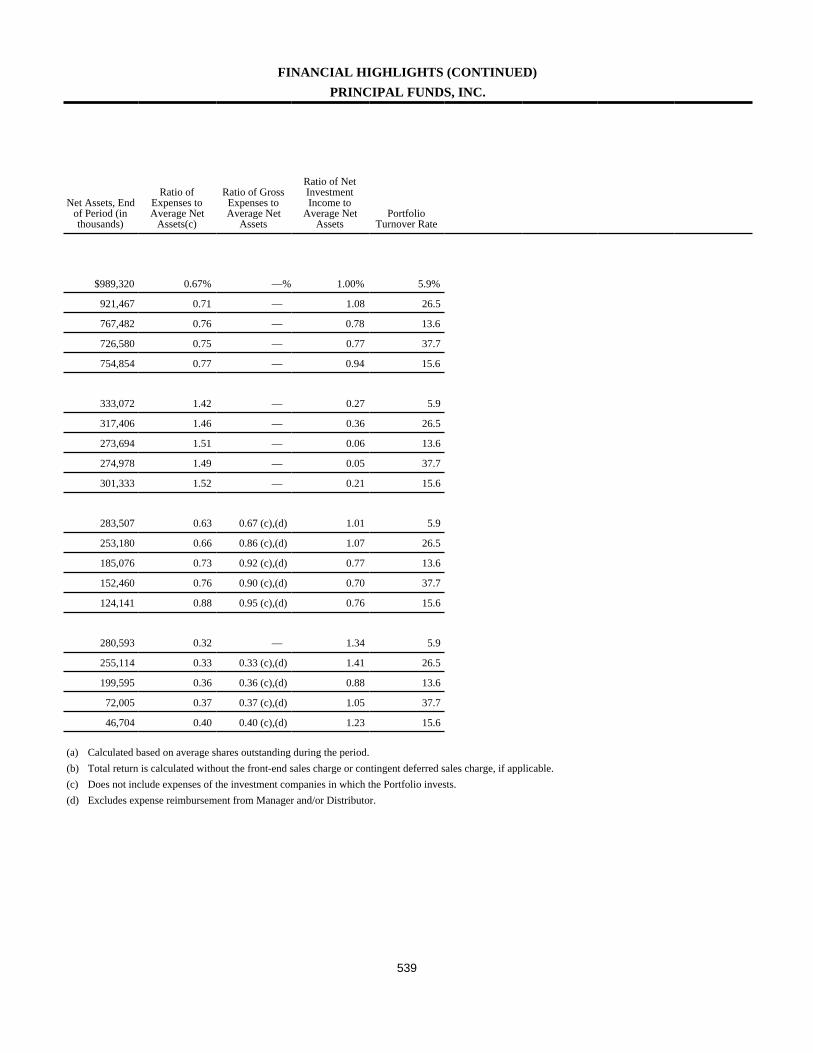
539
FINANCIAL HIGHLIGHTS (CONTINUED)PRINCIPAL FUNDS, INC.
Net Assets, Endof Period (inthousands)
Ratio ofExpenses toAverage Net
Assets(c)
Ratio of GrossExpenses toAverage Net
Assets
Ratio of NetInvestmentIncome to
Average NetAssets
PortfolioTurnover Rate
$989,320 0.67% —% 1.00% 5.9%
921,467 0.71 — 1.08 26.5
767,482 0.76 — 0.78 13.6
726,580 0.75 — 0.77 37.7
754,854 0.77 — 0.94 15.6
333,072 1.42 — 0.27 5.9
317,406 1.46 — 0.36 26.5
273,694 1.51 — 0.06 13.6
274,978 1.49 — 0.05 37.7
301,333 1.52 — 0.21 15.6
283,507 0.63 0.67 (c),(d) 1.01 5.9
253,180 0.66 0.86 (c),(d) 1.07 26.5
185,076 0.73 0.92 (c),(d) 0.77 13.6
152,460 0.76 0.90 (c),(d) 0.70 37.7
124,141 0.88 0.95 (c),(d) 0.76 15.6
280,593 0.32 — 1.34 5.9
255,114 0.33 0.33 (c),(d) 1.41 26.5
199,595 0.36 0.36 (c),(d) 0.88 13.6
72,005 0.37 0.37 (c),(d) 1.05 37.7
46,704 0.40 0.40 (c),(d) 1.23 15.6
(a) Calculated based on average shares outstanding during the period.(b) Total return is calculated without the front-end sales charge or contingent deferred sales charge, if applicable.(c) Does not include expenses of the investment companies in which the Portfolio invests.(d) Excludes expense reimbursement from Manager and/or Distributor.
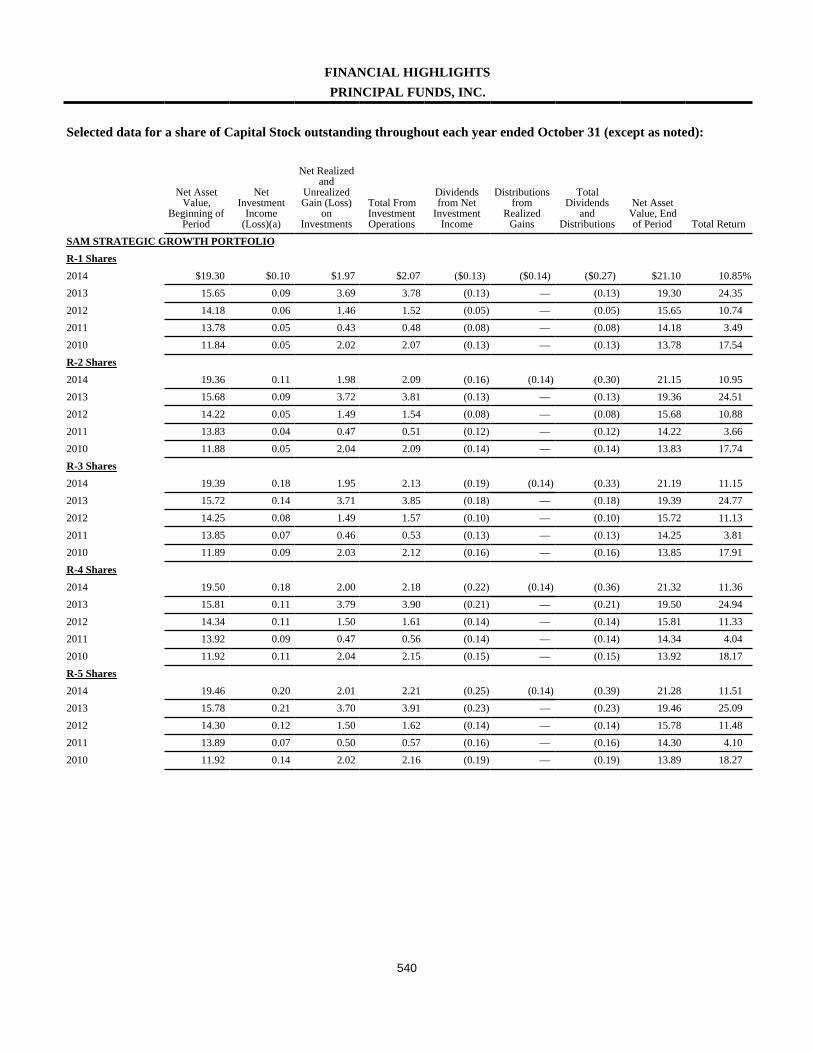
540
FINANCIAL HIGHLIGHTSPRINCIPAL FUNDS, INC.
Selected data for a share of Capital Stock outstanding throughout each year ended October 31 (except as noted):
Net AssetValue,
Beginning ofPeriod
NetInvestment
Income(Loss)(a)
Net Realizedand
UnrealizedGain (Loss)
onInvestments
Total FromInvestmentOperations
Dividendsfrom Net
InvestmentIncome
Distributionsfrom
RealizedGains
TotalDividends
andDistributions
Net AssetValue, Endof Period Total Return
SAM STRATEGIC GROWTH PORTFOLIOR-1 Shares2014 $19.30 $0.10 $1.97 $2.07 ($0.13) ($0.14) ($0.27) $21.10 10.85%2013 15.65 0.09 3.69 3.78 (0.13) — (0.13) 19.30 24.352012 14.18 0.06 1.46 1.52 (0.05) — (0.05) 15.65 10.742011 13.78 0.05 0.43 0.48 (0.08) — (0.08) 14.18 3.492010 11.84 0.05 2.02 2.07 (0.13) — (0.13) 13.78 17.54R-2 Shares2014 19.36 0.11 1.98 2.09 (0.16) (0.14) (0.30) 21.15 10.952013 15.68 0.09 3.72 3.81 (0.13) — (0.13) 19.36 24.512012 14.22 0.05 1.49 1.54 (0.08) — (0.08) 15.68 10.882011 13.83 0.04 0.47 0.51 (0.12) — (0.12) 14.22 3.662010 11.88 0.05 2.04 2.09 (0.14) — (0.14) 13.83 17.74R-3 Shares2014 19.39 0.18 1.95 2.13 (0.19) (0.14) (0.33) 21.19 11.152013 15.72 0.14 3.71 3.85 (0.18) — (0.18) 19.39 24.772012 14.25 0.08 1.49 1.57 (0.10) — (0.10) 15.72 11.132011 13.85 0.07 0.46 0.53 (0.13) — (0.13) 14.25 3.812010 11.89 0.09 2.03 2.12 (0.16) — (0.16) 13.85 17.91R-4 Shares2014 19.50 0.18 2.00 2.18 (0.22) (0.14) (0.36) 21.32 11.362013 15.81 0.11 3.79 3.90 (0.21) — (0.21) 19.50 24.942012 14.34 0.11 1.50 1.61 (0.14) — (0.14) 15.81 11.332011 13.92 0.09 0.47 0.56 (0.14) — (0.14) 14.34 4.042010 11.92 0.11 2.04 2.15 (0.15) — (0.15) 13.92 18.17R-5 Shares2014 19.46 0.20 2.01 2.21 (0.25) (0.14) (0.39) 21.28 11.512013 15.78 0.21 3.70 3.91 (0.23) — (0.23) 19.46 25.092012 14.30 0.12 1.50 1.62 (0.14) — (0.14) 15.78 11.482011 13.89 0.07 0.50 0.57 (0.16) — (0.16) 14.30 4.102010 11.92 0.14 2.02 2.16 (0.19) — (0.19) 13.89 18.27

541
FINANCIAL HIGHLIGHTS (CONTINUED)PRINCIPAL FUNDS, INC.
Net Assets, Endof Period (inthousands)
Ratio ofExpenses toAverage Net
Assets(c)
Ratio of GrossExpenses toAverage Net
Assets
Ratio of NetInvestmentIncome to
Average NetAssets
PortfolioTurnover Rate
$4,253 1.19% —% 0.47% 5.9%4,215 1.20 — 0.52 26.52,904 1.22 — 0.41 13.63,184 1.22 — 0.34 37.73,515 1.23 — 0.41 15.6
4,779 1.06 — 0.55 5.94,290 1.07 — 0.54 26.52,597 1.09 — 0.31 13.62,097 1.09 — 0.25 37.71,449 1.10 — 0.42 15.6
17,809 0.88 — 0.90 5.919,357 0.89 — 0.79 26.513,780 0.91 — 0.56 13.69,964 0.91 — 0.48 37.76,761 0.92 — 0.72 15.6
20,035 0.69 — 0.90 5.915,061 0.70 — 0.63 26.56,644 0.72 — 0.70 13.64,660 0.72 — 0.63 37.72,638 0.73 — 0.85 15.6
34,618 0.57 — 1.00 5.927,490 0.58 — 1.17 26.518,765 0.60 — 0.81 13.612,656 0.60 — 0.51 37.74,517 0.61 — 1.11 15.6
(a) Calculated based on average shares outstanding during the period.(b) Total return is calculated without the front-end sales charge or contingent deferred sales charge, if applicable.(c) Does not include expenses of the investment companies in which the Portfolio invests.(d) Excludes expense reimbursement from Manager and/or Distributor.
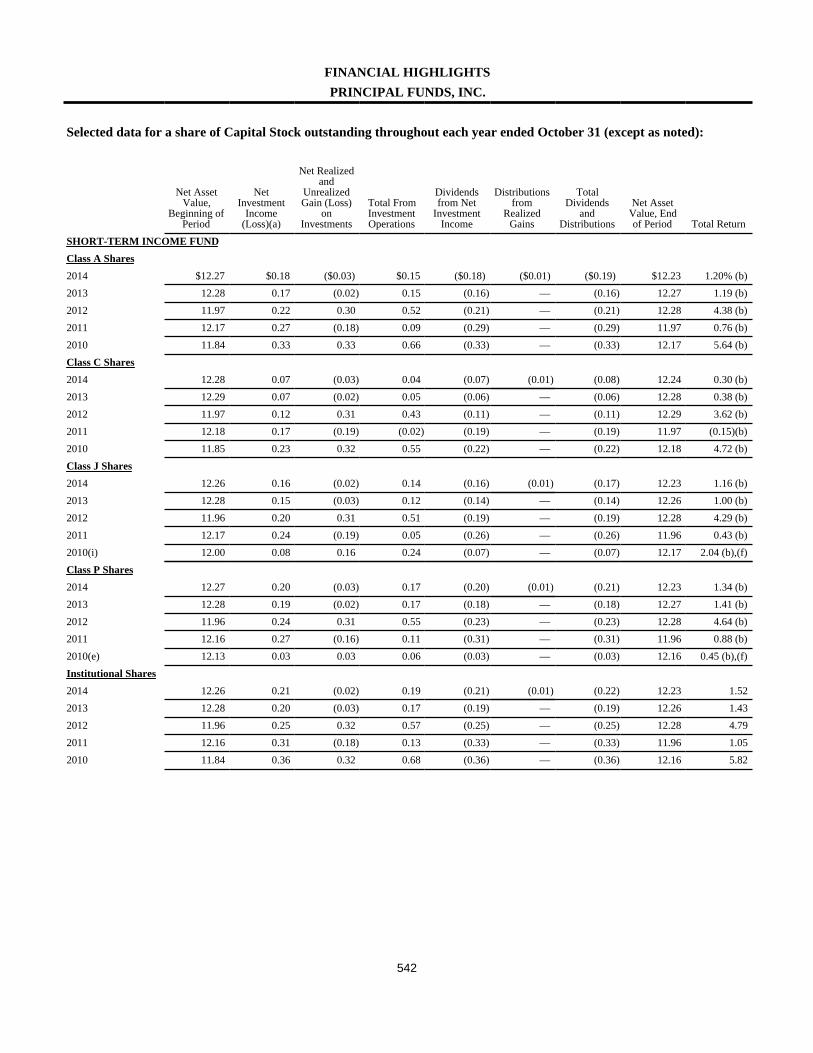
542
FINANCIAL HIGHLIGHTSPRINCIPAL FUNDS, INC.
Selected data for a share of Capital Stock outstanding throughout each year ended October 31 (except as noted):
Net AssetValue,
Beginning ofPeriod
NetInvestment
Income(Loss)(a)
Net Realizedand
UnrealizedGain (Loss)
onInvestments
Total FromInvestmentOperations
Dividendsfrom Net
InvestmentIncome
Distributionsfrom
RealizedGains
TotalDividends
andDistributions
Net AssetValue, Endof Period Total Return
SHORT-TERM INCOME FUNDClass A Shares2014 $12.27 $0.18 ($0.03) $0.15 ($0.18) ($0.01) ($0.19) $12.23 1.20% (b)2013 12.28 0.17 (0.02) 0.15 (0.16) — (0.16) 12.27 1.19 (b)2012 11.97 0.22 0.30 0.52 (0.21) — (0.21) 12.28 4.38 (b)2011 12.17 0.27 (0.18) 0.09 (0.29) — (0.29) 11.97 0.76 (b)2010 11.84 0.33 0.33 0.66 (0.33) — (0.33) 12.17 5.64 (b)Class C Shares2014 12.28 0.07 (0.03) 0.04 (0.07) (0.01) (0.08) 12.24 0.30 (b)2013 12.29 0.07 (0.02) 0.05 (0.06) — (0.06) 12.28 0.38 (b)2012 11.97 0.12 0.31 0.43 (0.11) — (0.11) 12.29 3.62 (b)2011 12.18 0.17 (0.19) (0.02) (0.19) — (0.19) 11.97 (0.15)(b)2010 11.85 0.23 0.32 0.55 (0.22) — (0.22) 12.18 4.72 (b)Class J Shares2014 12.26 0.16 (0.02) 0.14 (0.16) (0.01) (0.17) 12.23 1.16 (b)2013 12.28 0.15 (0.03) 0.12 (0.14) — (0.14) 12.26 1.00 (b)2012 11.96 0.20 0.31 0.51 (0.19) — (0.19) 12.28 4.29 (b)2011 12.17 0.24 (0.19) 0.05 (0.26) — (0.26) 11.96 0.43 (b)2010(i) 12.00 0.08 0.16 0.24 (0.07) — (0.07) 12.17 2.04 (b),(f)Class P Shares2014 12.27 0.20 (0.03) 0.17 (0.20) (0.01) (0.21) 12.23 1.34 (b)2013 12.28 0.19 (0.02) 0.17 (0.18) — (0.18) 12.27 1.41 (b)2012 11.96 0.24 0.31 0.55 (0.23) — (0.23) 12.28 4.64 (b)2011 12.16 0.27 (0.16) 0.11 (0.31) — (0.31) 11.96 0.88 (b)2010(e) 12.13 0.03 0.03 0.06 (0.03) — (0.03) 12.16 0.45 (b),(f)Institutional Shares2014 12.26 0.21 (0.02) 0.19 (0.21) (0.01) (0.22) 12.23 1.522013 12.28 0.20 (0.03) 0.17 (0.19) — (0.19) 12.26 1.432012 11.96 0.25 0.32 0.57 (0.25) — (0.25) 12.28 4.792011 12.16 0.31 (0.18) 0.13 (0.33) — (0.33) 11.96 1.052010 11.84 0.36 0.32 0.68 (0.36) — (0.36) 12.16 5.82
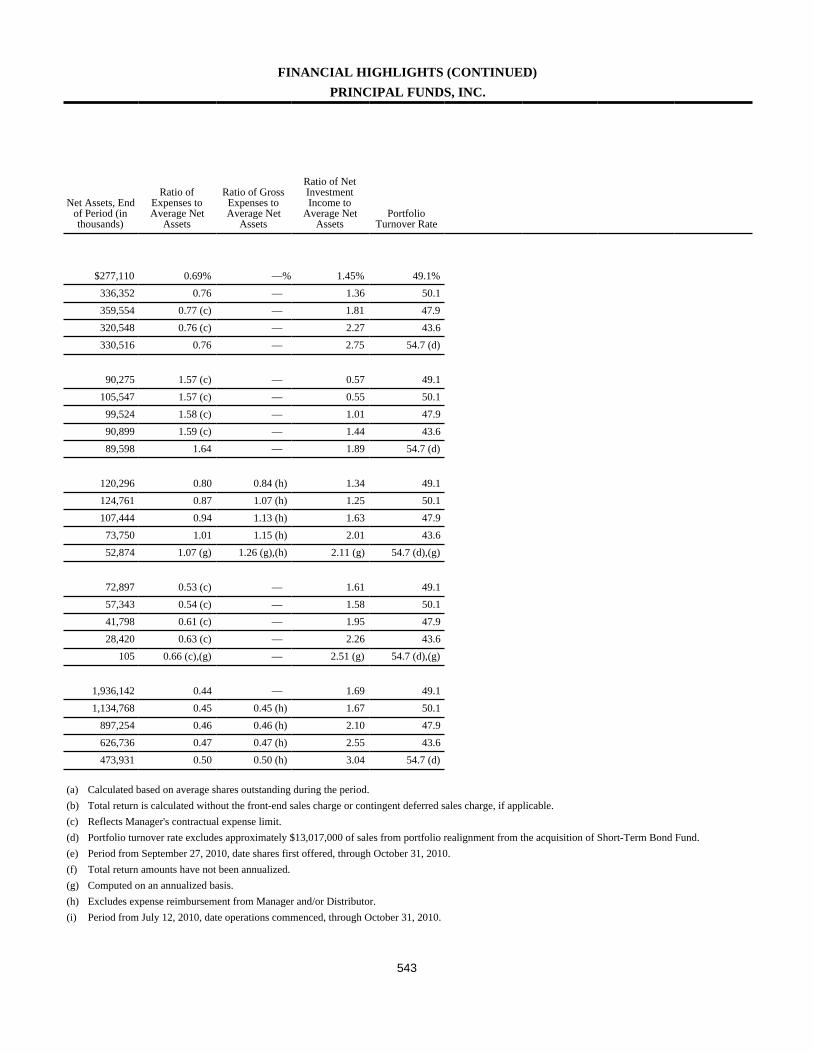
543
FINANCIAL HIGHLIGHTS (CONTINUED)PRINCIPAL FUNDS, INC.
Net Assets, Endof Period (inthousands)
Ratio ofExpenses toAverage Net
Assets
Ratio of GrossExpenses toAverage Net
Assets
Ratio of NetInvestmentIncome to
Average NetAssets
PortfolioTurnover Rate
$277,110 0.69% —% 1.45% 49.1%336,352 0.76 — 1.36 50.1359,554 0.77 (c) — 1.81 47.9320,548 0.76 (c) — 2.27 43.6330,516 0.76 — 2.75 54.7 (d)
90,275 1.57 (c) — 0.57 49.1105,547 1.57 (c) — 0.55 50.1
99,524 1.58 (c) — 1.01 47.990,899 1.59 (c) — 1.44 43.689,598 1.64 — 1.89 54.7 (d)
120,296 0.80 0.84 (h) 1.34 49.1124,761 0.87 1.07 (h) 1.25 50.1107,444 0.94 1.13 (h) 1.63 47.9
73,750 1.01 1.15 (h) 2.01 43.652,874 1.07 (g) 1.26 (g),(h) 2.11 (g) 54.7 (d),(g)
72,897 0.53 (c) — 1.61 49.157,343 0.54 (c) — 1.58 50.141,798 0.61 (c) — 1.95 47.928,420 0.63 (c) — 2.26 43.6
105 0.66 (c),(g) — 2.51 (g) 54.7 (d),(g)
1,936,142 0.44 — 1.69 49.11,134,768 0.45 0.45 (h) 1.67 50.1
897,254 0.46 0.46 (h) 2.10 47.9626,736 0.47 0.47 (h) 2.55 43.6473,931 0.50 0.50 (h) 3.04 54.7 (d)
(a) Calculated based on average shares outstanding during the period.(b) Total return is calculated without the front-end sales charge or contingent deferred sales charge, if applicable.(c) Reflects Manager's contractual expense limit.(d) Portfolio turnover rate excludes approximately $13,017,000 of sales from portfolio realignment from the acquisition of Short-Term Bond Fund.(e) Period from September 27, 2010, date shares first offered, through October 31, 2010.(f) Total return amounts have not been annualized.(g) Computed on an annualized basis.(h) Excludes expense reimbursement from Manager and/or Distributor.(i) Period from July 12, 2010, date operations commenced, through October 31, 2010.
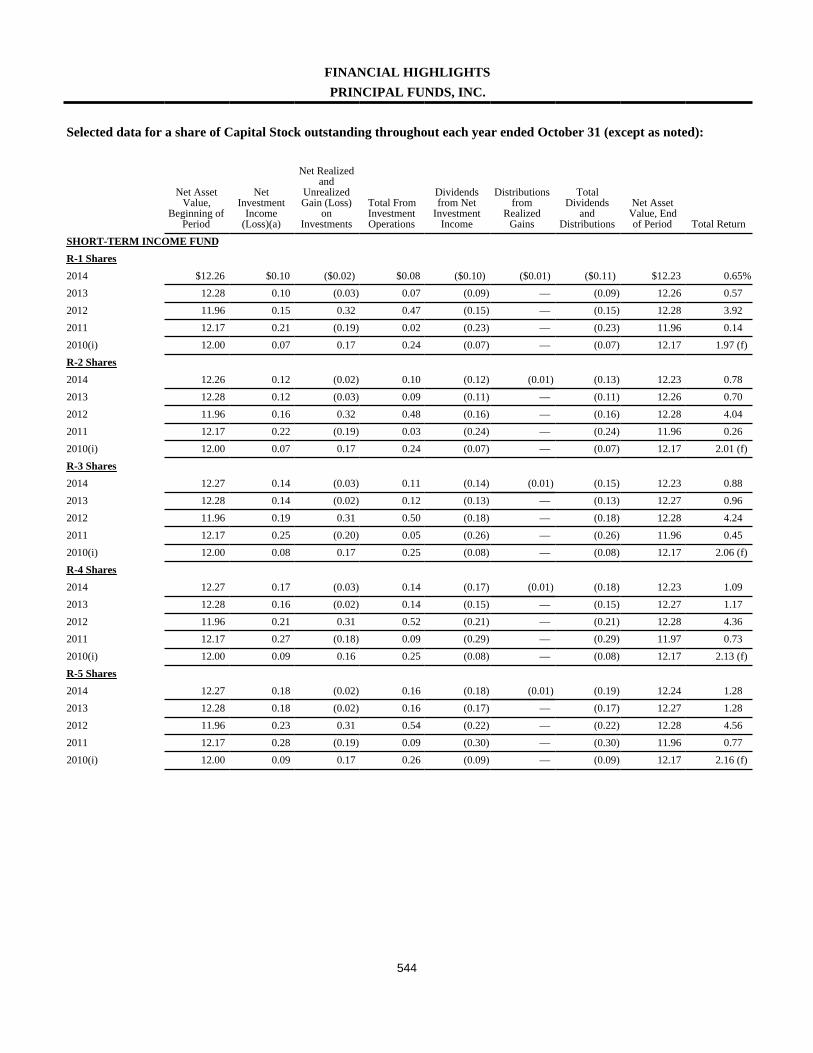
544
FINANCIAL HIGHLIGHTSPRINCIPAL FUNDS, INC.
Selected data for a share of Capital Stock outstanding throughout each year ended October 31 (except as noted):
Net AssetValue,
Beginning ofPeriod
NetInvestment
Income(Loss)(a)
Net Realizedand
UnrealizedGain (Loss)
onInvestments
Total FromInvestmentOperations
Dividendsfrom Net
InvestmentIncome
Distributionsfrom
RealizedGains
TotalDividends
andDistributions
Net AssetValue, Endof Period Total Return
SHORT-TERM INCOME FUNDR-1 Shares2014 $12.26 $0.10 ($0.02) $0.08 ($0.10) ($0.01) ($0.11) $12.23 0.65%2013 12.28 0.10 (0.03) 0.07 (0.09) — (0.09) 12.26 0.572012 11.96 0.15 0.32 0.47 (0.15) — (0.15) 12.28 3.922011 12.17 0.21 (0.19) 0.02 (0.23) — (0.23) 11.96 0.142010(i) 12.00 0.07 0.17 0.24 (0.07) — (0.07) 12.17 1.97 (f)R-2 Shares2014 12.26 0.12 (0.02) 0.10 (0.12) (0.01) (0.13) 12.23 0.782013 12.28 0.12 (0.03) 0.09 (0.11) — (0.11) 12.26 0.702012 11.96 0.16 0.32 0.48 (0.16) — (0.16) 12.28 4.042011 12.17 0.22 (0.19) 0.03 (0.24) — (0.24) 11.96 0.262010(i) 12.00 0.07 0.17 0.24 (0.07) — (0.07) 12.17 2.01 (f)R-3 Shares2014 12.27 0.14 (0.03) 0.11 (0.14) (0.01) (0.15) 12.23 0.882013 12.28 0.14 (0.02) 0.12 (0.13) — (0.13) 12.27 0.962012 11.96 0.19 0.31 0.50 (0.18) — (0.18) 12.28 4.242011 12.17 0.25 (0.20) 0.05 (0.26) — (0.26) 11.96 0.452010(i) 12.00 0.08 0.17 0.25 (0.08) — (0.08) 12.17 2.06 (f)R-4 Shares2014 12.27 0.17 (0.03) 0.14 (0.17) (0.01) (0.18) 12.23 1.092013 12.28 0.16 (0.02) 0.14 (0.15) — (0.15) 12.27 1.172012 11.96 0.21 0.31 0.52 (0.21) — (0.21) 12.28 4.362011 12.17 0.27 (0.18) 0.09 (0.29) — (0.29) 11.97 0.732010(i) 12.00 0.09 0.16 0.25 (0.08) — (0.08) 12.17 2.13 (f)R-5 Shares2014 12.27 0.18 (0.02) 0.16 (0.18) (0.01) (0.19) 12.24 1.282013 12.28 0.18 (0.02) 0.16 (0.17) — (0.17) 12.27 1.282012 11.96 0.23 0.31 0.54 (0.22) — (0.22) 12.28 4.562011 12.17 0.28 (0.19) 0.09 (0.30) — (0.30) 11.96 0.772010(i) 12.00 0.09 0.17 0.26 (0.09) — (0.09) 12.17 2.16 (f)
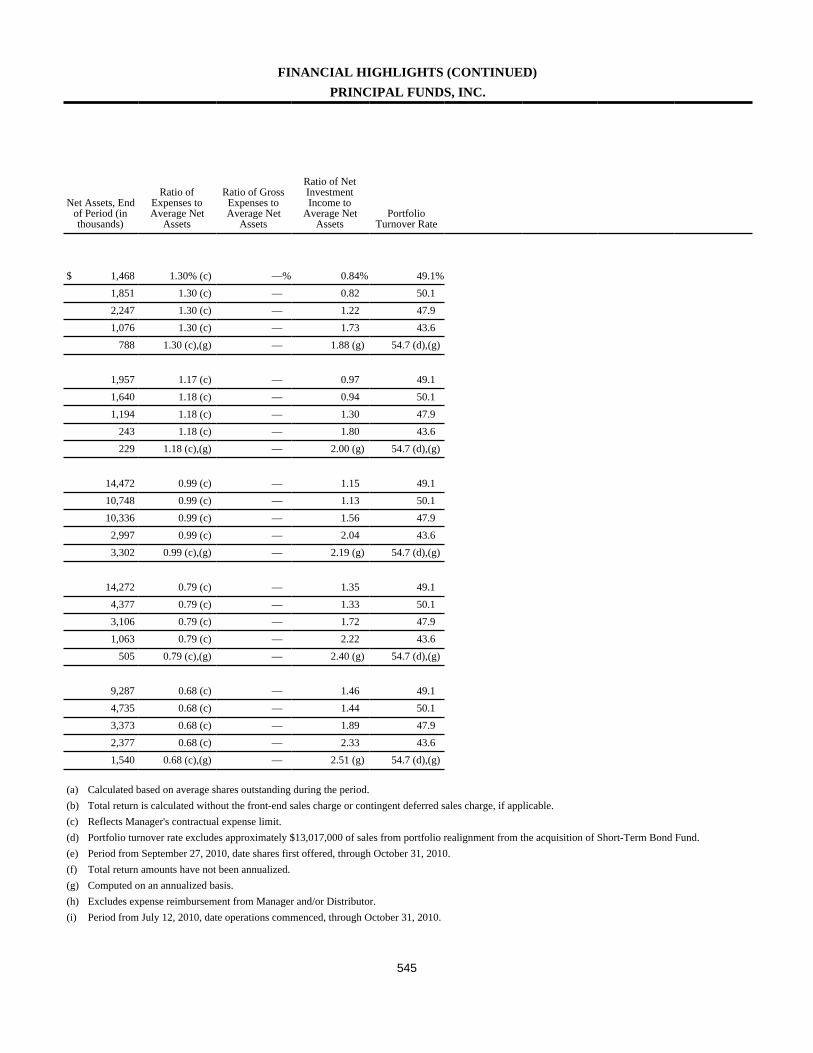
545
FINANCIAL HIGHLIGHTS (CONTINUED)PRINCIPAL FUNDS, INC.
Net Assets, Endof Period (inthousands)
Ratio ofExpenses toAverage Net
Assets
Ratio of GrossExpenses toAverage Net
Assets
Ratio of NetInvestmentIncome to
Average NetAssets
PortfolioTurnover Rate
$ 1,468 1.30% (c) —% 0.84% 49.1%1,851 1.30 (c) — 0.82 50.12,247 1.30 (c) — 1.22 47.91,076 1.30 (c) — 1.73 43.6
788 1.30 (c),(g) — 1.88 (g) 54.7 (d),(g)
1,957 1.17 (c) — 0.97 49.11,640 1.18 (c) — 0.94 50.11,194 1.18 (c) — 1.30 47.9
243 1.18 (c) — 1.80 43.6229 1.18 (c),(g) — 2.00 (g) 54.7 (d),(g)
14,472 0.99 (c) — 1.15 49.110,748 0.99 (c) — 1.13 50.110,336 0.99 (c) — 1.56 47.92,997 0.99 (c) — 2.04 43.63,302 0.99 (c),(g) — 2.19 (g) 54.7 (d),(g)
14,272 0.79 (c) — 1.35 49.14,377 0.79 (c) — 1.33 50.13,106 0.79 (c) — 1.72 47.91,063 0.79 (c) — 2.22 43.6
505 0.79 (c),(g) — 2.40 (g) 54.7 (d),(g)
9,287 0.68 (c) — 1.46 49.14,735 0.68 (c) — 1.44 50.13,373 0.68 (c) — 1.89 47.92,377 0.68 (c) — 2.33 43.61,540 0.68 (c),(g) — 2.51 (g) 54.7 (d),(g)
(a) Calculated based on average shares outstanding during the period.(b) Total return is calculated without the front-end sales charge or contingent deferred sales charge, if applicable.(c) Reflects Manager's contractual expense limit.(d) Portfolio turnover rate excludes approximately $13,017,000 of sales from portfolio realignment from the acquisition of Short-Term Bond Fund.(e) Period from September 27, 2010, date shares first offered, through October 31, 2010.(f) Total return amounts have not been annualized.(g) Computed on an annualized basis.(h) Excludes expense reimbursement from Manager and/or Distributor.(i) Period from July 12, 2010, date operations commenced, through October 31, 2010.
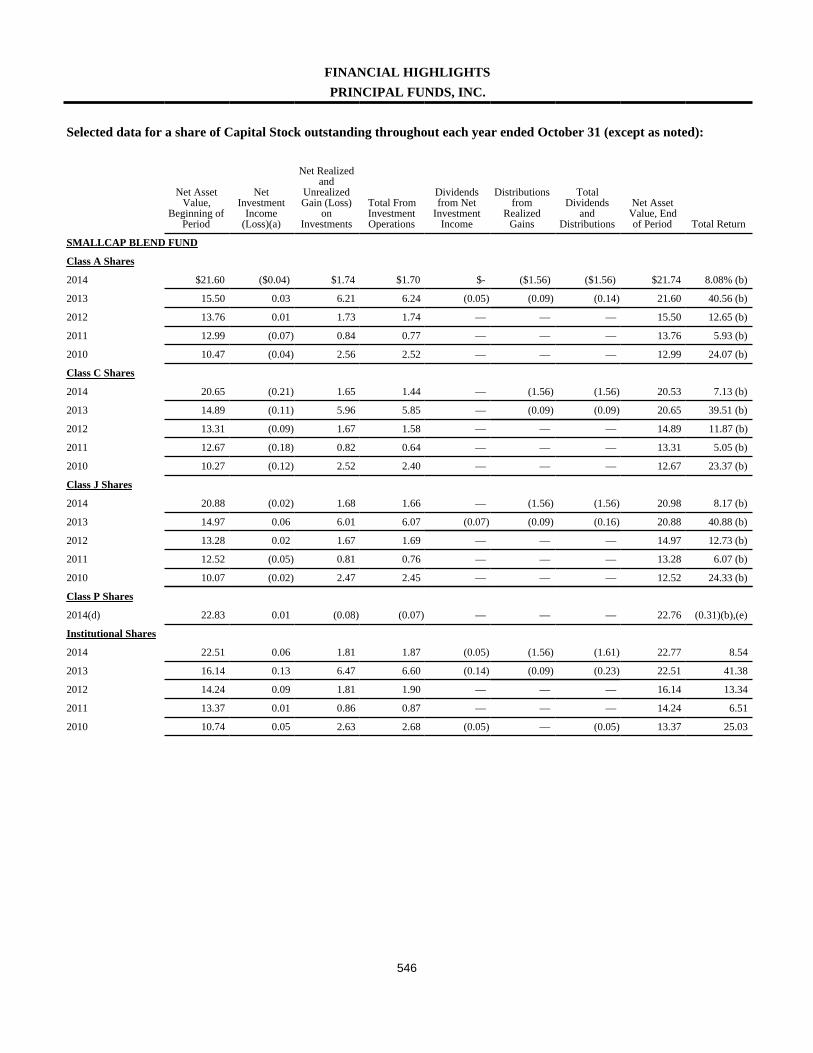
546
FINANCIAL HIGHLIGHTSPRINCIPAL FUNDS, INC.
Selected data for a share of Capital Stock outstanding throughout each year ended October 31 (except as noted):
Net AssetValue,
Beginning ofPeriod
NetInvestment
Income(Loss)(a)
Net Realizedand
UnrealizedGain (Loss)
onInvestments
Total FromInvestmentOperations
Dividendsfrom Net
InvestmentIncome
Distributionsfrom
RealizedGains
TotalDividends
andDistributions
Net AssetValue, Endof Period Total Return
SMALLCAP BLEND FUND
Class A Shares
2014 $21.60 ($0.04) $1.74 $1.70 $- ($1.56) ($1.56) $21.74 8.08% (b)
2013 15.50 0.03 6.21 6.24 (0.05) (0.09) (0.14) 21.60 40.56 (b)
2012 13.76 0.01 1.73 1.74 — — — 15.50 12.65 (b)
2011 12.99 (0.07) 0.84 0.77 — — — 13.76 5.93 (b)
2010 10.47 (0.04) 2.56 2.52 — — — 12.99 24.07 (b)
Class C Shares
2014 20.65 (0.21) 1.65 1.44 — (1.56) (1.56) 20.53 7.13 (b)
2013 14.89 (0.11) 5.96 5.85 — (0.09) (0.09) 20.65 39.51 (b)
2012 13.31 (0.09) 1.67 1.58 — — — 14.89 11.87 (b)
2011 12.67 (0.18) 0.82 0.64 — — — 13.31 5.05 (b)
2010 10.27 (0.12) 2.52 2.40 — — — 12.67 23.37 (b)
Class J Shares
2014 20.88 (0.02) 1.68 1.66 — (1.56) (1.56) 20.98 8.17 (b)
2013 14.97 0.06 6.01 6.07 (0.07) (0.09) (0.16) 20.88 40.88 (b)
2012 13.28 0.02 1.67 1.69 — — — 14.97 12.73 (b)
2011 12.52 (0.05) 0.81 0.76 — — — 13.28 6.07 (b)
2010 10.07 (0.02) 2.47 2.45 — — — 12.52 24.33 (b)
Class P Shares
2014(d) 22.83 0.01 (0.08) (0.07) — — — 22.76 (0.31)(b),(e)
Institutional Shares
2014 22.51 0.06 1.81 1.87 (0.05) (1.56) (1.61) 22.77 8.54
2013 16.14 0.13 6.47 6.60 (0.14) (0.09) (0.23) 22.51 41.38
2012 14.24 0.09 1.81 1.90 — — — 16.14 13.34
2011 13.37 0.01 0.86 0.87 — — — 14.24 6.51
2010 10.74 0.05 2.63 2.68 (0.05) — (0.05) 13.37 25.03
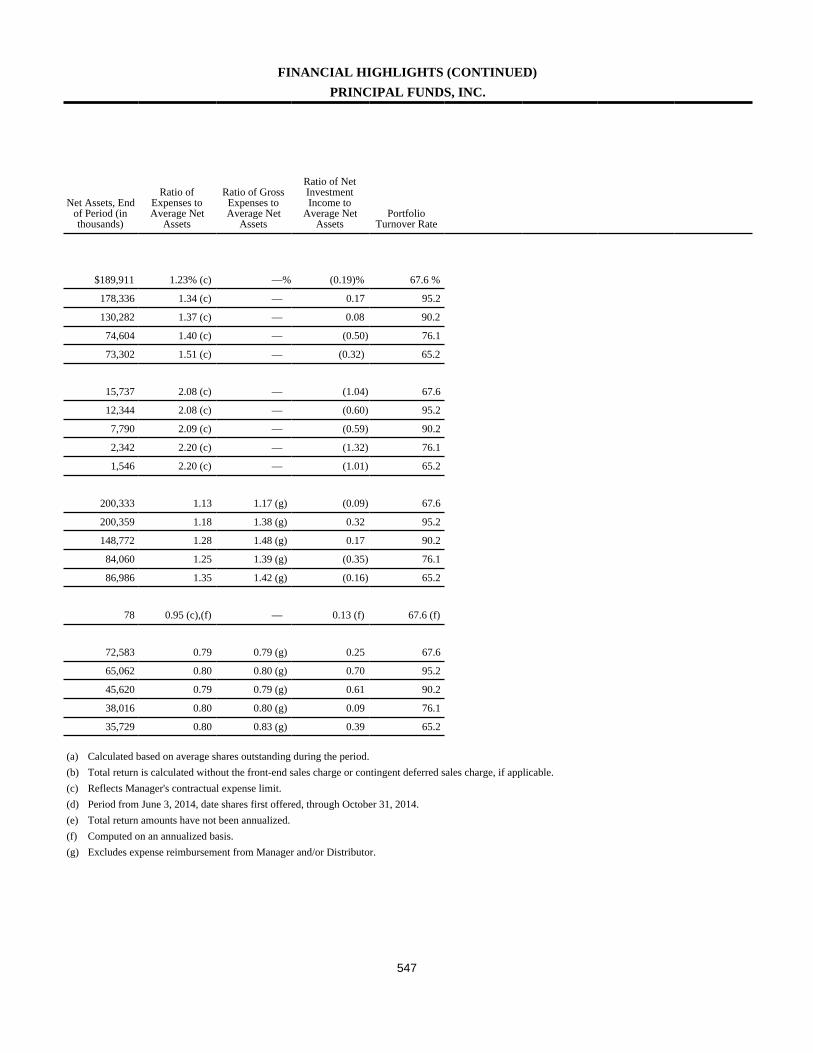
547
FINANCIAL HIGHLIGHTS (CONTINUED)PRINCIPAL FUNDS, INC.
Net Assets, Endof Period (inthousands)
Ratio ofExpenses toAverage Net
Assets
Ratio of GrossExpenses toAverage Net
Assets
Ratio of NetInvestmentIncome to
Average NetAssets
PortfolioTurnover Rate
$189,911 1.23% (c) —% (0.19)% 67.6 %
178,336 1.34 (c) — 0.17 95.2
130,282 1.37 (c) — 0.08 90.2
74,604 1.40 (c) — (0.50) 76.1
73,302 1.51 (c) — (0.32) 65.2
15,737 2.08 (c) — (1.04) 67.6
12,344 2.08 (c) — (0.60) 95.2
7,790 2.09 (c) — (0.59) 90.2
2,342 2.20 (c) — (1.32) 76.1
1,546 2.20 (c) — (1.01) 65.2
200,333 1.13 1.17 (g) (0.09) 67.6
200,359 1.18 1.38 (g) 0.32 95.2
148,772 1.28 1.48 (g) 0.17 90.2
84,060 1.25 1.39 (g) (0.35) 76.1
86,986 1.35 1.42 (g) (0.16) 65.2
78 0.95 (c),(f) — 0.13 (f) 67.6 (f)
72,583 0.79 0.79 (g) 0.25 67.6
65,062 0.80 0.80 (g) 0.70 95.2
45,620 0.79 0.79 (g) 0.61 90.2
38,016 0.80 0.80 (g) 0.09 76.1
35,729 0.80 0.83 (g) 0.39 65.2
(a) Calculated based on average shares outstanding during the period.(b) Total return is calculated without the front-end sales charge or contingent deferred sales charge, if applicable.(c) Reflects Manager's contractual expense limit.(d) Period from June 3, 2014, date shares first offered, through October 31, 2014.(e) Total return amounts have not been annualized.(f) Computed on an annualized basis.(g) Excludes expense reimbursement from Manager and/or Distributor.
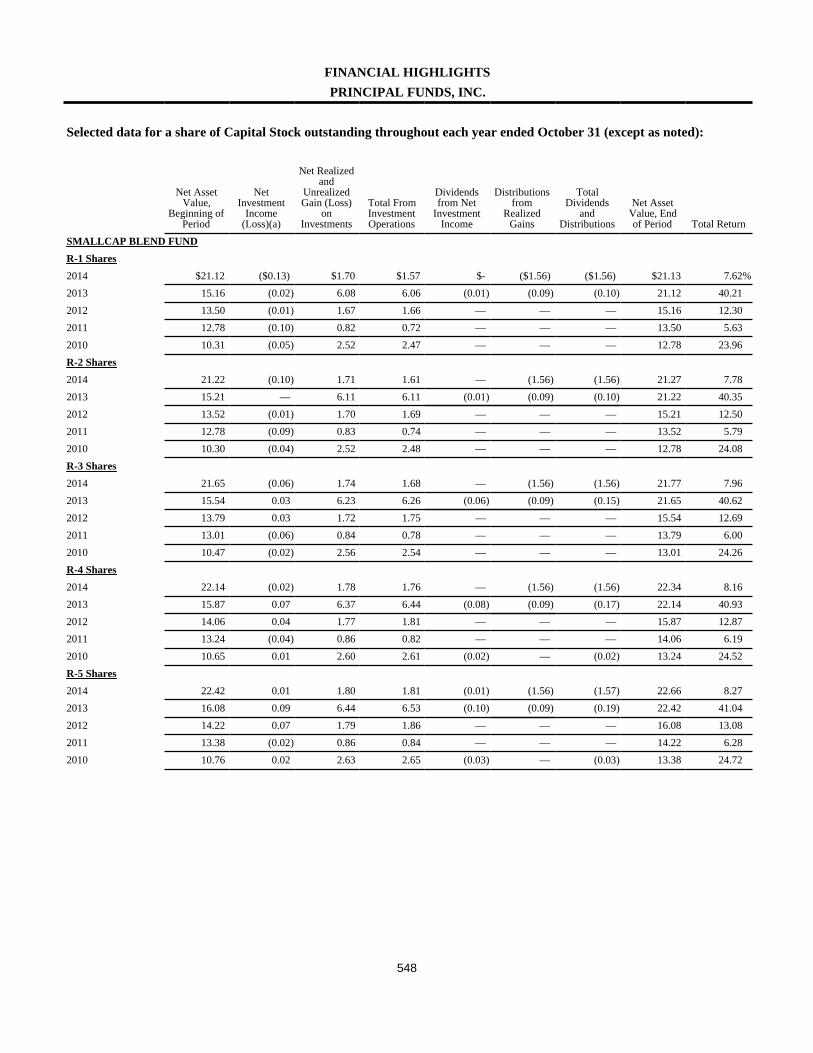
548
FINANCIAL HIGHLIGHTSPRINCIPAL FUNDS, INC.
Selected data for a share of Capital Stock outstanding throughout each year ended October 31 (except as noted):
Net AssetValue,
Beginning ofPeriod
NetInvestment
Income(Loss)(a)
Net Realizedand
UnrealizedGain (Loss)
onInvestments
Total FromInvestmentOperations
Dividendsfrom Net
InvestmentIncome
Distributionsfrom
RealizedGains
TotalDividends
andDistributions
Net AssetValue, Endof Period Total Return
SMALLCAP BLEND FUNDR-1 Shares2014 $21.12 ($0.13) $1.70 $1.57 $- ($1.56) ($1.56) $21.13 7.62%2013 15.16 (0.02) 6.08 6.06 (0.01) (0.09) (0.10) 21.12 40.212012 13.50 (0.01) 1.67 1.66 — — — 15.16 12.302011 12.78 (0.10) 0.82 0.72 — — — 13.50 5.632010 10.31 (0.05) 2.52 2.47 — — — 12.78 23.96R-2 Shares2014 21.22 (0.10) 1.71 1.61 — (1.56) (1.56) 21.27 7.782013 15.21 — 6.11 6.11 (0.01) (0.09) (0.10) 21.22 40.352012 13.52 (0.01) 1.70 1.69 — — — 15.21 12.502011 12.78 (0.09) 0.83 0.74 — — — 13.52 5.792010 10.30 (0.04) 2.52 2.48 — — — 12.78 24.08R-3 Shares2014 21.65 (0.06) 1.74 1.68 — (1.56) (1.56) 21.77 7.962013 15.54 0.03 6.23 6.26 (0.06) (0.09) (0.15) 21.65 40.622012 13.79 0.03 1.72 1.75 — — — 15.54 12.692011 13.01 (0.06) 0.84 0.78 — — — 13.79 6.002010 10.47 (0.02) 2.56 2.54 — — — 13.01 24.26R-4 Shares2014 22.14 (0.02) 1.78 1.76 — (1.56) (1.56) 22.34 8.162013 15.87 0.07 6.37 6.44 (0.08) (0.09) (0.17) 22.14 40.932012 14.06 0.04 1.77 1.81 — — — 15.87 12.872011 13.24 (0.04) 0.86 0.82 — — — 14.06 6.192010 10.65 0.01 2.60 2.61 (0.02) — (0.02) 13.24 24.52R-5 Shares2014 22.42 0.01 1.80 1.81 (0.01) (1.56) (1.57) 22.66 8.272013 16.08 0.09 6.44 6.53 (0.10) (0.09) (0.19) 22.42 41.042012 14.22 0.07 1.79 1.86 — — — 16.08 13.082011 13.38 (0.02) 0.86 0.84 — — — 14.22 6.282010 10.76 0.02 2.63 2.65 (0.03) — (0.03) 13.38 24.72
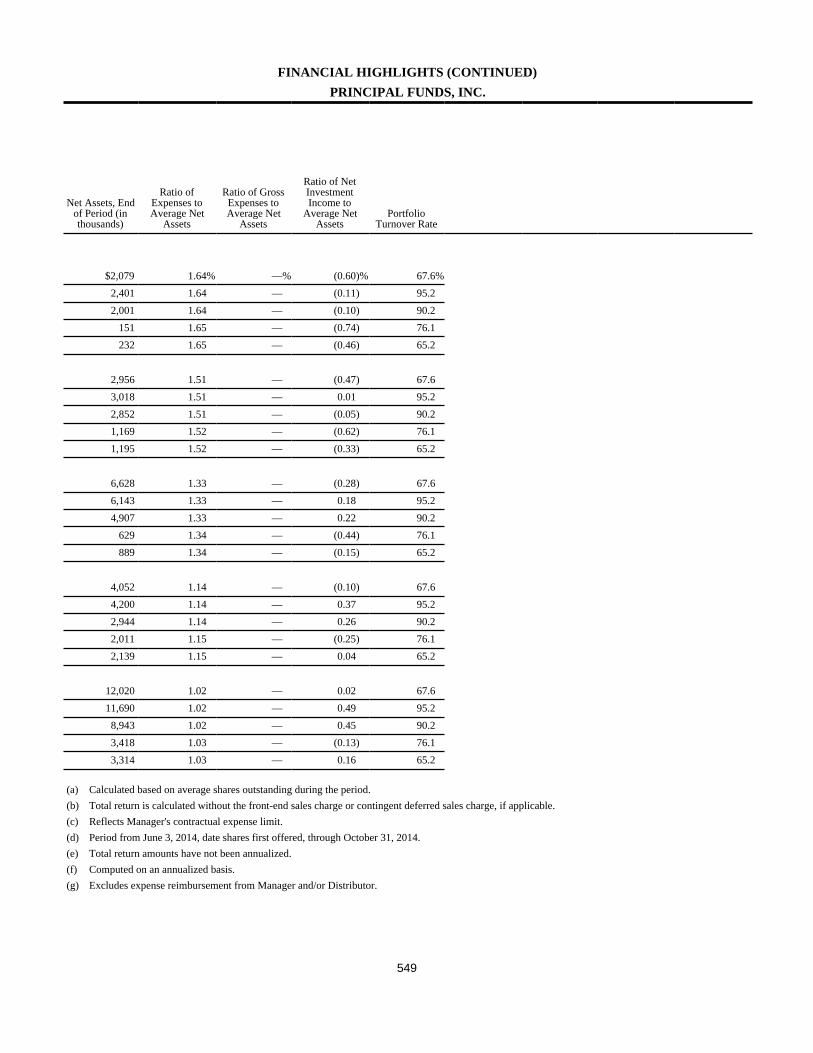
549
FINANCIAL HIGHLIGHTS (CONTINUED)PRINCIPAL FUNDS, INC.
Net Assets, Endof Period (inthousands)
Ratio ofExpenses toAverage Net
Assets
Ratio of GrossExpenses toAverage Net
Assets
Ratio of NetInvestmentIncome to
Average NetAssets
PortfolioTurnover Rate
$2,079 1.64% —% (0.60)% 67.6%2,401 1.64 — (0.11) 95.22,001 1.64 — (0.10) 90.2
151 1.65 — (0.74) 76.1232 1.65 — (0.46) 65.2
2,956 1.51 — (0.47) 67.63,018 1.51 — 0.01 95.22,852 1.51 — (0.05) 90.21,169 1.52 — (0.62) 76.11,195 1.52 — (0.33) 65.2
6,628 1.33 — (0.28) 67.66,143 1.33 — 0.18 95.24,907 1.33 — 0.22 90.2
629 1.34 — (0.44) 76.1889 1.34 — (0.15) 65.2
4,052 1.14 — (0.10) 67.64,200 1.14 — 0.37 95.22,944 1.14 — 0.26 90.22,011 1.15 — (0.25) 76.12,139 1.15 — 0.04 65.2
12,020 1.02 — 0.02 67.611,690 1.02 — 0.49 95.28,943 1.02 — 0.45 90.23,418 1.03 — (0.13) 76.13,314 1.03 — 0.16 65.2
(a) Calculated based on average shares outstanding during the period.(b) Total return is calculated without the front-end sales charge or contingent deferred sales charge, if applicable.(c) Reflects Manager's contractual expense limit.(d) Period from June 3, 2014, date shares first offered, through October 31, 2014.(e) Total return amounts have not been annualized.(f) Computed on an annualized basis.(g) Excludes expense reimbursement from Manager and/or Distributor.
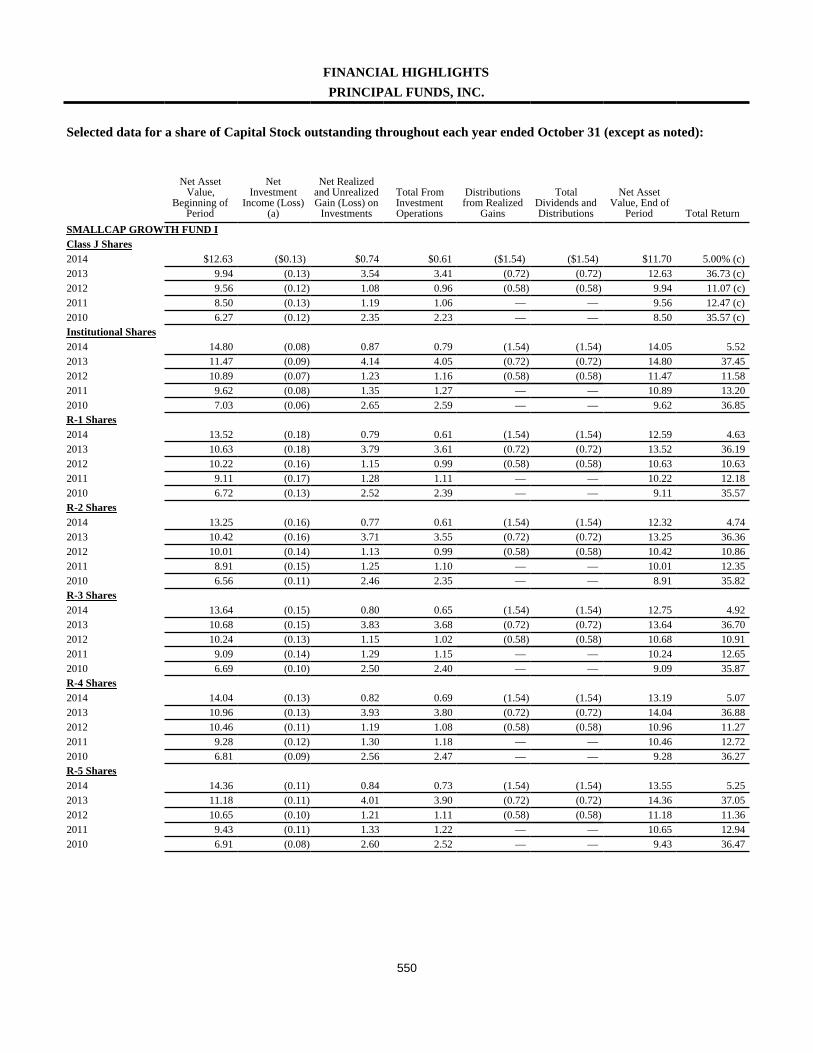
550
FINANCIAL HIGHLIGHTSPRINCIPAL FUNDS, INC.
Selected data for a share of Capital Stock outstanding throughout each year ended October 31 (except as noted):
Net AssetValue,
Beginning ofPeriod
NetInvestment
Income (Loss)(a)
Net Realizedand UnrealizedGain (Loss) on
Investments
Total FromInvestmentOperations
Distributionsfrom Realized
Gains
TotalDividends andDistributions
Net AssetValue, End of
Period Total ReturnSMALLCAP GROWTH FUND IClass J Shares2014 $12.63 ($0.13) $0.74 $0.61 ($1.54) ($1.54) $11.70 5.00% (c)2013 9.94 (0.13) 3.54 3.41 (0.72) (0.72) 12.63 36.73 (c)2012 9.56 (0.12) 1.08 0.96 (0.58) (0.58) 9.94 11.07 (c)2011 8.50 (0.13) 1.19 1.06 — — 9.56 12.47 (c)2010 6.27 (0.12) 2.35 2.23 — — 8.50 35.57 (c)Institutional Shares2014 14.80 (0.08) 0.87 0.79 (1.54) (1.54) 14.05 5.522013 11.47 (0.09) 4.14 4.05 (0.72) (0.72) 14.80 37.452012 10.89 (0.07) 1.23 1.16 (0.58) (0.58) 11.47 11.582011 9.62 (0.08) 1.35 1.27 — — 10.89 13.202010 7.03 (0.06) 2.65 2.59 — — 9.62 36.85R-1 Shares2014 13.52 (0.18) 0.79 0.61 (1.54) (1.54) 12.59 4.632013 10.63 (0.18) 3.79 3.61 (0.72) (0.72) 13.52 36.192012 10.22 (0.16) 1.15 0.99 (0.58) (0.58) 10.63 10.632011 9.11 (0.17) 1.28 1.11 — — 10.22 12.182010 6.72 (0.13) 2.52 2.39 — — 9.11 35.57R-2 Shares2014 13.25 (0.16) 0.77 0.61 (1.54) (1.54) 12.32 4.742013 10.42 (0.16) 3.71 3.55 (0.72) (0.72) 13.25 36.362012 10.01 (0.14) 1.13 0.99 (0.58) (0.58) 10.42 10.862011 8.91 (0.15) 1.25 1.10 — — 10.01 12.352010 6.56 (0.11) 2.46 2.35 — — 8.91 35.82R-3 Shares2014 13.64 (0.15) 0.80 0.65 (1.54) (1.54) 12.75 4.922013 10.68 (0.15) 3.83 3.68 (0.72) (0.72) 13.64 36.702012 10.24 (0.13) 1.15 1.02 (0.58) (0.58) 10.68 10.912011 9.09 (0.14) 1.29 1.15 — — 10.24 12.652010 6.69 (0.10) 2.50 2.40 — — 9.09 35.87R-4 Shares2014 14.04 (0.13) 0.82 0.69 (1.54) (1.54) 13.19 5.072013 10.96 (0.13) 3.93 3.80 (0.72) (0.72) 14.04 36.882012 10.46 (0.11) 1.19 1.08 (0.58) (0.58) 10.96 11.272011 9.28 (0.12) 1.30 1.18 — — 10.46 12.722010 6.81 (0.09) 2.56 2.47 — — 9.28 36.27R-5 Shares2014 14.36 (0.11) 0.84 0.73 (1.54) (1.54) 13.55 5.252013 11.18 (0.11) 4.01 3.90 (0.72) (0.72) 14.36 37.052012 10.65 (0.10) 1.21 1.11 (0.58) (0.58) 11.18 11.362011 9.43 (0.11) 1.33 1.22 — — 10.65 12.942010 6.91 (0.08) 2.60 2.52 — — 9.43 36.47
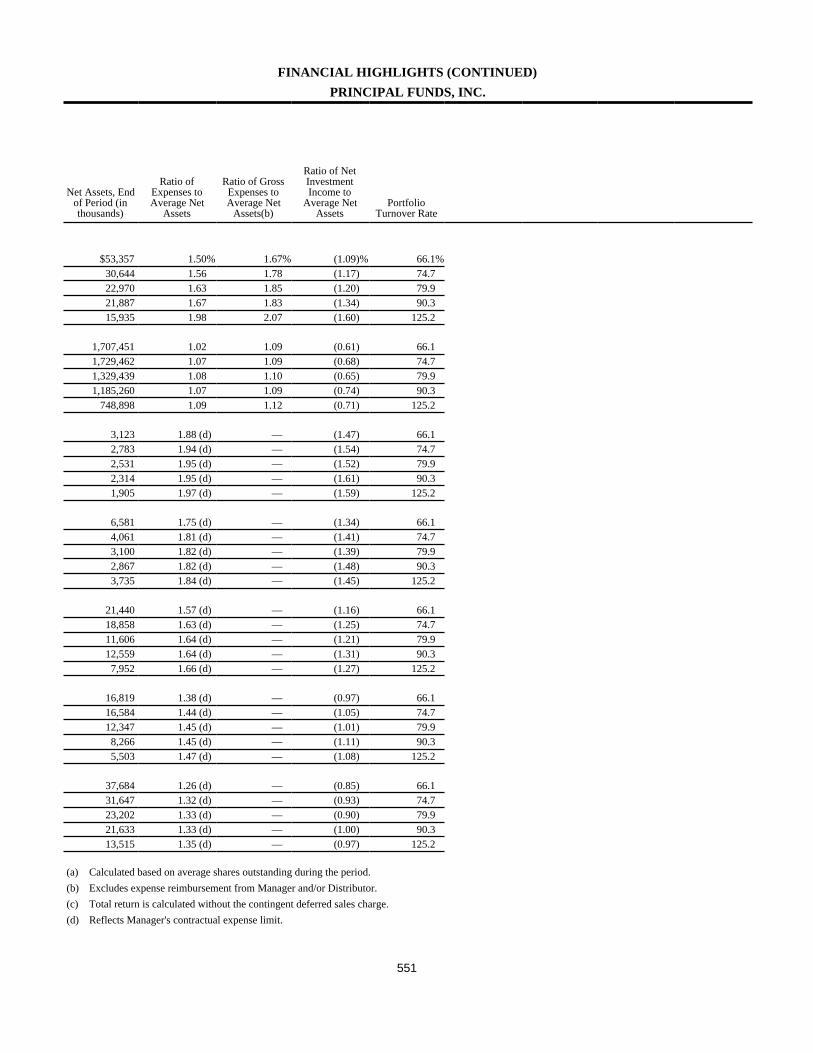
551
FINANCIAL HIGHLIGHTS (CONTINUED)PRINCIPAL FUNDS, INC.
Net Assets, Endof Period (inthousands)
Ratio ofExpenses toAverage Net
Assets
Ratio of GrossExpenses toAverage Net
Assets(b)
Ratio of NetInvestmentIncome to
Average NetAssets
PortfolioTurnover Rate
$53,357 1.50% 1.67% (1.09)% 66.1%30,644 1.56 1.78 (1.17) 74.722,970 1.63 1.85 (1.20) 79.921,887 1.67 1.83 (1.34) 90.315,935 1.98 2.07 (1.60) 125.2
1,707,451 1.02 1.09 (0.61) 66.11,729,462 1.07 1.09 (0.68) 74.71,329,439 1.08 1.10 (0.65) 79.91,185,260 1.07 1.09 (0.74) 90.3
748,898 1.09 1.12 (0.71) 125.2
3,123 1.88 (d) — (1.47) 66.12,783 1.94 (d) — (1.54) 74.72,531 1.95 (d) — (1.52) 79.92,314 1.95 (d) — (1.61) 90.31,905 1.97 (d) — (1.59) 125.2
6,581 1.75 (d) — (1.34) 66.14,061 1.81 (d) — (1.41) 74.73,100 1.82 (d) — (1.39) 79.92,867 1.82 (d) — (1.48) 90.33,735 1.84 (d) — (1.45) 125.2
21,440 1.57 (d) — (1.16) 66.118,858 1.63 (d) — (1.25) 74.711,606 1.64 (d) — (1.21) 79.912,559 1.64 (d) — (1.31) 90.37,952 1.66 (d) — (1.27) 125.2
16,819 1.38 (d) — (0.97) 66.116,584 1.44 (d) — (1.05) 74.712,347 1.45 (d) — (1.01) 79.98,266 1.45 (d) — (1.11) 90.35,503 1.47 (d) — (1.08) 125.2
37,684 1.26 (d) — (0.85) 66.131,647 1.32 (d) — (0.93) 74.723,202 1.33 (d) — (0.90) 79.921,633 1.33 (d) — (1.00) 90.313,515 1.35 (d) — (0.97) 125.2
(a) Calculated based on average shares outstanding during the period.(b) Excludes expense reimbursement from Manager and/or Distributor.(c) Total return is calculated without the contingent deferred sales charge.(d) Reflects Manager's contractual expense limit.
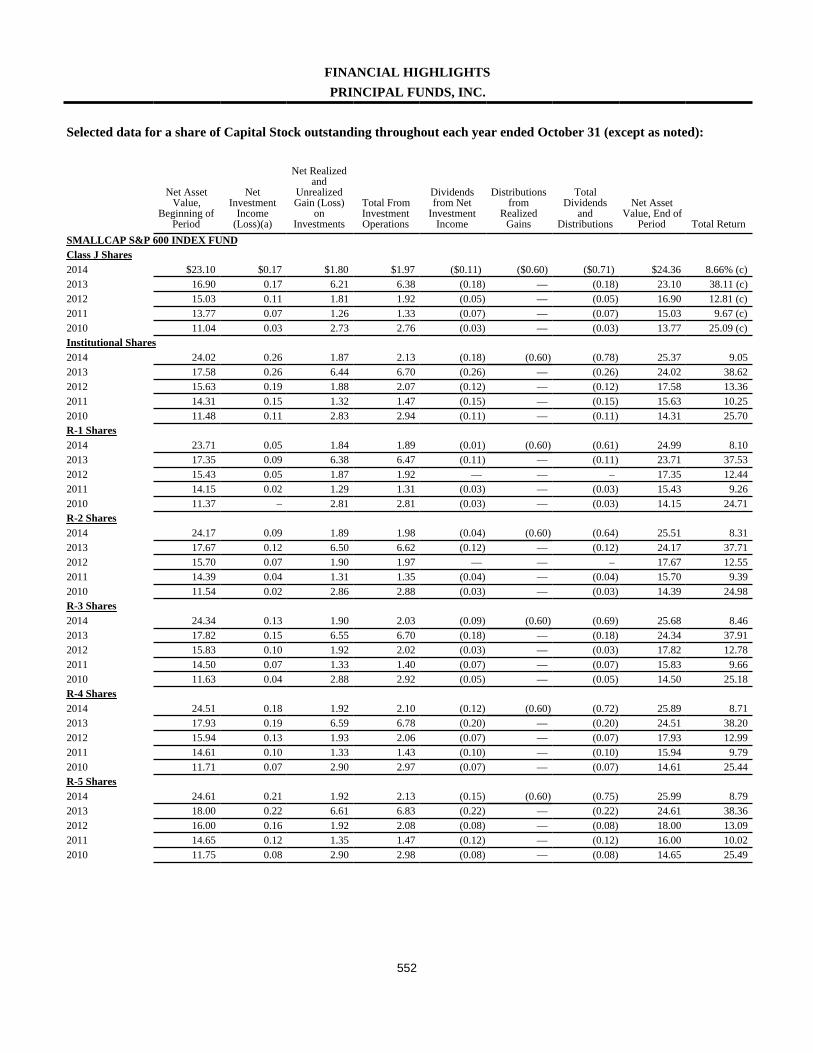
552
FINANCIAL HIGHLIGHTSPRINCIPAL FUNDS, INC.
Selected data for a share of Capital Stock outstanding throughout each year ended October 31 (except as noted):
Net AssetValue,
Beginning ofPeriod
NetInvestment
Income(Loss)(a)
Net Realizedand
UnrealizedGain (Loss)
onInvestments
Total FromInvestmentOperations
Dividendsfrom Net
InvestmentIncome
Distributionsfrom
RealizedGains
TotalDividends
andDistributions
Net AssetValue, End of
Period Total ReturnSMALLCAP S&P 600 INDEX FUNDClass J Shares2014 $23.10 $0.17 $1.80 $1.97 ($0.11) ($0.60) ($0.71) $24.36 8.66% (c)2013 16.90 0.17 6.21 6.38 (0.18) — (0.18) 23.10 38.11 (c)2012 15.03 0.11 1.81 1.92 (0.05) — (0.05) 16.90 12.81 (c)2011 13.77 0.07 1.26 1.33 (0.07) — (0.07) 15.03 9.67 (c)2010 11.04 0.03 2.73 2.76 (0.03) — (0.03) 13.77 25.09 (c)Institutional Shares2014 24.02 0.26 1.87 2.13 (0.18) (0.60) (0.78) 25.37 9.052013 17.58 0.26 6.44 6.70 (0.26) — (0.26) 24.02 38.622012 15.63 0.19 1.88 2.07 (0.12) — (0.12) 17.58 13.362011 14.31 0.15 1.32 1.47 (0.15) — (0.15) 15.63 10.252010 11.48 0.11 2.83 2.94 (0.11) — (0.11) 14.31 25.70R-1 Shares2014 23.71 0.05 1.84 1.89 (0.01) (0.60) (0.61) 24.99 8.102013 17.35 0.09 6.38 6.47 (0.11) — (0.11) 23.71 37.532012 15.43 0.05 1.87 1.92 — — – 17.35 12.442011 14.15 0.02 1.29 1.31 (0.03) — (0.03) 15.43 9.262010 11.37 – 2.81 2.81 (0.03) — (0.03) 14.15 24.71R-2 Shares2014 24.17 0.09 1.89 1.98 (0.04) (0.60) (0.64) 25.51 8.312013 17.67 0.12 6.50 6.62 (0.12) — (0.12) 24.17 37.712012 15.70 0.07 1.90 1.97 — — – 17.67 12.552011 14.39 0.04 1.31 1.35 (0.04) — (0.04) 15.70 9.392010 11.54 0.02 2.86 2.88 (0.03) — (0.03) 14.39 24.98R-3 Shares2014 24.34 0.13 1.90 2.03 (0.09) (0.60) (0.69) 25.68 8.462013 17.82 0.15 6.55 6.70 (0.18) — (0.18) 24.34 37.912012 15.83 0.10 1.92 2.02 (0.03) — (0.03) 17.82 12.782011 14.50 0.07 1.33 1.40 (0.07) — (0.07) 15.83 9.662010 11.63 0.04 2.88 2.92 (0.05) — (0.05) 14.50 25.18R-4 Shares2014 24.51 0.18 1.92 2.10 (0.12) (0.60) (0.72) 25.89 8.712013 17.93 0.19 6.59 6.78 (0.20) — (0.20) 24.51 38.202012 15.94 0.13 1.93 2.06 (0.07) — (0.07) 17.93 12.992011 14.61 0.10 1.33 1.43 (0.10) — (0.10) 15.94 9.792010 11.71 0.07 2.90 2.97 (0.07) — (0.07) 14.61 25.44R-5 Shares2014 24.61 0.21 1.92 2.13 (0.15) (0.60) (0.75) 25.99 8.792013 18.00 0.22 6.61 6.83 (0.22) — (0.22) 24.61 38.362012 16.00 0.16 1.92 2.08 (0.08) — (0.08) 18.00 13.092011 14.65 0.12 1.35 1.47 (0.12) — (0.12) 16.00 10.022010 11.75 0.08 2.90 2.98 (0.08) — (0.08) 14.65 25.49
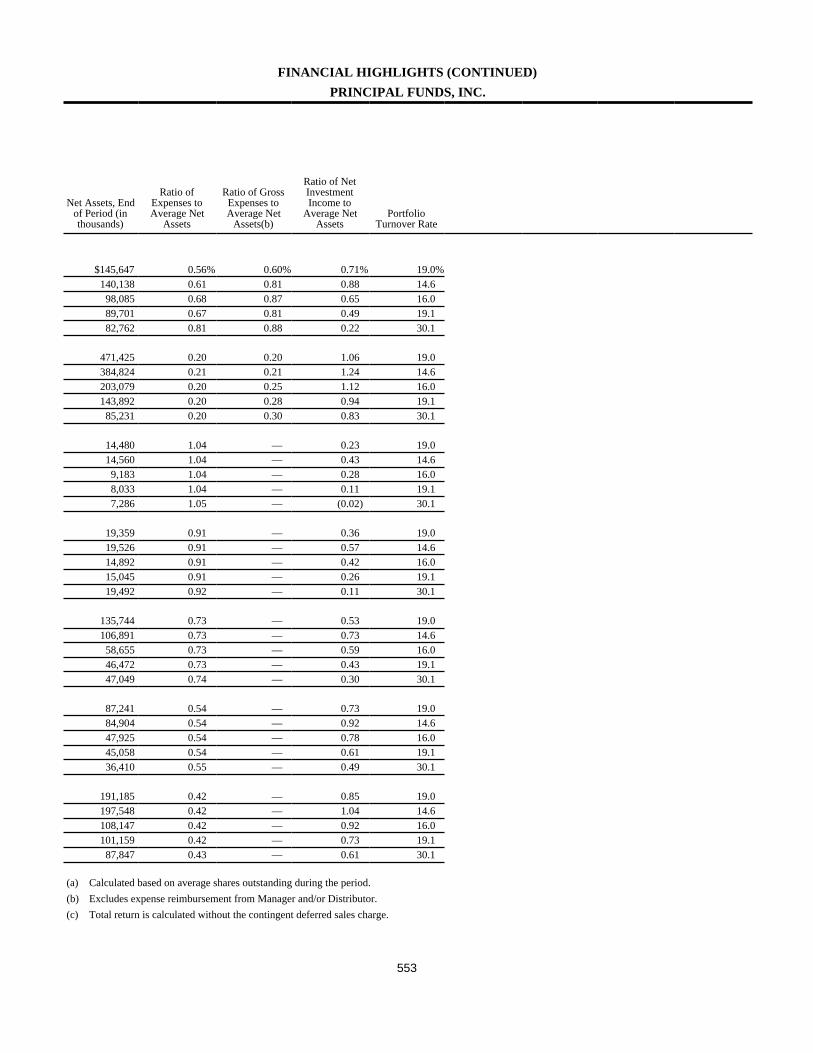
553
FINANCIAL HIGHLIGHTS (CONTINUED)PRINCIPAL FUNDS, INC.
Net Assets, Endof Period (inthousands)
Ratio ofExpenses toAverage Net
Assets
Ratio of GrossExpenses toAverage Net
Assets(b)
Ratio of NetInvestmentIncome to
Average NetAssets
PortfolioTurnover Rate
$145,647 0.56% 0.60% 0.71% 19.0%140,138 0.61 0.81 0.88 14.6
98,085 0.68 0.87 0.65 16.089,701 0.67 0.81 0.49 19.182,762 0.81 0.88 0.22 30.1
471,425 0.20 0.20 1.06 19.0384,824 0.21 0.21 1.24 14.6203,079 0.20 0.25 1.12 16.0143,892 0.20 0.28 0.94 19.1
85,231 0.20 0.30 0.83 30.1
14,480 1.04 — 0.23 19.014,560 1.04 — 0.43 14.69,183 1.04 — 0.28 16.08,033 1.04 — 0.11 19.17,286 1.05 — (0.02) 30.1
19,359 0.91 — 0.36 19.019,526 0.91 — 0.57 14.614,892 0.91 — 0.42 16.015,045 0.91 — 0.26 19.119,492 0.92 — 0.11 30.1
135,744 0.73 — 0.53 19.0106,891 0.73 — 0.73 14.6
58,655 0.73 — 0.59 16.046,472 0.73 — 0.43 19.147,049 0.74 — 0.30 30.1
87,241 0.54 — 0.73 19.084,904 0.54 — 0.92 14.647,925 0.54 — 0.78 16.045,058 0.54 — 0.61 19.136,410 0.55 — 0.49 30.1
191,185 0.42 — 0.85 19.0197,548 0.42 — 1.04 14.6108,147 0.42 — 0.92 16.0101,159 0.42 — 0.73 19.1
87,847 0.43 — 0.61 30.1
(a) Calculated based on average shares outstanding during the period.(b) Excludes expense reimbursement from Manager and/or Distributor.(c) Total return is calculated without the contingent deferred sales charge.
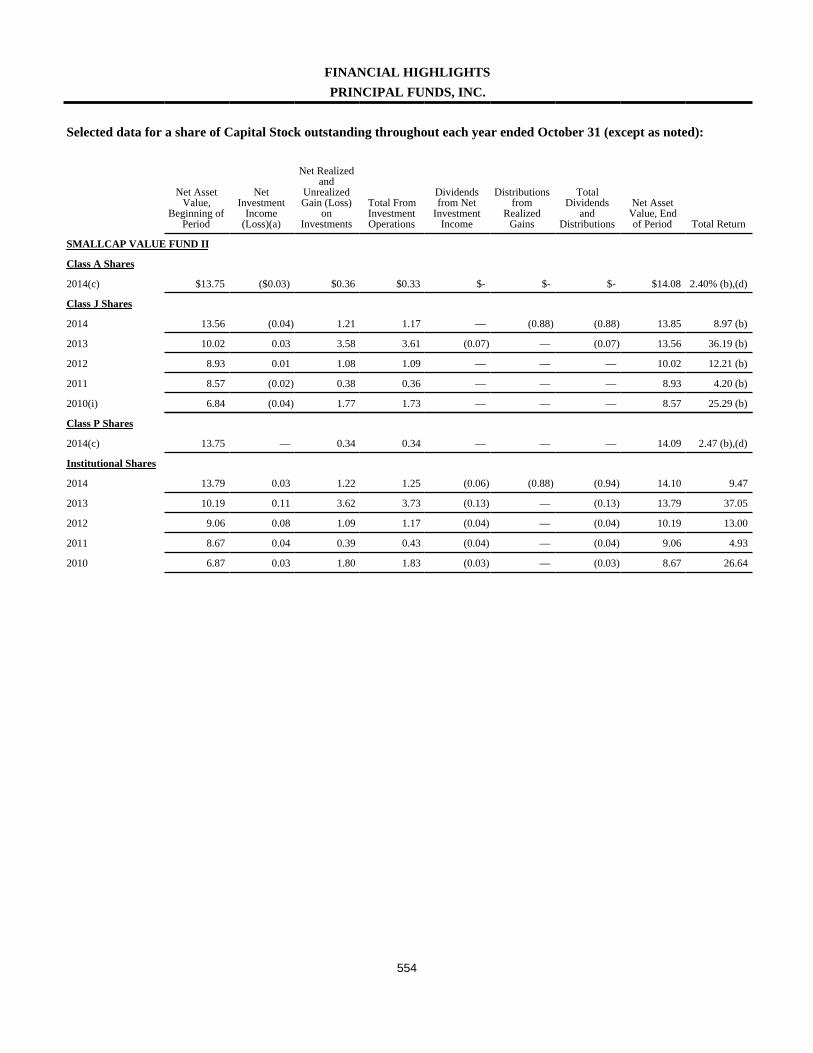
554
FINANCIAL HIGHLIGHTSPRINCIPAL FUNDS, INC.
Selected data for a share of Capital Stock outstanding throughout each year ended October 31 (except as noted):
Net AssetValue,
Beginning ofPeriod
NetInvestment
Income(Loss)(a)
Net Realizedand
UnrealizedGain (Loss)
onInvestments
Total FromInvestmentOperations
Dividendsfrom Net
InvestmentIncome
Distributionsfrom
RealizedGains
TotalDividends
andDistributions
Net AssetValue, Endof Period Total Return
SMALLCAP VALUE FUND II
Class A Shares
2014(c) $13.75 ($0.03) $0.36 $0.33 $- $- $- $14.08 2.40% (b),(d)
Class J Shares
2014 13.56 (0.04) 1.21 1.17 — (0.88) (0.88) 13.85 8.97 (b)
2013 10.02 0.03 3.58 3.61 (0.07) — (0.07) 13.56 36.19 (b)
2012 8.93 0.01 1.08 1.09 — — — 10.02 12.21 (b)
2011 8.57 (0.02) 0.38 0.36 — — — 8.93 4.20 (b)
2010(i) 6.84 (0.04) 1.77 1.73 — — — 8.57 25.29 (b)
Class P Shares
2014(c) 13.75 — 0.34 0.34 — — — 14.09 2.47 (b),(d)
Institutional Shares
2014 13.79 0.03 1.22 1.25 (0.06) (0.88) (0.94) 14.10 9.47
2013 10.19 0.11 3.62 3.73 (0.13) — (0.13) 13.79 37.05
2012 9.06 0.08 1.09 1.17 (0.04) — (0.04) 10.19 13.00
2011 8.67 0.04 0.39 0.43 (0.04) — (0.04) 9.06 4.93
2010 6.87 0.03 1.80 1.83 (0.03) — (0.03) 8.67 26.64
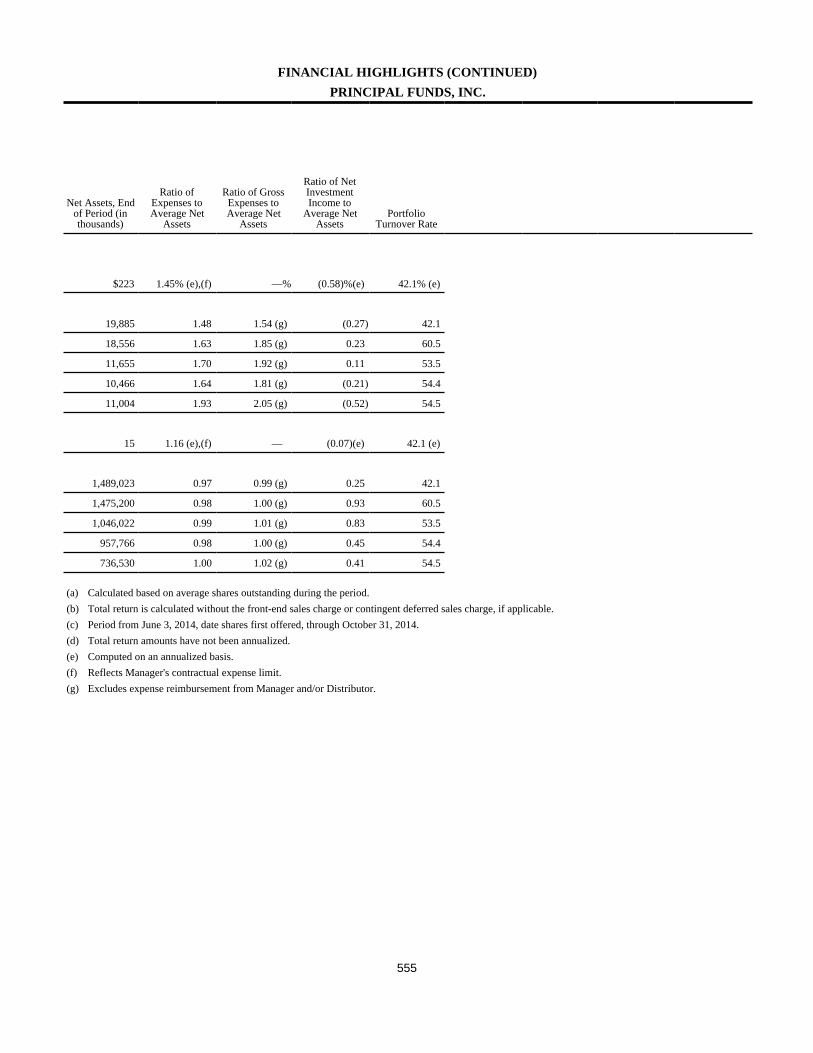
555
FINANCIAL HIGHLIGHTS (CONTINUED)PRINCIPAL FUNDS, INC.
Net Assets, Endof Period (inthousands)
Ratio ofExpenses toAverage Net
Assets
Ratio of GrossExpenses toAverage Net
Assets
Ratio of NetInvestmentIncome to
Average NetAssets
PortfolioTurnover Rate
$223 1.45% (e),(f) —% (0.58)%(e) 42.1% (e)
19,885 1.48 1.54 (g) (0.27) 42.1
18,556 1.63 1.85 (g) 0.23 60.5
11,655 1.70 1.92 (g) 0.11 53.5
10,466 1.64 1.81 (g) (0.21) 54.4
11,004 1.93 2.05 (g) (0.52) 54.5
15 1.16 (e),(f) — (0.07)(e) 42.1 (e)
1,489,023 0.97 0.99 (g) 0.25 42.1
1,475,200 0.98 1.00 (g) 0.93 60.5
1,046,022 0.99 1.01 (g) 0.83 53.5
957,766 0.98 1.00 (g) 0.45 54.4
736,530 1.00 1.02 (g) 0.41 54.5
(a) Calculated based on average shares outstanding during the period.(b) Total return is calculated without the front-end sales charge or contingent deferred sales charge, if applicable.(c) Period from June 3, 2014, date shares first offered, through October 31, 2014.(d) Total return amounts have not been annualized.(e) Computed on an annualized basis.(f) Reflects Manager's contractual expense limit.(g) Excludes expense reimbursement from Manager and/or Distributor.
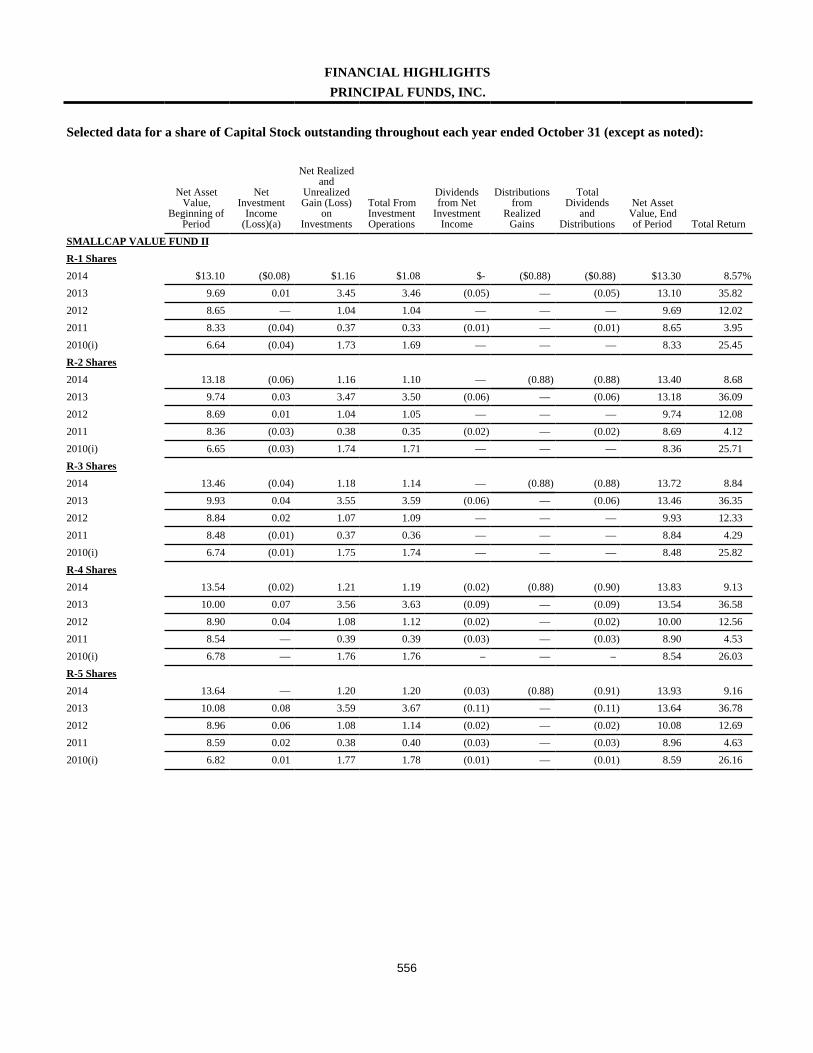
556
FINANCIAL HIGHLIGHTSPRINCIPAL FUNDS, INC.
Selected data for a share of Capital Stock outstanding throughout each year ended October 31 (except as noted):
Net AssetValue,
Beginning ofPeriod
NetInvestment
Income(Loss)(a)
Net Realizedand
UnrealizedGain (Loss)
onInvestments
Total FromInvestmentOperations
Dividendsfrom Net
InvestmentIncome
Distributionsfrom
RealizedGains
TotalDividends
andDistributions
Net AssetValue, Endof Period Total Return
SMALLCAP VALUE FUND IIR-1 Shares2014 $13.10 ($0.08) $1.16 $1.08 $- ($0.88) ($0.88) $13.30 8.57%2013 9.69 0.01 3.45 3.46 (0.05) — (0.05) 13.10 35.822012 8.65 — 1.04 1.04 — — — 9.69 12.022011 8.33 (0.04) 0.37 0.33 (0.01) — (0.01) 8.65 3.952010(i) 6.64 (0.04) 1.73 1.69 — — — 8.33 25.45R-2 Shares2014 13.18 (0.06) 1.16 1.10 — (0.88) (0.88) 13.40 8.682013 9.74 0.03 3.47 3.50 (0.06) — (0.06) 13.18 36.092012 8.69 0.01 1.04 1.05 — — — 9.74 12.082011 8.36 (0.03) 0.38 0.35 (0.02) — (0.02) 8.69 4.122010(i) 6.65 (0.03) 1.74 1.71 — — — 8.36 25.71R-3 Shares2014 13.46 (0.04) 1.18 1.14 — (0.88) (0.88) 13.72 8.842013 9.93 0.04 3.55 3.59 (0.06) — (0.06) 13.46 36.352012 8.84 0.02 1.07 1.09 — — — 9.93 12.332011 8.48 (0.01) 0.37 0.36 — — — 8.84 4.292010(i) 6.74 (0.01) 1.75 1.74 — — — 8.48 25.82R-4 Shares2014 13.54 (0.02) 1.21 1.19 (0.02) (0.88) (0.90) 13.83 9.132013 10.00 0.07 3.56 3.63 (0.09) — (0.09) 13.54 36.582012 8.90 0.04 1.08 1.12 (0.02) — (0.02) 10.00 12.562011 8.54 — 0.39 0.39 (0.03) — (0.03) 8.90 4.532010(i) 6.78 — 1.76 1.76 – — – 8.54 26.03R-5 Shares2014 13.64 — 1.20 1.20 (0.03) (0.88) (0.91) 13.93 9.162013 10.08 0.08 3.59 3.67 (0.11) — (0.11) 13.64 36.782012 8.96 0.06 1.08 1.14 (0.02) — (0.02) 10.08 12.692011 8.59 0.02 0.38 0.40 (0.03) — (0.03) 8.96 4.632010(i) 6.82 0.01 1.77 1.78 (0.01) — (0.01) 8.59 26.16
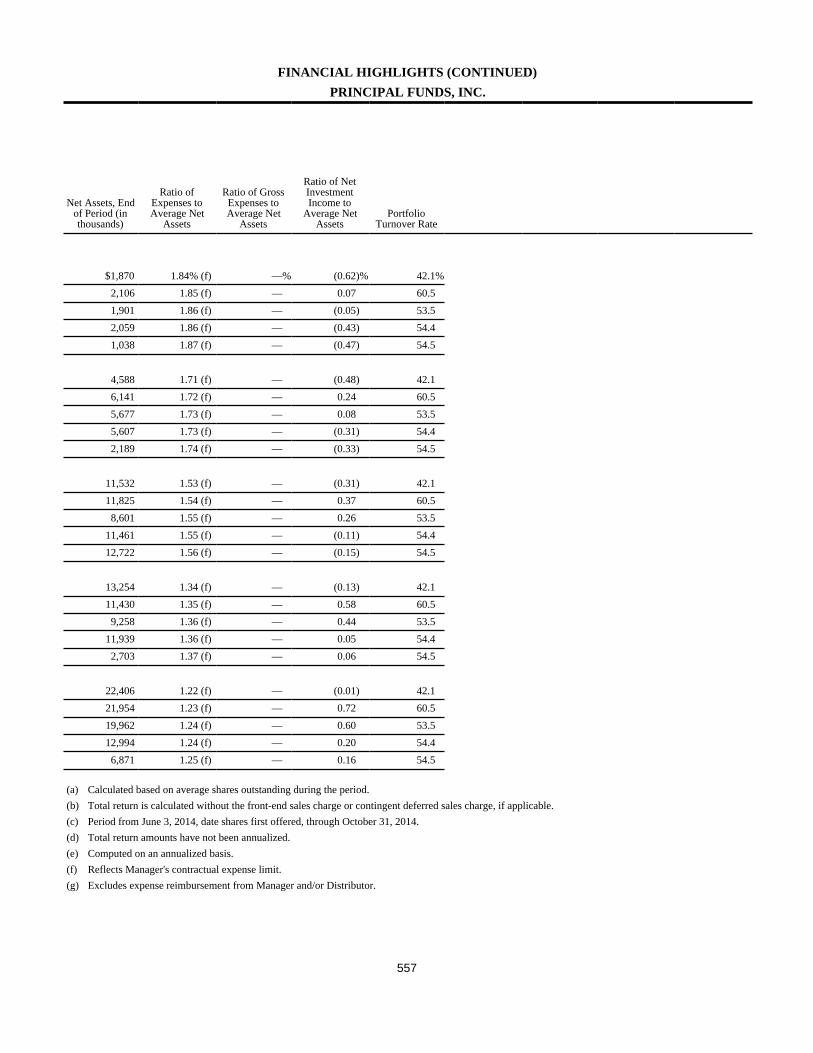
557
FINANCIAL HIGHLIGHTS (CONTINUED)PRINCIPAL FUNDS, INC.
Net Assets, Endof Period (inthousands)
Ratio ofExpenses toAverage Net
Assets
Ratio of GrossExpenses toAverage Net
Assets
Ratio of NetInvestmentIncome to
Average NetAssets
PortfolioTurnover Rate
$1,870 1.84% (f) —% (0.62)% 42.1%2,106 1.85 (f) — 0.07 60.51,901 1.86 (f) — (0.05) 53.52,059 1.86 (f) — (0.43) 54.41,038 1.87 (f) — (0.47) 54.5
4,588 1.71 (f) — (0.48) 42.16,141 1.72 (f) — 0.24 60.55,677 1.73 (f) — 0.08 53.55,607 1.73 (f) — (0.31) 54.42,189 1.74 (f) — (0.33) 54.5
11,532 1.53 (f) — (0.31) 42.111,825 1.54 (f) — 0.37 60.58,601 1.55 (f) — 0.26 53.5
11,461 1.55 (f) — (0.11) 54.412,722 1.56 (f) — (0.15) 54.5
13,254 1.34 (f) — (0.13) 42.111,430 1.35 (f) — 0.58 60.59,258 1.36 (f) — 0.44 53.5
11,939 1.36 (f) — 0.05 54.42,703 1.37 (f) — 0.06 54.5
22,406 1.22 (f) — (0.01) 42.121,954 1.23 (f) — 0.72 60.519,962 1.24 (f) — 0.60 53.512,994 1.24 (f) — 0.20 54.46,871 1.25 (f) — 0.16 54.5
(a) Calculated based on average shares outstanding during the period.(b) Total return is calculated without the front-end sales charge or contingent deferred sales charge, if applicable.(c) Period from June 3, 2014, date shares first offered, through October 31, 2014.(d) Total return amounts have not been annualized.(e) Computed on an annualized basis.(f) Reflects Manager's contractual expense limit.(g) Excludes expense reimbursement from Manager and/or Distributor.
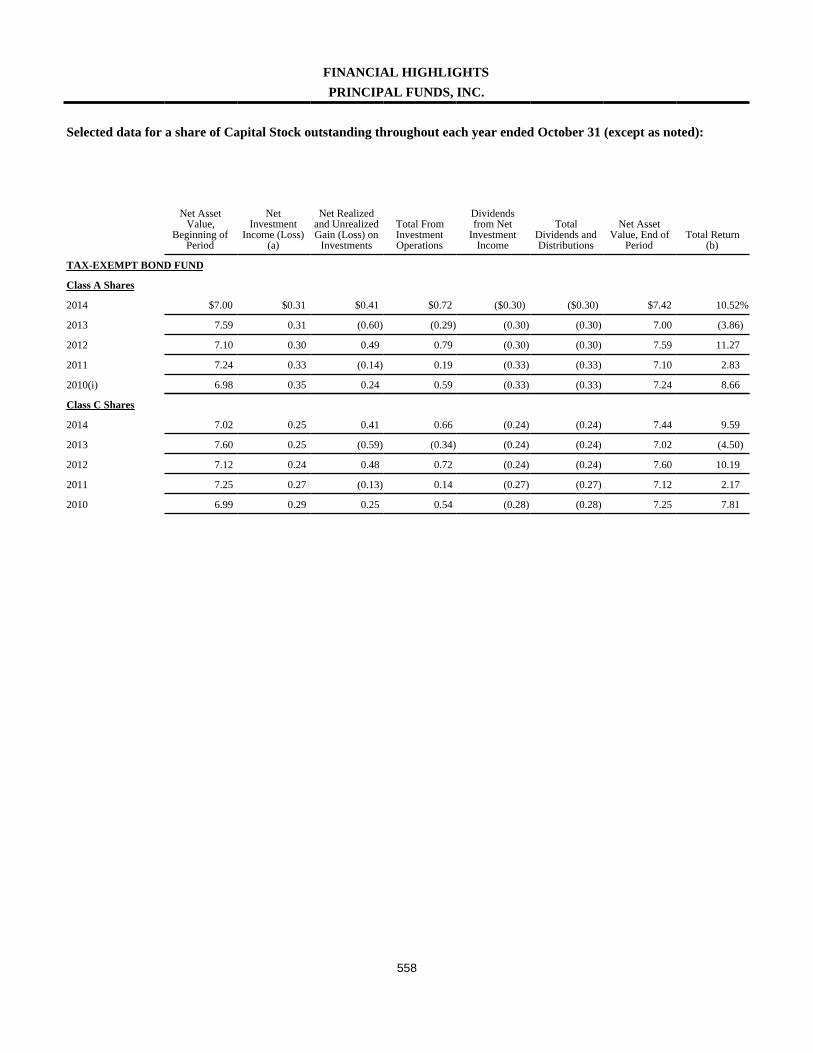
558
FINANCIAL HIGHLIGHTSPRINCIPAL FUNDS, INC.
Selected data for a share of Capital Stock outstanding throughout each year ended October 31 (except as noted):
Net AssetValue,
Beginning ofPeriod
NetInvestment
Income (Loss)(a)
Net Realizedand UnrealizedGain (Loss) on
Investments
Total FromInvestmentOperations
Dividendsfrom Net
InvestmentIncome
TotalDividends andDistributions
Net AssetValue, End of
PeriodTotal Return
(b)
TAX-EXEMPT BOND FUND
Class A Shares
2014 $7.00 $0.31 $0.41 $0.72 ($0.30) ($0.30) $7.42 10.52%
2013 7.59 0.31 (0.60) (0.29) (0.30) (0.30) 7.00 (3.86)
2012 7.10 0.30 0.49 0.79 (0.30) (0.30) 7.59 11.27
2011 7.24 0.33 (0.14) 0.19 (0.33) (0.33) 7.10 2.83
2010(i) 6.98 0.35 0.24 0.59 (0.33) (0.33) 7.24 8.66
Class C Shares
2014 7.02 0.25 0.41 0.66 (0.24) (0.24) 7.44 9.59
2013 7.60 0.25 (0.59) (0.34) (0.24) (0.24) 7.02 (4.50)
2012 7.12 0.24 0.48 0.72 (0.24) (0.24) 7.60 10.19
2011 7.25 0.27 (0.13) 0.14 (0.27) (0.27) 7.12 2.17
2010 6.99 0.29 0.25 0.54 (0.28) (0.28) 7.25 7.81
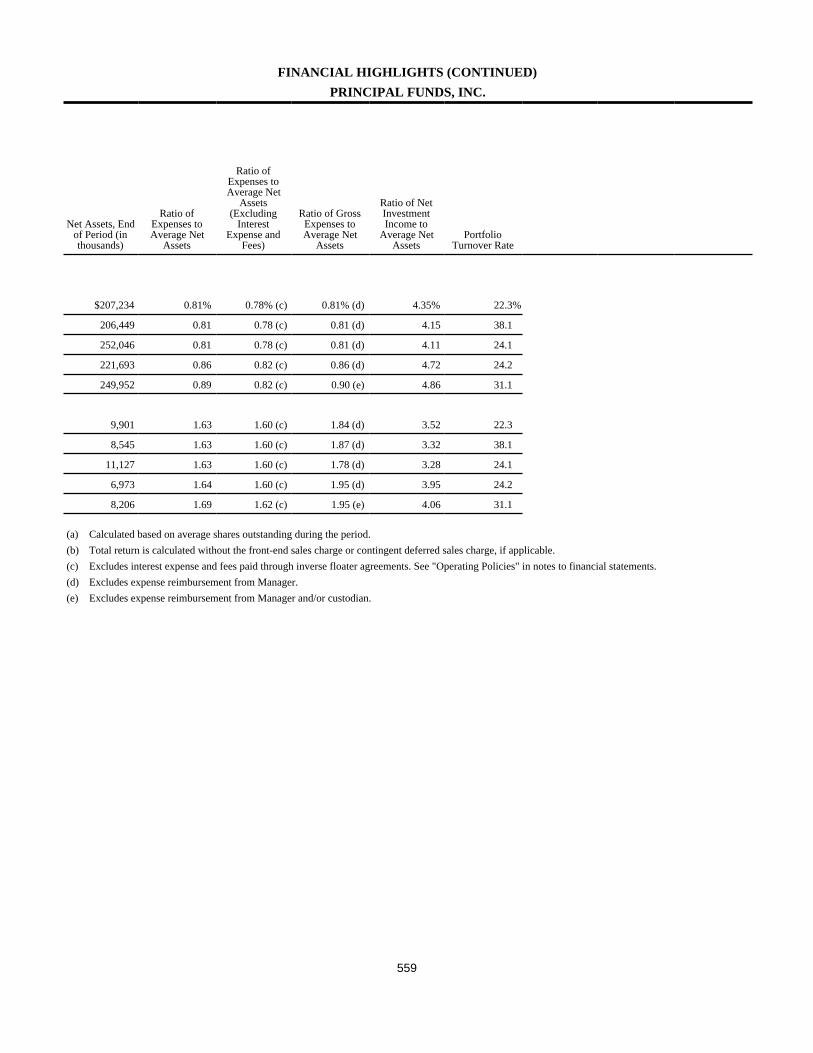
559
FINANCIAL HIGHLIGHTS (CONTINUED)PRINCIPAL FUNDS, INC.
Net Assets, Endof Period (inthousands)
Ratio ofExpenses toAverage Net
Assets
Ratio ofExpenses toAverage Net
Assets(Excluding
InterestExpense and
Fees)
Ratio of GrossExpenses toAverage Net
Assets
Ratio of NetInvestmentIncome to
Average NetAssets
PortfolioTurnover Rate
$207,234 0.81% 0.78% (c) 0.81% (d) 4.35% 22.3%
206,449 0.81 0.78 (c) 0.81 (d) 4.15 38.1
252,046 0.81 0.78 (c) 0.81 (d) 4.11 24.1
221,693 0.86 0.82 (c) 0.86 (d) 4.72 24.2
249,952 0.89 0.82 (c) 0.90 (e) 4.86 31.1
9,901 1.63 1.60 (c) 1.84 (d) 3.52 22.3
8,545 1.63 1.60 (c) 1.87 (d) 3.32 38.1
11,127 1.63 1.60 (c) 1.78 (d) 3.28 24.1
6,973 1.64 1.60 (c) 1.95 (d) 3.95 24.2
8,206 1.69 1.62 (c) 1.95 (e) 4.06 31.1
(a) Calculated based on average shares outstanding during the period.(b) Total return is calculated without the front-end sales charge or contingent deferred sales charge, if applicable.(c) Excludes interest expense and fees paid through inverse floater agreements. See "Operating Policies" in notes to financial statements.(d) Excludes expense reimbursement from Manager.(e) Excludes expense reimbursement from Manager and/or custodian.

560
APPENDIX A - DESCRIPTION OF BOND RATINGS:
Moody's Investors Service, Inc. Rating Definitions:Long-Term Obligation Ratings
Ratings assigned on Moody's global long-term obligation rating scales are forward-looking opinions of the relative credit risk of financial obligations issued by non-financial corporates, financial institutions, structured finance vehicles, project finance vehicles, and public sector entities. Long-term ratings are assigned to issuers or obligations with an original maturity of one year or more and reflect both on the likelihood of default on contractually promised payments and the expected financial loss suffered in the event of default.1
1 For certain structured finance, preferred stock and hybrid securities in which payment default events are either not defined or do not match investor’s expectations for timely payment, the ratings reflect the likelihood of impairment and the expected financial loss in the event of impairment.
Aaa: Obligations rated Aaa are judged to be of the highest quality, subject to the lowest level of credit risk.
Aa: Obligations rated Aa are judged to be of high quality and are subject to very low credit risk.
A: Obligations rated A are considered upper-medium grade and are subject to low credit risk.
Baa: Obligations rated Baa are subject to moderate credit risk. They are considered medium-grade and as such may possess certain speculative characteristics.
Ba: Obligations rated Ba are judged to be speculative and are subject to substantial credit risk.
B: Obligations rated B are considered speculative and are subject to high credit risk.
Caa: Obligations rated Caa are judged to be speculative of poor standing and are subject to very high credit risk.
Ca: Obligations rated Ca are highly speculative and are likely in, or very near, default, with some prospect of recovery of principal and interest.
C: Obligations rated C are the lowest rated class of bonds and are typically in default, with little prospect for recovery of principal or interest.
NOTE: Moody's appends numerical modifiers, 1, 2, and 3 to each generic rating classification from Aa through Caa. The modifier 1 indicates that the obligation ranks in the higher end of its generic rating category, the modifier 2 indicates a mid-range ranking, and the modifier 3 indicates a ranking in the lower end of that generic rating category. Additionally, a “(hyb)” indicator is appended to all ratings of hybrid securities issued by banks, issuers, financial companies, and securities firms.*
* By their terms, hybrid securities allow for the omission of scheduled dividends, interest, or principal payments, which can potentially result in impairment if such an omission occurs. Hybrid securities may also by subject to contractually allowable write-downs of principal that could result in impairment. Together the hybrid indicator, the long-term obligation rating assigned to a hybrid security is an expression of the relative credit risk associated with that security.
SHORT-TERM NOTES: Short-term ratings are assigned to obligations with an original maturity of thirteen months or less and reflect the likelihood of a default on contractually promised payments. Moody's employs the following three designations, all judged to be investment grade, to indicate the relative repayment ability of rated issuers:
Issuers rated Prime-1 (or related supporting institutions) have a superior ability to repay short-term debt obligations.
Issuers rated Prime-2 (or related supporting institutions) have a strong ability to repay short-term debt obligations.
Issuers rated Prime-3 (or related supporting institutions) have an acceptable ability to repay short-term promissory obligations.
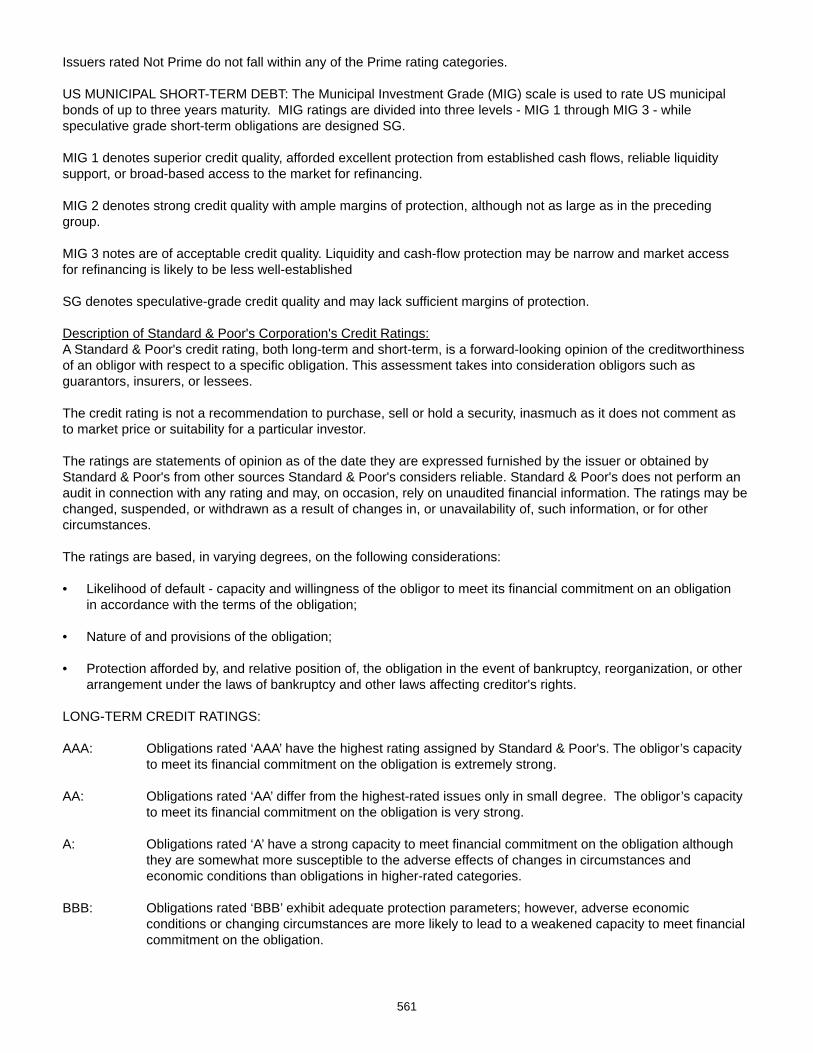
561
Issuers rated Not Prime do not fall within any of the Prime rating categories.
US MUNICIPAL SHORT-TERM DEBT: The Municipal Investment Grade (MIG) scale is used to rate US municipal bonds of up to three years maturity. MIG ratings are divided into three levels - MIG 1 through MIG 3 - while speculative grade short-term obligations are designed SG.
MIG 1 denotes superior credit quality, afforded excellent protection from established cash flows, reliable liquidity support, or broad-based access to the market for refinancing.
MIG 2 denotes strong credit quality with ample margins of protection, although not as large as in the preceding group.
MIG 3 notes are of acceptable credit quality. Liquidity and cash-flow protection may be narrow and market access for refinancing is likely to be less well-established
SG denotes speculative-grade credit quality and may lack sufficient margins of protection.
Description of Standard & Poor's Corporation's Credit Ratings:A Standard & Poor's credit rating, both long-term and short-term, is a forward-looking opinion of the creditworthiness of an obligor with respect to a specific obligation. This assessment takes into consideration obligors such as guarantors, insurers, or lessees.
The credit rating is not a recommendation to purchase, sell or hold a security, inasmuch as it does not comment as to market price or suitability for a particular investor.
The ratings are statements of opinion as of the date they are expressed furnished by the issuer or obtained by Standard & Poor's from other sources Standard & Poor's considers reliable. Standard & Poor's does not perform an audit in connection with any rating and may, on occasion, rely on unaudited financial information. The ratings may be changed, suspended, or withdrawn as a result of changes in, or unavailability of, such information, or for other circumstances.
The ratings are based, in varying degrees, on the following considerations:
• Likelihood of default - capacity and willingness of the obligor to meet its financial commitment on an obligation in accordance with the terms of the obligation;
• Nature of and provisions of the obligation;
• Protection afforded by, and relative position of, the obligation in the event of bankruptcy, reorganization, or other arrangement under the laws of bankruptcy and other laws affecting creditor's rights.
LONG-TERM CREDIT RATINGS:
AAA: Obligations rated ‘AAA’ have the highest rating assigned by Standard & Poor's. The obligor’s capacity to meet its financial commitment on the obligation is extremely strong.
AA: Obligations rated ‘AA’ differ from the highest-rated issues only in small degree. The obligor’s capacity to meet its financial commitment on the obligation is very strong.
A: Obligations rated ‘A’ have a strong capacity to meet financial commitment on the obligation although they are somewhat more susceptible to the adverse effects of changes in circumstances and economic conditions than obligations in higher-rated categories.
BBB: Obligations rated ‘BBB’ exhibit adequate protection parameters; however, adverse economic conditions or changing circumstances are more likely to lead to a weakened capacity to meet financial commitment on the obligation.
562
BB, B, CCC, Obligations rated ‘BB’, ‘B’, ‘CCC’, ‘CC’, and ‘C’ are regarded, on balance, as having significantCC, and C: speculative characteristics. ‘BB’ indicates the lowest degree of speculation and ‘C’ the highest degree
of speculation. While such obligations will likely have some quality and protective characteristics, these may be outweighed by large uncertainties or major risk exposures to adverse conditions.
BB: Obligations rated ‘BB’ are less vulnerable to nonpayment than other speculative issues. However it faces major ongoing uncertainties or exposure to adverse business, financial, or economic conditions which could lead to the obligor’s inadequate capacity to meet its financial commitment on the obligation.
B: Obligations rated ‘B’ are more vulnerable to nonpayment than ‘BB’ but the obligor currently has the capacity to meet its financial commitment on the obligation. Adverse business, financial, or economic conditions will likely impair this capacity.
CCC: Obligations rated ‘CCC’ are currently vulnerable to nonpayment and is dependent upon favorable business, financial, and economic conditions for the obligor to meet its financial commitment on the obligation. If adverse business, financial, or economic conditions occur, the obligor is not likely to have the capacity to meeting its financial commitment on the obligation.
CC: Obligations rated ‘CC’ are currently highly vulnerable to nonpayment. The ‘CC’ rating is used when a default has not yet occurred but Standard & Poor’s expects default to be a virtual certainty, regardless of anticipated time to default.
C: The rating ‘C’ is highly vulnerable to nonpayment, the obligation is expected to have lower relative seniority or lower ultimate recovery compared to higher rated obligations.
D: Obligations rated ‘D’ are in default, or in breach of an imputed promise. For non-hybrid capital instruments, the ‘D’ rating category is used when payments on an obligation are not made on the date due, unless Standard & Poor’s believes that such payments will be made within five business days in the absence of a stated grace period or within the earlier of the stated grace period or 30 calendar days. This rating will also be used upon filing for bankruptcy petition or the taking or similar action and where default is a virtual certainty. If an obligation is subject to a distressed exchange offer the rating is lowered to ‘D’.
Plus (+) or Minus (-): The ratings from ‘AA’ to ‘CCC’ may be modified by the addition of a plus or minus sign to show relative standing within the major rating categories.
NR: Indicates that no rating has been requested, that there is insufficient information on which to base a rating or that Standard & Poor’s does not rate a particular type of obligation as a matter of policy.
SHORT-TERM CREDIT RATINGS: Short-Term credit ratings are forward-looking opinions of the likelihood of timely payment of obligations having an original maturity of no more than 365 days. Ratings are graded into four categories, ranging from ‘A-1’ for the highest quality obligations to ‘D’ for the lowest. Ratings are applicable to both taxable and tax-exempt commercial paper. The four categories are as follows:
A-1: This is the highest category. The obligor’s capacity to meet its financial commitment on the obligation is strong. Within this category, certain obligations are designated with a plus sign (+). This indicates that the obligor’s capacity to meet its financial commitment on these obligations is extremely strong.
A-2: Issues carrying this designation are somewhat more susceptible to the adverse effects of the changes in circumstances and economic conditions than obligations in higher rating categories. However, the obligor’s capacity to meet its financial commitment on the obligation is satisfactory.
A-3: Issues carrying this designation exhibit adequate protection parameters. However, adverse economic conditions or changing circumstances are more likely to lead to a weakened capacity of the obligor to meet it financial commitment on the obligation.
563
B: Issues rated ‘B’ are regarded as vulnerable and have significant speculative characteristics. The obligor has capacity to meet financial commitments; however, it faces major ongoing uncertainties which could lead to obligor’s inadequate capacity to meet its financial obligations.
C: This rating is assigned to short-term debt obligations that are currently vulnerable to nonpayment and is dependent upon favorable business, financial, and economic conditions to meet its financial commitment on the obligation.
D: This rating indicates that the issue is either in default or in breach of an imputed promise. For non-hybrid capital instruments, the ‘D’ rating category is used when payments on an obligation are not made on the date due, unless Standard & Poor’s believes that such payments will be made within five business days in the absence of a stated grace period or within the earlier of the stated grace period or 30 calendar days. This rating will also be used upon filing for bankruptcy petition or the taking or similar action and where default is a virtual certainty. If an obligation is subject to a distressed exchange offer the rating is lowered to ‘D’.
MUNICIPAL SHORT-TERM NOTE RATINGS: Standard & Poor's rates U.S. municipal notes with a maturity of less than three years as follows:
SP-1: A strong capacity to pay principal and interest. Issues that possess a very strong capacity to pay debt service is given a "+" designation.
SP-2: A satisfactory capacity to pay principal and interest, with some vulnerability to adverse financial and economic changes over the terms of the notes.
SP-3: A speculative capacity to pay principal and interest.
Fitch, Inc. Rating Definitions:
Fitch’s credit ratings are forward looking and typically attempt to assess the likelihood of repayment by the obligor at “ultimate/final maturity” and thus material changes in economic conditions and expectations (for a particular issuer) may result in a rating change. Credit ratings are opinions on relative credit quality and not a predictive measure of specific default probability.
Investment Grade
AAA: Highest credit quality. ‘AAA’ ratings denote the lowest expectation of credit risk. They are assigned only in case of exceptionally strong capacity for payment of financial commitments. This capacity is highly unlikely to be adversely affected by foreseeable events.
AA: Very high credit quality. ‘AA’ ratings denote expectations of very low credit risk. They indicate very strong capacity for timely payment of financial commitments. This capacity is not significantly vulnerable to foreseeable events.
A: High credit quality. ‘A’ ratings denote low expectation of credit risk. The capacity for timely payment of financial commitments is considered strong. This capacity may, nevertheless, be more vulnerable to adverse business or economic conditions than is the case for higher ratings.
BBB: Good credit quality. ‘BBB’ ratings indicate that expectations of credit risk are currently low. The capacity for payment of financial commitments is considered adequate, but adverse business or economic conditions are more likely to impair this capacity.
Speculative Grade
BB: Speculative. ‘BB’ ratings indicate an elevated vulnerability to credit risk, particularly in the event of adverse changes in business or economic conditions over time; however, business or financial alternatives may be available to allow financial commitments to be met.
B: Highly speculative. ‘B’ ratings indicate that material credit risk is present.
564
CCC: Substantial credit risk. ‘CCC’ ratings indicate that substantial credit risk is present.
CC: Very high levels of credit risk. ‘CC’ ratings indicate very high levels of credit risk.
C: Exceptionally high levels of credit risk. ‘C’ indicates exceptionally high levels of credit risk.
D: Default. ‘D’ ratings indicate an issuer has entered into bankruptcy filings, administration, receivership, liquidation or which has otherwise ceased business.
Note: The modifiers “+” or “-“may be appended to a rating to denote relative status within major rating categories. Such suffixes are not added to the ‘AAA’ obligation rating category, or to corporate finance obligation ratings in the categories below ‘B’.
Short-Term Credit Ratings
A short-term issuer or obligation rating is based in all cases on the short-term vulnerability to default of the rated entity or security stream, and relates to the capacity to meet financial obligations in accordance with the documentation governing the relevant obligation. Short-Term Ratings are assigned to obligations whose initial maturity is viewed as “short term” based on market convention. Typically, this means up to 13 months for corporate, structured and sovereign obligations, and up to 36 months for obligations in US public finance markets.
F1: Highest short-term credit quality. Indicates the strongest intrinsic capacity for timely payment of financial commitments; may have an added “+” to denote any exceptionally strong credit feature.
F2: Good short-term credit quality. Good intrinsic capacity for timely payment of financial commitments.
F3: Fair short-term credit quality. The intrinsic capacity for timely payment of financial commitments is adequate.
B: Speculative short-term credit quality. Minimal capacity for timely payment of financial commitments, plus heightened vulnerability to near term adverse changes in financial and economic conditions.
C: High short-term default risk. Default is a real possibility.
RD: Restricted default. Indicates an entity that has defaulted on one or more of its financial commitments, although it continues to meet other financial obligations. Typically applicable to entity ratings only.
D: Default. Indicates a broad-based default event for an entity, or the default of a specific short-term obligation.
Recovery Ratings
Recovery Ratings are assigned to selected individual securities and obligations, most frequently for individual obligations of corporate issuers with speculative grade ratings.
Among the factors that affect recovery rates for securities are the collateral, the seniority relative to other obligations in the capital structure (where appropriate), and the expected value of the company or underlying collateral in distress.
The Recovery Rating scale is based upon the expected relative recovery characteristics of an obligation upon the curing of a default, emergence from insolvency or following the liquidation or termination of the obligor or its associated collateral. Recovery Ratings are an ordinal scale and do not attempt to precisely predict a given level of recovery. As a guideline in developing the rating assessments, the agency employs broad theoretical recovery bands in its ratings approach based on historical averages, but actual recoveries for a given security may deviate materially from historical averages.
RR1: Outstanding recovery prospects given default. ‘RR1’ rated securities have characteristics consistent with securities historically recovering 91%-100% of current principal and related interest.
565
RR2: Superior recovery prospects given default. ‘RR2’ rated securities have characteristics consistent with securities historically recovering 71%-90% of current principal and related interest.
RR3: Good recovery prospects given default. ‘RR3’ rated securities have characteristics consistent with securities historically recovering 51%-70% of current principal and related interest.
RR4: Average recovery prospects given default. ‘RR4’ rated securities have characteristics consistent with securities historically recovering 31%-50% of current principal and related interest.
RR5: Below average recovery prospects given default. ‘RR5’ rated securities have characteristics consistent with securities historically recovering 11%-30% of current principal and related interest.
RR6: Poor recovery prospects given default. ‘RR6’ rated securities have characteristics consistent with securities historically recovering 0%-10% of current principal and related interest.
566
APPENDIX B- RELATED PERFORMANCE OF ORIGIN ASSET MANAGEMENT LLP
Origin Asset Management LLP ("Origin") is the sub-advisor for the International Fund I (the "Fund"). The Fund has recently changed sub-advisors. Therefore, the Fund provides you with the following Performance Results table that shows the performance results of the Origin International (ex US) Composite as well as the performance of the MSCI EAFE Index NDTR D (the Fund’s primary benchmark) and the MSCI ACWI Ex-U.S. (the Fund’s primary benchmark effective June 30, 2014), broad-based securities market indexes comparable to Origin’s composite.
Origin’s composite consists of historical information about all client accounts Origin manages that have investment objectives, policies, and strategies substantially similar to those of the Fund. The composite is provided to illustrate Origin’s past performance in managing accounts with investment objectives and strategies substantially similar to those of the Fund. The composite does not represent the performance of the Fund. Origin’s composite is provided for time periods during which the Fund existed and, therefore, can be compared to the past performance of the Fund.
Origin computes its composite performance based upon its asset weighted average performance with regard to accounts it manages that have investment objectives, policies, and strategies substantially similar to those of the Fund. Origin’s composite performance results are net of all fees and expenses incurred by any client account in the composite. If Origin’s composite performance results were to be adjusted to reflect the fees and expenses of the Fund, the composite performance results shown would be lower. Although the Fund and the client accounts comprising the Origin composite have substantially similar investment objectives, policies, and strategies, you should not assume that the Fund will achieve the same performance as the composite. For example, the Fund's future performance may be better or worse than the composite's performance due to, among other things, differences in sales charges, expenses, asset sizes, and cash flows of the Fund and those of the client accounts represented in the composite.
The client accounts in Origin’s composite can change from time-to-time. None of the accounts included in the Origin composite are mutual funds registered under the Investment Company Act of 1940 (“1940 Act”). Those accounts are not subject to investment limitations, diversification requirements, and other restrictions imposed by the 1940 Act and the Internal Revenue Code. If such requirements were applicable to these accounts, the performance of the composite shown below may have been lower.
Portions of the information below are based on data supplied by Origin and from statistical services, reports, or other sources believed by Principal Management Corporation (“Principal”) to be reliable. However, Principal has not verified or audited such information.
The effect of taxes is not reflected in the composite performance information below because the effect would depend on each client's tax status.
Current performance of the Origin composite may be lower or higher than the performance data shown below.
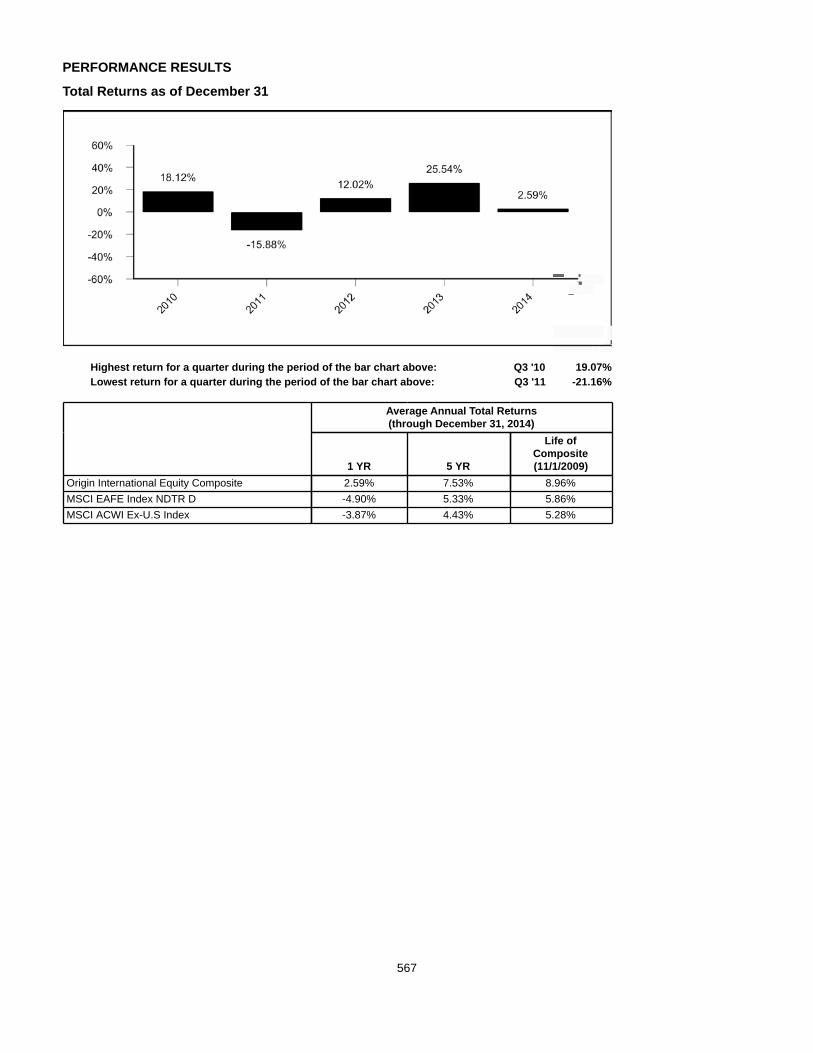
567
PERFORMANCE RESULTS
Total Returns as of December 31
Highest return for a quarter during the period of the bar chart above: Q3 '10 19.07%Lowest return for a quarter during the period of the bar chart above: Q3 '11 -21.16%
Average Annual Total Returns(through December 31, 2014)
1 YR 5 YR
Life ofComposite(11/1/2009)
Origin International Equity Composite 2.59% 7.53% 8.96%MSCI EAFE Index NDTR D -4.90% 5.33% 5.86%MSCI ACWI Ex-U.S Index -3.87% 4.43% 5.28%
568
ADDITIONAL INFORMATION
Additional information about the Fund is available in the Statement of Additional Information dated March 1, 2015, which is incorporated by reference into this prospectus. Additional information about the Funds’ investments is available in the Fund’s annual and semiannual reports to shareholders. In the Fund’s annual report, you will find a discussion of the market conditions and investment strategies that significantly affected the Funds’ performance during the last fiscal year. The Statement of Additional Information and the Fund’s annual and semiannual reports can be obtained free of charge by writing Principal Funds, P.O. Box 8024, Boston, MA 02266-8024. In addition, the Fund makes its Statement of Additional Information and annual and semiannual reports available, free of charge, on our website www.principalfunds.com/prospectus. To request this and other information about the Fund and to make shareholder inquiries, telephone 1-800-222-5852.
Information about the Fund (including the Statement of Additional Information) can be reviewed and copied at the Securities and Exchange Commission’s Public Reference Room in Washington, D.C. Information on the operation of the Public Reference Room may be obtained by calling the Commission at 1-202-551-8090. Reports and other information about the Fund are available on the EDGAR Database on the Commission’s internet site at http:// www.sec.gov. Copies of this information may be obtained, upon payment of a duplicating fee, by electronic request at the following e-mail address: [email protected], or by writing the Commission’s Public Reference Section, 100 F Street, N.E., Washington, D.C. 20549-1520.
The U.S. government does not insure or guarantee an investment in any of the Funds. There can be no assurance that the Money Market Fund will be able to maintain a stable share price of $1.00 per share.
Shares of the Funds are not deposits or obligations of, or guaranteed or endorsed by, any financial institution, nor are shares of the Funds federally insured by the Federal Deposit Insurance Corporation, the Federal Reserve Board, or any other agency.
Principal Funds, Inc. SEC File 811-07572


Principal Financial Group®, Des Moines, Iowa 50392-0001, www.principal.com
Principal Funds, Inc. is distributed by Principal Funds Distributor, Inc., member of the Principal Financial Group®. Principal Funds Distributor, Principal Shareholder Services, Principal Management Corporation and its affiliates, and Principal Funds, Inc. are collectively referred to as Principal Funds.
FV199A-16 | © 2012 Principal Financial Services, Inc. | 03/2012 | t12012502xk
WE’LL GIVE YOU AN EDGE®
FV716A-01 t140116037m2014 03/2014FV822A-0 | © 2015 Principal Financial Services,Inc. | 03/2015 | t140116037m
Principal Funds are distributed by Principal Funds Distributor, Inc.
FV822A-0 | © 2015 Principal Financial Services, Inc. | t150204040z | 03/2015