Embed Size (px)
Citation preview

PROSPECTUSNOVEMBER 1, 2016
SIT MUTUAL FUNDS:Sit Balanced Fund - SIBAX
Sit Dividend Growth Fund, Class I – SDVGXSit Dividend Growth Fund, Class S – SDVSX
Sit Global Dividend Growth Fund, Class I – GDGIXSit Global Dividend Growth Fund, Class S – GDGSX
Sit Large Cap Growth Fund – SNIGXSit Mid Cap Growth Fund – NBNGX
Sit ESG Growth Fund, Class I – IESGXSit ESG Growth Fund, Class S – SESGX
Sit Small Cap Dividend Growth Fund, Class I – SSCDXSit Small Cap Dividend Growth Fund, Class S – SDFSX
Sit International Growth Fund – SNGRXSit Small Cap Growth Fund – SSMGX
Sit Developing Markets Growth Fund – SDMGX
This prospectus describes ten stock funds that are part of the Sit Mutual Fund family of no-load mutual funds, which offer a selection of Funds to investors, each with a distinctive investment objective and risk/reward profile.
.
The Securities and Exchange Commission has not approved or disapproved these securities or passed upon the adequacy of this prospectus. Any representation to the contrary is a criminal offense.

Table of ContentsSUMMARY INFORMATION ABOUT THE FUNDS
Sit Balanced Fund 4Sit Dividend Growth Fund 9Sit Global Dividend Growth Fund 13Sit Large Cap Growth Fund 17Sit Mid Cap Growth Fund 21Sit ESG Growth Fund 25Sit Small Cap Dividend Growth Fund 28Sit International Growth Fund 31Sit Small Cap Growth Fund 35Sit Developing Markets Growth Fund 39
ADDITIONAL INFORMATION ABOUT THE FUNDSHow the Funds Invest 43More on the Funds’ Risks 44Temporary Defensive Investing 45Portfolio Turnover 46Portfolio Holdings Disclosure 46Duration 46Securities Ratings 46
MANAGEMENT OF THE FUNDSInvestment Adviser 47Portfolio Management 47
BUYING AND SELLING SHARESBuying Shares 51Selling Shares 52Exchanging Shares 52
ACCOUNT INFORMATION Pricing of Fund Shares 53When Orders are Effective 53Investing Through Financial Intermediaries 54Class I and Class S Shares 54Purchase Restrictions 55Excessive Trading in Fund Shares 55Small Account Balances / Mandatory Redemptions 55Uncashed Checks and Dormant Accounts 55Early Redemption Fee 56Investor Service Fees 56Customer Identification Program 56Mailing of Regulatory Documents 56Privacy Policy 57

DIVIDENDS AND DISTRIBUTIONS 58
TAXES Taxes on Distributions 59Taxes on Transactions 59Foreign Tax Credits 59Tax-Deferred Accounts 60
FINANCIAL HIGHLIGHTSSit Balanced Fund 61Sit Dividend Growth Fund - Class I 62Sit Dividend Growth Fund - Class S 63Sit Global Dividend Growth Fund - Class I 64Sit Global Dividend Growth Fund - Class S 65Sit Large Cap Growth Fund 66Sit Mid Cap Growth Fund 67Sit Small Cap Dividend Growth Fund - Class I 68Sit Small Cap Dividend Growth Fund - Class S 69Sit International Growth Fund 70Sit Small Cap Growth Fund 71Sit Developing Markets Growth Fund 72
FOR MORE INFORMATION 73

SUMMARY INFORMATION SIT BALANCED FUND
4
INVESTMENT OBJECTIVE
The Fund seeks long-term capital growth consistent with preservation of principal and seeks to provide shareholders with regular income.
FEES AND EXPENSES OF THE FUND
This table describes the fees and expenses that you may pay if you buy and hold shares of the Fund.
Shareholder Fees (fees paid directly from your investment) None
Annual Fund Operating Expenses (expenses that you pay each year as a percentage of the value of your investment)Management Fees 1.00% Acquired Fund Fees and Expenses(1) 0.02%
Total Annual Fund Operating Expenses 1.02%(1)
(1) The total annual fund operating expenses do not correlate to the ratio of expenses to average net assets shown in the Fund’s Financial Highlights, which does not include Acquired Fund Fees and Expenses. Acquired Fund Fees and Expenses represent fees and expenses incurred indirectly by the Fund as a result of its investment in shares of investment companies.
Example
This Example is intended to help you compare the cost of investing in the Fund with the cost of investing in other mutual funds. It assumes that you invest $10,000 in the Fund for the time periods indicated, that your investment has a 5% return each year, that the Fund’s operating expenses remain the same, and that you redeem all of your shares at the end of those periods. Although your actual costs and returns may be higher or lower, based on these assumptions your costs would be:
1 Year 3 Years 5 Years 10 Years
$105 $326 $566 $1,253
PORTFOLIO TURNOVER
The Fund pays transactions costs, such as commissions, when it buys and sells securities (or “turns over” its portfolio). A higher portfolio turnover rate may indicate higher transaction costs and may result in higher taxes when Fund shares are held in a taxable account. These costs, which are not reflected in annual fund operating expenses in the example, affect the Fund’s performance. During the most recent fiscal year, the Fund’s portfolio turnover rate was 54.46% of the average value of the portfolio.
Balanced

5
PRINCIPAL INVESTMENT STRATEGIES
The Fund seeks to achieve its objective by investing in a diversified portfolio of stocks and bonds. In seeking to achieve the Fund’s long-term capital growth objective, the Fund invests in common stocks of growth companies. To provide shareholders with regular income, the Fund invests in fixed-income securities and/or common stocks selected primarily for their dividend payment potential.
Between 35% and 65% of the Fund’s assets will be invested in common stocks and between 35% and 65% in fixed-income securi-ties. The Fund’s allocation of assets will vary over time in response to the Adviser’s evaluation of present and anticipated market and economic conditions.
The equity portion of the Fund’s portfolio is invested primarily in the common stocks of growth companies with a capitalization of $5 billion or more at the time of purchase.
In selecting equity securities for the Fund, the Adviser invests in growth-oriented companies it believes exhibit the potential for superior growth. The Adviser believes that a company’s earnings growth is the primary determinant of its potential long-term return and evaluates a company’s potential for above average long-term earnings and revenue growth. Several factors are considered in the Adviser’s evaluation of a company, including:
› unique product or service, › growing product demand, › dominant and growing market share, › management experience and capabilities, and › strong financial condition.
When selling equity securities for the Fund, the Adviser considers several factors, including changes in a company’s fundamentals and anticipated earnings.
The fixed-income portion of the Fund’s portfolio is invested primarily in a diversified portfolio of debt securities that may include the following securities:
› mortgage-backed securities (including collateralized mortgage obligations), such as securities issued by Government National Mortgage Association (GNMA securities are backed by the full faith and credit of the U.S. government), Federal Home Loan Mortgage Corporation (FHLMC) and Federal National Mortgage Association (FNMA) (FHLMC and FNMA securities are backed by the credit of the issuing governmental agency),
› asset-backed securities collateralized by assets such as automobile and credit card receivables, utilities, home improvement loans and home equity loans,
› obligations of the U.S. government, its agencies and instrumentalities, › corporate debt securities, › taxable municipal securities, and › short-term debt obligations, including commercial paper and bank instruments, such as certificates of deposit, time deposits,
and bankers’ acceptances. The Fund invests primarily in debt securities that, at the time of purchase, are either rated invest-ment-grade (BBB or above by Standard & Poor’s or Baa or above by Moody’s Investor Services), or, if unrated, determined to be of comparable quality by the Adviser. Unrated securities will not exceed 20% of the fixed-income portion of the Fund’s port-folio. As of September 30, 2016, there were no unrated securities in the fixed-income portion of the Fund’s portfolio.
In selecting fixed-income securities for the Fund, the Adviser seeks fixed-income securities providing maximum total return. In making purchase and sales decisions for the Fund, the Adviser considers its economic outlook and interest rate forecast, as well as its evaluation of a fixed-income security’s credit quality, yield, maturity, and liquidity. Based upon its economic outlook, the Adviser attempts to shift the fixed-income sector concentrations of the portfolio. Based upon its interest rate forecast, the Adviser attempts to shift the fixed-income portfolio’s average effective duration, seeking to maintain an average effective duration for the fixed-income portion of the Fund’s portfolio of 3 to 7 years. Duration is a measure of estimated price sensitivity relative to changes in interest rates. Portfolios with longer durations are typically more sensitive to changes in interest rates. For example, if interest rates rise by 1%, the market value of a security with an effective duration of 3 years would decrease by 3%, with all other factors being constant.
Summary — Sit Balanced Fund

6
PRINCIPAL INVESTMENT RISKS
You could lose money by investing in the Fund. The principal risks of investing in the Fund are as follows:
› Call Risk: Many bonds may be redeemed (“called”) at the option of the issuer before their stated maturity date. In general, an issuer will call its bonds if they can be refinanced by issuing new bonds which bear a lower interest rate. The Fund may then be forced to invest the unanticipated proceeds at lower interest rates, resulting in a decline in the Fund’s income.
› Credit Risk: The issuers or guarantors of securities of fixed-income securities owned by the Fund may default on the payment of principal or interest, or experience a decline in credit quality, causing the value of the Fund to decrease.
› Growth Style Investing Risk: Different types of stocks tend to shift into and out of favor with stock market investors depend-ing on market and economic conditions. The Fund invests in growth style stocks. The Fund’s performance may at times be better or worse than the performance of funds that focus on other types of stocks or that have a broader investment style.
› Income Risk: The income you earn from the Fund may decline due to declining interest rates. › Interest Rate Risk: An increase in interest rates may lower the Fund’s value and the overall return on your investment. The
magnitude of this decrease is often greater for longer-term fixed income securities than shorter-term securities. The Fund’s ex-posure to risks associated with rising interest rates may be increased due to the current period of historically low interest rates in the U.S. and the effect of potential governmental fiscal policy initiatives and resulting market reaction to those initiatives.
› Management Risk: A strategy used by the investment management team may not produce the intended results. › Market Risk: The market value of securities may fall or fail to rise. Market risk may affect a single issuer, sector of the econo-
my, or the market as a whole. The market value of securities may fluctuate, sometimes rapidly and unpredictably. › Prepayment and Extension Risk: Declining interest rates may compel borrowers to prepay mortgages and debt obligations
underlying the mortgage-backed and asset-backed securities owned by the Fund. The proceeds received by the Fund from pre-payments will likely be reinvested at interest rates lower than the original investment, thus resulting in a reduction of income to the Fund. Likewise, rising interest rates could reduce prepayments and extend the life of securities with lower interest rates, which may increase the sensitivity of the Fund’s value to rising interest rates.
HISTORICAL PERFORMANCE
The following bar chart and table provide information on the Fund’s volatility and performance. The Fund’s past performance before and after taxes is not necessarily an indication of how the Fund will perform in the future. The bar chart below is intended to provide you with an indication of the risks of investing in the Fund by showing changes in the Fund’s performance from year to year. The table below compares the Fund’s performance over different time periods to that of the Fund’s benchmark indices which are broad measures of market performance. Updated performance information is available at the Fund’s website at www.sitfunds.com or by calling 800-332-5580.
After-tax returns are calculated using historical highest individual federal marginal income tax rates and do not reflect the impact of state and local taxes. Actual after-tax returns depend on an investor’s tax situation and may differ from those shown. After-tax returns shown are not relevant to investors who hold their Fund shares through tax-deferred arrangements, such as 401(k) plans or individual retirement accounts.
Summary — Sit Balanced Fund
7
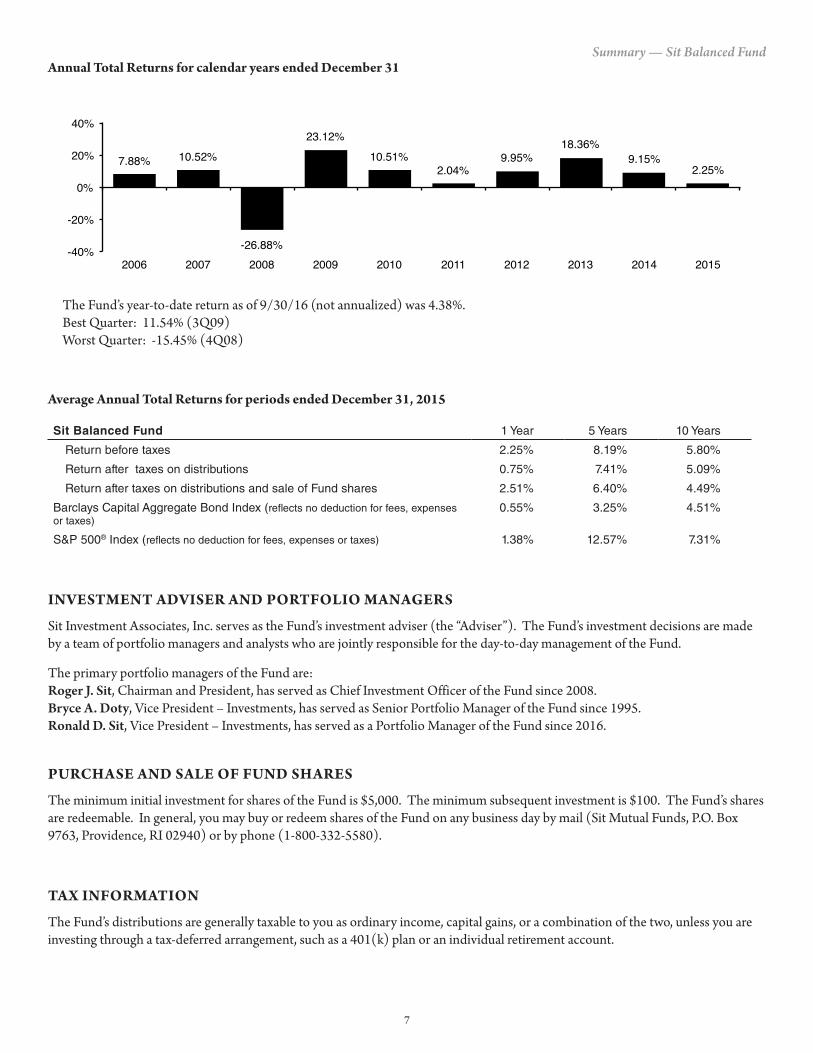
Annual Total Returns for calendar years ended December 31
7.88% 10.52%
-26.88%
23.12%10.51%
2.04%9.95%
18.36%9.15%
2.25%
-40%
-20%
0%
20%
40%
2006 2007 2008 2009 2010 2011 2012 2013 2014 2015
The Fund’s year-to-date return as of 9/30/16 (not annualized) was 4.38%. Best Quarter: 11.54% (3Q09) Worst Quarter: -15.45% (4Q08)
Average Annual Total Returns for periods ended December 31, 2015
Sit Balanced Fund 1 Year 5 Years 10 Years
Return before taxes 2.25% 8.19% 5.80%
Return after taxes on distributions 0.75% 7.41% 5.09%
Return after taxes on distributions and sale of Fund shares 2.51% 6.40% 4.49%
Barclays Capital Aggregate Bond Index (reflects no deduction for fees, expenses or taxes)
0.55% 3.25% 4.51%
S&P 500® Index (reflects no deduction for fees, expenses or taxes) 1.38% 12.57% 7.31%
INVESTMENT ADVISER AND PORTFOLIO MANAGERS
Sit Investment Associates, Inc. serves as the Fund’s investment adviser (the “Adviser”). The Fund’s investment decisions are made by a team of portfolio managers and analysts who are jointly responsible for the day-to-day management of the Fund.
The primary portfolio managers of the Fund are: Roger J. Sit, Chairman and President, has served as Chief Investment Officer of the Fund since 2008. Bryce A. Doty, Vice President – Investments, has served as Senior Portfolio Manager of the Fund since 1995. Ronald D. Sit, Vice President – Investments, has served as a Portfolio Manager of the Fund since 2016.
PURCHASE AND SALE OF FUND SHARES
The minimum initial investment for shares of the Fund is $5,000. The minimum subsequent investment is $100. The Fund’s shares are redeemable. In general, you may buy or redeem shares of the Fund on any business day by mail (Sit Mutual Funds, P.O. Box 9763, Providence, RI 02940) or by phone (1-800-332-5580).
TAX INFORMATION
The Fund’s distributions are generally taxable to you as ordinary income, capital gains, or a combination of the two, unless you are investing through a tax-deferred arrangement, such as a 401(k) plan or an individual retirement account.
Summary — Sit Balanced Fund

8
PAYMENTS TO BROKER-DEALERS AND OTHER FINANCIAL INTERMEDIARIES
If you purchase the Fund through a broker-dealer or other financial intermediary (such as a bank or financial adviser), the financial intermediary may impose account charges. The Fund and its related companies may also pay that intermediary for the sale of Fund shares and related services. These payments may create a conflict of interest by influencing the broker-dealer or other intermediary to recommend the Fund over another investment. Ask your intermediary or visit your intermediary’s website for more information.
Summary — Sit Balanced Fund

SUMMARY INFORMATION SIT DIVIDEND GROWTH FUND
9
INVESTMENT OBJECTIVE
The Fund primarily seeks to provide current income that exceeds the dividend yield of the S&P 500 Index and that grows over a period of years. Secondarily the Fund seeks long-term capital appreciation.
FEES AND EXPENSES OF THE FUND
This table describes the fees and expenses that you may pay if you buy and hold shares of the Fund.
Class I Class SShareholder Fees (fees paid directly from your investment)
Redemption Fee (as a percentage of amount redeemed only on shares held for less than 30 days) 2.00% 2.00%
Annual Fund Operating Expenses (expenses that you pay each year as a percentage of the value of your investment)Management Fees 1.00% 1.00% Distribution (12b-1) fees None 0.25%Acquired Fund Fees and Expenses(1) 0.07% 0.07%
Total Annual Fund Operating Expenses 1.07%(1) 1.32%(1)
(1) The total annual fund operating expenses do not correlate to the ratio of expenses to average net assets shown in the Fund’s Financial Highlights, which does not include Acquired Fund Fees and Expenses. Acquired Fund Fees and Expenses represent fees and expenses incurred indirectly by the Fund as a result of its investment in shares of investment companies.
Example
This Example is intended to help you compare the cost of investing in the Fund with the cost of investing in other mutual funds. It assumes that you invest $10,000 in the Fund for the time periods indicated, that your investment has a 5% return each year, that the Fund’s operating expenses remain the same, and that you redeem all of your shares at the end of those periods. Although your actual costs and returns may be higher or lower, based on these assumptions your costs would be:
1 Year 3 Years 5 Years 10 Years
Class I $110 $342 $593 $1,311
Class S $135 $421 $728 $1,598
PORTFOLIO TURNOVER
The Fund pays transactions costs, such as commissions, when it buys and sells securities (or “turns over” its portfolio). A higher portfolio turnover rate may indicate higher transaction costs and may result in higher taxes when Fund shares are held in a taxable account. These costs, which are not reflected in annual fund operating expenses in the example, affect the Fund’s performance. During the most recent fiscal year, the Fund’s portfolio turnover rate was 75.94% (both classes) of the average value of the portfolio.
Dividend

10
PRINCIPAL INVESTMENT STRATEGIES
The Fund seeks to achieve its objectives by investing, under normal market conditions, at least 80% of its net assets in dividend-pay-ing common stocks. The Fund may invest the balance of its assets in preferred stocks, convertible bonds, U.S. Treasury securities, closed-end investment companies, and master limited partnerships.
The Adviser invests in dividend paying growth-oriented companies it believes exhibit the potential for growth and growing dividend payments. The Adviser believes that a company’s earnings growth is a primary determinant of its potential long-term return, and that a record of increasing dividend payments is a strong indicator of financial health and growth prospects. By investing in dividend paying stocks it is anticipated that the holdings will tend to be in large to medium-sized companies (companies with market capi-talizations in excess of $2 billion). The Adviser considers several factors in its evaluation of a company’s potential for above average long-term earnings, revenue, and dividend growth, including:
› a record of paying dividends, › strong prospects for growing dividend payments indicated in part by growing earnings and cash flow, › unique product or service, › growing product demand, › dominant and growing market share, › management experience and capabilities, and › strong financial condition.
Since stocks that pay dividends tend to be less volatile and may not experience the same capital appreciation as stocks that don’t pay dividends, the Fund’s diversified portfolio of dividend paying stocks is expected to have lower volatility than that of the S&P 500 Index, but with a higher dividend yield and greater prospects for dividend growth.
The Fund may invest up to 20% of its net assets in securities of issuers domiciled outside the U.S.
When selling equity securities for the Fund, the Adviser considers several factors, including changes in a company’s fundamentals, anticipated earnings, anticipated dividend payments and financial position.
PRINCIPAL INVESTMENT RISKS
You could lose money by investing in the Fund. The principal risks of investing in the Fund are as follows:
› Dividend Paying Company Risk: The Fund’s income objective may limit its ability to appreciate during a broad market ad-vance because dividend paying stocks may not experience the same capital appreciation as non-dividend paying stocks. In ad-dition, stocks held by the Fund may reduce or stop paying dividends which could affect the Fund’s ability to generate income.
› Growth Style Investing Risk: Different types of stocks tend to shift into and out of favor with stock market investors depend-ing on market and economic conditions. The Fund invests in growth style stocks. The Fund’s performance may at times be better or worse than the performance of funds that focus on other types of stocks or that have a broader investment style.
› International Investing Risk: Because the Fund may invest in foreign securities, there is an international investing risk. Inter-national investing involves risks not typically associated with investing in U.S. securities which may adversely affect the Fund’s investment. These risks include currency risk, foreign securities market risk, foreign tax risk, information risk, investment restriction risk, and political and economic risks.
› Management Risk: A strategy used by the investment management team may not produce the intended results. › Market Risk: The market value of securities may fall or fail to rise. Market risk may affect a single issuer, sector of the econo-
my, or the market as a whole. The market value of securities may fluctuate, sometimes rapidly and unpredictably. › Mid Cap Stock Risk: Stocks of mid cap stocks may be subject to more abrupt or erratic market movement than stocks of
larger, more established companies.
Summary — Sit Dividend Growth Fund

11
HISTORICAL PERFORMANCE
The following bar chart and table provide information on the Fund’s volatility and performance. The Fund’s past performance before and after taxes is not necessarily an indication of how the Fund will perform in the future. The bar chart below is intended to provide you with an indication of the risks of investing in the Fund by showing changes in the Fund’s performance from year to year for Class I shares. The table below compares the Fund’s performance over different time periods to that of the Fund’s benchmark index, which is a broad measure of market performance. Updated performance information is available at the Fund’s website at www.sitfunds.com or by calling 800-332-5580.
After-tax returns are calculated using historical highest individual federal marginal income tax rates and do not reflect the impact of state and local taxes. Actual after-tax returns depend on an investor’s tax situation and may differ from those shown. After-tax returns shown are not relevant to investors who hold their Fund shares through tax-deferred arrangements, such as 401(k) plans or individual retirement accounts. After-tax returns are shown only for Class I shares; after-tax returns for Class S shares will vary.
Annual Total Returns for calendar years ended December 31 (Class I)
18.29%12.89%
-29.60%
25.59%16.43%
3.29%13.54%
28.18%
12.12%
0.51%
-50%
-30%
-10%
10%
30%
2006 2007 2008 2009 2010 2011 2012 2013 2014 2015
The Fund’s year-to-date return as of 9/30/16 (not annualized) was 7.56%. Best Quarter: 14.44% (2Q09) Worst Quarter: -19.13% (4Q08)
Average Annual Total Returns for periods ended December 31, 2015
Sit Dividend Growth Fund 1 Year 5 Years 10 Years
Class I Return before taxes (inception 12/31/03) 0.51% 11.12% 8.82%
Class I Return after taxes on distributions -2.47% 9.34% 7.61%
Class I Return after taxes on distributions and sale of Fund shares 2.71% 8.84% 7.17%
Class S Return before taxes (inception 3/31/06) 0.25% 10.83% N/A
S&P 500® Index (reflects no deduction for fees, expenses or taxes) 1.38% 12.57% 7.31%
INVESTMENT ADVISER AND PORTFOLIO MANAGERS
Sit Investment Associates, Inc. serves as the Fund’s investment adviser (the “Adviser”). The Fund’s investment decisions are made by a team of portfolio managers and analysts who are jointly responsible for the day-to-day management of the Fund.
The primary portfolio managers of the Fund are: Roger J. Sit, Chairman and President. Mr. Sit has served as Chief Investment Officer of the Fund since 2003. Kent L. Johnson, Vice President – Investments. Mr. Johnson has served as Portfolio Manager of the Fund since 2003. Michael J. Stellmacher, Vice President – Research and Investment Management of the Adviser. Mr. Stellmacher has served as Port-folio Manager of the Fund since 2003.
Summary — Sit Dividend Growth Fund

12
PURCHASE AND SALE OF FUND SHARES
The minimum initial investment for Class S shares of the Fund is $5,000, and the minimum initial investment for Class I shares of the Fund is $100,000. The minimum subsequent investment for either share class is $100. The Fund’s shares are redeemable. In general, you may buy or redeem shares of the Fund on any business day by mail (Sit Mutual Funds, P.O. Box 9763, Providence, RI 02940) or by phone (1-800-332-5580).
TAX INFORMATION
The Fund’s distributions are generally taxable to you as ordinary income, capital gains, or a combination of the two, unless you are investing through a tax-deferred arrangement, such as a 401(k) plan or an individual retirement account.
PAYMENTS TO BROKER-DEALERS AND OTHER FINANCIAL INTERMEDIARIES
If you purchase the Fund through a broker-dealer or other financial intermediary (such as a bank or financial adviser), the financial intermediary may impose account charges. The Fund and its related companies may also pay that intermediary for the sale of Fund shares and related services. These payments may create a conflict of interest by influencing the broker-dealer or other intermediary to recommend the Fund over another investment. Ask your intermediary or visit your intermediary’s website for more information.
Summary — Sit Dividend Growth Fund

SUMMARY INFORMATION SIT GLOBAL DIVIDEND GROWTH FUND
13
INVESTMENT OBJECTIVE
The Fund seeks to provide current income that exceeds the dividend yield of a composite index (comprised of 60% S&P 500® Index and 40% MSCI EAFE Index) and that grows over a period of years. Secondarily the Fund seeks long-term capital appreciation.
FEES AND EXPENSES OF THE FUND
This table describes the fees and expenses that you may pay if you buy and hold shares of the Fund.
Class I Class SShareholder Fees (fees paid directly from your investment)
Redemption Fee (as a percentage of amount redeemed only on shares held for less than 30 days) 2.00% 2.00%
Annual Fund Operating Expenses (expenses that you pay each year as a percentage of the value of your investment)Management Fees 1.25% 1.25% Distribution (12b-1) fees None 0.25%Acquired Fund Fees and Expenses(1) 0.02% 0.02%
Total Annual Fund Operating Expenses 1.27%(1) 1.52%(1)
(1) The total annual fund operating expenses do not correlate to the ratio of expenses to average net assets shown in the Fund’s Financial Highlights, which does not include Acquired Fund Fees and Expenses. Acquired Fund Fees and Expenses represent fees and expenses incurred indirectly by the Fund as a result of its investment in shares of investment companies.
Example
This example is intended to help you compare the cost of investing in the Fund with the cost of investing in other mutual funds. It assumes that you invest $10,000 in the Fund for the time periods indicated, that your investment has a 5% return each year, that the Fund’s operating expenses remain the same, and that you redeem all of your shares at the end of those periods. Although your actual costs and returns may be higher or lower, based on these assumptions your costs would be:
1 Year 3 Years 5 Years 10 Years
Class I $130 $405 $701 $1,541
Class S $156 $484 $835 $1,823
PORTFOLIO TURNOVER
The Fund pays transactions costs, such as commissions, when it buys and sells securities (or “turns over” its portfolio). A higher portfolio turnover rate may indicate higher transaction costs and may result in higher taxes when Fund shares are held in a taxable account. These costs, which are not reflected in annual fund operating expenses in the example, affect the Fund’s performance. During the most recent fiscal year, the Fund’s portfolio turnover rate was 48.30% (both classes) of the average value of the portfolio.
Global

14
PRINCIPAL INVESTMENT STRATEGIES
The Fund seeks to achieve its objectives by investing, under normal market conditions, at least 80% of its net assets in dividend-pay-ing common stocks issued by U.S. and foreign companies. The Fund may invest the balance of its assets in preferred stocks, convert-ible bonds, U.S. Treasury securities, closed-end investment companies, and master limited partnerships.
The Fund’s diversified portfolio is designed to have lower volatility than that of the MSCI World Index, but with a higher yield and greater prospects for dividend growth.
The Adviser invests in dividend paying growth-oriented companies it believes exhibit the potential for growth and growing dividend payments. The Adviser believes that a company’s earnings growth is a primary determinant of its potential long-term return, and that a record of increasing dividend payments is a strong indicator of financial health and growth prospects. By investing in dividend paying stocks it is anticipated that the holdings will tend to be in large to medium-sized companies (companies with market capital-ization in excess of $2 billion).
The Adviser considers several factors in its evaluation of a company’s potential for above average long-term earnings, revenue, and dividend growth, including:
› a record of paying dividends, › strong prospects for growing dividend payments indicated in part by growing earnings and cash flow, › unique product or service, › growing product demand, › dominant and growing market share, › management experience and capabilities, and › strong financial condition.
Since stocks that pay dividends tend to be less volatile and may not experience the same capital appreciation as stocks that don’t pay dividends, the Fund’s diversified portfolio of dividend paying stocks is expected to have lower volatility than that of the MSCI World Index, but with a higher dividend yield and greater prospects for dividend growth.
The Fund diversifies its investments among a number of different countries throughout the world, but not fewer than three coun-tries. Under normal market conditions, the Fund will invest significantly (at least 30% of its net assets) in companies outside the U.S.
When selling equity securities for the Fund, the Adviser considers several factors, including changes in the company’s fundamentals, anticipated earnings, anticipated dividend payments and financial position.
PRINCIPAL INVESTMENT RISKS
You could lose money by investing in the Fund. The principal risks of investing in the Fund are as follows:
› Dividend Paying Company Risk: The Fund’s income objective may limit its ability to appreciate during a broad market ad-vance because dividend paying stocks may not experience the same capital appreciation as non-dividend paying stocks. In ad-dition, stocks held by the Fund may reduce or stop paying dividends which could affect the Fund’s ability to generate income.
› Growth Style Investing Risk: Different types of stocks tend to shift into and out of favor with stock market investors depend-ing on market and economic conditions. The Fund invests in growth style stocks. The Fund’s performance may at times be better or worse than the performance of funds that focus on other types of stocks or that have a broader investment style.
› International Investing Risk: International investing involves risks not typically associated with investing in U.S. securities which may adversely affect the Fund’s investment. These risks include currency risk, foreign securities market risk, foreign tax risk, information risk, investment restriction risk, and political and economic risks.
› Management Risk: A strategy used by the investment management team may not produce the intended results. › Market Risk: The market value of securities may fall or fail to rise. Market risk may affect a single issuer, sector of the econo-
my, or the market as a whole. The market value of securities may fluctuate, sometimes rapidly and unpredictably. › Mid Cap Stock Risk: Stocks of mid cap stocks may be subject to more abrupt or erratic market movement than stocks of
larger, more established companies.
Summary — Sit Global Dividend Growth Fund

15
HISTORICAL PERFORMANCE
The following bar chart and table provide information on the Fund’s volatility and performance. The Fund’s past performance before and after taxes is not necessarily an indication of how the Fund will perform in the future. The bar chart below is intended to provide you with an indication of the risks of investing in the Fund by showing changes in the Fund’s performance from year to year for Class I shares. The table below compares the Fund’s performance over different time periods to that of the Fund’s benchmark index, which is a broad measure of market performance. Updated performance information is available at the Fund’s website at www.sitfunds.com or by calling 800-332-5580.
After-tax returns are calculated using historical highest individual federal marginal income tax rates and do not reflect the impact of state and local taxes. Actual after-tax returns depend on an investor’s tax situation and may differ from those shown. After-tax returns shown are not relevant to investors who hold their Fund shares through tax-deferred arrangements, such as 401(k) plans or individual retirement accounts. After-tax returns are shown only for Class I shares; after-tax returns for Class S shares will vary.
Annual Total Returns for calendar years ended December 31 (Class I)
-5.25%
24.65%
11.58%
-2.58%
13.61%21.70%
4.03%
-0.93%
-30%
-10%
10%
30%
2008 2009 2010 2011 2012 2013 2014 2015
The Fund’s year-to-date return as of 9/30/16 (not annualized) was 4.41% Best Quarter: 16.30% (2Q09); Worst Quarter: -16.65% (3Q11)
Average Annual Total Returns for periods ended December 31, 2015
Sit Global Dividend Growth Fund 1 Year 5 Years Life of Fund
Class I Return before taxes (inception 9/30/08) -0.93% 6.78% 8.68%
Class I Return after taxes on distributions -3.00% 5.47% 7.66%
Class I Return after taxes on distributions and sale of Fund shares 1.17% 5.35% 7.01%
Class S Return before taxes (inception 9/30/08) -1.21% 6.50% 8.40%
MSCI World Index (reflects no deduction for fees, expenses or taxes) -0.87% 7.59% 7.04%
INVESTMENT ADVISER AND PORTFOLIO MANAGERS
Sit Investment Associates, Inc. serves as the Fund’s investment adviser (the “Adviser”). The Fund’s investment decisions are made by a team of portfolio managers and analysts who are jointly responsible for the day-to-day management of the Fund.
The primary portfolio managers of the Fund are: Roger J. Sit, Chairman and President. Mr. Sit has served as Chief Investment Officer of the Fund since 2008, the Fund’s inception. Kent L. Johnson, Vice President – Investments. Mr. Johnson has served as Portfolio Manager of the Fund since 2008, the Fund’s inception. Michael J. Stellmacher, Vice President – Research and Investment Management of the Adviser. Mr. Stellmacher has served as Port-folio Manager of the Fund since 2008, the Fund’s inception. Tasha M. Murdoff, Vice President – Research and Investment Management of the Adviser. Ms. Murdoff has served as Portfolio Manager of the Fund since 2008, the Fund’s inception.
Summary — Sit Global Dividend Growth Fund

16
Raymond E. Sit, Vice President – Research and Investment Management of the Adviser. Mr. Sit has served as Portfolio Manager of the Fund since 2008, the Fund’s inception.
PURCHASE AND SALE OF FUND SHARES
The minimum initial investment for Class S shares of the Fund is $5,000, and the minimum initial investment for Class I shares of the Fund is $100,000. The minimum subsequent investment for either share class is $100. The Fund’s shares are redeemable. In general, you may buy or redeem shares of the Fund on any business day by mail (Sit Mutual Funds, P.O. Box 9763, Providence, RI 02940) or by phone (1-800-332-5580).
TAX INFORMATION
The Fund’s distributions are generally taxable to you as ordinary income, capital gains, or a combination of the two, unless you are investing through a tax-deferred arrangement, such as a 401(k) plan or an individual retirement account.
PAYMENTS TO BROKER-DEALERS AND OTHER FINANCIAL INTERMEDIARIES
If you purchase the Fund through a broker-dealer or other financial intermediary (such as a bank or financial adviser), the financial intermediary may impose account charges. The Fund and its related companies may also pay that intermediary for the sale of Fund shares and related services. These payments may create a conflict of interest by influencing the broker-dealer or other intermediary to recommend the Fund over another investment. Ask your intermediary or visit your intermediary’s website for more information.
Summary — Sit Global Dividend Growth Fund

SUMMARY INFORMATION SIT LARGE CAP GROWTH FUND
17
INVESTMENT OBJECTIVE
The Fund seeks to maximize long-term capital appreciation.
FEES AND EXPENSES OF THE FUND
This table describes the fees and expenses that you may pay if you buy and hold shares of the Fund.
Shareholder Fees (fees paid directly from your investment)Redemption Fee (as a percentatge of amount redeemed only on shares held for less than 30 days) 2.00%
Annual Fund Operating Expenses (expenses that you pay each year as a percentage of the value of your investment)Management Fees 1.00%
Total Annual Fund Operating Expenses 1.00%
Example
This Example is intended to help you compare the cost of investing in the Fund with the cost of investing in other mutual funds. It assumes that you invest $10,000 in the Fund for the time periods indicated, that your investment has a 5% return each year, that the Fund’s operating expenses remain the same, and that you redeem all of your shares at the end of those periods. Although your actual costs and returns may be higher or lower, based on these assumptions your costs would be:
1 Year 3 Years 5 Years 10 Years
$103 $320 $555 $1,229
PORTFOLIO TURNOVER
The Fund pays transactions costs, such as commissions, when it buys and sells securities (or “turns over” its portfolio). A higher portfolio turnover rate may indicate higher transaction costs and may result in higher taxes when Fund shares are held in a taxable account. These costs, which are not reflected in annual fund operating expenses in the example, affect the Fund’s performance. During the most recent fiscal year, the Fund’s portfolio turnover rate was 20.05% of the average value of the portfolio.
PRINCIPAL INVESTMENT STRATEGIES
The Fund seeks to achieve its objective by investing, under normal market conditions, at least 80% of its net assets in the common stocks of companies with capitalizations of $5 billion or more at the time of purchase.
The Adviser invests in domestic growth-oriented companies it believes exhibit the potential for superior growth. The Fund focuses on stocks issued by companies with long records of earnings and revenue growth. The Adviser believes that a company’s earnings

18
growth is the primary determinant of its potential long-term return and evaluates a company’s potential for above average long-term earnings and revenue growth. Several factors are considered in the Adviser’s evaluation of a company, including:
› unique product or service, › growing product demand, › dominant and growing market share, › management experience and capabilities, and › strong financial condition.
When selling equity securities for the Fund, the Adviser considers several factors, including changes in a company’s fundamentals and anticipated earnings.
PRINCIPAL INVESTMENT RISKS
You could lose money by investing in the Fund. The principal risks of investing in the Fund are as follows:
› Growth Style Investing Risk: Different types of stocks tend to shift into and out of favor with stock market investors depend-ing on market and economic conditions. The Fund invests in growth style stocks. The Fund’s performance may at times be better or worse than the performance of funds that focus on other types of stocks or that have a broader investment style.
› Management Risk: A strategy used by the investment management team may not produce the intended results. › Market Risk: The market value of securities may fall or fail to rise. Market risk may affect a single issuer, sector of the econo-
my, or the market as a whole. The market value of securities may fluctuate, sometimes rapidly and unpredictably.
HISTORICAL PERFORMANCE
The following bar chart and table provide information on the Fund’s volatility and performance. The Fund’s past performance before and after taxes is not necessarily an indication of how the Fund will perform in the future. The bar chart below is intended to provide you with an indication of the risks of investing in the Fund by showing changes in the Fund’s performance from year to year. The table below compares the Fund’s performance over different time periods to that of the Fund’s benchmark index, which is a broad measure of market performance. Updated performance information is available at the Fund’s website at www.sitfunds.com or by calling 800-332-5580.
After-tax returns are calculated using historical highest individual federal marginal income tax rates and do not reflect the impact of state and local taxes. Actual after-tax returns depend on an investor’s tax situation and may differ from those shown. After-tax returns shown are not relevant to investors who hold their Fund shares through tax-deferred arrangements, such as 401(k) plans or individual retirement accounts.
Summary — Sit Large Cap Growth Fund

19
Annual Total Returns for calendar years ended December 31
9.54% 14.14%
-34.10%
28.14%
10.79%
-0.53%
13.96%
29.21%
10.97%4.47%
-60%
-40%
-20%
0%
20%
40%
2006 2007 2008 2009 2010 2011 2012 2013 2014 2015
The Fund’s year-to-date return as of 9/30/16 (not annualized) was 3.58%. Best Quarter: 15.11% (3Q12) Worst Quarter: -21.13% (4Q08)
Average Annual Total Returns for periods ended December 31, 2015
Sit Large Cap Growth Fund 1 Year 5 Years 10 Years
Return before taxes 4.47% 11.17% 7.10%
Return after taxes on distributions -1.26% 8.09% 5.57%
Return after taxes on distributions and sale of Fund shares 7.25% 8.85% 5.74%
Russell 1000® Growth Index (reflects no deduction for fees, expenses or taxes) 5.67% 13.53% 8.53%
INVESTMENT ADVISER AND PORTFOLIO MANAGERS
Sit Investment Associates, Inc. serves as the Fund’s investment adviser (the “Adviser”). The Fund’s investment decisions are made by a team of portfolio managers and analysts who are jointly responsible for the day-to-day management of the Fund.
The primary portfolio managers of the Fund are: Roger J. Sit, Chairman and President. Mr. Sit has served as Chief Investment Officer of the Fund since 1997. Ronald D. Sit, Vice President – Investments. Mr. Sit has served as Portfolio Manager of the Fund since 1984. Michael J. Stellmacher, Vice President – Research and Investment Management of the Adviser. Mr. Stellmacher has served as Port-folio Manager of the Fund since 2008.
PURCHASE AND SALE OF FUND SHARES
The minimum initial investment for shares of the Fund is $5,000. The minimum subsequent investment is $100. The Fund’s shares are redeemable. In general, you may buy or redeem shares of the Fund on any business day by mail (Sit Mutual Funds, P.O. Box 9763, Providence, RI 02940) or by phone (1-800-332-5580).
TAX INFORMATION
The Fund’s distributions are generally taxable to you as ordinary income, capital gains, or a combination of the two, unless you are investing through a tax-deferred arrangement, such as a 401(k) plan or an individual retirement account.
Summary — Sit Large Cap Growth Fund

20
PAYMENTS TO BROKER-DEALERS AND OTHER FINANCIAL INTERMEDIARIES
If you purchase the Fund through a broker-dealer or other financial intermediary (such as a bank or financial adviser), the financial intermediary may impose account charges. The Fund and its related companies may also pay that intermediary for the sale of Fund shares and related services. These payments may create a conflict of interest by influencing the broker-dealer or other intermediary to recommend the Fund over another investment. Ask your intermediary or visit your intermediary’s website for more information.
Summary — Sit Large Cap Growth Fund

SUMMARY INFORMATION SIT MID CAP GROWTH FUND
21
INVESTMENT OBJECTIVE
The Fund seeks to maximize long-term capital appreciation.
FEES AND EXPENSES OF THE FUND
This table describes the fees and expenses that you may pay if you buy and hold shares of the Fund.
Shareholder Fees (fees paid directly from your investment)Redemption Fee (as a percentage of amount redeemed only on shares held for less than 30 days) 2.00%
Annual Fund Operating Expenses (expenses that you pay each year as a percentage of the value of your investment)Management Fees 1.25%
Total Annual Fund Operating Expenses 1.25%
Example
This Example is intended to help you compare the cost of investing in the Fund with the cost of investing in other mutual funds. It assumes that you invest $10,000 in the Fund for the time periods indicated, that your investment has a 5% return each year, that the Fund’s operating expenses remain the same, and that you redeem all of your shares at the end of those periods. Although your actual costs and returns may be higher or lower, based on these assumptions your costs would be:
1 Year 3 Years 5 Years 10 Years
$128 $399 $690 $1,518
PORTFOLIO TURNOVER
The Fund pays transactions costs, such as commissions, when it buys and sells securities (or “turns over” its portfolio). A higher portfolio turnover rate may indicate higher transaction costs and may result in higher taxes when Fund shares are held in a taxable account. These costs, which are not reflected in annual fund operating expenses in the example, affect the Fund’s performance. During the most recent fiscal year, the Fund’s portfolio turnover rate was 21.57% of the average value of the portfolio.
PRINCIPAL INVESTMENT STRATEGIES
The Fund seeks to achieve its objective by investing, under normal market conditions, at least 80% of its net assets in common stocks that, at the time of purchase, have market capitalizations that fall within the range of companies included in the Russell Mid-cap® Growth Index during the most recent 12-month period. The Russell Midcap® Growth Index ranged from approximately $171 million to $33 billion during the 12-month period ended September 30, 2016.
22
The Adviser invests in domestic growth-oriented medium to small companies it believes exhibit the potential for superior growth. The Adviser believes that a company’s earnings growth is the primary determinant of its potential long-term return and evaluates a company’s potential for above average long-term earnings and revenue growth. Several factors are considered in the Adviser’s evalu-ation of a company, including:
› unique product or service, › growing product demand, › dominant and growing market share, › management experience and capabilities, and › strong financial condition.
When selling equity securities for the Fund, the Adviser considers several factors, including changes in a company’s fundamentals and anticipated earnings.
PRINCIPAL INVESTMENT RISKS
You could lose money by investing in the Fund. The principal risks of investing in the Fund are as follows:
› Growth Style Investing Risk: Different types of stocks tend to shift into and out of favor with stock market investors depend-ing on market and economic conditions. The Fund invests in growth style stocks. The Fund’s performance may at times be better or worse than the performance of funds that focus on other types of stocks or that have a broader investment style.
› Management Risk: A strategy used by the investment management team may not produce the intended results. › Market Risk: The market value of securities may fall or fail to rise. Market risk may affect a single issuer, sector of the econo-
my, or the market as a whole. The market value of securities may fluctuate, sometimes rapidly and unpredictably. › Mid Cap Stock Risk: Stocks of mid cap companies may be subject to more abrupt or erratic market movements than stocks of
larger, more established companies.
HISTORICAL PERFORMANCE
The following bar chart and table provide information on the Fund’s volatility and performance. The Fund’s past performance before and after taxes is not necessarily an indication of how the Fund will perform in the future. The bar chart below is intended to provide you with an indication of the risks of investing in the Fund by showing changes in the Fund’s performance from year to year. The table below compares the Fund’s performance over different time periods to that of the Fund’s benchmark index, which is a broad measure of market performance. Updated performance information is available at the Fund’s website at www.sitfunds.com or by calling 800-332-5580.
The table includes returns both before and after taxes. After-tax returns are calculated using historical highest individual federal marginal income tax rates and do not reflect the impact of state and local taxes. Actual after-tax returns depend on an investor’s tax situation and may differ from those shown. After-tax returns shown are not relevant to investors who hold their Fund shares through tax-deferred arrangements, such as 401(k) plans or individual retirement accounts.
Summary — Sit Mid Cap Growth Fund

23
Annual Total Returns for calendar years ended December 31
9.56%18.87%
-45.34%
35.59%27.10%
-6.53%
18.36%
33.42%
6.01%
-2.22%
-60%
-40%
-20%
0%
20%
40%
2006 2007 2008 2009 2010 2011 2012 2013 2014 2015
The Fund’s year-to-date return as of 9/30/16 (not annualized) was 1.59%. Best Quarter: 19.71% (2Q09) Worst Quarter: -26.99% (4Q08)
Average Annual Total Returns for periods ended December 31, 2015
Sit Mid Cap Growth Fund 1 Year 5 Years 10 Years
Return before taxes -2.22% 8.88% 6.50%
Return after taxes on distributions -5.88% 7.07% 5.55%
Return after taxes on distributions and sale of Fund shares 1.69% 7.03% 5.26%
Russell Midcap® Growth Index (reflects no deduction for fees, expenses or taxes) -0.20% 11.54% 8.16%
INVESTMENT ADVISER AND PORTFOLIO MANAGERS
Sit Investment Associates, Inc. serves as the Fund’s investment adviser (the “Adviser”). The Fund’s investment decisions are made by a team of portfolio managers and analysts who are jointly responsible for the day-to-day management of the Fund.
The primary portfolio managers of the Fund are: Roger J. Sit, Chairman and President. Mr. Sit has served as Chief Investment Officer of the Fund since 2008. Kent L. Johnson, Vice President – Investments. Mr. Johnson has served as Portfolio Manager of the Fund for since 2003. Robert W. Sit, Vice President – Investments. Mr. Sit has served as Portfolio Manager of the Fund since 1997.
PURCHASE AND SALE OF FUND SHARES
The minimum initial investment for shares of the Fund is $5,000. The minimum subsequent investment is $100. The Fund’s shares are redeemable. In general, you may buy or redeem shares of the Fund on any business day by mail (Sit Mutual Funds, P.O. Box 9763, Providence, RI 02940) or by phone (1-800-332-5580).
TAX INFORMATION
The Fund’s distributions are generally taxable to you as ordinary income, capital gains, or a combination of the two, unless you are investing through a tax-deferred arrangement, such as a 401(k) plan or an individual retirement account.
Summary — Sit Mid Cap Growth Fund

24
PAYMENTS TO BROKER-DEALERS AND OTHER FINANCIAL INTERMEDIARIES
If you purchase the Fund through a broker-dealer or other financial intermediary (such as a bank or financial adviser), the financial intermediary may impose account charges. The Fund and its related companies may also pay that intermediary for the sale of Fund shares and related services. These payments may create a conflict of interest by influencing the broker-dealer or other intermediary to recommend the Fund over another investment. Ask your intermediary or visit your intermediary’s website for more information.
Summary — Sit Mid Cap Growth Fund

SUMMARY INFORMATION SIT ESG GROWTH FUND
25
INVESTMENT OBJECTIVE
The Fund seeks to maximize long-term capital appreciation.
FEES AND EXPENSES OF THE FUND
This table describes the fees and expenses that you may pay if you buy and hold shares of the Fund.
Class I Class SShareholder Fees (fees paid directly from your investment)
Redemption Fee (as a percentage of amount redeemed only on shares held for less than 30 days) 2.00% 2.00%
Annual Fund Operating Expenses (expenses that you pay each year as a percentage of the value of your investment)Management Fees 1.25% 1.25% Distribution (12b-1) fees None 0.25%
Total Annual Fund Operating Expenses 1.25% 1.50%
Example
This Example is intended to help you compare the cost of investing in the Fund with the cost of investing in other mutual funds. It assumes that you invest $10,000 in the Fund for the time periods indicated, that your investment has a 5% return each year, that the Fund’s operating expenses remain the same, and that you redeem all of your shares at the end of those periods. Although your actual costs and returns may be higher or lower, based on these assumptions your costs would be:
1 Year 3 Years 5 Years 10 Years
Class I $128 $399 $690 $1,518
Class S $154 $477 $824 $1,801
PORTFOLIO TURNOVER
The Fund pays transactions costs, such as commissions, when it buys and sells securities (or “turns over” its portfolio). A higher portfolio turnover rate may indicate higher transaction costs and may result in higher taxes when Fund shares are held in a taxable account. These costs, which are not reflected in annual fund operating expenses in the example, affect the Fund’s performance. The Fund’s inception date is June 30, 2016, therefore there is no turnover rate to report.

26
PRINCIPAL INVESTMENT STRATEGIES
The Fund seeks to achieve its objective by investing, under normal market conditions, at least 80% of its net assets in companies that the Adviser believes have strong environmental, social and corporate goverance (ESG) practices at the time of purchase.
The Adviser invests in growth-oriented companies it believes exhibit the potential for superior growth. The Fund focuses on stocks issued by companies with long records of earnings and revenue growth. The Adviser believes that a company’s earnings growth is the primary determinant of its potential long-term return, and evaluates a company’s potential for above average long-term earnings and revenue growth. Several factors are considered in the Adviser’s evaluation of a company, including:
› unique product or service, › growing product demand, › dominant and growing market share, › management experience and capabilities, and › strong financial condition.
In addition to the fundamental financial analysis, the stock selection process takes into consideration ESG screens from third-party providers that rank companies within an industry or sector based on several ESG characteristics, or the Adviser’s own analysis of a company’s ESG practices if such ranking is not available or the Adviser believes the available ranking is not accurate. The ESG screens utilize comparative weighted rankings of company ESG issues by sectors based on company and industry-specific factors, which assess a company’s sustainability policies, management systems and performance. Generally, the Adviser deems a company to have strong ESG practices when its industry ranking is in the top 50th percentile. ESG factors often require a subjective analy-sis and are subject to change. Environmental factors may include, for example, human capital concerns, product safety, workplace diversity and employee welfare. Governance factors may include, for example, corporate governance concerns, business ethics, sustainability policy and public policy concerns.
The Fund invests in the common stock of U.S. and foreign companies, and in American Depository Receipts and Global Depository Receipts of foreign companies. The Fund invests primarily in companies of large to medium capitalizations (companies with market capitalizations in excess of $2 billion).
When selling equity securities for the Fund, the Adviser considers several factors, including changes in a company’s fundamentals, anticipated earnings, financial position and ESG practices or ranking.
The Fund’s benchmark index to be used in connection with the Fund’s investment objective is the MSCI World Index, and such benchmark index may be changed from time to time with approval of the Fund’s Board of Directors. The MSCI World Index repre-sents large and mid-cap equity performance of 23 developed markets countries. The Fund will also compare its performance to the S&P 500 Index which represents the performance of 500 widely held common stocks of U.S. large-cap companies.
PRINCIPAL INVESTMENT RISKS
You could lose money by investing in the Fund. The principal risks of investing in the Fund are as follows:
› ESG Risk: The Fund’s ESG criteria may exclude securities of certain issuers for nonfinancial reasons and therefore the Fund may forgo some market opportunities available to funds that don’t use an ESG criteria. Stocks of companies with ESG prac-tices may shift into and out of favor with stock market investors depending on market and economic conditions, and the Fund’s performance may at times be better or worse than the performance of funds that do not use an ESG criteria.
› Growth Style Investing Risk: Different types of stocks tend to shift into and out of favor with stock market investors depend-ing on market and economic conditions. The Fund invests in growth style stocks. The Fund’s performance may at times be better or worse than the performance of funds that focus on other types of stocks or that have a broader investment style.
› International Investing Risk: Because the Fund may invest in foreign securities, there is an international investing risk. Inter-national investing involves risks not typically associated with investing in U.S. securities which may adversely affect the Fund’s investment. These risks include currency risk, foreign securities market risk, foreign tax risk, information risk, investment restriction risk, and political and economic risks.
› Management Risk: A strategy used by the investment management team may not produce the intended results.
Summary — Sit ESG Growth Fund
27
› Market Risk: The market value of securities may fall or fail to rise. Market risk may affect a single issuer, sector of the econo-my, or the market as a whole. The market value of securities may fluctuate, sometimes rapidly and unpredictably.
› New Fund Risk: The Fund’s inception is June 30, 2016. There can be no assurance that the Fund will grow to or maintain an economically viable size, in which case the Board of Directors may determine to liquidate the Fund.
› Mid Cap Stock Risk: Stocks of mid cap companies may be subject to more abrupt or erratic market movements than stocks of larger, more established companies.
HISTORICAL PERFORMANCE
The Fund’s inception is June 30, 2016, and therefore there is no annual total return or average annual total return information to report at this time. For current performance information, please call 1-800-332-5580 or visit www.sitinvest.com. The Fund’s past performance does not necessarily indicate how it will perform in the future.
INVESTMENT ADVISER AND PORTFOLIO MANAGERS
Sit Investment Associates, Inc. serves as the Fund’s investment adviser (the “Adviser”). The Fund’s investment decisions are made by a team of portfolio managers and analysts who are jointly responsible for the day-to-day management of the Fund.
The primary portfolio managers of the Fund are: Roger J. Sit, Chairman and President. Mr. Sit has served as Chief Investment Officer of the Fund since its inception on June 30, 2016. David A. Brown, Vice President – Research and Investment Management of the Adviser. Mr. Brown has served as Portfolio Man-ager of the Fund since its inception on June 30, 2016. Kent L. Johnson, Vice President – Investments. Mr. Johnson has served as Portfolio Manager of the Fund since its inception on June 30, 2016. Michael T. Manns, Vice President – Research and Investment Management of the Adviser. Mr. Manns has served as Portfolio Man-ager of the Fund since its inception on June 30, 2016. Tasha M. Murdoff, Vice President – Research and Investment Management of the Adviser. Ms. Murdoff has served as Portfolio Manager of the Fund since its inception on June 30, 2016.
PURCHASE AND SALE OF FUND SHARES
The minimum initial investment for Class S shares of the Fund is $5,000, and the minimum initial investment for Class I shares of the Fund is $100,000. The minimum subsequent investment for either share class is $100. The Fund’s shares are redeemable. In general, you may buy or redeem shares of the Fund on any business day by mail (Sit Mutual Funds, P.O. Box 9763, Providence, RI 02940) or by phone (1-800-332-5580).
TAX INFORMATION
The Fund’s distributions are generally taxable to you as ordinary income, capital gains, or a combination of the two, unless you are investing through a tax-deferred arrangement, such as a 401(k) plan or an individual retirement account which may be taxable upon withdrawal from the tax-deferred arrangement.
PAYMENTS TO BROKER-DEALERS AND OTHER FINANCIAL INTERMEDIARIES
If you purchase the Fund through a broker-dealer or other financial intermediary (such as a bank or financial adviser), the financial intermediary may impose account charges. The Fund and its related companies may also pay that intermediary for the sale of Fund shares and related services. These payments may create a conflict of interest by influencing the broker-dealer or other intermediary to recommend the Fund over another investment. Ask your intermediary or visit your intermediary’s website for more information.
Summary — Sit ESG Growth Fund

SUMMARY INFORMATION SIT SMALL CAP DIVIDEND GROWTH FUND
28
INVESTMENT OBJECTIVE
The Fund primarily seeks to provide current income that exceeds the Fund’s benchmark index and that grows over a period of years. Secondarily the Fund seeks long-term capital appreciation.
FEES AND EXPENSES OF THE FUND
This table describes the fees and expenses that you may pay if you buy and hold shares of the Fund.
Class I Class SShareholder Fees (fees paid directly from your investment)
Redemption Fee (as a percentage of amount redeemed only on shares held for less than 30 days) 2.00% 2.00%
Annual Fund Operating Expenses (expenses that you pay each year as a percentage of the value of your investment)Management Fees 1.25% 1.25% Distribution (12b-1) fees None 0.25%Acquired Fund Fees and Expenses(1) 0.08% 0.08%
Total Annual Fund Operating Expenses 1.33%(1) 1.58%(1)
(1) The total annual fund operating expenses do not correlate to the ratio of expenses to average net assets shown in the Fund’s Financial Highlights, which does not include Acquired Fund Fees and Expenses. Acquired Fund Fees and Expenses represent fees and expenses incurred indirectly by the Fund as a result of its investment in shares of investment companies.
Example
This Example is intended to help you compare the cost of investing in the Fund with the cost of investing in other mutual funds. It assumes that you invest $10,000 in the Fund for the time periods indicated, that your investment has a 5% return each year, that the Fund’s operating expenses remain the same, and that you redeem all of your shares at the end of those periods. Although your actual costs and returns may be higher or lower, based on these assumptions your costs would be:
1 Year 3 Years 5 Years 10 Years
Class I $136 $424 $733 $1,609
Class S $162 $502 $866 $1,889
PORTFOLIO TURNOVER
The Fund pays transactions costs, such as commissions, when it buys and sells securities (or “turns over” its portfolio). A higher portfolio turnover rate may indicate higher transaction costs and may result in higher taxes when Fund shares are held in a taxable account. These costs, which are not reflected in annual fund operating expenses in the example, affect the Fund’s performance. During the most recent fiscal year, the Fund’s portfolio turnover rate was 26.43% (both classes) of the average value of the portfolio.

29
PRINCIPAL INVESTMENT STRATEGIES
The Fund seeks to achieve its objectives by investing, under normal market conditions, at least 80% of its net assets in small cap dividend-paying common stocks. The Fund may invest the balance of its assets in preferred stocks, convertible bonds, U.S. Treasury securities (including Treasury bills, notes and bonds), closed-end investment companies, and master limited partnerships.
The Fund’s benchmark index to be used in connection with the Fund’s investment objective is the Russell 2000® Index, and such benchmark index may be changed from time to time with approval of the Fund’s Board of Directors. The Russell 2000® Index measures the performance of the 2,000 smallest companies in the Russell 3000® Index (which is made up of the 3,000 largest U.S. companies based on total market capitalization).
Small cap stocks are issued by companies with capitalizations at the time of purchase of up to $3 billion, or up to the market capi-talization of the largest company included in the Russell 2000® Index measured at the end of the previous twelve months. As of September 30, 2016, the market capitalization of the largest company included in the Russell 2000® Index measured at the end of the previous twelve months was $14.6 billion.
The Adviser invests in dividend paying, growth-oriented companies it believes exhibit the potential for growth and growing divi-dend payments. The Adviser believes that a company’s earnings growth is a primary determinant of its potential long-term return, and that a record of increasing dividend payments is a strong indicator of financial health and growth prospects. The Adviser consid-ers several factors in its evaluation of a company’s potential for above average long-term earnings, revenue, and dividend growth, including:
› a record of paying dividends, › strong prospects for growing dividend payments indicated in part by growing earnings and cash flow, › unique product or service, › growing product demand, › dominant and growing market share, › management experience and capabilities, and › strong financial condition.
Since stocks that pay dividends tend to be less volatile and may not experience the same capital appreciation as stocks that don’t pay dividends, the Fund’s diversified portfolio of dividend paying stocks is expected to have lower volatility than that of the Russell 2000® Index, but with a higher dividend yield and greater prospects for dividend growth.
The Fund may invest up to 20% of its net assets in securities of issuers domiciled outside the U.S.
When selling equity securities for the Fund, the Adviser considers several factors, including changes in a company’s fundamentals, anticipated earnings, anticipated dividend payments and financial position.
PRINCIPAL INVESTMENT RISKS
You could lose money by investing in the Fund. The principal risks of investing in the Fund are as follows:
› Dividend Paying Company Risk: The Fund’s income objective may limit its ability to appreciate during a broad market ad-vance because dividend paying stocks may not experience the same capital appreciation as non-dividend paying stocks. In ad-dition, stocks held by the Fund may reduce or stop paying dividends which could affect the Fund’s ability to generate income.
› Growth Style Investing Risk: Different types of stocks tend to shift into and out of favor with stock market investors depend-ing on market and economic conditions. The Fund invests in growth style stocks. The Fund’s performance may at times be better or worse than the performance of funds that focus on other types of stocks or that have a broader investment style.
› International Investing Risk: Because the Fund may invest in foreign securities, there is an international investing risk. Inter-national investing involves risks not typically associated with investing in U.S. securities which may adversely affect the Fund’s investment. These risks include currency risk, foreign securities market risk, foreign tax risk, information risk, investment restriction risk, and political and economic risks.
› Management Risk: A strategy used by the investment management team may not produce the intended results.
Summary — Sit Small Cap Dividend Growth Fund

30
› Market Risk: The market value of securities may fall or fail to rise. Market risk may affect a single issuer, sector of the econo-my, or the market as a whole. The market value of securities may fluctuate, sometimes rapidly and unpredictably.
› New Fund Risk: The Fund’s inception is March 31, 2015. There can be no assurance that the Fund will grow to or maintain an economically viable size, in which case the Board of Directors may determine to liquidate the Fund.
› Small Stock Risk: Stocks of smaller companies involve substantial risk. Prices of small cap stocks may be subject to more abrupt or erratic market movements than stocks of larger, more established companies. Additionally, for certain small cap stocks, there may also be limited liquidity or trading opportunities at a favorable price or time.
HISTORICAL PERFORMANCE
The Fund’s inception is March 31, 2015, and therefore there is no annual total return or average annual total return information to report at this time. The Fund’s year-to-date return as of 9/30/16 (not annualized) was 12.35%. The Fund’s best quarter was 4.53% (2Q16) and worst quarter was -7.93% (3Q15). For current performance information, please call 1-800-332-5580 or visit www.sitinvest.com. The Fund’s past performance does not necessarily indicate how it will perform in the future.
INVESTMENT ADVISER AND PORTFOLIO MANAGERS
Sit Investment Associates, Inc. serves as the Fund’s investment adviser (the “Adviser”). The Fund’s investment decisions are made by a team of portfolio managers and analysts who are jointly responsible for the day-to-day management of the Fund.
The primary portfolio managers of the Fund are: Roger J. Sit, Chairman and President. Mr. Sit has served as Chief Investment Officer of the Fund since its inception on March 31, 2015. Kent L. Johnson, Vice President – Investments. Mr. Johnson has served as Portfolio Manager of the Fund since its inception on March 31, 2015. Robert W. Sit, Vice President – Research and Investment Management of the Adviser. Mr. Sit has served as Portfolio Manager of the Fund since its inception on March 31, 2015. Michael T. Manns, Vice President – Research and Investment Management of the Adviser. Mr. Manns has served as Portfolio Man-ager of the Fund since its inception on March 31, 2015.
PURCHASE AND SALE OF FUND SHARES
The minimum initial investment for Class S shares of the Fund is $5,000, and the minimum initial investment for Class I shares of the Fund is $100,000. The minimum subsequent investment for either share class is $100. The Fund’s shares are redeemable. In general, you may buy or redeem shares of the Fund on any business day by mail (Sit Mutual Funds, P.O. Box 9763, Providence, RI 02940) or by phone (1-800-332-5580).
TAX INFORMATION
The Fund’s distributions are generally taxable to you as ordinary income, capital gains, or a combination of the two, unless you are investing through a tax-deferred arrangement, such as a 401(k) plan or an individual retirement account which may be taxable upon withdrawal from the tax-deferred arrangement.
PAYMENTS TO BROKER-DEALERS AND OTHER FINANCIAL INTERMEDIARIES
If you purchase the Fund through a broker-dealer or other financial intermediary (such as a bank or financial adviser), the financial intermediary may impose account charges. The Fund and its related companies may also pay that intermediary for the sale of Fund shares and related services. These payments may create a conflict of interest by influencing the broker-dealer or other intermediary to recommend the Fund over another investment. Ask your intermediary or visit your intermediary’s website for more information.
Summary — Sit Small Cap Dividend Growth Fund

SUMMARY INFORMATION SIT INTERNATIONAL GROWTH FUND
31
INVESTMENT OBJECTIVE
The Fund seeks long-term growth.
FEES AND EXPENSES OF THE FUND
This table describes the fees and expenses that you may pay if you buy and hold shares of the Fund.
Shareholder Fees (fees paid directly from your investment)Redemption Fee (as a percentage of amount redeemed only on shares held for less than 30 days) 2.00%
Annual Fund Operating Expenses (expenses that you pay each year as a percentage of the value of your investment)Management Fees 1.50% Acquired Fund Fees and Expenses(1) 0.01%
Total Annual Fund Operating Expenses 1.51%(1)
(1) The total annual fund operating expenses do not correlate to the ratio of expenses to average net assets shown in the Fund’s Financial Highlights, which does not include Acquired Fund Fees and Expenses. Acquired Fund Fees and Expenses represent fees and expenses incurred indirectly by the Fund as a result of its investment in shares of investment companies.
Example
This Example is intended to help you compare the cost of investing in the Fund with the cost of investing in other mutual funds. It assumes that you invest $10,000 in the Fund for the time periods indicated, that your investment has a 5% return each year, that the Fund’s operating expenses remain the same, and that you redeem all of your shares at the end of those periods. Although your actual costs and returns may be higher or lower, based on these assumptions your costs would be:
1 Year 3 Years 5 Years 10 Years
$155 $481 $829 $1,812
PORTFOLIO TURNOVER
The Fund pays transactions costs, such as commissions, when it buys and sells securities (or “turns over” its portfolio). A higher portfolio turnover rate may indicate higher transaction costs and may result in higher taxes when Fund shares are held in a taxable account. These costs, which are not reflected in annual fund operating expenses in the example, affect the Fund’s performance. During the most recent fiscal year, the Fund’s portfolio turnover rate was 37.94% of the average value of the portfolio.

32
PRINCIPAL INVESTMENT STRATEGIES
The Fund seeks to achieve its objective by investing, under normal market conditions, at least 90% of its net assets in common stocks of companies domiciled outside the United States.
In selecting investments for the Fund, the Adviser begins by selecting countries or regions in which to invest. In making its selec-tions, the Adviser considers several factors affecting the economy and equity market of foreign countries and regions, including:
› economic trends, › earnings outlook, › liquidity within the market, › fiscal and monetary policy, › currency exchange rate expectations, › market sentiment, and › social and political trends.
After the country and regional allocations are determined, the Adviser seeks industries and sectors that it believes have earnings growth prospects that are greater than the average. Within the selected industries and sectors, the Adviser invests in foreign growth-oriented companies it believes exhibit the potential for superior growth. The Adviser believes that a company’s earnings growth is the primary determinant of its potential long-term return and evaluates a company’s potential for above average long-term earnings and revenue growth.
Several factors are considered in the Adviser’s evaluation of a company, including:
› unique product or service, › growing product demand, › dominant and growing market share, › management experience and capabilities, and › strong financial condition.
When selling equity securities for the Fund, the Adviser considers several factors, including changes in a company’s fundamentals and anticipated earnings.
The Fund invests in common stocks of issuers domiciled in at least three foreign countries. As of September 30, 2016, the Fund was invested in common stocks of companies domiciled in 18 foreign countries. Up to 50% of the Fund’s total assets may be invested in equity securities of small-to medium-sized emerging growth companies in developed markets (such as Germany and Japan) and developing markets (such as Thailand and Brazil). Small companies generally have a capitalization of under $3.0 billion, and medium-sized companies generally have capitalizations between $2 and $15 billion. Emerging growth companies are small-and medium-sized companies that the Adviser believes have a potential for earnings growth over time that is above the growth rate of more established companies or are early in their life cycles.
The Fund may invest in securities representing underlying international securities such as sponsored American Depository Re-ceipts, European Depository Receipts and Global Depository Receipts.
In order to hedge against adverse movements in currency exchange rates, the Fund may from time to time enter into forward foreign currency exchange contracts.
PRINCIPAL INVESTMENT RISKS › Developing Markets Risk: Investment in developing markets are subject to unique political, economic, and market risks that
can cause the Fund’s investments to be more volatile and less liquid than investments in developed markets. › Foreign Currency Hedging Transactions Risk: If the Adviser’s forecast of exchange rate movements is incorrect, the Fund may
realize losses on their foreign currency transactions. In addition, the Fund’s hedging transactions may prevent the Funds from realizing the benefits of a favorable change in the value of foreign currencies.
Summary — Sit International Growth Fund

33
› Growth Style Investing Risk: Different types of stocks tend to shift into and out of favor with stock market investors depend-ing on market and economic conditions. The Fund invests in growth style stocks. The Fund’s performance may at times be better or worse than the performance of funds that focus on other types of stocks or that have a broader investment style.
› International Investing Risk: International investing involves risks not typically associated with investing in U.S. securities which may adversely affect the Fund’s investment. These risks include currency risk, foreign securities market risk, foreign tax risk, information risk, investment restriction risk, and political and economic risks.
› Management Risk: A strategy used by the investment management team may not produce the intended results. › Market Risk: The market value of securities may fall or fail to rise. Market risk may affect a single issuer, sector of the econo-
my, or the market as a whole. The market value of securities may fluctuate, sometimes rapidly and unpredictably. › Mid Cap Stock Risk: Stocks of mid cap stocks may be subject to more abrupt or erratic market movements than stocks of
larger, more established companies. › Small Cap Stock Risk: Stocks of smaller companies involve substantial risk. Prices of small cap stocks may be subject to more
abrupt or erratic market movements than stocks of larger, more established companies. Additionally, for certain small cap stocks, there may also be limited liquidity, or trading opportunities at a favorable price or time.
HISTORICAL PERFORMANCE
The following bar chart and table provide information on the Fund’s volatility and performance. The Fund’s past performance before and after taxes is not necessarily an indication of how the Fund will perform in the future. The bar chart below is intended to provide you with an indication of the risks of investing in the Fund by showing changes in the Fund’s performance from year to year. The table below compares the Fund’s performance over different time periods to that of the Fund’s benchmark index, which is a broad measure of market performance. Updated performance information is available at the Fund’s website at www.sitfunds.com or by calling 800-332-5580.
After-tax returns are calculated using historical highest individual federal marginal income tax rates and do not reflect the impact of state and local taxes. Actual after-tax returns depend on an investor’s tax situation and may differ from those shown. After-tax returns shown are not relevant to investors who hold their Fund shares through tax-deferred arrangements, such as 401(k) plans or individual retirement accounts.
Annual Total Returns for calendar years ended December 31
18.19% 16.08%
-44.99%
27.65%
9.51%
-10.80%
18.79% 17.56%
-7.88%
4.86%
-60%
-40%
-20%
0%
20%
40%
2006 2007 2008 2009 2010 2011 2012 2013 2014 2015
The Fund’s year-to-date return as of 9/30/16 (not annualized) was -0.26%. Best Quarter: 23.58% (2Q09) Worst Quarter: -23.52% (4Q08)
Summary — Sit International Growth Fund

34
Average Annual Total Returns for periods ended December 31, 2015
Sit International Growth Fund 1 Year 5 Years 10 Years
Return before taxes 4.86% 3.77% 2.41%
Return after taxes on distributions 3.17% 3.20% 2.05%
Return after taxes on distributions and sale of Fund shares 4.13% 2.95% 1.93%
MSCI EAFE Index(1) (reflects no deduction for fees, expenses or taxes) -0.81% 3.60% 3.03%
MSCI EAFE Growth Index(1) (reflects no deduction for fees, expenses or taxes) 4.09% 4.60% 4.03%(1) The index used to compare the Fund’s performance was changed to the MSCI EAFE Index from the MSCI EAFE Growth Index because the Fund’s investment adviser believes that the MSCI EAFE Index more accurately reflects the Fund’s investment objectives and strategies. It will be used to compare the Fund’s performance going forward.
INVESTMENT ADVISER AND PORTFOLIO MANAGERS
Sit Investment Associates, Inc. serves as the Fund’s investment adviser (the “Adviser”). The Fund’s investment decisions are made by a team of portfolio managers and analysts who are jointly responsible for the day-to-day management of the Fund.
The primary portfolio managers of the Fund are: Roger J. Sit, Chairman and President. Mr. Sit has served as Chief Investment Officer of the Fund since 1997. Tasha M. Murdoff, Vice President – Research and Investment Management of the Adviser. Ms. Murdoff has served as Portfolio Manager of the Fund since 2004.
PURCHASE AND SALE OF FUND SHARES
The minimum initial investment for shares of the Fund is $5,000. The minimum subsequent investment is $100. The Fund’s shares are redeemable. In general, you may buy or redeem shares of the Fund on any business day by mail (Sit Mutual Funds, P.O. Box 9763, Providence, RI 02940) or by phone (1-800-332-5580).
TAX INFORMATION
The Fund’s distributions are generally taxable to you as ordinary income, capital gains, or a combination of the two, unless you are investing through a tax-deferred arrangement, such as a 401(k) plan or an individual retirement account.
PAYMENTS TO BROKER-DEALERS AND OTHER FINANCIAL INTERMEDIARIES
If you purchase the Fund through a broker-dealer or other financial intermediary (such as a bank or financial adviser), the financial intermediary may impose account charges. The Fund and its related companies may also pay that intermediary for the sale of Fund shares and related services. These payments may create a conflict of interest by influencing the broker-dealer or other intermediary to recommend the Fund over another investment. Ask your intermediary or visit your intermediary’s website for more information.
Summary — Sit International Growth Fund

SUMMARY INFORMATION SIT SMALL CAP GROWTH FUND
35
INVESTMENT OBJECTIVE
The Fund seeks to maximize long-term capital appreciation.
FEES AND EXPENSES OF THE FUND
This table describes the fees and expenses that you may pay if you buy and hold shares of the Fund.
Shareholder Fees (fees paid directly from your investment)Redemption Fee (as a percentage of amount redeemed only on shares held for less than 30 days) 2.00%
Annual Fund Operating Expenses (expenses that you pay each year as a percentage of the value of your investment)Management Fees 1.50%
Total Annual Fund Operating Expenses 1.50%
Example
This Example is intended to help you compare the cost of investing in the Fund with the cost of investing in other mutual funds. It assumes that you invest $10,000 in the Fund for the time periods indicated, that your investment has a 5% return each year, that the Fund’s operating expenses remain the same, and that you redeem all of your shares at the end of those periods. Although your actual costs and returns may be higher or lower, based on these assumptions your costs would be:
1 Year 3 Years 5 Years 10 Years
$154 $477 $824 $1,801
PORTFOLIO TURNOVER
The Fund pays transactions costs, such as commissions, when it buys and sells securities (or “turns over” its portfolio). A higher portfolio turnover rate may indicate higher transaction costs and may result in higher taxes when Fund shares are held in a taxable account. These costs, which are not reflected in annual fund operating expenses in the example, affect the Fund’s performance. During the most recent fiscal year, the Fund’s portfolio turnover rate was 27.37% of the average value of the portfolio.
PRINCIPAL INVESTMENT STRATEGIES
The Fund seeks to achieve its objective by investing, under normal market conditions, at least 80% of its net assets in common stocks of companies with capitalizations at the time of purchase of up to $3.0 billion, or up to the market capitalization of the largest company included in the Russell 2000® Index measured at the end of the previous twelve months. The Russell 2000® Index mea-sures the performance of the 2,000 smallest companies in the Russell 3000® Index (which is made up of the 3,000 largest U.S. com-

36
panies based on total market capitalization). As of September 30, 2016, the market capitalization of the largest company included in the Russell 2000® Index measured at the end of the previous twelve months was $14.6 billion.
The Adviser invests in domestic growth-oriented small companies it believes exhibit the potential for superior growth. The Adviser believes that a company’s earnings growth is the primary determinant of its potential long-term return and evaluates a company’s potential for above average long-term earnings and revenue growth. Several factors are considered in the Adviser’s evaluation of a company, including:
› unique product or service, › growing product demand, › dominant and growing market share, › management experience and capabilities, and › strong financial condition.
When selling equity securities for the Fund, the Adviser considers several factors, including changes in a company’s fundamentals and anticipated earnings.
PRINCIPAL INVESTMENT RISKS
You could lose money by investing in the Fund. The principal risks of investing in the Fund are as follows:
› Growth Style Investing Risk: Different types of stocks tend to shift into and out of favor with stock market investors depend-ing on market and economic conditions. The Fund invests in growth style stocks. The Fund’s performance may at times be better or worse than the performance of funds that focus on other types of stocks or that have a broader investment style.
› Management Risk: A strategy used by the investment management team may not produce the intended results. › Market Risk: The market value of securities may fall or fail to rise. Market risk may affect a single issuer, sector of the econo-
my, or the market as a whole. The market value of securities may fluctuate, sometimes rapidly and unpredictably. › Small Cap Stock Risk: Stocks of smaller companies involve substantial risk. Prices of small cap stocks may be subject to more
abrupt or erratic market movements than stocks of larger, more established companies. Additionally, for certain small cap stocks, there may also be limited liquidity, or trading opportunities at a favorable price or time.
HISTORICAL PERFORMANCE
The following bar chart and table provide information on the Fund’s volatility and performance. The Fund’s past performance before and after taxes is not necessarily an indication of how the Fund will perform in the future. The bar chart below is intended to provide you with an indication of the risks of investing in the Fund by showing changes in the Fund’s performance from year to year. The table below compares the Fund’s performance over different time periods to that of the Fund’s benchmark index, which is a broad measure of market performance. Updated performance information is available at the Fund’s website at www.sitfunds.com or by calling 800-332-5580.
After-tax returns are calculated using historical highest individual federal marginal income tax rates and do not reflect the impact of state and local taxes. Actual after-tax returns depend on an investor’s tax situation and may differ from those shown. After-tax returns shown are not relevant to investors who hold their Fund shares through tax-deferred arrangements, such as 401(k) plans or individual retirement accounts.
Summary — Sit Small Cap Growth Fund
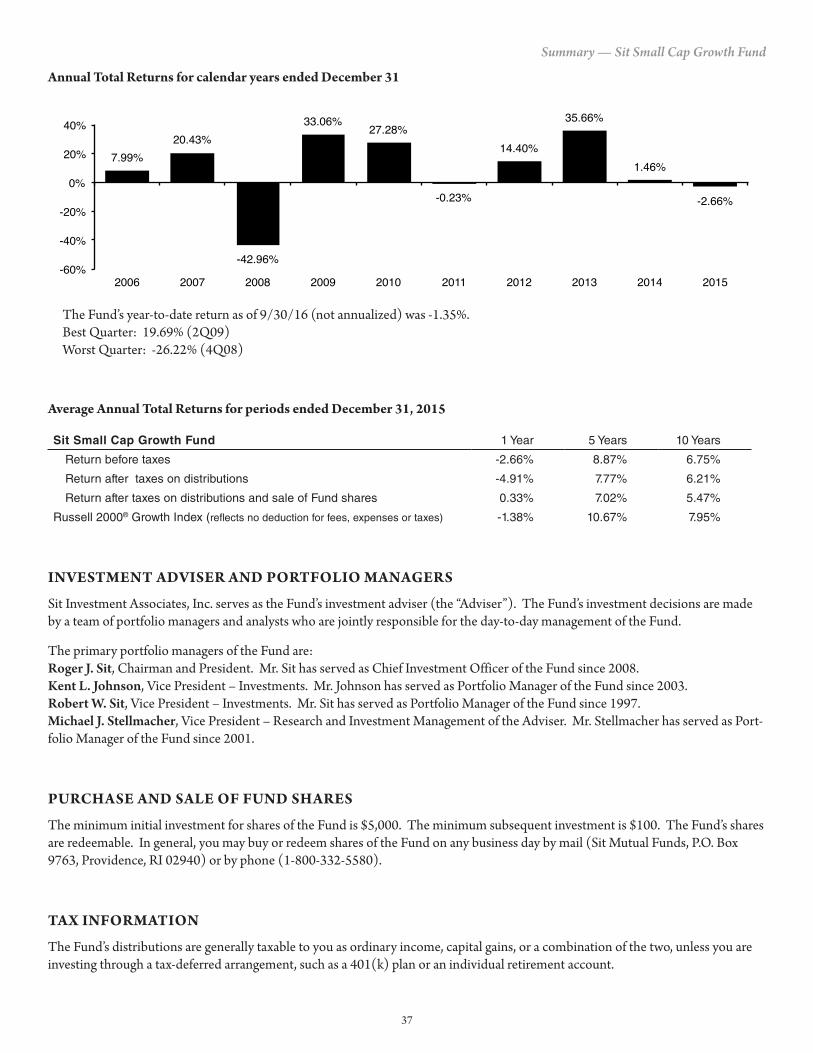
37
Annual Total Returns for calendar years ended December 31
7.99%20.43%
-42.96%
33.06%27.28%
-0.23%
14.40%
35.66%
1.46%
-2.66%
-60%
-40%
-20%
0%
20%
40%
2006 2007 2008 2009 2010 2011 2012 2013 2014 2015
The Fund’s year-to-date return as of 9/30/16 (not annualized) was -1.35%. Best Quarter: 19.69% (2Q09) Worst Quarter: -26.22% (4Q08)
Average Annual Total Returns for periods ended December 31, 2015
Sit Small Cap Growth Fund 1 Year 5 Years 10 Years
Return before taxes -2.66% 8.87% 6.75%
Return after taxes on distributions -4.91% 7.77% 6.21%
Return after taxes on distributions and sale of Fund shares 0.33% 7.02% 5.47%
Russell 2000® Growth Index (reflects no deduction for fees, expenses or taxes) -1.38% 10.67% 7.95%
INVESTMENT ADVISER AND PORTFOLIO MANAGERS
Sit Investment Associates, Inc. serves as the Fund’s investment adviser (the “Adviser”). The Fund’s investment decisions are made by a team of portfolio managers and analysts who are jointly responsible for the day-to-day management of the Fund.
The primary portfolio managers of the Fund are: Roger J. Sit, Chairman and President. Mr. Sit has served as Chief Investment Officer of the Fund since 2008. Kent L. Johnson, Vice President – Investments. Mr. Johnson has served as Portfolio Manager of the Fund since 2003. Robert W. Sit, Vice President – Investments. Mr. Sit has served as Portfolio Manager of the Fund since 1997. Michael J. Stellmacher, Vice President – Research and Investment Management of the Adviser. Mr. Stellmacher has served as Port-folio Manager of the Fund since 2001.
PURCHASE AND SALE OF FUND SHARES
The minimum initial investment for shares of the Fund is $5,000. The minimum subsequent investment is $100. The Fund’s shares are redeemable. In general, you may buy or redeem shares of the Fund on any business day by mail (Sit Mutual Funds, P.O. Box 9763, Providence, RI 02940) or by phone (1-800-332-5580).
TAX INFORMATION
The Fund’s distributions are generally taxable to you as ordinary income, capital gains, or a combination of the two, unless you are investing through a tax-deferred arrangement, such as a 401(k) plan or an individual retirement account.
Summary — Sit Small Cap Growth Fund

38
PAYMENTS TO BROKER-DEALERS AND OTHER FINANCIAL INTERMEDIARIES
If you purchase the Fund through a broker-dealer or other financial intermediary (such as a bank or financial adviser), the financial intermediary may impose account charges. The Fund and its related companies may also pay that intermediary for the sale of Fund shares and related services. These payments may create a conflict of interest by influencing the broker-dealer or other intermediary to recommend the Fund over another investment. Ask your intermediary or visit your intermediary’s website for more information.
Summary — Sit Small Cap Growth Fund

SUMMARY INFORMATION SIT DEVELOPING MARKETS GROWTH FUND
39
INVESTMENT OBJECTIVE
The Fund seeks to maximize long-term capital appreciation.
FEES AND EXPENSES OF THE FUND
This table describes the fees and expenses that you may pay if you buy and hold shares of the Fund.
Shareholder Fees (fees paid directly from your investment)Redemption Fee (as a percentage of amount redeemed only on shares held for less than 30 days) 2.00%
Annual Fund Operating Expenses (expenses that you pay each year as a percentage of the value of your investment)Management Fees 2.00% Acquired Fund Fees and Expenses(1) 0.02%
Total Annual Fund Operating Expenses 2.02%(1)
(1) The total annual fund operating expenses do not correlate to the ratio of expenses to average net assets shown in the Fund’s Financial Highlights, which does not include Acquired Fund Fees and Expenses. Acquired Fund Fees and Expenses represent fees and expenses incurred indirectly by the Fund as a result of its investment in shares of investment companies.
Example
This Example is intended to help you compare the cost of investing in the Fund with the cost of investing in other mutual funds. It assumes that you invest $10,000 in the Fund for the time periods indicated, that your investment has a 5% return each year, that the Fund’s operating expenses remain the same, and that you redeem all of your shares at the end of those periods. Although your actual costs and returns may be higher or lower, based on these assumptions your costs would be:
1 Year 3 Years 5 Years 10 Years
$207 $640 $1,098 $2,366
PORTFOLIO TURNOVER
The Fund pays transactions costs, such as commissions, when it buys and sells securities (or “turns over” its portfolio). A higher portfolio turnover rate may indicate higher transaction costs and may result in higher taxes when Fund shares are held in a taxable account. These costs, which are not reflected in annual fund operating expenses in the example, affect the Fund’s performance. During the most recent fiscal year, the Fund’s portfolio turnover rate was 28.14% of the average value of the portfolio.

40
PRINCIPAL INVESTMENT STRATEGIES
The Fund seeks to achieve its objective by investing, under normal market conditions, at least 80% of its net assets in common stocks of companies domiciled or operating in a developing market.
Developing markets are those countries that:
› have emerging stock markets as defined by the International Finance Corporation, › have low-to middle-income economies according to the World Bank, or › have similar developing characteristics, for example, countries in the MSCI EM Index and Hong Kong are considered to be
developing.
As of September 30, 2016, the Fund held investments in Hong Kong, South Korea, Taiwan, Thailand, Brazil, Mexico, South Africa, China, Singapore, Israel, India, Indonesia, Peru, Chile, Malaysia, Japan, Netherlands, and Turkey.
In selecting investments for the Fund, the Adviser begins by selecting countries or regions in which to invest. In making its selec-tions, the Adviser considers several factors affecting the economy and equity market of foreign countries and regions, including:
› economic trends, › earnings outlook, › liquidity within the market, › fiscal and monetary policy, › currency exchange rate expectations, › investment valuation, › market sentiment, and › social and political trends.
After the country and regional allocations are determined, the Adviser seeks industries and sectors that appear to have strong earnings growth prospects. Within the selected industries and sectors, the Adviser invests in foreign growth-oriented companies it believes exhibit the potential for superior growth. The Adviser believes that a company’s earnings growth is the primary determi-nant of its potential long-term return and evaluates a company’s potential for above average long-term earnings and revenue growth. Several factors are considered in the Adviser’s evaluation of a company, including:
› unique product or service, › growing product demand, › regional or country dominance and growing market share, › management experience and capabilities, and › strong financial condition.
When selling equity securities for the Fund, the Adviser considers several factors, including changes in a company’s fundamentals and anticipated earnings.
The Fund invests in small, medium and large sized companies. Small companies generally have capitalizations of under $3.0 billion, and large companies generally have a capitalization greater than $5 billion. The Fund may invest in securities representing underly-ing international securities such as sponsored American Depository Receipts, European Depository Receipts and Global Deposi-tory Receipts.
In order to hedge against adverse movements in currency exchange rates, the Fund may from time to time enter into forward foreign currency exchange contracts.
Summary — Sit Developing Markets Growth Fund

41
PRINCIPAL INVESTMENT RISKS › Developing Markets Risk: Investment in developing markets are subject to unique political, economic, and market risks that
can cause the Fund’s investments to be more volatile and less liquid than investments in developed markets. › Foreign Currency Hedging Transactions Risk: If the Adviser’s forecast of exchange rate movements is incorrect, the Fund may
realize losses on their foreign currency transactions. In addition, the Fund’s hedging transactions may prevent the Funds from realizing the benefits of a favorable change in the value of foreign currencies.
› Growth Style Investing Risk: Different types of stocks tend to shift into and out of favor with stock market investors depend-ing on market and economic conditions. The Fund invests in growth style stocks. The Fund’s performance may at times be better or worse than the performance of funds that focus on other types of stocks or that have a broader investment style.
› International Investing Risk: International investing involves risks not typically associated with investing in U.S. securities which may adversely affect the Fund’s investment. These risks include currency risk, foreign securities market risk, foreign tax risk, information risk, investment restriction risk, and political and economic risks.
› Management Risk: A strategy used by the investment management team may not produce the intended results. › Market Risk: The market value of securities may fall or fail to rise. Market risk may affect a single issuer, sector of the econo-
my, or the market as a whole. The market value of securities may fluctuate, sometimes rapidly and unpredictably. › Mid Cap Stock Risk: Stocks of mid cap stocks may be subject to more abrupt or erratic market movements than stocks of
larger, more established companies. › Small Cap Stock Risk: Stocks of smaller companies involve substantial risk. Prices of small cap stocks may be subject to more
abrupt or erratic market movements than stocks of larger, more established companies. Additionally, for certain small cap stocks, there may also be limited liquidity, or trading opportunities at a favorable price or time.
HISTORICAL PERFORMANCE
The following bar chart and table provide information on the Fund’s volatility and performance. The Fund’s past performance before and after taxes is not necessarily an indication of how the Fund will perform in the future. The bar chart below is intended to provide you with an indication of the risks of investing in the Fund by showing changes in the Fund’s performance from year to year. The table below compares the Fund’s performance over different time periods to that of the Fund’s benchmark index, which is a broad measure of market performance. Updated performance information is available at the Fund’s website at www.sitfunds.com or by calling 800-332-5580.
After-tax returns are calculated using historical highest individual federal marginal income tax rates and do not reflect the impact of state and local taxes. Actual after-tax returns depend on an investor’s tax situation and may differ from those shown. After-tax returns shown are not relevant to investors who hold their Fund shares through tax-deferred arrangements, such as 401(k) plans or individual retirement accounts.
Annual Total Returns for calendar years ended December 31
31.59%40.72%
-55.26%
73.97%
14.53%
-18.48%
11.08%0.59%
-7.79% -15.88%
-80%-60%-40%-20%0%20%40%60%80%
2006 2007 2008 2009 2010 2011 2012 2013 2014 2015
The Fund’s year-to-date return as of 9/30/16 (not annualized) was 10.86%. Best Quarter: 32.98% (2Q09) Worst Quarter: -30.73% (4Q08)
Summary — Sit Developing Markets Growth Fund

42
Average Annual Total Returns for periods ended December 31, 2015
Sit Developing Markets Growth Fund 1 Year 5 Years 10 Years
Return before taxes -15.88% -6.71% 1.55%
Return after taxes on distributions -16.48% -7.93% 0.72%
Return after taxes on distributions and sale of Fund shares -8.48% -4.48% 1.56%
MSCI Emerging Markets Index (reflects no deduction for fees, expenses or taxes) -16.96% -7.16% 1.18%
INVESTMENT ADVISER AND PORTFOLIO MANAGERS
Sit Investment Associates, Inc. serves as the Fund’s investment adviser (the “Adviser”). The Fund’s investment decisions are made by a team of portfolio managers and analysts who are jointly responsible for the day-to-day management of the Fund.
The primary portfolio managers of the Fund are: Roger J. Sit, Chairman and President. Mr. Sit has served as Chief Investment Officer of the Fund since 1997. Raymond E. Sit, Vice President – Research and Investment Management of the Adviser. Mr. Sit has served as Portfolio Manager of the Fund since 1994.
PURCHASE AND SALE OF FUND SHARES
The minimum initial investment for shares of the Fund is $5,000. The minimum subsequent investment is $100. The Fund’s shares are redeemable. In general, you may buy or redeem shares of the Fund on any business day by mail (Sit Mutual Funds, P.O. Box 9763, Providence, RI 02940) or by phone (1-800-332-5580).
TAX INFORMATION
The Fund’s distributions are generally taxable to you as ordinary income, capital gains, or a combination of the two, unless you are investing through a tax-deferred arrangement, such as a 401(k) plan or an individual retirement account.
PAYMENTS TO BROKER-DEALERS AND OTHER FINANCIAL INTERMEDIARIES
If you purchase the Fund through a broker-dealer or other financial intermediary (such as a bank or financial adviser), the financial intermediary may impose account charges. The Fund and its related companies may also pay that intermediary for the sale of Fund shares and related services. These payments may create a conflict of interest by influencing the broker-dealer or other intermediary to recommend the Fund over another investment. Ask your intermediary or visit your intermediary’s website for more information.
Summary — Sit Developing Markets Growth Fund

43
ADDITIONAL INFORMATION ABOUT THE FUNDS
Each Fund’s investment objective and its principal investment strategies and risks are described under “Summary Information About The Funds.” This section provides additional information about the Funds’ investments and certain portfolio management techniques the Funds may use, as well as the principal risks that may affect a Fund’s portfolio. The Funds’ investment objectives and certain other investment restrictions designated as fundamental may not be changed without shareholder approval. In seeking to achieve their investment objectives, the Funds may also invest in various types of securities and engage in various investment prac-tices which are not the principal focus of the Funds and therefore not described in this Prospectus. Additional information about some of these investments and portfolio management techniques and their associated risks is included in the Funds’ Statement of Additional Information.
HOW THE FUNDS INVEST
Securities for the Funds are determined by an experienced management team. Each Fund’s primary portfolio managers seek to en-sure that investments are compatible with the Fund’s investment objectives and strategies. The research team uses a combination of “top-down” and “bottom-up” analysis to identify companies that it believes have outstanding investment potential. The investment philosophy of the research team is to target growth-oriented opportunities and invest in companies with the potential to increase earnings at a faster rate than the representative economy and market index. Decisions to buy and sell securities are based on the management team’s best judgment to achieve the Funds’ investment objectives.
In selecting equity securities for a Fund, the Adviser invests in growth-oriented companies it believes exhibit the potential for su-perior growth. The Adviser believes that a company’s earnings growth is the primary determinant of its potential long-term return and evaluates a company’s potential for above average long-term earnings and revenue growth. Several factors are considered in the Adviser’s evaluation of a company, including: unique product or service, growing product demand, dominant and growing market share, management experience and capabilities, and strong financial condition.
In selecting foreign equity securities for the International Growth Fund and Developing Markets Growth Fund, the Adviser be-gins by selecting countries or regions in which to invest. In making its selections, the Adviser considers several factors affecting the economy and equity market of foreign countries and regions, including: economic trends, earnings outlook, liquidity within the market, fiscal and monetary policy, currency exchange rate expectations, market sentiment, and social and political trends.
After the country and regional allocations are determined, the Adviser seeks industries and sectors that it believes have earnings growth prospects that are greater than the average. Within the selected industries and sectors, the Adviser invests in foreign growth-oriented companies it believes exhibit the potential for superior growth.
In selecting fixed-income securities for the Balanced Fund, the Adviser seeks fixed-income securities providing maximum total return. In making purchase and sales decisions for the Fund, the Adviser considers its economic outlook and interest rate forecast, as well as its evaluation of a fixed-income security’s credit quality, yield, maturity, and liquidity. Based upon its economic outlook, the Adviser attempts to shift the fixed-income sector concentrations of the portfolio. Based upon its interest rate forecast, the Adviser attempts to shift the fixed-income portfolio’s average effective duration, seeking to maintain an average effective duration for the fixed-income portion of the Fund’s portfolio of 3 to 7 years.
When selling equity securities for a Fund, the Adviser considers several factors, including changes in a company’s fundamentals and anticipated earnings. Generally, the Adviser will sell a security when the company’s fundamentals or competitive position signifi-cantly deteriorate, or if a better alternative exists in the market.

44
MORE ON THE FUNDS’ RISKS
All investments carry some degree of risk which will affect the value of a Fund’s investments, investment performance and price of its shares. It is possible to lose money by investing in the Funds.
Developing Markets Risk: Developing Markets Growth Fund invests primarily in equity securities trading in developing markets. International Growth Fund and Global Dividend Growth Fund may also invest in such securities. The risks of international invest-ing are particularly significant in developing markets. Investing in securities of issuers in developing markets involves exposure to economic infrastructures that are generally less diverse and mature than, and to political systems that can be expected to have less stability than, those of developed countries. Other characteristics of developing market countries that may affect investment in their markets include certain governmental policies that may restrict investment by foreigners and the absence of developed legal struc-tures governing private and foreign investments and private property. The typical small size of the markets for securities issued by is-suers located in developing markets and the possibility of low or nonexistent volume of trading in those securities may also result in a lack of liquidity and in price volatility of those securities. In addition, issuers in developing markets typically are subject to a greater degree of change in earnings and business prospects than are companies in developed markets.
Dividend Paying Company Risk: The Funds’ income objective may limit its ability to appreciate during a broad market advance because dividend paying stocks may not experience the same capital appreciation as non-dividend paying stocks. In addition, stocks held by the Funds may reduce or stop paying dividends which could affect the Funds’ ability to generate income.
ESG Risk: The ESG Growth Fund’s ESG policy could cause it to perform differently compared to similar funds that do not have such a policy. The exclusionary criteria related to the ESG policy may result in the Fund foregoing opportunities to buy certain securities when it might otherwise be advantageous to do so, or selling securities for ESG reasons when it might otherwise be dis-advantageous for it to do so. The Fund will vote proxies in a manner that is consistent with its ESG criteria, which may or may not always be consistent with maximizing short-term performance of the issuer.
Growth Style Investing Risk: Different types of stocks tend to shift into and out of favor with stock market investors depending on market and economic conditions. The Funds invest in growth style stocks. The Funds’ performance may at times be better or worse than the performance of funds that focus on other types of stocks or that have a broader investment style.
International Investing Risk: International Growth Fund, Developing Markets Growth Fund, Global Dividend Growth Fund, Dividend Growth Fund, Small Cap Dividend Growth Fund, and ESG Growth Fund invest in equity securities that trade in mar-kets other than the United States. Each of the other Funds may also invest in international securities and may invest in depository receipts which have similar risks as foreign securities. International investing involves risks not typically associated with investing in U.S. securities which may adversely affect the Fund’s investment. These risks include:
Currency Risk: The value of the Funds’ foreign securities and currency computed in U.S. dollars will vary with increases and decreases in exchange rates. A decline in the value of any particular currency against the U.S. dollar will cause a decline in the U.S. dollar value of the Funds’ holdings of securities denominated in that currency.
Currency Hedging Transactions Risk: If the Adviser’s forecast of exchange rate movements is incorrect, the Funds may realize losses on their foreign currency transactions. In addition, the Funds’ hedging transactions may prevent the Funds from realizing the benefits of a favorable change in the value of foreign currencies.
Foreign Securities Market Risk: Securities of many non-U.S. companies may be less liquid and their prices more volatile than securities of comparable U.S. companies. Securities of companies traded in many countries outside the U.S., particularly devel-oping markets countries, may be subject to further risks due to the inexperience of local brokers and financial institutions, the possibility of permanent or temporary termination of trading, and greater spreads between bid and asked prices for securities. In addition, non-U.S. stock exchanges and brokers are subject to less governmental regulation, and commissions may be higher than in the United States. Also, there may be delays in the settlement of non-U.S. stock exchange transactions.
Foreign Tax Risk: The Funds’ income from foreign issuers may be subject to non-U.S. withholding taxes. In some countries, the Funds also may be subject to taxes on trading profits and, on certain securities transactions, transfer or stamp duties tax. To the extent foreign income taxes are paid by the Funds, U.S. shareholders may be entitled to a credit or deduction for U.S. tax purposes.
Additional Information about the Funds

45
Information Risk: Non-U.S. companies generally are not subject to uniform accounting, auditing and financial reporting stan-dards or to other regulatory requirements that apply to U.S. companies. As a result, less information may be available to investors concerning non-U.S. issuers. Accounting and financial reporting standards in developing markets may be especially lacking.
Investment Restrictions Risk: Some countries, particularly developing markets, restrict to varying degrees foreign investment in their securities markets. In some circumstances, these restrictions may limit or preclude investment in certain countries or may increase the cost of investing in securities of particular companies.
Political and Economic Risk: Investing in securities of non-U.S. companies may entail additional risks due to the potential po-litical, social and economic instability of certain countries, changes in international trade patterns, the possibility of the imposi-tion of exchange controls, expropriation, limits on removal of currency or other assets and nationalization of assets.
Management Risk: A strategy used by the investment management team may not produce the intended results.
Market Risk: The market value of securities may fall or fail to rise. Market risk may affect a single issuer, sector of the economy, or the market as a whole. The market value of securities may fluctuate, sometimes rapidly and unpredictably.
Mid Cap Stock Risk: Stocks of mid cap companies may be subject to more abrupt or erratic market movements than stocks of larger, more established companies, and may be slightly less volatile that those of small-cap companies. Mid-cap companies may have limited product lines, markets or financial resources, and they may be dependent on a limited management group.
New Fund Risk: The ESG Growth Fund has an inception date of June 30, 2016. There can be no assurance that the Fund will grow to or maintain an economically viable size, in which case the Board of Directors may determine to liquidate the Fund. The timing of any liquidation may not be favorable to certain individual shareholders.
Small Cap Stock Risk: Stocks of smaller companies involve substantial risk. Prices of small cap stocks may be subject to more abrupt or erratic market movements than stocks of larger, more established companies. Small companies may have limited product lines or financial resources, may be subject to greater degrees of change in their earnings and prospects, and may be dependent upon a small or inexperienced management group. Small cap stocks typically are traded in lower frequency and volume making them subject to wider price fluctuations and in some cases, there could be limited trading opportunities at a favorable price or time.
Risks That Apply Primarily to Sit Balanced Fund:
Call Risk: Many bonds may be redeemed (“called”) at the option of the issuer before their stated maturity date. In general, an issuer will call its bonds if they can be refinanced by issuing new bonds which bear a lower interest rate. The Fund may then be forced to invest the unanticipated proceeds at lower interest rates, resulting in a decline in the Fund’s income.
Credit Risk: The issuers or guarantors of securities of fixed-income securities owned by the Fund may default on the payment of principal or interest, or experience a decline in credit quality, causing the value of the Fund to decrease.
Income Risk: The income you earn from the Fund may decline due to declining interest rates.
Interest Rate Risk: An increase in interest rates may lower the Fund’s value and the overall return on your investment. The mag-nitude of this decrease is often greater for longer-term fixed income securities than shorter-term securities. The Fund’s exposure to risks associated with rising interest rates may be increased due to the current period of historically low interest rates in the U.S. and the effect of potential governmental fiscal policy initiatives and resulting market reaction to those initiatives.
Prepayment and Extension Risk: Declining interest rates may compel borrowers to prepay mortgages and debt obligations underlying the mortgage-backed securities owned by the Fund. The proceeds received by the Fund from prepayments will likely be reinvested at interest rates lower than the original investment, thus resulting in a reduction of income to the Fund. Likewise, rising interest rates could reduce prepayments and extend the life of securities with lower interest rates, which may increase the sensitivity of the Fund’s value to rising interest rates.
Additional Information about the Funds

46
TEMPORARY DEFENSIVE INVESTING
For temporary defensive purposes in periods of unusual market conditions, each Fund may invest all of its total assets in cash or short-term debt securities including certificates of deposit, bankers’ acceptances and other bank obligations, corporate and direct U.S. obligation bonds, notes, bills, commercial paper and repurchase agreements and other taxable obligations. Investing in these temporary investments may reduce a Fund’s yield and prevent a Fund from achieving its investment objective.
PORTFOLIO TURNOVER
The Funds may trade securities frequently, resulting, from time to time, in an annual portfolio turnover rate of over 100%. However, historically, the Funds’ turnover rate has been less than 100%. The “Financial Highlights” section of this Prospectus shows each Fund’s historical portfolio turnover rate. A high portfolio turnover rate generally will result in greater brokerage commission ex-penses borne by a Fund which may decrease the Fund’s yield. A high portfolio turnover rate may result in higher amounts of realized capital gain, including short-term capital gain, subject to the payment of taxes by shareholders.
PORTFOLIO HOLDINGS DISCLOSURE
Each Funds’ portfolio holdings are included in that Fund’s annual and semi-annual financial reports that are mailed to sharehold-ers of record. Additionally, a complete portfolio holdings report is filed quarterly with the SEC on Form N-Q and is available on the SEC website at www.sec.gov or upon request from a Sit Investor Service Representative. A complete description of the Funds’ portfolio holdings disclosure policies is available in the Funds’ Statement of Additional Information.
DURATION
The Balanced Fund attempts to maintain an average effective duration of 3 to 7 years for the fixed-income portion of its portfolio. Duration measures how much the value of a security is expected to change with a given change in interest rates. Effective duration is one means used to measure interest rate risk. The longer a security’s effective duration, the more sensitive its price is to changes in interest rates. For example, if interest rates rise by 1%, the market value of a security with an effective duration of 3 years would decrease by 3%, with all other factors being constant. The Adviser uses several methods to compute duration estimates appropriate for particular securities held in the Funds’ portfolios. Duration estimates are based on assumptions by the Adviser and subject to a number of limitations. Duration is most useful when interest rate changes are small and occur equally in short-term and long-term securities. In addition, it is difficult to calculate precisely for bonds with prepayment options, such as mortgage-related securities, because the calculation requires assumptions about prepayment rates.
SECURITIES RATINGS
When debt securities are rated by one or more independent rating agencies, the Adviser uses these ratings to determine bond qual-ity. Investment-grade debt securities are those that are rated within the four highest rating categories, which are AAA, AA, A, and BBB by Standard & Poor’s and Fitch Ratings, and Aaa, Aa, A and Baa by Moody’s Investor Services. If a debt security’s credit quality rating is downgraded after a Fund’s purchase, the Adviser will consider whether any action, such as selling the security, is warranted.
Additional Information about the Funds

47
MANAGEMENT OF THE FUNDS
INVESTMENT ADVISER
Sit Investment Associates, Inc. (the “Adviser”), 3300 IDS Center, 80 S. Eighth Street, Minneapolis, Minnesota 55402, is the Funds’ investment adviser. The Adviser was founded in 1981 and provides investment management services for both public and private cli-ents. As of September 30, 2016, the Adviser had approximately $13.7 billion in assets under management, including approximately $2.9 billion for the 14 Sit Mutual Funds.
Under Investment Management Agreements between the Funds and the Adviser (the “Agreements”), the Adviser manages the Funds’ business and investment activities, subject to the authority of the board of directors. A discussion regarding the basis of the board of directors’ approving the Agreements is available in the Stock Funds’ Semi- Annual Report for the period ended December 31. The Agreements require the Adviser to bear all of the Funds’ expenses except interest, brokerage commissions, transaction charges, acquired fund fees and expenses and certain extraordinary expenses. Each Fund pays the Adviser a monthly fee for its ser-vices. During their most recent fiscal year, the Funds paid the following advisory fees to the Adviser:
FundAdvisory fee as a % of
average daily net assetsBalanced Fund 1.00%Dividend Growth Fund - Class I shares 1.00%Dividend Growth Fund - Class S shares 1.00%Global Dividend Growth Fund - Class I shares 1.25%Global Dividend Growth Fund - Class S shares 1.25%Large Cap Growth Fund 1.00%Mid Cap Growth Fund 1.25%
ESG Growth Fund - Class I shares 1.25%ESG Growth Fund - Class S shares 1.25%Small Cap Dividend Growth Fund - Class I shares 1.25%Small Cap Dividend Growth Fund - Class S shares 1.25%International Growth Fund 1.50%Small Cap Growth Fund 1.50%Developing Markets Growth Fund 2.00%
PORTFOLIO MANAGEMENT
The Funds’ investment decisions are made by a team of portfolio managers and analysts who are jointly responsible for the day-to-day management of the Funds. The portfolio management team is led by Roger J. Sit, Chairman, President, Chief Executive Officer, and Global Chief Investment Officer of the Adviser.

48
The following table lists the individual team members that are primarily responsible for managing each Fund’s investments.
Portfolio Manager Title Role on Management Team
Experience with:• Management Team• Advisor• Industry Past 5 Years Business Experience
Balanced Fund
Roger J. Sit Chairman and President
Chief Investment Officer 8 yrs 18 yrs 26 yrs
7 m11 m5 m
Chairman, President, CEO and Global CIO of the Advisor; Chairman and CEO of Sit Invest-ment Fixed Income Advisors, Inc. (“SF”); Chair-man of SIA Securities Corp. (the “Distributor”).
Bryce A. DotyVice President — Investments
Senior Portfolio Manager 20 yrs 20 yrs 26 yrs
10 m11 m5 m
Senior Vice President and Senior Portfolio Manager of SF.
Ronald D. SitVice President — Investments
Portfolio Manager 0 yrs 32 yrs 32 yrs
1 m4 m4 m
Vice President — Equity Investments of the Adviser.
Dividend Growth Fund
Roger J. Sit Chairman and President
Chief Investment Officer 12 yrs 18 yrs 26 yrs
10 m11 m5 m
See above.
Kent L. JohnsonVice President — Investments
Portfolio Manager 12 yrs 27 yrs27 yrs
10 m9 m9 m
Sr. Vice President — Equity Investments of the Adviser.
Michael J. Stellmacher Vice President — Research and Invest-ment Management of the Adviser
Portfolio Manager 12 yrs 15 yrs25 yrs
10 m9 m8 m
Vice President — Research and Investment Management of the Adviser.
Global Dividend Growth Fund
Roger J. Sit Chairman and President
Chief Investment Officer 8 yrs 18 yrs 26 yrs
1 m11 m5 m
See above.
Kent L. JohnsonVice President — Investments
Portfolio Manager 8 yrs 27 yrs27 yrs
1 m9 m9 m
See above.
Michael J. Stellmacher Vice President — Research and Invest-ment Management of the Adviser
Portfolio Manager 8 yrs 15 yrs25 yrs
1 m9 m8 m
See above.
Tasha M. MurdoffVice President — Research and Invest-ment Management of the Adviser
Portfolio Manager 8 yrs 20 yrs20 yrs
1 m11 m11 m
Vice President — Research and Investment Management of the Adviser.
Raymond E. SitVice President — Research and Invest-ment Management of the Adviser
Portfolio Manager 8 yrs 22 yrs24 yrs
1 m2 m2 m
Vice President — Research and Investment Management of the Adviser.
Management of the Funds
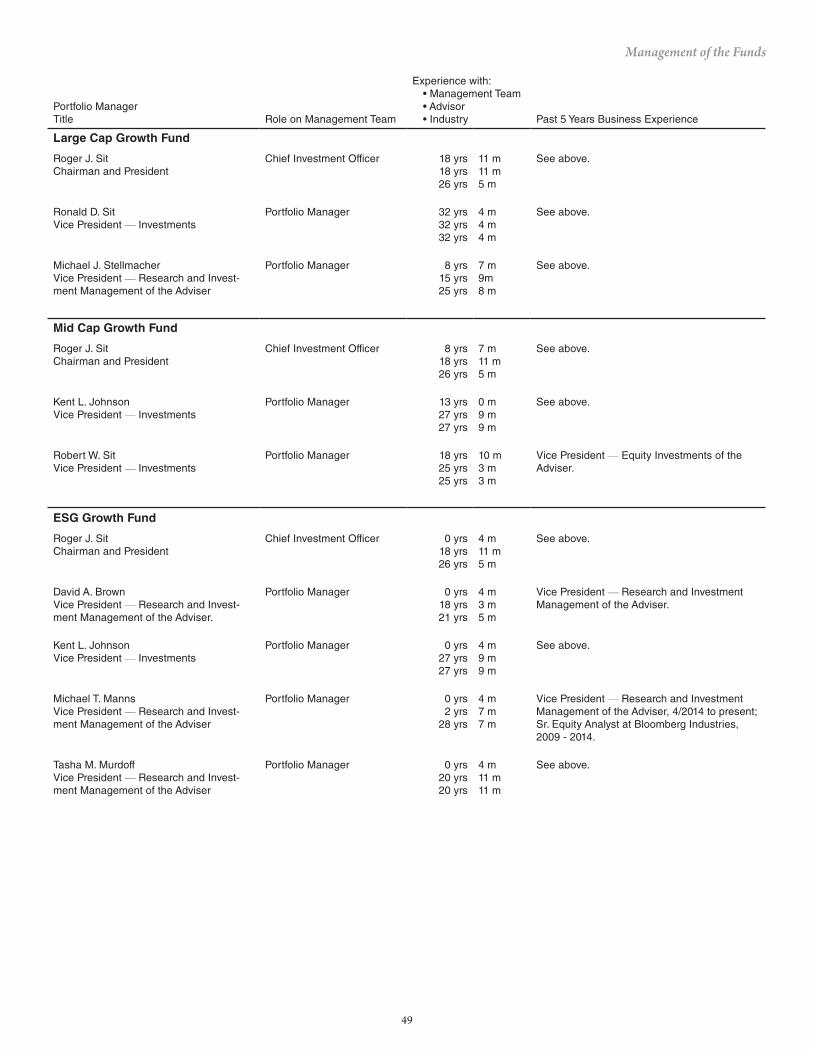
49
Portfolio Manager Title Role on Management Team
Experience with:• Management Team• Advisor• Industry Past 5 Years Business Experience
Large Cap Growth Fund
Roger J. Sit Chairman and President
Chief Investment Officer 18 yrs 18 yrs 26 yrs
11 m11 m5 m
See above.
Ronald D. SitVice President — Investments
Portfolio Manager 32 yrs 32 yrs 32 yrs
4 m4 m4 m
See above.
Michael J. Stellmacher Vice President — Research and Invest-ment Management of the Adviser
Portfolio Manager 8 yrs 15 yrs 25 yrs
7 m9m8 m
See above.
Mid Cap Growth Fund
Roger J. Sit Chairman and President
Chief Investment Officer 8 yrs 18 yrs 26 yrs
7 m11 m5 m
See above.
Kent L. JohnsonVice President — Investments
Portfolio Manager 13 yrs 27 yrs27 yrs
0 m9 m9 m
See above.
Robert W. SitVice President — Investments
Portfolio Manager 18 yrs 25 yrs 25 yrs
10 m3 m3 m
Vice President — Equity Investments of the Adviser.
ESG Growth Fund
Roger J. Sit Chairman and President
Chief Investment Officer 0 yrs 18 yrs 26 yrs
4 m11 m5 m
See above.
David A. BrownVice President — Research and Invest-ment Management of the Adviser.
Portfolio Manager 0 yrs 18 yrs21 yrs
4 m3 m5 m
Vice President — Research and Investment Management of the Adviser.
Kent L. JohnsonVice President — Investments
Portfolio Manager 0 yrs 27 yrs27 yrs
4 m9 m9 m
See above.
Michael T. MannsVice President — Research and Invest-ment Management of the Adviser
Portfolio Manager 0 yrs 2 yrs
28 yrs
4 m7 m7 m
Vice President — Research and Investment Management of the Adviser, 4/2014 to present; Sr. Equity Analyst at Bloomberg Industries, 2009 - 2014.
Tasha M. MurdoffVice President — Research and Invest-ment Management of the Adviser
Portfolio Manager 0 yrs 20 yrs20 yrs
4 m11 m11 m
See above.
Management of the Funds

50
Portfolio Manager Title Role on Management Team
Experience with:• Management Team• Advisor• Industry Past 5 Years Business Experience
Small Cap Dividend Growth Fund
Roger J. Sit Chairman and President
Chief Investment Officer 1 yrs 18 yrs 26 yrs
7 m11 m5 m
See above.
Kent L. JohnsonVice President — Investments
Portfolio Manager 1 yrs 27 yrs27 yrs
7 m9 m9 m
See above.
Michael T. MannsVice President — Research and Invest-ment Management of the Adviser
Portfolio Manager 1 yrs 2 yrs
28 yrs
7 m7 m7 m
See above.
Robert W. SitVice President — Investments
Portfolio Manager 1 yrs 25 yrs25 yrs
7 m3 m3 m
See above.
International Growth Fund
Roger J. Sit Chairman and President
Chief Investment Officer 18 yrs 18 yrs 26 yrs
11 m11 m5 m
See above.
Tasha M. MurdoffVice President — Research and Invest-ment Management of the Adviser
Portfolio Manager 12 yrs 20 yrs20 yrs
0 m11 m11 m
See above.
Small Cap Growth Fund
Roger J. Sit Chairman and President
Chief Investment Officer 7 yrs 18 yrs 26 yrs
7 m11 m5 m
See above.
Kent L. JohnsonVice President — Investments
Portfolio Manager 13 yrs 27 yrs27 yrs
0 m9 m9 m
See above.
Robert W. SitVice President — Investments
18 yrs 25 yrs 25 yrs
10 m3 m3 m
See above.
Michael J. Stellmacher Vice President — Research and Invest-ment Management of the Adviser
Portfolio Manager 15 yrs 15 yrs 25 yrs
9 m9 m8 m
See above.
Developing Markets Growth Fund
Roger J. Sit Chairman and President
Chief Investment Officer 18 yrs 18 yrs 26 yrs
11 m11 m5 m
See above.
Raymond E. SitVice President — Research and Invest-ment Management of the Adviser
Portfolio Manager 22 yrs 22 yrs 24 yrs
2 m2 m2 m
See above.
The Statement of Additional Information provides additional information about the Portfolio Managers’ compensation, other ac-counts managed by the Portfolio Managers, and the Portfolio Managers’ ownership of securities in the Fund, if any.
Management of the Funds

51
BUYING AND SELLING SHARES
BUYING SHARES
To Open an AccountMinimum Investment Invest by Check Invest by Wire Invest Online
$5,000 per Fund, except it is $100,000for Class I shares of Dividend Growth, Global Dividend Growth, Small Cap Dividend Growth, and ESG Growth Funds
Mail a completed account application with a check via regular mail or overnight delivery:
Regular Mail Overnight DeliverySit Mutual Funds Sit Mutual FundsP. O. Box 9763 4400 Computer DriveProvidence, RI 02940 Westborough, MA 01581
Mail your investment check, made payable to Sit Mutual Funds, along with your application.
Certain checks and other instruments are not accepted without prior approval such as:
• third party checks • money orders• starter checks • credit card checks
Prospectuses and account applications may be viewed and printed from our website, www.sitfunds.com.
Mail a completed account application with a request for a new account number to:
Regular Mail Sit Mutual Funds P. O. Box 9763 Providence, RI 02940
A representative will contact you with the new account number, or call us at 1-800-332-5580. Instruct your bank to wire your initial investment to:
Bank of New York MellonABA#: 011001234Credit: 0000733571 BNY Mellon Investment Servicing as Agent for Sit Mutual Funds Further Credit: Account Name New Sit Fund / Account Number
Bank Address (required by some financial institutions)Bank of New York Mellon135 Santilli HighwayEverett, MA 02149
Sit Mutual Funds does not charge a fee for incoming wires. Your bank may charge a fee for sending a wire.
You cannot open an account and make an initial purchase online.
• Shares may be purchased on any day the NYSE is open with a minimum initial investment of $5,000 per Fund except for Class I shares of Divi-dend Growth, Global Dividend Growth, Small Cap Dividend Growth, & ESG Growth Funds which have a minimum initial investment of $100,000.
• IRA accounts (regular, Roth and SEP) require a minimum initial investment of $2,000 per fund except for Class I shares of Dividend Growth, Global Dividend Growth, Small Cap Dividend Growth, and ESG Growth Funds which have a minimum initial investment of $100,000.
To Add to an AccountMinimum Investment Invest by Check Invest by Wire or ACH Invest Online
$100 Mail a completed investment slip for a particular fund (which you received in your account state-ment) or a letter of instruction with a check:
Regular Mail Overnight DeliverySit Mutual Funds Sit Mutual FundsP. O. Box 9763 4400 Computer DriveProvidence, RI 02940 Westborough, MA 01581
A letter of instruction must include your account number, the name(s) of the registered owner(s) and the Fund(s) that you want to purchase.
Certain checks and other instruments are not accepted without prior approval such as:
• third party checks • money orders• starter checks • credit card checks
Invest by Wire. Instruct your bank to wire your additional investment to us using the wire instructions provided above in “Invest by Wire.”
Invest by ACH. Call us at 1-800-332-5580 to request that a purchase be made electronically from your bank account. The shares purchased will be priced on the next business day following your telephone request made prior to the close of the NYSE.
Before using the ACH feature, you must set up the ACH option on your initial account application or a Change of Account Options Form.
You may purchase additional shares of a Sit Fund or invest in a new Sit Fund online.
Visit www.sitfunds.com to access your account. Your ac-count must have a designated bank account to execute transactions.
• Additional investments in any account must be at least $100.• You may set up an Automatic Investment Plan on your initial account application or on a Change of Account Options Form. The Plan will invest in
the selected Fund electronically from your bank account (via ACH) on any day the Funds are open.

52
SELLING SHARES
To Sell SharesSell by Mail Sell by Telephone Sell Online
Mail a written request that includes:• account number• names and signatures of all registered owners exactly as they
appear on the account• name of Fund and number of shares or dollar amount you
want to sell• Medallion signature guarantee(s) if you have requested that
the proceeds from the sale be:• paid to anyone other than the registered account owners• paid by check and mailed to an address other than the
registered address• sent via bank wire (currently an $8 fee) to a bank differ-
ent than the bank authorized by you on your account application
• supporting legal documents, if required • method of payment (check, wire transfer, or ACH)
Note for IRA Accounts: Mail a signed IRA Distribution Form to Sit Mutual Funds
Call us at 1-800-332-5580 and request a sale of shares.
Before selling shares by telephone, you must set up the option on your initial account application or a Change of Account Options Form. Pro-ceeds from the sale will be sent as directed on your application by check, bank wire or ACH. The Funds’ bank charges a wire fee to send the proceeds via bank wire (currently $8).
Note for IRA Accounts: Before selling shares from an IRA account by telephone, you must set up the option on an IRA Redemption Privileges Form.
You may sell shares of a Sit Fund online. Visit www.sitfunds.com to access your account. To send proceeds to your bank, you must have set up ACH instructions via your initial account applica-tion or via a Change of Ac-count Instructions form.
• Your sale proceeds will be paid as soon as possible, generally not later than 7 days after the Funds’ receipt of your request to sell. However, if you purchased shares with nonguaranteed funds, such as a personal check, and you sell shares, your sale proceeds payment will be delayed until your check clears, which may take 15 days. You may receive proceeds from the sales of your shares in one of three ways:
• By Mail: Your check will generally be mailed to the address of record within 7 days after receipt of your request.• By Wire: Your bank account will generally be credited within 1 to 2 business days after receipt of your request. The Funds’ bank charges
a wire fee (currently $8) which will be deducted from the balance of your account or from the amount being wired if your account has been completely redeemed. The recipient bank may also charge a wire fee.
• By ACH: Your bank account will generally be credited within 1 to 2 business days after receipt of your request. • Other Documents: Under certain circumstances, sales of shares may require additional legal documentation, such as sales by estates, trusts,
guardianships, custodianships, corporations, pension and profit sharing plans and other organizations.• Medallion Signature Guarantee: A medallion signature guarantee assures that a signature is genuine and protects shareholders from unauthor-
ized account transactions. A medallion signature guarantee may be obtained from a bank, brokerage firm, or other financial institution that is participating in a medallion program recognized by the Securities Transfer Association. A notary public stamp cannot be substituted for a medal-lion signature guarantee.
• You may set up an Automatic Withdrawal Plan (minimum $100) on your initial account application or on a Change of Account Options Form. The Plan will sell shares of the selected Fund and send the proceeds by check or by ACH.
EXCHANGING SHARES
To Exchange SharesExchange by Mail Exchange by Telephone Exchange Online
You may sell shares of one Sit Fund and purchase shares of another Sit Fund by mailing a letter of instruction signed by all registered owners of the account:
Regular Mail Overnight DeliverySit Mutual Funds Sit Mutual FundsP. O. Box 9763 4400 Computer DriveProvidence, RI 02940 Westborough, MA 01581
A letter of instruction must include your account number, the name(s) and the number of shares or dollar amount of the Fund(s) you want to sell and the name(s) of the Fund(s) you want to purchase.
You may sell shares of one Sit Fund and pur-chase shares of another Sit Fund by calling us at 1-800-332-5580. If you call after business hours, you will need your Personal Identification Num-ber to use the automatic telephone system.
You may sell shares of one Sit Fund and purchase shares of another Sit Fund online. Visit www.sitfunds.com to access your account.
• There is no transaction fee to sell shares of one or more Sit Funds and use the proceeds to buy shares of another Sit Fund.• Before making an exchange, please read the Prospectus and consider the investment objective of the Fund you are purchasing.• An exchange of shares is a sale for federal income tax purposes and you may have a taxable capital gain or loss.• You may set up an Automatic Exchange Plan on your initial account application or on a Change of Account Options Form. The Plan will sell
shares of one Sit Fund and invest in another Sit Fund on any day the Funds are open.
Buying and Selling Shares

53
ACCOUNT INFORMATION
PRICING OF FUND SHARES
Your price for purchasing, selling, or exchanging shares is based on the Fund’s net asset value (“NAV”) per share, which is calculated as of the close of regular trading on the New York Stock Exchange (“NYSE”) (generally 3:00 p.m. Central time) every day the ex-change is open. The NAV per share of the Funds will fluctuate. A Fund’s NAV per share is calculated by adding the total value of the Fund’s investments and other assets (including accrued income), subtracting its liabilities, and dividing by the number of outstand-ing shares of the Fund.
The Boards of Directors have adopted procedures for valuing investments and have delegated to the Adviser the daily valuation of such investments. Pursuant to the procedures, exchange-listed securities are normally valued at closing sale prices. In certain situ-ations, the Adviser may use the fair value of a security if prices are unavailable or are deemed unreliable, or if events occur after the close of a securities market (usually a foreign market) and before a Fund values its assets that would materially affect net asset value. In addition, for foreign equity securities that meet certain criteria, the Directors have approved the use of a fair value service that values such securities to reflect market trading that occurs after the close of the applicable foreign markets of comparable securities or other instruments that have a strong correlation to the fair-valued securities. The Adviser expects to fair value domestic securities in limited circumstances, such as when the securities are subject to restrictions on resale. A security that is fair valued may be valued at a price higher or lower than actual market quotations or the value determined by other mutual funds using their own fair valua-tion procedures. Fair value pricing involves subjective judgments and it is possible that the fair value determined for a security may be different than the value that could be realized upon the sale of that security. Because foreign securities trade on days when Fund shares are not priced, the value of foreign securities held by a Fund can change on days when Fund shares cannot be redeemed, and since Developing Markets Growth Fund and International Growth Fund invest primarily in such foreign securities, and the Global Dividend Growth Fund and ESG Growth Fund may invest in such foreign securities, the value of these Funds’ shares may change on days when you will be unable to purchase or redeem their shares.
Short-term debt securities maturing in less than 60 days are valued at amortized cost. The amortized cost method of valuation ini-tially values a security at its purchase cost, then consistently adjusts the cost value by amortizing/accreting any discount or premium paid until the security’s maturity without regard to fluctuating interest rates.
WHEN ORDERS ARE EFFECTIVE
Purchase, exchange, and sale orders are received and may be accepted by Sit Mutual Funds only on days the New York Stock Ex-change (“NYSE”) is open. The customary national business holidays observed by the NYSE are: New Year’s Day, Martin Luther King Jr. Day, President’s Day, Good Friday, Memorial Day, July Fourth, Labor Day, Thanksgiving Day and Christmas Day. Purchase, exchange, and sale orders received in good order by the Funds’ transfer agent at its Westborough office (4400 Computer Drive, Westborough, MA 01581) prior to the close of the NYSE (generally 3:00 p.m. Central time) are processed at the net asset value per share calculated for that business day, except purchases made to an existing account via Automated Clearing House, “ACH,” elec-tronic transfer of funds. ACH purchases are invested at the net asset value per share on the next business day (or, if the next business day is a bank holiday, then two business days) after your telephone call to the Funds if you call the Funds prior to the close of the NYSE. Your bank account will be debited within 1 to 2 business days.
If your purchase, exchange, or sale order is received after the close of the NYSE, the purchase, exchange or sale will be made at the net asset value calculated on the next day the NYSE is open.

54
INVESTING THROUGH FINANCIAL INTERMEDIARIES
There is no charge to invest, exchange, or sell shares when you make transactions directly through Sit Mutual Funds.
The Funds may authorize certain institutions acting as financial intermediaries (including banks, trust companies, brokers and investment advisers), to accept purchase, redemption and exchange orders from their customers on behalf of the Funds. A Fund will be deemed to have received an order when the order is received by the authorized intermediary in good form, and the order will be priced at the Fund’s per share NAV next determined, provided that the authorized intermediary forwards the order (and pay-ment for any purchase order) to the Funds (or their transfer agent) within agreed upon time periods. Investors purchasing shares through a financial intermediary should read their account agreements carefully. A financial intermediary’s requirements may differ from those listed in this Prospectus. A financial intermediary also may impose account charges, such as asset allocation fees, account maintenance fees and other charges. A financial intermediary may aggregate the amount invested in a Fund by their clients in order to meet the Fund’s minimum investment requirement. If you purchase the Fund through a broker-dealer or other financial interme-diary, the Fund and its related companies may pay the intermediary for the sale of Fund shares and related services. These payments may create a conflict of interest by influencing the broker-dealer or other intermediary and your salesperson to recommend the Fund over another investment. Ask your salesperson or visit your financial intermediary’s web site for more information.
The Dividend Growth, Global Dividend Growth, Small Cap Dividend Growth, and ESG Growth Funds offer shares in two classes and the ability of such Funds to monitor account balances through an omnibus account of a financial intermediary for purposes such as converting between share classes may be significantly limited or absent.
CLASS I AND CLASS S SHARES
Class I and Class S Shares:
The Dividend Growth, Global Dividend Growth, Small Cap Dividend Growth, and ESG Growth Funds offer shares in two classes: Class I shares and Class S shares. Different investment minimums and expenses apply to each share class, and as a result, the invest-ment performance of each will differ. For more information, please refer to the section titled “Buying and Selling Shares” and the “Fees and Expenses of the Fund” subsection within each Fund’s summary information.
Employees, officers or directors of the Adviser, and its affiliates, and family members of such employees, officers or directors, are entitled to purchase Class I shares with a minimum investment of $5,000 rather than the $100,000 minimum investment require-ment applicable to all other investors. In addition, shareholders of any Sit Mutual Fund as of the inception date of the Dividend Growth or Global Dividend Growth Funds (March 31, 2006 and September 30, 2008 respectively), are entitled to purchase that Fund’s Class I shares with a minimum investment of $5,000 rather than the $100,000 minimum investment requirement applicable to all other investors.
Distribution Plan – Class S Shares:
The issuer of the Dividend Growth, Global Dividend Growth, Small Cap Dividend Growth, and ESG Growth Funds - Sit Mutual Funds, Inc., has adopted on behalf of each Fund’s Class S shares a distribution plan (the “Distribution Plan”) pursuant to Rule 12b-1 under the Investment Company Act of 1940, which allows Class S shares to pay distribution fees for the sale and distribution of its shares. Under the Distribution Plan, Class S shares may pay as compensation up to an annual rate of 0.25% of the average daily net asset value of Class S shares to the Distributor or other qualified recipient under the Distribution Plan. As these fees are paid out of the Class S assets on an on-going basis, over time these fees will increase the cost of your investment and may cost you more than paying other types of sales charges.
Converting Shares:
A conversion between class shares is a non-taxable event.
Self-directed conversions. You may convert Class S shares into Class I shares at any time if your account balance in the Fund is at least $100,000. You may call an investor service representative or mail a request to the Funds.
Account Information

55
Automatic Conversions. Each of the Funds conduct periodic reviews of account balances and may convert an eligible investor’s Class S shares into Class I shares. The Fund will notify the investor in writing before any automatic conversion into Class I shares. You may instruct the Fund if you do not want to convert to the lower-cost Class I shares. If an investor no longer meets the require-ments for Class I shares, the Fund may convert the investor’s Class I shares into Class S shares. A decline in the investor’s account balance because of redemptions may result in such a conversion. The Fund will notify the investor in writing before any automatic conversion into Class S shares.
PURCHASE RESTRICTIONS
The Funds may reject or restrict any purchase or exchange order at any time when, in the judgment of management, it is in the best interests of the Funds. For example, see the discussion regarding “Excessive Trading in Fund Shares” below.
EXCESSIVE TRADING IN FUND SHARES
The Funds discourage excessive short-term trading that could be disruptive to the management of a Fund. When large dollar amounts are involved, a Fund may have difficulty implementing investment strategies, because it cannot predict how much cash it will have to invest. Excessive trading also may force a Fund to sell portfolio securities at disadvantageous times to raise the cash needed to satisfy a redemption request, and may increase brokerage expenses. These factors may hurt a Fund’s performance and its shareholders.
The Funds may, in the Funds’ discretion, reject any purchase or exchange order from a shareholder if the Funds determine that the shareholder’s short-term trading activity is excessive. The Funds’ Boards of Directors have approved policies and procedures de-signed to discourage excessive trading in Fund shares. For example, the Funds (except for the Balanced Fund) impose a redemption fee on shares held for less than 30 calendar days. Additionally, the Funds monitor purchase orders and investigate orders that exceed certain thresholds and attempt to confirm that the investment is not being made for a short-term, otherwise any such trade will be rejected. The Funds have the right to modify the market timing policy at any time without advance notice. The Funds seek to apply market timing policies and procedures uniformly to all shareholders. The Funds make reasonable efforts to apply these policies and procedures to shareholders who own shares through omnibus accounts, however, it should be noted that the ability of the Funds to monitor and limit excessive short-term trading of shareholders investing in a Fund through the omnibus account of a financial intermediary may be significantly limited or absent where the intermediary maintains the underlying shareholder accounts. Despite our efforts to discourage market timing, there is no guarantee that the Funds or their agents will be able to identify market timers or curtail their trading practices.
SMALL ACCOUNT BALANCES / MANDATORY REDEMPTIONS
The minimum investment in the Dividend Growth, Global Dividend Growth, Small Cap Dividend Growth, and ESG Growth Funds is $100,000 with respect to Class I shares and $5,000 with respect to Class S shares. The minimum investment in all other Funds is $5,000. The minimum investment requirement is applied at the omnibus account level for shares purchased through a financial intermediary. If your account balance in a Fund falls below $5,000 as a result of selling or exchanging shares, the Fund has the right to redeem your shares and send you the proceeds. Before redeeming your account, the Fund will mail you a notice of its intention to redeem, which will give you an opportunity to make an additional investment. If you do not increase the value of your account to at least $5,000 within 30 days of the date the notice was mailed, the Fund may redeem your account.
UNCASHED CHECKS AND DORMANT ACCOUNTS
The assets in your account are subject to state unclaimed property laws which apply to both shares held in the Fund and uncashed checks from dividends or other distributions from the Fund. If your account has had undeliverable mail, uncashed checks or inactivity for a period of time specified by your state, the Fund may be required to transfer the assets to the state in compliance with these laws.
Account Information
56
EARLY REDEMPTION FEE
Each Fund except the Balanced Fund charges a redemption fee on shares held for less than 30 calendar days. The fee is retained by the Fund for the benefit of its long-term shareholders. It is charged to discourage short-term trading of the Fund by market timers or other investors who do not share the long-term strategy of the Fund, and to reduce the expenses of long-term shareholders by reduc-ing the trading costs and other costs associated with short-term investments in the Fund. The Balanced Fund has not been suscep-tible to short-term trading and therefore does not charge a redemption fee.
The “first-in, first out” (FIFO) method is used to determine the holding period; this means that if you bought shares on different days, the shares purchased first will be redeemed first for the purpose of determining whether the fee applies.
The redemption fee will not be assessed on the following redemptions or exchanges:
› shares in accounts of asset allocation or wrap programs or other fee-based programs of intermediaries whose trading practices are determined by the Fund not to be detrimental to the Fund or long-term shareholders, such as model driven programs with periodic automatic portfolio rebalancing or non-discretionary rebalancing or asset allocation programs;
› shares acquired through reinvestment of dividends and/or capital gains; › shares redeemed in involuntary transactions, including, for example, shares redeemed from a shareholder account for purposes
of complying with the anti-money laundering (AML) requirements or required by law or regulation, a regulatory agency, or a court order;
› shares redeemed due to the shareholder’s death; and › shares redeemed from certain omnibus accounts held by financial intermediaries whose systems are unable to assess the re-
demption fee; certain employer-sponsored retirement accounts (including certain plans qualified under 401(k) of the Internal Revenue Code and other types of defined contribution or employee benefit plans); and shares redeemed in connection with required distributions from an IRA.
INVESTOR SERVICE FEES
Investor Services Representatives can provide many services to you. You will be charged a fee for some customized services, such as researching historical account statements and mailings via overnight delivery services. A schedule of services with applicable fees, if any, is available upon request.
CUSTOMER IDENTIFICATION PROGRAM
Federal law requires the Funds to obtain, verify and record identifying information, which may include the name, residential or busi-ness street address, date of birth (for an individual), social security or taxpayer identification number or other identifying informa-tion for each investor who opens an account with the Funds. Applications without this information, or without an indication that a social security or taxpayer identification number has been applied for, may not be accepted. After acceptance, to the extent permit-ted by applicable law or its customer identification program, the Funds reserve the right to: (a) place limits on account transactions until the investor’s identity is verified; (b) refuse an investment in the Funds; or (c) involuntarily redeem an investor’s shares and close an account in the event that an investor’s identity is not verified. The Funds and their agents will not be responsible for any loss in an investor’s account resulting from the investor’s delay in providing all required identifying information or from closing an account and redeeming an investor’s shares when an investor’s identity is not verified.
MAILING OF REGULATORY DOCUMENTS
The Funds’ practice is to “household,” or consolidate shareholder mailings of regulatory documents such as prospectuses, share-holder reports, and proxies to shareholders at a common address. This means that a single copy of these regulatory documents is sent to the address of record. If at any time you wish to receive multiple copies of the regulatory documents at your address, you may contact the Funds and the Funds will mail separate regulatory documents to each of your individual accounts within 30 days of your
Account Information
57
call. Regulatory documents are also available to you electronically. If you would like to receive this Prospectus or other regulatory document electronically, please visit www.sitfunds.com or call 1-800-332-5580 for information about registering for “e-delivery.”
PRIVACY POLICY
The Funds take their shareholders’ personal privacy seriously. In order to provide financial products and services, the Funds may collect nonpublic personal information about their shareholders from the following sources:
› Information we receive from account documentation, including applications, contracts, and other forms which may include (but is not limited to) information such as a shareholder’s name, address, tax identification number or social security number, assets and income;
› Information about shareholder transactions and communications with the Funds, their affiliates, agents or others which may include (but is not limited to) account numbers, balances, and transaction requests made through transfer agents, custodians or third party intermediaries.
The Funds do not disclose any nonpublic personal information about their shareholders or former shareholders to anyone outside the Fund’s organization except as necessary in order to provide services to their shareholders as permitted by law. For example, we may disclose nonpublic personal information about a shareholder to a non-affiliated company assisting the Funds in servicing ac-counts such as providing transfer agent services. To safeguard their shareholder’s personal information, the Funds insist that their service providers limit access to personal information to authorized employees and agents and maintain appropriate safeguards.
The Funds restrict access to their shareholders’ nonpublic personal information to those employees who need to know that informa-tion to provide products or services to their shareholders. The Funds maintain physical, electronic and procedural safeguards that comply with federal standards to guard their shareholders’ nonpublic personal information.
This privacy policy does not apply to a shareholder’s relationship with other financial service providers, such as broker dealers, cus-todians or other third party intermediaries.
Account Information

58
DIVIDENDS AND DISTRIBUTIONS
The Balanced, Dividend Growth, Global Dividend Growth, and Small Cap Dividend Growth Funds distribute quarterly dividends from their net investment income. Each of the other Funds distributes an annual dividend from its net investment income. Net investment income includes dividends on stocks and interest earned on bonds or other debt securities less operating expenses.
Capital gains, if any, are distributed at least once a year by each Fund. A capital gain occurs if a Fund sells portfolio securities for more than its cost. If you buy Fund shares just before a distribution, in effect, you “buy the distribution.” You will pay the full price for the shares and then receive a portion of that price back as a taxable distribution.
Dividend and capital gain distributions are automatically reinvested in additional shares of the Fund paying the distribution at the net asset value per share on the distribution date. However, you may request that distributions be automatically reinvested in another Sit Mutual Fund, or paid in cash. These requests may be made on the application, Change of Account Options form, or by written notice to Sit Mutual Funds. You will receive a quarterly statement reflecting the dividend payment and, if applicable, the reinvestment of dividends. If cash payment is requested, an ACH transfer will be initiated, or a check normally will be mailed within five business days after the payable date. No interest will accrue on uncashed distribution, dividend, or sales proceeds checks.
59
TAXES
Some of the tax consequences of investing in the Funds are discussed below. More information about taxes is in the Statement of Additional Information. However, because everyone’s tax situation is unique, always consult your tax professional about federal, state and local tax consequences.
TAXES ON DISTRIBUTIONS
Each Fund pays its shareholders distributions from its net investment income and any net capital gains that it has realized. For most investors, these distributions will be taxable, whether paid in cash or reinvested (unless your investment is in an IRA or other tax-advantaged account). You will be notified annually of the tax status of distributions to you.
Distributions paid from a Fund’s net investment income will be taxable as ordinary income or as qualified dividend income. Under current tax laws, ordinary income is taxed at higher rates than qualified dividend income and long-term capital gains. Generally, dividends that a Fund receives from domestic corporations and from foreign corporations whose stock is readily tradable on an established securities market in the U.S. or which are domiciled in countries on a list established by the Internal Revenue Service will qualify for qualified dividend treatment when paid out to investors. Under current law, for taxable years beginning on or after January 1, 2011, the tax rates applicable to ordinary income will apply to dividend income and the tax rates applicable to long-term capital gains will revert to the higher applicable rates under prior law.
Distributions paid from a Fund’s net short-term capital gains, if any, are taxable as ordinary income. Distributions paid from a Fund’s long-term capital gains, if any, are taxable as long-term capital gains, regardless of how long you have held your shares. The composi-tion of distributions in any year will depend upon a variety of market and other conditions and cannot be predicted accurately.
TAXES ON TRANSACTIONS
The sale or exchange of your shares in a Fund is a taxable transaction, and you may incur a capital gain or loss on the transaction. If you held the shares for more than one year, this gain or loss would be a long-term gain or loss. A gain or loss on shares held for one year or less is considered short-term and is taxed at the same rates as ordinary income.
FOREIGN TAX CREDITS
The International Growth, Developing Markets Growth, and Global Dividend Growth Funds may be required to pay withholding and other taxes imposed by foreign countries. If a Fund has more than 50% of its total assets invested in securities of foreign corpo-rations at the end of its taxable year, it may make an election that will permit you either to claim a foreign tax credit with respect to foreign taxes paid by the Fund or to deduct those amounts as an itemized deduction on your tax return. If a Fund makes this elec-tion, you will be notified and provided with sufficient information to calculate the amount you may deduct as foreign taxes paid or take into account when determining your foreign tax credit.

60
TAX-DEFERRED ACCOUNTS
Taxes on current income can be deferred by investing in Individual Retirement Accounts (IRAs), 401(k), pension, profit sharing, employee benefit, deferred compensation and other qualified retirement plans.
The Funds are available for your tax-deferred retirement plan with a $2,000 minimum investment per Fund (except for Class I shares of Dividend Growth, Global Dividend Growth, Small Cap Dividend Growth, and ESG Growth Funds, which have a mini-mum initial investment of $100,000), and subsequent contributions of at least $100. Such retirement plans must have a qualified plan sponsor or trustee. Tax-deferred retirement plans include 401(k), profit sharing, and money purchase plans as well as IRA, Roth IRA and SEP-IRAs. You should contact the Funds for specific plan documentation. IRA accounts with balances under $10,000 will be charged an annual $15 IRA custodial fee. Account balance minimum and custodial fee amount is subject to change with a 30-day written notice.
The federal tax laws governing these tax-deferred plans must be complied with to avoid adverse tax consequences. You should con-sult your tax adviser before investing.
Taxes

61
The tables that follow present performance information about the shares of each Fund. This information is intended to help you un-derstand each Fund’s financial performance for the past 5 years, or, in the case of the Sit Small Cap Dividend Growth Fund, for the past one year and 3 months ended June 30, 2016. The Sit ESG Growth Fund is not included since the Fund’s inception is June 30, 2016 and there is no financial information to report at this time. Some of this information reflects financial results for a single Fund share. The total returns in the tables represent the rate that you would have earned or lost on an investment in a Fund, assuming you reinvested all of your dividends and distributions. This information has been derived from the Funds’ financial statements, which have been audited by KPMG LLP, an independent registered public accounting firm, whose report, along with the Funds’ financial statements, is included in the Funds’ annual report, which is available upon request.
Financial Highlights — Balanced Fund
FINANCIAL HIGHLIGHTS
Years Ended June 30,2016 2015 2014 2013 2012
Net Asset Value:Beginning of period. . . . . . . . . . . . . . . . . . . . . . . . . . . . . . . . . . . . . . . . . . . . . . . $21.54 $21.01 $18.42 $16.97 $16.47
Operations:Net investment income 1. . . . . . . . . . . . . . . . . . . . . . . . . . . . . . . . . . . . . . . . . . . 0.26 0.25 0.27 0.27 0.29Net realized and unrealized gains (losses) . . . . . . . . . . . . . . . . . . . . . . . . . . . . . 0.04 1.16 2.58 1.46 0.46
Total from operations . . . . . . . . . . . . . . . . . . . . . . . . . . . . . . . . . . . . . . . . . . . . . . . 0.30 1.41 2.85 1.73 0.75
Distributions to Shareholders:From net investment income . . . . . . . . . . . . . . . . . . . . . . . . . . . . . . . . . . . . . . . . (0.45) (0.24) (0.26) (0.28) (0.25)From net realized gains . . . . . . . . . . . . . . . . . . . . . . . . . . . . . . . . . . . . . . . . . . . . (0.99) (0.64) — — —
Total distributions . . . . . . . . . . . . . . . . . . . . . . . . . . . . . . . . . . . . . . . . . . . . . . . . . . (1.44) (0.88) (0.26) (0.28) (0.25)
Net Asset Value:End of period. . . . . . . . . . . . . . . . . . . . . . . . . . . . . . . . . . . . . . . . . . . . . . . . . . . . $20.40 $21.54 $21.01 $18.42 $16.97
Total investment return 2 . . . . . . . . . . . . . . . . . . . . . . . . . . . . . . . . . . . . . . . . . . . . 1.47% 6.86% 15.58% 10.26% 4.61%
Net assets at end of period (000’s omitted). . . . . . . . . . . . . . . . . . . . . . . . . . . . . . . $23,511 $22,970 $15,645 $13,492 $11,821
Ratios: 3
Expenses . . . . . . . . . . . . . . . . . . . . . . . . . . . . . . . . . . . . . . . . . . . . . . . . . . . . . . . 1.00% 1.00% 1.00% 1.00% 1.00%Net investment income . . . . . . . . . . . . . . . . . . . . . . . . . . . . . . . . . . . . . . . . . . . . 1.25% 1.17% 1.36% 1.52% 1.75%
Portfolio turnover rate (excluding short-term securities) . . . . . . . . . . . . . . . . . . . . 54.46% 47.49% 54.52% 30.86% 47.01%
1 The net investment income per share is based on average shares outstanding for the period.2 Total investment return is based on the change in net asset value of a share during the period (not annualized) and assumes reinvestment of distributions at
net asset value.3 Ratios are annualized for periods less than one year. In addition to fees and expenses which the Fund bears directly, the Fund indirectly bears a pro rata share of the
fees and expenses of the acquired funds in which it invests. Such indirect expenses are not included in the above reported expense ratios.
FINANCIAL HIGHLIGHTSPer share income and capital changes for a share outstanding throughout the period. See accompanying notes to financial statements.
Sit Balanced Fund
58 SIT MUTUAL FUNDS ANNUAL REPORT

62
Financial Highlights — Sit Dividend Growth Fund - Class I
Financial Highlights
Class I Years Ended June 30,2013 2012 2011 2010 2009
Net Asset Value:Beginning of period . . . . . . . . . . . . . . . . . . . . . . . . . . . . . . . . . . . . . . . . . . . $14.10 $13.91 $10.64 $9.60 $13.11
Operations:Net investment income 1 . . . . . . . . . . . . . . . . . . . . . . . . . . . . . . . . . . . . . . . 0.27 0.24 0.21 0.19 0.23Net realized and unrealized gains (losses) . . . . . . . . . . . . . . . . . . . . . . . . . . 2.46 0.26 3.23 1.03 (3.09)
Total from operations . . . . . . . . . . . . . . . . . . . . . . . . . . . . . . . . . . . . . . . . . . . . 2.73 0.50 3.44 1.22 (2.86)Redemption fees 2 . . . . . . . . . . . . . . . . . . . . . . . . . . . . . . . . . . . . . . . . . . . . . — — — — —Distributions to Shareholders:
From net investment income. . . . . . . . . . . . . . . . . . . . . . . . . . . . . . . . . . . . . (0.26) (0.21) (0.17) (0.18) (0.26)From net realized gains. . . . . . . . . . . . . . . . . . . . . . . . . . . . . . . . . . . . . . . . . (0.22) (0.10) — — (0.39)
Total distributions . . . . . . . . . . . . . . . . . . . . . . . . . . . . . . . . . . . . . . . . . . . . . . . (0.48) (0.31) (0.17) (0.18) (0.65)Net Asset Value:
End of period . . . . . . . . . . . . . . . . . . . . . . . . . . . . . . . . . . . . . . . . . . . . . . . . $16.35 $14.10 $13.91 $10.64 $9.60
Total investment return 3 . . . . . . . . . . . . . . . . . . . . . . . . . . . . . . . . . . . . . . . . . 19.77% 3.76% 32.58% 12.71% (21.59%)
Net assets at end of period (000’s omitted) . . . . . . . . . . . . . . . . . . . . . . . . . . . $920,324 $619,667 $328,057 $39,430 $28,305Ratios: 4
Expenses . . . . . . . . . . . . . . . . . . . . . . . . . . . . . . . . . . . . . . . . . . . . . . . . . . . . 1.00% 1.00% 1.00% 1.00% 1.00%Net investment income . . . . . . . . . . . . . . . . . . . . . . . . . . . . . . . . . . . . . . . . . 1.78% 1.79% 1.59% 1.70% 2.35%
Portfolio turnover rate (excluding short-term securities) . . . . . . . . . . . . . . . . . 26.58% 26.84% 14.67% 31.84% 69.10%
Class S Years Ended June 30,2013 2012 2011 2010 2009
Net Asset Value:Beginning of period . . . . . . . . . . . . . . . . . . . . . . . . . . . . . . . . . . . . . . . . . . . . $14.06 $13.87 $10.61 $9.58 $13.08
Operations:Net investment income 1 . . . . . . . . . . . . . . . . . . . . . . . . . . . . . . . . . . . . . . . . 0.23 0.21 0.17 0.16 0.21Net realized and unrealized gains (losses) . . . . . . . . . . . . . . . . . . . . . . . . . . . 2.44 0.26 3.23 1.02 (3.09)
Total from operations . . . . . . . . . . . . . . . . . . . . . . . . . . . . . . . . . . . . . . . . . . . . . 2.67 0.47 3.40 1.18 (2.88)Redemption fees 2 . . . . . . . . . . . . . . . . . . . . . . . . . . . . . . . . . . . . . . . . . . . . . . — — — — —Distributions to Shareholders:
From net investment income. . . . . . . . . . . . . . . . . . . . . . . . . . . . . . . . . . . . . . (0.22) (0.18) (0.14) (0.15) (0.23)From net realized gains. . . . . . . . . . . . . . . . . . . . . . . . . . . . . . . . . . . . . . . . . . (0.22) (0.10) — — (0.39)
Total distributions . . . . . . . . . . . . . . . . . . . . . . . . . . . . . . . . . . . . . . . . . . . . . . . . (0.44) (0.28) (0.14) (0.15) (0.62)Net Asset Value:
End of period . . . . . . . . . . . . . . . . . . . . . . . . . . . . . . . . . . . . . . . . . . . . . . . . . $16.29 $14.06 $13.87 $10.61 $9.58
Total investment return 3 . . . . . . . . . . . . . . . . . . . . . . . . . . . . . . . . . . . . . . . . . . 19.39% 3.53% 32.27% 12.37% (21.79%)
Net assets at end of period (000’s omitted) . . . . . . . . . . . . . . . . . . . . . . . . . . . . $134,498 $100,878 $56,280 $24,894 $15,730Ratios: 4
Expenses . . . . . . . . . . . . . . . . . . . . . . . . . . . . . . . . . . . . . . . . . . . . . . . . . . . . . 1.25% 1.25% 1.25% 1.25% 1.25%Net investment income . . . . . . . . . . . . . . . . . . . . . . . . . . . . . . . . . . . . . . . . . . 1.53% 1.54% 1.34% 1.45% 2.10%
Portfolio turnover rate (excluding short-term securities) . . . . . . . . . . . . . . . . . . 26.58% 26.84% 14.67% 31.84% 69.10%
1 The net investment income per share is based on average shares outstanding for the period.2 Amount represents less than $0.01 per share.3 Total investment return is based on the change in net asset value of a share during the period (not annualized) and assumes reinvestment of distributions at net asset
value.4 Ratios are annualized for periods less than one year. In addition to fees and expenses which the Fund bears directly, the Fund indirectly bears a pro rata share of the
fees and expenses of the acquired funds in which it invests. Such indirect expenses are not included in the above reported expense ratios.
FINANCIAL HIGHLIGHTSPer share income and capital changes for a share outstanding throughout the period. See accompanying notes to financial statements.
Sit Dividend Growth Fund
53JUNE 30, 2013
Class I Years Ended June 30,2016 2015 2014 2013 2012
Net Asset Value:Beginning of period . . . . . . . . . . . . . . . . . . . . . . . . . . . . . . . . . . . . . . . . $17.40 $18.69 $16.35 $14.10 $13.91
Operations:Net investment income 1 . . . . . . . . . . . . . . . . . . . . . . . . . . . . . . . . . . . . 0.26 0.25 0.26 0.27 0.24Net realized and unrealized gains (losses) . . . . . . . . . . . . . . . . . . . . . . . 0.32 0.92 2.96 2.46 0.26
Total from operations . . . . . . . . . . . . . . . . . . . . . . . . . . . . . . . . . . . . . . . . . 0.58 1.17 3.22 2.73 0.50Redemption fees 2 . . . . . . . . . . . . . . . . . . . . . . . . . . . . . . . . . . . . . . . . . . — — — — —Distributions to Shareholders:
From net investment income . . . . . . . . . . . . . . . . . . . . . . . . . . . . . . . . . (0.32) (0.25) (0.25) (0.26) (0.21)From net realized gains . . . . . . . . . . . . . . . . . . . . . . . . . . . . . . . . . . . . . (1.84) (2.21) (0.63) (0.22) (0.10)
Total distributions. . . . . . . . . . . . . . . . . . . . . . . . . . . . . . . . . . . . . . . . . . . . (2.16) (2.46) (0.88) (0.48) (0.31)Net Asset Value:
End of period . . . . . . . . . . . . . . . . . . . . . . . . . . . . . . . . . . . . . . . . . . . . . $15.82 $17.40 $18.69 $16.35 $14.10
Total investment return 3 . . . . . . . . . . . . . . . . . . . . . . . . . . . . . . . . . . . . . . 3.94% 6.39% 20.26% 19.77% 3.76%
Net assets at end of period (000’s omitted) . . . . . . . . . . . . . . . . . . . . . . . . $942,244 $955,460 $1,017,106 $920,324 $619,667Ratios: 4
Expenses. . . . . . . . . . . . . . . . . . . . . . . . . . . . . . . . . . . . . . . . . . . . . . . . . 1.00% 1.00% 1.00% 1.00% 1.00%Net investment income . . . . . . . . . . . . . . . . . . . . . . . . . . . . . . . . . . . . . . 1.64% 1.39% 1.50% 1.78% 1.79%
Portfolio turnover rate (excluding short-term securities) . . . . . . . . . . . . . . 75.94% 57.69% 44.36% 26.58% 26.84%
Class S Years Ended June 30,2016 2015 2014 2013 2012
Net Asset Value:Beginning of period. . . . . . . . . . . . . . . . . . . . . . . . . . . . . . . . . . . . . . . . . . . . $17.34 $18.63 $16.29 $14.06 $13.87
Operations:Net investment income 1. . . . . . . . . . . . . . . . . . . . . . . . . . . . . . . . . . . . . . . . 0.22 0.21 0.22 0.23 0.21Net realized and unrealized gains (losses) . . . . . . . . . . . . . . . . . . . . . . . . . . 0.32 0.91 2.96 2.44 0.26
Total from operations . . . . . . . . . . . . . . . . . . . . . . . . . . . . . . . . . . . . . . . . . . . . 0.54 1.12 3.18 2.67 0.47Redemption fees 2 . . . . . . . . . . . . . . . . . . . . . . . . . . . . . . . . . . . . . . . . . . . . . . — — — — —Distributions to Shareholders:
From net investment income . . . . . . . . . . . . . . . . . . . . . . . . . . . . . . . . . . . . . (0.28) (0.20) (0.21) (0.22) (0.18)From net realized gains . . . . . . . . . . . . . . . . . . . . . . . . . . . . . . . . . . . . . . . . . (1.84) (2.21) (0.63) (0.22) (0.10)
Total distributions . . . . . . . . . . . . . . . . . . . . . . . . . . . . . . . . . . . . . . . . . . . . . . . (2.12) (2.41) (0.84) (0.44) (0.28)Net Asset Value:
End of period. . . . . . . . . . . . . . . . . . . . . . . . . . . . . . . . . . . . . . . . . . . . . . . . . $15.76 $17.34 $18.63 $16.29 $14.06
Total investment return 3 . . . . . . . . . . . . . . . . . . . . . . . . . . . . . . . . . . . . . . . . . 3.68% 6.13% 20.02% 19.39% 3.53%
Net assets at end of period (000’s omitted). . . . . . . . . . . . . . . . . . . . . . . . . . . . $67,620 $82,959 $103,433 $134,498 $100,878Ratios: 4
Expenses . . . . . . . . . . . . . . . . . . . . . . . . . . . . . . . . . . . . . . . . . . . . . . . . . . . . 1.25% 1.25% 1.25% 1.25% 1.25%Net investment income . . . . . . . . . . . . . . . . . . . . . . . . . . . . . . . . . . . . . . . . . 1.39% 1.14% 1.25% 1.53% 1.54%
Portfolio turnover rate (excluding short-term securities) . . . . . . . . . . . . . . . . . 75.94% 57.69% 44.36% 26.58% 26.84%
1 The net investment income per share is based on average shares outstanding for the period.2 Amount represents less than $0.01 per share.3 Total investment return is based on the change in net asset value of a share during the period (not annualized) and assumes reinvestment of distributions at
net asset value.4 Ratios are annualized for periods less than one year. In addition to fees and expenses which the Fund bears directly, the Fund indirectly bears a pro rata share of the
fees and expenses of the acquired funds in which it invests. Such indirect expenses are not included in the above reported expense ratios.
FINANCIAL HIGHLIGHTSPer share income and capital changes for a share outstanding throughout the period. See accompanying notes to financial statements.
Sit Dividend Growth Fund
59JUNE 30, 2016

63
Financial Highlights — Sit Dividend Growth Fund - Class S
Class I Years Ended June 30,2016 2015 2014 2013 2012
Net Asset Value:Beginning of period . . . . . . . . . . . . . . . . . . . . . . . . . . . . . . . . . . . . . . . . $17.40 $18.69 $16.35 $14.10 $13.91
Operations:Net investment income 1 . . . . . . . . . . . . . . . . . . . . . . . . . . . . . . . . . . . . 0.26 0.25 0.26 0.27 0.24Net realized and unrealized gains (losses) . . . . . . . . . . . . . . . . . . . . . . . 0.32 0.92 2.96 2.46 0.26
Total from operations . . . . . . . . . . . . . . . . . . . . . . . . . . . . . . . . . . . . . . . . . 0.58 1.17 3.22 2.73 0.50Redemption fees 2 . . . . . . . . . . . . . . . . . . . . . . . . . . . . . . . . . . . . . . . . . . — — — — —Distributions to Shareholders:
From net investment income . . . . . . . . . . . . . . . . . . . . . . . . . . . . . . . . . (0.32) (0.25) (0.25) (0.26) (0.21)From net realized gains . . . . . . . . . . . . . . . . . . . . . . . . . . . . . . . . . . . . . (1.84) (2.21) (0.63) (0.22) (0.10)
Total distributions. . . . . . . . . . . . . . . . . . . . . . . . . . . . . . . . . . . . . . . . . . . . (2.16) (2.46) (0.88) (0.48) (0.31)Net Asset Value:
End of period . . . . . . . . . . . . . . . . . . . . . . . . . . . . . . . . . . . . . . . . . . . . . $15.82 $17.40 $18.69 $16.35 $14.10
Total investment return 3 . . . . . . . . . . . . . . . . . . . . . . . . . . . . . . . . . . . . . . 3.94% 6.39% 20.26% 19.77% 3.76%
Net assets at end of period (000’s omitted) . . . . . . . . . . . . . . . . . . . . . . . . $942,244 $955,460 $1,017,106 $920,324 $619,667Ratios: 4
Expenses. . . . . . . . . . . . . . . . . . . . . . . . . . . . . . . . . . . . . . . . . . . . . . . . . 1.00% 1.00% 1.00% 1.00% 1.00%Net investment income . . . . . . . . . . . . . . . . . . . . . . . . . . . . . . . . . . . . . . 1.64% 1.39% 1.50% 1.78% 1.79%
Portfolio turnover rate (excluding short-term securities) . . . . . . . . . . . . . . 75.94% 57.69% 44.36% 26.58% 26.84%
Class S Years Ended June 30,2016 2015 2014 2013 2012
Net Asset Value:Beginning of period. . . . . . . . . . . . . . . . . . . . . . . . . . . . . . . . . . . . . . . . . . . . $17.34 $18.63 $16.29 $14.06 $13.87
Operations:Net investment income 1. . . . . . . . . . . . . . . . . . . . . . . . . . . . . . . . . . . . . . . . 0.22 0.21 0.22 0.23 0.21Net realized and unrealized gains (losses) . . . . . . . . . . . . . . . . . . . . . . . . . . 0.32 0.91 2.96 2.44 0.26
Total from operations . . . . . . . . . . . . . . . . . . . . . . . . . . . . . . . . . . . . . . . . . . . . 0.54 1.12 3.18 2.67 0.47Redemption fees 2 . . . . . . . . . . . . . . . . . . . . . . . . . . . . . . . . . . . . . . . . . . . . . . — — — — —Distributions to Shareholders:
From net investment income . . . . . . . . . . . . . . . . . . . . . . . . . . . . . . . . . . . . . (0.28) (0.20) (0.21) (0.22) (0.18)From net realized gains . . . . . . . . . . . . . . . . . . . . . . . . . . . . . . . . . . . . . . . . . (1.84) (2.21) (0.63) (0.22) (0.10)
Total distributions . . . . . . . . . . . . . . . . . . . . . . . . . . . . . . . . . . . . . . . . . . . . . . . (2.12) (2.41) (0.84) (0.44) (0.28)Net Asset Value:
End of period. . . . . . . . . . . . . . . . . . . . . . . . . . . . . . . . . . . . . . . . . . . . . . . . . $15.76 $17.34 $18.63 $16.29 $14.06
Total investment return 3 . . . . . . . . . . . . . . . . . . . . . . . . . . . . . . . . . . . . . . . . . 3.68% 6.13% 20.02% 19.39% 3.53%
Net assets at end of period (000’s omitted). . . . . . . . . . . . . . . . . . . . . . . . . . . . $67,620 $82,959 $103,433 $134,498 $100,878Ratios: 4
Expenses . . . . . . . . . . . . . . . . . . . . . . . . . . . . . . . . . . . . . . . . . . . . . . . . . . . . 1.25% 1.25% 1.25% 1.25% 1.25%Net investment income . . . . . . . . . . . . . . . . . . . . . . . . . . . . . . . . . . . . . . . . . 1.39% 1.14% 1.25% 1.53% 1.54%
Portfolio turnover rate (excluding short-term securities) . . . . . . . . . . . . . . . . . 75.94% 57.69% 44.36% 26.58% 26.84%
1 The net investment income per share is based on average shares outstanding for the period.2 Amount represents less than $0.01 per share.3 Total investment return is based on the change in net asset value of a share during the period (not annualized) and assumes reinvestment of distributions at
net asset value.4 Ratios are annualized for periods less than one year. In addition to fees and expenses which the Fund bears directly, the Fund indirectly bears a pro rata share of the
fees and expenses of the acquired funds in which it invests. Such indirect expenses are not included in the above reported expense ratios.
FINANCIAL HIGHLIGHTSPer share income and capital changes for a share outstanding throughout the period. See accompanying notes to financial statements.
Sit Dividend Growth Fund
59JUNE 30, 2016
Financial Highlights

64
Financial Highlights — Sit Global Dividend Growth Fund - Class I
Class I Years Ended June 30,2016 2015 2014 2013 2012
Net Asset Value:Beginning of period. . . . . . . . . . . . . . . . . . . . . . . . . . . . . . . . . . . . . . . . . . . . . . . $14.80 $15.74 $14.27 $12.55 $13.26
Operations:Net investment income 1. . . . . . . . . . . . . . . . . . . . . . . . . . . . . . . . . . . . . . . . . . . 0.21 0.20 0.23 0.25 0.24Net realized and unrealized gains (losses) . . . . . . . . . . . . . . . . . . . . . . . . . . . . . (0.48) 0.13 2.09 1.78 (0.58)
Total from operations . . . . . . . . . . . . . . . . . . . . . . . . . . . . . . . . . . . . . . . . . . . . . . . (0.27) 0.33 2.32 2.03 (0.34)Redemption fees . . . . . . . . . . . . . . . . . . . . . . . . . . . . . . . . . . . . . . . . . . . . . . . . . . — — — 2 — 2 —Distributions to Shareholders:
From net investment income . . . . . . . . . . . . . . . . . . . . . . . . . . . . . . . . . . . . . . . . (0.34) (0.20) (0.22) (0.23) (0.22)From net realized gains . . . . . . . . . . . . . . . . . . . . . . . . . . . . . . . . . . . . . . . . . . . . (1.00) (1.07) (0.63) (0.08) (0.15)
Total distributions . . . . . . . . . . . . . . . . . . . . . . . . . . . . . . . . . . . . . . . . . . . . . . . . . . (1.34) (1.27) (0.85) (0.31) (0.37)Net Asset Value:
End of period. . . . . . . . . . . . . . . . . . . . . . . . . . . . . . . . . . . . . . . . . . . . . . . . . . . . $13.19 $14.80 $15.74 $14.27 $12.55
Total investment return 3 . . . . . . . . . . . . . . . . . . . . . . . . . . . . . . . . . . . . . . . . . . . . (1.67%) 2.19% 16.76% 16.36% (2.44%)
Net assets at end of period (000’s omitted). . . . . . . . . . . . . . . . . . . . . . . . . . . . . . . $22,333 $21,424 $21,467 $14,196 $10,421Ratios: 4
Expenses . . . . . . . . . . . . . . . . . . . . . . . . . . . . . . . . . . . . . . . . . . . . . . . . . . . . . . . 1.25% 1.25% 1.25% 1.25% 1.25%Net investment income . . . . . . . . . . . . . . . . . . . . . . . . . . . . . . . . . . . . . . . . . . . . 1.56% 1.33% 1.55% 1.81% 1.97%
Portfolio turnover rate (excluding short-term securities) . . . . . . . . . . . . . . . . . . . . 48.30% 75.06% 48.68% 26.15% 26.65%
Class S Years Ended June 30,2016 2015 2014 2013 2012
Net Asset Value:Beginning of period . . . . . . . . . . . . . . . . . . . . . . . . . . . . . . . . . . . . . . . . . . . . . . . . $14.78 $15.72 $14.25 $12.54 $13.24
Operations:Net investment income 1 . . . . . . . . . . . . . . . . . . . . . . . . . . . . . . . . . . . . . . . . . . . . 0.18 0.16 0.20 0.21 0.21Net realized and unrealized gains (losses) . . . . . . . . . . . . . . . . . . . . . . . . . . . . . . . (0.48) 0.13 2.09 1.78 (0.57)
Total from operations . . . . . . . . . . . . . . . . . . . . . . . . . . . . . . . . . . . . . . . . . . . . . . . . . (0.30) 0.29 2.29 1.99 (0.36)Redemption fees . . . . . . . . . . . . . . . . . . . . . . . . . . . . . . . . . . . . . . . . . . . . . . . . . . . . — — — 2 — —Distributions to Shareholders:
From net investment income. . . . . . . . . . . . . . . . . . . . . . . . . . . . . . . . . . . . . . . . . . (0.30) (0.16) (0.19) (0.20) (0.19)From net realized gains. . . . . . . . . . . . . . . . . . . . . . . . . . . . . . . . . . . . . . . . . . . . . . (1.00) (1.07) (0.63) (0.08) (0.15)
Total distributions . . . . . . . . . . . . . . . . . . . . . . . . . . . . . . . . . . . . . . . . . . . . . . . . . . . . (1.30) (1.23) (0.82) (0.28) (0.34)Net Asset Value:
End of period . . . . . . . . . . . . . . . . . . . . . . . . . . . . . . . . . . . . . . . . . . . . . . . . . . . . . $13.18 $14.78 $15.72 $14.25 $12.54
Total investment return 3 . . . . . . . . . . . . . . . . . . . . . . . . . . . . . . . . . . . . . . . . . . . . . . (1.89%) 2.00% 16.49% 16.01% (2.60%)
Net assets at end of period (000’s omitted) . . . . . . . . . . . . . . . . . . . . . . . . . . . . . . . . $2,861 $3,451 $3,323 $3,257 $2,608Ratios: 4
Expenses . . . . . . . . . . . . . . . . . . . . . . . . . . . . . . . . . . . . . . . . . . . . . . . . . . . . . . . . . 1.50% 1.50% 1.50% 1.50% 1.50%Net investment income . . . . . . . . . . . . . . . . . . . . . . . . . . . . . . . . . . . . . . . . . . . . . . 1.31% 1.08% 1.30% 1.56% 1.72%
Portfolio turnover rate (excluding short-term securities) . . . . . . . . . . . . . . . . . . . . . . 48.30% 75.06% 48.68% 26.15% 26.65%
1 The net investment income per share is based on average shares outstanding for the period.2 Amount represents less than $0.01 per share.3 Total investment return is based on the change in net asset value of a share during the period (not annualized) and assumes reinvestment of distributions at
net asset value.4 Ratios are annualized for periods less than one year. In addition to fees and expenses which the Fund bears directly, the Fund indirectly bears a pro rata share of the
fees and expenses of the acquired funds in which it invests. Such indirect expenses are not included in the above reported expense ratios.
FINANCIAL HIGHLIGHTSPer share income and capital changes for a share outstanding throughout the period. See accompanying notes to financial statements.
Sit Global Dividend Growth Fund
60 SIT MUTUAL FUNDS ANNUAL REPORT
Financial Highlights
Class I Years Ended June 30,
NineMonths Ended
June 30,2013 2012 2011 2010 2009
Net Asset Value:Beginning of period . . . . . . . . . . . . . . . . . . . . . . . . . . . . . . . . $12.55 $13.26 $10.41 $9.70 $10.00
Operations:Net investment income 1 . . . . . . . . . . . . . . . . . . . . . . . . . . . . 0.25 0.24 0.20 0.17 0.15Net realized and unrealized gains (losses) . . . . . . . . . . . . . . . 1.78 (0.58) 2.95 0.68 (0.36)
Total from operations . . . . . . . . . . . . . . . . . . . . . . . . . . . . . . . . . 2.03 (0.34) 3.15 0.85 (0.21)Redemption fees 2 . . . . . . . . . . . . . . . . . . . . . . . . . . . . . . . . . . — — — — —Distributions to Shareholders:
From net investment income. . . . . . . . . . . . . . . . . . . . . . . . . . (0.23) (0.22) (0.17) (0.14) (0.09)From net realized gains. . . . . . . . . . . . . . . . . . . . . . . . . . . . . . (0.08) (0.15) (0.13) — —
Total distributions . . . . . . . . . . . . . . . . . . . . . . . . . . . . . . . . . . . . (0.31) (0.37) (0.30) (0.14) (0.09)Net Asset Value:
End of period . . . . . . . . . . . . . . . . . . . . . . . . . . . . . . . . . . . . . $14.27 $12.55 $13.26 $10.41 $9.70
Total investment return 3 . . . . . . . . . . . . . . . . . . . . . . . . . . . . . . 16.36% (2.44%) 30.55% 8.79% (2.06%)
Net assets at end of period (000’s omitted) . . . . . . . . . . . . . . . . $14,196 $10,421 $7,834 $2,832 $2,290Ratios: 4
Expenses . . . . . . . . . . . . . . . . . . . . . . . . . . . . . . . . . . . . . . . . . 1.25% 1.25% 1.25% 1.25% 1.25%Net investment income . . . . . . . . . . . . . . . . . . . . . . . . . . . . . . 1.81% 1.97% 1.57% 1.48% 2.30%
Portfolio turnover rate (excluding short-term securities) . . . . . . 26.15% 26.65% 21.84% 21.60% 17.69%5
Class S Years Ended June 30,
NineMonths Ended
June 30,2013 2012 2011 2010 2009
Net Asset Value:Beginning of period . . . . . . . . . . . . . . . . . . . . . . . . . . . . . . . . $12.54 $13.24 $10.40 $9.70 $10.00
Operations:Net investment income 1 . . . . . . . . . . . . . . . . . . . . . . . . . . . . 0.21 0.21 0.16 0.14 0.13Net realized and unrealized gains (losses) . . . . . . . . . . . . . . . 1.78 (0.57) 2.95 0.68 (0.36)
Total from operations . . . . . . . . . . . . . . . . . . . . . . . . . . . . . . . . . 1.99 (0.36) 3.11 0.82 (0.23)Distributions to Shareholders:
From net investment income. . . . . . . . . . . . . . . . . . . . . . . . . . (0.20) (0.19) (0.14) (0.12) (0.07)From net realized gains. . . . . . . . . . . . . . . . . . . . . . . . . . . . . . (0.08) (0.15) (0.13) — —
Total distributions . . . . . . . . . . . . . . . . . . . . . . . . . . . . . . . . . . . . (0.28) (0.34) (0.27) (0.12) (0.07)Net Asset Value:
End of period . . . . . . . . . . . . . . . . . . . . . . . . . . . . . . . . . . . . . $14.25 $12.54 $13.24 $10.40 $9.70
Total investment return 3 . . . . . . . . . . . . . . . . . . . . . . . . . . . . . . 16.01% (2.60%) 30.17% 8.47% (2.18%)
Net assets at end of period (000’s omitted) . . . . . . . . . . . . . . . . $3,257 $2,608 $1,444 $882 $740Ratios: 4
Expenses . . . . . . . . . . . . . . . . . . . . . . . . . . . . . . . . . . . . . . . . . 1.50% 1.50% 1.50% 1.50% 1.50%Net investment income . . . . . . . . . . . . . . . . . . . . . . . . . . . . . . 1.56% 1.72% 1.32% 1.23% 2.05%
Portfolio turnover rate (excluding short-term securities) . . . . . . 26.15% 26.65% 21.84% 21.60% 17.69%5
1 The net investment income per share is based on average shares outstanding for the period.2 Amount represents less than $0.01 per share.3 Total investment return is based on the change in net asset value of a share during the period (not annualized) and assumes reinvestment of distributions at net asset
value.4 Ratios are annualized for periods less than one year. In addition to fees and expenses which the Fund bears directly, the Fund indirectly bears a pro rata share of the
fees and expenses of the acquired funds in which it invests. Such indirect expenses are not included in the above reported expense ratios.5 Not annualized.
FINANCIAL HIGHLIGHTSPer share income and capital changes for a share outstanding throughout the period. See accompanying notes to financial statements.
Sit Global Dividend Growth Fund
1JUNE 30, 2013

65
Financial Highlights — Sit Global Dividend Growth Fund - Class S
Class I Years Ended June 30,2016 2015 2014 2013 2012
Net Asset Value:Beginning of period. . . . . . . . . . . . . . . . . . . . . . . . . . . . . . . . . . . . . . . . . . . . . . . $14.80 $15.74 $14.27 $12.55 $13.26
Operations:Net investment income 1. . . . . . . . . . . . . . . . . . . . . . . . . . . . . . . . . . . . . . . . . . . 0.21 0.20 0.23 0.25 0.24Net realized and unrealized gains (losses) . . . . . . . . . . . . . . . . . . . . . . . . . . . . . (0.48) 0.13 2.09 1.78 (0.58)
Total from operations . . . . . . . . . . . . . . . . . . . . . . . . . . . . . . . . . . . . . . . . . . . . . . . (0.27) 0.33 2.32 2.03 (0.34)Redemption fees . . . . . . . . . . . . . . . . . . . . . . . . . . . . . . . . . . . . . . . . . . . . . . . . . . — — — 2 — 2 —Distributions to Shareholders:
From net investment income . . . . . . . . . . . . . . . . . . . . . . . . . . . . . . . . . . . . . . . . (0.34) (0.20) (0.22) (0.23) (0.22)From net realized gains . . . . . . . . . . . . . . . . . . . . . . . . . . . . . . . . . . . . . . . . . . . . (1.00) (1.07) (0.63) (0.08) (0.15)
Total distributions . . . . . . . . . . . . . . . . . . . . . . . . . . . . . . . . . . . . . . . . . . . . . . . . . . (1.34) (1.27) (0.85) (0.31) (0.37)Net Asset Value:
End of period. . . . . . . . . . . . . . . . . . . . . . . . . . . . . . . . . . . . . . . . . . . . . . . . . . . . $13.19 $14.80 $15.74 $14.27 $12.55
Total investment return 3 . . . . . . . . . . . . . . . . . . . . . . . . . . . . . . . . . . . . . . . . . . . . (1.67%) 2.19% 16.76% 16.36% (2.44%)
Net assets at end of period (000’s omitted). . . . . . . . . . . . . . . . . . . . . . . . . . . . . . . $22,333 $21,424 $21,467 $14,196 $10,421Ratios: 4
Expenses . . . . . . . . . . . . . . . . . . . . . . . . . . . . . . . . . . . . . . . . . . . . . . . . . . . . . . . 1.25% 1.25% 1.25% 1.25% 1.25%Net investment income . . . . . . . . . . . . . . . . . . . . . . . . . . . . . . . . . . . . . . . . . . . . 1.56% 1.33% 1.55% 1.81% 1.97%
Portfolio turnover rate (excluding short-term securities) . . . . . . . . . . . . . . . . . . . . 48.30% 75.06% 48.68% 26.15% 26.65%
Class S Years Ended June 30,2016 2015 2014 2013 2012
Net Asset Value:Beginning of period . . . . . . . . . . . . . . . . . . . . . . . . . . . . . . . . . . . . . . . . . . . . . . . . $14.78 $15.72 $14.25 $12.54 $13.24
Operations:Net investment income 1 . . . . . . . . . . . . . . . . . . . . . . . . . . . . . . . . . . . . . . . . . . . . 0.18 0.16 0.20 0.21 0.21Net realized and unrealized gains (losses) . . . . . . . . . . . . . . . . . . . . . . . . . . . . . . . (0.48) 0.13 2.09 1.78 (0.57)
Total from operations . . . . . . . . . . . . . . . . . . . . . . . . . . . . . . . . . . . . . . . . . . . . . . . . . (0.30) 0.29 2.29 1.99 (0.36)Redemption fees . . . . . . . . . . . . . . . . . . . . . . . . . . . . . . . . . . . . . . . . . . . . . . . . . . . . — — — 2 — —Distributions to Shareholders:
From net investment income. . . . . . . . . . . . . . . . . . . . . . . . . . . . . . . . . . . . . . . . . . (0.30) (0.16) (0.19) (0.20) (0.19)From net realized gains. . . . . . . . . . . . . . . . . . . . . . . . . . . . . . . . . . . . . . . . . . . . . . (1.00) (1.07) (0.63) (0.08) (0.15)
Total distributions . . . . . . . . . . . . . . . . . . . . . . . . . . . . . . . . . . . . . . . . . . . . . . . . . . . . (1.30) (1.23) (0.82) (0.28) (0.34)Net Asset Value:
End of period . . . . . . . . . . . . . . . . . . . . . . . . . . . . . . . . . . . . . . . . . . . . . . . . . . . . . $13.18 $14.78 $15.72 $14.25 $12.54
Total investment return 3 . . . . . . . . . . . . . . . . . . . . . . . . . . . . . . . . . . . . . . . . . . . . . . (1.89%) 2.00% 16.49% 16.01% (2.60%)
Net assets at end of period (000’s omitted) . . . . . . . . . . . . . . . . . . . . . . . . . . . . . . . . $2,861 $3,451 $3,323 $3,257 $2,608Ratios: 4
Expenses . . . . . . . . . . . . . . . . . . . . . . . . . . . . . . . . . . . . . . . . . . . . . . . . . . . . . . . . . 1.50% 1.50% 1.50% 1.50% 1.50%Net investment income . . . . . . . . . . . . . . . . . . . . . . . . . . . . . . . . . . . . . . . . . . . . . . 1.31% 1.08% 1.30% 1.56% 1.72%
Portfolio turnover rate (excluding short-term securities) . . . . . . . . . . . . . . . . . . . . . . 48.30% 75.06% 48.68% 26.15% 26.65%
1 The net investment income per share is based on average shares outstanding for the period.2 Amount represents less than $0.01 per share.3 Total investment return is based on the change in net asset value of a share during the period (not annualized) and assumes reinvestment of distributions at
net asset value.4 Ratios are annualized for periods less than one year. In addition to fees and expenses which the Fund bears directly, the Fund indirectly bears a pro rata share of the
fees and expenses of the acquired funds in which it invests. Such indirect expenses are not included in the above reported expense ratios.
FINANCIAL HIGHLIGHTSPer share income and capital changes for a share outstanding throughout the period. See accompanying notes to financial statements.
Sit Global Dividend Growth Fund
60 SIT MUTUAL FUNDS ANNUAL REPORT
Financial Highlights

66
Financial Highlights — Sit Large Cap Growth Fund
Years Ended June 30,2016 2015 2014 2013 2012
Net Asset Value:Beginning of period. . . . . . . . . . . . . . . . . . . . . . . . . . . . . . . . . . . . . . . . . . $47.21 $52.51 $47.53 $45.53 $43.96
Operations:Net investment income 1. . . . . . . . . . . . . . . . . . . . . . . . . . . . . . . . . . . . . . 0.18 0.20 0.29 0.43 0.26Net realized and unrealized gains (losses) . . . . . . . . . . . . . . . . . . . . . . . . (0.42) 5.04 10.23 5.69 1.63
Total from operations . . . . . . . . . . . . . . . . . . . . . . . . . . . . . . . . . . . . . . . . . . (0.24) 5.24 10.52 6.12 1.89
Redemption fees 2 . . . . . . . . . . . . . . . . . . . . . . . . . . . . . . . . . . . . . . . . . . . . — — — — —
Distributions to Shareholders:From net investment income . . . . . . . . . . . . . . . . . . . . . . . . . . . . . . . . . . . (1.44) (0.24) (0.39) (0.46) (0.32)From net realized gains . . . . . . . . . . . . . . . . . . . . . . . . . . . . . . . . . . . . . . . (9.51) (10.30) (5.15) (3.66) —
Total distributions . . . . . . . . . . . . . . . . . . . . . . . . . . . . . . . . . . . . . . . . . . . . . (10.95) (10.54) (5.54) (4.12) (0.32)
Net Asset Value:End of period. . . . . . . . . . . . . . . . . . . . . . . . . . . . . . . . . . . . . . . . . . . . . . . $36.02 $47.21 $52.51 $47.53 $45.53
Total investment return 3 . . . . . . . . . . . . . . . . . . . . . . . . . . . . . . . . . . . . . . . (0.89%) 10.62% 22.92% 14.18% 4.39%
Net assets at end of period (000’s omitted). . . . . . . . . . . . . . . . . . . . . . . . . . $117,459 $144,807 $188,574 $196,285 $254,256
Ratios: 4
Expenses . . . . . . . . . . . . . . . . . . . . . . . . . . . . . . . . . . . . . . . . . . . . . . . . . . 1.00% 1.00% 1.00% 1.00% 1.00%Net investment income . . . . . . . . . . . . . . . . . . . . . . . . . . . . . . . . . . . . . . . 0.44% 0.41% 0.57% 0.92% 0.61%
Portfolio turnover rate (excluding short-term securities) . . . . . . . . . . . . . . . 20.05% 24.04% 27.34% 13.42% 15.06%
1 The net investment income per share is based on average shares outstanding for the period.2 Amount represents less than $0.01 per share.3 Total investment return is based on the change in net asset value of a share during the period (not annualized) and assumes reinvestment of distributions at
net asset value.4 Ratios are annualized for periods less than one year. In addition to fees and expenses which the Fund bears directly, the Fund indirectly bears a pro rata share of the
fees and expenses of the acquired funds in which it invests. Such indirect expenses are not included in the above reported expense ratios.
FINANCIAL HIGHLIGHTSPer share income and capital changes for a share outstanding throughout the period. See accompanying notes to financial statements.
Sit Large Cap Growth Fund
61JUNE 30, 2016
Financial Highlights

67
Financial Highlights — Sit Mid Cap Growth Fund
Years Ended June 30,2016 2015 2014 2013 2012
Net Asset Value:Beginning of period. . . . . . . . . . . . . . . . . . . . . . . . . . . . . . . . . . . . . . . . . . $20.22 $21.08 $17.69 $15.77 $15.88
Operations:Net investment loss 1 . . . . . . . . . . . . . . . . . . . . . . . . . . . . . . . . . . . . . . . . (0.04) (0.06) (0.07) (0.03) (0.05)Net realized and unrealized gains (losses) . . . . . . . . . . . . . . . . . . . . . . . . (1.92) 1.91 4.54 2.32 (0.06)
Total from operations . . . . . . . . . . . . . . . . . . . . . . . . . . . . . . . . . . . . . . . . . . (1.96) 1.85 4.47 2.29 (0.11)
Redemption fees 2 . . . . . . . . . . . . . . . . . . . . . . . . . . . . . . . . . . . . . . . . . . . . — — — — —
Distributions to Shareholders:From net realized gains . . . . . . . . . . . . . . . . . . . . . . . . . . . . . . . . . . . . . . . (2.90) (2.71) (1.08) (0.37) —
Net Asset Value:End of period. . . . . . . . . . . . . . . . . . . . . . . . . . . . . . . . . . . . . . . . . . . . . . . $15.36 $20.22 $21.08 $17.69 $15.77
Total investment return 3 . . . . . . . . . . . . . . . . . . . . . . . . . . . . . . . . . . . . . . . (9.97%) 9.52% 25.58% 14.70% (0.69%)
Net assets at end of period (000’s omitted). . . . . . . . . . . . . . . . . . . . . . . . . . $139,523 $171,854 $180,276 $152,129 $144,601
Ratios: 4
Expenses . . . . . . . . . . . . . . . . . . . . . . . . . . . . . . . . . . . . . . . . . . . . . . . . . . 1.25% 1.25% 1.25% 1.25% 1.25%Net investment loss . . . . . . . . . . . . . . . . . . . . . . . . . . . . . . . . . . . . . . . . . . (0.23%) (0.30%) (0.37%) (0.17%) (0.33%)
Portfolio turnover rate (excluding short-term securities) . . . . . . . . . . . . . . . 21.57% 23.39% 27.65% 16.91% 16.23%
1 The net investment income (loss) per share is based on average shares outstanding for the period.2 Amount represents less than $0.01 per share.3 Total investment return is based on the change in net asset value of a share during the period (not annualized) and assumes reinvestment of distributions at
net asset value.4 Ratios are annualized for periods less than one year. In addition to fees and expenses which the Fund bears directly, the Fund indirectly bears a pro rata share of the
fees and expenses of the acquired funds in which it invests. Such indirect expenses are not included in the above reported expense ratios.
FINANCIAL HIGHLIGHTSPer share income and capital changes for a share outstanding throughout the period. See accompanying notes to financial statements.
Sit Mid Cap Growth Fund
62 SIT MUTUAL FUNDS ANNUAL REPORT
Financial Highlights

68
Financial Highlights — Sit Small Cap Dividend Growth Fund - Class I
Financial Highlights
Class I Years Ended June 30,2013 2012 2011 2010 2009
Net Asset Value:Beginning of period . . . . . . . . . . . . . . . . . . . . . . . . . . . . . . . . . . . . . . . . . . . $14.10 $13.91 $10.64 $9.60 $13.11
Operations:Net investment income 1 . . . . . . . . . . . . . . . . . . . . . . . . . . . . . . . . . . . . . . . 0.27 0.24 0.21 0.19 0.23Net realized and unrealized gains (losses) . . . . . . . . . . . . . . . . . . . . . . . . . . 2.46 0.26 3.23 1.03 (3.09)
Total from operations . . . . . . . . . . . . . . . . . . . . . . . . . . . . . . . . . . . . . . . . . . . . 2.73 0.50 3.44 1.22 (2.86)Redemption fees 2 . . . . . . . . . . . . . . . . . . . . . . . . . . . . . . . . . . . . . . . . . . . . . — — — — —Distributions to Shareholders:
From net investment income. . . . . . . . . . . . . . . . . . . . . . . . . . . . . . . . . . . . . (0.26) (0.21) (0.17) (0.18) (0.26)From net realized gains. . . . . . . . . . . . . . . . . . . . . . . . . . . . . . . . . . . . . . . . . (0.22) (0.10) — — (0.39)
Total distributions . . . . . . . . . . . . . . . . . . . . . . . . . . . . . . . . . . . . . . . . . . . . . . . (0.48) (0.31) (0.17) (0.18) (0.65)Net Asset Value:
End of period . . . . . . . . . . . . . . . . . . . . . . . . . . . . . . . . . . . . . . . . . . . . . . . . $16.35 $14.10 $13.91 $10.64 $9.60
Total investment return 3 . . . . . . . . . . . . . . . . . . . . . . . . . . . . . . . . . . . . . . . . . 19.77% 3.76% 32.58% 12.71% (21.59%)
Net assets at end of period (000’s omitted) . . . . . . . . . . . . . . . . . . . . . . . . . . . $920,324 $619,667 $328,057 $39,430 $28,305Ratios: 4
Expenses . . . . . . . . . . . . . . . . . . . . . . . . . . . . . . . . . . . . . . . . . . . . . . . . . . . . 1.00% 1.00% 1.00% 1.00% 1.00%Net investment income . . . . . . . . . . . . . . . . . . . . . . . . . . . . . . . . . . . . . . . . . 1.78% 1.79% 1.59% 1.70% 2.35%
Portfolio turnover rate (excluding short-term securities) . . . . . . . . . . . . . . . . . 26.58% 26.84% 14.67% 31.84% 69.10%
Class S Years Ended June 30,2013 2012 2011 2010 2009
Net Asset Value:Beginning of period . . . . . . . . . . . . . . . . . . . . . . . . . . . . . . . . . . . . . . . . . . . . $14.06 $13.87 $10.61 $9.58 $13.08
Operations:Net investment income 1 . . . . . . . . . . . . . . . . . . . . . . . . . . . . . . . . . . . . . . . . 0.23 0.21 0.17 0.16 0.21Net realized and unrealized gains (losses) . . . . . . . . . . . . . . . . . . . . . . . . . . . 2.44 0.26 3.23 1.02 (3.09)
Total from operations . . . . . . . . . . . . . . . . . . . . . . . . . . . . . . . . . . . . . . . . . . . . . 2.67 0.47 3.40 1.18 (2.88)Redemption fees 2 . . . . . . . . . . . . . . . . . . . . . . . . . . . . . . . . . . . . . . . . . . . . . . — — — — —Distributions to Shareholders:
From net investment income. . . . . . . . . . . . . . . . . . . . . . . . . . . . . . . . . . . . . . (0.22) (0.18) (0.14) (0.15) (0.23)From net realized gains. . . . . . . . . . . . . . . . . . . . . . . . . . . . . . . . . . . . . . . . . . (0.22) (0.10) — — (0.39)
Total distributions . . . . . . . . . . . . . . . . . . . . . . . . . . . . . . . . . . . . . . . . . . . . . . . . (0.44) (0.28) (0.14) (0.15) (0.62)Net Asset Value:
End of period . . . . . . . . . . . . . . . . . . . . . . . . . . . . . . . . . . . . . . . . . . . . . . . . . $16.29 $14.06 $13.87 $10.61 $9.58
Total investment return 3 . . . . . . . . . . . . . . . . . . . . . . . . . . . . . . . . . . . . . . . . . . 19.39% 3.53% 32.27% 12.37% (21.79%)
Net assets at end of period (000’s omitted) . . . . . . . . . . . . . . . . . . . . . . . . . . . . $134,498 $100,878 $56,280 $24,894 $15,730Ratios: 4
Expenses . . . . . . . . . . . . . . . . . . . . . . . . . . . . . . . . . . . . . . . . . . . . . . . . . . . . . 1.25% 1.25% 1.25% 1.25% 1.25%Net investment income . . . . . . . . . . . . . . . . . . . . . . . . . . . . . . . . . . . . . . . . . . 1.53% 1.54% 1.34% 1.45% 2.10%
Portfolio turnover rate (excluding short-term securities) . . . . . . . . . . . . . . . . . . 26.58% 26.84% 14.67% 31.84% 69.10%
1 The net investment income per share is based on average shares outstanding for the period.2 Amount represents less than $0.01 per share.3 Total investment return is based on the change in net asset value of a share during the period (not annualized) and assumes reinvestment of distributions at net asset
value.4 Ratios are annualized for periods less than one year. In addition to fees and expenses which the Fund bears directly, the Fund indirectly bears a pro rata share of the
fees and expenses of the acquired funds in which it invests. Such indirect expenses are not included in the above reported expense ratios.
FINANCIAL HIGHLIGHTSPer share income and capital changes for a share outstanding throughout the period. See accompanying notes to financial statements.
Sit Dividend Growth Fund
53JUNE 30, 2013
Class I Year EndedJune 30, 2016
ThreeMonths Ended
June 30, 2015 *
Net Asset Value:Beginning of period . . . . . . . . . . . . . . . . . . . . . . . . . . . . . . . . . . . . . . . . . . . . . . . . . . . . . . . . . . . . . . $9.96 $10.00
Operations:Net investment income 1 . . . . . . . . . . . . . . . . . . . . . . . . . . . . . . . . . . . . . . . . . . . . . . . . . . . . . . . . . . 0.14 0.02Net realized and unrealized gains (losses) . . . . . . . . . . . . . . . . . . . . . . . . . . . . . . . . . . . . . . . . . . . . . 0.02 (0.06)
Total from operations . . . . . . . . . . . . . . . . . . . . . . . . . . . . . . . . . . . . . . . . . . . . . . . . . . . . . . . . . . . . . . . 0.16 (0.04)Distributions to Shareholders:
From net investment income. . . . . . . . . . . . . . . . . . . . . . . . . . . . . . . . . . . . . . . . . . . . . . . . . . . . . . . . (0.12) —From net realized gains. . . . . . . . . . . . . . . . . . . . . . . . . . . . . . . . . . . . . . . . . . . . . . . . . . . . . . . . . . . . — 2 —
Total distributions . . . . . . . . . . . . . . . . . . . . . . . . . . . . . . . . . . . . . . . . . . . . . . . . . . . . . . . . . . . . . . . . . . (0.12) —Net Asset Value:
End of period . . . . . . . . . . . . . . . . . . . . . . . . . . . . . . . . . . . . . . . . . . . . . . . . . . . . . . . . . . . . . . . . . . . $10.00 $9.96
Total investment return 3 . . . . . . . . . . . . . . . . . . . . . . . . . . . . . . . . . . . . . . . . . . . . . . . . . . . . . . . . . . . . 1.71% (0.40%)
Net assets at end of period (000’s omitted) . . . . . . . . . . . . . . . . . . . . . . . . . . . . . . . . . . . . . . . . . . . . . . $5,777 $3,708Ratios: 4
Expenses . . . . . . . . . . . . . . . . . . . . . . . . . . . . . . . . . . . . . . . . . . . . . . . . . . . . . . . . . . . . . . . . . . . . . . . 1.25% 1.25%Net investment income . . . . . . . . . . . . . . . . . . . . . . . . . . . . . . . . . . . . . . . . . . . . . . . . . . . . . . . . . . . . 1.46% 0.98%
Portfolio turnover rate (excluding short-term securities) . . . . . . . . . . . . . . . . . . . . . . . . . . . . . . . . . . . . 26.43% 2.63%5
Class S Year EndedJune 30, 2016
ThreeMonths Ended
June 30, 2015 *
Net Asset Value:Beginning of period . . . . . . . . . . . . . . . . . . . . . . . . . . . . . . . . . . . . . . . . . . . . . . . . . . . . . . . . . . . . . . $9.96 $10.00
Operations:Net investment income 1 . . . . . . . . . . . . . . . . . . . . . . . . . . . . . . . . . . . . . . . . . . . . . . . . . . . . . . . . . . 0.11 0.02Net realized and unrealized gains (losses) . . . . . . . . . . . . . . . . . . . . . . . . . . . . . . . . . . . . . . . . . . . . . 0.03 (0.06)
Total from operations . . . . . . . . . . . . . . . . . . . . . . . . . . . . . . . . . . . . . . . . . . . . . . . . . . . . . . . . . . . . . . . 0.14 (0.04)Distributions to Shareholders:
From net investment income. . . . . . . . . . . . . . . . . . . . . . . . . . . . . . . . . . . . . . . . . . . . . . . . . . . . . . . . (0.10) —From net realized gains. . . . . . . . . . . . . . . . . . . . . . . . . . . . . . . . . . . . . . . . . . . . . . . . . . . . . . . . . . . . — 2 —
Total distributions . . . . . . . . . . . . . . . . . . . . . . . . . . . . . . . . . . . . . . . . . . . . . . . . . . . . . . . . . . . . . . . . . . (0.10) —Net Asset Value:
End of period . . . . . . . . . . . . . . . . . . . . . . . . . . . . . . . . . . . . . . . . . . . . . . . . . . . . . . . . . . . . . . . . . . . $10.00 $9.96
Total investment return 3 . . . . . . . . . . . . . . . . . . . . . . . . . . . . . . . . . . . . . . . . . . . . . . . . . . . . . . . . . . . . 1.46% (0.40%)
Net assets at end of period (000’s omitted) . . . . . . . . . . . . . . . . . . . . . . . . . . . . . . . . . . . . . . . . . . . . . . $2,587 $2,230Ratios: 4
Expenses . . . . . . . . . . . . . . . . . . . . . . . . . . . . . . . . . . . . . . . . . . . . . . . . . . . . . . . . . . . . . . . . . . . . . . . 1.50% 1.50%Net investment income . . . . . . . . . . . . . . . . . . . . . . . . . . . . . . . . . . . . . . . . . . . . . . . . . . . . . . . . . . . . 1.21% 0.73%
Portfolio turnover rate (excluding short-term securities) . . . . . . . . . . . . . . . . . . . . . . . . . . . . . . . . . . . . 26.43% 2.63%5
* The Fund commenced investment operations on March 31, 2015.1 The net investment income per share is based on average shares outstanding for the period.2 Amount represents less than $0.01 per share.3 Total investment return is based on the change in net asset value of a share during the period (not annualized) and assumes reinvestment of distributions at
net asset value.4 Ratios are annualized for periods less than one year. In addition to fees and expenses which the Fund bears directly, the Fund indirectly bears a pro rata share of the
fees and expenses of the acquired funds in which it invests. Such indirect expenses are not included in the above reported expense ratios.5 Not annualized.
FINANCIAL HIGHLIGHTSPer share income and capital changes for a share outstanding throughout the period. See accompanying notes to financial statements.
Sit Small Cap Dividend Growth Fund
63JUNE 30, 2016

69
Financial Highlights — Sit Small Cap Dividend Growth Fund - Class S
Class I Year EndedJune 30, 2016
ThreeMonths Ended
June 30, 2015 *
Net Asset Value:Beginning of period . . . . . . . . . . . . . . . . . . . . . . . . . . . . . . . . . . . . . . . . . . . . . . . . . . . . . . . . . . . . . . $9.96 $10.00
Operations:Net investment income 1 . . . . . . . . . . . . . . . . . . . . . . . . . . . . . . . . . . . . . . . . . . . . . . . . . . . . . . . . . . 0.14 0.02Net realized and unrealized gains (losses) . . . . . . . . . . . . . . . . . . . . . . . . . . . . . . . . . . . . . . . . . . . . . 0.02 (0.06)
Total from operations . . . . . . . . . . . . . . . . . . . . . . . . . . . . . . . . . . . . . . . . . . . . . . . . . . . . . . . . . . . . . . . 0.16 (0.04)Distributions to Shareholders:
From net investment income. . . . . . . . . . . . . . . . . . . . . . . . . . . . . . . . . . . . . . . . . . . . . . . . . . . . . . . . (0.12) —From net realized gains. . . . . . . . . . . . . . . . . . . . . . . . . . . . . . . . . . . . . . . . . . . . . . . . . . . . . . . . . . . . — 2 —
Total distributions . . . . . . . . . . . . . . . . . . . . . . . . . . . . . . . . . . . . . . . . . . . . . . . . . . . . . . . . . . . . . . . . . . (0.12) —Net Asset Value:
End of period . . . . . . . . . . . . . . . . . . . . . . . . . . . . . . . . . . . . . . . . . . . . . . . . . . . . . . . . . . . . . . . . . . . $10.00 $9.96
Total investment return 3 . . . . . . . . . . . . . . . . . . . . . . . . . . . . . . . . . . . . . . . . . . . . . . . . . . . . . . . . . . . . 1.71% (0.40%)
Net assets at end of period (000’s omitted) . . . . . . . . . . . . . . . . . . . . . . . . . . . . . . . . . . . . . . . . . . . . . . $5,777 $3,708Ratios: 4
Expenses . . . . . . . . . . . . . . . . . . . . . . . . . . . . . . . . . . . . . . . . . . . . . . . . . . . . . . . . . . . . . . . . . . . . . . . 1.25% 1.25%Net investment income . . . . . . . . . . . . . . . . . . . . . . . . . . . . . . . . . . . . . . . . . . . . . . . . . . . . . . . . . . . . 1.46% 0.98%
Portfolio turnover rate (excluding short-term securities) . . . . . . . . . . . . . . . . . . . . . . . . . . . . . . . . . . . . 26.43% 2.63%5
Class S Year EndedJune 30, 2016
ThreeMonths Ended
June 30, 2015 *
Net Asset Value:Beginning of period . . . . . . . . . . . . . . . . . . . . . . . . . . . . . . . . . . . . . . . . . . . . . . . . . . . . . . . . . . . . . . $9.96 $10.00
Operations:Net investment income 1 . . . . . . . . . . . . . . . . . . . . . . . . . . . . . . . . . . . . . . . . . . . . . . . . . . . . . . . . . . 0.11 0.02Net realized and unrealized gains (losses) . . . . . . . . . . . . . . . . . . . . . . . . . . . . . . . . . . . . . . . . . . . . . 0.03 (0.06)
Total from operations . . . . . . . . . . . . . . . . . . . . . . . . . . . . . . . . . . . . . . . . . . . . . . . . . . . . . . . . . . . . . . . 0.14 (0.04)Distributions to Shareholders:
From net investment income. . . . . . . . . . . . . . . . . . . . . . . . . . . . . . . . . . . . . . . . . . . . . . . . . . . . . . . . (0.10) —From net realized gains. . . . . . . . . . . . . . . . . . . . . . . . . . . . . . . . . . . . . . . . . . . . . . . . . . . . . . . . . . . . — 2 —
Total distributions . . . . . . . . . . . . . . . . . . . . . . . . . . . . . . . . . . . . . . . . . . . . . . . . . . . . . . . . . . . . . . . . . . (0.10) —Net Asset Value:
End of period . . . . . . . . . . . . . . . . . . . . . . . . . . . . . . . . . . . . . . . . . . . . . . . . . . . . . . . . . . . . . . . . . . . $10.00 $9.96
Total investment return 3 . . . . . . . . . . . . . . . . . . . . . . . . . . . . . . . . . . . . . . . . . . . . . . . . . . . . . . . . . . . . 1.46% (0.40%)
Net assets at end of period (000’s omitted) . . . . . . . . . . . . . . . . . . . . . . . . . . . . . . . . . . . . . . . . . . . . . . $2,587 $2,230Ratios: 4
Expenses . . . . . . . . . . . . . . . . . . . . . . . . . . . . . . . . . . . . . . . . . . . . . . . . . . . . . . . . . . . . . . . . . . . . . . . 1.50% 1.50%Net investment income . . . . . . . . . . . . . . . . . . . . . . . . . . . . . . . . . . . . . . . . . . . . . . . . . . . . . . . . . . . . 1.21% 0.73%
Portfolio turnover rate (excluding short-term securities) . . . . . . . . . . . . . . . . . . . . . . . . . . . . . . . . . . . . 26.43% 2.63%5
* The Fund commenced investment operations on March 31, 2015.1 The net investment income per share is based on average shares outstanding for the period.2 Amount represents less than $0.01 per share.3 Total investment return is based on the change in net asset value of a share during the period (not annualized) and assumes reinvestment of distributions at
net asset value.4 Ratios are annualized for periods less than one year. In addition to fees and expenses which the Fund bears directly, the Fund indirectly bears a pro rata share of the
fees and expenses of the acquired funds in which it invests. Such indirect expenses are not included in the above reported expense ratios.5 Not annualized.
FINANCIAL HIGHLIGHTSPer share income and capital changes for a share outstanding throughout the period. See accompanying notes to financial statements.
Sit Small Cap Dividend Growth Fund
63JUNE 30, 2016
Financial Highlights

70
Financial Highlights — Sit International Growth Fund
Financial Highlights
Years Ended June 30,2016 2015 2014 2013 2012
Net Asset Value:Beginning of period . . . . . . . . . . . . . . . . . . . . . . . . . . . . . . . . . . . . . . . . . . . . . . $16.92 $17.44 $15.05 $13.29 $15.16
Operations:Net investment income 1 . . . . . . . . . . . . . . . . . . . . . . . . . . . . . . . . . . . . . . . . . . 0.12 0.09 0.28 0.20 0.22Net realized and unrealized gains (losses) . . . . . . . . . . . . . . . . . . . . . . . . . . . . . (1.47) (0.34) 2.28 1.80 (1.86)
Total from operations . . . . . . . . . . . . . . . . . . . . . . . . . . . . . . . . . . . . . . . . . . . . . . . (1.35) (0.25) 2.56 2.00 (1.64)
Redemption fees . . . . . . . . . . . . . . . . . . . . . . . . . . . . . . . . . . . . . . . . . . . . . . . . . — — — — — 2
Distributions to Shareholders:From net investment income. . . . . . . . . . . . . . . . . . . . . . . . . . . . . . . . . . . . . . . . (0.09) (0.27) (0.17) (0.24) (0.23)From net realized gains. . . . . . . . . . . . . . . . . . . . . . . . . . . . . . . . . . . . . . . . . . . . (1.00) — — — —
Total distributions . . . . . . . . . . . . . . . . . . . . . . . . . . . . . . . . . . . . . . . . . . . . . . . . . . (1.09) (0.27) (0.17) (0.24) (0.23)
Net Asset Value:End of period . . . . . . . . . . . . . . . . . . . . . . . . . . . . . . . . . . . . . . . . . . . . . . . . . . . $14.48 $16.92 $17.44 $15.05 $13.29
Total investment return 3 . . . . . . . . . . . . . . . . . . . . . . . . . . . . . . . . . . . . . . . . . . . . (8.19%) (1.35%) 17.06% 15.06% (10.69%)
Net assets at end of period (000’s omitted) . . . . . . . . . . . . . . . . . . . . . . . . . . . . . . $20,440 $22,485 $24,127 $20,890 $19,296
Ratios: 4
Expenses . . . . . . . . . . . . . . . . . . . . . . . . . . . . . . . . . . . . . . . . . . . . . . . . . . . . . . . 1.50% 1.50% 1.50% 1.50% 1.50%Net investment income . . . . . . . . . . . . . . . . . . . . . . . . . . . . . . . . . . . . . . . . . . . . 0.76% 0.55% 1.69% 1.39% 1.62%
Portfolio turnover rate (excluding short-term securities) . . . . . . . . . . . . . . . . . . . . 37.94% 56.97% 46.91% 27.93% 27.82%
1 The net investment income per share is based on average shares outstanding for the period.2 Amount represents less than $0.01 per share.3 Total investment return is based on the change in net asset value of a share during the period (not annualized) and assumes reinvestment of distributions at
net asset value.4 Ratios are annualized for periods less than one year. In addition to fees and expenses which the Fund bears directly, the Fund indirectly bears a pro rata share of the
fees and expenses of the acquired funds in which it invests. Such indirect expenses are not included in the above reported expense ratios.
FINANCIAL HIGHLIGHTSPer share income and capital changes for a share outstanding throughout the period. See accompanying notes to financial statements.
Sit International Growth Fund
65JUNE 30, 2016

71
Financial Highlights — Sit Small Cap Growth Fund
Years Ended June 30,2016 2015 2014 2013 2012
Net Asset Value:Beginning of period . . . . . . . . . . . . . . . . . . . . . . . . . . . . . . . . . . . . . . . . . . . . . $60.10 $61.38 $50.08 $43.90 $43.86
Operations:Net investment loss 1 . . . . . . . . . . . . . . . . . . . . . . . . . . . . . . . . . . . . . . . . . . . . (0.33) (0.48) (0.55) (0.30) (0.34)Net realized and unrealized gains (losses) . . . . . . . . . . . . . . . . . . . . . . . . . . . . (8.97) 6.26 11.85 6.48 0.38
Total from operations . . . . . . . . . . . . . . . . . . . . . . . . . . . . . . . . . . . . . . . . . . . . . . (9.30) 5.78 11.30 6.18 0.04
Redemption fees 2 . . . . . . . . . . . . . . . . . . . . . . . . . . . . . . . . . . . . . . . . . . . . . . . . — — — — —
Distributions to Shareholders:From net realized gains. . . . . . . . . . . . . . . . . . . . . . . . . . . . . . . . . . . . . . . . . . . (5.21) (7.06) — — —
Net Asset Value:End of period . . . . . . . . . . . . . . . . . . . . . . . . . . . . . . . . . . . . . . . . . . . . . . . . . . $45.59 $60.10 $61.38 $50.08 $43.90
Total investment return 3 . . . . . . . . . . . . . . . . . . . . . . . . . . . . . . . . . . . . . . . . . . . (16.00%) 10.38% 22.56% 14.08% 0.09%
Net assets at end of period (000’s omitted) . . . . . . . . . . . . . . . . . . . . . . . . . . . . . $81,209 $103,816 $99,510 $84,793 $78,202
Ratios: 4
Expenses . . . . . . . . . . . . . . . . . . . . . . . . . . . . . . . . . . . . . . . . . . . . . . . . . . . . . . 1.50% 1.50% 1.50% 1.50% 1.50%Net investment loss . . . . . . . . . . . . . . . . . . . . . . . . . . . . . . . . . . . . . . . . . . . . . . (0.65%) (0.81%) (0.94%) (0.64%) (0.82%)
Portfolio turnover rate (excluding short-term securities) . . . . . . . . . . . . . . . . . . . 27.37% 31.07% 33.38% 28.36% 22.32%
1 The net investment income (loss) per share is based on average shares outstanding for the period.2 Amount represents less than $0.01 per share.3 Total investment return is based on the change in net asset value of a share during the period (not annualized) and assumes reinvestment of distributions at
net asset value.4 Ratios are annualized for periods less than one year. In addition to fees and expenses which the Fund bears directly, the Fund indirectly bears a pro rata share of the
fees and expenses of the acquired funds in which it invests. Such indirect expenses are not included in the above reported expense ratios.
FINANCIAL HIGHLIGHTSPer share income and capital changes for a share outstanding throughout the period. See accompanying notes to financial statements.
Sit Small Cap Growth Fund
64 SIT MUTUAL FUNDS ANNUAL REPORT
Financial Highlights

72
Financial Highlights — Sit Developing Markets Growth Fund
Years Ended June 30,2016 2015 2014 2013 2012
Net Asset Value:Beginning of period . . . . . . . . . . . . . . . . . . . . . . . . . . . . . . . . . . . . . . . . . . . . . . $14.77 $17.48 $16.40 $17.70 $23.24
Operations:Net investment income (loss) 1 . . . . . . . . . . . . . . . . . . . . . . . . . . . . . . . . . . . . . 0.04 0.03 (0.01) 0.04 0.06Net realized and unrealized gains (losses) . . . . . . . . . . . . . . . . . . . . . . . . . . . . . (2.18) (1.41) 2.07 0.14 (3.89)
Total from operations . . . . . . . . . . . . . . . . . . . . . . . . . . . . . . . . . . . . . . . . . . . . . . . (2.14) (1.38) 2.06 0.18 (3.83)
Redemption fees . . . . . . . . . . . . . . . . . . . . . . . . . . . . . . . . . . . . . . . . . . . . . . . . . . — 2 — — — — 2
Distributions to Shareholders:From net investment income. . . . . . . . . . . . . . . . . . . . . . . . . . . . . . . . . . . . . . . . (0.02) — (0.03) (0.06) (0.06)From net realized gains. . . . . . . . . . . . . . . . . . . . . . . . . . . . . . . . . . . . . . . . . . . . (0.35) (1.33) (0.95) (1.42) (1.65)
Total distributions . . . . . . . . . . . . . . . . . . . . . . . . . . . . . . . . . . . . . . . . . . . . . . . . . . (0.37) (1.33) (0.98) (1.48) (1.71)
Net Asset Value:End of period . . . . . . . . . . . . . . . . . . . . . . . . . . . . . . . . . . . . . . . . . . . . . . . . . . . $12.26 $14.77 $17.48 $16.40 $17.70
Total investment return 3 . . . . . . . . . . . . . . . . . . . . . . . . . . . . . . . . . . . . . . . . . . . . (14.42%) (7.64%) 12.79% 0.36% (16.29%)
Net assets at end of period (000’s omitted) . . . . . . . . . . . . . . . . . . . . . . . . . . . . . . $7,297 $9,192 $10,808 $10,615 $11,634
Ratios: 4
Expenses . . . . . . . . . . . . . . . . . . . . . . . . . . . . . . . . . . . . . . . . . . . . . . . . . . . . . . . 2.00% 2.00% 2.00% 2.00% 2.00%Net investment income (loss) . . . . . . . . . . . . . . . . . . . . . . . . . . . . . . . . . . . . . . . 0.31% 0.16% (0.07%) 0.24% 0.29%
Portfolio turnover rate (excluding short-term securities) . . . . . . . . . . . . . . . . . . . . 28.14% 21.51% 21.45% 15.48% 22.56%
1 The net investment income (loss) per share is based on average shares outstanding for the period.2 Amount represents less than $0.01 per share.3 Total investment return is based on the change in net asset value of a share during the period (not annualized) and assumes reinvestment of distributions at
net asset value.4 Ratios are annualized for periods less than one year. In addition to fees and expenses which the Fund bears directly, the Fund indirectly bears a pro rata share of the
fees and expenses of the acquired funds in which it invests. Such indirect expenses are not included in the above reported expense ratios.
FINANCIAL HIGHLIGHTSPer share income and capital changes for a share outstanding throughout the period. See accompanying notes to financial statements.
Sit Developing Markets Growth Fund
66 SIT MUTUAL FUNDS ANNUAL REPORT
Financial Highlights

73
If you have any questions about the Funds or would like more information, please contact the Funds as noted below. You may ob-tain a free copy of the Funds’ Statement of Additional Information (“SAI”) and annual or semi-annual reports on the Funds’ website at www.sitfunds.com or by contacting the Funds as noted below.
The SAI contains more details about the Funds and their investment policies. The SAI is incorporated in this Prospectus by refer-ence.
The annual and semi-annual reports include a discussion of the market conditions and investment strategies that significantly af-fected the Funds’ performance during its most recent six- or 12-month periods, as applicable.
ONLINE
www.sitfunds.com or via email at [email protected]
TELEPHONE
1-800-332-5580 Investor Services Representatives are available Monday through Friday 7:30 to 5:30 p.m. Central Time.
Regular Mail: Sit Mutual Funds, P.O. Box 9763, Providence, RI 02940 Overnight Delivery: Sit Mutual Funds, 4400 Computer Drive, Westborough, MA 01581
TO WIRE MONEY FOR A PURCHASE
Contact the Funds at 1-800-332-5580 for wire instructions.
CONTACT THE SEC
You can go to the SEC’s web site at www.sec.gov to view these and other documents that Sit Mutual Funds has filed electronically with the SEC.
For a duplicating fee, copies of such information may be obtained by electronic request at the following email address: [email protected], or by writing the Commission’s Public Reference Section, Washington, D.C. 20549-1520. In addition, informa-tion about the Funds can be reviewed and copied at the Commission’s Public Reference Room in Washington, D.C. Call the Com-mission 202-551-8090 for information.
1940 Investment Company Act File Nos.: Sit Mid Cap Growth Fund, Inc. 811-03342
Sit Large Cap Growth Fund, Inc. 811-03343 Sit Mutual Funds, Inc. 811-06373
EquityFundsStatPro11-1-16
FOR MORE INFORMATION