Embed Size (px)
Citation preview
Remarkably, The SA economy has emerged from 2020 in robust fashion with strong GDP growth that suggests we might all have been over-pessimistic about the damage caused by the Covid-19 lock-down and political indecision. Furthermore, our balance of trade has been in positive territory every month since May
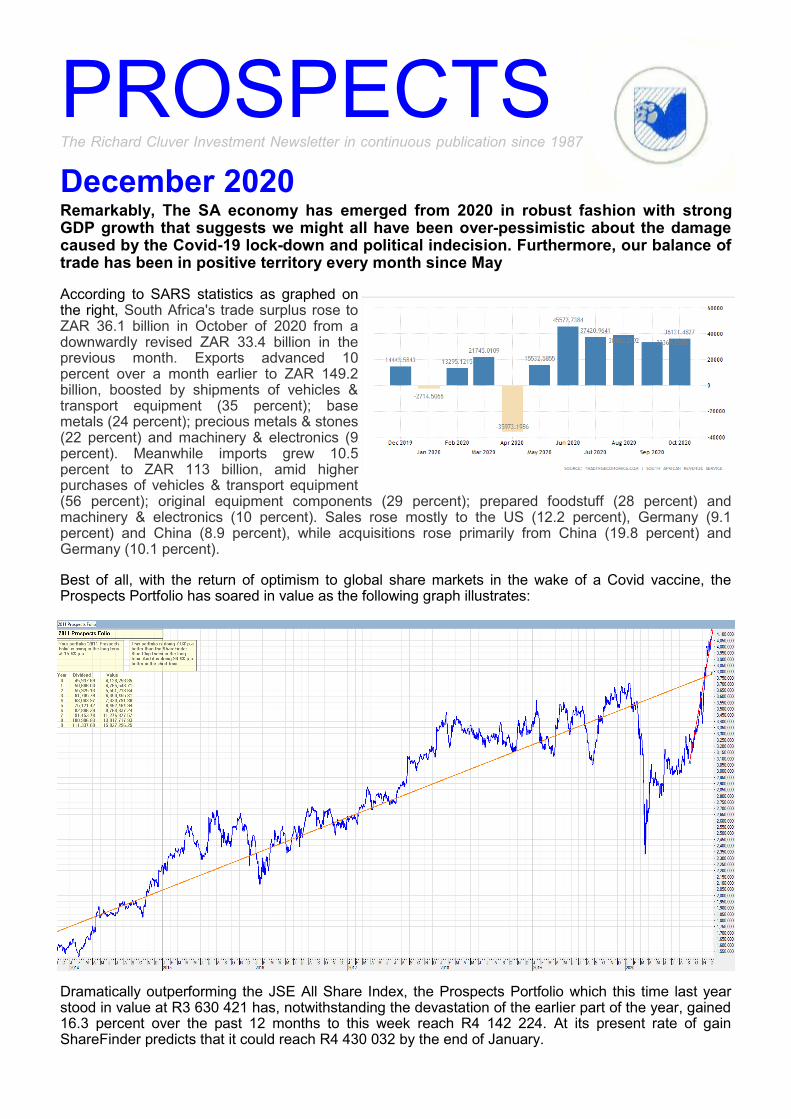
According to SARS statistics as graphed on the right, South Africa's trade surplus rose to ZAR 36.1 billion in October of 2020 from a downwardly revised ZAR 33.4 billion in the previous month. Exports advanced 10 percent over a month earlier to ZAR 149.2 billion, boosted by shipments of vehicles & transport equipment (35 percent); base metals (24 percent); precious metals & stones (22 percent) and machinery & electronics (9 percent). Meanwhile imports grew 10.5 percent to ZAR 113 billion, amid higher purchases of vehicles & transport equipment (56 percent); original equipment components (29 percent); prepared foodstuff (28 percent) and machinery & electronics (10 percent). Sales rose mostly to the US (12.2 percent), Germany (9.1 percent) and China (8.9 percent), while acquisitions rose primarily from China (19.8 percent) and Germany (10.1 percent).
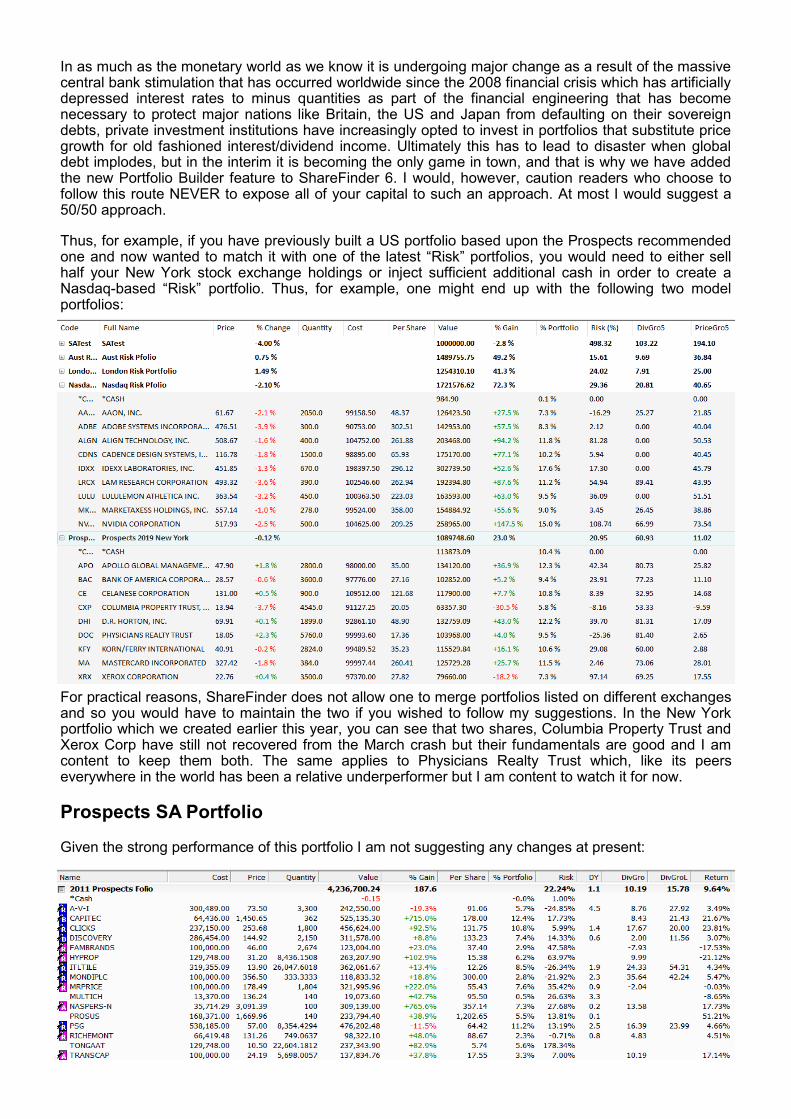
Best of all, with the return of optimism to global share markets in the wake of a Covid vaccine, the Prospects Portfolio has soared in value as the following graph illustrates:
Dramatically outperforming the JSE All Share Index, the Prospects Portfolio which this time last year stood in value at R3 630 421 has, notwithstanding the devastation of the earlier part of the year, gained 16.3 percent over the past 12 months to this week reach R4 142 224. At its present rate of gain ShareFinder predicts that it could reach R4 430 032 by the end of January.
December 2020
PROSPECTS The Richard Cluver Investment Newsletter in continuous publication since 1987

The performance of the Prospects portfolio stands in interesting contrast with that of Wall Street’s oldest indicator, the much loved Dow Jones Industrial Index which, as my next graph illustrates has done precisely half as well delivering an overall gain of 7.3 percent. Furthermore, the Dow has begun a decline which ShareFinder predicts will see a negative outlook for the Festive Season only resuming growth from around January 8:
But our star turn has been a new facility within the ShareFinder 6 Portfolios Builder module which enables users of the software to construct portfolios on a price-momentum basis. While, as I have written quite expensively recently, this technique offers a risky approach to the market because the companies it selects do not necessarily have the strong underpinning of a solid dividend growth history, the latter have, however, become the contemporary darlings of Wall Street and elsewhere because of the dramatic gains they have been making.
Starting with a virtual $1-million in the second week of December 2019, the ten shares selected for this portfolio gave us a startling 76.27 percent gain to this week reach $1 762 757 which is without doubt the best one year portfolio performance ShareFinder has ever delivered. Moreover, as you can clearly see from the graph, the February/March market crash barely impacted it suggesting perhaps that old investment theories are currently being re-written.
However, Wall Street is increasingly muttering the “B” word: bubble. Airbnb’s $83 billion market cap is more than that of Marriott, Hilton and Hyatt combined, while DoorDash’s $56 billion market cap is bigger than that of most restaurant chains. The median valuation of tech I.P.O.s this year is 24 times trailing revenue, while the same measure for the Nasdaq Composite Index is currently 4.3 times, while for tech I.P.O.s for most of the 2010s it averaged about six times.
In as much as the monetary world as we know it is undergoing major change as a result of the massive central bank stimulation that has occurred worldwide since the 2008 financial crisis which has artificially depressed interest rates to minus quantities as part of the financial engineering that has become necessary to protect major nations like Britain, the US and Japan from defaulting on their sovereign debts, private investment institutions have increasingly opted to invest in portfolios that substitute price growth for old fashioned interest/dividend income. Ultimately this has to lead to disaster when global debt implodes, but in the interim it is becoming the only game in town, and that is why we have added the new Portfolio Builder feature to ShareFinder 6. I would, however, caution readers who choose to follow this route NEVER to expose all of your capital to such an approach. At most I would suggest a 50/50 approach.
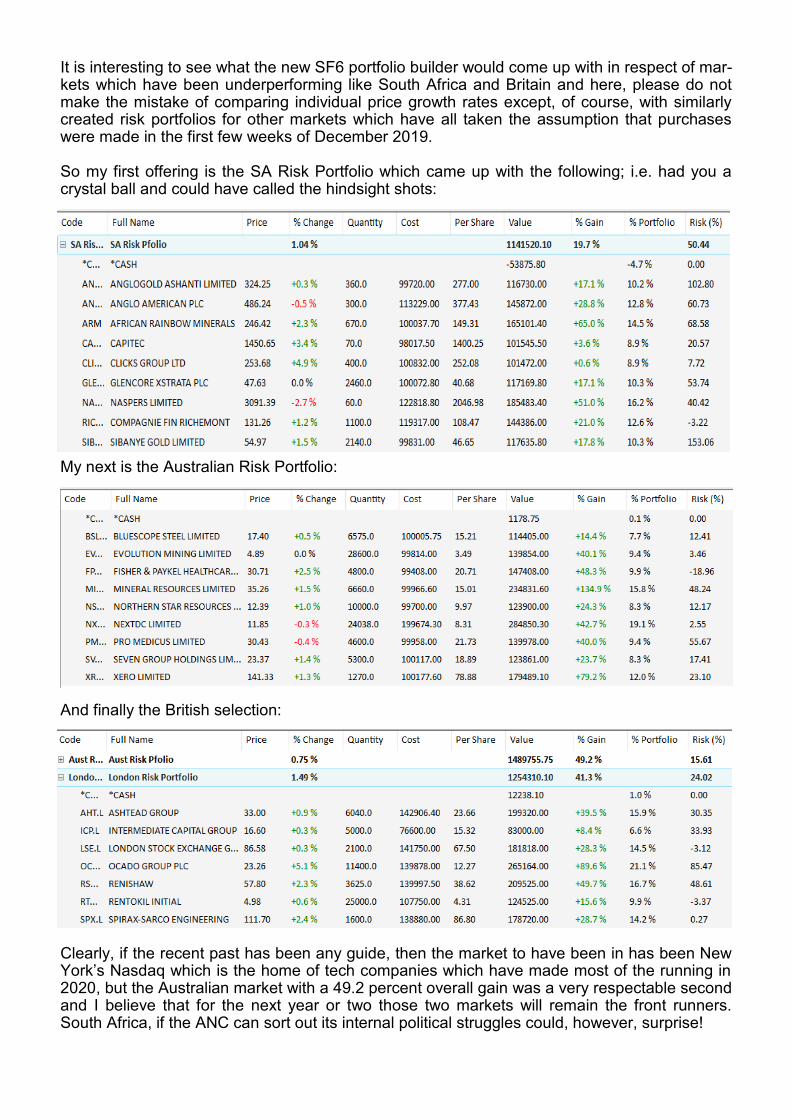
Thus, for example, if you have previously built a US portfolio based upon the Prospects recommended one and now wanted to match it with one of the latest “Risk” portfolios, you would need to either sell half your New York stock exchange holdings or inject sufficient additional cash in order to create a Nasdaq-based “Risk” portfolio. Thus, for example, one might end up with the following two model portfolios:
For practical reasons, ShareFinder does not allow one to merge portfolios listed on different exchanges and so you would have to maintain the two if you wished to follow my suggestions. In the New York portfolio which we created earlier this year, you can see that two shares, Columbia Property Trust and Xerox Corp have still not recovered from the March crash but their fundamentals are good and I am content to keep them both. The same applies to Physicians Realty Trust which, like its peers everywhere in the world has been a relative underperformer but I am content to watch it for now.
Prospects SA Portfolio
Given the strong performance of this portfolio I am not suggesting any changes at present:
It is interesting to see what the new SF6 portfolio builder would come up with in respect of mar-kets which have been underperforming like South Africa and Britain and here, please do not make the mistake of comparing individual price growth rates except, of course, with similarly created risk portfolios for other markets which have all taken the assumption that purchases were made in the first few weeks of December 2019. So my first offering is the SA Risk Portfolio which came up with the following; i.e. had you a crystal ball and could have called the hindsight shots:
My next is the Australian Risk Portfolio:
And finally the British selection:
Clearly, if the recent past has been any guide, then the market to have been in has been New York’s Nasdaq which is the home of tech companies which have made most of the running in 2020, but the Australian market with a 49.2 percent overall gain was a very respectable second and I believe that for the next year or two those two markets will remain the front runners. South Africa, if the ANC can sort out its internal political struggles could, however, surprise!
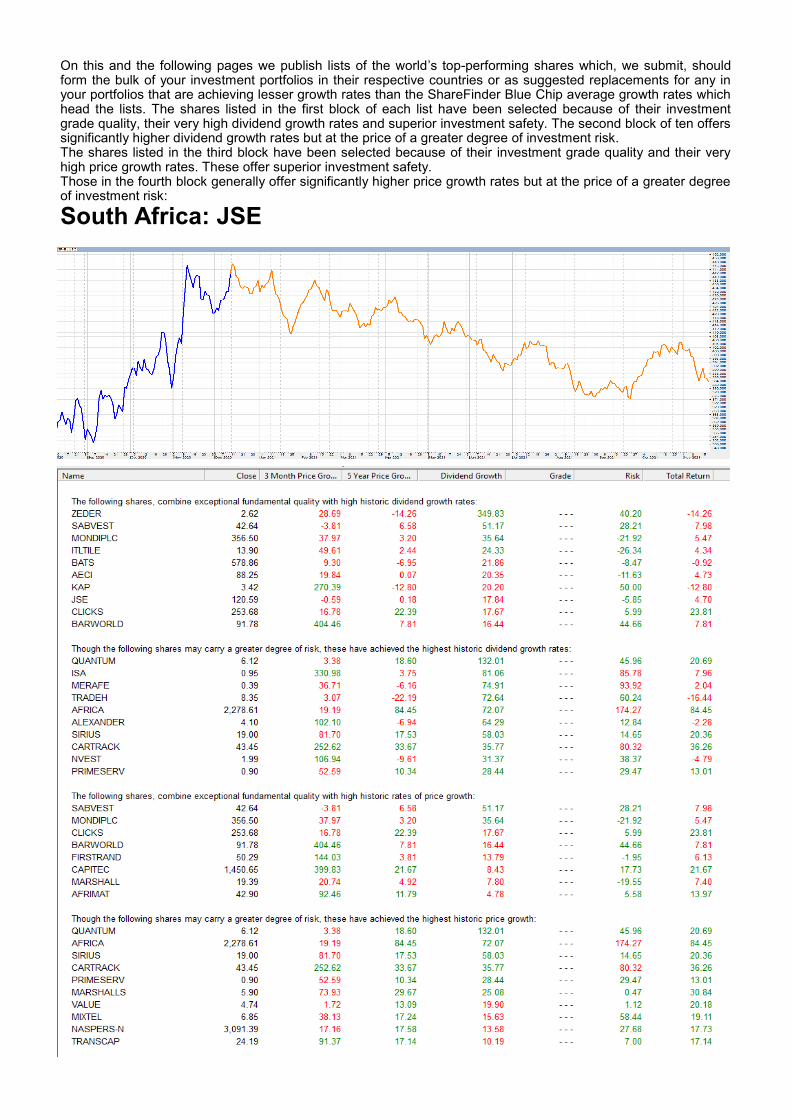
On this and the following pages we publish lists of the world’s top-performing shares which, we submit, should form the bulk of your investment portfolios in their respective countries or as suggested replacements for any in your portfolios that are achieving lesser growth rates than the ShareFinder Blue Chip average growth rates which head the lists. The shares listed in the first block of each list have been selected because of their investment grade quality, their very high dividend growth rates and superior investment safety. The second block of ten offers significantly higher dividend growth rates but at the price of a greater degree of investment risk. The shares listed in the third block have been selected because of their investment grade quality and their very high price growth rates. These offer superior investment safety. Those in the fourth block generally offer significantly higher price growth rates but at the price of a greater degree of investment risk:
South Africa: JSE

New York Stock Exchange
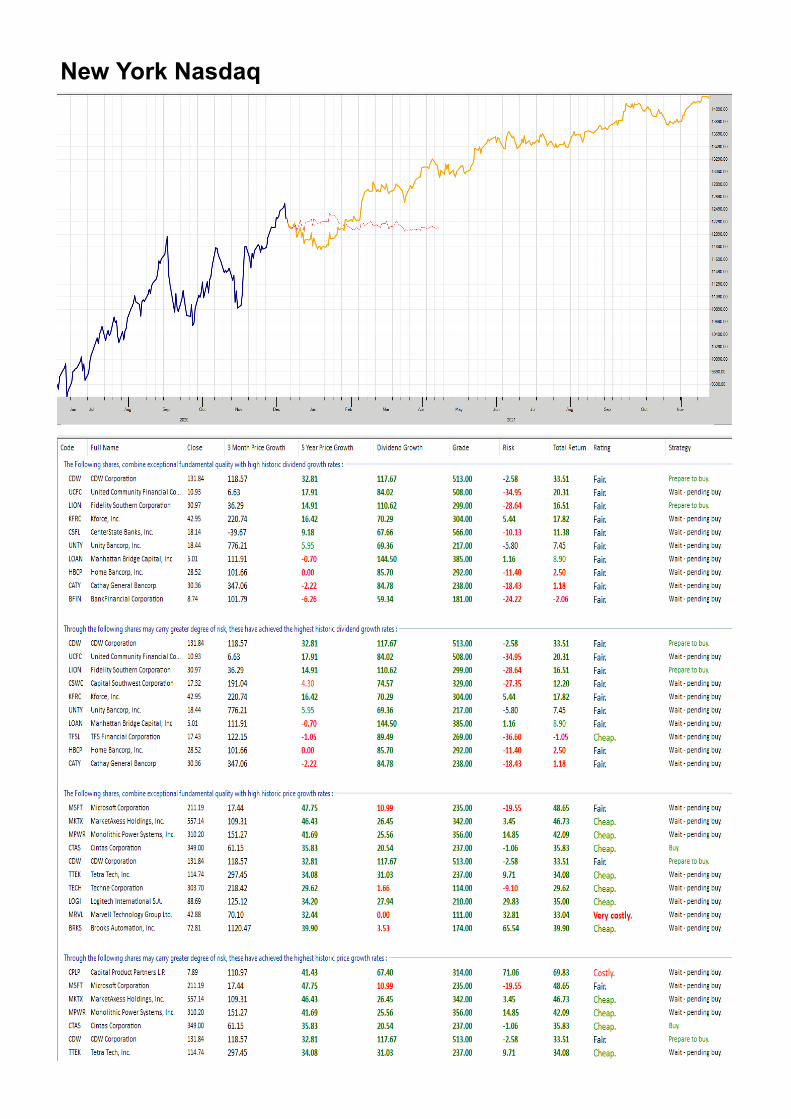
New York Nasdaq
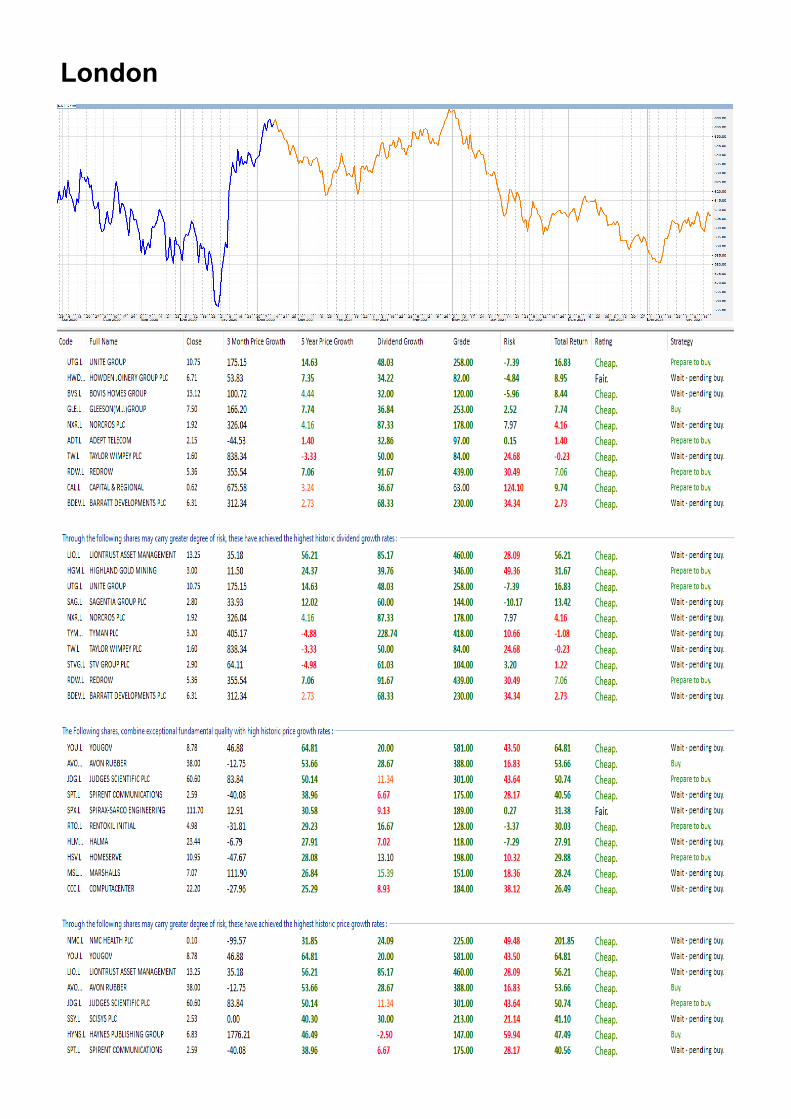
London

Australia