Embed Size (px)
Citation preview

Institute of Certified Management Accountants of Sri Lanka Level 5 - Integrative Case Study (ICS – 405) – May 2013 Examination
1
© Copyright Reserved Serial No………………
Institute of Certified Management Accountants of Sri Lanka
Level 5 – May 2013 Examination
Examination Date : 12th May 2013 Number of Pages : 16
Examination Time: 1.30 p:m. – 4.30 p:m. Number of Questions: 07
Instructions to candidates:
1. Time allowed is three (3) hours.
2. Attached to the question are Scenario I given in advance and Scenario II
3. The answers should be given in English language.
Subject Subject Code
Integrative Case Study (ICS - 405)
Question (100 Marks)
Prospects of Fraser & Neave Limited and Takeover
You are required to:
1. Assess the probability of success of the strategy of penetration into Indochina region of which most of
the countries adopted market economy in the recent past. (10 Marks)
2. Critically examine the possible issues that F&N would face in relations to good governance.
(10 Marks)
3. Assess the impact of likely delisting of F&N by SGX on Mr. Charoen, other shareholders and other
stakeholders. (15 Marks)
4. Business is likely to be more competitive and sophisticated in the future and therefore one of the key
success factors would be the ability to meet varied customer needs by offering a broader portfolio of
products.
Prepare a report to be presented to the new board on the capability, risks associated with and limitations
of F&N with respect to dairy sector in achieving the objectives of winning new customers and
maintaining the customer loyalty intact. (15 Marks)
5. Prepare a report to be presented to the new board on a SWOT analysis of property sector by paying
special attention on future growth and the strategy of locking raw materials. (15 Marks)
6. Prepare a report to be presented to the Board on the value of F&N based on the financial figures
available, estimates and any other suitable assumptions that you like you make. (15 Marks)
7. Discuss on appropriate corporate strategies that should be adopted by the management of F&N to gain
competitive advantages in future with respect to each business sector. (20 Marks)
(Total 100 Marks)

Institute of Certified Management Accountants of Sri Lanka Level 5 - Integrative Case Study (ICS – 405) – May 2013 Examination
2
Prospects of Fraser & Neave Limited and Takeover
Scenario I
Introduction
Southeast Asian companies have become more active in mergers and acquisitions in the recent past. It was the financial news around the world that major shareholders were trying to gain the control of Fraser & Neave Limited
(F&N), a well established group of companies mainly in the businesses of food & beverages, Properties and Printing and Publication. Mr. Charoen, a major shareholder of Thai Beverage Public Company Limited (Thai Beverage) showed the interest of acquiring F&N by convincing other major shareholder: Japan's Kirin Holdings company that had 15% stake in F&N. Mr. Charoen's offer price was 4.3% above the closing price of $8.51 when the offer was made. Prior to this, Overseas Chinese Bank Nominees Pte Ltd (OCBC) Group and Lee Rubber Company (Pte) Limited (“Lee Rubber”), other two major shareholders of F&N agreed to sell their combined stake of 22% in F&N at a price of $8.88 and 8.6% stake in Asia Pacific Breweries Limited (APBL) at $45 per share, to Thai Beverage Public Company Limited and Kindest Place Groups Limited respectively.
Heineken NV offered $50 per share for F&N’s direct and indirect stakes in APBL and $163 million for non-APBL assets in Asia Pacific Investment Pte Ltd (APIPL) in July 2012. During the month of August 2012, F&N Board announced the recommendation for sale of direct and indirect stakes in APBL to Heineken NV, at an improved offer of $53 per share (Total consideration of $5.6 billion) and non-APBL assets in APIPL for $163 million thus divesting a substantial part of its beer business. APIPL was the 50:50 joint venture company through which F&N and Heineken held their joint 64.8% interest in APBL.
The share price of F&N was affected by this tense situation irrupted due to of takeover bids and the changes in other socio economic factors. As a result, market price of shares of F&N fluctuated during the year 2012. Share price of F&N fell as the market digested news of Heineken's final offer to acquire its stake in APBL. Heineken and F&N were the two largest shareholders in APBL. Subsequently, F&N sold its entire 39.7% stake in APBL to Heineken by registering a gain of around $4.8 billion. As a result, Heineken's direct and deemed interest in APBL has gone up to 84.24%. Subsequent to this, Group’s beer portfolio now consists of a 55%-held brewery in Myanmar Brewery Limited (MBL) in Myanmar. MBL manufactures and sells Myanmar’s leading beer brands such as Myanmar Beer, Myanmar Double Strong and Andaman Gold. However, the Myanmar government issued several new beer licenses to other companies in the year thus creating another challenge that would be likely to be faced in future. Hence, a capacity upgrading plan was completed with a new high-speed bottling line installed during the year.
In connection with the takeover bid offered by Thai Beverage, other giant investors also launched takeover bids. Accordingly, TCC Assets Limited launched a mandatory conditional cash offer at $8.88 per share of F&N in September 2012 followed by another voluntary conditional cash offer by Union Enterprise Limited (OUE) to buy shares of F&N at $9.08 per share. The battle of taking the control of F&N ended in February 2013 by giving more than 90% of stake to the Thai businessman, Mr. Charoen through Thai beverage.
Brief History of F&N
F&N was established in 1883 and commenced its operations in food and beverage industry and. It is driven by the
philosophy of providing pure enjoyment and pure goodness to consumers by fulfilling their health and wellness
needs. The vision of F&N is to be a world-class multinational enterprise with an Asian base, providing superior
returns with a focus on Food & Beverage, Properties and Publishing & Printing businesses. Operations are carried
out with many fully owned subsidiaries (Both listed and unlisted), joint ventures and associate companies as exhibited
in the group structure given in figure 1. F&N is now operating over 20 countries with a workforce of more than
17,000 people.
Through the years, F&N has built a strong portfolio of brands known for their refreshing tastes and nourishing
goodness, a regional network of manufacturing plants and sales and distribution channels, and most importantly a
sound reputation as one of the region’s leading Food and Beverage producers. F&N holds the number 1 position in
Malaysia for soft drinks, and maintains key positions in dairies and beer segments in this region. The position of
brand image was further validated as F&N took the top spot in the Food & Beverage category in the 2012 Malaysia’s
Most Valuable Brands awards competition.
Institute of Certified Management Accountants of Sri Lanka Level 5 - Integrative Case Study (ICS – 405) – May 2013 Examination
3
The soft drinks division maintained the focus by vigorously defending on its leading position despite the emergence
of a partner (The Coca-Cola Company-TCCC) turned a competitor. The F&N ended its licensing partnership with
TCCC in Singapore, Malaysia and Brunei. This transformative step created challenges for the group to better place its
own products in a competitive environment. Accordingly, the efforts were made in marketing activities and boosted
investment in research and development facilities to expand products.
The core soft drinks brands led by 100 PLUS continued to lead the overall soft drinks category with a volume
expansion of about 12% to 57.3 million cases from 51.2 million cases in the year 2012 with an additional sales boost
coming from Brunei. Strong performances from F&N SEASONS brand in the Asian Soft Drinks category powered
the growth performance from “F&N Clearly Citrus”, a new entrant in the lemon- lime segment.
Initially, F&N manufactured soft drinks and later on ventured into brewing beer in 1931 followed by dairy operations
started in 1959. It started manufacturing glass bottles needed for its food and beverage section in 1972. By further
diversifying its operations, F&N started property development and management in 1990 and then moved to printing
and publishing business in the year 2000. F&N was subsequently listed on Singapore Stock Exchange and at present,
F&N is among the top 25 listed companies on the Singapore stock exchange.
Overshadows of continuing Euro debt crisis, recent region’s economic and political uncertainties and operational
problems slowed down the growth of F&N in the year 2012. The financial year 2012 began without the business from
Coca-Cola, a business partner for 73 years due to the expiration of licensing agreements. As a result, revenue and the
profit for the year 2012 were lower when compared to the previous year.
The revenue was further affected due to temporary cessation of production at flood-hit Dairies Thailand (A
subsidiary) though it was possible to bring the operations back to normal due to prompt actions taken and the
commitment of the management. Diaries Thailand maintained its supply pipeline via importation and managed to
sustain its market position despite the floods thus generating 79% of expected revenue even the factory was shut
down for 55 days. Dairies Thailand returned to full production by June 2012, and the division was rewarded for its
resilience and commitment when it achieved complete recovery to resume full production one month ahead of the
schedule. The Thai Food and Drug Administration awarded Dairies Thailand a certificate of recognition for being the
fastest to recover and its outstanding achievement in teamwork and strength.
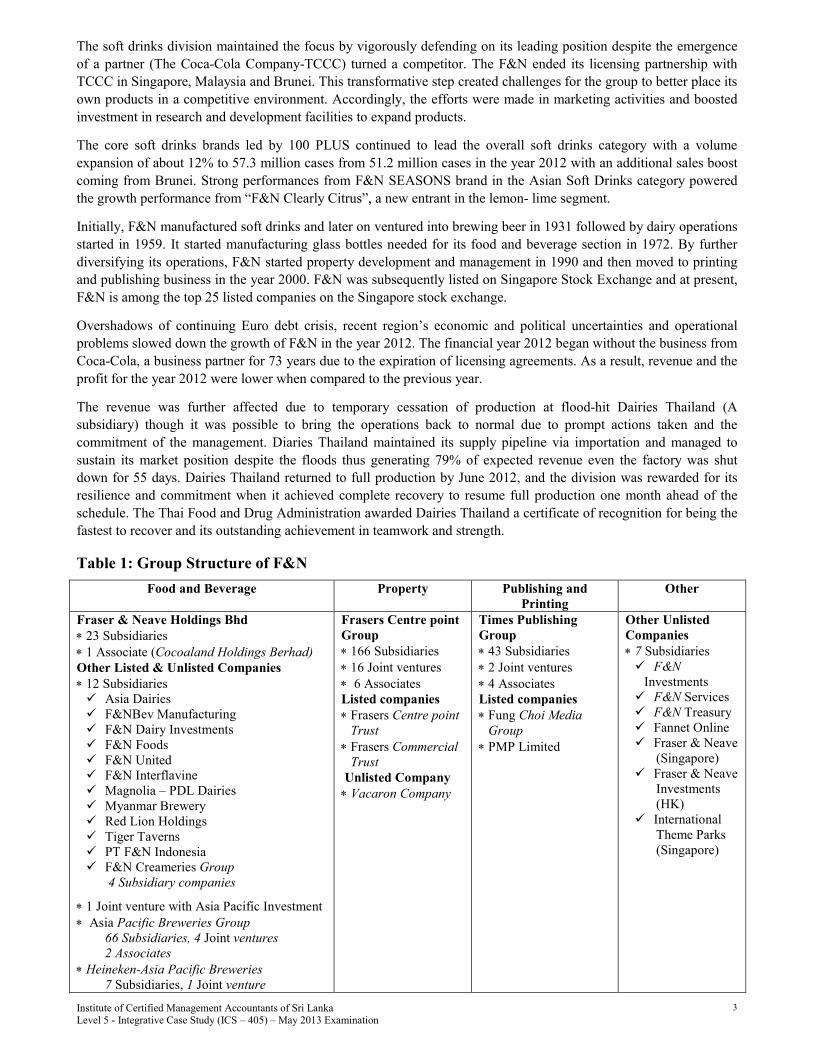
Table 1: Group Structure of F&N
Food and Beverage Property Publishing and
Printing
Other
Fraser & Neave Holdings Bhd
∗ 23 Subsidiaries
∗ 1 Associate (Cocoaland Holdings Berhad)
Other Listed & Unlisted Companies
∗ 12 Subsidiaries � Asia Dairies � F&NBev Manufacturing � F&N Dairy Investments � F&N Foods � F&N United � F&N Interflavine � Magnolia – PDL Dairies � Myanmar Brewery � Red Lion Holdings � Tiger Taverns � PT F&N Indonesia � F&N Creameries Group
4 Subsidiary companies
∗ 1 Joint venture with Asia Pacific Investment
∗ Asia Pacific Breweries Group
66 Subsidiaries, 4 Joint ventures
2 Associates
∗ Heineken-Asia Pacific Breweries
7 Subsidiaries, 1 Joint venture
Frasers Centre point
Group
∗ 166 Subsidiaries
∗ 16 Joint ventures
∗ 6 Associates
Listed companies
∗ Frasers Centre point
Trust
∗ Frasers Commercial
Trust
Unlisted Company
∗ Vacaron Company
Times Publishing
Group
∗ 43 Subsidiaries
∗ 2 Joint ventures
∗ 4 Associates
Listed companies
∗ Fung Choi Media
Group
∗ PMP Limited
Other Unlisted
Companies
∗ 7 Subsidiaries
� F&N
Investments
� F&N Services � F&N Treasury � Fannet Online � Fraser & Neave
(Singapore) � Fraser & Neave
Investments (HK)
� International Theme Parks (Singapore)

Institute of Certified Management Accountants of Sri Lanka Level 5 - Integrative Case Study (ICS – 405) – May 2013 Examination
4
Operations in Food and Beverage Section
Soft drinks and dairies business, with operations and investments in Singapore, Malaysia, Thailand, China and Vietnam, are operated primarily through Fraser & Neave Holdings Bhd; while Beer business is operated mainly through Asia Pacific Breweries Limited (APBL), in 37 breweries in 14 countries in the Asia Pacific region. The product portfolio comprises of F&N Nutrisoy, 100PLUS, F&N SEASONS, F&N Magnolia milk, F&N Fruit Tree Juices, F&N Ice Mountain, F&N aLIVE yoghurt, NutriTea and a range of F&N sparkling drinks for the soft drinks and dairies. Tiger, Anchor, Baron’s and ABC are the major brands for Beer section. F&N has been awarded with many accolades including HACCP accreditation since 2003.
Soft drink operation transformed into a highly competitive environment, following the entry of a former partner, Coca- Cola which turned to be a competitor. As a result, measures were taken to energize the marketplace by improving touch points to improve product availability, cold equipment services, merchandising intensity, increasing depth of inventory and selling space. Despite the challenges faced, the strength built over 129 years helped F&N to grow volume and revenue by 12% and 10% respectively. A year after the separation with Coca-Cola, the division has grown ahead of the market with volume growth in almost all categories.
100PLUS continued to be a mainstay at all major sporting events as the preferred isotonic beverage. Malaysians from all walks of life rallied to support the national contingent to the London Olympics in the 100PLUS Road to London Campaign. In conjunction with the campaign, national celebrity athletes including Datuk Lee Chong Wei, Pandalela Rinong, Khairul Fahmi Che Mat and Safee Sali were signed on as 100PLUS ambassadors.
F&N Clearly Citrus was introduced in November 2011 to complement the current exciting flavoured soft drinks line up. Major towns across Malaysia were invaded by F&N Clearly Citrus agents in bright yellow and green outfits, displaying the refreshing sight of lemons and limes.
Soft Drinks division extended its leadership positions in the F&B industry with new products armed with well-established brands like the 100PLUS isotonic drink, F&N Sparkling Drinks, F&N SEASONS Asian-inspired drinks and teas, as well as the F&N ICE MOUNTAIN water range. 100PLUS EDGE was introduced at the beginning of the year to herald the division’s efforts to offer more choices and to drive new and differentiated products across the soft drinks portfolio. While maintaining the growth in key markets of Singapore, Malaysia and Thailand, new ASEAN markets are also expected to grow in dairy business.
Properties
Properties section is operated by a Frasers Centrepoint Limited (FCL), a wholly owned subsidiary. F&N started its operations with a single shopping mall and has stretched its operations into businesses of property development, property investment, running serviced residences and maintaining investment funds in Australia, China, Japan, Hong Kong, Korea, New Zealand, Philippines, Thailand, UAE, Vietnam and the UK. In 2012, the Malaysian property market continued its growth but at a slower pace compared to 2011. The housing sector continues to be the primary driver of the Malaysian property market while residential property development continued at an active pace with good sales returns amidst rising prices of those properties. For the year ahead, the property market is expected to present a more challenging landscape in view of continuous construction cost pressures and new projects coming into the market.
Take-up rates for residential units in Singapore were encouraging in the year 2012 despite some cooling measures implemented by the Singapore Government. FCL launched four projects and sold 3,047 units during the current year and remains one of Singapore’s top three developers in terms of number of private non-landed residential (including Executive Condominium) units sold.
The entire interest in Frasers Property China Limited (FPCL), a subsidiary of FCL was sold during the year. In Australia, strong pre-sales of about 580 units was recorded in the year 2012. During the year, Frasers Commercial Trust (FCOT) acquired the remaining 50% interest in Caroline Chisholm Centre in Canberra and successfully unlocked value in the Key point which was divested at a gain of $73 million. In October 2012, FCOT completed its portfolio reshaping strategy which began two years ago, when it divested its remaining Japanese portfolio by focusing on its portfolios in Singapore and Australia.

Institute of Certified Management Accountants of Sri Lanka Level 5 - Integrative Case Study (ICS – 405) – May 2013 Examination
5
However, the revenue from properties section dropped during the year partly because of changes in accounting policy
as a result of adoption of IFRs. Under this new rule, earnings of overseas and certain Singapore residential
developments are recognized only upon completion, and not according to construction progress. Consequently,
despite achieving strong pre-sales of private residential units in Australia and China as well as executive
condominium units in Singapore, such revenue and profit were not recognized in the year 2012. Specifically, earnings
of the 573-unit Esparina Residences (99% sold), an executive condominium in Singapore, and phases 1 and 2 of the
mixed-use Central Park project in Australia (74% sold) would only be recognized upon construction completion in
the coming financial year. On the other hand, development property earnings were lifted by a $68 million gain from
the Group’s sale of its 50% stake in the mixed-use Central Park project in Australia to Sekisui House Ltd.
Singapore’s residential market remained resilient despite economic uncertainties and the government’s effort to cool
the property market. The first nine months of 2012 saw primary home sales totaling 17,927 units, up 12.7% from
15,904 units in 2011 and about 10% in 2010. It has been estimated that the aggregate residential sales in 2012 is
between 20,000 and 23,000 units. Overall, private home prices rose by 0.6% in 2012 indicating the highest increase
this year.
Even though Singapore office market is concerned about the Eurozone debt crisis and is propensity to slow the
growth momentum, the group managed to maintain it’s grow as expected. Suppressed leasing activities could be seen
among large space occupiers including major banks and financial institutions, as they remained cautious of the
economic uncertainties. It was observed that the majority of the take-ups in the last quarter of the year were of Grade
A office spaces of less than 20,000 square feet. The City Hall/Marina and Raffles Place/New Downtown micro-
markets saw the biggest jump by 2.6% and 1.7% respectively during the quarter. The city fringe micro-market
continued to enjoy the highest occupancy at 98.7%, whilst the Orchard Road micro-market experienced the lowest
rate at 87.4% as at end of September 2012. In general, the overall improvement in occupancy rate of Grade A office
space in Singapore has helped moderate rental decline for two consecutive quarters. On the other hand, the retail
property market in Singapore stayed buoyant with the opening of new malls, stores and restaurants.
Renowned F&B entrepreneurs and international brands are still looking for viable locations in new and existing malls
to establish their presence in Singapore. As a result, retail rents in both Orchard Road and Regional Centres (suburban
residential estates) have been steady. The monthly prime rents in Orchard Road at the end of September 2012
remained unchanged from the previous quarter staying firm at $31.60 per square foot, whilst the average monthly
gross rent of prime space in suburban stabilized at $29.75 per square foot per month. Meanwhile, the hospitality
sector continued to see positive demand in 2012, boosted by strong visitor arrivals as well as new setups by regional
headquarter offices in Singapore. In general, occupancy rates for serviced residences in Singapore are stronger than
for hotels, clocking an average occupancy of 91.8% in 2012 against an average of 86% for hotels.
Publishing & Printing
Times Publishing Limited is the largest publishing and printing company in Singapore. It comprises of publishing,
printing, direct sales, distribution and retailing of books, magazines and the provision of educational services and
operated through a global network established in South-East Asia, Hong Kong, China, Japan, Australia, Europe and
the USA. During the year under-performing Library reference business in the US was discontinued with a view to
focus on Education Publishing which has gained strong growth. A new office in Chile was recently set up to drive the
growth in education publishing business in Latin America.
Times Publishing Group’s revenue grew by 1% driven mainly by strong growth in Education Publishing and
increased contribution from the distribution of lifestyle products amidst a decline of print demand from Western
markets and weak retail sentiments. During the year, Education Publishing delivered a stellar performance with
double-digit growth in revenue and PBIT. The success was underpinned by investment foresight and proactive
management of the education publishing unit to improve both revenue and earnings. Overseas sales grew from 49%
to 62% of total education revenue over the last three years, as Education Publishing continued to gain momentum in
international market.

Institute of Certified Management Accountants of Sri Lanka Level 5 - Integrative Case Study (ICS – 405) – May 2013 Examination
6
The Group continued to face challenges in the Printing business as the print volume in Western markets declined.
However the efforts to diversify our revenue base to non-publishing segments and to increase our market shares from
domestic markets in Malaysia and China registered positive results. In the year, Times Printers embraced digital
opportunities by launching a host of digital services such as e-book conversion, app development and QR (Quick
Response) codes to seamlessly integrate print and web requirements of customers. An affirmation of superior quality
was displayed as Times Printers once again garnered recognition by winning numerous international awards.
Distribution division, achieved improvement in revenue through the diversification to lifestyle products and
expansion of its distribution network for non-book customers in Singapore, Malaysia and Hong Kong. Even though
there were closures of major bookstores in Singapore.
Distribution Network
F&N maintains an unparalleled nationwide distribution system to ensure the pervasiveness of brands and products in
marketplaces and townships. In addition, the partnership with a strong network of distributors ensures the flow of
deliveries, stocks and inventories to combined operation and service of 90,000 outlets. Apart from doubling the
investments in the installation of coolers, the F&N Partner Rewards program was enhanced with emphasis on
strengthening partner relationships. Partner loyalty reflects the division’s commitment in helping them transform
alongside F&N while establishing greater equity and pride in being an F&N distributor.
With an established and demographically-organized distribution network, the division is able to position products in
the marketplace and effectively gain insight into trends relating to on-ground market activities. Information
technology was a major enabler in advancing product and cooler penetration. The investment in 3G-enabled hand
held computers facilitated the provision of real time data processing and marinating the intelligence by helping the
division to respond faster to the market. Food and Beverage section in Malaysia harnessed the strength of employees
from across the Group to transform and reenergize the market in a four-day merchandising blitz. Over 600 employees
across the Group covered 2,800 outlets in Peninsular Malaysia to execute in-outlet merchandising thereby increasing
F&N brand presence. F&N products are available in 90% of the outlets nationwide making F&N brands the most
pervasive among FMCG products distributed in Malaysia itself.
Over time, with the experience and tacit knowledge gained, Food Beverage section of F&N regained control of all
aspects of its soft drinks business, from manufacturing and marketing to sales and distribution. F&N Foods Pte Ltd, a
subsidiary of F&N became the sole distributor of all F&N beverages in Singapore and Malaysian-listed subsidiary,
Fraser & Neave Holdings Bhd., covers Malaysia and Brunei distribution. This new structure allowed F&N to
aggressively push marketing and sales activities for all F&N beverages regionally as the Group consolidating position
as one of ASEAN’s leading F&B players.
New investment in Diaries Malaysia
After 52 years, plant at Dairies Malaysia was transformed to the state-of-the-art of technology with integrated
cannery, processing and filling facility and now it operates the most advanced technologies in canned milk production
with the move of its manufacturing facility. Manufacturing plant now operates in a 37.4 acre site within the Selangor
Halal Hub. Further, it enhanced capabilities and capacity and reinforced the plant to have ‘Halal’ credentials by
aiming relatively untapped markets of the Middle East, Africa and Indonesia. Investments in technology continue to
be a primary enabler to optimise efficiencies and output for faster response across the extensive distribution network.
The commercial production capacity of the new plant is 1.5 million cans per day. Technology has been incorporated
to implement just-in-time supply of cans by connecting Warehouse Distribution Centre is equipped with automated
storage and retrieval systems (ASRS) that amongst other things enables better inventory control and tracking,
increased workplace safety and most significantly, produce major savings in inventory storage costs by creating
greater storage density. Further, it incorporates heat recovery and integrated wastewater treatment process for
pollution controls. Immediate benefits of the new plant include the introduction of a new nitrogen filling process,
improved controls on viscosity of products and even better hygiene and quality processes. The half-tray packaging
capability available at the plant ensures greater visibility of finished product and promotes better handling while
reducing the use of packaging material. Dairies Malaysia plant is accredited with ISO 9001:2008, ISO22000:2005,
HACCP Codex and MS 1480 certification to validate its high standards of manufacturing and food safety.

Institute of Certified Management Accountants of Sri Lanka Level 5 - Integrative Case Study (ICS – 405) – May 2013 Examination
7
Corporate Governance
The Company is fully committed to good corporate governance practices and fair dealings in all its activities by
aligning with the principles and best practices. Board comprises of 9 directors and six subcommittees namely Group
Executive, Food & Beverage Committee, Risk Management, Audit, Nominating, and Remuneration & Staff
Establishment Committee. All the nine directors are non-executive directors and an independent non-executive
Chairman heads the Board. A formal evaluation process has been implemented to assess the effectiveness of the
Board and this is conducted by an external consultant. The Board’s ratings were especially noteworthy in the areas of
corporate social responsibility.
To strengthen corporate governance, the Board of Directors has adopted the Singapore Exchange Listing Ruling,
which requires companies listed on the Singapore Stock Exchange (SGX) to have a robust and effective system of
internal controls that address financial, operational and compliance risks.
Working Culture
Adequate investment is made to provide necessary training for employees on continuous basis. Recognizing the
importance of diversity in cultivating agility and creativity in the workplace, knowledge sharing initiatives across the
organization have begun with inter-placements of key senior managers in the soft drinks and dairies division.
Traditional hierarchy barriers are broken down with the introduction of an enterprise social network that promotes
employee interaction and collaboration on a social platform. It is intended to cross-fertilize of talents contributing to
the skills of human capital.
Executives’ Share Option Scheme
The ESOS which was established in October 2007 is in operation. Details of all the options granted to and exercised
by executives are given in table 2.
Table 2: Number of share options given and exercised in ESOS
The fair value of share options granted as at the date of grant is determined using the binomial valuation model taking into account the terms and conditions upon which the options were granted. The inputs to the model used are given in table 3 below.
Table 3: Inputs used valuation model

Institute of Certified Management Accountants of Sri Lanka Level 5 - Integrative Case Study (ICS – 405) – May 2013 Examination
8
Financial Information
Selected financial information of F&N for the last five years is given in figures 1, 2 and 3 below.
Figure 1: Financial performance
Year ended 30 September FY2008 FY2009 FY2010 FY2011 FY2012
Note
1 Profit statement ($ millions)
Revenue 4,990 5,146 5,697 6,355 5,570
Profit before taxation
- before interest 766 799 1,071 1,177 952
- before impairment, fair value adjustment & exceptional items 701 737 1,009 1,123 868
- after exceptional items 737 614 1,172 1,438 1,239
Attributable profit
2 - before fair value adjustment & exceptional items 372 462 584 643 472
- after exceptional items 436 357 728 898 836
Balance sheet ($ millions)
3 Net asset value 5,283 5,585 6,143 6,843 7,591
Total assets employed 13,526 13,868 13,523 13,924 14,651
Long-term borrowings 3,355 3,608 2,666 3,216 2,972
Market Capitalisation ($ millions)
at close of business on then first trading day after
preliminary announcement of results 4,308 5,408 9,127 8,745 13,355
1 Financial ratio (%)
Return on average shareholders’ equity
- profit before impairment, fair value adjustment & exceptional items 13.4 13.6 17.2 17.3 12.0
2 - attributable profit before fair value adjustment & exceptional items 7.1 8.5 10.0 9.9 6.5
4 Gearing ratio
- without non-controlling interest 83.3 65.5 46.8 34.5 29.8
- with non-controlling interest 68.6 54.7 41.4 30.8 27.4
1 Per share
Profit before impairment, fair value adjustment,
taxation and exceptional items (cents) 50.5 53.0 72.2 79.8 61.1
Attributable profit (cents) (basic)
- before fair value adjustment and exceptional items 26.8 33.2 41.8 45.7 33.2
- after exceptional items 31.4 25.7 52.1 63.8 58.9
3 Net asset value ($) 3.80 4.01 4.38 4.85 5.31
Dividend
- net (cents) 13.5 13.5 17.0 18.0 18.0
5 - cover (times) 2.0 2.5 2.5 2.5 1.8
Stock exchange Prices ($)
at close of business on the first trading day after
preliminary announcement of results 3.10 3.88 6.51 6.20 9.35

Institute of Certified Management Accountants of Sri Lanka Level 5 - Integrative Case Study (ICS – 405) – May 2013 Examination
9
Figure 2: Balance sheets as at 30th
September 2012 (in $’000)
The Group The Company
2012
2011
(Restated)
2010
(Restated)
2012
2011
SHARE CAPITAL AND RESERVES
Share capital 1,499,329 1,417,404 1,374,502 1,499,329 1,417,404
Treasury shares (23) - - (23) -
Reserves 6,092,150 5,425,965 4,707,223 2,840,319 2,755,660
7,591,456 6,843,369 6,081,725 4,339,625 4,173,064
Non-Controlling Interest 663,048 831,204 803,055 - -
8,254,504 7,674,573 6,884,780 4,339,625 4,173,064
Represented by:
NON-CURRENT ASSETS
Fixed assets 747,447 1,188,098 1,104,216 - -
Investment properties 2,837,787 2,476,740 2,139,026 - -
Subsidiary companies - - - 3,829,665 3,676,408
Joint venture companies - 60,101 89,839 - 434,421
Associated companies 1,495,514 1,382,200 1,355,249 82,383 82,383
Intangible assets 163,475 569,609 576,219 - -
Brands 30,337 73,519 74,275 212 -
Other investments 374,978 404,583 323,531 8,877 8,672
Other receivables 83,970 65,212 61,556 - -
Other assets 42,400 41,000 41,000 - -
Deferred tax assets 38,700 14,649 25,251 - -
TOTAL NON-CURRENT ASSETS 5,814,608 6,275,711 5,790,162 3,921,137 4,201,884
CURRENT ASSETS
Properties held for sale 4,441,491 4,254,487 4,488,047 - -
Inventories 265,936 373,497 391,916 - -
Trade receivables 551,668 961,457 1,021,283 - -
Other receivables 132,439 317,142 252,327 24 316
Subsidiary companies - - - 16,552 50,898
Joint venture companies 1,662 6,117 6,540 - -
Associated companies 13,122 13,181 10,798 - -
Short-term investments 60,448 3,604 3,429 - -
Bank fixed deposits 604,112 1,180,935 1,274,626 64,489 98,566
Cash and bank balances 1,044,833 418,672 424,290 91,793 1,002
7,115,711 7,529,092 7,873,256 172,858 150,782
Assets held for sale 1,720,659 119,542 38,262 434,421 -
TOTAL CURRENT ASSETS 8,836,370 7,648,634 7,911,518 607,279 150,782
Deduct: CURRENT LIABILITIES
Trade payables 529,751 673,442 724,740 - -
Other payables 905,456 1,012,643 1,013,210 8,338 5,125
Subsidiary companies - - - 17,823 5,164
Joint venture companies 3 14,263 6,350 - -
Associated companies 1,787 3,043 954 - -
Borrowings 936,296 747,546 1,908,709 - -
Provision for taxation 176,739 310,240 295,603 12,244 18,961
2,550,032 2,761,177 3,949,566 38,405 29,250
Liabilities held for sale 690,111 38,292 2,297 - -
TOTAL CURRENT LIABILITIES 3,240,143 2,799,469 3,951,863 38,405 29,250
NET CURRENT ASSETS 5,596,227 4,849,165 3,959,655 568,874 121,532
Deduct: NON-CURRENT LIABILITIES
Other payables 38,630 39,251 15,577 - -
Borrowings 2,971,647 3,215,900 2,666,032 150,000 150,000
Provision for employee benefits 17,346 20,405 25,044 - -
Deferred tax liabilities 128,708 174,747 158,384 386 352
3,156,331 3,450,303 2,865,037 150,386 150,352
8,254,504 7,674,573 6,884,780 4,339,625 4,173,064
Institute of Certified Management Accountants of Sri Lanka Level 5 - Integrative Case Study (ICS – 405) – May 2013 Examination
10
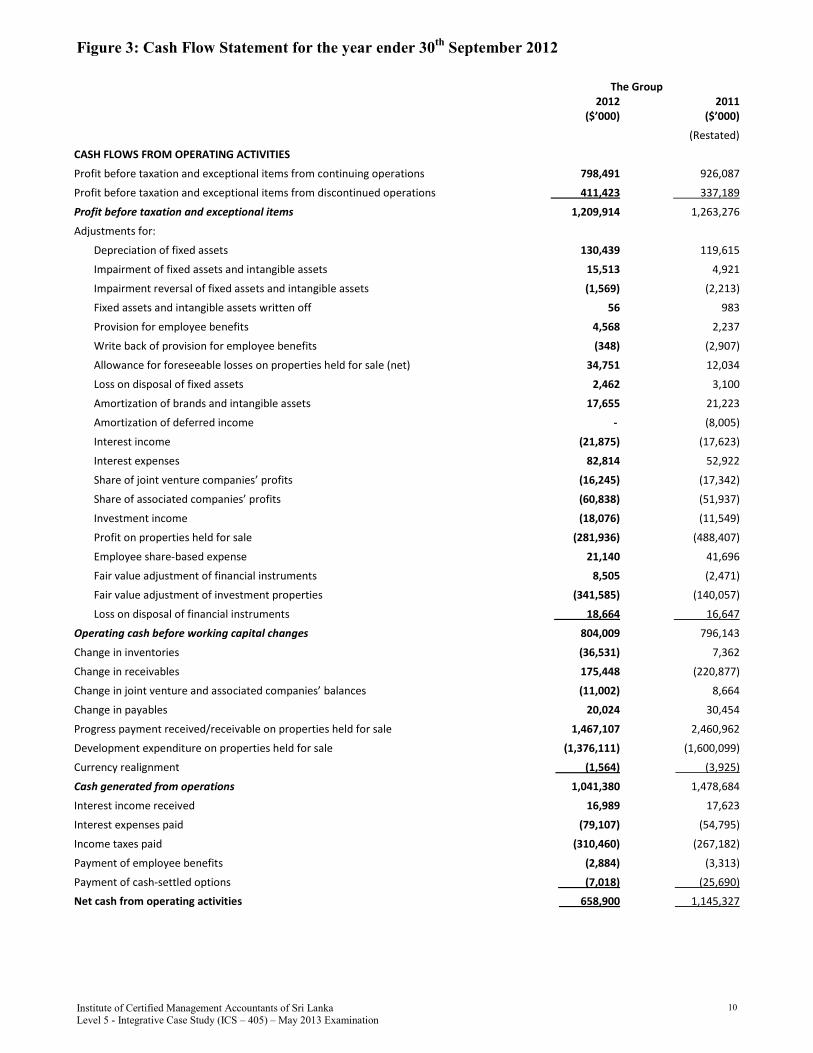
Figure 3: Cash Flow Statement for the year ender 30th
September 2012
The Group
2012
($’000)
2011
($’000)
(Restated)
CASH FLOWS FROM OPERATING ACTIVITIES
Profit before taxation and exceptional items from continuing operations 798,491 926,087
Profit before taxation and exceptional items from discontinued operations 411,423 337,189
Profit before taxation and exceptional items 1,209,914 1,263,276
Adjustments for:
Depreciation of fixed assets 130,439 119,615
Impairment of fixed assets and intangible assets 15,513 4,921
Impairment reversal of fixed assets and intangible assets (1,569) (2,213)
Fixed assets and intangible assets written off 56 983
Provision for employee benefits 4,568 2,237
Write back of provision for employee benefits (348) (2,907)
Allowance for foreseeable losses on properties held for sale (net) 34,751 12,034
Loss on disposal of fixed assets 2,462 3,100
Amortization of brands and intangible assets 17,655 21,223
Amortization of deferred income - (8,005)
Interest income (21,875) (17,623)
Interest expenses 82,814 52,922
Share of joint venture companies’ profits (16,245) (17,342)
Share of associated companies’ profits (60,838) (51,937)
Investment income (18,076) (11,549)
Profit on properties held for sale (281,936) (488,407)
Employee share-based expense 21,140 41,696
Fair value adjustment of financial instruments 8,505 (2,471)
Fair value adjustment of investment properties (341,585) (140,057)
Loss on disposal of financial instruments 18,664 16,647
Operating cash before working capital changes 804,009 796,143
Change in inventories (36,531) 7,362
Change in receivables 175,448 (220,877)
Change in joint venture and associated companies’ balances (11,002) 8,664
Change in payables 20,024 30,454
Progress payment received/receivable on properties held for sale 1,467,107 2,460,962
Development expenditure on properties held for sale (1,376,111) (1,600,099)
Currency realignment (1,564) (3,925)
Cash generated from operations 1,041,380 1,478,684
Interest income received 16,989 17,623
Interest expenses paid (79,107) (54,795)
Income taxes paid (310,460) (267,182)
Payment of employee benefits (2,884) (3,313)
Payment of cash-settled options (7,018) (25,690)
Net cash from operating activities 658,900 1,145,327

Institute of Certified Management Accountants of Sri Lanka Level 5 - Integrative Case Study (ICS – 405) – May 2013 Examination
11
CASH FLOWS FROM INVESTING ACTIVITIES
Dividends from joint venture and associated companies 89,949 71,773
Investment income 18,076 11,549
Proceeds from sale of fixed assets and assets held for sale 3,487 15,660
Proceeds from disposal of associated companies 37,603 97,957
Proceeds from sale of other and short term investments 703 294
Proceeds from disposal of intangible assets 1,688 -
Proceeds from disposal of subsidiary companies 55,946 28,748
Proceeds from sale of investment properties - 54,654
Purchase of fixed assets and investment properties (265,825) (348,773)
Purchase of other investments - (17,401)
Acquisition of non-controlling interests in subsidiary companies (4,054) (7,584)
Payment for intangible assets and brands (18,512) (15,799)
Development expenditure on investment properties under construction (53,232) (228,813)
Investments in associated and joint venture companies (22,234) (37,412)
Acquisition of subsidiary and joint venture companies (146,794) (27,086)
Repayment of loan from an associated company 9,607 -
Additional trade advances 1,643 663
Net cash used in investing activities (291,949) (401,570)
CASH FLOWS FROM FINANCING ACTIVITIES
Proceeds from/(Repayment of ) term loans and bank borrowings 323,522 (709,944)
Proceeds from issue of bonds - 300,000
Purchase of treasury shares (8,093) -
Proceeds from issue of shares:
-by subsidiary companies to non-controlling interests 21,482 20,682
-by the Company to shareholders 65,236 35,072
Payment of dividends:
-by subsidiary companies to non-controlling interests (163,018) (206,826)
-by the Company to shareholders (255,527) (253,381)
Net cash used in financing activities (16,398) (814,397)
Net increase/(decrease) in cash and cash equivalents 350,553 (70,640)
Cash and cash equivalents at beginning of year 1,597,635 1,695,123
Reclassified to assets held for sale (279,312) (1,383)
Effects of exchange rate changes on cash and cash equivalents (21,399) (25,465)
Cash and cash equivalents at end of year 1,647,477 1,597,635
Cash and cash equivalents at end of year comprise:
Cash and bank deposits 1,648,945 1,599,607
Bank overdrafts (1,468) (1,972)
1,647,477 1,597,635
Analysis of acquisition and disposal of subsidiary and joint venture companies
Net assets acquired:
Fixed assets 12,616 12,135
Investment properties 266,688 -
Other non-current assets 213 4,211
Current assets 14,155 16,498
Bank Borrowings (82,692) (103)
Non-current liabilities (23,965) (9,249)
Current liabilities - (2,315)
Non-controlling interests (471) (831)
Cash 12,340 7,036
198,884 27,382
Investment in associated company previously accounted for (43,878) -

Institute of Certified Management Accountants of Sri Lanka Level 5 - Integrative Case Study (ICS – 405) – May 2013 Examination
12
Goodwill on acquisition (net) 18,306 6,740
Consideration 173,312 34,122
Contribution of capital by non-controlling interests (14,178) -
Cash and cash equivalents of subsidiary and joint venture companies (12,340) (7,036)
Cash outflow on acquisition net of cash and cash equivalents acquired 146,794 27,086
Net assets disposed:
Fixed assets (278) (228)
Investment properties (235,402) -
Properties held for sale (303,213) -
Other non-current assets (1,421) (2,079)
Current assets (3,028) (169,693)
Non-current liabilities 222,621 1,510
Current liabilities 77,215 62,591
Non-controlling interests 191,455 7,933
Cash (205,675) (4,002)
(257,726) (103,968)
Realization of translation difference (34,632) 5,498
Provision for cost of disposal (100) -
Fair value of retained interest reclassified to investment in associated company 69,316 -
Consideration satisfied by other receivable - 84,352
Gain on disposal (38,479) (18,632)
Consideration received (261,621) (32,750)
Less: Cash of subsidiary companies disposed off 205,675 4,002
Cash inflow on disposal net of cash and cash equivalents disposed (55,946) (28,748)
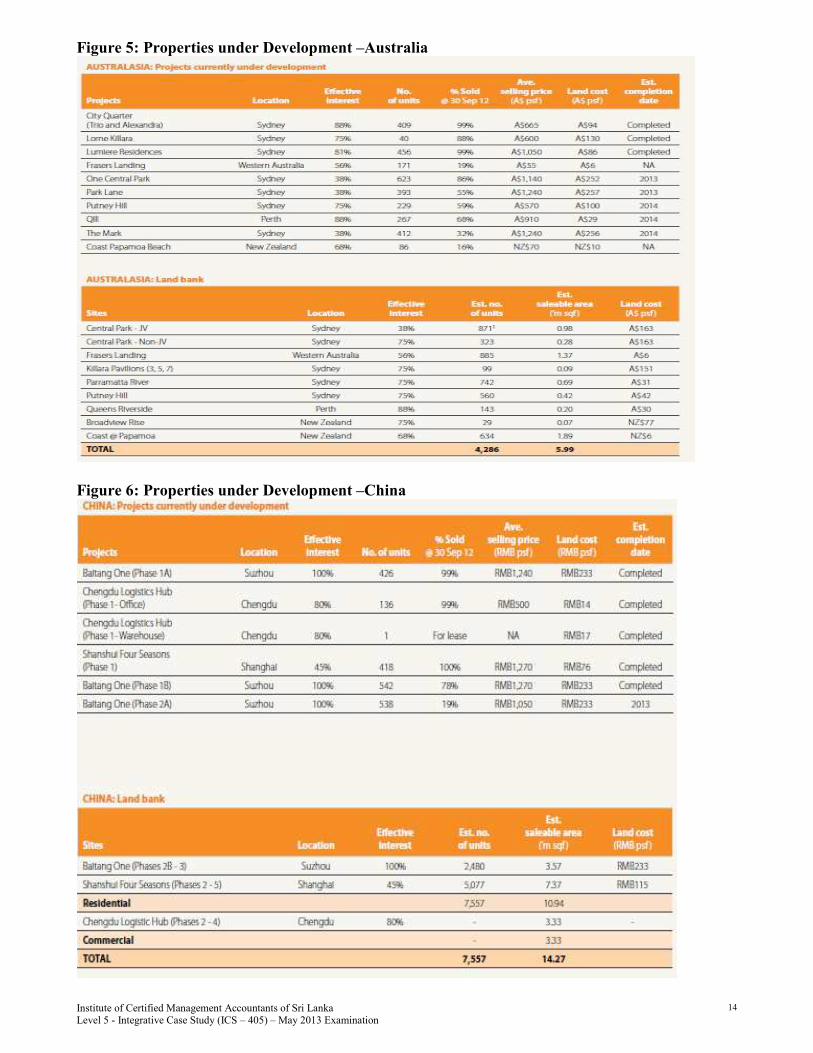
Some details of properties currently under development are given in figure 4, 5 and 6

Institute of Certified Management Accountants of Sri Lanka Level 5 - Integrative Case Study (ICS – 405) – May 2013 Examination
13
Figure 4: Properties under Development – Singapore
Institute of Certified Management Accountants of Sri Lanka Level 5 - Integrative Case Study (ICS – 405) – May 2013 Examination
14
Figure 5: Properties under Development –Australia
Figure 6: Properties under Development –China

Institute of Certified Management Accountants of Sri Lanka Level 5 - Integrative Case Study (ICS – 405) – May 2013 Examination
15
Growth Drivers
Underlying fundamentals of F&N’s connected with the strategic path for the future growth of businesses, the
following value drivers have been identified in generating value for shareholders in a responsible and sustainable
manner.
1. Forging strategic business partnerships and networks to gain entry and build our foundation in new markets &
Printing businesses.
2. Leveraging our strong global network to expand our market reach and tap on new business opportunities.
3. Harnessing R&D to enhance our innovative edge and deliver quality products in line with current lifestyle
trends.
4. Grooming leaders and developing staff systematically to ensure a continuous pool of talent.
5. Sharpening capital management and extracting operational efficiencies to enhance shareholder return.
End of Scenario I
Scenario II – A continuation of Scenario I
After the battle over acquiring the F&N, Mr. Charoen now holds more than 90% of equity of F&N. This situation has
created a threat to all other stakeholders as Singapore Stock Exchange (SGX), by referring to current listing rules can
delist the company on the ground that one shareholder owns more than 90% of equity of a company. Since this may
cause problems on the future growth and successes of F&N, Mr. Charoen has already initiated discussions with SGX
to explore the possibilities of keeping F&N listed. As an initial measure Mr Charoen, now being the chairman of
F&N appointed four independent directors, including former Singapore ambassador to Thailand and former Jardine
Cycle & Carriage boss Philip Eng, to the nine-man board by signaling that necessary balance in the board is
maintained to assure the public interest. The chairman also intends to use F&N’s regional networks to further raise his
profile outside Thailand. His hotel businesses which have well spread throughout the world, including the Plaza
Athenee in Manhattan and the Intercontinental in Singapore will also would be eyeing to form a real estate
investment trust (REIT) by spinning off these properties together with F&N’s serviced apartment arm.
Management expressed the intention of expanding its soft drink and dairy businesses through the established
distribution networks and joint partnerships with a view to reinforce its foothold in the food and beverage industry
across the Asia Pacific. The CEO is in a strong belief that the strategy of penetration into the Indochina region,
comprising Vietnam, Cambodia and Laos, and into Myanmar would offer great potential for dairies operations in
Thailand and Malaysia. As far as the export market is concerned, condensed and evaporated milk products are scaled
up to grow further. CEO further highlighted that a five-year manufacturing master plan is required in order to coup
with the capacity and to meet the growing demand. On the other hand, management has decided to adopt the strategy
of further diversifying its business operations in to new sectors and geographical areas.
The property sector is likely to be overshadowed due to negative impact of downturns in the global markets and the
recent financial crises took place around the world. For example, Austrade, an Australian government agent to
promote trade and businesses has already dropped real estate sector as a sector to be promoted. However,
management is striving to earn sustainable earnings from this sector by focusing on residential and commercial
properties including integrated commercial real estate models. Accordingly, F&N started a residential development
project. The first phase of it is expected to be launched towards the end of 2013. Further, it adopted a strategy of
gaining advantages of down turn trends of building raw materials prices which is partly due to financial crisis, by
locking in key materials required for constructions.
In the printing and publication sector, F&N responded to the recent changes in the Singapore school syllabus by
printing Marshall Cavendish Education series as learning support materials. The management is confident that this
print is in the best quality and helps enhance the teaching and learning experience as it supports the digital platforms.
One school principal has commented that these textbooks really empower students to be confident users of
technology in their learning process and develop skills through social media platforms. This product launch
generated great interest from schools and media as well.
End of Scenario II End of Question Paper
Institute of Certified Management Accountants of Sri Lanka Level 5 - Integrative Case Study (ICS – 405) – May 2013 Examination
16
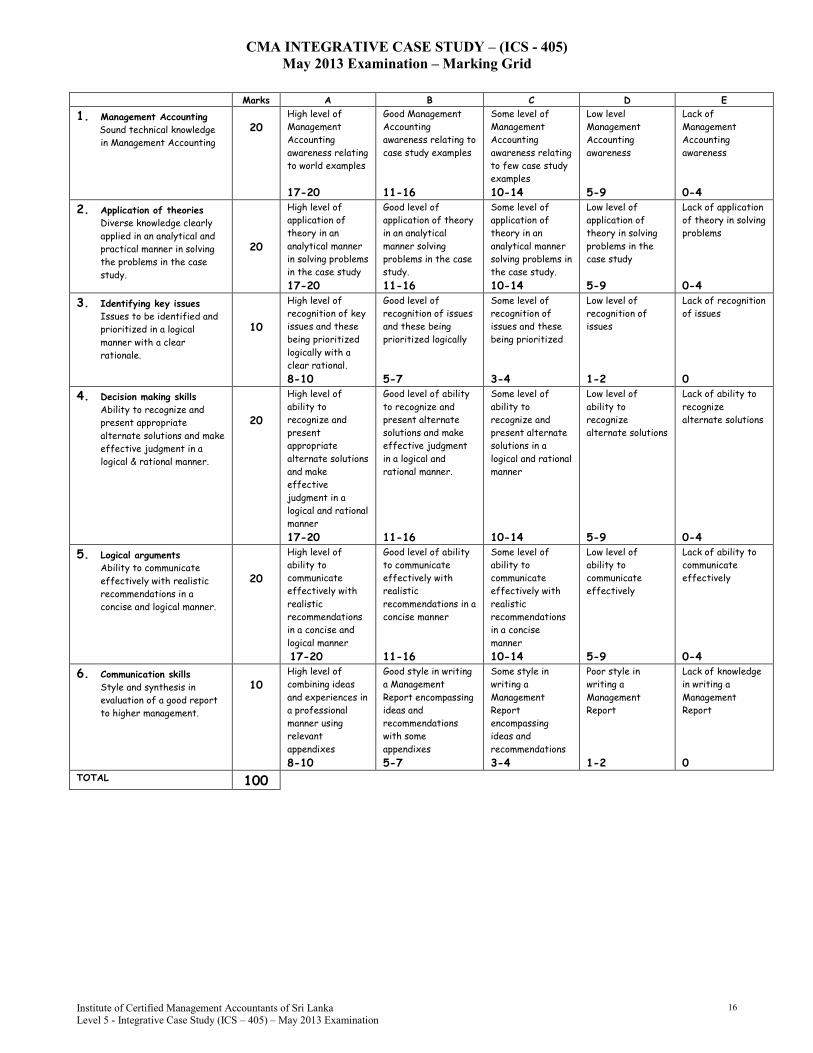
CMA INTEGRATIVE CASE STUDY – (ICS - 405)
May 2013 Examination – Marking Grid
Marks A B C D E
1. Management Accounting
Sound technical knowledge
in Management Accounting
20 High level of
Management
Accounting
awareness relating
to world examples
17-20
Good Management
Accounting
awareness relating to
case study examples
11-16
Some level of
Management
Accounting
awareness relating
to few case study
examples
10-14
Low level
Management
Accounting
awareness
5-9
Lack of
Management
Accounting
awareness
0-4
2. Application of theories
Diverse knowledge clearly
applied in an analytical and
practical manner in solving
the problems in the case
study.
20
High level of
application of
theory in an
analytical manner
in solving problems
in the case study
17-20
Good level of
application of theory
in an analytical
manner solving
problems in the case
study.
11-16
Some level of
application of
theory in an
analytical manner
solving problems in
the case study.
10-14
Low level of
application of
theory in solving
problems in the
case study
5-9
Lack of application
of theory in solving
problems
0-4
3. Identifying key issues
Issues to be identified and
prioritized in a logical
manner with a clear
rationale.
10
High level of
recognition of key
issues and these
being prioritized
logically with a
clear rational.
8-10
Good level of
recognition of issues
and these being
prioritized logically
5-7
Some level of
recognition of
issues and these
being prioritized
3-4
Low level of
recognition of
issues
1-2
Lack of recognition
of issues
0
4. Decision making skills
Ability to recognize and
present appropriate
alternate solutions and make
effective judgment in a
logical & rational manner.
20
High level of
ability to
recognize and
present
appropriate
alternate solutions
and make
effective
judgment in a
logical and rational
manner
17-20
Good level of ability
to recognize and
present alternate
solutions and make
effective judgment
in a logical and
rational manner.
11-16
Some level of
ability to
recognize and
present alternate
solutions in a
logical and rational
manner
10-14
Low level of
ability to
recognize
alternate solutions
5-9
Lack of ability to
recognize
alternate solutions
0-4
5. Logical arguments
Ability to communicate
effectively with realistic
recommendations in a
concise and logical manner.
20
High level of
ability to
communicate
effectively with
realistic
recommendations
in a concise and
logical manner
17-20
Good level of ability
to communicate
effectively with
realistic
recommendations in a
concise manner
11-16
Some level of
ability to
communicate
effectively with
realistic
recommendations
in a concise
manner
10-14
Low level of
ability to
communicate
effectively
5-9
Lack of ability to
communicate
effectively
0-4
6. Communication skills
Style and synthesis in
evaluation of a good report
to higher management.
10 High level of
combining ideas
and experiences in
a professional
manner using
relevant
appendixes
8-10
Good style in writing
a Management
Report encompassing
ideas and
recommendations
with some
appendixes
5-7
Some style in
writing a
Management
Report
encompassing
ideas and
recommendations
3-4
Poor style in
writing a
Management
Report
1-2
Lack of knowledge
in writing a
Management
Report
0 TOTAL 100