Embed Size (px)
Citation preview
Prospective evaluation of GPE’s country-level support to education Country Level Evaluation: Malawi Rachel Outhred, Abrehet Gebremedhin and Paul Chiwaya YEAR 2 REPORT | OCTOBER 2019

DRAFT REPORT (VX) – COUNTRY i
© UNIVERSALIA
Acronyms
ASC Annual School Census
BEC Basic Education Commission
BECE Basic Education Certificate Examination
CA Contribution Analysis
CEQ Country Evaluation Question
CFM Common Funding Mechanism
CLE Country Level Evaluation
CRS Creditor Reporting System
CSEC Civil Society Education Coalition
CSEF Civil Society Education Fund
CSO Civil Society Organization
CSR Country Status Report
DCP Developing Country Partner
DFID Department for International Development (United Kingdom)
DLI Disbursement Linked Indicators
DP Development Partner
ECD Early Childhood Development
ECE Early Child Education
EDG Education Donor Group
EDP Education Development Partner
EFA Education for All
DRAFT REPORT (VX) – COUNTRY ii
© UNIVERSALIA
EGMA Early Grades Math Assessment
EGRA Early Grades Reading Assessment
EMIS Education Management Information System
ESIP Education Sector Implementation Plan
ESP Education Sector Plan
ESPDG Education Sector Plan Development Grant
ESPIG Education Sector Plan Implementation Grant
ESR Education Sector Review
EU European Union
FTI Fast Track Initiative
FY Financial Year
GA Grant Agent
GATE Girls Access to Education
GDP Gross Domestic Product
GER Gross Enrollment Rate
GNI Gross National Income
GPE Global Partnership for Education
GRA Global and Regional Activities
HDI Human Development Index
HR Human Resource
IBRD International Bank for Reconstruction and Development
ICT Information Communication Technology
IIEP International Institute for Educational Planning
IMF International Monetary Fund

DRAFT REPORT (VX) – COUNTRY iii
© UNIVERSALIA
IMT Inclusive Management Team
ITRP Independent Technical Review Panel
JICA Japan International Cooperation Agency
JSR Joint Education Sector Review
JSS Junior Secondary School
KPI Key Performance Indicator
KQ Key Question
LEG Local Education Group
M&E Monitoring and Evaluation
MESIP Malawi Education Sector Implementation Project
MGDS Malawi Growth and Development Strategy
MLSS Malawi Longitudinal School Survey
MoEST Ministry of Education, Science and Technology
MOFED Ministry of Finance and Economic Development
MTR Mid Term Review
NCTVE National Commission for Technical and Vocational Examination
NESP National Education Sector Plan
NESIP National Education Sector Investment Plan
NGO Non-Governmental Organization
NPSE National Primary School Examination
ODA Official Development Assistance
OECD Organization for Economic Co-Operation and Development
PBF Performance-Based Scholarship
PDG Program Development Grant
DRAFT REPORT (VX) – COUNTRY iv
© UNIVERSALIA
PQTR Pupil Qualified Teacher Ratio
PRP Presidential Recovery Plan
PRSP Poverty Reduction Strategy Paper
PTR Pupil Teacher Ratio
SDG Sustainable Development Goal
SMC School Management Committee
SSS Senior Secondary School
ToC Theory of Change
TSC Teaching Service Commission
TVET Technical and Vocational Examination and Training
U.K. United Kingdom
UIS UNESCO Institute for Statistics
UMG Universalia Management Group
UNDP United Nations Development Program
UNESCO United Nations Educational, Scientific and Cultural Organization
UNICEF United Nations Children's Fund
USAID United States Agency for International Development
USD United States Dollar
VT Variable Tranche
WASH Water, Sanitation and Hygiene
WASSCE West Africa Senior School Certificate
WB World Bank

DRAFT REPORT (VX) – COUNTRY v
© UNIVERSALIA
Terminology
Alignment Basing support on partner countries’ national development strategies, institutions and procedures.1
Basic
education
Pre-primary (that is, education before Grade 1), primary (Grades 1-6), lower secondary (Grades 7-9), and adult literacy education, in formal and non-formal settings. This corresponds to International Standard Classification of Education (ISCED) 2011 levels 0-2.
Capacity In the context of this evaluation we understand capacity as the foundation for behavior change in individuals, groups or institutions. Capacity encompasses the three interrelated dimensions of motivation (political will, social norms, habitual processes), opportunity (factors outside of individuals e.g. resources, enabling environment) and capabilities (knowledge, skills).2
Education
systems
Collections of institutions, actions and processes that affect the educational status of citizens in the short and long run.3 Education systems are made up of a large number of actors (teachers, parents, politicians, bureaucrats, civil society organizations) interacting with each other in different institutions (schools, ministry departments) for different reasons (developing curriculums, monitoring school performance, managing teachers). All these interactions are governed by rules, beliefs, and behavioral norms that affect how actors react and adapt to changes in the system.4
Equity In the context of education, equity refers to securing all children’s rights to education, and their rights within and through education to realize their potential and aspirations. It requires implementing and institutionalizing arrangements that help ensure all children can achieve these aims. 5
1 OECD, Glossary of Aid Effectiveness Terms. http://www.oecd.org/dac/effectiveness/aideffectivenessglossary.htm. GPE understands ‘country systems’ to relate to a set of seven dimensions: Plan, Budget, Treasury, Procurement, Accounting, Audit and Report. Source: Methodology Sheet for Global Partnership for Education (GPE) Indicators. Indicator (29) Proportion of GPE grants aligned to national systems. 2 Mayne, John. The COM-B Theory of Change Model. Working paper. February 2017 3 Moore, Mark. 2015. Creating Efficient, Effective, and Just Educational Systems through Multi-Sector Strategies of Reform. RISE Working Paper 15/004, Research on Improving Systems of Education, Blavatnik School of Government, Oxford University, Oxford, U.K. 4 World Bank. 2003. World Development Report 2004: Making Services Work for Poor People. Washington, DC: World Bank; New York: Oxford University Press. 5 Equity and Inclusion in Education. A guide to support education sector plan preparation, revision and appraisal. GPE 2010, p.3. Available at: https://www.globalpartnership.org/content/equity-and-inclusion-education-guide-support-education-sector-plan-preparation-revision-and
DRAFT REPORT (VX) – COUNTRY vi
© UNIVERSALIA
Financial
additionality
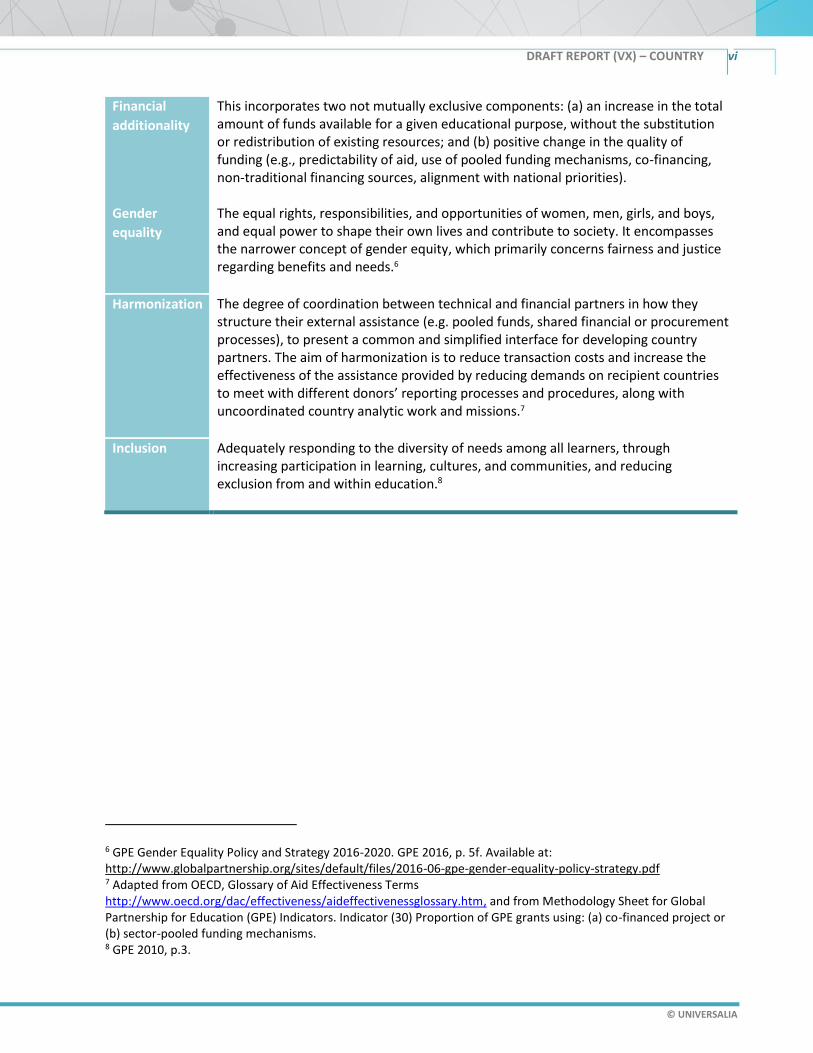
This incorporates two not mutually exclusive components: (a) an increase in the total amount of funds available for a given educational purpose, without the substitution or redistribution of existing resources; and (b) positive change in the quality of funding (e.g., predictability of aid, use of pooled funding mechanisms, co-financing, non-traditional financing sources, alignment with national priorities).
Gender
equality
The equal rights, responsibilities, and opportunities of women, men, girls, and boys, and equal power to shape their own lives and contribute to society. It encompasses the narrower concept of gender equity, which primarily concerns fairness and justice regarding benefits and needs.6
Harmonization The degree of coordination between technical and financial partners in how they structure their external assistance (e.g. pooled funds, shared financial or procurement processes), to present a common and simplified interface for developing country partners. The aim of harmonization is to reduce transaction costs and increase the effectiveness of the assistance provided by reducing demands on recipient countries to meet with different donors’ reporting processes and procedures, along with uncoordinated country analytic work and missions.7
Inclusion Adequately responding to the diversity of needs among all learners, through increasing participation in learning, cultures, and communities, and reducing exclusion from and within education.8
6 GPE Gender Equality Policy and Strategy 2016-2020. GPE 2016, p. 5f. Available at: http://www.globalpartnership.org/sites/default/files/2016-06-gpe-gender-equality-policy-strategy.pdf 7 Adapted from OECD, Glossary of Aid Effectiveness Terms http://www.oecd.org/dac/effectiveness/aideffectivenessglossary.htm, and from Methodology Sheet for Global Partnership for Education (GPE) Indicators. Indicator (30) Proportion of GPE grants using: (a) co-financed project or (b) sector-pooled funding mechanisms. 8 GPE 2010, p.3.

DRAFT REPORT (VX) – COUNTRY vii
© UNIVERSALIA
Contents
EXECUTIVE SUMMARY ............................................................................................... XIV
1 INTRODUCTION ...................................................................................................... 1
1.1 Background and purpose of the prospective evaluation ............................................................... 1
1.2 Methodology overview ................................................................................................................... 2
1.3 Structure of the report ................................................................................................................... 5
2 CONTEXT ................................................................................................................ 6
2.1 Overview of Malawi ........................................................................................................................ 6
2.2 Education sector in Malawi ............................................................................................................ 8
2.3 GPE in Malawi ............................................................................................................................... 11
3 GPE CONTRIBUTIONS TO SECTOR PLANNING, DIALOGUE/MONITORING, FINANCING AND IMPLEMENTATION. ...................................................................................... 14
3.1 Introduction .................................................................................................................................. 14
3.2 GPE contributions to sector planning .......................................................................................... 14
3.3 GPE contributions to mutual accountability through sector dialogue and monitoring/ .............. 23
3.4 GPE contributions to sector financing .......................................................................................... 37
3.5 GPE contributions to sector plan implementation ...................................................................... 49
4 PROGRESS TOWARDS A STRONGER EDUCATION SYSTEM ..................................... 62
4.1 Introduction .................................................................................................................................. 62
4.2 Progress towards a stronger education system ........................................................................... 62
5 PROGRESS TOWARDS STRONGER LEARNING OUTCOMES AND EQUITY ................. 75
5.1 Introduction .................................................................................................................................. 75
5.2 Progress towards impact-level outcomes .................................................................................... 75
6 CHANGES OVER TIME AND KEY INFLUENCING FACTORS ....................................... 86
7 CONCLUSIONS AND STRATEGIC QUESTIONS/ISSUES ............................................. 88
7.1 Conclusions ................................................................................................................................... 88
7.2 Good practices arising from Malawi ............................................................................................. 89
7.3 Strategic questions arising from this CLE for GPE ........................................................................ 89
8 ANNEXES .............................................................................................................. 90

DRAFT REPORT (VX) – COUNTRY viii
© UNIVERSALIA
Revised Evaluation Matrix .................................................................................................. 91
GPE ToC ............................................................................................................................ 110
Explanatory mechanisms and (implicit) contribution claims ........................................... 112
Interview protocols .......................................................................................................... 115
Risks to the Evaluation and Ethics .................................................................................... 117
Confirming and refuting evidence methodology ............................................................. 120
Stakeholder mapping ....................................................................................................... 124
List of consulted individuals ............................................................................................. 126
National educational policies and plans in Malawi .......................................................... 128
ESPIG funded project contributions to ESIP II implementation ....................................... 129
GPE Results Framework Data for Malawi ........................................................................ 134
Malawi sector financing data ........................................................................................... 138
Implementation progress (JSR 2018) ................................................................................ 140
Selected system-level country data ................................................................................. 143
Selected impact-level country data.................................................................................. 147

DRAFT REPORT (VX) – COUNTRY ix
© UNIVERSALIA
Figures
Figure 1 – The evaluation presents findings on key evaluation questions and contribution claims ............. 3
Figure 2 – Map of Malawi ............................................................................................................................... 8
Figure 3 – Sector dialogue functions and its strengths and weaknesses ..................................................... 25
Figure 4 – DLI 1 PQTR for Grades 1 & 2 for baseline (2017) and midline (2019) of ESPIG (source: MLSS &
EMIS) ........................................................................................................................................ 35
Figure 5 – Donor Funding Absorption in Education According to Data Source, 2018 ................................. 42
Figure 6 – Total ODA to Malawi Education Sector ....................................................................................... 44
Figure 7 – Total ODA to Malawi education sector approved in 2016 and 2017 .......................................... 47
Figure 8 – Problem-driven capacity assessment .......................................................................................... 52
Figure 9 – Distribution of public and private schools in Malawi .................................................................. 65
Figure 10 – Repetition rates in eight most disadvantaged districts for baseline (2016) and midline (2019)
..................................................................................................... Error! Bookmark not defined.
Figure 11 – Repetition rates, according to EMIS .............................................. Error! Bookmark not defined.
Figure 12 – Number of books per learner (Source: Author’s calculation from EMIS data) ......................... 68
Figure 13 – Percent enrollment of primary special needs learners by standard, according to EMIS in JSR
2018 ......................................................................................................................................... 79
Figure 14 – Total primary and secondary enrollment, according to UIS...................................................... 79
Figure 15 – Repetition Rates in Eight Most Disadvantaged Districts for Baseline (2016) and Midline (2019)
................................................................................................................................................. 80
Figure 16 – Primary Repetition Rates, according to EMIS ............................................................................ 81
Figure 17 – Primary Completion Rates, according to EMIS .......................................................................... 81
Figure 18 – Gross Enrollment Ratio, according to EMIS 2017 ...................................................................... 82
Figure 19 – Number of Lower Secondary OOSC, according to UIS .............................................................. 82
Figure 20 – Cumulative drop out demonstrated by declining enrollment by Standard in 2017/18, according
to EMIS .................................................................................................................................... 83
Figure 21 – Standard 2 Zero EGRA scores, according to USAID LAS ............................................................ 84
Figure 22 – Standard 4 EGRA scores, according to USAID LAS ..................................................................... 84
DRAFT REPORT (VX) – COUNTRY x
© UNIVERSALIA
Tables
Table 1 – Summary of Country and Education Context ................................................................................. 6
Table 2 – Summary for official school age by level & and number of schools, teachers and gross
enrollment rates in Malawi, in 2017 ......................................................................................... 9
Table 3 – GPE grants to Malawi.................................................................................................................... 12
Table 4 – Timeline of key events in the education sector in Malawi ........................................................... 13
Table 5 – Overview – CLE findings on sector planning and related GPE contributions ............................... 15
Table 6 – Summary of appraisal of ESIP II 2013/14-2017/18 against GPE criteria (Indicator 16a) .............. 16
Table 7 – Summary of DFID’s ESIP II appraisal in 2015 ................................................................................ 18
Table 8 – GPE contributions to sector planning in Malawi .......................................................................... 19
Table 9 – Summary of progress and GPE contributions to mutual accountability through sector dialogue
and monitoring ........................................................................................................................ 23
Table 10 – JSRs in Malawi and JSR quality standards as defined by GPE’s Results Framework .................. 29
Table 11 – GPE contributions to sector dialogue and monitoring during the 2017-2020 review period .... 31
Table 12 – Progress made and GPE contributions to sector financing ....................................................... 37
Table 13 – Domestic sector financing from 2013 to 2018 ........................................................................... 38
Table 14 – Nominal changes from 2017/18 (Year 1 CLE) to 2018/2019 (Year 2 CLE) in MoEST’s budget
allocations by education level ................................................................................................. 40
Table 15 – ODA sector financing from 2010 to 2017 ................................................................................... 43
Table 16 – GPE contributions to sector financing during the review period ............................................... 46
Table 17 – Progress made and GPE contributions to sector plan implementation ..................................... 49
Table 18 – Key output-level achievements for MESIP from 2015-2018 ...................................................... 50
Table 19 – GPE contributions to sector plan implementation during the review period ............................ 54
Table 20 – MESIP progress against targets .................................................................................................. 55
Table 21 – Assessment of the contribution of ESIP II implementation to system level change .................. 63
Table 22 – Assessment of Malawi’s education data system (including EMIS & MLSS) using SABER criteria70
Table 23 – List of system-level improvements in the review period (2017-2020) ....................................... 72

DRAFT REPORT (VX) – COUNTRY xi
© UNIVERSALIA
Table 24 – Overview: CLE findings on contribution of system-level changes to impact-level changes ....... 76
Table 25 – Trends in indicators for Access, Equity, Gender Equality and Inclusion in Basic Education ....... 76
Table 26 – Plausible Links Between System Level Changes and Student Outcomes ................................... 85
Table 27 – Assessment of the Plausibility of Each Contribution Claim at Year 1 and Endline ..................... 86
Table 28 – Overview of GPE Contribution to Country-level Objectives of the GPE ToC .............................. 88


DRAFT REPORT (VX) – COUNTRY xiii
© UNIVERSALIA
Acknowledgements
The evaluation team hereby wishes to express its gratitude to all stakeholders who were involved in and supported this evaluation, including the MoEST and the Ministry of Planning in Malawi, all development partners and civil society organizations who generously provided their time and expert judgements on the strengths and weaknesses of the education policy cycle in Malawi and the role of GPE.
Disclaimer
A draft version of this report was shared with the Secretariat, an Independent Technical Review Panel, and the Local Education Group in Malawi. The report was revised based on comments provided by the first two of these groups. The evaluation team appreciates the feedback received by stakeholders.

DRAFT REPORT (VX) – COUNTRY xiv
© UNIVERSALIA
Executive summary
A) Overview
This is the final annual report of the three-year prospective evaluation of the Global Partnership for Education (GPE) in Malawi – one of eight country prospective evaluations that will be complemented by a total of 20 summative country evaluations, to be carried out between 2018 and 2020. It follows a baseline report on Malawi, submitted in June 2018 and a first annual report, delivered in December 2018. This report presents the findings of the final prospective evaluation mission to the country, which took place from May 6 to May 10, 2019, as well as observations of the education sector plan implementation grant (ESPIG) mid-term review from May 25 to May 28, 2019. Conclusions are drawn based on the data collected and monitoring and assessment undertaken during the evaluation period.
B) Purpose and objectives
The prospective evaluations assess whether GPE inputs and influence point education sector planning, implementation and monitoring towards the intermediary outcomes outlined in its theory of change (ToC). In the first two years, the prospective evaluations have been forward-looking, and explore what happens while it happens. They closely observed initial decisions, documented the perspectives of decision-makers and focused on the activities and involvement of key stakeholders early in the period under review in order to understand whether progress was being made and whether, and to what extent, GPE was making a contribution. This report finalizes the evaluation for Malawi with a summative view of the 2017-2020 period.
The prospective evaluations also assess the relevance, efficiency and effectiveness of GPE’s inputs at country level, as well as the validity of GPE’s ToC in light of the GPE Strategic Plan 2016–2020. Furthermore, they seek to establish if and how GPE inputs and activities contribute to outcomes and potential impact at country level and are designed to assess GPE’s progress on its goals and objectives.
C) Education in Malawi
Malawi is a land-locked country in Southern Africa with an overall population growth of 3.5 percent. The total population is 17.6 million, out of which 45 percent is aged 14 or younger. Malawi is one of the least developed countries in the world, ranking 171 out of 188 on the Human Development Index (HDI) and a per capita GNI of US$360 in 2018.
Malawi’s young and rapidly growing population combined with the introduction of free primary education puts pressure on education. The system is “always in catch-up mode concurrently leading to high chronic repetition and dropout rates and low learning outcomes”. There are also significant urban and rural disparities in the Malawian education context. For example, the completion rate in urban primary schools is 52.9 percent, while in rural areas the completion rate is 23.9 percent. Wide variations in the deployment and distribution of teachers and a shortage of classrooms are other major constraints in delivering quality education to all in Malawi.

DRAFT REPORT (VX) – COUNTRY xv
© UNIVERSALIA
The Malawian education system is made up of pre-primary (ages 3-5), primary (Standards 1-8 and ages 6-13), secondary (Forms 1-4 and ages 14-17) and four years tertiary (ages 18-22) education. Eight years of primary schooling are compulsory. The academic year starts in September and ends in July. The language of instruction for Standards 1 to 4 is Chichewa and standard 5 onwards it is English.
The National Education Sector Plan (NESP 2008/09-2017/18, extended to 2019/2020) outlines the country’s strategy to expand early childhood education, improve the quality, relevance of and access to basic education, promote technical and vocational training responding to labor market needs, and support higher education and research. This 10-year plan was devised as an essential component for the realization of Malawi Growth and Development Strategy (MGDS).
NESP was operationalized by the Education Sector Implementation Plans (ESIPs). The lessons learned from ESIP I (2008-2012) informed ESIP II (2013-2017) and its action plan, according to the 2016/17 Education Sector Performance Plan. MoEST ESIP II focuses on identified thematic areas: early grade learning, learner retention, teaching and learning materials, teacher management and development, decentralization, education access and infrastructure, and skills development. Although Malawi started developing a new ESIP in 2017, the ESIP II has been extended beyond 2017, until the new ESIP is in place.
D) GPE in Malawi
Malawi has been a GPE partner since 2009, joining GPE’s predecessor the Fast Track Initiative (FTI). Malawi has received four grants so far, as well as two Civil Society Education Fund (CSEF) allocations to the Civil Society Education Coalition (CSEC). Malawi is also involved in the Global and Regional Activities (GRA) program.
GPE also provides a wide range of non-financial inputs such as technical assistance, advocacy, knowledge exchange, quality standards and funding requirements. These elements form part of the support that is being evaluated during the prospective evaluation undertaken in Malawi.
During the evaluation period (2017-2020), GPE engagement largely consists of the ESPIG – called the Malawi Education Sector Improvement Project (MESIP) – and non-financial support to planning, dialogue/monitoring and financing (e.g. technical support to the treasury regarding budgeting, etc.). The US$44.9 million Malawi Education Sector Improvement Project which reached its midterm in May, 2019, is the second ESPIG for MoEST. GPE’s new ESPIG funding model includes two mechanisms: the fixed tranche and the variable tranche, based on performance against key indicators set during the application process. The World Bank is the grant agent and the coordinating agency role is filled on a rotating basis, with DFID currently filling the role (2018/19). MESIP has five key components:
▪ Component 1 (US$10.24 million): Performance-based school improvement grants for improving promotion and retention;
▪ Component 2 (US$9.60 million): Improving equity for the most-disadvantaged, including girls;
▪ Component 3 (US$6.91 million): Improving learning outcomes, accountability and cost-effectiveness at school level;
▪ Component 4 (US$13.47 million): Variable part/disbursement linked indicators; and
▪ Component 5 (US$4.68 million): Project management, and sector program support and coordination.

DRAFT REPORT (VX) – COUNTRY xvi
© UNIVERSALIA
E) GPE contributions to sector planning
State of sector planning in Malawi, 2017-2020
Overall Malawi’s National Education Sector Plan (and associated implementation plans) is government owned and evidence-based. The education sector plan in Malawi is guided by the MoEST’s National Education Sector Plan 2008-2017 (NESP), extended to 2020, and it is part of the Malawi Growth and Development Strategy (MGDS). The NESP 2008-2020 is the national blueprint for educational aims and sets out to implement the strategies outlined in MGDS II: expanding equitable access to education; improving quality and relevance of education; and improving the governance and management of education services and programs. The NESP 2008-2020 is operationalized by two five-year Education Sector Implementation Plans (ESIPs). The first ESIP covered the first half of NESP implementation (2008 – 2012), while the second ESIP runs from 2013/14 to 2019/2020; it was extended as a result of the ESIP II Action Plan and is therefore the current implementation framework for NESP.
DFID commissioned an appraisal of ESIP II on behalf of the development partners (DPs) and Local Education Group (LEG) in 2014. Key issues and concerns raised during the appraisal period were not sufficiently addressed to support putting the plan into practice. While Malawi’s plan reflected an overall vision, was evidence-based, sensitive to context and attentive to disparities; the weaknesses of the plan in terms of strategy and achievability constrained implementation and the subsequent monitoring. Moreover, ESIP II does not address important sub-sectors outside of basic education.
In preparation for the upcoming planning process as NESP is slated to close in 2020, stakeholders reflected that the previous plan was too ambitious, did not have sufficient strategies to achieve targets, did not focus on outputs sufficiently and did not engage systematically with other ministries. Multiple key informants confirm that throughout the implementation of the plan, lessons from monitoring were not used to reflect back on the plan and develop strategies for implementation. This perspective was echoed by several stakeholder groups with regard to the link between planning and dialogue/monitoring.
GPE contributions to sector planning
A focus on adhering to GPE’s guidelines to sector plans was explicit in the preparation of the second implementation plan in 2013. DPs found the first iteration to be weak on analysis according to the October 2017 review of NESP and ESIP II. Therefore, Malawi received an ESPDG from GPE in 2014-2016 to develop ESIP II. Informed by a sector analysis (funded by UNICEF), the Malawi ESIP II focused on improving learning outcomes.
Stakeholders agreed GPE non-financial support (including technical support and funding requirements) improved ESIP II is many ways, as it was stronger in analysis and depth than the previous iteration (ESIP I). This increased the inclusiveness of the plan development process, the depth of the plan, the use of evidence and high-level dialogue with stakeholders. The inclusive planning process also led to more inclusive dialogue in Malawi, with the civil society groups regularly taking part in dialogue and plan implementation thereafter. While non-financial support was valued more than financial support for planning, on-budget support through an ESPIG acted as an incentive for government to follow GPE quality assurance processes during the planning stage.

DRAFT REPORT (VX) – COUNTRY xvii
© UNIVERSALIA
Multiple stakeholder groups confirmed that while the situation might change, Malawi does not currently plan to apply for an ESPDG for the planning process of the next ESP. The main reason cited was the time it takes to meet GPE requirements to receive an ESPDG, particularly concerning the level of effort required to comply. DPs reflected that this includes time-intensive requirements such as the education sector analysis and rounds of quality assurance. The next planning development process is likely to be funded by UNICEF, with technical support being provided by the European Union. However, rounds of quality assurance and undertaking an education sector analysis are linked to ESPIG funding. This indicates DPs either do not understand the ESPDG process and/or perceive all GPE processes to be cumbersome. While an ESPDG may not be sought for the next funding period, stakeholders believe lessons from the previous planning period would be applied to the next planning cycle.
Implications for GPE
There is uncertainty around the endorsement and quality of a sector plan if it is not deemed ‘achievable’. Achievability within the GPE operational model, as the evaluation team understands it, tends to refer to the extent to which the aims, objectives and indicators of success are likely to be achieved by country partners. The case of Malawi highlights that achievability should also include the extent to which there are robust strategies in place and the extent to which the implementation of these strategies is assigned to specific partners, departments and units, with reasonable timeframes attached. Currently, there is not yet an overall emphasis on achievability. It is instead, seen solely as a GPE quality criteria to be met.
There are also questions regarding how partners can address the issues raised at the planning stage more coherently. All of the reflections regarding implementation difficulties at the end of the policy cycle were highlighted at the beginning of the policy cycle, yet were not sufficiently addressed.
F) GPE contributions to sector dialogue and monitoring
State of sector dialogue and monitoring in Malawi, 2017-2020
Sector dialogue has historically been strong in the Malawi education sector. The LEG has been meeting since 2006 as the DPs were involved in the preparation of the NESP. Early on, sector dialogue was promoted within the LEG by a shared commitment of the GoM and its development partners towards a Sector Wide Approach (SWAp) to planning, development and financing of the education sector. There are adequate structures in place to support inclusive and frequent dialogue in Malawi: namely, the previously existing Sector Working Group (the LEG), the Education Development Partner Group, and a series of Technical Working Groups.
However, there has been a decline in participation and active dialogue since the start and beyond ESPIG implementation. Furthermore, there was no discernible improvement in the level of dialogue between the 2016 and 2017 JSRs. In the first prospective CLE in Malawi, despite the robust structure (LEG, TWGs, EDPGs, etc.) in place for promoting sector dialogue, there were infrequent opportunities for sector dialogue.
There have been improvements in inclusiveness. However, government’s accountability for implementation to donors, beneficiaries and citizens remains weak. CSOs and DPs both emphasized that there are still issues with the government’s accountability to both donors and beneficiaries for implementation and subsequent results. Therefore, a number of senior government officials and DPs

DRAFT REPORT (VX) – COUNTRY xviii
© UNIVERSALIA
agreed that MoEST sector dialogue remains output- rather than outcome-focused. A number of government stakeholders pushed for a stronger focus on output versus outcome indicators, as certain outcome indicator targets would not be met in time. Many stakeholders agreed that such issues are a symptom of a lack of strategic focus in education sector dialogue. Certain stakeholders also noted that it is difficult to have evidence-based dialogue in a context with contested, unreliable data. In Malawi, stakeholders had mixed views on the extent to which sector dialogue is evidence-based, both evidence about issues and effective solutions.
There are several monitoring tools in place in Malawi, including the Joint Sector Review. The main monitoring tool for the education sector in Malawi is the Education Management Information System (EMIS). To improve reliability and availability of quality education statistics, MoEST has institutionalized the decentralization of data collection to all zones and clusters in all education districts.
The Joint Sector Review process in Malawi is a well-established and continuing form of reporting and review, and it also engages a wide group of stakeholders, which helps it promote mutual accountability across the sector. The JSR is the main vehicle for reporting to stakeholders on progress towards targets and on finance as outlined in the ESIP II Action Plan. The most recent JSR took place in late 2018. Over time, the quality of the JSR process in Malawi has fluctuated during the review period. The most recent GPE results framework data available, during the review period, demonstrates this decline.
Significant investments were made to improve the collection, quality and frequency of sector monitoring; questions remain, however, on the reliability of EMIS data. There is little information available as to the extent to which education data is routinely and systematically verified as being reliable and valid. The Malawi Longitudinal School Survey was established to address the lack of education data available in Malawi for monitoring progress in education through three rounds of data collection (base, mid and endline). MLSS’ objective is to support EMIS and provide data for the impact evaluation of MESIP. The Malawi Longitudinal School Survey will monitor changes across the sector and provide an entry point for discussions on differences between data sources in Malawi. However, the extent to which MLSS improves the quality of education dialogue and monitoring (if at all) remains to be seen.
GPE contributions to sector dialogue and monitoring
The GPE contributions to monitoring through MESIP and the Secretariat’s advocacy supported improved sector dialogue and monitoring, and resulted in increased inclusiveness of processes in Malawi. GPE has also provided the Malawi Civil Society Education Coalition (CSEC) with a grant from the Civil Society Education Fund to support its engagement in education sector policy dialogue. CSEC confirmed that GoM’s receptiveness to civic engagement and dialogue has improved in the last three years. Additionally, the financial support from GPE’s ESPIG ensured frequent meetings of technical working groups took place during the implementation of ESIP II.
There are varied opinions among stakeholders as to the contribution of GPE to sector dialogue and monitoring. Some highlighted that the Secretariat CLE is more removed from the local context and therefore able to assess sector gaps more objectively than actors on the ground. However, others perceived little systematic benefits from being part of the partnership, outside of the funding provided for MESIP. In regards to monitoring, the extent to which capacity is being systematically built to collect, analyze and use data for decision making through the MESIP is constrained by politics within the ministry and the personalization of implementation.

DRAFT REPORT (VX) – COUNTRY xix
© UNIVERSALIA
The sector still struggles with a lack of a strategic approach to dialogue and monitoring. In particular, continued fiducial risks affecting harmonization, concerns regarding MESIP implementation and variable tranche indicators and payment conditions have placed pressure on relationships.
Implications for GPE
There are limitations in the use of performance-based payments in countries with weak monitoring system as shown by the effects of the GPE variable tranche support in Malawi. Therefore, there is need for strong consultations regarding the risk, reward, baseline values and data sources for results-based payment and a focus on shifting the cultural paradigm away from outputs towards outcomes.
G) GPE contributions to sector financing
State of sector financing in Malawi, 2017-2020
The GoM demonstrated a strong prioritization of education in budgeting, maintaining the percentage of government’s budget for education at or above 20 percent since 2011. In 2018/19, the largest share of the total government budget was allocated to the education sector. Different data sources paint different pictures regarding the education proportion of the budget. According to government data and GPE RF data, Malawi has reached this threshold maintaining the percentage of government budget for education at or above 20 percent since 2011 (except in 2017), but with a visible decline over time. UIS data reports a more significant decrease of education’s share of total government expenditure during the evaluation review period. Moreover, in real terms, the total domestic education budget has decreased in the last four years and education’s share of total government expenditures has also decreased. Overall, the largest component of the education budget for MoEST are recurrent costs.
Education receives the largest share of the government budget and basic education receives the largest share of the education budget. The basic education sector received the largest share of the overall education sector resources, 47.8 percent, of which the majority, 83 percent, was allocated to recurrent spending. Only 0.20 percent of government budgeting was allocated for early childhood development (ECD) in 2018/19. If inflation is considered, in real terms, the government’s allocation to ECD had decreased by 2%. Interestingly, higher (tertiary) education was allocated the second largest recurrent budget in 2018/19, 35.7 percent. Secondary education received 11.5 percent of the total education sector budget in 2018/19. This was an increase of 18 percent in nominal terms and 6% in real terms. However, this increase is not sufficient in the face of the difficult realities in the Malawi secondary education sector, including the relatively few schools and low rates of professionally trained secondary school teachers.
While the proportion of the government budget is increasing, actual expenditure is opaque. In addition, the weak reliability of funding compromises financing quality. Evidence confirms that the government’s absorption capacity is low, indicating that even where funds are available, they are not converted into activities in a timely manner. ESIP II financing remains uncertain, with domestic financing supporting recurrent costs at all levels of education and external funding focusing on capital projects. While the current ESPIG is US$44 million, a financing gap remains.
Total overseas development assistance (ODA) to Malawi has increased significantly, from almost US$954 million from all official donors and DPs in 2010 to US$1,515 million in 2017. ODA to the
DRAFT REPORT (VX) – COUNTRY xx
© UNIVERSALIA
education sector has followed a similar upwards trend, from US$89.8 million in 2010 to US$92.5 million in 2016 and then sharply increasing to US$148.7 million in 2017. The education sector’s share of total ODA to Malawi was 9.42 percent in 2010, dropping to 7.07 percent in 2016 and rising to 9.48 percent in 2017.
Over the NESP implementation period, the alignment and harmonization of international financing have gone through several stages. On-budget pooled funding is unlikely to take place in the foreseeable future. However, recent advances in joint funding amongst donors provides some hope for increased harmonization in the coming years. ODA support to education in Malawi has moved from pooled funding to off-budget support. It is now moving towards a joint funding arrangement managed by an independent fiduciary manager. Not all donors committed to a joint fund, but enough DPs are now on board for improvements in alignment and harmonization to occur.
The Capital Hill Cashgate Scandal in 2013 brought to light large-scale financial mismanagement, which led the majority of international DPs to suspend or withdraw their general budget support and sector budget support, as well as interest for a pooled funding mechanism. Since then, the Common Funding Mechanism (CFM) was established in December, 2017 and signed on by a number of DPs, namely Norway, Germany, the World Bank, UNICEF and DFID. An international accounting firm has been procured to provide the fiduciary oversight responsibility as required by the Common Funding Mechanism, which is known as the Joint Sector Reforms Fund. Though some donors have contributed already, many expressed a desire to wait and see for a few years before contributing to the Joint Fund.
GPE contributions to sector financing (domestic and ODA)
In 2016 and 2017 combined, GPE funding to education in Malawi made up approximately 19 percent of approved ODA to education in Malawi. This amount does not include the variable tranche disbursement. Though a low overall proportion of total funding, the Government of Malawi highly valued the project as the only on-budget support in the education sector, providing the Government of Malawi the opportunity to demonstrate capacity to implement and fiscally manage a large-scale project, and potentially address the concerns of other donors. 133. There has been a renewed commitment by the GoM for increasing its sector budget. However, it is not clear if this will result in increases in actual expenditure. The increased government commitment is likely due to a variety of reasons, including the President’s commitment to the education sector, GPE global advocacy and the government’s appreciation of the MESIP, the ESPIG, as currently the only type of on-budget support received. Increases in education budget must be accompanied by increased actual expenditure, transparency in expenditure and increased absorption capacity in order to support the efficient implementation of the sector plan and convert resources into a stronger system.
Improvements in the alignment and harmonization of international financing are taking place. There were mixed views regarding the extent to which GPE support influenced the establishment of the Joint Fund, however GPE global advocacy for harmonization and influences through MESIP are likely to have catalyzed the establishment of the Joint Fund. GPE’s financing, overseen by the Grant Agent’s project facilitation team to provide sound fiduciary oversight, have supported improving alignment and harmonization by rebuilding trust among international donors. By 2019, this has resulted in two donors committing funds to the Joint Fund and one additional donor announcing a contribution.
DRAFT REPORT (VX) – COUNTRY xxi
© UNIVERSALIA
Implications for GPE
The analysis implies interesting questions for GPE and its ability to influence sector financing. While there was a renewed commitment by the GoM to increase the education sector budget, the history of reallocations and differences between budget and expenditures in Malawi indicate this may not result in actual increases. Additionally, the absence of data on sector expenditure results in opaque funding flows. Therefore, there is a question about whether the extent to which budget commitments result in consistent budget expenditure is able to assessed in contexts like Malawi.
H) GPE contributions to sector plan implementation
State of sector plan implementation in Malawi, 2017-2020
After more than a decade of NESP implementation, sector implementation has yielded results that are well below expectations. There have been activities successfully implemented under ESIP II during the period under review. However, overall, advances tend to reflect successes in piloting several interventions, while large-scale implementation of the broad sector plan remains extremely constrained and capacity to implement is a resounding theme. Achievements in MESIP’s priority areas include the gender parity in enrollment of Standards 1 and 2 being achieved in the early years, the hours of the school day being increased, learning centers being introduced in 10 districts, improvements in the distribution of textbooks, the introduction of the new MLSS, the cluster system being piloted and the decentralizing of procurement of teaching and learning materials. In addition, the distribution of school-based grants, the start of latrine and water point construction at pilot schools and pilots of real-time data collection have been completed.
Limits in at-scale effective implementation speaks to issues in capacity. In Malawi, formal structures, including law and policies, were seen to be slight challenges to capacity in Malawi. Capacity constraints in the area of human and non-human resources were acknowledged, predominantly at district and school levels. Individual knowledge and technical skills were in place at the central level in the education sector but constrained at the district and school level. The greatest weakness in capacity stems from a combination of weak accountability mechanisms to hold central MoEST officials to account for implementation, an informal environment that supports a lack of transparency and limited political will and individual motivation to implement. There are financial transparency and accountability concerns at the district and central levels; however, at the school level there have been strong improvements regarding financial accountability. Additionally, an informal environment of withholding key information, passive resistance to agreed priorities, a highly hierarchal system and a lack of trust between stakeholder groups and created a political economy that runs counter to efficient implementation.
Strategic coordination across education actors in Malawi is limited and potentially fueled by the projectization of implementation as a result of limited confidence from development partners in public sector financial management and accountability. Stakeholders across groups highlighted a lack of coordination in relation to what is being implemented and where projects are being implemented. There were some participant narratives that hinted towards competition between programs and a focus on ‘who’ rather than ‘what’ is being done to implement. Similarly, NGOs work on a geographical basis, with different NGOs working across different districts. This can result in a lack of coverage in some areas and over-coverage in others.

DRAFT REPORT (VX) – COUNTRY xxii
© UNIVERSALIA
GPE contributions to sector plan implementation
The GPE has made some contributions to sector plan implementation. The ESPIG-funded government project, MESIP, has provided support to sector plan implementation. MESIP’s Performance-Based School Improvement Grants for Improving Promotion and Retention component has performed well. While the proportion of financial support from GPE is only one of a number of contributions to education in Malawi, being the only on-budget support brings both strengths and weaknesses. MESIP provides opportunities to increase government capacity to implement.
However, the contributions have been constrained by the same factors that affected overall implementation of the sector plan, particularly MESIP management and oversight concerns. They can be summarized as limited coordination, accountability and capacity. Legitimate questions regarding the sustainability of any built capacity for implementation and where resources will sit at the end of MESIP were raised by stakeholders across government and DPs. In addition, the personalization of MESIP has resulted in key officials who will be responsible for future activities during scale up having been excluded from MESIP activities.
Thanks to the ESPIG’s output-level DLRs, GPE contributed to the development of three additional implementation policies. However, concerns were raised regarding value for money and quality during the development of the policies. Some stakeholders noted that the political cost of not approving the outputs is extremely high and agree that there have been significant challenges in policy implementation. While the development of plans has been robust and the plans developed have been of reasonable quality, challenges remain in their implementation as well.
Implications for GPE
One implication from Malawi for the GPE ToC and country level operational model is the need to consider the political economy within the model. Currently, the model includes an assumption of political will to implement. There is also reason to reconsider the activities GPE should fund taking into account the tensions in Malawi from the high supervision requirements of construction, the possibility of leakage and the difficulties of procurement. Further questions on the appropriateness of the construction component should be highlighted in future ESPIG application assessments.
Many stakeholders questioned the variable tranche modality’s ability to increase motivation to implement the sector plan, though others felt the variable tranche influenced policy reform. However, they did not foresee impact believing that policies and plans would not be implemented because of capacity constraints. Overall, certain stakeholders were not convinced that efficiency in implementation would increase as a result of the variable tranche. The situation in Malawi raises the question as to when political will is not there, will a variable tranche increase efficiency?
I) System level change
Main trends
There have been improvements during the review period of increasing equity to access to education. Of note was that in December, 2018, secondary school tuition fees were removed to increase access to education, which builds on the introduction of Free Primary Education in Malawi in 1994, that

DRAFT REPORT (VX) – COUNTRY xxiii
© UNIVERSALIA
greatly reduced the cost of accessing primary school. The payment of secondary school fees was considered the primary reason for dropping out of school. Additionally, the National Child Protection Strategy 2012 – 2018 has worked to improve regulatory frameworks, adopt protective practices in early identification, case management and referral in the 10 most disadvantaged communities.
EMIS data provide an impressive picture of progress in reducing the Pupil per Classroom Rate (PPCR). However as has been noted earlier in this report, these figures differ by data source, and proposals for the verification of the construction of classrooms are under discussion. The number of public and private secondary schools has remained relatively stable over the review period. Completion rates remained low over the ESIP II period and are currently at 52 percent, although girls’ completion rate has more markedly increased. In Malawi, the Pupil Qualified Teacher Ratio remains poor. The sector plan has focused very specifically on reducing the PQTR. Different sources report PQTR differently, though EMIS data depicts an impressive picture of advances in PQTR. The PQTR in the early grades (Standards 1 and 2) remains significantly high and evidence of improvements differ by data source.
The struggle to deliver education efficiency is demonstrated by the proportion of learners repeating classes every year and this inefficiency is exacerbated by the lack of financial data available to hold the system to account. The system has not been able to keep up with growth, in terms of both the population as a whole and the proportion of children in the population attending school. Repetition rate targets have not been met (10 percent for 2017/18) and all efficiency indicators paint the same picture: the Malawi education system is extremely inefficient, and no real progress has been made in improving the efficiency of the system.
The quality and relevance of teaching in Malawi are hindered due to overcrowded classrooms, inadequate teacher training and a lack of professional development for teachers, which negatively impact pupil learning. Several planned activities to improve the quality and reliance of teaching in Malawi were not implemented. Improving the trained teacher to pupil ratio, teacher training and in-service teacher development, as well as reducing overcrowding, are a focus in ESIP II. However, employment and deployment of trained teachers is constrained. Several stakeholders reported that the employment of teachers has become politicized, with large numbers of teachers being employed and deployed in the run up to elections. Similarly, there is little data available on the resources within classrooms to support teaching instruction. Using EMIS data, the calculation of books in good condition per pupil by year group is shown above. Without more data, it is impossible to know if the quality and quantity of resources to support teaching and learning is improving.
While there have been some improvements in establishing systems to track and monitor implementation and system strength, credibility issues remain. The ability to accurately report on the state of the system is constrained by weaknesses in the system itself. The previous annual report for this evaluation in Malawi highlighted a significant lack of data to track and monitor implementation and system strength. Since that time, MLSS has provided some data on implementation, efficiency and equity in districts where MESIP is implemented and EMIS has significantly improved. With that said, the credibility issues regarding available data have come to the fore in the last year, as more data has become available the differences between sources have raised questions regarding credibility. At the strategic level, there is increased recognition that plans require more detailed strategies to support implementation in order to see system change.
There remains a weak enabling environment, incoherence in the system, low quality data and concerns regarding the desirability of evidence-based decision making in Malawi. There is currently no national learning assessment system in Malawi, but some evidence about learning is provided through examinations and donor-funded studies. Improvements to the quality and relevance of teaching instruction is difficult to track in the absence of studies with multiple points in time.

DRAFT REPORT (VX) – COUNTRY xxiv
© UNIVERSALIA
Likely links between sector plan implementation and system level change
Pockets of success are reflected in small changes at the system level. However, these changes cannot be robustly linked to deliver system change in Malawi. Significant changes to the efficiency and effectiveness of the system have not taken place in Malawi and equal access to a system struggling with such issues is not sufficient to deliver a quality education for all children.
There have been advances in financial alignment. However, as large amounts of donor funding are off-budget resulting in a large number of discrete projects, the predictability of international financing is still uncertain.
As Malawi nears the end of the ESIP II period, concerns raised at the planning stage of the policy cycle accurately describe the major barriers to plan implementation in Malawi. Data reliability, weaknesses in inter-ministerial coordination remains and high degrees of variability between different districts and divisions remain. Political and governance risks remain high and macroeconomic, capacity for implementation and sustainability, fiduciary and stakeholder risks remain substantial during this period. The analysis in the Year 2 CLE confirm that these barriers to implementation remain in Malawi’s education sector.
Implications for GPE
One potential implication from Malawi for the GPE ToC and country level operational model is the absence of data. The Malawi education sector struggles with limited implementation capacity and weak donor financing harmonization. Therefore, the lack of credible data and sector-wide implementation may undermine the operational model’s assumption to provide high levels of funding and expect such investment to result in system-level improvements.
J) Learning outcomes and equity
Changes in learning outcomes, equity and gender equality
Primary education provision for the majority of children has been achieved, however the system has been unable to account for delivery in improved learning outcomes. All levels of the Malawi education system (from pre-primary, to primary through tertiary education) continue to struggle to deliver quality education.
There are modest improvements in Equity, Gender Equality and Inclusion. However, few ESIP II targets were achieved. Gender parity was achieved for the first four standards of primary school and the enrollment of Special Needs Learners has increased. System level changes resulted in previously OOS learners transitioning back to formal basic education. Gender parity was achieved for the first four standards of primary school. The National Child Protection Strategy has been a contributing factor to the achievement of gender parity in Malawi, through community-level work on social norms, efforts to reduce child marriage and improving communication between schools and community leaders on the importance of education. However, ongoing improvements in sanitary facilities, supported through MESIP, are too recent to have affected gender parity. Data on out-of-school children (OOSC) in primary education in Malawi is lacking. Unfortunately, in secondary education, the number of OOSC
DRAFT REPORT (VX) – COUNTRY xxv
© UNIVERSALIA
appears to be increasing. Given the quality concerns with EMIS, it is difficult to assess if this small increase is real or due to data inconsistencies.
Modest growth in enrollments in Malawi relates to general population growth and high dropout rates, resulting in low primary school completion rates. Secondary total enrollment numbers are also increasing, but not at the same progressive rate as primary enrolment numbers. A major concern in Malawi remains the cumulative dropout over years due to high repetition rates. Learners progress slowly through the school years and eventually drop out before completion. In 2017/18, enrollment in Standard 8 was only 25 percent of enrollment in Standard 1, in the same year.
Despite the increasingly high level of overall spending on primary education over the past five years, learning outcomes remain relatively low. Data on learning outcomes is incomplete and somewhat out of date and national scores with regards to numeracy and literacy rates are currently not being tracked by the GPE-funded MESIP. Available data paints a worrying picture of the quality of education in Malawi. Evidence on the relationship between quality and dropout has been explored in several studies, finding statistically significant associations between low quality schools and high dropout rates. The small improvements in learning that can be observed are most likely a direct result of the USAID National Reading Program. Inputs need to be sustained and systemic changes in the practices and pedagogies of teachers need to take place to improve education service delivery.
Likely links to observed system level changes
There is very little evidence of wide-scale systemic change in Malawi, beyond certain improves in equity of access, and very little data indicating that learning takes place in schools. Data on learning outcomes by social group is scant and repetition, transition and completion indicators reflect an ineffective and inefficient system. It is unlikely that this system is producing impact in the areas of learning. Following the GPE ToC, while there have been pockets of success in implementation, implementation challenges have prevailed. System level achievements have mainly been made in the area of increasing equity in access. However, system-level improvements in learning have yet to be demonstrated.
Implications for GPE
The case study of Malawi provides a useful example of the importance of the political economy in education service delivery. Positive shifts in the political economy are the linchpin to improving implementation, transforming the system and delivering impact. Malawi provides confirmation of the GPE ToC in that it evidences the inability to shift the system in the absence of large-scale implementation. In addition, the Malawi case highlights that the GPE ToC’s does not tackle the politics of education service delivery and is therefore not flexible enough for a context like that in Malawi. Certainly, a focus on learning quality in the Local Education Group meetings and the JSRs will be easier to sustain when learning outcomes are regularly reported in a timely manner.
DRAFT REPORT (VX) – COUNTRY xxvi
© UNIVERSALIA
K) Conclusions and Strategic Questions
GPE contributions
The primary conclusion from observation and analysis of GPE in Malawi so far is that progress is not necessarily linear. Whilst Malawi has clearly benefited from the material support provided by the partnership to date, the results have been mixed. Progress and achievements are being made, but they are modest and small scale, despite both significant material and strategic investments being made to the sector. Noticeable challenges remain in the sector.
There is insufficient evidence to support a claim that material and strategic investments made by GPE have significantly contributed to the attainment of the objective of ensuring inclusive and quality education for all in Malawi. It is plausible, however that GPE support has improved the quality and inclusivity of the education sector plan and improved the inclusivity of sector dialogue. In time, this increased inclusivity may become one of the leverage points to improve accountability. However currently, this has not yet been realized.
There is evidence that GPE advocacy and financial support have contributed to better financing for the sector. This has become apparent now that the CFM has been operationalized. In addition, the GoM has increased its commitment to increasing its budget allocation to the education sector, however more work needs to be done to improve transparency in public finance management and track expenditure against these budget commitments.
Sufficient attention has not been paid to the existing capacity within the MoEST to implement. Certainly, many of the challenges faced have been highlighted at the planning stage and the option to simply be less ambitious in planning is misplaced. The likelihood remains that resources will continue to be increased to support the implementation of the plan, though actual implementation remains problematic. Some notable successes have been achieved; however, substantial components of the implementation remain well behind schedule.
Emerging good practice
In Malawi, though few best practices were identified, one key good practice includes:
▪ Alternative options to pooled funding in country contexts with weak fiduciary management and processes. Though harmonization in a pooled fund is not yet possible due to past financial scandals, a functional Common Funding Mechanism is in place with international oversight to support the implementation of the sector plan. Potential political economy barriers should be considered carefully prior to funding certain implementation activities, such as construction.
Strategic questions
The Malawi case provides four strategic questions on the GPE operational model and ToC.
▪ The Coordinating Agency role is the linchpin in the GPE ToC at the country level for mutual accountability. Presently this role is extremely demanding in terms of time and political cost. Does GPE perceive significant risks of not addressing the concerns of DPs regarding these
DRAFT REPORT (VX) – COUNTRY xxvii
© UNIVERSALIA
costs to being the CA, in that a sub-standard execution of the role will significantly affect GPE effectiveness?
▪ Does the introduction of performance-based payments have unintended consequences in contexts with weak systems like Malawi? The toll of measuring high stakes outputs and outcomes on fragile data systems can bring perverse incentives and weak systems may buckle under the pressure. While there has been a commitment to verify the results of the disbursement linked indicators through an independent contractor, it is not clear how this will be done retrospectively when the baseline, rather than midline, figures are disputed.
▪ Does the Secretariat consider the strength of national systems to produce reliable data against DLIs? It is recommended that the Secretariat consider the strength of mutual accountability in each country, before introducing results-based financing.
▪ Does the GPE’s operational model effectively consider the importance of a country’s political economy for system change? Ways to assess political barriers and develop strategies to shift the political economy need to be developed to strengthen many of the assumptions underpinning the ToC and operational model. Increasing alternative models and strategies beyond the current operational model for sub-optimal contexts where certain assumptions, particularly stakeholders having motivation (incentives) to do so, would strengthen the ToC. Serious consideration of Ministry capacity, efficient ways of working across departments, sustainability beyond ‘projects’ and addressing political economy barriers should be a key focus of the partnership going forward. It is recommended that GPE reviews the evidence base on the impact of the political economy on education systems (See the RISE program) and consider the implications for GPE processes. For example, GPE may consider introducing political economy analysis and strategy development for some or all member countries, to inform support at the country level.
DRAFT REPORT (VX) – COUNTRY 1
© UNIVERSALIA
1 Introduction
1.1 Background and purpose of the prospective evaluation
1. The Global Partnership for Education (GPE) is a multilateral global partnership and funding platform established in 2002 as the Education for All Fast Track Initiative (EFA/FTI) and renamed GPE in 2011. GPE aims to strengthen education systems in developing countries, in order to ensure improved and more equitable student learning outcomes, as well as improved equity, gender equality and inclusion in education.9 GPE brings together developing countries, donor countries, international organizations, civil society, teacher organizations, the private sector and foundations.10
2. This evaluation is part of a larger GPE study that comprises a total of eight prospective and 20 summative country level evaluations (CLE). The overall study is part of GPE’s monitoring and evaluation (M&E) strategy 2016-2020, which calls for a linked set of evaluation studies to explore how well GPE outputs and activities contribute to outcomes and impact11 at the country level.
3. The objective of each prospective CLE is to assess if GPE’s inputs and influence orient education sector planning, implementation, financing and dialogue/monitoring toward the intermediary outcomes as outlined in the theory of change12 (ToC). The prospective evaluations are forward-looking and explore what happens while it happens. They closely observe initial decisions, document the perspectives of decision-makers and focus on the activities and involvement of key stakeholders early in the period under review in order to understand whether progress is being made and whether GPE is making a contribution.
4. In this context, GPE support is defined as both financial inputs deriving from GPE grants and related funding requirements, and non-financial inputs deriving from the work of the Secretariat, the grant agent and the coordinating agency, and from GPE’s global-level engagement (e.g. technical assistance, advocacy, knowledge exchange, quality standards and funding requirements).
Box 1 – Scope of this prospective evaluation
This prospective country evaluation focuses on eliciting insights that can help GPE assess and, if needed, improve
its overall approach to supporting developing country partners. It does not set out to evaluate the performance
of the government of Malawi, other in-country stakeholders, or of specific GPE grants.
The core review period for the evaluation is 2017 to 2020. This period is covered by a baseline report and two
annual reports, which aim to track changes from GPE activities. This report presents a stand-alone summative
perspective at the end of the evaluation period and in section 6, addresses changes between reporting periods.
9 Global Partnership for Education (2016): GPE 2020. Improving learning and equity through stronger education systems. 10 Information on GPE partners can be found at https://www.globalpartnership.org/about-us 11 In the context of this assignment, the term “impact” is aligned with the terminology used by GPE to refer to sector level changes in the areas of learning, equity, gender equality and inclusion (reflected in GPE strategic goals 1 and 2 described in the GPE 2016-2020 Strategic Plan). While the country evaluations examine progress towards impact in this sense, they do not constitute formal impact evaluations, which usually entail counterfactual analysis based on randomized control trials. 12 The GPE theory of change is shown in Annex B.

DRAFT REPORT (VX) – COUNTRY 2
© UNIVERSALIA
1.2 Methodology overview
5. The methodology for the prospective evaluations is a theory-based contribution analysis approach, and the guiding framework is provided in an evaluation matrix and a generic country-level ToC, developed according to the existing overall ToC for the GPE Strategic Plan 2016–2020. The evaluation methodology envisages a seven-stage process. The first four stages focus on establishing a solid baseline for each country and the subsequent three stages constitute iterative annual country-level reporting. This is further described in Error! Reference source not found. and in the inception report.
6. There are three key evaluation questions for the GPE country-level evaluations (both the prospective and summative evaluation streams), which are presented below. The full details of the evaluation questions are presented in an evaluation matrix (included in Annex A). Figure 1 represents how these key evaluation questions relate to the contribution claims13 investigated in the evaluation.
▪ Key Evaluation Question I: Has GPE’s support to Malawi contributed to achieving country-level objectives related to sector planning, sector plan implementation, sector dialogue and monitoring, and more/better financing for education?14 If so, how?
▪ Key Evaluation Question II: Has the achievement of country-level objectives15 contributed to making the overall education system in Malawi more effective and efficient?
▪ Key Evaluation Question III: Have changes at education system level contributed to progress toward impact?
7. The guiding frameworks for the evaluation are the evaluation matrix (Annex A) and the country-level theory of change for Malawi (Annex B). A brief summary of the country evaluation methodology is provided in Annex D of this report. For further details, please refer to the overall assignment’s inception report (January 2018) and the revised approach for Years 2 and 3, published November 2018.16
8. This approach is consistent with that of the summative evaluations and thus contributes to their final combination in a 2020 synthesis report. In the application of contribution analysis, the prospective evaluations in Year 1 of the evaluation were forward-looking and assessed if inputs and influence in the education sector planning were conducive to intermediary outcomes, as per the ToC. Conversely, the summative evaluations trace the ToC ex-post from the contribution of inputs to intermediate outputs, outcomes and impact. These final prospective evaluations combine the forward-looking prospective evaluations from previous evaluation years with a final ex-post evaluation of what has taken place since the previous annual report to inform a 2020 synthesis report. The methodology for weighing confirming and refuting evidence is presented in Annex F.
13 The contribution claims are the theoretical mechanisms for change through GPE inputs. These are explained in more detail in Annex C. 14 Organisation for Economic Co-operation and Development (OECD) Development Assistance Committee (DAC) evaluation criteria of relevance, effectiveness, and efficiency. 15 GPE country-level objectives related to sector planning, plan implementation, and mutual accountability through sector dialogue and monitoring. 16 The revised methods approach is available at: https://www.globalpartnership.org/content/modified-approach-country-level-evaluations-fy-ii-2019-and-fy-iii-2020

DRAFT REPORT (VX) – COUNTRY 3
© UNIVERSALIA
Figure 1 – The evaluation presents findings on key evaluation questions and contribution claims
Box 2 – Color ratings in the CLEs
Throughout the report, we use tables to provide readers with broad overviews of key CLE findings on the respective issue. To facilitate quick orientation, we use a simple color-coding scheme that is based on a three-category scale in which green equals ‘strong/high/achieved’, amber equals ‘moderate/medium/partly achieved’, red signifies ‘low/weak/not achieved’, and grey indicates a lack of data. In each table, the respective meaning of the chosen color coding is clarified. The color coding is intended as a qualitative orientation tool to readers rather than as a quantifiable measure.
9. The focus for data collection and analysis is relevant to the key indicators in GPE’s results framework and additional indicators described in the respective countries’ ESPs. The evaluation team did not collect primary quantitative data but instead drew on secondary data for evaluation findings. In addition, two rounds of data collection were conducted, one in 2018 and another in 2019; each contributes to this final report.
10. Key informant interviews (KIIs) were conducted twice in Malawi (in 2018 and in 2019) and gathered information on the following:
▪ Education planning (including alignment of GPE grants to national sector plans 17 and coherence);
17 GPE’s Results Framework Indicator 29, Dimension 1 is based on whether the GPE-funded program is aligned with the education sector plan.

DRAFT REPORT (VX) – COUNTRY 4
© UNIVERSALIA
▪ The implementation of the ESP (including the stage of implementation against plans and implementation challenges);
▪ Sector dialogue;
▪ Monitoring (including the strengths and weaknesses of monitoring systems, both in terms of data production and transparency);
▪ Education financing;
▪ GPE financial and non-financial support in relation to the above topics; and
▪ Donor partner activities.
11. For this Year 2 evaluation report, the evaluation team consulted a total of 36 stakeholders in Malawi (see Annex I for a list of stakeholders), and reviewed a wide range of relevant documents, databases, websites as well as selected literature (please see footnotes throughout). In addition to the key informant interviews, the Evaluation Country Team also observed the mid-term review of the ESPIG in Malawi and presented initial reflections at the Local Education Group (LEG).
Purpose of Year 2 Evaluation
12. Prospective reporting allows for the investigation of unexpected changes and the examination of trends between years. The Year 2 evaluation report, designed to read as a standalone final evaluation of GPE’s contribution to education in Malawi, shows changes over time between the baseline (June, 2018) and this final report (September, 2019). It looks in more detail at the strength of evidence for Year 1, and provides a deeper understanding of the assumptions underlying GPE’s theory of change.
Changes from Y1 to Y2 of the Prospective CLEs
13. The eight prospective CLEs were originally envisaged to focus on one policy cycle and related GPE support, i.e. from sector planning and related sector dialogue to sector plan implementation and monitoring. This focus was modified in November, 2018.18 The first prospective CLE in December, 2018 took stock of the situation in Malawi’s education sector. Moving forward, the purpose of this second and final prospective CLE is to provide more confirmatory evidence and reflect changes over time by capturing the processes within Malawi’s policy cycle and sector that have taken place during the 2018-2019 period. This final prospective CLE in Malawi also seeks to examine the strength of the evidence and the implications of the evaluation findings for the GPE ToC and operational model.
Limitations and Mitigation Strategies
14. The data collection for the Year 2 evaluation mission to Malawi was originally scheduled to take place late in May, 2019. However, national general elections were confirmed to take place on May 21, 2019, a limitation which would negatively affect the breadth of interviews as fewer government stakeholders would be available during the mission. This was highlighted during the preparation period of the evaluation mission. Therefore, the evaluation team decided to conduct the mission earlier (May 6-10, 2019) to accommodate the elections, mitigating the possible limitation. Additional information on the implications of the election are presented in Section 2.1.
18 The revised methods approach is available at: https://www.globalpartnership.org/content/modified-approach-country-level-evaluations-fy-ii-2019-and-fy-iii-2020
DRAFT REPORT (VX) – COUNTRY 5
© UNIVERSALIA
1.3 Structure of the report
15. Following the introduction in this section, Section Error! Reference source not found. presents the country context that GPE support takes place. It documents: The broad political and geographical context of Malawi; an overview of the education sector in Malawi; and an outline of GPE financial and non-financial support to Malawi.
16. Section 3 presents the evaluation findings related to GPE’s contributions to sector planning; mutual accountability through inclusive policy dialogue and sector monitoring; sector financing; and sector plan implementation.
17. Section 0 discusses education system-level changes in Malawi during the period under review (2017-2020) and likely links between these changes and progress made towards the country-level objectives.
18. Section 1 presents an overview of the impact-level changes observable in Malawi.
19. Section 6 presents the changes observed over time in Malawi.
20. Finally, Section 7, presents overall conclusions of the evaluation and outlines several strategic questions to GPE.

DRAFT REPORT (VX) – COUNTRY 6
© UNIVERSALIA
2 Context
2.1 Overview of Malawi
21. This section provides the context to the evaluation, including the relevant historical, political and economic background, as well as that of the education sector and GPE’s involvement in Malawi. Its main features are described in Table 1 below.
Table 1 – Summary of Country and Education Context
Context area Features
Country Context ▪ Malawi is a land-locked country in Southern Africa with an overall population growth of 3%19 and a fertility rate of five children per woman.20
▪ The total population is 17.6 million, out of which 45 percent is aged 14 or younger.21
▪ It is one of the least developed countries in the world, ranking 171 out of 188 on the Human Development Index (HDI).
▪ Malawi has a per capita Gross National Income (GNI) of US$320.
▪ Malawi is an agricultural nation, with over 80 percent of the population as smallholder farmers, that is highly vulnerable to natural disasters.
▪ Cashgate, which occurred in late 2013 and is reportedly Malawi’s biggest corruption scandal, caused several donors to suspend or withdraw their on-treasury support and interest for a pooled funding mechanism.
▪ Presidential elections took place in late May 2019 and the incumbent president Peter Mutharika of the Democratic Progressive Party (DPP) was elected for another term.
Education Context ▪ The education sector received the highest share (over 20%) of the total government budget in 2018/19, MK345 billion.
▪ Gross enrollment ratio (GER) at primary level (UIS definition) is high at 140 percent.
▪ GER at secondary level falls dramatically to 38.14 percent, as of 2017.
▪ Most schools in Malawi suffer from a shortage of classrooms, resulting in both overcrowded classrooms and a high pupil-permanent classroom ratio. This varies by district, with the highest (Machinga 165:1) more than twice the lowest (Ntchisi at 80:1).22
▪ The completion rate in urban primary schools is 52.9 percent while it almost halves to 23.9 percent in rural schools.23
▪ Since joining the Fast Track Initiative in 2009, Malawi has received four grants from GPE, as well as two Civil Society Education Fund allocations.
19 UIS website, Malawi country profile, Population growth (annual %). 20 UNICEF (2015), Maternal and Newborn Health Disparities: Malawi. 21 Malawian National Statistical Office (MSO), 2018 Malawi Population and Census Main Report. Available at: http://www.nsomalawi.mw/images/stories/data_on_line/demography/census_2018/2018 percent20Malawi percent20Population percent20and percent20Housing percent20Census percent20Main percent20Report.pdf 22 UNICEF, UNICEF Malawi. January 2019. 2018/19 Education Budget Brief: Towards Improved Education for All in Malawi, p. 3. 23 Malawi Education Sector Improvement Project (MESIP) Project Appraisal Document, Aug, 2016.

DRAFT REPORT (VX) – COUNTRY 7
© UNIVERSALIA
Structure and features of the education system
▪ The Malawian Ministry of Education, Science and Technology (MoEST) leads all levels of education.
▪ The formal Malawian education system includes primary (Standards 1-8 and ages 6-13), secondary (Forms 1-4 and ages 14-17) and four years of tertiary (ages 18-22) education.24
▪ The eight years of primary schooling, is considered compulsory.
▪ The Government of Malawi (GoM) introduced the Free Primary Education Policy (FPE) in 1994 and a Free Secondary Education Policy in 2018.
▪ In 1998, the GoM adopted a national decentralization policy to devolve decision-making power closer to the schools.
Source: Author’s Elaboration
Country Context
22. The Republic of Malawi is a landlocked, low-income country in southern Africa with a total population of 17.6 million people.25 Almost half of the population are aged 14 years and younger26 and the population is growing at a rate of 3%.27 With a per capita GNI of US$320 in 2017, Malawi is among the world’s poorest countries, ranking 171 out of 188 on the Human Development Index (HDI).28 Almost 20 percent of the overall population live in severe multidimensional poverty, with another 28 percent near severe multidimensional poverty, and 71 percent of the population live below the poverty line of US$1.9 a day.29 Malnutrition levels remain high with 37 percent of children under the age of five stunted30 (with low height for age), indicating chronic food and nutrition insecurity. Child malnutrition negatively impacts on educational performance, health and immunity, as well as on the national economy.31 A recent study for Malawi found that 10.3 percent of GDP is lost annually because of stunting.32
24 UNESCO Institute for Statistics (UIS), Country Profile for Malawi. Available at: http://uis.unesco.org/en/country/MW 25 UNICEF Malawi. January 2019. 2018/19 Education Budget Brief: Towards Improved Education for All in Malawi. 26 UIS website, Malawi country profile. 27 UIS website, Malawi country profile, Population growth (annual %), from 2016 to 2017. 28 UNDP, Human Development Report, 2017. 29 Ibid. 30 Children are defined as stunted if their height-for-age is more than two standard deviations below the WHO Child Growth Standards median. (http://www.who.int/nutrition/healthygrowthproj_stunted_videos/en/) 31 Error! Reference source not found.: The Cost of Hunger. For additional information, please see: https://www.humanitarianresponse.info/ru/operations/malawi/document/malawi-cost-hunger-summary-report 32 Ibid.

DRAFT REPORT (VX) – COUNTRY 8
© UNIVERSALIA
23. In late 2013, a number of Malawian public officers were implicated in the Capital Hill Cashgate scandal, known as Cashgate, which involved the embezzlement of government funds through money transfers from government bank accounts to private companies for payment of bogus goods and services.33 This was reportedly Malawi’s biggest corruption scandal and caused several donors to suspend or withdraw their on-treasury support and interest for a pooled funding mechanism. This lack of external assistance, which the Government had not accounted for in sector plans, negatively impacted on budget execution in 2013-2014, also affecting the education budget.
24. Presidential elections took place in late May, 2019 and the incumbent president Arthur Peter Mutharika of the Democratic Progressive Party (DPP) was elected after a court case and allegations of corruption aimed at the incumbent shaping discourse around the vote34. Following his re-election, President Mutharika appointed Dr Susuwele Banda (the former Malawi Institute of Education Director) as the new Minister of Education. This appointment has been noted with optimism by parts of civil society due to his technical background in education; due to the continuity of government significant systematic change is not expected but remains to be seen.
2.2 Education sector in Malawi
25. The education system in Malawi provides education for children aged 3 to 22. The Malawian education system encompasses pre-primary (ages 3-5), albeit this is not part of the formal system and includes early childhood development, primary (Standards 1-8 and ages 6-13), secondary (Forms 1-4 and ages 14-17) and four years of tertiary (ages 18-22) education. The first eight years of schooling are compulsory typically from age 6 to age 13), though children often enter the education system when they are older than six years.35 The academic year starts in September and ends in July. There is also the possibility to undertake vocational or technical training instead of following the academic path into secondary school.
33 Chiwala, Victor Samuel (2018) Cash Gate scandal in Malawi. A presentation made at The Global Expert Group Meeting on Corruption involving Vast Quantities of Assets held in Lima, Peru. 34 https://www.bbc.co.uk/news/world-africa-48426781 UNICEF Malawi. January 2019. 2018/19 Education Budget Brief: Towards Improved Education for All in Malawi.
Figure 2 – Map of Malawi
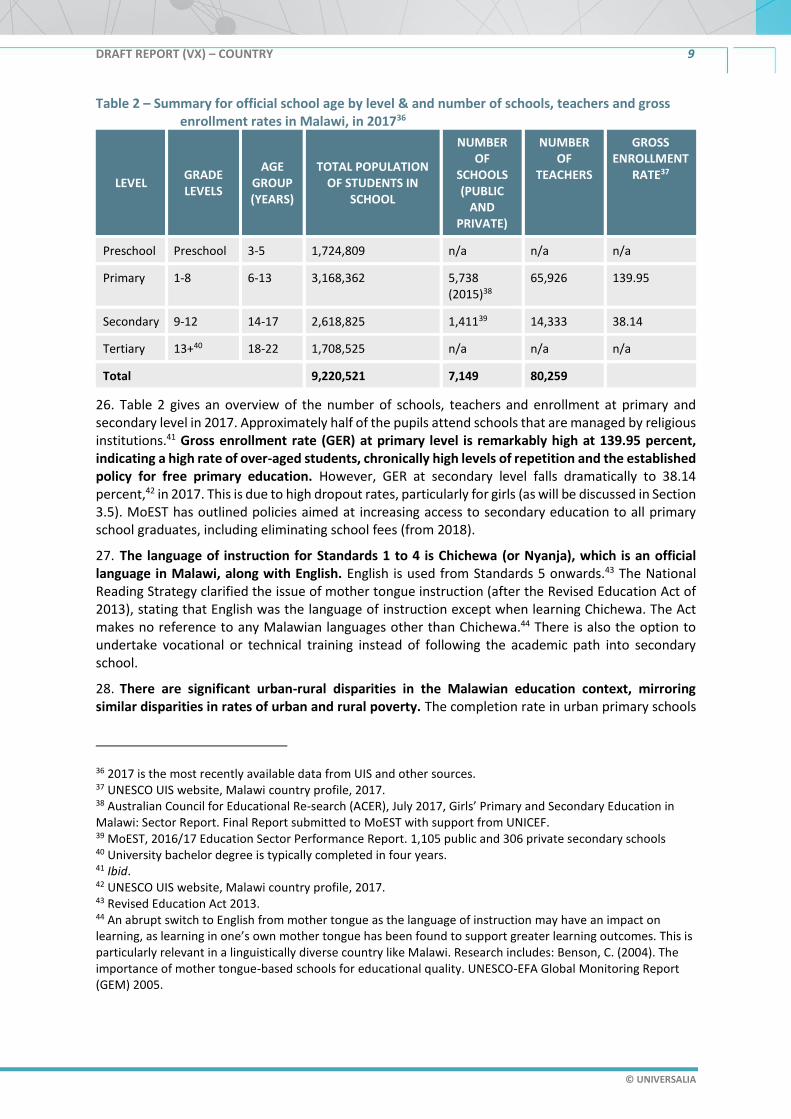
DRAFT REPORT (VX) – COUNTRY 9
© UNIVERSALIA
Table 2 – Summary for official school age by level & and number of schools, teachers and gross enrollment rates in Malawi, in 201736
LEVEL GRADE LEVELS
AGE GROUP (YEARS)
TOTAL POPULATION OF STUDENTS IN
SCHOOL
NUMBER OF
SCHOOLS (PUBLIC
AND PRIVATE)
NUMBER OF
TEACHERS
GROSS ENROLLMENT
RATE37
Preschool Preschool 3-5 1,724,809 n/a n/a n/a
Primary 1-8 6-13 3,168,362 5,738 (2015)38
65,926 139.95
Secondary 9-12 14-17 2,618,825 1,41139 14,333 38.14
Tertiary 13+40 18-22 1,708,525 n/a n/a n/a
Total 9,220,521 7,149 80,259
26. Table 2 gives an overview of the number of schools, teachers and enrollment at primary and secondary level in 2017. Approximately half of the pupils attend schools that are managed by religious institutions.41 Gross enrollment rate (GER) at primary level is remarkably high at 139.95 percent, indicating a high rate of over-aged students, chronically high levels of repetition and the established policy for free primary education. However, GER at secondary level falls dramatically to 38.14 percent,42 in 2017. This is due to high dropout rates, particularly for girls (as will be discussed in Section 3.5). MoEST has outlined policies aimed at increasing access to secondary education to all primary school graduates, including eliminating school fees (from 2018).
27. The language of instruction for Standards 1 to 4 is Chichewa (or Nyanja), which is an official language in Malawi, along with English. English is used from Standards 5 onwards.43 The National Reading Strategy clarified the issue of mother tongue instruction (after the Revised Education Act of 2013), stating that English was the language of instruction except when learning Chichewa. The Act makes no reference to any Malawian languages other than Chichewa.44 There is also the option to undertake vocational or technical training instead of following the academic path into secondary school.
28. There are significant urban-rural disparities in the Malawian education context, mirroring similar disparities in rates of urban and rural poverty. The completion rate in urban primary schools
36 2017 is the most recently available data from UIS and other sources. 37 UNESCO UIS website, Malawi country profile, 2017. 38 Australian Council for Educational Re-search (ACER), July 2017, Girls’ Primary and Secondary Education in Malawi: Sector Report. Final Report submitted to MoEST with support from UNICEF. 39 MoEST, 2016/17 Education Sector Performance Report. 1,105 public and 306 private secondary schools 40 University bachelor degree is typically completed in four years. 41 Ibid. 42 UNESCO UIS website, Malawi country profile, 2017. 43 Revised Education Act 2013. 44 An abrupt switch to English from mother tongue as the language of instruction may have an impact on learning, as learning in one’s own mother tongue has been found to support greater learning outcomes. This is particularly relevant in a linguistically diverse country like Malawi. Research includes: Benson, C. (2004). The importance of mother tongue-based schools for educational quality. UNESCO-EFA Global Monitoring Report (GEM) 2005.

DRAFT REPORT (VX) – COUNTRY 10
© UNIVERSALIA
is 52.9 percent, while it is less than half in rural areas, at 23.9 percent.45 Other factors are also prevalent, including low rates of female teachers in rural areas (e.g. female to male teacher ratio in Grades 6-8 stands at 0.22 in 2018 with a target of 0.31 for 2019),46 a wide variance of deployment and distribution of teachers resulting in high Pupil Qualified Teacher Ratio (PQTR, according to Malawi EMIS stands at 123:1 for Grades 1-2) and uneven support at the school and community levels.47 Furthermore, there is a shortage of classrooms in most Malawi schools, resulting in a high pupil-permanent classroom ratio. This varies by district, with the highest in Machinga (165:1), Lilongwe Rural East (160:1) and Rural West (140:1) and the lowest in Likoma (50:1) and Ntchisi (80:1).48
29. Malawi’s young and rapidly growing population and the introduction of the Free Primary Education Policy (FPE) in 1994 has created continued pressure on the education system. As the Project Appraisal Document (PAD) from 2016 states (p. 1-2), this pressure is “undermining progress since the system is always in a ‘catch-up’ mode concurrently leading to high chronic repetition and dropout rates and low learning outcomes.” It is also important to note that in order for students to be promoted to the next grade they must sit (and pass) an examination at the end of the school year.
National policies and plans
30. In 1998, the GoM adopted a national decentralization policy, aimed at improving the targeting of resources and devolving decision-making power closer to the schools. This meant that 34 education districts were subsequently established to deliver primary education, under the oversight of the Ministry of Education, Science and Technology (MoEST), which oversees all levels of education in Malawi. Its main priorities49 are to:
▪ Expand equitable access to education to enable all people to benefit;
▪ Improve quality and relevance of education to reduce drop-out and repetition and promote effective learning; and
▪ Improve governance and management of the system to enable more effective and efficient delivery of services.
31. Malawi has shown strong commitment to supporting the education sector through higher national allocation of resources to education over the last decade, maintaining the percentage of government budget for education at or above 20 percent since 2011.50 However, given the fiscal constraints due to the rise in inflation and the devaluation of the local currency, there is a higher risk of limited fiscal space leading to limited domestic financing to the sector. Following Cashgate in 2013, the majority of development partners (DPs) withdrew their support from the pool fund and are now supporting the implementation of the Education Sector Plan through discrete projects. A Joint Fund has been established, with Norwegian Agency for Development Cooperation (NORAD), German Government, and UNICEF committing funds, with potentially more DPs to follow. Several DPs (such as the European Union, USAID, DFID and the German Embassy) have been involved in education projects for almost 40 years in Malawi.
45 Malawi Education Sector Improvement Project (MESIP) Project Appraisal Document, Aug, 2016. 46 Malawi Education Sector Improvement Project (P1541865) Implementation and Status Report No. 6, May, 2019. 47 Ibid. 48 UNICEF Malawi. January 2019. 2018/19 Education Budget Brief: Towards Improved Education for All in Malawi. 49 Ministry of Education website: http://www.malawi.gov.mw/index.php?option=com_content&view=article&id=24&Itemid=80 50 Error! Reference source not found. Quality Assurance Review – Phase III

DRAFT REPORT (VX) – COUNTRY 11
© UNIVERSALIA
32. The National Education Sector Plan (NESP 2008/09-2017/18, extended to 2019/2020)51 outlines the country’s strategy to expand early childhood education, improve the quality, relevance of and access to basic education, promote technical and vocational training responding to labor market needs, and support higher education and research. The NESP was devised as an essential component of the Malawi Growth and Development Strategy (MGDS). Prior to NESP, the education sector was governed by the third Education Policy and Investment Framework for Education in Malawi (1995-2005).
33. The ten-year NESP was operationalized by implementation plans called the Education Sector Implementation Plans (ESIPs). The lessons learned from ESIP I (2008-2012) (such as better articulation of priority policies and objectives, and introduction of cross-cutting areas like special needs education, EMIS and M&E) informed ESIP II (2013-2017)52 and its action plan, according to the 2016/17 Education Sector Performance Plan. The MoEST’s ESIP II focuses on identified thematic areas: early grade learning, learner retention, teaching and learning materials, teacher management and development, decentralization, education access and infrastructure, and skills development. Although Malawi started developing a new ESIP in 2017, the ESIP II has been extended beyond 2017, until the new ESIP is in place, which will likely be in the first quarter of 2020, according to government and development partners supporting the Education Sector Analysis and ESP (EU and UNICEF).
2.3 GPE in Malawi
34. Malawi joined the Fast Track Initiative (FTI), GPE’s predecessor, in 2009. This followed the successful appraisal and endorsement of NESP by the Local Education Group (LEG).53 Malawi received four grants since, as shown in Table 3: one ESPDG (2013), one PDG (2015), and two ESPIGs (2010-2015 and 2016-2020). Malawi also received three Civil Society Education Fund (CSEF) grants from GPE, in 2016, 2017 and 2018 to support civil society engagement in GPE education sector policy, planning, accountability and monitoring. In Malawi, funding is allocated to the Civil Society Education Coalition (CSEC), which advocates for increases in education financing and provides accountability to the MoEST.
35. In Malawi, GPE also aims to provide a wide range of non-financial inputs, primarily provided by the work of the Secretariat, the grant agent, the coordinating agency, and from GPE’s global-level engagement (e.g. technical assistance, advocacy, knowledge exchange, quality standards and funding requirements).
36. Malawi is also involved in the Global and Regional Activities (GRA) program which supports research, capacity development and knowledge sharing at the regional and global levels through technical workshops, peer-learning events and conferences, focusing on learning outcomes, education financing, and out-of-school children. Malawi participated in GRA 1 which focused on linking reading assessments regionally in order to inform best practice, as well as GRA 12 (Disability, Health and Education in support of Learning for All), focused on strengthening inter-ministry collaboration on integrated school health and nutrition programs.
51 Malawi Local Education Donor Group, Sept 2009, Appraisal of GoM’s Education Sector Plans NESP and ESIP I. 52 Subsequently extended into 2019 as a result of the ESIP II Action Plan. 53 Implementation Completion and Results Report of ESPIG I (2010-2015), World Bank, December, 2015.
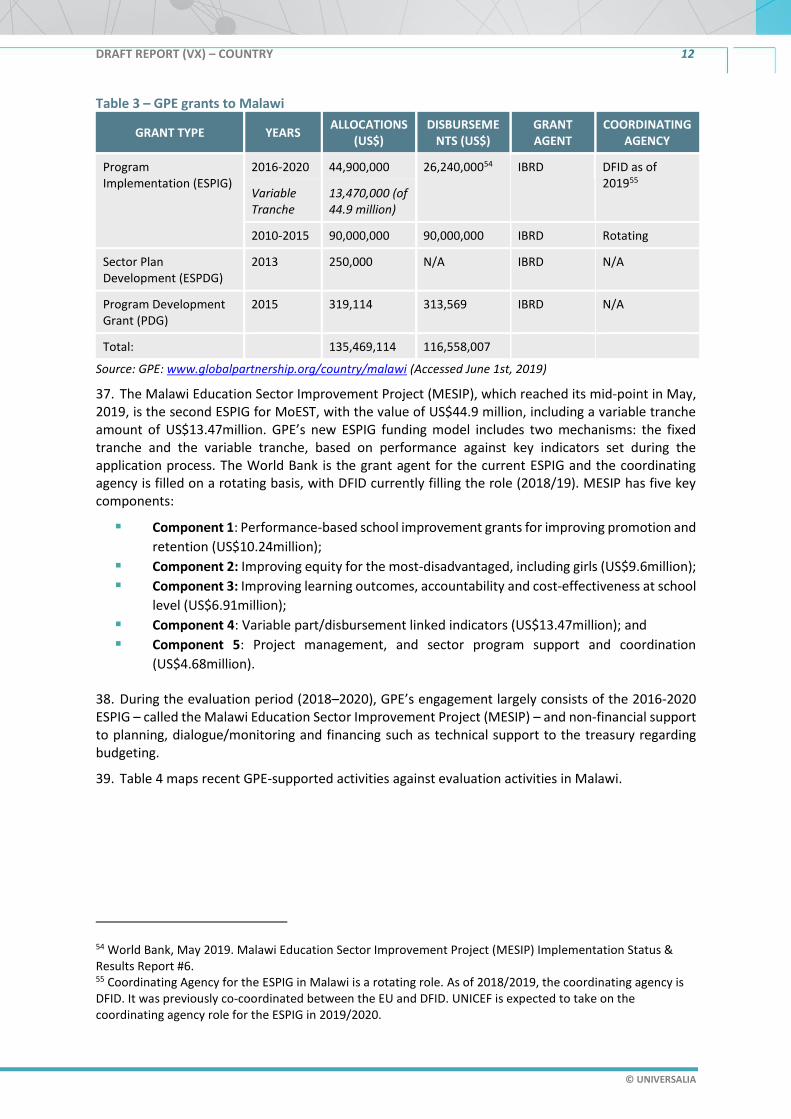
DRAFT REPORT (VX) – COUNTRY 12
© UNIVERSALIA
Table 3 – GPE grants to Malawi
GRANT TYPE YEARS ALLOCATIONS
(US$) DISBURSEME
NTS (US$) GRANT AGENT
COORDINATING AGENCY
Program Implementation (ESPIG)
2016-2020 44,900,000 26,240,00054 IBRD DFID as of 201955
Variable Tranche
13,470,000 (of 44.9 million)
2010-2015 90,000,000 90,000,000 IBRD Rotating
Sector Plan Development (ESPDG)
2013 250,000 N/A IBRD N/A
Program Development Grant (PDG)
2015 319,114 313,569 IBRD N/A
Total: 135,469,114 116,558,007
Source: GPE: www.globalpartnership.org/country/malawi (Accessed June 1st, 2019)
37. The Malawi Education Sector Improvement Project (MESIP), which reached its mid-point in May, 2019, is the second ESPIG for MoEST, with the value of US$44.9 million, including a variable tranche amount of US$13.47million. GPE’s new ESPIG funding model includes two mechanisms: the fixed tranche and the variable tranche, based on performance against key indicators set during the application process. The World Bank is the grant agent for the current ESPIG and the coordinating agency is filled on a rotating basis, with DFID currently filling the role (2018/19). MESIP has five key components:
▪ Component 1: Performance-based school improvement grants for improving promotion and
retention (US$10.24million);
▪ Component 2: Improving equity for the most-disadvantaged, including girls (US$9.6million);
▪ Component 3: Improving learning outcomes, accountability and cost-effectiveness at school
level (US$6.91million);
▪ Component 4: Variable part/disbursement linked indicators (US$13.47million); and
▪ Component 5: Project management, and sector program support and coordination
(US$4.68million).
38. During the evaluation period (2018–2020), GPE’s engagement largely consists of the 2016-2020 ESPIG – called the Malawi Education Sector Improvement Project (MESIP) – and non-financial support to planning, dialogue/monitoring and financing such as technical support to the treasury regarding budgeting.
39. Table 4 maps recent GPE-supported activities against evaluation activities in Malawi.
54 World Bank, May 2019. Malawi Education Sector Improvement Project (MESIP) Implementation Status & Results Report #6. 55 Coordinating Agency for the ESPIG in Malawi is a rotating role. As of 2018/2019, the coordinating agency is DFID. It was previously co-coordinated between the EU and DFID. UNICEF is expected to take on the coordinating agency role for the ESPIG in 2019/2020.
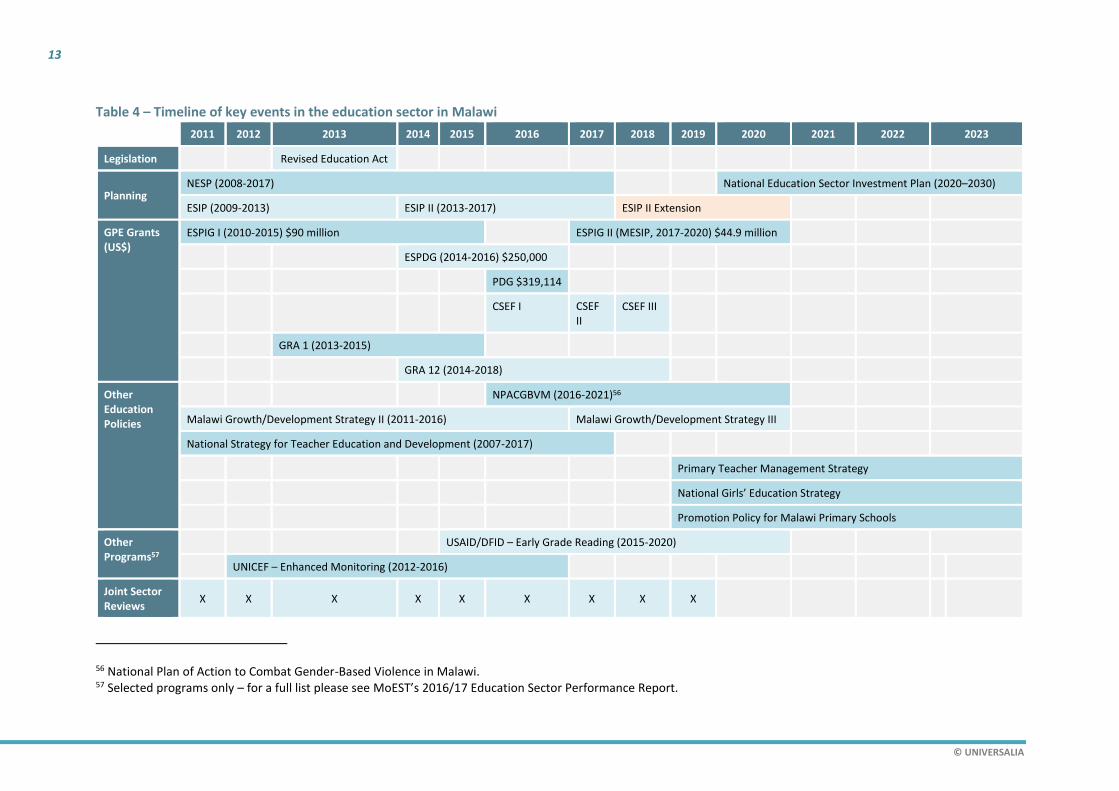
13
© UNIVERSALIA
Table 4 – Timeline of key events in the education sector in Malawi
2011 2012 2013 2014 2015 2016 2017 2018 2019 2020 2021 2022 2023
Legislation Revised Education Act
Planning NESP (2008-2017) National Education Sector Investment Plan (2020–2030)
ESIP (2009-2013) ESIP II (2013-2017) ESIP II Extension
GPE Grants (US$)
ESPIG I (2010-2015) $90 million ESPIG II (MESIP, 2017-2020) $44.9 million
ESPDG (2014-2016) $250,000
PDG $319,114
CSEF I CSEF II
CSEF III
GRA 1 (2013-2015)
GRA 12 (2014-2018)
Other Education Policies
NPACGBVM (2016-2021)56
Malawi Growth/Development Strategy II (2011-2016) Malawi Growth/Development Strategy III
National Strategy for Teacher Education and Development (2007-2017)
Primary Teacher Management Strategy
National Girls’ Education Strategy
Promotion Policy for Malawi Primary Schools
Other Programs57
USAID/DFID – Early Grade Reading (2015-2020)
UNICEF – Enhanced Monitoring (2012-2016)
Joint Sector Reviews
X X X X X X X X X
56 National Plan of Action to Combat Gender-Based Violence in Malawi. 57 Selected programs only – for a full list please see MoEST’s 2016/17 Education Sector Performance Report.
DRAFT REPORT (VX) – COUNTRY 14
© UNIVERSALIA
3 GPE contributions to sector planning, dialogue/monitoring, financing and implementation.
3.1 Introduction
40. This section summarizes findings related to Key Evaluation Question I of the evaluation matrix: “Has GPE’s support to Malawi contributed to achieving country-level objectives related to sector planning, sector plan implementation, sector dialogue and monitoring, and more/better financing for education? If so, how?”58
41. The GPE country-level ToC, developed in the inception report and adapted to the Malawi context, outlines four contribution claims related to GPE’s influence on progress towards achieving country-level objectives (one claim per objective). Each contribution claim is based on several underlying assumptions (see Annex C).
42. This section is structured around the four contribution claims. Each sub-section assesses the contribution claim by answering two sub-questions. Firstly, what changed in sector planning, mutual accountability, sector financing or ESP implementation respectively during the period under review? And secondly, has GPE’s support contributed to observed changes in (and across) these areas?
43. Throughout the report, color-coded tables provide readers with qualitative overviews of key CLE findings: green equals ‘strong/high/achieved’, amber equals ‘moderate/medium/partly achieved’, red equals ‘low/weak/not achieved’, and gray indicates a lack of sufficient data to rate the issue.
3.2 GPE contributions to sector planning59 60
44. A high-level overview of evaluation findings on sector planning is provided in Table 5. These observations are elaborated in the findings and supporting evidence presented in this section.
58 Improved planning, dialogue/monitoring, financing, and plan implementation correspond to Country-Level Objectives (CLOs) 1, 2, 3 and 4 of GPE’s 2016-2020 Strategic Plan. 59 This section addresses evaluation questions CEQ 1.1 a and 1.2 a, as well as (cross-cutting) CEQs 3.1 and 3.2. 60 This section triangulates findings on RF indicators 16a, 16b, 16c, 16d and 17.

DRAFT REPORT (VX) – COUNTRY 15
© UNIVERSALIA
Table 5 – Overview – CLE findings on sector planning and related GPE contributions
PROGRESS TOWARDS A GOVERNMENT-OWNED, CREDIBLE
AND EVIDENCE-BASED SECTOR PLAN FOCUSED ON EQUITY,
EFFICIENCY AND LEARNING. 61
DEGREE OF GPE CONTRIBUTION62
DEGREE TO WHICH UNDERLYING ASSUMPTIONS HOLD63
Partially achieved: Malawi’s ESP is government owned, evidence-based and relevant. It was developed through inclusive processes. However, issues, regarding lack of strategy, achievability of plans and sub-sectors outside of basic education, raised at the appraisal stages were not sufficiently addressed before the plan was approved.
Strong: GPE contributed significantly to planning in Malawi. Financial contributions include the ESPDG and non-financial contributions include a focus on inclusive processes and improving the depth of the plan.
1 2 3 4 5
STRENGTH OF THE CONFIRMING/REFUTING EVIDENCE64
1 2 3 4 5
Characteristics of sector planning during the review period (2017-2020)
Finding 1: Malawi’s National Education Sector Plan (and associated implementation plans), while endorsed, was assessed during the quality assurance process according to GPE quality standards and significant weaknesses were identified. Such weaknesses, including lack of strategy, unrealistic achievability and exclusion of key sub-sectors, were highlighted at the beginning of the policy cycle but were not sufficiently addressed.
Current policy lifecycle
45. Overall Malawi’s National Education Sector Plan (and associated implementation plans) is government owned and evidence-based. The education sector plan in Malawi is guided by the MoEST’s National Education Sector Plan 2008-2017 (NESP), extended to 2020, and it is part of the Malawi Growth and Development Strategy (MGDS). The NESP 2008-2020 is operationalized by two five-year Education Sector Implementation Plans (ESIPs). The first ESIP covered the first half of NESP implementation (2008 – 2012), while the second ESIP runs from 2013/14 to 2019/2020; it was
61 In this case, the objective would have been considered as ‘achieved’ if a sector plan underwent a rigorous appraisal process, as per GPE/IEEP guidelines, and was endorsed by development partners in country. 62 This assessment is based on whether the CLE found evidence of (i) GPE support influencing (parts of) sector planning; (ii) stakeholder perceptions on the relevance (relative influence) of GPE support (iii) existence or absence of additional or alternative factors beyond GPE support that were equally or more likely to explain (part of) the noted progress. 63 For sector planning, the five underlying assumptions in the country level ToC were: (1) country level stakeholders having capability to jointly improve sector analysis and planning; (2) stakeholders having opportunity (resources, time, conducive environment) to do so; (3) stakeholders having the motivation (incentives) to do so; (4) GPE having sufficient leverage within the country to influence sector planning, and (5) EMIS and learning assessment system producing relevant and reliable data to inform sector planning. 64 The methodology for weighing of confirming and refuting evidence for each contribution claim is presented in Error! Reference source not found..
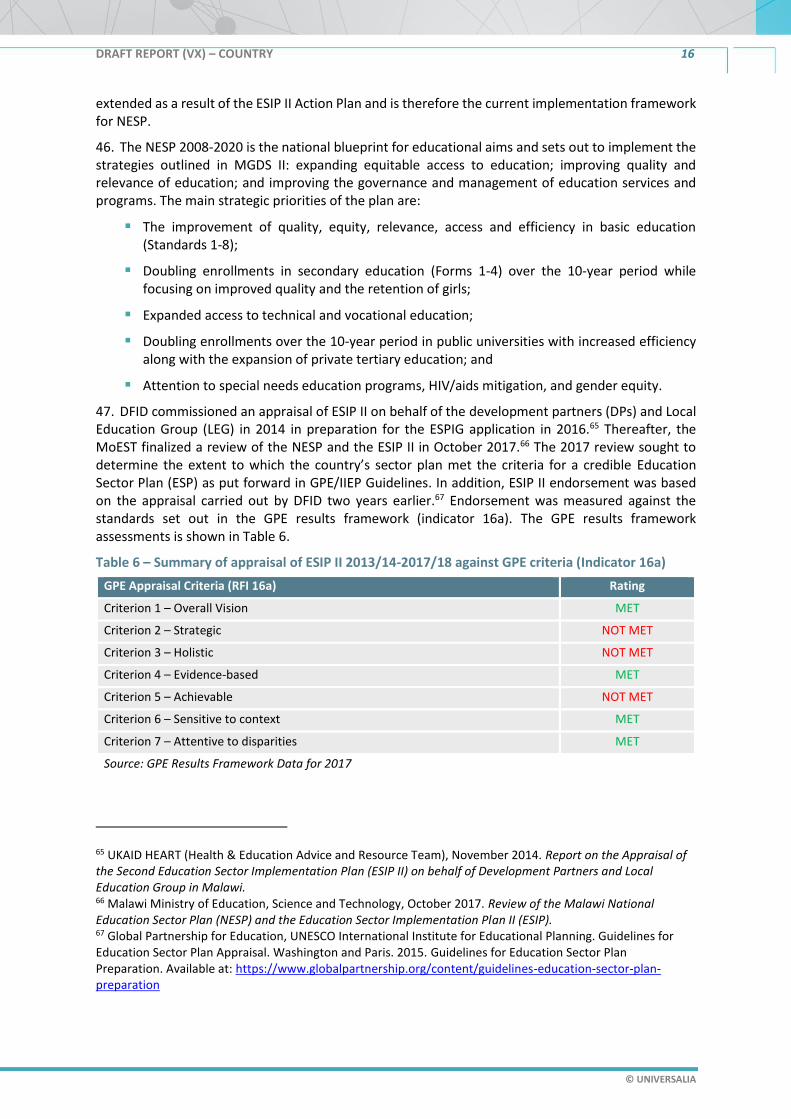
DRAFT REPORT (VX) – COUNTRY 16
© UNIVERSALIA
extended as a result of the ESIP II Action Plan and is therefore the current implementation framework for NESP.
46. The NESP 2008-2020 is the national blueprint for educational aims and sets out to implement the strategies outlined in MGDS II: expanding equitable access to education; improving quality and relevance of education; and improving the governance and management of education services and programs. The main strategic priorities of the plan are:
▪ The improvement of quality, equity, relevance, access and efficiency in basic education (Standards 1-8);
▪ Doubling enrollments in secondary education (Forms 1-4) over the 10-year period while focusing on improved quality and the retention of girls;
▪ Expanded access to technical and vocational education;
▪ Doubling enrollments over the 10-year period in public universities with increased efficiency along with the expansion of private tertiary education; and
▪ Attention to special needs education programs, HIV/aids mitigation, and gender equity.
47. DFID commissioned an appraisal of ESIP II on behalf of the development partners (DPs) and Local Education Group (LEG) in 2014 in preparation for the ESPIG application in 2016.65 Thereafter, the MoEST finalized a review of the NESP and the ESIP II in October 2017.66 The 2017 review sought to determine the extent to which the country’s sector plan met the criteria for a credible Education Sector Plan (ESP) as put forward in GPE/IIEP Guidelines. In addition, ESIP II endorsement was based on the appraisal carried out by DFID two years earlier.67 Endorsement was measured against the standards set out in the GPE results framework (indicator 16a). The GPE results framework assessments is shown in Table 6.
Table 6 – Summary of appraisal of ESIP II 2013/14-2017/18 against GPE criteria (Indicator 16a)
65 UKAID HEART (Health & Education Advice and Resource Team), November 2014. Report on the Appraisal of the Second Education Sector Implementation Plan (ESIP II) on behalf of Development Partners and Local Education Group in Malawi. 66 Malawi Ministry of Education, Science and Technology, October 2017. Review of the Malawi National Education Sector Plan (NESP) and the Education Sector Implementation Plan II (ESIP). 67 Global Partnership for Education, UNESCO International Institute for Educational Planning. Guidelines for Education Sector Plan Appraisal. Washington and Paris. 2015. Guidelines for Education Sector Plan Preparation. Available at: https://www.globalpartnership.org/content/guidelines-education-sector-plan-preparation
GPE Appraisal Criteria (RFI 16a) Rating
Criterion 1 – Overall Vision MET
Criterion 2 – Strategic NOT MET
Criterion 3 – Holistic NOT MET
Criterion 4 – Evidence-based MET
Criterion 5 – Achievable NOT MET
Criterion 6 – Sensitive to context MET
Criterion 7 – Attentive to disparities MET
Source: GPE Results Framework Data for 2017

DRAFT REPORT (VX) – COUNTRY 17
© UNIVERSALIA
48. In Malawi, the ESP was assessed to have only responded to four quality standards (overall vision, evidence-based, sensitive to context and attentive to disparities), suggesting the plan was endorsed despite the quality assurance process having identified a number of significant weaknesses according to quality standards. According to the GPE results framework, the ESP (e.g. ESIP II) should meet at least five of seven quality criteria to be considered credible as an indicator. ESIP II and other complementary studies, including: resource-mapping exercises, projection studies, and studies delving deeper on access, efficiency, teacher supply and demand, and school mapping were evidence-based as well as based on a thorough education sector analysis. Lessons learned from implementation of ESIP I were identified and fed into the design of ESIP II.68 ESIP II clearly outlines the uncertainty present in the education sector due to economic crises and, according to GPE RF data, is sensitive to Malawi’s particular context. The delivery of NESP commitments by ESIP II was vulnerable to the financial crises in 2011/12 and 2013/14. The uncertain economic outlook, drastic devaluation of the Kwacha and withheld funding due to Cashgate were all highlighted by ESIP II as significantly impacting the ability to plan and deliver on NESP commitments.69 In response to these challenges, the sector plan prioritized strengthening long- and medium-term sector reforms. ESIP II also presents three financial scenarios based on different assumptions of GoM and DP’s financing:
▪ High case: assuming continued increase in funding from government and development partners;
▪ Medium case: based on actual funding levels in 2013/14; and
▪ Lower case: assuming drastic cuts to the education budget.
49. Key issues and concerns raised during the appraisal period were not sufficiently addressed to support putting the plan into practice. While Malawi’s plan reflected an overall vision, was evidence-based, sensitive to context and attentive to disparities; the weaknesses of the plan in terms of strategy and achievability constrained implementation and the subsequent monitoring. Moreover, ESIP II does not address important sub-sectors outside of basic education.70 The plan lacks clarity on strategies for implementation and associated responsibilities and does not address ministry capacity to implement.71
50. The concerns raised at the time of the ESIP II appraisal in 2015 (see Table 7) have all materialized.
68 Education Sector Performance Key to Education Quality: Learning from the Past for Improved Outcomes 2016/17. DFID 2015. Report on the Appraisal of the Second Education Sector Implementation Plan (ESIP II) on behalf of Development Partners and Local Education Group in Malawi. 69 Education Sector Implementation Plan II (ESIP II) 2013/14-2017/18, The Government of Malawi. 70 Such as early childhood development (ECD), out-of-school youth, TVET and adult literacy. Documentary sources and stakeholder interviews suggest this inconsistency is due the MoEST’s preference to plan for sub-sectors under their formal purview. 71 DFID 2015. Report on the Appraisal of the Second Education Sector Implementation Plan (ESIP II) on behalf of Development Partners and Local Education Group in Malawi.

DRAFT REPORT (VX) – COUNTRY 18
© UNIVERSALIA
Table 7 – Summary of DFID’s ESIP II appraisal in 2015
Preparing for the next planning policy cycle
51. In preparation for the upcoming planning process as NESP is slated to close in 2020, stakeholders reflected that the previous plan was too ambitious, did not have sufficient strategies to achieve targets, did not focus on outputs sufficiently and did not engage systematically with other ministries. Most stakeholders in Malawi acknowledged that previous planning documents had been too ambitious and suggested that the next plan should couple ambition and achievability. However, CSOs argued that the plan was politicized rather than unachievable.72 Challenges in monitoring and implementing the plan also highlighted the need for clearer strategies and monitoring guidelines. One senior government official reflected “…the targets were made too high and we didn't pay enough effort to the strategies and how they will be achieved”. During the 2019 mission, a number of government stakeholders argued for a stronger focus on output versus outcome indicators. However strongly contested discussions regarding payment against the ESPIG’s disbursement linked indicators (DLIs) for the variable tranche were underway at the time of the mission and this perspective was likely informed by these discussions. DPs reflected that engagement with Ministries outside of education needs to be undertaken more systematically in the next planning period. The process experienced a lack of buy-in and was highlighted as an area of improvement to implementation of the plan.
52. Multiple key informants confirm that throughout the implementation of the plan, lessons from monitoring were not used to reflect back on the plan and develop strategies for implementation. This perspective was echoed by several stakeholder groups with regard to the link between planning and dialogue/monitoring.
72 For example, trained teachers were not hired for several years. Then immediately prior to an election, large numbers of teacher appointments were announced.
Appraisal
Question Response by Appraiser
Does the plan
contribute to the
achievement of
education sector
goals?
Yes. As currently drafted the plan describes the full sector and if implemented
effectively would enhance progress towards the achievement of education sector
goals.
Is there a high
likelihood that the
targeted
outcomes of the
plan will be
achieved?
No. There is not as yet sufficient clarity on how the different activities will be
implemented and who will be responsible. Given more work to develop a multi-year
implementation plan it seems likely that some of the ambitious targeted outcomes
could be achieved and improve the likelihood of achieving targets.
If there are risks,
how will they be
mitigated?
There are many risks, including the possibility of limited donor support given Cashgate
and this is currently being addressed at broader GoM level. However, the main risk is
the capacity and will within MoEST to implement the priorities, particularly in basic
education. This is not being mitigated and needs a clear explanation of how capacity
will be built up and support mobilized.
Has the plan
preparation
process been
participatory and
transparent?
Yes. DPs, CSOs including teachers’ unions and MoEST staff at different levels all
participated in preparation and the plan was widely shared with other stakeholders.

DRAFT REPORT (VX) – COUNTRY 19
© UNIVERSALIA
GPE contributions to sector planning
Finding 2: Sector planning had already been established in Malawi prior to joining GPE. Nevertheless, during the review period GPE made notable contributions, particularly non-financial, to strengthening sector planning including through Quality Assurance and Review processes. These include improving the depth of the plan, strengthening the use of evidence to support the plan and improving the inclusiveness of the planning process
53. GPE offers a series of financial and non-financial mechanisms to support sector planning. Table 8 provides an overview of these mechanisms, grouped by whether they are likely to have made a significant, moderately significant, or limited/no contribution to planning in Malawi. This grouping does not constitute a formal score.
Table 8 – GPE contributions to sector planning in Malawi
SIGNIFICANT CONTRIBUTION TO SECTOR PLANNING
• GPE Plan Quality Assurance and Review (QAR) processes: This resulted in an implementation plan (ESIP II) that was stronger in analysis and depth than the previous iteration (ESIP I).
• ESPDG Funding: ESPDG funding requirements on the use of evidence resulted in stronger use of evidence to support the plan, particularly the Country Status Report, and increased inclusiveness of the planning process, particularly with civil society organizations.
• CSEF Funding for CSOs: CSEF funding resulted in a challenge function to the government regarding the content of the plan.
MODERATE CONTRIBUTION TO SECTOR PLANNING
• GPE funding requirement 1 (a credible plan): The perspective of obtaining an ESPIG appears to have been an at least moderate incentive for the government to follow GPE quality assurance processes. However, a credible plan was not achieved and some suggested improvements were not put into place.
• GPE/IIEP quality standards and LEG endorsement: GPE supported the development of a sector plan. However, ESIP II was endorsed despite not meeting several key quality criteria.
LIMITED/NO CONTRIBUTION TO SECTOR PLANNING
N/A
NOT APPLICABLE/TOO EARLY TO TELL
N/A
54. It is not clear if NESP was developed in 2008 with GPE requirements in mind, therefore any GPE influence is unknown. Malawi joined the Fast Track Initiative in 2009, one year after the release of the National Education Sector Plan and corresponding ESIP I. The NESP was developed without direct financial support from a GPE Education Sector Plan Development Grant (ESPDG). While some government stakeholders recall that the NESP explicitly targeted the priorities and ideals of the Education for All’s National Plan of Action, to adhere to guidelines established by FTI73 and join in
73 National Education Sector Plan 2008-2017 (NESP), Malawi Ministry of Education, Science and Technology, June 2008.
DRAFT REPORT (VX) – COUNTRY 20
© UNIVERSALIA
2009, others were not convinced that these priorities, ideals and guidelines aligned with the content of the development process of NESP.
55. A focus on adhering to GPE’s guidelines to sector plans was explicit in the preparation of the second implementation plan in 2013. DPs found the first iteration to be weak on analysis according to the October 2017 review of NESP and ESIP II. Therefore, Malawi received an ESPDG from GPE in 2014-2016 to develop ESIP II. Informed by a sector analysis (funded by UNICEF), the Malawi ESIP II focused on improving learning outcomes. Several extensions of the ESPDG grant to Malawi were requested. Extensions allowed for the collection of data for the EMIS system to fulfill GPE’s New Funding Model criteria and to provide time for Malawi to align the ESP under the new funding model.
56. Specific GPE contributions, based on MoEST responding to Secretariat feedback, include:74
▪ A new general directive to have teacher houses for female teachers, to support girls’ education;
▪ The ESPIG’s unique nature as one of the few on-budget programs for Malawi’s MoEST, as an incentive for government to follow GPE quality assurance processes during the planning stage;
▪ Fiscal risk strategies were developed to minimize the risk of funding abuses and procurement delays for school performance-based funding; and
▪ Additional indicators were added to the Action Plan.
57. There was widespread agreement that GPE non-financial support (including technical support during the quality assurance and review process and funding requirements that promote use of evidence) improved the plan is many ways. This increased the inclusiveness of the plan development process,75 the depth of the plan, the use of evidence (the CSR) and high-level dialogue with stakeholders.76 The inclusive planning process also led to more inclusive dialogue in Malawi, with the Civil Society Education Coalition and the Teachers Union of Malawi regularly taking part in dialogue and plan implementation thereafter.
58. While government valued GPE financial support, many felt funding the development of the plan would not have been problematic without the ESPDG.77 As with the previous Annual Report for this evaluation, our main finding is that education sector planning, while to some extent supported by GPE initiatives, was already a key feature of the sector prior to GPE involvement. Several DPs (such as the USAID, DFID and the German Embassy) have been involved in education projects for almost 40 years, and they have been supporting, and aligning to MoEST activities to strengthen education sector planning for several decades, and certainly well before GPE involvement in Malawi. The GPE ESPDG (US$250,000) was a major financial contribution to the planning process. However, only the ESIP II benefited from GPE support, as the other two of the three planning documents (NESP and ESIP I) did not receive GPE funding. Additionally, DFID committed over US$4.016 million in 2013 to support both the development and implementation of the ESIP II; however, data is not publicly available on the portion of funding set aside for the development of the ESIP.78 GPE has contributed US$250,000 to the development of the ESIP II and US$44.9 million for the implementation of the ESIP II. Stakeholders during the second mission were thusly reasonably confident that other donors would have financed the plan’s development, if GPE had not.
59. While non-financial support was valued more than financial support for planning, on-budget support through an ESPIG acted as an incentive for government to follow GPE quality assurance
74 LEG response to GPE feedback 75 GPE Support to Malawi, 2018. 76 Implementation Completion and Results Report of ESPIG I (2010-2015), World Bank, December 2015. 77 For example, one government stakeholder stated ‘we never know who else could have jumped on it’. 78 Data extracted on April 29, 2019 from OECD.Stat.

DRAFT REPORT (VX) – COUNTRY 21
© UNIVERSALIA
processes during the planning stage. This feedback was then recognized to have improved the quality of the plan. Therefore, GPE non-financial contributions to planning (enabled by GPE financial contributions to implementation [ESPIG]) in Malawi were valued to a greater extent than the financial contribution to planning (the ESPDG).
60. Multiple stakeholder groups confirmed that while the situation might change, Malawi did not apply for an ESPDG for the planning process of the next ESP. Instead, EU and UNICEF have made available sufficient resources in terms of funding and technical advisors for conducting the ESA and for developing the next ESP. However, the process and requirements for quality assurance and independent appraisal of the ESA and ESP remain the same as with ESPDG, since the new ESP will be used to request a new ESPIG funding from GPE. The main reason cited for not pursuing an ESPDG was the time it takes to meet GPE requirements to receive an ESPDG, particularly concerning the level of effort required to comply. DPs reflected that this includes time-intensive requirements such as the education sector analysis and rounds of quality assurance. The next planning development process is likely to be funded by UNICEF, with technical support being provided by the European Union. However, rounds of quality assurance and undertaking an education sector analysis are linked to ESPIG funding. This indicates DPs either do not understand the ESPDG process and/or perceive all GPE processes to be cumbersome. While an ESPDG may not be sought for the next funding period, stakeholders believe lessons from the previous planning period would be applied to the next planning cycle.
Additional factors beyond GPE support
61. As noted above, other DPs, particularly DFID for plan development, besides GPE are engaged in the sector planning process, with interest to support the next sector planning process and taking on lessons learned from the previous cycle. Several DPs have historically supported and aligned to MoEST activities to strengthen education sector planning prior to GPE involvement in Malawi. Moreover, as Malawi has a history of sector planning, it is reasonable to assume positive influences in sector planning during the review period, beyond GPE support.
Implications for GPE’s ToC and country level operational model
62. There is uncertainty around the endorsement and quality of a sector plan if it is not deemed ‘achievable’. Achievability within the GPE operational model, as the evaluation team understands it, tends to refer to the extent to which the aims, objectives and indicators of success are likely to be achieved by country partners. The case of Malawi highlights that achievability should also include the extent to which there are robust strategies in place and the extent to which the implementation of these strategies is assigned to specific partners, departments and units, with reasonable timeframes attached. Currently, there is not yet an overall emphasis on achievability. It is instead, seen solely as a GPE quality criteria to be met.
63. There are also questions regarding how partners can address the issues raised at the planning stage more coherently. All of the reflections regarding implementation difficulties at the end of the policy cycle were highlighted at the beginning of the policy cycle, yet were not sufficiently addressed.
Box 3 - Testing Assumptions and Assessing Strength of Evidence
For sector planning, the five underlying assumptions in the country level ToC were: (1) country level stakeholders having the capabilities to jointly improve sector analysis and planning; (2) stakeholders having the opportunities (resources, time, conducive environment) to do so; (3) stakeholders having the motivation (incentives) to do so; (4) GPE having sufficient leverage within the country to influence sector planning, and (5) EMIS and learning assessment system producing relevant and reliable data to inform sector planning.

DRAFT REPORT (VX) – COUNTRY 22
© UNIVERSALIA
Three of five assumptions underlying sector planning in the GPE ToC in Malawi hold. However, additional assumptions not previously identified require further examination.
Assumption 1 holds. Past reviews of the NESP and ESIP II found the plans to be evidence-based, government-owned and developed through dialogue.
Assumption 2 holds. Moving forward, government, DPs and other stakeholders are positioned to jointly improve sector planning as the existing policy cycle in Malawi comes to an end. The resources are available for planning as ESIP II has been extended to the end of 2019. The LEG is placed well to work together in developing the new National Education Sector Investment Plan (NESIP) for 2020 to 2030.
Assumption 3 holds. Stakeholders have the motivation and incentive to improve sector analysis and planning, evidenced by the history of planning in Malawi.
Assumption 4 does not hold. GPE’s leverage in the education sector is constrained in Malawi, as DPs feel any plan development funding gaps can be met by other stakeholders and perceive technical support from the Secretariat to be a lesson now learnt, that can be carried into the next policy cycle with or without GPE.
Assumption 5 does not hold. While EMIS quality showed improvement over the review period and the MLSS is being implemented to support sector monitoring, there are still some significant gaps that adversely affect sector planning. GPE has supported improving the use of evidence to support the plan through MLSS but the reliability of the data remains limited.
The evidence for assessing changes in the education system in Malawi is reasonably strong. Between the two evaluation rounds, a significant amount of data was collected, both through primary qualitative data collection and documentation, through appraisal documents and responses related to the development of sector plans. There is a strong history of planning in Malawi, supported by both documentary evidence and stakeholder interviews. There was little divergence in stakeholder perspectives across stakeholder groups regarding the state of education sector planning and GPE contributions to planning, and therefore the data in support of the findings and assumptions above is strong.

DRAFT REPORT (VX) – COUNTRY 23
© UNIVERSALIA
3.3 GPE contributions to mutual accountability through sector dialogue and monitoring
A high-level overview of evaluation findings on mutual accountability for education sector progress and on related GPE contributions during the review period is provided in
64. Table 9. These observations are elaborated in the findings and supporting evidence presented below.
Table 9 – Summary of progress and GPE contributions to mutual accountability through sector dialogue and monitoring
PROGRESS MADE TOWARDS MUTUAL
ACCOUNTABILITY THROUGH
SECTOR DIALOGUE
DEGREE OF GPE
CONTRIBUTION (SECTOR
DIALOGUE)
PROGRESS MADE TOWARDS MUTUAL
ACCOUNTABILITY THROUGH
SECTOR MONITORING
DEGREE OF GPE
CONTRIBUTION (SECTOR
MONITORING)
DEGREE TO WHICH UNDERLYING ASSUMPTIONS
HOLD 79
Modest: While there are improvements in inclusive structures, there has been no progress in regularity and strategic nature of dialogue. A lack of strategic focus severely limits the quality of dialogue and impedes opportunities for mutual accountability.
Modest: GPE has contributed to more inclusion in the mechanisms that support dialogue in education, but this has not been enough to have made advances in mutual accountability
Modest: Monitoring processes and mechanisms in Malawi are well-established and inclusive but data credibility remains the primary challenge.
Modest: Some small contributions to monitoring have been established through MESIP, however these contributions have not tackled the primary challenge of monitoring in Malawi. In addition, the introduction of the variable tranche (VT) has strained relationships and monitoring system improvement.
1 2 3 4
STRENGTH OF THE CONFIRMING/REFUTING
EVIDENCE80
1 2 3 4 5
79 For sector dialogue and monitoring, the four underlying assumptions in the country level ToC were: (1) GPE has sufficient leverage at global and country levels to influence LEG existence and functioning; (2) Country level stakeholders having the capabilities to work together to solve education sector issues. (3) Stakeholders have the opportunities (resources, time, conducive environment) and (4) stakeholders have the motivation (incentives) to do so. In this case, assumptions 1, 2 and 4 hold. Assumption 3 does not hold. 80 The weighing of evidence for each contribution claim is presented in Annex D. For GPE contributions to mutual accountability in Malawi, the strength of the evidence is moderate.

DRAFT REPORT (VX) – COUNTRY 24
© UNIVERSALIA
Characteristics of sector dialogue
Finding 3: Mechanisms are in place for education sector dialogue, meetings are relatively frequent and there are improvements in integrating an equity and inclusion focus. However, a lack of strategic focus limits the quality of dialogue and impedes opportunities to hold stakeholders to account.
65. Based on documentary evidence and a series of interviews during the second mission, the current state of the frequency and quality of sector dialogue has not changed significantly from what was found in the 2018 and baseline CLEs. This need for better dialogue was highlighted in the 2018 Joint Sector Review (JSR), entitled Stakeholders Participation: A Means to Improve Learning Outcomes, which emphasized “improving the dialogue among all stakeholders in education…for aid effectiveness, harmonization, alignment and management of results” (p.10).
66. Sector dialogue has historically been strong in the Malawi education sector. The LEG has been meeting since 2006 as the DPs were involved in the preparation of the NESP. Early on, sector dialogue was promoted within the LEG by a shared commitment of the GoM and its development partners towards a Sector Wide Approach (SWAp) to planning, development and financing of the education sector.81 The preparation of the NESP in particular was characterized by dialogue, funding support and shared goals between GoM and DPs. This culminated in the successful appraisal and endorsement of the NESP 2008-2017 in early 2008. This commitment to sector dialogue was cemented through a memorandum of understanding between the MoEST and Ministry of Finance (MoF) and the DPs in 2010; the partnership principles emphasized the open exchange of information related to NESP between all stakeholders, participation of DPs and “an improved division of labor across the sectors of the economy” (p.5).82
67. There are adequate structures in place to support inclusive and frequent dialogue in Malawi. Three major groups collectively make up education sector dialogue functions (Figure 3) namely:
▪ The previously existing Sector Working Group (SWG) for education now operates as the Local Education Group (LEG), although there has been some duplication with both the SWG and the LEG operating in tandem at times. The SWG/LEG is chaired by MoEST’s Secretary of Education, Science and Technology and co-chaired by the coordinating agency. The group includes DPs (from May, 2019 these are DFID, the European Union, the Royal Norwegian Embassy, USAID, GIZ and the World Bank) and key education stakeholders (including the Civil Society Education Coalition (CSEC), NGOs and the Teachers Union of Malawi).
▪ The Education Development Partner Group (EDPG) is chaired by DFID, the coordinating agency, and includes all DPs working on education in Malawi. The EDP group chair functions on a rotating basis, in unison with the rotation of the coordinating agency. For the EDP the outgoing chair acts as co-chair and the incoming chair as deputy chair to ensure sustainability and proper handover. EDPG leadership mirrors DP’s leadership of the LEG.
▪ A series of Technical Working Groups (TWGs) exist to support dialogue on specific technical areas. Examples include those for adult literacy, monitoring and evaluation, private sector and infrastructure. MoEST, DPs, NGOs and CSOs participate in TWGs, and some TWGs are more well-established and active than others.
68. The structures in place for sector dialogue have positively impacted the development of ESIP II and ESPIG at key decision-making points. The LEG and DPs in Malawi, led by DFID, conducted an
81 EFA FTI, Malawi Update Correspondence, August 2006. 82 Memorandum of Understanding to contribute to the funding and implementation of the Malawi National Education Sector Plan between GoM and DPs, January 2010.
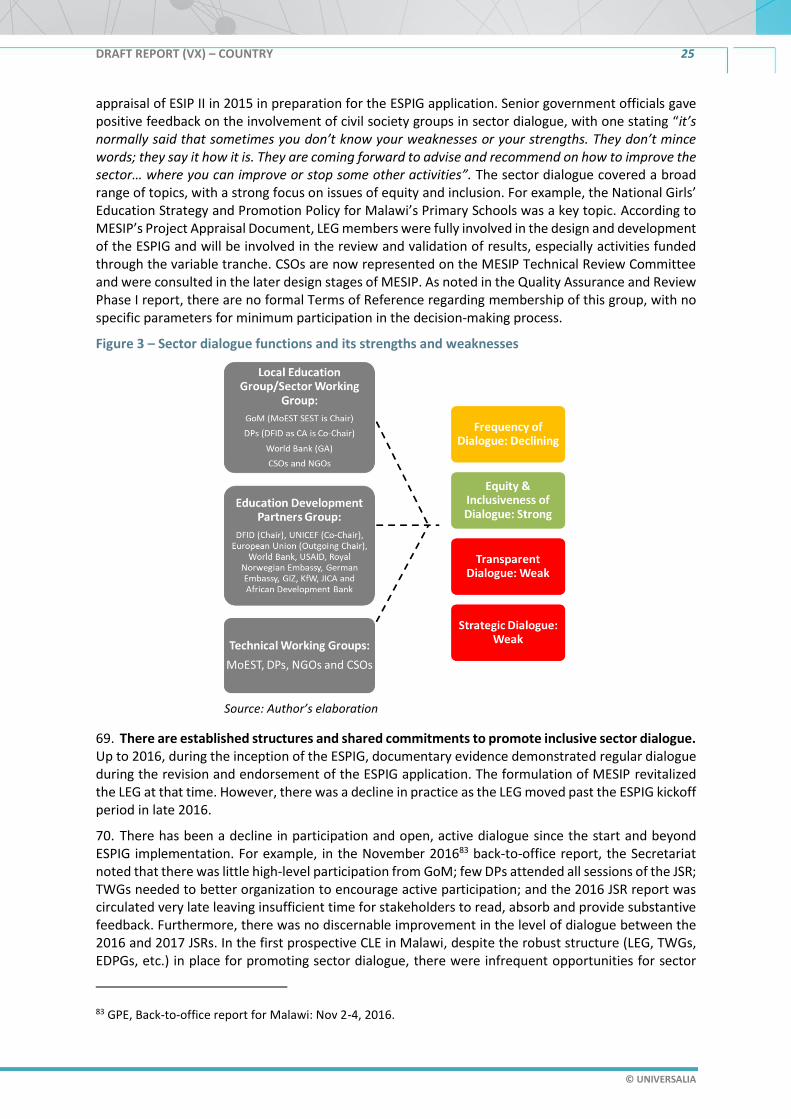
DRAFT REPORT (VX) – COUNTRY 25
© UNIVERSALIA
appraisal of ESIP II in 2015 in preparation for the ESPIG application. Senior government officials gave positive feedback on the involvement of civil society groups in sector dialogue, with one stating “it’s normally said that sometimes you don’t know your weaknesses or your strengths. They don’t mince words; they say it how it is. They are coming forward to advise and recommend on how to improve the sector… where you can improve or stop some other activities”. The sector dialogue covered a broad range of topics, with a strong focus on issues of equity and inclusion. For example, the National Girls’ Education Strategy and Promotion Policy for Malawi’s Primary Schools was a key topic. According to MESIP’s Project Appraisal Document, LEG members were fully involved in the design and development of the ESPIG and will be involved in the review and validation of results, especially activities funded through the variable tranche. CSOs are now represented on the MESIP Technical Review Committee and were consulted in the later design stages of MESIP. As noted in the Quality Assurance and Review Phase I report, there are no formal Terms of Reference regarding membership of this group, with no specific parameters for minimum participation in the decision-making process.
Figure 3 – Sector dialogue functions and its strengths and weaknesses
69. There are established structures and shared commitments to promote inclusive sector dialogue. Up to 2016, during the inception of the ESPIG, documentary evidence demonstrated regular dialogue during the revision and endorsement of the ESPIG application. The formulation of MESIP revitalized the LEG at that time. However, there was a decline in practice as the LEG moved past the ESPIG kickoff period in late 2016.
70. There has been a decline in participation and open, active dialogue since the start and beyond ESPIG implementation. For example, in the November 201683 back-to-office report, the Secretariat noted that there was little high-level participation from GoM; few DPs attended all sessions of the JSR; TWGs needed to better organization to encourage active participation; and the 2016 JSR report was circulated very late leaving insufficient time for stakeholders to read, absorb and provide substantive feedback. Furthermore, there was no discernable improvement in the level of dialogue between the 2016 and 2017 JSRs. In the first prospective CLE in Malawi, despite the robust structure (LEG, TWGs, EDPGs, etc.) in place for promoting sector dialogue, there were infrequent opportunities for sector
83 GPE, Back-to-office report for Malawi: Nov 2-4, 2016.
Source: Author’s elaboration
DRAFT REPORT (VX) – COUNTRY 26
© UNIVERSALIA
dialogue. For example, as in previous GPE observations, MoEST did not provide senior-level representation to encourage sector dialogue with senior stakeholders.
71. The Year 2 evaluation mission in May, 2019, found that there is little change since last year in improving sector dialogue. For instance, LEG meetings with MoEST and the DPs are not consistent and take place on an ad-hoc basis. Though there were instances of technical meetings between certain DPs and MoEST regarding the variable tranche, the LEG itself did not meet in 2018 nor prior to the mid-term review (MTR) of the ESPIG in March, 2019. However, a LEG meeting was convened during the MTR and another LEG meeting took place in May 2019. The MTR, while participatory and inclusive (discussed below), had inconsistent attendance by decision makers and key DPs. The issue of disbursement of the Variable Tranche (VT) payments against the DLIs heavily influenced both the frequency and the participation levels of both the MTR and the most recent LEG meeting. Some DPs believe the frequency of dialogue meetings is donor driven.
72. A positive shift took place in the inclusiveness of sector dialogue in 2016. Civil society groups applauded the government’s improved inclusion of civil society groups in meaningful sector dialogue. CSOs noted a shift in improved and substantive inclusion over the past three years (marked by the start of the ESPIG in 2016), with instances where MoEST requested technical inputs and invited CSOs to present at JSRs and other LEG meetings. Malawi CSOs were involved and consulted during the ESIP and MESIP design and are represented in the SWG. Interviews with CSOs and other stakeholders (such as Teacher Unions) suggested collaborative working. The past four years’ GPE results framework (RF) data for the RF indicator 19 showed representation of civil society and teachers in the LEG in Malawi.
73. There have been improvements in inclusiveness. However, government’s accountability for implementation to donors, beneficiaries and citizens remains weak. CSOs and DPs both emphasized that there are still issues with the government’s accountability to both donors and beneficiaries for implementation and subsequent results. Therefore, a number of senior government officials and DPs agreed that MoEST sector dialogue remains output- rather than outcome-focused. A number of government stakeholders pushed for a stronger focus on output versus outcome indicators, as certain outcome indicator targets would not be met in time.
74. Despite weaknesses in accountability at the central level, at the school level it was felt that school accountability was part of the lexicon of education sector dialogue. The Year 2 country level evaluation found this particularly true in schools being accountable to parents and communities through grievance addressing mechanisms and local systems.
75. Government, DPs and CSOs agreed that late dissemination of reports prior to meetings continues to hamper education dialogue. Senior government officials stated that this is a problem “on both sides we have an issue of reacting to issues rather than having a proper way of doing things”. During the ESPIG MTR in 2019, DPs emphasized the need for improved dialogue. For example, DPs were not included in the quarterly ESPIG status meetings, despite the agreement for regular meetings and production of regular and annual technical and financial reports to be submitted to the LEG for review and endorsement.84 Similarly, as noted above, both high-level MoEST stakeholders and certain DPs were absent at the 2019 MTR for key strategic discussions regarding implementation challenges and lessons learned. Evaluation participants emphasized this need to not only conduct LEG meetings more regularly, but for those meetings to not be dominated by logistics and management details. Because of the irregularity of meetings, they were largely occupied with progress reports on short-term implementation rather than being substantial and most importantly, strategic discussions around implications for future planning and implementation.
84 MOU to contribute to the funding and implementation of the Malawi National Education Sector Plan between GoM and DPs, January 2010.

DRAFT REPORT (VX) – COUNTRY 27
© UNIVERSALIA
76. All stakeholders agreed that such issues are a symptom of a lack of strategic focus in education sector dialogue. Several stakeholders also pointed to a lack of strategic planning over the calendar year, demonstrated by ad-hoc meetings and a lack of actionable points with time lines for follow up. Several government officials felt that sector dialogue was too focused on monitoring government activities, without due focus on DP programs. Conversely, DPs felt government was too focused on attending workshops and training than strategic implementation of the sector plan, with one DP saying “we talk about process things, like ‘we want to send someone to training’. It will help implementation in theory but not the actual more substantial activities”. This notion was similarly confirmed by other DP and CSO stakeholders as well, who questioned whether this was the most effective use of funding.
77. Certain stakeholders also noted that it is difficult to have evidence-based dialogue in a context with contested, unreliable data. In Malawi, stakeholders had mixed views on the extent to which sector dialogue is evidence-based, in terms of both evidence about issues and effective solutions. On one hand, stakeholders agreed that where credible evidence is available, decisions can be informed by the evidence. However, the limited credible data severely impeded the ability to make evidence-based decisions. Stakeholders also disagreed on the extent to which evidence-based decision making should be supported in circumstances where the data is not credible.85
Characteristics of sector monitoring
Finding 4: Although monitoring processes and mechanisms in Malawi are well-established and inclusive, their quality appears to be in decline and data credibility remains a challenge to evidence-based decision making.
78. There are several monitoring tools in place in Malawi, including the JSR. The main monitoring tool for the education sector in Malawi is the Education Management Information System (EMIS). This is supplemented by other tools, including the Integrated Financial Management Information System (IFMIS), Quarterly Progress Reports for the SWGs, Procurement Reports, Infrastructure reports, the Malawi national Examinations Board (MANEB), National Statistics Office Welfare Monitoring Survey (NSO-WMS), Southern Africa Consortium for Measuring Education Quality (SACMEQ), the Malawi Longitudinal School Survey (MLSS) and the Integrated Household Survey (IHS).The Monitoring tools/mechanisms are guided by the Education Research Monitoring and Evaluation Framework. To improve reliability and availability of quality education statistics, MoEST has institutionalized the decentralization of data collection to all zones and clusters in all education districts. The Joint Sector Review (JSR) process in Malawi seems to be a well-established and continuing form of reporting and review, and it also engages a wide group of stakeholders, which helps it promote mutual accountability across the sector. The JSR is the main vehicle for reporting to stakeholders on progress towards targets and on finance as outlined in the ESIP II Action Plan. To date, 17 annual JSRs have been held for the Malawian education sector, with the last one taking place in late 2018.
EMIS
79. Significant investments were made to improve the collection, quality and frequency of sector monitoring; questions remain, however, on the reliability of EMIS data.86 The previous annual report for this evaluation found that neither documentation nor interviews have provided any sense of the extent to which education data is routinely and systematically verified as being reliable and valid. For
85 According to the Baseline Diagnostics Note of the Malawi Longitudinal Schools Survey, the education sector in Malawi has suffered “from challenges related to the quality and the reliability of the data. It was also noted that the data has not been effective exploited for analysis or policy and strategy guidance”. MLSS Baseline Diagnostics Note Final. Page 2. 86 World Bank. MESIP Mid-Term Review Aide Memoire, March 18-April 2, 2019.

DRAFT REPORT (VX) – COUNTRY 28
© UNIVERSALIA
example, in the MTR Aide Memoire, the results from the annual school census by EMIS are considerably different from the results of the Malawi Longitudinal School Survey (MLSS) for the same districts. Similarly, DPs pointed to differing figures presented by the MESIP and MLSS teams during the mid-term review sessions.
80. While there are several activities being implemented to improve data, the impact on the quality of monitoring remains to be seen. The Malawi Longitudinal School Survey (MLSS), supported by the Government of Norway, World Bank and the GoM’s MoEST, is an independent, nationally representative sample survey that provides data on students, teachers and facilities. MLSS was established to address the lack of education data available in Malawi for monitoring progress in education through three rounds of data collection (base, mid and endline). MLSS’ objective is to support EMIS87 and provide data for the impact evaluation of MESIP. The Malawi Longitudinal School Survey will monitor changes across the sector and provide an entry point for discussions on differences between data sources in Malawi. However, the extent to which MLSS improves the quality of education dialogue and monitoring (if at all) remains to be seen.
81. The 2018 JSR outlined that the EMIS unit, within the Department of Planning, seeks to improve the quality and timeliness of the data it produces. According to academic research on the Malawi education sector, there are questions around the reliability of Malawi’s EMIS data.88 Concerns around the quality and reliability of data at school, district and national level were also echoed during the Year 2 CLE. Additionally, the EMIS Unit conducted the Validation Survey and the School Assessment Charts Survey (the report is forthcoming and not yet published).89 Therefore, a range of new initiatives are being undertaken to improve data quality and the verification of data sources, however these initiatives are in their infancy and their effectiveness cannot yet be measured.
Joint Sector Reviews
82. A key feature of the Joint Sector Reviews has been the extensive level of participation from all key stakeholders, and the breadth of representation not only across government but other key sectors such as teacher groups, civil society organizations and development partners. One of the strengths of sector monitoring in Malawi is the wide involvement of civil society in developing strategies to address key educational challenges, including repetition. Since 2013, the range of participants of the JSRs has increased. The duration has increased as well, with JSRs now being conducted over two days (previously only over a few hours) allowing for a vast range of issues to be discussed. Similarly, whereas early JSRs were often simply an opportunity for the Ministry and DPs to engage, the more recent JSRs concluded after identifying an action list and assigning responsibility with timeframes for each action to be completed.90
83. Over time, the quality of the JSR process in Malawi has fluctuated during the review period. The most recent data available, from 2014 and 2018, demonstrates this decline. The GPE Results Framework notes a decline in the use of evidence for decision making in the JSR. During the Y2 mission, stakeholders agreed that where credible evidence is available, decisions can be informed by the evidence. Additionally, as observed by the evaluation team during the mid-term review of the MESIP
87 MLSS initial midline findings. March 2019. ESPIG Mid Term Review. 88 According to Barnett (2018), though active misreporting is not a concern in Malawi where financial incentives for doing so are limited (school grants are not allocated on a per capita basis), it has been found that administrators “may not put substantial effort into the accuracy of the completed questionnaires, suggesting room for measurement error”, p.139. Ravishankar et al. (2016: xvii) reports that “official data on enrolment, repeaters and dropouts are mutually inconsistent” and suggests that pupils dropping out from school may be under-reported. 89 JSR 2018, page 105. 90 JSR 2018 and 2019 agendas.

DRAFT REPORT (VX) – COUNTRY 29
© UNIVERSALIA
and confirmed by DPs during the Y2 mission, strategic dialogue has declined and increasingly focuses on project implementation, plans are not systematically tracked by the JSR and follow up of recommendations for accountability is lacking. In 2014 Malawi’s joint sector review process successfully met three out of the five quality criteria of GPE’s Results Framework (Indicator 18): evidence-based, comprehensive, and anchored into an effective policy cycle.91
84. However, according to GPE’s Results Framework, by 2017, Malawi’s joint sector review process did not meet the adequate number of quality standards (3 out of 5). It achieved two quality standards: Standard 3 Comprehensive (defined above) and Standard 4 Monitoring Instrument: the JSR monitors sector performance and key indicators to help better identify implementation issues and real achievements with respect to ESP implementation and overall sector progress. While the improved use of monitoring instruments in 2018’s JSR process is to be commended, the process is no longer considered evidence-based or well-anchored in an effective policy cycle. Based on the most recent JSR, as described above, there are improvements in the participatory and inclusive nature of the November 2018 event.
Table 10 – JSRs in Malawi and JSR quality standards as defined by GPE’s Results Framework
JSR QUALITY STANDARDS92
GPE RF SCORE93 EVALUATOR ASSESSMENT BASED ON DOCUMENTS AND CONSULTED STAKEHOLDERS 2015 2018 2019
Standard 1: Participatory and inclusive
No No No
Reflecting on the most recent JSR and 2019 MTR of the ESPIG, there appears to be improvements in the participatory and inclusive nature in the last year. In the last year, there has been extensive participation from all key stakeholders, and the breadth of representation not only across government but other key sectors such as teacher groups, CSOs and DPs. However, a key issue that remains is the inconsistency of high-level participation from government stakeholders.
Standard 2: Evidence-based
Yes No No
The GPE RF notes a decline in the use of evidence for decision making in the JSR. Stakeholders agreed that where credible evidence is available, decisions can be informed by the evidence. However, the limited credible data on the situation in the country severely impeded the ability to make evidence-based decisions.
91 Standard 2 Evidence-Based: the JSR is informed by evidence including reliable education and financial data from the year under review, assessments of program implementation, documentary inputs combining primary and secondary data sources, feedback from beneficiaries, etc.; Standard 3 Comprehensive: the JSR should address and cover all the sub-sectors, as well as non-formal education and adult literacy. It should also discuss all the sources of funding identified in the annual action plan; and Standard 5 Anchored into an effective policy cycle: recommendations from the JSR effectively feed into addressing weaknesses in the ESP implementation so as to ensure it is being used as a planning instrument to influence future policy planning, design, and budget cycle. Dissemination of JSR recommendations incentivizes mutual accountability. 92 JSR quality criteria scored by GPE’s Results Framework (RF) indicator 18. GPE, Results Framework Indicators, Methodological Guidelines, version 8, June 2017, p.47. 93 Years listed in the table header are years of results framework data collection, which scored the Malawi JSR from the previous year (i.e., GPE RF 2015 scored the 2014 JSR. Note that each JSR reviews Malawi’s education sector performance for the previous year, such that the 2015 JSR evaluated sector performance in 2014). Only three years of GPE RF scores were available at the time of this review.
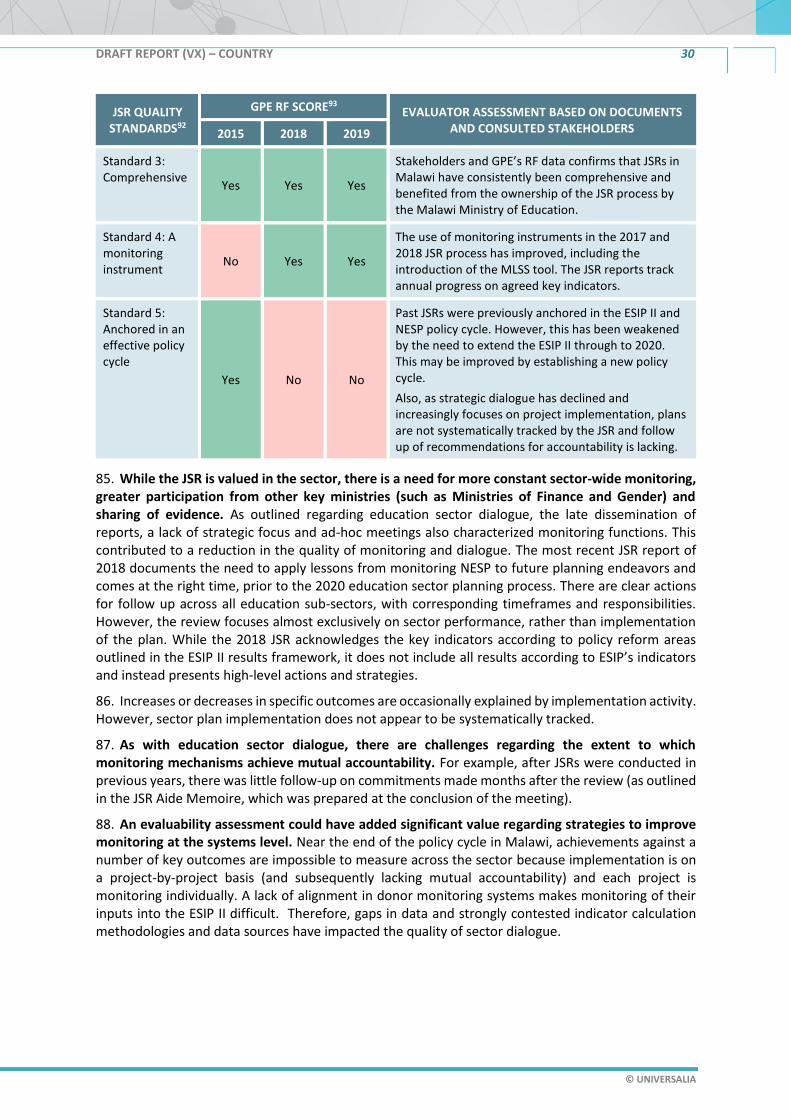
DRAFT REPORT (VX) – COUNTRY 30
© UNIVERSALIA
JSR QUALITY STANDARDS92
GPE RF SCORE93 EVALUATOR ASSESSMENT BASED ON DOCUMENTS AND CONSULTED STAKEHOLDERS 2015 2018 2019
Standard 3: Comprehensive
Yes Yes Yes
Stakeholders and GPE’s RF data confirms that JSRs in Malawi have consistently been comprehensive and benefited from the ownership of the JSR process by the Malawi Ministry of Education.
Standard 4: A monitoring instrument
No Yes Yes
The use of monitoring instruments in the 2017 and 2018 JSR process has improved, including the introduction of the MLSS tool. The JSR reports track annual progress on agreed key indicators.
Standard 5: Anchored in an effective policy cycle
Yes No No
Past JSRs were previously anchored in the ESIP II and NESP policy cycle. However, this has been weakened by the need to extend the ESIP II through to 2020. This may be improved by establishing a new policy cycle.
Also, as strategic dialogue has declined and increasingly focuses on project implementation, plans are not systematically tracked by the JSR and follow up of recommendations for accountability is lacking.
85. While the JSR is valued in the sector, there is a need for more constant sector-wide monitoring, greater participation from other key ministries (such as Ministries of Finance and Gender) and sharing of evidence. As outlined regarding education sector dialogue, the late dissemination of reports, a lack of strategic focus and ad-hoc meetings also characterized monitoring functions. This contributed to a reduction in the quality of monitoring and dialogue. The most recent JSR report of 2018 documents the need to apply lessons from monitoring NESP to future planning endeavors and comes at the right time, prior to the 2020 education sector planning process. There are clear actions for follow up across all education sub-sectors, with corresponding timeframes and responsibilities. However, the review focuses almost exclusively on sector performance, rather than implementation of the plan. While the 2018 JSR acknowledges the key indicators according to policy reform areas outlined in the ESIP II results framework, it does not include all results according to ESIP’s indicators and instead presents high-level actions and strategies.
86. Increases or decreases in specific outcomes are occasionally explained by implementation activity. However, sector plan implementation does not appear to be systematically tracked.
87. As with education sector dialogue, there are challenges regarding the extent to which monitoring mechanisms achieve mutual accountability. For example, after JSRs were conducted in previous years, there was little follow-up on commitments made months after the review (as outlined in the JSR Aide Memoire, which was prepared at the conclusion of the meeting).
88. An evaluability assessment could have added significant value regarding strategies to improve monitoring at the systems level. Near the end of the policy cycle in Malawi, achievements against a number of key outcomes are impossible to measure across the sector because implementation is on a project-by-project basis (and subsequently lacking mutual accountability) and each project is monitoring individually. A lack of alignment in donor monitoring systems makes monitoring of their inputs into the ESIP II difficult. Therefore, gaps in data and strongly contested indicator calculation methodologies and data sources have impacted the quality of sector dialogue.

DRAFT REPORT (VX) – COUNTRY 31
© UNIVERSALIA
GPE contributions to sector dialogue and monitoring
Finding 5: GPE has contributed to EMIS improvement and the inclusiveness of sector dialogue. However, a lack of strategic approach to dialogue and elements outside of dialogue and monitoring (continued fiducial risks perceived by DPs affecting harmonization, concerns regarding MESIP implementation and variable tranche indicators and payment conditions) place pressure on relationships, and mutual accountability has not been achieved.
89. The GPE contributions to monitoring through MESIP and the Secretariat’s advocacy supported improved sector dialogue and monitoring, and resulted in increased inclusiveness of processes in Malawi. Civil society groups highlighted the government’s improved inclusion of civil society groups in meaningful sector dialogue over the past three years as a result of GPE’s advocacy. GPE has also provided the Malawi Civil Society Education Coalition (CSEC) with a grant from the Civil Society Education Fund to support its engagement in education sector policy dialogue. CSEC confirmed that GoM’s receptiveness to civic engagement and dialogue has improved in the last three years. Regarding sector monitoring, CSEF’s contributions in the past partly enabled CSEC to conduct a series of public expenditure reviews and expenditure tracking of MoEST’s budgeting to support accountability. As has been stated, qualitative monitoring through joint sector reviews has been a key feature of the sector for over a decade, which have been in place since 2002. TWGs were also in place prior to ESIP II. However, the financial support from GPE’s ESPIG (currently the only grant) ensured frequent meetings took place during the implementation of ESIP II. This is particularly true of recent JSRs, an item of authorized expenditure under the current Malawi ESPIG.
Table 11 – GPE contributions to sector dialogue and monitoring during the 2017-2020 review period
SIGNIFICANT CONTRIBUTION TO MUTUAL ACCOUNTABILITY
▪ No significant contributions.
MODERATE CONTRIBUTION TO MUTUAL ACCOUNTABILITY
▪ ESPIG funding requirements supported improvements in the participation of civil society in sector dialogue and monitoring. This was widely recognized by all stakeholders as having been catalyzed by GPE and is valued by all stakeholders. This inclusion currently provides an additional voice to encourage accountability to government and DPs, but due to the shortcomings of dialogue listed above, is yet to translate into effects on implementation or an accountability mechanism.
▪ Civil Society Education Fund grants to Malawi’s Civil Society Education Coalition supported improving the inclusiveness of sector dialogue by being one of the funders of their initiatives, such as presenting at JSRs and producing budget expenditure analyses.
▪ GPE guidelines for ESP development. The development of the operational plan in Malawi had the potential to provide a strong framework for monitoring and mutual accountability. However, the lack of available data to monitor against targets has constrained advances towards mutual accountability.
▪ The Secretariat advocacy and guidance on conducting JSRs. GPE requirements for JSRs and funding allocated for JSRs within the ESPIG likely increased the frequency of JSRs. However, qualitative monitoring through joint sector reviews (JSRs)was a key feature of the sector for over a decade and JSRs were in place since 2002, prior to Malawi joining GPE.
▪ Program monitoring of ESPIG. This includes the programmatic M&E of the ESPIG, MESIP (Component 5), which uses Malawi’s EMIS, supporting school data collection and usage by using EMIS-HRMIS more effectively (Component 3) and capacity building within EMIS. However, such
DRAFT REPORT (VX) – COUNTRY 32
© UNIVERSALIA
capacity building efforts are perceived to be political by some MoEST officials and a lack of sustainability constrains the likely impact of these improvements in the future.
LIMITED/NO CONTRIBUTION TO MUTUAL ACCOUNTABILITY
▪ Variable tranche/introduction of performance-based payments through the DLIs. They have not had the intended effects on sector dialogue and monitoring. This has led to increased tensions between partners due to data with limited credibility and lack of mutual accountability.
90. There were mixed views from DPs on the contribution of GPE to sector dialogue and monitoring in the Malawi context. Some DPs highlighted that the Secretariat country lead is more removed from the local context and therefore able to assess sector gaps more objectively than actors on the ground. However, other DPs perceived little systematic benefits from being part of the partnership, outside of the funding provided for MESIP.
91. GPE financial support to monitoring includes the M&E component of MESIP94 (Component 5). The MESIP uses Malawi’s EMIS, dedicated monitoring of sub-programs, facility-level observations and independent third-party monitoring and verification for M&E. The vast majority of MESIP funds go to monitoring sub-programs being implemented in the most disadvantaged eight of 28 districts. Additionally, MESIP includes supporting school data collection and usage by using EMIS-HRMIS95 more effectively (Component 3) and capacity building with the provision of a two-day training session to EMIS staff nationally and vehicles to support data collection.
92. The extent to which capacity is being systematically built to collect, analyze and use data for decision making through the MESIP is constrained by politics within the ministry and the personalization of implementation. The involvement of government staff in MESIP, including aspects that build M&E capacity across the system, was perceived to be highly political and personalized. Individuals within government (both involved with and not involved with MESIP) reported this view. One government official stated, “I think in terms of capacity building, secretaries have benefited more than technical people”. Another DP stakeholder confirmed this inconsistency in data capacity and use across ministries and departments, noting “the M&E team and the EMIS team have not collaborated to see how they can work together and address issues”.
Additional factors beyond GPE support
93. While MLSS has been influenced by the ESPIG, it has also been supported through the Government of Norway, World Bank and MoEST. The Government of Norway and the World Bank, together with the GoM and MoEST, invested in the MLSS to collect data for an impact evaluation of the MESIP so that the results would encourage other development partners to invest in education in Malawi.96 It is too early in the implementation of MLSS to know if MLSS will leverage further funding for implementation.
94. Additional factors beyond GPE support include CSO funding from other donors and a strong DP presence in Malawi. As stated above, CSOs are now more active in participating in education sector dialogue. However, Malawi’s CSO associations are also funded by other donors, such as the Open Society Fund and the Swedish Embassy. These funds are used to build the capacity of member organizations to participate in education sector dialogue and hold the government accountable. Again, sector dialogue and monitoring mechanisms were established prior to Malawi joining GPE. The coordinating agency in Malawi enacts the prescribed dialogue and monitoring facilitation tasks as required within the role. However, the DP community is strong, demonstrated by the functioning
94 World Bank. August 29, 2016. Project Appraisal Document for Malawi Education Sector Improvement Project (MESIP). 95 Education Management Information System and Human Resource Management Information System. 96 MSLL Baseline.

DRAFT REPORT (VX) – COUNTRY 33
© UNIVERSALIA
nature of the Malawi Education Development Partner Group, and coordination is likely to take place in the absence of this official role.
95. The continued fiducial risks perceived by all DPs with representation in Malawi has had a significant impact on harmonization (see Section 3.4) and places pressure on government and DP relationships. Similarly, DP concerns regarding the implementation of MESIP (see Section 3.5) has impacted upon relationships in-country.
Unintended negative/unplanned positive effects of GPE support
Finding 6: The Variable Tranche component of GPE ESPIG necessitated conversations regarding data credibility in Malawi. However, the introduction of payments linked to data with limited credibility increased tensions between partners in Malawi and further highlighted the lack of mutual accountability.
96. MESIP being a distraction to other important activities was raised as an unintended negative effect of GPE support. Several DPs indicated that key individuals within the GoM failed to regularly attend coordination and planning meetings because they were concerned with MESIP. Since the GPE coordinating agency role requires additional responsibilities beyond the usual role of a DP, almost all DPs raised the issue of GPE demands on their time, and the political and financial costs of fulfilling the role. This will be discussed further in Section 3.5.
97. In addition, the introduction of performance-based payments through the DLIs has not necessarily had the desired effects in Malawi. The toll of measuring high stakes outputs and outcomes on fragile data systems can bring perverse incentives and weak systems may buckle under the pressure. While there has been a commitment to verify the results of the DLIs through an independent contractor, it is not clear how this will be done retrospectively when the baseline figures are disputed due to differing baseline values in EMIS and Malawi Longitudinal School Survey, rather than midline figures. This will be discussed further in Section 3.4.
98. The introduction of a variable tranche and the respective disbursement-linked indicators (DLIs) for MESIP necessitated cross-stakeholder discussions on the quality of EMIS data in Malawi. GPE’s use of results-based financing modalities in the Malawi education sector impacted not only the sector financing, but across the ToC with regards to sector dialogue, monitoring and mutual accountability.
99. At the time of the Year 2 CLE mission (May, 2019), the midline results for the second-round of disbursement linked results (DLRs) of the DLIs, were under discussion in Malawi. The first DLRs for the respective three DLIs were completed in June, 2018 through the development of three policies (see Sections 3.5 and 4 on sector plan implementation and education system strengthening). Consequently, a corresponding disbursement of US$6 million was made to the GoM.
100. Going forward, the second and final disbursements of the ESPIG’s variable tranche are linked to outcome variables, namely:
▪ DLI 1: Pupil Qualified Teacher Ratio for Grades 1 & 2 in the eight most disadvantaged districts;
▪ DLI 2: Female to Male Teacher Ratio in Grades 6-8 in the eight most disadvantaged districts;
▪ DLI 3: Repetition rates in Grades 1-4 in the eight most disadvantaged districts.
101. There is confusion around the indicators themselves and there is a lack of government ownership for the VT indicators. The MESIP MTR Aide Memoire report (April, 2019) states that two of the three DLIs are not reflected in MESIP’s results framework (RF). During the Year 2 CLE mission and observation of the ESPIG’s MTR, senior and mid-level government officials felt the DLI targets were too high and non-achievable. Some DPs highlighted that there was a lack of clarity from the Secretariat regarding what ‘stretch targets’ mean and they were concerned about the very limited

DRAFT REPORT (VX) – COUNTRY 34
© UNIVERSALIA
time for discussion. The additional discussion centered around how to create ownership for the VT and consensus among the MoEST, DPs and the grant agent (GA) of how it will be monitored objectively. For example, DPs raised the plethora of ‘gritting questions around indicators’ including percentage versus percentage point targets and how each variable is calculated.
102. One particularly contentious component of the variable tranche was DLI 1’s outcome indicator: Pupil Qualified Teacher Ratio for Grades 1 & 2 in the eight most disadvantaged districts. During the Year 2 CLE mission, almost all government officials said DLI 1 is made up of two components (enrolment numbers and number of teachers). They felt there was injustice in that improvements in enrolments were being ‘punished’ as they make up one of the two components of the indicator. When evaluators asked “presumably, people know that the program was trying to increase enrolment when the DLIs were agreed”, government officials responded that there was not enough focus on the relationship between increasing enrolment and its potential effect on the DLIs.
103. A potential reason for this confusion around the DLIs may be the turnover of senior government officials which contributed to a lack of institutional knowledge retention and reduced clarity.97 Additionally, a lack of clear agreement on a single data source to monitor the DLIs further exacerbated contentions around the discussion of the payment of the variable tranche. The MESIP’s Project Appraisal Document states that both MLSS and EMIS data will be used. There are strengths and weaknesses in using both MLSS and EMIS data for monitoring of the DLIs. EMIS is census-based and government owned, while MLSS is more independent and has significant technical support from experts. However, reporting rounds do not coincide, potentially introducing seasonal effects.
104. The use of two funding sources to evidence DLIs changes constrained relationships between stakeholders. While it has now been agreed to use EMIS data with an independent verification survey, it is not clear how baseline data will be verified retrospectively and many stakeholder groups are frustrated by this. The performance results of each DLI are significantly impacted by the choice of source. For example, the MESIP MTR Aide Memoire report includes shifts in data sources from MLSS to EMIS for certain intermediate-level indicators, including PQTR for Grades 1 and 2. Figure 4Error! Reference source not found. shows that the reduction in PQTR was high using EMIS data, yet almost unchanged using MLSS data. This demonstrates a fundamental challenge in Malawi to increase the quality of EMIS data in a system where there are credibility issues. Stakeholders hold very different perspectives on the extent to which decision making should be ‘evidence-based’ when the data base is of low quality. Therefore, there is tension between data quality and utilization in Malawi. The trade-offs between investing in independent verification surveys versus investing in EMIS to improve the quality of data are discussed in detail in Section 3.3: Sector Monitoring.
105. Government stakeholders rejected the MLSS findings for the variable tranche’s outcome indicators, stating that the MLSS team bypassed government processes and presented results prior to seeing or agreeing on the methodology. DPs recounted the DLI results being presented by the MLSS team and the MESIP team (using EMIS) on different days of the MESIP MTR and with vastly different messages regarding achievement.
97 For example, one government official stated: “when I saw [the DLIs] for MESIP, I thought ‘we have failed to achieve these things all these years?’ I was shocked to see them there. They said it should be a transformational change. Sometimes, I don’t know if it’s really wishing us as a nation to succeed or to fail”. Other government officials claimed, “what we have as the VT was to a large extent an imposition…”.

DRAFT REPORT (VX) – COUNTRY 35
© UNIVERSALIA
Figure 4 – DLI 1 PQTR for Grades 1 & 2 for baseline (2017) and midline (2019) of ESPIG (source: MLSS & EMIS)
106. Reported reasons for the differences include seasonal variations in school enrollment for the MLSS data and significant inflations in enrollment data in EMIS. During the most recent cycle of EMIS data, according to government interviews, an inflation adjustment was introduced (based on a study funded by UNICEF and carried out by the government M&E unit) and initiatives to reduce over-reporting implemented (including the introduction of unique student identifiers). These initiatives alone could significantly reduce enrolment figures between baseline and midline, without any actual changes in enrolment taking place. According to MLSS data, the rate of enrolment is only increasing at a level that is aligned with population growth in Malawi. As the DLI targets are based on changes from baseline, the source of data for baseline significantly impacts the target itself. Similarly, for DLI 3 (repetition rates in Grades 1-4 in the eight most disadvantaged districts), baseline values are extremely different depending on the data source. According to the MLSS data, repetition rates have increased, rather than decreased during this period, from 19.3 percent in 2017 to 21.5 percent in 2019.
107. Almost all DPs stated the need for an independent audit to verify the results and many highlighted the high level of fiduciary risk. Several DPs highlighted the risks for the Secretariat of accepting unverified data or data that lacks international credibility.
108. In addition, government and MESIP project staff consistently agreed that ‘real impact’ is being missed by the DPs through the reliance and focus on outcomes-level data. When asked to describe the impact on the ground, government and MESIP personnel consistently spoke of ‘a change of mindset’ and that students and communities value education more since MESIP implementation. While changes in attitudes towards education are important, at-scale impact achieved through implementation did not appear in these discussions. This suggests that the strategic and technical consultations required to facilitate a cultural paradigm shift towards a results-based focus have not taken place or have not been successful. Results-based financing shifts the implementation risk from the donor to the agent98 and it is important that this is understood by all stakeholders. In addition to risks, the rewards, data sources, verification processes and baseline figures should be clearly negotiated and agreed from inception.99
109. Both DPs and the GoM were concerned about the discretionary nature of funding received from any DLI. For example, a DP mentioned that they were surprised to find that disbursements could
98 OECD 2014. Key take-aways from experiences discussed during a technical workshop organised by the OECD Development Co-operation Directorate and the German Development Institute/Deutsches Institut für Entwicklungspolitik. 99 Ibid.
Baseline Midline
MLSS 118.34 117.07
EMIS 166 123
0
20
40
60
80
100
120
140
160
180
Pq
TR

DRAFT REPORT (VX) – COUNTRY 36
© UNIVERSALIA
be directed to areas outside of education. A government official was concerned that the funding may not return to the education budget. There was also contention, among stakeholder groups, around the likelihood of funds being used to fill gaps in rising unit costs for MESIP components.
Implications for GPE’s ToC and country level operational model
110. There are limitations in the use of performance-based payments in countries with weak monitoring system as shown by the effects of the GPE variable tranche support in Malawi. Therefore, there is need for strong consultations regarding the risk, reward, baseline values and data sources for results-based payment and a focus on shifting the cultural paradigm away from outputs towards outcomes.
Box 4 - Testing Assumptions and Assessing Strength of Evidence
For sector dialogue and monitoring, the four underlying assumptions in the country level ToC were: (1) GPE has sufficient leverage at global and country level to influence LEG existence and functioning; (2) country level stakeholders have capability to work together to solve education sector issues. (3) Stakeholders have the opportunities (resources, time, conducive environment) to do so; (4) stakeholders have the motivation (incentives) to do so. The final assessment at the end of the final year of this evaluation is:
Assumption 1 holds. GPE’s leverage in Malawi is strong with regard to dialogue and monitoring. This is evidenced by government and DPs establishing an additional dialogue mechanism to meet GPE standards, which was then disbanded when stakeholders were advised that the current mechanism meets GPE standards.
Assumption 2 holds. There is capability both in the government and in partner organizations to coordinate around sector issues, however this is often constrained by a lack of political will.
Assumption 3 is mixed. While many stakeholders have the opportunities to work together to solve education sector issues, in circumstances where the political will is not present such opportunities are significantly constrained.
Assumption 4 is mixed. The stakeholder groups responsible for solving education sector issues in Malawi are diverse. Where there is a breakdown in incentives, all stakeholders are constrained.
The evidence for assessing changes in the education system in Malawi is moderate. Dialogue and monitoring take part as usual practice for education sector actors. Both documentary evidence and stakeholder interviews confirm that while dialogue is frequent, it is not often strategic.

DRAFT REPORT (VX) – COUNTRY 37
© UNIVERSALIA
3.4 GPE contributions to sector financing100
111. A high-level overview of evaluation findings on sector financing and related GPE contributions during the review period is provided in
112. Table 12
113. Table 12 . These observations are elaborated in the findings and supporting evidence presented in this section.
Table 12 – Progress made and GPE contributions to sector financing 101
PROGRESS MADE TOWARDS MORE/BETTER EDUCATION SECTOR FINANCING
LIKELIHOOD OF GPE CONTRIBUTIONS TO102:
Total domestic education
expenditure.
Education share of domestic budget
Met 20%
Goal?103
Total intl. education financing
to country
Quality of intl.
financing
Amount of
domestic financing
Amount of international.
financing
Quality of international.
sector financing
Modest decrease according to UIS (disputed by other sources) 104
Modest decrease
Met Increase Improved Likely Likely Modest
ASSUMPTIONS105
1 2
STRENGTH OF UNDERLYING EVIDENCE
1 2
100 This section addresses evaluation questions CEQ 1.5 and 1.6, as well as (cross cutting) CEQs 3.1 and 3.2. 101 All data on ODA can be found at https://stats.oecd.org/ under the ‘development’ sub-menu. 102 Assessment is based on (i) existence/absence of positive change in respective area; (ii) stakeholder views on likelihood of GPE support/funding criteria having influenced domestic or international funding decisions; (iii) absence or existence of additional factors that are as/more likely than GPE support to explain noted trends. 103 One of GPE’s ESPIG funding requirements is that 20 percent of government expenditure be invested in education, or that government expenditure on education show an increase toward the 20 percent threshold. 104 UIS (April, 2019) reports a modest decrease in domestic expenditure: the value of the total domestic education budget decreased from US$326.51 million in 2013 to US$302.64 million in 2016. However, UNICEF’s 2018/19 Education Budget Brief for Malawi (January, 2019) reports that over the past seven years (2012-2019) total education spending has modestly tended upwards in both nominal and real terms (Source: Government-approved budget estimates, FY2012/13-2018/19). 105 1: GPE has sufficient leverage to influence the amount and quality of domestic education sector financing, 2: External (contextual) factors permit national and international stakeholders to increase/improve the quality of sector financing, 3: stakeholders have the opportunities (resources, time, conducive environment) to do so.
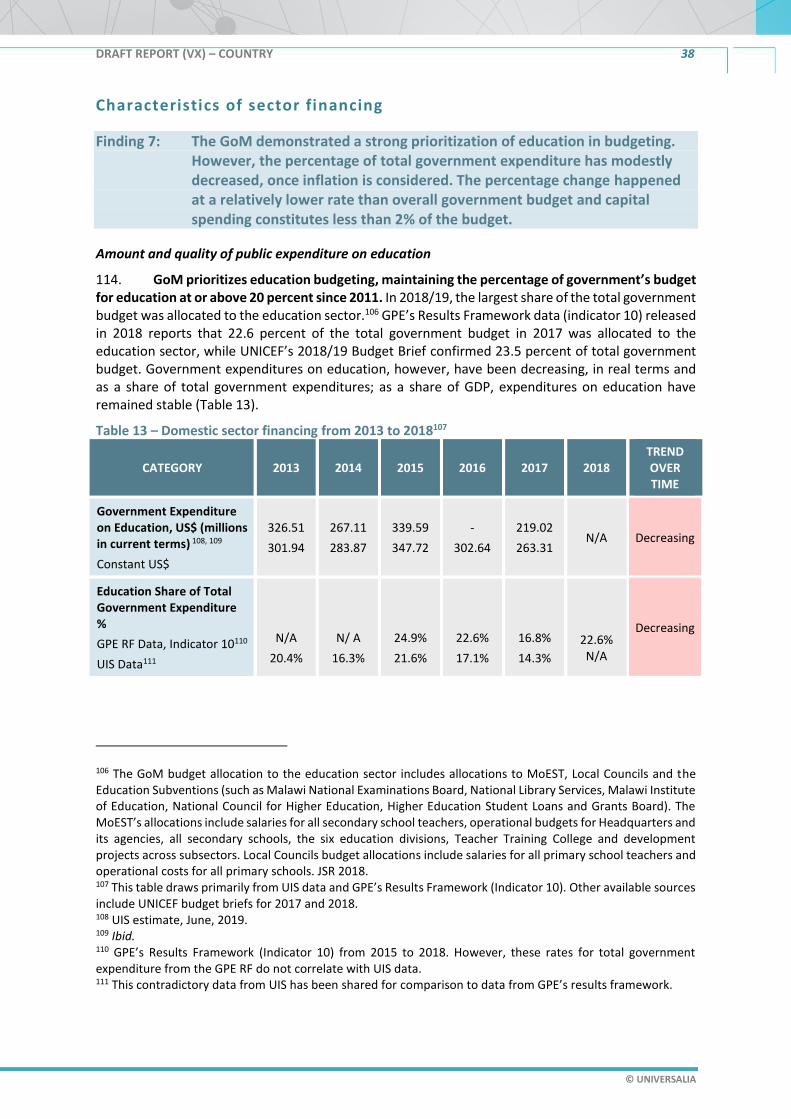
DRAFT REPORT (VX) – COUNTRY 38
© UNIVERSALIA
Characteristics of sector financing
Finding 7: The GoM demonstrated a strong prioritization of education in budgeting. However, the percentage of total government expenditure has modestly decreased, once inflation is considered. The percentage change happened at a relatively lower rate than overall government budget and capital spending constitutes less than 2% of the budget.
Amount and quality of public expenditure on education
114. GoM prioritizes education budgeting, maintaining the percentage of government’s budget for education at or above 20 percent since 2011. In 2018/19, the largest share of the total government budget was allocated to the education sector.106 GPE’s Results Framework data (indicator 10) released in 2018 reports that 22.6 percent of the total government budget in 2017 was allocated to the education sector, while UNICEF’s 2018/19 Budget Brief confirmed 23.5 percent of total government budget. Government expenditures on education, however, have been decreasing, in real terms and as a share of total government expenditures; as a share of GDP, expenditures on education have remained stable (Table 13).
Table 13 – Domestic sector financing from 2013 to 2018107
CATEGORY 2013 2014 2015 2016 2017 2018 TREND OVER TIME
Government Expenditure on Education, US$ (millions in current terms) 108, 109
Constant US$
326.51
301.94
267.11
283.87
339.59
347.72
-
302.64
219.02
263.31 N/A Decreasing
Education Share of Total Government Expenditure %
GPE RF Data, Indicator 10110
UIS Data111
N/A
20.4%
N/ A
16.3%
24.9%
21.6%
22.6%
17.1%
16.8%
14.3%
22.6% N/A
Decreasing
106 The GoM budget allocation to the education sector includes allocations to MoEST, Local Councils and the Education Subventions (such as Malawi National Examinations Board, National Library Services, Malawi Institute of Education, National Council for Higher Education, Higher Education Student Loans and Grants Board). The MoEST’s allocations include salaries for all secondary school teachers, operational budgets for Headquarters and its agencies, all secondary schools, the six education divisions, Teacher Training College and development projects across subsectors. Local Councils budget allocations include salaries for all primary school teachers and operational costs for all primary schools. JSR 2018. 107 This table draws primarily from UIS data and GPE’s Results Framework (Indicator 10). Other available sources include UNICEF budget briefs for 2017 and 2018. 108 UIS estimate, June, 2019. 109 Ibid. 110 GPE’s Results Framework (Indicator 10) from 2015 to 2018. However, these rates for total government expenditure from the GPE RF do not correlate with UIS data. 111 This contradictory data from UIS has been shared for comparison to data from GPE’s results framework.

DRAFT REPORT (VX) – COUNTRY 39
© UNIVERSALIA
CATEGORY 2013 2014 2015 2016 2017 2018 TREND OVER TIME
Education expenditure share of GDP, %112
5.4% 4.8% 5.61% 4.75% 4.0% N/A Stable
115. Under the GPE Funding Model (in place since 2015), one ESPIG funding requirements is that 20 percent of government expenditure be invested in education, or that government expenditures on education show an increase toward the 20 percent threshold. This includes budget for both recurrent and capital expenditures from public sources (and excludes debt service). Countries are considered successful if they maintain or are working towards 20 percent of the budget for the sector. Different data sources paint different pictures regarding the education proportion of the budget. According to government data and GPE RF data,113 Malawi has reached this threshold maintaining the percentage of government budget for education at or above 20 percent since 2011 (except in 2017), but with a visible decline over time.114 According to UIS data, this declined from 20.41 percent in 2013 to an estimated 14.34 percent in 2017 (most recent data available).115 Moreover, in real terms, the total domestic education budget has decreased in the last four years116 and education’s share of total government expenditures has also decreased.117 This may be a result of recent slow and inconsistent economic growth, cycles of economic crisis, and Malawi’s heavy dependence on foreign aid, which was suspended in 2014 in response to economic mismanagement.118 Capital expenditure appeared to be most affected during that period, as total recurrent costs comprised the bulk of education financing and remained consistent over time.119 However, conversely UNICEF’s 2018/2019 assessment of the government of Malawi’s education sector budgeting contends that most recently, the education sector received the highest share of the total government budget, 23.5 percent of the total government budget.
116. Education receives the largest share of the government budget and basic education receives the largest share of the education budget. According to UNICEF’s Education Budget Brief in FY 2018/2019, the basic education sector120 received the largest share of the overall education sector resources, 47.8 percent, of which the majority, 83 percent, was allocated to recurrent spending.121 In comparison, according to most recent UIS data from 2017, Malawi’s primary school population makes up 34 percent of the total in-school population (although it should be noted that the cost of education varies by sub-sector).122 This total budget allocation to basic education in FY 2018/19 (Malawian Kwacha 163 billion) increased by 17 percent in nominal terms and by 6.4 percent in real terms compared to MK139 billion in FY 2017/18 (and a significant increase from the MK99 billion allocated to basic education in 2016/17).
112 UIS Data for Malawi. 113 According to the GPE results framework data the GoM allocated 22.6 percent of total government budget to education financing in 2018, a slight decline from the 25.4 percent allocated according to the 2017 RF data. 114 MoEST, October 2017, Review Report for NESP 2008-2017 and ESIP II 2013/14 and 2017/18. 115 Data extracted on April 10, 2019 from UIS.Stat. 116 According to UIS, there has been a decrease in the value of the total domestic education budget, from US$326.51 million in 2013 to US$302.64 million in 2016. 117 Data extracted on April 10, 2019 from UIS.Stat. 118 World Bank. (December, 2018). Malawi Systematic Country Diagnostic: Breaking the Cycle of Low Growth and Slow Poverty Reduction. 119 UNICEF, January 2019. 2018/19 Education Budget Brief: Malawi. 120 The total budget reported under basic education is the sum total of allocations to the Ministry of Education, Science and Technology for basic education plus transfers to district councils for other recurrent transactions and personal emoluments. 121 UNICEF, January 2019. 2018/19 Education Budget Brief: Malawi. 122 UNESCO UIS website, Malawi country profile, 2017. Section: Education System.

DRAFT REPORT (VX) – COUNTRY 40
© UNIVERSALIA
117. Only 0.20 percent (MK669 million, US$916,000) of government budgeting was allocated for early childhood development (ECD) in 2018/19, which is nominally higher by 9 percent compared to the revised allocation in the previous year (MK616 million). However, if inflation is considered, in real terms, the government’s allocation to ECD had decreased by 2%. From 2019 to 2024, a US$60 million grant for “Investing in Early Years” from the World Bank will support ECD in Malawi. Interestingly, higher (tertiary) education was allocated the second largest recurrent budget in 2018/19, 35.7 percent. The tertiary education budget, totaling MK121 billion, has increased by 19% in nominal terms and 8% in real terms in 2018/19 from the revised budget of MK102 billion in 2017/18.
118. Secondary education received 11.5 percent of the total education sector budget in 2018/19. There was an increase in the secondary education budget from Year 1 of the CLE to Year 2 of the CLE, as MK39 billion was allocated in 2018/19 compared to the MK33 billion allocated in 2017/18. This was an increase of 18 percent in nominal terms and 6% in real terms. However, this increase is not sufficient in the face of the difficult realities in the Malawi secondary education sector, including the relatively few schools and low rates of professionally trained secondary school teachers. UNICEF 2018/19 Education Budget Brief highlights that this lack of appropriate funding for secondary schools is visible across both government and DP’s capital spending: “Analysis of capital investments by both Government and development partners show glaring disparities between primary and secondary education. Secondary education will get 28 percent (MK12 billion) of the total capital budget for education whilst basic education has been allocated 65 percent (MK28 billion).”123
Table 14 – Nominal changes from 2017/18 (Year 1 CLE) to 2018/2019 (Year 2 CLE) in MoEST’s budget allocations by education level
EDUCATION LEVEL
TOTAL GOM’S BUDGET ALLOCATION (NOMINAL VALUES)124 125
2017/18 2018/19
Early childhood development (pre-primary education)
MK616 million/US$843,550 MK669 million/
US$ 916,128
Basic education MK139 billion/ US$190,346,600
MK163 billion /
US$223,2122,00
Secondary education MK33 billion/
US$45,190,200
MK39 billion /
US$53,406,600
Tertiary education MK102 billion/
US$139,678,800
MK 121 billion /
US$165,697,400
119. While the proportion of the government budget is allocated to education meets GPE criteria and is increasing, actual expenditure is opaque. In addition, the weak reliability of funding compromises financing quality. Detailed expenditure data is not available. However, total figures provided by government indicate that while the 2017/18 budget projection for recurrent and capital (as a percent of the total budget) for education was 21.37 percent, the actual budget was 18.51 percent and actual expenditure was 16.79 percent.126 The reliability of domestic financing and public oversight are challenges in Malawi, both with regards to the reliability of data (discussed in sector monitoring) and reliability of public financial oversight. According to the MoEST ESIP II, reliability was
123 UNICEF, January 2019. 2018/19 Education Budget Brief: Malawi, pg. 7. 124 UNICEF, January 2019. 2018/19 Education Budget Brief: Malawi. 125 According to Malawi Kwacha-USD conversion, June 2019. 126 Figures provided by the Department of Planning, Malawi during the mission.
DRAFT REPORT (VX) – COUNTRY 41
© UNIVERSALIA
compromised by the establishment of a prudent fiscal policy to narrow the fiscal deficit, resulting in overwhelming overruns in primary expenditure and heavy borrowing from the banking system.127 Weak public financial management systems manifest in inadequate monitoring and reporting of fiscal risks, re-allocations of budget funds in response to political and external events, resulting in frequent shifts in budget prioritization. 128 Moreover, a lack of transparency in expenditure leads to difficulties in assessing efficient service delivery.129
120. Overall, the largest component of the education budget for MoEST are recurrent costs. Capital spending comprised of only 13 percent and recurrent costs, 87 percent of MoEST’s overall budget in 2018. Public personnel salary and benefits spending in 2016-17 consisted of 74 percent of total education spending.130 Drivers of recurrent and capital expenditure are different, with capital expenditures much more volatile and recurrent expenditures consistently for salaries. For example, the Review Report for NESP and ESIP II demonstrated that significant resources within the education sector are allocated for teacher salaries: with 61.8 percent of the 2016/17 recurrent education budget allocated for payment of salaries. Also as discussed in the Year 1 CLE, with DPs not using government systems in Malawi (and thus the GoM budget not capturing the full picture of development partners’ expenditure in the sector), it is likely that the total education expenditure may be understated in the GoM budget figures.
121. Stakeholder interviews and documentary evidence confirms that the government’s absorption capacity is low, indicating that even where funds are available, they are not converted into activities in a timely manner. Government capacity to absorb domestic funds was raised by DPs and CSOs in Malawi. Data on the extent to which government is able to absorb funds to implement education initiatives in Malawi provides a mixed picture. While the 2018 JSR report131 indicates high levels of absorption overall, a report produced by the Civil Society Education Coalition132 provides much lower absorption levels. For example, an analysis of the 2017/18 MoEST budget by the CSEC indicates that there are consistently issues with absorption. Only MK30 billion out of MK75 billion was disbursed to MoEST (39%) 2017/18 funding, according to CSEC. MoEST’s absorption capacity is one of the seven key recommendations for Parliament in CSECs Analysis of the 2018/19 Education Draft National Budget: “Parliament Committee should lobby for serious improvements in absorption capacity of MoEST, which is very low, hence leading to low spending, particularly for projects.”133
122. While it is not possible in this report to undertake a detailed analysis of absorption capacity, Secretariat and government documents clearly document GPE funding and other project-based funding absorption challenges. Budget utilization by projects ranged from 11 to 70 percent (including construction of teacher training colleges, girls’ hostels, primary and secondary schools, science laboratories and libraries). Desks for primary and secondary and support to higher education utilization rates were 100 percent or over. In terms of total budget, the total development (capital) budget parts 1 and 2 for Malawi utilized 37 percent of the approved budget (Figure 5).134
127 Education Sector Implementation Plan II (ESIP II) 2013/14-2017/18, The Government of Malawi, p. 17. 128 Report on the Evaluation of the Public Financial Management System of Malawi. Public Expenditure and Financial Accountability Assessment, November 2018. 129 Report on the Evaluation of the Public Financial Management System of Malawi. Public Expenditure and Financial Accountability Assessment November 2018. 130 Report on the Evaluation of the Public Financial Management System of Malawi. Public Expenditure and Financial Accountability Assessment November 2018, p.5. 131 The 2017/18 Education Sector Performance Report. 2018. MoEST. 132 Analysis of the National Budget Focusing of Education Sector. 2018. CSEC. 133 Ibid. 134 The 2017/18 Education Sector Performance Report. 2018. MoEST.

DRAFT REPORT (VX) – COUNTRY 42
© UNIVERSALIA
Figure 5 – Donor Funding Absorption in Education According to Data Source, 2018
123. One possible explanation for lower absorption rates may be protracted procurement processes, particularly for capital budget execution. UNICEF’s 2018/19 budget brief for Malawi outlines one instance: the procurement of desks which started in 2017/18 spilled over to 2018/19. In the 2018/19 Program Based Budget, the MoEST also noted that payment of contractors takes long.135 However, it should be noted as a fiduciary measure, donors often impose rigorous procurement practices to prevent mismanagement of funds.
124. ESIP II financing remains uncertain, with domestic financing supporting recurrent costs at all levels of education and external funding focusing on capital projects. While the current ESPIG is US$44 million, a financing gap remains. The National Education Sector Plan in Malawi receives both government and international financing for implementation. In spite of Cashgate in 2013/2014, the Government of Malawi has maintained education sector and the NESP as a top spending priority, as the education sector received the highest share of the total government budget in 2018/19 (MK345 billion/US$47.443 million).136 However, despite the government’s contributions, one of the primary concerns with implementing ESIP II is funding uncertainty. ESIP II is financed through domestic funding and externally funded (bilateral and multilateral) projects. Domestic resources are used for recurrent costs (salaries, operational expenses, and basic goods and services) at all levels of education. Externally funded projects focus on various development areas, including early grade reading, teaching and learning materials, teacher development and management, inclusive education, school health and nutrition, and other capital projects.
Amount and quality of international financing
135 UNICEF, January 2019. 2018/19 Education Budget Brief: Malawi, p. 10. 136 UNICEF, January 2019. 2018/19 Education Budget Brief: Malawi, p. 5.
0
10
20
30
40
50
60
70
80
90
100
Percent budget funded Percent funding spent Percent budget spent
Government ESPR 2018 Final Report Civil Society Education Coalition Analysis

DRAFT REPORT (VX) – COUNTRY 43
© UNIVERSALIA
Finding 8: The overall amounts of ODA to Malawi and of ODA to Malawi’s education sector has steadily increased over the past decade, with the share of total ODA maintaining a steady 9.4 percent. Over time, ODA support to education in Malawi has moved from pooled funding, to off-budget support and now towards a joint funding arrangement.
125. Total overseas development assistance (ODA) to Malawi has increased significantly, from almost US$954 million from all official donors and DPs in 2010 to US$1,515 million in 2017.137, 138 ODA to the education sector has followed a similar upwards trend, from US$89.8 million in 2010 to US$92.5 million in 2016 and then sharply increasing to US$148.7 million in 2017. The large jump in 2017 is in part due to gross disbursements by USAID for MoEST’s Early Grade Reading Improvement (EGRI) activity within the MERIT program (US$20 million)139 and by US Department of Agriculture to the World Food Program’s McGovern-Dole program (US$15.7million)140 (
Table 15 and
126. Figure 6).141 The education sector’s share of total ODA to Malawi was 9.42 percent in 2010, dropping to 7.07 percent in 2016 and rising to 9.48 percent in 2017.
Table 15 – ODA sector financing from 2010 to 2017142
FLOW 2010 2017 TREND
Total ODA, all sectors, US$ million (current), humanitarian and development
US$953.92 million US$1,568.93 million Rising
Total education ODA (humanitarian and development), US$ million (current)
US$89.82 million US$148.67 million Rising
Education ODA as % of total ODA 9.42% 9.48% Steady
Basic education ODA, US$ million (current)
US$51.75 million US$77.66 million Rising
137 Data extracted on June 26, 2019 from OECD.Stat. 138 There was however a small dip in 2011 to US$737million due to inflation during the economic crisis and a similar dip in 2014 to US$931million, presumably in response to the Capital Hill Cashgate Scandal. 139 The Malawi Early Grade Reading Improvement Activity (MERIT) will assist the Ministry of Education, Science and Technology to improve the reading skills of students in Standards/Grades 1-3. EGRI will work in districts that are beyond the reach of current USAID/Malawi-funded reading interventions. 140 The McGovern-Dole program donates agricultural commodities and provides financial and technical assistance to improve the education, food security and health of school-age children, especially girls, in developing countries. 141 Data extracted on April 29, 2019 from OECD.Stat. 142 This table draws primarily from OECD.Stat data.

DRAFT REPORT (VX) – COUNTRY 44
© UNIVERSALIA
Figure 6 – Total ODA to Malawi Education Sector143
127. Basic education has consistently received over 50 percent of total ODA to education in the past three years, reaching 52.2 percent of education ODA (US$77.66 million) in 2017 after a significant dip to 37 percent in 2013 and 2014.144 Recently, the EU has shifted focus to support secondary and TVET, based on other DP’s focus on basic education.
128. The Project Appraisal Document for the ESPIG (MESIP of August, 2016) estimated the financing needs of ESIP II at US$170 million. GPE’s current ESPIG is for a total of US$44.9 million, of which US$31.43 million is the fixed amount and is intended to catalyze other donor support, as it only covers 18 percent of the ESIP II financing gap. In addition to the fixed contribution, GPE’s financing includes a results-based modality for disbursement of the variable tranche of the GPE ESPIG (30 percent of the US$13.37 million total). Other development partners have contributed explicitly to the ESIP II, including from the Norwegian government (estimated at US$4.7 million annually), the German government (overall estimate of US$5 million) and UNICEF (overall estimate of US$1 million).
129. Over the NESP implementation period, the alignment and harmonization of international financing have gone through several stages. On-budget pooled funding is unlikely to take place in the foreseeable future. However, recent advances in joint funding amongst donors provides some hope for increased harmonization in the coming years. ODA support to education in Malawi has moved from pooled funding to off-budget support. It is now moving towards a joint funding arrangement managed by an independent fiduciary manager. Not all donors committed to a joint fund, but enough DPs are now on board for improvements in alignment and harmonization to occur.
130. In 2010, there was a Joint Financing Agreement and Memorandum of Understanding signed between the Ministry of Finance, MoEST and DPs for a potential pooled fund to support identified priority areas. Pooled funding was facilitated through the education Sector-Wide Approach (SWAp) program, leading to an increase in government and DP expenditure in 2011.145
131. The Capital Hill Cashgate Scandal in 2013 brought to light large-scale financial mismanagement, which led the majority of international DPs to suspend or withdraw their general budget support and sector budget support, as well as interest for a pooled funding mechanism. The withdrawal of this support led to a large budget deficit, forcing the government to print money to cover the deficit and pushing inflation. The World Bank estimated that in 2014/15, the government ran a fiscal deficit at 5.9 percent as a result146 and MoEST did not receive any pooled resources from development partners in 2015/16.147 Pooled funding mechanisms were disbanded (specifically SWAp)
143 Data extracted on April 29, 2019 from OECD.Stat. 144 Data extracted on April 29, 2019 from OECD.Stat. 145 MoEST, November 2016, 2015/2016 Education Sector Performance Report, p. 13. 146 GPE Malawi Briefing Note for G20 Summit, June 2017. 147 MoEST, November 2016, 2015/2016 Education Sector Performance Report, p. 14.
0
20
40
60
80
100
120
140
160
2010 2011 2012 2013 2014 2015 2016 2017
USD
Mill
ion
s

DRAFT REPORT (VX) – COUNTRY 45
© UNIVERSALIA
in 2014 and DPs’ significant contributions to pooled funding, previously accounting for 26.5 percent of education budget financing in 2013, were withdrawn. According to the MESIP Project Appraisal Document, this left a deep funding gap with all DP projects moved to being off-budget. In response to Cashgate, DPs who are party to the GPE therefore requested that any new GPE-financed project be overseen by a project facilitation team to provide fiduciary oversight and substantive support in establishing sound government systems.
132. Since then the Common Funding Mechanism (CFM) was established in December, 2017 and signed on by a number of DPs, namely Norway, Germany, the World Bank, UNICEF and DFID.148 An international accounting firm has been procured to provide the fiduciary oversight responsibility as required by the Common Funding Mechanism, which is known as the Joint Sector Reforms Fund. In 2017, Norway’s Ministry of Foreign Affairs and the German Ministry of Economic Cooperation and Development (BMZ) committed to providing basket funding to this new joint funding arrangement149 to support the implementation of the MoEST’s education sector plan. Most significantly, Norway earmarked US$19.34 million from 2017 to 2020 to support GoM to implement NESP and ESIP II through the MESIP thereby supporting ESIP II by extending the ESPIG beyond GPE’s direct financial support (as the ESPIG is slated to end in 2019). MESIP II is complementary to GPE’s ESPIG and earmarked to support MESIP pilot initiatives in four additional districts. Germany’s BMZ similarly contributed US$5.65 million to GoM to co-finance the basic education basket within NESP.150 During the 2019 mission, UNICEF confirmed they will also join the Joint Fund and DPs confirmed that PwC would do the fiduciary management of the Education Sector Joint Fund. Some DPs expressed a desire to wait and see for a few years before contributing to the Joint Fund. Other DPs’ contributions to the CFM will not be dependent on MESIP but will take lessons learned and project components from MESIP, including components 1 and 2, in different regions.
133. The potential for micro-level pooling of funding with other DPs (across PSIP and MESIP) was discussed during the Mid-Term Review of the ESPIG in March 2019 to address funding shortfalls for school construction as part of MESIP’s Component 2. This would essentially entail pooling funds from multiple donors at the sub-national level. This was not approved by government as MESIP implementers cited the schools’ autonomy to determine funding implementation from two separate plans.151
GPE contributions to sector financing
Finding 9: GPE advocacy for increased domestic financing to education may be one of a number of reasons for increased domestic financing, and financial support through an on-budget modality is highly valued by government. GPE support for harmonization has the potential to increase the quality of funding provided by other development partners, if the Joint Funding arrangements can demonstrate management of potential risks.
134. GPE offers a series of financial and non-financial mechanisms to support the quantity and quality of domestic and international sector financing. Table 16Error! Reference source not found.
148 https://www.norway.no/en/malawi/norway-malawi/news-events/news2/launch-of-the-education-services-joint-fund-and-common-fiduciary-oversight-arrangement/ 149 World Bank. December, 2017. MESIP Implementation Status & Results Report, No. 4. 150 Ibid. 151 For instance, one example emphasized during the MTR was that pooled micro-funding at school level was not possible (e.g. in response to cases of two donors providing funding for partial school construction of two schools in the same site) and emphasized the need for ‘school autonomy’ to make those decisions instead of coordination to fully build one school with multiple donor funding.

DRAFT REPORT (VX) – COUNTRY 46
© UNIVERSALIA
provides an overview of these mechanisms, grouped by whether they are likely to have made a significant, moderately significant, or no/limited contribution in Malawi. This grouping does not constitute a formal score.
Table 16 – GPE contributions to sector financing during the review period
SIGNIFICANT CONTRIBUTION TO DOMESTIC FINANCING
SIGNIFICANT CONTRIBUTION TO INTERNATIONAL FINANCING
▪ No significant contributions. ▪ ESPIG funds: In 2016 and 2017 combined, GPE funding to education in Malawi made up approximately 19 percent of approved ODA to education in Malawi. This amount does not include the variable tranche disbursement.152
MODERATE CONTRIBUTION TO DOMESTIC FINANCING
MODERATE CONTRIBUTION TO INTERNATIONAL FINANCING
▪ ESPIG funding requirement: Influencing commitments to domestic financing to education: increased government commitment is likely due to a variety of reasons, including the President’s commitment to the education sector, GPE global advocacy and the government’s appreciation of the MESIP program as currently the only type of on-budget support received. However, the extent to which budget commitments result in consistent budget expenditure is difficult to assess in Malawi.
▪ ESPIG modality: improved quality of funding and fund harmonization among some DPs through establishing the CFM/Joint Fund and supporting improved fiduciary government mechanisms in MESIP, decisions by DPs to contribute to the Joint Fund are influenced by the program components of MESIP.
▪ GPE advocacy: GPE support likely moderately influenced the establishment of the Joint Fund in Malawi. In addition, decisions regarding the Joint Fund-supported activities were heavily influenced by the program components of MESIP.
NOT APPLICABLE / TOO EARLY TO TELL
▪ Variable tranche/DLI influence on domestic spending: While the first VT disbursement (as part of the ESPIG) has taken place, it is unclear if the second disbursement criteria has been met due to weak or new data systems.
▪ GPE support for sector monitoring: GPE financial support has leveraged additional support to monitor the impact of MESIP: however, it is too early in the implementation of MLSS to know if MLSS will leverage further funding for implementation.
135. GPE’s proportion of international funding to education comprised about one fifth of total ODA in 2016 and 2017. Though a relatively low overall proportion of total funding153, the government of Malawi highly valued the project as the only on-budget support in the education sector. In 2016 and 2017 combined GPE funding to education in Malawi made up approximately 19 percent of approved ODA to education. This amount does not include the VT disbursement as the entirety of the VT amount’s disbursement is yet to be endorsed by the LEG.154 Documentary evidence and interview data from the mission provide a mixed picture on the strengths and weaknesses of GPE’s on-budget support.
152 There was no nationally compiled data on ODA to education due to the nature of off-budget support to education in Malawi. 153 It is helpful to note that the ESPIG in Malawi as a proportion of total international financing is relatively higher than in a number of other partner countries in the GPE. 154 2016 and 2017 values were used as OECD international data allocates ODA to the year of approval, rather than the year of disbursement. There was no nationally compiled data on ODA to education due to the nature of off budget support to education in Malawi. The use of 2016 data alone would inflate the GPE financial contribution and the 2017 data would deflate the contribution.

DRAFT REPORT (VX) – COUNTRY 47
© UNIVERSALIA
Figure 7 – Total ODA to Malawi education sector approved in 2016 and 2017155
136. By providing on-budget support GPE gives the government the opportunity to demonstrate capacity to implement and potentially address the concerns of other donors. However, this does not seem to have been successful in Malawi as DPs raised significant concerns regarding the management of fiduciary risks in MESIP.156 However, improvements in the alignment and harmonization of DP funding are taking place. GPE’s financing, overseen by the Grant Agent’s project facilitation team to provide sound fiduciary oversight, have supported improving alignment and harmonization of DP funding by rebuilding trust among DPs. Interviews conducted with DPs in April, 2018 led to the conclusion that more and more DPs were giving thought to combining and harmonizing
155 OECD.Stat. Creditor Reporting System on official donor funds to Malawi education sector in 2016 and 2017. Accessed on September 5th, 2019. 156 To be detailed in Section 3.5:
Box 5 - Testing Assumptions and Assessing Strength of Evidence
For sector financing, the two underlying assumptions in the country level ToC were: 1) GPE has sufficient leverage to influence the amount and quality of domestic education sector financing; and (2) External (contextual) factors permit national and international stakeholders to increase/improve the quality of sector financing. The final assessment at the end of the final year of this evaluation is:
Assumption 1 is mixed. While there was a renewed commitment by the GoM to increase the education sector budget, the history of reallocations and differences between budget and expenditures in Malawi indicate this may not result in actual increases. However, the national desire for on-budget financial support has focused government on GPE fiduciary requirements.
Assumption 2 is mixed. Despite Cashgate in 2013, Malawi’s DPs have increased confidence in the fiduciary systems in place in GoM. This rebuilding is in part due to GPE’s non-financial contributions of providing fiduciary oversight and substantive support in establishing sound government systems.
The evidence for assessing changes in the education system in Malawi is strong. The absence of data on sector expenditure points to disjointed and opaque funding flows in Malawi.
GPE contributions to sector plan implementation
81%
19%Other ODA to education
GPE ESPIG (not includingvariable tranche)

DRAFT REPORT (VX) – COUNTRY 48
© UNIVERSALIA
their investments in the sector and targeting key components of the implementation plan. As outlined above, by 2019 this had resulted in two donors committing funds to the Joint Fund and one additional donor announcing a contribution.
137. There were mixed views regarding the extent to which ESPIG funding influenced the establishment of the Joint Fund, however GPE global advocacy for harmonization and influences through MESIP are likely to have catalyzed the establishment of the Joint Fund. While the DPs committing funds were already likely to contribute the same value of funding to education, most did attribute part of the decision to join funds to GPE’s global advocacy for harmonization. In addition to the plausible GPE contribution to joint funding, decisions regarding the Joint Fund-supported activities were heavily influenced by the program components of MESIP. One DP stated “Norway has designed an entire program based on MESIP.” Therefore, while it is unlikely that GPE has contributed to the quantity of other DP funding, there is a potential quality contribution. However, this relies on the careful management of fiduciary risk to ensure funds are appropriately spent.
138. There has been a renewed commitment by the GoM for increasing its sector budget. However, it is not clear if this will result in increases in actual expenditure. Increases in the allocation of government funding to education have been observed over the period under review. In addition, in February 2018 the GoM announced an increase in the education budget from 24 percent in 2018 to 31 percent in 2020 at the GPE Replenishment Conference.157 The increased government commitment is likely due to a variety of reasons, including the President’s commitment to the education sector, GPE global advocacy and the government’s appreciation of the MESIP program as currently the only type of on-budget support received. Importantly, in discussions regarding increased domestic budget to education in Malawi, the issue of actual expenditure, transparency in expenditure and absorption capacity are important components of “more and better” funding to education. Increases in education budget must be accompanied by increased actual expenditure, transparency in expenditure and increased absorption capacity in order to support the efficient implementation of the sector plan and convert resources into a stronger system.
Additional factors beyond GPE support
139. The GPE ESPIG was designed with Cashgate and DPs’ subsequent funding responses in mind. Cashgate hindered significant movement by a large number of DPs towards harmonization of education funding through government-operated pooled funding modalities. As previously discussed, Cashgate was the most impactful education sector financing incident in the past ten years. This caused several donors to suspend or withdraw their on-treasury support and interest for a pooled funding mechanism.
140. Recent improvements in financing may reflect the current political situation in Malawi. Malawi had a contested election period in the first half of 2019. It was noted by a number of interviewees during the Year 2 CLE evaluation mission (May, 2019) that sudden actions in early 2019 such as hiring large numbers of teachers and promises of financial investment in school infrastructure may be a result of the election campaigning. After the election in May, 2019, implementation of such promises remains to be seen in the future.
Unintended negative/unplanned positive effects of GPE support
141. The Year 1 evaluation report in 2018 found that one unintended consequence of the strong focus on Basic Education in recent years is that some DPs (such as the EU) have shifted their focus towards neglected sectors within education (such as secondary schools and TVET), believing that basic education is now sufficiently supported when compared with other sub-sectors within education.
157 www.nyasatimes.com/csos-committed-implementation-malawi-govt-education-pledge/

DRAFT REPORT (VX) – COUNTRY 49
© UNIVERSALIA
Implications for GPE’s ToC and country level operational model 142. The analysis above implies interesting questions for GPE and its ability to influence sector financing. Particularly, there is a question about whether the extent to which budget commitments result in consistent budget expenditure is able to assessed in contexts like Malawi.
Box 5 - Testing Assumptions and Assessing Strength of Evidence
For sector financing, the two underlying assumptions in the country level ToC were: 1) GPE has sufficient leverage to influence the amount and quality of domestic education sector financing; and (2) External (contextual) factors permit national and international stakeholders to increase/improve the quality of sector financing. The final assessment at the end of the final year of this evaluation is:
Assumption 1 is mixed. While there was a renewed commitment by the GoM to increase the education sector budget, the history of reallocations and differences between budget and expenditures in Malawi indicate this may not result in actual increases. However, the national desire for on-budget financial support has focused government on GPE fiduciary requirements.
Assumption 2 is mixed. Despite Cashgate in 2013, Malawi’s DPs have increased confidence in the fiduciary systems in place in GoM. This rebuilding is in part due to GPE’s non-financial contributions of providing fiduciary oversight and substantive support in establishing sound government systems.
The evidence for assessing changes in the education system in Malawi is strong. The absence of data on sector expenditure points to disjointed and opaque funding flows in Malawi.

DRAFT REPORT (VX) – COUNTRY 50
© UNIVERSALIA
3.5 GPE contributions to sector plan implementation158 159
143. GPE’s contribution to sector plan implementation is modest. A high-level overview of evaluation findings on sector plan implementation and on related GPE contributions during the review period is provided in Table 17. These observations are elaborated in the findings and supporting evidence is presented it this section.
Table 17 – Progress made and GPE contributions to sector plan implementation
PROGRESS MADE TOWARDS SECTOR PLAN IMPLEMENATION
DEGREE OF GPE CONTRIBUTION DEGREE TO WHICH
UNDERLYING ASSUMPTIONS HOLD 160
Modest: Progress was made in implementing certain components of the ESPIG in eight districts (as of the MTR in March, 2019). However, implementation challenges remain, including insufficient human resources, technical know-how, insufficient hardware (such as weak ICT, lack of transportation, crumbling infrastructure etc.) and a lack of reliable data to inform decision making. Weaknesses in implementation appear to be driven by overly ambitious planning, which was not linked to the budget.
Modest: GPE has contributed in funding the implementation of a portion of the sector plan through MESIP. However, delays in MESIP implementation reflect implementation challenges across the sector. Some pockets of success exist but overall, the small-scale nature of MESIP and implementation challenges have resulted in a very modest contribution.
1 2 3 4 5
STRENGTH OF THE CONFIRMING/REFUTING
EVIDENCE161
1 2 3 4 5
158 This section addresses evaluation questions 1.3 and 1.4, as well as (cross cutting) CEQs 3.1 and 3.2. 159 This section triangulates findings on RF indicators 20, 21, 22, 23, 24 and 25. 160 For sector plan implementation, the five underlying assumptions in the country level ToC were: (1) Relevant country-level actors have the technical capabilities, motivation (political will, incentives) and opportunity (funding, conducive environment) to implement all elements of the sector plan; (2) Available domestic and international funding is sufficient in quantity and adequate in quality to implement all elements of the sector plan; (3) Country-level development partners have the motivation and opportunity (e.g. directive from respective donor government) to align their own activities with the priorities of the sector plan and to work through the LEG as a consultative and advisory forum; (4) Country-level stakeholders take part in regular, evidence-based joint sector reviews and apply recommendations deriving from these reviews to enhance equitable and evidence-based sector plan implementation; and (5) The sector plan includes provisions for strengthening EMIS and LAS to produce timely, relevant and reliable data. 161 The methodology for weighing the confirming and refuting evidence for each contribution claim is presented in Error! Reference source not found..

DRAFT REPORT (VX) – COUNTRY 51
© UNIVERSALIA
Characteristics of sector plan implementation
Finding 10: ESIP II implementation was modest due to a lack of coordination and a lack of accountability.
144. NESP has been implemented under two overarching interventions; the ESIP I (2009 – 2013) and the ESIP II (2014 – 2017). Reviews of both ESIP I and ESIP II – including MoEST’s 2017 review of NESP and ESIP II, DFID’s appraisal of the ESIP II on behalf of DPs and the LEG in Malawi, the 2019 MTR of the ESPIG, and the WB’s implementation completion and results report of ESIP I found implementation to consistently be behind schedule and largely below expectations.162 A summary of what was implemented according to ESIP II’s priority areas is presented below in Error! Reference source not found.. There is a lack of coordination in implementation across stakeholder groups, a lack of accountability to implement and a lack of capacity to implement that have resulted in modest advances in implementation in Malawi.
Table 18 – Key output-level achievements for MESIP from 2015-2018163
EQUITABLE ACCESS QUALITY SYSTEM
EFFICIENCY/GOVERNANCE
OUTPUTS LARGELY ACHIEVED DURING MESIP IMPLEMENTATION, 2015-2018
Policy development: a new operational national girls education policy has been developed and endorsed in 2018.
Construction: from 2017 to 2019, 56 classrooms (28 blocks) have been completed, benefitting 12,611 pupils (6,211 boys and 6,450 girls).
Infrastructure improvement: 39 total latrines have been completed in target schools, increasing access to sanitation for boys and girls.
Regulations and Policy Development: a new Strategy and action place on grade repetition has been developed and endorsed in 2018.
Community engagement: according to Component 1’s output to increase the number of communities sensitized on improving quality of learning, over 43,000 community members have directly benefited from sensitization activities.
Policy development: A new comprehensive teacher deployment strategy and action plan was developed and is in place in 2018.
Governance/efficiency: Developed and disseminated guidelines and strategies on school improvement plans to the 800 schools to address learner retention and completion.
OUTPUTS PARTIALLY OT NOT ACHIEVED DURING MESIP IMPLEMENTATION, 2015-2018
Community engagement: Pre-piloting and implementation has yet to begin on sensitizing mother groups on girls’ retention.
Infrastructure: installation of water points and boreholes at
Examination and assessments: in Y3 of MESIP, Component 1 plans to begin delivering standardized zonal tests to Standard 3 and Standard 4 learners.
Monitoring and Online data management platform: A beta tablet-based application has been developed, tablets and motorcycles have been procured, and training provided to Zonal EMIS officers and MoEST staff. A pre-pilot is
162 Education Sector Plan Review, Report prepared by Mambo MN., Cole P., & Ndala K. (September, 2012), submitted to MoEST (and 2012 JSR); HEART, on behalf of DFID (November, 2014) ‘Report on Appraisal of the Second Education Sector Implementation Plan (ESIP II) on behalf of Development Partners and Local Education Group in Malawi’; and MoEST, 2017 ‘Review Report for National Education Sector Plan 2008–2017, the Education Sector Implementation Plan II 2013/14 – 2017/18’ (October, 2017). 163 It is not possible for the evaluation to compare planned activities against implemented activities, so this table predominantly lists achieved outputs, as well as certain high-profile planned interventions that were not achieved.

DRAFT REPORT (VX) – COUNTRY 52
© UNIVERSALIA
EQUITABLE ACCESS QUALITY SYSTEM
EFFICIENCY/GOVERNANCE
target schools is still ongoing and none are yet completed.
currently underway with the full pilot implementation scheduled to begin in late 2019.
Governance and resource management: so far, only training materials to train teachers/PEAS on school resource management have been developed and piloted, and GA is providing extensive technical support to finalization of training content. This delivery is behind schedule.
145. After more than a decade of NESP implementation, the summary findings are that sector implementation has yielded results that are well below expectations.164 There have been activities successfully implemented under ESIP II during the period under review. However overall, advances tend to reflect successes in piloting several interventions, while large scale implementation of the broad sector plan remains extremely constrained and capacity to implement is a resounding theme. Achievements in MESIP’s priority areas include the gender parity in enrollment of Standards 1 and 2 being achieved in the early years, the hours of the school day being increased, learning centers being introduced in 10 districts, improvements in the distribution of textbooks, the introduction of the new MLSS, the cluster system being piloted and the decentralizing of procurement of teaching and learning materials. In addition, the distribution of school-based grants, the start of latrine and water point construction at pilot schools and pilots of real-time data collection have been completed. Greater detail on the overarching challenges in ESIP II implementation is presented below.
Capacity
146. Reviews of progress across ESIP I and II, the March/April 2019 mid-term review of MESIP and Year 2 CLE interview data indicate that as of June, 2019, there is insufficient capacity to implement the plans developed. Capacity can mean different things depending on context and is difficult to measure due to its relational nature. The CLE defines capacity as the foundation for behavior change in individuals, groups or institutions. Capacity encompasses the three interrelated dimensions of motivation (individual level), opportunity (institutional environment) and capabilities (organizational level).
147. In applying OPM’s problem-driven capacity assessment methodology165 to the Malawi case, we consider the institutional environment (the broad social system within which people and organizations function; laws, policies, regulations, public narratives, social norms and the interactions between the organization and the external environment), the organizational level (capability related to how people are organized to enable them to play their individual roles within the organization as a whole. Formally, the processes, systems and resources and informally, the ideas, values, norms and
164 Education Sector Plan Review, Report prepared by Mambo MN., Cole P., & Ndala K. (Sept 2012), submitted to MoEST (and 2012 JSR); HEART, on behalf of DFID (November 2014) ‘Report on Appraisal of the Second Education Sector Implementation Plan (ESIP II) on behalf of Development Partners and Local Education Group in Malawi’; and MoEST, 2017 ‘Review Report for National Education Sector Plan 2008 – 2017, the Education Sector Implementation Plan II 2013/14 – 2017/18’ (October, 2017), the Civil Society Coalition Analysis of National Budget Focusing of Education and the Malawi ESPR 2018. 165 Problem-driven capacity assessments. 2019. Oxford Policy Management. UK.
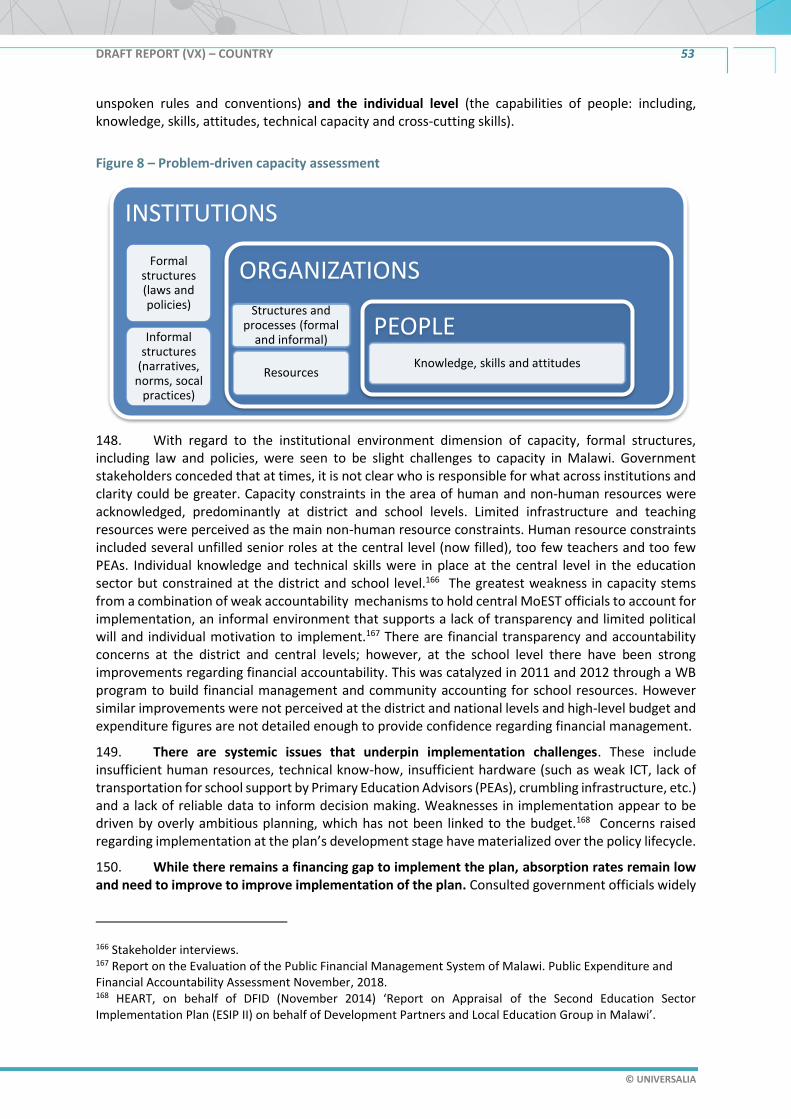
DRAFT REPORT (VX) – COUNTRY 53
© UNIVERSALIA
unspoken rules and conventions) and the individual level (the capabilities of people: including, knowledge, skills, attitudes, technical capacity and cross-cutting skills).
Figure 8 – Problem-driven capacity assessment
148. With regard to the institutional environment dimension of capacity, formal structures, including law and policies, were seen to be slight challenges to capacity in Malawi. Government stakeholders conceded that at times, it is not clear who is responsible for what across institutions and clarity could be greater. Capacity constraints in the area of human and non-human resources were acknowledged, predominantly at district and school levels. Limited infrastructure and teaching resources were perceived as the main non-human resource constraints. Human resource constraints included several unfilled senior roles at the central level (now filled), too few teachers and too few PEAs. Individual knowledge and technical skills were in place at the central level in the education sector but constrained at the district and school level.166 The greatest weakness in capacity stems from a combination of weak accountability mechanisms to hold central MoEST officials to account for implementation, an informal environment that supports a lack of transparency and limited political will and individual motivation to implement.167 There are financial transparency and accountability concerns at the district and central levels; however, at the school level there have been strong improvements regarding financial accountability. This was catalyzed in 2011 and 2012 through a WB program to build financial management and community accounting for school resources. However similar improvements were not perceived at the district and national levels and high-level budget and expenditure figures are not detailed enough to provide confidence regarding financial management.
149. There are systemic issues that underpin implementation challenges. These include insufficient human resources, technical know-how, insufficient hardware (such as weak ICT, lack of transportation for school support by Primary Education Advisors (PEAs), crumbling infrastructure, etc.) and a lack of reliable data to inform decision making. Weaknesses in implementation appear to be driven by overly ambitious planning, which has not been linked to the budget.168 Concerns raised regarding implementation at the plan’s development stage have materialized over the policy lifecycle.
150. While there remains a financing gap to implement the plan, absorption rates remain low and need to improve to improve implementation of the plan. Consulted government officials widely
166 Stakeholder interviews. 167 Report on the Evaluation of the Public Financial Management System of Malawi. Public Expenditure and Financial Accountability Assessment November, 2018. 168 HEART, on behalf of DFID (November 2014) ‘Report on Appraisal of the Second Education Sector Implementation Plan (ESIP II) on behalf of Development Partners and Local Education Group in Malawi’.
INSTITUTIONS
Formal structures (laws and policies)
Informal structures
(narratives, norms, socal
practices)
ORGANIZATIONS
Structures and processes (formal
and informal)
Resources
PEOPLEKnowledge, skills and attitudes
DRAFT REPORT (VX) – COUNTRY 54
© UNIVERSALIA
agreed that one major challenge to implementation was a lack of financing. The Project Appraisal Document for the ESPIG (MESIP, August, 2016) estimated the financing needs of ESIP II at US$170 million Conversely, DPs were uniform in their view that the financing gap cannot be legitimately framed as the major issue, when absorption rates remain low. Significant procurement delays resulted in inefficiencies in ESIP implementation. None of the targets that were set for the provision of infrastructure were met, although it was noted that there were noticeable improvements in the completion of infrastructure projects in 2011/12. Similarly, the sector has not been able to meet the ESIP II targets to reduce class size through the construction of more classrooms in schools (pupil permanent classroom ratio).
Coordination
151. Strategic coordination across education actors in Malawi is limited and potentially fueled by the projectization of implementation as a result of limited DP confidence in public sector financial management and accountability. Stakeholders across groups highlighted a lack of coordination in relation to what is being implemented and where projects are being implemented. One DP stated “If all of the actors were coordinated, if they focused on one delivery it would be achieved but since we do duplicative work, we are not making as much progress”. An established sector mapping of where all DPs interventions are happening across Malawi is not immediately clear in the Year 2 CLE. There were some participant narratives that hinted towards competition between programs and a focus on ‘who’ rather than ‘what’ is being done to implement. Similarly, NGOs work on a geographical basis, with different NGOs working across different districts. This can be problematic as individuals from NGOs and CSO agreed that this can result in a lack of coverage in some areas and over-coverage in others.
Accountability
152. DPs and CSOs felt that trends in what gets implemented are linked to activities that have more allowances, while important activities that need to be implemented are sidelined. DPs and CSOs highlighted the proliferation of international travel being implemented very effectively, while other key activities received poor oversight. One DP provided the example: “there is a MESIP component around the training of head teachers, so the consulting firm was procured and selected. There was no one on top of QA-ing what was getting done and then when it was too late when they were sharing 100-page training document that were of such poor quality and sharing it at the last minute”. This speaks to lacking mutual accountability that has therefore resulted in ineffective implementation. The MESIP midterm aide memoire similarly highlights concerns as to the timely implementation of the training of teachers (component 3) as activities consistently remain behind schedule and thus far, finalization of materials remains ongoing and training has only recently been piloted (as of September, 2019).169
153. There are formal structures in place to support implementation, and the knowledge and technical capacity of individuals at federal level of the ministry are in place. However, an informal environment of withholding key information, passive resistance to agreed priorities, a highly hierarchal system and a lack of trust between stakeholder groups has created a political economy that runs counter to efficient implementation. Unshared key information includes financial resources, expenditure and implementation locations.
154. DPs and CSOs outlined several examples whereby the political economy significantly impacts upon transparency, including passive resistance (non-attendance at agreed workshops) to develop strategies on particular issues that stakeholders felt government is unwilling to push forward (like a teacher deployment strategy). Several DPs outlined this as a major contributor to inefficiency and a barrier to value for money (VfM). Inefficiencies are linked to the hierarchy and systemically embedded. CSOs have attempted to increase accountability for implementation, which is fundamentally linked to
169 World Bank. (May 1, 2019). Malawi Education Sector Improvement Project (MESIP): ISR #6.
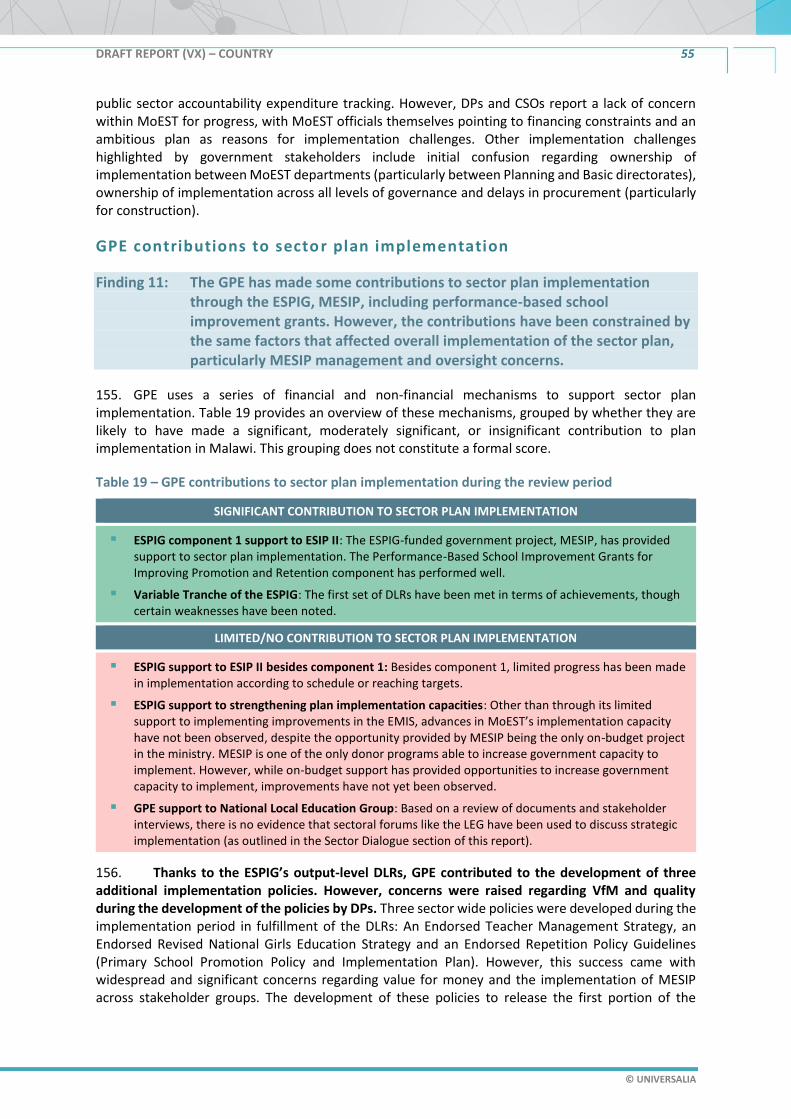
DRAFT REPORT (VX) – COUNTRY 55
© UNIVERSALIA
public sector accountability expenditure tracking. However, DPs and CSOs report a lack of concern within MoEST for progress, with MoEST officials themselves pointing to financing constraints and an ambitious plan as reasons for implementation challenges. Other implementation challenges highlighted by government stakeholders include initial confusion regarding ownership of implementation between MoEST departments (particularly between Planning and Basic directorates), ownership of implementation across all levels of governance and delays in procurement (particularly for construction).
GPE contributions to sector plan implementation
Finding 11: The GPE has made some contributions to sector plan implementation through the ESPIG, MESIP, including performance-based school improvement grants. However, the contributions have been constrained by the same factors that affected overall implementation of the sector plan, particularly MESIP management and oversight concerns.
155. GPE uses a series of financial and non-financial mechanisms to support sector plan implementation. Table 19 provides an overview of these mechanisms, grouped by whether they are likely to have made a significant, moderately significant, or insignificant contribution to plan implementation in Malawi. This grouping does not constitute a formal score.
Table 19 – GPE contributions to sector plan implementation during the review period
SIGNIFICANT CONTRIBUTION TO SECTOR PLAN IMPLEMENTATION
▪ ESPIG component 1 support to ESIP II: The ESPIG-funded government project, MESIP, has provided support to sector plan implementation. The Performance-Based School Improvement Grants for Improving Promotion and Retention component has performed well.
▪ Variable Tranche of the ESPIG: The first set of DLRs have been met in terms of achievements, though certain weaknesses have been noted.
LIMITED/NO CONTRIBUTION TO SECTOR PLAN IMPLEMENTATION
▪ ESPIG support to ESIP II besides component 1: Besides component 1, limited progress has been made in implementation according to schedule or reaching targets.
▪ ESPIG support to strengthening plan implementation capacities: Other than through its limited support to implementing improvements in the EMIS, advances in MoEST’s implementation capacity have not been observed, despite the opportunity provided by MESIP being the only on-budget project in the ministry. MESIP is one of the only donor programs able to increase government capacity to implement. However, while on-budget support has provided opportunities to increase government capacity to implement, improvements have not yet been observed.
▪ GPE support to National Local Education Group: Based on a review of documents and stakeholder interviews, there is no evidence that sectoral forums like the LEG have been used to discuss strategic implementation (as outlined in the Sector Dialogue section of this report).
156. Thanks to the ESPIG’s output-level DLRs, GPE contributed to the development of three additional implementation policies. However, concerns were raised regarding VfM and quality during the development of the policies by DPs. Three sector wide policies were developed during the implementation period in fulfillment of the DLRs: An Endorsed Teacher Management Strategy, an Endorsed Revised National Girls Education Strategy and an Endorsed Repetition Policy Guidelines (Primary School Promotion Policy and Implementation Plan). However, this success came with widespread and significant concerns regarding value for money and the implementation of MESIP across stakeholder groups. The development of these policies to release the first portion of the

DRAFT REPORT (VX) – COUNTRY 56
© UNIVERSALIA
variable tranche amount was not undertaken in a timely manner by government. DPs felt these situations placed a significant strain on the DP/government relationship as the DPs are aware policies are being rushed through to ensure the release of DLI-linked funding, detracting from the quality of the outputs. However, many DPs noted that the political cost of not approving the outputs is extremely high. Most stakeholder groups agree that there have been significant challenges in policy implementation. While the development of plans has been robust and the plans developed have been of reasonable quality, challenges remain in implementation.
157. The challenges impeding ESPIG support to ESIP II with regard to implementation, reflect the challenges experienced across sector plan implementation. They can be summarized as limited coordination, accountability and capacity. Namely, the quality of monitoring data as a barrier to monitoring implementation, the need to clarify roles and responsibilities further, a lack of capacity for implementation and the need for better coordination between DPs. Error! Reference source not found. outlines MESIP progress against targets.170 The World Bank conducted an annual implementation supervision and technical review mission in March, 2019 in order to establish the level of activities implemented.
Table 20 – MESIP progress against targets171
ESIP II Theme & NESP Objectives
MESIP Component Intermediate Results indicators
Status as of Mid-Term Target to Be Reached By 2018
Reform Theme 3: Learner Retention
C1: Performance-Based School Improvement Grants for Improving Promotion and Retention
Strategy and action plan on repetition reduction approved, endorsed and operationalized in target districts
Met
Participating schools received performance grant allocation
Met
Theme 6: Education Access and Infrastructure; Reform Theme: 3: Learner Retention
C2: Improving Equity for the Most Disadvantaged, Including Girls
Sanitary facilities (total number of blocks by gender, boys)
Not met, though 20% constructed by April, 2019
Sanitary facilities (total number of blocks by gender, girls)
Not met, though 20% constructed by April, 2019
Water facilities (hand washing points) Not met, none yet completed.
Reform Themes 1, 2 and 3
C3: Improving Learning Outcomes, Accountability and Cost-effectiveness at School-level
Schools with trained head-teachers and deputy head-teachers
Not met, no teachers yet trained. Training materials yet to be finalized.
Primary Education Advisors (PEAs) trained in teachers management at school level
Not met, though Training materials developed and piloted/pretested
Schools where observations of performance of school head-teachers, deputy head-teachers and PEAs were performed
*not yet due for reporting
170 MESIP Mid-Term Review Aide Memoire, April 2, 2019. 171 MESIP Mid-Term Review Aide Memoire, April 2, 2019.
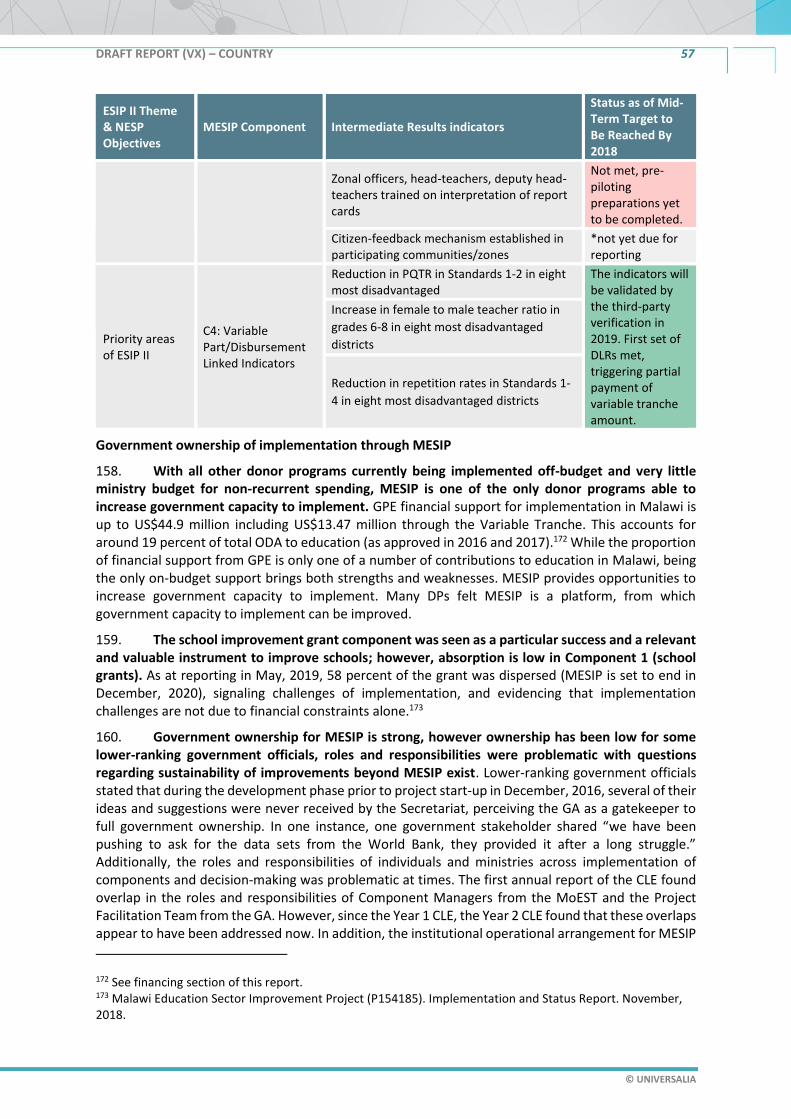
DRAFT REPORT (VX) – COUNTRY 57
© UNIVERSALIA
ESIP II Theme & NESP Objectives
MESIP Component Intermediate Results indicators
Status as of Mid-Term Target to Be Reached By 2018
Zonal officers, head-teachers, deputy head-teachers trained on interpretation of report cards
Not met, pre-piloting preparations yet to be completed.
Citizen-feedback mechanism established in participating communities/zones
*not yet due for reporting
Priority areas of ESIP II
C4: Variable Part/Disbursement Linked Indicators
Reduction in PQTR in Standards 1-2 in eight most disadvantaged
The indicators will be validated by the third-party verification in 2019. First set of DLRs met, triggering partial payment of variable tranche amount.
Increase in female to male teacher ratio in
grades 6-8 in eight most disadvantaged
districts
Reduction in repetition rates in Standards 1-
4 in eight most disadvantaged districts
Government ownership of implementation through MESIP
158. With all other donor programs currently being implemented off-budget and very little ministry budget for non-recurrent spending, MESIP is one of the only donor programs able to increase government capacity to implement. GPE financial support for implementation in Malawi is up to US$44.9 million including US$13.47 million through the Variable Tranche. This accounts for around 19 percent of total ODA to education (as approved in 2016 and 2017).172 While the proportion of financial support from GPE is only one of a number of contributions to education in Malawi, being the only on-budget support brings both strengths and weaknesses. MESIP provides opportunities to increase government capacity to implement. Many DPs felt MESIP is a platform, from which government capacity to implement can be improved.
159. The school improvement grant component was seen as a particular success and a relevant and valuable instrument to improve schools; however, absorption is low in Component 1 (school grants). As at reporting in May, 2019, 58 percent of the grant was dispersed (MESIP is set to end in December, 2020), signaling challenges of implementation, and evidencing that implementation challenges are not due to financial constraints alone.173
160. Government ownership for MESIP is strong, however ownership has been low for some lower-ranking government officials, roles and responsibilities were problematic with questions regarding sustainability of improvements beyond MESIP exist. Lower-ranking government officials stated that during the development phase prior to project start-up in December, 2016, several of their ideas and suggestions were never received by the Secretariat, perceiving the GA as a gatekeeper to full government ownership. In one instance, one government stakeholder shared “we have been pushing to ask for the data sets from the World Bank, they provided it after a long struggle.” Additionally, the roles and responsibilities of individuals and ministries across implementation of components and decision-making was problematic at times. The first annual report of the CLE found overlap in the roles and responsibilities of Component Managers from the MoEST and the Project Facilitation Team from the GA. However, since the Year 1 CLE, the Year 2 CLE found that these overlaps appear to have been addressed now. In addition, the institutional operational arrangement for MESIP
172 See financing section of this report. 173 Malawi Education Sector Improvement Project (P154185). Implementation and Status Report. November, 2018.

DRAFT REPORT (VX) – COUNTRY 58
© UNIVERSALIA
was raised after the Year 1 report for this evaluation, asking the question “is the Planning Department the ‘right’ home for MESIP?”. While the MoEST Director of Basic Education oversees the project implementation, the Planning Department is the home of MESIP regarding strategy development and accountability to the LEG and Secretariat, and the Component Leads sit within the Planning Department. The implementation of MESIP is undertaken by Primary Education Advisors (PEAs) and Desk Officers who sit within Basic Education.
Implementation capacity beyond MESIP duration
161. Legitimate questions regarding the sustainability of any built capacity for implementation and where resources will sit at the end of MESIP were raised by stakeholders across government and DPs. In addition, the personalization of MESIP has resulted in key officials who will be responsible for future activities during scale up having been excluded from MESIP activities. Key resources needed to support future implementation (like cars) are allocated to the Department of Planning. Department of Planning (DoP) staff argued that the feasibility of implementation and coordination of implementation is part of the DoP’s mandate. However, the DoP does seem to have stepped deeper into implementation than just assessing feasibility and coordinating across projects. In addition, the implementation of activities under MESIP have been extremely limited outside of the MESIP eight “most disadvantaged” districts. While there is a system support element to MESIP, the largest contributions have been in terms of physical resources, rather than building systems or capacity at the national level.174
162. While MESIP Project Officers were positive regarding the contribution of MESIP to capacity building, when we spoke to government officials who will be responsible for implementing system-wide interventions post-MESIP, they stated that they were excluded from MESIP activities. This reflects the views of several government officials, who see MESIP as a personal, not an institutionalized program. This raises issues regarding sustainability in terms of (1) how initiatives will be carried on in the future and (2) the extent to which important expertise are being fed into the creation of new system-wide initiatives being developed under MESIP. For example, many spoke highly of the GPE contribution to real-time data collection, however individuals with relevant expertise and likely future responsibility for the real-time data collection post-MESIP are unaware of the structures or systems being established. Under these circumstances, the long-term sustainability of these interventions is a risk.
163. Stakeholder interviews and a review of documentation indicates that management and oversight of MESIP requires improvement. Concerns include a lack of progress in key components of MESIP, potential conflicts of interest and a lack of VfM in some MESIP components with little accountability for rising and un-benchmarked unit costs. Little progress has been made in several component areas and the construction component of MESIP brings substantial fiduciary risks. The GA reliance on consultants has made it difficult for in-country stakeholders to reach any consensus on MESIP issues. As has been raised in other CLEs, a lack of clarity of roles and the resulting implications with the WB as GA and their role as lender was also raised in Malawi. Construction is an extremely difficult area of implementation in Malawi but is also very open to leakage. Concerns regarding the rising costs of implementing Component 2 were widely expressed and stakeholders did not feel the
174 For example, MESIP procured motorbikes for all the educational zones to support data collection for EMIS, across 34 districts. Capacity building is a major component of the MESIP M&E support to sector, however several government officials stated that there was only 1-2 days training provided at the sector level and the remaining
capacity building was for MESIP districts only.

DRAFT REPORT (VX) – COUNTRY 59
© UNIVERSALIA
GPE model supports VfM in construction implementation. DPs felt GPE funding would be better spent on improving systems, structures and capacity building.175
164. Many government officials explained MESIP construction challenges in terms of constrained financing.176 The first annual report for this evaluation, attributed higher inflation and rising unit costs to construction delays. However, as delays have continued, a range of explanations have been provided. Government stakeholders listed these as:
▪ Initially intending to work with small scale contractors and in the end, working with large contractors due to design needs, raising the costs.
▪ The assumption VAT would be waivered.
▪ Communities not helping with construction as much as anticipated.
▪ The person who costed the construction passed away.
▪ An international construction specialist imposed figures into the budget, resulting in unrealistic budgeting; and
▪ A lack of finances.
165. Staff within MESIP pointed to the lack of oversight of the MESIP M&E component to monitor implementation, not just budgets and outcomes. MESIP officers who could have raised issues regarding rising unit costs were not involved or informed as prices increased. There were no sources of verification that the new classrooms were being built and no benchmarking of unit costs. Several DPs implied that an independent audit of classroom procurement, estimation of actual costs against awarded costs and a costed plan for future infrastructure requirements were needed. This was also reflected in the MTR discussion and Aide Memoire.177 Several DPs indicated that DPs and NGOs are implementing programs that include the construction of classrooms across the country without experiencing the same issues with procurement and unit price increases. Stakeholders agreed to use the VT funding to cover the ever-increasing costs of construction.
Additional factors beyond GPE support
166. Projectized support for implementation of the national education sector plan has been provided by a range of actors in Malawi. USAID runs a range of large programs including reading and language acquisition programs, programs aimed at increasing female participation in secondary and tertiary education, an Early Grade Reading Improvement Activity, a program to strengthening early grade reading, textbook provision, work to strengthen national assessment in education, the Reading for All Malawi program and a range of programs under the Girls’ Education/Support to Adolescent Girls and Young Women program. USAID committed a total of US$140 million for the Education Portfolio in FY 2018 to be disbursed over multiple years. The purchases of registers to feed into more accurate EMIS data for schools was funded by MESIP, with a previous round being funded by UNICEF. EMIS was further supported by Save the Children, ActionAid, UNICEF and the Norwegian embassy. DFID has invested £11 million over the past five years to improve the learning environment and school infrastructure in over 320 primary and secondary schools. The Education Support in Malawi program was worth £4.7 million.178 In addition, a range of DPs and NGOs implement smaller programs across the country. For example, Plan works with the Ministry of Gender and Ministry of Justice on building
175 Speaking of construction specifically, one DP stated ‘when the governing environment is very weak and incentives are perverse and accountability is low, it will not succeed, no matter how well it is designed’. 176 One senior official stated ‘the proposed costs do not match the implemented costs so there is a shortfall’. 177 MESIP MTR Aide Memoire. 2019. 178 UK education invests in improving learning outcomes in Malawi. May 16, 2018.

DRAFT REPORT (VX) – COUNTRY 60
© UNIVERSALIA
capacity for child protection, including within schools. Plan and other NGOs also provide teacher training, capacity building for parent-teacher associations and hold an MoU with government.
Unintended negative/unplanned positive effects of GPE support
167. Unintended negative consequences include MESIP detracting from the implementation of other aspects of ESIP II, concerns regarding VfM in communication funding under MESIP, perverse incentives being introduced through the VT and the level of oversight required by country-level stakeholders. Some DPs felt that MESIP implementation has significantly detracted from implementation of other components of the ESIP II beyond MESIP and basic education. DPs felt that GoM staff often have not had time for projects funded outside of MESIP, stating “we see that it is very time consuming for the Ministry to implement GPE which means they don’t have time for other projects that are equally or even more important”. Therefore, potentially other sub-sectors within the NESP may not receive as much focus. This finding was also evident in the Year 1 CLE as last year, as DPs noted that while it is important to invest in the Basic Education sector, these investments should not be at the expense of other sectors such as at secondary or tertiary level education. The allocation of communication funding on jingles to advertise MESIP and branded leather notebooks raised VfM concerns. One DP suggested that instead, the communication funding could be directed to essential communications to districts and schools about specific workplans on MESIP implementation to increase accountability and drive implementation.
168. Most DPs felt that the time commitment needed to be coordinating agent and the role of a CA as intended was unclear. Many felt that the time spent on administrative tasks such as forwarding letters to GoM or the GA was unnecessary, and the Secretariat could take on more of these tasks. The time required to deal with ESPIGs that were not on track was also raised as extensive, particularly when the CA had its own programs to implement as well.
169. DPs highlighted that the extent to which the CA is willing to spend time and expend political capital on fulfilling the CA role is highly dependent on the extent to which the donor funds GPE. For example, it was stated that the UK’s significant investment in GPE did reinforce a greater level of accountability to fulfil the CA role in a comprehensive manner, while DPs who invest less may fulfil the CA role in a manner likened to a “post office”, sending and receiving mail.
170. While mutual accountability within the country and supporting the partnership was viewed as important, DPs highlighted the conflict between the time and political cost for the CA and other DPs participating in the LEG, to endorse DLI disbursements and monitor implementation of ESPIG outputs. With this mind, how does mutual accountability at the country level relate to accountability at the global level. While part of the GPE model, DPs often do not buy-in to the model. Specifically, the role and responsibilities of the coordinating agent are regarded as inappropriate (please note that the role of CA rotates every year in the Malawi education sector). DPs spoke of their own workloads, and specifically raised issues of dual and competing responsibilities and accountabilities. These concerns were most likely not felt by the Grant Agent role as it comes with financial compensation for the human resources required.
Implications for GPE’s ToC and country level operational model
171. One of the clearest implications from Malawi for the GPE ToC and country level operational model is the need to consider the political economy within the model. Currently, the model includes an assumption of political will to implement, but no flexibility in the ToC regarding how plan development, monitoring, sector dialogue and financing can lead to implementation in the absence of political will or how to build political will when it is not immediately present.
172. There is reason to reconsider the activities GPE should fund taking into account the tensions in Malawi from the high supervision requirements of construction, the possibility of

DRAFT REPORT (VX) – COUNTRY 61
© UNIVERSALIA
leakage and the difficulties of procurement. Further questions on the appropriateness of the construction component should be highlighted in future ESPIG application assessments. Construction was implemented by a range of donors and GPE financial support had no differential impact other than increased political tensions and potentially serious VfM concerns. Where there is mismanagement of funds and outcomes are not achieved, the Secretariat could withhold funding. The Secretariat is seen to be focused on moving funds, rather than taking responsibility for delivering in a cost-efficient manner. To ensure the credibility of GPE’s model and funding to Malawi, it is extremely important (1) to inspect constructed classrooms (2) evaluate unit costs against other programs’ and (3) verify179 the achievement of VT indicators prior to DLI disbursement.
173. Secretariat engagement in Malawi has not been felt by all stakeholders.”. DPs stated that there were no visits from the Secretariat between January 2018 and February 2019, as the Secretariat country leads ‘move away once the ESIP is submitted’. Some DPs expressed that while they feel part of a partnership of stakeholders in Malawi, it is not necessarily the GPE partnership, as the Secretariat is not present in conversations. Additionally, multiple individuals voiced that GPE roles and responsibilities take up a lot of time and mainly detract from their primary responsibilities. Many DPs felt the financial contributions leveraged by GPE (from donor countries, international organizations, the private sector and philanthropic foundations) to provide grants to partner developing countries should therefore result in greater responsibility and accountability by the GPE Secretariat to manage the funds in-country. This perception held by some DPs, however, demonstrates a misunderstanding among stakeholders of the distinct responsibilities of the Secretariat and the Grant Agent, which is responsible for ensuring GPE grants are appropriately managed, aligned with broader education sector developments and add value to the country-level processes and results.180
174. Individuals from most stakeholder groups were extremely skeptical about the variable tranche modality increasing motivation to implement the sector plan. Other DPs felt the variable tranche DLIs influenced policy reform. However, they did not foresee impact believing that policies and plans would not be implemented because of capacity constraints as discussed. Issues of quality were raised regarding the VT, straining the DP/government relationship as the political cost of not approving the outputs was extremely high. Several DPs did not feel the political cost of non-approval should be put onto donors and the Secretariat should have in-country presence to own the approval process.
175. Overall, DPs were not convinced that efficiency in implementation would increase as a result of the variable tranche. “What it was meant to influence; those are things that should be happening anyway in the absence of a variable tranche”. The situation in Malawi raises the question that when political will is not there, will a variable tranche increase efficiency?
Box 6 - Testing Assumptions and Assessing Strength of Evidence
For sector plan implementation, the five underlying assumptions in the country level ToC were: (1) Relevant country-level actors have the technical capabilities, motivation (political will, incentives) and opportunity (funding, conducive environment) to implement all elements of the sector plan; (2) Available domestic and international funding is sufficient in quantity and adequate in quality to implement all elements of the sector plan; (3) Country-level development partners have the motivation and opportunity (e.g. directive from respective donor government) to align their own activities with the priorities of the sector plan and to work through the LEG as a consultative and advisory forum; (4) Country-level stakeholders take part in regular, evidence-based joint sector reviews and apply recommendations deriving from these reviews to enhance equitable and evidence-based sector plan implementation; and (5) The sector plan includes provisions for
179 As outlined in the LEG response to feedback on the ESIPII. 180 Global Partnership for Education (June, 2019). Terms of Reference for GPE grant agents- ESPIG.

DRAFT REPORT (VX) – COUNTRY 62
© UNIVERSALIA
strengthening EMIS and LAS to produce timely, relevant and reliable data. The final assessment at the end of the final year of this evaluation is:
Assumption 1 partially holds: There are significant human capacity issues that limit the extent that MESIP can be implemented to support ESIP II.
Assumption 2 partially holds: Domestic and international financing emphasize education as a top spending priority; however, budget allocations remain insufficient to meet the ever-growing demand for education services.
Assumption 3 partially holds: There are concerns among development partners to fully align their finances with the government due to past mismanagement issues.
Assumption 4 partially holds: Though JSRs are participatory, the quality of JSRs has declined and evidence, when available, is not extensively used to inform sector plan implementation.
Assumption 5 holds: The NESP and ESIP II seek to improve EMIS and provide timelier, quality data, exemplified by the establishment of MLSS to support EMIS and produce additional data.
The evidence for assessing changes in the education system in regard to implementation in Malawi is strong. There is adequate data available on issues such as the quality of the JSR process and the challenges faced – and while it is difficult to decisively measure/determine motivation – there is ample evidence available to assess implementation capacity.

DRAFT REPORT (VX) – COUNTRY 63
© UNIVERSALIA
4 Progress towards a stronger education system181
4.1 Introduction
176. This section summarizes evaluation findings related to Key Evaluation Question II from the evaluation matrix: “Has sector plan implementation contributed to making the overall education system in Malawi more effective and efficient?”
177. Progress towards a stronger education system is measured by drawing on evidence of achievements in the priority areas outlined in ESIP II. The analysis focuses on changes in the existence and functioning of relevant institutions, as well as changes in relevant rules, norms and frameworks (e.g., standards, curricula, teaching and learning materials) that influence how actors in the education sector interact with each other.182
4.2 Progress towards a stronger education system
178. Table 21 provides an overview of system-level improvements observed in selected key aspects, whether the respective issue had been addressed in the ESIP II, and whether implementation contributed to the observed changes.183
181 This section triangulates findings against RF indicators 11, 12, 13, 15. 182 Please see definition of ‘education systems’ in the terminology table of this report. The GPE 2020 corporate results framework indicators defines six indicators for measuring system-level change: (a) increased public expenditure on education (RF10, covered in section 3.3 on education financing); (b) equitable allocation of teachers (RF11, covered here under Access and Equity); (c) improved ratios of pupils to trained teachers at the primary level (RF12, covered below under Quality and Relevance); (d) reduced student dropout and repetition rates (RF13, covered in section 5); (e) the proportion of key education indicators the country reports to UIS (RF14, covered here under Sector Management), and (f) the existence of a learning assessment system for basic education that meets quality standards (RF15, covered below under Quality and Relevance). 183 The fact that a certain issue had been addressed in the ESP does not guarantee that related changes occurred because of ESP implementation.

DRAFT REPORT (VX) – COUNTRY 64
© UNIVERSALIA
Table 21 – Assessment of the contribution of ESIP II implementation to system level change
PROGRESS/IMPROVEMENTS MADE DURING REVIEW
PERIOD
HAD ISSUE BEEN ADDRESED IN THE ESIP
II?
LIKELIHOOD OF ESIP II (2014-2019)
IMPLEMENTATION HAVING
CONTRIBUTED TO NOTED
IMPROVEMENTS
DEGREE TO WHICH UNDERLYING
ASSUMPTIONS HOLD
Access: Modest - Introduction of Free Primary Education in Malawi in 1994 greatly reduced the cost of accessing primary school. Most recently, there has been a removal of secondary school tuition fees in December 2018, which is expected to improve access. However, issues with access remain due to the disproportionally low number of secondary schools.
Yes – ESIP II includes a focus on improving access, including expanding complementary basic education and improving primary and particularly secondary access to education.
There has been moderate progress in certain aspects of ESIP, though limited to eight districts of MESIP implementation. implementation. There is potential for contribution to be realized in time, if MESIP is, in fact, building government capacity to implement.
1 2 3 4
Quality and Relevance: Modest - Little progress made in number of qualified teachers to pupil ratios. ESIP II found that pupil textbook ratios are getting worse. There have been changes in teacher training curriculum, and creation of more teacher training colleges, introduction of new curriculums for secondary education and complementary basic education, and procurement of curriculum-aligned textbooks.
Yes – ESIP II sets out to attempt a major policy shift at primary and secondary levels, through focus on better qualified teacher to pupil ratios, provision of learning materials, strengthening decentralization through school grants and focus on learning outcomes at lower primary level.
Equity: Modest - Improvements in equity in access. However, equal access to an ineffective system does not constitute impact. No data on equity in learning.
Yes – ESIP II has a greater focus on learners with special needs than ESIP I and highlights the significant drop in gender parity in girls’ enrollment after Standard 6.
STRENGTH OF THE CONFIRMING/REFUTIN
G EVIDENCE184
184 The methodology for weighing of confirming and refuting evidence for each contribution claim is presented in Error! Reference source not found..

DRAFT REPORT (VX) – COUNTRY 65
© UNIVERSALIA
PROGRESS/IMPROVEMENTS MADE DURING REVIEW
PERIOD
HAD ISSUE BEEN ADDRESED IN THE ESIP
II?
LIKELIHOOD OF ESIP II (2014-2019)
IMPLEMENTATION HAVING
CONTRIBUTED TO NOTED
IMPROVEMENTS
DEGREE TO WHICH UNDERLYING
ASSUMPTIONS HOLD
Management: Modest - Malawi’s EMIS has improved with regards to organization and structures at central and district level and some instances of evidence-based decision making takes place. However, credibility issues still remain and there is no learning assessment system in place.
Yes – ESIP II seeks to improve government and management through transfer of certain governance to the school level to decentralize decision-making and plans to train head teachers and school management committees.
1 2 3 4
Progress towards a stronger education system during the review period
Access
Finding 12: While isolated system-level improvements have been achieved with regard to access and equity, there is little evidence of fundamental progress across the educational system.
179. Improvements in terms of systemically removing the barriers to access to education include the recent removal of secondary school tuition, incorporating equity in primary education as a key thematic area in sector planning and improvements in the regulatory frameworks in child protection across the country. In December, 2018, secondary school tuition fees were removed to increase access to education, which builds on the introduction of Free Primary Education in Malawi in 1994, that greatly reduced the cost of accessing primary school. The payment of secondary school fees was considered the primary reason for dropping out of school. However, other fees continue to be levied on secondary school students at school level.
180. Malawi faces substantial inequities according to region and socioeconomics, special needs, disability and gender. The NESP in 2008 prioritized equity in primary education by incorporating this as a key thematic area in sector planning. This entails some indicators being used to track sector performance in improving both access and equity to education across all levels, including overall gross and net enrollment rates, repetition rates, gender parity in enrollment rates and special needs education enrollment rates. The National Child Protection Strategy (NCPS) 2012 – 2016 (extended to 2018) has worked to improve regulatory frameworks, adopt protective practices in early identification, case management and referral in the 10 most disadvantaged communities, testing a comprehensive Child Protection model in seven districts and establishing a national Child Protection Information Management System in place.
181. Access to education has generally increased across all education levels during the review period. EMIS data provide an impressive picture of progress in reducing the Pupil per Classroom Rate (PPCR). However as has been noted earlier in this report, these figures differ by data source, and proposals for the verification of the construction of classrooms are under discussion. Overall, the necessary number of schools and classrooms still has not been met. According to the 2018 JSR, in

DRAFT REPORT (VX) – COUNTRY 66
© UNIVERSALIA
2017/18, the pupil permanent classroom ratio (PpCR) for primary school was 116:1, against a sector target of 94:1.
182. The number of public and private secondary schools has remained relatively stable over the review period. A key ESP II target was for private secondary schools to constitute at least 33 percent of all secondary schools. This has not yet been achieved and indicates that more efforts are required to build Public Private Partnerships (PPPs) if private schools are to reduce the pressure on public service delivery engaging with the private sector.
Figure 9 – Distribution of public and private schools in Malawi
183. Significant delays in procurement and construction have hampered improvements in access. The project appraisal document of MESIP outlines the planned construction of 500 classroom blocks, 300 ablution blocks with special focus on girls’ sanitation needs and 150 water points to benefit 114 schools selected in the eight target districts of the ESPIG. As of April, 2019185, 56 classrooms (28 blocks) have been completed, benefiting 12,611 students (6,211 boys and 6,450 girls). A total of 39 latrines are complete (26 girls and 13 boys). Handwashing sites are at ongoing installation status in all sites and bore holes are not done yet. This delay in construction, increases in costs and the classification of Component 2’s rating as moderately unsatisfactorily according to the GA has been attributed by MoEST as due to an increase in costs from improvements in the primary classroom design, changes from the community-led construction models to certified engineering firms for quality works and higher material costs. GoM has committed to fulfilling the agreed target of 500 classrooms by using a large portion (US$4.08 million) of the earnings from the first variable tranche of US$6 million of Component 4.
184. In response to such delays, there was discussion in May, 2019 with the GA of the adoption of school led construction of learning shelters as a realistic solution to the ever-rising cost of classroom construction interfaced with the estimated 23,000 classroom gap for primary schools in Malawi, for effective and hygienic learning environments. The design is to be reviewed by the World Bank expert on construction to ensure compliance to global norms of quality, environmental protection and children’s safety. The MoEST has been encouraged to develop a construction plan that clearly articulates the proportion of permanent classrooms to learning shelters needed by schools to guide future investments in this area, so improvements remain to be seen moving forward.
185 MESIP Mid-Term Review Aide Memoire, April 2nd, 2019.
23.22% 24.75% 25.31% 21.69% 23.76%
76.80% 75.30% 75.70% 78.30% 76.30%
0%
10%
20%
30%
40%
50%
60%
70%
80%
90%
100%
2014 2015 2016 2017 2018
Private Schools Public Schools

DRAFT REPORT (VX) – COUNTRY 67
© UNIVERSALIA
Quality and relevance
Finding 13: There is a registered increase in trained teachers, more training in open and distance learning, and advances in Pupil Qualified Teacher Ratio over the review period. However, there is insufficient data to fully determine if the quality and relevance of teaching have improved over this time.
185. The quality and relevance of teaching in Malawi are hindered due to overcrowded classrooms, inadequate teacher training and a lack of professional development for teachers, which negatively impact pupil learning.186 Several planned activities to improve the quality of teaching in Malawi were not implemented. Improving the trained teacher to pupil ratio, teacher training and in-service teacher development, as well as reducing overcrowding, are a focus in ESIP II. Specifically, Policy Reform 1 under the ESIP II is set to increase the number of qualified primary, secondary and special needs teachers, and increasing the number of teacher training facilities.
186. In terms of teacher training, the number of graduating student teachers has been increasing.187 According to EMIS, in 2018 about 63 percent of the teachers in public secondary schools had either a diploma or degree in education or had a University Certificate of Education in addition to their degree, representing an improvement by 9.2 percent from 57.3 percent recorded in 2017. Entry requirements to teacher training programs were upgraded to ensure the quality of teacher trainees, and selection was reduced to 60 percent of institute capacity. While it was reported by LEG members in response to GPE comments on the ESIP II that 27,380 teachers had graduated between 2014 and 2017, employment and deployment of trained teachers is constrained.
187. Several stakeholders reported that the employment of teachers has become politicized, with large numbers of teachers being employed and deployed in the run up to elections.188 During the period, in order to meet the increasing demands of an increasing student population, a new approach of training teacher known as the Open and Distance Learning (ODL) was introduced in 2011. For primary education teachers, a diploma program was set to be introduced but was not finally implemented. Similarly, while orientation workshops were conducted for in-service teacher training programs, no specific budget line for implementing was available and therefore implementation did not occur. In addition, teacher training sites were to be build, but only half are now open, and many are significantly delayed due to procurement and construction difficulties.
188. Pupil Qualified Teacher Ratio (PQTR) is an indicator of system soundness and in Malawi the PQTR remains high. In Malawi the sector plan has focused very specifically on reducing the PQTR and increasing the number of qualified teachers (and the number of classrooms) was reflected in multiple documents and sector dialogue during the ESIP II period. Though often inconsistent, EMIS data depicts an impressive picture of advances in PQTR for primary school (approximately 65:1, down from approximately 80:1). The 2018 JSR logs unequal distributions of teachers between schools and between grades at the expense of the lower grades. In addition, as noted in the monitoring section of this report, different sources report PQTR differently. As can be seen in Figure 10, the PQTR in the early grades (Standards 1 and 2) is significantly higher and evidence of improvements differ by data source. There is very little public data available on the overall pupil teacher ratio in Malawi; UIS data only provides one data point in 2015 (42:1), and the 2018 JSR does not provide any data.
186 UNESCO (2018). World Teachers’ Day: Quality education requires well-trained teachers. Available at: https://iite.unesco.org/news/world-teachers-day-quality-education-requires-well-trained-teachers/ 187 LEG Appraisal Report Memo. 188 The mission was conducted three weeks prior to elections, and 9,630 primary teachers had just been employed and deployed, though many received their qualifications several years earlier.

DRAFT REPORT (VX) – COUNTRY 68
© UNIVERSALIA
189. The number of public and private secondary schools has remained relatively stable over the review period. A key ESP II target was for private secondary schools to constitute at least 33 percent of all secondary schools. This has not yet been achieved and indicates that more efforts are required to build Public Private Partnerships (PPPs) if private schools are to reduce the pressure on public service delivery engaging with the private sector.
Figure 10 – PQTR for Standards 1 and 2 for baseline (2016) and midline (2019) (Sources: MLSS and EMIS)
Figure 11 – Primary PQTR in Malawi (2018 JSR)189
189 This figure was provided by the 2018 JSR published by the Malawi MoEST. However, a source for this figure was not provided by the JSR. According to the JSR, the sources of information in the JSR include, but are not limited to the following: EMIS, quarterly progress reports from the sector working groups, financial monitoring reports, procurement reports and infrastructure reports.
Baseline Midline
MLSS 118.34 117.07
EMIS 166 123
0
20
40
60
80
100
120
140
160
180
MLSS EMIS

DRAFT REPORT (VX) – COUNTRY 69
© UNIVERSALIA
190. Teacher Training. Limited system level inputs are in place to improve the quality of teaching and learning in Malawi. The largest investments during the review period are being made through USAID’s support. However, RTI and USAID’s work on introducing scripted lessons in several districts in Malawi found that teachers in Malawi make content, structural and management changes to scripted lesson plans, with the majority of moderations being content moderations.190 According to a 2016 study on Malawi’s early grade reading activities, while teachers were encouraged to make modifications to tailor the lesson to their classrooms, the study found that the vast majority of modifications made to lesson plans hindered the stated objectives of the lesson and found that work remained on supporting teachers to interpret and utilize student errors and teachable moments. While slightly outdated (2016), this study highlights that there is some way to go in building teacher capacities to deliver quality teaching instruction in support of stated learning objectives.
191. There have also been changes in both pre-service and in-service teacher training. In 2017/18, to support pre-service teacher training, three teacher training colleges for primary school teachers were constructed and two of these schools were opened, namely Chiradzulu and Phalombe (total of nine public teacher training colleges). Regarding in-service training, in the third quarter of 2017/18, MoEST Management approved the Continuing Professional Development framework for all teachers and teacher educators. The Development of Continuous Professional Development has conducted orientation workshops in three educational districts on the contents of the framework targeting DEMs, CPAs and PEAs. However, there is no specific budget line for the implementation of CPD framework activities in the MoEST national budget for 2017/2018.
192. The MTR Aide Memoire acknowledges the need to introduce a diploma program for primary teacher education.191 However, major concerns presented by the MoEST include: not all current primary teachers would meet upgrading requirements for a diploma; it would take 10-15 years under the current teacher training college capacity to upgrade all primary teachers to a diploma level; and if the diploma was introduced as a pre-service initial primary teacher education, the number of teachers trained per year cause serious concern as a low number of student teachers could seriously endanger the PQTR on a medium and long-term. In comparison, most recent data indicate that 8,211 of secondary teachers are trained and 6,122 are untrained, according to MoEST, 2016/17 Education Sector Performance Report.
190 Malawi Early Grade Reading Activity Scripting Study Report (2016). P2. RTI. 191 MESIP Mid-Term Review Aide Memoire, April 2nd, 2019.
0.0
1.0
2.0
3.0
4.0
5.0
6.0
0
500000
1000000
1500000
2000000
2500000
3000000
3500000
4000000
4500000
Standard 1 Standard 2 Standard 3 Standard 4 Standard 5 Standard 6 Standard 7 Standard 8
Bo
oks
per
lear
ner
Nu
mb
er o
f le
arn
ers/
bo
oks
Books in good condition Learners enroled Number of books per learner
Figure 10 – Number of books per learner (Source: Author’s calculation from EMIS data)

DRAFT REPORT (VX) – COUNTRY 70
© UNIVERSALIA
193. Curriculum. The NESP prioritized improving the quality of primary and secondary curriculums. Therefore, through the ESIP II, reforms in the curriculums were highlighted in order to improve competency and learning. The national government in Malawi implemented an outcomes-based primary curriculum reform in 2007 entitled Primary Curriculum and Assessment Reform (PCAR), and a new secondary curriculum in 2017.192 Additionally, a special curriculum was developed for complementary basic education to increase access to basic education for marginalized children and adults through effective part-time learning (education delivered by NGOs), introduced in 2012/13.193
194. Teaching and Learning Materials. Similarly, there is little data available on the resources within classrooms to support teaching instruction. Using EMIS data, the calculation of books in good condition per pupil by year group is shown above. Without more data, it is impossible to know if the quality and quantity of resources to support teaching and learning is improving.
195. As of the 2018 JSR, the MoEST is aligning the assessment framework for the new Initial Primary Teacher Education curriculum to the new curriculum. To facilitate implementation, new textbooks were developed for the primary school curriculum. In 2017/18, there was a purchase of new teaching and learning materials for the new curriculum amounting to MK1.2 billion under the PCAR. A total of MK1.1 billion (0.83 percent of the basic education budget) in 2018 was allocated to the purchase of teaching and learning materials. The increase in curricula-aligned textbooks is a positive development in the last year. However, past concerns about the quality of textbooks suggest that there still remains a need for review of the textbooks and assurance that MoEST provide textbooks timely and in adequate quantities according to the needs of each school to ensure an effective implementation of the new curriculum.194
Sector Management
Finding 14: There is increased recognition that plans require more detailed strategies to support implementation in order to see system change. Malawi’s EMIS improved with regard to organization and structures at central and district level and there are some instances of evidence-based decision making. However, credibility issues still remain and there is no learning assessment system in place.
EMIS and MLSS
196. While there have been some improvements in establishing systems to track and monitor implementation and system strength, credibility issues remain. The ability to accurately report on the state of the system is constrained by weaknesses in the system itself. The previous annual report for this evaluation in Malawi highlighted a significant lack of data to track and monitor implementation and system strength. Since that time, MLSS has provided some data on implementation, efficiency and equity in districts where MESIP is implemented and EMIS has significantly improved. With that said, the credibility issues regarding available data have come to the fore in the last year, as more data has become available the differences between sources have raised questions regarding credibility. At
192 Chirwa, Grames W., & Naidoo, Devika. (2016). Teachers' perceptions of the quality of the new Expressive Arts textbooks for Malawi primary schools. South African Journal of Childhood Education, 6(1), 1-10. https://dx.doi.org/10.4102/sajce.v6i1.411 193 Government of Malawi, ESIP II. 194 Chirwa, Grames W., & Naidoo, Devika. (2016). Teachers' perceptions of the quality of the new Expressive Arts textbooks for Malawi primary schools. South African Journal of Childhood Education, 6(1), 1-10. https://dx.doi.org/10.4102/sajce.v6i1.411

DRAFT REPORT (VX) – COUNTRY 71
© UNIVERSALIA
the strategic level, there is increased recognition that plans require more detailed strategies to support implementation in order to see system change.
197. There are a range of monitoring structures in place in Malawi, as discussed in the monitoring section of this report. The Technical Working Groups meet regularly to review implementation progress and Sector Working Groups met every quarter. Joint Annual Sector Reviews reviewed implementation over the year for each sub-sector, leading to a signed Aide Memoire that highlighted areas that needed to be addressed. 195
198. There remains a weak enabling environment, incoherence in the data collection system, low quality data and concerns regarding the desirability of evidence-based decision making in Malawi. In our analysis below we review changes in the existence and functioning of EMIS, learning assessment systems, teachers, schools and classrooms, access to education, equity, efficiency and the political economy.
199. SABER-EMIS identifies four core policy areas that are shared by educational data systems that can be used as a basis for assessment of the education data system. These areas include (1) an enabling environment, where intended policies relate to a sustainable infrastructure and human resources that can handle data collection, management, and access; (2) System soundness where the processes ad structure of the system support the components of a comprehensive information management system; (3) Quality data which accurately collects, securely saves, and produces high-quality, timely information; and (4) Utilization for decision making, where the data is utilized to inform decisions in the sector. Table 22 – reports on the situation in Malawi against each of these core policy areas.
Table 22 – Assessment of Malawi’s education data system (including EMIS & MLSS) using SABER criteria
CORE AREAS SITUATION IN MALAWI
Enabling environment
There has been improvement in the organization and structures for data collection, storage and analysis in the current Malawi policy cycle, particularly with the introduction of MLSS and improvements in EMIS. However, there is still room for progress on the delineation of roles and responsibilities between different directorates. The political economy can also create barriers to an enabling environment. The hierarchical system can weaken data availability as permissions from ‘high up’ can be delayed. There remains a weak enabling environment and context. There is weak infrastructure to handle data and weak resources to collect, manage and analyze data, though there is improvement.
System soundness
There have been significant efforts to strengthen monitoring at national and district levels for EMIS. Previously staffed by educationalists, a new Head of the M&E unit was brought in from the National Statistics Office approximately four years ago. During this policy cycle an internal assessment of the Directorates was undertaken and data processes at the district and divisional offices were reviewed. As a result, a range of recommendations were made, and standardized statistical and data management processes were introduced.
195 Education Sector Plan Review, Report prepared by Mambo MN., Cole P. & Ndala K. (September 2012), submitted to MoEST (and 2012 JSR); HEART, on behalf of DFID (November 2014) ‘Report on Appraisal of the Second Education Sector Implementation Plan (ESIP II) on behalf of Development Partners and Local Education Group in Malawi’; and MoEST, 2017 ‘Review Report for National Education Sector Plan 2008–2017, and the Education Sector Implementation Plan II 2013/14–2017/18’ (October, 2017).

DRAFT REPORT (VX) – COUNTRY 72
© UNIVERSALIA
CORE AREAS SITUATION IN MALAWI
To support EMIS, there has been a recent introduction of zonal officers to oversee data collection at the school level. ZEMIS officers are said to have improved the quality of EMIS data, however some concerns remain regarding the statistical knowledge of zonal officers. Zonal officers are now trained to check figures provided by the Head Teacher so figures in the EMIS are less vulnerable to inflation. However, there remain weak links between components of the EMIS system and there is weak timely implementation across the EMIS system. This further weakens the EMIS system as it is often in ‘catch up’ mode.
Quality data
All stakeholders agreed that there are still credibility issues with EMIS data, despite improvements. A senior government official stated “I think they are not there yet. Because sometimes the data they collect has got a lot of flaws and areas that attract a lot of questions.” Another DP cited that the ‘lack of reliable data is related to the lack of ability to implement.’ As has been stated previously, the credibility issues related to EMIS data impact the political economy and the extent to which evidence-based decision making might be desirable.
Utilization
In Malawi there were mixed views on the extent to which data is used (particularly between EMIS and MLSS), when it is available. In some circumstances, evidence-based decision-making takes place. However, the political economy significantly shapes when data is or is not used. For example: Government stakeholders perceived MLSS processes to have sidestepped important depts and units in GoM, however this could potentially be linked to perverse incentives to embrace MLSS. This has significantly impacted upon the likely utilization of that data.
Learning Assessments
200. There is currently no national learning assessment system in Malawi, but some evidence about learning is provided through examinations and DP studies. 196RTI International has undertaken a number of reading assessments (EGRA) since 2016, and prior to that, in 2015 UNICEF implemented a Monitoring Learning Assessment (MLA). During the current policy cycle the intention was to build a national learning assessment system. The 2015 Appraisal Report Memo, jointly prepared by the LEG members states that in collaboration with DPs, MoEST was developing a National Assessment Framework to guide the measurement of learning achievement. This framework has not been finalized or utilized with no indications from stakeholders that a national learning assessment program was under development. Nevertheless, it is important to note that in order for students to be promoted to the next grade they must sit a test at the end of the school year (as already noted there are high rates of grade repetition for both boys and girls in Malawi). At the end of primary school (i.e. Standard 8), pupils sit the Primary School Leaving Certificate Examination (PSLCE), which determines whether or not the pupil is eligible to attend secondary school. The PSLC examinations are managed by the Malawi National Examinations Board (MANEB).197 The percent of students passing the PSLC has increased gradually, from less than 70% passing in 2014 to nearly 80% passing in 2018.
Teacher Management
201. Improvements to the quality and relevance of teaching instruction is difficult to track in the absence of studies with multiple points in time. The MoEST’s ESIP II focuses on identified
196 However, it should be noted that the Malawi Examinations Board reports on a Primary School Leaving Certificate (PSLC) based on an exam given at the end of Standard 8. 197 PSLCE includes six subjects: English, Chichewa, social/religious studies, Math, Science, and Art/Life Skills (Error! Reference source not found.).

DRAFT REPORT (VX) – COUNTRY 73
© UNIVERSALIA
thematic areas: early grade learning, learner retention, teaching and learning materials, teacher management and development, decentralization, education access and infrastructure, and skills development. Specifically, the ESIP II highlighted as a priority area to “maintain a motivated, high-performing teaching staff through robust teacher management”. Based on such policy, there seem to be recent efforts to improve teacher management and training.
202. In the last year, in order to fulfill an ESPIG DLR, MoEST developed and introduced a teacher management strategy in 2018. This includes efforts to improve the quality of secondary education that includes the provision of appropriate incentives to retain teachers in the teacher profession and enhancing continuous professional development. Data on the implementation of such incentives on a systematic/national level is not currently available.
Did ESP implementation contribute to system -level changes?
Finding 15: Key strategies intended to deliver system change in Malawi were not implemented at scale and fundamental changes in the efficiency and effectiveness of the system were not observed. Therefore, there is little evidence to link implementation and system changes in Malawi.
203. Pockets of success are reflected in small changes at the system level. However, these changes cannot be robustly linked to deliver system change in Malawi. The First Annual report for this evaluation and the previous implementation section of this report highlighted a number of commendable achievements including the distribution of school-based grants, community sensitization for girls’ education, real-time data collection being successfully piloted, training and resource prioritization to EMIS, and the extension of pilots into new schools and districts. However, significant changes to the efficiency and effectiveness of the system have not taken place in Malawi and equal access to such a system is not sufficient to deliver a quality education for all children.
Table 23 – List of system-level improvements in the review period (2017-2020)
SYSTEM-LEVEL CHANGE CHANGE DUE TO ESIP II
IMPLEMENTATION? IMPROVEMENT RELIED ON
DONOR FUNDS?
Some classrooms and handwashing sites have been completed, benefiting 12,611 students (6,211 boys and 6,450 girls).
Yes, ESIP II often highlights the need for more classrooms and facilities for students.
Yes – though GPE’s ESPIG funding in MESIP.
Improvements in pupil to qualified teacher ratios at the primary school level
Yes, ESIP II established constructing more teacher training colleges.
Both – government support of teachers through recurrent costs and DP support of teacher training.
Changes in both pre-service and in-service teacher training
ESIP II’s situational analysis highlights the need to improve teacher training; however, However, there is no specific budget line for the implementation of CPD framework activities in the MoEST national budget for 2017/2018.
Both – government development of continuing professional development frameworks, as well as significant support from donors, particularly USAID.

DRAFT REPORT (VX) – COUNTRY 74
© UNIVERSALIA
SYSTEM-LEVEL CHANGE CHANGE DUE TO ESIP II
IMPLEMENTATION? IMPROVEMENT RELIED ON
DONOR FUNDS?
New textbooks were developed for the primary school curriculum. In 2017/18, there was a purchase of new teaching and learning materials for the new curriculum.
Though ESIP II does mention planned activities to improve curriculum and textbook quality, it does not include mention of new teaching materials developed in response to the new primary curriculum.
No – this initiative has been government led and funded.
EMIS has seen limited improvements in establishing processes to track and monitor implementation and system strength.
ESIP II does mention the need to improve the timeliness and quality of EMIS data and systems, but does not include one key driver of EMIS improvements, capacity building from MLSS.
Donor driven – including support to MLSS
Removal of secondary school tuition in December, 2018
ESIP II did not refer to any plans to abolish public secondary school tuition.
No – this initiative has been government led and funded.
National Child Protection Strategy extension into 2018
ESIP II does not include any activities or guidelines regarding child protection.
Both – this initiative has been government led and supported by various donors and NGOs. For example, Plan works with the Ministry of Gender and Ministry of Justice on building capacity for child protection, including within schools.
204. There is little evidence to show any fundamental changes in the systemic operational environment in education in Malawi. Operational risks remain in place, concerns raised in 2014 are yet to be addressed; data reliability, weaknesses in inter-ministerial coordination remains and high degrees of variability between different districts and divisions remain. Additionally, the high staff turnover in MoEST continues. The MESIP Implementation Status Report does not describe any changes regarding the operational risks arising from key elements of the system from August 2016 to November 2018. Political and governance risks remain high and macroeconomic, capacity for implementation and sustainability, fiduciary and stakeholder risks remain substantial during this period.198
205. In addition, as Malawi nears the end of the ESIP II period, each of the five concerns raised at the planning stage of the policy cycle accurately describe the major barriers to plan implementation in Malawi: historical trends of low achievement of indicators against NESP, ESIP I and ESIP II, a lack of clarity of strategies and responsibilities for implementation, a lack of political will, a lack of capacity to implement and a failure to link financing sources to outputs. The analysis in the Year 2 CLE confirm that these barriers to implementation remain in Malawi’s education sector.
206. The previous annual report for this evaluation also reported similar challenges to those detailed in this report, including data reliability; weakness of inter-ministerial coordination; high degrees of variability between different districts and divisions both within MoEST and other stakeholders; and high levels of staff turnover and vacancies. Additionally, while there have been advances in financial alignment, large amounts of DP funding are off-budget resulting in a large
198 Malawi Education Sector Improvement Project P154185. November 2018.

DRAFT REPORT (VX) – COUNTRY 75
© UNIVERSALIA
number of discrete projects; and while there have been improvements within the last year, the predictability of DP funding is still uncertain.
Implications for GPE’s ToC and country -level operational model
207. One potential implication from Malawi for the GPE ToC and country level operational model is the absence of data. The Malawi education sector struggles with limited implementation capacity and weak donor financing harmonization. Therefore, the lack of credible data and sector-wide implementation may undermine the operational model’s assumption to provide high levels of funding and expect such investment to result in system-level improvements.
Box 7 - Testing Assumptions and Assessing Strength of Evidence
The four underlying assumptions for this contribution claim were (1) Sector plan implementation leads to improvements of previous shortcomings in relation to sector management; (2) there is sufficient national capacity (technical capabilities, political will, resources) to analyze, report on and use available data and maintain EMIS and LAS; (3) ESP implementation leads to improvements of previous shortcomings in relation to learning and (4) it leads to improvements in relation to equity.
Assumption 1 does not hold. Sector plan implementation in Malawi has not been consistent or efficient primarily due to weaknesses in sector management. In the case of Malawi, this assumption is circular.
Assumption 2 does not hold. While technical capabilities and some resources exist report on and use available data and maintain EMIS and LAS, the political economy in Malawi does not incentivize these actions.
Assumptions 3 and 4 cannot be assessed. Sector plan implementation has not been consistent or efficient in Malawi and therefore we cannot validate the influence of plan implementation.
The evidence for assessing changes in the education system in Malawi is weak. On one hand the lack of data on education systems provides strong evidence of system weakness. However, this lack of data also provides a weak evidence base regarding improvements or deterioration in other areas of the system.

DRAFT REPORT (VX) – COUNTRY 76
© UNIVERSALIA
5 Progress towards stronger learning outcomes and equity199
5.1 Introduction
208. This section provides a brief overview of medium-term trends in relation to basic education learning outcomes, equity, gender equality and inclusion that occurred in Malawi up to and during the review period (Key Evaluation Question III from the evaluation matrix: “Have improvements at education system level contributed to progress towards impact?”) Key sub-questions are:
▪ During the period under review, what changes have occurred in relation to (a) learning outcomes in basic education, (b) equity, gender equality and inclusion in education? (CEQ 6);
▪ Is there evidence to link changes in learning outcomes, equity, gender equality, and inclusion to system-level changes identified under CEQ 4? (CEQ 6);
▪ What other factors can explain changes in learning outcomes, equity, etc.? (CEQ 6); and
▪ What are the implications of evaluation findings for GPE support to Malawi? (Key Evaluation Question IV).
209. CLEs conducted during FY 2018 showed that trying to establish verifiable links between specific system-level improvements during the review period and impact-level trends is not feasible given (i) the relatively short CLE timeframe and (ii) the time lag that typically exists between specific innovations and their reflection in impact-level trends. This section illustrates trends in learning outcomes, equity, gender equality and inclusion, but does not attempt to directly link them to changes observed during the review period.
5.2 Progress towards impact-level outcomes
Finding 16: Available data is insufficient to measure any changes in learning outcomes in Malawi. There is progress in equity of access (though the system remains ineffective) and it cannot be determined as to whether this has resulted in quality education outcomes for all.
210. A high-level overview of evaluation findings on progress towards impact-level outcomes during the review period is provided in Table 24. These observations are elaborated in the findings and supporting evidence presented in this section.
199 This section triangulates findings against RF indicators 1 - 9

DRAFT REPORT (VX) – COUNTRY 77
© UNIVERSALIA
Table 24 – Overview: CLE findings on contribution of system-level changes to impact-level changes
IMPROVEMENTS MADE DURING THE 2012-2018
REVIEW PERIOD?
LIKELIHOOD THAT TRENDS WERE INFLUENCED BY SYSTEM-LEVEL CHANGES
DURING REVIEW PERIOD
DEGREE TO WHICH UNDERLYING
ASSUMPTIONS LIKELY HELD TRUE200
Equity, Gender Equality and Inclusion: Modest. Improvements in equity in access. However, equal access to an ineffective system does not constitute impact. No data on equity in learning.
Weak: Where access improved, it was likely due to the implementation of specific activities in the plan, including higher rates of out-of-school learners transitioning back to formal learning. However, increased equity in access is a precondition to impact and it is unlikely the Malawi education system is delivering impact in equitable learning.
1 2
Learning: Not sufficient data on learning to establish a trend.
Weak. Few systemic changes have taken place.
STRENGTH OF THE CONFIRMING/REFUTING EVIDENCE
1 2
Trends in equity, gender equality, inclusion and learning outcomes in the education sector in Malawi
Access Equity, Gender Equality and Inclusion in Basic Education
211. All levels of the Malawi education system (from pre-primary, to primary through tertiary education) are struggling to deliver quality education. Primary education provision for the majority of children has been achieved, however the system has been unable to account for delivery in learning outcomes.201 For example, according to the Malawi Exams board, only about 280,000 Standard 8 students sat the Primary School Leaving Certificate Examination in 2019 and only about 78% (218,000) of these passed.
Table 25 – Trends in indicators for Access, Equity, Gender Equality and Inclusion in Basic Education
INDICATORS THAT IMPROVED DURING THE 2017-2020 PERIOD
Total primary enrollment:
▪ UIS data shows improvement, from 3,687,625 children enrolled in 2012 to 4,433,977 children
enrolled in 2017, for a 20% increase over five years (average annual increase of 4%)
▪ The 2018 JSR states that the total enrollment has risen at an average rate of 2.2% per year
between 2013/14 to 2017/18, for a total increase of 9% in four years, according to EMIS.
Total secondary enrollment: UIS data shows increases in total enrollment, from 761,366 in 2012 to 998,940
in 2017, increasing at a rate of about 20% per year.
Primary net enrollment rate: The 2018 JSR states that NER increased only modestly from 85% in 2010/11 to
88% in 2016/17 to 90% in 2017/18, as enrolment growth is accompanied by general population growth
and high dropout rates. The NER in 2016/17 is at 87% for boys and 92% for girls.
200 The underlying assumptions for this contribution claim are (1) changes in the education system positively affect learning outcomes and equity, and (2) country-produced data on equity, efficiency and learning allow measuring/tracking these changes. 201 MLSS Baseline Diagnostics Note Final.

DRAFT REPORT (VX) – COUNTRY 78
© UNIVERSALIA
Primary to secondary transition rates: UIS does not provide any data and the 2018 JSR states the rate has
steadily increased from about 33% in 2011 to 39% in 2017. There are lower transition rates for girl
learners, though this gap has been shrinking in recent years. No additional data is available.
Access for children with special needs: The percentage of school aged special needs population in primary
school has increased from 2.5% in 2015/16 to 2.7% in 2016/17. The rate of special needs population in
secondary school increased from 1.3% in 2015/16 to 1.5% in 2016/2017, according to the 2018 JSR.
Complementary basic education: CBE centers in Malawi began with a pilot in 15 centers in three districts in
2006, had expanded to 600 CBE centers in 10 districts in 2013/13 and opened another 480 by 2017 for
1,080 CBE centers supporting 16,000 students, according to the 2018 JSR.
Enrollment to pre-primary school:
▪ UIS states it was 1,360,619 children enrolled in 2015 (the only data point)
▪ Access to early childhood development: the 2018 JSR reports that the percentage of preschool age
children with access to ECD has increased from 40% in 2015/16 to 45% in 2016/17
Gender equality
▪ The 2018 JSR states that primary enrollment in Malawi has reached gender parity. The GPI rate for
primary GER has remained constant at the desired level, from 1.02 in 2012 to 1.04 in 2017.
▪ UIS confirms this as the percentage of female students enrolled in primary education has
maintained at the desired level, from 50.44% in 2012 to 50.54% in 2017.
INDICATORS THAT STAGNATED DURING THE 2017-2020 PERIOD
Gender equality in all indicators:
UIS data shows the percentage of female enrollment in secondary school has remained relatively steady,
from 46.97% in 2012 to 48.42% in 2017.
Primary dropout rate: This has remained constant since 2012/2013 to 2016/2017 at about 4%, according to
EMIS.
Primary overage enrollment rate: Malawi has high gross enrollment rates due to over-age enrollment and
high rates of repetition. The percentage of overage children enrolled in primary education has remained
constant, from 18.98% in 2013 to 19.69% in 2017.
Primary completion rate: remained very low over the ESIP II period, stagnating at a low rate of about 52%
from 2012/203 to 2016/17, according to the 2018 JSR.
Secondary net enrollment rate: the 2018 JSR indicates that NER averaged around 13% in 2010, slightly
increased and has maintained at about 15% from 2014 to 2018.
Share of OOSC:
▪ UIS’ most recent data from 2009 records a total of 81,563 primary school age out-of-school
children.
▪ UIS data shows the total number of out-of-school adolescents (11-17) rising from 364,649 in 2009
to 417,904 in 2017.
▪ Malawi’s 2018 JSR reports that the percentage of out-of-school youth enrolled in complementary
basic education increased from 15% in 2015/16 to 16% in 2016/17.
School life expectancy: the primary school life expectancy has remained stable, from 8.4 in 2012 to 8.66 in
2017, according to UIS. The secondary school life expectancy is much lower on average and remained
relatively constant: 2.03 in 2012 to 2.29 (estimate) in 2017.
Primary survival rates to the last grade: 54.07% in 2013, according to UIS.
INDICATORS THAT DETERIORATED DURING THE –2017-202 PERIOD
Primary repetition rate: According to UIS, primary repetition rates have stagnated, at 20.23% in 2012 and
20.25% in 2013. They further deteriorated, to 24% in 2017/18, according to the 2018 JSR.

DRAFT REPORT (VX) – COUNTRY 79
© UNIVERSALIA
Primary gross enrollment rate: The 2018 JSR indicates high primary GER, rising from 120% in 2010/11 to
127% in 2017/18, according to EMIS. UIS depicts even higher rates, rising slightly from 136.29% in 2012 to
139.95% in 2017.
Secondary gross enrollment rate: Secondary GER rose from 33.33% in 2012 to 38.14% in 2017, though as
visible the overall ratios remain low in comparison to other SSA countries, according to UIS. The Malawi
2018 JSR depicts an even bleaker picture.
INDICATORS FOR WHICH NO CONCLUSIVE DATA IS AVAILABLE
Internal Efficiency Coefficient: UIS or JSR data is not available.
Regional differences: UIS or JSR data is not available.
Access for the poorest: UIS or JSR data is not available.
Pre-primary enrollment: UIS states it was 1,360,619 children enrolled in 2015. No other data points are
available.
Finding 17: Key equity achievements have taken place during the ESIP II period, including gender parity in the early years, a narrower gap between male and female completion rates, an increase in the number of enrolled learners with special needs and increased provisions for out-of-school children to transition back to school.
212. There are key improvements in Equity, Gender Equality and Inclusion. However, few ESIP II targets were achieved. Gender parity was achieved for the first four standards of primary school and the enrollment of Special Needs Learners has increased. System level changes resulted in previously OOS learners transitioning back to formal basic education. 202 Gender parity was achieved for the first four standards of primary school, according to the JSR 2018. For Standards 5-7 female enrolments were on average 8% higher than male enrolment. However, in Standard 8, male enrolment is much higher. The JSR concludes that this reflects higher repetition rates of male learners in this final year of primary school as they seek to improve selection into secondary schools. Some improvement in the Gender Parity Index (GPI) in secondary education was found between 2014 and 2018. However, few ESIP II targets related to equitable access have been achieved. There are also wide differences across regions, with the South East having the highest GPI of 0.95 and the Shire Highlands with the lowest GPI at 0.87.203
213. In terms of inclusion, the enrollment of Special Needs Learners (SNL) was one of the key interventions of the sector plan to reduce inequality. The JSR 2018 report finds that in the 2015 and 2016 (years 1 and 2 in the figure) targets were met and in 2017 the target was surpassed. For
202 JSR 2018. 203 Ibid.
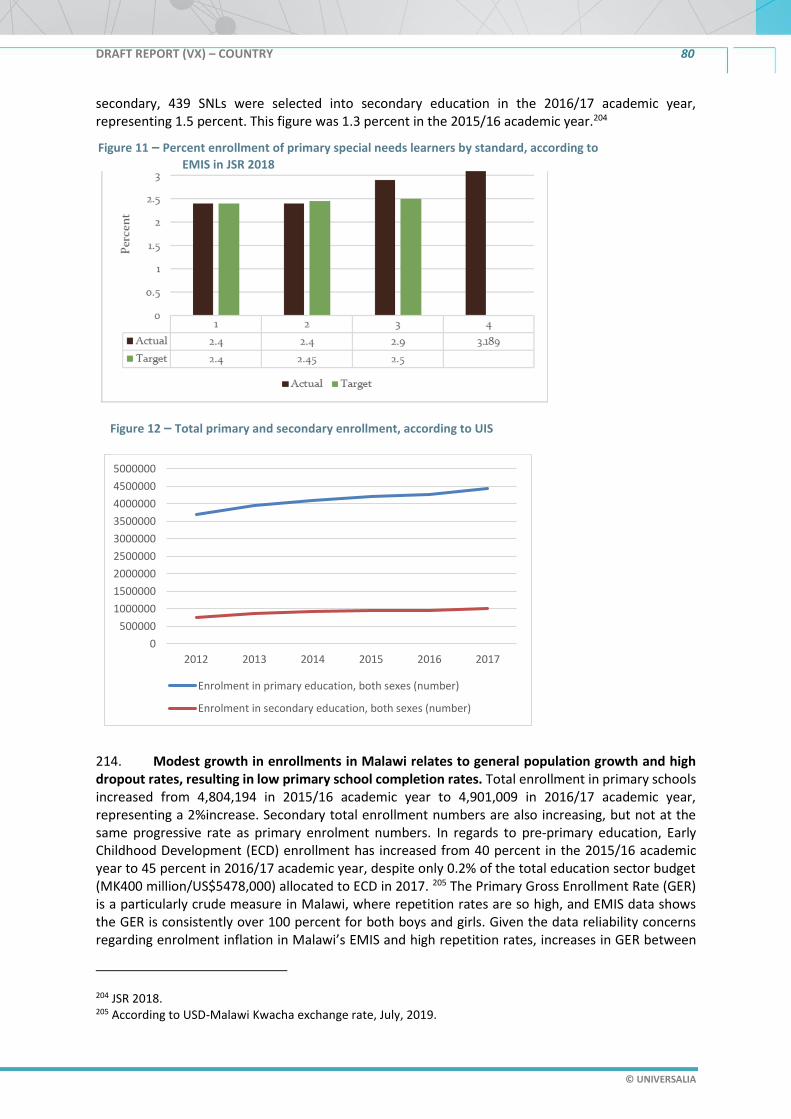
DRAFT REPORT (VX) – COUNTRY 80
© UNIVERSALIA
secondary, 439 SNLs were selected into secondary education in the 2016/17 academic year, representing 1.5 percent. This figure was 1.3 percent in the 2015/16 academic year.204
214. Modest growth in enrollments in Malawi relates to general population growth and high dropout rates, resulting in low primary school completion rates. Total enrollment in primary schools increased from 4,804,194 in 2015/16 academic year to 4,901,009 in 2016/17 academic year, representing a 2%increase. Secondary total enrollment numbers are also increasing, but not at the same progressive rate as primary enrolment numbers. In regards to pre-primary education, Early Childhood Development (ECD) enrollment has increased from 40 percent in the 2015/16 academic year to 45 percent in 2016/17 academic year, despite only 0.2% of the total education sector budget (MK400 million/US$5478,000) allocated to ECD in 2017. 205 The Primary Gross Enrollment Rate (GER) is a particularly crude measure in Malawi, where repetition rates are so high, and EMIS data shows the GER is consistently over 100 percent for both boys and girls. Given the data reliability concerns regarding enrolment inflation in Malawi’s EMIS and high repetition rates, increases in GER between
204 JSR 2018. 205 According to USD-Malawi Kwacha exchange rate, July, 2019.
Figure 11 – Percent enrollment of primary special needs learners by standard, according to
EMIS in JSR 2018
0
500000
1000000
1500000
2000000
2500000
3000000
3500000
4000000
4500000
5000000
2012 2013 2014 2015 2016 2017
Enrolment in primary education, both sexes (number)
Enrolment in secondary education, both sexes (number)
Figure 12 – Total primary and secondary enrollment, according to UIS

DRAFT REPORT (VX) – COUNTRY 81
© UNIVERSALIA
2013 and 2017 are unlikely to be a useful indicator of increased access. However, in spite of these significant increases in absolute numbers and enrollment rates over the past decade, the overall net enrollment rate in Malawi has only shown modest increases. According to the Malawi 2018 JSR, the Net Enrollment Rate (NER) increased to 88 percent in 2017/18 from 85% in 2010/11, slightly below the EMIS target of 93% by 2018.
215. Repetition. The struggle to deliver education efficiency206 is demonstrated by the proportion of learners repeating classes every year207 and this inefficiency is exacerbated by the lack of financial data available to hold the system to account.208 The system has not been able to keep up with growth, in terms of both the population as a whole and the proportion of children in the population attending school. Depending on the source of data, repetition rates are holding steady (EMIS) and potentially increasing in the most disadvantaged districts (MLSS), pupil to teacher ratios are either holding steady (MLSS) or decreasing (EMIS). Regardless of the data source repetition targets have not been met (10 percent for 2017/18) and all efficiency indicators paint the same picture: the Malawi education system is extremely inefficient, and no real progress has been made in improving the efficiency of the system.
206 MLSS Baseline Diagnostics Note Final. Page 2. 207 A WB report shows that the primary education systems requires 23 years’ investments to produce one graduate, as opposed to the 8-year norm for completing primary education in Malawi. MSLL Baseline Diagnostics Note. 208 Report on the Evaluation of the Public Financial Management System of Malawi. Public Expenditure and Financial Accountability Assessment November 2018.
Baseline Midline
MLSS 19.3 21.5
EMIS 22.8
17
18
19
20
21
22
23
24
REP
ETIT
ION
RA
TE IN
GR
AD
ES 1
-4
Figure 13 – Repetition Rates in Eight Most Disadvantaged Districts for Baseline (2016) and Midline (2019)

DRAFT REPORT (VX) – COUNTRY 82
© UNIVERSALIA
216. Completion rates remained low over the ESIP II period and are currently at 52 percent. Primary school completion (the share of children who complete the full cycle of primary school), does not measure on-time completion, a crucial issue in Malawi given the high repetition rates. The ESIP II set a target of 60 percent, which is yet to be achieved. During the review period, average completion rates have remained low, although girls’ completion rate has more markedly increased (Figure 17). Figure 17 – Primary Completion Rates, according to EMIS
Equity
217. Data on out-of-school children (OOSC) in primary education in Malawi is lacking (EMIS and UIS do not report). In secondary education, the number of OOSC is increasing, and this is predominately the case for female students. The JSR 2018 report notes that the percentage of OOS youth enrolled in Complementary Basic Education (CBE) has increased from 15 percent in 2015/16 to 16 percent in 2016/17. Given the quality concerns with EMIS, it is difficult to assess if this small increase is real or due to data inconsistencies.
Figure 14 – Primary Repetition Rates, according to EMIS

DRAFT REPORT (VX) – COUNTRY 83
© UNIVERSALIA
218. Dropout rates for primary boys and girls are currently around 4%, according to EMIS data. However, a major concern in Malawi is cumulative dropout over years due to high repetition rates. Learners progress slowly through the school years and eventually drop out before completion. In 2017/18, enrollment in Standard 8 was only 25 percent of enrollment in Standard 1, in the same year.
Figure 15 – Gross Enrollment Ratio, according to EMIS 2017
0
10
20
30
40
50
60
70
80
90
100
330000
340000
350000
360000
370000
380000
390000
400000
410000
420000
430000
2012 2013 2014 2015 2016 2017 2018
Per
cen
t fe
mal
e
Nu
mb
er o
f O
OSC
Out-of-school adolescents of lower secondary school age, both sexes (number)
Out-of-school adolescents of lower secondary school age, percentage female (%)
Figure 16 – Number of Lower Secondary OOSC, according to UIS

DRAFT REPORT (VX) – COUNTRY 84
© UNIVERSALIA
Figure 17 – Cumulative drop out demonstrated by declining enrollment by Standard in 2017/18, according to EMIS
Learning Outcomes in Basic Education
219. Despite the increasingly high level of overall spending on primary education over the past five years, the learning outcomes remain relatively low.209 Data on learning outcomes is incomplete and somewhat out of date and national scores with regards to numeracy and literacy rates are currently not being tracked by the GPE-funded MESIP. Available data paints a worrying picture of the quality of education in Malawi. For instance, only a third of all students by Standard 4 have reached appropriate levels of literacy and numeracy.210
220. Small improvements in learning over a short period of time can be observed. According to the Malawi National Reading Program Baseline Assessment (implemented in partnership with RTI in 2017), most learners had not yet acquired critical early grade reading skills. In Standard 2, 80 percent of learners scored zero in correctly and fluently reading a Chichewa text and 87 percent of learns scored zero in correctly and fluently reading an English text. As can be seen in Figure 21 and Figure 22, modest improvements can be observed between 2017 and 2018. Certainly, a focus on learning quality in LEG meetings and the JSRs will be easier to sustain when learning outcomes are regularly reported in a timely manner.
209 Error! Reference source not found., pp. 3-4. 210 World Bank. 2018. Facing Forward: Schooling for Learning in Africa, according to the SDI (Service Delivery Indicators) reading and mathematics assessments of students in standard four.

DRAFT REPORT (VX) – COUNTRY 85
© UNIVERSALIA
Figure 18 – Standard 2 Zero EGRA scores, according to USAID LAS
Figure 19 – Standard 4 EGRA scores, according to USAID LAS
Is there evidence to link changes in learning outcomes, equity, gender equality and inclusion to system -level changes identified? What other factors can explain observed changes (or lack thereof)?
221. There is very little evidence of wide-scale systemic change in Malawi and very little data indicating that learning takes place in schools. Data on learning outcomes by social group is scant and repetition, transition and completion indicators reflect an ineffective and inefficient system. It is unlikely that this system is producing impact in the areas of learning. Following the GPE ToC, while there have been pockets of success in implementation, implementation challenges have prevailed. System level achievements have mainly been made in the area of increasing equity in access. However, system-level improvements in learning have yet to be demonstrated. The small improvements in learning that can be observed are most likely a direct result of the USAID National Reading Program. Inputs need to be sustained and systemic changes in the practices and pedagogies of teachers need to take place to improve education service delivery.
222. Evidence on the relationship between quality and dropout has been explored in several studies, finding statistically significant associations between low quality schools and high dropout rates.211 As discussed in the previous section, approximately a quarter of learners repeat a year; only one in three students who enter primary school complete all eight years of primary education; and approximately one in 10 students drop out of primary education each year between Standards 1 and 4.212 Improving the quality of education in Malawi will likely improve these indicators.
223. The National Child Protection Strategy has been a contributing factor to the achievement of gender parity in Malawi, through community-level work on social norms, efforts to reduce child marriage and improving communication between schools and community leaders on the importance
211 Kushiyait, B. 2011. School Dropout and its relationship with quality of primary education in Nepal. The Geographical Journal of Nepal. Vol. 8, 2011: 23-32. Lloyd, Mensch and Clark. 2000. The Effects of Primary School Quality of School Dropout among Kenyan Girls and Boys. Comparative Education Review. Vol. 44. No 2. 212 See discussion below; MoEST ESPR 2017 using EMIS 2016 data.
0
20
40
60
80
100
2017 2018
Standard 2 scored zero for lettersound identification
Standard 2 Scored zero scores forEnglish oral reading fluency
0
20
40
60
80
100
2017 2018
Standard 4 reading comprehension inChichewa
Standard 4 learners reading Chichewaat grade level
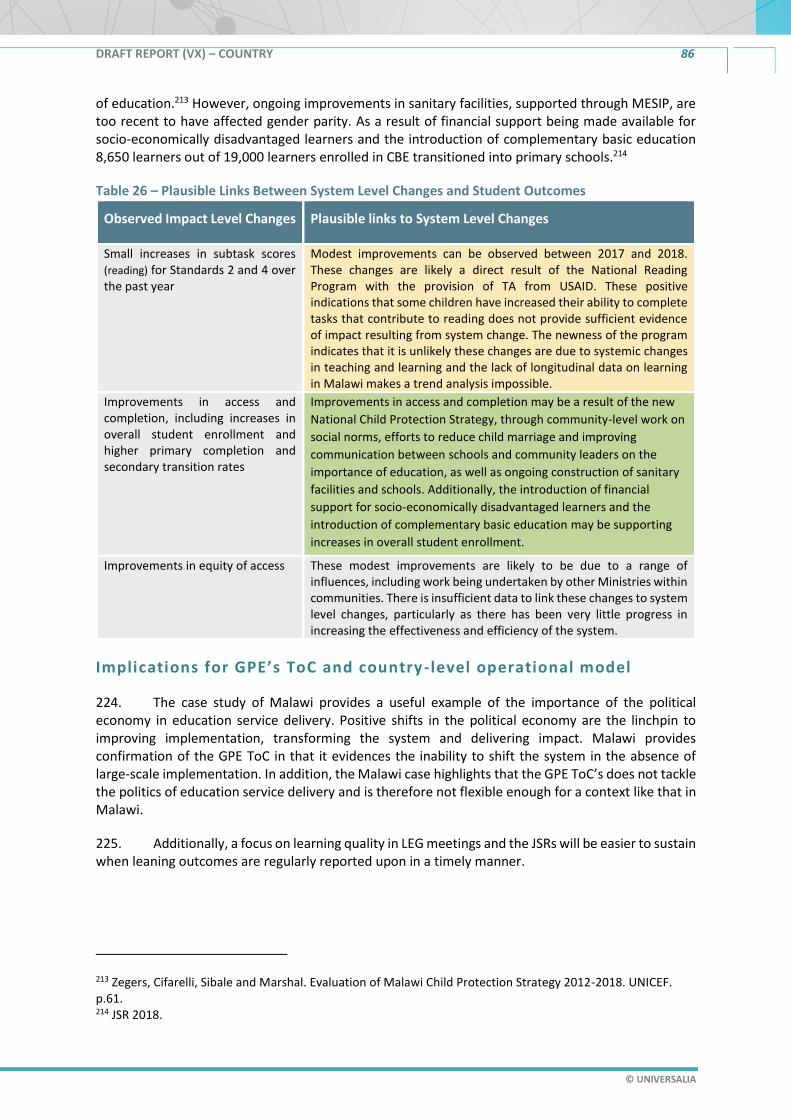
DRAFT REPORT (VX) – COUNTRY 86
© UNIVERSALIA
of education.213 However, ongoing improvements in sanitary facilities, supported through MESIP, are too recent to have affected gender parity. As a result of financial support being made available for socio-economically disadvantaged learners and the introduction of complementary basic education 8,650 learners out of 19,000 learners enrolled in CBE transitioned into primary schools.214
Table 26 – Plausible Links Between System Level Changes and Student Outcomes
Observed Impact Level Changes Plausible links to System Level Changes
Small increases in subtask scores (reading) for Standards 2 and 4 over the past year
Modest improvements can be observed between 2017 and 2018. These changes are likely a direct result of the National Reading Program with the provision of TA from USAID. These positive indications that some children have increased their ability to complete tasks that contribute to reading does not provide sufficient evidence of impact resulting from system change. The newness of the program indicates that it is unlikely these changes are due to systemic changes in teaching and learning and the lack of longitudinal data on learning in Malawi makes a trend analysis impossible.
Improvements in access and completion, including increases in overall student enrollment and higher primary completion and secondary transition rates
Improvements in access and completion may be a result of the new
National Child Protection Strategy, through community-level work on
social norms, efforts to reduce child marriage and improving
communication between schools and community leaders on the
importance of education, as well as ongoing construction of sanitary
facilities and schools. Additionally, the introduction of financial
support for socio-economically disadvantaged learners and the
introduction of complementary basic education may be supporting
increases in overall student enrollment.
Improvements in equity of access These modest improvements are likely to be due to a range of influences, including work being undertaken by other Ministries within communities. There is insufficient data to link these changes to system level changes, particularly as there has been very little progress in increasing the effectiveness and efficiency of the system.
Implications for GPE’s ToC and country -level operational model
224. The case study of Malawi provides a useful example of the importance of the political economy in education service delivery. Positive shifts in the political economy are the linchpin to improving implementation, transforming the system and delivering impact. Malawi provides confirmation of the GPE ToC in that it evidences the inability to shift the system in the absence of large-scale implementation. In addition, the Malawi case highlights that the GPE ToC’s does not tackle the politics of education service delivery and is therefore not flexible enough for a context like that in Malawi.
225. Additionally, a focus on learning quality in LEG meetings and the JSRs will be easier to sustain when leaning outcomes are regularly reported upon in a timely manner.
213 Zegers, Cifarelli, Sibale and Marshal. Evaluation of Malawi Child Protection Strategy 2012-2018. UNICEF. p.61. 214 JSR 2018.
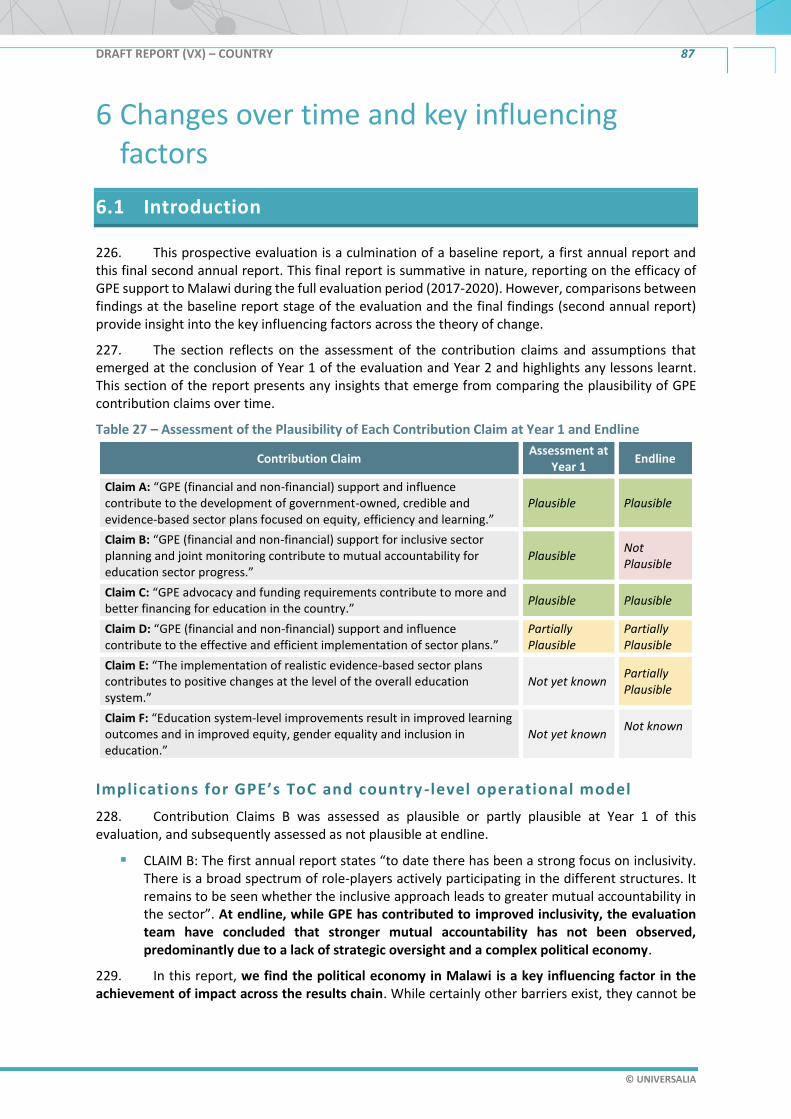
DRAFT REPORT (VX) – COUNTRY 87
© UNIVERSALIA
6 Changes over time and key influencing factors
6.1 Introduction
226. This prospective evaluation is a culmination of a baseline report, a first annual report and this final second annual report. This final report is summative in nature, reporting on the efficacy of GPE support to Malawi during the full evaluation period (2017-2020). However, comparisons between findings at the baseline report stage of the evaluation and the final findings (second annual report) provide insight into the key influencing factors across the theory of change.
227. The section reflects on the assessment of the contribution claims and assumptions that emerged at the conclusion of Year 1 of the evaluation and Year 2 and highlights any lessons learnt. This section of the report presents any insights that emerge from comparing the plausibility of GPE contribution claims over time.
Table 27 – Assessment of the Plausibility of Each Contribution Claim at Year 1 and Endline
Contribution Claim Assessment at
Year 1 Endline
Claim A: “GPE (financial and non-financial) support and influence contribute to the development of government-owned, credible and evidence-based sector plans focused on equity, efficiency and learning.”
Plausible Plausible
Claim B: “GPE (financial and non-financial) support for inclusive sector planning and joint monitoring contribute to mutual accountability for education sector progress.”
Plausible Not Plausible
Claim C: “GPE advocacy and funding requirements contribute to more and better financing for education in the country.”
Plausible Plausible
Claim D: “GPE (financial and non-financial) support and influence contribute to the effective and efficient implementation of sector plans.”
Partially Plausible
Partially Plausible
Claim E: “The implementation of realistic evidence-based sector plans contributes to positive changes at the level of the overall education system.”
Not yet known Partially Plausible
Claim F: “Education system-level improvements result in improved learning outcomes and in improved equity, gender equality and inclusion in education.”
Not yet known Not known
Implications for GPE’s ToC and country -level operational model
228. Contribution Claims B was assessed as plausible or partly plausible at Year 1 of this evaluation, and subsequently assessed as not plausible at endline.
▪ CLAIM B: The first annual report states “to date there has been a strong focus on inclusivity. There is a broad spectrum of role-players actively participating in the different structures. It remains to be seen whether the inclusive approach leads to greater mutual accountability in the sector”. At endline, while GPE has contributed to improved inclusivity, the evaluation team have concluded that stronger mutual accountability has not been observed, predominantly due to a lack of strategic oversight and a complex political economy.
229. In this report, we find the political economy in Malawi is a key influencing factor in the achievement of impact across the results chain. While certainly other barriers exist, they cannot be

DRAFT REPORT (VX) – COUNTRY 88
© UNIVERSALIA
overcome until there is a shift in the political economy. This includes issues around accountability, overly hierarchical systems and efficiency issues in implementation.
230. The Malawi case study is unable to provide evidence on the links between implementation, system change and impact, because implementation has been a significant challenge in the country. While unable to verify that sector plan implementation leads to system change, the situation certainly shows that implementing major strategies within a sector plan is unlikely to lead to system change.

DRAFT REPORT (VX) – COUNTRY 89
© UNIVERSALIA
7 Conclusions and strategic questions/issues 231. This final section of the report draws overall conclusions deriving from the evaluation findings and formulates several strategic questions that have been raised by the findings of the Malawi evaluation. These questions are of potential relevance for GPE overall and may warrant further exploration in other upcoming country-level evaluations.
7.1 Conclusions215
232. The primary conclusion from observation and analysis of GPE in Malawi so far is that progress is not necessarily linear. Whilst Malawi has clearly benefited from the material support provided by the partnership to date, the results have been mixed. Progress and achievements are being made, but they are modest and small scale, despite both significant material and strategic investments being made to the sector. Noticeable challenges remain in the sector.
233. There is insufficient evidence to support a claim that material and strategic investments made by GPE have significantly contributed to the attainment of the objective of ensuring inclusive and quality education for all in Malawi. It is plausible, however that GPE support has improved the quality and inclusivity of the education sector plan and improved the inclusivity of sector dialogue. In time, this increased inclusivity may become one of the leverage points to improve accountability. However currently, this has not yet been realized.
234. There is evidence that GPE advocacy and financial support have contributed to better financing for the sector. This has become apparent now that the CFM has been operationalized. In addition, the GoM has increased its commitment to increasing its budget allocation to the education sector, however more work needs to be done to improve transparency in public finance management and track expenditure against these budget commitments.
235. Sufficient attention has not been paid to the existing capacity within the MoEST to implement. Certainly, many of the challenges faced have been highlighted at the planning stage and the option to simply be less ambitious in planning is misplaced. The likelihood remains that resources will continue to be increased to support the implementation of the plan, though actual implementation remains problematic. Some notable successes have been achieved; however, substantial components of the implementation remain well behind schedule.
Table 28 – Overview of GPE Contribution to Country-level Objectives of the GPE ToC
COUNTRY-LEVEL OBJECTIVES RATING OF DEGREE/LIKELIHOOD OF GPE
CONTRIBUTION
Sector Planning Strong
Mutual Accountability Sector dialogue – modest
Sector monitoring – modest
Sector Financing
Domestic financing - strong
International financing - strong
Quality of financing - modest
Sector Plan Implementation Modest
215 This section addresses evaluation questions CEQ 7 and 8.

DRAFT REPORT (VX) – COUNTRY 90
© UNIVERSALIA
7.2 Good practices arising from Malawi
236. In Malawi, though few best practices were identified, one key lesson includes:
▪ Alternative options to pooled funding in country contexts with weak fiduciary management and processes. Though harmonization in a pooled fund is not yet possible due to past financial scandals, a functional Common Funding Mechanism is in place with international oversight to support the implementation of the sector plan. Potential political economy barriers should be considered carefully prior to funding certain implementation activities, such as construction.
7.3 Strategic questions arising from this CLE for GPE
237. The Malawi case provides four strategic questions on the GPE operational model and ToC.
▪ The Coordinating Agency role is the linchpin in the GPE ToC at the country level for mutual accountability. Presently this role is extremely demanding in terms of time and political cost. Does GPE perceive significant risks of not addressing the concerns of DPs regarding these costs to being the CA, in that a sub-standard execution of the role will significantly affect GPE effectiveness?
▪ Does the introduction of performance-based payments have unintended consequences in contexts with weak systems like Malawi? The toll of measuring high stakes outputs and outcomes on fragile data systems can bring perverse incentives and weak systems may buckle under the pressure. While there has been a commitment to verify the results of the disbursement linked indicators through an independent contractor, it is not clear how this will be done retrospectively when the baseline, rather than midline, figures are disputed.
▪ Does the Secretariat consider the strength of national systems to produce reliable data against DLIs? It is recommended that the Secretariat consider the strength of mutual accountability in each country, before introducing results-based financing.
▪ Does the GPE’s operational model effectively consider the importance of a country’s political economy for system change? Ways to assess political barriers and develop strategies to shift the political economy need to be developed to strengthen many of the assumptions underpinning the ToC and operational model. Increasing alternative models and strategies beyond the current operational model for sub-optimal contexts where certain assumptions, particularly stakeholders having motivation (incentives) to do so, would strengthen the ToC. Serious consideration of Ministry capacity, efficient ways of working across departments, sustainability beyond ‘projects’ and addressing political economy barriers should be a key focus of the partnership going forward. It is recommended that GPE reviews the evidence base on the impact of the political economy on education systems (See the RISE program) and consider the implications for GPE processes. For example, GPE may consider introducing political economy analysis and strategy development for some or all member countries, to inform support at the country level.

DRAFT REPORT (VX) – COUNTRY 91
© UNIVERSALIA
8 Annexes

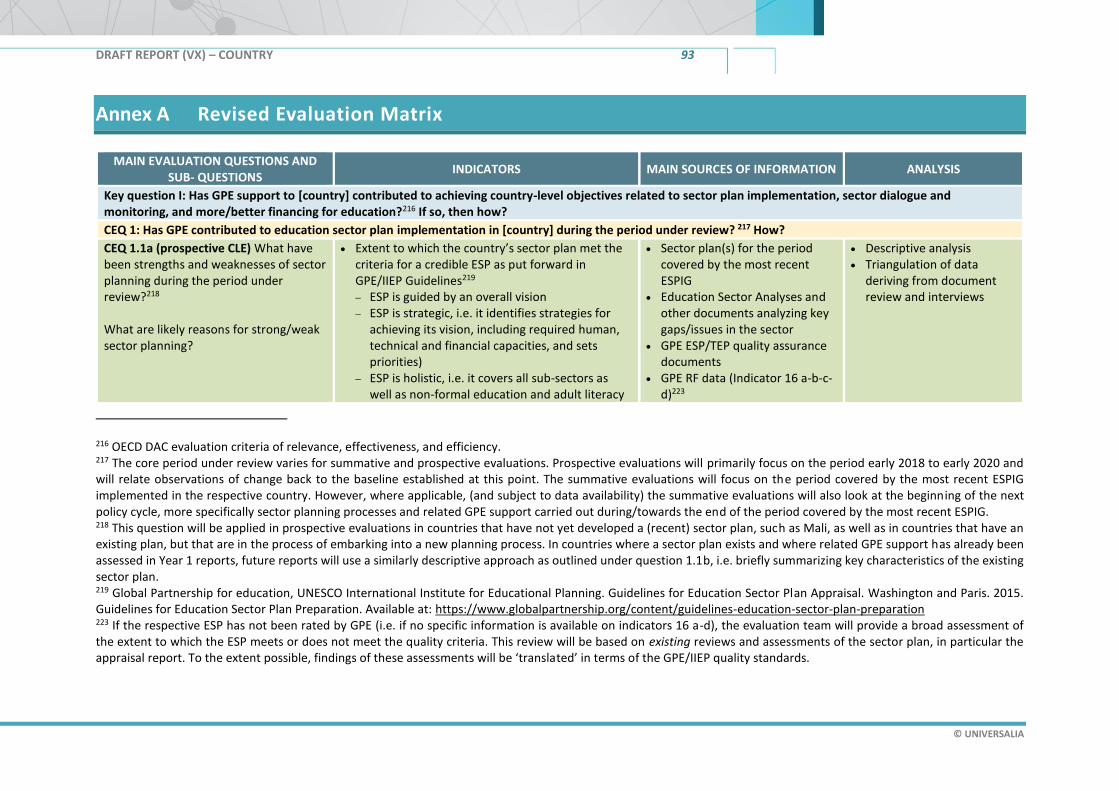
DRAFT REPORT (VX) – COUNTRY 93
© UNIVERSALIA
Revised Evaluation Matrix
MAIN EVALUATION QUESTIONS AND SUB- QUESTIONS
INDICATORS MAIN SOURCES OF INFORMATION ANALYSIS
Key question I: Has GPE support to [country] contributed to achieving country-level objectives related to sector plan implementation, sector dialogue and monitoring, and more/better financing for education?216 If so, then how?
CEQ 1: Has GPE contributed to education sector plan implementation in [country] during the period under review? 217 How?
CEQ 1.1a (prospective CLE) What have been strengths and weaknesses of sector planning during the period under review?218 What are likely reasons for strong/weak sector planning?
• Extent to which the country’s sector plan met the criteria for a credible ESP as put forward in GPE/IIEP Guidelines219 − ESP is guided by an overall vision − ESP is strategic, i.e. it identifies strategies for
achieving its vision, including required human, technical and financial capacities, and sets priorities)
− ESP is holistic, i.e. it covers all sub-sectors as well as non-formal education and adult literacy
• Sector plan(s) for the period covered by the most recent ESPIG
• Education Sector Analyses and other documents analyzing key gaps/issues in the sector
• GPE ESP/TEP quality assurance documents
• GPE RF data (Indicator 16 a-b-c-d)223
• Descriptive analysis • Triangulation of data
deriving from document review and interviews
216 OECD DAC evaluation criteria of relevance, effectiveness, and efficiency. 217 The core period under review varies for summative and prospective evaluations. Prospective evaluations will primarily focus on the period early 2018 to early 2020 and will relate observations of change back to the baseline established at this point. The summative evaluations will focus on the period covered by the most recent ESPIG implemented in the respective country. However, where applicable, (and subject to data availability) the summative evaluations will also look at the beginning of the next policy cycle, more specifically sector planning processes and related GPE support carried out during/towards the end of the period covered by the most recent ESPIG. 218 This question will be applied in prospective evaluations in countries that have not yet developed a (recent) sector plan, such as Mali, as well as in countries that have an existing plan, but that are in the process of embarking into a new planning process. In countries where a sector plan exists and where related GPE support has already been assessed in Year 1 reports, future reports will use a similarly descriptive approach as outlined under question 1.1b, i.e. briefly summarizing key characteristics of the existing sector plan. 219 Global Partnership for education, UNESCO International Institute for Educational Planning. Guidelines for Education Sector Plan Appraisal. Washington and Paris. 2015. Guidelines for Education Sector Plan Preparation. Available at: https://www.globalpartnership.org/content/guidelines-education-sector-plan-preparation 223 If the respective ESP has not been rated by GPE (i.e. if no specific information is available on indicators 16 a-d), the evaluation team will provide a broad assessment of the extent to which the ESP meets or does not meet the quality criteria. This review will be based on existing reviews and assessments of the sector plan, in particular the appraisal report. To the extent possible, findings of these assessments will be ‘translated’ in terms of the GPE/IIEP quality standards.

DRAFT REPORT (VX) – COUNTRY 94
© UNIVERSALIA
MAIN EVALUATION QUESTIONS AND SUB- QUESTIONS
INDICATORS MAIN SOURCES OF INFORMATION ANALYSIS
− ESP is evidence-based, i.e. it starts from an education sector analysis
− ESP is achievable − ESP is sensitive to context − ESP pays attention to disparities (e.g. between
girls/boys or between groups defined geographically, ethnically/culturally or by income)
• For TEPs: Extent to which the country’s sector plan met the criteria for a credible TEP as put forward in GPE/IIEP Guidelines220 − TEP is shared (state-driven, developed through
participatory process) − TEP is evidence-based − TEP is sensitive to context and pays attention to
disparities − TEP is strategic, i.e. it identifies strategies that
not only help address immediate needs but lay the foundation for realizing system’s long-term vision
− TEP is targeted (focused on critical education needs in the short and medium term, on system capacity development, on limited number of priorities)
− TEP is operational (feasible, including implementation and monitoring frameworks)
• Extent to which the ESP/TEP meets GPE quality criteria as outlined in the GPE 2020 results framework (indicators 16a, b, c and d)221
• Other relevant reports or reviews that comment on the quality of the sector plan
• Interviews
220 Global Partnership for Education, UNESCO International Institute for Educational Planning. Guidelines for Education Sector Plan Appraisal. Washington and Paris. 2016. Guidelines for Transitional Education Plan Preparation. Available at: https://www.globalpartnership.org/content/guidelines-transitional-education-plan-preparation 221 If no GPE ratings on these indicators are available, evaluation team’s assessment of extent to which the ESP meets the various criteria outlined under indicator 16a-d.

DRAFT REPORT (VX) – COUNTRY 95
© UNIVERSALIA
MAIN EVALUATION QUESTIONS AND SUB- QUESTIONS
INDICATORS MAIN SOURCES OF INFORMATION ANALYSIS
• Extent to which the ESP/TEP addresses the main issues/gaps in the education sector (as identified through Education Sector Analyses and/or other studies)
• Extent to which the process of sector plan preparation has been country-led, participatory, and transparent222
• Stakeholder views on strengths and weaknesses of the most recent sector planning process in terms of: − Leadership for and inclusiveness of sector plan
development − Relevance, coherence and achievability of the
sector plan
CEQ 1.1b (summative CLE) What characterized the education sector plan in place during the core period under review?
• ESP/TEP objectives/envisaged results and related targets
• For ESPs: Extent to which the country’s sector plan met the criteria for a credible ESP as put forward in GPE/IIEP Guidelines224 − ESP is guided by an overall vision − ESP is strategic, i.e. it identifies strategies for
achieving its vision, including required human, technical and financial capacities, and sets priorities)
• Sector plan(s) for the period covered by the most recent ESPIG
• GPE ESP/TEP quality assurance documents
• GPE RF data (indicator 16 a-b-c-d) 227
• Other relevant reports or reviews that comment on the quality of the sector plan
• Descriptive analysis
222 Global Partnership for Education, UNESCO International Institute for Educational Planning. Guidelines for Education Sector Plan Appraisal. Washington and Paris. 2015. Available at: http://unesdoc.unesco.org/images/0023/002337/233768e.pdf 224 Global Partnership for Education, UNESCO International Institute for Educational Planning. Guidelines for Education Sector Plan Appraisal. Washington and Paris. 2015. Guidelines for Education Sector Plan Preparation. Available at: https://www.globalpartnership.org/content/guidelines-education-sector-plan-preparation 227 If the respective ESP has not been rated by GPE (i.e. if no specific information is available on indicators 16 a-d), the evaluation team will provide a broad assessment of the extent to which the ESP meets or does not meet the quality criteria. This review will be based on existing reviews and assessments of the sector plan, in particular the appraisal report. To the extent possible, findings of these assessments will be ‘translated’ in terms of the GPE/IIEP quality standards.

DRAFT REPORT (VX) – COUNTRY 96
© UNIVERSALIA
MAIN EVALUATION QUESTIONS AND SUB- QUESTIONS
INDICATORS MAIN SOURCES OF INFORMATION ANALYSIS
− ESP is holistic, i.e. it covers all sub-sectors as well as non-formal education and adult literacy
− ESP is evidence-based, i.e. it starts from an education sector analysis
− ESP is achievable − ESP is sensitive to context − ESP pays attention to disparities (e.g. between
girls/boys or between groups defined geographically, ethnically/culturally or by income)
• For TEPs: Extent to which the country’s sector plan met the criteria for a credible TEP as put forward in GPE/IIEP Guidelines225 − TEP is shared (state-driven, developed through
participatory process) − TEP is evidence-based − TEP is sensitive to context and pays attention to
disparities − TEP is strategic, i.e. it identifies strategies that
not only help address immediate needs but lay the foundation for realizing system’s long-term vision
− TEP is targeted (focused on critical education needs in the short and medium term, on system capacity development, on limited number of priorities)
− TEP is operational (feasible, including implementation and monitoring frameworks)
225 Global Partnership for Education, UNESCO International Institute for Educational Planning. Guidelines for Education Sector Plan Appraisal. Washington and Paris. 2016. Guidelines for Transitional Education Plan Preparation. Available at: https://www.globalpartnership.org/content/guidelines-transitional-education-plan-preparation
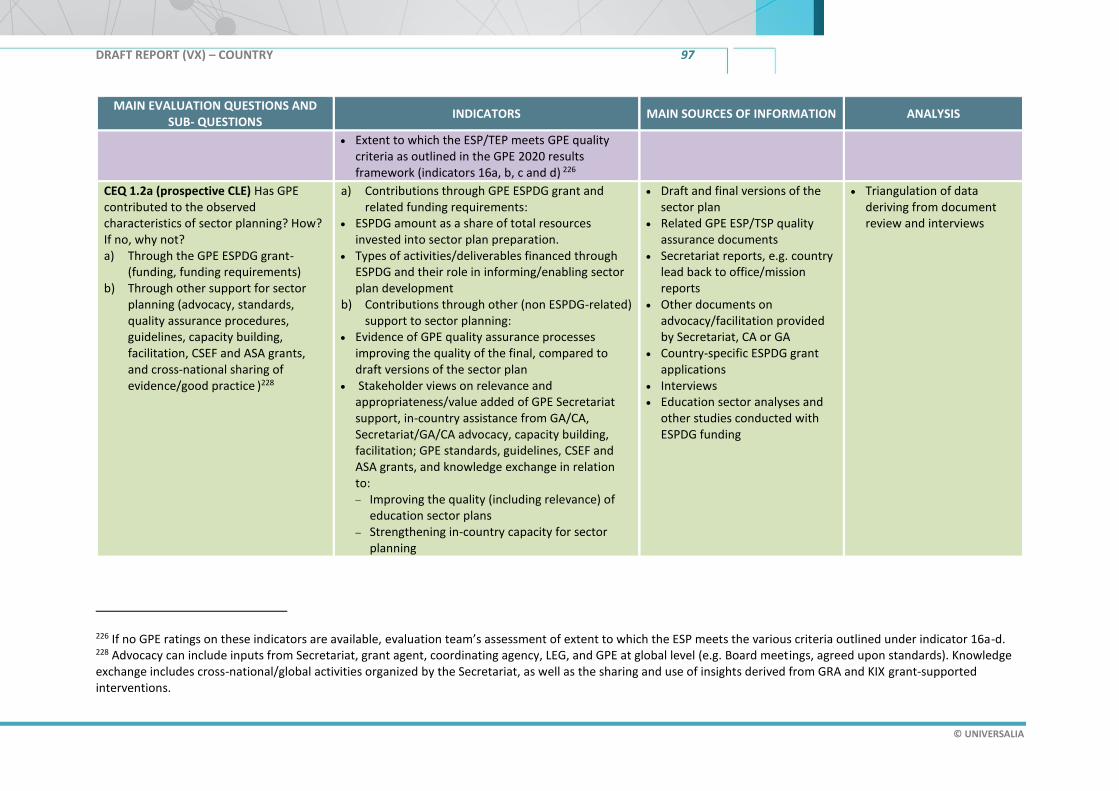
DRAFT REPORT (VX) – COUNTRY 97
© UNIVERSALIA
MAIN EVALUATION QUESTIONS AND SUB- QUESTIONS
INDICATORS MAIN SOURCES OF INFORMATION ANALYSIS
• Extent to which the ESP/TEP meets GPE quality criteria as outlined in the GPE 2020 results framework (indicators 16a, b, c and d) 226
CEQ 1.2a (prospective CLE) Has GPE contributed to the observed characteristics of sector planning? How? If no, why not? a) Through the GPE ESPDG grant-
(funding, funding requirements) b) Through other support for sector
planning (advocacy, standards, quality assurance procedures, guidelines, capacity building, facilitation, CSEF and ASA grants, and cross-national sharing of evidence/good practice )228
a) Contributions through GPE ESPDG grant and related funding requirements:
• ESPDG amount as a share of total resources invested into sector plan preparation.
• Types of activities/deliverables financed through ESPDG and their role in informing/enabling sector plan development
b) Contributions through other (non ESPDG-related) support to sector planning:
• Evidence of GPE quality assurance processes improving the quality of the final, compared to draft versions of the sector plan
• Stakeholder views on relevance and appropriateness/value added of GPE Secretariat support, in-country assistance from GA/CA, Secretariat/GA/CA advocacy, capacity building, facilitation; GPE standards, guidelines, CSEF and ASA grants, and knowledge exchange in relation to: − Improving the quality (including relevance) of
education sector plans − Strengthening in-country capacity for sector
planning
• Draft and final versions of the sector plan
• Related GPE ESP/TSP quality assurance documents
• Secretariat reports, e.g. country lead back to office/mission reports
• Other documents on advocacy/facilitation provided by Secretariat, CA or GA
• Country-specific ESPDG grant applications
• Interviews • Education sector analyses and
other studies conducted with ESPDG funding
• Triangulation of data deriving from document review and interviews
226 If no GPE ratings on these indicators are available, evaluation team’s assessment of extent to which the ESP meets the various criteria outlined under indicator 16a-d. 228 Advocacy can include inputs from Secretariat, grant agent, coordinating agency, LEG, and GPE at global level (e.g. Board meetings, agreed upon standards). Knowledge exchange includes cross-national/global activities organized by the Secretariat, as well as the sharing and use of insights derived from GRA and KIX grant-supported interventions.

DRAFT REPORT (VX) – COUNTRY 98
© UNIVERSALIA
MAIN EVALUATION QUESTIONS AND SUB- QUESTIONS
INDICATORS MAIN SOURCES OF INFORMATION ANALYSIS
CEQ 1.2b-d (summative CLE – currently in Part B of the matrix below and labelled CEQ 9-11)
CEQ 1.3 What have been strengths and weaknesses of sector plan implementation during the period under review? What are likely reasons for strong/weak sector plan implementation?
• Progress made towards implementing sector plan objectives/meeting implementation targets of current/most recent sector plan within envisaged timeframe (with focus on changes relevant in view of GPE 2020 envisaged impact and outcome areas).
• Extent to which sector plan implementation is funded (expected and actual funding gap)
• Evidence of government ownership of and leadership for plan implementation (country specific).229
• Government implementation capacity and management, e.g.: − Existence of clear operational/implementation
plans or equivalents to guide sector plan implementation and monitoring
− Clear roles and responsibilities related to plan implementation and monitoring
− Relevant staff have required knowledge/skills/experience)
• Extent to which development partners who have endorsed the plan have actively supported/contributed to its implementation in an aligned manner.
• Extent to which sector dialogue and monitoring have facilitated dynamic adaptation of sector plan
• Sector plan(s) for the period covered by the most recent (mostly) complete ESPIG
• DCP government ESP/TEP implementation documents including mid-term or final reviews
• Relevant program or sector evaluations, including reviews preceding the period of GPE support under review
• JSR reports • Reports or studies on ESP/TEP
implementation commissioned by other development partners and/or the DCP government
• CSO reports • Interviews • DCP’s plan implementation
progress reports
• Descriptive analysis • Triangulation of data
deriving from document review and interviews
229 For example, in some countries one indicator of country ownership may be the existence of measures to gradually transfer funding for specific ESP elements from GPE/development partner support to domestic funding. However, this indicator may not be applicable in all countries. Stakeholder interviews will be an important source for identifying appropriate, context-specific indicators for government ownership in each case.
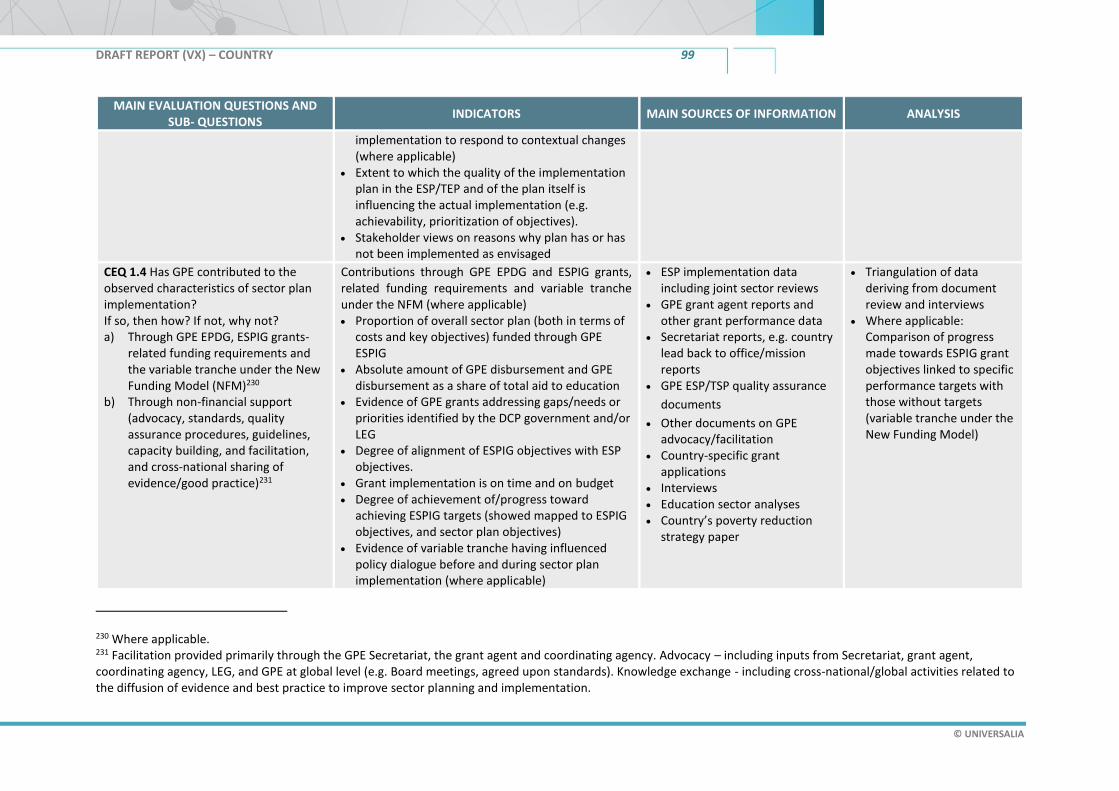
DRAFT REPORT (VX) – COUNTRY 99
© UNIVERSALIA
MAIN EVALUATION QUESTIONS AND SUB- QUESTIONS
INDICATORS MAIN SOURCES OF INFORMATION ANALYSIS
implementation to respond to contextual changes (where applicable)
• Extent to which the quality of the implementation plan in the ESP/TEP and of the plan itself is influencing the actual implementation (e.g. achievability, prioritization of objectives).
• Stakeholder views on reasons why plan has or has not been implemented as envisaged
CEQ 1.4 Has GPE contributed to the observed characteristics of sector plan implementation? If so, then how? If not, why not? a) Through GPE EPDG, ESPIG grants-
related funding requirements and the variable tranche under the New Funding Model (NFM)230
b) Through non-financial support (advocacy, standards, quality assurance procedures, guidelines, capacity building, and facilitation, and cross-national sharing of evidence/good practice)231
Contributions through GPE EPDG and ESPIG grants, related funding requirements and variable tranche under the NFM (where applicable) • Proportion of overall sector plan (both in terms of
costs and key objectives) funded through GPE ESPIG
• Absolute amount of GPE disbursement and GPE disbursement as a share of total aid to education
• Evidence of GPE grants addressing gaps/needs or priorities identified by the DCP government and/or LEG
• Degree of alignment of ESPIG objectives with ESP objectives.
• Grant implementation is on time and on budget • Degree of achievement of/progress toward
achieving ESPIG targets (showed mapped to ESPIG objectives, and sector plan objectives)
• Evidence of variable tranche having influenced policy dialogue before and during sector plan implementation (where applicable)
• ESP implementation data including joint sector reviews
• GPE grant agent reports and other grant performance data
• Secretariat reports, e.g. country lead back to office/mission reports
• GPE ESP/TSP quality assurance
documents
• Other documents on GPE advocacy/facilitation
• Country-specific grant applications
• Interviews • Education sector analyses • Country’s poverty reduction
strategy paper
• Triangulation of data deriving from document review and interviews
• Where applicable: Comparison of progress made towards ESPIG grant objectives linked to specific performance targets with those without targets (variable tranche under the New Funding Model)
230 Where applicable. 231 Facilitation provided primarily through the GPE Secretariat, the grant agent and coordinating agency. Advocacy – including inputs from Secretariat, grant agent, coordinating agency, LEG, and GPE at global level (e.g. Board meetings, agreed upon standards). Knowledge exchange - including cross-national/global activities related to the diffusion of evidence and best practice to improve sector planning and implementation.
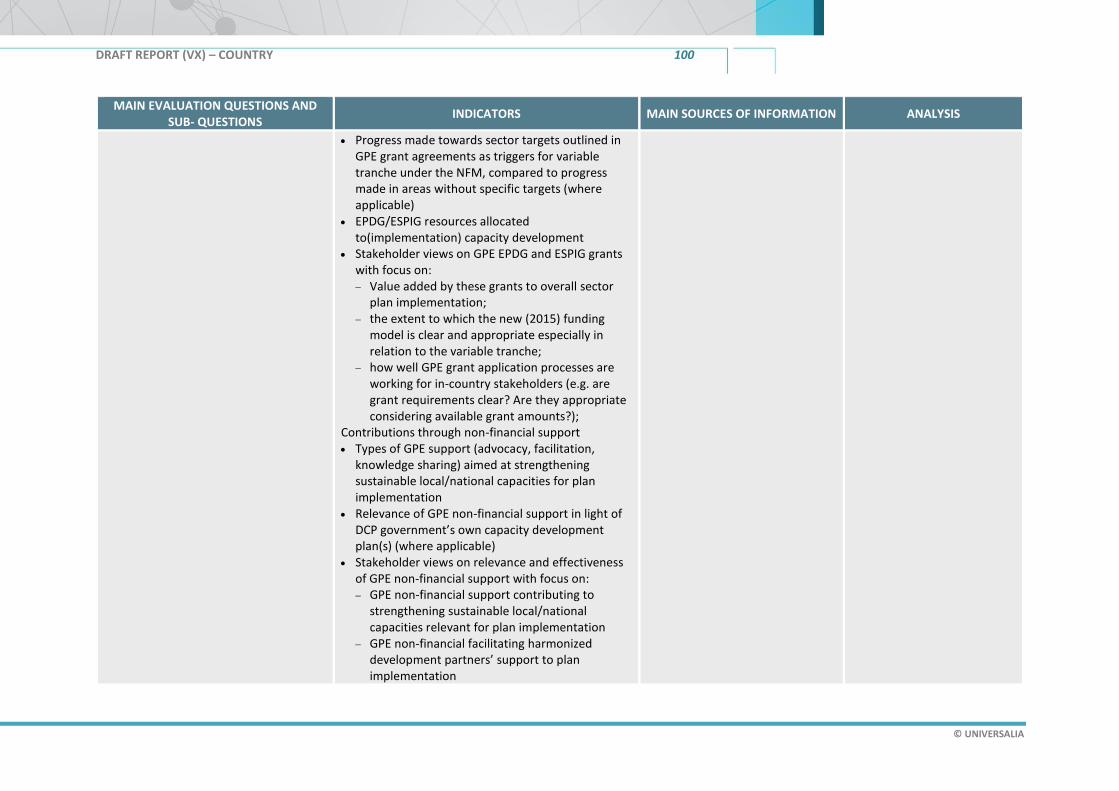
DRAFT REPORT (VX) – COUNTRY 100
© UNIVERSALIA
MAIN EVALUATION QUESTIONS AND SUB- QUESTIONS
INDICATORS MAIN SOURCES OF INFORMATION ANALYSIS
• Progress made towards sector targets outlined in GPE grant agreements as triggers for variable tranche under the NFM, compared to progress made in areas without specific targets (where applicable)
• EPDG/ESPIG resources allocated to(implementation) capacity development
• Stakeholder views on GPE EPDG and ESPIG grants with focus on: − Value added by these grants to overall sector
plan implementation; − the extent to which the new (2015) funding
model is clear and appropriate especially in relation to the variable tranche;
− how well GPE grant application processes are working for in-country stakeholders (e.g. are grant requirements clear? Are they appropriate considering available grant amounts?);
Contributions through non-financial support • Types of GPE support (advocacy, facilitation,
knowledge sharing) aimed at strengthening sustainable local/national capacities for plan implementation
• Relevance of GPE non-financial support in light of DCP government’s own capacity development plan(s) (where applicable)
• Stakeholder views on relevance and effectiveness of GPE non-financial support with focus on: − GPE non-financial support contributing to
strengthening sustainable local/national capacities relevant for plan implementation
− GPE non-financial facilitating harmonized development partners’ support to plan implementation
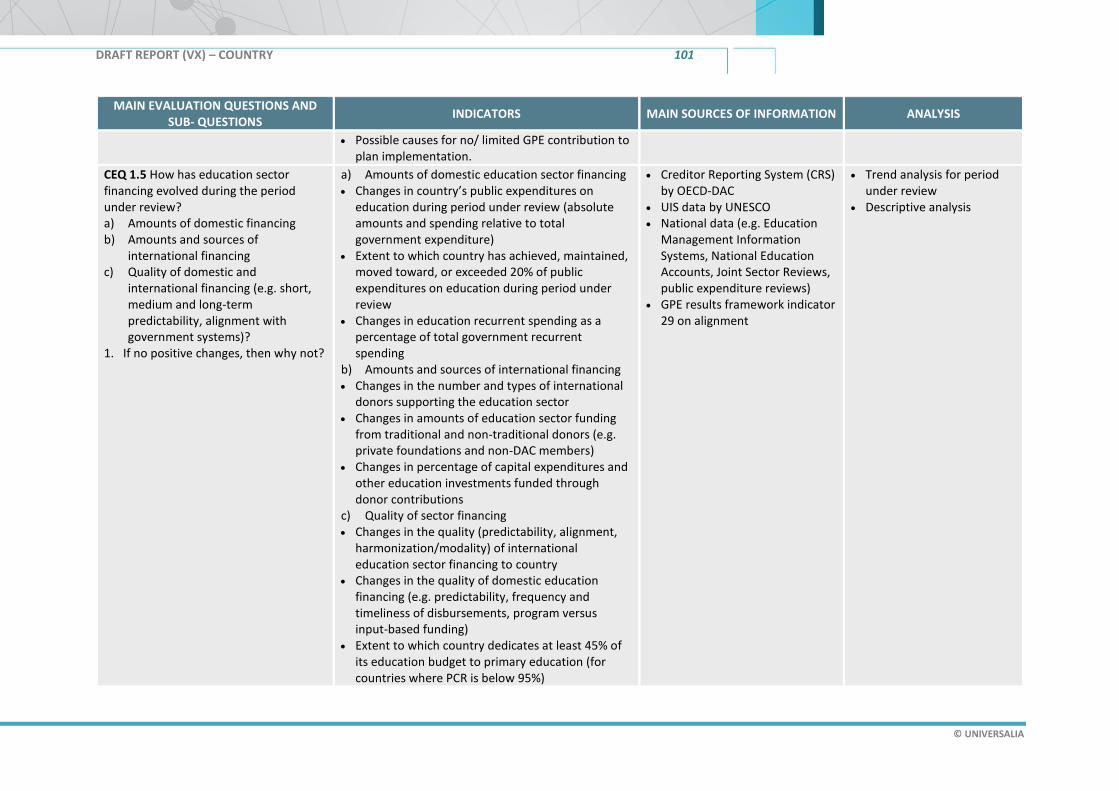
DRAFT REPORT (VX) – COUNTRY 101
© UNIVERSALIA
MAIN EVALUATION QUESTIONS AND SUB- QUESTIONS
INDICATORS MAIN SOURCES OF INFORMATION ANALYSIS
• Possible causes for no/ limited GPE contribution to plan implementation.
CEQ 1.5 How has education sector financing evolved during the period under review? a) Amounts of domestic financing b) Amounts and sources of
international financing c) Quality of domestic and
international financing (e.g. short, medium and long-term predictability, alignment with government systems)?
1. If no positive changes, then why not?
a) Amounts of domestic education sector financing • Changes in country’s public expenditures on
education during period under review (absolute amounts and spending relative to total government expenditure)
• Extent to which country has achieved, maintained, moved toward, or exceeded 20% of public expenditures on education during period under review
• Changes in education recurrent spending as a percentage of total government recurrent spending
b) Amounts and sources of international financing • Changes in the number and types of international
donors supporting the education sector • Changes in amounts of education sector funding
from traditional and non-traditional donors (e.g. private foundations and non-DAC members)
• Changes in percentage of capital expenditures and other education investments funded through donor contributions
c) Quality of sector financing • Changes in the quality (predictability, alignment,
harmonization/modality) of international education sector financing to country
• Changes in the quality of domestic education financing (e.g. predictability, frequency and timeliness of disbursements, program versus input-based funding)
• Extent to which country dedicates at least 45% of its education budget to primary education (for countries where PCR is below 95%)
• Creditor Reporting System (CRS) by OECD-DAC
• UIS data by UNESCO • National data (e.g. Education
Management Information Systems, National Education Accounts, Joint Sector Reviews, public expenditure reviews)
• GPE results framework indicator 29 on alignment
• Trend analysis for period under review
• Descriptive analysis
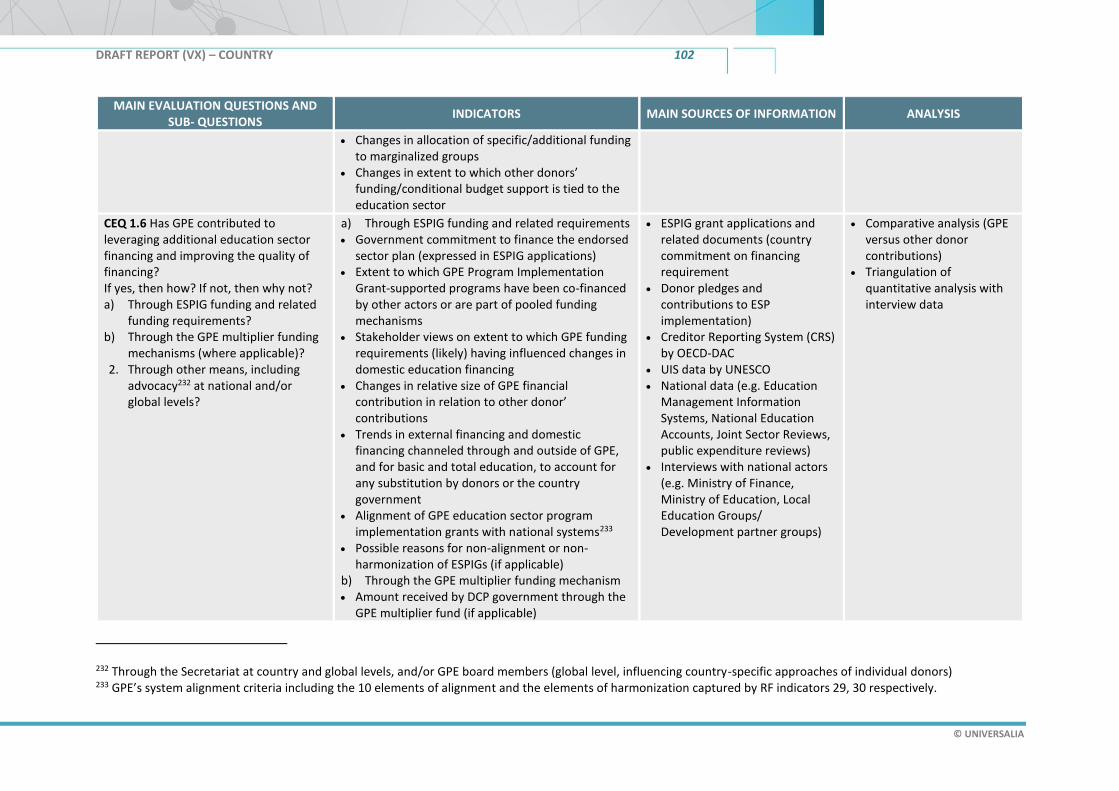
DRAFT REPORT (VX) – COUNTRY 102
© UNIVERSALIA
MAIN EVALUATION QUESTIONS AND SUB- QUESTIONS
INDICATORS MAIN SOURCES OF INFORMATION ANALYSIS
• Changes in allocation of specific/additional funding to marginalized groups
• Changes in extent to which other donors’ funding/conditional budget support is tied to the education sector
CEQ 1.6 Has GPE contributed to leveraging additional education sector financing and improving the quality of financing? If yes, then how? If not, then why not? a) Through ESPIG funding and related
funding requirements? b) Through the GPE multiplier funding
mechanisms (where applicable)? 2. Through other means, including
advocacy232 at national and/or global levels?
a) Through ESPIG funding and related requirements • Government commitment to finance the endorsed
sector plan (expressed in ESPIG applications) • Extent to which GPE Program Implementation
Grant-supported programs have been co-financed by other actors or are part of pooled funding mechanisms
• Stakeholder views on extent to which GPE funding requirements (likely) having influenced changes in domestic education financing
• Changes in relative size of GPE financial contribution in relation to other donor’ contributions
• Trends in external financing and domestic financing channeled through and outside of GPE, and for basic and total education, to account for any substitution by donors or the country government
• Alignment of GPE education sector program implementation grants with national systems233
• Possible reasons for non-alignment or non-harmonization of ESPIGs (if applicable)
b) Through the GPE multiplier funding mechanism • Amount received by DCP government through the
GPE multiplier fund (if applicable)
• ESPIG grant applications and related documents (country commitment on financing requirement
• Donor pledges and contributions to ESP implementation)
• Creditor Reporting System (CRS) by OECD-DAC
• UIS data by UNESCO • National data (e.g. Education
Management Information Systems, National Education Accounts, Joint Sector Reviews, public expenditure reviews)
• Interviews with national actors (e.g. Ministry of Finance, Ministry of Education, Local Education Groups/ Development partner groups)
• Comparative analysis (GPE versus other donor contributions)
• Triangulation of quantitative analysis with interview data
232 Through the Secretariat at country and global levels, and/or GPE board members (global level, influencing country-specific approaches of individual donors) 233 GPE’s system alignment criteria including the 10 elements of alignment and the elements of harmonization captured by RF indicators 29, 30 respectively.

DRAFT REPORT (VX) – COUNTRY 103
© UNIVERSALIA
MAIN EVALUATION QUESTIONS AND SUB- QUESTIONS
INDICATORS MAIN SOURCES OF INFORMATION ANALYSIS
• Stakeholder views on clarity and efficiency of multiplier application process
c) Through other means (especially advocacy) • Likelihood of GPE advocacy having contributed to
country meeting/approaching goal of 20% of the total national budget dedicated to education
• Changes in existing dynamics between education and finance ministries that stakeholders (at least partly) attribute to GPE advocacy234 (e.g. JSRs attended by senior MoF staff)
• Amounts and quality of additional resources likely mobilized with contribution from GPE advocacy efforts at country or global levels
• Amounts and sources of non-traditional financing (e.g. private or innovative finance) that can be linked to GPE leveraging
CEQ 2 Has GPE contributed to strengthening mutual accountability for the education sector during the period under review? If so, then how?
CEQ 2.1 Has sector dialogue changed during the period under review? If so, then how and why? If not, why not?
• Composition of the country’s LEG (in particular civil society and teacher association representation), and changes in this composition during period under review; other dialogue mechanisms in place (if any) and dynamics between those mechanisms
• Frequency of LEG meetings, and changes in frequency during period under review
• LEG members consulted for ESPIG application • Stakeholder views on changes in sector dialogue in
terms of: − Degree to which different actors lead,
contribute to, or facilitate dialogue − Inclusiveness − Consistency, clarity of roles and responsibilities
• LEG meeting notes • Joint sector reviews or
equivalents from before and during most recent ESPIG period
• GPE sector review assessments • ESP/TSP, and documents
illustrating process of their development
• Back to office reports/memos from Secretariat
• ESPIG grant applications (section V – information on stakeholder consultations)
• Interviews
• Pre-post comparison • Triangulate results of
document review and interviews
• Stakeholder analysis and mapping
234 This advocacy can have taken place in the context of GPE support to education sector planning, sector dialogue, and/or plan implementation

DRAFT REPORT (VX) – COUNTRY 104
© UNIVERSALIA
MAIN EVALUATION QUESTIONS AND SUB- QUESTIONS
INDICATORS MAIN SOURCES OF INFORMATION ANALYSIS
− Meaningfulness (i.e. perceptions on whether, when and how stakeholder input is taken into account for decision making)
− Quality (evidence-based, transparent) − Likely causes for no/limited (changes in) sector
dialogue
CEQ 2.2 Has sector monitoring changed? If so, then how and why? If not, why not?
• Extent to which plan implementation is being monitored (e.g. results framework with targets, performance review meetings, annual progress reports… and actual use of these monitoring tools)
• Frequency of joint sector reviews conducted, and changes in frequency during period under review; nature of JSR meetings held; and any other monitoring events at country level (e.g., DP meetings…)
• Extent to which joint sector reviews conducted during period of most recent ESPIG met GPE quality standards (if data is available: compared to JSRs conducted prior to this period)
• Evidence deriving from JSRs is reflected in DCP government decisions (e.g. adjustments to sector plan implementation) and sector planning
• Stakeholder views on changes in JSRs in terms of them being: − Inclusive and participatory, involving the right
number and types of stakeholders − Aligned to existing sector plan and/or policy
framework − Evidence based − Used for learning/informing decision-making − Embedded in the policy cycle (timing of JSR
appropriate to inform decision making; processes in place to follow up on JRS
• LEG and JSR meeting notes • Joint sector review reports/aide
memoires or equivalents from before and during most recent ESPIG period
• GPE sector review assessments • Grant agent reports • Back to office reports/memos
from Secretariat • Interviews
• Pre-post comparison • Triangulate the results of
document review and interviews

DRAFT REPORT (VX) – COUNTRY 105
© UNIVERSALIA
MAIN EVALUATION QUESTIONS AND SUB- QUESTIONS
INDICATORS MAIN SOURCES OF INFORMATION ANALYSIS
recommendations)235 and recommendations are acted upon and implemented
• Stakeholder views on extent to which current practices of sector dialogue and monitoring amount to ‘mutual accountability’ for the education sector.
• Likely causes for no/ limited (changes in) sector monitoring.
CEQ 2.3 Has GPE contributed to observed changes in sector dialogue and monitoring? If so, then how? If not, why not? a) Through GPE grants and funding
requirements236 b) Through other support (capacity
development, advocacy, standards, quality assurance, guidelines, facilitation, cross-national sharing of evidence/good practice)237
a) Grants and funding requirements • Proportion of total costs for sector dialogue
mechanisms (and/or related specific events) funded through GPE grants
• Proportion of total costs for sector monitoring mechanisms (e.g. JSR) funded through GPE grants
• Stakeholder views on extent to which GPE funding process (e.g. selection of grant agent, development of program document, grant application) and grant requirements positively or negatively influenced the existence and functioning of mechanisms for sector dialogue and/or monitoring
b) Non-grant related support
• LEG meeting notes • Joint sector reviews or
equivalents from before and during most recent ESPIG period
• GPE sector review assessments • Grant agent reports • Back to office reports/memos
from Secretariat • Interviews • CSEF, KIX documents etc.
• Triangulate the results of document review and interviews
235 Criteria adapted from: Global Partnership for Education. Effective Joint Sector Reviews as (Mutual) Accountability Platforms. GPE Working Paper #1. Washington. June 2017. Available at: https://www.globalpartnership.org/blog/helping-partners-make-best-use-joint-sector-reviews 236 All relevant GPE grants to country/actors in country, including CSEF and KIX, where applicable. 237 Capacity development and facilitation primarily through Secretariat, coordinating agency (especially in relation to sector dialogue) and grant agent (especially in relation to sector monitoring). Advocacy through Secretariat (country lead), CA, as well as (possibly) GPE at the global level (e.g. Board meetings, agreed upon standards). Knowledge exchange includes cross-national/global activities organized by the Secretariat, as well as the sharing and use of insights derived from GRA and KIX grant-supported interventions. Knowledge sharing also possible through other GPE partners at country level (e.g. other donors/LEG members) if provided primarily in their role as GPE partners.

DRAFT REPORT (VX) – COUNTRY 106
© UNIVERSALIA
MAIN EVALUATION QUESTIONS AND SUB- QUESTIONS
INDICATORS MAIN SOURCES OF INFORMATION ANALYSIS
• Support is aimed at strengthening local/national capacities for conducting inclusive and evidence-based sector dialogue and monitoring
• Support is targeted at gaps/weaknesses of sector dialogue/monitoring identified by DCP government and/or LEG
• Support for strengthening sector dialogue/monitoring is adapted to meet the technical and cultural requirements of the specific context in [country]
a) and b) • Stakeholder view on relevance and
appropriateness of GPE grants and related funding process and requirements, and of other support in relation to: − Addressing existing needs/priorities − Respecting characteristics of the national
context − Adding value to country-driven processes (e.g.
around JSRs)
• Possible causes for no/ limited GPE contributions to dialogue/monitoring.
CEQ 3: Has GPE support had unintended/unplanned effects? What factors other than GPE support have contributed to observed changes in sector planning, sector plan implementation, sector financing and monitoring?
CEQ 3.1 What factors other than GPE support are likely to have contributed to the observed changes (or lack thereof) in sector planning, financing, plan implementation, and in sector dialogue and monitoring?
• Changes in nature and extent of financial/non-financial support to the education sector provided by development partners/donors (traditional/non-traditional donors including foundations)
• Contributions (or lack thereof) to sector plan implementation, sector dialogue or monitoring made by actors other than GPE
• Changes/events in national or regional context(s) − Political context (e.g. changes in
government/leadership)
• Documents illustrating changes in priorities pursued by (traditional/non-traditional) donors related implications for [country]
• Relevant studies/reports commissioned by other education sector actors (e.g. donors, multilateral agencies) regarding nature/changes in
• Triangulate the results of document review and interviews

DRAFT REPORT (VX) – COUNTRY 107
© UNIVERSALIA
MAIN EVALUATION QUESTIONS AND SUB- QUESTIONS
INDICATORS MAIN SOURCES OF INFORMATION ANALYSIS
− Economic context − Social/environmental contexts (e.g. natural
disasters, conflict, health crises) − Other (context-specific)
their contributions and related results
• Government and other (e.g. media) reports on changes in relevant national contexts and implications for the education sector
• Interviews
CEQ 3.2 During the period under review, have there been unintended, positive or negative, consequences of GPE financial and non-financial support?
• Types of unintended, positive and negative, effects on sector planning, financing, sector plan implementation, sector dialogue and monitoring deriving from GPE grants and funding requirements
• Types of unintended, positive and negative, effects deriving from other GPE support.
• All data sources outlined for CEQs 1 and 2 above
• Interviews
• Triangulate the results of document review and interviews
Key question II: Has sector plan implementation contributed to making the overall education system in [country] more effective and efficient?
CEQ 4 During the period under review, how has the education system changed in relation to: a) Improving access to education and
equity? b) Enhancing education quality and
relevance (quality of teaching/instruction)?
c) Sector Management?238
a) Improving education access and equity - focus on extent to which DCP meets its own performance indicators, where available, e.g. related to:240 • Changes in number of schools relative to children • Changes in the average distance to schools • Changes in costs of education to families • Changes in the availability of programs to improve
children’s’ readiness for school) • New/expanded measures put in place to ensure
meeting the educational needs of children with
• Education Management Information System (EMIS)
• UIS data • World Bank data • Household survey data • ASER/UWEZO other citizen-led
surveys • Grant agent progress reports • Implementing partner progress
reports
• Pre-post comparison of statistical data for periods under review
• Triangulate the results of document review with statistical data, interviews and literature on ‘good practice’ in specific areas of systems strengthening
238 The sub-questions reflect indicators under Strategic Goal #3 as outlined in the GPE results framework as well as country-specific indicators for system-level change and elements (such as institutional strengthening) of particular interest to the Secretariat. 240 The noted indicators are examples of relevant measures to indicate removal of barriers to education access. Applicability may vary across countries. Where no country specific indicators and/or data are available, the CLE will draw upon UIS (and other) data on the described indicators.

DRAFT REPORT (VX) – COUNTRY 108
© UNIVERSALIA
MAIN EVALUATION QUESTIONS AND SUB- QUESTIONS
INDICATORS MAIN SOURCES OF INFORMATION ANALYSIS
If there were no changes in the education system, then why not and with what implications?239
special needs and of learners from disadvantaged groups
• New/expanded measures put in place to ensure gender equality in education
b) Enhancing education quality and relevance (Quality of teaching/instruction) – focus on extent to which DCP meets its own performance indicators, e.g. related to: • Changes in pupil/trained teacher ratio during
period under review • Changes in equitable allocation of teachers
(measured by relationship between number of teachers and number of pupils per school)
• Changes in relevance and clarity of (basic education) curricula
• Changes in the quality and availability of teaching and learning materials
• Changes in teacher pre-service and in-service training
• Changes in incentives for schools/teachers c) Sector Management – focus on extent to which DCP meets its own performance indicators, e.g. related to: • Changes in the institutional capacity of key
ministries and/or other relevant government agencies (e.g. staffing, structure, organizational culture, funding)
• Changes in whether country has and how it uses EMIS data to inform policy dialogue, decision making and sector monitoring
• Mid-term Evaluation reports • GPE annual Results Report • Appraisal Reports • Public expenditure reports • CSO reports • SABER database • Education financing studies • Literature on good practices in
education system domains addressed in country’s sector plan
• Interviews • ESPIG grant applications • Relevant documents/reports
illustrating changes in key ministries’ institutional capacity (e.g. on restructuring, internal resource allocation)
239 Implications for education access and equity, quality and relevance, and sector management, as well as likely implications for progress towards learning outcomes and gender equality/equity.

DRAFT REPORT (VX) – COUNTRY 109
© UNIVERSALIA
MAIN EVALUATION QUESTIONS AND SUB- QUESTIONS
INDICATORS MAIN SOURCES OF INFORMATION ANALYSIS
• If no functioning EMIS is in place, existence of a realistic remedial strategy in place
• Changes in whether country has and how it uses quality learning assessment system within the basic education cycle during period under review
(a-c): • Likely causes for no/ limited changes at system
level (based on literature review and stakeholder views)
CEQ 5 How has sector plan implementation contributed to observed changes at education system level?
• The specific measures put in place as part of sector plan implementation address previously identified bottlenecks at system level
• Alternative explanations for observed changes at system level (e.g. changes due to external factors, continuation of trend that was already present before current/most recent policy cycle, targeted efforts outside of the education sector plan)
• Sources as shown for CEQ 4 • Literature on good practices in
education system domains addressed in country’s sector plan
• Education sector analyses • Country’s poverty reduction
strategy paper
Key question III: Have improvements at education system level contributed to progress towards impact?
CEQ 6 During the period under review, what changes have occurred in relation to: a) Learning outcomes (basic
education)? b) Equity, gender equality and
inclusion in education? Is there evidence to link changes in learning outcomes, equity, gender equality, and inclusion to system-level changes identified under CEQ 4? What other factors can explain changes
in learning outcomes, equity, etc.?
Changes/trends in DCP’s core indicators related to learning/equity as outlined in current sector plan and disaggregated (if data is available). For example: a) Learning outcomes • Changes/trends in learning outcomes (basic
education) during period under review (by gender, by socio-economic group, by rural/urban locations)
b) Equity, gender equality, and inclusion • Changes in gross and net enrollment rates (basic
education) during review period (by gender, by socio-economic group, by rural/urban)
• Changes in proportion of children (girls/boys) who complete (i) primary, (ii) lower-secondary education
• Sector performance data available from GPE, UIS, DCP government and other reliable sources
• Teacher Development Information System (TDIS)
• Education Management Information System (EMIS)
• National examination data • International and regional
learning assessment data • EGRA/EGMA data • ASER/UWEZO other citizen-led
surveys • Grant agent and Implementing
partner progress reports
• Pre-post comparison of available education sector data (examination of trends) during and up to 5 years before core period under review
• Triangulation of statistical data with qualitative document analysis

DRAFT REPORT (VX) – COUNTRY 110
© UNIVERSALIA
MAIN EVALUATION QUESTIONS AND SUB- QUESTIONS
INDICATORS MAIN SOURCES OF INFORMATION ANALYSIS
• Changes in transition rates from primary to lower secondary education (by gender, by socio-economic group)
• Changes in out of school rate for (i) primary, (ii) lower-secondary education (by gender, socio-economic group, rural/urban location)
• Changes in dropout and/or repetition rates (depending on data availability) for (i) primary, (ii) lower-secondary education
• Changes in the distribution of out of school children (girls/boys; children with/without disability; ethnic, geographic and/or economic backgrounds)
• Plausible links between changes in country’s change trajectory related to learning outcomes, equity, gender equality, and inclusion during period under review on the one hand, and specific system-level changes put in place during the same period
• Additional explanations for observed changes in learning outcomes, equity, gender equality, and inclusion other than system-level changes noted under CEQ 4 and 5
• Likely reasons for impact-level changes during period under review
• Mid-term Evaluation reports • GPE annual Results Report • Studies/evaluation reports on
education (sub)sector(s) in country commissioned by the DCP government or other development partners (where available)
• Literature on key factors affecting learning outcomes, equity, equality, and inclusion in comparable settings
Key question IV: What are implications of evaluation findings for GPE support to [country]?
CEQ 7 What, if any, aspects of GPE support to [country] should be improved? What, if any, good practices
• Insights deriving from answering evaluation questions above e.g. in relation to: − Clarity and relevance of the roles and
responsibilities of key GPE actors at the country level (Secretariat, GA, CA, DCP government, other actors)
− Strengths and weaknesses of how and whether GPE key country-level actors fulfill their roles
• All of the above as well as (for summative evaluations) sources applied for CEQs 9, 10 and 11 (part B below)
• Triangulation of data collected and analysis conducted for other evaluation questions
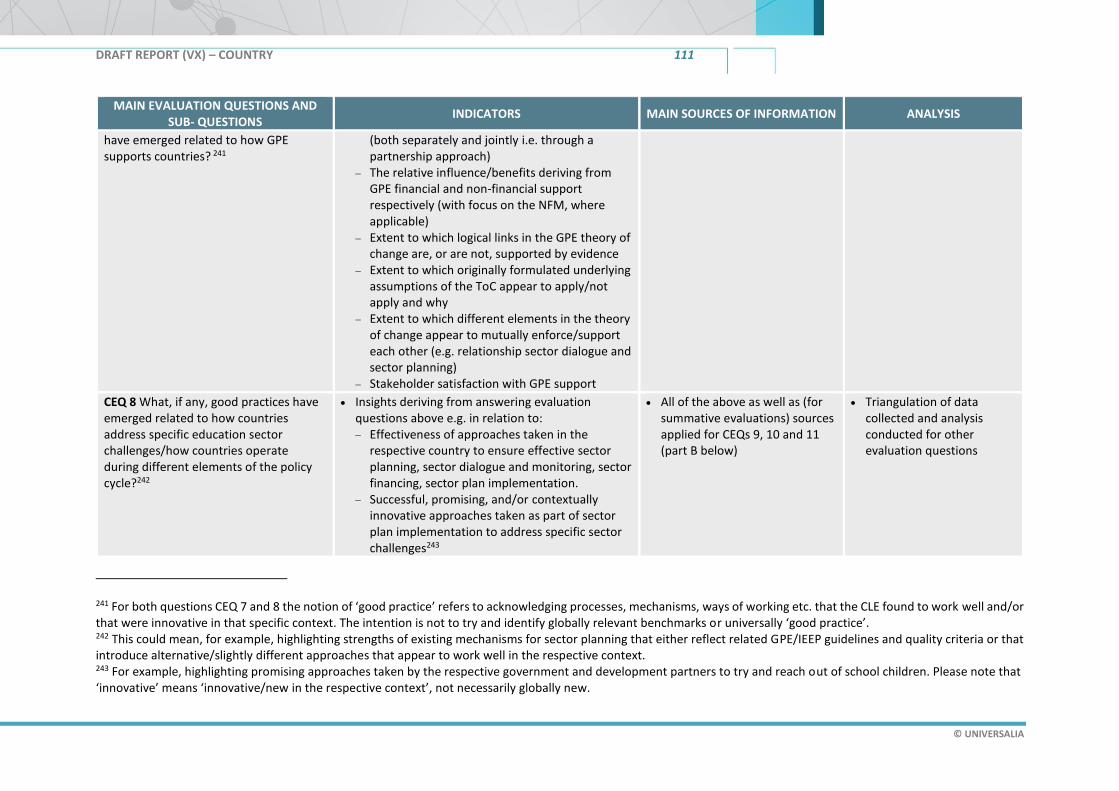
DRAFT REPORT (VX) – COUNTRY 111
© UNIVERSALIA
MAIN EVALUATION QUESTIONS AND SUB- QUESTIONS
INDICATORS MAIN SOURCES OF INFORMATION ANALYSIS
have emerged related to how GPE supports countries? 241
(both separately and jointly i.e. through a partnership approach)
− The relative influence/benefits deriving from GPE financial and non-financial support respectively (with focus on the NFM, where applicable)
− Extent to which logical links in the GPE theory of change are, or are not, supported by evidence
− Extent to which originally formulated underlying assumptions of the ToC appear to apply/not apply and why
− Extent to which different elements in the theory of change appear to mutually enforce/support each other (e.g. relationship sector dialogue and sector planning)
− Stakeholder satisfaction with GPE support
CEQ 8 What, if any, good practices have emerged related to how countries address specific education sector challenges/how countries operate during different elements of the policy cycle?242
• Insights deriving from answering evaluation questions above e.g. in relation to: − Effectiveness of approaches taken in the
respective country to ensure effective sector planning, sector dialogue and monitoring, sector financing, sector plan implementation.
− Successful, promising, and/or contextually innovative approaches taken as part of sector plan implementation to address specific sector challenges243
• All of the above as well as (for summative evaluations) sources applied for CEQs 9, 10 and 11 (part B below)
• Triangulation of data collected and analysis conducted for other evaluation questions
241 For both questions CEQ 7 and 8 the notion of ‘good practice’ refers to acknowledging processes, mechanisms, ways of working etc. that the CLE found to work well and/or that were innovative in that specific context. The intention is not to try and identify globally relevant benchmarks or universally ‘good practice’. 242 This could mean, for example, highlighting strengths of existing mechanisms for sector planning that either reflect related GPE/IEEP guidelines and quality criteria or that introduce alternative/slightly different approaches that appear to work well in the respective context. 243 For example, highlighting promising approaches taken by the respective government and development partners to try and reach out of school children. Please note that ‘innovative’ means ‘innovative/new in the respective context’, not necessarily globally new.

DRAFT REPORT (VX) – COUNTRY 112
© UNIVERSALIA
GPE ToC
g

DRAFT REPORT (VX) – COUNTRY 113
© UNIVERSALIA

DRAFT REPORT (VX) – COUNTRY 114
© UNIVERSALIA
Explanatory mechanisms and (implicit) contribution claims
# EXPLANATORY MECHANISM (IMPLICIT) CONTRIBUTION CLAIM
1 – GPE contributions to sector planning
1.1, 1.2, 1.3 and 1.4
BECAUSE • (1) GPE provides Education Sector Plan Development Grants and guidance, quality assurance, capacity
development and technical guidance • (2) GPE promotes (at global and country levels) evidence-based and adaptive planning • (3) GPE promotes and facilitates cross-national sharing of evidence and good practice • (4) GPE fosters clear roles, responsibilities and accountabilities among stakeholders in policy dialogue and
their collaboration in a coordinated, harmonized way to solve sector issues • (5) Data on systems, equity, and learning generated through quality EMIS and LAS are fed back and used to
inform sector planning DCP government produces and owns credible and evidence-based sector plans focused on equity, efficiency, and learning
Contribution claim A: GPE (financial and non-financial) support and influence contribute to the development of government owned, credible and evidence-based sector plans focused on equity, efficiency and learning.
2 - GPE contributions to sector plan implementation, sector monitoring, and dialogue
2.1 BECAUSE • (1) GPE provides CSEF and ASA grants • (2) GPE supports and promotes evidence-based and inclusive national sector monitoring and adaptive
planning at global and country levels • (3) GPE promotes and facilitates cross-national sharing of evidence and good practice • (4) GPE fosters clear roles, responsibilities and accountabilities among stakeholders in policy dialogue and
their collaboration in a coordinated, harmonized way to solve sector issues There is mutual accountability for sector progress through inclusive sector policy dialogue and monitoring
Contribution claim B: GPE (financial and non-financial) support for inclusive sector planning and joint monitoring contribute to mutual accountability for education sector progress.
2.2 BECAUSE • (1) GPE advocates for and establishes mechanisms for increased, harmonized, and better aligned
international financing for education, and • (2) GPE funding requirements include the promotion of improvements in domestic financing for education
promotes There is more and better financing for education mobilized in the country.
Contribution claim C: GPE advocacy and funding requirements contribute to more and better financing for education in the country.
2.3, 2.4, 2.5, 2.6 2.7 and 2.8
BECAUSE • (1) GPE provides funding through PDGs and ESPIGS
Contribution claim D: GPE (financial and non-financial) support and influence
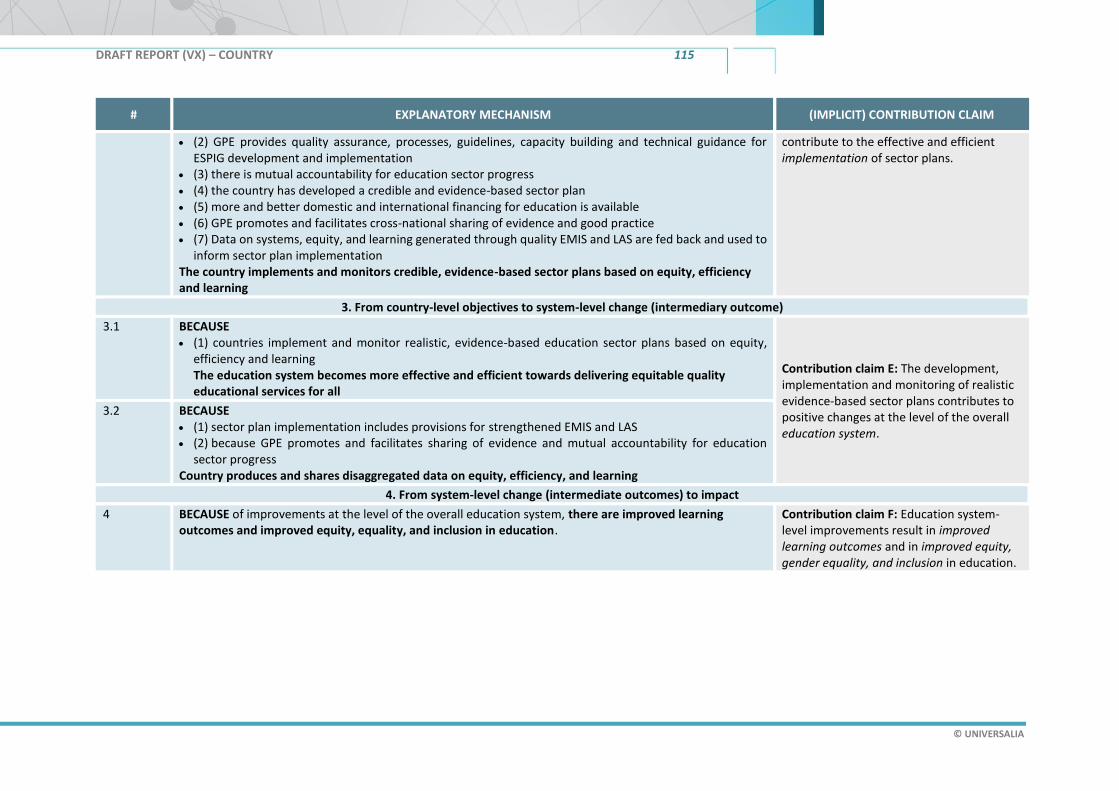
DRAFT REPORT (VX) – COUNTRY 115
© UNIVERSALIA
# EXPLANATORY MECHANISM (IMPLICIT) CONTRIBUTION CLAIM
• (2) GPE provides quality assurance, processes, guidelines, capacity building and technical guidance for ESPIG development and implementation
• (3) there is mutual accountability for education sector progress • (4) the country has developed a credible and evidence-based sector plan • (5) more and better domestic and international financing for education is available • (6) GPE promotes and facilitates cross-national sharing of evidence and good practice • (7) Data on systems, equity, and learning generated through quality EMIS and LAS are fed back and used to
inform sector plan implementation The country implements and monitors credible, evidence-based sector plans based on equity, efficiency and learning
contribute to the effective and efficient implementation of sector plans.
3. From country-level objectives to system-level change (intermediary outcome)
3.1 BECAUSE • (1) countries implement and monitor realistic, evidence-based education sector plans based on equity,
efficiency and learning The education system becomes more effective and efficient towards delivering equitable quality educational services for all
Contribution claim E: The development, implementation and monitoring of realistic evidence-based sector plans contributes to positive changes at the level of the overall education system.
3.2 BECAUSE • (1) sector plan implementation includes provisions for strengthened EMIS and LAS • (2) because GPE promotes and facilitates sharing of evidence and mutual accountability for education
sector progress Country produces and shares disaggregated data on equity, efficiency, and learning
4. From system-level change (intermediate outcomes) to impact
4 BECAUSE of improvements at the level of the overall education system, there are improved learning outcomes and improved equity, equality, and inclusion in education.
Contribution claim F: Education system-level improvements result in improved learning outcomes and in improved equity, gender equality, and inclusion in education.


DRAFT REPORT (VX) – COUNTRY 117
© UNIVERSALIA
Interview protocols
These guidelines are not intended as questionnaires. It will not be possible to cover all issues in all categories with all individuals or groups. The evaluation team members will use their judgment and focus on areas which are likely to add most to the team’s existing knowledge, while allowing interviewees and groups to highlight the issues that are most important to them.
The evaluators will formulate questions in a (non-technical) way that respondents can easily relate to, while generating evidence that is relevant to the evaluation questions that the evaluators have in mind.
Approach to interviews
▪ Interviews will be a major source of information for this evaluation. These will be a means to extract evidence, as well as to triangulate evidence drawn from other interviews and the document review, and will form part of the consultative process.
▪ A stakeholder analysis, as presented in baseline report, will inform the selection of interviewees. Over the evaluation period the evaluation team aims to target a comprehensive range of stakeholders that fully represent all significant institutional, policy and beneficiary interests. The team will periodically review the list of those interviewed to ensure that any potential gaps are addressed and to prevent under-representation of key stakeholders.
▪ All interviews will comply with the team’s commitment to the respective evaluation ethics (the work of the evaluation team will be guided by: OECD DAC Evaluation Quality Standards for Development Evaluation;244 UNEG Norms, Standards, Ethical Guidelines and Code of Conduct for Evaluation in the UN System;245 the World Bank’s principles and standards for evaluating global and regional partnership programs;246 ALNAP’s Evaluation of Humanitarian Action Guide;247 the Sphere Handbook and Standards for Monitoring and Evaluation;248 and Guidance on Ethical Research Involving Children.249)
▪ Interviews will be conducted in confidence and usually on a one-to-one or one-to-two basis (to enable note-taking). Reports will not quote informants by name and will not include direct quotes where it could risk revealing the participant’s identity or attribution without prior consent.
▪ A protocol and standard format for recording interview notes is presented below. This will be used for all interviews and will ensure systematic recording of details, while allowing for flexibility in the specific questions asked. Interview notes will be written up, consolidated into an interview compendium and shared among team members via the internal team-only e-library. To respect interviewee confidentiality, the interview notes will be accessible only to team members. The compendium of interview notes will facilitate analysis across all interviews and will enable searches on key thematic terms, initiatives and so on. This will maximize the analytical potential of interviews and the possibilities for triangulation.
244 http://www.oecd.org/development/evaluation/qualitystandards.pdf 245 http://www.uneval.org/document/detail/21 and http://www.uneval.org/document/detail/22 , http://www.uneval.org/document/detail/102 and http://www.unevaluation.org/document/detail/100 246 http://siteresources.worldbank.org/EXTGLOREGPARPROG/Resources/sourcebook.pdf 247 http://www.alnap.org/resource/23592.aspx 248 http://www.sphereproject.org/silo/files/sphere-for-monitoring-and-evaluation.pdf 249 http://childethics.com/

DRAFT REPORT (VX) – COUNTRY 118
© UNIVERSALIA
Focus group discussions
▪ The evaluation team may also make use of focus group discussions. Similar to the interview guides, the sub-headings and discussion guide points used are linked to the areas of enquiry and evaluation questions set out in the evaluation matrix, and are intended as a guide only, for the evaluation team to follow flexibly in order to maximize its learning from each discussion group.
▪ All focus group discussions will reflect with the evaluation team’s commitment to appropriate evaluation ethics (as referenced above).

DRAFT REPORT (VX) – COUNTRY 119
© UNIVERSALIA
Risks to the Evaluation and Ethics
Risks to the evaluation
The table below outlines the key anticipated risks and limitations as outlined in the risk management and contingency plan section of the inception report. It also puts forward the anticipated mechanisms to mitigate risks.
Annex Table 1: Key anticipated risks and limitations, and proposed mitigation mechanisms
ANTICIPATED RISK AND CONSEQUENCES MITIGATION MECHANISMS
Delays in the timing of the 24 country visits
Consequences: some country evaluation reports are submitted later than required to inform GPE strategy and impact committee and/or Board meetings, or to feed into the synthesis report.
Likelihood: High
If full evaluation/progress reports are not yet complete, the evaluation team will provide the Secretariat with at least an overview of emerging key findings at the agreed-upon timelines that are linked to SIC and Board meetings or the submission of synthesis reports. The full reports will be submitted as soon as possible thereafter and will be reflected in subsequent synthesis reports in case important information was missed.
Conflict or fragility undermine the ability of our teams to conduct in-country data collection for summative or prospective evaluations
Consequences: international consultants cannot conduct in-person data collection on the ground. Delays in conducting of site visits and of subsequent deliverables.
Likelihood: Medium to high
Change timing of site visits, and postpone related deliverables.
Change order in which 22 summative evaluations are conducted and/or make use of the contingency provision of two extra countries included in the sample for summative evaluations.
Collect data from individual in-country stakeholders via email, telephone, Skype; use electronic survey to reach several stakeholders at once.
Increase level of effort of national consultant(s) to ensure in-country data collection.
Interventions are not implemented within the lifecycle of the evaluation
This constitutes a particular risk for the prospective evaluations. While a lack of implementation can create learning opportunities in impact evaluations, such situations do not present value for money.
Likelihood: Medium
If interventions are not implemented within the lifecycle of the evaluation, data on bottlenecks, barriers, contextual factors and the political economy will be able to shed light on why implementation did not take place and the extent to which such factors were within GPE’s control.
Large data and evidence gaps
Consequences: inability to conduct reliable trend analysis. Lack of a solid basis on which to assess country progress made in strengthening the overall education system and education outcomes, as well as GPE contributions along the ToC.
Likelihood: Medium, but varying by country
Inclusion of data availability as a consideration in the sampling strategy. Work with the Secretariat and in-country stakeholders to fill data gaps. For prospective evaluations, if gaps identified as baseline cannot be filled, adjust the prospective evaluation focus to make the most of alternative data that may be available.
Use of qualitative data – e.g. based on stakeholder consultations – to reconstruct likely baseline for key issues relevant for assembling the contribution story.
Clearly identify data gaps and implications for data analysis in all deliverables.

DRAFT REPORT (VX) – COUNTRY 120
© UNIVERSALIA
ANTICIPATED RISK AND CONSEQUENCES MITIGATION MECHANISMS
Structure of available data is limiting
To assess education sector progress, the evaluation team will use the best data available at country level. However, the format of available data may vary by country. For example, countries may use different criteria to define ‘inclusion’ in their data. This can pose challenges to synthesizing findings on GPE contributions in the respective area.
Likelihood: Medium
As qualitative synthesis does not face the same limitations, we will mitigate this risk by describing differences in measurement criteria across countries.
Inaccessibility of in-country partners, resulting in incomplete datasets; limited triangulation; partners not fully seeing their views reflected in, and therefore rejecting, evaluation findings and forward-looking suggestions; increases in costs and time required for data collection; and delays in completing data collection and submitting deliverables.
Likelihood: Medium
Reaching out to in-country stakeholders as early as possible before scheduled missions to explore their availability.
Data collection via email, telephone, Skype, or through local consultants before or after site visits.
Close collaboration with the Secretariat country lead and in-country focal point (e.g. coordinating agency) to identify and gain access to all key in-country stakeholders.
Consult other individuals from the same stakeholder group if key envisaged informants are not available.
Being part of an evaluation changes the behavior of actors, independent of GPE support
GPE partners within prospective evaluation countries may, involuntarily, perceive the prospective evaluation countries as showcase examples and increase efforts due to the evaluation.
Likelihood: Medium to low
The evaluation team will review the performance data for the full set of GPE countries and see if the prospective evaluation countries have moved in their performance ranking over the lifecycle of the evaluation.
Evaluations (perceived to be) not sufficiently independent from the Secretariat Consequences: negative effects on credibility of evaluation findings and forward-looking suggestions in the eyes of key stakeholders. Limited use of evaluations to inform decision-making and/or behaviors of key stakeholders. Reputational damage for the Secretariat and consortium members.
Likelihood: Medium to low
Findings, conclusions and forward-looking suggestions will be based on clearly identified evidence.
Review of all draft deliverables by an Independent Technical Review Panel (ITRP).
The evaluation team will incorporate feedback received on draft deliverables as follows: (a) factual errors will be corrected; (b) for other substantive comments, the evaluation team will decide based on the available evidence whether (and how) to incorporate them or not. If comments/suggestions are not accepted, the evaluation team will explain why.
Prospective country evaluation teams becoming excessively sympathetic to GPE or others through repeat visits
This can result in overly positive reports that miss areas requiring constructive criticism.
Likelihood: Medium to low
The internal, independent and external quality assurance mechanisms described in Section 4.3, as well as feedback received from the ITRP, will make it possible to identify any cases where prospective evaluation reports provide insufficient evidence for overly positive assessments.

DRAFT REPORT (VX) – COUNTRY 121
© UNIVERSALIA
ANTICIPATED RISK AND CONSEQUENCES MITIGATION MECHANISMS
Countries no longer willing to participate in, or wish to withdraw partway through, an (prospective) evaluation
Consequences: an unbalanced sample of summative or prospective evaluations. Difficulty completing all eight prospective evaluations in a consistent manner.
Likelihood: Medium to low
A transparent selection/sampling process.
Early work with GPE country leads and in-country implementing partners to build support for all country-level evaluations.
Early and ongoing direct engagement with senior decision-makers in DCPs to ensure that key stakeholders understand the nature and anticipated duration –especially of the prospective evaluations.
Ethics
The members of our consortium abide by and uphold internationally recognized ethical practices and codes of conduct for evaluations, especially when they take place in humanitarian and conflict situations, and with affected and vulnerable populations.
For this evaluation the team has been guided by: OECD DAC Evaluation Quality Standards for Development Evaluation; UNEG Norms, Standards, Ethical Guidelines and Code of Conduct for Evaluation in the UN System; the World Bank’s principles and standards for evaluating global and regional partnership programs; ALNAP’s Evaluation of Humanitarian Action Guide; the Sphere Handbook and Standards for Monitoring and Evaluation; and Guidance on Ethical Research Involving Children.

DRAFT REPORT (VX) – COUNTRY 122
© UNIVERSALIA
Confirming and refuting evidence methodology
This evaluation pays attention to how contribution analysis can identify and determine the extent of influencing factors and alternative explanations and weighs confirming and refuting evidence. Following Lemire, Nielsen and Dyadal,250 we use the Relevant Explanation Finder (REF) as an operational framework to provide structure for enabling transparent and explicit decision-making regarding weighing confirming and refuting factors in the evaluative inquiry.
For each item of evidence, the evaluation team recorded the contribution claim the evidence relates to, described the item of evidence, recorded the data source and assessed whether the evidence confirms or refutes the contribution claim. The degree of influence on the contribution claim was assessed for each item of evidence, being judged on the basis of certainty, robustness, validity, prevalence and theoretical grounding.
Confirming and refuting evidence emerging from interview data was assessed by analyzing the impartiality of the informant (to what extent does this person have a vested interest in the subject of the fragment?), knowledge (How much knowledge/experience does the subject have of the subject of the fragment?) and coherency (How coherent is their point? Do they provide evidence?).
The assessment of plausibility for each contribution claim was then made on the basis of:
▪ The preconditions of contribution are in place (did the change happen? If not, there could not have been a contribution)
▪ Where GPE provided inputs or support for this change
▪ Other support provided outside of the partnership
▪ Supporting and refuting evidence
▪ The extent to which the assumptions hold; and
▪ Logical reasoning
250 Lemire, Nielsen and Dybdal, 2012. Making contribution analysis work: A practical framework for handling influencing factors and alternative explanations. Evaluation volume 18: 294.

DRAFT REPORT (VX) – COUNTRY 123
© UNIVERSALIA
Annex Table 2 Strength of evidence assessment example – documents Number Certainty Robustness Validity Prevalence Theoretical grounding
Degree to which the evidence
is confirming or refuting the
explanation (i.e. identifier)
Degree to which the evidence is identified
as a significant explanation or influencing
factor across a broad range of evidence
Degree to which the
evidence measures the
explanation and is reliable
Degree to which the evidence
contributes to the outcome of
interest across a wide range of
contexts
The evidence is informed by theory (identifies
existing theories of which it is an example)
and is cast in specific terms (i.e. it is not
vague)
Doc1 weak n/a moderate strong strong
Doc2
Annex Table 3 Strength of evidence assessment - interviews
Fragment # Interviewee Contribution
Claim Position View Impartiality Knowledge Coherency
Use interviewee
code
To which contribution
claim does the view
stated pertain
Does the viewpoint
confirm or refute the
contribution claim
Give details of the view of
the interviewee given in
the fragment
To what extent does this
person have a vested interest
in the subject of the fragment
How much
knowledge/experience does the
subject have of the subject of
the fragment
How coherent is
their point? Do they
provide evidence?
1 MoE4a A
Interviewee asserts that
CSOs were involved at
all stages of planning
n/a weak weak
2

DRAFT REPORT (VX) – COUNTRY 124
© UNIVERSALIA
Annex Table 4 Example of weighing of evidence to support contribution claim plausibility and identification of influencing factors
Contribution claim A: GPE (financial and non-financial) support and influence contribute to the development of government-owned, credible and
evidence-based sector plans focused on equity, efficiency and learning.
Preconditions GPE
support/inputs
Non-GPE
support/inputs
Supporting
Evidence
Refuting
Evidence Assumption met Assessment Reasoning
What has been
achieved in sector
planning in the
review period
What
(specifically) has
GPE done to
support each of
these
achievements?
What (specifically) have
others done to support each
of these achievements?
List docs and interviews that
support or refute GPE support
resulted in a contribution
Were the generic
assumptions met
On the basis of the
precondition being
met, GPE inputs and
the evidence, is the
GPE contribution
plausible
What is the overall
narrative for why
the contribution is
plausible or not
plausible?
Follow up from year
one issue 1
Did GPE input to
address this
issue?
Who else supported or
inputted into this and how?
Doc 4, 7, 9, 11
etc. Doc4
Country level stakeholders
have the capabilities to
jointly improve sector
analysis and planning
Plausible
A credible quality
plan is in place + it
was developed
through inclusive
processes + GPE
provided financial
support for plan
development + GPE
provided technical
support which
improved the quality
of the plan + most
members of the LEG
agree GPE
contributed + the
ESPIG completion
reports detail GPE
contributions +
plans prior to
becoming a GPE
member were not
credible and did not
Follow up from year
one issue 2
Did GPE input to
address this
issue?
Who else supported or
inputted into this and how? Doc3 Int3
stakeholders have the
opportunities (resources,
time, conducive
environment) to do so
Follow up from year
one issue 3
Did GPE input to
address this
issue?
Who else supported or
inputted into this and how? Int1
stakeholders have the
motivation (incentives) to
do so
ESP is guided by an
overall vision, is
strategic and
holistic
Did GPE input to
this?
Who else supported or
inputted into this and how? Int3
GPE has sufficient leverage
within the country to
influence sector planning
ESP is achievable,
sensitive to content
and pays attention
to disparities
Did GPE input to
this?
Who else supported or
inputted into this and how?
EMIS and LASs produce
relevant and reliable data to
inform sector planning

DRAFT REPORT (VX) – COUNTRY 125
© UNIVERSALIA
ESP meets GPE
quality criteria
Did GPE input to
this?
Who else supported or
inputted into this and how?
focus on equity,
efficiency and
learning. Process has been
country-led,
participatory and
transparent
Did GPE input to
this?
Who else supported or
inputted into this and how?
Other areas of
support
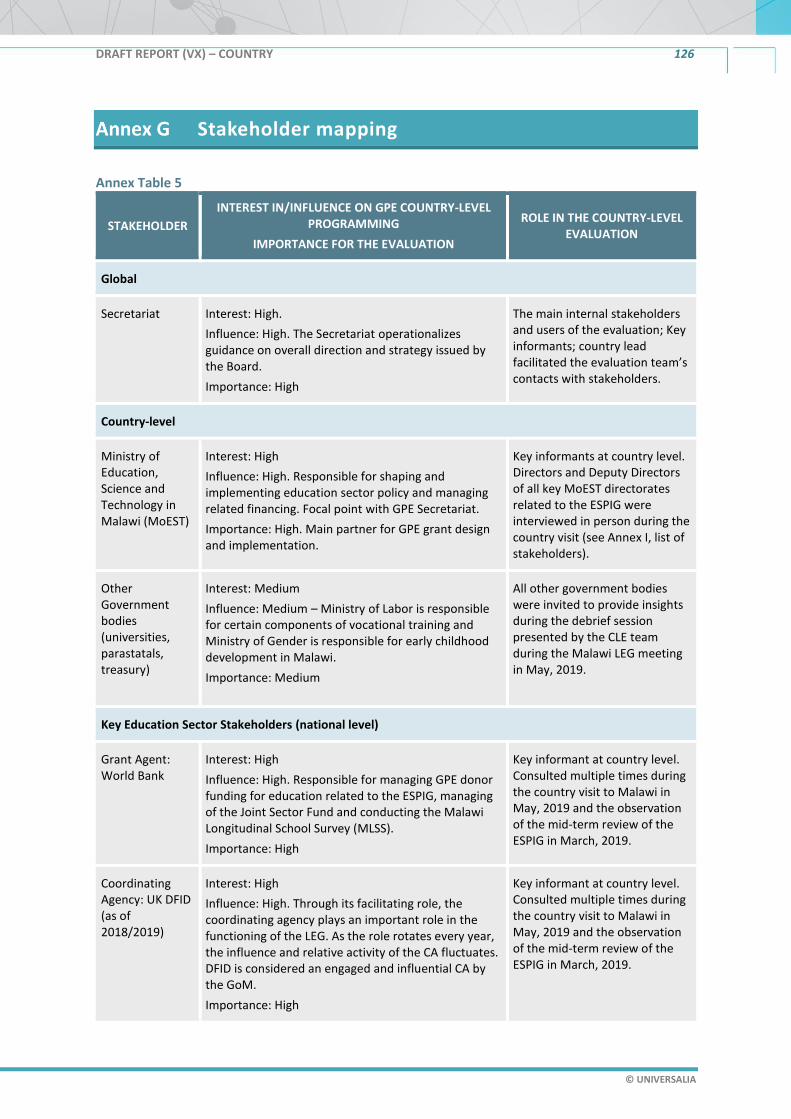
DRAFT REPORT (VX) – COUNTRY 126
© UNIVERSALIA
Stakeholder mapping
Annex Table 5
STAKEHOLDER
INTEREST IN/INFLUENCE ON GPE COUNTRY-LEVEL PROGRAMMING
IMPORTANCE FOR THE EVALUATION
ROLE IN THE COUNTRY-LEVEL EVALUATION
Global
Secretariat Interest: High.
Influence: High. The Secretariat operationalizes guidance on overall direction and strategy issued by the Board.
Importance: High
The main internal stakeholders and users of the evaluation; Key informants; country lead facilitated the evaluation team’s contacts with stakeholders.
Country-level
Ministry of Education, Science and Technology in Malawi (MoEST)
Interest: High
Influence: High. Responsible for shaping and implementing education sector policy and managing related financing. Focal point with GPE Secretariat.
Importance: High. Main partner for GPE grant design and implementation.
Key informants at country level. Directors and Deputy Directors of all key MoEST directorates related to the ESPIG were interviewed in person during the country visit (see Annex I, list of stakeholders).
Other Government bodies (universities, parastatals, treasury)
Interest: Medium
Influence: Medium – Ministry of Labor is responsible for certain components of vocational training and Ministry of Gender is responsible for early childhood development in Malawi.
Importance: Medium
All other government bodies were invited to provide insights during the debrief session presented by the CLE team during the Malawi LEG meeting in May, 2019.
Key Education Sector Stakeholders (national level)
Grant Agent: World Bank
Interest: High
Influence: High. Responsible for managing GPE donor funding for education related to the ESPIG, managing of the Joint Sector Fund and conducting the Malawi Longitudinal School Survey (MLSS).
Importance: High
Key informant at country level. Consulted multiple times during the country visit to Malawi in May, 2019 and the observation of the mid-term review of the ESPIG in March, 2019.
Coordinating Agency: UK DFID (as of 2018/2019)
Interest: High
Influence: High. Through its facilitating role, the coordinating agency plays an important role in the functioning of the LEG. As the role rotates every year, the influence and relative activity of the CA fluctuates. DFID is considered an engaged and influential CA by the GoM.
Importance: High
Key informant at country level. Consulted multiple times during the country visit to Malawi in May, 2019 and the observation of the mid-term review of the ESPIG in March, 2019.

DRAFT REPORT (VX) – COUNTRY 127
© UNIVERSALIA
STAKEHOLDER
INTEREST IN/INFLUENCE ON GPE COUNTRY-LEVEL PROGRAMMING
IMPORTANCE FOR THE EVALUATION
ROLE IN THE COUNTRY-LEVEL EVALUATION
Development Partners (donor agencies, multilateral organizations): USAID, Royal Norwegian Embassy, the European Union, UNICEF and the German Embassy.
Interest: High
Influence: Medium-High, through their participation in the LEG, in sector monitoring exercises, as well as to their own activities in the education sector.
Importance: High
Key informants at country level were interviewed in person during the country visit.
Domestic non-governmental organizations:
Civil Society Education Coalition and Teacher’s Union of Malawi
Interest: High
Influence: Low. Most are not members of the LEG but several have participated in sector planning consultations and education sector reviews.
Importance: Medium-High.
Key informants at country level were consulted during the country site visit.
Philanthropic Foundations
Interest: NA
Influence: NA
Importance: NA
No consultations conducted.
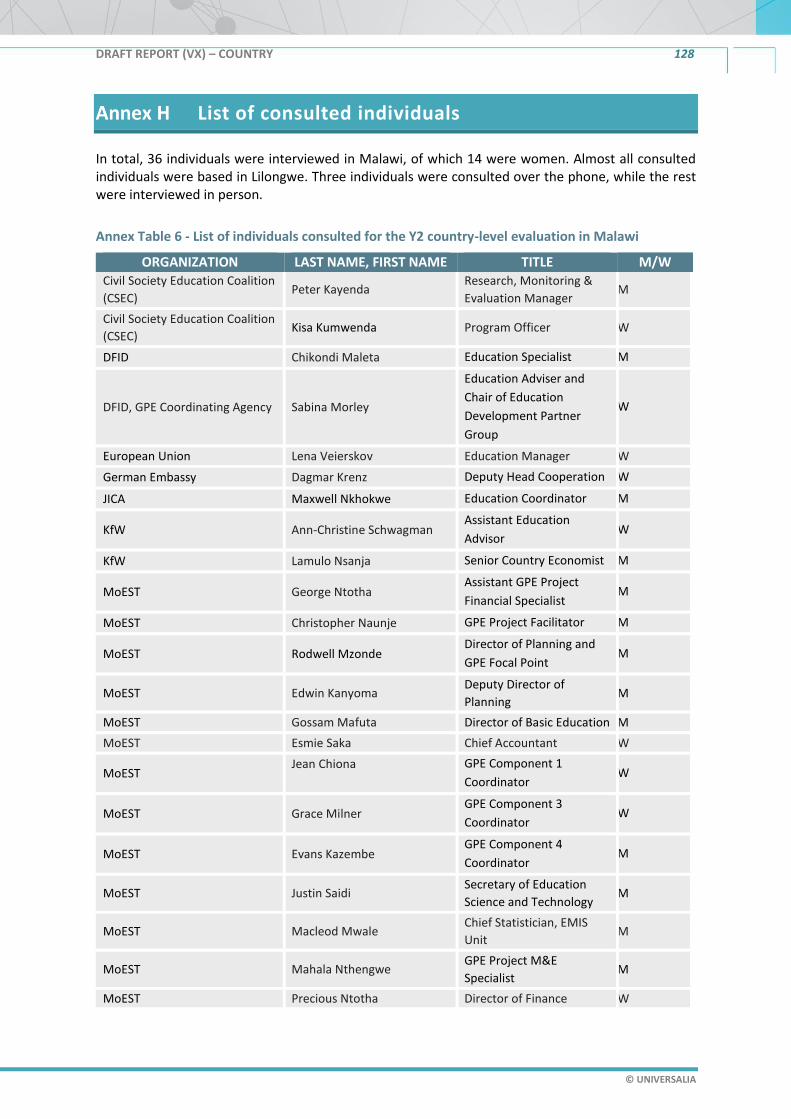
DRAFT REPORT (VX) – COUNTRY 128
© UNIVERSALIA
List of consulted individuals
In total, 36 individuals were interviewed in Malawi, of which 14 were women. Almost all consulted individuals were based in Lilongwe. Three individuals were consulted over the phone, while the rest were interviewed in person.
Annex Table 6 - List of individuals consulted for the Y2 country-level evaluation in Malawi
ORGANIZATION LAST NAME, FIRST NAME TITLE M/W Civil Society Education Coalition
(CSEC) Peter Kayenda
Research, Monitoring &
Evaluation Manager M
Civil Society Education Coalition
(CSEC) Kisa Kumwenda Program Officer W
DFID Chikondi Maleta Education Specialist M
DFID, GPE Coordinating Agency Sabina Morley
Education Adviser and
Chair of Education
Development Partner
Group
W
European Union Lena Veierskov Education Manager W
German Embassy Dagmar Krenz Deputy Head Cooperation W
JICA Maxwell Nkhokwe Education Coordinator M
KfW Ann-Christine Schwagman Assistant Education
Advisor W
KfW Lamulo Nsanja Senior Country Economist M
MoEST George Ntotha Assistant GPE Project
Financial Specialist M
MoEST Christopher Naunje GPE Project Facilitator M
MoEST Rodwell Mzonde Director of Planning and
GPE Focal Point M
MoEST Edwin Kanyoma Deputy Director of
Planning M
MoEST Gossam Mafuta Director of Basic Education M
MoEST Esmie Saka Chief Accountant W
MoEST Jean Chiona
GPE Component 1
Coordinator W
MoEST Grace Milner GPE Component 3
Coordinator W
MoEST Evans Kazembe GPE Component 4
Coordinator M
MoEST Justin Saidi Secretary of Education
Science and Technology M
MoEST Macleod Mwale Chief Statistician, EMIS
Unit M
MoEST Mahala Nthengwe GPE Project M&E
Specialist M
MoEST Precious Ntotha Director of Finance W
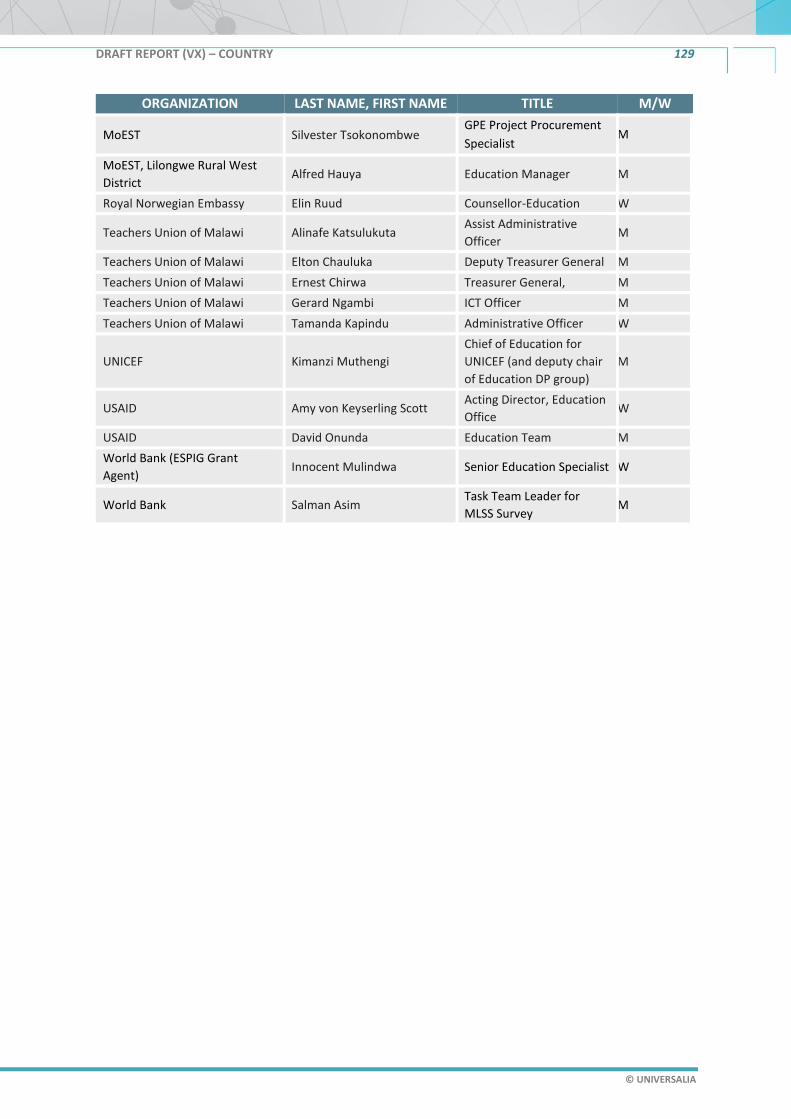
DRAFT REPORT (VX) – COUNTRY 129
© UNIVERSALIA
ORGANIZATION LAST NAME, FIRST NAME TITLE M/W
MoEST Silvester Tsokonombwe GPE Project Procurement
Specialist M
MoEST, Lilongwe Rural West
District Alfred Hauya Education Manager M
Royal Norwegian Embassy Elin Ruud Counsellor-Education W
Teachers Union of Malawi Alinafe Katsulukuta Assist Administrative
Officer M
Teachers Union of Malawi Elton Chauluka Deputy Treasurer General M
Teachers Union of Malawi Ernest Chirwa Treasurer General, M
Teachers Union of Malawi Gerard Ngambi ICT Officer M
Teachers Union of Malawi Tamanda Kapindu Administrative Officer W
UNICEF Kimanzi Muthengi
Chief of Education for
UNICEF (and deputy chair
of Education DP group)
M
USAID Amy von Keyserling Scott Acting Director, Education
Office W
USAID David Onunda Education Team M
World Bank (ESPIG Grant
Agent) Innocent Mulindwa Senior Education Specialist W
World Bank Salman Asim Task Team Leader for
MLSS Survey M

DRAFT REPORT (VX) – COUNTRY 130
© UNIVERSALIA
National educational policies and plans in Malawi
Policy Year
Education Act 1962
Free Primary Education Policy 1994
Policy and Investment Framework 2000
National Strategy for Teacher Education and Development (NSTED) 2007-2017
National Education Sector Plan (NESP) 2008-2017
Education Sector Implementation Plan (ESIP) I 2009-2013
Malawi Growth and Development Strategy II 2011–2016
Revised Education Act 2013
Education Sector Implementation Plan (ESIP) II 2013-2017251
Malawi National Girls Education Strategy (NGES) 2014
National Plan of Action to Combat Gender-Based Violence in Malawi252 2016-2021
Malawi Growth and Development Strategy II 2017-2022
251 Subsequently extended into 2019 as a result of the ESIP II Action Plan. 252 Published by the Ministry of Gender, Children, Disability and Social Welfare (November 2016); Error! Reference source not found..

DRAFT REPORT (VX) – COUNTRY 131
© UNIVERSALIA
ESPIG funded project contributions to ESIP II implementation
Annex Table 7
ESPIG COMPONENT ESPIG ACHIEVEMENTS253/254/255
1. COMPONENT ONE – Performance-Based School improvement grants for improving promotion and retention ($10.24M)
Sub-component 1.1 Improving the equity and quality of primary education service delivery in early grade levels
As at November 2018, no additional classrooms had been built or rehabilitated at the primary level resulting from project intervention (with a 2020 December target of 500). The initial MLSS findings for Component 1 reports that most sampled C1 schools constructed one learning shelter for use mainly by Standards 1-3. This reduced in the number of open-air classes in C1 schools. In addition, the initial MLSS midline data states that the reduction in open air classrooms (11. 5 to 8.4 percent in the lower standards and 10.3 to 3.7 percent in Standards 1 and 2 between 2016-2018) is due to the construction of classrooms in selected component 1 schools, however the number of constructed permanent classrooms is unclear. 754 learning shelters were constructed, as well as 297 washrooms to support adolescent girls’ retention and completion of primary school.
Grade-wise promotion rates in lower primary grades, from 68 percent to 79 percent, with an 81 percent December 2020 target. The ESPIG MTR in April, 2019 found that promotion rates have stagnated; repetition worsened within project schools; and drop-out rates remain within reach.
In Component 1 schools more teachers have been allocated to the lower grades. The initial MLSS data indicates this has reduced the PTRs in Standards 1-2 from 121.8 to 115.5 between 2016 and 2018. However, the initial findings also indicate that the increases in enrollments have reduced the impact of this allocation to the early years, indicating an approximately similar PTR. It is not clear how these two findings can coexist.
MLSS midline data finds that MESIP is not on target to meet the 20 percent reduction in PqTR in the early grades. According to the MESIP MTR aide memoire from April 2019, the PqTR currently stands at 123, falling short of the MTR target of 149.4.
267 schools have received performance grant allocations with a target of 400 by December 2020.
Unfortunately, the implementation of these measures has not resulted in a reduced repetition rate in Standards 1-4 with selected Component 1 schools showing an increase from 19 – 22 percent between 2016 and 2018. Advances in achieving the second goal of Component 1 (reduction in girls’ dropout in Standards 6-8) are also extremely modest, dropping from 7.6 to 7 percent between 2016 and 2018. However, the schools eligible for performance-based grants did see decreases in female dropout, while ineligible schools saw increases.
The ratio of female to male teachers in Standards 6-8 rose slightly in Component 1 sampled schools between 2016 – 2018 (from 0.21 to 0.23). However, those schools eligible for performance-based pay saw greater increases (.19 to .22)
253 Malawi Education Sector Improvement Project (P1541865) Implementation and Status Report No. 6, May, 2019. 254 MLSS presentation, March 24th,2019. Initial findings of MESIP 255 MESIP Mid-Term Review Aide Memoire, April 2nd, 2019.

DRAFT REPORT (VX) – COUNTRY 132
© UNIVERSALIA
ESPIG COMPONENT ESPIG ACHIEVEMENTS253/254/255
whereas ineligible schools saw a slight increase in the proportion of male teachers (.24 to .23 female to male ratio). An improvement worth noting for C1 schools in 8 districts is that while at baseline 5 percent of schools had no female teachers, there are no longer any schools without at least one female teacher. 353 auxiliary teachers (101) female) were hired by school management teams to fill their teacher needs; and 3,074 male and 3,081 female teachers were involved in remedial classes provided to pupils of grades 1-4 in all of the 800 schools.
53,223 pupils returned to school by Term 3 of t019 (26,425 boys and 26,803 girls), 1,251
Sub-component 1.2: Improved accountability and functioning at the school level
Pupil teacher Ratio in the lower primary grades baseline 145, current 118 with a 98 target by December 2020.
The ESPIG has developed and disseminated guidelines and strategies to the 800 schools with a view to address learner retention and completion. The guidelines and strategies have supported the development of two cycles of School Improvement Plans (SIPs) with close participation of the community.
However, integration of MESIP plans into school-specific development plans for integrated planning is still weak, according to the MTR of the ESPIG, and deserves attention for the second half of the project cycle. The need to improve the efficiency of PSIP grants so they get to schools in time was highlighted as an issue.
Sub-component 1.3: Pilot interventions for cost-effective improvements in learning outcomes
All four pilot interventions planned under component 1 are being implemented. Processing for the third round of base-grants in ongoing; as well as preparations for the second round of performance-based funding grants.
The interventions are: (a) school leadership program to change school level management, which is being implemented through Component 3.1; (b) real-time school data collection and usage implemented through Component 3.2; and (c) community involvement in schools targeting improved retention of teenage girls which is implemented through Component 3.3; and Component 1 school level interventions. Additional pilot interventions include the school base grants to the 800 schools as well as performance-based funding (PBFs) to 400 of the 800 schools, which are implemented through Component 1. Going forward (as of the MTR of the ESPIG in April, 2019), there is a proposal by the MoEST to drop this indicator because implementation of pilots is not an end.
1. COMPONENT TWO: IMPROVING EQUITY FOR THE MOST DISADVANTAGED, INCLUDING GIRLS ($9.6M)
Sub-component 2.1 The PAD outlines the planned construction of 500 classroom blocks, 300 ablution blocks with special focus on girls’ sanitation needs and 150 water points to benefit 114 schools selected in the eight target districts of the ESPIG. As of April, 2019, 56 classrooms (28 blocks) have been completed, benefiting 12,611 students (6,211 boys and 6,450 girls). A total of 39 latrines are complete (26 girls and 13 boys). Handwashing sites are at ongoing installation status in all sites and bore holes are not done yet. This delay in construction, increases in costs and the classification of Component 2’s rating as moderately unsatisfactorily according to the GA has been attributed by MoEST as due to increase in costs from improvements in the primary classroom design, changes from the community-led construction models to certified engineering firms for quality works and higher material costs. GoM has committed to fulfilling the agreed target of 500 classrooms by using a large portion (US$4.08 million) of the earnings from the first variable tranche of US$6 million of Component 4.
In response to such delays, there was discussion in May, 2019 with the GA of the adoption of school led construction of learning shelters as a realistic solution to the ever-rising cost of classroom construction interfaced with the estimated
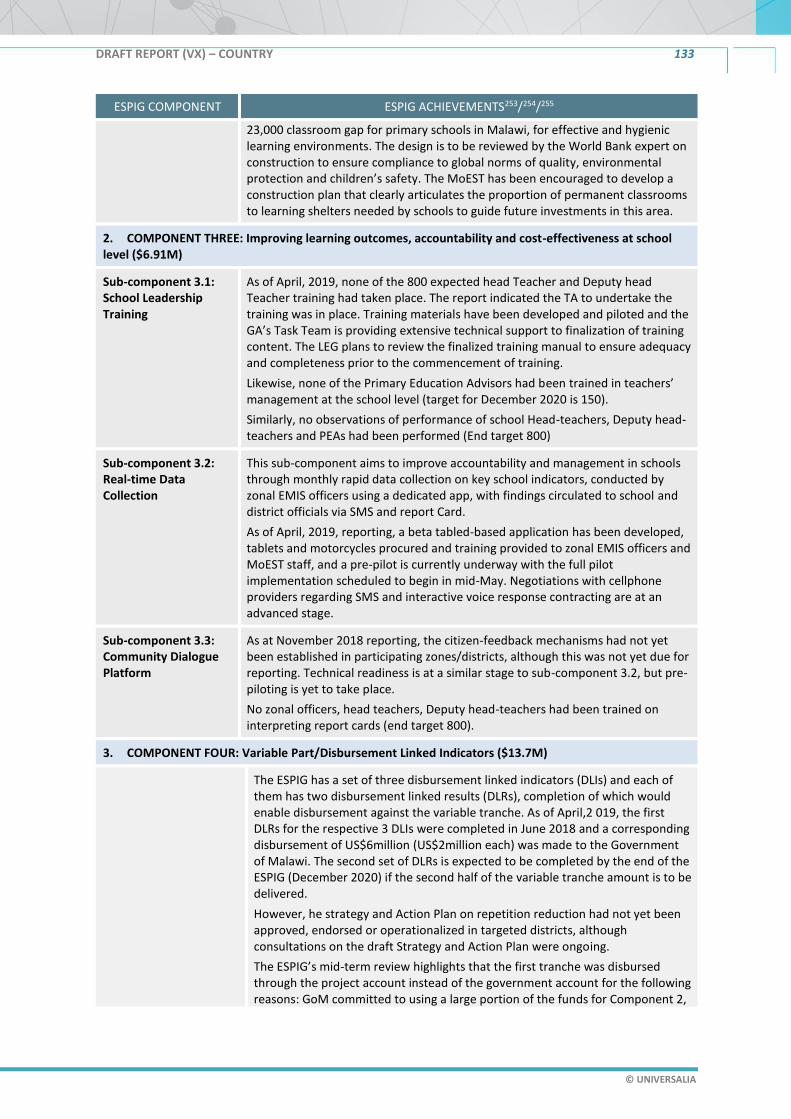
DRAFT REPORT (VX) – COUNTRY 133
© UNIVERSALIA
ESPIG COMPONENT ESPIG ACHIEVEMENTS253/254/255
23,000 classroom gap for primary schools in Malawi, for effective and hygienic learning environments. The design is to be reviewed by the World Bank expert on construction to ensure compliance to global norms of quality, environmental protection and children’s safety. The MoEST has been encouraged to develop a construction plan that clearly articulates the proportion of permanent classrooms to learning shelters needed by schools to guide future investments in this area.
2. COMPONENT THREE: Improving learning outcomes, accountability and cost-effectiveness at school level ($6.91M)
Sub-component 3.1: School Leadership Training
As of April, 2019, none of the 800 expected head Teacher and Deputy head Teacher training had taken place. The report indicated the TA to undertake the training was in place. Training materials have been developed and piloted and the GA’s Task Team is providing extensive technical support to finalization of training content. The LEG plans to review the finalized training manual to ensure adequacy and completeness prior to the commencement of training.
Likewise, none of the Primary Education Advisors had been trained in teachers’ management at the school level (target for December 2020 is 150).
Similarly, no observations of performance of school Head-teachers, Deputy head-teachers and PEAs had been performed (End target 800)
Sub-component 3.2: Real-time Data Collection
This sub-component aims to improve accountability and management in schools through monthly rapid data collection on key school indicators, conducted by zonal EMIS officers using a dedicated app, with findings circulated to school and district officials via SMS and report Card.
As of April, 2019, reporting, a beta tabled-based application has been developed, tablets and motorcycles procured and training provided to zonal EMIS officers and MoEST staff, and a pre-pilot is currently underway with the full pilot implementation scheduled to begin in mid-May. Negotiations with cellphone providers regarding SMS and interactive voice response contracting are at an advanced stage.
Sub-component 3.3: Community Dialogue Platform
As at November 2018 reporting, the citizen-feedback mechanisms had not yet been established in participating zones/districts, although this was not yet due for reporting. Technical readiness is at a similar stage to sub-component 3.2, but pre-piloting is yet to take place.
No zonal officers, head teachers, Deputy head-teachers had been trained on interpreting report cards (end target 800).
3. COMPONENT FOUR: Variable Part/Disbursement Linked Indicators ($13.7M)
The ESPIG has a set of three disbursement linked indicators (DLIs) and each of them has two disbursement linked results (DLRs), completion of which would enable disbursement against the variable tranche. As of April,2 019, the first DLRs for the respective 3 DLIs were completed in June 2018 and a corresponding disbursement of US$6million (US$2million each) was made to the Government of Malawi. The second set of DLRs is expected to be completed by the end of the ESPIG (December 2020) if the second half of the variable tranche amount is to be delivered.
However, he strategy and Action Plan on repetition reduction had not yet been approved, endorsed or operationalized in targeted districts, although consultations on the draft Strategy and Action Plan were ongoing.
The ESPIG’s mid-term review highlights that the first tranche was disbursed through the project account instead of the government account for the following reasons: GoM committed to using a large portion of the funds for Component 2,

DRAFT REPORT (VX) – COUNTRY 134
© UNIVERSALIA
ESPIG COMPONENT ESPIG ACHIEVEMENTS253/254/255
to meet the agreed target of 500 classrooms, in addition to the operationalization of the work plans of the respective strategies developed; and the Education Development Partners expressed caution against the reallocation funds away from agreed ESPIG interventions if the funds were not routed to the project account.
The 3 DLIs whose DLRs would trigger disbursement of the variable tranche in two installments are the following:
Endorsement of a comprehensive strategy and action plan for improving the distribution of teachers: Achieved
DLI 1: 20 percent reduction in PqTR grades 1 and 2 in 8 most disadvantaged districts – as of April, 2019 stands at 117.07 (target is 94.6).256
DLI 2: 10 percent increase in female to male teacher ratio in grades 608 in 8 most disadvantaged districts – as of April, 2019 stands at 0.22 (target is 0.31).
Endorsement of a comprehensive strategy and action plan for improving female to male teacher ratio: Achieved.
DLI 3: 10 percent reduction in repetition rate in grades 1-4 in most disadvantaged districts – as of April, 2019 stands at 21.5 percent (target is 17.4 percent).
DLR: Endorsement of national implementation strategy and action plan for promoting efficiency measures at the school level to reduce repetition in lower primary: Achieved.
4. COMPONENT FIVE: Project management, and sector program support and coordination ($4.68M)
Financial Management At the mid-term of the ESPIG as of April, 2019, disbursement stands at 58 percent of the US $44.9 million committed funds. The project is on course for disbursements. The GA’s financial management team conducted an in-depth financial review of Component 1 follow up to the 3 rounds of school grant disbursements that have been done.
As a grant agent for the GPE funds to the ESPIG in Malawi, the World Bank is a signatory to the Joint Education Services Fund (JESF) as well as the Commo Fiduciary Oversight Arrangement (CFOA) declarations. However, the ESPIG’s funds go to project accounts, not to the JESF account for the other development partners. The Fiduciary Agent – Price Waterhouse Coopers – oversees the ESPIG funds, including approving requisitions prior to their being signed off by the GoM’s Secretary of Education, Science and Technology.
The independent auditors, Graham Carr, issued an ‘unqualified audit opinion’ on the project financial statements for the period July 2017 – June 2018; the audit for 2018/2019 has not been prepared or completed as of July 2019. The 2017/2017 audit report highlighted areas of financial control and accountability that need improvement. The GA’s financial management team also conducted an in-depth assessment of project expenditures in a sample of project beneficiary schools with special focus on component 1 because of the grants to schools. The progress and outputs from the school grants is highlighted but there remains a need to improve cashbook management and financial records keeping at the school level.
Procurement At the mid-term of the ESPIG in April, 2019, MESIP had only one major procurement pending processing. This is the procurement of the third-party validation firm to validate the achievement of the second and last set of DLRs for
256Malawi Longitudinal School Survey Mid-Term Results Presentation on MESIP, March 24th, 2019.

DRAFT REPORT (VX) – COUNTRY 135
© UNIVERSALIA
ESPIG COMPONENT ESPIG ACHIEVEMENTS253/254/255
the variable tranche. GA conducts a project post-procurement review (PPR) process and initial findings have yet to be shared.
Safeguards At the central level, the capacity of the system to undertake safeguards as required by the ESPIG is considered satisfactory. However, the capacity of the Primary Education Advisors (PEAs) located at the zonal office is considered weak despite the training that has been provided. The MoEST monitors safeguards compliance. There are Grievances Redress Mechanism (GRM) Committees at the school, community and zonal levels. This is in addition to the district and project facilitation team levels. The GRM establishment facilitates presentation of complaints and grievances as well as the provision of resolutions to all project affected persons.

DRAFT REPORT (VX) – COUNTRY 136
© UNIVERSALIA
GPE Results Framework Data for Malawi
RF # Indicator Description GPE RFI Data
2016 2017 2018 2019
Sector Planning
RF16a Proportion of endorsed (a) education sector
plans (ESP) or (b) transitional education plans
(TEP) meeting quality standards257
0 (4/7)
RF16b Proportion of ESPs/TEPs that have a teaching
and learning strategy meeting quality
standards
RF16c Proportion of ESPs/TEPs with a strategy to
respond to marginalized groups that meets
quality standards (including gender,
disability, and other context-relevant
dimensions)
RF16d Proportion of ESPs/TEPs with a strategy to
improve efficiency that meets quality
standards
RF17 Proportion of DCPs or States with a data
strategy that meets quality standards258
Dialogue and Monitoring
RF18 Proportion of joint sector reviews (JSRs)
meeting quality standards259 0 (2/5)260
RF19 Proportion of LEGs with (a) civil society and
(b) teacher representation 1 1 1 1261
Sector Financing
257 Standard 1 - Guided by an overall vision; Standard 2 – Strategic; Standard 3 – Holistic; Standard 4 - Evidence-based; Standard 5 – Achievable; Standard 6 - Sensitive to context; and Standard 7 - Attentive to disparities. 258 Country must either be producing timely data on 12 key indicators, or have a robust strategy to address this. Detailed in their ESPIG application 259 Criteria for assessment: 1. Inclusion/Participation; 2. Aligned to ESP; 3. Evidence Based; 4. Informing Action 5. Embeddedness in Policy Cycle. JSR must meet three of these standards to be considered adequate. The GPE RFI assessment should be backed up or revised using the data from desk review and missions. In the case that no assessment exists, an assessment can be made from available data. 260 Met criteria 3 (comprehensive) and 4 (monitoring instrument) 261 Both teachers and civil society represented

DRAFT REPORT (VX) – COUNTRY 137
© UNIVERSALIA
RF10 Proportion of DCPs that have (a) increased
their public expenditure on education; or (b)
maintained sector spending at 20 percent or
above262
22.6 22.6 16.8
RF29 Proportion of GPE grants aligned to national
systems263 10/10 3/10 3/10 3/10
RF 30 Proportion of GPE grants using: (a) co-
financed project or (b) sector pooled funding
mechanisms
0 0 1 0
RF31 Proportion of country missions addressing
domestic financing issues 1/1 2/4 2/4 0/1
Sector Plan Implementation
RF20 Proportion of grants supporting
EMIS/learning assessment systems264 0, 1 0, 1 0, 1
RF21 Proportion of textbooks purchased and
distributed through GPE grants, out of the
total planned by GPE grants N/A
RF22 Proportion of teachers trained through GPE
grants, out of the total planned by GPE
grants
RF23 Proportion of classrooms built or
rehabilitated through GPE grants, out of the
total planned by GPE grants
0
percent265
RF25 Proportion of GPE program grants assessed
as on-track with implementation266 Delayed Delayed Delayed
System Level Changes
RF11 Equitable allocation of teachers, as measured
by the relationship (R2) between the number
of teachers and the number of pupils per
school in each DCP
0.58
262 Data from different sources if available Excluding debt servicing from national budget All national bodies that play a part in education (ministries, parastatals etc.) Focus on execution rate. If not available use budgeted amount and most recently available execution rate Disaggregated by capital and recurrent expenditure where possible 263 This is assessed using a 10-point questionnaire (given in RFI technical guidelines). This should be triangulated with an assessment of alignment based on interviews and desk review. 264 Only learning assessment system (Malawi Longitudinal School System) 265 Goal was for 100, 0 rehabilitated 266 This is based on a semi-structured qualitative assessment from Grant Agents and GPE CLs
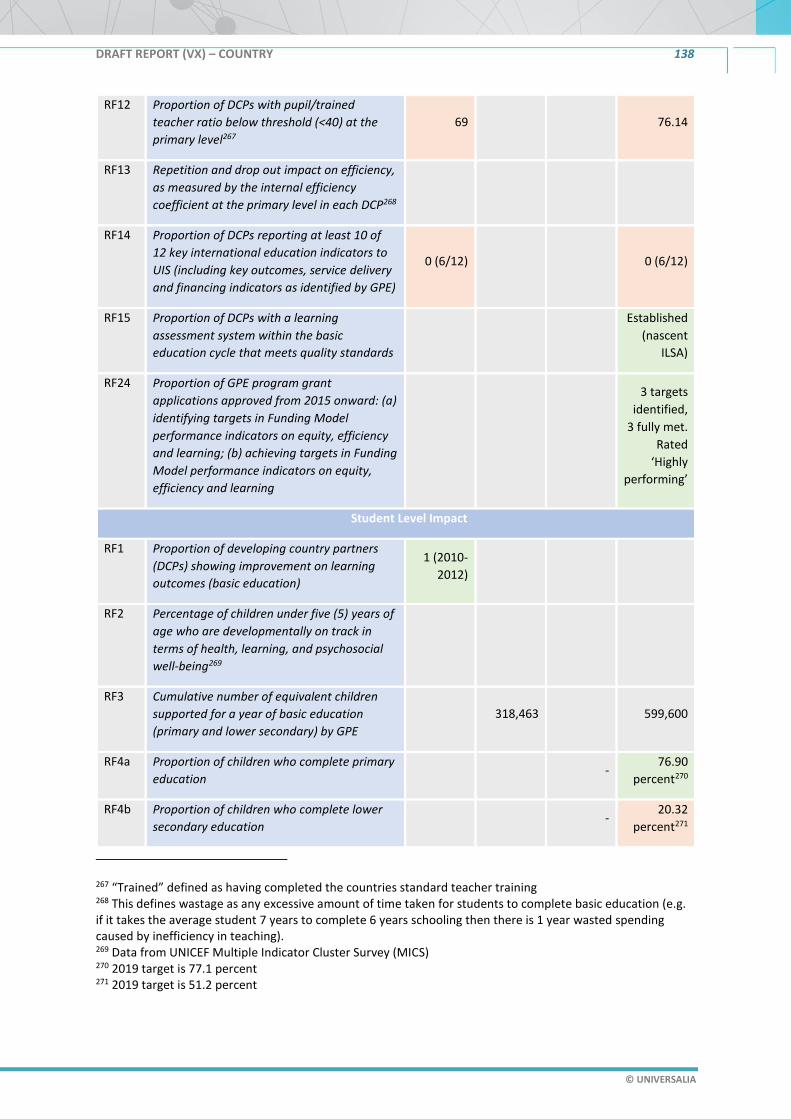
DRAFT REPORT (VX) – COUNTRY 138
© UNIVERSALIA
RF12 Proportion of DCPs with pupil/trained
teacher ratio below threshold (<40) at the
primary level267
69 76.14
RF13 Repetition and drop out impact on efficiency,
as measured by the internal efficiency
coefficient at the primary level in each DCP268
RF14 Proportion of DCPs reporting at least 10 of
12 key international education indicators to
UIS (including key outcomes, service delivery
and financing indicators as identified by GPE)
0 (6/12) 0 (6/12)
RF15 Proportion of DCPs with a learning
assessment system within the basic
education cycle that meets quality standards
Established
(nascent
ILSA)
RF24 Proportion of GPE program grant
applications approved from 2015 onward: (a)
identifying targets in Funding Model
performance indicators on equity, efficiency
and learning; (b) achieving targets in Funding
Model performance indicators on equity,
efficiency and learning
3 targets
identified,
3 fully met.
Rated
‘Highly
performing’
Student Level Impact
RF1 Proportion of developing country partners
(DCPs) showing improvement on learning
outcomes (basic education)
1 (2010-
2012)
RF2 Percentage of children under five (5) years of
age who are developmentally on track in
terms of health, learning, and psychosocial
well-being269
RF3 Cumulative number of equivalent children
supported for a year of basic education
(primary and lower secondary) by GPE 318,463 599,600
RF4a Proportion of children who complete primary
education -
76.90
percent270
RF4b Proportion of children who complete lower
secondary education -
20.32
percent271
267 “Trained” defined as having completed the countries standard teacher training 268 This defines wastage as any excessive amount of time taken for students to complete basic education (e.g. if it takes the average student 7 years to complete 6 years schooling then there is 1 year wasted spending caused by inefficiency in teaching). 269 Data from UNICEF Multiple Indicator Cluster Survey (MICS) 270 2019 target is 77.1 percent 271 2019 target is 51.2 percent

DRAFT REPORT (VX) – COUNTRY 139
© UNIVERSALIA
RF5a Proportion of GPE DCPs within set thresholds
for gender parity index of completion rates
for primary education - 1.02272
RF5b Proportion of GPE DCPs within set thresholds
for gender parity index of completion rates
for lower secondary education - .91
RF6 Pre-primary gross enrolment ratio 80.52 -
RF7a Out-of-school rate for children of primary
school age -
RF7b Out-of-school rate for children of lower
secondary school age 23.09 23.99
RF8a Gender parity index of out-of-school rate for
primary education
RF8b Gender parity index of out-of-school rate for
lower secondary education 1.02 1.05
RF9 Equity index273 0.441 .435
Source: GPE Results Framework Data
272 Thresholds between .88 and 1.02 273 Measurement of learning outcome disparities in gender, wealth and location (rural v. urban)
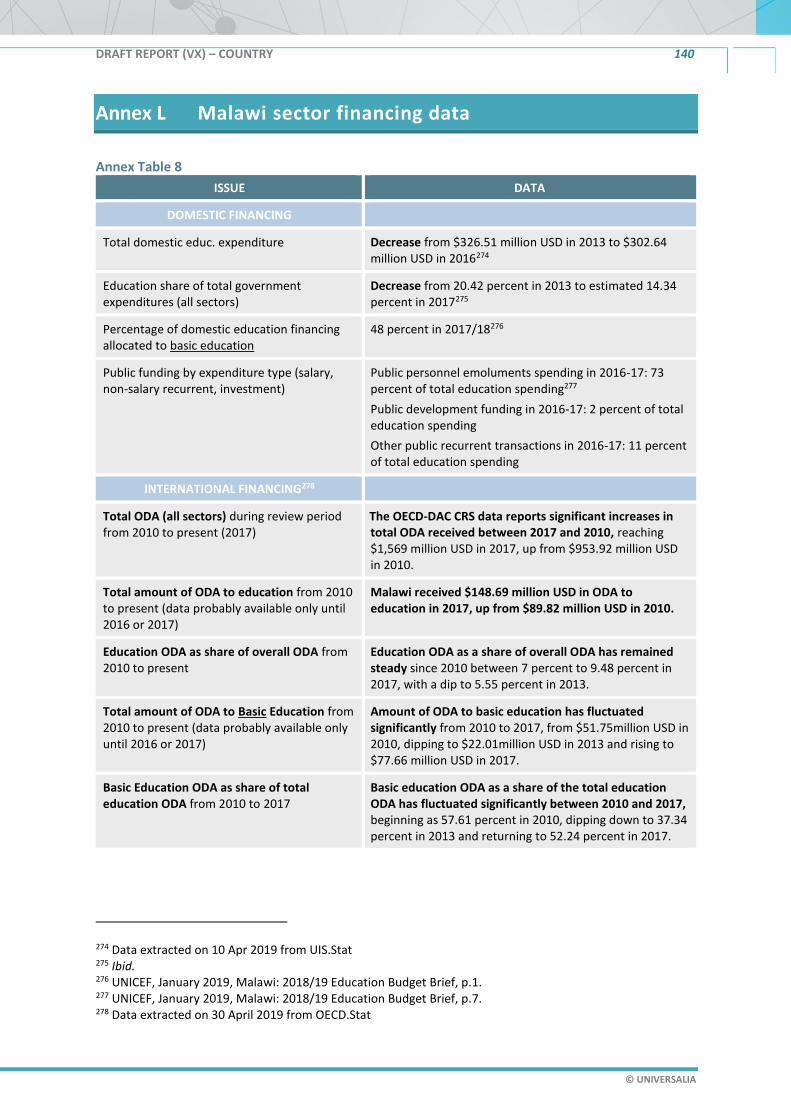
DRAFT REPORT (VX) – COUNTRY 140
© UNIVERSALIA
Malawi sector financing data
Annex Table 8
ISSUE DATA
DOMESTIC FINANCING
Total domestic educ. expenditure Decrease from $326.51 million USD in 2013 to $302.64 million USD in 2016274
Education share of total government expenditures (all sectors)
Decrease from 20.42 percent in 2013 to estimated 14.34 percent in 2017275
Percentage of domestic education financing allocated to basic education
48 percent in 2017/18276
Public funding by expenditure type (salary, non-salary recurrent, investment)
Public personnel emoluments spending in 2016-17: 73 percent of total education spending277
Public development funding in 2016-17: 2 percent of total education spending
Other public recurrent transactions in 2016-17: 11 percent of total education spending
INTERNATIONAL FINANCING278
Total ODA (all sectors) during review period from 2010 to present (2017)
The OECD-DAC CRS data reports significant increases in total ODA received between 2017 and 2010, reaching $1,569 million USD in 2017, up from $953.92 million USD in 2010.
Total amount of ODA to education from 2010 to present (data probably available only until 2016 or 2017)
Malawi received $148.69 million USD in ODA to education in 2017, up from $89.82 million USD in 2010.
Education ODA as share of overall ODA from 2010 to present
Education ODA as a share of overall ODA has remained steady since 2010 between 7 percent to 9.48 percent in 2017, with a dip to 5.55 percent in 2013.
Total amount of ODA to Basic Education from 2010 to present (data probably available only until 2016 or 2017)
Amount of ODA to basic education has fluctuated significantly from 2010 to 2017, from $51.75million USD in 2010, dipping to $22.01million USD in 2013 and rising to $77.66 million USD in 2017.
Basic Education ODA as share of total education ODA from 2010 to 2017
Basic education ODA as a share of the total education ODA has fluctuated significantly between 2010 and 2017, beginning as 57.61 percent in 2010, dipping down to 37.34 percent in 2013 and returning to 52.24 percent in 2017.
274 Data extracted on 10 Apr 2019 from UIS.Stat 275 Ibid. 276 UNICEF, January 2019, Malawi: 2018/19 Education Budget Brief, p.1. 277 UNICEF, January 2019, Malawi: 2018/19 Education Budget Brief, p.7. 278 Data extracted on 30 April 2019 from OECD.Stat
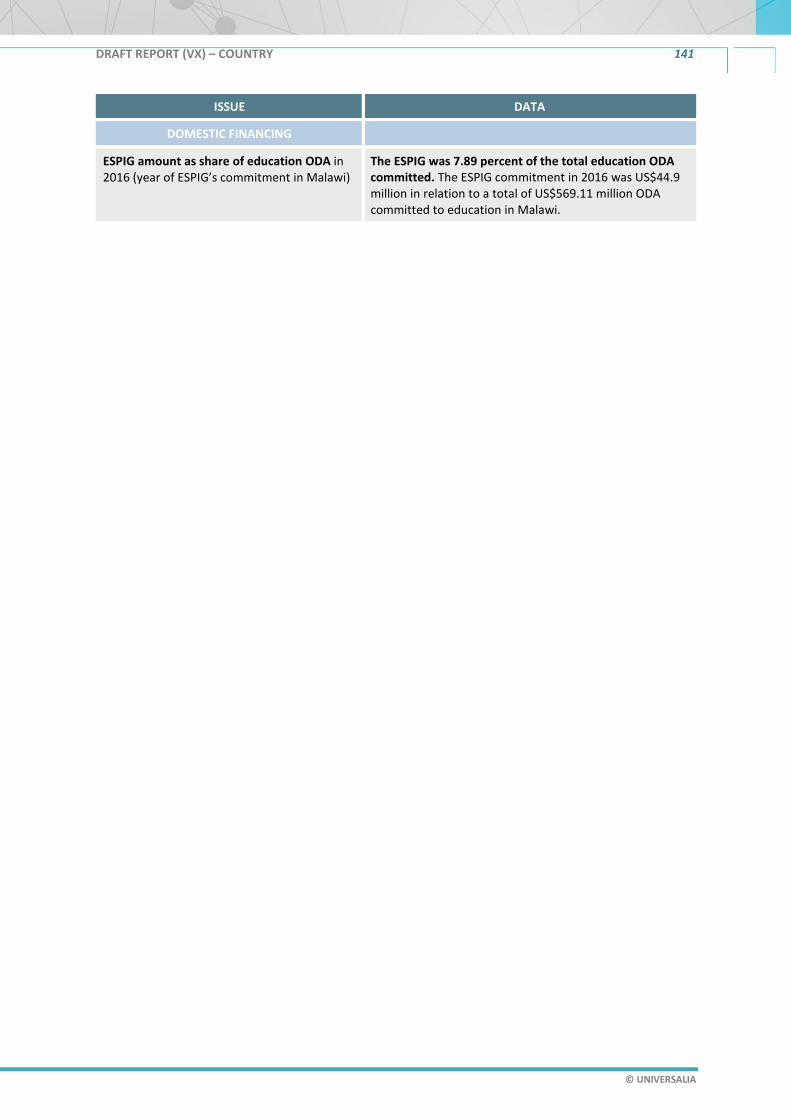
DRAFT REPORT (VX) – COUNTRY 141
© UNIVERSALIA
ISSUE DATA
DOMESTIC FINANCING
ESPIG amount as share of education ODA in 2016 (year of ESPIG’s commitment in Malawi)
The ESPIG was 7.89 percent of the total education ODA committed. The ESPIG commitment in 2016 was US$44.9 million in relation to a total of US$569.11 million ODA committed to education in Malawi.

DRAFT REPORT (VX) – COUNTRY 142
© UNIVERSALIA
Implementation progress (JSR 2018)
Sub-sector Issue Progress
Basic Education Increase monitoring and supervision on
increased learning time to 4 hours
A study on the benefits of the policy is
drafted but not officially released.
Sensitize DEMS on the need to re-deploy
teachers to lower grades
Developed posting guidelines for
primary school teachers. Dissemination
of guidelines not clear.
Conduct an analysis of what has been done re
double shifting primary schools to extend
learning time.
Study revealed the double shift school
are not implementing the additional
hour.
Finalize the rural allowance policy No completed.
Review existing assessment of learning
outcomes that will inform the setting of
learning outcome targets
Not done
Finalize promotion strategy Done
Conduct a workshop on bottlenecks of the
flow of PSIP funds to schools
Not done.
Secondary Conduct consultations on turning some
schools to double shift.
Not done
Develop possible models for maximizing use of
facilities and establishing a cluster system
Partially implemented. Ongoing.
Higher Education Complete higher education bill Not done
Expand infrastructure for teaching and
learning
Implemented partially, in one
university
Develop National Qualification Framework for
Higher Education
Not done.
Develop Institutional Qualification
Frameworks
Finalized in one university, in progress
in three universities.
Establish Higher Education Management
Information System
Done

DRAFT REPORT (VX) – COUNTRY 143
© UNIVERSALIA
Promote Entrepreneurship skills and programs
in HEIs
Only in new programs. Partially done.
Identify HE SEED grants for research and
development in key priority areas
Not clear.
Support bridging courses for girls and students
for disadvantaged environments
Policy developed but not implemented.
Support ODL & E-learning initiatives Two universities have increased ODL
intake but it is not clear what support
was provided by the Ministry that led to
this.
Provide supporting facilities and human
resource develop for HEIs to support learners
with disabilities
Not done.
Review the act for HESLGB to support diploma
students
Not done.
Support HEIs with seed resources to establish
bankable investments
Not done.
Teacher
Education
Review selection criteria for PTTCs Done.
Align the assessment framework for IPTE
curriculum to new curriculum
Not done.
Review diploma options Not done.
Establish Secondary Teacher Education
Institutions Association
No done.
Cross-cutting Sensitize on SNE and Inclusive Education at
secondary and tertiary levels
In 5 secondary schools and three
colleges.
Disseminate and ensure all schools use the
assessment tools that have been developed.
Not done.
Support assessment teams to coordinate
diagnostic assessment in the districts
Undertaken in 4 districts.
Conduct regular CPDs for Inclusive Education Not clear.
Strengthen the monitoring component at
national and district levels using mainstream
resources
Done.

DRAFT REPORT (VX) – COUNTRY 144
© UNIVERSALIA
Cascade guidance and counselling training
targeting SHN coordinators to school level
Not done.
Fully disseminate the Integrated SHN Policy
and its revised Strategic Plan to the grass root
level.
Launched but not disseminated. Not
done.
Involve all key stakeholders including Civil
Society Organizations
Done.
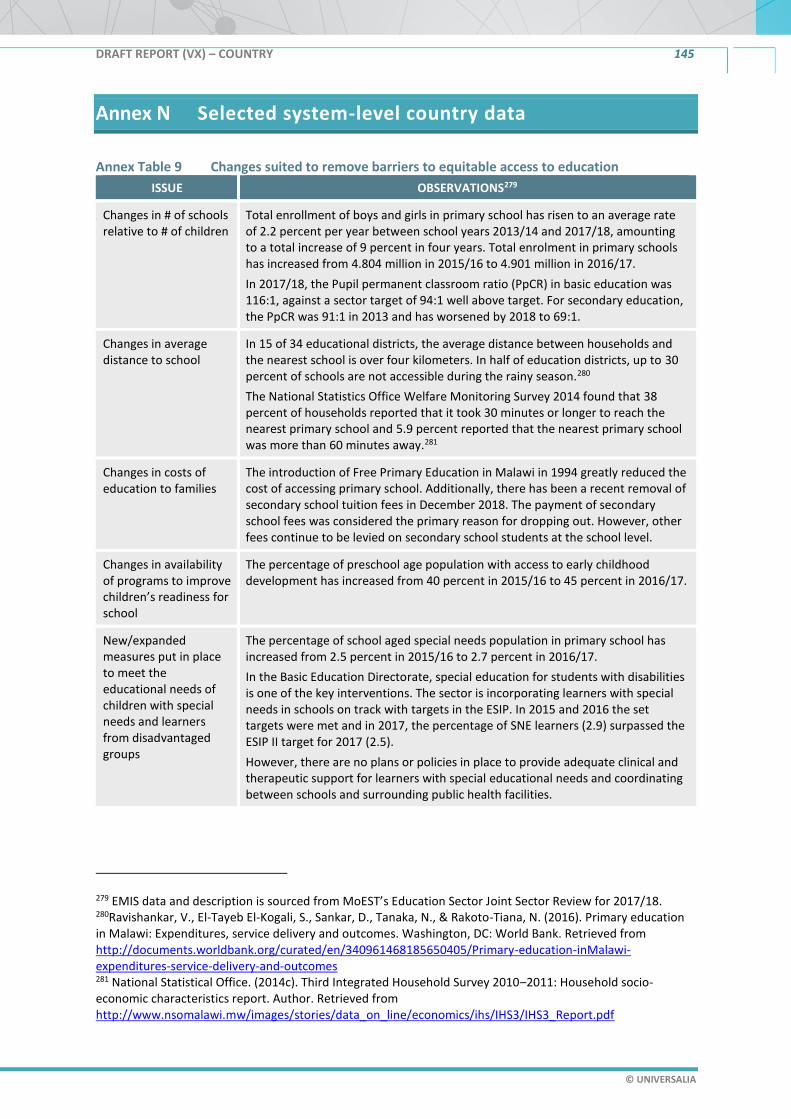
DRAFT REPORT (VX) – COUNTRY 145
© UNIVERSALIA
Selected system-level country data
Annex Table 9 Changes suited to remove barriers to equitable access to education
ISSUE OBSERVATIONS279
Changes in # of schools relative to # of children
Total enrollment of boys and girls in primary school has risen to an average rate of 2.2 percent per year between school years 2013/14 and 2017/18, amounting to a total increase of 9 percent in four years. Total enrolment in primary schools has increased from 4.804 million in 2015/16 to 4.901 million in 2016/17.
In 2017/18, the Pupil permanent classroom ratio (PpCR) in basic education was 116:1, against a sector target of 94:1 well above target. For secondary education, the PpCR was 91:1 in 2013 and has worsened by 2018 to 69:1.
Changes in average distance to school
In 15 of 34 educational districts, the average distance between households and the nearest school is over four kilometers. In half of education districts, up to 30 percent of schools are not accessible during the rainy season.280
The National Statistics Office Welfare Monitoring Survey 2014 found that 38 percent of households reported that it took 30 minutes or longer to reach the nearest primary school and 5.9 percent reported that the nearest primary school was more than 60 minutes away.281
Changes in costs of education to families
The introduction of Free Primary Education in Malawi in 1994 greatly reduced the cost of accessing primary school. Additionally, there has been a recent removal of secondary school tuition fees in December 2018. The payment of secondary school fees was considered the primary reason for dropping out. However, other fees continue to be levied on secondary school students at the school level.
Changes in availability of programs to improve children’s readiness for school
The percentage of preschool age population with access to early childhood development has increased from 40 percent in 2015/16 to 45 percent in 2016/17.
New/expanded measures put in place to meet the educational needs of children with special needs and learners from disadvantaged groups
The percentage of school aged special needs population in primary school has increased from 2.5 percent in 2015/16 to 2.7 percent in 2016/17.
In the Basic Education Directorate, special education for students with disabilities is one of the key interventions. The sector is incorporating learners with special needs in schools on track with targets in the ESIP. In 2015 and 2016 the set targets were met and in 2017, the percentage of SNE learners (2.9) surpassed the ESIP II target for 2017 (2.5).
However, there are no plans or policies in place to provide adequate clinical and therapeutic support for learners with special educational needs and coordinating between schools and surrounding public health facilities.
279 EMIS data and description is sourced from MoEST’s Education Sector Joint Sector Review for 2017/18. 280Ravishankar, V., El-Tayeb El-Kogali, S., Sankar, D., Tanaka, N., & Rakoto-Tiana, N. (2016). Primary education in Malawi: Expenditures, service delivery and outcomes. Washington, DC: World Bank. Retrieved from http://documents.worldbank.org/curated/en/340961468185650405/Primary-education-inMalawi-expenditures-service-delivery-and-outcomes 281 National Statistical Office. (2014c). Third Integrated Household Survey 2010–2011: Household socio-economic characteristics report. Author. Retrieved from http://www.nsomalawi.mw/images/stories/data_on_line/economics/ihs/IHS3/IHS3_Report.pdf

DRAFT REPORT (VX) – COUNTRY 146
© UNIVERSALIA
ISSUE OBSERVATIONS279
New/expanded measures put in place to further gender equality in education
The gender parity index for primary education is currently at 1.00 (as of JSR 2018), significantly equality in enrollment. However, while there is approximate gender parity for the first 4 standards, for standard 5-7 female enrollment is on average 8 percent higher than male enrollment which then dips in standard 8 as male enrollment is higher.
The ESIP targets for gender parity index in secondary enrollment have never been achieved and the gap between the targets and actual performance has actually been widening each passing year. In 2014, GPI in secondary school was .88 and has only reached .92 in 2018 (2018 target is 1.00, full parity).
For secondary education, the MoEST has put in strategies to increase equitable access to secondary education, to: increase enrollment; provide safe and gender responsive sanitary facilities; maximize the use of existing infrastructure.
Annex Table 10 Changes suited to remove barriers to quality education
ISSUE OBSERVATIONS
Changes in Pupil/teacher ratios (basic education)
The national average of PqTR in 2017/18 is an average 70:1, a decrease from an average of 80:1 in 2015/16.
However, there are significant disparities hidden within the PqTR figure between both various schools and different standards within the same school. In 2017/18, 25 percent of all public primary school shad a PqTR of 87:1 or higher and 10 percent of all schools had a PqTR of 107:1 or higher. At lower standards, PqTRs often range above 1001:1.
Changes in pupil/trained teacher ratio
No data
Changes in equitable allocation of teachers (measured by relationship between number of teachers and number of pupils per school
There are significant disparities hidden within the PqTR figure between both various schools and different standards within the same school. In 2017/18, 25 percent of all public primary school shad a PqTR of 87:1 or higher and 10 percent of all schools had a PqTR of 107:1 or higher. At lower standards, PqTRs often range above 1001:1.
Changes in relevance and clarity of (basic education) curricula
As of the 2018 JSR, the MoEST is aligning the assessment framework for the new Initial Primary Teacher Education curriculum to the new curriculum.
In 2017/18, there was a purchase of new teaching and learning materials for the new curriculum amounting to MK1.2 billion under the Primary Curriculum and Assessment Reform (PCAR).
Changes in availability and quality of teaching and learning materials
A total of MK1.1 billion (0.83 percent of the basic education budget) in 2018 was allocated to the purchase of teaching and learning materials.
Changes to pre-service teacher training
In 2017/18, construction of 3 teacher training colleges for primary school teachers and opening of two of these schools, namely Chiradzulu and Phalombe (total of 9 public teacher training colleges). There is an acknowledgement for the need to introduce a diploma program for primary teacher education. However, major concerns from the MoEST include: not all current primary teachers would meet upgrading requirements for a diploma; it would take 10-15 years under the current TTC capacity to upgrade all primary teachers to a diploma level; and if the diploma was introduced as a pre-service initial primary teacher education,

DRAFT REPORT (VX) – COUNTRY 147
© UNIVERSALIA
the number of teachers trained per year are cause for serious concern as a low number of student teachers could seriously endanger the PqTR on a medium and long-term.
Changes to in-service teacher training
In the third quarter of 2017/18, MoEST Management approved the Continuing Professional Development framework for all teachers and teacher educators. The Development of Continuous Professional Development has conducted orientation workshops in three educational districts on the contents of the framework targeting DEMs, CPAs and PEAs. However, there is no specific budget line for the implementation of CPD framework activities in the MoEST national budget.
Changes in incentives for schools/teachers
MoEST has developed a strategy to improve the quality of secondary education that includes the provision of appropriate incentives to retain teachers in the teacher profession and enhancing continuous professional development. Data on the implementation of such incentives on a systematic/national level is not currently available.
Annex Table 11 Progress in strengthening sector management
ISSUE OBSERVATIONS
Changes in the institutional capacity of key ministries and/or other relevant government agencies (e.g. staffing, structure, organizational culture, funding)
N/A
Is a quality learning assessment system (LAS) within basic education cycle in place?
Before 2004, Malawi did not have any clear national policies regulating educational assessments, except for national examinations. Internal efficiency of the educational system was therefore based largely on examination results and educational indicators such as enrollment, dropout and survival rates, pupil-to-teacher and pupil-to-textbook ratios to inform decisions made by the MoEST.282
Malawi’s MoEST began the National Reading Assessment in 2017, conducting a baseline using the EGRA instrument. MoEST will conduct NRAs again in 2018 and 2020.
Changes in how country uses LAS.
With the introduction of Malawi’s National Reading Assessment in 2017, MoEST and DPs will be able to measure progress in reading as well as design and administer continuous and end-of-year assessments in reading to inform remediation for learning who are lagging behind.
282 Chulu, B. W. (2013). Institutionalization of assessment capacity in developing nations: the case of Malawi. Assessment in Education: Principles, Policy & Practice, 20(4), 407-423.

DRAFT REPORT (VX) – COUNTRY 148
© UNIVERSALIA
ISSUE OBSERVATIONS
Does country have functioning EMIS?
The main monitoring tool for monitoring the sector is the Education Management Information System (EMIS) which is supplemented by other tools/source, e.g. Integrated Financial Management Information System (IFMIS), Quarterly Progress Reports for the SWGs, Procurement Reports, Infrastructure reports, the Malawi national Examinations Board (MANEB), National Statistics Office Welfare Monitoring Survey (NSO-WMS), Southern Africa Consortium for Measuring Education Quality (SACMEQ), the Malawi Longitudinal School Survey (MLSS) and the Integrated Household Survey (IHS).
The EMIS Unit has conducted the EMIS Validation Survey and the School Assessment Charts Survey and the report is forthcoming, as of June, 2019.
The MLSS is an independent, nationally representative sample survey that provides data on students, teachers and facilities. MLSS has been established to address the lack of education data available in Malawi to monitor progress in education.
Changes in how country uses EMIS data to inform policy dialogue, decision making and sector monitoring
The Monitoring Tools/Mechanisms are guided by the Education Research Monitoring and Evaluation Framework. To improve reliability and availability of quality education statistics, MoEST has institutionalized the decentralization of data collection to all zones and clusters in all education districts.
The objective for conducting the MLSS is to provide data for evaluation of MESIP and to provide data to support EMIS. MLSS will monitor changes across the sector and provide an entry point for discussions on differences between data sources in Malawi.

DRAFT REPORT (VX) – COUNTRY 149
© UNIVERSALIA
Selected impact-level country data
Annex Table 12 Progress in strengthening sector management
ISSUE OBSERVED TRENDS (UIS DATA) (UP TO AND INCLUDING DURING
REVIEW PERIOD)
2017/2018 JSR & EMIS DATA283
Learning outcomes
Changes/trends in learning outcomes (basic education) during period under review (by gender, by socio-economic group, by rural/urban locations)
No data. The 2017 National Reading Assessment baseline found that most learners do not have critical early grade reading skills. In standard 2, 80 percent and 87 percent of learners that were tested for Chichewa and English respectively scored zero in correctly and fluently reading a text.
89 percent and 99 percent of standard 2 learners tested for Chichewa and English, respectively, were unable to correctly answer a single comprehension question after reading text. Greater detail in In Annex Tables 7 and 8 below.
Equity, gender equality and inclusion
Changes in (i) gross and (ii) net enrollment rates (basic education including pre-primary) during review period (by gender, by socio-economic group, by rural/urban
Total enrollment in ECD/pre-primary education in 2015: 1,360,619 (female: 678,836; male: 681,783)
Total enrollment in primary education: increased from 3,687,625 in 2012 to 4,433,977 in 2017
Female enrollment in primary education: increased from 1,859,959 in 2020 to 2,240,847 in 2017
Male enrollment in basic education: increased from 1,827,666 in 2012 to 2,193,130 in 2017
Though there have been significant increases in absolute enrollment, the Net Enrollment Rate (NER) has only increased modestly because of higher population increases and high dropout resulting in low primary school completion rate. EMIS figures show that NER increased from 88 percent to 90 percent between 2016/17 to 2017/18. This is still slightly below the EMIS II target of 93 percent.
Gross enrolment rates for all enrolled learners is much higher than NER, reaching 137 percent in 2017/18 from 122 percent in 2016/17.
283 EMIS data and description is sourced from MoEST’s Education Sector Joint Sector Review for 2017/18.
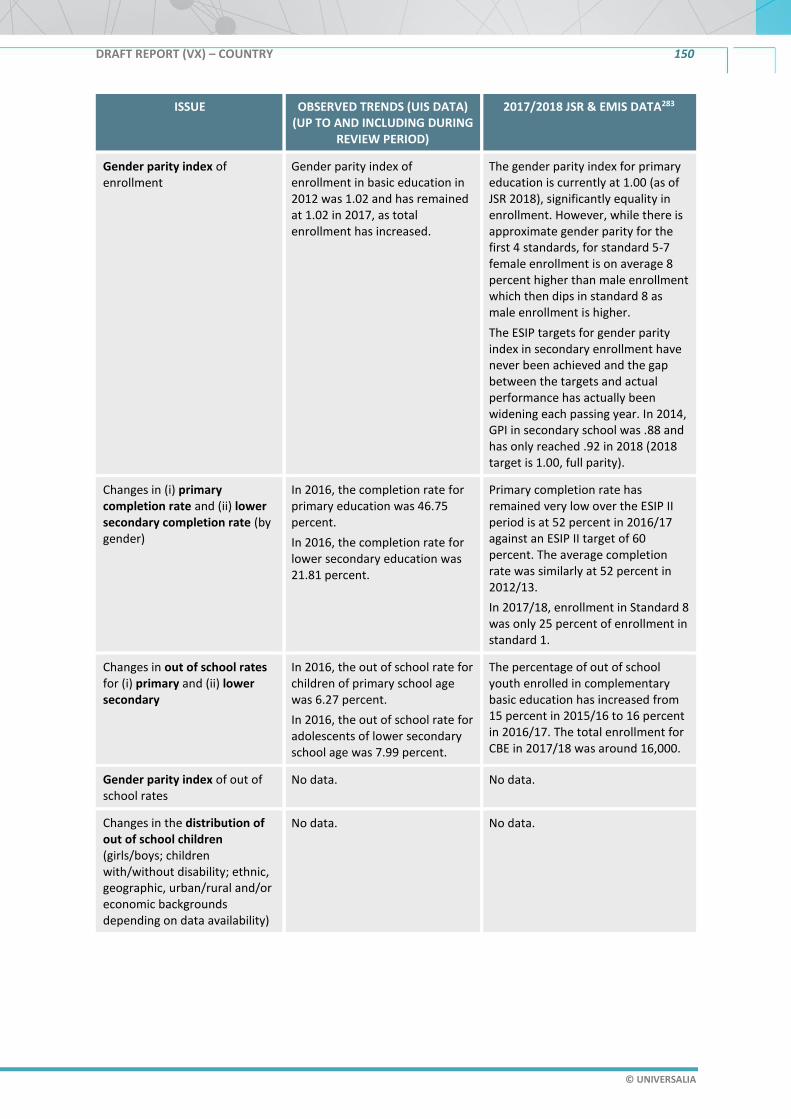
DRAFT REPORT (VX) – COUNTRY 150
© UNIVERSALIA
ISSUE OBSERVED TRENDS (UIS DATA) (UP TO AND INCLUDING DURING
REVIEW PERIOD)
2017/2018 JSR & EMIS DATA283
Gender parity index of enrollment
Gender parity index of enrollment in basic education in 2012 was 1.02 and has remained at 1.02 in 2017, as total enrollment has increased.
The gender parity index for primary education is currently at 1.00 (as of JSR 2018), significantly equality in enrollment. However, while there is approximate gender parity for the first 4 standards, for standard 5-7 female enrollment is on average 8 percent higher than male enrollment which then dips in standard 8 as male enrollment is higher.
The ESIP targets for gender parity index in secondary enrollment have never been achieved and the gap between the targets and actual performance has actually been widening each passing year. In 2014, GPI in secondary school was .88 and has only reached .92 in 2018 (2018 target is 1.00, full parity).
Changes in (i) primary completion rate and (ii) lower secondary completion rate (by gender)
In 2016, the completion rate for primary education was 46.75 percent.
In 2016, the completion rate for lower secondary education was 21.81 percent.
Primary completion rate has remained very low over the ESIP II period is at 52 percent in 2016/17 against an ESIP II target of 60 percent. The average completion rate was similarly at 52 percent in 2012/13.
In 2017/18, enrollment in Standard 8 was only 25 percent of enrollment in standard 1.
Changes in out of school rates for (i) primary and (ii) lower secondary
In 2016, the out of school rate for children of primary school age was 6.27 percent.
In 2016, the out of school rate for adolescents of lower secondary school age was 7.99 percent.
The percentage of out of school youth enrolled in complementary basic education has increased from 15 percent in 2015/16 to 16 percent in 2016/17. The total enrollment for CBE in 2017/18 was around 16,000.
Gender parity index of out of school rates
No data. No data.
Changes in the distribution of out of school children (girls/boys; children with/without disability; ethnic, geographic, urban/rural and/or economic backgrounds depending on data availability)
No data. No data.

DRAFT REPORT (VX) – COUNTRY 151
© UNIVERSALIA
ISSUE OBSERVED TRENDS (UIS DATA) (UP TO AND INCLUDING DURING
REVIEW PERIOD)
2017/2018 JSR & EMIS DATA283
Changes in transition rates from primary to lower secondary education (by gender, by socio-economic group)
No data. No data.
Changes in dropout and/or repetition rates (depending on data availability) for (i) primary, (ii) lower-secondary education
No data on repetition rates in primary education or lower secondary education.
Repetition rates in primary school for both boys and girls have been perpetually high since the implementation of ESIP II in 2013. Repetition rates were at 24.5 percent in 2012/13 and remained at 24 percent in 2017/18, far above the sector target of 10 percent.
Dropout rates for primary school boys and girls are relatively constant since 2012/13 and are currently at 4 percent. The sector has surpassed the ESIP II targets of 8 percent for girls and 6 percent for boys. However, in Malawi these still lead to a considerable cumulative dropout rates (that is annual dropout adding up over years) in part because of high repetition, which makes learners progress slowly through standards and eventually drop out before completion.
Continuously high dropout rates resulting in low primary school completion rates.