Embed Size (px)
Citation preview
International Electronic Journal of Elementary Education, 2015, 7(2), 107-124.
ISSN:1307-9298 Copyright © IEJEE www.iejee.com
Prospective elementary and secondary school mathematics teachers’ statistical reasoning
Rabia KARATOPRAK University of Iowa, United States
Gülseren KARAGÖZ AKAR
Boğaziçi University, Turkey
Bengü BÖRKAN Boğaziçi University, Turkey
Received: 25 December 2014 / Revised: 3 January 2015 / Accepted: 1 February 2015
Abstract
This study investigated prospective elementary (PEMTs) and secondary (PSMTs) school mathematics teachers’ statistical reasoning. The study began with the adaptation of the Statistical Reasoning Assessment (Garfield, 2003) test. Then, the test was administered to 82 PEMTs and 91 PSMTs in a metropolitan city of Turkey. Results showed that both groups were equally successful in understanding independence, and understanding importance of large samples. However, results from selecting appropriate measures of center together with the misconceptions assessing the same subscales showed that both groups selected mode rather than mean as an appropriate average. This suggested their lack of attention to the categorical and interval/ratio variables while examining data. Similarly, both groups were successful in interpreting and computing probability; however, they had equiprobability bias, law of small numbers and representativeness misconceptions. The results imply a change in some questions in the Statistical Reasoning Assessment test and that teacher training programs should include statistics courses focusing on studying characteristics of samples.
Keywords: Statistical reasoning, Prospective teachers, Statistics education, SRA.
Introduction
The importance of statistical reasoning is increasing because in today’s world individuals face daily issues such as participating in a debate or community action or being aware of some phenomena such as crime rates, population growth, spread of diseases, industrial production, educational achievement, employment trends etc. (NCTM, 2005; Watson & Callingham,
This article is a written from the first author’s master thesis called Assessing Preservice Mathematics Teachers’ Statistical Reasoning. Rabia KARATOPRAK, Faculty of Education, University of Iowa, USA. E-Mail: [email protected]
International Electronic Journal of Elementary Education Vol.7, Issue 2, 107-124,2015
108
2003). However, an individual's statistical reasoning is not always intuitive (NCTM, 2005); therefore, strengthening and developing individual’s statistical reasoning as an outcome of schooling is necessary (Gal, 2002; Watson & Callingham, 2003; Garfield & Ben-Zvi, 2007).
In this respect it is important for prospective teachers to have statistical reasoning (Garfield, 2002) because what teachers know is what their students know (Fennema & Franke, 1992; Heaton & Mickelson, 2002). However, some small scale studies pointed to the fact that both PEMTs and PSMTs lack the reasoning necessary to determine when and why to use statistical constructs such as mean, median, variance and distribution (Canada, 2008; Groth & Bergner, 2006; Makar & Confrey, 2005; Leavy, 2006). By the same token, a study done with 66 PEMTs and PSMTs on their probability misconceptions showed that both groups had equiprobablity bias and misconception of law of small numbers (Jendraszek, 2010).
Although small scale studies provided important information about prospective teachers’ existing meanings of some statistical constructs and probability misconceptions, these studies pointed to the lack of knowledge and reasoning in statistics in parts such as understanding variability (e.g., Makar & Confrey, 2005), understanding mean (e.g., Groth & Bergner, 2006) and misconceptions regarding probability, etc. (e.g.,Jendraszek , 2010). On the other hand, Garfield (2003) provided the field with a paper-and-pencil Statistical Reasoning Assessment test (SRA) to examine large number of individuals’ statistical reasoning. In this regard, this study aimed at determining prospective elementary and secondary mathematics teachers' statistical reasoning types. Examining a comparatively large number of prospective teachers’ statistical reasoning (N=173) with SRA test might further assist teacher preparation programs with what to focus on specifically (Shaugnessy, 2007; Bulut, 2001) due to SRA’s capacity for the design of instructions since responses provide in-depth information about both correct reasoning skills and misconceptions (Sundre, 2003). Studying both PEMTs’ and PSMTs’ statistical reasoning types in juxtaposition to each other with participants coming from a metropolitan city of Turkey might provide a description of the knowledge repertoire of these prospective teachers with respect to the statistical concepts. Also, since both groups come from a different educational program at the university level, comparing their statistical reasoning might add to the literature the differences among these groups based on which recommendations specific to each program can be made.
Being informed by the aforementioned studies the following research questions were investigated:
I. What are the statistical reasoning types of prospective elementary school mathematics teachers?
II. What are the statistical reasoning types of prospective secondary school mathematics teachers?
III. Is there any difference between statistical reasoning types of prospective secondary school mathematics teachers and elementary school mathematics teachers?
In particular, this research study is situated in Turkey, done with Turkish prospective teachers educated in a different context than their peers in different countries. Yet, results pointed to the similarities with previous research (e.g., Jendraszek, 2010) and extended it by focusing on prospective teachers’ reasoning regarding each sub-scale. In this regard, results of this study might further assist teacher preparation programs, courses for teaching statistics, to focus specifically (Shaugnessy, 2007; Bulut, 2001) on prospective teachers’ knowledge of variables and sampling.
Teachers’ Statistical Reasoning / Karatoprak, Karagöz Akar & Börkan
109
Literature Review
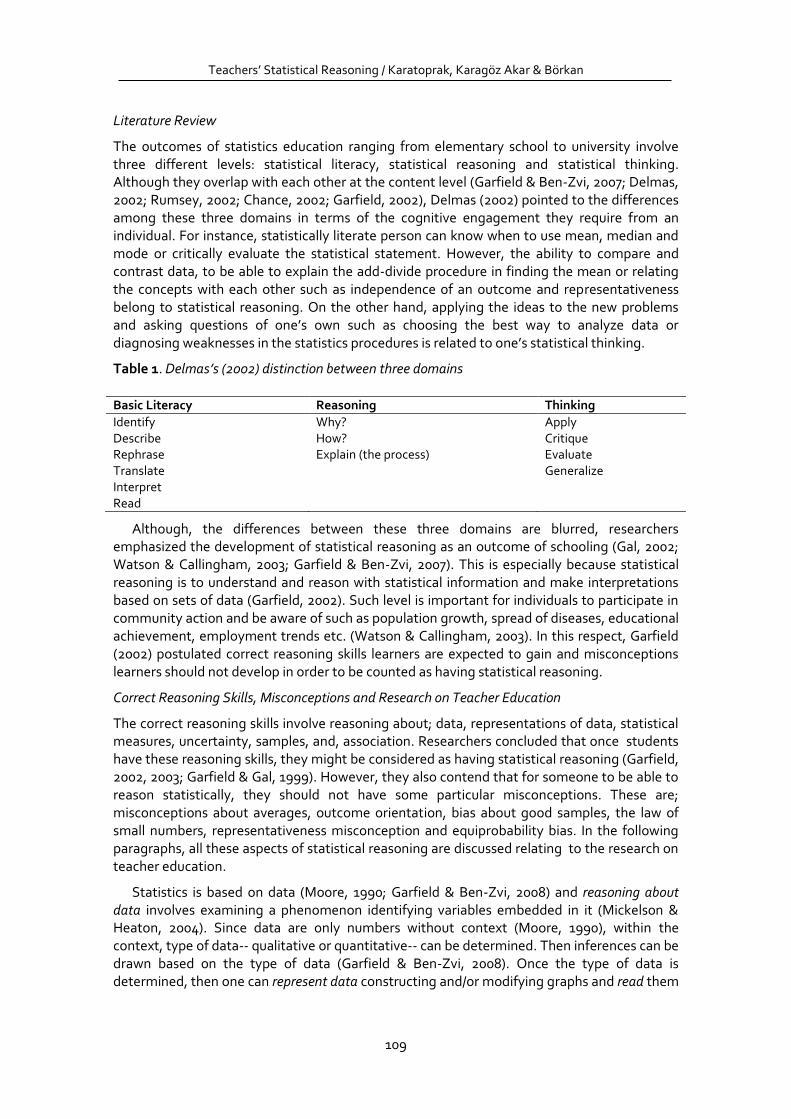
The outcomes of statistics education ranging from elementary school to university involve three different levels: statistical literacy, statistical reasoning and statistical thinking. Although they overlap with each other at the content level (Garfield & Ben-Zvi, 2007; Delmas, 2002; Rumsey, 2002; Chance, 2002; Garfield, 2002), Delmas (2002) pointed to the differences among these three domains in terms of the cognitive engagement they require from an individual. For instance, statistically literate person can know when to use mean, median and mode or critically evaluate the statistical statement. However, the ability to compare and contrast data, to be able to explain the add-divide procedure in finding the mean or relating the concepts with each other such as independence of an outcome and representativeness belong to statistical reasoning. On the other hand, applying the ideas to the new problems and asking questions of one’s own such as choosing the best way to analyze data or diagnosing weaknesses in the statistics procedures is related to one’s statistical thinking.
Table 1. Delmas’s (2002) distinction between three domains
Basic Literacy Reasoning Thinking
Identify Describe Rephrase Translate Interpret Read
Why? How? Explain (the process)
Apply Critique Evaluate Generalize
Although, the differences between these three domains are blurred, researchers emphasized the development of statistical reasoning as an outcome of schooling (Gal, 2002; Watson & Callingham, 2003; Garfield & Ben-Zvi, 2007). This is especially because statistical reasoning is to understand and reason with statistical information and make interpretations based on sets of data (Garfield, 2002). Such level is important for individuals to participate in community action and be aware of such as population growth, spread of diseases, educational achievement, employment trends etc. (Watson & Callingham, 2003). In this respect, Garfield (2002) postulated correct reasoning skills learners are expected to gain and misconceptions learners should not develop in order to be counted as having statistical reasoning.
Correct Reasoning Skills, Misconceptions and Research on Teacher Education
The correct reasoning skills involve reasoning about; data, representations of data, statistical measures, uncertainty, samples, and, association. Researchers concluded that once students have these reasoning skills, they might be considered as having statistical reasoning (Garfield, 2002, 2003; Garfield & Gal, 1999). However, they also contend that for someone to be able to reason statistically, they should not have some particular misconceptions. These are; misconceptions about averages, outcome orientation, bias about good samples, the law of small numbers, representativeness misconception and equiprobability bias. In the following paragraphs, all these aspects of statistical reasoning are discussed relating to the research on teacher education.
Statistics is based on data (Moore, 1990; Garfield & Ben-Zvi, 2008) and reasoning about data involves examining a phenomenon identifying variables embedded in it (Mickelson & Heaton, 2004). Since data are only numbers without context (Moore, 1990), within the context, type of data-- qualitative or quantitative-- can be determined. Then inferences can be drawn based on the type of data (Garfield & Ben-Zvi, 2008). Once the type of data is determined, then one can represent data constructing and/or modifying graphs and read them
International Electronic Journal of Elementary Education Vol.7, Issue 2, 107-124,2015
110
to interpret data and recognize the general characteristics (Garfield, 2003). While interpreting data some statistical measures are used such as measures of center (mean, median and mode), spread and position. While interpreting data knowing about when and how to use them is necessary (Garfield, 2003). Nevertheless, some might think that averages are the most frequent number or regard mean and median as the same. Moreover, some might argue that groups are compared according to their averages and average is calculated with add-divide procedure regardless of the outliers. Researchers stated that students should not be using these types of (incorrect) reasoning while analyzing statistical information (Garfield, 2002, 2003; Garfield & Gal, 1999). Nevertheless, Groth and Bergner (2006) found out that only 3 out of 46 prospective elementary mathematics teachers could think about hypothetical situations in which one of the mean, median and mode might be a better measure of center although all of them could discuss the procedures of these measures. By the same token, Makar and Confrey (2005) found out that PSMTs use of language while describing variation and distribution emerged from the shape of the distribution rather than their understanding of variation while comparing two data sets. These researchers concluded that PSMTs reasoning about measures of distribution was weak. Similarly, some other research studies focusing on PEMTs’ statistical concepts in analyzing and comparing data sets showed that PEMTs were not able to take into account measures of spread (Canada, 2008; Leavy, 2006).
Reasoning about uncertainty is also an indispensable component in statistical reasoning. It refers to understanding and using the ideas of randomness, chance, and likelihood to know the ways of determining the probability of events (Garfield, 2003). Outcome of an event cannot be determined certainly even if possible outcomes are definite (Moore, 1990). At the same time, each outcome is uncertain. Thus the phenomenon under investigation is called as random (Moore, 1990) and its likelihood could be measured. However, one might have the tendency to decide by looking at just a single event rather than series of the events (Konold, Pollatsek, Well, Lohmeier, & Lipson, 1993). In this case outcome orientation approach develops. For instance, as can be seen in SRA, one who has outcome orientation sees 70% likelihood of rain in ten days as it should rain in each of the ten days (Garfield, 2003), although there is still a 30% chance of not to rain for each day. By the same token, one might also think that the likelihood of events is the same since it happens by chance (Lecoutre, 1992); concluding that they are equiprobable by nature. One who thinks this way has the equiprobability bias (Lecoutre, 1992). For example, when two dice are simultaneously thrown, the possibility of obtaining two fives and the possibility of obtaining one five and one six on two rolls can be seen as equally likely by someone who has this conception.
Statistical reasoning also involves reasoning about samples that requires being able to know the part-whole relationship between sample and population (Watson & Moritz, 2000). Sample is a subset of the population and by examining this subset; results of the sample can be generalized to population. To be able to generalize the results randomness, representativeness and bias are critical notions to be considered (Watson & Moritz, 2000). Knowing about characteristics of samples also allows individuals to interpret the relationship between variables, the association (Garfield, 2003). Whether there is a relationship between variables or to what degree the relationship exists are the concerning questions. Furthermore, in order to select a representative sample, members should be selected randomly (Gay et al., 2009). However just random selection does not guarantee the representativeness since sample size also effects the results (Tversky & Kahneman, 1971). Small samples even if randomly selected might not show all of the properties of the population since variability exists within the population (Watson & Moritz, 2000).On the other hand, some might think that good samples have to represent a high percentage of the population. That is they might think that if sample size is a large percentage of a population then it is a good sample (Garfield
Teachers’ Statistical Reasoning / Karatoprak, Karagöz Akar & Börkan
111
& Ben-Zvi, 2008; Garfield, 2003). One who has this misconception thinks that if population size increases then sample size should also increase. However for a reliable estimation absolute size of the sample is important rather than the sample size relative to the population (Smith, 2004). A well-chosen sample can provide sound estimations even if the sample is not a high percentage of the population (Garfield & Ben-Zvi, 2008). In other words, as stated earlier, randomly chosen sufficient number of participants as a sample can provide representativeness and unbiased results. However, there is a subtle but an important issue such that randomly drawn two samples are similar to each other since they are randomly chosen. However these two samples might be different from each other since random samples varies, especially the small ones (Garfield & Ben-Zvi, 2008). Thus, one who only takes into consideration the randomness ignoring the sample size might think that randomly drawn any sample should have the same characteristics of the population without considering sample size (Tversky & Kahneman, 1971). Therefore, they might conclude that small samples resemble the populations in making inferences (Garfield, 2003) since drawn randomly. This is called as the law of small numbers misconception (Kahneman & Tversky, 1974). Interestingly, Jendraszek (2010) investigated PEMTs and PSMTs (N=66) probability misconceptions and found out that both groups had equiprobability bias and the law of small numbers misconception.
By the same token, one might think that the likelihood of a sample being representative depends on how it resembles to the population (Kahneman & Tversky, 1974). One who thinks this way has representativeness misconception because s/he tends to use heuristics instead of probability principles. For instance, as a result of flipping a fair coin 6 times, obtaining HTHTHT can be seen as less likely than obtaining HTTTHT, by those holding the representativeness misconception. Some research done with PEMTs showed that only a few of them (10 out of 54) were able to point to the characteristics of sample which is representative part of the whole (Groth & Bergner, 2005). Similarly, Heaton and Mickelson (2002) examined PEMTs’ integration of statistical investigation to the elementary school curricula. They found that PEMTs ignored the representativeness of the data they used. Özen (2012) also found out that PEMTs used the sample size as the only aspect of statistics and they failed to relate it with the context.
Aforementioned research points to prospective teachers’ lack of knowledge in statistical concepts such as understanding the use of mean or variability etc. Doing further research with SRA might provide detailed information on both PEMTs’ and PSMTs’ statistical reasoning types holistically. That is, results might further shed light on the different sub-understandings and misconceptions simultaneously and in juxtaposition to each other. This in turn might assist teacher educators to determine specific pathways to help prospective teachers to reason statistically.
Method
Research Design
Research design of the study is a descriptive research in which statistical reasoning of prospective mathematics teachers, is described with quantitative data and presented existing differences between PEMTs and PSMTs (Gay et al., 2009). Groups are established according to the grouping variable which is the teaching level of prospective mathematics teachers.
Participants
Target population of the study is senior students studying in the elementary and secondary school mathematics teaching programs in Istanbul, Turkey. Convenience sampling was used
International Electronic Journal of Elementary Education Vol.7, Issue 2, 107-124,2015
112
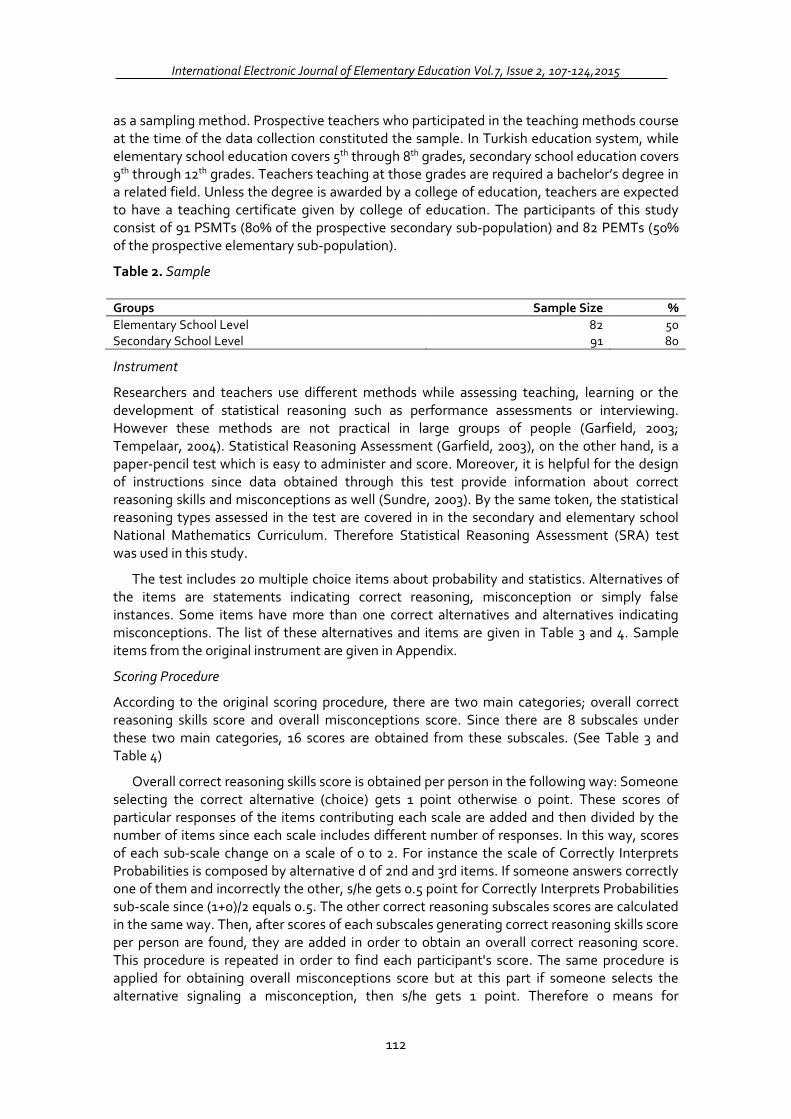
as a sampling method. Prospective teachers who participated in the teaching methods course at the time of the data collection constituted the sample. In Turkish education system, while elementary school education covers 5th through 8th grades, secondary school education covers 9th through 12th grades. Teachers teaching at those grades are required a bachelor’s degree in a related field. Unless the degree is awarded by a college of education, teachers are expected to have a teaching certificate given by college of education. The participants of this study consist of 91 PSMTs (80% of the prospective secondary sub-population) and 82 PEMTs (50% of the prospective elementary sub-population).
Table 2. Sample
Groups Sample Size %
Elementary School Level 82 50 Secondary School Level 91 80
Instrument
Researchers and teachers use different methods while assessing teaching, learning or the development of statistical reasoning such as performance assessments or interviewing. However these methods are not practical in large groups of people (Garfield, 2003; Tempelaar, 2004). Statistical Reasoning Assessment (Garfield, 2003), on the other hand, is a paper-pencil test which is easy to administer and score. Moreover, it is helpful for the design of instructions since data obtained through this test provide information about correct reasoning skills and misconceptions as well (Sundre, 2003). By the same token, the statistical reasoning types assessed in the test are covered in in the secondary and elementary school National Mathematics Curriculum. Therefore Statistical Reasoning Assessment (SRA) test was used in this study.
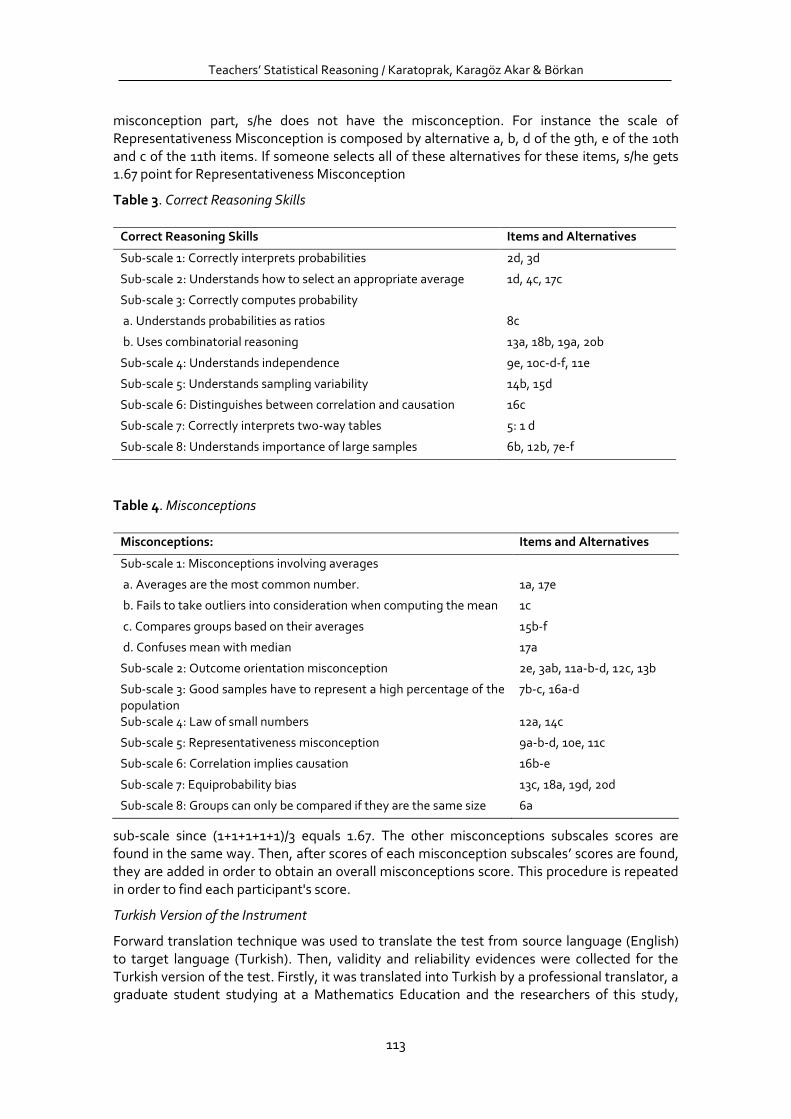
The test includes 20 multiple choice items about probability and statistics. Alternatives of the items are statements indicating correct reasoning, misconception or simply false instances. Some items have more than one correct alternatives and alternatives indicating misconceptions. The list of these alternatives and items are given in Table 3 and 4. Sample items from the original instrument are given in Appendix.
Scoring Procedure
According to the original scoring procedure, there are two main categories; overall correct reasoning skills score and overall misconceptions score. Since there are 8 subscales under these two main categories, 16 scores are obtained from these subscales. (See Table 3 and Table 4)
Overall correct reasoning skills score is obtained per person in the following way: Someone selecting the correct alternative (choice) gets 1 point otherwise 0 point. These scores of particular responses of the items contributing each scale are added and then divided by the number of items since each scale includes different number of responses. In this way, scores of each sub-scale change on a scale of 0 to 2. For instance the scale of Correctly Interprets Probabilities is composed by alternative d of 2nd and 3rd items. If someone answers correctly one of them and incorrectly the other, s/he gets 0.5 point for Correctly Interprets Probabilities sub-scale since (1+0)/2 equals 0.5. The other correct reasoning subscales scores are calculated in the same way. Then, after scores of each subscales generating correct reasoning skills score per person are found, they are added in order to obtain an overall correct reasoning score. This procedure is repeated in order to find each participant's score. The same procedure is applied for obtaining overall misconceptions score but at this part if someone selects the alternative signaling a misconception, then s/he gets 1 point. Therefore 0 means for
Teachers’ Statistical Reasoning / Karatoprak, Karagöz Akar & Börkan
113
misconception part, s/he does not have the misconception. For instance the scale of Representativeness Misconception is composed by alternative a, b, d of the 9th, e of the 10th and c of the 11th items. If someone selects all of these alternatives for these items, s/he gets 1.67 point for Representativeness Misconception
Table 3. Correct Reasoning Skills
Correct Reasoning Skills Items and Alternatives
Sub-scale 1: Correctly interprets probabilities 2d, 3d
Sub-scale 2: Understands how to select an appropriate average 1d, 4c, 17c
Sub-scale 3: Correctly computes probability
a. Understands probabilities as ratios 8c
b. Uses combinatorial reasoning 13a, 18b, 19a, 20b
Sub-scale 4: Understands independence 9e, 10c-d-f, 11e
Sub-scale 5: Understands sampling variability 14b, 15d
Sub-scale 6: Distinguishes between correlation and causation 16c
Sub-scale 7: Correctly interprets two-way tables 5: 1 d
Sub-scale 8: Understands importance of large samples 6b, 12b, 7e-f
Table 4. Misconceptions
Misconceptions: Items and Alternatives
Sub-scale 1: Misconceptions involving averages
a. Averages are the most common number. 1a, 17e
b. Fails to take outliers into consideration when computing the mean 1c
c. Compares groups based on their averages 15b-f
d. Confuses mean with median 17a
Sub-scale 2: Outcome orientation misconception 2e, 3ab, 11a-b-d, 12c, 13b
Sub-scale 3: Good samples have to represent a high percentage of the population
7b-c, 16a-d
Sub-scale 4: Law of small numbers 12a, 14c
Sub-scale 5: Representativeness misconception 9a-b-d, 10e, 11c
Sub-scale 6: Correlation implies causation 16b-e
Sub-scale 7: Equiprobability bias 13c, 18a, 19d, 20d
Sub-scale 8: Groups can only be compared if they are the same size 6a
sub-scale since (1+1+1+1+1)/3 equals 1.67. The other misconceptions subscales scores are found in the same way. Then, after scores of each misconception subscales’ scores are found, they are added in order to obtain an overall misconceptions score. This procedure is repeated in order to find each participant's score.
Turkish Version of the Instrument
Forward translation technique was used to translate the test from source language (English) to target language (Turkish). Then, validity and reliability evidences were collected for the Turkish version of the test. Firstly, it was translated into Turkish by a professional translator, a graduate student studying at a Mathematics Education and the researchers of this study,
International Electronic Journal of Elementary Education Vol.7, Issue 2, 107-124,2015
114
independently. After translation, the first and second author revised the translated instruments independently and after reaching on agreement, final version was constructed. Then, a Turkish teacher controlled the grammar of the test. Finally four experts’ opinions on equivalence of both versions were obtained and then the test was finalized.
Afterwards, in order to establish empirical evidence for linguistic equivalence, 61 university students who were competent at both languages, took firstly the original instrument and three weeks later they took the Turkish version. The number of participants should be at least 30 for this equivalence study because of the parametric analysis requirement (Gay et al., 2009). Also at least two weeks should be left between test administrations as a precaution (Aksayan & Gozum, 2002). If shorter than two weeks, participants might remember the items and higher scores might appear. Therefore, they retook the Turkish version of the instrument, three weeks later.
The equivalence of the forms was examined at the item level. Participants’ responses were coded as 1 for correct answers and 0 for incorrect answers. This coding procedure was done for each correct alternative for the questions with multiple correct answers. Also blank answers were coded as 0. Since variable of interest is dichotomous, data were matched-pair and data could be represented by 2x2 table, McNemar test was used in analysis of the items (Basturk, 2010). Significant difference was not appeared in the items, except 1st, 2nd, 4th, 10th-c, 11th, 13th and 17th. Back translated versions of these items and original versions were compared by a Ph.D. candidate in mathematics education who is competent in both languages. Since no difference was recognized, cross-tables of McNemar Test were examined. According to McNemar analysis of these items, significant difference stemmed from the difference between incorrect answers in administration of original version and correct answers in administration of translated version. It was seen that most of the participants answered incorrectly in the original instrument whereas they answered correctly in Turkish version. Furthermore 1st, 4th and 17th items assess selecting an appropriate average and 2nd, 10th-c, 11th, and 13th items assess outcome orientation misconception. Since these items are related to two subjects and their answers were incorrect in the original version while correct in Turkish version, it is accounted for the data that significant difference might have resulted from participants’ learning of these subjects rather than the language.
Also, correlation coefficients were examined between overall scores obtained from Turkish and English version of the test. First, normal distribution assumption was checked by Kolmogorov-Smirnov Test for both overall correct reasoning skills score and overall misconceptions scores of Turkish and English version (Buyukozturk, 2010). For both overall scores in each group, normal distribution assumption were hold (p>.05) and statistically significant correlation coefficients were obtained; for overall correct reasoning skills score, r= 0.639, p < .01 and for overall misconceptions score, r= 0.337, p < .01.
Since test-retest reliability coefficient was calculated in the original study in which the test was developed, it was calculated in this study, too. The same 61 university students took Turkish version of the SRA three weeks later. Kolmogorov-Smirnov Test for both overall scores in each administration shows that the distributions are normally distributed. Statistically significant and high Pearson correlation coefficient between results of two administrations for correct reasoning skills score [r= 0.756, p < .01] and misconceptions score, [r= 0.627, p < .01] were found. In the original study, reliability for the correct reasoning skills scale and for the misconceptions scale were found .70 and .75, respectively. So reliability results are parallel with the original study.
Teachers’ Statistical Reasoning / Karatoprak, Karagöz Akar & Börkan
115
Procedures and Data Analysis
Data were collected during the teaching methods course of the secondary and elementary school mathematics education programs in each university. Participation to the study was voluntary.
For data analysis two sets of eight sub-scale scores and two overall scores were obtained (See Instrument section for how to calculate scale scores). Normal distribution assumption was checked by Kolmogorov-Smirnov Test for each sub-scale and results showed that normality assumption was failed for each of them (p<.05). Therefore comparison between groups was analysed by Mann Whitney U Test for all of the subscales except distinguishes between correlation and causation and groups can only be compared if they are the same size subscales. These subscales were compared by Chi-Square Test since there is only one item contributing to these subscales. At the same time, scores of both PSMTs and PEMTs were analysed descriptively for each subscale.
Results
In this section, particular subscales (types) of correct reasoning skills and misconceptions were examined for both groups. Then, statistical reasoning scores were compared across two groups.
In terms of how to select an appropriate average, both groups’ mean scores were 0.454 and 0.447 and the percentages were 30.8% and 34.1% for the 1st and 46.2% and 36.6% for the 4th item in the SRA. This showed that a small portion of prospective teachers could select mean as the meaningful average. This result was also consistent with the misconceptions involving averages subscale regarding the first item such that 61.6% of PSMTs and 56.1% of PEMTs had difficulties in determining the appropriate measure of center. For instance almost half of these prospective teachers who have misconceptions chose mode in place of mean and the other half of them overlooked the outlier in the data. However, results showed that both groups of prospective teachers (around 6% for both) were successful in not confusing mean and median while choosing the appropriate average for the given data set.
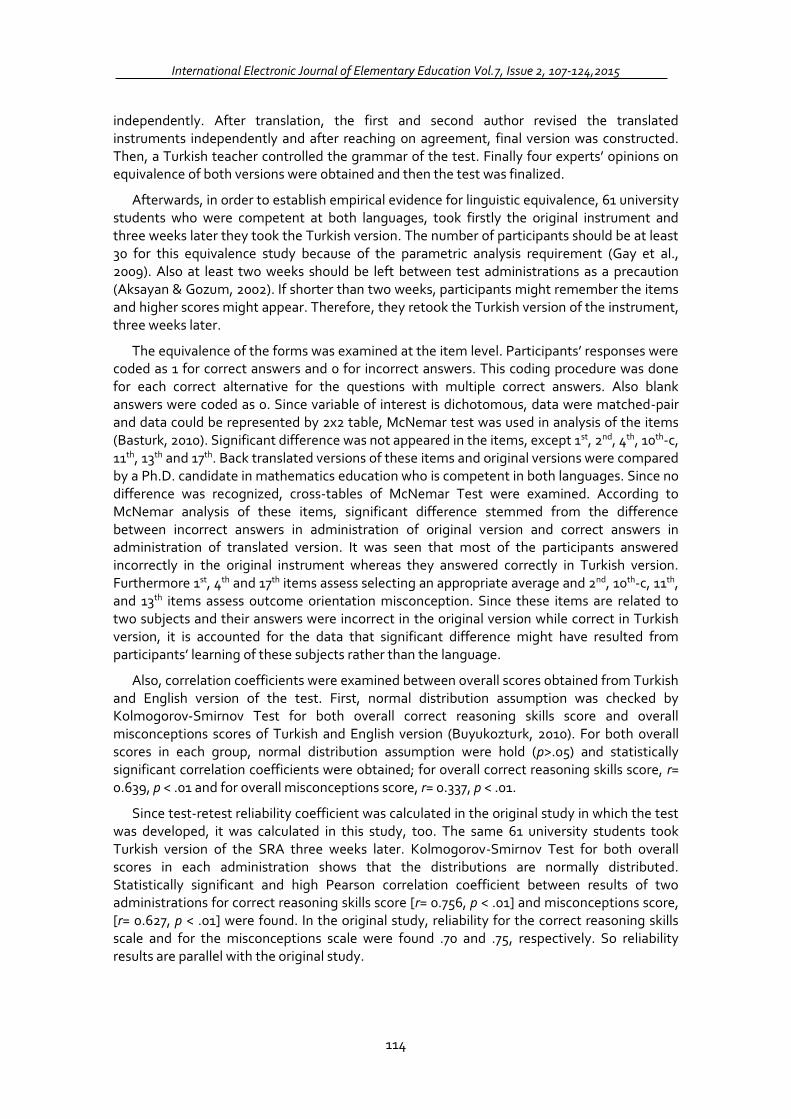
As the data indicate in Table 5, there was no statistically significant difference (U= 3676.5; p > .05, r=-.01) between PEMTs and PSMTs’ scores regarding how to select an appropriate average.
Table 5. Mann Whitney U Test for How to select an appropriate average
Groups N Mean Rank Sum of Ranks U Z p
Elementary Level 82 86.34 7079.50 3676.5 -.174 .862 Secondary Level 91 87.60 7971.50
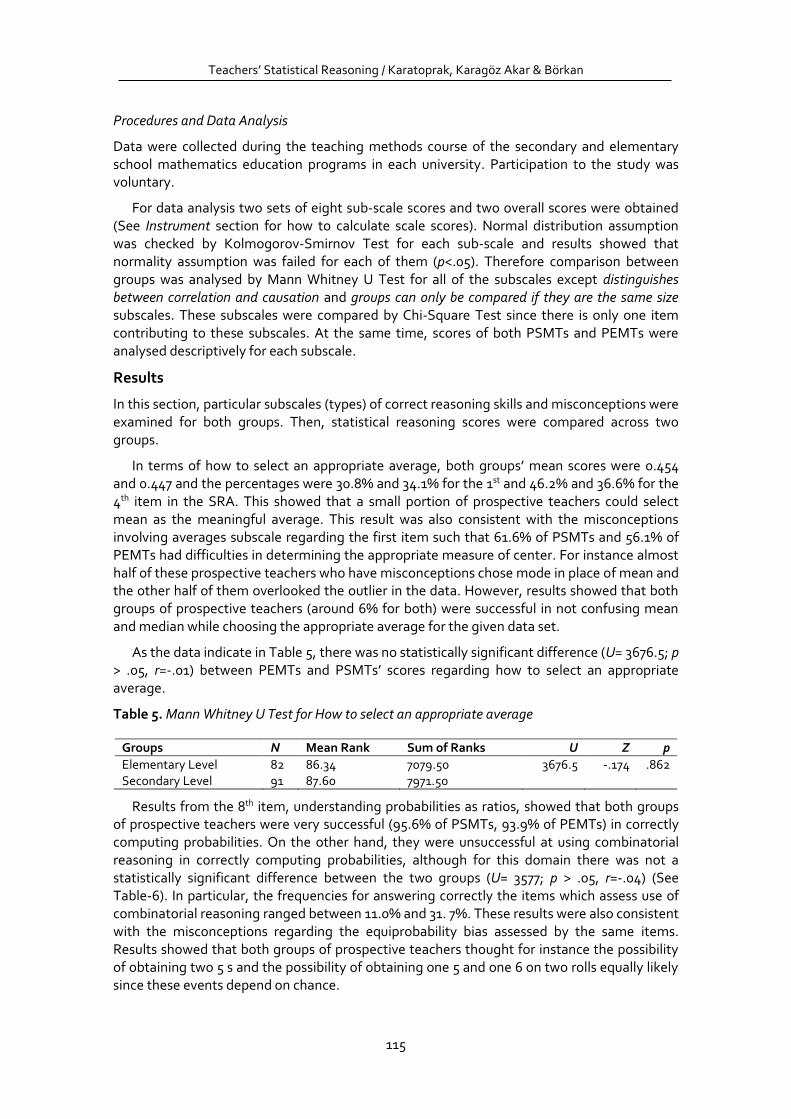
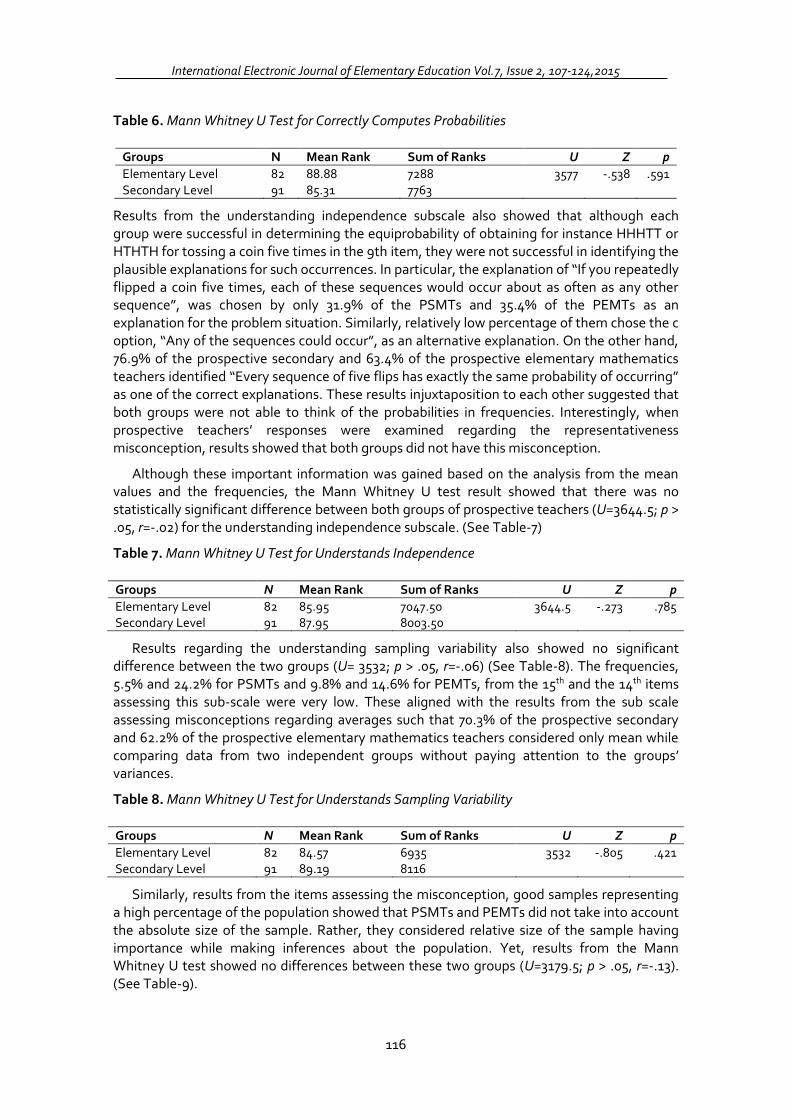
Results from the 8th item, understanding probabilities as ratios, showed that both groups of prospective teachers were very successful (95.6% of PSMTs, 93.9% of PEMTs) in correctly computing probabilities. On the other hand, they were unsuccessful at using combinatorial reasoning in correctly computing probabilities, although for this domain there was not a statistically significant difference between the two groups (U= 3577; p > .05, r=-.04) (See Table-6). In particular, the frequencies for answering correctly the items which assess use of combinatorial reasoning ranged between 11.0% and 31. 7%. These results were also consistent with the misconceptions regarding the equiprobability bias assessed by the same items. Results showed that both groups of prospective teachers thought for instance the possibility of obtaining two 5 s and the possibility of obtaining one 5 and one 6 on two rolls equally likely since these events depend on chance.
International Electronic Journal of Elementary Education Vol.7, Issue 2, 107-124,2015
116
Table 6. Mann Whitney U Test for Correctly Computes Probabilities
Groups N Mean Rank Sum of Ranks U Z p
Elementary Level 82 88.88 7288 3577 -.538 .591 Secondary Level 91 85.31 7763
Results from the understanding independence subscale also showed that although each group were successful in determining the equiprobability of obtaining for instance HHHTT or HTHTH for tossing a coin five times in the 9th item, they were not successful in identifying the plausible explanations for such occurrences. In particular, the explanation of “If you repeatedly flipped a coin five times, each of these sequences would occur about as often as any other sequence”, was chosen by only 31.9% of the PSMTs and 35.4% of the PEMTs as an explanation for the problem situation. Similarly, relatively low percentage of them chose the c option, “Any of the sequences could occur”, as an alternative explanation. On the other hand, 76.9% of the prospective secondary and 63.4% of the prospective elementary mathematics teachers identified “Every sequence of five flips has exactly the same probability of occurring” as one of the correct explanations. These results injuxtaposition to each other suggested that both groups were not able to think of the probabilities in frequencies. Interestingly, when prospective teachers’ responses were examined regarding the representativeness misconception, results showed that both groups did not have this misconception.
Although these important information was gained based on the analysis from the mean values and the frequencies, the Mann Whitney U test result showed that there was no statistically significant difference between both groups of prospective teachers (U=3644.5; p > .05, r=-.02) for the understanding independence subscale. (See Table-7)
Table 7. Mann Whitney U Test for Understands Independence
Groups N Mean Rank Sum of Ranks U Z p
Elementary Level 82 85.95 7047.50 3644.5 -.273 .785 Secondary Level 91 87.95 8003.50
Results regarding the understanding sampling variability also showed no significant difference between the two groups (U= 3532; p > .05, r=-.06) (See Table-8). The frequencies, 5.5% and 24.2% for PSMTs and 9.8% and 14.6% for PEMTs, from the 15th and the 14th items assessing this sub-scale were very low. These aligned with the results from the sub scale assessing misconceptions regarding averages such that 70.3% of the prospective secondary and 62.2% of the prospective elementary mathematics teachers considered only mean while comparing data from two independent groups without paying attention to the groups’ variances.
Table 8. Mann Whitney U Test for Understands Sampling Variability
Groups N Mean Rank Sum of Ranks U Z p
Elementary Level 82 84.57 6935 3532 -.805 .421 Secondary Level 91 89.19 8116
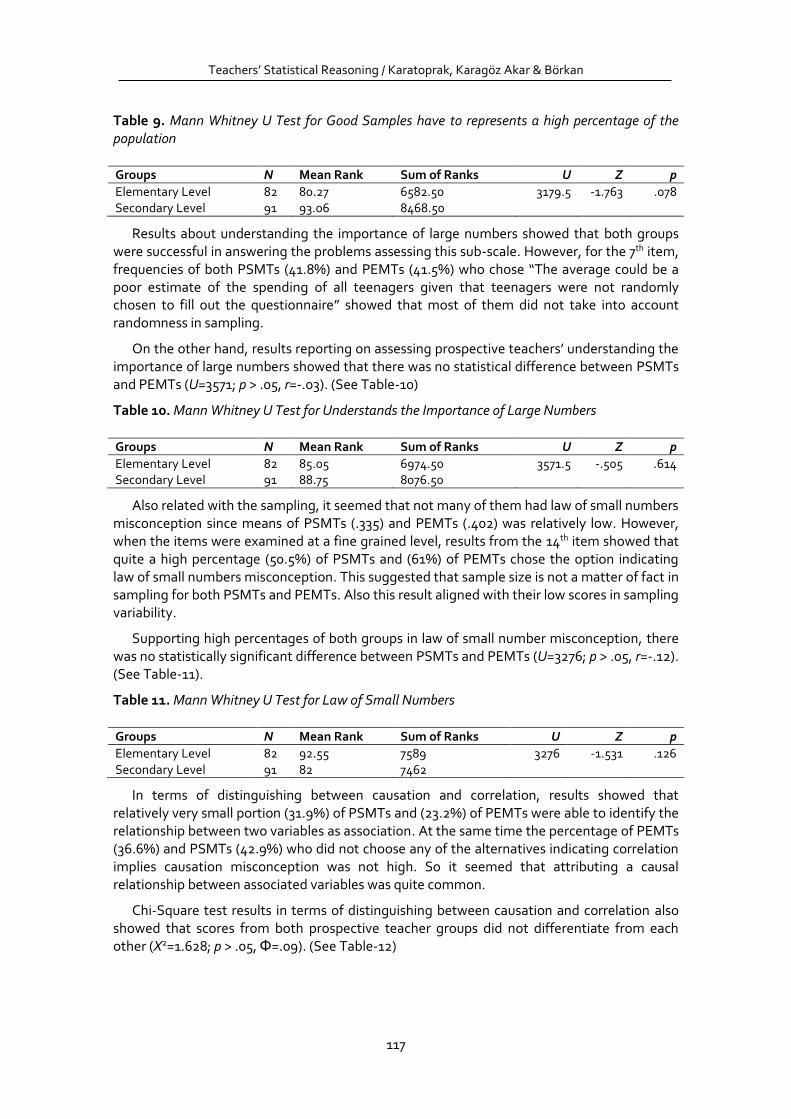
Similarly, results from the items assessing the misconception, good samples representing a high percentage of the population showed that PSMTs and PEMTs did not take into account the absolute size of the sample. Rather, they considered relative size of the sample having importance while making inferences about the population. Yet, results from the Mann Whitney U test showed no differences between these two groups (U=3179.5; p > .05, r=-.13). (See Table-9).
Teachers’ Statistical Reasoning / Karatoprak, Karagöz Akar & Börkan
117
Table 9. Mann Whitney U Test for Good Samples have to represents a high percentage of the population
Groups N Mean Rank Sum of Ranks U Z p
Elementary Level 82 80.27 6582.50 3179.5 -1.763 .078 Secondary Level 91 93.06 8468.50
Results about understanding the importance of large numbers showed that both groups were successful in answering the problems assessing this sub-scale. However, for the 7th item, frequencies of both PSMTs (41.8%) and PEMTs (41.5%) who chose “The average could be a poor estimate of the spending of all teenagers given that teenagers were not randomly chosen to fill out the questionnaire” showed that most of them did not take into account randomness in sampling.
On the other hand, results reporting on assessing prospective teachers’ understanding the importance of large numbers showed that there was no statistical difference between PSMTs and PEMTs (U=3571; p > .05, r=-.03). (See Table-10)
Table 10. Mann Whitney U Test for Understands the Importance of Large Numbers
Groups N Mean Rank Sum of Ranks U Z p
Elementary Level 82 85.05 6974.50 3571.5 -.505 .614 Secondary Level 91 88.75 8076.50
Also related with the sampling, it seemed that not many of them had law of small numbers misconception since means of PSMTs (.335) and PEMTs (.402) was relatively low. However, when the items were examined at a fine grained level, results from the 14th item showed that quite a high percentage (50.5%) of PSMTs and (61%) of PEMTs chose the option indicating law of small numbers misconception. This suggested that sample size is not a matter of fact in sampling for both PSMTs and PEMTs. Also this result aligned with their low scores in sampling variability.
Supporting high percentages of both groups in law of small number misconception, there was no statistically significant difference between PSMTs and PEMTs (U=3276; p > .05, r=-.12). (See Table-11).
Table 11. Mann Whitney U Test for Law of Small Numbers
Groups N Mean Rank Sum of Ranks U Z p
Elementary Level 82 92.55 7589 3276 -1.531 .126 Secondary Level 91 82 7462
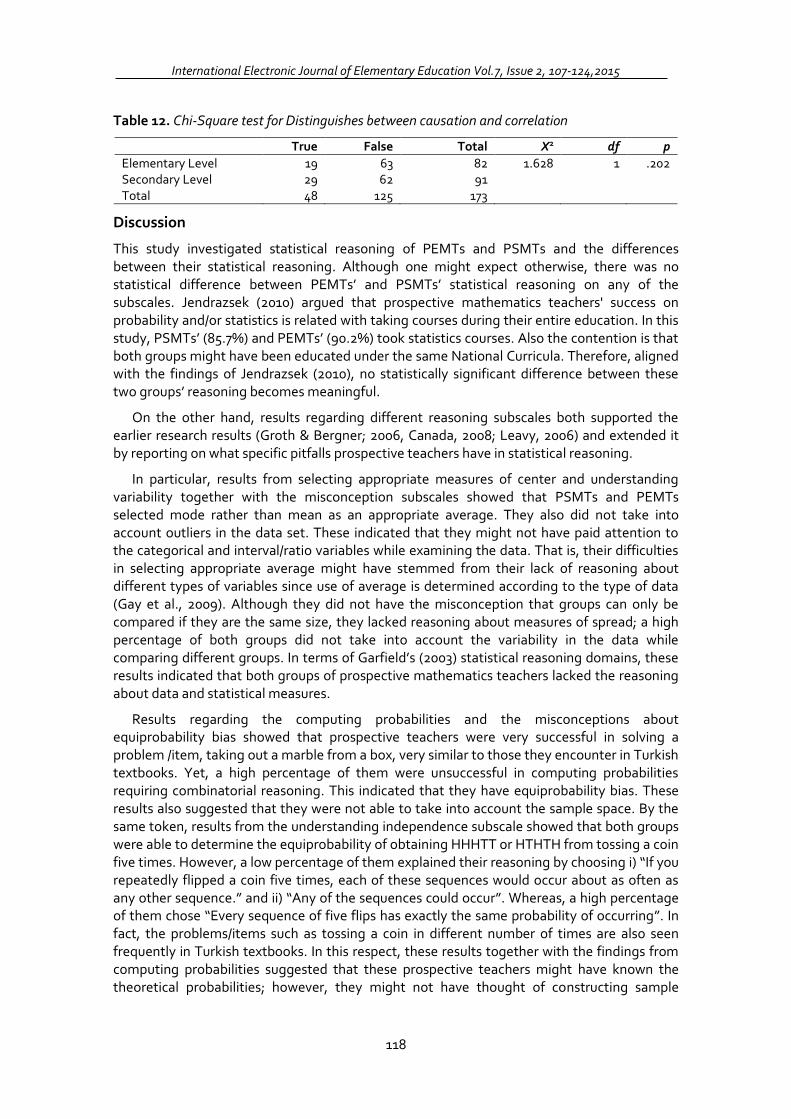
In terms of distinguishing between causation and correlation, results showed that relatively very small portion (31.9%) of PSMTs and (23.2%) of PEMTs were able to identify the relationship between two variables as association. At the same time the percentage of PEMTs (36.6%) and PSMTs (42.9%) who did not choose any of the alternatives indicating correlation implies causation misconception was not high. So it seemed that attributing a causal relationship between associated variables was quite common.
Chi-Square test results in terms of distinguishing between causation and correlation also showed that scores from both prospective teacher groups did not differentiate from each other (X2=1.628; p > .05, Φ=.09). (See Table-12)
International Electronic Journal of Elementary Education Vol.7, Issue 2, 107-124,2015
118
Table 12. Chi-Square test for Distinguishes between causation and correlation
True False Total X2 df p
Elementary Level 19 63 82 1.628 1 .202 Secondary Level 29 62 91 Total 48 125 173
Discussion
This study investigated statistical reasoning of PEMTs and PSMTs and the differences between their statistical reasoning. Although one might expect otherwise, there was no statistical difference between PEMTs’ and PSMTs’ statistical reasoning on any of the subscales. Jendrazsek (2010) argued that prospective mathematics teachers' success on probability and/or statistics is related with taking courses during their entire education. In this study, PSMTs’ (85.7%) and PEMTs’ (90.2%) took statistics courses. Also the contention is that both groups might have been educated under the same National Curricula. Therefore, aligned with the findings of Jendrazsek (2010), no statistically significant difference between these two groups’ reasoning becomes meaningful.
On the other hand, results regarding different reasoning subscales both supported the earlier research results (Groth & Bergner; 2006, Canada, 2008; Leavy, 2006) and extended it by reporting on what specific pitfalls prospective teachers have in statistical reasoning.
In particular, results from selecting appropriate measures of center and understanding variability together with the misconception subscales showed that PSMTs and PEMTs selected mode rather than mean as an appropriate average. They also did not take into account outliers in the data set. These indicated that they might not have paid attention to the categorical and interval/ratio variables while examining the data. That is, their difficulties in selecting appropriate average might have stemmed from their lack of reasoning about different types of variables since use of average is determined according to the type of data (Gay et al., 2009). Although they did not have the misconception that groups can only be compared if they are the same size, they lacked reasoning about measures of spread; a high percentage of both groups did not take into account the variability in the data while comparing different groups. In terms of Garfield’s (2003) statistical reasoning domains, these results indicated that both groups of prospective mathematics teachers lacked the reasoning about data and statistical measures.
Results regarding the computing probabilities and the misconceptions about equiprobability bias showed that prospective teachers were very successful in solving a problem /item, taking out a marble from a box, very similar to those they encounter in Turkish textbooks. Yet, a high percentage of them were unsuccessful in computing probabilities requiring combinatorial reasoning. This indicated that they have equiprobability bias. These results also suggested that they were not able to take into account the sample space. By the same token, results from the understanding independence subscale showed that both groups were able to determine the equiprobability of obtaining HHHTT or HTHTH from tossing a coin five times. However, a low percentage of them explained their reasoning by choosing i) “If you repeatedly flipped a coin five times, each of these sequences would occur about as often as any other sequence.” and ii) “Any of the sequences could occur”. Whereas, a high percentage of them chose “Every sequence of five flips has exactly the same probability of occurring”. In fact, the problems/items such as tossing a coin in different number of times are also seen frequently in Turkish textbooks. In this respect, these results together with the findings from computing probabilities suggested that these prospective teachers might have known the theoretical probabilities; however, they might not have thought of constructing sample
Teachers’ Statistical Reasoning / Karatoprak, Karagöz Akar & Börkan
119
spaces experimentally, indicating a limitation on their part in terms of using the frequency approach . Similarly, over 90 % of prospective teachers’ solving these problems theoretically indicated that they did not have representativeness misconception. However, not choosing i and ii as explanatory statements for equiprobability of the given sequences might indeed be taken as evincing that the representativeness misconception could be concealed by prospective teachers’ success in computing the probabilities in these items theoretically. In this regard, we propose to modify and/or change items assessing representativeness misconception in SRA.
Prospective teachers’ lack of reasoning with sample space also corresponded with the results from assessing good samples represents a high percentage of the population and law of small numbers misconceptions. Neither group of prospective teachers did take into account the absolute size of the sample nor did they pay attention to the sample size. Quite a high number of them ignored the effect of small samples on results; that is, results vary more in small samples (Well, Pollatsek & Boyce, 1990). So they could not take into account variation in sampling. Similarly, both groups were successful in answering the problems assessing the understanding importance of large samples subscale. However, a low percentage of both groups of prospective teachers choosing “The average could be a poor estimate of the spending of all teenagers given that teenagers were not randomly chosen to fill out the questionnaire” suggested that prospective teachers did not take into account the importance of random choice in making inferences from samples to populations. In terms of Garfield’s (2003) statistical reasoning domains, all these results injuxtaposition to each other suggested that, these prospective teachers lacked reasoning with sampling since randomness, representativeness and bias are critical notions to be considered to generalize results from samples to population (Watson & Moritz, 2000).
As literature suggests, teachers' knowledge affect students' knowledge (Heaton & Mickelson, 2002; Yolcu, 2012).Therefore, if prospective teachers have difficulties in understanding these concepts such as reasoning about data, statistical measures, sampling and combinatorial reasoning or misconceptions such as equiprobability bias and representativeness misconception students will have lack of understanding in these concepts or these misconceptions. In order to develop correct reasoning, mathematics education programs were recommended to include teaching probability and statistics courses (Bulut, 2001). However in our study 90.2% of the PEMTs took a course to teach probability and statistics. 85.7% of the PSMTs took statistics courses. So, contents of statistics courses in teacher education programs might be improved taking the results of this study into consideration. Moreover previous research showed that the more courses prospective teachers take, the higher their performance is in probability (Jendraszek, 2010). Therefore, the number of courses to teach statistics might be increased in mathematics education programs so that their correct reasoning skills might develop.
Additionally, participants of this study are PEMTs and PSMTs studying in Istanbul. Also participants were not selected randomly because of practical reasons. So the results of this study are contextual and cannot be generalized to all prospective mathematics teachers. Therefore more studies with different participants especially from other regions of Turkey need to be conducted in order to have an idea about statistical reasoning of Turkish prospective teachers.
Lastly, instrument was obtained from SRA which was not developed originally for Turkish context. There are correctly answered items by most of the participants in both groups. For instance, the 8th item which involved the context of drawing out marbles from two boxes might be replaced with new ones. Likewise, results showed that most of the participants
International Electronic Journal of Elementary Education Vol.7, Issue 2, 107-124,2015
120
answered the 2nd item correctly. This item could be excluded from the test or the context of the item could be changed in order to lessen the familiarity with the problem situation. Regarding the context of Turkish education system, especially for university entrance exam, students frequently solve similar and/or much more difficult items during preparation. Therefore, prospective teachers’ familiarity might result in high scores and less information about their reasoning in these items. At the same time, there are items that definitely should be kept in SRA. For instance, items like the 13th, 18th,19th or 20th could be used to determine prospective teachers’ use of combinatorial reasoning in computing probabilities. Taken all these into account, a new instrument might be developed or SRA might be modified.
• • •
Rabia KARATOPRAK graduated from Secondary School Integrated BS & MS Program in Teaching Mathematics program of Boğaziçi University in 2011. She earned M.S. degree from the Department of Secondary School Science and Mathematics Education at Boğaziçi University in 2014. Currently she is a Ph.D. student in the University of Iowa Educational Measurement and Statistics Program. Her research interests include instrument development and statistics education. Gulseren KARAGOZ AKAR earned her B.S degree from the Department of Secondary Science and Mathematics Education at The Middle East Technical University in 1996. She pursued on her master and doctorate studies in mathematics education field at The Pennsylvania State University and got her Ph.D. in 2007. Currently, she is a faculty member at the Department of Secondary School Science and Mathematics Education at Boğaziçi University. Her current interests include students’ learning of mathematics through their own activity, conceptual understanding in mathematics, and prospective teachers’ conceptualization processes of effective mathematics teaching. Bengu BORKAN received her BS (1999) from Middle East Technical University in Chemistry Education, and her MS (2001) and her PhD degree (2006) from the Ohio State University in Quantitative Research, Evaluation and Measurement in education. She also holds a minor degree in Cognitive Psychology. From March 2007 to December 2007, she worked as an instructor in Dokuz Eylül University in İzmir/Turkey before joining Bogazici University in January 2008. Her current research interests include cognitive psychology in survey research, web-based survey, attitude measurement, measurement in education and program evaluation.
References
Aksayan S., & Gözüm. S. (2002). Kültürlerarası Ölçek Uyarlaması için Rehber I: Ölçek Uyarlama Aşamaları ve Dil Uyarlaması. Hemşirelik Araştırma Dergisi; 4(1):9-14
Baştürk, R. (2010). Bütün Yönleriyle SPSS Örnekli Nonparametrik Istatiksel Yöntemler. Ankara: Anı Yayıncılık.
Bulut, S. (2001). Matematik Ögretmen Adaylarının Olasılık Performanslarının İncelenmesi. Hacettepe Universitesi Egitim Fakültesi Dergisi, 20, 33-39.
Buyukozturk, S. (2006). Sosyal Bilimler İçin Veri Analizi El Kitabı. Pegem Yayınları, Ankara. Canada, D. L. (2008). Conceptions of Distribution Held by Middle School Students and
Preservice Teachers. In C. Batanero, G. Burrill, C. Reading, and A. Rossman (Eds.),
Teachers’ Statistical Reasoning / Karatoprak, Karagöz Akar & Börkan
121
Proceedings of the ICMI Study 18 and 2008 IASE Round Table of Conference. Retrieved from http://iase-web.org/documents/papers/rt2008/T2P9_Canada.pdf.
Chance, B. (2002). Components of Statistical Thinking and Implications for Instruction and Assessment. Journal of Statistics Education, 10(3).
Delmas, R. C. (2002). Statistical Literacy, Reasoning, and Learning: A Commentary. Journal of Statistics Education, 10(3).
Fennema, E., & Franke, M. L. (1992). Teachers' Knowledge and Its Impact. In D. A. Grouws (Ed.), Handbook of research on mathematics teaching and learning: A project of the national council of teachers of mathematics (p. 147-165). Macmillan Publishing Co, Inc.
Fritz, C. O., Morris, P. E., & Richler, J. J. (2012). Effect Size Estimates: Current Use, Calculations, and Interpretation. Journal of Experimental Psychology: General,141(1), 2.
Gal, I. (2002). Adults' Statistical Literacy: Meanings, Components, Responsibilities. International Statistical Review, 70(1), 1-25.
Garfield, J. (2002). The Challenge of Developing Statistical Reasoning. Journal of Statistics Education, 10(3), 1-11.
Garfield, J. B. (2003). Assessing Statistical Reasoning. Statistics Education Research Journal, 2(1), 22-38.
Garfield, J., & Ben‐Zvi, D. (2007). How Students Learn Statistics Revisited: A Current Review of Research On Teaching And Learning Statistics. International Statistical Review, 75(3), 372-396.
Garfield, J. B., & Ben-Zvi, D. (2008). Developing Students’ Statistical Reasoning. Connecting Research and Teaching Practice. The Netherlands: Springer.
Garfield, J., & Gal, I. (1999). Teaching and Assessing Statistical Reasoning. NCTM 1999 Yearbook: Mathematical Reasoning, pp. 1-17. Retrieved from Https://Apps3.Cehd.Umn.Edu/Artist/Articles/Garfield01.Pdf.
Gay, L. R., Mills, G. E., & Airasian, P. (2009). Educational research: Competencies for Analysis and Applications. Upper Saddle River, NJ, USA: Pearson Education.
Groth, R. E., & Bergner, J. A. (2005). Preservice Elementary School Teachers' Metaphors for The Concept of Statistical Sample. Statistics Education Research Journal, 4(2), 27-42.
Groth, R. E., & Bergner, J. A. (2006). Preservice Elementary Teachers' Conceptual and Procedural Knowledge of Mean, Median, and Mode. Mathematical Thinking and Learning, 8(1), 37-63.
Heaton, R. M., & Mickelson, W. T. (2002). The Learning and Teaching of Statistical Investigation In Teaching And Teacher Education. Journal of Mathematics Teacher Education, 5 (1), 35-59.
Jendraszek, P. (2010). An Analysis of A Misconception of Probability Among Future Mathematics Teachers. Journal of Mathematics Education at Teachers College, 1 (1).
Kahneman, D., & Tversky, A. (1974). Subjective probability: A judgment of Representativeness. In The Concept of Probability in Psychological Experiments (pp. 25-48). Springer Netherlands.
Konold, C., Pollatsek, A., Well, A., Lohmeier, J., & Lipson, A. (1993). Inconsistencies in Students' Reasoning about Probability. Journal for Research in Mathematics Education, 24, 392-392.
Leavy, A. M., (2006). Using Data Comparison to Support a Focus on Distribution: Examining Preservice Teacher's Understandings of Distribution When Engaged in Statistical Inquiry. Statistics Education Research Journal, 5, (2), 89-114.
Lecoutre, M. P. (1992). Cognitive Models and Problem Spaces in “Purely Random” Situations. Educational Studies in Mathematics, 23(6), 557-568.
Makar, K., & Confrey, J. (2005). Variation-talk: Articulating Meaning in Statistics. Statistics Education Research Journal, 4(1), 27-54.
International Electronic Journal of Elementary Education Vol.7, Issue 2, 107-124,2015
122
Mickelson, W. T., & Heaton, R. M. (2004). Primary Teachers’ Statistical Reasoning about Data. In The Challenge Of Developing Statistical Literacy, Reasoning and Thinking (pp. 327-352). Springer Netherlands.
Milli Eğitim Bakanlığı, (2013a). İlköğretim Matematik Dersi 6-8. Sınıflar Öğretim Programı ve Kılavuzu. Ankara.
Milli Eğitim Bakanlığı, (2013b). Ortaöğretim Matematik Dersi 9-12. Sınıflar Öğretim Programı ve Kılavuzu. Ankara.
Moore, D. S. (1990). Uncertainty. In Steen, L. A. (Ed.). On The Shoulders of Giants: New Approaches to Numeracy (pp. 96-137). National Academies Press.
NCTM. (2005). Principles and Standards for School Mathematics. Reston, VA, USA: National Council of Teachers of Mathematics.
Özen, M. (2012), Investigation of Pre-service Mathematics Teachers’ Critical Thinking Processes Through Statistical and Probabilistic Knowledge in the Context of Popular Media Texts. Middle East Technical University. Unpublished M. S. Thesis.
Rumsey, D. J. (2002). Statistical Literacy as A Goal For İntroductory Statistics Courses. Journal of Statistics Education, 10(3), 6-13.
Shaughnessy, J. M. (2007). Research on Statistics Learning. In F. K. Lester (Ed.), Second Handbook of Research on Mathematics Teaching and Learning (p. 957-1009). IAP.
Smith, M. H. (2004). A Sample/Population Size Activity: Is it the Sample Size of the Sample as a Fraction of the Population That Matters? Journal of Statistics Education, 12(2).
Sundre, D. L. (2003). Assessment of Quantitative Reasoning to Enhance Educational Quality. In American Educational Research Association Meeting. Chicago.
Tempelaar, D. (2004). Statistical Reasoning Assessment: An analysis of the SRA Instrument. In The ARTIST Roundtable Conference on Assessment in Statistics. Appleton, Wisconsin, Citeseer.
Tversky, A., & Kahneman, D. (1971). Belief in the Law of Small Numbers. Psychological Bulletin, 76(2), 105.
Ulutaş, F., & Ubuz, B. (2008). Research and Trends in Mathematics Education: 2000 to 2006. İlköğretim Online Dergisi, 7.
Watson, J., & Callingham, R. (2003). Statistical Literacy: A Complex Hierarchical Construct. Statistics Education Research Journal, 2(2), 3-46.
Well, A. D., Pollatsek, A., & Boyce, S. J. (1990). Understanding the Effects of Sample Size on the Variability of the Mean. Organizational Behaviour and Human Decision Processes, 47(2), 289-312.
Yolcu, A. (2012). An Investigation of Eighth Grade Students’ Statistical Literacy, Attitudes Towards Statistics and Their Relationship. M. S. Thesis. Middle East Technical University. Unpublished M. S. Thesis.
Teachers’ Statistical Reasoning / Karatoprak, Karagöz Akar & Börkan
123
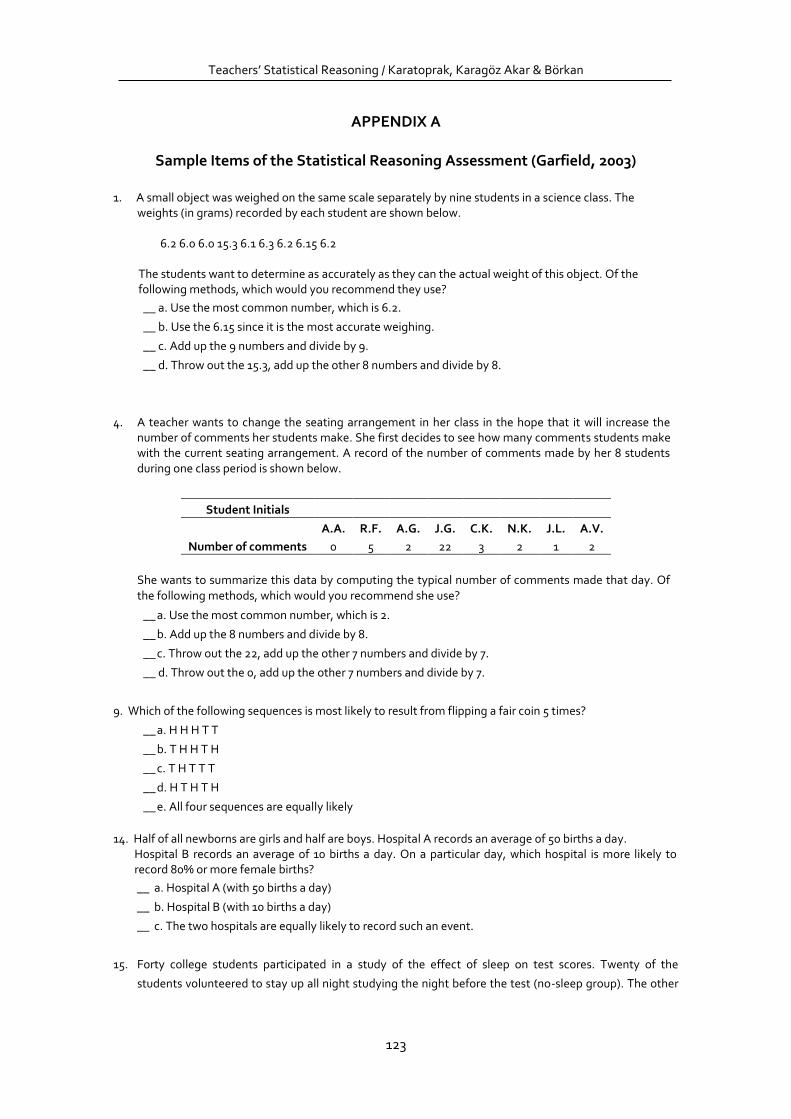
APPENDIX A
Sample Items of the Statistical Reasoning Assessment (Garfield, 2003) 1. A small object was weighed on the same scale separately by nine students in a science class. The
weights (in grams) recorded by each student are shown below. 6.2 6.0 6.0 15.3 6.1 6.3 6.2 6.15 6.2 The students want to determine as accurately as they can the actual weight of this object. Of the following methods, which would you recommend they use?
__ a. Use the most common number, which is 6.2.
__ b. Use the 6.15 since it is the most accurate weighing.
__ c. Add up the 9 numbers and divide by 9.
__ d. Throw out the 15.3, add up the other 8 numbers and divide by 8.
4. A teacher wants to change the seating arrangement in her class in the hope that it will increase the number of comments her students make. She first decides to see how many comments students make with the current seating arrangement. A record of the number of comments made by her 8 students during one class period is shown below.
Student Initials
Number of comments
A.A. R.F. A.G. J.G. C.K. N.K. J.L. A.V.
0 5 2 22 3 2 1 2
She wants to summarize this data by computing the typical number of comments made that day. Of the following methods, which would you recommend she use?
__ a. Use the most common number, which is 2.
__ b. Add up the 8 numbers and divide by 8.
__ c. Throw out the 22, add up the other 7 numbers and divide by 7.
__ d. Throw out the 0, add up the other 7 numbers and divide by 7.
9. Which of the following sequences is most likely to result from flipping a fair coin 5 times?
__ a. H H H T T
__ b. T H H T H
__ c. T H T T T
__ d. H T H T H
__ e. All four sequences are equally likely
14. Half of all newborns are girls and half are boys. Hospital A records an average of 50 births a day. Hospital B records an average of 10 births a day. On a particular day, which hospital is more likely to record 80% or more female births?
__ a. Hospital A (with 50 births a day)
__ b. Hospital B (with 10 births a day)
__ c. The two hospitals are equally likely to record such an event.
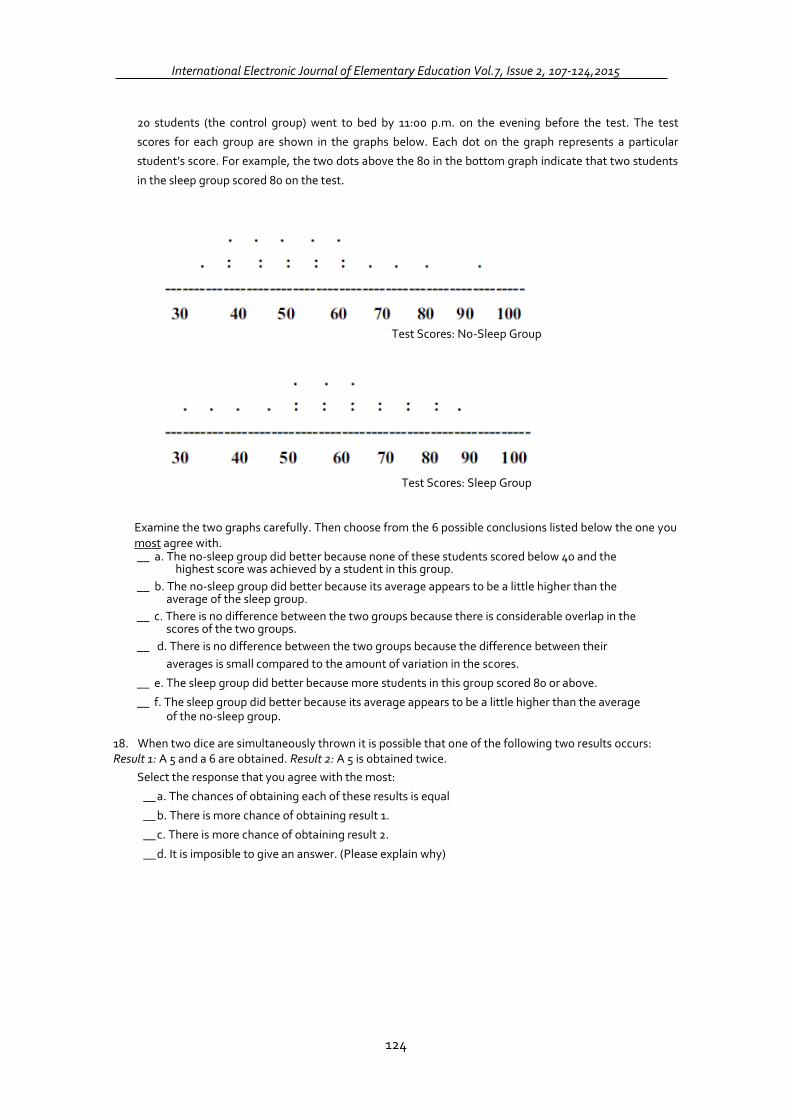
15. Forty college students participated in a study of the effect of sleep on test scores. Twenty of the
students volunteered to stay up all night studying the night before the test (no-sleep group). The other
International Electronic Journal of Elementary Education Vol.7, Issue 2, 107-124,2015
124
20 students (the control group) went to bed by 11:00 p.m. on the evening before the test. The test
scores for each group are shown in the graphs below. Each dot on the graph represents a particular
student’s score. For example, the two dots above the 80 in the bottom graph indicate that two students
in the sleep group scored 80 on the test.
Test Scores: No-Sleep Group
Test Scores: Sleep Group
Examine the two graphs carefully. Then choose from the 6 possible conclusions listed below the one you most agree with. __ a. The no-sleep group did better because none of these students scored below 40 and the
highest score was achieved by a student in this group.
__ b. The no-sleep group did better because its average appears to be a little higher than the average of the sleep group.
__ c. There is no difference between the two groups because there is considerable overlap in the scores of the two groups.
__ d. There is no difference between the two groups because the difference between their
averages is small compared to the amount of variation in the scores.
__ e. The sleep group did better because more students in this group scored 80 or above.
__ f. The sleep group did better because its average appears to be a little higher than the average of the no-sleep group.
18. When two dice are simultaneously thrown it is possible that one of the following two results occurs: Result 1: A 5 and a 6 are obtained. Result 2: A 5 is obtained twice.
Select the response that you agree with the most:
__ a. The chances of obtaining each of these results is equal
__ b. There is more chance of obtaining result 1.
__ c. There is more chance of obtaining result 2.
__ d. It is imposible to give an answer. (Please explain why)