Embed Size (px)
Citation preview
ANNUAL REPORTMAY 31, 2017
GearedShort MarketCapSH Short S&P500®
PSQ Short QQQ®
DOG Short Dow30SM
MYY Short MidCap400RWM Short Russell2000SBB Short SmallCap600SDS UltraShort S&P500®
QID UltraShort QQQ®
DXD UltraShort Dow30SM
MZZ UltraShort MidCap400TWM UltraShort Russell2000SDD UltraShort SmallCap600SPXU UltraPro Short S&P500®
SQQQ UltraPro Short QQQ®
SDOW UltraPro Short Dow30SM
SMDD UltraPro Short MidCap400SRTY UltraPro Short Russell2000
Short SectorSBM Short Basic MaterialsSEF Short FinancialsDDG Short Oil & GasREK Short Real EstateKRS Short S&P Regional BankingSMN UltraShort Basic MaterialsBIS UltraShort Nasdaq BiotechnologySZK UltraShort Consumer GoodsSCC UltraShort Consumer ServicesSKF UltraShort FinancialsGDXS UltraShort Gold MinersRXD UltraShort Health CareSIJ UltraShort IndustrialsDUG UltraShort Oil & GasSOP UltraShort Oil & Gas Exploration & ProductionSRS UltraShort Real EstateSSG UltraShort SemiconductorsREW UltraShort TechnologySDP UltraShort UtilitiesZBIO UltraPro Short Nasdaq BiotechnologyFINZ UltraPro Short Financial Select Sector
Short InternationalEFZ Short MSCI EAFEEUM Short MSCI Emerging MarketsYXI Short FTSE China 50EFU UltraShort MSCI EAFEEEV UltraShort MSCI Emerging MarketsEPV UltraShort FTSE EuropeBZQ UltraShort MSCI Brazil CappedFXP UltraShort FTSE China 50EWV UltraShort MSCI JapanSMK UltraShort MSCI Mexico Capped IMI
Short Fixed IncomeTBX Short 7-10 Year TreasuryTBF Short 20+ Year TreasurySJB Short High YieldTBZ UltraShort 3-7 Year TreasuryPST UltraShort 7-10 Year TreasuryTBT UltraShort 20+ Year TreasuryTPS UltraShort TIPSTTT UltraPro Short 20+ Year Treasury
Ultra MarketCapSSO Ultra S&P500®
QLD Ultra QQQ®
DDM Ultra Dow30SM
MVV Ultra MidCap400UWM Ultra Russell2000SAA Ultra SmallCap600UPRO UltraPro S&P500®
TQQQ UltraPro QQQ®
UDOW UltraPro Dow30SM
UMDD UltraPro MidCap400URTY UltraPro Russell2000
Ultra SectorUYM Ultra Basic MaterialsBIB Ultra Nasdaq BiotechnologyUGE Ultra Consumer GoodsUCC Ultra Consumer ServicesUYG Ultra FinancialsGDXX Ultra Gold MinersGDJJ Ultra Junior MinersRXL Ultra Health CareUXI Ultra IndustrialsDIG Ultra Oil & GasUOP Ultra Oil & Gas Exploration & ProductionURE Ultra Real EstateKRU Ultra S&P Regional BankingUSD Ultra SemiconductorsROM Ultra TechnologyLTL Ultra TelecommunicationsUPW Ultra UtilitiesUBIO UltraPro Nasdaq BiotechnologyFINU UltraPro Financial Select Sector
Ultra InternationalEFO Ultra MSCI EAFEEET Ultra MSCI Emerging MarketsUPV Ultra FTSE EuropeUBR Ultra MSCI Brazil CappedXPP Ultra FTSE China 50EZJ Ultra MSCI JapanUMX Ultra MSCI Mexico Capped IMI
Ultra Fixed IncomeUST Ultra 7-10 Year TreasuryUBT Ultra 20+ Year TreasuryUJB Ultra High Yield
PROSHARES TRUST Distributor: SEI Investments Distribution Co.
Merrill Corp - Proshares Trust Geared Book [96 Funds] Annual Report [Funds] 333-089822 05-31-2017 ED [AUX] | eperez | 28-Jul-17 17:35 | 17-15159-3.aa | Sequence: 1CHKSUM Content: 36150 Layout: 18602 Graphics: 64408 CLEAN
JOB: 17-15159-3 CYCLE#;BL#: 5; 0 TRIM: 8.25" x 10.75" COMPOSITECOLORS: Black, ~note-color 2, ~note-color 3 GRAPHICS: proshares_k_logo.eps V1.5
TABLE OF CONTENTS
Receive investor materials electronically:
Shareholders may sign up for electronic delivery of investor materials. By doing so, you will receive the information faster and help us reduce theimpact on the environment of providing these materials. To enroll in electronic delivery,
1. Go to www.icsdelivery.com2. Select the first letter of your brokerage firm’s name.3. From the list that follows, select your brokerage firm. If your brokerage firm is not listed, electronic delivery may not be available. Please contact
your brokerage firm.4. Complete the information requested, including the e-mail address where you would like to receive notifications for electronic documents.
Your information will be kept confidential and will not be used for any purpose other than electronic delivery. If you change your mind, you can cancelelectronic delivery at any time and revert to physical delivery of your materials. Just go to www.icsdelivery.com, perform the first three steps above,and follow the instructions for cancelling electronic delivery. If you have any questions, please contact your brokerage firm.
I Shareholder Letter
II Management Discussion of Fund
Performance
CII Expense Examples
1 Schedule of Portfolio Investments
2 Geared
177 Statements of Assets and
Liabilities
194 Statements of Operations
211 Statements of Changes in Net
Assets
244 Financial Highlights
291 Notes to Financial Statements
328 Report of Independent Registered
Public Accounting Firm
329 Federal Tax Information
330 Proxy Voting & Quarterly Portfolio
Holdings Information
331 Trustees and Executive Officers of
ProShares Trust
Merrill Corp - Proshares Trust Geared Book [96 Funds] Annual Report [Funds] 333-089822 05-31-2017 ED [AUX] | eperez | 28-Jul-17 17:35 | 17-15159-3.aa | Sequence: 2CHKSUM Content: 62069 Layout: 49422 Graphics: No Graphics CLEAN
JOB: 17-15159-3 CYCLE#;BL#: 5; 0 TRIM: 8.25" x 10.75" COMPOSITECOLORS: Black, ~HTML color, ~note-color 2, ~watermark GRAPHICS: none V1.5

Merrill Corp - Merrill Corporation ED True Blanks 8.25x10.75 Prospectus [Funds] Style Only | rradatz | 04-Aug-10 15:22 | 07-28247-6.tb1 | Sequence: 1CHKSUM Content: No Content Layout: 0 Graphics: No Graphics CLEAN
JOB: 07-28247-6 CYCLE#;BL#: 2; 0 TRIM: 8.25" x 10.75" COMPOSITECOLORS: none GRAPHICS: none V1.5
PROSHARES.COM :: I
DEAR SHAREHOLDER:I am pleased to present the ProShares Trust Annual Report for thetwelve months ended May 31, 2017.
Equity Markets Strong across the Board
It was a strong period for U.S. equities, though not without its chal-lenges. Stocks reeled and rapidly recovered from the Brexit vote inJune 2016. Markets also endured a tumultuous and uncertain U.S.election season during the second half of the year. But PresidentTrump’s victory in November kicked off what would become a broad-based equity rally that remained in effect the rest of the period. Large-,mid- and small-cap stocks all turned in solid results. The S&P 500®
and the Dow® were up 17.5% and 21.2%, respectively, while the S&PMidCap 400® gained 17.2% and the Russell 2000® Index rose 20.3%.The U.S. economy expanded during the first quarter of 2017, with realGDP increasing at an annual rate of 1.2%. This was down from fourthquarter 2016 results, however, which saw GDP increase by 2.1%.
Nine of 10 Dow Jones U.S. Industry Indices gained during thetwelve-month period. Technology, industrials and financials werein the lead, up 35.4%, 21.5% and 18.5%, respectively. Health careand telecommunications were the laggards, returning 9.3% and1.6%. Oil & Gas was the sole loser, declining 1.7% during the period.
Stocks outside the United States turned in firmly positive results.The MSCI EAFE Index, which tracks developed markets outsideNorth America, rose 16.4%, boosted by a strong 17% return in European equities, as measured by the MSCI Europe Index. Strongearnings momentum helped drive returns in Japan, and low valu-ations and relatively stable commodity prices contributed to a renewed appeal in emerging markets. Japan was up 15%, as meas-ured by the MSCI Japan Index. Emerging markets, which shook offa sharp decline after the U.S. presidential election, returned a remarkable 27.4% for the period, according to the MSCI EmergingMarkets Index.
Despite its relative strength in November and December, the U.S.dollar ended the period down 0.30%, as measured by BloombergDollar Spot Index.
Bond Markets Mixed
The Fed hiked its Fed Funds overnight lending rate in both December and March. Corporate credit, particularly the high-yieldbond market, rose during the 12-month period. Treasurys declinedamid positive economic sentiment and factors supporting a firmeroutlook for inflation. The Markit iBoxx $ Liquid Investment GradeIndex was up 4.2%. High-yield bonds benefitted from strong equitymarket tailwinds, rising 12%, as measured by the Markit iBoxx $Liquid High Yield Index. Longer-dated Treasurys suffered morethan those of shorter duration, with the Ryan Labs Treasury30 Year and 10 Year Indexes down 2.8% and 1.8%, respectively. TheBarclays U.S. Aggregate Bond Index rose 1.6%.
ProShares Lineup Continues to Expand
At the forefront of the ETF revolution since 2006, ProShares cele-brated its 10th anniversary this year. ProShares offers one of thelargest lineups of ETFs, with more than $27 billion in assets, andis the leader in strategies such as dividend growth, alternative andgeared (leveraged and inverse). Assets in our Dividend Growerssuite grew substantially over the last twelve months, ending theperiod at just under $4 billion. And with interest rates on the move,there was significant interest in our Interest Rate Hedge Bondsuite, which more than doubled in assets under management.ProShares also launched the only K-1 free U.S. crude oil ETF, whichallows investors to avoid the complicated tax reporting of mostother crude oil funds.
Thank you for investing in ProShares. We appreciate your continued trust and confidence.
Sincerely,
Michael L. Sapir
Chairman of the Board of Trustees
Merrill Corp - Proshares Trust Geared Book [96 Funds] Annual Report [Funds] 333-089822 05-31-2017 ED [AUX] | eperez | 28-Jul-17 17:35 | 17-15159-3.ba | Sequence: 1CHKSUM Content: 18522 Layout: 55709 Graphics: 659 CLEAN
JOB: 17-15159-3 CYCLE#;BL#: 5; 0 TRIM: 8.25" x 10.75" COMPOSITECOLORS: Black, ~note-color 2, ~note-color 3 GRAPHICS: Michael_Sapir_2016_photo.eps, michael_sapir_k_sig.eps V1.5

II :: MAY 31, 2017 :: MANAGEMENT DISCUSSION OF FUND PERFORMANCE PROSHARES TRUST
MANAGEMENT DISCUSSION OF FUND PERFORMANCE
Merrill Corp - Proshares Trust Geared Book [96 Funds] Annual Report [Funds] 333-089822 05-31-2017 ED [AUX] | eperez | 28-Jul-17 17:35 | 17-15159-3.ca | Sequence: 1CHKSUM Content: 37299 Layout: 1516 Graphics: No Graphics CLEAN
JOB: 17-15159-3 CYCLE#;BL#: 5; 0 TRIM: 8.25" x 10.75" COMPOSITECOLORS: Black, ~note-color 2, ~note-color 3 GRAPHICS: none V1.5
PROSHARES TRUST MANAGEMENT DISCUSSION OF FUND PERFORMANCE :: MAY 31, 2017 :: III
Investment Strategies and Techniques — Geared Funds:
Ninety six (96) ProShares Geared exchange-traded funds (“ETFs”) werein existence for the entire period covered by this annual report (eachProShares Geared ETF, a “Fund” and, collectively, the “Funds”).
Each Geared Fund seeks daily investment results, before fees and ex-penses, that correspond to a multiple (i.e., 3x or 2x), the inverse (i.e., -1x)or an inverse multiple (i.e., -3x or -2x) of the daily performance of an un-derlying index. This means the Funds seek investment results for asingle day only, as measured from the time the Fund calculates its netasset value (“NAV”) to the time of the Fund’s next NAV calculation, notfor longer periods. The return of such Fund for a period longer than asingle day will be the result of each day’s returns compounded over theperiod, which will very likely differ from the Fund’s stated leveraged,inverse, or inverse leveraged multiple times the return of the Fund’sindex for that period. During periods of higher market volatility, thevolatility of a Fund’s index may affect the Fund’s return as much as ormore than the return of the index.
ProShare Advisors LLC (“PSA”), the Funds’ investment adviser, uses apassive approach in seeking to achieve the investment objective ofeach Geared Fund. Using this approach, PSA determines the type, quan-tity and mix of investment positions that a Fund should hold to ap-proximate the daily performance of its index.
When managing the Geared Funds, PSA does not invest the assets ofthe Funds in securities or financial instruments based on its view ofthe investment merit of a particular security, instrument, or company.In addition, PSA does not conduct conventional investment researchor analysis; forecast market movements, trends or market conditions;or take defensive positions in managing assets of the Funds.
The Geared Funds make significant use of investment techniques thatmay be considered aggressive, including the use of swap agreements,futures contracts, forward contracts, and similar instruments (collec-tively, “derivatives”). Funds using these techniques are exposed to risksdifferent from, or possibly greater than, the risks associated with in-vesting directly in securities, including one or more of the following:counterparty risk (i.e., the risk that a counterparty is unable or unwill-ing to make timely payments) on the amount the Fund expects to re-ceive from a derivatives counterparty, liquidity risk (i.e., the ability ofa Fund to acquire or dispose of certain holdings quickly or at pricesthat represent true market value in the judgment of PSA), and in-creased correlation risk (i.e., the Fund’s ability to achieve a high degreeof correlation with its index). If a counterparty becomes bankrupt, orfails to perform its obligations, the value of an investment in the Fundmay decline. With respect to swaps and forward contracts, the Fundsseek to mitigate these risks by generally requiring derivatives coun-terparties to post collateral for the benefit of each Fund, marked tomarket daily, in an amount approximately equal to the amount thecounterparty owes the Fund, subject to certain minimum thresholds.
The Funds primarily enter into derivatives with counterparties thatare major global financial institutions. Any costs associated with usingderivatives will have the effect of lowering the Fund’s return.
Factors that Materially Affected the Performance of EachFund during the Year Ended May 31, 20171:
Primary factors affecting Fund performance, before fees and expenses,include the following: the total return of the securities and derivatives(if any) held by the Fund, including the performance of the referenceassets to which any derivatives are linked, financing rates paid orearned by the Fund associated with cash and, in certain cases, deriva-tive positions; stock dividends, premiums and bond yields paid orearned by the Fund (including those included in the total return of de-rivatives contracts); the types of derivative contracts (if any) used bythe Fund and their correlation to the relevant index or asset fees, ex-penses, and transaction costs; other miscellaneous factors; and, in thecase of the Geared Funds, the volatility of the Fund’s index (and its im-pact on compounding).
• Index Performance: The performance of each Geared Fund’s indexand, in turn, the factors and market conditions affecting that indexare principal factors driving Fund performance.2
• Compounding of Daily Returns and Volatility: Each Geared Fund seeksto return a multiple (i.e., 3x or 2x), the inverse (i.e., -1x) or an inversemultiple (i.e., -3x or -2x) of its index return for a single day only. Forlonger periods, performance may be greater than or less than theone-day multiple times the index return. This is due to the effectsof compounding, which exists in all investments, but has a moresignificant impact on geared funds. In general, during periods ofhigher index volatility, compounding will cause Fund performancefor periods longer than a single day to be more or less than the mul-tiple of the return of the index. This effect becomes more pro-nounced as volatility increases. Conversely, in periods of lower indexvolatility (particularly when combined with higher index returns),Fund returns over longer periods can be higher than the multipleof the return of the index. Actual results for a particular period, be-fore fees and expenses, are also dependent on the following factors:
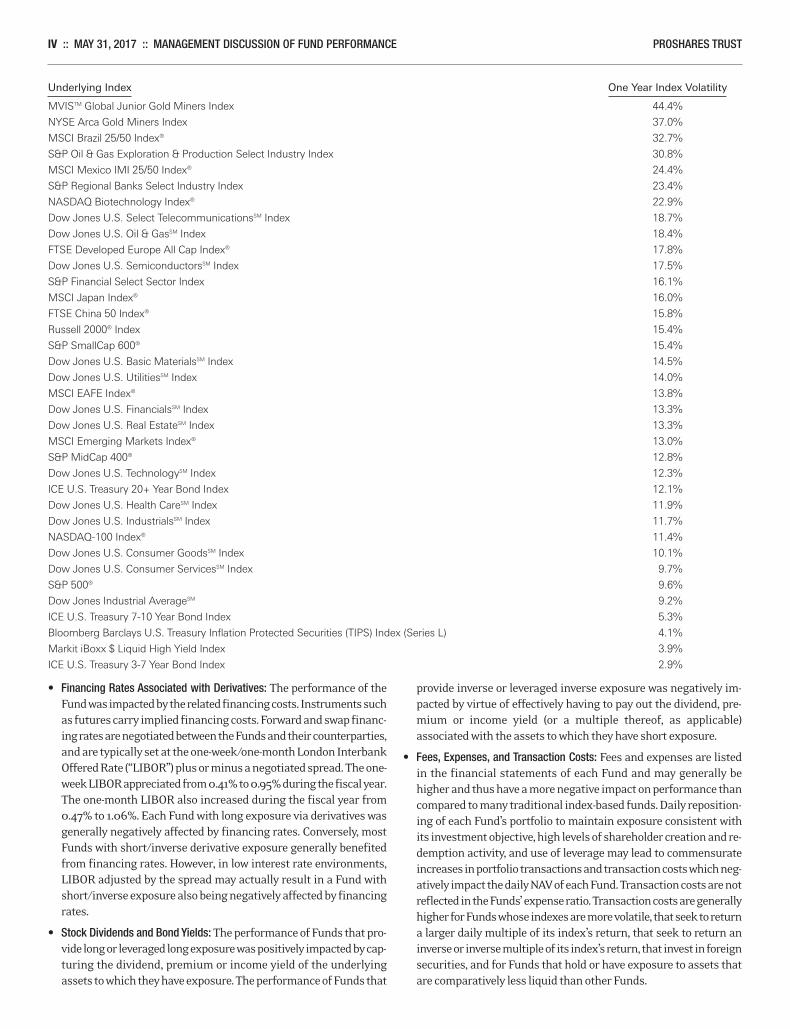
a) period of time; b) financing rates associated with derivatives;c) other Fund expenses; d) dividends and interest paid with respectto the securities in the index, e) the index’s volatility; and f) theindex’s performance. Longer holding periods, higher index volatility,inverse exposure and/or greater leverage each exacerbates the im-pact of compounding on a Fund’s performance. During periods ofhigher index volatility, the volatility of an index may affect a Fund’sreturn as much as or more than the return of its index. Daily volatil-ity for the U.S. equity markets decreased from a year ago. The volatil-ity for the S&P 500 for the year ended May 31, 2017, was 9.6%, whichwas lower than the prior year’s volatility of 16.7%. The volatility ofeach index utilized by a Geared Fund is shown below.
1 Past performance is not a guarantee of future results.2 Indexes do not actually hold a portfolio of securities and/or financial instruments. Indexes do not incur fees, expenses and transaction costs.
Fees, expenses and transaction costs incurred by the Funds negatively impact the performance of the Funds relative to their index. Performanceof each Fund will generally differ from the performance of the Fund’s index.
Merrill Corp - Proshares Trust Geared Book [96 Funds] Annual Report [Funds] 333-089822 05-31-2017 ED [AUX] | eperez | 28-Jul-17 17:35 | 17-15159-3.ca | Sequence: 2CHKSUM Content: 13640 Layout: 18605 Graphics: No Graphics CLEAN
JOB: 17-15159-3 CYCLE#;BL#: 5; 0 TRIM: 8.25" x 10.75" COMPOSITECOLORS: Black, ~note-color 2, ~note-color 3 GRAPHICS: none V1.5
IV :: MAY 31, 2017 :: MANAGEMENT DISCUSSION OF FUND PERFORMANCE PROSHARES TRUST
• Financing Rates Associated with Derivatives: The performance of theFund was impacted by the related financing costs. Instruments suchas futures carry implied financing costs. Forward and swap financ-ing rates are negotiated between the Funds and their counterparties,and are typically set at the one-week/one-month London InterbankOffered Rate (“LIBOR”) plus or minus a negotiated spread. The one-week LIBOR appreciated from 0.41% to 0.95% during the fiscal year.The one-month LIBOR also increased during the fiscal year from0.47% to 1.06%. Each Fund with long exposure via derivatives wasgenerally negatively affected by financing rates. Conversely, mostFunds with short/inverse derivative exposure generally benefitedfrom financing rates. However, in low interest rate environments,LIBOR adjusted by the spread may actually result in a Fund withshort/inverse exposure also being negatively affected by financingrates.
• Stock Dividends and Bond Yields: The performance of Funds that pro-vide long or leveraged long exposure was positively impacted by cap-turing the dividend, premium or income yield of the underlyingassets to which they have exposure. The performance of Funds that
provide inverse or leveraged inverse exposure was negatively im-pacted by virtue of effectively having to pay out the dividend, pre-mium or income yield (or a multiple thereof, as applicable)associated with the assets to which they have short exposure.
• Fees, Expenses, and Transaction Costs: Fees and expenses are listedin the financial statements of each Fund and may generally behigher and thus have a more negative impact on performance thancompared to many traditional index-based funds. Daily reposition-ing of each Fund’s portfolio to maintain exposure consistent withits investment objective, high levels of shareholder creation and re-demption activity, and use of leverage may lead to commensurateincreases in portfolio transactions and transaction costs which neg-atively impact the daily NAV of each Fund. Transaction costs are notreflected in the Funds’ expense ratio. Transaction costs are generallyhigher for Funds whose indexes are more volatile, that seek to returna larger daily multiple of its index’s return, that seek to return aninverse or inverse multiple of its index’s return, that invest in foreignsecurities, and for Funds that hold or have exposure to assets thatare comparatively less liquid than other Funds.
Underlying Index One Year Index Volatility MVISTM Global Junior Gold Miners Index 44.4%
NYSE Arca Gold Miners Index 37.0%
MSCI Brazil 25/50 Index® 32.7%
S&P Oil & Gas Exploration & Production Select Industry Index 30.8%
MSCI Mexico IMI 25/50 Index® 24.4%
S&P Regional Banks Select Industry Index 23.4%
NASDAQ Biotechnology Index® 22.9%
Dow Jones U.S. Select TelecommunicationsSM Index 18.7%
Dow Jones U.S. Oil & GasSM Index 18.4%
FTSE Developed Europe All Cap Index® 17.8%
Dow Jones U.S. SemiconductorsSM Index 17.5%
S&P Financial Select Sector Index 16.1%
MSCI Japan Index® 16.0%
FTSE China 50 Index® 15.8%
Russell 2000® Index 15.4%
S&P SmallCap 600® 15.4%
Dow Jones U.S. Basic MaterialsSM Index 14.5%
Dow Jones U.S. UtilitiesSM Index 14.0%
MSCI EAFE Index® 13.8%
Dow Jones U.S. FinancialsSM Index 13.3%
Dow Jones U.S. Real EstateSM Index 13.3%
MSCI Emerging Markets Index® 13.0%
S&P MidCap 400® 12.8%
Dow Jones U.S. TechnologySM Index 12.3%
ICE U.S. Treasury 20+ Year Bond Index 12.1%
Dow Jones U.S. Health CareSM Index 11.9%
Dow Jones U.S. IndustrialsSM Index 11.7%
NASDAQ-100 Index® 11.4%
Dow Jones U.S. Consumer GoodsSM Index 10.1%
Dow Jones U.S. Consumer ServicesSM Index 9.7%
S&P 500® 9.6%
Dow Jones Industrial AverageSM 9.2%
ICE U.S. Treasury 7-10 Year Bond Index 5.3%
Bloomberg Barclays U.S. Treasury Inflation Protected Securities (TIPS) Index (Series L) 4.1%
Markit iBoxx $ Liquid High Yield Index 3.9%
ICE U.S. Treasury 3-7 Year Bond Index 2.9%
Merrill Corp - Proshares Trust Geared Book [96 Funds] Annual Report [Funds] 333-089822 05-31-2017 ED [AUX] | eperez | 28-Jul-17 17:35 | 17-15159-3.ca | Sequence: 3CHKSUM Content: 55802 Layout: 27553 Graphics: No Graphics CLEAN
JOB: 17-15159-3 CYCLE#;BL#: 5; 0 TRIM: 8.25" x 10.75" COMPOSITECOLORS: Black, ~note-color 2, ~note-color 3 GRAPHICS: none V1.5
PROSHARES TRUST MANAGEMENT DISCUSSION OF FUND PERFORMANCE :: MAY 31, 2017 :: V
• Miscellaneous factors: Each Fund holds a mix of securities and/or de-rivatives that is designed to provide returns that seek to achieve itsinvestment objective. Certain Geared Funds may obtain exposureto only a representative sample of the securities of their index andmay not have investment exposure to all securities of the index ormay have weightings that are different from that of its index. CertainGeared Funds may also obtain exposure to securities not containedin the relevant index or in financial instruments, with the intent ofobtaining exposure with aggregate characteristics similar to thoseof a multiple of the Index.
In addition, certain Funds invested in swap agreements that werebased on ETFs that are designed to track the performance of theFund’s index rather than swap agreements that were based on theFund’s index. Because the closing price of an ETF may not perfectlytrack the performance of its index, there are deviations between thereturn of a swap whose reference asset is an ETF and the return ofa swap based directly on the Fund’s index. Thus, the performanceof a Fund investing significantly in swap agreements based on anETF may correlate less with its index than a Fund investing in swapagreements based directly on the Fund’s index.
Merrill Corp - Proshares Trust Geared Book [96 Funds] Annual Report [Funds] 333-089822 05-31-2017 ED [AUX] | eperez | 28-Jul-17 17:35 | 17-15159-3.ca | Sequence: 4CHKSUM Content: 37292 Layout: 7753 Graphics: No Graphics CLEAN
JOB: 17-15159-3 CYCLE#;BL#: 5; 0 TRIM: 8.25" x 10.75" COMPOSITECOLORS: Black, ~note-color 2, ~note-color 3 GRAPHICS: none V1.5
VI ::nlSH SHORT S&P500® :: MANAGEMENT DISCUSSION OF FUND PERFORMANCE PROSHARES TRUST
Value of a $10,000 Investment at Net Asset Value*
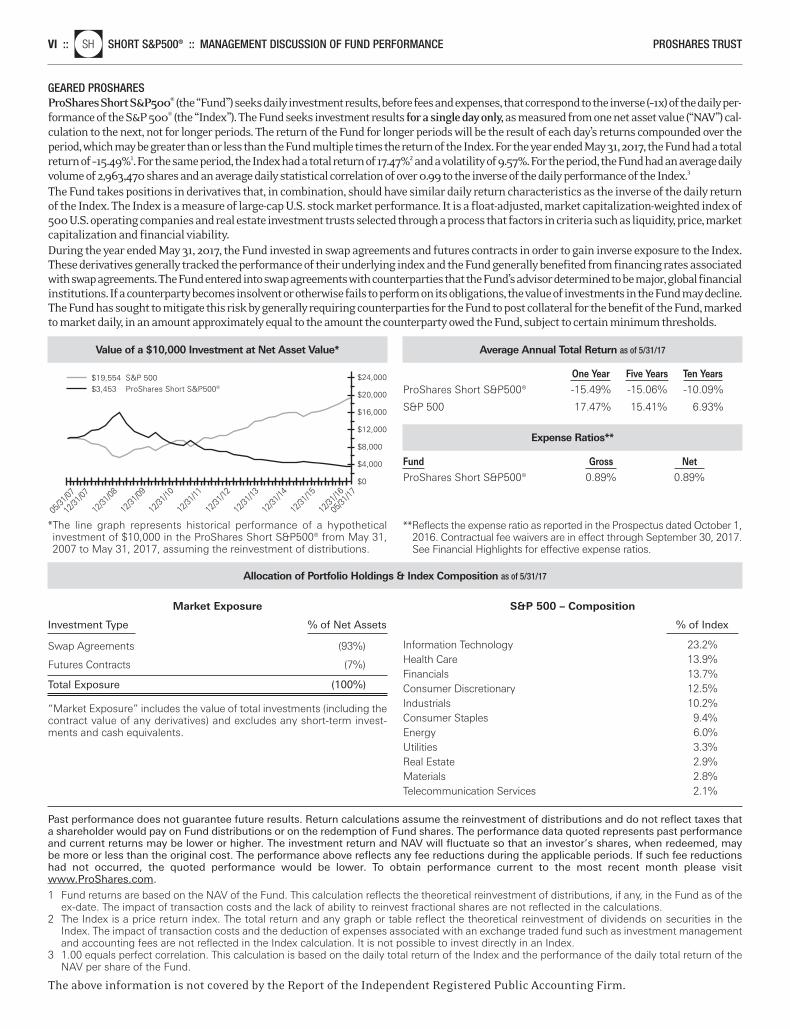
*The line graph represents historical performance of a hypothetical investment of $10,000 in the ProShares Short S&P500® from May 31,2007 to May 31, 2017, assuming the reinvestment of distributions.
$24,000
$20,000
$16,000
$0
$12,000
$4,000
$8,000
$19,554 S&P 500$3,453 ProShares Short S&P500®
12/31
/07
12/31
/10
12/31
/09
12/31
/08
12/31
/16
12/31
/15
12/31
/14
12/31
/13
12/31
/12
12/31
/11
05/31
/17
05/31
/07
Average Annual Total Return as of 5/31/17
One Year Five Years Ten Years ProShares Short S&P500® -15.49% -15.06% -10.09%
S&P 500 17.47% 15.41% 6.93%
Expense Ratios**
Fund Gross Net ProShares Short S&P500® 0.89% 0.89%
**Reflects the expense ratio as reported in the Prospectus dated October 1,2016. Contractual fee waivers are in effect through September 30, 2017.See Financial Highlights for effective expense ratios.
Market Exposure
Investment Type % of Net Assets
Swap Agreements (93%)
Futures Contracts (7%)
Total Exposure (100%)
“Market Exposure” includes the value of total investments (including thecontract value of any derivatives) and excludes any short-term invest-ments and cash equivalents.
S&P 500 – Composition
% of Index Information Technology 23.2%Health Care 13.9%Financials 13.7%Consumer Discretionary 12.5%Industrials 10.2%Consumer Staples 9.4%Energy 6.0%Utilities 3.3%Real Estate 2.9%Materials 2.8%Telecommunication Services 2.1%
GEARED PROSHARES
ProShares Short S&P500® (the “Fund”) seeks daily investment results, before fees and expenses, that correspond to the inverse (–1x) of the daily per-formance of the S&P 500® (the “Index”). The Fund seeks investment results for a single day only,as measured from one net asset value (“NAV”) cal-culation to the next, not for longer periods. The return of the Fund for longer periods will be the result of each day’s returns compounded over theperiod, which may be greater than or less than the Fund multiple times the return of the Index. For the year ended May 31, 2017, the Fund had a totalreturn of –15.49%1. For the same period, the Index had a total return of 17.47%2 and a volatility of 9.57%. For the period, the Fund had an average dailyvolume of 2,963,470 shares and an average daily statistical correlation of over 0.99 to the inverse of the daily performance of the Index.3
The Fund takes positions in derivatives that, in combination, should have similar daily return characteristics as the inverse of the daily returnof the Index. The Index is a measure of large-cap U.S. stock market performance. It is a float-adjusted, market capitalization-weighted index of500 U.S. operating companies and real estate investment trusts selected through a process that factors in criteria such as liquidity, price, marketcapitalization and financial viability.During the year ended May 31, 2017, the Fund invested in swap agreements and futures contracts in order to gain inverse exposure to the Index.These derivatives generally tracked the performance of their underlying index and the Fund generally benefited from financing rates associatedwith swap agreements. The Fund entered into swap agreements with counterparties that the Fund’s advisor determined to be major, global financialinstitutions. If a counterparty becomes insolvent or otherwise fails to perform on its obligations, the value of investments in the Fund may decline.The Fund has sought to mitigate this risk by generally requiring counterparties for the Fund to post collateral for the benefit of the Fund, markedto market daily, in an amount approximately equal to the amount the counterparty owed the Fund, subject to certain minimum thresholds.
Allocation of Portfolio Holdings & Index Composition as of 5/31/17
Past performance does not guarantee future results. Return calculations assume the reinvestment of distributions and do not reflect taxes thata shareholder would pay on Fund distributions or on the redemption of Fund shares. The performance data quoted represents past performanceand current returns may be lower or higher. The investment return and NAV will fluctuate so that an investor’s shares, when redeemed, maybe more or less than the original cost. The performance above reflects any fee reductions during the applicable periods. If such fee reductionshad not occurred, the quoted performance would be lower. To obtain performance current to the most recent month please visitwww.ProShares.com.
1 Fund returns are based on the NAV of the Fund. This calculation reflects the theoretical reinvestment of distributions, if any, in the Fund as of theex-date. The impact of transaction costs and the lack of ability to reinvest fractional shares are not reflected in the calculations.
2 The Index is a price return index. The total return and any graph or table reflect the theoretical reinvestment of dividends on securities in theIndex. The impact of transaction costs and the deduction of expenses associated with an exchange traded fund such as investment managementand accounting fees are not reflected in the Index calculation. It is not possible to invest directly in an Index.
3 1.00 equals perfect correlation. This calculation is based on the daily total return of the Index and the performance of the daily total return of theNAV per share of the Fund.
The above information is not covered by the Report of the Independent Registered Public Accounting Firm.
Merrill Corp - Proshares Trust Geared Book [96 Funds] Annual Report [Funds] 333-089822 05-31-2017 ED [AUX] | eperez | 28-Jul-17 17:35 | 17-15159-3.ca | Sequence: 5CHKSUM Content: 64050 Layout: 16455 Graphics: 5445 CLEAN
JOB: 17-15159-3 CYCLE#;BL#: 5; 0 TRIM: 8.25" x 10.75" COMPOSITECOLORS: Black, ~note-color 2, ~note-color 3 GRAPHICS: 15159-3_SH_L.eps V1.5
PROSHARES TRUST MANAGEMENT DISCUSSION OF FUND PERFORMANCE :: SHORT QQQ®nlPSQ :: VII
Value of a $10,000 Investment at Net Asset Value*
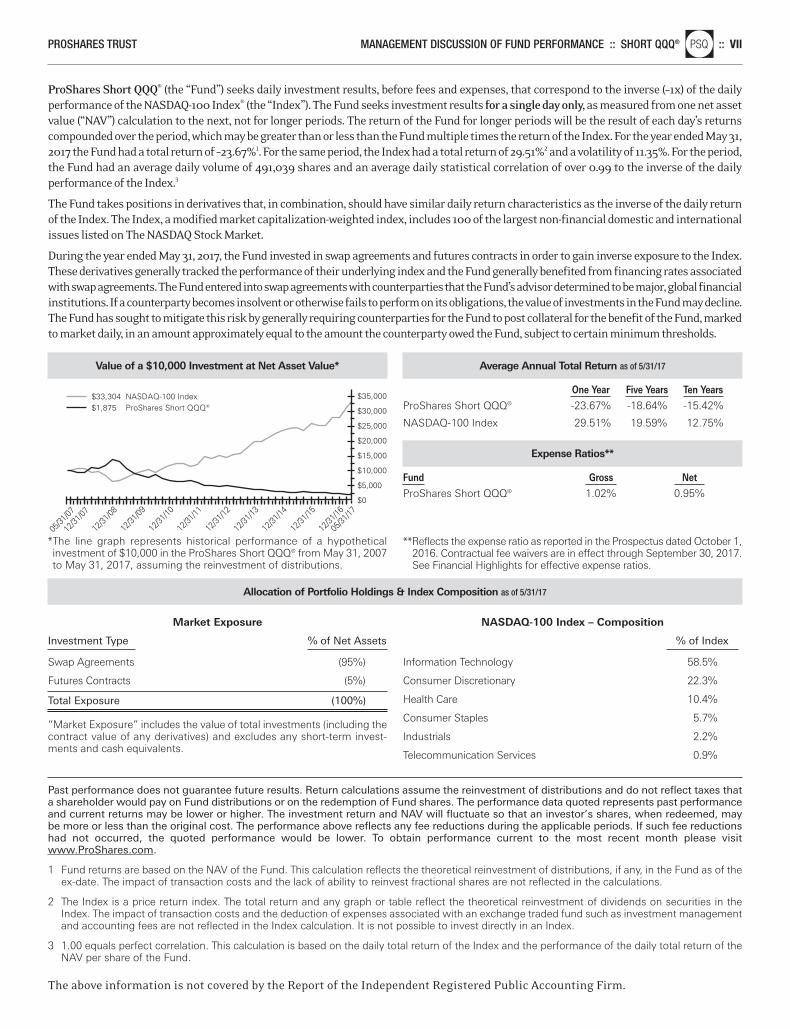
*The line graph represents historical performance of a hypothetical investment of $10,000 in the ProShares Short QQQ® from May 31, 2007to May 31, 2017, assuming the reinvestment of distributions.
$35,000
$30,000
$25,000
$20,000
$0
$15,000
$5,000
$10,000
$33,304 NASDAQ-100 Index$1,875 ProShares Short QQQ®
12/31
/07
12/31
/10
12/31
/09
12/31
/08
12/31
/16
12/31
/15
12/31
/14
12/31
/13
12/31
/12
12/31
/11
05/31
/17
05/31
/07
Average Annual Total Return as of 5/31/17
One Year Five Years Ten Years ProShares Short QQQ® -23.67% -18.64% -15.42%
NASDAQ-100 Index 29.51% 19.59% 12.75%
Expense Ratios**
Fund Gross Net ProShares Short QQQ® 1.02% 0.95%
**Reflects the expense ratio as reported in the Prospectus dated October 1,2016. Contractual fee waivers are in effect through September 30, 2017.See Financial Highlights for effective expense ratios.
Market Exposure
Investment Type % of Net Assets
Swap Agreements (95%)
Futures Contracts (5%)
Total Exposure (100%)
“Market Exposure” includes the value of total investments (including thecontract value of any derivatives) and excludes any short-term invest-ments and cash equivalents.
NASDAQ-100 Index – Composition
% of Index
Information Technology 58.5%
Consumer Discretionary 22.3%
Health Care 10.4%
Consumer Staples 5.7%
Industrials 2.2%
Telecommunication Services 0.9%
ProShares Short QQQ® (the “Fund”) seeks daily investment results, before fees and expenses, that correspond to the inverse (–1x) of the dailyperformance of the NASDAQ-100 Index® (the “Index”). The Fund seeks investment results for a single day only, as measured from one net assetvalue (“NAV”) calculation to the next, not for longer periods. The return of the Fund for longer periods will be the result of each day’s returnscompounded over the period, which may be greater than or less than the Fund multiple times the return of the Index. For the year ended May 31,2017 the Fund had a total return of –23.67%1. For the same period, the Index had a total return of 29.51%2 and a volatility of 11.35%. For the period,the Fund had an average daily volume of 491,039 shares and an average daily statistical correlation of over 0.99 to the inverse of the daily performance of the Index.3
The Fund takes positions in derivatives that, in combination, should have similar daily return characteristics as the inverse of the daily returnof the Index. The Index, a modified market capitalization-weighted index, includes 100 of the largest non-financial domestic and internationalissues listed on The NASDAQ Stock Market.
During the year ended May 31, 2017, the Fund invested in swap agreements and futures contracts in order to gain inverse exposure to the Index.These derivatives generally tracked the performance of their underlying index and the Fund generally benefited from financing rates associatedwith swap agreements. The Fund entered into swap agreements with counterparties that the Fund’s advisor determined to be major, global financialinstitutions. If a counterparty becomes insolvent or otherwise fails to perform on its obligations, the value of investments in the Fund may decline.The Fund has sought to mitigate this risk by generally requiring counterparties for the Fund to post collateral for the benefit of the Fund, markedto market daily, in an amount approximately equal to the amount the counterparty owed the Fund, subject to certain minimum thresholds.
Allocation of Portfolio Holdings & Index Composition as of 5/31/17
Past performance does not guarantee future results. Return calculations assume the reinvestment of distributions and do not reflect taxes thata shareholder would pay on Fund distributions or on the redemption of Fund shares. The performance data quoted represents past performanceand current returns may be lower or higher. The investment return and NAV will fluctuate so that an investor’s shares, when redeemed, maybe more or less than the original cost. The performance above reflects any fee reductions during the applicable periods. If such fee reductionshad not occurred, the quoted performance would be lower. To obtain performance current to the most recent month please visitwww.ProShares.com.
1 Fund returns are based on the NAV of the Fund. This calculation reflects the theoretical reinvestment of distributions, if any, in the Fund as of theex-date. The impact of transaction costs and the lack of ability to reinvest fractional shares are not reflected in the calculations.
2 The Index is a price return index. The total return and any graph or table reflect the theoretical reinvestment of dividends on securities in theIndex. The impact of transaction costs and the deduction of expenses associated with an exchange traded fund such as investment managementand accounting fees are not reflected in the Index calculation. It is not possible to invest directly in an Index.
3 1.00 equals perfect correlation. This calculation is based on the daily total return of the Index and the performance of the daily total return of theNAV per share of the Fund.
The above information is not covered by the Report of the Independent Registered Public Accounting Firm.
Merrill Corp - Proshares Trust Geared Book [96 Funds] Annual Report [Funds] 333-089822 05-31-2017 ED [AUX] | eperez | 28-Jul-17 17:35 | 17-15159-3.ca | Sequence: 6CHKSUM Content: 42271 Layout: 31906 Graphics: 4921 CLEAN
JOB: 17-15159-3 CYCLE#;BL#: 5; 0 TRIM: 8.25" x 10.75" COMPOSITECOLORS: Black, ~note-color 2, ~note-color 3 GRAPHICS: 15159-3_PSQ_L.eps V1.5
VIII ::nlDOG SHORT DOW30SM :: MANAGEMENT DISCUSSION OF FUND PERFORMANCE PROSHARES TRUST
Value of a $10,000 Investment at Net Asset Value*
*The line graph represents historical performance of a hypothetical investment of $10,000 in the ProShares Short Dow30SM from May 31,2007 to May 31, 2017, assuming the reinvestment of distributions.
$24,000
$20,000
$16,000
$0
$12,000
$4,000
$8,000
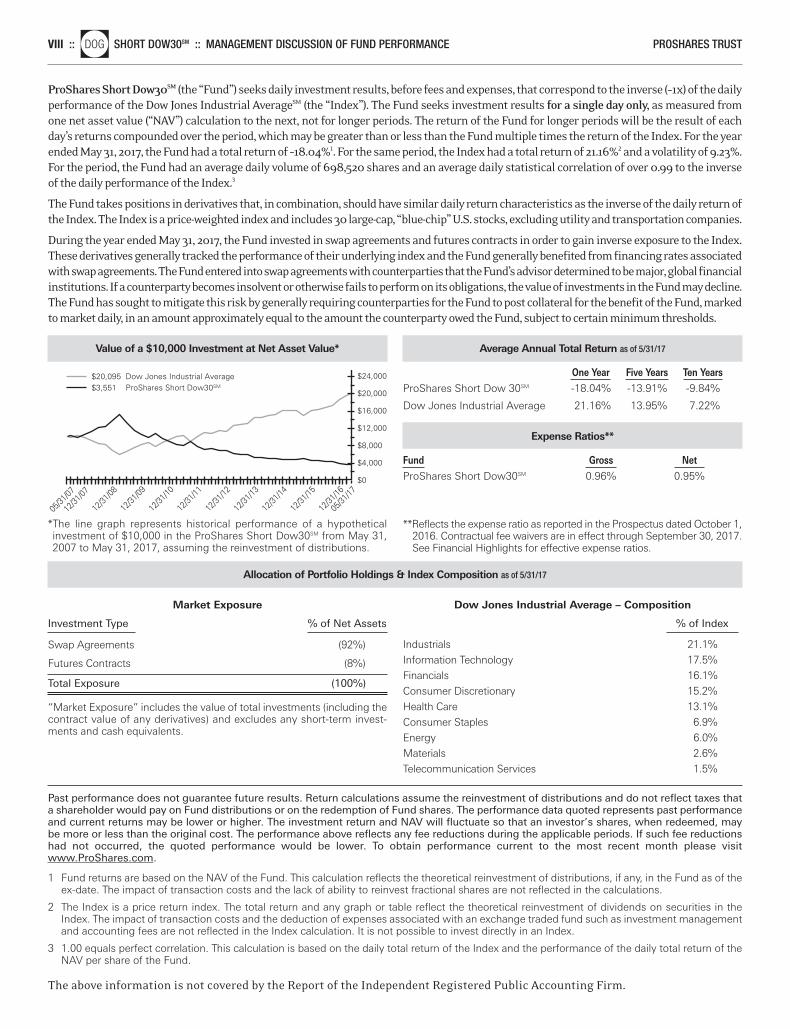
$20,095 Dow Jones Industrial Average$3,551 ProShares Short Dow30SM
12/31
/07
12/31
/10
12/31
/09
12/31
/08
12/31
/16
12/31
/15
12/31
/14
12/31
/13
12/31
/12
12/31
/11
05/31
/17
05/31
/07
Average Annual Total Return as of 5/31/17
One Year Five Years Ten Years ProShares Short Dow 30SM -18.04% -13.91% -9.84%
Dow Jones Industrial Average 21.16% 13.95% 7.22%
Expense Ratios**
Fund Gross Net ProShares Short Dow30SM 0.96% 0.95%
**Reflects the expense ratio as reported in the Prospectus dated October 1,2016. Contractual fee waivers are in effect through September 30, 2017.See Financial Highlights for effective expense ratios.
Market Exposure
Investment Type % of Net Assets
Swap Agreements (92%)
Futures Contracts (8%)
Total Exposure (100%)
“Market Exposure” includes the value of total investments (including thecontract value of any derivatives) and excludes any short-term invest-ments and cash equivalents.
Dow Jones Industrial Average – Composition
% of Index
Industrials 21.1%
Information Technology 17.5%
Financials 16.1%
Consumer Discretionary 15.2%
Health Care 13.1%
Consumer Staples 6.9%
Energy 6.0%
Materials 2.6%
Telecommunication Services 1.5%
ProShares Short Dow30SM (the “Fund”) seeks daily investment results, before fees and expenses, that correspond to the inverse (–1x) of the dailyperformance of the Dow Jones Industrial AverageSM (the “Index”). The Fund seeks investment results for a single day only, as measured fromone net asset value (“NAV”) calculation to the next, not for longer periods. The return of the Fund for longer periods will be the result of eachday’s returns compounded over the period, which may be greater than or less than the Fund multiple times the return of the Index. For the yearended May 31, 2017, the Fund had a total return of –18.04%1. For the same period, the Index had a total return of 21.16%2 and a volatility of 9.23%.For the period, the Fund had an average daily volume of 698,520 shares and an average daily statistical correlation of over 0.99 to the inverseof the daily performance of the Index.3
The Fund takes positions in derivatives that, in combination, should have similar daily return characteristics as the inverse of the daily return ofthe Index. The Index is a price-weighted index and includes 30 large-cap, “blue-chip” U.S. stocks, excluding utility and transportation companies.
During the year ended May 31, 2017, the Fund invested in swap agreements and futures contracts in order to gain inverse exposure to the Index.These derivatives generally tracked the performance of their underlying index and the Fund generally benefited from financing rates associatedwith swap agreements. The Fund entered into swap agreements with counterparties that the Fund’s advisor determined to be major, global financialinstitutions. If a counterparty becomes insolvent or otherwise fails to perform on its obligations, the value of investments in the Fund may decline.The Fund has sought to mitigate this risk by generally requiring counterparties for the Fund to post collateral for the benefit of the Fund, markedto market daily, in an amount approximately equal to the amount the counterparty owed the Fund, subject to certain minimum thresholds.
Allocation of Portfolio Holdings & Index Composition as of 5/31/17
Past performance does not guarantee future results. Return calculations assume the reinvestment of distributions and do not reflect taxes thata shareholder would pay on Fund distributions or on the redemption of Fund shares. The performance data quoted represents past performanceand current returns may be lower or higher. The investment return and NAV will fluctuate so that an investor’s shares, when redeemed, maybe more or less than the original cost. The performance above reflects any fee reductions during the applicable periods. If such fee reductionshad not occurred, the quoted performance would be lower. To obtain performance current to the most recent month please visitwww.ProShares.com.
1 Fund returns are based on the NAV of the Fund. This calculation reflects the theoretical reinvestment of distributions, if any, in the Fund as of theex-date. The impact of transaction costs and the lack of ability to reinvest fractional shares are not reflected in the calculations.
2 The Index is a price return index. The total return and any graph or table reflect the theoretical reinvestment of dividends on securities in theIndex. The impact of transaction costs and the deduction of expenses associated with an exchange traded fund such as investment managementand accounting fees are not reflected in the Index calculation. It is not possible to invest directly in an Index.
3 1.00 equals perfect correlation. This calculation is based on the daily total return of the Index and the performance of the daily total return of theNAV per share of the Fund.
The above information is not covered by the Report of the Independent Registered Public Accounting Firm.
Merrill Corp - Proshares Trust Geared Book [96 Funds] Annual Report [Funds] 333-089822 05-31-2017 ED [AUX] | eperez | 28-Jul-17 17:35 | 17-15159-3.ca | Sequence: 7CHKSUM Content: 10430 Layout: 25678 Graphics: 37893 CLEAN
JOB: 17-15159-3 CYCLE#;BL#: 5; 0 TRIM: 8.25" x 10.75" COMPOSITECOLORS: Black, ~note-color 2, ~note-color 3 GRAPHICS: 15159-3_DOG_L.eps V1.5
PROSHARES TRUST MANAGEMENT DISCUSSION OF FUND PERFORMANCE :: SHORT MIDCAP400nlMYY :: IX
Value of a $10,000 Investment at Net Asset Value*
*The line graph represents historical performance of a hypothetical investment of $10,000 in the ProShares Short MidCap400 from May 31,2007 to May 31, 2017, assuming the reinvestment of distributions.
$24,000
$20,000
$16,000
$0
$12,000
$4,000
$8,000
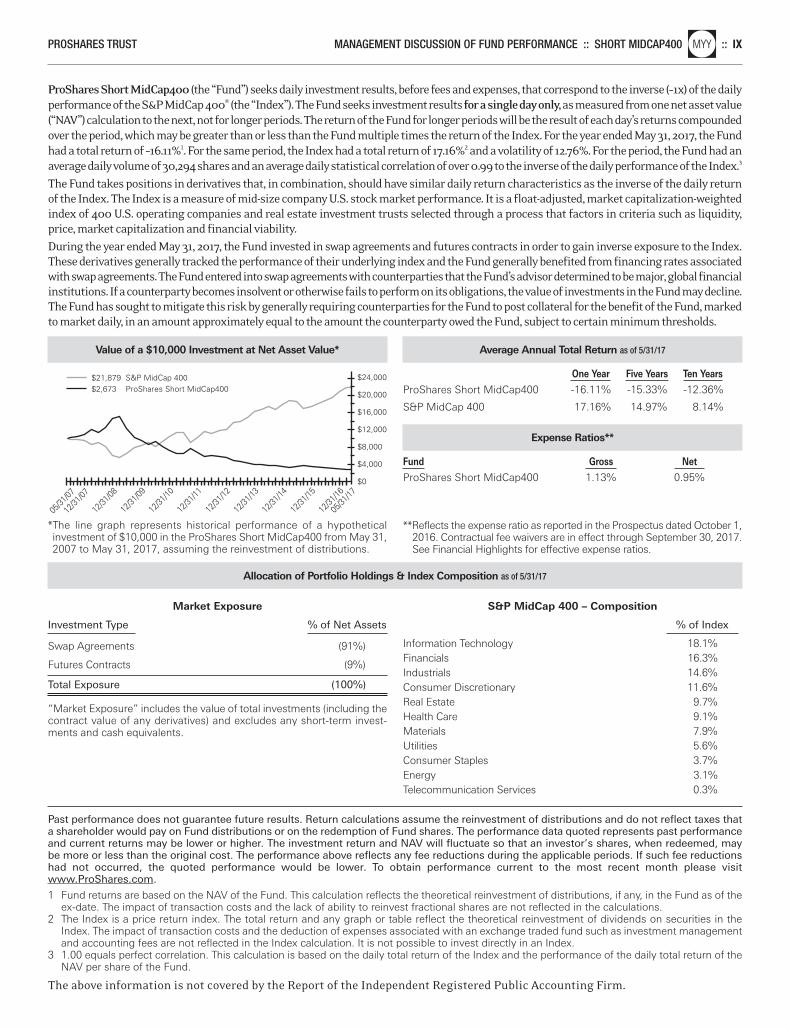
$21,879 S&P MidCap 400$2,673 ProShares Short MidCap400
12/31
/07
12/31
/10
12/31
/09
12/31
/08
12/31
/16
12/31
/15
12/31
/14
12/31
/13
12/31
/12
12/31
/11
05/31
/17
05/31
/07
Average Annual Total Return as of 5/31/17
One Year Five Years Ten Years ProShares Short MidCap400 -16.11% -15.33% -12.36%
S&P MidCap 400 17.16% 14.97% 8.14%
Expense Ratios**
Fund Gross Net ProShares Short MidCap400 1.13% 0.95%
**Reflects the expense ratio as reported in the Prospectus dated October 1,2016. Contractual fee waivers are in effect through September 30, 2017.See Financial Highlights for effective expense ratios.
Market Exposure
Investment Type % of Net Assets
Swap Agreements (91%)
Futures Contracts (9%)
Total Exposure (100%)
“Market Exposure” includes the value of total investments (including thecontract value of any derivatives) and excludes any short-term invest-ments and cash equivalents.
S&P MidCap 400 – Composition
% of Index Information Technology 18.1%Financials 16.3%Industrials 14.6%Consumer Discretionary 11.6%Real Estate 9.7%Health Care 9.1%Materials 7.9%Utilities 5.6%Consumer Staples 3.7%Energy 3.1%Telecommunication Services 0.3%
ProShares Short MidCap400 (the “Fund”) seeks daily investment results, before fees and expenses, that correspond to the inverse (–1x) of the dailyperformance of the S&P MidCap 400® (the “Index”). The Fund seeks investment results for a single day only,as measured from one net asset value(“NAV”) calculation to the next, not for longer periods. The return of the Fund for longer periods will be the result of each day’s returns compoundedover the period, which may be greater than or less than the Fund multiple times the return of the Index. For the year ended May 31, 2017, the Fundhad a total return of –16.11%1. For the same period, the Index had a total return of 17.16%2 and a volatility of 12.76%. For the period, the Fund had anaverage daily volume of 30,294 shares and an average daily statistical correlation of over 0.99 to the inverse of the daily performance of the Index.3
The Fund takes positions in derivatives that, in combination, should have similar daily return characteristics as the inverse of the daily returnof the Index. The Index is a measure of mid-size company U.S. stock market performance. It is a float-adjusted, market capitalization-weightedindex of 400 U.S. operating companies and real estate investment trusts selected through a process that factors in criteria such as liquidity,price, market capitalization and financial viability.
During the year ended May 31, 2017, the Fund invested in swap agreements and futures contracts in order to gain inverse exposure to the Index.These derivatives generally tracked the performance of their underlying index and the Fund generally benefited from financing rates associatedwith swap agreements. The Fund entered into swap agreements with counterparties that the Fund’s advisor determined to be major, global financialinstitutions. If a counterparty becomes insolvent or otherwise fails to perform on its obligations, the value of investments in the Fund may decline.The Fund has sought to mitigate this risk by generally requiring counterparties for the Fund to post collateral for the benefit of the Fund, markedto market daily, in an amount approximately equal to the amount the counterparty owed the Fund, subject to certain minimum thresholds.
Allocation of Portfolio Holdings & Index Composition as of 5/31/17
Past performance does not guarantee future results. Return calculations assume the reinvestment of distributions and do not reflect taxes thata shareholder would pay on Fund distributions or on the redemption of Fund shares. The performance data quoted represents past performanceand current returns may be lower or higher. The investment return and NAV will fluctuate so that an investor’s shares, when redeemed, maybe more or less than the original cost. The performance above reflects any fee reductions during the applicable periods. If such fee reductionshad not occurred, the quoted performance would be lower. To obtain performance current to the most recent month please visitwww.ProShares.com.
1 Fund returns are based on the NAV of the Fund. This calculation reflects the theoretical reinvestment of distributions, if any, in the Fund as of theex-date. The impact of transaction costs and the lack of ability to reinvest fractional shares are not reflected in the calculations.
2 The Index is a price return index. The total return and any graph or table reflect the theoretical reinvestment of dividends on securities in theIndex. The impact of transaction costs and the deduction of expenses associated with an exchange traded fund such as investment managementand accounting fees are not reflected in the Index calculation. It is not possible to invest directly in an Index.
3 1.00 equals perfect correlation. This calculation is based on the daily total return of the Index and the performance of the daily total return of theNAV per share of the Fund.
The above information is not covered by the Report of the Independent Registered Public Accounting Firm.
Merrill Corp - Proshares Trust Geared Book [96 Funds] Annual Report [Funds] 333-089822 05-31-2017 ED [AUX] | eperez | 28-Jul-17 17:35 | 17-15159-3.ca | Sequence: 8CHKSUM Content: 62049 Layout: 57266 Graphics: 27406 CLEAN
JOB: 17-15159-3 CYCLE#;BL#: 5; 0 TRIM: 8.25" x 10.75" COMPOSITECOLORS: Black, ~note-color 2, ~note-color 3 GRAPHICS: 15159-3_MYY_L.eps V1.5
X ::nlRWM SHORT RUSSELL2000 :: MANAGEMENT DISCUSSION OF FUND PERFORMANCE PROSHARES TRUST
Value of a $10,000 Investment at Net Asset Value*
*The line graph represents historical performance of a hypothetical investment of $10,000 in the ProShares Short Russell2000 from May 31,2007 to May 31, 2017, assuming the reinvestment of distributions.
$22,000
$18,000
$2,000
$10,000
$14,000
$6,000
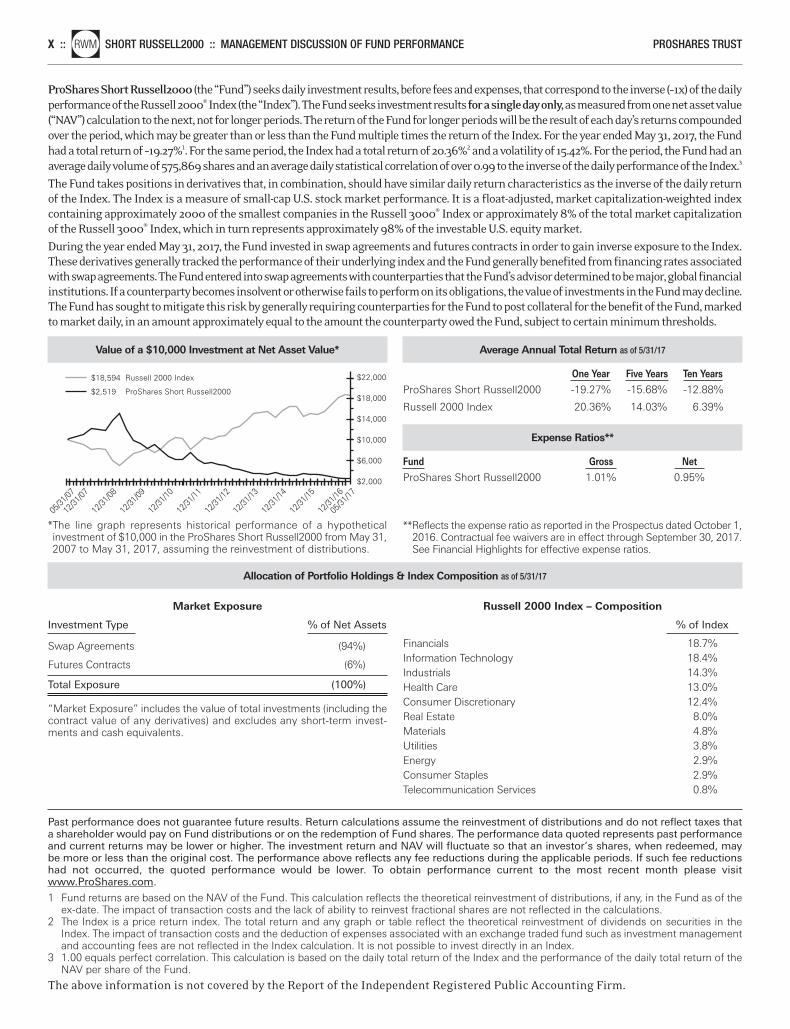
$18,594 Russell 2000 Index
$2,519 ProShares Short Russell2000
05/31
/07
12/31
/07
12/31
/08
12/31
/10
12/31
/16
12/31
/15
12/31
/14
12/31
/13
12/31
/12
12/31
/11
12/31
/09
05/31
/17
Average Annual Total Return as of 5/31/17
One Year Five Years Ten Years ProShares Short Russell2000 -19.27% -15.68% -12.88%
Russell 2000 Index 20.36% 14.03% 6.39%
Expense Ratios**
Fund Gross Net ProShares Short Russell2000 1.01% 0.95%
**Reflects the expense ratio as reported in the Prospectus dated October 1,2016. Contractual fee waivers are in effect through September 30, 2017.See Financial Highlights for effective expense ratios.
Market Exposure
Investment Type % of Net Assets
Swap Agreements (94%)
Futures Contracts (6%)
Total Exposure (100%)
“Market Exposure” includes the value of total investments (including thecontract value of any derivatives) and excludes any short-term invest-ments and cash equivalents.
Russell 2000 Index – Composition
% of Index Financials 18.7%Information Technology 18.4%Industrials 14.3%Health Care 13.0%Consumer Discretionary 12.4%Real Estate 8.0%Materials 4.8%Utilities 3.8%Energy 2.9%Consumer Staples 2.9%Telecommunication Services 0.8%
ProShares Short Russell2000(the “Fund”) seeks daily investment results, before fees and expenses, that correspond to the inverse (–1x) of the dailyperformance of the Russell 2000® Index (the “Index”). The Fund seeks investment results for a single day only,as measured from one net asset value(“NAV”) calculation to the next, not for longer periods. The return of the Fund for longer periods will be the result of each day’s returns compoundedover the period, which may be greater than or less than the Fund multiple times the return of the Index. For the year ended May 31, 2017, the Fundhad a total return of –19.27%1. For the same period, the Index had a total return of 20.36%2 and a volatility of 15.42%. For the period, the Fund had anaverage daily volume of 575,869 shares and an average daily statistical correlation of over 0.99 to the inverse of the daily performance of the Index.3
The Fund takes positions in derivatives that, in combination, should have similar daily return characteristics as the inverse of the daily returnof the Index. The Index is a measure of small-cap U.S. stock market performance. It is a float-adjusted, market capitalization-weighted indexcontaining approximately 2000 of the smallest companies in the Russell 3000® Index or approximately 8% of the total market capitalizationof the Russell 3000® Index, which in turn represents approximately 98% of the investable U.S. equity market.
During the year ended May 31, 2017, the Fund invested in swap agreements and futures contracts in order to gain inverse exposure to the Index.These derivatives generally tracked the performance of their underlying index and the Fund generally benefited from financing rates associatedwith swap agreements. The Fund entered into swap agreements with counterparties that the Fund’s advisor determined to be major, global financialinstitutions. If a counterparty becomes insolvent or otherwise fails to perform on its obligations, the value of investments in the Fund may decline.The Fund has sought to mitigate this risk by generally requiring counterparties for the Fund to post collateral for the benefit of the Fund, markedto market daily, in an amount approximately equal to the amount the counterparty owed the Fund, subject to certain minimum thresholds.
Allocation of Portfolio Holdings & Index Composition as of 5/31/17
Past performance does not guarantee future results. Return calculations assume the reinvestment of distributions and do not reflect taxes thata shareholder would pay on Fund distributions or on the redemption of Fund shares. The performance data quoted represents past performanceand current returns may be lower or higher. The investment return and NAV will fluctuate so that an investor’s shares, when redeemed, maybe more or less than the original cost. The performance above reflects any fee reductions during the applicable periods. If such fee reductionshad not occurred, the quoted performance would be lower. To obtain performance current to the most recent month please visitwww.ProShares.com.
1 Fund returns are based on the NAV of the Fund. This calculation reflects the theoretical reinvestment of distributions, if any, in the Fund as of theex-date. The impact of transaction costs and the lack of ability to reinvest fractional shares are not reflected in the calculations.
2 The Index is a price return index. The total return and any graph or table reflect the theoretical reinvestment of dividends on securities in theIndex. The impact of transaction costs and the deduction of expenses associated with an exchange traded fund such as investment managementand accounting fees are not reflected in the Index calculation. It is not possible to invest directly in an Index.
3 1.00 equals perfect correlation. This calculation is based on the daily total return of the Index and the performance of the daily total return of theNAV per share of the Fund.
The above information is not covered by the Report of the Independent Registered Public Accounting Firm.
Merrill Corp - Proshares Trust Geared Book [96 Funds] Annual Report [Funds] 333-089822 05-31-2017 ED [AUX] | eperez | 28-Jul-17 17:35 | 17-15159-3.ca | Sequence: 9CHKSUM Content: 60643 Layout: 56550 Graphics: 22604 CLEAN
JOB: 17-15159-3 CYCLE#;BL#: 5; 0 TRIM: 8.25" x 10.75" COMPOSITECOLORS: Black, ~note-color 2, ~note-color 3 GRAPHICS: 15159-3_RWM_L.eps V1.5
PROSHARES TRUST MANAGEMENT DISCUSSION OF FUND PERFORMANCE :: SHORT SMALLCAP600nlSBB :: XI
Value of a $10,000 Investment at Net Asset Value*
*The line graph represents historical performance of a hypothetical investment of $10,000 in the ProShares Short SmallCap600 fromMay 31, 2007 to May 31, 2017, assuming the reinvestment of distributions.
$24,000
$20,000
$16,000
$0
$12,000
$4,000
$8,000
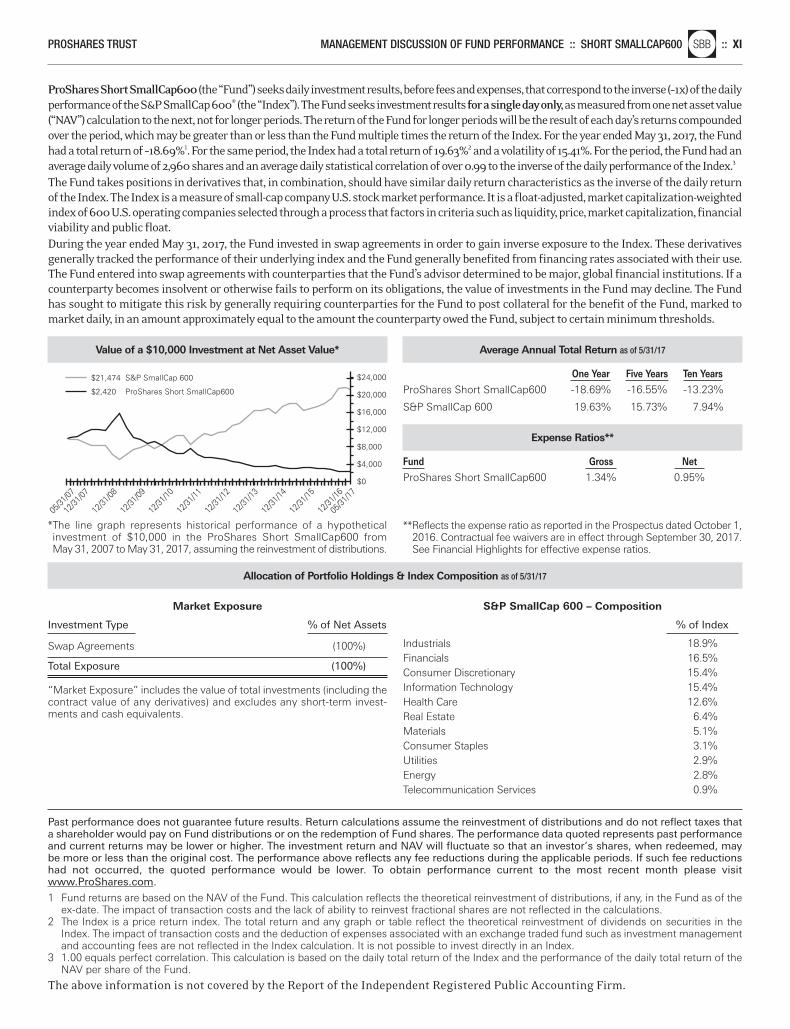
$21,474 S&P SmallCap 600
$2,420 ProShares Short SmallCap600
05/31
/07
12/31
/07
12/31
/08
12/31
/10
12/31
/16
12/31
/15
12/31
/14
12/31
/13
12/31
/12
12/31
/11
12/31
/09
05/31
/17
Average Annual Total Return as of 5/31/17
One Year Five Years Ten Years ProShares Short SmallCap600 -18.69% -16.55% -13.23%
S&P SmallCap 600 19.63% 15.73% 7.94%
Expense Ratios**
Fund Gross Net ProShares Short SmallCap600 1.34% 0.95%
**Reflects the expense ratio as reported in the Prospectus dated October 1,2016. Contractual fee waivers are in effect through September 30, 2017.See Financial Highlights for effective expense ratios.
Market Exposure
Investment Type % of Net Assets
Swap Agreements (100%)
Total Exposure (100%)
“Market Exposure” includes the value of total investments (including thecontract value of any derivatives) and excludes any short-term invest-ments and cash equivalents.
S&P SmallCap 600 – Composition
% of Index Industrials 18.9%Financials 16.5%Consumer Discretionary 15.4%Information Technology 15.4%Health Care 12.6%Real Estate 6.4%Materials 5.1%Consumer Staples 3.1%Utilities 2.9%Energy 2.8%Telecommunication Services 0.9%
ProShares Short SmallCap600(the “Fund”) seeks daily investment results, before fees and expenses, that correspond to the inverse (–1x) of the dailyperformance of the S&P SmallCap 600® (the “Index”). The Fund seeks investment results for a single day only,as measured from one net asset value(“NAV”) calculation to the next, not for longer periods. The return of the Fund for longer periods will be the result of each day’s returns compoundedover the period, which may be greater than or less than the Fund multiple times the return of the Index. For the year ended May 31, 2017, the Fundhad a total return of –18.69%1. For the same period, the Index had a total return of 19.63%2 and a volatility of 15.41%. For the period, the Fund had anaverage daily volume of 2,960 shares and an average daily statistical correlation of over 0.99 to the inverse of the daily performance of the Index.3
The Fund takes positions in derivatives that, in combination, should have similar daily return characteristics as the inverse of the daily returnof the Index. The Index is a measure of small-cap company U.S. stock market performance. It is a float-adjusted, market capitalization-weightedindex of 600 U.S. operating companies selected through a process that factors in criteria such as liquidity, price, market capitalization, financialviability and public float.During the year ended May 31, 2017, the Fund invested in swap agreements in order to gain inverse exposure to the Index. These derivativesgenerally tracked the performance of their underlying index and the Fund generally benefited from financing rates associated with their use.The Fund entered into swap agreements with counterparties that the Fund’s advisor determined to be major, global financial institutions. If acounterparty becomes insolvent or otherwise fails to perform on its obligations, the value of investments in the Fund may decline. The Fundhas sought to mitigate this risk by generally requiring counterparties for the Fund to post collateral for the benefit of the Fund, marked tomarket daily, in an amount approximately equal to the amount the counterparty owed the Fund, subject to certain minimum thresholds.
Allocation of Portfolio Holdings & Index Composition as of 5/31/17
Past performance does not guarantee future results. Return calculations assume the reinvestment of distributions and do not reflect taxes thata shareholder would pay on Fund distributions or on the redemption of Fund shares. The performance data quoted represents past performanceand current returns may be lower or higher. The investment return and NAV will fluctuate so that an investor’s shares, when redeemed, maybe more or less than the original cost. The performance above reflects any fee reductions during the applicable periods. If such fee reductionshad not occurred, the quoted performance would be lower. To obtain performance current to the most recent month please visitwww.ProShares.com.
1 Fund returns are based on the NAV of the Fund. This calculation reflects the theoretical reinvestment of distributions, if any, in the Fund as of theex-date. The impact of transaction costs and the lack of ability to reinvest fractional shares are not reflected in the calculations.
2 The Index is a price return index. The total return and any graph or table reflect the theoretical reinvestment of dividends on securities in theIndex. The impact of transaction costs and the deduction of expenses associated with an exchange traded fund such as investment managementand accounting fees are not reflected in the Index calculation. It is not possible to invest directly in an Index.
3 1.00 equals perfect correlation. This calculation is based on the daily total return of the Index and the performance of the daily total return of theNAV per share of the Fund.
The above information is not covered by the Report of the Independent Registered Public Accounting Firm.
Merrill Corp - Proshares Trust Geared Book [96 Funds] Annual Report [Funds] 333-089822 05-31-2017 ED [AUX] | eperez | 28-Jul-17 17:35 | 17-15159-3.ca | Sequence: 10CHKSUM Content: 44572 Layout: 61363 Graphics: 8217 CLEAN
JOB: 17-15159-3 CYCLE#;BL#: 5; 0 TRIM: 8.25" x 10.75" COMPOSITECOLORS: Black, ~note-color 2, ~note-color 3 GRAPHICS: 15159-3_SBB_L.eps V1.5
XII ::nlSDS ULTRASHORT S&P500® :: MANAGEMENT DISCUSSION OF FUND PERFORMANCE PROSHARES TRUST
Value of a $10,000 Investment at Net Asset Value*
*The line graph represents historical performance of a hypothetical investment of $10,000 in the ProShares UltraShort S&P500® fromMay 31, 2007 to May 31, 2017, assuming the reinvestment of distributions.
$25,000
$20,000
$0
$15,000
$5,000
$10,000
$19,554 S&P 500$789 ProShares UltraShort S&P500®
12/31
/07
12/31
/10
12/31
/09
12/31
/08
12/31
/16
12/31
/15
12/31
/14
12/31
/13
12/31
/12
12/31
/11
05/31
/17
05/31
/07
Average Annual Total Return as of 5/31/17
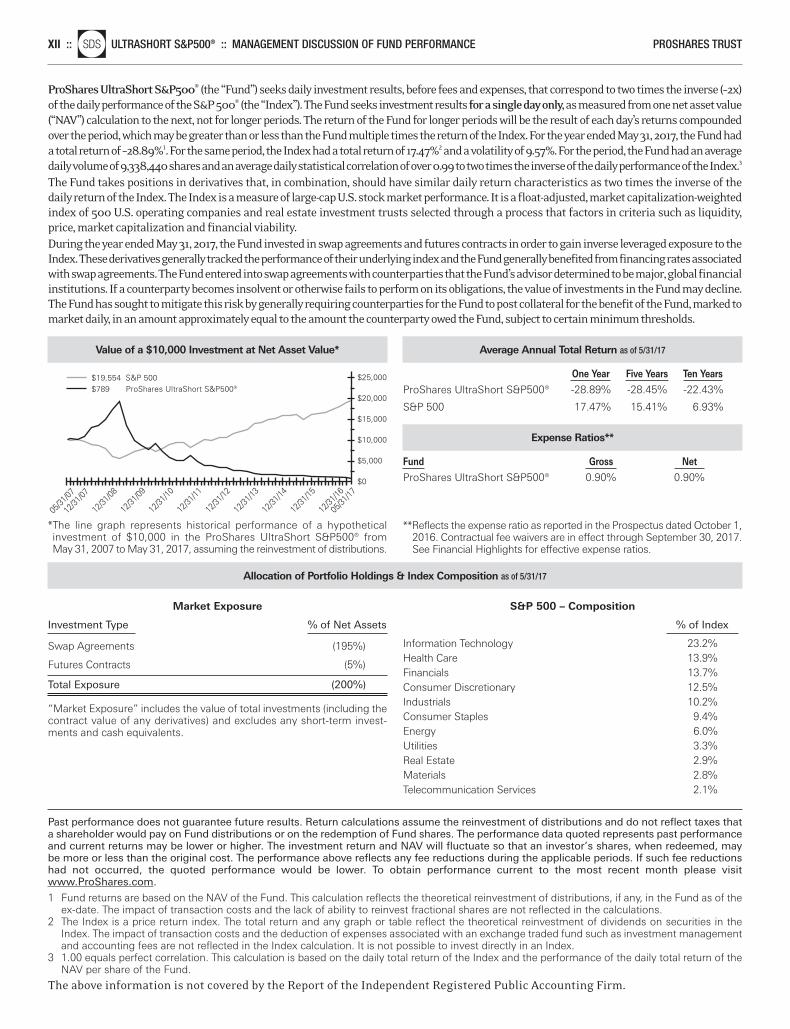
One Year Five Years Ten Years ProShares UltraShort S&P500® -28.89% -28.45% -22.43%
S&P 500 17.47% 15.41% 6.93%
Expense Ratios**
Fund Gross Net ProShares UltraShort S&P500® 0.90% 0.90%
**Reflects the expense ratio as reported in the Prospectus dated October 1,2016. Contractual fee waivers are in effect through September 30, 2017.See Financial Highlights for effective expense ratios.
Market Exposure
Investment Type % of Net Assets
Swap Agreements (195%)
Futures Contracts (5%)
Total Exposure (200%)
“Market Exposure” includes the value of total investments (including thecontract value of any derivatives) and excludes any short-term invest-ments and cash equivalents.
S&P 500 – Composition
% of Index Information Technology 23.2%Health Care 13.9%Financials 13.7%Consumer Discretionary 12.5%Industrials 10.2%Consumer Staples 9.4%Energy 6.0%Utilities 3.3%Real Estate 2.9%Materials 2.8%Telecommunication Services 2.1%
ProShares UltraShort S&P500® (the “Fund”) seeks daily investment results, before fees and expenses, that correspond to two times the inverse (–2x)of the daily performance of the S&P 500® (the “Index”). The Fund seeks investment results for a single day only,as measured from one net asset value(“NAV”) calculation to the next, not for longer periods. The return of the Fund for longer periods will be the result of each day’s returns compoundedover the period, which may be greater than or less than the Fund multiple times the return of the Index. For the year ended May 31, 2017, the Fund hada total return of –28.89%1. For the same period, the Index had a total return of 17.47%2 and a volatility of 9.57%. For the period, the Fund had an averagedaily volume of 9,338,440 shares and an average daily statistical correlation of over 0.99 to two times the inverse of the daily performance of the Index.3
The Fund takes positions in derivatives that, in combination, should have similar daily return characteristics as two times the inverse of thedaily return of the Index. The Index is a measure of large-cap U.S. stock market performance. It is a float-adjusted, market capitalization-weightedindex of 500 U.S. operating companies and real estate investment trusts selected through a process that factors in criteria such as liquidity,price, market capitalization and financial viability.During the year ended May 31, 2017, the Fund invested in swap agreements and futures contracts in order to gain inverse leveraged exposure to theIndex. These derivatives generally tracked the performance of their underlying index and the Fund generally benefited from financing rates associatedwith swap agreements. The Fund entered into swap agreements with counterparties that the Fund’s advisor determined to be major, global financialinstitutions. If a counterparty becomes insolvent or otherwise fails to perform on its obligations, the value of investments in the Fund may decline.The Fund has sought to mitigate this risk by generally requiring counterparties for the Fund to post collateral for the benefit of the Fund, marked tomarket daily, in an amount approximately equal to the amount the counterparty owed the Fund, subject to certain minimum thresholds.
Allocation of Portfolio Holdings & Index Composition as of 5/31/17
Past performance does not guarantee future results. Return calculations assume the reinvestment of distributions and do not reflect taxes thata shareholder would pay on Fund distributions or on the redemption of Fund shares. The performance data quoted represents past performanceand current returns may be lower or higher. The investment return and NAV will fluctuate so that an investor’s shares, when redeemed, maybe more or less than the original cost. The performance above reflects any fee reductions during the applicable periods. If such fee reductionshad not occurred, the quoted performance would be lower. To obtain performance current to the most recent month please visitwww.ProShares.com.
1 Fund returns are based on the NAV of the Fund. This calculation reflects the theoretical reinvestment of distributions, if any, in the Fund as of theex-date. The impact of transaction costs and the lack of ability to reinvest fractional shares are not reflected in the calculations.
2 The Index is a price return index. The total return and any graph or table reflect the theoretical reinvestment of dividends on securities in theIndex. The impact of transaction costs and the deduction of expenses associated with an exchange traded fund such as investment managementand accounting fees are not reflected in the Index calculation. It is not possible to invest directly in an Index.
3 1.00 equals perfect correlation. This calculation is based on the daily total return of the Index and the performance of the daily total return of theNAV per share of the Fund.
The above information is not covered by the Report of the Independent Registered Public Accounting Firm.
Merrill Corp - Proshares Trust Geared Book [96 Funds] Annual Report [Funds] 333-089822 05-31-2017 ED [AUX] | eperez | 28-Jul-17 17:35 | 17-15159-3.ca | Sequence: 11CHKSUM Content: 31168 Layout: 33648 Graphics: 2199 CLEAN
JOB: 17-15159-3 CYCLE#;BL#: 5; 0 TRIM: 8.25" x 10.75" COMPOSITECOLORS: Black, ~note-color 2, ~note-color 3 GRAPHICS: 15159-3_SDS_L.eps V1.5
PROSHARES TRUST MANAGEMENT DISCUSSION OF FUND PERFORMANCE :: ULTRASHORT QQQ®nlQID :: XIII
Value of a $10,000 Investment at Net Asset Value*
*The line graph represents historical performance of a hypothetical investment of $10,000 in the ProShares UltraShort QQQ® from May 31,2007 to May 31, 2017, assuming the reinvestment of distributions.
$35,000
$20,000
$25,000
$30,000
$0
$15,000
$5,000
$10,000
$33,304 NASDAQ-100 Index$219 ProShares UltraShort QQQ®
12/31
/07
12/31
/10
12/31
/09
12/31
/08
12/31
/16
12/31
/15
12/31
/14
12/31
/13
12/31
/12
12/31
/11
05/31
/17
05/31
/07
Average Annual Total Return as of 5/31/17
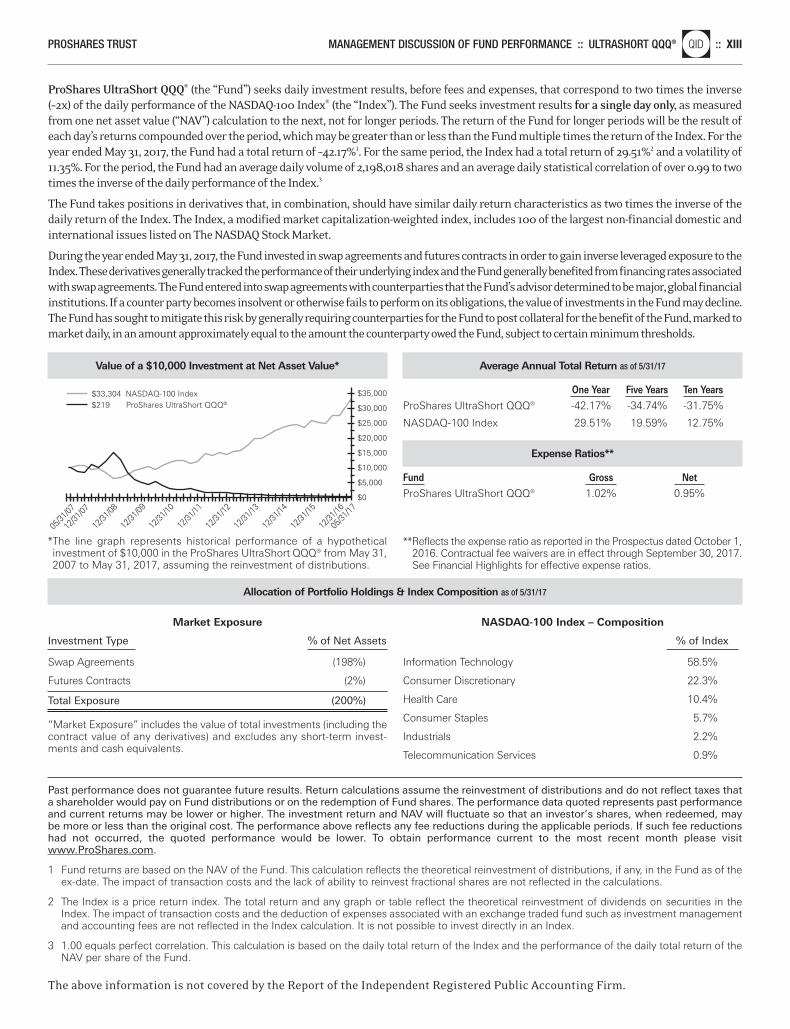
One Year Five Years Ten Years ProShares UltraShort QQQ® -42.17% -34.74% -31.75%
NASDAQ-100 Index 29.51% 19.59% 12.75%
Expense Ratios**
Fund Gross Net ProShares UltraShort QQQ® 1.02% 0.95%
**Reflects the expense ratio as reported in the Prospectus dated October 1,2016. Contractual fee waivers are in effect through September 30, 2017.See Financial Highlights for effective expense ratios.
Market Exposure
Investment Type % of Net Assets
Swap Agreements (198%)
Futures Contracts (2%)
Total Exposure (200%)
“Market Exposure” includes the value of total investments (including thecontract value of any derivatives) and excludes any short-term invest-ments and cash equivalents.
NASDAQ-100 Index – Composition
% of Index
Information Technology 58.5%
Consumer Discretionary 22.3%
Health Care 10.4%
Consumer Staples 5.7%
Industrials 2.2%
Telecommunication Services 0.9%
ProShares UltraShort QQQ® (the “Fund”) seeks daily investment results, before fees and expenses, that correspond to two times the inverse(–2x) of the daily performance of the NASDAQ-100 Index® (the “Index”). The Fund seeks investment results for a single day only, as measuredfrom one net asset value (“NAV”) calculation to the next, not for longer periods. The return of the Fund for longer periods will be the result ofeach day’s returns compounded over the period, which may be greater than or less than the Fund multiple times the return of the Index. For theyear ended May 31, 2017, the Fund had a total return of –42.17%1. For the same period, the Index had a total return of 29.51%2 and a volatility of11.35%. For the period, the Fund had an average daily volume of 2,198,018 shares and an average daily statistical correlation of over 0.99 to twotimes the inverse of the daily performance of the Index.3
The Fund takes positions in derivatives that, in combination, should have similar daily return characteristics as two times the inverse of thedaily return of the Index. The Index, a modified market capitalization-weighted index, includes 100 of the largest non-financial domestic andinternational issues listed on The NASDAQ Stock Market.
During the year ended May 31, 2017, the Fund invested in swap agreements and futures contracts in order to gain inverse leveraged exposure to theIndex. These derivatives generally tracked the performance of their underlying index and the Fund generally benefited from financing rates associatedwith swap agreements. The Fund entered into swap agreements with counterparties that the Fund’s advisor determined to be major, global financialinstitutions. If a counter party becomes insolvent or otherwise fails to perform on its obligations, the value of investments in the Fund may decline.The Fund has sought to mitigate this risk by generally requiring counterparties for the Fund to post collateral for the benefit of the Fund, marked tomarket daily, in an amount approximately equal to the amount the counterparty owed the Fund, subject to certain minimum thresholds.
Allocation of Portfolio Holdings & Index Composition as of 5/31/17
Past performance does not guarantee future results. Return calculations assume the reinvestment of distributions and do not reflect taxes thata shareholder would pay on Fund distributions or on the redemption of Fund shares. The performance data quoted represents past performanceand current returns may be lower or higher. The investment return and NAV will fluctuate so that an investor’s shares, when redeemed, maybe more or less than the original cost. The performance above reflects any fee reductions during the applicable periods. If such fee reductionshad not occurred, the quoted performance would be lower. To obtain performance current to the most recent month please visitwww.ProShares.com.
1 Fund returns are based on the NAV of the Fund. This calculation reflects the theoretical reinvestment of distributions, if any, in the Fund as of theex-date. The impact of transaction costs and the lack of ability to reinvest fractional shares are not reflected in the calculations.
2 The Index is a price return index. The total return and any graph or table reflect the theoretical reinvestment of dividends on securities in theIndex. The impact of transaction costs and the deduction of expenses associated with an exchange traded fund such as investment managementand accounting fees are not reflected in the Index calculation. It is not possible to invest directly in an Index.
3 1.00 equals perfect correlation. This calculation is based on the daily total return of the Index and the performance of the daily total return of theNAV per share of the Fund.
The above information is not covered by the Report of the Independent Registered Public Accounting Firm.
Merrill Corp - Proshares Trust Geared Book [96 Funds] Annual Report [Funds] 333-089822 05-31-2017 ED [AUX] | eperez | 28-Jul-17 17:35 | 17-15159-3.ca | Sequence: 12CHKSUM Content: 49668 Layout: 20101 Graphics: 40436 CLEAN
JOB: 17-15159-3 CYCLE#;BL#: 5; 0 TRIM: 8.25" x 10.75" COMPOSITECOLORS: Black, ~note-color 2, ~note-color 3 GRAPHICS: 15159-3_QID_L.eps V1.5
XIV ::nlDXD ULTRASHORT DOW30SM :: MANAGEMENT DISCUSSION OF FUND PERFORMANCE PROSHARES TRUST
Value of a $10,000 Investment at Net Asset Value*
*The line graph represents historical performance of a hypothetical investment of $10,000 in the ProShares UltraShort Dow30SM fromMay 31, 2007 to May 31, 2017, assuming the reinvestment of distributions.
$25,000
$20,000
$0
$15,000
$5,000
$10,000
$20,095 Dow Jones Industrial Average$883 ProShares UltraShort Dow30SM
12/31
/07
12/31
/10
12/31
/09
12/31
/08
12/31
/16
12/31
/15
12/31
/14
12/31
/13
12/31
/12
12/31
/11
05/31
/17
05/31
/07
Average Annual Total Return as of 5/31/17
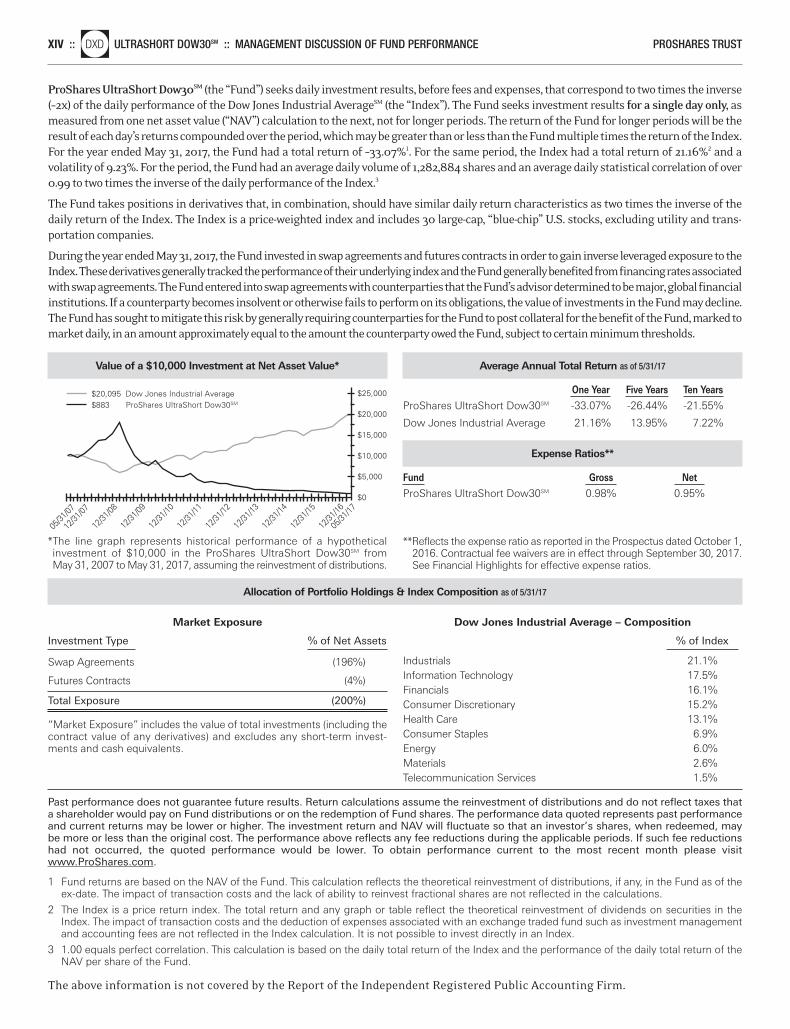
One Year Five Years Ten Years ProShares UltraShort Dow30SM -33.07% -26.44% -21.55%
Dow Jones Industrial Average 21.16% 13.95% 7.22%
Expense Ratios**
Fund Gross Net ProShares UltraShort Dow30SM 0.98% 0.95%
**Reflects the expense ratio as reported in the Prospectus dated October 1,2016. Contractual fee waivers are in effect through September 30, 2017.See Financial Highlights for effective expense ratios.
Market Exposure
Investment Type % of Net Assets
Swap Agreements (196%)
Futures Contracts (4%)
Total Exposure (200%)
“Market Exposure” includes the value of total investments (including thecontract value of any derivatives) and excludes any short-term invest-ments and cash equivalents.
Dow Jones Industrial Average – Composition
% of Index Industrials 21.1%Information Technology 17.5%Financials 16.1%Consumer Discretionary 15.2%Health Care 13.1%Consumer Staples 6.9%Energy 6.0%Materials 2.6%Telecommunication Services 1.5%
ProShares UltraShort Dow30SM (the “Fund”) seeks daily investment results, before fees and expenses, that correspond to two times the inverse(–2x) of the daily performance of the Dow Jones Industrial AverageSM (the “Index”). The Fund seeks investment results for a single day only, asmeasured from one net asset value (“NAV”) calculation to the next, not for longer periods. The return of the Fund for longer periods will be theresult of each day’s returns compounded over the period, which may be greater than or less than the Fund multiple times the return of the Index.For the year ended May 31, 2017, the Fund had a total return of –33.07%1. For the same period, the Index had a total return of 21.16%2 and avolatility of 9.23%. For the period, the Fund had an average daily volume of 1,282,884 shares and an average daily statistical correlation of over0.99 to two times the inverse of the daily performance of the Index.3
The Fund takes positions in derivatives that, in combination, should have similar daily return characteristics as two times the inverse of thedaily return of the Index. The Index is a price-weighted index and includes 30 large-cap, “blue-chip” U.S. stocks, excluding utility and trans-portation companies.
During the year ended May 31, 2017, the Fund invested in swap agreements and futures contracts in order to gain inverse leveraged exposure to theIndex. These derivatives generally tracked the performance of their underlying index and the Fund generally benefited from financing rates associatedwith swap agreements. The Fund entered into swap agreements with counterparties that the Fund’s advisor determined to be major, global financialinstitutions. If a counterparty becomes insolvent or otherwise fails to perform on its obligations, the value of investments in the Fund may decline.The Fund has sought to mitigate this risk by generally requiring counterparties for the Fund to post collateral for the benefit of the Fund, marked tomarket daily, in an amount approximately equal to the amount the counterparty owed the Fund, subject to certain minimum thresholds.
Allocation of Portfolio Holdings & Index Composition as of 5/31/17
Past performance does not guarantee future results. Return calculations assume the reinvestment of distributions and do not reflect taxes thata shareholder would pay on Fund distributions or on the redemption of Fund shares. The performance data quoted represents past performanceand current returns may be lower or higher. The investment return and NAV will fluctuate so that an investor’s shares, when redeemed, maybe more or less than the original cost. The performance above reflects any fee reductions during the applicable periods. If such fee reductionshad not occurred, the quoted performance would be lower. To obtain performance current to the most recent month please visitwww.ProShares.com.
1 Fund returns are based on the NAV of the Fund. This calculation reflects the theoretical reinvestment of distributions, if any, in the Fund as of theex-date. The impact of transaction costs and the lack of ability to reinvest fractional shares are not reflected in the calculations.
2 The Index is a price return index. The total return and any graph or table reflect the theoretical reinvestment of dividends on securities in theIndex. The impact of transaction costs and the deduction of expenses associated with an exchange traded fund such as investment managementand accounting fees are not reflected in the Index calculation. It is not possible to invest directly in an Index.
3 1.00 equals perfect correlation. This calculation is based on the daily total return of the Index and the performance of the daily total return of theNAV per share of the Fund.
The above information is not covered by the Report of the Independent Registered Public Accounting Firm.
Merrill Corp - Proshares Trust Geared Book [96 Funds] Annual Report [Funds] 333-089822 05-31-2017 ED [AUX] | eperez | 28-Jul-17 17:35 | 17-15159-3.ca | Sequence: 13CHKSUM Content: 25293 Layout: 37629 Graphics: 23766 CLEAN
JOB: 17-15159-3 CYCLE#;BL#: 5; 0 TRIM: 8.25" x 10.75" COMPOSITECOLORS: Black, ~note-color 2, ~note-color 3 GRAPHICS: 15159-3_DXD_L.eps V1.5
PROSHARES TRUST MANAGEMENT DISCUSSION OF FUND PERFORMANCE :: ULTRASHORT MIDCAP400nlMZZ :: XV
Value of a $10,000 Investment at Net Asset Value*
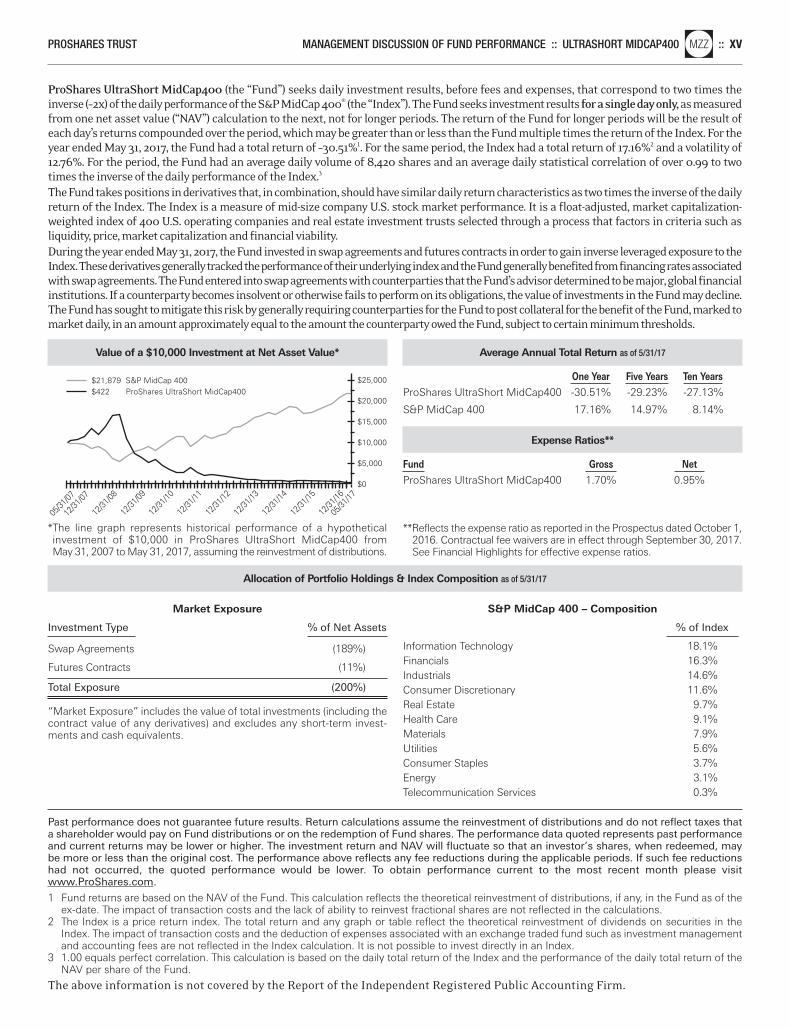
*The line graph represents historical performance of a hypothetical investment of $10,000 in ProShares UltraShort MidCap400 fromMay 31, 2007 to May 31, 2017, assuming the reinvestment of distributions.
$25,000
$20,000
$0
$15,000
$5,000
$10,000
$21,879 S&P MidCap 400$422 ProShares UltraShort MidCap400
12/31
/07
12/31
/10
12/31
/09
12/31
/08
12/31
/16
12/31
/15
12/31
/14
12/31
/13
12/31
/12
12/31
/11
05/31
/17
05/31
/07
Average Annual Total Return as of 5/31/17
One Year Five Years Ten Years ProShares UltraShort MidCap400 -30.51% -29.23% -27.13%
S&P MidCap 400 17.16% 14.97% 8.14%
Expense Ratios**
Fund Gross Net ProShares UltraShort MidCap400 1.70% 0.95%
**Reflects the expense ratio as reported in the Prospectus dated October 1,2016. Contractual fee waivers are in effect through September 30, 2017.See Financial Highlights for effective expense ratios.
Market Exposure
Investment Type % of Net Assets
Swap Agreements (189%)
Futures Contracts (11%)
Total Exposure (200%)
“Market Exposure” includes the value of total investments (including thecontract value of any derivatives) and excludes any short-term invest-ments and cash equivalents.
S&P MidCap 400 – Composition
% of Index Information Technology 18.1%Financials 16.3%Industrials 14.6%Consumer Discretionary 11.6%Real Estate 9.7%Health Care 9.1%Materials 7.9%Utilities 5.6%Consumer Staples 3.7%Energy 3.1%Telecommunication Services 0.3%
ProShares UltraShort MidCap400 (the “Fund”) seeks daily investment results, before fees and expenses, that correspond to two times theinverse (–2x) of the daily performance of the S&P MidCap 400® (the “Index”). The Fund seeks investment results for a single day only,as measuredfrom one net asset value (“NAV”) calculation to the next, not for longer periods. The return of the Fund for longer periods will be the result ofeach day’s returns compounded over the period, which may be greater than or less than the Fund multiple times the return of the Index. For theyear ended May 31, 2017, the Fund had a total return of –30.51%1. For the same period, the Index had a total return of 17.16%2 and a volatility of12.76%. For the period, the Fund had an average daily volume of 8,420 shares and an average daily statistical correlation of over 0.99 to twotimes the inverse of the daily performance of the Index.3
The Fund takes positions in derivatives that, in combination, should have similar daily return characteristics as two times the inverse of the dailyreturn of the Index. The Index is a measure of mid-size company U.S. stock market performance. It is a float-adjusted, market capitalization-weighted index of 400 U.S. operating companies and real estate investment trusts selected through a process that factors in criteria such asliquidity, price, market capitalization and financial viability.During the year ended May 31, 2017, the Fund invested in swap agreements and futures contracts in order to gain inverse leveraged exposure to theIndex. These derivatives generally tracked the performance of their underlying index and the Fund generally benefited from financing rates associatedwith swap agreements. The Fund entered into swap agreements with counterparties that the Fund’s advisor determined to be major, global financialinstitutions. If a counterparty becomes insolvent or otherwise fails to perform on its obligations, the value of investments in the Fund may decline.The Fund has sought to mitigate this risk by generally requiring counterparties for the Fund to post collateral for the benefit of the Fund, marked tomarket daily, in an amount approximately equal to the amount the counterparty owed the Fund, subject to certain minimum thresholds.
Allocation of Portfolio Holdings & Index Composition as of 5/31/17
Past performance does not guarantee future results. Return calculations assume the reinvestment of distributions and do not reflect taxes thata shareholder would pay on Fund distributions or on the redemption of Fund shares. The performance data quoted represents past performanceand current returns may be lower or higher. The investment return and NAV will fluctuate so that an investor’s shares, when redeemed, maybe more or less than the original cost. The performance above reflects any fee reductions during the applicable periods. If such fee reductionshad not occurred, the quoted performance would be lower. To obtain performance current to the most recent month please visitwww.ProShares.com.
1 Fund returns are based on the NAV of the Fund. This calculation reflects the theoretical reinvestment of distributions, if any, in the Fund as of theex-date. The impact of transaction costs and the lack of ability to reinvest fractional shares are not reflected in the calculations.
2 The Index is a price return index. The total return and any graph or table reflect the theoretical reinvestment of dividends on securities in theIndex. The impact of transaction costs and the deduction of expenses associated with an exchange traded fund such as investment managementand accounting fees are not reflected in the Index calculation. It is not possible to invest directly in an Index.
3 1.00 equals perfect correlation. This calculation is based on the daily total return of the Index and the performance of the daily total return of theNAV per share of the Fund.
The above information is not covered by the Report of the Independent Registered Public Accounting Firm.
Merrill Corp - Proshares Trust Geared Book [96 Funds] Annual Report [Funds] 333-089822 05-31-2017 ED [AUX] | eperez | 28-Jul-17 17:35 | 17-15159-3.ca | Sequence: 14CHKSUM Content: 23900 Layout: 22511 Graphics: 53134 CLEAN
JOB: 17-15159-3 CYCLE#;BL#: 5; 0 TRIM: 8.25" x 10.75" COMPOSITECOLORS: Black, ~note-color 2, ~note-color 3 GRAPHICS: 15159-3_MZZ_L.eps V1.5
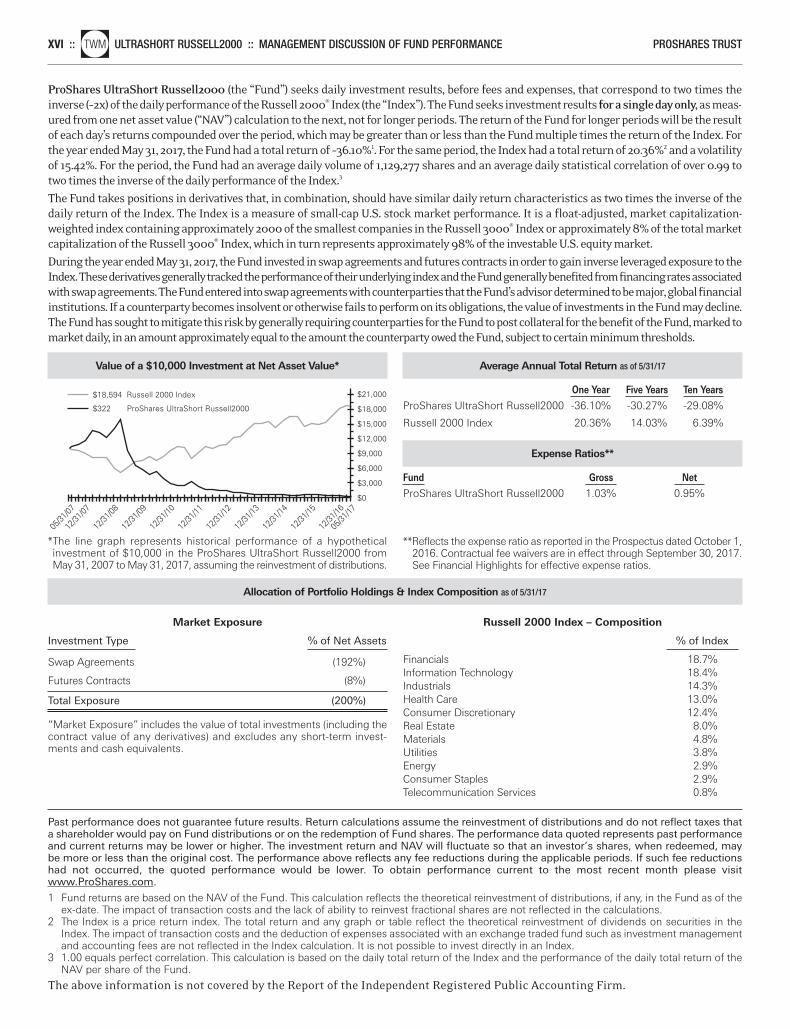
XVI ::nlTWM ULTRASHORT RUSSELL2000 :: MANAGEMENT DISCUSSION OF FUND PERFORMANCE PROSHARES TRUST
Value of a $10,000 Investment at Net Asset Value*
*The line graph represents historical performance of a hypothetical investment of $10,000 in the ProShares UltraShort Russell2000 fromMay 31, 2007 to May 31, 2017, assuming the reinvestment of distributions.
$21,000
$18,000
$0
$12,000
$15,000
$3,000
$6,000
$9,000
$18,594 Russell 2000 Index
$322 ProShares UltraShort Russell2000
12/31
/07
12/31
/08
12/31
/10
12/31
/16
12/31
/15
12/31
/14
12/31
/13
12/31
/12
12/31
/11
12/31
/09
05/31
/17
05/31
/07
Average Annual Total Return as of 5/31/17
One Year Five Years Ten Years ProShares UltraShort Russell2000 -36.10% -30.27% -29.08%
Russell 2000 Index 20.36% 14.03% 6.39%
Expense Ratios**
Fund Gross Net ProShares UltraShort Russell2000 1.03% 0.95%
**Reflects the expense ratio as reported in the Prospectus dated October 1,2016. Contractual fee waivers are in effect through September 30, 2017.See Financial Highlights for effective expense ratios.
Market Exposure
Investment Type % of Net Assets
Swap Agreements (192%)
Futures Contracts (8%)
Total Exposure (200%)
“Market Exposure” includes the value of total investments (including thecontract value of any derivatives) and excludes any short-term invest-ments and cash equivalents.
Russell 2000 Index – Composition
% of Index Financials 18.7%Information Technology 18.4%Industrials 14.3%Health Care 13.0%Consumer Discretionary 12.4%Real Estate 8.0%Materials 4.8%Utilities 3.8%Energy 2.9%Consumer Staples 2.9%Telecommunication Services 0.8%
ProShares UltraShort Russell2000 (the “Fund”) seeks daily investment results, before fees and expenses, that correspond to two times theinverse (–2x) of the daily performance of the Russell 2000® Index (the “Index”). The Fund seeks investment results for a single day only,as meas-ured from one net asset value (“NAV”) calculation to the next, not for longer periods. The return of the Fund for longer periods will be the resultof each day’s returns compounded over the period, which may be greater than or less than the Fund multiple times the return of the Index. Forthe year ended May 31, 2017, the Fund had a total return of –36.10%1. For the same period, the Index had a total return of 20.36%2 and a volatilityof 15.42%. For the period, the Fund had an average daily volume of 1,129,277 shares and an average daily statistical correlation of over 0.99 totwo times the inverse of the daily performance of the Index.3
The Fund takes positions in derivatives that, in combination, should have similar daily return characteristics as two times the inverse of thedaily return of the Index. The Index is a measure of small-cap U.S. stock market performance. It is a float-adjusted, market capitalization-weighted index containing approximately 2000 of the smallest companies in the Russell 3000® Index or approximately 8% of the total marketcapitalization of the Russell 3000® Index, which in turn represents approximately 98% of the investable U.S. equity market.
During the year ended May 31, 2017, the Fund invested in swap agreements and futures contracts in order to gain inverse leveraged exposure to theIndex. These derivatives generally tracked the performance of their underlying index and the Fund generally benefited from financing rates associatedwith swap agreements. The Fund entered into swap agreements with counterparties that the Fund’s advisor determined to be major, global financialinstitutions. If a counterparty becomes insolvent or otherwise fails to perform on its obligations, the value of investments in the Fund may decline.The Fund has sought to mitigate this risk by generally requiring counterparties for the Fund to post collateral for the benefit of the Fund, marked tomarket daily, in an amount approximately equal to the amount the counterparty owed the Fund, subject to certain minimum thresholds.
Allocation of Portfolio Holdings & Index Composition as of 5/31/17
Past performance does not guarantee future results. Return calculations assume the reinvestment of distributions and do not reflect taxes thata shareholder would pay on Fund distributions or on the redemption of Fund shares. The performance data quoted represents past performanceand current returns may be lower or higher. The investment return and NAV will fluctuate so that an investor’s shares, when redeemed, maybe more or less than the original cost. The performance above reflects any fee reductions during the applicable periods. If such fee reductionshad not occurred, the quoted performance would be lower. To obtain performance current to the most recent month please visitwww.ProShares.com.
1 Fund returns are based on the NAV of the Fund. This calculation reflects the theoretical reinvestment of distributions, if any, in the Fund as of theex-date. The impact of transaction costs and the lack of ability to reinvest fractional shares are not reflected in the calculations.
2 The Index is a price return index. The total return and any graph or table reflect the theoretical reinvestment of dividends on securities in theIndex. The impact of transaction costs and the deduction of expenses associated with an exchange traded fund such as investment managementand accounting fees are not reflected in the Index calculation. It is not possible to invest directly in an Index.
3 1.00 equals perfect correlation. This calculation is based on the daily total return of the Index and the performance of the daily total return of theNAV per share of the Fund.
The above information is not covered by the Report of the Independent Registered Public Accounting Firm.
Merrill Corp - Proshares Trust Geared Book [96 Funds] Annual Report [Funds] 333-089822 05-31-2017 ED [AUX] | eperez | 28-Jul-17 17:35 | 17-15159-3.ca | Sequence: 15CHKSUM Content: 20163 Layout: 46561 Graphics: 44107 CLEAN
JOB: 17-15159-3 CYCLE#;BL#: 5; 0 TRIM: 8.25" x 10.75" COMPOSITECOLORS: Black, ~note-color 2, ~note-color 3 GRAPHICS: 15159-3_TWM_L.eps V1.5
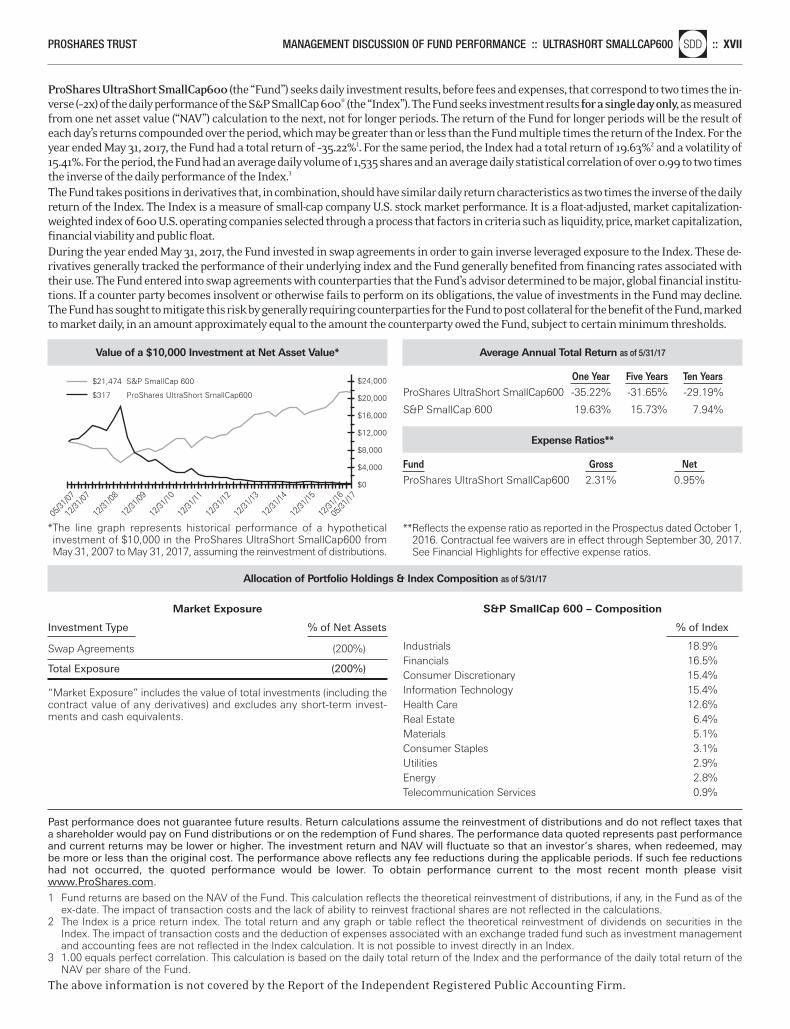
PROSHARES TRUST MANAGEMENT DISCUSSION OF FUND PERFORMANCE :: ULTRASHORT SMALLCAP600nlSDD :: XVII
Value of a $10,000 Investment at Net Asset Value*
*The line graph represents historical performance of a hypothetical investment of $10,000 in the ProShares UltraShort SmallCap600 fromMay 31, 2007 to May 31, 2017, assuming the reinvestment of distributions.
$24,000
$20,000
$16,000
$0
$12,000
$4,000
$8,000
$21,474 S&P SmallCap 600
$317 ProShares UltraShort SmallCap600
05/31
/07
12/31
/07
12/31
/08
12/31
/10
12/31
/16
12/31
/15
12/31
/14
12/31
/13
12/31
/12
12/31
/11
12/31
/09
05/31
/17
Average Annual Total Return as of 5/31/17
One Year Five Years Ten Years ProShares UltraShort SmallCap600 -35.22% -31.65% -29.19%
S&P SmallCap 600 19.63% 15.73% 7.94%
Expense Ratios**
Fund Gross Net ProShares UltraShort SmallCap600 2.31% 0.95%
**Reflects the expense ratio as reported in the Prospectus dated October 1,2016. Contractual fee waivers are in effect through September 30, 2017.See Financial Highlights for effective expense ratios.
Market Exposure
Investment Type % of Net Assets
Swap Agreements (200%)
Total Exposure (200%)
“Market Exposure” includes the value of total investments (including thecontract value of any derivatives) and excludes any short-term invest-ments and cash equivalents.
S&P SmallCap 600 – Composition
% of Index Industrials 18.9%Financials 16.5%Consumer Discretionary 15.4%Information Technology 15.4%Health Care 12.6%Real Estate 6.4%Materials 5.1%Consumer Staples 3.1%Utilities 2.9%Energy 2.8%Telecommunication Services 0.9%
ProShares UltraShort SmallCap600 (the “Fund”) seeks daily investment results, before fees and expenses, that correspond to two times the in-verse (–2x) of the daily performance of the S&P SmallCap 600® (the “Index”). The Fund seeks investment results for a single day only,as measuredfrom one net asset value (“NAV”) calculation to the next, not for longer periods. The return of the Fund for longer periods will be the result ofeach day’s returns compounded over the period, which may be greater than or less than the Fund multiple times the return of the Index. For theyear ended May 31, 2017, the Fund had a total return of –35.22%1. For the same period, the Index had a total return of 19.63%2 and a volatility of15.41%. For the period, the Fund had an average daily volume of 1,535 shares and an average daily statistical correlation of over 0.99 to two timesthe inverse of the daily performance of the Index.3
The Fund takes positions in derivatives that, in combination, should have similar daily return characteristics as two times the inverse of the dailyreturn of the Index. The Index is a measure of small-cap company U.S. stock market performance. It is a float-adjusted, market capitalization-weighted index of 600 U.S. operating companies selected through a process that factors in criteria such as liquidity, price, market capitalization,financial viability and public float.During the year ended May 31, 2017, the Fund invested in swap agreements in order to gain inverse leveraged exposure to the Index. These de-rivatives generally tracked the performance of their underlying index and the Fund generally benefited from financing rates associated withtheir use. The Fund entered into swap agreements with counterparties that the Fund’s advisor determined to be major, global financial institu-tions. If a counter party becomes insolvent or otherwise fails to perform on its obligations, the value of investments in the Fund may decline.The Fund has sought to mitigate this risk by generally requiring counterparties for the Fund to post collateral for the benefit of the Fund, markedto market daily, in an amount approximately equal to the amount the counterparty owed the Fund, subject to certain minimum thresholds.
Allocation of Portfolio Holdings & Index Composition as of 5/31/17
Past performance does not guarantee future results. Return calculations assume the reinvestment of distributions and do not reflect taxes thata shareholder would pay on Fund distributions or on the redemption of Fund shares. The performance data quoted represents past performanceand current returns may be lower or higher. The investment return and NAV will fluctuate so that an investor’s shares, when redeemed, maybe more or less than the original cost. The performance above reflects any fee reductions during the applicable periods. If such fee reductionshad not occurred, the quoted performance would be lower. To obtain performance current to the most recent month please visitwww.ProShares.com.
1 Fund returns are based on the NAV of the Fund. This calculation reflects the theoretical reinvestment of distributions, if any, in the Fund as of theex-date. The impact of transaction costs and the lack of ability to reinvest fractional shares are not reflected in the calculations.
2 The Index is a price return index. The total return and any graph or table reflect the theoretical reinvestment of dividends on securities in theIndex. The impact of transaction costs and the deduction of expenses associated with an exchange traded fund such as investment managementand accounting fees are not reflected in the Index calculation. It is not possible to invest directly in an Index.
3 1.00 equals perfect correlation. This calculation is based on the daily total return of the Index and the performance of the daily total return of theNAV per share of the Fund.
The above information is not covered by the Report of the Independent Registered Public Accounting Firm.
Merrill Corp - Proshares Trust Geared Book [96 Funds] Annual Report [Funds] 333-089822 05-31-2017 ED [AUX] | eperez | 28-Jul-17 17:35 | 17-15159-3.ca | Sequence: 16CHKSUM Content: 47505 Layout: 33389 Graphics: 57205 CLEAN
JOB: 17-15159-3 CYCLE#;BL#: 5; 0 TRIM: 8.25" x 10.75" COMPOSITECOLORS: Black, ~note-color 2, ~note-color 3 GRAPHICS: 15159-3_SDD_L.eps V1.5
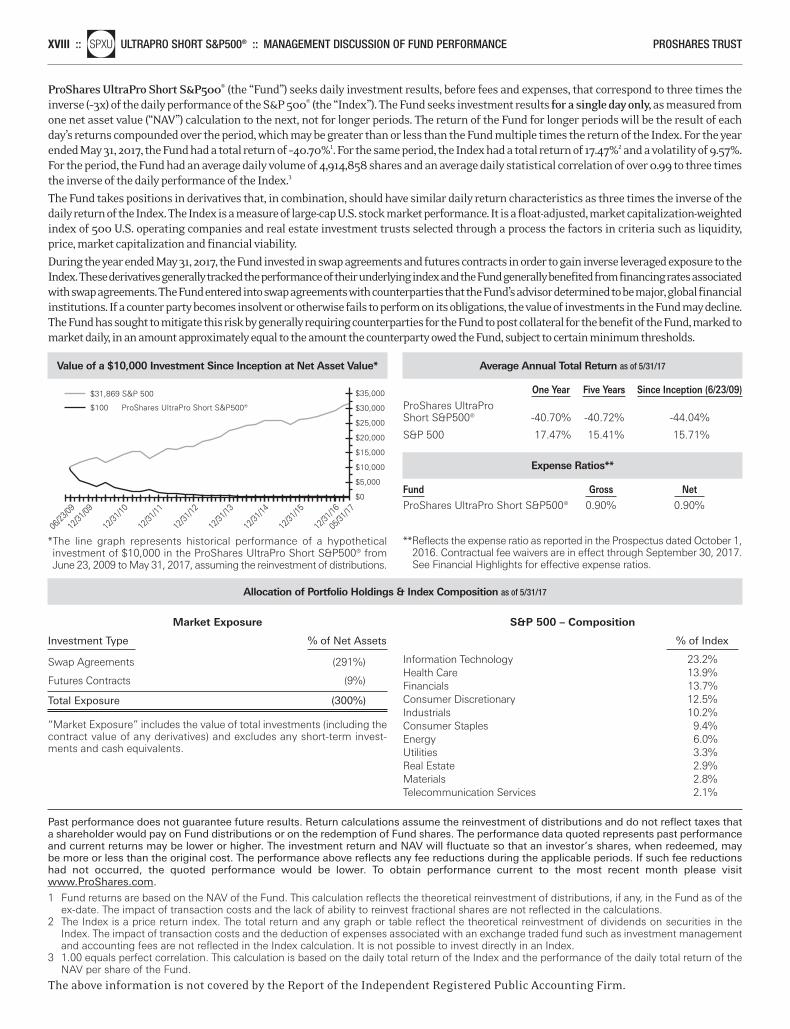
XVIII ::nlSPXU ULTRAPRO SHORT S&P500® :: MANAGEMENT DISCUSSION OF FUND PERFORMANCE PROSHARES TRUST
Value of a $10,000 Investment Since Inception at Net Asset Value*
*The line graph represents historical performance of a hypothetical investment of $10,000 in the ProShares UltraPro Short S&P500® fromJune 23, 2009 to May 31, 2017, assuming the reinvestment of distributions.
$31,869 S&P 500
$100 ProShares UltraPro Short S&P500®
06/23
/09
12/31
/09
12/31
/10
12/31
/11
12/31
/12
12/31
/16
12/31
/15
12/31
/14
12/31
/13
05/31
/17
$35,000
$30,000
$25,000
$0
$10,000
$5,000
$15,000
$20,000
Average Annual Total Return as of 5/31/17
One Year Five Years Since Inception (6/23/09) ProShares UltraPro Short S&P500® -40.70% -40.72% -44.04%
S&P 500 17.47% 15.41% 15.71%
Expense Ratios**
Fund Gross Net ProShares UltraPro Short S&P500® 0.90% 0.90%
**Reflects the expense ratio as reported in the Prospectus dated October 1,2016. Contractual fee waivers are in effect through September 30, 2017.See Financial Highlights for effective expense ratios.
Market Exposure
Investment Type % of Net Assets
Swap Agreements (291%)
Futures Contracts (9%)
Total Exposure (300%)
“Market Exposure” includes the value of total investments (including thecontract value of any derivatives) and excludes any short-term invest-ments and cash equivalents.
S&P 500 – Composition
% of Index Information Technology 23.2%Health Care 13.9%Financials 13.7%Consumer Discretionary 12.5%Industrials 10.2%Consumer Staples 9.4%Energy 6.0%Utilities 3.3%Real Estate 2.9%Materials 2.8%Telecommunication Services 2.1%
ProShares UltraPro Short S&P500® (the “Fund”) seeks daily investment results, before fees and expenses, that correspond to three times theinverse (–3x) of the daily performance of the S&P 500® (the “Index”). The Fund seeks investment results for a single day only, as measured fromone net asset value (“NAV”) calculation to the next, not for longer periods. The return of the Fund for longer periods will be the result of eachday’s returns compounded over the period, which may be greater than or less than the Fund multiple times the return of the Index. For the yearended May 31, 2017, the Fund had a total return of –40.70%1. For the same period, the Index had a total return of 17.47%2 and a volatility of 9.57%.For the period, the Fund had an average daily volume of 4,914,858 shares and an average daily statistical correlation of over 0.99 to three timesthe inverse of the daily performance of the Index.3
The Fund takes positions in derivatives that, in combination, should have similar daily return characteristics as three times the inverse of thedaily return of the Index. The Index is a measure of large-cap U.S. stock market performance. It is a float-adjusted, market capitalization-weightedindex of 500 U.S. operating companies and real estate investment trusts selected through a process the factors in criteria such as liquidity,price, market capitalization and financial viability.
During the year ended May 31, 2017, the Fund invested in swap agreements and futures contracts in order to gain inverse leveraged exposure to theIndex. These derivatives generally tracked the performance of their underlying index and the Fund generally benefited from financing rates associatedwith swap agreements. The Fund entered into swap agreements with counterparties that the Fund’s advisor determined to be major, global financialinstitutions. If a counter party becomes insolvent or otherwise fails to perform on its obligations, the value of investments in the Fund may decline.The Fund has sought to mitigate this risk by generally requiring counterparties for the Fund to post collateral for the benefit of the Fund, marked tomarket daily, in an amount approximately equal to the amount the counterparty owed the Fund, subject to certain minimum thresholds.
Allocation of Portfolio Holdings & Index Composition as of 5/31/17
Past performance does not guarantee future results. Return calculations assume the reinvestment of distributions and do not reflect taxes thata shareholder would pay on Fund distributions or on the redemption of Fund shares. The performance data quoted represents past performanceand current returns may be lower or higher. The investment return and NAV will fluctuate so that an investor’s shares, when redeemed, maybe more or less than the original cost. The performance above reflects any fee reductions during the applicable periods. If such fee reductionshad not occurred, the quoted performance would be lower. To obtain performance current to the most recent month please visitwww.ProShares.com.
1 Fund returns are based on the NAV of the Fund. This calculation reflects the theoretical reinvestment of distributions, if any, in the Fund as of theex-date. The impact of transaction costs and the lack of ability to reinvest fractional shares are not reflected in the calculations.
2 The Index is a price return index. The total return and any graph or table reflect the theoretical reinvestment of dividends on securities in theIndex. The impact of transaction costs and the deduction of expenses associated with an exchange traded fund such as investment managementand accounting fees are not reflected in the Index calculation. It is not possible to invest directly in an Index.
3 1.00 equals perfect correlation. This calculation is based on the daily total return of the Index and the performance of the daily total return of theNAV per share of the Fund.
The above information is not covered by the Report of the Independent Registered Public Accounting Firm.
Merrill Corp - Proshares Trust Geared Book [96 Funds] Annual Report [Funds] 333-089822 05-31-2017 ED [AUX] | eperez | 28-Jul-17 17:35 | 17-15159-3.ca | Sequence: 17CHKSUM Content: 37167 Layout: 26744 Graphics: 43875 CLEAN
JOB: 17-15159-3 CYCLE#;BL#: 5; 0 TRIM: 8.25" x 10.75" COMPOSITECOLORS: Black, ~note-color 2, ~note-color 3 GRAPHICS: 15159-3_SPXU_L.eps V1.5
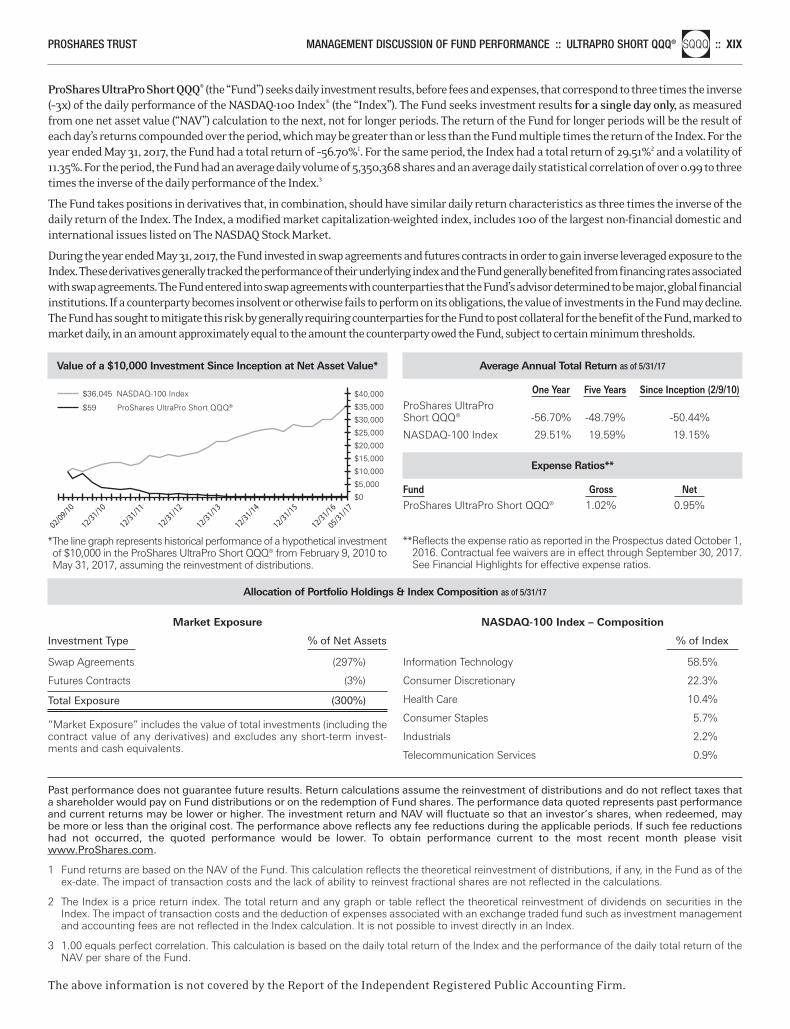
PROSHARES TRUST MANAGEMENT DISCUSSION OF FUND PERFORMANCE :: ULTRAPRO SHORT QQQ®nlSQQQ :: XIX
Value of a $10,000 Investment Since Inception at Net Asset Value*
*The line graph represents historical performance of a hypothetical investmentof $10,000 in the ProShares UltraPro Short QQQ® from February 9, 2010 toMay 31, 2017, assuming the reinvestment of distributions.
$36,045 NASDAQ-100 Index
$59 ProShares UltraPro Short QQQ®
02/09/10
12/31/10
12/31/16
12/31/15
12/31/14
12/31/13
12/31/12
12/31/11
05/31/17
$40,000
$35,000
$30,000
$25,000
$20,000
$0
$15,000
$5,000
$10,000
Average Annual Total Return as of 5/31/17
One Year Five Years Since Inception (2/9/10) ProShares UltraPro Short QQQ® -56.70% -48.79% -50.44%
NASDAQ-100 Index 29.51% 19.59% 19.15%
Expense Ratios**
Fund Gross Net ProShares UltraPro Short QQQ® 1.02% 0.95%
**Reflects the expense ratio as reported in the Prospectus dated October 1,2016. Contractual fee waivers are in effect through September 30, 2017.See Financial Highlights for effective expense ratios.
Market Exposure
Investment Type % of Net Assets
Swap Agreements (297%)
Futures Contracts (3%)
Total Exposure (300%)
“Market Exposure” includes the value of total investments (including thecontract value of any derivatives) and excludes any short-term invest-ments and cash equivalents.
NASDAQ-100 Index – Composition
% of Index
Information Technology 58.5%
Consumer Discretionary 22.3%
Health Care 10.4%
Consumer Staples 5.7%
Industrials 2.2%
Telecommunication Services 0.9%
ProShares UltraPro Short QQQ® (the “Fund”) seeks daily investment results, before fees and expenses, that correspond to three times the inverse(–3x) of the daily performance of the NASDAQ-100 Index® (the “Index”). The Fund seeks investment results for a single day only, as measuredfrom one net asset value (“NAV”) calculation to the next, not for longer periods. The return of the Fund for longer periods will be the result ofeach day’s returns compounded over the period, which may be greater than or less than the Fund multiple times the return of the Index. For theyear ended May 31, 2017, the Fund had a total return of –56.70%1. For the same period, the Index had a total return of 29.51%2 and a volatility of11.35%. For the period, the Fund had an average daily volume of 5,350,368 shares and an average daily statistical correlation of over 0.99 to threetimes the inverse of the daily performance of the Index.3
The Fund takes positions in derivatives that, in combination, should have similar daily return characteristics as three times the inverse of thedaily return of the Index. The Index, a modified market capitalization-weighted index, includes 100 of the largest non-financial domestic andinternational issues listed on The NASDAQ Stock Market.
During the year ended May 31, 2017, the Fund invested in swap agreements and futures contracts in order to gain inverse leveraged exposure to theIndex. These derivatives generally tracked the performance of their underlying index and the Fund generally benefited from financing rates associatedwith swap agreements. The Fund entered into swap agreements with counterparties that the Fund’s advisor determined to be major, global financialinstitutions. If a counterparty becomes insolvent or otherwise fails to perform on its obligations, the value of investments in the Fund may decline.The Fund has sought to mitigate this risk by generally requiring counterparties for the Fund to post collateral for the benefit of the Fund, marked tomarket daily, in an amount approximately equal to the amount the counterparty owed the Fund, subject to certain minimum thresholds.
Allocation of Portfolio Holdings & Index Composition as of 5/31/17
Past performance does not guarantee future results. Return calculations assume the reinvestment of distributions and do not reflect taxes thata shareholder would pay on Fund distributions or on the redemption of Fund shares. The performance data quoted represents past performanceand current returns may be lower or higher. The investment return and NAV will fluctuate so that an investor’s shares, when redeemed, maybe more or less than the original cost. The performance above reflects any fee reductions during the applicable periods. If such fee reductionshad not occurred, the quoted performance would be lower. To obtain performance current to the most recent month please visitwww.ProShares.com.
1 Fund returns are based on the NAV of the Fund. This calculation reflects the theoretical reinvestment of distributions, if any, in the Fund as of theex-date. The impact of transaction costs and the lack of ability to reinvest fractional shares are not reflected in the calculations.
2 The Index is a price return index. The total return and any graph or table reflect the theoretical reinvestment of dividends on securities in theIndex. The impact of transaction costs and the deduction of expenses associated with an exchange traded fund such as investment managementand accounting fees are not reflected in the Index calculation. It is not possible to invest directly in an Index.
3 1.00 equals perfect correlation. This calculation is based on the daily total return of the Index and the performance of the daily total return of theNAV per share of the Fund.
The above information is not covered by the Report of the Independent Registered Public Accounting Firm.
Merrill Corp - Proshares Trust Geared Book [96 Funds] Annual Report [Funds] 333-089822 05-31-2017 ED [AUX] | eperez | 28-Jul-17 17:35 | 17-15159-3.ca | Sequence: 18CHKSUM Content: 43247 Layout: 47563 Graphics: 9897 CLEAN
JOB: 17-15159-3 CYCLE#;BL#: 5; 0 TRIM: 8.25" x 10.75" COMPOSITECOLORS: Black, ~note-color 2, ~note-color 3 GRAPHICS: 15159-3_SQQQ_L.eps V1.5
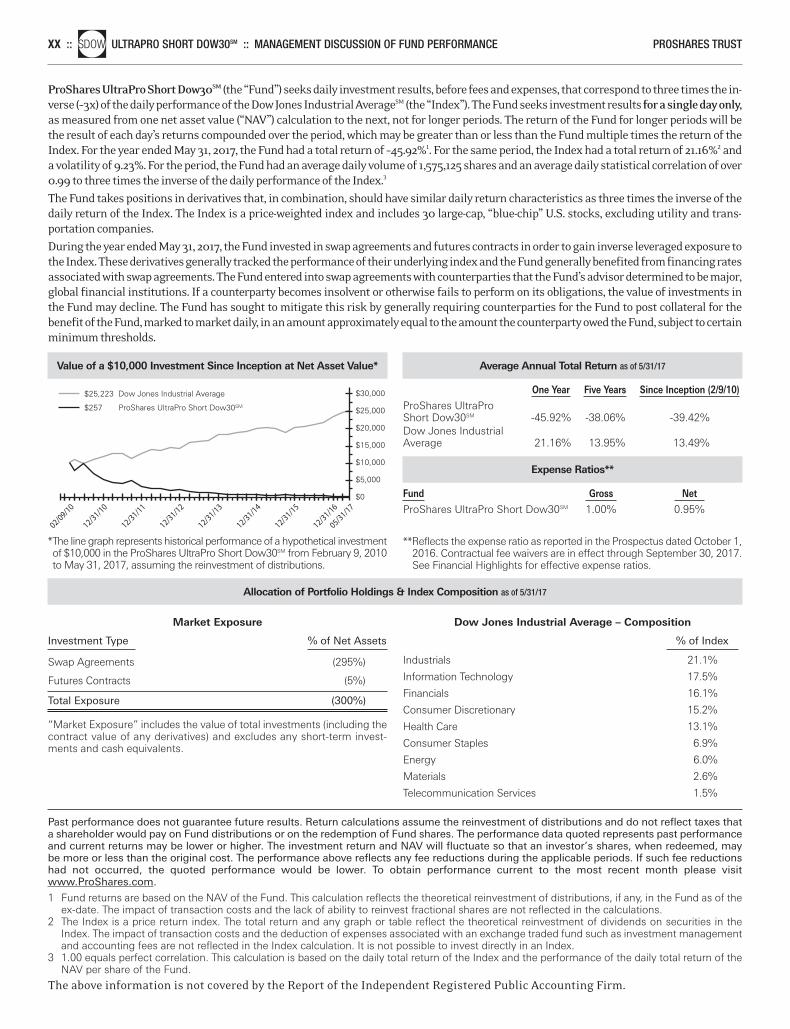
XX ::nlSDOW ULTRAPRO SHORT DOW30SM :: MANAGEMENT DISCUSSION OF FUND PERFORMANCE PROSHARES TRUST
Value of a $10,000 Investment Since Inception at Net Asset Value*
*The line graph represents historical performance of a hypothetical investmentof $10,000 in the ProShares UltraPro Short Dow30SM from February 9, 2010to May 31, 2017, assuming the reinvestment of distributions.
$30,000
$25,000
$20,000
$0
$5,000
$10,000
$15,000
$25,223 Dow Jones Industrial Average
$257 ProShares UltraPro Short Dow30SM
02/09/10
12/31/10
12/31/16
12/31/15
12/31/14
12/31/13
12/31/12
12/31/11
05/31/17
Average Annual Total Return as of 5/31/17
One Year Five Years Since Inception (2/9/10) ProShares UltraPro Short Dow30SM -45.92% -38.06% -39.42%Dow Jones Industrial Average 21.16% 13.95% 13.49%
Expense Ratios**
Fund Gross Net ProShares UltraPro Short Dow30SM 1.00% 0.95%
**Reflects the expense ratio as reported in the Prospectus dated October 1,2016. Contractual fee waivers are in effect through September 30, 2017.See Financial Highlights for effective expense ratios.
Market Exposure
Investment Type % of Net Assets
Swap Agreements (295%)
Futures Contracts (5%)
Total Exposure (300%)
“Market Exposure” includes the value of total investments (including thecontract value of any derivatives) and excludes any short-term invest-ments and cash equivalents.
Dow Jones Industrial Average – Composition
% of Index Industrials 21.1%
Information Technology 17.5%
Financials 16.1%
Consumer Discretionary 15.2%
Health Care 13.1%
Consumer Staples 6.9%
Energy 6.0%
Materials 2.6%
Telecommunication Services 1.5%
ProShares UltraPro Short Dow30SM (the “Fund”) seeks daily investment results, before fees and expenses, that correspond to three times the in-verse (–3x) of the daily performance of the Dow Jones Industrial AverageSM (the “Index”). The Fund seeks investment results for a single day only,as measured from one net asset value (“NAV”) calculation to the next, not for longer periods. The return of the Fund for longer periods will bethe result of each day’s returns compounded over the period, which may be greater than or less than the Fund multiple times the return of theIndex. For the year ended May 31, 2017, the Fund had a total return of –45.92%1. For the same period, the Index had a total return of 21.16%2 anda volatility of 9.23%. For the period, the Fund had an average daily volume of 1,575,125 shares and an average daily statistical correlation of over0.99 to three times the inverse of the daily performance of the Index.3
The Fund takes positions in derivatives that, in combination, should have similar daily return characteristics as three times the inverse of thedaily return of the Index. The Index is a price-weighted index and includes 30 large-cap, “blue-chip” U.S. stocks, excluding utility and trans-portation companies.
During the year ended May 31, 2017, the Fund invested in swap agreements and futures contracts in order to gain inverse leveraged exposure tothe Index. These derivatives generally tracked the performance of their underlying index and the Fund generally benefited from financing ratesassociated with swap agreements. The Fund entered into swap agreements with counterparties that the Fund’s advisor determined to be major,global financial institutions. If a counterparty becomes insolvent or otherwise fails to perform on its obligations, the value of investments inthe Fund may decline. The Fund has sought to mitigate this risk by generally requiring counterparties for the Fund to post collateral for thebenefit of the Fund, marked to market daily, in an amount approximately equal to the amount the counterparty owed the Fund, subject to certainminimum thresholds.
Allocation of Portfolio Holdings & Index Composition as of 5/31/17
Past performance does not guarantee future results. Return calculations assume the reinvestment of distributions and do not reflect taxes thata shareholder would pay on Fund distributions or on the redemption of Fund shares. The performance data quoted represents past performanceand current returns may be lower or higher. The investment return and NAV will fluctuate so that an investor’s shares, when redeemed, maybe more or less than the original cost. The performance above reflects any fee reductions during the applicable periods. If such fee reductionshad not occurred, the quoted performance would be lower. To obtain performance current to the most recent month please visitwww.ProShares.com.
1 Fund returns are based on the NAV of the Fund. This calculation reflects the theoretical reinvestment of distributions, if any, in the Fund as of theex-date. The impact of transaction costs and the lack of ability to reinvest fractional shares are not reflected in the calculations.
2 The Index is a price return index. The total return and any graph or table reflect the theoretical reinvestment of dividends on securities in theIndex. The impact of transaction costs and the deduction of expenses associated with an exchange traded fund such as investment managementand accounting fees are not reflected in the Index calculation. It is not possible to invest directly in an Index.
3 1.00 equals perfect correlation. This calculation is based on the daily total return of the Index and the performance of the daily total return of theNAV per share of the Fund.
The above information is not covered by the Report of the Independent Registered Public Accounting Firm.
Merrill Corp - Proshares Trust Geared Book [96 Funds] Annual Report [Funds] 333-089822 05-31-2017 ED [AUX] | eperez | 28-Jul-17 17:35 | 17-15159-3.ca | Sequence: 19CHKSUM Content: 42087 Layout: 16935 Graphics: 29373 CLEAN
JOB: 17-15159-3 CYCLE#;BL#: 5; 0 TRIM: 8.25" x 10.75" COMPOSITECOLORS: Black, ~note-color 2, ~note-color 3 GRAPHICS: 15159-3_SDOW_L.eps V1.5
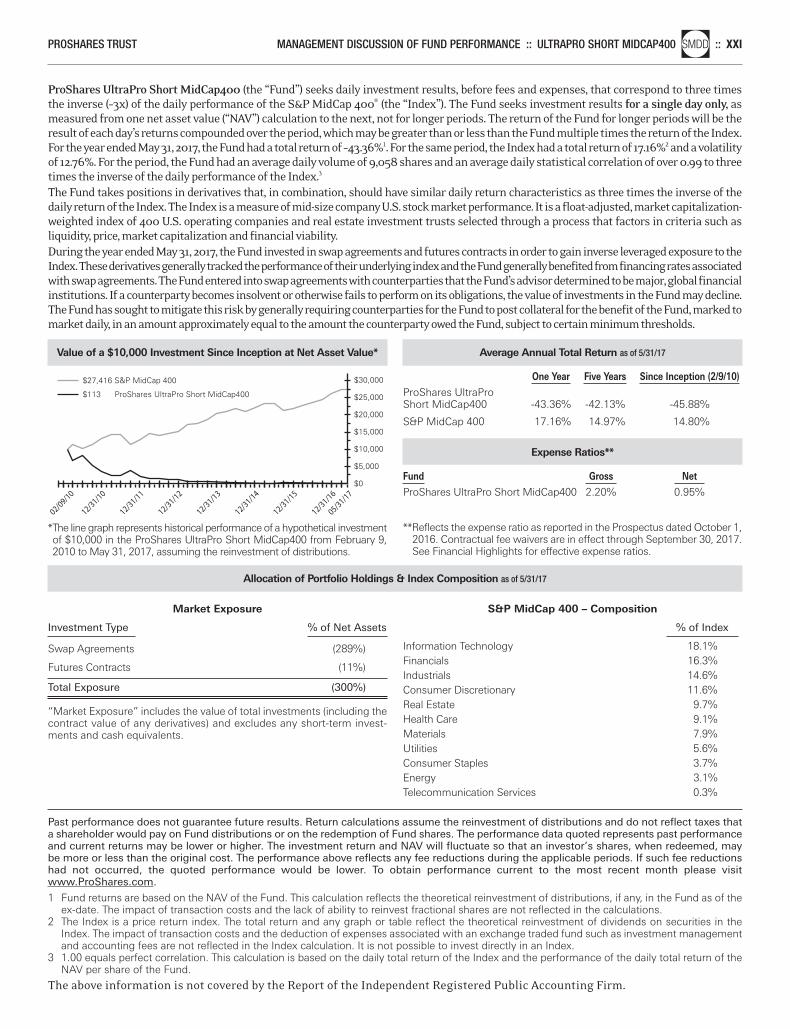
PROSHARES TRUST MANAGEMENT DISCUSSION OF FUND PERFORMANCE :: ULTRAPRO SHORT MIDCAP400nlSMDD :: XXI
Value of a $10,000 Investment Since Inception at Net Asset Value*
*The line graph represents historical performance of a hypothetical investmentof $10,000 in the ProShares UltraPro Short MidCap400 from February 9,2010 to May 31, 2017, assuming the reinvestment of distributions.
$30,000
$25,000
$15,000
$20,000
$0
$5,000
$10,000
$27,416 S&P MidCap 400
$113 ProShares UltraPro Short MidCap400
02/09/10
12/31/10
12/31/16
12/31/15
12/31/14
12/31/13
12/31/12
12/31/11
05/31/17
Average Annual Total Return as of 5/31/17
One Year Five Years Since Inception (2/9/10) ProShares UltraPro Short MidCap400 -43.36% -42.13% -45.88%
S&P MidCap 400 17.16% 14.97% 14.80%
Expense Ratios**
Fund Gross Net ProShares UltraPro Short MidCap400 2.20% 0.95%
**Reflects the expense ratio as reported in the Prospectus dated October 1,2016. Contractual fee waivers are in effect through September 30, 2017.See Financial Highlights for effective expense ratios.
Market Exposure
Investment Type % of Net Assets
Swap Agreements (289%)
Futures Contracts (11%)
Total Exposure (300%)
“Market Exposure” includes the value of total investments (including thecontract value of any derivatives) and excludes any short-term invest-ments and cash equivalents.
S&P MidCap 400 – Composition
% of Index Information Technology 18.1%Financials 16.3%Industrials 14.6%Consumer Discretionary 11.6%Real Estate 9.7%Health Care 9.1%Materials 7.9%Utilities 5.6%Consumer Staples 3.7%Energy 3.1%Telecommunication Services 0.3%
ProShares UltraPro Short MidCap400 (the “Fund”) seeks daily investment results, before fees and expenses, that correspond to three timesthe inverse (–3x) of the daily performance of the S&P MidCap 400® (the “Index”). The Fund seeks investment results for a single day only, asmeasured from one net asset value (“NAV”) calculation to the next, not for longer periods. The return of the Fund for longer periods will be theresult of each day’s returns compounded over the period, which may be greater than or less than the Fund multiple times the return of the Index.For the year ended May 31, 2017, the Fund had a total return of –43.36%1. For the same period, the Index had a total return of 17.16%2 and a volatilityof 12.76%. For the period, the Fund had an average daily volume of 9,058 shares and an average daily statistical correlation of over 0.99 to threetimes the inverse of the daily performance of the Index.3
The Fund takes positions in derivatives that, in combination, should have similar daily return characteristics as three times the inverse of thedaily return of the Index. The Index is a measure of mid-size company U.S. stock market performance. It is a float-adjusted, market capitalization-weighted index of 400 U.S. operating companies and real estate investment trusts selected through a process that factors in criteria such asliquidity, price, market capitalization and financial viability.During the year ended May 31, 2017, the Fund invested in swap agreements and futures contracts in order to gain inverse leveraged exposure to theIndex. These derivatives generally tracked the performance of their underlying index and the Fund generally benefited from financing rates associatedwith swap agreements. The Fund entered into swap agreements with counterparties that the Fund’s advisor determined to be major, global financialinstitutions. If a counterparty becomes insolvent or otherwise fails to perform on its obligations, the value of investments in the Fund may decline.The Fund has sought to mitigate this risk by generally requiring counterparties for the Fund to post collateral for the benefit of the Fund, marked tomarket daily, in an amount approximately equal to the amount the counterparty owed the Fund, subject to certain minimum thresholds.
Allocation of Portfolio Holdings & Index Composition as of 5/31/17
Past performance does not guarantee future results. Return calculations assume the reinvestment of distributions and do not reflect taxes thata shareholder would pay on Fund distributions or on the redemption of Fund shares. The performance data quoted represents past performanceand current returns may be lower or higher. The investment return and NAV will fluctuate so that an investor’s shares, when redeemed, maybe more or less than the original cost. The performance above reflects any fee reductions during the applicable periods. If such fee reductionshad not occurred, the quoted performance would be lower. To obtain performance current to the most recent month please visitwww.ProShares.com.
1 Fund returns are based on the NAV of the Fund. This calculation reflects the theoretical reinvestment of distributions, if any, in the Fund as of theex-date. The impact of transaction costs and the lack of ability to reinvest fractional shares are not reflected in the calculations.
2 The Index is a price return index. The total return and any graph or table reflect the theoretical reinvestment of dividends on securities in theIndex. The impact of transaction costs and the deduction of expenses associated with an exchange traded fund such as investment managementand accounting fees are not reflected in the Index calculation. It is not possible to invest directly in an Index.
3 1.00 equals perfect correlation. This calculation is based on the daily total return of the Index and the performance of the daily total return of theNAV per share of the Fund.
The above information is not covered by the Report of the Independent Registered Public Accounting Firm.
Merrill Corp - Proshares Trust Geared Book [96 Funds] Annual Report [Funds] 333-089822 05-31-2017 ED [AUX] | eperez | 28-Jul-17 17:35 | 17-15159-3.ca | Sequence: 20CHKSUM Content: 58236 Layout: 33064 Graphics: 16326 CLEAN
JOB: 17-15159-3 CYCLE#;BL#: 5; 0 TRIM: 8.25" x 10.75" COMPOSITECOLORS: Black, ~note-color 2, ~note-color 3 GRAPHICS: 15159-3_SMDD_L.eps V1.5
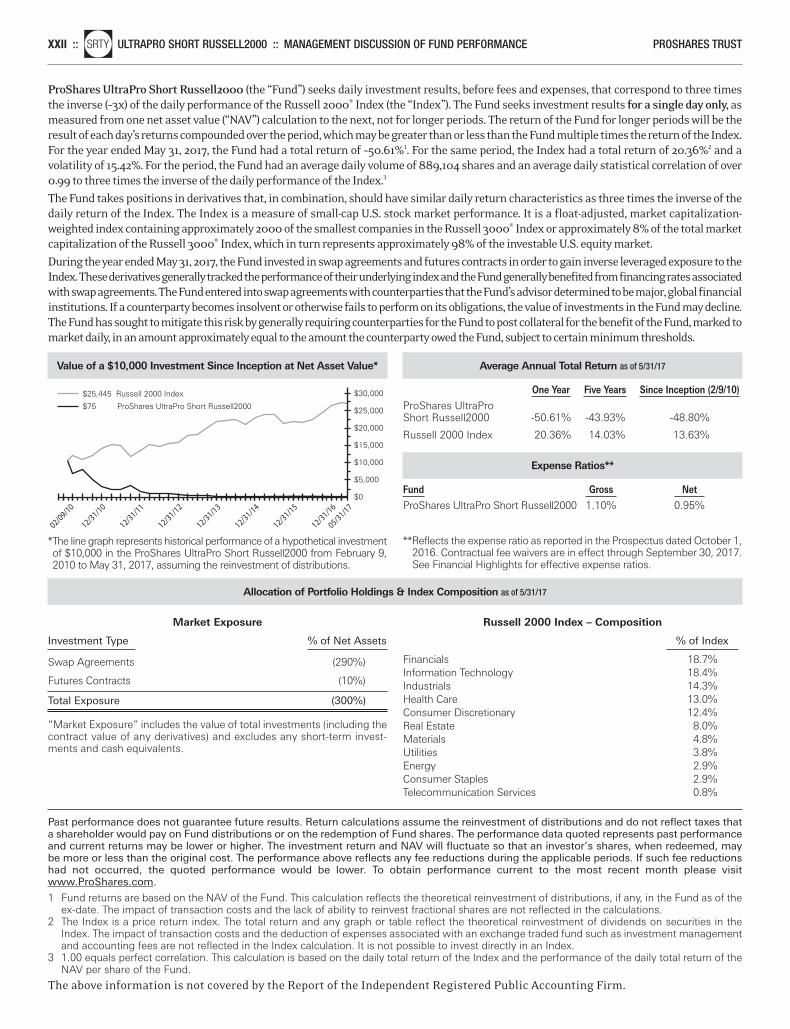
XXII ::nlSRTY ULTRAPRO SHORT RUSSELL2000 :: MANAGEMENT DISCUSSION OF FUND PERFORMANCE PROSHARES TRUST
Value of a $10,000 Investment Since Inception at Net Asset Value*
*The line graph represents historical performance of a hypothetical investmentof $10,000 in the ProShares UltraPro Short Russell2000 from February 9,2010 to May 31, 2017, assuming the reinvestment of distributions.
$30,000
$25,000
$15,000
$20,000
$0
$5,000
$10,000
$25,445 Russell 2000 Index
$75 ProShares UltraPro Short Russell2000
02/09/10
12/31/10
12/31/16
12/31/15
12/31/14
12/31/13
12/31/12
12/31/11
05/31/17
Average Annual Total Return as of 5/31/17
One Year Five Years Since Inception (2/9/10) ProShares UltraPro Short Russell2000 -50.61% -43.93% -48.80%
Russell 2000 Index 20.36% 14.03% 13.63%
Expense Ratios**
Fund Gross Net ProShares UltraPro Short Russell2000 1.10% 0.95%
**Reflects the expense ratio as reported in the Prospectus dated October 1,2016. Contractual fee waivers are in effect through September 30, 2017.See Financial Highlights for effective expense ratios.
Market Exposure
Investment Type % of Net Assets
Swap Agreements (290%)
Futures Contracts (10%)
Total Exposure (300%)
“Market Exposure” includes the value of total investments (including thecontract value of any derivatives) and excludes any short-term invest-ments and cash equivalents.
Russell 2000 Index – Composition
% of Index Financials 18.7%Information Technology 18.4%Industrials 14.3%Health Care 13.0%Consumer Discretionary 12.4%Real Estate 8.0%Materials 4.8%Utilities 3.8%Energy 2.9%Consumer Staples 2.9%Telecommunication Services 0.8%
ProShares UltraPro Short Russell2000 (the “Fund”) seeks daily investment results, before fees and expenses, that correspond to three timesthe inverse (–3x) of the daily performance of the Russell 2000® Index (the “Index”). The Fund seeks investment results for a single day only, asmeasured from one net asset value (“NAV”) calculation to the next, not for longer periods. The return of the Fund for longer periods will be theresult of each day’s returns compounded over the period, which may be greater than or less than the Fund multiple times the return of the Index.For the year ended May 31, 2017, the Fund had a total return of –50.61%1. For the same period, the Index had a total return of 20.36%2 and avolatility of 15.42%. For the period, the Fund had an average daily volume of 889,104 shares and an average daily statistical correlation of over0.99 to three times the inverse of the daily performance of the Index.3
The Fund takes positions in derivatives that, in combination, should have similar daily return characteristics as three times the inverse of thedaily return of the Index. The Index is a measure of small-cap U.S. stock market performance. It is a float-adjusted, market capitalization-weighted index containing approximately 2000 of the smallest companies in the Russell 3000® Index or approximately 8% of the total marketcapitalization of the Russell 3000® Index, which in turn represents approximately 98% of the investable U.S. equity market.
During the year ended May 31, 2017, the Fund invested in swap agreements and futures contracts in order to gain inverse leveraged exposure to theIndex. These derivatives generally tracked the performance of their underlying index and the Fund generally benefited from financing rates associatedwith swap agreements. The Fund entered into swap agreements with counterparties that the Fund’s advisor determined to be major, global financialinstitutions. If a counterparty becomes insolvent or otherwise fails to perform on its obligations, the value of investments in the Fund may decline.The Fund has sought to mitigate this risk by generally requiring counterparties for the Fund to post collateral for the benefit of the Fund, marked tomarket daily, in an amount approximately equal to the amount the counterparty owed the Fund, subject to certain minimum thresholds.
Allocation of Portfolio Holdings & Index Composition as of 5/31/17
Past performance does not guarantee future results. Return calculations assume the reinvestment of distributions and do not reflect taxes thata shareholder would pay on Fund distributions or on the redemption of Fund shares. The performance data quoted represents past performanceand current returns may be lower or higher. The investment return and NAV will fluctuate so that an investor’s shares, when redeemed, maybe more or less than the original cost. The performance above reflects any fee reductions during the applicable periods. If such fee reductionshad not occurred, the quoted performance would be lower. To obtain performance current to the most recent month please visitwww.ProShares.com.
1 Fund returns are based on the NAV of the Fund. This calculation reflects the theoretical reinvestment of distributions, if any, in the Fund as of theex-date. The impact of transaction costs and the lack of ability to reinvest fractional shares are not reflected in the calculations.
2 The Index is a price return index. The total return and any graph or table reflect the theoretical reinvestment of dividends on securities in theIndex. The impact of transaction costs and the deduction of expenses associated with an exchange traded fund such as investment managementand accounting fees are not reflected in the Index calculation. It is not possible to invest directly in an Index.
3 1.00 equals perfect correlation. This calculation is based on the daily total return of the Index and the performance of the daily total return of theNAV per share of the Fund.
The above information is not covered by the Report of the Independent Registered Public Accounting Firm.
Merrill Corp - Proshares Trust Geared Book [96 Funds] Annual Report [Funds] 333-089822 05-31-2017 ED [AUX] | eperez | 28-Jul-17 17:35 | 17-15159-3.ca | Sequence: 21CHKSUM Content: 57475 Layout: 48086 Graphics: 21553 CLEAN
JOB: 17-15159-3 CYCLE#;BL#: 5; 0 TRIM: 8.25" x 10.75" COMPOSITECOLORS: Black, ~note-color 2, ~note-color 3 GRAPHICS: 15159-3_SRTY_L.eps V1.5
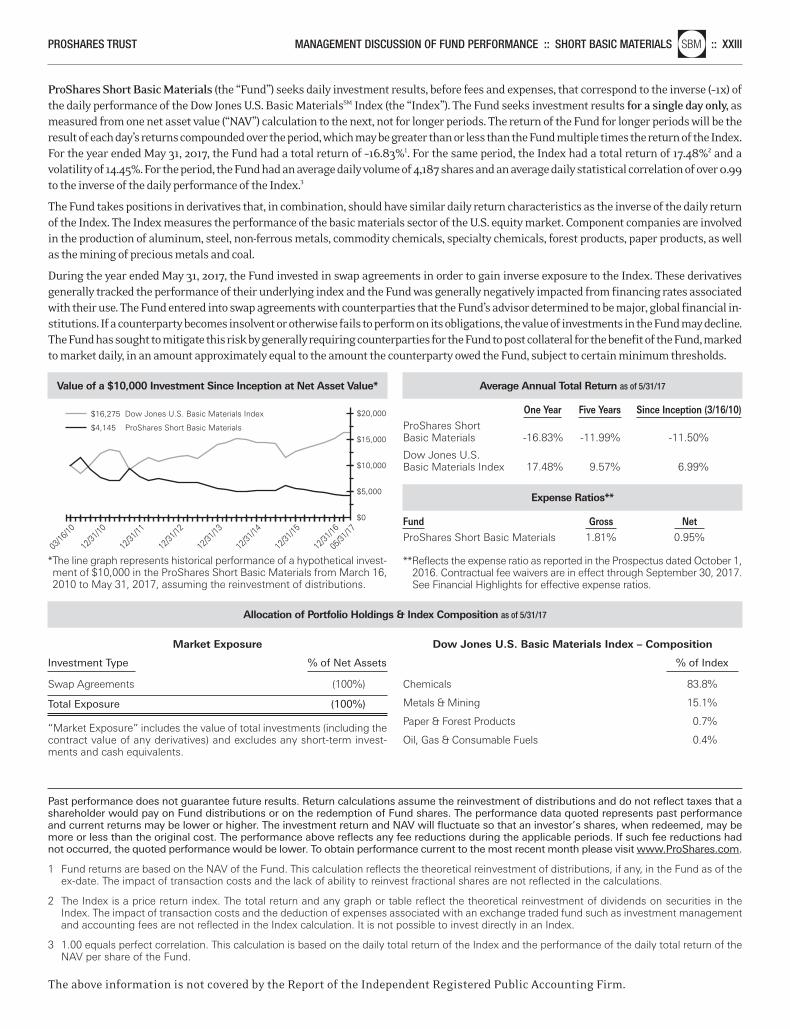
ProShares Short Basic Materials (the “Fund”) seeks daily investment results, before fees and expenses, that correspond to the inverse (–1x) ofthe daily performance of the Dow Jones U.S. Basic MaterialsSM Index (the “Index”). The Fund seeks investment results for a single day only, asmeasured from one net asset value (“NAV”) calculation to the next, not for longer periods. The return of the Fund for longer periods will be theresult of each day’s returns compounded over the period, which may be greater than or less than the Fund multiple times the return of the Index.For the year ended May 31, 2017, the Fund had a total return of –16.83%1. For the same period, the Index had a total return of 17.48%2 and avolatility of 14.45%. For the period, the Fund had an average daily volume of 4,187 shares and an average daily statistical correlation of over 0.99to the inverse of the daily performance of the Index.3
The Fund takes positions in derivatives that, in combination, should have similar daily return characteristics as the inverse of the daily returnof the Index. The Index measures the performance of the basic materials sector of the U.S. equity market. Component companies are involvedin the production of aluminum, steel, non-ferrous metals, commodity chemicals, specialty chemicals, forest products, paper products, as wellas the mining of precious metals and coal.
During the year ended May 31, 2017, the Fund invested in swap agreements in order to gain inverse exposure to the Index. These derivativesgenerally tracked the performance of their underlying index and the Fund was generally negatively impacted from financing rates associatedwith their use. The Fund entered into swap agreements with counterparties that the Fund’s advisor determined to be major, global financial in-stitutions. If a counterparty becomes insolvent or otherwise fails to perform on its obligations, the value of investments in the Fund may decline.The Fund has sought to mitigate this risk by generally requiring counterparties for the Fund to post collateral for the benefit of the Fund, markedto market daily, in an amount approximately equal to the amount the counterparty owed the Fund, subject to certain minimum thresholds.
Past performance does not guarantee future results. Return calculations assume the reinvestment of distributions and do not reflect taxes that ashareholder would pay on Fund distributions or on the redemption of Fund shares. The performance data quoted represents past performanceand current returns may be lower or higher. The investment return and NAV will fluctuate so that an investor’s shares, when redeemed, may bemore or less than the original cost. The performance above reflects any fee reductions during the applicable periods. If such fee reductions hadnot occurred, the quoted performance would be lower. To obtain performance current to the most recent month please visit www.ProShares.com.
1 Fund returns are based on the NAV of the Fund. This calculation reflects the theoretical reinvestment of distributions, if any, in the Fund as of theex-date. The impact of transaction costs and the lack of ability to reinvest fractional shares are not reflected in the calculations.
2 The Index is a price return index. The total return and any graph or table reflect the theoretical reinvestment of dividends on securities in theIndex. The impact of transaction costs and the deduction of expenses associated with an exchange traded fund such as investment managementand accounting fees are not reflected in the Index calculation. It is not possible to invest directly in an Index.
3 1.00 equals perfect correlation. This calculation is based on the daily total return of the Index and the performance of the daily total return of theNAV per share of the Fund.
The above information is not covered by the Report of the Independent Registered Public Accounting Firm.
PROSHARES TRUST MANAGEMENT DISCUSSION OF FUND PERFORMANCE :: SHORT BASIC MATERIALSnlSBM :: XXIII
Value of a $10,000 Investment Since Inception at Net Asset Value*
*The line graph represents historical performance of a hypothetical invest-ment of $10,000 in the ProShares Short Basic Materials from March 16,2010 to May 31, 2017, assuming the reinvestment of distributions.
$20,000
$0
$5,000
$10,000
$15,000
$16,275 Dow Jones U.S. Basic Materials Index
$4,145 ProShares Short Basic Materials
03/16
/10
12/31
/10
12/31
/15
12/31
/16
12/31
/14
12/31
/13
12/31
/12
12/31
/11
05/31
/17
Average Annual Total Return as of 5/31/17
One Year Five Years Since Inception (3/16/10) ProShares Short Basic Materials -16.83% -11.99% -11.50%
Dow Jones U.S. Basic Materials Index 17.48% 9.57% 6.99%
Expense Ratios**
Fund Gross Net ProShares Short Basic Materials 1.81% 0.95%
**Reflects the expense ratio as reported in the Prospectus dated October 1,2016. Contractual fee waivers are in effect through September 30, 2017.See Financial Highlights for effective expense ratios.
Allocation of Portfolio Holdings & Index Composition as of 5/31/17
Market Exposure
Investment Type % of Net Assets
Swap Agreements (100%)
Total Exposure (100%)
“Market Exposure” includes the value of total investments (including thecontract value of any derivatives) and excludes any short-term invest-ments and cash equivalents.
Dow Jones U.S. Basic Materials Index – Composition
% of Index
Chemicals 83.8%
Metals & Mining 15.1%
Paper & Forest Products 0.7%
Oil, Gas & Consumable Fuels 0.4%
Merrill Corp - Proshares Trust Geared Book [96 Funds] Annual Report [Funds] 333-089822 05-31-2017 ED [AUX] | eperez | 28-Jul-17 17:35 | 17-15159-3.cc | Sequence: 1CHKSUM Content: 52905 Layout: 22670 Graphics: 25776 CLEAN
JOB: 17-15159-3 CYCLE#;BL#: 5; 0 TRIM: 8.25" x 10.75" COMPOSITECOLORS: Black, ~note-color 2, ~note-color 3 GRAPHICS: 15159-3_SBM_L.eps V1.5
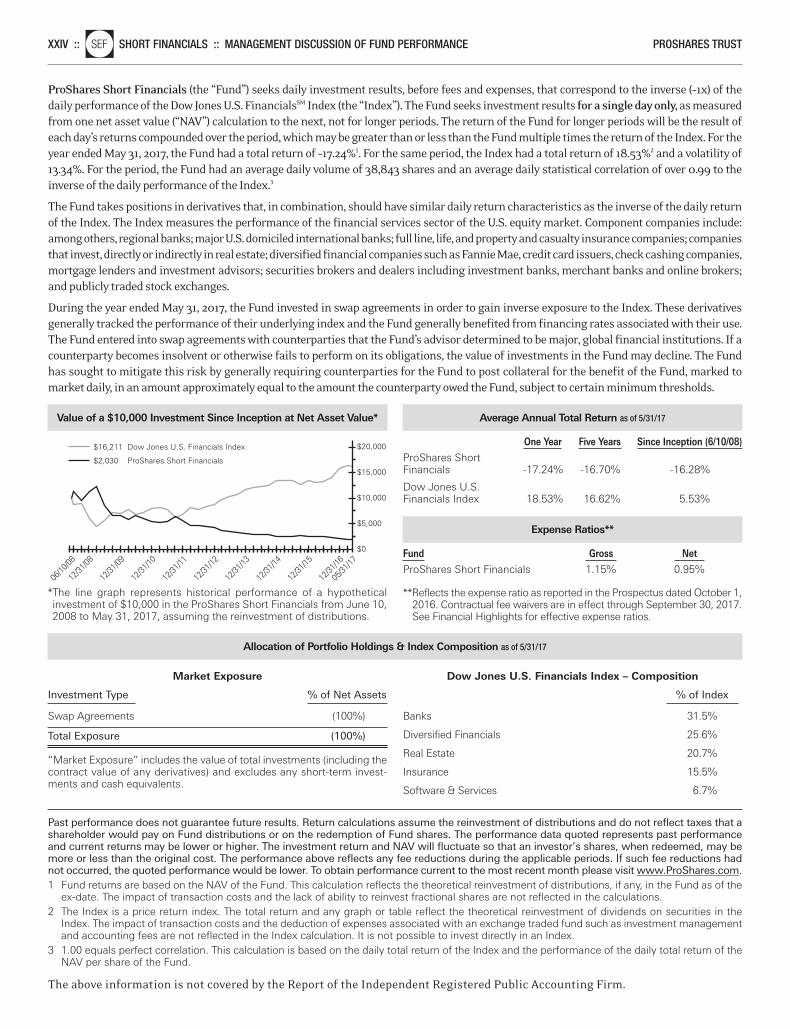
ProShares Short Financials (the “Fund”) seeks daily investment results, before fees and expenses, that correspond to the inverse (–1x) of thedaily performance of the Dow Jones U.S. FinancialsSM Index (the “Index”). The Fund seeks investment results for a single day only, as measuredfrom one net asset value (“NAV”) calculation to the next, not for longer periods. The return of the Fund for longer periods will be the result ofeach day’s returns compounded over the period, which may be greater than or less than the Fund multiple times the return of the Index. For theyear ended May 31, 2017, the Fund had a total return of –17.24%1. For the same period, the Index had a total return of 18.53%2 and a volatility of13.34%. For the period, the Fund had an average daily volume of 38,843 shares and an average daily statistical correlation of over 0.99 to theinverse of the daily performance of the Index.3
The Fund takes positions in derivatives that, in combination, should have similar daily return characteristics as the inverse of the daily returnof the Index. The Index measures the performance of the financial services sector of the U.S. equity market. Component companies include:among others, regional banks; major U.S. domiciled international banks; full line, life, and property and casualty insurance companies; companiesthat invest, directly or indirectly in real estate; diversified financial companies such as Fannie Mae, credit card issuers, check cashing companies,mortgage lenders and investment advisors; securities brokers and dealers including investment banks, merchant banks and online brokers;and publicly traded stock exchanges.
During the year ended May 31, 2017, the Fund invested in swap agreements in order to gain inverse exposure to the Index. These derivativesgenerally tracked the performance of their underlying index and the Fund generally benefited from financing rates associated with their use.The Fund entered into swap agreements with counterparties that the Fund’s advisor determined to be major, global financial institutions. If acounterparty becomes insolvent or otherwise fails to perform on its obligations, the value of investments in the Fund may decline. The Fundhas sought to mitigate this risk by generally requiring counterparties for the Fund to post collateral for the benefit of the Fund, marked tomarket daily, in an amount approximately equal to the amount the counterparty owed the Fund, subject to certain minimum thresholds.
Past performance does not guarantee future results. Return calculations assume the reinvestment of distributions and do not reflect taxes that ashareholder would pay on Fund distributions or on the redemption of Fund shares. The performance data quoted represents past performanceand current returns may be lower or higher. The investment return and NAV will fluctuate so that an investor’s shares, when redeemed, may bemore or less than the original cost. The performance above reflects any fee reductions during the applicable periods. If such fee reductions hadnot occurred, the quoted performance would be lower. To obtain performance current to the most recent month please visit www.ProShares.com.1 Fund returns are based on the NAV of the Fund. This calculation reflects the theoretical reinvestment of distributions, if any, in the Fund as of the
ex-date. The impact of transaction costs and the lack of ability to reinvest fractional shares are not reflected in the calculations.2 The Index is a price return index. The total return and any graph or table reflect the theoretical reinvestment of dividends on securities in the
Index. The impact of transaction costs and the deduction of expenses associated with an exchange traded fund such as investment managementand accounting fees are not reflected in the Index calculation. It is not possible to invest directly in an Index.
3 1.00 equals perfect correlation. This calculation is based on the daily total return of the Index and the performance of the daily total return of theNAV per share of the Fund.
The above information is not covered by the Report of the Independent Registered Public Accounting Firm.
XXIV ::nlSEF SHORT FINANCIALS :: MANAGEMENT DISCUSSION OF FUND PERFORMANCE PROSHARES TRUST
Value of a $10,000 Investment Since Inception at Net Asset Value*
*The line graph represents historical performance of a hypothetical investment of $10,000 in the ProShares Short Financials from June 10,2008 to May 31, 2017, assuming the reinvestment of distributions.
$20,000
$0
$5,000
$10,000
$15,000
$16,211 Dow Jones U.S. Financials Index
$2,030 ProShares Short Financials
06/10
/08
12/31
/08
12/31
/09
12/31
/10
12/31
/16
12/31
/15
12/31
/14
12/31
/13
12/31
/12
12/31
/11
05/31
/17
Average Annual Total Return as of 5/31/17
One Year Five Years Since Inception (6/10/08) ProShares Short Financials -17.24% -16.70% -16.28%
Dow Jones U.S. Financials Index 18.53% 16.62% 5.53%
Expense Ratios**
Fund Gross Net ProShares Short Financials 1.15% 0.95%
**Reflects the expense ratio as reported in the Prospectus dated October 1,2016. Contractual fee waivers are in effect through September 30, 2017.See Financial Highlights for effective expense ratios.
Allocation of Portfolio Holdings & Index Composition as of 5/31/17
Market Exposure
Investment Type % of Net Assets
Swap Agreements (100%)
Total Exposure (100%)
“Market Exposure” includes the value of total investments (including thecontract value of any derivatives) and excludes any short-term invest-ments and cash equivalents.
Dow Jones U.S. Financials Index – Composition
% of Index
Banks 31.5%
Diversified Financials 25.6%
Real Estate 20.7%
Insurance 15.5%
Software & Services 6.7%
Merrill Corp - Proshares Trust Geared Book [96 Funds] Annual Report [Funds] 333-089822 05-31-2017 ED [AUX] | eperez | 28-Jul-17 17:35 | 17-15159-3.cc | Sequence: 2CHKSUM Content: 21949 Layout: 44480 Graphics: 54481 CLEAN
JOB: 17-15159-3 CYCLE#;BL#: 5; 0 TRIM: 8.25" x 10.75" COMPOSITECOLORS: Black, ~note-color 2, ~note-color 3 GRAPHICS: 15159-3_SEF_L.eps V1.5
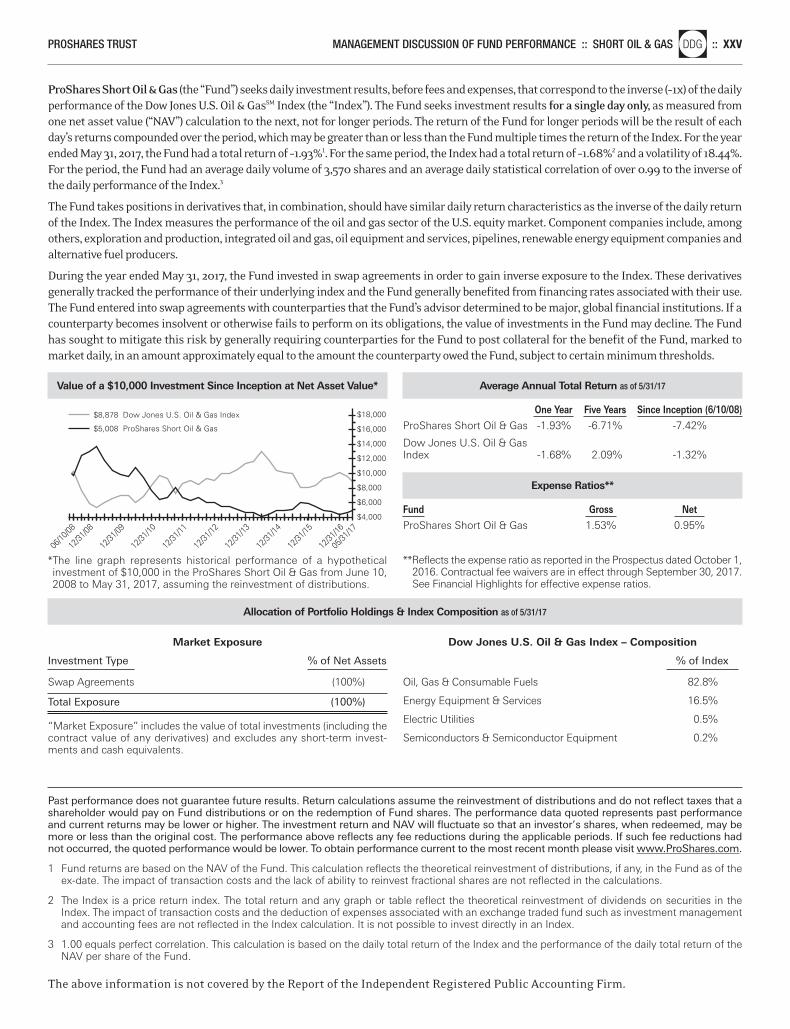
ProShares Short Oil & Gas (the “Fund”) seeks daily investment results, before fees and expenses, that correspond to the inverse (–1x) of the dailyperformance of the Dow Jones U.S. Oil & GasSM Index (the “Index”). The Fund seeks investment results for a single day only, as measured fromone net asset value (“NAV”) calculation to the next, not for longer periods. The return of the Fund for longer periods will be the result of eachday’s returns compounded over the period, which may be greater than or less than the Fund multiple times the return of the Index. For the yearended May 31, 2017, the Fund had a total return of –1.93%1. For the same period, the Index had a total return of –1.68%2 and a volatility of 18.44%.For the period, the Fund had an average daily volume of 3,570 shares and an average daily statistical correlation of over 0.99 to the inverse ofthe daily performance of the Index.3
The Fund takes positions in derivatives that, in combination, should have similar daily return characteristics as the inverse of the daily returnof the Index. The Index measures the performance of the oil and gas sector of the U.S. equity market. Component companies include, amongothers, exploration and production, integrated oil and gas, oil equipment and services, pipelines, renewable energy equipment companies andalternative fuel producers.
During the year ended May 31, 2017, the Fund invested in swap agreements in order to gain inverse exposure to the Index. These derivativesgenerally tracked the performance of their underlying index and the Fund generally benefited from financing rates associated with their use.The Fund entered into swap agreements with counterparties that the Fund’s advisor determined to be major, global financial institutions. If acounterparty becomes insolvent or otherwise fails to perform on its obligations, the value of investments in the Fund may decline. The Fundhas sought to mitigate this risk by generally requiring counterparties for the Fund to post collateral for the benefit of the Fund, marked tomarket daily, in an amount approximately equal to the amount the counterparty owed the Fund, subject to certain minimum thresholds.
Past performance does not guarantee future results. Return calculations assume the reinvestment of distributions and do not reflect taxes that ashareholder would pay on Fund distributions or on the redemption of Fund shares. The performance data quoted represents past performanceand current returns may be lower or higher. The investment return and NAV will fluctuate so that an investor’s shares, when redeemed, may bemore or less than the original cost. The performance above reflects any fee reductions during the applicable periods. If such fee reductions hadnot occurred, the quoted performance would be lower. To obtain performance current to the most recent month please visit www.ProShares.com.
1 Fund returns are based on the NAV of the Fund. This calculation reflects the theoretical reinvestment of distributions, if any, in the Fund as of theex-date. The impact of transaction costs and the lack of ability to reinvest fractional shares are not reflected in the calculations.
2 The Index is a price return index. The total return and any graph or table reflect the theoretical reinvestment of dividends on securities in theIndex. The impact of transaction costs and the deduction of expenses associated with an exchange traded fund such as investment managementand accounting fees are not reflected in the Index calculation. It is not possible to invest directly in an Index.
3 1.00 equals perfect correlation. This calculation is based on the daily total return of the Index and the performance of the daily total return of theNAV per share of the Fund.
The above information is not covered by the Report of the Independent Registered Public Accounting Firm.
PROSHARES TRUST MANAGEMENT DISCUSSION OF FUND PERFORMANCE :: SHORT OIL & GASnlDDG :: XXV
Value of a $10,000 Investment Since Inception at Net Asset Value*
*The line graph represents historical performance of a hypothetical investment of $10,000 in the ProShares Short Oil & Gas from June 10,2008 to May 31, 2017, assuming the reinvestment of distributions.
$18,000
$4,000
$6,000
$8,000
$10,000
$12,000
$14,000
$16,000
$8,878 Dow Jones U.S. Oil & Gas Index
$5,008 ProShares Short Oil & Gas
06/10
/08
12/31
/08
12/31
/09
12/31
/10
12/31
/16
12/31
/15
12/31
/14
12/31
/13
12/31
/12
12/31
/11
05/31
/17
Average Annual Total Return as of 5/31/17
One Year Five Years Since Inception (6/10/08) ProShares Short Oil & Gas -1.93% -6.71% -7.42%
Dow Jones U.S. Oil & Gas Index -1.68% 2.09% -1.32%
Expense Ratios**
Fund Gross Net ProShares Short Oil & Gas 1.53% 0.95%
**Reflects the expense ratio as reported in the Prospectus dated October 1,2016. Contractual fee waivers are in effect through September 30, 2017.See Financial Highlights for effective expense ratios.
Allocation of Portfolio Holdings & Index Composition as of 5/31/17
Market Exposure
Investment Type % of Net Assets
Swap Agreements (100%)
Total Exposure (100%)
“Market Exposure” includes the value of total investments (including thecontract value of any derivatives) and excludes any short-term invest-ments and cash equivalents.
Dow Jones U.S. Oil & Gas Index – Composition
% of Index
Oil, Gas & Consumable Fuels 82.8%
Energy Equipment & Services 16.5%
Electric Utilities 0.5%
Semiconductors & Semiconductor Equipment 0.2%
Merrill Corp - Proshares Trust Geared Book [96 Funds] Annual Report [Funds] 333-089822 05-31-2017 ED [AUX] | eperez | 28-Jul-17 17:35 | 17-15159-3.cc | Sequence: 3CHKSUM Content: 40326 Layout: 29989 Graphics: 48480 CLEAN
JOB: 17-15159-3 CYCLE#;BL#: 5; 0 TRIM: 8.25" x 10.75" COMPOSITECOLORS: Black, ~note-color 2, ~note-color 3 GRAPHICS: 15159-3_DDG_L.eps V1.5
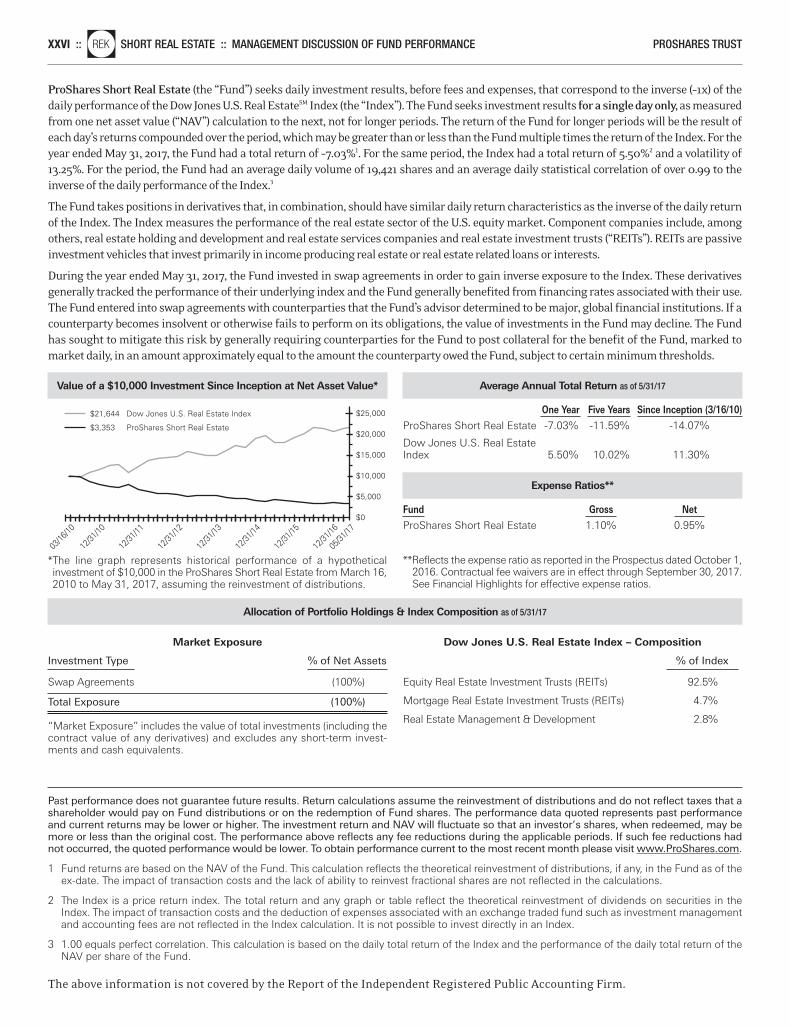
ProShares Short Real Estate (the “Fund”) seeks daily investment results, before fees and expenses, that correspond to the inverse (–1x) of thedaily performance of the Dow Jones U.S. Real EstateSM Index (the “Index”). The Fund seeks investment results for a single day only,as measuredfrom one net asset value (“NAV”) calculation to the next, not for longer periods. The return of the Fund for longer periods will be the result ofeach day’s returns compounded over the period, which may be greater than or less than the Fund multiple times the return of the Index. For theyear ended May 31, 2017, the Fund had a total return of –7.03%1. For the same period, the Index had a total return of 5.50%2 and a volatility of13.25%. For the period, the Fund had an average daily volume of 19,421 shares and an average daily statistical correlation of over 0.99 to theinverse of the daily performance of the Index.3
The Fund takes positions in derivatives that, in combination, should have similar daily return characteristics as the inverse of the daily returnof the Index. The Index measures the performance of the real estate sector of the U.S. equity market. Component companies include, amongothers, real estate holding and development and real estate services companies and real estate investment trusts (“REITs”). REITs are passiveinvestment vehicles that invest primarily in income producing real estate or real estate related loans or interests.
During the year ended May 31, 2017, the Fund invested in swap agreements in order to gain inverse exposure to the Index. These derivativesgenerally tracked the performance of their underlying index and the Fund generally benefited from financing rates associated with their use.The Fund entered into swap agreements with counterparties that the Fund’s advisor determined to be major, global financial institutions. If acounterparty becomes insolvent or otherwise fails to perform on its obligations, the value of investments in the Fund may decline. The Fundhas sought to mitigate this risk by generally requiring counterparties for the Fund to post collateral for the benefit of the Fund, marked tomarket daily, in an amount approximately equal to the amount the counterparty owed the Fund, subject to certain minimum thresholds.
Past performance does not guarantee future results. Return calculations assume the reinvestment of distributions and do not reflect taxes that ashareholder would pay on Fund distributions or on the redemption of Fund shares. The performance data quoted represents past performanceand current returns may be lower or higher. The investment return and NAV will fluctuate so that an investor’s shares, when redeemed, may bemore or less than the original cost. The performance above reflects any fee reductions during the applicable periods. If such fee reductions hadnot occurred, the quoted performance would be lower. To obtain performance current to the most recent month please visit www.ProShares.com.
1 Fund returns are based on the NAV of the Fund. This calculation reflects the theoretical reinvestment of distributions, if any, in the Fund as of theex-date. The impact of transaction costs and the lack of ability to reinvest fractional shares are not reflected in the calculations.
2 The Index is a price return index. The total return and any graph or table reflect the theoretical reinvestment of dividends on securities in theIndex. The impact of transaction costs and the deduction of expenses associated with an exchange traded fund such as investment managementand accounting fees are not reflected in the Index calculation. It is not possible to invest directly in an Index.
3 1.00 equals perfect correlation. This calculation is based on the daily total return of the Index and the performance of the daily total return of theNAV per share of the Fund.
The above information is not covered by the Report of the Independent Registered Public Accounting Firm.
XXVI ::nlREK SHORT REAL ESTATE :: MANAGEMENT DISCUSSION OF FUND PERFORMANCE PROSHARES TRUST
Value of a $10,000 Investment Since Inception at Net Asset Value*
*The line graph represents historical performance of a hypothetical investment of $10,000 in the ProShares Short Real Estate from March 16,2010 to May 31, 2017, assuming the reinvestment of distributions.
$25,000
$20,000
$0
$5,000
$10,000
$15,000
$21,644 Dow Jones U.S. Real Estate Index
$3,353 ProShares Short Real Estate
03/16
/10
12/31
/10
12/31
/15
12/31
/16
12/31
/14
12/31
/13
12/31
/12
12/31
/11
05/31
/17
Average Annual Total Return as of 5/31/17
One Year Five Years Since Inception (3/16/10) ProShares Short Real Estate -7.03% -11.59% -14.07%
Dow Jones U.S. Real Estate Index 5.50% 10.02% 11.30%
Expense Ratios**
Fund Gross Net ProShares Short Real Estate 1.10% 0.95%
**Reflects the expense ratio as reported in the Prospectus dated October 1,2016. Contractual fee waivers are in effect through September 30, 2017.See Financial Highlights for effective expense ratios.
Allocation of Portfolio Holdings & Index Composition as of 5/31/17
Market Exposure
Investment Type % of Net Assets
Swap Agreements (100%)
Total Exposure (100%)
“Market Exposure” includes the value of total investments (including thecontract value of any derivatives) and excludes any short-term invest-ments and cash equivalents.
Dow Jones U.S. Real Estate Index – Composition
% of Index
Equity Real Estate Investment Trusts (REITs) 92.5%
Mortgage Real Estate Investment Trusts (REITs) 4.7%
Real Estate Management & Development 2.8%
Merrill Corp - Proshares Trust Geared Book [96 Funds] Annual Report [Funds] 333-089822 05-31-2017 ED [AUX] | eperez | 28-Jul-17 17:35 | 17-15159-3.cc | Sequence: 4CHKSUM Content: 38553 Layout: 28834 Graphics: 16686 CLEAN
JOB: 17-15159-3 CYCLE#;BL#: 5; 0 TRIM: 8.25" x 10.75" COMPOSITECOLORS: Black, ~note-color 2, ~note-color 3 GRAPHICS: 15159-3_REK_L.eps V1.5
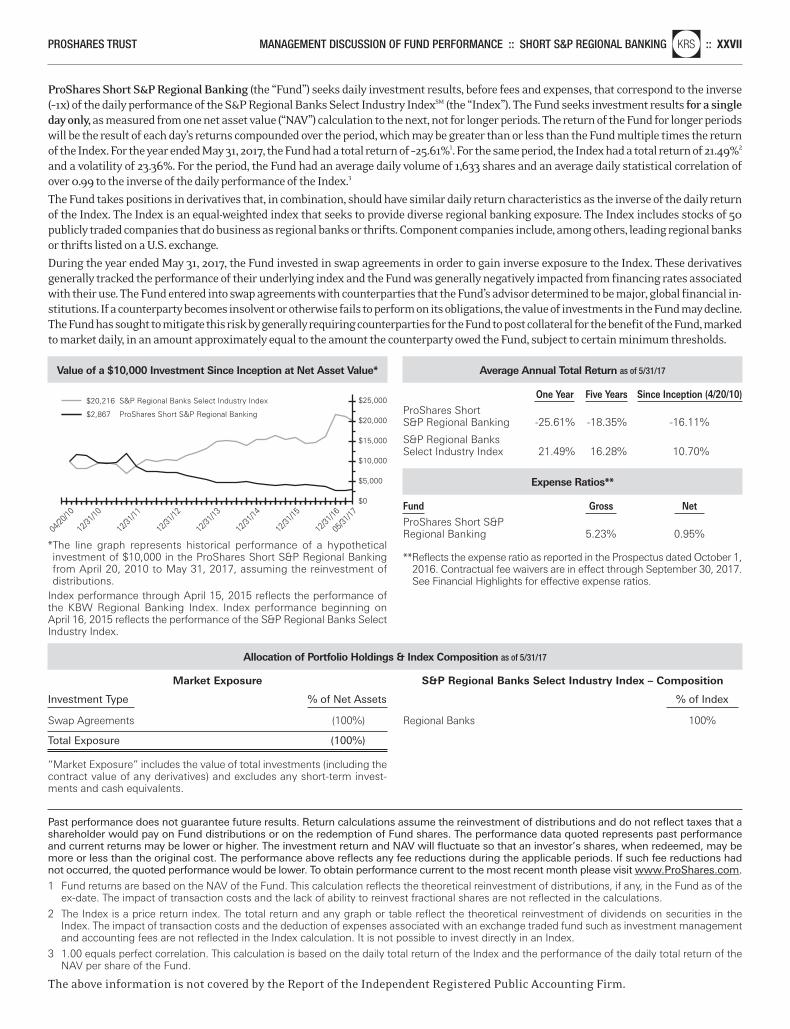
ProShares Short S&P Regional Banking (the “Fund”) seeks daily investment results, before fees and expenses, that correspond to the inverse(–1x) of the daily performance of the S&P Regional Banks Select Industry IndexSM (the “Index”). The Fund seeks investment results for a singleday only, as measured from one net asset value (“NAV”) calculation to the next, not for longer periods. The return of the Fund for longer periodswill be the result of each day’s returns compounded over the period, which may be greater than or less than the Fund multiple times the returnof the Index. For the year ended May 31, 2017, the Fund had a total return of –25.61%1. For the same period, the Index had a total return of 21.49%2
and a volatility of 23.36%. For the period, the Fund had an average daily volume of 1,633 shares and an average daily statistical correlation ofover 0.99 to the inverse of the daily performance of the Index.3
The Fund takes positions in derivatives that, in combination, should have similar daily return characteristics as the inverse of the daily returnof the Index. The Index is an equal-weighted index that seeks to provide diverse regional banking exposure. The Index includes stocks of 50publicly traded companies that do business as regional banks or thrifts. Component companies include, among others, leading regional banksor thrifts listed on a U.S. exchange.
During the year ended May 31, 2017, the Fund invested in swap agreements in order to gain inverse exposure to the Index. These derivativesgenerally tracked the performance of their underlying index and the Fund was generally negatively impacted from financing rates associatedwith their use. The Fund entered into swap agreements with counterparties that the Fund’s advisor determined to be major, global financial in-stitutions. If a counterparty becomes insolvent or otherwise fails to perform on its obligations, the value of investments in the Fund may decline.The Fund has sought to mitigate this risk by generally requiring counterparties for the Fund to post collateral for the benefit of the Fund, markedto market daily, in an amount approximately equal to the amount the counterparty owed the Fund, subject to certain minimum thresholds.
Past performance does not guarantee future results. Return calculations assume the reinvestment of distributions and do not reflect taxes that ashareholder would pay on Fund distributions or on the redemption of Fund shares. The performance data quoted represents past performanceand current returns may be lower or higher. The investment return and NAV will fluctuate so that an investor’s shares, when redeemed, may bemore or less than the original cost. The performance above reflects any fee reductions during the applicable periods. If such fee reductions hadnot occurred, the quoted performance would be lower. To obtain performance current to the most recent month please visit www.ProShares.com.
1 Fund returns are based on the NAV of the Fund. This calculation reflects the theoretical reinvestment of distributions, if any, in the Fund as of theex-date. The impact of transaction costs and the lack of ability to reinvest fractional shares are not reflected in the calculations.
2 The Index is a price return index. The total return and any graph or table reflect the theoretical reinvestment of dividends on securities in theIndex. The impact of transaction costs and the deduction of expenses associated with an exchange traded fund such as investment managementand accounting fees are not reflected in the Index calculation. It is not possible to invest directly in an Index.
3 1.00 equals perfect correlation. This calculation is based on the daily total return of the Index and the performance of the daily total return of theNAV per share of the Fund.
The above information is not covered by the Report of the Independent Registered Public Accounting Firm.
PROSHARES TRUST MANAGEMENT DISCUSSION OF FUND PERFORMANCE :: SHORT S&P REGIONAL BANKINGnlKRS :: XXVII
Value of a $10,000 Investment Since Inception at Net Asset Value*
*The line graph represents historical performance of a hypothetical investment of $10,000 in the ProShares Short S&P Regional Bankingfrom April 20, 2010 to May 31, 2017, assuming the reinvestment of distributions.
Index performance through April 15, 2015 reflects the performance ofthe KBW Regional Banking Index. Index performance beginning onApril 16, 2015 reflects the performance of the S&P Regional Banks SelectIndustry Index.
$25,000
$20,000
$0
$5,000
$10,000
$15,000
$20,216 S&P Regional Banks Select Industry Index
04/20
/10
12/31
/10
12/31
/13
12/31
/16
12/31
/15
12/31
/14
12/31
/12
12/31
/11
05/31
/17
$2,867 ProShares Short S&P Regional Banking
Average Annual Total Return as of 5/31/17
One Year Five Years Since Inception (4/20/10) ProShares Short S&P Regional Banking -25.61% -18.35% -16.11%
S&P Regional Banks Select Industry Index 21.49% 16.28% 10.70%
Expense Ratios**
Fund Gross Net ProShares Short S&P Regional Banking 5.23% 0.95%
**Reflects the expense ratio as reported in the Prospectus dated October 1,2016. Contractual fee waivers are in effect through September 30, 2017.See Financial Highlights for effective expense ratios.
Allocation of Portfolio Holdings & Index Composition as of 5/31/17
Market Exposure
Investment Type % of Net Assets
Swap Agreements (100%)
Total Exposure (100%)
“Market Exposure” includes the value of total investments (including thecontract value of any derivatives) and excludes any short-term invest-ments and cash equivalents.
S&P Regional Banks Select Industry Index – Composition
% of Index
Regional Banks 100%
Merrill Corp - Proshares Trust Geared Book [96 Funds] Annual Report [Funds] 333-089822 05-31-2017 ED [AUX] | eperez | 28-Jul-17 17:35 | 17-15159-3.cc | Sequence: 5CHKSUM Content: 26859 Layout: 30956 Graphics: 43734 CLEAN
JOB: 17-15159-3 CYCLE#;BL#: 5; 0 TRIM: 8.25" x 10.75" COMPOSITECOLORS: Black, ~note-color 2, ~note-color 3 GRAPHICS: 15159-3_KRS_L.eps V1.5
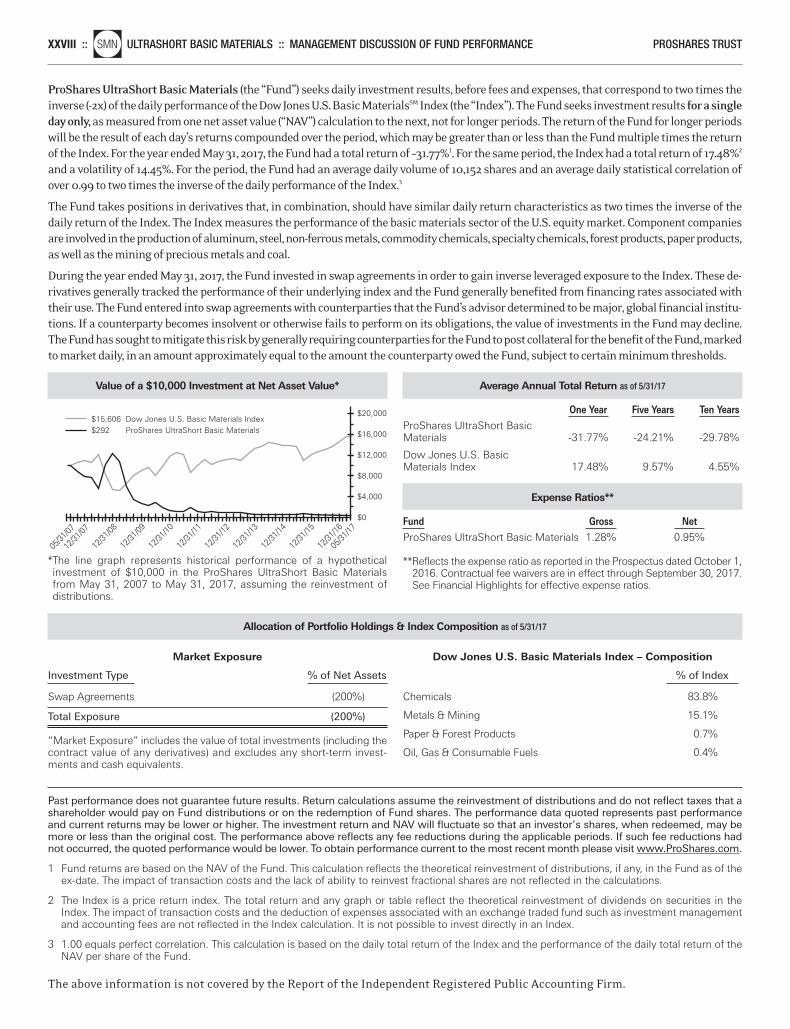
ProShares UltraShort Basic Materials (the “Fund”) seeks daily investment results, before fees and expenses, that correspond to two times theinverse (-2x) of the daily performance of the Dow Jones U.S. Basic MaterialsSM Index (the “Index”). The Fund seeks investment results for a singleday only, as measured from one net asset value (“NAV”) calculation to the next, not for longer periods. The return of the Fund for longer periodswill be the result of each day’s returns compounded over the period, which may be greater than or less than the Fund multiple times the returnof the Index. For the year ended May 31, 2017, the Fund had a total return of –31.77%1. For the same period, the Index had a total return of 17.48%2
and a volatility of 14.45%. For the period, the Fund had an average daily volume of 10,152 shares and an average daily statistical correlation ofover 0.99 to two times the inverse of the daily performance of the Index.3
The Fund takes positions in derivatives that, in combination, should have similar daily return characteristics as two times the inverse of thedaily return of the Index. The Index measures the performance of the basic materials sector of the U.S. equity market. Component companiesare involved in the production of aluminum, steel, non-ferrous metals, commodity chemicals, specialty chemicals, forest products, paper products,as well as the mining of precious metals and coal.
During the year ended May 31, 2017, the Fund invested in swap agreements in order to gain inverse leveraged exposure to the Index. These de-rivatives generally tracked the performance of their underlying index and the Fund generally benefited from financing rates associated withtheir use. The Fund entered into swap agreements with counterparties that the Fund’s advisor determined to be major, global financial institu-tions. If a counterparty becomes insolvent or otherwise fails to perform on its obligations, the value of investments in the Fund may decline.The Fund has sought to mitigate this risk by generally requiring counterparties for the Fund to post collateral for the benefit of the Fund, markedto market daily, in an amount approximately equal to the amount the counterparty owed the Fund, subject to certain minimum thresholds.
Past performance does not guarantee future results. Return calculations assume the reinvestment of distributions and do not reflect taxes that ashareholder would pay on Fund distributions or on the redemption of Fund shares. The performance data quoted represents past performanceand current returns may be lower or higher. The investment return and NAV will fluctuate so that an investor’s shares, when redeemed, may bemore or less than the original cost. The performance above reflects any fee reductions during the applicable periods. If such fee reductions hadnot occurred, the quoted performance would be lower. To obtain performance current to the most recent month please visit www.ProShares.com.
1 Fund returns are based on the NAV of the Fund. This calculation reflects the theoretical reinvestment of distributions, if any, in the Fund as of theex-date. The impact of transaction costs and the lack of ability to reinvest fractional shares are not reflected in the calculations.
2 The Index is a price return index. The total return and any graph or table reflect the theoretical reinvestment of dividends on securities in theIndex. The impact of transaction costs and the deduction of expenses associated with an exchange traded fund such as investment managementand accounting fees are not reflected in the Index calculation. It is not possible to invest directly in an Index.
3 1.00 equals perfect correlation. This calculation is based on the daily total return of the Index and the performance of the daily total return of theNAV per share of the Fund.
The above information is not covered by the Report of the Independent Registered Public Accounting Firm.
XXVIII ::nlSMN ULTRASHORT BASIC MATERIALS :: MANAGEMENT DISCUSSION OF FUND PERFORMANCE PROSHARES TRUST
Value of a $10,000 Investment at Net Asset Value*
*The line graph represents historical performance of a hypothetical investment of $10,000 in the ProShares UltraShort Basic Materialsfrom May 31, 2007 to May 31, 2017, assuming the reinvestment of distributions.
$20,000
$16,000
$0
$12,000
$4,000
$8,000
$15,606 Dow Jones U.S. Basic Materials Index$292 ProShares UltraShort Basic Materials
12/31
/07
12/31
/10
12/31
/09
12/31
/08
12/31
/13
12/31
/16
12/31
/15
12/31
/14
12/31
/12
12/31
/11
05/31
/17
05/31
/07
Average Annual Total Return as of 5/31/17
One Year Five Years Ten Years ProShares UltraShort Basic Materials -31.77% -24.21% -29.78%
Dow Jones U.S. Basic Materials Index 17.48% 9.57% 4.55%
Expense Ratios**
Fund Gross Net ProShares UltraShort Basic Materials 1.28% 0.95%
**Reflects the expense ratio as reported in the Prospectus dated October 1,2016. Contractual fee waivers are in effect through September 30, 2017.See Financial Highlights for effective expense ratios.
Allocation of Portfolio Holdings & Index Composition as of 5/31/17
Market Exposure
Investment Type % of Net Assets
Swap Agreements (200%)
Total Exposure (200%)
“Market Exposure” includes the value of total investments (including thecontract value of any derivatives) and excludes any short-term invest-ments and cash equivalents.
Dow Jones U.S. Basic Materials Index – Composition
% of Index
Chemicals 83.8%
Metals & Mining 15.1%
Paper & Forest Products 0.7%
Oil, Gas & Consumable Fuels 0.4%
Merrill Corp - Proshares Trust Geared Book [96 Funds] Annual Report [Funds] 333-089822 05-31-2017 ED [AUX] | eperez | 28-Jul-17 17:35 | 17-15159-3.cc | Sequence: 6CHKSUM Content: 55549 Layout: 34152 Graphics: 7602 CLEAN
JOB: 17-15159-3 CYCLE#;BL#: 5; 0 TRIM: 8.25" x 10.75" COMPOSITECOLORS: Black, ~note-color 2, ~note-color 3 GRAPHICS: 15159-3_SMN_L.eps V1.5
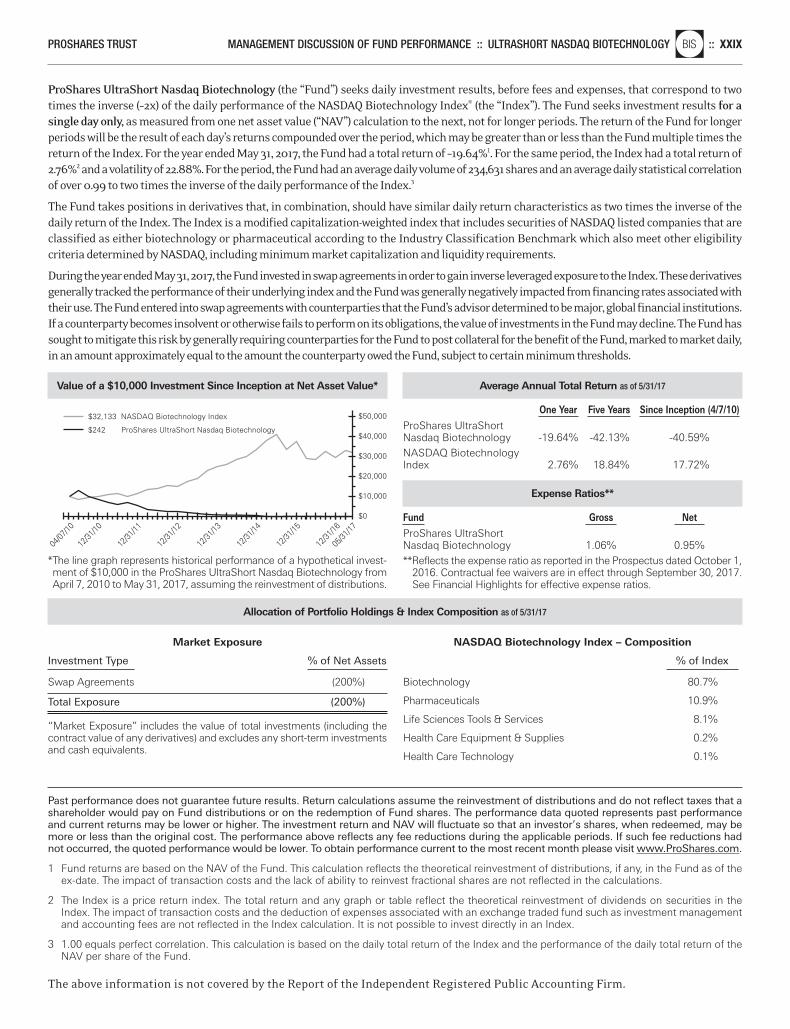
ProShares UltraShort Nasdaq Biotechnology (the “Fund”) seeks daily investment results, before fees and expenses, that correspond to twotimes the inverse (–2x) of the daily performance of the NASDAQ Biotechnology Index® (the “Index”). The Fund seeks investment results for asingle day only, as measured from one net asset value (“NAV”) calculation to the next, not for longer periods. The return of the Fund for longerperiods will be the result of each day’s returns compounded over the period, which may be greater than or less than the Fund multiple times thereturn of the Index. For the year ended May 31, 2017, the Fund had a total return of –19.64%1. For the same period, the Index had a total return of2.76%2 and a volatility of 22.88%. For the period, the Fund had an average daily volume of 234,631 shares and an average daily statistical correlationof over 0.99 to two times the inverse of the daily performance of the Index.3
The Fund takes positions in derivatives that, in combination, should have similar daily return characteristics as two times the inverse of thedaily return of the Index. The Index is a modified capitalization-weighted index that includes securities of NASDAQ listed companies that areclassified as either biotechnology or pharmaceutical according to the Industry Classification Benchmark which also meet other eligibilitycriteria determined by NASDAQ, including minimum market capitalization and liquidity requirements.
During the year ended May 31, 2017, the Fund invested in swap agreements in order to gain inverse leveraged exposure to the Index. These derivativesgenerally tracked the performance of their underlying index and the Fund was generally negatively impacted from financing rates associated withtheir use. The Fund entered into swap agreements with counterparties that the Fund’s advisor determined to be major, global financial institutions.If a counterparty becomes insolvent or otherwise fails to perform on its obligations, the value of investments in the Fund may decline. The Fund hassought to mitigate this risk by generally requiring counterparties for the Fund to post collateral for the benefit of the Fund, marked to market daily,in an amount approximately equal to the amount the counterparty owed the Fund, subject to certain minimum thresholds.
Past performance does not guarantee future results. Return calculations assume the reinvestment of distributions and do not reflect taxes that ashareholder would pay on Fund distributions or on the redemption of Fund shares. The performance data quoted represents past performanceand current returns may be lower or higher. The investment return and NAV will fluctuate so that an investor’s shares, when redeemed, may bemore or less than the original cost. The performance above reflects any fee reductions during the applicable periods. If such fee reductions hadnot occurred, the quoted performance would be lower. To obtain performance current to the most recent month please visit www.ProShares.com.
1 Fund returns are based on the NAV of the Fund. This calculation reflects the theoretical reinvestment of distributions, if any, in the Fund as of theex-date. The impact of transaction costs and the lack of ability to reinvest fractional shares are not reflected in the calculations.
2 The Index is a price return index. The total return and any graph or table reflect the theoretical reinvestment of dividends on securities in theIndex. The impact of transaction costs and the deduction of expenses associated with an exchange traded fund such as investment managementand accounting fees are not reflected in the Index calculation. It is not possible to invest directly in an Index.
3 1.00 equals perfect correlation. This calculation is based on the daily total return of the Index and the performance of the daily total return of theNAV per share of the Fund.
The above information is not covered by the Report of the Independent Registered Public Accounting Firm.
PROSHARES TRUST MANAGEMENT DISCUSSION OF FUND PERFORMANCE :: ULTRASHORT NASDAQ BIOTECHNOLOGYnlBIS :: XXIX
Value of a $10,000 Investment Since Inception at Net Asset Value*
*The line graph represents historical performance of a hypothetical invest-ment of $10,000 in the ProShares UltraShort Nasdaq Biotechnology fromApril 7, 2010 to May 31, 2017, assuming the reinvestment of distributions.
$50,000
$40,000
$0
$10,000
$20,000
$30,000
$32,133 NASDAQ Biotechnology Index
$242 ProShares UltraShort Nasdaq Biotechnology
04/07
/10
12/31
/10
12/31
/16
12/31
/15
12/31
/14
12/31
/13
12/31
/12
12/31
/11
05/31
/17
Average Annual Total Return as of 5/31/17
One Year Five Years Since Inception (4/7/10) ProShares UltraShort Nasdaq Biotechnology -19.64% -42.13% -40.59%NASDAQ Biotechnology Index 2.76% 18.84% 17.72%
Expense Ratios**
Fund Gross Net ProShares UltraShort Nasdaq Biotechnology 1.06% 0.95%**Reflects the expense ratio as reported in the Prospectus dated October 1,
2016. Contractual fee waivers are in effect through September 30, 2017.See Financial Highlights for effective expense ratios.
Allocation of Portfolio Holdings & Index Composition as of 5/31/17
Market Exposure
Investment Type % of Net Assets
Swap Agreements (200%)
Total Exposure (200%)
“Market Exposure” includes the value of total investments (including thecontract value of any derivatives) and excludes any short-term investmentsand cash equivalents.
NASDAQ Biotechnology Index – Composition
% of Index
Biotechnology 80.7%
Pharmaceuticals 10.9%
Life Sciences Tools & Services 8.1%
Health Care Equipment & Supplies 0.2%
Health Care Technology 0.1%
Merrill Corp - Proshares Trust Geared Book [96 Funds] Annual Report [Funds] 333-089822 05-31-2017 ED [AUX] | eperez | 28-Jul-17 17:35 | 17-15159-3.cc | Sequence: 7CHKSUM Content: 45498 Layout: 16950 Graphics: 53697 CLEAN
JOB: 17-15159-3 CYCLE#;BL#: 5; 0 TRIM: 8.25" x 10.75" COMPOSITECOLORS: Black, ~note-color 2, ~note-color 3 GRAPHICS: 15159-3_BIS_L.eps V1.5
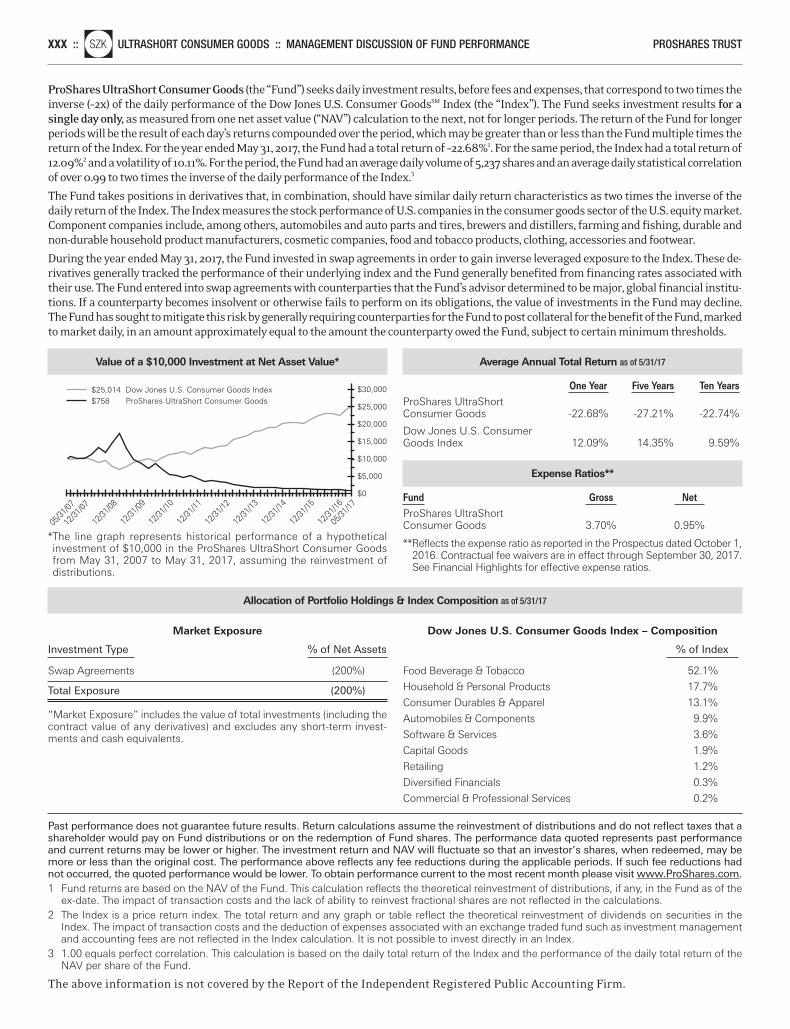
ProShares UltraShort Consumer Goods (the “Fund”) seeks daily investment results, before fees and expenses, that correspond to two times theinverse (–2x) of the daily performance of the Dow Jones U.S. Consumer GoodsSM Index (the “Index”). The Fund seeks investment results for asingle day only, as measured from one net asset value (“NAV”) calculation to the next, not for longer periods. The return of the Fund for longerperiods will be the result of each day’s returns compounded over the period, which may be greater than or less than the Fund multiple times thereturn of the Index. For the year ended May 31, 2017, the Fund had a total return of –22.68%1. For the same period, the Index had a total return of12.09%2 and a volatility of 10.11%. For the period, the Fund had an average daily volume of 5,237 shares and an average daily statistical correlationof over 0.99 to two times the inverse of the daily performance of the Index.3
The Fund takes positions in derivatives that, in combination, should have similar daily return characteristics as two times the inverse of thedaily return of the Index. The Index measures the stock performance of U.S. companies in the consumer goods sector of the U.S. equity market.Component companies include, among others, automobiles and auto parts and tires, brewers and distillers, farming and fishing, durable andnon-durable household product manufacturers, cosmetic companies, food and tobacco products, clothing, accessories and footwear.
During the year ended May 31, 2017, the Fund invested in swap agreements in order to gain inverse leveraged exposure to the Index. These de-rivatives generally tracked the performance of their underlying index and the Fund generally benefited from financing rates associated withtheir use. The Fund entered into swap agreements with counterparties that the Fund’s advisor determined to be major, global financial institu-tions. If a counterparty becomes insolvent or otherwise fails to perform on its obligations, the value of investments in the Fund may decline.The Fund has sought to mitigate this risk by generally requiring counterparties for the Fund to post collateral for the benefit of the Fund, markedto market daily, in an amount approximately equal to the amount the counterparty owed the Fund, subject to certain minimum thresholds.
XXX ::nlSZK ULTRASHORT CONSUMER GOODS :: MANAGEMENT DISCUSSION OF FUND PERFORMANCE PROSHARES TRUST
Value of a $10,000 Investment at Net Asset Value*
*The line graph represents historical performance of a hypothetical investment of $10,000 in the ProShares UltraShort Consumer Goodsfrom May 31, 2007 to May 31, 2017, assuming the reinvestment ofdistributions.
$30,000
$25,000
$20,000
$0
$15,000
$5,000
$10,000
$25,014 Dow Jones U.S. Consumer Goods Index$758 ProShares UltraShort Consumer Goods
12/31
/07
12/31
/10
12/31
/09
12/31
/08
12/31
/16
12/31
/15
12/31
/14
12/31
/13
12/31
/12
12/31
/11
05/31
/17
05/31
/07
Average Annual Total Return as of 5/31/17
One Year Five Years Ten Years ProShares UltraShort Consumer Goods -22.68% -27.21% -22.74%
Dow Jones U.S. ConsumerGoods Index 12.09% 14.35% 9.59%
Expense Ratios**
Fund Gross Net ProShares UltraShortConsumer Goods 3.70% 0.95%
**Reflects the expense ratio as reported in the Prospectus dated October 1,2016. Contractual fee waivers are in effect through September 30, 2017.See Financial Highlights for effective expense ratios.
Allocation of Portfolio Holdings & Index Composition as of 5/31/17
Market Exposure
Investment Type % of Net Assets
Swap Agreements (200%)
Total Exposure (200%)
“Market Exposure” includes the value of total investments (including thecontract value of any derivatives) and excludes any short-term invest-ments and cash equivalents.
Dow Jones U.S. Consumer Goods Index – Composition
% of Index
Food Beverage & Tobacco 52.1%
Household & Personal Products 17.7%
Consumer Durables & Apparel 13.1%
Automobiles & Components 9.9%
Software & Services 3.6%
Capital Goods 1.9%
Retailing 1.2%
Diversified Financials 0.3%
Commercial & Professional Services 0.2%
Past performance does not guarantee future results. Return calculations assume the reinvestment of distributions and do not reflect taxes that ashareholder would pay on Fund distributions or on the redemption of Fund shares. The performance data quoted represents past performanceand current returns may be lower or higher. The investment return and NAV will fluctuate so that an investor’s shares, when redeemed, may bemore or less than the original cost. The performance above reflects any fee reductions during the applicable periods. If such fee reductions hadnot occurred, the quoted performance would be lower. To obtain performance current to the most recent month please visit www.ProShares.com.1 Fund returns are based on the NAV of the Fund. This calculation reflects the theoretical reinvestment of distributions, if any, in the Fund as of the
ex-date. The impact of transaction costs and the lack of ability to reinvest fractional shares are not reflected in the calculations.2 The Index is a price return index. The total return and any graph or table reflect the theoretical reinvestment of dividends on securities in the
Index. The impact of transaction costs and the deduction of expenses associated with an exchange traded fund such as investment managementand accounting fees are not reflected in the Index calculation. It is not possible to invest directly in an Index.
3 1.00 equals perfect correlation. This calculation is based on the daily total return of the Index and the performance of the daily total return of theNAV per share of the Fund.
The above information is not covered by the Report of the Independent Registered Public Accounting Firm.
Merrill Corp - Proshares Trust Geared Book [96 Funds] Annual Report [Funds] 333-089822 05-31-2017 ED [AUX] | eperez | 28-Jul-17 17:35 | 17-15159-3.cc | Sequence: 8CHKSUM Content: 41832 Layout: 8977 Graphics: 6144 CLEAN
JOB: 17-15159-3 CYCLE#;BL#: 5; 0 TRIM: 8.25" x 10.75" COMPOSITECOLORS: Black, ~note-color 2, ~note-color 3 GRAPHICS: 15159-3_SZK_L.eps V1.5
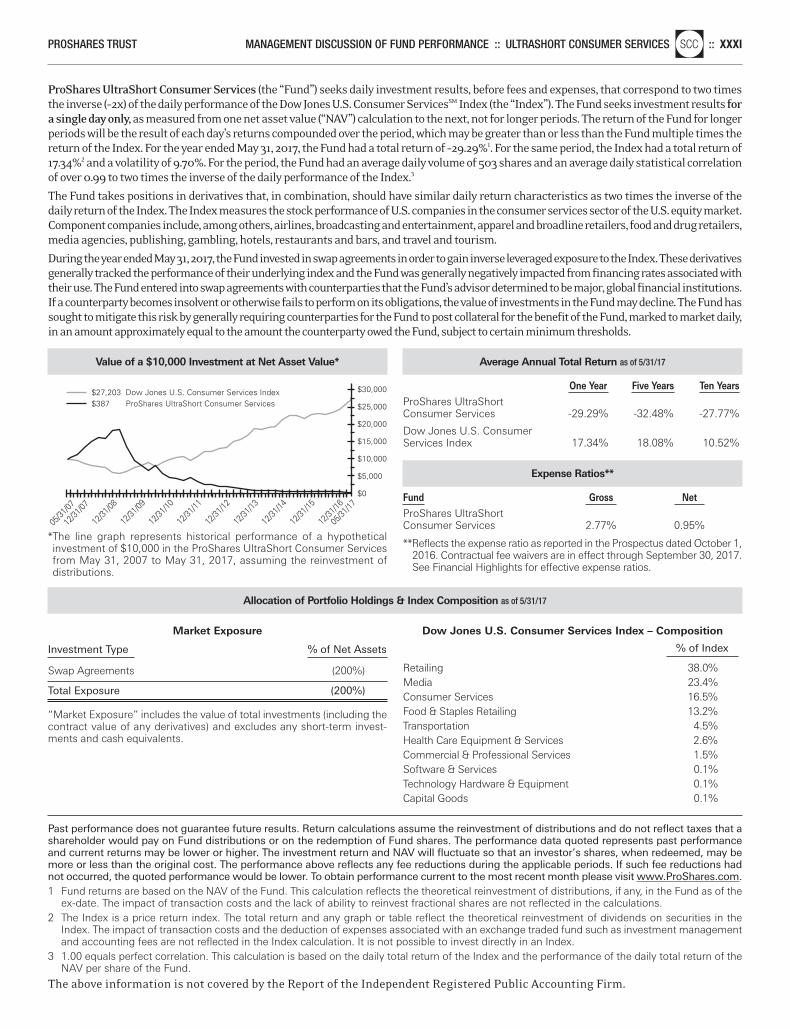
ProShares UltraShort Consumer Services (the “Fund”) seeks daily investment results, before fees and expenses, that correspond to two timesthe inverse (–2x) of the daily performance of the Dow Jones U.S. Consumer ServicesSM Index (the “Index”). The Fund seeks investment results fora single day only, as measured from one net asset value (“NAV”) calculation to the next, not for longer periods. The return of the Fund for longerperiods will be the result of each day’s returns compounded over the period, which may be greater than or less than the Fund multiple times thereturn of the Index. For the year ended May 31, 2017, the Fund had a total return of –29.29%1. For the same period, the Index had a total return of17.34%2 and a volatility of 9.70%. For the period, the Fund had an average daily volume of 503 shares and an average daily statistical correlationof over 0.99 to two times the inverse of the daily performance of the Index.3
The Fund takes positions in derivatives that, in combination, should have similar daily return characteristics as two times the inverse of thedaily return of the Index. The Index measures the stock performance of U.S. companies in the consumer services sector of the U.S. equity market.Component companies include, among others, airlines, broadcasting and entertainment, apparel and broadline retailers, food and drug retailers,media agencies, publishing, gambling, hotels, restaurants and bars, and travel and tourism.
During the year ended May 31, 2017, the Fund invested in swap agreements in order to gain inverse leveraged exposure to the Index. These derivativesgenerally tracked the performance of their underlying index and the Fund was generally negatively impacted from financing rates associated withtheir use. The Fund entered into swap agreements with counterparties that the Fund’s advisor determined to be major, global financial institutions.If a counterparty becomes insolvent or otherwise fails to perform on its obligations, the value of investments in the Fund may decline. The Fund hassought to mitigate this risk by generally requiring counterparties for the Fund to post collateral for the benefit of the Fund, marked to market daily,in an amount approximately equal to the amount the counterparty owed the Fund, subject to certain minimum thresholds.
PROSHARES TRUST MANAGEMENT DISCUSSION OF FUND PERFORMANCE :: ULTRASHORT CONSUMER SERVICESnlSCC :: XXXI
Value of a $10,000 Investment at Net Asset Value*
*The line graph represents historical performance of a hypothetical investment of $10,000 in the ProShares UltraShort Consumer Servicesfrom May 31, 2007 to May 31, 2017, assuming the reinvestment of distributions.
$30,000
$25,000
$20,000
$0
$15,000
$5,000
$10,000
$27,203 Dow Jones U.S. Consumer Services Index$387 ProShares UltraShort Consumer Services
12/31
/07
12/31
/10
12/31
/09
12/31
/08
12/31
/16
12/31
/15
12/31
/14
12/31
/13
12/31
/12
12/31
/11
05/31
/17
05/31
/07
Average Annual Total Return as of 5/31/17
One Year Five Years Ten Years ProShares UltraShort Consumer Services -29.29% -32.48% -27.77%
Dow Jones U.S. Consumer Services Index 17.34% 18.08% 10.52%
Expense Ratios**
Fund Gross Net ProShares UltraShort Consumer Services 2.77% 0.95%
**Reflects the expense ratio as reported in the Prospectus dated October 1,2016. Contractual fee waivers are in effect through September 30, 2017.See Financial Highlights for effective expense ratios.
Allocation of Portfolio Holdings & Index Composition as of 5/31/17
Market Exposure
Investment Type % of Net Assets
Swap Agreements (200%)
Total Exposure (200%)
“Market Exposure” includes the value of total investments (including thecontract value of any derivatives) and excludes any short-term invest-ments and cash equivalents.
Dow Jones U.S. Consumer Services Index – Composition
% of Index Retailing 38.0%Media 23.4%Consumer Services 16.5%Food & Staples Retailing 13.2%Transportation 4.5%Health Care Equipment & Services 2.6%Commercial & Professional Services 1.5%Software & Services 0.1%Technology Hardware & Equipment 0.1%Capital Goods 0.1%
Past performance does not guarantee future results. Return calculations assume the reinvestment of distributions and do not reflect taxes that ashareholder would pay on Fund distributions or on the redemption of Fund shares. The performance data quoted represents past performanceand current returns may be lower or higher. The investment return and NAV will fluctuate so that an investor’s shares, when redeemed, may bemore or less than the original cost. The performance above reflects any fee reductions during the applicable periods. If such fee reductions hadnot occurred, the quoted performance would be lower. To obtain performance current to the most recent month please visit www.ProShares.com.1 Fund returns are based on the NAV of the Fund. This calculation reflects the theoretical reinvestment of distributions, if any, in the Fund as of the
ex-date. The impact of transaction costs and the lack of ability to reinvest fractional shares are not reflected in the calculations.2 The Index is a price return index. The total return and any graph or table reflect the theoretical reinvestment of dividends on securities in the
Index. The impact of transaction costs and the deduction of expenses associated with an exchange traded fund such as investment managementand accounting fees are not reflected in the Index calculation. It is not possible to invest directly in an Index.
3 1.00 equals perfect correlation. This calculation is based on the daily total return of the Index and the performance of the daily total return of theNAV per share of the Fund.
The above information is not covered by the Report of the Independent Registered Public Accounting Firm.
Merrill Corp - Proshares Trust Geared Book [96 Funds] Annual Report [Funds] 333-089822 05-31-2017 ED [AUX] | eperez | 28-Jul-17 17:35 | 17-15159-3.cc | Sequence: 9CHKSUM Content: 44914 Layout: 32145 Graphics: 9742 CLEAN
JOB: 17-15159-3 CYCLE#;BL#: 5; 0 TRIM: 8.25" x 10.75" COMPOSITECOLORS: Black, ~note-color 2, ~note-color 3 GRAPHICS: 15159-3_SCC_L.eps V1.5
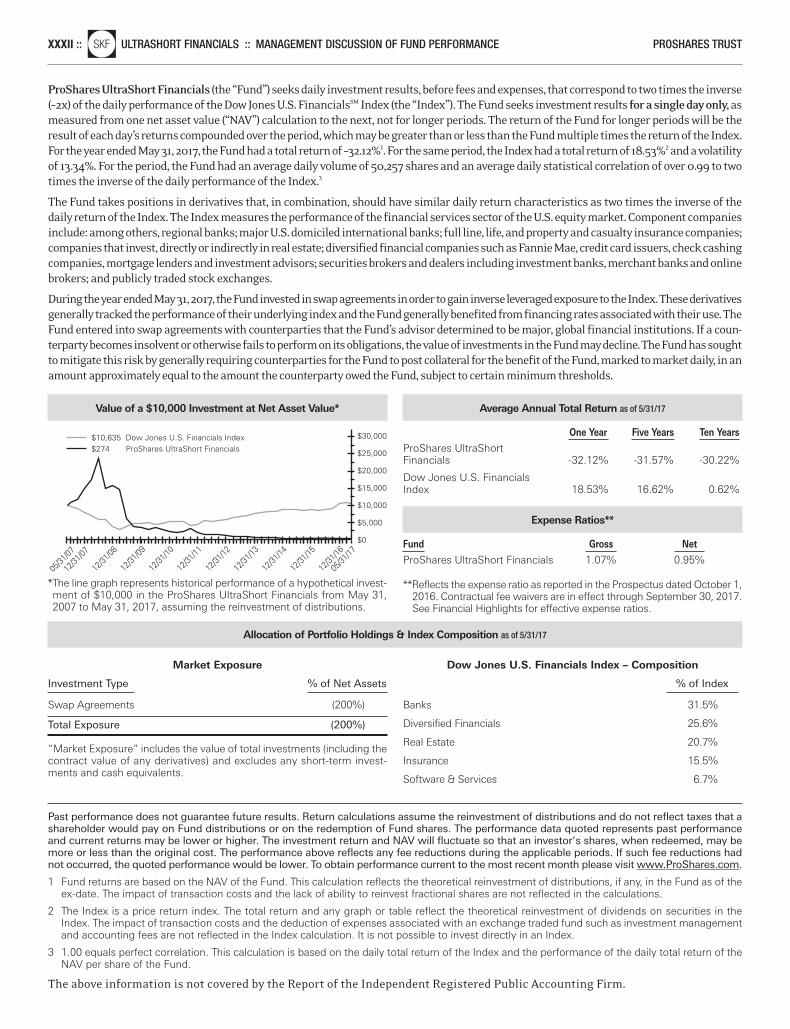
ProShares UltraShort Financials (the “Fund”) seeks daily investment results, before fees and expenses, that correspond to two times the inverse(–2x) of the daily performance of the Dow Jones U.S. FinancialsSM Index (the “Index”). The Fund seeks investment results for a single day only,asmeasured from one net asset value (“NAV”) calculation to the next, not for longer periods. The return of the Fund for longer periods will be theresult of each day’s returns compounded over the period, which may be greater than or less than the Fund multiple times the return of the Index.For the year ended May 31, 2017, the Fund had a total return of –32.12%1. For the same period, the Index had a total return of 18.53%2 and a volatilityof 13.34%. For the period, the Fund had an average daily volume of 50,257 shares and an average daily statistical correlation of over 0.99 to twotimes the inverse of the daily performance of the Index.3
The Fund takes positions in derivatives that, in combination, should have similar daily return characteristics as two times the inverse of thedaily return of the Index. The Index measures the performance of the financial services sector of the U.S. equity market. Component companiesinclude: among others, regional banks; major U.S. domiciled international banks; full line, life, and property and casualty insurance companies;companies that invest, directly or indirectly in real estate; diversified financial companies such as Fannie Mae, credit card issuers, check cashingcompanies, mortgage lenders and investment advisors; securities brokers and dealers including investment banks, merchant banks and onlinebrokers; and publicly traded stock exchanges.
During the year ended May 31, 2017, the Fund invested in swap agreements in order to gain inverse leveraged exposure to the Index. These derivativesgenerally tracked the performance of their underlying index and the Fund generally benefited from financing rates associated with their use. TheFund entered into swap agreements with counterparties that the Fund’s advisor determined to be major, global financial institutions. If a coun-terparty becomes insolvent or otherwise fails to perform on its obligations, the value of investments in the Fund may decline. The Fund has soughtto mitigate this risk by generally requiring counterparties for the Fund to post collateral for the benefit of the Fund, marked to market daily, in anamount approximately equal to the amount the counterparty owed the Fund, subject to certain minimum thresholds.
XXXII ::nlSKF ULTRASHORT FINANCIALS :: MANAGEMENT DISCUSSION OF FUND PERFORMANCE PROSHARES TRUST
Value of a $10,000 Investment at Net Asset Value*
*The line graph represents historical performance of a hypothetical invest-ment of $10,000 in the ProShares UltraShort Financials from May 31,2007 to May 31, 2017, assuming the reinvestment of distributions.
$30,000
$25,000
$20,000
$0
$15,000
$5,000
$10,000
$10,635 Dow Jones U.S. Financials Index$274 ProShares UltraShort Financials
12/31
/07
12/31
/10
12/31
/09
12/31
/08
12/31
/16
12/31
/15
12/31
/14
12/31
/13
12/31
/12
12/31
/11
05/31
/17
05/31
/07
Average Annual Total Return as of 5/31/17
One Year Five Years Ten Years ProShares UltraShortFinancials -32.12% -31.57% -30.22%
Dow Jones U.S. FinancialsIndex 18.53% 16.62% 0.62%
Expense Ratios**
Fund Gross Net ProShares UltraShort Financials 1.07% 0.95%
**Reflects the expense ratio as reported in the Prospectus dated October 1,2016. Contractual fee waivers are in effect through September 30, 2017.See Financial Highlights for effective expense ratios.
Allocation of Portfolio Holdings & Index Composition as of 5/31/17
Market Exposure
Investment Type % of Net Assets
Swap Agreements (200%)
Total Exposure (200%)
“Market Exposure” includes the value of total investments (including thecontract value of any derivatives) and excludes any short-term invest-ments and cash equivalents.
Dow Jones U.S. Financials Index – Composition
% of Index
Banks 31.5%
Diversified Financials 25.6%
Real Estate 20.7%
Insurance 15.5%
Software & Services 6.7%
Past performance does not guarantee future results. Return calculations assume the reinvestment of distributions and do not reflect taxes that ashareholder would pay on Fund distributions or on the redemption of Fund shares. The performance data quoted represents past performanceand current returns may be lower or higher. The investment return and NAV will fluctuate so that an investor’s shares, when redeemed, may bemore or less than the original cost. The performance above reflects any fee reductions during the applicable periods. If such fee reductions hadnot occurred, the quoted performance would be lower. To obtain performance current to the most recent month please visit www.ProShares.com.
1 Fund returns are based on the NAV of the Fund. This calculation reflects the theoretical reinvestment of distributions, if any, in the Fund as of theex-date. The impact of transaction costs and the lack of ability to reinvest fractional shares are not reflected in the calculations.
2 The Index is a price return index. The total return and any graph or table reflect the theoretical reinvestment of dividends on securities in theIndex. The impact of transaction costs and the deduction of expenses associated with an exchange traded fund such as investment managementand accounting fees are not reflected in the Index calculation. It is not possible to invest directly in an Index.
3 1.00 equals perfect correlation. This calculation is based on the daily total return of the Index and the performance of the daily total return of theNAV per share of the Fund.
The above information is not covered by the Report of the Independent Registered Public Accounting Firm.
Merrill Corp - Proshares Trust Geared Book [96 Funds] Annual Report [Funds] 333-089822 05-31-2017 ED [AUX] | eperez | 28-Jul-17 17:35 | 17-15159-3.cc | Sequence: 10CHKSUM Content: 26536 Layout: 54855 Graphics: 51370 CLEAN
JOB: 17-15159-3 CYCLE#;BL#: 5; 0 TRIM: 8.25" x 10.75" COMPOSITECOLORS: Black, ~note-color 2, ~note-color 3 GRAPHICS: 15159-3_SKF_L.eps V1.5
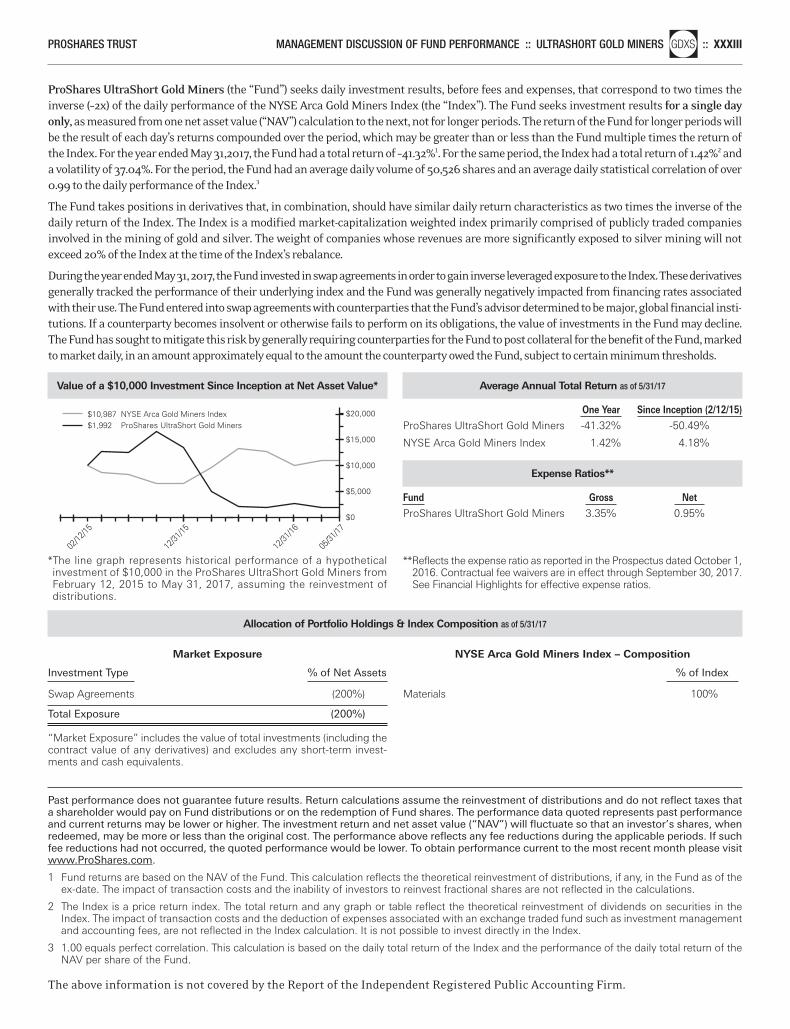
ProShares UltraShort Gold Miners (the “Fund”) seeks daily investment results, before fees and expenses, that correspond to two times theinverse (–2x) of the daily performance of the NYSE Arca Gold Miners Index (the “Index”). The Fund seeks investment results for a single dayonly, as measured from one net asset value (“NAV”) calculation to the next, not for longer periods. The return of the Fund for longer periods willbe the result of each day’s returns compounded over the period, which may be greater than or less than the Fund multiple times the return ofthe Index. For the year ended May 31,2017, the Fund had a total return of –41.32%1. For the same period, the Index had a total return of 1.42%2 anda volatility of 37.04%. For the period, the Fund had an average daily volume of 50,526 shares and an average daily statistical correlation of over0.99 to the daily performance of the Index.3
The Fund takes positions in derivatives that, in combination, should have similar daily return characteristics as two times the inverse of thedaily return of the Index. The Index is a modified market-capitalization weighted index primarily comprised of publicly traded companiesinvolved in the mining of gold and silver. The weight of companies whose revenues are more significantly exposed to silver mining will notexceed 20% of the Index at the time of the Index’s rebalance.
During the year ended May 31, 2017, the Fund invested in swap agreements in order to gain inverse leveraged exposure to the Index. These derivativesgenerally tracked the performance of their underlying index and the Fund was generally negatively impacted from financing rates associatedwith their use. The Fund entered into swap agreements with counterparties that the Fund’s advisor determined to be major, global financial insti-tutions. If a counterparty becomes insolvent or otherwise fails to perform on its obligations, the value of investments in the Fund may decline.The Fund has sought to mitigate this risk by generally requiring counterparties for the Fund to post collateral for the benefit of the Fund, markedto market daily, in an amount approximately equal to the amount the counterparty owed the Fund, subject to certain minimum thresholds.
PROSHARES TRUST MANAGEMENT DISCUSSION OF FUND PERFORMANCE :: ULTRASHORT GOLD MINERSnlGDXS :: XXXIII
Value of a $10,000 Investment Since Inception at Net Asset Value*
*The line graph represents historical performance of a hypothetical investment of $10,000 in the ProShares UltraShort Gold Miners fromFebruary 12, 2015 to May 31, 2017, assuming the reinvestment ofdistributions.
$20,000
$15,000
$0
$10,000
$5,000
02/12
/15
12/31
/15
12/31
/16
05/31
/17
$10,987 NYSE Arca Gold Miners Index$1,992 ProShares UltraShort Gold Miners
Average Annual Total Return as of 5/31/17
One Year Since Inception (2/12/15) ProShares UltraShort Gold Miners -41.32% -50.49%
NYSE Arca Gold Miners Index 1.42% 4.18%
Expense Ratios**
Fund Gross Net ProShares UltraShort Gold Miners 3.35% 0.95%
**Reflects the expense ratio as reported in the Prospectus dated October 1,2016. Contractual fee waivers are in effect through September 30, 2017.See Financial Highlights for effective expense ratios.
Allocation of Portfolio Holdings & Index Composition as of 5/31/17
Market Exposure
Investment Type % of Net Assets
Swap Agreements (200%)
Total Exposure (200%)
“Market Exposure” includes the value of total investments (including thecontract value of any derivatives) and excludes any short-term invest-ments and cash equivalents.
NYSE Arca Gold Miners Index – Composition
% of Index
Materials 100%
Past performance does not guarantee future results. Return calculations assume the reinvestment of distributions and do not reflect taxes thata shareholder would pay on Fund distributions or on the redemption of Fund shares. The performance data quoted represents past performanceand current returns may be lower or higher. The investment return and net asset value (“NAV”) will fluctuate so that an investor’s shares, whenredeemed, may be more or less than the original cost. The performance above reflects any fee reductions during the applicable periods. If suchfee reductions had not occurred, the quoted performance would be lower. To obtain performance current to the most recent month please visitwww.ProShares.com.
1 Fund returns are based on the NAV of the Fund. This calculation reflects the theoretical reinvestment of distributions, if any, in the Fund as of theex-date. The impact of transaction costs and the inability of investors to reinvest fractional shares are not reflected in the calculations.
2 The Index is a price return index. The total return and any graph or table reflect the theoretical reinvestment of dividends on securities in theIndex. The impact of transaction costs and the deduction of expenses associated with an exchange traded fund such as investment managementand accounting fees, are not reflected in the Index calculation. It is not possible to invest directly in the Index.
3 1.00 equals perfect correlation. This calculation is based on the daily total return of the Index and the performance of the daily total return of theNAV per share of the Fund.
The above information is not covered by the Report of the Independent Registered Public Accounting Firm.
Merrill Corp - Proshares Trust Geared Book [96 Funds] Annual Report [Funds] 333-089822 05-31-2017 ED [AUX] | eperez | 28-Jul-17 17:35 | 17-15159-3.cc | Sequence: 11CHKSUM Content: 30984 Layout: 34378 Graphics: 5393 CLEAN
JOB: 17-15159-3 CYCLE#;BL#: 5; 0 TRIM: 8.25" x 10.75" COMPOSITECOLORS: Black, ~note-color 2, ~note-color 3 GRAPHICS: 15159-3_GDXS_L.eps V1.5
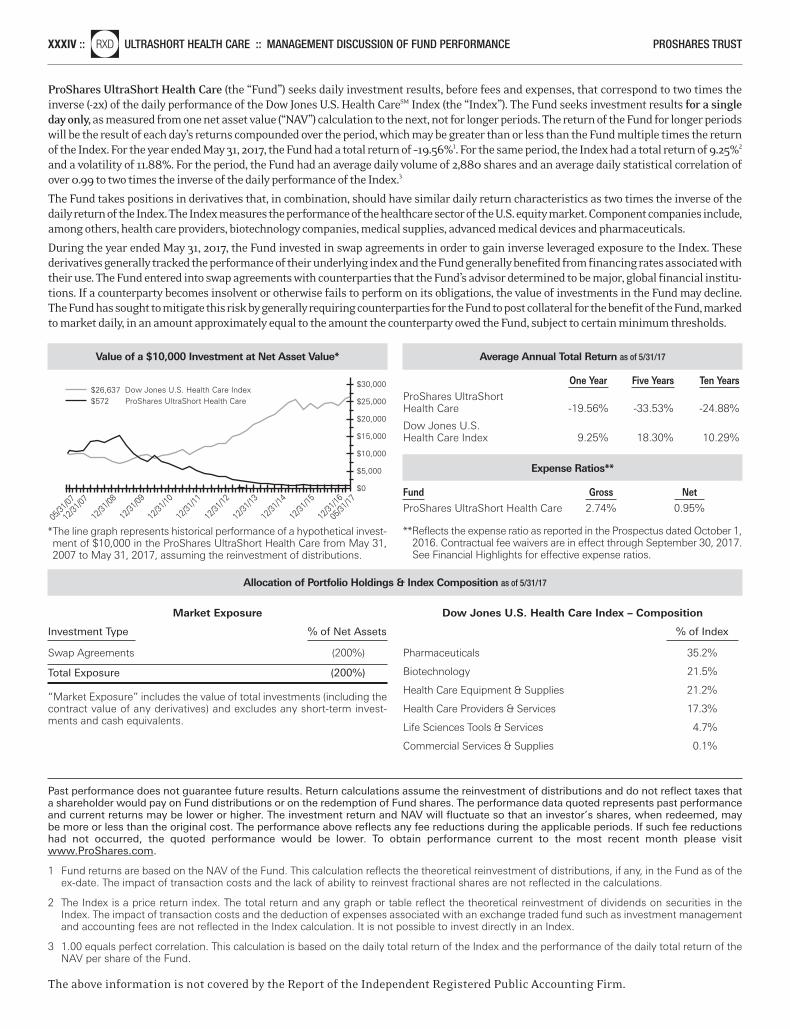
ProShares UltraShort Health Care (the “Fund”) seeks daily investment results, before fees and expenses, that correspond to two times theinverse (-2x) of the daily performance of the Dow Jones U.S. Health CareSM Index (the “Index”). The Fund seeks investment results for a singleday only, as measured from one net asset value (“NAV”) calculation to the next, not for longer periods. The return of the Fund for longer periodswill be the result of each day’s returns compounded over the period, which may be greater than or less than the Fund multiple times the returnof the Index. For the year ended May 31, 2017, the Fund had a total return of –19.56%1. For the same period, the Index had a total return of 9.25%2
and a volatility of 11.88%. For the period, the Fund had an average daily volume of 2,880 shares and an average daily statistical correlation ofover 0.99 to two times the inverse of the daily performance of the Index.3
The Fund takes positions in derivatives that, in combination, should have similar daily return characteristics as two times the inverse of thedaily return of the Index. The Index measures the performance of the healthcare sector of the U.S. equity market. Component companies include,among others, health care providers, biotechnology companies, medical supplies, advanced medical devices and pharmaceuticals.
During the year ended May 31, 2017, the Fund invested in swap agreements in order to gain inverse leveraged exposure to the Index. These derivatives generally tracked the performance of their underlying index and the Fund generally benefited from financing rates associated withtheir use. The Fund entered into swap agreements with counterparties that the Fund’s advisor determined to be major, global financial institu-tions. If a counterparty becomes insolvent or otherwise fails to perform on its obligations, the value of investments in the Fund may decline.The Fund has sought to mitigate this risk by generally requiring counterparties for the Fund to post collateral for the benefit of the Fund, markedto market daily, in an amount approximately equal to the amount the counterparty owed the Fund, subject to certain minimum thresholds.
XXXIV ::nlRXD ULTRASHORT HEALTH CARE :: MANAGEMENT DISCUSSION OF FUND PERFORMANCE PROSHARES TRUST
Value of a $10,000 Investment at Net Asset Value*
*The line graph represents historical performance of a hypothetical invest-ment of $10,000 in the ProShares UltraShort Health Care from May 31,2007 to May 31, 2017, assuming the reinvestment of distributions.
$30,000
$25,000
$20,000
$0
$15,000
$5,000
$10,000
$26,637 Dow Jones U.S. Health Care Index$572 ProShares UltraShort Health Care
12/31
/07
12/31
/10
12/31
/09
12/31
/08
12/31
/13
12/31
/16
12/31
/15
12/31
/14
12/31
/12
12/31
/11
05/31
/17
05/31
/07
Average Annual Total Return as of 5/31/17
One Year Five Years Ten Years ProShares UltraShortHealth Care -19.56% -33.53% -24.88%
Dow Jones U.S.Health Care Index 9.25% 18.30% 10.29%
Expense Ratios**
Fund Gross Net ProShares UltraShort Health Care 2.74% 0.95%
**Reflects the expense ratio as reported in the Prospectus dated October 1,2016. Contractual fee waivers are in effect through September 30, 2017.See Financial Highlights for effective expense ratios.
Allocation of Portfolio Holdings & Index Composition as of 5/31/17
Market Exposure
Investment Type % of Net Assets
Swap Agreements (200%)
Total Exposure (200%)
“Market Exposure” includes the value of total investments (including thecontract value of any derivatives) and excludes any short-term invest-ments and cash equivalents.
Dow Jones U.S. Health Care Index – Composition
% of Index
Pharmaceuticals 35.2%
Biotechnology 21.5%
Health Care Equipment & Supplies 21.2%
Health Care Providers & Services 17.3%
Life Sciences Tools & Services 4.7%
Commercial Services & Supplies 0.1%
Past performance does not guarantee future results. Return calculations assume the reinvestment of distributions and do not reflect taxes thata shareholder would pay on Fund distributions or on the redemption of Fund shares. The performance data quoted represents past performanceand current returns may be lower or higher. The investment return and NAV will fluctuate so that an investor’s shares, when redeemed, maybe more or less than the original cost. The performance above reflects any fee reductions during the applicable periods. If such fee reductionshad not occurred, the quoted performance would be lower. To obtain performance current to the most recent month please visitwww.ProShares.com.
1 Fund returns are based on the NAV of the Fund. This calculation reflects the theoretical reinvestment of distributions, if any, in the Fund as of theex-date. The impact of transaction costs and the lack of ability to reinvest fractional shares are not reflected in the calculations.
2 The Index is a price return index. The total return and any graph or table reflect the theoretical reinvestment of dividends on securities in theIndex. The impact of transaction costs and the deduction of expenses associated with an exchange traded fund such as investment managementand accounting fees are not reflected in the Index calculation. It is not possible to invest directly in an Index.
3 1.00 equals perfect correlation. This calculation is based on the daily total return of the Index and the performance of the daily total return of theNAV per share of the Fund.
The above information is not covered by the Report of the Independent Registered Public Accounting Firm.
Merrill Corp - Proshares Trust Geared Book [96 Funds] Annual Report [Funds] 333-089822 05-31-2017 ED [AUX] | eperez | 28-Jul-17 17:35 | 17-15159-3.cc | Sequence: 12CHKSUM Content: 14159 Layout: 13980 Graphics: 6042 CLEAN
JOB: 17-15159-3 CYCLE#;BL#: 5; 0 TRIM: 8.25" x 10.75" COMPOSITECOLORS: Black, ~note-color 2, ~note-color 3 GRAPHICS: 15159-3_RXD_L.eps V1.5
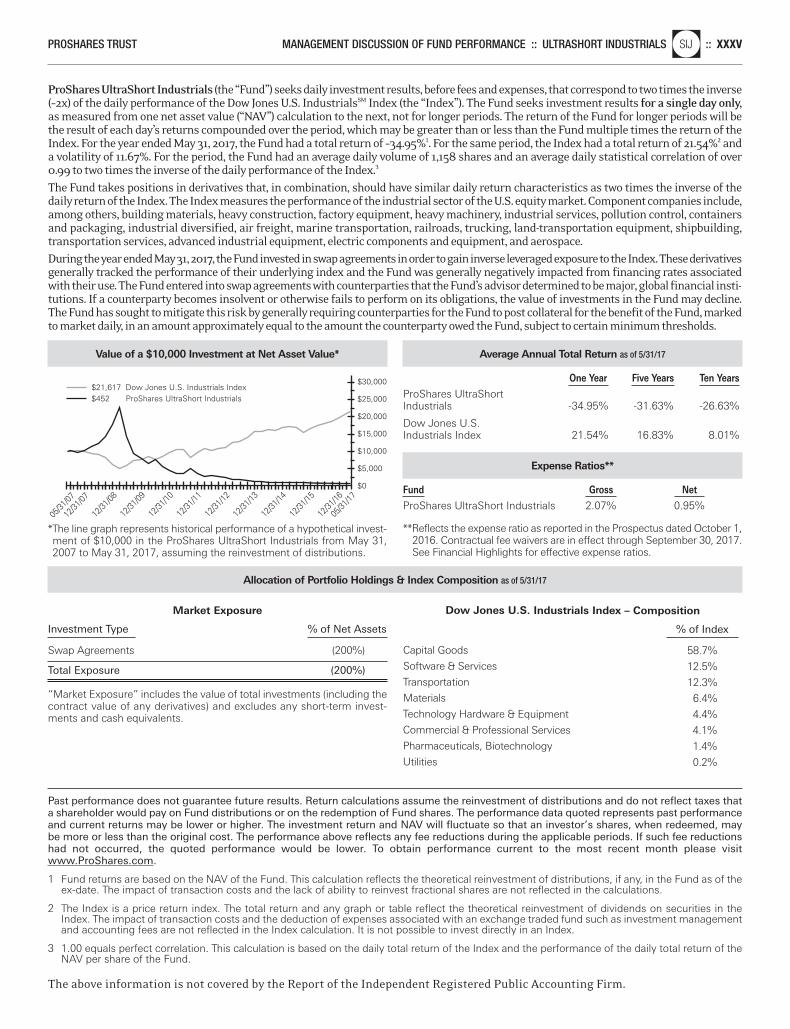
ProShares UltraShort Industrials (the “Fund”) seeks daily investment results, before fees and expenses, that correspond to two times the inverse(–2x) of the daily performance of the Dow Jones U.S. IndustrialsSM Index (the “Index”). The Fund seeks investment results for a single day only,as measured from one net asset value (“NAV”) calculation to the next, not for longer periods. The return of the Fund for longer periods will bethe result of each day’s returns compounded over the period, which may be greater than or less than the Fund multiple times the return of theIndex. For the year ended May 31, 2017, the Fund had a total return of –34.95%1. For the same period, the Index had a total return of 21.54%2 anda volatility of 11.67%. For the period, the Fund had an average daily volume of 1,158 shares and an average daily statistical correlation of over0.99 to two times the inverse of the daily performance of the Index.3
The Fund takes positions in derivatives that, in combination, should have similar daily return characteristics as two times the inverse of thedaily return of the Index. The Index measures the performance of the industrial sector of the U.S. equity market. Component companies include,among others, building materials, heavy construction, factory equipment, heavy machinery, industrial services, pollution control, containersand packaging, industrial diversified, air freight, marine transportation, railroads, trucking, land-transportation equipment, shipbuilding,transportation services, advanced industrial equipment, electric components and equipment, and aerospace.During the year ended May 31, 2017, the Fund invested in swap agreements in order to gain inverse leveraged exposure to the Index. These derivativesgenerally tracked the performance of their underlying index and the Fund was generally negatively impacted from financing rates associatedwith their use. The Fund entered into swap agreements with counterparties that the Fund’s advisor determined to be major, global financial insti-tutions. If a counterparty becomes insolvent or otherwise fails to perform on its obligations, the value of investments in the Fund may decline.The Fund has sought to mitigate this risk by generally requiring counterparties for the Fund to post collateral for the benefit of the Fund, markedto market daily, in an amount approximately equal to the amount the counterparty owed the Fund, subject to certain minimum thresholds.
PROSHARES TRUST MANAGEMENT DISCUSSION OF FUND PERFORMANCE :: ULTRASHORT INDUSTRIALSnlSIJ :: XXXV
Value of a $10,000 Investment at Net Asset Value*
*The line graph represents historical performance of a hypothetical invest-ment of $10,000 in the ProShares UltraShort Industrials from May 31,2007 to May 31, 2017, assuming the reinvestment of distributions.
$30,000
$25,000
$20,000
$0
$15,000
$5,000
$10,000
$21,617 Dow Jones U.S. Industrials Index$452 ProShares UltraShort Industrials
12/31
/07
12/31
/10
12/31
/09
12/31
/08
12/31
/13
12/31
/16
12/31
/15
12/31
/14
12/31
/12
12/31
/11
05/31
/17
05/31
/07
Average Annual Total Return as of 5/31/17
One Year Five Years Ten Years ProShares UltraShort Industrials -34.95% -31.63% -26.63%
Dow Jones U.S. Industrials Index 21.54% 16.83% 8.01%
Expense Ratios**
Fund Gross Net ProShares UltraShort Industrials 2.07% 0.95%
**Reflects the expense ratio as reported in the Prospectus dated October 1,2016. Contractual fee waivers are in effect through September 30, 2017.See Financial Highlights for effective expense ratios.
Allocation of Portfolio Holdings & Index Composition as of 5/31/17
Market Exposure
Investment Type % of Net Assets
Swap Agreements (200%)
Total Exposure (200%)
“Market Exposure” includes the value of total investments (including thecontract value of any derivatives) and excludes any short-term invest-ments and cash equivalents.
Dow Jones U.S. Industrials Index – Composition
% of Index
Capital Goods 58.7%Software & Services 12.5%Transportation 12.3%Materials 6.4%Technology Hardware & Equipment 4.4%Commercial & Professional Services 4.1%Pharmaceuticals, Biotechnology 1.4%Utilities 0.2%
Past performance does not guarantee future results. Return calculations assume the reinvestment of distributions and do not reflect taxes thata shareholder would pay on Fund distributions or on the redemption of Fund shares. The performance data quoted represents past performanceand current returns may be lower or higher. The investment return and NAV will fluctuate so that an investor’s shares, when redeemed, maybe more or less than the original cost. The performance above reflects any fee reductions during the applicable periods. If such fee reductionshad not occurred, the quoted performance would be lower. To obtain performance current to the most recent month please visitwww.ProShares.com.
1 Fund returns are based on the NAV of the Fund. This calculation reflects the theoretical reinvestment of distributions, if any, in the Fund as of theex-date. The impact of transaction costs and the lack of ability to reinvest fractional shares are not reflected in the calculations.
2 The Index is a price return index. The total return and any graph or table reflect the theoretical reinvestment of dividends on securities in theIndex. The impact of transaction costs and the deduction of expenses associated with an exchange traded fund such as investment managementand accounting fees are not reflected in the Index calculation. It is not possible to invest directly in an Index.
3 1.00 equals perfect correlation. This calculation is based on the daily total return of the Index and the performance of the daily total return of theNAV per share of the Fund.
The above information is not covered by the Report of the Independent Registered Public Accounting Firm.
Merrill Corp - Proshares Trust Geared Book [96 Funds] Annual Report [Funds] 333-089822 05-31-2017 ED [AUX] | eperez | 28-Jul-17 17:35 | 17-15159-3.cc | Sequence: 13CHKSUM Content: 56538 Layout: 18015 Graphics: 12008 CLEAN
JOB: 17-15159-3 CYCLE#;BL#: 5; 0 TRIM: 8.25" x 10.75" COMPOSITECOLORS: Black, ~note-color 2, ~note-color 3 GRAPHICS: 15159-3_SIJ_L.eps V1.5
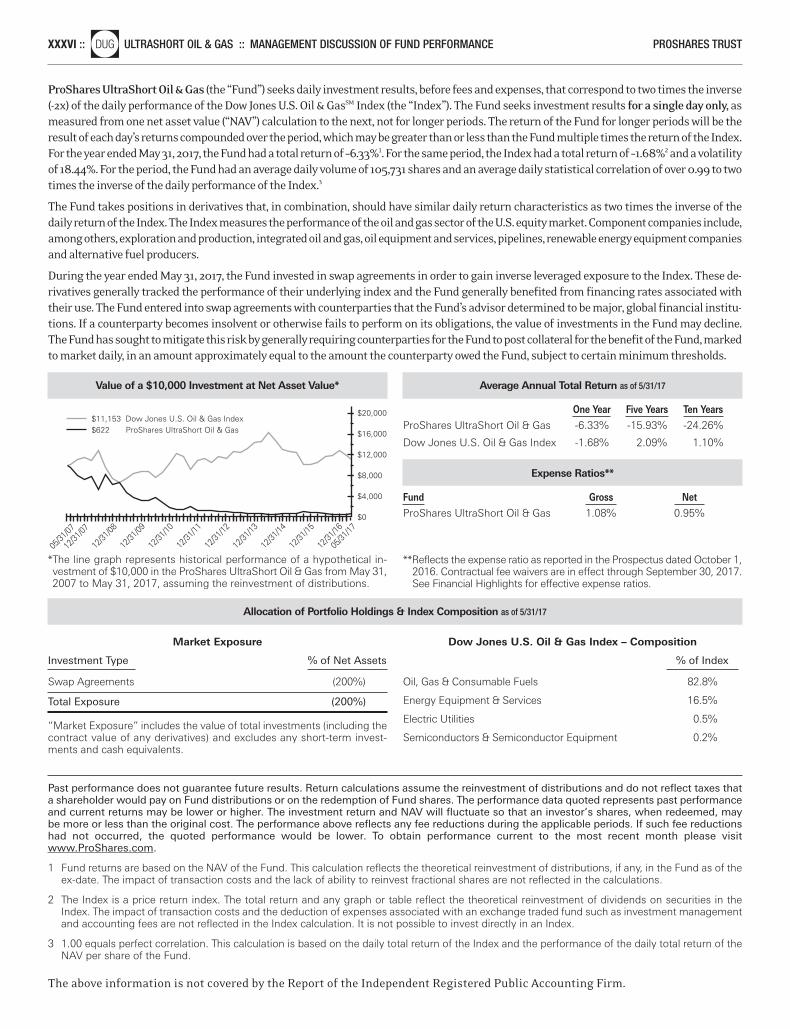
ProShares UltraShort Oil & Gas (the “Fund”) seeks daily investment results, before fees and expenses, that correspond to two times the inverse(-2x) of the daily performance of the Dow Jones U.S. Oil & GasSM Index (the “Index”). The Fund seeks investment results for a single day only, asmeasured from one net asset value (“NAV”) calculation to the next, not for longer periods. The return of the Fund for longer periods will be theresult of each day’s returns compounded over the period, which may be greater than or less than the Fund multiple times the return of the Index.For the year ended May 31, 2017, the Fund had a total return of –6.33%1. For the same period, the Index had a total return of –1.68%2 and a volatilityof 18.44%. For the period, the Fund had an average daily volume of 105,731 shares and an average daily statistical correlation of over 0.99 to twotimes the inverse of the daily performance of the Index.3
The Fund takes positions in derivatives that, in combination, should have similar daily return characteristics as two times the inverse of thedaily return of the Index. The Index measures the performance of the oil and gas sector of the U.S. equity market. Component companies include,among others, exploration and production, integrated oil and gas, oil equipment and services, pipelines, renewable energy equipment companiesand alternative fuel producers.
During the year ended May 31, 2017, the Fund invested in swap agreements in order to gain inverse leveraged exposure to the Index. These de-rivatives generally tracked the performance of their underlying index and the Fund generally benefited from financing rates associated withtheir use. The Fund entered into swap agreements with counterparties that the Fund’s advisor determined to be major, global financial institu-tions. If a counterparty becomes insolvent or otherwise fails to perform on its obligations, the value of investments in the Fund may decline.The Fund has sought to mitigate this risk by generally requiring counterparties for the Fund to post collateral for the benefit of the Fund, markedto market daily, in an amount approximately equal to the amount the counterparty owed the Fund, subject to certain minimum thresholds.
XXXVI ::nlDUG ULTRASHORT OIL & GAS :: MANAGEMENT DISCUSSION OF FUND PERFORMANCE PROSHARES TRUST
Value of a $10,000 Investment at Net Asset Value*
*The line graph represents historical performance of a hypothetical in-vestment of $10,000 in the ProShares UltraShort Oil & Gas from May 31,2007 to May 31, 2017, assuming the reinvestment of distributions.
$20,000
$16,000
$0
$12,000
$4,000
$8,000
$11,153 Dow Jones U.S. Oil & Gas Index$622 ProShares UltraShort Oil & Gas
12/31
/07
12/31
/10
12/31
/09
12/31
/08
12/31
/13
12/31
/16
12/31
/15
12/31
/14
12/31
/12
12/31
/11
05/31
/17
05/31
/07
Average Annual Total Return as of 5/31/17
One Year Five Years Ten Years ProShares UltraShort Oil & Gas -6.33% -15.93% -24.26%
Dow Jones U.S. Oil & Gas Index -1.68% 2.09% 1.10%
Expense Ratios**
Fund Gross Net ProShares UltraShort Oil & Gas 1.08% 0.95%
**Reflects the expense ratio as reported in the Prospectus dated October 1,2016. Contractual fee waivers are in effect through September 30, 2017.See Financial Highlights for effective expense ratios.
Market Exposure
Investment Type % of Net Assets
Swap Agreements (200%)
Total Exposure (200%)
“Market Exposure” includes the value of total investments (including thecontract value of any derivatives) and excludes any short-term invest-ments and cash equivalents.
Dow Jones U.S. Oil & Gas Index – Composition
% of Index
Oil, Gas & Consumable Fuels 82.8%
Energy Equipment & Services 16.5%
Electric Utilities 0.5%
Semiconductors & Semiconductor Equipment 0.2%
Past performance does not guarantee future results. Return calculations assume the reinvestment of distributions and do not reflect taxes thata shareholder would pay on Fund distributions or on the redemption of Fund shares. The performance data quoted represents past performanceand current returns may be lower or higher. The investment return and NAV will fluctuate so that an investor’s shares, when redeemed, maybe more or less than the original cost. The performance above reflects any fee reductions during the applicable periods. If such fee reductionshad not occurred, the quoted performance would be lower. To obtain performance current to the most recent month please visitwww.ProShares.com.
1 Fund returns are based on the NAV of the Fund. This calculation reflects the theoretical reinvestment of distributions, if any, in the Fund as of theex-date. The impact of transaction costs and the lack of ability to reinvest fractional shares are not reflected in the calculations.
2 The Index is a price return index. The total return and any graph or table reflect the theoretical reinvestment of dividends on securities in theIndex. The impact of transaction costs and the deduction of expenses associated with an exchange traded fund such as investment managementand accounting fees are not reflected in the Index calculation. It is not possible to invest directly in an Index.
3 1.00 equals perfect correlation. This calculation is based on the daily total return of the Index and the performance of the daily total return of theNAV per share of the Fund.
The above information is not covered by the Report of the Independent Registered Public Accounting Firm.
Allocation of Portfolio Holdings & Index Composition as of 5/31/17
Merrill Corp - Proshares Trust Geared Book [96 Funds] Annual Report [Funds] 333-089822 05-31-2017 ED [AUX] | eperez | 28-Jul-17 17:35 | 17-15159-3.cc | Sequence: 14CHKSUM Content: 42709 Layout: 27201 Graphics: 57033 CLEAN
JOB: 17-15159-3 CYCLE#;BL#: 5; 0 TRIM: 8.25" x 10.75" COMPOSITECOLORS: Black, ~note-color 2, ~note-color 3 GRAPHICS: 15159-3_DUG_L.eps V1.5
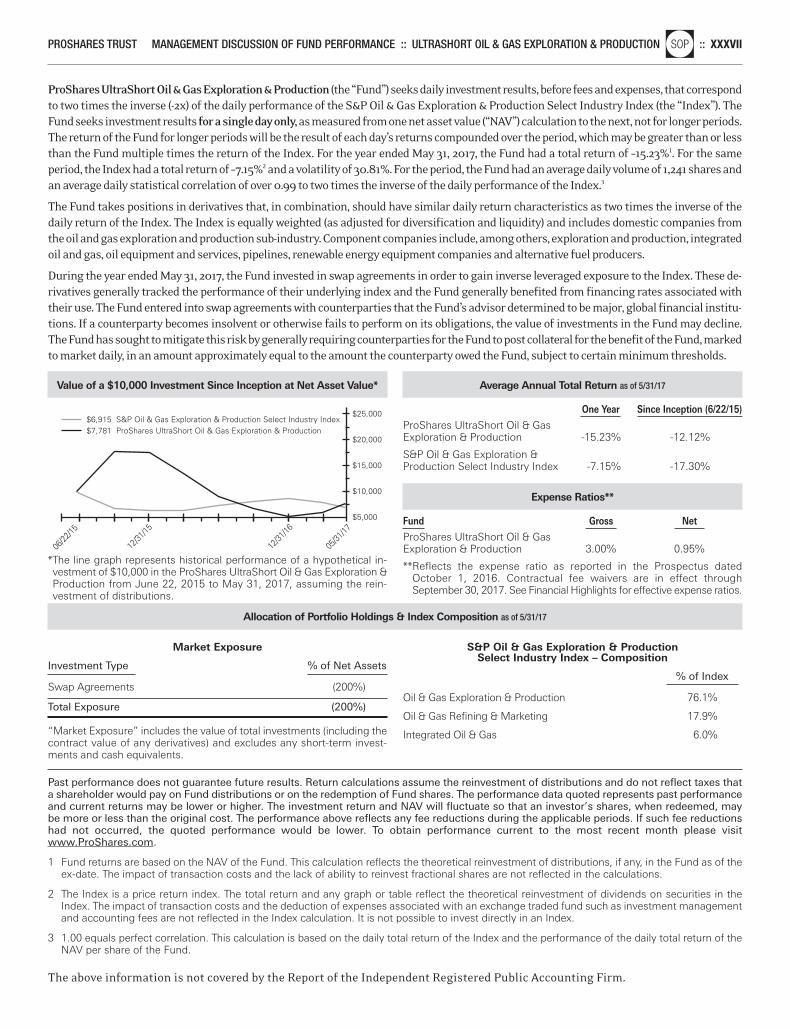
PROSHARES TRUST MANAGEMENT DISCUSSION OF FUND PERFORMANCE :: ULTRASHORT OIL & GAS EXPLORATION & PRODUCTIONnlSOP :: XXXVII
ProShares UltraShort Oil & Gas Exploration & Production (the “Fund”) seeks daily investment results, before fees and expenses, that correspondto two times the inverse (-2x) of the daily performance of the S&P Oil & Gas Exploration & Production Select Industry Index (the “Index”). TheFund seeks investment resultsfor a single day only,as measured from one net asset value (“NAV”) calculation to the next, not for longer periods.The return of the Fund for longer periods will be the result of each day’s returns compounded over the period, which may be greater than or lessthan the Fund multiple times the return of the Index. For the year ended May 31, 2017, the Fund had a total return of –15.23%1. For the sameperiod, the Index had a total return of –7.15%2 and a volatility of 30.81%. For the period, the Fund had an average daily volume of 1,241 shares andan average daily statistical correlation of over 0.99 to two times the inverse of the daily performance of the Index.3
The Fund takes positions in derivatives that, in combination, should have similar daily return characteristics as two times the inverse of thedaily return of the Index. The Index is equally weighted (as adjusted for diversification and liquidity) and includes domestic companies fromthe oil and gas exploration and production sub-industry. Component companies include, among others, exploration and production, integratedoil and gas, oil equipment and services, pipelines, renewable energy equipment companies and alternative fuel producers.
During the year ended May 31, 2017, the Fund invested in swap agreements in order to gain inverse leveraged exposure to the Index. These de-rivatives generally tracked the performance of their underlying index and the Fund generally benefited from financing rates associated withtheir use. The Fund entered into swap agreements with counterparties that the Fund’s advisor determined to be major, global financial institu-tions. If a counterparty becomes insolvent or otherwise fails to perform on its obligations, the value of investments in the Fund may decline.The Fund has sought to mitigate this risk by generally requiring counterparties for the Fund to post collateral for the benefit of the Fund, markedto market daily, in an amount approximately equal to the amount the counterparty owed the Fund, subject to certain minimum thresholds.
Value of a $10,000 Investment Since Inception at Net Asset Value*
*The line graph represents historical performance of a hypothetical in-vestment of $10,000 in the ProShares UltraShort Oil & Gas Exploration &Production from June 22, 2015 to May 31, 2017, assuming the rein-vestment of distributions.
$25,000
$5,000
$15,000
$10,000
$20,000
$6,915 S&P Oil & Gas Exploration & Production Select Industry Index$7,781 ProShares UltraShort Oil & Gas Exploration & Production
12/31
/15
12/31
/16
05/31
/17
06/22
/15
Average Annual Total Return as of 5/31/17
One Year Since Inception (6/22/15) ProShares UltraShort Oil & Gas Exploration & Production -15.23% -12.12%
S&P Oil & Gas Exploration & Production Select Industry Index -7.15% -17.30%
Expense Ratios**
Fund Gross Net ProShares UltraShort Oil & Gas Exploration & Production 3.00% 0.95%
**Reflects the expense ratio as reported in the Prospectus dated October 1, 2016. Contractual fee waivers are in effect through September 30, 2017. See Financial Highlights for effective expense ratios.
Market Exposure
Investment Type % of Net Assets
Swap Agreements (200%)
Total Exposure (200%)
“Market Exposure” includes the value of total investments (including thecontract value of any derivatives) and excludes any short-term invest-ments and cash equivalents.
S&P Oil & Gas Exploration & ProductionSelect Industry Index – Composition
% of Index
Oil & Gas Exploration & Production 76.1%
Oil & Gas Refining & Marketing 17.9%
Integrated Oil & Gas 6.0%
Past performance does not guarantee future results. Return calculations assume the reinvestment of distributions and do not reflect taxes thata shareholder would pay on Fund distributions or on the redemption of Fund shares. The performance data quoted represents past performanceand current returns may be lower or higher. The investment return and NAV will fluctuate so that an investor’s shares, when redeemed, maybe more or less than the original cost. The performance above reflects any fee reductions during the applicable periods. If such fee reductionshad not occurred, the quoted performance would be lower. To obtain performance current to the most recent month please visitwww.ProShares.com.
1 Fund returns are based on the NAV of the Fund. This calculation reflects the theoretical reinvestment of distributions, if any, in the Fund as of theex-date. The impact of transaction costs and the lack of ability to reinvest fractional shares are not reflected in the calculations.
2 The Index is a price return index. The total return and any graph or table reflect the theoretical reinvestment of dividends on securities in theIndex. The impact of transaction costs and the deduction of expenses associated with an exchange traded fund such as investment managementand accounting fees are not reflected in the Index calculation. It is not possible to invest directly in an Index.
3 1.00 equals perfect correlation. This calculation is based on the daily total return of the Index and the performance of the daily total return of theNAV per share of the Fund.
The above information is not covered by the Report of the Independent Registered Public Accounting Firm.
Allocation of Portfolio Holdings & Index Composition as of 5/31/17
Merrill Corp - Proshares Trust Geared Book [96 Funds] Annual Report [Funds] 333-089822 05-31-2017 ED [AUX] | eperez | 28-Jul-17 17:35 | 17-15159-3.cc | Sequence: 15CHKSUM Content: 2744 Layout: 52060 Graphics: 55586 CLEAN
JOB: 17-15159-3 CYCLE#;BL#: 5; 0 TRIM: 8.25" x 10.75" COMPOSITECOLORS: Black, ~note-color 2, ~note-color 3 GRAPHICS: 15159-3_SOP_L.eps V1.5
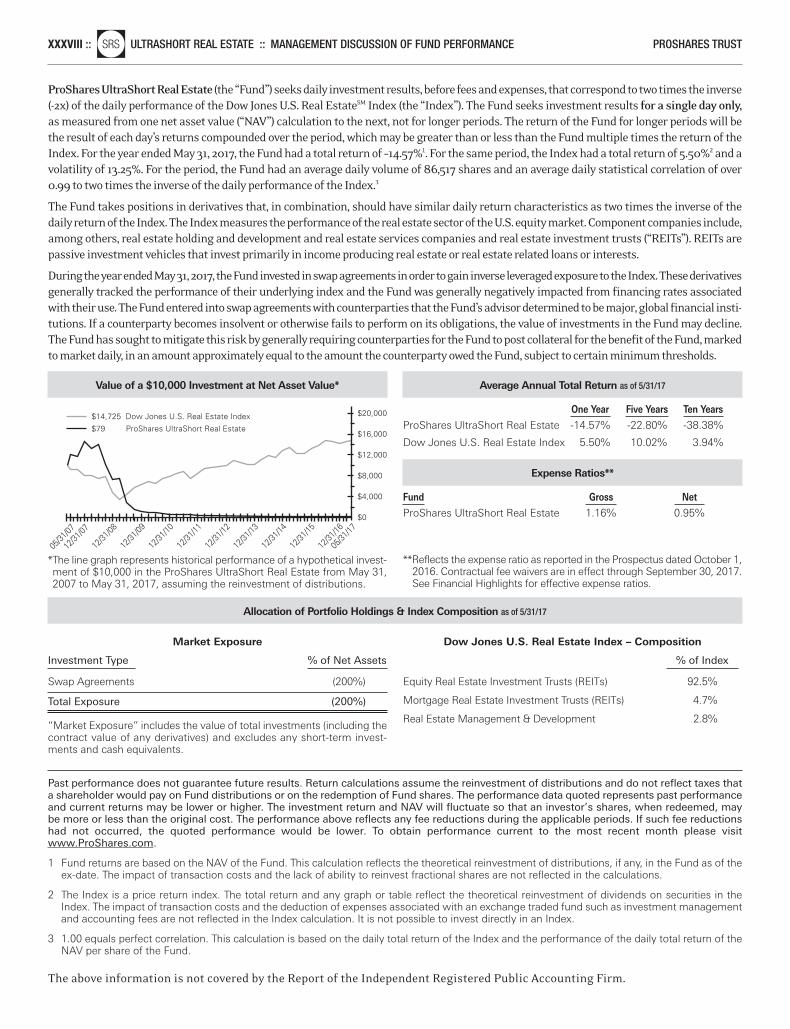
XXXVIII ::nlSRS ULTRASHORT REAL ESTATE :: MANAGEMENT DISCUSSION OF FUND PERFORMANCE PROSHARES TRUST
ProShares UltraShort Real Estate (the “Fund”) seeks daily investment results, before fees and expenses, that correspond to two times the inverse(-2x) of the daily performance of the Dow Jones U.S. Real EstateSM Index (the “Index”). The Fund seeks investment results for a single day only,as measured from one net asset value (“NAV”) calculation to the next, not for longer periods. The return of the Fund for longer periods will bethe result of each day’s returns compounded over the period, which may be greater than or less than the Fund multiple times the return of theIndex. For the year ended May 31, 2017, the Fund had a total return of –14.57%1. For the same period, the Index had a total return of 5.50%2 and avolatility of 13.25%. For the period, the Fund had an average daily volume of 86,517 shares and an average daily statistical correlation of over0.99 to two times the inverse of the daily performance of the Index.3
The Fund takes positions in derivatives that, in combination, should have similar daily return characteristics as two times the inverse of thedaily return of the Index. The Index measures the performance of the real estate sector of the U.S. equity market. Component companies include,among others, real estate holding and development and real estate services companies and real estate investment trusts (“REITs”). REITs arepassive investment vehicles that invest primarily in income producing real estate or real estate related loans or interests.
During the year ended May 31, 2017, the Fund invested in swap agreements in order to gain inverse leveraged exposure to the Index. These derivativesgenerally tracked the performance of their underlying index and the Fund was generally negatively impacted from financing rates associatedwith their use. The Fund entered into swap agreements with counterparties that the Fund’s advisor determined to be major, global financial insti-tutions. If a counterparty becomes insolvent or otherwise fails to perform on its obligations, the value of investments in the Fund may decline.The Fund has sought to mitigate this risk by generally requiring counterparties for the Fund to post collateral for the benefit of the Fund, markedto market daily, in an amount approximately equal to the amount the counterparty owed the Fund, subject to certain minimum thresholds.
Value of a $10,000 Investment at Net Asset Value*
*The line graph represents historical performance of a hypothetical invest-ment of $10,000 in the ProShares UltraShort Real Estate from May 31,2007 to May 31, 2017, assuming the reinvestment of distributions.
$20,000
$16,000
$0
$12,000
$4,000
$8,000
$14,725 Dow Jones U.S. Real Estate Index
$79 ProShares UltraShort Real Estate
12/31
/07
12/31
/10
12/31
/09
12/31
/08
12/31
/16
12/31
/15
12/31
/14
12/31
/13
12/31
/12
12/31
/11
05/31
/17
05/31
/07
Average Annual Total Return as of 5/31/17
One Year Five Years Ten Years ProShares UltraShort Real Estate -14.57% -22.80% -38.38%
Dow Jones U.S. Real Estate Index 5.50% 10.02% 3.94%
Expense Ratios**
Fund Gross Net ProShares UltraShort Real Estate 1.16% 0.95%
**Reflects the expense ratio as reported in the Prospectus dated October 1,2016. Contractual fee waivers are in effect through September 30, 2017.See Financial Highlights for effective expense ratios.
Market Exposure
Investment Type % of Net Assets
Swap Agreements (200%)
Total Exposure (200%)
“Market Exposure” includes the value of total investments (including thecontract value of any derivatives) and excludes any short-term invest-ments and cash equivalents.
Dow Jones U.S. Real Estate Index – Composition
% of Index
Equity Real Estate Investment Trusts (REITs) 92.5%
Mortgage Real Estate Investment Trusts (REITs) 4.7%
Real Estate Management & Development 2.8%
Past performance does not guarantee future results. Return calculations assume the reinvestment of distributions and do not reflect taxes thata shareholder would pay on Fund distributions or on the redemption of Fund shares. The performance data quoted represents past performanceand current returns may be lower or higher. The investment return and NAV will fluctuate so that an investor’s shares, when redeemed, maybe more or less than the original cost. The performance above reflects any fee reductions during the applicable periods. If such fee reductionshad not occurred, the quoted performance would be lower. To obtain performance current to the most recent month please visitwww.ProShares.com.
1 Fund returns are based on the NAV of the Fund. This calculation reflects the theoretical reinvestment of distributions, if any, in the Fund as of theex-date. The impact of transaction costs and the lack of ability to reinvest fractional shares are not reflected in the calculations.
2 The Index is a price return index. The total return and any graph or table reflect the theoretical reinvestment of dividends on securities in theIndex. The impact of transaction costs and the deduction of expenses associated with an exchange traded fund such as investment managementand accounting fees are not reflected in the Index calculation. It is not possible to invest directly in an Index.
3 1.00 equals perfect correlation. This calculation is based on the daily total return of the Index and the performance of the daily total return of theNAV per share of the Fund.
The above information is not covered by the Report of the Independent Registered Public Accounting Firm.
Allocation of Portfolio Holdings & Index Composition as of 5/31/17
Merrill Corp - Proshares Trust Geared Book [96 Funds] Annual Report [Funds] 333-089822 05-31-2017 ED [AUX] | eperez | 28-Jul-17 17:35 | 17-15159-3.cc | Sequence: 16CHKSUM Content: 54937 Layout: 44901 Graphics: 55430 CLEAN
JOB: 17-15159-3 CYCLE#;BL#: 5; 0 TRIM: 8.25" x 10.75" COMPOSITECOLORS: Black, ~note-color 2, ~note-color 3 GRAPHICS: 15159-3_SRS_L.eps V1.5
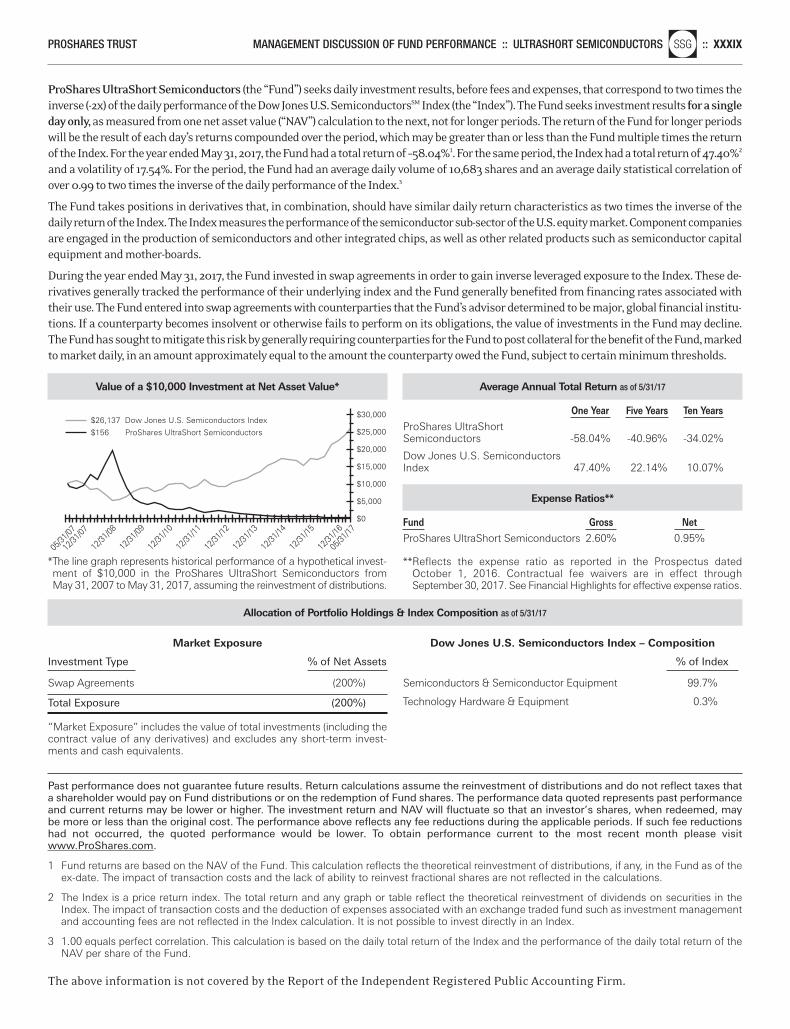
PROSHARES TRUST MANAGEMENT DISCUSSION OF FUND PERFORMANCE :: ULTRASHORT SEMICONDUCTORSnlSSG :: XXXIX
ProShares UltraShort Semiconductors (the “Fund”) seeks daily investment results, before fees and expenses, that correspond to two times theinverse (-2x) of the daily performance of the Dow Jones U.S. SemiconductorsSM Index (the “Index”). The Fund seeks investment resultsfor a singleday only, as measured from one net asset value (“NAV”) calculation to the next, not for longer periods. The return of the Fund for longer periodswill be the result of each day’s returns compounded over the period, which may be greater than or less than the Fund multiple times the returnof the Index. For the year ended May 31, 2017, the Fund had a total return of –58.04%1. For the same period, the Index had a total return of 47.40%2
and a volatility of 17.54%. For the period, the Fund had an average daily volume of 10,683 shares and an average daily statistical correlation ofover 0.99 to two times the inverse of the daily performance of the Index.3
The Fund takes positions in derivatives that, in combination, should have similar daily return characteristics as two times the inverse of thedaily return of the Index. The Index measures the performance of the semiconductor sub-sector of the U.S. equity market. Component companiesare engaged in the production of semiconductors and other integrated chips, as well as other related products such as semiconductor capitalequipment and mother-boards.
During the year ended May 31, 2017, the Fund invested in swap agreements in order to gain inverse leveraged exposure to the Index. These de-rivatives generally tracked the performance of their underlying index and the Fund generally benefited from financing rates associated withtheir use. The Fund entered into swap agreements with counterparties that the Fund’s advisor determined to be major, global financial institu-tions. If a counterparty becomes insolvent or otherwise fails to perform on its obligations, the value of investments in the Fund may decline.The Fund has sought to mitigate this risk by generally requiring counterparties for the Fund to post collateral for the benefit of the Fund, markedto market daily, in an amount approximately equal to the amount the counterparty owed the Fund, subject to certain minimum thresholds.
Value of a $10,000 Investment at Net Asset Value*
*The line graph represents historical performance of a hypothetical invest-ment of $10,000 in the ProShares UltraShort Semiconductors fromMay 31, 2007 to May 31, 2017, assuming the reinvestment of distributions.
$30,000
$20,000
$25,000
$0
$15,000
$5,000
$10,000
$26,137 Dow Jones U.S. Semiconductors Index
$156 ProShares UltraShort Semiconductors
12/31
/07
12/31
/10
12/31
/09
12/31
/08
12/31
/16
12/31
/15
12/31
/14
12/31
/13
12/31
/12
12/31
/11
05/31
/17
05/31
/07
Average Annual Total Return as of 5/31/17
One Year Five Years Ten Years ProShares UltraShort Semiconductors -58.04% -40.96% -34.02%
Dow Jones U.S. Semiconductors Index 47.40% 22.14% 10.07%
Expense Ratios**
Fund Gross Net ProShares UltraShort Semiconductors 2.60% 0.95%
**Reflects the expense ratio as reported in the Prospectus dated October 1, 2016. Contractual fee waivers are in effect through September 30, 2017. See Financial Highlights for effective expense ratios.
Market Exposure
Investment Type % of Net Assets
Swap Agreements (200%)
Total Exposure (200%)
“Market Exposure” includes the value of total investments (including thecontract value of any derivatives) and excludes any short-term invest-ments and cash equivalents.
Dow Jones U.S. Semiconductors Index – Composition
% of Index
Semiconductors & Semiconductor Equipment 99.7%
Technology Hardware & Equipment 0.3%
Past performance does not guarantee future results. Return calculations assume the reinvestment of distributions and do not reflect taxes thata shareholder would pay on Fund distributions or on the redemption of Fund shares. The performance data quoted represents past performanceand current returns may be lower or higher. The investment return and NAV will fluctuate so that an investor’s shares, when redeemed, maybe more or less than the original cost. The performance above reflects any fee reductions during the applicable periods. If such fee reductionshad not occurred, the quoted performance would be lower. To obtain performance current to the most recent month please visitwww.ProShares.com.
1 Fund returns are based on the NAV of the Fund. This calculation reflects the theoretical reinvestment of distributions, if any, in the Fund as of theex-date. The impact of transaction costs and the lack of ability to reinvest fractional shares are not reflected in the calculations.
2 The Index is a price return index. The total return and any graph or table reflect the theoretical reinvestment of dividends on securities in theIndex. The impact of transaction costs and the deduction of expenses associated with an exchange traded fund such as investment managementand accounting fees are not reflected in the Index calculation. It is not possible to invest directly in an Index.
3 1.00 equals perfect correlation. This calculation is based on the daily total return of the Index and the performance of the daily total return of theNAV per share of the Fund.
The above information is not covered by the Report of the Independent Registered Public Accounting Firm.
Allocation of Portfolio Holdings & Index Composition as of 5/31/17
Merrill Corp - Proshares Trust Geared Book [96 Funds] Annual Report [Funds] 333-089822 05-31-2017 ED [AUX] | eperez | 28-Jul-17 17:35 | 17-15159-3.cc | Sequence: 17CHKSUM Content: 62883 Layout: 373 Graphics: 4521 CLEAN
JOB: 17-15159-3 CYCLE#;BL#: 5; 0 TRIM: 8.25" x 10.75" COMPOSITECOLORS: Black, ~note-color 2, ~note-color 3 GRAPHICS: 15159-3_SSG_L.eps V1.5
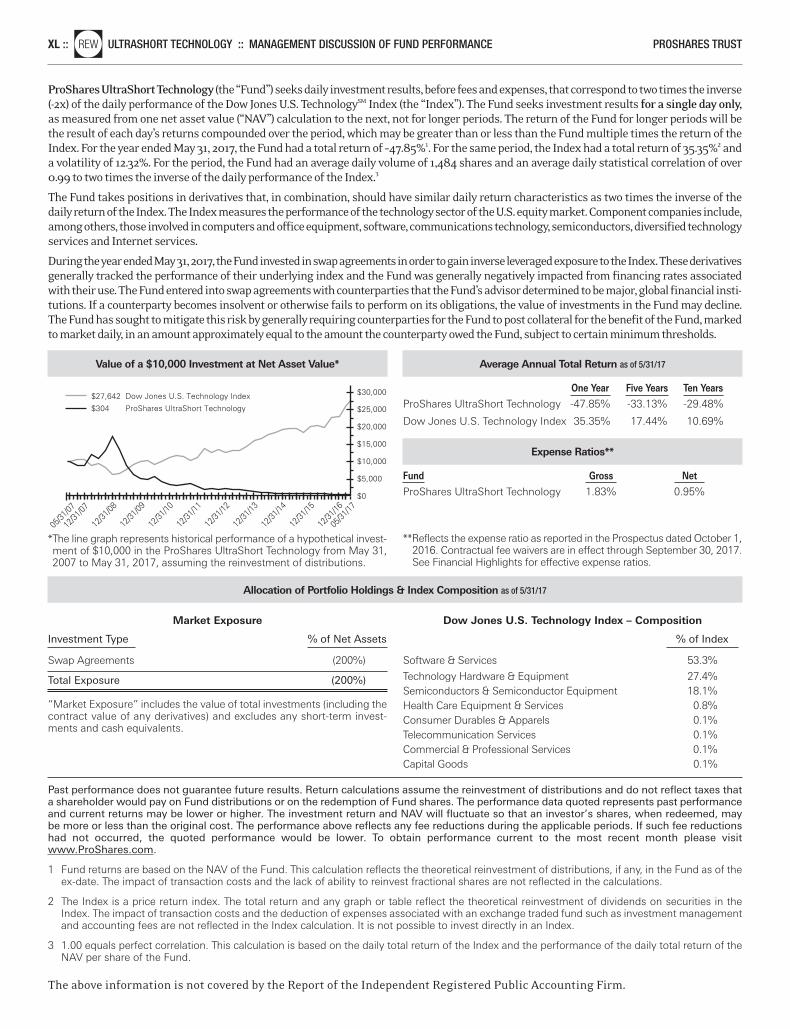
XL ::nlREW ULTRASHORT TECHNOLOGY :: MANAGEMENT DISCUSSION OF FUND PERFORMANCE PROSHARES TRUST
ProShares UltraShort Technology (the “Fund”) seeks daily investment results, before fees and expenses, that correspond to two times the inverse(-2x) of the daily performance of the Dow Jones U.S. TechnologySM Index (the “Index”). The Fund seeks investment results for a single day only,as measured from one net asset value (“NAV”) calculation to the next, not for longer periods. The return of the Fund for longer periods will bethe result of each day’s returns compounded over the period, which may be greater than or less than the Fund multiple times the return of theIndex. For the year ended May 31, 2017, the Fund had a total return of –47.85%1. For the same period, the Index had a total return of 35.35%2 anda volatility of 12.32%. For the period, the Fund had an average daily volume of 1,484 shares and an average daily statistical correlation of over0.99 to two times the inverse of the daily performance of the Index.3
The Fund takes positions in derivatives that, in combination, should have similar daily return characteristics as two times the inverse of thedaily return of the Index. The Index measures the performance of the technology sector of the U.S. equity market. Component companies include,among others, those involved in computers and office equipment, software, communications technology, semiconductors, diversified technologyservices and Internet services.
During the year ended May 31, 2017, the Fund invested in swap agreements in order to gain inverse leveraged exposure to the Index. These derivativesgenerally tracked the performance of their underlying index and the Fund was generally negatively impacted from financing rates associatedwith their use. The Fund entered into swap agreements with counterparties that the Fund’s advisor determined to be major, global financial insti-tutions. If a counterparty becomes insolvent or otherwise fails to perform on its obligations, the value of investments in the Fund may decline.The Fund has sought to mitigate this risk by generally requiring counterparties for the Fund to post collateral for the benefit of the Fund, markedto market daily, in an amount approximately equal to the amount the counterparty owed the Fund, subject to certain minimum thresholds.
Value of a $10,000 Investment at Net Asset Value*
*The line graph represents historical performance of a hypothetical invest-ment of $10,000 in the ProShares UltraShort Technology from May 31,2007 to May 31, 2017, assuming the reinvestment of distributions.
$30,000
$25,000
$20,000
$0
$15,000
$5,000
$10,000
$27,642 Dow Jones U.S. Technology Index
$304 ProShares UltraShort Technology
12/31
/07
12/31
/10
12/31
/09
12/31
/08
12/31
/16
12/31
/15
12/31
/14
12/31
/13
12/31
/12
12/31
/11
05/31
/17
05/31
/07
Average Annual Total Return as of 5/31/17
One Year Five Years Ten Years ProShares UltraShort Technology -47.85% -33.13% -29.48%
Dow Jones U.S. Technology Index 35.35% 17.44% 10.69%
Expense Ratios**
Fund Gross Net ProShares UltraShort Technology 1.83% 0.95%
**Reflects the expense ratio as reported in the Prospectus dated October 1,2016. Contractual fee waivers are in effect through September 30, 2017.See Financial Highlights for effective expense ratios.
Market Exposure
Investment Type % of Net Assets
Swap Agreements (200%)
Total Exposure (200%)
“Market Exposure” includes the value of total investments (including thecontract value of any derivatives) and excludes any short-term invest-ments and cash equivalents.
Dow Jones U.S. Technology Index – Composition
% of Index
Software & Services 53.3%
Technology Hardware & Equipment 27.4%Semiconductors & Semiconductor Equipment 18.1%Health Care Equipment & Services 0.8%Consumer Durables & Apparels 0.1%Telecommunication Services 0.1%Commercial & Professional Services 0.1%Capital Goods 0.1%
Past performance does not guarantee future results. Return calculations assume the reinvestment of distributions and do not reflect taxes thata shareholder would pay on Fund distributions or on the redemption of Fund shares. The performance data quoted represents past performanceand current returns may be lower or higher. The investment return and NAV will fluctuate so that an investor’s shares, when redeemed, maybe more or less than the original cost. The performance above reflects any fee reductions during the applicable periods. If such fee reductionshad not occurred, the quoted performance would be lower. To obtain performance current to the most recent month please visitwww.ProShares.com.
1 Fund returns are based on the NAV of the Fund. This calculation reflects the theoretical reinvestment of distributions, if any, in the Fund as of theex-date. The impact of transaction costs and the lack of ability to reinvest fractional shares are not reflected in the calculations.
2 The Index is a price return index. The total return and any graph or table reflect the theoretical reinvestment of dividends on securities in theIndex. The impact of transaction costs and the deduction of expenses associated with an exchange traded fund such as investment managementand accounting fees are not reflected in the Index calculation. It is not possible to invest directly in an Index.
3 1.00 equals perfect correlation. This calculation is based on the daily total return of the Index and the performance of the daily total return of theNAV per share of the Fund.
The above information is not covered by the Report of the Independent Registered Public Accounting Firm.
Allocation of Portfolio Holdings & Index Composition as of 5/31/17
Merrill Corp - Proshares Trust Geared Book [96 Funds] Annual Report [Funds] 333-089822 05-31-2017 ED [AUX] | eperez | 28-Jul-17 17:35 | 17-15159-3.cc | Sequence: 18CHKSUM Content: 41755 Layout: 13806 Graphics: 22350 CLEAN
JOB: 17-15159-3 CYCLE#;BL#: 5; 0 TRIM: 8.25" x 10.75" COMPOSITECOLORS: Black, ~note-color 2, ~note-color 3 GRAPHICS: 15159-3_REW_L.eps V1.5
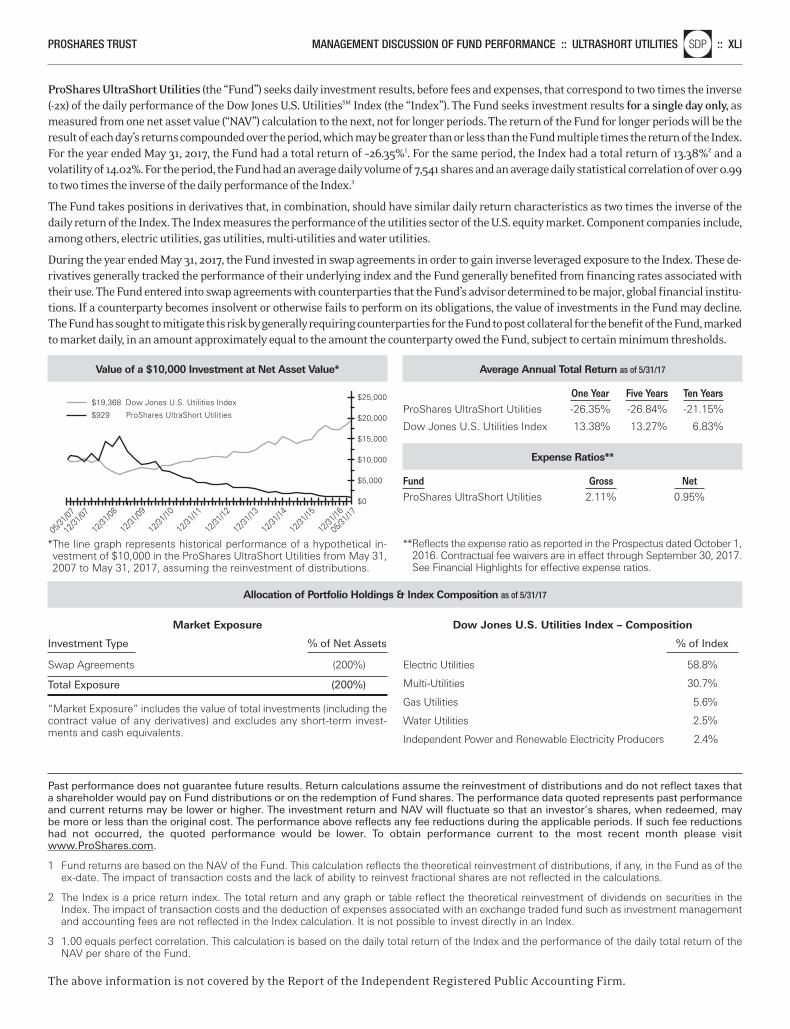
PROSHARES TRUST MANAGEMENT DISCUSSION OF FUND PERFORMANCE :: ULTRASHORT UTILITIESnlSDP :: XLI
ProShares UltraShort Utilities (the “Fund”) seeks daily investment results, before fees and expenses, that correspond to two times the inverse(-2x) of the daily performance of the Dow Jones U.S. UtilitiesSM Index (the “Index”). The Fund seeks investment results for a single day only, asmeasured from one net asset value (“NAV”) calculation to the next, not for longer periods. The return of the Fund for longer periods will be theresult of each day’s returns compounded over the period, which may be greater than or less than the Fund multiple times the return of the Index.For the year ended May 31, 2017, the Fund had a total return of –26.35%1. For the same period, the Index had a total return of 13.38%2 and avolatility of 14.02%. For the period, the Fund had an average daily volume of 7,541 shares and an average daily statistical correlation of over 0.99to two times the inverse of the daily performance of the Index.3
The Fund takes positions in derivatives that, in combination, should have similar daily return characteristics as two times the inverse of thedaily return of the Index. The Index measures the performance of the utilities sector of the U.S. equity market. Component companies include,among others, electric utilities, gas utilities, multi-utilities and water utilities.
During the year ended May 31, 2017, the Fund invested in swap agreements in order to gain inverse leveraged exposure to the Index. These de-rivatives generally tracked the performance of their underlying index and the Fund generally benefited from financing rates associated withtheir use. The Fund entered into swap agreements with counterparties that the Fund’s advisor determined to be major, global financial institu-tions. If a counterparty becomes insolvent or otherwise fails to perform on its obligations, the value of investments in the Fund may decline.The Fund has sought to mitigate this risk by generally requiring counterparties for the Fund to post collateral for the benefit of the Fund, markedto market daily, in an amount approximately equal to the amount the counterparty owed the Fund, subject to certain minimum thresholds.
Value of a $10,000 Investment at Net Asset Value*
*The line graph represents historical performance of a hypothetical in-vestment of $10,000 in the ProShares UltraShort Utilities from May 31,2007 to May 31, 2017, assuming the reinvestment of distributions.
$25,000
$20,000
$0
$15,000
$5,000
$10,000
$19,368 Dow Jones U.S. Utilities Index
$929 ProShares UltraShort Utilities
12/31
/07
12/31
/10
12/31
/09
12/31
/08
12/31
/16
12/31
/15
12/31
/14
12/31
/13
12/31
/12
12/31
/11
05/31
/17
05/31
/07
Market Exposure
Investment Type % of Net Assets
Swap Agreements (200%)
Total Exposure (200%)
“Market Exposure” includes the value of total investments (including thecontract value of any derivatives) and excludes any short-term invest-ments and cash equivalents.
Dow Jones U.S. Utilities Index – Composition
% of Index
Electric Utilities 58.8%
Multi-Utilities 30.7%
Gas Utilities 5.6%
Water Utilities 2.5%
Independent Power and Renewable Electricity Producers 2.4%
Past performance does not guarantee future results. Return calculations assume the reinvestment of distributions and do not reflect taxes thata shareholder would pay on Fund distributions or on the redemption of Fund shares. The performance data quoted represents past performanceand current returns may be lower or higher. The investment return and NAV will fluctuate so that an investor’s shares, when redeemed, maybe more or less than the original cost. The performance above reflects any fee reductions during the applicable periods. If such fee reductionshad not occurred, the quoted performance would be lower. To obtain performance current to the most recent month please visitwww.ProShares.com.
1 Fund returns are based on the NAV of the Fund. This calculation reflects the theoretical reinvestment of distributions, if any, in the Fund as of theex-date. The impact of transaction costs and the lack of ability to reinvest fractional shares are not reflected in the calculations.
2 The Index is a price return index. The total return and any graph or table reflect the theoretical reinvestment of dividends on securities in theIndex. The impact of transaction costs and the deduction of expenses associated with an exchange traded fund such as investment managementand accounting fees are not reflected in the Index calculation. It is not possible to invest directly in an Index.
3 1.00 equals perfect correlation. This calculation is based on the daily total return of the Index and the performance of the daily total return of theNAV per share of the Fund.
The above information is not covered by the Report of the Independent Registered Public Accounting Firm.
Allocation of Portfolio Holdings & Index Composition as of 5/31/17
Average Annual Total Return as of 5/31/17
One Year Five Years Ten Years ProShares UltraShort Utilities -26.35% -26.84% -21.15%
Dow Jones U.S. Utilities Index 13.38% 13.27% 6.83%
Expense Ratios**
Fund Gross Net ProShares UltraShort Utilities 2.11% 0.95%
**Reflects the expense ratio as reported in the Prospectus dated October 1,2016. Contractual fee waivers are in effect through September 30, 2017.See Financial Highlights for effective expense ratios.
Merrill Corp - Proshares Trust Geared Book [96 Funds] Annual Report [Funds] 333-089822 05-31-2017 ED [AUX] | eperez | 28-Jul-17 17:35 | 17-15159-3.cc | Sequence: 19CHKSUM Content: 52928 Layout: 36244 Graphics: 60068 CLEAN
JOB: 17-15159-3 CYCLE#;BL#: 5; 0 TRIM: 8.25" x 10.75" COMPOSITECOLORS: Black, ~note-color 2, ~note-color 3 GRAPHICS: 15159-3_SDP_L.eps V1.5
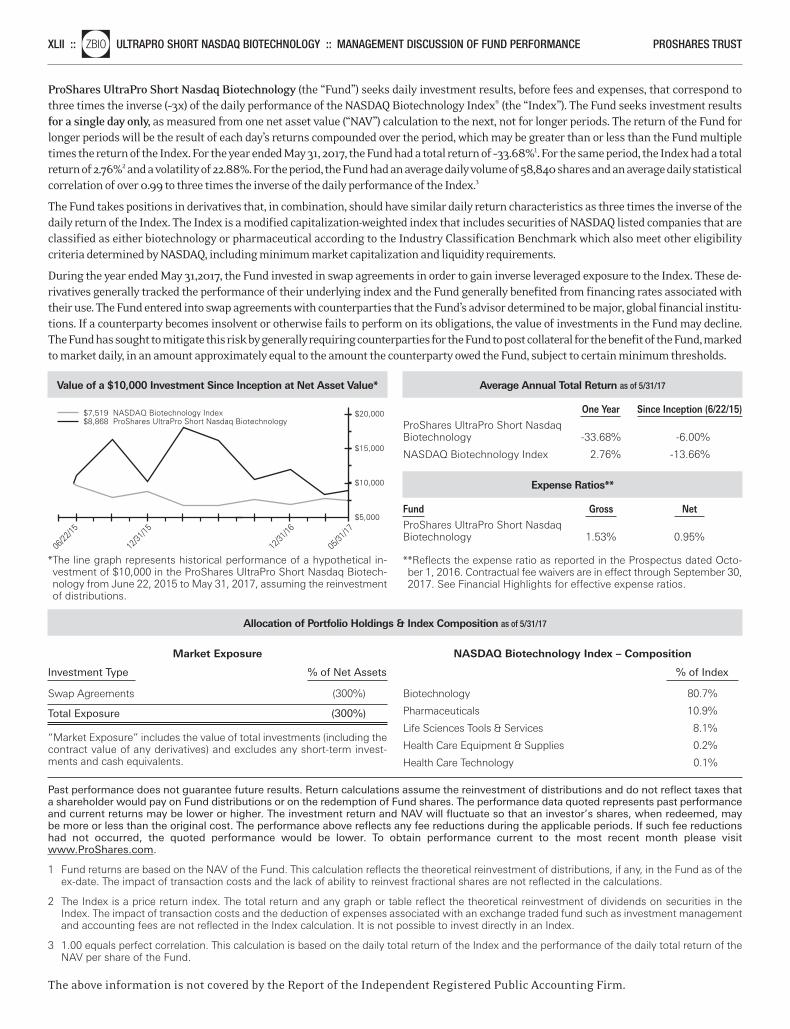
XLII ::nlZBIO ULTRAPRO SHORT NASDAQ BIOTECHNOLOGY :: MANAGEMENT DISCUSSION OF FUND PERFORMANCE PROSHARES TRUST
ProShares UltraPro Short Nasdaq Biotechnology (the “Fund”) seeks daily investment results, before fees and expenses, that correspond tothree times the inverse (–3x) of the daily performance of the NASDAQ Biotechnology Index® (the “Index”). The Fund seeks investment resultsfor a single day only, as measured from one net asset value (“NAV”) calculation to the next, not for longer periods. The return of the Fund forlonger periods will be the result of each day’s returns compounded over the period, which may be greater than or less than the Fund multipletimes the return of the Index. For the year ended May 31, 2017, the Fund had a total return of –33.68%1. For the same period, the Index had a totalreturn of 2.76%2 and a volatility of 22.88%. For the period, the Fund had an average daily volume of 58,840 shares and an average daily statisticalcorrelation of over 0.99 to three times the inverse of the daily performance of the Index.3
The Fund takes positions in derivatives that, in combination, should have similar daily return characteristics as three times the inverse of thedaily return of the Index. The Index is a modified capitalization-weighted index that includes securities of NASDAQ listed companies that areclassified as either biotechnology or pharmaceutical according to the Industry Classification Benchmark which also meet other eligibilitycriteria determined by NASDAQ, including minimum market capitalization and liquidity requirements.
During the year ended May 31,2017, the Fund invested in swap agreements in order to gain inverse leveraged exposure to the Index. These de-rivatives generally tracked the performance of their underlying index and the Fund generally benefited from financing rates associated withtheir use. The Fund entered into swap agreements with counterparties that the Fund’s advisor determined to be major, global financial institu-tions. If a counterparty becomes insolvent or otherwise fails to perform on its obligations, the value of investments in the Fund may decline.The Fund has sought to mitigate this risk by generally requiring counterparties for the Fund to post collateral for the benefit of the Fund, markedto market daily, in an amount approximately equal to the amount the counterparty owed the Fund, subject to certain minimum thresholds.
Value of a $10,000 Investment Since Inception at Net Asset Value*
*The line graph represents historical performance of a hypothetical in-vestment of $10,000 in the ProShares UltraPro Short Nasdaq Biotech-nology from June 22, 2015 to May 31, 2017, assuming the reinvestmentof distributions.
$20,000
$5,000
$10,000
$15,000
$7,519 NASDAQ Biotechnology Index$8,868 ProShares UltraPro Short Nasdaq Biotechnology
06/22
/15
12/31
/16
12/31
/15
05/31
/17
Average Annual Total Return as of 5/31/17
One Year Since Inception (6/22/15) ProShares UltraPro Short Nasdaq Biotechnology -33.68% -6.00%
NASDAQ Biotechnology Index 2.76% -13.66%
Expense Ratios**
Fund Gross Net ProShares UltraPro Short Nasdaq Biotechnology 1.53% 0.95%
**Reflects the expense ratio as reported in the Prospectus dated Octo-ber 1, 2016. Contractual fee waivers are in effect through September 30,2017. See Financial Highlights for effective expense ratios.
Market Exposure
Investment Type % of Net Assets
Swap Agreements (300%)
Total Exposure (300%)
“Market Exposure” includes the value of total investments (including thecontract value of any derivatives) and excludes any short-term invest-ments and cash equivalents.
NASDAQ Biotechnology Index – Composition
% of Index
Biotechnology 80.7%
Pharmaceuticals 10.9%
Life Sciences Tools & Services 8.1%
Health Care Equipment & Supplies 0.2%
Health Care Technology 0.1%
Past performance does not guarantee future results. Return calculations assume the reinvestment of distributions and do not reflect taxes thata shareholder would pay on Fund distributions or on the redemption of Fund shares. The performance data quoted represents past performanceand current returns may be lower or higher. The investment return and NAV will fluctuate so that an investor’s shares, when redeemed, maybe more or less than the original cost. The performance above reflects any fee reductions during the applicable periods. If such fee reductionshad not occurred, the quoted performance would be lower. To obtain performance current to the most recent month please visitwww.ProShares.com.
1 Fund returns are based on the NAV of the Fund. This calculation reflects the theoretical reinvestment of distributions, if any, in the Fund as of theex-date. The impact of transaction costs and the lack of ability to reinvest fractional shares are not reflected in the calculations.
2 The Index is a price return index. The total return and any graph or table reflect the theoretical reinvestment of dividends on securities in theIndex. The impact of transaction costs and the deduction of expenses associated with an exchange traded fund such as investment managementand accounting fees are not reflected in the Index calculation. It is not possible to invest directly in an Index.
3 1.00 equals perfect correlation. This calculation is based on the daily total return of the Index and the performance of the daily total return of theNAV per share of the Fund.
The above information is not covered by the Report of the Independent Registered Public Accounting Firm.
Allocation of Portfolio Holdings & Index Composition as of 5/31/17
Merrill Corp - Proshares Trust Geared Book [96 Funds] Annual Report [Funds] 333-089822 05-31-2017 ED [AUX] | eperez | 28-Jul-17 17:35 | 17-15159-3.cc | Sequence: 20CHKSUM Content: 62697 Layout: 14014 Graphics: 49536 CLEAN
JOB: 17-15159-3 CYCLE#;BL#: 5; 0 TRIM: 8.25" x 10.75" COMPOSITECOLORS: Black, ~note-color 2, ~note-color 3 GRAPHICS: 15159-3_ZBIO_L.eps V1.5
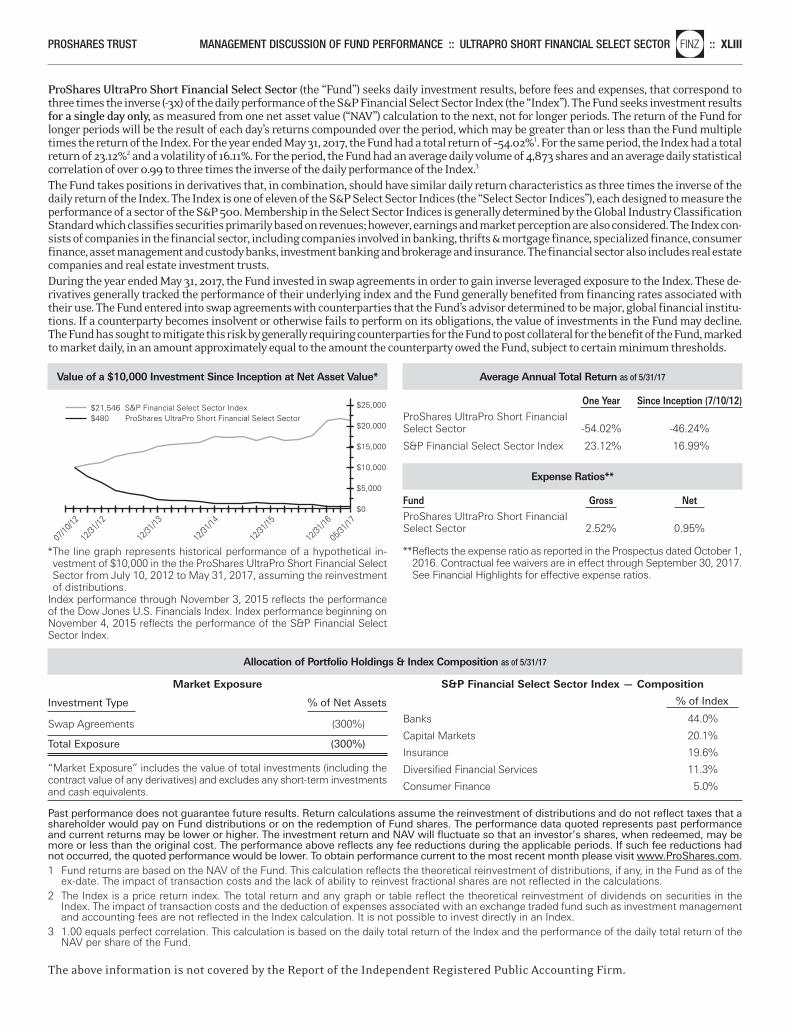
PROSHARES TRUST MANAGEMENT DISCUSSION OF FUND PERFORMANCE :: ULTRAPRO SHORT FINANCIAL SELECT SECTORnlFINZ :: XLIII
ProShares UltraPro Short Financial Select Sector (the “Fund”) seeks daily investment results, before fees and expenses, that correspond tothree times the inverse (-3x) of the daily performance of the S&P Financial Select Sector Index (the “Index”). The Fund seeks investment resultsfor a single day only, as measured from one net asset value (“NAV”) calculation to the next, not for longer periods. The return of the Fund forlonger periods will be the result of each day’s returns compounded over the period, which may be greater than or less than the Fund multipletimes the return of the Index. For the year ended May 31, 2017, the Fund had a total return of –54.02%1. For the same period, the Index had a totalreturn of 23.12%2 and a volatility of 16.11%. For the period, the Fund had an average daily volume of 4,873 shares and an average daily statisticalcorrelation of over 0.99 to three times the inverse of the daily performance of the Index.3
The Fund takes positions in derivatives that, in combination, should have similar daily return characteristics as three times the inverse of thedaily return of the Index. The Index is one of eleven of the S&P Select Sector Indices (the “Select Sector Indices”), each designed to measure theperformance of a sector of the S&P 500. Membership in the Select Sector Indices is generally determined by the Global Industry ClassificationStandard which classifies securities primarily based on revenues; however, earnings and market perception are also considered. The Index con-sists of companies in the financial sector, including companies involved in banking, thrifts & mortgage finance, specialized finance, consumerfinance, asset management and custody banks, investment banking and brokerage and insurance. The financial sector also includes real estatecompanies and real estate investment trusts.During the year ended May 31, 2017, the Fund invested in swap agreements in order to gain inverse leveraged exposure to the Index. These de-rivatives generally tracked the performance of their underlying index and the Fund generally benefited from financing rates associated withtheir use. The Fund entered into swap agreements with counterparties that the Fund’s advisor determined to be major, global financial institu-tions. If a counterparty becomes insolvent or otherwise fails to perform on its obligations, the value of investments in the Fund may decline.The Fund has sought to mitigate this risk by generally requiring counterparties for the Fund to post collateral for the benefit of the Fund, markedto market daily, in an amount approximately equal to the amount the counterparty owed the Fund, subject to certain minimum thresholds.
Value of a $10,000 Investment Since Inception at Net Asset Value*
*The line graph represents historical performance of a hypothetical in-vestment of $10,000 in the the ProShares UltraPro Short Financial SelectSector from July 10, 2012 to May 31, 2017, assuming the reinvestmentof distributions.
Index performance through November 3, 2015 reflects the performanceof the Dow Jones U.S. Financials Index. Index performance beginning onNovember 4, 2015 reflects the performance of the S&P Financial SelectSector Index.
$25,000
$20,000
$15,000
$0
$21,546 S&P Financial Select Sector Index$480 ProShares UltraPro Short Financial Select Sector
07/10
/12
12/31
/12
12/31
/13
12/31
/16
12/31
/15
12/31
/14
05/31
/17
$5,000
$10,000
Average Annual Total Return as of 5/31/17
One Year Since Inception (7/10/12) ProShares UltraPro Short Financial Select Sector -54.02% -46.24%
S&P Financial Select Sector Index 23.12% 16.99%
Expense Ratios**
Fund Gross Net ProShares UltraPro Short Financial Select Sector 2.52% 0.95%
**Reflects the expense ratio as reported in the Prospectus dated October 1,2016. Contractual fee waivers are in effect through September 30, 2017.See Financial Highlights for effective expense ratios.
Past performance does not guarantee future results. Return calculations assume the reinvestment of distributions and do not reflect taxes that ashareholder would pay on Fund distributions or on the redemption of Fund shares. The performance data quoted represents past performanceand current returns may be lower or higher. The investment return and NAV will fluctuate so that an investor’s shares, when redeemed, may bemore or less than the original cost. The performance above reflects any fee reductions during the applicable periods. If such fee reductions hadnot occurred, the quoted performance would be lower. To obtain performance current to the most recent month please visit www.ProShares.com.1 Fund returns are based on the NAV of the Fund. This calculation reflects the theoretical reinvestment of distributions, if any, in the Fund as of the
ex-date. The impact of transaction costs and the lack of ability to reinvest fractional shares are not reflected in the calculations.2 The Index is a price return index. The total return and any graph or table reflect the theoretical reinvestment of dividends on securities in the
Index. The impact of transaction costs and the deduction of expenses associated with an exchange traded fund such as investment managementand accounting fees are not reflected in the Index calculation. It is not possible to invest directly in an Index.
3 1.00 equals perfect correlation. This calculation is based on the daily total return of the Index and the performance of the daily total return of theNAV per share of the Fund.
The above information is not covered by the Report of the Independent Registered Public Accounting Firm.
Market Exposure
Investment Type % of Net Assets
Swap Agreements (300%)
Total Exposure (300%)
“Market Exposure” includes the value of total investments (including thecontract value of any derivatives) and excludes any short-term investmentsand cash equivalents.
S&P Financial Select Sector Index — Composition
% of Index Banks 44.0%
Capital Markets 20.1%
Insurance 19.6%
Diversified Financial Services 11.3%
Consumer Finance 5.0%
Allocation of Portfolio Holdings & Index Composition as of 5/31/17
Merrill Corp - Proshares Trust Geared Book [96 Funds] Annual Report [Funds] 333-089822 05-31-2017 ED [AUX] | eperez | 28-Jul-17 17:35 | 17-15159-3.ce | Sequence: 1CHKSUM Content: 45086 Layout: 24716 Graphics: 23694 CLEAN
JOB: 17-15159-3 CYCLE#;BL#: 5; 0 TRIM: 8.25" x 10.75" COMPOSITECOLORS: Black, ~note-color 2 GRAPHICS: 15159-3_FINZ_L.eps V1.5
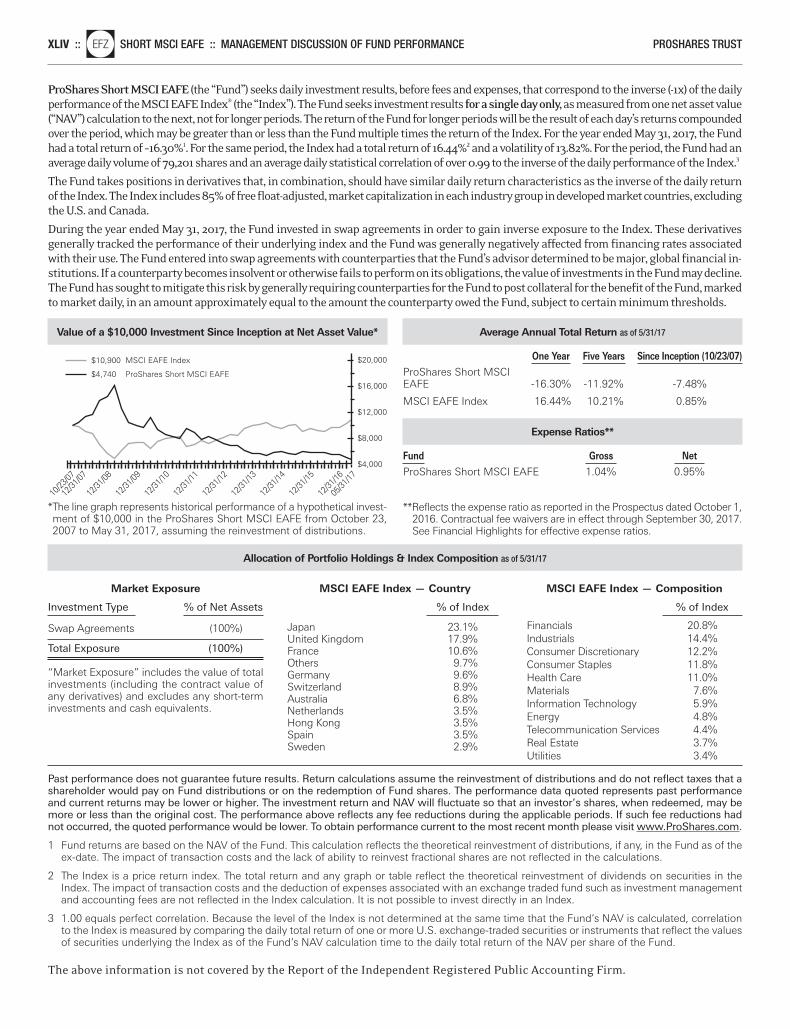
ProShares Short MSCI EAFE (the “Fund”) seeks daily investment results, before fees and expenses, that correspond to the inverse (-1x) of the dailyperformance of the MSCI EAFE Index® (the “Index”). The Fund seeks investment results for a single day only,as measured from one net asset value(“NAV”) calculation to the next, not for longer periods. The return of the Fund for longer periods will be the result of each day’s returns compoundedover the period, which may be greater than or less than the Fund multiple times the return of the Index. For the year ended May 31, 2017, the Fundhad a total return of –16.30%1. For the same period, the Index had a total return of 16.44%2 and a volatility of 13.82%. For the period, the Fund had anaverage daily volume of 79,201 shares and an average daily statistical correlation of over 0.99 to the inverse of the daily performance of the Index.3
The Fund takes positions in derivatives that, in combination, should have similar daily return characteristics as the inverse of the daily returnof the Index. The Index includes 85% of free float-adjusted, market capitalization in each industry group in developed market countries, excludingthe U.S. and Canada.
During the year ended May 31, 2017, the Fund invested in swap agreements in order to gain inverse exposure to the Index. These derivativesgenerally tracked the performance of their underlying index and the Fund was generally negatively affected from financing rates associatedwith their use. The Fund entered into swap agreements with counterparties that the Fund’s advisor determined to be major, global financial in-stitutions. If a counterparty becomes insolvent or otherwise fails to perform on its obligations, the value of investments in the Fund may decline.The Fund has sought to mitigate this risk by generally requiring counterparties for the Fund to post collateral for the benefit of the Fund, markedto market daily, in an amount approximately equal to the amount the counterparty owed the Fund, subject to certain minimum thresholds.
Past performance does not guarantee future results. Return calculations assume the reinvestment of distributions and do not reflect taxes that ashareholder would pay on Fund distributions or on the redemption of Fund shares. The performance data quoted represents past performanceand current returns may be lower or higher. The investment return and NAV will fluctuate so that an investor’s shares, when redeemed, may bemore or less than the original cost. The performance above reflects any fee reductions during the applicable periods. If such fee reductions hadnot occurred, the quoted performance would be lower. To obtain performance current to the most recent month please visit www.ProShares.com.
1 Fund returns are based on the NAV of the Fund. This calculation reflects the theoretical reinvestment of distributions, if any, in the Fund as of theex-date. The impact of transaction costs and the lack of ability to reinvest fractional shares are not reflected in the calculations.
2 The Index is a price return index. The total return and any graph or table reflect the theoretical reinvestment of dividends on securities in theIndex. The impact of transaction costs and the deduction of expenses associated with an exchange traded fund such as investment managementand accounting fees are not reflected in the Index calculation. It is not possible to invest directly in an Index.
3 1.00 equals perfect correlation. Because the level of the Index is not determined at the same time that the Fund’s NAV is calculated, correlationto the Index is measured by comparing the daily total return of one or more U.S. exchange-traded securities or instruments that reflect the valuesof securities underlying the Index as of the Fund’s NAV calculation time to the daily total return of the NAV per share of the Fund.
The above information is not covered by the Report of the Independent Registered Public Accounting Firm.
XLIV ::nlEFZ SHORT MSCI EAFE :: MANAGEMENT DISCUSSION OF FUND PERFORMANCE PROSHARES TRUST
Value of a $10,000 Investment Since Inception at Net Asset Value*
*The line graph represents historical performance of a hypothetical invest-ment of $10,000 in the ProShares Short MSCI EAFE from October 23,2007 to May 31, 2017, assuming the reinvestment of distributions.
$20,000
$4,000
$12,000
$16,000
$8,000
$10,900 MSCI EAFE Index
$4,740 ProShares Short MSCI EAFE
10/23
/07
12/31
/07
12/31
/08
12/31
/10
12/31
/12
12/31
/16
12/31
/15
12/31
/14
12/31
/13
12/31
/11
12/31
/09
05/31
/17
Average Annual Total Return as of 5/31/17
One Year Five Years Since Inception (10/23/07) ProShares Short MSCI EAFE -16.30% -11.92% -7.48%
MSCI EAFE Index 16.44% 10.21% 0.85%
Expense Ratios**
Fund Gross Net ProShares Short MSCI EAFE 1.04% 0.95%
**Reflects the expense ratio as reported in the Prospectus dated October 1,2016. Contractual fee waivers are in effect through September 30, 2017.See Financial Highlights for effective expense ratios.
Market Exposure
Investment Type % of Net Assets
Swap Agreements (100%)
Total Exposure (100%)
“Market Exposure” includes the value of totalinvestments (including the contract value ofany derivatives) and excludes any short-terminvestments and cash equivalents.
MSCI EAFE Index — Country
% of Index Japan 23.1%United Kingdom 17.9%France 10.6%Others 9.7%Germany 9.6%Switzerland 8.9%Australia 6.8%Netherlands 3.5%Hong Kong 3.5%Spain 3.5%Sweden 2.9%
MSCI EAFE Index — Composition
% of Index Financials 20.8%Industrials 14.4%Consumer Discretionary 12.2%Consumer Staples 11.8%Health Care 11.0%Materials 7.6%Information Technology 5.9%Energy 4.8%Telecommunication Services 4.4%Real Estate 3.7%Utilities 3.4%
Allocation of Portfolio Holdings & Index Composition as of 5/31/17
Merrill Corp - Proshares Trust Geared Book [96 Funds] Annual Report [Funds] 333-089822 05-31-2017 ED [AUX] | eperez | 28-Jul-17 17:35 | 17-15159-3.ce | Sequence: 2CHKSUM Content: 32607 Layout: 34262 Graphics: 13284 CLEAN
JOB: 17-15159-3 CYCLE#;BL#: 5; 0 TRIM: 8.25" x 10.75" COMPOSITECOLORS: Black, ~note-color 2, ~note-color 3 GRAPHICS: 15159-3_EFZ_L.eps V1.5
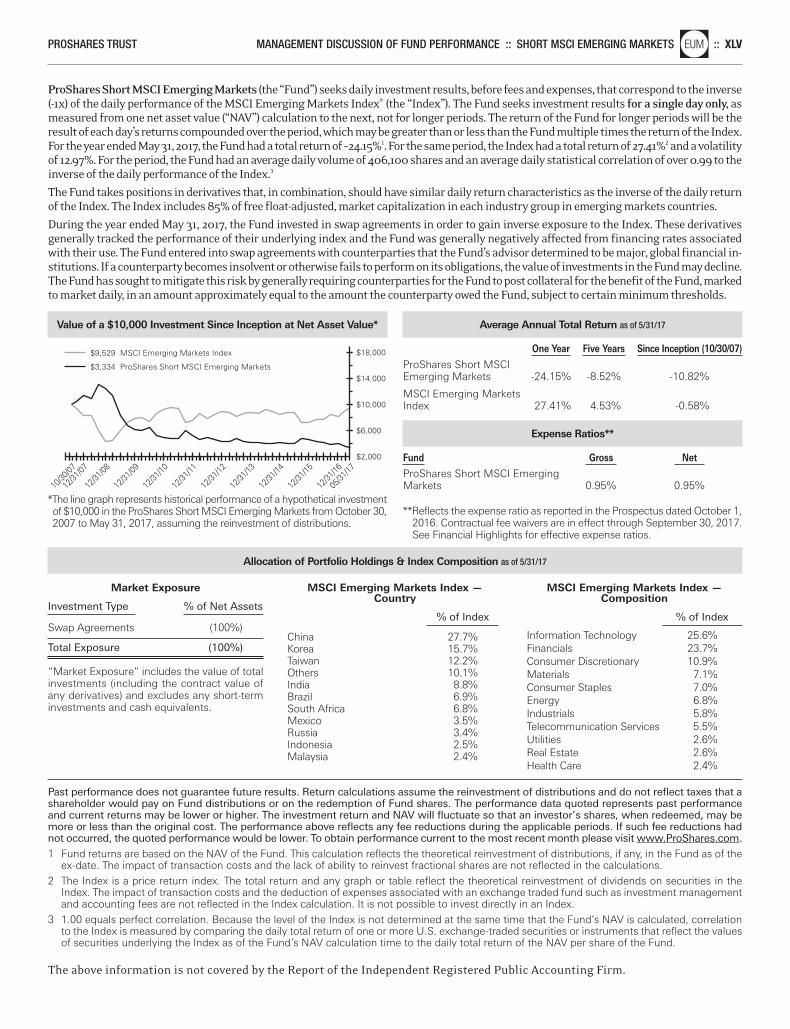
Past performance does not guarantee future results. Return calculations assume the reinvestment of distributions and do not reflect taxes that ashareholder would pay on Fund distributions or on the redemption of Fund shares. The performance data quoted represents past performanceand current returns may be lower or higher. The investment return and NAV will fluctuate so that an investor’s shares, when redeemed, may bemore or less than the original cost. The performance above reflects any fee reductions during the applicable periods. If such fee reductions hadnot occurred, the quoted performance would be lower. To obtain performance current to the most recent month please visit www.ProShares.com.
1 Fund returns are based on the NAV of the Fund. This calculation reflects the theoretical reinvestment of distributions, if any, in the Fund as of theex-date. The impact of transaction costs and the lack of ability to reinvest fractional shares are not reflected in the calculations.
2 The Index is a price return index. The total return and any graph or table reflect the theoretical reinvestment of dividends on securities in theIndex. The impact of transaction costs and the deduction of expenses associated with an exchange traded fund such as investment managementand accounting fees are not reflected in the Index calculation. It is not possible to invest directly in an Index.
3 1.00 equals perfect correlation. Because the level of the Index is not determined at the same time that the Fund’s NAV is calculated, correlationto the Index is measured by comparing the daily total return of one or more U.S. exchange-traded securities or instruments that reflect the valuesof securities underlying the Index as of the Fund’s NAV calculation time to the daily total return of the NAV per share of the Fund.
The above information is not covered by the Report of the Independent Registered Public Accounting Firm.
PROSHARES TRUST MANAGEMENT DISCUSSION OF FUND PERFORMANCE :: SHORT MSCI EMERGING MARKETSnnlEUM :: XLV
ProShares Short MSCI Emerging Markets (the “Fund”) seeks daily investment results, before fees and expenses, that correspond to the inverse(-1x) of the daily performance of the MSCI Emerging Markets Index® (the “Index”). The Fund seeks investment results for a single day only, asmeasured from one net asset value (“NAV”) calculation to the next, not for longer periods. The return of the Fund for longer periods will be theresult of each day’s returns compounded over the period, which may be greater than or less than the Fund multiple times the return of the Index.For the year ended May 31, 2017, the Fund had a total return of –24.15%1. For the same period, the Index had a total return of 27.41%2 and a volatilityof 12.97%. For the period, the Fund had an average daily volume of 406,100 shares and an average daily statistical correlation of over 0.99 to theinverse of the daily performance of the Index.3
The Fund takes positions in derivatives that, in combination, should have similar daily return characteristics as the inverse of the daily returnof the Index. The Index includes 85% of free float-adjusted, market capitalization in each industry group in emerging markets countries.
During the year ended May 31, 2017, the Fund invested in swap agreements in order to gain inverse exposure to the Index. These derivativesgenerally tracked the performance of their underlying index and the Fund was generally negatively affected from financing rates associatedwith their use. The Fund entered into swap agreements with counterparties that the Fund’s advisor determined to be major, global financial in-stitutions. If a counterparty becomes insolvent or otherwise fails to perform on its obligations, the value of investments in the Fund may decline.The Fund has sought to mitigate this risk by generally requiring counterparties for the Fund to post collateral for the benefit of the Fund, markedto market daily, in an amount approximately equal to the amount the counterparty owed the Fund, subject to certain minimum thresholds.
Value of a $10,000 Investment Since Inception at Net Asset Value*
*The line graph represents historical performance of a hypothetical investmentof $10,000 in the ProShares Short MSCI Emerging Markets from October 30,2007 to May 31, 2017, assuming the reinvestment of distributions.
$18,000
$2,000
$10,000
$14,000
$6,000
$9,529 MSCI Emerging Markets Index
$3,334 ProShares Short MSCI Emerging Markets
10/30
/07
12/31
/07
12/31
/08
12/31
/10
12/31
/12
12/31
/16
12/31
/15
12/31
/14
12/31
/13
12/31
/11
12/31
/09
05/31
/17
Average Annual Total Return as of 5/31/17
One Year Five Years Since Inception (10/30/07) ProShares Short MSCI Emerging Markets -24.15% -8.52% -10.82%
MSCI Emerging Markets Index 27.41% 4.53% -0.58%
Expense Ratios**
Fund Gross Net ProShares Short MSCI Emerging Markets 0.95% 0.95%
**Reflects the expense ratio as reported in the Prospectus dated October 1,2016. Contractual fee waivers are in effect through September 30, 2017.See Financial Highlights for effective expense ratios.
Market Exposure
Investment Type % of Net Assets
Swap Agreements (100%)
Total Exposure (100%)
“Market Exposure” includes the value of totalinvestments (including the contract value ofany derivatives) and excludes any short-terminvestments and cash equivalents.
MSCI Emerging Markets Index —Country
% of Index China 27.7%Korea 15.7%Taiwan 12.2%Others 10.1%India 8.8%Brazil 6.9%South Africa 6.8%Mexico 3.5%Russia 3.4%Indonesia 2.5%Malaysia 2.4%
MSCI Emerging Markets Index —Composition
% of Index Information Technology 25.6%Financials 23.7%Consumer Discretionary 10.9%Materials 7.1%Consumer Staples 7.0%Energy 6.8%Industrials 5.8%Telecommunication Services 5.5%Utilities 2.6%Real Estate 2.6%Health Care 2.4%
Allocation of Portfolio Holdings & Index Composition as of 5/31/17
Merrill Corp - Proshares Trust Geared Book [96 Funds] Annual Report [Funds] 333-089822 05-31-2017 ED [AUX] | eperez | 28-Jul-17 17:35 | 17-15159-3.ce | Sequence: 3CHKSUM Content: 59858 Layout: 36202 Graphics: 30525 CLEAN
JOB: 17-15159-3 CYCLE#;BL#: 5; 0 TRIM: 8.25" x 10.75" COMPOSITECOLORS: Black, ~note-color 2 GRAPHICS: 15159-3_EUM_L.eps V1.5
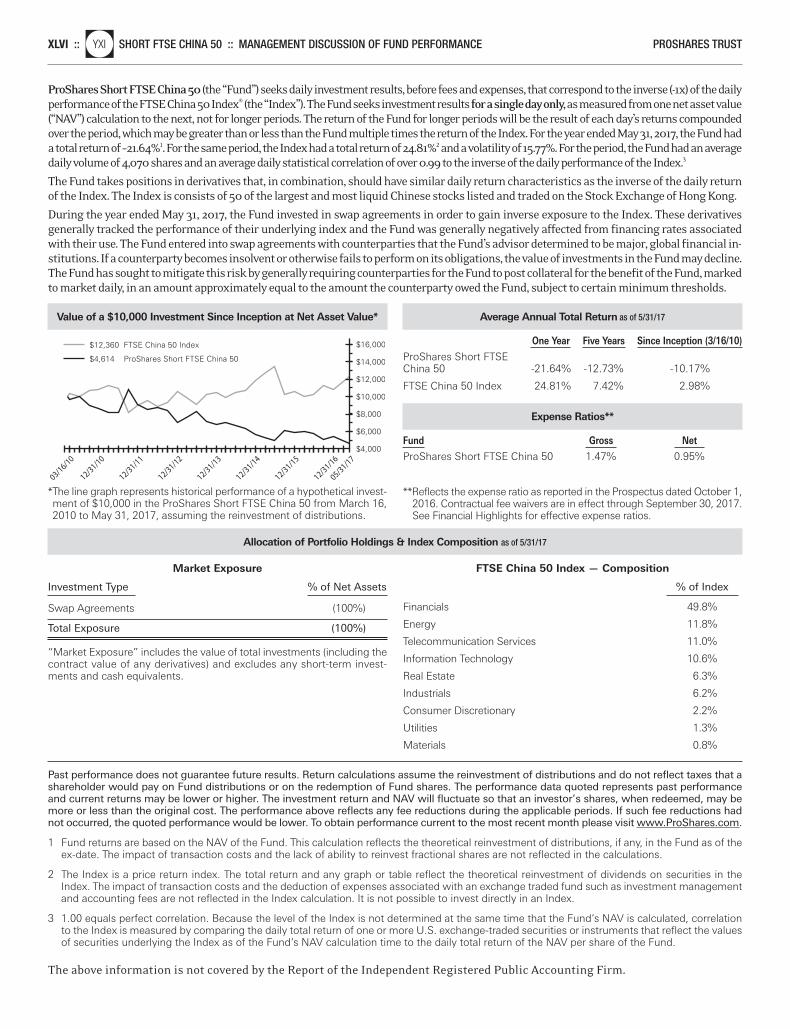
Past performance does not guarantee future results. Return calculations assume the reinvestment of distributions and do not reflect taxes that ashareholder would pay on Fund distributions or on the redemption of Fund shares. The performance data quoted represents past performanceand current returns may be lower or higher. The investment return and NAV will fluctuate so that an investor’s shares, when redeemed, may bemore or less than the original cost. The performance above reflects any fee reductions during the applicable periods. If such fee reductions hadnot occurred, the quoted performance would be lower. To obtain performance current to the most recent month please visit www.ProShares.com.
1 Fund returns are based on the NAV of the Fund. This calculation reflects the theoretical reinvestment of distributions, if any, in the Fund as of theex-date. The impact of transaction costs and the lack of ability to reinvest fractional shares are not reflected in the calculations.
2 The Index is a price return index. The total return and any graph or table reflect the theoretical reinvestment of dividends on securities in theIndex. The impact of transaction costs and the deduction of expenses associated with an exchange traded fund such as investment managementand accounting fees are not reflected in the Index calculation. It is not possible to invest directly in an Index.
3 1.00 equals perfect correlation. Because the level of the Index is not determined at the same time that the Fund’s NAV is calculated, correlationto the Index is measured by comparing the daily total return of one or more U.S. exchange-traded securities or instruments that reflect the valuesof securities underlying the Index as of the Fund’s NAV calculation time to the daily total return of the NAV per share of the Fund.
The above information is not covered by the Report of the Independent Registered Public Accounting Firm.
XLVI ::nlYXI SHORT FTSE CHINA 50 :: MANAGEMENT DISCUSSION OF FUND PERFORMANCE PROSHARES TRUST
Value of a $10,000 Investment Since Inception at Net Asset Value*
*The line graph represents historical performance of a hypothetical invest-ment of $10,000 in the ProShares Short FTSE China 50 from March 16,2010 to May 31, 2017, assuming the reinvestment of distributions.
$16,000
$14,000
$4,000
$6,000
$8,000
$10,000
$12,000
$12,360 FTSE China 50 Index
$4,614 ProShares Short FTSE China 50
03/16/10
12/31/10
12/31/15
12/31/16
12/31/14
12/31/13
12/31/12
12/31/11
05/31/17
Average Annual Total Return as of 5/31/17
One Year Five Years Since Inception (3/16/10) ProShares Short FTSE China 50 -21.64% -12.73% -10.17%
FTSE China 50 Index 24.81% 7.42% 2.98%
Expense Ratios**
Fund Gross Net ProShares Short FTSE China 50 1.47% 0.95%
**Reflects the expense ratio as reported in the Prospectus dated October 1,2016. Contractual fee waivers are in effect through September 30, 2017.See Financial Highlights for effective expense ratios.
Market Exposure
Investment Type % of Net Assets
Swap Agreements (100%)
Total Exposure (100%)
“Market Exposure” includes the value of total investments (including thecontract value of any derivatives) and excludes any short-term invest-ments and cash equivalents.
FTSE China 50 Index — Composition
% of Index Financials 49.8%
Energy 11.8%
Telecommunication Services 11.0%
Information Technology 10.6%
Real Estate 6.3%
Industrials 6.2%
Consumer Discretionary 2.2%
Utilities 1.3%
Materials 0.8%
ProShares Short FTSE China 50(the “Fund”) seeks daily investment results, before fees and expenses, that correspond to the inverse (-1x) of the dailyperformance of the FTSE China 50 Index® (the “Index”). The Fund seeks investment results for a single day only,as measured from one net asset value(“NAV”) calculation to the next, not for longer periods. The return of the Fund for longer periods will be the result of each day’s returns compoundedover the period, which may be greater than or less than the Fund multiple times the return of the Index. For the year ended May 31, 2017, the Fund hada total return of –21.64%1. For the same period, the Index had a total return of 24.81%2 and a volatility of 15.77%. For the period, the Fund had an averagedaily volume of 4,070 shares and an average daily statistical correlation of over 0.99 to the inverse of the daily performance of the Index.3
The Fund takes positions in derivatives that, in combination, should have similar daily return characteristics as the inverse of the daily returnof the Index. The Index is consists of 50 of the largest and most liquid Chinese stocks listed and traded on the Stock Exchange of Hong Kong.
During the year ended May 31, 2017, the Fund invested in swap agreements in order to gain inverse exposure to the Index. These derivativesgenerally tracked the performance of their underlying index and the Fund was generally negatively affected from financing rates associatedwith their use. The Fund entered into swap agreements with counterparties that the Fund’s advisor determined to be major, global financial in-stitutions. If a counterparty becomes insolvent or otherwise fails to perform on its obligations, the value of investments in the Fund may decline.The Fund has sought to mitigate this risk by generally requiring counterparties for the Fund to post collateral for the benefit of the Fund, markedto market daily, in an amount approximately equal to the amount the counterparty owed the Fund, subject to certain minimum thresholds.
Allocation of Portfolio Holdings & Index Composition as of 5/31/17
Merrill Corp - Proshares Trust Geared Book [96 Funds] Annual Report [Funds] 333-089822 05-31-2017 ED [AUX] | eperez | 28-Jul-17 17:35 | 17-15159-3.ce | Sequence: 4CHKSUM Content: 13113 Layout: 25221 Graphics: 993 CLEAN
JOB: 17-15159-3 CYCLE#;BL#: 5; 0 TRIM: 8.25" x 10.75" COMPOSITECOLORS: Black, ~note-color 2, ~note-color 3 GRAPHICS: 15159-3_YXI_L.eps V1.5
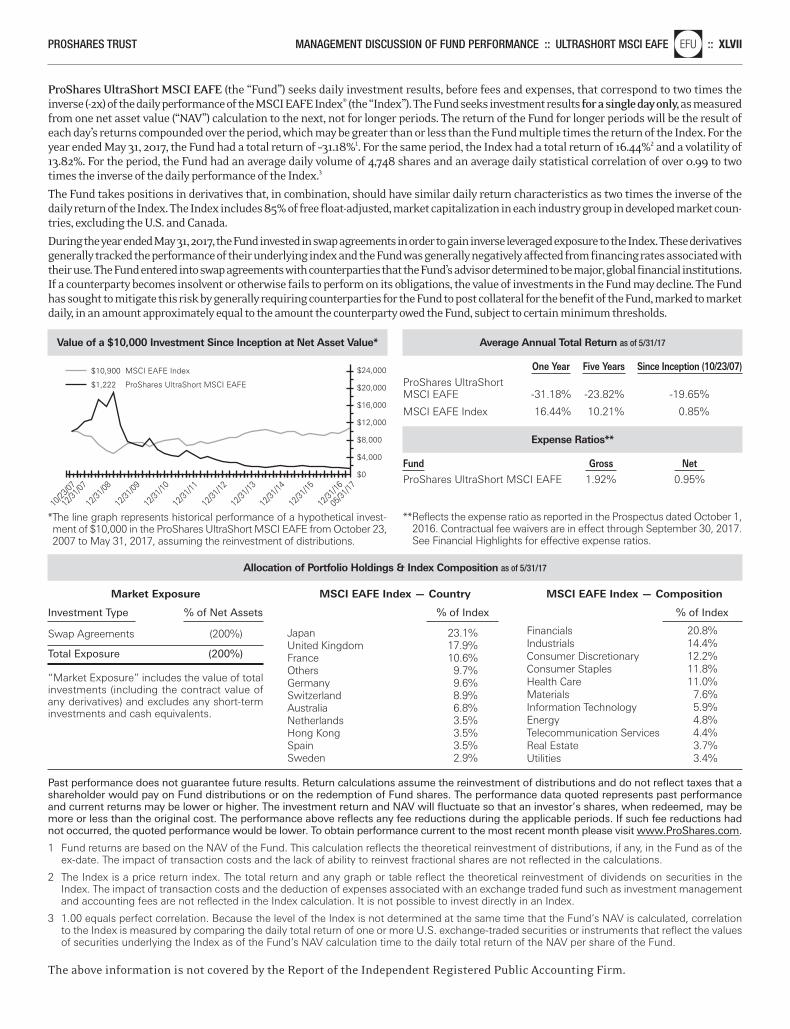
Past performance does not guarantee future results. Return calculations assume the reinvestment of distributions and do not reflect taxes that ashareholder would pay on Fund distributions or on the redemption of Fund shares. The performance data quoted represents past performanceand current returns may be lower or higher. The investment return and NAV will fluctuate so that an investor’s shares, when redeemed, may bemore or less than the original cost. The performance above reflects any fee reductions during the applicable periods. If such fee reductions hadnot occurred, the quoted performance would be lower. To obtain performance current to the most recent month please visit www.ProShares.com.
1 Fund returns are based on the NAV of the Fund. This calculation reflects the theoretical reinvestment of distributions, if any, in the Fund as of theex-date. The impact of transaction costs and the lack of ability to reinvest fractional shares are not reflected in the calculations.
2 The Index is a price return index. The total return and any graph or table reflect the theoretical reinvestment of dividends on securities in theIndex. The impact of transaction costs and the deduction of expenses associated with an exchange traded fund such as investment managementand accounting fees are not reflected in the Index calculation. It is not possible to invest directly in an Index.
3 1.00 equals perfect correlation. Because the level of the Index is not determined at the same time that the Fund’s NAV is calculated, correlationto the Index is measured by comparing the daily total return of one or more U.S. exchange-traded securities or instruments that reflect the valuesof securities underlying the Index as of the Fund’s NAV calculation time to the daily total return of the NAV per share of the Fund.
The above information is not covered by the Report of the Independent Registered Public Accounting Firm.
PROSHARES TRUST MANAGEMENT DISCUSSION OF FUND PERFORMANCE :: ULTRASHORT MSCI EAFEnlEFU :: XLVII
ProShares UltraShort MSCI EAFE (the “Fund”) seeks daily investment results, before fees and expenses, that correspond to two times theinverse (-2x) of the daily performance of the MSCI EAFE Index® (the “Index”). The Fund seeks investment results for a single day only,as measuredfrom one net asset value (“NAV”) calculation to the next, not for longer periods. The return of the Fund for longer periods will be the result ofeach day’s returns compounded over the period, which may be greater than or less than the Fund multiple times the return of the Index. For theyear ended May 31, 2017, the Fund had a total return of –31.18%1. For the same period, the Index had a total return of 16.44%2 and a volatility of13.82%. For the period, the Fund had an average daily volume of 4,748 shares and an average daily statistical correlation of over 0.99 to twotimes the inverse of the daily performance of the Index.3
The Fund takes positions in derivatives that, in combination, should have similar daily return characteristics as two times the inverse of thedaily return of the Index. The Index includes 85% of free float-adjusted, market capitalization in each industry group in developed market coun-tries, excluding the U.S. and Canada.
During the year ended May 31, 2017, the Fund invested in swap agreements in order to gain inverse leveraged exposure to the Index. These derivativesgenerally tracked the performance of their underlying index and the Fund was generally negatively affected from financing rates associated withtheir use. The Fund entered into swap agreements with counterparties that the Fund’s advisor determined to be major, global financial institutions.If a counterparty becomes insolvent or otherwise fails to perform on its obligations, the value of investments in the Fund may decline. The Fundhas sought to mitigate this risk by generally requiring counterparties for the Fund to post collateral for the benefit of the Fund, marked to marketdaily, in an amount approximately equal to the amount the counterparty owed the Fund, subject to certain minimum thresholds.
Value of a $10,000 Investment Since Inception at Net Asset Value*
*The line graph represents historical performance of a hypothetical invest-ment of $10,000 in the ProShares UltraShort MSCI EAFE from October 23,2007 to May 31, 2017, assuming the reinvestment of distributions.
$24,000
$0
$12,000
$16,000
$20,000
$4,000
$8,000
$10,900 MSCI EAFE Index
$1,222 ProShares UltraShort MSCI EAFE
10/23
/07
12/31
/07
12/31
/08
12/31
/10
12/31
/16
12/31
/15
12/31
/14
12/31
/13
12/31
/12
12/31
/11
12/31
/09
05/31
/17
Average Annual Total Return as of 5/31/17
One Year Five Years Since Inception (10/23/07) ProShares UltraShort MSCI EAFE -31.18% -23.82% -19.65%
MSCI EAFE Index 16.44% 10.21% 0.85%
Expense Ratios**
Fund Gross Net ProShares UltraShort MSCI EAFE 1.92% 0.95%
**Reflects the expense ratio as reported in the Prospectus dated October 1,2016. Contractual fee waivers are in effect through September 30, 2017.See Financial Highlights for effective expense ratios.
Market Exposure
Investment Type % of Net Assets
Swap Agreements (200%)
Total Exposure (200%)
“Market Exposure” includes the value of totalinvestments (including the contract value ofany derivatives) and excludes any short-terminvestments and cash equivalents.
MSCI EAFE Index — Country
% of Index Japan 23.1%United Kingdom 17.9%France 10.6%Others 9.7%Germany 9.6%Switzerland 8.9%Australia 6.8%Netherlands 3.5%Hong Kong 3.5%Spain 3.5%Sweden 2.9%
MSCI EAFE Index — Composition
% of Index Financials 20.8%Industrials 14.4%Consumer Discretionary 12.2%Consumer Staples 11.8%Health Care 11.0%Materials 7.6%Information Technology 5.9%Energy 4.8%Telecommunication Services 4.4%Real Estate 3.7%Utilities 3.4%
Allocation of Portfolio Holdings & Index Composition as of 5/31/17
Merrill Corp - Proshares Trust Geared Book [96 Funds] Annual Report [Funds] 333-089822 05-31-2017 ED [AUX] | eperez | 28-Jul-17 17:35 | 17-15159-3.ce | Sequence: 5CHKSUM Content: 64213 Layout: 65206 Graphics: 28974 CLEAN
JOB: 17-15159-3 CYCLE#;BL#: 5; 0 TRIM: 8.25" x 10.75" COMPOSITECOLORS: Black, ~note-color 2 GRAPHICS: 15159-3_EFU_L.eps V1.5
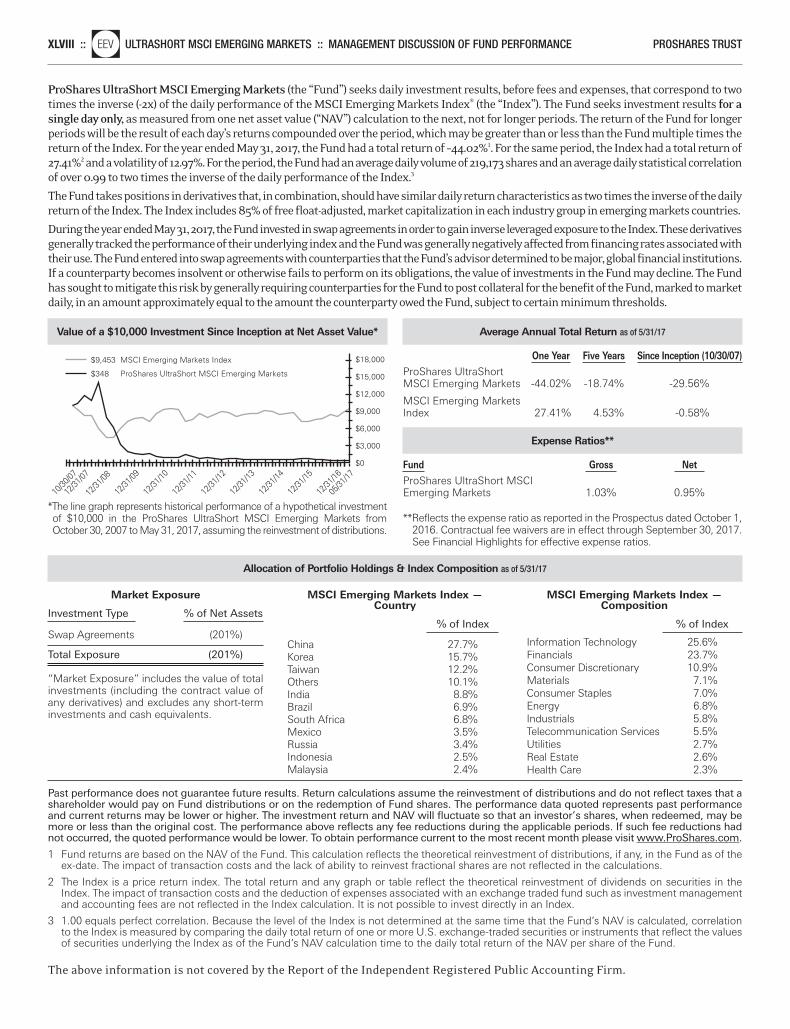
Past performance does not guarantee future results. Return calculations assume the reinvestment of distributions and do not reflect taxes that ashareholder would pay on Fund distributions or on the redemption of Fund shares. The performance data quoted represents past performanceand current returns may be lower or higher. The investment return and NAV will fluctuate so that an investor’s shares, when redeemed, may bemore or less than the original cost. The performance above reflects any fee reductions during the applicable periods. If such fee reductions hadnot occurred, the quoted performance would be lower. To obtain performance current to the most recent month please visit www.ProShares.com.
1 Fund returns are based on the NAV of the Fund. This calculation reflects the theoretical reinvestment of distributions, if any, in the Fund as of theex-date. The impact of transaction costs and the lack of ability to reinvest fractional shares are not reflected in the calculations.
2 The Index is a price return index. The total return and any graph or table reflect the theoretical reinvestment of dividends on securities in theIndex. The impact of transaction costs and the deduction of expenses associated with an exchange traded fund such as investment managementand accounting fees are not reflected in the Index calculation. It is not possible to invest directly in an Index.
3 1.00 equals perfect correlation. Because the level of the Index is not determined at the same time that the Fund’s NAV is calculated, correlationto the Index is measured by comparing the daily total return of one or more U.S. exchange-traded securities or instruments that reflect the valuesof securities underlying the Index as of the Fund’s NAV calculation time to the daily total return of the NAV per share of the Fund.
The above information is not covered by the Report of the Independent Registered Public Accounting Firm.
XLVIII ::nlEEV ULTRASHORT MSCI EMERGING MARKETS :: MANAGEMENT DISCUSSION OF FUND PERFORMANCE PROSHARES TRUST
Value of a $10,000 Investment Since Inception at Net Asset Value*
*The line graph represents historical performance of a hypothetical investmentof $10,000 in the ProShares UltraShort MSCI Emerging Markets from October 30, 2007 to May 31, 2017, assuming the reinvestment of distributions.
$18,000
$0
$12,000
$15,000
$6,000
$9,000
$3,000
$9,453 MSCI Emerging Markets Index
$348 ProShares UltraShort MSCI Emerging Markets
10/30
/07
12/31
/07
12/31
/08
12/31
/10
12/31
/12
12/31
/16
12/31
/15
12/31
/14
12/31
/13
12/31
/11
12/31
/09
05/31
/17
Average Annual Total Return as of 5/31/17
One Year Five Years Since Inception (10/30/07) ProShares UltraShort MSCI Emerging Markets -44.02% -18.74% -29.56%
MSCI Emerging Markets Index 27.41% 4.53% -0.58%
Expense Ratios**
Fund Gross Net ProShares UltraShort MSCI Emerging Markets 1.03% 0.95%
**Reflects the expense ratio as reported in the Prospectus dated October 1,2016. Contractual fee waivers are in effect through September 30, 2017.See Financial Highlights for effective expense ratios.
Market Exposure
Investment Type % of Net Assets
Swap Agreements (201%)
Total Exposure (201%)
“Market Exposure” includes the value of totalinvestments (including the contract value ofany derivatives) and excludes any short-terminvestments and cash equivalents.
MSCI Emerging Markets Index —Country
% of Index China 27.7%Korea 15.7%Taiwan 12.2%Others 10.1%India 8.8%Brazil 6.9%South Africa 6.8%Mexico 3.5%Russia 3.4%Indonesia 2.5%Malaysia 2.4%
MSCI Emerging Markets Index —Composition
% of Index Information Technology 25.6%Financials 23.7%Consumer Discretionary 10.9%Materials 7.1%Consumer Staples 7.0%Energy 6.8%Industrials 5.8%Telecommunication Services 5.5%Utilities 2.7%Real Estate 2.6%Health Care 2.3%
Allocation of Portfolio Holdings & Index Composition as of 5/31/17
ProShares UltraShort MSCI Emerging Markets (the “Fund”) seeks daily investment results, before fees and expenses, that correspond to twotimes the inverse (-2x) of the daily performance of the MSCI Emerging Markets Index® (the “Index”). The Fund seeks investment results for asingle day only, as measured from one net asset value (“NAV”) calculation to the next, not for longer periods. The return of the Fund for longerperiods will be the result of each day’s returns compounded over the period, which may be greater than or less than the Fund multiple times thereturn of the Index. For the year ended May 31, 2017, the Fund had a total return of –44.02%1. For the same period, the Index had a total return of27.41%2 and a volatility of 12.97%. For the period, the Fund had an average daily volume of 219,173 shares and an average daily statistical correlationof over 0.99 to two times the inverse of the daily performance of the Index.3
The Fund takes positions in derivatives that, in combination, should have similar daily return characteristics as two times the inverse of the dailyreturn of the Index. The Index includes 85% of free float-adjusted, market capitalization in each industry group in emerging markets countries.
During the year ended May 31, 2017, the Fund invested in swap agreements in order to gain inverse leveraged exposure to the Index. These derivativesgenerally tracked the performance of their underlying index and the Fund was generally negatively affected from financing rates associated withtheir use. The Fund entered into swap agreements with counterparties that the Fund’s advisor determined to be major, global financial institutions.If a counterparty becomes insolvent or otherwise fails to perform on its obligations, the value of investments in the Fund may decline. The Fundhas sought to mitigate this risk by generally requiring counterparties for the Fund to post collateral for the benefit of the Fund, marked to marketdaily, in an amount approximately equal to the amount the counterparty owed the Fund, subject to certain minimum thresholds.
Merrill Corp - Proshares Trust Geared Book [96 Funds] Annual Report [Funds] 333-089822 05-31-2017 ED [AUX] | eperez | 28-Jul-17 17:35 | 17-15159-3.ce | Sequence: 6CHKSUM Content: 28915 Layout: 63131 Graphics: 20112 CLEAN
JOB: 17-15159-3 CYCLE#;BL#: 5; 0 TRIM: 8.25" x 10.75" COMPOSITECOLORS: Black, ~note-color 2, ~note-color 3 GRAPHICS: 15159-3_EEV_L.eps V1.5
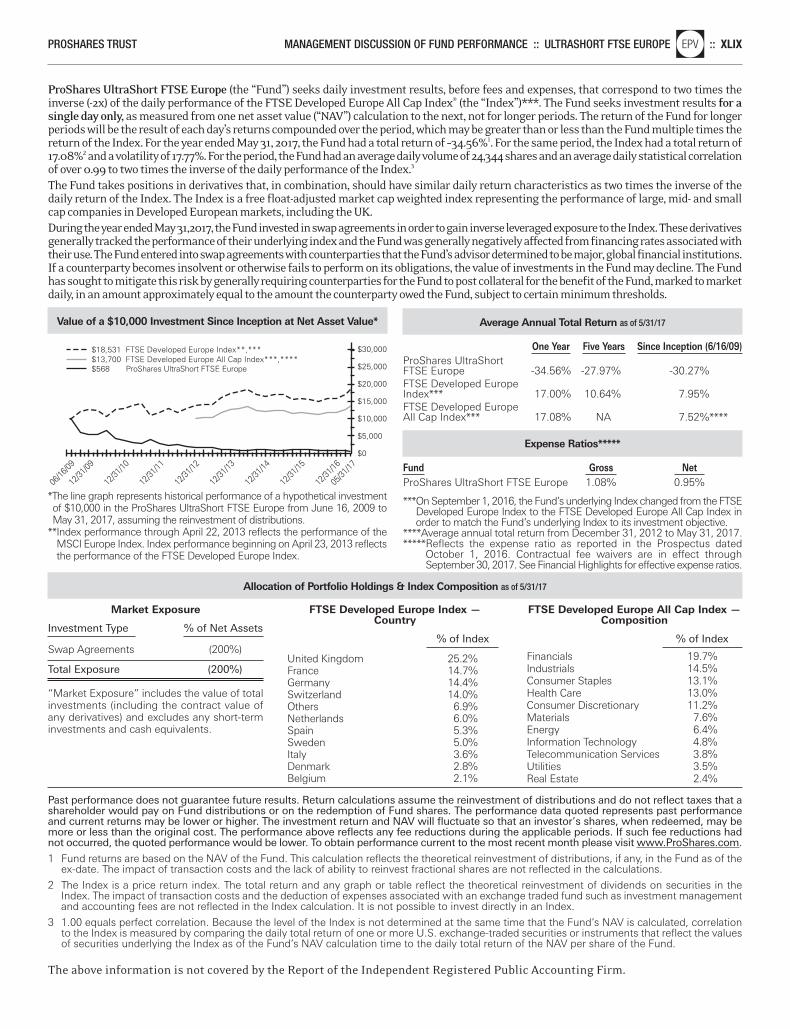
Past performance does not guarantee future results. Return calculations assume the reinvestment of distributions and do not reflect taxes that ashareholder would pay on Fund distributions or on the redemption of Fund shares. The performance data quoted represents past performanceand current returns may be lower or higher. The investment return and NAV will fluctuate so that an investor’s shares, when redeemed, may bemore or less than the original cost. The performance above reflects any fee reductions during the applicable periods. If such fee reductions hadnot occurred, the quoted performance would be lower. To obtain performance current to the most recent month please visit www.ProShares.com.
1 Fund returns are based on the NAV of the Fund. This calculation reflects the theoretical reinvestment of distributions, if any, in the Fund as of theex-date. The impact of transaction costs and the lack of ability to reinvest fractional shares are not reflected in the calculations.
2 The Index is a price return index. The total return and any graph or table reflect the theoretical reinvestment of dividends on securities in theIndex. The impact of transaction costs and the deduction of expenses associated with an exchange traded fund such as investment managementand accounting fees are not reflected in the Index calculation. It is not possible to invest directly in an Index.
3 1.00 equals perfect correlation. Because the level of the Index is not determined at the same time that the Fund’s NAV is calculated, correlationto the Index is measured by comparing the daily total return of one or more U.S. exchange-traded securities or instruments that reflect the valuesof securities underlying the Index as of the Fund’s NAV calculation time to the daily total return of the NAV per share of the Fund.
The above information is not covered by the Report of the Independent Registered Public Accounting Firm.
PROSHARES TRUST MANAGEMENT DISCUSSION OF FUND PERFORMANCE :: ULTRASHORT FTSE EUROPEnlEPV :: XLIX
Value of a $10,000 Investment Since Inception at Net Asset Value*
*The line graph represents historical performance of a hypothetical investmentof $10,000 in the ProShares UltraShort FTSE Europe from June 16, 2009 toMay 31, 2017, assuming the reinvestment of distributions.
**Index performance through April 22, 2013 reflects the performance of theMSCI Europe Index. Index performance beginning on April 23, 2013 reflectsthe performance of the FTSE Developed Europe Index.
$30,000
$25,000
$0
$5,000
$10,000
$20,000
$15,000
$18,531 FTSE Developed Europe Index**,***$13,700 FTSE Developed Europe All Cap Index***,****$568 ProShares UltraShort FTSE Europe
12/31
/09
06/16
/09
12/31
/10
12/31
/16
12/31
/15
12/31
/14
12/31
/13
12/31
/12
12/31
/11
05/31
/17
Average Annual Total Return as of 5/31/17
One Year Five Years Since Inception (6/16/09) ProShares UltraShort FTSE Europe -34.56% -27.97% -30.27%FTSE Developed Europe Index*** 17.00% 10.64% 7.95%FTSE Developed Europe All Cap Index*** 17.08% NA 7.52%****
Expense Ratios*****
Fund Gross Net ProShares UltraShort FTSE Europe 1.08% 0.95%
***On September 1, 2016, the Fund’s underlying Index changed from the FTSEDeveloped Europe Index to the FTSE Developed Europe All Cap Index inorder to match the Fund’s underlying Index to its investment objective.
****Average annual total return from December 31, 2012 to May 31, 2017.*****Reflects the expense ratio as reported in the Prospectus dated
October 1, 2016. Contractual fee waivers are in effect through September 30, 2017. See Financial Highlights for effective expense ratios.
Market Exposure
Investment Type % of Net Assets
Swap Agreements (200%)
Total Exposure (200%)
“Market Exposure” includes the value of totalinvestments (including the contract value ofany derivatives) and excludes any short-terminvestments and cash equivalents.
FTSE Developed Europe Index —Country
% of Index United Kingdom 25.2%France 14.7%Germany 14.4%Switzerland 14.0%Others 6.9%Netherlands 6.0%Spain 5.3%Sweden 5.0%Italy 3.6%Denmark 2.8%Belgium 2.1%
FTSE Developed Europe All Cap Index —Composition
% of Index Financials 19.7%Industrials 14.5%Consumer Staples 13.1%Health Care 13.0%Consumer Discretionary 11.2%Materials 7.6%Energy 6.4%Information Technology 4.8%Telecommunication Services 3.8%Utilities 3.5%Real Estate 2.4%
Allocation of Portfolio Holdings & Index Composition as of 5/31/17
ProShares UltraShort FTSE Europe (the “Fund”) seeks daily investment results, before fees and expenses, that correspond to two times theinverse (-2x) of the daily performance of the FTSE Developed Europe All Cap Index® (the “Index”)***. The Fund seeks investment results for asingle day only, as measured from one net asset value (“NAV”) calculation to the next, not for longer periods. The return of the Fund for longerperiods will be the result of each day’s returns compounded over the period, which may be greater than or less than the Fund multiple times thereturn of the Index. For the year ended May 31, 2017, the Fund had a total return of –34.56%1. For the same period, the Index had a total return of17.08%2 and a volatility of 17.77%. For the period, the Fund had an average daily volume of 24,344 shares and an average daily statistical correlationof over 0.99 to two times the inverse of the daily performance of the Index.3
The Fund takes positions in derivatives that, in combination, should have similar daily return characteristics as two times the inverse of thedaily return of the Index. The Index is a free float-adjusted market cap weighted index representing the performance of large, mid- and smallcap companies in Developed European markets, including the UK.During the year ended May 31,2017, the Fund invested in swap agreements in order to gain inverse leveraged exposure to the Index. These derivativesgenerally tracked the performance of their underlying index and the Fund was generally negatively affected from financing rates associated withtheir use. The Fund entered into swap agreements with counterparties that the Fund’s advisor determined to be major, global financial institutions.If a counterparty becomes insolvent or otherwise fails to perform on its obligations, the value of investments in the Fund may decline. The Fundhas sought to mitigate this risk by generally requiring counterparties for the Fund to post collateral for the benefit of the Fund, marked to marketdaily, in an amount approximately equal to the amount the counterparty owed the Fund, subject to certain minimum thresholds.
Merrill Corp - Proshares Trust Geared Book [96 Funds] Annual Report [Funds] 333-089822 05-31-2017 ED [AUX] | eperez | 28-Jul-17 17:35 | 17-15159-3.ce | Sequence: 7CHKSUM Content: 49419 Layout: 6530 Graphics: 22257 CLEAN
JOB: 17-15159-3 CYCLE#;BL#: 5; 0 TRIM: 8.25" x 10.75" COMPOSITECOLORS: Black, ~note-color 2 GRAPHICS: 15159-3_EPV_L.eps V1.5
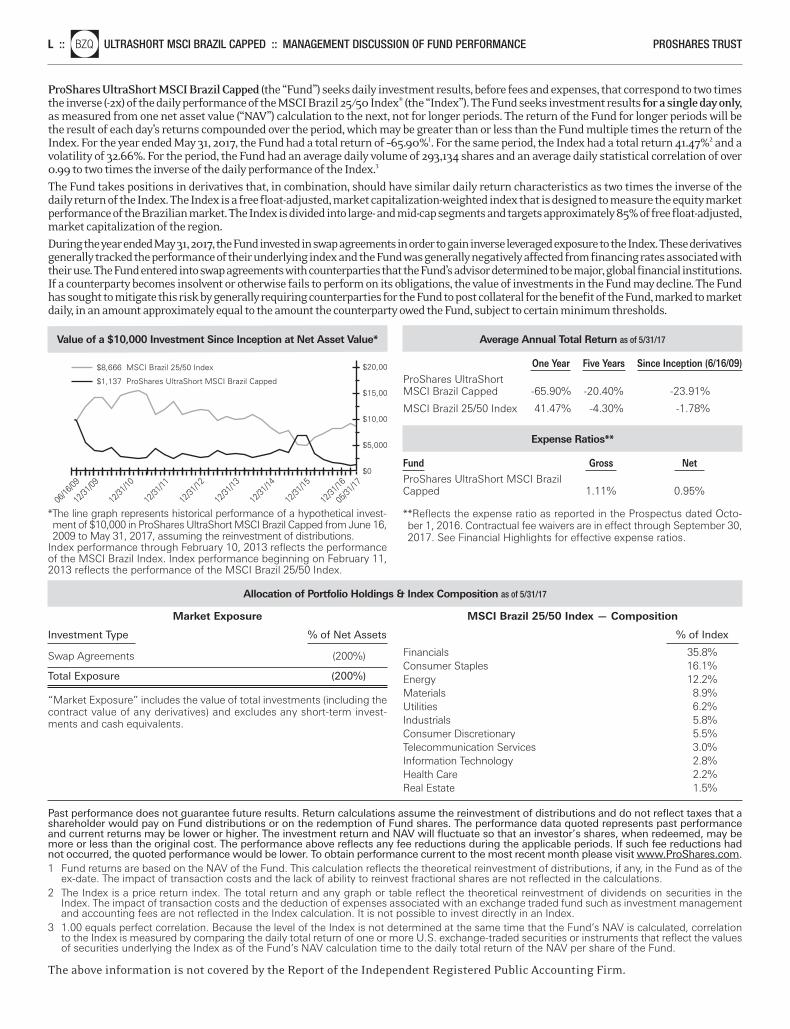
Past performance does not guarantee future results. Return calculations assume the reinvestment of distributions and do not reflect taxes that ashareholder would pay on Fund distributions or on the redemption of Fund shares. The performance data quoted represents past performanceand current returns may be lower or higher. The investment return and NAV will fluctuate so that an investor’s shares, when redeemed, may bemore or less than the original cost. The performance above reflects any fee reductions during the applicable periods. If such fee reductions hadnot occurred, the quoted performance would be lower. To obtain performance current to the most recent month please visit www.ProShares.com.1 Fund returns are based on the NAV of the Fund. This calculation reflects the theoretical reinvestment of distributions, if any, in the Fund as of the
ex-date. The impact of transaction costs and the lack of ability to reinvest fractional shares are not reflected in the calculations.2 The Index is a price return index. The total return and any graph or table reflect the theoretical reinvestment of dividends on securities in the
Index. The impact of transaction costs and the deduction of expenses associated with an exchange traded fund such as investment managementand accounting fees are not reflected in the Index calculation. It is not possible to invest directly in an Index.
3 1.00 equals perfect correlation. Because the level of the Index is not determined at the same time that the Fund’s NAV is calculated, correlationto the Index is measured by comparing the daily total return of one or more U.S. exchange-traded securities or instruments that reflect the valuesof securities underlying the Index as of the Fund’s NAV calculation time to the daily total return of the NAV per share of the Fund.
The above information is not covered by the Report of the Independent Registered Public Accounting Firm.
L ::nlBZQ ULTRASHORT MSCI BRAZIL CAPPED :: MANAGEMENT DISCUSSION OF FUND PERFORMANCE PROSHARES TRUST
Value of a $10,000 Investment Since Inception at Net Asset Value*
*The line graph represents historical performance of a hypothetical invest-ment of $10,000 in ProShares UltraShort MSCI Brazil Capped from June 16,2009 to May 31, 2017, assuming the reinvestment of distributions.
Index performance through February 10, 2013 reflects the performanceof the MSCI Brazil Index. Index performance beginning on February 11,2013 reflects the performance of the MSCI Brazil 25/50 Index.
$20,00
$0
$5,000
$10,00
$15,00
$8,666 MSCI Brazil 25/50 Index
$1,137 ProShares UltraShort MSCI Brazil Capped
06/16
/0912
/31/09
12/31
/10
12/31
/16
12/31
/15
12/31
/14
12/31
/13
12/31
/12
12/31
/11
05/31
/17
Average Annual Total Return as of 5/31/17
One Year Five Years Since Inception (6/16/09) ProShares UltraShort MSCI Brazil Capped -65.90% -20.40% -23.91%
MSCI Brazil 25/50 Index 41.47% -4.30% -1.78%
Expense Ratios**
Fund Gross Net ProShares UltraShort MSCI Brazil Capped 1.11% 0.95%
**Reflects the expense ratio as reported in the Prospectus dated Octo-ber 1, 2016. Contractual fee waivers are in effect through September 30,2017. See Financial Highlights for effective expense ratios.
Market Exposure
Investment Type % of Net Assets
Swap Agreements (200%)
Total Exposure (200%)
“Market Exposure” includes the value of total investments (including thecontract value of any derivatives) and excludes any short-term invest-ments and cash equivalents.
MSCI Brazil 25/50 Index — Composition
% of Index Financials 35.8%Consumer Staples 16.1%Energy 12.2%Materials 8.9%Utilities 6.2%Industrials 5.8%Consumer Discretionary 5.5%Telecommunication Services 3.0%Information Technology 2.8%Health Care 2.2%Real Estate 1.5%
ProShares UltraShort MSCI Brazil Capped (the “Fund”) seeks daily investment results, before fees and expenses, that correspond to two timesthe inverse (-2x) of the daily performance of the MSCI Brazil 25/50 Index® (the “Index”). The Fund seeks investment results for a single day only,as measured from one net asset value (“NAV”) calculation to the next, not for longer periods. The return of the Fund for longer periods will bethe result of each day’s returns compounded over the period, which may be greater than or less than the Fund multiple times the return of theIndex. For the year ended May 31, 2017, the Fund had a total return of –65.90%1. For the same period, the Index had a total return 41.47%2 and avolatility of 32.66%. For the period, the Fund had an average daily volume of 293,134 shares and an average daily statistical correlation of over0.99 to two times the inverse of the daily performance of the Index.3
The Fund takes positions in derivatives that, in combination, should have similar daily return characteristics as two times the inverse of thedaily return of the Index. The Index is a free float-adjusted, market capitalization-weighted index that is designed to measure the equity marketperformance of the Brazilian market. The Index is divided into large- and mid-cap segments and targets approximately 85% of free float-adjusted,market capitalization of the region.During the year ended May 31, 2017, the Fund invested in swap agreements in order to gain inverse leveraged exposure to the Index. These derivativesgenerally tracked the performance of their underlying index and the Fund was generally negatively affected from financing rates associated withtheir use. The Fund entered into swap agreements with counterparties that the Fund’s advisor determined to be major, global financial institutions.If a counterparty becomes insolvent or otherwise fails to perform on its obligations, the value of investments in the Fund may decline. The Fundhas sought to mitigate this risk by generally requiring counterparties for the Fund to post collateral for the benefit of the Fund, marked to marketdaily, in an amount approximately equal to the amount the counterparty owed the Fund, subject to certain minimum thresholds.
Allocation of Portfolio Holdings & Index Composition as of 5/31/17
Merrill Corp - Proshares Trust Geared Book [96 Funds] Annual Report [Funds] 333-089822 05-31-2017 ED [AUX] | eperez | 28-Jul-17 17:35 | 17-15159-3.ce | Sequence: 8CHKSUM Content: 43927 Layout: 9851 Graphics: 63992 CLEAN
JOB: 17-15159-3 CYCLE#;BL#: 5; 0 TRIM: 8.25" x 10.75" COMPOSITECOLORS: Black, ~note-color 2, ~note-color 3 GRAPHICS: 15159-3_BZQ_L.eps V1.5
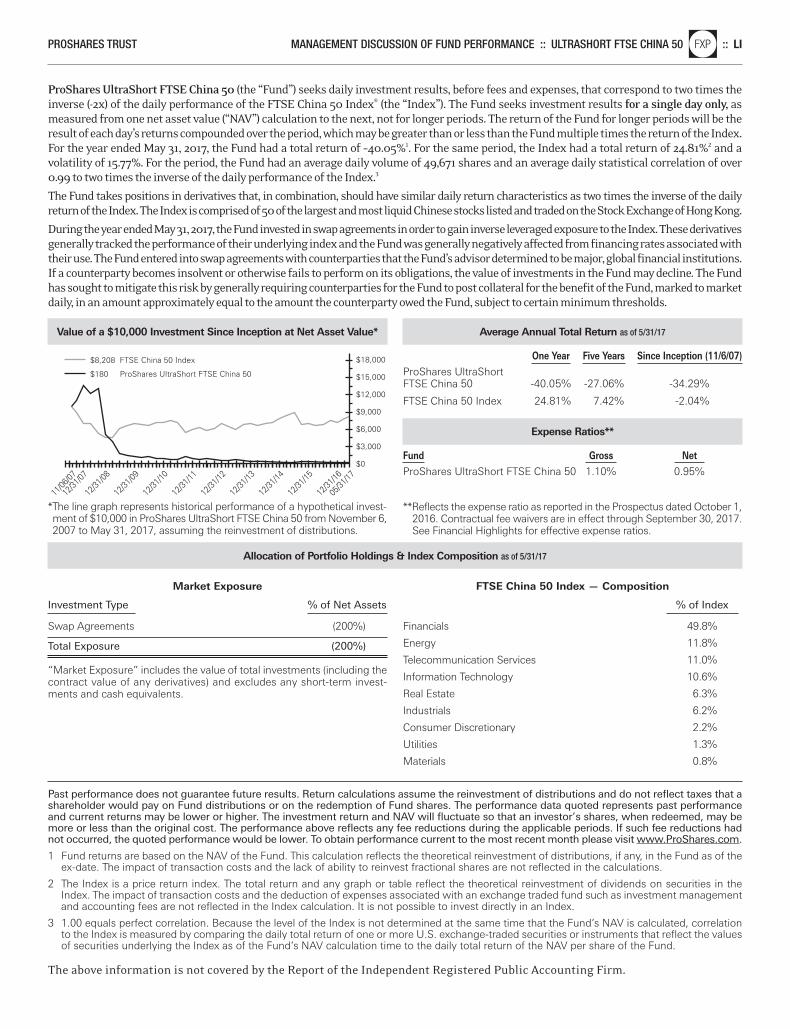
ProShares UltraShort FTSE China 50 (the “Fund”) seeks daily investment results, before fees and expenses, that correspond to two times theinverse (-2x) of the daily performance of the FTSE China 50 Index® (the “Index”). The Fund seeks investment results for a single day only, asmeasured from one net asset value (“NAV”) calculation to the next, not for longer periods. The return of the Fund for longer periods will be theresult of each day’s returns compounded over the period, which may be greater than or less than the Fund multiple times the return of the Index.For the year ended May 31, 2017, the Fund had a total return of –40.05%1. For the same period, the Index had a total return of 24.81%2 and avolatility of 15.77%. For the period, the Fund had an average daily volume of 49,671 shares and an average daily statistical correlation of over0.99 to two times the inverse of the daily performance of the Index.3
The Fund takes positions in derivatives that, in combination, should have similar daily return characteristics as two times the inverse of the dailyreturn of the Index. The Index is comprised of 50 of the largest and most liquid Chinese stocks listed and traded on the Stock Exchange of Hong Kong.
During the year ended May 31, 2017, the Fund invested in swap agreements in order to gain inverse leveraged exposure to the Index. These derivativesgenerally tracked the performance of their underlying index and the Fund was generally negatively affected from financing rates associated withtheir use. The Fund entered into swap agreements with counterparties that the Fund’s advisor determined to be major, global financial institutions.If a counterparty becomes insolvent or otherwise fails to perform on its obligations, the value of investments in the Fund may decline. The Fundhas sought to mitigate this risk by generally requiring counterparties for the Fund to post collateral for the benefit of the Fund, marked to marketdaily, in an amount approximately equal to the amount the counterparty owed the Fund, subject to certain minimum thresholds.
Past performance does not guarantee future results. Return calculations assume the reinvestment of distributions and do not reflect taxes that ashareholder would pay on Fund distributions or on the redemption of Fund shares. The performance data quoted represents past performanceand current returns may be lower or higher. The investment return and NAV will fluctuate so that an investor’s shares, when redeemed, may bemore or less than the original cost. The performance above reflects any fee reductions during the applicable periods. If such fee reductions hadnot occurred, the quoted performance would be lower. To obtain performance current to the most recent month please visit www.ProShares.com.
1 Fund returns are based on the NAV of the Fund. This calculation reflects the theoretical reinvestment of distributions, if any, in the Fund as of theex-date. The impact of transaction costs and the lack of ability to reinvest fractional shares are not reflected in the calculations.
2 The Index is a price return index. The total return and any graph or table reflect the theoretical reinvestment of dividends on securities in theIndex. The impact of transaction costs and the deduction of expenses associated with an exchange traded fund such as investment managementand accounting fees are not reflected in the Index calculation. It is not possible to invest directly in an Index.
3 1.00 equals perfect correlation. Because the level of the Index is not determined at the same time that the Fund’s NAV is calculated, correlationto the Index is measured by comparing the daily total return of one or more U.S. exchange-traded securities or instruments that reflect the valuesof securities underlying the Index as of the Fund’s NAV calculation time to the daily total return of the NAV per share of the Fund.
The above information is not covered by the Report of the Independent Registered Public Accounting Firm.
PROSHARES TRUST MANAGEMENT DISCUSSION OF FUND PERFORMANCE :: ULTRASHORT FTSE CHINA 50nlFXP :: LI
Value of a $10,000 Investment Since Inception at Net Asset Value*
*The line graph represents historical performance of a hypothetical invest-ment of $10,000 in ProShares UltraShort FTSE China 50 from November 6,2007 to May 31, 2017, assuming the reinvestment of distributions.
$18,000
$0
$12,000
$15,000
$6,000
$3,000
$9,000
$8,208 FTSE China 50 Index
$180 ProShares UltraShort FTSE China 50
11/06
/07
12/31
/07
12/31
/08
12/31
/10
12/31
/16
12/31
/15
12/31
/14
12/31
/13
12/31
/12
12/31
/11
12/31
/09
05/31
/17
Average Annual Total Return as of 5/31/17
One Year Five Years Since Inception (11/6/07) ProShares UltraShort FTSE China 50 -40.05% -27.06% -34.29%
FTSE China 50 Index 24.81% 7.42% -2.04%
Expense Ratios**
Fund Gross Net ProShares UltraShort FTSE China 50 1.10% 0.95%
**Reflects the expense ratio as reported in the Prospectus dated October 1,2016. Contractual fee waivers are in effect through September 30, 2017.See Financial Highlights for effective expense ratios.
Market Exposure
Investment Type % of Net Assets
Swap Agreements (200%)
Total Exposure (200%)
“Market Exposure” includes the value of total investments (including thecontract value of any derivatives) and excludes any short-term invest-ments and cash equivalents.
FTSE China 50 Index — Composition
% of Index
Financials 49.8%
Energy 11.8%
Telecommunication Services 11.0%
Information Technology 10.6%
Real Estate 6.3%
Industrials 6.2%
Consumer Discretionary 2.2%
Utilities 1.3%
Materials 0.8%
Allocation of Portfolio Holdings & Index Composition as of 5/31/17
Merrill Corp - Proshares Trust Geared Book [96 Funds] Annual Report [Funds] 333-089822 05-31-2017 ED [AUX] | eperez | 28-Jul-17 17:35 | 17-15159-3.ce | Sequence: 9CHKSUM Content: 6755 Layout: 11875 Graphics: 19335 CLEAN
JOB: 17-15159-3 CYCLE#;BL#: 5; 0 TRIM: 8.25" x 10.75" COMPOSITECOLORS: Black, ~note-color 2 GRAPHICS: 15159-3_FXP_L.eps V1.5
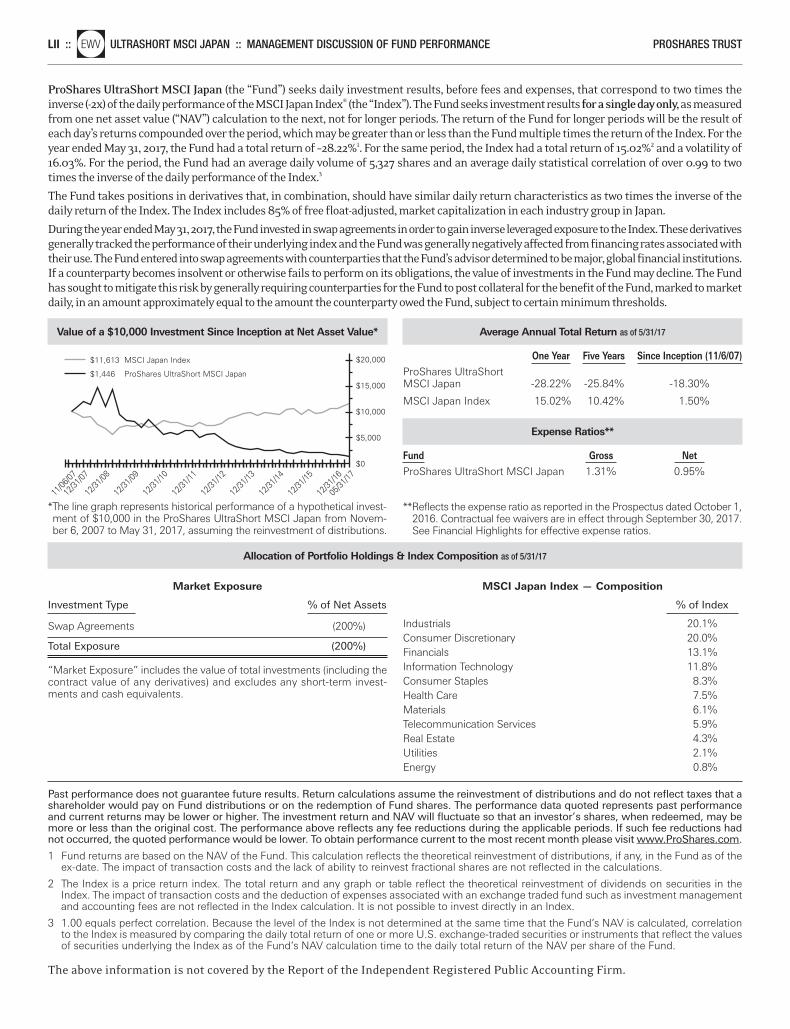
Past performance does not guarantee future results. Return calculations assume the reinvestment of distributions and do not reflect taxes that ashareholder would pay on Fund distributions or on the redemption of Fund shares. The performance data quoted represents past performanceand current returns may be lower or higher. The investment return and NAV will fluctuate so that an investor’s shares, when redeemed, may bemore or less than the original cost. The performance above reflects any fee reductions during the applicable periods. If such fee reductions hadnot occurred, the quoted performance would be lower. To obtain performance current to the most recent month please visit www.ProShares.com.
1 Fund returns are based on the NAV of the Fund. This calculation reflects the theoretical reinvestment of distributions, if any, in the Fund as of theex-date. The impact of transaction costs and the lack of ability to reinvest fractional shares are not reflected in the calculations.
2 The Index is a price return index. The total return and any graph or table reflect the theoretical reinvestment of dividends on securities in theIndex. The impact of transaction costs and the deduction of expenses associated with an exchange traded fund such as investment managementand accounting fees are not reflected in the Index calculation. It is not possible to invest directly in an Index.
3 1.00 equals perfect correlation. Because the level of the Index is not determined at the same time that the Fund’s NAV is calculated, correlationto the Index is measured by comparing the daily total return of one or more U.S. exchange-traded securities or instruments that reflect the valuesof securities underlying the Index as of the Fund’s NAV calculation time to the daily total return of the NAV per share of the Fund.
The above information is not covered by the Report of the Independent Registered Public Accounting Firm.
LII ::nlEWV ULTRASHORT MSCI JAPAN :: MANAGEMENT DISCUSSION OF FUND PERFORMANCE PROSHARES TRUST
ProShares UltraShort MSCI Japan (the “Fund”) seeks daily investment results, before fees and expenses, that correspond to two times theinverse (-2x) of the daily performance of the MSCI Japan Index® (the “Index”). The Fund seeks investment results for a single day only,as measuredfrom one net asset value (“NAV”) calculation to the next, not for longer periods. The return of the Fund for longer periods will be the result ofeach day’s returns compounded over the period, which may be greater than or less than the Fund multiple times the return of the Index. For theyear ended May 31, 2017, the Fund had a total return of –28.22%1. For the same period, the Index had a total return of 15.02%2 and a volatility of16.03%. For the period, the Fund had an average daily volume of 5,327 shares and an average daily statistical correlation of over 0.99 to twotimes the inverse of the daily performance of the Index.3
The Fund takes positions in derivatives that, in combination, should have similar daily return characteristics as two times the inverse of thedaily return of the Index. The Index includes 85% of free float-adjusted, market capitalization in each industry group in Japan.
During the year ended May 31, 2017, the Fund invested in swap agreements in order to gain inverse leveraged exposure to the Index. These derivativesgenerally tracked the performance of their underlying index and the Fund was generally negatively affected from financing rates associated withtheir use. The Fund entered into swap agreements with counterparties that the Fund’s advisor determined to be major, global financial institutions.If a counterparty becomes insolvent or otherwise fails to perform on its obligations, the value of investments in the Fund may decline. The Fundhas sought to mitigate this risk by generally requiring counterparties for the Fund to post collateral for the benefit of the Fund, marked to marketdaily, in an amount approximately equal to the amount the counterparty owed the Fund, subject to certain minimum thresholds.
Value of a $10,000 Investment Since Inception at Net Asset Value*
*The line graph represents historical performance of a hypothetical invest-ment of $10,000 in the ProShares UltraShort MSCI Japan from Novem-ber 6, 2007 to May 31, 2017, assuming the reinvestment of distributions.
$20,000
$0
$10,000
$15,000
$5,000
$11,613 MSCI Japan Index
$1,446 ProShares UltraShort MSCI Japan
11/06
/07
12/31
/07
12/31
/08
12/31
/10
12/31
/16
12/31
/15
12/31
/14
12/31
/13
12/31
/12
12/31
/11
12/31
/09
05/31
/17
Average Annual Total Return as of 5/31/17
One Year Five Years Since Inception (11/6/07) ProShares UltraShort MSCI Japan -28.22% -25.84% -18.30%
MSCI Japan Index 15.02% 10.42% 1.50%
Expense Ratios**
Fund Gross Net ProShares UltraShort MSCI Japan 1.31% 0.95%
**Reflects the expense ratio as reported in the Prospectus dated October 1,2016. Contractual fee waivers are in effect through September 30, 2017.See Financial Highlights for effective expense ratios.
Market Exposure
Investment Type % of Net Assets
Swap Agreements (200%)
Total Exposure (200%)
“Market Exposure” includes the value of total investments (including thecontract value of any derivatives) and excludes any short-term invest-ments and cash equivalents.
MSCI Japan Index — Composition
% of Index Industrials 20.1%Consumer Discretionary 20.0%Financials 13.1%Information Technology 11.8%Consumer Staples 8.3%Health Care 7.5%Materials 6.1%Telecommunication Services 5.9%Real Estate 4.3%Utilities 2.1%Energy 0.8%
Allocation of Portfolio Holdings & Index Composition as of 5/31/17
Merrill Corp - Proshares Trust Geared Book [96 Funds] Annual Report [Funds] 333-089822 05-31-2017 ED [AUX] | eperez | 28-Jul-17 17:35 | 17-15159-3.ce | Sequence: 10CHKSUM Content: 12986 Layout: 44935 Graphics: 61054 CLEAN
JOB: 17-15159-3 CYCLE#;BL#: 5; 0 TRIM: 8.25" x 10.75" COMPOSITECOLORS: Black, ~note-color 2, ~note-color 3 GRAPHICS: 15159-3_EWV_L.eps V1.5
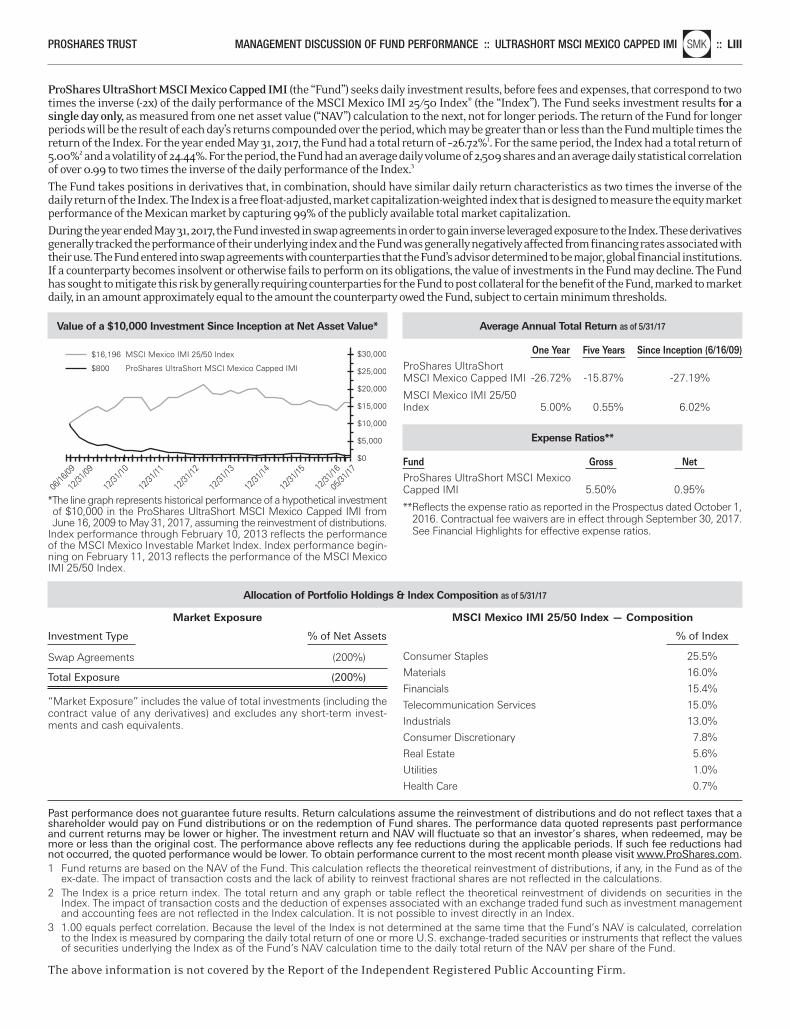
PROSHARES TRUST MANAGEMENT DISCUSSION OF FUND PERFORMANCE :: ULTRASHORT MSCI MEXICO CAPPED IMInlSMK :: LIII
Past performance does not guarantee future results. Return calculations assume the reinvestment of distributions and do not reflect taxes that ashareholder would pay on Fund distributions or on the redemption of Fund shares. The performance data quoted represents past performanceand current returns may be lower or higher. The investment return and NAV will fluctuate so that an investor’s shares, when redeemed, may bemore or less than the original cost. The performance above reflects any fee reductions during the applicable periods. If such fee reductions hadnot occurred, the quoted performance would be lower. To obtain performance current to the most recent month please visit www.ProShares.com.1 Fund returns are based on the NAV of the Fund. This calculation reflects the theoretical reinvestment of distributions, if any, in the Fund as of the
ex-date. The impact of transaction costs and the lack of ability to reinvest fractional shares are not reflected in the calculations.2 The Index is a price return index. The total return and any graph or table reflect the theoretical reinvestment of dividends on securities in the
Index. The impact of transaction costs and the deduction of expenses associated with an exchange traded fund such as investment managementand accounting fees are not reflected in the Index calculation. It is not possible to invest directly in an Index.
3 1.00 equals perfect correlation. Because the level of the Index is not determined at the same time that the Fund’s NAV is calculated, correlationto the Index is measured by comparing the daily total return of one or more U.S. exchange-traded securities or instruments that reflect the valuesof securities underlying the Index as of the Fund’s NAV calculation time to the daily total return of the NAV per share of the Fund.
The above information is not covered by the Report of the Independent Registered Public Accounting Firm.
Value of a $10,000 Investment Since Inception at Net Asset Value*
*The line graph represents historical performance of a hypothetical investmentof $10,000 in the ProShares UltraShort MSCI Mexico Capped IMI fromJune 16, 2009 to May 31, 2017, assuming the reinvestment of distributions.
Index performance through February 10, 2013 reflects the performanceof the MSCI Mexico Investable Market Index. Index performance begin-ning on February 11, 2013 reflects the performance of the MSCI MexicoIMI 25/50 Index.
$30,000
$25,000
$20,000
$0
$5,000
$10,000
$15,000
$16,196 MSCI Mexico IMI 25/50 Index
$800 ProShares UltraShort MSCI Mexico Capped IMI
06/16
/0912
/31/09
12/31
/10
12/31
/16
12/31
/15
12/31
/14
12/31
/13
12/31
/12
12/31
/11
05/31
/17
Average Annual Total Return as of 5/31/17
One Year Five Years Since Inception (6/16/09) ProShares UltraShort MSCI Mexico Capped IMI -26.72% -15.87% -27.19%
MSCI Mexico IMI 25/50 Index 5.00% 0.55% 6.02%
Expense Ratios**
Fund Gross Net ProShares UltraShort MSCI Mexico Capped IMI 5.50% 0.95%
**Reflects the expense ratio as reported in the Prospectus dated October 1,2016. Contractual fee waivers are in effect through September 30, 2017.See Financial Highlights for effective expense ratios.
Market Exposure
Investment Type % of Net Assets
Swap Agreements (200%)
Total Exposure (200%)
“Market Exposure” includes the value of total investments (including thecontract value of any derivatives) and excludes any short-term invest-ments and cash equivalents.
MSCI Mexico IMI 25/50 Index — Composition
% of Index Consumer Staples 25.5%
Materials 16.0%
Financials 15.4%
Telecommunication Services 15.0%
Industrials 13.0%
Consumer Discretionary 7.8%
Real Estate 5.6%
Utilities 1.0%
Health Care 0.7%
ProShares UltraShort MSCI Mexico Capped IMI (the “Fund”) seeks daily investment results, before fees and expenses, that correspond to twotimes the inverse (-2x) of the daily performance of the MSCI Mexico IMI 25/50 Index® (the “Index”). The Fund seeks investment results for asingle day only, as measured from one net asset value (“NAV”) calculation to the next, not for longer periods. The return of the Fund for longerperiods will be the result of each day’s returns compounded over the period, which may be greater than or less than the Fund multiple times thereturn of the Index. For the year ended May 31, 2017, the Fund had a total return of –26.72%1. For the same period, the Index had a total return of5.00%2 and a volatility of 24.44%. For the period, the Fund had an average daily volume of 2,509 shares and an average daily statistical correlationof over 0.99 to two times the inverse of the daily performance of the Index.3
The Fund takes positions in derivatives that, in combination, should have similar daily return characteristics as two times the inverse of thedaily return of the Index. The Index is a free float-adjusted, market capitalization-weighted index that is designed to measure the equity marketperformance of the Mexican market by capturing 99% of the publicly available total market capitalization.During the year ended May 31, 2017, the Fund invested in swap agreements in order to gain inverse leveraged exposure to the Index. These derivativesgenerally tracked the performance of their underlying index and the Fund was generally negatively affected from financing rates associated withtheir use. The Fund entered into swap agreements with counterparties that the Fund’s advisor determined to be major, global financial institutions.If a counterparty becomes insolvent or otherwise fails to perform on its obligations, the value of investments in the Fund may decline. The Fundhas sought to mitigate this risk by generally requiring counterparties for the Fund to post collateral for the benefit of the Fund, marked to marketdaily, in an amount approximately equal to the amount the counterparty owed the Fund, subject to certain minimum thresholds.
Allocation of Portfolio Holdings & Index Composition as of 5/31/17
Merrill Corp - Proshares Trust Geared Book [96 Funds] Annual Report [Funds] 333-089822 05-31-2017 ED [AUX] | eperez | 28-Jul-17 17:35 | 17-15159-3.ce | Sequence: 11CHKSUM Content: 29681 Layout: 3816 Graphics: 7700 CLEAN
JOB: 17-15159-3 CYCLE#;BL#: 5; 0 TRIM: 8.25" x 10.75" COMPOSITECOLORS: Black, ~note-color 2 GRAPHICS: 15159-3_SMK_L.eps V1.5
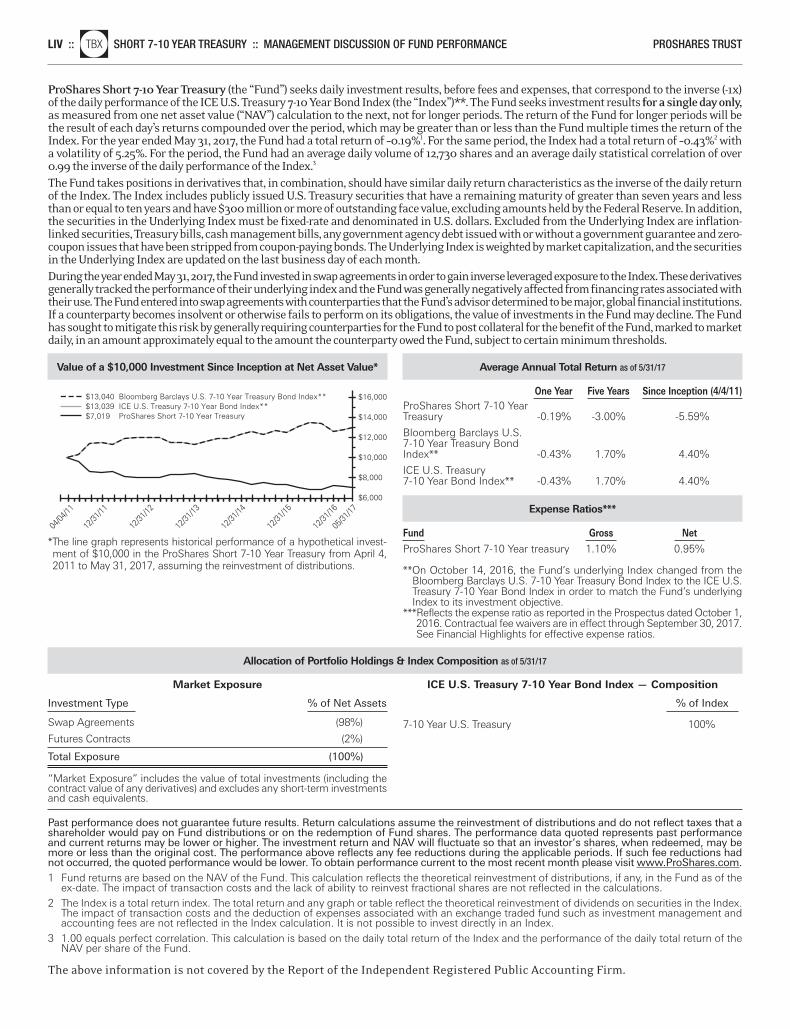
LIV ::nlTBX SHORT 7-10 YEAR TREASURY :: MANAGEMENT DISCUSSION OF FUND PERFORMANCE PROSHARES TRUST
ProShares Short 7-10 Year Treasury (the “Fund”) seeks daily investment results, before fees and expenses, that correspond to the inverse (-1x)of the daily performance of the ICE U.S. Treasury 7-10 Year Bond Index (the “Index”)**. The Fund seeks investment results for a single day only,as measured from one net asset value (“NAV”) calculation to the next, not for longer periods. The return of the Fund for longer periods will bethe result of each day’s returns compounded over the period, which may be greater than or less than the Fund multiple times the return of theIndex. For the year ended May 31, 2017, the Fund had a total return of –0.19%1. For the same period, the Index had a total return of –0.43%2 witha volatility of 5.25%. For the period, the Fund had an average daily volume of 12,730 shares and an average daily statistical correlation of over0.99 the inverse of the daily performance of the Index.3
The Fund takes positions in derivatives that, in combination, should have similar daily return characteristics as the inverse of the daily returnof the Index. The Index includes publicly issued U.S. Treasury securities that have a remaining maturity of greater than seven years and lessthan or equal to ten years and have $300 million or more of outstanding face value, excluding amounts held by the Federal Reserve. In addition,the securities in the Underlying Index must be fixed-rate and denominated in U.S. dollars. Excluded from the Underlying Index are inflation-linked securities, Treasury bills, cash management bills, any government agency debt issued with or without a government guarantee and zero-coupon issues that have been stripped from coupon-paying bonds. The Underlying Index is weighted by market capitalization, and the securitiesin the Underlying Index are updated on the last business day of each month.During the year ended May 31, 2017, the Fund invested in swap agreements in order to gain inverse leveraged exposure to the Index. These derivativesgenerally tracked the performance of their underlying index and the Fund was generally negatively affected from financing rates associated withtheir use. The Fund entered into swap agreements with counterparties that the Fund’s advisor determined to be major, global financial institutions.If a counterparty becomes insolvent or otherwise fails to perform on its obligations, the value of investments in the Fund may decline. The Fundhas sought to mitigate this risk by generally requiring counterparties for the Fund to post collateral for the benefit of the Fund, marked to marketdaily, in an amount approximately equal to the amount the counterparty owed the Fund, subject to certain minimum thresholds.
Value of a $10,000 Investment Since Inception at Net Asset Value*
*The line graph represents historical performance of a hypothetical invest-ment of $10,000 in the ProShares Short 7-10 Year Treasury from April 4,2011 to May 31, 2017, assuming the reinvestment of distributions.
$16,000
$14,000
$6,000
$8,000
$10,000
$12,000
$13,039 ICE U.S. Treasury 7-10 Year Bond Index**$13,040 Bloomberg Barclays U.S. 7-10 Year Treasury Bond Index**
$7,019 ProShares Short 7-10 Year Treasury
04/04
/11
12/31
/12
12/31
/14
12/31
/16
12/31
/15
12/31
/13
12/31
/11
05/31
/17
Average Annual Total Return as of 5/31/17
One Year Five Years Since Inception (4/4/11) ProShares Short 7-10 Year Treasury -0.19% -3.00% -5.59%
Bloomberg Barclays U.S. 7-10 Year Treasury Bond Index** -0.43% 1.70% 4.40%
ICE U.S. Treasury 7-10 Year Bond Index** -0.43% 1.70% 4.40%
Expense Ratios***
Fund Gross Net ProShares Short 7-10 Year treasury 1.10% 0.95%
**On October 14, 2016, the Fund’s underlying Index changed from theBloomberg Barclays U.S. 7-10 Year Treasury Bond Index to the ICE U.S.Treasury 7-10 Year Bond Index in order to match the Fund’s underlyingIndex to its investment objective.
***Reflects the expense ratio as reported in the Prospectus dated October 1,2016. Contractual fee waivers are in effect through September 30, 2017.See Financial Highlights for effective expense ratios.
Market Exposure
Investment Type % of Net Assets Swap Agreements (98%)
Futures Contracts (2%)
Total Exposure (100%)
“Market Exposure” includes the value of total investments (including thecontract value of any derivatives) and excludes any short-term investmentsand cash equivalents.
ICE U.S. Treasury 7-10 Year Bond Index — Composition
% of Index
7-10 Year U.S. Treasury 100%
Allocation of Portfolio Holdings & Index Composition as of 5/31/17
Past performance does not guarantee future results. Return calculations assume the reinvestment of distributions and do not reflect taxes that ashareholder would pay on Fund distributions or on the redemption of Fund shares. The performance data quoted represents past performanceand current returns may be lower or higher. The investment return and NAV will fluctuate so that an investor’s shares, when redeemed, may bemore or less than the original cost. The performance above reflects any fee reductions during the applicable periods. If such fee reductions hadnot occurred, the quoted performance would be lower. To obtain performance current to the most recent month please visit www.ProShares.com.1 Fund returns are based on the NAV of the Fund. This calculation reflects the theoretical reinvestment of distributions, if any, in the Fund as of the
ex-date. The impact of transaction costs and the lack of ability to reinvest fractional shares are not reflected in the calculations.2 The Index is a total return index. The total return and any graph or table reflect the theoretical reinvestment of dividends on securities in the Index.
The impact of transaction costs and the deduction of expenses associated with an exchange traded fund such as investment management andaccounting fees are not reflected in the Index calculation. It is not possible to invest directly in an Index.
3 1.00 equals perfect correlation. This calculation is based on the daily total return of the Index and the performance of the daily total return of theNAV per share of the Fund.
The above information is not covered by the Report of the Independent Registered Public Accounting Firm.
Merrill Corp - Proshares Trust Geared Book [96 Funds] Annual Report [Funds] 333-089822 05-31-2017 ED [AUX] | eperez | 28-Jul-17 17:35 | 17-15159-3.ce | Sequence: 12CHKSUM Content: 2350 Layout: 49877 Graphics: 54350 CLEAN
JOB: 17-15159-3 CYCLE#;BL#: 5; 0 TRIM: 8.25" x 10.75" COMPOSITECOLORS: Black, ~note-color 2, ~note-color 3 GRAPHICS: 15159-3_TBX_L.eps V1.5
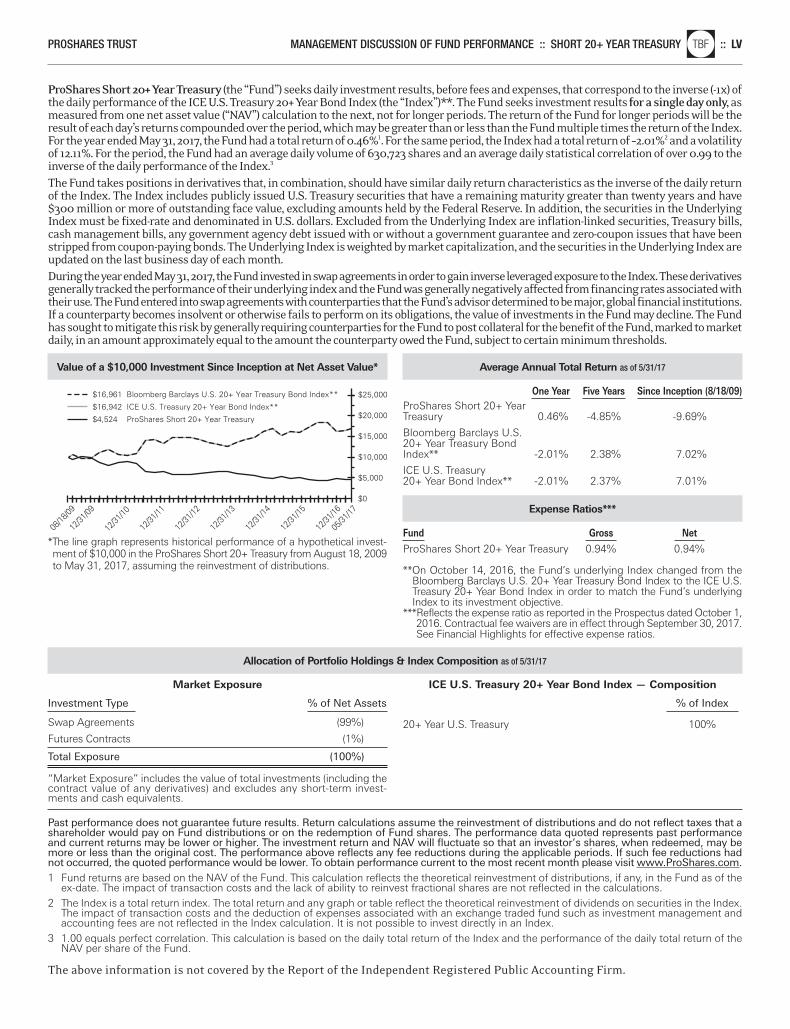
PROSHARES TRUST MANAGEMENT DISCUSSION OF FUND PERFORMANCE :: SHORT 20+ YEAR TREASURYnlTBF :: LV
ProShares Short 20+ Year Treasury (the “Fund”) seeks daily investment results, before fees and expenses, that correspond to the inverse (-1x) ofthe daily performance of the ICE U.S. Treasury 20+ Year Bond Index (the “Index”)**. The Fund seeks investment results for a single day only, asmeasured from one net asset value (“NAV”) calculation to the next, not for longer periods. The return of the Fund for longer periods will be theresult of each day’s returns compounded over the period, which may be greater than or less than the Fund multiple times the return of the Index.For the year ended May 31, 2017, the Fund had a total return of 0.46%1. For the same period, the Index had a total return of –2.01%2 and a volatilityof 12.11%. For the period, the Fund had an average daily volume of 630,723 shares and an average daily statistical correlation of over 0.99 to theinverse of the daily performance of the Index.3
The Fund takes positions in derivatives that, in combination, should have similar daily return characteristics as the inverse of the daily returnof the Index. The Index includes publicly issued U.S. Treasury securities that have a remaining maturity greater than twenty years and have$300 million or more of outstanding face value, excluding amounts held by the Federal Reserve. In addition, the securities in the UnderlyingIndex must be fixed-rate and denominated in U.S. dollars. Excluded from the Underlying Index are inflation-linked securities, Treasury bills,cash management bills, any government agency debt issued with or without a government guarantee and zero-coupon issues that have beenstripped from coupon-paying bonds. The Underlying Index is weighted by market capitalization, and the securities in the Underlying Index areupdated on the last business day of each month.During the year ended May 31, 2017, the Fund invested in swap agreements in order to gain inverse leveraged exposure to the Index. These derivativesgenerally tracked the performance of their underlying index and the Fund was generally negatively affected from financing rates associated withtheir use. The Fund entered into swap agreements with counterparties that the Fund’s advisor determined to be major, global financial institutions.If a counterparty becomes insolvent or otherwise fails to perform on its obligations, the value of investments in the Fund may decline. The Fundhas sought to mitigate this risk by generally requiring counterparties for the Fund to post collateral for the benefit of the Fund, marked to marketdaily, in an amount approximately equal to the amount the counterparty owed the Fund, subject to certain minimum thresholds.
Value of a $10,000 Investment Since Inception at Net Asset Value*
*The line graph represents historical performance of a hypothetical invest-ment of $10,000 in the ProShares Short 20+ Treasury from August 18, 2009to May 31, 2017, assuming the reinvestment of distributions.
$25,000
$20,000
$15,000
$0
$10,000
$5,000
$16,942 ICE U.S. Treasury 20+ Year Bond Index**
$16,961 Bloomberg Barclays U.S. 20+ Year Treasury Bond Index**
$4,524 ProShares Short 20+ Year Treasury
12/31
/09
08/18
/09
12/31
/10
12/31
/13
12/31
/12
12/31
/11
05/31
/17
12/31
/16
12/31
/15
12/31
/14
Average Annual Total Return as of 5/31/17
One Year Five Years Since Inception (8/18/09) ProShares Short 20+ Year Treasury 0.46% -4.85% -9.69%
Bloomberg Barclays U.S. 20+ Year Treasury Bond Index** -2.01% 2.38% 7.02%
ICE U.S. Treasury 20+ Year Bond Index** -2.01% 2.37% 7.01%
Expense Ratios***
Fund Gross Net ProShares Short 20+ Year Treasury 0.94% 0.94%
**On October 14, 2016, the Fund’s underlying Index changed from theBloomberg Barclays U.S. 20+ Year Treasury Bond Index to the ICE U.S.Treasury 20+ Year Bond Index in order to match the Fund’s underlyingIndex to its investment objective.
***Reflects the expense ratio as reported in the Prospectus dated October 1,2016. Contractual fee waivers are in effect through September 30, 2017.See Financial Highlights for effective expense ratios.
Market Exposure
Investment Type % of Net Assets Swap Agreements (99%)
Futures Contracts (1%)
Total Exposure (100%)
“Market Exposure” includes the value of total investments (including thecontract value of any derivatives) and excludes any short-term invest-ments and cash equivalents.
ICE U.S. Treasury 20+ Year Bond Index — Composition
% of Index
20+ Year U.S. Treasury 100%
Allocation of Portfolio Holdings & Index Composition as of 5/31/17
Past performance does not guarantee future results. Return calculations assume the reinvestment of distributions and do not reflect taxes that ashareholder would pay on Fund distributions or on the redemption of Fund shares. The performance data quoted represents past performanceand current returns may be lower or higher. The investment return and NAV will fluctuate so that an investor’s shares, when redeemed, may bemore or less than the original cost. The performance above reflects any fee reductions during the applicable periods. If such fee reductions hadnot occurred, the quoted performance would be lower. To obtain performance current to the most recent month please visit www.ProShares.com.1 Fund returns are based on the NAV of the Fund. This calculation reflects the theoretical reinvestment of distributions, if any, in the Fund as of the
ex-date. The impact of transaction costs and the lack of ability to reinvest fractional shares are not reflected in the calculations.2 The Index is a total return index. The total return and any graph or table reflect the theoretical reinvestment of dividends on securities in the Index.
The impact of transaction costs and the deduction of expenses associated with an exchange traded fund such as investment management andaccounting fees are not reflected in the Index calculation. It is not possible to invest directly in an Index.
3 1.00 equals perfect correlation. This calculation is based on the daily total return of the Index and the performance of the daily total return of theNAV per share of the Fund.
The above information is not covered by the Report of the Independent Registered Public Accounting Firm.
Merrill Corp - Proshares Trust Geared Book [96 Funds] Annual Report [Funds] 333-089822 05-31-2017 ED [AUX] | eperez | 28-Jul-17 17:35 | 17-15159-3.ce | Sequence: 13CHKSUM Content: 16567 Layout: 32411 Graphics: 54984 CLEAN
JOB: 17-15159-3 CYCLE#;BL#: 5; 0 TRIM: 8.25" x 10.75" COMPOSITECOLORS: Black, ~note-color 2, ~note-color 3 GRAPHICS: 15159-3_TBF_L.eps V1.5
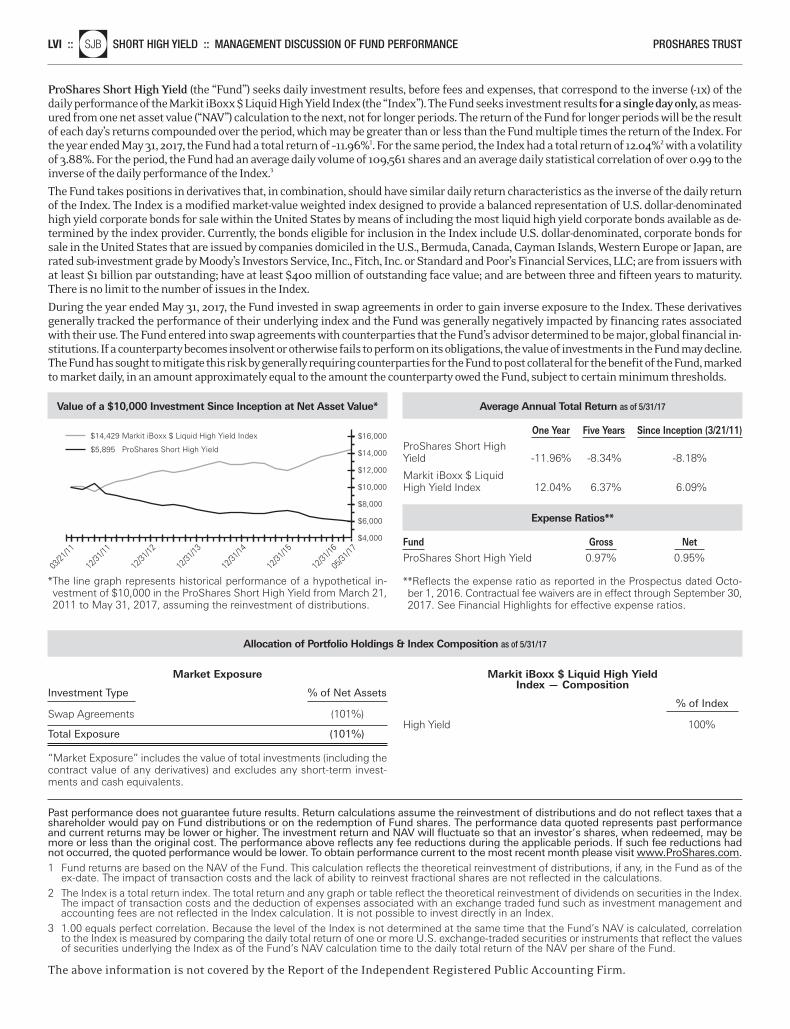
ProShares Short High Yield (the “Fund”) seeks daily investment results, before fees and expenses, that correspond to the inverse (-1x) of thedaily performance of the Markit iBoxx $ Liquid High Yield Index (the “Index”). The Fund seeks investment results for a single day only,as meas-ured from one net asset value (“NAV”) calculation to the next, not for longer periods. The return of the Fund for longer periods will be the resultof each day’s returns compounded over the period, which may be greater than or less than the Fund multiple times the return of the Index. Forthe year ended May 31, 2017, the Fund had a total return of –11.96%1. For the same period, the Index had a total return of 12.04%2 with a volatilityof 3.88%. For the period, the Fund had an average daily volume of 109,561 shares and an average daily statistical correlation of over 0.99 to theinverse of the daily performance of the Index.3
The Fund takes positions in derivatives that, in combination, should have similar daily return characteristics as the inverse of the daily returnof the Index. The Index is a modified market-value weighted index designed to provide a balanced representation of U.S. dollar-denominatedhigh yield corporate bonds for sale within the United States by means of including the most liquid high yield corporate bonds available as de-termined by the index provider. Currently, the bonds eligible for inclusion in the Index include U.S. dollar-denominated, corporate bonds forsale in the United States that are issued by companies domiciled in the U.S., Bermuda, Canada, Cayman Islands, Western Europe or Japan, arerated sub-investment grade by Moody’s Investors Service, Inc., Fitch, Inc. or Standard and Poor’s Financial Services, LLC; are from issuers withat least $1 billion par outstanding; have at least $400 million of outstanding face value; and are between three and fifteen years to maturity.There is no limit to the number of issues in the Index.
During the year ended May 31, 2017, the Fund invested in swap agreements in order to gain inverse exposure to the Index. These derivativesgenerally tracked the performance of their underlying index and the Fund was generally negatively impacted by financing rates associatedwith their use. The Fund entered into swap agreements with counterparties that the Fund’s advisor determined to be major, global financial in-stitutions. If a counterparty becomes insolvent or otherwise fails to perform on its obligations, the value of investments in the Fund may decline.The Fund has sought to mitigate this risk by generally requiring counterparties for the Fund to post collateral for the benefit of the Fund, markedto market daily, in an amount approximately equal to the amount the counterparty owed the Fund, subject to certain minimum thresholds.
Past performance does not guarantee future results. Return calculations assume the reinvestment of distributions and do not reflect taxes that ashareholder would pay on Fund distributions or on the redemption of Fund shares. The performance data quoted represents past performanceand current returns may be lower or higher. The investment return and NAV will fluctuate so that an investor’s shares, when redeemed, may bemore or less than the original cost. The performance above reflects any fee reductions during the applicable periods. If such fee reductions hadnot occurred, the quoted performance would be lower. To obtain performance current to the most recent month please visit www.ProShares.com.1 Fund returns are based on the NAV of the Fund. This calculation reflects the theoretical reinvestment of distributions, if any, in the Fund as of the
ex-date. The impact of transaction costs and the lack of ability to reinvest fractional shares are not reflected in the calculations.2 The Index is a total return index. The total return and any graph or table reflect the theoretical reinvestment of dividends on securities in the Index.
The impact of transaction costs and the deduction of expenses associated with an exchange traded fund such as investment management andaccounting fees are not reflected in the Index calculation. It is not possible to invest directly in an Index.
3 1.00 equals perfect correlation. Because the level of the Index is not determined at the same time that the Fund’s NAV is calculated, correlationto the Index is measured by comparing the daily total return of one or more U.S. exchange-traded securities or instruments that reflect the valuesof securities underlying the Index as of the Fund’s NAV calculation time to the daily total return of the NAV per share of the Fund.
The above information is not covered by the Report of the Independent Registered Public Accounting Firm.
LVI ::nlSJB SHORT HIGH YIELD :: MANAGEMENT DISCUSSION OF FUND PERFORMANCE PROSHARES TRUST
Value of a $10,000 Investment Since Inception at Net Asset Value*
*The line graph represents historical performance of a hypothetical in-vestment of $10,000 in the ProShares Short High Yield from March 21,2011 to May 31, 2017, assuming the reinvestment of distributions.
$16,000
$14,000
$12,000
$4,000
$6,000
$8,000
$10,000
$14,429 Markit iBoxx $ Liquid High Yield Index
$5,895 ProShares Short High Yield
03/21
/11
12/31
/16
12/31
/15
12/31
/14
12/31
/13
12/31
/11
12/31
/12
05/31
/17
Average Annual Total Return as of 5/31/17
One Year Five Years Since Inception (3/21/11) ProShares Short High Yield -11.96% -8.34% -8.18%
Markit iBoxx $ Liquid High Yield Index 12.04% 6.37% 6.09%
Expense Ratios**
Fund Gross Net ProShares Short High Yield 0.97% 0.95%
**Reflects the expense ratio as reported in the Prospectus dated Octo-ber 1, 2016. Contractual fee waivers are in effect through September 30,2017. See Financial Highlights for effective expense ratios.
Market Exposure
Investment Type % of Net Assets
Swap Agreements (101%)
Total Exposure (101%)
“Market Exposure” includes the value of total investments (including thecontract value of any derivatives) and excludes any short-term invest-ments and cash equivalents.
Markit iBoxx $ Liquid High YieldIndex — Composition
% of Index
High Yield 100%
Allocation of Portfolio Holdings & Index Composition as of 5/31/17
Merrill Corp - Proshares Trust Geared Book [96 Funds] Annual Report [Funds] 333-089822 05-31-2017 ED [AUX] | eperez | 28-Jul-17 17:35 | 17-15159-3.ce | Sequence: 14CHKSUM Content: 49741 Layout: 15108 Graphics: 45774 CLEAN
JOB: 17-15159-3 CYCLE#;BL#: 5; 0 TRIM: 8.25" x 10.75" COMPOSITECOLORS: Black, ~note-color 2, ~note-color 3 GRAPHICS: 15159-3_SJB_L.eps V1.5
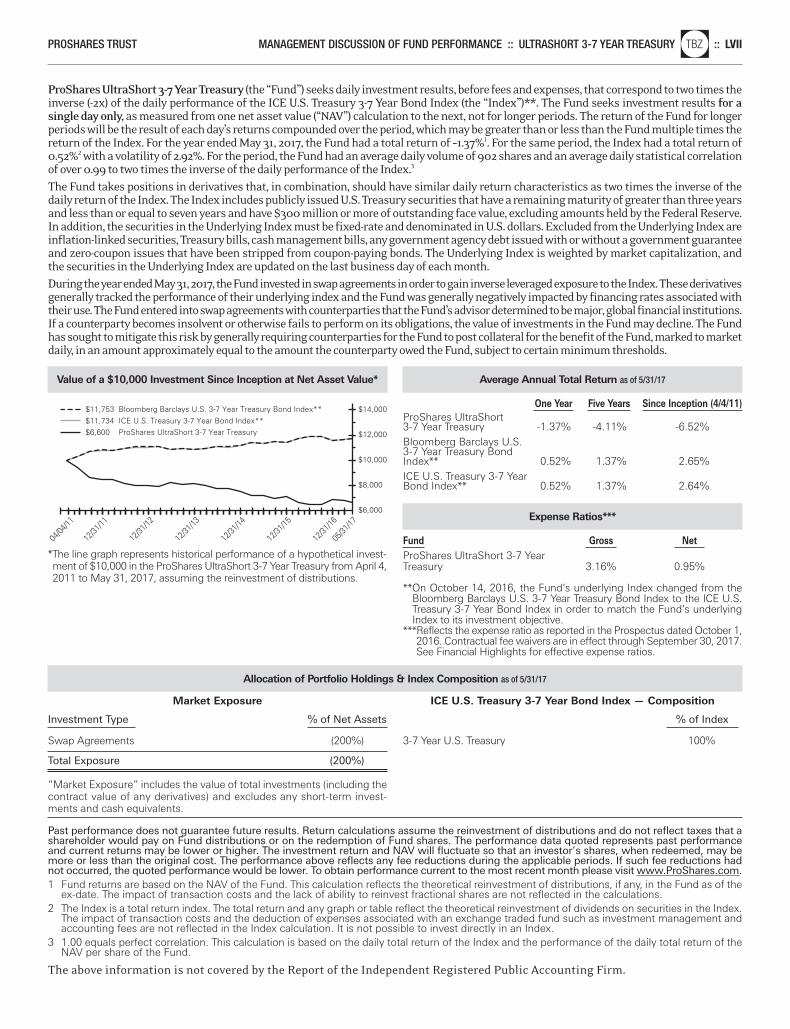
Past performance does not guarantee future results. Return calculations assume the reinvestment of distributions and do not reflect taxes that ashareholder would pay on Fund distributions or on the redemption of Fund shares. The performance data quoted represents past performanceand current returns may be lower or higher. The investment return and NAV will fluctuate so that an investor’s shares, when redeemed, may bemore or less than the original cost. The performance above reflects any fee reductions during the applicable periods. If such fee reductions hadnot occurred, the quoted performance would be lower. To obtain performance current to the most recent month please visit www.ProShares.com.1 Fund returns are based on the NAV of the Fund. This calculation reflects the theoretical reinvestment of distributions, if any, in the Fund as of the
ex-date. The impact of transaction costs and the lack of ability to reinvest fractional shares are not reflected in the calculations.2 The Index is a total return index. The total return and any graph or table reflect the theoretical reinvestment of dividends on securities in the Index.
The impact of transaction costs and the deduction of expenses associated with an exchange traded fund such as investment management andaccounting fees are not reflected in the Index calculation. It is not possible to invest directly in an Index.
3 1.00 equals perfect correlation. This calculation is based on the daily total return of the Index and the performance of the daily total return of theNAV per share of the Fund.
The above information is not covered by the Report of the Independent Registered Public Accounting Firm.
PROSHARES TRUST MANAGEMENT DISCUSSION OF FUND PERFORMANCE :: ULTRASHORT 3-7 YEAR TREASURYnlTBZ :: LVII
ProShares UltraShort 3-7 Year Treasury (the “Fund”) seeks daily investment results, before fees and expenses, that correspond to two times theinverse (-2x) of the daily performance of the ICE U.S. Treasury 3-7 Year Bond Index (the “Index”)**. The Fund seeks investment results for asingle day only, as measured from one net asset value (“NAV”) calculation to the next, not for longer periods. The return of the Fund for longerperiods will be the result of each day’s returns compounded over the period, which may be greater than or less than the Fund multiple times thereturn of the Index. For the year ended May 31, 2017, the Fund had a total return of –1.37%1. For the same period, the Index had a total return of0.52%2 with a volatility of 2.92%. For the period, the Fund had an average daily volume of 902 shares and an average daily statistical correlationof over 0.99 to two times the inverse of the daily performance of the Index.3
The Fund takes positions in derivatives that, in combination, should have similar daily return characteristics as two times the inverse of thedaily return of the Index. The Index includes publicly issued U.S. Treasury securities that have a remaining maturity of greater than three yearsand less than or equal to seven years and have $300 million or more of outstanding face value, excluding amounts held by the Federal Reserve.In addition, the securities in the Underlying Index must be fixed-rate and denominated in U.S. dollars. Excluded from the Underlying Index areinflation-linked securities, Treasury bills, cash management bills, any government agency debt issued with or without a government guaranteeand zero-coupon issues that have been stripped from coupon-paying bonds. The Underlying Index is weighted by market capitalization, andthe securities in the Underlying Index are updated on the last business day of each month.During the year ended May 31, 2017, the Fund invested in swap agreements in order to gain inverse leveraged exposure to the Index. These derivativesgenerally tracked the performance of their underlying index and the Fund was generally negatively impacted by financing rates associated withtheir use. The Fund entered into swap agreements with counterparties that the Fund’s advisor determined to be major, global financial institutions.If a counterparty becomes insolvent or otherwise fails to perform on its obligations, the value of investments in the Fund may decline. The Fundhas sought to mitigate this risk by generally requiring counterparties for the Fund to post collateral for the benefit of the Fund, marked to marketdaily, in an amount approximately equal to the amount the counterparty owed the Fund, subject to certain minimum thresholds.
Value of a $10,000 Investment Since Inception at Net Asset Value*
*The line graph represents historical performance of a hypothetical invest-ment of $10,000 in the ProShares UltraShort 3-7 Year Treasury from April 4,2011 to May 31, 2017, assuming the reinvestment of distributions.
$14,000
$6,000
$8,000
$10,000
$12,000
$11,734 ICE U.S. Treasury 3-7 Year Bond Index**$11,753 Bloomberg Barclays U.S. 3-7 Year Treasury Bond Index**
$6,600 ProShares UltraShort 3-7 Year Treasury
04/04
/11
12/31
/12
12/31
/16
12/31
/15
12/31
/14
12/31
/13
12/31
/11
05/31
/17
Average Annual Total Return as of 5/31/17
One Year Five Years Since Inception (4/4/11) ProShares UltraShort 3-7 Year Treasury -1.37% -4.11% -6.52%Bloomberg Barclays U.S. 3-7 Year Treasury Bond Index** 0.52% 1.37% 2.65%ICE U.S. Treasury 3-7 Year Bond Index** 0.52% 1.37% 2.64%
Expense Ratios***
Fund Gross Net ProShares UltraShort 3-7 Year Treasury 3.16% 0.95%
**On October 14, 2016, the Fund’s underlying Index changed from theBloomberg Barclays U.S. 3-7 Year Treasury Bond Index to the ICE U.S.Treasury 3-7 Year Bond Index in order to match the Fund’s underlyingIndex to its investment objective.
***Reflects the expense ratio as reported in the Prospectus dated October 1,2016. Contractual fee waivers are in effect through September 30, 2017.See Financial Highlights for effective expense ratios.
Market Exposure
Investment Type % of Net Assets
Swap Agreements (200%)
Total Exposure (200%)
“Market Exposure” includes the value of total investments (including thecontract value of any derivatives) and excludes any short-term invest-ments and cash equivalents.
ICE U.S. Treasury 3-7 Year Bond Index — Composition
% of Index
3-7 Year U.S. Treasury 100%
Allocation of Portfolio Holdings & Index Composition as of 5/31/17
Merrill Corp - Proshares Trust Geared Book [96 Funds] Annual Report [Funds] 333-089822 05-31-2017 ED [AUX] | eperez | 28-Jul-17 17:35 | 17-15159-3.ce | Sequence: 15CHKSUM Content: 45712 Layout: 52443 Graphics: 44303 CLEAN
JOB: 17-15159-3 CYCLE#;BL#: 5; 0 TRIM: 8.25" x 10.75" COMPOSITECOLORS: Black, ~note-color 2, ~note-color 3 GRAPHICS: 15159-3_TBZ_L.eps V1.5
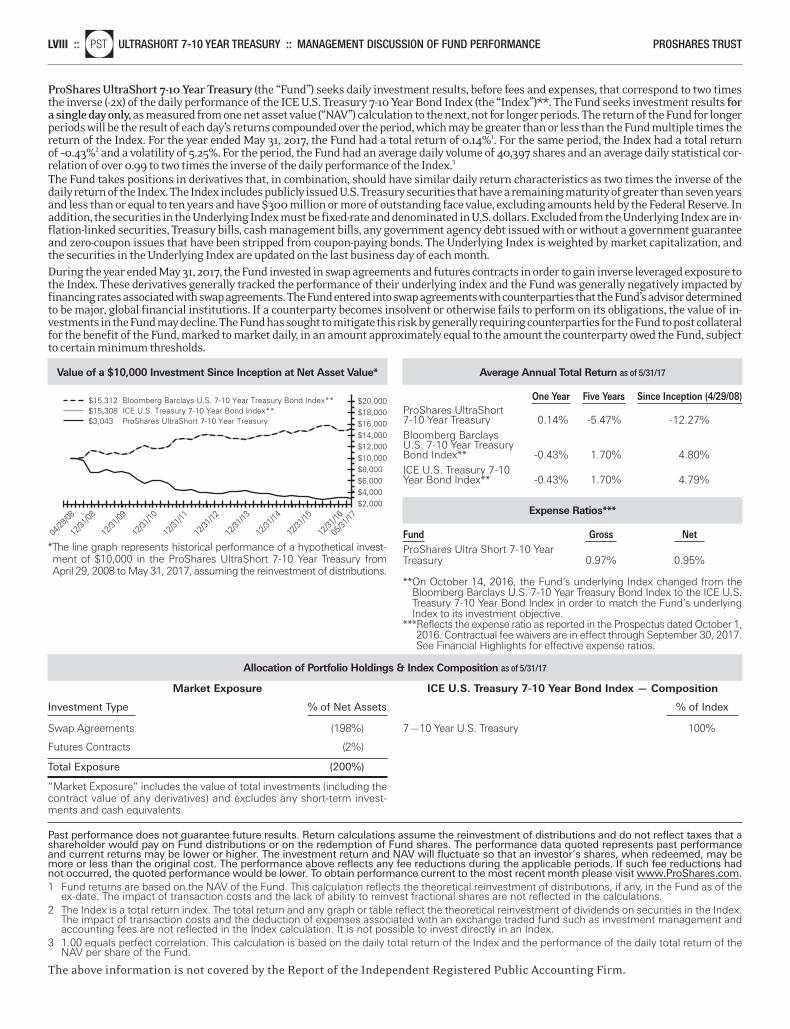
LVIII ::nlPST ULTRASHORT 7-10 YEAR TREASURY :: MANAGEMENT DISCUSSION OF FUND PERFORMANCE PROSHARES TRUST
Past performance does not guarantee future results. Return calculations assume the reinvestment of distributions and do not reflect taxes that ashareholder would pay on Fund distributions or on the redemption of Fund shares. The performance data quoted represents past performanceand current returns may be lower or higher. The investment return and NAV will fluctuate so that an investor’s shares, when redeemed, may bemore or less than the original cost. The performance above reflects any fee reductions during the applicable periods. If such fee reductions hadnot occurred, the quoted performance would be lower. To obtain performance current to the most recent month please visit www.ProShares.com.1 Fund returns are based on the NAV of the Fund. This calculation reflects the theoretical reinvestment of distributions, if any, in the Fund as of the
ex-date. The impact of transaction costs and the lack of ability to reinvest fractional shares are not reflected in the calculations.2 The Index is a total return index. The total return and any graph or table reflect the theoretical reinvestment of dividends on securities in the Index.
The impact of transaction costs and the deduction of expenses associated with an exchange traded fund such as investment management andaccounting fees are not reflected in the Index calculation. It is not possible to invest directly in an Index.
3 1.00 equals perfect correlation. This calculation is based on the daily total return of the Index and the performance of the daily total return of theNAV per share of the Fund.
The above information is not covered by the Report of the Independent Registered Public Accounting Firm.
ProShares UltraShort 7-10 Year Treasury (the “Fund”) seeks daily investment results, before fees and expenses, that correspond to two timesthe inverse (-2x) of the daily performance of the ICE U.S. Treasury 7-10 Year Bond Index (the “Index”)**. The Fund seeks investment results fora single day only, as measured from one net asset value (“NAV”) calculation to the next, not for longer periods. The return of the Fund for longerperiods will be the result of each day’s returns compounded over the period, which may be greater than or less than the Fund multiple times thereturn of the Index. For the year ended May 31, 2017, the Fund had a total return of 0.14%1. For the same period, the Index had a total returnof –0.43%2 and a volatility of 5.25%. For the period, the Fund had an average daily volume of 40,397 shares and an average daily statistical cor-relation of over 0.99 to two times the inverse of the daily performance of the Index.3
The Fund takes positions in derivatives that, in combination, should have similar daily return characteristics as two times the inverse of thedaily return of the Index. The Index includes publicly issued U.S. Treasury securities that have a remaining maturity of greater than seven yearsand less than or equal to ten years and have $300 million or more of outstanding face value, excluding amounts held by the Federal Reserve. Inaddition, the securities in the Underlying Index must be fixed-rate and denominated in U.S. dollars. Excluded from the Underlying Index are in-flation-linked securities, Treasury bills, cash management bills, any government agency debt issued with or without a government guaranteeand zero-coupon issues that have been stripped from coupon-paying bonds. The Underlying Index is weighted by market capitalization, andthe securities in the Underlying Index are updated on the last business day of each month.During the year ended May 31, 2017, the Fund invested in swap agreements and futures contracts in order to gain inverse leveraged exposure tothe Index. These derivatives generally tracked the performance of their underlying index and the Fund was generally negatively impacted byfinancing rates associated with swap agreements. The Fund entered into swap agreements with counterparties that the Fund’s advisor determinedto be major, global financial institutions. If a counterparty becomes insolvent or otherwise fails to perform on its obligations, the value of in-vestments in the Fund may decline. The Fund has sought to mitigate this risk by generally requiring counterparties for the Fund to post collateralfor the benefit of the Fund, marked to market daily, in an amount approximately equal to the amount the counterparty owed the Fund, subjectto certain minimum thresholds.
Value of a $10,000 Investment Since Inception at Net Asset Value*
*The line graph represents historical performance of a hypothetical invest-ment of $10,000 in the ProShares UltraShort 7-10 Year Treasury fromApril 29, 2008 to May 31, 2017, assuming the reinvestment of distributions.
$20,000$18,000$16,000
$2,000$4,000$6,000$8,000$10,000$12,000$14,000
$15,308 ICE U.S. Treasury 7-10 Year Bond Index**$15,312 Bloomberg Barclays U.S. 7-10 Year Treasury Bond Index**
$3,043 ProShares UltraShort 7-10 Year Treasury
04/29
/08
12/31
/08
12/31
/09
12/31
/10
12/31
/13
12/31
/16
12/31
/15
12/31
/14
12/31
/12
12/31
/11
05/31
/17
Average Annual Total Return as of 5/31/17
One Year Five Years Since Inception (4/29/08) ProShares UltraShort 7-10 Year Treasury 0.14% -5.47% -12.27%Bloomberg Barclays U.S. 7-10 Year Treasury Bond Index** -0.43% 1.70% 4.80%ICE U.S. Treasury 7-10 Year Bond Index** -0.43% 1.70% 4.79%
Expense Ratios***
Fund Gross Net ProShares Ultra Short 7-10 Year Treasury 0.97% 0.95%
**On October 14, 2016, the Fund’s underlying Index changed from theBloomberg Barclays U.S. 7-10 Year Treasury Bond Index to the ICE U.S.Treasury 7-10 Year Bond Index in order to match the Fund’s underlyingIndex to its investment objective.
***Reflects the expense ratio as reported in the Prospectus dated October 1,2016. Contractual fee waivers are in effect through September 30, 2017.See Financial Highlights for effective expense ratios.
Market Exposure
Investment Type % of Net Assets
Swap Agreements (198%)
Futures Contracts (2%)
Total Exposure (200%)
“Market Exposure” includes the value of total investments (including thecontract value of any derivatives) and excludes any short-term invest-ments and cash equivalents.
ICE U.S. Treasury 7-10 Year Bond Index — Composition
% of Index
7—10 Year U.S. Treasury 100%
Allocation of Portfolio Holdings & Index Composition as of 5/31/17
Merrill Corp - Proshares Trust Geared Book [96 Funds] Annual Report [Funds] 333-089822 05-31-2017 ED [AUX] | eperez | 28-Jul-17 17:35 | 17-15159-3.ce | Sequence: 16CHKSUM Content: 62202 Layout: 58587 Graphics: 4932 CLEAN
JOB: 17-15159-3 CYCLE#;BL#: 5; 0 TRIM: 8.25" x 10.75" COMPOSITECOLORS: Black, ~note-color 2, ~note-color 3 GRAPHICS: 15159-3_PST_L.eps V1.5
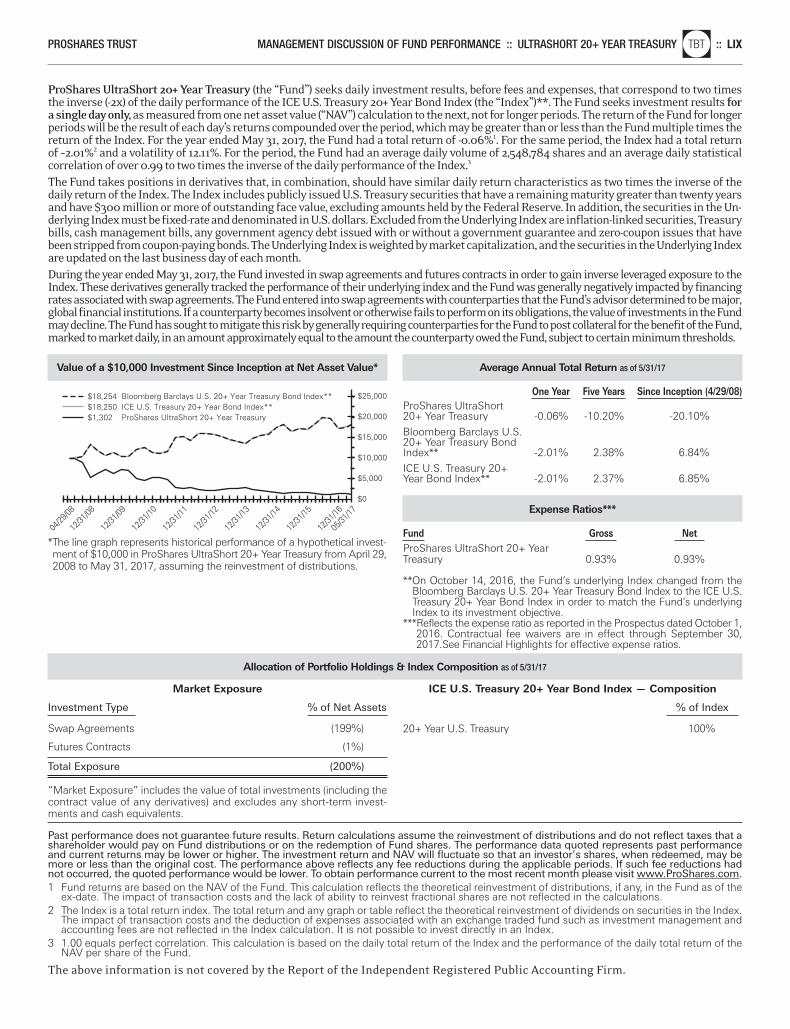
PROSHARES TRUST MANAGEMENT DISCUSSION OF FUND PERFORMANCE :: ULTRASHORT 20+ YEAR TREASURYnlTBT :: LIX
Past performance does not guarantee future results. Return calculations assume the reinvestment of distributions and do not reflect taxes that ashareholder would pay on Fund distributions or on the redemption of Fund shares. The performance data quoted represents past performanceand current returns may be lower or higher. The investment return and NAV will fluctuate so that an investor’s shares, when redeemed, may bemore or less than the original cost. The performance above reflects any fee reductions during the applicable periods. If such fee reductions hadnot occurred, the quoted performance would be lower. To obtain performance current to the most recent month please visit www.ProShares.com.1 Fund returns are based on the NAV of the Fund. This calculation reflects the theoretical reinvestment of distributions, if any, in the Fund as of the
ex-date. The impact of transaction costs and the lack of ability to reinvest fractional shares are not reflected in the calculations.2 The Index is a total return index. The total return and any graph or table reflect the theoretical reinvestment of dividends on securities in the Index.
The impact of transaction costs and the deduction of expenses associated with an exchange traded fund such as investment management andaccounting fees are not reflected in the Index calculation. It is not possible to invest directly in an Index.
3 1.00 equals perfect correlation. This calculation is based on the daily total return of the Index and the performance of the daily total return of theNAV per share of the Fund.
The above information is not covered by the Report of the Independent Registered Public Accounting Firm.
ProShares UltraShort 20+ Year Treasury (the “Fund”) seeks daily investment results, before fees and expenses, that correspond to two timesthe inverse (-2x) of the daily performance of the ICE U.S. Treasury 20+ Year Bond Index (the “Index”)**. The Fund seeks investment results fora single day only, as measured from one net asset value (“NAV”) calculation to the next, not for longer periods. The return of the Fund for longerperiods will be the result of each day’s returns compounded over the period, which may be greater than or less than the Fund multiple times thereturn of the Index. For the year ended May 31, 2017, the Fund had a total return of -0.06%1. For the same period, the Index had a total returnof –2.01%2 and a volatility of 12.11%. For the period, the Fund had an average daily volume of 2,548,784 shares and an average daily statisticalcorrelation of over 0.99 to two times the inverse of the daily performance of the Index.3
The Fund takes positions in derivatives that, in combination, should have similar daily return characteristics as two times the inverse of thedaily return of the Index. The Index includes publicly issued U.S. Treasury securities that have a remaining maturity greater than twenty yearsand have $300 million or more of outstanding face value, excluding amounts held by the Federal Reserve. In addition, the securities in the Un-derlying Index must be fixed-rate and denominated in U.S. dollars. Excluded from the Underlying Index are inflation-linked securities, Treasurybills, cash management bills, any government agency debt issued with or without a government guarantee and zero-coupon issues that havebeen stripped from coupon-paying bonds. The Underlying Index is weighted by market capitalization, and the securities in the Underlying Indexare updated on the last business day of each month.During the year ended May 31, 2017, the Fund invested in swap agreements and futures contracts in order to gain inverse leveraged exposure to theIndex. These derivatives generally tracked the performance of their underlying index and the Fund was generally negatively impacted by financingrates associated with swap agreements. The Fund entered into swap agreements with counterparties that the Fund’s advisor determined to be major,global financial institutions. If a counterparty becomes insolvent or otherwise fails to perform on its obligations, the value of investments in the Fundmay decline. The Fund has sought to mitigate this risk by generally requiring counterparties for the Fund to post collateral for the benefit of the Fund,marked to market daily, in an amount approximately equal to the amount the counterparty owed the Fund, subject to certain minimum thresholds.
Value of a $10,000 Investment Since Inception at Net Asset Value*
*The line graph represents historical performance of a hypothetical invest-ment of $10,000 in ProShares UltraShort 20+ Year Treasury from April 29,2008 to May 31, 2017, assuming the reinvestment of distributions.
$25,000
$20,000
$15,000
$0
$5,000
$10,000
$18,254 Bloomberg Barclays U.S. 20+ Year Treasury Bond Index**$18,250 ICE U.S. Treasury 20+ Year Bond Index**$1,302 ProShares UltraShort 20+ Year Treasury
04/29
/08
12/31
/08
12/31
/09
12/31
/10
12/31
/16
12/31
/15
12/31
/14
12/31
/13
12/31
/12
12/31
/11
05/31
/17
Average Annual Total Return as of 5/31/17
One Year Five Years Since Inception (4/29/08) ProShares UltraShort 20+ Year Treasury -0.06% -10.20% -20.10%
Bloomberg Barclays U.S. 20+ Year Treasury Bond Index** -2.01% 2.38% 6.84%
ICE U.S. Treasury 20+ Year Bond Index** -2.01% 2.37% 6.85%
Expense Ratios***
Fund Gross Net ProShares UltraShort 20+ Year Treasury 0.93% 0.93%
**On October 14, 2016, the Fund’s underlying Index changed from theBloomberg Barclays U.S. 20+ Year Treasury Bond Index to the ICE U.S.Treasury 20+ Year Bond Index in order to match the Fund’s underlyingIndex to its investment objective.
***Reflects the expense ratio as reported in the Prospectus dated October 1,2016. Contractual fee waivers are in effect through September 30,2017.See Financial Highlights for effective expense ratios.
Market Exposure
Investment Type % of Net Assets
Swap Agreements (199%)
Futures Contracts (1%)
Total Exposure (200%)
“Market Exposure” includes the value of total investments (including thecontract value of any derivatives) and excludes any short-term invest-ments and cash equivalents.
ICE U.S. Treasury 20+ Year Bond Index — Composition
% of Index
20+ Year U.S. Treasury 100%
Allocation of Portfolio Holdings & Index Composition as of 5/31/17
Merrill Corp - Proshares Trust Geared Book [96 Funds] Annual Report [Funds] 333-089822 05-31-2017 ED [AUX] | eperez | 28-Jul-17 17:35 | 17-15159-3.ce | Sequence: 17CHKSUM Content: 43602 Layout: 58612 Graphics: 432 CLEAN
JOB: 17-15159-3 CYCLE#;BL#: 5; 0 TRIM: 8.25" x 10.75" COMPOSITECOLORS: Black, ~note-color 2, ~note-color 3 GRAPHICS: 15159-3_TBT_L.eps V1.5
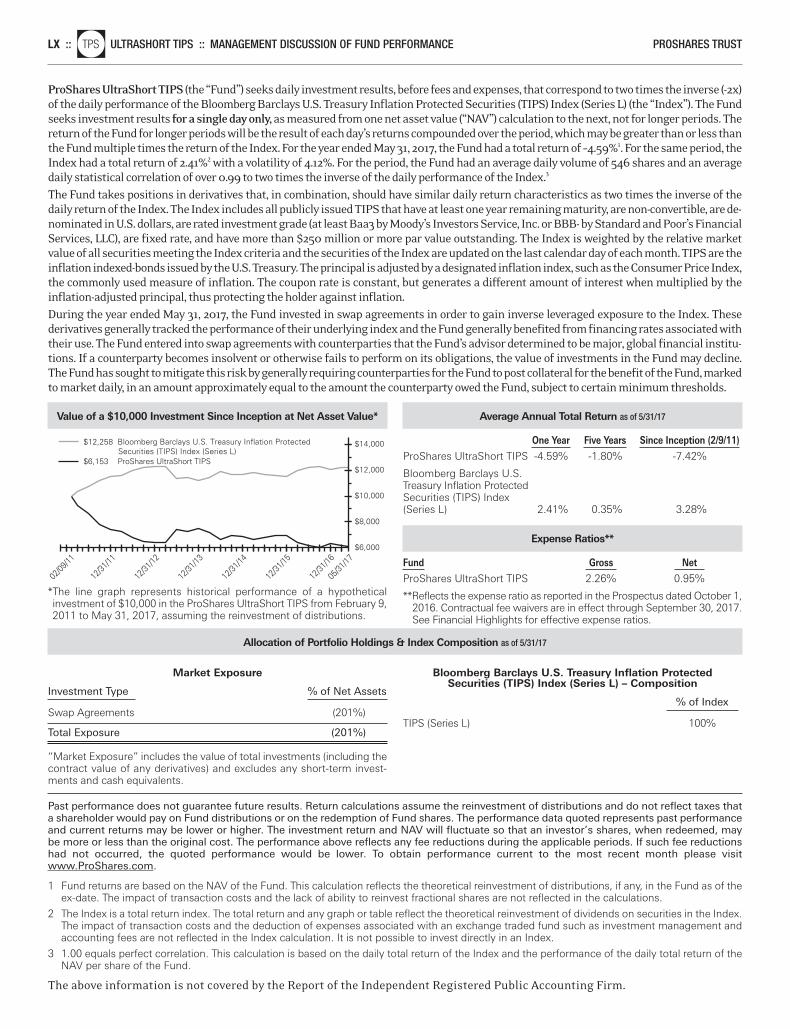
LX ::nlTPS ULTRASHORT TIPS :: MANAGEMENT DISCUSSION OF FUND PERFORMANCE PROSHARES TRUST
Value of a $10,000 Investment Since Inception at Net Asset Value*
*The line graph represents historical performance of a hypothetical investment of $10,000 in the ProShares UltraShort TIPS from February 9,2011 to May 31, 2017, assuming the reinvestment of distributions.
$14,000
$12,000
$6,000
$8,000
$10,000
02/09
/11
12/31
/11
12/31
/16
12/31
/15
12/31
/14
12/31
/13
12/31
/12
05/31
/17
$12,258 Bloomberg Barclays U.S. Treasury Inflation Protected Securities (TIPS) Index (Series L)$6,153 ProShares UltraShort TIPS
Average Annual Total Return as of 5/31/17
One Year Five Years Since Inception (2/9/11) ProShares UltraShort TIPS -4.59% -1.80% -7.42%
Bloomberg Barclays U.S. Treasury Inflation ProtectedSecurities (TIPS) Index (Series L) 2.41% 0.35% 3.28%
Expense Ratios**
Fund Gross Net ProShares UltraShort TIPS 2.26% 0.95%
**Reflects the expense ratio as reported in the Prospectus dated October 1,2016. Contractual fee waivers are in effect through September 30, 2017.See Financial Highlights for effective expense ratios.
Market Exposure
Investment Type % of Net Assets
Swap Agreements (201%)
Total Exposure (201%)
“Market Exposure” includes the value of total investments (including thecontract value of any derivatives) and excludes any short-term invest-ments and cash equivalents.
Bloomberg Barclays U.S. Treasury Inflation Protected Securities (TIPS) Index (Series L) – Composition
% of Index
TIPS (Series L) 100%
ProShares UltraShort TIPS (the “Fund”) seeks daily investment results, before fees and expenses, that correspond to two times the inverse (-2x)of the daily performance of the Bloomberg Barclays U.S. Treasury Inflation Protected Securities (TIPS) Index (Series L) (the “Index”). The Fundseeks investment results for a single day only, as measured from one net asset value (“NAV”) calculation to the next, not for longer periods. Thereturn of the Fund for longer periods will be the result of each day’s returns compounded over the period, which may be greater than or less thanthe Fund multiple times the return of the Index. For the year ended May 31, 2017, the Fund had a total return of –4.59%1. For the same period, theIndex had a total return of 2.41%2 with a volatility of 4.12%. For the period, the Fund had an average daily volume of 546 shares and an averagedaily statistical correlation of over 0.99 to two times the inverse of the daily performance of the Index.3
The Fund takes positions in derivatives that, in combination, should have similar daily return characteristics as two times the inverse of thedaily return of the Index. The Index includes all publicly issued TIPS that have at least one year remaining maturity, are non-convertible, are de-nominated in U.S. dollars, are rated investment grade (at least Baa3 by Moody’s Investors Service, Inc. or BBB- by Standard and Poor’s FinancialServices, LLC), are fixed rate, and have more than $250 million or more par value outstanding. The Index is weighted by the relative marketvalue of all securities meeting the Index criteria and the securities of the Index are updated on the last calendar day of each month. TIPS are theinflation indexed-bonds issued by the U.S. Treasury. The principal is adjusted by a designated inflation index, such as the Consumer Price Index,the commonly used measure of inflation. The coupon rate is constant, but generates a different amount of interest when multiplied by the inflation-adjusted principal, thus protecting the holder against inflation.During the year ended May 31, 2017, the Fund invested in swap agreements in order to gain inverse leveraged exposure to the Index. These derivatives generally tracked the performance of their underlying index and the Fund generally benefited from financing rates associated withtheir use. The Fund entered into swap agreements with counterparties that the Fund’s advisor determined to be major, global financial institu-tions. If a counterparty becomes insolvent or otherwise fails to perform on its obligations, the value of investments in the Fund may decline.The Fund has sought to mitigate this risk by generally requiring counterparties for the Fund to post collateral for the benefit of the Fund, markedto market daily, in an amount approximately equal to the amount the counterparty owed the Fund, subject to certain minimum thresholds.
Allocation of Portfolio Holdings & Index Composition as of 5/31/17
Past performance does not guarantee future results. Return calculations assume the reinvestment of distributions and do not reflect taxes thata shareholder would pay on Fund distributions or on the redemption of Fund shares. The performance data quoted represents past performanceand current returns may be lower or higher. The investment return and NAV will fluctuate so that an investor’s shares, when redeemed, maybe more or less than the original cost. The performance above reflects any fee reductions during the applicable periods. If such fee reductionshad not occurred, the quoted performance would be lower. To obtain performance current to the most recent month please visitwww.ProShares.com.
1 Fund returns are based on the NAV of the Fund. This calculation reflects the theoretical reinvestment of distributions, if any, in the Fund as of theex-date. The impact of transaction costs and the lack of ability to reinvest fractional shares are not reflected in the calculations.
2 The Index is a total return index. The total return and any graph or table reflect the theoretical reinvestment of dividends on securities in the Index.The impact of transaction costs and the deduction of expenses associated with an exchange traded fund such as investment management andaccounting fees are not reflected in the Index calculation. It is not possible to invest directly in an Index.
3 1.00 equals perfect correlation. This calculation is based on the daily total return of the Index and the performance of the daily total return of theNAV per share of the Fund.
The above information is not covered by the Report of the Independent Registered Public Accounting Firm.
Merrill Corp - Proshares Trust Geared Book [96 Funds] Annual Report [Funds] 333-089822 05-31-2017 ED [AUX] | eperez | 28-Jul-17 17:35 | 17-15159-3.ce | Sequence: 18CHKSUM Content: 52945 Layout: 58121 Graphics: 63463 CLEAN
JOB: 17-15159-3 CYCLE#;BL#: 5; 0 TRIM: 8.25" x 10.75" COMPOSITECOLORS: Black, ~note-color 2, ~note-color 3 GRAPHICS: 15159-3_TPS_L.eps V1.5
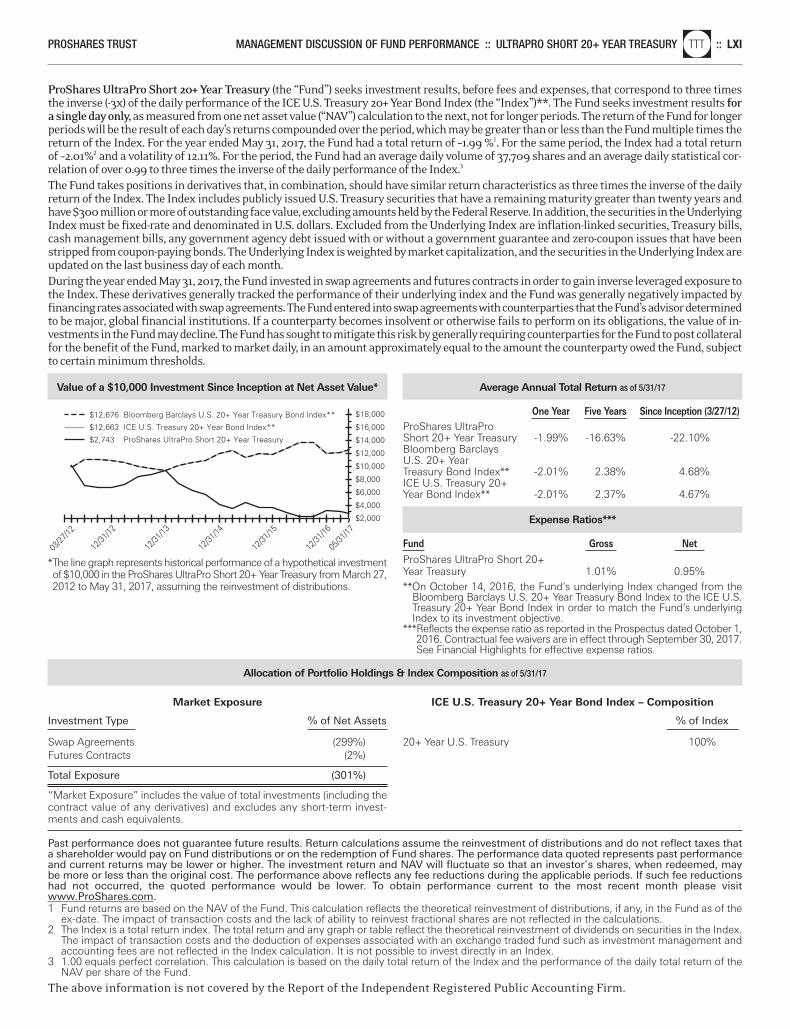
PROSHARES TRUST MANAGEMENT DISCUSSION OF FUND PERFORMANCE :: ULTRAPRO SHORT 20+ YEAR TREASURYnlTTT :: LXI
Value of a $10,000 Investment Since Inception at Net Asset Value*
*The line graph represents historical performance of a hypothetical investmentof $10,000 in the ProShares UltraPro Short 20+ Year Treasury from March 27,2012 to May 31, 2017, assuming the reinvestment of distributions.
$18,000
$16,000
$14,000
$2,000
$4,000
$6,000
$8,000
$10,000
$12,000
$12,663 ICE U.S. Treasury 20+ Year Bond Index**
$12,676 Bloomberg Barclays U.S. 20+ Year Treasury Bond Index**
$2,743 ProShares UltraPro Short 20+ Year Treasury
03/27
/12
12/31
/13
12/31
/16
12/31
/15
12/31
/14
12/31
/12
05/31
/17
Average Annual Total Return as of 5/31/17
One Year Five Years Since Inception (3/27/12) ProShares UltraPro Short 20+ Year Treasury -1.99% -16.63% -22.10%Bloomberg Barclays U.S. 20+ YearTreasury Bond Index** -2.01% 2.38% 4.68%ICE U.S. Treasury 20+ Year Bond Index** -2.01% 2.37% 4.67%
Expense Ratios***
Fund Gross Net ProShares UltraPro Short 20+ Year Treasury 1.01% 0.95%**On October 14, 2016, the Fund’s underlying Index changed from the
Bloomberg Barclays U.S. 20+ Year Treasury Bond Index to the ICE U.S.Treasury 20+ Year Bond Index in order to match the Fund’s underlyingIndex to its investment objective.
***Reflects the expense ratio as reported in the Prospectus dated October 1,2016. Contractual fee waivers are in effect through September 30, 2017.See Financial Highlights for effective expense ratios.
Market Exposure
Investment Type % of Net Assets
Swap Agreements (299%)Futures Contracts (2%)
Total Exposure (301%)
“Market Exposure” includes the value of total investments (including thecontract value of any derivatives) and excludes any short-term invest-ments and cash equivalents.
ICE U.S. Treasury 20+ Year Bond Index – Composition
% of Index
20+ Year U.S. Treasury 100%
ProShares UltraPro Short 20+ Year Treasury (the “Fund”) seeks investment results, before fees and expenses, that correspond to three timesthe inverse (-3x) of the daily performance of the ICE U.S. Treasury 20+ Year Bond Index (the “Index”)**. The Fund seeks investment results fora single day only, as measured from one net asset value (“NAV”) calculation to the next, not for longer periods. The return of the Fund for longerperiods will be the result of each day’s returns compounded over the period, which may be greater than or less than the Fund multiple times thereturn of the Index. For the year ended May 31, 2017, the Fund had a total return of –1.99 %1. For the same period, the Index had a total returnof –2.01%2 and a volatility of 12.11%. For the period, the Fund had an average daily volume of 37,709 shares and an average daily statistical cor-relation of over 0.99 to three times the inverse of the daily performance of the Index.3
The Fund takes positions in derivatives that, in combination, should have similar return characteristics as three times the inverse of the dailyreturn of the Index. The Index includes publicly issued U.S. Treasury securities that have a remaining maturity greater than twenty years andhave $300 million or more of outstanding face value, excluding amounts held by the Federal Reserve. In addition, the securities in the UnderlyingIndex must be fixed-rate and denominated in U.S. dollars. Excluded from the Underlying Index are inflation-linked securities, Treasury bills,cash management bills, any government agency debt issued with or without a government guarantee and zero-coupon issues that have beenstripped from coupon-paying bonds. The Underlying Index is weighted by market capitalization, and the securities in the Underlying Index areupdated on the last business day of each month.During the year ended May 31, 2017, the Fund invested in swap agreements and futures contracts in order to gain inverse leveraged exposure tothe Index. These derivatives generally tracked the performance of their underlying index and the Fund was generally negatively impacted byfinancing rates associated with swap agreements. The Fund entered into swap agreements with counterparties that the Fund’s advisor determinedto be major, global financial institutions. If a counterparty becomes insolvent or otherwise fails to perform on its obligations, the value of in-vestments in the Fund may decline. The Fund has sought to mitigate this risk by generally requiring counterparties for the Fund to post collateralfor the benefit of the Fund, marked to market daily, in an amount approximately equal to the amount the counterparty owed the Fund, subjectto certain minimum thresholds.
Allocation of Portfolio Holdings & Index Composition as of 5/31/17
Past performance does not guarantee future results. Return calculations assume the reinvestment of distributions and do not reflect taxes thata shareholder would pay on Fund distributions or on the redemption of Fund shares. The performance data quoted represents past performanceand current returns may be lower or higher. The investment return and NAV will fluctuate so that an investor’s shares, when redeemed, maybe more or less than the original cost. The performance above reflects any fee reductions during the applicable periods. If such fee reductionshad not occurred, the quoted performance would be lower. To obtain performance current to the most recent month please visitwww.ProShares.com.1 Fund returns are based on the NAV of the Fund. This calculation reflects the theoretical reinvestment of distributions, if any, in the Fund as of the
ex-date. The impact of transaction costs and the lack of ability to reinvest fractional shares are not reflected in the calculations.2 The Index is a total return index. The total return and any graph or table reflect the theoretical reinvestment of dividends on securities in the Index.
The impact of transaction costs and the deduction of expenses associated with an exchange traded fund such as investment management andaccounting fees are not reflected in the Index calculation. It is not possible to invest directly in an Index.
3 1.00 equals perfect correlation. This calculation is based on the daily total return of the Index and the performance of the daily total return of theNAV per share of the Fund.
The above information is not covered by the Report of the Independent Registered Public Accounting Firm.
Merrill Corp - Proshares Trust Geared Book [96 Funds] Annual Report [Funds] 333-089822 05-31-2017 ED [AUX] | eperez | 28-Jul-17 17:35 | 17-15159-3.ce | Sequence: 19CHKSUM Content: 42973 Layout: 5756 Graphics: 40768 CLEAN
JOB: 17-15159-3 CYCLE#;BL#: 5; 0 TRIM: 8.25" x 10.75" COMPOSITECOLORS: Black, ~note-color 2, ~note-color 3 GRAPHICS: 15159-3_TTT_L.eps V1.5
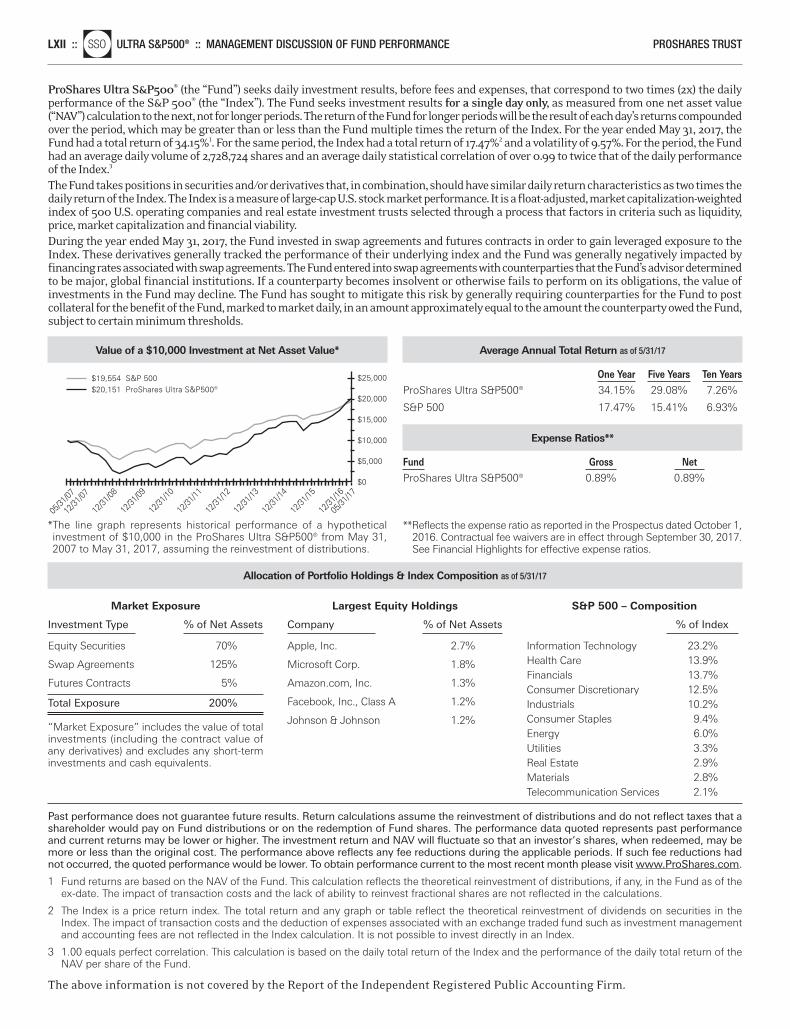
LXII ::nlSSO ULTRA S&P500® :: MANAGEMENT DISCUSSION OF FUND PERFORMANCE PROSHARES TRUST
Value of a $10,000 Investment at Net Asset Value*
*The line graph represents historical performance of a hypothetical investment of $10,000 in the ProShares Ultra S&P500® from May 31,2007 to May 31, 2017, assuming the reinvestment of distributions.
$25,000
$20,000
$0
$15,000
$5,000
$10,000
$19,554 S&P 500$20,151 ProShares Ultra S&P500®
12/31
/07
12/31
/10
12/31
/09
12/31
/08
12/31
/16
12/31
/15
12/31
/14
12/31
/13
12/31
/12
12/31
/11
05/31
/17
05/31
/07
Average Annual Total Return as of 5/31/17
One Year Five Years Ten Years ProShares Ultra S&P500® 34.15% 29.08% 7.26%
S&P 500 17.47% 15.41% 6.93%
Expense Ratios**
Fund Gross Net ProShares Ultra S&P500® 0.89% 0.89%
**Reflects the expense ratio as reported in the Prospectus dated October 1,2016. Contractual fee waivers are in effect through September 30, 2017.See Financial Highlights for effective expense ratios.
ProShares Ultra S&P500® (the “Fund”) seeks daily investment results, before fees and expenses, that correspond to two times (2x) the daily performance of the S&P 500® (the “Index”). The Fund seeks investment results for a single day only, as measured from one net asset value(“NAV”) calculation to the next, not for longer periods. The return of the Fund for longer periods will be the result of each day’s returns compoundedover the period, which may be greater than or less than the Fund multiple times the return of the Index. For the year ended May 31, 2017, theFund had a total return of 34.15%1. For the same period, the Index had a total return of 17.47%2 and a volatility of 9.57%. For the period, the Fundhad an average daily volume of 2,728,724 shares and an average daily statistical correlation of over 0.99 to twice that of the daily performanceof the Index.3
The Fund takes positions in securities and/or derivatives that, in combination, should have similar daily return characteristics as two times thedaily return of the Index. The Index is a measure of large-cap U.S. stock market performance. It is a float-adjusted, market capitalization-weightedindex of 500 U.S. operating companies and real estate investment trusts selected through a process that factors in criteria such as liquidity,price, market capitalization and financial viability.During the year ended May 31, 2017, the Fund invested in swap agreements and futures contracts in order to gain leveraged exposure to theIndex. These derivatives generally tracked the performance of their underlying index and the Fund was generally negatively impacted by financing rates associated with swap agreements. The Fund entered into swap agreements with counterparties that the Fund’s advisor determinedto be major, global financial institutions. If a counterparty becomes insolvent or otherwise fails to perform on its obligations, the value of investments in the Fund may decline. The Fund has sought to mitigate this risk by generally requiring counterparties for the Fund to postcollateral for the benefit of the Fund, marked to market daily, in an amount approximately equal to the amount the counterparty owed the Fund,subject to certain minimum thresholds.
Allocation of Portfolio Holdings & Index Composition as of 5/31/17
Past performance does not guarantee future results. Return calculations assume the reinvestment of distributions and do not reflect taxes that ashareholder would pay on Fund distributions or on the redemption of Fund shares. The performance data quoted represents past performanceand current returns may be lower or higher. The investment return and NAV will fluctuate so that an investor’s shares, when redeemed, may bemore or less than the original cost. The performance above reflects any fee reductions during the applicable periods. If such fee reductions hadnot occurred, the quoted performance would be lower. To obtain performance current to the most recent month please visit www.ProShares.com.
1 Fund returns are based on the NAV of the Fund. This calculation reflects the theoretical reinvestment of distributions, if any, in the Fund as of theex-date. The impact of transaction costs and the lack of ability to reinvest fractional shares are not reflected in the calculations.
2 The Index is a price return index. The total return and any graph or table reflect the theoretical reinvestment of dividends on securities in theIndex. The impact of transaction costs and the deduction of expenses associated with an exchange traded fund such as investment managementand accounting fees are not reflected in the Index calculation. It is not possible to invest directly in an Index.
3 1.00 equals perfect correlation. This calculation is based on the daily total return of the Index and the performance of the daily total return of theNAV per share of the Fund.
The above information is not covered by the Report of the Independent Registered Public Accounting Firm.
Market Exposure
Investment Type % of Net Assets
Equity Securities 70%
Swap Agreements 125%
Futures Contracts 5%
Total Exposure 200%
“Market Exposure” includes the value of totalinvestments (including the contract value ofany derivatives) and excludes any short-terminvestments and cash equivalents.
Largest Equity Holdings
Company % of Net Assets
Apple, Inc. 2.7%
Microsoft Corp. 1.8%
Amazon.com, Inc. 1.3%
Facebook, Inc., Class A 1.2%
Johnson & Johnson 1.2%
S&P 500 – Composition
% of Index
Information Technology 23.2%Health Care 13.9%Financials 13.7%Consumer Discretionary 12.5%Industrials 10.2%Consumer Staples 9.4%Energy 6.0%Utilities 3.3%Real Estate 2.9%Materials 2.8%Telecommunication Services 2.1%
Merrill Corp - Proshares Trust Geared Book [96 Funds] Annual Report [Funds] 333-089822 05-31-2017 ED [AUX] | eperez | 28-Jul-17 17:36 | 17-15159-3.cg | Sequence: 1CHKSUM Content: 60363 Layout: 3500 Graphics: 60436 CLEAN
JOB: 17-15159-3 CYCLE#;BL#: 5; 0 TRIM: 8.25" x 10.75" COMPOSITECOLORS: Black, ~note-color 2, ~note-color 3 GRAPHICS: 15159-3_SSO_L.eps V1.5
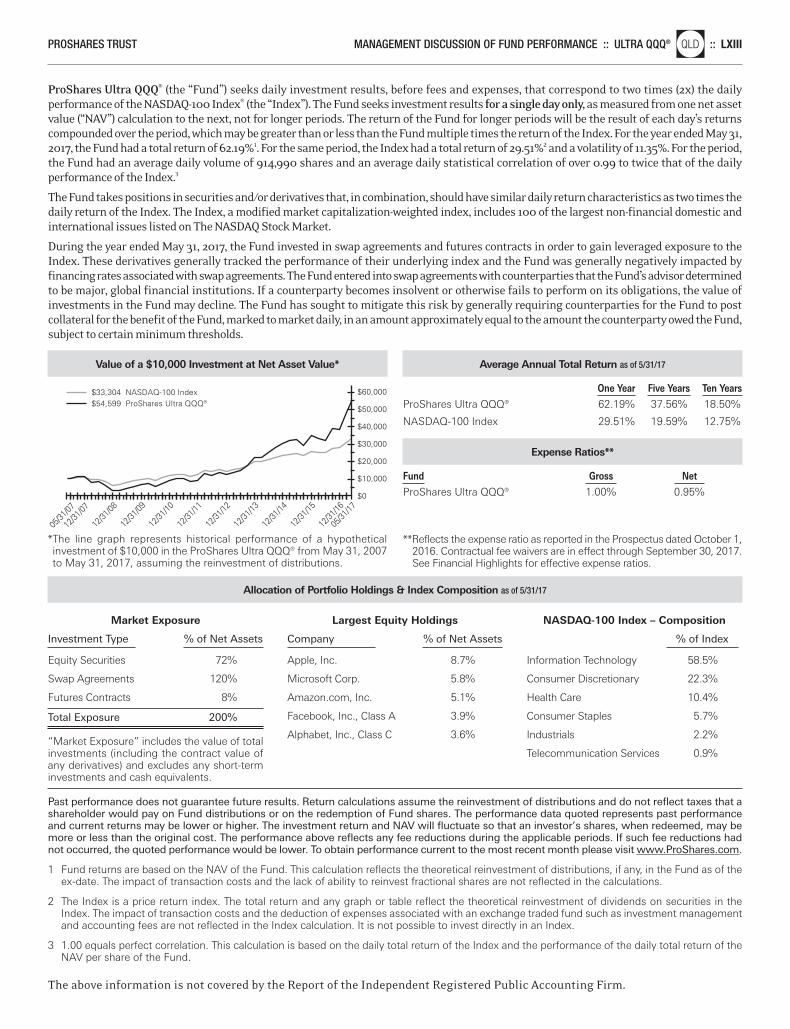
PROSHARES TRUST MANAGEMENT DISCUSSION OF FUND PERFORMANCE :: ULTRA QQQ®nlQLD :: LXIII
Value of a $10,000 Investment at Net Asset Value*
*The line graph represents historical performance of a hypothetical investment of $10,000 in the ProShares Ultra QQQ® from May 31, 2007to May 31, 2017, assuming the reinvestment of distributions.
$60,000
$50,000
$40,000
$0
$30,000
$10,000
$20,000
$33,304 NASDAQ-100 Index$54,599 ProShares Ultra QQQ®
12/31
/07
12/31
/10
12/31
/09
12/31
/08
12/31
/16
12/31
/15
12/31
/14
12/31
/13
12/31
/12
12/31
/11
05/31
/17
05/31
/07
Average Annual Total Return as of 5/31/17
One Year Five Years Ten Years ProShares Ultra QQQ® 62.19% 37.56% 18.50%
NASDAQ-100 Index 29.51% 19.59% 12.75%
Expense Ratios**
Fund Gross Net ProShares Ultra QQQ® 1.00% 0.95%
**Reflects the expense ratio as reported in the Prospectus dated October 1,2016. Contractual fee waivers are in effect through September 30, 2017.See Financial Highlights for effective expense ratios.
ProShares Ultra QQQ® (the “Fund”) seeks daily investment results, before fees and expenses, that correspond to two times (2x) the daily performance of the NASDAQ-100 Index® (the “Index”). The Fund seeks investment results for a single day only, as measured from one net assetvalue (“NAV”) calculation to the next, not for longer periods. The return of the Fund for longer periods will be the result of each day’s returnscompounded over the period, which may be greater than or less than the Fund multiple times the return of the Index. For the year ended May 31,2017, the Fund had a total return of 62.19%1. For the same period, the Index had a total return of 29.51%2 and a volatility of 11.35%. For the period,the Fund had an average daily volume of 914,990 shares and an average daily statistical correlation of over 0.99 to twice that of the daily performance of the Index.3
The Fund takes positions in securities and/or derivatives that, in combination, should have similar daily return characteristics as twotimes thedaily return of the Index. The Index, a modified market capitalization-weighted index, includes 100 of the largest non-financial domestic andinternational issues listed on The NASDAQ Stock Market.
During the year ended May 31, 2017, the Fund invested in swap agreements and futures contracts in order to gain leveraged exposure to theIndex. These derivatives generally tracked the performance of their underlying index and the Fund was generally negatively impacted by financing rates associated with swap agreements. The Fund entered into swap agreements with counterparties that the Fund’s advisor determinedto be major, global financial institutions. If a counterparty becomes insolvent or otherwise fails to perform on its obligations, the value of investments in the Fund may decline. The Fund has sought to mitigate this risk by generally requiring counterparties for the Fund to postcollateral for the benefit of the Fund, marked to market daily, in an amount approximately equal to the amount the counterparty owed the Fund,subject to certain minimum thresholds.
Allocation of Portfolio Holdings & Index Composition as of 5/31/17
Past performance does not guarantee future results. Return calculations assume the reinvestment of distributions and do not reflect taxes that ashareholder would pay on Fund distributions or on the redemption of Fund shares. The performance data quoted represents past performanceand current returns may be lower or higher. The investment return and NAV will fluctuate so that an investor’s shares, when redeemed, may bemore or less than the original cost. The performance above reflects any fee reductions during the applicable periods. If such fee reductions hadnot occurred, the quoted performance would be lower. To obtain performance current to the most recent month please visit www.ProShares.com.
1 Fund returns are based on the NAV of the Fund. This calculation reflects the theoretical reinvestment of distributions, if any, in the Fund as of theex-date. The impact of transaction costs and the lack of ability to reinvest fractional shares are not reflected in the calculations.
2 The Index is a price return index. The total return and any graph or table reflect the theoretical reinvestment of dividends on securities in theIndex. The impact of transaction costs and the deduction of expenses associated with an exchange traded fund such as investment managementand accounting fees are not reflected in the Index calculation. It is not possible to invest directly in an Index.
3 1.00 equals perfect correlation. This calculation is based on the daily total return of the Index and the performance of the daily total return of theNAV per share of the Fund.
The above information is not covered by the Report of the Independent Registered Public Accounting Firm.
Market Exposure
Investment Type % of Net Assets
Equity Securities 72%
Swap Agreements 120%
Futures Contracts 8%
Total Exposure 200%
“Market Exposure” includes the value of totalinvestments (including the contract value ofany derivatives) and excludes any short-terminvestments and cash equivalents.
Largest Equity Holdings
Company % of Net Assets
Apple, Inc. 8.7%
Microsoft Corp. 5.8%
Amazon.com, Inc. 5.1%
Facebook, Inc., Class A 3.9%
Alphabet, Inc., Class C 3.6%
NASDAQ-100 Index – Composition
% of Index
Information Technology 58.5%
Consumer Discretionary 22.3%
Health Care 10.4%
Consumer Staples 5.7%
Industrials 2.2%
Telecommunication Services 0.9%
Merrill Corp - Proshares Trust Geared Book [96 Funds] Annual Report [Funds] 333-089822 05-31-2017 ED [AUX] | eperez | 28-Jul-17 17:36 | 17-15159-3.cg | Sequence: 2CHKSUM Content: 29811 Layout: 47306 Graphics: 9879 CLEAN
JOB: 17-15159-3 CYCLE#;BL#: 5; 0 TRIM: 8.25" x 10.75" COMPOSITECOLORS: Black, ~note-color 2, ~note-color 3 GRAPHICS: 15159-3_QLD_L.eps V1.5
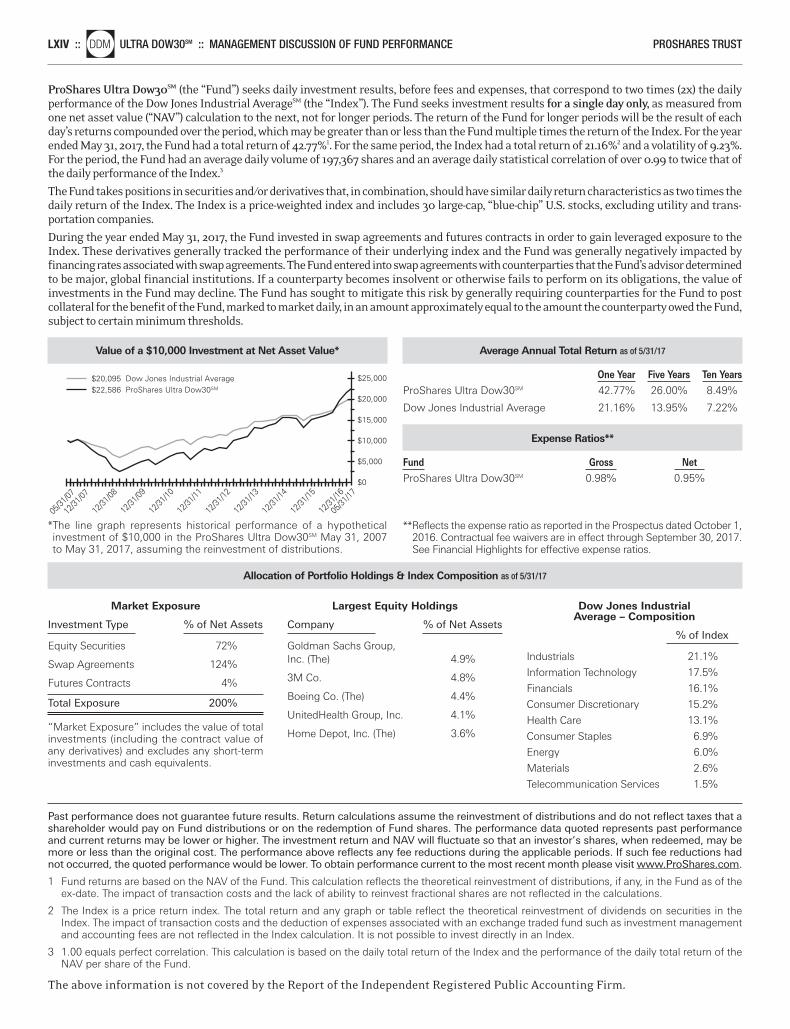
LXIV ::nlDDM ULTRA DOW30SM :: MANAGEMENT DISCUSSION OF FUND PERFORMANCE PROSHARES TRUST
Value of a $10,000 Investment at Net Asset Value*
*The line graph represents historical performance of a hypothetical investment of $10,000 in the ProShares Ultra Dow30SM May 31, 2007to May 31, 2017, assuming the reinvestment of distributions.
$25,000
$20,000
$0
$15,000
$5,000
$10,000
$20,095 Dow Jones Industrial Average$22,586 ProShares Ultra Dow30SM
12/31
/07
12/31
/10
12/31
/09
12/31
/08
12/31
/16
12/31
/15
12/31
/14
12/31
/13
12/31
/12
12/31
/11
05/31
/17
05/31
/07
Average Annual Total Return as of 5/31/17
One Year Five Years Ten Years ProShares Ultra Dow30SM 42.77% 26.00% 8.49%
Dow Jones Industrial Average 21.16% 13.95% 7.22%
Expense Ratios**
Fund Gross Net ProShares Ultra Dow30SM 0.98% 0.95%
**Reflects the expense ratio as reported in the Prospectus dated October 1,2016. Contractual fee waivers are in effect through September 30, 2017.See Financial Highlights for effective expense ratios.
ProShares Ultra Dow30SM (the “Fund”) seeks daily investment results, before fees and expenses, that correspond to two times (2x) the daily performance of the Dow Jones Industrial AverageSM (the “Index”). The Fund seeks investment results for a single day only, as measured fromone net asset value (“NAV”) calculation to the next, not for longer periods. The return of the Fund for longer periods will be the result of eachday’s returns compounded over the period, which may be greater than or less than the Fund multiple times the return of the Index. For the yearended May 31, 2017, the Fund had a total return of 42.77%1. For the same period, the Index had a total return of 21.16%2 and a volatility of 9.23%.For the period, the Fund had an average daily volume of 197,367 shares and an average daily statistical correlation of over 0.99 to twice that ofthe daily performance of the Index.3
The Fund takes positions in securities and/or derivatives that, in combination, should have similar daily return characteristics as two times thedaily return of the Index. The Index is a price-weighted index and includes 30 large-cap, “blue-chip” U.S. stocks, excluding utility and trans-portation companies.
During the year ended May 31, 2017, the Fund invested in swap agreements and futures contracts in order to gain leveraged exposure to theIndex. These derivatives generally tracked the performance of their underlying index and the Fund was generally negatively impacted by financing rates associated with swap agreements. The Fund entered into swap agreements with counterparties that the Fund’s advisor determinedto be major, global financial institutions. If a counterparty becomes insolvent or otherwise fails to perform on its obligations, the value of investments in the Fund may decline. The Fund has sought to mitigate this risk by generally requiring counterparties for the Fund to postcollateral for the benefit of the Fund, marked to market daily, in an amount approximately equal to the amount the counterparty owed the Fund,subject to certain minimum thresholds.
Allocation of Portfolio Holdings & Index Composition as of 5/31/17
Past performance does not guarantee future results. Return calculations assume the reinvestment of distributions and do not reflect taxes that ashareholder would pay on Fund distributions or on the redemption of Fund shares. The performance data quoted represents past performanceand current returns may be lower or higher. The investment return and NAV will fluctuate so that an investor’s shares, when redeemed, may bemore or less than the original cost. The performance above reflects any fee reductions during the applicable periods. If such fee reductions hadnot occurred, the quoted performance would be lower. To obtain performance current to the most recent month please visit www.ProShares.com.
1 Fund returns are based on the NAV of the Fund. This calculation reflects the theoretical reinvestment of distributions, if any, in the Fund as of theex-date. The impact of transaction costs and the lack of ability to reinvest fractional shares are not reflected in the calculations.
2 The Index is a price return index. The total return and any graph or table reflect the theoretical reinvestment of dividends on securities in theIndex. The impact of transaction costs and the deduction of expenses associated with an exchange traded fund such as investment managementand accounting fees are not reflected in the Index calculation. It is not possible to invest directly in an Index.
3 1.00 equals perfect correlation. This calculation is based on the daily total return of the Index and the performance of the daily total return of theNAV per share of the Fund.
The above information is not covered by the Report of the Independent Registered Public Accounting Firm.
Market Exposure
Investment Type % of Net Assets
Equity Securities 72%
Swap Agreements 124%
Futures Contracts 4%
Total Exposure 200%
“Market Exposure” includes the value of totalinvestments (including the contract value ofany derivatives) and excludes any short-terminvestments and cash equivalents.
Largest Equity Holdings
Company % of Net Assets
Goldman Sachs Group,Inc. (The) 4.9%
3M Co. 4.8%
Boeing Co. (The) 4.4%
UnitedHealth Group, Inc. 4.1%
Home Depot, Inc. (The) 3.6%
Dow Jones IndustrialAverage – Composition
% of Index
Industrials 21.1%
Information Technology 17.5%
Financials 16.1%
Consumer Discretionary 15.2%
Health Care 13.1%
Consumer Staples 6.9%
Energy 6.0%
Materials 2.6%
Telecommunication Services 1.5%
Merrill Corp - Proshares Trust Geared Book [96 Funds] Annual Report [Funds] 333-089822 05-31-2017 ED [AUX] | eperez | 28-Jul-17 17:36 | 17-15159-3.cg | Sequence: 3CHKSUM Content: 13635 Layout: 16139 Graphics: 24198 CLEAN
JOB: 17-15159-3 CYCLE#;BL#: 5; 0 TRIM: 8.25" x 10.75" COMPOSITECOLORS: Black, ~note-color 2, ~note-color 3 GRAPHICS: 15159-3_DDM_L.eps V1.5
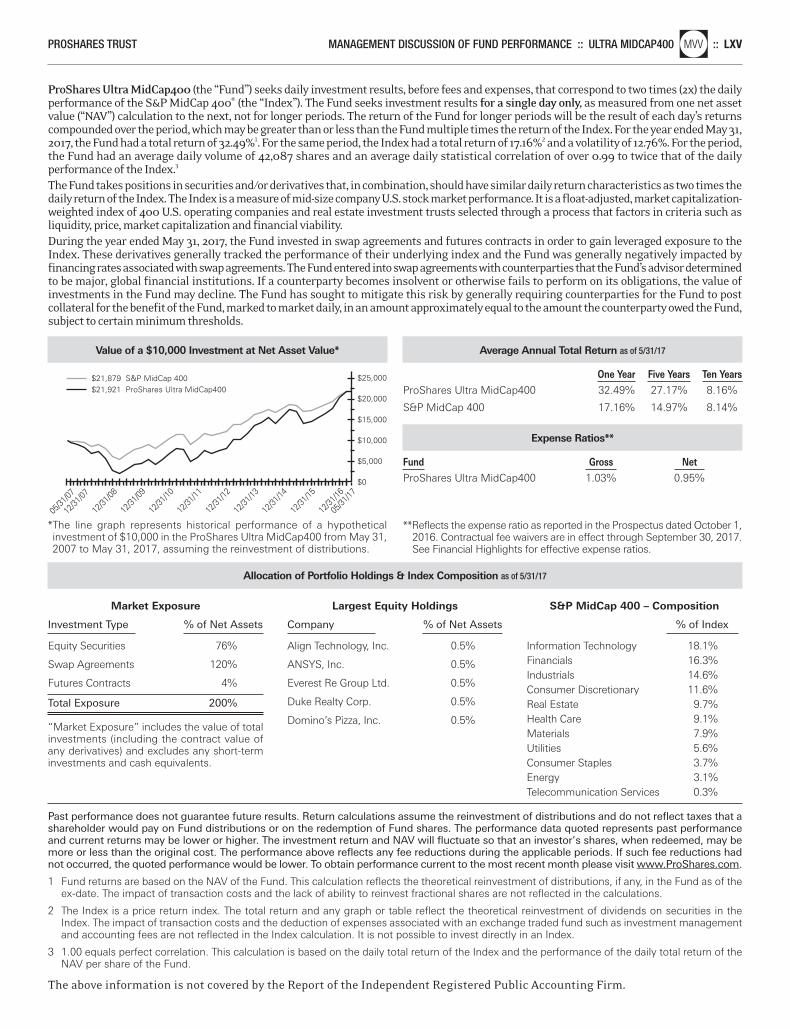
PROSHARES TRUST MANAGEMENT DISCUSSION OF FUND PERFORMANCE :: ULTRA MIDCAP400nlMVV :: LXV
Value of a $10,000 Investment at Net Asset Value*
*The line graph represents historical performance of a hypothetical investment of $10,000 in the ProShares Ultra MidCap400 from May 31,2007 to May 31, 2017, assuming the reinvestment of distributions.
$25,000
$20,000
$0
$15,000
$5,000
$10,000
$21,879 S&P MidCap 400$21,921 ProShares Ultra MidCap400
12/31
/07
12/31
/10
12/31
/09
12/31
/08
12/31
/16
12/31
/15
12/31
/14
12/31
/13
12/31
/12
12/31
/11
05/31
/17
05/31
/07
Average Annual Total Return as of 5/31/17
One Year Five Years Ten Years ProShares Ultra MidCap400 32.49% 27.17% 8.16%
S&P MidCap 400 17.16% 14.97% 8.14%
Expense Ratios**
Fund Gross Net ProShares Ultra MidCap400 1.03% 0.95%
**Reflects the expense ratio as reported in the Prospectus dated October 1,2016. Contractual fee waivers are in effect through September 30, 2017.See Financial Highlights for effective expense ratios.
ProShares Ultra MidCap400 (the “Fund”) seeks daily investment results, before fees and expenses, that correspond to two times (2x) the dailyperformance of the S&P MidCap 400® (the “Index”). The Fund seeks investment results for a single day only, as measured from one net assetvalue (“NAV”) calculation to the next, not for longer periods. The return of the Fund for longer periods will be the result of each day’s returnscompounded over the period, which may be greater than or less than the Fund multiple times the return of the Index. For the year ended May 31,2017, the Fund had a total return of 32.49%1. For the same period, the Index had a total return of 17.16%2 and a volatility of 12.76%. For the period,the Fund had an average daily volume of 42,087 shares and an average daily statistical correlation of over 0.99 to twice that of the daily performance of the Index.3
The Fund takes positions in securities and/or derivatives that, in combination, should have similar daily return characteristics as two times thedaily return of the Index. The Index is a measure of mid-size company U.S. stock market performance. It is a float-adjusted, market capitalization-weighted index of 400 U.S. operating companies and real estate investment trusts selected through a process that factors in criteria such asliquidity, price, market capitalization and financial viability.During the year ended May 31, 2017, the Fund invested in swap agreements and futures contracts in order to gain leveraged exposure to theIndex. These derivatives generally tracked the performance of their underlying index and the Fund was generally negatively impacted by financing rates associated with swap agreements. The Fund entered into swap agreements with counterparties that the Fund’s advisor determinedto be major, global financial institutions. If a counterparty becomes insolvent or otherwise fails to perform on its obligations, the value of investments in the Fund may decline. The Fund has sought to mitigate this risk by generally requiring counterparties for the Fund to postcollateral for the benefit of the Fund, marked to market daily, in an amount approximately equal to the amount the counterparty owed the Fund,subject to certain minimum thresholds.
Allocation of Portfolio Holdings & Index Composition as of 5/31/17
Past performance does not guarantee future results. Return calculations assume the reinvestment of distributions and do not reflect taxes that ashareholder would pay on Fund distributions or on the redemption of Fund shares. The performance data quoted represents past performanceand current returns may be lower or higher. The investment return and NAV will fluctuate so that an investor’s shares, when redeemed, may bemore or less than the original cost. The performance above reflects any fee reductions during the applicable periods. If such fee reductions hadnot occurred, the quoted performance would be lower. To obtain performance current to the most recent month please visit www.ProShares.com.
1 Fund returns are based on the NAV of the Fund. This calculation reflects the theoretical reinvestment of distributions, if any, in the Fund as of theex-date. The impact of transaction costs and the lack of ability to reinvest fractional shares are not reflected in the calculations.
2 The Index is a price return index. The total return and any graph or table reflect the theoretical reinvestment of dividends on securities in theIndex. The impact of transaction costs and the deduction of expenses associated with an exchange traded fund such as investment managementand accounting fees are not reflected in the Index calculation. It is not possible to invest directly in an Index.
3 1.00 equals perfect correlation. This calculation is based on the daily total return of the Index and the performance of the daily total return of theNAV per share of the Fund.
The above information is not covered by the Report of the Independent Registered Public Accounting Firm.
Market Exposure
Investment Type % of Net Assets
Equity Securities 76%
Swap Agreements 120%
Futures Contracts 4%
Total Exposure 200%
“Market Exposure” includes the value of totalinvestments (including the contract value ofany derivatives) and excludes any short-terminvestments and cash equivalents.
Largest Equity Holdings
Company % of Net Assets
Align Technology, Inc. 0.5%
ANSYS, Inc. 0.5%
Everest Re Group Ltd. 0.5%
Duke Realty Corp. 0.5%
Domino’s Pizza, Inc. 0.5%
S&P MidCap 400 – Composition
% of Index
Information Technology 18.1%Financials 16.3%Industrials 14.6%Consumer Discretionary 11.6%Real Estate 9.7%Health Care 9.1%Materials 7.9%Utilities 5.6%Consumer Staples 3.7%Energy 3.1%Telecommunication Services 0.3%
Merrill Corp - Proshares Trust Geared Book [96 Funds] Annual Report [Funds] 333-089822 05-31-2017 ED [AUX] | eperez | 28-Jul-17 17:36 | 17-15159-3.cg | Sequence: 4CHKSUM Content: 44339 Layout: 35774 Graphics: 58108 CLEAN
JOB: 17-15159-3 CYCLE#;BL#: 5; 0 TRIM: 8.25" x 10.75" COMPOSITECOLORS: Black, ~note-color 2, ~note-color 3 GRAPHICS: 15159-3_MVV_L.eps V1.5
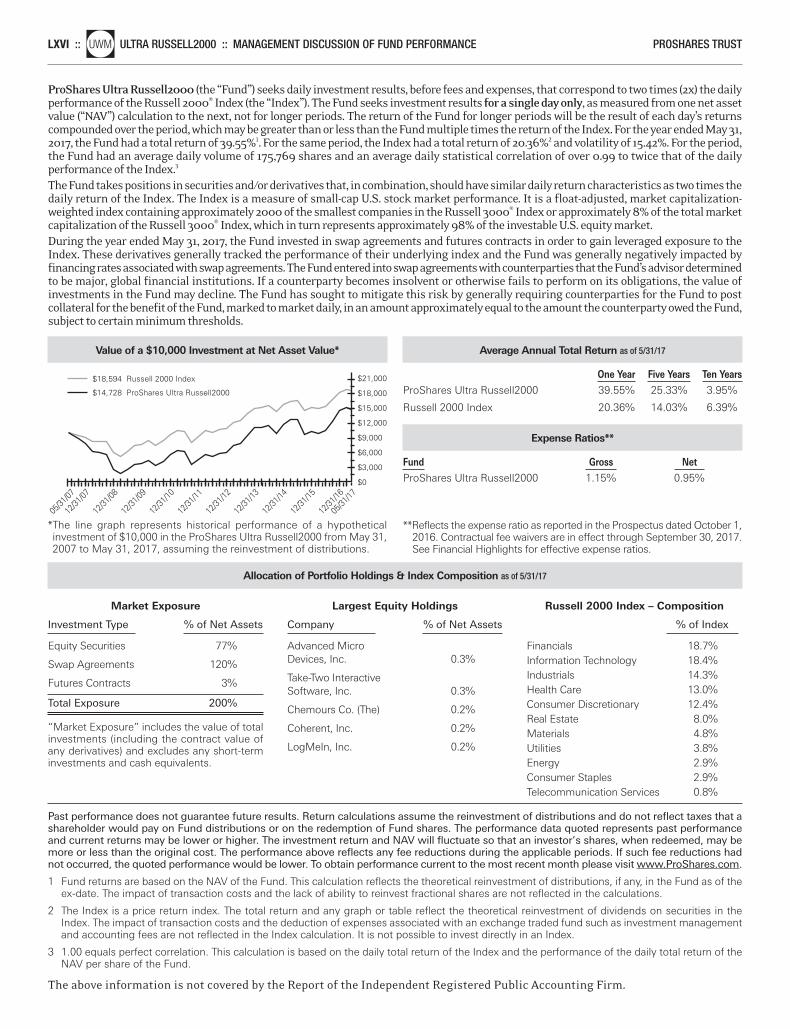
LXVI ::nlUWM ULTRA RUSSELL2000 :: MANAGEMENT DISCUSSION OF FUND PERFORMANCE PROSHARES TRUST
Value of a $10,000 Investment at Net Asset Value*
*The line graph represents historical performance of a hypothetical investment of $10,000 in the ProShares Ultra Russell2000 from May 31,2007 to May 31, 2017, assuming the reinvestment of distributions.
$21,000
$18,000
$15,000
$0
$12,000
$9,000
$3,000
$6,000
$18,594 Russell 2000 Index
$14,728 ProShares Ultra Russell2000
05/31
/07
12/31
/07
12/31
/08
12/31
/10
12/31
/11
12/31
/09
05/31
/17
12/31
/16
12/31
/15
12/31
/14
12/31
/13
12/31
/12
Average Annual Total Return as of 5/31/17
One Year Five Years Ten Years ProShares Ultra Russell2000 39.55% 25.33% 3.95%
Russell 2000 Index 20.36% 14.03% 6.39%
Expense Ratios**
Fund Gross Net ProShares Ultra Russell2000 1.15% 0.95%
**Reflects the expense ratio as reported in the Prospectus dated October 1,2016. Contractual fee waivers are in effect through September 30, 2017.See Financial Highlights for effective expense ratios.
ProShares Ultra Russell2000 (the “Fund”) seeks daily investment results, before fees and expenses, that correspond to two times (2x) the dailyperformance of the Russell 2000® Index (the “Index”). The Fund seeks investment results for a single day only, as measured from one net assetvalue (“NAV”) calculation to the next, not for longer periods. The return of the Fund for longer periods will be the result of each day’s returnscompounded over the period, which may be greater than or less than the Fund multiple times the return of the Index. For the year ended May 31,2017, the Fund had a total return of 39.55%1. For the same period, the Index had a total return of 20.36%2 and volatility of 15.42%. For the period,the Fund had an average daily volume of 175,769 shares and an average daily statistical correlation of over 0.99 to twice that of the daily performance of the Index.3
The Fund takes positions in securities and/or derivatives that, in combination, should have similar daily return characteristics as two times thedaily return of the Index. The Index is a measure of small-cap U.S. stock market performance. It is a float-adjusted, market capitalization-weighted index containing approximately 2000 of the smallest companies in the Russell 3000® Index or approximately 8% of the total marketcapitalization of the Russell 3000® Index, which in turn represents approximately 98% of the investable U.S. equity market.During the year ended May 31, 2017, the Fund invested in swap agreements and futures contracts in order to gain leveraged exposure to theIndex. These derivatives generally tracked the performance of their underlying index and the Fund was generally negatively impacted by financing rates associated with swap agreements. The Fund entered into swap agreements with counterparties that the Fund’s advisor determinedto be major, global financial institutions. If a counterparty becomes insolvent or otherwise fails to perform on its obligations, the value of investments in the Fund may decline. The Fund has sought to mitigate this risk by generally requiring counterparties for the Fund to postcollateral for the benefit of the Fund, marked to market daily, in an amount approximately equal to the amount the counterparty owed the Fund,subject to certain minimum thresholds.
Allocation of Portfolio Holdings & Index Composition as of 5/31/17
Past performance does not guarantee future results. Return calculations assume the reinvestment of distributions and do not reflect taxes that ashareholder would pay on Fund distributions or on the redemption of Fund shares. The performance data quoted represents past performanceand current returns may be lower or higher. The investment return and NAV will fluctuate so that an investor’s shares, when redeemed, may bemore or less than the original cost. The performance above reflects any fee reductions during the applicable periods. If such fee reductions hadnot occurred, the quoted performance would be lower. To obtain performance current to the most recent month please visit www.ProShares.com.
1 Fund returns are based on the NAV of the Fund. This calculation reflects the theoretical reinvestment of distributions, if any, in the Fund as of theex-date. The impact of transaction costs and the lack of ability to reinvest fractional shares are not reflected in the calculations.
2 The Index is a price return index. The total return and any graph or table reflect the theoretical reinvestment of dividends on securities in theIndex. The impact of transaction costs and the deduction of expenses associated with an exchange traded fund such as investment managementand accounting fees are not reflected in the Index calculation. It is not possible to invest directly in an Index.
3 1.00 equals perfect correlation. This calculation is based on the daily total return of the Index and the performance of the daily total return of theNAV per share of the Fund.
The above information is not covered by the Report of the Independent Registered Public Accounting Firm.
Market Exposure
Investment Type % of Net Assets
Equity Securities 77%
Swap Agreements 120%
Futures Contracts 3%
Total Exposure 200%
“Market Exposure” includes the value of totalinvestments (including the contract value ofany derivatives) and excludes any short-terminvestments and cash equivalents.
Largest Equity Holdings
Company % of Net Assets
Advanced MicroDevices, Inc. 0.3%
Take-Two InteractiveSoftware, Inc. 0.3%
Chemours Co. (The) 0.2%
Coherent, Inc. 0.2%
LogMeIn, Inc. 0.2%
Russell 2000 Index – Composition
% of Index
Financials 18.7%Information Technology 18.4%Industrials 14.3%Health Care 13.0%Consumer Discretionary 12.4%Real Estate 8.0%Materials 4.8%Utilities 3.8%Energy 2.9%Consumer Staples 2.9%Telecommunication Services 0.8%
Merrill Corp - Proshares Trust Geared Book [96 Funds] Annual Report [Funds] 333-089822 05-31-2017 ED [AUX] | eperez | 28-Jul-17 17:36 | 17-15159-3.cg | Sequence: 5CHKSUM Content: 18412 Layout: 39343 Graphics: 60522 CLEAN
JOB: 17-15159-3 CYCLE#;BL#: 5; 0 TRIM: 8.25" x 10.75" COMPOSITECOLORS: Black, ~note-color 2, ~note-color 3 GRAPHICS: 15159-3_UWM_L.eps V1.5
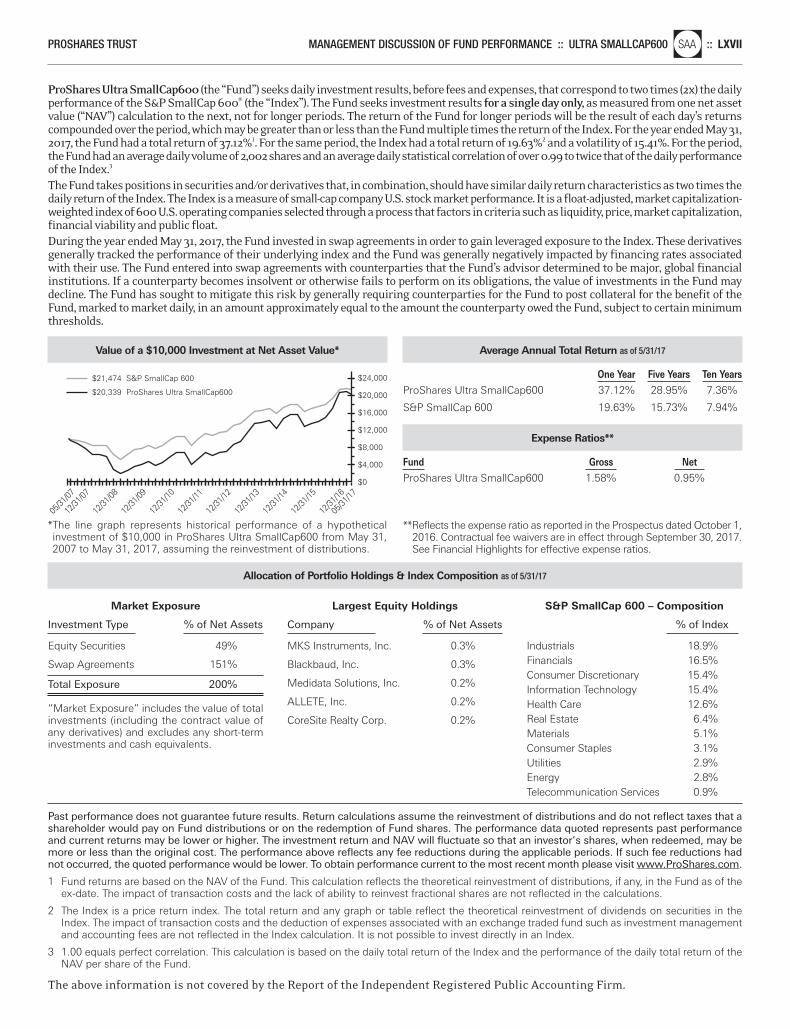
PROSHARES TRUST MANAGEMENT DISCUSSION OF FUND PERFORMANCE :: ULTRA SMALLCAP600nlSAA :: LXVII
Value of a $10,000 Investment at Net Asset Value*
*The line graph represents historical performance of a hypothetical investment of $10,000 in ProShares Ultra SmallCap600 from May 31,2007 to May 31, 2017, assuming the reinvestment of distributions.
$24,000
$20,000
$16,000
$0
$12,000
$4,000
$8,000
$21,474 S&P SmallCap 600
$20,339 ProShares Ultra SmallCap600
05/31
/07
12/31
/07
12/31
/08
12/31
/10
12/31
/11
12/31
/09
05/31
/17
12/31
/16
12/31
/15
12/31
/14
12/31
/13
12/31
/12
Average Annual Total Return as of 5/31/17
One Year Five Years Ten Years ProShares Ultra SmallCap600 37.12% 28.95% 7.36%
S&P SmallCap 600 19.63% 15.73% 7.94%
Expense Ratios**
Fund Gross Net ProShares Ultra SmallCap600 1.58% 0.95%
**Reflects the expense ratio as reported in the Prospectus dated October 1,2016. Contractual fee waivers are in effect through September 30, 2017.See Financial Highlights for effective expense ratios.
ProShares Ultra SmallCap600 (the “Fund”) seeks daily investment results, before fees and expenses, that correspond to two times (2x) the dailyperformance of the S&P SmallCap 600® (the “Index”). The Fund seeks investment results for a single day only, as measured from one net assetvalue (“NAV”) calculation to the next, not for longer periods. The return of the Fund for longer periods will be the result of each day’s returnscompounded over the period, which may be greater than or less than the Fund multiple times the return of the Index. For the year ended May 31,2017, the Fund had a total return of 37.12%1. For the same period, the Index had a total return of 19.63%2 and a volatility of 15.41%. For the period,the Fund had an average daily volume of 2,002 shares and an average daily statistical correlation of over 0.99 to twice that of the daily performanceof the Index.3
The Fund takes positions in securities and/or derivatives that, in combination, should have similar daily return characteristics as two times thedaily return of the Index. The Index is a measure of small-cap company U.S. stock market performance. It is a float-adjusted, market capitalization-weighted index of 600 U.S. operating companies selected through a process that factors in criteria such as liquidity, price, market capitalization,financial viability and public float.During the year ended May 31, 2017, the Fund invested in swap agreements in order to gain leveraged exposure to the Index. These derivativesgenerally tracked the performance of their underlying index and the Fund was generally negatively impacted by financing rates associatedwith their use. The Fund entered into swap agreements with counterparties that the Fund’s advisor determined to be major, global financial institutions. If a counterparty becomes insolvent or otherwise fails to perform on its obligations, the value of investments in the Fund maydecline. The Fund has sought to mitigate this risk by generally requiring counterparties for the Fund to post collateral for the benefit of theFund, marked to market daily, in an amount approximately equal to the amount the counterparty owed the Fund, subject to certain minimumthresholds.
Allocation of Portfolio Holdings & Index Composition as of 5/31/17
Past performance does not guarantee future results. Return calculations assume the reinvestment of distributions and do not reflect taxes that ashareholder would pay on Fund distributions or on the redemption of Fund shares. The performance data quoted represents past performanceand current returns may be lower or higher. The investment return and NAV will fluctuate so that an investor’s shares, when redeemed, may bemore or less than the original cost. The performance above reflects any fee reductions during the applicable periods. If such fee reductions hadnot occurred, the quoted performance would be lower. To obtain performance current to the most recent month please visit www.ProShares.com.
1 Fund returns are based on the NAV of the Fund. This calculation reflects the theoretical reinvestment of distributions, if any, in the Fund as of theex-date. The impact of transaction costs and the lack of ability to reinvest fractional shares are not reflected in the calculations.
2 The Index is a price return index. The total return and any graph or table reflect the theoretical reinvestment of dividends on securities in theIndex. The impact of transaction costs and the deduction of expenses associated with an exchange traded fund such as investment managementand accounting fees are not reflected in the Index calculation. It is not possible to invest directly in an Index.
3 1.00 equals perfect correlation. This calculation is based on the daily total return of the Index and the performance of the daily total return of theNAV per share of the Fund.
The above information is not covered by the Report of the Independent Registered Public Accounting Firm.
Market Exposure
Investment Type % of Net Assets
Equity Securities 49%
Swap Agreements 151%
Total Exposure 200%
“Market Exposure” includes the value of totalinvestments (including the contract value ofany derivatives) and excludes any short-terminvestments and cash equivalents.
Largest Equity Holdings
Company % of Net Assets
MKS Instruments, Inc. 0.3%
Blackbaud, Inc. 0.3%
Medidata Solutions, Inc. 0.2%
ALLETE, Inc. 0.2%
CoreSite Realty Corp. 0.2%
S&P SmallCap 600 – Composition
% of Index
Industrials 18.9%Financials 16.5%Consumer Discretionary 15.4%Information Technology 15.4%Health Care 12.6%Real Estate 6.4%Materials 5.1%Consumer Staples 3.1%Utilities 2.9%Energy 2.8%Telecommunication Services 0.9%
Merrill Corp - Proshares Trust Geared Book [96 Funds] Annual Report [Funds] 333-089822 05-31-2017 ED [AUX] | eperez | 28-Jul-17 17:36 | 17-15159-3.cg | Sequence: 6CHKSUM Content: 1340 Layout: 42920 Graphics: 11056 CLEAN
JOB: 17-15159-3 CYCLE#;BL#: 5; 0 TRIM: 8.25" x 10.75" COMPOSITECOLORS: Black, ~note-color 2, ~note-color 3 GRAPHICS: 15159-3_SAA_L.eps V1.5
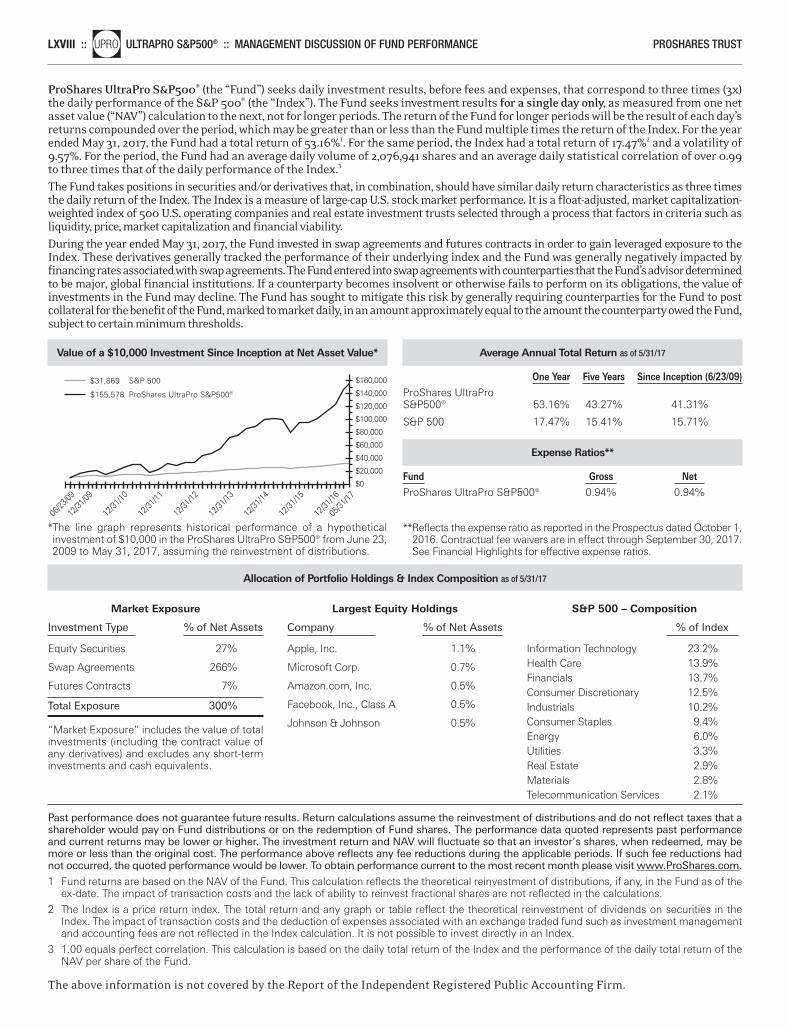
LXVIII ::nlUPRO ULTRAPRO S&P500® :: MANAGEMENT DISCUSSION OF FUND PERFORMANCE PROSHARES TRUST
Value of a $10,000 Investment Since Inception at Net Asset Value*
*The line graph represents historical performance of a hypothetical investment of $10,000 in the ProShares UltraPro S&P500® from June 23,2009 to May 31, 2017, assuming the reinvestment of distributions.
$31,869 S&P 500
$155,578 ProShares UltraPro S&P500®
06/23
/09
12/31
/09
12/31
/10
12/31
/11
12/31
/12
12/31
/16
12/31
/15
12/31
/14
12/31
/13
05/31
/17
$160,000
$140,000
$120,000
$100,000
$0
$40,000
$20,000
$60,000
$80,000
Average Annual Total Return as of 5/31/17
One Year Five Years Since Inception (6/23/09) ProShares UltraProS&P500® 53.16% 43.27% 41.31%
S&P 500 17.47% 15.41% 15.71%
Expense Ratios**
Fund Gross Net ProShares UltraPro S&P500® 0.94% 0.94%
**Reflects the expense ratio as reported in the Prospectus dated October 1,2016. Contractual fee waivers are in effect through September 30, 2017.See Financial Highlights for effective expense ratios.
ProShares UltraPro S&P500® (the “Fund”) seeks daily investment results, before fees and expenses, that correspond to three times (3x)the daily performance of the S&P 500® (the “Index”). The Fund seeks investment results for a single day only, as measured from one netasset value (“NAV”) calculation to the next, not for longer periods. The return of the Fund for longer periods will be the result of each day’sreturns compounded over the period, which may be greater than or less than the Fund multiple times the return of the Index. For the yearended May 31, 2017, the Fund had a total return of 53.16%1. For the same period, the Index had a total return of 17.47%2 and a volatility of9.57%. For the period, the Fund had an average daily volume of 2,076,941 shares and an average daily statistical correlation of over 0.99to three times that of the daily performance of the Index.3
The Fund takes positions in securities and/or derivatives that, in combination, should have similar daily return characteristics as three timesthe daily return of the Index. The Index is a measure of large-cap U.S. stock market performance. It is a float-adjusted, market capitalization-weighted index of 500 U.S. operating companies and real estate investment trusts selected through a process that factors in criteria such as liquidity, price, market capitalization and financial viability.During the year ended May 31, 2017, the Fund invested in swap agreements and futures contracts in order to gain leveraged exposure to theIndex. These derivatives generally tracked the performance of their underlying index and the Fund was generally negatively impacted by financing rates associated with swap agreements. The Fund entered into swap agreements with counterparties that the Fund’s advisor determinedto be major, global financial institutions. If a counterparty becomes insolvent or otherwise fails to perform on its obligations, the value of investments in the Fund may decline. The Fund has sought to mitigate this risk by generally requiring counterparties for the Fund to postcollateral for the benefit of the Fund, marked to market daily, in an amount approximately equal to the amount the counterparty owed the Fund,subject to certain minimum thresholds.
Allocation of Portfolio Holdings & Index Composition as of 5/31/17
Past performance does not guarantee future results. Return calculations assume the reinvestment of distributions and do not reflect taxes that ashareholder would pay on Fund distributions or on the redemption of Fund shares. The performance data quoted represents past performanceand current returns may be lower or higher. The investment return and NAV will fluctuate so that an investor’s shares, when redeemed, may bemore or less than the original cost. The performance above reflects any fee reductions during the applicable periods. If such fee reductions hadnot occurred, the quoted performance would be lower. To obtain performance current to the most recent month please visit www.ProShares.com.
1 Fund returns are based on the NAV of the Fund. This calculation reflects the theoretical reinvestment of distributions, if any, in the Fund as of theex-date. The impact of transaction costs and the lack of ability to reinvest fractional shares are not reflected in the calculations.
2 The Index is a price return index. The total return and any graph or table reflect the theoretical reinvestment of dividends on securities in theIndex. The impact of transaction costs and the deduction of expenses associated with an exchange traded fund such as investment managementand accounting fees are not reflected in the Index calculation. It is not possible to invest directly in an Index.
3 1.00 equals perfect correlation. This calculation is based on the daily total return of the Index and the performance of the daily total return of theNAV per share of the Fund.
The above information is not covered by the Report of the Independent Registered Public Accounting Firm.
Market Exposure
Investment Type % of Net Assets
Equity Securities 27%
Swap Agreements 266%
Futures Contracts 7%
Total Exposure 300%
“Market Exposure” includes the value of totalinvestments (including the contract value ofany derivatives) and excludes any short-terminvestments and cash equivalents.
Largest Equity Holdings
Company % of Net Assets
Apple, Inc. 1.1%
Microsoft Corp. 0.7%
Amazon.com, Inc. 0.5%
Facebook, Inc., Class A 0.5%
Johnson & Johnson 0.5%
S&P 500 – Composition
% of Index
Information Technology 23.2%Health Care 13.9%Financials 13.7%Consumer Discretionary 12.5%Industrials 10.2%Consumer Staples 9.4%Energy 6.0%Utilities 3.3%Real Estate 2.9%Materials 2.8%Telecommunication Services 2.1%
Merrill Corp - Proshares Trust Geared Book [96 Funds] Annual Report [Funds] 333-089822 05-31-2017 ED [AUX] | eperez | 28-Jul-17 17:36 | 17-15159-3.cg | Sequence: 7CHKSUM Content: 2473 Layout: 29384 Graphics: 52065 CLEAN
JOB: 17-15159-3 CYCLE#;BL#: 5; 0 TRIM: 8.25" x 10.75" COMPOSITECOLORS: Black, ~note-color 2, ~note-color 3 GRAPHICS: 15159-3_UPRO_L.eps V1.5
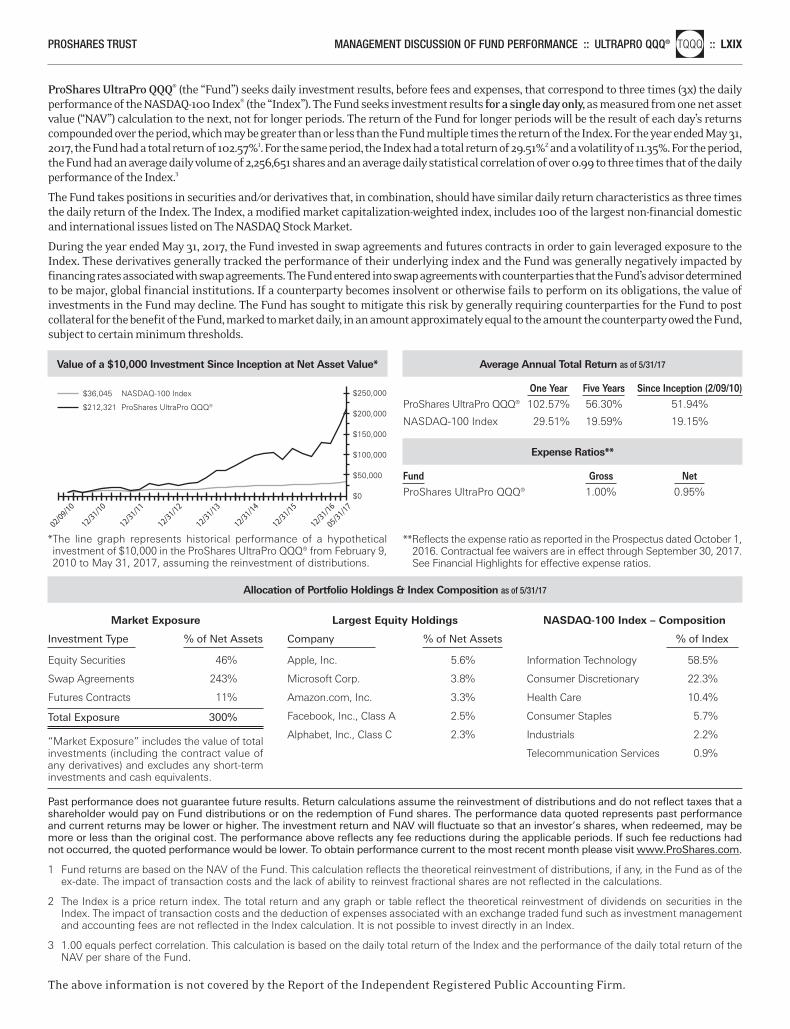
PROSHARES TRUST MANAGEMENT DISCUSSION OF FUND PERFORMANCE :: ULTRAPRO QQQ®nlTQQQ :: LXIX
Value of a $10,000 Investment Since Inception at Net Asset Value*
*The line graph represents historical performance of a hypothetical investment of $10,000 in the ProShares UltraPro QQQ® from February 9,2010 to May 31, 2017, assuming the reinvestment of distributions.
$250,000
$100,000
$150,000
$200,000
$50,000
$0
$36,045 NASDAQ-100 Index
$212,321 ProShares UltraPro QQQ®
02/09/10
12/31/10
12/31/16
12/31/15
12/31/14
12/31/13
12/31/12
12/31/11
05/31/17
Average Annual Total Return as of 5/31/17
One Year Five Years Since Inception (2/09/10) ProShares UltraPro QQQ® 102.57% 56.30% 51.94%
NASDAQ-100 Index 29.51% 19.59% 19.15%
Expense Ratios**
Fund Gross Net ProShares UltraPro QQQ® 1.00% 0.95%
**Reflects the expense ratio as reported in the Prospectus dated October 1,2016. Contractual fee waivers are in effect through September 30, 2017.See Financial Highlights for effective expense ratios.
ProShares UltraPro QQQ® (the “Fund”) seeks daily investment results, before fees and expenses, that correspond to three times (3x) the dailyperformance of the NASDAQ-100 Index® (the “Index”). The Fund seeks investment results for a single day only, as measured from one net assetvalue (“NAV”) calculation to the next, not for longer periods. The return of the Fund for longer periods will be the result of each day’s returnscompounded over the period, which may be greater than or less than the Fund multiple times the return of the Index. For the year ended May 31,2017, the Fund had a total return of 102.57%1. For the same period, the Index had a total return of 29.51%2 and a volatility of 11.35%. For the period,the Fund had an average daily volume of 2,256,651 shares and an average daily statistical correlation of over 0.99 to three times that of the dailyperformance of the Index.3
The Fund takes positions in securities and/or derivatives that, in combination, should have similar daily return characteristics as three timesthe daily return of the Index. The Index, a modified market capitalization-weighted index, includes 100 of the largest non-financial domesticand international issues listed on The NASDAQ Stock Market.
During the year ended May 31, 2017, the Fund invested in swap agreements and futures contracts in order to gain leveraged exposure to theIndex. These derivatives generally tracked the performance of their underlying index and the Fund was generally negatively impacted by financing rates associated with swap agreements. The Fund entered into swap agreements with counterparties that the Fund’s advisor determinedto be major, global financial institutions. If a counterparty becomes insolvent or otherwise fails to perform on its obligations, the value of investments in the Fund may decline. The Fund has sought to mitigate this risk by generally requiring counterparties for the Fund to postcollateral for the benefit of the Fund, marked to market daily, in an amount approximately equal to the amount the counterparty owed the Fund,subject to certain minimum thresholds.
Allocation of Portfolio Holdings & Index Composition as of 5/31/17
Past performance does not guarantee future results. Return calculations assume the reinvestment of distributions and do not reflect taxes that ashareholder would pay on Fund distributions or on the redemption of Fund shares. The performance data quoted represents past performanceand current returns may be lower or higher. The investment return and NAV will fluctuate so that an investor’s shares, when redeemed, may bemore or less than the original cost. The performance above reflects any fee reductions during the applicable periods. If such fee reductions hadnot occurred, the quoted performance would be lower. To obtain performance current to the most recent month please visit www.ProShares.com.
1 Fund returns are based on the NAV of the Fund. This calculation reflects the theoretical reinvestment of distributions, if any, in the Fund as of theex-date. The impact of transaction costs and the lack of ability to reinvest fractional shares are not reflected in the calculations.
2 The Index is a price return index. The total return and any graph or table reflect the theoretical reinvestment of dividends on securities in theIndex. The impact of transaction costs and the deduction of expenses associated with an exchange traded fund such as investment managementand accounting fees are not reflected in the Index calculation. It is not possible to invest directly in an Index.
3 1.00 equals perfect correlation. This calculation is based on the daily total return of the Index and the performance of the daily total return of theNAV per share of the Fund.
The above information is not covered by the Report of the Independent Registered Public Accounting Firm.
Market Exposure
Investment Type % of Net Assets
Equity Securities 46%
Swap Agreements 243%
Futures Contracts 11%
Total Exposure 300%
“Market Exposure” includes the value of totalinvestments (including the contract value ofany derivatives) and excludes any short-terminvestments and cash equivalents.
Largest Equity Holdings
Company % of Net Assets
Apple, Inc. 5.6%
Microsoft Corp. 3.8%
Amazon.com, Inc. 3.3%
Facebook, Inc., Class A 2.5%
Alphabet, Inc., Class C 2.3%
NASDAQ-100 Index – Composition
% of Index
Information Technology 58.5%
Consumer Discretionary 22.3%
Health Care 10.4%
Consumer Staples 5.7%
Industrials 2.2%
Telecommunication Services 0.9%
Merrill Corp - Proshares Trust Geared Book [96 Funds] Annual Report [Funds] 333-089822 05-31-2017 ED [AUX] | eperez | 28-Jul-17 17:36 | 17-15159-3.cg | Sequence: 8CHKSUM Content: 59357 Layout: 3434 Graphics: 25710 CLEAN
JOB: 17-15159-3 CYCLE#;BL#: 5; 0 TRIM: 8.25" x 10.75" COMPOSITECOLORS: Black, ~note-color 2, ~note-color 3 GRAPHICS: 15159-3_TQQQ_L.eps V1.5
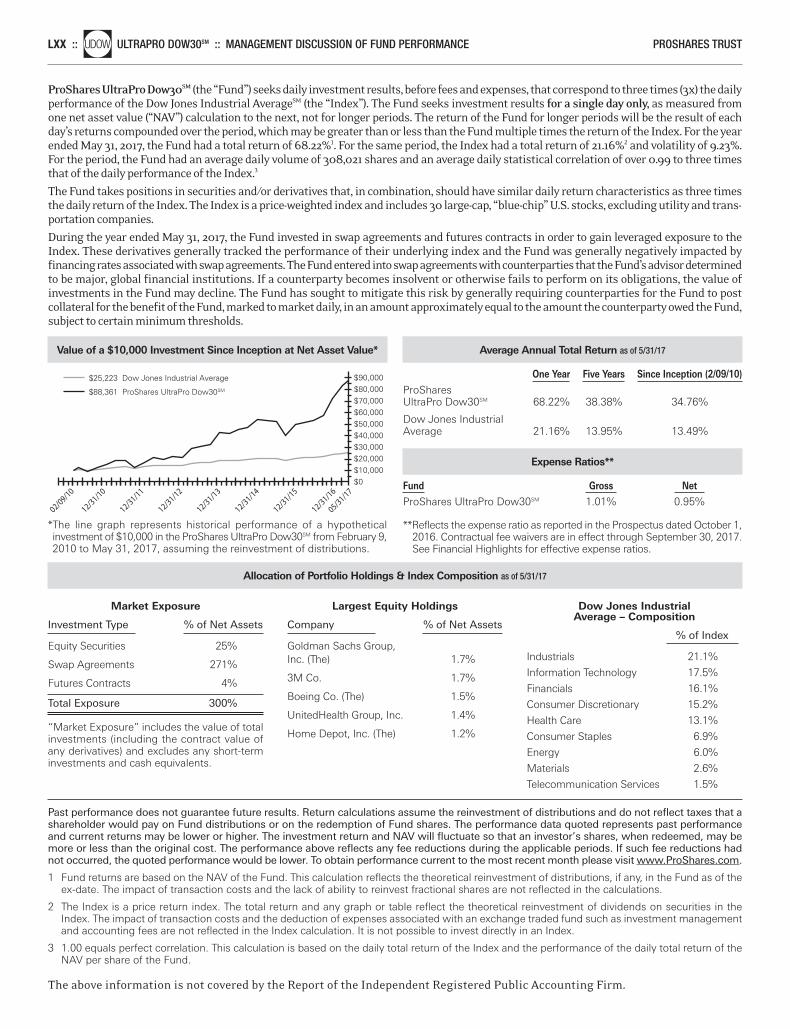
LXX ::nlUDOW ULTRAPRO DOW30SM :: MANAGEMENT DISCUSSION OF FUND PERFORMANCE PROSHARES TRUST
Value of a $10,000 Investment Since Inception at Net Asset Value*
*The line graph represents historical performance of a hypothetical investment of $10,000 in the ProShares UltraPro Dow30SM from February 9,2010 to May 31, 2017, assuming the reinvestment of distributions.
$90,000$80,000
$60,000$70,000
$40,000$50,000
$20,000$10,000
$30,000
$0
$25,223 Dow Jones Industrial Average
$88,361 ProShares UltraPro Dow30SM
02/09/10
12/31/10
12/31/16
12/31/15
12/31/14
12/31/13
12/31/12
12/31/11
05/31/17
Average Annual Total Return as of 5/31/17
One Year Five Years Since Inception (2/09/10) ProSharesUltraPro Dow30SM 68.22% 38.38% 34.76%
Dow Jones IndustrialAverage 21.16% 13.95% 13.49%
Expense Ratios**
Fund Gross Net ProShares UltraPro Dow30SM 1.01% 0.95%
**Reflects the expense ratio as reported in the Prospectus dated October 1,2016. Contractual fee waivers are in effect through September 30, 2017.See Financial Highlights for effective expense ratios.
ProShares UltraPro Dow30SM (the “Fund”) seeks daily investment results, before fees and expenses, that correspond to three times (3x) the dailyperformance of the Dow Jones Industrial AverageSM (the “Index”). The Fund seeks investment results for a single day only, as measured fromone net asset value (“NAV”) calculation to the next, not for longer periods. The return of the Fund for longer periods will be the result of eachday’s returns compounded over the period, which may be greater than or less than the Fund multiple times the return of the Index. For the yearended May 31, 2017, the Fund had a total return of 68.22%1. For the same period, the Index had a total return of 21.16%2 and volatility of 9.23%.For the period, the Fund had an average daily volume of 308,021 shares and an average daily statistical correlation of over 0.99 to three timesthat of the daily performance of the Index.3
The Fund takes positions in securities and/or derivatives that, in combination, should have similar daily return characteristics as three timesthe daily return of the Index. The Index is a price-weighted index and includes 30 large-cap, “blue-chip” U.S. stocks, excluding utility and trans-portation companies.
During the year ended May 31, 2017, the Fund invested in swap agreements and futures contracts in order to gain leveraged exposure to theIndex. These derivatives generally tracked the performance of their underlying index and the Fund was generally negatively impacted by financing rates associated with swap agreements. The Fund entered into swap agreements with counterparties that the Fund’s advisor determinedto be major, global financial institutions. If a counterparty becomes insolvent or otherwise fails to perform on its obligations, the value of investments in the Fund may decline. The Fund has sought to mitigate this risk by generally requiring counterparties for the Fund to postcollateral for the benefit of the Fund, marked to market daily, in an amount approximately equal to the amount the counterparty owed the Fund,subject to certain minimum thresholds.
Allocation of Portfolio Holdings & Index Composition as of 5/31/17
Past performance does not guarantee future results. Return calculations assume the reinvestment of distributions and do not reflect taxes that ashareholder would pay on Fund distributions or on the redemption of Fund shares. The performance data quoted represents past performanceand current returns may be lower or higher. The investment return and NAV will fluctuate so that an investor’s shares, when redeemed, may bemore or less than the original cost. The performance above reflects any fee reductions during the applicable periods. If such fee reductions hadnot occurred, the quoted performance would be lower. To obtain performance current to the most recent month please visit www.ProShares.com.
1 Fund returns are based on the NAV of the Fund. This calculation reflects the theoretical reinvestment of distributions, if any, in the Fund as of theex-date. The impact of transaction costs and the lack of ability to reinvest fractional shares are not reflected in the calculations.
2 The Index is a price return index. The total return and any graph or table reflect the theoretical reinvestment of dividends on securities in theIndex. The impact of transaction costs and the deduction of expenses associated with an exchange traded fund such as investment managementand accounting fees are not reflected in the Index calculation. It is not possible to invest directly in an Index.
3 1.00 equals perfect correlation. This calculation is based on the daily total return of the Index and the performance of the daily total return of theNAV per share of the Fund.
The above information is not covered by the Report of the Independent Registered Public Accounting Firm.
Market Exposure
Investment Type % of Net Assets
Equity Securities 25%
Swap Agreements 271%
Futures Contracts 4%
Total Exposure 300%
“Market Exposure” includes the value of totalinvestments (including the contract value ofany derivatives) and excludes any short-terminvestments and cash equivalents.
Largest Equity Holdings
Company % of Net Assets
Goldman Sachs Group,Inc. (The) 1.7%
3M Co. 1.7%
Boeing Co. (The) 1.5%
UnitedHealth Group, Inc. 1.4%
Home Depot, Inc. (The) 1.2%
Dow Jones IndustrialAverage – Composition
% of Index
Industrials 21.1%
Information Technology 17.5%
Financials 16.1%
Consumer Discretionary 15.2%
Health Care 13.1%
Consumer Staples 6.9%
Energy 6.0%
Materials 2.6%
Telecommunication Services 1.5%
Merrill Corp - Proshares Trust Geared Book [96 Funds] Annual Report [Funds] 333-089822 05-31-2017 ED [AUX] | eperez | 28-Jul-17 17:36 | 17-15159-3.cg | Sequence: 9CHKSUM Content: 10152 Layout: 18342 Graphics: 15509 CLEAN
JOB: 17-15159-3 CYCLE#;BL#: 5; 0 TRIM: 8.25" x 10.75" COMPOSITECOLORS: Black, ~note-color 2, ~note-color 3 GRAPHICS: 15159-3_UDOW_L.eps V1.5
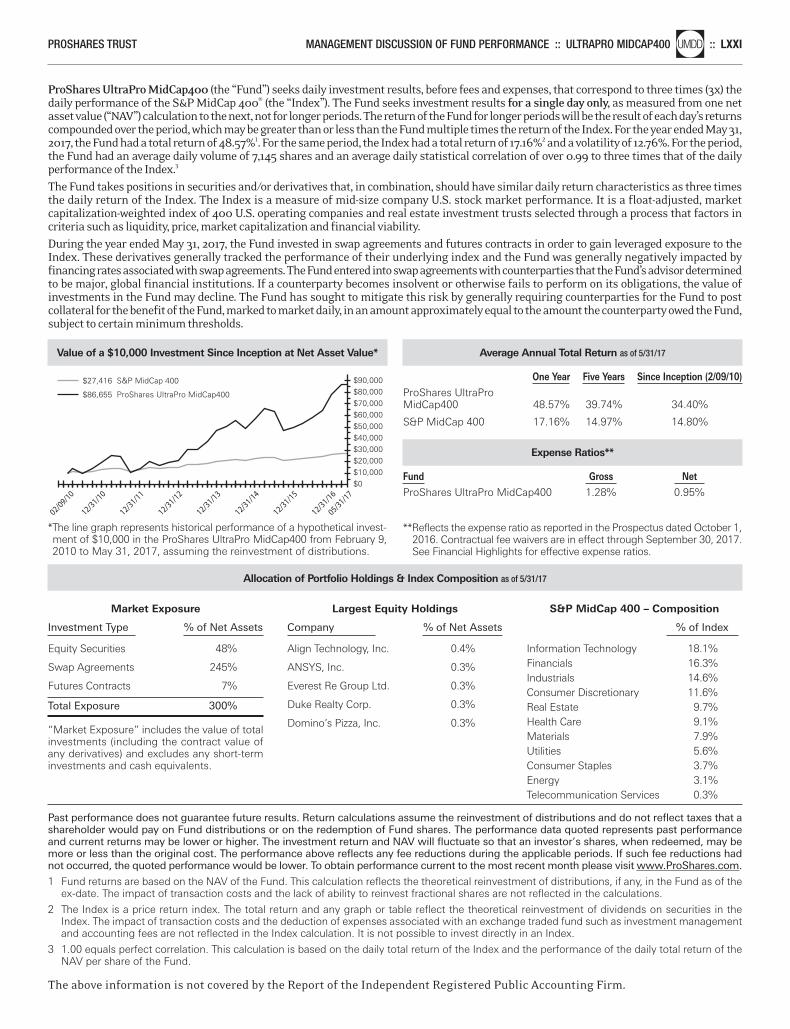
PROSHARES TRUST MANAGEMENT DISCUSSION OF FUND PERFORMANCE :: ULTRAPRO MIDCAP400nlUMDD :: LXXI
Value of a $10,000 Investment Since Inception at Net Asset Value*
*The line graph represents historical performance of a hypothetical invest-ment of $10,000 in the ProShares UltraPro MidCap400 from February 9,2010 to May 31, 2017, assuming the reinvestment of distributions.
$90,000
$40,000
$60,000
$80,000$70,000
$20,000$30,000
$50,000
$10,000$0
$27,416 S&P MidCap 400
$86,655 ProShares UltraPro MidCap400
02/09/10
12/31/10
12/31/16
12/31/15
12/31/14
12/31/13
12/31/12
12/31/11
05/31/17
Average Annual Total Return as of 5/31/17
One Year Five Years Since Inception (2/09/10) ProShares UltraProMidCap400 48.57% 39.74% 34.40%
S&P MidCap 400 17.16% 14.97% 14.80%
Expense Ratios**
Fund Gross Net ProShares UltraPro MidCap400 1.28% 0.95%
**Reflects the expense ratio as reported in the Prospectus dated October 1,2016. Contractual fee waivers are in effect through September 30, 2017.See Financial Highlights for effective expense ratios.
ProShares UltraPro MidCap400 (the “Fund”) seeks daily investment results, before fees and expenses, that correspond to three times (3x) thedaily performance of the S&P MidCap 400® (the “Index”). The Fund seeks investment results for a single day only, as measured from one netasset value (“NAV”) calculation to the next, not for longer periods. The return of the Fund for longer periods will be the result of each day’s returnscompounded over the period, which may be greater than or less than the Fund multiple times the return of the Index. For the year ended May 31,2017, the Fund had a total return of 48.57%1. For the same period, the Index had a total return of 17.16%2 and a volatility of 12.76%. For the period,the Fund had an average daily volume of 7,145 shares and an average daily statistical correlation of over 0.99 to three times that of the daily performance of the Index.3
The Fund takes positions in securities and/or derivatives that, in combination, should have similar daily return characteristics as three timesthe daily return of the Index. The Index is a measure of mid-size company U.S. stock market performance. It is a float-adjusted, market capitalization-weighted index of 400 U.S. operating companies and real estate investment trusts selected through a process that factors incriteria such as liquidity, price, market capitalization and financial viability.During the year ended May 31, 2017, the Fund invested in swap agreements and futures contracts in order to gain leveraged exposure to theIndex. These derivatives generally tracked the performance of their underlying index and the Fund was generally negatively impacted by financing rates associated with swap agreements. The Fund entered into swap agreements with counterparties that the Fund’s advisor determinedto be major, global financial institutions. If a counterparty becomes insolvent or otherwise fails to perform on its obligations, the value of investments in the Fund may decline. The Fund has sought to mitigate this risk by generally requiring counterparties for the Fund to postcollateral for the benefit of the Fund, marked to market daily, in an amount approximately equal to the amount the counterparty owed the Fund,subject to certain minimum thresholds.
Allocation of Portfolio Holdings & Index Composition as of 5/31/17
Past performance does not guarantee future results. Return calculations assume the reinvestment of distributions and do not reflect taxes that ashareholder would pay on Fund distributions or on the redemption of Fund shares. The performance data quoted represents past performanceand current returns may be lower or higher. The investment return and NAV will fluctuate so that an investor’s shares, when redeemed, may bemore or less than the original cost. The performance above reflects any fee reductions during the applicable periods. If such fee reductions hadnot occurred, the quoted performance would be lower. To obtain performance current to the most recent month please visit www.ProShares.com.
1 Fund returns are based on the NAV of the Fund. This calculation reflects the theoretical reinvestment of distributions, if any, in the Fund as of theex-date. The impact of transaction costs and the lack of ability to reinvest fractional shares are not reflected in the calculations.
2 The Index is a price return index. The total return and any graph or table reflect the theoretical reinvestment of dividends on securities in theIndex. The impact of transaction costs and the deduction of expenses associated with an exchange traded fund such as investment managementand accounting fees are not reflected in the Index calculation. It is not possible to invest directly in an Index.
3 1.00 equals perfect correlation. This calculation is based on the daily total return of the Index and the performance of the daily total return of theNAV per share of the Fund.
The above information is not covered by the Report of the Independent Registered Public Accounting Firm.
Market Exposure
Investment Type % of Net Assets
Equity Securities 48%
Swap Agreements 245%
Futures Contracts 7%
Total Exposure 300%
“Market Exposure” includes the value of totalinvestments (including the contract value ofany derivatives) and excludes any short-terminvestments and cash equivalents.
Largest Equity Holdings
Company % of Net Assets
Align Technology, Inc. 0.4%
ANSYS, Inc. 0.3%
Everest Re Group Ltd. 0.3%
Duke Realty Corp. 0.3%
Domino’s Pizza, Inc. 0.3%
S&P MidCap 400 – Composition
% of Index
Information Technology 18.1%Financials 16.3%Industrials 14.6%Consumer Discretionary 11.6%Real Estate 9.7%Health Care 9.1%Materials 7.9%Utilities 5.6%Consumer Staples 3.7%Energy 3.1%Telecommunication Services 0.3%
Merrill Corp - Proshares Trust Geared Book [96 Funds] Annual Report [Funds] 333-089822 05-31-2017 ED [AUX] | eperez | 28-Jul-17 17:36 | 17-15159-3.cg | Sequence: 10CHKSUM Content: 45162 Layout: 8406 Graphics: 23136 CLEAN
JOB: 17-15159-3 CYCLE#;BL#: 5; 0 TRIM: 8.25" x 10.75" COMPOSITECOLORS: Black, ~note-color 2, ~note-color 3 GRAPHICS: 15159-3_UMDD_L.eps V1.5
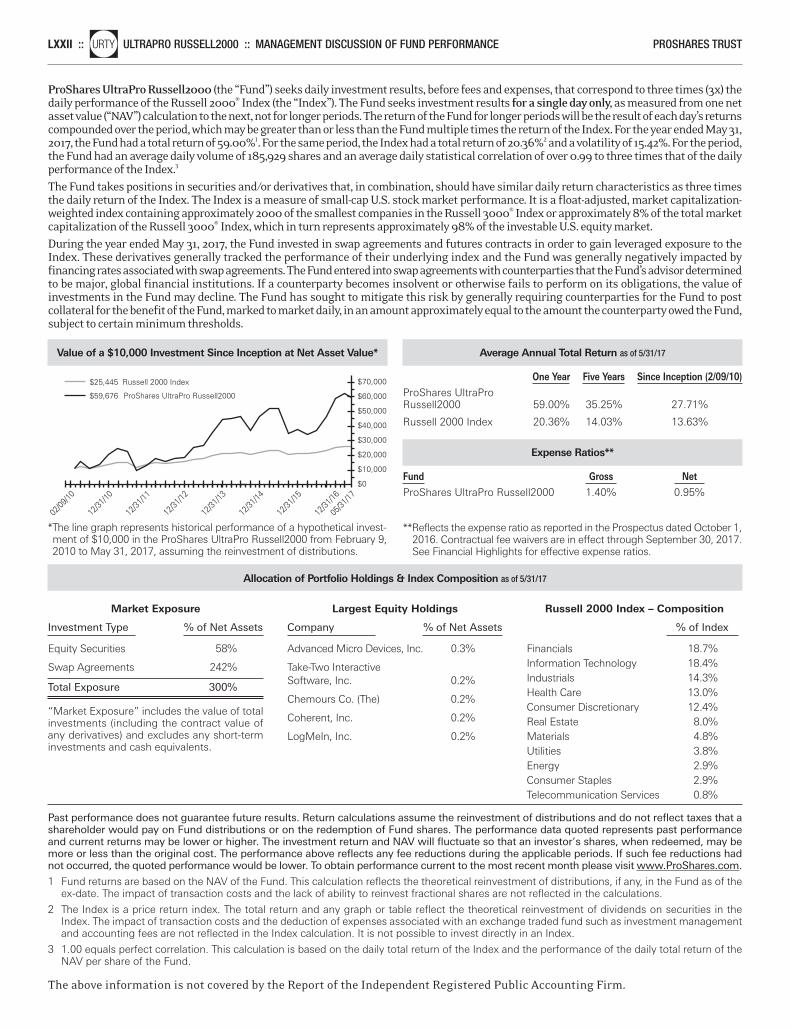
LXXII ::nlURTY ULTRAPRO RUSSELL2000 :: MANAGEMENT DISCUSSION OF FUND PERFORMANCE PROSHARES TRUST
Value of a $10,000 Investment Since Inception at Net Asset Value*
*The line graph represents historical performance of a hypothetical invest-ment of $10,000 in the ProShares UltraPro Russell2000 from February 9,2010 to May 31, 2017, assuming the reinvestment of distributions.
$70,000
$60,000
$50,000
$30,000
$40,000
$20,000
$0
$10,000
$25,445 Russell 2000 Index
$59,676 ProShares UltraPro Russell2000
02/09
/10
12/31
/10
12/31
/16
12/31
/15
12/31
/14
12/31
/13
12/31
/12
12/31
/11
05/31
/17
Average Annual Total Return as of 5/31/17
One Year Five Years Since Inception (2/09/10) ProShares UltraProRussell2000 59.00% 35.25% 27.71%
Russell 2000 Index 20.36% 14.03% 13.63%
Expense Ratios**
Fund Gross Net ProShares UltraPro Russell2000 1.40% 0.95%
**Reflects the expense ratio as reported in the Prospectus dated October 1,2016. Contractual fee waivers are in effect through September 30, 2017.See Financial Highlights for effective expense ratios.
ProShares UltraPro Russell2000 (the “Fund”) seeks daily investment results, before fees and expenses, that correspond to three times (3x) thedaily performance of the Russell 2000® Index (the “Index”). The Fund seeks investment results for a single day only, as measured from one netasset value (“NAV”) calculation to the next, not for longer periods. The return of the Fund for longer periods will be the result of each day’s returnscompounded over the period, which may be greater than or less than the Fund multiple times the return of the Index. For the year ended May 31,2017, the Fund had a total return of 59.00%1. For the same period, the Index had a total return of 20.36%2 and a volatility of 15.42%. For the period,the Fund had an average daily volume of 185,929 shares and an average daily statistical correlation of over 0.99 to three times that of the dailyperformance of the Index.3
The Fund takes positions in securities and/or derivatives that, in combination, should have similar daily return characteristics as three timesthe daily return of the Index. The Index is a measure of small-cap U.S. stock market performance. It is a float-adjusted, market capitalization-weighted index containing approximately 2000 of the smallest companies in the Russell 3000® Index or approximately 8% of the total marketcapitalization of the Russell 3000® Index, which in turn represents approximately 98% of the investable U.S. equity market.During the year ended May 31, 2017, the Fund invested in swap agreements and futures contracts in order to gain leveraged exposure to theIndex. These derivatives generally tracked the performance of their underlying index and the Fund was generally negatively impacted by financing rates associated with swap agreements. The Fund entered into swap agreements with counterparties that the Fund’s advisor determinedto be major, global financial institutions. If a counterparty becomes insolvent or otherwise fails to perform on its obligations, the value of investments in the Fund may decline. The Fund has sought to mitigate this risk by generally requiring counterparties for the Fund to postcollateral for the benefit of the Fund, marked to market daily, in an amount approximately equal to the amount the counterparty owed the Fund,subject to certain minimum thresholds.
Allocation of Portfolio Holdings & Index Composition as of 5/31/17
Past performance does not guarantee future results. Return calculations assume the reinvestment of distributions and do not reflect taxes that ashareholder would pay on Fund distributions or on the redemption of Fund shares. The performance data quoted represents past performanceand current returns may be lower or higher. The investment return and NAV will fluctuate so that an investor’s shares, when redeemed, may bemore or less than the original cost. The performance above reflects any fee reductions during the applicable periods. If such fee reductions hadnot occurred, the quoted performance would be lower. To obtain performance current to the most recent month please visit www.ProShares.com.
1 Fund returns are based on the NAV of the Fund. This calculation reflects the theoretical reinvestment of distributions, if any, in the Fund as of theex-date. The impact of transaction costs and the lack of ability to reinvest fractional shares are not reflected in the calculations.
2 The Index is a price return index. The total return and any graph or table reflect the theoretical reinvestment of dividends on securities in theIndex. The impact of transaction costs and the deduction of expenses associated with an exchange traded fund such as investment managementand accounting fees are not reflected in the Index calculation. It is not possible to invest directly in an Index.
3 1.00 equals perfect correlation. This calculation is based on the daily total return of the Index and the performance of the daily total return of theNAV per share of the Fund.
The above information is not covered by the Report of the Independent Registered Public Accounting Firm.
Market Exposure
Investment Type % of Net Assets
Equity Securities 58%
Swap Agreements 242%
Total Exposure 300%
“Market Exposure” includes the value of totalinvestments (including the contract value ofany derivatives) and excludes any short-terminvestments and cash equivalents.
Largest Equity Holdings
Company % of Net Assets
Advanced Micro Devices, Inc. 0.3%
Take-Two InteractiveSoftware, Inc. 0.2%
Chemours Co. (The) 0.2%
Coherent, Inc. 0.2%
LogMeIn, Inc. 0.2%
Russell 2000 Index – Composition
% of Index
Financials 18.7%Information Technology 18.4%Industrials 14.3%Health Care 13.0%Consumer Discretionary 12.4%Real Estate 8.0%Materials 4.8%Utilities 3.8%Energy 2.9%Consumer Staples 2.9%Telecommunication Services 0.8%
Merrill Corp - Proshares Trust Geared Book [96 Funds] Annual Report [Funds] 333-089822 05-31-2017 ED [AUX] | eperez | 28-Jul-17 17:36 | 17-15159-3.cg | Sequence: 11CHKSUM Content: 23055 Layout: 9278 Graphics: 43751 CLEAN
JOB: 17-15159-3 CYCLE#;BL#: 5; 0 TRIM: 8.25" x 10.75" COMPOSITECOLORS: Black, ~note-color 2, ~note-color 3 GRAPHICS: 15159-3_URTY_L.eps V1.5
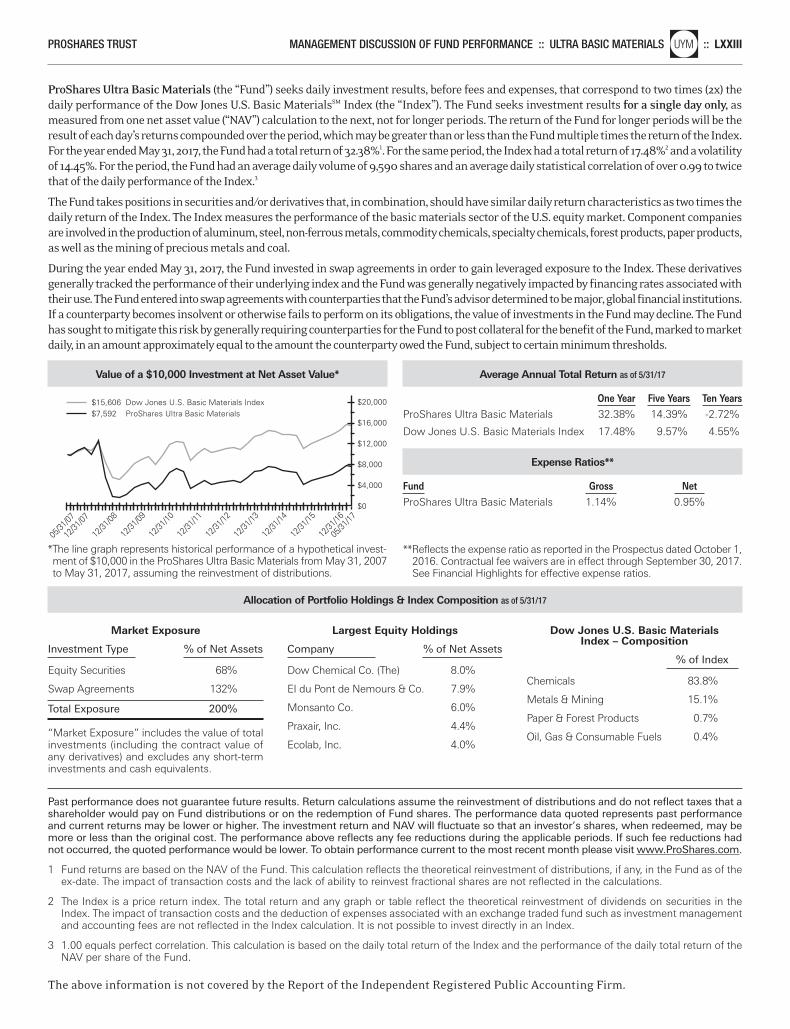
PROSHARES TRUST MANAGEMENT DISCUSSION OF FUND PERFORMANCE :: ULTRA BASIC MATERIALSnlUYM :: LXXIII
Value of a $10,000 Investment at Net Asset Value*
*The line graph represents historical performance of a hypothetical invest-ment of $10,000 in the ProShares Ultra Basic Materials from May 31, 2007to May 31, 2017, assuming the reinvestment of distributions.
$20,000
$16,000
$0
$12,000
$4,000
$8,000
$15,606 Dow Jones U.S. Basic Materials Index$7,592 ProShares Ultra Basic Materials
12/31
/07
12/31
/10
12/31
/09
12/31
/08
12/31
/16
12/31
/15
12/31
/14
12/31
/13
12/31
/12
12/31
/11
05/31
/17
05/31
/07
Average Annual Total Return as of 5/31/17
One Year Five Years Ten Years ProShares Ultra Basic Materials 32.38% 14.39% -2.72%
Dow Jones U.S. Basic Materials Index 17.48% 9.57% 4.55%
Expense Ratios**
Fund Gross Net ProShares Ultra Basic Materials 1.14% 0.95%
**Reflects the expense ratio as reported in the Prospectus dated October 1,2016. Contractual fee waivers are in effect through September 30, 2017.See Financial Highlights for effective expense ratios.
ProShares Ultra Basic Materials (the “Fund”) seeks daily investment results, before fees and expenses, that correspond to two times (2x) thedaily performance of the Dow Jones U.S. Basic MaterialsSM Index (the “Index”). The Fund seeks investment results for a single day only, as measured from one net asset value (“NAV”) calculation to the next, not for longer periods. The return of the Fund for longer periods will be theresult of each day’s returns compounded over the period, which may be greater than or less than the Fund multiple times the return of the Index.For the year ended May 31, 2017, the Fund had a total return of 32.38%1. For the same period, the Index had a total return of 17.48%2 and a volatilityof 14.45%. For the period, the Fund had an average daily volume of 9,590 shares and an average daily statistical correlation of over 0.99 to twicethat of the daily performance of the Index.3
The Fund takes positions in securities and/or derivatives that, in combination, should have similar daily return characteristics as two times thedaily return of the Index. The Index measures the performance of the basic materials sector of the U.S. equity market. Component companiesare involved in the production of aluminum, steel, non-ferrous metals, commodity chemicals, specialty chemicals, forest products, paper products,as well as the mining of precious metals and coal.
During the year ended May 31, 2017, the Fund invested in swap agreements in order to gain leveraged exposure to the Index. These derivativesgenerally tracked the performance of their underlying index and the Fund was generally negatively impacted by financing rates associated withtheir use. The Fund entered into swap agreements with counterparties that the Fund’s advisor determined to be major, global financial institutions.If a counterparty becomes insolvent or otherwise fails to perform on its obligations, the value of investments in the Fund may decline. The Fundhas sought to mitigate this risk by generally requiring counterparties for the Fund to post collateral for the benefit of the Fund, marked to marketdaily, in an amount approximately equal to the amount the counterparty owed the Fund, subject to certain minimum thresholds.
Allocation of Portfolio Holdings & Index Composition as of 5/31/17
Past performance does not guarantee future results. Return calculations assume the reinvestment of distributions and do not reflect taxes that ashareholder would pay on Fund distributions or on the redemption of Fund shares. The performance data quoted represents past performanceand current returns may be lower or higher. The investment return and NAV will fluctuate so that an investor’s shares, when redeemed, may bemore or less than the original cost. The performance above reflects any fee reductions during the applicable periods. If such fee reductions hadnot occurred, the quoted performance would be lower. To obtain performance current to the most recent month please visit www.ProShares.com.
1 Fund returns are based on the NAV of the Fund. This calculation reflects the theoretical reinvestment of distributions, if any, in the Fund as of theex-date. The impact of transaction costs and the lack of ability to reinvest fractional shares are not reflected in the calculations.
2 The Index is a price return index. The total return and any graph or table reflect the theoretical reinvestment of dividends on securities in theIndex. The impact of transaction costs and the deduction of expenses associated with an exchange traded fund such as investment managementand accounting fees are not reflected in the Index calculation. It is not possible to invest directly in an Index.
3 1.00 equals perfect correlation. This calculation is based on the daily total return of the Index and the performance of the daily total return of theNAV per share of the Fund.
The above information is not covered by the Report of the Independent Registered Public Accounting Firm.
Market Exposure
Investment Type % of Net Assets
Equity Securities 68%
Swap Agreements 132%
Total Exposure 200%
“Market Exposure” includes the value of totalinvestments (including the contract value ofany derivatives) and excludes any short-terminvestments and cash equivalents.
Largest Equity Holdings
Company % of Net Assets
Dow Chemical Co. (The) 8.0%
EI du Pont de Nemours & Co. 7.9%
Monsanto Co. 6.0%
Praxair, Inc. 4.4%
Ecolab, Inc. 4.0%
Dow Jones U.S. Basic MaterialsIndex – Composition
% of Index
Chemicals 83.8%
Metals & Mining 15.1%
Paper & Forest Products 0.7%
Oil, Gas & Consumable Fuels 0.4%
Merrill Corp - Proshares Trust Geared Book [96 Funds] Annual Report [Funds] 333-089822 05-31-2017 ED [AUX] | eperez | 28-Jul-17 17:36 | 17-15159-3.cg | Sequence: 12CHKSUM Content: 51259 Layout: 63581 Graphics: 52436 CLEAN
JOB: 17-15159-3 CYCLE#;BL#: 5; 0 TRIM: 8.25" x 10.75" COMPOSITECOLORS: Black, ~note-color 2, ~note-color 3 GRAPHICS: 15159-3_UYM_L.eps V1.5
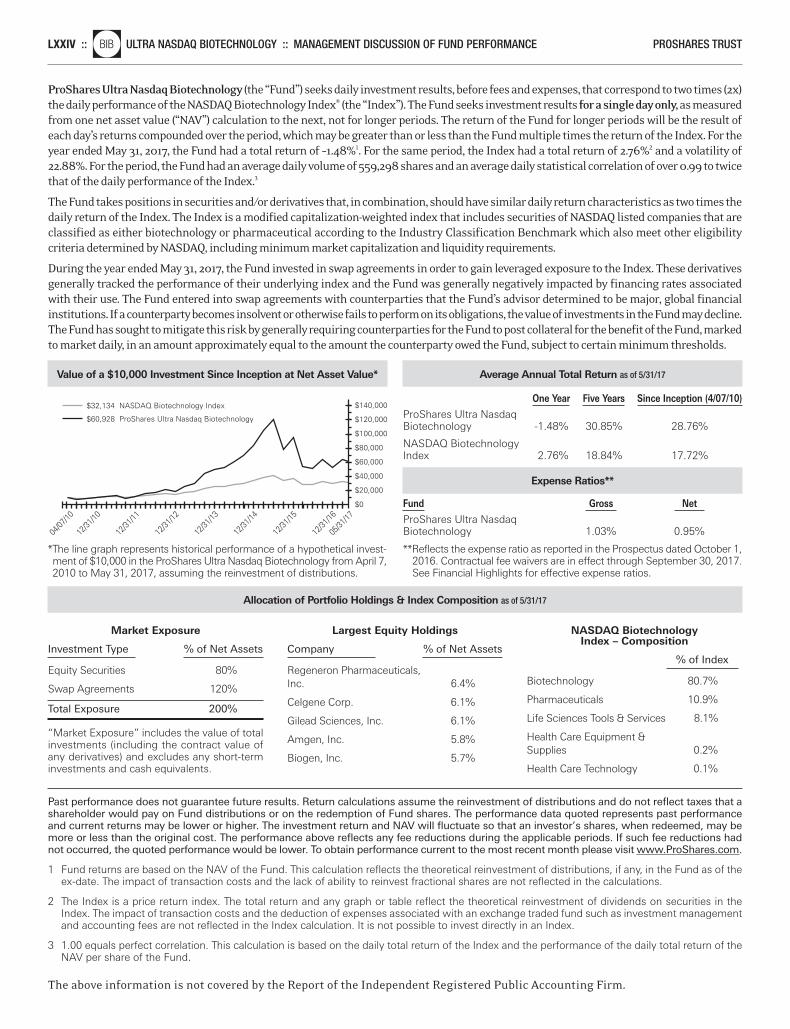
LXXIV ::nlBIB ULTRA NASDAQ BIOTECHNOLOGY :: MANAGEMENT DISCUSSION OF FUND PERFORMANCE PROSHARES TRUST
Value of a $10,000 Investment Since Inception at Net Asset Value*
*The line graph represents historical performance of a hypothetical invest-ment of $10,000 in the ProShares Ultra Nasdaq Biotechnology from April 7,2010 to May 31, 2017, assuming the reinvestment of distributions.
$140,000
$120,000
$40,000
$60,000
$80,000
$100,000
$0
$20,000
$32,134 NASDAQ Biotechnology Index
$60,928 ProShares Ultra Nasdaq Biotechnology
04/07
/10
12/31
/10
12/31
/16
12/31
/15
12/31
/14
12/31
/13
12/31
/12
12/31
/11
05/31
/17
Average Annual Total Return as of 5/31/17
One Year Five Years Since Inception (4/07/10) ProShares Ultra NasdaqBiotechnology -1.48% 30.85% 28.76%
NASDAQ BiotechnologyIndex 2.76% 18.84% 17.72%
Expense Ratios**
Fund Gross Net ProShares Ultra NasdaqBiotechnology 1.03% 0.95%
**Reflects the expense ratio as reported in the Prospectus dated October 1,2016. Contractual fee waivers are in effect through September 30, 2017.See Financial Highlights for effective expense ratios.
ProShares Ultra Nasdaq Biotechnology (the “Fund”) seeks daily investment results, before fees and expenses, that correspond to two times (2x)the daily performance of the NASDAQ Biotechnology Index® (the “Index”). The Fund seeks investment results for a single day only,as measuredfrom one net asset value (“NAV”) calculation to the next, not for longer periods. The return of the Fund for longer periods will be the result ofeach day’s returns compounded over the period, which may be greater than or less than the Fund multiple times the return of the Index. For theyear ended May 31, 2017, the Fund had a total return of –1.48%1. For the same period, the Index had a total return of 2.76%2 and a volatility of22.88%. For the period, the Fund had an average daily volume of 559,298 shares and an average daily statistical correlation of over 0.99 to twicethat of the daily performance of the Index.3
The Fund takes positions in securities and/or derivatives that, in combination, should have similar daily return characteristics as two times thedaily return of the Index. The Index is a modified capitalization-weighted index that includes securities of NASDAQ listed companies that areclassified as either biotechnology or pharmaceutical according to the Industry Classification Benchmark which also meet other eligibilitycriteria determined by NASDAQ, including minimum market capitalization and liquidity requirements.
During the year ended May 31, 2017, the Fund invested in swap agreements in order to gain leveraged exposure to the Index. These derivativesgenerally tracked the performance of their underlying index and the Fund was generally negatively impacted by financing rates associatedwith their use. The Fund entered into swap agreements with counterparties that the Fund’s advisor determined to be major, global financial institutions. If a counterparty becomes insolvent or otherwise fails to perform on its obligations, the value of investments in the Fund may decline.The Fund has sought to mitigate this risk by generally requiring counterparties for the Fund to post collateral for the benefit of the Fund, markedto market daily, in an amount approximately equal to the amount the counterparty owed the Fund, subject to certain minimum thresholds.
Allocation of Portfolio Holdings & Index Composition as of 5/31/17
Past performance does not guarantee future results. Return calculations assume the reinvestment of distributions and do not reflect taxes that ashareholder would pay on Fund distributions or on the redemption of Fund shares. The performance data quoted represents past performanceand current returns may be lower or higher. The investment return and NAV will fluctuate so that an investor’s shares, when redeemed, may bemore or less than the original cost. The performance above reflects any fee reductions during the applicable periods. If such fee reductions hadnot occurred, the quoted performance would be lower. To obtain performance current to the most recent month please visit www.ProShares.com.
1 Fund returns are based on the NAV of the Fund. This calculation reflects the theoretical reinvestment of distributions, if any, in the Fund as of theex-date. The impact of transaction costs and the lack of ability to reinvest fractional shares are not reflected in the calculations.
2 The Index is a price return index. The total return and any graph or table reflect the theoretical reinvestment of dividends on securities in theIndex. The impact of transaction costs and the deduction of expenses associated with an exchange traded fund such as investment managementand accounting fees are not reflected in the Index calculation. It is not possible to invest directly in an Index.
3 1.00 equals perfect correlation. This calculation is based on the daily total return of the Index and the performance of the daily total return of theNAV per share of the Fund.
The above information is not covered by the Report of the Independent Registered Public Accounting Firm.
Market Exposure
Investment Type % of Net Assets
Equity Securities 80%
Swap Agreements 120%
Total Exposure 200%
“Market Exposure” includes the value of totalinvestments (including the contract value ofany derivatives) and excludes any short-terminvestments and cash equivalents.
Largest Equity Holdings
Company % of Net Assets
Regeneron Pharmaceuticals,Inc. 6.4%
Celgene Corp. 6.1%
Gilead Sciences, Inc. 6.1%
Amgen, Inc. 5.8%
Biogen, Inc. 5.7%
NASDAQ BiotechnologyIndex – Composition
% of Index
Biotechnology 80.7%
Pharmaceuticals 10.9%
Life Sciences Tools & Services 8.1%
Health Care Equipment &Supplies 0.2%
Health Care Technology 0.1%
Merrill Corp - Proshares Trust Geared Book [96 Funds] Annual Report [Funds] 333-089822 05-31-2017 ED [AUX] | eperez | 28-Jul-17 17:36 | 17-15159-3.cg | Sequence: 13CHKSUM Content: 45150 Layout: 25228 Graphics: 51905 CLEAN
JOB: 17-15159-3 CYCLE#;BL#: 5; 0 TRIM: 8.25" x 10.75" COMPOSITECOLORS: Black, ~note-color 2, ~note-color 3 GRAPHICS: 15159-3_BIB_L.eps V1.5
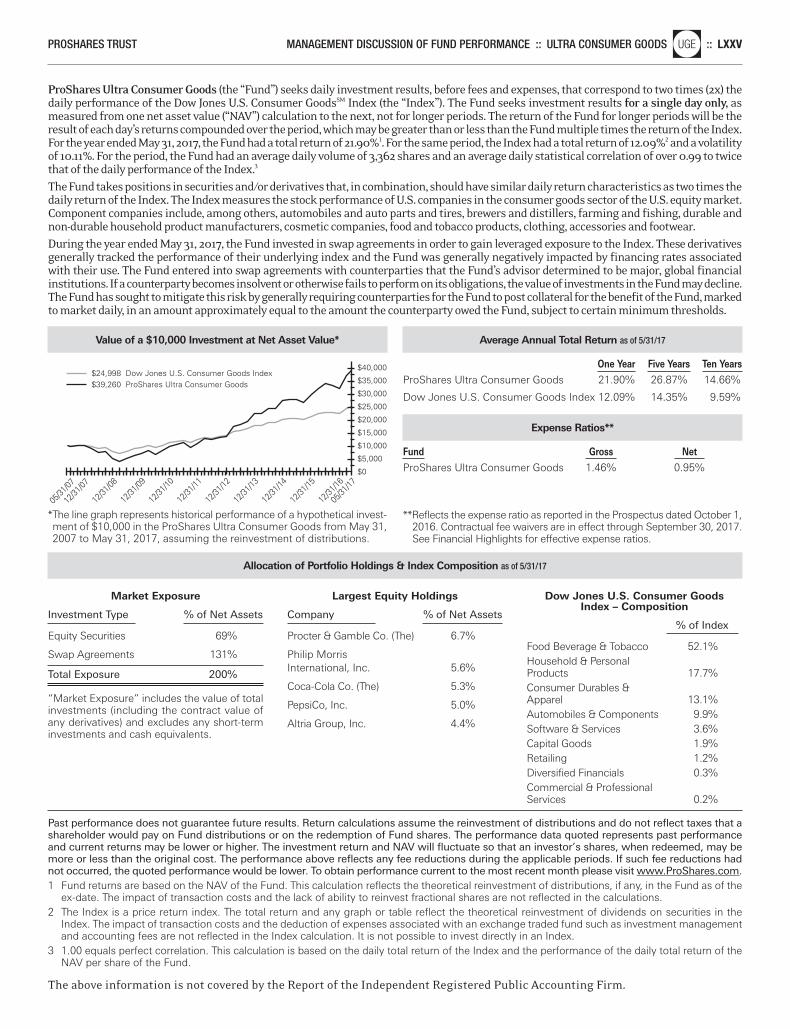
PROSHARES TRUST MANAGEMENT DISCUSSION OF FUND PERFORMANCE :: ULTRA CONSUMER GOODSnlUGE :: LXXV
Value of a $10,000 Investment at Net Asset Value*
*The line graph represents historical performance of a hypothetical invest-ment of $10,000 in the ProShares Ultra Consumer Goods from May 31,2007 to May 31, 2017, assuming the reinvestment of distributions.
$24,998 Dow Jones U.S. Consumer Goods Index$39,260 ProShares Ultra Consumer Goods
$40,000
$35,000
$30,000
$25,000
$20,000
$0
$15,000
$5,000
$10,000
12/31
/07
12/31
/10
12/31
/09
12/31
/08
12/31
/16
12/31
/15
12/31
/14
12/31
/13
12/31
/12
12/31
/11
05/31
/17
05/31
/07
Average Annual Total Return as of 5/31/17
One Year Five Years Ten Years ProShares Ultra Consumer Goods 21.90% 26.87% 14.66%
Dow Jones U.S. Consumer Goods Index 12.09% 14.35% 9.59%
Expense Ratios**
Fund Gross Net ProShares Ultra Consumer Goods 1.46% 0.95%
**Reflects the expense ratio as reported in the Prospectus dated October 1,2016. Contractual fee waivers are in effect through September 30, 2017.See Financial Highlights for effective expense ratios.
ProShares Ultra Consumer Goods (the “Fund”) seeks daily investment results, before fees and expenses, that correspond to two times (2x) thedaily performance of the Dow Jones U.S. Consumer GoodsSM Index (the “Index”). The Fund seeks investment results for a single day only, asmeasured from one net asset value (“NAV”) calculation to the next, not for longer periods. The return of the Fund for longer periods will be theresult of each day’s returns compounded over the period, which may be greater than or less than the Fund multiple times the return of the Index.For the year ended May 31, 2017, the Fund had a total return of 21.90%1. For the same period, the Index had a total return of 12.09%2 and a volatilityof 10.11%. For the period, the Fund had an average daily volume of 3,362 shares and an average daily statistical correlation of over 0.99 to twicethat of the daily performance of the Index.3
The Fund takes positions in securities and/or derivatives that, in combination, should have similar daily return characteristics as two times thedaily return of the Index. The Index measures the stock performance of U.S. companies in the consumer goods sector of the U.S. equity market.Component companies include, among others, automobiles and auto parts and tires, brewers and distillers, farming and fishing, durable andnon-durable household product manufacturers, cosmetic companies, food and tobacco products, clothing, accessories and footwear.During the year ended May 31, 2017, the Fund invested in swap agreements in order to gain leveraged exposure to the Index. These derivativesgenerally tracked the performance of their underlying index and the Fund was generally negatively impacted by financing rates associatedwith their use. The Fund entered into swap agreements with counterparties that the Fund’s advisor determined to be major, global financial institutions. If a counterparty becomes insolvent or otherwise fails to perform on its obligations, the value of investments in the Fund may decline.The Fund has sought to mitigate this risk by generally requiring counterparties for the Fund to post collateral for the benefit of the Fund, markedto market daily, in an amount approximately equal to the amount the counterparty owed the Fund, subject to certain minimum thresholds.
Allocation of Portfolio Holdings & Index Composition as of 5/31/17
Past performance does not guarantee future results. Return calculations assume the reinvestment of distributions and do not reflect taxes that ashareholder would pay on Fund distributions or on the redemption of Fund shares. The performance data quoted represents past performanceand current returns may be lower or higher. The investment return and NAV will fluctuate so that an investor’s shares, when redeemed, may bemore or less than the original cost. The performance above reflects any fee reductions during the applicable periods. If such fee reductions hadnot occurred, the quoted performance would be lower. To obtain performance current to the most recent month please visit www.ProShares.com.1 Fund returns are based on the NAV of the Fund. This calculation reflects the theoretical reinvestment of distributions, if any, in the Fund as of the
ex-date. The impact of transaction costs and the lack of ability to reinvest fractional shares are not reflected in the calculations.2 The Index is a price return index. The total return and any graph or table reflect the theoretical reinvestment of dividends on securities in the
Index. The impact of transaction costs and the deduction of expenses associated with an exchange traded fund such as investment managementand accounting fees are not reflected in the Index calculation. It is not possible to invest directly in an Index.
3 1.00 equals perfect correlation. This calculation is based on the daily total return of the Index and the performance of the daily total return of theNAV per share of the Fund.
The above information is not covered by the Report of the Independent Registered Public Accounting Firm.
Market Exposure
Investment Type % of Net Assets
Equity Securities 69%
Swap Agreements 131%
Total Exposure 200%
“Market Exposure” includes the value of totalinvestments (including the contract value ofany derivatives) and excludes any short-terminvestments and cash equivalents.
Largest Equity Holdings
Company % of Net Assets
Procter & Gamble Co. (The) 6.7%
Philip MorrisInternational, Inc. 5.6%
Coca-Cola Co. (The) 5.3%
PepsiCo, Inc. 5.0%
Altria Group, Inc. 4.4%
Dow Jones U.S. Consumer GoodsIndex – Composition
% of Index
Food Beverage & Tobacco 52.1%Household & PersonalProducts 17.7%Consumer Durables &Apparel 13.1%Automobiles & Components 9.9%Software & Services 3.6%Capital Goods 1.9%Retailing 1.2%Diversified Financials 0.3%Commercial & ProfessionalServices 0.2%
Merrill Corp - Proshares Trust Geared Book [96 Funds] Annual Report [Funds] 333-089822 05-31-2017 ED [AUX] | eperez | 28-Jul-17 17:36 | 17-15159-3.cg | Sequence: 14CHKSUM Content: 29168 Layout: 28255 Graphics: 63601 CLEAN
JOB: 17-15159-3 CYCLE#;BL#: 5; 0 TRIM: 8.25" x 10.75" COMPOSITECOLORS: Black, ~note-color 2, ~note-color 3 GRAPHICS: 15159-3_UGE_L.eps V1.5
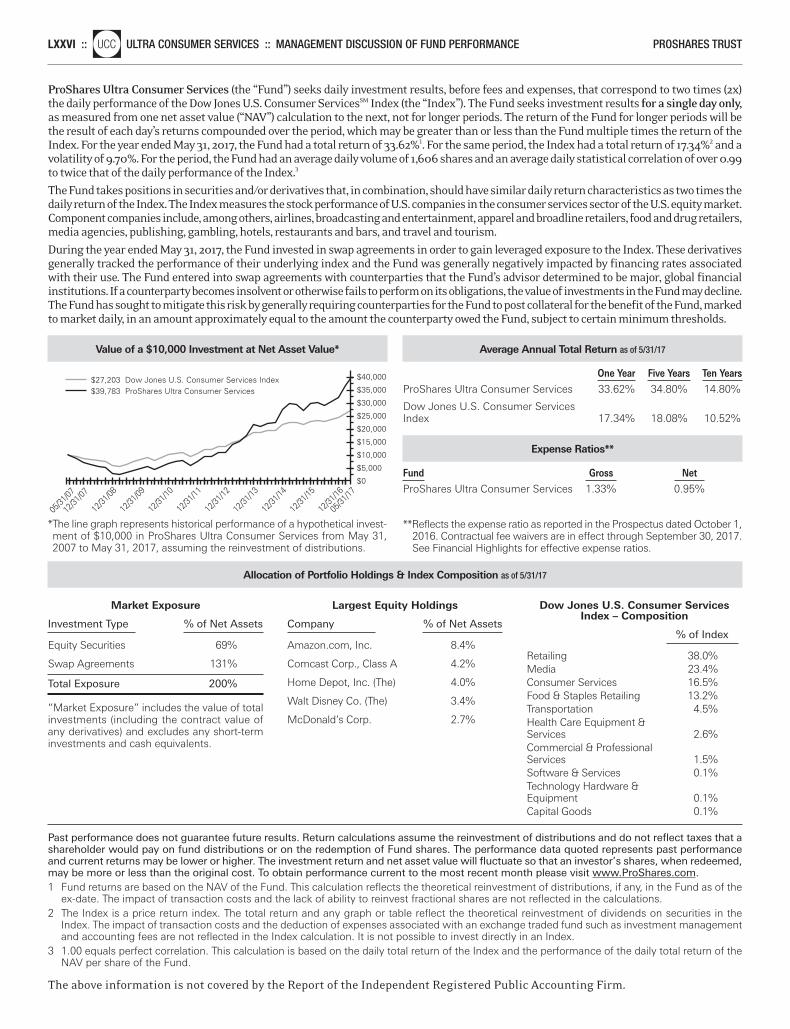
LXXVI ::nlUCC ULTRA CONSUMER SERVICES :: MANAGEMENT DISCUSSION OF FUND PERFORMANCE PROSHARES TRUST
Value of a $10,000 Investment at Net Asset Value*
*The line graph represents historical performance of a hypothetical invest-ment of $10,000 in ProShares Ultra Consumer Services from May 31,2007 to May 31, 2017, assuming the reinvestment of distributions.
$40,000
$35,000
$25,000
$30,000
$20,000
$0
$15,000
$5,000
$10,000
$27,203 Dow Jones U.S. Consumer Services Index$39,783 ProShares Ultra Consumer Services
12/31
/07
12/31
/10
12/31
/09
12/31
/08
12/31
/16
12/31
/15
12/31
/14
12/31
/13
12/31
/12
12/31
/11
05/31
/17
05/31
/07
Average Annual Total Return as of 5/31/17
One Year Five Years Ten Years ProShares Ultra Consumer Services 33.62% 34.80% 14.80%
Dow Jones U.S. Consumer ServicesIndex 17.34% 18.08% 10.52%
Expense Ratios**
Fund Gross Net ProShares Ultra Consumer Services 1.33% 0.95%
**Reflects the expense ratio as reported in the Prospectus dated October 1,2016. Contractual fee waivers are in effect through September 30, 2017.See Financial Highlights for effective expense ratios.
ProShares Ultra Consumer Services (the “Fund”) seeks daily investment results, before fees and expenses, that correspond to two times (2x)the daily performance of the Dow Jones U.S. Consumer ServicesSM Index (the “Index”). The Fund seeks investment results for a single day only,as measured from one net asset value (“NAV”) calculation to the next, not for longer periods. The return of the Fund for longer periods will bethe result of each day’s returns compounded over the period, which may be greater than or less than the Fund multiple times the return of theIndex. For the year ended May 31, 2017, the Fund had a total return of 33.62%1. For the same period, the Index had a total return of 17.34%2 and avolatility of 9.70%. For the period, the Fund had an average daily volume of 1,606 shares and an average daily statistical correlation of over 0.99to twice that of the daily performance of the Index.3
The Fund takes positions in securities and/or derivatives that, in combination, should have similar daily return characteristics as two times thedaily return of the Index. The Index measures the stock performance of U.S. companies in the consumer services sector of the U.S. equity market.Component companies include, among others, airlines, broadcasting and entertainment, apparel and broadline retailers, food and drug retailers,media agencies, publishing, gambling, hotels, restaurants and bars, and travel and tourism.
During the year ended May 31, 2017, the Fund invested in swap agreements in order to gain leveraged exposure to the Index. These derivativesgenerally tracked the performance of their underlying index and the Fund was generally negatively impacted by financing rates associatedwith their use. The Fund entered into swap agreements with counterparties that the Fund’s advisor determined to be major, global financial institutions. If a counterparty becomes insolvent or otherwise fails to perform on its obligations, the value of investments in the Fund may decline.The Fund has sought to mitigate this risk by generally requiring counterparties for the Fund to post collateral for the benefit of the Fund, markedto market daily, in an amount approximately equal to the amount the counterparty owed the Fund, subject to certain minimum thresholds.
Allocation of Portfolio Holdings & Index Composition as of 5/31/17
Past performance does not guarantee future results. Return calculations assume the reinvestment of distributions and do not reflect taxes that ashareholder would pay on fund distributions or on the redemption of Fund shares. The performance data quoted represents past performanceand current returns may be lower or higher. The investment return and net asset value will fluctuate so that an investor’s shares, when redeemed,may be more or less than the original cost. To obtain performance current to the most recent month please visit www.ProShares.com.1 Fund returns are based on the NAV of the Fund. This calculation reflects the theoretical reinvestment of distributions, if any, in the Fund as of the
ex-date. The impact of transaction costs and the lack of ability to reinvest fractional shares are not reflected in the calculations.2 The Index is a price return index. The total return and any graph or table reflect the theoretical reinvestment of dividends on securities in the
Index. The impact of transaction costs and the deduction of expenses associated with an exchange traded fund such as investment managementand accounting fees are not reflected in the Index calculation. It is not possible to invest directly in an Index.
3 1.00 equals perfect correlation. This calculation is based on the daily total return of the Index and the performance of the daily total return of theNAV per share of the Fund.
The above information is not covered by the Report of the Independent Registered Public Accounting Firm.
Market Exposure
Investment Type % of Net Assets
Equity Securities 69%
Swap Agreements 131%
Total Exposure 200%
“Market Exposure” includes the value of totalinvestments (including the contract value ofany derivatives) and excludes any short-terminvestments and cash equivalents.
Largest Equity Holdings
Company % of Net Assets
Amazon.com, Inc. 8.4%
Comcast Corp., Class A 4.2%
Home Depot, Inc. (The) 4.0%
Walt Disney Co. (The) 3.4%
McDonald’s Corp. 2.7%
Dow Jones U.S. Consumer ServicesIndex – Composition
% of Index
Retailing 38.0%Media 23.4%Consumer Services 16.5%Food & Staples Retailing 13.2%Transportation 4.5%Health Care Equipment &Services 2.6%Commercial & ProfessionalServices 1.5%Software & Services 0.1%Technology Hardware &Equipment 0.1%Capital Goods 0.1%
Merrill Corp - Proshares Trust Geared Book [96 Funds] Annual Report [Funds] 333-089822 05-31-2017 ED [AUX] | eperez | 28-Jul-17 17:36 | 17-15159-3.cg | Sequence: 15CHKSUM Content: 37354 Layout: 56047 Graphics: 10713 CLEAN
JOB: 17-15159-3 CYCLE#;BL#: 5; 0 TRIM: 8.25" x 10.75" COMPOSITECOLORS: Black, ~note-color 2, ~note-color 3 GRAPHICS: 15159-3_UCC_L.eps V1.5
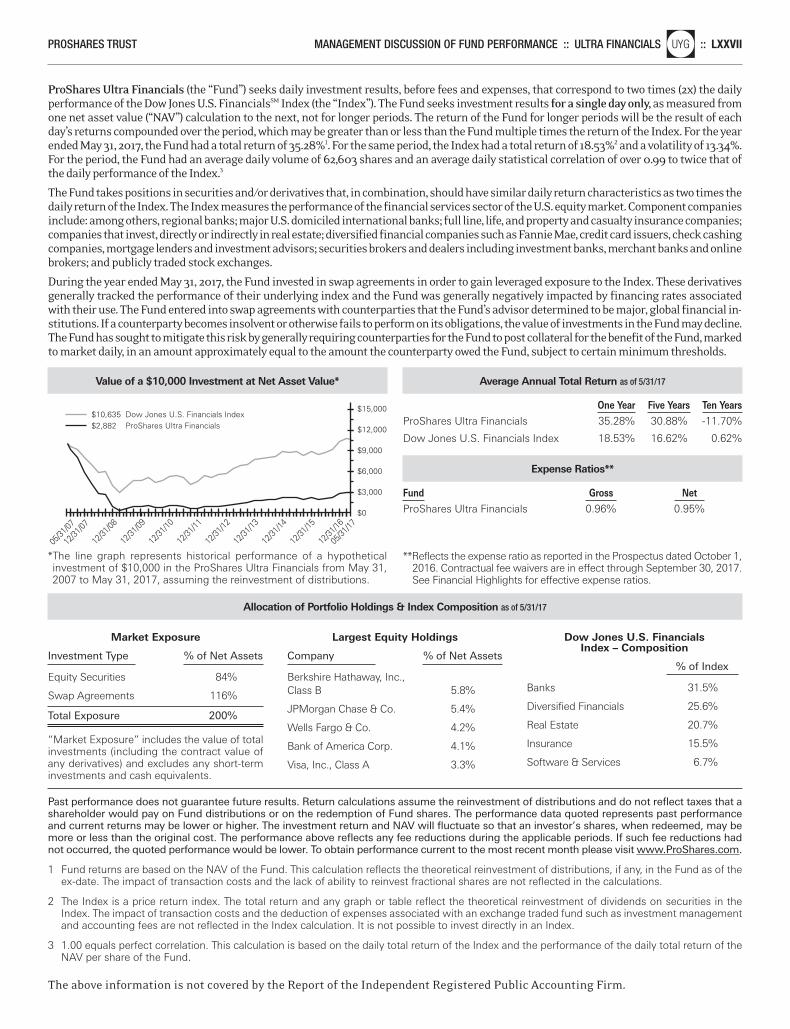
PROSHARES TRUST MANAGEMENT DISCUSSION OF FUND PERFORMANCE :: ULTRA FINANCIALSnlUYG :: LXXVII
Value of a $10,000 Investment at Net Asset Value*
*The line graph represents historical performance of a hypothetical investment of $10,000 in the ProShares Ultra Financials from May 31,2007 to May 31, 2017, assuming the reinvestment of distributions.
$15,000
$12,000
$0
$9,000
$3,000
$6,000
$10,635 Dow Jones U.S. Financials Index$2,882 ProShares Ultra Financials
12/31
/07
12/31
/10
12/31
/09
12/31
/08
12/31
/16
12/31
/15
12/31
/14
12/31
/13
12/31
/12
12/31
/11
05/31
/17
05/31
/07
Average Annual Total Return as of 5/31/17
One Year Five Years Ten Years ProShares Ultra Financials 35.28% 30.88% -11.70%
Dow Jones U.S. Financials Index 18.53% 16.62% 0.62%
Expense Ratios**
Fund Gross Net ProShares Ultra Financials 0.96% 0.95%
**Reflects the expense ratio as reported in the Prospectus dated October 1,2016. Contractual fee waivers are in effect through September 30, 2017.See Financial Highlights for effective expense ratios.
ProShares Ultra Financials (the “Fund”) seeks daily investment results, before fees and expenses, that correspond to two times (2x) the dailyperformance of the Dow Jones U.S. FinancialsSM Index (the “Index”). The Fund seeks investment results for a single day only, as measured fromone net asset value (“NAV”) calculation to the next, not for longer periods. The return of the Fund for longer periods will be the result of eachday’s returns compounded over the period, which may be greater than or less than the Fund multiple times the return of the Index. For the yearended May 31, 2017, the Fund had a total return of 35.28%1. For the same period, the Index had a total return of 18.53%2 and a volatility of 13.34%.For the period, the Fund had an average daily volume of 62,603 shares and an average daily statistical correlation of over 0.99 to twice that ofthe daily performance of the Index.3
The Fund takes positions in securities and/or derivatives that, in combination, should have similar daily return characteristics as two times thedaily return of the Index. The Index measures the performance of the financial services sector of the U.S. equity market. Component companiesinclude: among others, regional banks; major U.S. domiciled international banks; full line, life, and property and casualty insurance companies;companies that invest, directly or indirectly in real estate; diversified financial companies such as Fannie Mae, credit card issuers, check cashingcompanies, mortgage lenders and investment advisors; securities brokers and dealers including investment banks, merchant banks and onlinebrokers; and publicly traded stock exchanges.
During the year ended May 31, 2017, the Fund invested in swap agreements in order to gain leveraged exposure to the Index. These derivativesgenerally tracked the performance of their underlying index and the Fund was generally negatively impacted by financing rates associatedwith their use. The Fund entered into swap agreements with counterparties that the Fund’s advisor determined to be major, global financial in-stitutions. If a counterparty becomes insolvent or otherwise fails to perform on its obligations, the value of investments in the Fund may decline.The Fund has sought to mitigate this risk by generally requiring counterparties for the Fund to post collateral for the benefit of the Fund, markedto market daily, in an amount approximately equal to the amount the counterparty owed the Fund, subject to certain minimum thresholds.
Allocation of Portfolio Holdings & Index Composition as of 5/31/17
Past performance does not guarantee future results. Return calculations assume the reinvestment of distributions and do not reflect taxes that ashareholder would pay on Fund distributions or on the redemption of Fund shares. The performance data quoted represents past performanceand current returns may be lower or higher. The investment return and NAV will fluctuate so that an investor’s shares, when redeemed, may bemore or less than the original cost. The performance above reflects any fee reductions during the applicable periods. If such fee reductions hadnot occurred, the quoted performance would be lower. To obtain performance current to the most recent month please visit www.ProShares.com.
1 Fund returns are based on the NAV of the Fund. This calculation reflects the theoretical reinvestment of distributions, if any, in the Fund as of theex-date. The impact of transaction costs and the lack of ability to reinvest fractional shares are not reflected in the calculations.
2 The Index is a price return index. The total return and any graph or table reflect the theoretical reinvestment of dividends on securities in theIndex. The impact of transaction costs and the deduction of expenses associated with an exchange traded fund such as investment managementand accounting fees are not reflected in the Index calculation. It is not possible to invest directly in an Index.
3 1.00 equals perfect correlation. This calculation is based on the daily total return of the Index and the performance of the daily total return of theNAV per share of the Fund.
The above information is not covered by the Report of the Independent Registered Public Accounting Firm.
Market Exposure
Investment Type % of Net Assets
Equity Securities 84%
Swap Agreements 116%
Total Exposure 200%
“Market Exposure” includes the value of totalinvestments (including the contract value ofany derivatives) and excludes any short-terminvestments and cash equivalents.
Largest Equity Holdings
Company % of Net Assets
Berkshire Hathaway, Inc.,Class B 5.8%
JPMorgan Chase & Co. 5.4%
Wells Fargo & Co. 4.2%
Bank of America Corp. 4.1%
Visa, Inc., Class A 3.3%
Dow Jones U.S. FinancialsIndex – Composition
% of Index
Banks 31.5%
Diversified Financials 25.6%
Real Estate 20.7%
Insurance 15.5%
Software & Services 6.7%
Merrill Corp - Proshares Trust Geared Book [96 Funds] Annual Report [Funds] 333-089822 05-31-2017 ED [AUX] | eperez | 28-Jul-17 17:36 | 17-15159-3.cg | Sequence: 16CHKSUM Content: 8517 Layout: 62151 Graphics: 32238 CLEAN
JOB: 17-15159-3 CYCLE#;BL#: 5; 0 TRIM: 8.25" x 10.75" COMPOSITECOLORS: Black, ~note-color 2, ~note-color 3 GRAPHICS: 15159-3_UYG_L.eps V1.5
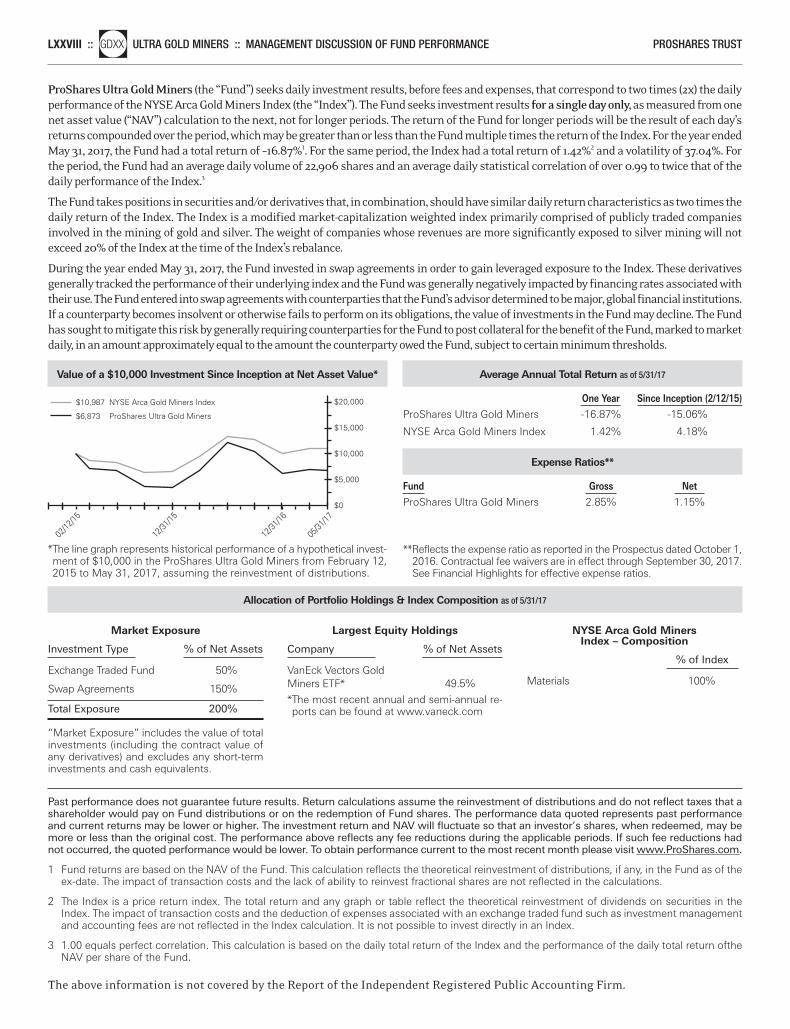
LXXVIII ::nlGDXX ULTRA GOLD MINERS :: MANAGEMENT DISCUSSION OF FUND PERFORMANCE PROSHARES TRUST
Value of a $10,000 Investment Since Inception at Net Asset Value*
*The line graph represents historical performance of a hypothetical invest-ment of $10,000 in the ProShares Ultra Gold Miners from February 12,2015 to May 31, 2017, assuming the reinvestment of distributions.
$20,000
$15,000
$0
$10,000
$5,000
$10,987 NYSE Arca Gold Miners Index
$6,873 ProShares Ultra Gold Miners
02/12
/15
12/31
/15
12/31
/16
05/31
/17
Average Annual Total Return as of 5/31/17
One Year Since Inception (2/12/15) ProShares Ultra Gold Miners -16.87% -15.06%
NYSE Arca Gold Miners Index 1.42% 4.18%
Expense Ratios**
Fund Gross Net ProShares Ultra Gold Miners 2.85% 1.15%
**Reflects the expense ratio as reported in the Prospectus dated October 1,2016. Contractual fee waivers are in effect through September 30, 2017.See Financial Highlights for effective expense ratios.
ProShares Ultra Gold Miners (the “Fund”) seeks daily investment results, before fees and expenses, that correspond to two times (2x) the dailyperformance of the NYSE Arca Gold Miners Index (the “Index”). The Fund seeks investment results for a single day only, as measured from onenet asset value (“NAV”) calculation to the next, not for longer periods. The return of the Fund for longer periods will be the result of each day’sreturns compounded over the period, which may be greater than or less than the Fund multiple times the return of the Index. For the year endedMay 31, 2017, the Fund had a total return of –16.87%1. For the same period, the Index had a total return of 1.42%2 and a volatility of 37.04%. Forthe period, the Fund had an average daily volume of 22,906 shares and an average daily statistical correlation of over 0.99 to twice that of thedaily performance of the Index.3
The Fund takes positions in securities and/or derivatives that, in combination, should have similar daily return characteristics as two times thedaily return of the Index. The Index is a modified market-capitalization weighted index primarily comprised of publicly traded companiesinvolved in the mining of gold and silver. The weight of companies whose revenues are more significantly exposed to silver mining will notexceed 20% of the Index at the time of the Index’s rebalance.
During the year ended May 31, 2017, the Fund invested in swap agreements in order to gain leveraged exposure to the Index. These derivativesgenerally tracked the performance of their underlying index and the Fund was generally negatively impacted by financing rates associated withtheir use. The Fund entered into swap agreements with counterparties that the Fund’s advisor determined to be major, global financial institutions.If a counterparty becomes insolvent or otherwise fails to perform on its obligations, the value of investments in the Fund may decline. The Fundhas sought to mitigate this risk by generally requiring counterparties for the Fund to post collateral for the benefit of the Fund, marked to marketdaily, in an amount approximately equal to the amount the counterparty owed the Fund, subject to certain minimum thresholds.
Allocation of Portfolio Holdings & Index Composition as of 5/31/17
Past performance does not guarantee future results. Return calculations assume the reinvestment of distributions and do not reflect taxes that ashareholder would pay on Fund distributions or on the redemption of Fund shares. The performance data quoted represents past performanceand current returns may be lower or higher. The investment return and NAV will fluctuate so that an investor’s shares, when redeemed, may bemore or less than the original cost. The performance above reflects any fee reductions during the applicable periods. If such fee reductions hadnot occurred, the quoted performance would be lower. To obtain performance current to the most recent month please visit www.ProShares.com.
1 Fund returns are based on the NAV of the Fund. This calculation reflects the theoretical reinvestment of distributions, if any, in the Fund as of theex-date. The impact of transaction costs and the lack of ability to reinvest fractional shares are not reflected in the calculations.
2 The Index is a price return index. The total return and any graph or table reflect the theoretical reinvestment of dividends on securities in theIndex. The impact of transaction costs and the deduction of expenses associated with an exchange traded fund such as investment managementand accounting fees are not reflected in the Index calculation. It is not possible to invest directly in an Index.
3 1.00 equals perfect correlation. This calculation is based on the daily total return of the Index and the performance of the daily total return oftheNAV per share of the Fund.
The above information is not covered by the Report of the Independent Registered Public Accounting Firm.
Market Exposure
Investment Type % of Net Assets
Exchange Traded Fund 50%
Swap Agreements 150%
Total Exposure 200%
“Market Exposure” includes the value of totalinvestments (including the contract value ofany derivatives) and excludes any short-terminvestments and cash equivalents.
Largest Equity Holdings
Company % of Net Assets
VanEck Vectors GoldMiners ETF* 49.5%
*The most recent annual and semi-annual re-ports can be found at www.vaneck.com
NYSE Arca Gold MinersIndex – Composition
% of Index
Materials 100%
Merrill Corp - Proshares Trust Geared Book [96 Funds] Annual Report [Funds] 333-089822 05-31-2017 ED [AUX] | eperez | 28-Jul-17 17:36 | 17-15159-3.cg | Sequence: 17CHKSUM Content: 25755 Layout: 40852 Graphics: 63795 CLEAN
JOB: 17-15159-3 CYCLE#;BL#: 5; 0 TRIM: 8.25" x 10.75" COMPOSITECOLORS: Black, ~note-color 2, ~note-color 3 GRAPHICS: 15159-3_GDXX_L.eps V1.5
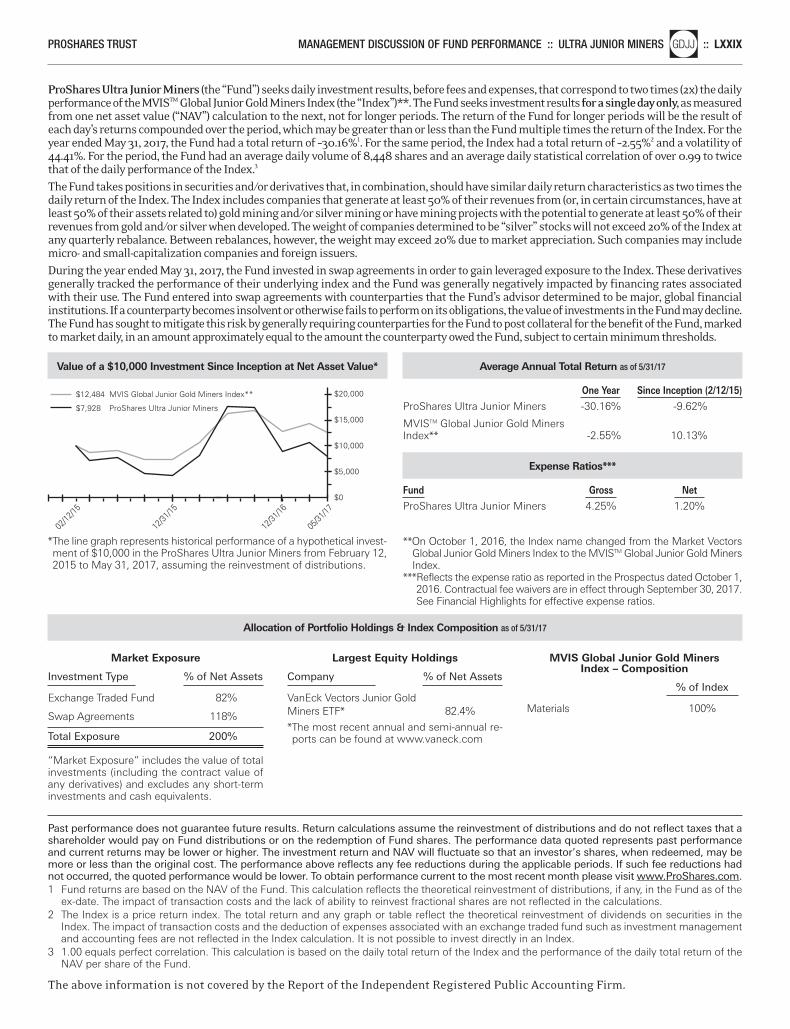
PROSHARES TRUST MANAGEMENT DISCUSSION OF FUND PERFORMANCE :: ULTRA JUNIOR MINERSnlGDJJ :: LXXIX
Value of a $10,000 Investment Since Inception at Net Asset Value*
*The line graph represents historical performance of a hypothetical invest-ment of $10,000 in the ProShares Ultra Junior Miners from February 12,2015 to May 31, 2017, assuming the reinvestment of distributions.
$20,000
$15,000
$0
$10,000
$5,000
$12,484 MVIS Global Junior Gold Miners Index**
$7,928 ProShares Ultra Junior Miners
02/12
/15
12/31
/15
12/31
/16
05/31
/17
Average Annual Total Return as of 5/31/17
One Year Since Inception (2/12/15) ProShares Ultra Junior Miners -30.16% -9.62%
MVISTM Global Junior Gold Miners Index** -2.55% 10.13%
Expense Ratios***
Fund Gross Net ProShares Ultra Junior Miners 4.25% 1.20%
**On October 1, 2016, the Index name changed from the Market VectorsGlobal Junior Gold Miners Index to the MVISTM Global Junior Gold MinersIndex.
***Reflects the expense ratio as reported in the Prospectus dated October 1,2016. Contractual fee waivers are in effect through September 30, 2017.See Financial Highlights for effective expense ratios.
ProShares Ultra Junior Miners (the “Fund”) seeks daily investment results, before fees and expenses, that correspond to two times (2x) the dailyperformance of the MVISTM Global Junior Gold Miners Index (the “Index”)**. The Fund seeks investment results for a single day only,as measuredfrom one net asset value (“NAV”) calculation to the next, not for longer periods. The return of the Fund for longer periods will be the result ofeach day’s returns compounded over the period, which may be greater than or less than the Fund multiple times the return of the Index. For theyear ended May 31, 2017, the Fund had a total return of –30.16%1. For the same period, the Index had a total return of –2.55%2 and a volatility of44.41%. For the period, the Fund had an average daily volume of 8,448 shares and an average daily statistical correlation of over 0.99 to twicethat of the daily performance of the Index.3
The Fund takes positions in securities and/or derivatives that, in combination, should have similar daily return characteristics as two times thedaily return of the Index. The Index includes companies that generate at least 50% of their revenues from (or, in certain circumstances, have atleast 50% of their assets related to) gold mining and/or silver mining or have mining projects with the potential to generate at least 50% of theirrevenues from gold and/or silver when developed. The weight of companies determined to be “silver” stocks will not exceed 20% of the Index atany quarterly rebalance. Between rebalances, however, the weight may exceed 20% due to market appreciation. Such companies may includemicro- and small-capitalization companies and foreign issuers.During the year ended May 31, 2017, the Fund invested in swap agreements in order to gain leveraged exposure to the Index. These derivativesgenerally tracked the performance of their underlying index and the Fund was generally negatively impacted by financing rates associatedwith their use. The Fund entered into swap agreements with counterparties that the Fund’s advisor determined to be major, global financial institutions. If a counterparty becomes insolvent or otherwise fails to perform on its obligations, the value of investments in the Fund may decline.The Fund has sought to mitigate this risk by generally requiring counterparties for the Fund to post collateral for the benefit of the Fund, markedto market daily, in an amount approximately equal to the amount the counterparty owed the Fund, subject to certain minimum thresholds.
Allocation of Portfolio Holdings & Index Composition as of 5/31/17
P ast performance does not guarantee future results. Return calculations assume the reinvestment of distributions and do not reflect taxes that ashareholder would pay on Fund distributions or on the redemption of Fund shares. The performance data quoted represents past performanceand current returns may be lower or higher. The investment return and NAV will fluctuate so that an investor’s shares, when redeemed, may bemore or less than the original cost. The performance above reflects any fee reductions during the applicable periods. If such fee reductions hadnot occurred, the quoted performance would be lower. To obtain performance current to the most recent month please visit www.ProShares.com.1 Fund returns are based on the NAV of the Fund. This calculation reflects the theoretical reinvestment of distributions, if any, in the Fund as of the
ex-date. The impact of transaction costs and the lack of ability to reinvest fractional shares are not reflected in the calculations.2 The Index is a price return index. The total return and any graph or table reflect the theoretical reinvestment of dividends on securities in the
Index. The impact of transaction costs and the deduction of expenses associated with an exchange traded fund such as investment managementand accounting fees are not reflected in the Index calculation. It is not possible to invest directly in an Index.
3 1.00 equals perfect correlation. This calculation is based on the daily total return of the Index and the performance of the daily total return of theNAV per share of the Fund.
The above information is not covered by the Report of the Independent Registered Public Accounting Firm.
Market Exposure
Investment Type % of Net Assets
Exchange Traded Fund 82%
Swap Agreements 118%
Total Exposure 200%
“Market Exposure” includes the value of totalinvestments (including the contract value ofany derivatives) and excludes any short-terminvestments and cash equivalents.
Largest Equity Holdings
Company % of Net Assets
VanEck Vectors Junior GoldMiners ETF* 82.4%
*The most recent annual and semi-annual re-ports can be found at www.vaneck.com
MVIS Global Junior Gold MinersIndex – Composition
% of Index
Materials 100%
Merrill Corp - Proshares Trust Geared Book [96 Funds] Annual Report [Funds] 333-089822 05-31-2017 ED [AUX] | eperez | 28-Jul-17 17:36 | 17-15159-3.cg | Sequence: 18CHKSUM Content: 19594 Layout: 23896 Graphics: 2617 CLEAN
JOB: 17-15159-3 CYCLE#;BL#: 5; 0 TRIM: 8.25" x 10.75" COMPOSITECOLORS: Black, ~note-color 2, ~note-color 3 GRAPHICS: 15159-3_GDJJ_L.eps V1.5
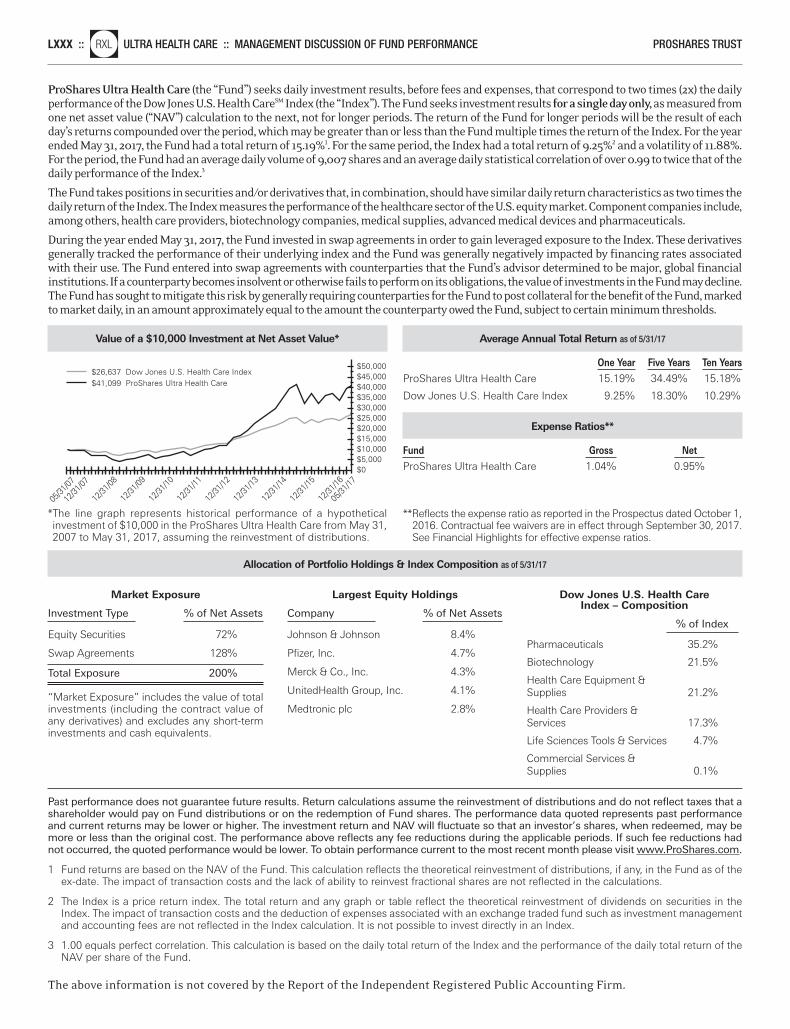
LXXX ::nlRXL ULTRA HEALTH CARE :: MANAGEMENT DISCUSSION OF FUND PERFORMANCE PROSHARES TRUST
Value of a $10,000 Investment at Net Asset Value*
*The line graph represents historical performance of a hypothetical investment of $10,000 in the ProShares Ultra Health Care from May 31,2007 to May 31, 2017, assuming the reinvestment of distributions.
$26,637 Dow Jones U.S. Health Care Index$41,099 ProShares Ultra Health Care
$50,000
$0$5,000$10,000$15,000$20,000$25,000$30,000$35,000$40,000$45,000
12/31
/07
12/31
/10
12/31
/09
12/31
/08
12/31
/16
12/31
/15
12/31
/14
12/31
/13
12/31
/12
12/31
/11
05/31
/17
05/31
/07
Average Annual Total Return as of 5/31/17
One Year Five Years Ten Years ProShares Ultra Health Care 15.19% 34.49% 15.18%
Dow Jones U.S. Health Care Index 9.25% 18.30% 10.29%
Expense Ratios**
Fund Gross Net ProShares Ultra Health Care 1.04% 0.95%
**Reflects the expense ratio as reported in the Prospectus dated October 1,2016. Contractual fee waivers are in effect through September 30, 2017.See Financial Highlights for effective expense ratios.
ProShares Ultra Health Care (the “Fund”) seeks daily investment results, before fees and expenses, that correspond to two times (2x) the dailyperformance of the Dow Jones U.S. Health CareSM Index (the “Index”). The Fund seeks investment results for a single day only,as measured fromone net asset value (“NAV”) calculation to the next, not for longer periods. The return of the Fund for longer periods will be the result of eachday’s returns compounded over the period, which may be greater than or less than the Fund multiple times the return of the Index. For the yearended May 31, 2017, the Fund had a total return of 15.19%1. For the same period, the Index had a total return of 9.25%2 and a volatility of 11.88%.For the period, the Fund had an average daily volume of 9,007 shares and an average daily statistical correlation of over 0.99 to twice that of thedaily performance of the Index.3
The Fund takes positions in securities and/or derivatives that, in combination, should have similar daily return characteristics as two times thedaily return of the Index. The Index measures the performance of the healthcare sector of the U.S. equity market. Component companies include,among others, health care providers, biotechnology companies, medical supplies, advanced medical devices and pharmaceuticals.
During the year ended May 31, 2017, the Fund invested in swap agreements in order to gain leveraged exposure to the Index. These derivativesgenerally tracked the performance of their underlying index and the Fund was generally negatively impacted by financing rates associatedwith their use. The Fund entered into swap agreements with counterparties that the Fund’s advisor determined to be major, global financial institutions. If a counterparty becomes insolvent or otherwise fails to perform on its obligations, the value of investments in the Fund may decline.The Fund has sought to mitigate this risk by generally requiring counterparties for the Fund to post collateral for the benefit of the Fund, markedto market daily, in an amount approximately equal to the amount the counterparty owed the Fund, subject to certain minimum thresholds.
Allocation of Portfolio Holdings & Index Composition as of 5/31/17
Past performance does not guarantee future results. Return calculations assume the reinvestment of distributions and do not reflect taxes that ashareholder would pay on Fund distributions or on the redemption of Fund shares. The performance data quoted represents past performanceand current returns may be lower or higher. The investment return and NAV will fluctuate so that an investor’s shares, when redeemed, may bemore or less than the original cost. The performance above reflects any fee reductions during the applicable periods. If such fee reductions hadnot occurred, the quoted performance would be lower. To obtain performance current to the most recent month please visit www.ProShares.com.
1 Fund returns are based on the NAV of the Fund. This calculation reflects the theoretical reinvestment of distributions, if any, in the Fund as of theex-date. The impact of transaction costs and the lack of ability to reinvest fractional shares are not reflected in the calculations.
2 The Index is a price return index. The total return and any graph or table reflect the theoretical reinvestment of dividends on securities in theIndex. The impact of transaction costs and the deduction of expenses associated with an exchange traded fund such as investment managementand accounting fees are not reflected in the Index calculation. It is not possible to invest directly in an Index.
3 1.00 equals perfect correlation. This calculation is based on the daily total return of the Index and the performance of the daily total return of theNAV per share of the Fund.
The above information is not covered by the Report of the Independent Registered Public Accounting Firm.
Market Exposure
Investment Type % of Net Assets
Equity Securities 72%
Swap Agreements 128%
Total Exposure 200%
“Market Exposure” includes the value of totalinvestments (including the contract value ofany derivatives) and excludes any short-terminvestments and cash equivalents.
Largest Equity Holdings
Company % of Net Assets
Johnson & Johnson 8.4%
Pfizer, Inc. 4.7%
Merck & Co., Inc. 4.3%
UnitedHealth Group, Inc. 4.1%
Medtronic plc 2.8%
Dow Jones U.S. Health CareIndex – Composition
% of Index Pharmaceuticals 35.2%
Biotechnology 21.5%
Health Care Equipment &Supplies 21.2%
Health Care Providers & Services 17.3%
Life Sciences Tools & Services 4.7%
Commercial Services & Supplies 0.1%
Merrill Corp - Proshares Trust Geared Book [96 Funds] Annual Report [Funds] 333-089822 05-31-2017 ED [AUX] | eperez | 28-Jul-17 17:36 | 17-15159-3.cg | Sequence: 19CHKSUM Content: 45617 Layout: 32240 Graphics: 61298 CLEAN
JOB: 17-15159-3 CYCLE#;BL#: 5; 0 TRIM: 8.25" x 10.75" COMPOSITECOLORS: Black, ~note-color 2, ~note-color 3 GRAPHICS: 15159-3_RXL_L.eps V1.5
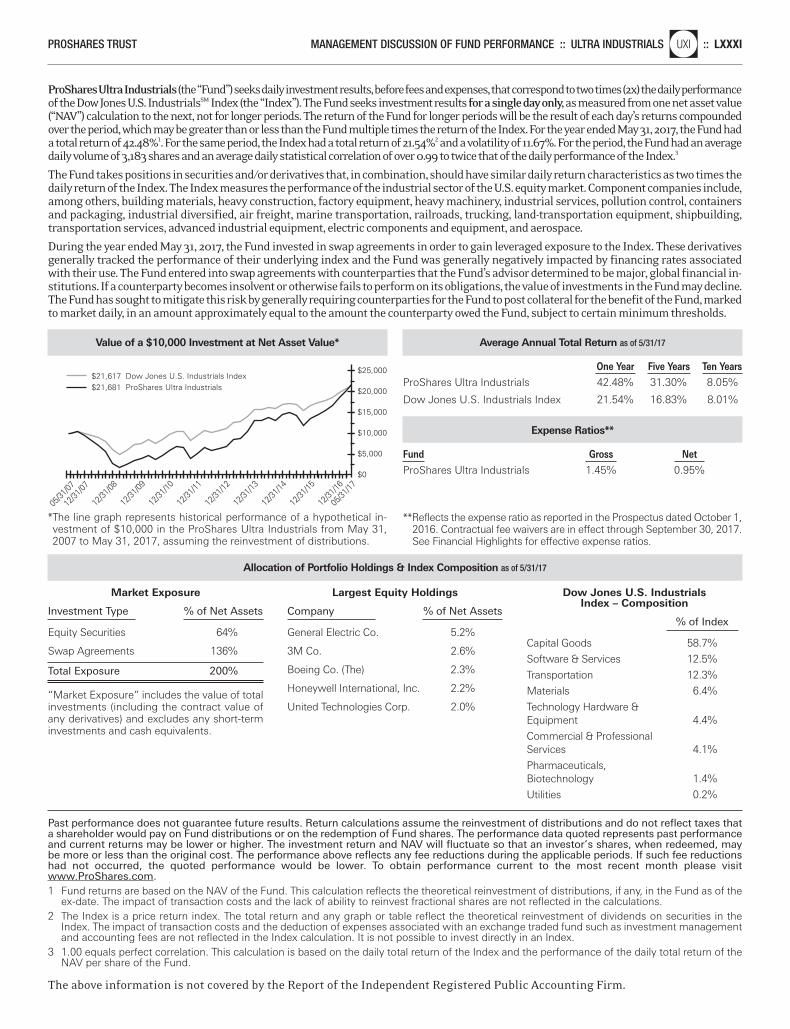
ProShares Ultra Industrials(the “Fund”) seeks daily investment results, before fees and expenses, that correspond to two times (2x) the daily performanceof the Dow Jones U.S. IndustrialsSM Index (the “Index”). The Fund seeks investment results for a single day only,as measured from one net asset value(“NAV”) calculation to the next, not for longer periods. The return of the Fund for longer periods will be the result of each day’s returns compoundedover the period, which may be greater than or less than the Fund multiple times the return of the Index. For the year ended May 31, 2017, the Fund hada total return of 42.48%1. For the same period, the Index had a total return of 21.54%2 and a volatility of 11.67%. For the period, the Fund had an averagedaily volume of 3,183 shares and an average daily statistical correlation of over 0.99 to twice that of the daily performance of the Index.3
The Fund takes positions in securities and/or derivatives that, in combination, should have similar daily return characteristics as two times thedaily return of the Index. The Index measures the performance of the industrial sector of the U.S. equity market. Component companies include,among others, building materials, heavy construction, factory equipment, heavy machinery, industrial services, pollution control, containersand packaging, industrial diversified, air freight, marine transportation, railroads, trucking, land-transportation equipment, shipbuilding,transportation services, advanced industrial equipment, electric components and equipment, and aerospace.
During the year ended May 31, 2017, the Fund invested in swap agreements in order to gain leveraged exposure to the Index. These derivativesgenerally tracked the performance of their underlying index and the Fund was generally negatively impacted by financing rates associatedwith their use. The Fund entered into swap agreements with counterparties that the Fund’s advisor determined to be major, global financial in-stitutions. If a counterparty becomes insolvent or otherwise fails to perform on its obligations, the value of investments in the Fund may decline.The Fund has sought to mitigate this risk by generally requiring counterparties for the Fund to post collateral for the benefit of the Fund, markedto market daily, in an amount approximately equal to the amount the counterparty owed the Fund, subject to certain minimum thresholds.
Value of a $10,000 Investment at Net Asset Value*
*The line graph represents historical performance of a hypothetical in-vestment of $10,000 in the ProShares Ultra Industrials from May 31,2007 to May 31, 2017, assuming the reinvestment of distributions.
$25,000
$20,000
$15,000
$0
$10,000
$5,000
$21,617 Dow Jones U.S. Industrials Index$21,681 ProShares Ultra Industrials
12/31
/07
12/31
/10
12/31
/09
12/31
/08
12/31
/16
12/31
/15
12/31
/14
12/31
/13
12/31
/12
12/31
/11
05/31
/17
05/31
/07
Average Annual Total Return as of 5/31/17
One Year Five Years Ten Years ProShares Ultra Industrials 42.48% 31.30% 8.05%
Dow Jones U.S. Industrials Index 21.54% 16.83% 8.01%
Expense Ratios**
Fund Gross Net ProShares Ultra Industrials 1.45% 0.95%
**Reflects the expense ratio as reported in the Prospectus dated October 1,2016. Contractual fee waivers are in effect through September 30, 2017.See Financial Highlights for effective expense ratios.
Past performance does not guarantee future results. Return calculations assume the reinvestment of distributions and do not reflect taxes thata shareholder would pay on Fund distributions or on the redemption of Fund shares. The performance data quoted represents past performanceand current returns may be lower or higher. The investment return and NAV will fluctuate so that an investor’s shares, when redeemed, maybe more or less than the original cost. The performance above reflects any fee reductions during the applicable periods. If such fee reductionshad not occurred, the quoted performance would be lower. To obtain performance current to the most recent month please visitwww.ProShares.com.1 Fund returns are based on the NAV of the Fund. This calculation reflects the theoretical reinvestment of distributions, if any, in the Fund as of the
ex-date. The impact of transaction costs and the lack of ability to reinvest fractional shares are not reflected in the calculations.2 The Index is a price return index. The total return and any graph or table reflect the theoretical reinvestment of dividends on securities in the
Index. The impact of transaction costs and the deduction of expenses associated with an exchange traded fund such as investment managementand accounting fees are not reflected in the Index calculation. It is not possible to invest directly in an Index.
3 1.00 equals perfect correlation. This calculation is based on the daily total return of the Index and the performance of the daily total return of theNAV per share of the Fund.
The above information is not covered by the Report of the Independent Registered Public Accounting Firm.
PROSHARES TRUST MANAGEMENT DISCUSSION OF FUND PERFORMANCE :: ULTRA INDUSTRIALSnlUXI :: LXXXI
Market Exposure
Investment Type % of Net Assets
Equity Securities 64%
Swap Agreements 136%
Total Exposure 200%
“Market Exposure” includes the value of totalinvestments (including the contract value ofany derivatives) and excludes any short-terminvestments and cash equivalents.
Largest Equity Holdings
Company % of Net Assets
General Electric Co. 5.2%
3M Co. 2.6%
Boeing Co. (The) 2.3%
Honeywell International, Inc. 2.2%
United Technologies Corp. 2.0%
Dow Jones U.S. Industrials Index – Composition
% of Index
Capital Goods 58.7%
Software & Services 12.5%
Transportation 12.3%
Materials 6.4%
Technology Hardware & Equipment 4.4%
Commercial & Professional Services 4.1%
Pharmaceuticals, Biotechnology 1.4%
Utilities 0.2%
Allocation of Portfolio Holdings & Index Composition as of 5/31/17
Merrill Corp - Proshares Trust Geared Book [96 Funds] Annual Report [Funds] 333-089822 05-31-2017 ED [AUX] | eperez | 28-Jul-17 17:36 | 17-15159-3.ci | Sequence: 1CHKSUM Content: 19265 Layout: 43268 Graphics: 6222 CLEAN
JOB: 17-15159-3 CYCLE#;BL#: 5; 0 TRIM: 8.25" x 10.75" COMPOSITECOLORS: Black, ~note-color 2, ~note-color 3 GRAPHICS: 15159-3_UXI_L.eps V1.5
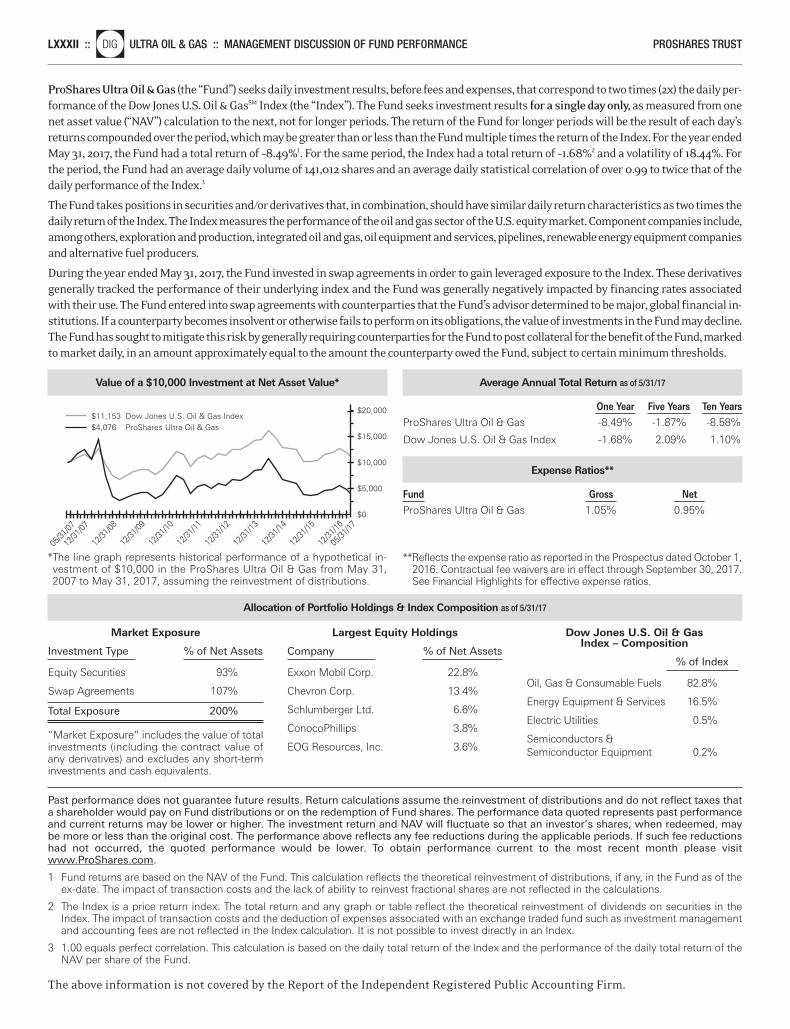
ProShares Ultra Oil & Gas (the “Fund”) seeks daily investment results, before fees and expenses, that correspond to two times (2x) the daily per-formance of the Dow Jones U.S. Oil & GasSM Index (the “Index”). The Fund seeks investment results for a single day only, as measured from onenet asset value (“NAV”) calculation to the next, not for longer periods. The return of the Fund for longer periods will be the result of each day’sreturns compounded over the period, which may be greater than or less than the Fund multiple times the return of the Index. For the year endedMay 31, 2017, the Fund had a total return of –8.49%1. For the same period, the Index had a total return of –1.68%2 and a volatility of 18.44%. Forthe period, the Fund had an average daily volume of 141,012 shares and an average daily statistical correlation of over 0.99 to twice that of thedaily performance of the Index.3
The Fund takes positions in securities and/or derivatives that, in combination, should have similar daily return characteristics as two times thedaily return of the Index. The Index measures the performance of the oil and gas sector of the U.S. equity market. Component companies include,among others, exploration and production, integrated oil and gas, oil equipment and services, pipelines, renewable energy equipment companiesand alternative fuel producers.
During the year ended May 31, 2017, the Fund invested in swap agreements in order to gain leveraged exposure to the Index. These derivativesgenerally tracked the performance of their underlying index and the Fund was generally negatively impacted by financing rates associatedwith their use. The Fund entered into swap agreements with counterparties that the Fund’s advisor determined to be major, global financial in-stitutions. If a counterparty becomes insolvent or otherwise fails to perform on its obligations, the value of investments in the Fund may decline.The Fund has sought to mitigate this risk by generally requiring counterparties for the Fund to post collateral for the benefit of the Fund, markedto market daily, in an amount approximately equal to the amount the counterparty owed the Fund, subject to certain minimum thresholds.
Value of a $10,000 Investment at Net Asset Value*
*The line graph represents historical performance of a hypothetical in-vestment of $10,000 in the ProShares Ultra Oil & Gas from May 31,2007 to May 31, 2017, assuming the reinvestment of distributions.
$20,000
$0
$15,000
$5,000
$10,000
$11,153 Dow Jones U.S. Oil & Gas Index$4,076 ProShares Ultra Oil & Gas
12/31
/07
12/31
/10
12/31
/09
12/31
/08
12/31
/16
12/31
/15
12/31
/14
12/31
/13
12/31
/12
12/31
/11
05/31
/17
05/31
/07
Average Annual Total Return as of 5/31/17
One Year Five Years Ten Years ProShares Ultra Oil & Gas -8.49% -1.87% -8.58%
Dow Jones U.S. Oil & Gas Index -1.68% 2.09% 1.10%
Expense Ratios**
Fund Gross Net ProShares Ultra Oil & Gas 1.05% 0.95%
**Reflects the expense ratio as reported in the Prospectus dated October 1,2016. Contractual fee waivers are in effect through September 30, 2017.See Financial Highlights for effective expense ratios.
Past performance does not guarantee future results. Return calculations assume the reinvestment of distributions and do not reflect taxes thata shareholder would pay on Fund distributions or on the redemption of Fund shares. The performance data quoted represents past performanceand current returns may be lower or higher. The investment return and NAV will fluctuate so that an investor’s shares, when redeemed, maybe more or less than the original cost. The performance above reflects any fee reductions during the applicable periods. If such fee reductionshad not occurred, the quoted performance would be lower. To obtain performance current to the most recent month please visitwww.ProShares.com.
1 Fund returns are based on the NAV of the Fund. This calculation reflects the theoretical reinvestment of distributions, if any, in the Fund as of theex-date. The impact of transaction costs and the lack of ability to reinvest fractional shares are not reflected in the calculations.
2 The Index is a price return index. The total return and any graph or table reflect the theoretical reinvestment of dividends on securities in theIndex. The impact of transaction costs and the deduction of expenses associated with an exchange traded fund such as investment managementand accounting fees are not reflected in the Index calculation. It is not possible to invest directly in an Index.
3 1.00 equals perfect correlation. This calculation is based on the daily total return of the Index and the performance of the daily total return of theNAV per share of the Fund.
The above information is not covered by the Report of the Independent Registered Public Accounting Firm.
LXXXII ::nlDIG ULTRA OIL & GAS :: MANAGEMENT DISCUSSION OF FUND PERFORMANCE PROSHARES TRUST
Market Exposure
Investment Type % of Net Assets
Equity Securities 93%
Swap Agreements 107%
Total Exposure 200%
“Market Exposure” includes the value of totalinvestments (including the contract value ofany derivatives) and excludes any short-terminvestments and cash equivalents.
Largest Equity Holdings
Company % of Net Assets
Exxon Mobil Corp. 22.8%
Chevron Corp. 13.4%
Schlumberger Ltd. 6.6%
ConocoPhillips 3.8%
EOG Resources, Inc. 3.6%
Dow Jones U.S. Oil & Gas Index – Composition
% of Index
Oil, Gas & Consumable Fuels 82.8%
Energy Equipment & Services 16.5%
Electric Utilities 0.5%
Semiconductors & Semiconductor Equipment 0.2%
Allocation of Portfolio Holdings & Index Composition as of 5/31/17
Merrill Corp - Proshares Trust Geared Book [96 Funds] Annual Report [Funds] 333-089822 05-31-2017 ED [AUX] | eperez | 28-Jul-17 17:36 | 17-15159-3.ci | Sequence: 2CHKSUM Content: 56762 Layout: 9253 Graphics: 26138 CLEAN
JOB: 17-15159-3 CYCLE#;BL#: 5; 0 TRIM: 8.25" x 10.75" COMPOSITECOLORS: Black, ~note-color 2, ~note-color 3 GRAPHICS: 15159-3_DIG_L.eps V1.5
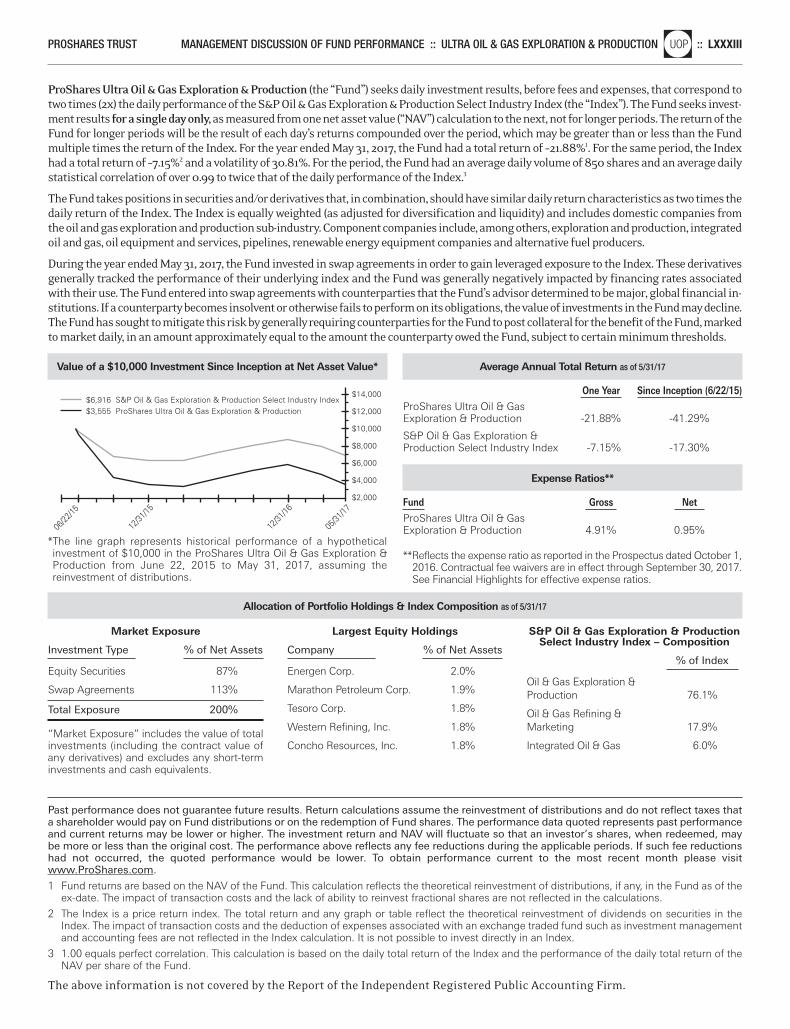
ProShares Ultra Oil & Gas Exploration & Production (the “Fund”) seeks daily investment results, before fees and expenses, that correspond totwo times (2x) the daily performance of the S&P Oil & Gas Exploration & Production Select Industry Index (the “Index”). The Fund seeks invest-ment results for a single day only,as measured from one net asset value (“NAV”) calculation to the next, not for longer periods. The return of theFund for longer periods will be the result of each day’s returns compounded over the period, which may be greater than or less than the Fundmultiple times the return of the Index. For the year ended May 31, 2017, the Fund had a total return of –21.88%1. For the same period, the Indexhad a total return of –7.15%2 and a volatility of 30.81%. For the period, the Fund had an average daily volume of 850 shares and an average dailystatistical correlation of over 0.99 to twice that of the daily performance of the Index.3
The Fund takes positions in securities and/or derivatives that, in combination, should have similar daily return characteristics as two times thedaily return of the Index. The Index is equally weighted (as adjusted for diversification and liquidity) and includes domestic companies fromthe oil and gas exploration and production sub-industry. Component companies include, among others, exploration and production, integratedoil and gas, oil equipment and services, pipelines, renewable energy equipment companies and alternative fuel producers.
During the year ended May 31, 2017, the Fund invested in swap agreements in order to gain leveraged exposure to the Index. These derivativesgenerally tracked the performance of their underlying index and the Fund was generally negatively impacted by financing rates associatedwith their use. The Fund entered into swap agreements with counterparties that the Fund’s advisor determined to be major, global financial in-stitutions. If a counterparty becomes insolvent or otherwise fails to perform on its obligations, the value of investments in the Fund may decline.The Fund has sought to mitigate this risk by generally requiring counterparties for the Fund to post collateral for the benefit of the Fund, markedto market daily, in an amount approximately equal to the amount the counterparty owed the Fund, subject to certain minimum thresholds.
Past performance does not guarantee future results. Return calculations assume the reinvestment of distributions and do not reflect taxes thata shareholder would pay on Fund distributions or on the redemption of Fund shares. The performance data quoted represents past performanceand current returns may be lower or higher. The investment return and NAV will fluctuate so that an investor’s shares, when redeemed, maybe more or less than the original cost. The performance above reflects any fee reductions during the applicable periods. If such fee reductionshad not occurred, the quoted performance would be lower. To obtain performance current to the most recent month please visitwww.ProShares.com.
1 Fund returns are based on the NAV of the Fund. This calculation reflects the theoretical reinvestment of distributions, if any, in the Fund as of theex-date. The impact of transaction costs and the lack of ability to reinvest fractional shares are not reflected in the calculations.
2 The Index is a price return index. The total return and any graph or table reflect the theoretical reinvestment of dividends on securities in theIndex. The impact of transaction costs and the deduction of expenses associated with an exchange traded fund such as investment managementand accounting fees are not reflected in the Index calculation. It is not possible to invest directly in an Index.
3 1.00 equals perfect correlation. This calculation is based on the daily total return of the Index and the performance of the daily total return of theNAV per share of the Fund.
The above information is not covered by the Report of the Independent Registered Public Accounting Firm.
PROSHARES TRUST MANAGEMENT DISCUSSION OF FUND PERFORMANCE :: ULTRA OIL & GAS EXPLORATION & PRODUCTIONnlUOP :: LXXXIII
Value of a $10,000 Investment Since Inception at Net Asset Value*
*The line graph represents historical performance of a hypothetical investment of $10,000 in the ProShares Ultra Oil & Gas Exploration &Production from June 22, 2015 to May 31, 2017, assuming the reinvestment of distributions.
$14,000
$2,000
$6,000
$4,000
$8,000
$10,000
$12,000$6,916 S&P Oil & Gas Exploration & Production Select Industry Index$3,555 ProShares Ultra Oil & Gas Exploration & Production
12/31
/15
12/31
/16
05/31
/17
06/22
/15
Average Annual Total Return as of 5/31/17
One Year Since Inception (6/22/15) ProShares Ultra Oil & Gas Exploration & Production -21.88% -41.29%
S&P Oil & Gas Exploration & Production Select Industry Index -7.15% -17.30%
Expense Ratios**
Fund Gross Net ProShares Ultra Oil & Gas Exploration & Production 4.91% 0.95%
**Reflects the expense ratio as reported in the Prospectus dated October 1,2016. Contractual fee waivers are in effect through September 30, 2017.See Financial Highlights for effective expense ratios.
Market Exposure
Investment Type % of Net Assets
Equity Securities 87%
Swap Agreements 113%
Total Exposure 200%
“Market Exposure” includes the value of totalinvestments (including the contract value ofany derivatives) and excludes any short-terminvestments and cash equivalents.
Largest Equity Holdings
Company % of Net Assets
Energen Corp. 2.0%
Marathon Petroleum Corp. 1.9%
Tesoro Corp. 1.8%
Western Refining, Inc. 1.8%
Concho Resources, Inc. 1.8%
S&P Oil & Gas Exploration & Production Select Industry Index – Composition
% of Index
Oil & Gas Exploration & Production 76.1%
Oil & Gas Refining & Marketing 17.9%
Integrated Oil & Gas 6.0%
Allocation of Portfolio Holdings & Index Composition as of 5/31/17
Merrill Corp - Proshares Trust Geared Book [96 Funds] Annual Report [Funds] 333-089822 05-31-2017 ED [AUX] | eperez | 28-Jul-17 17:36 | 17-15159-3.ci | Sequence: 3CHKSUM Content: 25738 Layout: 60578 Graphics: 30241 CLEAN
JOB: 17-15159-3 CYCLE#;BL#: 5; 0 TRIM: 8.25" x 10.75" COMPOSITECOLORS: Black, ~note-color 2, ~note-color 3 GRAPHICS: 15159-3_UOP_L.eps V1.5
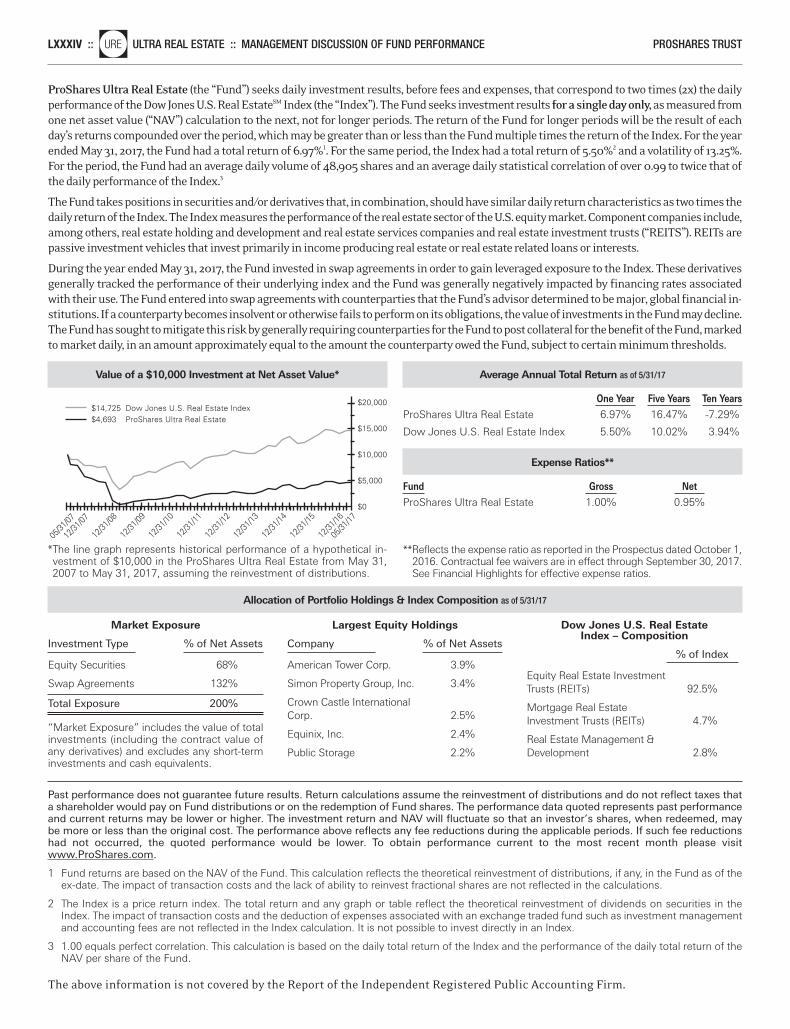
ProShares Ultra Real Estate (the “Fund”) seeks daily investment results, before fees and expenses, that correspond to two times (2x) the dailyperformance of the Dow Jones U.S. Real EstateSM Index (the “Index”). The Fund seeks investment results for a single day only,as measured fromone net asset value (“NAV”) calculation to the next, not for longer periods. The return of the Fund for longer periods will be the result of eachday’s returns compounded over the period, which may be greater than or less than the Fund multiple times the return of the Index. For the yearended May 31, 2017, the Fund had a total return of 6.97%1. For the same period, the Index had a total return of 5.50%2 and a volatility of 13.25%.For the period, the Fund had an average daily volume of 48,905 shares and an average daily statistical correlation of over 0.99 to twice that ofthe daily performance of the Index.3
The Fund takes positions in securities and/or derivatives that, in combination, should have similar daily return characteristics as two times thedaily return of the Index. The Index measures the performance of the real estate sector of the U.S. equity market. Component companies include,among others, real estate holding and development and real estate services companies and real estate investment trusts (“REITS”). REITs arepassive investment vehicles that invest primarily in income producing real estate or real estate related loans or interests.
During the year ended May 31, 2017, the Fund invested in swap agreements in order to gain leveraged exposure to the Index. These derivativesgenerally tracked the performance of their underlying index and the Fund was generally negatively impacted by financing rates associatedwith their use. The Fund entered into swap agreements with counterparties that the Fund’s advisor determined to be major, global financial in-stitutions. If a counterparty becomes insolvent or otherwise fails to perform on its obligations, the value of investments in the Fund may decline.The Fund has sought to mitigate this risk by generally requiring counterparties for the Fund to post collateral for the benefit of the Fund, markedto market daily, in an amount approximately equal to the amount the counterparty owed the Fund, subject to certain minimum thresholds.
Past performance does not guarantee future results. Return calculations assume the reinvestment of distributions and do not reflect taxes thata shareholder would pay on Fund distributions or on the redemption of Fund shares. The performance data quoted represents past performanceand current returns may be lower or higher. The investment return and NAV will fluctuate so that an investor’s shares, when redeemed, maybe more or less than the original cost. The performance above reflects any fee reductions during the applicable periods. If such fee reductionshad not occurred, the quoted performance would be lower. To obtain performance current to the most recent month please visitwww.ProShares.com.
1 Fund returns are based on the NAV of the Fund. This calculation reflects the theoretical reinvestment of distributions, if any, in the Fund as of theex-date. The impact of transaction costs and the lack of ability to reinvest fractional shares are not reflected in the calculations.
2 The Index is a price return index. The total return and any graph or table reflect the theoretical reinvestment of dividends on securities in theIndex. The impact of transaction costs and the deduction of expenses associated with an exchange traded fund such as investment managementand accounting fees are not reflected in the Index calculation. It is not possible to invest directly in an Index.
3 1.00 equals perfect correlation. This calculation is based on the daily total return of the Index and the performance of the daily total return of theNAV per share of the Fund.
The above information is not covered by the Report of the Independent Registered Public Accounting Firm.
LXXXIV ::nlURE ULTRA REAL ESTATE :: MANAGEMENT DISCUSSION OF FUND PERFORMANCE PROSHARES TRUST
Value of a $10,000 Investment at Net Asset Value*
*The line graph represents historical performance of a hypothetical in-vestment of $10,000 in the ProShares Ultra Real Estate from May 31,2007 to May 31, 2017, assuming the reinvestment of distributions.
$20,000
$0
$15,000
$5,000
$10,000
$14,725 Dow Jones U.S. Real Estate Index$4,693 ProShares Ultra Real Estate
12/31
/07
12/31
/10
12/31
/09
12/31
/08
12/31
/16
12/31
/15
12/31
/14
12/31
/13
12/31
/12
12/31
/11
05/31
/17
05/31
/07
Average Annual Total Return as of 5/31/17
One Year Five Years Ten Years ProShares Ultra Real Estate 6.97% 16.47% -7.29%
Dow Jones U.S. Real Estate Index 5.50% 10.02% 3.94%
Expense Ratios**
Fund Gross Net ProShares Ultra Real Estate 1.00% 0.95%
**Reflects the expense ratio as reported in the Prospectus dated October 1,2016. Contractual fee waivers are in effect through September 30, 2017.See Financial Highlights for effective expense ratios.
Market Exposure
Investment Type % of Net Assets
Equity Securities 68%
Swap Agreements 132%
Total Exposure 200%
“Market Exposure” includes the value of totalinvestments (including the contract value ofany derivatives) and excludes any short-terminvestments and cash equivalents.
Largest Equity Holdings
Company % of Net Assets
American Tower Corp. 3.9%
Simon Property Group, Inc. 3.4%
Crown Castle International Corp. 2.5%
Equinix, Inc. 2.4%
Public Storage 2.2%
Dow Jones U.S. Real Estate Index – Composition
% of Index
Equity Real Estate Investment Trusts (REITs) 92.5%
Mortgage Real Estate Investment Trusts (REITs) 4.7%
Real Estate Management & Development 2.8%
Allocation of Portfolio Holdings & Index Composition as of 5/31/17
Merrill Corp - Proshares Trust Geared Book [96 Funds] Annual Report [Funds] 333-089822 05-31-2017 ED [AUX] | eperez | 28-Jul-17 17:36 | 17-15159-3.ci | Sequence: 4CHKSUM Content: 46793 Layout: 6799 Graphics: 49020 CLEAN
JOB: 17-15159-3 CYCLE#;BL#: 5; 0 TRIM: 8.25" x 10.75" COMPOSITECOLORS: Black, ~note-color 2, ~note-color 3 GRAPHICS: 15159-3_URE_L.eps V1.5
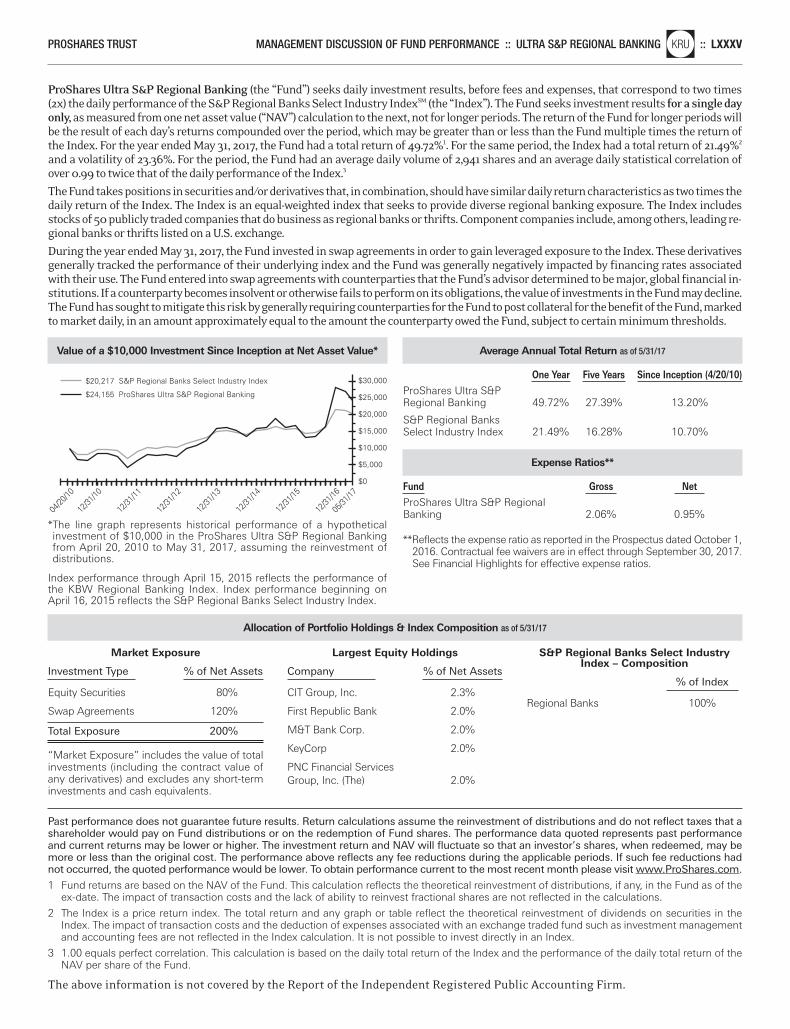
ProShares Ultra S&P Regional Banking (the “Fund”) seeks daily investment results, before fees and expenses, that correspond to two times(2x) the daily performance of the S&P Regional Banks Select Industry IndexSM (the “Index”). The Fund seeks investment results for a single dayonly, as measured from one net asset value (“NAV”) calculation to the next, not for longer periods. The return of the Fund for longer periods willbe the result of each day’s returns compounded over the period, which may be greater than or less than the Fund multiple times the return ofthe Index. For the year ended May 31, 2017, the Fund had a total return of 49.72%1. For the same period, the Index had a total return of 21.49%2
and a volatility of 23.36%. For the period, the Fund had an average daily volume of 2,941 shares and an average daily statistical correlation ofover 0.99 to twice that of the daily performance of the Index.3
The Fund takes positions in securities and/or derivatives that, in combination, should have similar daily return characteristics as two times thedaily return of the Index. The Index is an equal-weighted index that seeks to provide diverse regional banking exposure. The Index includesstocks of 50 publicly traded companies that do business as regional banks or thrifts. Component companies include, among others, leading re-gional banks or thrifts listed on a U.S. exchange.
During the year ended May 31, 2017, the Fund invested in swap agreements in order to gain leveraged exposure to the Index. These derivativesgenerally tracked the performance of their underlying index and the Fund was generally negatively impacted by financing rates associatedwith their use. The Fund entered into swap agreements with counterparties that the Fund’s advisor determined to be major, global financial in-stitutions. If a counterparty becomes insolvent or otherwise fails to perform on its obligations, the value of investments in the Fund may decline.The Fund has sought to mitigate this risk by generally requiring counterparties for the Fund to post collateral for the benefit of the Fund, markedto market daily, in an amount approximately equal to the amount the counterparty owed the Fund, subject to certain minimum thresholds.
Past performance does not guarantee future results. Return calculations assume the reinvestment of distributions and do not reflect taxes that ashareholder would pay on Fund distributions or on the redemption of Fund shares. The performance data quoted represents past performanceand current returns may be lower or higher. The investment return and NAV will fluctuate so that an investor’s shares, when redeemed, may bemore or less than the original cost. The performance above reflects any fee reductions during the applicable periods. If such fee reductions hadnot occurred, the quoted performance would be lower. To obtain performance current to the most recent month please visit www.ProShares.com.
1 Fund returns are based on the NAV of the Fund. This calculation reflects the theoretical reinvestment of distributions, if any, in the Fund as of theex-date. The impact of transaction costs and the lack of ability to reinvest fractional shares are not reflected in the calculations.
2 The Index is a price return index. The total return and any graph or table reflect the theoretical reinvestment of dividends on securities in theIndex. The impact of transaction costs and the deduction of expenses associated with an exchange traded fund such as investment managementand accounting fees are not reflected in the Index calculation. It is not possible to invest directly in an Index.
3 1.00 equals perfect correlation. This calculation is based on the daily total return of the Index and the performance of the daily total return of theNAV per share of the Fund.
The above information is not covered by the Report of the Independent Registered Public Accounting Firm.
PROSHARES TRUST MANAGEMENT DISCUSSION OF FUND PERFORMANCE :: ULTRA S&P REGIONAL BANKINGnlKRU :: LXXXV
Value of a $10,000 Investment Since Inception at Net Asset Value*
*The line graph represents historical performance of a hypothetical investment of $10,000 in the ProShares Ultra S&P Regional Bankingfrom April 20, 2010 to May 31, 2017, assuming the reinvestment of distributions.
Index performance through April 15, 2015 reflects the performance ofthe KBW Regional Banking Index. Index performance beginning onApril 16, 2015 reflects the S&P Regional Banks Select Industry Index.
$30,000
$25,000
$20,000
$0
$5,000
$10,000
$15,000
$20,217 S&P Regional Banks Select Industry Index
$24,155 ProShares Ultra S&P Regional Banking
04/20
/10
12/31
/10
12/31
/16
12/31
/15
12/31
/14
12/31
/13
12/31
/12
12/31
/11
05/31
/17
Average Annual Total Return as of 5/31/17
One Year Five Years Since Inception (4/20/10) ProShares Ultra S&P Regional Banking 49.72% 27.39% 13.20%
S&P Regional Banks Select Industry Index 21.49% 16.28% 10.70%
Expense Ratios**
Fund Gross Net ProShares Ultra S&P Regional Banking 2.06% 0.95%
**Reflects the expense ratio as reported in the Prospectus dated October 1,2016. Contractual fee waivers are in effect through September 30, 2017.See Financial Highlights for effective expense ratios.
Market Exposure
Investment Type % of Net Assets
Equity Securities 80%
Swap Agreements 120%
Total Exposure 200%
“Market Exposure” includes the value of totalinvestments (including the contract value ofany derivatives) and excludes any short-terminvestments and cash equivalents.
Largest Equity Holdings
Company % of Net Assets
CIT Group, Inc. 2.3%
First Republic Bank 2.0%
M&T Bank Corp. 2.0%
KeyCorp 2.0%
PNC Financial Services Group, Inc. (The) 2.0%
S&P Regional Banks Select Industry Index – Composition
% of Index
Regional Banks 100%
Allocation of Portfolio Holdings & Index Composition as of 5/31/17
Merrill Corp - Proshares Trust Geared Book [96 Funds] Annual Report [Funds] 333-089822 05-31-2017 ED [AUX] | eperez | 28-Jul-17 17:36 | 17-15159-3.ci | Sequence: 5CHKSUM Content: 21395 Layout: 35718 Graphics: 46898 CLEAN
JOB: 17-15159-3 CYCLE#;BL#: 5; 0 TRIM: 8.25" x 10.75" COMPOSITECOLORS: Black, ~note-color 2, ~note-color 3 GRAPHICS: 15159-3_KRU_L.eps V1.5
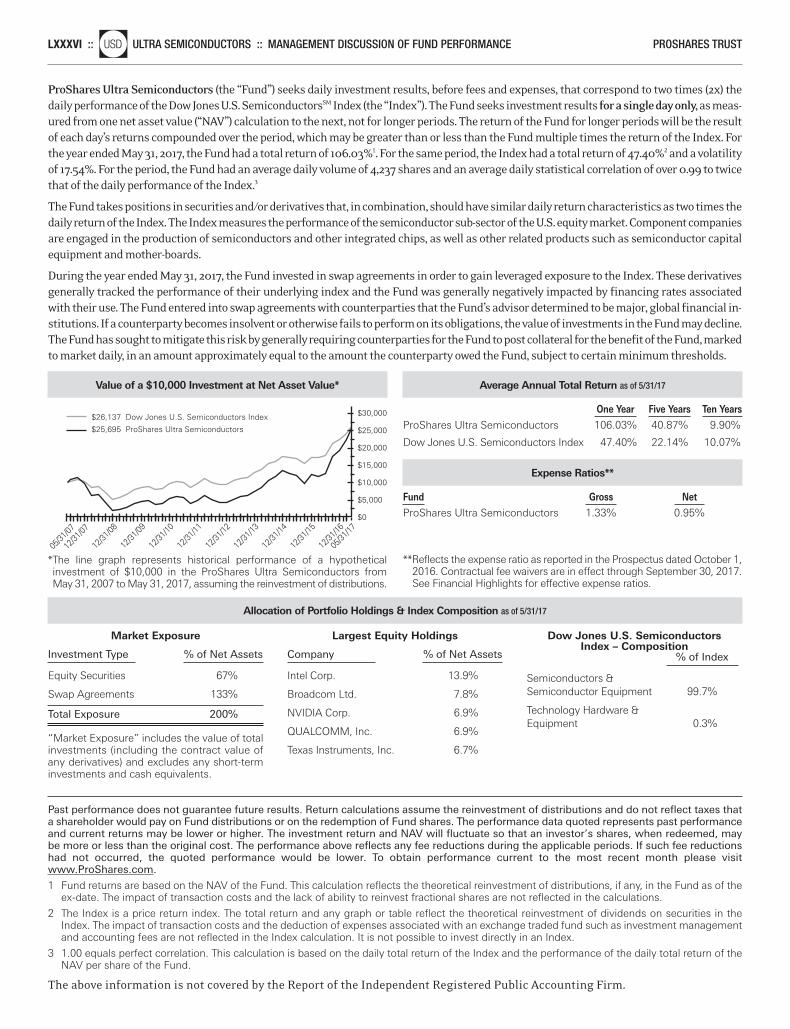
ProShares Ultra Semiconductors (the “Fund”) seeks daily investment results, before fees and expenses, that correspond to two times (2x) thedaily performance of the Dow Jones U.S. SemiconductorsSM Index (the “Index”). The Fund seeks investment results for a single day only,as meas-ured from one net asset value (“NAV”) calculation to the next, not for longer periods. The return of the Fund for longer periods will be the resultof each day’s returns compounded over the period, which may be greater than or less than the Fund multiple times the return of the Index. Forthe year ended May 31, 2017, the Fund had a total return of 106.03%1. For the same period, the Index had a total return of 47.40%2 and a volatilityof 17.54%. For the period, the Fund had an average daily volume of 4,237 shares and an average daily statistical correlation of over 0.99 to twicethat of the daily performance of the Index.3
The Fund takes positions in securities and/or derivatives that, in combination, should have similar daily return characteristics as two times thedaily return of the Index. The Index measures the performance of the semiconductor sub-sector of the U.S. equity market. Component companiesare engaged in the production of semiconductors and other integrated chips, as well as other related products such as semiconductor capitalequipment and mother-boards.
During the year ended May 31, 2017, the Fund invested in swap agreements in order to gain leveraged exposure to the Index. These derivativesgenerally tracked the performance of their underlying index and the Fund was generally negatively impacted by financing rates associatedwith their use. The Fund entered into swap agreements with counterparties that the Fund’s advisor determined to be major, global financial in-stitutions. If a counterparty becomes insolvent or otherwise fails to perform on its obligations, the value of investments in the Fund may decline.The Fund has sought to mitigate this risk by generally requiring counterparties for the Fund to post collateral for the benefit of the Fund, markedto market daily, in an amount approximately equal to the amount the counterparty owed the Fund, subject to certain minimum thresholds.
Past performance does not guarantee future results. Return calculations assume the reinvestment of distributions and do not reflect taxes thata shareholder would pay on Fund distributions or on the redemption of Fund shares. The performance data quoted represents past performanceand current returns may be lower or higher. The investment return and NAV will fluctuate so that an investor’s shares, when redeemed, maybe more or less than the original cost. The performance above reflects any fee reductions during the applicable periods. If such fee reductionshad not occurred, the quoted performance would be lower. To obtain performance current to the most recent month please visitwww.ProShares.com.
1 Fund returns are based on the NAV of the Fund. This calculation reflects the theoretical reinvestment of distributions, if any, in the Fund as of theex-date. The impact of transaction costs and the lack of ability to reinvest fractional shares are not reflected in the calculations.
2 The Index is a price return index. The total return and any graph or table reflect the theoretical reinvestment of dividends on securities in theIndex. The impact of transaction costs and the deduction of expenses associated with an exchange traded fund such as investment managementand accounting fees are not reflected in the Index calculation. It is not possible to invest directly in an Index.
3 1.00 equals perfect correlation. This calculation is based on the daily total return of the Index and the performance of the daily total return of theNAV per share of the Fund.
The above information is not covered by the Report of the Independent Registered Public Accounting Firm.
LXXXVI ::nlUSD ULTRA SEMICONDUCTORS :: MANAGEMENT DISCUSSION OF FUND PERFORMANCE PROSHARES TRUST
Value of a $10,000 Investment at Net Asset Value*
*The line graph represents historical performance of a hypothetical investment of $10,000 in the ProShares Ultra Semiconductors fromMay 31, 2007 to May 31, 2017, assuming the reinvestment of distributions.
$26,137 Dow Jones U.S. Semiconductors Index
$25,695 ProShares Ultra Semiconductors
12/31
/07
12/31
/10
12/31
/09
12/31
/08
12/31
/16
12/31
/15
12/31
/14
12/31
/13
12/31
/12
12/31
/11
05/31
/17
05/31
/07
$30,000
$25,000
$20,000
$0
$15,000
$5,000
$10,000
Average Annual Total Return as of 5/31/17
One Year Five Years Ten Years ProShares Ultra Semiconductors 106.03% 40.87% 9.90%
Dow Jones U.S. Semiconductors Index 47.40% 22.14% 10.07%
Expense Ratios**
Fund Gross Net ProShares Ultra Semiconductors 1.33% 0.95%
**Reflects the expense ratio as reported in the Prospectus dated October 1,2016. Contractual fee waivers are in effect through September 30, 2017.See Financial Highlights for effective expense ratios.
Market Exposure
Investment Type % of Net Assets
Equity Securities 67%
Swap Agreements 133%
Total Exposure 200%
“Market Exposure” includes the value of totalinvestments (including the contract value ofany derivatives) and excludes any short-terminvestments and cash equivalents.
Largest Equity Holdings
Company % of Net Assets
Intel Corp. 13.9%
Broadcom Ltd. 7.8%
NVIDIA Corp. 6.9%
QUALCOMM, Inc. 6.9%
Texas Instruments, Inc. 6.7%
Dow Jones U.S. Semiconductors Index – Composition
% of Index
Semiconductors & Semiconductor Equipment 99.7%
Technology Hardware & Equipment 0.3%
Allocation of Portfolio Holdings & Index Composition as of 5/31/17
Merrill Corp - Proshares Trust Geared Book [96 Funds] Annual Report [Funds] 333-089822 05-31-2017 ED [AUX] | eperez | 28-Jul-17 17:36 | 17-15159-3.ci | Sequence: 6CHKSUM Content: 42839 Layout: 31502 Graphics: 42308 CLEAN
JOB: 17-15159-3 CYCLE#;BL#: 5; 0 TRIM: 8.25" x 10.75" COMPOSITECOLORS: Black, ~note-color 2, ~note-color 3 GRAPHICS: 15159-3_USD_L.eps V1.5
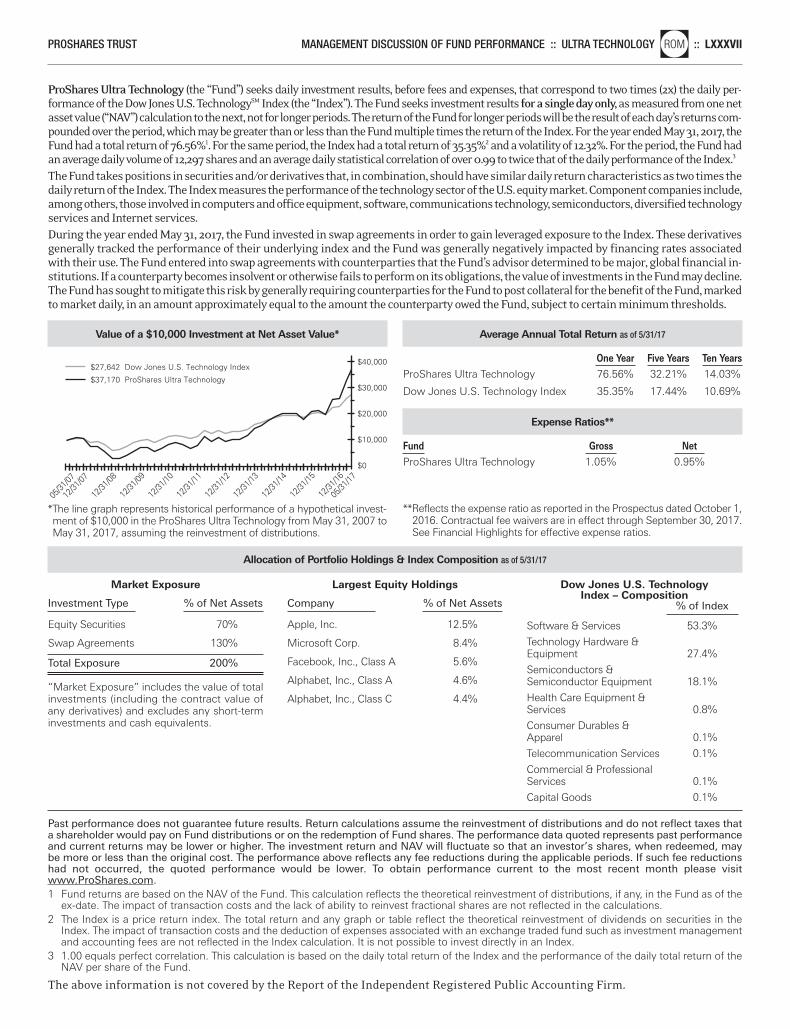
ProShares Ultra Technology (the “Fund”) seeks daily investment results, before fees and expenses, that correspond to two times (2x) the daily per-formance of the Dow Jones U.S. TechnologySM Index (the “Index”). The Fund seeks investment results for a single day only,as measured from one netasset value (“NAV”) calculation to the next, not for longer periods. The return of the Fund for longer periods will be the result of each day’s returns com-pounded over the period, which may be greater than or less than the Fund multiple times the return of the Index. For the year ended May 31, 2017, theFund had a total return of 76.56%1. For the same period, the Index had a total return of 35.35%2 and a volatility of 12.32%. For the period, the Fund hadan average daily volume of 12,297 shares and an average daily statistical correlation of over 0.99 to twice that of the daily performance of the Index.3
The Fund takes positions in securities and/or derivatives that, in combination, should have similar daily return characteristics as two times thedaily return of the Index. The Index measures the performance of the technology sector of the U.S. equity market. Component companies include,among others, those involved in computers and office equipment, software, communications technology, semiconductors, diversified technologyservices and Internet services.During the year ended May 31, 2017, the Fund invested in swap agreements in order to gain leveraged exposure to the Index. These derivativesgenerally tracked the performance of their underlying index and the Fund was generally negatively impacted by financing rates associatedwith their use. The Fund entered into swap agreements with counterparties that the Fund’s advisor determined to be major, global financial in-stitutions. If a counterparty becomes insolvent or otherwise fails to perform on its obligations, the value of investments in the Fund may decline.The Fund has sought to mitigate this risk by generally requiring counterparties for the Fund to post collateral for the benefit of the Fund, markedto market daily, in an amount approximately equal to the amount the counterparty owed the Fund, subject to certain minimum thresholds.
Past performance does not guarantee future results. Return calculations assume the reinvestment of distributions and do not reflect taxes thata shareholder would pay on Fund distributions or on the redemption of Fund shares. The performance data quoted represents past performanceand current returns may be lower or higher. The investment return and NAV will fluctuate so that an investor’s shares, when redeemed, maybe more or less than the original cost. The performance above reflects any fee reductions during the applicable periods. If such fee reductionshad not occurred, the quoted performance would be lower. To obtain performance current to the most recent month please visitwww.ProShares.com.1 Fund returns are based on the NAV of the Fund. This calculation reflects the theoretical reinvestment of distributions, if any, in the Fund as of the
ex-date. The impact of transaction costs and the lack of ability to reinvest fractional shares are not reflected in the calculations.2 The Index is a price return index. The total return and any graph or table reflect the theoretical reinvestment of dividends on securities in the
Index. The impact of transaction costs and the deduction of expenses associated with an exchange traded fund such as investment managementand accounting fees are not reflected in the Index calculation. It is not possible to invest directly in an Index.
3 1.00 equals perfect correlation. This calculation is based on the daily total return of the Index and the performance of the daily total return of theNAV per share of the Fund.
The above information is not covered by the Report of the Independent Registered Public Accounting Firm.
PROSHARES TRUST MANAGEMENT DISCUSSION OF FUND PERFORMANCE :: ULTRA TECHNOLOGYnlROM :: LXXXVII
Value of a $10,000 Investment at Net Asset Value*
*The line graph represents historical performance of a hypothetical invest-ment of $10,000 in the ProShares Ultra Technology from May 31, 2007 toMay 31, 2017, assuming the reinvestment of distributions.
$40,000
$30,000
$10,000
$0
$20,000
$27,642 Dow Jones U.S. Technology Index
$37,170 ProShares Ultra Technology
12/31
/07
12/31
/10
12/31
/09
12/31
/08
12/31
/13
12/31
/16
12/31
/15
12/31
/14
12/31
/12
12/31
/11
05/31
/17
05/31
/07
Average Annual Total Return as of 5/31/17
One Year Five Years Ten Years ProShares Ultra Technology 76.56% 32.21% 14.03%
Dow Jones U.S. Technology Index 35.35% 17.44% 10.69%
Expense Ratios**
Fund Gross Net ProShares Ultra Technology 1.05% 0.95%
**Reflects the expense ratio as reported in the Prospectus dated October 1,2016. Contractual fee waivers are in effect through September 30, 2017.See Financial Highlights for effective expense ratios.
Market Exposure
Investment Type % of Net Assets
Equity Securities 70%
Swap Agreements 130%
Total Exposure 200%
“Market Exposure” includes the value of totalinvestments (including the contract value ofany derivatives) and excludes any short-terminvestments and cash equivalents.
Largest Equity Holdings
Company % of Net Assets
Apple, Inc. 12.5%
Microsoft Corp. 8.4%
Facebook, Inc., Class A 5.6%
Alphabet, Inc., Class A 4.6%
Alphabet, Inc., Class C 4.4%
Dow Jones U.S. Technology Index – Composition
% of Index Software & Services 53.3%
Technology Hardware & Equipment 27.4%
Semiconductors & Semiconductor Equipment 18.1%
Health Care Equipment & Services 0.8%
Consumer Durables & Apparel 0.1%
Telecommunication Services 0.1%
Commercial & Professional Services 0.1%
Capital Goods 0.1%
Allocation of Portfolio Holdings & Index Composition as of 5/31/17
Merrill Corp - Proshares Trust Geared Book [96 Funds] Annual Report [Funds] 333-089822 05-31-2017 ED [AUX] | eperez | 28-Jul-17 17:36 | 17-15159-3.ci | Sequence: 7CHKSUM Content: 54389 Layout: 34291 Graphics: 17180 CLEAN
JOB: 17-15159-3 CYCLE#;BL#: 5; 0 TRIM: 8.25" x 10.75" COMPOSITECOLORS: Black, ~note-color 2, ~note-color 3 GRAPHICS: 15159-3_ROM_L.eps V1.5
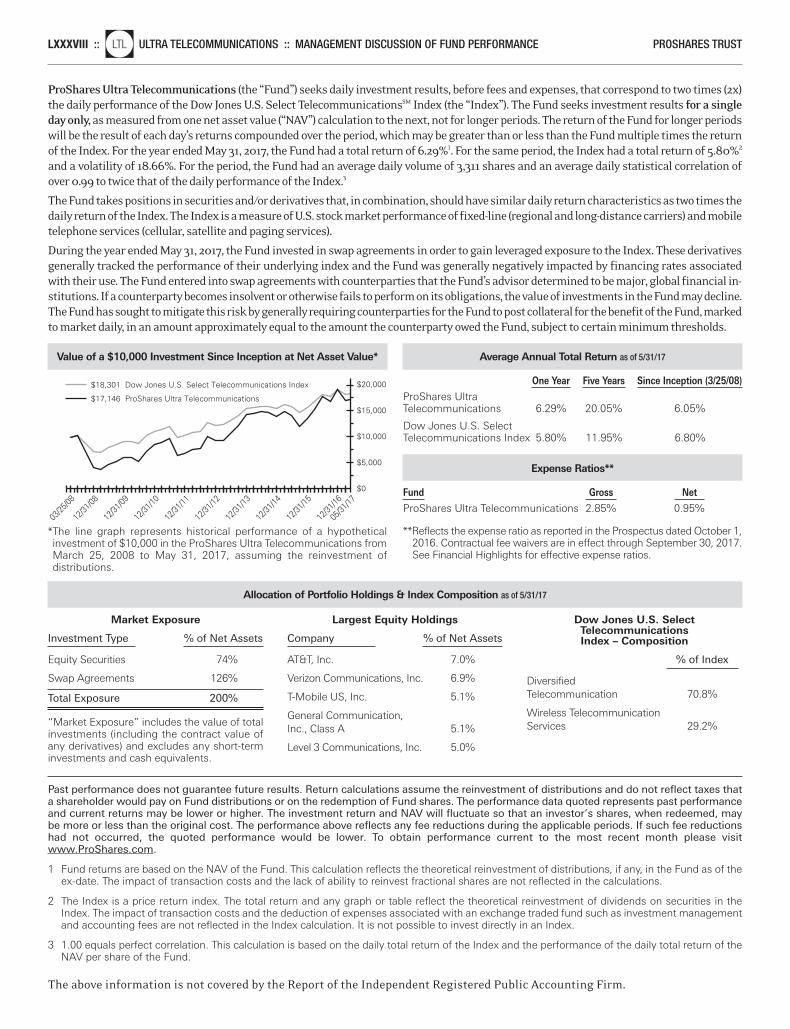
LXXXVIII ::nlLTL ULTRA TELECOMMUNICATIONS :: MANAGEMENT DISCUSSION OF FUND PERFORMANCE PROSHARES TRUST
ProShares Ultra Telecommunications (the “Fund”) seeks daily investment results, before fees and expenses, that correspond to two times (2x)the daily performance of the Dow Jones U.S. Select TelecommunicationsSM Index (the “Index”). The Fund seeks investment results for a singleday only, as measured from one net asset value (“NAV”) calculation to the next, not for longer periods. The return of the Fund for longer periodswill be the result of each day’s returns compounded over the period, which may be greater than or less than the Fund multiple times the returnof the Index. For the year ended May 31, 2017, the Fund had a total return of 6.29%1. For the same period, the Index had a total return of 5.80%2
and a volatility of 18.66%. For the period, the Fund had an average daily volume of 3,311 shares and an average daily statistical correlation ofover 0.99 to twice that of the daily performance of the Index.3
The Fund takes positions in securities and/or derivatives that, in combination, should have similar daily return characteristics as two times thedaily return of the Index. The Index is a measure of U.S. stock market performance of fixed-line (regional and long-distance carriers) and mobiletelephone services (cellular, satellite and paging services).
During the year ended May 31, 2017, the Fund invested in swap agreements in order to gain leveraged exposure to the Index. These derivativesgenerally tracked the performance of their underlying index and the Fund was generally negatively impacted by financing rates associatedwith their use. The Fund entered into swap agreements with counterparties that the Fund’s advisor determined to be major, global financial in-stitutions. If a counterparty becomes insolvent or otherwise fails to perform on its obligations, the value of investments in the Fund may decline.The Fund has sought to mitigate this risk by generally requiring counterparties for the Fund to post collateral for the benefit of the Fund, markedto market daily, in an amount approximately equal to the amount the counterparty owed the Fund, subject to certain minimum thresholds.
Past performance does not guarantee future results. Return calculations assume the reinvestment of distributions and do not reflect taxes thata shareholder would pay on Fund distributions or on the redemption of Fund shares. The performance data quoted represents past performanceand current returns may be lower or higher. The investment return and NAV will fluctuate so that an investor’s shares, when redeemed, maybe more or less than the original cost. The performance above reflects any fee reductions during the applicable periods. If such fee reductionshad not occurred, the quoted performance would be lower. To obtain performance current to the most recent month please visitwww.ProShares.com.
1 Fund returns are based on the NAV of the Fund. This calculation reflects the theoretical reinvestment of distributions, if any, in the Fund as of theex-date. The impact of transaction costs and the lack of ability to reinvest fractional shares are not reflected in the calculations.
2 The Index is a price return index. The total return and any graph or table reflect the theoretical reinvestment of dividends on securities in theIndex. The impact of transaction costs and the deduction of expenses associated with an exchange traded fund such as investment managementand accounting fees are not reflected in the Index calculation. It is not possible to invest directly in an Index.
3 1.00 equals perfect correlation. This calculation is based on the daily total return of the Index and the performance of the daily total return of theNAV per share of the Fund.
The above information is not covered by the Report of the Independent Registered Public Accounting Firm.
Value of a $10,000 Investment Since Inception at Net Asset Value*
*The line graph represents historical performance of a hypothetical investment of $10,000 in the ProShares Ultra Telecommunications fromMarch 25, 2008 to May 31, 2017, assuming the reinvestment of distributions.
$20,000
$0
$18,301 Dow Jones U.S. Select Telecommunications Index
$17,146 ProShares Ultra Telecommunications
03/25
/08
12/31
/08
12/31
/10
12/31
/16
12/31
/15
12/31
/14
12/31
/13
12/31
/12
12/31
/11
12/31
/09
05/31
/17
$5,000
$10,000
$15,000
Average Annual Total Return as of 5/31/17
One Year Five Years Since Inception (3/25/08) ProShares Ultra Telecommunications 6.29% 20.05% 6.05%
Dow Jones U.S. Select Telecommunications Index 5.80% 11.95% 6.80%
Expense Ratios**
Fund Gross Net ProShares Ultra Telecommunications 2.85% 0.95%
**Reflects the expense ratio as reported in the Prospectus dated October 1,2016. Contractual fee waivers are in effect through September 30, 2017.See Financial Highlights for effective expense ratios.
Market Exposure
Investment Type % of Net Assets
Equity Securities 74%
Swap Agreements 126%
Total Exposure 200%
“Market Exposure” includes the value of totalinvestments (including the contract value ofany derivatives) and excludes any short-terminvestments and cash equivalents.
Largest Equity Holdings
Company % of Net Assets
AT&T, Inc. 7.0%
Verizon Communications, Inc. 6.9%
T-Mobile US, Inc. 5.1%
General Communication, Inc., Class A 5.1%
Level 3 Communications, Inc. 5.0%
Dow Jones U.S. Select Telecommunications Index – Composition
% of Index
Diversified Telecommunication 70.8%
Wireless Telecommunication Services 29.2%
Allocation of Portfolio Holdings & Index Composition as of 5/31/17
Merrill Corp - Proshares Trust Geared Book [96 Funds] Annual Report [Funds] 333-089822 05-31-2017 ED [AUX] | eperez | 28-Jul-17 17:36 | 17-15159-3.ci | Sequence: 8CHKSUM Content: 3237 Layout: 4143 Graphics: 53474 CLEAN
JOB: 17-15159-3 CYCLE#;BL#: 5; 0 TRIM: 8.25" x 10.75" COMPOSITECOLORS: Black, ~note-color 2, ~note-color 3 GRAPHICS: 15159-3_LTL_L.eps V1.5
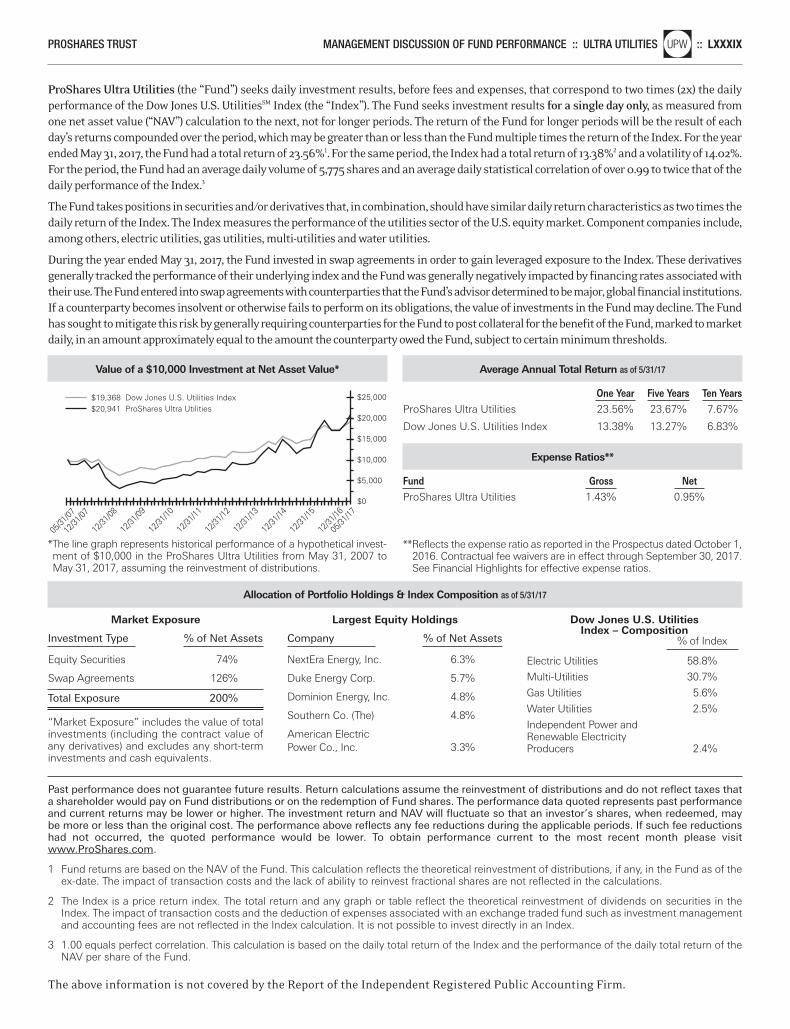
ProShares Ultra Utilities (the “Fund”) seeks daily investment results, before fees and expenses, that correspond to two times (2x) the dailyperformance of the Dow Jones U.S. UtilitiesSM Index (the “Index”). The Fund seeks investment results for a single day only, as measured fromone net asset value (“NAV”) calculation to the next, not for longer periods. The return of the Fund for longer periods will be the result of eachday’s returns compounded over the period, which may be greater than or less than the Fund multiple times the return of the Index. For the yearended May 31, 2017, the Fund had a total return of 23.56%1. For the same period, the Index had a total return of 13.38%2 and a volatility of 14.02%.For the period, the Fund had an average daily volume of 5,775 shares and an average daily statistical correlation of over 0.99 to twice that of thedaily performance of the Index.3
The Fund takes positions in securities and/or derivatives that, in combination, should have similar daily return characteristics as two times thedaily return of the Index. The Index measures the performance of the utilities sector of the U.S. equity market. Component companies include,among others, electric utilities, gas utilities, multi-utilities and water utilities.
During the year ended May 31, 2017, the Fund invested in swap agreements in order to gain leveraged exposure to the Index. These derivativesgenerally tracked the performance of their underlying index and the Fund was generally negatively impacted by financing rates associated withtheir use. The Fund entered into swap agreements with counterparties that the Fund’s advisor determined to be major, global financial institutions.If a counterparty becomes insolvent or otherwise fails to perform on its obligations, the value of investments in the Fund may decline. The Fundhas sought to mitigate this risk by generally requiring counterparties for the Fund to post collateral for the benefit of the Fund, marked to marketdaily, in an amount approximately equal to the amount the counterparty owed the Fund, subject to certain minimum thresholds.
Past performance does not guarantee future results. Return calculations assume the reinvestment of distributions and do not reflect taxes thata shareholder would pay on Fund distributions or on the redemption of Fund shares. The performance data quoted represents past performanceand current returns may be lower or higher. The investment return and NAV will fluctuate so that an investor’s shares, when redeemed, maybe more or less than the original cost. The performance above reflects any fee reductions during the applicable periods. If such fee reductionshad not occurred, the quoted performance would be lower. To obtain performance current to the most recent month please visitwww.ProShares.com.
1 Fund returns are based on the NAV of the Fund. This calculation reflects the theoretical reinvestment of distributions, if any, in the Fund as of theex-date. The impact of transaction costs and the lack of ability to reinvest fractional shares are not reflected in the calculations.
2 The Index is a price return index. The total return and any graph or table reflect the theoretical reinvestment of dividends on securities in theIndex. The impact of transaction costs and the deduction of expenses associated with an exchange traded fund such as investment managementand accounting fees are not reflected in the Index calculation. It is not possible to invest directly in an Index.
3 1.00 equals perfect correlation. This calculation is based on the daily total return of the Index and the performance of the daily total return of theNAV per share of the Fund.
The above information is not covered by the Report of the Independent Registered Public Accounting Firm.
PROSHARES TRUST MANAGEMENT DISCUSSION OF FUND PERFORMANCE :: ULTRA UTILITIESnlUPW :: LXXXIX
Value of a $10,000 Investment at Net Asset Value*
*The line graph represents historical performance of a hypothetical invest-ment of $10,000 in the ProShares Ultra Utilities from May 31, 2007 toMay 31, 2017, assuming the reinvestment of distributions.
$19,368 Dow Jones U.S. Utilities Index$20,941 ProShares Ultra Utilities
$25,000
$20,000
$0
$15,000
$5,000
$10,000
12/31
/07
12/31
/10
12/31
/09
12/31
/08
12/31
/16
12/31
/15
12/31
/14
12/31
/13
12/31
/12
12/31
/11
05/31
/17
05/31
/07
Average Annual Total Return as of 5/31/17
One Year Five Years Ten Years ProShares Ultra Utilities 23.56% 23.67% 7.67%
Dow Jones U.S. Utilities Index 13.38% 13.27% 6.83%
Expense Ratios**
Fund Gross Net ProShares Ultra Utilities 1.43% 0.95%
**Reflects the expense ratio as reported in the Prospectus dated October 1,2016. Contractual fee waivers are in effect through September 30, 2017.See Financial Highlights for effective expense ratios.
Market Exposure
Investment Type % of Net Assets
Equity Securities 74%
Swap Agreements 126%
Total Exposure 200%
“Market Exposure” includes the value of totalinvestments (including the contract value ofany derivatives) and excludes any short-terminvestments and cash equivalents.
Largest Equity Holdings
Company % of Net Assets
NextEra Energy, Inc. 6.3%
Duke Energy Corp. 5.7%
Dominion Energy, Inc. 4.8%
Southern Co. (The) 4.8%
American Electric Power Co., Inc. 3.3%
Dow Jones U.S. Utilities Index – Composition
% of Index Electric Utilities 58.8%
Multi-Utilities 30.7%
Gas Utilities 5.6%
Water Utilities 2.5%
Independent Power and Renewable Electricity Producers 2.4%
Allocation of Portfolio Holdings & Index Composition as of 5/31/17
Merrill Corp - Proshares Trust Geared Book [96 Funds] Annual Report [Funds] 333-089822 05-31-2017 ED [AUX] | eperez | 28-Jul-17 17:36 | 17-15159-3.ci | Sequence: 9CHKSUM Content: 46996 Layout: 27945 Graphics: 31130 CLEAN
JOB: 17-15159-3 CYCLE#;BL#: 5; 0 TRIM: 8.25" x 10.75" COMPOSITECOLORS: Black, ~note-color 2, ~note-color 3 GRAPHICS: 15159-3_UPW_L.eps V1.5
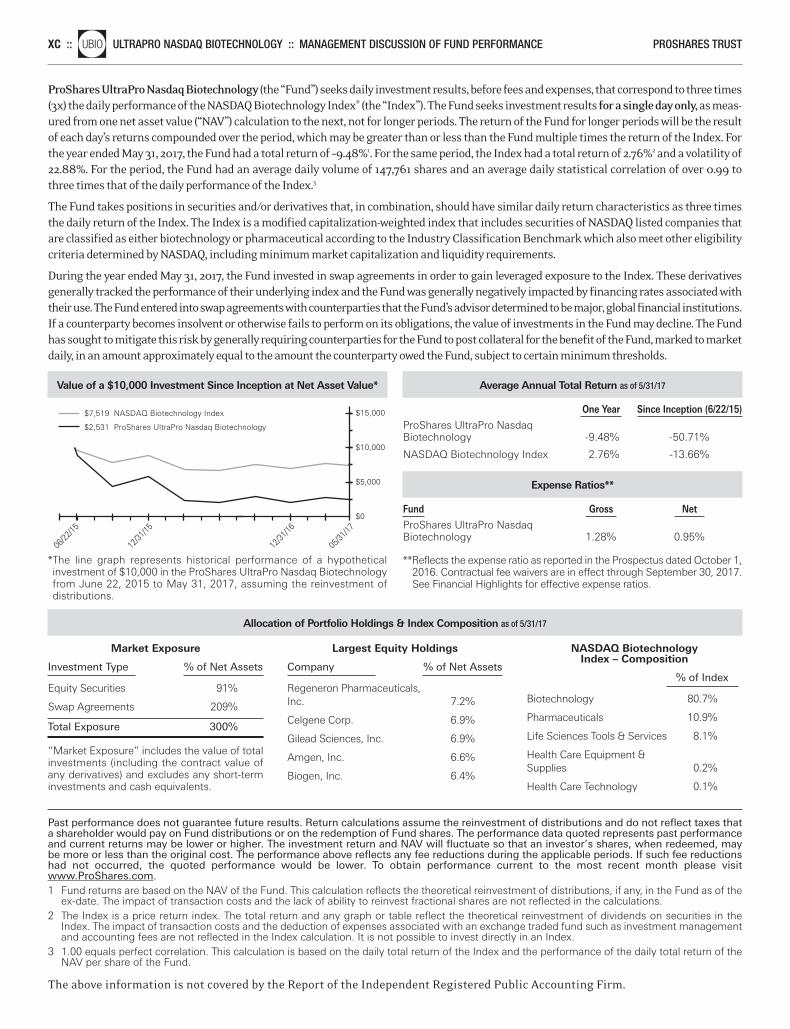
ProShares UltraPro Nasdaq Biotechnology (the “Fund”) seeks daily investment results, before fees and expenses, that correspond to three times(3x) the daily performance of the NASDAQ Biotechnology Index® (the “Index”). The Fund seeks investment results for a single day only,as meas-ured from one net asset value (“NAV”) calculation to the next, not for longer periods. The return of the Fund for longer periods will be the resultof each day’s returns compounded over the period, which may be greater than or less than the Fund multiple times the return of the Index. Forthe year ended May 31, 2017, the Fund had a total return of –9.48%1. For the same period, the Index had a total return of 2.76%2 and a volatility of22.88%. For the period, the Fund had an average daily volume of 147,761 shares and an average daily statistical correlation of over 0.99 tothree times that of the daily performance of the Index.3
The Fund takes positions in securities and/or derivatives that, in combination, should have similar daily return characteristics as three timesthe daily return of the Index. The Index is a modified capitalization-weighted index that includes securities of NASDAQ listed companies thatare classified as either biotechnology or pharmaceutical according to the Industry Classification Benchmark which also meet other eligibilitycriteria determined by NASDAQ, including minimum market capitalization and liquidity requirements.
During the year ended May 31, 2017, the Fund invested in swap agreements in order to gain leveraged exposure to the Index. These derivativesgenerally tracked the performance of their underlying index and the Fund was generally negatively impacted by financing rates associated withtheir use. The Fund entered into swap agreements with counterparties that the Fund’s advisor determined to be major, global financial institutions.If a counterparty becomes insolvent or otherwise fails to perform on its obligations, the value of investments in the Fund may decline. The Fundhas sought to mitigate this risk by generally requiring counterparties for the Fund to post collateral for the benefit of the Fund, marked to marketdaily, in an amount approximately equal to the amount the counterparty owed the Fund, subject to certain minimum thresholds.
XC ::nlUBIO ULTRAPRO NASDAQ BIOTECHNOLOGY :: MANAGEMENT DISCUSSION OF FUND PERFORMANCE PROSHARES TRUST
Value of a $10,000 Investment Since Inception at Net Asset Value*
*The line graph represents historical performance of a hypothetical investment of $10,000 in the ProShares UltraPro Nasdaq Biotechnologyfrom June 22, 2015 to May 31, 2017, assuming the reinvestment of distributions.
$15,000
$0
$5,000
$10,000
$7,519 NASDAQ Biotechnology Index
$2,531 ProShares UltraPro Nasdaq Biotechnology
06/22
/15
12/31
/16
12/31
/15
05/31
/17
Average Annual Total Return as of 5/31/17
One Year Since Inception (6/22/15) ProShares UltraPro Nasdaq Biotechnology -9.48% -50.71%
NASDAQ Biotechnology Index 2.76% -13.66%
Expense Ratios**
Fund Gross Net ProShares UltraPro Nasdaq Biotechnology 1.28% 0.95%
**Reflects the expense ratio as reported in the Prospectus dated October 1,2016. Contractual fee waivers are in effect through September 30, 2017.See Financial Highlights for effective expense ratios.
Market Exposure
Investment Type % of Net Assets
Equity Securities 91%
Swap Agreements 209%
Total Exposure 300%
“Market Exposure” includes the value of totalinvestments (including the contract value ofany derivatives) and excludes any short-terminvestments and cash equivalents.
Largest Equity Holdings
Company % of Net Assets
Regeneron Pharmaceuticals, Inc. 7.2%
Celgene Corp. 6.9%
Gilead Sciences, Inc. 6.9%
Amgen, Inc. 6.6%
Biogen, Inc. 6.4%
NASDAQ Biotechnology Index – Composition
% of Index
Biotechnology 80.7%
Pharmaceuticals 10.9%
Life Sciences Tools & Services 8.1%
Health Care Equipment & Supplies 0.2%
Health Care Technology 0.1%
Allocation of Portfolio Holdings & Index Composition as of 5/31/17
Past performance does not guarantee future results. Return calculations assume the reinvestment of distributions and do not reflect taxes thata shareholder would pay on Fund distributions or on the redemption of Fund shares. The performance data quoted represents past performanceand current returns may be lower or higher. The investment return and NAV will fluctuate so that an investor’s shares, when redeemed, maybe more or less than the original cost. The performance above reflects any fee reductions during the applicable periods. If such fee reductionshad not occurred, the quoted performance would be lower. To obtain performance current to the most recent month please visitwww.ProShares.com.1 Fund returns are based on the NAV of the Fund. This calculation reflects the theoretical reinvestment of distributions, if any, in the Fund as of the
ex-date. The impact of transaction costs and the lack of ability to reinvest fractional shares are not reflected in the calculations.2 The Index is a price return index. The total return and any graph or table reflect the theoretical reinvestment of dividends on securities in the
Index. The impact of transaction costs and the deduction of expenses associated with an exchange traded fund such as investment managementand accounting fees are not reflected in the Index calculation. It is not possible to invest directly in an Index.
3 1.00 equals perfect correlation. This calculation is based on the daily total return of the Index and the performance of the daily total return of theNAV per share of the Fund.
The above information is not covered by the Report of the Independent Registered Public Accounting Firm.
Merrill Corp - Proshares Trust Geared Book [96 Funds] Annual Report [Funds] 333-089822 05-31-2017 ED [AUX] | eperez | 28-Jul-17 17:36 | 17-15159-3.ci | Sequence: 10CHKSUM Content: 11651 Layout: 26309 Graphics: 23153 CLEAN
JOB: 17-15159-3 CYCLE#;BL#: 5; 0 TRIM: 8.25" x 10.75" COMPOSITECOLORS: Black, ~note-color 2, ~note-color 3 GRAPHICS: 15159-3_UBIO_L.eps V1.5
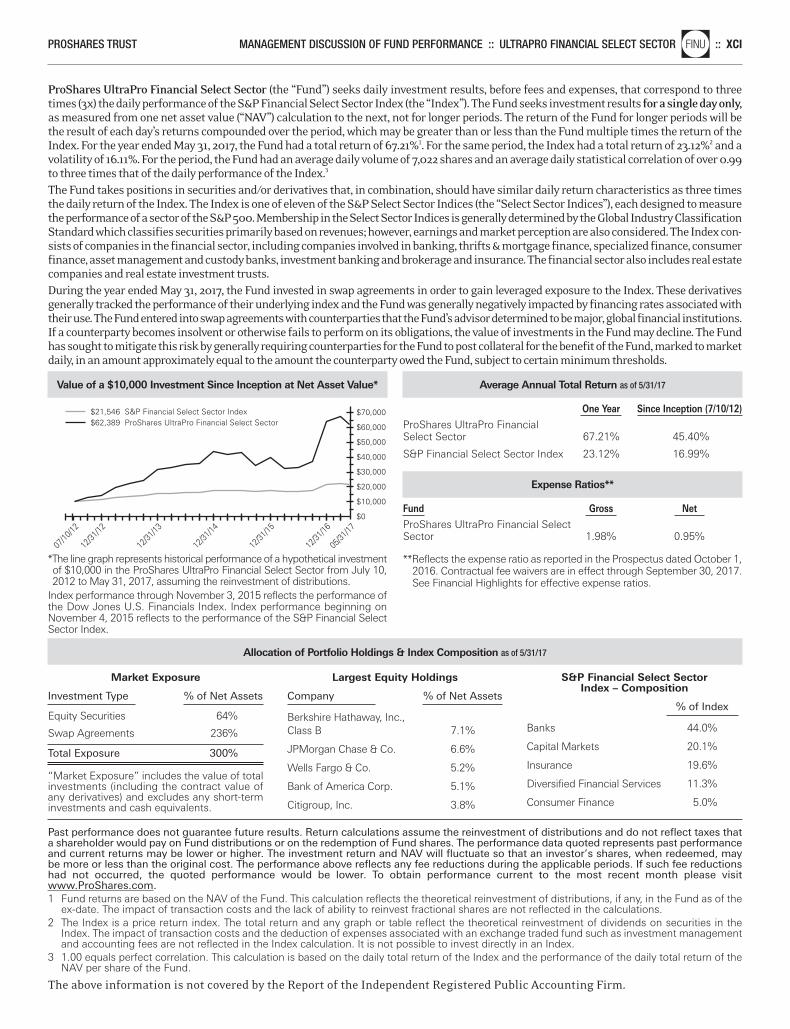
ProShares UltraPro Financial Select Sector (the “Fund”) seeks daily investment results, before fees and expenses, that correspond to threetimes (3x) the daily performance of the S&P Financial Select Sector Index (the “Index”). The Fund seeks investment results for a single day only,as measured from one net asset value (“NAV”) calculation to the next, not for longer periods. The return of the Fund for longer periods will bethe result of each day’s returns compounded over the period, which may be greater than or less than the Fund multiple times the return of theIndex. For the year ended May 31, 2017, the Fund had a total return of 67.21%1. For the same period, the Index had a total return of 23.12%2 and avolatility of 16.11%. For the period, the Fund had an average daily volume of 7,022 shares and an average daily statistical correlation of over 0.99to three times that of the daily performance of the Index.3
The Fund takes positions in securities and/or derivatives that, in combination, should have similar daily return characteristics as three timesthe daily return of the Index. The Index is one of eleven of the S&P Select Sector Indices (the “Select Sector Indices”), each designed to measurethe performance of a sector of the S&P 500. Membership in the Select Sector Indices is generally determined by the Global Industry ClassificationStandard which classifies securities primarily based on revenues; however, earnings and market perception are also considered. The Index con-sists of companies in the financial sector, including companies involved in banking, thrifts & mortgage finance, specialized finance, consumerfinance, asset management and custody banks, investment banking and brokerage and insurance. The financial sector also includes real estatecompanies and real estate investment trusts.During the year ended May 31, 2017, the Fund invested in swap agreements in order to gain leveraged exposure to the Index. These derivativesgenerally tracked the performance of their underlying index and the Fund was generally negatively impacted by financing rates associated withtheir use. The Fund entered into swap agreements with counterparties that the Fund’s advisor determined to be major, global financial institutions.If a counterparty becomes insolvent or otherwise fails to perform on its obligations, the value of investments in the Fund may decline. The Fundhas sought to mitigate this risk by generally requiring counterparties for the Fund to post collateral for the benefit of the Fund, marked to marketdaily, in an amount approximately equal to the amount the counterparty owed the Fund, subject to certain minimum thresholds.
PROSHARES TRUST MANAGEMENT DISCUSSION OF FUND PERFORMANCE :: ULTRAPRO FINANCIAL SELECT SECTORnlFINU :: XCI
Past performance does not guarantee future results. Return calculations assume the reinvestment of distributions and do not reflect taxes thata shareholder would pay on Fund distributions or on the redemption of Fund shares. The performance data quoted represents past performanceand current returns may be lower or higher. The investment return and NAV will fluctuate so that an investor’s shares, when redeemed, maybe more or less than the original cost. The performance above reflects any fee reductions during the applicable periods. If such fee reductionshad not occurred, the quoted performance would be lower. To obtain performance current to the most recent month please visitwww.ProShares.com.1 Fund returns are based on the NAV of the Fund. This calculation reflects the theoretical reinvestment of distributions, if any, in the Fund as of the
ex-date. The impact of transaction costs and the lack of ability to reinvest fractional shares are not reflected in the calculations.2 The Index is a price return index. The total return and any graph or table reflect the theoretical reinvestment of dividends on securities in the
Index. The impact of transaction costs and the deduction of expenses associated with an exchange traded fund such as investment managementand accounting fees are not reflected in the Index calculation. It is not possible to invest directly in an Index.
3 1.00 equals perfect correlation. This calculation is based on the daily total return of the Index and the performance of the daily total return of theNAV per share of the Fund.
The above information is not covered by the Report of the Independent Registered Public Accounting Firm.
Value of a $10,000 Investment Since Inception at Net Asset Value*
*The line graph represents historical performance of a hypothetical investmentof $10,000 in the ProShares UltraPro Financial Select Sector from July 10,2012 to May 31, 2017, assuming the reinvestment of distributions.
Index performance through November 3, 2015 reflects the performance ofthe Dow Jones U.S. Financials Index. Index performance beginning on November 4, 2015 reflects to the performance of the S&P Financial SelectSector Index.
$70,000
$60,000
$50,000
$30,000
$40,000
$0
$21,546 S&P Financial Select Sector Index$62,389 ProShares UltraPro Financial Select Sector
07/10
/12
12/31
/12
12/31
/16
12/31
/15
12/31
/14
12/31
/13
05/31
/17
$10,000
$20,000
Average Annual Total Return as of 5/31/17
One Year Since Inception (7/10/12) ProShares UltraPro Financial Select Sector 67.21% 45.40%
S&P Financial Select Sector Index 23.12% 16.99%
Expense Ratios**
Fund Gross Net ProShares UltraPro Financial Select Sector 1.98% 0.95%
**Reflects the expense ratio as reported in the Prospectus dated October 1,2016. Contractual fee waivers are in effect through September 30, 2017.See Financial Highlights for effective expense ratios.
Market Exposure
Investment Type % of Net Assets Equity Securities 64%
Swap Agreements 236%
Total Exposure 300%
“Market Exposure” includes the value of totalinvestments (including the contract value ofany derivatives) and excludes any short-terminvestments and cash equivalents.
Largest Equity Holdings
Company % of Net Assets
Berkshire Hathaway, Inc., Class B 7.1%
JPMorgan Chase & Co. 6.6%
Wells Fargo & Co. 5.2%
Bank of America Corp. 5.1%
Citigroup, Inc. 3.8%
S&P Financial Select Sector Index – Composition
% of Index
Banks 44.0%
Capital Markets 20.1%
Insurance 19.6%
Diversified Financial Services 11.3%
Consumer Finance 5.0%
Allocation of Portfolio Holdings & Index Composition as of 5/31/17
Merrill Corp - Proshares Trust Geared Book [96 Funds] Annual Report [Funds] 333-089822 05-31-2017 ED [AUX] | eperez | 28-Jul-17 17:36 | 17-15159-3.ci | Sequence: 11CHKSUM Content: 14901 Layout: 16698 Graphics: 46481 CLEAN
JOB: 17-15159-3 CYCLE#;BL#: 5; 0 TRIM: 8.25" x 10.75" COMPOSITECOLORS: Black, ~note-color 2, ~note-color 3 GRAPHICS: 15159-3_FINU_L.eps V1.5
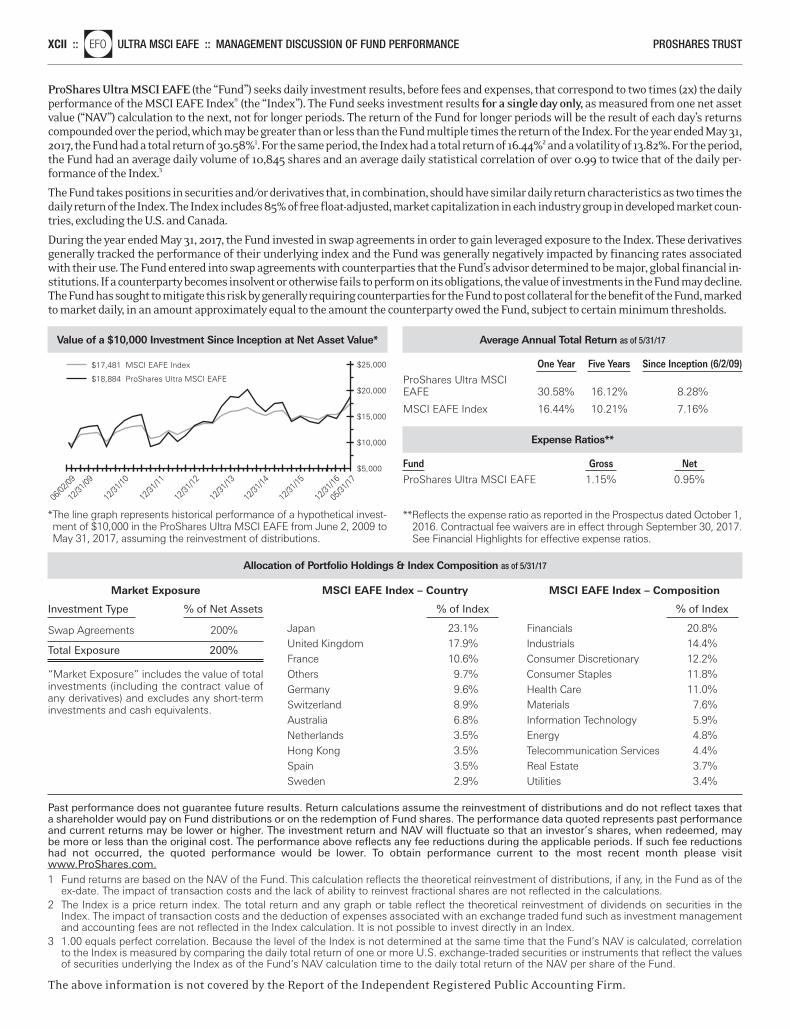
ProShares Ultra MSCI EAFE (the “Fund”) seeks daily investment results, before fees and expenses, that correspond to two times (2x) the dailyperformance of the MSCI EAFE Index® (the “Index”). The Fund seeks investment results for a single day only, as measured from one net assetvalue (“NAV”) calculation to the next, not for longer periods. The return of the Fund for longer periods will be the result of each day’s returnscompounded over the period, which may be greater than or less than the Fund multiple times the return of the Index. For the year ended May 31,2017, the Fund had a total return of 30.58%1. For the same period, the Index had a total return of 16.44%2 and a volatility of 13.82%. For the period,the Fund had an average daily volume of 10,845 shares and an average daily statistical correlation of over 0.99 to twice that of the daily per-formance of the Index.3
The Fund takes positions in securities and/or derivatives that, in combination, should have similar daily return characteristics as two times thedaily return of the Index. The Index includes 85% of free float-adjusted, market capitalization in each industry group in developed market coun-tries, excluding the U.S. and Canada.
During the year ended May 31, 2017, the Fund invested in swap agreements in order to gain leveraged exposure to the Index. These derivativesgenerally tracked the performance of their underlying index and the Fund was generally negatively impacted by financing rates associatedwith their use. The Fund entered into swap agreements with counterparties that the Fund’s advisor determined to be major, global financial in-stitutions. If a counterparty becomes insolvent or otherwise fails to perform on its obligations, the value of investments in the Fund may decline.The Fund has sought to mitigate this risk by generally requiring counterparties for the Fund to post collateral for the benefit of the Fund, markedto market daily, in an amount approximately equal to the amount the counterparty owed the Fund, subject to certain minimum thresholds.
XCII ::nlEFO ULTRA MSCI EAFE :: MANAGEMENT DISCUSSION OF FUND PERFORMANCE PROSHARES TRUST
Past performance does not guarantee future results. Return calculations assume the reinvestment of distributions and do not reflect taxes thata shareholder would pay on Fund distributions or on the redemption of Fund shares. The performance data quoted represents past performanceand current returns may be lower or higher. The investment return and NAV will fluctuate so that an investor’s shares, when redeemed, maybe more or less than the original cost. The performance above reflects any fee reductions during the applicable periods. If such fee reductionshad not occurred, the quoted performance would be lower. To obtain performance current to the most recent month please visitwww.ProShares.com.1 Fund returns are based on the NAV of the Fund. This calculation reflects the theoretical reinvestment of distributions, if any, in the Fund as of the
ex-date. The impact of transaction costs and the lack of ability to reinvest fractional shares are not reflected in the calculations.2 The Index is a price return index. The total return and any graph or table reflect the theoretical reinvestment of dividends on securities in the
Index. The impact of transaction costs and the deduction of expenses associated with an exchange traded fund such as investment managementand accounting fees are not reflected in the Index calculation. It is not possible to invest directly in an Index.
3 1.00 equals perfect correlation. Because the level of the Index is not determined at the same time that the Fund’s NAV is calculated, correlationto the Index is measured by comparing the daily total return of one or more U.S. exchange-traded securities or instruments that reflect the valuesof securities underlying the Index as of the Fund’s NAV calculation time to the daily total return of the NAV per share of the Fund.
The above information is not covered by the Report of the Independent Registered Public Accounting Firm.
Value of a $10,000 Investment Since Inception at Net Asset Value*
*The line graph represents historical performance of a hypothetical invest-ment of $10,000 in the ProShares Ultra MSCI EAFE from June 2, 2009 toMay 31, 2017, assuming the reinvestment of distributions.
$25,000
$20,000
$5,000
$10,000
$15,000
$17,481 MSCI EAFE Index
$18,884 ProShares Ultra MSCI EAFE
06/02
/09
12/31
/09
12/31
/10
12/31
/16
12/31
/15
12/31
/14
12/31
/13
12/31
/12
12/31
/11
05/31
/17
Average Annual Total Return as of 5/31/17
One Year Five Years Since Inception (6/2/09) ProShares Ultra MSCI EAFE 30.58% 16.12% 8.28%
MSCI EAFE Index 16.44% 10.21% 7.16%
Expense Ratios**
Fund Gross Net ProShares Ultra MSCI EAFE 1.15% 0.95%
**Reflects the expense ratio as reported in the Prospectus dated October 1,2016. Contractual fee waivers are in effect through September 30, 2017.See Financial Highlights for effective expense ratios.
Market Exposure
Investment Type % of Net Assets
Swap Agreements 200%
Total Exposure 200%
“Market Exposure” includes the value of totalinvestments (including the contract value ofany derivatives) and excludes any short-terminvestments and cash equivalents.
MSCI EAFE Index – Country
% of Index Japan 23.1%United Kingdom 17.9%France 10.6%Others 9.7%Germany 9.6%Switzerland 8.9%Australia 6.8%Netherlands 3.5%Hong Kong 3.5%Spain 3.5%Sweden 2.9%
MSCI EAFE Index – Composition
% of Index Financials 20.8%Industrials 14.4%Consumer Discretionary 12.2%Consumer Staples 11.8%Health Care 11.0%Materials 7.6%Information Technology 5.9%Energy 4.8%Telecommunication Services 4.4%Real Estate 3.7%Utilities 3.4%
Allocation of Portfolio Holdings & Index Composition as of 5/31/17
Merrill Corp - Proshares Trust Geared Book [96 Funds] Annual Report [Funds] 333-089822 05-31-2017 ED [AUX] | eperez | 28-Jul-17 17:36 | 17-15159-3.ci | Sequence: 12CHKSUM Content: 7243 Layout: 48558 Graphics: 3113 CLEAN
JOB: 17-15159-3 CYCLE#;BL#: 5; 0 TRIM: 8.25" x 10.75" COMPOSITECOLORS: Black, ~note-color 2, ~note-color 3 GRAPHICS: 15159-3_EFO_L.eps V1.5
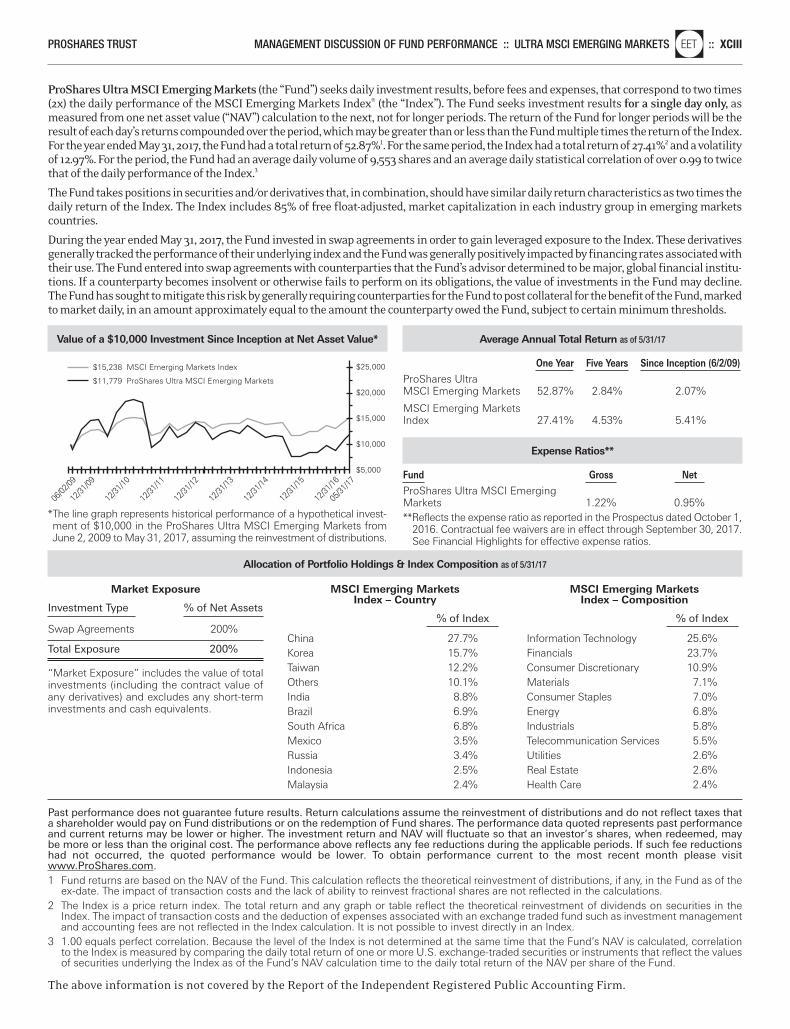
ProShares Ultra MSCI Emerging Markets (the “Fund”) seeks daily investment results, before fees and expenses, that correspond to two times(2x) the daily performance of the MSCI Emerging Markets Index® (the “Index”). The Fund seeks investment results for a single day only, asmeasured from one net asset value (“NAV”) calculation to the next, not for longer periods. The return of the Fund for longer periods will be theresult of each day’s returns compounded over the period, which may be greater than or less than the Fund multiple times the return of the Index.For the year ended May 31, 2017, the Fund had a total return of 52.87%1. For the same period, the Index had a total return of 27.41%2 and a volatilityof 12.97%. For the period, the Fund had an average daily volume of 9,553 shares and an average daily statistical correlation of over 0.99 to twicethat of the daily performance of the Index.3
The Fund takes positions in securities and/or derivatives that, in combination, should have similar daily return characteristics as two times thedaily return of the Index. The Index includes 85% of free float-adjusted, market capitalization in each industry group in emerging marketscountries.
During the year ended May 31, 2017, the Fund invested in swap agreements in order to gain leveraged exposure to the Index. These derivativesgenerally tracked the performance of their underlying index and the Fund was generally positively impacted by financing rates associated withtheir use. The Fund entered into swap agreements with counterparties that the Fund’s advisor determined to be major, global financial institu-tions. If a counterparty becomes insolvent or otherwise fails to perform on its obligations, the value of investments in the Fund may decline.The Fund has sought to mitigate this risk by generally requiring counterparties for the Fund to post collateral for the benefit of the Fund, markedto market daily, in an amount approximately equal to the amount the counterparty owed the Fund, subject to certain minimum thresholds.
PROSHARES TRUST MANAGEMENT DISCUSSION OF FUND PERFORMANCE :: ULTRA MSCI EMERGING MARKETSnlEET :: XCIII
Value of a $10,000 Investment Since Inception at Net Asset Value*
*The line graph represents historical performance of a hypothetical invest-ment of $10,000 in the ProShares Ultra MSCI Emerging Markets fromJune 2, 2009 to May 31, 2017, assuming the reinvestment of distributions.
$25,000
$20,000
$5,000
$10,000
$15,000
$15,238 MSCI Emerging Markets Index
$11,779 ProShares Ultra MSCI Emerging Markets
06/02
/09
12/31
/09
12/31
/10
12/31
/16
12/31
/15
12/31
/14
12/31
/13
12/31
/12
12/31
/11
05/31
/17
Average Annual Total Return as of 5/31/17
One Year Five Years Since Inception (6/2/09) ProShares UltraMSCI Emerging Markets 52.87% 2.84% 2.07%
MSCI Emerging Markets Index 27.41% 4.53% 5.41%
Expense Ratios**
Fund Gross Net ProShares Ultra MSCI Emerging Markets 1.22% 0.95%**Reflects the expense ratio as reported in the Prospectus dated October 1,
2016. Contractual fee waivers are in effect through September 30, 2017.See Financial Highlights for effective expense ratios.
Past performance does not guarantee future results. Return calculations assume the reinvestment of distributions and do not reflect taxes thata shareholder would pay on Fund distributions or on the redemption of Fund shares. The performance data quoted represents past performanceand current returns may be lower or higher. The investment return and NAV will fluctuate so that an investor’s shares, when redeemed, maybe more or less than the original cost. The performance above reflects any fee reductions during the applicable periods. If such fee reductionshad not occurred, the quoted performance would be lower. To obtain performance current to the most recent month please visitwww.ProShares.com.1 Fund returns are based on the NAV of the Fund. This calculation reflects the theoretical reinvestment of distributions, if any, in the Fund as of the
ex-date. The impact of transaction costs and the lack of ability to reinvest fractional shares are not reflected in the calculations.2 The Index is a price return index. The total return and any graph or table reflect the theoretical reinvestment of dividends on securities in the
Index. The impact of transaction costs and the deduction of expenses associated with an exchange traded fund such as investment managementand accounting fees are not reflected in the Index calculation. It is not possible to invest directly in an Index.
3 1.00 equals perfect correlation. Because the level of the Index is not determined at the same time that the Fund’s NAV is calculated, correlationto the Index is measured by comparing the daily total return of one or more U.S. exchange-traded securities or instruments that reflect the valuesof securities underlying the Index as of the Fund’s NAV calculation time to the daily total return of the NAV per share of the Fund.
The above information is not covered by the Report of the Independent Registered Public Accounting Firm.
Market Exposure
Investment Type % of Net Assets
Swap Agreements 200%
Total Exposure 200%
“Market Exposure” includes the value of totalinvestments (including the contract value ofany derivatives) and excludes any short-terminvestments and cash equivalents.
MSCI Emerging Markets Index – Country
% of Index China 27.7%Korea 15.7%Taiwan 12.2%Others 10.1%India 8.8%Brazil 6.9%South Africa 6.8%Mexico 3.5%Russia 3.4%Indonesia 2.5%Malaysia 2.4%
MSCI Emerging Markets Index – Composition
% of Index Information Technology 25.6%Financials 23.7%Consumer Discretionary 10.9%Materials 7.1%Consumer Staples 7.0%Energy 6.8%Industrials 5.8%Telecommunication Services 5.5%Utilities 2.6%Real Estate 2.6%Health Care 2.4%
Allocation of Portfolio Holdings & Index Composition as of 5/31/17
Merrill Corp - Proshares Trust Geared Book [96 Funds] Annual Report [Funds] 333-089822 05-31-2017 ED [AUX] | eperez | 28-Jul-17 17:36 | 17-15159-3.ci | Sequence: 13CHKSUM Content: 3717 Layout: 37926 Graphics: 49800 CLEAN
JOB: 17-15159-3 CYCLE#;BL#: 5; 0 TRIM: 8.25" x 10.75" COMPOSITECOLORS: Black, ~note-color 2, ~note-color 3 GRAPHICS: 15159-3_EET_L.eps V1.5
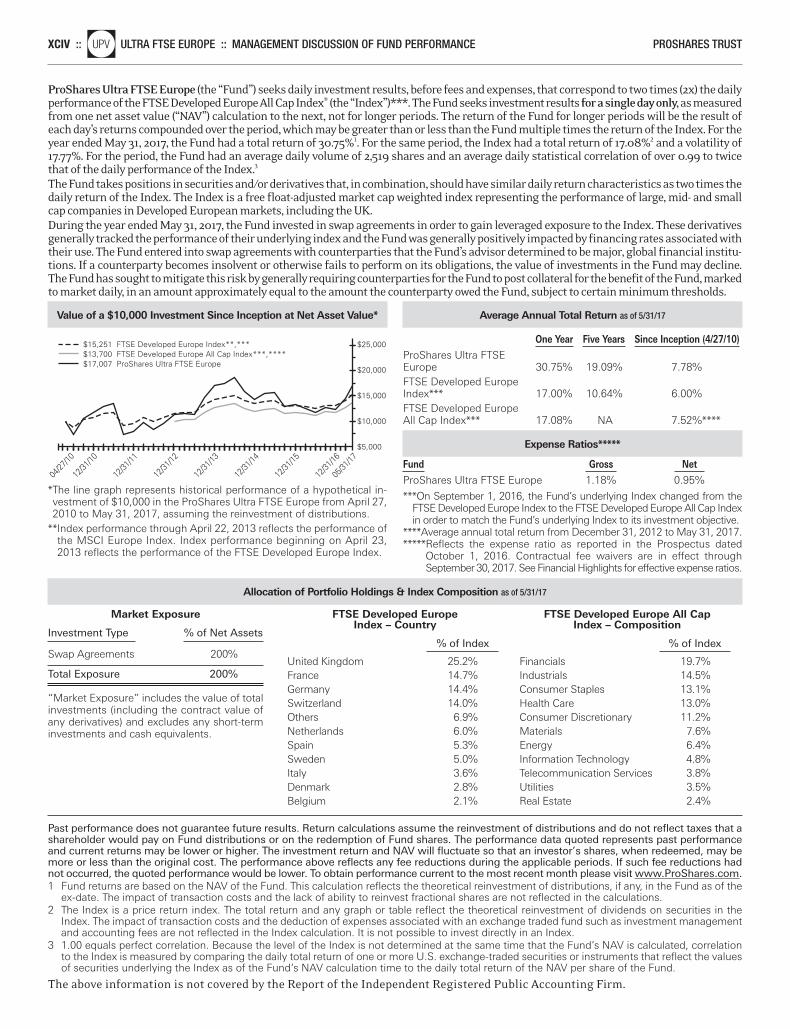
XCIV ::nlUPV ULTRA FTSE EUROPE :: MANAGEMENT DISCUSSION OF FUND PERFORMANCE PROSHARES TRUST
Value of a $10,000 Investment Since Inception at Net Asset Value*
*The line graph represents historical performance of a hypothetical in-vestment of $10,000 in the ProShares Ultra FTSE Europe from April 27,2010 to May 31, 2017, assuming the reinvestment of distributions.
**Index performance through April 22, 2013 reflects the performance ofthe MSCI Europe Index. Index performance beginning on April 23,2013 reflects the performance of the FTSE Developed Europe Index.
$13,700 FTSE Developed Europe All Cap Index***,****$15,251 FTSE Developed Europe Index**,***
$17,007 ProShares Ultra FTSE Europe
04/27
/10
12/31
/10
12/31
/12
12/31
/16
12/31
/15
12/31
/14
12/31
/13
12/31
/11
05/31
/17
$25,000
$20,000
$5,000
$10,000
$15,000
Average Annual Total Return as of 5/31/17
One Year Five Years Since Inception (4/27/10) ProShares Ultra FTSE Europe 30.75% 19.09% 7.78%FTSE Developed Europe Index*** 17.00% 10.64% 6.00%FTSE Developed Europe All Cap Index*** 17.08% NA 7.52%****
Expense Ratios*****
Fund Gross Net ProShares Ultra FTSE Europe 1.18% 0.95%
***On September 1, 2016, the Fund’s underlying Index changed from theFTSE Developed Europe Index to the FTSE Developed Europe All Cap Indexin order to match the Fund’s underlying Index to its investment objective.
****Average annual total return from December 31, 2012 to May 31, 2017.*****Reflects the expense ratio as reported in the Prospectus dated
October 1, 2016. Contractual fee waivers are in effect through September 30, 2017. See Financial Highlights for effective expense ratios.
ProShares Ultra FTSE Europe (the “Fund”) seeks daily investment results, before fees and expenses, that correspond to two times (2x) the dailyperformance of the FTSE Developed Europe All Cap Index® (the “Index”)***. The Fund seeks investment results for a single day only,as measuredfrom one net asset value (“NAV”) calculation to the next, not for longer periods. The return of the Fund for longer periods will be the result ofeach day’s returns compounded over the period, which may be greater than or less than the Fund multiple times the return of the Index. For theyear ended May 31, 2017, the Fund had a total return of 30.75%1. For the same period, the Index had a total return of 17.08%2 and a volatility of17.77%. For the period, the Fund had an average daily volume of 2,519 shares and an average daily statistical correlation of over 0.99 to twicethat of the daily performance of the Index.3
The Fund takes positions in securities and/or derivatives that, in combination, should have similar daily return characteristics as two times thedaily return of the Index. The Index is a free float-adjusted market cap weighted index representing the performance of large, mid- and smallcap companies in Developed European markets, including the UK.During the year ended May 31, 2017, the Fund invested in swap agreements in order to gain leveraged exposure to the Index. These derivativesgenerally tracked the performance of their underlying index and the Fund was generally positively impacted by financing rates associated withtheir use. The Fund entered into swap agreements with counterparties that the Fund’s advisor determined to be major, global financial institu-tions. If a counterparty becomes insolvent or otherwise fails to perform on its obligations, the value of investments in the Fund may decline.The Fund has sought to mitigate this risk by generally requiring counterparties for the Fund to post collateral for the benefit of the Fund, markedto market daily, in an amount approximately equal to the amount the counterparty owed the Fund, subject to certain minimum thresholds.
Past performance does not guarantee future results. Return calculations assume the reinvestment of distributions and do not reflect taxes that ashareholder would pay on Fund distributions or on the redemption of Fund shares. The performance data quoted represents past performanceand current returns may be lower or higher. The investment return and NAV will fluctuate so that an investor’s shares, when redeemed, may bemore or less than the original cost. The performance above reflects any fee reductions during the applicable periods. If such fee reductions hadnot occurred, the quoted performance would be lower. To obtain performance current to the most recent month please visit www.ProShares.com.1 Fund returns are based on the NAV of the Fund. This calculation reflects the theoretical reinvestment of distributions, if any, in the Fund as of the
ex-date. The impact of transaction costs and the lack of ability to reinvest fractional shares are not reflected in the calculations.2 The Index is a price return index. The total return and any graph or table reflect the theoretical reinvestment of dividends on securities in the
Index. The impact of transaction costs and the deduction of expenses associated with an exchange traded fund such as investment managementand accounting fees are not reflected in the Index calculation. It is not possible to invest directly in an Index.
3 1.00 equals perfect correlation. Because the level of the Index is not determined at the same time that the Fund’s NAV is calculated, correlationto the Index is measured by comparing the daily total return of one or more U.S. exchange-traded securities or instruments that reflect the valuesof securities underlying the Index as of the Fund’s NAV calculation time to the daily total return of the NAV per share of the Fund.
The above information is not covered by the Report of the Independent Registered Public Accounting Firm.
Allocation of Portfolio Holdings & Index Composition as of 5/31/17
Market Exposure
Investment Type % of Net Assets
Swap Agreements 200%
Total Exposure 200%
“Market Exposure” includes the value of totalinvestments (including the contract value ofany derivatives) and excludes any short-terminvestments and cash equivalents.
FTSE Developed Europe Index – Country
% of Index United Kingdom 25.2%France 14.7%Germany 14.4%Switzerland 14.0%Others 6.9%Netherlands 6.0%Spain 5.3%Sweden 5.0%Italy 3.6%Denmark 2.8%Belgium 2.1%
FTSE Developed Europe All CapIndex – Composition
% of Index Financials 19.7%Industrials 14.5%Consumer Staples 13.1%Health Care 13.0%Consumer Discretionary 11.2%Materials 7.6%Energy 6.4%Information Technology 4.8%Telecommunication Services 3.8%Utilities 3.5%Real Estate 2.4%
Merrill Corp - Proshares Trust Geared Book [96 Funds] Annual Report [Funds] 333-089822 05-31-2017 ED [AUX] | eperez | 28-Jul-17 17:36 | 17-15159-3.ci | Sequence: 14CHKSUM Content: 9865 Layout: 64794 Graphics: 7643 CLEAN
JOB: 17-15159-3 CYCLE#;BL#: 5; 0 TRIM: 8.25" x 10.75" COMPOSITECOLORS: Black, ~note-color 2, ~note-color 3 GRAPHICS: 15159-3_UPV_L.eps V1.5
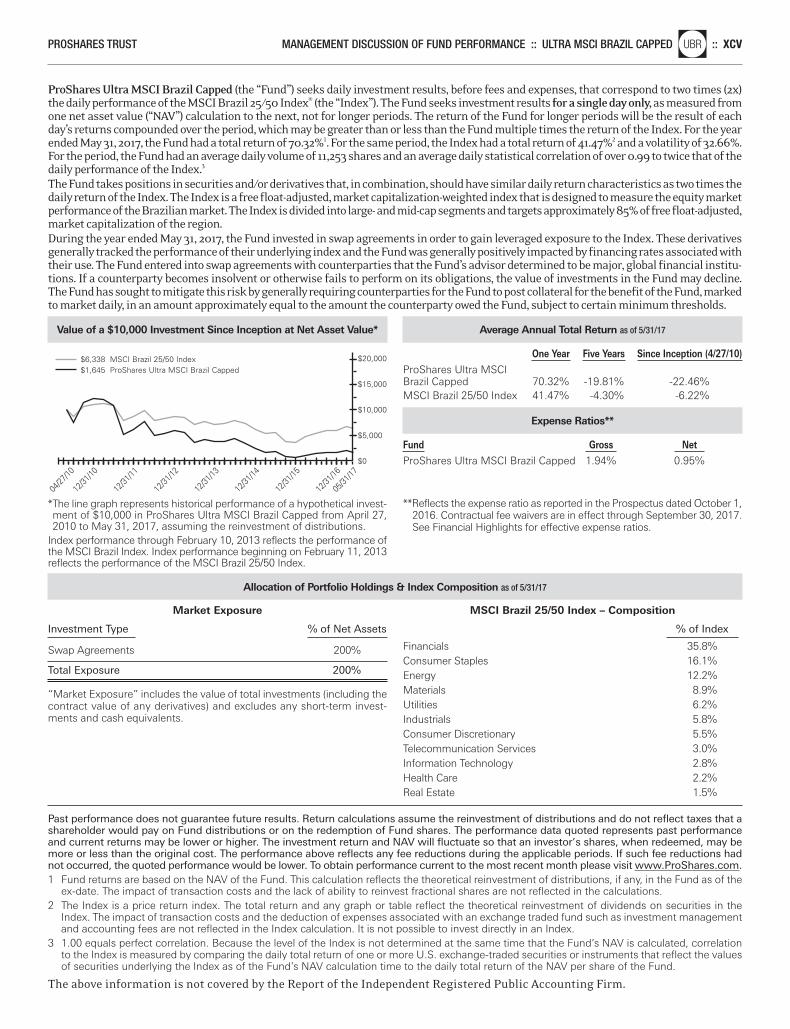
PROSHARES TRUST MANAGEMENT DISCUSSION OF FUND PERFORMANCE :: ULTRA MSCI BRAZIL CAPPEDnlUBR :: XCV
Value of a $10,000 Investment Since Inception at Net Asset Value*
*The line graph represents historical performance of a hypothetical invest-ment of $10,000 in ProShares Ultra MSCI Brazil Capped from April 27,2010 to May 31, 2017, assuming the reinvestment of distributions.
Index performance through February 10, 2013 reflects the performance ofthe MSCI Brazil Index. Index performance beginning on February 11, 2013reflects the performance of the MSCI Brazil 25/50 Index.
$1,645 ProShares Ultra MSCI Brazil Capped$6,338 MSCI Brazil 25/50 Index
04/27
/10
12/31
/10
12/31
/12
12/31
/16
12/31
/15
12/31
/14
12/31
/13
12/31
/11
05/31
/17
$20,000
$15,000
$0
$5,000
$10,000
Average Annual Total Return as of 5/31/17
One Year Five Years Since Inception (4/27/10) ProShares Ultra MSCI Brazil Capped 70.32% -19.81% -22.46%MSCI Brazil 25/50 Index 41.47% -4.30% -6.22%
Expense Ratios**
Fund Gross Net ProShares Ultra MSCI Brazil Capped 1.94% 0.95%
**Reflects the expense ratio as reported in the Prospectus dated October 1,2016. Contractual fee waivers are in effect through September 30, 2017.See Financial Highlights for effective expense ratios.
ProShares Ultra MSCI Brazil Capped (the “Fund”) seeks daily investment results, before fees and expenses, that correspond to two times (2x)the daily performance of the MSCI Brazil 25/50 Index® (the “Index”). The Fund seeks investment results for a single day only,as measured fromone net asset value (“NAV”) calculation to the next, not for longer periods. The return of the Fund for longer periods will be the result of eachday’s returns compounded over the period, which may be greater than or less than the Fund multiple times the return of the Index. For the yearended May 31, 2017, the Fund had a total return of 70.32%1. For the same period, the Index had a total return of41.47%2 and a volatility of 32.66%.For the period, the Fund had an average daily volume of 11,253 shares and an average daily statistical correlation of over 0.99 to twice that of thedaily performance of the Index.3
The Fund takes positions in securities and/or derivatives that, in combination, should have similar daily return characteristics as two times thedaily return of the Index. The Index is a free float-adjusted, market capitalization-weighted index that is designed to measure the equity marketperformance of the Brazilian market. The Index is divided into large- and mid-cap segments and targets approximately 85% of free float-adjusted,market capitalization of the region.During the year ended May 31, 2017, the Fund invested in swap agreements in order to gain leveraged exposure to the Index. These derivativesgenerally tracked the performance of their underlying index and the Fund was generally positively impacted by financing rates associated withtheir use. The Fund entered into swap agreements with counterparties that the Fund’s advisor determined to be major, global financial institu-tions. If a counterparty becomes insolvent or otherwise fails to perform on its obligations, the value of investments in the Fund may decline.The Fund has sought to mitigate this risk by generally requiring counterparties for the Fund to post collateral for the benefit of the Fund, markedto market daily, in an amount approximately equal to the amount the counterparty owed the Fund, subject to certain minimum thresholds.
Past performance does not guarantee future results. Return calculations assume the reinvestment of distributions and do not reflect taxes that ashareholder would pay on Fund distributions or on the redemption of Fund shares. The performance data quoted represents past performanceand current returns may be lower or higher. The investment return and NAV will fluctuate so that an investor’s shares, when redeemed, may bemore or less than the original cost. The performance above reflects any fee reductions during the applicable periods. If such fee reductions hadnot occurred, the quoted performance would be lower. To obtain performance current to the most recent month please visit www.ProShares.com.1 Fund returns are based on the NAV of the Fund. This calculation reflects the theoretical reinvestment of distributions, if any, in the Fund as of the
ex-date. The impact of transaction costs and the lack of ability to reinvest fractional shares are not reflected in the calculations.2 The Index is a price return index. The total return and any graph or table reflect the theoretical reinvestment of dividends on securities in the
Index. The impact of transaction costs and the deduction of expenses associated with an exchange traded fund such as investment managementand accounting fees are not reflected in the Index calculation. It is not possible to invest directly in an Index.
3 1.00 equals perfect correlation. Because the level of the Index is not determined at the same time that the Fund’s NAV is calculated, correlationto the Index is measured by comparing the daily total return of one or more U.S. exchange-traded securities or instruments that reflect the valuesof securities underlying the Index as of the Fund’s NAV calculation time to the daily total return of the NAV per share of the Fund.
The above information is not covered by the Report of the Independent Registered Public Accounting Firm.
Allocation of Portfolio Holdings & Index Composition as of 5/31/17
Market Exposure
Investment Type % of Net Assets
Swap Agreements 200%
Total Exposure 200%
“Market Exposure” includes the value of total investments (including thecontract value of any derivatives) and excludes any short-term invest-ments and cash equivalents.
MSCI Brazil 25/50 Index – Composition
% of Index Financials 35.8%Consumer Staples 16.1%Energy 12.2%Materials 8.9%Utilities 6.2%Industrials 5.8%Consumer Discretionary 5.5%Telecommunication Services 3.0%Information Technology 2.8%Health Care 2.2%Real Estate 1.5%
Merrill Corp - Proshares Trust Geared Book [96 Funds] Annual Report [Funds] 333-089822 05-31-2017 ED [AUX] | eperez | 28-Jul-17 17:36 | 17-15159-3.ci | Sequence: 15CHKSUM Content: 16077 Layout: 41067 Graphics: 34789 CLEAN
JOB: 17-15159-3 CYCLE#;BL#: 5; 0 TRIM: 8.25" x 10.75" COMPOSITECOLORS: Black, ~note-color 2, ~note-color 3 GRAPHICS: 15159-3_UBR_L.eps V1.5
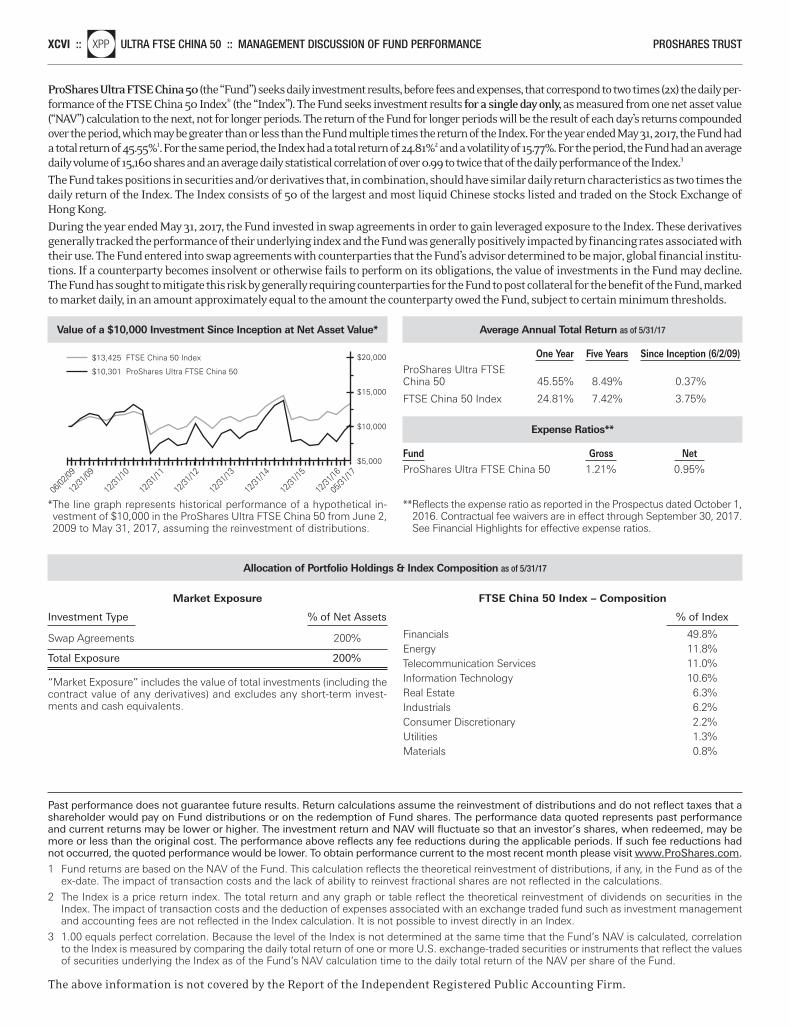
XCVI ::nlXPP ULTRA FTSE CHINA 50 :: MANAGEMENT DISCUSSION OF FUND PERFORMANCE PROSHARES TRUST
Value of a $10,000 Investment Since Inception at Net Asset Value*
*The line graph represents historical performance of a hypothetical in-vestment of $10,000 in the ProShares Ultra FTSE China 50 from June 2,2009 to May 31, 2017, assuming the reinvestment of distributions.
$20,000
$5,000
$10,000
$15,000
$13,425 FTSE China 50 Index
$10,301 ProShares Ultra FTSE China 50
06/02
/09
12/31
/09
12/31
/10
12/31
/16
12/31
/15
12/31
/14
12/31
/13
12/31
/12
12/31
/11
05/31
/17
Average Annual Total Return as of 5/31/17
One Year Five Years Since Inception (6/2/09) ProShares Ultra FTSE China 50 45.55% 8.49% 0.37%
FTSE China 50 Index 24.81% 7.42% 3.75%
Expense Ratios**
Fund Gross Net ProShares Ultra FTSE China 50 1.21% 0.95%
**Reflects the expense ratio as reported in the Prospectus dated October 1,2016. Contractual fee waivers are in effect through September 30, 2017.See Financial Highlights for effective expense ratios.
ProShares Ultra FTSE China 50(the “Fund”) seeks daily investment results, before fees and expenses, that correspond to two times (2x) the daily per-formance of the FTSE China 50 Index® (the “Index”). The Fund seeks investment results for a single day only, as measured from one net asset value(“NAV”) calculation to the next, not for longer periods. The return of the Fund for longer periods will be the result of each day’s returns compoundedover the period, which may be greater than or less than the Fund multiple times the return of the Index. For the year ended May 31, 2017, the Fund hada total return of 45.55%1. For the same period, the Index had a total return of 24.81%2 and a volatility of 15.77%. For the period, the Fund had an averagedaily volume of 15,160 shares and an average daily statistical correlation of over 0.99 to twice that of the daily performance of the Index.3
The Fund takes positions in securities and/or derivatives that, in combination, should have similar daily return characteristics as two times thedaily return of the Index. The Index consists of 50 of the largest and most liquid Chinese stocks listed and traded on the Stock Exchange ofHong Kong.During the year ended May 31, 2017, the Fund invested in swap agreements in order to gain leveraged exposure to the Index. These derivativesgenerally tracked the performance of their underlying index and the Fund was generally positively impacted by financing rates associated withtheir use. The Fund entered into swap agreements with counterparties that the Fund’s advisor determined to be major, global financial institu-tions. If a counterparty becomes insolvent or otherwise fails to perform on its obligations, the value of investments in the Fund may decline.The Fund has sought to mitigate this risk by generally requiring counterparties for the Fund to post collateral for the benefit of the Fund, markedto market daily, in an amount approximately equal to the amount the counterparty owed the Fund, subject to certain minimum thresholds.
Past performance does not guarantee future results. Return calculations assume the reinvestment of distributions and do not reflect taxes that ashareholder would pay on Fund distributions or on the redemption of Fund shares. The performance data quoted represents past performanceand current returns may be lower or higher. The investment return and NAV will fluctuate so that an investor’s shares, when redeemed, may bemore or less than the original cost. The performance above reflects any fee reductions during the applicable periods. If such fee reductions hadnot occurred, the quoted performance would be lower. To obtain performance current to the most recent month please visit www.ProShares.com.
1 Fund returns are based on the NAV of the Fund. This calculation reflects the theoretical reinvestment of distributions, if any, in the Fund as of theex-date. The impact of transaction costs and the lack of ability to reinvest fractional shares are not reflected in the calculations.
2 The Index is a price return index. The total return and any graph or table reflect the theoretical reinvestment of dividends on securities in theIndex. The impact of transaction costs and the deduction of expenses associated with an exchange traded fund such as investment managementand accounting fees are not reflected in the Index calculation. It is not possible to invest directly in an Index.
3 1.00 equals perfect correlation. Because the level of the Index is not determined at the same time that the Fund’s NAV is calculated, correlationto the Index is measured by comparing the daily total return of one or more U.S. exchange-traded securities or instruments that reflect the valuesof securities underlying the Index as of the Fund’s NAV calculation time to the daily total return of the NAV per share of the Fund.
The above information is not covered by the Report of the Independent Registered Public Accounting Firm.
Allocation of Portfolio Holdings & Index Composition as of 5/31/17
Market Exposure
Investment Type % of Net Assets
Swap Agreements 200%
Total Exposure 200%
“Market Exposure” includes the value of total investments (including thecontract value of any derivatives) and excludes any short-term invest-ments and cash equivalents.
FTSE China 50 Index – Composition
% of Index Financials 49.8%Energy 11.8%Telecommunication Services 11.0%Information Technology 10.6%Real Estate 6.3%Industrials 6.2%Consumer Discretionary 2.2%Utilities 1.3%Materials 0.8%
Merrill Corp - Proshares Trust Geared Book [96 Funds] Annual Report [Funds] 333-089822 05-31-2017 ED [AUX] | eperez | 28-Jul-17 17:36 | 17-15159-3.ci | Sequence: 16CHKSUM Content: 45784 Layout: 22920 Graphics: 60356 CLEAN
JOB: 17-15159-3 CYCLE#;BL#: 5; 0 TRIM: 8.25" x 10.75" COMPOSITECOLORS: Black, ~note-color 2, ~note-color 3 GRAPHICS: 15159-3_XPP_L.eps V1.5
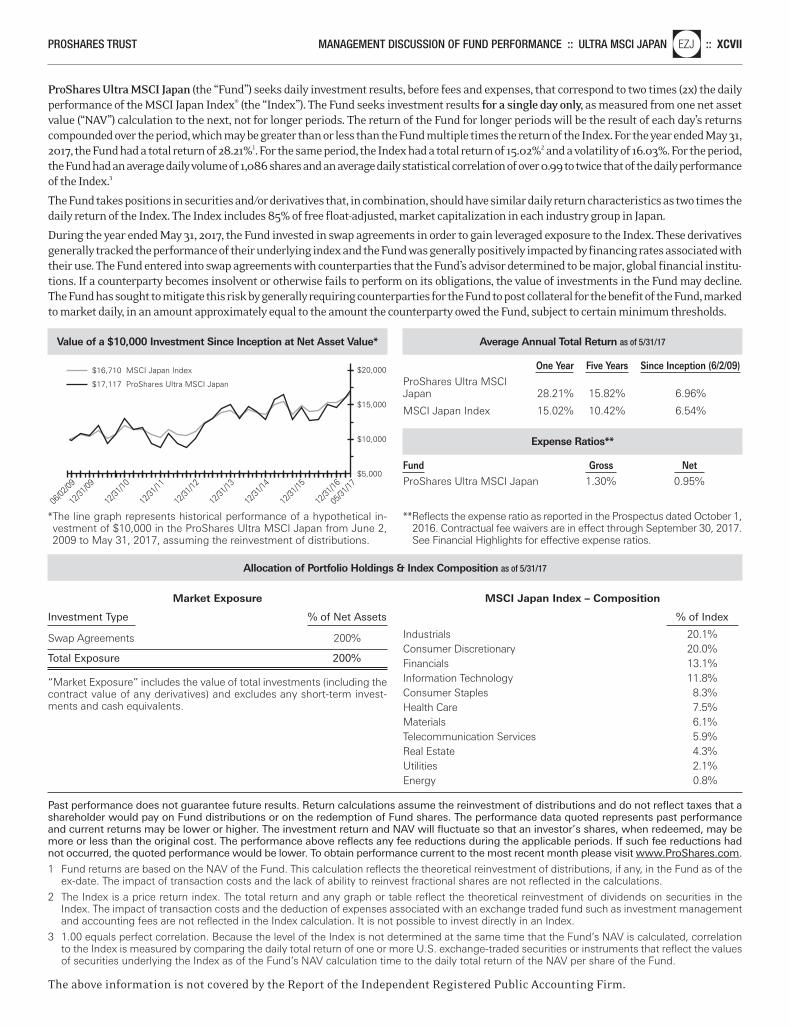
PROSHARES TRUST MANAGEMENT DISCUSSION OF FUND PERFORMANCE :: ULTRA MSCI JAPANnlEZJ :: XCVII
Value of a $10,000 Investment Since Inception at Net Asset Value*
*The line graph represents historical performance of a hypothetical in-vestment of $10,000 in the ProShares Ultra MSCI Japan from June 2,2009 to May 31, 2017, assuming the reinvestment of distributions.
$20,000
$5,000
$10,000
$15,000
$16,710 MSCI Japan Index
$17,117 ProShares Ultra MSCI Japan
06/02
/09
12/31
/09
12/31
/10
12/31
/16
12/31
/15
12/31
/14
12/31
/13
12/31
/12
12/31
/11
05/31
/17
Average Annual Total Return as of 5/31/17
One Year Five Years Since Inception (6/2/09) ProShares Ultra MSCI Japan 28.21% 15.82% 6.96%
MSCI Japan Index 15.02% 10.42% 6.54%
Expense Ratios**
Fund Gross Net ProShares Ultra MSCI Japan 1.30% 0.95%
**Reflects the expense ratio as reported in the Prospectus dated October 1,2016. Contractual fee waivers are in effect through September 30, 2017.See Financial Highlights for effective expense ratios.
ProShares Ultra MSCI Japan (the “Fund”) seeks daily investment results, before fees and expenses, that correspond to two times (2x) the dailyperformance of the MSCI Japan Index® (the “Index”). The Fund seeks investment results for a single day only, as measured from one net assetvalue (“NAV”) calculation to the next, not for longer periods. The return of the Fund for longer periods will be the result of each day’s returnscompounded over the period, which may be greater than or less than the Fund multiple times the return of the Index. For the year ended May 31,2017, the Fund had a total return of 28.21%1. For the same period, the Index had a total return of 15.02%2 and a volatility of 16.03%. For the period,the Fund had an average daily volume of 1,086 shares and an average daily statistical correlation of over 0.99 to twice that of the daily performanceof the Index.3
The Fund takes positions in securities and/or derivatives that, in combination, should have similar daily return characteristics as two times thedaily return of the Index. The Index includes 85% of free float-adjusted, market capitalization in each industry group in Japan.
During the year ended May 31, 2017, the Fund invested in swap agreements in order to gain leveraged exposure to the Index. These derivativesgenerally tracked the performance of their underlying index and the Fund was generally positively impacted by financing rates associated withtheir use. The Fund entered into swap agreements with counterparties that the Fund’s advisor determined to be major, global financial institu-tions. If a counterparty becomes insolvent or otherwise fails to perform on its obligations, the value of investments in the Fund may decline.The Fund has sought to mitigate this risk by generally requiring counterparties for the Fund to post collateral for the benefit of the Fund, markedto market daily, in an amount approximately equal to the amount the counterparty owed the Fund, subject to certain minimum thresholds.
Past performance does not guarantee future results. Return calculations assume the reinvestment of distributions and do not reflect taxes that ashareholder would pay on Fund distributions or on the redemption of Fund shares. The performance data quoted represents past performanceand current returns may be lower or higher. The investment return and NAV will fluctuate so that an investor’s shares, when redeemed, may bemore or less than the original cost. The performance above reflects any fee reductions during the applicable periods. If such fee reductions hadnot occurred, the quoted performance would be lower. To obtain performance current to the most recent month please visit www.ProShares.com.
1 Fund returns are based on the NAV of the Fund. This calculation reflects the theoretical reinvestment of distributions, if any, in the Fund as of theex-date. The impact of transaction costs and the lack of ability to reinvest fractional shares are not reflected in the calculations.
2 The Index is a price return index. The total return and any graph or table reflect the theoretical reinvestment of dividends on securities in theIndex. The impact of transaction costs and the deduction of expenses associated with an exchange traded fund such as investment managementand accounting fees are not reflected in the Index calculation. It is not possible to invest directly in an Index.
3 1.00 equals perfect correlation. Because the level of the Index is not determined at the same time that the Fund’s NAV is calculated, correlationto the Index is measured by comparing the daily total return of one or more U.S. exchange-traded securities or instruments that reflect the valuesof securities underlying the Index as of the Fund’s NAV calculation time to the daily total return of the NAV per share of the Fund.
The above information is not covered by the Report of the Independent Registered Public Accounting Firm.
Allocation of Portfolio Holdings & Index Composition as of 5/31/17
Market Exposure
Investment Type % of Net Assets
Swap Agreements 200%
Total Exposure 200%
“Market Exposure” includes the value of total investments (including thecontract value of any derivatives) and excludes any short-term invest-ments and cash equivalents.
MSCI Japan Index – Composition
% of Index Industrials 20.1%Consumer Discretionary 20.0%Financials 13.1%Information Technology 11.8%Consumer Staples 8.3%Health Care 7.5%Materials 6.1%Telecommunication Services 5.9%Real Estate 4.3%Utilities 2.1%Energy 0.8%
Merrill Corp - Proshares Trust Geared Book [96 Funds] Annual Report [Funds] 333-089822 05-31-2017 ED [AUX] | eperez | 28-Jul-17 17:36 | 17-15159-3.ci | Sequence: 17CHKSUM Content: 41581 Layout: 33283 Graphics: 31294 CLEAN
JOB: 17-15159-3 CYCLE#;BL#: 5; 0 TRIM: 8.25" x 10.75" COMPOSITECOLORS: Black, ~note-color 2, ~note-color 3 GRAPHICS: 15159-3_EZJ_L.eps V1.5
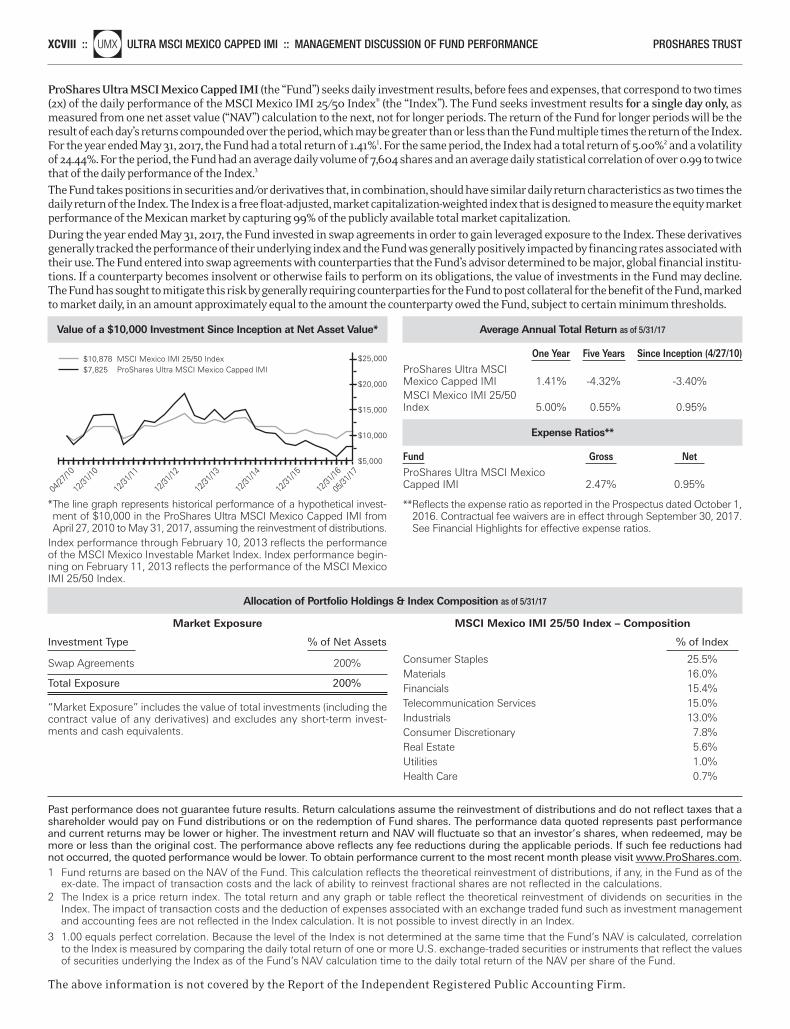
XCVIII ::nlUMX ULTRA MSCI MEXICO CAPPED IMI :: MANAGEMENT DISCUSSION OF FUND PERFORMANCE PROSHARES TRUST
Value of a $10,000 Investment Since Inception at Net Asset Value*
*The line graph represents historical performance of a hypothetical invest-ment of $10,000 in the ProShares Ultra MSCI Mexico Capped IMI fromApril 27, 2010 to May 31, 2017, assuming the reinvestment of distributions.
Index performance through February 10, 2013 reflects the performanceof the MSCI Mexico Investable Market Index. Index performance begin-ning on February 11, 2013 reflects the performance of the MSCI MexicoIMI 25/50 Index.
$10,878 MSCI Mexico IMI 25/50 Index$7,825 ProShares Ultra MSCI Mexico Capped IMI
04/27
/10
12/31
/10
12/31
/12
12/31
/16
12/31
/15
12/31
/14
12/31
/13
12/31
/11
05/31
/17
$25,000
$20,000
$5,000
$10,000
$15,000
Average Annual Total Return as of 5/31/17
One Year Five Years Since Inception (4/27/10) ProShares Ultra MSCI Mexico Capped IMI 1.41% -4.32% -3.40%MSCI Mexico IMI 25/50 Index 5.00% 0.55% 0.95%
Expense Ratios**
Fund Gross Net ProShares Ultra MSCI Mexico Capped IMI 2.47% 0.95%
**Reflects the expense ratio as reported in the Prospectus dated October 1,2016. Contractual fee waivers are in effect through September 30, 2017.See Financial Highlights for effective expense ratios.
ProShares Ultra MSCI Mexico Capped IMI (the “Fund”) seeks daily investment results, before fees and expenses, that correspond to two times(2x) of the daily performance of the MSCI Mexico IMI 25/50 Index® (the “Index”). The Fund seeks investment results for a single day only, asmeasured from one net asset value (“NAV”) calculation to the next, not for longer periods. The return of the Fund for longer periods will be theresult of each day’s returns compounded over the period, which may be greater than or less than the Fund multiple times the return of the Index.For the year ended May 31, 2017, the Fund had a total return of 1.41%1. For the same period, the Index had a total return of 5.00%2 and a volatilityof 24.44%. For the period, the Fund had an average daily volume of 7,604 shares and an average daily statistical correlation of over 0.99 to twicethat of the daily performance of the Index.3
The Fund takes positions in securities and/or derivatives that, in combination, should have similar daily return characteristics as two times thedaily return of the Index. The Index is a free float-adjusted, market capitalization-weighted index that is designed to measure the equity marketperformance of the Mexican market by capturing 99% of the publicly available total market capitalization.During the year ended May 31, 2017, the Fund invested in swap agreements in order to gain leveraged exposure to the Index. These derivativesgenerally tracked the performance of their underlying index and the Fund was generally positively impacted by financing rates associated withtheir use. The Fund entered into swap agreements with counterparties that the Fund’s advisor determined to be major, global financial institu-tions. If a counterparty becomes insolvent or otherwise fails to perform on its obligations, the value of investments in the Fund may decline.The Fund has sought to mitigate this risk by generally requiring counterparties for the Fund to post collateral for the benefit of the Fund, markedto market daily, in an amount approximately equal to the amount the counterparty owed the Fund, subject to certain minimum thresholds.
Past performance does not guarantee future results. Return calculations assume the reinvestment of distributions and do not reflect taxes that ashareholder would pay on Fund distributions or on the redemption of Fund shares. The performance data quoted represents past performanceand current returns may be lower or higher. The investment return and NAV will fluctuate so that an investor’s shares, when redeemed, may bemore or less than the original cost. The performance above reflects any fee reductions during the applicable periods. If such fee reductions hadnot occurred, the quoted performance would be lower. To obtain performance current to the most recent month please visit www.ProShares.com.1 Fund returns are based on the NAV of the Fund. This calculation reflects the theoretical reinvestment of distributions, if any, in the Fund as of the
ex-date. The impact of transaction costs and the lack of ability to reinvest fractional shares are not reflected in the calculations.2 The Index is a price return index. The total return and any graph or table reflect the theoretical reinvestment of dividends on securities in the
Index. The impact of transaction costs and the deduction of expenses associated with an exchange traded fund such as investment managementand accounting fees are not reflected in the Index calculation. It is not possible to invest directly in an Index.
3 1.00 equals perfect correlation. Because the level of the Index is not determined at the same time that the Fund’s NAV is calculated, correlationto the Index is measured by comparing the daily total return of one or more U.S. exchange-traded securities or instruments that reflect the valuesof securities underlying the Index as of the Fund’s NAV calculation time to the daily total return of the NAV per share of the Fund.
The above information is not covered by the Report of the Independent Registered Public Accounting Firm.
Allocation of Portfolio Holdings & Index Composition as of 5/31/17
Market Exposure
Investment Type % of Net Assets
Swap Agreements 200%
Total Exposure 200%
“Market Exposure” includes the value of total investments (including thecontract value of any derivatives) and excludes any short-term invest-ments and cash equivalents.
MSCI Mexico IMI 25/50 Index – Composition
% of Index Consumer Staples 25.5%Materials 16.0%Financials 15.4%Telecommunication Services 15.0%Industrials 13.0%Consumer Discretionary 7.8%Real Estate 5.6%Utilities 1.0%Health Care 0.7%
Merrill Corp - Proshares Trust Geared Book [96 Funds] Annual Report [Funds] 333-089822 05-31-2017 ED [AUX] | eperez | 28-Jul-17 17:36 | 17-15159-3.ci | Sequence: 18CHKSUM Content: 33734 Layout: 40360 Graphics: 24141 CLEAN
JOB: 17-15159-3 CYCLE#;BL#: 5; 0 TRIM: 8.25" x 10.75" COMPOSITECOLORS: Black, ~note-color 2, ~note-color 3 GRAPHICS: 15159-3_UMX_L.eps V1.5
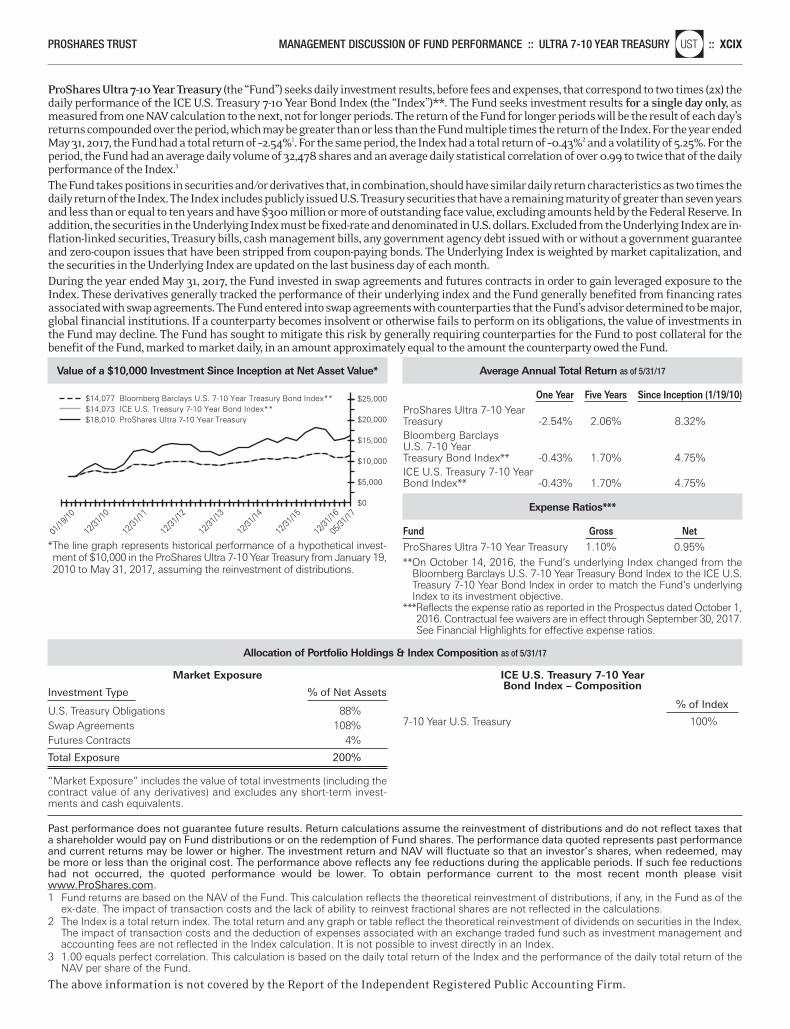
ProShares Ultra 7-10 Year Treasury (the “Fund”) seeks daily investment results, before fees and expenses, that correspond to two times (2x) thedaily performance of the ICE U.S. Treasury 7-10 Year Bond Index (the “Index”)**. The Fund seeks investment results for a single day only, asmeasured from one NAV calculation to the next, not for longer periods. The return of the Fund for longer periods will be the result of each day’sreturns compounded over the period, which may be greater than or less than the Fund multiple times the return of the Index. For the year endedMay 31, 2017, the Fund had a total return of –2.54%1. For the same period, the Index had a total return of –0.43%2 and a volatility of 5.25%. For theperiod, the Fund had an average daily volume of 32,478 shares and an average daily statistical correlation of over 0.99 to twice that of the dailyperformance of the Index.3
The Fund takes positions in securities and/or derivatives that, in combination, should have similar daily return characteristics as two times thedaily return of the Index. The Index includes publicly issued U.S. Treasury securities that have a remaining maturity of greater than seven yearsand less than or equal to ten years and have $300 million or more of outstanding face value, excluding amounts held by the Federal Reserve. Inaddition, the securities in the Underlying Index must be fixed-rate and denominated in U.S. dollars. Excluded from the Underlying Index are in-flation-linked securities, Treasury bills, cash management bills, any government agency debt issued with or without a government guaranteeand zero-coupon issues that have been stripped from coupon-paying bonds. The Underlying Index is weighted by market capitalization, andthe securities in the Underlying Index are updated on the last business day of each month.During the year ended May 31, 2017, the Fund invested in swap agreements and futures contracts in order to gain leveraged exposure to theIndex. These derivatives generally tracked the performance of their underlying index and the Fund generally benefited from financing ratesassociated with swap agreements. The Fund entered into swap agreements with counterparties that the Fund’s advisor determined to be major,global financial institutions. If a counterparty becomes insolvent or otherwise fails to perform on its obligations, the value of investments inthe Fund may decline. The Fund has sought to mitigate this risk by generally requiring counterparties for the Fund to post collateral for thebenefit of the Fund, marked to market daily, in an amount approximately equal to the amount the counterparty owed the Fund.
PROSHARES TRUST MANAGEMENT DISCUSSION OF FUND PERFORMANCE :: ULTRA 7-10 YEAR TREASURYnlUST :: XCIX
Value of a $10,000 Investment Since Inception at Net Asset Value*
*The line graph represents historical performance of a hypothetical invest-ment of $10,000 in the ProShares Ultra 7-10 Year Treasury from January 19,2010 to May 31, 2017, assuming the reinvestment of distributions.
$14,073 ICE U.S. Treasury 7-10 Year Bond Index**$14,077 Bloomberg Barclays U.S. 7-10 Year Treasury Bond Index**
$18,010 ProShares Ultra 7-10 Year Treasury
01/19
/10
12/31
/10
12/31
/11
12/31
/12
12/31
/16
12/31
/15
12/31
/14
12/31
/13
05/31
/17
$25,000
$20,000
$0
$5,000
$10,000
$15,000
Average Annual Total Return as of 5/31/17
One Year Five Years Since Inception (1/19/10) ProShares Ultra 7-10 Year Treasury -2.54% 2.06% 8.32%Bloomberg Barclays U.S. 7-10 YearTreasury Bond Index** -0.43% 1.70% 4.75%ICE U.S. Treasury 7-10 Year Bond Index** -0.43% 1.70% 4.75%
Expense Ratios***
Fund Gross Net ProShares Ultra 7-10 Year Treasury 1.10% 0.95%**On October 14, 2016, the Fund’s underlying Index changed from the
Bloomberg Barclays U.S. 7-10 Year Treasury Bond Index to the ICE U.S.Treasury 7-10 Year Bond Index in order to match the Fund’s underlyingIndex to its investment objective.
***Reflects the expense ratio as reported in the Prospectus dated October 1,2016. Contractual fee waivers are in effect through September 30, 2017.See Financial Highlights for effective expense ratios.
Allocation of Portfolio Holdings & Index Composition as of 5/31/17
Market Exposure
Investment Type % of Net Assets U.S. Treasury Obligations 88%Swap Agreements 108%Futures Contracts 4%
Total Exposure 200%
“Market Exposure” includes the value of total investments (including thecontract value of any derivatives) and excludes any short-term invest-ments and cash equivalents.
ICE U.S. Treasury 7-10 YearBond Index – Composition
% of Index 7-10 Year U.S. Treasury 100%
Past performance does not guarantee future results. Return calculations assume the reinvestment of distributions and do not reflect taxes thata shareholder would pay on Fund distributions or on the redemption of Fund shares. The performance data quoted represents past performanceand current returns may be lower or higher. The investment return and NAV will fluctuate so that an investor’s shares, when redeemed, maybe more or less than the original cost. The performance above reflects any fee reductions during the applicable periods. If such fee reductionshad not occurred, the quoted performance would be lower. To obtain performance current to the most recent month please visitwww.ProShares.com.1 Fund returns are based on the NAV of the Fund. This calculation reflects the theoretical reinvestment of distributions, if any, in the Fund as of the
ex-date. The impact of transaction costs and the lack of ability to reinvest fractional shares are not reflected in the calculations.2 The Index is a total return index. The total return and any graph or table reflect the theoretical reinvestment of dividends on securities in the Index.
The impact of transaction costs and the deduction of expenses associated with an exchange traded fund such as investment management andaccounting fees are not reflected in the Index calculation. It is not possible to invest directly in an Index.
3 1.00 equals perfect correlation. This calculation is based on the daily total return of the Index and the performance of the daily total return of theNAV per share of the Fund.
The above information is not covered by the Report of the Independent Registered Public Accounting Firm.
Merrill Corp - Proshares Trust Geared Book [96 Funds] Annual Report [Funds] 333-089822 05-31-2017 ED [AUX] | eperez | 28-Jul-17 17:36 | 17-15159-3.ci | Sequence: 19CHKSUM Content: 45824 Layout: 34048 Graphics: 44246 CLEAN
JOB: 17-15159-3 CYCLE#;BL#: 5; 0 TRIM: 8.25" x 10.75" COMPOSITECOLORS: Black, ~note-color 2, ~note-color 3 GRAPHICS: 15159-3_UST_L.eps V1.5
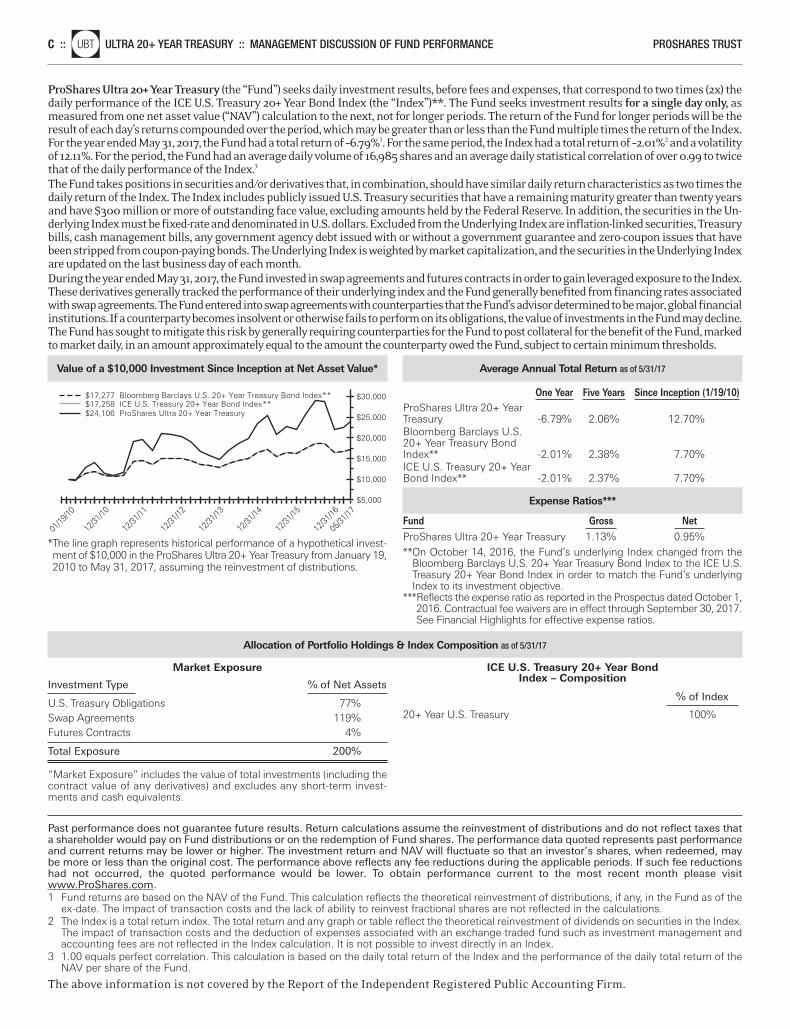
ProShares Ultra 20+ Year Treasury (the “Fund”) seeks daily investment results, before fees and expenses, that correspond to two times (2x) thedaily performance of the ICE U.S. Treasury 20+ Year Bond Index (the “Index”)**. The Fund seeks investment results for a single day only, asmeasured from one net asset value (“NAV”) calculation to the next, not for longer periods. The return of the Fund for longer periods will be theresult of each day’s returns compounded over the period, which may be greater than or less than the Fund multiple times the return of the Index.For the year ended May 31, 2017, the Fund had a total return of –6.79%1. For the same period, the Index had a total return of –2.01%2 and a volatilityof 12.11%. For the period, the Fund had an average daily volume of 16,985 shares and an average daily statistical correlation of over 0.99 to twicethat of the daily performance of the Index.3
The Fund takes positions in securities and/or derivatives that, in combination, should have similar daily return characteristics as two times thedaily return of the Index. The Index includes publicly issued U.S. Treasury securities that have a remaining maturity greater than twenty yearsand have $300 million or more of outstanding face value, excluding amounts held by the Federal Reserve. In addition, the securities in the Un-derlying Index must be fixed-rate and denominated in U.S. dollars. Excluded from the Underlying Index are inflation-linked securities, Treasurybills, cash management bills, any government agency debt issued with or without a government guarantee and zero-coupon issues that havebeen stripped from coupon-paying bonds. The Underlying Index is weighted by market capitalization, and the securities in the Underlying Indexare updated on the last business day of each month.During the year ended May 31, 2017, the Fund invested in swap agreements and futures contracts in order to gain leveraged exposure to the Index.These derivatives generally tracked the performance of their underlying index and the Fund generally benefited from financing rates associatedwith swap agreements. The Fund entered into swap agreements with counterparties that the Fund’s advisor determined to be major, global financialinstitutions. If a counterparty becomes insolvent or otherwise fails to perform on its obligations, the value of investments in the Fund may decline.The Fund has sought to mitigate this risk by generally requiring counterparties for the Fund to post collateral for the benefit of the Fund, markedto market daily, in an amount approximately equal to the amount the counterparty owed the Fund, subject to certain minimum thresholds.
C ::nlUBT ULTRA 20+ YEAR TREASURY :: MANAGEMENT DISCUSSION OF FUND PERFORMANCE PROSHARES TRUST
Value of a $10,000 Investment Since Inception at Net Asset Value*
*The line graph represents historical performance of a hypothetical invest-ment of $10,000 in the ProShares Ultra 20+ Year Treasury from January 19,2010 to May 31, 2017, assuming the reinvestment of distributions.
$17,277 Bloomberg Barclays U.S. 20+ Year Treasury Bond Index**$17,258 ICE U.S. Treasury 20+ Year Bond Index**$24,106 ProShares Ultra 20+ Year Treasury
01/19
/10
12/31
/10
12/31
/11
12/31
/12
12/31
/16
12/31
/15
12/31
/14
12/31
/13
05/31
/17
$30,000
$25,000
$5,000
$10,000
$15,000
$20,000
Average Annual Total Return as of 5/31/17
One Year Five Years Since Inception (1/19/10) ProShares Ultra 20+ Year Treasury -6.79% 2.06% 12.70%Bloomberg Barclays U.S. 20+ Year Treasury Bond Index** -2.01% 2.38% 7.70%ICE U.S. Treasury 20+ Year Bond Index** -2.01% 2.37% 7.70%
Expense Ratios***
Fund Gross Net ProShares Ultra 20+ Year Treasury 1.13% 0.95%**On October 14, 2016, the Fund’s underlying Index changed from the
Bloomberg Barclays U.S. 20+ Year Treasury Bond Index to the ICE U.S.Treasury 20+ Year Bond Index in order to match the Fund’s underlyingIndex to its investment objective.
***Reflects the expense ratio as reported in the Prospectus dated October 1,2016. Contractual fee waivers are in effect through September 30, 2017.See Financial Highlights for effective expense ratios.
Past performance does not guarantee future results. Return calculations assume the reinvestment of distributions and do not reflect taxes thata shareholder would pay on Fund distributions or on the redemption of Fund shares. The performance data quoted represents past performanceand current returns may be lower or higher. The investment return and NAV will fluctuate so that an investor’s shares, when redeemed, maybe more or less than the original cost. The performance above reflects any fee reductions during the applicable periods. If such fee reductionshad not occurred, the quoted performance would be lower. To obtain performance current to the most recent month please visitwww.ProShares.com.1 Fund returns are based on the NAV of the Fund. This calculation reflects the theoretical reinvestment of distributions, if any, in the Fund as of the
ex-date. The impact of transaction costs and the lack of ability to reinvest fractional shares are not reflected in the calculations.2 The Index is a total return index. The total return and any graph or table reflect the theoretical reinvestment of dividends on securities in the Index.
The impact of transaction costs and the deduction of expenses associated with an exchange traded fund such as investment management andaccounting fees are not reflected in the Index calculation. It is not possible to invest directly in an Index.
3 1.00 equals perfect correlation. This calculation is based on the daily total return of the Index and the performance of the daily total return of theNAV per share of the Fund.
The above information is not covered by the Report of the Independent Registered Public Accounting Firm.
Allocation of Portfolio Holdings & Index Composition as of 5/31/17
Market Exposure
Investment Type % of Net Assets U.S. Treasury Obligations 77%Swap Agreements 119%Futures Contracts 4%
Total Exposure 200%
“Market Exposure” includes the value of total investments (including thecontract value of any derivatives) and excludes any short-term invest-ments and cash equivalents.
ICE U.S. Treasury 20+ Year Bond Index – Composition
% of Index 20+ Year U.S. Treasury 100%
Merrill Corp - Proshares Trust Geared Book [96 Funds] Annual Report [Funds] 333-089822 05-31-2017 ED [AUX] | eperez | 28-Jul-17 17:36 | 17-15159-3.ci | Sequence: 20CHKSUM Content: 43786 Layout: 35622 Graphics: 27614 CLEAN
JOB: 17-15159-3 CYCLE#;BL#: 5; 0 TRIM: 8.25" x 10.75" COMPOSITECOLORS: Black, ~note-color 2, ~note-color 3 GRAPHICS: 15159-3_UBT_L.eps V1.5
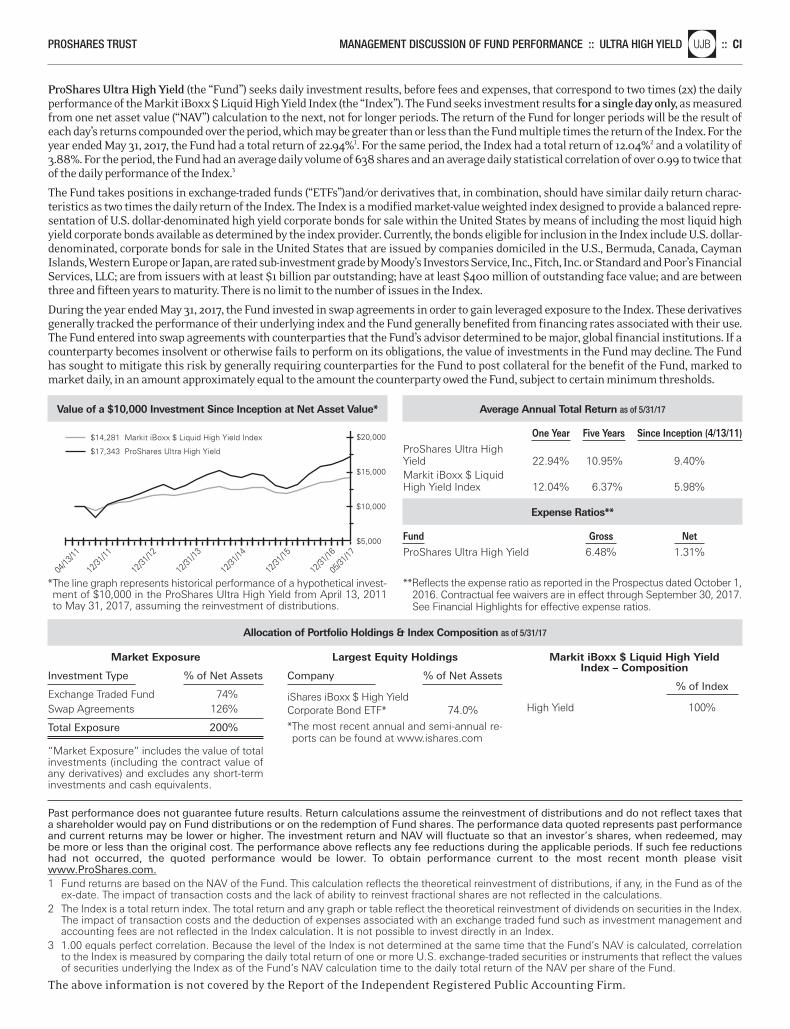
ProShares Ultra High Yield (the “Fund”) seeks daily investment results, before fees and expenses, that correspond to two times (2x) the dailyperformance of the Markit iBoxx $ Liquid High Yield Index (the “Index”). The Fund seeks investment results for a single day only, as measuredfrom one net asset value (“NAV”) calculation to the next, not for longer periods. The return of the Fund for longer periods will be the result ofeach day’s returns compounded over the period, which may be greater than or less than the Fund multiple times the return of the Index. For theyear ended May 31, 2017, the Fund had a total return of 22.94%1. For the same period, the Index had a total return of 12.04%2 and a volatility of3.88%. For the period, the Fund had an average daily volume of 638 shares and an average daily statistical correlation of over 0.99 to twice thatof the daily performance of the Index.3
The Fund takes positions in exchange-traded funds (“ETFs”)and/or derivatives that, in combination, should have similar daily return charac-teristics as two times the daily return of the Index. The Index is a modified market-value weighted index designed to provide a balanced repre-sentation of U.S. dollar-denominated high yield corporate bonds for sale within the United States by means of including the most liquid highyield corporate bonds available as determined by the index provider. Currently, the bonds eligible for inclusion in the Index include U.S. dollar-denominated, corporate bonds for sale in the United States that are issued by companies domiciled in the U.S., Bermuda, Canada, CaymanIslands, Western Europe or Japan, are rated sub-investment grade by Moody’s Investors Service, Inc., Fitch, Inc. or Standard and Poor’s FinancialServices, LLC; are from issuers with at least $1 billion par outstanding; have at least $400 million of outstanding face value; and are betweenthree and fifteen years to maturity. There is no limit to the number of issues in the Index.
During the year ended May 31, 2017, the Fund invested in swap agreements in order to gain leveraged exposure to the Index. These derivativesgenerally tracked the performance of their underlying index and the Fund generally benefited from financing rates associated with their use.The Fund entered into swap agreements with counterparties that the Fund’s advisor determined to be major, global financial institutions. If acounterparty becomes insolvent or otherwise fails to perform on its obligations, the value of investments in the Fund may decline. The Fundhas sought to mitigate this risk by generally requiring counterparties for the Fund to post collateral for the benefit of the Fund, marked tomarket daily, in an amount approximately equal to the amount the counterparty owed the Fund, subject to certain minimum thresholds.
PROSHARES TRUST MANAGEMENT DISCUSSION OF FUND PERFORMANCE :: ULTRA HIGH YIELDnlUJB :: CI
Value of a $10,000 Investment Since Inception at Net Asset Value*
*The line graph represents historical performance of a hypothetical invest-ment of $10,000 in the ProShares Ultra High Yield from April 13, 2011to May 31, 2017, assuming the reinvestment of distributions.
$20,000
$5,000
$10,000
$15,000
$14,281 Markit iBoxx $ Liquid High Yield Index
$17,343 ProShares Ultra High Yield
04/13
/11
12/31
/16
12/31
/15
12/31
/14
12/31
/13
12/31
/12
12/31
/11
05/31
/17
Average Annual Total Return as of 5/31/17
One Year Five Years Since Inception (4/13/11) ProShares Ultra High Yield 22.94% 10.95% 9.40%Markit iBoxx $ Liquid High Yield Index 12.04% 6.37% 5.98%
Expense Ratios**
Fund Gross Net ProShares Ultra High Yield 6.48% 1.31%
**Reflects the expense ratio as reported in the Prospectus dated October 1,2016. Contractual fee waivers are in effect through September 30, 2017.See Financial Highlights for effective expense ratios.
Past performance does not guarantee future results. Return calculations assume the reinvestment of distributions and do not reflect taxes thata shareholder would pay on Fund distributions or on the redemption of Fund shares. The performance data quoted represents past performanceand current returns may be lower or higher. The investment return and NAV will fluctuate so that an investor’s shares, when redeemed, maybe more or less than the original cost. The performance above reflects any fee reductions during the applicable periods. If such fee reductionshad not occurred, the quoted performance would be lower. To obtain performance current to the most recent month please visitwww.ProShares.com.1 Fund returns are based on the NAV of the Fund. This calculation reflects the theoretical reinvestment of distributions, if any, in the Fund as of the
ex-date. The impact of transaction costs and the lack of ability to reinvest fractional shares are not reflected in the calculations.2 The Index is a total return index. The total return and any graph or table reflect the theoretical reinvestment of dividends on securities in the Index.
The impact of transaction costs and the deduction of expenses associated with an exchange traded fund such as investment management andaccounting fees are not reflected in the Index calculation. It is not possible to invest directly in an Index.
3 1.00 equals perfect correlation. Because the level of the Index is not determined at the same time that the Fund’s NAV is calculated, correlationto the Index is measured by comparing the daily total return of one or more U.S. exchange-traded securities or instruments that reflect the valuesof securities underlying the Index as of the Fund’s NAV calculation time to the daily total return of the NAV per share of the Fund.
The above information is not covered by the Report of the Independent Registered Public Accounting Firm.
Allocation of Portfolio Holdings & Index Composition as of 5/31/17
Market Exposure
Investment Type % of Net Assets Exchange Traded Fund 74%Swap Agreements 126%
Total Exposure 200%
“Market Exposure” includes the value of totalinvestments (including the contract value ofany derivatives) and excludes any short-terminvestments and cash equivalents.
Largest Equity Holdings
Company % of Net Assets
iShares iBoxx $ High YieldCorporate Bond ETF* 74.0%
*The most recent annual and semi-annual re-ports can be found at www.ishares.com
Markit iBoxx $ Liquid High Yield Index – Composition
% of Index
High Yield 100%
Merrill Corp - Proshares Trust Geared Book [96 Funds] Annual Report [Funds] 333-089822 05-31-2017 ED [AUX] | eperez | 28-Jul-17 17:36 | 17-15159-3.ci | Sequence: 21CHKSUM Content: 4813 Layout: 19958 Graphics: 12484 CLEAN
JOB: 17-15159-3 CYCLE#;BL#: 5; 0 TRIM: 8.25" x 10.75" COMPOSITECOLORS: Black, ~note-color 2, ~note-color 3 GRAPHICS: 15159-3_UJB_L.eps V1.5

CII :: EXPENSE EXAMPLES (UNAUDITED) PROSHARES TRUST
EXPENSE EXAMPLES
Merrill Corp - Proshares Trust Geared Book [96 Funds] Annual Report [Funds] 333-089822 05-31-2017 ED [AUX] | eperez | 28-Jul-17 17:36 | 17-15159-3.ea | Sequence: 1CHKSUM Content: 24614 Layout: 27009 Graphics: No Graphics CLEAN
JOB: 17-15159-3 CYCLE#;BL#: 5; 0 TRIM: 8.25" x 10.75" COMPOSITECOLORS: Black, ~note-color 2, ~note-color 3 GRAPHICS: none V1.5
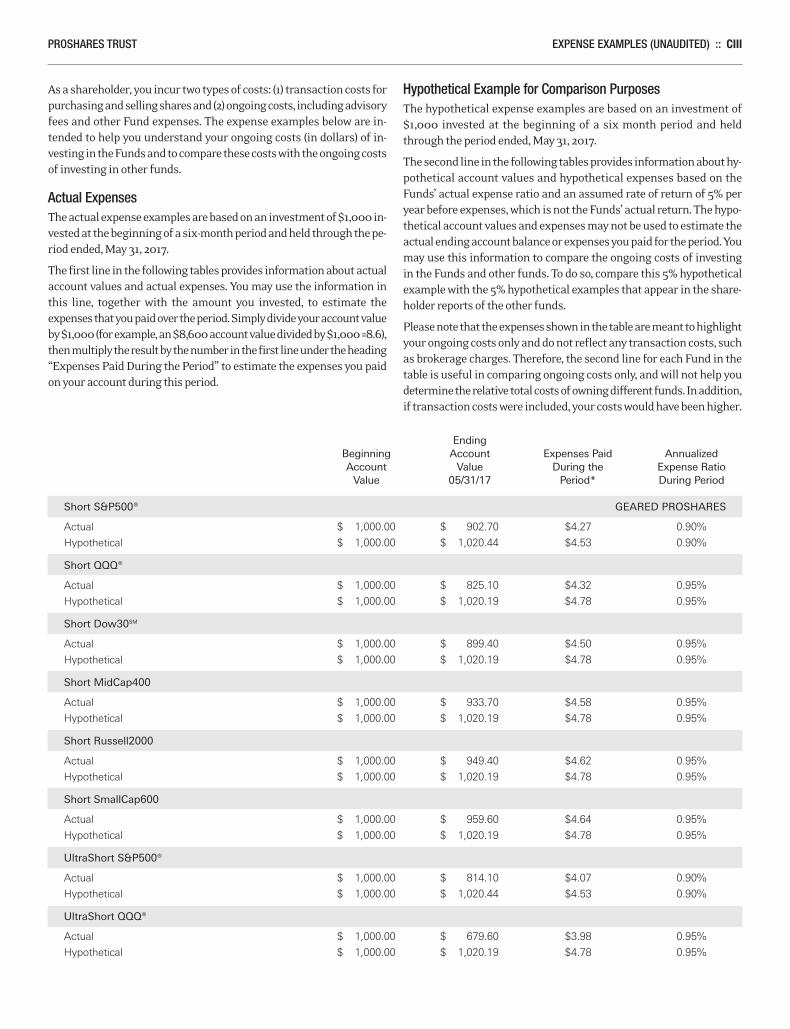
PROSHARES TRUST EXPENSE EXAMPLES (UNAUDITED) :: CIII
As a shareholder, you incur two types of costs: (1) transaction costs forpurchasing and selling shares and (2) ongoing costs, including advisoryfees and other Fund expenses. The expense examples below are in-tended to help you understand your ongoing costs (in dollars) of in-vesting in the Funds and to compare these costs with the ongoing costsof investing in other funds.
Actual ExpensesThe actual expense examples are based on an investment of $1,000 in-vested at the beginning of a six-month period and held through the pe-riod ended, May 31, 2017.
The first line in the following tables provides information about actualaccount values and actual expenses. You may use the information inthis line, together with the amount you invested, to estimate the expenses that you paid over the period. Simply divide your account valueby $1,000 (for example, an $8,600 account value divided by $1,000 =8.6),then multiply the result by the number in the first line under the heading“Expenses Paid During the Period” to estimate the expenses you paidon your account during this period.
Hypothetical Example for Comparison PurposesThe hypothetical expense examples are based on an investment of$1,000 invested at the beginning of a six month period and heldthrough the period ended, May 31, 2017.
The second line in the following tables provides information about hy-pothetical account values and hypothetical expenses based on theFunds’ actual expense ratio and an assumed rate of return of 5% peryear before expenses, which is not the Funds’ actual return. The hypo-thetical account values and expenses may not be used to estimate theactual ending account balance or expenses you paid for the period. Youmay use this information to compare the ongoing costs of investingin the Funds and other funds. To do so, compare this 5% hypotheticalexample with the 5% hypothetical examples that appear in the share-holder reports of the other funds.
Please note that the expenses shown in the table are meant to highlightyour ongoing costs only and do not reflect any transaction costs, suchas brokerage charges. Therefore, the second line for each Fund in thetable is useful in comparing ongoing costs only, and will not help youdetermine the relative total costs of owning different funds. In addition,if transaction costs were included, your costs would have been higher.
Ending Beginning Account Expenses Paid Annualized Account Value During the Expense Ratio Value 05/31/17 Period* During Period
Short S&P500® GEARED PROSHARES
Actual $ 1,000.00 $ 902.70 $4.27 0.90%
Hypothetical $ 1,000.00 $ 1,020.44 $4.53 0.90%
Short QQQ®
Actual $ 1,000.00 $ 825.10 $4.32 0.95%
Hypothetical $ 1,000.00 $ 1,020.19 $4.78 0.95%
Short Dow30SM
Actual $ 1,000.00 $ 899.40 $4.50 0.95%
Hypothetical $ 1,000.00 $ 1,020.19 $4.78 0.95%
Short MidCap400
Actual $ 1,000.00 $ 933.70 $4.58 0.95%
Hypothetical $ 1,000.00 $ 1,020.19 $4.78 0.95%
Short Russell2000
Actual $ 1,000.00 $ 949.40 $4.62 0.95%
Hypothetical $ 1,000.00 $ 1,020.19 $4.78 0.95%
Short SmallCap600
Actual $ 1,000.00 $ 959.60 $4.64 0.95%
Hypothetical $ 1,000.00 $ 1,020.19 $4.78 0.95%
UltraShort S&P500®
Actual $ 1,000.00 $ 814.10 $4.07 0.90%
Hypothetical $ 1,000.00 $ 1,020.44 $4.53 0.90%
UltraShort QQQ®
Actual $ 1,000.00 $ 679.60 $3.98 0.95%
Hypothetical $ 1,000.00 $ 1,020.19 $4.78 0.95%
Merrill Corp - Proshares Trust Geared Book [96 Funds] Annual Report [Funds] 333-089822 05-31-2017 ED [AUX] | eperez | 28-Jul-17 17:36 | 17-15159-3.ea | Sequence: 2CHKSUM Content: 8586 Layout: 49077 Graphics: No Graphics CLEAN
JOB: 17-15159-3 CYCLE#;BL#: 5; 0 TRIM: 8.25" x 10.75" COMPOSITECOLORS: Black, ~note-color 2, ~note-color 3 GRAPHICS: none V1.5
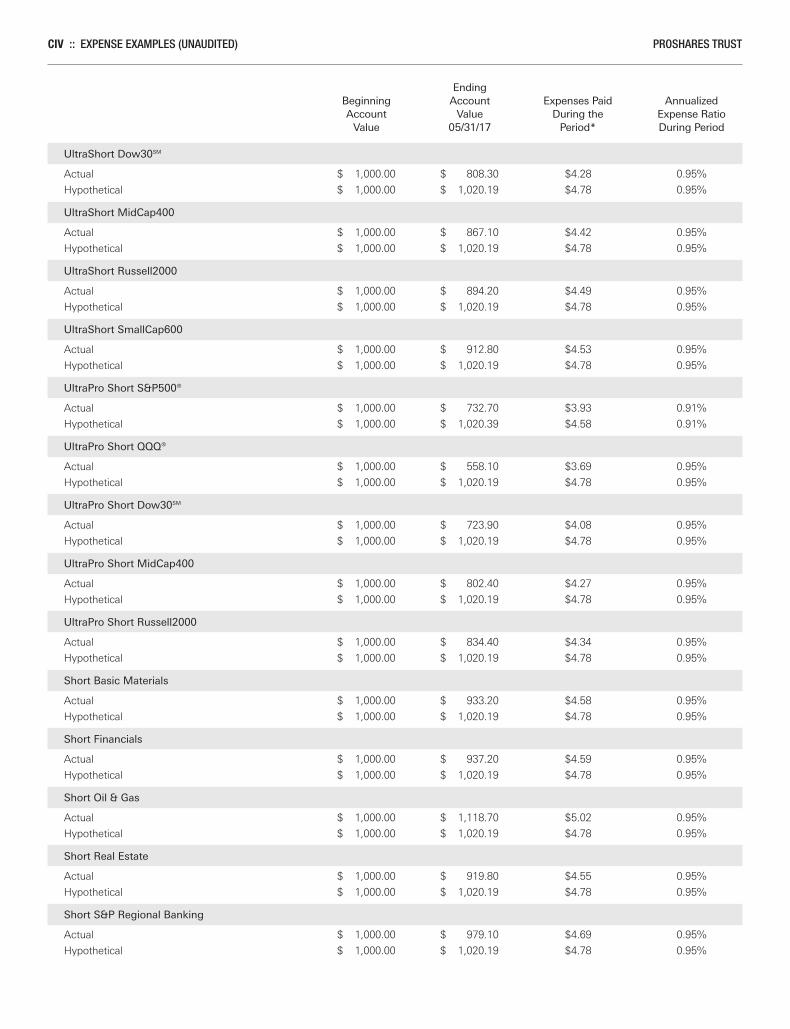
CIV :: EXPENSE EXAMPLES (UNAUDITED) PROSHARES TRUST
Ending Beginning Account Expenses Paid Annualized Account Value During the Expense Ratio Value 05/31/17 Period* During Period
UltraShort Dow30SM
Actual $ 1,000.00 $ 808.30 $4.28 0.95%
Hypothetical $ 1,000.00 $ 1,020.19 $4.78 0.95%
UltraShort MidCap400
Actual $ 1,000.00 $ 867.10 $4.42 0.95%
Hypothetical $ 1,000.00 $ 1,020.19 $4.78 0.95%
UltraShort Russell2000
Actual $ 1,000.00 $ 894.20 $4.49 0.95%
Hypothetical $ 1,000.00 $ 1,020.19 $4.78 0.95%
UltraShort SmallCap600
Actual $ 1,000.00 $ 912.80 $4.53 0.95%
Hypothetical $ 1,000.00 $ 1,020.19 $4.78 0.95%
UltraPro Short S&P500®
Actual $ 1,000.00 $ 732.70 $3.93 0.91%
Hypothetical $ 1,000.00 $ 1,020.39 $4.58 0.91%
UltraPro Short QQQ®
Actual $ 1,000.00 $ 558.10 $3.69 0.95%
Hypothetical $ 1,000.00 $ 1,020.19 $4.78 0.95%
UltraPro Short Dow30SM
Actual $ 1,000.00 $ 723.90 $4.08 0.95%
Hypothetical $ 1,000.00 $ 1,020.19 $4.78 0.95%
UltraPro Short MidCap400
Actual $ 1,000.00 $ 802.40 $4.27 0.95%
Hypothetical $ 1,000.00 $ 1,020.19 $4.78 0.95%
UltraPro Short Russell2000
Actual $ 1,000.00 $ 834.40 $4.34 0.95%
Hypothetical $ 1,000.00 $ 1,020.19 $4.78 0.95%
Short Basic Materials
Actual $ 1,000.00 $ 933.20 $4.58 0.95%
Hypothetical $ 1,000.00 $ 1,020.19 $4.78 0.95%
Short Financials
Actual $ 1,000.00 $ 937.20 $4.59 0.95%
Hypothetical $ 1,000.00 $ 1,020.19 $4.78 0.95%
Short Oil & Gas
Actual $ 1,000.00 $ 1,118.70 $5.02 0.95%
Hypothetical $ 1,000.00 $ 1,020.19 $4.78 0.95%
Short Real Estate
Actual $ 1,000.00 $ 919.80 $4.55 0.95%
Hypothetical $ 1,000.00 $ 1,020.19 $4.78 0.95%
Short S&P Regional Banking
Actual $ 1,000.00 $ 979.10 $4.69 0.95%
Hypothetical $ 1,000.00 $ 1,020.19 $4.78 0.95%
Merrill Corp - Proshares Trust Geared Book [96 Funds] Annual Report [Funds] 333-089822 05-31-2017 ED [AUX] | eperez | 28-Jul-17 17:36 | 17-15159-3.ea | Sequence: 3CHKSUM Content: 33155 Layout: 34044 Graphics: No Graphics CLEAN
JOB: 17-15159-3 CYCLE#;BL#: 5; 0 TRIM: 8.25" x 10.75" COMPOSITECOLORS: Black, ~note-color 2, ~note-color 3 GRAPHICS: none V1.5
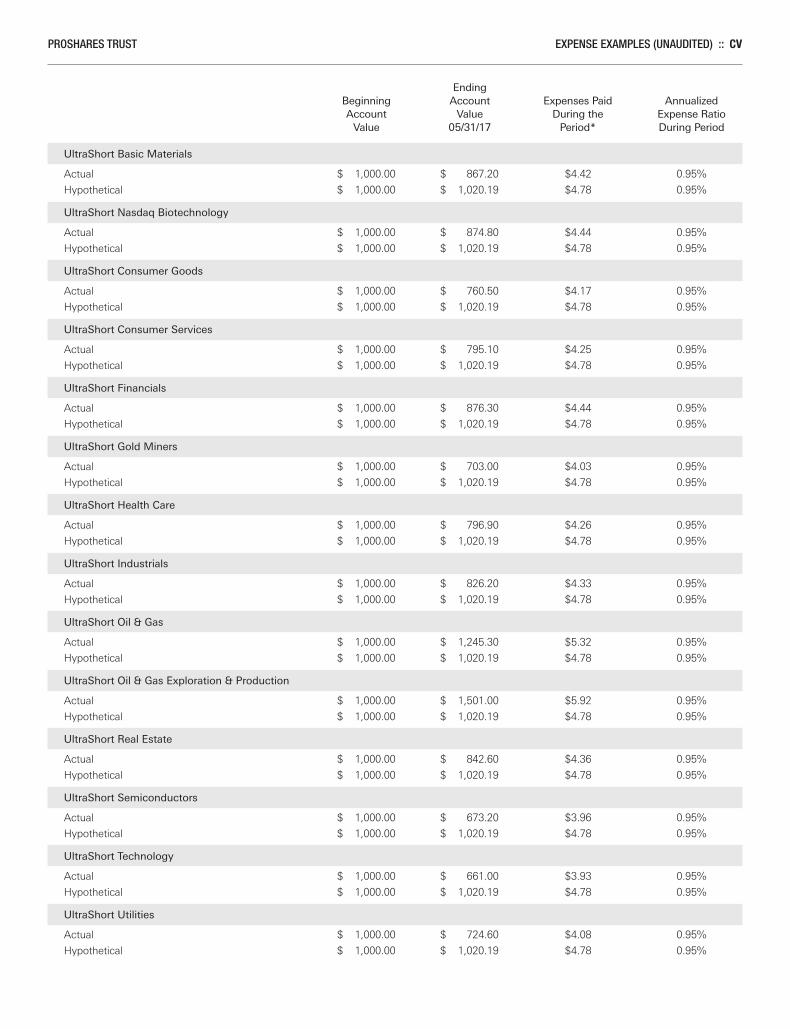
PROSHARES TRUST EXPENSE EXAMPLES (UNAUDITED) :: CV
Ending Beginning Account Expenses Paid Annualized Account Value During the Expense Ratio Value 05/31/17 Period* During Period
UltraShort Basic Materials
Actual $ 1,000.00 $ 867.20 $4.42 0.95%
Hypothetical $ 1,000.00 $ 1,020.19 $4.78 0.95%
UltraShort Nasdaq Biotechnology
Actual $ 1,000.00 $ 874.80 $4.44 0.95%
Hypothetical $ 1,000.00 $ 1,020.19 $4.78 0.95%
UltraShort Consumer Goods
Actual $ 1,000.00 $ 760.50 $4.17 0.95%
Hypothetical $ 1,000.00 $ 1,020.19 $4.78 0.95%
UltraShort Consumer Services
Actual $ 1,000.00 $ 795.10 $4.25 0.95%
Hypothetical $ 1,000.00 $ 1,020.19 $4.78 0.95%
UltraShort Financials
Actual $ 1,000.00 $ 876.30 $4.44 0.95%
Hypothetical $ 1,000.00 $ 1,020.19 $4.78 0.95%
UltraShort Gold Miners
Actual $ 1,000.00 $ 703.00 $4.03 0.95%
Hypothetical $ 1,000.00 $ 1,020.19 $4.78 0.95%
UltraShort Health Care
Actual $ 1,000.00 $ 796.90 $4.26 0.95%
Hypothetical $ 1,000.00 $ 1,020.19 $4.78 0.95%
UltraShort Industrials
Actual $ 1,000.00 $ 826.20 $4.33 0.95%
Hypothetical $ 1,000.00 $ 1,020.19 $4.78 0.95%
UltraShort Oil & Gas
Actual $ 1,000.00 $ 1,245.30 $5.32 0.95%
Hypothetical $ 1,000.00 $ 1,020.19 $4.78 0.95%
UltraShort Oil & Gas Exploration & Production
Actual $ 1,000.00 $ 1,501.00 $5.92 0.95%
Hypothetical $ 1,000.00 $ 1,020.19 $4.78 0.95%
UltraShort Real Estate
Actual $ 1,000.00 $ 842.60 $4.36 0.95%
Hypothetical $ 1,000.00 $ 1,020.19 $4.78 0.95%
UltraShort Semiconductors
Actual $ 1,000.00 $ 673.20 $3.96 0.95%
Hypothetical $ 1,000.00 $ 1,020.19 $4.78 0.95%
UltraShort Technology
Actual $ 1,000.00 $ 661.00 $3.93 0.95%
Hypothetical $ 1,000.00 $ 1,020.19 $4.78 0.95%
UltraShort Utilities
Actual $ 1,000.00 $ 724.60 $4.08 0.95%
Hypothetical $ 1,000.00 $ 1,020.19 $4.78 0.95%
Merrill Corp - Proshares Trust Geared Book [96 Funds] Annual Report [Funds] 333-089822 05-31-2017 ED [AUX] | eperez | 28-Jul-17 17:36 | 17-15159-3.ea | Sequence: 4CHKSUM Content: 63737 Layout: 55843 Graphics: No Graphics CLEAN
JOB: 17-15159-3 CYCLE#;BL#: 5; 0 TRIM: 8.25" x 10.75" COMPOSITECOLORS: Black, ~note-color 2, ~note-color 3 GRAPHICS: none V1.5
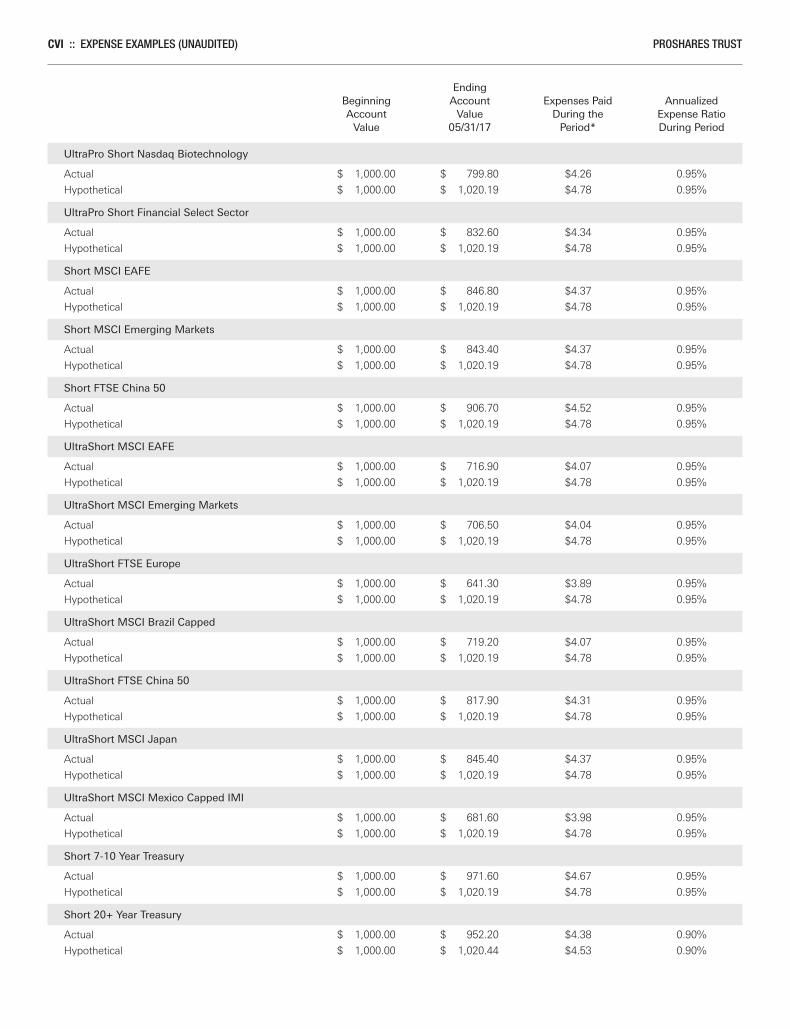
CVI :: EXPENSE EXAMPLES (UNAUDITED) PROSHARES TRUST
Ending Beginning Account Expenses Paid Annualized Account Value During the Expense Ratio Value 05/31/17 Period* During Period
UltraPro Short Nasdaq Biotechnology
Actual $ 1,000.00 $ 799.80 $4.26 0.95%
Hypothetical $ 1,000.00 $ 1,020.19 $4.78 0.95%
UltraPro Short Financial Select Sector
Actual $ 1,000.00 $ 832.60 $4.34 0.95%
Hypothetical $ 1,000.00 $ 1,020.19 $4.78 0.95%
Short MSCI EAFE
Actual $ 1,000.00 $ 846.80 $4.37 0.95%
Hypothetical $ 1,000.00 $ 1,020.19 $4.78 0.95%
Short MSCI Emerging Markets
Actual $ 1,000.00 $ 843.40 $4.37 0.95%
Hypothetical $ 1,000.00 $ 1,020.19 $4.78 0.95%
Short FTSE China 50
Actual $ 1,000.00 $ 906.70 $4.52 0.95%
Hypothetical $ 1,000.00 $ 1,020.19 $4.78 0.95%
UltraShort MSCI EAFE
Actual $ 1,000.00 $ 716.90 $4.07 0.95%
Hypothetical $ 1,000.00 $ 1,020.19 $4.78 0.95%
UltraShort MSCI Emerging Markets
Actual $ 1,000.00 $ 706.50 $4.04 0.95%
Hypothetical $ 1,000.00 $ 1,020.19 $4.78 0.95%
UltraShort FTSE Europe
Actual $ 1,000.00 $ 641.30 $3.89 0.95%
Hypothetical $ 1,000.00 $ 1,020.19 $4.78 0.95%
UltraShort MSCI Brazil Capped
Actual $ 1,000.00 $ 719.20 $4.07 0.95%
Hypothetical $ 1,000.00 $ 1,020.19 $4.78 0.95%
UltraShort FTSE China 50
Actual $ 1,000.00 $ 817.90 $4.31 0.95%
Hypothetical $ 1,000.00 $ 1,020.19 $4.78 0.95%
UltraShort MSCI Japan
Actual $ 1,000.00 $ 845.40 $4.37 0.95%
Hypothetical $ 1,000.00 $ 1,020.19 $4.78 0.95%
UltraShort MSCI Mexico Capped IMI
Actual $ 1,000.00 $ 681.60 $3.98 0.95%
Hypothetical $ 1,000.00 $ 1,020.19 $4.78 0.95%
Short 7-10 Year Treasury
Actual $ 1,000.00 $ 971.60 $4.67 0.95%
Hypothetical $ 1,000.00 $ 1,020.19 $4.78 0.95%
Short 20+ Year Treasury
Actual $ 1,000.00 $ 952.20 $4.38 0.90%
Hypothetical $ 1,000.00 $ 1,020.44 $4.53 0.90%
Merrill Corp - Proshares Trust Geared Book [96 Funds] Annual Report [Funds] 333-089822 05-31-2017 ED [AUX] | eperez | 28-Jul-17 17:36 | 17-15159-3.ea | Sequence: 5CHKSUM Content: 59908 Layout: 34044 Graphics: No Graphics CLEAN
JOB: 17-15159-3 CYCLE#;BL#: 5; 0 TRIM: 8.25" x 10.75" COMPOSITECOLORS: Black, ~note-color 2, ~note-color 3 GRAPHICS: none V1.5
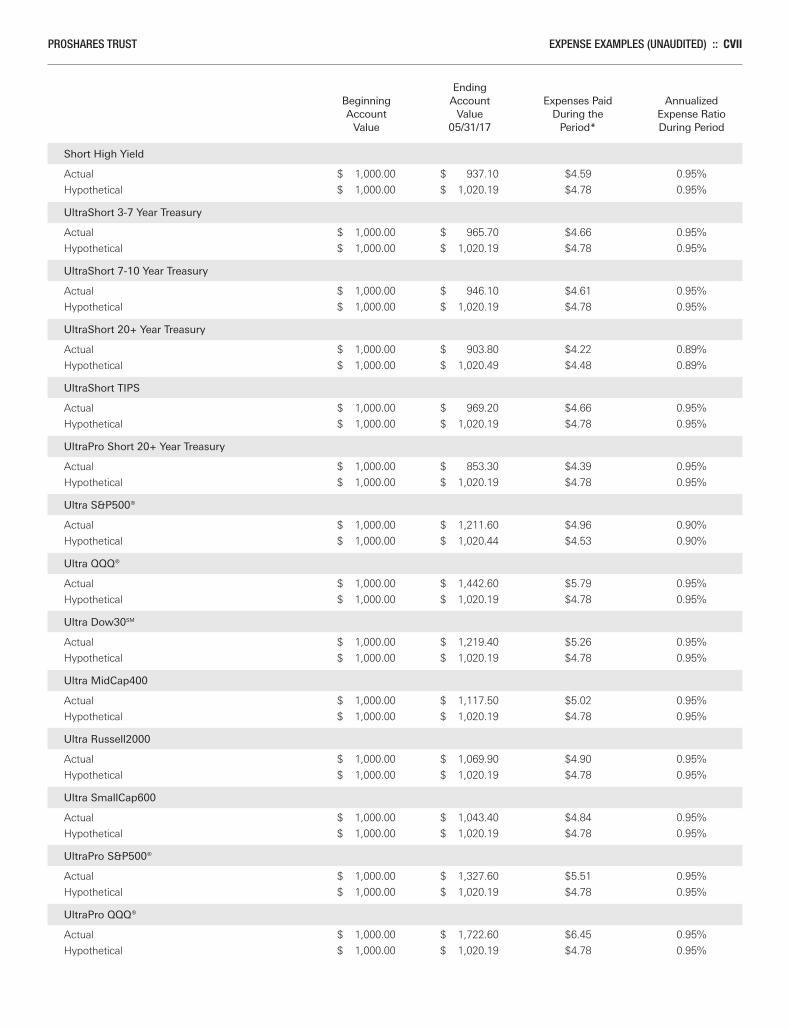
PROSHARES TRUST EXPENSE EXAMPLES (UNAUDITED) :: CVII
Ending Beginning Account Expenses Paid Annualized Account Value During the Expense Ratio Value 05/31/17 Period* During Period
Short High Yield
Actual $ 1,000.00 $ 937.10 $4.59 0.95%
Hypothetical $ 1,000.00 $ 1,020.19 $4.78 0.95%
UltraShort 3-7 Year Treasury
Actual $ 1,000.00 $ 965.70 $4.66 0.95%
Hypothetical $ 1,000.00 $ 1,020.19 $4.78 0.95%
UltraShort 7-10 Year Treasury
Actual $ 1,000.00 $ 946.10 $4.61 0.95%
Hypothetical $ 1,000.00 $ 1,020.19 $4.78 0.95%
UltraShort 20+ Year Treasury
Actual $ 1,000.00 $ 903.80 $4.22 0.89%
Hypothetical $ 1,000.00 $ 1,020.49 $4.48 0.89%
UltraShort TIPS
Actual $ 1,000.00 $ 969.20 $4.66 0.95%
Hypothetical $ 1,000.00 $ 1,020.19 $4.78 0.95%
UltraPro Short 20+ Year Treasury
Actual $ 1,000.00 $ 853.30 $4.39 0.95%
Hypothetical $ 1,000.00 $ 1,020.19 $4.78 0.95%
Ultra S&P500®
Actual $ 1,000.00 $ 1,211.60 $4.96 0.90%
Hypothetical $ 1,000.00 $ 1,020.44 $4.53 0.90%
Ultra QQQ®
Actual $ 1,000.00 $ 1,442.60 $5.79 0.95%
Hypothetical $ 1,000.00 $ 1,020.19 $4.78 0.95%
Ultra Dow30SM
Actual $ 1,000.00 $ 1,219.40 $5.26 0.95%
Hypothetical $ 1,000.00 $ 1,020.19 $4.78 0.95%
Ultra MidCap400
Actual $ 1,000.00 $ 1,117.50 $5.02 0.95%
Hypothetical $ 1,000.00 $ 1,020.19 $4.78 0.95%
Ultra Russell2000
Actual $ 1,000.00 $ 1,069.90 $4.90 0.95%
Hypothetical $ 1,000.00 $ 1,020.19 $4.78 0.95%
Ultra SmallCap600
Actual $ 1,000.00 $ 1,043.40 $4.84 0.95%
Hypothetical $ 1,000.00 $ 1,020.19 $4.78 0.95%
UltraPro S&P500®
Actual $ 1,000.00 $ 1,327.60 $5.51 0.95%
Hypothetical $ 1,000.00 $ 1,020.19 $4.78 0.95%
UltraPro QQQ®
Actual $ 1,000.00 $ 1,722.60 $6.45 0.95%
Hypothetical $ 1,000.00 $ 1,020.19 $4.78 0.95%
Merrill Corp - Proshares Trust Geared Book [96 Funds] Annual Report [Funds] 333-089822 05-31-2017 ED [AUX] | eperez | 28-Jul-17 17:36 | 17-15159-3.ea | Sequence: 6CHKSUM Content: 17972 Layout: 55843 Graphics: No Graphics CLEAN
JOB: 17-15159-3 CYCLE#;BL#: 5; 0 TRIM: 8.25" x 10.75" COMPOSITECOLORS: Black, ~note-color 2, ~note-color 3 GRAPHICS: none V1.5
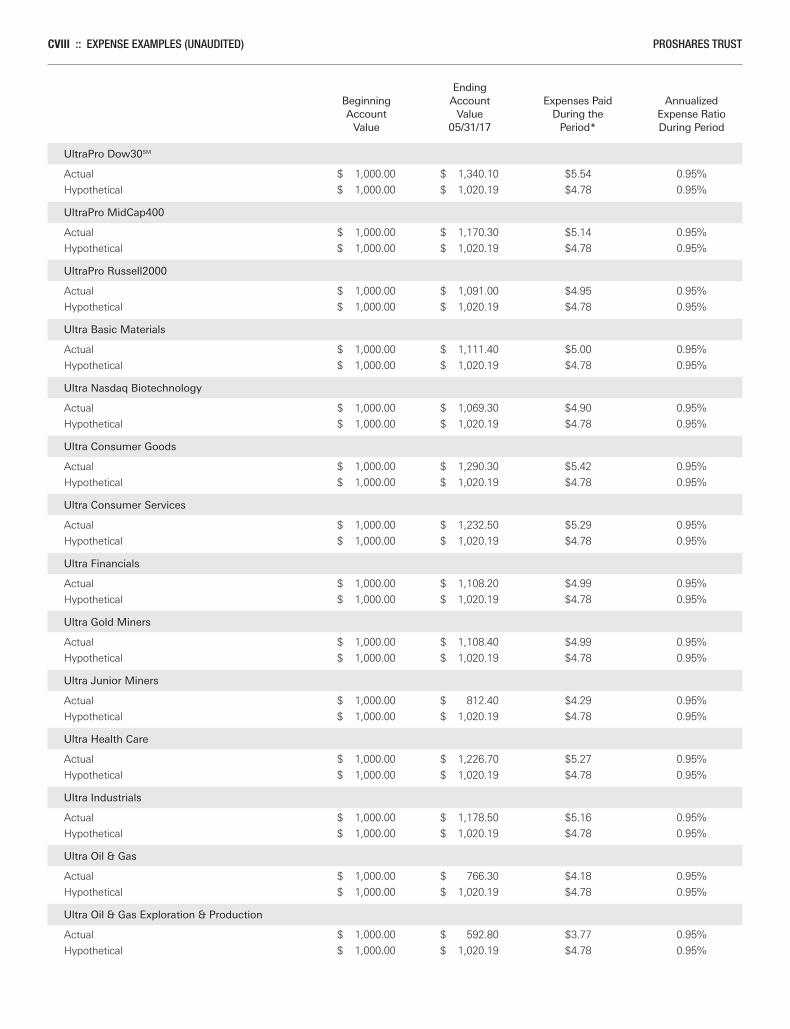
CVIII :: EXPENSE EXAMPLES (UNAUDITED) PROSHARES TRUST
Ending Beginning Account Expenses Paid Annualized Account Value During the Expense Ratio Value 05/31/17 Period* During Period
UltraPro Dow30SM
Actual $ 1,000.00 $ 1,340.10 $5.54 0.95%
Hypothetical $ 1,000.00 $ 1,020.19 $4.78 0.95%
UltraPro MidCap400
Actual $ 1,000.00 $ 1,170.30 $5.14 0.95%
Hypothetical $ 1,000.00 $ 1,020.19 $4.78 0.95%
UltraPro Russell2000
Actual $ 1,000.00 $ 1,091.00 $4.95 0.95%
Hypothetical $ 1,000.00 $ 1,020.19 $4.78 0.95%
Ultra Basic Materials
Actual $ 1,000.00 $ 1,111.40 $5.00 0.95%
Hypothetical $ 1,000.00 $ 1,020.19 $4.78 0.95%
Ultra Nasdaq Biotechnology
Actual $ 1,000.00 $ 1,069.30 $4.90 0.95%
Hypothetical $ 1,000.00 $ 1,020.19 $4.78 0.95%
Ultra Consumer Goods
Actual $ 1,000.00 $ 1,290.30 $5.42 0.95%
Hypothetical $ 1,000.00 $ 1,020.19 $4.78 0.95%
Ultra Consumer Services
Actual $ 1,000.00 $ 1,232.50 $5.29 0.95%
Hypothetical $ 1,000.00 $ 1,020.19 $4.78 0.95%
Ultra Financials
Actual $ 1,000.00 $ 1,108.20 $4.99 0.95%
Hypothetical $ 1,000.00 $ 1,020.19 $4.78 0.95%
Ultra Gold Miners
Actual $ 1,000.00 $ 1,108.40 $4.99 0.95%
Hypothetical $ 1,000.00 $ 1,020.19 $4.78 0.95%
Ultra Junior Miners
Actual $ 1,000.00 $ 812.40 $4.29 0.95%
Hypothetical $ 1,000.00 $ 1,020.19 $4.78 0.95%
Ultra Health Care
Actual $ 1,000.00 $ 1,226.70 $5.27 0.95%
Hypothetical $ 1,000.00 $ 1,020.19 $4.78 0.95%
Ultra Industrials
Actual $ 1,000.00 $ 1,178.50 $5.16 0.95%
Hypothetical $ 1,000.00 $ 1,020.19 $4.78 0.95%
Ultra Oil & Gas
Actual $ 1,000.00 $ 766.30 $4.18 0.95%
Hypothetical $ 1,000.00 $ 1,020.19 $4.78 0.95%
Ultra Oil & Gas Exploration & Production
Actual $ 1,000.00 $ 592.80 $3.77 0.95%
Hypothetical $ 1,000.00 $ 1,020.19 $4.78 0.95%
Merrill Corp - Proshares Trust Geared Book [96 Funds] Annual Report [Funds] 333-089822 05-31-2017 ED [AUX] | eperez | 28-Jul-17 17:36 | 17-15159-3.ea | Sequence: 7CHKSUM Content: 33106 Layout: 48918 Graphics: No Graphics CLEAN
JOB: 17-15159-3 CYCLE#;BL#: 5; 0 TRIM: 8.25" x 10.75" COMPOSITECOLORS: Black, ~note-color 2, ~note-color 3 GRAPHICS: none V1.5
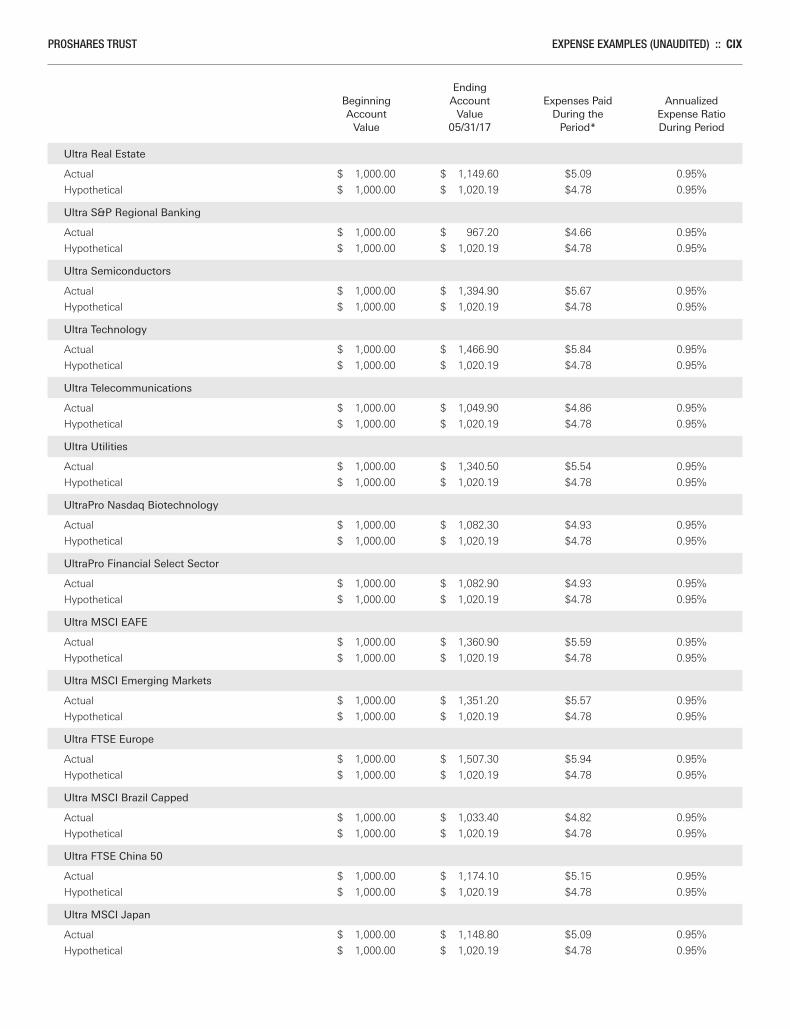
PROSHARES TRUST EXPENSE EXAMPLES (UNAUDITED) :: CIX
Ending Beginning Account Expenses Paid Annualized Account Value During the Expense Ratio Value 05/31/17 Period* During Period
Ultra Real Estate
Actual $ 1,000.00 $ 1,149.60 $5.09 0.95%
Hypothetical $ 1,000.00 $ 1,020.19 $4.78 0.95%
Ultra S&P Regional Banking
Actual $ 1,000.00 $ 967.20 $4.66 0.95%
Hypothetical $ 1,000.00 $ 1,020.19 $4.78 0.95%
Ultra Semiconductors
Actual $ 1,000.00 $ 1,394.90 $5.67 0.95%
Hypothetical $ 1,000.00 $ 1,020.19 $4.78 0.95%
Ultra Technology
Actual $ 1,000.00 $ 1,466.90 $5.84 0.95%
Hypothetical $ 1,000.00 $ 1,020.19 $4.78 0.95%
Ultra Telecommunications
Actual $ 1,000.00 $ 1,049.90 $4.86 0.95%
Hypothetical $ 1,000.00 $ 1,020.19 $4.78 0.95%
Ultra Utilities
Actual $ 1,000.00 $ 1,340.50 $5.54 0.95%
Hypothetical $ 1,000.00 $ 1,020.19 $4.78 0.95%
UltraPro Nasdaq Biotechnology
Actual $ 1,000.00 $ 1,082.30 $4.93 0.95%
Hypothetical $ 1,000.00 $ 1,020.19 $4.78 0.95%
UltraPro Financial Select Sector
Actual $ 1,000.00 $ 1,082.90 $4.93 0.95%
Hypothetical $ 1,000.00 $ 1,020.19 $4.78 0.95%
Ultra MSCI EAFE
Actual $ 1,000.00 $ 1,360.90 $5.59 0.95%
Hypothetical $ 1,000.00 $ 1,020.19 $4.78 0.95%
Ultra MSCI Emerging Markets
Actual $ 1,000.00 $ 1,351.20 $5.57 0.95%
Hypothetical $ 1,000.00 $ 1,020.19 $4.78 0.95%
Ultra FTSE Europe
Actual $ 1,000.00 $ 1,507.30 $5.94 0.95%
Hypothetical $ 1,000.00 $ 1,020.19 $4.78 0.95%
Ultra MSCI Brazil Capped
Actual $ 1,000.00 $ 1,033.40 $4.82 0.95%
Hypothetical $ 1,000.00 $ 1,020.19 $4.78 0.95%
Ultra FTSE China 50
Actual $ 1,000.00 $ 1,174.10 $5.15 0.95%
Hypothetical $ 1,000.00 $ 1,020.19 $4.78 0.95%
Ultra MSCI Japan
Actual $ 1,000.00 $ 1,148.80 $5.09 0.95%
Hypothetical $ 1,000.00 $ 1,020.19 $4.78 0.95%
Merrill Corp - Proshares Trust Geared Book [96 Funds] Annual Report [Funds] 333-089822 05-31-2017 ED [AUX] | eperez | 28-Jul-17 17:36 | 17-15159-3.ea | Sequence: 8CHKSUM Content: 12020 Layout: 31390 Graphics: No Graphics CLEAN
JOB: 17-15159-3 CYCLE#;BL#: 5; 0 TRIM: 8.25" x 10.75" COMPOSITECOLORS: Black, ~note-color 2, ~note-color 3 GRAPHICS: none V1.5
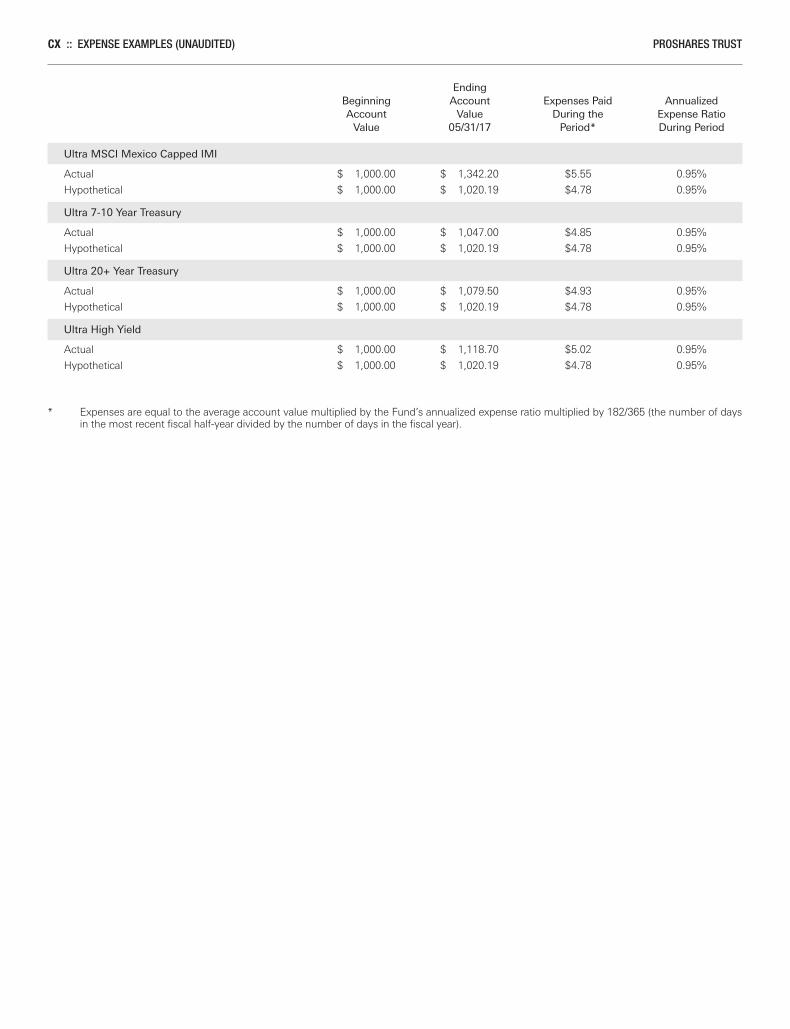
CX :: EXPENSE EXAMPLES (UNAUDITED) PROSHARES TRUST
Ending Beginning Account Expenses Paid Annualized Account Value During the Expense Ratio Value 05/31/17 Period* During Period
Ultra MSCI Mexico Capped IMI
Actual $ 1,000.00 $ 1,342.20 $5.55 0.95%
Hypothetical $ 1,000.00 $ 1,020.19 $4.78 0.95%
Ultra 7-10 Year Treasury
Actual $ 1,000.00 $ 1,047.00 $4.85 0.95%
Hypothetical $ 1,000.00 $ 1,020.19 $4.78 0.95%
Ultra 20+ Year Treasury
Actual $ 1,000.00 $ 1,079.50 $4.93 0.95%
Hypothetical $ 1,000.00 $ 1,020.19 $4.78 0.95%
Ultra High Yield
Actual $ 1,000.00 $ 1,118.70 $5.02 0.95%
Hypothetical $ 1,000.00 $ 1,020.19 $4.78 0.95%
* Expenses are equal to the average account value multiplied by the Fund’s annualized expense ratio multiplied by 182/365 (the number of daysin the most recent fiscal half-year divided by the number of days in the fiscal year).
Merrill Corp - Proshares Trust Geared Book [96 Funds] Annual Report [Funds] 333-089822 05-31-2017 ED [AUX] | eperez | 28-Jul-17 17:36 | 17-15159-3.ea | Sequence: 9CHKSUM Content: 62041 Layout: 33176 Graphics: No Graphics CLEAN
JOB: 17-15159-3 CYCLE#;BL#: 5; 0 TRIM: 8.25" x 10.75" COMPOSITECOLORS: Black, ~note-color 2, ~note-color 3 GRAPHICS: none V1.5

PROSHARES TRUST SCHEDULE OF PORTFOLIO INVESTMENTS :: MAY 31, 2017 :: 1
SCHEDULE OF PORTFOLIO INVESTMENTS
Merrill Corp - Proshares Trust Geared Book [96 Funds] Annual Report [Funds] 333-089822 05-31-2017 ED [AUX] | eperez | 28-Jul-17 17:37 | 17-15159-3.fa | Sequence: 1CHKSUM Content: 60843 Layout: 45011 Graphics: No Graphics CLEAN
JOB: 17-15159-3 CYCLE#;BL#: 5; 0 TRIM: 8.25" x 10.75" COMPOSITECOLORS: Black, ~note-color 2, ~note-color 3 GRAPHICS: none V1.5
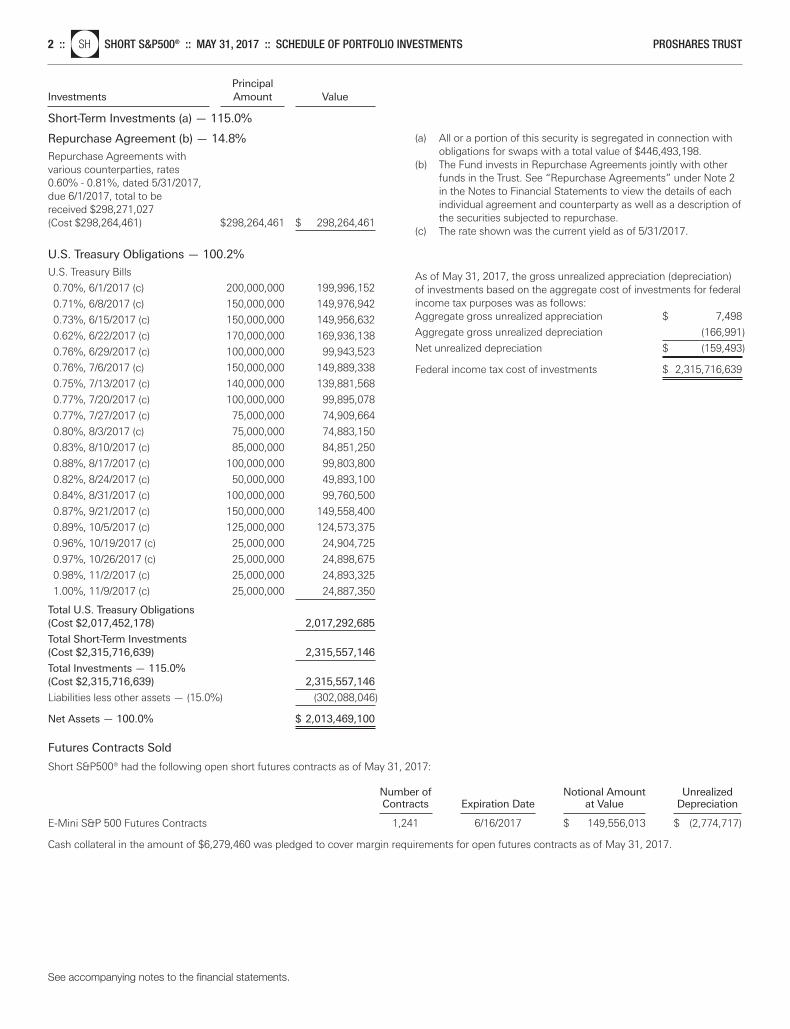
See accompanying notes to the financial statements.
2 ::nlSH SHORT S&P500® :: MAY 31, 2017 :: SCHEDULE OF PORTFOLIO INVESTMENTS PROSHARES TRUST
Principal Investments Amount Value
Short-Term Investments (a) — 115.0%
Repurchase Agreement (b) — 14.8%
Repurchase Agreements with various counterparties, rates 0.60% - 0.81%, dated 5/31/2017, due 6/1/2017, total to be received $298,271,027 (Cost $298,264,461) $298,264,461 $ 298,264,461
U.S. Treasury Obligations — 100.2%
U.S. Treasury Bills
0.70%, 6/1/2017 (c) 200,000,000 199,996,152
0.71%, 6/8/2017 (c) 150,000,000 149,976,942
0.73%, 6/15/2017 (c) 150,000,000 149,956,632
0.62%, 6/22/2017 (c) 170,000,000 169,936,138
0.76%, 6/29/2017 (c) 100,000,000 99,943,523
0.76%, 7/6/2017 (c) 150,000,000 149,889,338
0.75%, 7/13/2017 (c) 140,000,000 139,881,568
0.77%, 7/20/2017 (c) 100,000,000 99,895,078
0.77%, 7/27/2017 (c) 75,000,000 74,909,664
0.80%, 8/3/2017 (c) 75,000,000 74,883,150
0.83%, 8/10/2017 (c) 85,000,000 84,851,250
0.88%, 8/17/2017 (c) 100,000,000 99,803,800
0.82%, 8/24/2017 (c) 50,000,000 49,893,100
0.84%, 8/31/2017 (c) 100,000,000 99,760,500
0.87%, 9/21/2017 (c) 150,000,000 149,558,400
0.89%, 10/5/2017 (c) 125,000,000 124,573,375
0.96%, 10/19/2017 (c) 25,000,000 24,904,725
0.97%, 10/26/2017 (c) 25,000,000 24,898,675
0.98%, 11/2/2017 (c) 25,000,000 24,893,325
1.00%, 11/9/2017 (c) 25,000,000 24,887,350
Total U.S. Treasury Obligations(Cost $2,017,452,178) 2,017,292,685
Total Short-Term Investments(Cost $2,315,716,639) 2,315,557,146
Total Investments — 115.0%(Cost $2,315,716,639) 2,315,557,146
Liabilities less other assets — (15.0%) (302,088,046)
Net Assets — 100.0% $ 2,013,469,100
Futures Contracts Sold
Short S&P500® had the following open short futures contracts as of May 31, 2017:
Number of Notional Amount Unrealized Contracts Expiration Date at Value Depreciation E-Mini S&P 500 Futures Contracts 1,241 6/16/2017 $ 149,556,013 $ (2,774,717)
Cash collateral in the amount of $6,279,460 was pledged to cover margin requirements for open futures contracts as of May 31, 2017.
(a) All or a portion of this security is segregated in connection withobligations for swaps with a total value of $446,493,198.
(b) The Fund invests in Repurchase Agreements jointly with otherfunds in the Trust. See “Repurchase Agreements” under Note 2in the Notes to Financial Statements to view the details of eachindividual agreement and counterparty as well as a description ofthe securities subjected to repurchase.
(c) The rate shown was the current yield as of 5/31/2017.
As of May 31, 2017, the gross unrealized appreciation (depreciation)of investments based on the aggregate cost of investments for federalincome tax purposes was as follows:Aggregate gross unrealized appreciation $ 7,498
Aggregate gross unrealized depreciation (166,991)
Net unrealized depreciation $ (159,493)
Federal income tax cost of investments $ 2,315,716,639
Merrill Corp - Proshares Trust Geared Book [96 Funds] Annual Report [Funds] 333-089822 05-31-2017 ED [AUX] | eperez | 28-Jul-17 17:37 | 17-15159-3.fa | Sequence: 2CHKSUM Content: 46817 Layout: 36158 Graphics: No Graphics CLEAN
JOB: 17-15159-3 CYCLE#;BL#: 5; 0 TRIM: 8.25" x 10.75" COMPOSITECOLORS: Black, ~note-color 2, ~note-color 3 GRAPHICS: none V1.5
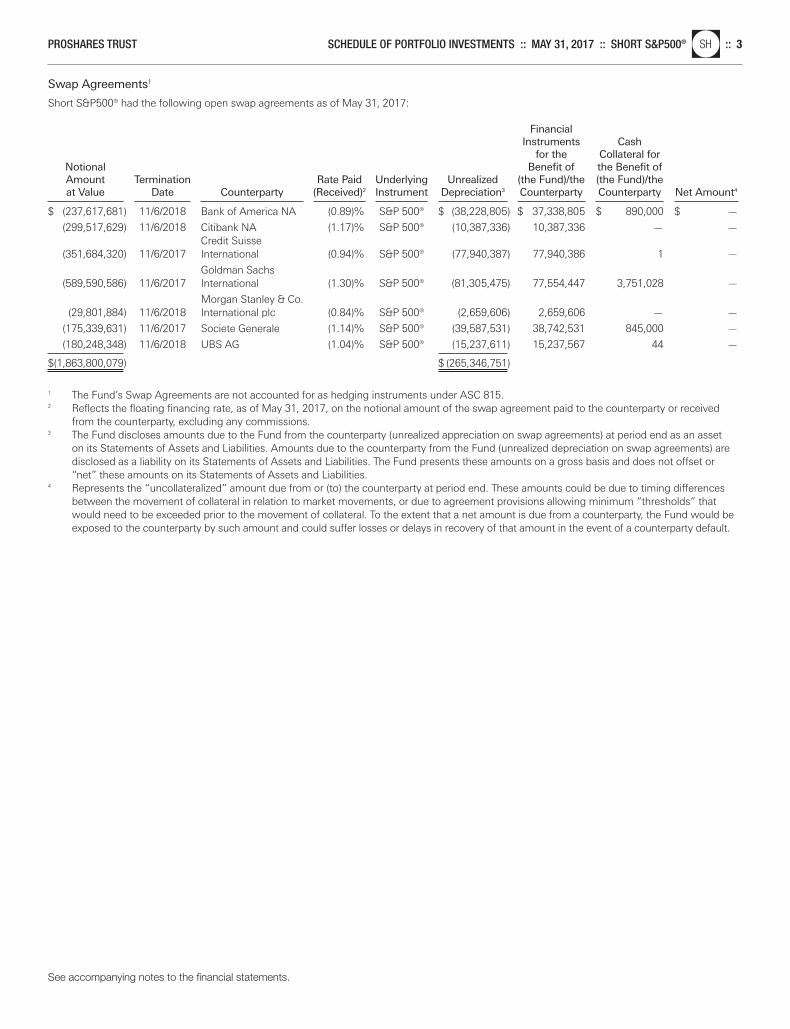
Swap Agreements1
Short S&P500® had the following open swap agreements as of May 31, 2017:
Financial Instruments Cash
for the Collateral for Notional Benefit of the Benefit of Amount Termination Rate Paid Underlying Unrealized (the Fund)/the (the Fund)/the at Value Date Counterparty (Received)2 Instrument Depreciation3 Counterparty Counterparty Net Amount4
$ (237,617,681) 11/6/2018 Bank of America NA (0.89)% S&P 500® $ (38,228,805) $ 37,338,805 $ 890,000 $ —
(299,517,629) 11/6/2018 Citibank NA (1.17)% S&P 500® (10,387,336) 10,387,336 — —Credit Suisse
(351,684,320) 11/6/2017 International (0.94)% S&P 500® (77,940,387) 77,940,386 1 —
Goldman Sachs (589,590,586) 11/6/2017 International (1.30)% S&P 500® (81,305,475) 77,554,447 3,751,028 —
Morgan Stanley & Co. (29,801,884) 11/6/2018 International plc (0.84)% S&P 500® (2,659,606) 2,659,606 — —
(175,339,631) 11/6/2017 Societe Generale (1.14)% S&P 500® (39,587,531) 38,742,531 845,000 —
(180,248,348) 11/6/2018 UBS AG (1.04)% S&P 500® (15,237,611) 15,237,567 44 —
$(1,863,800,079) $ (265,346,751)
1 The Fund’s Swap Agreements are not accounted for as hedging instruments under ASC 815.2 Reflects the floating financing rate, as of May 31, 2017, on the notional amount of the swap agreement paid to the counterparty or received
from the counterparty, excluding any commissions.3 The Fund discloses amounts due to the Fund from the counterparty (unrealized appreciation on swap agreements) at period end as an asset
on its Statements of Assets and Liabilities. Amounts due to the counterparty from the Fund (unrealized depreciation on swap agreements) aredisclosed as a liability on its Statements of Assets and Liabilities. The Fund presents these amounts on a gross basis and does not offset or“net” these amounts on its Statements of Assets and Liabilities.
4 Represents the “uncollateralized” amount due from or (to) the counterparty at period end. These amounts could be due to timing differencesbetween the movement of collateral in relation to market movements, or due to agreement provisions allowing minimum “thresholds” thatwould need to be exceeded prior to the movement of collateral. To the extent that a net amount is due from a counterparty, the Fund would beexposed to the counterparty by such amount and could suffer losses or delays in recovery of that amount in the event of a counterparty default.
See accompanying notes to the financial statements.
PROSHARES TRUST SCHEDULE OF PORTFOLIO INVESTMENTS :: MAY 31, 2017 :: SHORT S&P500®nlSH :: 3
Merrill Corp - Proshares Trust Geared Book [96 Funds] Annual Report [Funds] 333-089822 05-31-2017 ED [AUX] | eperez | 28-Jul-17 17:37 | 17-15159-3.fa | Sequence: 3CHKSUM Content: 58062 Layout: 45129 Graphics: No Graphics CLEAN
JOB: 17-15159-3 CYCLE#;BL#: 5; 0 TRIM: 8.25" x 10.75" COMPOSITECOLORS: Black, ~note-color 2, ~note-color 3 GRAPHICS: none V1.5
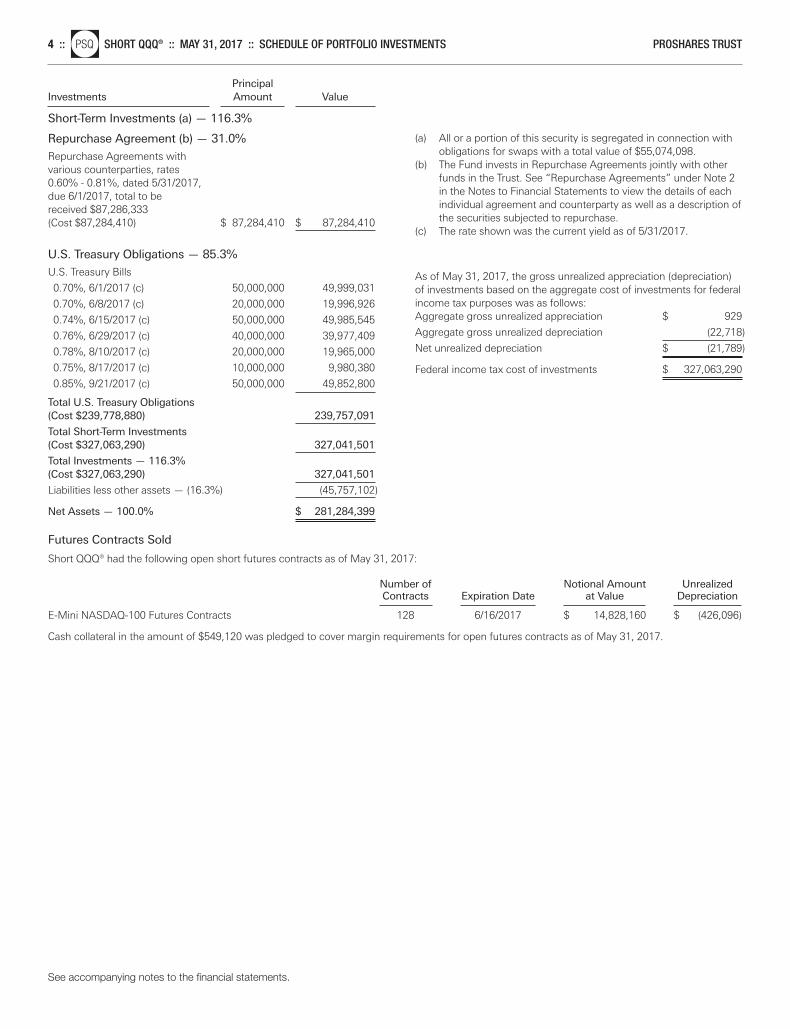
Principal Investments Amount Value
Short-Term Investments (a) — 116.3%
Repurchase Agreement (b) — 31.0%
Repurchase Agreements with various counterparties, rates 0.60% - 0.81%, dated 5/31/2017, due 6/1/2017, total to be received $87,286,333 (Cost $87,284,410) $ 87,284,410 $ 87,284,410
U.S. Treasury Obligations — 85.3%
U.S. Treasury Bills
0.70%, 6/1/2017 (c) 50,000,000 49,999,031
0.70%, 6/8/2017 (c) 20,000,000 19,996,926
0.74%, 6/15/2017 (c) 50,000,000 49,985,545
0.76%, 6/29/2017 (c) 40,000,000 39,977,409
0.78%, 8/10/2017 (c) 20,000,000 19,965,000
0.75%, 8/17/2017 (c) 10,000,000 9,980,380
0.85%, 9/21/2017 (c) 50,000,000 49,852,800
Total U.S. Treasury Obligations(Cost $239,778,880) 239,757,091
Total Short-Term Investments(Cost $327,063,290) 327,041,501
Total Investments — 116.3%(Cost $327,063,290) 327,041,501
Liabilities less other assets — (16.3%) (45,757,102)
Net Assets — 100.0% $ 281,284,399
Futures Contracts Sold
Short QQQ® had the following open short futures contracts as of May 31, 2017:
Number of Notional Amount Unrealized Contracts Expiration Date at Value Depreciation E-Mini NASDAQ-100 Futures Contracts 128 6/16/2017 $ 14,828,160 $ (426,096)
Cash collateral in the amount of $549,120 was pledged to cover margin requirements for open futures contracts as of May 31, 2017.
(a) All or a portion of this security is segregated in connection withobligations for swaps with a total value of $55,074,098.
(b) The Fund invests in Repurchase Agreements jointly with otherfunds in the Trust. See “Repurchase Agreements” under Note 2in the Notes to Financial Statements to view the details of eachindividual agreement and counterparty as well as a description ofthe securities subjected to repurchase.
(c) The rate shown was the current yield as of 5/31/2017.
As of May 31, 2017, the gross unrealized appreciation (depreciation)of investments based on the aggregate cost of investments for federalincome tax purposes was as follows:Aggregate gross unrealized appreciation $ 929
Aggregate gross unrealized depreciation (22,718)
Net unrealized depreciation $ (21,789)
Federal income tax cost of investments $ 327,063,290
See accompanying notes to the financial statements.
4 ::nlPSQ SHORT QQQ® :: MAY 31, 2017 :: SCHEDULE OF PORTFOLIO INVESTMENTS PROSHARES TRUST
Merrill Corp - Proshares Trust Geared Book [96 Funds] Annual Report [Funds] 333-089822 05-31-2017 ED [AUX] | eperez | 28-Jul-17 17:37 | 17-15159-3.fa | Sequence: 4CHKSUM Content: 38415 Layout: 51770 Graphics: No Graphics CLEAN
JOB: 17-15159-3 CYCLE#;BL#: 5; 0 TRIM: 8.25" x 10.75" COMPOSITECOLORS: Black, ~note-color 2, ~note-color 3 GRAPHICS: none V1.5
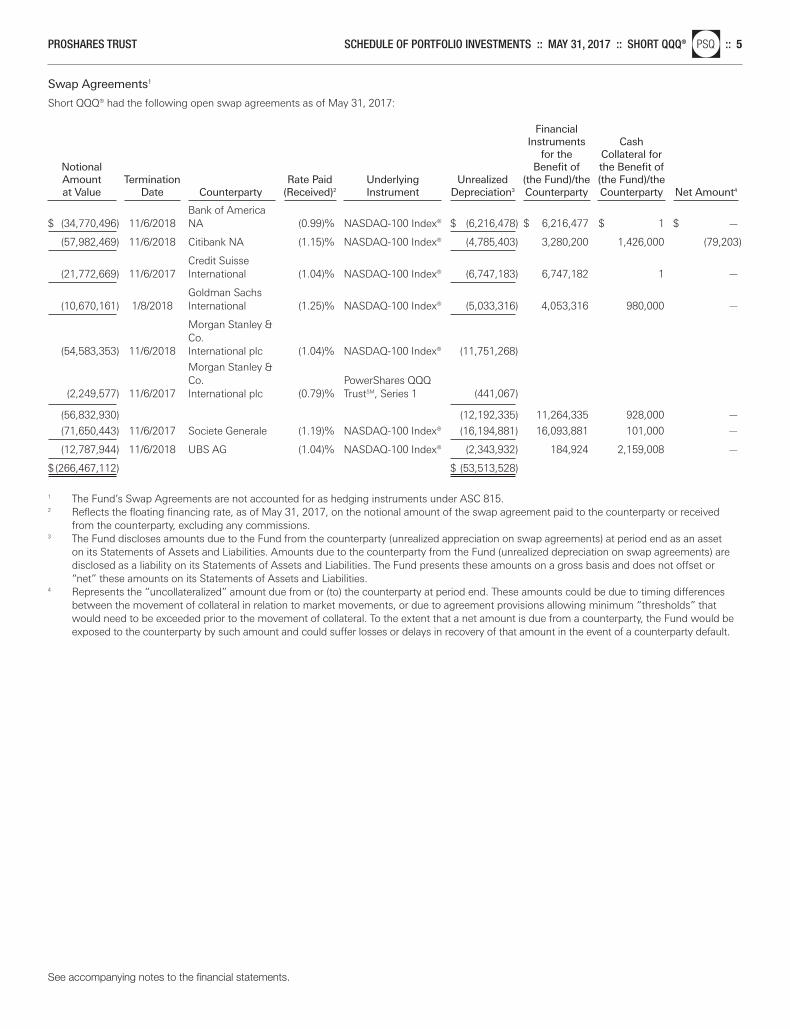
Swap Agreements1
Short QQQ® had the following open swap agreements as of May 31, 2017:
Financial Instruments Cash
for the Collateral for Notional Benefit of the Benefit of Amount Termination Rate Paid Underlying Unrealized (the Fund)/the (the Fund)/the at Value Date Counterparty (Received)2 Instrument Depreciation3 Counterparty Counterparty Net Amount4
Bank of America
$ (34,770,496) 11/6/2018 NA (0.99)% NASDAQ-100 Index® $ (6,216,478) $ 6,216,477 $ 1 $ —
(57,982,469) 11/6/2018 Citibank NA (1.15)% NASDAQ-100 Index® (4,785,403) 3,280,200 1,426,000 (79,203)
Credit Suisse (21,772,669) 11/6/2017 International (1.04)% NASDAQ-100 Index® (6,747,183) 6,747,182 1 —
Goldman Sachs (10,670,161) 1/8/2018 International (1.25)% NASDAQ-100 Index® (5,033,316) 4,053,316 980,000 —
Morgan Stanley & Co.
(54,583,353) 11/6/2018 International plc (1.04)% NASDAQ-100 Index® (11,751,268)
Morgan Stanley & Co. PowerShares QQQ
(2,249,577) 11/6/2017 International plc (0.79)% TrustSM, Series 1 (441,067)
(56,832,930) (12,192,335) 11,264,335 928,000 —
(71,650,443) 11/6/2017 Societe Generale (1.19)% NASDAQ-100 Index® (16,194,881) 16,093,881 101,000 —
(12,787,944) 11/6/2018 UBS AG (1.04)% NASDAQ-100 Index® (2,343,932) 184,924 2,159,008 —
$(266,467,112) $ (53,513,528)
1 The Fund’s Swap Agreements are not accounted for as hedging instruments under ASC 815.2 Reflects the floating financing rate, as of May 31, 2017, on the notional amount of the swap agreement paid to the counterparty or received
from the counterparty, excluding any commissions.3 The Fund discloses amounts due to the Fund from the counterparty (unrealized appreciation on swap agreements) at period end as an asset
on its Statements of Assets and Liabilities. Amounts due to the counterparty from the Fund (unrealized depreciation on swap agreements) aredisclosed as a liability on its Statements of Assets and Liabilities. The Fund presents these amounts on a gross basis and does not offset or“net” these amounts on its Statements of Assets and Liabilities.
4 Represents the “uncollateralized” amount due from or (to) the counterparty at period end. These amounts could be due to timing differencesbetween the movement of collateral in relation to market movements, or due to agreement provisions allowing minimum “thresholds” thatwould need to be exceeded prior to the movement of collateral. To the extent that a net amount is due from a counterparty, the Fund would beexposed to the counterparty by such amount and could suffer losses or delays in recovery of that amount in the event of a counterparty default.
See accompanying notes to the financial statements.
PROSHARES TRUST SCHEDULE OF PORTFOLIO INVESTMENTS :: MAY 31, 2017 :: SHORT QQQ®nlPSQ :: 5
Merrill Corp - Proshares Trust Geared Book [96 Funds] Annual Report [Funds] 333-089822 05-31-2017 ED [AUX] | eperez | 28-Jul-17 17:37 | 17-15159-3.fa | Sequence: 5CHKSUM Content: 15640 Layout: 54960 Graphics: No Graphics CLEAN
JOB: 17-15159-3 CYCLE#;BL#: 5; 0 TRIM: 8.25" x 10.75" COMPOSITECOLORS: Black, ~note-color 2, ~note-color 3 GRAPHICS: none V1.5
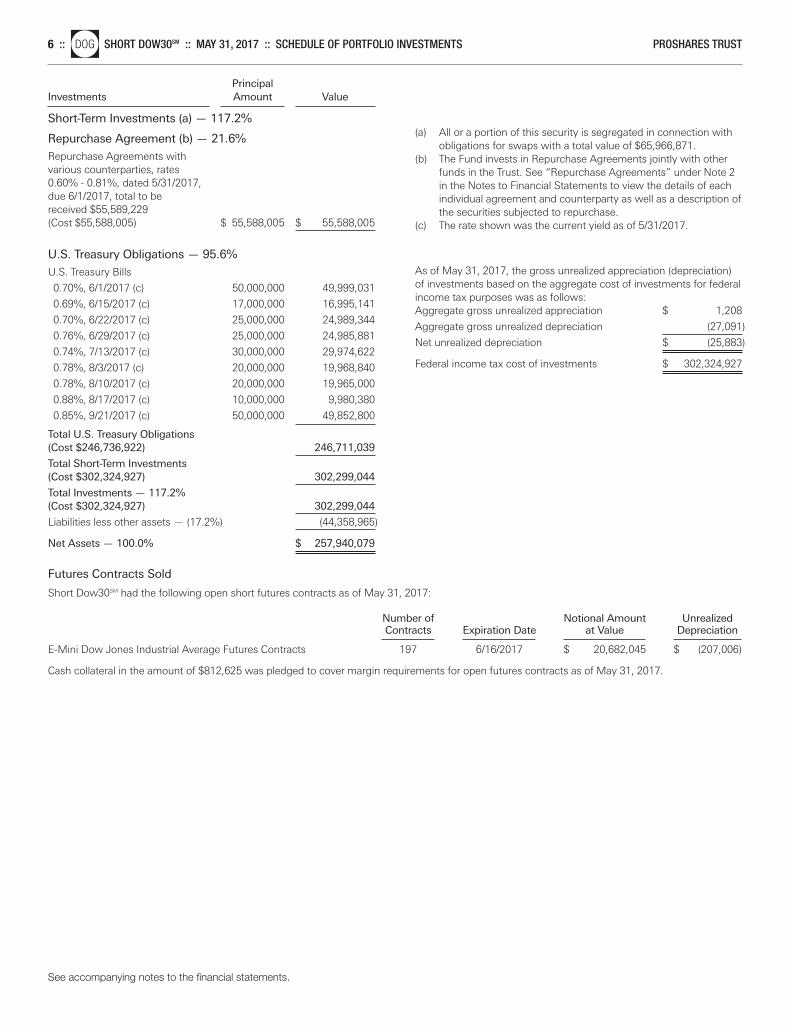
Principal Investments Amount Value
Short-Term Investments (a) — 117.2%
Repurchase Agreement (b) — 21.6%
Repurchase Agreements with various counterparties, rates 0.60% - 0.81%, dated 5/31/2017, due 6/1/2017, total to be received $55,589,229 (Cost $55,588,005) $ 55,588,005 $ 55,588,005
U.S. Treasury Obligations — 95.6%
U.S. Treasury Bills
0.70%, 6/1/2017 (c) 50,000,000 49,999,031
0.69%, 6/15/2017 (c) 17,000,000 16,995,141
0.70%, 6/22/2017 (c) 25,000,000 24,989,344
0.76%, 6/29/2017 (c) 25,000,000 24,985,881
0.74%, 7/13/2017 (c) 30,000,000 29,974,622
0.78%, 8/3/2017 (c) 20,000,000 19,968,840
0.78%, 8/10/2017 (c) 20,000,000 19,965,000
0.88%, 8/17/2017 (c) 10,000,000 9,980,380
0.85%, 9/21/2017 (c) 50,000,000 49,852,800
Total U.S. Treasury Obligations(Cost $246,736,922) 246,711,039
Total Short-Term Investments(Cost $302,324,927) 302,299,044
Total Investments — 117.2%(Cost $302,324,927) 302,299,044
Liabilities less other assets — (17.2%) (44,358,965)
Net Assets — 100.0% $ 257,940,079
Futures Contracts Sold
Short Dow30SM had the following open short futures contracts as of May 31, 2017:
Number of Notional Amount Unrealized Contracts Expiration Date at Value Depreciation E-Mini Dow Jones Industrial Average Futures Contracts 197 6/16/2017 $ 20,682,045 $ (207,006)
Cash collateral in the amount of $812,625 was pledged to cover margin requirements for open futures contracts as of May 31, 2017.
(a) All or a portion of this security is segregated in connection withobligations for swaps with a total value of $65,966,871.
(b) The Fund invests in Repurchase Agreements jointly with otherfunds in the Trust. See “Repurchase Agreements” under Note 2in the Notes to Financial Statements to view the details of eachindividual agreement and counterparty as well as a description ofthe securities subjected to repurchase.
(c) The rate shown was the current yield as of 5/31/2017.
As of May 31, 2017, the gross unrealized appreciation (depreciation)of investments based on the aggregate cost of investments for federalincome tax purposes was as follows:Aggregate gross unrealized appreciation $ 1,208
Aggregate gross unrealized depreciation (27,091)
Net unrealized depreciation $ (25,883)
Federal income tax cost of investments $ 302,324,927
See accompanying notes to the financial statements.
6 ::nlDOG SHORT DOW30SM :: MAY 31, 2017 :: SCHEDULE OF PORTFOLIO INVESTMENTS PROSHARES TRUST
Merrill Corp - Proshares Trust Geared Book [96 Funds] Annual Report [Funds] 333-089822 05-31-2017 ED [AUX] | eperez | 28-Jul-17 17:37 | 17-15159-3.fa | Sequence: 6CHKSUM Content: 59705 Layout: 2878 Graphics: No Graphics CLEAN
JOB: 17-15159-3 CYCLE#;BL#: 5; 0 TRIM: 8.25" x 10.75" COMPOSITECOLORS: Black, ~note-color 2, ~note-color 3 GRAPHICS: none V1.5
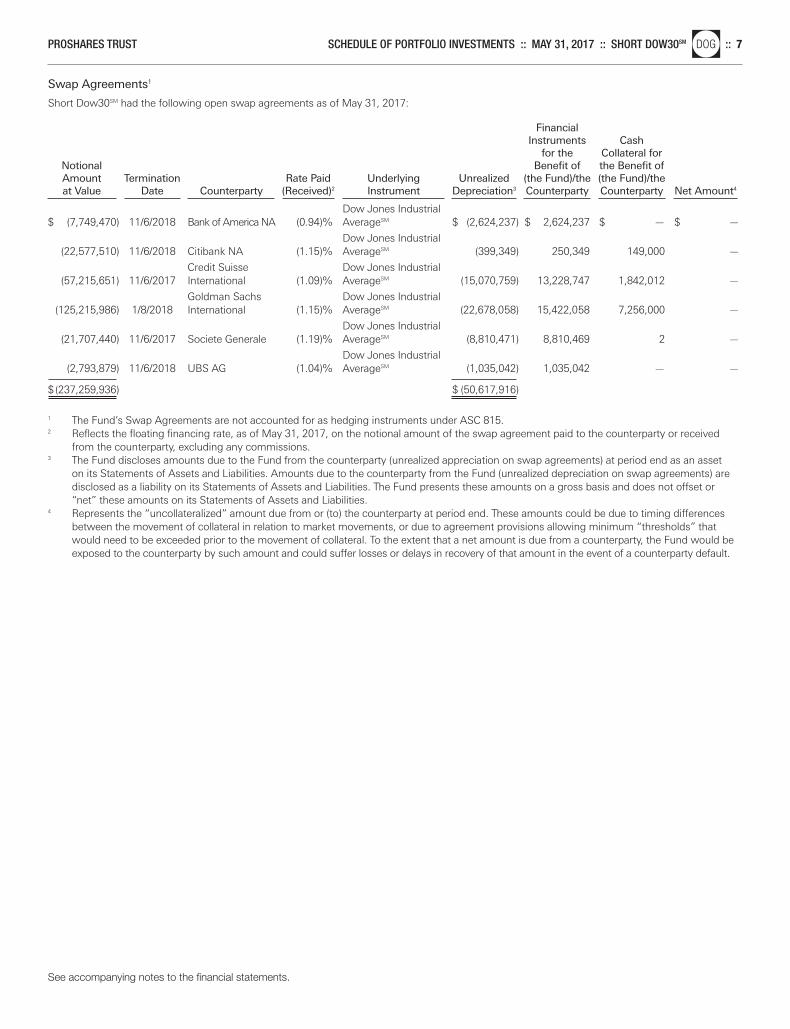
Swap Agreements1
Short Dow30SM had the following open swap agreements as of May 31, 2017:
Financial Instruments Cash
for the Collateral for Notional Benefit of the Benefit of Amount Termination Rate Paid Underlying Unrealized (the Fund)/the (the Fund)/the at Value Date Counterparty (Received)2 Instrument Depreciation3 Counterparty Counterparty Net Amount4
Dow Jones Industrial
$ (7,749,470) 11/6/2018 Bank of America NA (0.94)% AverageSM $ (2,624,237) $ 2,624,237 $ — $ —
Dow Jones Industrial (22,577,510) 11/6/2018 Citibank NA (1.15)% AverageSM (399,349) 250,349 149,000 —
Credit Suisse Dow Jones Industrial (57,215,651) 11/6/2017 International (1.09)% AverageSM (15,070,759) 13,228,747 1,842,012 —
Goldman Sachs Dow Jones Industrial (125,215,986) 1/8/2018 International (1.15)% AverageSM (22,678,058) 15,422,058 7,256,000 —
Dow Jones Industrial (21,707,440) 11/6/2017 Societe Generale (1.19)% AverageSM (8,810,471) 8,810,469 2 —
Dow Jones Industrial (2,793,879) 11/6/2018 UBS AG (1.04)% AverageSM (1,035,042) 1,035,042 — —
$(237,259,936) $ (50,617,916)
1 The Fund’s Swap Agreements are not accounted for as hedging instruments under ASC 815.2 Reflects the floating financing rate, as of May 31, 2017, on the notional amount of the swap agreement paid to the counterparty or received
from the counterparty, excluding any commissions.3 The Fund discloses amounts due to the Fund from the counterparty (unrealized appreciation on swap agreements) at period end as an asset
on its Statements of Assets and Liabilities. Amounts due to the counterparty from the Fund (unrealized depreciation on swap agreements) aredisclosed as a liability on its Statements of Assets and Liabilities. The Fund presents these amounts on a gross basis and does not offset or“net” these amounts on its Statements of Assets and Liabilities.
4 Represents the “uncollateralized” amount due from or (to) the counterparty at period end. These amounts could be due to timing differencesbetween the movement of collateral in relation to market movements, or due to agreement provisions allowing minimum “thresholds” thatwould need to be exceeded prior to the movement of collateral. To the extent that a net amount is due from a counterparty, the Fund would beexposed to the counterparty by such amount and could suffer losses or delays in recovery of that amount in the event of a counterparty default.
See accompanying notes to the financial statements.
PROSHARES TRUST SCHEDULE OF PORTFOLIO INVESTMENTS :: MAY 31, 2017 :: SHORT DOW30SMnlDOG :: 7
Merrill Corp - Proshares Trust Geared Book [96 Funds] Annual Report [Funds] 333-089822 05-31-2017 ED [AUX] | eperez | 28-Jul-17 17:37 | 17-15159-3.fa | Sequence: 7CHKSUM Content: 38023 Layout: 42872 Graphics: No Graphics CLEAN
JOB: 17-15159-3 CYCLE#;BL#: 5; 0 TRIM: 8.25" x 10.75" COMPOSITECOLORS: Black, ~note-color 2, ~note-color 3 GRAPHICS: none V1.5

Principal Investments Amount Value
Short-Term Investment — 99.9%
Repurchase Agreement (a) — 99.9%
Repurchase Agreements with various counterparties, rates 0.60% - 0.81%, dated 5/31/2017, due 6/1/2017, total to be received $14,684,110 (Cost $14,683,786) $ 14,683,786 $ 14,683,786
Total Investments — 99.9%(Cost $14,683,786) (b) 14,683,786
Other assets less liabilities — 0.1% 9,190
Net Assets — 100.0% $ 14,692,976
Futures Contracts Sold
Short MidCap400 had the following open short futures contracts as of May 31, 2017:
Number of Notional Amount Unrealized Contracts Expiration Date at Value Appreciation E-Mini S&P MidCap 400 Futures Contracts 8 6/16/2017 $ 1,376,080 $ 7,869
Cash collateral in the amount of $58,960 was pledged to cover margin requirements for open futures contracts as of May 31, 2017.
Swap Agreements1
Short MidCap400 had the following open swap agreements as of May 31, 2017:
Financial Instruments Cash
for the Collateral for Notional Benefit of the Benefit of Amount Termination Rate Paid Underlying Unrealized (the Fund)/the (the Fund)/the at Value Date Counterparty (Received)2 Instrument Depreciation3 Counterparty Counterparty Net Amount4
Bank of
$ (1,312,359) 11/6/2018 America NA (0.79)% S&P MidCap 400® $ (270,426) $ — $ 80,000 $ (190,426)(521,088) 11/6/2017 Citibank NA (0.95)% S&P MidCap 400® (317,923) — 100,000 (217,923)
Credit Suisse (4,454,598) 11/6/2017 International (0.99)% S&P MidCap 400® (2,186,138) — 2,186,138 —
Morgan Stanley & Co. International
(1,267,517) 11/6/2017 plc (0.69)% S&P MidCap 400® (695,061) — 597,000 (98,061)(5,744,301) 11/6/2017 Societe Generale (0.89)% S&P MidCap 400® (1,840,375) — 1,793,000 (47,375)
$ (13,299,863) $ (5,309,923)
1 The Fund’s Swap Agreements are not accounted for as hedging instruments under ASC 815.2 Reflects the floating financing rate, as of May 31, 2017, on the notional amount of the swap agreement paid to the counterparty or received
from the counterparty, excluding any commissions.3 The Fund discloses amounts due to the Fund from the counterparty (unrealized appreciation on swap agreements) at period end as an asset
on its Statements of Assets and Liabilities. Amounts due to the counterparty from the Fund (unrealized depreciation on swap agreements) aredisclosed as a liability on its Statements of Assets and Liabilities. The Fund presents these amounts on a gross basis and does not offset or“net” these amounts on its Statements of Assets and Liabilities.
4 Represents the “uncollateralized” amount due from or (to) the counterparty at period end. These amounts could be due to timing differencesbetween the movement of collateral in relation to market movements, or due to agreement provisions allowing minimum “thresholds” thatwould need to be exceeded prior to the movement of collateral. To the extent that a net amount is due from a counterparty, the Fund would beexposed to the counterparty by such amount and could suffer losses or delays in recovery of that amount in the event of a counterparty default.
(a) The Fund invests in Repurchase Agreements jointly with otherfunds in the Trust. See “Repurchase Agreements” under Note 2in the Notes to Financial Statements to view the details of eachindividual agreement and counterparty as well as a description ofthe securities subjected to repurchase.
(b) Tax basis equals book cost.
See accompanying notes to the financial statements.
8 ::nlMYY SHORT MIDCAP400 :: MAY 31, 2017 :: SCHEDULE OF PORTFOLIO INVESTMENTS PROSHARES TRUST
Merrill Corp - Proshares Trust Geared Book [96 Funds] Annual Report [Funds] 333-089822 05-31-2017 ED [AUX] | eperez | 28-Jul-17 17:37 | 17-15159-3.fa | Sequence: 8CHKSUM Content: 41516 Layout: 24720 Graphics: No Graphics CLEAN
JOB: 17-15159-3 CYCLE#;BL#: 5; 0 TRIM: 8.25" x 10.75" COMPOSITECOLORS: Black, ~note-color 2, ~note-color 3 GRAPHICS: none V1.5
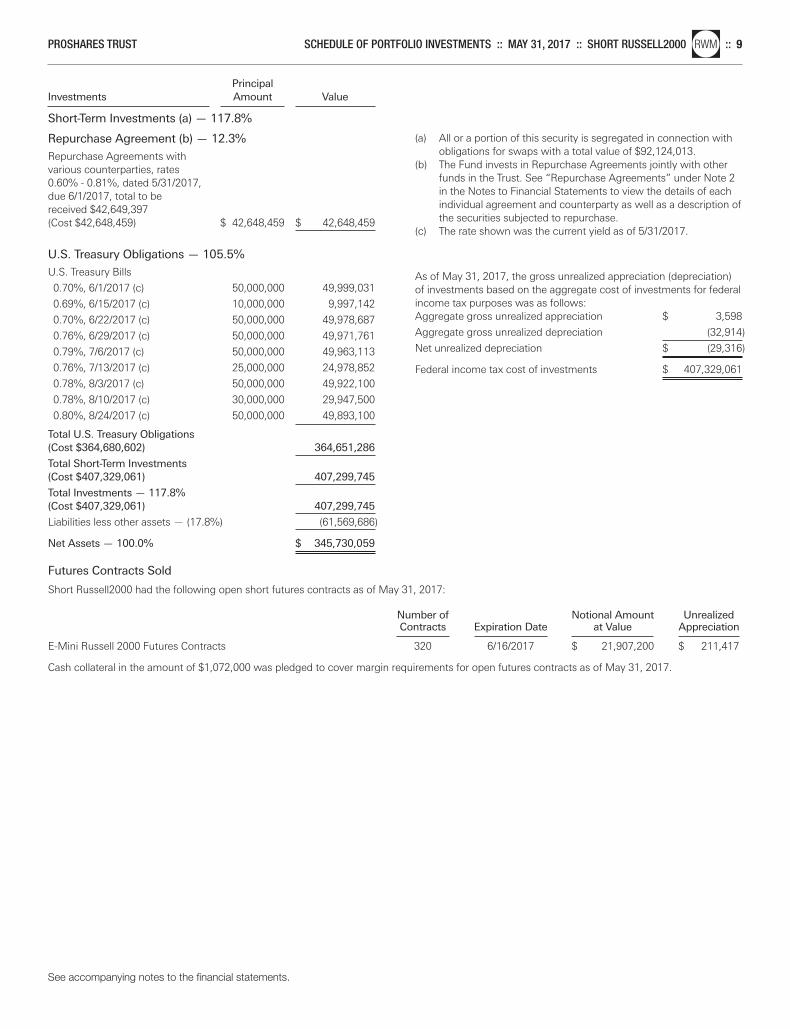
Principal Investments Amount Value
Short-Term Investments (a) — 117.8%
Repurchase Agreement (b) — 12.3%
Repurchase Agreements with various counterparties, rates 0.60% - 0.81%, dated 5/31/2017, due 6/1/2017, total to be received $42,649,397 (Cost $42,648,459) $ 42,648,459 $ 42,648,459
U.S. Treasury Obligations — 105.5%
U.S. Treasury Bills
0.70%, 6/1/2017 (c) 50,000,000 49,999,031
0.69%, 6/15/2017 (c) 10,000,000 9,997,142
0.70%, 6/22/2017 (c) 50,000,000 49,978,687
0.76%, 6/29/2017 (c) 50,000,000 49,971,761
0.79%, 7/6/2017 (c) 50,000,000 49,963,113
0.76%, 7/13/2017 (c) 25,000,000 24,978,852
0.78%, 8/3/2017 (c) 50,000,000 49,922,100
0.78%, 8/10/2017 (c) 30,000,000 29,947,500
0.80%, 8/24/2017 (c) 50,000,000 49,893,100
Total U.S. Treasury Obligations(Cost $364,680,602) 364,651,286
Total Short-Term Investments(Cost $407,329,061) 407,299,745
Total Investments — 117.8%(Cost $407,329,061) 407,299,745
Liabilities less other assets — (17.8%) (61,569,686)
Net Assets — 100.0% $ 345,730,059
Futures Contracts Sold
Short Russell2000 had the following open short futures contracts as of May 31, 2017:
Number of Notional Amount Unrealized Contracts Expiration Date at Value Appreciation E-Mini Russell 2000 Futures Contracts 320 6/16/2017 $ 21,907,200 $ 211,417
Cash collateral in the amount of $1,072,000 was pledged to cover margin requirements for open futures contracts as of May 31, 2017.
(a) All or a portion of this security is segregated in connection withobligations for swaps with a total value of $92,124,013.
(b) The Fund invests in Repurchase Agreements jointly with otherfunds in the Trust. See “Repurchase Agreements” under Note 2in the Notes to Financial Statements to view the details of eachindividual agreement and counterparty as well as a description ofthe securities subjected to repurchase.
(c) The rate shown was the current yield as of 5/31/2017.
As of May 31, 2017, the gross unrealized appreciation (depreciation)of investments based on the aggregate cost of investments for federalincome tax purposes was as follows:Aggregate gross unrealized appreciation $ 3,598
Aggregate gross unrealized depreciation (32,914)
Net unrealized depreciation $ (29,316)
Federal income tax cost of investments $ 407,329,061
See accompanying notes to the financial statements.
PROSHARES TRUST SCHEDULE OF PORTFOLIO INVESTMENTS :: MAY 31, 2017 :: SHORT RUSSELL2000nlRWM :: 9
Merrill Corp - Proshares Trust Geared Book [96 Funds] Annual Report [Funds] 333-089822 05-31-2017 ED [AUX] | eperez | 28-Jul-17 17:37 | 17-15159-3.fa | Sequence: 9CHKSUM Content: 9057 Layout: 14998 Graphics: No Graphics CLEAN
JOB: 17-15159-3 CYCLE#;BL#: 5; 0 TRIM: 8.25" x 10.75" COMPOSITECOLORS: Black, ~note-color 2, ~note-color 3 GRAPHICS: none V1.5
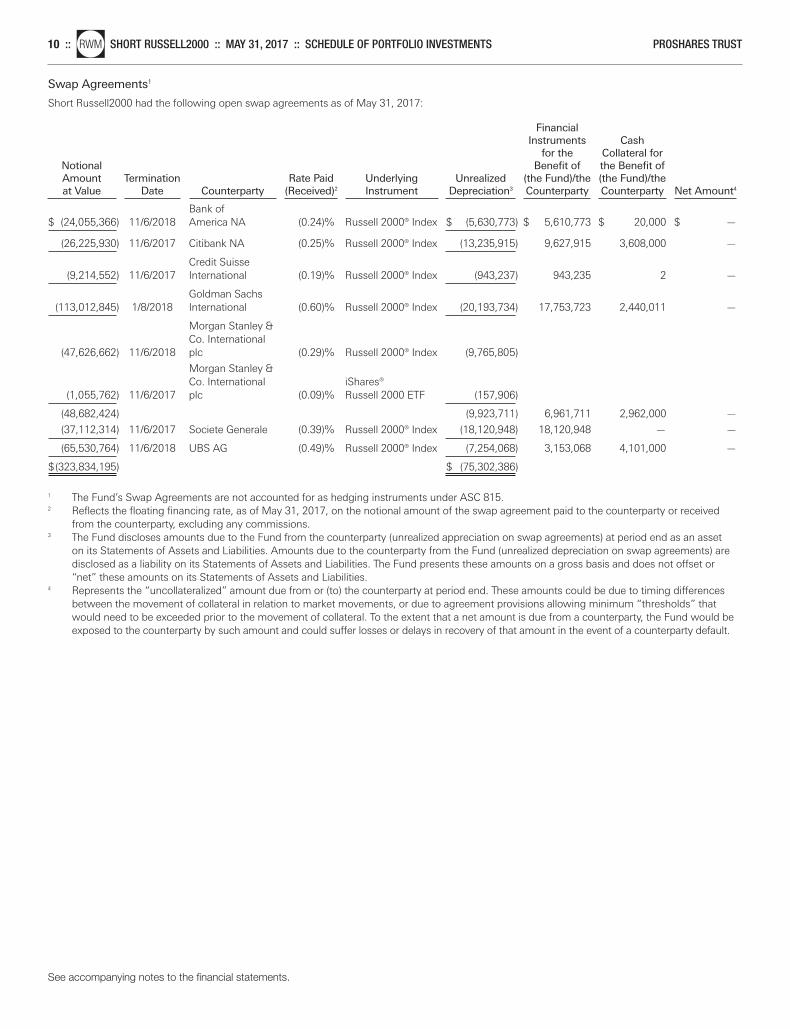
Swap Agreements1
Short Russell2000 had the following open swap agreements as of May 31, 2017:
Financial Instruments Cash
for the Collateral for Notional Benefit of the Benefit of Amount Termination Rate Paid Underlying Unrealized (the Fund)/the (the Fund)/the at Value Date Counterparty (Received)2 Instrument Depreciation3 Counterparty Counterparty Net Amount4
Bank of
$ (24,055,366) 11/6/2018 America NA (0.24)% Russell 2000® Index $ (5,630,773) $ 5,610,773 $ 20,000 $ —
(26,225,930) 11/6/2017 Citibank NA (0.25)% Russell 2000® Index (13,235,915) 9,627,915 3,608,000 —
Credit Suisse (9,214,552) 11/6/2017 International (0.19)% Russell 2000® Index (943,237) 943,235 2 —
Goldman Sachs (113,012,845) 1/8/2018 International (0.60)% Russell 2000® Index (20,193,734) 17,753,723 2,440,011 —
Morgan Stanley & Co. International
(47,626,662) 11/6/2018 plc (0.29)% Russell 2000® Index (9,765,805)
Morgan Stanley & Co. International iShares®
(1,055,762) 11/6/2017 plc (0.09)% Russell 2000 ETF (157,906)
(48,682,424) (9,923,711) 6,961,711 2,962,000 —
(37,112,314) 11/6/2017 Societe Generale (0.39)% Russell 2000® Index (18,120,948) 18,120,948 — —
(65,530,764) 11/6/2018 UBS AG (0.49)% Russell 2000® Index (7,254,068) 3,153,068 4,101,000 —
$(323,834,195) $ (75,302,386)
1 The Fund’s Swap Agreements are not accounted for as hedging instruments under ASC 815.2 Reflects the floating financing rate, as of May 31, 2017, on the notional amount of the swap agreement paid to the counterparty or received
from the counterparty, excluding any commissions.3 The Fund discloses amounts due to the Fund from the counterparty (unrealized appreciation on swap agreements) at period end as an asset
on its Statements of Assets and Liabilities. Amounts due to the counterparty from the Fund (unrealized depreciation on swap agreements) aredisclosed as a liability on its Statements of Assets and Liabilities. The Fund presents these amounts on a gross basis and does not offset or“net” these amounts on its Statements of Assets and Liabilities.
4 Represents the “uncollateralized” amount due from or (to) the counterparty at period end. These amounts could be due to timing differencesbetween the movement of collateral in relation to market movements, or due to agreement provisions allowing minimum “thresholds” thatwould need to be exceeded prior to the movement of collateral. To the extent that a net amount is due from a counterparty, the Fund would beexposed to the counterparty by such amount and could suffer losses or delays in recovery of that amount in the event of a counterparty default.
See accompanying notes to the financial statements.
10 ::nlRWM SHORT RUSSELL2000 :: MAY 31, 2017 :: SCHEDULE OF PORTFOLIO INVESTMENTS PROSHARES TRUST
Merrill Corp - Proshares Trust Geared Book [96 Funds] Annual Report [Funds] 333-089822 05-31-2017 ED [AUX] | eperez | 28-Jul-17 17:37 | 17-15159-3.fa | Sequence: 10CHKSUM Content: 31891 Layout: 16010 Graphics: No Graphics CLEAN
JOB: 17-15159-3 CYCLE#;BL#: 5; 0 TRIM: 8.25" x 10.75" COMPOSITECOLORS: Black, ~note-color 2, ~note-color 3 GRAPHICS: none V1.5
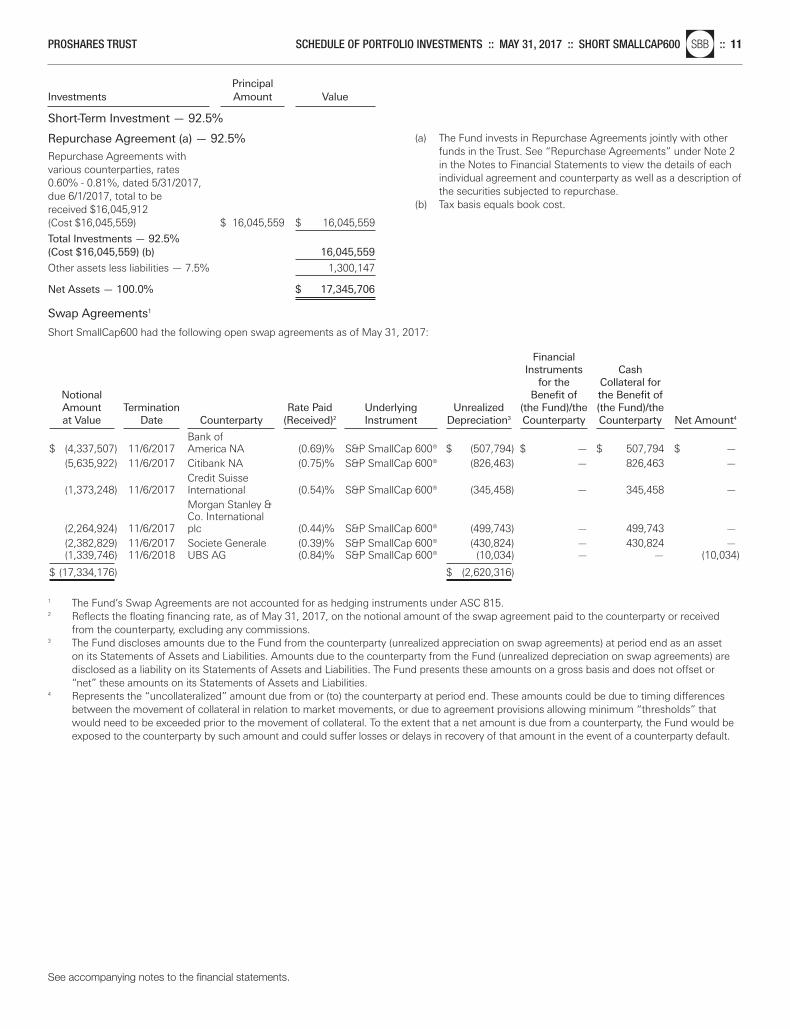
Principal Investments Amount Value
Short-Term Investment — 92.5%
Repurchase Agreement (a) — 92.5%
Repurchase Agreements with various counterparties, rates 0.60% - 0.81%, dated 5/31/2017, due 6/1/2017, total to be received $16,045,912 (Cost $16,045,559) $ 16,045,559 $ 16,045,559
Total Investments — 92.5%(Cost $16,045,559) (b) 16,045,559
Other assets less liabilities — 7.5% 1,300,147
Net Assets — 100.0% $ 17,345,706
Swap Agreements1
Short SmallCap600 had the following open swap agreements as of May 31, 2017:
Financial Instruments Cash
for the Collateral for Notional Benefit of the Benefit of Amount Termination Rate Paid Underlying Unrealized (the Fund)/the (the Fund)/the at Value Date Counterparty (Received)2 Instrument Depreciation3 Counterparty Counterparty Net Amount4
Bank of
$ (4,337,507) 11/6/2017 America NA (0.69)% S&P SmallCap 600® $ (507,794) $ — $ 507,794 $ —(5,635,922) 11/6/2017 Citibank NA (0.75)% S&P SmallCap 600® (826,463) — 826,463 —
Credit Suisse (1,373,248) 11/6/2017 International (0.54)% S&P SmallCap 600® (345,458) — 345,458 —
Morgan Stanley & Co. International
(2,264,924) 11/6/2017 plc (0.44)% S&P SmallCap 600® (499,743) — 499,743 —(2,382,829) 11/6/2017 Societe Generale (0.39)% S&P SmallCap 600® (430,824) — 430,824 —(1,339,746) 11/6/2018 UBS AG (0.84)% S&P SmallCap 600® (10,034) — — (10,034)
$ (17,334,176) $ (2,620,316)
1 The Fund’s Swap Agreements are not accounted for as hedging instruments under ASC 815.2 Reflects the floating financing rate, as of May 31, 2017, on the notional amount of the swap agreement paid to the counterparty or received
from the counterparty, excluding any commissions.3 The Fund discloses amounts due to the Fund from the counterparty (unrealized appreciation on swap agreements) at period end as an asset
on its Statements of Assets and Liabilities. Amounts due to the counterparty from the Fund (unrealized depreciation on swap agreements) aredisclosed as a liability on its Statements of Assets and Liabilities. The Fund presents these amounts on a gross basis and does not offset or“net” these amounts on its Statements of Assets and Liabilities.
4 Represents the “uncollateralized” amount due from or (to) the counterparty at period end. These amounts could be due to timing differencesbetween the movement of collateral in relation to market movements, or due to agreement provisions allowing minimum “thresholds” thatwould need to be exceeded prior to the movement of collateral. To the extent that a net amount is due from a counterparty, the Fund would beexposed to the counterparty by such amount and could suffer losses or delays in recovery of that amount in the event of a counterparty default.
(a) The Fund invests in Repurchase Agreements jointly with otherfunds in the Trust. See “Repurchase Agreements” under Note 2in the Notes to Financial Statements to view the details of eachindividual agreement and counterparty as well as a description ofthe securities subjected to repurchase.
(b) Tax basis equals book cost.
See accompanying notes to the financial statements.
PROSHARES TRUST SCHEDULE OF PORTFOLIO INVESTMENTS :: MAY 31, 2017 :: SHORT SMALLCAP600nlSBB :: 11
Merrill Corp - Proshares Trust Geared Book [96 Funds] Annual Report [Funds] 333-089822 05-31-2017 ED [AUX] | eperez | 28-Jul-17 17:37 | 17-15159-3.fa | Sequence: 11CHKSUM Content: 8158 Layout: 45830 Graphics: No Graphics CLEAN
JOB: 17-15159-3 CYCLE#;BL#: 5; 0 TRIM: 8.25" x 10.75" COMPOSITECOLORS: Black, ~note-color 2, ~note-color 3 GRAPHICS: none V1.5
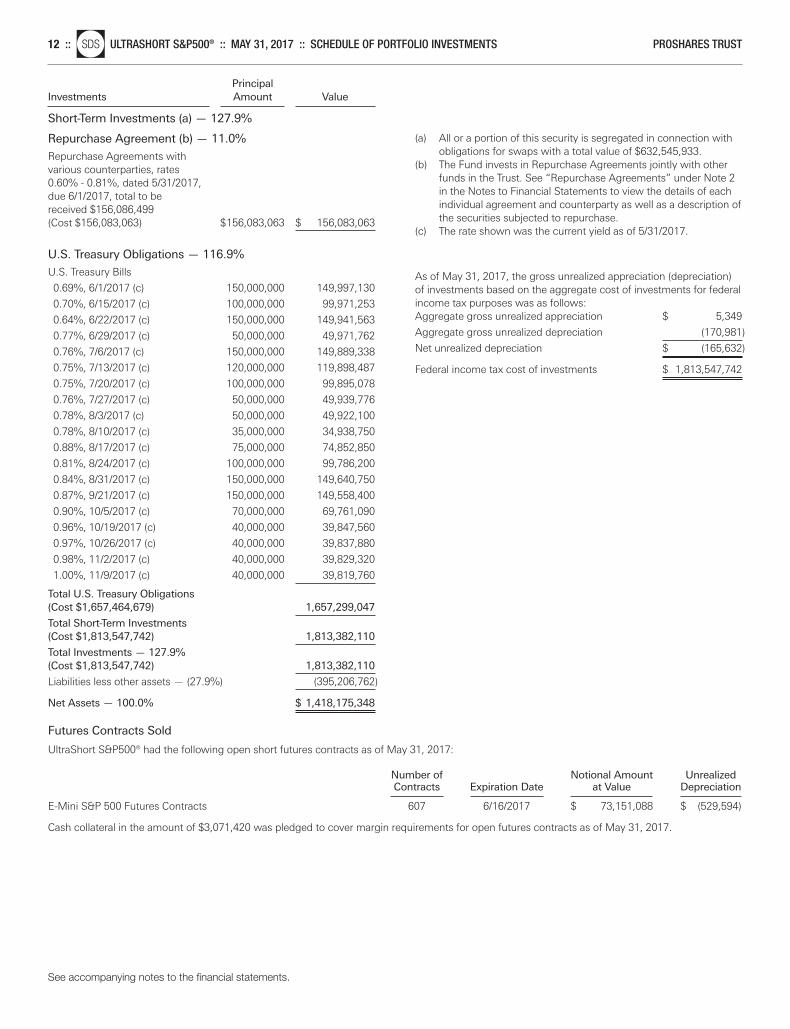
See accompanying notes to the financial statements.
12 ::nlSDS ULTRASHORT S&P500® :: MAY 31, 2017 :: SCHEDULE OF PORTFOLIO INVESTMENTS PROSHARES TRUST
Principal Investments Amount Value
Short-Term Investments (a) — 127.9%
Repurchase Agreement (b) — 11.0%
Repurchase Agreements with various counterparties, rates 0.60% - 0.81%, dated 5/31/2017, due 6/1/2017, total to be received $156,086,499 (Cost $156,083,063) $156,083,063 $ 156,083,063
U.S. Treasury Obligations — 116.9%
U.S. Treasury Bills
0.69%, 6/1/2017 (c) 150,000,000 149,997,130
0.70%, 6/15/2017 (c) 100,000,000 99,971,253
0.64%, 6/22/2017 (c) 150,000,000 149,941,563
0.77%, 6/29/2017 (c) 50,000,000 49,971,762
0.76%, 7/6/2017 (c) 150,000,000 149,889,338
0.75%, 7/13/2017 (c) 120,000,000 119,898,487
0.75%, 7/20/2017 (c) 100,000,000 99,895,078
0.76%, 7/27/2017 (c) 50,000,000 49,939,776
0.78%, 8/3/2017 (c) 50,000,000 49,922,100
0.78%, 8/10/2017 (c) 35,000,000 34,938,750
0.88%, 8/17/2017 (c) 75,000,000 74,852,850
0.81%, 8/24/2017 (c) 100,000,000 99,786,200
0.84%, 8/31/2017 (c) 150,000,000 149,640,750
0.87%, 9/21/2017 (c) 150,000,000 149,558,400
0.90%, 10/5/2017 (c) 70,000,000 69,761,090
0.96%, 10/19/2017 (c) 40,000,000 39,847,560
0.97%, 10/26/2017 (c) 40,000,000 39,837,880
0.98%, 11/2/2017 (c) 40,000,000 39,829,320
1.00%, 11/9/2017 (c) 40,000,000 39,819,760
Total U.S. Treasury Obligations(Cost $1,657,464,679) 1,657,299,047
Total Short-Term Investments(Cost $1,813,547,742) 1,813,382,110
Total Investments — 127.9%(Cost $1,813,547,742) 1,813,382,110
Liabilities less other assets — (27.9%) (395,206,762)
Net Assets — 100.0% $ 1,418,175,348
Futures Contracts Sold
UltraShort S&P500® had the following open short futures contracts as of May 31, 2017:
Number of Notional Amount Unrealized Contracts Expiration Date at Value Depreciation E-Mini S&P 500 Futures Contracts 607 6/16/2017 $ 73,151,088 $ (529,594)
Cash collateral in the amount of $3,071,420 was pledged to cover margin requirements for open futures contracts as of May 31, 2017.
(a) All or a portion of this security is segregated in connection withobligations for swaps with a total value of $632,545,933.
(b) The Fund invests in Repurchase Agreements jointly with otherfunds in the Trust. See “Repurchase Agreements” under Note 2in the Notes to Financial Statements to view the details of eachindividual agreement and counterparty as well as a description ofthe securities subjected to repurchase.
(c) The rate shown was the current yield as of 5/31/2017.
As of May 31, 2017, the gross unrealized appreciation (depreciation)of investments based on the aggregate cost of investments for federalincome tax purposes was as follows:Aggregate gross unrealized appreciation $ 5,349
Aggregate gross unrealized depreciation (170,981)
Net unrealized depreciation $ (165,632)
Federal income tax cost of investments $ 1,813,547,742
Merrill Corp - Proshares Trust Geared Book [96 Funds] Annual Report [Funds] 333-089822 05-31-2017 ED [AUX] | eperez | 28-Jul-17 17:37 | 17-15159-3.fa | Sequence: 12CHKSUM Content: 21639 Layout: 20901 Graphics: No Graphics CLEAN
JOB: 17-15159-3 CYCLE#;BL#: 5; 0 TRIM: 8.25" x 10.75" COMPOSITECOLORS: Black, ~note-color 2, ~note-color 3 GRAPHICS: none V1.5
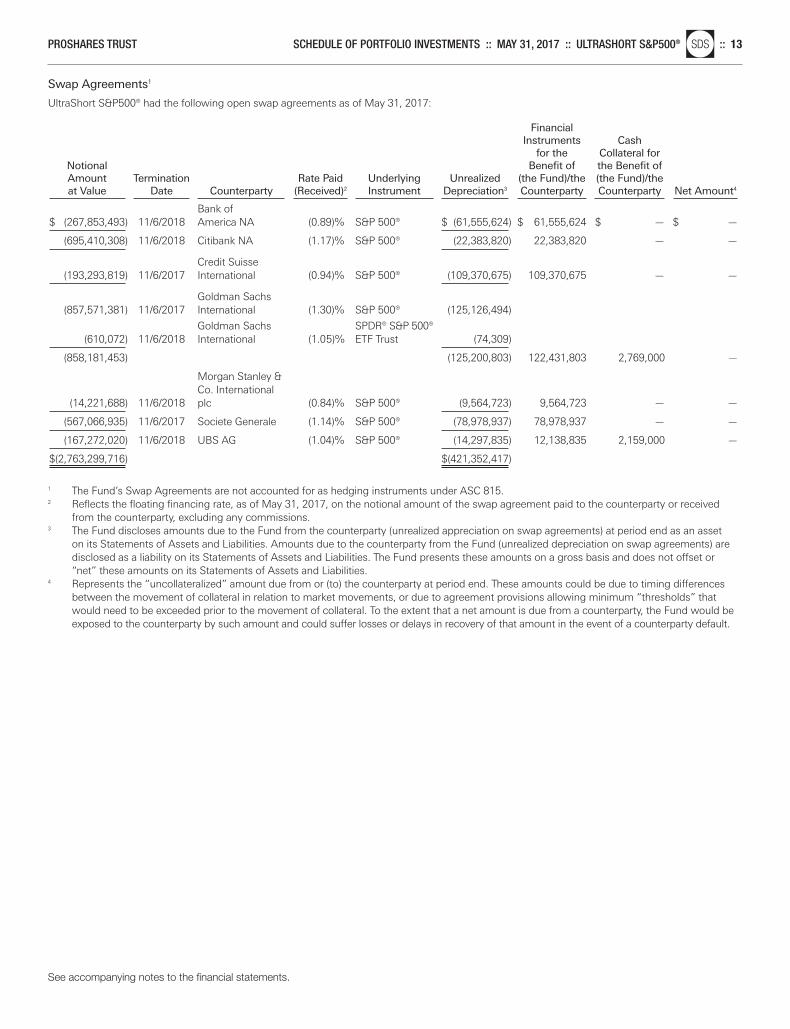
See accompanying notes to the financial statements.
PROSHARES TRUST SCHEDULE OF PORTFOLIO INVESTMENTS :: MAY 31, 2017 :: ULTRASHORT S&P500®nlSDS :: 13
Swap Agreements1
UltraShort S&P500® had the following open swap agreements as of May 31, 2017:
Financial Instruments Cash
for the Collateral for Notional Benefit of the Benefit of Amount Termination Rate Paid Underlying Unrealized (the Fund)/the (the Fund)/the at Value Date Counterparty (Received)2 Instrument Depreciation3 Counterparty Counterparty Net Amount4
Bank of
$ (267,853,493) 11/6/2018 America NA (0.89)% S&P 500® $ (61,555,624) $ 61,555,624 $ — $ —
(695,410,308) 11/6/2018 Citibank NA (1.17)% S&P 500® (22,383,820) 22,383,820 — —
Credit Suisse (193,293,819) 11/6/2017 International (0.94)% S&P 500® (109,370,675) 109,370,675 — —
Goldman Sachs (857,571,381) 11/6/2017 International (1.30)% S&P 500® (125,126,494)
Goldman Sachs SPDR® S&P 500® (610,072) 11/6/2018 International (1.05)% ETF Trust (74,309)
(858,181,453) (125,200,803) 122,431,803 2,769,000 —
Morgan Stanley & Co. International
(14,221,688) 11/6/2018 plc (0.84)% S&P 500® (9,564,723) 9,564,723 — —
(567,066,935) 11/6/2017 Societe Generale (1.14)% S&P 500® (78,978,937) 78,978,937 — —
(167,272,020) 11/6/2018 UBS AG (1.04)% S&P 500® (14,297,835) 12,138,835 2,159,000 —
$(2,763,299,716) $(421,352,417)
1 The Fund’s Swap Agreements are not accounted for as hedging instruments under ASC 815.2 Reflects the floating financing rate, as of May 31, 2017, on the notional amount of the swap agreement paid to the counterparty or received
from the counterparty, excluding any commissions.3 The Fund discloses amounts due to the Fund from the counterparty (unrealized appreciation on swap agreements) at period end as an asset
on its Statements of Assets and Liabilities. Amounts due to the counterparty from the Fund (unrealized depreciation on swap agreements) aredisclosed as a liability on its Statements of Assets and Liabilities. The Fund presents these amounts on a gross basis and does not offset or“net” these amounts on its Statements of Assets and Liabilities.
4 Represents the “uncollateralized” amount due from or (to) the counterparty at period end. These amounts could be due to timing differencesbetween the movement of collateral in relation to market movements, or due to agreement provisions allowing minimum “thresholds” thatwould need to be exceeded prior to the movement of collateral. To the extent that a net amount is due from a counterparty, the Fund would beexposed to the counterparty by such amount and could suffer losses or delays in recovery of that amount in the event of a counterparty default.
Merrill Corp - Proshares Trust Geared Book [96 Funds] Annual Report [Funds] 333-089822 05-31-2017 ED [AUX] | eperez | 28-Jul-17 17:37 | 17-15159-3.fa | Sequence: 13CHKSUM Content: 61228 Layout: 42273 Graphics: No Graphics CLEAN
JOB: 17-15159-3 CYCLE#;BL#: 5; 0 TRIM: 8.25" x 10.75" COMPOSITECOLORS: Black, ~note-color 2, ~note-color 3 GRAPHICS: none V1.5
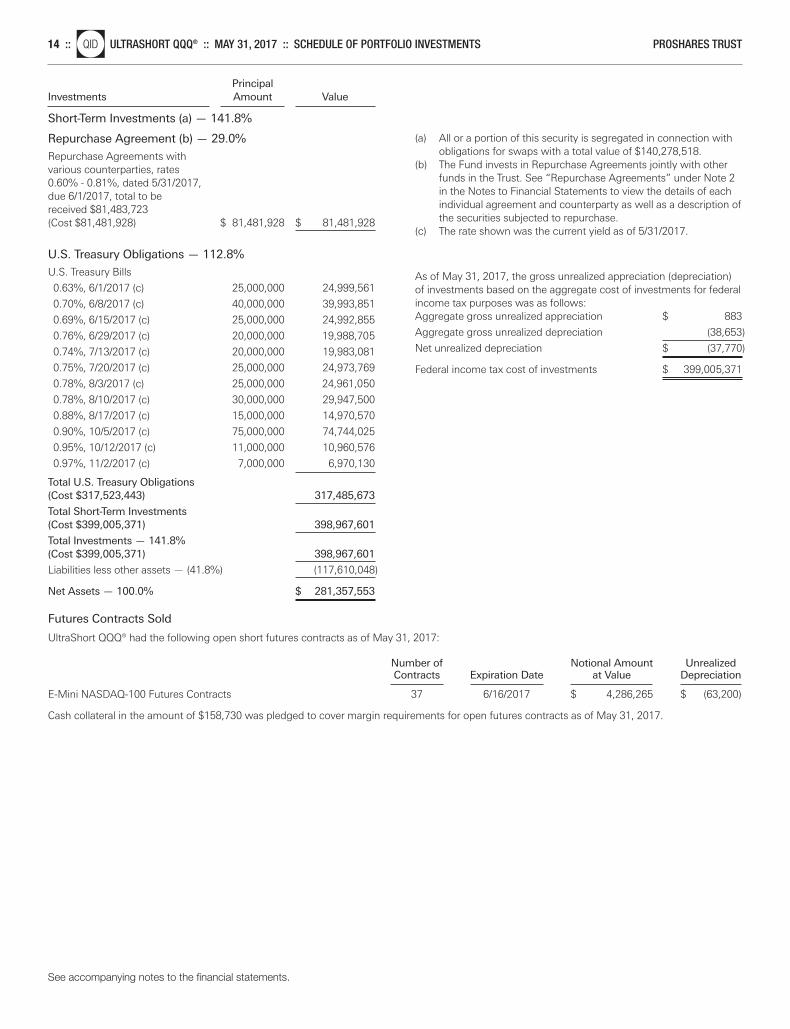
See accompanying notes to the financial statements.
14 ::nlQID ULTRASHORT QQQ® :: MAY 31, 2017 :: SCHEDULE OF PORTFOLIO INVESTMENTS PROSHARES TRUST
Principal Investments Amount Value
Short-Term Investments (a) — 141.8%
Repurchase Agreement (b) — 29.0%
Repurchase Agreements with various counterparties, rates 0.60% - 0.81%, dated 5/31/2017, due 6/1/2017, total to be received $81,483,723 (Cost $81,481,928) $ 81,481,928 $ 81,481,928
U.S. Treasury Obligations — 112.8%
U.S. Treasury Bills
0.63%, 6/1/2017 (c) 25,000,000 24,999,561
0.70%, 6/8/2017 (c) 40,000,000 39,993,851
0.69%, 6/15/2017 (c) 25,000,000 24,992,855
0.76%, 6/29/2017 (c) 20,000,000 19,988,705
0.74%, 7/13/2017 (c) 20,000,000 19,983,081
0.75%, 7/20/2017 (c) 25,000,000 24,973,769
0.78%, 8/3/2017 (c) 25,000,000 24,961,050
0.78%, 8/10/2017 (c) 30,000,000 29,947,500
0.88%, 8/17/2017 (c) 15,000,000 14,970,570
0.90%, 10/5/2017 (c) 75,000,000 74,744,025
0.95%, 10/12/2017 (c) 11,000,000 10,960,576
0.97%, 11/2/2017 (c) 7,000,000 6,970,130
Total U.S. Treasury Obligations(Cost $317,523,443) 317,485,673
Total Short-Term Investments(Cost $399,005,371) 398,967,601
Total Investments — 141.8%(Cost $399,005,371) 398,967,601
Liabilities less other assets — (41.8%) (117,610,048)
Net Assets — 100.0% $ 281,357,553
Futures Contracts Sold
UltraShort QQQ® had the following open short futures contracts as of May 31, 2017:
Number of Notional Amount Unrealized Contracts Expiration Date at Value Depreciation E-Mini NASDAQ-100 Futures Contracts 37 6/16/2017 $ 4,286,265 $ (63,200)
Cash collateral in the amount of $158,730 was pledged to cover margin requirements for open futures contracts as of May 31, 2017.
(a) All or a portion of this security is segregated in connection withobligations for swaps with a total value of $140,278,518.
(b) The Fund invests in Repurchase Agreements jointly with otherfunds in the Trust. See “Repurchase Agreements” under Note 2in the Notes to Financial Statements to view the details of eachindividual agreement and counterparty as well as a description ofthe securities subjected to repurchase.
(c) The rate shown was the current yield as of 5/31/2017.
As of May 31, 2017, the gross unrealized appreciation (depreciation)of investments based on the aggregate cost of investments for federalincome tax purposes was as follows:Aggregate gross unrealized appreciation $ 883
Aggregate gross unrealized depreciation (38,653)
Net unrealized depreciation $ (37,770)
Federal income tax cost of investments $ 399,005,371
Merrill Corp - Proshares Trust Geared Book [96 Funds] Annual Report [Funds] 333-089822 05-31-2017 ED [AUX] | eperez | 28-Jul-17 17:37 | 17-15159-3.fa | Sequence: 14CHKSUM Content: 52145 Layout: 25379 Graphics: No Graphics CLEAN
JOB: 17-15159-3 CYCLE#;BL#: 5; 0 TRIM: 8.25" x 10.75" COMPOSITECOLORS: Black, ~note-color 2, ~note-color 3 GRAPHICS: none V1.5
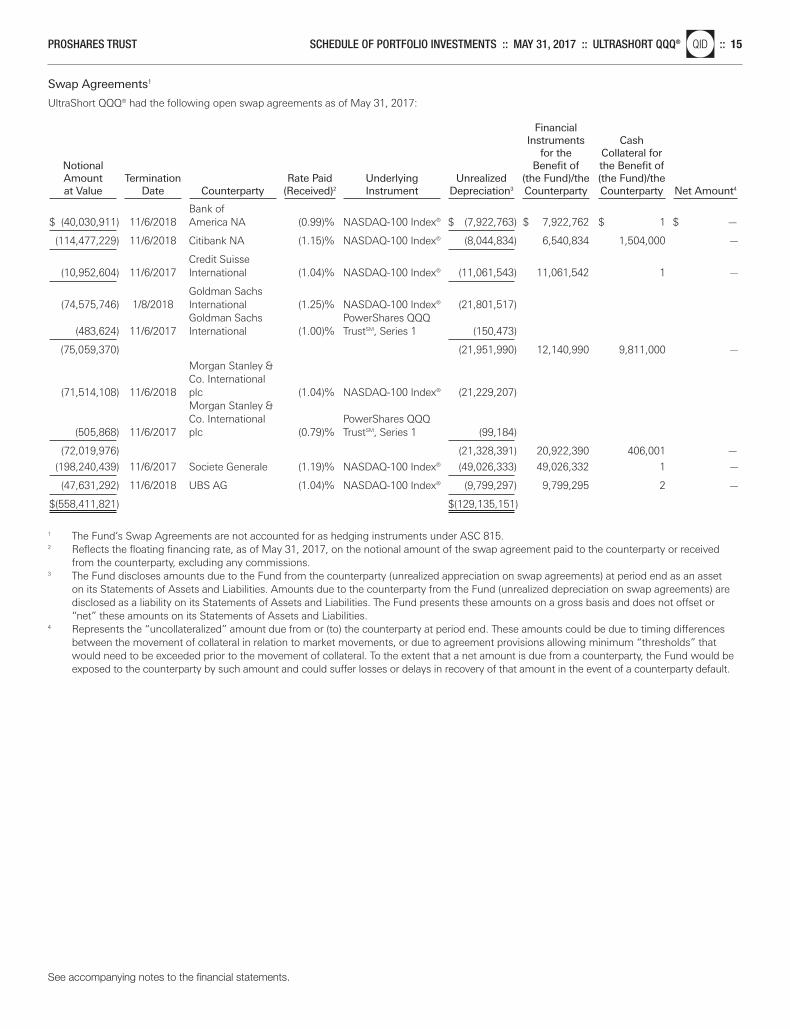
See accompanying notes to the financial statements.
PROSHARES TRUST SCHEDULE OF PORTFOLIO INVESTMENTS :: MAY 31, 2017 :: ULTRASHORT QQQ®nlQID :: 15
Swap Agreements1
UltraShort QQQ® had the following open swap agreements as of May 31, 2017:
Financial Instruments Cash
for the Collateral for Notional Benefit of the Benefit of Amount Termination Rate Paid Underlying Unrealized (the Fund)/the (the Fund)/the at Value Date Counterparty (Received)2 Instrument Depreciation3 Counterparty Counterparty Net Amount4
Bank of
$ (40,030,911) 11/6/2018 America NA (0.99)% NASDAQ-100 Index® $ (7,922,763) $ 7,922,762 $ 1 $ —
(114,477,229) 11/6/2018 Citibank NA (1.15)% NASDAQ-100 Index® (8,044,834) 6,540,834 1,504,000 —
Credit Suisse (10,952,604) 11/6/2017 International (1.04)% NASDAQ-100 Index® (11,061,543) 11,061,542 1 —
Goldman Sachs (74,575,746) 1/8/2018 International (1.25)% NASDAQ-100 Index® (21,801,517)
Goldman Sachs PowerShares QQQ (483,624) 11/6/2017 International (1.00)% TrustSM, Series 1 (150,473)
(75,059,370) (21,951,990) 12,140,990 9,811,000 —
Morgan Stanley & Co. International
(71,514,108) 11/6/2018 plc (1.04)% NASDAQ-100 Index® (21,229,207) Morgan Stanley & Co. International PowerShares QQQ
(505,868) 11/6/2017 plc (0.79)% TrustSM, Series 1 (99,184)
(72,019,976) (21,328,391) 20,922,390 406,001 —
(198,240,439) 11/6/2017 Societe Generale (1.19)% NASDAQ-100 Index® (49,026,333) 49,026,332 1 —
(47,631,292) 11/6/2018 UBS AG (1.04)% NASDAQ-100 Index® (9,799,297) 9,799,295 2 —
$(558,411,821) $(129,135,151)
1 The Fund’s Swap Agreements are not accounted for as hedging instruments under ASC 815.2 Reflects the floating financing rate, as of May 31, 2017, on the notional amount of the swap agreement paid to the counterparty or received
from the counterparty, excluding any commissions.3 The Fund discloses amounts due to the Fund from the counterparty (unrealized appreciation on swap agreements) at period end as an asset
on its Statements of Assets and Liabilities. Amounts due to the counterparty from the Fund (unrealized depreciation on swap agreements) aredisclosed as a liability on its Statements of Assets and Liabilities. The Fund presents these amounts on a gross basis and does not offset or“net” these amounts on its Statements of Assets and Liabilities.
4 Represents the “uncollateralized” amount due from or (to) the counterparty at period end. These amounts could be due to timing differencesbetween the movement of collateral in relation to market movements, or due to agreement provisions allowing minimum “thresholds” thatwould need to be exceeded prior to the movement of collateral. To the extent that a net amount is due from a counterparty, the Fund would beexposed to the counterparty by such amount and could suffer losses or delays in recovery of that amount in the event of a counterparty default.
Merrill Corp - Proshares Trust Geared Book [96 Funds] Annual Report [Funds] 333-089822 05-31-2017 ED [AUX] | eperez | 28-Jul-17 17:37 | 17-15159-3.fa | Sequence: 15CHKSUM Content: 30186 Layout: 23562 Graphics: No Graphics CLEAN
JOB: 17-15159-3 CYCLE#;BL#: 5; 0 TRIM: 8.25" x 10.75" COMPOSITECOLORS: Black, ~note-color 2, ~note-color 3 GRAPHICS: none V1.5
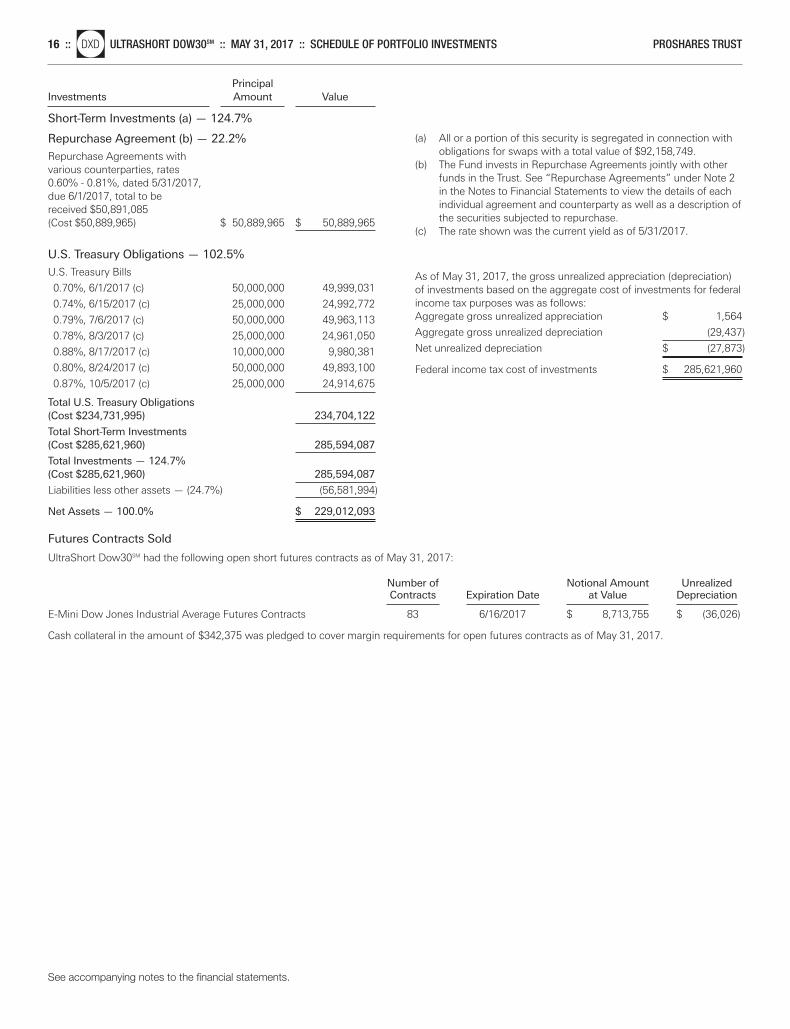
See accompanying notes to the financial statements.
16 ::nlDXD ULTRASHORT DOW30SM :: MAY 31, 2017 :: SCHEDULE OF PORTFOLIO INVESTMENTS PROSHARES TRUST
Principal Investments Amount Value
Short-Term Investments (a) — 124.7%
Repurchase Agreement (b) — 22.2%
Repurchase Agreements with various counterparties, rates 0.60% - 0.81%, dated 5/31/2017, due 6/1/2017, total to be received $50,891,085 (Cost $50,889,965) $ 50,889,965 $ 50,889,965
U.S. Treasury Obligations — 102.5%
U.S. Treasury Bills
0.70%, 6/1/2017 (c) 50,000,000 49,999,031
0.74%, 6/15/2017 (c) 25,000,000 24,992,772
0.79%, 7/6/2017 (c) 50,000,000 49,963,113
0.78%, 8/3/2017 (c) 25,000,000 24,961,050
0.88%, 8/17/2017 (c) 10,000,000 9,980,381
0.80%, 8/24/2017 (c) 50,000,000 49,893,100
0.87%, 10/5/2017 (c) 25,000,000 24,914,675
Total U.S. Treasury Obligations(Cost $234,731,995) 234,704,122
Total Short-Term Investments(Cost $285,621,960) 285,594,087
Total Investments — 124.7%(Cost $285,621,960) 285,594,087
Liabilities less other assets — (24.7%) (56,581,994)
Net Assets — 100.0% $ 229,012,093
Futures Contracts Sold
UltraShort Dow30SM had the following open short futures contracts as of May 31, 2017:
Number of Notional Amount Unrealized Contracts Expiration Date at Value Depreciation E-Mini Dow Jones Industrial Average Futures Contracts 83 6/16/2017 $ 8,713,755 $ (36,026)
Cash collateral in the amount of $342,375 was pledged to cover margin requirements for open futures contracts as of May 31, 2017.
(a) All or a portion of this security is segregated in connection withobligations for swaps with a total value of $92,158,749.
(b) The Fund invests in Repurchase Agreements jointly with otherfunds in the Trust. See “Repurchase Agreements” under Note 2in the Notes to Financial Statements to view the details of eachindividual agreement and counterparty as well as a description ofthe securities subjected to repurchase.
(c) The rate shown was the current yield as of 5/31/2017.
As of May 31, 2017, the gross unrealized appreciation (depreciation)of investments based on the aggregate cost of investments for federalincome tax purposes was as follows:Aggregate gross unrealized appreciation $ 1,564
Aggregate gross unrealized depreciation (29,437)
Net unrealized depreciation $ (27,873)
Federal income tax cost of investments $ 285,621,960
Merrill Corp - Proshares Trust Geared Book [96 Funds] Annual Report [Funds] 333-089822 05-31-2017 ED [AUX] | eperez | 28-Jul-17 17:37 | 17-15159-3.fa | Sequence: 16CHKSUM Content: 36662 Layout: 30168 Graphics: No Graphics CLEAN
JOB: 17-15159-3 CYCLE#;BL#: 5; 0 TRIM: 8.25" x 10.75" COMPOSITECOLORS: Black, ~note-color 2, ~note-color 3 GRAPHICS: none V1.5
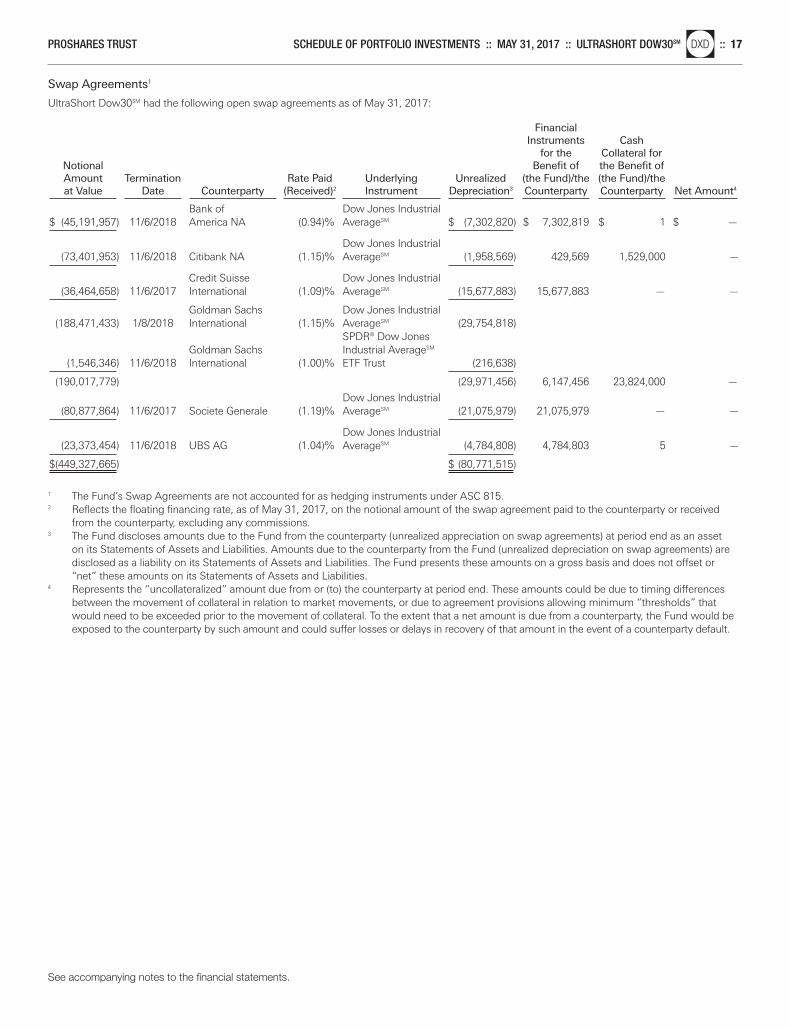
See accompanying notes to the financial statements.
PROSHARES TRUST SCHEDULE OF PORTFOLIO INVESTMENTS :: MAY 31, 2017 :: ULTRASHORT DOW30SMnlDXD :: 17
Swap Agreements1
UltraShort Dow30SM had the following open swap agreements as of May 31, 2017:
Financial Instruments Cash
for the Collateral for Notional Benefit of the Benefit of Amount Termination Rate Paid Underlying Unrealized (the Fund)/the (the Fund)/the at Value Date Counterparty (Received)2 Instrument Depreciation3 Counterparty Counterparty Net Amount4
Bank of Dow Jones Industrial
$ (45,191,957) 11/6/2018 America NA (0.94)% AverageSM $ (7,302,820) $ 7,302,819 $ 1 $ —
Dow Jones Industrial (73,401,953) 11/6/2018 Citibank NA (1.15)% AverageSM (1,958,569) 429,569 1,529,000 —
Credit Suisse Dow Jones Industrial (36,464,658) 11/6/2017 International (1.09)% AverageSM (15,677,883) 15,677,883 — —
Goldman Sachs Dow Jones Industrial (188,471,433) 1/8/2018 International (1.15)% AverageSM (29,754,818)
SPDR® Dow Jones Goldman Sachs Industrial AverageSM
(1,546,346) 11/6/2018 International (1.00)% ETF Trust (216,638)
(190,017,779) (29,971,456) 6,147,456 23,824,000 —
Dow Jones Industrial (80,877,864) 11/6/2017 Societe Generale (1.19)% AverageSM (21,075,979) 21,075,979 — —
Dow Jones Industrial (23,373,454) 11/6/2018 UBS AG (1.04)% AverageSM (4,784,808) 4,784,803 5 —
$(449,327,665) $ (80,771,515)
1 The Fund’s Swap Agreements are not accounted for as hedging instruments under ASC 815.2 Reflects the floating financing rate, as of May 31, 2017, on the notional amount of the swap agreement paid to the counterparty or received
from the counterparty, excluding any commissions.3 The Fund discloses amounts due to the Fund from the counterparty (unrealized appreciation on swap agreements) at period end as an asset
on its Statements of Assets and Liabilities. Amounts due to the counterparty from the Fund (unrealized depreciation on swap agreements) aredisclosed as a liability on its Statements of Assets and Liabilities. The Fund presents these amounts on a gross basis and does not offset or“net” these amounts on its Statements of Assets and Liabilities.
4 Represents the “uncollateralized” amount due from or (to) the counterparty at period end. These amounts could be due to timing differencesbetween the movement of collateral in relation to market movements, or due to agreement provisions allowing minimum “thresholds” thatwould need to be exceeded prior to the movement of collateral. To the extent that a net amount is due from a counterparty, the Fund would beexposed to the counterparty by such amount and could suffer losses or delays in recovery of that amount in the event of a counterparty default.
Merrill Corp - Proshares Trust Geared Book [96 Funds] Annual Report [Funds] 333-089822 05-31-2017 ED [AUX] | eperez | 28-Jul-17 17:37 | 17-15159-3.fa | Sequence: 17CHKSUM Content: 39940 Layout: 25212 Graphics: No Graphics CLEAN
JOB: 17-15159-3 CYCLE#;BL#: 5; 0 TRIM: 8.25" x 10.75" COMPOSITECOLORS: Black, ~note-color 2, ~note-color 3 GRAPHICS: none V1.5
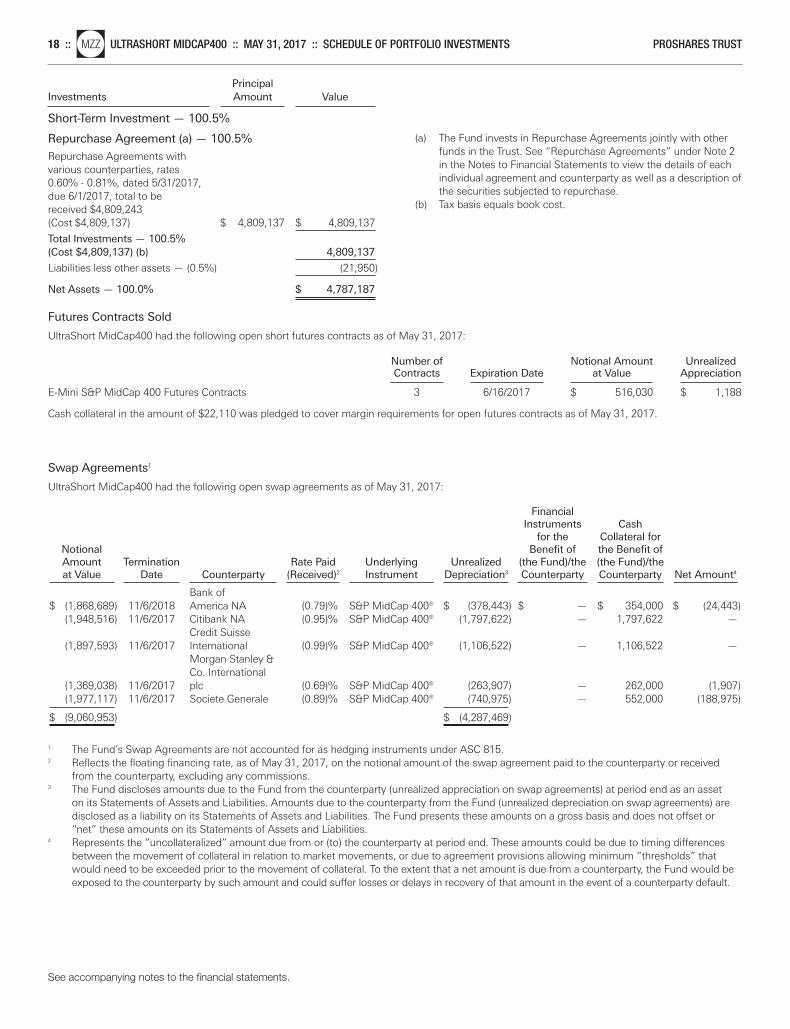
Principal Investments Amount Value
Short-Term Investment — 100.5%
Repurchase Agreement (a) — 100.5%
Repurchase Agreements with various counterparties, rates 0.60% - 0.81%, dated 5/31/2017, due 6/1/2017, total to be received $4,809,243 (Cost $4,809,137) $ 4,809,137 $ 4,809,137
Total Investments — 100.5%(Cost $4,809,137) (b) 4,809,137
Liabilities less other assets — (0.5%) (21,950)
Net Assets — 100.0% $ 4,787,187
Futures Contracts Sold
UltraShort MidCap400 had the following open short futures contracts as of May 31, 2017:
Number of Notional Amount Unrealized Contracts Expiration Date at Value Appreciation E-Mini S&P MidCap 400 Futures Contracts 3 6/16/2017 $ 516,030 $ 1,188
Cash collateral in the amount of $22,110 was pledged to cover margin requirements for open futures contracts as of May 31, 2017.
Swap Agreements1
UltraShort MidCap400 had the following open swap agreements as of May 31, 2017:
Financial Instruments Cash
for the Collateral for Notional Benefit of the Benefit of Amount Termination Rate Paid Underlying Unrealized (the Fund)/the (the Fund)/the at Value Date Counterparty (Received)2 Instrument Depreciation3 Counterparty Counterparty Net Amount4
Bank of
$ (1,868,689) 11/6/2018 America NA (0.79)% S&P MidCap 400® $ (378,443) $ — $ 354,000 $ (24,443)(1,948,516) 11/6/2017 Citibank NA (0.95)% S&P MidCap 400® (1,797,622) — 1,797,622 —
Credit Suisse (1,897,593) 11/6/2017 International (0.99)% S&P MidCap 400® (1,106,522) — 1,106,522 —
Morgan Stanley & Co. International
(1,369,038) 11/6/2017 plc (0.69)% S&P MidCap 400® (263,907) — 262,000 (1,907)(1,977,117) 11/6/2017 Societe Generale (0.89)% S&P MidCap 400® (740,975) — 552,000 (188,975)
$ (9,060,953) $ (4,287,469)
1 The Fund’s Swap Agreements are not accounted for as hedging instruments under ASC 815.2 Reflects the floating financing rate, as of May 31, 2017, on the notional amount of the swap agreement paid to the counterparty or received
from the counterparty, excluding any commissions.3 The Fund discloses amounts due to the Fund from the counterparty (unrealized appreciation on swap agreements) at period end as an asset
on its Statements of Assets and Liabilities. Amounts due to the counterparty from the Fund (unrealized depreciation on swap agreements) aredisclosed as a liability on its Statements of Assets and Liabilities. The Fund presents these amounts on a gross basis and does not offset or“net” these amounts on its Statements of Assets and Liabilities.
4 Represents the “uncollateralized” amount due from or (to) the counterparty at period end. These amounts could be due to timing differencesbetween the movement of collateral in relation to market movements, or due to agreement provisions allowing minimum “thresholds” thatwould need to be exceeded prior to the movement of collateral. To the extent that a net amount is due from a counterparty, the Fund would beexposed to the counterparty by such amount and could suffer losses or delays in recovery of that amount in the event of a counterparty default.
(a) The Fund invests in Repurchase Agreements jointly with otherfunds in the Trust. See “Repurchase Agreements” under Note 2in the Notes to Financial Statements to view the details of eachindividual agreement and counterparty as well as a description ofthe securities subjected to repurchase.
(b) Tax basis equals book cost.
See accompanying notes to the financial statements.
18 ::nlMZZ ULTRASHORT MIDCAP400 :: MAY 31, 2017 :: SCHEDULE OF PORTFOLIO INVESTMENTS PROSHARES TRUST
Merrill Corp - Proshares Trust Geared Book [96 Funds] Annual Report [Funds] 333-089822 05-31-2017 ED [AUX] | eperez | 28-Jul-17 17:37 | 17-15159-3.fc | Sequence: 1CHKSUM Content: 38280 Layout: 36291 Graphics: No Graphics CLEAN
JOB: 17-15159-3 CYCLE#;BL#: 5; 0 TRIM: 8.25" x 10.75" COMPOSITECOLORS: Black, ~note-color 2, ~note-color 3 GRAPHICS: none V1.5
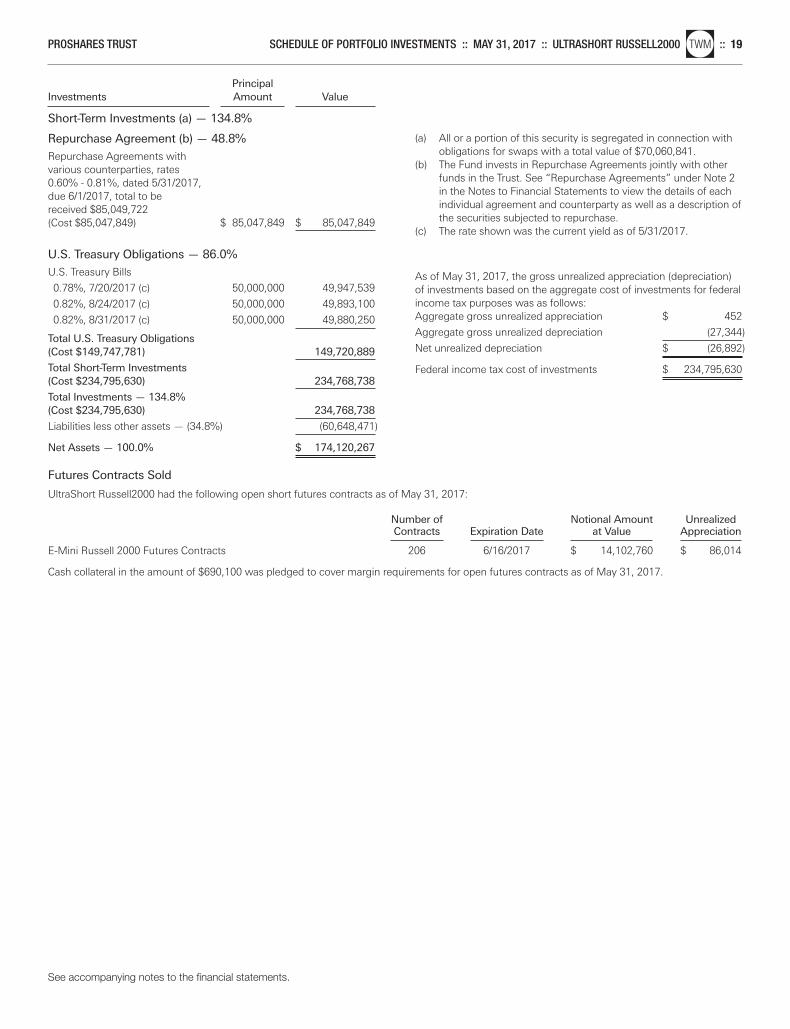
See accompanying notes to the financial statements.
PROSHARES TRUST SCHEDULE OF PORTFOLIO INVESTMENTS :: MAY 31, 2017 :: ULTRASHORT RUSSELL2000nlTWM :: 19
Principal Investments Amount Value
Short-Term Investments (a) — 134.8%
Repurchase Agreement (b) — 48.8%
Repurchase Agreements with various counterparties, rates 0.60% - 0.81%, dated 5/31/2017, due 6/1/2017, total to be received $85,049,722 (Cost $85,047,849) $ 85,047,849 $ 85,047,849
U.S. Treasury Obligations — 86.0%
U.S. Treasury Bills
0.78%, 7/20/2017 (c) 50,000,000 49,947,539
0.82%, 8/24/2017 (c) 50,000,000 49,893,100
0.82%, 8/31/2017 (c) 50,000,000 49,880,250
Total U.S. Treasury Obligations(Cost $149,747,781) 149,720,889
Total Short-Term Investments(Cost $234,795,630) 234,768,738
Total Investments — 134.8%(Cost $234,795,630) 234,768,738
Liabilities less other assets — (34.8%) (60,648,471)
Net Assets — 100.0% $ 174,120,267
Futures Contracts Sold
UltraShort Russell2000 had the following open short futures contracts as of May 31, 2017:
Number of Notional Amount Unrealized Contracts Expiration Date at Value Appreciation E-Mini Russell 2000 Futures Contracts 206 6/16/2017 $ 14,102,760 $ 86,014
Cash collateral in the amount of $690,100 was pledged to cover margin requirements for open futures contracts as of May 31, 2017.
(a) All or a portion of this security is segregated in connection withobligations for swaps with a total value of $70,060,841.
(b) The Fund invests in Repurchase Agreements jointly with otherfunds in the Trust. See “Repurchase Agreements” under Note 2in the Notes to Financial Statements to view the details of eachindividual agreement and counterparty as well as a description ofthe securities subjected to repurchase.
(c) The rate shown was the current yield as of 5/31/2017.
As of May 31, 2017, the gross unrealized appreciation (depreciation)of investments based on the aggregate cost of investments for federalincome tax purposes was as follows:Aggregate gross unrealized appreciation $ 452
Aggregate gross unrealized depreciation (27,344)
Net unrealized depreciation $ (26,892)
Federal income tax cost of investments $ 234,795,630
Merrill Corp - Proshares Trust Geared Book [96 Funds] Annual Report [Funds] 333-089822 05-31-2017 ED [AUX] | eperez | 28-Jul-17 17:37 | 17-15159-3.fc | Sequence: 2CHKSUM Content: 44927 Layout: 23656 Graphics: No Graphics CLEAN
JOB: 17-15159-3 CYCLE#;BL#: 5; 0 TRIM: 8.25" x 10.75" COMPOSITECOLORS: Black, ~note-color 2, ~note-color 3 GRAPHICS: none V1.5
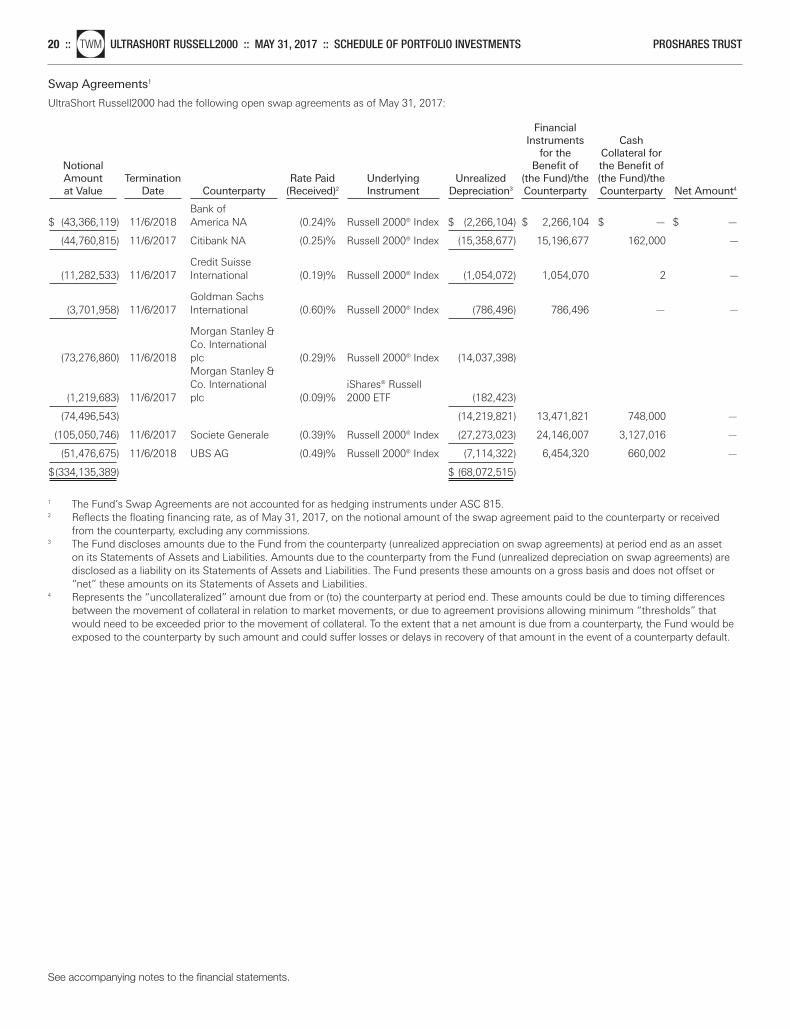
See accompanying notes to the financial statements.
20 ::nlTWM ULTRASHORT RUSSELL2000 :: MAY 31, 2017 :: SCHEDULE OF PORTFOLIO INVESTMENTS PROSHARES TRUST
Swap Agreements1
UltraShort Russell2000 had the following open swap agreements as of May 31, 2017:
Financial Instruments Cash
for the Collateral for Notional Benefit of the Benefit of Amount Termination Rate Paid Underlying Unrealized (the Fund)/the (the Fund)/the at Value Date Counterparty (Received)2 Instrument Depreciation3 Counterparty Counterparty Net Amount4
Bank of
$ (43,366,119) 11/6/2018 America NA (0.24)% Russell 2000® Index $ (2,266,104) $ 2,266,104 $ — $ —
(44,760,815) 11/6/2017 Citibank NA (0.25)% Russell 2000® Index (15,358,677) 15,196,677 162,000 —
Credit Suisse (11,282,533) 11/6/2017 International (0.19)% Russell 2000® Index (1,054,072) 1,054,070 2 —
Goldman Sachs (3,701,958) 11/6/2017 International (0.60)% Russell 2000® Index (786,496) 786,496 — —
Morgan Stanley & Co. International
(73,276,860) 11/6/2018 plc (0.29)% Russell 2000® Index (14,037,398) Morgan Stanley & Co. International iShares® Russell
(1,219,683) 11/6/2017 plc (0.09)% 2000 ETF (182,423)
(74,496,543) (14,219,821) 13,471,821 748,000 —
(105,050,746) 11/6/2017 Societe Generale (0.39)% Russell 2000® Index (27,273,023) 24,146,007 3,127,016 —
(51,476,675) 11/6/2018 UBS AG (0.49)% Russell 2000® Index (7,114,322) 6,454,320 660,002 —
$(334,135,389) $ (68,072,515)
1 The Fund’s Swap Agreements are not accounted for as hedging instruments under ASC 815.2 Reflects the floating financing rate, as of May 31, 2017, on the notional amount of the swap agreement paid to the counterparty or received
from the counterparty, excluding any commissions.3 The Fund discloses amounts due to the Fund from the counterparty (unrealized appreciation on swap agreements) at period end as an asset
on its Statements of Assets and Liabilities. Amounts due to the counterparty from the Fund (unrealized depreciation on swap agreements) aredisclosed as a liability on its Statements of Assets and Liabilities. The Fund presents these amounts on a gross basis and does not offset or“net” these amounts on its Statements of Assets and Liabilities.
4 Represents the “uncollateralized” amount due from or (to) the counterparty at period end. These amounts could be due to timing differencesbetween the movement of collateral in relation to market movements, or due to agreement provisions allowing minimum “thresholds” thatwould need to be exceeded prior to the movement of collateral. To the extent that a net amount is due from a counterparty, the Fund would beexposed to the counterparty by such amount and could suffer losses or delays in recovery of that amount in the event of a counterparty default.
Merrill Corp - Proshares Trust Geared Book [96 Funds] Annual Report [Funds] 333-089822 05-31-2017 ED [AUX] | eperez | 28-Jul-17 17:37 | 17-15159-3.fc | Sequence: 3CHKSUM Content: 6624 Layout: 13373 Graphics: No Graphics CLEAN
JOB: 17-15159-3 CYCLE#;BL#: 5; 0 TRIM: 8.25" x 10.75" COMPOSITECOLORS: Black, ~note-color 2, ~note-color 3 GRAPHICS: none V1.5
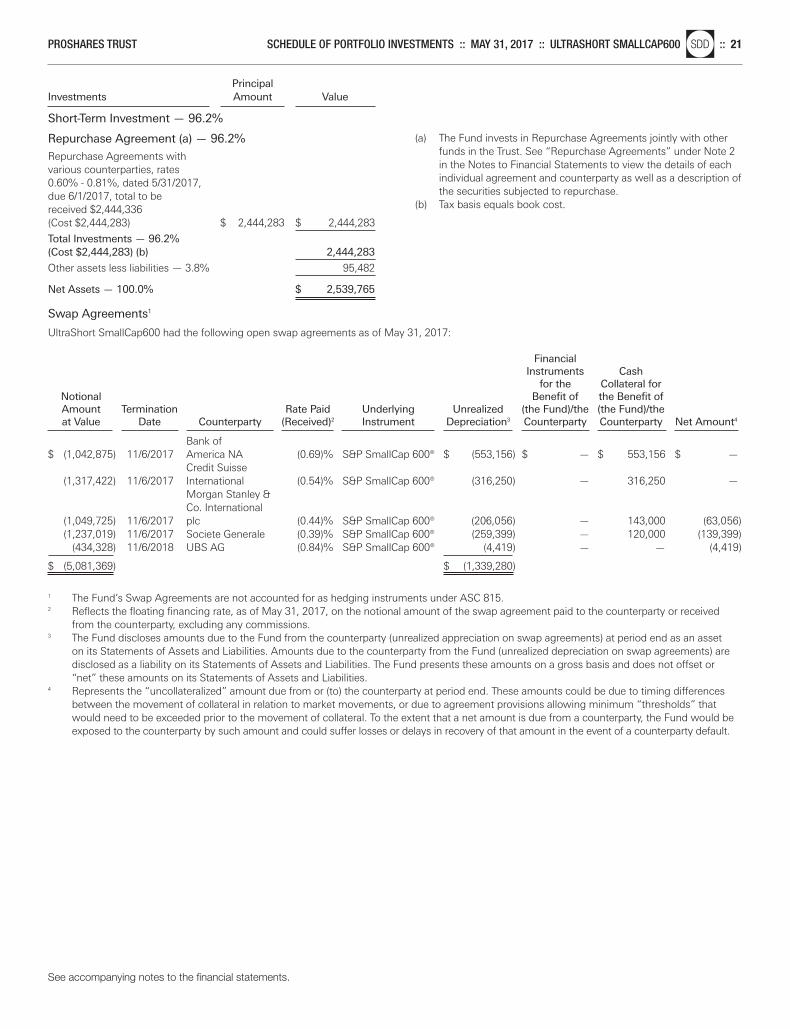
Principal Investments Amount Value
Short-Term Investment — 96.2%
Repurchase Agreement (a) — 96.2%
Repurchase Agreements with various counterparties, rates 0.60% - 0.81%, dated 5/31/2017, due 6/1/2017, total to be received $2,444,336 (Cost $2,444,283) $ 2,444,283 $ 2,444,283
Total Investments — 96.2%(Cost $2,444,283) (b) 2,444,283
Other assets less liabilities — 3.8% 95,482
Net Assets — 100.0% $ 2,539,765
Swap Agreements1
UltraShort SmallCap600 had the following open swap agreements as of May 31, 2017:
Financial Instruments Cash
for the Collateral for Notional Benefit of the Benefit of Amount Termination Rate Paid Underlying Unrealized (the Fund)/the (the Fund)/the at Value Date Counterparty (Received)2 Instrument Depreciation3 Counterparty Counterparty Net Amount4
Bank of
$ (1,042,875) 11/6/2017 America NA (0.69)% S&P SmallCap 600® $ (553,156) $ — $ 553,156 $ —Credit Suisse
(1,317,422) 11/6/2017 International (0.54)% S&P SmallCap 600® (316,250) — 316,250 —Morgan Stanley & Co. International
(1,049,725) 11/6/2017 plc (0.44)% S&P SmallCap 600® (206,056) — 143,000 (63,056)(1,237,019) 11/6/2017 Societe Generale (0.39)% S&P SmallCap 600® (259,399) — 120,000 (139,399)
(434,328) 11/6/2018 UBS AG (0.84)% S&P SmallCap 600® (4,419) — — (4,419) $ (5,081,369) $ (1,339,280)
1 The Fund’s Swap Agreements are not accounted for as hedging instruments under ASC 815.2 Reflects the floating financing rate, as of May 31, 2017, on the notional amount of the swap agreement paid to the counterparty or received
from the counterparty, excluding any commissions.3 The Fund discloses amounts due to the Fund from the counterparty (unrealized appreciation on swap agreements) at period end as an asset
on its Statements of Assets and Liabilities. Amounts due to the counterparty from the Fund (unrealized depreciation on swap agreements) aredisclosed as a liability on its Statements of Assets and Liabilities. The Fund presents these amounts on a gross basis and does not offset or“net” these amounts on its Statements of Assets and Liabilities.
4 Represents the “uncollateralized” amount due from or (to) the counterparty at period end. These amounts could be due to timing differencesbetween the movement of collateral in relation to market movements, or due to agreement provisions allowing minimum “thresholds” thatwould need to be exceeded prior to the movement of collateral. To the extent that a net amount is due from a counterparty, the Fund would beexposed to the counterparty by such amount and could suffer losses or delays in recovery of that amount in the event of a counterparty default.
(a) The Fund invests in Repurchase Agreements jointly with otherfunds in the Trust. See “Repurchase Agreements” under Note 2in the Notes to Financial Statements to view the details of eachindividual agreement and counterparty as well as a description ofthe securities subjected to repurchase.
(b) Tax basis equals book cost.
See accompanying notes to the financial statements.
PROSHARES TRUST SCHEDULE OF PORTFOLIO INVESTMENTS :: MAY 31, 2017 :: ULTRASHORT SMALLCAP600nlSDD :: 21
Merrill Corp - Proshares Trust Geared Book [96 Funds] Annual Report [Funds] 333-089822 05-31-2017 ED [AUX] | eperez | 28-Jul-17 17:37 | 17-15159-3.fc | Sequence: 4CHKSUM Content: 44888 Layout: 2532 Graphics: No Graphics CLEAN
JOB: 17-15159-3 CYCLE#;BL#: 5; 0 TRIM: 8.25" x 10.75" COMPOSITECOLORS: Black, ~note-color 2, ~note-color 3 GRAPHICS: none V1.5
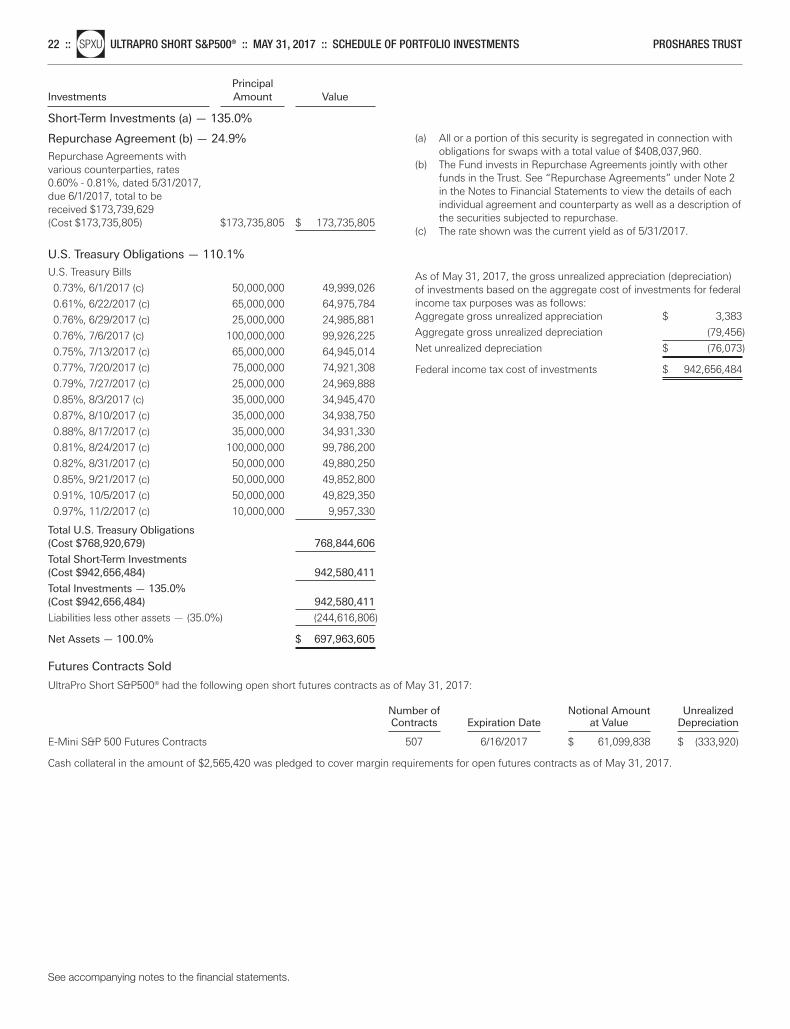
See accompanying notes to the financial statements.
22 ::nlSPXU ULTRAPRO SHORT S&P500® :: MAY 31, 2017 :: SCHEDULE OF PORTFOLIO INVESTMENTS PROSHARES TRUST
Principal Investments Amount Value
Short-Term Investments (a) — 135.0%
Repurchase Agreement (b) — 24.9%
Repurchase Agreements with various counterparties, rates 0.60% - 0.81%, dated 5/31/2017, due 6/1/2017, total to be received $173,739,629 (Cost $173,735,805) $173,735,805 $ 173,735,805
U.S. Treasury Obligations — 110.1%
U.S. Treasury Bills
0.73%, 6/1/2017 (c) 50,000,000 49,999,026
0.61%, 6/22/2017 (c) 65,000,000 64,975,784
0.76%, 6/29/2017 (c) 25,000,000 24,985,881
0.76%, 7/6/2017 (c) 100,000,000 99,926,225
0.75%, 7/13/2017 (c) 65,000,000 64,945,014
0.77%, 7/20/2017 (c) 75,000,000 74,921,308
0.79%, 7/27/2017 (c) 25,000,000 24,969,888
0.85%, 8/3/2017 (c) 35,000,000 34,945,470
0.87%, 8/10/2017 (c) 35,000,000 34,938,750
0.88%, 8/17/2017 (c) 35,000,000 34,931,330
0.81%, 8/24/2017 (c) 100,000,000 99,786,200
0.82%, 8/31/2017 (c) 50,000,000 49,880,250
0.85%, 9/21/2017 (c) 50,000,000 49,852,800
0.91%, 10/5/2017 (c) 50,000,000 49,829,350
0.97%, 11/2/2017 (c) 10,000,000 9,957,330
Total U.S. Treasury Obligations(Cost $768,920,679) 768,844,606
Total Short-Term Investments(Cost $942,656,484) 942,580,411
Total Investments — 135.0%(Cost $942,656,484) 942,580,411
Liabilities less other assets — (35.0%) (244,616,806)
Net Assets — 100.0% $ 697,963,605
Futures Contracts Sold
UltraPro Short S&P500® had the following open short futures contracts as of May 31, 2017:
Number of Notional Amount Unrealized Contracts Expiration Date at Value Depreciation E-Mini S&P 500 Futures Contracts 507 6/16/2017 $ 61,099,838 $ (333,920)
Cash collateral in the amount of $2,565,420 was pledged to cover margin requirements for open futures contracts as of May 31, 2017.
(a) All or a portion of this security is segregated in connection withobligations for swaps with a total value of $408,037,960.
(b) The Fund invests in Repurchase Agreements jointly with otherfunds in the Trust. See “Repurchase Agreements” under Note 2in the Notes to Financial Statements to view the details of eachindividual agreement and counterparty as well as a description ofthe securities subjected to repurchase.
(c) The rate shown was the current yield as of 5/31/2017.
As of May 31, 2017, the gross unrealized appreciation (depreciation)of investments based on the aggregate cost of investments for federalincome tax purposes was as follows:Aggregate gross unrealized appreciation $ 3,383
Aggregate gross unrealized depreciation (79,456)
Net unrealized depreciation $ (76,073)
Federal income tax cost of investments $ 942,656,484
Merrill Corp - Proshares Trust Geared Book [96 Funds] Annual Report [Funds] 333-089822 05-31-2017 ED [AUX] | eperez | 28-Jul-17 17:37 | 17-15159-3.fc | Sequence: 5CHKSUM Content: 11073 Layout: 51396 Graphics: No Graphics CLEAN
JOB: 17-15159-3 CYCLE#;BL#: 5; 0 TRIM: 8.25" x 10.75" COMPOSITECOLORS: Black, ~note-color 2, ~note-color 3 GRAPHICS: none V1.5
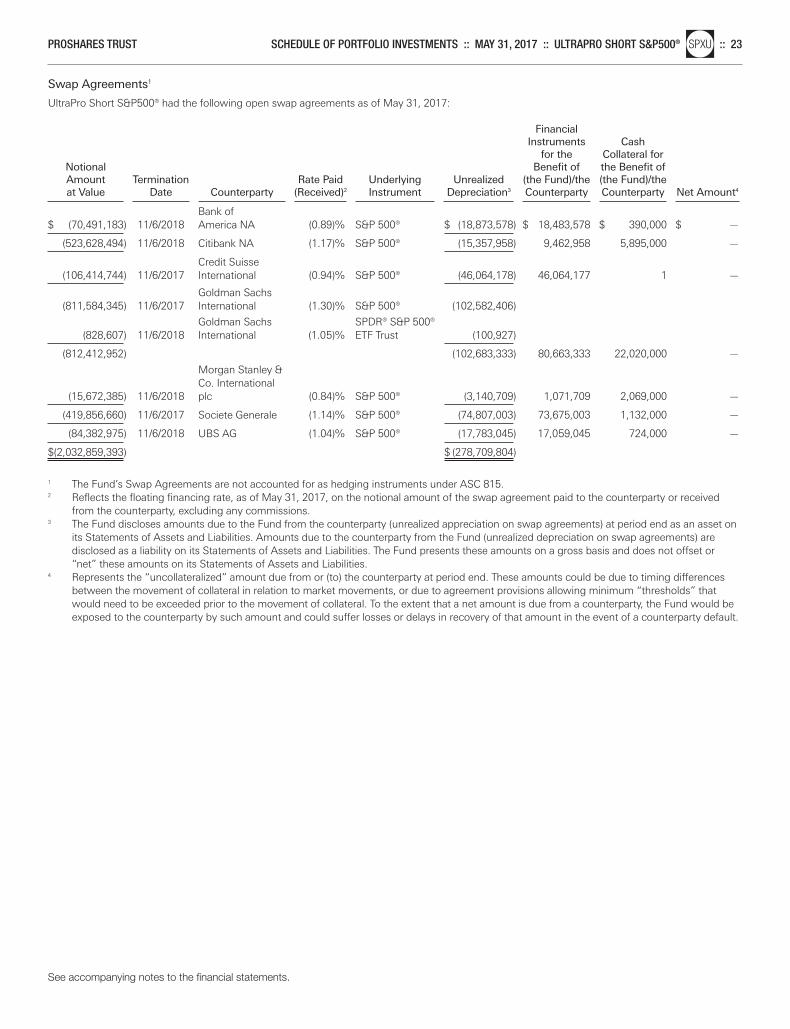
Swap Agreements1
UltraPro Short S&P500® had the following open swap agreements as of May 31, 2017:
Financial Instruments Cash
for the Collateral for Notional Benefit of the Benefit of Amount Termination Rate Paid Underlying Unrealized (the Fund)/the (the Fund)/the at Value Date Counterparty (Received)2 Instrument Depreciation3 Counterparty Counterparty Net Amount4
Bank of
$ (70,491,183) 11/6/2018 America NA (0.89)% S&P 500® $ (18,873,578) $ 18,483,578 $ 390,000 $ —
(523,628,494) 11/6/2018 Citibank NA (1.17)% S&P 500® (15,357,958) 9,462,958 5,895,000 —
Credit Suisse (106,414,744) 11/6/2017 International (0.94)% S&P 500® (46,064,178) 46,064,177 1 —
Goldman Sachs (811,584,345) 11/6/2017 International (1.30)% S&P 500® (102,582,406)
Goldman Sachs SPDR® S&P 500® (828,607) 11/6/2018 International (1.05)% ETF Trust (100,927)
(812,412,952) (102,683,333) 80,663,333 22,020,000 —
Morgan Stanley & Co. International
(15,672,385) 11/6/2018 plc (0.84)% S&P 500® (3,140,709) 1,071,709 2,069,000 —
(419,856,660) 11/6/2017 Societe Generale (1.14)% S&P 500® (74,807,003) 73,675,003 1,132,000 —
(84,382,975) 11/6/2018 UBS AG (1.04)% S&P 500® (17,783,045) 17,059,045 724,000 —
$(2,032,859,393) $ (278,709,804)
1 The Fund’s Swap Agreements are not accounted for as hedging instruments under ASC 815.2 Reflects the floating financing rate, as of May 31, 2017, on the notional amount of the swap agreement paid to the counterparty or received
from the counterparty, excluding any commissions.3 The Fund discloses amounts due to the Fund from the counterparty (unrealized appreciation on swap agreements) at period end as an asset on
its Statements of Assets and Liabilities. Amounts due to the counterparty from the Fund (unrealized depreciation on swap agreements) are disclosed as a liability on its Statements of Assets and Liabilities. The Fund presents these amounts on a gross basis and does not offset or“net” these amounts on its Statements of Assets and Liabilities.
4 Represents the “uncollateralized” amount due from or (to) the counterparty at period end. These amounts could be due to timing differencesbetween the movement of collateral in relation to market movements, or due to agreement provisions allowing minimum “thresholds” thatwould need to be exceeded prior to the movement of collateral. To the extent that a net amount is due from a counterparty, the Fund would beexposed to the counterparty by such amount and could suffer losses or delays in recovery of that amount in the event of a counterparty default.
See accompanying notes to the financial statements.
PROSHARES TRUST SCHEDULE OF PORTFOLIO INVESTMENTS :: MAY 31, 2017 :: ULTRAPRO SHORT S&P500®nlSPXU :: 23
Merrill Corp - Proshares Trust Geared Book [96 Funds] Annual Report [Funds] 333-089822 05-31-2017 ED [AUX] | eperez | 28-Jul-17 17:37 | 17-15159-3.fc | Sequence: 6CHKSUM Content: 50839 Layout: 28275 Graphics: No Graphics CLEAN
JOB: 17-15159-3 CYCLE#;BL#: 5; 0 TRIM: 8.25" x 10.75" COMPOSITECOLORS: Black, ~note-color 2, ~note-color 3 GRAPHICS: none V1.5

See accompanying notes to the financial statements.
24 ::nlSQQQ ULTRAPRO SHORT QQQ® :: MAY 31, 2017 :: SCHEDULE OF PORTFOLIO INVESTMENTS PROSHARES TRUST
Principal Investments Amount Value
Short-Term Investments (a) — 166.2%
Repurchase Agreement (b) — 32.2%
Repurchase Agreements with various counterparties, rates 0.60% - 0.81%, dated 5/31/2017, due 6/1/2017, total to be received $159,685,880 (Cost $159,682,364) $159,682,364 $ 159,682,364
U.S. Treasury Obligations — 134.0%
U.S. Treasury Bills
0.63%, 6/1/2017 (c) 50,000,000 49,999,075
0.69%, 6/8/2017 (c) 40,000,000 39,993,845
0.71%, 6/15/2017 (c) 100,000,000 99,970,815
0.71%, 6/22/2017 (c) 30,000,000 29,987,074
0.76%, 6/29/2017 (c) 50,000,000 49,971,761
0.74%, 7/6/2017 (c) 20,000,000 19,985,200
0.76%, 7/13/2017 (c) 100,000,000 99,915,406
0.75%, 7/20/2017 (c) 50,000,000 49,947,539
0.79%, 7/27/2017 (c) 30,000,000 29,963,866
0.85%, 8/3/2017 (c) 25,000,000 24,961,050
0.87%, 8/10/2017 (c) 25,000,000 24,956,250
0.88%, 8/17/2017 (c) 35,000,000 34,931,330
0.85%, 8/31/2017 (c) 50,000,000 49,880,250
0.88%, 9/21/2017 (c) 50,000,000 49,852,800
0.97%, 11/2/2017 (c) 10,000,000 9,957,330
Total U.S. Treasury Obligations(Cost $664,304,555) 664,273,591
Total Short-Term Investments(Cost $823,986,919) 823,955,955
Total Investments — 166.2%(Cost $823,986,919) 823,955,955
Liabilities less other assets — (66.2%) (328,069,593)
Net Assets — 100.0% $ 495,886,362
Futures Contracts Sold
UltraPro Short QQQ® had the following open short futures contracts as of May 31, 2017:
Number of Notional Amount Unrealized Contracts Expiration Date at Value Depreciation E-Mini NASDAQ-100 Futures Contracts 147 6/16/2017 $ 17,029,215 $ (292,864)
Cash collateral in the amount of $630,630 was pledged to cover margin requirements for open futures contracts as of May 31, 2017.
(a) All or a portion of this security is segregated in connection withobligations for swaps with a total value of $408,509,307.
(b) The Fund invests in Repurchase Agreements jointly with otherfunds in the Trust. See “Repurchase Agreements” under Note 2in the Notes to Financial Statements to view the details of eachindividual agreement and counterparty as well as a description ofthe securities subjected to repurchase.
(c) The rate shown was the current yield as of 5/31/2017.
As of May 31, 2017, the gross unrealized appreciation (depreciation)of investments based on the aggregate cost of investments for federalincome tax purposes was as follows:Aggregate gross unrealized appreciation $ 5,127
Aggregate gross unrealized depreciation (36,091)
Net unrealized depreciation $ (30,964)
Federal income tax cost of investments $ 823,986,919
Merrill Corp - Proshares Trust Geared Book [96 Funds] Annual Report [Funds] 333-089822 05-31-2017 ED [AUX] | eperez | 28-Jul-17 17:37 | 17-15159-3.fc | Sequence: 7CHKSUM Content: 41045 Layout: 44853 Graphics: No Graphics CLEAN
JOB: 17-15159-3 CYCLE#;BL#: 5; 0 TRIM: 8.25" x 10.75" COMPOSITECOLORS: Black, ~note-color 2, ~note-color 3 GRAPHICS: none V1.5
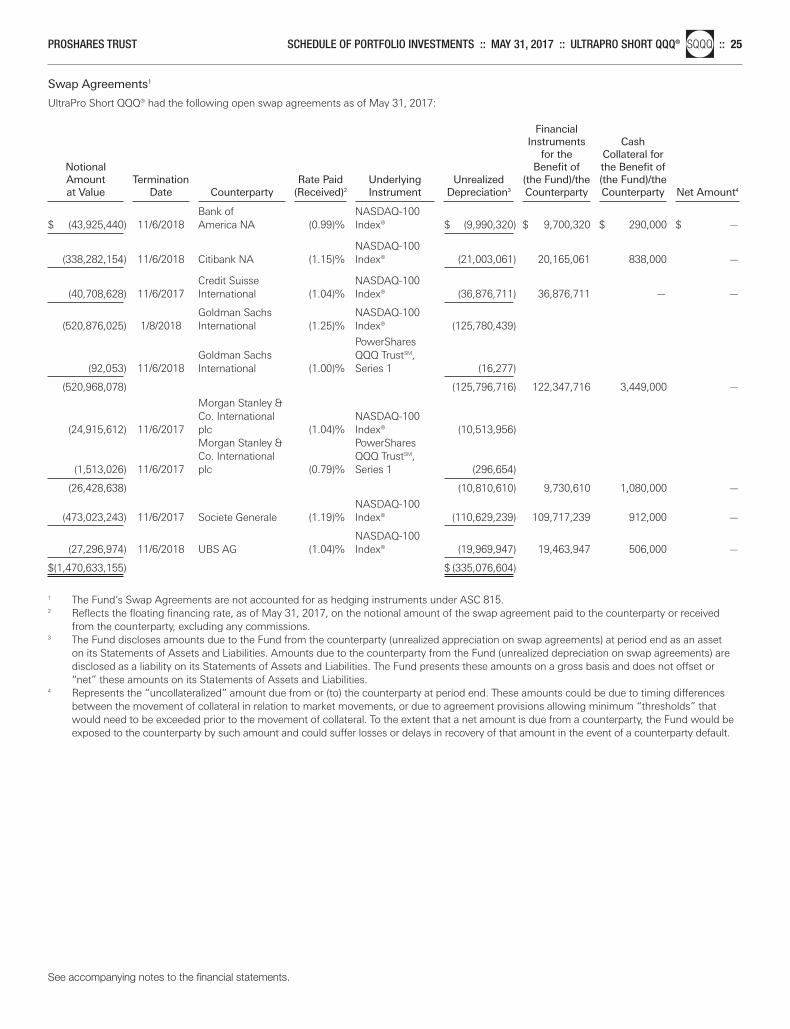
Swap Agreements1
UltraPro Short QQQ® had the following open swap agreements as of May 31, 2017:
Financial Instruments Cash
for the Collateral for Notional Benefit of the Benefit of Amount Termination Rate Paid Underlying Unrealized (the Fund)/the (the Fund)/the at Value Date Counterparty (Received)2 Instrument Depreciation3 Counterparty Counterparty Net Amount4
Bank of NASDAQ-100
$ (43,925,440) 11/6/2018 America NA (0.99)% Index® $ (9,990,320) $ 9,700,320 $ 290,000 $ —
NASDAQ-100 (338,282,154) 11/6/2018 Citibank NA (1.15)% Index® (21,003,061) 20,165,061 838,000 —
Credit Suisse NASDAQ-100 (40,708,628) 11/6/2017 International (1.04)% Index® (36,876,711) 36,876,711 — —
Goldman Sachs NASDAQ-100 (520,876,025) 1/8/2018 International (1.25)% Index® (125,780,439)
PowerShares Goldman Sachs QQQ TrustSM,
(92,053) 11/6/2018 International (1.00)% Series 1 (16,277)
(520,968,078) (125,796,716) 122,347,716 3,449,000 —
Morgan Stanley & Co. International NASDAQ-100
(24,915,612) 11/6/2017 plc (1.04)% Index® (10,513,956) Morgan Stanley & PowerShares Co. International QQQ TrustSM,
(1,513,026) 11/6/2017 plc (0.79)% Series 1 (296,654)
(26,428,638) (10,810,610) 9,730,610 1,080,000 —
NASDAQ-100 (473,023,243) 11/6/2017 Societe Generale (1.19)% Index® (110,629,239) 109,717,239 912,000 —
NASDAQ-100 (27,296,974) 11/6/2018 UBS AG (1.04)% Index® (19,969,947) 19,463,947 506,000 —
$(1,470,633,155) $ (335,076,604)
1 The Fund’s Swap Agreements are not accounted for as hedging instruments under ASC 815.2 Reflects the floating financing rate, as of May 31, 2017, on the notional amount of the swap agreement paid to the counterparty or received
from the counterparty, excluding any commissions.3 The Fund discloses amounts due to the Fund from the counterparty (unrealized appreciation on swap agreements) at period end as an asset
on its Statements of Assets and Liabilities. Amounts due to the counterparty from the Fund (unrealized depreciation on swap agreements) aredisclosed as a liability on its Statements of Assets and Liabilities. The Fund presents these amounts on a gross basis and does not offset or“net” these amounts on its Statements of Assets and Liabilities.
4 Represents the “uncollateralized” amount due from or (to) the counterparty at period end. These amounts could be due to timing differencesbetween the movement of collateral in relation to market movements, or due to agreement provisions allowing minimum “thresholds” thatwould need to be exceeded prior to the movement of collateral. To the extent that a net amount is due from a counterparty, the Fund would beexposed to the counterparty by such amount and could suffer losses or delays in recovery of that amount in the event of a counterparty default.
See accompanying notes to the financial statements.
PROSHARES TRUST SCHEDULE OF PORTFOLIO INVESTMENTS :: MAY 31, 2017 :: ULTRAPRO SHORT QQQ®nlSQQQ :: 25
Merrill Corp - Proshares Trust Geared Book [96 Funds] Annual Report [Funds] 333-089822 05-31-2017 ED [AUX] | eperez | 28-Jul-17 17:37 | 17-15159-3.fc | Sequence: 8CHKSUM Content: 56215 Layout: 8374 Graphics: No Graphics CLEAN
JOB: 17-15159-3 CYCLE#;BL#: 5; 0 TRIM: 8.25" x 10.75" COMPOSITECOLORS: Black, ~note-color 2, ~note-color 3 GRAPHICS: none V1.5
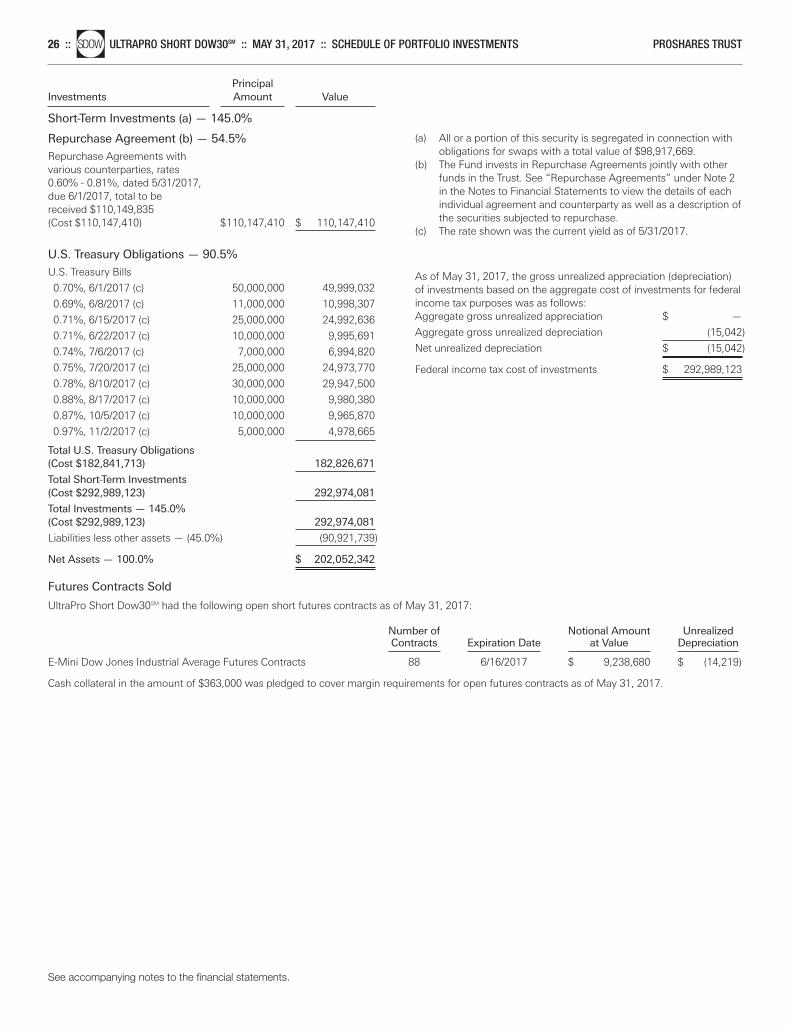
See accompanying notes to the financial statements.
26 ::nlSDOW ULTRAPRO SHORT DOW30SM :: MAY 31, 2017 :: SCHEDULE OF PORTFOLIO INVESTMENTS PROSHARES TRUST
Principal Investments Amount Value
Short-Term Investments (a) — 145.0%
Repurchase Agreement (b) — 54.5%
Repurchase Agreements with various counterparties, rates 0.60% - 0.81%, dated 5/31/2017, due 6/1/2017, total to be received $110,149,835 (Cost $110,147,410) $110,147,410 $ 110,147,410
U.S. Treasury Obligations — 90.5%
U.S. Treasury Bills
0.70%, 6/1/2017 (c) 50,000,000 49,999,032
0.69%, 6/8/2017 (c) 11,000,000 10,998,307
0.71%, 6/15/2017 (c) 25,000,000 24,992,636
0.71%, 6/22/2017 (c) 10,000,000 9,995,691
0.74%, 7/6/2017 (c) 7,000,000 6,994,820
0.75%, 7/20/2017 (c) 25,000,000 24,973,770
0.78%, 8/10/2017 (c) 30,000,000 29,947,500
0.88%, 8/17/2017 (c) 10,000,000 9,980,380
0.87%, 10/5/2017 (c) 10,000,000 9,965,870
0.97%, 11/2/2017 (c) 5,000,000 4,978,665
Total U.S. Treasury Obligations(Cost $182,841,713) 182,826,671
Total Short-Term Investments(Cost $292,989,123) 292,974,081
Total Investments — 145.0%(Cost $292,989,123) 292,974,081
Liabilities less other assets — (45.0%) (90,921,739)
Net Assets — 100.0% $ 202,052,342
Futures Contracts Sold
UltraPro Short Dow30SM had the following open short futures contracts as of May 31, 2017:
Number of Notional Amount Unrealized Contracts Expiration Date at Value Depreciation E-Mini Dow Jones Industrial Average Futures Contracts 88 6/16/2017 $ 9,238,680 $ (14,219)
Cash collateral in the amount of $363,000 was pledged to cover margin requirements for open futures contracts as of May 31, 2017.
(a) All or a portion of this security is segregated in connection withobligations for swaps with a total value of $98,917,669.
(b) The Fund invests in Repurchase Agreements jointly with otherfunds in the Trust. See “Repurchase Agreements” under Note 2in the Notes to Financial Statements to view the details of eachindividual agreement and counterparty as well as a description ofthe securities subjected to repurchase.
(c) The rate shown was the current yield as of 5/31/2017.
As of May 31, 2017, the gross unrealized appreciation (depreciation)of investments based on the aggregate cost of investments for federalincome tax purposes was as follows:Aggregate gross unrealized appreciation $ —
Aggregate gross unrealized depreciation (15,042)
Net unrealized depreciation $ (15,042)
Federal income tax cost of investments $ 292,989,123
Merrill Corp - Proshares Trust Geared Book [96 Funds] Annual Report [Funds] 333-089822 05-31-2017 ED [AUX] | eperez | 28-Jul-17 17:37 | 17-15159-3.fc | Sequence: 9CHKSUM Content: 36387 Layout: 4932 Graphics: No Graphics CLEAN
JOB: 17-15159-3 CYCLE#;BL#: 5; 0 TRIM: 8.25" x 10.75" COMPOSITECOLORS: Black, ~note-color 2, ~note-color 3 GRAPHICS: none V1.5
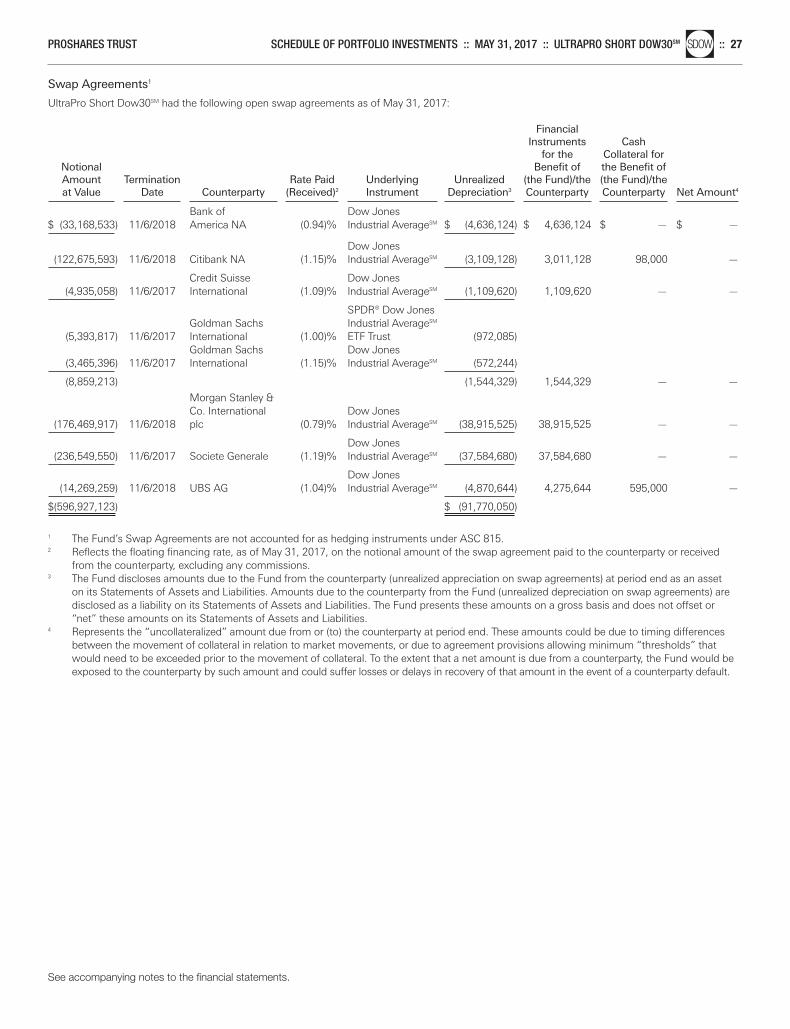
Swap Agreements1
UltraPro Short Dow30SM had the following open swap agreements as of May 31, 2017:
Financial Instruments Cash
for the Collateral for Notional Benefit of the Benefit of Amount Termination Rate Paid Underlying Unrealized (the Fund)/the (the Fund)/the at Value Date Counterparty (Received)2 Instrument Depreciation3 Counterparty Counterparty Net Amount4
Bank of Dow Jones
$ (33,168,533) 11/6/2018 America NA (0.94)% Industrial AverageSM $ (4,636,124) $ 4,636,124 $ — $ —
Dow Jones (122,675,593) 11/6/2018 Citibank NA (1.15)% Industrial AverageSM (3,109,128) 3,011,128 98,000 —
Credit Suisse Dow Jones (4,935,058) 11/6/2017 International (1.09)% Industrial AverageSM (1,109,620) 1,109,620 — —
SPDR® Dow Jones Goldman Sachs Industrial AverageSM
(5,393,817) 11/6/2017 International (1.00)% ETF Trust (972,085) Goldman Sachs Dow Jones
(3,465,396) 11/6/2017 International (1.15)% Industrial AverageSM (572,244)
(8,859,213) (1,544,329) 1,544,329 — —
Morgan Stanley & Co. International Dow Jones
(176,469,917) 11/6/2018 plc (0.79)% Industrial AverageSM (38,915,525) 38,915,525 — —
Dow Jones (236,549,550) 11/6/2017 Societe Generale (1.19)% Industrial AverageSM (37,584,680) 37,584,680 — —
Dow Jones (14,269,259) 11/6/2018 UBS AG (1.04)% Industrial AverageSM (4,870,644) 4,275,644 595,000 —
$(596,927,123) $ (91,770,050)
1 The Fund’s Swap Agreements are not accounted for as hedging instruments under ASC 815.2 Reflects the floating financing rate, as of May 31, 2017, on the notional amount of the swap agreement paid to the counterparty or received
from the counterparty, excluding any commissions.3 The Fund discloses amounts due to the Fund from the counterparty (unrealized appreciation on swap agreements) at period end as an asset
on its Statements of Assets and Liabilities. Amounts due to the counterparty from the Fund (unrealized depreciation on swap agreements) aredisclosed as a liability on its Statements of Assets and Liabilities. The Fund presents these amounts on a gross basis and does not offset or“net” these amounts on its Statements of Assets and Liabilities.
4 Represents the “uncollateralized” amount due from or (to) the counterparty at period end. These amounts could be due to timing differencesbetween the movement of collateral in relation to market movements, or due to agreement provisions allowing minimum “thresholds” thatwould need to be exceeded prior to the movement of collateral. To the extent that a net amount is due from a counterparty, the Fund would beexposed to the counterparty by such amount and could suffer losses or delays in recovery of that amount in the event of a counterparty default.
See accompanying notes to the financial statements.
PROSHARES TRUST SCHEDULE OF PORTFOLIO INVESTMENTS :: MAY 31, 2017 :: ULTRAPRO SHORT DOW30SMnlSDOW :: 27
Merrill Corp - Proshares Trust Geared Book [96 Funds] Annual Report [Funds] 333-089822 05-31-2017 ED [AUX] | eperez | 28-Jul-17 17:37 | 17-15159-3.fc | Sequence: 10CHKSUM Content: 64643 Layout: 7438 Graphics: No Graphics CLEAN
JOB: 17-15159-3 CYCLE#;BL#: 5; 0 TRIM: 8.25" x 10.75" COMPOSITECOLORS: Black, ~note-color 2, ~note-color 3 GRAPHICS: none V1.5
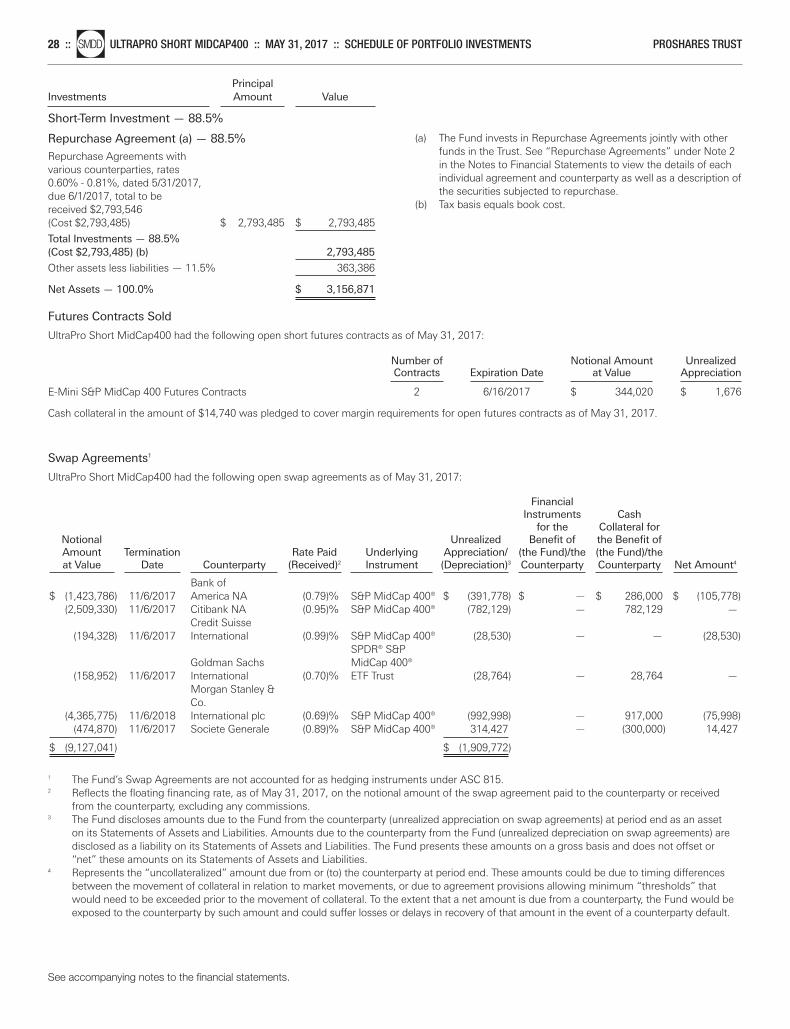
See accompanying notes to the financial statements.
28 ::nlSMDD ULTRAPRO SHORT MIDCAP400 :: MAY 31, 2017 :: SCHEDULE OF PORTFOLIO INVESTMENTS PROSHARES TRUST
Principal Investments Amount Value
Short-Term Investment — 88.5%
Repurchase Agreement (a) — 88.5%
Repurchase Agreements with various counterparties, rates 0.60% - 0.81%, dated 5/31/2017, due 6/1/2017, total to be received $2,793,546 (Cost $2,793,485) $ 2,793,485 $ 2,793,485
Total Investments — 88.5%(Cost $2,793,485) (b) 2,793,485
Other assets less liabilities — 11.5% 363,386
Net Assets — 100.0% $ 3,156,871
Futures Contracts Sold
UltraPro Short MidCap400 had the following open short futures contracts as of May 31, 2017:
Number of Notional Amount Unrealized Contracts Expiration Date at Value Appreciation E-Mini S&P MidCap 400 Futures Contracts 2 6/16/2017 $ 344,020 $ 1,676
Cash collateral in the amount of $14,740 was pledged to cover margin requirements for open futures contracts as of May 31, 2017.
Swap Agreements1
UltraPro Short MidCap400 had the following open swap agreements as of May 31, 2017:
Financial Instruments Cash
for the Collateral for Notional Unrealized Benefit of the Benefit of Amount Termination Rate Paid Underlying Appreciation/ (the Fund)/the (the Fund)/the at Value Date Counterparty (Received)2 Instrument (Depreciation)3 Counterparty Counterparty Net Amount4
Bank of
$ (1,423,786) 11/6/2017 America NA (0.79)% S&P MidCap 400® $ (391,778) $ — $ 286,000 $ (105,778)(2,509,330) 11/6/2017 Citibank NA (0.95)% S&P MidCap 400® (782,129) — 782,129 —
Credit Suisse (194,328) 11/6/2017 International (0.99)% S&P MidCap 400® (28,530) — — (28,530)
SPDR® S&P Goldman Sachs MidCap 400®
(158,952) 11/6/2017 International (0.70)% ETF Trust (28,764) — 28,764 —Morgan Stanley & Co.
(4,365,775) 11/6/2018 International plc (0.69)% S&P MidCap 400® (992,998) — 917,000 (75,998)(474,870) 11/6/2017 Societe Generale (0.89)% S&P MidCap 400® 314,427 — (300,000) 14,427
$ (9,127,041) $ (1,909,772)
1 The Fund’s Swap Agreements are not accounted for as hedging instruments under ASC 815.2 Reflects the floating financing rate, as of May 31, 2017, on the notional amount of the swap agreement paid to the counterparty or received
from the counterparty, excluding any commissions.3 The Fund discloses amounts due to the Fund from the counterparty (unrealized appreciation on swap agreements) at period end as an asset
on its Statements of Assets and Liabilities. Amounts due to the counterparty from the Fund (unrealized depreciation on swap agreements) aredisclosed as a liability on its Statements of Assets and Liabilities. The Fund presents these amounts on a gross basis and does not offset or“net” these amounts on its Statements of Assets and Liabilities.
4 Represents the “uncollateralized” amount due from or (to) the counterparty at period end. These amounts could be due to timing differencesbetween the movement of collateral in relation to market movements, or due to agreement provisions allowing minimum “thresholds” thatwould need to be exceeded prior to the movement of collateral. To the extent that a net amount is due from a counterparty, the Fund would beexposed to the counterparty by such amount and could suffer losses or delays in recovery of that amount in the event of a counterparty default.
(a) The Fund invests in Repurchase Agreements jointly with otherfunds in the Trust. See “Repurchase Agreements” under Note 2in the Notes to Financial Statements to view the details of eachindividual agreement and counterparty as well as a description ofthe securities subjected to repurchase.
(b) Tax basis equals book cost.
Merrill Corp - Proshares Trust Geared Book [96 Funds] Annual Report [Funds] 333-089822 05-31-2017 ED [AUX] | eperez | 28-Jul-17 17:37 | 17-15159-3.fc | Sequence: 11CHKSUM Content: 36493 Layout: 6290 Graphics: No Graphics CLEAN
JOB: 17-15159-3 CYCLE#;BL#: 5; 0 TRIM: 8.25" x 10.75" COMPOSITECOLORS: Black, ~note-color 2, ~note-color 3 GRAPHICS: none V1.5

See accompanying notes to the financial statements.
PROSHARES TRUST SCHEDULE OF PORTFOLIO INVESTMENTS :: MAY 31, 2017 :: ULTRAPRO SHORT RUSSELL2000nlSRTY :: 29
Principal Investments Amount Value
Short-Term Investments (a) — 113.9%
Repurchase Agreement (b) — 24.3%
Repurchase Agreements with various counterparties, rates 0.60% - 0.81%, dated 5/31/2017, due 6/1/2017, total to be received $27,096,269 (Cost $27,095,672) $ 27,095,672 $ 27,095,672
U.S. Treasury Obligations — 89.6%
U.S. Treasury Bills
0.71%, 6/15/2017 (c) 25,000,000 24,992,636
0.78%, 8/10/2017 (c) 25,000,000 24,956,250
0.85%, 8/31/2017 (c) 50,000,000 49,880,250
Total U.S. Treasury Obligations(Cost $99,848,591) 99,829,136
Total Short-Term Investments(Cost $126,944,263) 126,924,808
Total Investments — 113.9%(Cost $126,944,263) 126,924,808
Liabilities less other assets — (13.9%) (15,499,862)
Net Assets — 100.0% $ 111,424,946
Futures Contracts Sold
UltraPro Short Russell2000 had the following open short futures contracts as of May 31, 2017:
Number of Notional Amount Unrealized Contracts Expiration Date at Value Appreciation E-Mini Russell 2000 Futures Contracts 166 6/16/2017 $ 11,364,360 $ 120,391
Cash collateral in the amount of $556,100 was pledged to cover margin requirements for open futures contracts as of May 31, 2017.
(a) All or a portion of this security is segregated in connection withobligations for swaps with a total value of $22,948,744.
(b) The Fund invests in Repurchase Agreements jointly with otherfunds in the Trust. See “Repurchase Agreements” under Note 2in the Notes to Financial Statements to view the details of eachindividual agreement and counterparty as well as a description ofthe securities subjected to repurchase.
(c) The rate shown was the current yield as of 5/31/2017.
As of May 31, 2017, the gross unrealized appreciation (depreciation)of investments based on the aggregate cost of investments for federalincome tax purposes was as follows:Aggregate gross unrealized appreciation $ —
Aggregate gross unrealized depreciation (19,455)
Net unrealized depreciation $ (19,455)
Federal income tax cost of investments $ 126,944,263
Merrill Corp - Proshares Trust Geared Book [96 Funds] Annual Report [Funds] 333-089822 05-31-2017 ED [AUX] | eperez | 28-Jul-17 17:37 | 17-15159-3.fc | Sequence: 12CHKSUM Content: 12406 Layout: 389 Graphics: No Graphics CLEAN
JOB: 17-15159-3 CYCLE#;BL#: 5; 0 TRIM: 8.25" x 10.75" COMPOSITECOLORS: Black, ~note-color 2, ~note-color 3 GRAPHICS: none V1.5

Swap Agreements1
UltraPro Short Russell2000 had the following open swap agreements as of May 31, 2017:
Financial Instruments Cash
for the Collateral for Notional Benefit of the Benefit of Amount Termination Rate Paid Underlying Unrealized (the Fund)/the (the Fund)/the at Value Date Counterparty (Received)2 Instrument Depreciation3 Counterparty Counterparty Net Amount4
Bank of
$ (34,307,357) 11/6/2018 America NA (0.24)% Russell 2000® Index $ (3,949,595) $ 895,595 $ 3,054,000 $ —
(28,381,823) 11/6/2017 Citibank NA (0.25)% Russell 2000® Index (12,696,713) 1,747,516 10,949,197 —
Credit Suisse (2,753,319) 11/6/2017 International (0.19)% Russell 2000® Index (291,857) — 291,857 —
Goldman Sachs (2,343,990) 11/6/2017 International (0.60)% Russell 2000® Index (303,961) 303,961 — —
Morgan Stanley & Co. International
(81,692,662) 11/6/2018 plc (0.29)% Russell 2000® Index (14,780,364) Morgan Stanley & Co. International iShares®
(488,047) 11/6/2017 plc (0.09)% Russell 2000 ETF (72,995)
(82,180,709) (14,853,359) 5,599,359 9,254,000 —
(90,862,582) 11/6/2017 Societe Generale (0.39)% Russell 2000® Index (19,991,546) 9,059,546 10,932,000 —
(82,081,092) 11/6/2018 UBS AG (0.49)% Russell 2000® Index (1,142,823) 1,142,823 — —
$(322,910,872) $ (53,229,854)
1 The Fund’s Swap Agreements are not accounted for as hedging instruments under ASC 815.2 Reflects the floating financing rate, as of May 31, 2017, on the notional amount of the swap agreement paid to the counterparty or received
from the counterparty, excluding any commissions.3 The Fund discloses amounts due to the Fund from the counterparty (unrealized appreciation on swap agreements) at period end as an asset on
its Statements of Assets and Liabilities. Amounts due to the counterparty from the Fund (unrealized depreciation on swap agreements) are disclosed as a liability on its Statements of Assets and Liabilities. The Fund presents these amounts on a gross basis and does not offset or“net” these amounts on its Statements of Assets and Liabilities.
4 Represents the “uncollateralized” amount due from or (to) the counterparty at period end. These amounts could be due to timing differencesbetween the movement of collateral in relation to market movements, or due to agreement provisions allowing minimum “thresholds” thatwould need to be exceeded prior to the movement of collateral. To the extent that a net amount is due from a counterparty, the Fund would beexposed to the counterparty by such amount and could suffer losses or delays in recovery of that amount in the event of a counterparty default.
See accompanying notes to the financial statements.
30 ::nlSRTY ULTRAPRO SHORT RUSSELL2000 :: MAY 31, 2017 :: SCHEDULE OF PORTFOLIO INVESTMENTS PROSHARES TRUST
Merrill Corp - Proshares Trust Geared Book [96 Funds] Annual Report [Funds] 333-089822 05-31-2017 ED [AUX] | eperez | 28-Jul-17 17:37 | 17-15159-3.fc | Sequence: 13CHKSUM Content: 47083 Layout: 12680 Graphics: No Graphics CLEAN
JOB: 17-15159-3 CYCLE#;BL#: 5; 0 TRIM: 8.25" x 10.75" COMPOSITECOLORS: Black, ~note-color 2, ~note-color 3 GRAPHICS: none V1.5
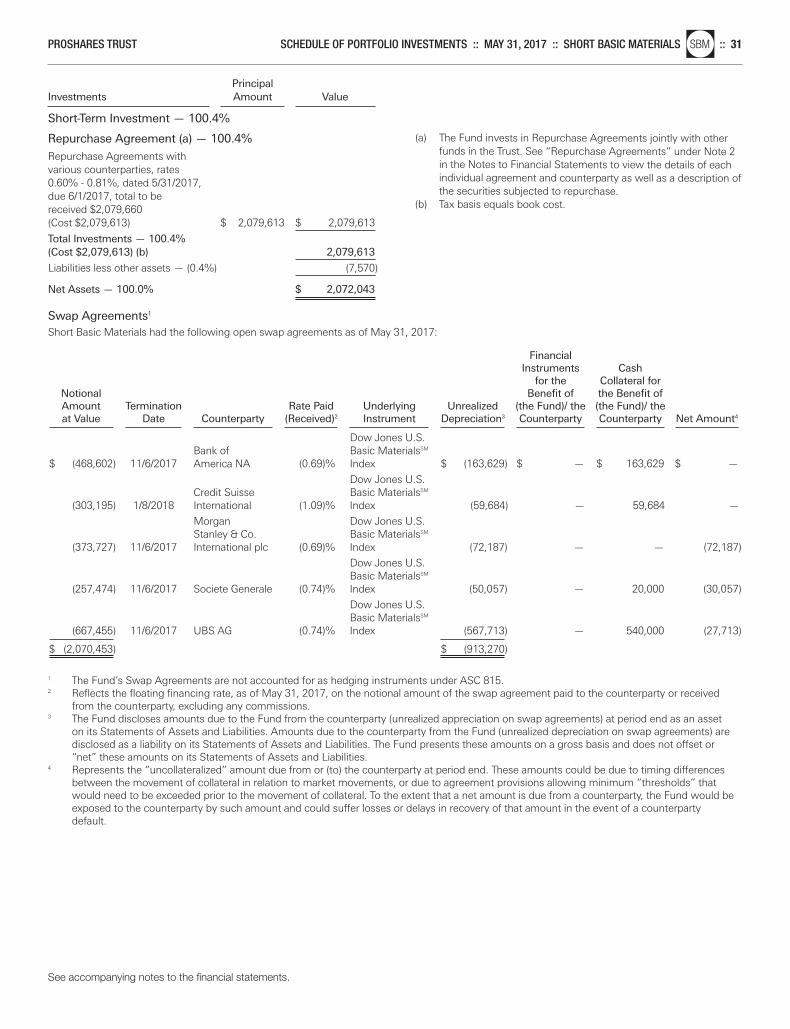
See accompanying notes to the financial statements.
PROSHARES TRUST SCHEDULE OF PORTFOLIO INVESTMENTS :: MAY 31, 2017 :: SHORT BASIC MATERIALSnlSBM :: 31
Principal Investments Amount Value
Short-Term Investment — 100.4%
Repurchase Agreement (a) — 100.4%
Repurchase Agreements with various counterparties, rates 0.60% - 0.81%, dated 5/31/2017, due 6/1/2017, total to be received $2,079,660 (Cost $2,079,613) $ 2,079,613 $ 2,079,613
Total Investments — 100.4%(Cost $2,079,613) (b) 2,079,613
Liabilities less other assets — (0.4%) (7,570)
Net Assets — 100.0% $ 2,072,043
Swap Agreements1
Short Basic Materials had the following open swap agreements as of May 31, 2017:
Financial Instruments Cash
for the Collateral for Notional Benefit of the Benefit of Amount Termination Rate Paid Underlying Unrealized (the Fund)/ the (the Fund)/ the at Value Date Counterparty (Received)2 Instrument Depreciation3 Counterparty Counterparty Net Amount4
Dow Jones U.S.
Bank of Basic MaterialsSM $ (468,602) 11/6/2017 America NA (0.69)% Index $ (163,629) $ — $ 163,629 $ —
Dow Jones U.S. Credit Suisse Basic MaterialsSM
(303,195) 1/8/2018 International (1.09)% Index (59,684) — 59,684 —
Morgan Dow Jones U.S. Stanley & Co. Basic MaterialsSM
(373,727) 11/6/2017 International plc (0.69)% Index (72,187) — — (72,187)
Dow Jones U.S. Basic MaterialsSM
(257,474) 11/6/2017 Societe Generale (0.74)% Index (50,057) — 20,000 (30,057)
Dow Jones U.S. Basic MaterialsSM
(667,455) 11/6/2017 UBS AG (0.74)% Index (567,713) — 540,000 (27,713)
$ (2,070,453) $ (913,270)
1 The Fund’s Swap Agreements are not accounted for as hedging instruments under ASC 815.2 Reflects the floating financing rate, as of May 31, 2017, on the notional amount of the swap agreement paid to the counterparty or received
from the counterparty, excluding any commissions.3 The Fund discloses amounts due to the Fund from the counterparty (unrealized appreciation on swap agreements) at period end as an asset
on its Statements of Assets and Liabilities. Amounts due to the counterparty from the Fund (unrealized depreciation on swap agreements) aredisclosed as a liability on its Statements of Assets and Liabilities. The Fund presents these amounts on a gross basis and does not offset or“net” these amounts on its Statements of Assets and Liabilities.
4 Represents the “uncollateralized” amount due from or (to) the counterparty at period end. These amounts could be due to timing differencesbetween the movement of collateral in relation to market movements, or due to agreement provisions allowing minimum “thresholds” thatwould need to be exceeded prior to the movement of collateral. To the extent that a net amount is due from a counterparty, the Fund would beexposed to the counterparty by such amount and could suffer losses or delays in recovery of that amount in the event of a counterparty default.
(a) The Fund invests in Repurchase Agreements jointly with otherfunds in the Trust. See “Repurchase Agreements” under Note 2in the Notes to Financial Statements to view the details of eachindividual agreement and counterparty as well as a description ofthe securities subjected to repurchase.
(b) Tax basis equals book cost.
Merrill Corp - Proshares Trust Geared Book [96 Funds] Annual Report [Funds] 333-089822 05-31-2017 ED [AUX] | eperez | 28-Jul-17 17:37 | 17-15159-3.fe | Sequence: 1CHKSUM Content: 56840 Layout: 61594 Graphics: No Graphics CLEAN
JOB: 17-15159-3 CYCLE#;BL#: 5; 0 TRIM: 8.25" x 10.75" COMPOSITECOLORS: Black, ~note-color 2, ~note-color 3 GRAPHICS: none V1.5
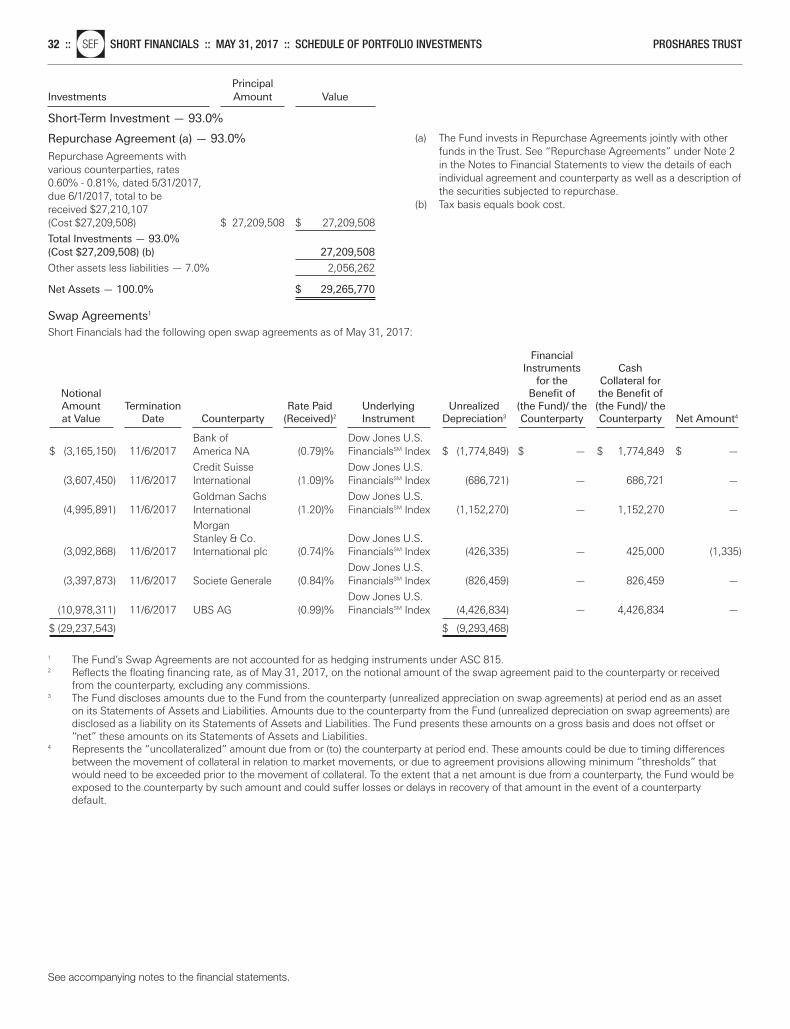
See accompanying notes to the financial statements.
32 ::nlSEF SHORT FINANCIALS :: MAY 31, 2017 :: SCHEDULE OF PORTFOLIO INVESTMENTS PROSHARES TRUST
Principal Investments Amount Value
Short-Term Investment — 93.0%
Repurchase Agreement (a) — 93.0%
Repurchase Agreements with various counterparties, rates 0.60% - 0.81%, dated 5/31/2017, due 6/1/2017, total to be received $27,210,107 (Cost $27,209,508) $ 27,209,508 $ 27,209,508
Total Investments — 93.0%(Cost $27,209,508) (b) 27,209,508
Other assets less liabilities — 7.0% 2,056,262
Net Assets — 100.0% $ 29,265,770
Swap Agreements1
Short Financials had the following open swap agreements as of May 31, 2017:
Financial Instruments Cash
for the Collateral for Notional Benefit of the Benefit of Amount Termination Rate Paid Underlying Unrealized (the Fund)/ the (the Fund)/ the at Value Date Counterparty (Received)2 Instrument Depreciation3 Counterparty Counterparty Net Amount4
Bank of Dow Jones U.S.
$ (3,165,150) 11/6/2017 America NA (0.79)% FinancialsSM Index $ (1,774,849) $ — $ 1,774,849 $ —
Credit Suisse Dow Jones U.S. (3,607,450) 11/6/2017 International (1.09)% FinancialsSM Index (686,721) — 686,721 —
Goldman Sachs Dow Jones U.S. (4,995,891) 11/6/2017 International (1.20)% FinancialsSM Index (1,152,270) — 1,152,270 —
Morgan Stanley & Co. Dow Jones U.S.
(3,092,868) 11/6/2017 International plc (0.74)% FinancialsSM Index (426,335) — 425,000 (1,335)
Dow Jones U.S. (3,397,873) 11/6/2017 Societe Generale (0.84)% FinancialsSM Index (826,459) — 826,459 —
Dow Jones U.S. (10,978,311) 11/6/2017 UBS AG (0.99)% FinancialsSM Index (4,426,834) — 4,426,834 —
$ (29,237,543) $ (9,293,468)
1 The Fund’s Swap Agreements are not accounted for as hedging instruments under ASC 815.2 Reflects the floating financing rate, as of May 31, 2017, on the notional amount of the swap agreement paid to the counterparty or received
from the counterparty, excluding any commissions.3 The Fund discloses amounts due to the Fund from the counterparty (unrealized appreciation on swap agreements) at period end as an asset
on its Statements of Assets and Liabilities. Amounts due to the counterparty from the Fund (unrealized depreciation on swap agreements) aredisclosed as a liability on its Statements of Assets and Liabilities. The Fund presents these amounts on a gross basis and does not offset or“net” these amounts on its Statements of Assets and Liabilities.
4 Represents the “uncollateralized” amount due from or (to) the counterparty at period end. These amounts could be due to timing differencesbetween the movement of collateral in relation to market movements, or due to agreement provisions allowing minimum “thresholds” thatwould need to be exceeded prior to the movement of collateral. To the extent that a net amount is due from a counterparty, the Fund would beexposed to the counterparty by such amount and could suffer losses or delays in recovery of that amount in the event of a counterparty default.
(a) The Fund invests in Repurchase Agreements jointly with otherfunds in the Trust. See “Repurchase Agreements” under Note 2in the Notes to Financial Statements to view the details of eachindividual agreement and counterparty as well as a description ofthe securities subjected to repurchase.
(b) Tax basis equals book cost.
Merrill Corp - Proshares Trust Geared Book [96 Funds] Annual Report [Funds] 333-089822 05-31-2017 ED [AUX] | eperez | 28-Jul-17 17:37 | 17-15159-3.fe | Sequence: 2CHKSUM Content: 1062 Layout: 1087 Graphics: No Graphics CLEAN
JOB: 17-15159-3 CYCLE#;BL#: 5; 0 TRIM: 8.25" x 10.75" COMPOSITECOLORS: Black, ~note-color 2, ~note-color 3 GRAPHICS: none V1.5
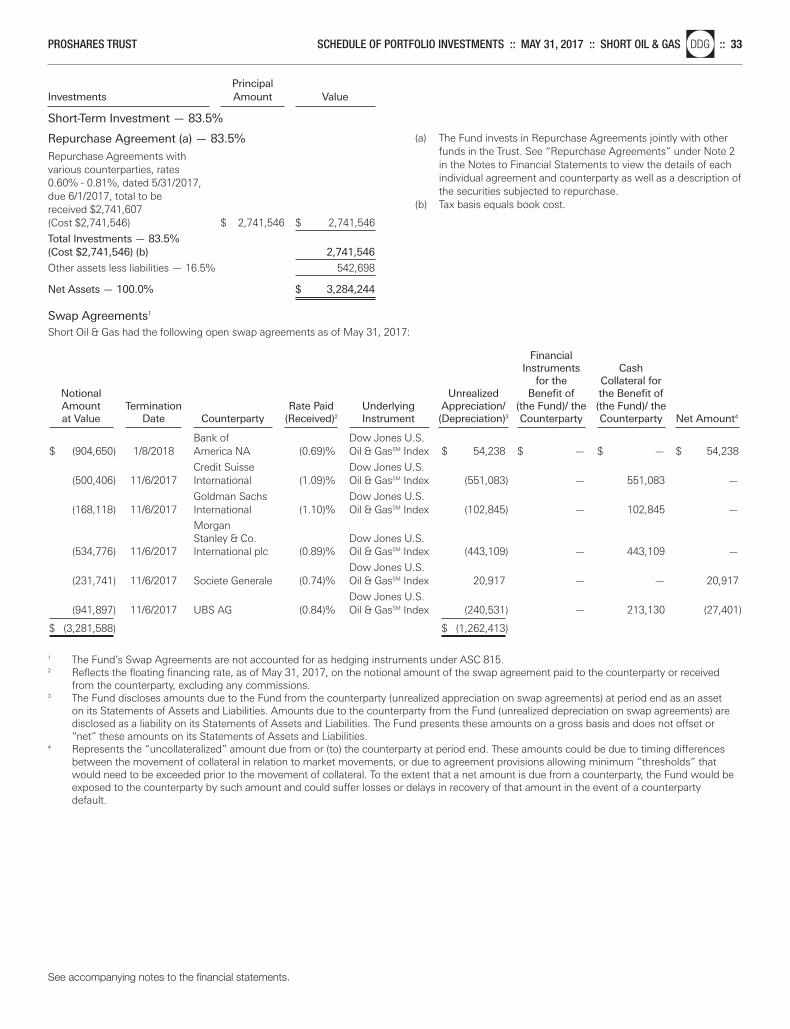
See accompanying notes to the financial statements.
PROSHARES TRUST SCHEDULE OF PORTFOLIO INVESTMENTS :: MAY 31, 2017 :: SHORT OIL & GASnlDDG :: 33
Principal Investments Amount Value
Short-Term Investment — 83.5%
Repurchase Agreement (a) — 83.5%
Repurchase Agreements with various counterparties, rates 0.60% - 0.81%, dated 5/31/2017, due 6/1/2017, total to be received $2,741,607 (Cost $2,741,546) $ 2,741,546 $ 2,741,546
Total Investments — 83.5%(Cost $2,741,546) (b) 2,741,546
Other assets less liabilities — 16.5% 542,698
Net Assets — 100.0% $ 3,284,244
Swap Agreements1
Short Oil & Gas had the following open swap agreements as of May 31, 2017:
Financial Instruments Cash
for the Collateral for Notional Unrealized Benefit of the Benefit of Amount Termination Rate Paid Underlying Appreciation/ (the Fund)/ the (the Fund)/ the at Value Date Counterparty (Received)2 Instrument (Depreciation)3 Counterparty Counterparty Net Amount4
Bank of Dow Jones U.S.
$ (904,650) 1/8/2018 America NA (0.69)% Oil & GasSM Index $ 54,238 $ — $ — $ 54,238
Credit Suisse Dow Jones U.S. (500,406) 11/6/2017 International (1.09)% Oil & GasSM Index (551,083) — 551,083 —
Goldman Sachs Dow Jones U.S. (168,118) 11/6/2017 International (1.10)% Oil & GasSM Index (102,845) — 102,845 —
Morgan Stanley & Co. Dow Jones U.S.
(534,776) 11/6/2017 International plc (0.89)% Oil & GasSM Index (443,109) — 443,109 —
Dow Jones U.S. (231,741) 11/6/2017 Societe Generale (0.74)% Oil & GasSM Index 20,917 — — 20,917
Dow Jones U.S. (941,897) 11/6/2017 UBS AG (0.84)% Oil & GasSM Index (240,531) — 213,130 (27,401)
$ (3,281,588) $ (1,262,413)
1 The Fund’s Swap Agreements are not accounted for as hedging instruments under ASC 815.2 Reflects the floating financing rate, as of May 31, 2017, on the notional amount of the swap agreement paid to the counterparty or received
from the counterparty, excluding any commissions.3 The Fund discloses amounts due to the Fund from the counterparty (unrealized appreciation on swap agreements) at period end as an asset
on its Statements of Assets and Liabilities. Amounts due to the counterparty from the Fund (unrealized depreciation on swap agreements) aredisclosed as a liability on its Statements of Assets and Liabilities. The Fund presents these amounts on a gross basis and does not offset or“net” these amounts on its Statements of Assets and Liabilities.
4 Represents the “uncollateralized” amount due from or (to) the counterparty at period end. These amounts could be due to timing differencesbetween the movement of collateral in relation to market movements, or due to agreement provisions allowing minimum “thresholds” thatwould need to be exceeded prior to the movement of collateral. To the extent that a net amount is due from a counterparty, the Fund would beexposed to the counterparty by such amount and could suffer losses or delays in recovery of that amount in the event of a counterparty default.
(a) The Fund invests in Repurchase Agreements jointly with otherfunds in the Trust. See “Repurchase Agreements” under Note 2in the Notes to Financial Statements to view the details of eachindividual agreement and counterparty as well as a description ofthe securities subjected to repurchase.
(b) Tax basis equals book cost.
Merrill Corp - Proshares Trust Geared Book [96 Funds] Annual Report [Funds] 333-089822 05-31-2017 ED [AUX] | eperez | 28-Jul-17 17:37 | 17-15159-3.fe | Sequence: 3CHKSUM Content: 575 Layout: 41470 Graphics: No Graphics CLEAN
JOB: 17-15159-3 CYCLE#;BL#: 5; 0 TRIM: 8.25" x 10.75" COMPOSITECOLORS: Black, ~note-color 2, ~note-color 3 GRAPHICS: none V1.5
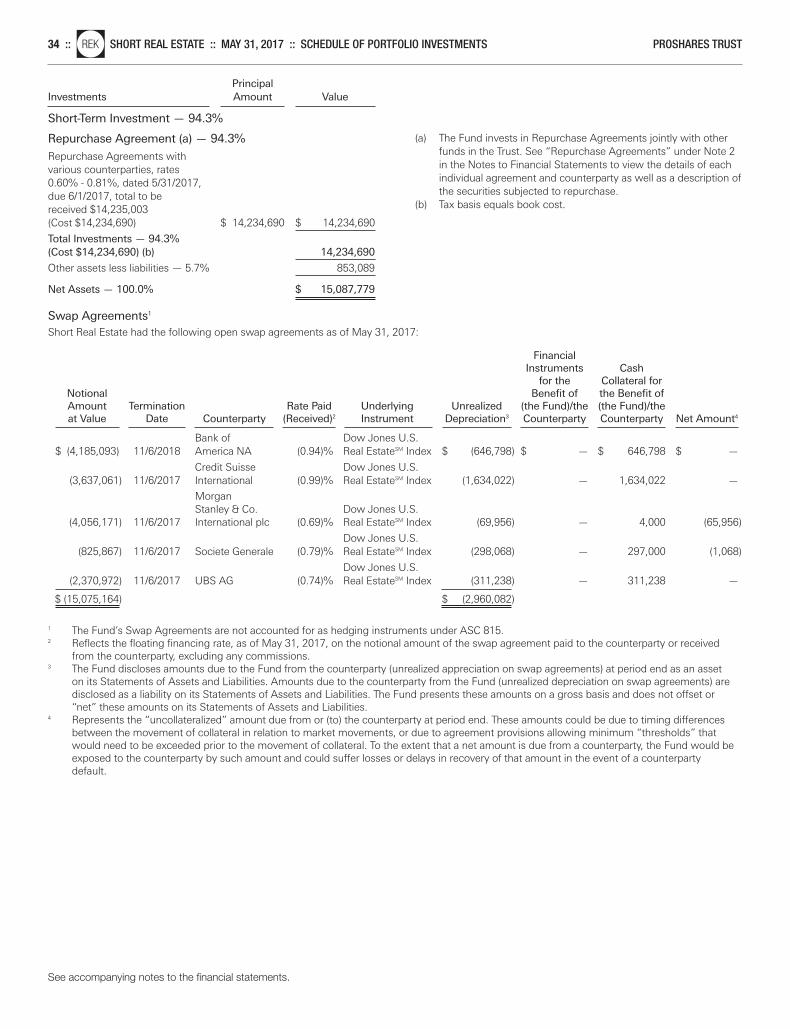
See accompanying notes to the financial statements.
34 ::nlREK SHORT REAL ESTATE :: MAY 31, 2017 :: SCHEDULE OF PORTFOLIO INVESTMENTS PROSHARES TRUST
Principal Investments Amount Value
Short-Term Investment — 94.3%
Repurchase Agreement (a) — 94.3%
Repurchase Agreements with various counterparties, rates 0.60% - 0.81%, dated 5/31/2017, due 6/1/2017, total to be received $14,235,003 (Cost $14,234,690) $ 14,234,690 $ 14,234,690
Total Investments — 94.3%(Cost $14,234,690) (b) 14,234,690
Other assets less liabilities — 5.7% 853,089
Net Assets — 100.0% $ 15,087,779
Swap Agreements1
Short Real Estate had the following open swap agreements as of May 31, 2017:
Financial Instruments Cash
for the Collateral for Notional Benefit of the Benefit of Amount Termination Rate Paid Underlying Unrealized (the Fund)/the (the Fund)/the at Value Date Counterparty (Received)2 Instrument Depreciation3 Counterparty Counterparty Net Amount4
Bank of Dow Jones U.S.
$ (4,185,093) 11/6/2018 America NA (0.94)% Real EstateSM Index $ (646,798) $ — $ 646,798 $ —
Credit Suisse Dow Jones U.S. (3,637,061) 11/6/2017 International (0.99)% Real EstateSM Index (1,634,022) — 1,634,022 —
Morgan Stanley & Co. Dow Jones U.S.
(4,056,171) 11/6/2017 International plc (0.69)% Real EstateSM Index (69,956) — 4,000 (65,956)
Dow Jones U.S. (825,867) 11/6/2017 Societe Generale (0.79)% Real EstateSM Index (298,068) — 297,000 (1,068)
Dow Jones U.S. (2,370,972) 11/6/2017 UBS AG (0.74)% Real EstateSM Index (311,238) — 311,238 —
$ (15,075,164) $ (2,960,082)
1 The Fund’s Swap Agreements are not accounted for as hedging instruments under ASC 815.2 Reflects the floating financing rate, as of May 31, 2017, on the notional amount of the swap agreement paid to the counterparty or received
from the counterparty, excluding any commissions.3 The Fund discloses amounts due to the Fund from the counterparty (unrealized appreciation on swap agreements) at period end as an asset
on its Statements of Assets and Liabilities. Amounts due to the counterparty from the Fund (unrealized depreciation on swap agreements) aredisclosed as a liability on its Statements of Assets and Liabilities. The Fund presents these amounts on a gross basis and does not offset or“net” these amounts on its Statements of Assets and Liabilities.
4 Represents the “uncollateralized” amount due from or (to) the counterparty at period end. These amounts could be due to timing differencesbetween the movement of collateral in relation to market movements, or due to agreement provisions allowing minimum “thresholds” thatwould need to be exceeded prior to the movement of collateral. To the extent that a net amount is due from a counterparty, the Fund would beexposed to the counterparty by such amount and could suffer losses or delays in recovery of that amount in the event of a counterparty default.
(a) The Fund invests in Repurchase Agreements jointly with otherfunds in the Trust. See “Repurchase Agreements” under Note 2in the Notes to Financial Statements to view the details of eachindividual agreement and counterparty as well as a description ofthe securities subjected to repurchase.
(b) Tax basis equals book cost.
Merrill Corp - Proshares Trust Geared Book [96 Funds] Annual Report [Funds] 333-089822 05-31-2017 ED [AUX] | eperez | 28-Jul-17 17:37 | 17-15159-3.fe | Sequence: 4CHKSUM Content: 57867 Layout: 33646 Graphics: No Graphics CLEAN
JOB: 17-15159-3 CYCLE#;BL#: 5; 0 TRIM: 8.25" x 10.75" COMPOSITECOLORS: Black, ~note-color 2, ~note-color 3 GRAPHICS: none V1.5
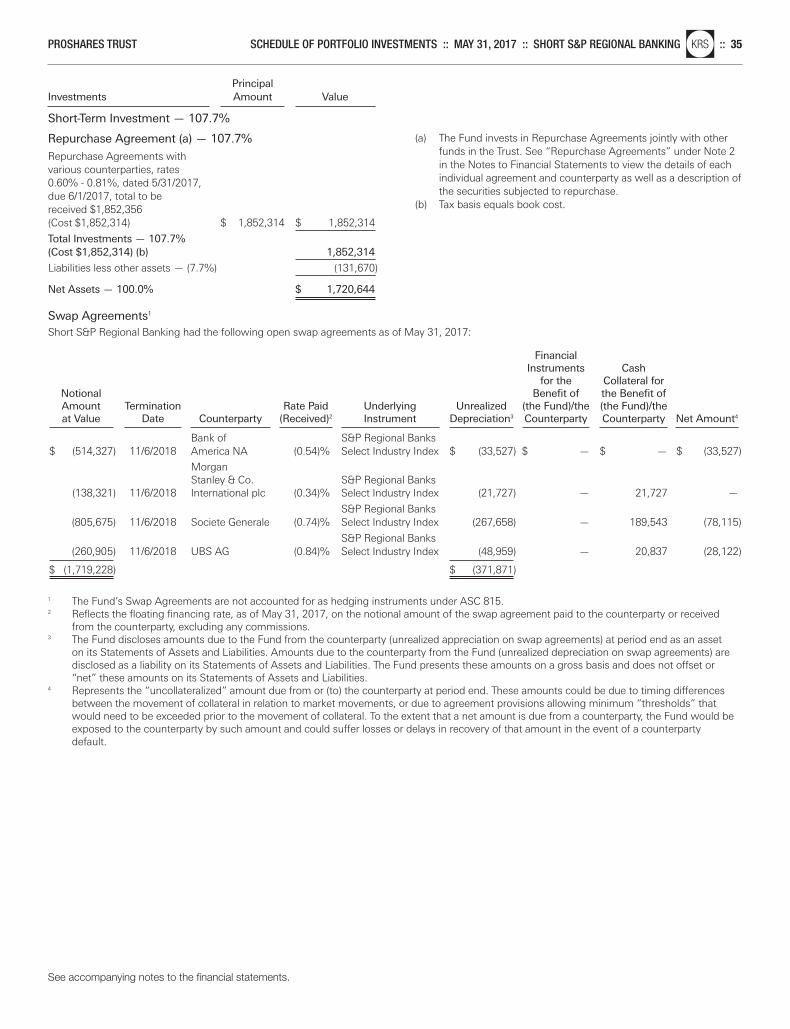
See accompanying notes to the financial statements.
PROSHARES TRUST SCHEDULE OF PORTFOLIO INVESTMENTS :: MAY 31, 2017 :: SHORT S&P REGIONAL BANKINGnlKRS :: 35
Principal Investments Amount Value
Short-Term Investment — 107.7%
Repurchase Agreement (a) — 107.7%
Repurchase Agreements with various counterparties, rates 0.60% - 0.81%, dated 5/31/2017, due 6/1/2017, total to be received $1,852,356 (Cost $1,852,314) $ 1,852,314 $ 1,852,314
Total Investments — 107.7%(Cost $1,852,314) (b) 1,852,314
Liabilities less other assets — (7.7%) (131,670)
Net Assets — 100.0% $ 1,720,644
Swap Agreements1
Short S&P Regional Banking had the following open swap agreements as of May 31, 2017:
Financial Instruments Cash
for the Collateral for Notional Benefit of the Benefit of Amount Termination Rate Paid Underlying Unrealized (the Fund)/the (the Fund)/the at Value Date Counterparty (Received)2 Instrument Depreciation3 Counterparty Counterparty Net Amount4
Bank of S&P Regional Banks
$ (514,327) 11/6/2018 America NA (0.54)% Select Industry Index $ (33,527) $ — $ — $ (33,527)
Morgan Stanley & Co. S&P Regional Banks
(138,321) 11/6/2018 International plc (0.34)% Select Industry Index (21,727) — 21,727 —
S&P Regional Banks (805,675) 11/6/2018 Societe Generale (0.74)% Select Industry Index (267,658) — 189,543 (78,115)
S&P Regional Banks (260,905) 11/6/2018 UBS AG (0.84)% Select Industry Index (48,959) — 20,837 (28,122)
$ (1,719,228) $ (371,871)
1 The Fund’s Swap Agreements are not accounted for as hedging instruments under ASC 815.2 Reflects the floating financing rate, as of May 31, 2017, on the notional amount of the swap agreement paid to the counterparty or received
from the counterparty, excluding any commissions.3 The Fund discloses amounts due to the Fund from the counterparty (unrealized appreciation on swap agreements) at period end as an asset
on its Statements of Assets and Liabilities. Amounts due to the counterparty from the Fund (unrealized depreciation on swap agreements) aredisclosed as a liability on its Statements of Assets and Liabilities. The Fund presents these amounts on a gross basis and does not offset or“net” these amounts on its Statements of Assets and Liabilities.
4 Represents the “uncollateralized” amount due from or (to) the counterparty at period end. These amounts could be due to timing differencesbetween the movement of collateral in relation to market movements, or due to agreement provisions allowing minimum “thresholds” thatwould need to be exceeded prior to the movement of collateral. To the extent that a net amount is due from a counterparty, the Fund would beexposed to the counterparty by such amount and could suffer losses or delays in recovery of that amount in the event of a counterparty
default.
(a) The Fund invests in Repurchase Agreements jointly with otherfunds in the Trust. See “Repurchase Agreements” under Note 2in the Notes to Financial Statements to view the details of eachindividual agreement and counterparty as well as a description ofthe securities subjected to repurchase.
(b) Tax basis equals book cost.
Merrill Corp - Proshares Trust Geared Book [96 Funds] Annual Report [Funds] 333-089822 05-31-2017 ED [AUX] | eperez | 28-Jul-17 17:37 | 17-15159-3.fe | Sequence: 5CHKSUM Content: 64385 Layout: 30599 Graphics: No Graphics CLEAN
JOB: 17-15159-3 CYCLE#;BL#: 5; 0 TRIM: 8.25" x 10.75" COMPOSITECOLORS: Black, ~note-color 2, ~note-color 3 GRAPHICS: none V1.5
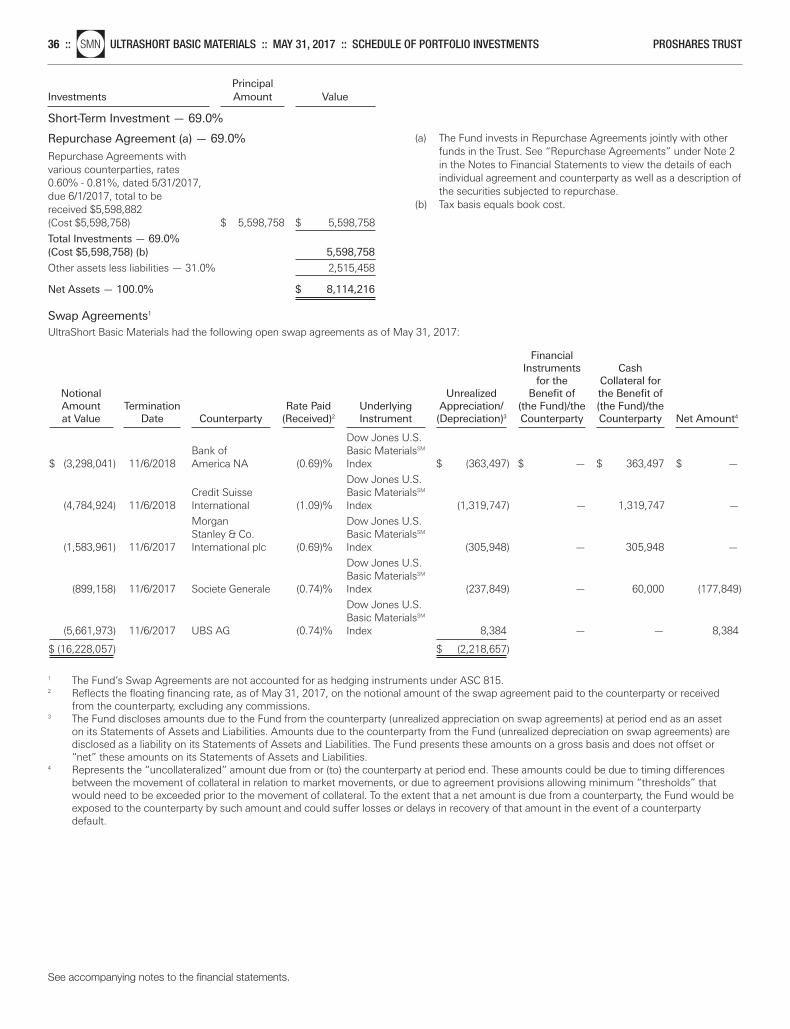
See accompanying notes to the financial statements.
36 ::nlSMN ULTRASHORT BASIC MATERIALS :: MAY 31, 2017 :: SCHEDULE OF PORTFOLIO INVESTMENTS PROSHARES TRUST
Principal Investments Amount Value
Short-Term Investment — 69.0%
Repurchase Agreement (a) — 69.0%
Repurchase Agreements with various counterparties, rates 0.60% - 0.81%, dated 5/31/2017, due 6/1/2017, total to be received $5,598,882 (Cost $5,598,758) $ 5,598,758 $ 5,598,758
Total Investments — 69.0%(Cost $5,598,758) (b) 5,598,758
Other assets less liabilities — 31.0% 2,515,458
Net Assets — 100.0% $ 8,114,216
Swap Agreements1
UltraShort Basic Materials had the following open swap agreements as of May 31, 2017:
Financial Instruments Cash
for the Collateral for Notional Unrealized Benefit of the Benefit of Amount Termination Rate Paid Underlying Appreciation/ (the Fund)/the (the Fund)/the at Value Date Counterparty (Received)2 Instrument (Depreciation)3 Counterparty Counterparty Net Amount4
Dow Jones U.S.
Bank of Basic MaterialsSM $ (3,298,041) 11/6/2018 America NA (0.69)% Index $ (363,497) $ — $ 363,497 $ —
Dow Jones U.S. Credit Suisse Basic MaterialsSM
(4,784,924) 11/6/2018 International (1.09)% Index (1,319,747) — 1,319,747 —
Morgan Dow Jones U.S. Stanley & Co. Basic MaterialsSM
(1,583,961) 11/6/2017 International plc (0.69)% Index (305,948) — 305,948 —
Dow Jones U.S. Basic MaterialsSM
(899,158) 11/6/2017 Societe Generale (0.74)% Index (237,849) — 60,000 (177,849)
Dow Jones U.S. Basic MaterialsSM
(5,661,973) 11/6/2017 UBS AG (0.74)% Index 8,384 — — 8,384
$ (16,228,057) $ (2,218,657)
1 The Fund’s Swap Agreements are not accounted for as hedging instruments under ASC 815.2 Reflects the floating financing rate, as of May 31, 2017, on the notional amount of the swap agreement paid to the counterparty or received
from the counterparty, excluding any commissions.3 The Fund discloses amounts due to the Fund from the counterparty (unrealized appreciation on swap agreements) at period end as an asset
on its Statements of Assets and Liabilities. Amounts due to the counterparty from the Fund (unrealized depreciation on swap agreements) aredisclosed as a liability on its Statements of Assets and Liabilities. The Fund presents these amounts on a gross basis and does not offset or“net” these amounts on its Statements of Assets and Liabilities.
4 Represents the “uncollateralized” amount due from or (to) the counterparty at period end. These amounts could be due to timing differencesbetween the movement of collateral in relation to market movements, or due to agreement provisions allowing minimum “thresholds” thatwould need to be exceeded prior to the movement of collateral. To the extent that a net amount is due from a counterparty, the Fund would beexposed to the counterparty by such amount and could suffer losses or delays in recovery of that amount in the event of a counterparty default.
(a) The Fund invests in Repurchase Agreements jointly with otherfunds in the Trust. See “Repurchase Agreements” under Note 2in the Notes to Financial Statements to view the details of eachindividual agreement and counterparty as well as a description ofthe securities subjected to repurchase.
(b) Tax basis equals book cost.
Merrill Corp - Proshares Trust Geared Book [96 Funds] Annual Report [Funds] 333-089822 05-31-2017 ED [AUX] | eperez | 28-Jul-17 17:37 | 17-15159-3.fe | Sequence: 6CHKSUM Content: 1431 Layout: 42475 Graphics: No Graphics CLEAN
JOB: 17-15159-3 CYCLE#;BL#: 5; 0 TRIM: 8.25" x 10.75" COMPOSITECOLORS: Black, ~note-color 2, ~note-color 3 GRAPHICS: none V1.5
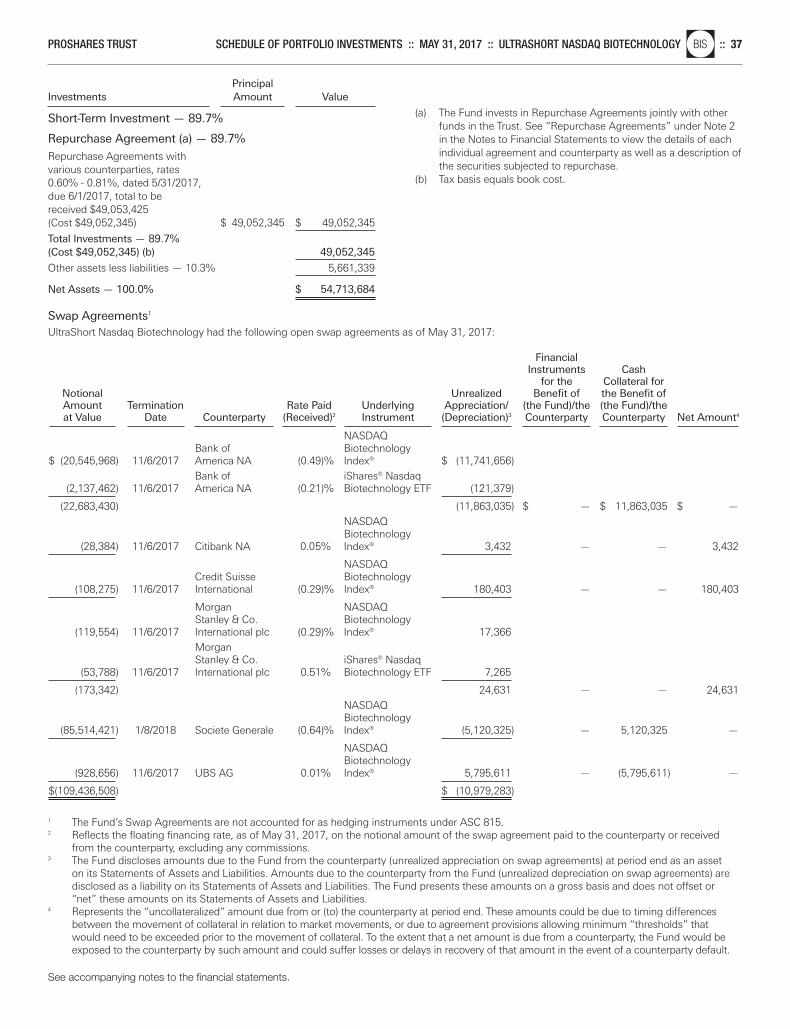
See accompanying notes to the financial statements.
PROSHARES TRUST SCHEDULE OF PORTFOLIO INVESTMENTS :: MAY 31, 2017 :: ULTRASHORT NASDAQ BIOTECHNOLOGYnlBIS :: 37
Principal Investments Amount Value
Short-Term Investment — 89.7%
Repurchase Agreement (a) — 89.7%
Repurchase Agreements with various counterparties, rates 0.60% - 0.81%, dated 5/31/2017, due 6/1/2017, total to be received $49,053,425 (Cost $49,052,345) $ 49,052,345 $ 49,052,345
Total Investments — 89.7%(Cost $49,052,345) (b) 49,052,345
Other assets less liabilities — 10.3% 5,661,339
Net Assets — 100.0% $ 54,713,684
Swap Agreements1
UltraShort Nasdaq Biotechnology had the following open swap agreements as of May 31, 2017:
Financial Instruments Cash
for the Collateral for Notional Unrealized Benefit of the Benefit of Amount Termination Rate Paid Underlying Appreciation/ (the Fund)/the (the Fund)/the at Value Date Counterparty (Received)2 Instrument (Depreciation)3 Counterparty Counterparty Net Amount4
NASDAQ
Bank of Biotechnology $ (20,545,968) 11/6/2017 America NA (0.49)% Index® $ (11,741,656)
Bank of iShares® Nasdaq (2,137,462) 11/6/2017 America NA (0.21)% Biotechnology ETF (121,379)
(22,683,430) (11,863,035) $ — $ 11,863,035 $ —NASDAQ Biotechnology
(28,384) 11/6/2017 Citibank NA 0.05% Index® 3,432 — — 3,432
NASDAQ Credit Suisse Biotechnology
(108,275) 11/6/2017 International (0.29)% Index® 180,403 — — 180,403
Morgan NASDAQ Stanley & Co. Biotechnology
(119,554) 11/6/2017 International plc (0.29)% Index® 17,366 Morgan Stanley & Co. iShares® Nasdaq
(53,788) 11/6/2017 International plc 0.51% Biotechnology ETF 7,265
(173,342) 24,631 — — 24,631NASDAQ Biotechnology
(85,514,421) 1/8/2018 Societe Generale (0.64)% Index® (5,120,325) — 5,120,325 —
NASDAQ Biotechnology
(928,656) 11/6/2017 UBS AG 0.01% Index® 5,795,611 — (5,795,611) —
$(109,436,508) $ (10,979,283)
1 The Fund’s Swap Agreements are not accounted for as hedging instruments under ASC 815.2 Reflects the floating financing rate, as of May 31, 2017, on the notional amount of the swap agreement paid to the counterparty or received
from the counterparty, excluding any commissions.3 The Fund discloses amounts due to the Fund from the counterparty (unrealized appreciation on swap agreements) at period end as an asset
on its Statements of Assets and Liabilities. Amounts due to the counterparty from the Fund (unrealized depreciation on swap agreements) aredisclosed as a liability on its Statements of Assets and Liabilities. The Fund presents these amounts on a gross basis and does not offset or“net” these amounts on its Statements of Assets and Liabilities.
4 Represents the “uncollateralized” amount due from or (to) the counterparty at period end. These amounts could be due to timing differencesbetween the movement of collateral in relation to market movements, or due to agreement provisions allowing minimum “thresholds” thatwould need to be exceeded prior to the movement of collateral. To the extent that a net amount is due from a counterparty, the Fund would beexposed to the counterparty by such amount and could suffer losses or delays in recovery of that amount in the event of a counterparty default.
(a) The Fund invests in Repurchase Agreements jointly with otherfunds in the Trust. See “Repurchase Agreements” under Note 2in the Notes to Financial Statements to view the details of eachindividual agreement and counterparty as well as a description ofthe securities subjected to repurchase.
(b) Tax basis equals book cost.
Merrill Corp - Proshares Trust Geared Book [96 Funds] Annual Report [Funds] 333-089822 05-31-2017 ED [AUX] | eperez | 28-Jul-17 17:37 | 17-15159-3.fe | Sequence: 7CHKSUM Content: 44931 Layout: 3611 Graphics: No Graphics CLEAN
JOB: 17-15159-3 CYCLE#;BL#: 5; 0 TRIM: 8.25" x 10.75" COMPOSITECOLORS: Black, ~note-color 2, ~note-color 3 GRAPHICS: none V1.5
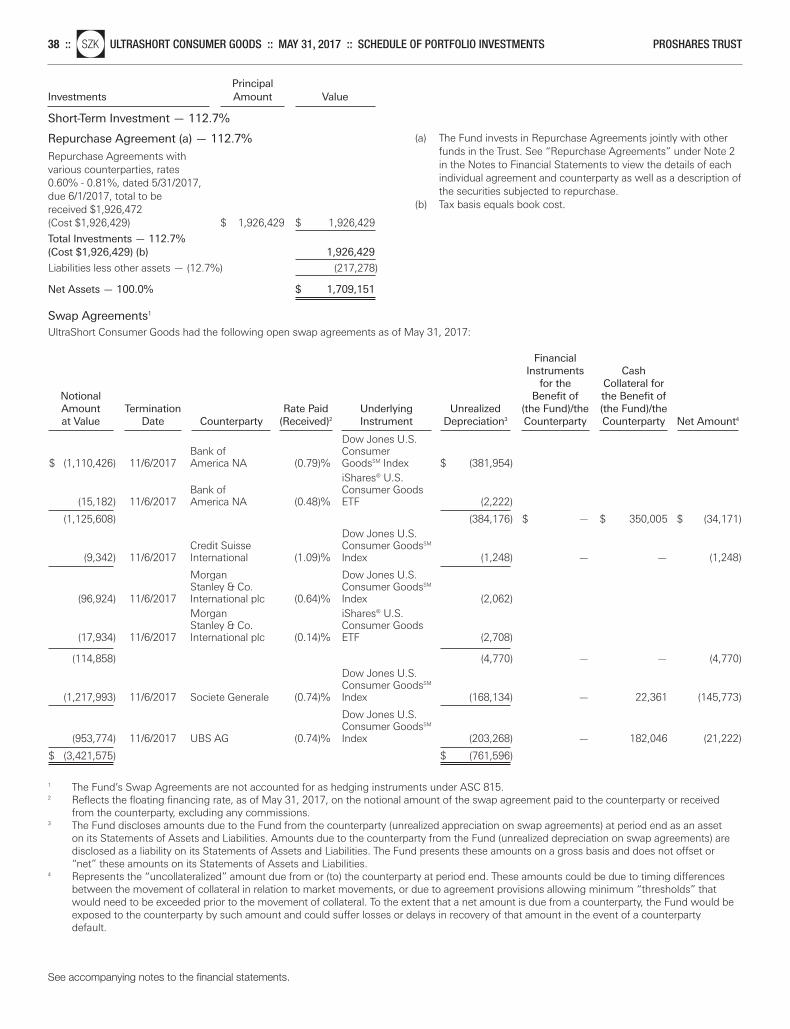
See accompanying notes to the financial statements.
38 ::nlSZK ULTRASHORT CONSUMER GOODS :: MAY 31, 2017 :: SCHEDULE OF PORTFOLIO INVESTMENTS PROSHARES TRUST
Principal Investments Amount Value
Short-Term Investment — 112.7%
Repurchase Agreement (a) — 112.7%
Repurchase Agreements with various counterparties, rates 0.60% - 0.81%, dated 5/31/2017, due 6/1/2017, total to be received $1,926,472 (Cost $1,926,429) $ 1,926,429 $ 1,926,429
Total Investments — 112.7%(Cost $1,926,429) (b) 1,926,429
Liabilities less other assets — (12.7%) (217,278)
Net Assets — 100.0% $ 1,709,151
Swap Agreements1
UltraShort Consumer Goods had the following open swap agreements as of May 31, 2017:
Financial Instruments Cash
for the Collateral for Notional Benefit of the Benefit of Amount Termination Rate Paid Underlying Unrealized (the Fund)/the (the Fund)/the at Value Date Counterparty (Received)2 Instrument Depreciation3 Counterparty Counterparty Net Amount4
Dow Jones U.S.
Bank of Consumer $ (1,110,426) 11/6/2017 America NA (0.79)% GoodsSM Index $ (381,954)
iShares® U.S. Bank of Consumer Goods
(15,182) 11/6/2017 America NA (0.48)% ETF (2,222)
(1,125,608) (384,176) $ — $ 350,005 $ (34,171)Dow Jones U.S.
Credit Suisse Consumer GoodsSM (9,342) 11/6/2017 International (1.09)% Index (1,248) — — (1,248)
Morgan Dow Jones U.S. Stanley & Co. Consumer GoodsSM
(96,924) 11/6/2017 International plc (0.64)% Index (2,062) Morgan iShares® U.S. Stanley & Co. Consumer Goods
(17,934) 11/6/2017 International plc (0.14)% ETF (2,708)
(114,858) (4,770) — — (4,770)Dow Jones U.S. Consumer GoodsSM
(1,217,993) 11/6/2017 Societe Generale (0.74)% Index (168,134) — 22,361 (145,773)
Dow Jones U.S. Consumer GoodsSM
(953,774) 11/6/2017 UBS AG (0.74)% Index (203,268) — 182,046 (21,222)
$ (3,421,575) $ (761,596)
1 The Fund’s Swap Agreements are not accounted for as hedging instruments under ASC 815.2 Reflects the floating financing rate, as of May 31, 2017, on the notional amount of the swap agreement paid to the counterparty or received
from the counterparty, excluding any commissions.3 The Fund discloses amounts due to the Fund from the counterparty (unrealized appreciation on swap agreements) at period end as an asset
on its Statements of Assets and Liabilities. Amounts due to the counterparty from the Fund (unrealized depreciation on swap agreements) aredisclosed as a liability on its Statements of Assets and Liabilities. The Fund presents these amounts on a gross basis and does not offset or“net” these amounts on its Statements of Assets and Liabilities.
4 Represents the “uncollateralized” amount due from or (to) the counterparty at period end. These amounts could be due to timing differencesbetween the movement of collateral in relation to market movements, or due to agreement provisions allowing minimum “thresholds” thatwould need to be exceeded prior to the movement of collateral. To the extent that a net amount is due from a counterparty, the Fund would beexposed to the counterparty by such amount and could suffer losses or delays in recovery of that amount in the event of a counterparty default.
(a) The Fund invests in Repurchase Agreements jointly with otherfunds in the Trust. See “Repurchase Agreements” under Note 2in the Notes to Financial Statements to view the details of eachindividual agreement and counterparty as well as a description ofthe securities subjected to repurchase.
(b) Tax basis equals book cost.
Merrill Corp - Proshares Trust Geared Book [96 Funds] Annual Report [Funds] 333-089822 05-31-2017 ED [AUX] | eperez | 28-Jul-17 17:37 | 17-15159-3.fe | Sequence: 8CHKSUM Content: 47803 Layout: 10252 Graphics: No Graphics CLEAN
JOB: 17-15159-3 CYCLE#;BL#: 5; 0 TRIM: 8.25" x 10.75" COMPOSITECOLORS: Black, ~note-color 2, ~note-color 3 GRAPHICS: none V1.5

See accompanying notes to the financial statements.
PROSHARES TRUST SCHEDULE OF PORTFOLIO INVESTMENTS :: MAY 31, 2017 :: ULTRASHORT CONSUMER SERVICESnlSCC :: 39
Principal Investments Amount Value
Short-Term Investment — 133.0%
Repurchase Agreement (a) — 133.0%
Repurchase Agreements with various counterparties, rates 0.60% - 0.81%, dated 5/31/2017, due 6/1/2017, total to be received $2,362,820 (Cost $2,362,768) $ 2,362,768 $ 2,362,768
Total Investments — 133.0%(Cost $2,362,768) (b) 2,362,768
Liabilities less other assets — (33.0%) (586,417)
Net Assets — 100.0% $ 1,776,351
Swap Agreements1
UltraShort Consumer Services had the following open swap agreements as of May 31, 2017:
Financial Instruments Cash
for the Collateral for Notional Benefit of the Benefit of Amount Termination Rate Paid Underlying Unrealized (the Fund)/the (the Fund)/the at Value Date Counterparty (Received)2 Instrument Depreciation3 Counterparty Counterparty Net Amount4
Dow Jones U.S.
Bank of Consumer $ (314,527) 11/6/2017 America NA (0.84)% ServicesSM Index $ (283,574)
iShares® U.S. Bank of Consumer Services
(20,255) 11/6/2017 America NA (0.48)% ETF (2,540)
(334,782) (286,114) $ — $ 60,000 $ (226,114)
Dow Jones U.S. Credit Suisse Consumer ServicesSM
(144,544) 11/6/2017 International (1.09)% Index (18,196) — — (18,196)
Morgan Dow Jones U.S. Stanley & Co. Consumer ServicesSM
(882,798) 11/6/2017 International plc (0.49)% Index (115,940) Morgan iShares® U.S. Stanley & Co. Consumer Services
(9,908) 11/6/2017 International plc 0.01% ETF (1,310)
(892,706) (117,250) — — (117,250)
Dow Jones U.S. Consumer ServicesSM
(1,819,316) 11/6/2017 Societe Generale (0.74)% Index (232,981) — 26,000 (206,981)
Dow Jones U.S. Consumer ServicesSM
(360,747) 11/6/2017 UBS AG (0.74)% Index (22,599) — 17,000 (5,599)
$ (3,552,095) $ (677,140)
1 The Fund’s Swap Agreements are not accounted for as hedging instruments under ASC 815.2 Reflects the floating financing rate, as of May 31, 2017, on the notional amount of the swap agreement paid to the counterparty or received
from the counterparty, excluding any commissions.3 The Fund discloses amounts due to the Fund from the counterparty (unrealized appreciation on swap agreements) at period end as an asset on
its Statements of Assets and Liabilities. Amounts due to the counterparty from the Fund (unrealized depreciation on swap agreements) are disclosed as a liability on its Statements of Assets and Liabilities. The Fund presents these amounts on a gross basis and does not offset or“net” these amounts on its Statements of Assets and Liabilities.
4 Represents the “uncollateralized” amount due from or (to) the counterparty at period end. These amounts could be due to timing differencesbetween the movement of collateral in relation to market movements, or due to agreement provisions allowing minimum “thresholds” thatwould need to be exceeded prior to the movement of collateral. To the extent that a net amount is due from a counterparty, the Fund would beexposed to the counterparty by such amount and could suffer losses or delays in recovery of that amount in the event of a counterparty default.
(a) The Fund invests in Repurchase Agreements jointly with otherfunds in the Trust. See “Repurchase Agreements” under Note 2in the Notes to Financial Statements to view the details of eachindividual agreement and counterparty as well as a description ofthe securities subjected to repurchase.
(b) Tax basis equals book cost.
Merrill Corp - Proshares Trust Geared Book [96 Funds] Annual Report [Funds] 333-089822 05-31-2017 ED [AUX] | eperez | 28-Jul-17 17:37 | 17-15159-3.fg | Sequence: 1CHKSUM Content: 44116 Layout: 25242 Graphics: No Graphics CLEAN
JOB: 17-15159-3 CYCLE#;BL#: 5; 0 TRIM: 8.25" x 10.75" COMPOSITECOLORS: Black, ~note-color 2, ~note-color 3 GRAPHICS: none V1.5
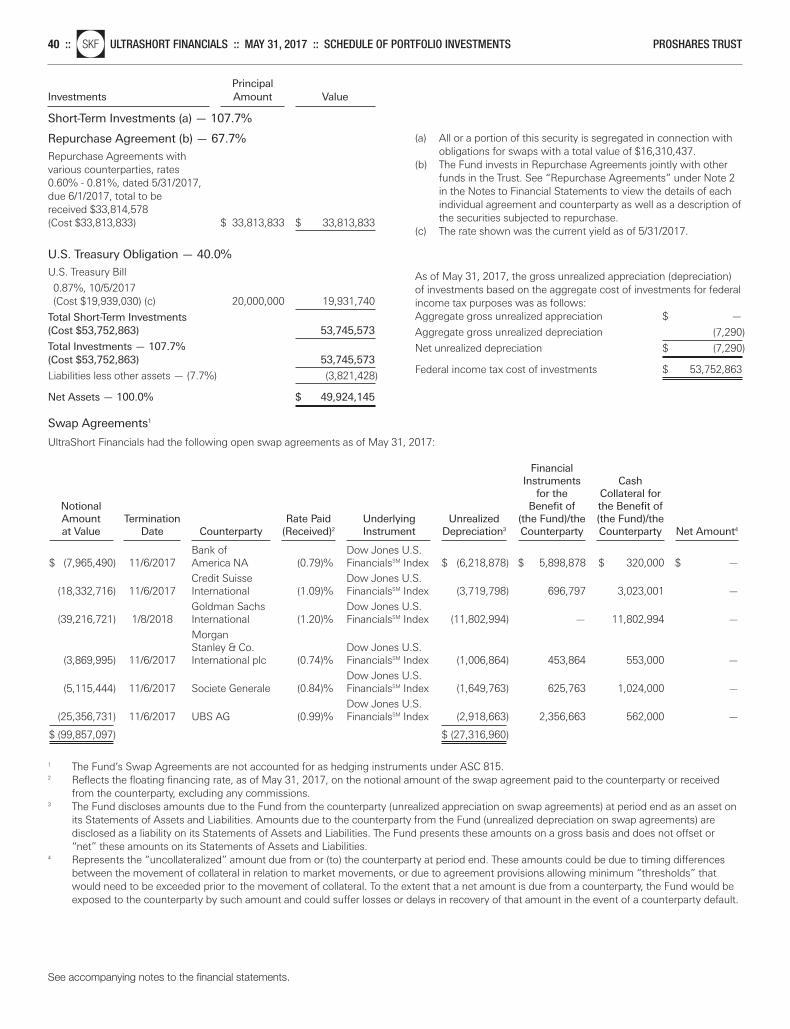
See accompanying notes to the financial statements.
40 ::nlSKF ULTRASHORT FINANCIALS :: MAY 31, 2017 :: SCHEDULE OF PORTFOLIO INVESTMENTS PROSHARES TRUST
Principal Investments Amount Value
Short-Term Investments (a) — 107.7%
Repurchase Agreement (b) — 67.7%
Repurchase Agreements with various counterparties, rates 0.60% - 0.81%, dated 5/31/2017, due 6/1/2017, total to be received $33,814,578 (Cost $33,813,833) $ 33,813,833 $ 33,813,833
U.S. Treasury Obligation — 40.0%
U.S. Treasury Bill
0.87%, 10/5/2017 (Cost $19,939,030) (c) 20,000,000 19,931,740
Total Short-Term Investments(Cost $53,752,863) 53,745,573
Total Investments — 107.7%(Cost $53,752,863) 53,745,573
Liabilities less other assets — (7.7%) (3,821,428)
Net Assets — 100.0% $ 49,924,145
Swap Agreements1
UltraShort Financials had the following open swap agreements as of May 31, 2017:
Financial Instruments Cash
for the Collateral for Notional Benefit of the Benefit of Amount Termination Rate Paid Underlying Unrealized (the Fund)/the (the Fund)/the at Value Date Counterparty (Received)2 Instrument Depreciation3 Counterparty Counterparty Net Amount4
Bank of Dow Jones U.S.
$ (7,965,490) 11/6/2017 America NA (0.79)% FinancialsSM Index $ (6,218,878) $ 5,898,878 $ 320,000 $ —Credit Suisse Dow Jones U.S.
(18,332,716) 11/6/2017 International (1.09)% FinancialsSM Index (3,719,798) 696,797 3,023,001 —Goldman Sachs Dow Jones U.S.
(39,216,721) 1/8/2018 International (1.20)% FinancialsSM Index (11,802,994) — 11,802,994 —Morgan Stanley & Co. Dow Jones U.S.
(3,869,995) 11/6/2017 International plc (0.74)% FinancialsSM Index (1,006,864) 453,864 553,000 —Dow Jones U.S.
(5,115,444) 11/6/2017 Societe Generale (0.84)% FinancialsSM Index (1,649,763) 625,763 1,024,000 —Dow Jones U.S.
(25,356,731) 11/6/2017 UBS AG (0.99)% FinancialsSM Index (2,918,663) 2,356,663 562,000 —
$ (99,857,097) $ (27,316,960)
1 The Fund’s Swap Agreements are not accounted for as hedging instruments under ASC 815.2 Reflects the floating financing rate, as of May 31, 2017, on the notional amount of the swap agreement paid to the counterparty or received
from the counterparty, excluding any commissions.3 The Fund discloses amounts due to the Fund from the counterparty (unrealized appreciation on swap agreements) at period end as an asset on
its Statements of Assets and Liabilities. Amounts due to the counterparty from the Fund (unrealized depreciation on swap agreements) are disclosed as a liability on its Statements of Assets and Liabilities. The Fund presents these amounts on a gross basis and does not offset or“net” these amounts on its Statements of Assets and Liabilities.
4 Represents the “uncollateralized” amount due from or (to) the counterparty at period end. These amounts could be due to timing differencesbetween the movement of collateral in relation to market movements, or due to agreement provisions allowing minimum “thresholds” thatwould need to be exceeded prior to the movement of collateral. To the extent that a net amount is due from a counterparty, the Fund would beexposed to the counterparty by such amount and could suffer losses or delays in recovery of that amount in the event of a counterparty default.
(a) All or a portion of this security is segregated in connection withobligations for swaps with a total value of $16,310,437.
(b) The Fund invests in Repurchase Agreements jointly with otherfunds in the Trust. See “Repurchase Agreements” under Note 2in the Notes to Financial Statements to view the details of eachindividual agreement and counterparty as well as a description ofthe securities subjected to repurchase.
(c) The rate shown was the current yield as of 5/31/2017.
As of May 31, 2017, the gross unrealized appreciation (depreciation)of investments based on the aggregate cost of investments for federalincome tax purposes was as follows:Aggregate gross unrealized appreciation $ —
Aggregate gross unrealized depreciation (7,290)
Net unrealized depreciation $ (7,290)
Federal income tax cost of investments $ 53,752,863
Merrill Corp - Proshares Trust Geared Book [96 Funds] Annual Report [Funds] 333-089822 05-31-2017 ED [AUX] | eperez | 28-Jul-17 17:37 | 17-15159-3.fg | Sequence: 2CHKSUM Content: 59056 Layout: 27648 Graphics: No Graphics CLEAN
JOB: 17-15159-3 CYCLE#;BL#: 5; 0 TRIM: 8.25" x 10.75" COMPOSITECOLORS: Black, ~note-color 2, ~note-color 3 GRAPHICS: none V1.5
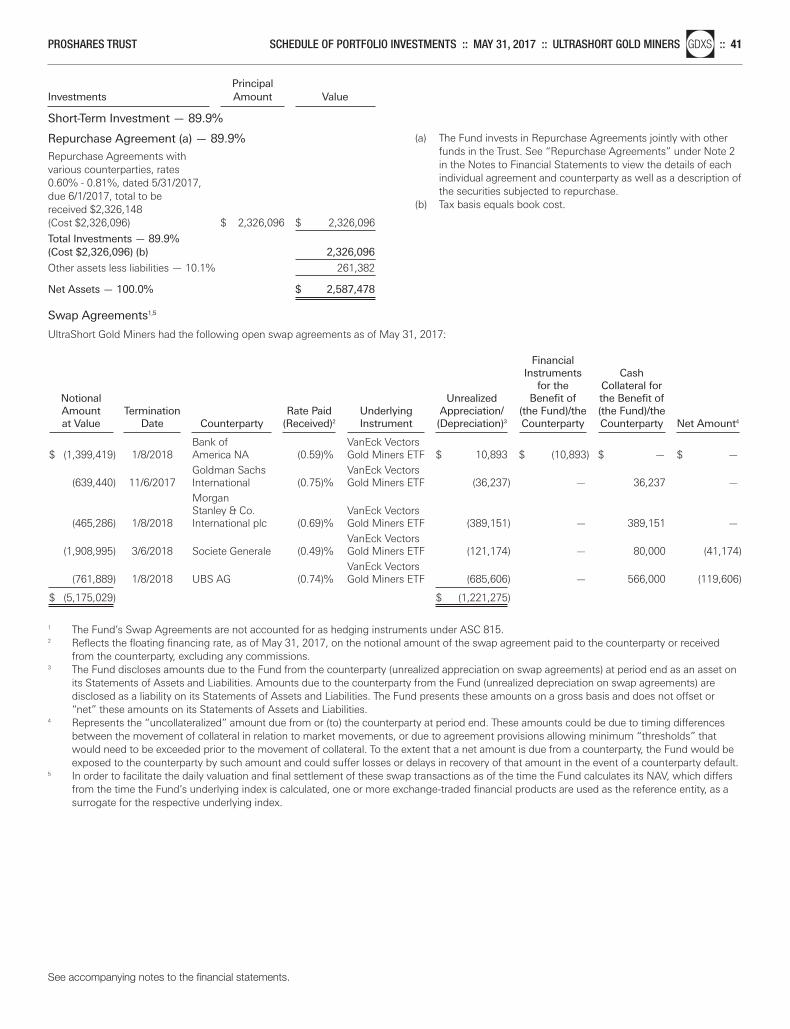
See accompanying notes to the financial statements.
PROSHARES TRUST SCHEDULE OF PORTFOLIO INVESTMENTS :: MAY 31, 2017 :: ULTRASHORT GOLD MINERSnlGDXS :: 41
Principal Investments Amount Value
Short-Term Investment — 89.9%
Repurchase Agreement (a) — 89.9%
Repurchase Agreements with various counterparties, rates 0.60% - 0.81%, dated 5/31/2017, due 6/1/2017, total to be received $2,326,148 (Cost $2,326,096) $ 2,326,096 $ 2,326,096
Total Investments — 89.9%(Cost $2,326,096) (b) 2,326,096
Other assets less liabilities — 10.1% 261,382
Net Assets — 100.0% $ 2,587,478
Swap Agreements1,5
UltraShort Gold Miners had the following open swap agreements as of May 31, 2017:
Financial Instruments Cash
for the Collateral for Notional Unrealized Benefit of the Benefit of Amount Termination Rate Paid Underlying Appreciation/ (the Fund)/the (the Fund)/the at Value Date Counterparty (Received)2 Instrument (Depreciation)3 Counterparty Counterparty Net Amount4
Bank of VanEck Vectors
$ (1,399,419) 1/8/2018 America NA (0.59)% Gold Miners ETF $ 10,893 $ (10,893) $ — $ —Goldman Sachs VanEck Vectors
(639,440) 11/6/2017 International (0.75)% Gold Miners ETF (36,237) — 36,237 —Morgan Stanley & Co. VanEck Vectors
(465,286) 1/8/2018 International plc (0.69)% Gold Miners ETF (389,151) — 389,151 —VanEck Vectors
(1,908,995) 3/6/2018 Societe Generale (0.49)% Gold Miners ETF (121,174) — 80,000 (41,174)VanEck Vectors
(761,889) 1/8/2018 UBS AG (0.74)% Gold Miners ETF (685,606) — 566,000 (119,606)
$ (5,175,029) $ (1,221,275)
1 The Fund’s Swap Agreements are not accounted for as hedging instruments under ASC 815.2 Reflects the floating financing rate, as of May 31, 2017, on the notional amount of the swap agreement paid to the counterparty or received
from the counterparty, excluding any commissions.3 The Fund discloses amounts due to the Fund from the counterparty (unrealized appreciation on swap agreements) at period end as an asset on
its Statements of Assets and Liabilities. Amounts due to the counterparty from the Fund (unrealized depreciation on swap agreements) are disclosed as a liability on its Statements of Assets and Liabilities. The Fund presents these amounts on a gross basis and does not offset or“net” these amounts on its Statements of Assets and Liabilities.
4 Represents the “uncollateralized” amount due from or (to) the counterparty at period end. These amounts could be due to timing differencesbetween the movement of collateral in relation to market movements, or due to agreement provisions allowing minimum “thresholds” thatwould need to be exceeded prior to the movement of collateral. To the extent that a net amount is due from a counterparty, the Fund would beexposed to the counterparty by such amount and could suffer losses or delays in recovery of that amount in the event of a counterparty default.
5 In order to facilitate the daily valuation and final settlement of these swap transactions as of the time the Fund calculates its NAV, which differsfrom the time the Fund’s underlying index is calculated, one or more exchange-traded financial products are used as the reference entity, as asurrogate for the respective underlying index.
(a) The Fund invests in Repurchase Agreements jointly with otherfunds in the Trust. See “Repurchase Agreements” under Note 2in the Notes to Financial Statements to view the details of eachindividual agreement and counterparty as well as a description ofthe securities subjected to repurchase.
(b) Tax basis equals book cost.
Merrill Corp - Proshares Trust Geared Book [96 Funds] Annual Report [Funds] 333-089822 05-31-2017 ED [AUX] | eperez | 28-Jul-17 17:37 | 17-15159-3.fg | Sequence: 3CHKSUM Content: 3188 Layout: 58617 Graphics: No Graphics CLEAN
JOB: 17-15159-3 CYCLE#;BL#: 5; 0 TRIM: 8.25" x 10.75" COMPOSITECOLORS: Black, ~note-color 2, ~note-color 3 GRAPHICS: none V1.5
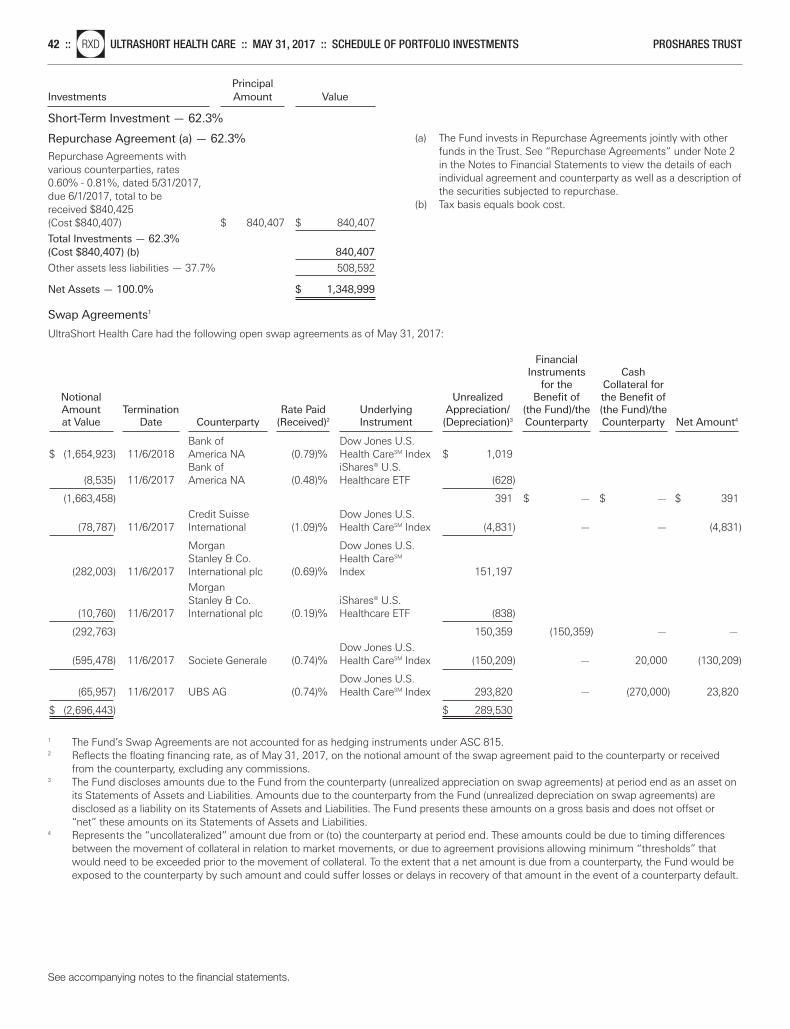
See accompanying notes to the financial statements.
42 ::nlRXD ULTRASHORT HEALTH CARE :: MAY 31, 2017 :: SCHEDULE OF PORTFOLIO INVESTMENTS PROSHARES TRUST
Principal Investments Amount Value
Short-Term Investment — 62.3%
Repurchase Agreement (a) — 62.3%
Repurchase Agreements with various counterparties, rates 0.60% - 0.81%, dated 5/31/2017, due 6/1/2017, total to be received $840,425 (Cost $840,407) $ 840,407 $ 840,407
Total Investments — 62.3%(Cost $840,407) (b) 840,407
Other assets less liabilities — 37.7% 508,592
Net Assets — 100.0% $ 1,348,999
Swap Agreements1
UltraShort Health Care had the following open swap agreements as of May 31, 2017:
Financial Instruments Cash
for the Collateral for Notional Unrealized Benefit of the Benefit of Amount Termination Rate Paid Underlying Appreciation/ (the Fund)/the (the Fund)/the at Value Date Counterparty (Received)2 Instrument (Depreciation)3 Counterparty Counterparty Net Amount4
Bank of Dow Jones U.S.
$ (1,654,923) 11/6/2018 America NA (0.79)% Health CareSM Index $ 1,019 Bank of iShares® U.S.
(8,535) 11/6/2017 America NA (0.48)% Healthcare ETF (628)
(1,663,458) 391 $ — $ — $ 391
Credit Suisse Dow Jones U.S. (78,787) 11/6/2017 International (1.09)% Health CareSM Index (4,831) — — (4,831)
Morgan Dow Jones U.S. Stanley & Co. Health CareSM
(282,003) 11/6/2017 International plc (0.69)% Index 151,197
Morgan Stanley & Co. iShares® U.S.
(10,760) 11/6/2017 International plc (0.19)% Healthcare ETF (838)
(292,763) 150,359 (150,359) — —
Dow Jones U.S. (595,478) 11/6/2017 Societe Generale (0.74)% Health CareSM Index (150,209) — 20,000 (130,209)
Dow Jones U.S. (65,957) 11/6/2017 UBS AG (0.74)% Health CareSM Index 293,820 — (270,000) 23,820
$ (2,696,443) $ 289,530
1 The Fund’s Swap Agreements are not accounted for as hedging instruments under ASC 815.2 Reflects the floating financing rate, as of May 31, 2017, on the notional amount of the swap agreement paid to the counterparty or received
from the counterparty, excluding any commissions.3 The Fund discloses amounts due to the Fund from the counterparty (unrealized appreciation on swap agreements) at period end as an asset on
its Statements of Assets and Liabilities. Amounts due to the counterparty from the Fund (unrealized depreciation on swap agreements) are disclosed as a liability on its Statements of Assets and Liabilities. The Fund presents these amounts on a gross basis and does not offset or“net” these amounts on its Statements of Assets and Liabilities.
4 Represents the “uncollateralized” amount due from or (to) the counterparty at period end. These amounts could be due to timing differencesbetween the movement of collateral in relation to market movements, or due to agreement provisions allowing minimum “thresholds” thatwould need to be exceeded prior to the movement of collateral. To the extent that a net amount is due from a counterparty, the Fund would beexposed to the counterparty by such amount and could suffer losses or delays in recovery of that amount in the event of a counterparty default.
(a) The Fund invests in Repurchase Agreements jointly with otherfunds in the Trust. See “Repurchase Agreements” under Note 2in the Notes to Financial Statements to view the details of eachindividual agreement and counterparty as well as a description ofthe securities subjected to repurchase.
(b) Tax basis equals book cost.
Merrill Corp - Proshares Trust Geared Book [96 Funds] Annual Report [Funds] 333-089822 05-31-2017 ED [AUX] | eperez | 28-Jul-17 17:37 | 17-15159-3.fg | Sequence: 4CHKSUM Content: 52017 Layout: 6748 Graphics: No Graphics CLEAN
JOB: 17-15159-3 CYCLE#;BL#: 5; 0 TRIM: 8.25" x 10.75" COMPOSITECOLORS: Black, ~note-color 2, ~note-color 3 GRAPHICS: none V1.5
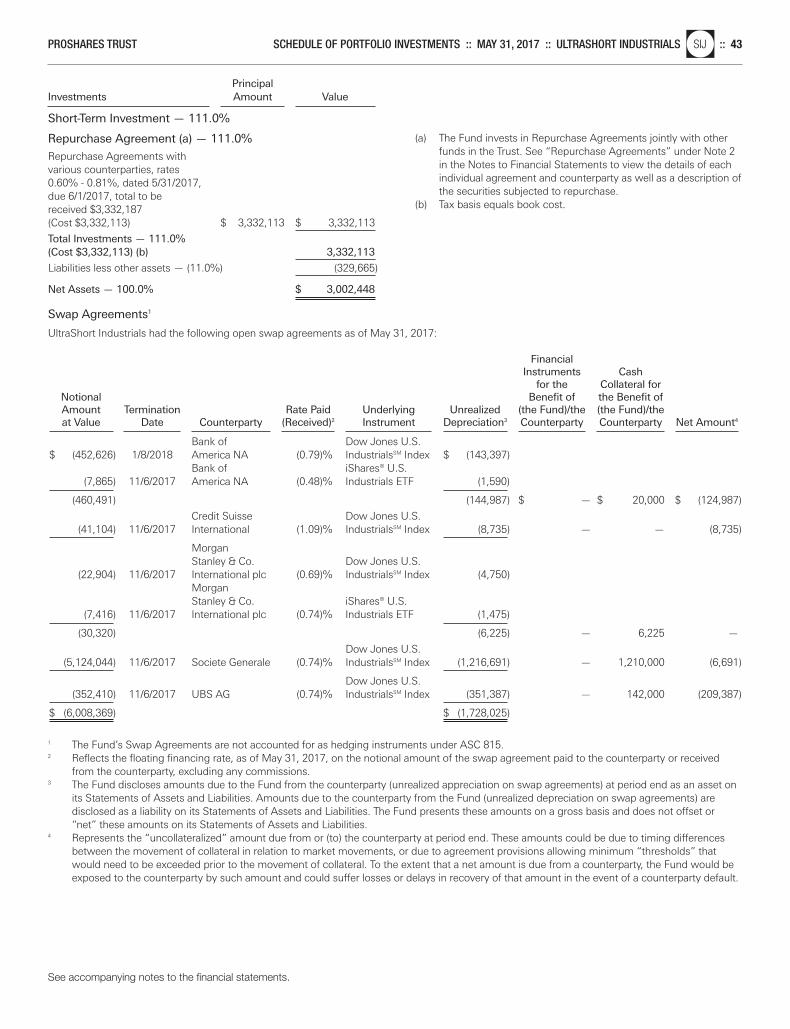
See accompanying notes to the financial statements.
PROSHARES TRUST SCHEDULE OF PORTFOLIO INVESTMENTS :: MAY 31, 2017 :: ULTRASHORT INDUSTRIALSnlSIJ :: 43
Principal Investments Amount Value
Short-Term Investment — 111.0%
Repurchase Agreement (a) — 111.0%
Repurchase Agreements with various counterparties, rates 0.60% - 0.81%, dated 5/31/2017, due 6/1/2017, total to be received $3,332,187 (Cost $3,332,113) $ 3,332,113 $ 3,332,113
Total Investments — 111.0%(Cost $3,332,113) (b) 3,332,113
Liabilities less other assets — (11.0%) (329,665)
Net Assets — 100.0% $ 3,002,448
Swap Agreements1
UltraShort Industrials had the following open swap agreements as of May 31, 2017:
Financial Instruments Cash
for the Collateral for Notional Benefit of the Benefit of Amount Termination Rate Paid Underlying Unrealized (the Fund)/the (the Fund)/the at Value Date Counterparty (Received)2 Instrument Depreciation3 Counterparty Counterparty Net Amount4
Bank of Dow Jones U.S.
$ (452,626) 1/8/2018 America NA (0.79)% IndustrialsSM Index $ (143,397) Bank of iShares® U.S.
(7,865) 11/6/2017 America NA (0.48)% Industrials ETF (1,590)
(460,491) (144,987) $ — $ 20,000 $ (124,987)
Credit Suisse Dow Jones U.S. (41,104) 11/6/2017 International (1.09)% IndustrialsSM Index (8,735) — — (8,735)
Morgan Stanley & Co. Dow Jones U.S.
(22,904) 11/6/2017 International plc (0.69)% IndustrialsSM Index (4,750) Morgan Stanley & Co. iShares® U.S.
(7,416) 11/6/2017 International plc (0.74)% Industrials ETF (1,475)
(30,320) (6,225) — 6,225 —
Dow Jones U.S. (5,124,044) 11/6/2017 Societe Generale (0.74)% IndustrialsSM Index (1,216,691) — 1,210,000 (6,691)
Dow Jones U.S. (352,410) 11/6/2017 UBS AG (0.74)% IndustrialsSM Index (351,387) — 142,000 (209,387)
$ (6,008,369) $ (1,728,025)
1 The Fund’s Swap Agreements are not accounted for as hedging instruments under ASC 815.2 Reflects the floating financing rate, as of May 31, 2017, on the notional amount of the swap agreement paid to the counterparty or received
from the counterparty, excluding any commissions.3 The Fund discloses amounts due to the Fund from the counterparty (unrealized appreciation on swap agreements) at period end as an asset on
its Statements of Assets and Liabilities. Amounts due to the counterparty from the Fund (unrealized depreciation on swap agreements) are disclosed as a liability on its Statements of Assets and Liabilities. The Fund presents these amounts on a gross basis and does not offset or“net” these amounts on its Statements of Assets and Liabilities.
4 Represents the “uncollateralized” amount due from or (to) the counterparty at period end. These amounts could be due to timing differencesbetween the movement of collateral in relation to market movements, or due to agreement provisions allowing minimum “thresholds” thatwould need to be exceeded prior to the movement of collateral. To the extent that a net amount is due from a counterparty, the Fund would beexposed to the counterparty by such amount and could suffer losses or delays in recovery of that amount in the event of a counterparty default.
(a) The Fund invests in Repurchase Agreements jointly with otherfunds in the Trust. See “Repurchase Agreements” under Note 2in the Notes to Financial Statements to view the details of eachindividual agreement and counterparty as well as a description ofthe securities subjected to repurchase.
(b) Tax basis equals book cost.
Merrill Corp - Proshares Trust Geared Book [96 Funds] Annual Report [Funds] 333-089822 05-31-2017 ED [AUX] | eperez | 28-Jul-17 17:37 | 17-15159-3.fg | Sequence: 5CHKSUM Content: 16577 Layout: 3156 Graphics: No Graphics CLEAN
JOB: 17-15159-3 CYCLE#;BL#: 5; 0 TRIM: 8.25" x 10.75" COMPOSITECOLORS: Black, ~note-color 2, ~note-color 3 GRAPHICS: none V1.5
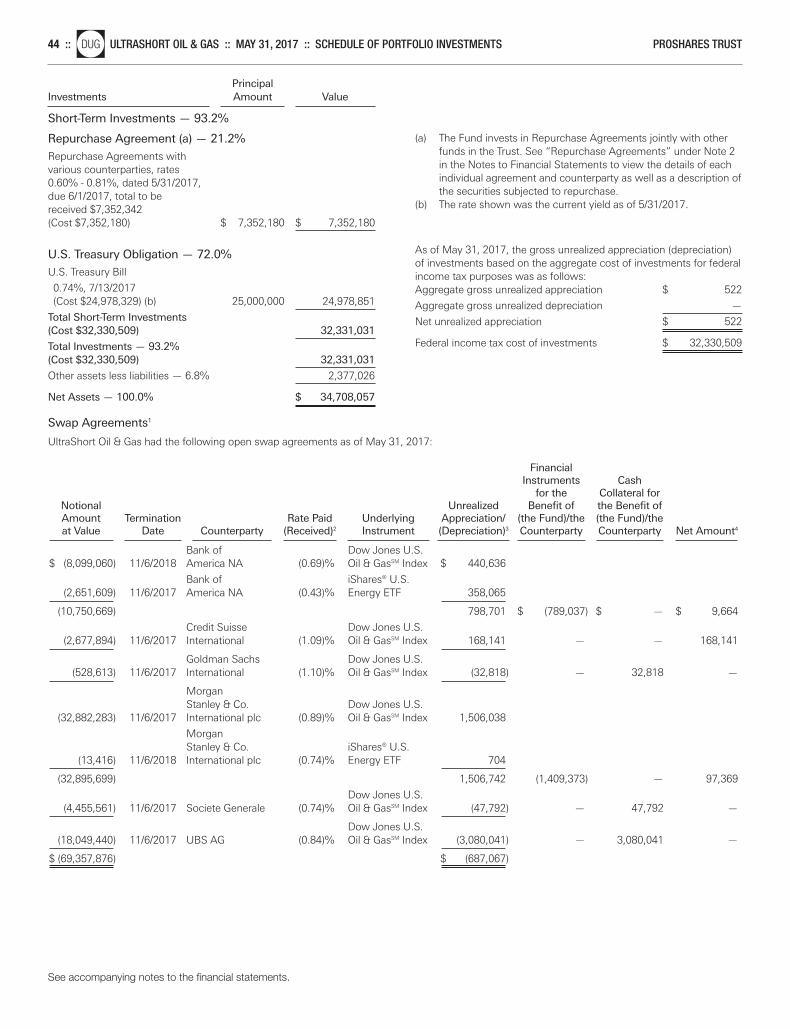
See accompanying notes to the financial statements.
44 ::nlDUG ULTRASHORT OIL & GAS :: MAY 31, 2017 :: SCHEDULE OF PORTFOLIO INVESTMENTS PROSHARES TRUST
Principal Investments Amount Value
Short-Term Investments — 93.2%
Repurchase Agreement (a) — 21.2%
Repurchase Agreements with various counterparties, rates 0.60% - 0.81%, dated 5/31/2017, due 6/1/2017, total to be received $7,352,342 (Cost $7,352,180) $ 7,352,180 $ 7,352,180
U.S. Treasury Obligation — 72.0%
U.S. Treasury Bill
0.74%, 7/13/2017 (Cost $24,978,329) (b) 25,000,000 24,978,851
Total Short-Term Investments(Cost $32,330,509) 32,331,031
Total Investments — 93.2%(Cost $32,330,509) 32,331,031
Other assets less liabilities — 6.8% 2,377,026
Net Assets — 100.0% $ 34,708,057
Swap Agreements1
UltraShort Oil & Gas had the following open swap agreements as of May 31, 2017:
Financial Instruments Cash
for the Collateral for Notional Unrealized Benefit of the Benefit of Amount Termination Rate Paid Underlying Appreciation/ (the Fund)/the (the Fund)/the at Value Date Counterparty (Received)2 Instrument (Depreciation)3 Counterparty Counterparty Net Amount4
Bank of Dow Jones U.S.
$ (8,099,060) 11/6/2018 America NA (0.69)% Oil & GasSM Index $ 440,636
Bank of iShares® U.S. (2,651,609) 11/6/2017 America NA (0.43)% Energy ETF 358,065
(10,750,669) 798,701 $ (789,037) $ — $ 9,664
Credit Suisse Dow Jones U.S. (2,677,894) 11/6/2017 International (1.09)% Oil & GasSM Index 168,141 — — 168,141
Goldman Sachs Dow Jones U.S. (528,613) 11/6/2017 International (1.10)% Oil & GasSM Index (32,818) — 32,818 —
Morgan Stanley & Co. Dow Jones U.S.
(32,882,283) 11/6/2017 International plc (0.89)% Oil & GasSM Index 1,506,038
Morgan Stanley & Co. iShares® U.S.
(13,416) 11/6/2018 International plc (0.74)% Energy ETF 704
(32,895,699) 1,506,742 (1,409,373) — 97,369
Dow Jones U.S. (4,455,561) 11/6/2017 Societe Generale (0.74)% Oil & GasSM Index (47,792) — 47,792 —
Dow Jones U.S. (18,049,440) 11/6/2017 UBS AG (0.84)% Oil & GasSM Index (3,080,041) — 3,080,041 —
$ (69,357,876) $ (687,067)
(a) The Fund invests in Repurchase Agreements jointly with otherfunds in the Trust. See “Repurchase Agreements” under Note 2in the Notes to Financial Statements to view the details of eachindividual agreement and counterparty as well as a description ofthe securities subjected to repurchase.
(b) The rate shown was the current yield as of 5/31/2017.
As of May 31, 2017, the gross unrealized appreciation (depreciation)of investments based on the aggregate cost of investments for federalincome tax purposes was as follows:Aggregate gross unrealized appreciation $ 522
Aggregate gross unrealized depreciation —
Net unrealized appreciation $ 522
Federal income tax cost of investments $ 32,330,509
Merrill Corp - Proshares Trust Geared Book [96 Funds] Annual Report [Funds] 333-089822 05-31-2017 ED [AUX] | eperez | 28-Jul-17 17:37 | 17-15159-3.fg | Sequence: 6CHKSUM Content: 22566 Layout: 5222 Graphics: No Graphics CLEAN
JOB: 17-15159-3 CYCLE#;BL#: 5; 0 TRIM: 8.25" x 10.75" COMPOSITECOLORS: Black, ~note-color 2, ~note-color 3 GRAPHICS: none V1.5

See accompanying notes to the financial statements.
PROSHARES TRUST SCHEDULE OF PORTFOLIO INVESTMENTS :: MAY 31, 2017 :: ULTRASHORT OIL & GASnlDUG :: 45
1 The Fund’s Swap Agreements are not accounted for as hedging instruments under ASC 815.2 Reflects the floating financing rate, as of May 31, 2017, on the notional amount of the swap agreement paid to the counterparty or received
from the counterparty, excluding any commissions.3 The Fund discloses amounts due to the Fund from the counterparty (unrealized appreciation on swap agreements) at period end as an asset on
its Statements of Assets and Liabilities. Amounts due to the counterparty from the Fund (unrealized depreciation on swap agreements) are disclosed as a liability on its Statements of Assets and Liabilities. The Fund presents these amounts on a gross basis and does not offset or“net” these amounts on its Statements of Assets and Liabilities.
4 Represents the “uncollateralized” amount due from or (to) the counterparty at period end. These amounts could be due to timing differencesbetween the movement of collateral in relation to market movements, or due to agreement provisions allowing minimum “thresholds” thatwould need to be exceeded prior to the movement of collateral. To the extent that a net amount is due from a counterparty, the Fund would beexposed to the counterparty by such amount and could suffer losses or delays in recovery of that amount in the event of a counterparty default.
Merrill Corp - Proshares Trust Geared Book [96 Funds] Annual Report [Funds] 333-089822 05-31-2017 ED [AUX] | eperez | 28-Jul-17 17:37 | 17-15159-3.fg | Sequence: 7CHKSUM Content: 26639 Layout: 59251 Graphics: No Graphics CLEAN
JOB: 17-15159-3 CYCLE#;BL#: 5; 0 TRIM: 8.25" x 10.75" COMPOSITECOLORS: Black, ~note-color 2, ~note-color 3 GRAPHICS: none V1.5
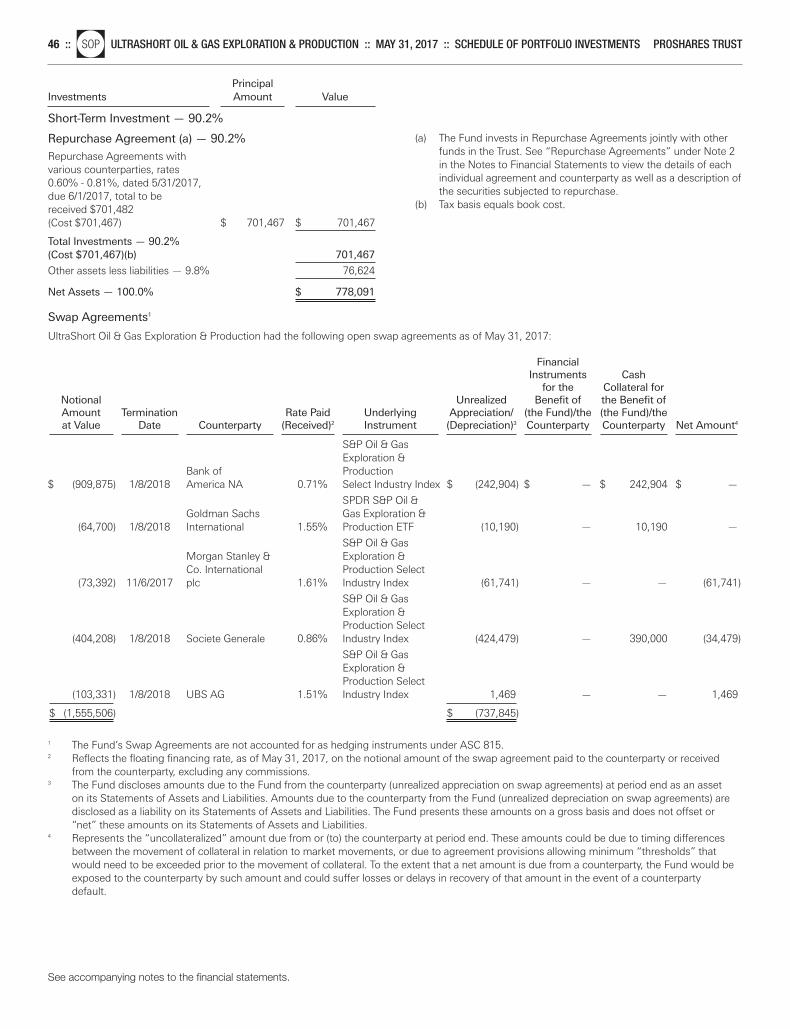
See accompanying notes to the financial statements.
46 ::nlSOP ULTRASHORT OIL & GAS EXPLORATION & PRODUCTION :: MAY 31, 2017 :: SCHEDULE OF PORTFOLIO INVESTMENTS PROSHARES TRUST
PrincipalInvestments Amount Value
Short-Term Investment — 90.2%
Repurchase Agreement (a) — 90.2%
Repurchase Agreements with various counterparties, rates 0.60% - 0.81%, dated 5/31/2017, due 6/1/2017, total to be received $701,482 (Cost $701,467) $ 701,467 $ 701,467
Total Investments — 90.2%(Cost $701,467)(b) 701,467
Other assets less liabilities — 9.8% 76,624
Net Assets — 100.0% $ 778,091
Swap Agreements1
UltraShort Oil & Gas Exploration & Production had the following open swap agreements as of May 31, 2017:
Financial Instruments Cash
for the Collateral for Notional Unrealized Benefit of the Benefit of Amount Termination Rate Paid Underlying Appreciation/ (the Fund)/the (the Fund)/the at Value Date Counterparty (Received)2 Instrument (Depreciation)3 Counterparty Counterparty Net Amount4
S&P Oil & Gas Exploration &
Bank of Production $ (909,875) 1/8/2018 America NA 0.71% Select Industry Index $ (242,904) $ — $ 242,904 $ —
SPDR S&P Oil & Goldman Sachs Gas Exploration &
(64,700) 1/8/2018 International 1.55% Production ETF (10,190) — 10,190 —
S&P Oil & Gas Morgan Stanley & Exploration & Co. International Production Select
(73,392) 11/6/2017 plc 1.61% Industry Index (61,741) — — (61,741)
S&P Oil & Gas Exploration & Production Select
(404,208) 1/8/2018 Societe Generale 0.86% Industry Index (424,479) — 390,000 (34,479)
S&P Oil & Gas Exploration & Production Select
(103,331) 1/8/2018 UBS AG 1.51% Industry Index 1,469 — — 1,469
$ (1,555,506) $ (737,845)
1 The Fund’s Swap Agreements are not accounted for as hedging instruments under ASC 815.2 Reflects the floating financing rate, as of May 31, 2017, on the notional amount of the swap agreement paid to the counterparty or received
from the counterparty, excluding any commissions.3 The Fund discloses amounts due to the Fund from the counterparty (unrealized appreciation on swap agreements) at period end as an asset
on its Statements of Assets and Liabilities. Amounts due to the counterparty from the Fund (unrealized depreciation on swap agreements) aredisclosed as a liability on its Statements of Assets and Liabilities. The Fund presents these amounts on a gross basis and does not offset or“net” these amounts on its Statements of Assets and Liabilities.
4 Represents the “uncollateralized” amount due from or (to) the counterparty at period end. These amounts could be due to timing differencesbetween the movement of collateral in relation to market movements, or due to agreement provisions allowing minimum “thresholds” thatwould need to be exceeded prior to the movement of collateral. To the extent that a net amount is due from a counterparty, the Fund would beexposed to the counterparty by such amount and could suffer losses or delays in recovery of that amount in the event of a counterparty default.
(a) The Fund invests in Repurchase Agreements jointly with otherfunds in the Trust. See “Repurchase Agreements” under Note 2in the Notes to Financial Statements to view the details of eachindividual agreement and counterparty as well as a description ofthe securities subjected to repurchase.
(b) Tax basis equals book cost.
Merrill Corp - Proshares Trust Geared Book [96 Funds] Annual Report [Funds] 333-089822 05-31-2017 ED [AUX] | eperez | 28-Jul-17 17:37 | 17-15159-3.fi | Sequence: 1CHKSUM Content: 36731 Layout: 14248 Graphics: No Graphics CLEAN
JOB: 17-15159-3 CYCLE#;BL#: 5; 0 TRIM: 8.25" x 10.75" COMPOSITECOLORS: Black, ~note-color 2, ~note-color 3 GRAPHICS: none V1.5
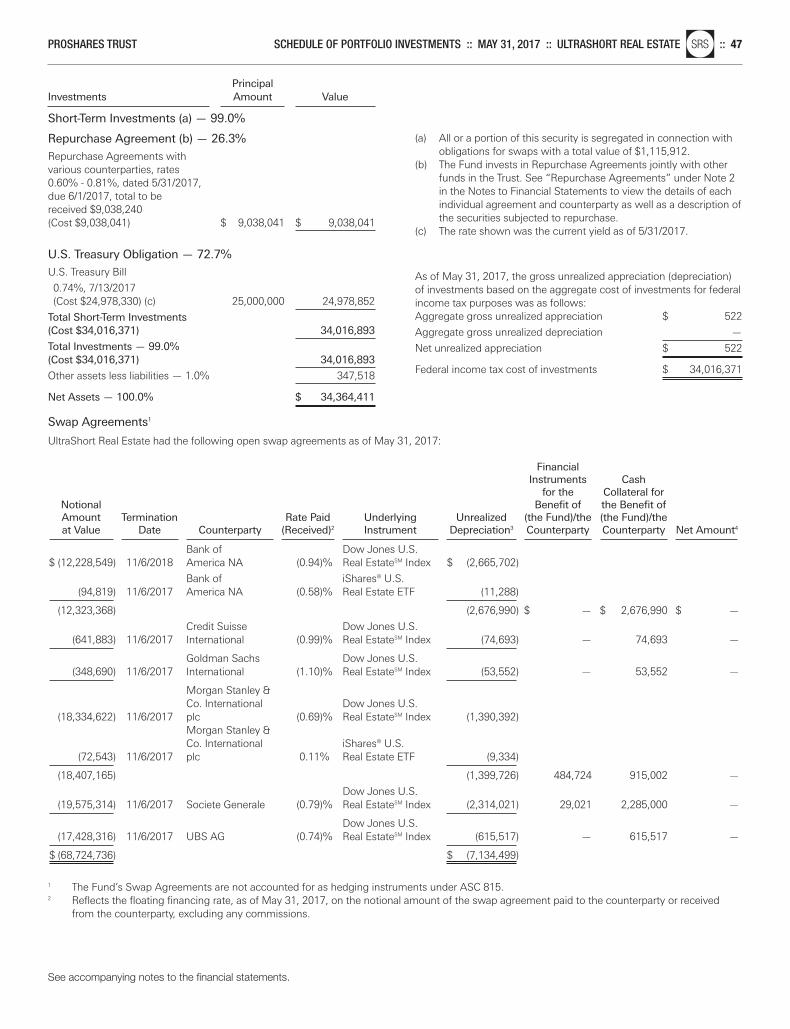
See accompanying notes to the financial statements.
PROSHARES TRUST SCHEDULE OF PORTFOLIO INVESTMENTS :: MAY 31, 2017 :: ULTRASHORT REAL ESTATEnlSRS :: 47
PrincipalInvestments Amount Value
Short-Term Investments (a) — 99.0%
Repurchase Agreement (b) — 26.3%
Repurchase Agreements with various counterparties, rates 0.60% - 0.81%, dated 5/31/2017, due 6/1/2017, total to be received $9,038,240 (Cost $9,038,041) $ 9,038,041 $ 9,038,041
U.S. Treasury Obligation — 72.7%
U.S. Treasury Bill
0.74%, 7/13/2017 (Cost $24,978,330) (c) 25,000,000 24,978,852
Total Short-Term Investments(Cost $34,016,371) 34,016,893
Total Investments — 99.0%(Cost $34,016,371) 34,016,893
Other assets less liabilities — 1.0% 347,518
Net Assets — 100.0% $ 34,364,411
Swap Agreements1
UltraShort Real Estate had the following open swap agreements as of May 31, 2017:
Financial Instruments Cash
for the Collateral for Notional Benefit of the Benefit of Amount Termination Rate Paid Underlying Unrealized (the Fund)/the (the Fund)/the at Value Date Counterparty (Received)2 Instrument Depreciation3 Counterparty Counterparty Net Amount4
Bank of Dow Jones U.S.
$ (12,228,549) 11/6/2018 America NA (0.94)% Real EstateSM Index $ (2,665,702)
Bank of iShares® U.S. (94,819) 11/6/2017 America NA (0.58)% Real Estate ETF (11,288)
(12,323,368) (2,676,990) $ — $ 2,676,990 $ —
Credit Suisse Dow Jones U.S. (641,883) 11/6/2017 International (0.99)% Real EstateSM Index (74,693) — 74,693 —
Goldman Sachs Dow Jones U.S. (348,690) 11/6/2017 International (1.10)% Real EstateSM Index (53,552) — 53,552 —
Morgan Stanley & Co. International Dow Jones U.S.
(18,334,622) 11/6/2017 plc (0.69)% Real EstateSM Index (1,390,392) Morgan Stanley & Co. International iShares® U.S.
(72,543) 11/6/2017 plc 0.11% Real Estate ETF (9,334)
(18,407,165) (1,399,726) 484,724 915,002 —
Dow Jones U.S. (19,575,314) 11/6/2017 Societe Generale (0.79)% Real EstateSM Index (2,314,021) 29,021 2,285,000 —
Dow Jones U.S. (17,428,316) 11/6/2017 UBS AG (0.74)% Real EstateSM Index (615,517) — 615,517 —
$ (68,724,736) $ (7,134,499)
1 The Fund’s Swap Agreements are not accounted for as hedging instruments under ASC 815.2 Reflects the floating financing rate, as of May 31, 2017, on the notional amount of the swap agreement paid to the counterparty or received
from the counterparty, excluding any commissions.
(a) All or a portion of this security is segregated in connection withobligations for swaps with a total value of $1,115,912.
(b) The Fund invests in Repurchase Agreements jointly with otherfunds in the Trust. See “Repurchase Agreements” under Note 2in the Notes to Financial Statements to view the details of eachindividual agreement and counterparty as well as a description ofthe securities subjected to repurchase.
(c) The rate shown was the current yield as of 5/31/2017.
As of May 31, 2017, the gross unrealized appreciation (depreciation)of investments based on the aggregate cost of investments for federalincome tax purposes was as follows:Aggregate gross unrealized appreciation $ 522
Aggregate gross unrealized depreciation —
Net unrealized appreciation $ 522
Federal income tax cost of investments $ 34,016,371
Merrill Corp - Proshares Trust Geared Book [96 Funds] Annual Report [Funds] 333-089822 05-31-2017 ED [AUX] | eperez | 28-Jul-17 17:37 | 17-15159-3.fi | Sequence: 2CHKSUM Content: 11765 Layout: 30820 Graphics: No Graphics CLEAN
JOB: 17-15159-3 CYCLE#;BL#: 5; 0 TRIM: 8.25" x 10.75" COMPOSITECOLORS: Black, ~note-color 2, ~note-color 3 GRAPHICS: none V1.5
See accompanying notes to the financial statements.
3 The Fund discloses amounts due to the Fund from the counterparty (unrealized appreciation on swap agreements) at period end as an asseton its Statements of Assets and Liabilities. Amounts due to the counterparty from the Fund (unrealized depreciation on swap agreements) aredisclosed as a liability on its Statements of Assets and Liabilities. The Fund presents these amounts on a gross basis and does not offset or“net” these amounts on its Statements of Assets and Liabilities.
4 Represents the “uncollateralized” amount due from or (to) the counterparty at period end. These amounts could be due to timing differencesbetween the movement of collateral in relation to market movements, or due to agreement provisions allowing minimum “thresholds” thatwould need to be exceeded prior to the movement of collateral. To the extent that a net amount is due from a counterparty, the Fund would beexposed to the counterparty by such amount and could suffer losses or delays in recovery of that amount in the event of a counterparty default.
48 ::nlSRS ULTRASHORT REAL ESTATE :: MAY 31, 2017 :: SCHEDULE OF PORTFOLIO INVESTMENTS PROSHARES TRUST
Merrill Corp - Proshares Trust Geared Book [96 Funds] Annual Report [Funds] 333-089822 05-31-2017 ED [AUX] | eperez | 28-Jul-17 17:37 | 17-15159-3.fi | Sequence: 3CHKSUM Content: 20802 Layout: 36688 Graphics: No Graphics CLEAN
JOB: 17-15159-3 CYCLE#;BL#: 5; 0 TRIM: 8.25" x 10.75" COMPOSITECOLORS: Black, ~note-color 2, ~note-color 3 GRAPHICS: none V1.5
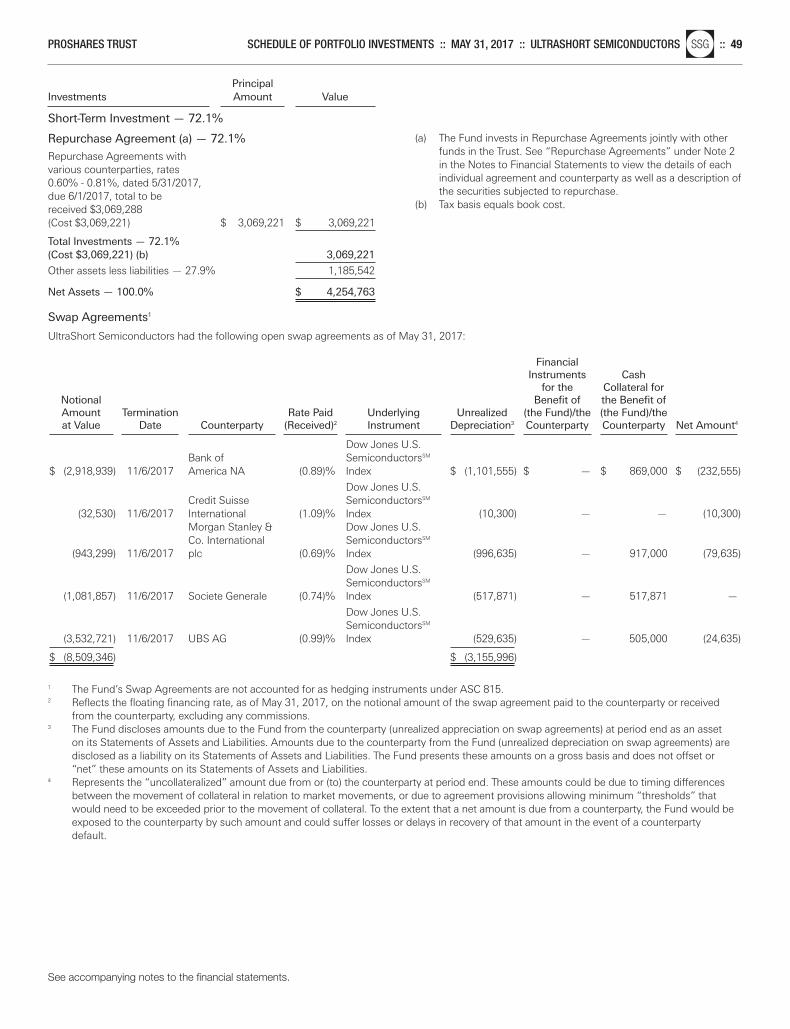
See accompanying notes to the financial statements.
PROSHARES TRUST SCHEDULE OF PORTFOLIO INVESTMENTS :: MAY 31, 2017 :: ULTRASHORT SEMICONDUCTORSnlSSG :: 49
PrincipalInvestments Amount Value
Short-Term Investment — 72.1%
Repurchase Agreement (a) — 72.1%
Repurchase Agreements with various counterparties, rates 0.60% - 0.81%, dated 5/31/2017, due 6/1/2017, total to be received $3,069,288 (Cost $3,069,221) $ 3,069,221 $ 3,069,221
Total Investments — 72.1%(Cost $3,069,221) (b) 3,069,221
Other assets less liabilities — 27.9% 1,185,542
Net Assets — 100.0% $ 4,254,763
Swap Agreements1
UltraShort Semiconductors had the following open swap agreements as of May 31, 2017:
Financial Instruments Cash
for the Collateral for Notional Benefit of the Benefit of Amount Termination Rate Paid Underlying Unrealized (the Fund)/the (the Fund)/the at Value Date Counterparty (Received)2 Instrument Depreciation3 Counterparty Counterparty Net Amount4
Dow Jones U.S.
Bank of SemiconductorsSM $ (2,918,939) 11/6/2017 America NA (0.89)% Index $ (1,101,555) $ — $ 869,000 $ (232,555)
Dow Jones U.S. Credit Suisse SemiconductorsSM
(32,530) 11/6/2017 International (1.09)% Index (10,300) — — (10,300)Morgan Stanley & Dow Jones U.S. Co. International SemiconductorsSM
(943,299) 11/6/2017 plc (0.69)% Index (996,635) — 917,000 (79,635)
Dow Jones U.S. SemiconductorsSM
(1,081,857) 11/6/2017 Societe Generale (0.74)% Index (517,871) — 517,871 —
Dow Jones U.S. SemiconductorsSM
(3,532,721) 11/6/2017 UBS AG (0.99)% Index (529,635) — 505,000 (24,635)
$ (8,509,346) $ (3,155,996)
1 The Fund’s Swap Agreements are not accounted for as hedging instruments under ASC 815.2 Reflects the floating financing rate, as of May 31, 2017, on the notional amount of the swap agreement paid to the counterparty or received
from the counterparty, excluding any commissions.3 The Fund discloses amounts due to the Fund from the counterparty (unrealized appreciation on swap agreements) at period end as an asset
on its Statements of Assets and Liabilities. Amounts due to the counterparty from the Fund (unrealized depreciation on swap agreements) aredisclosed as a liability on its Statements of Assets and Liabilities. The Fund presents these amounts on a gross basis and does not offset or“net” these amounts on its Statements of Assets and Liabilities.
4 Represents the “uncollateralized” amount due from or (to) the counterparty at period end. These amounts could be due to timing differencesbetween the movement of collateral in relation to market movements, or due to agreement provisions allowing minimum “thresholds” thatwould need to be exceeded prior to the movement of collateral. To the extent that a net amount is due from a counterparty, the Fund would beexposed to the counterparty by such amount and could suffer losses or delays in recovery of that amount in the event of a counterparty default.
(a) The Fund invests in Repurchase Agreements jointly with otherfunds in the Trust. See “Repurchase Agreements” under Note 2in the Notes to Financial Statements to view the details of eachindividual agreement and counterparty as well as a description ofthe securities subjected to repurchase.
(b) Tax basis equals book cost.
Merrill Corp - Proshares Trust Geared Book [96 Funds] Annual Report [Funds] 333-089822 05-31-2017 ED [AUX] | eperez | 28-Jul-17 17:37 | 17-15159-3.fi | Sequence: 4CHKSUM Content: 45486 Layout: 60763 Graphics: No Graphics CLEAN
JOB: 17-15159-3 CYCLE#;BL#: 5; 0 TRIM: 8.25" x 10.75" COMPOSITECOLORS: Black, ~note-color 2, ~note-color 3 GRAPHICS: none V1.5
See accompanying notes to the financial statements.
50 ::nlREW ULTRASHORT TECHNOLOGY :: MAY 31, 2017 :: SCHEDULE OF PORTFOLIO INVESTMENTS PROSHARES TRUST
PrincipalInvestments Amount Value
Short-Term Investment — 106.1%
Repurchase Agreement (a) — 106.1%
Repurchase Agreements with various counterparties, rates 0.60% - 0.81%, dated 5/31/2017, due 6/1/2017, total to be received $2,408,865 (Cost $2,408,812) $ 2,408,812 $ 2,408,812
Total Investments — 106.1%(Cost $2,408,812) (b) 2,408,812
Liabilities less other assets — (6.1%) (138,861)
Net Assets — 100.0% $ 2,269,951
Swap Agreements1
UltraShort Technology had the following open swap agreements as of May 31, 2017:
Financial Instruments Cash
for the Collateral for Notional Unrealized Benefit of the Benefit of Amount Termination Rate Paid Underlying Appreciation/ (the Fund)/the (the Fund)/the at Value Date Counterparty (Received)2 Instrument (Depreciation)3 Counterparty Counterparty Net Amount4
Bank of Dow Jones U.S.
$ (393,550) 11/6/2017 America NA (0.89)% TechnologySM Index $ (208,591)
Bank of iShares® U.S. (90,111) 11/6/2017 America NA (0.53)% Technology ETF (15,597)
(483,661) (224,188) $ — $ 224,188 $ —
Credit Suisse Dow Jones U.S. (39,501) 11/6/2017 International (1.09)% TechnologySM Index 9,069 — — 9,069
Morgan Stanley & Co. International Dow Jones U.S.
(310,161) 11/6/2017 plc (0.69)% TechnologySM Index (53,105) Morgan Stanley & Co. International iShares® U.S.
(13,386) 11/6/2017 plc (0.74)% Technology ETF (3,171)
(323,547) (56,276) — 10,000 (46,276)
Dow Jones U.S. (2,771,787) 11/6/2017 Societe Generale (0.74)% TechnologySM Index (1,196,909) — 1,161,000 (35,909)
Dow Jones U.S. (926,323) 11/6/2017 UBS AG (0.74)% TechnologySM Index (771,240) — 690,200 (81,040)
$ (4,544,819) $ (2,239,544)
1 The Fund’s Swap Agreements are not accounted for as hedging instruments under ASC 815.2 Reflects the floating financing rate, as of May 31, 2017, on the notional amount of the swap agreement paid to the counterparty or received
from the counterparty, excluding any commissions.3 The Fund discloses amounts due to the Fund from the counterparty (unrealized appreciation on swap agreements) at period end as an asset
on its Statements of Assets and Liabilities. Amounts due to the counterparty from the Fund (unrealized depreciation on swap agreements) aredisclosed as a liability on its Statements of Assets and Liabilities. The Fund presents these amounts on a gross basis and does not offset or“net” these amounts on its Statements of Assets and Liabilities.
4 Represents the “uncollateralized” amount due from or (to) the counterparty at period end. These amounts could be due to timing differencesbetween the movement of collateral in relation to market movements, or due to agreement provisions allowing minimum “thresholds” thatwould need to be exceeded prior to the movement of collateral. To the extent that a net amount is due from a counterparty, the Fund would beexposed to the counterparty by such amount and could suffer losses or delays in recovery of that amount in the event of a counterparty default.
(a) The Fund invests in Repurchase Agreements jointly with otherfunds in the Trust. See “Repurchase Agreements” under Note 2in the Notes to Financial Statements to view the details of eachindividual agreement and counterparty as well as a description ofthe securities subjected to repurchase.
(b) Tax basis equals book cost.
Merrill Corp - Proshares Trust Geared Book [96 Funds] Annual Report [Funds] 333-089822 05-31-2017 ED [AUX] | eperez | 28-Jul-17 17:37 | 17-15159-3.fi | Sequence: 5CHKSUM Content: 55783 Layout: 39339 Graphics: No Graphics CLEAN
JOB: 17-15159-3 CYCLE#;BL#: 5; 0 TRIM: 8.25" x 10.75" COMPOSITECOLORS: Black, ~note-color 2, ~note-color 3 GRAPHICS: none V1.5
PrincipalInvestments Amount Value
Short-Term Investment — 86.0%
Repurchase Agreement (a) — 86.0%
Repurchase Agreements with various counterparties, rates 0.60% - 0.81%, dated 5/31/2017, due 6/1/2017, total to be received $6,403,751 (Cost $6,403,611) $ 6,403,611 $ 6,403,611
Total Investments — 86.0%(Cost $6,403,611) (b) 6,403,611
Other assets less liabilities — 14.0% 1,043,651
Net Assets — 100.0% $ 7,447,262
Swap Agreements1
UltraShort Utilities had the following open swap agreements as of May 31, 2017:
Financial Instruments Cash
for the Collateral for Notional Benefit of the Benefit of Amount Termination Rate Paid Underlying Unrealized (the Fund)/the (the Fund)/the at Value Date Counterparty (Received)2 Instrument Depreciation3 Counterparty Counterparty Net Amount4
Bank of Dow Jones U.S.
$ (5,641,773) 11/6/2017 America NA (0.79)% UtilitiesSM Index $ (1,478,702) $ — $ 1,478,702 $ —
Credit Suisse Dow Jones U.S. (8,367,491) 11/6/2017 International (1.09)% UtilitiesSM Index (1,590,890) — 1,590,890 —
Morgan Stanley & Co. International Dow Jones U.S.
(132,114) 11/6/2017 plc (0.69)% UtilitiesSM Index (35,028) — 35,028 —
Dow Jones U.S. (398,199) 11/6/2017 Societe Generale (0.74)% UtilitiesSM Index (122,882) — 122,882 —
Dow Jones U.S. (361,561) 11/6/2017 UBS AG (0.74)% UtilitiesSM Index (200,139) — 200,139 —
$ (14,901,138) $ (3,427,641)
1 The Fund’s Swap Agreements are not accounted for as hedging instruments under ASC 815.2 Reflects the floating financing rate, as of May 31, 2017, on the notional amount of the swap agreement paid to the counterparty or received
from the counterparty, excluding any commissions.3 The Fund discloses amounts due to the Fund from the counterparty (unrealized appreciation on swap agreements) at period end as an asset
on its Statements of Assets and Liabilities. Amounts due to the counterparty from the Fund (unrealized depreciation on swap agreements) aredisclosed as a liability on its Statements of Assets and Liabilities. The Fund presents these amounts on a gross basis and does not offset or“net” these amounts on its Statements of Assets and Liabilities.
4 Represents the “uncollateralized” amount due from or (to) the counterparty at period end. These amounts could be due to timing differencesbetween the movement of collateral in relation to market movements, or due to agreement provisions allowing minimum “thresholds” thatwould need to be exceeded prior to the movement of collateral. To the extent that a net amount is due from a counterparty, the Fund would beexposed to the counterparty by such amount and could suffer losses or delays in recovery of that amount in the event of a counterparty default.
(a) The Fund invests in Repurchase Agreements jointly with otherfunds in the Trust. See “Repurchase Agreements” under Note 2in the Notes to Financial Statements to view the details of eachindividual agreement and counterparty as well as a description ofthe securities subjected to repurchase.
(b) Tax basis equals book cost.
See accompanying notes to the financial statements.
PROSHARES TRUST SCHEDULE OF PORTFOLIO INVESTMENTS :: MAY 31, 2017 :: ULTRASHORT UTILITIESnlSDP :: 51
Merrill Corp - Proshares Trust Geared Book [96 Funds] Annual Report [Funds] 333-089822 05-31-2017 ED [AUX] | eperez | 28-Jul-17 17:37 | 17-15159-3.fi | Sequence: 6CHKSUM Content: 36647 Layout: 17275 Graphics: No Graphics CLEAN
JOB: 17-15159-3 CYCLE#;BL#: 5; 0 TRIM: 8.25" x 10.75" COMPOSITECOLORS: Black, ~note-color 2, ~note-color 3 GRAPHICS: none V1.5
PrincipalInvestments Amount Value
Short-Term Investment — 35.6%
Repurchase Agreement (a) — 35.6%
Repurchase Agreements with various counterparties, rates 0.60% - 0.81%, dated 5/31/2017, due 6/1/2017, total to be received $2,528,732 (Cost $2,528,677) $ 2,528,677 $ 2,528,677
Total Investments — 35.6%(Cost $2,528,677) (b) 2,528,677
Other assets less liabilities — 64.4% 4,565,381
Net Assets — 100.0% $ 7,094,058
Swap Agreements1
UltraPro Short Nasdaq Biotechnology had the following open swap agreements as of May 31, 2017:
Financial Instruments Cash
for the Collateral for Notional Unrealized Benefit of the Benefit of Amount Termination Rate Paid Underlying Appreciation/ (the Fund)/the (the Fund)/the at Value Date Counterparty (Received)2 Instrument (Depreciation)3 Counterparty Counterparty Net Amount4
NASDAQ
Bank of Biotechnology $ (6,445,490) 1/8/2018 America NA (0.49)% Index® $ 124,177 $ — $ — $ 124,177
NASDAQ Goldman Sachs Biotechnology
(9,634,417) 1/8/2018 International (0.50)% Index® (123,411) — 123,411 —
NASDAQ Biotechnology
(1,918,971) 1/8/2018 Societe Generale (0.64)% Index® 1,454,879 — (1,454,879) —
NASDAQ Biotechnology
(3,288,330) 1/8/2018 UBS AG 0.01% Index® (866,821) — 866,821 —
$ (21,287,208) $ 588,824
1 The Fund’s Swap Agreements are not accounted for as hedging instruments under ASC 815.2 Reflects the floating financing rate, as of May 31, 2017, on the notional amount of the swap agreement paid to the counterparty or received
from the counterparty, excluding any commissions.3 The Fund discloses amounts due to the Fund from the counterparty (unrealized appreciation on swap agreements) at period end as an asset
on its Statements of Assets and Liabilities. Amounts due to the counterparty from the Fund (unrealized depreciation on swap agreements) aredisclosed as a liability on its Statements of Assets and Liabilities. The Fund presents these amounts on a gross basis and does not offset or“net” these amounts on its Statements of Assets and Liabilities.
4 Represents the “uncollateralized” amount due from or (to) the counterparty at period end. These amounts could be due to timing differencesbetween the movement of collateral in relation to market movements, or due to agreement provisions allowing minimum “thresholds” thatwould need to be exceeded prior to the movement of collateral. To the extent that a net amount is due from a counterparty, the Fund would beexposed to the counterparty by such amount and could suffer losses or delays in recovery of that amount in the event of a counterparty default.
(a) The Fund invests in Repurchase Agreements jointly with otherfunds in the Trust. See “Repurchase Agreements” under Note 2in the Notes to Financial Statements to view the details of eachindividual agreement and counterparty as well as a description ofthe securities subjected to repurchase.
(b) Tax basis equals book cost.
See accompanying notes to the financial statements.
52 ::nlZBIO ULTRAPRO SHORT NASDAQ BIOTECHNOLOGY :: MAY 31, 2017 :: SCHEDULE OF PORTFOLIO INVESTMENTS PROSHARES TRUST
Merrill Corp - Proshares Trust Geared Book [96 Funds] Annual Report [Funds] 333-089822 05-31-2017 ED [AUX] | eperez | 28-Jul-17 17:37 | 17-15159-3.fi | Sequence: 7CHKSUM Content: 36687 Layout: 20365 Graphics: No Graphics CLEAN
JOB: 17-15159-3 CYCLE#;BL#: 5; 0 TRIM: 8.25" x 10.75" COMPOSITECOLORS: Black, ~note-color 2, ~note-color 3 GRAPHICS: none V1.5
PrincipalInvestments Amount Value
Short-Term Investment — 86.7%
Repurchase Agreement (a) — 86.7%
Repurchase Agreements with various counterparties, rates 0.60% - 0.81%, dated 5/31/2017, due 6/1/2017, total to be received $1,917,023 (Cost $1,916,981) $ 1,916,981 $ 1,916,981
Total Investments — 86.7%(Cost $1,916,981) (b) 1,916,981
Other assets less liabilities — 13.3% 293,318
Net Assets — 100.0% $ 2,210,299
Swap Agreements1
UltraPro Short Financial Select Sector had the following open swap agreements as of May 31, 2017:
Financial Instruments Cash
for the Collateral for Notional Unrealized Benefit of the Benefit of Amount Termination Rate Paid Underlying Appreciation/ (the Fund)/the (the Fund)/the at Value Date Counterparty (Received)2 Instrument (Depreciation)3 Counterparty Counterparty Net Amount4
S&P Financial Select
$ (23,969) 11/6/2017 Bank of America NA (0.79)% Sector Index $ 233,009 $ (233,009) $ — $ —
Morgan Stanley & Co. International S&P Financial Select
(2,823,287) 11/6/2017 plc (0.74)% Sector Index (818,206) — 818,206 —
S&P Financial Select (1,987,997) 11/6/2018 Societe Generale (0.84)% Sector Index (80,532) — 50,000 (30,532)
S&P Financial Select (1,797,132) 1/8/2018 UBS AG (0.74)% Sector Index (440,813) — 440,813 —
$ (6,632,385) $ (1,106,542)
1 The Fund’s Swap Agreements are not accounted for as hedging instruments under ASC 815.2 Reflects the floating financing rate, as of May 31, 2017, on the notional amount of the swap agreement paid to the counterparty or received
from the counterparty, excluding any commissions.3 The Fund discloses amounts due to the Fund from the counterparty (unrealized appreciation on swap agreements) at period end as an asset
on its Statements of Assets and Liabilities. Amounts due to the counterparty from the Fund (unrealized depreciation on swap agreements) aredisclosed as a liability on its Statements of Assets and Liabilities. The Fund presents these amounts on a gross basis and does not offset or“net” these amounts on its Statements of Assets and Liabilities.
4 Represents the “uncollateralized” amount due from or (to) the counterparty at period end. These amounts could be due to timing differencesbetween the movement of collateral in relation to market movements, or due to agreement provisions allowing minimum “thresholds” thatwould need to be exceeded prior to the movement of collateral. To the extent that a net amount is due from a counterparty, the Fund would beexposed to the counterparty by such amount and could suffer losses or delays in recovery of that amount in the event of a counterparty default.
(a) The Fund invests in Repurchase Agreements jointly with otherfunds in the Trust. See “Repurchase Agreements” under Note 2in the Notes to Financial Statements to view the details of eachindividual agreement and counterparty as well as a description ofthe securities subjected to repurchase.
(b) Tax basis equals book cost.
See accompanying notes to the financial statements.
PROSHARES TRUST SCHEDULE OF PORTFOLIO INVESTMENTS :: MAY 31, 2017 :: ULTRAPRO SHORT FINANCIAL SELECT SECTORnlFINZ :: 53
Merrill Corp - Proshares Trust Geared Book [96 Funds] Annual Report [Funds] 333-089822 05-31-2017 ED [AUX] | eperez | 28-Jul-17 17:37 | 17-15159-3.fi | Sequence: 8CHKSUM Content: 21934 Layout: 28357 Graphics: No Graphics CLEAN
JOB: 17-15159-3 CYCLE#;BL#: 5; 0 TRIM: 8.25" x 10.75" COMPOSITECOLORS: Black, ~note-color 2, ~note-color 3 GRAPHICS: none V1.5
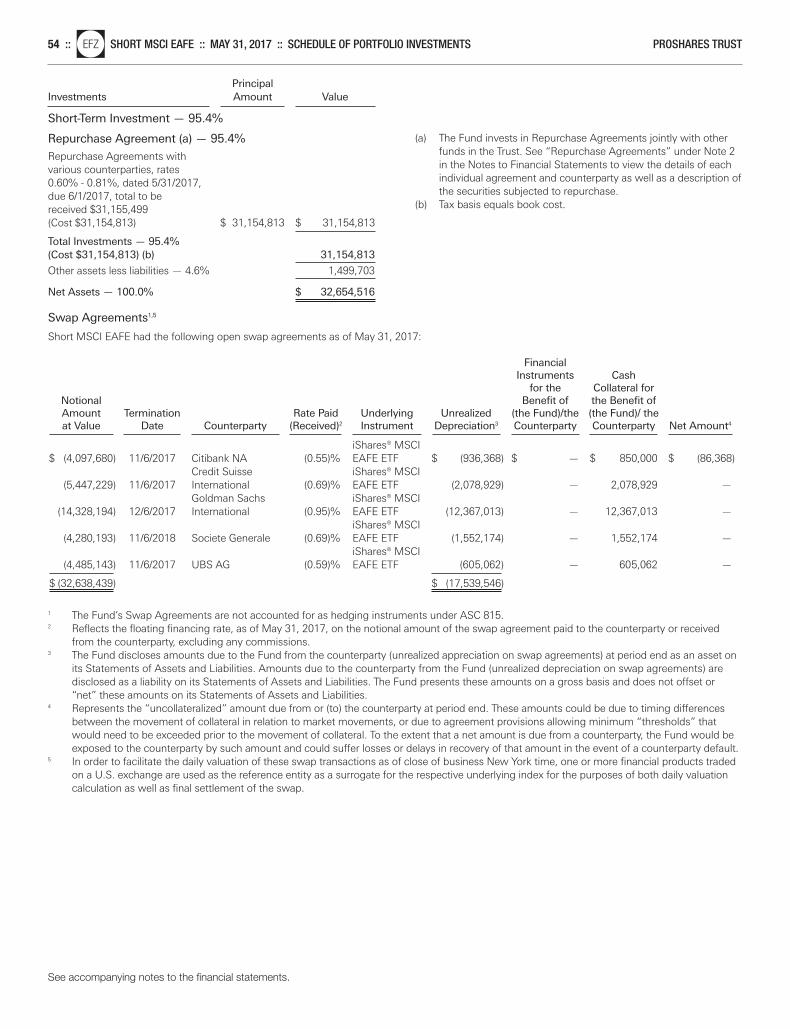
Principal Investments Amount Value
Short-Term Investment — 95.4%
Repurchase Agreement (a) — 95.4%
Repurchase Agreements with various counterparties, rates 0.60% - 0.81%, dated 5/31/2017, due 6/1/2017, total to be received $31,155,499 (Cost $31,154,813) $ 31,154,813 $ 31,154,813
Total Investments — 95.4%(Cost $31,154,813) (b) 31,154,813
Other assets less liabilities — 4.6% 1,499,703
Net Assets — 100.0% $ 32,654,516
Swap Agreements1,5
Short MSCI EAFE had the following open swap agreements as of May 31, 2017:
Financial Instruments Cash
for the Collateral for Notional Benefit of the Benefit of Amount Termination Rate Paid Underlying Unrealized (the Fund)/the (the Fund)/ the at Value Date Counterparty (Received)2 Instrument Depreciation3 Counterparty Counterparty Net Amount4
iShares® MSCI
$ (4,097,680) 11/6/2017 Citibank NA (0.55)% EAFE ETF $ (936,368) $ — $ 850,000 $ (86,368)Credit Suisse iShares® MSCI
(5,447,229) 11/6/2017 International (0.69)% EAFE ETF (2,078,929) — 2,078,929 —Goldman Sachs iShares® MSCI
(14,328,194) 12/6/2017 International (0.95)% EAFE ETF (12,367,013) — 12,367,013 —iShares® MSCI
(4,280,193) 11/6/2018 Societe Generale (0.69)% EAFE ETF (1,552,174) — 1,552,174 —iShares® MSCI
(4,485,143) 11/6/2017 UBS AG (0.59)% EAFE ETF (605,062) — 605,062 —
$ (32,638,439) $ (17,539,546)
1 The Fund’s Swap Agreements are not accounted for as hedging instruments under ASC 815.2 Reflects the floating financing rate, as of May 31, 2017, on the notional amount of the swap agreement paid to the counterparty or received
from the counterparty, excluding any commissions.3 The Fund discloses amounts due to the Fund from the counterparty (unrealized appreciation on swap agreements) at period end as an asset on
its Statements of Assets and Liabilities. Amounts due to the counterparty from the Fund (unrealized depreciation on swap agreements) aredisclosed as a liability on its Statements of Assets and Liabilities. The Fund presents these amounts on a gross basis and does not offset or“net” these amounts on its Statements of Assets and Liabilities.
4 Represents the “uncollateralized” amount due from or (to) the counterparty at period end. These amounts could be due to timing differencesbetween the movement of collateral in relation to market movements, or due to agreement provisions allowing minimum “thresholds” thatwould need to be exceeded prior to the movement of collateral. To the extent that a net amount is due from a counterparty, the Fund would beexposed to the counterparty by such amount and could suffer losses or delays in recovery of that amount in the event of a counterparty default.
5 In order to facilitate the daily valuation of these swap transactions as of close of business New York time, one or more financial products tradedon a U.S. exchange are used as the reference entity as a surrogate for the respective underlying index for the purposes of both daily valuationcalculation as well as final settlement of the swap.
(a) The Fund invests in Repurchase Agreements jointly with otherfunds in the Trust. See “Repurchase Agreements” under Note 2in the Notes to Financial Statements to view the details of eachindividual agreement and counterparty as well as a description ofthe securities subjected to repurchase.
(b) Tax basis equals book cost.
See accompanying notes to the financial statements.
54 ::nlEFZ SHORT MSCI EAFE :: MAY 31, 2017 :: SCHEDULE OF PORTFOLIO INVESTMENTS PROSHARES TRUST
Merrill Corp - Proshares Trust Geared Book [96 Funds] Annual Report [Funds] 333-089822 05-31-2017 ED [AUX] | eperez | 28-Jul-17 17:37 | 17-15159-3.fk | Sequence: 1CHKSUM Content: 47279 Layout: 33993 Graphics: No Graphics CLEAN
JOB: 17-15159-3 CYCLE#;BL#: 5; 0 TRIM: 8.25" x 10.75" COMPOSITECOLORS: Black, ~note-color 2, ~note-color 3 GRAPHICS: none V1.5
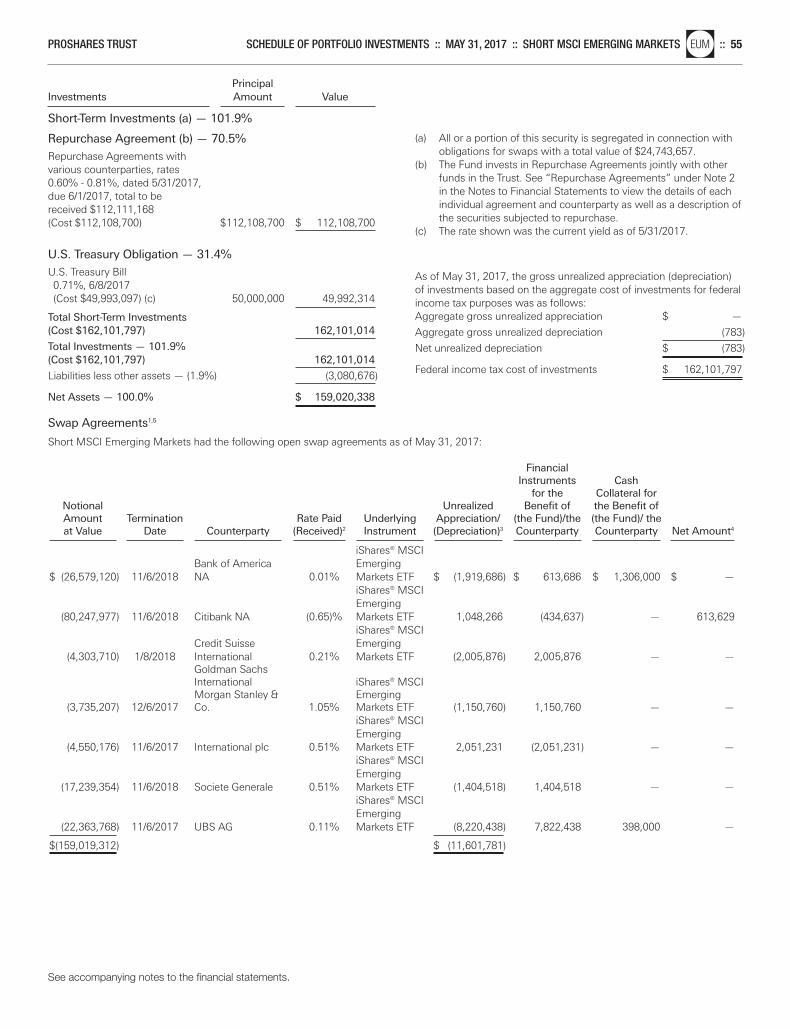
Principal Investments Amount Value
Short-Term Investments (a) — 101.9%
Repurchase Agreement (b) — 70.5%
Repurchase Agreements with various counterparties, rates 0.60% - 0.81%, dated 5/31/2017, due 6/1/2017, total to be received $112,111,168 (Cost $112,108,700) $112,108,700 $ 112,108,700
U.S. Treasury Obligation — 31.4%
U.S. Treasury Bill0.71%, 6/8/2017 (Cost $49,993,097) (c) 50,000,000 49,992,314
Total Short-Term Investments(Cost $162,101,797) 162,101,014
Total Investments — 101.9%(Cost $162,101,797) 162,101,014
Liabilities less other assets — (1.9%) (3,080,676)
Net Assets — 100.0% $ 159,020,338
Swap Agreements1,5
Short MSCI Emerging Markets had the following open swap agreements as of May 31, 2017:
Financial Instruments Cash
for the Collateral for Notional Unrealized Benefit of the Benefit of Amount Termination Rate Paid Underlying Appreciation/ (the Fund)/the (the Fund)/ the at Value Date Counterparty (Received)2 Instrument (Depreciation)3 Counterparty Counterparty Net Amount4
iShares® MSCI
Bank of America Emerging $ (26,579,120) 11/6/2018 NA 0.01% Markets ETF $ (1,919,686) $ 613,686 $ 1,306,000 $ —
iShares® MSCI Emerging
(80,247,977) 11/6/2018 Citibank NA (0.65)% Markets ETF 1,048,266 (434,637) — 613,629iShares® MSCI
Credit Suisse Emerging (4,303,710) 1/8/2018 International 0.21% Markets ETF (2,005,876) 2,005,876 — —
Goldman Sachs International iShares® MSCI Morgan Stanley & Emerging
(3,735,207) 12/6/2017 Co. 1.05% Markets ETF (1,150,760) 1,150,760 — —iShares® MSCI Emerging
(4,550,176) 11/6/2017 International plc 0.51% Markets ETF 2,051,231 (2,051,231) — —iShares® MSCI Emerging
(17,239,354) 11/6/2018 Societe Generale 0.51% Markets ETF (1,404,518) 1,404,518 — —iShares® MSCI Emerging
(22,363,768) 11/6/2017 UBS AG 0.11% Markets ETF (8,220,438) 7,822,438 398,000 —
$(159,019,312) $ (11,601,781)
(a) All or a portion of this security is segregated in connection withobligations for swaps with a total value of $24,743,657.
(b) The Fund invests in Repurchase Agreements jointly with otherfunds in the Trust. See “Repurchase Agreements” under Note 2in the Notes to Financial Statements to view the details of eachindividual agreement and counterparty as well as a description ofthe securities subjected to repurchase.
(c) The rate shown was the current yield as of 5/31/2017.
As of May 31, 2017, the gross unrealized appreciation (depreciation)of investments based on the aggregate cost of investments for federalincome tax purposes was as follows:Aggregate gross unrealized appreciation $ —
Aggregate gross unrealized depreciation (783)
Net unrealized depreciation $ (783)
Federal income tax cost of investments $ 162,101,797
See accompanying notes to the financial statements.
PROSHARES TRUST SCHEDULE OF PORTFOLIO INVESTMENTS :: MAY 31, 2017 :: SHORT MSCI EMERGING MARKETSnlEUM :: 55
Merrill Corp - Proshares Trust Geared Book [96 Funds] Annual Report [Funds] 333-089822 05-31-2017 ED [AUX] | eperez | 28-Jul-17 17:37 | 17-15159-3.fk | Sequence: 2CHKSUM Content: 42778 Layout: 27497 Graphics: No Graphics CLEAN
JOB: 17-15159-3 CYCLE#;BL#: 5; 0 TRIM: 8.25" x 10.75" COMPOSITECOLORS: Black, ~note-color 2, ~note-color 3 GRAPHICS: none V1.5
1 The Fund’s Swap Agreements are not accounted for as hedging instruments under ASC 815.2 Reflects the floating financing rate, as of May 31, 2017, on the notional amount of the swap agreement paid to the counterparty or received
from the counterparty, excluding any commissions.3 The Fund discloses amounts due to the Fund from the counterparty (unrealized appreciation on swap agreements) at period end as an asset on
its Statements of Assets and Liabilities. Amounts due to the counterparty from the Fund (unrealized depreciation on swap agreements) are disclosed as a liability on its Statements of Assets and Liabilities. The Fund presents these amounts on a gross basis and does not offset or“net” these amounts on its Statements of Assets and Liabilities.
4 Represents the “uncollateralized” amount due from or (to) the counterparty at period end. These amounts could be due to timing differencesbetween the movement of collateral in relation to market movements, or due to agreement provisions allowing minimum “thresholds” thatwould need to be exceeded prior to the movement of collateral. To the extent that a net amount is due from a counterparty, the Fund would beexposed to the counterparty by such amount and could suffer losses or delays in recovery of that amount in the event of a counterparty default.
5 In order to facilitate the daily valuation of these swap transactions as of close of business New York time, one or more financial products tradedon a U.S. exchange are used as the reference entity as a surrogate for the respective underlying index for the purposes of both daily valuationcalculation as well as final settlement of the swap.
See accompanying notes to the financial statements.
56 ::nlEUM SHORT MSCI EMERGING MARKETS :: MAY 31, 2017 :: SCHEDULE OF PORTFOLIO INVESTMENTS PROSHARES TRUST
Merrill Corp - Proshares Trust Geared Book [96 Funds] Annual Report [Funds] 333-089822 05-31-2017 ED [AUX] | eperez | 28-Jul-17 17:37 | 17-15159-3.fk | Sequence: 3CHKSUM Content: 23338 Layout: 18904 Graphics: No Graphics CLEAN
JOB: 17-15159-3 CYCLE#;BL#: 5; 0 TRIM: 8.25" x 10.75" COMPOSITECOLORS: Black, ~note-color 2, ~note-color 3 GRAPHICS: none V1.5
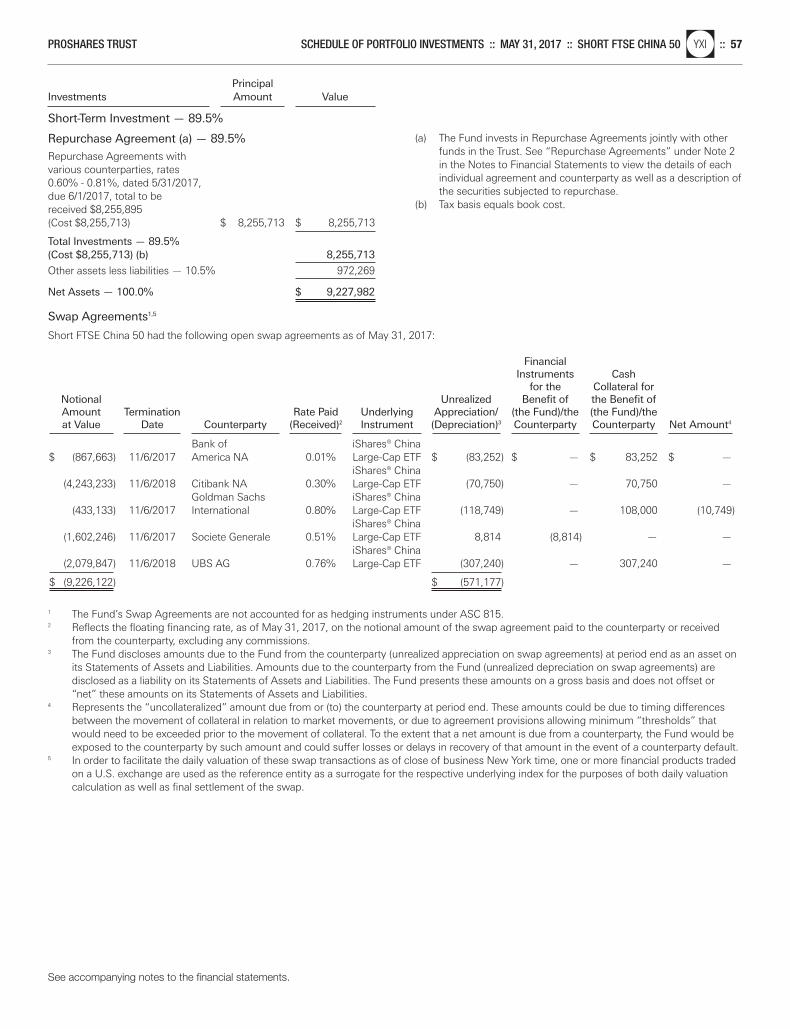
Principal Investments Amount Value
Short-Term Investment — 89.5%
Repurchase Agreement (a) — 89.5%
Repurchase Agreements with various counterparties, rates 0.60% - 0.81%, dated 5/31/2017, due 6/1/2017, total to be received $8,255,895 (Cost $8,255,713) $ 8,255,713 $ 8,255,713
Total Investments — 89.5%(Cost $8,255,713) (b) 8,255,713
Other assets less liabilities — 10.5% 972,269
Net Assets — 100.0% $ 9,227,982
Swap Agreements1,5
Short FTSE China 50 had the following open swap agreements as of May 31, 2017:
Financial Instruments Cash
for the Collateral for Notional Unrealized Benefit of the Benefit of Amount Termination Rate Paid Underlying Appreciation/ (the Fund)/the (the Fund)/the at Value Date Counterparty (Received)2 Instrument (Depreciation)3 Counterparty Counterparty Net Amount4
Bank of iShares® China
$ (867,663) 11/6/2017 America NA 0.01% Large-Cap ETF $ (83,252) $ — $ 83,252 $ —iShares® China
(4,243,233) 11/6/2018 Citibank NA 0.30% Large-Cap ETF (70,750) — 70,750 —Goldman Sachs iShares® China
(433,133) 11/6/2017 International 0.80% Large-Cap ETF (118,749) — 108,000 (10,749)iShares® China
(1,602,246) 11/6/2017 Societe Generale 0.51% Large-Cap ETF 8,814 (8,814) — —iShares® China
(2,079,847) 11/6/2018 UBS AG 0.76% Large-Cap ETF (307,240) — 307,240 —
$ (9,226,122) $ (571,177)
1 The Fund’s Swap Agreements are not accounted for as hedging instruments under ASC 815.2 Reflects the floating financing rate, as of May 31, 2017, on the notional amount of the swap agreement paid to the counterparty or received
from the counterparty, excluding any commissions.3 The Fund discloses amounts due to the Fund from the counterparty (unrealized appreciation on swap agreements) at period end as an asset on
its Statements of Assets and Liabilities. Amounts due to the counterparty from the Fund (unrealized depreciation on swap agreements) are disclosed as a liability on its Statements of Assets and Liabilities. The Fund presents these amounts on a gross basis and does not offset or“net” these amounts on its Statements of Assets and Liabilities.
4 Represents the “uncollateralized” amount due from or (to) the counterparty at period end. These amounts could be due to timing differencesbetween the movement of collateral in relation to market movements, or due to agreement provisions allowing minimum “thresholds” thatwould need to be exceeded prior to the movement of collateral. To the extent that a net amount is due from a counterparty, the Fund would beexposed to the counterparty by such amount and could suffer losses or delays in recovery of that amount in the event of a counterparty default.
5 In order to facilitate the daily valuation of these swap transactions as of close of business New York time, one or more financial products tradedon a U.S. exchange are used as the reference entity as a surrogate for the respective underlying index for the purposes of both daily valuationcalculation as well as final settlement of the swap.
(a) The Fund invests in Repurchase Agreements jointly with otherfunds in the Trust. See “Repurchase Agreements” under Note 2in the Notes to Financial Statements to view the details of eachindividual agreement and counterparty as well as a description ofthe securities subjected to repurchase.
(b) Tax basis equals book cost.
See accompanying notes to the financial statements.
PROSHARES TRUST SCHEDULE OF PORTFOLIO INVESTMENTS :: MAY 31, 2017 :: SHORT FTSE CHINA 50nlYXI :: 57
Merrill Corp - Proshares Trust Geared Book [96 Funds] Annual Report [Funds] 333-089822 05-31-2017 ED [AUX] | eperez | 28-Jul-17 17:37 | 17-15159-3.fk | Sequence: 4CHKSUM Content: 40755 Layout: 42667 Graphics: No Graphics CLEAN
JOB: 17-15159-3 CYCLE#;BL#: 5; 0 TRIM: 8.25" x 10.75" COMPOSITECOLORS: Black, ~note-color 2, ~note-color 3 GRAPHICS: none V1.5
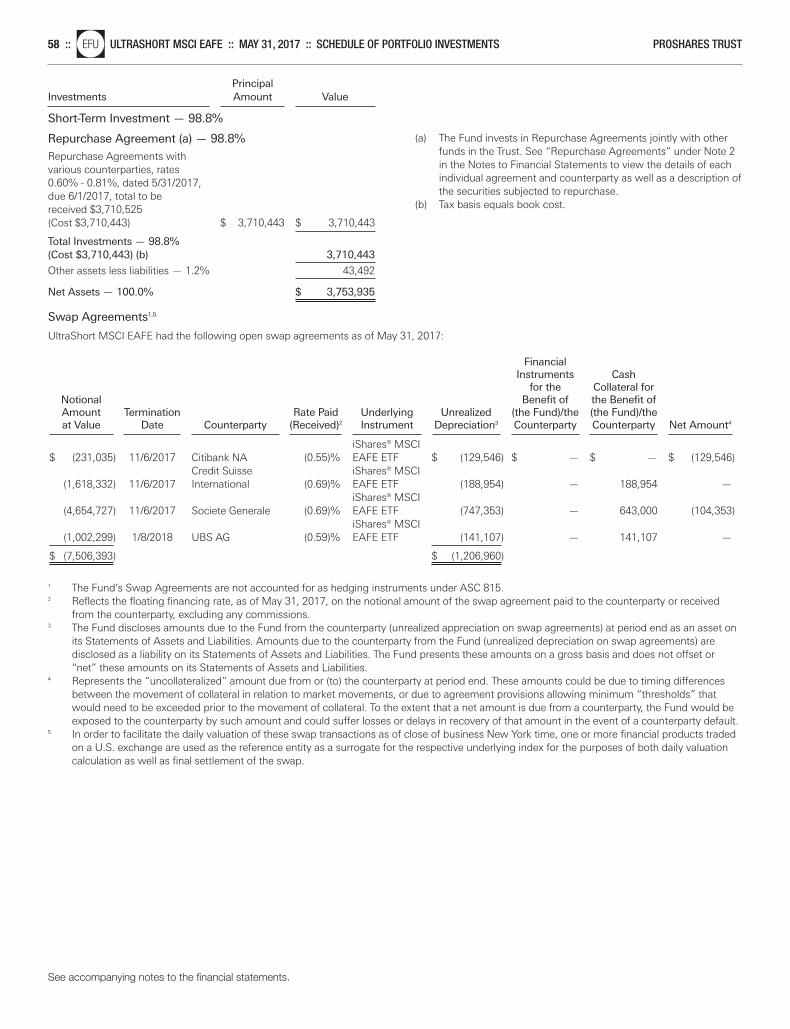
Principal Investments Amount Value
Short-Term Investment — 98.8%
Repurchase Agreement (a) — 98.8%
Repurchase Agreements with various counterparties, rates 0.60% - 0.81%, dated 5/31/2017, due 6/1/2017, total to be received $3,710,525 (Cost $3,710,443) $ 3,710,443 $ 3,710,443
Total Investments — 98.8%(Cost $3,710,443) (b) 3,710,443
Other assets less liabilities — 1.2% 43,492
Net Assets — 100.0% $ 3,753,935
Swap Agreements1,5
UltraShort MSCI EAFE had the following open swap agreements as of May 31, 2017:
Financial Instruments Cash
for the Collateral for Notional Benefit of the Benefit of Amount Termination Rate Paid Underlying Unrealized (the Fund)/the (the Fund)/the at Value Date Counterparty (Received)2 Instrument Depreciation3 Counterparty Counterparty Net Amount4
iShares® MSCI
$ (231,035) 11/6/2017 Citibank NA (0.55)% EAFE ETF $ (129,546) $ — $ — $ (129,546)Credit Suisse iShares® MSCI
(1,618,332) 11/6/2017 International (0.69)% EAFE ETF (188,954) — 188,954 —iShares® MSCI
(4,654,727) 11/6/2017 Societe Generale (0.69)% EAFE ETF (747,353) — 643,000 (104,353)iShares® MSCI
(1,002,299) 1/8/2018 UBS AG (0.59)% EAFE ETF (141,107) — 141,107 —
$ (7,506,393) $ (1,206,960)
1 The Fund’s Swap Agreements are not accounted for as hedging instruments under ASC 815.2 Reflects the floating financing rate, as of May 31, 2017, on the notional amount of the swap agreement paid to the counterparty or received
from the counterparty, excluding any commissions.3 The Fund discloses amounts due to the Fund from the counterparty (unrealized appreciation on swap agreements) at period end as an asset on
its Statements of Assets and Liabilities. Amounts due to the counterparty from the Fund (unrealized depreciation on swap agreements) are disclosed as a liability on its Statements of Assets and Liabilities. The Fund presents these amounts on a gross basis and does not offset or“net” these amounts on its Statements of Assets and Liabilities.
4 Represents the “uncollateralized” amount due from or (to) the counterparty at period end. These amounts could be due to timing differencesbetween the movement of collateral in relation to market movements, or due to agreement provisions allowing minimum “thresholds” thatwould need to be exceeded prior to the movement of collateral. To the extent that a net amount is due from a counterparty, the Fund would beexposed to the counterparty by such amount and could suffer losses or delays in recovery of that amount in the event of a counterparty default.
5 In order to facilitate the daily valuation of these swap transactions as of close of business New York time, one or more financial products tradedon a U.S. exchange are used as the reference entity as a surrogate for the respective underlying index for the purposes of both daily valuationcalculation as well as final settlement of the swap.
(a) The Fund invests in Repurchase Agreements jointly with otherfunds in the Trust. See “Repurchase Agreements” under Note 2in the Notes to Financial Statements to view the details of eachindividual agreement and counterparty as well as a description ofthe securities subjected to repurchase.
(b) Tax basis equals book cost.
See accompanying notes to the financial statements.
58 ::nlEFU ULTRASHORT MSCI EAFE :: MAY 31, 2017 :: SCHEDULE OF PORTFOLIO INVESTMENTS PROSHARES TRUST
Merrill Corp - Proshares Trust Geared Book [96 Funds] Annual Report [Funds] 333-089822 05-31-2017 ED [AUX] | eperez | 28-Jul-17 17:37 | 17-15159-3.fk | Sequence: 5CHKSUM Content: 60423 Layout: 29234 Graphics: No Graphics CLEAN
JOB: 17-15159-3 CYCLE#;BL#: 5; 0 TRIM: 8.25" x 10.75" COMPOSITECOLORS: Black, ~note-color 2, ~note-color 3 GRAPHICS: none V1.5
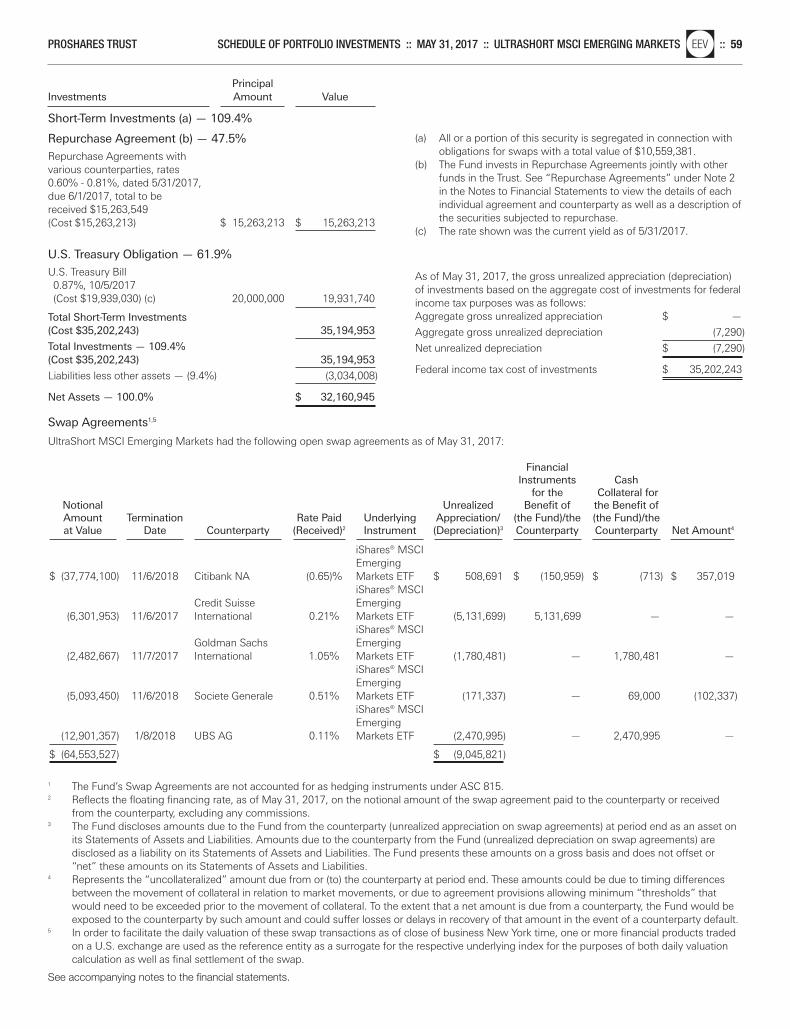
Principal Investments Amount Value
Short-Term Investments (a) — 109.4%
Repurchase Agreement (b) — 47.5%
Repurchase Agreements with various counterparties, rates 0.60% - 0.81%, dated 5/31/2017, due 6/1/2017, total to be received $15,263,549 (Cost $15,263,213) $ 15,263,213 $ 15,263,213
U.S. Treasury Obligation — 61.9%
U.S. Treasury Bill0.87%, 10/5/2017 (Cost $19,939,030) (c) 20,000,000 19,931,740
Total Short-Term Investments(Cost $35,202,243) 35,194,953
Total Investments — 109.4%(Cost $35,202,243) 35,194,953
Liabilities less other assets — (9.4%) (3,034,008)
Net Assets — 100.0% $ 32,160,945
Swap Agreements1,5
UltraShort MSCI Emerging Markets had the following open swap agreements as of May 31, 2017:
Financial Instruments Cash
for the Collateral for Notional Unrealized Benefit of the Benefit of Amount Termination Rate Paid Underlying Appreciation/ (the Fund)/the (the Fund)/the at Value Date Counterparty (Received)2 Instrument (Depreciation)3 Counterparty Counterparty Net Amount4
iShares® MSCI Emerging
$ (37,774,100) 11/6/2018 Citibank NA (0.65)% Markets ETF $ 508,691 $ (150,959) $ (713) $ 357,019iShares® MSCI
Credit Suisse Emerging (6,301,953) 11/6/2017 International 0.21% Markets ETF (5,131,699) 5,131,699 — —
iShares® MSCI Goldman Sachs Emerging
(2,482,667) 11/7/2017 International 1.05% Markets ETF (1,780,481) — 1,780,481 —iShares® MSCI Emerging
(5,093,450) 11/6/2018 Societe Generale 0.51% Markets ETF (171,337) — 69,000 (102,337)iShares® MSCI Emerging
(12,901,357) 1/8/2018 UBS AG 0.11% Markets ETF (2,470,995) — 2,470,995 —
$ (64,553,527) $ (9,045,821)
1 The Fund’s Swap Agreements are not accounted for as hedging instruments under ASC 815.2 Reflects the floating financing rate, as of May 31, 2017, on the notional amount of the swap agreement paid to the counterparty or received
from the counterparty, excluding any commissions.3 The Fund discloses amounts due to the Fund from the counterparty (unrealized appreciation on swap agreements) at period end as an asset on
its Statements of Assets and Liabilities. Amounts due to the counterparty from the Fund (unrealized depreciation on swap agreements) are disclosed as a liability on its Statements of Assets and Liabilities. The Fund presents these amounts on a gross basis and does not offset or“net” these amounts on its Statements of Assets and Liabilities.
4 Represents the “uncollateralized” amount due from or (to) the counterparty at period end. These amounts could be due to timing differencesbetween the movement of collateral in relation to market movements, or due to agreement provisions allowing minimum “thresholds” thatwould need to be exceeded prior to the movement of collateral. To the extent that a net amount is due from a counterparty, the Fund would beexposed to the counterparty by such amount and could suffer losses or delays in recovery of that amount in the event of a counterparty default.
5 In order to facilitate the daily valuation of these swap transactions as of close of business New York time, one or more financial products tradedon a U.S. exchange are used as the reference entity as a surrogate for the respective underlying index for the purposes of both daily valuationcalculation as well as final settlement of the swap.
(a) All or a portion of this security is segregated in connection withobligations for swaps with a total value of $10,559,381.
(b) The Fund invests in Repurchase Agreements jointly with otherfunds in the Trust. See “Repurchase Agreements” under Note 2in the Notes to Financial Statements to view the details of eachindividual agreement and counterparty as well as a description ofthe securities subjected to repurchase.
(c) The rate shown was the current yield as of 5/31/2017.
As of May 31, 2017, the gross unrealized appreciation (depreciation)of investments based on the aggregate cost of investments for federalincome tax purposes was as follows:Aggregate gross unrealized appreciation $ —
Aggregate gross unrealized depreciation (7,290)
Net unrealized depreciation $ (7,290)
Federal income tax cost of investments $ 35,202,243
See accompanying notes to the financial statements.
PROSHARES TRUST SCHEDULE OF PORTFOLIO INVESTMENTS :: MAY 31, 2017 :: ULTRASHORT MSCI EMERGING MARKETSnlEEV :: 59
Merrill Corp - Proshares Trust Geared Book [96 Funds] Annual Report [Funds] 333-089822 05-31-2017 ED [AUX] | eperez | 28-Jul-17 17:37 | 17-15159-3.fk | Sequence: 6CHKSUM Content: 29235 Layout: 54786 Graphics: No Graphics CLEAN
JOB: 17-15159-3 CYCLE#;BL#: 5; 0 TRIM: 8.25" x 10.75" COMPOSITECOLORS: Black, ~note-color 2, ~note-color 3 GRAPHICS: none V1.5
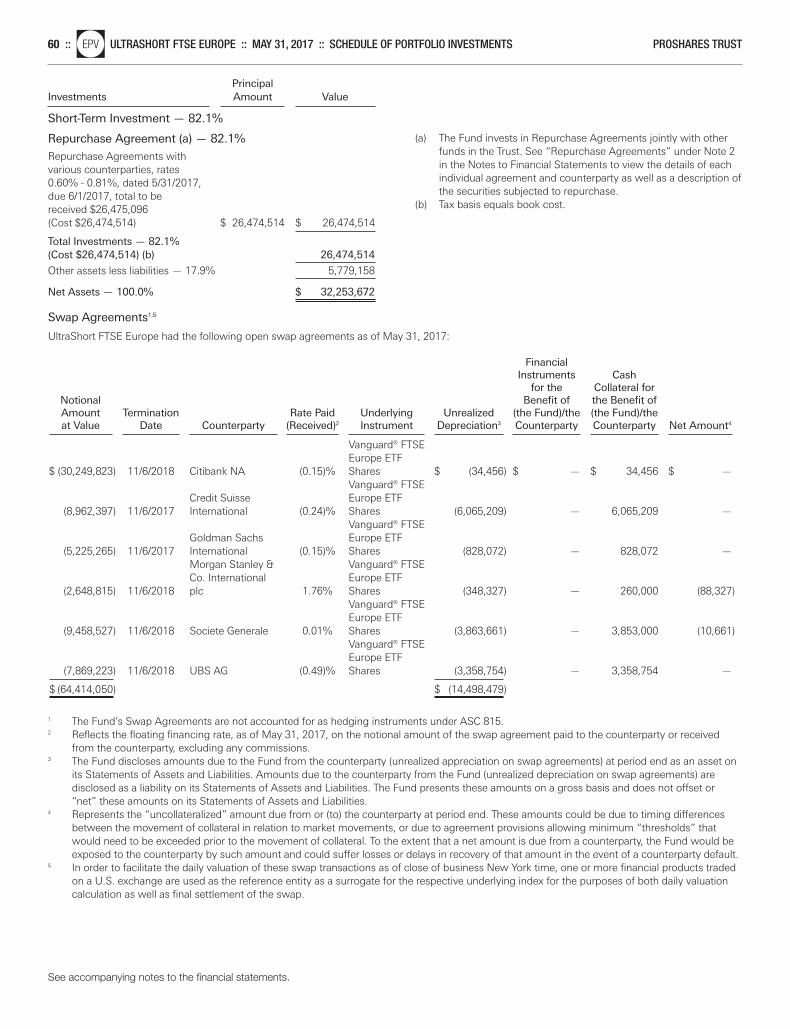
Principal Investments Amount Value
Short-Term Investment — 82.1%
Repurchase Agreement (a) — 82.1%
Repurchase Agreements with various counterparties, rates 0.60% - 0.81%, dated 5/31/2017, due 6/1/2017, total to be received $26,475,096 (Cost $26,474,514) $ 26,474,514 $ 26,474,514
Total Investments — 82.1%(Cost $26,474,514) (b) 26,474,514
Other assets less liabilities — 17.9% 5,779,158
Net Assets — 100.0% $ 32,253,672
Swap Agreements1,5
UltraShort FTSE Europe had the following open swap agreements as of May 31, 2017:
Financial Instruments Cash
for the Collateral for Notional Benefit of the Benefit of Amount Termination Rate Paid Underlying Unrealized (the Fund)/the (the Fund)/the at Value Date Counterparty (Received)2 Instrument Depreciation3 Counterparty Counterparty Net Amount4
Vanguard® FTSE Europe ETF
$ (30,249,823) 11/6/2018 Citibank NA (0.15)% Shares $ (34,456) $ — $ 34,456 $ —Vanguard® FTSE
Credit Suisse Europe ETF (8,962,397) 11/6/2017 International (0.24)% Shares (6,065,209) — 6,065,209 —
Vanguard® FTSE Goldman Sachs Europe ETF
(5,225,265) 11/6/2017 International (0.15)% Shares (828,072) — 828,072 —Morgan Stanley & Vanguard® FTSE Co. International Europe ETF
(2,648,815) 11/6/2018 plc 1.76% Shares (348,327) — 260,000 (88,327)Vanguard® FTSE Europe ETF
(9,458,527) 11/6/2018 Societe Generale 0.01% Shares (3,863,661) — 3,853,000 (10,661)Vanguard® FTSE Europe ETF
(7,869,223) 11/6/2018 UBS AG (0.49)% Shares (3,358,754) — 3,358,754 —
$ (64,414,050) $ (14,498,479)
1 The Fund’s Swap Agreements are not accounted for as hedging instruments under ASC 815.2 Reflects the floating financing rate, as of May 31, 2017, on the notional amount of the swap agreement paid to the counterparty or received
from the counterparty, excluding any commissions.3 The Fund discloses amounts due to the Fund from the counterparty (unrealized appreciation on swap agreements) at period end as an asset on
its Statements of Assets and Liabilities. Amounts due to the counterparty from the Fund (unrealized depreciation on swap agreements) are disclosed as a liability on its Statements of Assets and Liabilities. The Fund presents these amounts on a gross basis and does not offset or“net” these amounts on its Statements of Assets and Liabilities.
4 Represents the “uncollateralized” amount due from or (to) the counterparty at period end. These amounts could be due to timing differencesbetween the movement of collateral in relation to market movements, or due to agreement provisions allowing minimum “thresholds” thatwould need to be exceeded prior to the movement of collateral. To the extent that a net amount is due from a counterparty, the Fund would beexposed to the counterparty by such amount and could suffer losses or delays in recovery of that amount in the event of a counterparty default.
5 In order to facilitate the daily valuation of these swap transactions as of close of business New York time, one or more financial products tradedon a U.S. exchange are used as the reference entity as a surrogate for the respective underlying index for the purposes of both daily valuationcalculation as well as final settlement of the swap.
(a) The Fund invests in Repurchase Agreements jointly with otherfunds in the Trust. See “Repurchase Agreements” under Note 2in the Notes to Financial Statements to view the details of eachindividual agreement and counterparty as well as a description ofthe securities subjected to repurchase.
(b) Tax basis equals book cost.
See accompanying notes to the financial statements.
60 ::nlEPV ULTRASHORT FTSE EUROPE :: MAY 31, 2017 :: SCHEDULE OF PORTFOLIO INVESTMENTS PROSHARES TRUST
Merrill Corp - Proshares Trust Geared Book [96 Funds] Annual Report [Funds] 333-089822 05-31-2017 ED [AUX] | eperez | 28-Jul-17 17:37 | 17-15159-3.fk | Sequence: 7CHKSUM Content: 52344 Layout: 19055 Graphics: No Graphics CLEAN
JOB: 17-15159-3 CYCLE#;BL#: 5; 0 TRIM: 8.25" x 10.75" COMPOSITECOLORS: Black, ~note-color 2, ~note-color 3 GRAPHICS: none V1.5
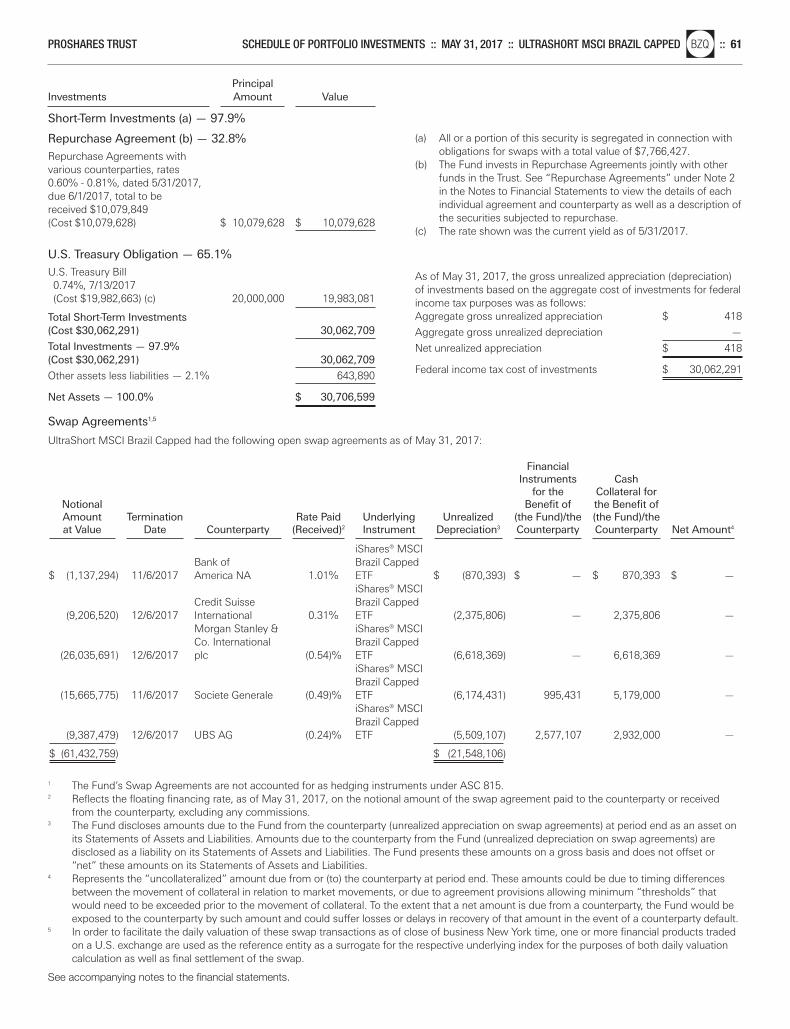
Principal Investments Amount Value
Short-Term Investments (a) — 97.9%
Repurchase Agreement (b) — 32.8%
Repurchase Agreements with various counterparties, rates 0.60% - 0.81%, dated 5/31/2017, due 6/1/2017, total to be received $10,079,849 (Cost $10,079,628) $ 10,079,628 $ 10,079,628
U.S. Treasury Obligation — 65.1%
U.S. Treasury Bill0.74%, 7/13/2017 (Cost $19,982,663) (c) 20,000,000 19,983,081
Total Short-Term Investments(Cost $30,062,291) 30,062,709
Total Investments — 97.9%(Cost $30,062,291) 30,062,709
Other assets less liabilities — 2.1% 643,890
Net Assets — 100.0% $ 30,706,599
Swap Agreements1,5
UltraShort MSCI Brazil Capped had the following open swap agreements as of May 31, 2017:
Financial Instruments Cash
for the Collateral for Notional Benefit of the Benefit of Amount Termination Rate Paid Underlying Unrealized (the Fund)/the (the Fund)/the at Value Date Counterparty (Received)2 Instrument Depreciation3 Counterparty Counterparty Net Amount4
iShares® MSCI
Bank of Brazil Capped $ (1,137,294) 11/6/2017 America NA 1.01% ETF $ (870,393) $ — $ 870,393 $ —
iShares® MSCI Credit Suisse Brazil Capped
(9,206,520) 12/6/2017 International 0.31% ETF (2,375,806) — 2,375,806 —Morgan Stanley & iShares® MSCI Co. International Brazil Capped
(26,035,691) 12/6/2017 plc (0.54)% ETF (6,618,369) — 6,618,369 —iShares® MSCI Brazil Capped
(15,665,775) 11/6/2017 Societe Generale (0.49)% ETF (6,174,431) 995,431 5,179,000 —iShares® MSCI Brazil Capped
(9,387,479) 12/6/2017 UBS AG (0.24)% ETF (5,509,107) 2,577,107 2,932,000 —
$ (61,432,759) $ (21,548,106)
1 The Fund’s Swap Agreements are not accounted for as hedging instruments under ASC 815.2 Reflects the floating financing rate, as of May 31, 2017, on the notional amount of the swap agreement paid to the counterparty or received
from the counterparty, excluding any commissions.3 The Fund discloses amounts due to the Fund from the counterparty (unrealized appreciation on swap agreements) at period end as an asset on
its Statements of Assets and Liabilities. Amounts due to the counterparty from the Fund (unrealized depreciation on swap agreements) are disclosed as a liability on its Statements of Assets and Liabilities. The Fund presents these amounts on a gross basis and does not offset or“net” these amounts on its Statements of Assets and Liabilities.
4 Represents the “uncollateralized” amount due from or (to) the counterparty at period end. These amounts could be due to timing differencesbetween the movement of collateral in relation to market movements, or due to agreement provisions allowing minimum “thresholds” thatwould need to be exceeded prior to the movement of collateral. To the extent that a net amount is due from a counterparty, the Fund would beexposed to the counterparty by such amount and could suffer losses or delays in recovery of that amount in the event of a counterparty default.
5 In order to facilitate the daily valuation of these swap transactions as of close of business New York time, one or more financial products tradedon a U.S. exchange are used as the reference entity as a surrogate for the respective underlying index for the purposes of both daily valuationcalculation as well as final settlement of the swap.
(a) All or a portion of this security is segregated in connection withobligations for swaps with a total value of $7,766,427.
(b) The Fund invests in Repurchase Agreements jointly with otherfunds in the Trust. See “Repurchase Agreements” under Note 2in the Notes to Financial Statements to view the details of eachindividual agreement and counterparty as well as a description ofthe securities subjected to repurchase.
(c) The rate shown was the current yield as of 5/31/2017.
As of May 31, 2017, the gross unrealized appreciation (depreciation)of investments based on the aggregate cost of investments for federalincome tax purposes was as follows:Aggregate gross unrealized appreciation $ 418
Aggregate gross unrealized depreciation —
Net unrealized appreciation $ 418
Federal income tax cost of investments $ 30,062,291
See accompanying notes to the financial statements.
PROSHARES TRUST SCHEDULE OF PORTFOLIO INVESTMENTS :: MAY 31, 2017 :: ULTRASHORT MSCI BRAZIL CAPPEDnlBZQ :: 61
Merrill Corp - Proshares Trust Geared Book [96 Funds] Annual Report [Funds] 333-089822 05-31-2017 ED [AUX] | eperez | 28-Jul-17 17:37 | 17-15159-3.fk | Sequence: 8CHKSUM Content: 59625 Layout: 42818 Graphics: No Graphics CLEAN
JOB: 17-15159-3 CYCLE#;BL#: 5; 0 TRIM: 8.25" x 10.75" COMPOSITECOLORS: Black, ~note-color 2, ~note-color 3 GRAPHICS: none V1.5
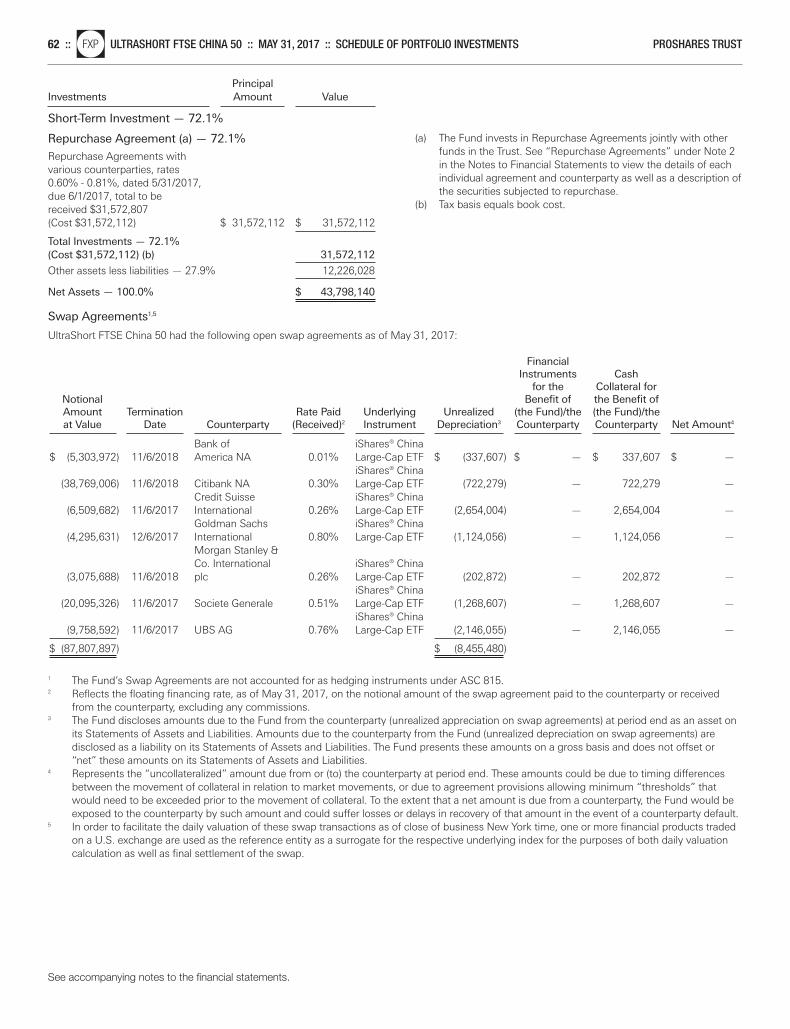
Principal Investments Amount Value
Short-Term Investment — 72.1%
Repurchase Agreement (a) — 72.1%
Repurchase Agreements with various counterparties, rates 0.60% - 0.81%, dated 5/31/2017, due 6/1/2017, total to be received $31,572,807 (Cost $31,572,112) $ 31,572,112 $ 31,572,112
Total Investments — 72.1%(Cost $31,572,112) (b) 31,572,112
Other assets less liabilities — 27.9% 12,226,028
Net Assets — 100.0% $ 43,798,140
Swap Agreements1,5
UltraShort FTSE China 50 had the following open swap agreements as of May 31, 2017:
Financial Instruments Cash
for the Collateral for Notional Benefit of the Benefit of Amount Termination Rate Paid Underlying Unrealized (the Fund)/the (the Fund)/the at Value Date Counterparty (Received)2 Instrument Depreciation3 Counterparty Counterparty Net Amount4
Bank of iShares® China
$ (5,303,972) 11/6/2018 America NA 0.01% Large-Cap ETF $ (337,607) $ — $ 337,607 $ —iShares® China
(38,769,006) 11/6/2018 Citibank NA 0.30% Large-Cap ETF (722,279) — 722,279 —Credit Suisse iShares® China
(6,509,682) 11/6/2017 International 0.26% Large-Cap ETF (2,654,004) — 2,654,004 —Goldman Sachs iShares® China
(4,295,631) 12/6/2017 International 0.80% Large-Cap ETF (1,124,056) — 1,124,056 —Morgan Stanley & Co. International iShares® China
(3,075,688) 11/6/2018 plc 0.26% Large-Cap ETF (202,872) — 202,872 —iShares® China
(20,095,326) 11/6/2017 Societe Generale 0.51% Large-Cap ETF (1,268,607) — 1,268,607 —iShares® China
(9,758,592) 11/6/2017 UBS AG 0.76% Large-Cap ETF (2,146,055) — 2,146,055 —
$ (87,807,897) $ (8,455,480)
1 The Fund’s Swap Agreements are not accounted for as hedging instruments under ASC 815.2 Reflects the floating financing rate, as of May 31, 2017, on the notional amount of the swap agreement paid to the counterparty or received
from the counterparty, excluding any commissions.3 The Fund discloses amounts due to the Fund from the counterparty (unrealized appreciation on swap agreements) at period end as an asset on
its Statements of Assets and Liabilities. Amounts due to the counterparty from the Fund (unrealized depreciation on swap agreements) are disclosed as a liability on its Statements of Assets and Liabilities. The Fund presents these amounts on a gross basis and does not offset or“net” these amounts on its Statements of Assets and Liabilities.
4 Represents the “uncollateralized” amount due from or (to) the counterparty at period end. These amounts could be due to timing differencesbetween the movement of collateral in relation to market movements, or due to agreement provisions allowing minimum “thresholds” thatwould need to be exceeded prior to the movement of collateral. To the extent that a net amount is due from a counterparty, the Fund would beexposed to the counterparty by such amount and could suffer losses or delays in recovery of that amount in the event of a counterparty default.
5 In order to facilitate the daily valuation of these swap transactions as of close of business New York time, one or more financial products tradedon a U.S. exchange are used as the reference entity as a surrogate for the respective underlying index for the purposes of both daily valuationcalculation as well as final settlement of the swap.
(a) The Fund invests in Repurchase Agreements jointly with otherfunds in the Trust. See “Repurchase Agreements” under Note 2in the Notes to Financial Statements to view the details of eachindividual agreement and counterparty as well as a description ofthe securities subjected to repurchase.
(b) Tax basis equals book cost.
See accompanying notes to the financial statements.
62 ::nlFXP ULTRASHORT FTSE CHINA 50 :: MAY 31, 2017 :: SCHEDULE OF PORTFOLIO INVESTMENTS PROSHARES TRUST
Merrill Corp - Proshares Trust Geared Book [96 Funds] Annual Report [Funds] 333-089822 05-31-2017 ED [AUX] | eperez | 28-Jul-17 17:37 | 17-15159-3.fk | Sequence: 9CHKSUM Content: 56747 Layout: 34221 Graphics: No Graphics CLEAN
JOB: 17-15159-3 CYCLE#;BL#: 5; 0 TRIM: 8.25" x 10.75" COMPOSITECOLORS: Black, ~note-color 2, ~note-color 3 GRAPHICS: none V1.5
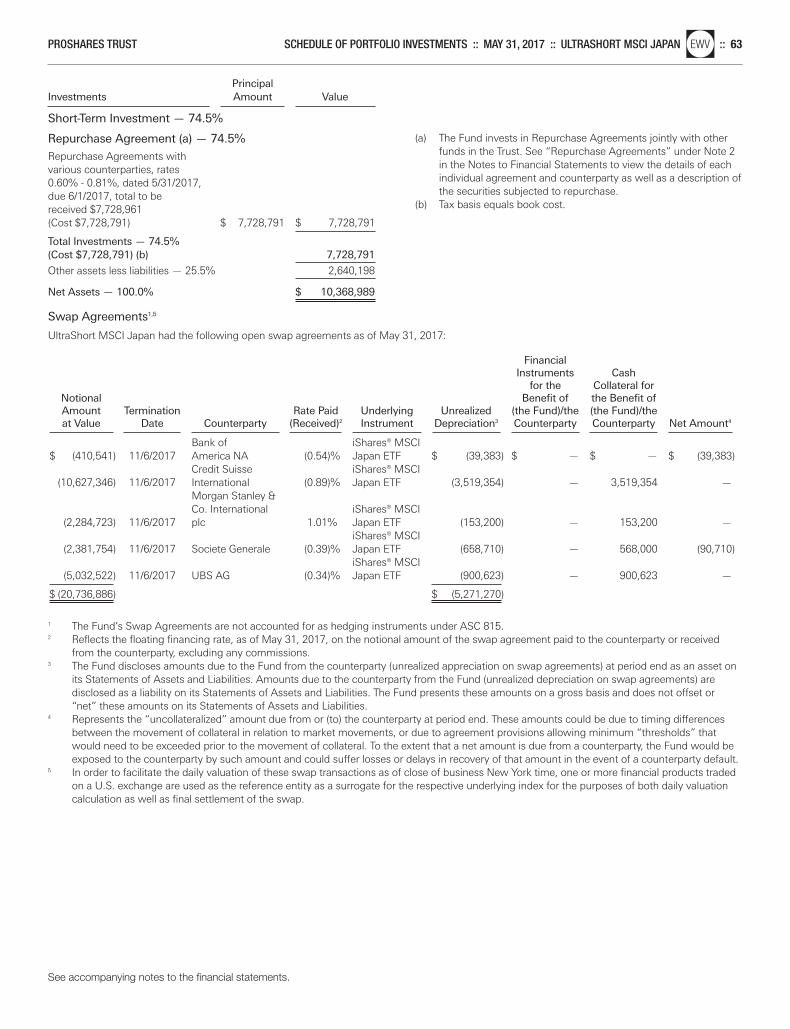
Principal Investments Amount Value
Short-Term Investment — 74.5%
Repurchase Agreement (a) — 74.5%
Repurchase Agreements with various counterparties, rates 0.60% - 0.81%, dated 5/31/2017, due 6/1/2017, total to be received $7,728,961 (Cost $7,728,791) $ 7,728,791 $ 7,728,791
Total Investments — 74.5%(Cost $7,728,791) (b) 7,728,791
Other assets less liabilities — 25.5% 2,640,198
Net Assets — 100.0% $ 10,368,989
Swap Agreements1,5
UltraShort MSCI Japan had the following open swap agreements as of May 31, 2017:
Financial Instruments Cash
for the Collateral for Notional Benefit of the Benefit of Amount Termination Rate Paid Underlying Unrealized (the Fund)/the (the Fund)/the at Value Date Counterparty (Received)2 Instrument Depreciation3 Counterparty Counterparty Net Amount4
Bank of iShares® MSCI
$ (410,541) 11/6/2017 America NA (0.54)% Japan ETF $ (39,383) $ — $ — $ (39,383)Credit Suisse iShares® MSCI
(10,627,346) 11/6/2017 International (0.89)% Japan ETF (3,519,354) — 3,519,354 —Morgan Stanley & Co. International iShares® MSCI
(2,284,723) 11/6/2017 plc 1.01% Japan ETF (153,200) — 153,200 —iShares® MSCI
(2,381,754) 11/6/2017 Societe Generale (0.39)% Japan ETF (658,710) — 568,000 (90,710)iShares® MSCI
(5,032,522) 11/6/2017 UBS AG (0.34)% Japan ETF (900,623) — 900,623 —
$ (20,736,886) $ (5,271,270)
1 The Fund’s Swap Agreements are not accounted for as hedging instruments under ASC 815.2 Reflects the floating financing rate, as of May 31, 2017, on the notional amount of the swap agreement paid to the counterparty or received
from the counterparty, excluding any commissions.3 The Fund discloses amounts due to the Fund from the counterparty (unrealized appreciation on swap agreements) at period end as an asset on
its Statements of Assets and Liabilities. Amounts due to the counterparty from the Fund (unrealized depreciation on swap agreements) are disclosed as a liability on its Statements of Assets and Liabilities. The Fund presents these amounts on a gross basis and does not offset or“net” these amounts on its Statements of Assets and Liabilities.
4 Represents the “uncollateralized” amount due from or (to) the counterparty at period end. These amounts could be due to timing differencesbetween the movement of collateral in relation to market movements, or due to agreement provisions allowing minimum “thresholds” thatwould need to be exceeded prior to the movement of collateral. To the extent that a net amount is due from a counterparty, the Fund would beexposed to the counterparty by such amount and could suffer losses or delays in recovery of that amount in the event of a counterparty default.
5 In order to facilitate the daily valuation of these swap transactions as of close of business New York time, one or more financial products tradedon a U.S. exchange are used as the reference entity as a surrogate for the respective underlying index for the purposes of both daily valuationcalculation as well as final settlement of the swap.
(a) The Fund invests in Repurchase Agreements jointly with otherfunds in the Trust. See “Repurchase Agreements” under Note 2in the Notes to Financial Statements to view the details of eachindividual agreement and counterparty as well as a description ofthe securities subjected to repurchase.
(b) Tax basis equals book cost.
See accompanying notes to the financial statements.
PROSHARES TRUST SCHEDULE OF PORTFOLIO INVESTMENTS :: MAY 31, 2017 :: ULTRASHORT MSCI JAPANnlEWV :: 63
Merrill Corp - Proshares Trust Geared Book [96 Funds] Annual Report [Funds] 333-089822 05-31-2017 ED [AUX] | eperez | 28-Jul-17 17:37 | 17-15159-3.fk | Sequence: 10CHKSUM Content: 38425 Layout: 47698 Graphics: No Graphics CLEAN
JOB: 17-15159-3 CYCLE#;BL#: 5; 0 TRIM: 8.25" x 10.75" COMPOSITECOLORS: Black, ~note-color 2, ~note-color 3 GRAPHICS: none V1.5
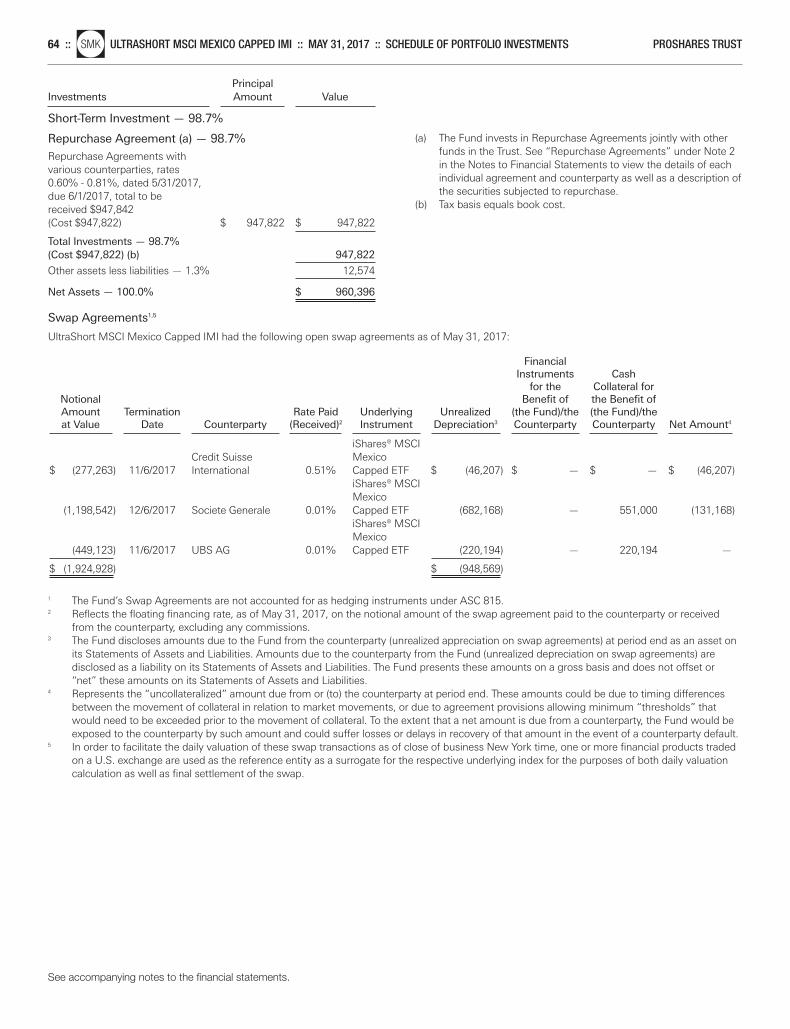
Principal Investments Amount Value
Short-Term Investment — 98.7%
Repurchase Agreement (a) — 98.7%
Repurchase Agreements with various counterparties, rates 0.60% - 0.81%, dated 5/31/2017, due 6/1/2017, total to be received $947,842 (Cost $947,822) $ 947,822 $ 947,822
Total Investments — 98.7%(Cost $947,822) (b) 947,822
Other assets less liabilities — 1.3% 12,574
Net Assets — 100.0% $ 960,396
Swap Agreements1,5
UltraShort MSCI Mexico Capped IMI had the following open swap agreements as of May 31, 2017:
Financial Instruments Cash
for the Collateral for Notional Benefit of the Benefit of Amount Termination Rate Paid Underlying Unrealized (the Fund)/the (the Fund)/the at Value Date Counterparty (Received)2 Instrument Depreciation3 Counterparty Counterparty Net Amount4
iShares® MSCI
Credit Suisse Mexico $ (277,263) 11/6/2017 International 0.51% Capped ETF $ (46,207) $ — $ — $ (46,207)
iShares® MSCI Mexico
(1,198,542) 12/6/2017 Societe Generale 0.01% Capped ETF (682,168) — 551,000 (131,168)iShares® MSCI Mexico
(449,123) 11/6/2017 UBS AG 0.01% Capped ETF (220,194) — 220,194 —
$ (1,924,928) $ (948,569)
1 The Fund’s Swap Agreements are not accounted for as hedging instruments under ASC 815.2 Reflects the floating financing rate, as of May 31, 2017, on the notional amount of the swap agreement paid to the counterparty or received
from the counterparty, excluding any commissions.3 The Fund discloses amounts due to the Fund from the counterparty (unrealized appreciation on swap agreements) at period end as an asset on
its Statements of Assets and Liabilities. Amounts due to the counterparty from the Fund (unrealized depreciation on swap agreements) are disclosed as a liability on its Statements of Assets and Liabilities. The Fund presents these amounts on a gross basis and does not offset or“net” these amounts on its Statements of Assets and Liabilities.
4 Represents the “uncollateralized” amount due from or (to) the counterparty at period end. These amounts could be due to timing differencesbetween the movement of collateral in relation to market movements, or due to agreement provisions allowing minimum “thresholds” thatwould need to be exceeded prior to the movement of collateral. To the extent that a net amount is due from a counterparty, the Fund would beexposed to the counterparty by such amount and could suffer losses or delays in recovery of that amount in the event of a counterparty default.
5 In order to facilitate the daily valuation of these swap transactions as of close of business New York time, one or more financial products tradedon a U.S. exchange are used as the reference entity as a surrogate for the respective underlying index for the purposes of both daily valuationcalculation as well as final settlement of the swap.
(a) The Fund invests in Repurchase Agreements jointly with otherfunds in the Trust. See “Repurchase Agreements” under Note 2in the Notes to Financial Statements to view the details of eachindividual agreement and counterparty as well as a description ofthe securities subjected to repurchase.
(b) Tax basis equals book cost.
See accompanying notes to the financial statements.
64 ::nlSMK ULTRASHORT MSCI MEXICO CAPPED IMI :: MAY 31, 2017 :: SCHEDULE OF PORTFOLIO INVESTMENTS PROSHARES TRUST
Merrill Corp - Proshares Trust Geared Book [96 Funds] Annual Report [Funds] 333-089822 05-31-2017 ED [AUX] | eperez | 28-Jul-17 17:37 | 17-15159-3.fk | Sequence: 11CHKSUM Content: 35844 Layout: 65480 Graphics: No Graphics CLEAN
JOB: 17-15159-3 CYCLE#;BL#: 5; 0 TRIM: 8.25" x 10.75" COMPOSITECOLORS: Black, ~note-color 2, ~note-color 3 GRAPHICS: none V1.5
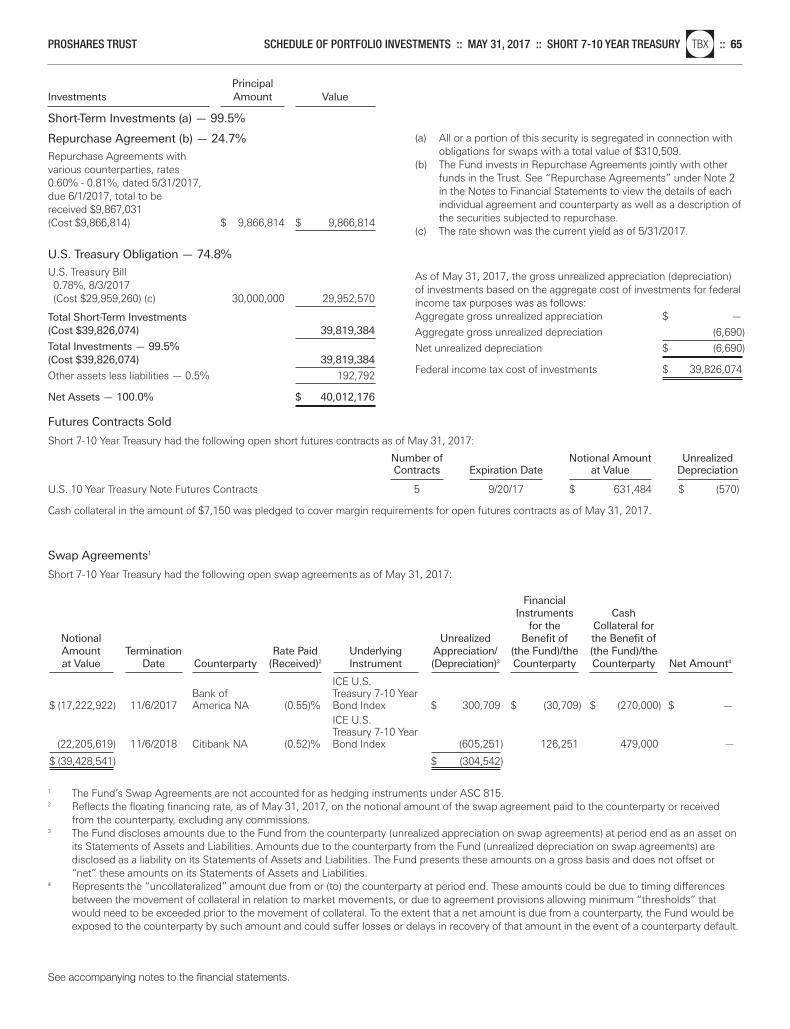
PrincipalInvestments Amount Value
Short-Term Investments (a) — 99.5%
Repurchase Agreement (b) — 24.7%
Repurchase Agreements with various counterparties, rates 0.60% - 0.81%, dated 5/31/2017, due 6/1/2017, total to be received $9,867,031(Cost $9,866,814) $ 9,866,814 $ 9,866,814
U.S. Treasury Obligation — 74.8%
U.S. Treasury Bill0.78%, 8/3/2017(Cost $29,959,260) (c) 30,000,000 29,952,570
Total Short-Term Investments(Cost $39,826,074) 39,819,384
Total Investments — 99.5%(Cost $39,826,074) 39,819,384
Other assets less liabilities — 0.5% 192,792
Net Assets — 100.0% $ 40,012,176
Futures Contracts Sold
Short 7-10 Year Treasury had the following open short futures contracts as of May 31, 2017:
Number of Notional Amount UnrealizedContracts Expiration Date at Value Depreciation
U.S. 10 Year Treasury Note Futures Contracts 5 9/20/17 $ 631,484 $ (570)
Cash collateral in the amount of $7,150 was pledged to cover margin requirements for open futures contracts as of May 31, 2017.
Swap Agreements1
Short 7-10 Year Treasury had the following open swap agreements as of May 31, 2017:
Financial Instruments Cash
for the Collateral for Notional Unrealized Benefit of the Benefit of Amount Termination Rate Paid Underlying Appreciation/ (the Fund)/the (the Fund)/the at Value Date Counterparty (Received)2 Instrument (Depreciation)3 Counterparty Counterparty Net Amount4
ICE U.S.
Bank of Treasury 7-10 Year $ (17,222,922) 11/6/2017 America NA (0.55)% Bond Index $ 300,709 $ (30,709) $ (270,000) $ —
ICE U.S. Treasury 7-10 Year
(22,205,619) 11/6/2018 Citibank NA (0.52)% Bond Index (605,251) 126,251 479,000 —
$ (39,428,541) $ (304,542)
1 The Fund’s Swap Agreements are not accounted for as hedging instruments under ASC 815.2 Reflects the floating financing rate, as of May 31, 2017, on the notional amount of the swap agreement paid to the counterparty or received
from the counterparty, excluding any commissions.3 The Fund discloses amounts due to the Fund from the counterparty (unrealized appreciation on swap agreements) at period end as an asset on
its Statements of Assets and Liabilities. Amounts due to the counterparty from the Fund (unrealized depreciation on swap agreements) are disclosed as a liability on its Statements of Assets and Liabilities. The Fund presents these amounts on a gross basis and does not offset or“net” these amounts on its Statements of Assets and Liabilities.
4 Represents the “uncollateralized” amount due from or (to) the counterparty at period end. These amounts could be due to timing differencesbetween the movement of collateral in relation to market movements, or due to agreement provisions allowing minimum “thresholds” thatwould need to be exceeded prior to the movement of collateral. To the extent that a net amount is due from a counterparty, the Fund would beexposed to the counterparty by such amount and could suffer losses or delays in recovery of that amount in the event of a counterparty default.
(a) All or a portion of this security is segregated in connection withobligations for swaps with a total value of $310,509.
(b) The Fund invests in Repurchase Agreements jointly with otherfunds in the Trust. See “Repurchase Agreements” under Note 2in the Notes to Financial Statements to view the details of eachindividual agreement and counterparty as well as a description ofthe securities subjected to repurchase.
(c) The rate shown was the current yield as of 5/31/2017.
As of May 31, 2017, the gross unrealized appreciation (depreciation)of investments based on the aggregate cost of investments for federalincome tax purposes was as follows:Aggregate gross unrealized appreciation $ —
Aggregate gross unrealized depreciation (6,690)
Net unrealized depreciation $ (6,690)
Federal income tax cost of investments $ 39,826,074
See accompanying notes to the financial statements.
PROSHARES TRUST SCHEDULE OF PORTFOLIO INVESTMENTS :: MAY 31, 2017 :: SHORT 7-10 YEAR TREASURYnlTBX :: 65
Merrill Corp - Proshares Trust Geared Book [96 Funds] Annual Report [Funds] 333-089822 05-31-2017 ED [AUX] | eperez | 28-Jul-17 17:38 | 17-15159-3.fm | Sequence: 1CHKSUM Content: 13841 Layout: 25795 Graphics: No Graphics CLEAN
JOB: 17-15159-3 CYCLE#;BL#: 5; 0 TRIM: 8.25" x 10.75" COMPOSITECOLORS: Black, ~note-color 2, ~note-color 3 GRAPHICS: none V1.5
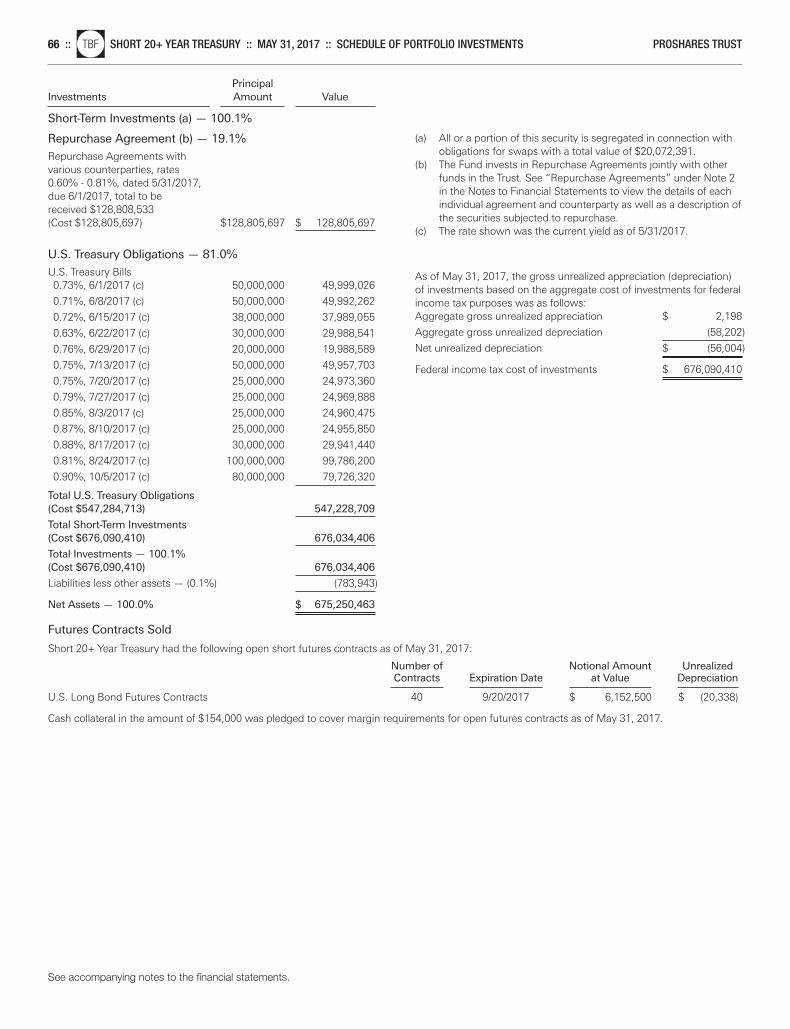
PrincipalInvestments Amount Value
Short-Term Investments (a) — 100.1%
Repurchase Agreement (b) — 19.1%
Repurchase Agreements with various counterparties, rates 0.60% - 0.81%, dated 5/31/2017, due 6/1/2017, total to be received $128,808,533(Cost $128,805,697) $128,805,697 $ 128,805,697
U.S. Treasury Obligations — 81.0%
U.S. Treasury Bills0.73%, 6/1/2017 (c) 50,000,000 49,999,026
0.71%, 6/8/2017 (c) 50,000,000 49,992,262
0.72%, 6/15/2017 (c) 38,000,000 37,989,055
0.63%, 6/22/2017 (c) 30,000,000 29,988,541
0.76%, 6/29/2017 (c) 20,000,000 19,988,589
0.75%, 7/13/2017 (c) 50,000,000 49,957,703
0.75%, 7/20/2017 (c) 25,000,000 24,973,360
0.79%, 7/27/2017 (c) 25,000,000 24,969,888
0.85%, 8/3/2017 (c) 25,000,000 24,960,475
0.87%, 8/10/2017 (c) 25,000,000 24,955,850
0.88%, 8/17/2017 (c) 30,000,000 29,941,440
0.81%, 8/24/2017 (c) 100,000,000 99,786,200
0.90%, 10/5/2017 (c) 80,000,000 79,726,320
Total U.S. Treasury Obligations(Cost $547,284,713) 547,228,709
Total Short-Term Investments(Cost $676,090,410) 676,034,406
Total Investments — 100.1%(Cost $676,090,410) 676,034,406
Liabilities less other assets — (0.1%) (783,943)
Net Assets — 100.0% $ 675,250,463
Futures Contracts Sold
Short 20+ Year Treasury had the following open short futures contracts as of May 31, 2017:
Number of Notional Amount UnrealizedContracts Expiration Date at Value Depreciation
U.S. Long Bond Futures Contracts 40 9/20/2017 $ 6,152,500 $ (20,338)
Cash collateral in the amount of $154,000 was pledged to cover margin requirements for open futures contracts as of May 31, 2017.
(a) All or a portion of this security is segregated in connection withobligations for swaps with a total value of $20,072,391.
(b) The Fund invests in Repurchase Agreements jointly with otherfunds in the Trust. See “Repurchase Agreements” under Note 2in the Notes to Financial Statements to view the details of eachindividual agreement and counterparty as well as a description ofthe securities subjected to repurchase.
(c) The rate shown was the current yield as of 5/31/2017.
As of May 31, 2017, the gross unrealized appreciation (depreciation)of investments based on the aggregate cost of investments for federalincome tax purposes was as follows:Aggregate gross unrealized appreciation $ 2,198
Aggregate gross unrealized depreciation (58,202)
Net unrealized depreciation $ (56,004)
Federal income tax cost of investments $ 676,090,410
See accompanying notes to the financial statements.
66 ::nlTBF SHORT 20+ YEAR TREASURY :: MAY 31, 2017 :: SCHEDULE OF PORTFOLIO INVESTMENTS PROSHARES TRUST
Merrill Corp - Proshares Trust Geared Book [96 Funds] Annual Report [Funds] 333-089822 05-31-2017 ED [AUX] | eperez | 28-Jul-17 17:38 | 17-15159-3.fm | Sequence: 2CHKSUM Content: 38802 Layout: 15267 Graphics: No Graphics CLEAN
JOB: 17-15159-3 CYCLE#;BL#: 5; 0 TRIM: 8.25" x 10.75" COMPOSITECOLORS: Black, ~note-color 2, ~note-color 3 GRAPHICS: none V1.5
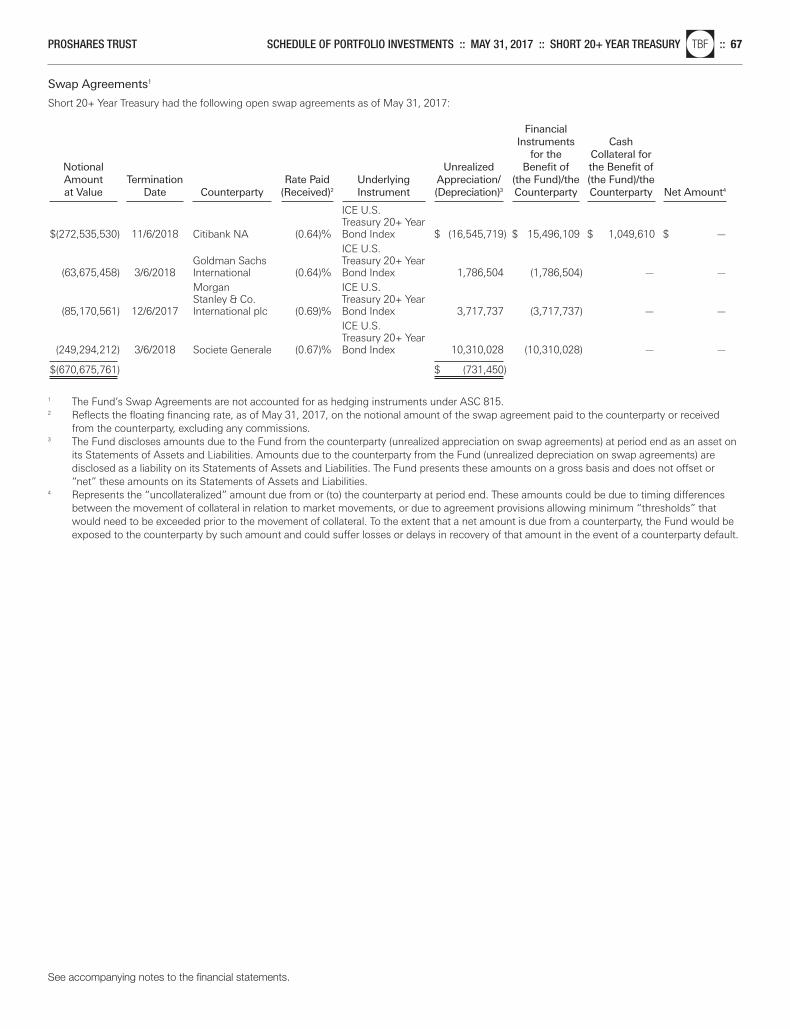
Swap Agreements1
Short 20+ Year Treasury had the following open swap agreements as of May 31, 2017:
Financial Instruments Cash
for the Collateral for Notional Unrealized Benefit of the Benefit of Amount Termination Rate Paid Underlying Appreciation/ (the Fund)/the (the Fund)/the at Value Date Counterparty (Received)2 Instrument (Depreciation)3 Counterparty Counterparty Net Amount4
ICE U.S. Treasury 20+ Year
$(272,535,530) 11/6/2018 Citibank NA (0.64)% Bond Index $ (16,545,719) $ 15,496,109 $ 1,049,610 $ —ICE U.S.
Goldman Sachs Treasury 20+ Year (63,675,458) 3/6/2018 International (0.64)% Bond Index 1,786,504 (1,786,504) — —
Morgan ICE U.S. Stanley & Co. Treasury 20+ Year
(85,170,561) 12/6/2017 International plc (0.69)% Bond Index 3,717,737 (3,717,737) — —ICE U.S. Treasury 20+ Year
(249,294,212) 3/6/2018 Societe Generale (0.67)% Bond Index 10,310,028 (10,310,028) — —
$(670,675,761) $ (731,450)
1 The Fund’s Swap Agreements are not accounted for as hedging instruments under ASC 815.2 Reflects the floating financing rate, as of May 31, 2017, on the notional amount of the swap agreement paid to the counterparty or received
from the counterparty, excluding any commissions.3 The Fund discloses amounts due to the Fund from the counterparty (unrealized appreciation on swap agreements) at period end as an asset on
its Statements of Assets and Liabilities. Amounts due to the counterparty from the Fund (unrealized depreciation on swap agreements) are disclosed as a liability on its Statements of Assets and Liabilities. The Fund presents these amounts on a gross basis and does not offset or“net” these amounts on its Statements of Assets and Liabilities.
4 Represents the “uncollateralized” amount due from or (to) the counterparty at period end. These amounts could be due to timing differencesbetween the movement of collateral in relation to market movements, or due to agreement provisions allowing minimum “thresholds” thatwould need to be exceeded prior to the movement of collateral. To the extent that a net amount is due from a counterparty, the Fund would beexposed to the counterparty by such amount and could suffer losses or delays in recovery of that amount in the event of a counterparty default.
See accompanying notes to the financial statements.
PROSHARES TRUST SCHEDULE OF PORTFOLIO INVESTMENTS :: MAY 31, 2017 :: SHORT 20+ YEAR TREASURYnlTBF :: 67
Merrill Corp - Proshares Trust Geared Book [96 Funds] Annual Report [Funds] 333-089822 05-31-2017 ED [AUX] | eperez | 28-Jul-17 17:38 | 17-15159-3.fm | Sequence: 3CHKSUM Content: 10435 Layout: 50751 Graphics: No Graphics CLEAN
JOB: 17-15159-3 CYCLE#;BL#: 5; 0 TRIM: 8.25" x 10.75" COMPOSITECOLORS: Black, ~note-color 2, ~note-color 3 GRAPHICS: none V1.5
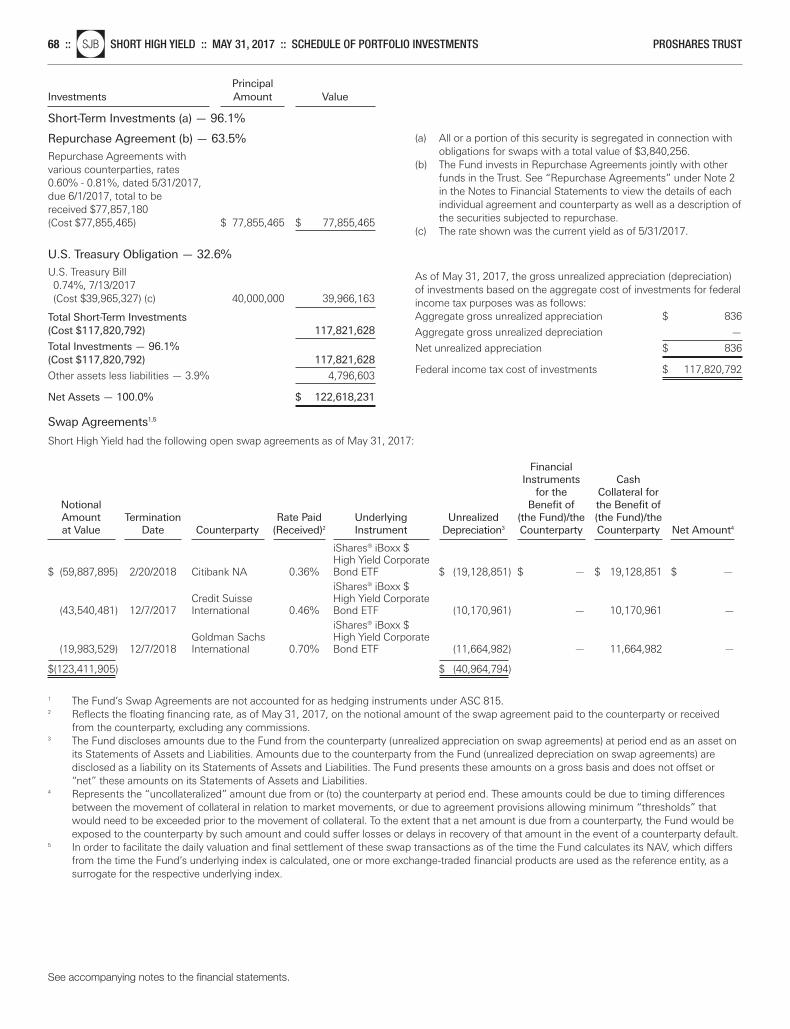
PrincipalInvestments Amount Value
Short-Term Investments (a) — 96.1%
Repurchase Agreement (b) — 63.5%
Repurchase Agreements with various counterparties, rates 0.60% - 0.81%, dated 5/31/2017, due 6/1/2017, total to be received $77,857,180(Cost $77,855,465) $ 77,855,465 $ 77,855,465
U.S. Treasury Obligation — 32.6%
U.S. Treasury Bill0.74%, 7/13/2017(Cost $39,965,327) (c) 40,000,000 39,966,163
Total Short-Term Investments(Cost $117,820,792) 117,821,628
Total Investments — 96.1%(Cost $117,820,792) 117,821,628
Other assets less liabilities — 3.9% 4,796,603
Net Assets — 100.0% $ 122,618,231
Swap Agreements1,5
Short High Yield had the following open swap agreements as of May 31, 2017:
Financial Instruments Cash
for the Collateral for Notional Benefit of the Benefit of Amount Termination Rate Paid Underlying Unrealized (the Fund)/the (the Fund)/the at Value Date Counterparty (Received)2 Instrument Depreciation3 Counterparty Counterparty Net Amount4
iShares® iBoxx $ High Yield Corporate
$ (59,887,895) 2/20/2018 Citibank NA 0.36% Bond ETF $ (19,128,851) $ — $ 19,128,851 $ —iShares® iBoxx $
Credit Suisse High Yield Corporate (43,540,481) 12/7/2017 International 0.46% Bond ETF (10,170,961) — 10,170,961 —
iShares® iBoxx $ Goldman Sachs High Yield Corporate
(19,983,529) 12/7/2018 International 0.70% Bond ETF (11,664,982) — 11,664,982 —
$(123,411,905) $ (40,964,794)
1 The Fund’s Swap Agreements are not accounted for as hedging instruments under ASC 815.2 Reflects the floating financing rate, as of May 31, 2017, on the notional amount of the swap agreement paid to the counterparty or received
from the counterparty, excluding any commissions.3 The Fund discloses amounts due to the Fund from the counterparty (unrealized appreciation on swap agreements) at period end as an asset on
its Statements of Assets and Liabilities. Amounts due to the counterparty from the Fund (unrealized depreciation on swap agreements) are disclosed as a liability on its Statements of Assets and Liabilities. The Fund presents these amounts on a gross basis and does not offset or“net” these amounts on its Statements of Assets and Liabilities.
4 Represents the “uncollateralized” amount due from or (to) the counterparty at period end. These amounts could be due to timing differencesbetween the movement of collateral in relation to market movements, or due to agreement provisions allowing minimum “thresholds” thatwould need to be exceeded prior to the movement of collateral. To the extent that a net amount is due from a counterparty, the Fund would beexposed to the counterparty by such amount and could suffer losses or delays in recovery of that amount in the event of a counterparty default.
5 In order to facilitate the daily valuation and final settlement of these swap transactions as of the time the Fund calculates its NAV, which differsfrom the time the Fund’s underlying index is calculated, one or more exchange-traded financial products are used as the reference entity, as asurrogate for the respective underlying index.
(a) All or a portion of this security is segregated in connection withobligations for swaps with a total value of $3,840,256.
(b) The Fund invests in Repurchase Agreements jointly with otherfunds in the Trust. See “Repurchase Agreements” under Note 2in the Notes to Financial Statements to view the details of eachindividual agreement and counterparty as well as a description ofthe securities subjected to repurchase.
(c) The rate shown was the current yield as of 5/31/2017.
As of May 31, 2017, the gross unrealized appreciation (depreciation)of investments based on the aggregate cost of investments for federalincome tax purposes was as follows:Aggregate gross unrealized appreciation $ 836
Aggregate gross unrealized depreciation —
Net unrealized appreciation $ 836
Federal income tax cost of investments $ 117,820,792
See accompanying notes to the financial statements.
68 ::nlSJB SHORT HIGH YIELD :: MAY 31, 2017 :: SCHEDULE OF PORTFOLIO INVESTMENTS PROSHARES TRUST
Merrill Corp - Proshares Trust Geared Book [96 Funds] Annual Report [Funds] 333-089822 05-31-2017 ED [AUX] | eperez | 28-Jul-17 17:38 | 17-15159-3.fm | Sequence: 4CHKSUM Content: 38308 Layout: 29934 Graphics: No Graphics CLEAN
JOB: 17-15159-3 CYCLE#;BL#: 5; 0 TRIM: 8.25" x 10.75" COMPOSITECOLORS: Black, ~note-color 2, ~note-color 3 GRAPHICS: none V1.5
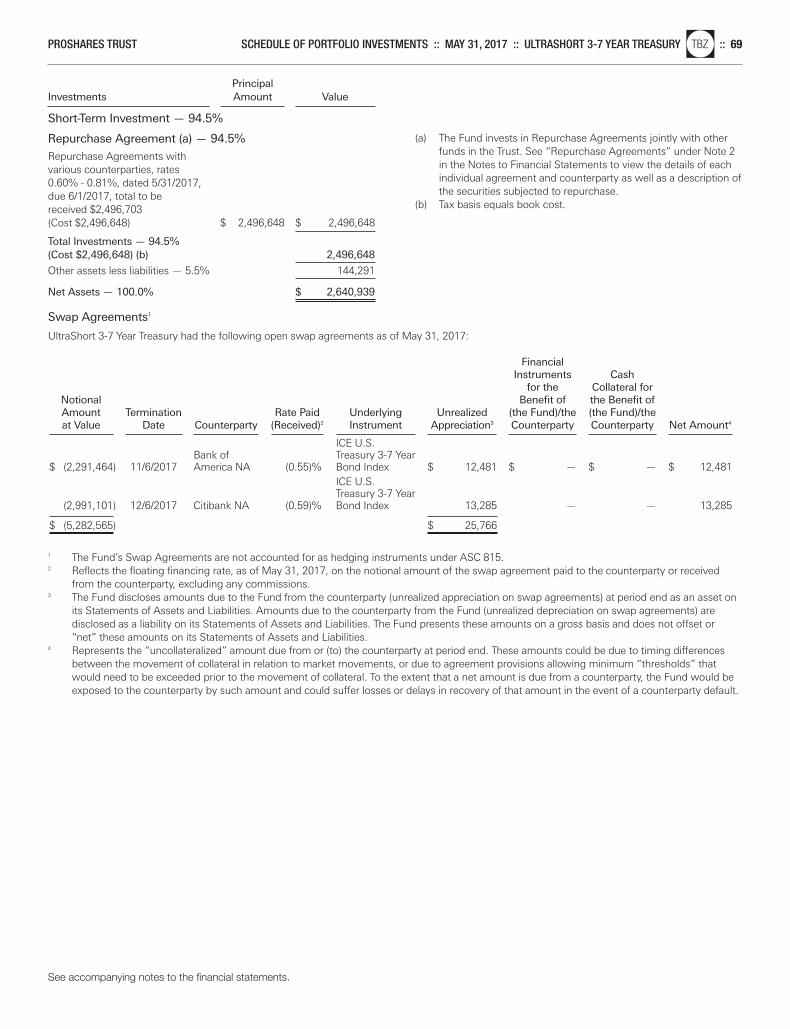
PrincipalInvestments Amount Value
Short-Term Investment — 94.5%
Repurchase Agreement (a) — 94.5%
Repurchase Agreements with various counterparties, rates 0.60% - 0.81%, dated 5/31/2017, due 6/1/2017, total to be received $2,496,703(Cost $2,496,648) $ 2,496,648 $ 2,496,648
Total Investments — 94.5%(Cost $2,496,648) (b) 2,496,648
Other assets less liabilities — 5.5% 144,291
Net Assets — 100.0% $ 2,640,939
Swap Agreements1
UltraShort 3-7 Year Treasury had the following open swap agreements as of May 31, 2017:
Financial Instruments Cash
for the Collateral for Notional Benefit of the Benefit of Amount Termination Rate Paid Underlying Unrealized (the Fund)/the (the Fund)/the at Value Date Counterparty (Received)2 Instrument Appreciation3 Counterparty Counterparty Net Amount4
ICE U.S.
Bank of Treasury 3-7 Year $ (2,291,464) 11/6/2017 America NA (0.55)% Bond Index $ 12,481 $ — $ — $ 12,481
ICE U.S. Treasury 3-7 Year
(2,991,101) 12/6/2017 Citibank NA (0.59)% Bond Index 13,285 — — 13,285
$ (5,282,565) $ 25,766
1 The Fund’s Swap Agreements are not accounted for as hedging instruments under ASC 815.2 Reflects the floating financing rate, as of May 31, 2017, on the notional amount of the swap agreement paid to the counterparty or received
from the counterparty, excluding any commissions.3 The Fund discloses amounts due to the Fund from the counterparty (unrealized appreciation on swap agreements) at period end as an asset on
its Statements of Assets and Liabilities. Amounts due to the counterparty from the Fund (unrealized depreciation on swap agreements) are disclosed as a liability on its Statements of Assets and Liabilities. The Fund presents these amounts on a gross basis and does not offset or“net” these amounts on its Statements of Assets and Liabilities.
4 Represents the “uncollateralized” amount due from or (to) the counterparty at period end. These amounts could be due to timing differencesbetween the movement of collateral in relation to market movements, or due to agreement provisions allowing minimum “thresholds” thatwould need to be exceeded prior to the movement of collateral. To the extent that a net amount is due from a counterparty, the Fund would beexposed to the counterparty by such amount and could suffer losses or delays in recovery of that amount in the event of a counterparty default.
(a) The Fund invests in Repurchase Agreements jointly with otherfunds in the Trust. See “Repurchase Agreements” under Note 2in the Notes to Financial Statements to view the details of eachindividual agreement and counterparty as well as a description ofthe securities subjected to repurchase.
(b) Tax basis equals book cost.
See accompanying notes to the financial statements.
PROSHARES TRUST SCHEDULE OF PORTFOLIO INVESTMENTS :: MAY 31, 2017 :: ULTRASHORT 3-7 YEAR TREASURYnlTBZ :: 69
Merrill Corp - Proshares Trust Geared Book [96 Funds] Annual Report [Funds] 333-089822 05-31-2017 ED [AUX] | eperez | 28-Jul-17 17:38 | 17-15159-3.fm | Sequence: 5CHKSUM Content: 33098 Layout: 11634 Graphics: No Graphics CLEAN
JOB: 17-15159-3 CYCLE#;BL#: 5; 0 TRIM: 8.25" x 10.75" COMPOSITECOLORS: Black, ~note-color 2, ~note-color 3 GRAPHICS: none V1.5
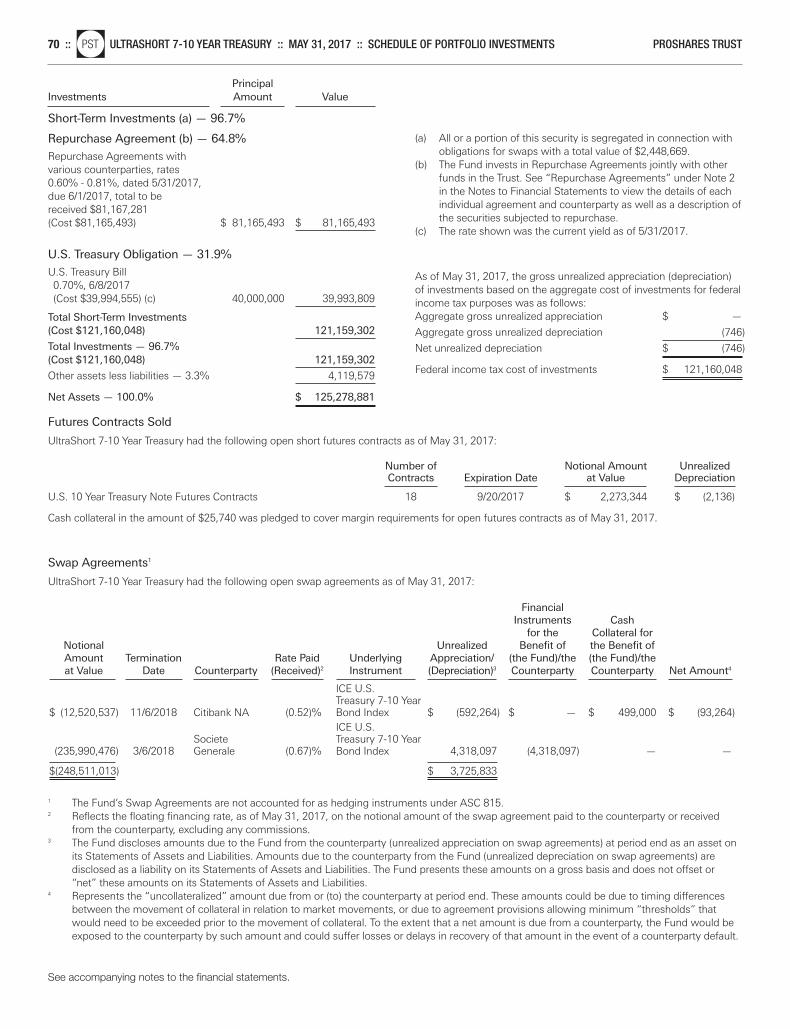
Futures Contracts Sold
UltraShort 7-10 Year Treasury had the following open short futures contracts as of May 31, 2017:
Number of Notional Amount Unrealized Contracts Expiration Date at Value Depreciation U.S. 10 Year Treasury Note Futures Contracts 18 9/20/2017 $ 2,273,344 $ (2,136)
Cash collateral in the amount of $25,740 was pledged to cover margin requirements for open futures contracts as of May 31, 2017.
Swap Agreements1
UltraShort 7-10 Year Treasury had the following open swap agreements as of May 31, 2017:
Financial Instruments Cash
for the Collateral for Notional Unrealized Benefit of the Benefit of Amount Termination Rate Paid Underlying Appreciation/ (the Fund)/the (the Fund)/the at Value Date Counterparty (Received)2 Instrument (Depreciation)3 Counterparty Counterparty Net Amount4
ICE U.S. Treasury 7-10 Year
$ (12,520,537) 11/6/2018 Citibank NA (0.52)% Bond Index $ (592,264) $ — $ 499,000 $ (93,264)ICE U.S.
Societe Treasury 7-10 Year (235,990,476) 3/6/2018 Generale (0.67)% Bond Index 4,318,097 (4,318,097) — —
$(248,511,013) $ 3,725,833
1 The Fund’s Swap Agreements are not accounted for as hedging instruments under ASC 815.2 Reflects the floating financing rate, as of May 31, 2017, on the notional amount of the swap agreement paid to the counterparty or received
from the counterparty, excluding any commissions.3 The Fund discloses amounts due to the Fund from the counterparty (unrealized appreciation on swap agreements) at period end as an asset on
its Statements of Assets and Liabilities. Amounts due to the counterparty from the Fund (unrealized depreciation on swap agreements) are disclosed as a liability on its Statements of Assets and Liabilities. The Fund presents these amounts on a gross basis and does not offset or“net” these amounts on its Statements of Assets and Liabilities.
4 Represents the “uncollateralized” amount due from or (to) the counterparty at period end. These amounts could be due to timing differencesbetween the movement of collateral in relation to market movements, or due to agreement provisions allowing minimum “thresholds” thatwould need to be exceeded prior to the movement of collateral. To the extent that a net amount is due from a counterparty, the Fund would beexposed to the counterparty by such amount and could suffer losses or delays in recovery of that amount in the event of a counterparty default.
See accompanying notes to the financial statements.
70 ::nlPST ULTRASHORT 7-10 YEAR TREASURY :: MAY 31, 2017 :: SCHEDULE OF PORTFOLIO INVESTMENTS PROSHARES TRUST
PrincipalInvestments Amount Value
Short-Term Investments (a) — 96.7%
Repurchase Agreement (b) — 64.8%
Repurchase Agreements with various counterparties, rates 0.60% - 0.81%, dated 5/31/2017, due 6/1/2017, total to be received $81,167,281(Cost $81,165,493) $ 81,165,493 $ 81,165,493
U.S. Treasury Obligation — 31.9%
U.S. Treasury Bill0.70%, 6/8/2017(Cost $39,994,555) (c) 40,000,000 39,993,809
Total Short-Term Investments(Cost $121,160,048) 121,159,302
Total Investments — 96.7%(Cost $121,160,048) 121,159,302
Other assets less liabilities — 3.3% 4,119,579
Net Assets — 100.0% $ 125,278,881
(a) All or a portion of this security is segregated in connection withobligations for swaps with a total value of $2,448,669.
(b) The Fund invests in Repurchase Agreements jointly with otherfunds in the Trust. See “Repurchase Agreements” under Note 2in the Notes to Financial Statements to view the details of eachindividual agreement and counterparty as well as a description ofthe securities subjected to repurchase.
(c) The rate shown was the current yield as of 5/31/2017.
As of May 31, 2017, the gross unrealized appreciation (depreciation)of investments based on the aggregate cost of investments for federalincome tax purposes was as follows:Aggregate gross unrealized appreciation $ —
Aggregate gross unrealized depreciation (746)
Net unrealized depreciation $ (746)
Federal income tax cost of investments $ 121,160,048
Merrill Corp - Proshares Trust Geared Book [96 Funds] Annual Report [Funds] 333-089822 05-31-2017 ED [AUX] | eperez | 28-Jul-17 17:38 | 17-15159-3.fm | Sequence: 6CHKSUM Content: 30105 Layout: 49539 Graphics: No Graphics CLEAN
JOB: 17-15159-3 CYCLE#;BL#: 5; 0 TRIM: 8.25" x 10.75" COMPOSITECOLORS: Black, ~note-color 2, ~note-color 3 GRAPHICS: none V1.5
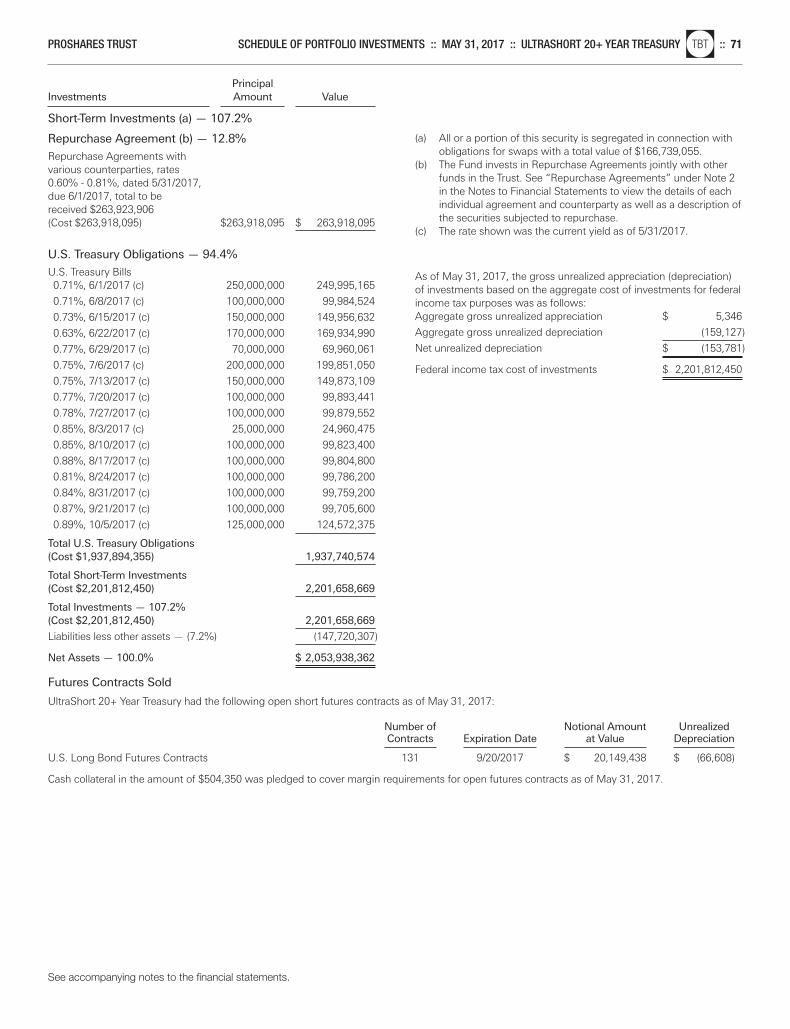
Futures Contracts Sold
UltraShort 20+ Year Treasury had the following open short futures contracts as of May 31, 2017:
Number of Notional Amount Unrealized Contracts Expiration Date at Value Depreciation U.S. Long Bond Futures Contracts 131 9/20/2017 $ 20,149,438 $ (66,608)
Cash collateral in the amount of $504,350 was pledged to cover margin requirements for open futures contracts as of May 31, 2017.
See accompanying notes to the financial statements.
PROSHARES TRUST SCHEDULE OF PORTFOLIO INVESTMENTS :: MAY 31, 2017 :: ULTRASHORT 20+ YEAR TREASURYnlTBT :: 71
PrincipalInvestments Amount Value
Short-Term Investments (a) — 107.2%
Repurchase Agreement (b) — 12.8%
Repurchase Agreements with various counterparties, rates 0.60% - 0.81%, dated 5/31/2017, due 6/1/2017, total to be received $263,923,906(Cost $263,918,095) $263,918,095 $ 263,918,095
U.S. Treasury Obligations — 94.4%
U.S. Treasury Bills0.71%, 6/1/2017 (c) 250,000,000 249,995,165
0.71%, 6/8/2017 (c) 100,000,000 99,984,524
0.73%, 6/15/2017 (c) 150,000,000 149,956,632
0.63%, 6/22/2017 (c) 170,000,000 169,934,990
0.77%, 6/29/2017 (c) 70,000,000 69,960,061
0.75%, 7/6/2017 (c) 200,000,000 199,851,050
0.75%, 7/13/2017 (c) 150,000,000 149,873,109
0.77%, 7/20/2017 (c) 100,000,000 99,893,441
0.78%, 7/27/2017 (c) 100,000,000 99,879,552
0.85%, 8/3/2017 (c) 25,000,000 24,960,475
0.85%, 8/10/2017 (c) 100,000,000 99,823,400
0.88%, 8/17/2017 (c) 100,000,000 99,804,800
0.81%, 8/24/2017 (c) 100,000,000 99,786,200
0.84%, 8/31/2017 (c) 100,000,000 99,759,200
0.87%, 9/21/2017 (c) 100,000,000 99,705,600
0.89%, 10/5/2017 (c) 125,000,000 124,572,375
Total U.S. Treasury Obligations(Cost $1,937,894,355) 1,937,740,574
Total Short-Term Investments(Cost $2,201,812,450) 2,201,658,669
Total Investments — 107.2%(Cost $2,201,812,450) 2,201,658,669
Liabilities less other assets — (7.2%) (147,720,307)
Net Assets — 100.0% $ 2,053,938,362
(a) All or a portion of this security is segregated in connection withobligations for swaps with a total value of $166,739,055.
(b) The Fund invests in Repurchase Agreements jointly with otherfunds in the Trust. See “Repurchase Agreements” under Note 2in the Notes to Financial Statements to view the details of eachindividual agreement and counterparty as well as a description ofthe securities subjected to repurchase.
(c) The rate shown was the current yield as of 5/31/2017.
As of May 31, 2017, the gross unrealized appreciation (depreciation)of investments based on the aggregate cost of investments for federalincome tax purposes was as follows:Aggregate gross unrealized appreciation $ 5,346
Aggregate gross unrealized depreciation (159,127)
Net unrealized depreciation $ (153,781)
Federal income tax cost of investments $ 2,201,812,450
Merrill Corp - Proshares Trust Geared Book [96 Funds] Annual Report [Funds] 333-089822 05-31-2017 ED [AUX] | eperez | 28-Jul-17 17:38 | 17-15159-3.fm | Sequence: 7CHKSUM Content: 10827 Layout: 53412 Graphics: No Graphics CLEAN
JOB: 17-15159-3 CYCLE#;BL#: 5; 0 TRIM: 8.25" x 10.75" COMPOSITECOLORS: Black, ~note-color 2, ~note-color 3 GRAPHICS: none V1.5
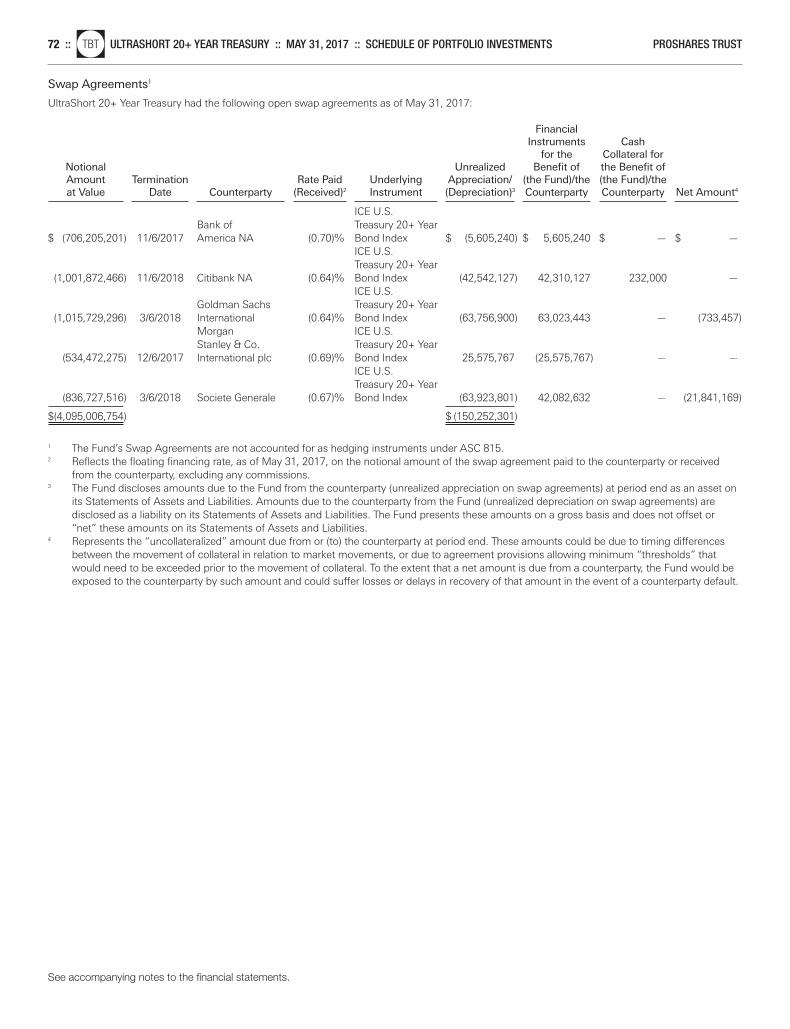
See accompanying notes to the financial statements.
72 ::nlTBT ULTRASHORT 20+ YEAR TREASURY :: MAY 31, 2017 :: SCHEDULE OF PORTFOLIO INVESTMENTS PROSHARES TRUST
Swap Agreements1
UltraShort 20+ Year Treasury had the following open swap agreements as of May 31, 2017:
Financial Instruments Cash
for the Collateral for Notional Unrealized Benefit of the Benefit of Amount Termination Rate Paid Underlying Appreciation/ (the Fund)/the (the Fund)/the at Value Date Counterparty (Received)2 Instrument (Depreciation)3 Counterparty Counterparty Net Amount4
ICE U.S.
Bank of Treasury 20+ Year $ (706,205,201) 11/6/2017 America NA (0.70)% Bond Index $ (5,605,240) $ 5,605,240 $ — $ —
ICE U.S. Treasury 20+ Year
(1,001,872,466) 11/6/2018 Citibank NA (0.64)% Bond Index (42,542,127) 42,310,127 232,000 —ICE U.S.
Goldman Sachs Treasury 20+ Year (1,015,729,296) 3/6/2018 International (0.64)% Bond Index (63,756,900) 63,023,443 — (733,457)
Morgan ICE U.S. Stanley & Co. Treasury 20+ Year
(534,472,275) 12/6/2017 International plc (0.69)% Bond Index 25,575,767 (25,575,767) — —ICE U.S. Treasury 20+ Year
(836,727,516) 3/6/2018 Societe Generale (0.67)% Bond Index (63,923,801) 42,082,632 — (21,841,169)
$(4,095,006,754) $ (150,252,301)
1 The Fund’s Swap Agreements are not accounted for as hedging instruments under ASC 815.2 Reflects the floating financing rate, as of May 31, 2017, on the notional amount of the swap agreement paid to the counterparty or received
from the counterparty, excluding any commissions.3 The Fund discloses amounts due to the Fund from the counterparty (unrealized appreciation on swap agreements) at period end as an asset on
its Statements of Assets and Liabilities. Amounts due to the counterparty from the Fund (unrealized depreciation on swap agreements) are disclosed as a liability on its Statements of Assets and Liabilities. The Fund presents these amounts on a gross basis and does not offset or“net” these amounts on its Statements of Assets and Liabilities.
4 Represents the “uncollateralized” amount due from or (to) the counterparty at period end. These amounts could be due to timing differencesbetween the movement of collateral in relation to market movements, or due to agreement provisions allowing minimum “thresholds” thatwould need to be exceeded prior to the movement of collateral. To the extent that a net amount is due from a counterparty, the Fund would beexposed to the counterparty by such amount and could suffer losses or delays in recovery of that amount in the event of a counterparty default.
Merrill Corp - Proshares Trust Geared Book [96 Funds] Annual Report [Funds] 333-089822 05-31-2017 ED [AUX] | eperez | 28-Jul-17 17:38 | 17-15159-3.fm | Sequence: 8CHKSUM Content: 55695 Layout: 56635 Graphics: No Graphics CLEAN
JOB: 17-15159-3 CYCLE#;BL#: 5; 0 TRIM: 8.25" x 10.75" COMPOSITECOLORS: Black, ~note-color 2, ~note-color 3 GRAPHICS: none V1.5
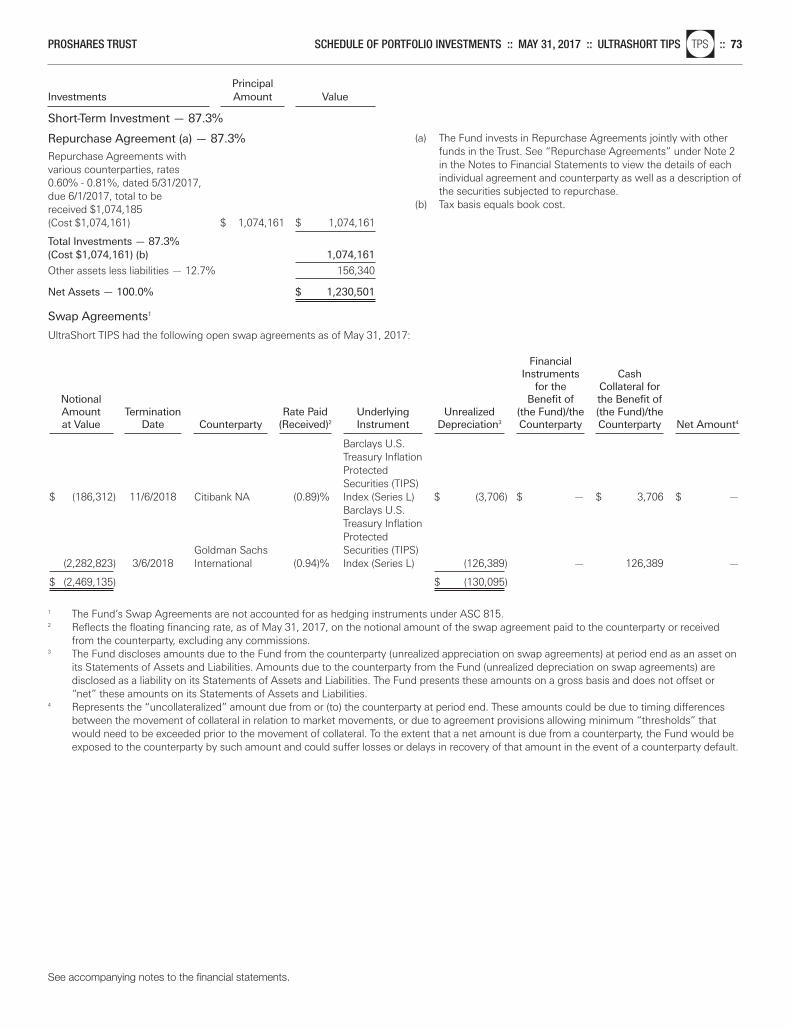
PrincipalInvestments Amount Value
Short-Term Investment — 87.3%
Repurchase Agreement (a) — 87.3%
Repurchase Agreements with various counterparties, rates 0.60% - 0.81%, dated 5/31/2017, due 6/1/2017, total to be received $1,074,185(Cost $1,074,161) $ 1,074,161 $ 1,074,161
Total Investments — 87.3%(Cost $1,074,161) (b) 1,074,161
Other assets less liabilities — 12.7% 156,340
Net Assets — 100.0% $ 1,230,501
Swap Agreements1
UltraShort TIPS had the following open swap agreements as of May 31, 2017:
Financial Instruments Cash
for the Collateral for Notional Benefit of the Benefit of Amount Termination Rate Paid Underlying Unrealized (the Fund)/the (the Fund)/the at Value Date Counterparty (Received)2 Instrument Depreciation3 Counterparty Counterparty Net Amount4
Barclays U.S. Treasury Inflation Protected Securities (TIPS)
$ (186,312) 11/6/2018 Citibank NA (0.89)% Index (Series L) $ (3,706) $ — $ 3,706 $ —Barclays U.S. Treasury Inflation Protected
Goldman Sachs Securities (TIPS) (2,282,823) 3/6/2018 International (0.94)% Index (Series L) (126,389) — 126,389 —
$ (2,469,135) $ (130,095)
1 The Fund’s Swap Agreements are not accounted for as hedging instruments under ASC 815.2 Reflects the floating financing rate, as of May 31, 2017, on the notional amount of the swap agreement paid to the counterparty or received
from the counterparty, excluding any commissions.3 The Fund discloses amounts due to the Fund from the counterparty (unrealized appreciation on swap agreements) at period end as an asset on
its Statements of Assets and Liabilities. Amounts due to the counterparty from the Fund (unrealized depreciation on swap agreements) are disclosed as a liability on its Statements of Assets and Liabilities. The Fund presents these amounts on a gross basis and does not offset or“net” these amounts on its Statements of Assets and Liabilities.
4 Represents the “uncollateralized” amount due from or (to) the counterparty at period end. These amounts could be due to timing differencesbetween the movement of collateral in relation to market movements, or due to agreement provisions allowing minimum “thresholds” thatwould need to be exceeded prior to the movement of collateral. To the extent that a net amount is due from a counterparty, the Fund would beexposed to the counterparty by such amount and could suffer losses or delays in recovery of that amount in the event of a counterparty default.
(a) The Fund invests in Repurchase Agreements jointly with otherfunds in the Trust. See “Repurchase Agreements” under Note 2in the Notes to Financial Statements to view the details of eachindividual agreement and counterparty as well as a description ofthe securities subjected to repurchase.
(b) Tax basis equals book cost.
See accompanying notes to the financial statements.
PROSHARES TRUST SCHEDULE OF PORTFOLIO INVESTMENTS :: MAY 31, 2017 :: ULTRASHORT TIPSnlTPS :: 73
Merrill Corp - Proshares Trust Geared Book [96 Funds] Annual Report [Funds] 333-089822 05-31-2017 ED [AUX] | eperez | 28-Jul-17 17:38 | 17-15159-3.fm | Sequence: 9CHKSUM Content: 10494 Layout: 30347 Graphics: No Graphics CLEAN
JOB: 17-15159-3 CYCLE#;BL#: 5; 0 TRIM: 8.25" x 10.75" COMPOSITECOLORS: Black, ~note-color 2, ~note-color 3 GRAPHICS: none V1.5
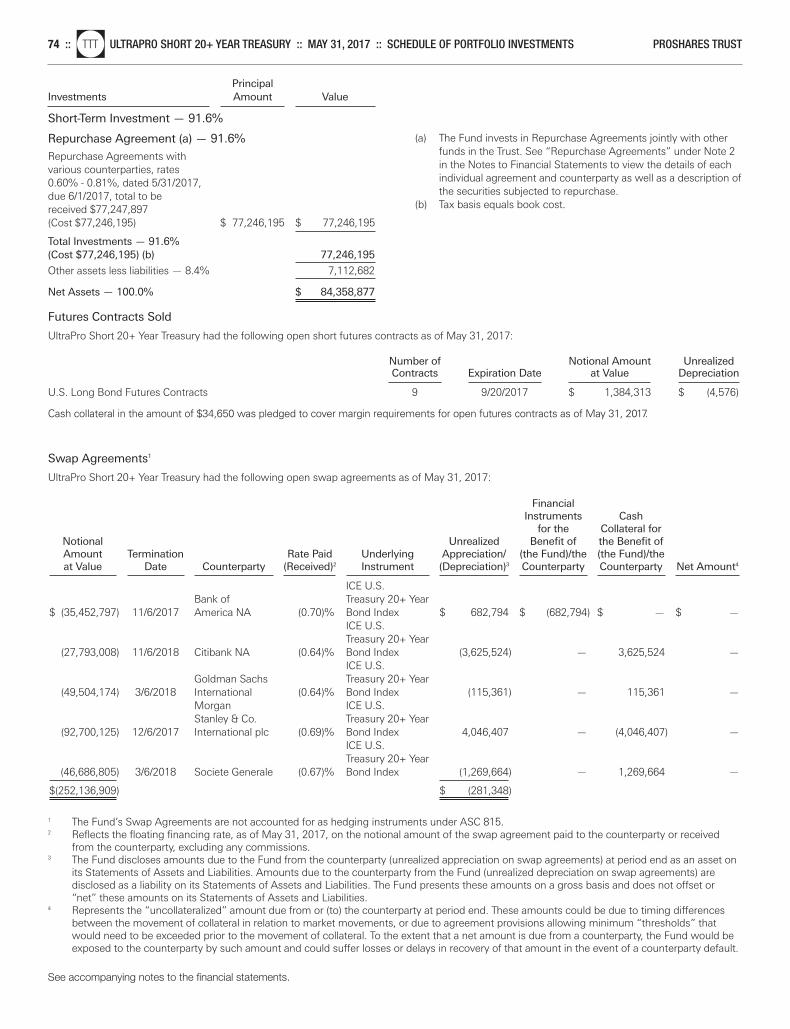
PrincipalInvestments Amount Value
Short-Term Investment — 91.6%
Repurchase Agreement (a) — 91.6%
Repurchase Agreements with various counterparties, rates 0.60% - 0.81%, dated 5/31/2017, due 6/1/2017, total to be received $77,247,897(Cost $77,246,195) $ 77,246,195 $ 77,246,195
Total Investments — 91.6%(Cost $77,246,195) (b) 77,246,195
Other assets less liabilities — 8.4% 7,112,682
Net Assets — 100.0% $ 84,358,877
Futures Contracts Sold
UltraPro Short 20+ Year Treasury had the following open short futures contracts as of May 31, 2017:
Number of Notional Amount Unrealized Contracts Expiration Date at Value Depreciation U.S. Long Bond Futures Contracts 9 9/20/2017 $ 1,384,313 $ (4,576)
Cash collateral in the amount of $34,650 was pledged to cover margin requirements for open futures contracts as of May 31, 2017.
Swap Agreements1
UltraPro Short 20+ Year Treasury had the following open swap agreements as of May 31, 2017:
Financial Instruments Cash
for the Collateral for Notional Unrealized Benefit of the Benefit of Amount Termination Rate Paid Underlying Appreciation/ (the Fund)/the (the Fund)/the at Value Date Counterparty (Received)2 Instrument (Depreciation)3 Counterparty Counterparty Net Amount4
ICE U.S.
Bank of Treasury 20+ Year $ (35,452,797) 11/6/2017 America NA (0.70)% Bond Index $ 682,794 $ (682,794) $ — $ —
ICE U.S. Treasury 20+ Year
(27,793,008) 11/6/2018 Citibank NA (0.64)% Bond Index (3,625,524) — 3,625,524 —ICE U.S.
Goldman Sachs Treasury 20+ Year (49,504,174) 3/6/2018 International (0.64)% Bond Index (115,361) — 115,361 —
Morgan ICE U.S. Stanley & Co. Treasury 20+ Year
(92,700,125) 12/6/2017 International plc (0.69)% Bond Index 4,046,407 — (4,046,407) —ICE U.S. Treasury 20+ Year
(46,686,805) 3/6/2018 Societe Generale (0.67)% Bond Index (1,269,664) — 1,269,664 —
$(252,136,909) $ (281,348)
1 The Fund’s Swap Agreements are not accounted for as hedging instruments under ASC 815.2 Reflects the floating financing rate, as of May 31, 2017, on the notional amount of the swap agreement paid to the counterparty or received
from the counterparty, excluding any commissions.3 The Fund discloses amounts due to the Fund from the counterparty (unrealized appreciation on swap agreements) at period end as an asset on
its Statements of Assets and Liabilities. Amounts due to the counterparty from the Fund (unrealized depreciation on swap agreements) are disclosed as a liability on its Statements of Assets and Liabilities. The Fund presents these amounts on a gross basis and does not offset or“net” these amounts on its Statements of Assets and Liabilities.
4 Represents the “uncollateralized” amount due from or (to) the counterparty at period end. These amounts could be due to timing differencesbetween the movement of collateral in relation to market movements, or due to agreement provisions allowing minimum “thresholds” thatwould need to be exceeded prior to the movement of collateral. To the extent that a net amount is due from a counterparty, the Fund would beexposed to the counterparty by such amount and could suffer losses or delays in recovery of that amount in the event of a counterparty default.
(a) The Fund invests in Repurchase Agreements jointly with otherfunds in the Trust. See “Repurchase Agreements” under Note 2in the Notes to Financial Statements to view the details of eachindividual agreement and counterparty as well as a description ofthe securities subjected to repurchase.
(b) Tax basis equals book cost.
See accompanying notes to the financial statements.
74 ::nlTTT ULTRAPRO SHORT 20+ YEAR TREASURY :: MAY 31, 2017 :: SCHEDULE OF PORTFOLIO INVESTMENTS PROSHARES TRUST
Merrill Corp - Proshares Trust Geared Book [96 Funds] Annual Report [Funds] 333-089822 05-31-2017 ED [AUX] | eperez | 28-Jul-17 17:38 | 17-15159-3.fm | Sequence: 10CHKSUM Content: 62871 Layout: 5888 Graphics: No Graphics CLEAN
JOB: 17-15159-3 CYCLE#;BL#: 5; 0 TRIM: 8.25" x 10.75" COMPOSITECOLORS: Black, ~note-color 2, ~note-color 3 GRAPHICS: none V1.5
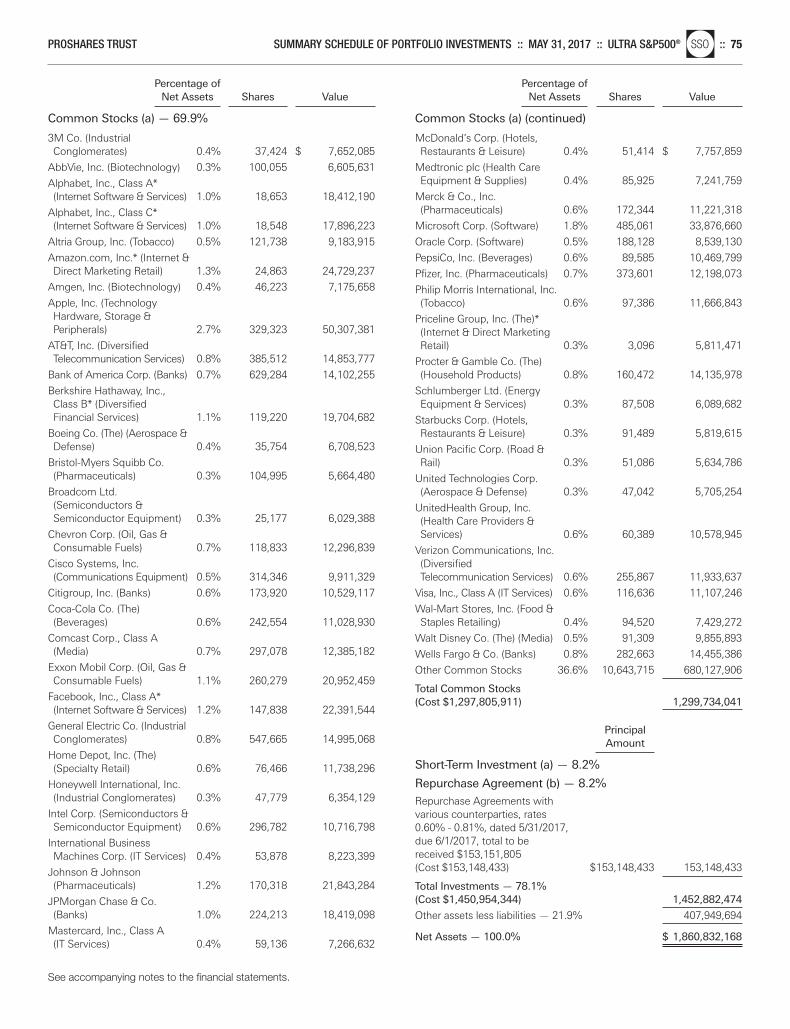
Percentage of Net Assets Shares Value
Common Stocks (a) — 69.9%
Percentage of Net Assets Shares Value
Common Stocks (a) (continued)
3M Co. (Industrial Conglomerates) 0.4% 37,424 $ 7,652,085
AbbVie, Inc. (Biotechnology) 0.3% 100,055 6,605,631
Alphabet, Inc., Class A* (Internet Software & Services) 1.0% 18,653 18,412,190
Alphabet, Inc., Class C* (Internet Software & Services) 1.0% 18,548 17,896,223
Altria Group, Inc. (Tobacco) 0.5% 121,738 9,183,915
Amazon.com, Inc.* (Internet & Direct Marketing Retail) 1.3% 24,863 24,729,237
Amgen, Inc. (Biotechnology) 0.4% 46,223 7,175,658
Apple, Inc. (Technology Hardware, Storage & Peripherals) 2.7% 329,323 50,307,381
AT&T, Inc. (Diversified Telecommunication Services) 0.8% 385,512 14,853,777
Bank of America Corp. (Banks) 0.7% 629,284 14,102,255
Berkshire Hathaway, Inc., Class B* (Diversified Financial Services) 1.1% 119,220 19,704,682
Boeing Co. (The) (Aerospace & Defense) 0.4% 35,754 6,708,523
Bristol-Myers Squibb Co. (Pharmaceuticals) 0.3% 104,995 5,664,480
Broadcom Ltd. (Semiconductors & Semiconductor Equipment) 0.3% 25,177 6,029,388
Chevron Corp. (Oil, Gas & Consumable Fuels) 0.7% 118,833 12,296,839
Cisco Systems, Inc. (Communications Equipment) 0.5% 314,346 9,911,329
Citigroup, Inc. (Banks) 0.6% 173,920 10,529,117
Coca-Cola Co. (The) (Beverages) 0.6% 242,554 11,028,930
Comcast Corp., Class A (Media) 0.7% 297,078 12,385,182
Exxon Mobil Corp. (Oil, Gas & Consumable Fuels) 1.1% 260,279 20,952,459
Facebook, Inc., Class A* (Internet Software & Services) 1.2% 147,838 22,391,544
General Electric Co. (Industrial Conglomerates) 0.8% 547,665 14,995,068
Home Depot, Inc. (The) (Specialty Retail) 0.6% 76,466 11,738,296
Honeywell International, Inc. (Industrial Conglomerates) 0.3% 47,779 6,354,129
Intel Corp. (Semiconductors & Semiconductor Equipment) 0.6% 296,782 10,716,798
International Business Machines Corp. (IT Services) 0.4% 53,878 8,223,399
Johnson & Johnson (Pharmaceuticals) 1.2% 170,318 21,843,284
JPMorgan Chase & Co. (Banks) 1.0% 224,213 18,419,098
Mastercard, Inc., Class A (IT Services) 0.4% 59,136 7,266,632
McDonald’s Corp. (Hotels, Restaurants & Leisure) 0.4% 51,414 $ 7,757,859
Medtronic plc (Health Care Equipment & Supplies) 0.4% 85,925 7,241,759
Merck & Co., Inc. (Pharmaceuticals) 0.6% 172,344 11,221,318
Microsoft Corp. (Software) 1.8% 485,061 33,876,660
Oracle Corp. (Software) 0.5% 188,128 8,539,130
PepsiCo, Inc. (Beverages) 0.6% 89,585 10,469,799
Pfizer, Inc. (Pharmaceuticals) 0.7% 373,601 12,198,073
Philip Morris International, Inc. (Tobacco) 0.6% 97,386 11,666,843
Priceline Group, Inc. (The)* (Internet & Direct Marketing Retail) 0.3% 3,096 5,811,471
Procter & Gamble Co. (The) (Household Products) 0.8% 160,472 14,135,978
Schlumberger Ltd. (Energy Equipment & Services) 0.3% 87,508 6,089,682
Starbucks Corp. (Hotels, Restaurants & Leisure) 0.3% 91,489 5,819,615
Union Pacific Corp. (Road & Rail) 0.3% 51,086 5,634,786
United Technologies Corp. (Aerospace & Defense) 0.3% 47,042 5,705,254
UnitedHealth Group, Inc. (Health Care Providers & Services) 0.6% 60,389 10,578,945
Verizon Communications, Inc. (Diversified Telecommunication Services) 0.6% 255,867 11,933,637
Visa, Inc., Class A (IT Services) 0.6% 116,636 11,107,246
Wal-Mart Stores, Inc. (Food & Staples Retailing) 0.4% 94,520 7,429,272
Walt Disney Co. (The) (Media) 0.5% 91,309 9,855,893
Wells Fargo & Co. (Banks) 0.8% 282,663 14,455,386
Other Common Stocks 36.6% 10,643,715 680,127,906
Total Common Stocks(Cost $1,297,805,911) 1,299,734,041
Principal Amount
Short-Term Investment (a) — 8.2%
Repurchase Agreement (b) — 8.2%
Repurchase Agreements with various counterparties, rates 0.60% - 0.81%, dated 5/31/2017, due 6/1/2017, total to be received $153,151,805(Cost $153,148,433) $153,148,433 153,148,433
Total Investments — 78.1%(Cost $1,450,954,344) 1,452,882,474
Other assets less liabilities — 21.9% 407,949,694
Net Assets — 100.0% $ 1,860,832,168
See accompanying notes to the financial statements.
PROSHARES TRUST SUMMARY SCHEDULE OF PORTFOLIO INVESTMENTS :: MAY 31, 2017 :: ULTRA S&P500®nlSSO :: 75
Merrill Corp - Proshares Trust Geared Book [96 Funds] Annual Report [Funds] 333-089822 05-31-2017 ED [AUX] | eperez | 28-Jul-17 17:38 | 17-15159-3.fo | Sequence: 1CHKSUM Content: 59212 Layout: 60039 Graphics: No Graphics CLEAN
JOB: 17-15159-3 CYCLE#;BL#: 5; 0 TRIM: 8.25" x 10.75" COMPOSITECOLORS: Black, ~note-color 2, ~note-color 3 GRAPHICS: none V1.5
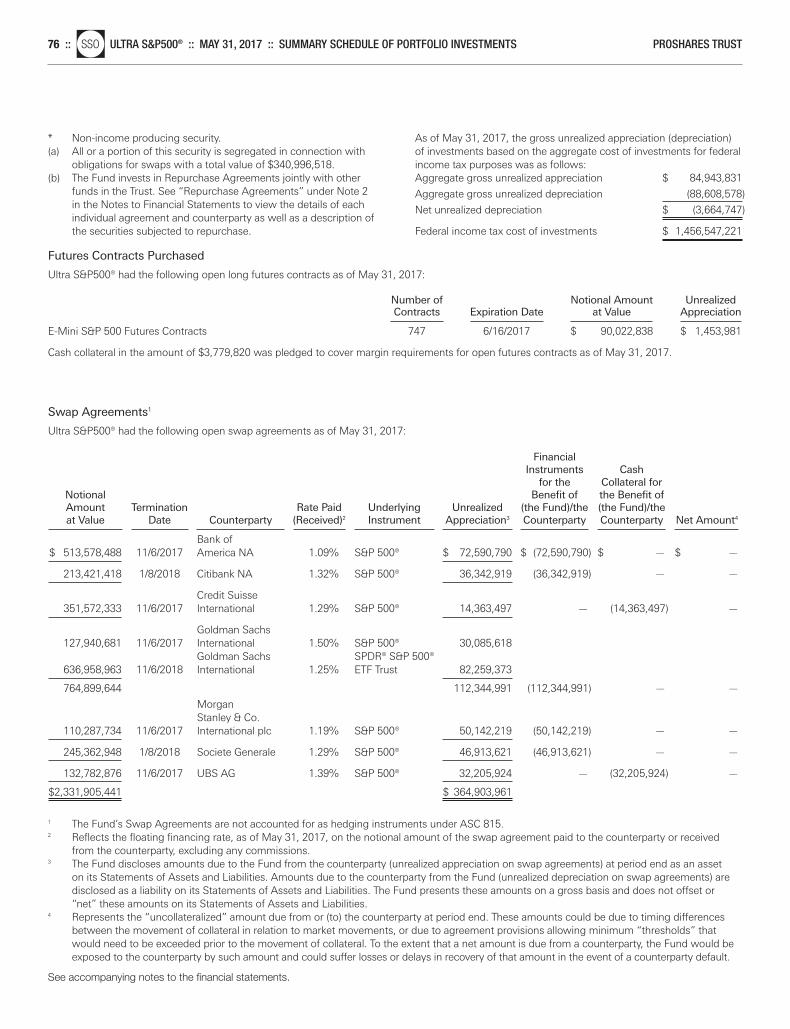
* Non-income producing security.(a) All or a portion of this security is segregated in connection with
obligations for swaps with a total value of $340,996,518.(b) The Fund invests in Repurchase Agreements jointly with other
funds in the Trust. See “Repurchase Agreements” under Note 2in the Notes to Financial Statements to view the details of eachindividual agreement and counterparty as well as a description ofthe securities subjected to repurchase.
Futures Contracts Purchased
Ultra S&P500® had the following open long futures contracts as of May 31, 2017:
Number of Notional Amount Unrealized Contracts Expiration Date at Value Appreciation E-Mini S&P 500 Futures Contracts 747 6/16/2017 $ 90,022,838 $ 1,453,981
Cash collateral in the amount of $3,779,820 was pledged to cover margin requirements for open futures contracts as of May 31, 2017.
Swap Agreements1
Ultra S&P500® had the following open swap agreements as of May 31, 2017:
Financial Instruments Cash
for the Collateral for Notional Benefit of the Benefit of Amount Termination Rate Paid Underlying Unrealized (the Fund)/the (the Fund)/the at Value Date Counterparty (Received)2 Instrument Appreciation3 Counterparty Counterparty Net Amount4
Bank of
$ 513,578,488 11/6/2017 America NA 1.09% S&P 500® $ 72,590,790 $ (72,590,790) $ — $ —
213,421,418 1/8/2018 Citibank NA 1.32% S&P 500® 36,342,919 (36,342,919) — —
Credit Suisse 351,572,333 11/6/2017 International 1.29% S&P 500® 14,363,497 — (14,363,497) —
Goldman Sachs 127,940,681 11/6/2017 International 1.50% S&P 500® 30,085,618
Goldman Sachs SPDR® S&P 500® 636,958,963 11/6/2018 International 1.25% ETF Trust 82,259,373
764,899,644 112,344,991 (112,344,991) — —
Morgan Stanley & Co.
110,287,734 11/6/2017 International plc 1.19% S&P 500® 50,142,219 (50,142,219) — —
245,362,948 1/8/2018 Societe Generale 1.29% S&P 500® 46,913,621 (46,913,621) — —
132,782,876 11/6/2017 UBS AG 1.39% S&P 500® 32,205,924 — (32,205,924) —
$2,331,905,441 $ 364,903,961
1 The Fund’s Swap Agreements are not accounted for as hedging instruments under ASC 815.2 Reflects the floating financing rate, as of May 31, 2017, on the notional amount of the swap agreement paid to the counterparty or received
from the counterparty, excluding any commissions.3 The Fund discloses amounts due to the Fund from the counterparty (unrealized appreciation on swap agreements) at period end as an asset
on its Statements of Assets and Liabilities. Amounts due to the counterparty from the Fund (unrealized depreciation on swap agreements) aredisclosed as a liability on its Statements of Assets and Liabilities. The Fund presents these amounts on a gross basis and does not offset or“net” these amounts on its Statements of Assets and Liabilities.
4 Represents the “uncollateralized” amount due from or (to) the counterparty at period end. These amounts could be due to timing differencesbetween the movement of collateral in relation to market movements, or due to agreement provisions allowing minimum “thresholds” thatwould need to be exceeded prior to the movement of collateral. To the extent that a net amount is due from a counterparty, the Fund would beexposed to the counterparty by such amount and could suffer losses or delays in recovery of that amount in the event of a counterparty default.
As of May 31, 2017, the gross unrealized appreciation (depreciation)of investments based on the aggregate cost of investments for federalincome tax purposes was as follows:Aggregate gross unrealized appreciation $ 84,943,831
Aggregate gross unrealized depreciation (88,608,578)
Net unrealized depreciation $ (3,664,747)
Federal income tax cost of investments $ 1,456,547,221
See accompanying notes to the financial statements.
76 ::nlSSO ULTRA S&P500® :: MAY 31, 2017 :: SUMMARY SCHEDULE OF PORTFOLIO INVESTMENTS PROSHARES TRUST
Merrill Corp - Proshares Trust Geared Book [96 Funds] Annual Report [Funds] 333-089822 05-31-2017 ED [AUX] | eperez | 28-Jul-17 17:38 | 17-15159-3.fo | Sequence: 2CHKSUM Content: 62989 Layout: 15120 Graphics: No Graphics CLEAN
JOB: 17-15159-3 CYCLE#;BL#: 5; 0 TRIM: 8.25" x 10.75" COMPOSITECOLORS: Black, ~note-color 2, ~note-color 3 GRAPHICS: none V1.5
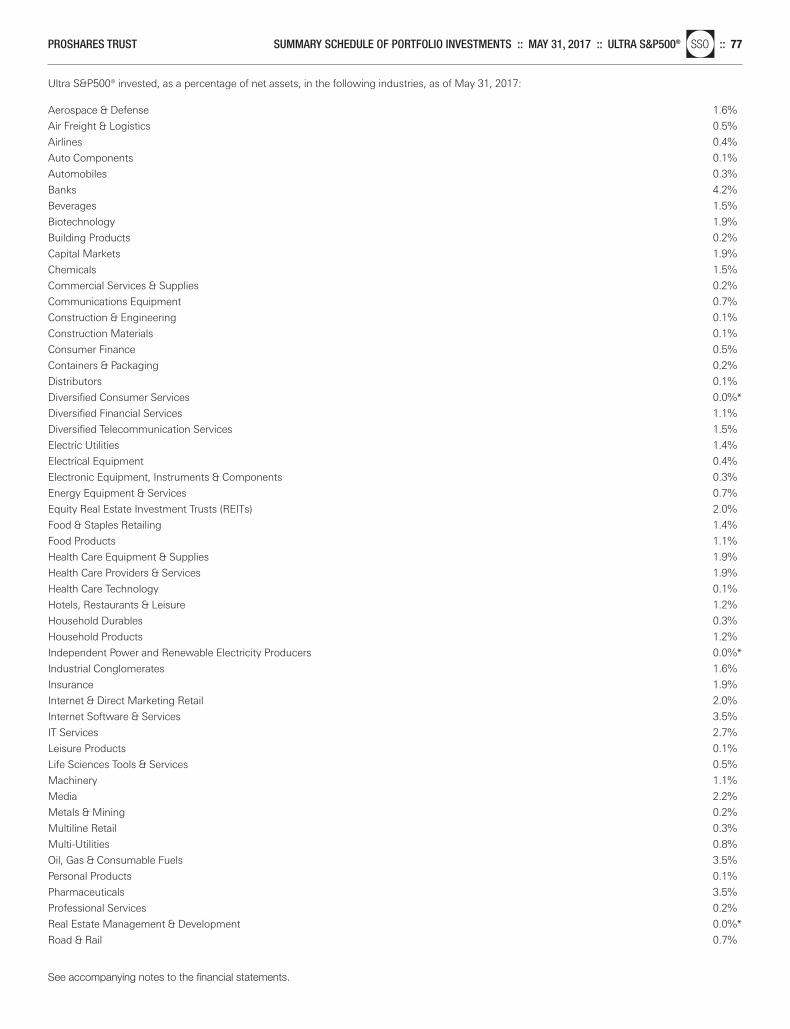
Ultra S&P500® invested, as a percentage of net assets, in the following industries, as of May 31, 2017:
Aerospace & Defense 1.6%
Air Freight & Logistics 0.5%
Airlines 0.4%
Auto Components 0.1%
Automobiles 0.3%
Banks 4.2%
Beverages 1.5%
Biotechnology 1.9%
Building Products 0.2%
Capital Markets 1.9%
Chemicals 1.5%
Commercial Services & Supplies 0.2%
Communications Equipment 0.7%
Construction & Engineering 0.1%
Construction Materials 0.1%
Consumer Finance 0.5%
Containers & Packaging 0.2%
Distributors 0.1%
Diversified Consumer Services 0.0%*
Diversified Financial Services 1.1%
Diversified Telecommunication Services 1.5%
Electric Utilities 1.4%
Electrical Equipment 0.4%
Electronic Equipment, Instruments & Components 0.3%
Energy Equipment & Services 0.7%
Equity Real Estate Investment Trusts (REITs) 2.0%
Food & Staples Retailing 1.4%
Food Products 1.1%
Health Care Equipment & Supplies 1.9%
Health Care Providers & Services 1.9%
Health Care Technology 0.1%
Hotels, Restaurants & Leisure 1.2%
Household Durables 0.3%
Household Products 1.2%
Independent Power and Renewable Electricity Producers 0.0%*
Industrial Conglomerates 1.6%
Insurance 1.9%
Internet & Direct Marketing Retail 2.0%
Internet Software & Services 3.5%
IT Services 2.7%
Leisure Products 0.1%
Life Sciences Tools & Services 0.5%
Machinery 1.1%
Media 2.2%
Metals & Mining 0.2%
Multiline Retail 0.3%
Multi-Utilities 0.8%
Oil, Gas & Consumable Fuels 3.5%
Personal Products 0.1%
Pharmaceuticals 3.5%
Professional Services 0.2%
Real Estate Management & Development 0.0%*
Road & Rail 0.7%
See accompanying notes to the financial statements.
PROSHARES TRUST SUMMARY SCHEDULE OF PORTFOLIO INVESTMENTS :: MAY 31, 2017 :: ULTRA S&P500®nlSSO :: 77
Merrill Corp - Proshares Trust Geared Book [96 Funds] Annual Report [Funds] 333-089822 05-31-2017 ED [AUX] | eperez | 28-Jul-17 17:38 | 17-15159-3.fo | Sequence: 3CHKSUM Content: 53809 Layout: 8125 Graphics: No Graphics CLEAN
JOB: 17-15159-3 CYCLE#;BL#: 5; 0 TRIM: 8.25" x 10.75" COMPOSITECOLORS: Black, ~note-color 2, ~note-color 3 GRAPHICS: none V1.5
Semiconductors & Semiconductor Equipment 2.5%
Software 3.4%
Specialty Retail 1.6%
Technology Hardware, Storage & Peripherals 3.1%
Textiles, Apparel & Luxury Goods 0.5%
Tobacco 1.3%
Trading Companies & Distributors 0.1%
Water Utilities 0.0%*
Other1 30.1% 100.0%
* Amount represents less than 0.05%.1 Includes any non-equity securities and net other assets (liabilities).
See accompanying notes to the financial statements.
78 ::nlSSO ULTRA S&P500® :: MAY 31, 2017 :: SUMMARY SCHEDULE OF PORTFOLIO INVESTMENTS PROSHARES TRUST
Merrill Corp - Proshares Trust Geared Book [96 Funds] Annual Report [Funds] 333-089822 05-31-2017 ED [AUX] | eperez | 28-Jul-17 17:38 | 17-15159-3.fo | Sequence: 4CHKSUM Content: 38546 Layout: 38616 Graphics: No Graphics CLEAN
JOB: 17-15159-3 CYCLE#;BL#: 5; 0 TRIM: 8.25" x 10.75" COMPOSITECOLORS: Black, ~note-color 2, ~note-color 3 GRAPHICS: none V1.5
Investments Shares Value
Common Stocks (a) — 72.2%
Investments Shares Value
Common Stocks (a) (continued)
Airlines — 0.3%
American Airlines Group, Inc. 68,625 $ 3,322,136
Automobiles — 0.6%
Tesla, Inc.* 20,413 6,961,037
Beverages — 0.3%
Monster Beverage Corp.* 77,720 3,929,523
Biotechnology — 5.4%
Alexion Pharmaceuticals, Inc.* 30,574 2,997,169
Amgen, Inc. 100,245 15,562,034
Biogen, Inc.* 29,395 7,283,199
BioMarin Pharmaceutical, Inc.* 23,530 2,062,169
Celgene Corp.* 105,896 12,115,562
Gilead Sciences, Inc. 177,916 11,544,969
Incyte Corp.* 25,782 3,334,386
Regeneron Pharmaceuticals, Inc.* 14,179 6,509,012
Shire plc, ADR 11,190 1,932,737
Vertex Pharmaceuticals, Inc.* 33,817 4,179,781
67,521,018
Commercial Services & Supplies — 0.1%
Cintas Corp. 14,298 1,799,832
Communications Equipment — 1.7%
Cisco Systems, Inc. 681,661 21,492,771
Food & Staples Retailing — 1.8%
Costco Wholesale Corp. 59,789 10,787,729
Walgreens Boots Alliance, Inc. 146,928 11,904,107
22,691,836
Food Products — 2.0%
Kraft Heinz Co. (The) 165,675 15,275,235
Mondelez International, Inc., Class A 207,800 9,681,402
24,956,637
Health Care Equipment & Supplies — 0.8%
DENTSPLY SIRONA, Inc. 31,427 1,996,243
Hologic, Inc.* 38,017 1,646,516
IDEXX Laboratories, Inc.* 11,979 2,017,144
Intuitive Surgical, Inc.* 5,280 4,829,511
10,489,414
Health Care Providers & Services — 0.6%
Express Scripts Holding Co.* 82,450 4,926,387
Henry Schein, Inc.* 10,780 1,983,197
6,909,584
Health Care Technology — 0.2%
Cerner Corp.* 44,881 $ 2,932,973
Hotels, Restaurants & Leisure — 1.7%
Marriott International, Inc., Class A 52,210 5,620,406
Norwegian Cruise Line Holdings Ltd.* 30,943 1,546,222
Starbucks Corp. 198,379 12,618,888
Wynn Resorts Ltd. 13,874 1,785,584
21,571,100
Internet & Direct Marketing Retail — 7.9%
Amazon.com, Inc.* 64,952 64,602,558
Ctrip.com International Ltd., ADR* 57,103 3,120,679
Expedia, Inc. 18,649 2,681,353
JD.com, Inc., ADR* 124,844 4,997,505
Liberty Interactive Corp. QVC Group, Class A* 57,879 1,357,842
Liberty Ventures, Series A* 11,046 595,269
Netflix, Inc.* 58,587 9,553,782
Priceline Group, Inc. (The)* 6,693 12,563,364
99,472,352
Internet Software & Services — 12.5%
Akamai Technologies, Inc.* 23,574 1,111,514
Alphabet, Inc., Class A* 40,443 39,920,881
Alphabet, Inc., Class C* 47,224 45,564,548
Baidu, Inc., ADR* 37,459 6,971,120
eBay, Inc.* 147,966 5,075,234
Facebook, Inc., Class A* 320,582 48,555,350
NetEase, Inc., ADR 10,214 2,908,743
Yahoo!, Inc.* 129,874 6,535,260
156,642,650
IT Services — 2.1%
Automatic Data Processing, Inc. 61,104 6,255,217
Cognizant Technology Solutions Corp., Class A 82,584 5,525,695
Fiserv, Inc.* 29,206 3,658,928
Paychex, Inc. 48,845 2,893,089
PayPal Holdings, Inc.* 164,374 8,581,967
26,914,896
Leisure Products — 0.2%
Hasbro, Inc. 16,919 1,780,894
Mattel, Inc. 46,613 1,067,904
2,848,798
Life Sciences Tools & Services — 0.3%
Illumina, Inc.* 19,914 3,531,947
See accompanying notes to the financial statements.
PROSHARES TRUST SCHEDULE OF PORTFOLIO INVESTMENTS :: MAY 31, 2017 :: ULTRA QQQ®nlQLD :: 79
Merrill Corp - Proshares Trust Geared Book [96 Funds] Annual Report [Funds] 333-089822 05-31-2017 ED [AUX] | eperez | 28-Jul-17 17:38 | 17-15159-3.fo | Sequence: 5CHKSUM Content: 34010 Layout: 34702 Graphics: No Graphics CLEAN
JOB: 17-15159-3 CYCLE#;BL#: 5; 0 TRIM: 8.25" x 10.75" COMPOSITECOLORS: Black, ~note-color 2, ~note-color 3 GRAPHICS: none V1.5
Investments Shares Value
Common Stocks (a) (continued)
Investments Shares Value
Common Stocks (a) (continued)
Machinery — 0.2%
PACCAR, Inc. 47,764 $ 3,007,221
Media — 4.7%
Charter Communications, Inc., Class A* 36,602 12,647,821
Comcast Corp., Class A 644,210 26,857,115Discovery Communications, Inc., Class A* 20,776 550,564
Discovery Communications, Inc., Class C* 31,241 806,955
DISH Network Corp., Class A* 30,888 1,969,728Liberty Global plc, Class A* 34,496 1,054,887Liberty Global plc, Class C* 85,851 2,551,492Liberty Global plc LiLAC, Class A* 6,833 144,244Liberty Global plc LiLAC, Class C* 16,423 344,226Sirius XM Holdings, Inc. 641,820 3,369,555Twenty-First Century Fox, Inc., Class A 143,239 3,884,642Twenty-First Century Fox, Inc., Class B 108,693 2,923,842Viacom, Inc., Class B 47,296 1,645,428
58,750,499Multiline Retail — 0.2%
Dollar Tree, Inc.* 32,134 2,496,812
Pharmaceuticals — 0.2%
Mylan NV* 72,838 2,839,225
Professional Services — 0.2%
Verisk Analytics, Inc.* 22,642 1,831,511
Road & Rail — 0.7%
CSX Corp. 126,106 6,831,162JB Hunt Transport Services, Inc. 15,151 1,293,592
8,124,754Semiconductors & Semiconductor Equipment — 8.0%
Analog Devices, Inc. 50,122 4,298,463Applied Materials, Inc. 146,985 6,743,672Broadcom Ltd. 54,589 13,072,974Intel Corp. 643,568 23,239,240KLA-Tencor Corp. 21,334 2,218,736Lam Research Corp. 22,166 3,439,498Maxim Integrated Products, Inc. 38,479 1,839,296Microchip Technology, Inc. 29,460 2,454,018Micron Technology, Inc.* 150,105 4,618,731NVIDIA Corp. 77,114 11,131,406QUALCOMM, Inc. 201,052 11,514,248Skyworks Solutions, Inc. 25,171 2,678,950Texas Instruments, Inc. 136,069 11,224,332Xilinx, Inc. 33,885 2,260,468
100,734,032
Software — 8.8%
Activision Blizzard, Inc. 102,340 $ 5,995,077
Adobe Systems, Inc.* 67,253 9,540,511
Autodesk, Inc.* 30,294 3,385,960
CA, Inc. 56,894 1,807,522
Check Point Software Technologies Ltd.* 23,341 2,615,359
Citrix Systems, Inc.* 21,282 1,756,616
Electronic Arts, Inc.* 41,960 4,755,327
Intuit, Inc. 34,817 4,896,663
Microsoft Corp. 1,051,859 73,461,833
Symantec Corp. 84,235 2,553,163
110,768,031
Specialty Retail — 0.8%
O’Reilly Automotive, Inc.* 12,474 3,019,706
Ross Stores, Inc. 53,647 3,429,116
Tractor Supply Co. 17,794 981,339
Ulta Beauty, Inc.* 8,471 2,582,300
10,012,461
Technology Hardware, Storage & Peripherals — 9.1%
Apple, Inc. 714,151 109,093,706
Seagate Technology plc 40,179 1,750,599
Western Digital Corp. 39,212 3,531,433
114,375,738
Trading Companies & Distributors — 0.1%
Fastenal Co. 39,374 1,699,776
Wireless Telecommunication Services — 0.7%
T-Mobile US, Inc.* 112,505 7,585,087
Vodafone Group plc, ADR 59,251 1,792,935
9,378,022
Total Common Stocks(Cost $785,414,871) 908,006,586
Principal Amount
Short-Term Investment (a) — 7.8%
Repurchase Agreement (b) — 7.8%
Repurchase Agreements with various counterparties, rates 0.60% - 0.81%, dated 5/31/2017, due 6/1/2017, total to be received $97,670,486(Cost $97,668,337) $ 97,668,337 97,668,337
Total Investments — 80.0%(Cost $883,083,208) 1,005,674,923
Other assets less liabilities — 20.0% 252,077,036
Net Assets — 100.0% $ 1,257,751,959
See accompanying notes to the financial statements.
80 ::nlQLD ULTRA QQQ® :: MAY 31, 2017 :: SCHEDULE OF PORTFOLIO INVESTMENTS PROSHARES TRUST
Merrill Corp - Proshares Trust Geared Book [96 Funds] Annual Report [Funds] 333-089822 05-31-2017 ED [AUX] | eperez | 28-Jul-17 17:38 | 17-15159-3.fo | Sequence: 6CHKSUM Content: 44651 Layout: 49900 Graphics: No Graphics CLEAN
JOB: 17-15159-3 CYCLE#;BL#: 5; 0 TRIM: 8.25" x 10.75" COMPOSITECOLORS: Black, ~note-color 2, ~note-color 3 GRAPHICS: none V1.5
* Non-income producing security.(a) All or a portion of this security is segregated in connection with
obligations for swaps with a total value of $124,639,818.(b) The Fund invests in Repurchase Agreements jointly with other
funds in the Trust. See “Repurchase Agreements” under Note 2in the Notes to Financial Statements to view the details of eachindividual agreement and counterparty as well as a description ofthe securities subjected to repurchase.
AbbreviationsADR American Depositary Receipt
Futures Contracts Purchased
Ultra QQQ® had the following open long futures contracts as of May 31, 2017:
Number of Notional Amount Unrealized Contracts Expiration Date at Value Appreciation E-Mini NASDAQ-100 Futures Contracts 830 6/16/2017 $ 96,151,350 $ 4,166,831
Cash collateral in the amount of $3,560,700 was pledged to cover margin requirements for open futures contracts as of May 31, 2017.
Swap Agreements1
Ultra QQQ® had the following open swap agreements as of May 31, 2017:
FinancialInstruments Cash
for the Collateral for Notional Benefit of the Benefit of Amount Termination Rate Paid Underlying Unrealized (the Fund)/the (the Fund)/the at Value Date Counterparty (Received)2 Instrument Appreciation3 Counterparty Counterparty Net Amount4
Bank of NASDAQ-100
$ 485,353,883 11/6/2017 America NA 1.19% Index® $ 77,827,475 $ (77,827,475) $ — $ —
NASDAQ-100 86,097,410 11/6/2017 Citibank NA 1.40% Index® 27,260,663 (27,260,663) — —
Credit Suisse NASDAQ-100 127,641,554 11/6/2018 International 1.39% Index® 15,054,405 — (15,054,405) —
Goldman Sachs NASDAQ-100 77,043,730 11/6/2017 International 1.50% Index® 16,094,440
Goldman Sachs PowerShares QQQ 153,528,325 11/6/2017 International 1.25% TrustSM, Series 1 30,078,856
230,572,055 46,173,296 (46,173,296) — —
Morgan Stanley & Co. NASDAQ-100
32,685,815 11/6/2017 International plc 1.39% Index® 3,298,213 Morgan Stanley & Co. PowerShares QQQ
208,437,116 11/6/2017 International plc 1.39% TrustSM, Series 1 42,566,541
241,122,931 45,864,754 (45,864,754) — —
NASDAQ-100 227,025,529 11/6/2017 Societe Generale 1.34% Index® 33,529,614 (33,529,614) — —
NASDAQ-100 113,583,596 11/6/2018 UBS AG 1.39% Index® 17,686,145 — (17,686,145) —
$1,511,396,958 $ 263,396,352
As of May 31, 2017, the gross unrealized appreciation (depreciation)of investments based on the aggregate cost of investments for federalincome tax purposes was as follows:Aggregate gross unrealized appreciation $ 155,195,763
Aggregate gross unrealized depreciation (33,540,043)
Net unrealized appreciation $ 121,655,720
Federal income tax cost of investments $ 884,019,203
See accompanying notes to the financial statements.
PROSHARES TRUST SCHEDULE OF PORTFOLIO INVESTMENTS :: MAY 31, 2017 :: ULTRA QQQ®nlQLD :: 81
Merrill Corp - Proshares Trust Geared Book [96 Funds] Annual Report [Funds] 333-089822 05-31-2017 ED [AUX] | eperez | 28-Jul-17 17:38 | 17-15159-3.fo | Sequence: 7CHKSUM Content: 8317 Layout: 35983 Graphics: No Graphics CLEAN
JOB: 17-15159-3 CYCLE#;BL#: 5; 0 TRIM: 8.25" x 10.75" COMPOSITECOLORS: Black, ~note-color 2, ~note-color 3 GRAPHICS: none V1.5
1 The Fund’s Swap Agreements are not accounted for as hedging instruments under ASC 815.2 Reflects the floating financing rate, as of May 31, 2017, on the notional amount of the swap agreement paid to the counterparty or received
from the counterparty, excluding any commissions.3 The Fund discloses amounts due to the Fund from the counterparty (unrealized appreciation on swap agreements) at period end as an asset on
its Statements of Assets and Liabilities. Amounts due to the counterparty from the Fund (unrealized depreciation on swap agreements) are disclosed as a liability on its Statements of Assets and Liabilities. The Fund presents these amounts on a gross basis and does not offset or“net” these amounts on its Statements of Assets and Liabilities.
4 Represents the “uncollateralized” amount due from or (to) the counterparty at period end. These amounts could be due to timing differencesbetween the movement of collateral in relation to market movements, or due to agreement provisions allowing minimum “thresholds” thatwould need to be exceeded prior to the movement of collateral. To the extent that a net amount is due from a counterparty, the Fund would beexposed to the counterparty by such amount and could suffer losses or delays in recovery of that amount in the event of a counterparty default.
See accompanying notes to the financial statements.
82 ::nlQLD ULTRA QQQ® :: MAY 31, 2017 :: SCHEDULE OF PORTFOLIO INVESTMENTS PROSHARES TRUST
Merrill Corp - Proshares Trust Geared Book [96 Funds] Annual Report [Funds] 333-089822 05-31-2017 ED [AUX] | eperez | 28-Jul-17 17:38 | 17-15159-3.fo | Sequence: 8CHKSUM Content: 21055 Layout: 57925 Graphics: No Graphics CLEAN
JOB: 17-15159-3 CYCLE#;BL#: 5; 0 TRIM: 8.25" x 10.75" COMPOSITECOLORS: Black, ~note-color 2, ~note-color 3 GRAPHICS: none V1.5
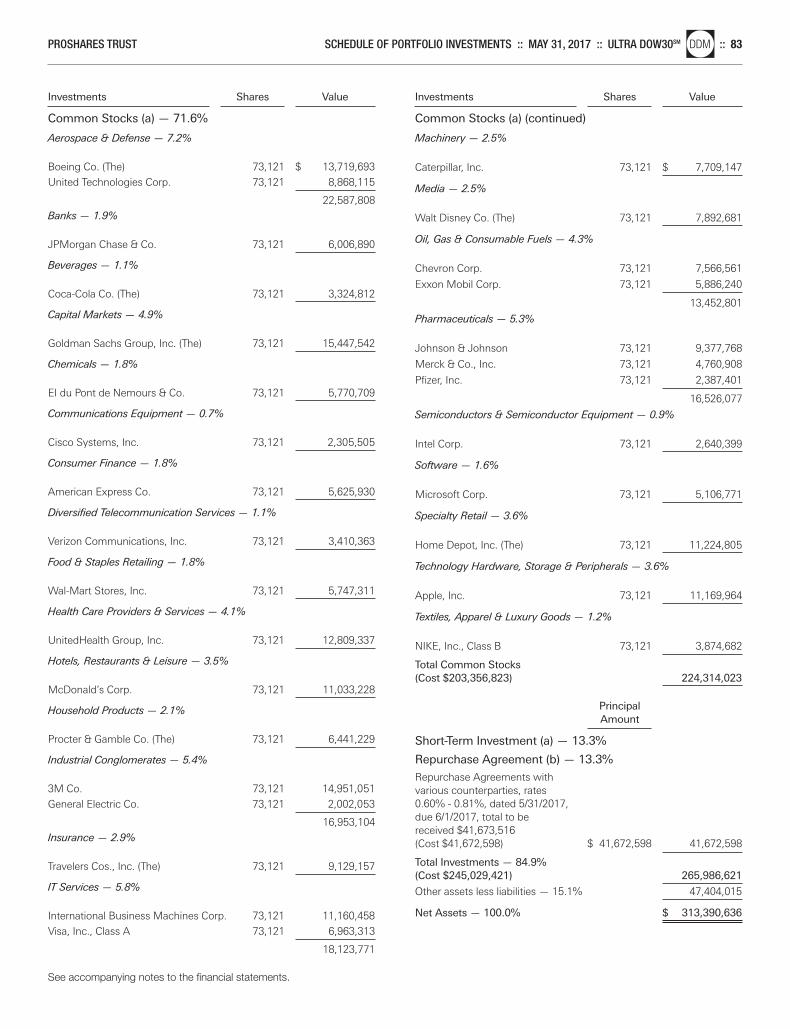
Investments Shares Value
Common Stocks (a) — 71.6%
Investments Shares Value
Common Stocks (a) (continued)
Aerospace & Defense — 7.2%
Boeing Co. (The) 73,121 $ 13,719,693United Technologies Corp. 73,121 8,868,115
22,587,808Banks — 1.9%
JPMorgan Chase & Co. 73,121 6,006,890
Beverages — 1.1%
Coca-Cola Co. (The) 73,121 3,324,812
Capital Markets — 4.9%
Goldman Sachs Group, Inc. (The) 73,121 15,447,542
Chemicals — 1.8%
EI du Pont de Nemours & Co. 73,121 5,770,709
Communications Equipment — 0.7%
Cisco Systems, Inc. 73,121 2,305,505
Consumer Finance — 1.8%
American Express Co. 73,121 5,625,930
Diversified Telecommunication Services — 1.1%
Verizon Communications, Inc. 73,121 3,410,363
Food & Staples Retailing — 1.8%
Wal-Mart Stores, Inc. 73,121 5,747,311
Health Care Providers & Services — 4.1%
UnitedHealth Group, Inc. 73,121 12,809,337
Hotels, Restaurants & Leisure — 3.5%
McDonald’s Corp. 73,121 11,033,228
Household Products — 2.1%
Procter & Gamble Co. (The) 73,121 6,441,229
Industrial Conglomerates — 5.4%
3M Co. 73,121 14,951,051General Electric Co. 73,121 2,002,053
16,953,104Insurance — 2.9%
Travelers Cos., Inc. (The) 73,121 9,129,157
IT Services — 5.8%
International Business Machines Corp. 73,121 11,160,458Visa, Inc., Class A 73,121 6,963,313
18,123,771
Machinery — 2.5%
Caterpillar, Inc. 73,121 $ 7,709,147
Media — 2.5%
Walt Disney Co. (The) 73,121 7,892,681
Oil, Gas & Consumable Fuels — 4.3%
Chevron Corp. 73,121 7,566,561
Exxon Mobil Corp. 73,121 5,886,240
13,452,801
Pharmaceuticals — 5.3%
Johnson & Johnson 73,121 9,377,768
Merck & Co., Inc. 73,121 4,760,908
Pfizer, Inc. 73,121 2,387,401
16,526,077
Semiconductors & Semiconductor Equipment — 0.9%
Intel Corp. 73,121 2,640,399
Software — 1.6%
Microsoft Corp. 73,121 5,106,771
Specialty Retail — 3.6%
Home Depot, Inc. (The) 73,121 11,224,805
Technology Hardware, Storage & Peripherals — 3.6%
Apple, Inc. 73,121 11,169,964
Textiles, Apparel & Luxury Goods — 1.2%
NIKE, Inc., Class B 73,121 3,874,682
Total Common Stocks(Cost $203,356,823) 224,314,023
Principal Amount
Short-Term Investment (a) — 13.3%
Repurchase Agreement (b) — 13.3%
Repurchase Agreements with various counterparties, rates 0.60% - 0.81%, dated 5/31/2017, due 6/1/2017, total to be received $41,673,516(Cost $41,672,598) $ 41,672,598 41,672,598
Total Investments — 84.9%(Cost $245,029,421) 265,986,621
Other assets less liabilities — 15.1% 47,404,015
Net Assets — 100.0% $ 313,390,636
See accompanying notes to the financial statements.
PROSHARES TRUST SCHEDULE OF PORTFOLIO INVESTMENTS :: MAY 31, 2017 :: ULTRA DOW30SMnlDDM :: 83
Merrill Corp - Proshares Trust Geared Book [96 Funds] Annual Report [Funds] 333-089822 05-31-2017 ED [AUX] | eperez | 28-Jul-17 17:38 | 17-15159-3.fo | Sequence: 9CHKSUM Content: 11958 Layout: 61922 Graphics: No Graphics CLEAN
JOB: 17-15159-3 CYCLE#;BL#: 5; 0 TRIM: 8.25" x 10.75" COMPOSITECOLORS: Black, ~note-color 2, ~note-color 3 GRAPHICS: none V1.5
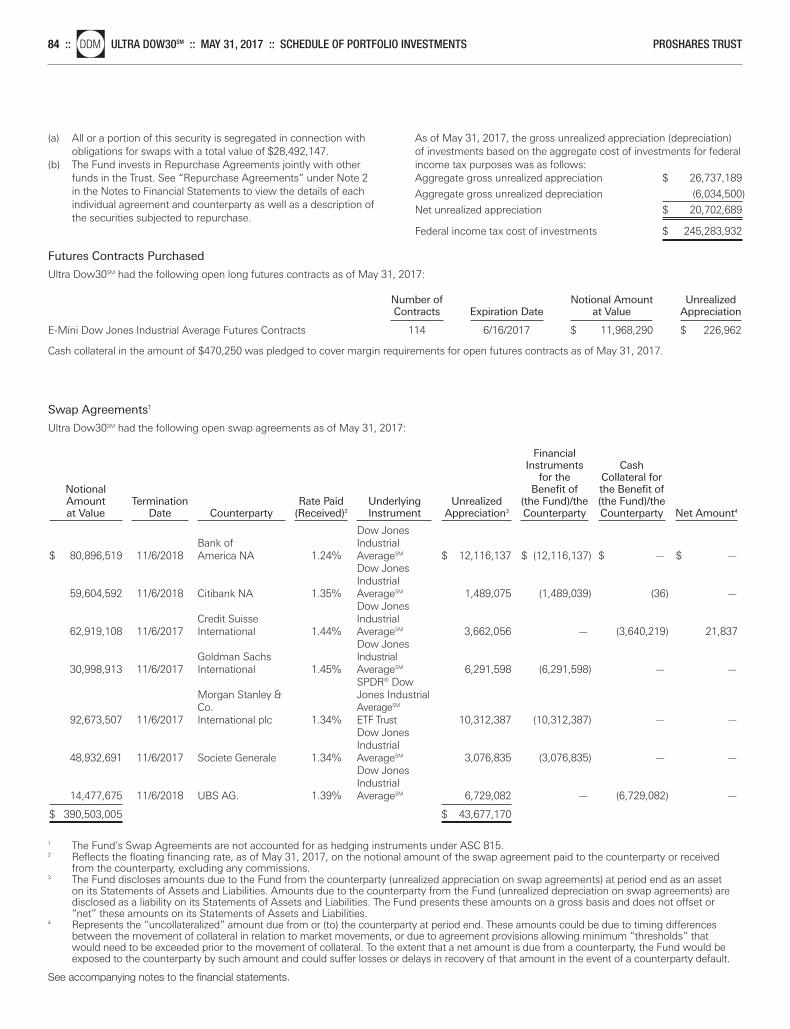
(a) All or a portion of this security is segregated in connection withobligations for swaps with a total value of $28,492,147.
(b) The Fund invests in Repurchase Agreements jointly with otherfunds in the Trust. See “Repurchase Agreements” under Note 2in the Notes to Financial Statements to view the details of eachindividual agreement and counterparty as well as a description ofthe securities subjected to repurchase.
As of May 31, 2017, the gross unrealized appreciation (depreciation)of investments based on the aggregate cost of investments for federalincome tax purposes was as follows:Aggregate gross unrealized appreciation $ 26,737,189
Aggregate gross unrealized depreciation (6,034,500)
Net unrealized appreciation $ 20,702,689
Federal income tax cost of investments $ 245,283,932
See accompanying notes to the financial statements.
84 ::nlDDM ULTRA DOW30SM :: MAY 31, 2017 :: SCHEDULE OF PORTFOLIO INVESTMENTS PROSHARES TRUST
Futures Contracts Purchased
Ultra Dow30SM had the following open long futures contracts as of May 31, 2017:
Number of Notional Amount Unrealized Contracts Expiration Date at Value Appreciation E-Mini Dow Jones Industrial Average Futures Contracts 114 6/16/2017 $ 11,968,290 $ 226,962
Cash collateral in the amount of $470,250 was pledged to cover margin requirements for open futures contracts as of May 31, 2017.
Swap Agreements1
Ultra Dow30SM had the following open swap agreements as of May 31, 2017:
Financial Instruments Cash
for the Collateral for Notional Benefit of the Benefit of Amount Termination Rate Paid Underlying Unrealized (the Fund)/the (the Fund)/the at Value Date Counterparty (Received)2 Instrument Appreciation3 Counterparty Counterparty Net Amount4
Dow Jones
Bank of Industrial $ 80,896,519 11/6/2018 America NA 1.24% AverageSM $ 12,116,137 $ (12,116,137) $ — $ —
Dow Jones Industrial
59,604,592 11/6/2018 Citibank NA 1.35% AverageSM 1,489,075 (1,489,039) (36) —Dow Jones
Credit Suisse Industrial 62,919,108 11/6/2017 International 1.44% AverageSM 3,662,056 — (3,640,219) 21,837
Dow Jones Goldman Sachs Industrial
30,998,913 11/6/2017 International 1.45% AverageSM 6,291,598 (6,291,598) — —SPDR® Dow
Morgan Stanley & Jones Industrial Co. AverageSM
92,673,507 11/6/2017 International plc 1.34% ETF Trust 10,312,387 (10,312,387) — —Dow Jones Industrial
48,932,691 11/6/2017 Societe Generale 1.34% AverageSM 3,076,835 (3,076,835) — —Dow Jones Industrial
14,477,675 11/6/2018 UBS AG. 1.39% AverageSM 6,729,082 — (6,729,082) —
$ 390,503,005 $ 43,677,170
1 The Fund’s Swap Agreements are not accounted for as hedging instruments under ASC 815.2 Reflects the floating financing rate, as of May 31, 2017, on the notional amount of the swap agreement paid to the counterparty or received
from the counterparty, excluding any commissions.3 The Fund discloses amounts due to the Fund from the counterparty (unrealized appreciation on swap agreements) at period end as an asset
on its Statements of Assets and Liabilities. Amounts due to the counterparty from the Fund (unrealized depreciation on swap agreements) aredisclosed as a liability on its Statements of Assets and Liabilities. The Fund presents these amounts on a gross basis and does not offset or“net” these amounts on its Statements of Assets and Liabilities.
4 Represents the “uncollateralized” amount due from or (to) the counterparty at period end. These amounts could be due to timing differencesbetween the movement of collateral in relation to market movements, or due to agreement provisions allowing minimum “thresholds” thatwould need to be exceeded prior to the movement of collateral. To the extent that a net amount is due from a counterparty, the Fund would beexposed to the counterparty by such amount and could suffer losses or delays in recovery of that amount in the event of a counterparty default.
Merrill Corp - Proshares Trust Geared Book [96 Funds] Annual Report [Funds] 333-089822 05-31-2017 ED [AUX] | eperez | 28-Jul-17 17:38 | 17-15159-3.fo | Sequence: 10CHKSUM Content: 14947 Layout: 18996 Graphics: No Graphics CLEAN
JOB: 17-15159-3 CYCLE#;BL#: 5; 0 TRIM: 8.25" x 10.75" COMPOSITECOLORS: Black, ~note-color 2, ~note-color 3 GRAPHICS: none V1.5
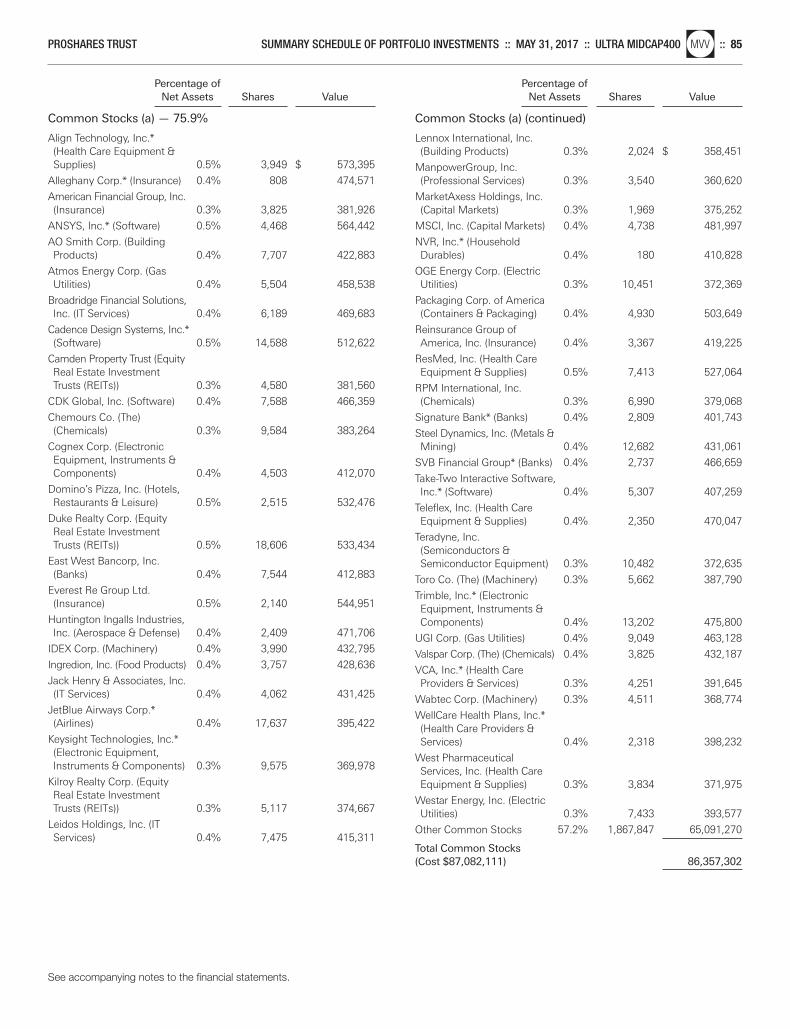
Percentage of Net Assets Shares Value
Common Stocks (a) — 75.9%
Percentage of Net Assets Shares Value
Common Stocks (a) (continued)
Align Technology, Inc.* (Health Care Equipment & Supplies) 0.5% 3,949 $ 573,395
Alleghany Corp.* (Insurance) 0.4% 808 474,571
American Financial Group, Inc. (Insurance) 0.3% 3,825 381,926
ANSYS, Inc.* (Software) 0.5% 4,468 564,442
AO Smith Corp. (Building Products) 0.4% 7,707 422,883
Atmos Energy Corp. (Gas Utilities) 0.4% 5,504 458,538
Broadridge Financial Solutions, Inc. (IT Services) 0.4% 6,189 469,683
Cadence Design Systems, Inc.* (Software) 0.5% 14,588 512,622
Camden Property Trust (Equity Real Estate Investment Trusts (REITs)) 0.3% 4,580 381,560
CDK Global, Inc. (Software) 0.4% 7,588 466,359
Chemours Co. (The) (Chemicals) 0.3% 9,584 383,264
Cognex Corp. (Electronic Equipment, Instruments & Components) 0.4% 4,503 412,070
Domino’s Pizza, Inc. (Hotels, Restaurants & Leisure) 0.5% 2,515 532,476
Duke Realty Corp. (Equity Real Estate Investment Trusts (REITs)) 0.5% 18,606 533,434
East West Bancorp, Inc. (Banks) 0.4% 7,544 412,883
Everest Re Group Ltd. (Insurance) 0.5% 2,140 544,951
Huntington Ingalls Industries, Inc. (Aerospace & Defense) 0.4% 2,409 471,706
IDEX Corp. (Machinery) 0.4% 3,990 432,795
Ingredion, Inc. (Food Products) 0.4% 3,757 428,636
Jack Henry & Associates, Inc. (IT Services) 0.4% 4,062 431,425
JetBlue Airways Corp.* (Airlines) 0.4% 17,637 395,422
Keysight Technologies, Inc.* (Electronic Equipment, Instruments & Components) 0.3% 9,575 369,978
Kilroy Realty Corp. (Equity Real Estate Investment Trusts (REITs)) 0.3% 5,117 374,667
Leidos Holdings, Inc. (IT Services) 0.4% 7,475 415,311
Lennox International, Inc. (Building Products) 0.3% 2,024 $ 358,451
ManpowerGroup, Inc. (Professional Services) 0.3% 3,540 360,620
MarketAxess Holdings, Inc. (Capital Markets) 0.3% 1,969 375,252
MSCI, Inc. (Capital Markets) 0.4% 4,738 481,997
NVR, Inc.* (Household Durables) 0.4% 180 410,828
OGE Energy Corp. (Electric Utilities) 0.3% 10,451 372,369
Packaging Corp. of America (Containers & Packaging) 0.4% 4,930 503,649
Reinsurance Group of America, Inc. (Insurance) 0.4% 3,367 419,225
ResMed, Inc. (Health Care Equipment & Supplies) 0.5% 7,413 527,064
RPM International, Inc. (Chemicals) 0.3% 6,990 379,068
Signature Bank* (Banks) 0.4% 2,809 401,743
Steel Dynamics, Inc. (Metals & Mining) 0.4% 12,682 431,061
SVB Financial Group* (Banks) 0.4% 2,737 466,659
Take-Two Interactive Software, Inc.* (Software) 0.4% 5,307 407,259
Teleflex, Inc. (Health Care Equipment & Supplies) 0.4% 2,350 470,047
Teradyne, Inc. (Semiconductors & Semiconductor Equipment) 0.3% 10,482 372,635
Toro Co. (The) (Machinery) 0.3% 5,662 387,790
Trimble, Inc.* (Electronic Equipment, Instruments & Components) 0.4% 13,202 475,800
UGI Corp. (Gas Utilities) 0.4% 9,049 463,128
Valspar Corp. (The) (Chemicals) 0.4% 3,825 432,187
VCA, Inc.* (Health Care Providers & Services) 0.3% 4,251 391,645
Wabtec Corp. (Machinery) 0.3% 4,511 368,774
WellCare Health Plans, Inc.* (Health Care Providers & Services) 0.4% 2,318 398,232
West Pharmaceutical Services, Inc. (Health Care Equipment & Supplies) 0.3% 3,834 371,975
Westar Energy, Inc. (Electric Utilities) 0.3% 7,433 393,577
Other Common Stocks 57.2% 1,867,847 65,091,270
Total Common Stocks(Cost $87,082,111) 86,357,302
See accompanying notes to the financial statements.
PROSHARES TRUST SUMMARY SCHEDULE OF PORTFOLIO INVESTMENTS :: MAY 31, 2017 :: ULTRA MIDCAP400nlMVV :: 85
Merrill Corp - Proshares Trust Geared Book [96 Funds] Annual Report [Funds] 333-089822 05-31-2017 ED [AUX] | eperez | 28-Jul-17 17:38 | 17-15159-3.fo | Sequence: 11CHKSUM Content: 1586 Layout: 27185 Graphics: No Graphics CLEAN
JOB: 17-15159-3 CYCLE#;BL#: 5; 0 TRIM: 8.25" x 10.75" COMPOSITECOLORS: Black, ~note-color 2, ~note-color 3 GRAPHICS: none V1.5
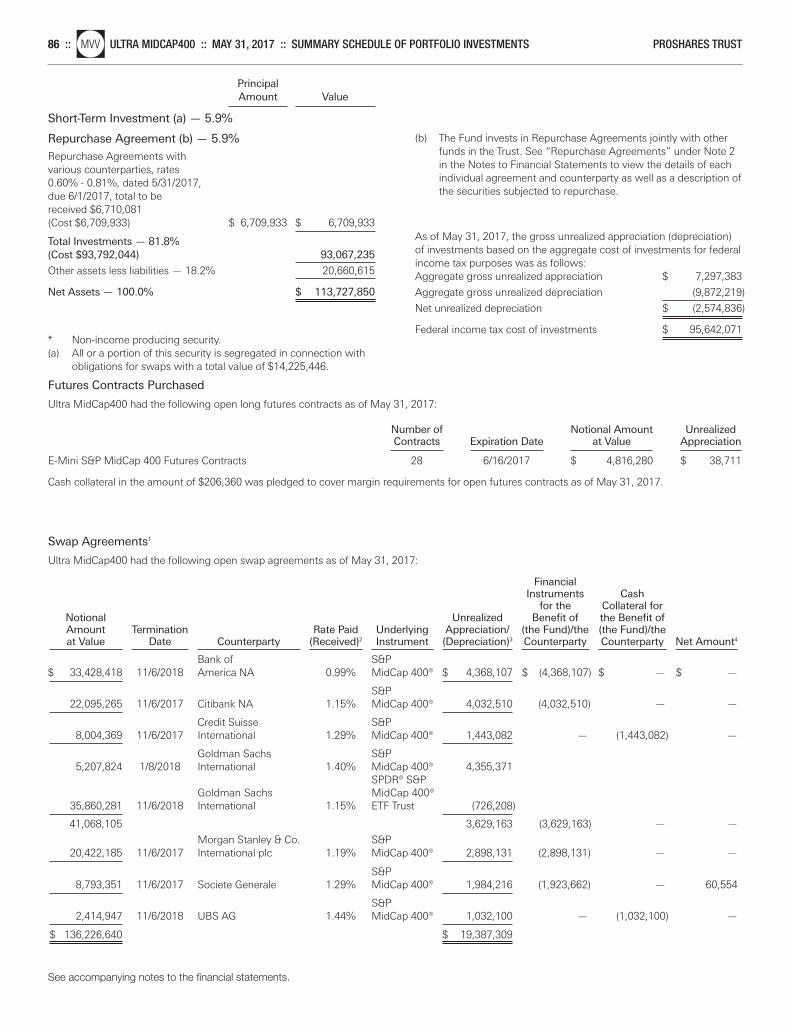
Principal Amount Value
Short-Term Investment (a) — 5.9%
Repurchase Agreement (b) — 5.9%
Repurchase Agreements with various counterparties, rates 0.60% - 0.81%, dated 5/31/2017, due 6/1/2017, total to be received $6,710,081(Cost $6,709,933) $ 6,709,933 $ 6,709,933
Total Investments — 81.8%(Cost $93,792,044) 93,067,235
Other assets less liabilities — 18.2% 20,660,615
Net Assets — 100.0% $ 113,727,850
* Non-income producing security.(a) All or a portion of this security is segregated in connection with
obligations for swaps with a total value of $14,225,446.
Futures Contracts Purchased
Ultra MidCap400 had the following open long futures contracts as of May 31, 2017:
Number of Notional Amount Unrealized Contracts Expiration Date at Value Appreciation E-Mini S&P MidCap 400 Futures Contracts 28 6/16/2017 $ 4,816,280 $ 38,711
Cash collateral in the amount of $206,360 was pledged to cover margin requirements for open futures contracts as of May 31, 2017.
Swap Agreements1
Ultra MidCap400 had the following open swap agreements as of May 31, 2017:
Financial Instruments Cash
for the Collateral for Notional Unrealized Benefit of the Benefit of Amount Termination Rate Paid Underlying Appreciation/ (the Fund)/the (the Fund)/the at Value Date Counterparty (Received)2 Instrument (Depreciation)3 Counterparty Counterparty Net Amount4
Bank of S&P
$ 33,428,418 11/6/2018 America NA 0.99% MidCap 400® $ 4,368,107 $ (4,368,107) $ — $ —
S&P 22,095,265 11/6/2017 Citibank NA 1.15% MidCap 400® 4,032,510 (4,032,510) — —
Credit Suisse S&P 8,004,369 11/6/2017 International 1.29% MidCap 400® 1,443,082 — (1,443,082) —
Goldman Sachs S&P 5,207,824 1/8/2018 International 1.40% MidCap 400® 4,355,371
SPDR® S&P Goldman Sachs MidCap 400®
35,860,281 11/6/2018 International 1.15% ETF Trust (726,208)
41,068,105 3,629,163 (3,629,163) — —
Morgan Stanley & Co. S&P 20,422,185 11/6/2017 International plc 1.19% MidCap 400® 2,898,131 (2,898,131) — —
S&P 8,793,351 11/6/2017 Societe Generale 1.29% MidCap 400® 1,984,216 (1,923,662) — 60,554
S&P 2,414,947 11/6/2018 UBS AG 1.44% MidCap 400® 1,032,100 — (1,032,100) —
$ 136,226,640 $ 19,387,309
(b) The Fund invests in Repurchase Agreements jointly with otherfunds in the Trust. See “Repurchase Agreements” under Note 2in the Notes to Financial Statements to view the details of eachindividual agreement and counterparty as well as a description ofthe securities subjected to repurchase.
As of May 31, 2017, the gross unrealized appreciation (depreciation)of investments based on the aggregate cost of investments for federalincome tax purposes was as follows:Aggregate gross unrealized appreciation $ 7,297,383
Aggregate gross unrealized depreciation (9,872,219)
Net unrealized depreciation $ (2,574,836)
Federal income tax cost of investments $ 95,642,071
See accompanying notes to the financial statements.
86 ::nlMVV ULTRA MIDCAP400 :: MAY 31, 2017 :: SUMMARY SCHEDULE OF PORTFOLIO INVESTMENTS PROSHARES TRUST
Merrill Corp - Proshares Trust Geared Book [96 Funds] Annual Report [Funds] 333-089822 05-31-2017 ED [AUX] | eperez | 28-Jul-17 17:38 | 17-15159-3.fo | Sequence: 12CHKSUM Content: 40896 Layout: 17225 Graphics: No Graphics CLEAN
JOB: 17-15159-3 CYCLE#;BL#: 5; 0 TRIM: 8.25" x 10.75" COMPOSITECOLORS: Black, ~note-color 2, ~note-color 3 GRAPHICS: none V1.5
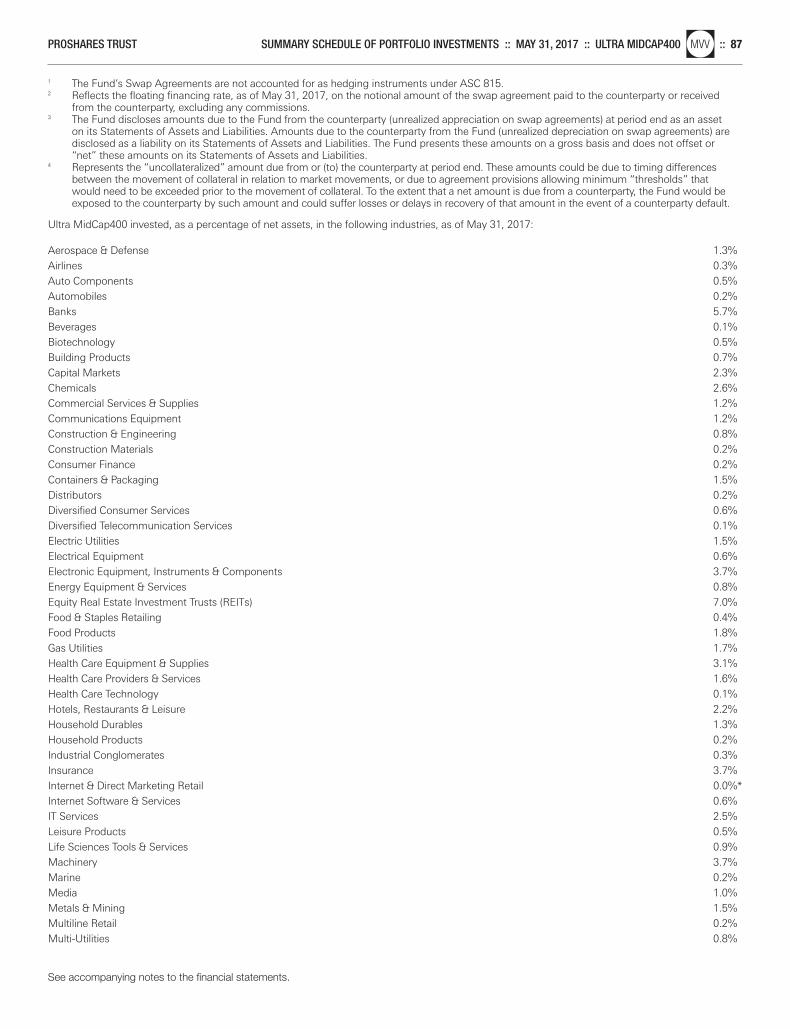
1 The Fund’s Swap Agreements are not accounted for as hedging instruments under ASC 815.2 Reflects the floating financing rate, as of May 31, 2017, on the notional amount of the swap agreement paid to the counterparty or received
from the counterparty, excluding any commissions.3 The Fund discloses amounts due to the Fund from the counterparty (unrealized appreciation on swap agreements) at period end as an asset
on its Statements of Assets and Liabilities. Amounts due to the counterparty from the Fund (unrealized depreciation on swap agreements) aredisclosed as a liability on its Statements of Assets and Liabilities. The Fund presents these amounts on a gross basis and does not offset or“net” these amounts on its Statements of Assets and Liabilities.
4 Represents the “uncollateralized” amount due from or (to) the counterparty at period end. These amounts could be due to timing differencesbetween the movement of collateral in relation to market movements, or due to agreement provisions allowing minimum “thresholds” thatwould need to be exceeded prior to the movement of collateral. To the extent that a net amount is due from a counterparty, the Fund would beexposed to the counterparty by such amount and could suffer losses or delays in recovery of that amount in the event of a counterparty default.
Ultra MidCap400 invested, as a percentage of net assets, in the following industries, as of May 31, 2017:
Aerospace & Defense 1.3%Airlines 0.3%Auto Components 0.5%Automobiles 0.2%Banks 5.7%Beverages 0.1%Biotechnology 0.5%Building Products 0.7%Capital Markets 2.3%Chemicals 2.6%Commercial Services & Supplies 1.2%Communications Equipment 1.2%Construction & Engineering 0.8%Construction Materials 0.2%Consumer Finance 0.2%Containers & Packaging 1.5%Distributors 0.2%Diversified Consumer Services 0.6%Diversified Telecommunication Services 0.1%Electric Utilities 1.5%Electrical Equipment 0.6%Electronic Equipment, Instruments & Components 3.7%Energy Equipment & Services 0.8%Equity Real Estate Investment Trusts (REITs) 7.0%Food & Staples Retailing 0.4%Food Products 1.8%Gas Utilities 1.7%Health Care Equipment & Supplies 3.1%Health Care Providers & Services 1.6%Health Care Technology 0.1%Hotels, Restaurants & Leisure 2.2%Household Durables 1.3%Household Products 0.2%Industrial Conglomerates 0.3%Insurance 3.7%Internet & Direct Marketing Retail 0.0%*Internet Software & Services 0.6%IT Services 2.5%Leisure Products 0.5%Life Sciences Tools & Services 0.9%Machinery 3.7%Marine 0.2%Media 1.0%Metals & Mining 1.5%Multiline Retail 0.2%Multi-Utilities 0.8%
See accompanying notes to the financial statements.
PROSHARES TRUST SUMMARY SCHEDULE OF PORTFOLIO INVESTMENTS :: MAY 31, 2017 :: ULTRA MIDCAP400nlMVV :: 87
Merrill Corp - Proshares Trust Geared Book [96 Funds] Annual Report [Funds] 333-089822 05-31-2017 ED [AUX] | eperez | 28-Jul-17 17:38 | 17-15159-3.fo | Sequence: 13CHKSUM Content: 38263 Layout: 14690 Graphics: No Graphics CLEAN
JOB: 17-15159-3 CYCLE#;BL#: 5; 0 TRIM: 8.25" x 10.75" COMPOSITECOLORS: Black, ~note-color 2, ~note-color 3 GRAPHICS: none V1.5
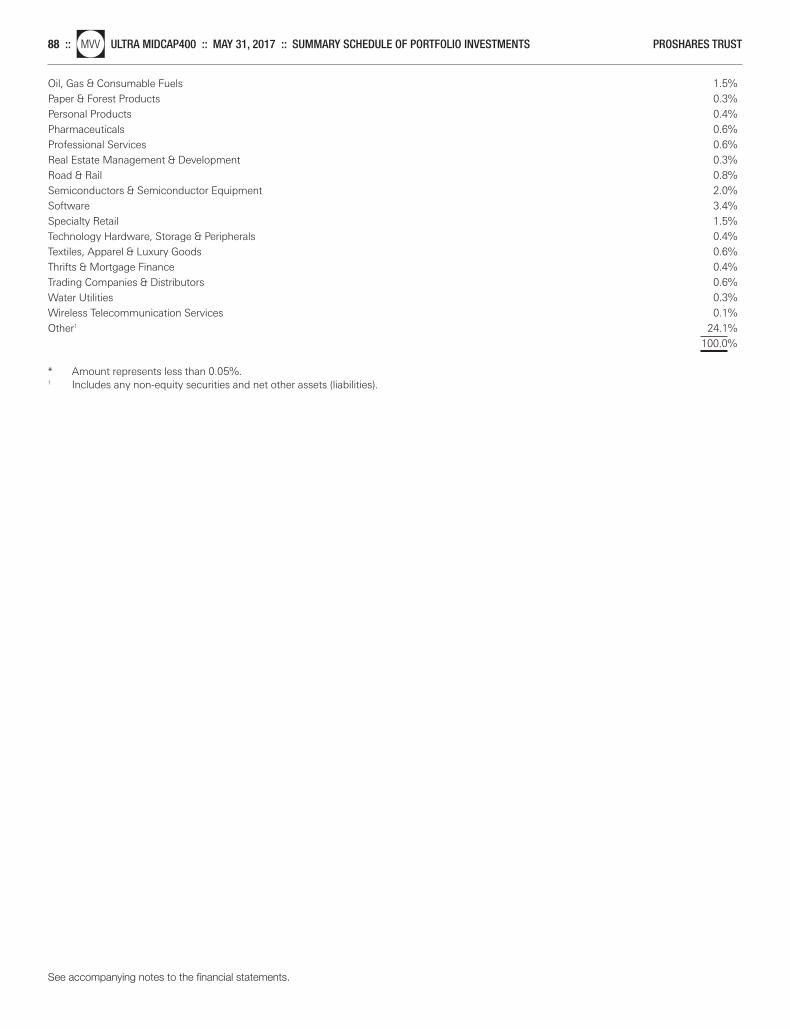
Oil, Gas & Consumable Fuels 1.5%Paper & Forest Products 0.3%Personal Products 0.4%Pharmaceuticals 0.6%Professional Services 0.6%Real Estate Management & Development 0.3%Road & Rail 0.8%Semiconductors & Semiconductor Equipment 2.0%Software 3.4%Specialty Retail 1.5%Technology Hardware, Storage & Peripherals 0.4%Textiles, Apparel & Luxury Goods 0.6%Thrifts & Mortgage Finance 0.4%Trading Companies & Distributors 0.6%Water Utilities 0.3%Wireless Telecommunication Services 0.1%Other1 24.1% 100.0%
* Amount represents less than 0.05%.1 Includes any non-equity securities and net other assets (liabilities).
See accompanying notes to the financial statements.
88 ::nlMVV ULTRA MIDCAP400 :: MAY 31, 2017 :: SUMMARY SCHEDULE OF PORTFOLIO INVESTMENTS PROSHARES TRUST
Merrill Corp - Proshares Trust Geared Book [96 Funds] Annual Report [Funds] 333-089822 05-31-2017 ED [AUX] | eperez | 28-Jul-17 17:38 | 17-15159-3.fo | Sequence: 14CHKSUM Content: 26973 Layout: 50040 Graphics: No Graphics CLEAN
JOB: 17-15159-3 CYCLE#;BL#: 5; 0 TRIM: 8.25" x 10.75" COMPOSITECOLORS: Black, ~note-color 2, ~note-color 3 GRAPHICS: none V1.5
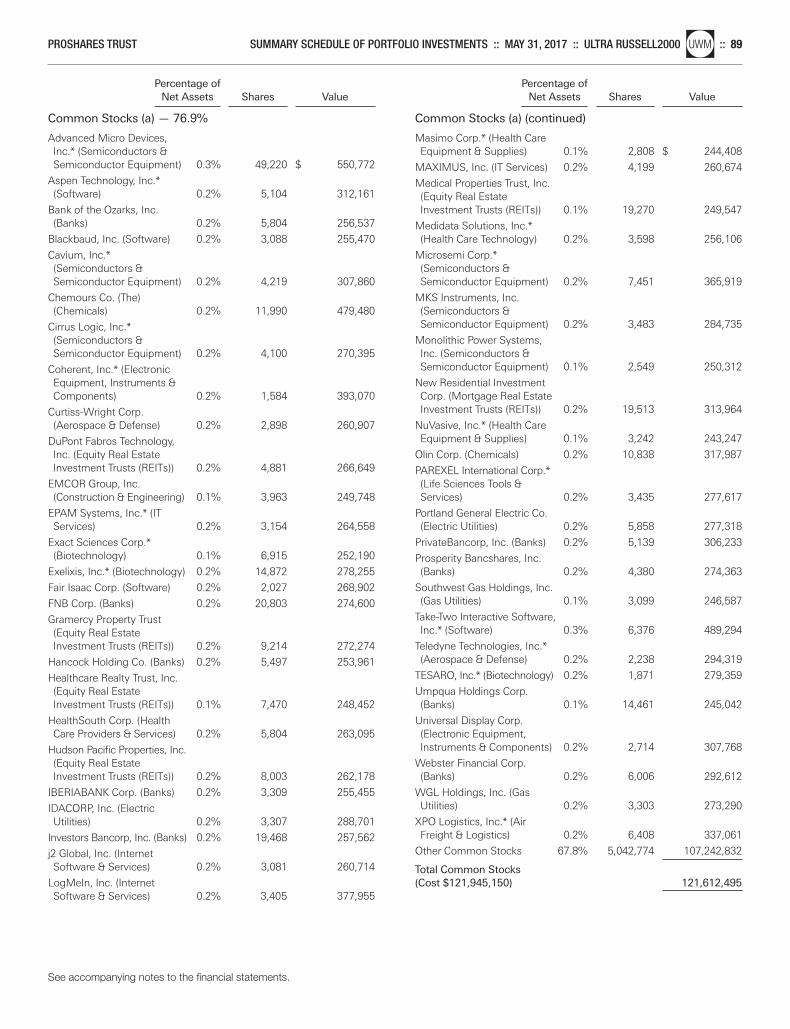
Percentage of Net Assets Shares Value
Common Stocks (a) — 76.9%
Percentage of Net Assets Shares Value
Common Stocks (a) (continued)
Advanced Micro Devices, Inc.* (Semiconductors & Semiconductor Equipment) 0.3% 49,220 $ 550,772
Aspen Technology, Inc.* (Software) 0.2% 5,104 312,161
Bank of the Ozarks, Inc. (Banks) 0.2% 5,804 256,537
Blackbaud, Inc. (Software) 0.2% 3,088 255,470
Cavium, Inc.* (Semiconductors & Semiconductor Equipment) 0.2% 4,219 307,860
Chemours Co. (The) (Chemicals) 0.2% 11,990 479,480
Cirrus Logic, Inc.* (Semiconductors & Semiconductor Equipment) 0.2% 4,100 270,395
Coherent, Inc.* (Electronic Equipment, Instruments & Components) 0.2% 1,584 393,070
Curtiss-Wright Corp. (Aerospace & Defense) 0.2% 2,898 260,907
DuPont Fabros Technology, Inc. (Equity Real Estate Investment Trusts (REITs)) 0.2% 4,881 266,649
EMCOR Group, Inc. (Construction & Engineering) 0.1% 3,963 249,748
EPAM Systems, Inc.* (IT Services) 0.2% 3,154 264,558
Exact Sciences Corp.* (Biotechnology) 0.1% 6,915 252,190
Exelixis, Inc.* (Biotechnology) 0.2% 14,872 278,255
Fair Isaac Corp. (Software) 0.2% 2,027 268,902
FNB Corp. (Banks) 0.2% 20,803 274,600
Gramercy Property Trust (Equity Real Estate Investment Trusts (REITs)) 0.2% 9,214 272,274
Hancock Holding Co. (Banks) 0.2% 5,497 253,961
Healthcare Realty Trust, Inc. (Equity Real Estate Investment Trusts (REITs)) 0.1% 7,470 248,452
HealthSouth Corp. (Health Care Providers & Services) 0.2% 5,804 263,095
Hudson Pacific Properties, Inc. (Equity Real Estate Investment Trusts (REITs)) 0.2% 8,003 262,178
IBERIABANK Corp. (Banks) 0.2% 3,309 255,455
IDACORP, Inc. (Electric Utilities) 0.2% 3,307 288,701
Investors Bancorp, Inc. (Banks) 0.2% 19,468 257,562
j2 Global, Inc. (Internet Software & Services) 0.2% 3,081 260,714
LogMeIn, Inc. (Internet Software & Services) 0.2% 3,405 377,955
Masimo Corp.* (Health Care Equipment & Supplies) 0.1% 2,808 $ 244,408
MAXIMUS, Inc. (IT Services) 0.2% 4,199 260,674
Medical Properties Trust, Inc. (Equity Real Estate Investment Trusts (REITs)) 0.1% 19,270 249,547
Medidata Solutions, Inc.* (Health Care Technology) 0.2% 3,598 256,106
Microsemi Corp.* (Semiconductors & Semiconductor Equipment) 0.2% 7,451 365,919
MKS Instruments, Inc. (Semiconductors & Semiconductor Equipment) 0.2% 3,483 284,735
Monolithic Power Systems, Inc. (Semiconductors & Semiconductor Equipment) 0.1% 2,549 250,312
New Residential Investment Corp. (Mortgage Real Estate Investment Trusts (REITs)) 0.2% 19,513 313,964
NuVasive, Inc.* (Health Care Equipment & Supplies) 0.1% 3,242 243,247
Olin Corp. (Chemicals) 0.2% 10,838 317,987
PAREXEL International Corp.* (Life Sciences Tools & Services) 0.2% 3,435 277,617
Portland General Electric Co. (Electric Utilities) 0.2% 5,858 277,318
PrivateBancorp, Inc. (Banks) 0.2% 5,139 306,233
Prosperity Bancshares, Inc. (Banks) 0.2% 4,380 274,363
Southwest Gas Holdings, Inc. (Gas Utilities) 0.1% 3,099 246,587
Take-Two Interactive Software, Inc.* (Software) 0.3% 6,376 489,294
Teledyne Technologies, Inc.* (Aerospace & Defense) 0.2% 2,238 294,319
TESARO, Inc.* (Biotechnology) 0.2% 1,871 279,359
Umpqua Holdings Corp. (Banks) 0.1% 14,461 245,042
Universal Display Corp. (Electronic Equipment, Instruments & Components) 0.2% 2,714 307,768
Webster Financial Corp. (Banks) 0.2% 6,006 292,612
WGL Holdings, Inc. (Gas Utilities) 0.2% 3,303 273,290
XPO Logistics, Inc.* (Air Freight & Logistics) 0.2% 6,408 337,061
Other Common Stocks 67.8% 5,042,774 107,242,832
Total Common Stocks(Cost $121,945,150) 121,612,495
See accompanying notes to the financial statements.
PROSHARES TRUST SUMMARY SCHEDULE OF PORTFOLIO INVESTMENTS :: MAY 31, 2017 :: ULTRA RUSSELL2000nlUWM :: 89
Merrill Corp - Proshares Trust Geared Book [96 Funds] Annual Report [Funds] 333-089822 05-31-2017 ED [AUX] | eperez | 28-Jul-17 17:38 | 17-15159-3.fo | Sequence: 15CHKSUM Content: 25293 Layout: 19158 Graphics: No Graphics CLEAN
JOB: 17-15159-3 CYCLE#;BL#: 5; 0 TRIM: 8.25" x 10.75" COMPOSITECOLORS: Black, ~note-color 2, ~note-color 3 GRAPHICS: none V1.5
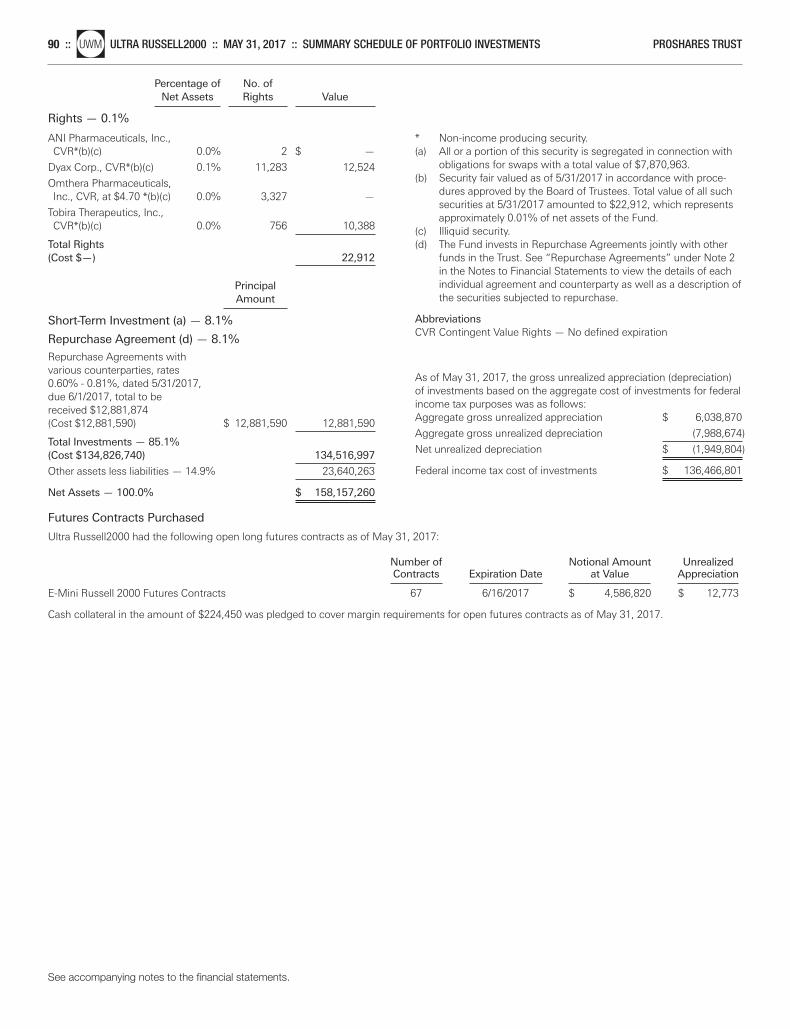
Percentage of No. of Net Assets Rights Value
Rights — 0.1%
ANI Pharmaceuticals, Inc., CVR*(b)(c) 0.0% 2 $ —
Dyax Corp., CVR*(b)(c) 0.1% 11,283 12,524
Omthera Pharmaceuticals, Inc., CVR, at $4.70 *(b)(c) 0.0% 3,327 —
Tobira Therapeutics, Inc., CVR*(b)(c) 0.0% 756 10,388
Total Rights(Cost $—) 22,912
Principal Amount
Short-Term Investment (a) — 8.1%
Repurchase Agreement (d) — 8.1%
Repurchase Agreements with various counterparties, rates 0.60% - 0.81%, dated 5/31/2017, due 6/1/2017, total to be received $12,881,874(Cost $12,881,590) $ 12,881,590 12,881,590
Total Investments — 85.1%(Cost $134,826,740) 134,516,997
Other assets less liabilities — 14.9% 23,640,263
Net Assets — 100.0% $ 158,157,260
Futures Contracts Purchased
Ultra Russell2000 had the following open long futures contracts as of May 31, 2017:
Number of Notional Amount Unrealized Contracts Expiration Date at Value Appreciation E-Mini Russell 2000 Futures Contracts 67 6/16/2017 $ 4,586,820 $ 12,773
Cash collateral in the amount of $224,450 was pledged to cover margin requirements for open futures contracts as of May 31, 2017.
* Non-income producing security.(a) All or a portion of this security is segregated in connection with
obligations for swaps with a total value of $7,870,963.(b) Security fair valued as of 5/31/2017 in accordance with proce-
dures approved by the Board of Trustees. Total value of all suchsecurities at 5/31/2017 amounted to $22,912, which representsapproximately 0.01% of net assets of the Fund.
(c) Illiquid security.(d) The Fund invests in Repurchase Agreements jointly with other
funds in the Trust. See “Repurchase Agreements” under Note 2in the Notes to Financial Statements to view the details of eachindividual agreement and counterparty as well as a description ofthe securities subjected to repurchase.
AbbreviationsCVR Contingent Value Rights — No defined expiration
As of May 31, 2017, the gross unrealized appreciation (depreciation)of investments based on the aggregate cost of investments for federalincome tax purposes was as follows:Aggregate gross unrealized appreciation $ 6,038,870
Aggregate gross unrealized depreciation (7,988,674)
Net unrealized depreciation $ (1,949,804)
Federal income tax cost of investments $ 136,466,801
See accompanying notes to the financial statements.
90 ::nlUWM ULTRA RUSSELL2000 :: MAY 31, 2017 :: SUMMARY SCHEDULE OF PORTFOLIO INVESTMENTS PROSHARES TRUST
Merrill Corp - Proshares Trust Geared Book [96 Funds] Annual Report [Funds] 333-089822 05-31-2017 ED [AUX] | eperez | 28-Jul-17 17:38 | 17-15159-3.fo | Sequence: 16CHKSUM Content: 6406 Layout: 41816 Graphics: No Graphics CLEAN
JOB: 17-15159-3 CYCLE#;BL#: 5; 0 TRIM: 8.25" x 10.75" COMPOSITECOLORS: Black, ~note-color 2, ~note-color 3 GRAPHICS: none V1.5
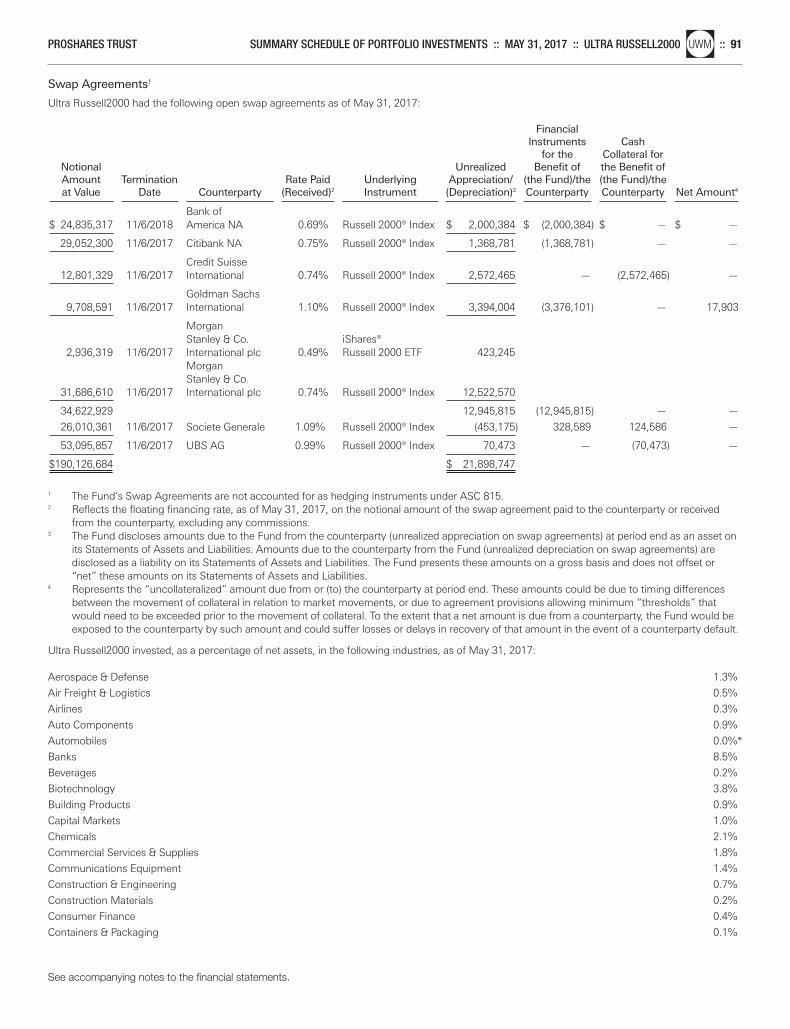
Swap Agreements1
Ultra Russell2000 had the following open swap agreements as of May 31, 2017:
Financial Instruments Cash
for the Collateral for Notional Unrealized Benefit of the Benefit of Amount Termination Rate Paid Underlying Appreciation/ (the Fund)/the (the Fund)/the at Value Date Counterparty (Received)2 Instrument (Depreciation)3 Counterparty Counterparty Net Amount4
Bank of
$ 24,835,317 11/6/2018 America NA 0.69% Russell 2000® Index $ 2,000,384 $ (2,000,384) $ — $ —
29,052,300 11/6/2017 Citibank NA 0.75% Russell 2000® Index 1,368,781 (1,368,781) — —
Credit Suisse 12,801,329 11/6/2017 International 0.74% Russell 2000® Index 2,572,465 — (2,572,465) —
Goldman Sachs 9,708,591 11/6/2017 International 1.10% Russell 2000® Index 3,394,004 (3,376,101) — 17,903
Morgan Stanley & Co. iShares®
2,936,319 11/6/2017 International plc 0.49% Russell 2000 ETF 423,245 Morgan Stanley & Co.
31,686,610 11/6/2017 International plc 0.74% Russell 2000® Index 12,522,570
34,622,929 12,945,815 (12,945,815) — —
26,010,361 11/6/2017 Societe Generale 1.09% Russell 2000® Index (453,175) 328,589 124,586 —
53,095,857 11/6/2017 UBS AG 0.99% Russell 2000® Index 70,473 — (70,473) —
$190,126,684 $ 21,898,747
1 The Fund’s Swap Agreements are not accounted for as hedging instruments under ASC 815.2 Reflects the floating financing rate, as of May 31, 2017, on the notional amount of the swap agreement paid to the counterparty or received
from the counterparty, excluding any commissions.3 The Fund discloses amounts due to the Fund from the counterparty (unrealized appreciation on swap agreements) at period end as an asset on
its Statements of Assets and Liabilities. Amounts due to the counterparty from the Fund (unrealized depreciation on swap agreements) are disclosed as a liability on its Statements of Assets and Liabilities. The Fund presents these amounts on a gross basis and does not offset or“net” these amounts on its Statements of Assets and Liabilities.
4 Represents the “uncollateralized” amount due from or (to) the counterparty at period end. These amounts could be due to timing differencesbetween the movement of collateral in relation to market movements, or due to agreement provisions allowing minimum “thresholds” thatwould need to be exceeded prior to the movement of collateral. To the extent that a net amount is due from a counterparty, the Fund would beexposed to the counterparty by such amount and could suffer losses or delays in recovery of that amount in the event of a counterparty default.
Ultra Russell2000 invested, as a percentage of net assets, in the following industries, as of May 31, 2017:
Aerospace & Defense 1.3%
Air Freight & Logistics 0.5%
Airlines 0.3%
Auto Components 0.9%
Automobiles 0.0%*
Banks 8.5%
Beverages 0.2%
Biotechnology 3.8%
Building Products 0.9%
Capital Markets 1.0%
Chemicals 2.1%
Commercial Services & Supplies 1.8%
Communications Equipment 1.4%
Construction & Engineering 0.7%
Construction Materials 0.2%
Consumer Finance 0.4%
Containers & Packaging 0.1%
See accompanying notes to the financial statements.
PROSHARES TRUST SUMMARY SCHEDULE OF PORTFOLIO INVESTMENTS :: MAY 31, 2017 :: ULTRA RUSSELL2000nlUWM :: 91
Merrill Corp - Proshares Trust Geared Book [96 Funds] Annual Report [Funds] 333-089822 05-31-2017 ED [AUX] | eperez | 28-Jul-17 17:38 | 17-15159-3.fo | Sequence: 17CHKSUM Content: 27455 Layout: 24961 Graphics: No Graphics CLEAN
JOB: 17-15159-3 CYCLE#;BL#: 5; 0 TRIM: 8.25" x 10.75" COMPOSITECOLORS: Black, ~note-color 2, ~note-color 3 GRAPHICS: none V1.5
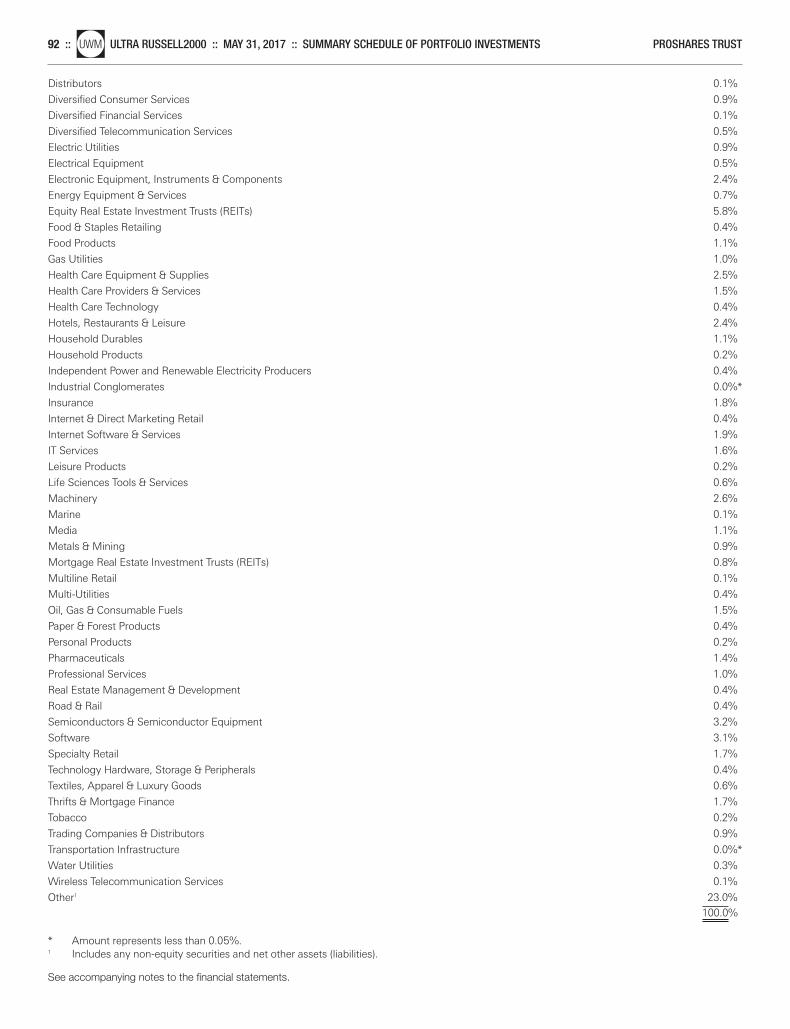
Distributors 0.1%
Diversified Consumer Services 0.9%
Diversified Financial Services 0.1%
Diversified Telecommunication Services 0.5%
Electric Utilities 0.9%
Electrical Equipment 0.5%
Electronic Equipment, Instruments & Components 2.4%
Energy Equipment & Services 0.7%
Equity Real Estate Investment Trusts (REITs) 5.8%
Food & Staples Retailing 0.4%
Food Products 1.1%
Gas Utilities 1.0%
Health Care Equipment & Supplies 2.5%
Health Care Providers & Services 1.5%
Health Care Technology 0.4%
Hotels, Restaurants & Leisure 2.4%
Household Durables 1.1%
Household Products 0.2%
Independent Power and Renewable Electricity Producers 0.4%
Industrial Conglomerates 0.0%*
Insurance 1.8%
Internet & Direct Marketing Retail 0.4%
Internet Software & Services 1.9%
IT Services 1.6%
Leisure Products 0.2%
Life Sciences Tools & Services 0.6%
Machinery 2.6%
Marine 0.1%
Media 1.1%
Metals & Mining 0.9%
Mortgage Real Estate Investment Trusts (REITs) 0.8%
Multiline Retail 0.1%
Multi-Utilities 0.4%
Oil, Gas & Consumable Fuels 1.5%
Paper & Forest Products 0.4%
Personal Products 0.2%
Pharmaceuticals 1.4%
Professional Services 1.0%
Real Estate Management & Development 0.4%
Road & Rail 0.4%
Semiconductors & Semiconductor Equipment 3.2%
Software 3.1%
Specialty Retail 1.7%
Technology Hardware, Storage & Peripherals 0.4%
Textiles, Apparel & Luxury Goods 0.6%
Thrifts & Mortgage Finance 1.7%
Tobacco 0.2%
Trading Companies & Distributors 0.9%
Transportation Infrastructure 0.0%*
Water Utilities 0.3%
Wireless Telecommunication Services 0.1%
Other1 23.0% 100.0%
* Amount represents less than 0.05%.1 Includes any non-equity securities and net other assets (liabilities).
See accompanying notes to the financial statements.
92 ::nlUWM ULTRA RUSSELL2000 :: MAY 31, 2017 :: SUMMARY SCHEDULE OF PORTFOLIO INVESTMENTS PROSHARES TRUST
Merrill Corp - Proshares Trust Geared Book [96 Funds] Annual Report [Funds] 333-089822 05-31-2017 ED [AUX] | eperez | 28-Jul-17 17:38 | 17-15159-3.fo | Sequence: 18CHKSUM Content: 50794 Layout: 40919 Graphics: No Graphics CLEAN
JOB: 17-15159-3 CYCLE#;BL#: 5; 0 TRIM: 8.25" x 10.75" COMPOSITECOLORS: Black, ~note-color 2, ~note-color 3 GRAPHICS: none V1.5
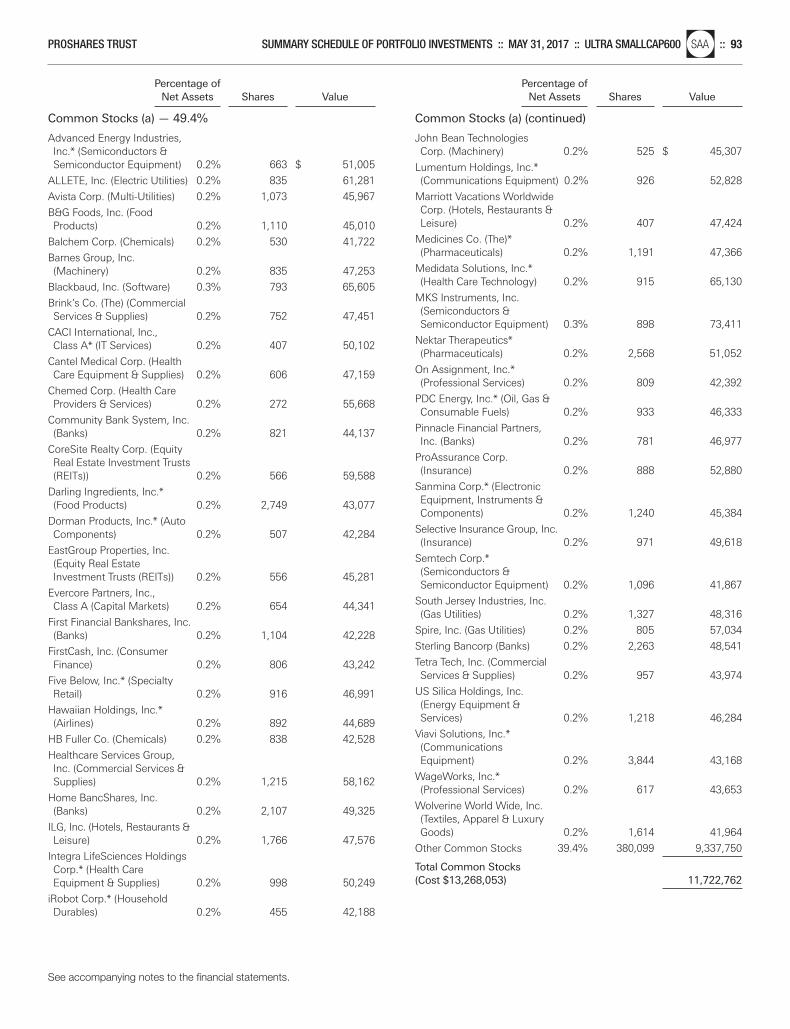
Percentage of Net Assets Shares Value
Common Stocks (a) — 49.4%
Percentage of Net Assets Shares Value
Common Stocks (a) (continued)
Advanced Energy Industries, Inc.* (Semiconductors & Semiconductor Equipment) 0.2% 663 $ 51,005
ALLETE, Inc. (Electric Utilities) 0.2% 835 61,281
Avista Corp. (Multi-Utilities) 0.2% 1,073 45,967
B&G Foods, Inc. (Food Products) 0.2% 1,110 45,010
Balchem Corp. (Chemicals) 0.2% 530 41,722
Barnes Group, Inc. (Machinery) 0.2% 835 47,253
Blackbaud, Inc. (Software) 0.3% 793 65,605
Brink’s Co. (The) (Commercial Services & Supplies) 0.2% 752 47,451
CACI International, Inc., Class A* (IT Services) 0.2% 407 50,102
Cantel Medical Corp. (Health Care Equipment & Supplies) 0.2% 606 47,159
Chemed Corp. (Health Care Providers & Services) 0.2% 272 55,668
Community Bank System, Inc.(Banks) 0.2% 821 44,137
CoreSite Realty Corp. (Equity Real Estate Investment Trusts(REITs)) 0.2% 566 59,588
Darling Ingredients, Inc.* (Food Products) 0.2% 2,749 43,077
Dorman Products, Inc.* (Auto Components) 0.2% 507 42,284
EastGroup Properties, Inc. (Equity Real Estate Investment Trusts (REITs)) 0.2% 556 45,281
Evercore Partners, Inc., Class A (Capital Markets) 0.2% 654 44,341
First Financial Bankshares, Inc.(Banks) 0.2% 1,104 42,228
FirstCash, Inc. (Consumer Finance) 0.2% 806 43,242
Five Below, Inc.* (Specialty Retail) 0.2% 916 46,991
Hawaiian Holdings, Inc.* (Airlines) 0.2% 892 44,689
HB Fuller Co. (Chemicals) 0.2% 838 42,528
Healthcare Services Group, Inc. (Commercial Services & Supplies) 0.2% 1,215 58,162
Home BancShares, Inc. (Banks) 0.2% 2,107 49,325
ILG, Inc. (Hotels, Restaurants & Leisure) 0.2% 1,766 47,576
Integra LifeSciences Holdings Corp.* (Health Care Equipment & Supplies) 0.2% 998 50,249
iRobot Corp.* (Household Durables) 0.2% 455 42,188
John Bean Technologies Corp. (Machinery) 0.2% 525 $ 45,307
Lumentum Holdings, Inc.* (Communications Equipment) 0.2% 926 52,828
Marriott Vacations Worldwide Corp. (Hotels, Restaurants & Leisure) 0.2% 407 47,424
Medicines Co. (The)* (Pharmaceuticals) 0.2% 1,191 47,366
Medidata Solutions, Inc.* (Health Care Technology) 0.2% 915 65,130
MKS Instruments, Inc. (Semiconductors & Semiconductor Equipment) 0.3% 898 73,411
Nektar Therapeutics* (Pharmaceuticals) 0.2% 2,568 51,052
On Assignment, Inc.* (Professional Services) 0.2% 809 42,392
PDC Energy, Inc.* (Oil, Gas & Consumable Fuels) 0.2% 933 46,333
Pinnacle Financial Partners, Inc. (Banks) 0.2% 781 46,977
ProAssurance Corp. (Insurance) 0.2% 888 52,880
Sanmina Corp.* (Electronic Equipment, Instruments & Components) 0.2% 1,240 45,384
Selective Insurance Group, Inc. (Insurance) 0.2% 971 49,618
Semtech Corp.* (Semiconductors & Semiconductor Equipment) 0.2% 1,096 41,867
South Jersey Industries, Inc. (Gas Utilities) 0.2% 1,327 48,316
Spire, Inc. (Gas Utilities) 0.2% 805 57,034
Sterling Bancorp (Banks) 0.2% 2,263 48,541
Tetra Tech, Inc. (Commercial Services & Supplies) 0.2% 957 43,974
US Silica Holdings, Inc. (Energy Equipment & Services) 0.2% 1,218 46,284
Viavi Solutions, Inc.* (Communications Equipment) 0.2% 3,844 43,168
WageWorks, Inc.* (Professional Services) 0.2% 617 43,653
Wolverine World Wide, Inc. (Textiles, Apparel & Luxury Goods) 0.2% 1,614 41,964
Other Common Stocks 39.4% 380,099 9,337,750
Total Common Stocks(Cost $13,268,053) 11,722,762
See accompanying notes to the financial statements.
PROSHARES TRUST SUMMARY SCHEDULE OF PORTFOLIO INVESTMENTS :: MAY 31, 2017 :: ULTRA SMALLCAP600nlSAA :: 93
Merrill Corp - Proshares Trust Geared Book [96 Funds] Annual Report [Funds] 333-089822 05-31-2017 ED [AUX] | eperez | 28-Jul-17 17:38 | 17-15159-3.fq | Sequence: 1CHKSUM Content: 17064 Layout: 13153 Graphics: No Graphics CLEAN
JOB: 17-15159-3 CYCLE#;BL#: 5; 0 TRIM: 8.25" x 10.75" COMPOSITECOLORS: Black, ~note-color 2, ~note-color 3 GRAPHICS: none V1.5
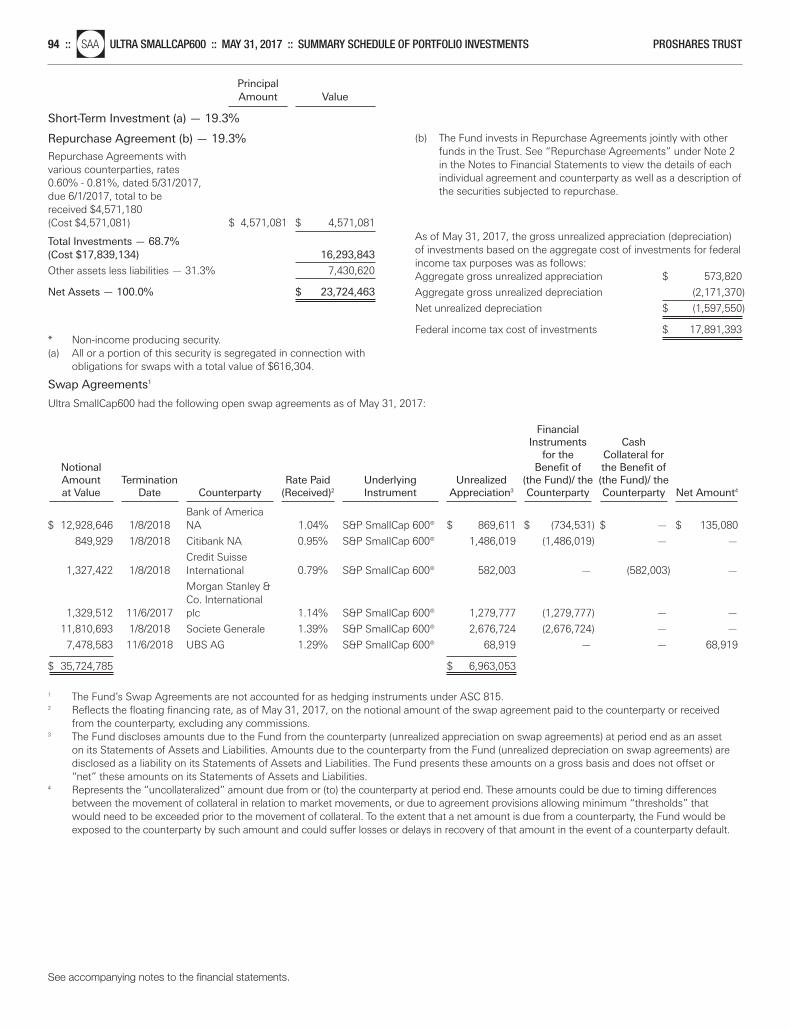
Principal Amount Value
Short-Term Investment (a) — 19.3%
Repurchase Agreement (b) — 19.3%
Repurchase Agreements with various counterparties, rates 0.60% - 0.81%, dated 5/31/2017, due 6/1/2017, total to be received $4,571,180 (Cost $4,571,081) $ 4,571,081 $ 4,571,081
Total Investments — 68.7%(Cost $17,839,134) 16,293,843
Other assets less liabilities — 31.3% 7,430,620
Net Assets — 100.0% $ 23,724,463
* Non-income producing security.(a) All or a portion of this security is segregated in connection with
obligations for swaps with a total value of $616,304.
(b) The Fund invests in Repurchase Agreements jointly with otherfunds in the Trust. See “Repurchase Agreements” under Note 2in the Notes to Financial Statements to view the details of eachindividual agreement and counterparty as well as a description ofthe securities subjected to repurchase.
As of May 31, 2017, the gross unrealized appreciation (depreciation)of investments based on the aggregate cost of investments for federalincome tax purposes was as follows:Aggregate gross unrealized appreciation $ 573,820
Aggregate gross unrealized depreciation (2,171,370)
Net unrealized depreciation $ (1,597,550)
Federal income tax cost of investments $ 17,891,393
See accompanying notes to the financial statements.
94 ::nlSAA ULTRA SMALLCAP600 :: MAY 31, 2017 :: SUMMARY SCHEDULE OF PORTFOLIO INVESTMENTS PROSHARES TRUST
Swap Agreements1
Ultra SmallCap600 had the following open swap agreements as of May 31, 2017:
Financial Instruments Cash
for the Collateral for Notional Benefit of the Benefit of Amount Termination Rate Paid Underlying Unrealized (the Fund)/ the (the Fund)/ the at Value Date Counterparty (Received)2 Instrument Appreciation3 Counterparty Counterparty Net Amount4
Bank of America
$ 12,928,646 1/8/2018 NA 1.04% S&P SmallCap 600® $ 869,611 $ (734,531) $ — $ 135,080
849,929 1/8/2018 Citibank NA 0.95% S&P SmallCap 600® 1,486,019 (1,486,019) — —
Credit Suisse 1,327,422 1/8/2018 International 0.79% S&P SmallCap 600® 582,003 — (582,003) —
Morgan Stanley & Co. International
1,329,512 11/6/2017 plc 1.14% S&P SmallCap 600® 1,279,777 (1,279,777) — —
11,810,693 1/8/2018 Societe Generale 1.39% S&P SmallCap 600® 2,676,724 (2,676,724) — —
7,478,583 11/6/2018 UBS AG 1.29% S&P SmallCap 600® 68,919 — — 68,919
$ 35,724,785 $ 6,963,053
1 The Fund’s Swap Agreements are not accounted for as hedging instruments under ASC 815.2 Reflects the floating financing rate, as of May 31, 2017, on the notional amount of the swap agreement paid to the counterparty or received
from the counterparty, excluding any commissions.3 The Fund discloses amounts due to the Fund from the counterparty (unrealized appreciation on swap agreements) at period end as an asset
on its Statements of Assets and Liabilities. Amounts due to the counterparty from the Fund (unrealized depreciation on swap agreements) aredisclosed as a liability on its Statements of Assets and Liabilities. The Fund presents these amounts on a gross basis and does not offset or“net” these amounts on its Statements of Assets and Liabilities.
4 Represents the “uncollateralized” amount due from or (to) the counterparty at period end. These amounts could be due to timing differencesbetween the movement of collateral in relation to market movements, or due to agreement provisions allowing minimum “thresholds” thatwould need to be exceeded prior to the movement of collateral. To the extent that a net amount is due from a counterparty, the Fund would beexposed to the counterparty by such amount and could suffer losses or delays in recovery of that amount in the event of a counterparty default.
Merrill Corp - Proshares Trust Geared Book [96 Funds] Annual Report [Funds] 333-089822 05-31-2017 ED [AUX] | eperez | 28-Jul-17 17:38 | 17-15159-3.fq | Sequence: 2CHKSUM Content: 21695 Layout: 38999 Graphics: No Graphics CLEAN
JOB: 17-15159-3 CYCLE#;BL#: 5; 0 TRIM: 8.25" x 10.75" COMPOSITECOLORS: Black, ~note-color 2, ~note-color 3 GRAPHICS: none V1.5
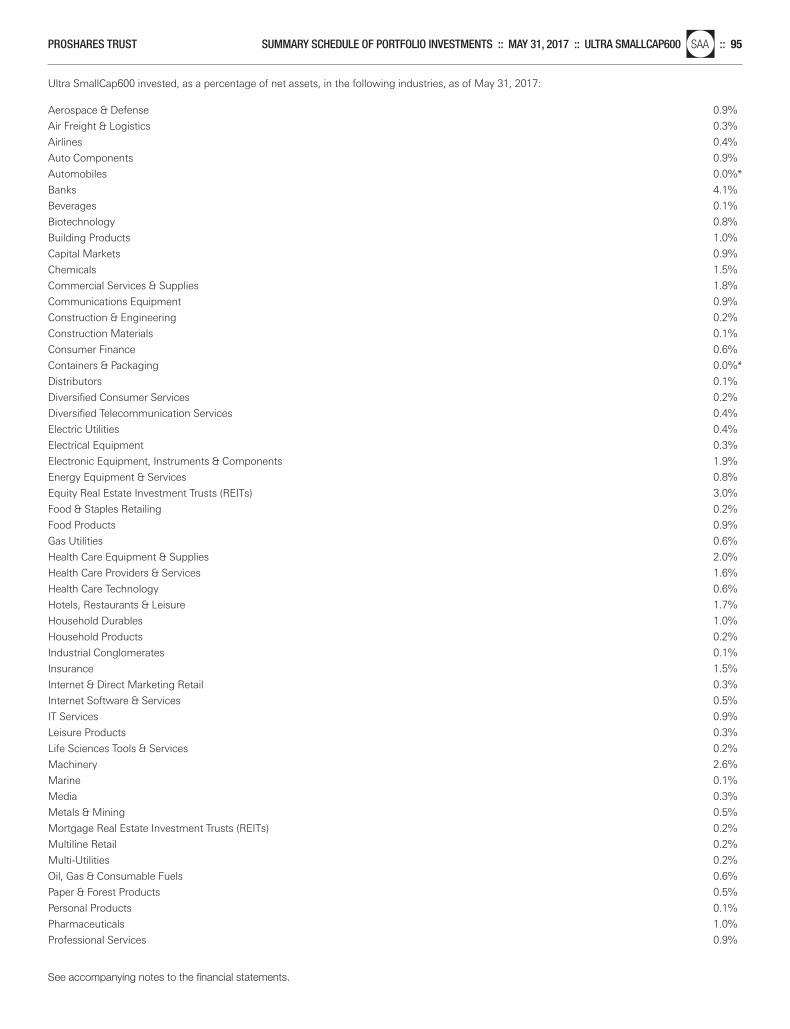
Ultra SmallCap600 invested, as a percentage of net assets, in the following industries, as of May 31, 2017:
Aerospace & Defense 0.9%
Air Freight & Logistics 0.3%
Airlines 0.4%
Auto Components 0.9%
Automobiles 0.0%*
Banks 4.1%
Beverages 0.1%
Biotechnology 0.8%
Building Products 1.0%
Capital Markets 0.9%
Chemicals 1.5%
Commercial Services & Supplies 1.8%
Communications Equipment 0.9%
Construction & Engineering 0.2%
Construction Materials 0.1%
Consumer Finance 0.6%
Containers & Packaging 0.0%*
Distributors 0.1%
Diversified Consumer Services 0.2%
Diversified Telecommunication Services 0.4%
Electric Utilities 0.4%
Electrical Equipment 0.3%
Electronic Equipment, Instruments & Components 1.9%
Energy Equipment & Services 0.8%
Equity Real Estate Investment Trusts (REITs) 3.0%
Food & Staples Retailing 0.2%
Food Products 0.9%
Gas Utilities 0.6%
Health Care Equipment & Supplies 2.0%
Health Care Providers & Services 1.6%
Health Care Technology 0.6%
Hotels, Restaurants & Leisure 1.7%
Household Durables 1.0%
Household Products 0.2%
Industrial Conglomerates 0.1%
Insurance 1.5%
Internet & Direct Marketing Retail 0.3%
Internet Software & Services 0.5%
IT Services 0.9%
Leisure Products 0.3%
Life Sciences Tools & Services 0.2%
Machinery 2.6%
Marine 0.1%
Media 0.3%
Metals & Mining 0.5%
Mortgage Real Estate Investment Trusts (REITs) 0.2%
Multiline Retail 0.2%
Multi-Utilities 0.2%
Oil, Gas & Consumable Fuels 0.6%
Paper & Forest Products 0.5%
Personal Products 0.1%
Pharmaceuticals 1.0%
Professional Services 0.9%
See accompanying notes to the financial statements.
PROSHARES TRUST SUMMARY SCHEDULE OF PORTFOLIO INVESTMENTS :: MAY 31, 2017 :: ULTRA SMALLCAP600nlSAA :: 95
Merrill Corp - Proshares Trust Geared Book [96 Funds] Annual Report [Funds] 333-089822 05-31-2017 ED [AUX] | eperez | 28-Jul-17 17:38 | 17-15159-3.fq | Sequence: 3CHKSUM Content: 40403 Layout: 6587 Graphics: No Graphics CLEAN
JOB: 17-15159-3 CYCLE#;BL#: 5; 0 TRIM: 8.25" x 10.75" COMPOSITECOLORS: Black, ~note-color 2, ~note-color 3 GRAPHICS: none V1.5
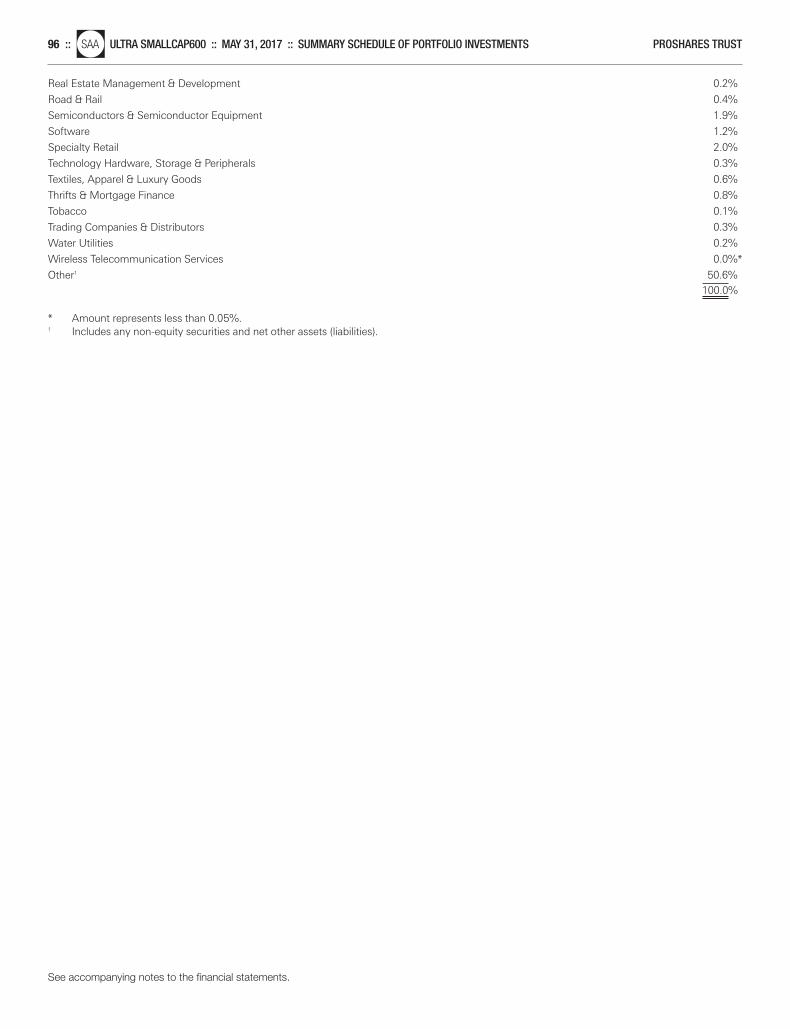
Real Estate Management & Development 0.2%
Road & Rail 0.4%
Semiconductors & Semiconductor Equipment 1.9%
Software 1.2%
Specialty Retail 2.0%
Technology Hardware, Storage & Peripherals 0.3%
Textiles, Apparel & Luxury Goods 0.6%
Thrifts & Mortgage Finance 0.8%
Tobacco 0.1%
Trading Companies & Distributors 0.3%
Water Utilities 0.2%
Wireless Telecommunication Services 0.0%*
Other1 50.6% 100.0%
* Amount represents less than 0.05%.1 Includes any non-equity securities and net other assets (liabilities).
See accompanying notes to the financial statements.
96 ::nlSAA ULTRA SMALLCAP600 :: MAY 31, 2017 :: SUMMARY SCHEDULE OF PORTFOLIO INVESTMENTS PROSHARES TRUST
Merrill Corp - Proshares Trust Geared Book [96 Funds] Annual Report [Funds] 333-089822 05-31-2017 ED [AUX] | eperez | 28-Jul-17 17:38 | 17-15159-3.fq | Sequence: 4CHKSUM Content: 9407 Layout: 18904 Graphics: No Graphics CLEAN
JOB: 17-15159-3 CYCLE#;BL#: 5; 0 TRIM: 8.25" x 10.75" COMPOSITECOLORS: Black, ~note-color 2, ~note-color 3 GRAPHICS: none V1.5
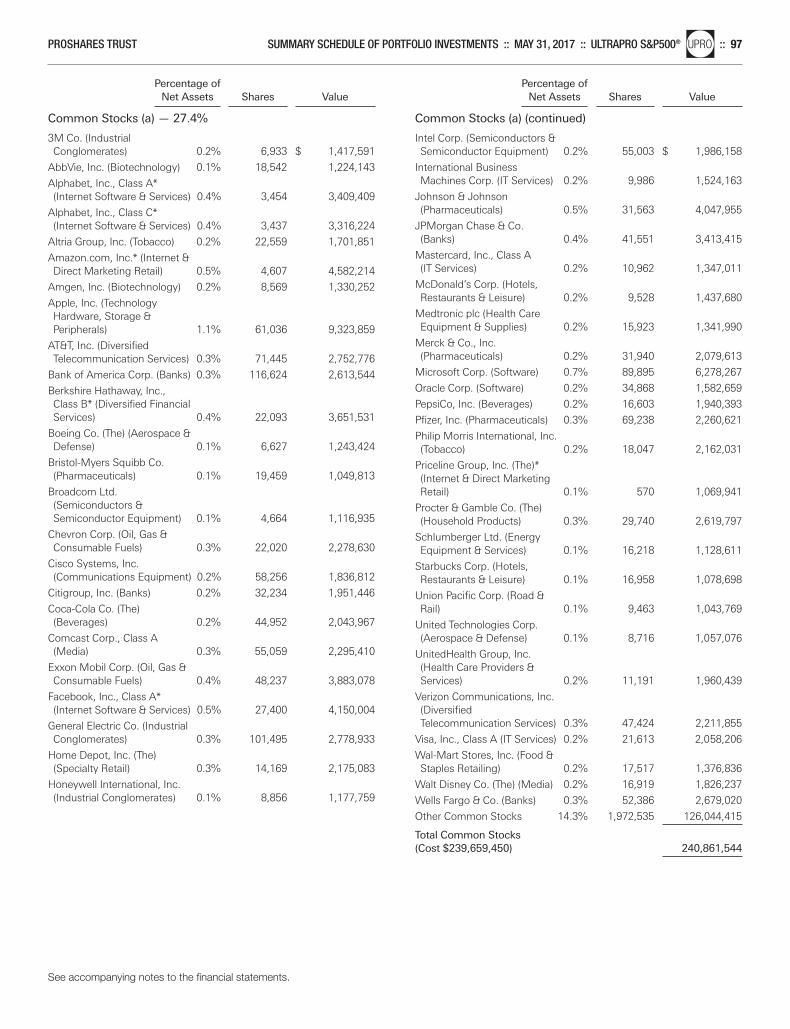
Percentage of Net Assets Shares Value
Common Stocks (a) — 27.4%
Percentage of Net Assets Shares Value
Common Stocks (a) (continued)
3M Co. (Industrial Conglomerates) 0.2% 6,933 $ 1,417,591
AbbVie, Inc. (Biotechnology) 0.1% 18,542 1,224,143
Alphabet, Inc., Class A* (Internet Software & Services) 0.4% 3,454 3,409,409
Alphabet, Inc., Class C* (Internet Software & Services) 0.4% 3,437 3,316,224
Altria Group, Inc. (Tobacco) 0.2% 22,559 1,701,851
Amazon.com, Inc.* (Internet &Direct Marketing Retail) 0.5% 4,607 4,582,214
Amgen, Inc. (Biotechnology) 0.2% 8,569 1,330,252
Apple, Inc. (Technology Hardware, Storage & Peripherals) 1.1% 61,036 9,323,859
AT&T, Inc. (Diversified Telecommunication Services) 0.3% 71,445 2,752,776
Bank of America Corp. (Banks) 0.3% 116,624 2,613,544
Berkshire Hathaway, Inc., Class B* (Diversified Financial Services) 0.4% 22,093 3,651,531
Boeing Co. (The) (Aerospace & Defense) 0.1% 6,627 1,243,424
Bristol-Myers Squibb Co. (Pharmaceuticals) 0.1% 19,459 1,049,813
Broadcom Ltd. (Semiconductors & Semiconductor Equipment) 0.1% 4,664 1,116,935
Chevron Corp. (Oil, Gas & Consumable Fuels) 0.3% 22,020 2,278,630
Cisco Systems, Inc. (Communications Equipment) 0.2% 58,256 1,836,812
Citigroup, Inc. (Banks) 0.2% 32,234 1,951,446
Coca-Cola Co. (The) (Beverages) 0.2% 44,952 2,043,967
Comcast Corp., Class A (Media) 0.3% 55,059 2,295,410
Exxon Mobil Corp. (Oil, Gas & Consumable Fuels) 0.4% 48,237 3,883,078
Facebook, Inc., Class A* (Internet Software & Services) 0.5% 27,400 4,150,004
General Electric Co. (Industrial Conglomerates) 0.3% 101,495 2,778,933
Home Depot, Inc. (The) (Specialty Retail) 0.3% 14,169 2,175,083
Honeywell International, Inc. (Industrial Conglomerates) 0.1% 8,856 1,177,759
Intel Corp. (Semiconductors & Semiconductor Equipment) 0.2% 55,003 $ 1,986,158
International Business Machines Corp. (IT Services) 0.2% 9,986 1,524,163
Johnson & Johnson (Pharmaceuticals) 0.5% 31,563 4,047,955
JPMorgan Chase & Co. (Banks) 0.4% 41,551 3,413,415
Mastercard, Inc., Class A (IT Services) 0.2% 10,962 1,347,011
McDonald’s Corp. (Hotels, Restaurants & Leisure) 0.2% 9,528 1,437,680
Medtronic plc (Health Care Equipment & Supplies) 0.2% 15,923 1,341,990
Merck & Co., Inc. (Pharmaceuticals) 0.2% 31,940 2,079,613
Microsoft Corp. (Software) 0.7% 89,895 6,278,267
Oracle Corp. (Software) 0.2% 34,868 1,582,659
PepsiCo, Inc. (Beverages) 0.2% 16,603 1,940,393
Pfizer, Inc. (Pharmaceuticals) 0.3% 69,238 2,260,621
Philip Morris International, Inc. (Tobacco) 0.2% 18,047 2,162,031
Priceline Group, Inc. (The)* (Internet & Direct Marketing Retail) 0.1% 570 1,069,941
Procter & Gamble Co. (The) (Household Products) 0.3% 29,740 2,619,797
Schlumberger Ltd. (Energy Equipment & Services) 0.1% 16,218 1,128,611
Starbucks Corp. (Hotels, Restaurants & Leisure) 0.1% 16,958 1,078,698
Union Pacific Corp. (Road & Rail) 0.1% 9,463 1,043,769
United Technologies Corp. (Aerospace & Defense) 0.1% 8,716 1,057,076
UnitedHealth Group, Inc. (Health Care Providers & Services) 0.2% 11,191 1,960,439
Verizon Communications, Inc. (Diversified Telecommunication Services) 0.3% 47,424 2,211,855
Visa, Inc., Class A (IT Services) 0.2% 21,613 2,058,206
Wal-Mart Stores, Inc. (Food & Staples Retailing) 0.2% 17,517 1,376,836
Walt Disney Co. (The) (Media) 0.2% 16,919 1,826,237
Wells Fargo & Co. (Banks) 0.3% 52,386 2,679,020
Other Common Stocks 14.3% 1,972,535 126,044,415
Total Common Stocks (Cost $239,659,450) 240,861,544
See accompanying notes to the financial statements.
PROSHARES TRUST SUMMARY SCHEDULE OF PORTFOLIO INVESTMENTS :: MAY 31, 2017 :: ULTRAPRO S&P500®nlUPRO :: 97
Merrill Corp - Proshares Trust Geared Book [96 Funds] Annual Report [Funds] 333-089822 05-31-2017 ED [AUX] | eperez | 28-Jul-17 17:38 | 17-15159-3.fq | Sequence: 5CHKSUM Content: 44923 Layout: 24597 Graphics: No Graphics CLEAN
JOB: 17-15159-3 CYCLE#;BL#: 5; 0 TRIM: 8.25" x 10.75" COMPOSITECOLORS: Black, ~note-color 2, ~note-color 3 GRAPHICS: none V1.5
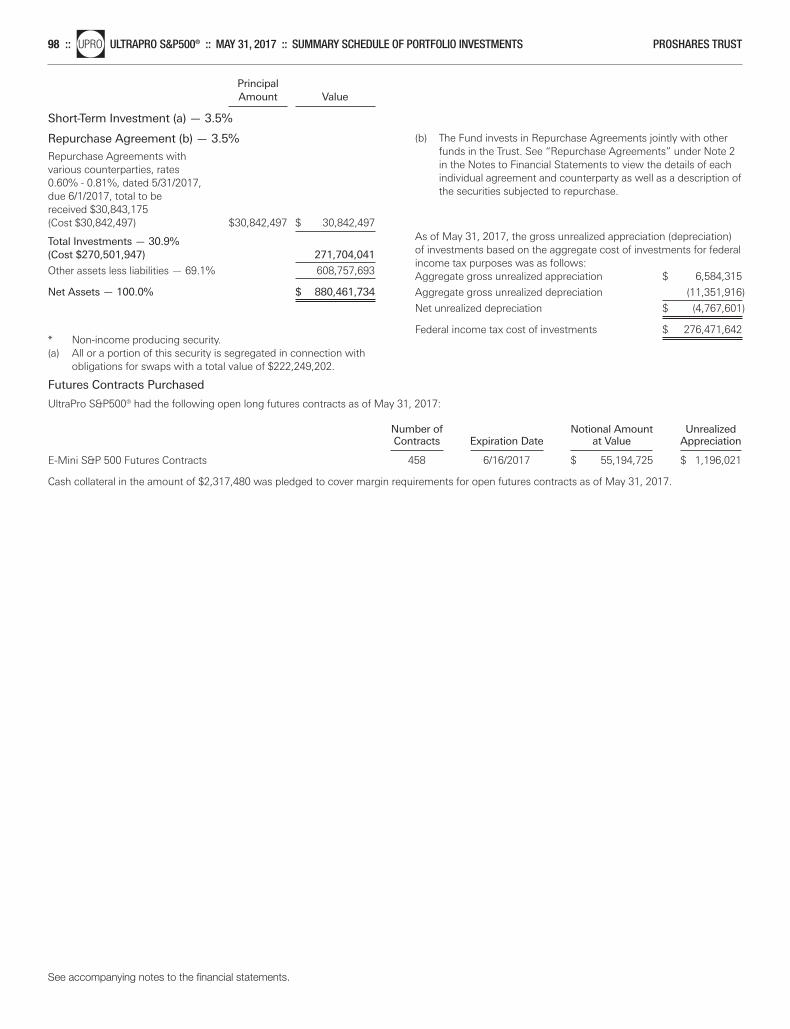
Principal Amount Value
Short-Term Investment (a) — 3.5%
Repurchase Agreement (b) — 3.5%
Repurchase Agreements with various counterparties, rates 0.60% - 0.81%, dated 5/31/2017, due 6/1/2017, total to be received $30,843,175 (Cost $30,842,497) $30,842,497 $ 30,842,497
Total Investments — 30.9%(Cost $270,501,947) 271,704,041
Other assets less liabilities — 69.1% 608,757,693
Net Assets — 100.0% $ 880,461,734
* Non-income producing security.(a) All or a portion of this security is segregated in connection with
obligations for swaps with a total value of $222,249,202.
(b) The Fund invests in Repurchase Agreements jointly with otherfunds in the Trust. See “Repurchase Agreements” under Note 2in the Notes to Financial Statements to view the details of eachindividual agreement and counterparty as well as a description ofthe securities subjected to repurchase.
As of May 31, 2017, the gross unrealized appreciation (depreciation)of investments based on the aggregate cost of investments for federalincome tax purposes was as follows:Aggregate gross unrealized appreciation $ 6,584,315
Aggregate gross unrealized depreciation (11,351,916)
Net unrealized depreciation $ (4,767,601)
Federal income tax cost of investments $ 276,471,642
See accompanying notes to the financial statements.
98 ::nlUPRO ULTRAPRO S&P500® :: MAY 31, 2017 :: SUMMARY SCHEDULE OF PORTFOLIO INVESTMENTS PROSHARES TRUST
Futures Contracts Purchased
UltraPro S&P500® had the following open long futures contracts as of May 31, 2017:
Number of Notional Amount Unrealized Contracts Expiration Date at Value Appreciation E-Mini S&P 500 Futures Contracts 458 6/16/2017 $ 55,194,725 $ 1,196,021
Cash collateral in the amount of $2,317,480 was pledged to cover margin requirements for open futures contracts as of May 31, 2017.
Merrill Corp - Proshares Trust Geared Book [96 Funds] Annual Report [Funds] 333-089822 05-31-2017 ED [AUX] | eperez | 28-Jul-17 17:38 | 17-15159-3.fq | Sequence: 6CHKSUM Content: 21521 Layout: 36700 Graphics: No Graphics CLEAN
JOB: 17-15159-3 CYCLE#;BL#: 5; 0 TRIM: 8.25" x 10.75" COMPOSITECOLORS: Black, ~note-color 2, ~note-color 3 GRAPHICS: none V1.5
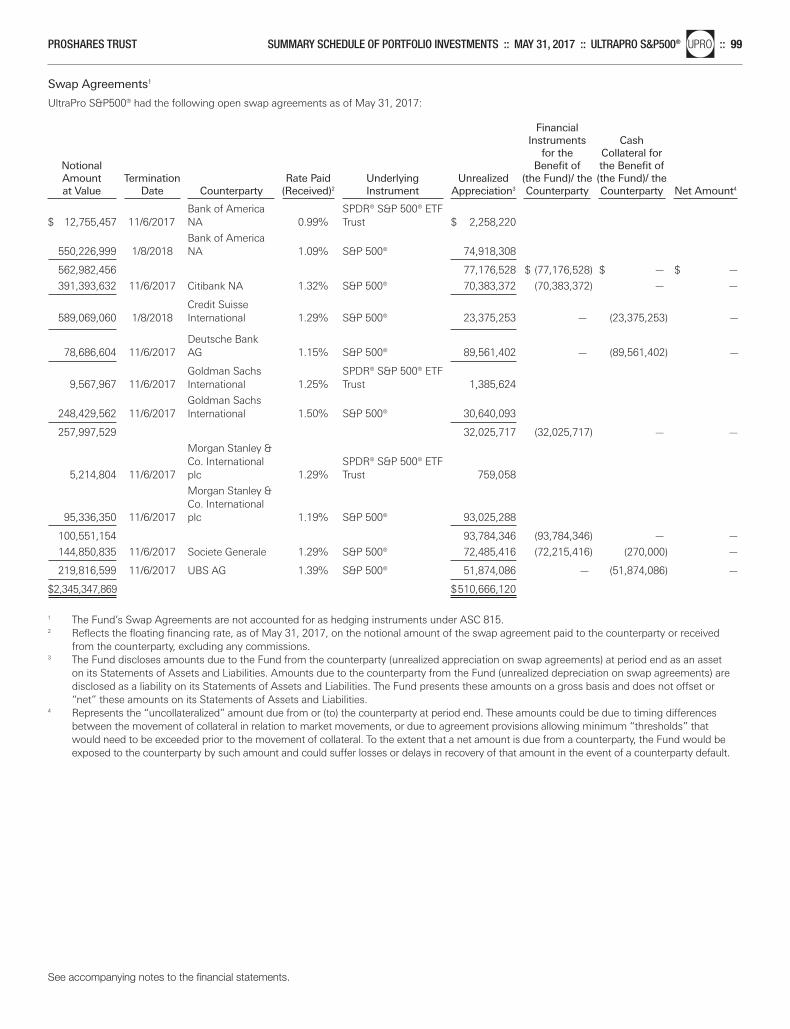
Swap Agreements1
UltraPro S&P500® had the following open swap agreements as of May 31, 2017:
Financial Instruments Cash
for the Collateral for Notional Benefit of the Benefit of Amount Termination Rate Paid Underlying Unrealized (the Fund)/ the (the Fund)/ the at Value Date Counterparty (Received)2 Instrument Appreciation3 Counterparty Counterparty Net Amount4
Bank of America SPDR® S&P 500® ETF
$ 12,755,457 11/6/2017 NA 0.99% Trust $ 2,258,220
Bank of America 550,226,999 1/8/2018 NA 1.09% S&P 500® 74,918,308
562,982,456 77,176,528 $ (77,176,528) $ — $ —
391,393,632 11/6/2017 Citibank NA 1.32% S&P 500® 70,383,372 (70,383,372) — —
Credit Suisse 589,069,060 1/8/2018 International 1.29% S&P 500® 23,375,253 — (23,375,253) —
Deutsche Bank 78,686,604 11/6/2017 AG 1.15% S&P 500® 89,561,402 — (89,561,402) —
Goldman Sachs SPDR® S&P 500® ETF 9,567,967 11/6/2017 International 1.25% Trust 1,385,624
Goldman Sachs 248,429,562 11/6/2017 International 1.50% S&P 500® 30,640,093
257,997,529 32,025,717 (32,025,717) — —
Morgan Stanley & Co. International SPDR® S&P 500® ETF
5,214,804 11/6/2017 plc 1.29% Trust 759,058
Morgan Stanley & Co. International
95,336,350 11/6/2017 plc 1.19% S&P 500® 93,025,288
100,551,154 93,784,346 (93,784,346) — —
144,850,835 11/6/2017 Societe Generale 1.29% S&P 500® 72,485,416 (72,215,416) (270,000) —
219,816,599 11/6/2017 UBS AG 1.39% S&P 500® 51,874,086 — (51,874,086) —
$2,345,347,869 $510,666,120
1 The Fund’s Swap Agreements are not accounted for as hedging instruments under ASC 815.2 Reflects the floating financing rate, as of May 31, 2017, on the notional amount of the swap agreement paid to the counterparty or received
from the counterparty, excluding any commissions.3 The Fund discloses amounts due to the Fund from the counterparty (unrealized appreciation on swap agreements) at period end as an asset
on its Statements of Assets and Liabilities. Amounts due to the counterparty from the Fund (unrealized depreciation on swap agreements) aredisclosed as a liability on its Statements of Assets and Liabilities. The Fund presents these amounts on a gross basis and does not offset or“net” these amounts on its Statements of Assets and Liabilities.
4 Represents the “uncollateralized” amount due from or (to) the counterparty at period end. These amounts could be due to timing differencesbetween the movement of collateral in relation to market movements, or due to agreement provisions allowing minimum “thresholds” thatwould need to be exceeded prior to the movement of collateral. To the extent that a net amount is due from a counterparty, the Fund would beexposed to the counterparty by such amount and could suffer losses or delays in recovery of that amount in the event of a counterparty default.
See accompanying notes to the financial statements.
PROSHARES TRUST SUMMARY SCHEDULE OF PORTFOLIO INVESTMENTS :: MAY 31, 2017 :: ULTRAPRO S&P500®nlUPRO :: 99
Merrill Corp - Proshares Trust Geared Book [96 Funds] Annual Report [Funds] 333-089822 05-31-2017 ED [AUX] | eperez | 28-Jul-17 17:38 | 17-15159-3.fq | Sequence: 7CHKSUM Content: 50144 Layout: 19099 Graphics: No Graphics CLEAN
JOB: 17-15159-3 CYCLE#;BL#: 5; 0 TRIM: 8.25" x 10.75" COMPOSITECOLORS: Black, ~note-color 2, ~note-color 3 GRAPHICS: none V1.5
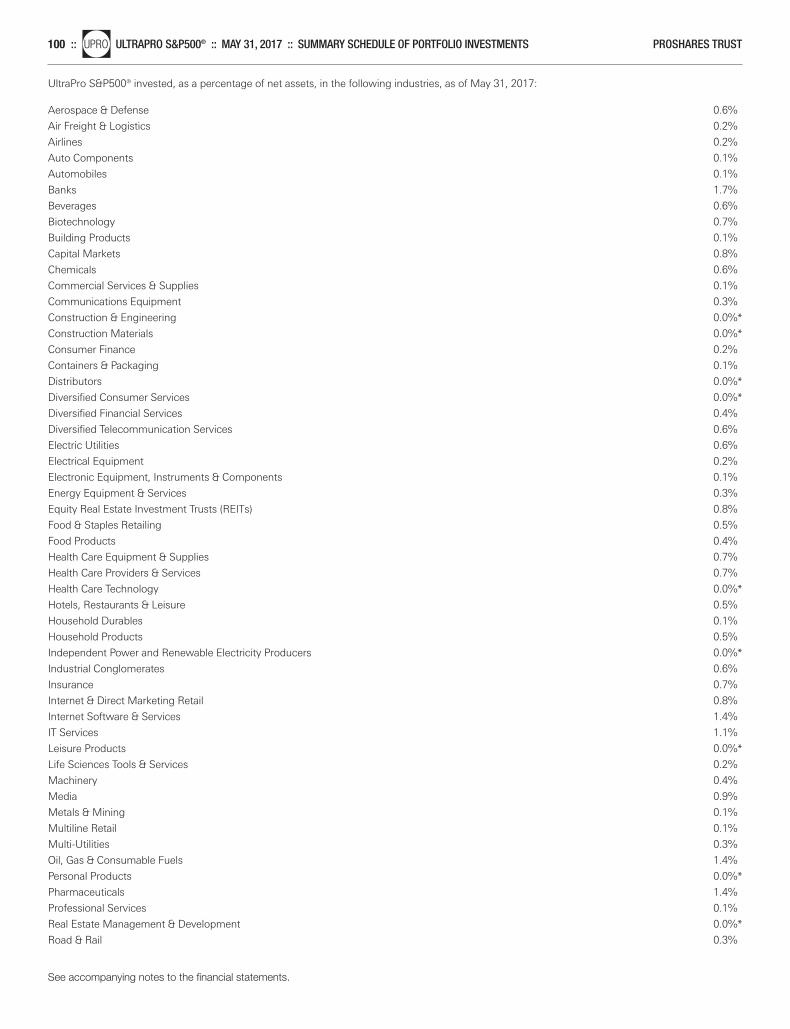
UltraPro S&P500® invested, as a percentage of net assets, in the following industries, as of May 31, 2017:
Aerospace & Defense 0.6%
Air Freight & Logistics 0.2%
Airlines 0.2%
Auto Components 0.1%
Automobiles 0.1%
Banks 1.7%
Beverages 0.6%
Biotechnology 0.7%
Building Products 0.1%
Capital Markets 0.8%
Chemicals 0.6%
Commercial Services & Supplies 0.1%
Communications Equipment 0.3%
Construction & Engineering 0.0%*
Construction Materials 0.0%*
Consumer Finance 0.2%
Containers & Packaging 0.1%
Distributors 0.0%*
Diversified Consumer Services 0.0%*
Diversified Financial Services 0.4%
Diversified Telecommunication Services 0.6%
Electric Utilities 0.6%
Electrical Equipment 0.2%
Electronic Equipment, Instruments & Components 0.1%
Energy Equipment & Services 0.3%
Equity Real Estate Investment Trusts (REITs) 0.8%
Food & Staples Retailing 0.5%
Food Products 0.4%
Health Care Equipment & Supplies 0.7%
Health Care Providers & Services 0.7%
Health Care Technology 0.0%*
Hotels, Restaurants & Leisure 0.5%
Household Durables 0.1%
Household Products 0.5%
Independent Power and Renewable Electricity Producers 0.0%*
Industrial Conglomerates 0.6%
Insurance 0.7%
Internet & Direct Marketing Retail 0.8%
Internet Software & Services 1.4%
IT Services 1.1%
Leisure Products 0.0%*
Life Sciences Tools & Services 0.2%
Machinery 0.4%
Media 0.9%
Metals & Mining 0.1%
Multiline Retail 0.1%
Multi-Utilities 0.3%
Oil, Gas & Consumable Fuels 1.4%
Personal Products 0.0%*
Pharmaceuticals 1.4%
Professional Services 0.1%
Real Estate Management & Development 0.0%*
Road & Rail 0.3%
See accompanying notes to the financial statements.
100 ::nlUPRO ULTRAPRO S&P500® :: MAY 31, 2017 :: SUMMARY SCHEDULE OF PORTFOLIO INVESTMENTS PROSHARES TRUST
Merrill Corp - Proshares Trust Geared Book [96 Funds] Annual Report [Funds] 333-089822 05-31-2017 ED [AUX] | eperez | 28-Jul-17 17:38 | 17-15159-3.fq | Sequence: 8CHKSUM Content: 4462 Layout: 18541 Graphics: No Graphics CLEAN
JOB: 17-15159-3 CYCLE#;BL#: 5; 0 TRIM: 8.25" x 10.75" COMPOSITECOLORS: Black, ~note-color 2, ~note-color 3 GRAPHICS: none V1.5
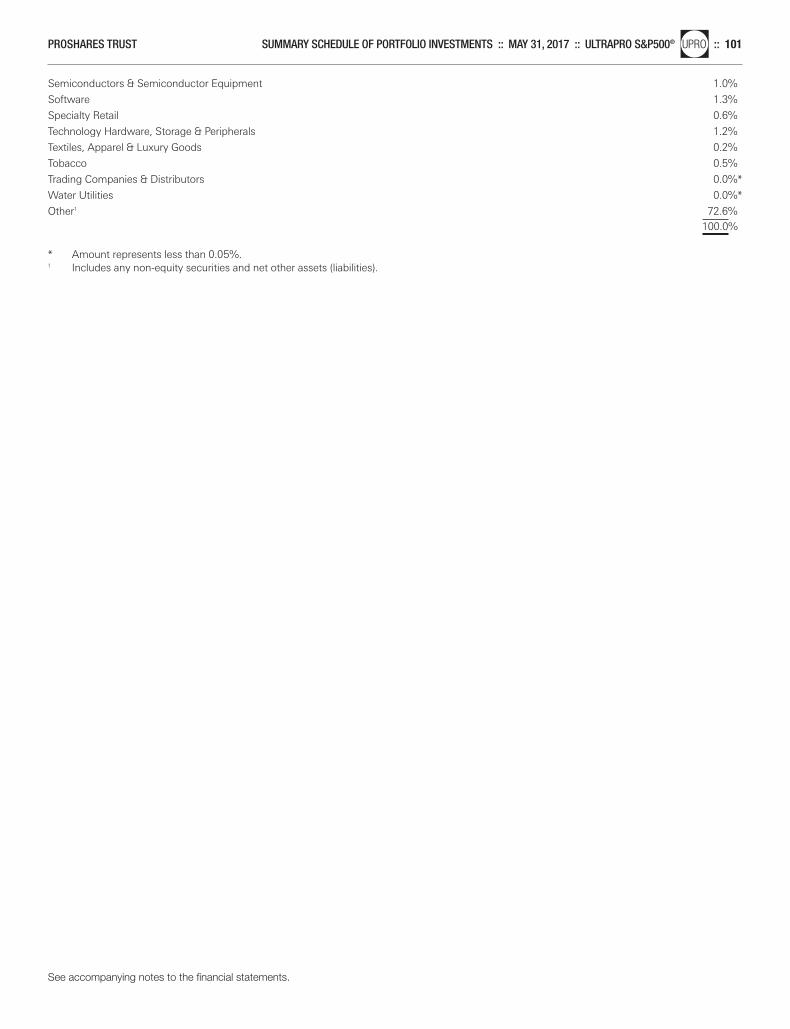
Semiconductors & Semiconductor Equipment 1.0%
Software 1.3%
Specialty Retail 0.6%
Technology Hardware, Storage & Peripherals 1.2%
Textiles, Apparel & Luxury Goods 0.2%
Tobacco 0.5%
Trading Companies & Distributors 0.0%*
Water Utilities 0.0%*
Other1 72.6% 100.0%
* Amount represents less than 0.05%.1 Includes any non-equity securities and net other assets (liabilities).
See accompanying notes to the financial statements.
PROSHARES TRUST SUMMARY SCHEDULE OF PORTFOLIO INVESTMENTS :: MAY 31, 2017 :: ULTRAPRO S&P500®nlUPRO :: 101
Merrill Corp - Proshares Trust Geared Book [96 Funds] Annual Report [Funds] 333-089822 05-31-2017 ED [AUX] | eperez | 28-Jul-17 17:38 | 17-15159-3.fq | Sequence: 9CHKSUM Content: 7352 Layout: 18712 Graphics: No Graphics CLEAN
JOB: 17-15159-3 CYCLE#;BL#: 5; 0 TRIM: 8.25" x 10.75" COMPOSITECOLORS: Black, ~note-color 2, ~note-color 3 GRAPHICS: none V1.5
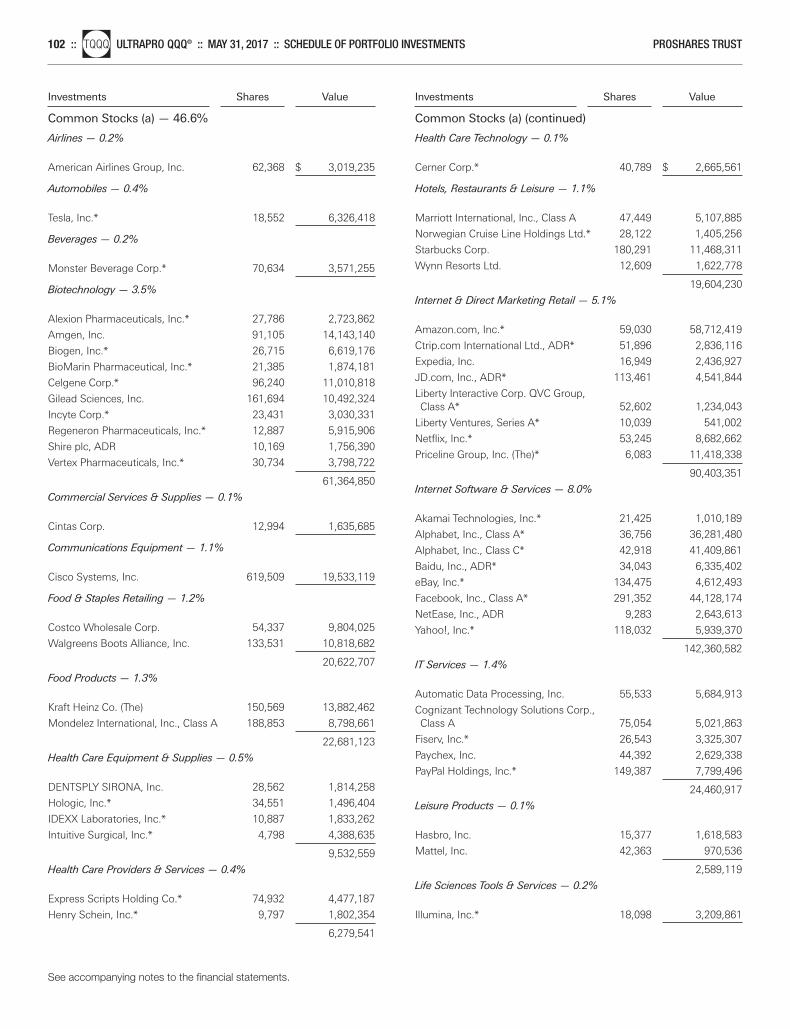
Investments Shares Value
Common Stocks (a) — 46.6%
Investments Shares Value
Common Stocks (a) (continued)
Airlines — 0.2%
American Airlines Group, Inc. 62,368 $ 3,019,235
Automobiles — 0.4%
Tesla, Inc.* 18,552 6,326,418
Beverages — 0.2%
Monster Beverage Corp.* 70,634 3,571,255
Biotechnology — 3.5%
Alexion Pharmaceuticals, Inc.* 27,786 2,723,862
Amgen, Inc. 91,105 14,143,140
Biogen, Inc.* 26,715 6,619,176
BioMarin Pharmaceutical, Inc.* 21,385 1,874,181
Celgene Corp.* 96,240 11,010,818
Gilead Sciences, Inc. 161,694 10,492,324
Incyte Corp.* 23,431 3,030,331
Regeneron Pharmaceuticals, Inc.* 12,887 5,915,906
Shire plc, ADR 10,169 1,756,390
Vertex Pharmaceuticals, Inc.* 30,734 3,798,722
61,364,850
Commercial Services & Supplies — 0.1%
Cintas Corp. 12,994 1,635,685
Communications Equipment — 1.1%
Cisco Systems, Inc. 619,509 19,533,119
Food & Staples Retailing — 1.2%
Costco Wholesale Corp. 54,337 9,804,025
Walgreens Boots Alliance, Inc. 133,531 10,818,682
20,622,707
Food Products — 1.3%
Kraft Heinz Co. (The) 150,569 13,882,462
Mondelez International, Inc., Class A 188,853 8,798,661
22,681,123
Health Care Equipment & Supplies — 0.5%
DENTSPLY SIRONA, Inc. 28,562 1,814,258
Hologic, Inc.* 34,551 1,496,404
IDEXX Laboratories, Inc.* 10,887 1,833,262
Intuitive Surgical, Inc.* 4,798 4,388,635
9,532,559
Health Care Providers & Services — 0.4%
Express Scripts Holding Co.* 74,932 4,477,187
Henry Schein, Inc.* 9,797 1,802,354
6,279,541
Health Care Technology — 0.1%
Cerner Corp.* 40,789 $ 2,665,561
Hotels, Restaurants & Leisure — 1.1%
Marriott International, Inc., Class A 47,449 5,107,885
Norwegian Cruise Line Holdings Ltd.* 28,122 1,405,256
Starbucks Corp. 180,291 11,468,311
Wynn Resorts Ltd. 12,609 1,622,778
19,604,230
Internet & Direct Marketing Retail — 5.1%
Amazon.com, Inc.* 59,030 58,712,419
Ctrip.com International Ltd., ADR* 51,896 2,836,116
Expedia, Inc. 16,949 2,436,927
JD.com, Inc., ADR* 113,461 4,541,844
Liberty Interactive Corp. QVC Group, Class A* 52,602 1,234,043
Liberty Ventures, Series A* 10,039 541,002
Netflix, Inc.* 53,245 8,682,662
Priceline Group, Inc. (The)* 6,083 11,418,338
90,403,351
Internet Software & Services — 8.0%
Akamai Technologies, Inc.* 21,425 1,010,189
Alphabet, Inc., Class A* 36,756 36,281,480
Alphabet, Inc., Class C* 42,918 41,409,861
Baidu, Inc., ADR* 34,043 6,335,402
eBay, Inc.* 134,475 4,612,493
Facebook, Inc., Class A* 291,352 44,128,174
NetEase, Inc., ADR 9,283 2,643,613
Yahoo!, Inc.* 118,032 5,939,370
142,360,582
IT Services — 1.4%
Automatic Data Processing, Inc. 55,533 5,684,913
Cognizant Technology Solutions Corp., Class A 75,054 5,021,863
Fiserv, Inc.* 26,543 3,325,307
Paychex, Inc. 44,392 2,629,338
PayPal Holdings, Inc.* 149,387 7,799,496
24,460,917
Leisure Products — 0.1%
Hasbro, Inc. 15,377 1,618,583
Mattel, Inc. 42,363 970,536
2,589,119
Life Sciences Tools & Services — 0.2%
Illumina, Inc.* 18,098 3,209,861
See accompanying notes to the financial statements.
102 ::nlTQQQ ULTRAPRO QQQ® :: MAY 31, 2017 :: SCHEDULE OF PORTFOLIO INVESTMENTS PROSHARES TRUST
Merrill Corp - Proshares Trust Geared Book [96 Funds] Annual Report [Funds] 333-089822 05-31-2017 ED [AUX] | eperez | 28-Jul-17 17:38 | 17-15159-3.fq | Sequence: 10CHKSUM Content: 30852 Layout: 4024 Graphics: No Graphics CLEAN
JOB: 17-15159-3 CYCLE#;BL#: 5; 0 TRIM: 8.25" x 10.75" COMPOSITECOLORS: Black, ~note-color 2, ~note-color 3 GRAPHICS: none V1.5
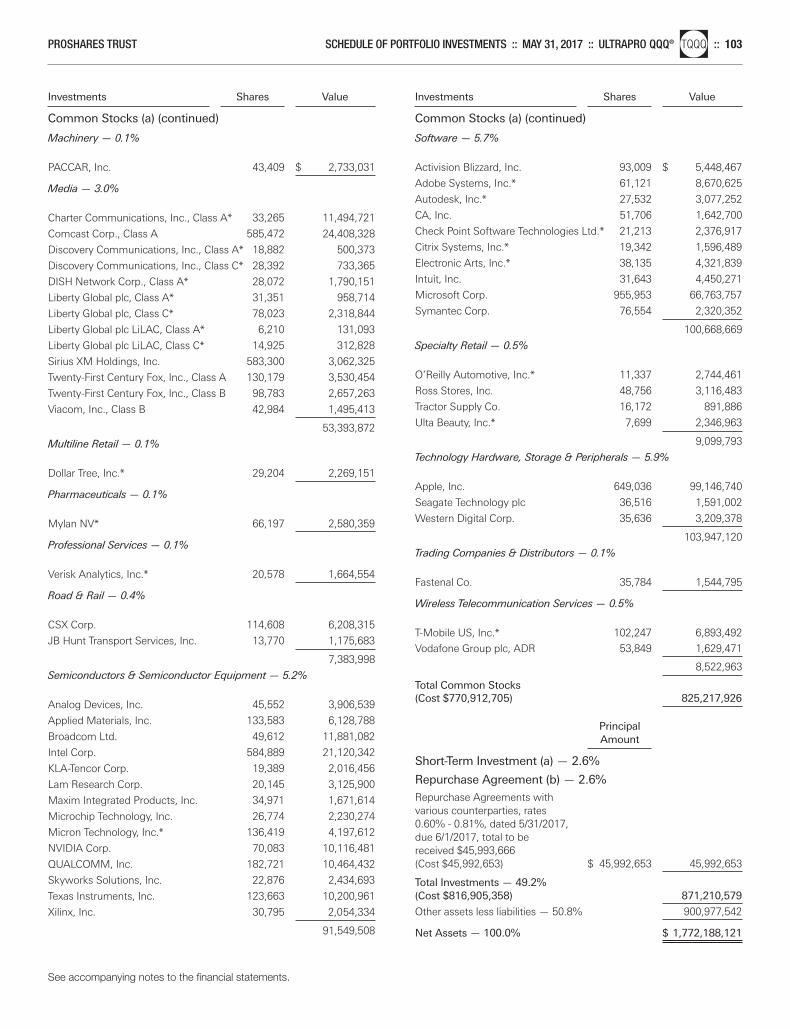
Investments Shares Value
Common Stocks (a) (continued)
Investments Shares Value
Common Stocks (a) (continued)
Machinery — 0.1%
PACCAR, Inc. 43,409 $ 2,733,031
Media — 3.0%
Charter Communications, Inc., Class A* 33,265 11,494,721
Comcast Corp., Class A 585,472 24,408,328
Discovery Communications, Inc., Class A* 18,882 500,373
Discovery Communications, Inc., Class C* 28,392 733,365
DISH Network Corp., Class A* 28,072 1,790,151
Liberty Global plc, Class A* 31,351 958,714
Liberty Global plc, Class C* 78,023 2,318,844
Liberty Global plc LiLAC, Class A* 6,210 131,093
Liberty Global plc LiLAC, Class C* 14,925 312,828
Sirius XM Holdings, Inc. 583,300 3,062,325
Twenty-First Century Fox, Inc., Class A 130,179 3,530,454
Twenty-First Century Fox, Inc., Class B 98,783 2,657,263
Viacom, Inc., Class B 42,984 1,495,413
53,393,872
Multiline Retail — 0.1%
Dollar Tree, Inc.* 29,204 2,269,151
Pharmaceuticals — 0.1%
Mylan NV* 66,197 2,580,359
Professional Services — 0.1%
Verisk Analytics, Inc.* 20,578 1,664,554
Road & Rail — 0.4%
CSX Corp. 114,608 6,208,315
JB Hunt Transport Services, Inc. 13,770 1,175,683
7,383,998
Semiconductors & Semiconductor Equipment — 5.2%
Analog Devices, Inc. 45,552 3,906,539
Applied Materials, Inc. 133,583 6,128,788
Broadcom Ltd. 49,612 11,881,082
Intel Corp. 584,889 21,120,342
KLA-Tencor Corp. 19,389 2,016,456
Lam Research Corp. 20,145 3,125,900
Maxim Integrated Products, Inc. 34,971 1,671,614
Microchip Technology, Inc. 26,774 2,230,274
Micron Technology, Inc.* 136,419 4,197,612
NVIDIA Corp. 70,083 10,116,481
QUALCOMM, Inc. 182,721 10,464,432
Skyworks Solutions, Inc. 22,876 2,434,693
Texas Instruments, Inc. 123,663 10,200,961
Xilinx, Inc. 30,795 2,054,334
91,549,508
Software — 5.7%
Activision Blizzard, Inc. 93,009 $ 5,448,467
Adobe Systems, Inc.* 61,121 8,670,625
Autodesk, Inc.* 27,532 3,077,252
CA, Inc. 51,706 1,642,700
Check Point Software Technologies Ltd.* 21,213 2,376,917
Citrix Systems, Inc.* 19,342 1,596,489
Electronic Arts, Inc.* 38,135 4,321,839
Intuit, Inc. 31,643 4,450,271
Microsoft Corp. 955,953 66,763,757
Symantec Corp. 76,554 2,320,352
100,668,669
Specialty Retail — 0.5%
O’Reilly Automotive, Inc.* 11,337 2,744,461
Ross Stores, Inc. 48,756 3,116,483
Tractor Supply Co. 16,172 891,886
Ulta Beauty, Inc.* 7,699 2,346,963
9,099,793
Technology Hardware, Storage & Peripherals — 5.9%
Apple, Inc. 649,036 99,146,740
Seagate Technology plc 36,516 1,591,002
Western Digital Corp. 35,636 3,209,378
103,947,120
Trading Companies & Distributors — 0.1%
Fastenal Co. 35,784 1,544,795
Wireless Telecommunication Services — 0.5%
T-Mobile US, Inc.* 102,247 6,893,492
Vodafone Group plc, ADR 53,849 1,629,471
8,522,963
Total Common Stocks(Cost $770,912,705) 825,217,926
Principal Amount
Short-Term Investment (a) — 2.6%
Repurchase Agreement (b) — 2.6%
Repurchase Agreements with various counterparties, rates 0.60% - 0.81%, dated 5/31/2017,due 6/1/2017, total to be received $45,993,666 (Cost $45,992,653) $ 45,992,653 45,992,653
Total Investments — 49.2%(Cost $816,905,358) 871,210,579
Other assets less liabilities — 50.8% 900,977,542
Net Assets — 100.0% $ 1,772,188,121
See accompanying notes to the financial statements.
PROSHARES TRUST SCHEDULE OF PORTFOLIO INVESTMENTS :: MAY 31, 2017 :: ULTRAPRO QQQ®nlTQQQ :: 103
Merrill Corp - Proshares Trust Geared Book [96 Funds] Annual Report [Funds] 333-089822 05-31-2017 ED [AUX] | eperez | 28-Jul-17 17:38 | 17-15159-3.fq | Sequence: 11CHKSUM Content: 63417 Layout: 57579 Graphics: No Graphics CLEAN
JOB: 17-15159-3 CYCLE#;BL#: 5; 0 TRIM: 8.25" x 10.75" COMPOSITECOLORS: Black, ~note-color 2, ~note-color 3 GRAPHICS: none V1.5
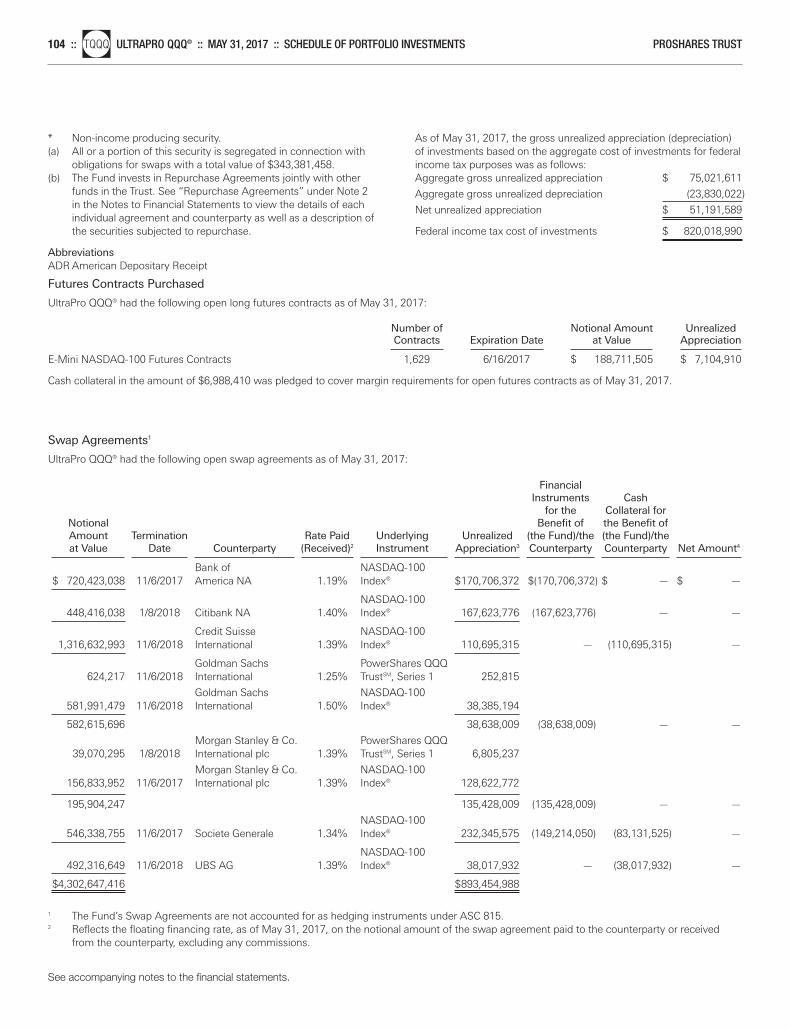
* Non-income producing security.(a) All or a portion of this security is segregated in connection with
obligations for swaps with a total value of $343,381,458.(b) The Fund invests in Repurchase Agreements jointly with other
funds in the Trust. See “Repurchase Agreements” under Note 2in the Notes to Financial Statements to view the details of eachindividual agreement and counterparty as well as a description ofthe securities subjected to repurchase.
AbbreviationsADR American Depositary Receipt
As of May 31, 2017, the gross unrealized appreciation (depreciation)of investments based on the aggregate cost of investments for federalincome tax purposes was as follows:Aggregate gross unrealized appreciation $ 75,021,611
Aggregate gross unrealized depreciation (23,830,022)
Net unrealized appreciation $ 51,191,589
Federal income tax cost of investments $ 820,018,990
See accompanying notes to the financial statements.
104 ::nlTQQQ ULTRAPRO QQQ® :: MAY 31, 2017 :: SCHEDULE OF PORTFOLIO INVESTMENTS PROSHARES TRUST
Futures Contracts Purchased
UltraPro QQQ® had the following open long futures contracts as of May 31, 2017:
Number of Notional Amount Unrealized Contracts Expiration Date at Value Appreciation E-Mini NASDAQ-100 Futures Contracts 1,629 6/16/2017 $ 188,711,505 $ 7,104,910
Cash collateral in the amount of $6,988,410 was pledged to cover margin requirements for open futures contracts as of May 31, 2017.
Swap Agreements1
UltraPro QQQ® had the following open swap agreements as of May 31, 2017:
Financial Instruments Cash
for the Collateral for Notional Benefit of the Benefit of Amount Termination Rate Paid Underlying Unrealized (the Fund)/the (the Fund)/the at Value Date Counterparty (Received)2 Instrument Appreciation3 Counterparty Counterparty Net Amount4
Bank of NASDAQ-100
$ 720,423,038 11/6/2017 America NA 1.19% Index® $170,706,372 $(170,706,372) $ — $ —
NASDAQ-100 448,416,038 1/8/2018 Citibank NA 1.40% Index® 167,623,776 (167,623,776) — —
Credit Suisse NASDAQ-100 1,316,632,993 11/6/2018 International 1.39% Index® 110,695,315 — (110,695,315) —
Goldman Sachs PowerShares QQQ 624,217 11/6/2018 International 1.25% TrustSM, Series 1 252,815
Goldman Sachs NASDAQ-100 581,991,479 11/6/2018 International 1.50% Index® 38,385,194
582,615,696 38,638,009 (38,638,009) — —
Morgan Stanley & Co. PowerShares QQQ 39,070,295 1/8/2018 International plc 1.39% TrustSM, Series 1 6,805,237
Morgan Stanley & Co. NASDAQ-100 156,833,952 11/6/2017 International plc 1.39% Index® 128,622,772
195,904,247 135,428,009 (135,428,009) — —
NASDAQ-100 546,338,755 11/6/2017 Societe Generale 1.34% Index® 232,345,575 (149,214,050) (83,131,525) —
NASDAQ-100 492,316,649 11/6/2018 UBS AG 1.39% Index® 38,017,932 — (38,017,932) —
$4,302,647,416 $893,454,988
1 The Fund’s Swap Agreements are not accounted for as hedging instruments under ASC 815.2 Reflects the floating financing rate, as of May 31, 2017, on the notional amount of the swap agreement paid to the counterparty or received
from the counterparty, excluding any commissions.
Merrill Corp - Proshares Trust Geared Book [96 Funds] Annual Report [Funds] 333-089822 05-31-2017 ED [AUX] | eperez | 28-Jul-17 17:38 | 17-15159-3.fq | Sequence: 12CHKSUM Content: 5639 Layout: 2582 Graphics: No Graphics CLEAN
JOB: 17-15159-3 CYCLE#;BL#: 5; 0 TRIM: 8.25" x 10.75" COMPOSITECOLORS: Black, ~note-color 2, ~note-color 3 GRAPHICS: none V1.5

3 The Fund discloses amounts due to the Fund from the counterparty (unrealized appreciation on swap agreements) at period end as an asseton its Statements of Assets and Liabilities. Amounts due to the counterparty from the Fund (unrealized depreciation on swap agreements) aredisclosed as a liability on its Statements of Assets and Liabilities. The Fund presents these amounts on a gross basis and does not offset or“net” these amounts on its Statements of Assets and Liabilities.
4 Represents the “uncollateralized” amount due from or (to) the counterparty at period end. These amounts could be due to timing differencesbetween the movement of collateral in relation to market movements, or due to agreement provisions allowing minimum “thresholds” thatwould need to be exceeded prior to the movement of collateral. To the extent that a net amount is due from a counterparty, the Fund would beexposed to the counterparty by such amount and could suffer losses or delays in recovery of that amount in the event of a counterparty default.
See accompanying notes to the financial statements.
PROSHARES TRUST SCHEDULE OF PORTFOLIO INVESTMENTS :: MAY 31, 2017 :: ULTRAPRO QQQ®nlTQQQ :: 105
Merrill Corp - Proshares Trust Geared Book [96 Funds] Annual Report [Funds] 333-089822 05-31-2017 ED [AUX] | eperez | 28-Jul-17 17:38 | 17-15159-3.fq | Sequence: 13CHKSUM Content: 29808 Layout: 18712 Graphics: No Graphics CLEAN
JOB: 17-15159-3 CYCLE#;BL#: 5; 0 TRIM: 8.25" x 10.75" COMPOSITECOLORS: Black, ~note-color 2, ~note-color 3 GRAPHICS: none V1.5
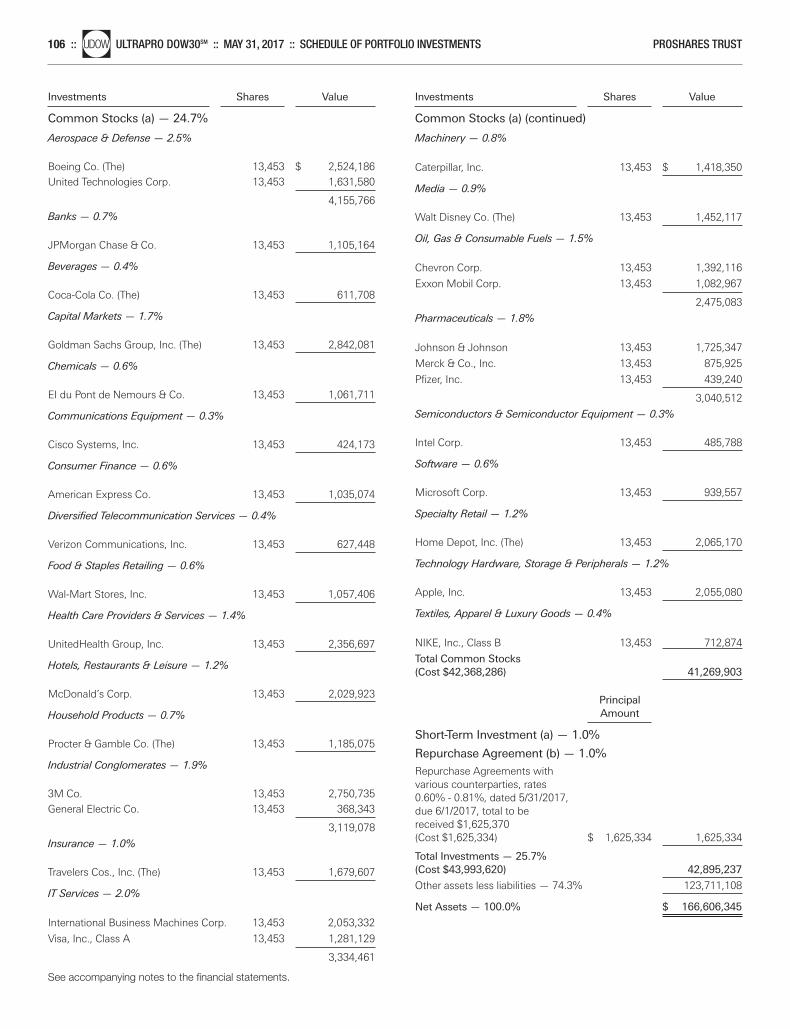
Investments Shares Value
Common Stocks (a) — 24.7%
Investments Shares Value
Common Stocks (a) (continued)
Aerospace & Defense — 2.5%
Boeing Co. (The) 13,453 $ 2,524,186United Technologies Corp. 13,453 1,631,580
4,155,766
Banks — 0.7%
JPMorgan Chase & Co. 13,453 1,105,164
Beverages — 0.4%
Coca-Cola Co. (The) 13,453 611,708
Capital Markets — 1.7%
Goldman Sachs Group, Inc. (The) 13,453 2,842,081
Chemicals — 0.6%
EI du Pont de Nemours & Co. 13,453 1,061,711
Communications Equipment — 0.3%
Cisco Systems, Inc. 13,453 424,173
Consumer Finance — 0.6%
American Express Co. 13,453 1,035,074
Diversified Telecommunication Services — 0.4%
Verizon Communications, Inc. 13,453 627,448
Food & Staples Retailing — 0.6%
Wal-Mart Stores, Inc. 13,453 1,057,406
Health Care Providers & Services — 1.4%
UnitedHealth Group, Inc. 13,453 2,356,697
Hotels, Restaurants & Leisure — 1.2%
McDonald’s Corp. 13,453 2,029,923
Household Products — 0.7%
Procter & Gamble Co. (The) 13,453 1,185,075
Industrial Conglomerates — 1.9%
3M Co. 13,453 2,750,735General Electric Co. 13,453 368,343
3,119,078
Insurance — 1.0%
Travelers Cos., Inc. (The) 13,453 1,679,607
IT Services — 2.0%
International Business Machines Corp. 13,453 2,053,332
Visa, Inc., Class A 13,453 1,281,129
3,334,461
Machinery — 0.8%
Caterpillar, Inc. 13,453 $ 1,418,350
Media — 0.9%
Walt Disney Co. (The) 13,453 1,452,117
Oil, Gas & Consumable Fuels — 1.5%
Chevron Corp. 13,453 1,392,116
Exxon Mobil Corp. 13,453 1,082,967
2,475,083
Pharmaceuticals — 1.8%
Johnson & Johnson 13,453 1,725,347
Merck & Co., Inc. 13,453 875,925
Pfizer, Inc. 13,453 439,240
3,040,512
Semiconductors & Semiconductor Equipment — 0.3%
Intel Corp. 13,453 485,788
Software — 0.6%
Microsoft Corp. 13,453 939,557
Specialty Retail — 1.2%
Home Depot, Inc. (The) 13,453 2,065,170
Technology Hardware, Storage & Peripherals — 1.2%
Apple, Inc. 13,453 2,055,080
Textiles, Apparel & Luxury Goods — 0.4%
NIKE, Inc., Class B 13,453 712,874
Total Common Stocks(Cost $42,368,286) 41,269,903
Principal Amount
Short-Term Investment (a) — 1.0%
Repurchase Agreement (b) — 1.0%
Repurchase Agreements with various counterparties, rates 0.60% - 0.81%, dated 5/31/2017, due 6/1/2017, total to be received $1,625,370 (Cost $1,625,334) $ 1,625,334 1,625,334
Total Investments — 25.7%(Cost $43,993,620) 42,895,237
Other assets less liabilities — 74.3% 123,711,108
Net Assets — 100.0% $ 166,606,345
See accompanying notes to the financial statements.
106 ::nlUDOW ULTRAPRO DOW30SM :: MAY 31, 2017 :: SCHEDULE OF PORTFOLIO INVESTMENTS PROSHARES TRUST
Merrill Corp - Proshares Trust Geared Book [96 Funds] Annual Report [Funds] 333-089822 05-31-2017 ED [AUX] | eperez | 28-Jul-17 17:38 | 17-15159-3.fq | Sequence: 14CHKSUM Content: 11166 Layout: 50697 Graphics: No Graphics CLEAN
JOB: 17-15159-3 CYCLE#;BL#: 5; 0 TRIM: 8.25" x 10.75" COMPOSITECOLORS: Black, ~note-color 2, ~note-color 3 GRAPHICS: none V1.5
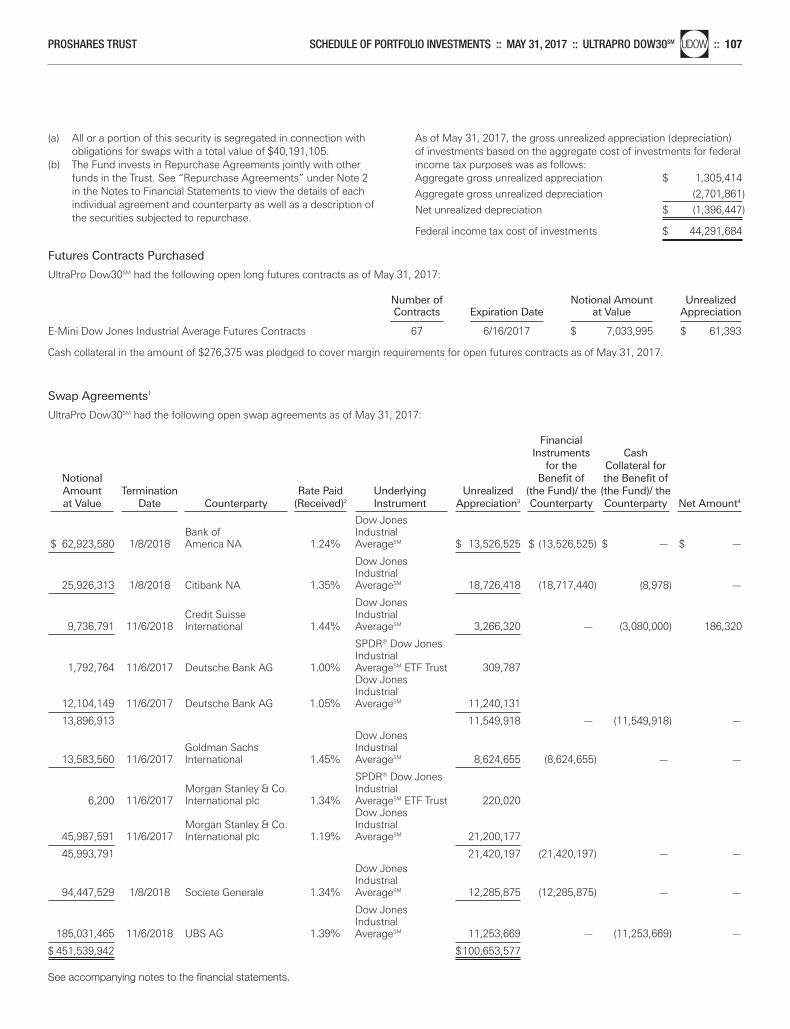
(a) All or a portion of this security is segregated in connection withobligations for swaps with a total value of $40,191,105.
(b) The Fund invests in Repurchase Agreements jointly with otherfunds in the Trust. See “Repurchase Agreements” under Note 2in the Notes to Financial Statements to view the details of eachindividual agreement and counterparty as well as a description ofthe securities subjected to repurchase.
As of May 31, 2017, the gross unrealized appreciation (depreciation)of investments based on the aggregate cost of investments for federalincome tax purposes was as follows:Aggregate gross unrealized appreciation $ 1,305,414
Aggregate gross unrealized depreciation (2,701,861)
Net unrealized depreciation $ (1,396,447)
Federal income tax cost of investments $ 44,291,684
See accompanying notes to the financial statements.
PROSHARES TRUST SCHEDULE OF PORTFOLIO INVESTMENTS :: MAY 31, 2017 :: ULTRAPRO DOW30SMnlUDOW :: 107
Futures Contracts Purchased
UltraPro Dow30SM had the following open long futures contracts as of May 31, 2017:
Number of Notional Amount Unrealized Contracts Expiration Date at Value Appreciation E-Mini Dow Jones Industrial Average Futures Contracts 67 6/16/2017 $ 7,033,995 $ 61,393
Cash collateral in the amount of $276,375 was pledged to cover margin requirements for open futures contracts as of May 31, 2017.
Swap Agreements1
UltraPro Dow30SM had the following open swap agreements as of May 31, 2017:
Financial Instruments Cash
for the Collateral for Notional Benefit of the Benefit of Amount Termination Rate Paid Underlying Unrealized (the Fund)/ the (the Fund)/ the at Value Date Counterparty (Received)2 Instrument Appreciation3 Counterparty Counterparty Net Amount4
Dow Jones
Bank of Industrial $ 62,923,580 1/8/2018 America NA 1.24% AverageSM $ 13,526,525 $ (13,526,525) $ — $ —
Dow Jones Industrial
25,926,313 1/8/2018 Citibank NA 1.35% AverageSM 18,726,418 (18,717,440) (8,978) —
Dow Jones Credit Suisse Industrial
9,736,791 11/6/2018 International 1.44% AverageSM 3,266,320 — (3,080,000) 186,320
SPDR® Dow Jones Industrial
1,792,764 11/6/2017 Deutsche Bank AG 1.00% AverageSM ETF Trust 309,787Dow Jones Industrial
12,104,149 11/6/2017 Deutsche Bank AG 1.05% AverageSM 11,240,131
13,896,913 11,549,918 — (11,549,918) —Dow Jones
Goldman Sachs Industrial 13,583,560 11/6/2017 International 1.45% AverageSM 8,624,655 (8,624,655) — —
SPDR® Dow Jones Morgan Stanley & Co. Industrial
6,200 11/6/2017 International plc 1.34% AverageSM ETF Trust 220,020 Dow Jones
Morgan Stanley & Co. Industrial 45,987,591 11/6/2017 International plc 1.19% AverageSM 21,200,177
45,993,791 21,420,197 (21,420,197) — —Dow Jones Industrial
94,447,529 1/8/2018 Societe Generale 1.34% AverageSM 12,285,875 (12,285,875) — —
Dow Jones Industrial
185,031,465 11/6/2018 UBS AG 1.39% AverageSM 11,253,669 — (11,253,669) —
$ 451,539,942 $100,653,577
Merrill Corp - Proshares Trust Geared Book [96 Funds] Annual Report [Funds] 333-089822 05-31-2017 ED [AUX] | eperez | 28-Jul-17 17:38 | 17-15159-3.fq | Sequence: 15CHKSUM Content: 56313 Layout: 46596 Graphics: No Graphics CLEAN
JOB: 17-15159-3 CYCLE#;BL#: 5; 0 TRIM: 8.25" x 10.75" COMPOSITECOLORS: Black, ~note-color 2, ~note-color 3 GRAPHICS: none V1.5
1 The Fund’s Swap Agreements are not accounted for as hedging instruments under ASC 815.2 Reflects the floating financing rate, as of May 31, 2017, on the notional amount of the swap agreement paid to the counterparty or received
from the counterparty, excluding any commissions.3 The Fund discloses amounts due to the Fund from the counterparty (unrealized appreciation on swap agreements) at period end as an asset on
its Statements of Assets and Liabilities. Amounts due to the counterparty from the Fund (unrealized depreciation on swap agreements) are disclosed as a liability on its Statements of Assets and Liabilities. The Fund presents these amounts on a gross basis and does not offset or“net” these amounts on its Statements of Assets and Liabilities.
4 Represents the “uncollateralized” amount due from or (to) the counterparty at period end. These amounts could be due to timing differencesbetween the movement of collateral in relation to market movements, or due to agreement provisions allowing minimum “thresholds” thatwould need to be exceeded prior to the movement of collateral. To the extent that a net amount is due from a counterparty, the Fund would beexposed to the counterparty by such amount and could suffer losses or delays in recovery of that amount in the event of a counterparty default.
See accompanying notes to the financial statements.
108 ::nlUDOW ULTRAPRO DOW30SM :: MAY 31, 2017 :: SCHEDULE OF PORTFOLIO INVESTMENTS PROSHARES TRUST
Merrill Corp - Proshares Trust Geared Book [96 Funds] Annual Report [Funds] 333-089822 05-31-2017 ED [AUX] | eperez | 28-Jul-17 17:38 | 17-15159-3.fq | Sequence: 16CHKSUM Content: 45169 Layout: 59134 Graphics: No Graphics CLEAN
JOB: 17-15159-3 CYCLE#;BL#: 5; 0 TRIM: 8.25" x 10.75" COMPOSITECOLORS: Black, ~note-color 2, ~note-color 3 GRAPHICS: none V1.5
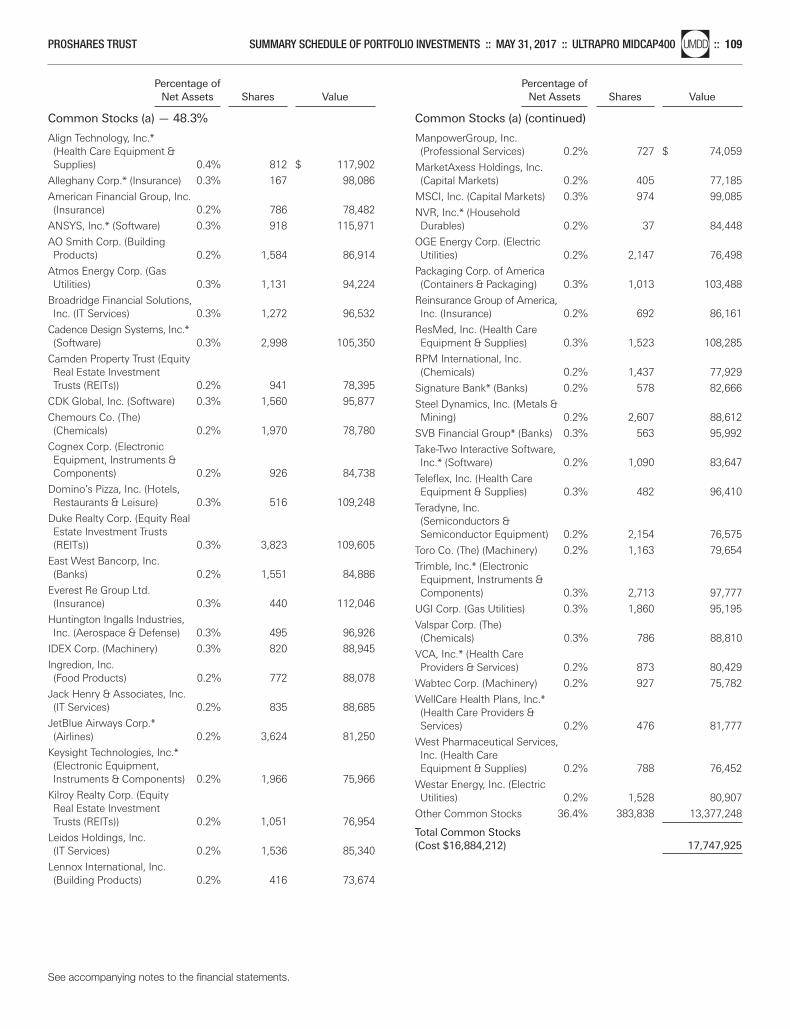
Percentage of Net Assets Shares Value
Common Stocks (a) — 48.3%
Percentage of Net Assets Shares Value
Common Stocks (a) (continued)
Align Technology, Inc.* (Health Care Equipment & Supplies) 0.4% 812 $ 117,902
Alleghany Corp.* (Insurance) 0.3% 167 98,086
American Financial Group, Inc. (Insurance) 0.2% 786 78,482
ANSYS, Inc.* (Software) 0.3% 918 115,971
AO Smith Corp. (Building Products) 0.2% 1,584 86,914
Atmos Energy Corp. (Gas Utilities) 0.3% 1,131 94,224
Broadridge Financial Solutions, Inc. (IT Services) 0.3% 1,272 96,532
Cadence Design Systems, Inc.* (Software) 0.3% 2,998 105,350
Camden Property Trust (Equity Real Estate Investment Trusts (REITs)) 0.2% 941 78,395
CDK Global, Inc. (Software) 0.3% 1,560 95,877
Chemours Co. (The) (Chemicals) 0.2% 1,970 78,780
Cognex Corp. (Electronic Equipment, Instruments & Components) 0.2% 926 84,738
Domino’s Pizza, Inc. (Hotels, Restaurants & Leisure) 0.3% 516 109,248
Duke Realty Corp. (Equity Real Estate Investment Trusts (REITs)) 0.3% 3,823 109,605
East West Bancorp, Inc. (Banks) 0.2% 1,551 84,886
Everest Re Group Ltd. (Insurance) 0.3% 440 112,046
Huntington Ingalls Industries, Inc. (Aerospace & Defense) 0.3% 495 96,926
IDEX Corp. (Machinery) 0.3% 820 88,945
Ingredion, Inc. (Food Products) 0.2% 772 88,078
Jack Henry & Associates, Inc. (IT Services) 0.2% 835 88,685
JetBlue Airways Corp.* (Airlines) 0.2% 3,624 81,250
Keysight Technologies, Inc.* (Electronic Equipment, Instruments & Components) 0.2% 1,966 75,966
Kilroy Realty Corp. (Equity Real Estate Investment Trusts (REITs)) 0.2% 1,051 76,954
Leidos Holdings, Inc. (IT Services) 0.2% 1,536 85,340
Lennox International, Inc. (Building Products) 0.2% 416 73,674
ManpowerGroup, Inc. (Professional Services) 0.2% 727 $ 74,059
MarketAxess Holdings, Inc. (Capital Markets) 0.2% 405 77,185
MSCI, Inc. (Capital Markets) 0.3% 974 99,085
NVR, Inc.* (Household Durables) 0.2% 37 84,448
OGE Energy Corp. (Electric Utilities) 0.2% 2,147 76,498
Packaging Corp. of America (Containers & Packaging) 0.3% 1,013 103,488
Reinsurance Group of America, Inc. (Insurance) 0.2% 692 86,161
ResMed, Inc. (Health Care Equipment & Supplies) 0.3% 1,523 108,285
RPM International, Inc. (Chemicals) 0.2% 1,437 77,929
Signature Bank* (Banks) 0.2% 578 82,666
Steel Dynamics, Inc. (Metals & Mining) 0.2% 2,607 88,612
SVB Financial Group* (Banks) 0.3% 563 95,992
Take-Two Interactive Software, Inc.* (Software) 0.2% 1,090 83,647
Teleflex, Inc. (Health Care Equipment & Supplies) 0.3% 482 96,410
Teradyne, Inc. (Semiconductors & Semiconductor Equipment) 0.2% 2,154 76,575
Toro Co. (The) (Machinery) 0.2% 1,163 79,654
Trimble, Inc.* (Electronic Equipment, Instruments & Components) 0.3% 2,713 97,777
UGI Corp. (Gas Utilities) 0.3% 1,860 95,195
Valspar Corp. (The) (Chemicals) 0.3% 786 88,810
VCA, Inc.* (Health Care Providers & Services) 0.2% 873 80,429
Wabtec Corp. (Machinery) 0.2% 927 75,782
WellCare Health Plans, Inc.* (Health Care Providers & Services) 0.2% 476 81,777
West Pharmaceutical Services, Inc. (Health Care Equipment & Supplies) 0.2% 788 76,452
Westar Energy, Inc. (Electric Utilities) 0.2% 1,528 80,907
Other Common Stocks 36.4% 383,838 13,377,248
Total Common Stocks (Cost $16,884,212) 17,747,925
See accompanying notes to the financial statements.
PROSHARES TRUST SUMMARY SCHEDULE OF PORTFOLIO INVESTMENTS :: MAY 31, 2017 :: ULTRAPRO MIDCAP400nlUMDD :: 109
Merrill Corp - Proshares Trust Geared Book [96 Funds] Annual Report [Funds] 333-089822 05-31-2017 ED [AUX] | eperez | 28-Jul-17 17:38 | 17-15159-3.fq | Sequence: 17CHKSUM Content: 41148 Layout: 15862 Graphics: No Graphics CLEAN
JOB: 17-15159-3 CYCLE#;BL#: 5; 0 TRIM: 8.25" x 10.75" COMPOSITECOLORS: Black, ~note-color 2, ~note-color 3 GRAPHICS: none V1.5
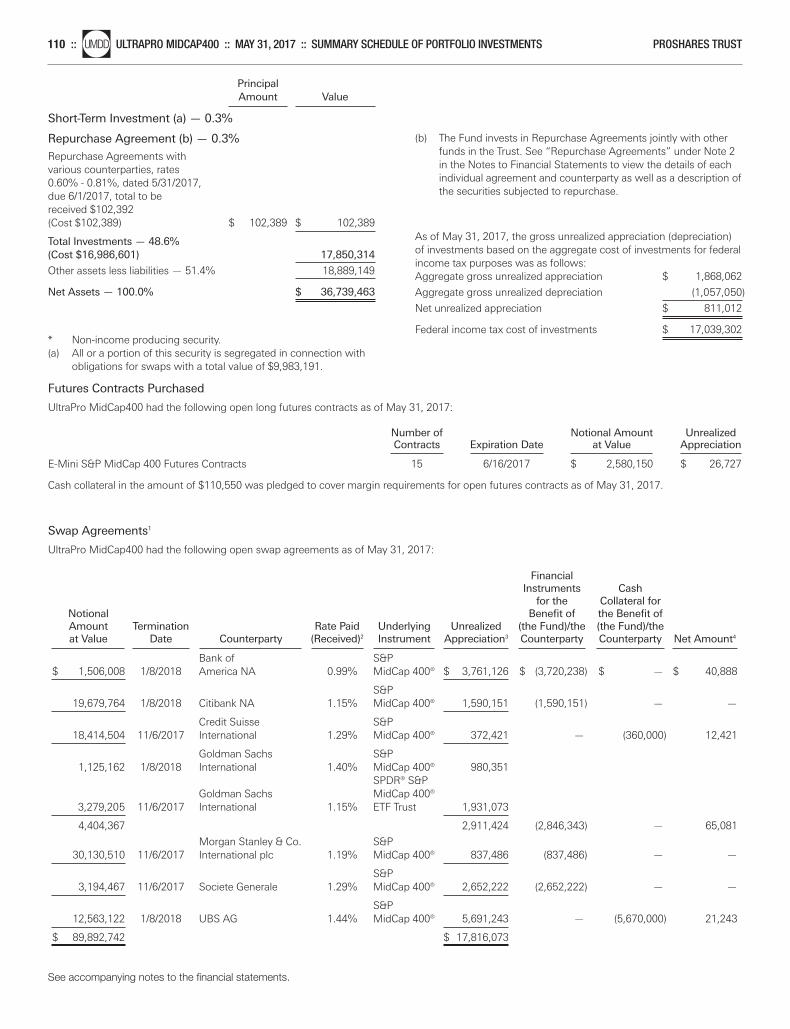
Principal Amount Value
Short-Term Investment (a) — 0.3%
Repurchase Agreement (b) — 0.3%
Repurchase Agreements with various counterparties, rates 0.60% - 0.81%, dated 5/31/2017, due 6/1/2017, total to be received $102,392 (Cost $102,389) $ 102,389 $ 102,389
Total Investments — 48.6%(Cost $16,986,601) 17,850,314
Other assets less liabilities — 51.4% 18,889,149
Net Assets — 100.0% $ 36,739,463
* Non-income producing security.(a) All or a portion of this security is segregated in connection with
obligations for swaps with a total value of $9,983,191.
(b) The Fund invests in Repurchase Agreements jointly with otherfunds in the Trust. See “Repurchase Agreements” under Note 2in the Notes to Financial Statements to view the details of eachindividual agreement and counterparty as well as a description ofthe securities subjected to repurchase.
As of May 31, 2017, the gross unrealized appreciation (depreciation)of investments based on the aggregate cost of investments for federalincome tax purposes was as follows:Aggregate gross unrealized appreciation $ 1,868,062
Aggregate gross unrealized depreciation (1,057,050)
Net unrealized appreciation $ 811,012
Federal income tax cost of investments $ 17,039,302
See accompanying notes to the financial statements.
110 ::nlUMDD ULTRAPRO MIDCAP400 :: MAY 31, 2017 :: SUMMARY SCHEDULE OF PORTFOLIO INVESTMENTS PROSHARES TRUST
Futures Contracts Purchased
UltraPro MidCap400 had the following open long futures contracts as of May 31, 2017:
Number of Notional Amount Unrealized Contracts Expiration Date at Value Appreciation E-Mini S&P MidCap 400 Futures Contracts 15 6/16/2017 $ 2,580,150 $ 26,727
Cash collateral in the amount of $110,550 was pledged to cover margin requirements for open futures contracts as of May 31, 2017.
Swap Agreements1
UltraPro MidCap400 had the following open swap agreements as of May 31, 2017:
Financial Instruments Cash
for the Collateral for Notional Benefit of the Benefit of Amount Termination Rate Paid Underlying Unrealized (the Fund)/the (the Fund)/the at Value Date Counterparty (Received)2 Instrument Appreciation3 Counterparty Counterparty Net Amount4
Bank of S&P
$ 1,506,008 1/8/2018 America NA 0.99% MidCap 400® $ 3,761,126 $ (3,720,238) $ — $ 40,888
S&P 19,679,764 1/8/2018 Citibank NA 1.15% MidCap 400® 1,590,151 (1,590,151) — —
Credit Suisse S&P 18,414,504 11/6/2017 International 1.29% MidCap 400® 372,421 — (360,000) 12,421
Goldman Sachs S&P 1,125,162 1/8/2018 International 1.40% MidCap 400® 980,351
SPDR® S&P Goldman Sachs MidCap 400®
3,279,205 11/6/2017 International 1.15% ETF Trust 1,931,073
4,404,367 2,911,424 (2,846,343) — 65,081
Morgan Stanley & Co. S&P 30,130,510 11/6/2017 International plc 1.19% MidCap 400® 837,486 (837,486) — —
S&P 3,194,467 11/6/2017 Societe Generale 1.29% MidCap 400® 2,652,222 (2,652,222) — —
S&P 12,563,122 1/8/2018 UBS AG 1.44% MidCap 400® 5,691,243 — (5,670,000) 21,243
$ 89,892,742 $ 17,816,073
Merrill Corp - Proshares Trust Geared Book [96 Funds] Annual Report [Funds] 333-089822 05-31-2017 ED [AUX] | eperez | 28-Jul-17 17:38 | 17-15159-3.fq | Sequence: 18CHKSUM Content: 45932 Layout: 38222 Graphics: No Graphics CLEAN
JOB: 17-15159-3 CYCLE#;BL#: 5; 0 TRIM: 8.25" x 10.75" COMPOSITECOLORS: Black, ~note-color 2, ~note-color 3 GRAPHICS: none V1.5
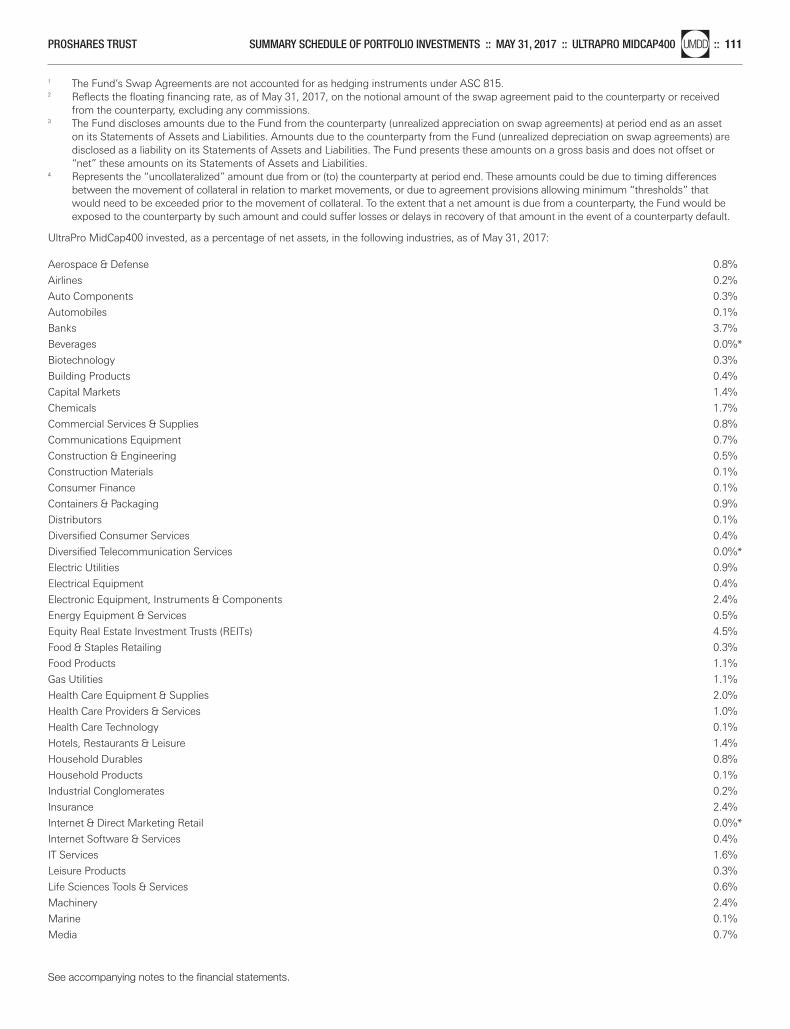
1 The Fund’s Swap Agreements are not accounted for as hedging instruments under ASC 815.2 Reflects the floating financing rate, as of May 31, 2017, on the notional amount of the swap agreement paid to the counterparty or received
from the counterparty, excluding any commissions.3 The Fund discloses amounts due to the Fund from the counterparty (unrealized appreciation on swap agreements) at period end as an asset
on its Statements of Assets and Liabilities. Amounts due to the counterparty from the Fund (unrealized depreciation on swap agreements) aredisclosed as a liability on its Statements of Assets and Liabilities. The Fund presents these amounts on a gross basis and does not offset or“net” these amounts on its Statements of Assets and Liabilities.
4 Represents the “uncollateralized” amount due from or (to) the counterparty at period end. These amounts could be due to timing differencesbetween the movement of collateral in relation to market movements, or due to agreement provisions allowing minimum “thresholds” thatwould need to be exceeded prior to the movement of collateral. To the extent that a net amount is due from a counterparty, the Fund would beexposed to the counterparty by such amount and could suffer losses or delays in recovery of that amount in the event of a counterparty default.
UltraPro MidCap400 invested, as a percentage of net assets, in the following industries, as of May 31, 2017:
Aerospace & Defense 0.8%
Airlines 0.2%
Auto Components 0.3%
Automobiles 0.1%
Banks 3.7%
Beverages 0.0%*
Biotechnology 0.3%
Building Products 0.4%
Capital Markets 1.4%
Chemicals 1.7%
Commercial Services & Supplies 0.8%
Communications Equipment 0.7%
Construction & Engineering 0.5%
Construction Materials 0.1%
Consumer Finance 0.1%
Containers & Packaging 0.9%
Distributors 0.1%
Diversified Consumer Services 0.4%
Diversified Telecommunication Services 0.0%*
Electric Utilities 0.9%
Electrical Equipment 0.4%
Electronic Equipment, Instruments & Components 2.4%
Energy Equipment & Services 0.5%
Equity Real Estate Investment Trusts (REITs) 4.5%
Food & Staples Retailing 0.3%
Food Products 1.1%
Gas Utilities 1.1%
Health Care Equipment & Supplies 2.0%
Health Care Providers & Services 1.0%
Health Care Technology 0.1%
Hotels, Restaurants & Leisure 1.4%
Household Durables 0.8%
Household Products 0.1%
Industrial Conglomerates 0.2%
Insurance 2.4%
Internet & Direct Marketing Retail 0.0%*
Internet Software & Services 0.4%
IT Services 1.6%
Leisure Products 0.3%
Life Sciences Tools & Services 0.6%
Machinery 2.4%
Marine 0.1%
Media 0.7%
See accompanying notes to the financial statements.
PROSHARES TRUST SUMMARY SCHEDULE OF PORTFOLIO INVESTMENTS :: MAY 31, 2017 :: ULTRAPRO MIDCAP400nlUMDD :: 111
Merrill Corp - Proshares Trust Geared Book [96 Funds] Annual Report [Funds] 333-089822 05-31-2017 ED [AUX] | eperez | 28-Jul-17 17:38 | 17-15159-3.fq | Sequence: 19CHKSUM Content: 61823 Layout: 516 Graphics: No Graphics CLEAN
JOB: 17-15159-3 CYCLE#;BL#: 5; 0 TRIM: 8.25" x 10.75" COMPOSITECOLORS: Black, ~note-color 2, ~note-color 3 GRAPHICS: none V1.5
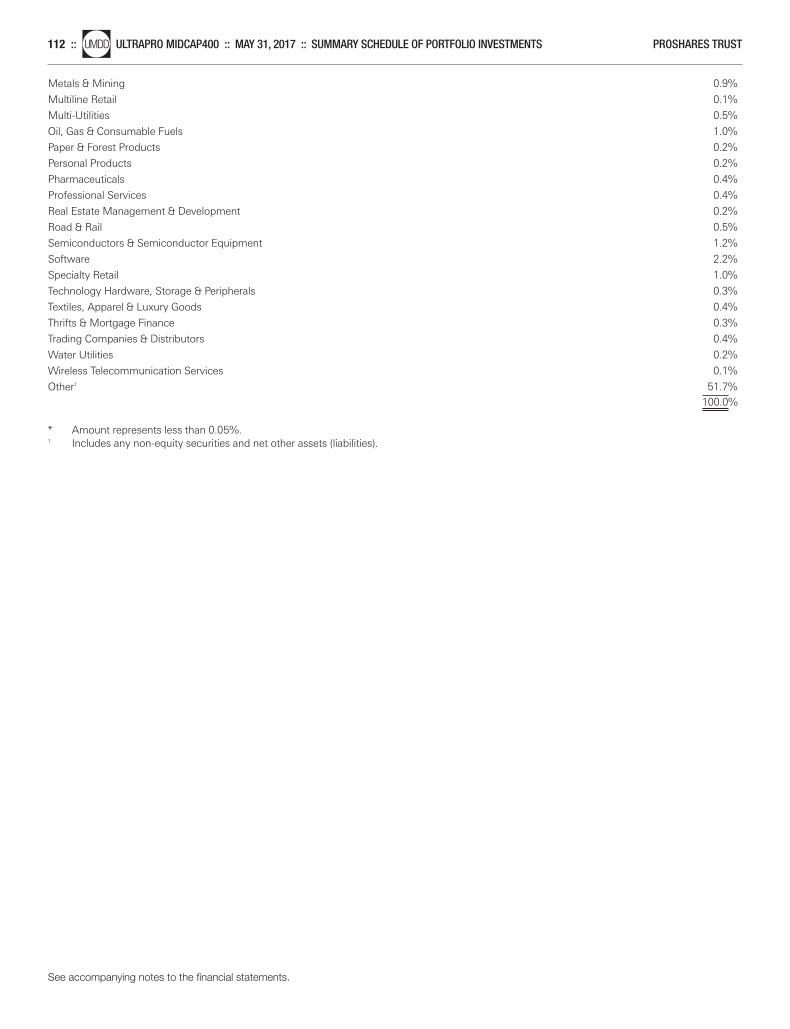
Metals & Mining 0.9%
Multiline Retail 0.1%
Multi-Utilities 0.5%
Oil, Gas & Consumable Fuels 1.0%
Paper & Forest Products 0.2%
Personal Products 0.2%
Pharmaceuticals 0.4%
Professional Services 0.4%
Real Estate Management & Development 0.2%
Road & Rail 0.5%
Semiconductors & Semiconductor Equipment 1.2%
Software 2.2%
Specialty Retail 1.0%
Technology Hardware, Storage & Peripherals 0.3%
Textiles, Apparel & Luxury Goods 0.4%
Thrifts & Mortgage Finance 0.3%
Trading Companies & Distributors 0.4%
Water Utilities 0.2%
Wireless Telecommunication Services 0.1%
Other1 51.7% 100.0%
* Amount represents less than 0.05%.1 Includes any non-equity securities and net other assets (liabilities).
See accompanying notes to the financial statements.
112 ::nlUMDD ULTRAPRO MIDCAP400 :: MAY 31, 2017 :: SUMMARY SCHEDULE OF PORTFOLIO INVESTMENTS PROSHARES TRUST
Merrill Corp - Proshares Trust Geared Book [96 Funds] Annual Report [Funds] 333-089822 05-31-2017 ED [AUX] | eperez | 28-Jul-17 17:38 | 17-15159-3.fq | Sequence: 20CHKSUM Content: 23899 Layout: 61731 Graphics: No Graphics CLEAN
JOB: 17-15159-3 CYCLE#;BL#: 5; 0 TRIM: 8.25" x 10.75" COMPOSITECOLORS: Black, ~note-color 2, ~note-color 3 GRAPHICS: none V1.5
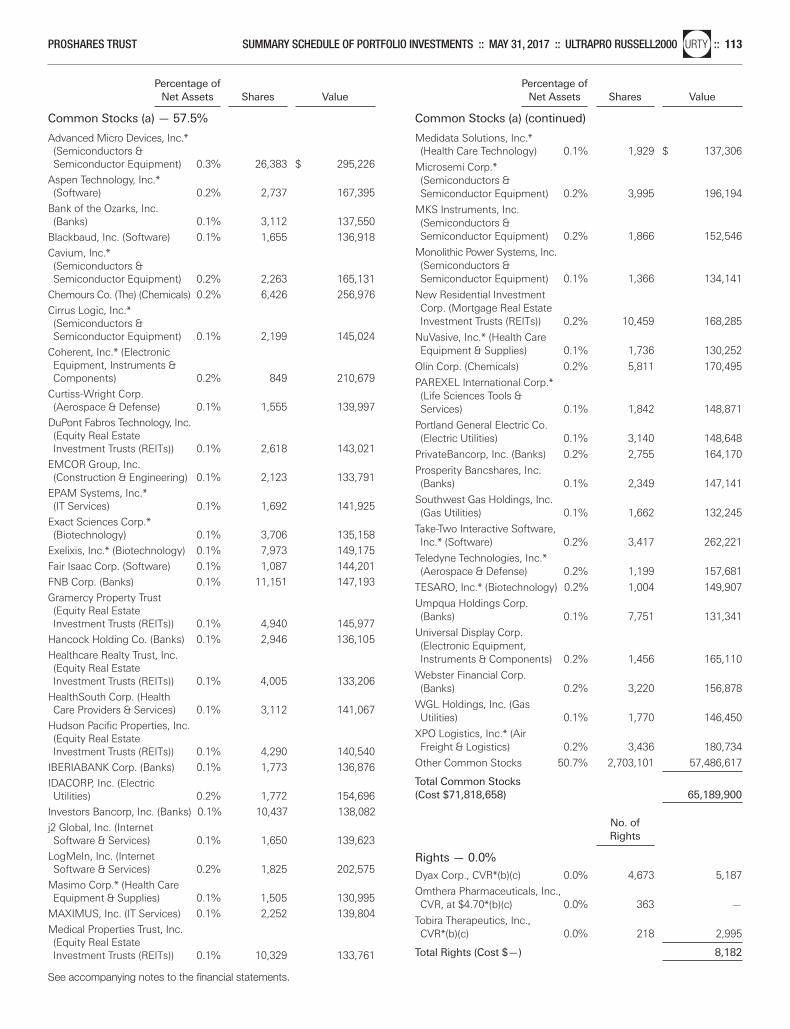
Percentage of Net Assets Shares Value
Common Stocks (a) — 57.5%
Percentage of Net Assets Shares Value
Common Stocks (a) (continued)
Advanced Micro Devices, Inc.* (Semiconductors & Semiconductor Equipment) 0.3% 26,383 $ 295,226
Aspen Technology, Inc.* (Software) 0.2% 2,737 167,395
Bank of the Ozarks, Inc. (Banks) 0.1% 3,112 137,550
Blackbaud, Inc. (Software) 0.1% 1,655 136,918
Cavium, Inc.* (Semiconductors & Semiconductor Equipment) 0.2% 2,263 165,131
Chemours Co. (The) (Chemicals) 0.2% 6,426 256,976
Cirrus Logic, Inc.* (Semiconductors & Semiconductor Equipment) 0.1% 2,199 145,024
Coherent, Inc.* (Electronic Equipment, Instruments & Components) 0.2% 849 210,679
Curtiss-Wright Corp. (Aerospace & Defense) 0.1% 1,555 139,997
DuPont Fabros Technology, Inc. (Equity Real Estate Investment Trusts (REITs)) 0.1% 2,618 143,021
EMCOR Group, Inc. (Construction & Engineering) 0.1% 2,123 133,791
EPAM Systems, Inc.* (IT Services) 0.1% 1,692 141,925
Exact Sciences Corp.* (Biotechnology) 0.1% 3,706 135,158
Exelixis, Inc.* (Biotechnology) 0.1% 7,973 149,175
Fair Isaac Corp. (Software) 0.1% 1,087 144,201
FNB Corp. (Banks) 0.1% 11,151 147,193
Gramercy Property Trust (Equity Real Estate Investment Trusts (REITs)) 0.1% 4,940 145,977
Hancock Holding Co. (Banks) 0.1% 2,946 136,105
Healthcare Realty Trust, Inc. (Equity Real Estate Investment Trusts (REITs)) 0.1% 4,005 133,206
HealthSouth Corp. (Health Care Providers & Services) 0.1% 3,112 141,067
Hudson Pacific Properties, Inc. (Equity Real Estate Investment Trusts (REITs)) 0.1% 4,290 140,540
IBERIABANK Corp. (Banks) 0.1% 1,773 136,876
IDACORP, Inc. (Electric Utilities) 0.2% 1,772 154,696
Investors Bancorp, Inc. (Banks) 0.1% 10,437 138,082
j2 Global, Inc. (Internet Software & Services) 0.1% 1,650 139,623
LogMeIn, Inc. (Internet Software & Services) 0.2% 1,825 202,575
Masimo Corp.* (Health Care Equipment & Supplies) 0.1% 1,505 130,995
MAXIMUS, Inc. (IT Services) 0.1% 2,252 139,804
Medical Properties Trust, Inc. (Equity Real Estate Investment Trusts (REITs)) 0.1% 10,329 133,761
Medidata Solutions, Inc.* (Health Care Technology) 0.1% 1,929 $ 137,306
Microsemi Corp.* (Semiconductors & Semiconductor Equipment) 0.2% 3,995 196,194
MKS Instruments, Inc. (Semiconductors & Semiconductor Equipment) 0.2% 1,866 152,546
Monolithic Power Systems, Inc.(Semiconductors & Semiconductor Equipment) 0.1% 1,366 134,141
New Residential Investment Corp. (Mortgage Real Estate Investment Trusts (REITs)) 0.2% 10,459 168,285
NuVasive, Inc.* (Health Care Equipment & Supplies) 0.1% 1,736 130,252
Olin Corp. (Chemicals) 0.2% 5,811 170,495
PAREXEL International Corp.* (Life Sciences Tools & Services) 0.1% 1,842 148,871
Portland General Electric Co. (Electric Utilities) 0.1% 3,140 148,648
PrivateBancorp, Inc. (Banks) 0.2% 2,755 164,170
Prosperity Bancshares, Inc. (Banks) 0.1% 2,349 147,141
Southwest Gas Holdings, Inc. (Gas Utilities) 0.1% 1,662 132,245
Take-Two Interactive Software, Inc.* (Software) 0.2% 3,417 262,221
Teledyne Technologies, Inc.* (Aerospace & Defense) 0.2% 1,199 157,681
TESARO, Inc.* (Biotechnology) 0.2% 1,004 149,907
Umpqua Holdings Corp. (Banks) 0.1% 7,751 131,341
Universal Display Corp. (Electronic Equipment, Instruments & Components) 0.2% 1,456 165,110
Webster Financial Corp. (Banks) 0.2% 3,220 156,878
WGL Holdings, Inc. (Gas Utilities) 0.1% 1,770 146,450
XPO Logistics, Inc.* (Air Freight & Logistics) 0.2% 3,436 180,734
Other Common Stocks 50.7% 2,703,101 57,486,617
Total Common Stocks (Cost $71,818,658) 65,189,900
No. of Rights
Rights — 0.0%
Dyax Corp., CVR*(b)(c) 0.0% 4,673 5,187
Omthera Pharmaceuticals, Inc., CVR, at $4.70*(b)(c) 0.0% 363 —
Tobira Therapeutics, Inc., CVR*(b)(c) 0.0% 218 2,995
Total Rights (Cost $—) 8,182
See accompanying notes to the financial statements.
PROSHARES TRUST SUMMARY SCHEDULE OF PORTFOLIO INVESTMENTS :: MAY 31, 2017 :: ULTRAPRO RUSSELL2000nlURTY :: 113
Merrill Corp - Proshares Trust Geared Book [96 Funds] Annual Report [Funds] 333-089822 05-31-2017 ED [AUX] | eperez | 28-Jul-17 17:38 | 17-15159-3.fq | Sequence: 21CHKSUM Content: 51798 Layout: 24835 Graphics: No Graphics CLEAN
JOB: 17-15159-3 CYCLE#;BL#: 5; 0 TRIM: 8.25" x 10.75" COMPOSITECOLORS: Black, ~note-color 2, ~note-color 3 GRAPHICS: none V1.5
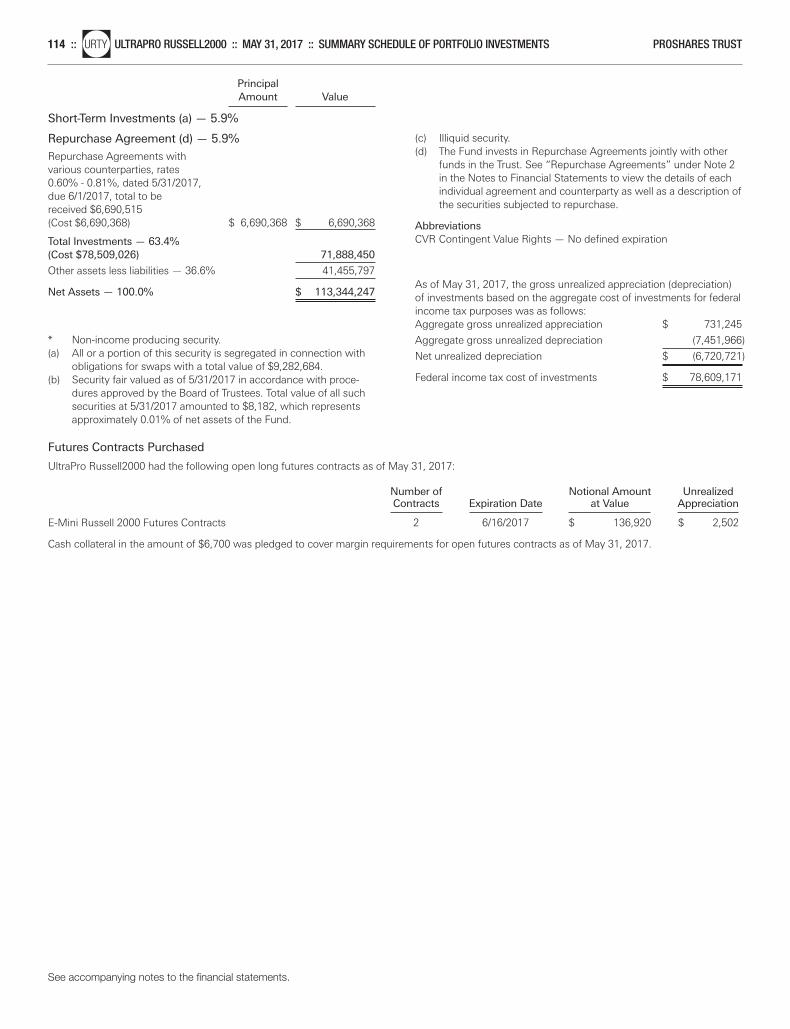
Principal Amount Value
Short-Term Investments (a) — 5.9%
Repurchase Agreement (d) — 5.9%
Repurchase Agreements with various counterparties, rates 0.60% - 0.81%, dated 5/31/2017, due 6/1/2017, total to be received $6,690,515 (Cost $6,690,368) $ 6,690,368 $ 6,690,368
Total Investments — 63.4%(Cost $78,509,026) 71,888,450
Other assets less liabilities — 36.6% 41,455,797
Net Assets — 100.0% $ 113,344,247
* Non-income producing security.(a) All or a portion of this security is segregated in connection with
obligations for swaps with a total value of $9,282,684.(b) Security fair valued as of 5/31/2017 in accordance with proce-
dures approved by the Board of Trustees. Total value of all suchsecurities at 5/31/2017 amounted to $8,182, which representsapproximately 0.01% of net assets of the Fund.
(c) Illiquid security.(d) The Fund invests in Repurchase Agreements jointly with other
funds in the Trust. See “Repurchase Agreements” under Note 2in the Notes to Financial Statements to view the details of eachindividual agreement and counterparty as well as a description ofthe securities subjected to repurchase.
AbbreviationsCVR Contingent Value Rights — No defined expiration
As of May 31, 2017, the gross unrealized appreciation (depreciation)of investments based on the aggregate cost of investments for federalincome tax purposes was as follows:Aggregate gross unrealized appreciation $ 731,245
Aggregate gross unrealized depreciation (7,451,966)
Net unrealized depreciation $ (6,720,721)
Federal income tax cost of investments $ 78,609,171
See accompanying notes to the financial statements.
114 ::nlURTY ULTRAPRO RUSSELL2000 :: MAY 31, 2017 :: SUMMARY SCHEDULE OF PORTFOLIO INVESTMENTS PROSHARES TRUST
Futures Contracts Purchased
UltraPro Russell2000 had the following open long futures contracts as of May 31, 2017:
Number of Notional Amount Unrealized Contracts Expiration Date at Value Appreciation E-Mini Russell 2000 Futures Contracts 2 6/16/2017 $ 136,920 $ 2,502
Cash collateral in the amount of $6,700 was pledged to cover margin requirements for open futures contracts as of May 31, 2017.
Merrill Corp - Proshares Trust Geared Book [96 Funds] Annual Report [Funds] 333-089822 05-31-2017 ED [AUX] | eperez | 28-Jul-17 17:38 | 17-15159-3.fq | Sequence: 22CHKSUM Content: 5873 Layout: 58131 Graphics: No Graphics CLEAN
JOB: 17-15159-3 CYCLE#;BL#: 5; 0 TRIM: 8.25" x 10.75" COMPOSITECOLORS: Black, ~note-color 2, ~note-color 3 GRAPHICS: none V1.5
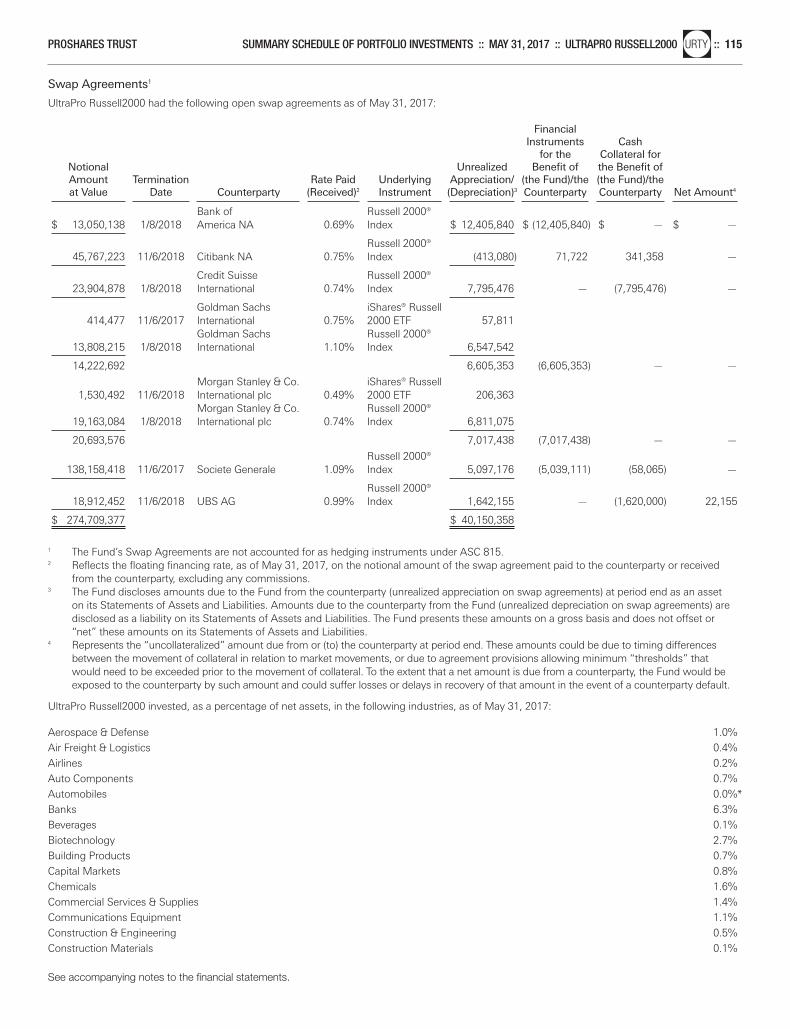
Swap Agreements1
UltraPro Russell2000 had the following open swap agreements as of May 31, 2017:
Financial Instruments Cash
for the Collateral for Notional Unrealized Benefit of the Benefit of Amount Termination Rate Paid Underlying Appreciation/ (the Fund)/the (the Fund)/the at Value Date Counterparty (Received)2 Instrument (Depreciation)3 Counterparty Counterparty Net Amount4
Bank of Russell 2000®
$ 13,050,138 1/8/2018 America NA 0.69% Index $ 12,405,840 $ (12,405,840) $ — $ —
Russell 2000® 45,767,223 11/6/2018 Citibank NA 0.75% Index (413,080) 71,722 341,358 —
Credit Suisse Russell 2000® 23,904,878 1/8/2018 International 0.74% Index 7,795,476 — (7,795,476) —
Goldman Sachs iShares® Russell 414,477 11/6/2017 International 0.75% 2000 ETF 57,811
Goldman Sachs Russell 2000® 13,808,215 1/8/2018 International 1.10% Index 6,547,542
14,222,692 6,605,353 (6,605,353) — —
Morgan Stanley & Co. iShares® Russell 1,530,492 11/6/2018 International plc 0.49% 2000 ETF 206,363
Morgan Stanley & Co. Russell 2000® 19,163,084 1/8/2018 International plc 0.74% Index 6,811,075
20,693,576 7,017,438 (7,017,438) — —
Russell 2000® 138,158,418 11/6/2017 Societe Generale 1.09% Index 5,097,176 (5,039,111) (58,065) —
Russell 2000® 18,912,452 11/6/2018 UBS AG 0.99% Index 1,642,155 — (1,620,000) 22,155
$ 274,709,377 $ 40,150,358
1 The Fund’s Swap Agreements are not accounted for as hedging instruments under ASC 815.2 Reflects the floating financing rate, as of May 31, 2017, on the notional amount of the swap agreement paid to the counterparty or received
from the counterparty, excluding any commissions.3 The Fund discloses amounts due to the Fund from the counterparty (unrealized appreciation on swap agreements) at period end as an asset
on its Statements of Assets and Liabilities. Amounts due to the counterparty from the Fund (unrealized depreciation on swap agreements) aredisclosed as a liability on its Statements of Assets and Liabilities. The Fund presents these amounts on a gross basis and does not offset or“net” these amounts on its Statements of Assets and Liabilities.
4 Represents the “uncollateralized” amount due from or (to) the counterparty at period end. These amounts could be due to timing differencesbetween the movement of collateral in relation to market movements, or due to agreement provisions allowing minimum “thresholds” thatwould need to be exceeded prior to the movement of collateral. To the extent that a net amount is due from a counterparty, the Fund would beexposed to the counterparty by such amount and could suffer losses or delays in recovery of that amount in the event of a counterparty default.
UltraPro Russell2000 invested, as a percentage of net assets, in the following industries, as of May 31, 2017:
Aerospace & Defense 1.0%Air Freight & Logistics 0.4%Airlines 0.2%Auto Components 0.7%Automobiles 0.0%*Banks 6.3%Beverages 0.1%Biotechnology 2.7%Building Products 0.7%Capital Markets 0.8%Chemicals 1.6%Commercial Services & Supplies 1.4%Communications Equipment 1.1%Construction & Engineering 0.5%Construction Materials 0.1%
See accompanying notes to the financial statements.
PROSHARES TRUST SUMMARY SCHEDULE OF PORTFOLIO INVESTMENTS :: MAY 31, 2017 :: ULTRAPRO RUSSELL2000nlURTY :: 115
Merrill Corp - Proshares Trust Geared Book [96 Funds] Annual Report [Funds] 333-089822 05-31-2017 ED [AUX] | eperez | 28-Jul-17 17:38 | 17-15159-3.fq | Sequence: 23CHKSUM Content: 53364 Layout: 32800 Graphics: No Graphics CLEAN
JOB: 17-15159-3 CYCLE#;BL#: 5; 0 TRIM: 8.25" x 10.75" COMPOSITECOLORS: Black, ~note-color 2, ~note-color 3 GRAPHICS: none V1.5
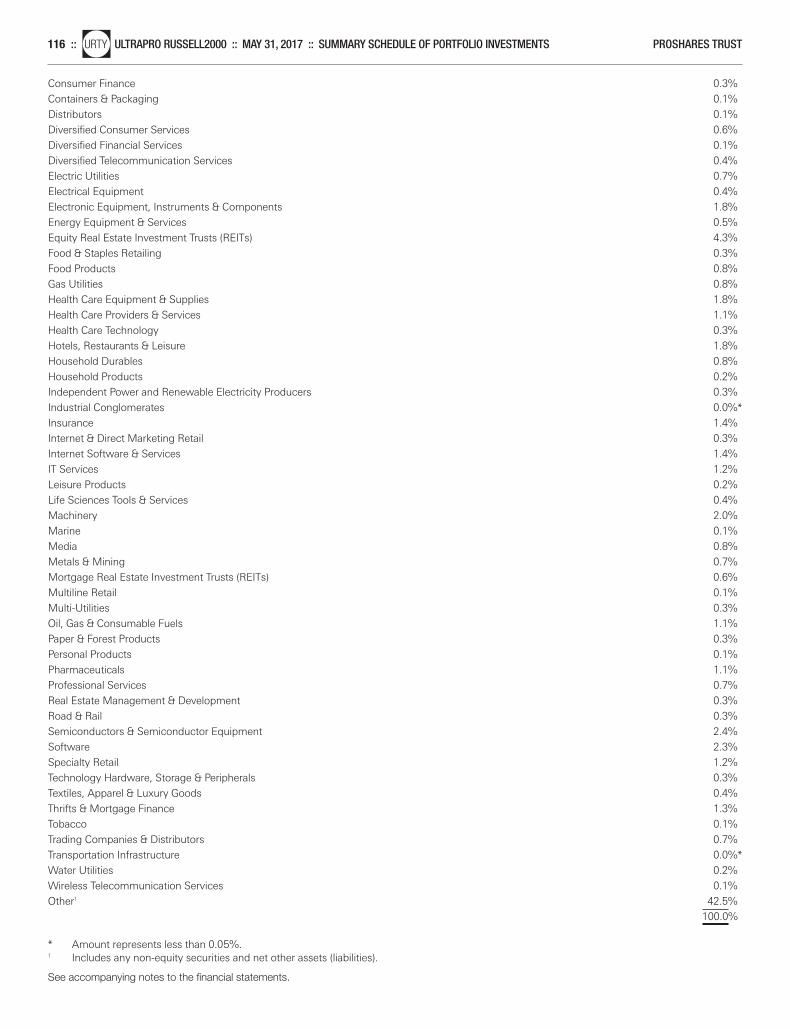
Consumer Finance 0.3%Containers & Packaging 0.1%Distributors 0.1%Diversified Consumer Services 0.6%Diversified Financial Services 0.1%Diversified Telecommunication Services 0.4%Electric Utilities 0.7%Electrical Equipment 0.4%Electronic Equipment, Instruments & Components 1.8%Energy Equipment & Services 0.5%Equity Real Estate Investment Trusts (REITs) 4.3%Food & Staples Retailing 0.3%Food Products 0.8%Gas Utilities 0.8%Health Care Equipment & Supplies 1.8%Health Care Providers & Services 1.1%Health Care Technology 0.3%Hotels, Restaurants & Leisure 1.8%Household Durables 0.8%Household Products 0.2%Independent Power and Renewable Electricity Producers 0.3%Industrial Conglomerates 0.0%*Insurance 1.4%Internet & Direct Marketing Retail 0.3%Internet Software & Services 1.4%IT Services 1.2%Leisure Products 0.2%Life Sciences Tools & Services 0.4%Machinery 2.0%Marine 0.1%Media 0.8%Metals & Mining 0.7%Mortgage Real Estate Investment Trusts (REITs) 0.6%Multiline Retail 0.1%Multi-Utilities 0.3%Oil, Gas & Consumable Fuels 1.1%Paper & Forest Products 0.3%Personal Products 0.1%Pharmaceuticals 1.1%Professional Services 0.7%Real Estate Management & Development 0.3%Road & Rail 0.3%Semiconductors & Semiconductor Equipment 2.4%Software 2.3%Specialty Retail 1.2%Technology Hardware, Storage & Peripherals 0.3%Textiles, Apparel & Luxury Goods 0.4%Thrifts & Mortgage Finance 1.3%Tobacco 0.1%Trading Companies & Distributors 0.7%Transportation Infrastructure 0.0%*Water Utilities 0.2%Wireless Telecommunication Services 0.1%Other1 42.5% 100.0%
* Amount represents less than 0.05%.1 Includes any non-equity securities and net other assets (liabilities).
See accompanying notes to the financial statements.
116 ::nlURTY ULTRAPRO RUSSELL2000 :: MAY 31, 2017 :: SUMMARY SCHEDULE OF PORTFOLIO INVESTMENTS PROSHARES TRUST
Merrill Corp - Proshares Trust Geared Book [96 Funds] Annual Report [Funds] 333-089822 05-31-2017 ED [AUX] | eperez | 28-Jul-17 17:38 | 17-15159-3.fq | Sequence: 24CHKSUM Content: 7353 Layout: 32298 Graphics: No Graphics CLEAN
JOB: 17-15159-3 CYCLE#;BL#: 5; 0 TRIM: 8.25" x 10.75" COMPOSITECOLORS: Black, ~note-color 2, ~note-color 3 GRAPHICS: none V1.5
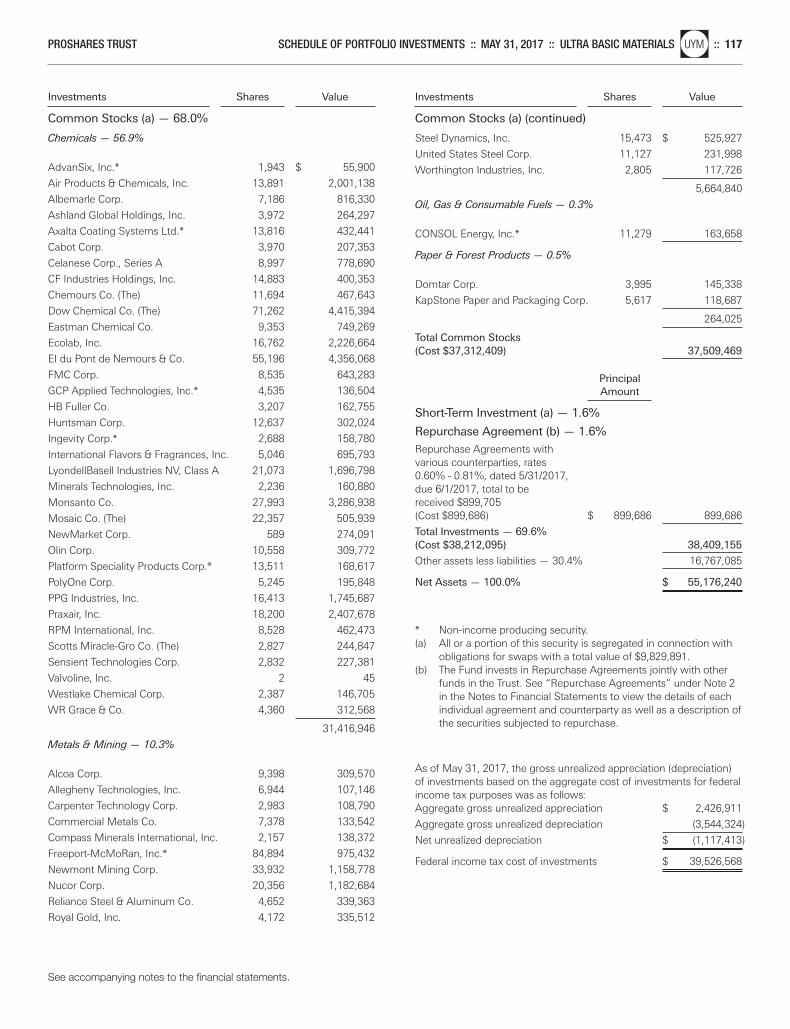
Investments Shares Value
Common Stocks (a) — 68.0%
Investments Shares Value
Common Stocks (a) (continued)
Chemicals — 56.9%
AdvanSix, Inc.* 1,943 $ 55,900
Air Products & Chemicals, Inc. 13,891 2,001,138
Albemarle Corp. 7,186 816,330
Ashland Global Holdings, Inc. 3,972 264,297
Axalta Coating Systems Ltd.* 13,816 432,441
Cabot Corp. 3,970 207,353
Celanese Corp., Series A 8,997 778,690
CF Industries Holdings, Inc. 14,883 400,353
Chemours Co. (The) 11,694 467,643
Dow Chemical Co. (The) 71,262 4,415,394
Eastman Chemical Co. 9,353 749,269
Ecolab, Inc. 16,762 2,226,664
EI du Pont de Nemours & Co. 55,196 4,356,068
FMC Corp. 8,535 643,283
GCP Applied Technologies, Inc.* 4,535 136,504
HB Fuller Co. 3,207 162,755
Huntsman Corp. 12,637 302,024
Ingevity Corp.* 2,688 158,780
International Flavors & Fragrances, Inc. 5,046 695,793
LyondellBasell Industries NV, Class A 21,073 1,696,798
Minerals Technologies, Inc. 2,236 160,880
Monsanto Co. 27,993 3,286,938
Mosaic Co. (The) 22,357 505,939
NewMarket Corp. 589 274,091
Olin Corp. 10,558 309,772
Platform Speciality Products Corp.* 13,511 168,617
PolyOne Corp. 5,245 195,848
PPG Industries, Inc. 16,413 1,745,687
Praxair, Inc. 18,200 2,407,678
RPM International, Inc. 8,528 462,473
Scotts Miracle-Gro Co. (The) 2,827 244,847
Sensient Technologies Corp. 2,832 227,381
Valvoline, Inc. 2 45
Westlake Chemical Corp. 2,387 146,705
WR Grace & Co. 4,360 312,568
31,416,946
Metals & Mining — 10.3%
Alcoa Corp. 9,398 309,570
Allegheny Technologies, Inc. 6,944 107,146
Carpenter Technology Corp. 2,983 108,790
Commercial Metals Co. 7,378 133,542
Compass Minerals International, Inc. 2,157 138,372
Freeport-McMoRan, Inc.* 84,894 975,432
Newmont Mining Corp. 33,932 1,158,778
Nucor Corp. 20,356 1,182,684
Reliance Steel & Aluminum Co. 4,652 339,363
Royal Gold, Inc. 4,172 335,512
Steel Dynamics, Inc. 15,473 $ 525,927
United States Steel Corp. 11,127 231,998
Worthington Industries, Inc. 2,805 117,726
5,664,840
Oil, Gas & Consumable Fuels — 0.3%
CONSOL Energy, Inc.* 11,279 163,658
Paper & Forest Products — 0.5%
Domtar Corp. 3,995 145,338
KapStone Paper and Packaging Corp. 5,617 118,687
264,025
Total Common Stocks(Cost $37,312,409) 37,509,469
Principal Amount
Short-Term Investment (a) — 1.6%
Repurchase Agreement (b) — 1.6%
Repurchase Agreements with various counterparties, rates 0.60% - 0.81%, dated 5/31/2017, due 6/1/2017, total to be received $899,705 (Cost $899,686) $ 899,686 899,686
Total Investments — 69.6%(Cost $38,212,095) 38,409,155
Other assets less liabilities — 30.4% 16,767,085
Net Assets — 100.0% $ 55,176,240
* Non-income producing security.(a) All or a portion of this security is segregated in connection with
obligations for swaps with a total value of $9,829,891.(b) The Fund invests in Repurchase Agreements jointly with other
funds in the Trust. See “Repurchase Agreements” under Note 2in the Notes to Financial Statements to view the details of eachindividual agreement and counterparty as well as a description ofthe securities subjected to repurchase.
As of May 31, 2017, the gross unrealized appreciation (depreciation)of investments based on the aggregate cost of investments for federalincome tax purposes was as follows:Aggregate gross unrealized appreciation $ 2,426,911
Aggregate gross unrealized depreciation (3,544,324)
Net unrealized depreciation $ (1,117,413)
Federal income tax cost of investments $ 39,526,568
See accompanying notes to the financial statements.
PROSHARES TRUST SCHEDULE OF PORTFOLIO INVESTMENTS :: MAY 31, 2017 :: ULTRA BASIC MATERIALSnlUYM :: 117
Merrill Corp - Proshares Trust Geared Book [96 Funds] Annual Report [Funds] 333-089822 05-31-2017 ED [AUX] | eperez | 28-Jul-17 17:39 | 17-15159-3.fs | Sequence: 1CHKSUM Content: 708 Layout: 44428 Graphics: No Graphics CLEAN
JOB: 17-15159-3 CYCLE#;BL#: 5; 0 TRIM: 8.25" x 10.75" COMPOSITECOLORS: Black, ~note-color 2, ~note-color 3 GRAPHICS: none V1.5
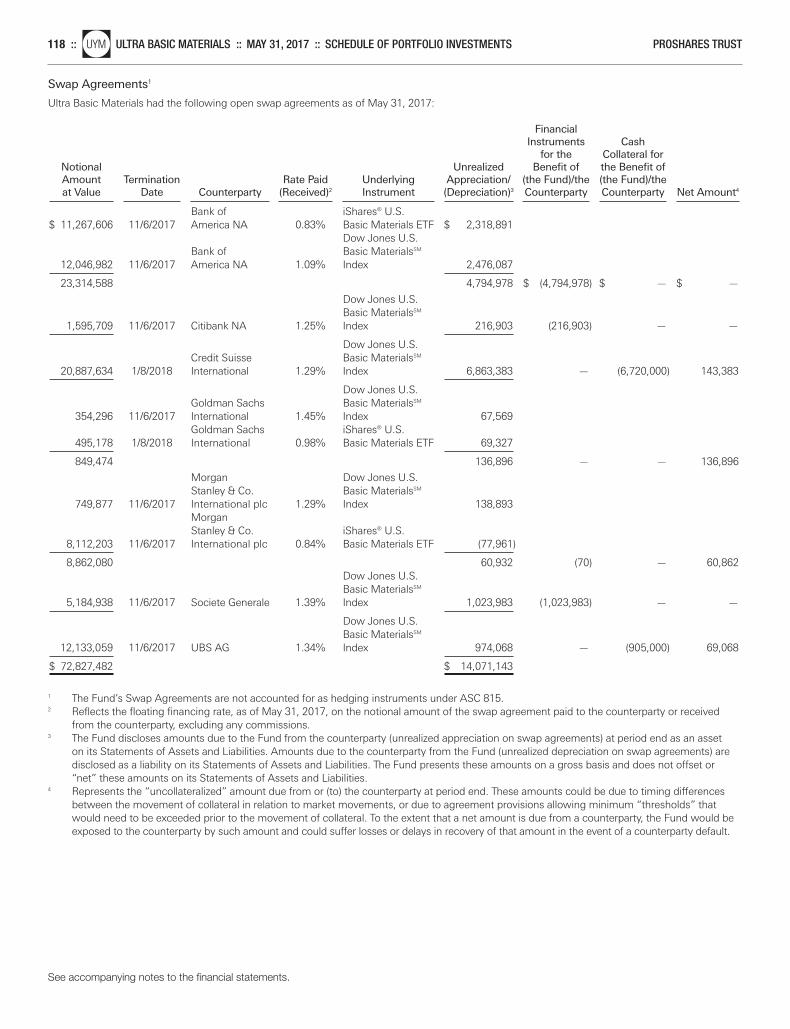
Swap Agreements1
Ultra Basic Materials had the following open swap agreements as of May 31, 2017:
Financial Instruments Cash
for the Collateral for Notional Unrealized Benefit of the Benefit of Amount Termination Rate Paid Underlying Appreciation/ (the Fund)/the (the Fund)/the at Value Date Counterparty (Received)2 Instrument (Depreciation)3 Counterparty Counterparty Net Amount4
Bank of iShares® U.S.
$ 11,267,606 11/6/2017 America NA 0.83% Basic Materials ETF $ 2,318,891 Dow Jones U.S.
Bank of Basic MaterialsSM 12,046,982 11/6/2017 America NA 1.09% Index 2,476,087
23,314,588 4,794,978 $ (4,794,978) $ — $ —
Dow Jones U.S. Basic MaterialsSM
1,595,709 11/6/2017 Citibank NA 1.25% Index 216,903 (216,903) — —
Dow Jones U.S. Credit Suisse Basic MaterialsSM
20,887,634 1/8/2018 International 1.29% Index 6,863,383 — (6,720,000) 143,383
Dow Jones U.S. Goldman Sachs Basic MaterialsSM
354,296 11/6/2017 International 1.45% Index 67,569 Goldman Sachs iShares® U.S.
495,178 1/8/2018 International 0.98% Basic Materials ETF 69,327
849,474 136,896 — — 136,896
Morgan Dow Jones U.S. Stanley & Co. Basic MaterialsSM
749,877 11/6/2017 International plc 1.29% Index 138,893 Morgan Stanley & Co. iShares® U.S.
8,112,203 11/6/2017 International plc 0.84% Basic Materials ETF (77,961)
8,862,080 60,932 (70) — 60,862Dow Jones U.S. Basic MaterialsSM
5,184,938 11/6/2017 Societe Generale 1.39% Index 1,023,983 (1,023,983) — —
Dow Jones U.S. Basic MaterialsSM
12,133,059 11/6/2017 UBS AG 1.34% Index 974,068 — (905,000) 69,068
$ 72,827,482 $ 14,071,143
1 The Fund’s Swap Agreements are not accounted for as hedging instruments under ASC 815.2 Reflects the floating financing rate, as of May 31, 2017, on the notional amount of the swap agreement paid to the counterparty or received
from the counterparty, excluding any commissions.3 The Fund discloses amounts due to the Fund from the counterparty (unrealized appreciation on swap agreements) at period end as an asset
on its Statements of Assets and Liabilities. Amounts due to the counterparty from the Fund (unrealized depreciation on swap agreements) aredisclosed as a liability on its Statements of Assets and Liabilities. The Fund presents these amounts on a gross basis and does not offset or“net” these amounts on its Statements of Assets and Liabilities.
4 Represents the “uncollateralized” amount due from or (to) the counterparty at period end. These amounts could be due to timing differencesbetween the movement of collateral in relation to market movements, or due to agreement provisions allowing minimum “thresholds” thatwould need to be exceeded prior to the movement of collateral. To the extent that a net amount is due from a counterparty, the Fund would beexposed to the counterparty by such amount and could suffer losses or delays in recovery of that amount in the event of a counterparty default.
See accompanying notes to the financial statements.
118 ::nlUYM ULTRA BASIC MATERIALS :: MAY 31, 2017 :: SCHEDULE OF PORTFOLIO INVESTMENTS PROSHARES TRUST
Merrill Corp - Proshares Trust Geared Book [96 Funds] Annual Report [Funds] 333-089822 05-31-2017 ED [AUX] | eperez | 28-Jul-17 17:39 | 17-15159-3.fs | Sequence: 2CHKSUM Content: 41522 Layout: 44269 Graphics: No Graphics CLEAN
JOB: 17-15159-3 CYCLE#;BL#: 5; 0 TRIM: 8.25" x 10.75" COMPOSITECOLORS: Black, ~note-color 2, ~note-color 3 GRAPHICS: none V1.5
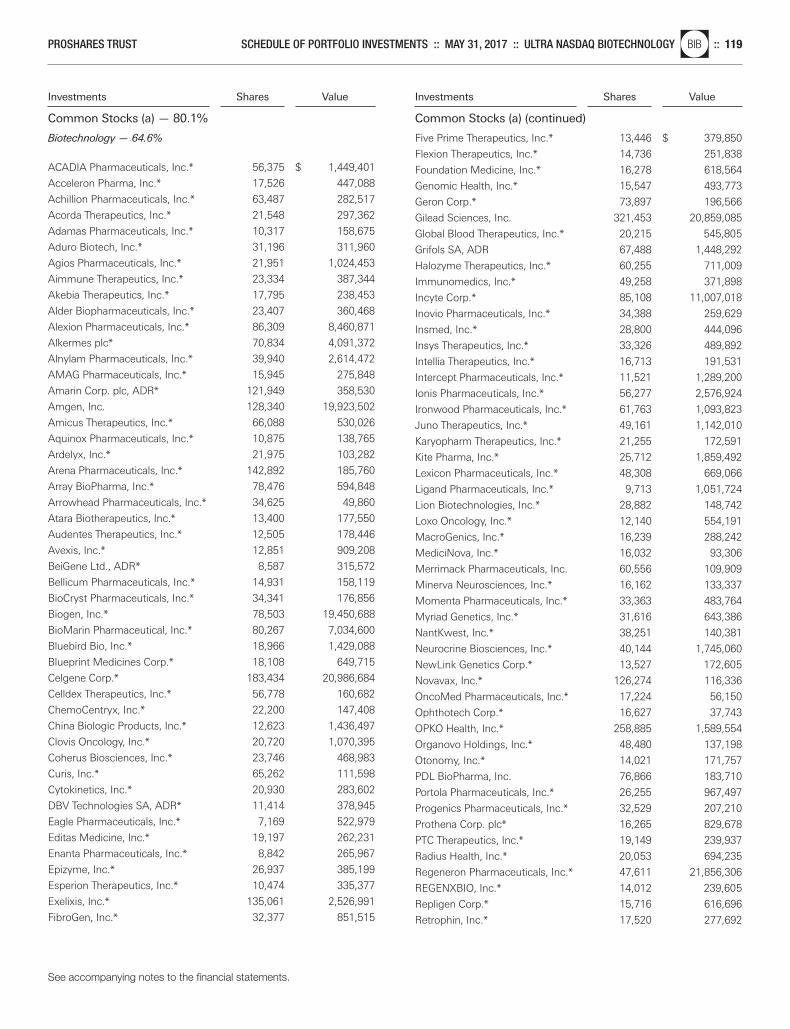
Investments Shares Value
Common Stocks (a) — 80.1%
Investments Shares Value
Common Stocks (a) (continued)
Biotechnology — 64.6%
ACADIA Pharmaceuticals, Inc.* 56,375 $ 1,449,401
Acceleron Pharma, Inc.* 17,526 447,088
Achillion Pharmaceuticals, Inc.* 63,487 282,517
Acorda Therapeutics, Inc.* 21,548 297,362
Adamas Pharmaceuticals, Inc.* 10,317 158,675
Aduro Biotech, Inc.* 31,196 311,960
Agios Pharmaceuticals, Inc.* 21,951 1,024,453
Aimmune Therapeutics, Inc.* 23,334 387,344
Akebia Therapeutics, Inc.* 17,795 238,453
Alder Biopharmaceuticals, Inc.* 23,407 360,468
Alexion Pharmaceuticals, Inc.* 86,309 8,460,871
Alkermes plc* 70,834 4,091,372
Alnylam Pharmaceuticals, Inc.* 39,940 2,614,472
AMAG Pharmaceuticals, Inc.* 15,945 275,848
Amarin Corp. plc, ADR* 121,949 358,530
Amgen, Inc. 128,340 19,923,502
Amicus Therapeutics, Inc.* 66,088 530,026
Aquinox Pharmaceuticals, Inc.* 10,875 138,765
Ardelyx, Inc.* 21,975 103,282
Arena Pharmaceuticals, Inc.* 142,892 185,760
Array BioPharma, Inc.* 78,476 594,848
Arrowhead Pharmaceuticals, Inc.* 34,625 49,860
Atara Biotherapeutics, Inc.* 13,400 177,550
Audentes Therapeutics, Inc.* 12,505 178,446
Avexis, Inc.* 12,851 909,208
BeiGene Ltd., ADR* 8,587 315,572
Bellicum Pharmaceuticals, Inc.* 14,931 158,119
BioCryst Pharmaceuticals, Inc.* 34,341 176,856
Biogen, Inc.* 78,503 19,450,688
BioMarin Pharmaceutical, Inc.* 80,267 7,034,600
Bluebird Bio, Inc.* 18,966 1,429,088
Blueprint Medicines Corp.* 18,108 649,715
Celgene Corp.* 183,434 20,986,684
Celldex Therapeutics, Inc.* 56,778 160,682
ChemoCentryx, Inc.* 22,200 147,408
China Biologic Products, Inc.* 12,623 1,436,497
Clovis Oncology, Inc.* 20,720 1,070,395
Coherus Biosciences, Inc.* 23,746 468,983
Curis, Inc.* 65,262 111,598
Cytokinetics, Inc.* 20,930 283,602
DBV Technologies SA, ADR* 11,414 378,945
Eagle Pharmaceuticals, Inc.* 7,169 522,979
Editas Medicine, Inc.* 19,197 262,231
Enanta Pharmaceuticals, Inc.* 8,842 265,967
Epizyme, Inc.* 26,937 385,199
Esperion Therapeutics, Inc.* 10,474 335,377
Exelixis, Inc.* 135,061 2,526,991
FibroGen, Inc.* 32,377 851,515
Five Prime Therapeutics, Inc.* 13,446 $ 379,850
Flexion Therapeutics, Inc.* 14,736 251,838
Foundation Medicine, Inc.* 16,278 618,564
Genomic Health, Inc.* 15,547 493,773
Geron Corp.* 73,897 196,566
Gilead Sciences, Inc. 321,453 20,859,085
Global Blood Therapeutics, Inc.* 20,215 545,805
Grifols SA, ADR 67,488 1,448,292
Halozyme Therapeutics, Inc.* 60,255 711,009
Immunomedics, Inc.* 49,258 371,898
Incyte Corp.* 85,108 11,007,018
Inovio Pharmaceuticals, Inc.* 34,388 259,629
Insmed, Inc.* 28,800 444,096
Insys Therapeutics, Inc.* 33,326 489,892
Intellia Therapeutics, Inc.* 16,713 191,531
Intercept Pharmaceuticals, Inc.* 11,521 1,289,200
Ionis Pharmaceuticals, Inc.* 56,277 2,576,924
Ironwood Pharmaceuticals, Inc.* 61,763 1,093,823
Juno Therapeutics, Inc.* 49,161 1,142,010
Karyopharm Therapeutics, Inc.* 21,255 172,591
Kite Pharma, Inc.* 25,712 1,859,492
Lexicon Pharmaceuticals, Inc.* 48,308 669,066
Ligand Pharmaceuticals, Inc.* 9,713 1,051,724
Lion Biotechnologies, Inc.* 28,882 148,742
Loxo Oncology, Inc.* 12,140 554,191
MacroGenics, Inc.* 16,239 288,242
MediciNova, Inc.* 16,032 93,306
Merrimack Pharmaceuticals, Inc. 60,556 109,909
Minerva Neurosciences, Inc.* 16,162 133,337
Momenta Pharmaceuticals, Inc.* 33,363 483,764
Myriad Genetics, Inc.* 31,616 643,386
NantKwest, Inc.* 38,251 140,381
Neurocrine Biosciences, Inc.* 40,144 1,745,060
NewLink Genetics Corp.* 13,527 172,605
Novavax, Inc.* 126,274 116,336
OncoMed Pharmaceuticals, Inc.* 17,224 56,150
Ophthotech Corp.* 16,627 37,743
OPKO Health, Inc.* 258,885 1,589,554
Organovo Holdings, Inc.* 48,480 137,198
Otonomy, Inc.* 14,021 171,757
PDL BioPharma, Inc. 76,866 183,710
Portola Pharmaceuticals, Inc.* 26,255 967,497
Progenics Pharmaceuticals, Inc.* 32,529 207,210
Prothena Corp. plc* 16,265 829,678
PTC Therapeutics, Inc.* 19,149 239,937
Radius Health, Inc.* 20,053 694,235
Regeneron Pharmaceuticals, Inc.* 47,611 21,856,306
REGENXBIO, Inc.* 14,012 239,605
Repligen Corp.* 15,716 616,696
Retrophin, Inc.* 17,520 277,692
See accompanying notes to the financial statements.
PROSHARES TRUST SCHEDULE OF PORTFOLIO INVESTMENTS :: MAY 31, 2017 :: ULTRA NASDAQ BIOTECHNOLOGYnlBIB :: 119
Merrill Corp - Proshares Trust Geared Book [96 Funds] Annual Report [Funds] 333-089822 05-31-2017 ED [AUX] | eperez | 28-Jul-17 17:39 | 17-15159-3.fs | Sequence: 3CHKSUM Content: 51141 Layout: 53329 Graphics: No Graphics CLEAN
JOB: 17-15159-3 CYCLE#;BL#: 5; 0 TRIM: 8.25" x 10.75" COMPOSITECOLORS: Black, ~note-color 2, ~note-color 3 GRAPHICS: none V1.5
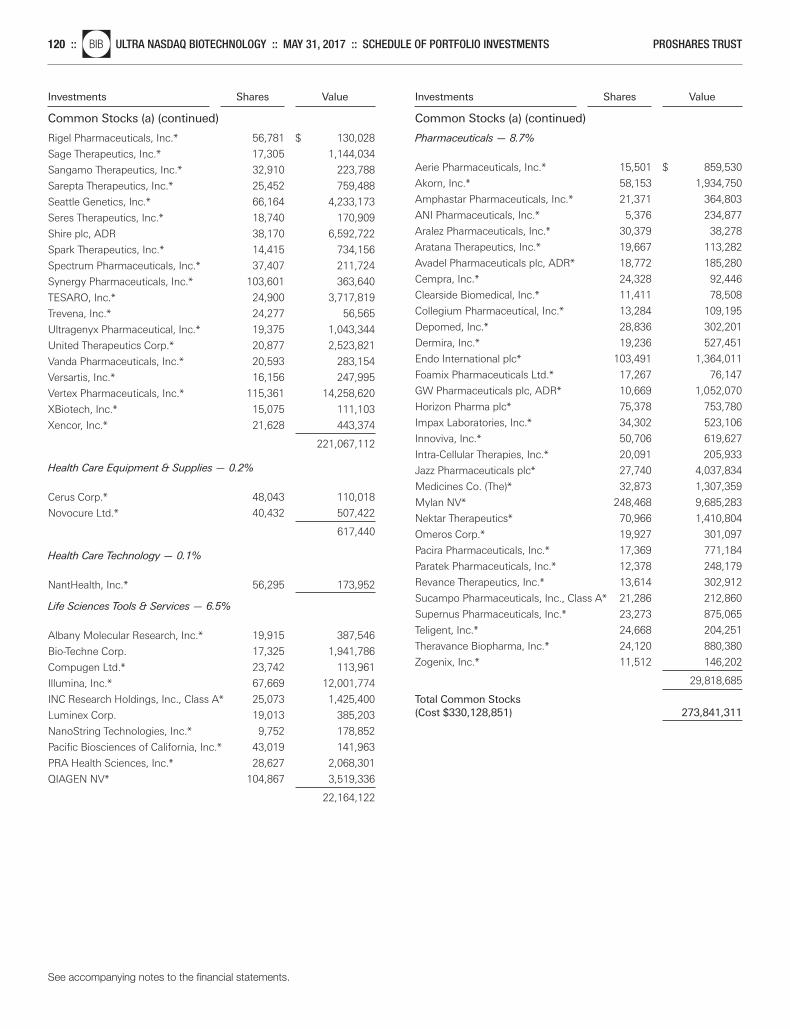
Investments Shares Value
Common Stocks (a) (continued)
Investments Shares Value
Common Stocks (a) (continued)
Rigel Pharmaceuticals, Inc.* 56,781 $ 130,028
Sage Therapeutics, Inc.* 17,305 1,144,034
Sangamo Therapeutics, Inc.* 32,910 223,788
Sarepta Therapeutics, Inc.* 25,452 759,488
Seattle Genetics, Inc.* 66,164 4,233,173
Seres Therapeutics, Inc.* 18,740 170,909
Shire plc, ADR 38,170 6,592,722
Spark Therapeutics, Inc.* 14,415 734,156
Spectrum Pharmaceuticals, Inc.* 37,407 211,724
Synergy Pharmaceuticals, Inc.* 103,601 363,640
TESARO, Inc.* 24,900 3,717,819
Trevena, Inc.* 24,277 56,565
Ultragenyx Pharmaceutical, Inc.* 19,375 1,043,344
United Therapeutics Corp.* 20,877 2,523,821
Vanda Pharmaceuticals, Inc.* 20,593 283,154
Versartis, Inc.* 16,156 247,995
Vertex Pharmaceuticals, Inc.* 115,361 14,258,620
XBiotech, Inc.* 15,075 111,103
Xencor, Inc.* 21,628 443,374
221,067,112
Health Care Equipment & Supplies — 0.2%
Cerus Corp.* 48,043 110,018
Novocure Ltd.* 40,432 507,422
617,440
Health Care Technology — 0.1%
NantHealth, Inc.* 56,295 173,952
Life Sciences Tools & Services — 6.5%
Albany Molecular Research, Inc.* 19,915 387,546
Bio-Techne Corp. 17,325 1,941,786
Compugen Ltd.* 23,742 113,961
Illumina, Inc.* 67,669 12,001,774
INC Research Holdings, Inc., Class A* 25,073 1,425,400
Luminex Corp. 19,013 385,203
NanoString Technologies, Inc.* 9,752 178,852
Pacific Biosciences of California, Inc.* 43,019 141,963
PRA Health Sciences, Inc.* 28,627 2,068,301
QIAGEN NV* 104,867 3,519,336
22,164,122
Pharmaceuticals — 8.7%
Aerie Pharmaceuticals, Inc.* 15,501 $ 859,530
Akorn, Inc.* 58,153 1,934,750
Amphastar Pharmaceuticals, Inc.* 21,371 364,803
ANI Pharmaceuticals, Inc.* 5,376 234,877
Aralez Pharmaceuticals, Inc.* 30,379 38,278
Aratana Therapeutics, Inc.* 19,667 113,282
Avadel Pharmaceuticals plc, ADR* 18,772 185,280
Cempra, Inc.* 24,328 92,446
Clearside Biomedical, Inc.* 11,411 78,508
Collegium Pharmaceutical, Inc.* 13,284 109,195
Depomed, Inc.* 28,836 302,201
Dermira, Inc.* 19,236 527,451
Endo International plc* 103,491 1,364,011
Foamix Pharmaceuticals Ltd.* 17,267 76,147
GW Pharmaceuticals plc, ADR* 10,669 1,052,070
Horizon Pharma plc* 75,378 753,780
Impax Laboratories, Inc.* 34,302 523,106
Innoviva, Inc.* 50,706 619,627
Intra-Cellular Therapies, Inc.* 20,091 205,933
Jazz Pharmaceuticals plc* 27,740 4,037,834
Medicines Co. (The)* 32,873 1,307,359
Mylan NV* 248,468 9,685,283
Nektar Therapeutics* 70,966 1,410,804
Omeros Corp.* 19,927 301,097
Pacira Pharmaceuticals, Inc.* 17,369 771,184
Paratek Pharmaceuticals, Inc.* 12,378 248,179
Revance Therapeutics, Inc.* 13,614 302,912
Sucampo Pharmaceuticals, Inc., Class A* 21,286 212,860
Supernus Pharmaceuticals, Inc.* 23,273 875,065
Teligent, Inc.* 24,668 204,251
Theravance Biopharma, Inc.* 24,120 880,380
Zogenix, Inc.* 11,512 146,202
29,818,685
Total Common Stocks(Cost $330,128,851) 273,841,311
See accompanying notes to the financial statements.
120 ::nlBIB ULTRA NASDAQ BIOTECHNOLOGY :: MAY 31, 2017 :: SCHEDULE OF PORTFOLIO INVESTMENTS PROSHARES TRUST
Merrill Corp - Proshares Trust Geared Book [96 Funds] Annual Report [Funds] 333-089822 05-31-2017 ED [AUX] | eperez | 28-Jul-17 17:39 | 17-15159-3.fs | Sequence: 4CHKSUM Content: 41551 Layout: 46703 Graphics: No Graphics CLEAN
JOB: 17-15159-3 CYCLE#;BL#: 5; 0 TRIM: 8.25" x 10.75" COMPOSITECOLORS: Black, ~note-color 2, ~note-color 3 GRAPHICS: none V1.5
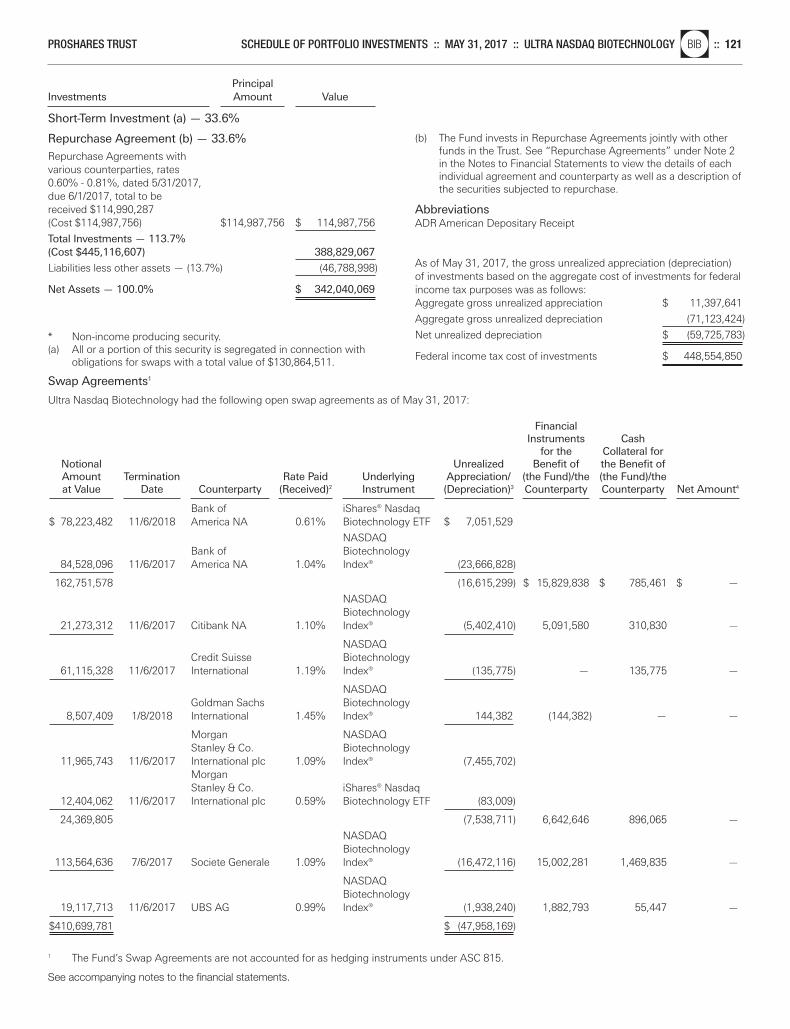
Principal Investments Amount Value
Short-Term Investment (a) — 33.6%
Repurchase Agreement (b) — 33.6%
Repurchase Agreements with various counterparties, rates 0.60% - 0.81%, dated 5/31/2017, due 6/1/2017, total to be received $114,990,287 (Cost $114,987,756) $114,987,756 $ 114,987,756
Total Investments — 113.7%(Cost $445,116,607) 388,829,067
Liabilities less other assets — (13.7%) (46,788,998)
Net Assets — 100.0% $ 342,040,069
* Non-income producing security.(a) All or a portion of this security is segregated in connection with
obligations for swaps with a total value of $130,864,511.
Swap Agreements1
Ultra Nasdaq Biotechnology had the following open swap agreements as of May 31, 2017:
Financial Instruments Cash
for the Collateral for Notional Unrealized Benefit of the Benefit of Amount Termination Rate Paid Underlying Appreciation/ (the Fund)/the (the Fund)/the at Value Date Counterparty (Received)2 Instrument (Depreciation)3 Counterparty Counterparty Net Amount4
Bank of iShares® Nasdaq
$ 78,223,482 11/6/2018 America NA 0.61% Biotechnology ETF $ 7,051,529
NASDAQ Bank of Biotechnology
84,528,096 11/6/2017 America NA 1.04% Index® (23,666,828)
162,751,578 (16,615,299) $ 15,829,838 $ 785,461 $ —
NASDAQ Biotechnology
21,273,312 11/6/2017 Citibank NA 1.10% Index® (5,402,410) 5,091,580 310,830 —
NASDAQ Credit Suisse Biotechnology
61,115,328 11/6/2017 International 1.19% Index® (135,775) — 135,775 —
NASDAQ Goldman Sachs Biotechnology
8,507,409 1/8/2018 International 1.45% Index® 144,382 (144,382) — —
Morgan NASDAQ Stanley & Co. Biotechnology
11,965,743 11/6/2017 International plc 1.09% Index® (7,455,702) Morgan Stanley & Co. iShares® Nasdaq
12,404,062 11/6/2017 International plc 0.59% Biotechnology ETF (83,009)
24,369,805 (7,538,711) 6,642,646 896,065 —
NASDAQ Biotechnology
113,564,636 7/6/2017 Societe Generale 1.09% Index® (16,472,116) 15,002,281 1,469,835 —
NASDAQ Biotechnology
19,117,713 11/6/2017 UBS AG 0.99% Index® (1,938,240) 1,882,793 55,447 —
$410,699,781 $ (47,958,169)
1 The Fund’s Swap Agreements are not accounted for as hedging instruments under ASC 815.
(b) The Fund invests in Repurchase Agreements jointly with otherfunds in the Trust. See “Repurchase Agreements” under Note 2in the Notes to Financial Statements to view the details of eachindividual agreement and counterparty as well as a description ofthe securities subjected to repurchase.
AbbreviationsADR American Depositary Receipt
As of May 31, 2017, the gross unrealized appreciation (depreciation)of investments based on the aggregate cost of investments for federalincome tax purposes was as follows:Aggregate gross unrealized appreciation $ 11,397,641
Aggregate gross unrealized depreciation (71,123,424)
Net unrealized depreciation $ (59,725,783)
Federal income tax cost of investments $ 448,554,850
See accompanying notes to the financial statements.
PROSHARES TRUST SCHEDULE OF PORTFOLIO INVESTMENTS :: MAY 31, 2017 :: ULTRA NASDAQ BIOTECHNOLOGYnlBIB :: 121
Merrill Corp - Proshares Trust Geared Book [96 Funds] Annual Report [Funds] 333-089822 05-31-2017 ED [AUX] | eperez | 28-Jul-17 17:39 | 17-15159-3.fs | Sequence: 5CHKSUM Content: 22725 Layout: 48456 Graphics: No Graphics CLEAN
JOB: 17-15159-3 CYCLE#;BL#: 5; 0 TRIM: 8.25" x 10.75" COMPOSITECOLORS: Black, ~note-color 2, ~note-color 3 GRAPHICS: none V1.5

2 Reflects the floating financing rate, as of May 31, 2017, on the notional amount of the swap agreement paid to the counterparty or receivedfrom the counterparty, excluding any commissions.
3 The Fund discloses amounts due to the Fund from the counterparty (unrealized appreciation on swap agreements) at period end as an asseton its Statements of Assets and Liabilities. Amounts due to the counterparty from the Fund (unrealized depreciation on swap agreements) aredisclosed as a liability on its Statements of Assets and Liabilities. The Fund presents these amounts on a gross basis and does not offset or“net” these amounts on its Statements of Assets and Liabilities.
4 Represents the “uncollateralized” amount due from or (to) the counterparty at period end. These amounts could be due to timing differencesbetween the movement of collateral in relation to market movements, or due to agreement provisions allowing minimum “thresholds” thatwould need to be exceeded prior to the movement of collateral. To the extent that a net amount is due from a counterparty, the Fund would beexposed to the counterparty by such amount and could suffer losses or delays in recovery of that amount in the event of a counterparty default.
See accompanying notes to the financial statements.
122 ::nlBIB ULTRA NASDAQ BIOTECHNOLOGY :: MAY 31, 2017 :: SCHEDULE OF PORTFOLIO INVESTMENTS PROSHARES TRUST
Merrill Corp - Proshares Trust Geared Book [96 Funds] Annual Report [Funds] 333-089822 05-31-2017 ED [AUX] | eperez | 28-Jul-17 17:39 | 17-15159-3.fs | Sequence: 6CHKSUM Content: 24234 Layout: 62290 Graphics: No Graphics CLEAN
JOB: 17-15159-3 CYCLE#;BL#: 5; 0 TRIM: 8.25" x 10.75" COMPOSITECOLORS: Black, ~note-color 2, ~note-color 3 GRAPHICS: none V1.5
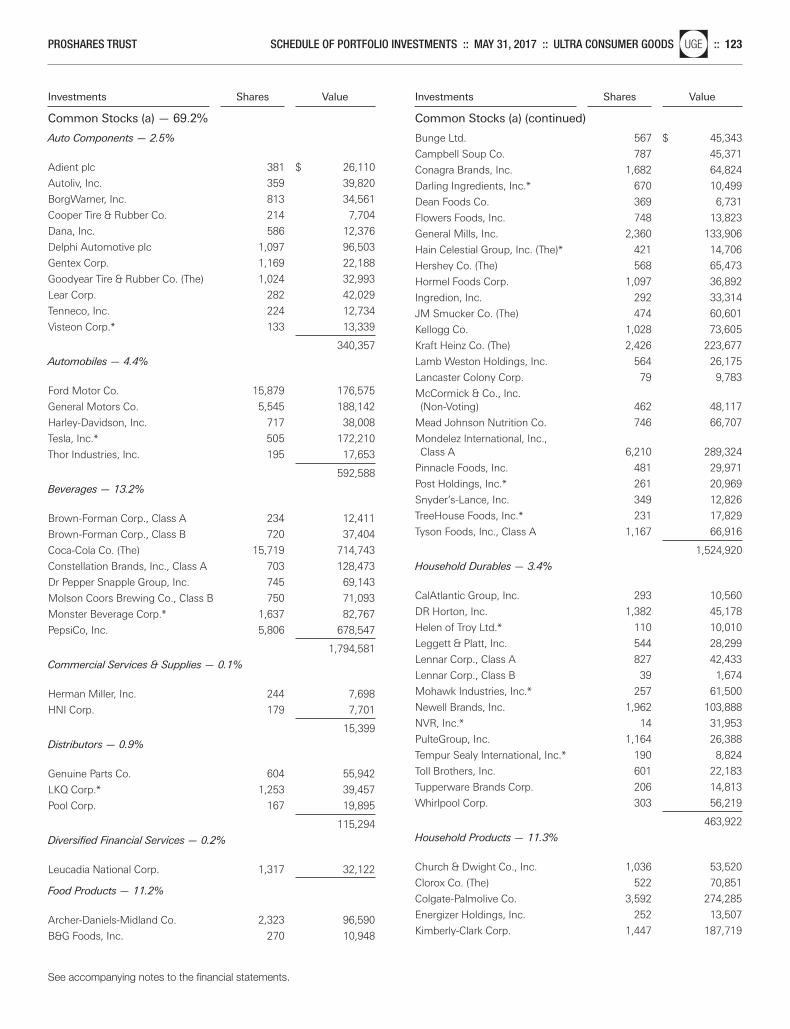
Investments Shares Value
Common Stocks (a) — 69.2%
Investments Shares Value
Common Stocks (a) (continued)
Auto Components — 2.5%
Adient plc 381 $ 26,110
Autoliv, Inc. 359 39,820
BorgWarner, Inc. 813 34,561
Cooper Tire & Rubber Co. 214 7,704
Dana, Inc. 586 12,376
Delphi Automotive plc 1,097 96,503
Gentex Corp. 1,169 22,188
Goodyear Tire & Rubber Co. (The) 1,024 32,993
Lear Corp. 282 42,029
Tenneco, Inc. 224 12,734
Visteon Corp.* 133 13,339
340,357
Automobiles — 4.4%
Ford Motor Co. 15,879 176,575
General Motors Co. 5,545 188,142
Harley-Davidson, Inc. 717 38,008
Tesla, Inc.* 505 172,210
Thor Industries, Inc. 195 17,653
592,588
Beverages — 13.2%
Brown-Forman Corp., Class A 234 12,411
Brown-Forman Corp., Class B 720 37,404
Coca-Cola Co. (The) 15,719 714,743
Constellation Brands, Inc., Class A 703 128,473
Dr Pepper Snapple Group, Inc. 745 69,143
Molson Coors Brewing Co., Class B 750 71,093
Monster Beverage Corp.* 1,637 82,767
PepsiCo, Inc. 5,806 678,547
1,794,581
Commercial Services & Supplies — 0.1%
Herman Miller, Inc. 244 7,698
HNI Corp. 179 7,701
15,399
Distributors — 0.9%
Genuine Parts Co. 604 55,942
LKQ Corp.* 1,253 39,457
Pool Corp. 167 19,895
115,294
Diversified Financial Services — 0.2%
Leucadia National Corp. 1,317 32,122
Food Products — 11.2%
Archer-Daniels-Midland Co. 2,323 96,590
B&G Foods, Inc. 270 10,948
Bunge Ltd. 567 $ 45,343
Campbell Soup Co. 787 45,371
Conagra Brands, Inc. 1,682 64,824
Darling Ingredients, Inc.* 670 10,499
Dean Foods Co. 369 6,731
Flowers Foods, Inc. 748 13,823
General Mills, Inc. 2,360 133,906
Hain Celestial Group, Inc. (The)* 421 14,706
Hershey Co. (The) 568 65,473
Hormel Foods Corp. 1,097 36,892
Ingredion, Inc. 292 33,314
JM Smucker Co. (The) 474 60,601
Kellogg Co. 1,028 73,605
Kraft Heinz Co. (The) 2,426 223,677
Lamb Weston Holdings, Inc. 564 26,175
Lancaster Colony Corp. 79 9,783
McCormick & Co., Inc. (Non-Voting) 462 48,117
Mead Johnson Nutrition Co. 746 66,707
Mondelez International, Inc., Class A 6,210 289,324
Pinnacle Foods, Inc. 481 29,971
Post Holdings, Inc.* 261 20,969
Snyder’s-Lance, Inc. 349 12,826
TreeHouse Foods, Inc.* 231 17,829
Tyson Foods, Inc., Class A 1,167 66,916
1,524,920
Household Durables — 3.4%
CalAtlantic Group, Inc. 293 10,560
DR Horton, Inc. 1,382 45,178
Helen of Troy Ltd.* 110 10,010
Leggett & Platt, Inc. 544 28,299
Lennar Corp., Class A 827 42,433
Lennar Corp., Class B 39 1,674
Mohawk Industries, Inc.* 257 61,500
Newell Brands, Inc. 1,962 103,888
NVR, Inc.* 14 31,953
PulteGroup, Inc. 1,164 26,388
Tempur Sealy International, Inc.* 190 8,824
Toll Brothers, Inc. 601 22,183
Tupperware Brands Corp. 206 14,813
Whirlpool Corp. 303 56,219
463,922
Household Products — 11.3%
Church & Dwight Co., Inc. 1,036 53,520
Clorox Co. (The) 522 70,851
Colgate-Palmolive Co. 3,592 274,285
Energizer Holdings, Inc. 252 13,507
Kimberly-Clark Corp. 1,447 187,719
See accompanying notes to the financial statements.
PROSHARES TRUST SCHEDULE OF PORTFOLIO INVESTMENTS :: MAY 31, 2017 :: ULTRA CONSUMER GOODSnlUGE :: 123
Merrill Corp - Proshares Trust Geared Book [96 Funds] Annual Report [Funds] 333-089822 05-31-2017 ED [AUX] | eperez | 28-Jul-17 17:39 | 17-15159-3.fs | Sequence: 7CHKSUM Content: 49632 Layout: 19215 Graphics: No Graphics CLEAN
JOB: 17-15159-3 CYCLE#;BL#: 5; 0 TRIM: 8.25" x 10.75" COMPOSITECOLORS: Black, ~note-color 2, ~note-color 3 GRAPHICS: none V1.5
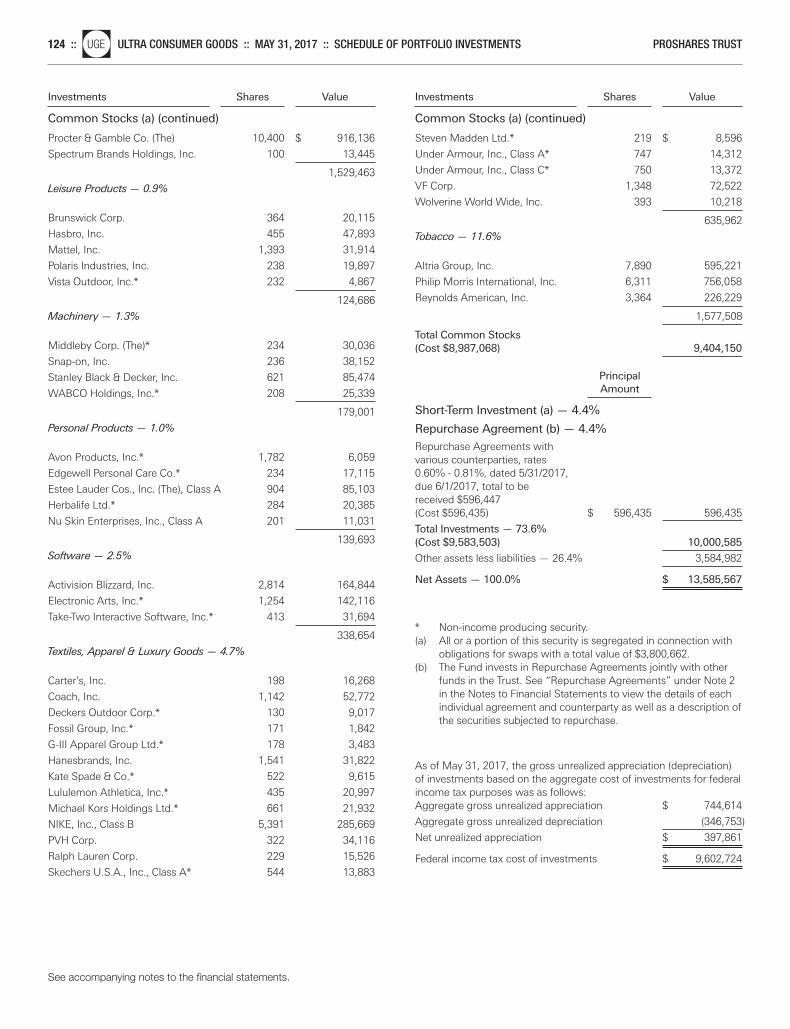
Investments Shares Value
Common Stocks (a) (continued)
Investments Shares Value
Common Stocks (a) (continued)
Procter & Gamble Co. (The) 10,400 $ 916,136
Spectrum Brands Holdings, Inc. 100 13,445
1,529,463
Leisure Products — 0.9%
Brunswick Corp. 364 20,115
Hasbro, Inc. 455 47,893
Mattel, Inc. 1,393 31,914
Polaris Industries, Inc. 238 19,897
Vista Outdoor, Inc.* 232 4,867
124,686
Machinery — 1.3%
Middleby Corp. (The)* 234 30,036
Snap-on, Inc. 236 38,152
Stanley Black & Decker, Inc. 621 85,474
WABCO Holdings, Inc.* 208 25,339
179,001
Personal Products — 1.0%
Avon Products, Inc.* 1,782 6,059
Edgewell Personal Care Co.* 234 17,115
Estee Lauder Cos., Inc. (The), Class A 904 85,103
Herbalife Ltd.* 284 20,385
Nu Skin Enterprises, Inc., Class A 201 11,031
139,693
Software — 2.5%
Activision Blizzard, Inc. 2,814 164,844
Electronic Arts, Inc.* 1,254 142,116
Take-Two Interactive Software, Inc.* 413 31,694
338,654
Textiles, Apparel & Luxury Goods — 4.7%
Carter’s, Inc. 198 16,268
Coach, Inc. 1,142 52,772
Deckers Outdoor Corp.* 130 9,017
Fossil Group, Inc.* 171 1,842
G-III Apparel Group Ltd.* 178 3,483
Hanesbrands, Inc. 1,541 31,822
Kate Spade & Co.* 522 9,615
Lululemon Athletica, Inc.* 435 20,997
Michael Kors Holdings Ltd.* 661 21,932
NIKE, Inc., Class B 5,391 285,669
PVH Corp. 322 34,116
Ralph Lauren Corp. 229 15,526
Skechers U.S.A., Inc., Class A* 544 13,883
Steven Madden Ltd.* 219 $ 8,596
Under Armour, Inc., Class A* 747 14,312
Under Armour, Inc., Class C* 750 13,372
VF Corp. 1,348 72,522
Wolverine World Wide, Inc. 393 10,218
635,962
Tobacco — 11.6%
Altria Group, Inc. 7,890 595,221
Philip Morris International, Inc. 6,311 756,058
Reynolds American, Inc. 3,364 226,229
1,577,508
Total Common Stocks(Cost $8,987,068) 9,404,150
Principal Amount
Short-Term Investment (a) — 4.4%
Repurchase Agreement (b) — 4.4%
Repurchase Agreements with various counterparties, rates 0.60% - 0.81%, dated 5/31/2017, due 6/1/2017, total to be received $596,447 (Cost $596,435) $ 596,435 596,435
Total Investments — 73.6%(Cost $9,583,503) 10,000,585
Other assets less liabilities — 26.4% 3,584,982
Net Assets — 100.0% $ 13,585,567
* Non-income producing security.(a) All or a portion of this security is segregated in connection with
obligations for swaps with a total value of $3,800,662.(b) The Fund invests in Repurchase Agreements jointly with other
funds in the Trust. See “Repurchase Agreements” under Note 2in the Notes to Financial Statements to view the details of eachindividual agreement and counterparty as well as a description ofthe securities subjected to repurchase.
As of May 31, 2017, the gross unrealized appreciation (depreciation)of investments based on the aggregate cost of investments for federalincome tax purposes was as follows:Aggregate gross unrealized appreciation $ 744,614
Aggregate gross unrealized depreciation (346,753)
Net unrealized appreciation $ 397,861
Federal income tax cost of investments $ 9,602,724
See accompanying notes to the financial statements.
124 ::nlUGE ULTRA CONSUMER GOODS :: MAY 31, 2017 :: SCHEDULE OF PORTFOLIO INVESTMENTS PROSHARES TRUST
Merrill Corp - Proshares Trust Geared Book [96 Funds] Annual Report [Funds] 333-089822 05-31-2017 ED [AUX] | eperez | 28-Jul-17 17:39 | 17-15159-3.fs | Sequence: 8CHKSUM Content: 1911 Layout: 9159 Graphics: No Graphics CLEAN
JOB: 17-15159-3 CYCLE#;BL#: 5; 0 TRIM: 8.25" x 10.75" COMPOSITECOLORS: Black, ~note-color 2, ~note-color 3 GRAPHICS: none V1.5
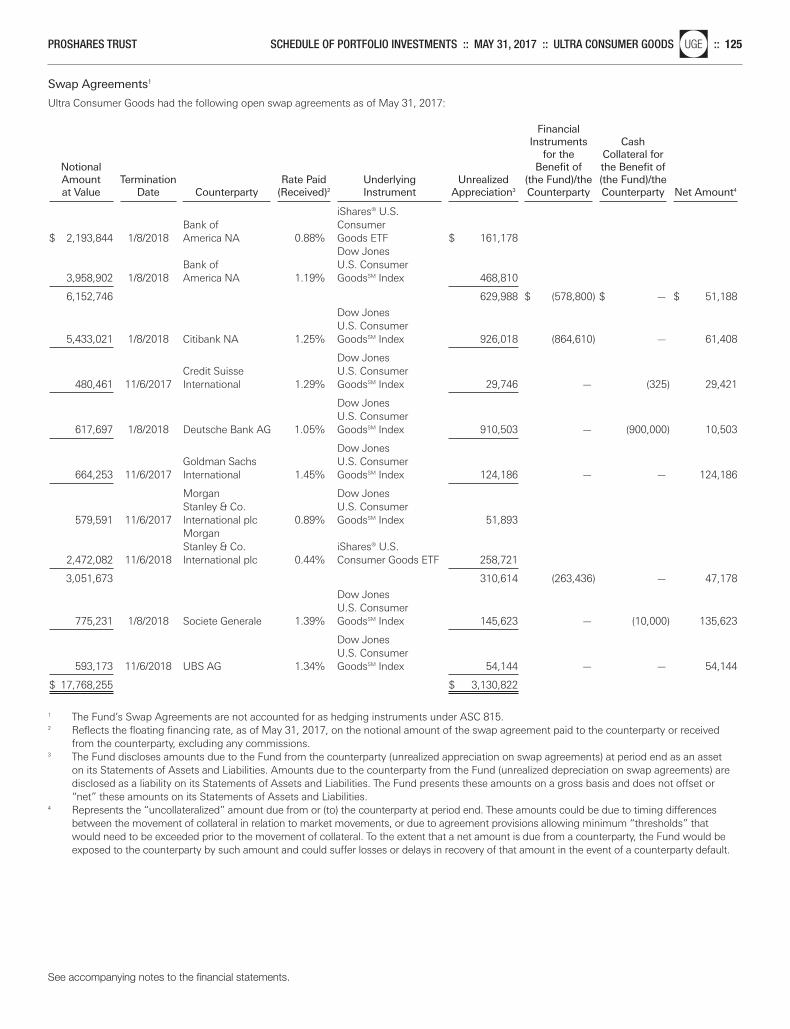
Swap Agreements1
Ultra Consumer Goods had the following open swap agreements as of May 31, 2017:
Financial Instruments Cash
for the Collateral for Notional Benefit of the Benefit of Amount Termination Rate Paid Underlying Unrealized (the Fund)/the (the Fund)/the at Value Date Counterparty (Received)2 Instrument Appreciation3 Counterparty Counterparty Net Amount4
iShares® U.S.
Bank of Consumer$ 2,193,844 1/8/2018 America NA 0.88% Goods ETF $ 161,178
Dow Jones Bank of U.S. Consumer
3,958,902 1/8/2018 America NA 1.19% GoodsSM Index 468,810
6,152,746 629,988 $ (578,800) $ — $ 51,188
Dow Jones U.S. Consumer
5,433,021 1/8/2018 Citibank NA 1.25% GoodsSM Index 926,018 (864,610) — 61,408
Dow Jones Credit Suisse U.S. Consumer
480,461 11/6/2017 International 1.29% GoodsSM Index 29,746 — (325) 29,421
Dow Jones U.S. Consumer
617,697 1/8/2018 Deutsche Bank AG 1.05% GoodsSM Index 910,503 — (900,000) 10,503
Dow Jones Goldman Sachs U.S. Consumer
664,253 11/6/2017 International 1.45% GoodsSM Index 124,186 — — 124,186
Morgan Dow Jones Stanley & Co. U.S. Consumer
579,591 11/6/2017 International plc 0.89% GoodsSM Index 51,893 Morgan Stanley & Co. iShares® U.S.
2,472,082 11/6/2018 International plc 0.44% Consumer Goods ETF 258,721
3,051,673 310,614 (263,436) — 47,178
Dow Jones U.S. Consumer
775,231 1/8/2018 Societe Generale 1.39% GoodsSM Index 145,623 — (10,000) 135,623
Dow Jones U.S. Consumer
593,173 11/6/2018 UBS AG 1.34% GoodsSM Index 54,144 — — 54,144
$ 17,768,255 $ 3,130,822
1 The Fund’s Swap Agreements are not accounted for as hedging instruments under ASC 815.2 Reflects the floating financing rate, as of May 31, 2017, on the notional amount of the swap agreement paid to the counterparty or received
from the counterparty, excluding any commissions.3 The Fund discloses amounts due to the Fund from the counterparty (unrealized appreciation on swap agreements) at period end as an asset
on its Statements of Assets and Liabilities. Amounts due to the counterparty from the Fund (unrealized depreciation on swap agreements) aredisclosed as a liability on its Statements of Assets and Liabilities. The Fund presents these amounts on a gross basis and does not offset or“net” these amounts on its Statements of Assets and Liabilities.
4 Represents the “uncollateralized” amount due from or (to) the counterparty at period end. These amounts could be due to timing differencesbetween the movement of collateral in relation to market movements, or due to agreement provisions allowing minimum “thresholds” thatwould need to be exceeded prior to the movement of collateral. To the extent that a net amount is due from a counterparty, the Fund would beexposed to the counterparty by such amount and could suffer losses or delays in recovery of that amount in the event of a counterparty default.
See accompanying notes to the financial statements.
PROSHARES TRUST SCHEDULE OF PORTFOLIO INVESTMENTS :: MAY 31, 2017 :: ULTRA CONSUMER GOODSnlUGE :: 125
Merrill Corp - Proshares Trust Geared Book [96 Funds] Annual Report [Funds] 333-089822 05-31-2017 ED [AUX] | eperez | 28-Jul-17 17:39 | 17-15159-3.fs | Sequence: 9CHKSUM Content: 10457 Layout: 17471 Graphics: No Graphics CLEAN
JOB: 17-15159-3 CYCLE#;BL#: 5; 0 TRIM: 8.25" x 10.75" COMPOSITECOLORS: Black, ~note-color 2, ~note-color 3 GRAPHICS: none V1.5
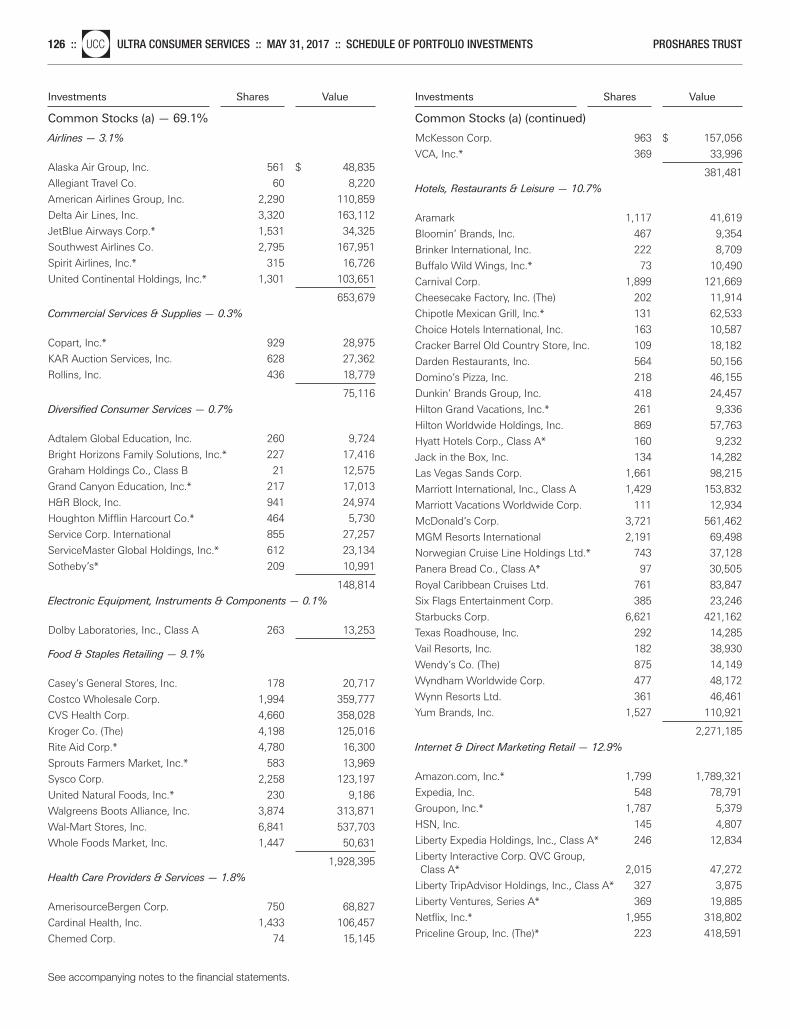
Investments Shares Value
Common Stocks (a) — 69.1%
Investments Shares Value
Common Stocks (a) (continued)
Airlines — 3.1%
Alaska Air Group, Inc. 561 $ 48,835
Allegiant Travel Co. 60 8,220
American Airlines Group, Inc. 2,290 110,859
Delta Air Lines, Inc. 3,320 163,112
JetBlue Airways Corp.* 1,531 34,325
Southwest Airlines Co. 2,795 167,951
Spirit Airlines, Inc.* 315 16,726
United Continental Holdings, Inc.* 1,301 103,651
653,679
Commercial Services & Supplies — 0.3%
Copart, Inc.* 929 28,975
KAR Auction Services, Inc. 628 27,362
Rollins, Inc. 436 18,779
75,116
Diversified Consumer Services — 0.7%
Adtalem Global Education, Inc. 260 9,724
Bright Horizons Family Solutions, Inc.* 227 17,416
Graham Holdings Co., Class B 21 12,575
Grand Canyon Education, Inc.* 217 17,013
H&R Block, Inc. 941 24,974
Houghton Mifflin Harcourt Co.* 464 5,730
Service Corp. International 855 27,257
ServiceMaster Global Holdings, Inc.* 612 23,134
Sotheby’s* 209 10,991
148,814
Electronic Equipment, Instruments & Components — 0.1%
Dolby Laboratories, Inc., Class A 263 13,253
Food & Staples Retailing — 9.1%
Casey’s General Stores, Inc. 178 20,717
Costco Wholesale Corp. 1,994 359,777
CVS Health Corp. 4,660 358,028
Kroger Co. (The) 4,198 125,016
Rite Aid Corp.* 4,780 16,300
Sprouts Farmers Market, Inc.* 583 13,969
Sysco Corp. 2,258 123,197
United Natural Foods, Inc.* 230 9,186
Walgreens Boots Alliance, Inc. 3,874 313,871
Wal-Mart Stores, Inc. 6,841 537,703
Whole Foods Market, Inc. 1,447 50,631
1,928,395
Health Care Providers & Services — 1.8%
AmerisourceBergen Corp. 750 68,827
Cardinal Health, Inc. 1,433 106,457
Chemed Corp. 74 15,145
McKesson Corp. 963 $ 157,056
VCA, Inc.* 369 33,996
381,481
Hotels, Restaurants & Leisure — 10.7%
Aramark 1,117 41,619
Bloomin’ Brands, Inc. 467 9,354
Brinker International, Inc. 222 8,709
Buffalo Wild Wings, Inc.* 73 10,490
Carnival Corp. 1,899 121,669
Cheesecake Factory, Inc. (The) 202 11,914
Chipotle Mexican Grill, Inc.* 131 62,533
Choice Hotels International, Inc. 163 10,587
Cracker Barrel Old Country Store, Inc. 109 18,182
Darden Restaurants, Inc. 564 50,156
Domino’s Pizza, Inc. 218 46,155
Dunkin’ Brands Group, Inc. 418 24,457
Hilton Grand Vacations, Inc.* 261 9,336
Hilton Worldwide Holdings, Inc. 869 57,763
Hyatt Hotels Corp., Class A* 160 9,232
Jack in the Box, Inc. 134 14,282
Las Vegas Sands Corp. 1,661 98,215
Marriott International, Inc., Class A 1,429 153,832
Marriott Vacations Worldwide Corp. 111 12,934
McDonald’s Corp. 3,721 561,462
MGM Resorts International 2,191 69,498
Norwegian Cruise Line Holdings Ltd.* 743 37,128
Panera Bread Co., Class A* 97 30,505
Royal Caribbean Cruises Ltd. 761 83,847
Six Flags Entertainment Corp. 385 23,246
Starbucks Corp. 6,621 421,162
Texas Roadhouse, Inc. 292 14,285
Vail Resorts, Inc. 182 38,930
Wendy’s Co. (The) 875 14,149
Wyndham Worldwide Corp. 477 48,172
Wynn Resorts Ltd. 361 46,461
Yum Brands, Inc. 1,527 110,921
2,271,185
Internet & Direct Marketing Retail — 12.9%
Amazon.com, Inc.* 1,799 1,789,321
Expedia, Inc. 548 78,791
Groupon, Inc.* 1,787 5,379
HSN, Inc. 145 4,807
Liberty Expedia Holdings, Inc., Class A* 246 12,834
Liberty Interactive Corp. QVC Group, Class A* 2,015 47,272
Liberty TripAdvisor Holdings, Inc., Class A* 327 3,875
Liberty Ventures, Series A* 369 19,885
Netflix, Inc.* 1,955 318,802
Priceline Group, Inc. (The)* 223 418,591
See accompanying notes to the financial statements.
126 ::nlUCC ULTRA CONSUMER SERVICES :: MAY 31, 2017 :: SCHEDULE OF PORTFOLIO INVESTMENTS PROSHARES TRUST
Merrill Corp - Proshares Trust Geared Book [96 Funds] Annual Report [Funds] 333-089822 05-31-2017 ED [AUX] | eperez | 28-Jul-17 17:39 | 17-15159-3.fs | Sequence: 10CHKSUM Content: 8949 Layout: 56242 Graphics: No Graphics CLEAN
JOB: 17-15159-3 CYCLE#;BL#: 5; 0 TRIM: 8.25" x 10.75" COMPOSITECOLORS: Black, ~note-color 2, ~note-color 3 GRAPHICS: none V1.5
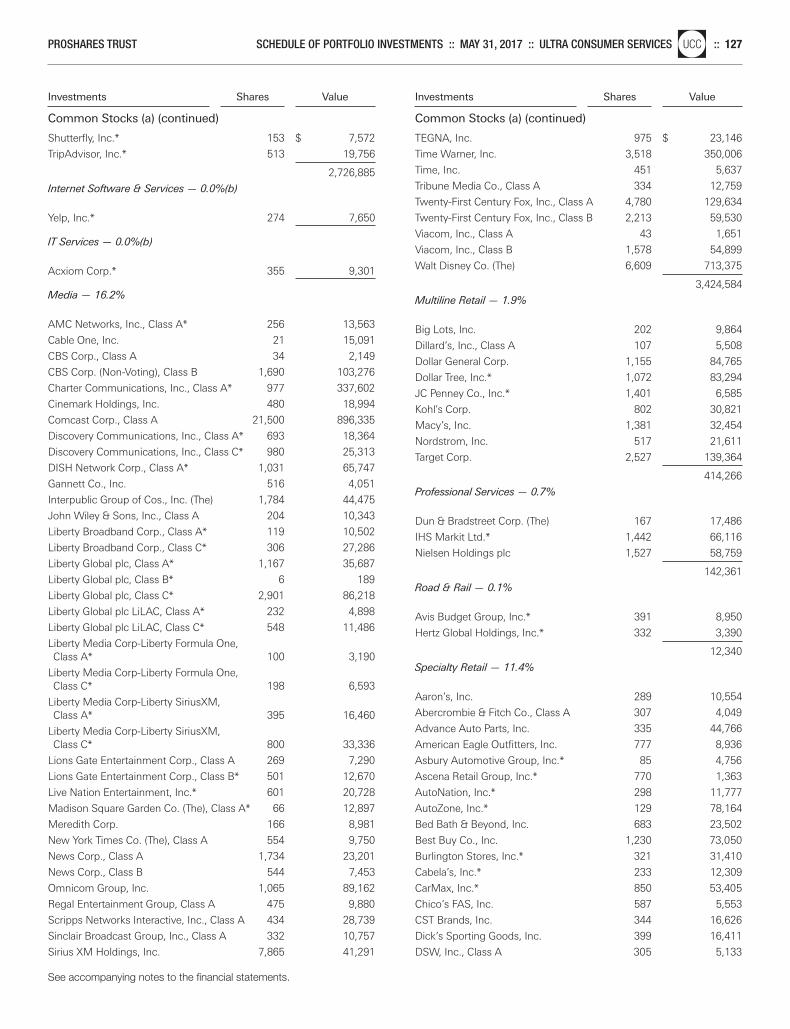
Investments Shares Value
Common Stocks (a) (continued)
Investments Shares Value
Common Stocks (a) (continued)
Shutterfly, Inc.* 153 $ 7,572
TripAdvisor, Inc.* 513 19,756
2,726,885
Internet Software & Services — 0.0%(b)
Yelp, Inc.* 274 7,650
IT Services — 0.0%(b)
Acxiom Corp.* 355 9,301
Media — 16.2%
AMC Networks, Inc., Class A* 256 13,563
Cable One, Inc. 21 15,091
CBS Corp., Class A 34 2,149
CBS Corp. (Non-Voting), Class B 1,690 103,276
Charter Communications, Inc., Class A* 977 337,602
Cinemark Holdings, Inc. 480 18,994
Comcast Corp., Class A 21,500 896,335
Discovery Communications, Inc., Class A* 693 18,364
Discovery Communications, Inc., Class C* 980 25,313
DISH Network Corp., Class A* 1,031 65,747
Gannett Co., Inc. 516 4,051
Interpublic Group of Cos., Inc. (The) 1,784 44,475
John Wiley & Sons, Inc., Class A 204 10,343
Liberty Broadband Corp., Class A* 119 10,502
Liberty Broadband Corp., Class C* 306 27,286
Liberty Global plc, Class A* 1,167 35,687
Liberty Global plc, Class B* 6 189
Liberty Global plc, Class C* 2,901 86,218
Liberty Global plc LiLAC, Class A* 232 4,898
Liberty Global plc LiLAC, Class C* 548 11,486
Liberty Media Corp-Liberty Formula One, Class A* 100 3,190
Liberty Media Corp-Liberty Formula One, Class C* 198 6,593
Liberty Media Corp-Liberty SiriusXM, Class A* 395 16,460
Liberty Media Corp-Liberty SiriusXM, Class C* 800 33,336
Lions Gate Entertainment Corp., Class A 269 7,290
Lions Gate Entertainment Corp., Class B* 501 12,670
Live Nation Entertainment, Inc.* 601 20,728
Madison Square Garden Co. (The), Class A* 66 12,897
Meredith Corp. 166 8,981
New York Times Co. (The), Class A 554 9,750
News Corp., Class A 1,734 23,201
News Corp., Class B 544 7,453
Omnicom Group, Inc. 1,065 89,162
Regal Entertainment Group, Class A 475 9,880
Scripps Networks Interactive, Inc., Class A 434 28,739
Sinclair Broadcast Group, Inc., Class A 332 10,757
Sirius XM Holdings, Inc. 7,865 41,291
TEGNA, Inc. 975 $ 23,146
Time Warner, Inc. 3,518 350,006
Time, Inc. 451 5,637
Tribune Media Co., Class A 334 12,759
Twenty-First Century Fox, Inc., Class A 4,780 129,634
Twenty-First Century Fox, Inc., Class B 2,213 59,530
Viacom, Inc., Class A 43 1,651
Viacom, Inc., Class B 1,578 54,899
Walt Disney Co. (The) 6,609 713,375
3,424,584
Multiline Retail — 1.9%
Big Lots, Inc. 202 9,864
Dillard’s, Inc., Class A 107 5,508
Dollar General Corp. 1,155 84,765
Dollar Tree, Inc.* 1,072 83,294
JC Penney Co., Inc.* 1,401 6,585
Kohl’s Corp. 802 30,821
Macy’s, Inc. 1,381 32,454
Nordstrom, Inc. 517 21,611
Target Corp. 2,527 139,364
414,266
Professional Services — 0.7%
Dun & Bradstreet Corp. (The) 167 17,486
IHS Markit Ltd.* 1,442 66,116
Nielsen Holdings plc 1,527 58,759
142,361
Road & Rail — 0.1%
Avis Budget Group, Inc.* 391 8,950
Hertz Global Holdings, Inc.* 332 3,390
12,340
Specialty Retail — 11.4%
Aaron’s, Inc. 289 10,554
Abercrombie & Fitch Co., Class A 307 4,049
Advance Auto Parts, Inc. 335 44,766
American Eagle Outfitters, Inc. 777 8,936
Asbury Automotive Group, Inc.* 85 4,756
Ascena Retail Group, Inc.* 770 1,363
AutoNation, Inc.* 298 11,777
AutoZone, Inc.* 129 78,164
Bed Bath & Beyond, Inc. 683 23,502
Best Buy Co., Inc. 1,230 73,050
Burlington Stores, Inc.* 321 31,410
Cabela’s, Inc.* 233 12,309
CarMax, Inc.* 850 53,405
Chico’s FAS, Inc. 587 5,553
CST Brands, Inc. 344 16,626
Dick’s Sporting Goods, Inc. 399 16,411
DSW, Inc., Class A 305 5,133
See accompanying notes to the financial statements.
PROSHARES TRUST SCHEDULE OF PORTFOLIO INVESTMENTS :: MAY 31, 2017 :: ULTRA CONSUMER SERVICESnlUCC :: 127
Merrill Corp - Proshares Trust Geared Book [96 Funds] Annual Report [Funds] 333-089822 05-31-2017 ED [AUX] | eperez | 28-Jul-17 17:39 | 17-15159-3.fs | Sequence: 11CHKSUM Content: 2036 Layout: 47389 Graphics: No Graphics CLEAN
JOB: 17-15159-3 CYCLE#;BL#: 5; 0 TRIM: 8.25" x 10.75" COMPOSITECOLORS: Black, ~note-color 2, ~note-color 3 GRAPHICS: none V1.5
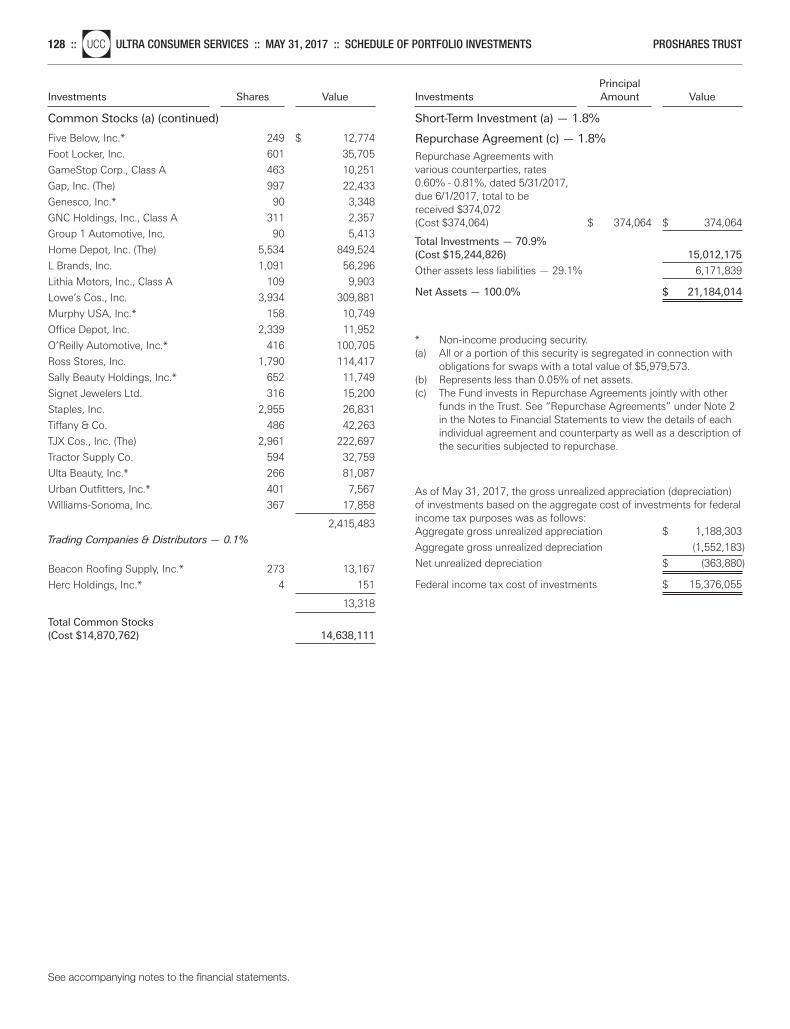
Investments Shares Value
Common Stocks (a) (continued)
Principal Investments Amount Value
Short-Term Investment (a) — 1.8%
Five Below, Inc.* 249 $ 12,774
Foot Locker, Inc. 601 35,705
GameStop Corp., Class A 463 10,251
Gap, Inc. (The) 997 22,433
Genesco, Inc.* 90 3,348
GNC Holdings, Inc., Class A 311 2,357
Group 1 Automotive, Inc. 90 5,413
Home Depot, Inc. (The) 5,534 849,524
L Brands, Inc. 1,091 56,296
Lithia Motors, Inc., Class A 109 9,903
Lowe’s Cos., Inc. 3,934 309,881
Murphy USA, Inc.* 158 10,749
Office Depot, Inc. 2,339 11,952
O’Reilly Automotive, Inc.* 416 100,705
Ross Stores, Inc. 1,790 114,417
Sally Beauty Holdings, Inc.* 652 11,749
Signet Jewelers Ltd. 316 15,200
Staples, Inc. 2,955 26,831
Tiffany & Co. 486 42,263
TJX Cos., Inc. (The) 2,961 222,697
Tractor Supply Co. 594 32,759
Ulta Beauty, Inc.* 266 81,087
Urban Outfitters, Inc.* 401 7,567
Williams-Sonoma, Inc. 367 17,858
2,415,483
Trading Companies & Distributors — 0.1%
Beacon Roofing Supply, Inc.* 273 13,167
Herc Holdings, Inc.* 4 151
13,318
Total Common Stocks(Cost $14,870,762) 14,638,111
Repurchase Agreement (c) — 1.8%
Repurchase Agreements with various counterparties, rates 0.60% - 0.81%, dated 5/31/2017, due 6/1/2017, total to be received $374,072 (Cost $374,064) $ 374,064 $ 374,064
Total Investments — 70.9%(Cost $15,244,826) 15,012,175
Other assets less liabilities — 29.1% 6,171,839
Net Assets — 100.0% $ 21,184,014
* Non-income producing security.(a) All or a portion of this security is segregated in connection with
obligations for swaps with a total value of $5,979,573.(b) Represents less than 0.05% of net assets.(c) The Fund invests in Repurchase Agreements jointly with other
funds in the Trust. See “Repurchase Agreements” under Note 2in the Notes to Financial Statements to view the details of eachindividual agreement and counterparty as well as a description ofthe securities subjected to repurchase.
As of May 31, 2017, the gross unrealized appreciation (depreciation)of investments based on the aggregate cost of investments for federalincome tax purposes was as follows:Aggregate gross unrealized appreciation $ 1,188,303
Aggregate gross unrealized depreciation (1,552,183)
Net unrealized depreciation $ (363,880)
Federal income tax cost of investments $ 15,376,055
See accompanying notes to the financial statements.
128 ::nlUCC ULTRA CONSUMER SERVICES :: MAY 31, 2017 :: SCHEDULE OF PORTFOLIO INVESTMENTS PROSHARES TRUST
Merrill Corp - Proshares Trust Geared Book [96 Funds] Annual Report [Funds] 333-089822 05-31-2017 ED [AUX] | eperez | 28-Jul-17 17:39 | 17-15159-3.fs | Sequence: 12CHKSUM Content: 3085 Layout: 7997 Graphics: No Graphics CLEAN
JOB: 17-15159-3 CYCLE#;BL#: 5; 0 TRIM: 8.25" x 10.75" COMPOSITECOLORS: Black, ~note-color 2, ~note-color 3 GRAPHICS: none V1.5
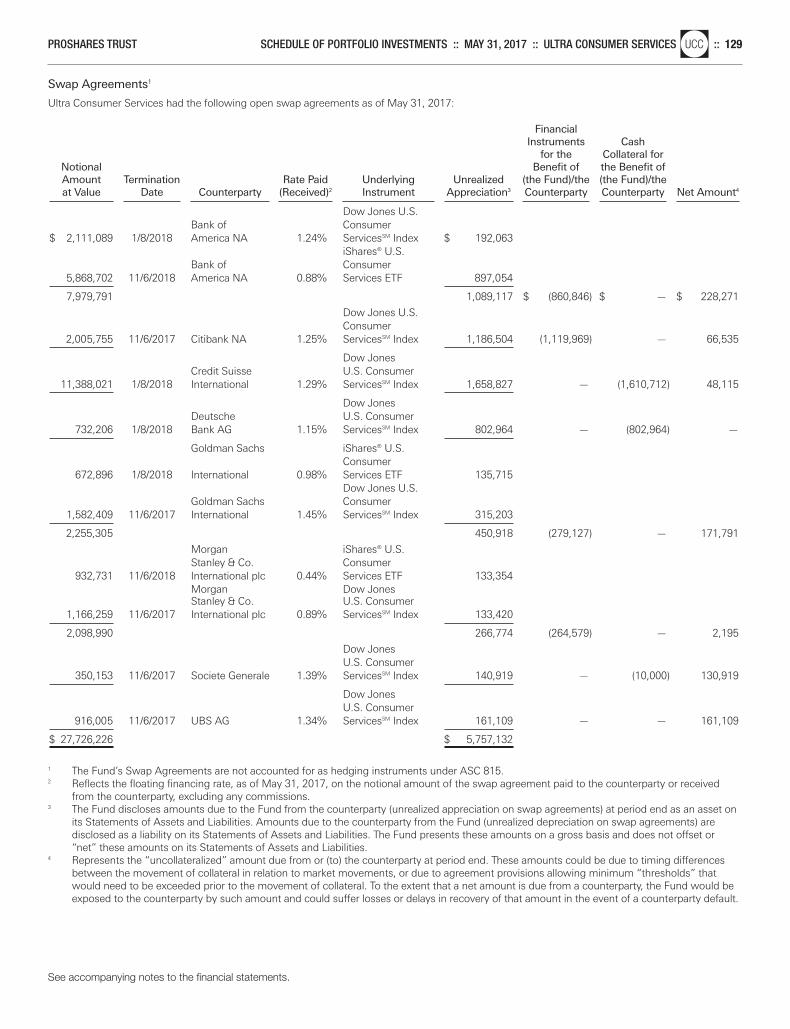
Swap Agreements1
Ultra Consumer Services had the following open swap agreements as of May 31, 2017:
Financial Instruments Cash
for the Collateral for Notional Benefit of the Benefit of Amount Termination Rate Paid Underlying Unrealized (the Fund)/the (the Fund)/the at Value Date Counterparty (Received)2 Instrument Appreciation3 Counterparty Counterparty Net Amount4
Dow Jones U.S.
Bank of Consumer $ 2,111,089 1/8/2018 America NA 1.24% ServicesSM Index $ 192,063
iShares® U.S. Bank of Consumer
5,868,702 11/6/2018 America NA 0.88% Services ETF 897,054
7,979,791 1,089,117 $ (860,846) $ — $ 228,271
Dow Jones U.S. Consumer
2,005,755 11/6/2017 Citibank NA 1.25% ServicesSM Index 1,186,504 (1,119,969) — 66,535
Dow Jones Credit Suisse U.S. Consumer
11,388,021 1/8/2018 International 1.29% ServicesSM Index 1,658,827 — (1,610,712) 48,115
Dow Jones Deutsche U.S. Consumer
732,206 1/8/2018 Bank AG 1.15% ServicesSM Index 802,964 — (802,964) —
Goldman Sachs iShares® U.S. Consumer
672,896 1/8/2018 International 0.98% Services ETF 135,715 Dow Jones U.S.
Goldman Sachs Consumer 1,582,409 11/6/2017 International 1.45% ServicesSM Index 315,203
2,255,305 450,918 (279,127) — 171,791
Morgan iShares® U.S. Stanley & Co. Consumer
932,731 11/6/2018 International plc 0.44% Services ETF 133,354 Morgan Dow Jones Stanley & Co. U.S. Consumer
1,166,259 11/6/2017 International plc 0.89% ServicesSM Index 133,420
2,098,990 266,774 (264,579) — 2,195
Dow Jones U.S. Consumer
350,153 11/6/2017 Societe Generale 1.39% ServicesSM Index 140,919 — (10,000) 130,919
Dow Jones U.S. Consumer
916,005 11/6/2017 UBS AG 1.34% ServicesSM Index 161,109 — — 161,109
$ 27,726,226 $ 5,757,132
1 The Fund’s Swap Agreements are not accounted for as hedging instruments under ASC 815.2 Reflects the floating financing rate, as of May 31, 2017, on the notional amount of the swap agreement paid to the counterparty or received
from the counterparty, excluding any commissions.3 The Fund discloses amounts due to the Fund from the counterparty (unrealized appreciation on swap agreements) at period end as an asset on
its Statements of Assets and Liabilities. Amounts due to the counterparty from the Fund (unrealized depreciation on swap agreements) are disclosed as a liability on its Statements of Assets and Liabilities. The Fund presents these amounts on a gross basis and does not offset or“net” these amounts on its Statements of Assets and Liabilities.
4 Represents the “uncollateralized” amount due from or (to) the counterparty at period end. These amounts could be due to timing differencesbetween the movement of collateral in relation to market movements, or due to agreement provisions allowing minimum “thresholds” thatwould need to be exceeded prior to the movement of collateral. To the extent that a net amount is due from a counterparty, the Fund would beexposed to the counterparty by such amount and could suffer losses or delays in recovery of that amount in the event of a counterparty default.
See accompanying notes to the financial statements.
PROSHARES TRUST SCHEDULE OF PORTFOLIO INVESTMENTS :: MAY 31, 2017 :: ULTRA CONSUMER SERVICESnlUCC :: 129
Merrill Corp - Proshares Trust Geared Book [96 Funds] Annual Report [Funds] 333-089822 05-31-2017 ED [AUX] | eperez | 28-Jul-17 17:39 | 17-15159-3.fs | Sequence: 13CHKSUM Content: 1296 Layout: 34856 Graphics: No Graphics CLEAN
JOB: 17-15159-3 CYCLE#;BL#: 5; 0 TRIM: 8.25" x 10.75" COMPOSITECOLORS: Black, ~note-color 2, ~note-color 3 GRAPHICS: none V1.5
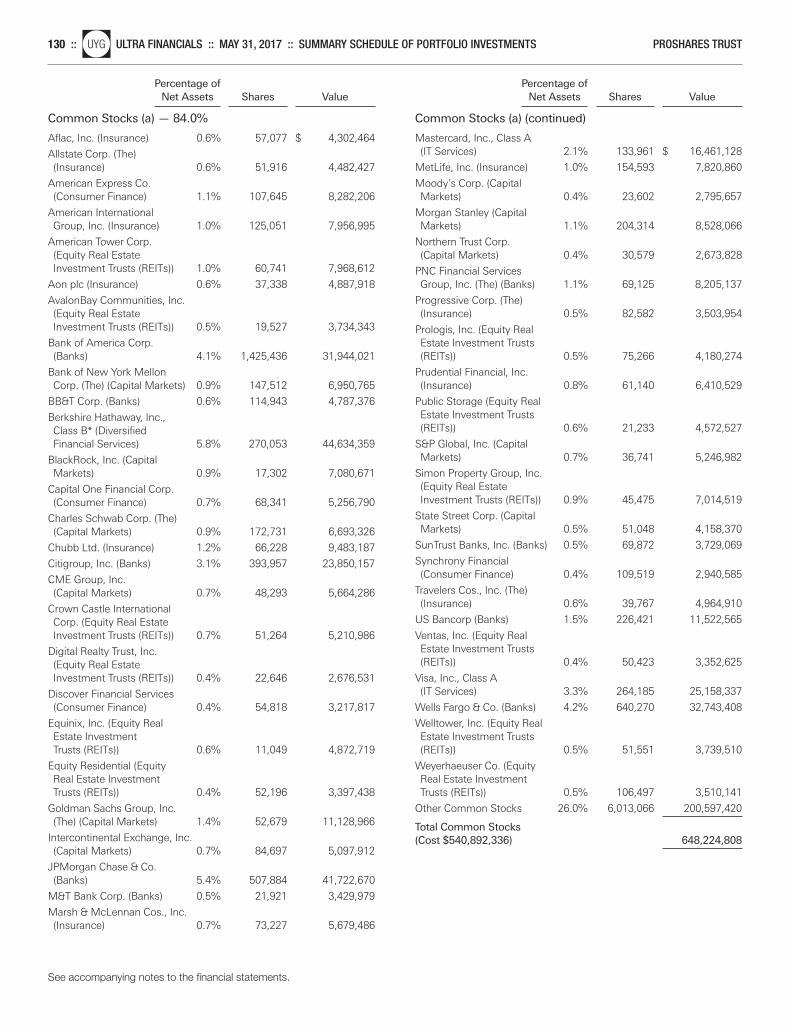
Percentage of Net Assets Shares Value
Common Stocks (a) — 84.0%
Percentage of Net Assets Shares Value
Common Stocks (a) (continued)
Aflac, Inc. (Insurance) 0.6% 57,077 $ 4,302,464
Allstate Corp. (The) (Insurance) 0.6% 51,916 4,482,427
American Express Co. (Consumer Finance) 1.1% 107,645 8,282,206
American International Group, Inc. (Insurance) 1.0% 125,051 7,956,995
American Tower Corp. (Equity Real Estate Investment Trusts (REITs)) 1.0% 60,741 7,968,612
Aon plc (Insurance) 0.6% 37,338 4,887,918
AvalonBay Communities, Inc. (Equity Real Estate Investment Trusts (REITs)) 0.5% 19,527 3,734,343
Bank of America Corp. (Banks) 4.1% 1,425,436 31,944,021
Bank of New York Mellon Corp. (The) (Capital Markets) 0.9% 147,512 6,950,765
BB&T Corp. (Banks) 0.6% 114,943 4,787,376
Berkshire Hathaway, Inc., Class B* (Diversified Financial Services) 5.8% 270,053 44,634,359
BlackRock, Inc. (Capital Markets) 0.9% 17,302 7,080,671
Capital One Financial Corp. (Consumer Finance) 0.7% 68,341 5,256,790
Charles Schwab Corp. (The) (Capital Markets) 0.9% 172,731 6,693,326
Chubb Ltd. (Insurance) 1.2% 66,228 9,483,187
Citigroup, Inc. (Banks) 3.1% 393,957 23,850,157
CME Group, Inc. (Capital Markets) 0.7% 48,293 5,664,286
Crown Castle International Corp. (Equity Real Estate Investment Trusts (REITs)) 0.7% 51,264 5,210,986
Digital Realty Trust, Inc. (Equity Real Estate Investment Trusts (REITs)) 0.4% 22,646 2,676,531
Discover Financial Services (Consumer Finance) 0.4% 54,818 3,217,817
Equinix, Inc. (Equity Real Estate Investment Trusts (REITs)) 0.6% 11,049 4,872,719
Equity Residential (Equity Real Estate Investment Trusts (REITs)) 0.4% 52,196 3,397,438
Goldman Sachs Group, Inc. (The) (Capital Markets) 1.4% 52,679 11,128,966
Intercontinental Exchange, Inc. (Capital Markets) 0.7% 84,697 5,097,912
JPMorgan Chase & Co. (Banks) 5.4% 507,884 41,722,670
M&T Bank Corp. (Banks) 0.5% 21,921 3,429,979
Marsh & McLennan Cos., Inc. (Insurance) 0.7% 73,227 5,679,486
Mastercard, Inc., Class A (IT Services) 2.1% 133,961 $ 16,461,128
MetLife, Inc. (Insurance) 1.0% 154,593 7,820,860
Moody’s Corp. (Capital Markets) 0.4% 23,602 2,795,657
Morgan Stanley (Capital Markets) 1.1% 204,314 8,528,066
Northern Trust Corp. (Capital Markets) 0.4% 30,579 2,673,828
PNC Financial Services Group, Inc. (The) (Banks) 1.1% 69,125 8,205,137
Progressive Corp. (The) (Insurance) 0.5% 82,582 3,503,954
Prologis, Inc. (Equity Real Estate Investment Trusts (REITs)) 0.5% 75,266 4,180,274
Prudential Financial, Inc. (Insurance) 0.8% 61,140 6,410,529
Public Storage (Equity Real Estate Investment Trusts (REITs)) 0.6% 21,233 4,572,527
S&P Global, Inc. (Capital Markets) 0.7% 36,741 5,246,982
Simon Property Group, Inc. (Equity Real Estate Investment Trusts (REITs)) 0.9% 45,475 7,014,519
State Street Corp. (Capital Markets) 0.5% 51,048 4,158,370
SunTrust Banks, Inc. (Banks) 0.5% 69,872 3,729,069
Synchrony Financial (Consumer Finance) 0.4% 109,519 2,940,585
Travelers Cos., Inc. (The) (Insurance) 0.6% 39,767 4,964,910
US Bancorp (Banks) 1.5% 226,421 11,522,565
Ventas, Inc. (Equity Real Estate Investment Trusts (REITs)) 0.4% 50,423 3,352,625
Visa, Inc., Class A (IT Services) 3.3% 264,185 25,158,337
Wells Fargo & Co. (Banks) 4.2% 640,270 32,743,408
Welltower, Inc. (Equity Real Estate Investment Trusts (REITs)) 0.5% 51,551 3,739,510
Weyerhaeuser Co. (Equity Real Estate Investment Trusts (REITs)) 0.5% 106,497 3,510,141
Other Common Stocks 26.0% 6,013,066 200,597,420
Total Common Stocks (Cost $540,892,336) 648,224,808
See accompanying notes to the financial statements.
130 ::nlUYG ULTRA FINANCIALS :: MAY 31, 2017 :: SUMMARY SCHEDULE OF PORTFOLIO INVESTMENTS PROSHARES TRUST
Merrill Corp - Proshares Trust Geared Book [96 Funds] Annual Report [Funds] 333-089822 05-31-2017 ED [AUX] | eperez | 28-Jul-17 17:39 | 17-15159-3.fs | Sequence: 14CHKSUM Content: 6745 Layout: 60300 Graphics: No Graphics CLEAN
JOB: 17-15159-3 CYCLE#;BL#: 5; 0 TRIM: 8.25" x 10.75" COMPOSITECOLORS: Black, ~note-color 2, ~note-color 3 GRAPHICS: none V1.5
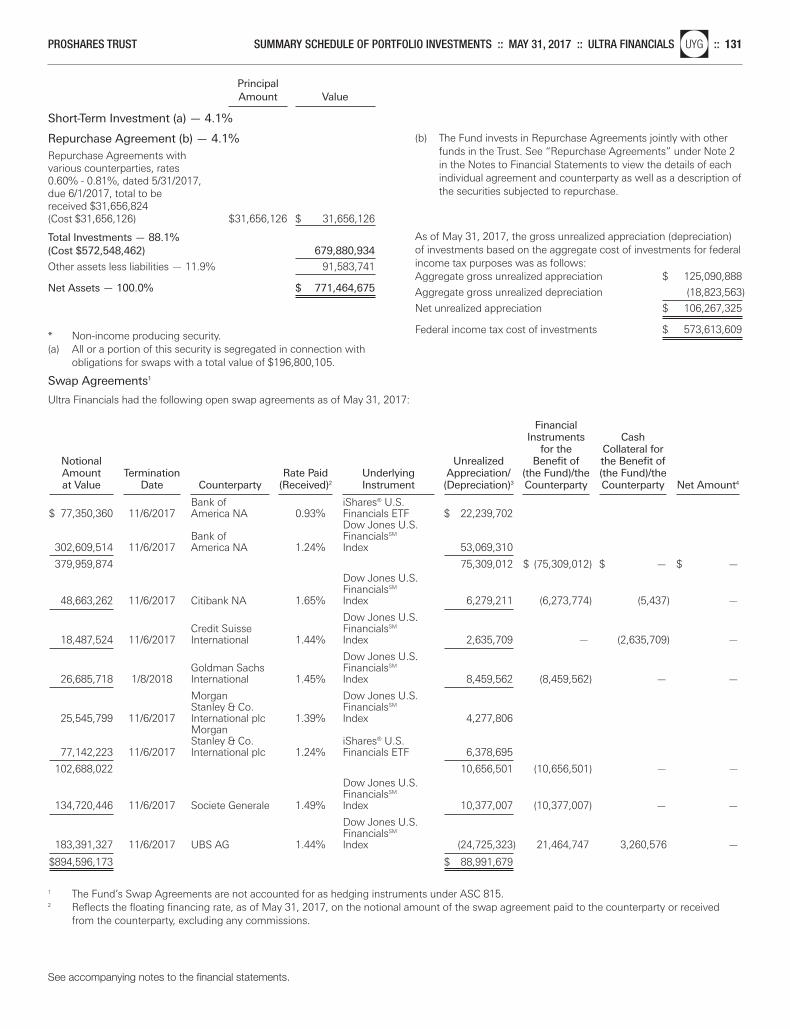
Principal Amount Value
Short-Term Investment (a) — 4.1%
Repurchase Agreement (b) — 4.1%Repurchase Agreements with various counterparties, rates 0.60% - 0.81%, dated 5/31/2017, due 6/1/2017, total to be received $31,656,824 (Cost $31,656,126) $31,656,126 $ 31,656,126
Total Investments — 88.1%(Cost $572,548,462) 679,880,934
Other assets less liabilities — 11.9% 91,583,741
Net Assets — 100.0% $ 771,464,675
* Non-income producing security.(a) All or a portion of this security is segregated in connection with
obligations for swaps with a total value of $196,800,105.
(b) The Fund invests in Repurchase Agreements jointly with otherfunds in the Trust. See “Repurchase Agreements” under Note 2in the Notes to Financial Statements to view the details of eachindividual agreement and counterparty as well as a description ofthe securities subjected to repurchase.
As of May 31, 2017, the gross unrealized appreciation (depreciation)of investments based on the aggregate cost of investments for federalincome tax purposes was as follows:Aggregate gross unrealized appreciation $ 125,090,888
Aggregate gross unrealized depreciation (18,823,563)
Net unrealized appreciation $ 106,267,325
Federal income tax cost of investments $ 573,613,609
See accompanying notes to the financial statements.
PROSHARES TRUST SUMMARY SCHEDULE OF PORTFOLIO INVESTMENTS :: MAY 31, 2017 :: ULTRA FINANCIALSnlUYG :: 131
Swap Agreements1
Ultra Financials had the following open swap agreements as of May 31, 2017:
Financial Instruments Cash
for the Collateral for Notional Unrealized Benefit of the Benefit of Amount Termination Rate Paid Underlying Appreciation/ (the Fund)/the (the Fund)/the at Value Date Counterparty (Received)2 Instrument (Depreciation)3 Counterparty Counterparty Net Amount4
Bank of iShares® U.S.
$ 77,350,360 11/6/2017 America NA 0.93% Financials ETF $ 22,239,702 Dow Jones U.S.
Bank of FinancialsSM 302,609,514 11/6/2017 America NA 1.24% Index 53,069,310
379,959,874 75,309,012 $ (75,309,012) $ — $ —Dow Jones U.S. FinancialsSM
48,663,262 11/6/2017 Citibank NA 1.65% Index 6,279,211 (6,273,774) (5,437) —
Dow Jones U.S. Credit Suisse FinancialsSM
18,487,524 11/6/2017 International 1.44% Index 2,635,709 — (2,635,709) —
Dow Jones U.S. Goldman Sachs FinancialsSM
26,685,718 1/8/2018 International 1.45% Index 8,459,562 (8,459,562) — —
Morgan Dow Jones U.S. Stanley & Co. FinancialsSM
25,545,799 11/6/2017 International plc 1.39% Index 4,277,806 Morgan Stanley & Co. iShares® U.S.
77,142,223 11/6/2017 International plc 1.24% Financials ETF 6,378,695
102,688,022 10,656,501 (10,656,501) — —Dow Jones U.S. FinancialsSM
134,720,446 11/6/2017 Societe Generale 1.49% Index 10,377,007 (10,377,007) — —
Dow Jones U.S. FinancialsSM
183,391,327 11/6/2017 UBS AG 1.44% Index (24,725,323) 21,464,747 3,260,576 —
$894,596,173 $ 88,991,679
1 The Fund’s Swap Agreements are not accounted for as hedging instruments under ASC 815.2 Reflects the floating financing rate, as of May 31, 2017, on the notional amount of the swap agreement paid to the counterparty or received
from the counterparty, excluding any commissions.
Merrill Corp - Proshares Trust Geared Book [96 Funds] Annual Report [Funds] 333-089822 05-31-2017 ED [AUX] | eperez | 28-Jul-17 17:39 | 17-15159-3.fs | Sequence: 15CHKSUM Content: 50108 Layout: 59446 Graphics: No Graphics CLEAN
JOB: 17-15159-3 CYCLE#;BL#: 5; 0 TRIM: 8.25" x 10.75" COMPOSITECOLORS: Black, ~note-color 2, ~note-color 3 GRAPHICS: none V1.5
3 The Fund discloses amounts due to the Fund from the counterparty (unrealized appreciation on swap agreements) at period end as an asseton its Statements of Assets and Liabilities. Amounts due to the counterparty from the Fund (unrealized depreciation on swap agreements) aredisclosed as a liability on its Statements of Assets and Liabilities. The Fund presents these amounts on a gross basis and does not offset or“net” these amounts on its Statements of Assets and Liabilities.
4 Represents the “uncollateralized” amount due from or (to) the counterparty at period end. These amounts could be due to timing differencesbetween the movement of collateral in relation to market movements, or due to agreement provisions allowing minimum “thresholds” thatwould need to be exceeded prior to the movement of collateral. To the extent that a net amount is due from a counterparty, the Fund would beexposed to the counterparty by such amount and could suffer losses or delays in recovery of that amount in the event of a counterparty default.
Ultra Financials invested, as a percentage of net assets, in the following industries, as of May 31, 2017:
Banks 26.2%
Capital Markets 11.8%
Consumer Finance 2.9%
Diversified Financial Services 5.9%
Equity Real Estate Investment Trusts (REITs) 16.9%
Insurance 13.0%
IT Services 5.6%
Mortgage Real Estate Investment Trusts (REITs) 0.9%
Real Estate Management & Development 0.5%
Thrifts & Mortgage Finance 0.3%
Other1 16.0% 100.0%
1 Includes any non-equity securities and net other assets (liabilities).
See accompanying notes to the financial statements.
132 ::nlUYG ULTRA FINANCIALS :: MAY 31, 2017 :: SUMMARY SCHEDULE OF PORTFOLIO INVESTMENTS PROSHARES TRUST
Merrill Corp - Proshares Trust Geared Book [96 Funds] Annual Report [Funds] 333-089822 05-31-2017 ED [AUX] | eperez | 28-Jul-17 17:39 | 17-15159-3.fs | Sequence: 16CHKSUM Content: 24461 Layout: 55787 Graphics: No Graphics CLEAN
JOB: 17-15159-3 CYCLE#;BL#: 5; 0 TRIM: 8.25" x 10.75" COMPOSITECOLORS: Black, ~note-color 2, ~note-color 3 GRAPHICS: none V1.5
Investments Shares Value
Exchange Traded Fund (a) — 49.6%
VanEck Vectors Gold Miners ETF (Cost $7,196,989) 270,143 $ 6,129,545
Principal Amount
Short-Term Investment (a) — 45.2%
Repurchase Agreement (b) — 45.2%
Repurchase Agreements with various counterparties, rates 0.60% - 0.81%, dated 5/31/2017, due 6/1/2017, total to be received $5,595,516 (Cost $5,595,392) $ 5,595,392 5,595,392
Total Investments — 94.8%(Cost $12,792,381) 11,724,937
Other assets less liabilities — 5.2% 647,046
Net Assets — 100.0% $ 12,371,983
Swap Agreements1,5
Ultra Gold Miners had the following open swap agreements as of May 31, 2017:
Financial Instruments Cash
for the Collateral for Notional Benefit of the Benefit of Amount Termination Rate Paid Underlying Unrealized (the Fund)/the (the Fund)/the at Value Date Counterparty (Received)2 Instrument Depreciation3 Counterparty Counterparty Net Amount4
Bank of VanEck Vectors
$ 3,994,894 11/6/2018 America NA 1.49% Gold Miners ETF $ (680,509) $ — $ 680,509 $ —Goldman Sachs VanEck Vectors
4,020,488 1/8/2018 International 1.50% Gold Miners ETF (907,105) 218,383 688,722 —Morgan Stanley & Co. VanEck Vectors
2,629,090 11/6/2018 International plc 1.89% Gold Miners ETF (815,452) — 815,452 —Societe VanEck Vectors
5,789,212 11/6/2018 Generale 1.49% Gold Miners ETF (441,911) 377,867 64,044 —VanEck Vectors
2,179,315 11/6/2018 UBS AG 1.44% Gold Miners ETF (139,641) — 139,641 —
$ 18,612,999 $ (2,984,618)
1 The Fund’s Swap Agreements are not accounted for as hedging instruments under ASC 815.2 Reflects the floating financing rate, as of May 31, 2017, on the notional amount of the swap agreement paid to the counterparty or received
from the counterparty, excluding any commissions.3 The Fund discloses amounts due to the Fund from the counterparty (unrealized appreciation on swap agreements) at period end as an asset on
its Statements of Assets and Liabilities. Amounts due to the counterparty from the Fund (unrealized depreciation on swap agreements) are disclosed as a liability on its Statements of Assets and Liabilities. The Fund presents these amounts on a gross basis and does not offset or“net” these amounts on its Statements of Assets and Liabilities.
4 Represents the “uncollateralized” amount due from or (to) the counterparty at period end. These amounts could be due to timing differences between the movement of collateral in relation to market movements, or due to agreement provisions allowing minimum “thresholds” thatwould need to be exceeded prior to the movement of collateral. To the extent that a net amount is due from a counterparty, the Fund would beexposed to the counterparty by such amount and could suffer losses or delays in recovery of that amount in the event of a counterparty default.
5 In order to facilitate the daily valuation and final settlement of these swap transactions as of the time the Fund calculates its NAV, which differsfrom the time the Fund’s underlying index is calculated, one or more exchange-traded financial products are used as the reference entity, as a surrogate for the respective underlying index.
(a) All or a portion of this security is segregated in connection withobligations for swaps with a total value of $3,082,414.
(b) The Fund invests in Repurchase Agreements jointly with otherfunds in the Trust. See “Repurchase Agreements” under Note 2in the Notes to Financial Statements to view the details of eachindividual agreement and counterparty as well as a description ofthe securities subjected to repurchase.
As of May 31, 2017, the gross unrealized appreciation (depreciation)of investments based on the aggregate cost of investments for federalincome tax purposes was as follows:Aggregate gross unrealized appreciation $ —
Aggregate gross unrealized depreciation (1,067,444)
Net unrealized depreciation $ (1,067,444)
Federal income tax cost of investments $ 12,792,381
See accompanying notes to the financial statements.
PROSHARES TRUST SCHEDULE OF PORTFOLIO INVESTMENTS :: MAY 31, 2017 :: ULTRA GOLD MINERSnlGDXX :: 133
Merrill Corp - Proshares Trust Geared Book [96 Funds] Annual Report [Funds] 333-089822 05-31-2017 ED [AUX] | eperez | 28-Jul-17 17:39 | 17-15159-3.fs | Sequence: 17CHKSUM Content: 59347 Layout: 56081 Graphics: No Graphics CLEAN
JOB: 17-15159-3 CYCLE#;BL#: 5; 0 TRIM: 8.25" x 10.75" COMPOSITECOLORS: Black, ~note-color 2, ~note-color 3 GRAPHICS: none V1.5
Investments Shares Value
Exchange Traded Fund (a) — 82.3%
VanEck Vectors Junior Gold Miners ETF (Cost $5,934,727) 124,638 $ 3,917,372
Principal Amount
Short-Term Investment (a) — 23.2%
Repurchase Agreement (b) — 23.2%
Repurchase Agreements with various counterparties, rates 0.60% - 0.81%, dated 5/31/2017, due 6/1/2017, total to be received $1,102,088 (Cost $1,102,064) $ 1,102,064 1,102,064
Total Investments — 105.5%(Cost $7,036,791) 5,019,436
Liabilities less other assets — (5.5%) (262,950)
Net Assets — 100.0% $ 4,756,486
Swap Agreements1,5
Ultra Junior Miners had the following open swap agreements as of May 31, 2017:
Financial Instruments Cash
for the Collateral for Notional Benefit of the Benefit of Amount Termination Rate Paid Underlying Unrealized (the Fund)/the (the Fund)/the at Value Date Counterparty (Received)2 Instrument Depreciation3 Counterparty Counterparty Net Amount4
VanEck Vectors
Bank of Junior Gold $ 1,179,266 11/6/2018 America NA 1.49% Miners ETF $ (268,784) $ — $ 268,784 $ —
VanEck Vectors Goldman Sachs Junior Gold
148,873 11/6/2017 International 1.30% Miners ETF (158,525) — 158,525 —Morgan VanEck Vectors Stanley & Co. Junior Gold
36,016 1/8/2018 International plc 1.89% Miners ETF (4,839) — 4,839 —VanEck Vectors
Societe Junior Gold 68,941 11/6/2018 Generale 1.49% Miners ETF (14,589) — — (14,589)
VanEck Vectors Junior Gold
4,175,984 11/6/2017 UBS AG 1.44% Miners ETF (2,695,683) 699,264 1,996,419 —
$ 5,609,080 $ (3,142,420)
1 The Fund’s Swap Agreements are not accounted for as hedging instruments under ASC 815.2 Reflects the floating financing rate, as of May 31, 2017, on the notional amount of the swap agreement paid to the counterparty or received
from the counterparty, excluding any commissions.3 The Fund discloses amounts due to the Fund from the counterparty (unrealized appreciation on swap agreements) at period end as an asset on
its Statements of Assets and Liabilities. Amounts due to the counterparty from the Fund (unrealized depreciation on swap agreements) are disclosed as a liability on its Statements of Assets and Liabilities. The Fund presents these amounts on a gross basis and does not offset or“net” these amounts on its Statements of Assets and Liabilities.
4 Represents the “uncollateralized” amount due from or (to) the counterparty at period end. These amounts could be due to timing differences between the movement of collateral in relation to market movements, or due to agreement provisions allowing minimum “thresholds” thatwould need to be exceeded prior to the movement of collateral. To the extent that a net amount is due from a counterparty, the Fund would beexposed to the counterparty by such amount and could suffer losses or delays in recovery of that amount in the event of a counterparty default.
5 In order to facilitate the daily valuation and final settlement of these swap transactions as of the time the Fund calculates its NAV, which differsfrom the time the Fund’s underlying index is calculated, one or more exchange-traded financial products are used as the reference entity, as a surrogate for the respective underlying index.
(a) All or a portion of this security is segregated in connection withobligations for swaps with a total value of $3,255,394.
(b) The Fund invests in Repurchase Agreements jointly with otherfunds in the Trust. See “Repurchase Agreements” under Note 2in the Notes to Financial Statements to view the details of eachindividual agreement and counterparty as well as a description ofthe securities subjected to repurchase.
As of May 31, 2017, the gross unrealized appreciation (depreciation)of investments based on the aggregate cost of investments for federalincome tax purposes was as follows:Aggregate gross unrealized appreciation $ —
Aggregate gross unrealized depreciation (2,017,355)
Net unrealized depreciation $ (2,017,355)
Federal income tax cost of investments $ 7,036,791
See accompanying notes to the financial statements.
134 ::nlGDJJ ULTRA JUNIOR MINERS :: MAY 31, 2017 :: SCHEDULE OF PORTFOLIO INVESTMENTS PROSHARES TRUST
Merrill Corp - Proshares Trust Geared Book [96 Funds] Annual Report [Funds] 333-089822 05-31-2017 ED [AUX] | eperez | 28-Jul-17 17:39 | 17-15159-3.fs | Sequence: 18CHKSUM Content: 64040 Layout: 41891 Graphics: No Graphics CLEAN
JOB: 17-15159-3 CYCLE#;BL#: 5; 0 TRIM: 8.25" x 10.75" COMPOSITECOLORS: Black, ~note-color 2, ~note-color 3 GRAPHICS: none V1.5
Investments Shares Value
Common Stocks (a) — 72.2%
Investments Shares Value
Common Stocks (a) (continued)
Biotechnology — 15.5%
AbbVie, Inc. 31,459 $ 2,076,923
ACADIA Pharmaceuticals, Inc.* 1,865 47,949
Agios Pharmaceuticals, Inc.* 812 37,896
Alexion Pharmaceuticals, Inc.* 4,433 434,567
Alkermes plc* 3,010 173,858
Alnylam Pharmaceuticals, Inc.* 1,409 92,233
Amgen, Inc. 14,535 2,256,413
AquaBounty Technologies, Inc.* 28 230
Biogen, Inc.* 4,261 1,055,748
BioMarin Pharmaceutical, Inc.* 3,395 297,538
Bioverativ, Inc.* 2,131 117,397
Bluebird Bio, Inc.* 806 60,732
Celgene Corp.* 15,355 1,756,766
Gilead Sciences, Inc. 25,797 1,673,967
Incyte Corp.* 3,339 431,833
Intercept Pharmaceuticals, Inc.* 347 38,829
Intrexon Corp.* 1,193 25,435
Ionis Pharmaceuticals, Inc.* 2,392 109,530
Juno Therapeutics, Inc.* 1,505 34,961
Kite Pharma, Inc.* 963 69,644
Ligand Pharmaceuticals, Inc.* 374 40,497
Myriad Genetics, Inc.* 1,344 27,350
Neurocrine Biosciences, Inc.* 1,719 74,725
Novavax, Inc.* 5,353 4,932
OPKO Health, Inc.* 7,152 43,913
Portola Pharmaceuticals, Inc.* 1,116 41,125
Radius Health, Inc.* 732 25,342
Regeneron Pharmaceuticals, Inc.* 1,501 689,049
Seattle Genetics, Inc.* 1,912 122,330
TESARO, Inc.* 674 100,635
Ultragenyx Pharmaceutical, Inc.* 758 40,818
United Therapeutics Corp.* 888 107,350
Vertex Pharmaceuticals, Inc.* 4,903 606,011
12,716,526
Commercial Services & Supplies — 0.1%
Healthcare Services Group, Inc. 1,437 68,789
Health Care Equipment & Supplies — 15.3%
Abbott Laboratories 34,101 1,557,052
ABIOMED, Inc.* 799 109,806
Alere, Inc.* 1,717 83,292
Align Technology, Inc.* 1,489 216,203
Baxter International, Inc. 9,593 568,961
Becton Dickinson and Co. 4,448 841,695
Boston Scientific Corp.* 26,911 727,404
Cooper Cos., Inc. (The) 966 211,312
CR Bard, Inc. 1,421 436,858
Danaher Corp. 12,041 1,022,762
DENTSPLY SIRONA, Inc. 4,534 $ 288,000
DexCom, Inc.* 1,669 111,556
Edwards Lifesciences Corp.* 4,194 482,604
Haemonetics Corp.* 1,026 41,840
Halyard Health, Inc.* 921 33,101
Hill-Rom Holdings, Inc. 1,174 90,821
Hologic, Inc.* 5,513 238,768
IDEXX Laboratories, Inc.* 1,737 292,493
Intuitive Surgical, Inc.* 725 663,143
Medtronic plc 27,018 2,277,077
NuVasive, Inc.* 998 74,880
ResMed, Inc. 2,796 198,796
STERIS plc 1,676 129,990
Stryker Corp. 6,108 873,200
Teleflex, Inc. 887 177,418
Varex Imaging Corp.* 739 25,385
Varian Medical Systems, Inc.* 1,844 182,593
West Pharmaceutical Services, Inc. 1,446 140,291
Zimmer Biomet Holdings, Inc. 3,969 473,144
12,570,445
Health Care Providers & Services — 12.5%
Acadia Healthcare Co., Inc.* 1,503 62,134
Aetna, Inc. 6,547 948,398
Anthem, Inc. 5,218 951,502
Brookdale Senior Living, Inc.* 3,672 50,453
Centene Corp.* 3,396 246,652
Cigna Corp. 5,073 817,920
Community Health Systems, Inc.* 2,247 19,886
DaVita, Inc.* 3,073 203,617
Envision Healthcare Corp.* 2,319 126,641
Express Scripts Holding Co.* 11,956 714,371
HCA Healthcare, Inc.* 5,699 466,805
HealthSouth Corp. 1,758 79,690
Henry Schein, Inc.* 1,563 287,545
Humana, Inc. 2,947 684,470
Laboratory Corp. of America Holdings* 2,019 280,641
LifePoint Health, Inc.* 789 47,971
Magellan Health, Inc.* 466 32,038
MEDNAX, Inc.* 1,851 100,509
Molina Healthcare, Inc.* 840 54,239
Owens & Minor, Inc. 1,205 38,415
Patterson Cos., Inc. 1,623 71,672
Quest Diagnostics, Inc. 2,714 295,202
Tenet Healthcare Corp.* 1,576 26,067
UnitedHealth Group, Inc. 18,988 3,326,318
Universal Health Services, Inc., Class B 1,763 200,383
WellCare Health Plans, Inc.* 874 150,153
10,283,692
See accompanying notes to the financial statements.
PROSHARES TRUST SCHEDULE OF PORTFOLIO INVESTMENTS :: MAY 31, 2017 :: ULTRA HEALTH CAREnlRXL :: 135
Merrill Corp - Proshares Trust Geared Book [96 Funds] Annual Report [Funds] 333-089822 05-31-2017 ED [AUX] | eperez | 28-Jul-17 17:39 | 17-15159-3.fu | Sequence: 1CHKSUM Content: 29591 Layout: 5801 Graphics: No Graphics CLEAN
JOB: 17-15159-3 CYCLE#;BL#: 5; 0 TRIM: 8.25" x 10.75" COMPOSITECOLORS: Black, ~note-color 2, ~note-color 3 GRAPHICS: none V1.5
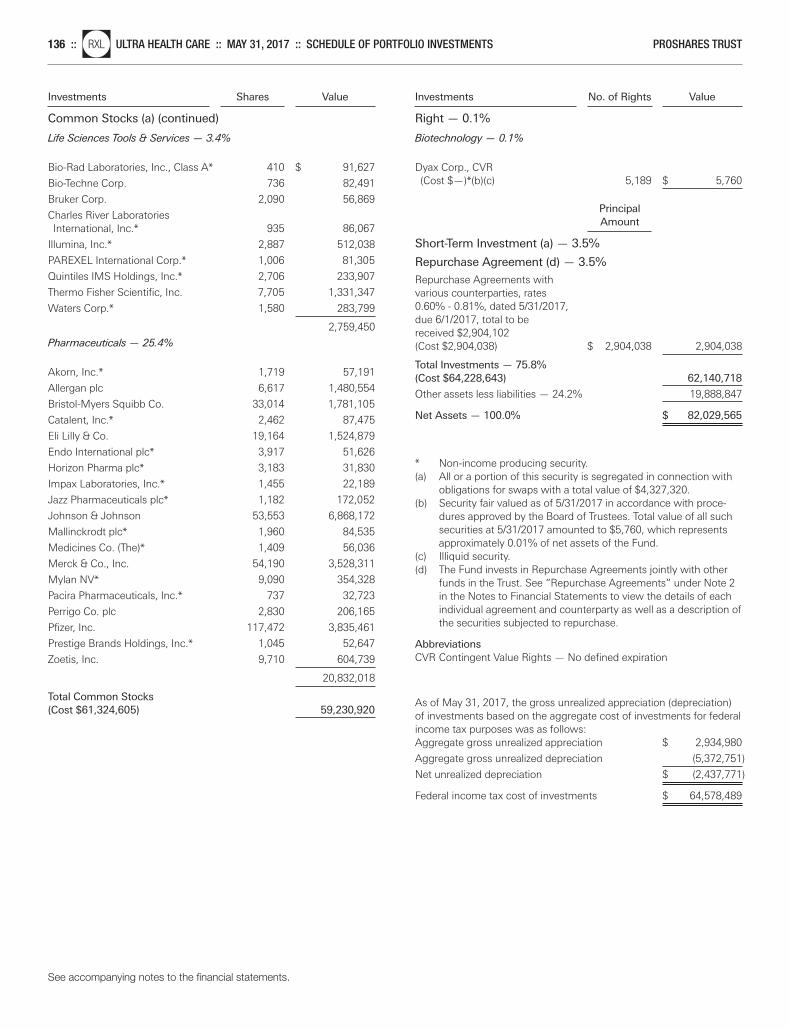
Investments Shares Value
Common Stocks (a) (continued)
Investments No. of Rights Value
Right — 0.1%
Life Sciences Tools & Services — 3.4%
Bio-Rad Laboratories, Inc., Class A* 410 $ 91,627
Bio-Techne Corp. 736 82,491
Bruker Corp. 2,090 56,869
Charles River Laboratories International, Inc.* 935 86,067
Illumina, Inc.* 2,887 512,038
PAREXEL International Corp.* 1,006 81,305
Quintiles IMS Holdings, Inc.* 2,706 233,907
Thermo Fisher Scientific, Inc. 7,705 1,331,347
Waters Corp.* 1,580 283,799
2,759,450
Pharmaceuticals — 25.4%
Akorn, Inc.* 1,719 57,191
Allergan plc 6,617 1,480,554
Bristol-Myers Squibb Co. 33,014 1,781,105
Catalent, Inc.* 2,462 87,475
Eli Lilly & Co. 19,164 1,524,879
Endo International plc* 3,917 51,626
Horizon Pharma plc* 3,183 31,830
Impax Laboratories, Inc.* 1,455 22,189
Jazz Pharmaceuticals plc* 1,182 172,052
Johnson & Johnson 53,553 6,868,172
Mallinckrodt plc* 1,960 84,535
Medicines Co. (The)* 1,409 56,036
Merck & Co., Inc. 54,190 3,528,311
Mylan NV* 9,090 354,328
Pacira Pharmaceuticals, Inc.* 737 32,723
Perrigo Co. plc 2,830 206,165
Pfizer, Inc. 117,472 3,835,461
Prestige Brands Holdings, Inc.* 1,045 52,647
Zoetis, Inc. 9,710 604,739
20,832,018
Total Common Stocks(Cost $61,324,605) 59,230,920
Biotechnology — 0.1%
Dyax Corp., CVR (Cost $—)*(b)(c) 5,189 $ 5,760
Principal Amount
Short-Term Investment (a) — 3.5%
Repurchase Agreement (d) — 3.5%
Repurchase Agreements with various counterparties, rates 0.60% - 0.81%, dated 5/31/2017, due 6/1/2017, total to be received $2,904,102 (Cost $2,904,038) $ 2,904,038 2,904,038
Total Investments — 75.8%(Cost $64,228,643) 62,140,718
Other assets less liabilities — 24.2% 19,888,847
Net Assets — 100.0% $ 82,029,565
* Non-income producing security.(a) All or a portion of this security is segregated in connection with
obligations for swaps with a total value of $4,327,320.(b) Security fair valued as of 5/31/2017 in accordance with proce-
dures approved by the Board of Trustees. Total value of all suchsecurities at 5/31/2017 amounted to $5,760, which representsapproximately 0.01% of net assets of the Fund.
(c) Illiquid security.(d) The Fund invests in Repurchase Agreements jointly with other
funds in the Trust. See “Repurchase Agreements” under Note 2in the Notes to Financial Statements to view the details of eachindividual agreement and counterparty as well as a description ofthe securities subjected to repurchase.
AbbreviationsCVR Contingent Value Rights — No defined expiration
As of May 31, 2017, the gross unrealized appreciation (depreciation)of investments based on the aggregate cost of investments for federalincome tax purposes was as follows:Aggregate gross unrealized appreciation $ 2,934,980
Aggregate gross unrealized depreciation (5,372,751)
Net unrealized depreciation $ (2,437,771)
Federal income tax cost of investments $ 64,578,489
See accompanying notes to the financial statements.
136 ::nlRXL ULTRA HEALTH CARE :: MAY 31, 2017 :: SCHEDULE OF PORTFOLIO INVESTMENTS PROSHARES TRUST
Merrill Corp - Proshares Trust Geared Book [96 Funds] Annual Report [Funds] 333-089822 05-31-2017 ED [AUX] | eperez | 28-Jul-17 17:39 | 17-15159-3.fu | Sequence: 2CHKSUM Content: 4174 Layout: 19909 Graphics: No Graphics CLEAN
JOB: 17-15159-3 CYCLE#;BL#: 5; 0 TRIM: 8.25" x 10.75" COMPOSITECOLORS: Black, ~note-color 2, ~note-color 3 GRAPHICS: none V1.5
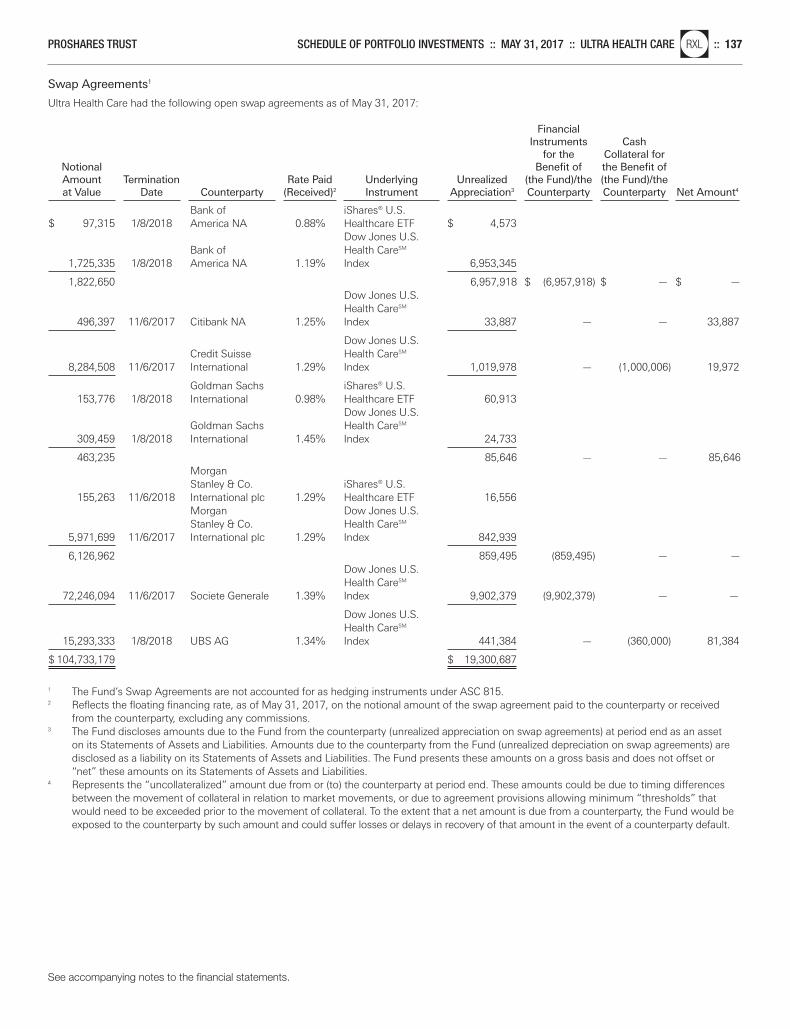
Swap Agreements1
Ultra Health Care had the following open swap agreements as of May 31, 2017:
Financial Instruments Cash
for the Collateral for Notional Benefit of the Benefit of Amount Termination Rate Paid Underlying Unrealized (the Fund)/the (the Fund)/the at Value Date Counterparty (Received)2 Instrument Appreciation3 Counterparty Counterparty Net Amount4
Bank of iShares® U.S.
$ 97,315 1/8/2018 America NA 0.88% Healthcare ETF $ 4,573 Dow Jones U.S.
Bank of Health CareSM 1,725,335 1/8/2018 America NA 1.19% Index 6,953,345
1,822,650 6,957,918 $ (6,957,918) $ — $ —Dow Jones U.S. Health CareSM
496,397 11/6/2017 Citibank NA 1.25% Index 33,887 — — 33,887
Dow Jones U.S. Credit Suisse Health CareSM
8,284,508 11/6/2017 International 1.29% Index 1,019,978 — (1,000,006) 19,972
Goldman Sachs iShares® U.S. 153,776 1/8/2018 International 0.98% Healthcare ETF 60,913
Dow Jones U.S. Goldman Sachs Health CareSM
309,459 1/8/2018 International 1.45% Index 24,733
463,235 85,646 — — 85,646Morgan Stanley & Co. iShares® U.S.
155,263 11/6/2018 International plc 1.29% Healthcare ETF 16,556 Morgan Dow Jones U.S. Stanley & Co. Health CareSM
5,971,699 11/6/2017 International plc 1.29% Index 842,939
6,126,962 859,495 (859,495) — —Dow Jones U.S. Health CareSM
72,246,094 11/6/2017 Societe Generale 1.39% Index 9,902,379 (9,902,379) — —
Dow Jones U.S. Health CareSM
15,293,333 1/8/2018 UBS AG 1.34% Index 441,384 — (360,000) 81,384
$ 104,733,179 $ 19,300,687
1 The Fund’s Swap Agreements are not accounted for as hedging instruments under ASC 815.2 Reflects the floating financing rate, as of May 31, 2017, on the notional amount of the swap agreement paid to the counterparty or received
from the counterparty, excluding any commissions.3 The Fund discloses amounts due to the Fund from the counterparty (unrealized appreciation on swap agreements) at period end as an asset
on its Statements of Assets and Liabilities. Amounts due to the counterparty from the Fund (unrealized depreciation on swap agreements) aredisclosed as a liability on its Statements of Assets and Liabilities. The Fund presents these amounts on a gross basis and does not offset or“net” these amounts on its Statements of Assets and Liabilities.
4 Represents the “uncollateralized” amount due from or (to) the counterparty at period end. These amounts could be due to timing differencesbetween the movement of collateral in relation to market movements, or due to agreement provisions allowing minimum “thresholds” thatwould need to be exceeded prior to the movement of collateral. To the extent that a net amount is due from a counterparty, the Fund would beexposed to the counterparty by such amount and could suffer losses or delays in recovery of that amount in the event of a counterparty default.
See accompanying notes to the financial statements.
PROSHARES TRUST SCHEDULE OF PORTFOLIO INVESTMENTS :: MAY 31, 2017 :: ULTRA HEALTH CAREnlRXL :: 137
Merrill Corp - Proshares Trust Geared Book [96 Funds] Annual Report [Funds] 333-089822 05-31-2017 ED [AUX] | eperez | 28-Jul-17 17:39 | 17-15159-3.fu | Sequence: 3CHKSUM Content: 20340 Layout: 38341 Graphics: No Graphics CLEAN
JOB: 17-15159-3 CYCLE#;BL#: 5; 0 TRIM: 8.25" x 10.75" COMPOSITECOLORS: Black, ~note-color 2, ~note-color 3 GRAPHICS: none V1.5
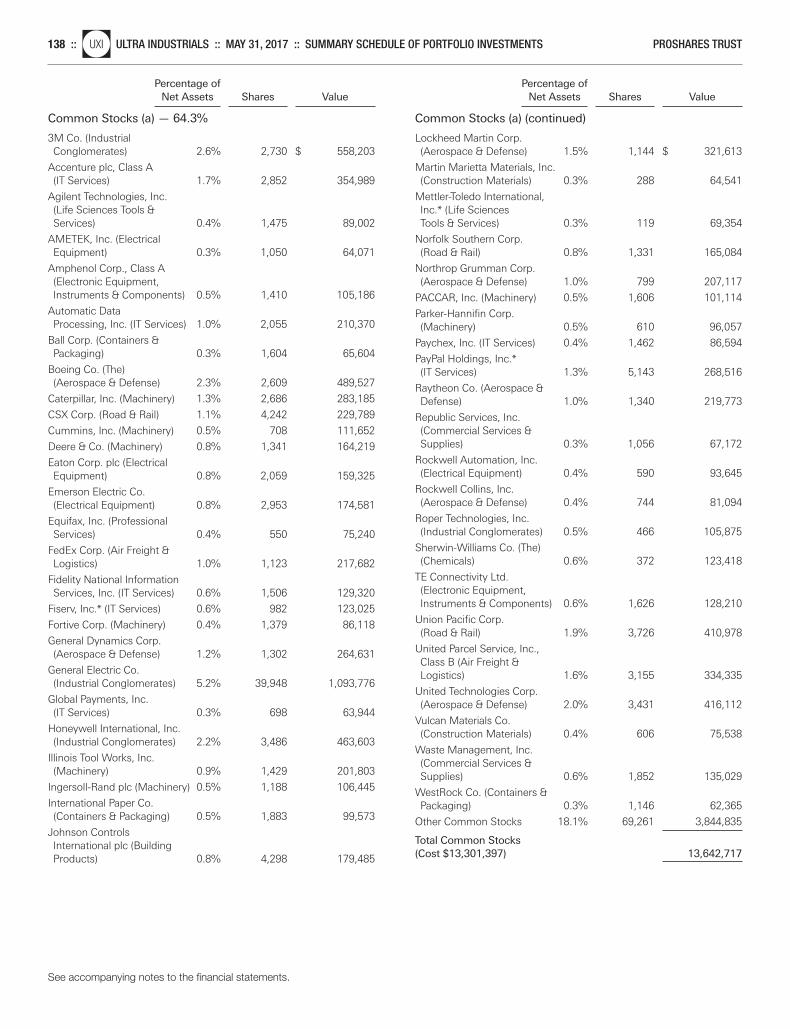
Percentage of Net Assets Shares Value
Common Stocks (a) — 64.3%
Percentage of Net Assets Shares Value
Common Stocks (a) (continued)
3M Co. (Industrial Conglomerates) 2.6% 2,730 $ 558,203
Accenture plc, Class A (IT Services) 1.7% 2,852 354,989
Agilent Technologies, Inc. (Life Sciences Tools & Services) 0.4% 1,475 89,002
AMETEK, Inc. (Electrical Equipment) 0.3% 1,050 64,071
Amphenol Corp., Class A (Electronic Equipment, Instruments & Components) 0.5% 1,410 105,186
Automatic Data Processing, Inc. (IT Services) 1.0% 2,055 210,370
Ball Corp. (Containers & Packaging) 0.3% 1,604 65,604
Boeing Co. (The) (Aerospace & Defense) 2.3% 2,609 489,527
Caterpillar, Inc. (Machinery) 1.3% 2,686 283,185
CSX Corp. (Road & Rail) 1.1% 4,242 229,789
Cummins, Inc. (Machinery) 0.5% 708 111,652
Deere & Co. (Machinery) 0.8% 1,341 164,219
Eaton Corp. plc (Electrical Equipment) 0.8% 2,059 159,325
Emerson Electric Co. (Electrical Equipment) 0.8% 2,953 174,581
Equifax, Inc. (Professional Services) 0.4% 550 75,240
FedEx Corp. (Air Freight & Logistics) 1.0% 1,123 217,682
Fidelity National Information Services, Inc. (IT Services) 0.6% 1,506 129,320
Fiserv, Inc.* (IT Services) 0.6% 982 123,025
Fortive Corp. (Machinery) 0.4% 1,379 86,118
General Dynamics Corp. (Aerospace & Defense) 1.2% 1,302 264,631
General Electric Co. (Industrial Conglomerates) 5.2% 39,948 1,093,776
Global Payments, Inc. (IT Services) 0.3% 698 63,944
Honeywell International, Inc. (Industrial Conglomerates) 2.2% 3,486 463,603
Illinois Tool Works, Inc. (Machinery) 0.9% 1,429 201,803
Ingersoll-Rand plc (Machinery) 0.5% 1,188 106,445
International Paper Co. (Containers & Packaging) 0.5% 1,883 99,573
Johnson Controls International plc (Building Products) 0.8% 4,298 179,485
Lockheed Martin Corp. (Aerospace & Defense) 1.5% 1,144 $ 321,613
Martin Marietta Materials, Inc. (Construction Materials) 0.3% 288 64,541
Mettler-Toledo International, Inc.* (Life Sciences Tools & Services) 0.3% 119 69,354
Norfolk Southern Corp. (Road & Rail) 0.8% 1,331 165,084
Northrop Grumman Corp. (Aerospace & Defense) 1.0% 799 207,117
PACCAR, Inc. (Machinery) 0.5% 1,606 101,114
Parker-Hannifin Corp. (Machinery) 0.5% 610 96,057
Paychex, Inc. (IT Services) 0.4% 1,462 86,594
PayPal Holdings, Inc.* (IT Services) 1.3% 5,143 268,516
Raytheon Co. (Aerospace & Defense) 1.0% 1,340 219,773
Republic Services, Inc. (Commercial Services & Supplies) 0.3% 1,056 67,172
Rockwell Automation, Inc. (Electrical Equipment) 0.4% 590 93,645
Rockwell Collins, Inc. (Aerospace & Defense) 0.4% 744 81,094
Roper Technologies, Inc. (Industrial Conglomerates) 0.5% 466 105,875
Sherwin-Williams Co. (The) (Chemicals) 0.6% 372 123,418
TE Connectivity Ltd. (Electronic Equipment, Instruments & Components) 0.6% 1,626 128,210
Union Pacific Corp. (Road & Rail) 1.9% 3,726 410,978
United Parcel Service, Inc., Class B (Air Freight & Logistics) 1.6% 3,155 334,335
United Technologies Corp. (Aerospace & Defense) 2.0% 3,431 416,112
Vulcan Materials Co. (Construction Materials) 0.4% 606 75,538
Waste Management, Inc. (Commercial Services & Supplies) 0.6% 1,852 135,029
WestRock Co. (Containers & Packaging) 0.3% 1,146 62,365
Other Common Stocks 18.1% 69,261 3,844,835
Total Common Stocks (Cost $13,301,397) 13,642,717
See accompanying notes to the financial statements.
138 ::nlUXI ULTRA INDUSTRIALS :: MAY 31, 2017 :: SUMMARY SCHEDULE OF PORTFOLIO INVESTMENTS PROSHARES TRUST
Merrill Corp - Proshares Trust Geared Book [96 Funds] Annual Report [Funds] 333-089822 05-31-2017 ED [AUX] | eperez | 28-Jul-17 17:39 | 17-15159-3.fu | Sequence: 4CHKSUM Content: 45195 Layout: 47283 Graphics: No Graphics CLEAN
JOB: 17-15159-3 CYCLE#;BL#: 5; 0 TRIM: 8.25" x 10.75" COMPOSITECOLORS: Black, ~note-color 2, ~note-color 3 GRAPHICS: none V1.5
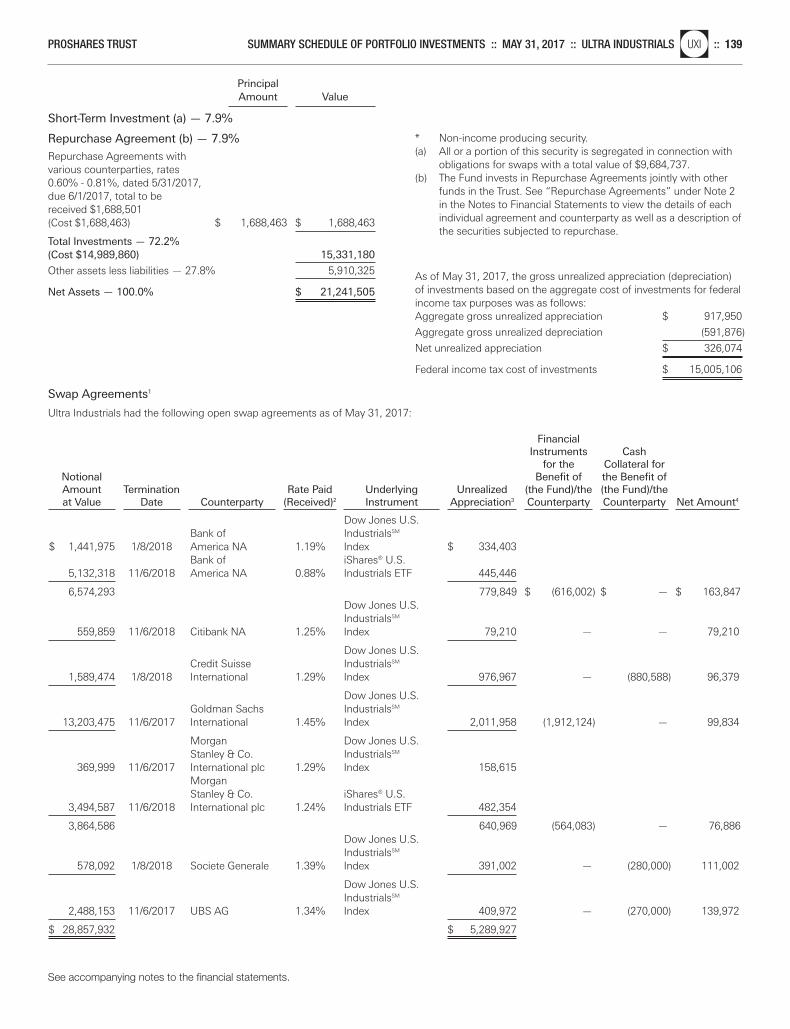
Principal Amount Value
Short-Term Investment (a) — 7.9%
Repurchase Agreement (b) — 7.9%
Repurchase Agreements with various counterparties, rates 0.60% - 0.81%, dated 5/31/2017, due 6/1/2017, total to be received $1,688,501 (Cost $1,688,463) $ 1,688,463 $ 1,688,463
Total Investments — 72.2%(Cost $14,989,860) 15,331,180
Other assets less liabilities — 27.8% 5,910,325
Net Assets — 100.0% $ 21,241,505
Swap Agreements1
Ultra Industrials had the following open swap agreements as of May 31, 2017:
Financial Instruments Cash
for the Collateral for Notional Benefit of the Benefit of Amount Termination Rate Paid Underlying Unrealized (the Fund)/the (the Fund)/the at Value Date Counterparty (Received)2 Instrument Appreciation3 Counterparty Counterparty Net Amount4
Dow Jones U.S.
Bank of IndustrialsSM $ 1,441,975 1/8/2018 America NA 1.19% Index $ 334,403
Bank of iShares® U.S. 5,132,318 11/6/2018 America NA 0.88% Industrials ETF 445,446
6,574,293 779,849 $ (616,002) $ — $ 163,847Dow Jones U.S. IndustrialsSM
559,859 11/6/2018 Citibank NA 1.25% Index 79,210 — — 79,210
Dow Jones U.S. Credit Suisse IndustrialsSM
1,589,474 1/8/2018 International 1.29% Index 976,967 — (880,588) 96,379
Dow Jones U.S. Goldman Sachs IndustrialsSM
13,203,475 11/6/2017 International 1.45% Index 2,011,958 (1,912,124) — 99,834
Morgan Dow Jones U.S. Stanley & Co. IndustrialsSM
369,999 11/6/2017 International plc 1.29% Index 158,615 Morgan Stanley & Co. iShares® U.S.
3,494,587 11/6/2018 International plc 1.24% Industrials ETF 482,354
3,864,586 640,969 (564,083) — 76,886Dow Jones U.S. IndustrialsSM
578,092 1/8/2018 Societe Generale 1.39% Index 391,002 — (280,000) 111,002
Dow Jones U.S. IndustrialsSM
2,488,153 11/6/2017 UBS AG 1.34% Index 409,972 — (270,000) 139,972
$ 28,857,932 $ 5,289,927
* Non-income producing security.(a) All or a portion of this security is segregated in connection with
obligations for swaps with a total value of $9,684,737.(b) The Fund invests in Repurchase Agreements jointly with other
funds in the Trust. See “Repurchase Agreements” under Note 2in the Notes to Financial Statements to view the details of eachindividual agreement and counterparty as well as a description ofthe securities subjected to repurchase.
As of May 31, 2017, the gross unrealized appreciation (depreciation)of investments based on the aggregate cost of investments for federalincome tax purposes was as follows:Aggregate gross unrealized appreciation $ 917,950
Aggregate gross unrealized depreciation (591,876)
Net unrealized appreciation $ 326,074
Federal income tax cost of investments $ 15,005,106
See accompanying notes to the financial statements.
PROSHARES TRUST SUMMARY SCHEDULE OF PORTFOLIO INVESTMENTS :: MAY 31, 2017 :: ULTRA INDUSTRIALSnlUXI :: 139
Merrill Corp - Proshares Trust Geared Book [96 Funds] Annual Report [Funds] 333-089822 05-31-2017 ED [AUX] | eperez | 28-Jul-17 17:39 | 17-15159-3.fu | Sequence: 5CHKSUM Content: 64190 Layout: 35721 Graphics: No Graphics CLEAN
JOB: 17-15159-3 CYCLE#;BL#: 5; 0 TRIM: 8.25" x 10.75" COMPOSITECOLORS: Black, ~note-color 2, ~note-color 3 GRAPHICS: none V1.5
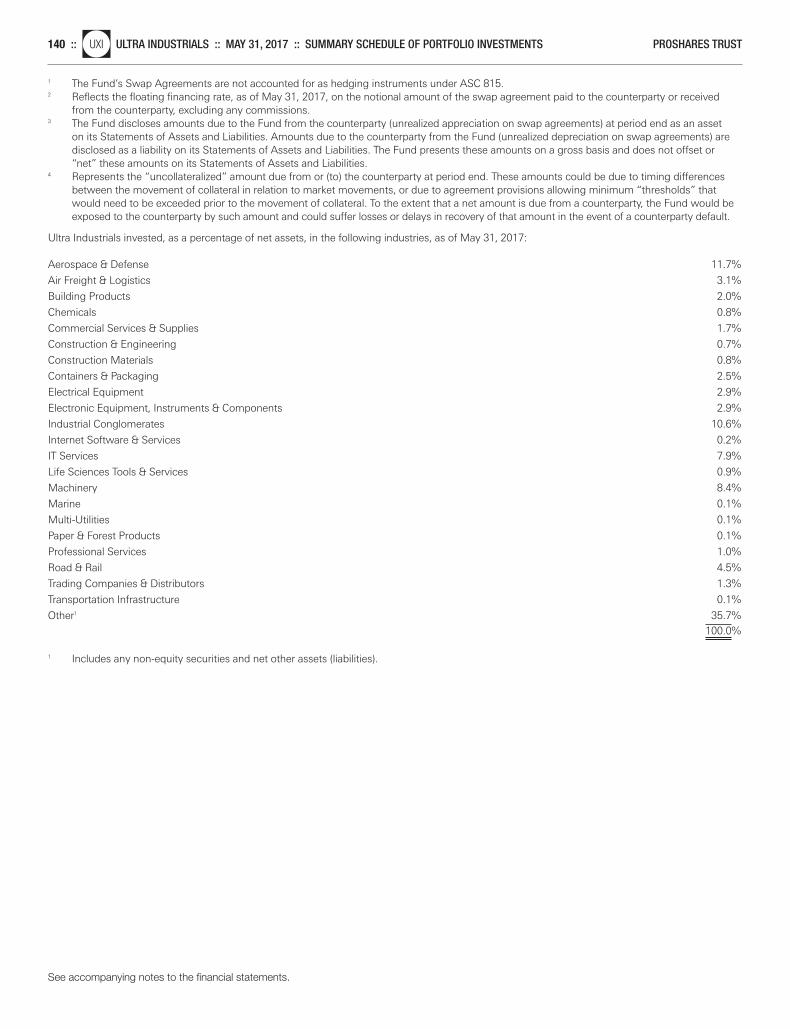
1 The Fund’s Swap Agreements are not accounted for as hedging instruments under ASC 815.2 Reflects the floating financing rate, as of May 31, 2017, on the notional amount of the swap agreement paid to the counterparty or received
from the counterparty, excluding any commissions.3 The Fund discloses amounts due to the Fund from the counterparty (unrealized appreciation on swap agreements) at period end as an asset
on its Statements of Assets and Liabilities. Amounts due to the counterparty from the Fund (unrealized depreciation on swap agreements) aredisclosed as a liability on its Statements of Assets and Liabilities. The Fund presents these amounts on a gross basis and does not offset or“net” these amounts on its Statements of Assets and Liabilities.
4 Represents the “uncollateralized” amount due from or (to) the counterparty at period end. These amounts could be due to timing differencesbetween the movement of collateral in relation to market movements, or due to agreement provisions allowing minimum “thresholds” thatwould need to be exceeded prior to the movement of collateral. To the extent that a net amount is due from a counterparty, the Fund would beexposed to the counterparty by such amount and could suffer losses or delays in recovery of that amount in the event of a counterparty default.
Ultra Industrials invested, as a percentage of net assets, in the following industries, as of May 31, 2017:
Aerospace & Defense 11.7%
Air Freight & Logistics 3.1%
Building Products 2.0%
Chemicals 0.8%
Commercial Services & Supplies 1.7%
Construction & Engineering 0.7%
Construction Materials 0.8%
Containers & Packaging 2.5%
Electrical Equipment 2.9%
Electronic Equipment, Instruments & Components 2.9%
Industrial Conglomerates 10.6%
Internet Software & Services 0.2%
IT Services 7.9%
Life Sciences Tools & Services 0.9%
Machinery 8.4%
Marine 0.1%
Multi-Utilities 0.1%
Paper & Forest Products 0.1%
Professional Services 1.0%
Road & Rail 4.5%
Trading Companies & Distributors 1.3%
Transportation Infrastructure 0.1%
Other1 35.7% 100.0%
1 Includes any non-equity securities and net other assets (liabilities).
See accompanying notes to the financial statements.
140 ::nlUXI ULTRA INDUSTRIALS :: MAY 31, 2017 :: SUMMARY SCHEDULE OF PORTFOLIO INVESTMENTS PROSHARES TRUST
Merrill Corp - Proshares Trust Geared Book [96 Funds] Annual Report [Funds] 333-089822 05-31-2017 ED [AUX] | eperez | 28-Jul-17 17:39 | 17-15159-3.fu | Sequence: 6CHKSUM Content: 6589 Layout: 18904 Graphics: No Graphics CLEAN
JOB: 17-15159-3 CYCLE#;BL#: 5; 0 TRIM: 8.25" x 10.75" COMPOSITECOLORS: Black, ~note-color 2, ~note-color 3 GRAPHICS: none V1.5
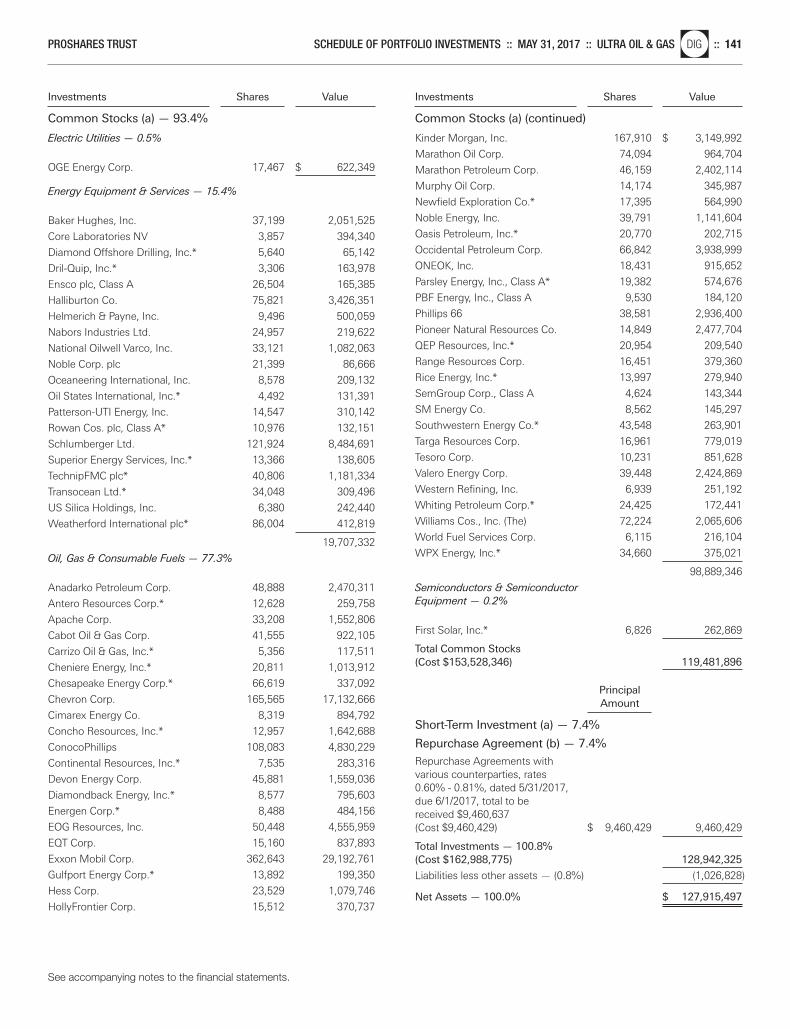
Investments Shares Value
Common Stocks (a) — 93.4%
Investments Shares Value
Common Stocks (a) (continued)
Electric Utilities — 0.5%
OGE Energy Corp. 17,467 $ 622,349
Energy Equipment & Services — 15.4%
Baker Hughes, Inc. 37,199 2,051,525
Core Laboratories NV 3,857 394,340
Diamond Offshore Drilling, Inc.* 5,640 65,142
Dril-Quip, Inc.* 3,306 163,978
Ensco plc, Class A 26,504 165,385
Halliburton Co. 75,821 3,426,351
Helmerich & Payne, Inc. 9,496 500,059
Nabors Industries Ltd. 24,957 219,622
National Oilwell Varco, Inc. 33,121 1,082,063
Noble Corp. plc 21,399 86,666
Oceaneering International, Inc. 8,578 209,132
Oil States International, Inc.* 4,492 131,391
Patterson-UTI Energy, Inc. 14,547 310,142
Rowan Cos. plc, Class A* 10,976 132,151
Schlumberger Ltd. 121,924 8,484,691
Superior Energy Services, Inc.* 13,366 138,605
TechnipFMC plc* 40,806 1,181,334
Transocean Ltd.* 34,048 309,496
US Silica Holdings, Inc. 6,380 242,440
Weatherford International plc* 86,004 412,819
19,707,332
Oil, Gas & Consumable Fuels — 77.3%
Anadarko Petroleum Corp. 48,888 2,470,311
Antero Resources Corp.* 12,628 259,758
Apache Corp. 33,208 1,552,806
Cabot Oil & Gas Corp. 41,555 922,105
Carrizo Oil & Gas, Inc.* 5,356 117,511
Cheniere Energy, Inc.* 20,811 1,013,912
Chesapeake Energy Corp.* 66,619 337,092
Chevron Corp. 165,565 17,132,666
Cimarex Energy Co. 8,319 894,792
Concho Resources, Inc.* 12,957 1,642,688
ConocoPhillips 108,083 4,830,229
Continental Resources, Inc.* 7,535 283,316
Devon Energy Corp. 45,881 1,559,036
Diamondback Energy, Inc.* 8,577 795,603
Energen Corp.* 8,488 484,156
EOG Resources, Inc. 50,448 4,555,959
EQT Corp. 15,160 837,893
Exxon Mobil Corp. 362,643 29,192,761
Gulfport Energy Corp.* 13,892 199,350
Hess Corp. 23,529 1,079,746
HollyFrontier Corp. 15,512 370,737
Kinder Morgan, Inc. 167,910 $ 3,149,992
Marathon Oil Corp. 74,094 964,704
Marathon Petroleum Corp. 46,159 2,402,114
Murphy Oil Corp. 14,174 345,987
Newfield Exploration Co.* 17,395 564,990
Noble Energy, Inc. 39,791 1,141,604
Oasis Petroleum, Inc.* 20,770 202,715
Occidental Petroleum Corp. 66,842 3,938,999
ONEOK, Inc. 18,431 915,652
Parsley Energy, Inc., Class A* 19,382 574,676
PBF Energy, Inc., Class A 9,530 184,120
Phillips 66 38,581 2,936,400
Pioneer Natural Resources Co. 14,849 2,477,704
QEP Resources, Inc.* 20,954 209,540
Range Resources Corp. 16,451 379,360
Rice Energy, Inc.* 13,997 279,940
SemGroup Corp., Class A 4,624 143,344
SM Energy Co. 8,562 145,297
Southwestern Energy Co.* 43,548 263,901
Targa Resources Corp. 16,961 779,019
Tesoro Corp. 10,231 851,628
Valero Energy Corp. 39,448 2,424,869
Western Refining, Inc. 6,939 251,192
Whiting Petroleum Corp.* 24,425 172,441
Williams Cos., Inc. (The) 72,224 2,065,606
World Fuel Services Corp. 6,115 216,104
WPX Energy, Inc.* 34,660 375,021
98,889,346
Semiconductors & Semiconductor
Equipment — 0.2%
First Solar, Inc.* 6,826 262,869
Total Common Stocks(Cost $153,528,346) 119,481,896
Principal Amount
Short-Term Investment (a) — 7.4%
Repurchase Agreement (b) — 7.4%
Repurchase Agreements with various counterparties, rates 0.60% - 0.81%, dated 5/31/2017, due 6/1/2017, total to be received $9,460,637 (Cost $9,460,429) $ 9,460,429 9,460,429
Total Investments — 100.8%(Cost $162,988,775) 128,942,325
Liabilities less other assets — (0.8%) (1,026,828)
Net Assets — 100.0% $ 127,915,497
See accompanying notes to the financial statements.
PROSHARES TRUST SCHEDULE OF PORTFOLIO INVESTMENTS :: MAY 31, 2017 :: ULTRA OIL & GASnlDIG :: 141
Merrill Corp - Proshares Trust Geared Book [96 Funds] Annual Report [Funds] 333-089822 05-31-2017 ED [AUX] | eperez | 28-Jul-17 17:39 | 17-15159-3.fu | Sequence: 7CHKSUM Content: 1679 Layout: 46143 Graphics: No Graphics CLEAN
JOB: 17-15159-3 CYCLE#;BL#: 5; 0 TRIM: 8.25" x 10.75" COMPOSITECOLORS: Black, ~note-color 2, ~note-color 3 GRAPHICS: none V1.5
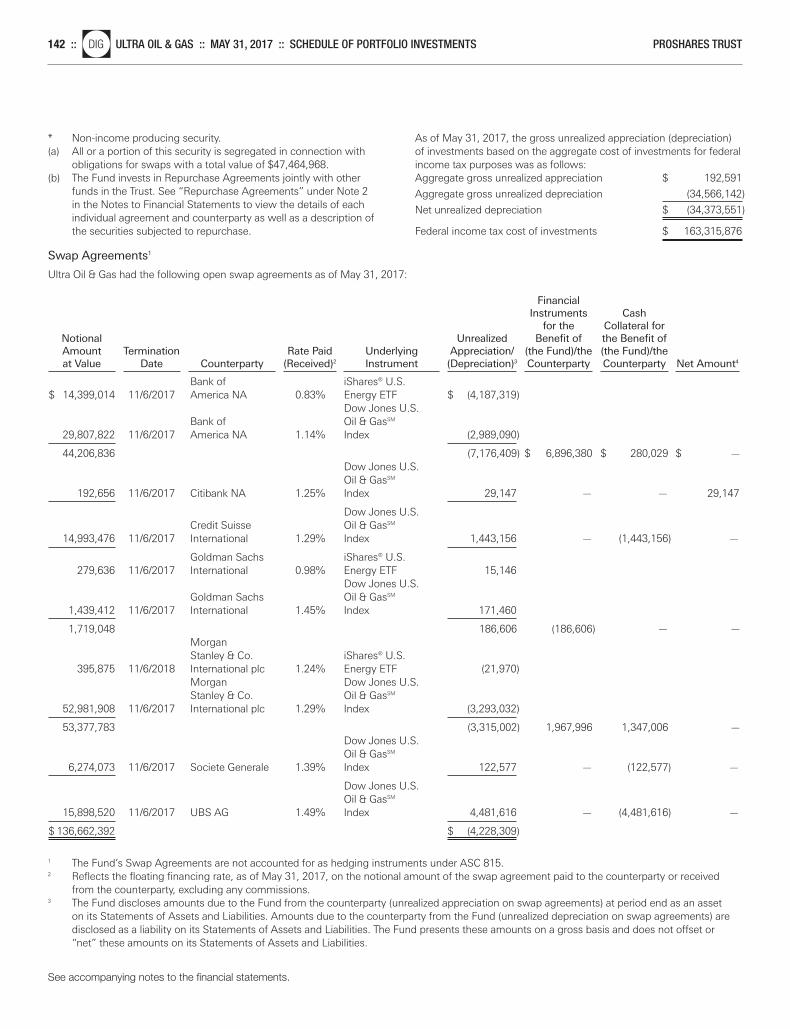
* Non-income producing security.(a) All or a portion of this security is segregated in connection with
obligations for swaps with a total value of $47,464,968.(b) The Fund invests in Repurchase Agreements jointly with other
funds in the Trust. See “Repurchase Agreements” under Note 2in the Notes to Financial Statements to view the details of eachindividual agreement and counterparty as well as a description ofthe securities subjected to repurchase.
Swap Agreements1
Ultra Oil & Gas had the following open swap agreements as of May 31, 2017:
Financial Instruments Cash
for the Collateral for Notional Unrealized Benefit of the Benefit of Amount Termination Rate Paid Underlying Appreciation/ (the Fund)/the (the Fund)/the at Value Date Counterparty (Received)2 Instrument (Depreciation)3 Counterparty Counterparty Net Amount4
Bank of iShares® U.S.
$ 14,399,014 11/6/2017 America NA 0.83% Energy ETF $ (4,187,319) Dow Jones U.S.
Bank of Oil & GasSM 29,807,822 11/6/2017 America NA 1.14% Index (2,989,090)
44,206,836 (7,176,409) $ 6,896,380 $ 280,029 $ —Dow Jones U.S. Oil & GasSM
192,656 11/6/2017 Citibank NA 1.25% Index 29,147 — — 29,147
Dow Jones U.S. Credit Suisse Oil & GasSM
14,993,476 11/6/2017 International 1.29% Index 1,443,156 — (1,443,156) —
Goldman Sachs iShares® U.S. 279,636 11/6/2017 International 0.98% Energy ETF 15,146
Dow Jones U.S. Goldman Sachs Oil & GasSM
1,439,412 11/6/2017 International 1.45% Index 171,460
1,719,048 186,606 (186,606) — —Morgan Stanley & Co. iShares® U.S.
395,875 11/6/2018 International plc 1.24% Energy ETF (21,970) Morgan Dow Jones U.S. Stanley & Co. Oil & GasSM
52,981,908 11/6/2017 International plc 1.29% Index (3,293,032)
53,377,783 (3,315,002) 1,967,996 1,347,006 —Dow Jones U.S. Oil & GasSM
6,274,073 11/6/2017 Societe Generale 1.39% Index 122,577 — (122,577) —
Dow Jones U.S. Oil & GasSM
15,898,520 11/6/2017 UBS AG 1.49% Index 4,481,616 — (4,481,616) —
$ 136,662,392 $ (4,228,309)
1 The Fund’s Swap Agreements are not accounted for as hedging instruments under ASC 815.2 Reflects the floating financing rate, as of May 31, 2017, on the notional amount of the swap agreement paid to the counterparty or received
from the counterparty, excluding any commissions.3 The Fund discloses amounts due to the Fund from the counterparty (unrealized appreciation on swap agreements) at period end as an asset
on its Statements of Assets and Liabilities. Amounts due to the counterparty from the Fund (unrealized depreciation on swap agreements) aredisclosed as a liability on its Statements of Assets and Liabilities. The Fund presents these amounts on a gross basis and does not offset or“net” these amounts on its Statements of Assets and Liabilities.
As of May 31, 2017, the gross unrealized appreciation (depreciation)of investments based on the aggregate cost of investments for federalincome tax purposes was as follows:Aggregate gross unrealized appreciation $ 192,591
Aggregate gross unrealized depreciation (34,566,142)
Net unrealized depreciation $ (34,373,551)
Federal income tax cost of investments $ 163,315,876
See accompanying notes to the financial statements.
142 ::nlDIG ULTRA OIL & GAS :: MAY 31, 2017 :: SCHEDULE OF PORTFOLIO INVESTMENTS PROSHARES TRUST
Merrill Corp - Proshares Trust Geared Book [96 Funds] Annual Report [Funds] 333-089822 05-31-2017 ED [AUX] | eperez | 28-Jul-17 17:39 | 17-15159-3.fu | Sequence: 8CHKSUM Content: 22041 Layout: 35987 Graphics: No Graphics CLEAN
JOB: 17-15159-3 CYCLE#;BL#: 5; 0 TRIM: 8.25" x 10.75" COMPOSITECOLORS: Black, ~note-color 2, ~note-color 3 GRAPHICS: none V1.5

4 Represents the “uncollateralized” amount due from or (to) the counterparty at period end. These amounts could be due to timing differencesbetween the movement of collateral in relation to market movements, or due to agreement provisions allowing minimum “thresholds” thatwould need to be exceeded prior to the movement of collateral. To the extent that a net amount is due from a counterparty, the Fund would beexposed to the counterparty by such amount and could suffer losses or delays in recovery of that amount in the event of a counterparty default.
See accompanying notes to the financial statements.
PROSHARES TRUST SCHEDULE OF PORTFOLIO INVESTMENTS :: MAY 31, 2017 :: ULTRA OIL & GASnlDIG :: 143
Merrill Corp - Proshares Trust Geared Book [96 Funds] Annual Report [Funds] 333-089822 05-31-2017 ED [AUX] | eperez | 28-Jul-17 17:39 | 17-15159-3.fu | Sequence: 9CHKSUM Content: 20903 Layout: 18712 Graphics: No Graphics CLEAN
JOB: 17-15159-3 CYCLE#;BL#: 5; 0 TRIM: 8.25" x 10.75" COMPOSITECOLORS: Black, ~note-color 2, ~note-color 3 GRAPHICS: none V1.5
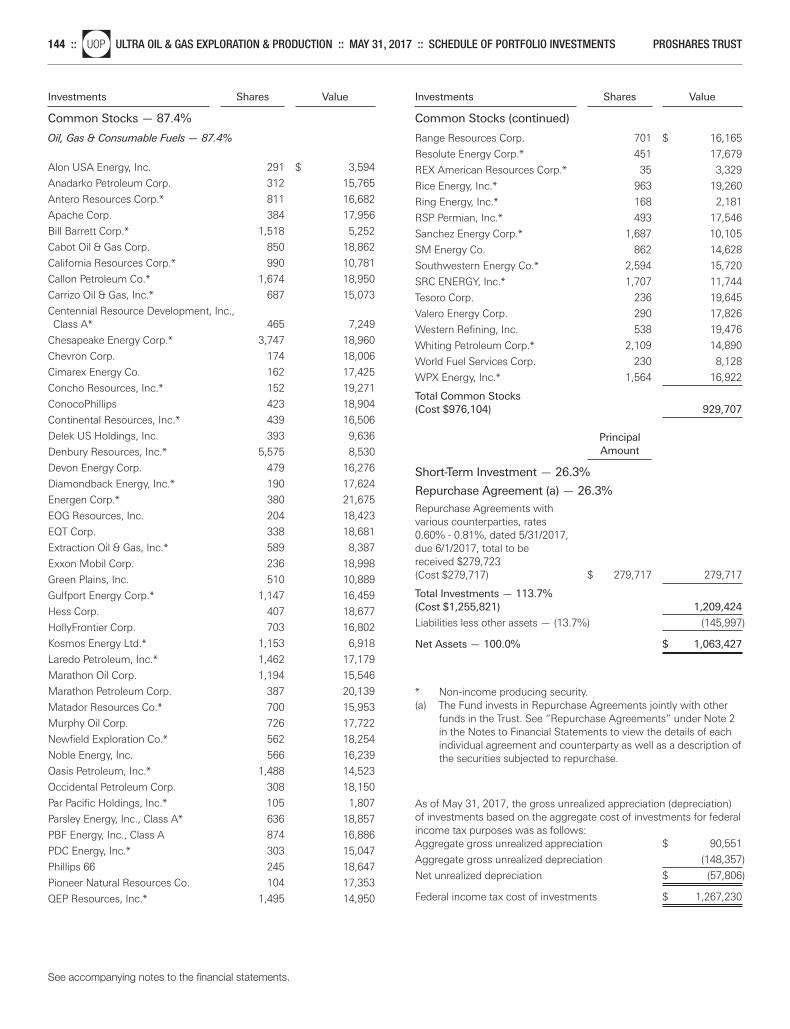
Investments Shares Value
Common Stocks — 87.4%
Investments Shares Value
Common Stocks (continued)
Oil, Gas & Consumable Fuels — 87.4%
Alon USA Energy, Inc. 291 $ 3,594
Anadarko Petroleum Corp. 312 15,765
Antero Resources Corp.* 811 16,682
Apache Corp. 384 17,956
Bill Barrett Corp.* 1,518 5,252
Cabot Oil & Gas Corp. 850 18,862
California Resources Corp.* 990 10,781
Callon Petroleum Co.* 1,674 18,950
Carrizo Oil & Gas, Inc.* 687 15,073
Centennial Resource Development, Inc., Class A* 465 7,249
Chesapeake Energy Corp.* 3,747 18,960
Chevron Corp. 174 18,006
Cimarex Energy Co. 162 17,425
Concho Resources, Inc.* 152 19,271
ConocoPhillips 423 18,904
Continental Resources, Inc.* 439 16,506
Delek US Holdings, Inc. 393 9,636
Denbury Resources, Inc.* 5,575 8,530
Devon Energy Corp. 479 16,276
Diamondback Energy, Inc.* 190 17,624
Energen Corp.* 380 21,675
EOG Resources, Inc. 204 18,423
EQT Corp. 338 18,681
Extraction Oil & Gas, Inc.* 589 8,387
Exxon Mobil Corp. 236 18,998
Green Plains, Inc. 510 10,889
Gulfport Energy Corp.* 1,147 16,459
Hess Corp. 407 18,677
HollyFrontier Corp. 703 16,802
Kosmos Energy Ltd.* 1,153 6,918
Laredo Petroleum, Inc.* 1,462 17,179
Marathon Oil Corp. 1,194 15,546
Marathon Petroleum Corp. 387 20,139
Matador Resources Co.* 700 15,953
Murphy Oil Corp. 726 17,722
Newfield Exploration Co.* 562 18,254
Noble Energy, Inc. 566 16,239
Oasis Petroleum, Inc.* 1,488 14,523
Occidental Petroleum Corp. 308 18,150
Par Pacific Holdings, Inc.* 105 1,807
Parsley Energy, Inc., Class A* 636 18,857
PBF Energy, Inc., Class A 874 16,886
PDC Energy, Inc.* 303 15,047
Phillips 66 245 18,647
Pioneer Natural Resources Co. 104 17,353
QEP Resources, Inc.* 1,495 14,950
Range Resources Corp. 701 $ 16,165
Resolute Energy Corp.* 451 17,679
REX American Resources Corp.* 35 3,329
Rice Energy, Inc.* 963 19,260
Ring Energy, Inc.* 168 2,181
RSP Permian, Inc.* 493 17,546
Sanchez Energy Corp.* 1,687 10,105
SM Energy Co. 862 14,628
Southwestern Energy Co.* 2,594 15,720
SRC ENERGY, Inc.* 1,707 11,744
Tesoro Corp. 236 19,645
Valero Energy Corp. 290 17,826
Western Refining, Inc. 538 19,476
Whiting Petroleum Corp.* 2,109 14,890
World Fuel Services Corp. 230 8,128
WPX Energy, Inc.* 1,564 16,922
Total Common Stocks(Cost $976,104) 929,707
Principal Amount
Short-Term Investment — 26.3%
Repurchase Agreement (a) — 26.3%
Repurchase Agreements with various counterparties, rates 0.60% - 0.81%, dated 5/31/2017, due 6/1/2017, total to be received $279,723 (Cost $279,717) $ 279,717 279,717
Total Investments — 113.7%(Cost $1,255,821) 1,209,424
Liabilities less other assets — (13.7%) (145,997)
Net Assets — 100.0% $ 1,063,427
* Non-income producing security.(a) The Fund invests in Repurchase Agreements jointly with other
funds in the Trust. See “Repurchase Agreements” under Note 2in the Notes to Financial Statements to view the details of eachindividual agreement and counterparty as well as a description ofthe securities subjected to repurchase.
As of May 31, 2017, the gross unrealized appreciation (depreciation)of investments based on the aggregate cost of investments for federalincome tax purposes was as follows:Aggregate gross unrealized appreciation $ 90,551
Aggregate gross unrealized depreciation (148,357)
Net unrealized depreciation $ (57,806)
Federal income tax cost of investments $ 1,267,230
See accompanying notes to the financial statements.
144 ::nlUOP ULTRA OIL & GAS EXPLORATION & PRODUCTION :: MAY 31, 2017 :: SCHEDULE OF PORTFOLIO INVESTMENTS PROSHARES TRUST
Merrill Corp - Proshares Trust Geared Book [96 Funds] Annual Report [Funds] 333-089822 05-31-2017 ED [AUX] | eperez | 28-Jul-17 17:39 | 17-15159-3.fu | Sequence: 10CHKSUM Content: 36758 Layout: 61592 Graphics: No Graphics CLEAN
JOB: 17-15159-3 CYCLE#;BL#: 5; 0 TRIM: 8.25" x 10.75" COMPOSITECOLORS: Black, ~note-color 2, ~note-color 3 GRAPHICS: none V1.5
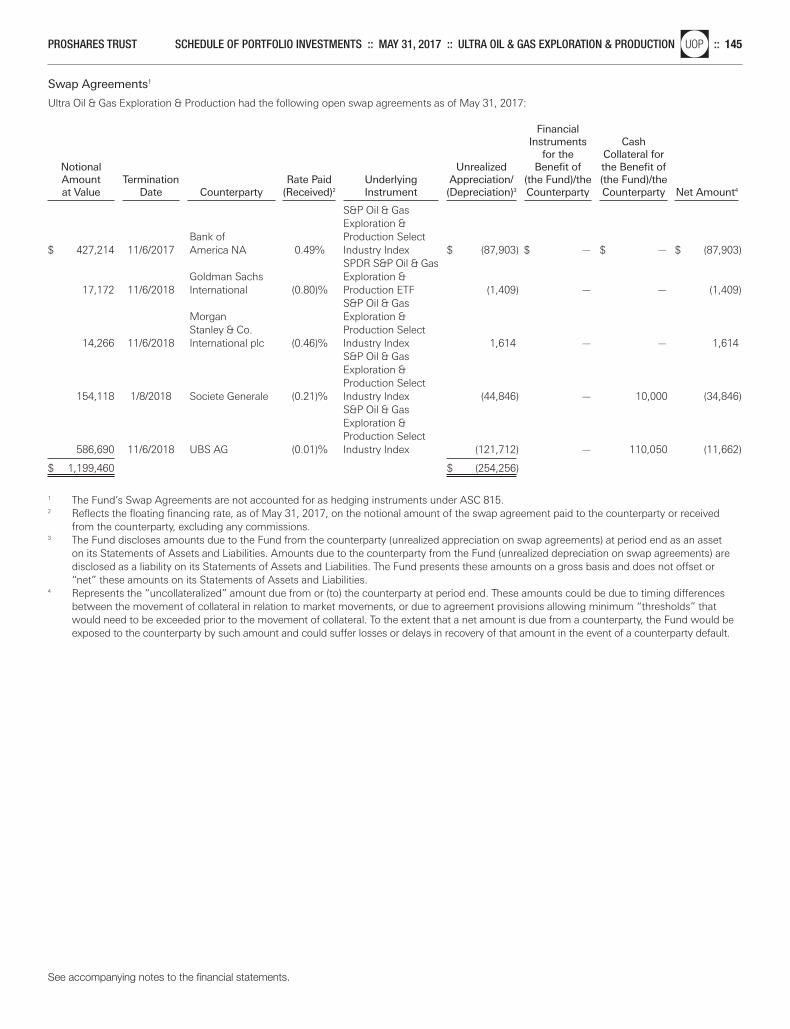
Swap Agreements1
Ultra Oil & Gas Exploration & Production had the following open swap agreements as of May 31, 2017:
Financial Instruments Cash
for the Collateral for Notional Unrealized Benefit of the Benefit of Amount Termination Rate Paid Underlying Appreciation/ (the Fund)/the (the Fund)/the at Value Date Counterparty (Received)2 Instrument (Depreciation)3 Counterparty Counterparty Net Amount4
S&P Oil & Gas Exploration &
Bank of Production Select $ 427,214 11/6/2017 America NA 0.49% Industry Index $ (87,903) $ — $ — $ (87,903)
SPDR S&P Oil & Gas Goldman Sachs Exploration &
17,172 11/6/2018 International (0.80)% Production ETF (1,409) — — (1,409)S&P Oil & Gas
Morgan Exploration & Stanley & Co. Production Select
14,266 11/6/2018 International plc (0.46)% Industry Index 1,614 — — 1,614S&P Oil & Gas Exploration & Production Select
154,118 1/8/2018 Societe Generale (0.21)% Industry Index (44,846) — 10,000 (34,846)S&P Oil & Gas Exploration & Production Select
586,690 11/6/2018 UBS AG (0.01)% Industry Index (121,712) — 110,050 (11,662)
$ 1,199,460 $ (254,256)
1 The Fund’s Swap Agreements are not accounted for as hedging instruments under ASC 815.2 Reflects the floating financing rate, as of May 31, 2017, on the notional amount of the swap agreement paid to the counterparty or received
from the counterparty, excluding any commissions.3 The Fund discloses amounts due to the Fund from the counterparty (unrealized appreciation on swap agreements) at period end as an asset
on its Statements of Assets and Liabilities. Amounts due to the counterparty from the Fund (unrealized depreciation on swap agreements) aredisclosed as a liability on its Statements of Assets and Liabilities. The Fund presents these amounts on a gross basis and does not offset or“net” these amounts on its Statements of Assets and Liabilities.
4 Represents the “uncollateralized” amount due from or (to) the counterparty at period end. These amounts could be due to timing differencesbetween the movement of collateral in relation to market movements, or due to agreement provisions allowing minimum “thresholds” thatwould need to be exceeded prior to the movement of collateral. To the extent that a net amount is due from a counterparty, the Fund would beexposed to the counterparty by such amount and could suffer losses or delays in recovery of that amount in the event of a counterparty default.
See accompanying notes to the financial statements.
PROSHARES TRUST SCHEDULE OF PORTFOLIO INVESTMENTS :: MAY 31, 2017 :: ULTRA OIL & GAS EXPLORATION & PRODUCTIONnlUOP :: 145
Merrill Corp - Proshares Trust Geared Book [96 Funds] Annual Report [Funds] 333-089822 05-31-2017 ED [AUX] | eperez | 28-Jul-17 17:39 | 17-15159-3.fu | Sequence: 11CHKSUM Content: 11103 Layout: 1338 Graphics: No Graphics CLEAN
JOB: 17-15159-3 CYCLE#;BL#: 5; 0 TRIM: 8.25" x 10.75" COMPOSITECOLORS: Black, ~note-color 2, ~note-color 3 GRAPHICS: none V1.5
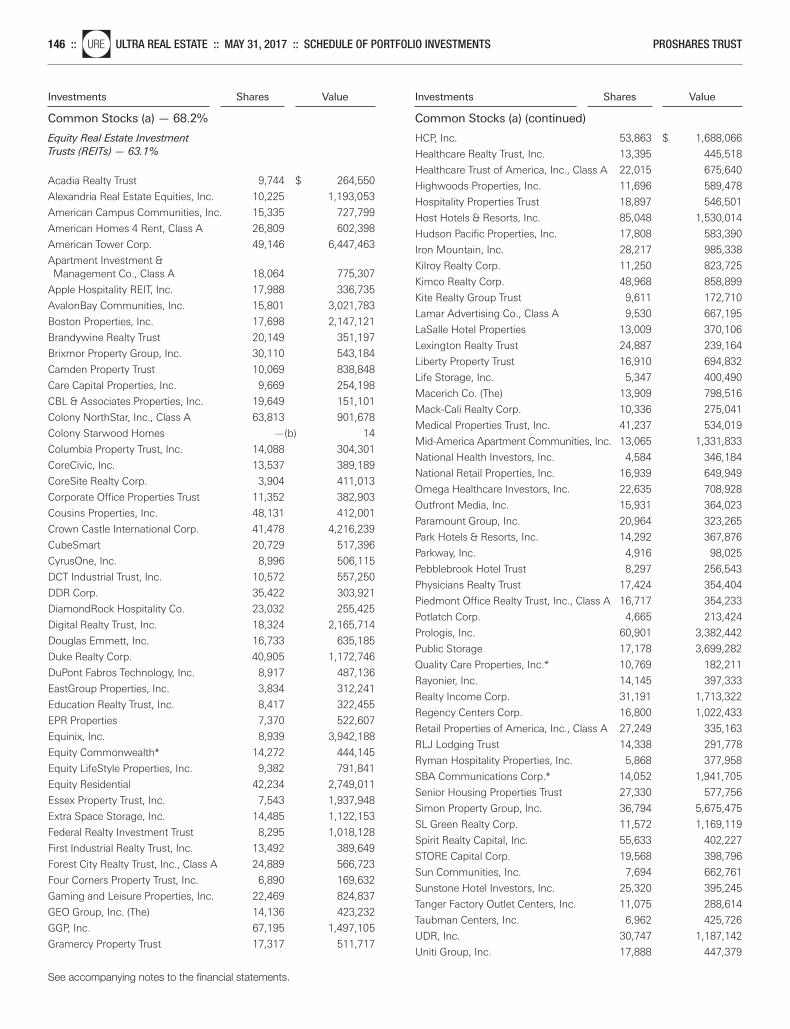
Investments Shares Value
Common Stocks (a) — 68.2%
Investments Shares Value
Common Stocks (a) (continued)
Equity Real Estate Investment
Trusts (REITs) — 63.1%
Acadia Realty Trust 9,744 $ 264,550
Alexandria Real Estate Equities, Inc. 10,225 1,193,053
American Campus Communities, Inc. 15,335 727,799
American Homes 4 Rent, Class A 26,809 602,398
American Tower Corp. 49,146 6,447,463
Apartment Investment & Management Co., Class A 18,064 775,307
Apple Hospitality REIT, Inc. 17,988 336,735
AvalonBay Communities, Inc. 15,801 3,021,783
Boston Properties, Inc. 17,698 2,147,121
Brandywine Realty Trust 20,149 351,197
Brixmor Property Group, Inc. 30,110 543,184
Camden Property Trust 10,069 838,848
Care Capital Properties, Inc. 9,669 254,198
CBL & Associates Properties, Inc. 19,649 151,101
Colony NorthStar, Inc., Class A 63,813 901,678
Colony Starwood Homes —(b) 14
Columbia Property Trust, Inc. 14,088 304,301
CoreCivic, Inc. 13,537 389,189
CoreSite Realty Corp. 3,904 411,013
Corporate Office Properties Trust 11,352 382,903
Cousins Properties, Inc. 48,131 412,001
Crown Castle International Corp. 41,478 4,216,239
CubeSmart 20,729 517,396
CyrusOne, Inc. 8,996 506,115
DCT Industrial Trust, Inc. 10,572 557,250
DDR Corp. 35,422 303,921
DiamondRock Hospitality Co. 23,032 255,425
Digital Realty Trust, Inc. 18,324 2,165,714
Douglas Emmett, Inc. 16,733 635,185
Duke Realty Corp. 40,905 1,172,746
DuPont Fabros Technology, Inc. 8,917 487,136
EastGroup Properties, Inc. 3,834 312,241
Education Realty Trust, Inc. 8,417 322,455
EPR Properties 7,370 522,607
Equinix, Inc. 8,939 3,942,188
Equity Commonwealth* 14,272 444,145
Equity LifeStyle Properties, Inc. 9,382 791,841
Equity Residential 42,234 2,749,011
Essex Property Trust, Inc. 7,543 1,937,948
Extra Space Storage, Inc. 14,485 1,122,153
Federal Realty Investment Trust 8,295 1,018,128
First Industrial Realty Trust, Inc. 13,492 389,649
Forest City Realty Trust, Inc., Class A 24,889 566,723
Four Corners Property Trust, Inc. 6,890 169,632
Gaming and Leisure Properties, Inc. 22,469 824,837
GEO Group, Inc. (The) 14,136 423,232
GGP, Inc. 67,195 1,497,105
Gramercy Property Trust 17,317 511,717
HCP, Inc. 53,863 $ 1,688,066
Healthcare Realty Trust, Inc. 13,395 445,518
Healthcare Trust of America, Inc., Class A 22,015 675,640
Highwoods Properties, Inc. 11,696 589,478
Hospitality Properties Trust 18,897 546,501
Host Hotels & Resorts, Inc. 85,048 1,530,014
Hudson Pacific Properties, Inc. 17,808 583,390
Iron Mountain, Inc. 28,217 985,338
Kilroy Realty Corp. 11,250 823,725
Kimco Realty Corp. 48,968 858,899
Kite Realty Group Trust 9,611 172,710
Lamar Advertising Co., Class A 9,530 667,195
LaSalle Hotel Properties 13,009 370,106
Lexington Realty Trust 24,887 239,164
Liberty Property Trust 16,910 694,832
Life Storage, Inc. 5,347 400,490
Macerich Co. (The) 13,909 798,516
Mack-Cali Realty Corp. 10,336 275,041
Medical Properties Trust, Inc. 41,237 534,019
Mid-America Apartment Communities, Inc. 13,065 1,331,833
National Health Investors, Inc. 4,584 346,184
National Retail Properties, Inc. 16,939 649,949
Omega Healthcare Investors, Inc. 22,635 708,928
Outfront Media, Inc. 15,931 364,023
Paramount Group, Inc. 20,964 323,265
Park Hotels & Resorts, Inc. 14,292 367,876
Parkway, Inc. 4,916 98,025
Pebblebrook Hotel Trust 8,297 256,543
Physicians Realty Trust 17,424 354,404
Piedmont Office Realty Trust, Inc., Class A 16,717 354,233
Potlatch Corp. 4,665 213,424
Prologis, Inc. 60,901 3,382,442
Public Storage 17,178 3,699,282
Quality Care Properties, Inc.* 10,769 182,211
Rayonier, Inc. 14,145 397,333
Realty Income Corp. 31,191 1,713,322
Regency Centers Corp. 16,800 1,022,433
Retail Properties of America, Inc., Class A 27,249 335,163
RLJ Lodging Trust 14,338 291,778
Ryman Hospitality Properties, Inc. 5,868 377,958
SBA Communications Corp.* 14,052 1,941,705
Senior Housing Properties Trust 27,330 577,756
Simon Property Group, Inc. 36,794 5,675,475
SL Green Realty Corp. 11,572 1,169,119
Spirit Realty Capital, Inc. 55,633 402,227
STORE Capital Corp. 19,568 398,796
Sun Communities, Inc. 7,694 662,761
Sunstone Hotel Investors, Inc. 25,320 395,245
Tanger Factory Outlet Centers, Inc. 11,075 288,614
Taubman Centers, Inc. 6,962 425,726
UDR, Inc. 30,747 1,187,142
Uniti Group, Inc. 17,888 447,379
See accompanying notes to the financial statements.
146 ::nlURE ULTRA REAL ESTATE :: MAY 31, 2017 :: SCHEDULE OF PORTFOLIO INVESTMENTS PROSHARES TRUST
Merrill Corp - Proshares Trust Geared Book [96 Funds] Annual Report [Funds] 333-089822 05-31-2017 ED [AUX] | eperez | 28-Jul-17 17:39 | 17-15159-3.fu | Sequence: 12CHKSUM Content: 6455 Layout: 21647 Graphics: No Graphics CLEAN
JOB: 17-15159-3 CYCLE#;BL#: 5; 0 TRIM: 8.25" x 10.75" COMPOSITECOLORS: Black, ~note-color 2, ~note-color 3 GRAPHICS: none V1.5
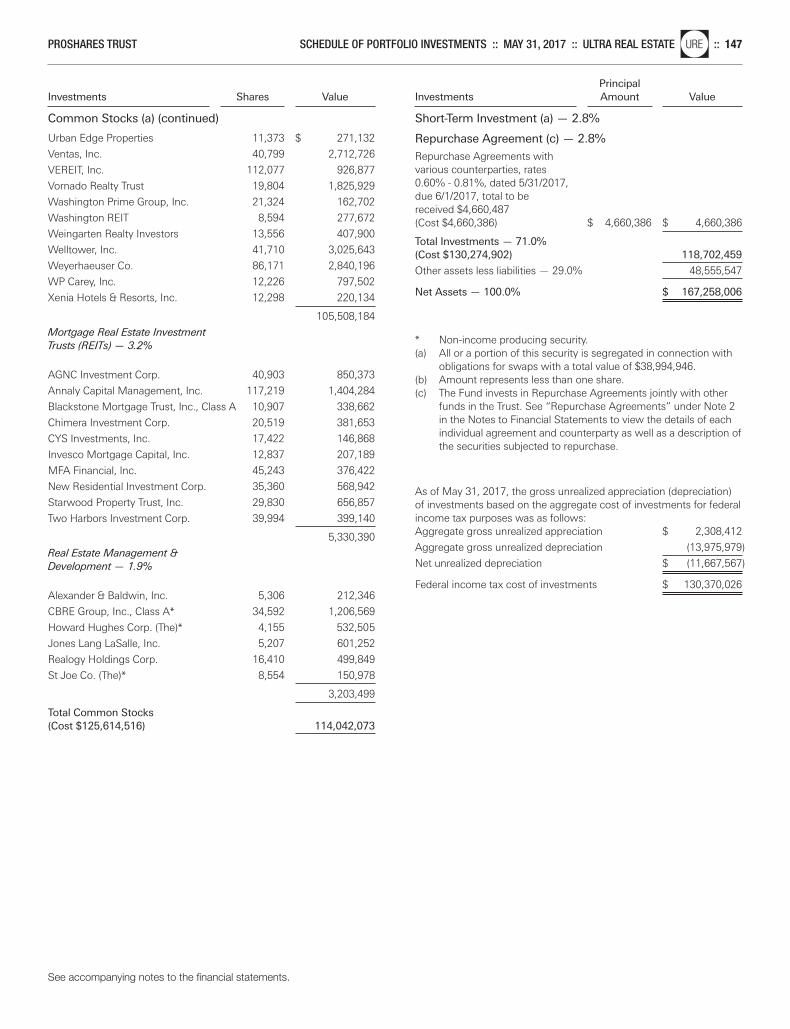
Investments Shares Value
Common Stocks (a) (continued)
PrincipalInvestments Amount Value
Short-Term Investment (a) — 2.8%
Urban Edge Properties 11,373 $ 271,132
Ventas, Inc. 40,799 2,712,726
VEREIT, Inc. 112,077 926,877
Vornado Realty Trust 19,804 1,825,929
Washington Prime Group, Inc. 21,324 162,702
Washington REIT 8,594 277,672
Weingarten Realty Investors 13,556 407,900
Welltower, Inc. 41,710 3,025,643
Weyerhaeuser Co. 86,171 2,840,196
WP Carey, Inc. 12,226 797,502
Xenia Hotels & Resorts, Inc. 12,298 220,134
105,508,184
Mortgage Real Estate Investment
Trusts (REITs) — 3.2%
AGNC Investment Corp. 40,903 850,373
Annaly Capital Management, Inc. 117,219 1,404,284
Blackstone Mortgage Trust, Inc., Class A 10,907 338,662
Chimera Investment Corp. 20,519 381,653
CYS Investments, Inc. 17,422 146,868
Invesco Mortgage Capital, Inc. 12,837 207,189
MFA Financial, Inc. 45,243 376,422
New Residential Investment Corp. 35,360 568,942
Starwood Property Trust, Inc. 29,830 656,857
Two Harbors Investment Corp. 39,994 399,140
5,330,390
Real Estate Management &
Development — 1.9%
Alexander & Baldwin, Inc. 5,306 212,346
CBRE Group, Inc., Class A* 34,592 1,206,569
Howard Hughes Corp. (The)* 4,155 532,505
Jones Lang LaSalle, Inc. 5,207 601,252
Realogy Holdings Corp. 16,410 499,849
St Joe Co. (The)* 8,554 150,978
3,203,499
Total Common Stocks(Cost $125,614,516) 114,042,073
Repurchase Agreement (c) — 2.8%
Repurchase Agreements with various counterparties, rates 0.60% - 0.81%, dated 5/31/2017, due 6/1/2017, total to be received $4,660,487 (Cost $4,660,386) $ 4,660,386 $ 4,660,386
Total Investments — 71.0%(Cost $130,274,902) 118,702,459
Other assets less liabilities — 29.0% 48,555,547
Net Assets — 100.0% $ 167,258,006
* Non-income producing security.(a) All or a portion of this security is segregated in connection with
obligations for swaps with a total value of $38,994,946.(b) Amount represents less than one share.(c) The Fund invests in Repurchase Agreements jointly with other
funds in the Trust. See “Repurchase Agreements” under Note 2in the Notes to Financial Statements to view the details of eachindividual agreement and counterparty as well as a description ofthe securities subjected to repurchase.
As of May 31, 2017, the gross unrealized appreciation (depreciation)of investments based on the aggregate cost of investments for federalincome tax purposes was as follows:Aggregate gross unrealized appreciation $ 2,308,412
Aggregate gross unrealized depreciation (13,975,979)
Net unrealized depreciation $ (11,667,567)
Federal income tax cost of investments $ 130,370,026
See accompanying notes to the financial statements.
PROSHARES TRUST SCHEDULE OF PORTFOLIO INVESTMENTS :: MAY 31, 2017 :: ULTRA REAL ESTATEnlURE :: 147
Merrill Corp - Proshares Trust Geared Book [96 Funds] Annual Report [Funds] 333-089822 05-31-2017 ED [AUX] | eperez | 28-Jul-17 17:39 | 17-15159-3.fu | Sequence: 13CHKSUM Content: 60570 Layout: 10041 Graphics: No Graphics CLEAN
JOB: 17-15159-3 CYCLE#;BL#: 5; 0 TRIM: 8.25" x 10.75" COMPOSITECOLORS: Black, ~note-color 2, ~note-color 3 GRAPHICS: none V1.5
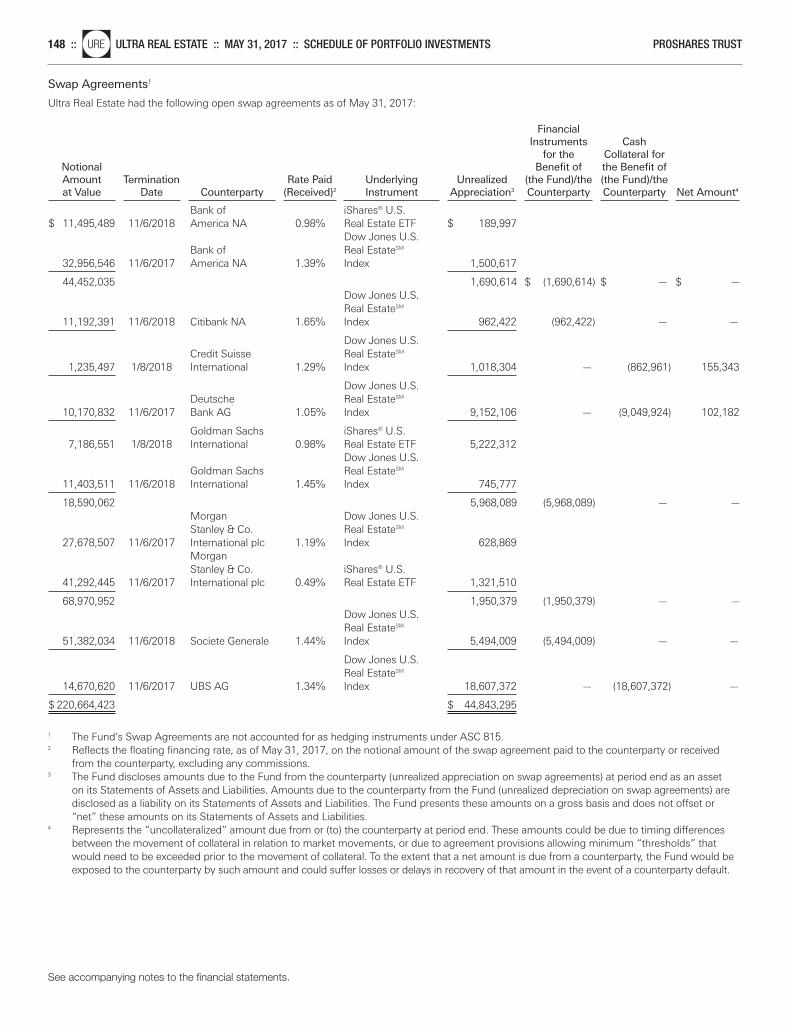
Swap Agreements1
Ultra Real Estate had the following open swap agreements as of May 31, 2017:
Financial Instruments Cash
for the Collateral for Notional Benefit of the Benefit of Amount Termination Rate Paid Underlying Unrealized (the Fund)/the (the Fund)/the at Value Date Counterparty (Received)2 Instrument Appreciation3 Counterparty Counterparty Net Amount4
Bank of iShares® U.S.
$ 11,495,489 11/6/2018 America NA 0.98% Real Estate ETF $ 189,997 Dow Jones U.S.
Bank of Real EstateSM 32,956,546 11/6/2017 America NA 1.39% Index 1,500,617
44,452,035 1,690,614 $ (1,690,614) $ — $ —Dow Jones U.S. Real EstateSM
11,192,391 11/6/2018 Citibank NA 1.65% Index 962,422 (962,422) — —
Dow Jones U.S. Credit Suisse Real EstateSM
1,235,497 1/8/2018 International 1.29% Index 1,018,304 — (862,961) 155,343
Dow Jones U.S. Deutsche Real EstateSM
10,170,832 11/6/2017 Bank AG 1.05% Index 9,152,106 — (9,049,924) 102,182
Goldman Sachs iShares® U.S. 7,186,551 1/8/2018 International 0.98% Real Estate ETF 5,222,312
Dow Jones U.S. Goldman Sachs Real EstateSM
11,403,511 11/6/2018 International 1.45% Index 745,777
18,590,062 5,968,089 (5,968,089) — —Morgan Dow Jones U.S. Stanley & Co. Real EstateSM
27,678,507 11/6/2017 International plc 1.19% Index 628,869 Morgan Stanley & Co. iShares® U.S.
41,292,445 11/6/2017 International plc 0.49% Real Estate ETF 1,321,510
68,970,952 1,950,379 (1,950,379) — —Dow Jones U.S. Real EstateSM
51,382,034 11/6/2018 Societe Generale 1.44% Index 5,494,009 (5,494,009) — —
Dow Jones U.S. Real EstateSM
14,670,620 11/6/2017 UBS AG 1.34% Index 18,607,372 — (18,607,372) —
$ 220,664,423 $ 44,843,295
1 The Fund’s Swap Agreements are not accounted for as hedging instruments under ASC 815.2 Reflects the floating financing rate, as of May 31, 2017, on the notional amount of the swap agreement paid to the counterparty or received
from the counterparty, excluding any commissions.3 The Fund discloses amounts due to the Fund from the counterparty (unrealized appreciation on swap agreements) at period end as an asset
on its Statements of Assets and Liabilities. Amounts due to the counterparty from the Fund (unrealized depreciation on swap agreements) aredisclosed as a liability on its Statements of Assets and Liabilities. The Fund presents these amounts on a gross basis and does not offset or“net” these amounts on its Statements of Assets and Liabilities.
4 Represents the “uncollateralized” amount due from or (to) the counterparty at period end. These amounts could be due to timing differencesbetween the movement of collateral in relation to market movements, or due to agreement provisions allowing minimum “thresholds” thatwould need to be exceeded prior to the movement of collateral. To the extent that a net amount is due from a counterparty, the Fund would beexposed to the counterparty by such amount and could suffer losses or delays in recovery of that amount in the event of a counterparty default.
See accompanying notes to the financial statements.
148 ::nlURE ULTRA REAL ESTATE :: MAY 31, 2017 :: SCHEDULE OF PORTFOLIO INVESTMENTS PROSHARES TRUST
Merrill Corp - Proshares Trust Geared Book [96 Funds] Annual Report [Funds] 333-089822 05-31-2017 ED [AUX] | eperez | 28-Jul-17 17:39 | 17-15159-3.fu | Sequence: 14CHKSUM Content: 33790 Layout: 51271 Graphics: No Graphics CLEAN
JOB: 17-15159-3 CYCLE#;BL#: 5; 0 TRIM: 8.25" x 10.75" COMPOSITECOLORS: Black, ~note-color 2, ~note-color 3 GRAPHICS: none V1.5
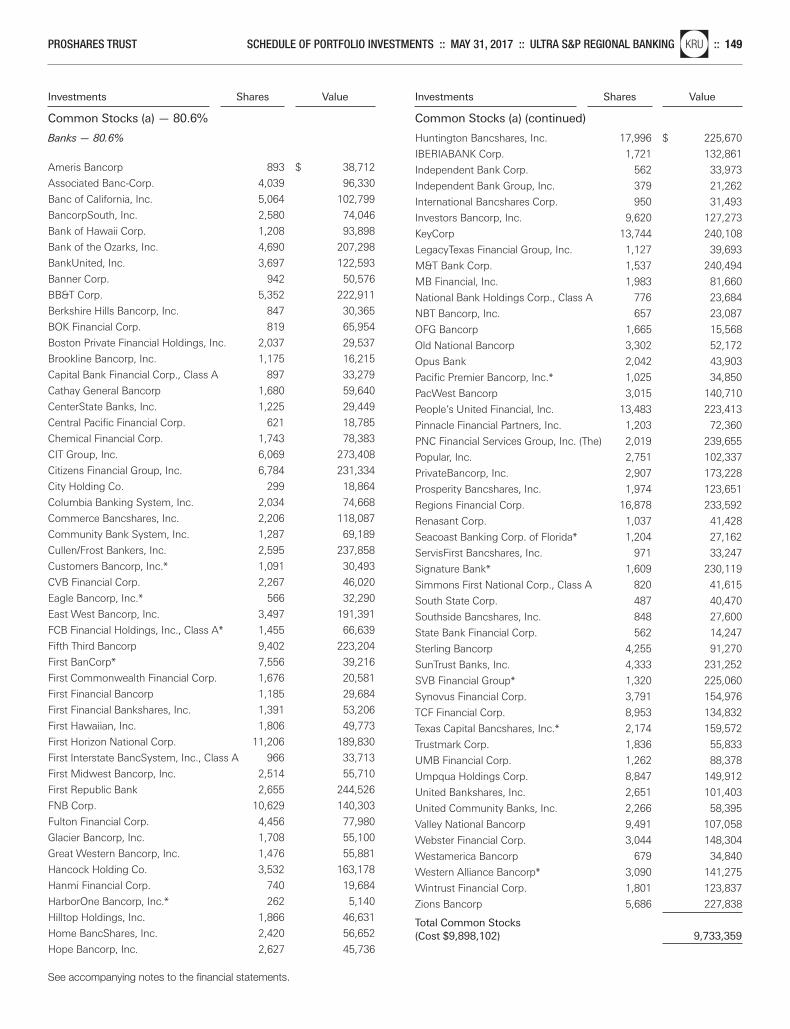
Investments Shares Value
Common Stocks (a) — 80.6%
Investments Shares Value
Common Stocks (a) (continued)
Banks — 80.6%
Ameris Bancorp 893 $ 38,712
Associated Banc-Corp. 4,039 96,330
Banc of California, Inc. 5,064 102,799
BancorpSouth, Inc. 2,580 74,046
Bank of Hawaii Corp. 1,208 93,898
Bank of the Ozarks, Inc. 4,690 207,298
BankUnited, Inc. 3,697 122,593
Banner Corp. 942 50,576
BB&T Corp. 5,352 222,911
Berkshire Hills Bancorp, Inc. 847 30,365
BOK Financial Corp. 819 65,954
Boston Private Financial Holdings, Inc. 2,037 29,537
Brookline Bancorp, Inc. 1,175 16,215
Capital Bank Financial Corp., Class A 897 33,279
Cathay General Bancorp 1,680 59,640
CenterState Banks, Inc. 1,225 29,449
Central Pacific Financial Corp. 621 18,785
Chemical Financial Corp. 1,743 78,383
CIT Group, Inc. 6,069 273,408
Citizens Financial Group, Inc. 6,784 231,334
City Holding Co. 299 18,864
Columbia Banking System, Inc. 2,034 74,668
Commerce Bancshares, Inc. 2,206 118,087
Community Bank System, Inc. 1,287 69,189
Cullen/Frost Bankers, Inc. 2,595 237,858
Customers Bancorp, Inc.* 1,091 30,493
CVB Financial Corp. 2,267 46,020
Eagle Bancorp, Inc.* 566 32,290
East West Bancorp, Inc. 3,497 191,391
FCB Financial Holdings, Inc., Class A* 1,455 66,639
Fifth Third Bancorp 9,402 223,204
First BanCorp* 7,556 39,216
First Commonwealth Financial Corp. 1,676 20,581
First Financial Bancorp 1,185 29,684
First Financial Bankshares, Inc. 1,391 53,206
First Hawaiian, Inc. 1,806 49,773
First Horizon National Corp. 11,206 189,830
First Interstate BancSystem, Inc., Class A 966 33,713
First Midwest Bancorp, Inc. 2,514 55,710
First Republic Bank 2,655 244,526
FNB Corp. 10,629 140,303
Fulton Financial Corp. 4,456 77,980
Glacier Bancorp, Inc. 1,708 55,100
Great Western Bancorp, Inc. 1,476 55,881
Hancock Holding Co. 3,532 163,178
Hanmi Financial Corp. 740 19,684
HarborOne Bancorp, Inc.* 262 5,140
Hilltop Holdings, Inc. 1,866 46,631
Home BancShares, Inc. 2,420 56,652
Hope Bancorp, Inc. 2,627 45,736
Huntington Bancshares, Inc. 17,996 $ 225,670
IBERIABANK Corp. 1,721 132,861
Independent Bank Corp. 562 33,973
Independent Bank Group, Inc. 379 21,262
International Bancshares Corp. 950 31,493
Investors Bancorp, Inc. 9,620 127,273
KeyCorp 13,744 240,108
LegacyTexas Financial Group, Inc. 1,127 39,693
M&T Bank Corp. 1,537 240,494
MB Financial, Inc. 1,983 81,660
National Bank Holdings Corp., Class A 776 23,684
NBT Bancorp, Inc. 657 23,087
OFG Bancorp 1,665 15,568
Old National Bancorp 3,302 52,172
Opus Bank 2,042 43,903
Pacific Premier Bancorp, Inc.* 1,025 34,850
PacWest Bancorp 3,015 140,710
People’s United Financial, Inc. 13,483 223,413
Pinnacle Financial Partners, Inc. 1,203 72,360
PNC Financial Services Group, Inc. (The) 2,019 239,655
Popular, Inc. 2,751 102,337
PrivateBancorp, Inc. 2,907 173,228
Prosperity Bancshares, Inc. 1,974 123,651
Regions Financial Corp. 16,878 233,592
Renasant Corp. 1,037 41,428
Seacoast Banking Corp. of Florida* 1,204 27,162
ServisFirst Bancshares, Inc. 971 33,247
Signature Bank* 1,609 230,119
Simmons First National Corp., Class A 820 41,615
South State Corp. 487 40,470
Southside Bancshares, Inc. 848 27,600
State Bank Financial Corp. 562 14,247
Sterling Bancorp 4,255 91,270
SunTrust Banks, Inc. 4,333 231,252
SVB Financial Group* 1,320 225,060
Synovus Financial Corp. 3,791 154,976
TCF Financial Corp. 8,953 134,832
Texas Capital Bancshares, Inc.* 2,174 159,572
Trustmark Corp. 1,836 55,833
UMB Financial Corp. 1,262 88,378
Umpqua Holdings Corp. 8,847 149,912
United Bankshares, Inc. 2,651 101,403
United Community Banks, Inc. 2,266 58,395
Valley National Bancorp 9,491 107,058
Webster Financial Corp. 3,044 148,304
Westamerica Bancorp 679 34,840
Western Alliance Bancorp* 3,090 141,275
Wintrust Financial Corp. 1,801 123,837
Zions Bancorp 5,686 227,838
Total Common Stocks(Cost $9,898,102) 9,733,359
See accompanying notes to the financial statements.
PROSHARES TRUST SCHEDULE OF PORTFOLIO INVESTMENTS :: MAY 31, 2017 :: ULTRA S&P REGIONAL BANKINGnlKRU :: 149
Merrill Corp - Proshares Trust Geared Book [96 Funds] Annual Report [Funds] 333-089822 05-31-2017 ED [AUX] | eperez | 28-Jul-17 17:39 | 17-15159-3.fu | Sequence: 15CHKSUM Content: 44296 Layout: 63176 Graphics: No Graphics CLEAN
JOB: 17-15159-3 CYCLE#;BL#: 5; 0 TRIM: 8.25" x 10.75" COMPOSITECOLORS: Black, ~note-color 2, ~note-color 3 GRAPHICS: none V1.5
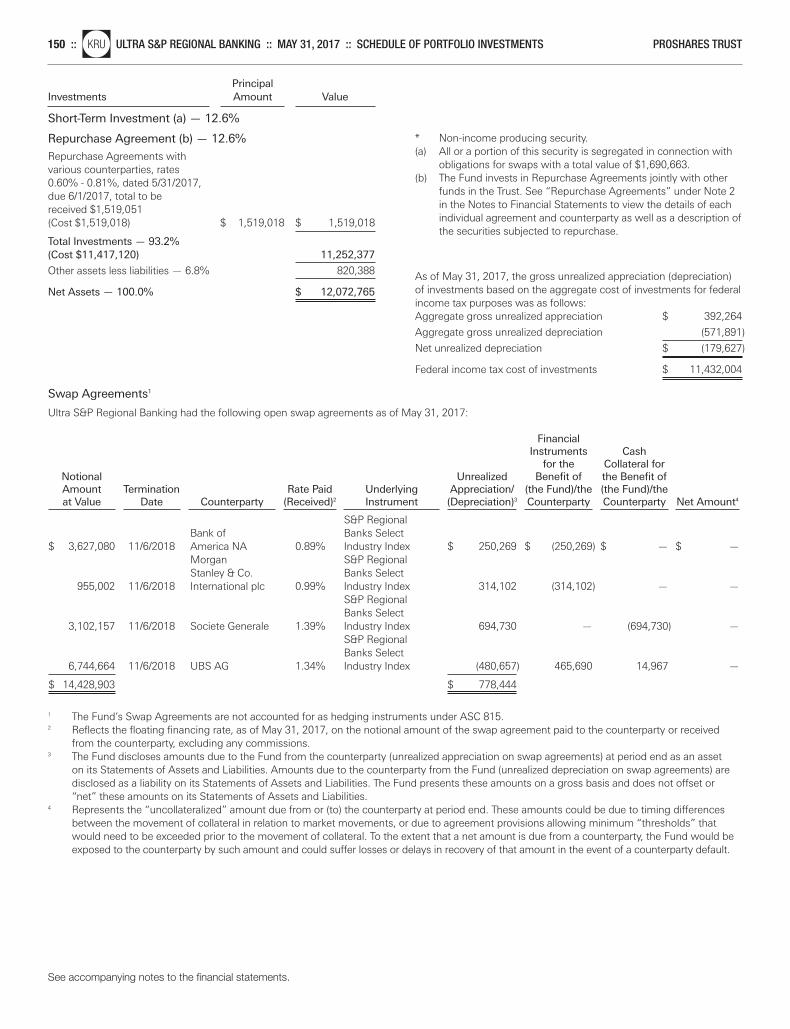
Principal Investments Amount Value
Short-Term Investment (a) — 12.6%
Repurchase Agreement (b) — 12.6%
Repurchase Agreements with various counterparties, rates 0.60% - 0.81%, dated 5/31/2017, due 6/1/2017, total to be received $1,519,051 (Cost $1,519,018) $ 1,519,018 $ 1,519,018
Total Investments — 93.2%(Cost $11,417,120) 11,252,377
Other assets less liabilities — 6.8% 820,388
Net Assets — 100.0% $ 12,072,765
Swap Agreements1
Ultra S&P Regional Banking had the following open swap agreements as of May 31, 2017:
Financial Instruments Cash
for the Collateral for Notional Unrealized Benefit of the Benefit of Amount Termination Rate Paid Underlying Appreciation/ (the Fund)/the (the Fund)/the at Value Date Counterparty (Received)2 Instrument (Depreciation)3 Counterparty Counterparty Net Amount4
S&P Regional
Bank of Banks Select $ 3,627,080 11/6/2018 America NA 0.89% Industry Index $ 250,269 $ (250,269) $ — $ —
Morgan S&P Regional Stanley & Co. Banks Select
955,002 11/6/2018 International plc 0.99% Industry Index 314,102 (314,102) — —S&P Regional Banks Select
3,102,157 11/6/2018 Societe Generale 1.39% Industry Index 694,730 — (694,730) —S&P Regional Banks Select
6,744,664 11/6/2018 UBS AG 1.34% Industry Index (480,657) 465,690 14,967 —
$ 14,428,903 $ 778,444
1 The Fund’s Swap Agreements are not accounted for as hedging instruments under ASC 815.2 Reflects the floating financing rate, as of May 31, 2017, on the notional amount of the swap agreement paid to the counterparty or received
from the counterparty, excluding any commissions.3 The Fund discloses amounts due to the Fund from the counterparty (unrealized appreciation on swap agreements) at period end as an asset
on its Statements of Assets and Liabilities. Amounts due to the counterparty from the Fund (unrealized depreciation on swap agreements) aredisclosed as a liability on its Statements of Assets and Liabilities. The Fund presents these amounts on a gross basis and does not offset or“net” these amounts on its Statements of Assets and Liabilities.
4 Represents the “uncollateralized” amount due from or (to) the counterparty at period end. These amounts could be due to timing differencesbetween the movement of collateral in relation to market movements, or due to agreement provisions allowing minimum “thresholds” thatwould need to be exceeded prior to the movement of collateral. To the extent that a net amount is due from a counterparty, the Fund would beexposed to the counterparty by such amount and could suffer losses or delays in recovery of that amount in the event of a counterparty default.
* Non-income producing security.(a) All or a portion of this security is segregated in connection with
obligations for swaps with a total value of $1,690,663.(b) The Fund invests in Repurchase Agreements jointly with other
funds in the Trust. See “Repurchase Agreements” under Note 2in the Notes to Financial Statements to view the details of eachindividual agreement and counterparty as well as a description ofthe securities subjected to repurchase.
As of May 31, 2017, the gross unrealized appreciation (depreciation)of investments based on the aggregate cost of investments for federalincome tax purposes was as follows:Aggregate gross unrealized appreciation $ 392,264
Aggregate gross unrealized depreciation (571,891)
Net unrealized depreciation $ (179,627)
Federal income tax cost of investments $ 11,432,004
See accompanying notes to the financial statements.
150 ::nlKRU ULTRA S&P REGIONAL BANKING :: MAY 31, 2017 :: SCHEDULE OF PORTFOLIO INVESTMENTS PROSHARES TRUST
Merrill Corp - Proshares Trust Geared Book [96 Funds] Annual Report [Funds] 333-089822 05-31-2017 ED [AUX] | eperez | 28-Jul-17 17:39 | 17-15159-3.fu | Sequence: 16CHKSUM Content: 27289 Layout: 41289 Graphics: No Graphics CLEAN
JOB: 17-15159-3 CYCLE#;BL#: 5; 0 TRIM: 8.25" x 10.75" COMPOSITECOLORS: Black, ~note-color 2, ~note-color 3 GRAPHICS: none V1.5
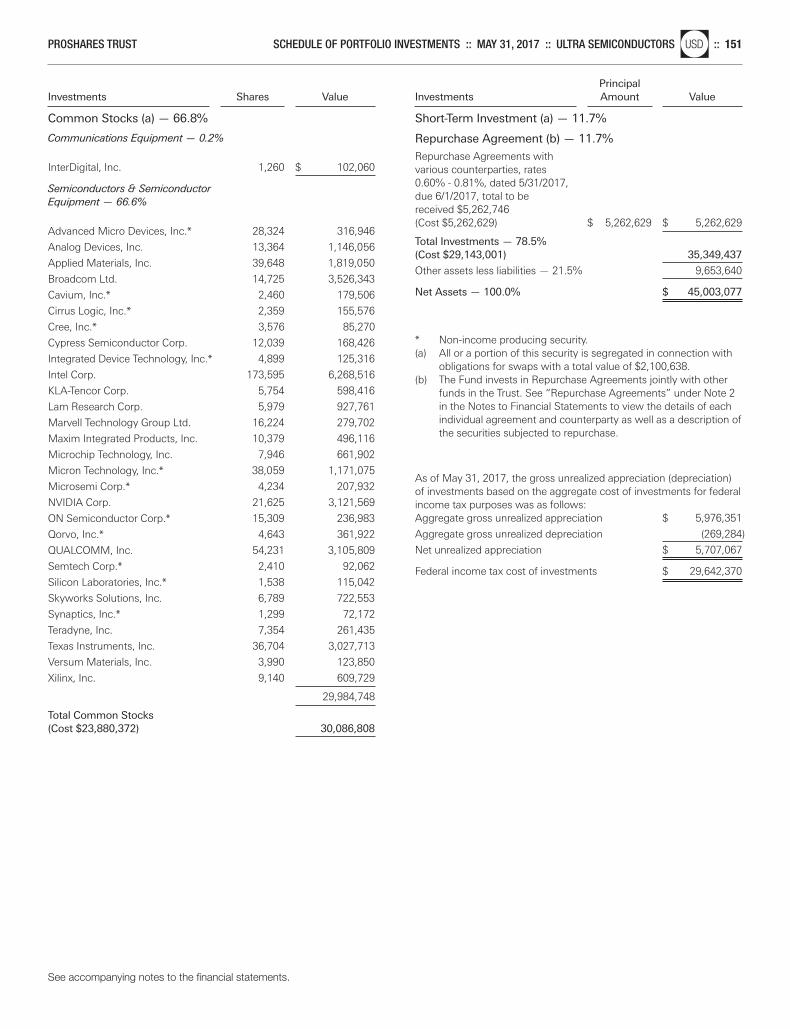
Investments Shares Value
Common Stocks (a) — 66.8%
PrincipalInvestments Amount Value
Short-Term Investment (a) — 11.7%
Communications Equipment — 0.2%
InterDigital, Inc. 1,260 $ 102,060
Semiconductors & Semiconductor
Equipment — 66.6%
Advanced Micro Devices, Inc.* 28,324 316,946
Analog Devices, Inc. 13,364 1,146,056
Applied Materials, Inc. 39,648 1,819,050
Broadcom Ltd. 14,725 3,526,343
Cavium, Inc.* 2,460 179,506
Cirrus Logic, Inc.* 2,359 155,576
Cree, Inc.* 3,576 85,270
Cypress Semiconductor Corp. 12,039 168,426
Integrated Device Technology, Inc.* 4,899 125,316
Intel Corp. 173,595 6,268,516
KLA-Tencor Corp. 5,754 598,416
Lam Research Corp. 5,979 927,761
Marvell Technology Group Ltd. 16,224 279,702
Maxim Integrated Products, Inc. 10,379 496,116
Microchip Technology, Inc. 7,946 661,902
Micron Technology, Inc.* 38,059 1,171,075
Microsemi Corp.* 4,234 207,932
NVIDIA Corp. 21,625 3,121,569
ON Semiconductor Corp.* 15,309 236,983
Qorvo, Inc.* 4,643 361,922
QUALCOMM, Inc. 54,231 3,105,809
Semtech Corp.* 2,410 92,062
Silicon Laboratories, Inc.* 1,538 115,042
Skyworks Solutions, Inc. 6,789 722,553
Synaptics, Inc.* 1,299 72,172
Teradyne, Inc. 7,354 261,435
Texas Instruments, Inc. 36,704 3,027,713
Versum Materials, Inc. 3,990 123,850
Xilinx, Inc. 9,140 609,729
29,984,748
Total Common Stocks(Cost $23,880,372) 30,086,808
Repurchase Agreement (b) — 11.7%
Repurchase Agreements with various counterparties, rates 0.60% - 0.81%, dated 5/31/2017, due 6/1/2017, total to be received $5,262,746 (Cost $5,262,629) $ 5,262,629 $ 5,262,629
Total Investments — 78.5%(Cost $29,143,001) 35,349,437
Other assets less liabilities — 21.5% 9,653,640
Net Assets — 100.0% $ 45,003,077
* Non-income producing security.(a) All or a portion of this security is segregated in connection with
obligations for swaps with a total value of $2,100,638.(b) The Fund invests in Repurchase Agreements jointly with other
funds in the Trust. See “Repurchase Agreements” under Note 2in the Notes to Financial Statements to view the details of eachindividual agreement and counterparty as well as a description ofthe securities subjected to repurchase.
As of May 31, 2017, the gross unrealized appreciation (depreciation)of investments based on the aggregate cost of investments for federalincome tax purposes was as follows:Aggregate gross unrealized appreciation $ 5,976,351
Aggregate gross unrealized depreciation (269,284)
Net unrealized appreciation $ 5,707,067
Federal income tax cost of investments $ 29,642,370
See accompanying notes to the financial statements.
PROSHARES TRUST SCHEDULE OF PORTFOLIO INVESTMENTS :: MAY 31, 2017 :: ULTRA SEMICONDUCTORSnlUSD :: 151
Merrill Corp - Proshares Trust Geared Book [96 Funds] Annual Report [Funds] 333-089822 05-31-2017 ED [AUX] | eperez | 28-Jul-17 17:39 | 17-15159-3.fu | Sequence: 17CHKSUM Content: 20113 Layout: 43674 Graphics: No Graphics CLEAN
JOB: 17-15159-3 CYCLE#;BL#: 5; 0 TRIM: 8.25" x 10.75" COMPOSITECOLORS: Black, ~note-color 2, ~note-color 3 GRAPHICS: none V1.5
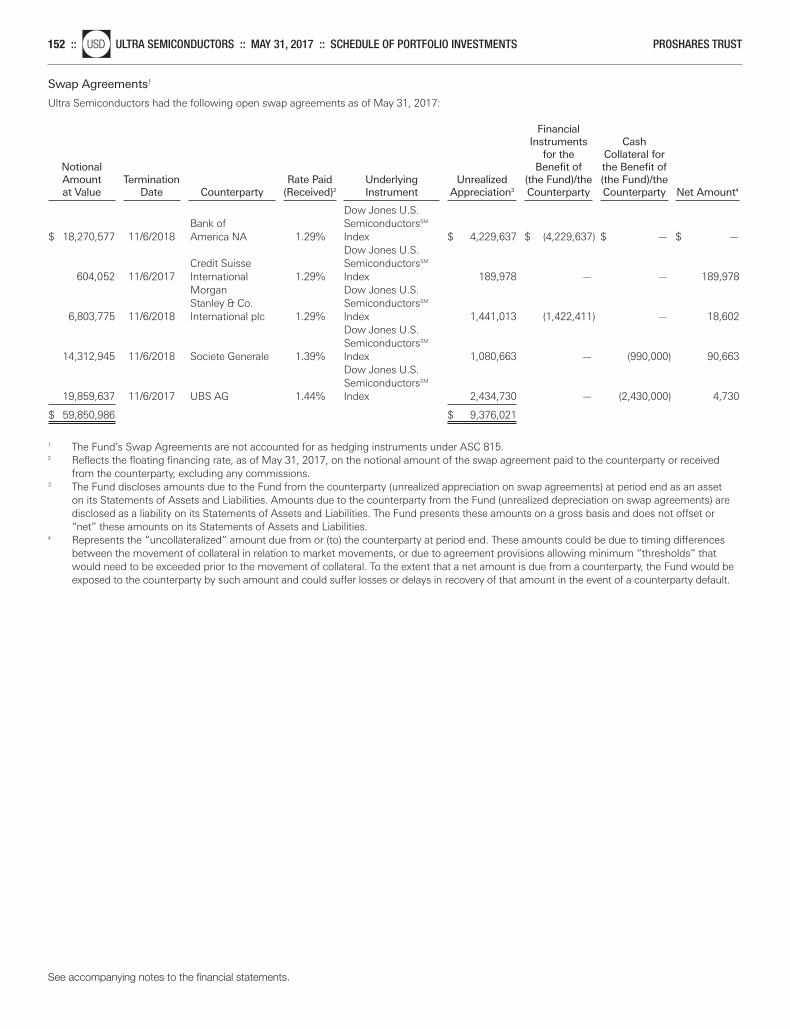
Swap Agreements1
Ultra Semiconductors had the following open swap agreements as of May 31, 2017:
Financial Instruments Cash
for the Collateral for Notional Benefit of the Benefit of Amount Termination Rate Paid Underlying Unrealized (the Fund)/the (the Fund)/the at Value Date Counterparty (Received)2 Instrument Appreciation3 Counterparty Counterparty Net Amount4
Dow Jones U.S.
Bank of SemiconductorsSM $ 18,270,577 11/6/2018 America NA 1.29% Index $ 4,229,637 $ (4,229,637) $ — $ —
Dow Jones U.S. Credit Suisse SemiconductorsSM
604,052 11/6/2017 International 1.29% Index 189,978 — — 189,978Morgan Dow Jones U.S. Stanley & Co. SemiconductorsSM
6,803,775 11/6/2018 International plc 1.29% Index 1,441,013 (1,422,411) — 18,602Dow Jones U.S. SemiconductorsSM
14,312,945 11/6/2018 Societe Generale 1.39% Index 1,080,663 — (990,000) 90,663Dow Jones U.S. SemiconductorsSM
19,859,637 11/6/2017 UBS AG 1.44% Index 2,434,730 — (2,430,000) 4,730
$ 59,850,986 $ 9,376,021
1 The Fund’s Swap Agreements are not accounted for as hedging instruments under ASC 815.2 Reflects the floating financing rate, as of May 31, 2017, on the notional amount of the swap agreement paid to the counterparty or received
from the counterparty, excluding any commissions.3 The Fund discloses amounts due to the Fund from the counterparty (unrealized appreciation on swap agreements) at period end as an asset
on its Statements of Assets and Liabilities. Amounts due to the counterparty from the Fund (unrealized depreciation on swap agreements) aredisclosed as a liability on its Statements of Assets and Liabilities. The Fund presents these amounts on a gross basis and does not offset or“net” these amounts on its Statements of Assets and Liabilities.
4 Represents the “uncollateralized” amount due from or (to) the counterparty at period end. These amounts could be due to timing differencesbetween the movement of collateral in relation to market movements, or due to agreement provisions allowing minimum “thresholds” thatwould need to be exceeded prior to the movement of collateral. To the extent that a net amount is due from a counterparty, the Fund would beexposed to the counterparty by such amount and could suffer losses or delays in recovery of that amount in the event of a counterparty default.
See accompanying notes to the financial statements.
152 ::nlUSD ULTRA SEMICONDUCTORS :: MAY 31, 2017 :: SCHEDULE OF PORTFOLIO INVESTMENTS PROSHARES TRUST
Merrill Corp - Proshares Trust Geared Book [96 Funds] Annual Report [Funds] 333-089822 05-31-2017 ED [AUX] | eperez | 28-Jul-17 17:39 | 17-15159-3.fu | Sequence: 18CHKSUM Content: 57213 Layout: 7150 Graphics: No Graphics CLEAN
JOB: 17-15159-3 CYCLE#;BL#: 5; 0 TRIM: 8.25" x 10.75" COMPOSITECOLORS: Black, ~note-color 2, ~note-color 3 GRAPHICS: none V1.5
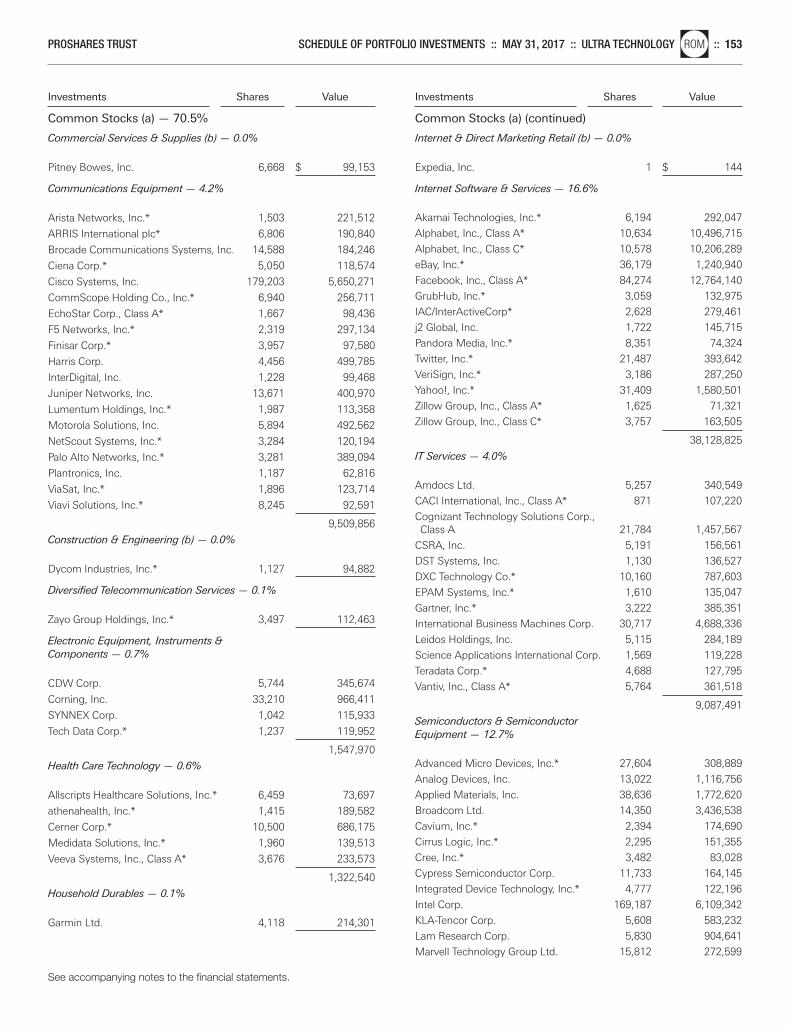
Investments Shares Value
Common Stocks (a) — 70.5%
Investments Shares Value
Common Stocks (a) (continued)
Commercial Services & Supplies (b) — 0.0%
Pitney Bowes, Inc. 6,668 $ 99,153
Communications Equipment — 4.2%
Arista Networks, Inc.* 1,503 221,512
ARRIS International plc* 6,806 190,840
Brocade Communications Systems, Inc. 14,588 184,246
Ciena Corp.* 5,050 118,574
Cisco Systems, Inc. 179,203 5,650,271
CommScope Holding Co., Inc.* 6,940 256,711
EchoStar Corp., Class A* 1,667 98,436
F5 Networks, Inc.* 2,319 297,134
Finisar Corp.* 3,957 97,580
Harris Corp. 4,456 499,785
InterDigital, Inc. 1,228 99,468
Juniper Networks, Inc. 13,671 400,970
Lumentum Holdings, Inc.* 1,987 113,358
Motorola Solutions, Inc. 5,894 492,562
NetScout Systems, Inc.* 3,284 120,194
Palo Alto Networks, Inc.* 3,281 389,094
Plantronics, Inc. 1,187 62,816
ViaSat, Inc.* 1,896 123,714
Viavi Solutions, Inc.* 8,245 92,591
9,509,856
Construction & Engineering (b) — 0.0%
Dycom Industries, Inc.* 1,127 94,882
Diversified Telecommunication Services — 0.1%
Zayo Group Holdings, Inc.* 3,497 112,463
Electronic Equipment, Instruments &
Components — 0.7%
CDW Corp. 5,744 345,674
Corning, Inc. 33,210 966,411
SYNNEX Corp. 1,042 115,933
Tech Data Corp.* 1,237 119,952
1,547,970
Health Care Technology — 0.6%
Allscripts Healthcare Solutions, Inc.* 6,459 73,697
athenahealth, Inc.* 1,415 189,582
Cerner Corp.* 10,500 686,175
Medidata Solutions, Inc.* 1,960 139,513
Veeva Systems, Inc., Class A* 3,676 233,573
1,322,540
Household Durables — 0.1%
Garmin Ltd. 4,118 214,301
Internet & Direct Marketing Retail (b) — 0.0%
Expedia, Inc. 1 $ 144
Internet Software & Services — 16.6%
Akamai Technologies, Inc.* 6,194 292,047
Alphabet, Inc., Class A* 10,634 10,496,715
Alphabet, Inc., Class C* 10,578 10,206,289
eBay, Inc.* 36,179 1,240,940
Facebook, Inc., Class A* 84,274 12,764,140
GrubHub, Inc.* 3,059 132,975
IAC/InterActiveCorp* 2,628 279,461
j2 Global, Inc. 1,722 145,715
Pandora Media, Inc.* 8,351 74,324
Twitter, Inc.* 21,487 393,642
VeriSign, Inc.* 3,186 287,250
Yahoo!, Inc.* 31,409 1,580,501
Zillow Group, Inc., Class A* 1,625 71,321
Zillow Group, Inc., Class C* 3,757 163,505
38,128,825
IT Services — 4.0%
Amdocs Ltd. 5,257 340,549
CACI International, Inc., Class A* 871 107,220
Cognizant Technology Solutions Corp., Class A 21,784 1,457,567
CSRA, Inc. 5,191 156,561
DST Systems, Inc. 1,130 136,527
DXC Technology Co.* 10,160 787,603
EPAM Systems, Inc.* 1,610 135,047
Gartner, Inc.* 3,222 385,351
International Business Machines Corp. 30,717 4,688,336
Leidos Holdings, Inc. 5,115 284,189
Science Applications International Corp. 1,569 119,228
Teradata Corp.* 4,688 127,795
Vantiv, Inc., Class A* 5,764 361,518
9,087,491
Semiconductors & Semiconductor
Equipment — 12.7%
Advanced Micro Devices, Inc.* 27,604 308,889
Analog Devices, Inc. 13,022 1,116,756
Applied Materials, Inc. 38,636 1,772,620
Broadcom Ltd. 14,350 3,436,538
Cavium, Inc.* 2,394 174,690
Cirrus Logic, Inc.* 2,295 151,355
Cree, Inc.* 3,482 83,028
Cypress Semiconductor Corp. 11,733 164,145
Integrated Device Technology, Inc.* 4,777 122,196
Intel Corp. 169,187 6,109,342
KLA-Tencor Corp. 5,608 583,232
Lam Research Corp. 5,830 904,641
Marvell Technology Group Ltd. 15,812 272,599
See accompanying notes to the financial statements.
PROSHARES TRUST SCHEDULE OF PORTFOLIO INVESTMENTS :: MAY 31, 2017 :: ULTRA TECHNOLOGYnlROM :: 153
Merrill Corp - Proshares Trust Geared Book [96 Funds] Annual Report [Funds] 333-089822 05-31-2017 ED [AUX] | eperez | 28-Jul-17 17:39 | 17-15159-3.fu | Sequence: 19CHKSUM Content: 42409 Layout: 13054 Graphics: No Graphics CLEAN
JOB: 17-15159-3 CYCLE#;BL#: 5; 0 TRIM: 8.25" x 10.75" COMPOSITECOLORS: Black, ~note-color 2, ~note-color 3 GRAPHICS: none V1.5
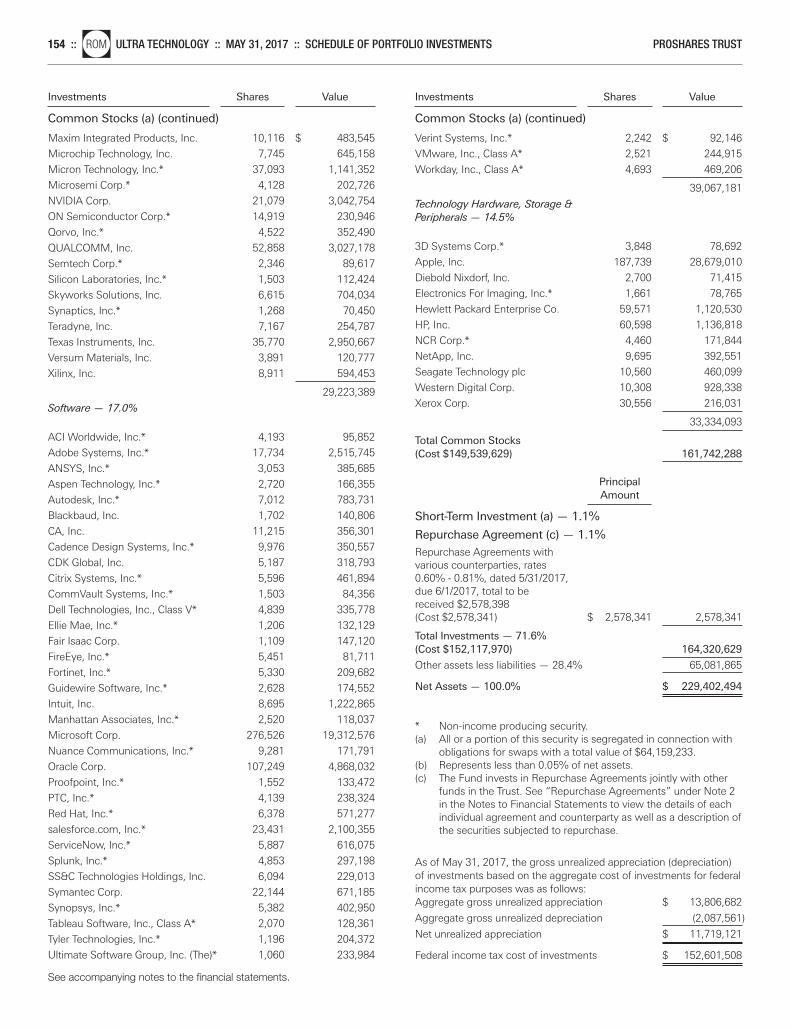
Investments Shares Value
Common Stocks (a) (continued)
Investments Shares Value
Common Stocks (a) (continued)
Maxim Integrated Products, Inc. 10,116 $ 483,545
Microchip Technology, Inc. 7,745 645,158
Micron Technology, Inc.* 37,093 1,141,352
Microsemi Corp.* 4,128 202,726
NVIDIA Corp. 21,079 3,042,754
ON Semiconductor Corp.* 14,919 230,946
Qorvo, Inc.* 4,522 352,490
QUALCOMM, Inc. 52,858 3,027,178
Semtech Corp.* 2,346 89,617
Silicon Laboratories, Inc.* 1,503 112,424
Skyworks Solutions, Inc. 6,615 704,034
Synaptics, Inc.* 1,268 70,450
Teradyne, Inc. 7,167 254,787
Texas Instruments, Inc. 35,770 2,950,667
Versum Materials, Inc. 3,891 120,777
Xilinx, Inc. 8,911 594,453
29,223,389
Software — 17.0%
ACI Worldwide, Inc.* 4,193 95,852
Adobe Systems, Inc.* 17,734 2,515,745
ANSYS, Inc.* 3,053 385,685
Aspen Technology, Inc.* 2,720 166,355
Autodesk, Inc.* 7,012 783,731
Blackbaud, Inc. 1,702 140,806
CA, Inc. 11,215 356,301
Cadence Design Systems, Inc.* 9,976 350,557
CDK Global, Inc. 5,187 318,793
Citrix Systems, Inc.* 5,596 461,894
CommVault Systems, Inc.* 1,503 84,356
Dell Technologies, Inc., Class V* 4,839 335,778
Ellie Mae, Inc.* 1,206 132,129
Fair Isaac Corp. 1,109 147,120
FireEye, Inc.* 5,451 81,711
Fortinet, Inc.* 5,330 209,682
Guidewire Software, Inc.* 2,628 174,552
Intuit, Inc. 8,695 1,222,865
Manhattan Associates, Inc.* 2,520 118,037
Microsoft Corp. 276,526 19,312,576
Nuance Communications, Inc.* 9,281 171,791
Oracle Corp. 107,249 4,868,032
Proofpoint, Inc.* 1,552 133,472
PTC, Inc.* 4,139 238,324
Red Hat, Inc.* 6,378 571,277
salesforce.com, Inc.* 23,431 2,100,355
ServiceNow, Inc.* 5,887 616,075
Splunk, Inc.* 4,853 297,198
SS&C Technologies Holdings, Inc. 6,094 229,013
Symantec Corp. 22,144 671,185
Synopsys, Inc.* 5,382 402,950
Tableau Software, Inc., Class A* 2,070 128,361
Tyler Technologies, Inc.* 1,196 204,372
Ultimate Software Group, Inc. (The)* 1,060 233,984
Verint Systems, Inc.* 2,242 $ 92,146
VMware, Inc., Class A* 2,521 244,915
Workday, Inc., Class A* 4,693 469,206
39,067,181
Technology Hardware, Storage &
Peripherals — 14.5%
3D Systems Corp.* 3,848 78,692
Apple, Inc. 187,739 28,679,010
Diebold Nixdorf, Inc. 2,700 71,415
Electronics For Imaging, Inc.* 1,661 78,765
Hewlett Packard Enterprise Co. 59,571 1,120,530
HP, Inc. 60,598 1,136,818
NCR Corp.* 4,460 171,844
NetApp, Inc. 9,695 392,551
Seagate Technology plc 10,560 460,099
Western Digital Corp. 10,308 928,338
Xerox Corp. 30,556 216,031
33,334,093
Total Common Stocks(Cost $149,539,629) 161,742,288
Principal Amount
Short-Term Investment (a) — 1.1%
Repurchase Agreement (c) — 1.1%Repurchase Agreements with various counterparties, rates 0.60% - 0.81%, dated 5/31/2017, due 6/1/2017, total to be received $2,578,398 (Cost $2,578,341) $ 2,578,341 2,578,341
Total Investments — 71.6%(Cost $152,117,970) 164,320,629
Other assets less liabilities — 28.4% 65,081,865
Net Assets — 100.0% $ 229,402,494
* Non-income producing security.(a) All or a portion of this security is segregated in connection with
obligations for swaps with a total value of $64,159,233.(b) Represents less than 0.05% of net assets.(c) The Fund invests in Repurchase Agreements jointly with other
funds in the Trust. See “Repurchase Agreements” under Note 2in the Notes to Financial Statements to view the details of eachindividual agreement and counterparty as well as a description ofthe securities subjected to repurchase.
As of May 31, 2017, the gross unrealized appreciation (depreciation)of investments based on the aggregate cost of investments for federalincome tax purposes was as follows:Aggregate gross unrealized appreciation $ 13,806,682
Aggregate gross unrealized depreciation (2,087,561)
Net unrealized appreciation $ 11,719,121
Federal income tax cost of investments $ 152,601,508
See accompanying notes to the financial statements.
154 ::nlROM ULTRA TECHNOLOGY :: MAY 31, 2017 :: SCHEDULE OF PORTFOLIO INVESTMENTS PROSHARES TRUST
Merrill Corp - Proshares Trust Geared Book [96 Funds] Annual Report [Funds] 333-089822 05-31-2017 ED [AUX] | eperez | 28-Jul-17 17:39 | 17-15159-3.fu | Sequence: 20CHKSUM Content: 12978 Layout: 34106 Graphics: No Graphics CLEAN
JOB: 17-15159-3 CYCLE#;BL#: 5; 0 TRIM: 8.25" x 10.75" COMPOSITECOLORS: Black, ~note-color 2, ~note-color 3 GRAPHICS: none V1.5
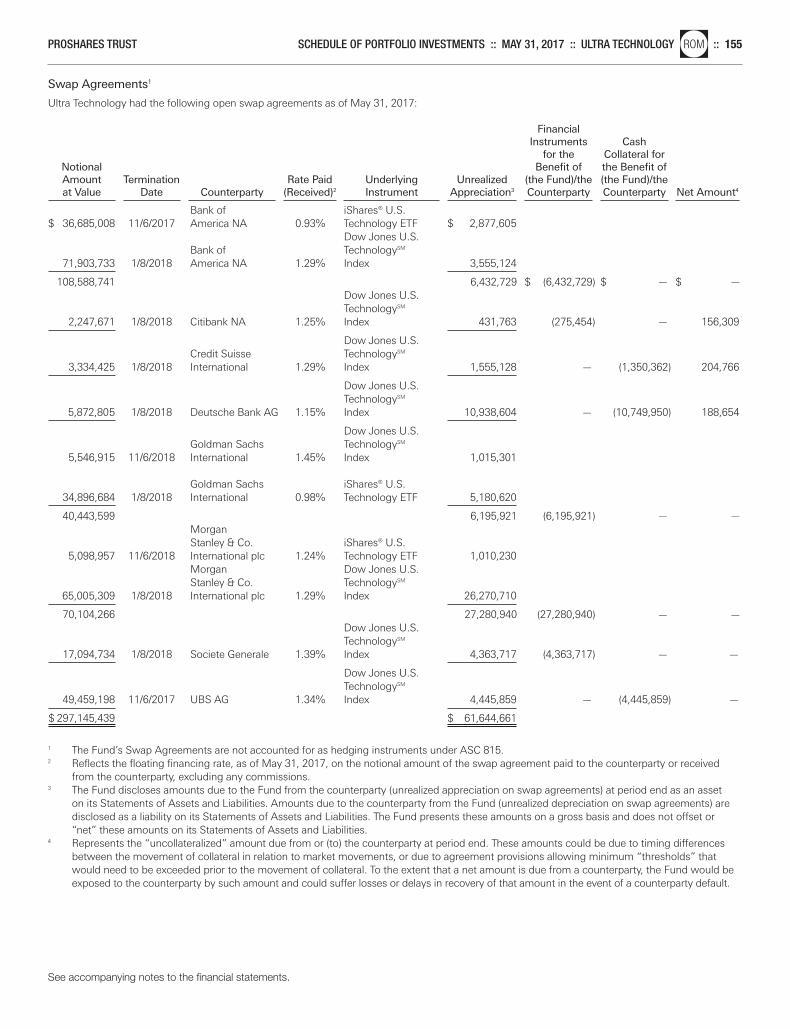
Swap Agreements1
Ultra Technology had the following open swap agreements as of May 31, 2017:
Financial Instruments Cash
for the Collateral for Notional Benefit of the Benefit of Amount Termination Rate Paid Underlying Unrealized (the Fund)/the (the Fund)/the at Value Date Counterparty (Received)2 Instrument Appreciation3 Counterparty Counterparty Net Amount4
Bank of iShares® U.S.
$ 36,685,008 11/6/2017 America NA 0.93% Technology ETF $ 2,877,605 Dow Jones U.S.
Bank of TechnologySM 71,903,733 1/8/2018 America NA 1.29% Index 3,555,124
108,588,741 6,432,729 $ (6,432,729) $ — $ —Dow Jones U.S. TechnologySM
2,247,671 1/8/2018 Citibank NA 1.25% Index 431,763 (275,454) — 156,309
Dow Jones U.S. Credit Suisse TechnologySM
3,334,425 1/8/2018 International 1.29% Index 1,555,128 — (1,350,362) 204,766
Dow Jones U.S. TechnologySM
5,872,805 1/8/2018 Deutsche Bank AG 1.15% Index 10,938,604 — (10,749,950) 188,654
Dow Jones U.S. Goldman Sachs TechnologySM
5,546,915 11/6/2018 International 1.45% Index 1,015,301
Goldman Sachs iShares® U.S. 34,896,684 1/8/2018 International 0.98% Technology ETF 5,180,620
40,443,599 6,195,921 (6,195,921) — —Morgan Stanley & Co. iShares® U.S.
5,098,957 11/6/2018 International plc 1.24% Technology ETF 1,010,230 Morgan Dow Jones U.S. Stanley & Co. TechnologySM
65,005,309 1/8/2018 International plc 1.29% Index 26,270,710
70,104,266 27,280,940 (27,280,940) — —Dow Jones U.S. TechnologySM
17,094,734 1/8/2018 Societe Generale 1.39% Index 4,363,717 (4,363,717) — —
Dow Jones U.S. TechnologySM
49,459,198 11/6/2017 UBS AG 1.34% Index 4,445,859 — (4,445,859) —
$ 297,145,439 $ 61,644,661
1 The Fund’s Swap Agreements are not accounted for as hedging instruments under ASC 815.2 Reflects the floating financing rate, as of May 31, 2017, on the notional amount of the swap agreement paid to the counterparty or received
from the counterparty, excluding any commissions.3 The Fund discloses amounts due to the Fund from the counterparty (unrealized appreciation on swap agreements) at period end as an asset
on its Statements of Assets and Liabilities. Amounts due to the counterparty from the Fund (unrealized depreciation on swap agreements) aredisclosed as a liability on its Statements of Assets and Liabilities. The Fund presents these amounts on a gross basis and does not offset or“net” these amounts on its Statements of Assets and Liabilities.
4 Represents the “uncollateralized” amount due from or (to) the counterparty at period end. These amounts could be due to timing differencesbetween the movement of collateral in relation to market movements, or due to agreement provisions allowing minimum “thresholds” thatwould need to be exceeded prior to the movement of collateral. To the extent that a net amount is due from a counterparty, the Fund would beexposed to the counterparty by such amount and could suffer losses or delays in recovery of that amount in the event of a counterparty default.
See accompanying notes to the financial statements.
PROSHARES TRUST SCHEDULE OF PORTFOLIO INVESTMENTS :: MAY 31, 2017 :: ULTRA TECHNOLOGYnlROM :: 155
Merrill Corp - Proshares Trust Geared Book [96 Funds] Annual Report [Funds] 333-089822 05-31-2017 ED [AUX] | eperez | 28-Jul-17 17:39 | 17-15159-3.fu | Sequence: 21CHKSUM Content: 41394 Layout: 9271 Graphics: No Graphics CLEAN
JOB: 17-15159-3 CYCLE#;BL#: 5; 0 TRIM: 8.25" x 10.75" COMPOSITECOLORS: Black, ~note-color 2, ~note-color 3 GRAPHICS: none V1.5
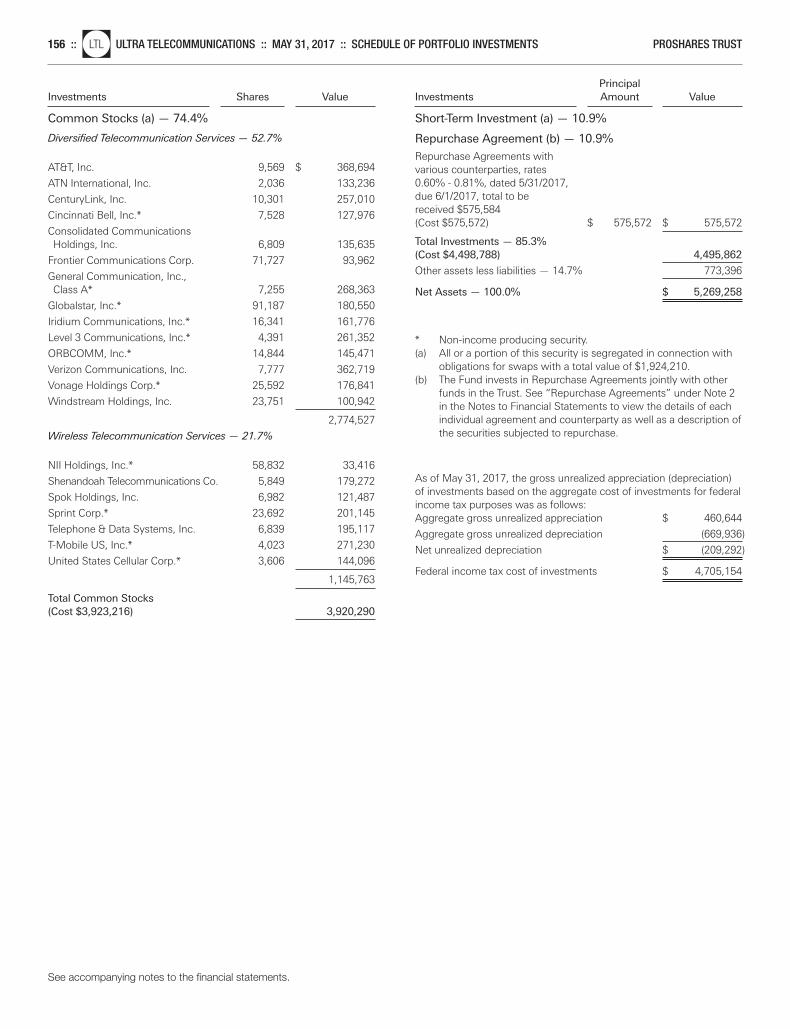
Investments Shares Value
Common Stocks (a) — 74.4%
PrincipalInvestments Amount Value
Short-Term Investment (a) — 10.9%
Diversified Telecommunication Services — 52.7%
AT&T, Inc. 9,569 $ 368,694
ATN International, Inc. 2,036 133,236
CenturyLink, Inc. 10,301 257,010
Cincinnati Bell, Inc.* 7,528 127,976
Consolidated Communications Holdings, Inc. 6,809 135,635
Frontier Communications Corp. 71,727 93,962
General Communication, Inc., Class A* 7,255 268,363
Globalstar, Inc.* 91,187 180,550
Iridium Communications, Inc.* 16,341 161,776
Level 3 Communications, Inc.* 4,391 261,352
ORBCOMM, Inc.* 14,844 145,471
Verizon Communications, Inc. 7,777 362,719
Vonage Holdings Corp.* 25,592 176,841
Windstream Holdings, Inc. 23,751 100,942
2,774,527
Wireless Telecommunication Services — 21.7%
NII Holdings, Inc.* 58,832 33,416
Shenandoah Telecommunications Co. 5,849 179,272
Spok Holdings, Inc. 6,982 121,487
Sprint Corp.* 23,692 201,145
Telephone & Data Systems, Inc. 6,839 195,117
T-Mobile US, Inc.* 4,023 271,230
United States Cellular Corp.* 3,606 144,096
1,145,763
Total Common Stocks(Cost $3,923,216) 3,920,290
Repurchase Agreement (b) — 10.9%
Repurchase Agreements with various counterparties, rates 0.60% - 0.81%, dated 5/31/2017, due 6/1/2017, total to be received $575,584 (Cost $575,572) $ 575,572 $ 575,572
Total Investments — 85.3%(Cost $4,498,788) 4,495,862
Other assets less liabilities — 14.7% 773,396
Net Assets — 100.0% $ 5,269,258
* Non-income producing security.(a) All or a portion of this security is segregated in connection with
obligations for swaps with a total value of $1,924,210.(b) The Fund invests in Repurchase Agreements jointly with other
funds in the Trust. See “Repurchase Agreements” under Note 2in the Notes to Financial Statements to view the details of eachindividual agreement and counterparty as well as a description ofthe securities subjected to repurchase.
As of May 31, 2017, the gross unrealized appreciation (depreciation)of investments based on the aggregate cost of investments for federalincome tax purposes was as follows:Aggregate gross unrealized appreciation $ 460,644
Aggregate gross unrealized depreciation (669,936)
Net unrealized depreciation $ (209,292)
Federal income tax cost of investments $ 4,705,154
See accompanying notes to the financial statements.
156 ::nlLTL ULTRA TELECOMMUNICATIONS :: MAY 31, 2017 :: SCHEDULE OF PORTFOLIO INVESTMENTS PROSHARES TRUST
Merrill Corp - Proshares Trust Geared Book [96 Funds] Annual Report [Funds] 333-089822 05-31-2017 ED [AUX] | eperez | 28-Jul-17 17:40 | 17-15159-3.fw | Sequence: 1CHKSUM Content: 34479 Layout: 343 Graphics: No Graphics CLEAN
JOB: 17-15159-3 CYCLE#;BL#: 5; 0 TRIM: 8.25" x 10.75" COMPOSITECOLORS: Black, ~note-color 2, ~note-color 3 GRAPHICS: none V1.5
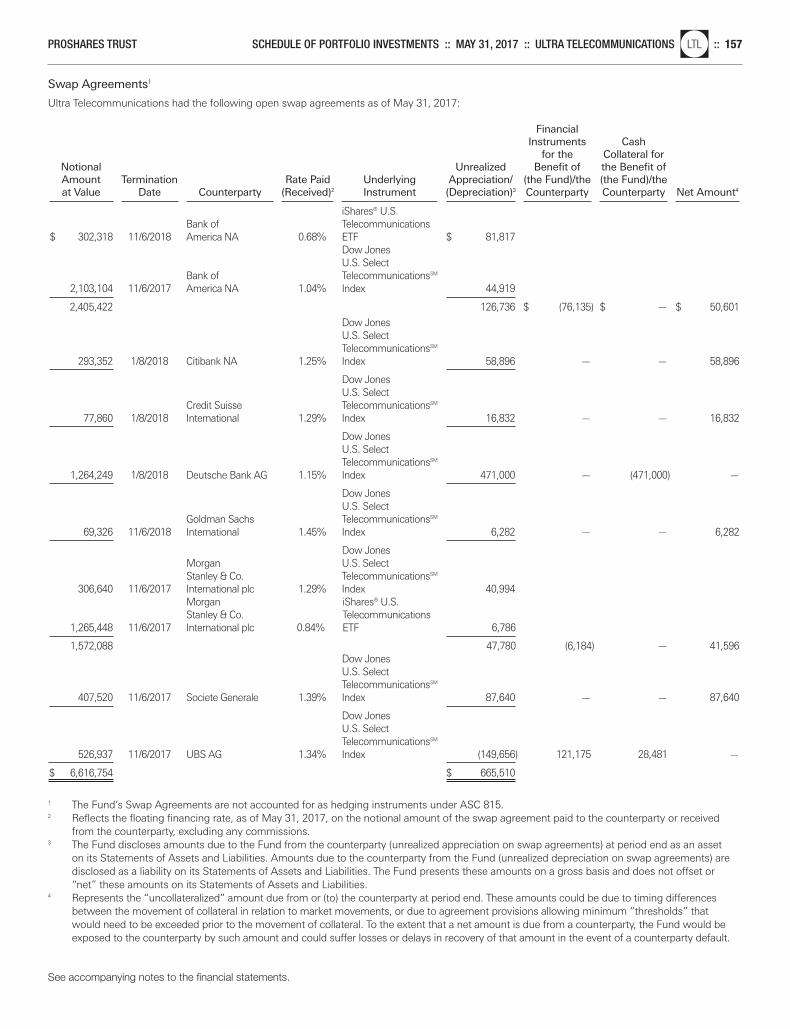
Swap Agreements1
Ultra Telecommunications had the following open swap agreements as of May 31, 2017:
Financial Instruments Cash
for the Collateral for Notional Unrealized Benefit of the Benefit of Amount Termination Rate Paid Underlying Appreciation/ (the Fund)/the (the Fund)/the at Value Date Counterparty (Received)2 Instrument (Depreciation)3 Counterparty Counterparty Net Amount4
iShares® U.S.
Bank of Telecommunications $ 302,318 11/6/2018 America NA 0.68% ETF $ 81,817
Dow Jones U.S. Select
Bank of TelecommunicationsSM 2,103,104 11/6/2017 America NA 1.04% Index 44,919
2,405,422 126,736 $ (76,135) $ — $ 50,601
Dow Jones U.S. Select TelecommunicationsSM
293,352 1/8/2018 Citibank NA 1.25% Index 58,896 — — 58,896
Dow Jones U.S. Select
Credit Suisse TelecommunicationsSM 77,860 1/8/2018 International 1.29% Index 16,832 — — 16,832
Dow Jones U.S. Select TelecommunicationsSM
1,264,249 1/8/2018 Deutsche Bank AG 1.15% Index 471,000 — (471,000) —
Dow Jones U.S. Select
Goldman Sachs TelecommunicationsSM 69,326 11/6/2018 International 1.45% Index 6,282 — — 6,282
Dow Jones Morgan U.S. Select Stanley & Co. TelecommunicationsSM
306,640 11/6/2017 International plc 1.29% Index 40,994 Morgan iShares® U.S. Stanley & Co. Telecommunications
1,265,448 11/6/2017 International plc 0.84% ETF 6,786
1,572,088 47,780 (6,184) — 41,596Dow Jones U.S. Select TelecommunicationsSM
407,520 11/6/2017 Societe Generale 1.39% Index 87,640 — — 87,640
Dow Jones U.S. Select TelecommunicationsSM
526,937 11/6/2017 UBS AG 1.34% Index (149,656) 121,175 28,481 —
$ 6,616,754 $ 665,510
1 The Fund’s Swap Agreements are not accounted for as hedging instruments under ASC 815.2 Reflects the floating financing rate, as of May 31, 2017, on the notional amount of the swap agreement paid to the counterparty or received
from the counterparty, excluding any commissions.3 The Fund discloses amounts due to the Fund from the counterparty (unrealized appreciation on swap agreements) at period end as an asset
on its Statements of Assets and Liabilities. Amounts due to the counterparty from the Fund (unrealized depreciation on swap agreements) aredisclosed as a liability on its Statements of Assets and Liabilities. The Fund presents these amounts on a gross basis and does not offset or“net” these amounts on its Statements of Assets and Liabilities.
4 Represents the “uncollateralized” amount due from or (to) the counterparty at period end. These amounts could be due to timing differencesbetween the movement of collateral in relation to market movements, or due to agreement provisions allowing minimum “thresholds” thatwould need to be exceeded prior to the movement of collateral. To the extent that a net amount is due from a counterparty, the Fund would beexposed to the counterparty by such amount and could suffer losses or delays in recovery of that amount in the event of a counterparty default.
See accompanying notes to the financial statements.
PROSHARES TRUST SCHEDULE OF PORTFOLIO INVESTMENTS :: MAY 31, 2017 :: ULTRA TELECOMMUNICATIONSnlLTL :: 157
Merrill Corp - Proshares Trust Geared Book [96 Funds] Annual Report [Funds] 333-089822 05-31-2017 ED [AUX] | eperez | 28-Jul-17 17:40 | 17-15159-3.fw | Sequence: 2CHKSUM Content: 9117 Layout: 20209 Graphics: No Graphics CLEAN
JOB: 17-15159-3 CYCLE#;BL#: 5; 0 TRIM: 8.25" x 10.75" COMPOSITECOLORS: Black, ~note-color 2, ~note-color 3 GRAPHICS: none V1.5
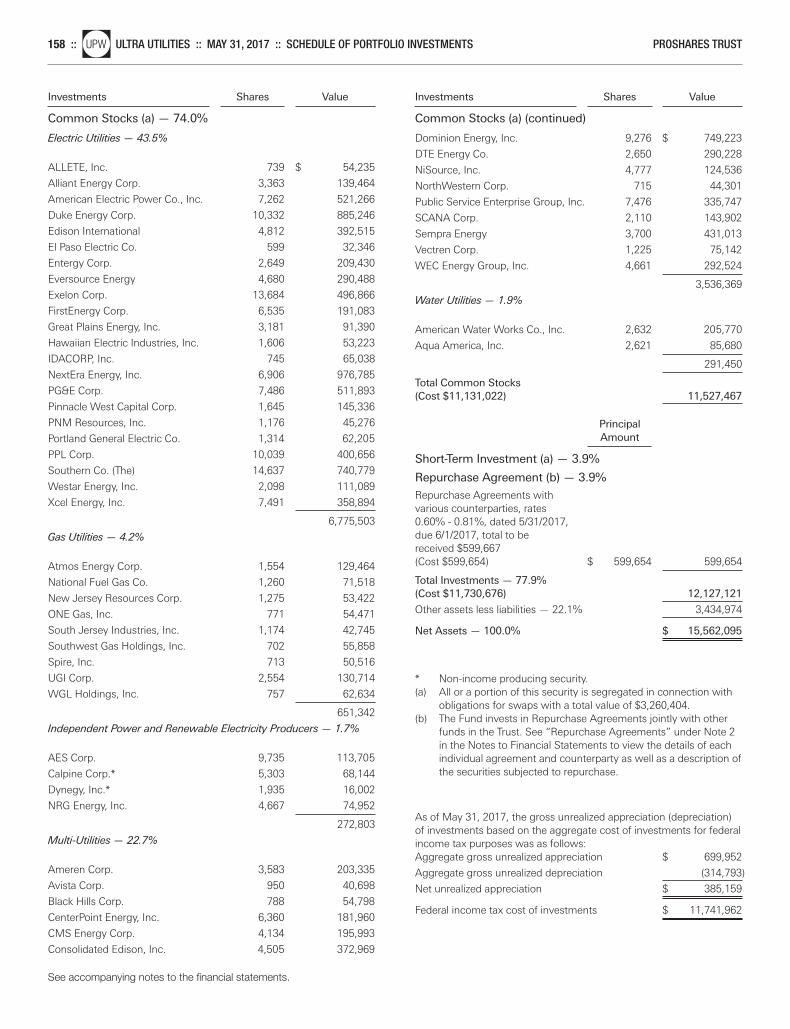
Investments Shares Value
Common Stocks (a) — 74.0%
Investments Shares Value
Common Stocks (a) (continued)
Electric Utilities — 43.5%
ALLETE, Inc. 739 $ 54,235
Alliant Energy Corp. 3,363 139,464
American Electric Power Co., Inc. 7,262 521,266
Duke Energy Corp. 10,332 885,246
Edison International 4,812 392,515
El Paso Electric Co. 599 32,346
Entergy Corp. 2,649 209,430
Eversource Energy 4,680 290,488
Exelon Corp. 13,684 496,866
FirstEnergy Corp. 6,535 191,083
Great Plains Energy, Inc. 3,181 91,390
Hawaiian Electric Industries, Inc. 1,606 53,223
IDACORP, Inc. 745 65,038
NextEra Energy, Inc. 6,906 976,785
PG&E Corp. 7,486 511,893
Pinnacle West Capital Corp. 1,645 145,336
PNM Resources, Inc. 1,176 45,276
Portland General Electric Co. 1,314 62,205
PPL Corp. 10,039 400,656
Southern Co. (The) 14,637 740,779
Westar Energy, Inc. 2,098 111,089
Xcel Energy, Inc. 7,491 358,894
6,775,503
Gas Utilities — 4.2%
Atmos Energy Corp. 1,554 129,464
National Fuel Gas Co. 1,260 71,518
New Jersey Resources Corp. 1,275 53,422
ONE Gas, Inc. 771 54,471
South Jersey Industries, Inc. 1,174 42,745
Southwest Gas Holdings, Inc. 702 55,858
Spire, Inc. 713 50,516
UGI Corp. 2,554 130,714
WGL Holdings, Inc. 757 62,634
651,342
Independent Power and Renewable Electricity Producers — 1.7%
AES Corp. 9,735 113,705
Calpine Corp.* 5,303 68,144
Dynegy, Inc.* 1,935 16,002
NRG Energy, Inc. 4,667 74,952
272,803
Multi-Utilities — 22.7%
Ameren Corp. 3,583 203,335
Avista Corp. 950 40,698
Black Hills Corp. 788 54,798
CenterPoint Energy, Inc. 6,360 181,960
CMS Energy Corp. 4,134 195,993
Consolidated Edison, Inc. 4,505 372,969
Dominion Energy, Inc. 9,276 $ 749,223
DTE Energy Co. 2,650 290,228
NiSource, Inc. 4,777 124,536
NorthWestern Corp. 715 44,301
Public Service Enterprise Group, Inc. 7,476 335,747
SCANA Corp. 2,110 143,902
Sempra Energy 3,700 431,013
Vectren Corp. 1,225 75,142
WEC Energy Group, Inc. 4,661 292,524
3,536,369
Water Utilities — 1.9%
American Water Works Co., Inc. 2,632 205,770
Aqua America, Inc. 2,621 85,680
291,450
Total Common Stocks(Cost $11,131,022) 11,527,467
Principal Amount
Short-Term Investment (a) — 3.9%
Repurchase Agreement (b) — 3.9%
Repurchase Agreements with various counterparties, rates 0.60% - 0.81%, dated 5/31/2017, due 6/1/2017, total to be received $599,667 (Cost $599,654) $ 599,654 599,654
Total Investments — 77.9%(Cost $11,730,676) 12,127,121
Other assets less liabilities — 22.1% 3,434,974
Net Assets — 100.0% $ 15,562,095
* Non-income producing security.(a) All or a portion of this security is segregated in connection with
obligations for swaps with a total value of $3,260,404.(b) The Fund invests in Repurchase Agreements jointly with other
funds in the Trust. See “Repurchase Agreements” under Note 2in the Notes to Financial Statements to view the details of eachindividual agreement and counterparty as well as a description ofthe securities subjected to repurchase.
As of May 31, 2017, the gross unrealized appreciation (depreciation)of investments based on the aggregate cost of investments for federalincome tax purposes was as follows:Aggregate gross unrealized appreciation $ 699,952
Aggregate gross unrealized depreciation (314,793)
Net unrealized appreciation $ 385,159
Federal income tax cost of investments $ 11,741,962
See accompanying notes to the financial statements.
158 ::nlUPW ULTRA UTILITIES :: MAY 31, 2017 :: SCHEDULE OF PORTFOLIO INVESTMENTS PROSHARES TRUST
Merrill Corp - Proshares Trust Geared Book [96 Funds] Annual Report [Funds] 333-089822 05-31-2017 ED [AUX] | eperez | 28-Jul-17 17:40 | 17-15159-3.fw | Sequence: 3CHKSUM Content: 37795 Layout: 44809 Graphics: No Graphics CLEAN
JOB: 17-15159-3 CYCLE#;BL#: 5; 0 TRIM: 8.25" x 10.75" COMPOSITECOLORS: Black, ~note-color 2, ~note-color 3 GRAPHICS: none V1.5
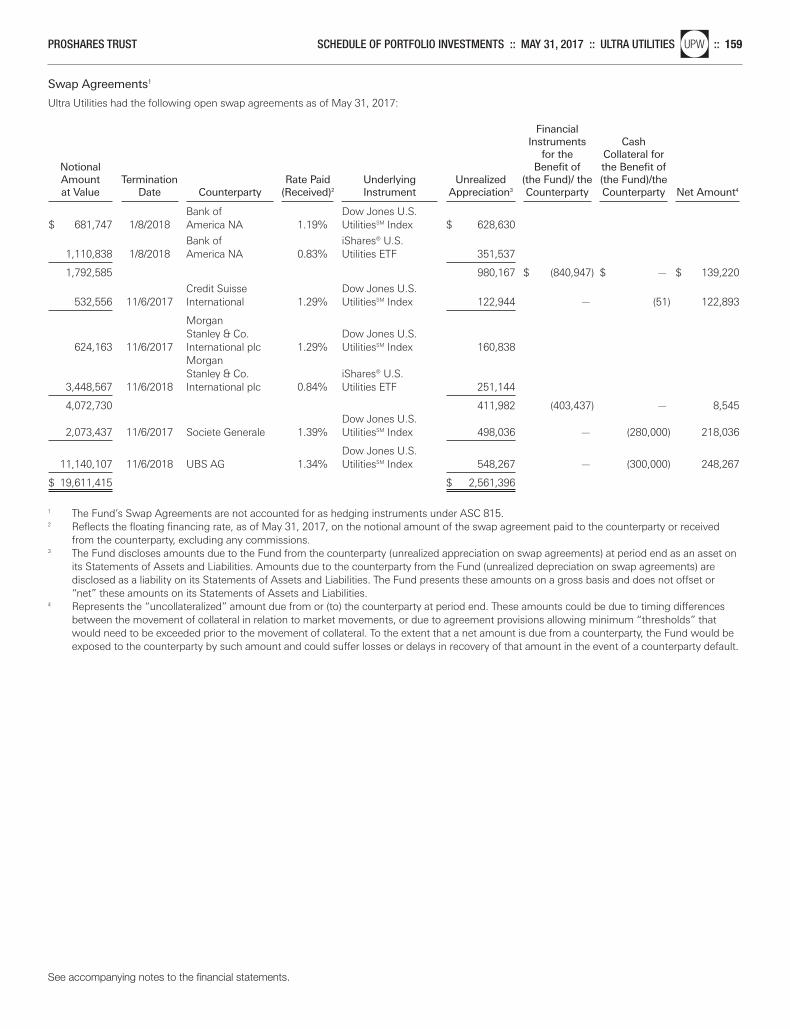
See accompanying notes to the financial statements.
PROSHARES TRUST SCHEDULE OF PORTFOLIO INVESTMENTS :: MAY 31, 2017 :: ULTRA UTILITIESnlUPW :: 159
Swap Agreements1
Ultra Utilities had the following open swap agreements as of May 31, 2017:
Financial Instruments Cash
for the Collateral for Notional Benefit of the Benefit of Amount Termination Rate Paid Underlying Unrealized (the Fund)/ the (the Fund)/the at Value Date Counterparty (Received)2 Instrument Appreciation3 Counterparty Counterparty Net Amount4
Bank of Dow Jones U.S.
$ 681,747 1/8/2018 America NA 1.19% UtilitiesSM Index $ 628,630
Bank of iShares® U.S. 1,110,838 1/8/2018 America NA 0.83% Utilities ETF 351,537
1,792,585 980,167 $ (840,947) $ — $ 139,220
Credit Suisse Dow Jones U.S. 532,556 11/6/2017 International 1.29% UtilitiesSM Index 122,944 — (51) 122,893
Morgan Stanley & Co. Dow Jones U.S.
624,163 11/6/2017 International plc 1.29% UtilitiesSM Index 160,838 Morgan Stanley & Co. iShares® U.S.
3,448,567 11/6/2018 International plc 0.84% Utilities ETF 251,144
4,072,730 411,982 (403,437) — 8,545Dow Jones U.S.
2,073,437 11/6/2017 Societe Generale 1.39% UtilitiesSM Index 498,036 — (280,000) 218,036
Dow Jones U.S. 11,140,107 11/6/2018 UBS AG 1.34% UtilitiesSM Index 548,267 — (300,000) 248,267
$ 19,611,415 $ 2,561,396
1 The Fund’s Swap Agreements are not accounted for as hedging instruments under ASC 815.2 Reflects the floating financing rate, as of May 31, 2017, on the notional amount of the swap agreement paid to the counterparty or received
from the counterparty, excluding any commissions.3 The Fund discloses amounts due to the Fund from the counterparty (unrealized appreciation on swap agreements) at period end as an asset on
its Statements of Assets and Liabilities. Amounts due to the counterparty from the Fund (unrealized depreciation on swap agreements) are disclosed as a liability on its Statements of Assets and Liabilities. The Fund presents these amounts on a gross basis and does not offset or“net” these amounts on its Statements of Assets and Liabilities.
4 Represents the “uncollateralized” amount due from or (to) the counterparty at period end. These amounts could be due to timing differencesbetween the movement of collateral in relation to market movements, or due to agreement provisions allowing minimum “thresholds” thatwould need to be exceeded prior to the movement of collateral. To the extent that a net amount is due from a counterparty, the Fund would beexposed to the counterparty by such amount and could suffer losses or delays in recovery of that amount in the event of a counterparty default.
Merrill Corp - Proshares Trust Geared Book [96 Funds] Annual Report [Funds] 333-089822 05-31-2017 ED [AUX] | eperez | 28-Jul-17 17:40 | 17-15159-3.fw | Sequence: 4CHKSUM Content: 45102 Layout: 17113 Graphics: No Graphics CLEAN
JOB: 17-15159-3 CYCLE#;BL#: 5; 0 TRIM: 8.25" x 10.75" COMPOSITECOLORS: Black, ~note-color 2, ~note-color 3 GRAPHICS: none V1.5
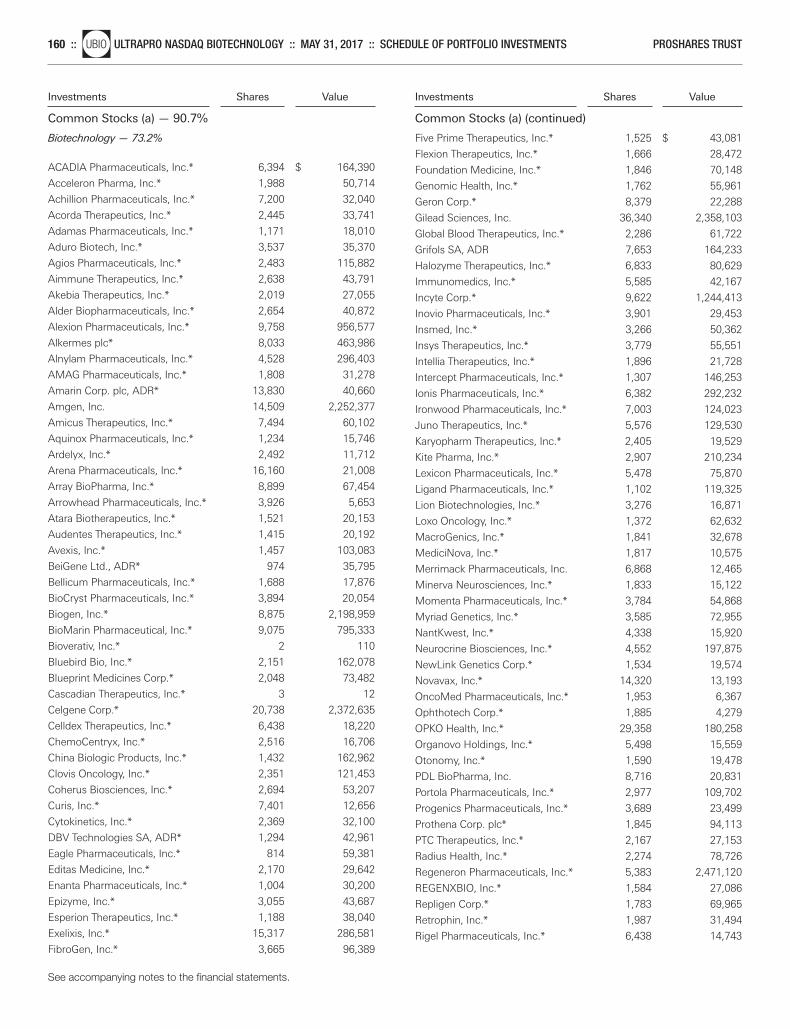
Investments Shares Value
Common Stocks (a) — 90.7%
Investments Shares Value
Common Stocks (a) (continued)
Biotechnology — 73.2%
ACADIA Pharmaceuticals, Inc.* 6,394 $ 164,390
Acceleron Pharma, Inc.* 1,988 50,714
Achillion Pharmaceuticals, Inc.* 7,200 32,040
Acorda Therapeutics, Inc.* 2,445 33,741
Adamas Pharmaceuticals, Inc.* 1,171 18,010
Aduro Biotech, Inc.* 3,537 35,370
Agios Pharmaceuticals, Inc.* 2,483 115,882
Aimmune Therapeutics, Inc.* 2,638 43,791
Akebia Therapeutics, Inc.* 2,019 27,055
Alder Biopharmaceuticals, Inc.* 2,654 40,872
Alexion Pharmaceuticals, Inc.* 9,758 956,577
Alkermes plc* 8,033 463,986
Alnylam Pharmaceuticals, Inc.* 4,528 296,403
AMAG Pharmaceuticals, Inc.* 1,808 31,278
Amarin Corp. plc, ADR* 13,830 40,660
Amgen, Inc. 14,509 2,252,377
Amicus Therapeutics, Inc.* 7,494 60,102
Aquinox Pharmaceuticals, Inc.* 1,234 15,746
Ardelyx, Inc.* 2,492 11,712
Arena Pharmaceuticals, Inc.* 16,160 21,008
Array BioPharma, Inc.* 8,899 67,454
Arrowhead Pharmaceuticals, Inc.* 3,926 5,653
Atara Biotherapeutics, Inc.* 1,521 20,153
Audentes Therapeutics, Inc.* 1,415 20,192
Avexis, Inc.* 1,457 103,083
BeiGene Ltd., ADR* 974 35,795
Bellicum Pharmaceuticals, Inc.* 1,688 17,876
BioCryst Pharmaceuticals, Inc.* 3,894 20,054
Biogen, Inc.* 8,875 2,198,959
BioMarin Pharmaceutical, Inc.* 9,075 795,333
Bioverativ, Inc.* 2 110
Bluebird Bio, Inc.* 2,151 162,078
Blueprint Medicines Corp.* 2,048 73,482
Cascadian Therapeutics, Inc.* 3 12
Celgene Corp.* 20,738 2,372,635
Celldex Therapeutics, Inc.* 6,438 18,220
ChemoCentryx, Inc.* 2,516 16,706
China Biologic Products, Inc.* 1,432 162,962
Clovis Oncology, Inc.* 2,351 121,453
Coherus Biosciences, Inc.* 2,694 53,207
Curis, Inc.* 7,401 12,656
Cytokinetics, Inc.* 2,369 32,100
DBV Technologies SA, ADR* 1,294 42,961
Eagle Pharmaceuticals, Inc.* 814 59,381
Editas Medicine, Inc.* 2,170 29,642
Enanta Pharmaceuticals, Inc.* 1,004 30,200
Epizyme, Inc.* 3,055 43,687
Esperion Therapeutics, Inc.* 1,188 38,040
Exelixis, Inc.* 15,317 286,581
FibroGen, Inc.* 3,665 96,389
Five Prime Therapeutics, Inc.* 1,525 $ 43,081
Flexion Therapeutics, Inc.* 1,666 28,472
Foundation Medicine, Inc.* 1,846 70,148
Genomic Health, Inc.* 1,762 55,961
Geron Corp.* 8,379 22,288
Gilead Sciences, Inc. 36,340 2,358,103
Global Blood Therapeutics, Inc.* 2,286 61,722
Grifols SA, ADR 7,653 164,233
Halozyme Therapeutics, Inc.* 6,833 80,629
Immunomedics, Inc.* 5,585 42,167
Incyte Corp.* 9,622 1,244,413
Inovio Pharmaceuticals, Inc.* 3,901 29,453
Insmed, Inc.* 3,266 50,362
Insys Therapeutics, Inc.* 3,779 55,551
Intellia Therapeutics, Inc.* 1,896 21,728
Intercept Pharmaceuticals, Inc.* 1,307 146,253
Ionis Pharmaceuticals, Inc.* 6,382 292,232
Ironwood Pharmaceuticals, Inc.* 7,003 124,023
Juno Therapeutics, Inc.* 5,576 129,530
Karyopharm Therapeutics, Inc.* 2,405 19,529
Kite Pharma, Inc.* 2,907 210,234
Lexicon Pharmaceuticals, Inc.* 5,478 75,870
Ligand Pharmaceuticals, Inc.* 1,102 119,325
Lion Biotechnologies, Inc.* 3,276 16,871
Loxo Oncology, Inc.* 1,372 62,632
MacroGenics, Inc.* 1,841 32,678
MediciNova, Inc.* 1,817 10,575
Merrimack Pharmaceuticals, Inc. 6,868 12,465
Minerva Neurosciences, Inc.* 1,833 15,122
Momenta Pharmaceuticals, Inc.* 3,784 54,868
Myriad Genetics, Inc.* 3,585 72,955
NantKwest, Inc.* 4,338 15,920
Neurocrine Biosciences, Inc.* 4,552 197,875
NewLink Genetics Corp.* 1,534 19,574
Novavax, Inc.* 14,320 13,193
OncoMed Pharmaceuticals, Inc.* 1,953 6,367
Ophthotech Corp.* 1,885 4,279
OPKO Health, Inc.* 29,358 180,258
Organovo Holdings, Inc.* 5,498 15,559
Otonomy, Inc.* 1,590 19,478
PDL BioPharma, Inc. 8,716 20,831
Portola Pharmaceuticals, Inc.* 2,977 109,702
Progenics Pharmaceuticals, Inc.* 3,689 23,499
Prothena Corp. plc* 1,845 94,113
PTC Therapeutics, Inc.* 2,167 27,153
Radius Health, Inc.* 2,274 78,726
Regeneron Pharmaceuticals, Inc.* 5,383 2,471,120
REGENXBIO, Inc.* 1,584 27,086
Repligen Corp.* 1,783 69,965
Retrophin, Inc.* 1,987 31,494
Rigel Pharmaceuticals, Inc.* 6,438 14,743
See accompanying notes to the financial statements.
160 ::nlUBIO ULTRAPRO NASDAQ BIOTECHNOLOGY :: MAY 31, 2017 :: SCHEDULE OF PORTFOLIO INVESTMENTS PROSHARES TRUST
Merrill Corp - Proshares Trust Geared Book [96 Funds] Annual Report [Funds] 333-089822 05-31-2017 ED [AUX] | eperez | 28-Jul-17 17:40 | 17-15159-3.fw | Sequence: 5CHKSUM Content: 28652 Layout: 25327 Graphics: No Graphics CLEAN
JOB: 17-15159-3 CYCLE#;BL#: 5; 0 TRIM: 8.25" x 10.75" COMPOSITECOLORS: Black, ~note-color 2, ~note-color 3 GRAPHICS: none V1.5
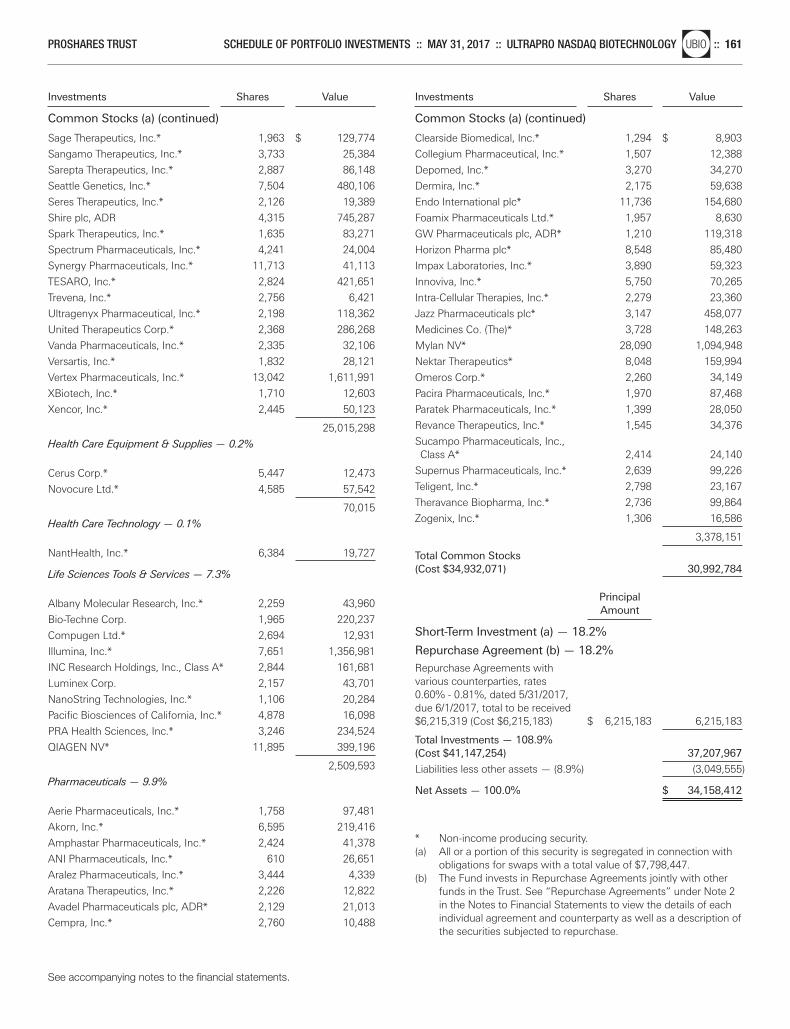
PROSHARES TRUST SCHEDULE OF PORTFOLIO INVESTMENTS :: MAY 31, 2017 :: ULTRAPRO NASDAQ BIOTECHNOLOGYnlUBIO :: 161
Investments Shares Value
Common Stocks (a) (continued)
Investments Shares Value
Common Stocks (a) (continued)
Sage Therapeutics, Inc.* 1,963 $ 129,774
Sangamo Therapeutics, Inc.* 3,733 25,384
Sarepta Therapeutics, Inc.* 2,887 86,148
Seattle Genetics, Inc.* 7,504 480,106
Seres Therapeutics, Inc.* 2,126 19,389
Shire plc, ADR 4,315 745,287
Spark Therapeutics, Inc.* 1,635 83,271
Spectrum Pharmaceuticals, Inc.* 4,241 24,004
Synergy Pharmaceuticals, Inc.* 11,713 41,113
TESARO, Inc.* 2,824 421,651
Trevena, Inc.* 2,756 6,421
Ultragenyx Pharmaceutical, Inc.* 2,198 118,362
United Therapeutics Corp.* 2,368 286,268
Vanda Pharmaceuticals, Inc.* 2,335 32,106
Versartis, Inc.* 1,832 28,121
Vertex Pharmaceuticals, Inc.* 13,042 1,611,991
XBiotech, Inc.* 1,710 12,603
Xencor, Inc.* 2,445 50,123
25,015,298
Health Care Equipment & Supplies — 0.2%
Cerus Corp.* 5,447 12,473
Novocure Ltd.* 4,585 57,542
70,015
Health Care Technology — 0.1%
NantHealth, Inc.* 6,384 19,727
Life Sciences Tools & Services — 7.3%
Albany Molecular Research, Inc.* 2,259 43,960
Bio-Techne Corp. 1,965 220,237
Compugen Ltd.* 2,694 12,931
Illumina, Inc.* 7,651 1,356,981
INC Research Holdings, Inc., Class A* 2,844 161,681
Luminex Corp. 2,157 43,701
NanoString Technologies, Inc.* 1,106 20,284
Pacific Biosciences of California, Inc.* 4,878 16,098
PRA Health Sciences, Inc.* 3,246 234,524
QIAGEN NV* 11,895 399,196
2,509,593
Pharmaceuticals — 9.9%
Aerie Pharmaceuticals, Inc.* 1,758 97,481
Akorn, Inc.* 6,595 219,416
Amphastar Pharmaceuticals, Inc.* 2,424 41,378
ANI Pharmaceuticals, Inc.* 610 26,651
Aralez Pharmaceuticals, Inc.* 3,444 4,339
Aratana Therapeutics, Inc.* 2,226 12,822
Avadel Pharmaceuticals plc, ADR* 2,129 21,013
Cempra, Inc.* 2,760 10,488
Clearside Biomedical, Inc.* 1,294 $ 8,903
Collegium Pharmaceutical, Inc.* 1,507 12,388
Depomed, Inc.* 3,270 34,270
Dermira, Inc.* 2,175 59,638
Endo International plc* 11,736 154,680
Foamix Pharmaceuticals Ltd.* 1,957 8,630
GW Pharmaceuticals plc, ADR* 1,210 119,318
Horizon Pharma plc* 8,548 85,480
Impax Laboratories, Inc.* 3,890 59,323
Innoviva, Inc.* 5,750 70,265
Intra-Cellular Therapies, Inc.* 2,279 23,360
Jazz Pharmaceuticals plc* 3,147 458,077
Medicines Co. (The)* 3,728 148,263
Mylan NV* 28,090 1,094,948
Nektar Therapeutics* 8,048 159,994
Omeros Corp.* 2,260 34,149
Pacira Pharmaceuticals, Inc.* 1,970 87,468
Paratek Pharmaceuticals, Inc.* 1,399 28,050
Revance Therapeutics, Inc.* 1,545 34,376
Sucampo Pharmaceuticals, Inc., Class A* 2,414 24,140
Supernus Pharmaceuticals, Inc.* 2,639 99,226
Teligent, Inc.* 2,798 23,167
Theravance Biopharma, Inc.* 2,736 99,864
Zogenix, Inc.* 1,306 16,586
3,378,151
Total Common Stocks(Cost $34,932,071) 30,992,784
Principal Amount
Short-Term Investment (a) — 18.2%
Repurchase Agreement (b) — 18.2%
Repurchase Agreements with various counterparties, rates 0.60% - 0.81%, dated 5/31/2017, due 6/1/2017, total to be received $6,215,319 (Cost $6,215,183) $ 6,215,183 6,215,183
Total Investments — 108.9%(Cost $41,147,254) 37,207,967
Liabilities less other assets — (8.9%) (3,049,555)
Net Assets — 100.0% $ 34,158,412
* Non-income producing security.(a) All or a portion of this security is segregated in connection with
obligations for swaps with a total value of $7,798,447.(b) The Fund invests in Repurchase Agreements jointly with other
funds in the Trust. See “Repurchase Agreements” under Note 2in the Notes to Financial Statements to view the details of eachindividual agreement and counterparty as well as a description ofthe securities subjected to repurchase.
See accompanying notes to the financial statements.
Merrill Corp - Proshares Trust Geared Book [96 Funds] Annual Report [Funds] 333-089822 05-31-2017 ED [AUX] | eperez | 28-Jul-17 17:40 | 17-15159-3.fw | Sequence: 6CHKSUM Content: 7051 Layout: 44477 Graphics: No Graphics CLEAN
JOB: 17-15159-3 CYCLE#;BL#: 5; 0 TRIM: 8.25" x 10.75" COMPOSITECOLORS: Black, ~note-color 2, ~note-color 3 GRAPHICS: none V1.5
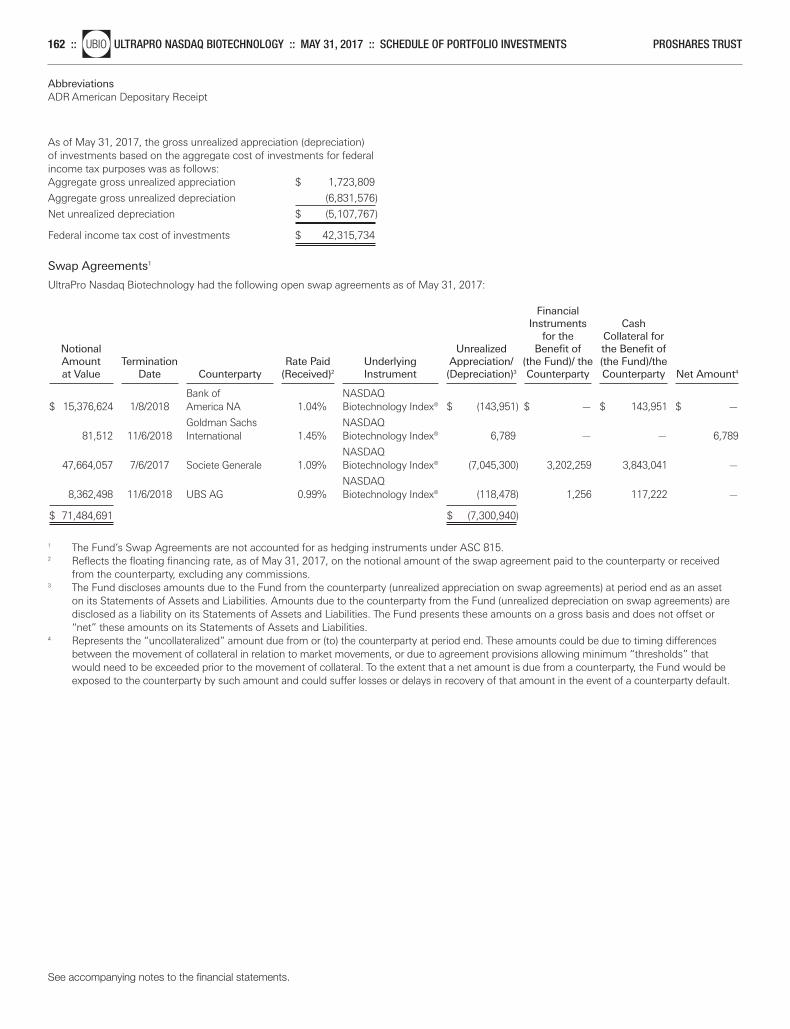
See accompanying notes to the financial statements.
162 ::nlUBIO ULTRAPRO NASDAQ BIOTECHNOLOGY :: MAY 31, 2017 :: SCHEDULE OF PORTFOLIO INVESTMENTS PROSHARES TRUST
AbbreviationsADR American Depositary Receipt
As of May 31, 2017, the gross unrealized appreciation (depreciation)of investments based on the aggregate cost of investments for federalincome tax purposes was as follows:Aggregate gross unrealized appreciation $ 1,723,809
Aggregate gross unrealized depreciation (6,831,576)
Net unrealized depreciation $ (5,107,767)
Federal income tax cost of investments $ 42,315,734
Swap Agreements1
UltraPro Nasdaq Biotechnology had the following open swap agreements as of May 31, 2017:
Financial Instruments Cash
for the Collateral for Notional Unrealized Benefit of the Benefit of Amount Termination Rate Paid Underlying Appreciation/ (the Fund)/ the (the Fund)/the at Value Date Counterparty (Received)2 Instrument (Depreciation)3 Counterparty Counterparty Net Amount4
Bank of NASDAQ
$ 15,376,624 1/8/2018 America NA 1.04% Biotechnology Index® $ (143,951) $ — $ 143,951 $ —
Goldman Sachs NASDAQ 81,512 11/6/2018 International 1.45% Biotechnology Index® 6,789 — — 6,789
NASDAQ 47,664,057 7/6/2017 Societe Generale 1.09% Biotechnology Index® (7,045,300) 3,202,259 3,843,041 —
NASDAQ 8,362,498 11/6/2018 UBS AG 0.99% Biotechnology Index® (118,478) 1,256 117,222 —
$ 71,484,691 $ (7,300,940)
1 The Fund’s Swap Agreements are not accounted for as hedging instruments under ASC 815.2 Reflects the floating financing rate, as of May 31, 2017, on the notional amount of the swap agreement paid to the counterparty or received
from the counterparty, excluding any commissions.3 The Fund discloses amounts due to the Fund from the counterparty (unrealized appreciation on swap agreements) at period end as an asset
on its Statements of Assets and Liabilities. Amounts due to the counterparty from the Fund (unrealized depreciation on swap agreements) aredisclosed as a liability on its Statements of Assets and Liabilities. The Fund presents these amounts on a gross basis and does not offset or“net” these amounts on its Statements of Assets and Liabilities.
4 Represents the “uncollateralized” amount due from or (to) the counterparty at period end. These amounts could be due to timing differencesbetween the movement of collateral in relation to market movements, or due to agreement provisions allowing minimum “thresholds” thatwould need to be exceeded prior to the movement of collateral. To the extent that a net amount is due from a counterparty, the Fund would beexposed to the counterparty by such amount and could suffer losses or delays in recovery of that amount in the event of a counterparty default.
Merrill Corp - Proshares Trust Geared Book [96 Funds] Annual Report [Funds] 333-089822 05-31-2017 ED [AUX] | eperez | 28-Jul-17 17:40 | 17-15159-3.fw | Sequence: 7CHKSUM Content: 59207 Layout: 22961 Graphics: No Graphics CLEAN
JOB: 17-15159-3 CYCLE#;BL#: 5; 0 TRIM: 8.25" x 10.75" COMPOSITECOLORS: Black, ~note-color 2, ~note-color 3 GRAPHICS: none V1.5
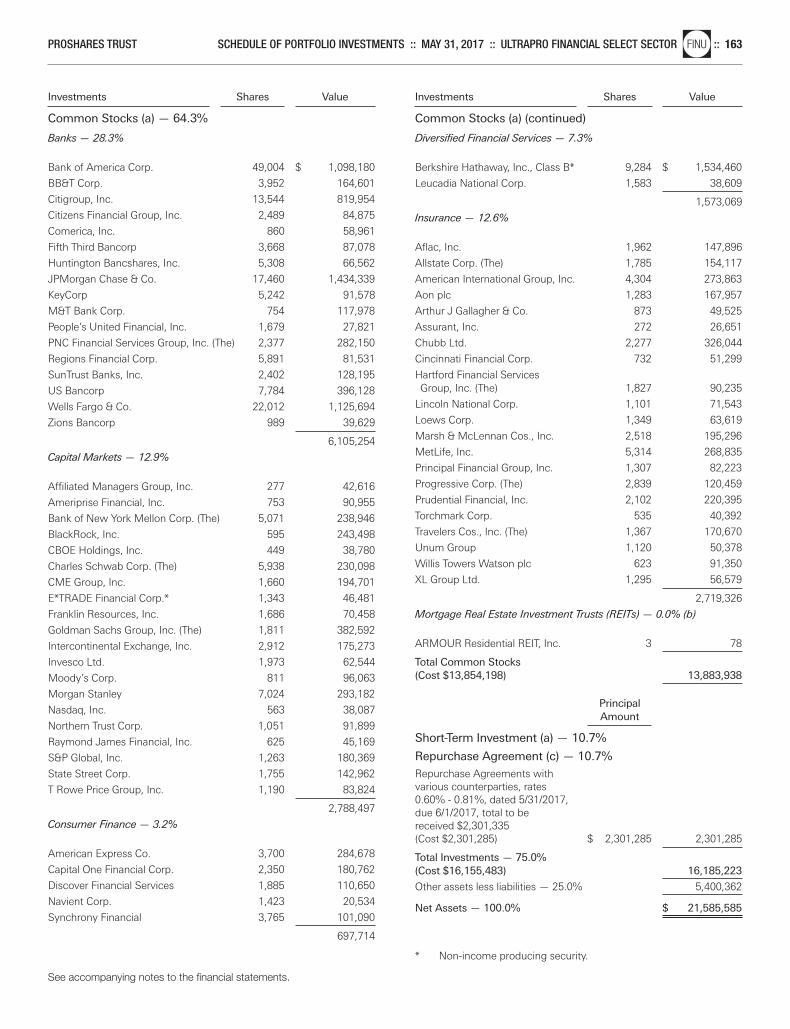
Investments Shares Value
Common Stocks (a) — 64.3%
Investments Shares Value
Common Stocks (a) (continued)
Banks — 28.3%
Bank of America Corp. 49,004 $ 1,098,180
BB&T Corp. 3,952 164,601
Citigroup, Inc. 13,544 819,954
Citizens Financial Group, Inc. 2,489 84,875
Comerica, Inc. 860 58,961
Fifth Third Bancorp 3,668 87,078
Huntington Bancshares, Inc. 5,308 66,562
JPMorgan Chase & Co. 17,460 1,434,339
KeyCorp 5,242 91,578
M&T Bank Corp. 754 117,978
People’s United Financial, Inc. 1,679 27,821
PNC Financial Services Group, Inc. (The) 2,377 282,150
Regions Financial Corp. 5,891 81,531
SunTrust Banks, Inc. 2,402 128,195
US Bancorp 7,784 396,128
Wells Fargo & Co. 22,012 1,125,694
Zions Bancorp 989 39,629
6,105,254
Capital Markets — 12.9%
Affiliated Managers Group, Inc. 277 42,616
Ameriprise Financial, Inc. 753 90,955
Bank of New York Mellon Corp. (The) 5,071 238,946
BlackRock, Inc. 595 243,498
CBOE Holdings, Inc. 449 38,780
Charles Schwab Corp. (The) 5,938 230,098
CME Group, Inc. 1,660 194,701
E*TRADE Financial Corp.* 1,343 46,481
Franklin Resources, Inc. 1,686 70,458
Goldman Sachs Group, Inc. (The) 1,811 382,592
Intercontinental Exchange, Inc. 2,912 175,273
Invesco Ltd. 1,973 62,544
Moody’s Corp. 811 96,063
Morgan Stanley 7,024 293,182
Nasdaq, Inc. 563 38,087
Northern Trust Corp. 1,051 91,899
Raymond James Financial, Inc. 625 45,169
S&P Global, Inc. 1,263 180,369
State Street Corp. 1,755 142,962
T Rowe Price Group, Inc. 1,190 83,824
2,788,497
Consumer Finance — 3.2%
American Express Co. 3,700 284,678
Capital One Financial Corp. 2,350 180,762
Discover Financial Services 1,885 110,650
Navient Corp. 1,423 20,534
Synchrony Financial 3,765 101,090
697,714
Diversified Financial Services — 7.3%
Berkshire Hathaway, Inc., Class B* 9,284 $ 1,534,460
Leucadia National Corp. 1,583 38,609
1,573,069
Insurance — 12.6%
Aflac, Inc. 1,962 147,896
Allstate Corp. (The) 1,785 154,117
American International Group, Inc. 4,304 273,863
Aon plc 1,283 167,957
Arthur J Gallagher & Co. 873 49,525
Assurant, Inc. 272 26,651
Chubb Ltd. 2,277 326,044
Cincinnati Financial Corp. 732 51,299
Hartford Financial Services Group, Inc. (The) 1,827 90,235
Lincoln National Corp. 1,101 71,543
Loews Corp. 1,349 63,619
Marsh & McLennan Cos., Inc. 2,518 195,296
MetLife, Inc. 5,314 268,835
Principal Financial Group, Inc. 1,307 82,223
Progressive Corp. (The) 2,839 120,459
Prudential Financial, Inc. 2,102 220,395
Torchmark Corp. 535 40,392
Travelers Cos., Inc. (The) 1,367 170,670
Unum Group 1,120 50,378
Willis Towers Watson plc 623 91,350
XL Group Ltd. 1,295 56,579
2,719,326
Mortgage Real Estate Investment Trusts (REITs) — 0.0% (b)
ARMOUR Residential REIT, Inc. 3 78
Total Common Stocks(Cost $13,854,198) 13,883,938
Principal Amount
Short-Term Investment (a) — 10.7%
Repurchase Agreement (c) — 10.7%Repurchase Agreements with various counterparties, rates 0.60% - 0.81%, dated 5/31/2017, due 6/1/2017, total to be received $2,301,335 (Cost $2,301,285) $ 2,301,285 2,301,285
Total Investments — 75.0%(Cost $16,155,483) 16,185,223
Other assets less liabilities — 25.0% 5,400,362
Net Assets — 100.0% $ 21,585,585
* Non-income producing security.
See accompanying notes to the financial statements.
PROSHARES TRUST SCHEDULE OF PORTFOLIO INVESTMENTS :: MAY 31, 2017 :: ULTRAPRO FINANCIAL SELECT SECTORnlFINU :: 163
Merrill Corp - Proshares Trust Geared Book [96 Funds] Annual Report [Funds] 333-089822 05-31-2017 ED [AUX] | eperez | 28-Jul-17 17:40 | 17-15159-3.fw | Sequence: 8CHKSUM Content: 41700 Layout: 64382 Graphics: No Graphics CLEAN
JOB: 17-15159-3 CYCLE#;BL#: 5; 0 TRIM: 8.25" x 10.75" COMPOSITECOLORS: Black, ~note-color 2, ~note-color 3 GRAPHICS: none V1.5
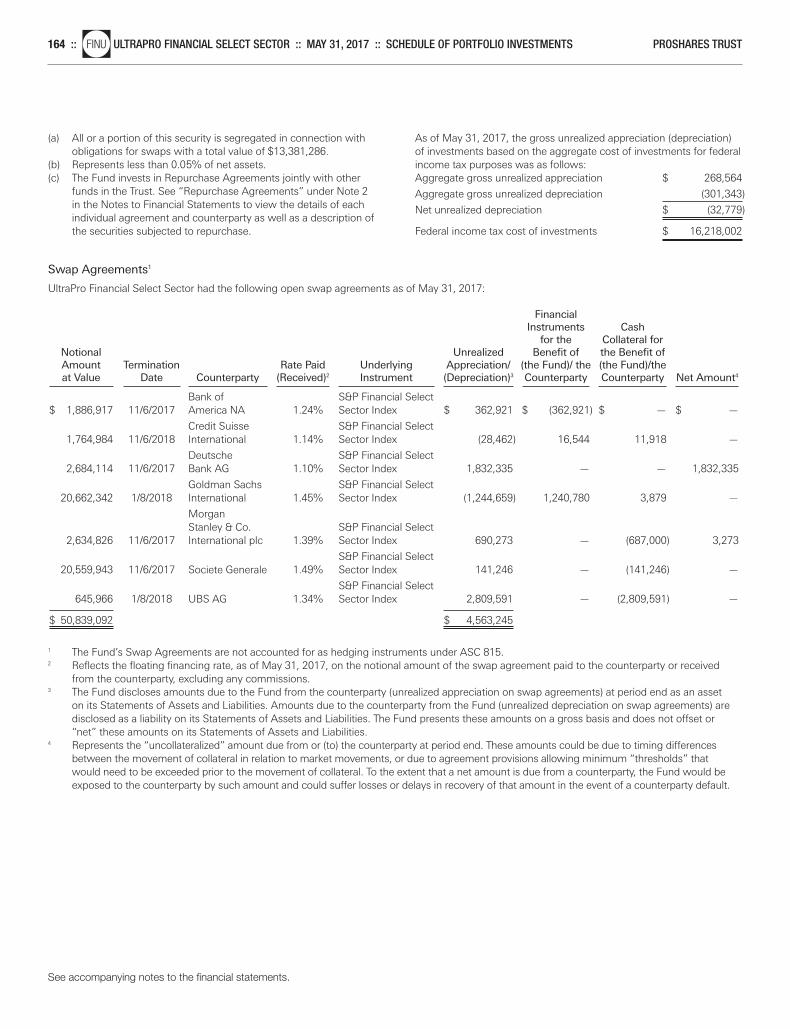
See accompanying notes to the financial statements.
164 ::nlFINU ULTRAPRO FINANCIAL SELECT SECTOR :: MAY 31, 2017 :: SCHEDULE OF PORTFOLIO INVESTMENTS PROSHARES TRUST
(a) All or a portion of this security is segregated in connection withobligations for swaps with a total value of $13,381,286.
(b) Represents less than 0.05% of net assets.(c) The Fund invests in Repurchase Agreements jointly with other
funds in the Trust. See “Repurchase Agreements” under Note 2in the Notes to Financial Statements to view the details of eachindividual agreement and counterparty as well as a description ofthe securities subjected to repurchase.
Swap Agreements1
UltraPro Financial Select Sector had the following open swap agreements as of May 31, 2017:
Financial Instruments Cash
for the Collateral for Notional Unrealized Benefit of the Benefit of Amount Termination Rate Paid Underlying Appreciation/ (the Fund)/ the (the Fund)/the at Value Date Counterparty (Received)2 Instrument (Depreciation)3 Counterparty Counterparty Net Amount4
Bank of S&P Financial Select
$ 1,886,917 11/6/2017 America NA 1.24% Sector Index $ 362,921 $ (362,921) $ — $ —
Credit Suisse S&P Financial Select 1,764,984 11/6/2018 International 1.14% Sector Index (28,462) 16,544 11,918 —
Deutsche S&P Financial Select 2,684,114 11/6/2017 Bank AG 1.10% Sector Index 1,832,335 — — 1,832,335
Goldman Sachs S&P Financial Select 20,662,342 1/8/2018 International 1.45% Sector Index (1,244,659) 1,240,780 3,879 —
Morgan Stanley & Co. S&P Financial Select
2,634,826 11/6/2017 International plc 1.39% Sector Index 690,273 — (687,000) 3,273
S&P Financial Select 20,559,943 11/6/2017 Societe Generale 1.49% Sector Index 141,246 — (141,246) —
S&P Financial Select 645,966 1/8/2018 UBS AG 1.34% Sector Index 2,809,591 — (2,809,591) —
$ 50,839,092 $ 4,563,245
1 The Fund’s Swap Agreements are not accounted for as hedging instruments under ASC 815.2 Reflects the floating financing rate, as of May 31, 2017, on the notional amount of the swap agreement paid to the counterparty or received
from the counterparty, excluding any commissions.3 The Fund discloses amounts due to the Fund from the counterparty (unrealized appreciation on swap agreements) at period end as an asset
on its Statements of Assets and Liabilities. Amounts due to the counterparty from the Fund (unrealized depreciation on swap agreements) aredisclosed as a liability on its Statements of Assets and Liabilities. The Fund presents these amounts on a gross basis and does not offset or“net” these amounts on its Statements of Assets and Liabilities.
4 Represents the “uncollateralized” amount due from or (to) the counterparty at period end. These amounts could be due to timing differencesbetween the movement of collateral in relation to market movements, or due to agreement provisions allowing minimum “thresholds” thatwould need to be exceeded prior to the movement of collateral. To the extent that a net amount is due from a counterparty, the Fund would beexposed to the counterparty by such amount and could suffer losses or delays in recovery of that amount in the event of a counterparty default.
As of May 31, 2017, the gross unrealized appreciation (depreciation)of investments based on the aggregate cost of investments for federalincome tax purposes was as follows:Aggregate gross unrealized appreciation $ 268,564
Aggregate gross unrealized depreciation (301,343)
Net unrealized depreciation $ (32,779)
Federal income tax cost of investments $ 16,218,002
Merrill Corp - Proshares Trust Geared Book [96 Funds] Annual Report [Funds] 333-089822 05-31-2017 ED [AUX] | eperez | 28-Jul-17 17:40 | 17-15159-3.fw | Sequence: 9CHKSUM Content: 16349 Layout: 931 Graphics: No Graphics CLEAN
JOB: 17-15159-3 CYCLE#;BL#: 5; 0 TRIM: 8.25" x 10.75" COMPOSITECOLORS: Black, ~note-color 2, ~note-color 3 GRAPHICS: none V1.5
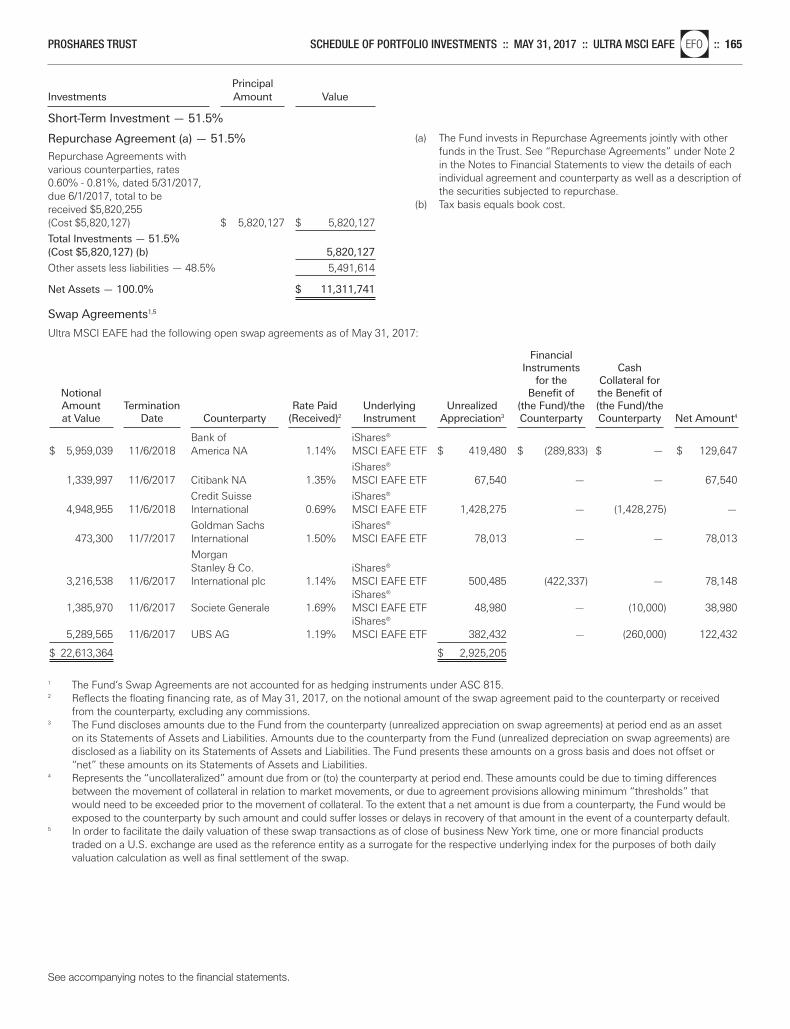
See accompanying notes to the financial statements.
PROSHARES TRUST SCHEDULE OF PORTFOLIO INVESTMENTS :: MAY 31, 2017 :: ULTRA MSCI EAFEnlEFO :: 165
PrincipalInvestments Amount Value
Short-Term Investment — 51.5%
Repurchase Agreement (a) — 51.5%
Repurchase Agreements with various counterparties, rates 0.60% - 0.81%, dated 5/31/2017, due 6/1/2017, total to be received $5,820,255 (Cost $5,820,127) $ 5,820,127 $ 5,820,127
Total Investments — 51.5%(Cost $5,820,127) (b) 5,820,127
Other assets less liabilities — 48.5% 5,491,614
Net Assets — 100.0% $ 11,311,741
(a) The Fund invests in Repurchase Agreements jointly with otherfunds in the Trust. See “Repurchase Agreements” under Note 2in the Notes to Financial Statements to view the details of eachindividual agreement and counterparty as well as a description ofthe securities subjected to repurchase.
(b) Tax basis equals book cost.
Swap Agreements1,5
Ultra MSCI EAFE had the following open swap agreements as of May 31, 2017:
Financial Instruments Cash
for the Collateral for Notional Benefit of the Benefit of Amount Termination Rate Paid Underlying Unrealized (the Fund)/the (the Fund)/the at Value Date Counterparty (Received)2 Instrument Appreciation3 Counterparty Counterparty Net Amount4
Bank of iShares®
$ 5,959,039 11/6/2018 America NA 1.14% MSCI EAFE ETF $ 419,480 $ (289,833) $ — $ 129,647
iShares® 1,339,997 11/6/2017 Citibank NA 1.35% MSCI EAFE ETF 67,540 — — 67,540
Credit Suisse iShares® 4,948,955 11/6/2018 International 0.69% MSCI EAFE ETF 1,428,275 — (1,428,275) —
Goldman Sachs iShares® 473,300 11/7/2017 International 1.50% MSCI EAFE ETF 78,013 — — 78,013
Morgan Stanley & Co. iShares®
3,216,538 11/6/2017 International plc 1.14% MSCI EAFE ETF 500,485 (422,337) — 78,148iShares®
1,385,970 11/6/2017 Societe Generale 1.69% MSCI EAFE ETF 48,980 — (10,000) 38,980iShares®
5,289,565 11/6/2017 UBS AG 1.19% MSCI EAFE ETF 382,432 — (260,000) 122,432
$ 22,613,364 $ 2,925,205
1 The Fund’s Swap Agreements are not accounted for as hedging instruments under ASC 815.2 Reflects the floating financing rate, as of May 31, 2017, on the notional amount of the swap agreement paid to the counterparty or received
from the counterparty, excluding any commissions.3 The Fund discloses amounts due to the Fund from the counterparty (unrealized appreciation on swap agreements) at period end as an asset
on its Statements of Assets and Liabilities. Amounts due to the counterparty from the Fund (unrealized depreciation on swap agreements) aredisclosed as a liability on its Statements of Assets and Liabilities. The Fund presents these amounts on a gross basis and does not offset or“net” these amounts on its Statements of Assets and Liabilities.
4 Represents the “uncollateralized” amount due from or (to) the counterparty at period end. These amounts could be due to timing differencesbetween the movement of collateral in relation to market movements, or due to agreement provisions allowing minimum “thresholds” thatwould need to be exceeded prior to the movement of collateral. To the extent that a net amount is due from a counterparty, the Fund would beexposed to the counterparty by such amount and could suffer losses or delays in recovery of that amount in the event of a counterparty default.
5 In order to facilitate the daily valuation of these swap transactions as of close of business New York time, one or more financial productstraded on a U.S. exchange are used as the reference entity as a surrogate for the respective underlying index for the purposes of both dailyvaluation calculation as well as final settlement of the swap.
Merrill Corp - Proshares Trust Geared Book [96 Funds] Annual Report [Funds] 333-089822 05-31-2017 ED [AUX] | eperez | 28-Jul-17 17:40 | 17-15159-3.fw | Sequence: 10CHKSUM Content: 11055 Layout: 28039 Graphics: No Graphics CLEAN
JOB: 17-15159-3 CYCLE#;BL#: 5; 0 TRIM: 8.25" x 10.75" COMPOSITECOLORS: Black, ~note-color 2, ~note-color 3 GRAPHICS: none V1.5
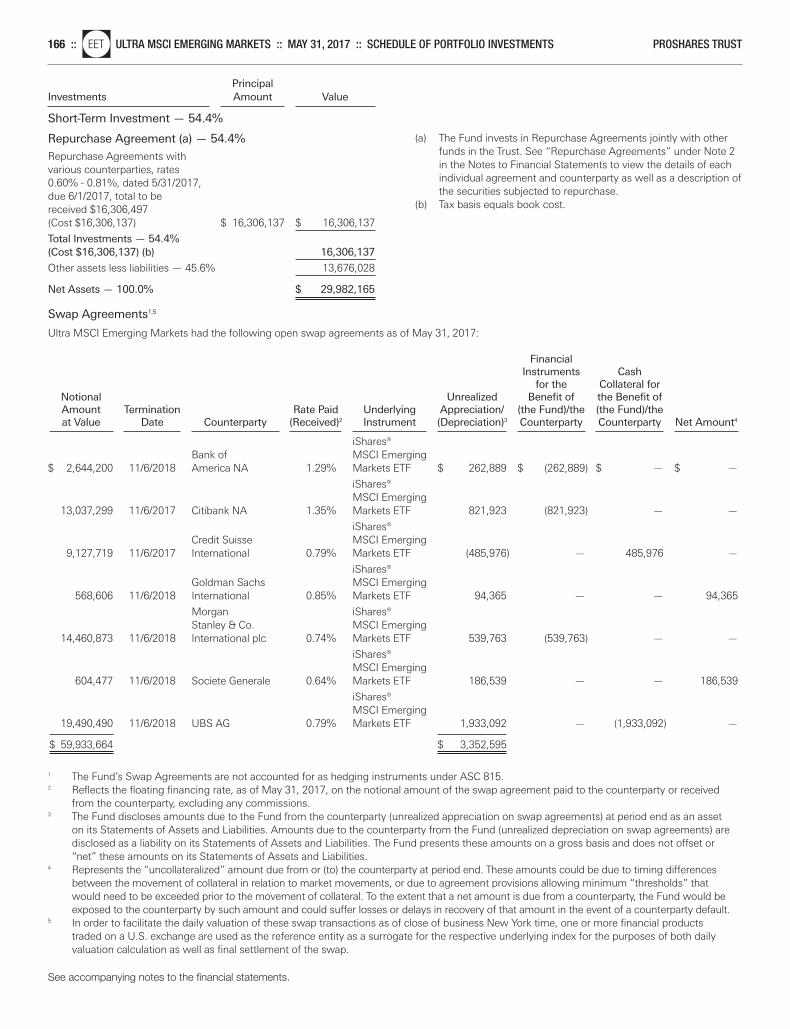
See accompanying notes to the financial statements.
166 ::nlEET ULTRA MSCI EMERGING MARKETS :: MAY 31, 2017 :: SCHEDULE OF PORTFOLIO INVESTMENTS PROSHARES TRUST
PrincipalInvestments Amount Value
Short-Term Investment — 54.4%
Repurchase Agreement (a) — 54.4%
Repurchase Agreements with various counterparties, rates 0.60% - 0.81%, dated 5/31/2017, due 6/1/2017, total to be received $16,306,497 (Cost $16,306,137) $ 16,306,137 $ 16,306,137
Total Investments — 54.4%(Cost $16,306,137) (b) 16,306,137
Other assets less liabilities — 45.6% 13,676,028
Net Assets — 100.0% $ 29,982,165
(a) The Fund invests in Repurchase Agreements jointly with otherfunds in the Trust. See “Repurchase Agreements” under Note 2in the Notes to Financial Statements to view the details of eachindividual agreement and counterparty as well as a description ofthe securities subjected to repurchase.
(b) Tax basis equals book cost.
Swap Agreements1,5
Ultra MSCI Emerging Markets had the following open swap agreements as of May 31, 2017:
Financial Instruments Cash
for the Collateral for Notional Unrealized Benefit of the Benefit of Amount Termination Rate Paid Underlying Appreciation/ (the Fund)/the (the Fund)/the at Value Date Counterparty (Received)2 Instrument (Depreciation)3 Counterparty Counterparty Net Amount4
iShares®
Bank of MSCI Emerging $ 2,644,200 11/6/2018 America NA 1.29% Markets ETF $ 262,889 $ (262,889) $ — $ —
iShares® MSCI Emerging
13,037,299 11/6/2017 Citibank NA 1.35% Markets ETF 821,923 (821,923) — —
iShares® Credit Suisse MSCI Emerging
9,127,719 11/6/2017 International 0.79% Markets ETF (485,976) — 485,976 —
iShares® Goldman Sachs MSCI Emerging
568,606 11/6/2018 International 0.85% Markets ETF 94,365 — — 94,365
Morgan iShares® Stanley & Co. MSCI Emerging
14,460,873 11/6/2018 International plc 0.74% Markets ETF 539,763 (539,763) — —
iShares® MSCI Emerging
604,477 11/6/2018 Societe Generale 0.64% Markets ETF 186,539 — — 186,539
iShares® MSCI Emerging
19,490,490 11/6/2018 UBS AG 0.79% Markets ETF 1,933,092 — (1,933,092) —
$ 59,933,664 $ 3,352,595
1 The Fund’s Swap Agreements are not accounted for as hedging instruments under ASC 815.2 Reflects the floating financing rate, as of May 31, 2017, on the notional amount of the swap agreement paid to the counterparty or received
from the counterparty, excluding any commissions.3 The Fund discloses amounts due to the Fund from the counterparty (unrealized appreciation on swap agreements) at period end as an asset
on its Statements of Assets and Liabilities. Amounts due to the counterparty from the Fund (unrealized depreciation on swap agreements) aredisclosed as a liability on its Statements of Assets and Liabilities. The Fund presents these amounts on a gross basis and does not offset or“net” these amounts on its Statements of Assets and Liabilities.
4 Represents the “uncollateralized” amount due from or (to) the counterparty at period end. These amounts could be due to timing differencesbetween the movement of collateral in relation to market movements, or due to agreement provisions allowing minimum “thresholds” thatwould need to be exceeded prior to the movement of collateral. To the extent that a net amount is due from a counterparty, the Fund would beexposed to the counterparty by such amount and could suffer losses or delays in recovery of that amount in the event of a counterparty default.
5 In order to facilitate the daily valuation of these swap transactions as of close of business New York time, one or more financial productstraded on a U.S. exchange are used as the reference entity as a surrogate for the respective underlying index for the purposes of both dailyvaluation calculation as well as final settlement of the swap.
Merrill Corp - Proshares Trust Geared Book [96 Funds] Annual Report [Funds] 333-089822 05-31-2017 ED [AUX] | eperez | 28-Jul-17 17:40 | 17-15159-3.fw | Sequence: 11CHKSUM Content: 62131 Layout: 4305 Graphics: No Graphics CLEAN
JOB: 17-15159-3 CYCLE#;BL#: 5; 0 TRIM: 8.25" x 10.75" COMPOSITECOLORS: Black, ~note-color 2, ~note-color 3 GRAPHICS: none V1.5

See accompanying notes to the financial statements.
PROSHARES TRUST SCHEDULE OF PORTFOLIO INVESTMENTS :: MAY 31, 2017 :: ULTRA FTSE EUROPEnlUPV :: 167
PrincipalInvestments Amount Value
Short-Term Investment — 60.0%
Repurchase Agreement (a) — 60.0%
Repurchase Agreements with various counterparties, rates 0.60% - 0.81%, dated 5/31/2017, due 6/1/2017, total to be received $7,657,055 (Cost $7,656,887) $ 7,656,887 $ 7,656,887
Total Investments — 60.0%(Cost $7,656,887) (b) 7,656,887
Other assets less liabilities — 40.0% 5,100,683
Net Assets — 100.0% $ 12,757,570
(a) The Fund invests in Repurchase Agreements jointly with otherfunds in the Trust. See “Repurchase Agreements” under Note 2in the Notes to Financial Statements to view the details of eachindividual agreement and counterparty as well as a description ofthe securities subjected to repurchase.
(b) Tax basis equals book cost.
Swap Agreements1,5
Ultra FTSE Europe had the following open swap agreements as of May 31, 2017:
Financial Instruments Cash
for the Collateral for Notional Unrealized Benefit of the Benefit of Amount Termination Rate Paid Underlying Appreciation/ (the Fund)/the (the Fund)/the at Value Date Counterparty (Received)2 Instrument (Depreciation)3 Counterparty Counterparty Net Amount4
Bank of Vanguard® FTSE
$ 508,830 11/6/2017 America NA 1.04% Europe ETF Shares $ 141,610 $ (121,124) $ — $ 20,486
Vanguard® FTSE 1,158,167 11/6/2017 Citibank NA 1.15% Europe ETF Shares 45,960 — — 45,960
Credit Suisse Vanguard® FTSE 3,226,699 11/6/2017 International 0.79% Europe ETF Shares (28,449) — 28,449 —
Goldman Sachs Vanguard® FTSE 1,007,169 11/7/2017 International 0.75% Europe ETF Shares 133,871 — — 133,871
Morgan Stanley & Co. Vanguard® FTSE
7,605,946 11/6/2017 International plc 0.49% Europe ETF Shares 1,430,533 (1,389,986) — 40,547
Vanguard® FTSE 4,205,286 11/6/2017 Societe Generale 0.99% Europe ETF Shares 495,583 — (350,000) 145,583
Vanguard® FTSE 7,798,199 11/6/2017 UBS AG 0.99% Europe ETF Shares 697,587 — (620,000) 77,587
$ 25,510,296 $ 2,916,695
1 The Fund’s Swap Agreements are not accounted for as hedging instruments under ASC 815.2 Reflects the floating financing rate, as of May 31, 2017, on the notional amount of the swap agreement paid to the counterparty or received
from the counterparty, excluding any commissions.3 The Fund discloses amounts due to the Fund from the counterparty (unrealized appreciation on swap agreements) at period end as an asset
on its Statements of Assets and Liabilities. Amounts due to the counterparty from the Fund (unrealized depreciation on swap agreements) aredisclosed as a liability on its Statements of Assets and Liabilities. The Fund presents these amounts on a gross basis and does not offset or“net” these amounts on its Statements of Assets and Liabilities.
4 Represents the “uncollateralized” amount due from or (to) the counterparty at period end. These amounts could be due to timing differencesbetween the movement of collateral in relation to market movements, or due to agreement provisions allowing minimum “thresholds” thatwould need to be exceeded prior to the movement of collateral. To the extent that a net amount is due from a counterparty, the Fund would beexposed to the counterparty by such amount and could suffer losses or delays in recovery of that amount in the event of a counterparty default.
5 In order to facilitate the daily valuation of these swap transactions as of close of business New York time, one or more financial productstraded on a U.S. exchange are used as the reference entity as a surrogate for the respective underlying index for the purposes of both dailyvaluation calculation as well as final settlement of the swap.
Merrill Corp - Proshares Trust Geared Book [96 Funds] Annual Report [Funds] 333-089822 05-31-2017 ED [AUX] | eperez | 28-Jul-17 17:40 | 17-15159-3.fw | Sequence: 12CHKSUM Content: 22122 Layout: 23134 Graphics: No Graphics CLEAN
JOB: 17-15159-3 CYCLE#;BL#: 5; 0 TRIM: 8.25" x 10.75" COMPOSITECOLORS: Black, ~note-color 2, ~note-color 3 GRAPHICS: none V1.5
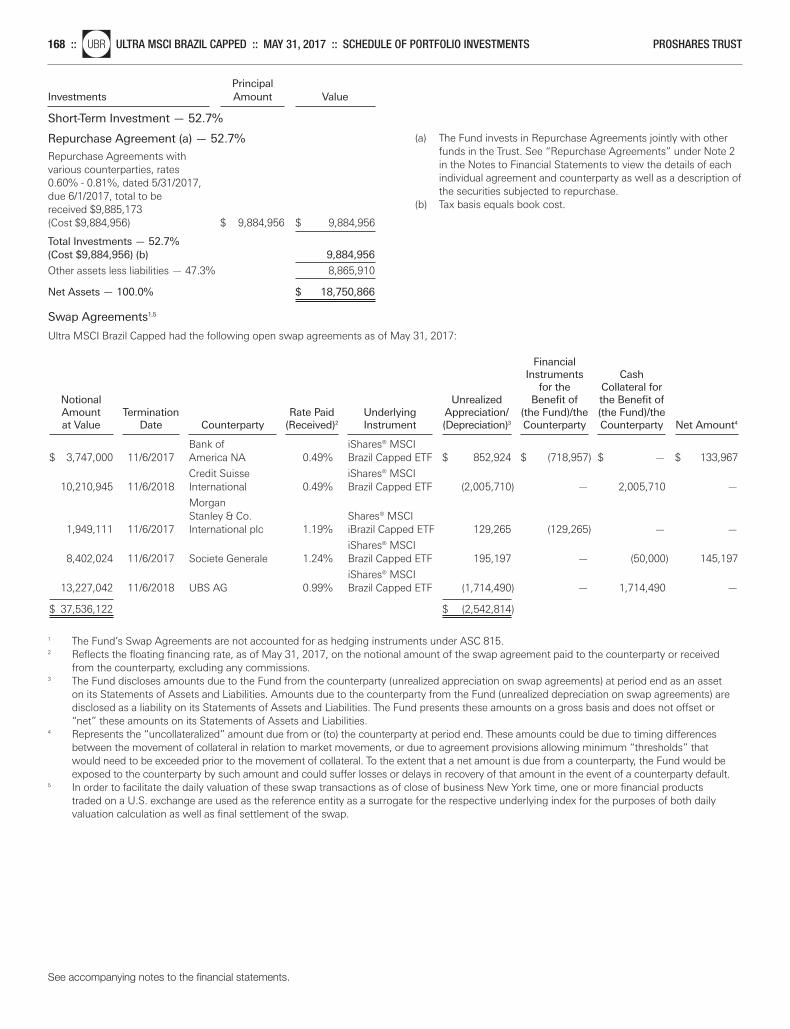
See accompanying notes to the financial statements.
168 ::nlUBR ULTRA MSCI BRAZIL CAPPED :: MAY 31, 2017 :: SCHEDULE OF PORTFOLIO INVESTMENTS PROSHARES TRUST
PrincipalInvestments Amount Value
Short-Term Investment — 52.7%
Repurchase Agreement (a) — 52.7%
Repurchase Agreements with various counterparties, rates 0.60% - 0.81%, dated 5/31/2017, due 6/1/2017, total to be received $9,885,173 (Cost $9,884,956) $ 9,884,956 $ 9,884,956
Total Investments — 52.7%(Cost $9,884,956) (b) 9,884,956
Other assets less liabilities — 47.3% 8,865,910
Net Assets — 100.0% $ 18,750,866
(a) The Fund invests in Repurchase Agreements jointly with otherfunds in the Trust. See “Repurchase Agreements” under Note 2in the Notes to Financial Statements to view the details of eachindividual agreement and counterparty as well as a description ofthe securities subjected to repurchase.
(b) Tax basis equals book cost.
Swap Agreements1,5
Ultra MSCI Brazil Capped had the following open swap agreements as of May 31, 2017:
Financial Instruments Cash
for the Collateral for Notional Unrealized Benefit of the Benefit of Amount Termination Rate Paid Underlying Appreciation/ (the Fund)/the (the Fund)/the at Value Date Counterparty (Received)2 Instrument (Depreciation)3 Counterparty Counterparty Net Amount4
Bank of iShares® MSCI
$ 3,747,000 11/6/2017 America NA 0.49% Brazil Capped ETF $ 852,924 $ (718,957) $ — $ 133,967
Credit Suisse iShares® MSCI 10,210,945 11/6/2018 International 0.49% Brazil Capped ETF (2,005,710) — 2,005,710 —
Morgan Stanley & Co. Shares® MSCI
1,949,111 11/6/2017 International plc 1.19% iBrazil Capped ETF 129,265 (129,265) — —
iShares® MSCI 8,402,024 11/6/2017 Societe Generale 1.24% Brazil Capped ETF 195,197 — (50,000) 145,197
iShares® MSCI 13,227,042 11/6/2018 UBS AG 0.99% Brazil Capped ETF (1,714,490) — 1,714,490 —
$ 37,536,122 $ (2,542,814)
1 The Fund’s Swap Agreements are not accounted for as hedging instruments under ASC 815.2 Reflects the floating financing rate, as of May 31, 2017, on the notional amount of the swap agreement paid to the counterparty or received
from the counterparty, excluding any commissions.3 The Fund discloses amounts due to the Fund from the counterparty (unrealized appreciation on swap agreements) at period end as an asset
on its Statements of Assets and Liabilities. Amounts due to the counterparty from the Fund (unrealized depreciation on swap agreements) aredisclosed as a liability on its Statements of Assets and Liabilities. The Fund presents these amounts on a gross basis and does not offset or“net” these amounts on its Statements of Assets and Liabilities.
4 Represents the “uncollateralized” amount due from or (to) the counterparty at period end. These amounts could be due to timing differencesbetween the movement of collateral in relation to market movements, or due to agreement provisions allowing minimum “thresholds” thatwould need to be exceeded prior to the movement of collateral. To the extent that a net amount is due from a counterparty, the Fund would beexposed to the counterparty by such amount and could suffer losses or delays in recovery of that amount in the event of a counterparty default.
5 In order to facilitate the daily valuation of these swap transactions as of close of business New York time, one or more financial productstraded on a U.S. exchange are used as the reference entity as a surrogate for the respective underlying index for the purposes of both dailyvaluation calculation as well as final settlement of the swap.
Merrill Corp - Proshares Trust Geared Book [96 Funds] Annual Report [Funds] 333-089822 05-31-2017 ED [AUX] | eperez | 28-Jul-17 17:40 | 17-15159-3.fw | Sequence: 13CHKSUM Content: 30417 Layout: 11822 Graphics: No Graphics CLEAN
JOB: 17-15159-3 CYCLE#;BL#: 5; 0 TRIM: 8.25" x 10.75" COMPOSITECOLORS: Black, ~note-color 2, ~note-color 3 GRAPHICS: none V1.5
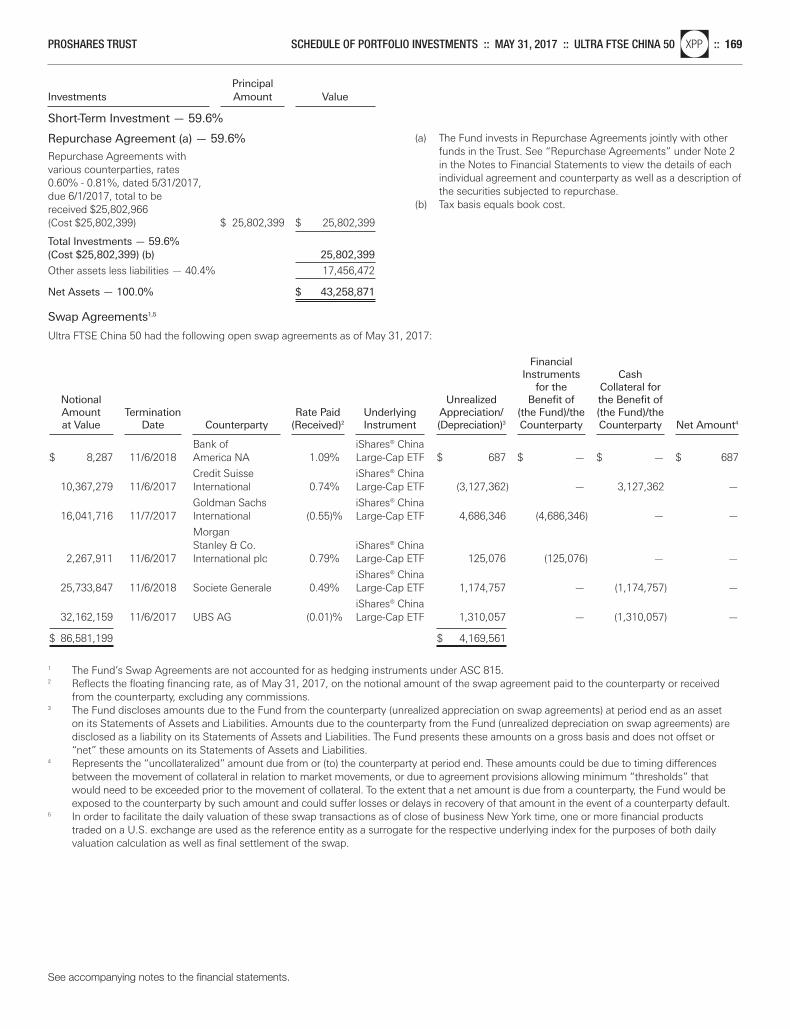
See accompanying notes to the financial statements.
PROSHARES TRUST SCHEDULE OF PORTFOLIO INVESTMENTS :: MAY 31, 2017 :: ULTRA FTSE CHINA 50nlXPP :: 169
PrincipalInvestments Amount Value
Short-Term Investment — 59.6%
Repurchase Agreement (a) — 59.6%
Repurchase Agreements with various counterparties, rates 0.60% - 0.81%, dated 5/31/2017, due 6/1/2017, total to be received $25,802,966 (Cost $25,802,399) $ 25,802,399 $ 25,802,399
Total Investments — 59.6%(Cost $25,802,399) (b) 25,802,399
Other assets less liabilities — 40.4% 17,456,472
Net Assets — 100.0% $ 43,258,871
(a) The Fund invests in Repurchase Agreements jointly with otherfunds in the Trust. See “Repurchase Agreements” under Note 2in the Notes to Financial Statements to view the details of eachindividual agreement and counterparty as well as a description ofthe securities subjected to repurchase.
(b) Tax basis equals book cost.
Swap Agreements1,5
Ultra FTSE China 50 had the following open swap agreements as of May 31, 2017:
Financial Instruments Cash
for the Collateral for Notional Unrealized Benefit of the Benefit of Amount Termination Rate Paid Underlying Appreciation/ (the Fund)/the (the Fund)/the at Value Date Counterparty (Received)2 Instrument (Depreciation)3 Counterparty Counterparty Net Amount4
Bank of iShares® China
$ 8,287 11/6/2018 America NA 1.09% Large-Cap ETF $ 687 $ — $ — $ 687
Credit Suisse iShares® China 10,367,279 11/6/2017 International 0.74% Large-Cap ETF (3,127,362) — 3,127,362 —
Goldman Sachs iShares® China 16,041,716 11/7/2017 International (0.55)% Large-Cap ETF 4,686,346 (4,686,346) — —
Morgan Stanley & Co. iShares® China
2,267,911 11/6/2017 International plc 0.79% Large-Cap ETF 125,076 (125,076) — —
iShares® China 25,733,847 11/6/2018 Societe Generale 0.49% Large-Cap ETF 1,174,757 — (1,174,757) —
iShares® China 32,162,159 11/6/2017 UBS AG (0.01)% Large-Cap ETF 1,310,057 — (1,310,057) —
$ 86,581,199 $ 4,169,561
1 The Fund’s Swap Agreements are not accounted for as hedging instruments under ASC 815.2 Reflects the floating financing rate, as of May 31, 2017, on the notional amount of the swap agreement paid to the counterparty or received
from the counterparty, excluding any commissions.3 The Fund discloses amounts due to the Fund from the counterparty (unrealized appreciation on swap agreements) at period end as an asset
on its Statements of Assets and Liabilities. Amounts due to the counterparty from the Fund (unrealized depreciation on swap agreements) aredisclosed as a liability on its Statements of Assets and Liabilities. The Fund presents these amounts on a gross basis and does not offset or“net” these amounts on its Statements of Assets and Liabilities.
4 Represents the “uncollateralized” amount due from or (to) the counterparty at period end. These amounts could be due to timing differencesbetween the movement of collateral in relation to market movements, or due to agreement provisions allowing minimum “thresholds” thatwould need to be exceeded prior to the movement of collateral. To the extent that a net amount is due from a counterparty, the Fund would beexposed to the counterparty by such amount and could suffer losses or delays in recovery of that amount in the event of a counterparty default.
5 In order to facilitate the daily valuation of these swap transactions as of close of business New York time, one or more financial productstraded on a U.S. exchange are used as the reference entity as a surrogate for the respective underlying index for the purposes of both dailyvaluation calculation as well as final settlement of the swap.
Merrill Corp - Proshares Trust Geared Book [96 Funds] Annual Report [Funds] 333-089822 05-31-2017 ED [AUX] | eperez | 28-Jul-17 17:40 | 17-15159-3.fw | Sequence: 14CHKSUM Content: 8147 Layout: 50365 Graphics: No Graphics CLEAN
JOB: 17-15159-3 CYCLE#;BL#: 5; 0 TRIM: 8.25" x 10.75" COMPOSITECOLORS: Black, ~note-color 2, ~note-color 3 GRAPHICS: none V1.5
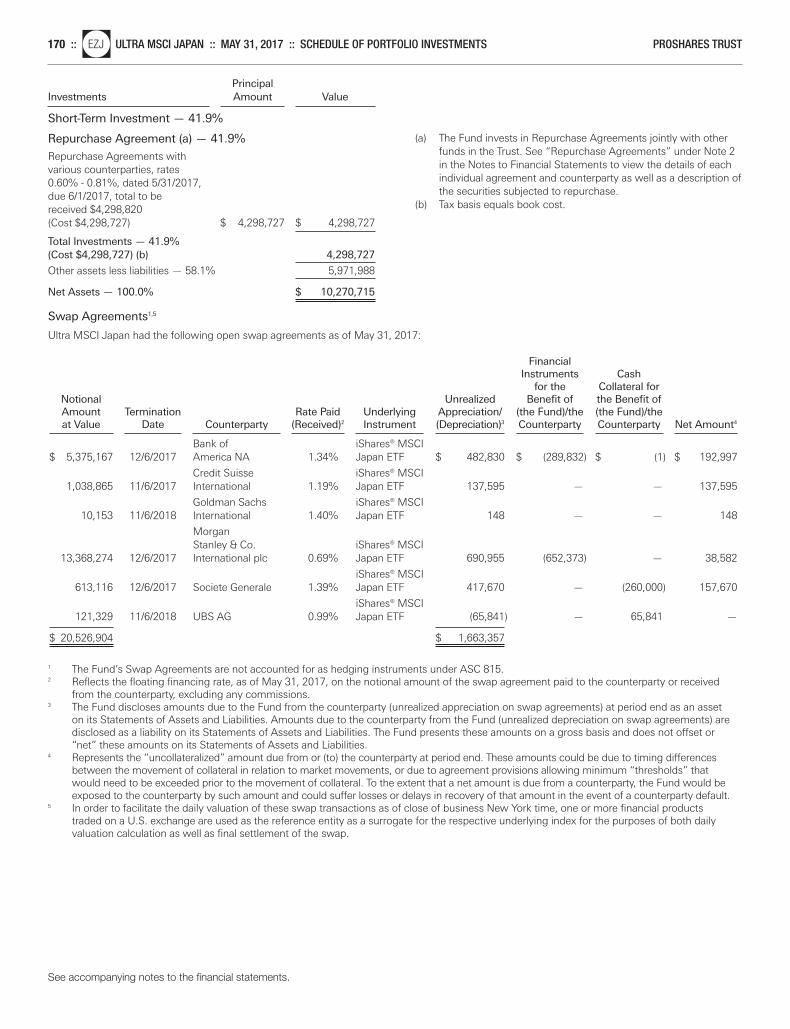
See accompanying notes to the financial statements.
170 ::nlEZJ ULTRA MSCI JAPAN :: MAY 31, 2017 :: SCHEDULE OF PORTFOLIO INVESTMENTS PROSHARES TRUST
PrincipalInvestments Amount Value
Short-Term Investment — 41.9%
Repurchase Agreement (a) — 41.9%
Repurchase Agreements with various counterparties, rates 0.60% - 0.81%, dated 5/31/2017, due 6/1/2017, total to be received $4,298,820 (Cost $4,298,727) $ 4,298,727 $ 4,298,727
Total Investments — 41.9%(Cost $4,298,727) (b) 4,298,727
Other assets less liabilities — 58.1% 5,971,988
Net Assets — 100.0% $ 10,270,715
(a) The Fund invests in Repurchase Agreements jointly with otherfunds in the Trust. See “Repurchase Agreements” under Note 2in the Notes to Financial Statements to view the details of eachindividual agreement and counterparty as well as a description ofthe securities subjected to repurchase.
(b) Tax basis equals book cost.
Swap Agreements1,5
Ultra MSCI Japan had the following open swap agreements as of May 31, 2017:
Financial Instruments Cash
for the Collateral for Notional Unrealized Benefit of the Benefit of Amount Termination Rate Paid Underlying Appreciation/ (the Fund)/the (the Fund)/the at Value Date Counterparty (Received)2 Instrument (Depreciation)3 Counterparty Counterparty Net Amount4
Bank of iShares® MSCI
$ 5,375,167 12/6/2017 America NA 1.34% Japan ETF $ 482,830 $ (289,832) $ (1) $ 192,997
Credit Suisse iShares® MSCI 1,038,865 11/6/2017 International 1.19% Japan ETF 137,595 — — 137,595
Goldman Sachs iShares® MSCI 10,153 11/6/2018 International 1.40% Japan ETF 148 — — 148
Morgan Stanley & Co. iShares® MSCI
13,368,274 12/6/2017 International plc 0.69% Japan ETF 690,955 (652,373) — 38,582
iShares® MSCI 613,116 12/6/2017 Societe Generale 1.39% Japan ETF 417,670 — (260,000) 157,670
iShares® MSCI 121,329 11/6/2018 UBS AG 0.99% Japan ETF (65,841) — 65,841 —
$ 20,526,904 $ 1,663,357
1 The Fund’s Swap Agreements are not accounted for as hedging instruments under ASC 815.2 Reflects the floating financing rate, as of May 31, 2017, on the notional amount of the swap agreement paid to the counterparty or received
from the counterparty, excluding any commissions.3 The Fund discloses amounts due to the Fund from the counterparty (unrealized appreciation on swap agreements) at period end as an asset
on its Statements of Assets and Liabilities. Amounts due to the counterparty from the Fund (unrealized depreciation on swap agreements) aredisclosed as a liability on its Statements of Assets and Liabilities. The Fund presents these amounts on a gross basis and does not offset or“net” these amounts on its Statements of Assets and Liabilities.
4 Represents the “uncollateralized” amount due from or (to) the counterparty at period end. These amounts could be due to timing differencesbetween the movement of collateral in relation to market movements, or due to agreement provisions allowing minimum “thresholds” thatwould need to be exceeded prior to the movement of collateral. To the extent that a net amount is due from a counterparty, the Fund would beexposed to the counterparty by such amount and could suffer losses or delays in recovery of that amount in the event of a counterparty default.
5 In order to facilitate the daily valuation of these swap transactions as of close of business New York time, one or more financial productstraded on a U.S. exchange are used as the reference entity as a surrogate for the respective underlying index for the purposes of both dailyvaluation calculation as well as final settlement of the swap.
Merrill Corp - Proshares Trust Geared Book [96 Funds] Annual Report [Funds] 333-089822 05-31-2017 ED [AUX] | eperez | 28-Jul-17 17:40 | 17-15159-3.fw | Sequence: 15CHKSUM Content: 40964 Layout: 62325 Graphics: No Graphics CLEAN
JOB: 17-15159-3 CYCLE#;BL#: 5; 0 TRIM: 8.25" x 10.75" COMPOSITECOLORS: Black, ~note-color 2, ~note-color 3 GRAPHICS: none V1.5
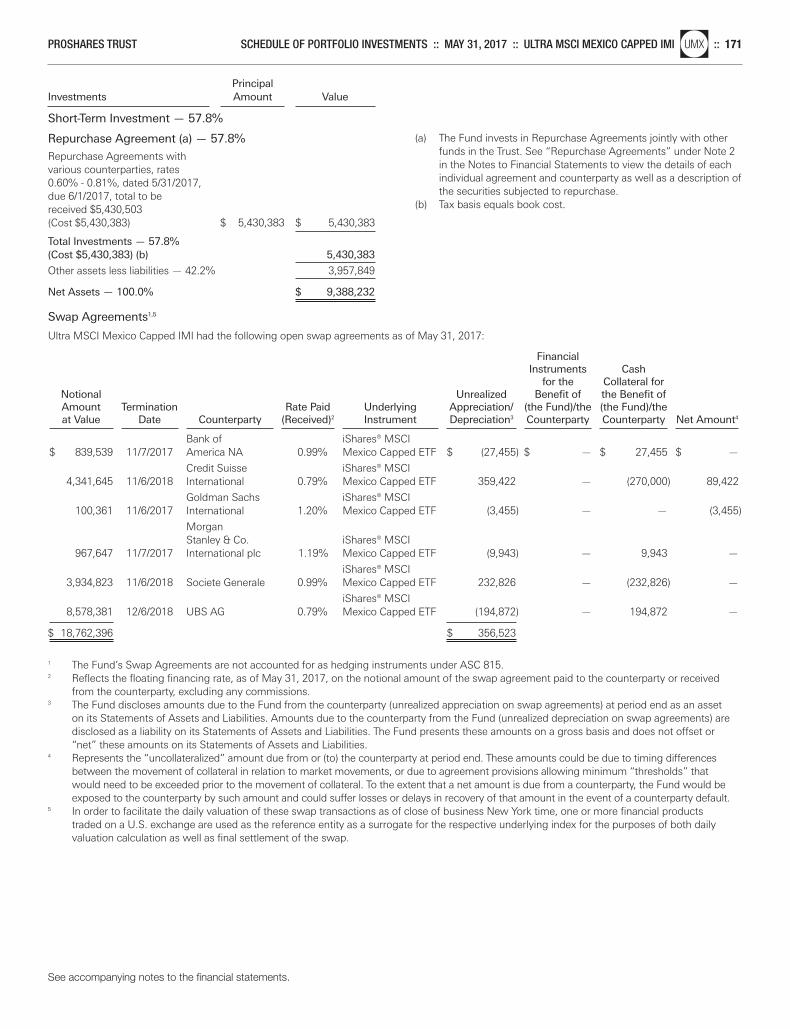
See accompanying notes to the financial statements.
PROSHARES TRUST SCHEDULE OF PORTFOLIO INVESTMENTS :: MAY 31, 2017 :: ULTRA MSCI MEXICO CAPPED IMInlUMX :: 171
PrincipalInvestments Amount Value
Short-Term Investment — 57.8%
Repurchase Agreement (a) — 57.8%
Repurchase Agreements with various counterparties, rates 0.60% - 0.81%, dated 5/31/2017, due 6/1/2017, total to be received $5,430,503 (Cost $5,430,383) $ 5,430,383 $ 5,430,383
Total Investments — 57.8%(Cost $5,430,383) (b) 5,430,383
Other assets less liabilities — 42.2% 3,957,849
Net Assets — 100.0% $ 9,388,232
(a) The Fund invests in Repurchase Agreements jointly with otherfunds in the Trust. See “Repurchase Agreements” under Note 2in the Notes to Financial Statements to view the details of eachindividual agreement and counterparty as well as a description ofthe securities subjected to repurchase.
(b) Tax basis equals book cost.
Swap Agreements1,5
Ultra MSCI Mexico Capped IMI had the following open swap agreements as of May 31, 2017:
Financial Instruments Cash
for the Collateral for Notional Unrealized Benefit of the Benefit of Amount Termination Rate Paid Underlying Appreciation/ (the Fund)/the (the Fund)/the at Value Date Counterparty (Received)2 Instrument Depreciation3 Counterparty Counterparty Net Amount4
Bank of iShares® MSCI
$ 839,539 11/7/2017 America NA 0.99% Mexico Capped ETF $ (27,455) $ — $ 27,455 $ —
Credit Suisse iShares® MSCI 4,341,645 11/6/2018 International 0.79% Mexico Capped ETF 359,422 — (270,000) 89,422
Goldman Sachs iShares® MSCI 100,361 11/6/2017 International 1.20% Mexico Capped ETF (3,455) — — (3,455)
Morgan Stanley & Co. iShares® MSCI
967,647 11/7/2017 International plc 1.19% Mexico Capped ETF (9,943) — 9,943 —
iShares® MSCI 3,934,823 11/6/2018 Societe Generale 0.99% Mexico Capped ETF 232,826 — (232,826) —
iShares® MSCI 8,578,381 12/6/2018 UBS AG 0.79% Mexico Capped ETF (194,872) — 194,872 —
$ 18,762,396 $ 356,523
1 The Fund’s Swap Agreements are not accounted for as hedging instruments under ASC 815.2 Reflects the floating financing rate, as of May 31, 2017, on the notional amount of the swap agreement paid to the counterparty or received
from the counterparty, excluding any commissions.3 The Fund discloses amounts due to the Fund from the counterparty (unrealized appreciation on swap agreements) at period end as an asset
on its Statements of Assets and Liabilities. Amounts due to the counterparty from the Fund (unrealized depreciation on swap agreements) aredisclosed as a liability on its Statements of Assets and Liabilities. The Fund presents these amounts on a gross basis and does not offset or“net” these amounts on its Statements of Assets and Liabilities.
4 Represents the “uncollateralized” amount due from or (to) the counterparty at period end. These amounts could be due to timing differencesbetween the movement of collateral in relation to market movements, or due to agreement provisions allowing minimum “thresholds” thatwould need to be exceeded prior to the movement of collateral. To the extent that a net amount is due from a counterparty, the Fund would beexposed to the counterparty by such amount and could suffer losses or delays in recovery of that amount in the event of a counterparty default.
5 In order to facilitate the daily valuation of these swap transactions as of close of business New York time, one or more financial productstraded on a U.S. exchange are used as the reference entity as a surrogate for the respective underlying index for the purposes of both dailyvaluation calculation as well as final settlement of the swap.
Merrill Corp - Proshares Trust Geared Book [96 Funds] Annual Report [Funds] 333-089822 05-31-2017 ED [AUX] | eperez | 28-Jul-17 17:40 | 17-15159-3.fw | Sequence: 16CHKSUM Content: 44969 Layout: 61354 Graphics: No Graphics CLEAN
JOB: 17-15159-3 CYCLE#;BL#: 5; 0 TRIM: 8.25" x 10.75" COMPOSITECOLORS: Black, ~note-color 2, ~note-color 3 GRAPHICS: none V1.5
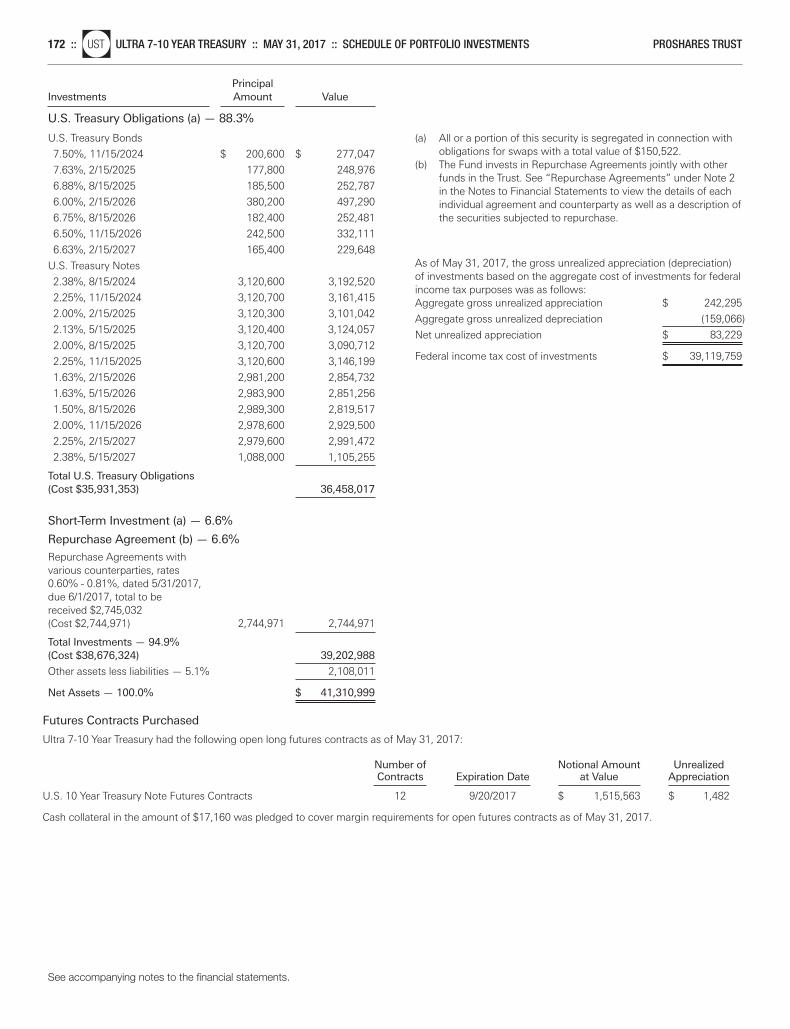
See accompanying notes to the financial statements.
172 ::nlUST ULTRA 7-10 YEAR TREASURY :: MAY 31, 2017 :: SCHEDULE OF PORTFOLIO INVESTMENTS PROSHARES TRUST
PrincipalInvestments Amount Value
U.S. Treasury Obligations (a) — 88.3%
U.S. Treasury Bonds
7.50%, 11/15/2024 $ 200,600 $ 277,047
7.63%, 2/15/2025 177,800 248,976
6.88%, 8/15/2025 185,500 252,787
6.00%, 2/15/2026 380,200 497,290
6.75%, 8/15/2026 182,400 252,481
6.50%, 11/15/2026 242,500 332,111
6.63%, 2/15/2027 165,400 229,648
U.S. Treasury Notes
2.38%, 8/15/2024 3,120,600 3,192,520
2.25%, 11/15/2024 3,120,700 3,161,415
2.00%, 2/15/2025 3,120,300 3,101,042
2.13%, 5/15/2025 3,120,400 3,124,057
2.00%, 8/15/2025 3,120,700 3,090,712
2.25%, 11/15/2025 3,120,600 3,146,199
1.63%, 2/15/2026 2,981,200 2,854,732
1.63%, 5/15/2026 2,983,900 2,851,256
1.50%, 8/15/2026 2,989,300 2,819,517
2.00%, 11/15/2026 2,978,600 2,929,500
2.25%, 2/15/2027 2,979,600 2,991,472
2.38%, 5/15/2027 1,088,000 1,105,255
Total U.S. Treasury Obligations(Cost $35,931,353) 36,458,017
Short-Term Investment (a) — 6.6%
Repurchase Agreement (b) — 6.6%
Repurchase Agreements with various counterparties, rates 0.60% - 0.81%, dated 5/31/2017, due 6/1/2017, total to be received $2,745,032 (Cost $2,744,971) 2,744,971 2,744,971
Total Investments — 94.9%(Cost $38,676,324) 39,202,988
Other assets less liabilities — 5.1% 2,108,011
Net Assets — 100.0% $ 41,310,999
Futures Contracts Purchased
Ultra 7-10 Year Treasury had the following open long futures contracts as of May 31, 2017:
Number of Notional Amount Unrealized Contracts Expiration Date at Value Appreciation U.S. 10 Year Treasury Note Futures Contracts 12 9/20/2017 $ 1,515,563 $ 1,482
Cash collateral in the amount of $17,160 was pledged to cover margin requirements for open futures contracts as of May 31, 2017.
(a) All or a portion of this security is segregated in connection withobligations for swaps with a total value of $150,522.
(b) The Fund invests in Repurchase Agreements jointly with otherfunds in the Trust. See “Repurchase Agreements” under Note 2in the Notes to Financial Statements to view the details of eachindividual agreement and counterparty as well as a description ofthe securities subjected to repurchase.
As of May 31, 2017, the gross unrealized appreciation (depreciation)of investments based on the aggregate cost of investments for federalincome tax purposes was as follows:Aggregate gross unrealized appreciation $ 242,295
Aggregate gross unrealized depreciation (159,066)
Net unrealized appreciation $ 83,229
Federal income tax cost of investments $ 39,119,759
Merrill Corp - Proshares Trust Geared Book [96 Funds] Annual Report [Funds] 333-089822 05-31-2017 ED [AUX] | eperez | 28-Jul-17 17:40 | 17-15159-3.fw | Sequence: 17CHKSUM Content: 51365 Layout: 26585 Graphics: No Graphics CLEAN
JOB: 17-15159-3 CYCLE#;BL#: 5; 0 TRIM: 8.25" x 10.75" COMPOSITECOLORS: Black, ~note-color 2, ~note-color 3 GRAPHICS: none V1.5
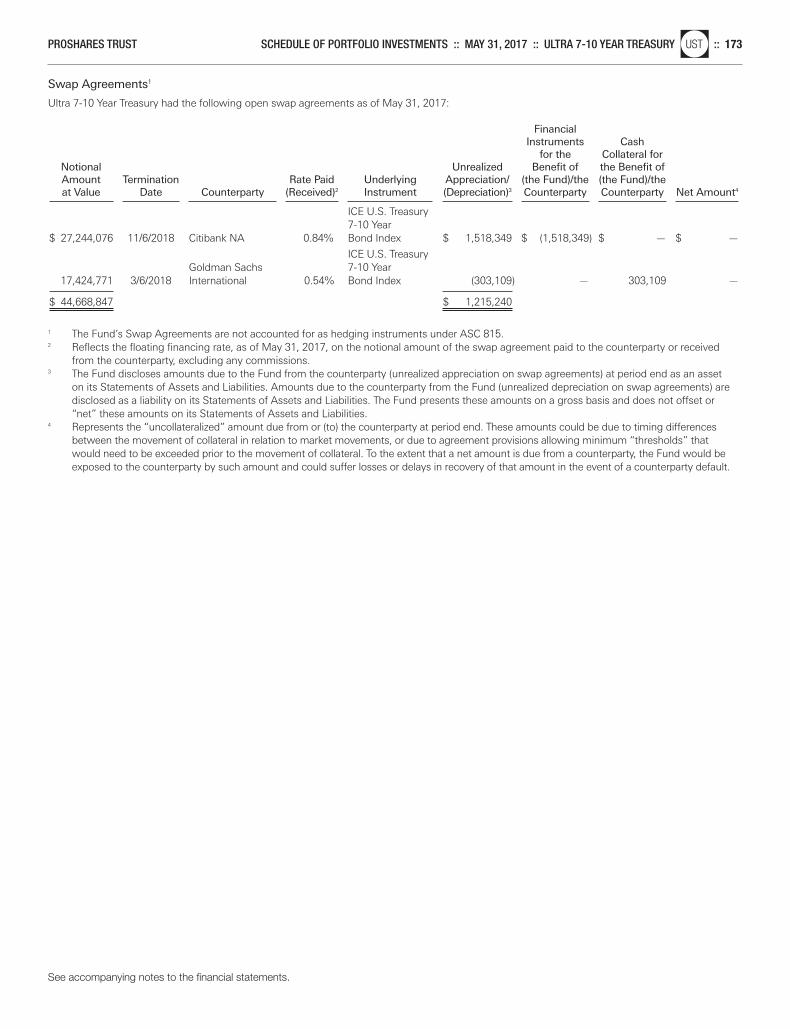
See accompanying notes to the financial statements.
PROSHARES TRUST SCHEDULE OF PORTFOLIO INVESTMENTS :: MAY 31, 2017 :: ULTRA 7-10 YEAR TREASURYnlUST :: 173
Swap Agreements1
Ultra 7-10 Year Treasury had the following open swap agreements as of May 31, 2017:
Financial Instruments Cash
for the Collateral for Notional Unrealized Benefit of the Benefit of Amount Termination Rate Paid Underlying Appreciation/ (the Fund)/the (the Fund)/the at Value Date Counterparty (Received)2 Instrument (Depreciation)3 Counterparty Counterparty Net Amount4
ICE U.S. Treasury 7-10 Year
$ 27,244,076 11/6/2018 Citibank NA 0.84% Bond Index $ 1,518,349 $ (1,518,349) $ — $ —
ICE U.S. Treasury Goldman Sachs 7-10 Year
17,424,771 3/6/2018 International 0.54% Bond Index (303,109) — 303,109 —
$ 44,668,847 $ 1,215,240
1 The Fund’s Swap Agreements are not accounted for as hedging instruments under ASC 815.2 Reflects the floating financing rate, as of May 31, 2017, on the notional amount of the swap agreement paid to the counterparty or received
from the counterparty, excluding any commissions.3 The Fund discloses amounts due to the Fund from the counterparty (unrealized appreciation on swap agreements) at period end as an asset
on its Statements of Assets and Liabilities. Amounts due to the counterparty from the Fund (unrealized depreciation on swap agreements) aredisclosed as a liability on its Statements of Assets and Liabilities. The Fund presents these amounts on a gross basis and does not offset or“net” these amounts on its Statements of Assets and Liabilities.
4 Represents the “uncollateralized” amount due from or (to) the counterparty at period end. These amounts could be due to timing differencesbetween the movement of collateral in relation to market movements, or due to agreement provisions allowing minimum “thresholds” thatwould need to be exceeded prior to the movement of collateral. To the extent that a net amount is due from a counterparty, the Fund would beexposed to the counterparty by such amount and could suffer losses or delays in recovery of that amount in the event of a counterparty default.
Merrill Corp - Proshares Trust Geared Book [96 Funds] Annual Report [Funds] 333-089822 05-31-2017 ED [AUX] | eperez | 28-Jul-17 17:40 | 17-15159-3.fw | Sequence: 18CHKSUM Content: 16619 Layout: 61964 Graphics: No Graphics CLEAN
JOB: 17-15159-3 CYCLE#;BL#: 5; 0 TRIM: 8.25" x 10.75" COMPOSITECOLORS: Black, ~note-color 2, ~note-color 3 GRAPHICS: none V1.5
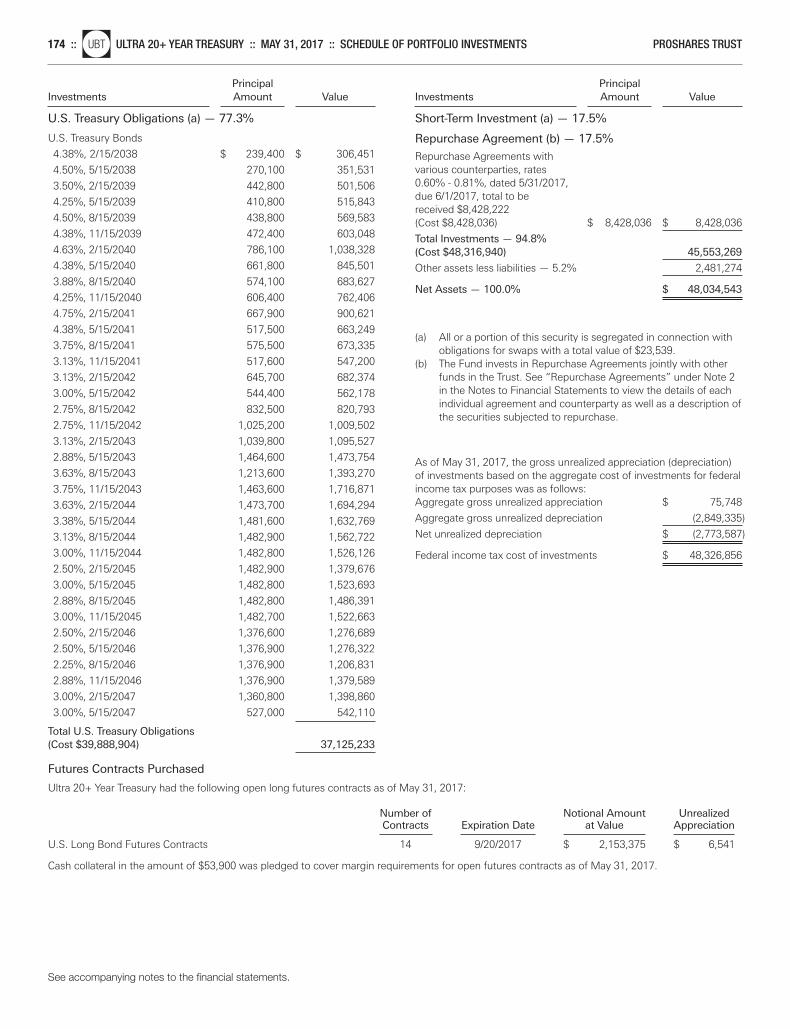
See accompanying notes to the financial statements.
174 ::nlUBT ULTRA 20+ YEAR TREASURY :: MAY 31, 2017 :: SCHEDULE OF PORTFOLIO INVESTMENTS PROSHARES TRUST
PrincipalInvestments Amount Value
U.S. Treasury Obligations (a) — 77.3%
Principal Investments Amount Value
Short-Term Investment (a) — 17.5%
U.S. Treasury Bonds
4.38%, 2/15/2038 $ 239,400 $ 306,451
4.50%, 5/15/2038 270,100 351,531
3.50%, 2/15/2039 442,800 501,506
4.25%, 5/15/2039 410,800 515,843
4.50%, 8/15/2039 438,800 569,583
4.38%, 11/15/2039 472,400 603,048
4.63%, 2/15/2040 786,100 1,038,328
4.38%, 5/15/2040 661,800 845,501
3.88%, 8/15/2040 574,100 683,627
4.25%, 11/15/2040 606,400 762,406
4.75%, 2/15/2041 667,900 900,621
4.38%, 5/15/2041 517,500 663,249
3.75%, 8/15/2041 575,500 673,335
3.13%, 11/15/2041 517,600 547,200
3.13%, 2/15/2042 645,700 682,374
3.00%, 5/15/2042 544,400 562,178
2.75%, 8/15/2042 832,500 820,793
2.75%, 11/15/2042 1,025,200 1,009,502
3.13%, 2/15/2043 1,039,800 1,095,527
2.88%, 5/15/2043 1,464,600 1,473,754
3.63%, 8/15/2043 1,213,600 1,393,270
3.75%, 11/15/2043 1,463,600 1,716,871
3.63%, 2/15/2044 1,473,700 1,694,294
3.38%, 5/15/2044 1,481,600 1,632,769
3.13%, 8/15/2044 1,482,900 1,562,722
3.00%, 11/15/2044 1,482,800 1,526,126
2.50%, 2/15/2045 1,482,900 1,379,676
3.00%, 5/15/2045 1,482,800 1,523,693
2.88%, 8/15/2045 1,482,800 1,486,391
3.00%, 11/15/2045 1,482,700 1,522,663
2.50%, 2/15/2046 1,376,600 1,276,689
2.50%, 5/15/2046 1,376,900 1,276,322
2.25%, 8/15/2046 1,376,900 1,206,831
2.88%, 11/15/2046 1,376,900 1,379,589
3.00%, 2/15/2047 1,360,800 1,398,860
3.00%, 5/15/2047 527,000 542,110
Total U.S. Treasury Obligations(Cost $39,888,904) 37,125,233
Futures Contracts Purchased
Ultra 20+ Year Treasury had the following open long futures contracts as of May 31, 2017:
Number of Notional Amount Unrealized Contracts Expiration Date at Value Appreciation U.S. Long Bond Futures Contracts 14 9/20/2017 $ 2,153,375 $ 6,541
Cash collateral in the amount of $53,900 was pledged to cover margin requirements for open futures contracts as of May 31, 2017.
Repurchase Agreement (b) — 17.5%
Repurchase Agreements with various counterparties, rates 0.60% - 0.81%, dated 5/31/2017, due 6/1/2017, total to be received $8,428,222 (Cost $8,428,036) $ 8,428,036 $ 8,428,036
Total Investments — 94.8%(Cost $48,316,940) 45,553,269
Other assets less liabilities — 5.2% 2,481,274
Net Assets — 100.0% $ 48,034,543
(a) All or a portion of this security is segregated in connection withobligations for swaps with a total value of $23,539.
(b) The Fund invests in Repurchase Agreements jointly with otherfunds in the Trust. See “Repurchase Agreements” under Note 2in the Notes to Financial Statements to view the details of eachindividual agreement and counterparty as well as a description ofthe securities subjected to repurchase.
As of May 31, 2017, the gross unrealized appreciation (depreciation)of investments based on the aggregate cost of investments for federalincome tax purposes was as follows:Aggregate gross unrealized appreciation $ 75,748
Aggregate gross unrealized depreciation (2,849,335)
Net unrealized depreciation $ (2,773,587)
Federal income tax cost of investments $ 48,326,856
Merrill Corp - Proshares Trust Geared Book [96 Funds] Annual Report [Funds] 333-089822 05-31-2017 ED [AUX] | eperez | 28-Jul-17 17:40 | 17-15159-3.fw | Sequence: 19CHKSUM Content: 53349 Layout: 19460 Graphics: No Graphics CLEAN
JOB: 17-15159-3 CYCLE#;BL#: 5; 0 TRIM: 8.25" x 10.75" COMPOSITECOLORS: Black, ~note-color 2, ~note-color 3 GRAPHICS: none V1.5
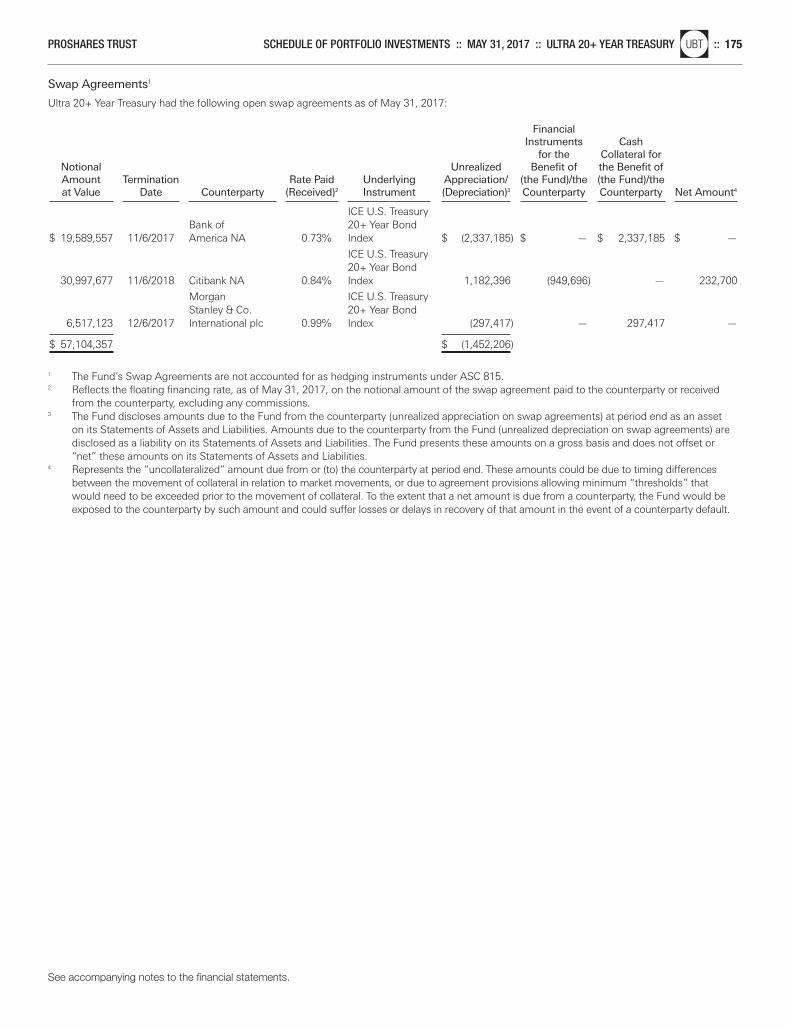
See accompanying notes to the financial statements.
PROSHARES TRUST SCHEDULE OF PORTFOLIO INVESTMENTS :: MAY 31, 2017 :: ULTRA 20+ YEAR TREASURYnlUBT :: 175
Swap Agreements1
Ultra 20+ Year Treasury had the following open swap agreements as of May 31, 2017:
Financial Instruments Cash
for the Collateral for Notional Unrealized Benefit of the Benefit of Amount Termination Rate Paid Underlying Appreciation/ (the Fund)/the (the Fund)/the at Value Date Counterparty (Received)2 Instrument (Depreciation)3 Counterparty Counterparty Net Amount4
ICE U.S. Treasury
Bank of 20+ Year Bond $ 19,589,557 11/6/2017 America NA 0.73% Index $ (2,337,185) $ — $ 2,337,185 $ —
ICE U.S. Treasury 20+ Year Bond
30,997,677 11/6/2018 Citibank NA 0.84% Index 1,182,396 (949,696) — 232,700
Morgan ICE U.S. Treasury Stanley & Co. 20+ Year Bond
6,517,123 12/6/2017 International plc 0.99% Index (297,417) — 297,417 —
$ 57,104,357 $ (1,452,206)
1 The Fund’s Swap Agreements are not accounted for as hedging instruments under ASC 815.2 Reflects the floating financing rate, as of May 31, 2017, on the notional amount of the swap agreement paid to the counterparty or received
from the counterparty, excluding any commissions.3 The Fund discloses amounts due to the Fund from the counterparty (unrealized appreciation on swap agreements) at period end as an asset
on its Statements of Assets and Liabilities. Amounts due to the counterparty from the Fund (unrealized depreciation on swap agreements) aredisclosed as a liability on its Statements of Assets and Liabilities. The Fund presents these amounts on a gross basis and does not offset or“net” these amounts on its Statements of Assets and Liabilities.
4 Represents the “uncollateralized” amount due from or (to) the counterparty at period end. These amounts could be due to timing differencesbetween the movement of collateral in relation to market movements, or due to agreement provisions allowing minimum “thresholds” thatwould need to be exceeded prior to the movement of collateral. To the extent that a net amount is due from a counterparty, the Fund would beexposed to the counterparty by such amount and could suffer losses or delays in recovery of that amount in the event of a counterparty default.
Merrill Corp - Proshares Trust Geared Book [96 Funds] Annual Report [Funds] 333-089822 05-31-2017 ED [AUX] | eperez | 28-Jul-17 17:40 | 17-15159-3.fw | Sequence: 20CHKSUM Content: 39358 Layout: 56576 Graphics: No Graphics CLEAN
JOB: 17-15159-3 CYCLE#;BL#: 5; 0 TRIM: 8.25" x 10.75" COMPOSITECOLORS: Black, ~note-color 2, ~note-color 3 GRAPHICS: none V1.5
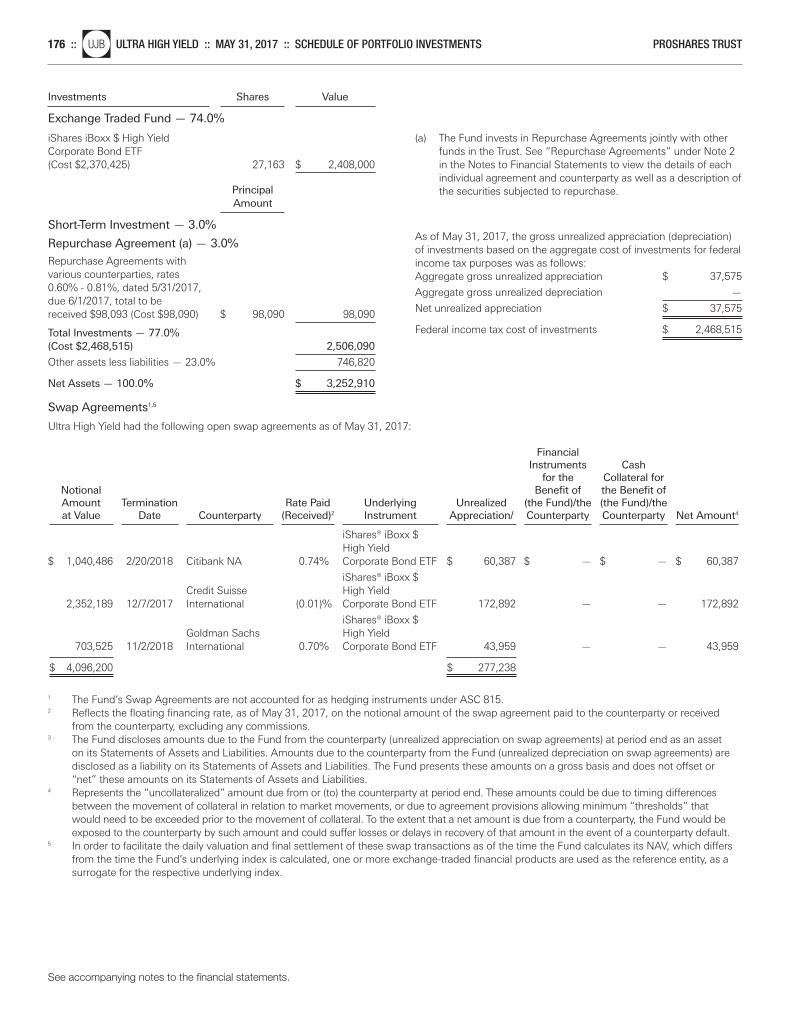
See accompanying notes to the financial statements.
176 ::nlUJB ULTRA HIGH YIELD :: MAY 31, 2017 :: SCHEDULE OF PORTFOLIO INVESTMENTS PROSHARES TRUST
Investments Shares Value
Exchange Traded Fund — 74.0%
iShares iBoxx $ High Yield Corporate Bond ETF (Cost $2,370,425) 27,163 $ 2,408,000
Principal Amount
Short-Term Investment — 3.0%
Repurchase Agreement (a) — 3.0%
Repurchase Agreements with various counterparties, rates 0.60% - 0.81%, dated 5/31/2017, due 6/1/2017, total to be received $98,093 (Cost $98,090) $ 98,090 98,090
Total Investments — 77.0%(Cost $2,468,515) 2,506,090
Other assets less liabilities — 23.0% 746,820
Net Assets — 100.0% $ 3,252,910
Swap Agreements1,5
Ultra High Yield had the following open swap agreements as of May 31, 2017:
Financial Instruments Cash
for the Collateral for Notional Benefit of the Benefit of Amount Termination Rate Paid Underlying Unrealized (the Fund)/the (the Fund)/the at Value Date Counterparty (Received)2 Instrument Appreciation/ Counterparty Counterparty Net Amount4
iShares® iBoxx $ High Yield
$ 1,040,486 2/20/2018 Citibank NA 0.74% Corporate Bond ETF $ 60,387 $ — $ — $ 60,387
iShares® iBoxx $ Credit Suisse High Yield
2,352,189 12/7/2017 International (0.01)% Corporate Bond ETF 172,892 — — 172,892
iShares® iBoxx $ Goldman Sachs High Yield
703,525 11/2/2018 International 0.70% Corporate Bond ETF 43,959 — — 43,959
$ 4,096,200 $ 277,238
1 The Fund’s Swap Agreements are not accounted for as hedging instruments under ASC 815.2 Reflects the floating financing rate, as of May 31, 2017, on the notional amount of the swap agreement paid to the counterparty or received
from the counterparty, excluding any commissions.3 The Fund discloses amounts due to the Fund from the counterparty (unrealized appreciation on swap agreements) at period end as an asset
on its Statements of Assets and Liabilities. Amounts due to the counterparty from the Fund (unrealized depreciation on swap agreements) aredisclosed as a liability on its Statements of Assets and Liabilities. The Fund presents these amounts on a gross basis and does not offset or“net” these amounts on its Statements of Assets and Liabilities.
4 Represents the “uncollateralized” amount due from or (to) the counterparty at period end. These amounts could be due to timing differencesbetween the movement of collateral in relation to market movements, or due to agreement provisions allowing minimum “thresholds” thatwould need to be exceeded prior to the movement of collateral. To the extent that a net amount is due from a counterparty, the Fund would beexposed to the counterparty by such amount and could suffer losses or delays in recovery of that amount in the event of a counterparty default.
5 In order to facilitate the daily valuation and final settlement of these swap transactions as of the time the Fund calculates its NAV, which differsfrom the time the Fund’s underlying index is calculated, one or more exchange-traded financial products are used as the reference entity, as asurrogate for the respective underlying index.
(a) The Fund invests in Repurchase Agreements jointly with otherfunds in the Trust. See “Repurchase Agreements” under Note 2in the Notes to Financial Statements to view the details of eachindividual agreement and counterparty as well as a description ofthe securities subjected to repurchase.
As of May 31, 2017, the gross unrealized appreciation (depreciation)of investments based on the aggregate cost of investments for federalincome tax purposes was as follows:Aggregate gross unrealized appreciation $ 37,575
Aggregate gross unrealized depreciation —
Net unrealized appreciation $ 37,575
Federal income tax cost of investments $ 2,468,515
Merrill Corp - Proshares Trust Geared Book [96 Funds] Annual Report [Funds] 333-089822 05-31-2017 ED [AUX] | eperez | 28-Jul-17 17:40 | 17-15159-3.fw | Sequence: 21CHKSUM Content: 20480 Layout: 65309 Graphics: No Graphics CLEAN
JOB: 17-15159-3 CYCLE#;BL#: 5; 0 TRIM: 8.25" x 10.75" COMPOSITECOLORS: Black, ~note-color 2, ~note-color 3 GRAPHICS: none V1.5

PROSHARES TRUST STATEMENTS OF ASSETS AND LIABILITIES :: MAY 31, 2017 :: 177
STATEMENTS OF ASSETS AND LIABILITIES
Merrill Corp - Proshares Trust Geared Book [96 Funds] Annual Report [Funds] 333-089822 05-31-2017 ED [AUX] | eperez | 28-Jul-17 17:40 | 17-15159-3.ga | Sequence: 1CHKSUM Content: 59366 Layout: 45011 Graphics: No Graphics CLEAN
JOB: 17-15159-3 CYCLE#;BL#: 5; 0 TRIM: 8.25" x 10.75" COMPOSITECOLORS: Black, ~note-color 2, ~note-color 3 GRAPHICS: none V1.5
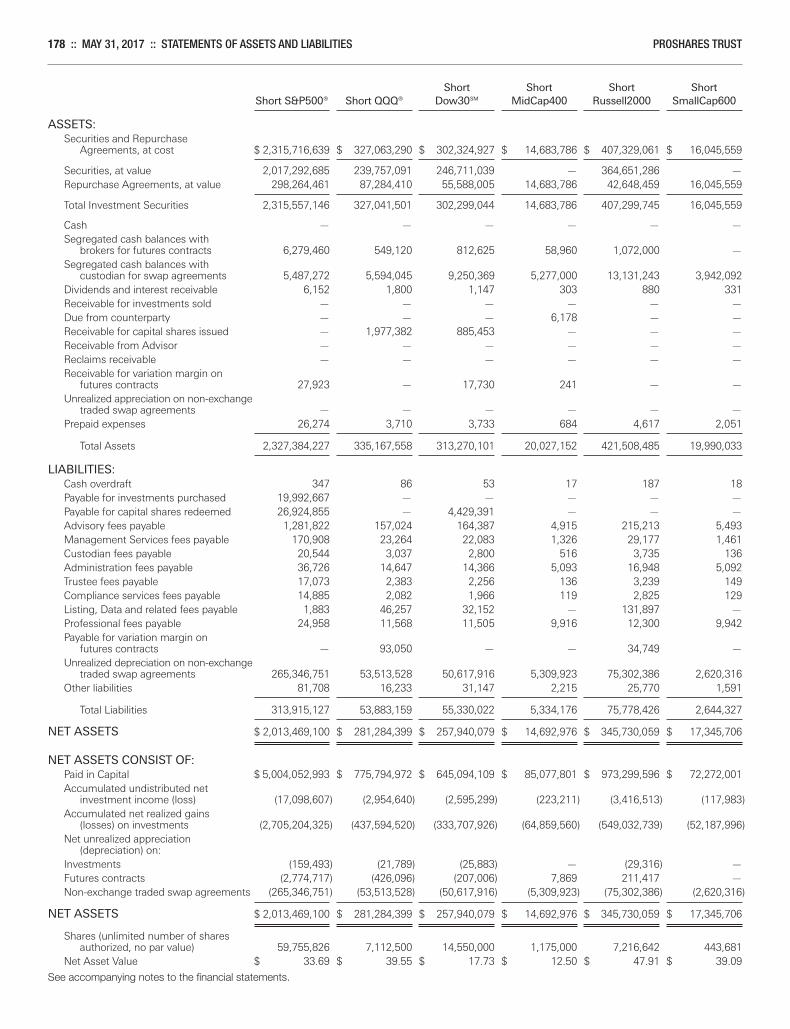
178 :: MAY 31, 2017 :: STATEMENTS OF ASSETS AND LIABILITIES PROSHARES TRUST
Short Short Short Short Short S&P500® Short QQQ® Dow30SM MidCap400 Russell2000 SmallCap600
ASSETS:Securities and Repurchase
Agreements, at cost $ 2,315,716,639 $ 327,063,290 $ 302,324,927 $ 14,683,786 $ 407,329,061 $ 16,045,559
Securities, at value 2,017,292,685 239,757,091 246,711,039 — 364,651,286 —Repurchase Agreements, at value 298,264,461 87,284,410 55,588,005 14,683,786 42,648,459 16,045,559
Total Investment Securities 2,315,557,146 327,041,501 302,299,044 14,683,786 407,299,745 16,045,559
Cash — — — — — —Segregated cash balances with
brokers for futures contracts 6,279,460 549,120 812,625 58,960 1,072,000 —Segregated cash balances with
custodian for swap agreements 5,487,272 5,594,045 9,250,369 5,277,000 13,131,243 3,942,092Dividends and interest receivable 6,152 1,800 1,147 303 880 331Receivable for investments sold — — — — — —Due from counterparty — — — 6,178 — —Receivable for capital shares issued — 1,977,382 885,453 — — —Receivable from Advisor — — — — — —Reclaims receivable — — — — — —Receivable for variation margin on
futures contracts 27,923 — 17,730 241 — —Unrealized appreciation on non-exchange
traded swap agreements — — — — — —Prepaid expenses 26,274 3,710 3,733 684 4,617 2,051
Total Assets 2,327,384,227 335,167,558 313,270,101 20,027,152 421,508,485 19,990,033
LIABILITIES:Cash overdraft 347 86 53 17 187 18Payable for investments purchased 19,992,667 — — — — —Payable for capital shares redeemed 26,924,855 — 4,429,391 — — —Advisory fees payable 1,281,822 157,024 164,387 4,915 215,213 5,493Management Services fees payable 170,908 23,264 22,083 1,326 29,177 1,461Custodian fees payable 20,544 3,037 2,800 516 3,735 136Administration fees payable 36,726 14,647 14,366 5,093 16,948 5,092Trustee fees payable 17,073 2,383 2,256 136 3,239 149Compliance services fees payable 14,885 2,082 1,966 119 2,825 129Listing, Data and related fees payable 1,883 46,257 32,152 — 131,897 —Professional fees payable 24,958 11,568 11,505 9,916 12,300 9,942Payable for variation margin on
futures contracts — 93,050 — — 34,749 —Unrealized depreciation on non-exchange
traded swap agreements 265,346,751 53,513,528 50,617,916 5,309,923 75,302,386 2,620,316Other liabilities 81,708 16,233 31,147 2,215 25,770 1,591
Total Liabilities 313,915,127 53,883,159 55,330,022 5,334,176 75,778,426 2,644,327
NET ASSETS $ 2,013,469,100 $ 281,284,399 $ 257,940,079 $ 14,692,976 $ 345,730,059 $ 17,345,706
NET ASSETS CONSIST OF:Paid in Capital $ 5,004,052,993 $ 775,794,972 $ 645,094,109 $ 85,077,801 $ 973,299,596 $ 72,272,001Accumulated undistributed net
investment income (loss) (17,098,607) (2,954,640) (2,595,299) (223,211) (3,416,513) (117,983)Accumulated net realized gains
(losses) on investments (2,705,204,325) (437,594,520) (333,707,926) (64,859,560) (549,032,739) (52,187,996)Net unrealized appreciation
(depreciation) on:Investments (159,493) (21,789) (25,883) — (29,316) —Futures contracts (2,774,717) (426,096) (207,006) 7,869 211,417 —Non-exchange traded swap agreements (265,346,751) (53,513,528) (50,617,916) (5,309,923) (75,302,386) (2,620,316)
NET ASSETS $ 2,013,469,100 $ 281,284,399 $ 257,940,079 $ 14,692,976 $ 345,730,059 $ 17,345,706
Shares (unlimited number of sharesauthorized, no par value) 59,755,826 7,112,500 14,550,000 1,175,000 7,216,642 443,681
Net Asset Value $ 33.69 $ 39.55 $ 17.73 $ 12.50 $ 47.91 $ 39.09
See accompanying notes to the financial statements.
Merrill Corp - Proshares Trust Geared Book [96 Funds] Annual Report [Funds] 333-089822 05-31-2017 ED [AUX] | eperez | 28-Jul-17 17:40 | 17-15159-3.ga | Sequence: 2CHKSUM Content: 41808 Layout: 10344 Graphics: No Graphics CLEAN
JOB: 17-15159-3 CYCLE#;BL#: 5; 0 TRIM: 8.25" x 10.75" COMPOSITECOLORS: Black, ~note-color 2, ~note-color 3 GRAPHICS: none V1.5
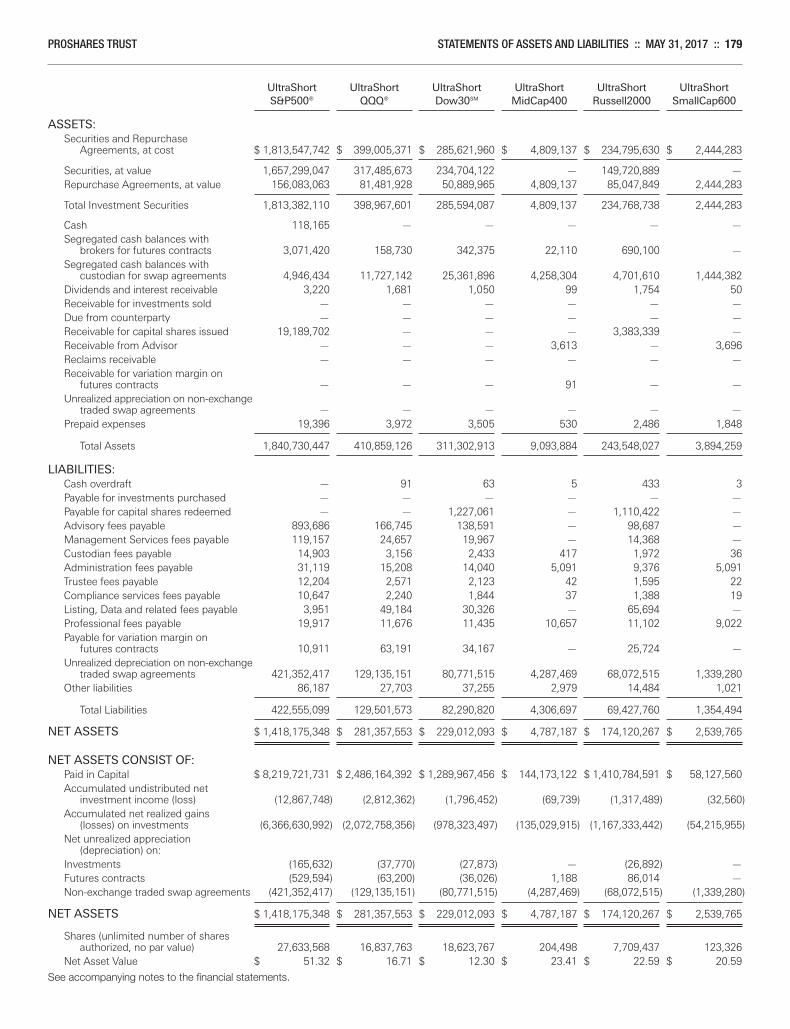
PROSHARES TRUST STATEMENTS OF ASSETS AND LIABILITIES :: MAY 31, 2017 :: 179
UltraShort UltraShort UltraShort UltraShort UltraShort UltraShort S&P500® QQQ® Dow30SM MidCap400 Russell2000 SmallCap600
ASSETS:Securities and Repurchase
Agreements, at cost $ 1,813,547,742 $ 399,005,371 $ 285,621,960 $ 4,809,137 $ 234,795,630 $ 2,444,283
Securities, at value 1,657,299,047 317,485,673 234,704,122 — 149,720,889 —Repurchase Agreements, at value 156,083,063 81,481,928 50,889,965 4,809,137 85,047,849 2,444,283
Total Investment Securities 1,813,382,110 398,967,601 285,594,087 4,809,137 234,768,738 2,444,283
Cash 118,165 — — — — —Segregated cash balances with
brokers for futures contracts 3,071,420 158,730 342,375 22,110 690,100 —Segregated cash balances with
custodian for swap agreements 4,946,434 11,727,142 25,361,896 4,258,304 4,701,610 1,444,382Dividends and interest receivable 3,220 1,681 1,050 99 1,754 50Receivable for investments sold — — — — — —Due from counterparty — — — — — —Receivable for capital shares issued 19,189,702 — — — 3,383,339 —Receivable from Advisor — — — 3,613 — 3,696Reclaims receivable — — — — — —Receivable for variation margin on
futures contracts — — — 91 — —Unrealized appreciation on non-exchange
traded swap agreements — — — — — —Prepaid expenses 19,396 3,972 3,505 530 2,486 1,848
Total Assets 1,840,730,447 410,859,126 311,302,913 9,093,884 243,548,027 3,894,259
LIABILITIES:Cash overdraft — 91 63 5 433 3Payable for investments purchased — — — — — —Payable for capital shares redeemed — — 1,227,061 — 1,110,422 —Advisory fees payable 893,686 166,745 138,591 — 98,687 —Management Services fees payable 119,157 24,657 19,967 — 14,368 —Custodian fees payable 14,903 3,156 2,433 417 1,972 36Administration fees payable 31,119 15,208 14,040 5,091 9,376 5,091Trustee fees payable 12,204 2,571 2,123 42 1,595 22Compliance services fees payable 10,647 2,240 1,844 37 1,388 19Listing, Data and related fees payable 3,951 49,184 30,326 — 65,694 —Professional fees payable 19,917 11,676 11,435 10,657 11,102 9,022Payable for variation margin on
futures contracts 10,911 63,191 34,167 — 25,724 —Unrealized depreciation on non-exchange
traded swap agreements 421,352,417 129,135,151 80,771,515 4,287,469 68,072,515 1,339,280Other liabilities 86,187 27,703 37,255 2,979 14,484 1,021
Total Liabilities 422,555,099 129,501,573 82,290,820 4,306,697 69,427,760 1,354,494
NET ASSETS $ 1,418,175,348 $ 281,357,553 $ 229,012,093 $ 4,787,187 $ 174,120,267 $ 2,539,765
NET ASSETS CONSIST OF:Paid in Capital $ 8,219,721,731 $ 2,486,164,392 $ 1,289,967,456 $ 144,173,122 $ 1,410,784,591 $ 58,127,560Accumulated undistributed net
investment income (loss) (12,867,748) (2,812,362) (1,796,452) (69,739) (1,317,489) (32,560)Accumulated net realized gains
(losses) on investments (6,366,630,992) (2,072,758,356) (978,323,497) (135,029,915) (1,167,333,442) (54,215,955)Net unrealized appreciation
(depreciation) on:Investments (165,632) (37,770) (27,873) — (26,892) —Futures contracts (529,594) (63,200) (36,026) 1,188 86,014 —Non-exchange traded swap agreements (421,352,417) (129,135,151) (80,771,515) (4,287,469) (68,072,515) (1,339,280)
NET ASSETS $ 1,418,175,348 $ 281,357,553 $ 229,012,093 $ 4,787,187 $ 174,120,267 $ 2,539,765
Shares (unlimited number of sharesauthorized, no par value) 27,633,568 16,837,763 18,623,767 204,498 7,709,437 123,326
Net Asset Value $ 51.32 $ 16.71 $ 12.30 $ 23.41 $ 22.59 $ 20.59
See accompanying notes to the financial statements.
Merrill Corp - Proshares Trust Geared Book [96 Funds] Annual Report [Funds] 333-089822 05-31-2017 ED [AUX] | eperez | 28-Jul-17 17:40 | 17-15159-3.ga | Sequence: 3CHKSUM Content: 43007 Layout: 49489 Graphics: No Graphics CLEAN
JOB: 17-15159-3 CYCLE#;BL#: 5; 0 TRIM: 8.25" x 10.75" COMPOSITECOLORS: Black, ~note-color 2, ~note-color 3 GRAPHICS: none V1.5
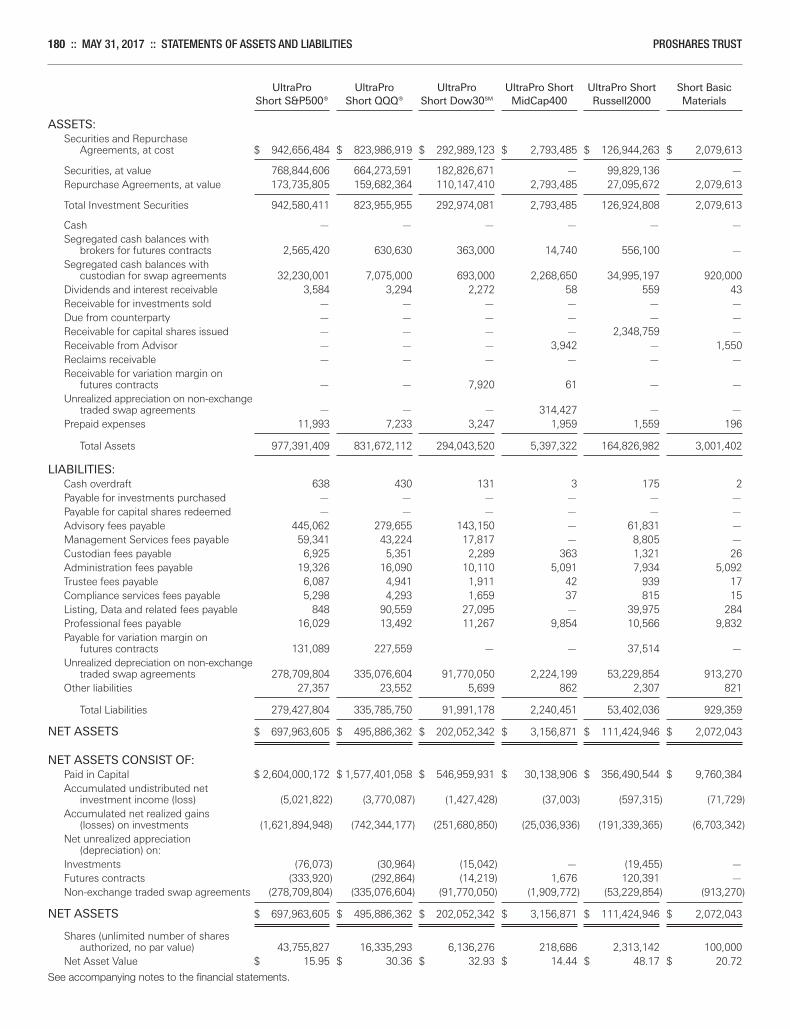
180 :: MAY 31, 2017 :: STATEMENTS OF ASSETS AND LIABILITIES PROSHARES TRUST
UltraPro UltraPro UltraPro UltraPro Short UltraPro Short Short Basic Short S&P500® Short QQQ® Short Dow30SM MidCap400 Russell2000 Materials
ASSETS:Securities and Repurchase
Agreements, at cost $ 942,656,484 $ 823,986,919 $ 292,989,123 $ 2,793,485 $ 126,944,263 $ 2,079,613
Securities, at value 768,844,606 664,273,591 182,826,671 — 99,829,136 —Repurchase Agreements, at value 173,735,805 159,682,364 110,147,410 2,793,485 27,095,672 2,079,613
Total Investment Securities 942,580,411 823,955,955 292,974,081 2,793,485 126,924,808 2,079,613
Cash — — — — — —Segregated cash balances with
brokers for futures contracts 2,565,420 630,630 363,000 14,740 556,100 —Segregated cash balances with
custodian for swap agreements 32,230,001 7,075,000 693,000 2,268,650 34,995,197 920,000Dividends and interest receivable 3,584 3,294 2,272 58 559 43Receivable for investments sold — — — — — —Due from counterparty — — — — — —Receivable for capital shares issued — — — — 2,348,759 —Receivable from Advisor — — — 3,942 — 1,550Reclaims receivable — — — — — —Receivable for variation margin on
futures contracts — — 7,920 61 — —Unrealized appreciation on non-exchange
traded swap agreements — — — 314,427 — —Prepaid expenses 11,993 7,233 3,247 1,959 1,559 196
Total Assets 977,391,409 831,672,112 294,043,520 5,397,322 164,826,982 3,001,402
LIABILITIES:Cash overdraft 638 430 131 3 175 2Payable for investments purchased — — — — — —Payable for capital shares redeemed — — — — — —Advisory fees payable 445,062 279,655 143,150 — 61,831 —Management Services fees payable 59,341 43,224 17,817 — 8,805 —Custodian fees payable 6,925 5,351 2,289 363 1,321 26Administration fees payable 19,326 16,090 10,110 5,091 7,934 5,092Trustee fees payable 6,087 4,941 1,911 42 939 17Compliance services fees payable 5,298 4,293 1,659 37 815 15Listing, Data and related fees payable 848 90,559 27,095 — 39,975 284Professional fees payable 16,029 13,492 11,267 9,854 10,566 9,832Payable for variation margin on
futures contracts 131,089 227,559 — — 37,514 —Unrealized depreciation on non-exchange
traded swap agreements 278,709,804 335,076,604 91,770,050 2,224,199 53,229,854 913,270Other liabilities 27,357 23,552 5,699 862 2,307 821
Total Liabilities 279,427,804 335,785,750 91,991,178 2,240,451 53,402,036 929,359
NET ASSETS $ 697,963,605 $ 495,886,362 $ 202,052,342 $ 3,156,871 $ 111,424,946 $ 2,072,043
NET ASSETS CONSIST OF:Paid in Capital $ 2,604,000,172 $ 1,577,401,058 $ 546,959,931 $ 30,138,906 $ 356,490,544 $ 9,760,384Accumulated undistributed net
investment income (loss) (5,021,822) (3,770,087) (1,427,428) (37,003) (597,315) (71,729)Accumulated net realized gains
(losses) on investments (1,621,894,948) (742,344,177) (251,680,850) (25,036,936) (191,339,365) (6,703,342)Net unrealized appreciation
(depreciation) on:Investments (76,073) (30,964) (15,042) — (19,455) —Futures contracts (333,920) (292,864) (14,219) 1,676 120,391 —Non-exchange traded swap agreements (278,709,804) (335,076,604) (91,770,050) (1,909,772) (53,229,854) (913,270)
NET ASSETS $ 697,963,605 $ 495,886,362 $ 202,052,342 $ 3,156,871 $ 111,424,946 $ 2,072,043
Shares (unlimited number of sharesauthorized, no par value) 43,755,827 16,335,293 6,136,276 218,686 2,313,142 100,000
Net Asset Value $ 15.95 $ 30.36 $ 32.93 $ 14.44 $ 48.17 $ 20.72
See accompanying notes to the financial statements.
Merrill Corp - Proshares Trust Geared Book [96 Funds] Annual Report [Funds] 333-089822 05-31-2017 ED [AUX] | eperez | 28-Jul-17 17:40 | 17-15159-3.ga | Sequence: 4CHKSUM Content: 376 Layout: 65404 Graphics: No Graphics CLEAN
JOB: 17-15159-3 CYCLE#;BL#: 5; 0 TRIM: 8.25" x 10.75" COMPOSITECOLORS: Black, ~note-color 2, ~note-color 3 GRAPHICS: none V1.5
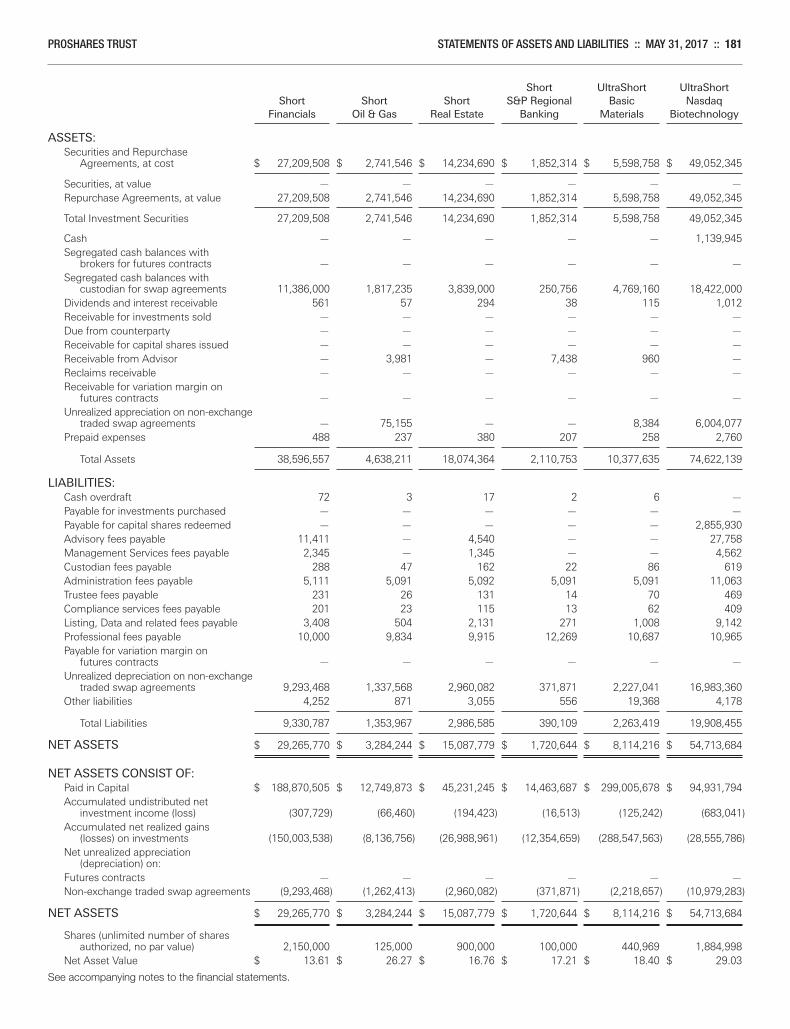
PROSHARES TRUST STATEMENTS OF ASSETS AND LIABILITIES :: MAY 31, 2017 :: 181
Short UltraShort UltraShort Short Short Short S&P Regional Basic Nasdaq Financials Oil & Gas Real Estate Banking Materials Biotechnology
ASSETS:Securities and Repurchase
Agreements, at cost $ 27,209,508 $ 2,741,546 $ 14,234,690 $ 1,852,314 $ 5,598,758 $ 49,052,345
Securities, at value — — — — — —Repurchase Agreements, at value 27,209,508 2,741,546 14,234,690 1,852,314 5,598,758 49,052,345
Total Investment Securities 27,209,508 2,741,546 14,234,690 1,852,314 5,598,758 49,052,345
Cash — — — — — 1,139,945Segregated cash balances with
brokers for futures contracts — — — — — —Segregated cash balances with
custodian for swap agreements 11,386,000 1,817,235 3,839,000 250,756 4,769,160 18,422,000Dividends and interest receivable 561 57 294 38 115 1,012Receivable for investments sold — — — — — —Due from counterparty — — — — — —Receivable for capital shares issued — — — — — —Receivable from Advisor — 3,981 — 7,438 960 —Reclaims receivable — — — — — —Receivable for variation margin on
futures contracts — — — — — —Unrealized appreciation on non-exchange
traded swap agreements — 75,155 — — 8,384 6,004,077Prepaid expenses 488 237 380 207 258 2,760
Total Assets 38,596,557 4,638,211 18,074,364 2,110,753 10,377,635 74,622,139
LIABILITIES:Cash overdraft 72 3 17 2 6 —Payable for investments purchased — — — — — —Payable for capital shares redeemed — — — — — 2,855,930Advisory fees payable 11,411 — 4,540 — — 27,758Management Services fees payable 2,345 — 1,345 — — 4,562Custodian fees payable 288 47 162 22 86 619Administration fees payable 5,111 5,091 5,092 5,091 5,091 11,063Trustee fees payable 231 26 131 14 70 469Compliance services fees payable 201 23 115 13 62 409Listing, Data and related fees payable 3,408 504 2,131 271 1,008 9,142Professional fees payable 10,000 9,834 9,915 12,269 10,687 10,965Payable for variation margin on
futures contracts — — — — — —Unrealized depreciation on non-exchange
traded swap agreements 9,293,468 1,337,568 2,960,082 371,871 2,227,041 16,983,360Other liabilities 4,252 871 3,055 556 19,368 4,178
Total Liabilities 9,330,787 1,353,967 2,986,585 390,109 2,263,419 19,908,455
NET ASSETS $ 29,265,770 $ 3,284,244 $ 15,087,779 $ 1,720,644 $ 8,114,216 $ 54,713,684
NET ASSETS CONSIST OF:Paid in Capital $ 188,870,505 $ 12,749,873 $ 45,231,245 $ 14,463,687 $ 299,005,678 $ 94,931,794Accumulated undistributed net
investment income (loss) (307,729) (66,460) (194,423) (16,513) (125,242) (683,041)Accumulated net realized gains
(losses) on investments (150,003,538) (8,136,756) (26,988,961) (12,354,659) (288,547,563) (28,555,786)Net unrealized appreciation
(depreciation) on:Futures contracts — — — — — —Non-exchange traded swap agreements (9,293,468) (1,262,413) (2,960,082) (371,871) (2,218,657) (10,979,283)
NET ASSETS $ 29,265,770 $ 3,284,244 $ 15,087,779 $ 1,720,644 $ 8,114,216 $ 54,713,684
Shares (unlimited number of sharesauthorized, no par value) 2,150,000 125,000 900,000 100,000 440,969 1,884,998
Net Asset Value $ 13.61 $ 26.27 $ 16.76 $ 17.21 $ 18.40 $ 29.03
See accompanying notes to the financial statements.
Merrill Corp - Proshares Trust Geared Book [96 Funds] Annual Report [Funds] 333-089822 05-31-2017 ED [AUX] | eperez | 28-Jul-17 17:40 | 17-15159-3.ga | Sequence: 5CHKSUM Content: 60285 Layout: 8518 Graphics: No Graphics CLEAN
JOB: 17-15159-3 CYCLE#;BL#: 5; 0 TRIM: 8.25" x 10.75" COMPOSITECOLORS: Black, ~note-color 2, ~note-color 3 GRAPHICS: none V1.5
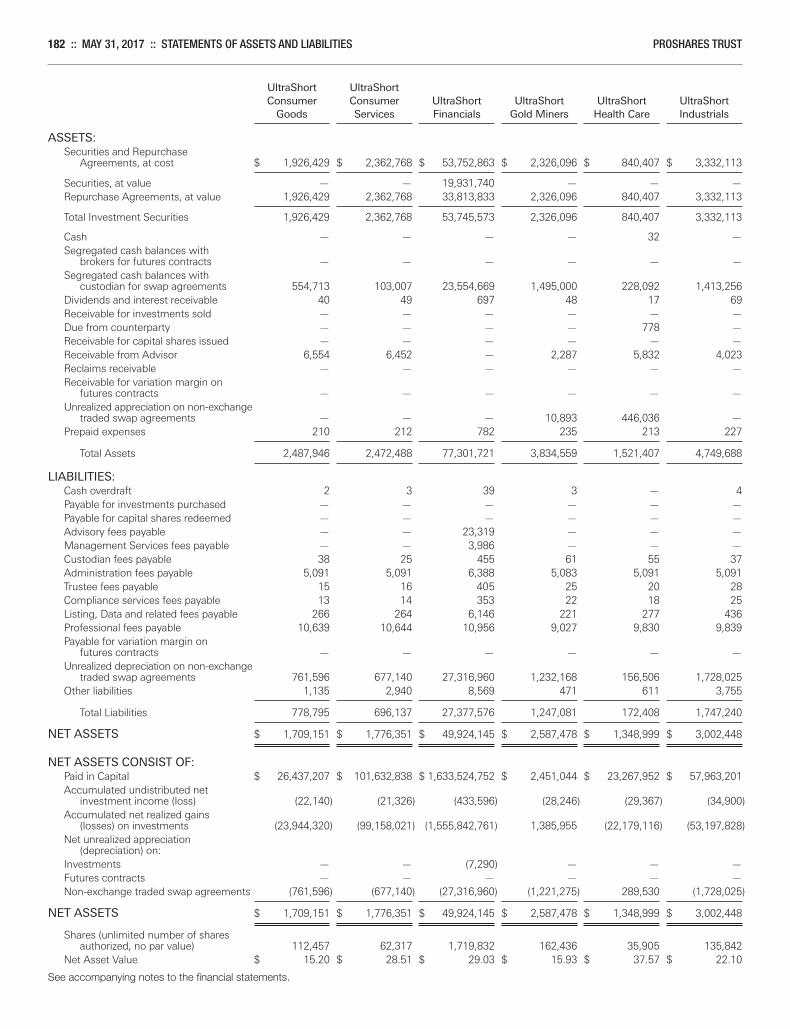
182 :: MAY 31, 2017 :: STATEMENTS OF ASSETS AND LIABILITIES PROSHARES TRUST
UltraShort UltraShort Consumer Consumer UltraShort UltraShort UltraShort UltraShort Goods Services Financials Gold Miners Health Care Industrials
ASSETS:Securities and Repurchase
Agreements, at cost $ 1,926,429 $ 2,362,768 $ 53,752,863 $ 2,326,096 $ 840,407 $ 3,332,113
Securities, at value — — 19,931,740 — — —Repurchase Agreements, at value 1,926,429 2,362,768 33,813,833 2,326,096 840,407 3,332,113
Total Investment Securities 1,926,429 2,362,768 53,745,573 2,326,096 840,407 3,332,113
Cash — — — — 32 —Segregated cash balances with
brokers for futures contracts — — — — — —Segregated cash balances with
custodian for swap agreements 554,713 103,007 23,554,669 1,495,000 228,092 1,413,256Dividends and interest receivable 40 49 697 48 17 69Receivable for investments sold — — — — — —Due from counterparty — — — — 778 —Receivable for capital shares issued — — — — — —Receivable from Advisor 6,554 6,452 — 2,287 5,832 4,023Reclaims receivable — — — — — —Receivable for variation margin on
futures contracts — — — — — —Unrealized appreciation on non-exchange
traded swap agreements — — — 10,893 446,036 —Prepaid expenses 210 212 782 235 213 227
Total Assets 2,487,946 2,472,488 77,301,721 3,834,559 1,521,407 4,749,688
LIABILITIES:Cash overdraft 2 3 39 3 — 4Payable for investments purchased — — — — — —Payable for capital shares redeemed — — — — — —Advisory fees payable — — 23,319 — — —Management Services fees payable — — 3,986 — — —Custodian fees payable 38 25 455 61 55 37Administration fees payable 5,091 5,091 6,388 5,083 5,091 5,091Trustee fees payable 15 16 405 25 20 28Compliance services fees payable 13 14 353 22 18 25Listing, Data and related fees payable 266 264 6,146 221 277 436Professional fees payable 10,639 10,644 10,956 9,027 9,830 9,839Payable for variation margin on
futures contracts — — — — — —Unrealized depreciation on non-exchange
traded swap agreements 761,596 677,140 27,316,960 1,232,168 156,506 1,728,025Other liabilities 1,135 2,940 8,569 471 611 3,755
Total Liabilities 778,795 696,137 27,377,576 1,247,081 172,408 1,747,240
NET ASSETS $ 1,709,151 $ 1,776,351 $ 49,924,145 $ 2,587,478 $ 1,348,999 $ 3,002,448
NET ASSETS CONSIST OF:Paid in Capital $ 26,437,207 $ 101,632,838 $ 1,633,524,752 $ 2,451,044 $ 23,267,952 $ 57,963,201Accumulated undistributed net
investment income (loss) (22,140) (21,326) (433,596) (28,246) (29,367) (34,900)Accumulated net realized gains
(losses) on investments (23,944,320) (99,158,021) (1,555,842,761) 1,385,955 (22,179,116) (53,197,828)Net unrealized appreciation
(depreciation) on:Investments — — (7,290) — — —Futures contracts — — — — — —Non-exchange traded swap agreements (761,596) (677,140) (27,316,960) (1,221,275) 289,530 (1,728,025)
NET ASSETS $ 1,709,151 $ 1,776,351 $ 49,924,145 $ 2,587,478 $ 1,348,999 $ 3,002,448
Shares (unlimited number of sharesauthorized, no par value) 112,457 62,317 1,719,832 162,436 35,905 135,842
Net Asset Value $ 15.20 $ 28.51 $ 29.03 $ 15.93 $ 37.57 $ 22.10
See accompanying notes to the financial statements.
Merrill Corp - Proshares Trust Geared Book [96 Funds] Annual Report [Funds] 333-089822 05-31-2017 ED [AUX] | eperez | 28-Jul-17 17:40 | 17-15159-3.ga | Sequence: 6CHKSUM Content: 28556 Layout: 41142 Graphics: No Graphics CLEAN
JOB: 17-15159-3 CYCLE#;BL#: 5; 0 TRIM: 8.25" x 10.75" COMPOSITECOLORS: Black, ~note-color 2, ~note-color 3 GRAPHICS: none V1.5
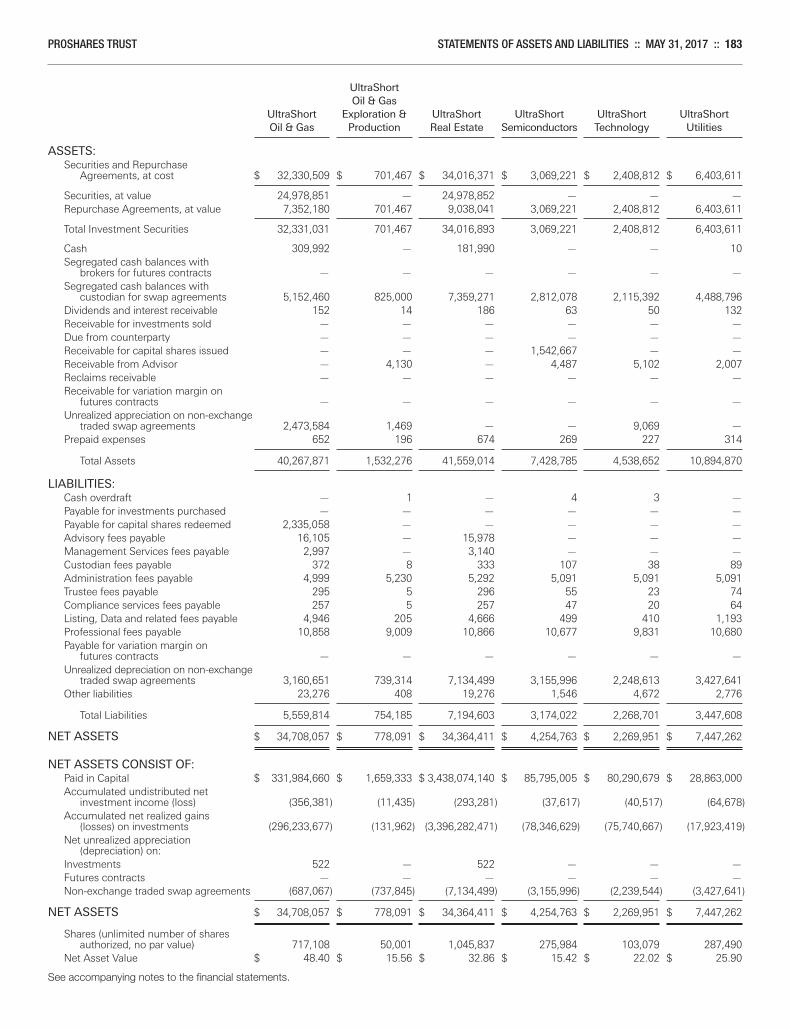
PROSHARES TRUST STATEMENTS OF ASSETS AND LIABILITIES :: MAY 31, 2017 :: 183
UltraShort Oil & Gas UltraShort Exploration & UltraShort UltraShort UltraShort UltraShort Oil & Gas Production Real Estate Semiconductors Technology Utilities
ASSETS:Securities and Repurchase
Agreements, at cost $ 32,330,509 $ 701,467 $ 34,016,371 $ 3,069,221 $ 2,408,812 $ 6,403,611
Securities, at value 24,978,851 — 24,978,852 — — —Repurchase Agreements, at value 7,352,180 701,467 9,038,041 3,069,221 2,408,812 6,403,611
Total Investment Securities 32,331,031 701,467 34,016,893 3,069,221 2,408,812 6,403,611
Cash 309,992 — 181,990 — — 10Segregated cash balances with
brokers for futures contracts — — — — — —Segregated cash balances with
custodian for swap agreements 5,152,460 825,000 7,359,271 2,812,078 2,115,392 4,488,796Dividends and interest receivable 152 14 186 63 50 132Receivable for investments sold — — — — — —Due from counterparty — — — — — —Receivable for capital shares issued — — — 1,542,667 — —Receivable from Advisor — 4,130 — 4,487 5,102 2,007Reclaims receivable — — — — — —Receivable for variation margin on
futures contracts — — — — — —Unrealized appreciation on non-exchange
traded swap agreements 2,473,584 1,469 — — 9,069 —Prepaid expenses 652 196 674 269 227 314
Total Assets 40,267,871 1,532,276 41,559,014 7,428,785 4,538,652 10,894,870
LIABILITIES:Cash overdraft — 1 — 4 3 —Payable for investments purchased — — — — — —Payable for capital shares redeemed 2,335,058 — — — — —Advisory fees payable 16,105 — 15,978 — — —Management Services fees payable 2,997 — 3,140 — — —Custodian fees payable 372 8 333 107 38 89Administration fees payable 4,999 5,230 5,292 5,091 5,091 5,091Trustee fees payable 295 5 296 55 23 74Compliance services fees payable 257 5 257 47 20 64Listing, Data and related fees payable 4,946 205 4,666 499 410 1,193Professional fees payable 10,858 9,009 10,866 10,677 9,831 10,680Payable for variation margin on
futures contracts — — — — — —Unrealized depreciation on non-exchange
traded swap agreements 3,160,651 739,314 7,134,499 3,155,996 2,248,613 3,427,641Other liabilities 23,276 408 19,276 1,546 4,672 2,776
Total Liabilities 5,559,814 754,185 7,194,603 3,174,022 2,268,701 3,447,608
NET ASSETS $ 34,708,057 $ 778,091 $ 34,364,411 $ 4,254,763 $ 2,269,951 $ 7,447,262
NET ASSETS CONSIST OF:Paid in Capital $ 331,984,660 $ 1,659,333 $ 3,438,074,140 $ 85,795,005 $ 80,290,679 $ 28,863,000Accumulated undistributed net
investment income (loss) (356,381) (11,435) (293,281) (37,617) (40,517) (64,678)Accumulated net realized gains
(losses) on investments (296,233,677) (131,962) (3,396,282,471) (78,346,629) (75,740,667) (17,923,419)Net unrealized appreciation
(depreciation) on:Investments 522 — 522 — — —Futures contracts — — — — — —Non-exchange traded swap agreements (687,067) (737,845) (7,134,499) (3,155,996) (2,239,544) (3,427,641)
NET ASSETS $ 34,708,057 $ 778,091 $ 34,364,411 $ 4,254,763 $ 2,269,951 $ 7,447,262
Shares (unlimited number of sharesauthorized, no par value) 717,108 50,001 1,045,837 275,984 103,079 287,490
Net Asset Value $ 48.40 $ 15.56 $ 32.86 $ 15.42 $ 22.02 $ 25.90
See accompanying notes to the financial statements.
Merrill Corp - Proshares Trust Geared Book [96 Funds] Annual Report [Funds] 333-089822 05-31-2017 ED [AUX] | eperez | 28-Jul-17 17:40 | 17-15159-3.ga | Sequence: 7CHKSUM Content: 46884 Layout: 33000 Graphics: No Graphics CLEAN
JOB: 17-15159-3 CYCLE#;BL#: 5; 0 TRIM: 8.25" x 10.75" COMPOSITECOLORS: Black, ~note-color 2, ~note-color 3 GRAPHICS: none V1.5
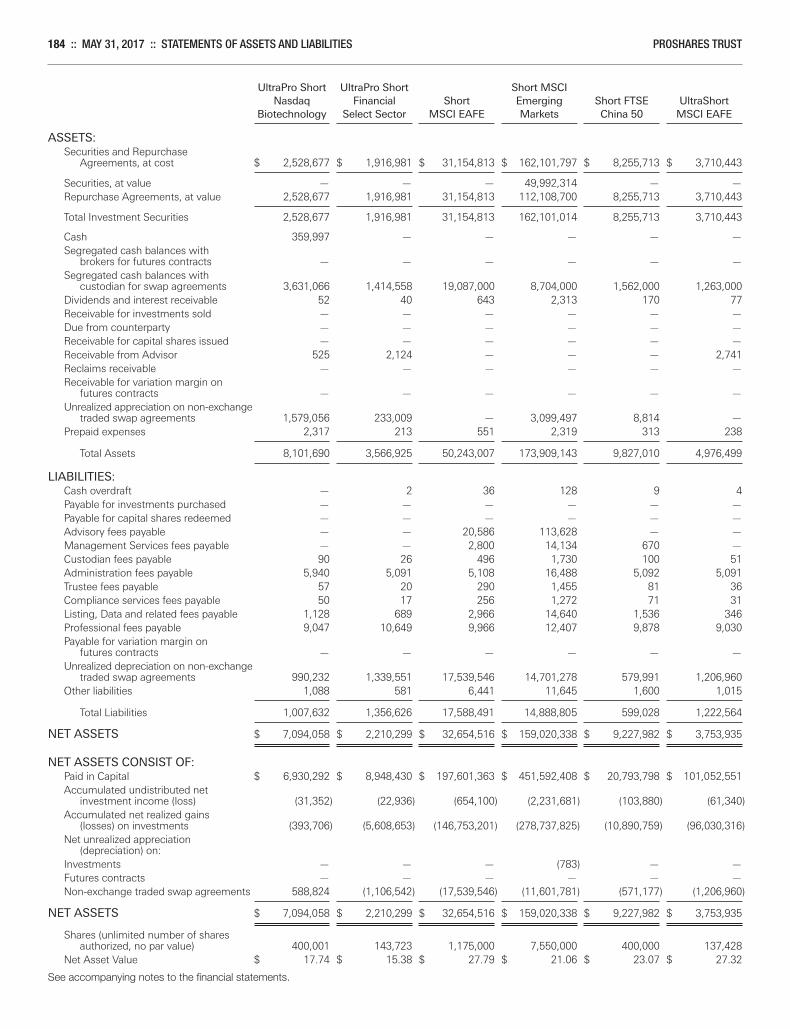
184 :: MAY 31, 2017 :: STATEMENTS OF ASSETS AND LIABILITIES PROSHARES TRUST
UltraPro Short UltraPro Short Short MSCI Nasdaq Financial Short Emerging Short FTSE UltraShort Biotechnology Select Sector MSCI EAFE Markets China 50 MSCI EAFE
ASSETS:Securities and Repurchase
Agreements, at cost $ 2,528,677 $ 1,916,981 $ 31,154,813 $ 162,101,797 $ 8,255,713 $ 3,710,443
Securities, at value — — — 49,992,314 — —Repurchase Agreements, at value 2,528,677 1,916,981 31,154,813 112,108,700 8,255,713 3,710,443
Total Investment Securities 2,528,677 1,916,981 31,154,813 162,101,014 8,255,713 3,710,443
Cash 359,997 — — — — —Segregated cash balances with
brokers for futures contracts — — — — — —Segregated cash balances with
custodian for swap agreements 3,631,066 1,414,558 19,087,000 8,704,000 1,562,000 1,263,000Dividends and interest receivable 52 40 643 2,313 170 77Receivable for investments sold — — — — — —Due from counterparty — — — — — —Receivable for capital shares issued — — — — — —Receivable from Advisor 525 2,124 — — — 2,741Reclaims receivable — — — — — —Receivable for variation margin on
futures contracts — — — — — —Unrealized appreciation on non-exchange
traded swap agreements 1,579,056 233,009 — 3,099,497 8,814 —Prepaid expenses 2,317 213 551 2,319 313 238
Total Assets 8,101,690 3,566,925 50,243,007 173,909,143 9,827,010 4,976,499
LIABILITIES:Cash overdraft — 2 36 128 9 4Payable for investments purchased — — — — — —Payable for capital shares redeemed — — — — — —Advisory fees payable — — 20,586 113,628 — —Management Services fees payable — — 2,800 14,134 670 —Custodian fees payable 90 26 496 1,730 100 51Administration fees payable 5,940 5,091 5,108 16,488 5,092 5,091Trustee fees payable 57 20 290 1,455 81 36Compliance services fees payable 50 17 256 1,272 71 31Listing, Data and related fees payable 1,128 689 2,966 14,640 1,536 346Professional fees payable 9,047 10,649 9,966 12,407 9,878 9,030Payable for variation margin on
futures contracts — — — — — —Unrealized depreciation on non-exchange
traded swap agreements 990,232 1,339,551 17,539,546 14,701,278 579,991 1,206,960Other liabilities 1,088 581 6,441 11,645 1,600 1,015
Total Liabilities 1,007,632 1,356,626 17,588,491 14,888,805 599,028 1,222,564
NET ASSETS $ 7,094,058 $ 2,210,299 $ 32,654,516 $ 159,020,338 $ 9,227,982 $ 3,753,935
NET ASSETS CONSIST OF:Paid in Capital $ 6,930,292 $ 8,948,430 $ 197,601,363 $ 451,592,408 $ 20,793,798 $ 101,052,551Accumulated undistributed net
investment income (loss) (31,352) (22,936) (654,100) (2,231,681) (103,880) (61,340)Accumulated net realized gains
(losses) on investments (393,706) (5,608,653) (146,753,201) (278,737,825) (10,890,759) (96,030,316)Net unrealized appreciation
(depreciation) on:Investments — — — (783) — —Futures contracts — — — — — —Non-exchange traded swap agreements 588,824 (1,106,542) (17,539,546) (11,601,781) (571,177) (1,206,960)
NET ASSETS $ 7,094,058 $ 2,210,299 $ 32,654,516 $ 159,020,338 $ 9,227,982 $ 3,753,935
Shares (unlimited number of sharesauthorized, no par value) 400,001 143,723 1,175,000 7,550,000 400,000 137,428
Net Asset Value $ 17.74 $ 15.38 $ 27.79 $ 21.06 $ 23.07 $ 27.32
See accompanying notes to the financial statements.
Merrill Corp - Proshares Trust Geared Book [96 Funds] Annual Report [Funds] 333-089822 05-31-2017 ED [AUX] | eperez | 28-Jul-17 17:40 | 17-15159-3.ga | Sequence: 8CHKSUM Content: 19404 Layout: 11069 Graphics: No Graphics CLEAN
JOB: 17-15159-3 CYCLE#;BL#: 5; 0 TRIM: 8.25" x 10.75" COMPOSITECOLORS: Black, ~note-color 2, ~note-color 3 GRAPHICS: none V1.5
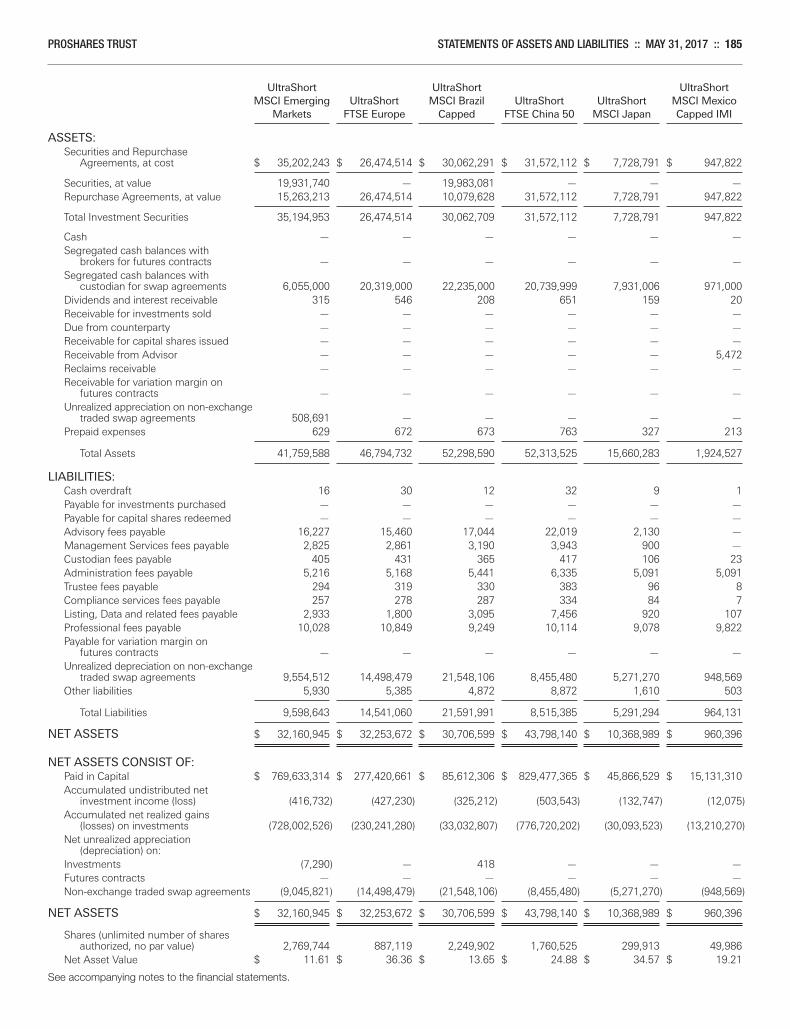
PROSHARES TRUST STATEMENTS OF ASSETS AND LIABILITIES :: MAY 31, 2017 :: 185
UltraShort UltraShort UltraShort MSCI Emerging UltraShort MSCI Brazil UltraShort UltraShort MSCI Mexico Markets FTSE Europe Capped FTSE China 50 MSCI Japan Capped IMI
ASSETS:Securities and Repurchase
Agreements, at cost $ 35,202,243 $ 26,474,514 $ 30,062,291 $ 31,572,112 $ 7,728,791 $ 947,822
Securities, at value 19,931,740 — 19,983,081 — — —Repurchase Agreements, at value 15,263,213 26,474,514 10,079,628 31,572,112 7,728,791 947,822
Total Investment Securities 35,194,953 26,474,514 30,062,709 31,572,112 7,728,791 947,822
Cash — — — — — —Segregated cash balances with
brokers for futures contracts — — — — — —Segregated cash balances with
custodian for swap agreements 6,055,000 20,319,000 22,235,000 20,739,999 7,931,006 971,000Dividends and interest receivable 315 546 208 651 159 20Receivable for investments sold — — — — — —Due from counterparty — — — — — —Receivable for capital shares issued — — — — — —Receivable from Advisor — — — — — 5,472Reclaims receivable — — — — — —Receivable for variation margin on
futures contracts — — — — — —Unrealized appreciation on non-exchange
traded swap agreements 508,691 — — — — —Prepaid expenses 629 672 673 763 327 213
Total Assets 41,759,588 46,794,732 52,298,590 52,313,525 15,660,283 1,924,527
LIABILITIES:Cash overdraft 16 30 12 32 9 1Payable for investments purchased — — — — — —Payable for capital shares redeemed — — — — — —Advisory fees payable 16,227 15,460 17,044 22,019 2,130 —Management Services fees payable 2,825 2,861 3,190 3,943 900 —Custodian fees payable 405 431 365 417 106 23Administration fees payable 5,216 5,168 5,441 6,335 5,091 5,091Trustee fees payable 294 319 330 383 96 8Compliance services fees payable 257 278 287 334 84 7Listing, Data and related fees payable 2,933 1,800 3,095 7,456 920 107Professional fees payable 10,028 10,849 9,249 10,114 9,078 9,822Payable for variation margin on
futures contracts — — — — — —Unrealized depreciation on non-exchange
traded swap agreements 9,554,512 14,498,479 21,548,106 8,455,480 5,271,270 948,569Other liabilities 5,930 5,385 4,872 8,872 1,610 503
Total Liabilities 9,598,643 14,541,060 21,591,991 8,515,385 5,291,294 964,131
NET ASSETS $ 32,160,945 $ 32,253,672 $ 30,706,599 $ 43,798,140 $ 10,368,989 $ 960,396
NET ASSETS CONSIST OF:Paid in Capital $ 769,633,314 $ 277,420,661 $ 85,612,306 $ 829,477,365 $ 45,866,529 $ 15,131,310Accumulated undistributed net
investment income (loss) (416,732) (427,230) (325,212) (503,543) (132,747) (12,075)Accumulated net realized gains
(losses) on investments (728,002,526) (230,241,280) (33,032,807) (776,720,202) (30,093,523) (13,210,270)Net unrealized appreciation
(depreciation) on:Investments (7,290) — 418 — — —Futures contracts — — — — — —Non-exchange traded swap agreements (9,045,821) (14,498,479) (21,548,106) (8,455,480) (5,271,270) (948,569)
NET ASSETS $ 32,160,945 $ 32,253,672 $ 30,706,599 $ 43,798,140 $ 10,368,989 $ 960,396
Shares (unlimited number of sharesauthorized, no par value) 2,769,744 887,119 2,249,902 1,760,525 299,913 49,986
Net Asset Value $ 11.61 $ 36.36 $ 13.65 $ 24.88 $ 34.57 $ 19.21
See accompanying notes to the financial statements.
Merrill Corp - Proshares Trust Geared Book [96 Funds] Annual Report [Funds] 333-089822 05-31-2017 ED [AUX] | eperez | 28-Jul-17 17:40 | 17-15159-3.ga | Sequence: 9CHKSUM Content: 48785 Layout: 14085 Graphics: No Graphics CLEAN
JOB: 17-15159-3 CYCLE#;BL#: 5; 0 TRIM: 8.25" x 10.75" COMPOSITECOLORS: Black, ~note-color 2, ~note-color 3 GRAPHICS: none V1.5
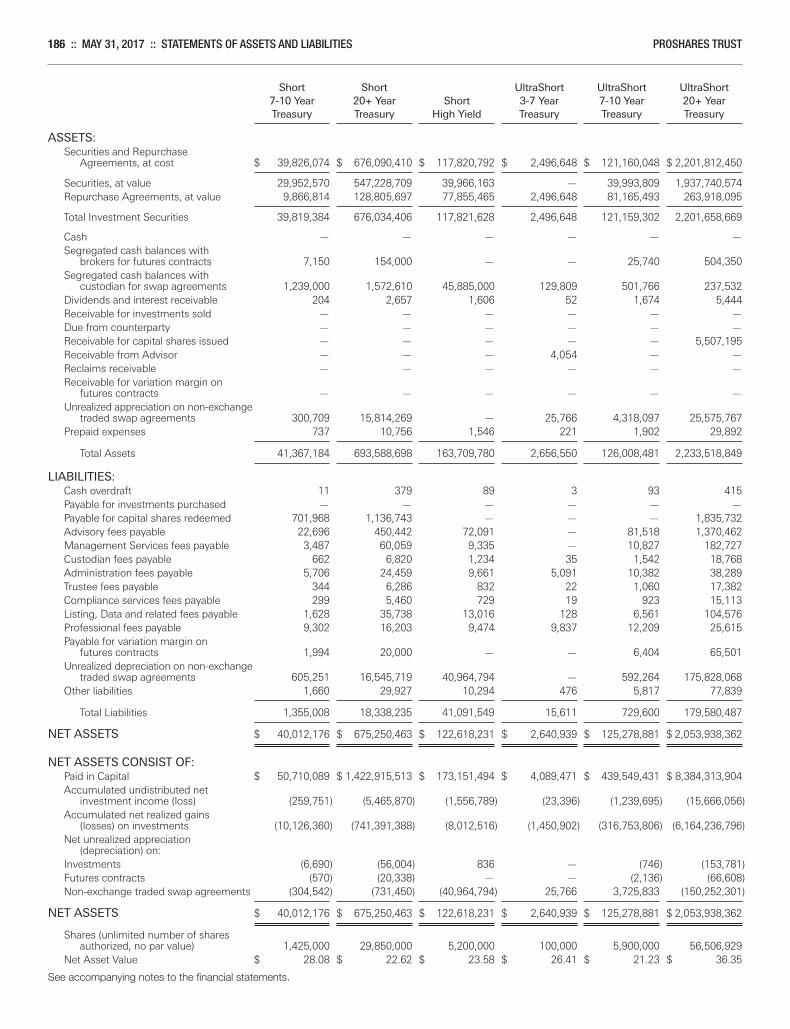
186 :: MAY 31, 2017 :: STATEMENTS OF ASSETS AND LIABILITIES PROSHARES TRUST
Short Short UltraShort UltraShort UltraShort 7-10 Year 20+ Year Short 3-7 Year 7-10 Year 20+ Year Treasury Treasury High Yield Treasury Treasury Treasury
ASSETS:Securities and Repurchase
Agreements, at cost $ 39,826,074 $ 676,090,410 $ 117,820,792 $ 2,496,648 $ 121,160,048 $ 2,201,812,450
Securities, at value 29,952,570 547,228,709 39,966,163 — 39,993,809 1,937,740,574Repurchase Agreements, at value 9,866,814 128,805,697 77,855,465 2,496,648 81,165,493 263,918,095
Total Investment Securities 39,819,384 676,034,406 117,821,628 2,496,648 121,159,302 2,201,658,669
Cash — — — — — —Segregated cash balances with
brokers for futures contracts 7,150 154,000 — — 25,740 504,350Segregated cash balances with
custodian for swap agreements 1,239,000 1,572,610 45,885,000 129,809 501,766 237,532Dividends and interest receivable 204 2,657 1,606 52 1,674 5,444Receivable for investments sold — — — — — —Due from counterparty — — — — — —Receivable for capital shares issued — — — — — 5,507,195Receivable from Advisor — — — 4,054 — —Reclaims receivable — — — — — —Receivable for variation margin on
futures contracts — — — — — —Unrealized appreciation on non-exchange
traded swap agreements 300,709 15,814,269 — 25,766 4,318,097 25,575,767Prepaid expenses 737 10,756 1,546 221 1,902 29,892
Total Assets 41,367,184 693,588,698 163,709,780 2,656,550 126,008,481 2,233,518,849
LIABILITIES:Cash overdraft 11 379 89 3 93 415Payable for investments purchased — — — — — —Payable for capital shares redeemed 701,968 1,136,743 — — — 1,835,732Advisory fees payable 22,696 450,442 72,091 — 81,518 1,370,462Management Services fees payable 3,487 60,059 9,335 — 10,827 182,727Custodian fees payable 662 6,820 1,234 35 1,542 18,768Administration fees payable 5,706 24,459 9,661 5,091 10,382 38,289Trustee fees payable 344 6,286 832 22 1,060 17,382Compliance services fees payable 299 5,460 729 19 923 15,113Listing, Data and related fees payable 1,628 35,738 13,016 128 6,561 104,576Professional fees payable 9,302 16,203 9,474 9,837 12,209 25,615Payable for variation margin on
futures contracts 1,994 20,000 — — 6,404 65,501Unrealized depreciation on non-exchange
traded swap agreements 605,251 16,545,719 40,964,794 — 592,264 175,828,068Other liabilities 1,660 29,927 10,294 476 5,817 77,839
Total Liabilities 1,355,008 18,338,235 41,091,549 15,611 729,600 179,580,487
NET ASSETS $ 40,012,176 $ 675,250,463 $ 122,618,231 $ 2,640,939 $ 125,278,881 $ 2,053,938,362
NET ASSETS CONSIST OF:Paid in Capital $ 50,710,089 $ 1,422,915,513 $ 173,151,494 $ 4,089,471 $ 439,549,431 $ 8,384,313,904Accumulated undistributed net
investment income (loss) (259,751) (5,465,870) (1,556,789) (23,396) (1,239,695) (15,666,056)Accumulated net realized gains
(losses) on investments (10,126,360) (741,391,388) (8,012,516) (1,450,902) (316,753,806) (6,164,236,796)Net unrealized appreciation
(depreciation) on:Investments (6,690) (56,004) 836 — (746) (153,781)Futures contracts (570) (20,338) — — (2,136) (66,608)Non-exchange traded swap agreements (304,542) (731,450) (40,964,794) 25,766 3,725,833 (150,252,301)
NET ASSETS $ 40,012,176 $ 675,250,463 $ 122,618,231 $ 2,640,939 $ 125,278,881 $ 2,053,938,362
Shares (unlimited number of sharesauthorized, no par value) 1,425,000 29,850,000 5,200,000 100,000 5,900,000 56,506,929
Net Asset Value $ 28.08 $ 22.62 $ 23.58 $ 26.41 $ 21.23 $ 36.35
See accompanying notes to the financial statements.
Merrill Corp - Proshares Trust Geared Book [96 Funds] Annual Report [Funds] 333-089822 05-31-2017 ED [AUX] | eperez | 28-Jul-17 17:40 | 17-15159-3.ga | Sequence: 10CHKSUM Content: 226 Layout: 15743 Graphics: No Graphics CLEAN
JOB: 17-15159-3 CYCLE#;BL#: 5; 0 TRIM: 8.25" x 10.75" COMPOSITECOLORS: Black, ~note-color 2, ~note-color 3 GRAPHICS: none V1.5
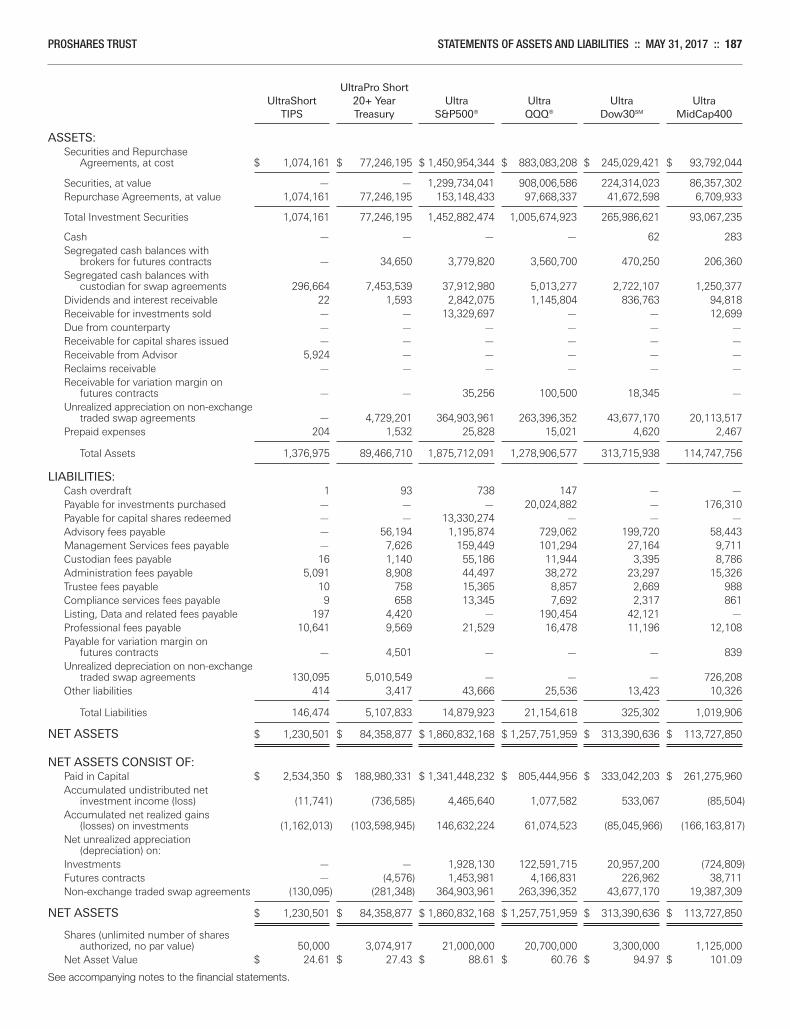
PROSHARES TRUST STATEMENTS OF ASSETS AND LIABILITIES :: MAY 31, 2017 :: 187
UltraPro Short UltraShort 20+ Year Ultra Ultra Ultra Ultra TIPS Treasury S&P500® QQQ® Dow30SM MidCap400
ASSETS:Securities and Repurchase
Agreements, at cost $ 1,074,161 $ 77,246,195 $ 1,450,954,344 $ 883,083,208 $ 245,029,421 $ 93,792,044
Securities, at value — — 1,299,734,041 908,006,586 224,314,023 86,357,302Repurchase Agreements, at value 1,074,161 77,246,195 153,148,433 97,668,337 41,672,598 6,709,933
Total Investment Securities 1,074,161 77,246,195 1,452,882,474 1,005,674,923 265,986,621 93,067,235
Cash — — — — 62 283Segregated cash balances with
brokers for futures contracts — 34,650 3,779,820 3,560,700 470,250 206,360Segregated cash balances with
custodian for swap agreements 296,664 7,453,539 37,912,980 5,013,277 2,722,107 1,250,377Dividends and interest receivable 22 1,593 2,842,075 1,145,804 836,763 94,818Receivable for investments sold — — 13,329,697 — — 12,699Due from counterparty — — — — — —Receivable for capital shares issued — — — — — —Receivable from Advisor 5,924 — — — — —Reclaims receivable — — — — — —Receivable for variation margin on
futures contracts — — 35,256 100,500 18,345 —Unrealized appreciation on non-exchange
traded swap agreements — 4,729,201 364,903,961 263,396,352 43,677,170 20,113,517Prepaid expenses 204 1,532 25,828 15,021 4,620 2,467
Total Assets 1,376,975 89,466,710 1,875,712,091 1,278,906,577 313,715,938 114,747,756
LIABILITIES:Cash overdraft 1 93 738 147 — —Payable for investments purchased — — — 20,024,882 — 176,310Payable for capital shares redeemed — — 13,330,274 — — —Advisory fees payable — 56,194 1,195,874 729,062 199,720 58,443Management Services fees payable — 7,626 159,449 101,294 27,164 9,711Custodian fees payable 16 1,140 55,186 11,944 3,395 8,786Administration fees payable 5,091 8,908 44,497 38,272 23,297 15,326Trustee fees payable 10 758 15,365 8,857 2,669 988Compliance services fees payable 9 658 13,345 7,692 2,317 861Listing, Data and related fees payable 197 4,420 — 190,454 42,121 —Professional fees payable 10,641 9,569 21,529 16,478 11,196 12,108Payable for variation margin on
futures contracts — 4,501 — — — 839Unrealized depreciation on non-exchange
traded swap agreements 130,095 5,010,549 — — — 726,208Other liabilities 414 3,417 43,666 25,536 13,423 10,326
Total Liabilities 146,474 5,107,833 14,879,923 21,154,618 325,302 1,019,906
NET ASSETS $ 1,230,501 $ 84,358,877 $ 1,860,832,168 $ 1,257,751,959 $ 313,390,636 $ 113,727,850
NET ASSETS CONSIST OF:Paid in Capital $ 2,534,350 $ 188,980,331 $ 1,341,448,232 $ 805,444,956 $ 333,042,203 $ 261,275,960Accumulated undistributed net
investment income (loss) (11,741) (736,585) 4,465,640 1,077,582 533,067 (85,504)Accumulated net realized gains
(losses) on investments (1,162,013) (103,598,945) 146,632,224 61,074,523 (85,045,966) (166,163,817)Net unrealized appreciation
(depreciation) on:Investments — — 1,928,130 122,591,715 20,957,200 (724,809)Futures contracts — (4,576) 1,453,981 4,166,831 226,962 38,711Non-exchange traded swap agreements (130,095) (281,348) 364,903,961 263,396,352 43,677,170 19,387,309
NET ASSETS $ 1,230,501 $ 84,358,877 $ 1,860,832,168 $ 1,257,751,959 $ 313,390,636 $ 113,727,850
Shares (unlimited number of sharesauthorized, no par value) 50,000 3,074,917 21,000,000 20,700,000 3,300,000 1,125,000
Net Asset Value $ 24.61 $ 27.43 $ 88.61 $ 60.76 $ 94.97 $ 101.09
See accompanying notes to the financial statements.
Merrill Corp - Proshares Trust Geared Book [96 Funds] Annual Report [Funds] 333-089822 05-31-2017 ED [AUX] | eperez | 28-Jul-17 17:40 | 17-15159-3.ga | Sequence: 11CHKSUM Content: 45839 Layout: 31184 Graphics: No Graphics CLEAN
JOB: 17-15159-3 CYCLE#;BL#: 5; 0 TRIM: 8.25" x 10.75" COMPOSITECOLORS: Black, ~note-color 2, ~note-color 3 GRAPHICS: none V1.5
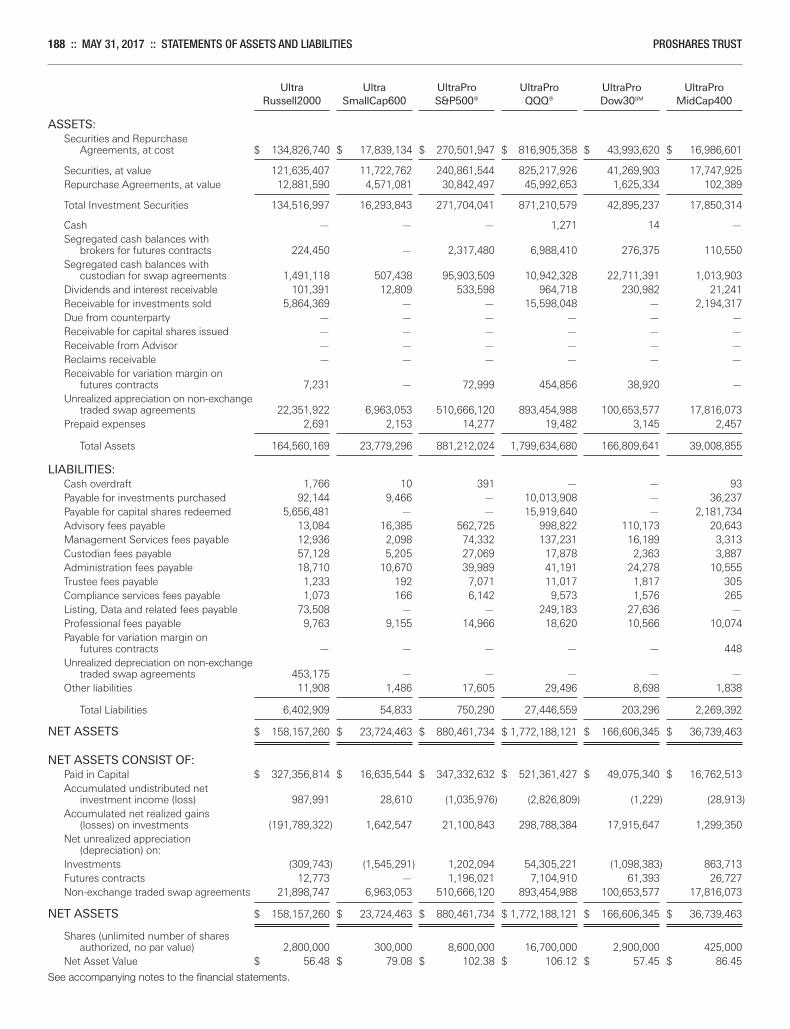
188 :: MAY 31, 2017 :: STATEMENTS OF ASSETS AND LIABILITIES PROSHARES TRUST
Ultra Ultra UltraPro UltraPro UltraPro UltraPro Russell2000 SmallCap600 S&P500® QQQ® Dow30SM MidCap400
ASSETS:Securities and Repurchase
Agreements, at cost $ 134,826,740 $ 17,839,134 $ 270,501,947 $ 816,905,358 $ 43,993,620 $ 16,986,601
Securities, at value 121,635,407 11,722,762 240,861,544 825,217,926 41,269,903 17,747,925Repurchase Agreements, at value 12,881,590 4,571,081 30,842,497 45,992,653 1,625,334 102,389
Total Investment Securities 134,516,997 16,293,843 271,704,041 871,210,579 42,895,237 17,850,314
Cash — — — 1,271 14 —Segregated cash balances with
brokers for futures contracts 224,450 — 2,317,480 6,988,410 276,375 110,550Segregated cash balances with
custodian for swap agreements 1,491,118 507,438 95,903,509 10,942,328 22,711,391 1,013,903Dividends and interest receivable 101,391 12,809 533,598 964,718 230,982 21,241Receivable for investments sold 5,864,369 — — 15,598,048 — 2,194,317Due from counterparty — — — — — —Receivable for capital shares issued — — — — — —Receivable from Advisor — — — — — —Reclaims receivable — — — — — —Receivable for variation margin on
futures contracts 7,231 — 72,999 454,856 38,920 —Unrealized appreciation on non-exchange
traded swap agreements 22,351,922 6,963,053 510,666,120 893,454,988 100,653,577 17,816,073Prepaid expenses 2,691 2,153 14,277 19,482 3,145 2,457
Total Assets 164,560,169 23,779,296 881,212,024 1,799,634,680 166,809,641 39,008,855
LIABILITIES:Cash overdraft 1,766 10 391 — — 93Payable for investments purchased 92,144 9,466 — 10,013,908 — 36,237Payable for capital shares redeemed 5,656,481 — — 15,919,640 — 2,181,734Advisory fees payable 13,084 16,385 562,725 998,822 110,173 20,643Management Services fees payable 12,936 2,098 74,332 137,231 16,189 3,313Custodian fees payable 57,128 5,205 27,069 17,878 2,363 3,887Administration fees payable 18,710 10,670 39,989 41,191 24,278 10,555Trustee fees payable 1,233 192 7,071 11,017 1,817 305Compliance services fees payable 1,073 166 6,142 9,573 1,576 265Listing, Data and related fees payable 73,508 — — 249,183 27,636 —Professional fees payable 9,763 9,155 14,966 18,620 10,566 10,074Payable for variation margin on
futures contracts — — — — — 448Unrealized depreciation on non-exchange
traded swap agreements 453,175 — — — — —Other liabilities 11,908 1,486 17,605 29,496 8,698 1,838
Total Liabilities 6,402,909 54,833 750,290 27,446,559 203,296 2,269,392
NET ASSETS $ 158,157,260 $ 23,724,463 $ 880,461,734 $ 1,772,188,121 $ 166,606,345 $ 36,739,463
NET ASSETS CONSIST OF:Paid in Capital $ 327,356,814 $ 16,635,544 $ 347,332,632 $ 521,361,427 $ 49,075,340 $ 16,762,513Accumulated undistributed net
investment income (loss) 987,991 28,610 (1,035,976) (2,826,809) (1,229) (28,913)Accumulated net realized gains
(losses) on investments (191,789,322) 1,642,547 21,100,843 298,788,384 17,915,647 1,299,350Net unrealized appreciation
(depreciation) on:Investments (309,743) (1,545,291) 1,202,094 54,305,221 (1,098,383) 863,713Futures contracts 12,773 — 1,196,021 7,104,910 61,393 26,727Non-exchange traded swap agreements 21,898,747 6,963,053 510,666,120 893,454,988 100,653,577 17,816,073
NET ASSETS $ 158,157,260 $ 23,724,463 $ 880,461,734 $ 1,772,188,121 $ 166,606,345 $ 36,739,463
Shares (unlimited number of sharesauthorized, no par value) 2,800,000 300,000 8,600,000 16,700,000 2,900,000 425,000
Net Asset Value $ 56.48 $ 79.08 $ 102.38 $ 106.12 $ 57.45 $ 86.45
See accompanying notes to the financial statements.
Merrill Corp - Proshares Trust Geared Book [96 Funds] Annual Report [Funds] 333-089822 05-31-2017 ED [AUX] | eperez | 28-Jul-17 17:40 | 17-15159-3.ga | Sequence: 12CHKSUM Content: 42647 Layout: 18480 Graphics: No Graphics CLEAN
JOB: 17-15159-3 CYCLE#;BL#: 5; 0 TRIM: 8.25" x 10.75" COMPOSITECOLORS: Black, ~note-color 2, ~note-color 3 GRAPHICS: none V1.5
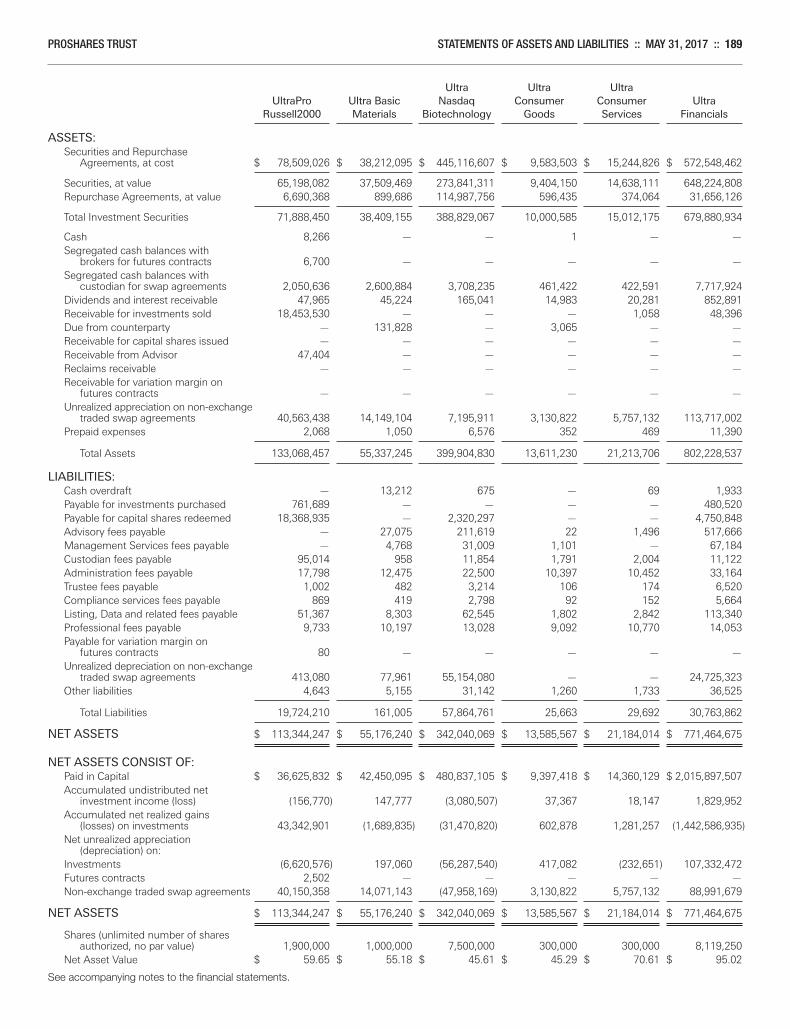
PROSHARES TRUST STATEMENTS OF ASSETS AND LIABILITIES :: MAY 31, 2017 :: 189
Ultra Ultra Ultra UltraPro Ultra Basic Nasdaq Consumer Consumer Ultra Russell2000 Materials Biotechnology Goods Services Financials
ASSETS:Securities and Repurchase
Agreements, at cost $ 78,509,026 $ 38,212,095 $ 445,116,607 $ 9,583,503 $ 15,244,826 $ 572,548,462
Securities, at value 65,198,082 37,509,469 273,841,311 9,404,150 14,638,111 648,224,808Repurchase Agreements, at value 6,690,368 899,686 114,987,756 596,435 374,064 31,656,126
Total Investment Securities 71,888,450 38,409,155 388,829,067 10,000,585 15,012,175 679,880,934
Cash 8,266 — — 1 — —Segregated cash balances with
brokers for futures contracts 6,700 — — — — —Segregated cash balances with
custodian for swap agreements 2,050,636 2,600,884 3,708,235 461,422 422,591 7,717,924Dividends and interest receivable 47,965 45,224 165,041 14,983 20,281 852,891Receivable for investments sold 18,453,530 — — — 1,058 48,396Due from counterparty — 131,828 — 3,065 — —Receivable for capital shares issued — — — — — —Receivable from Advisor 47,404 — — — — —Reclaims receivable — — — — — —Receivable for variation margin on
futures contracts — — — — — —Unrealized appreciation on non-exchange
traded swap agreements 40,563,438 14,149,104 7,195,911 3,130,822 5,757,132 113,717,002Prepaid expenses 2,068 1,050 6,576 352 469 11,390
Total Assets 133,068,457 55,337,245 399,904,830 13,611,230 21,213,706 802,228,537
LIABILITIES:Cash overdraft — 13,212 675 — 69 1,933Payable for investments purchased 761,689 — — — — 480,520Payable for capital shares redeemed 18,368,935 — 2,320,297 — — 4,750,848Advisory fees payable — 27,075 211,619 22 1,496 517,666Management Services fees payable — 4,768 31,009 1,101 — 67,184Custodian fees payable 95,014 958 11,854 1,791 2,004 11,122Administration fees payable 17,798 12,475 22,500 10,397 10,452 33,164Trustee fees payable 1,002 482 3,214 106 174 6,520Compliance services fees payable 869 419 2,798 92 152 5,664Listing, Data and related fees payable 51,367 8,303 62,545 1,802 2,842 113,340Professional fees payable 9,733 10,197 13,028 9,092 10,770 14,053Payable for variation margin on
futures contracts 80 — — — — —Unrealized depreciation on non-exchange
traded swap agreements 413,080 77,961 55,154,080 — — 24,725,323Other liabilities 4,643 5,155 31,142 1,260 1,733 36,525
Total Liabilities 19,724,210 161,005 57,864,761 25,663 29,692 30,763,862
NET ASSETS $ 113,344,247 $ 55,176,240 $ 342,040,069 $ 13,585,567 $ 21,184,014 $ 771,464,675
NET ASSETS CONSIST OF:Paid in Capital $ 36,625,832 $ 42,450,095 $ 480,837,105 $ 9,397,418 $ 14,360,129 $ 2,015,897,507Accumulated undistributed net
investment income (loss) (156,770) 147,777 (3,080,507) 37,367 18,147 1,829,952Accumulated net realized gains
(losses) on investments 43,342,901 (1,689,835) (31,470,820) 602,878 1,281,257 (1,442,586,935)Net unrealized appreciation
(depreciation) on:Investments (6,620,576) 197,060 (56,287,540) 417,082 (232,651) 107,332,472Futures contracts 2,502 — — — — —Non-exchange traded swap agreements 40,150,358 14,071,143 (47,958,169) 3,130,822 5,757,132 88,991,679
NET ASSETS $ 113,344,247 $ 55,176,240 $ 342,040,069 $ 13,585,567 $ 21,184,014 $ 771,464,675
Shares (unlimited number of sharesauthorized, no par value) 1,900,000 1,000,000 7,500,000 300,000 300,000 8,119,250
Net Asset Value $ 59.65 $ 55.18 $ 45.61 $ 45.29 $ 70.61 $ 95.02
See accompanying notes to the financial statements.
Merrill Corp - Proshares Trust Geared Book [96 Funds] Annual Report [Funds] 333-089822 05-31-2017 ED [AUX] | eperez | 28-Jul-17 17:40 | 17-15159-3.ga | Sequence: 13CHKSUM Content: 15351 Layout: 54737 Graphics: No Graphics CLEAN
JOB: 17-15159-3 CYCLE#;BL#: 5; 0 TRIM: 8.25" x 10.75" COMPOSITECOLORS: Black, ~note-color 2, ~note-color 3 GRAPHICS: none V1.5
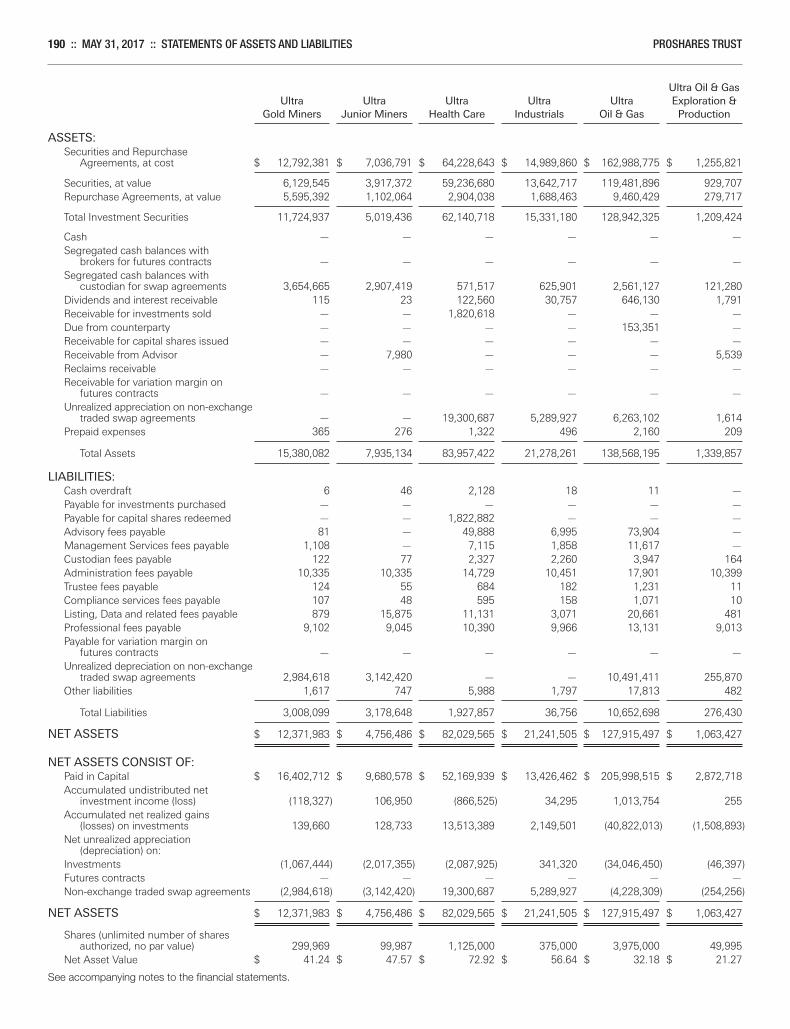
190 :: MAY 31, 2017 :: STATEMENTS OF ASSETS AND LIABILITIES PROSHARES TRUST
Ultra Oil & Gas Ultra Ultra Ultra Ultra Ultra Exploration & Gold Miners Junior Miners Health Care Industrials Oil & Gas Production
ASSETS:Securities and Repurchase
Agreements, at cost $ 12,792,381 $ 7,036,791 $ 64,228,643 $ 14,989,860 $ 162,988,775 $ 1,255,821
Securities, at value 6,129,545 3,917,372 59,236,680 13,642,717 119,481,896 929,707Repurchase Agreements, at value 5,595,392 1,102,064 2,904,038 1,688,463 9,460,429 279,717
Total Investment Securities 11,724,937 5,019,436 62,140,718 15,331,180 128,942,325 1,209,424
Cash — — — — — —Segregated cash balances with
brokers for futures contracts — — — — — —Segregated cash balances with
custodian for swap agreements 3,654,665 2,907,419 571,517 625,901 2,561,127 121,280Dividends and interest receivable 115 23 122,560 30,757 646,130 1,791Receivable for investments sold — — 1,820,618 — — —Due from counterparty — — — — 153,351 —Receivable for capital shares issued — — — — — —Receivable from Advisor — 7,980 — — — 5,539Reclaims receivable — — — — — —Receivable for variation margin on
futures contracts — — — — — —Unrealized appreciation on non-exchange
traded swap agreements — — 19,300,687 5,289,927 6,263,102 1,614Prepaid expenses 365 276 1,322 496 2,160 209
Total Assets 15,380,082 7,935,134 83,957,422 21,278,261 138,568,195 1,339,857
LIABILITIES:Cash overdraft 6 46 2,128 18 11 —Payable for investments purchased — — — — — —Payable for capital shares redeemed — — 1,822,882 — — —Advisory fees payable 81 — 49,888 6,995 73,904 —Management Services fees payable 1,108 — 7,115 1,858 11,617 —Custodian fees payable 122 77 2,327 2,260 3,947 164Administration fees payable 10,335 10,335 14,729 10,451 17,901 10,399Trustee fees payable 124 55 684 182 1,231 11Compliance services fees payable 107 48 595 158 1,071 10Listing, Data and related fees payable 879 15,875 11,131 3,071 20,661 481Professional fees payable 9,102 9,045 10,390 9,966 13,131 9,013Payable for variation margin on
futures contracts — — — — — —Unrealized depreciation on non-exchange
traded swap agreements 2,984,618 3,142,420 — — 10,491,411 255,870Other liabilities 1,617 747 5,988 1,797 17,813 482
Total Liabilities 3,008,099 3,178,648 1,927,857 36,756 10,652,698 276,430
NET ASSETS $ 12,371,983 $ 4,756,486 $ 82,029,565 $ 21,241,505 $ 127,915,497 $ 1,063,427
NET ASSETS CONSIST OF:Paid in Capital $ 16,402,712 $ 9,680,578 $ 52,169,939 $ 13,426,462 $ 205,998,515 $ 2,872,718Accumulated undistributed net
investment income (loss) (118,327) 106,950 (866,525) 34,295 1,013,754 255Accumulated net realized gains
(losses) on investments 139,660 128,733 13,513,389 2,149,501 (40,822,013) (1,508,893)Net unrealized appreciation
(depreciation) on:Investments (1,067,444) (2,017,355) (2,087,925) 341,320 (34,046,450) (46,397)Futures contracts — — — — — —Non-exchange traded swap agreements (2,984,618) (3,142,420) 19,300,687 5,289,927 (4,228,309) (254,256)
NET ASSETS $ 12,371,983 $ 4,756,486 $ 82,029,565 $ 21,241,505 $ 127,915,497 $ 1,063,427
Shares (unlimited number of sharesauthorized, no par value) 299,969 99,987 1,125,000 375,000 3,975,000 49,995
Net Asset Value $ 41.24 $ 47.57 $ 72.92 $ 56.64 $ 32.18 $ 21.27
See accompanying notes to the financial statements.
Merrill Corp - Proshares Trust Geared Book [96 Funds] Annual Report [Funds] 333-089822 05-31-2017 ED [AUX] | eperez | 28-Jul-17 17:40 | 17-15159-3.ga | Sequence: 14CHKSUM Content: 18568 Layout: 38286 Graphics: No Graphics CLEAN
JOB: 17-15159-3 CYCLE#;BL#: 5; 0 TRIM: 8.25" x 10.75" COMPOSITECOLORS: Black, ~note-color 2, ~note-color 3 GRAPHICS: none V1.5
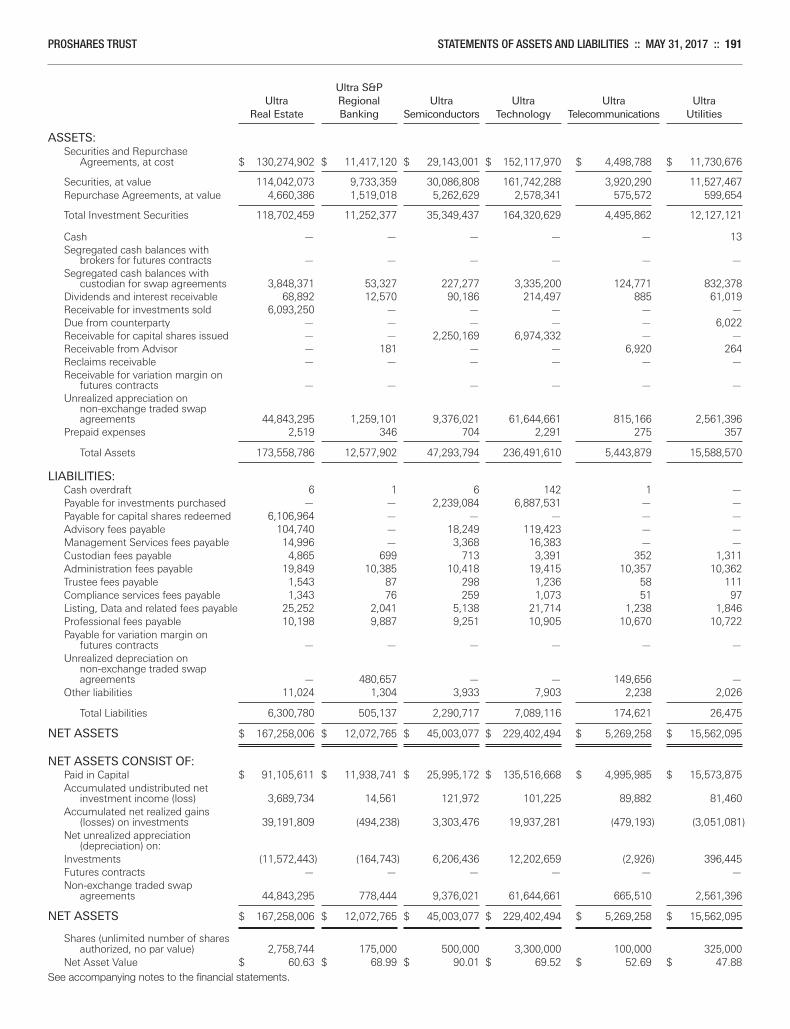
PROSHARES TRUST STATEMENTS OF ASSETS AND LIABILITIES :: MAY 31, 2017 :: 191
Ultra S&P Ultra Regional Ultra Ultra Ultra Ultra Real Estate Banking Semiconductors Technology Telecommunications Utilities
ASSETS:Securities and Repurchase
Agreements, at cost $ 130,274,902 $ 11,417,120 $ 29,143,001 $ 152,117,970 $ 4,498,788 $ 11,730,676
Securities, at value 114,042,073 9,733,359 30,086,808 161,742,288 3,920,290 11,527,467Repurchase Agreements, at value 4,660,386 1,519,018 5,262,629 2,578,341 575,572 599,654
Total Investment Securities 118,702,459 11,252,377 35,349,437 164,320,629 4,495,862 12,127,121
Cash — — — — — 13Segregated cash balances with
brokers for futures contracts — — — — — —Segregated cash balances with
custodian for swap agreements 3,848,371 53,327 227,277 3,335,200 124,771 832,378Dividends and interest receivable 68,892 12,570 90,186 214,497 885 61,019Receivable for investments sold 6,093,250 — — — — —Due from counterparty — — — — — 6,022Receivable for capital shares issued — — 2,250,169 6,974,332 — —Receivable from Advisor — 181 — — 6,920 264Reclaims receivable — — — — — —Receivable for variation margin on
futures contracts — — — — — —Unrealized appreciation on
non-exchange traded swap agreements 44,843,295 1,259,101 9,376,021 61,644,661 815,166 2,561,396
Prepaid expenses 2,519 346 704 2,291 275 357
Total Assets 173,558,786 12,577,902 47,293,794 236,491,610 5,443,879 15,588,570
LIABILITIES:Cash overdraft 6 1 6 142 1 —Payable for investments purchased — — 2,239,084 6,887,531 — —Payable for capital shares redeemed 6,106,964 — — — — —Advisory fees payable 104,740 — 18,249 119,423 — —Management Services fees payable 14,996 — 3,368 16,383 — —Custodian fees payable 4,865 699 713 3,391 352 1,311Administration fees payable 19,849 10,385 10,418 19,415 10,357 10,362Trustee fees payable 1,543 87 298 1,236 58 111Compliance services fees payable 1,343 76 259 1,073 51 97Listing, Data and related fees payable 25,252 2,041 5,138 21,714 1,238 1,846Professional fees payable 10,198 9,887 9,251 10,905 10,670 10,722Payable for variation margin on
futures contracts — — — — — —Unrealized depreciation on
non-exchange traded swap agreements — 480,657 — — 149,656 —
Other liabilities 11,024 1,304 3,933 7,903 2,238 2,026
Total Liabilities 6,300,780 505,137 2,290,717 7,089,116 174,621 26,475 NET ASSETS $ 167,258,006 $ 12,072,765 $ 45,003,077 $ 229,402,494 $ 5,269,258 $ 15,562,095
NET ASSETS CONSIST OF:Paid in Capital $ 91,105,611 $ 11,938,741 $ 25,995,172 $ 135,516,668 $ 4,995,985 $ 15,573,875Accumulated undistributed net
investment income (loss) 3,689,734 14,561 121,972 101,225 89,882 81,460Accumulated net realized gains
(losses) on investments 39,191,809 (494,238) 3,303,476 19,937,281 (479,193) (3,051,081)Net unrealized appreciation
(depreciation) on:Investments (11,572,443) (164,743) 6,206,436 12,202,659 (2,926) 396,445Futures contracts — — — — — —Non-exchange traded swap
agreements 44,843,295 778,444 9,376,021 61,644,661 665,510 2,561,396 NET ASSETS $ 167,258,006 $ 12,072,765 $ 45,003,077 $ 229,402,494 $ 5,269,258 $ 15,562,095
Shares (unlimited number of sharesauthorized, no par value) 2,758,744 175,000 500,000 3,300,000 100,000 325,000
Net Asset Value $ 60.63 $ 68.99 $ 90.01 $ 69.52 $ 52.69 $ 47.88See accompanying notes to the financial statements.
Merrill Corp - Proshares Trust Geared Book [96 Funds] Annual Report [Funds] 333-089822 05-31-2017 ED [AUX] | eperez | 28-Jul-17 17:40 | 17-15159-3.ga | Sequence: 15CHKSUM Content: 30537 Layout: 62520 Graphics: No Graphics CLEAN
JOB: 17-15159-3 CYCLE#;BL#: 5; 0 TRIM: 8.25" x 10.75" COMPOSITECOLORS: Black, ~note-color 2, ~note-color 3 GRAPHICS: none V1.5
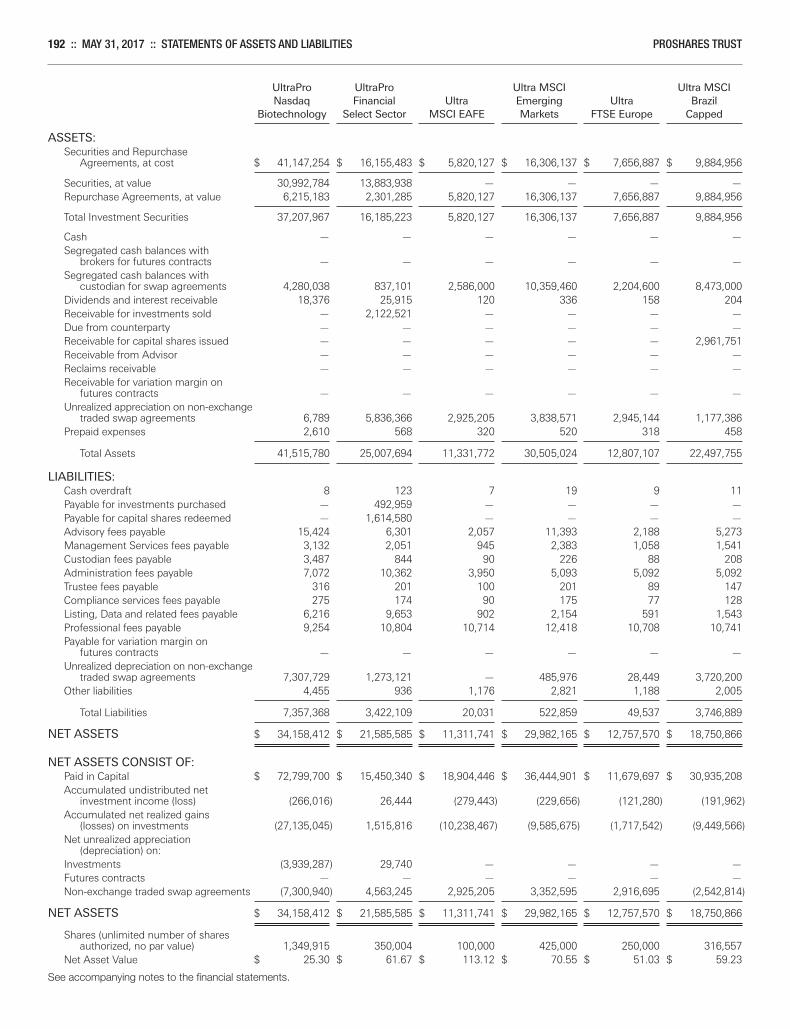
192 :: MAY 31, 2017 :: STATEMENTS OF ASSETS AND LIABILITIES PROSHARES TRUST
UltraPro UltraPro Ultra MSCI Ultra MSCI Nasdaq Financial Ultra Emerging Ultra Brazil Biotechnology Select Sector MSCI EAFE Markets FTSE Europe Capped
ASSETS:Securities and Repurchase
Agreements, at cost $ 41,147,254 $ 16,155,483 $ 5,820,127 $ 16,306,137 $ 7,656,887 $ 9,884,956
Securities, at value 30,992,784 13,883,938 — — — —Repurchase Agreements, at value 6,215,183 2,301,285 5,820,127 16,306,137 7,656,887 9,884,956
Total Investment Securities 37,207,967 16,185,223 5,820,127 16,306,137 7,656,887 9,884,956
Cash — — — — — —Segregated cash balances with
brokers for futures contracts — — — — — —Segregated cash balances with
custodian for swap agreements 4,280,038 837,101 2,586,000 10,359,460 2,204,600 8,473,000Dividends and interest receivable 18,376 25,915 120 336 158 204Receivable for investments sold — 2,122,521 — — — —Due from counterparty — — — — — —Receivable for capital shares issued — — — — — 2,961,751Receivable from Advisor — — — — — —Reclaims receivable — — — — — —Receivable for variation margin on
futures contracts — — — — — —Unrealized appreciation on non-exchange
traded swap agreements 6,789 5,836,366 2,925,205 3,838,571 2,945,144 1,177,386Prepaid expenses 2,610 568 320 520 318 458
Total Assets 41,515,780 25,007,694 11,331,772 30,505,024 12,807,107 22,497,755
LIABILITIES:Cash overdraft 8 123 7 19 9 11Payable for investments purchased — 492,959 — — — —Payable for capital shares redeemed — 1,614,580 — — — —Advisory fees payable 15,424 6,301 2,057 11,393 2,188 5,273Management Services fees payable 3,132 2,051 945 2,383 1,058 1,541Custodian fees payable 3,487 844 90 226 88 208Administration fees payable 7,072 10,362 3,950 5,093 5,092 5,092Trustee fees payable 316 201 100 201 89 147Compliance services fees payable 275 174 90 175 77 128Listing, Data and related fees payable 6,216 9,653 902 2,154 591 1,543Professional fees payable 9,254 10,804 10,714 12,418 10,708 10,741Payable for variation margin on
futures contracts — — — — — —Unrealized depreciation on non-exchange
traded swap agreements 7,307,729 1,273,121 — 485,976 28,449 3,720,200Other liabilities 4,455 936 1,176 2,821 1,188 2,005
Total Liabilities 7,357,368 3,422,109 20,031 522,859 49,537 3,746,889
NET ASSETS $ 34,158,412 $ 21,585,585 $ 11,311,741 $ 29,982,165 $ 12,757,570 $ 18,750,866
NET ASSETS CONSIST OF:Paid in Capital $ 72,799,700 $ 15,450,340 $ 18,904,446 $ 36,444,901 $ 11,679,697 $ 30,935,208Accumulated undistributed net
investment income (loss) (266,016) 26,444 (279,443) (229,656) (121,280) (191,962)Accumulated net realized gains
(losses) on investments (27,135,045) 1,515,816 (10,238,467) (9,585,675) (1,717,542) (9,449,566)Net unrealized appreciation
(depreciation) on:Investments (3,939,287) 29,740 — — — —Futures contracts — — — — — —Non-exchange traded swap agreements (7,300,940) 4,563,245 2,925,205 3,352,595 2,916,695 (2,542,814)
NET ASSETS $ 34,158,412 $ 21,585,585 $ 11,311,741 $ 29,982,165 $ 12,757,570 $ 18,750,866
Shares (unlimited number of sharesauthorized, no par value) 1,349,915 350,004 100,000 425,000 250,000 316,557
Net Asset Value $ 25.30 $ 61.67 $ 113.12 $ 70.55 $ 51.03 $ 59.23
See accompanying notes to the financial statements.
Merrill Corp - Proshares Trust Geared Book [96 Funds] Annual Report [Funds] 333-089822 05-31-2017 ED [AUX] | eperez | 28-Jul-17 17:40 | 17-15159-3.ga | Sequence: 16CHKSUM Content: 49498 Layout: 15413 Graphics: No Graphics CLEAN
JOB: 17-15159-3 CYCLE#;BL#: 5; 0 TRIM: 8.25" x 10.75" COMPOSITECOLORS: Black, ~note-color 2, ~note-color 3 GRAPHICS: none V1.5
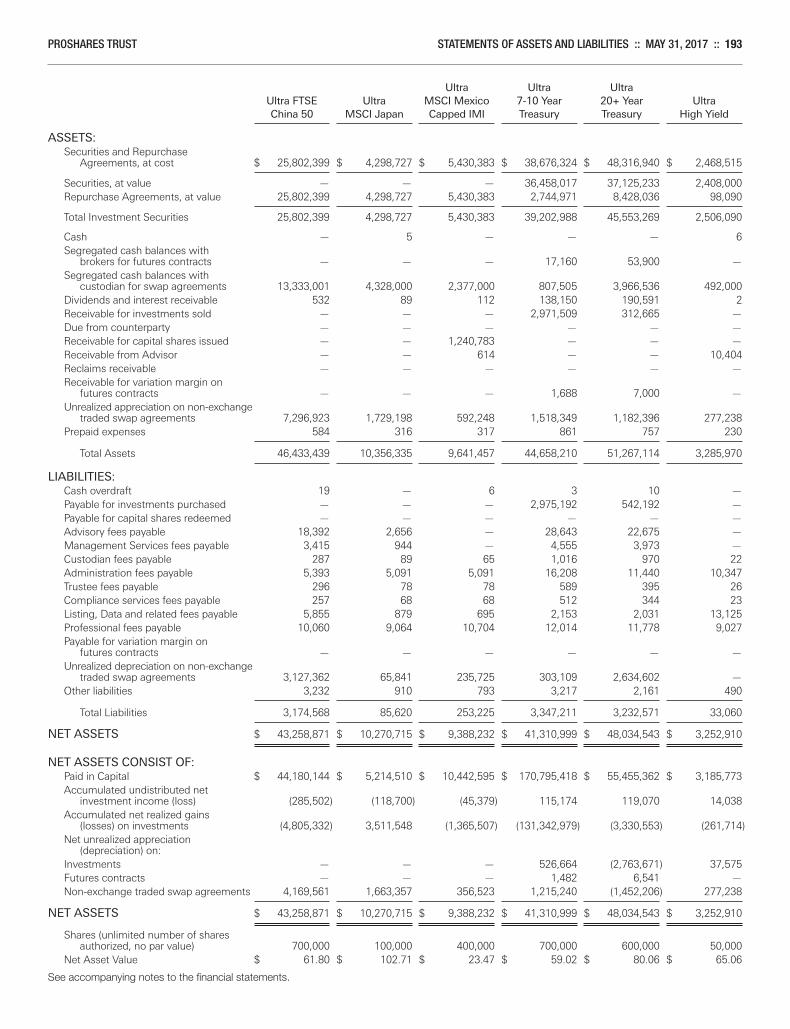
PROSHARES TRUST STATEMENTS OF ASSETS AND LIABILITIES :: MAY 31, 2017 :: 193
Ultra Ultra Ultra Ultra FTSE Ultra MSCI Mexico 7-10 Year 20+ Year Ultra China 50 MSCI Japan Capped IMI Treasury Treasury High Yield
ASSETS:Securities and Repurchase
Agreements, at cost $ 25,802,399 $ 4,298,727 $ 5,430,383 $ 38,676,324 $ 48,316,940 $ 2,468,515
Securities, at value — — — 36,458,017 37,125,233 2,408,000Repurchase Agreements, at value 25,802,399 4,298,727 5,430,383 2,744,971 8,428,036 98,090
Total Investment Securities 25,802,399 4,298,727 5,430,383 39,202,988 45,553,269 2,506,090
Cash — 5 — — — 6Segregated cash balances with
brokers for futures contracts — — — 17,160 53,900 —Segregated cash balances with
custodian for swap agreements 13,333,001 4,328,000 2,377,000 807,505 3,966,536 492,000Dividends and interest receivable 532 89 112 138,150 190,591 2Receivable for investments sold — — — 2,971,509 312,665 —Due from counterparty — — — — — —Receivable for capital shares issued — — 1,240,783 — — —Receivable from Advisor — — 614 — — 10,404Reclaims receivable — — — — — —Receivable for variation margin on
futures contracts — — — 1,688 7,000 —Unrealized appreciation on non-exchange
traded swap agreements 7,296,923 1,729,198 592,248 1,518,349 1,182,396 277,238Prepaid expenses 584 316 317 861 757 230
Total Assets 46,433,439 10,356,335 9,641,457 44,658,210 51,267,114 3,285,970
LIABILITIES:Cash overdraft 19 — 6 3 10 —Payable for investments purchased — — — 2,975,192 542,192 —Payable for capital shares redeemed — — — — — —Advisory fees payable 18,392 2,656 — 28,643 22,675 —Management Services fees payable 3,415 944 — 4,555 3,973 —Custodian fees payable 287 89 65 1,016 970 22Administration fees payable 5,393 5,091 5,091 16,208 11,440 10,347Trustee fees payable 296 78 78 589 395 26Compliance services fees payable 257 68 68 512 344 23Listing, Data and related fees payable 5,855 879 695 2,153 2,031 13,125Professional fees payable 10,060 9,064 10,704 12,014 11,778 9,027Payable for variation margin on
futures contracts — — — — — —Unrealized depreciation on non-exchange
traded swap agreements 3,127,362 65,841 235,725 303,109 2,634,602 —Other liabilities 3,232 910 793 3,217 2,161 490
Total Liabilities 3,174,568 85,620 253,225 3,347,211 3,232,571 33,060
NET ASSETS $ 43,258,871 $ 10,270,715 $ 9,388,232 $ 41,310,999 $ 48,034,543 $ 3,252,910
NET ASSETS CONSIST OF:Paid in Capital $ 44,180,144 $ 5,214,510 $ 10,442,595 $ 170,795,418 $ 55,455,362 $ 3,185,773Accumulated undistributed net
investment income (loss) (285,502) (118,700) (45,379) 115,174 119,070 14,038Accumulated net realized gains
(losses) on investments (4,805,332) 3,511,548 (1,365,507) (131,342,979) (3,330,553) (261,714)Net unrealized appreciation
(depreciation) on:Investments — — — 526,664 (2,763,671) 37,575Futures contracts — — — 1,482 6,541 —Non-exchange traded swap agreements 4,169,561 1,663,357 356,523 1,215,240 (1,452,206) 277,238
NET ASSETS $ 43,258,871 $ 10,270,715 $ 9,388,232 $ 41,310,999 $ 48,034,543 $ 3,252,910
Shares (unlimited number of sharesauthorized, no par value) 700,000 100,000 400,000 700,000 600,000 50,000
Net Asset Value $ 61.80 $ 102.71 $ 23.47 $ 59.02 $ 80.06 $ 65.06
See accompanying notes to the financial statements.
Merrill Corp - Proshares Trust Geared Book [96 Funds] Annual Report [Funds] 333-089822 05-31-2017 ED [AUX] | eperez | 28-Jul-17 17:40 | 17-15159-3.ga | Sequence: 17CHKSUM Content: 4408 Layout: 35034 Graphics: No Graphics CLEAN
JOB: 17-15159-3 CYCLE#;BL#: 5; 0 TRIM: 8.25" x 10.75" COMPOSITECOLORS: Black, ~note-color 2, ~note-color 3 GRAPHICS: none V1.5

194 :: FOR THE PERIODS ENDED MAY 31, 2017 :: STATEMENTS OF OPERATIONS PROSHARES TRUST
STATEMENTS OF OPERATIONS
Merrill Corp - Proshares Trust Geared Book [96 Funds] Annual Report [Funds] 333-089822 05-31-2017 ED [AUX] | eperez | 28-Jul-17 17:41 | 17-15159-3.gc | Sequence: 1CHKSUM Content: 26282 Layout: 27009 Graphics: No Graphics CLEAN
JOB: 17-15159-3 CYCLE#;BL#: 5; 0 TRIM: 8.25" x 10.75" COMPOSITECOLORS: Black, ~note-color 2, ~note-color 3 GRAPHICS: none V1.5

PROSHARES TRUST STATEMENTS OF OPERATIONS :: FOR THE PERIODS ENDED MAY 31, 2017 :: 195
Short Short Short Short Short Short S&P500® QQQ® Dow30SM MidCap400 Russell2000 SmallCap600 Year Ended Year Ended Year Ended Year Ended Year Ended Year Ended May 31, 2017 May 31, 2017 May 31, 2017 May 31, 2017 May 31, 2017 May 31, 2017
INVESTMENT INCOME:Dividends $ — $ — $ — $ — $ — $ —Interest 9,682,997 1,443,403 1,294,824 80,148 1,816,560 56,487Foreign withholding tax on income — — — — — —
Total Investment Income 9,682,997 1,443,403 1,294,824 80,148 1,816,560 56,487
EXPENSES:Advisory fees (Note 4) 17,040,372 2,521,271 2,254,572 162,368 2,967,754 103,977Management Services fees (Note 4) 2,272,022 336,165 300,606 21,649 395,696 13,863Professional fees 78,658 31,336 30,682 18,807 32,981 18,585Administration fees (Note 5) 236,609 111,014 104,697 39,120 120,569 39,114Custodian fees (Note 6) 163,993 24,240 21,465 3,569 27,859 811Printing and Shareholder reports 226,704 47,077 69,441 4,594 68,267 2,570Listing, Data and related fees (Note 7) 10,489 341,580 125,410 8,420 381,832 8,420Trustees fees (Note 8) 52,082 7,416 7,162 521 9,363 338Compliance services fees (Note 4) 12,667 1,698 1,853 109 2,390 131Recoupment of prior expenses
waived and/or reimbursed by Advisor (Note 4) — — — — — —
Other fees 193,392 34,842 25,121 5,882 34,549 4,889
Total Gross Expenses before fees waived and/or reimbursed 20,286,988 3,456,639 2,941,009 265,039 4,041,260 192,698
LESS:Expenses waived and/or reimbursed by Advisor (Note 4) — (259,476) (81,759) (59,090) (277,829) (60,876)
Total Net Expenses 20,286,988 3,197,163 2,859,250 205,949 3,763,431 131,822
Net Investment Income (Loss) (10,603,991) (1,753,760) (1,564,426) (125,801) (1,946,871) (75,335)
NET REALIZED GAIN (LOSS) ON:Investments 164 6,254 41 147 (69) —Futures contracts (23,064,113) (4,491,439) (3,321,330) (378,224) (5,605,526) —Non-exchange traded swap agreements (239,387,182) (57,160,053) (25,332,035) (1,308,811) (62,122,139) (195,746)In-kind redemptions of investments — — — — — —Foreign currency transactions — — — — — — Net realized gain (loss) (262,451,131) (61,645,238) (28,653,324) (1,686,888) (67,727,734) (195,746)
CHANGE IN NET UNREALIZED APPRECIATION/DEPRECIATION ON:Investments (65,190) 6,253 (21,953) — (14,118) —Futures contracts 1,328,881 (298,199) (127,996) 61,106 1,158,765 —Non-exchange traded swap agreements (80,155,710) (18,000,409) (27,426,354) (2,120,540) (24,065,799) (1,959,938) Change in net unrealized
appreciation/depreciation (78,892,019) (18,292,355) (27,576,303) (2,059,434) (22,921,152) (1,959,938) Net realized and unrealized gain (loss) (341,343,150) (79,937,593) (56,229,627) (3,746,322) (90,648,886) (2,155,684) Change in Net Assets Resulting
from Operations $ (351,947,141) $ (81,691,353) $ (57,794,053) $ (3,872,123) $ (92,595,757) $ (2,231,019)
See accompanying notes to the financial statements.
Merrill Corp - Proshares Trust Geared Book [96 Funds] Annual Report [Funds] 333-089822 05-31-2017 ED [AUX] | eperez | 28-Jul-17 17:41 | 17-15159-3.gc | Sequence: 2CHKSUM Content: 56743 Layout: 56853 Graphics: No Graphics CLEAN
JOB: 17-15159-3 CYCLE#;BL#: 5; 0 TRIM: 8.25" x 10.75" COMPOSITECOLORS: Black, ~note-color 2, ~note-color 3 GRAPHICS: none V1.5
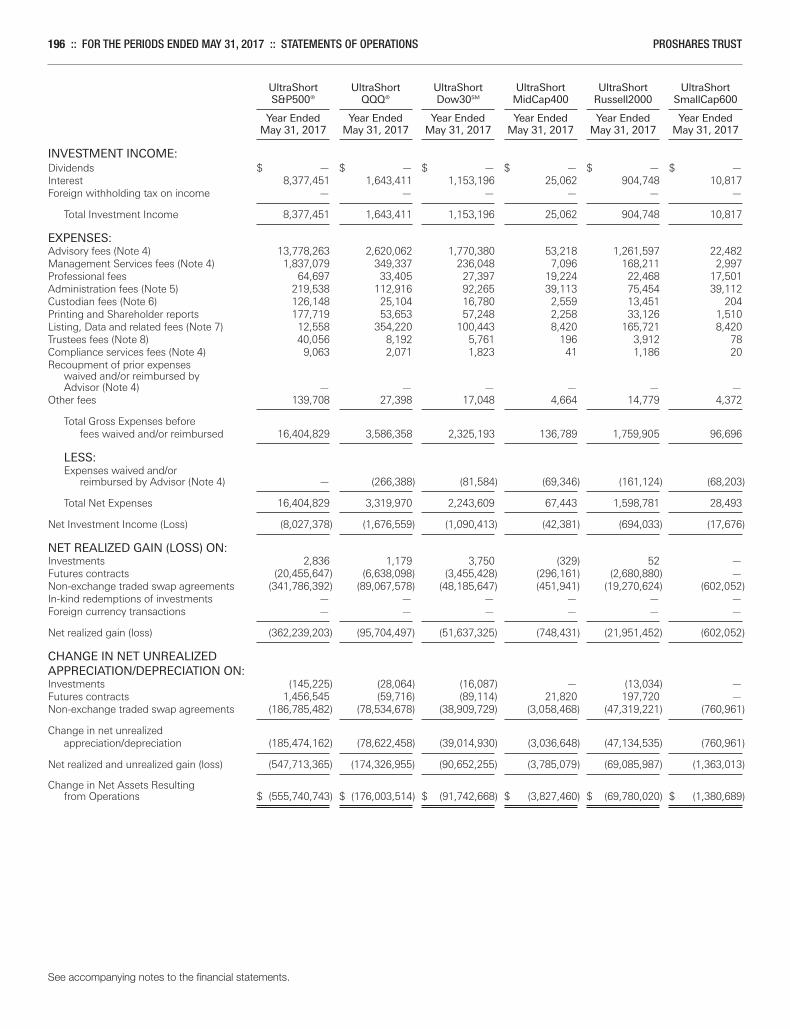
196 :: FOR THE PERIODS ENDED MAY 31, 2017 :: STATEMENTS OF OPERATIONS PROSHARES TRUST
UltraShort UltraShort UltraShort UltraShort UltraShort UltraShort S&P500® QQQ® Dow30SM MidCap400 Russell2000 SmallCap600 Year Ended Year Ended Year Ended Year Ended Year Ended Year Ended May 31, 2017 May 31, 2017 May 31, 2017 May 31, 2017 May 31, 2017 May 31, 2017
INVESTMENT INCOME:Dividends $ — $ — $ — $ — $ — $ —Interest 8,377,451 1,643,411 1,153,196 25,062 904,748 10,817Foreign withholding tax on income — — — — — —
Total Investment Income 8,377,451 1,643,411 1,153,196 25,062 904,748 10,817
EXPENSES:Advisory fees (Note 4) 13,778,263 2,620,062 1,770,380 53,218 1,261,597 22,482Management Services fees (Note 4) 1,837,079 349,337 236,048 7,096 168,211 2,997Professional fees 64,697 33,405 27,397 19,224 22,468 17,501Administration fees (Note 5) 219,538 112,916 92,265 39,113 75,454 39,112Custodian fees (Note 6) 126,148 25,104 16,780 2,559 13,451 204Printing and Shareholder reports 177,719 53,653 57,248 2,258 33,126 1,510Listing, Data and related fees (Note 7) 12,558 354,220 100,443 8,420 165,721 8,420Trustees fees (Note 8) 40,056 8,192 5,761 196 3,912 78Compliance services fees (Note 4) 9,063 2,071 1,823 41 1,186 20Recoupment of prior expenses
waived and/or reimbursed by Advisor (Note 4) — — — — — —
Other fees 139,708 27,398 17,048 4,664 14,779 4,372
Total Gross Expenses before fees waived and/or reimbursed 16,404,829 3,586,358 2,325,193 136,789 1,759,905 96,696
LESS:Expenses waived and/or reimbursed by Advisor (Note 4) — (266,388) (81,584) (69,346) (161,124) (68,203)
Total Net Expenses 16,404,829 3,319,970 2,243,609 67,443 1,598,781 28,493
Net Investment Income (Loss) (8,027,378) (1,676,559) (1,090,413) (42,381) (694,033) (17,676)
NET REALIZED GAIN (LOSS) ON:Investments 2,836 1,179 3,750 (329) 52 —Futures contracts (20,455,647) (6,638,098) (3,455,428) (296,161) (2,680,880) —Non-exchange traded swap agreements (341,786,392) (89,067,578) (48,185,647) (451,941) (19,270,624) (602,052)In-kind redemptions of investments — — — — — —Foreign currency transactions — — — — — — Net realized gain (loss) (362,239,203) (95,704,497) (51,637,325) (748,431) (21,951,452) (602,052)
CHANGE IN NET UNREALIZED APPRECIATION/DEPRECIATION ON:Investments (145,225) (28,064) (16,087) — (13,034) —Futures contracts 1,456,545 (59,716) (89,114) 21,820 197,720 —Non-exchange traded swap agreements (186,785,482) (78,534,678) (38,909,729) (3,058,468) (47,319,221) (760,961) Change in net unrealized
appreciation/depreciation (185,474,162) (78,622,458) (39,014,930) (3,036,648) (47,134,535) (760,961) Net realized and unrealized gain (loss) (547,713,365) (174,326,955) (90,652,255) (3,785,079) (69,085,987) (1,363,013) Change in Net Assets Resulting
from Operations $ (555,740,743) $ (176,003,514) $ (91,742,668) $ (3,827,460) $ (69,780,020) $ (1,380,689)
See accompanying notes to the financial statements.
Merrill Corp - Proshares Trust Geared Book [96 Funds] Annual Report [Funds] 333-089822 05-31-2017 ED [AUX] | eperez | 28-Jul-17 17:41 | 17-15159-3.gc | Sequence: 3CHKSUM Content: 45904 Layout: 11271 Graphics: No Graphics CLEAN
JOB: 17-15159-3 CYCLE#;BL#: 5; 0 TRIM: 8.25" x 10.75" COMPOSITECOLORS: Black, ~note-color 2, ~note-color 3 GRAPHICS: none V1.5
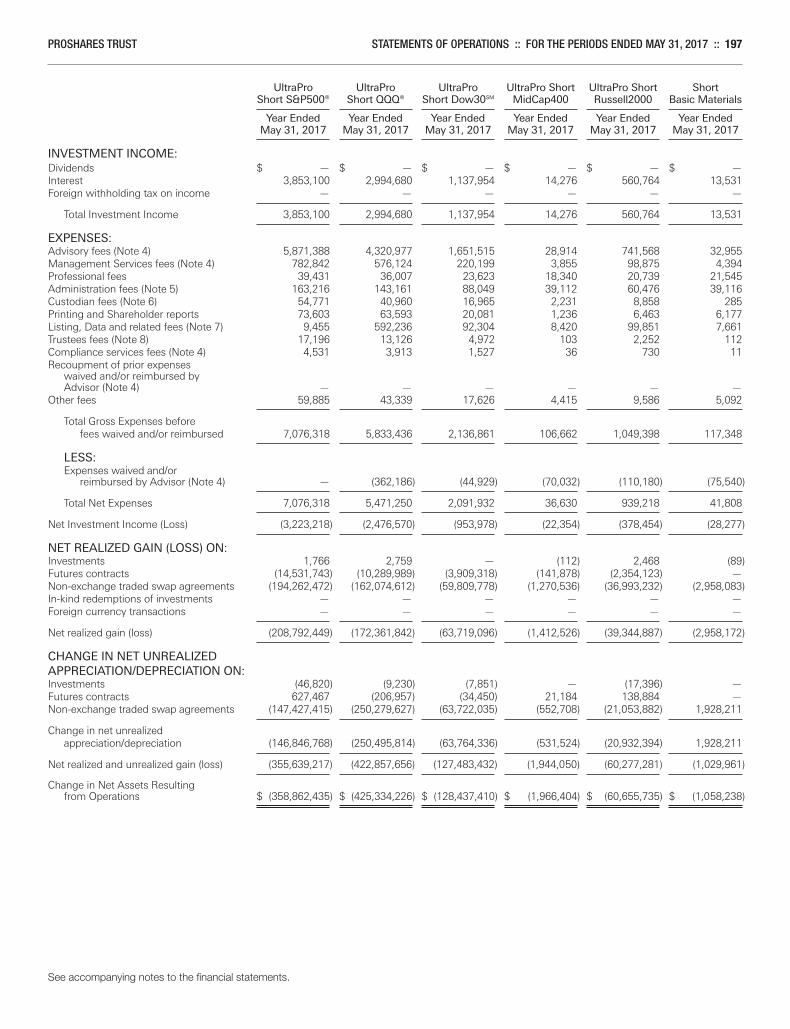
PROSHARES TRUST STATEMENTS OF OPERATIONS :: FOR THE PERIODS ENDED MAY 31, 2017 :: 197
UltraPro UltraPro UltraPro UltraPro Short UltraPro Short Short Short S&P500® Short QQQ® Short Dow30SM MidCap400 Russell2000 Basic Materials Year Ended Year Ended Year Ended Year Ended Year Ended Year Ended May 31, 2017 May 31, 2017 May 31, 2017 May 31, 2017 May 31, 2017 May 31, 2017
INVESTMENT INCOME:Dividends $ — $ — $ — $ — $ — $ —Interest 3,853,100 2,994,680 1,137,954 14,276 560,764 13,531Foreign withholding tax on income — — — — — —
Total Investment Income 3,853,100 2,994,680 1,137,954 14,276 560,764 13,531
EXPENSES:Advisory fees (Note 4) 5,871,388 4,320,977 1,651,515 28,914 741,568 32,955Management Services fees (Note 4) 782,842 576,124 220,199 3,855 98,875 4,394Professional fees 39,431 36,007 23,623 18,340 20,739 21,545Administration fees (Note 5) 163,216 143,161 88,049 39,112 60,476 39,116Custodian fees (Note 6) 54,771 40,960 16,965 2,231 8,858 285Printing and Shareholder reports 73,603 63,593 20,081 1,236 6,463 6,177Listing, Data and related fees (Note 7) 9,455 592,236 92,304 8,420 99,851 7,661Trustees fees (Note 8) 17,196 13,126 4,972 103 2,252 112Compliance services fees (Note 4) 4,531 3,913 1,527 36 730 11Recoupment of prior expenses
waived and/or reimbursed by Advisor (Note 4) — — — — — —
Other fees 59,885 43,339 17,626 4,415 9,586 5,092
Total Gross Expenses before fees waived and/or reimbursed 7,076,318 5,833,436 2,136,861 106,662 1,049,398 117,348
LESS:Expenses waived and/or reimbursed by Advisor (Note 4) — (362,186) (44,929) (70,032) (110,180) (75,540)
Total Net Expenses 7,076,318 5,471,250 2,091,932 36,630 939,218 41,808
Net Investment Income (Loss) (3,223,218) (2,476,570) (953,978) (22,354) (378,454) (28,277)
NET REALIZED GAIN (LOSS) ON:Investments 1,766 2,759 — (112) 2,468 (89)Futures contracts (14,531,743) (10,289,989) (3,909,318) (141,878) (2,354,123) —Non-exchange traded swap agreements (194,262,472) (162,074,612) (59,809,778) (1,270,536) (36,993,232) (2,958,083)In-kind redemptions of investments — — — — — —Foreign currency transactions — — — — — — Net realized gain (loss) (208,792,449) (172,361,842) (63,719,096) (1,412,526) (39,344,887) (2,958,172)
CHANGE IN NET UNREALIZED APPRECIATION/DEPRECIATION ON:Investments (46,820) (9,230) (7,851) — (17,396) —Futures contracts 627,467 (206,957) (34,450) 21,184 138,884 —Non-exchange traded swap agreements (147,427,415) (250,279,627) (63,722,035) (552,708) (21,053,882) 1,928,211 Change in net unrealized
appreciation/depreciation (146,846,768) (250,495,814) (63,764,336) (531,524) (20,932,394) 1,928,211 Net realized and unrealized gain (loss) (355,639,217) (422,857,656) (127,483,432) (1,944,050) (60,277,281) (1,029,961) Change in Net Assets Resulting
from Operations $ (358,862,435) $ (425,334,226) $ (128,437,410) $ (1,966,404) $ (60,655,735) $ (1,058,238)
See accompanying notes to the financial statements.
Merrill Corp - Proshares Trust Geared Book [96 Funds] Annual Report [Funds] 333-089822 05-31-2017 ED [AUX] | eperez | 28-Jul-17 17:41 | 17-15159-3.gc | Sequence: 4CHKSUM Content: 19635 Layout: 38839 Graphics: No Graphics CLEAN
JOB: 17-15159-3 CYCLE#;BL#: 5; 0 TRIM: 8.25" x 10.75" COMPOSITECOLORS: Black, ~note-color 2, ~note-color 3 GRAPHICS: none V1.5
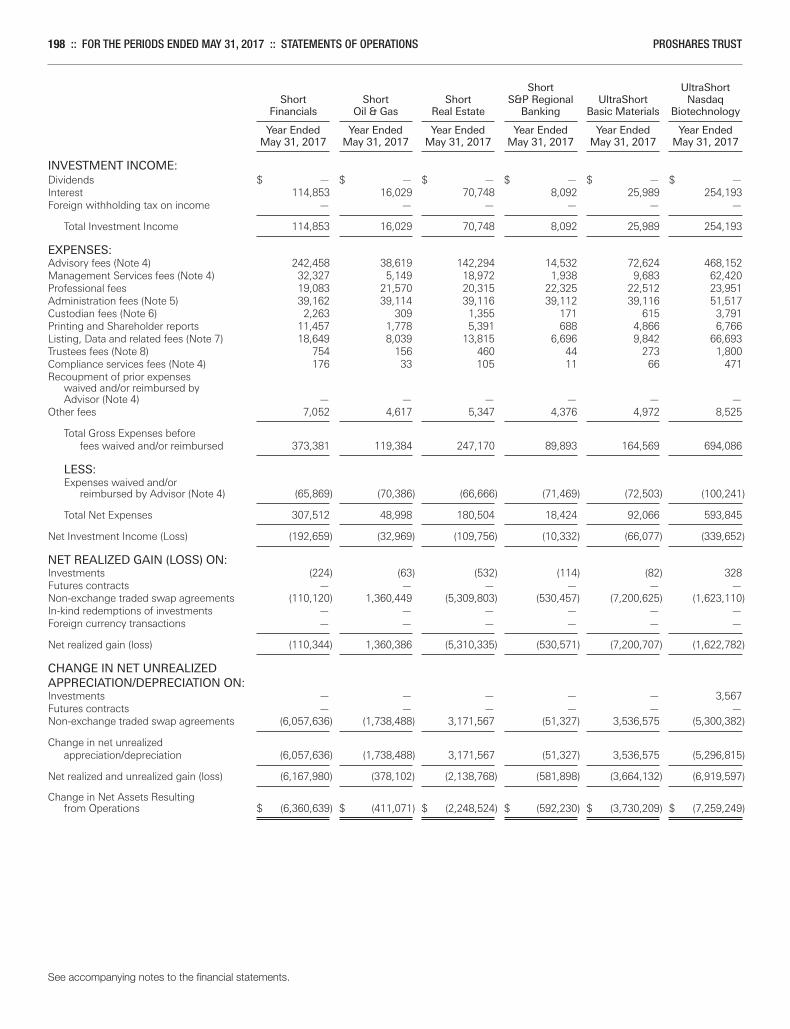
198 :: FOR THE PERIODS ENDED MAY 31, 2017 :: STATEMENTS OF OPERATIONS PROSHARES TRUST
Short UltraShort Short Short Short S&P Regional UltraShort Nasdaq Financials Oil & Gas Real Estate Banking Basic Materials Biotechnology Year Ended Year Ended Year Ended Year Ended Year Ended Year Ended May 31, 2017 May 31, 2017 May 31, 2017 May 31, 2017 May 31, 2017 May 31, 2017
INVESTMENT INCOME:Dividends $ — $ — $ — $ — $ — $ —Interest 114,853 16,029 70,748 8,092 25,989 254,193Foreign withholding tax on income — — — — — —
Total Investment Income 114,853 16,029 70,748 8,092 25,989 254,193
EXPENSES:Advisory fees (Note 4) 242,458 38,619 142,294 14,532 72,624 468,152Management Services fees (Note 4) 32,327 5,149 18,972 1,938 9,683 62,420Professional fees 19,083 21,570 20,315 22,325 22,512 23,951Administration fees (Note 5) 39,162 39,114 39,116 39,112 39,116 51,517Custodian fees (Note 6) 2,263 309 1,355 171 615 3,791Printing and Shareholder reports 11,457 1,778 5,391 688 4,866 6,766Listing, Data and related fees (Note 7) 18,649 8,039 13,815 6,696 9,842 66,693Trustees fees (Note 8) 754 156 460 44 273 1,800Compliance services fees (Note 4) 176 33 105 11 66 471Recoupment of prior expenses
waived and/or reimbursed by Advisor (Note 4) — — — — — —
Other fees 7,052 4,617 5,347 4,376 4,972 8,525
Total Gross Expenses before fees waived and/or reimbursed 373,381 119,384 247,170 89,893 164,569 694,086
LESS:Expenses waived and/or reimbursed by Advisor (Note 4) (65,869) (70,386) (66,666) (71,469) (72,503) (100,241)
Total Net Expenses 307,512 48,998 180,504 18,424 92,066 593,845
Net Investment Income (Loss) (192,659) (32,969) (109,756) (10,332) (66,077) (339,652)
NET REALIZED GAIN (LOSS) ON:Investments (224) (63) (532) (114) (82) 328Futures contracts — — — — — —Non-exchange traded swap agreements (110,120) 1,360,449 (5,309,803) (530,457) (7,200,625) (1,623,110)In-kind redemptions of investments — — — — — —Foreign currency transactions — — — — — — Net realized gain (loss) (110,344) 1,360,386 (5,310,335) (530,571) (7,200,707) (1,622,782)
CHANGE IN NET UNREALIZED APPRECIATION/DEPRECIATION ON:Investments — — — — — 3,567Futures contracts — — — — — —Non-exchange traded swap agreements (6,057,636) (1,738,488) 3,171,567 (51,327) 3,536,575 (5,300,382) Change in net unrealized
appreciation/depreciation (6,057,636) (1,738,488) 3,171,567 (51,327) 3,536,575 (5,296,815) Net realized and unrealized gain (loss) (6,167,980) (378,102) (2,138,768) (581,898) (3,664,132) (6,919,597) Change in Net Assets Resulting
from Operations $ (6,360,639) $ (411,071) $ (2,248,524) $ (592,230) $ (3,730,209) $ (7,259,249)
See accompanying notes to the financial statements.
Merrill Corp - Proshares Trust Geared Book [96 Funds] Annual Report [Funds] 333-089822 05-31-2017 ED [AUX] | eperez | 28-Jul-17 17:41 | 17-15159-3.gc | Sequence: 5CHKSUM Content: 29708 Layout: 19872 Graphics: No Graphics CLEAN
JOB: 17-15159-3 CYCLE#;BL#: 5; 0 TRIM: 8.25" x 10.75" COMPOSITECOLORS: Black, ~note-color 2, ~note-color 3 GRAPHICS: none V1.5
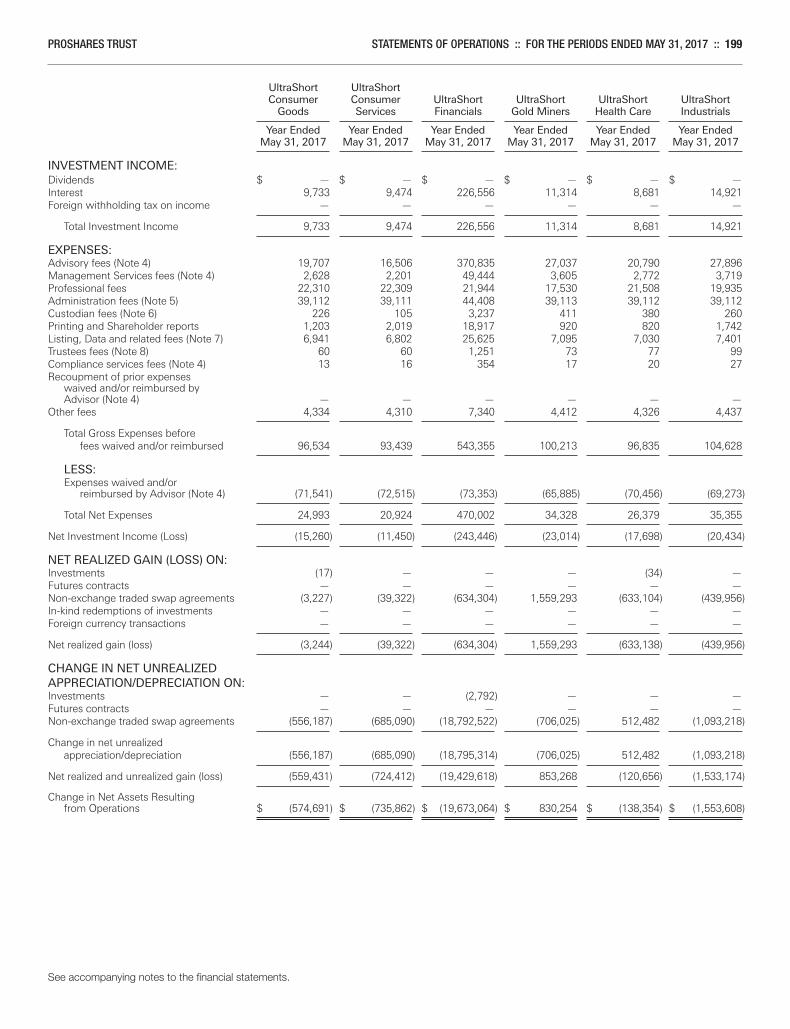
PROSHARES TRUST STATEMENTS OF OPERATIONS :: FOR THE PERIODS ENDED MAY 31, 2017 :: 199
UltraShort UltraShort Consumer Consumer UltraShort UltraShort UltraShort UltraShort Goods Services Financials Gold Miners Health Care Industrials Year Ended Year Ended Year Ended Year Ended Year Ended Year Ended May 31, 2017 May 31, 2017 May 31, 2017 May 31, 2017 May 31, 2017 May 31, 2017
INVESTMENT INCOME:Dividends $ — $ — $ — $ — $ — $ —Interest 9,733 9,474 226,556 11,314 8,681 14,921Foreign withholding tax on income — — — — — —
Total Investment Income 9,733 9,474 226,556 11,314 8,681 14,921
EXPENSES:Advisory fees (Note 4) 19,707 16,506 370,835 27,037 20,790 27,896Management Services fees (Note 4) 2,628 2,201 49,444 3,605 2,772 3,719Professional fees 22,310 22,309 21,944 17,530 21,508 19,935Administration fees (Note 5) 39,112 39,111 44,408 39,113 39,112 39,112Custodian fees (Note 6) 226 105 3,237 411 380 260Printing and Shareholder reports 1,203 2,019 18,917 920 820 1,742Listing, Data and related fees (Note 7) 6,941 6,802 25,625 7,095 7,030 7,401Trustees fees (Note 8) 60 60 1,251 73 77 99Compliance services fees (Note 4) 13 16 354 17 20 27Recoupment of prior expenses
waived and/or reimbursed by Advisor (Note 4) — — — — — —
Other fees 4,334 4,310 7,340 4,412 4,326 4,437
Total Gross Expenses before fees waived and/or reimbursed 96,534 93,439 543,355 100,213 96,835 104,628
LESS:Expenses waived and/or reimbursed by Advisor (Note 4) (71,541) (72,515) (73,353) (65,885) (70,456) (69,273)
Total Net Expenses 24,993 20,924 470,002 34,328 26,379 35,355
Net Investment Income (Loss) (15,260) (11,450) (243,446) (23,014) (17,698) (20,434)
NET REALIZED GAIN (LOSS) ON:Investments (17) — — — (34) —Futures contracts — — — — — —Non-exchange traded swap agreements (3,227) (39,322) (634,304) 1,559,293 (633,104) (439,956)In-kind redemptions of investments — — — — — —Foreign currency transactions — — — — — — Net realized gain (loss) (3,244) (39,322) (634,304) 1,559,293 (633,138) (439,956)
CHANGE IN NET UNREALIZED APPRECIATION/DEPRECIATION ON:Investments — — (2,792) — — —Futures contracts — — — — — —Non-exchange traded swap agreements (556,187) (685,090) (18,792,522) (706,025) 512,482 (1,093,218) Change in net unrealized
appreciation/depreciation (556,187) (685,090) (18,795,314) (706,025) 512,482 (1,093,218) Net realized and unrealized gain (loss) (559,431) (724,412) (19,429,618) 853,268 (120,656) (1,533,174) Change in Net Assets Resulting
from Operations $ (574,691) $ (735,862) $ (19,673,064) $ 830,254 $ (138,354) $ (1,553,608)
See accompanying notes to the financial statements.
Merrill Corp - Proshares Trust Geared Book [96 Funds] Annual Report [Funds] 333-089822 05-31-2017 ED [AUX] | eperez | 28-Jul-17 17:41 | 17-15159-3.gc | Sequence: 6CHKSUM Content: 9797 Layout: 33564 Graphics: No Graphics CLEAN
JOB: 17-15159-3 CYCLE#;BL#: 5; 0 TRIM: 8.25" x 10.75" COMPOSITECOLORS: Black, ~note-color 2, ~note-color 3 GRAPHICS: none V1.5
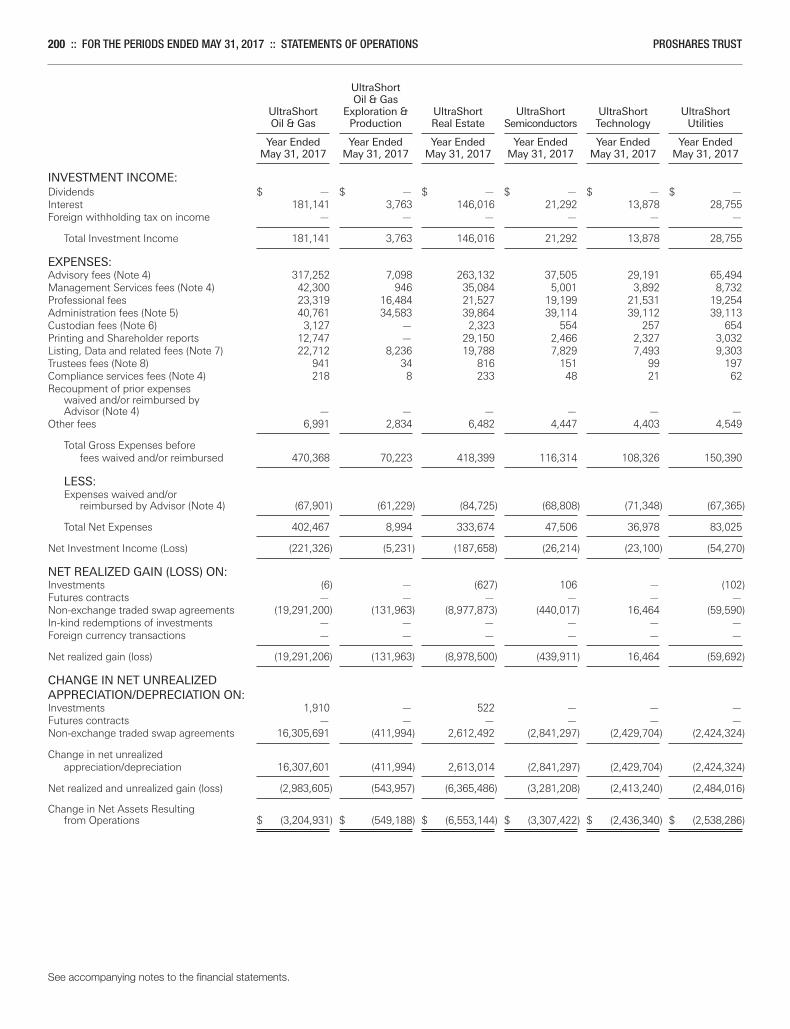
200 :: FOR THE PERIODS ENDED MAY 31, 2017 :: STATEMENTS OF OPERATIONS PROSHARES TRUST
UltraShort Oil & Gas UltraShort Exploration & UltraShort UltraShort UltraShort UltraShort Oil & Gas Production Real Estate Semiconductors Technology Utilities Year Ended Year Ended Year Ended Year Ended Year Ended Year Ended May 31, 2017 May 31, 2017 May 31, 2017 May 31, 2017 May 31, 2017 May 31, 2017
INVESTMENT INCOME:Dividends $ — $ — $ — $ — $ — $ —Interest 181,141 3,763 146,016 21,292 13,878 28,755Foreign withholding tax on income — — — — — —
Total Investment Income 181,141 3,763 146,016 21,292 13,878 28,755
EXPENSES:Advisory fees (Note 4) 317,252 7,098 263,132 37,505 29,191 65,494Management Services fees (Note 4) 42,300 946 35,084 5,001 3,892 8,732Professional fees 23,319 16,484 21,527 19,199 21,531 19,254Administration fees (Note 5) 40,761 34,583 39,864 39,114 39,112 39,113Custodian fees (Note 6) 3,127 — 2,323 554 257 654Printing and Shareholder reports 12,747 — 29,150 2,466 2,327 3,032Listing, Data and related fees (Note 7) 22,712 8,236 19,788 7,829 7,493 9,303Trustees fees (Note 8) 941 34 816 151 99 197Compliance services fees (Note 4) 218 8 233 48 21 62Recoupment of prior expenses
waived and/or reimbursed by Advisor (Note 4) — — — — — —
Other fees 6,991 2,834 6,482 4,447 4,403 4,549
Total Gross Expenses before fees waived and/or reimbursed 470,368 70,223 418,399 116,314 108,326 150,390
LESS:Expenses waived and/or reimbursed by Advisor (Note 4) (67,901) (61,229) (84,725) (68,808) (71,348) (67,365)
Total Net Expenses 402,467 8,994 333,674 47,506 36,978 83,025
Net Investment Income (Loss) (221,326) (5,231) (187,658) (26,214) (23,100) (54,270)
NET REALIZED GAIN (LOSS) ON:Investments (6) — (627) 106 — (102)Futures contracts — — — — — —Non-exchange traded swap agreements (19,291,200) (131,963) (8,977,873) (440,017) 16,464 (59,590)In-kind redemptions of investments — — — — — —Foreign currency transactions — — — — — — Net realized gain (loss) (19,291,206) (131,963) (8,978,500) (439,911) 16,464 (59,692)
CHANGE IN NET UNREALIZED APPRECIATION/DEPRECIATION ON:Investments 1,910 — 522 — — —Futures contracts — — — — — —Non-exchange traded swap agreements 16,305,691 (411,994) 2,612,492 (2,841,297) (2,429,704) (2,424,324) Change in net unrealized
appreciation/depreciation 16,307,601 (411,994) 2,613,014 (2,841,297) (2,429,704) (2,424,324) Net realized and unrealized gain (loss) (2,983,605) (543,957) (6,365,486) (3,281,208) (2,413,240) (2,484,016) Change in Net Assets Resulting
from Operations $ (3,204,931) $ (549,188) $ (6,553,144) $ (3,307,422) $ (2,436,340) $ (2,538,286)
See accompanying notes to the financial statements.
Merrill Corp - Proshares Trust Geared Book [96 Funds] Annual Report [Funds] 333-089822 05-31-2017 ED [AUX] | eperez | 28-Jul-17 17:41 | 17-15159-3.gc | Sequence: 7CHKSUM Content: 57067 Layout: 12716 Graphics: No Graphics CLEAN
JOB: 17-15159-3 CYCLE#;BL#: 5; 0 TRIM: 8.25" x 10.75" COMPOSITECOLORS: Black, ~note-color 2, ~note-color 3 GRAPHICS: none V1.5

PROSHARES TRUST STATEMENTS OF OPERATIONS :: FOR THE PERIODS ENDED MAY 31, 2017 :: 201
UltraPro Short UltraPro Short Short MSCI Nasdaq Financial Select Short Emerging Short FTSE UltraShort Biotechnology Sector MSCI EAFE Markets China 50 MSCI EAFE Year Ended Year Ended Year Ended Year Ended Year Ended Year Ended May 31, 2017 May 31, 2017 May 31, 2017 May 31, 2017 May 31, 2017 May 31, 2017
INVESTMENT INCOME:Dividends $ — $ — $ — $ — $ — $ —Interest 13,852 6,213 259,851 904,031 38,710 17,066Foreign withholding tax on income — — — — — —
Total Investment Income 13,852 6,213 259,851 904,031 38,710 17,066
EXPENSES:Advisory fees (Note 4) 56,953 14,767 514,521 1,627,297 80,871 43,387Management Services fees (Note 4) 7,594 1,969 68,602 216,970 10,783 5,785Professional fees 16,696 20,704 19,927 28,691 18,494 19,167Administration fees (Note 5) 35,582 40,112 49,614 90,439 39,117 39,112Custodian fees (Note 6) 720 125 5,050 12,505 731 392Printing and Shareholder reports 1,663 4,633 25,151 33,340 3,120 1,469Listing, Data and related fees (Note 7) 10,469 11,491 35,478 94,441 16,164 8,254Trustees fees (Note 8) 202 58 1,594 6,012 245 135Compliance services fees (Note 4) 55 19 209 1,478 63 27Recoupment of prior expenses
waived and/or reimbursed by Advisor (Note 4) — — — — — —
Other fees 4,503 4,308 10,631 17,388 4,851 4,519
Total Gross Expenses before fees waived and/or reimbursed 134,437 98,186 730,777 2,128,561 174,439 122,247
LESS:Expenses waived and/or reimbursed by Advisor (Note 4) (62,176) (79,485) (77,935) (65,333) (71,901) (67,232)
Total Net Expenses 72,261 18,701 652,842 2,063,228 102,538 55,015
Net Investment Income (Loss) (58,409) (12,488) (392,991) (1,159,197) (63,828) (37,949)
NET REALIZED GAIN (LOSS) ON:Investments — — 312 1,532 66 (187)Futures contracts — — — — — —Non-exchange traded swap agreements (973,316) 438,572 (2,194,471) (79,130,937) (3,455,694) (889,522)In-kind redemptions of investments — — — — — —Foreign currency transactions — — — — — — Net realized gain (loss) (973,316) 438,572 (2,194,159) (79,129,405) (3,455,628) (889,709)
CHANGE IN NET UNREALIZED APPRECIATION/DEPRECIATION ON:Investments — — 1,261 5,071 — —Futures contracts — — — — — —Non-exchange traded swap agreements 805,650 (1,667,316) (7,260,556) 17,455,963 882,259 (885,260) Change in net unrealized
appreciation/depreciation 805,650 (1,667,316) (7,259,295) 17,461,034 882,259 (885,260) Net realized and unrealized gain (loss) (167,666) (1,228,744) (9,453,454) (61,668,371) (2,573,369) (1,774,969) Change in Net Assets Resulting
from Operations $ (226,075) $ (1,241,232) $ (9,846,445) $ (62,827,568) $ (2,637,197) $ (1,812,918)
See accompanying notes to the financial statements.
Merrill Corp - Proshares Trust Geared Book [96 Funds] Annual Report [Funds] 333-089822 05-31-2017 ED [AUX] | eperez | 28-Jul-17 17:41 | 17-15159-3.gc | Sequence: 8CHKSUM Content: 675 Layout: 39870 Graphics: No Graphics CLEAN
JOB: 17-15159-3 CYCLE#;BL#: 5; 0 TRIM: 8.25" x 10.75" COMPOSITECOLORS: Black, ~note-color 2, ~note-color 3 GRAPHICS: none V1.5
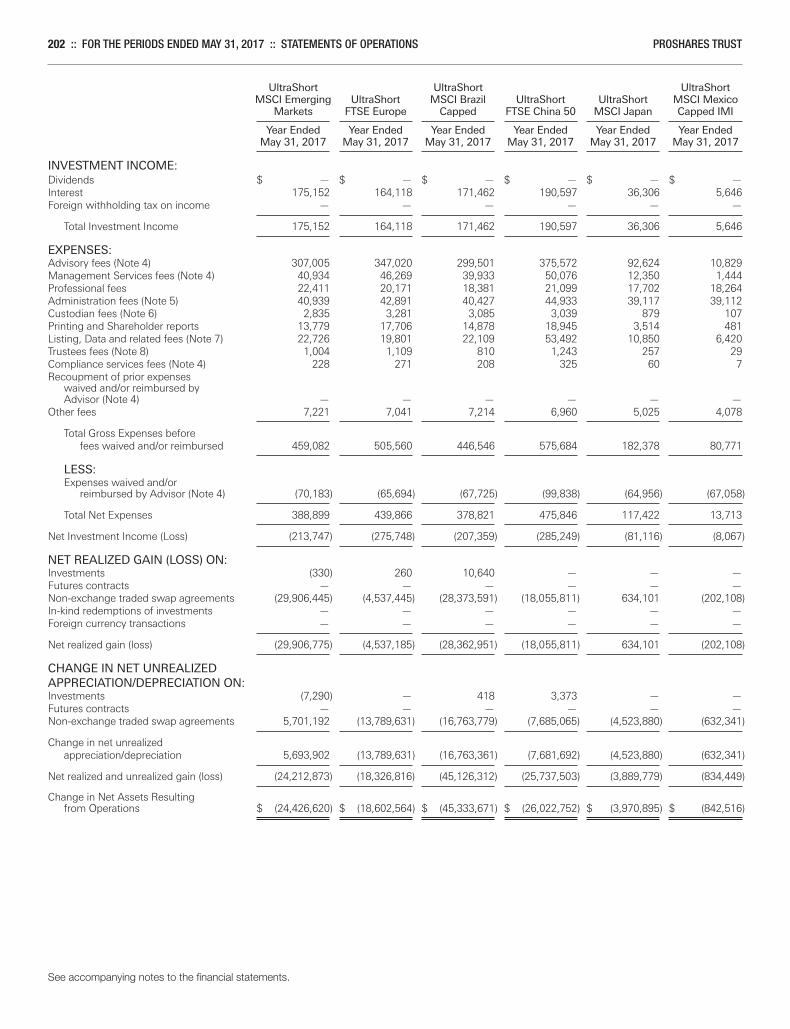
202 :: FOR THE PERIODS ENDED MAY 31, 2017 :: STATEMENTS OF OPERATIONS PROSHARES TRUST
UltraShort UltraShort UltraShort MSCI Emerging UltraShort MSCI Brazil UltraShort UltraShort MSCI Mexico Markets FTSE Europe Capped FTSE China 50 MSCI Japan Capped IMI Year Ended Year Ended Year Ended Year Ended Year Ended Year Ended May 31, 2017 May 31, 2017 May 31, 2017 May 31, 2017 May 31, 2017 May 31, 2017
INVESTMENT INCOME:Dividends $ — $ — $ — $ — $ — $ —Interest 175,152 164,118 171,462 190,597 36,306 5,646Foreign withholding tax on income — — — — — —
Total Investment Income 175,152 164,118 171,462 190,597 36,306 5,646
EXPENSES:Advisory fees (Note 4) 307,005 347,020 299,501 375,572 92,624 10,829Management Services fees (Note 4) 40,934 46,269 39,933 50,076 12,350 1,444Professional fees 22,411 20,171 18,381 21,099 17,702 18,264Administration fees (Note 5) 40,939 42,891 40,427 44,933 39,117 39,112Custodian fees (Note 6) 2,835 3,281 3,085 3,039 879 107Printing and Shareholder reports 13,779 17,706 14,878 18,945 3,514 481Listing, Data and related fees (Note 7) 22,726 19,801 22,109 53,492 10,850 6,420Trustees fees (Note 8) 1,004 1,109 810 1,243 257 29Compliance services fees (Note 4) 228 271 208 325 60 7Recoupment of prior expenses
waived and/or reimbursed by Advisor (Note 4) — — — — — —
Other fees 7,221 7,041 7,214 6,960 5,025 4,078
Total Gross Expenses before fees waived and/or reimbursed 459,082 505,560 446,546 575,684 182,378 80,771
LESS:Expenses waived and/or reimbursed by Advisor (Note 4) (70,183) (65,694) (67,725) (99,838) (64,956) (67,058)
Total Net Expenses 388,899 439,866 378,821 475,846 117,422 13,713
Net Investment Income (Loss) (213,747) (275,748) (207,359) (285,249) (81,116) (8,067)
NET REALIZED GAIN (LOSS) ON:Investments (330) 260 10,640 — — —Futures contracts — — — — — —Non-exchange traded swap agreements (29,906,445) (4,537,445) (28,373,591) (18,055,811) 634,101 (202,108)In-kind redemptions of investments — — — — — —Foreign currency transactions — — — — — — Net realized gain (loss) (29,906,775) (4,537,185) (28,362,951) (18,055,811) 634,101 (202,108)
CHANGE IN NET UNREALIZED APPRECIATION/DEPRECIATION ON:Investments (7,290) — 418 3,373 — —Futures contracts — — — — — —Non-exchange traded swap agreements 5,701,192 (13,789,631) (16,763,779) (7,685,065) (4,523,880) (632,341) Change in net unrealized
appreciation/depreciation 5,693,902 (13,789,631) (16,763,361) (7,681,692) (4,523,880) (632,341) Net realized and unrealized gain (loss) (24,212,873) (18,326,816) (45,126,312) (25,737,503) (3,889,779) (834,449) Change in Net Assets Resulting
from Operations $ (24,426,620) $ (18,602,564) $ (45,333,671) $ (26,022,752) $ (3,970,895) $ (842,516)
See accompanying notes to the financial statements.
Merrill Corp - Proshares Trust Geared Book [96 Funds] Annual Report [Funds] 333-089822 05-31-2017 ED [AUX] | eperez | 28-Jul-17 17:41 | 17-15159-3.gc | Sequence: 9CHKSUM Content: 41729 Layout: 53232 Graphics: No Graphics CLEAN
JOB: 17-15159-3 CYCLE#;BL#: 5; 0 TRIM: 8.25" x 10.75" COMPOSITECOLORS: Black, ~note-color 2, ~note-color 3 GRAPHICS: none V1.5
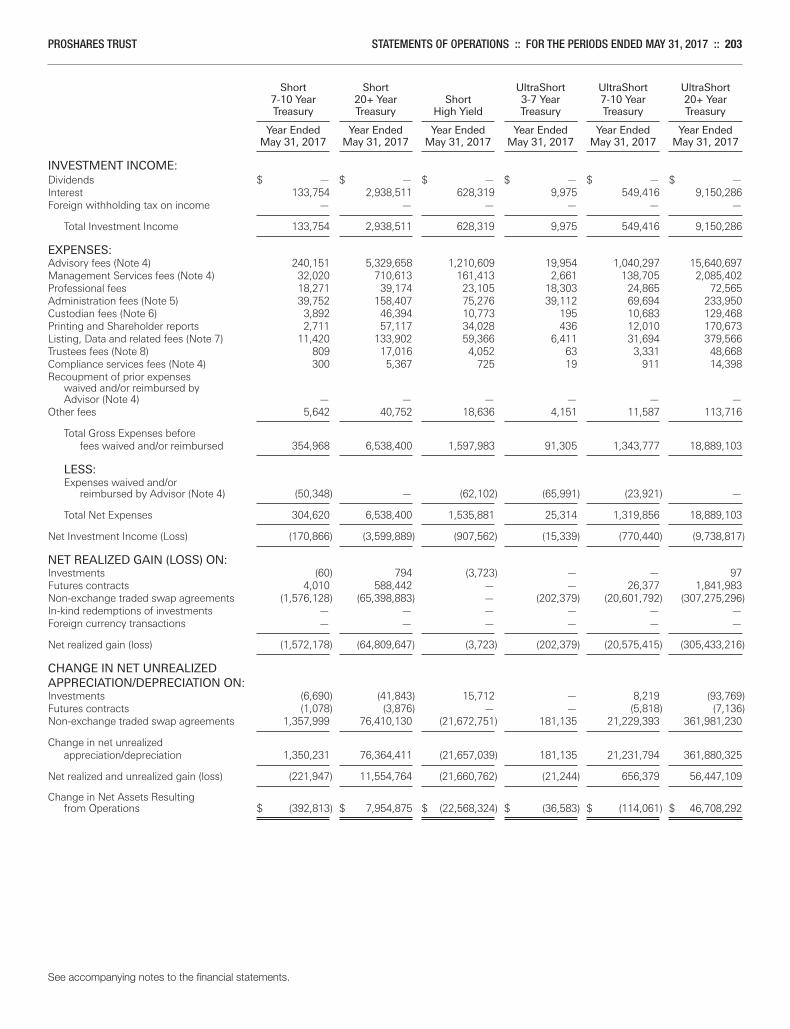
PROSHARES TRUST STATEMENTS OF OPERATIONS :: FOR THE PERIODS ENDED MAY 31, 2017 :: 203
Short Short UltraShort UltraShort UltraShort 7-10 Year 20+ Year Short 3-7 Year 7-10 Year 20+ Year Treasury Treasury High Yield Treasury Treasury Treasury Year Ended Year Ended Year Ended Year Ended Year Ended Year Ended May 31, 2017 May 31, 2017 May 31, 2017 May 31, 2017 May 31, 2017 May 31, 2017
INVESTMENT INCOME:Dividends $ — $ — $ — $ — $ — $ —Interest 133,754 2,938,511 628,319 9,975 549,416 9,150,286Foreign withholding tax on income — — — — — —
Total Investment Income 133,754 2,938,511 628,319 9,975 549,416 9,150,286
EXPENSES:Advisory fees (Note 4) 240,151 5,329,658 1,210,609 19,954 1,040,297 15,640,697Management Services fees (Note 4) 32,020 710,613 161,413 2,661 138,705 2,085,402Professional fees 18,271 39,174 23,105 18,303 24,865 72,565Administration fees (Note 5) 39,752 158,407 75,276 39,112 69,694 233,950Custodian fees (Note 6) 3,892 46,394 10,773 195 10,683 129,468Printing and Shareholder reports 2,711 57,117 34,028 436 12,010 170,673Listing, Data and related fees (Note 7) 11,420 133,902 59,366 6,411 31,694 379,566Trustees fees (Note 8) 809 17,016 4,052 63 3,331 48,668Compliance services fees (Note 4) 300 5,367 725 19 911 14,398Recoupment of prior expenses
waived and/or reimbursed by Advisor (Note 4) — — — — — —
Other fees 5,642 40,752 18,636 4,151 11,587 113,716
Total Gross Expenses before fees waived and/or reimbursed 354,968 6,538,400 1,597,983 91,305 1,343,777 18,889,103
LESS:Expenses waived and/or reimbursed by Advisor (Note 4) (50,348) — (62,102) (65,991) (23,921) —
Total Net Expenses 304,620 6,538,400 1,535,881 25,314 1,319,856 18,889,103
Net Investment Income (Loss) (170,866) (3,599,889) (907,562) (15,339) (770,440) (9,738,817)
NET REALIZED GAIN (LOSS) ON:Investments (60) 794 (3,723) — — 97Futures contracts 4,010 588,442 — — 26,377 1,841,983Non-exchange traded swap agreements (1,576,128) (65,398,883) — (202,379) (20,601,792) (307,275,296)In-kind redemptions of investments — — — — — —Foreign currency transactions — — — — — — Net realized gain (loss) (1,572,178) (64,809,647) (3,723) (202,379) (20,575,415) (305,433,216)
CHANGE IN NET UNREALIZED APPRECIATION/DEPRECIATION ON:Investments (6,690) (41,843) 15,712 — 8,219 (93,769)Futures contracts (1,078) (3,876) — — (5,818) (7,136)Non-exchange traded swap agreements 1,357,999 76,410,130 (21,672,751) 181,135 21,229,393 361,981,230 Change in net unrealized
appreciation/depreciation 1,350,231 76,364,411 (21,657,039) 181,135 21,231,794 361,880,325 Net realized and unrealized gain (loss) (221,947) 11,554,764 (21,660,762) (21,244) 656,379 56,447,109 Change in Net Assets Resulting
from Operations $ (392,813) $ 7,954,875 $ (22,568,324) $ (36,583) $ (114,061) $ 46,708,292
See accompanying notes to the financial statements.
Merrill Corp - Proshares Trust Geared Book [96 Funds] Annual Report [Funds] 333-089822 05-31-2017 ED [AUX] | eperez | 28-Jul-17 17:41 | 17-15159-3.gc | Sequence: 10CHKSUM Content: 53775 Layout: 38839 Graphics: No Graphics CLEAN
JOB: 17-15159-3 CYCLE#;BL#: 5; 0 TRIM: 8.25" x 10.75" COMPOSITECOLORS: Black, ~note-color 2, ~note-color 3 GRAPHICS: none V1.5
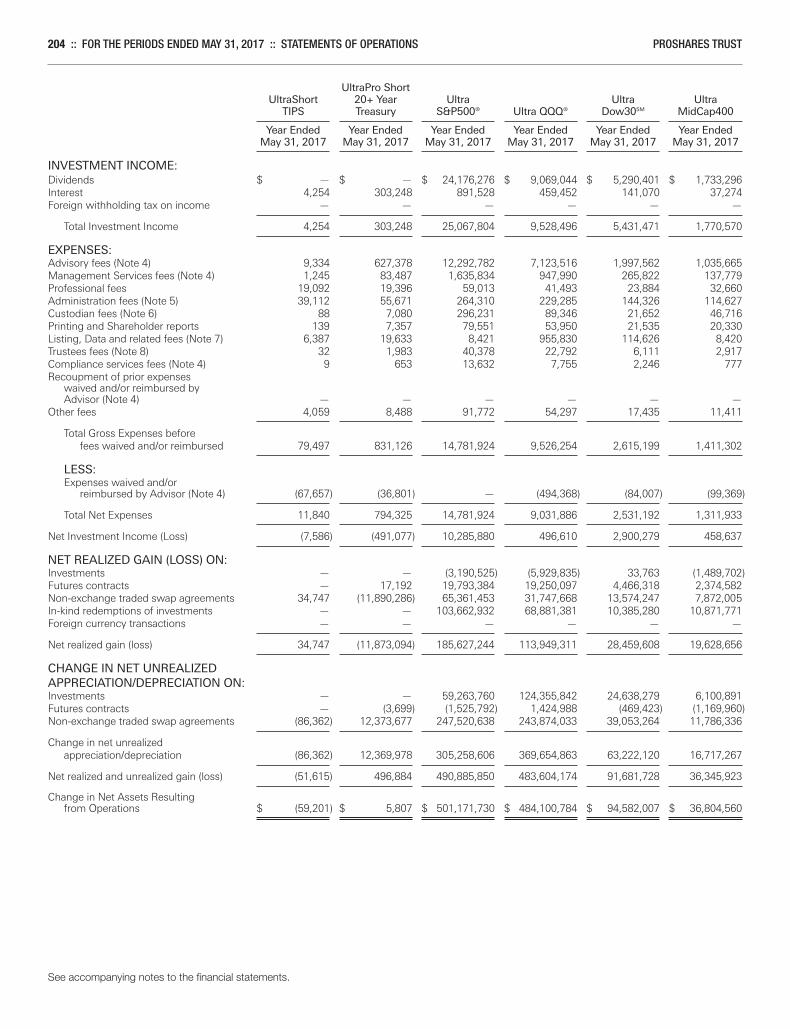
204 :: FOR THE PERIODS ENDED MAY 31, 2017 :: STATEMENTS OF OPERATIONS PROSHARES TRUST
UltraPro Short UltraShort 20+ Year Ultra Ultra Ultra TIPS Treasury S&P500® Ultra QQQ® Dow30SM MidCap400 Year Ended Year Ended Year Ended Year Ended Year Ended Year Ended May 31, 2017 May 31, 2017 May 31, 2017 May 31, 2017 May 31, 2017 May 31, 2017
INVESTMENT INCOME:Dividends $ — $ — $ 24,176,276 $ 9,069,044 $ 5,290,401 $ 1,733,296Interest 4,254 303,248 891,528 459,452 141,070 37,274Foreign withholding tax on income — — — — — —
Total Investment Income 4,254 303,248 25,067,804 9,528,496 5,431,471 1,770,570
EXPENSES:Advisory fees (Note 4) 9,334 627,378 12,292,782 7,123,516 1,997,562 1,035,665Management Services fees (Note 4) 1,245 83,487 1,635,834 947,990 265,822 137,779Professional fees 19,092 19,396 59,013 41,493 23,884 32,660Administration fees (Note 5) 39,112 55,671 264,310 229,285 144,326 114,627Custodian fees (Note 6) 88 7,080 296,231 89,346 21,652 46,716Printing and Shareholder reports 139 7,357 79,551 53,950 21,535 20,330Listing, Data and related fees (Note 7) 6,387 19,633 8,421 955,830 114,626 8,420Trustees fees (Note 8) 32 1,983 40,378 22,792 6,111 2,917Compliance services fees (Note 4) 9 653 13,632 7,755 2,246 777Recoupment of prior expenses
waived and/or reimbursed by Advisor (Note 4) — — — — — —
Other fees 4,059 8,488 91,772 54,297 17,435 11,411
Total Gross Expenses before fees waived and/or reimbursed 79,497 831,126 14,781,924 9,526,254 2,615,199 1,411,302
LESS:Expenses waived and/or reimbursed by Advisor (Note 4) (67,657) (36,801) — (494,368) (84,007) (99,369)
Total Net Expenses 11,840 794,325 14,781,924 9,031,886 2,531,192 1,311,933
Net Investment Income (Loss) (7,586) (491,077) 10,285,880 496,610 2,900,279 458,637
NET REALIZED GAIN (LOSS) ON:Investments — — (3,190,525) (5,929,835) 33,763 (1,489,702)Futures contracts — 17,192 19,793,384 19,250,097 4,466,318 2,374,582Non-exchange traded swap agreements 34,747 (11,890,286) 65,361,453 31,747,668 13,574,247 7,872,005In-kind redemptions of investments — — 103,662,932 68,881,381 10,385,280 10,871,771Foreign currency transactions — — — — — — Net realized gain (loss) 34,747 (11,873,094) 185,627,244 113,949,311 28,459,608 19,628,656
CHANGE IN NET UNREALIZED APPRECIATION/DEPRECIATION ON:Investments — — 59,263,760 124,355,842 24,638,279 6,100,891Futures contracts — (3,699) (1,525,792) 1,424,988 (469,423) (1,169,960)Non-exchange traded swap agreements (86,362) 12,373,677 247,520,638 243,874,033 39,053,264 11,786,336 Change in net unrealized
appreciation/depreciation (86,362) 12,369,978 305,258,606 369,654,863 63,222,120 16,717,267 Net realized and unrealized gain (loss) (51,615) 496,884 490,885,850 483,604,174 91,681,728 36,345,923 Change in Net Assets Resulting
from Operations $ (59,201) $ 5,807 $ 501,171,730 $ 484,100,784 $ 94,582,007 $ 36,804,560
See accompanying notes to the financial statements.
Merrill Corp - Proshares Trust Geared Book [96 Funds] Annual Report [Funds] 333-089822 05-31-2017 ED [AUX] | eperez | 28-Jul-17 17:41 | 17-15159-3.gc | Sequence: 11CHKSUM Content: 49633 Layout: 8934 Graphics: No Graphics CLEAN
JOB: 17-15159-3 CYCLE#;BL#: 5; 0 TRIM: 8.25" x 10.75" COMPOSITECOLORS: Black, ~note-color 2, ~note-color 3 GRAPHICS: none V1.5
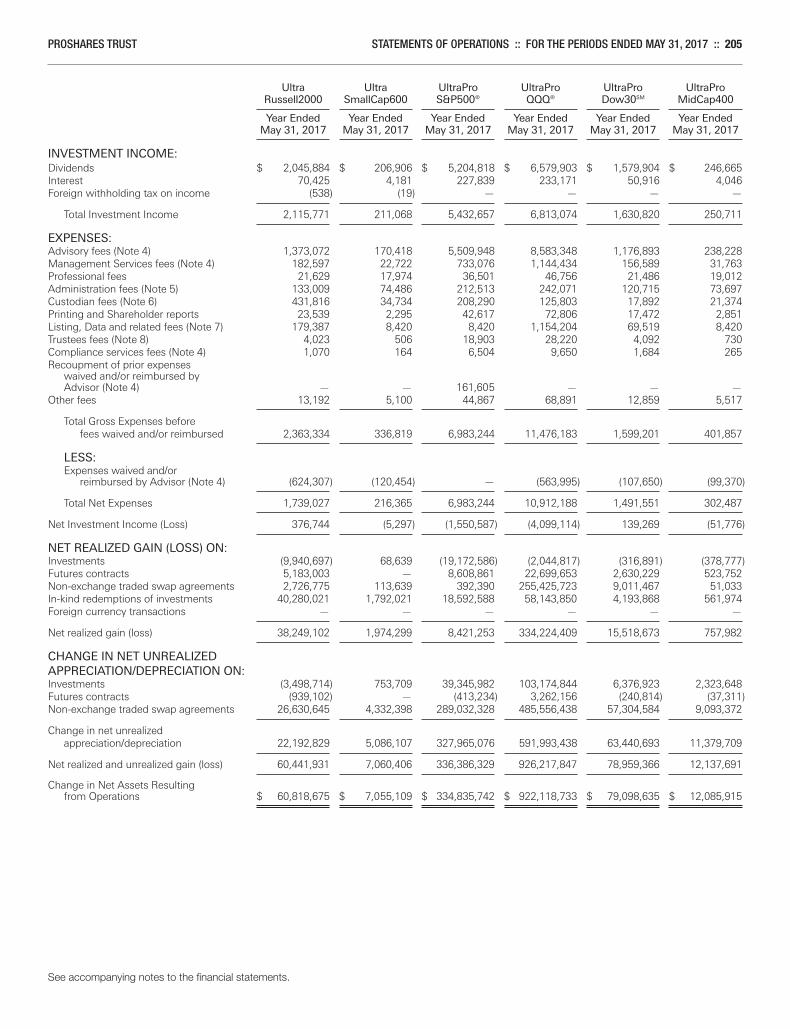
PROSHARES TRUST STATEMENTS OF OPERATIONS :: FOR THE PERIODS ENDED MAY 31, 2017 :: 205
Ultra Ultra UltraPro UltraPro UltraPro UltraPro Russell2000 SmallCap600 S&P500® QQQ® Dow30SM MidCap400 Year Ended Year Ended Year Ended Year Ended Year Ended Year Ended May 31, 2017 May 31, 2017 May 31, 2017 May 31, 2017 May 31, 2017 May 31, 2017
INVESTMENT INCOME:Dividends $ 2,045,884 $ 206,906 $ 5,204,818 $ 6,579,903 $ 1,579,904 $ 246,665Interest 70,425 4,181 227,839 233,171 50,916 4,046Foreign withholding tax on income (538) (19) — — — —
Total Investment Income 2,115,771 211,068 5,432,657 6,813,074 1,630,820 250,711
EXPENSES:Advisory fees (Note 4) 1,373,072 170,418 5,509,948 8,583,348 1,176,893 238,228Management Services fees (Note 4) 182,597 22,722 733,076 1,144,434 156,589 31,763Professional fees 21,629 17,974 36,501 46,756 21,486 19,012Administration fees (Note 5) 133,009 74,486 212,513 242,071 120,715 73,697Custodian fees (Note 6) 431,816 34,734 208,290 125,803 17,892 21,374Printing and Shareholder reports 23,539 2,295 42,617 72,806 17,472 2,851Listing, Data and related fees (Note 7) 179,387 8,420 8,420 1,154,204 69,519 8,420Trustees fees (Note 8) 4,023 506 18,903 28,220 4,092 730Compliance services fees (Note 4) 1,070 164 6,504 9,650 1,684 265Recoupment of prior expenses
waived and/or reimbursed by Advisor (Note 4) — — 161,605 — — —
Other fees 13,192 5,100 44,867 68,891 12,859 5,517
Total Gross Expenses before fees waived and/or reimbursed 2,363,334 336,819 6,983,244 11,476,183 1,599,201 401,857
LESS:Expenses waived and/or reimbursed by Advisor (Note 4) (624,307) (120,454) — (563,995) (107,650) (99,370)
Total Net Expenses 1,739,027 216,365 6,983,244 10,912,188 1,491,551 302,487
Net Investment Income (Loss) 376,744 (5,297) (1,550,587) (4,099,114) 139,269 (51,776)
NET REALIZED GAIN (LOSS) ON:Investments (9,940,697) 68,639 (19,172,586) (2,044,817) (316,891) (378,777)Futures contracts 5,183,003 — 8,608,861 22,699,653 2,630,229 523,752Non-exchange traded swap agreements 2,726,775 113,639 392,390 255,425,723 9,011,467 51,033In-kind redemptions of investments 40,280,021 1,792,021 18,592,588 58,143,850 4,193,868 561,974Foreign currency transactions — — — — — — Net realized gain (loss) 38,249,102 1,974,299 8,421,253 334,224,409 15,518,673 757,982
CHANGE IN NET UNREALIZED APPRECIATION/DEPRECIATION ON:Investments (3,498,714) 753,709 39,345,982 103,174,844 6,376,923 2,323,648Futures contracts (939,102) — (413,234) 3,262,156 (240,814) (37,311)Non-exchange traded swap agreements 26,630,645 4,332,398 289,032,328 485,556,438 57,304,584 9,093,372 Change in net unrealized
appreciation/depreciation 22,192,829 5,086,107 327,965,076 591,993,438 63,440,693 11,379,709 Net realized and unrealized gain (loss) 60,441,931 7,060,406 336,386,329 926,217,847 78,959,366 12,137,691 Change in Net Assets Resulting
from Operations $ 60,818,675 $ 7,055,109 $ 334,835,742 $ 922,118,733 $ 79,098,635 $ 12,085,915
See accompanying notes to the financial statements.
Merrill Corp - Proshares Trust Geared Book [96 Funds] Annual Report [Funds] 333-089822 05-31-2017 ED [AUX] | eperez | 28-Jul-17 17:41 | 17-15159-3.gc | Sequence: 12CHKSUM Content: 25655 Layout: 55912 Graphics: No Graphics CLEAN
JOB: 17-15159-3 CYCLE#;BL#: 5; 0 TRIM: 8.25" x 10.75" COMPOSITECOLORS: Black, ~note-color 2, ~note-color 3 GRAPHICS: none V1.5
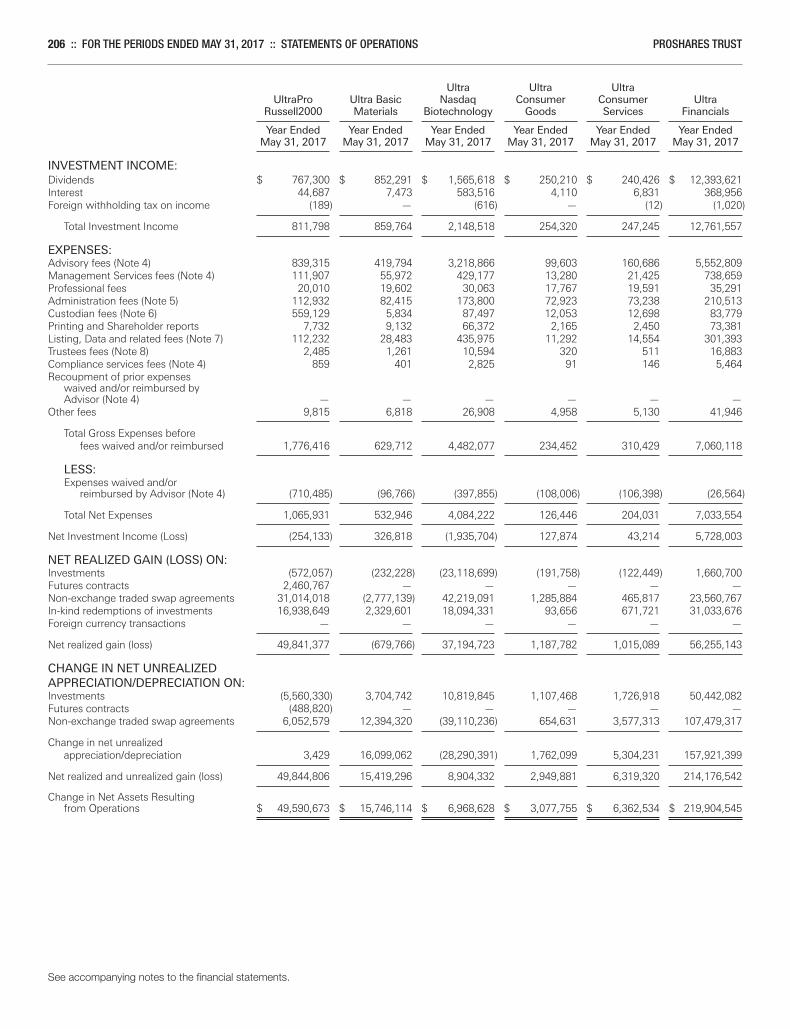
206 :: FOR THE PERIODS ENDED MAY 31, 2017 :: STATEMENTS OF OPERATIONS PROSHARES TRUST
Ultra Ultra Ultra UltraPro Ultra Basic Nasdaq Consumer Consumer Ultra Russell2000 Materials Biotechnology Goods Services Financials Year Ended Year Ended Year Ended Year Ended Year Ended Year Ended May 31, 2017 May 31, 2017 May 31, 2017 May 31, 2017 May 31, 2017 May 31, 2017
INVESTMENT INCOME:Dividends $ 767,300 $ 852,291 $ 1,565,618 $ 250,210 $ 240,426 $ 12,393,621Interest 44,687 7,473 583,516 4,110 6,831 368,956Foreign withholding tax on income (189) — (616) — (12) (1,020)
Total Investment Income 811,798 859,764 2,148,518 254,320 247,245 12,761,557
EXPENSES:Advisory fees (Note 4) 839,315 419,794 3,218,866 99,603 160,686 5,552,809Management Services fees (Note 4) 111,907 55,972 429,177 13,280 21,425 738,659Professional fees 20,010 19,602 30,063 17,767 19,591 35,291Administration fees (Note 5) 112,932 82,415 173,800 72,923 73,238 210,513Custodian fees (Note 6) 559,129 5,834 87,497 12,053 12,698 83,779Printing and Shareholder reports 7,732 9,132 66,372 2,165 2,450 73,381Listing, Data and related fees (Note 7) 112,232 28,483 435,975 11,292 14,554 301,393Trustees fees (Note 8) 2,485 1,261 10,594 320 511 16,883Compliance services fees (Note 4) 859 401 2,825 91 146 5,464Recoupment of prior expenses
waived and/or reimbursed by Advisor (Note 4) — — — — — —
Other fees 9,815 6,818 26,908 4,958 5,130 41,946
Total Gross Expenses before fees waived and/or reimbursed 1,776,416 629,712 4,482,077 234,452 310,429 7,060,118
LESS:Expenses waived and/or reimbursed by Advisor (Note 4) (710,485) (96,766) (397,855) (108,006) (106,398) (26,564)
Total Net Expenses 1,065,931 532,946 4,084,222 126,446 204,031 7,033,554
Net Investment Income (Loss) (254,133) 326,818 (1,935,704) 127,874 43,214 5,728,003
NET REALIZED GAIN (LOSS) ON:Investments (572,057) (232,228) (23,118,699) (191,758) (122,449) 1,660,700Futures contracts 2,460,767 — — — — —Non-exchange traded swap agreements 31,014,018 (2,777,139) 42,219,091 1,285,884 465,817 23,560,767In-kind redemptions of investments 16,938,649 2,329,601 18,094,331 93,656 671,721 31,033,676Foreign currency transactions — — — — — — Net realized gain (loss) 49,841,377 (679,766) 37,194,723 1,187,782 1,015,089 56,255,143
CHANGE IN NET UNREALIZED APPRECIATION/DEPRECIATION ON:Investments (5,560,330) 3,704,742 10,819,845 1,107,468 1,726,918 50,442,082Futures contracts (488,820) — — — — —Non-exchange traded swap agreements 6,052,579 12,394,320 (39,110,236) 654,631 3,577,313 107,479,317 Change in net unrealized
appreciation/depreciation 3,429 16,099,062 (28,290,391) 1,762,099 5,304,231 157,921,399 Net realized and unrealized gain (loss) 49,844,806 15,419,296 8,904,332 2,949,881 6,319,320 214,176,542 Change in Net Assets Resulting
from Operations $ 49,590,673 $ 15,746,114 $ 6,968,628 $ 3,077,755 $ 6,362,534 $ 219,904,545
See accompanying notes to the financial statements.
Merrill Corp - Proshares Trust Geared Book [96 Funds] Annual Report [Funds] 333-089822 05-31-2017 ED [AUX] | eperez | 28-Jul-17 17:41 | 17-15159-3.gc | Sequence: 13CHKSUM Content: 58221 Layout: 20334 Graphics: No Graphics CLEAN
JOB: 17-15159-3 CYCLE#;BL#: 5; 0 TRIM: 8.25" x 10.75" COMPOSITECOLORS: Black, ~note-color 2, ~note-color 3 GRAPHICS: none V1.5
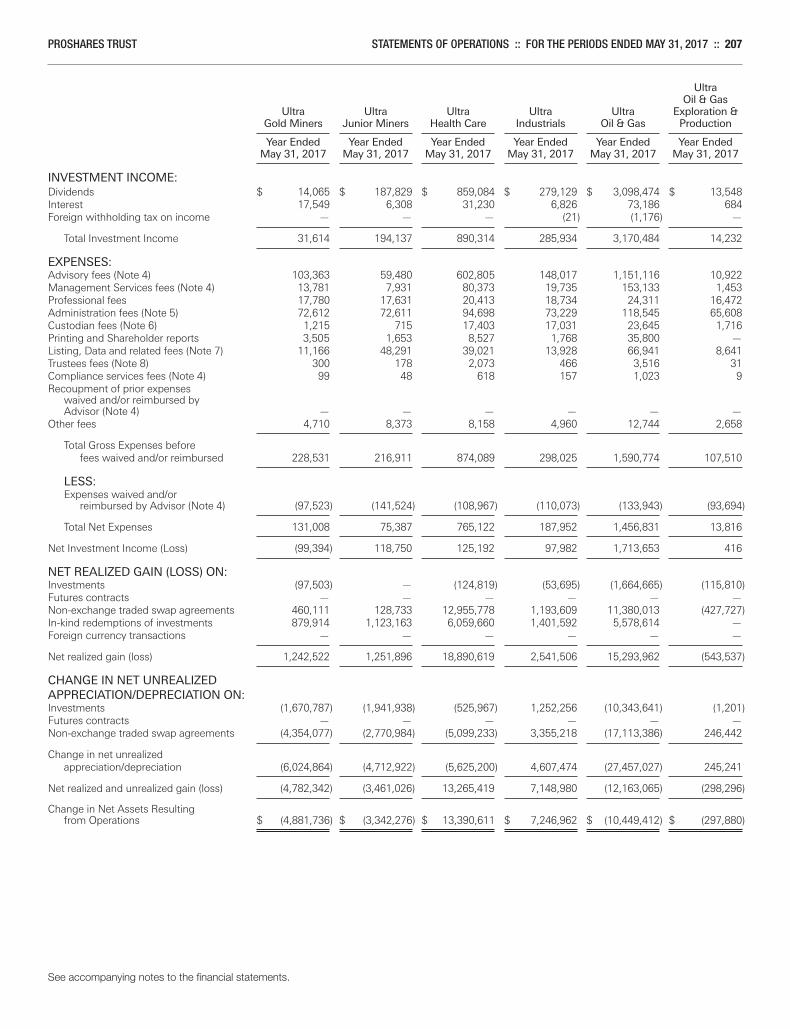
PROSHARES TRUST STATEMENTS OF OPERATIONS :: FOR THE PERIODS ENDED MAY 31, 2017 :: 207
Ultra Oil & Gas Ultra Ultra Ultra Ultra Ultra Exploration & Gold Miners Junior Miners Health Care Industrials Oil & Gas Production Year Ended Year Ended Year Ended Year Ended Year Ended Year Ended May 31, 2017 May 31, 2017 May 31, 2017 May 31, 2017 May 31, 2017 May 31, 2017
INVESTMENT INCOME:Dividends $ 14,065 $ 187,829 $ 859,084 $ 279,129 $ 3,098,474 $ 13,548Interest 17,549 6,308 31,230 6,826 73,186 684Foreign withholding tax on income — — — (21) (1,176) —
Total Investment Income 31,614 194,137 890,314 285,934 3,170,484 14,232
EXPENSES:Advisory fees (Note 4) 103,363 59,480 602,805 148,017 1,151,116 10,922Management Services fees (Note 4) 13,781 7,931 80,373 19,735 153,133 1,453Professional fees 17,780 17,631 20,413 18,734 24,311 16,472Administration fees (Note 5) 72,612 72,611 94,698 73,229 118,545 65,608Custodian fees (Note 6) 1,215 715 17,403 17,031 23,645 1,716Printing and Shareholder reports 3,505 1,653 8,527 1,768 35,800 —Listing, Data and related fees (Note 7) 11,166 48,291 39,021 13,928 66,941 8,641Trustees fees (Note 8) 300 178 2,073 466 3,516 31Compliance services fees (Note 4) 99 48 618 157 1,023 9Recoupment of prior expenses
waived and/or reimbursed by Advisor (Note 4) — — — — — —
Other fees 4,710 8,373 8,158 4,960 12,744 2,658
Total Gross Expenses before fees waived and/or reimbursed 228,531 216,911 874,089 298,025 1,590,774 107,510
LESS:Expenses waived and/or reimbursed by Advisor (Note 4) (97,523) (141,524) (108,967) (110,073) (133,943) (93,694)
Total Net Expenses 131,008 75,387 765,122 187,952 1,456,831 13,816
Net Investment Income (Loss) (99,394) 118,750 125,192 97,982 1,713,653 416
NET REALIZED GAIN (LOSS) ON:Investments (97,503) — (124,819) (53,695) (1,664,665) (115,810)Futures contracts — — — — — —Non-exchange traded swap agreements 460,111 128,733 12,955,778 1,193,609 11,380,013 (427,727)In-kind redemptions of investments 879,914 1,123,163 6,059,660 1,401,592 5,578,614 —Foreign currency transactions — — — — — — Net realized gain (loss) 1,242,522 1,251,896 18,890,619 2,541,506 15,293,962 (543,537)
CHANGE IN NET UNREALIZED APPRECIATION/DEPRECIATION ON:Investments (1,670,787) (1,941,938) (525,967) 1,252,256 (10,343,641) (1,201)Futures contracts — — — — — —Non-exchange traded swap agreements (4,354,077) (2,770,984) (5,099,233) 3,355,218 (17,113,386) 246,442 Change in net unrealized
appreciation/depreciation (6,024,864) (4,712,922) (5,625,200) 4,607,474 (27,457,027) 245,241 Net realized and unrealized gain (loss) (4,782,342) (3,461,026) 13,265,419 7,148,980 (12,163,065) (298,296) Change in Net Assets Resulting
from Operations $ (4,881,736) $ (3,342,276) $ 13,390,611 $ 7,246,962 $ (10,449,412) $ (297,880)
See accompanying notes to the financial statements.
Merrill Corp - Proshares Trust Geared Book [96 Funds] Annual Report [Funds] 333-089822 05-31-2017 ED [AUX] | eperez | 28-Jul-17 17:41 | 17-15159-3.gc | Sequence: 14CHKSUM Content: 14225 Layout: 24758 Graphics: No Graphics CLEAN
JOB: 17-15159-3 CYCLE#;BL#: 5; 0 TRIM: 8.25" x 10.75" COMPOSITECOLORS: Black, ~note-color 2, ~note-color 3 GRAPHICS: none V1.5
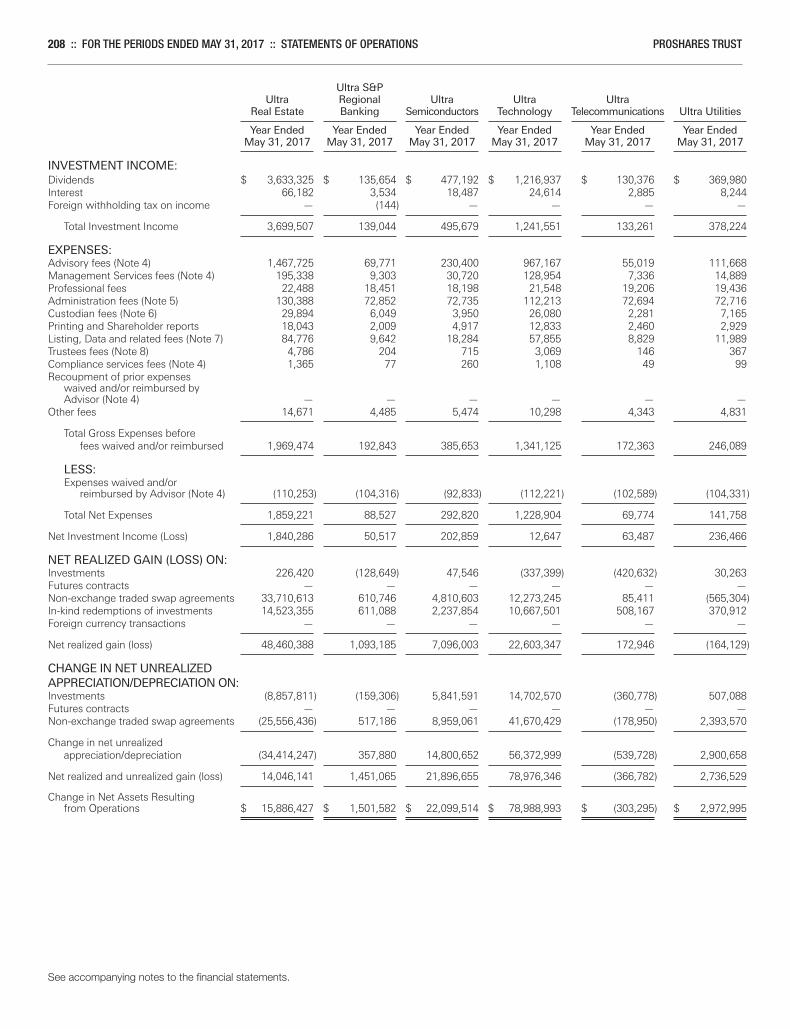
208 :: FOR THE PERIODS ENDED MAY 31, 2017 :: STATEMENTS OF OPERATIONS PROSHARES TRUST
Ultra S&P Ultra Regional Ultra Ultra Ultra Real Estate Banking Semiconductors Technology Telecommunications Ultra Utilities Year Ended Year Ended Year Ended Year Ended Year Ended Year Ended May 31, 2017 May 31, 2017 May 31, 2017 May 31, 2017 May 31, 2017 May 31, 2017
INVESTMENT INCOME:Dividends $ 3,633,325 $ 135,654 $ 477,192 $ 1,216,937 $ 130,376 $ 369,980Interest 66,182 3,534 18,487 24,614 2,885 8,244Foreign withholding tax on income — (144) — — — —
Total Investment Income 3,699,507 139,044 495,679 1,241,551 133,261 378,224
EXPENSES:Advisory fees (Note 4) 1,467,725 69,771 230,400 967,167 55,019 111,668Management Services fees (Note 4) 195,338 9,303 30,720 128,954 7,336 14,889Professional fees 22,488 18,451 18,198 21,548 19,206 19,436Administration fees (Note 5) 130,388 72,852 72,735 112,213 72,694 72,716Custodian fees (Note 6) 29,894 6,049 3,950 26,080 2,281 7,165Printing and Shareholder reports 18,043 2,009 4,917 12,833 2,460 2,929Listing, Data and related fees (Note 7) 84,776 9,642 18,284 57,855 8,829 11,989Trustees fees (Note 8) 4,786 204 715 3,069 146 367Compliance services fees (Note 4) 1,365 77 260 1,108 49 99Recoupment of prior expenses
waived and/or reimbursed by Advisor (Note 4) — — — — — —
Other fees 14,671 4,485 5,474 10,298 4,343 4,831
Total Gross Expenses before fees waived and/or reimbursed 1,969,474 192,843 385,653 1,341,125 172,363 246,089
LESS:Expenses waived and/or reimbursed by Advisor (Note 4) (110,253) (104,316) (92,833) (112,221) (102,589) (104,331)
Total Net Expenses 1,859,221 88,527 292,820 1,228,904 69,774 141,758
Net Investment Income (Loss) 1,840,286 50,517 202,859 12,647 63,487 236,466
NET REALIZED GAIN (LOSS) ON:Investments 226,420 (128,649) 47,546 (337,399) (420,632) 30,263Futures contracts — — — — — —Non-exchange traded swap agreements 33,710,613 610,746 4,810,603 12,273,245 85,411 (565,304)In-kind redemptions of investments 14,523,355 611,088 2,237,854 10,667,501 508,167 370,912Foreign currency transactions — — — — — — Net realized gain (loss) 48,460,388 1,093,185 7,096,003 22,603,347 172,946 (164,129)
CHANGE IN NET UNREALIZED APPRECIATION/DEPRECIATION ON:Investments (8,857,811) (159,306) 5,841,591 14,702,570 (360,778) 507,088Futures contracts — — — — — —Non-exchange traded swap agreements (25,556,436) 517,186 8,959,061 41,670,429 (178,950) 2,393,570 Change in net unrealized
appreciation/depreciation (34,414,247) 357,880 14,800,652 56,372,999 (539,728) 2,900,658 Net realized and unrealized gain (loss) 14,046,141 1,451,065 21,896,655 78,976,346 (366,782) 2,736,529 Change in Net Assets Resulting
from Operations $ 15,886,427 $ 1,501,582 $ 22,099,514 $ 78,988,993 $ (303,295) $ 2,972,995
See accompanying notes to the financial statements.
Merrill Corp - Proshares Trust Geared Book [96 Funds] Annual Report [Funds] 333-089822 05-31-2017 ED [AUX] | eperez | 28-Jul-17 17:41 | 17-15159-3.gc | Sequence: 15CHKSUM Content: 23953 Layout: 18535 Graphics: No Graphics CLEAN
JOB: 17-15159-3 CYCLE#;BL#: 5; 0 TRIM: 8.25" x 10.75" COMPOSITECOLORS: Black, ~note-color 2, ~note-color 3 GRAPHICS: none V1.5
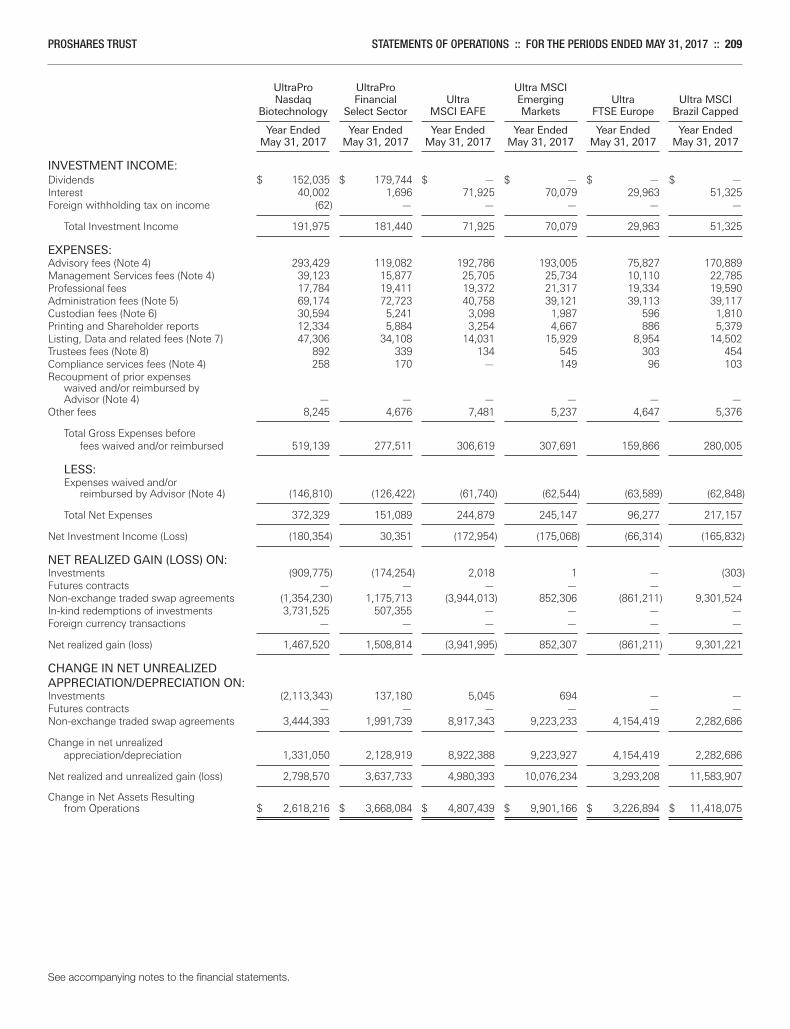
PROSHARES TRUST STATEMENTS OF OPERATIONS :: FOR THE PERIODS ENDED MAY 31, 2017 :: 209
UltraPro UltraPro Ultra MSCI Nasdaq Financial Ultra Emerging Ultra Ultra MSCI Biotechnology Select Sector MSCI EAFE Markets FTSE Europe Brazil Capped Year Ended Year Ended Year Ended Year Ended Year Ended Year Ended May 31, 2017 May 31, 2017 May 31, 2017 May 31, 2017 May 31, 2017 May 31, 2017
INVESTMENT INCOME:Dividends $ 152,035 $ 179,744 $ — $ — $ — $ —Interest 40,002 1,696 71,925 70,079 29,963 51,325Foreign withholding tax on income (62) — — — — —
Total Investment Income 191,975 181,440 71,925 70,079 29,963 51,325
EXPENSES:Advisory fees (Note 4) 293,429 119,082 192,786 193,005 75,827 170,889Management Services fees (Note 4) 39,123 15,877 25,705 25,734 10,110 22,785Professional fees 17,784 19,411 19,372 21,317 19,334 19,590Administration fees (Note 5) 69,174 72,723 40,758 39,121 39,113 39,117Custodian fees (Note 6) 30,594 5,241 3,098 1,987 596 1,810Printing and Shareholder reports 12,334 5,884 3,254 4,667 886 5,379Listing, Data and related fees (Note 7) 47,306 34,108 14,031 15,929 8,954 14,502Trustees fees (Note 8) 892 339 134 545 303 454Compliance services fees (Note 4) 258 170 — 149 96 103Recoupment of prior expenses
waived and/or reimbursed by Advisor (Note 4) — — — — — —
Other fees 8,245 4,676 7,481 5,237 4,647 5,376
Total Gross Expenses before fees waived and/or reimbursed 519,139 277,511 306,619 307,691 159,866 280,005
LESS:Expenses waived and/or reimbursed by Advisor (Note 4) (146,810) (126,422) (61,740) (62,544) (63,589) (62,848)
Total Net Expenses 372,329 151,089 244,879 245,147 96,277 217,157
Net Investment Income (Loss) (180,354) 30,351 (172,954) (175,068) (66,314) (165,832)
NET REALIZED GAIN (LOSS) ON:Investments (909,775) (174,254) 2,018 1 — (303)Futures contracts — — — — — —Non-exchange traded swap agreements (1,354,230) 1,175,713 (3,944,013) 852,306 (861,211) 9,301,524In-kind redemptions of investments 3,731,525 507,355 — — — —Foreign currency transactions — — — — — — Net realized gain (loss) 1,467,520 1,508,814 (3,941,995) 852,307 (861,211) 9,301,221
CHANGE IN NET UNREALIZED APPRECIATION/DEPRECIATION ON:Investments (2,113,343) 137,180 5,045 694 — —Futures contracts — — — — — —Non-exchange traded swap agreements 3,444,393 1,991,739 8,917,343 9,223,233 4,154,419 2,282,686 Change in net unrealized
appreciation/depreciation 1,331,050 2,128,919 8,922,388 9,223,927 4,154,419 2,282,686 Net realized and unrealized gain (loss) 2,798,570 3,637,733 4,980,393 10,076,234 3,293,208 11,583,907 Change in Net Assets Resulting
from Operations $ 2,618,216 $ 3,668,084 $ 4,807,439 $ 9,901,166 $ 3,226,894 $ 11,418,075
See accompanying notes to the financial statements.
Merrill Corp - Proshares Trust Geared Book [96 Funds] Annual Report [Funds] 333-089822 05-31-2017 ED [AUX] | eperez | 28-Jul-17 17:41 | 17-15159-3.gc | Sequence: 16CHKSUM Content: 61861 Layout: 12998 Graphics: No Graphics CLEAN
JOB: 17-15159-3 CYCLE#;BL#: 5; 0 TRIM: 8.25" x 10.75" COMPOSITECOLORS: Black, ~note-color 2, ~note-color 3 GRAPHICS: none V1.5
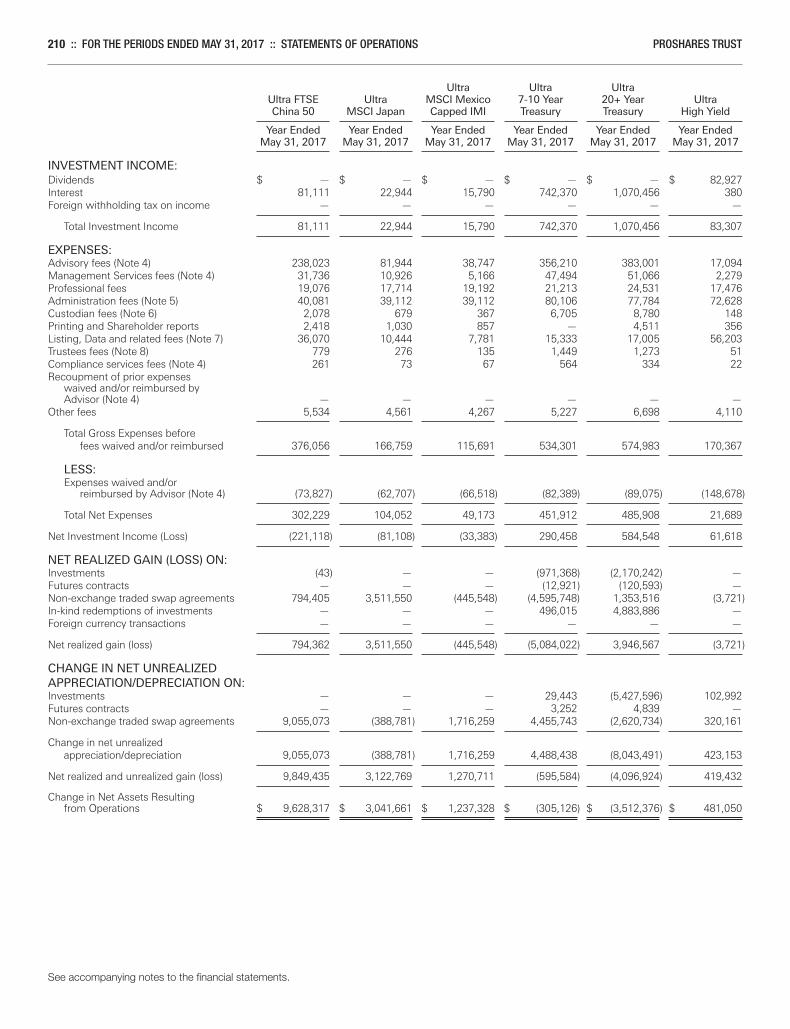
210 :: FOR THE PERIODS ENDED MAY 31, 2017 :: STATEMENTS OF OPERATIONS PROSHARES TRUST
Ultra Ultra Ultra Ultra FTSE Ultra MSCI Mexico 7-10 Year 20+ Year Ultra China 50 MSCI Japan Capped IMI Treasury Treasury High Yield Year Ended Year Ended Year Ended Year Ended Year Ended Year Ended May 31, 2017 May 31, 2017 May 31, 2017 May 31, 2017 May 31, 2017 May 31, 2017
INVESTMENT INCOME:Dividends $ — $ — $ — $ — $ — $ 82,927Interest 81,111 22,944 15,790 742,370 1,070,456 380Foreign withholding tax on income — — — — — —
Total Investment Income 81,111 22,944 15,790 742,370 1,070,456 83,307
EXPENSES:Advisory fees (Note 4) 238,023 81,944 38,747 356,210 383,001 17,094Management Services fees (Note 4) 31,736 10,926 5,166 47,494 51,066 2,279Professional fees 19,076 17,714 19,192 21,213 24,531 17,476Administration fees (Note 5) 40,081 39,112 39,112 80,106 77,784 72,628Custodian fees (Note 6) 2,078 679 367 6,705 8,780 148Printing and Shareholder reports 2,418 1,030 857 — 4,511 356Listing, Data and related fees (Note 7) 36,070 10,444 7,781 15,333 17,005 56,203Trustees fees (Note 8) 779 276 135 1,449 1,273 51Compliance services fees (Note 4) 261 73 67 564 334 22Recoupment of prior expenses
waived and/or reimbursed by Advisor (Note 4) — — — — — —
Other fees 5,534 4,561 4,267 5,227 6,698 4,110
Total Gross Expenses before fees waived and/or reimbursed 376,056 166,759 115,691 534,301 574,983 170,367
LESS:Expenses waived and/or reimbursed by Advisor (Note 4) (73,827) (62,707) (66,518) (82,389) (89,075) (148,678)
Total Net Expenses 302,229 104,052 49,173 451,912 485,908 21,689
Net Investment Income (Loss) (221,118) (81,108) (33,383) 290,458 584,548 61,618
NET REALIZED GAIN (LOSS) ON:Investments (43) — — (971,368) (2,170,242) —Futures contracts — — — (12,921) (120,593) —Non-exchange traded swap agreements 794,405 3,511,550 (445,548) (4,595,748) 1,353,516 (3,721)In-kind redemptions of investments — — — 496,015 4,883,886 —Foreign currency transactions — — — — — — Net realized gain (loss) 794,362 3,511,550 (445,548) (5,084,022) 3,946,567 (3,721)
CHANGE IN NET UNREALIZED APPRECIATION/DEPRECIATION ON:Investments — — — 29,443 (5,427,596) 102,992Futures contracts — — — 3,252 4,839 —Non-exchange traded swap agreements 9,055,073 (388,781) 1,716,259 4,455,743 (2,620,734) 320,161 Change in net unrealized
appreciation/depreciation 9,055,073 (388,781) 1,716,259 4,488,438 (8,043,491) 423,153 Net realized and unrealized gain (loss) 9,849,435 3,122,769 1,270,711 (595,584) (4,096,924) 419,432 Change in Net Assets Resulting
from Operations $ 9,628,317 $ 3,041,661 $ 1,237,328 $ (305,126) $ (3,512,376) $ 481,050
See accompanying notes to the financial statements.
Merrill Corp - Proshares Trust Geared Book [96 Funds] Annual Report [Funds] 333-089822 05-31-2017 ED [AUX] | eperez | 28-Jul-17 17:41 | 17-15159-3.gc | Sequence: 17CHKSUM Content: 62718 Layout: 13592 Graphics: No Graphics CLEAN
JOB: 17-15159-3 CYCLE#;BL#: 5; 0 TRIM: 8.25" x 10.75" COMPOSITECOLORS: Black, ~note-color 2, ~note-color 3 GRAPHICS: none V1.5

PROSHARES TRUST STATEMENTS OF CHANGES IN NET ASSETS :: FOR THE PERIODS INDICATED :: 211
STATEMENTS OF CHANGES IN NET ASSETS
Merrill Corp - Proshares Trust Geared Book [96 Funds] Annual Report [Funds] 333-089822 05-31-2017 ED [AUX] | eperez | 28-Jul-17 17:42 | 17-15159-3.ge | Sequence: 1CHKSUM Content: 15656 Layout: 45011 Graphics: No Graphics CLEAN
JOB: 17-15159-3 CYCLE#;BL#: 5; 0 TRIM: 8.25" x 10.75" COMPOSITECOLORS: Black, ~note-color 2, ~note-color 3 GRAPHICS: none V1.5

212 :: FOR THE PERIODS INDICATED :: STATEMENTS OF CHANGES IN NET ASSETS PROSHARES TRUST
Short S&P500® Short QQQ® Short Dow30SM
Year Ended Year Ended Year Ended Year Ended Year Ended Year Ended May 31, 2017 May 31, 2016 May 31, 2017 May 31, 2016 May 31, 2017 May 31, 2016
FROM INVESTMENT ACTIVITIES:
OPERATIONS:Net investment income (loss) $ (10,603,991) $ (15,196,057) $ (1,753,760) $ (2,544,217) $ (1,564,426) $ (2,761,283)
Net realized gain (loss) (262,451,131) (185,831,025) (61,645,238) (55,322,721) (28,653,324) (27,406,938)
Change in net unrealizedappreciation/depreciation (78,892,019) (29,207,344) (18,292,355) 10,287,856 (27,576,303) 6,680,682
Change in Net Assets Resultingfrom Operations (351,947,141) (230,234,426) (81,691,353) (47,579,082) (57,794,053) (23,487,539)
DISTRIBUTIONS TO SHAREHOLDERS FROM:Net investment income — — — — — —
Net realized gains on investments — — — — — —
Tax return of capital — — — — — —
Total distributions — — — — — —
CAPITAL TRANSACTIONS (a):Proceeds from shares issued 1,233,493,319 3,131,972,478 256,044,701 602,008,089 107,861,258 408,293,223
Cost of shares redeemed (1,880,891,275) (1,428,313,441) (357,420,620) (272,370,171) (138,206,524) (291,939,303)
Change in net assets resultingfrom capital transactions (647,397,956) 1,703,659,037 (101,375,919) 329,637,918 (30,345,266) 116,353,920
Change in net assets (999,345,097) 1,473,424,611 (183,067,272) 282,058,836 (88,139,319) 92,866,381
NET ASSETS:Beginning of period $ 3,012,814,197 $ 1,539,389,586 $ 464,351,671 $ 182,292,835 $ 346,079,398 $ 253,213,017
End of period $ 2,013,469,100 $ 3,012,814,197 $ 281,284,399 $ 464,351,671 $ 257,940,079 $ 346,079,398
Accumulated undistributednet investment income (loss)included in end of periodnet assets $ (17,098,607) $ (20,200,132) $ (2,954,640) $ (3,248,043) $ (2,595,299) $ (3,605,834)
SHARE TRANSACTIONS:Beginning of period 75,562,500(b) 36,762,500(b) 8,962,500 3,312,500 16,000,000 11,200,000
Issued 33,475,000(b) 72,525,000(b) 5,300,000 10,650,000 5,400,000 17,400,000
Issued in-kind —(b) —(b) — — — —
Redeemed (49,281,674)(b) (33,725,000)(b) (7,150,000) (5,000,000) (6,850,000) (12,600,000)
Redemption in-kind —(b) —(b) — — — —
Shares outstanding, end of period 59,755,826(b) 75,562,500(b) 7,112,500 8,962,500 14,550,000 16,000,000
(a) Capital share transactions may include transaction fees associated with Creation and Redemption transactions which occurred during the period.See Note 10 to the Financial Statements.
(b) As described in Note 13, share amounts have been restated on a retroactive basis to reflect a 1:2 reverse stock split effective June 24, 2016.
See accompanying notes to the financial statements.
Merrill Corp - Proshares Trust Geared Book [96 Funds] Annual Report [Funds] 333-089822 05-31-2017 ED [AUX] | eperez | 28-Jul-17 17:42 | 17-15159-3.ge | Sequence: 2CHKSUM Content: 42985 Layout: 45590 Graphics: No Graphics CLEAN
JOB: 17-15159-3 CYCLE#;BL#: 5; 0 TRIM: 8.25" x 10.75" COMPOSITECOLORS: Black, ~note-color 2, ~note-color 3 GRAPHICS: none V1.5
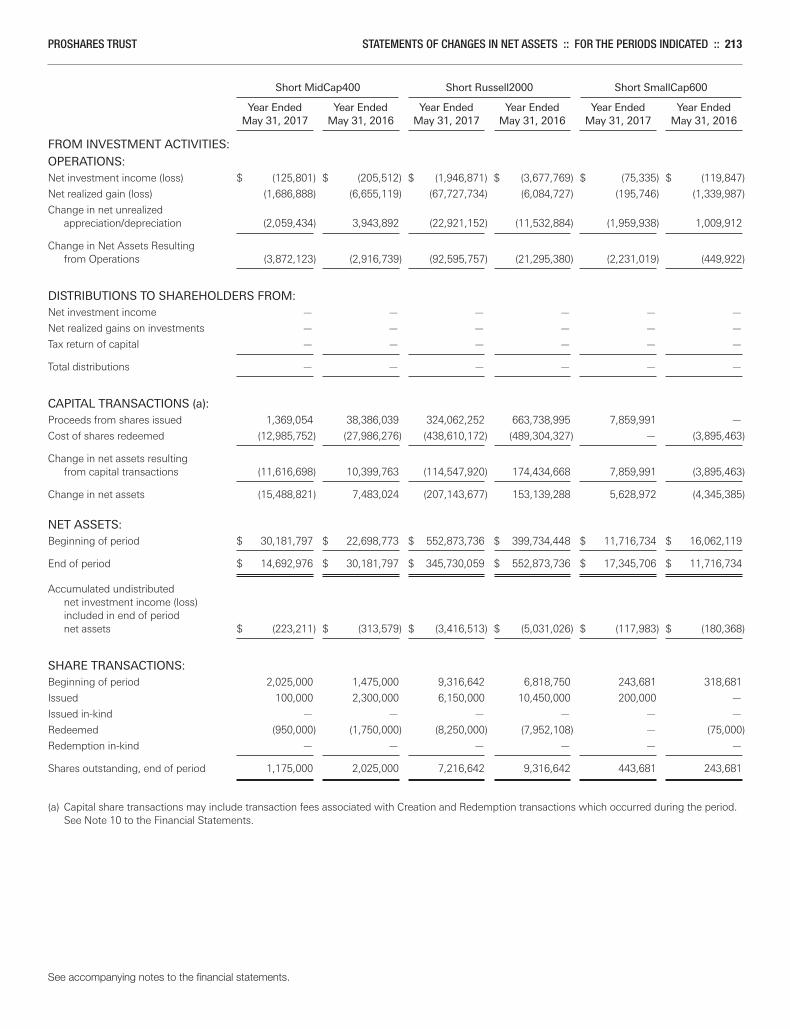
PROSHARES TRUST STATEMENTS OF CHANGES IN NET ASSETS :: FOR THE PERIODS INDICATED :: 213
Short MidCap400 Short Russell2000 Short SmallCap600 Year Ended Year Ended Year Ended Year Ended Year Ended Year Ended May 31, 2017 May 31, 2016 May 31, 2017 May 31, 2016 May 31, 2017 May 31, 2016
FROM INVESTMENT ACTIVITIES:
OPERATIONS:Net investment income (loss) $ (125,801) $ (205,512) $ (1,946,871) $ (3,677,769) $ (75,335) $ (119,847)
Net realized gain (loss) (1,686,888) (6,655,119) (67,727,734) (6,084,727) (195,746) (1,339,987)
Change in net unrealizedappreciation/depreciation (2,059,434) 3,943,892 (22,921,152) (11,532,884) (1,959,938) 1,009,912
Change in Net Assets Resultingfrom Operations (3,872,123) (2,916,739) (92,595,757) (21,295,380) (2,231,019) (449,922)
DISTRIBUTIONS TO SHAREHOLDERS FROM:Net investment income — — — — — —
Net realized gains on investments — — — — — —
Tax return of capital — — — — — —
Total distributions — — — — — —
CAPITAL TRANSACTIONS (a):Proceeds from shares issued 1,369,054 38,386,039 324,062,252 663,738,995 7,859,991 —
Cost of shares redeemed (12,985,752) (27,986,276) (438,610,172) (489,304,327) — (3,895,463)
Change in net assets resultingfrom capital transactions (11,616,698) 10,399,763 (114,547,920) 174,434,668 7,859,991 (3,895,463)
Change in net assets (15,488,821) 7,483,024 (207,143,677) 153,139,288 5,628,972 (4,345,385)
NET ASSETS:Beginning of period $ 30,181,797 $ 22,698,773 $ 552,873,736 $ 399,734,448 $ 11,716,734 $ 16,062,119
End of period $ 14,692,976 $ 30,181,797 $ 345,730,059 $ 552,873,736 $ 17,345,706 $ 11,716,734
Accumulated undistributednet investment income (loss)included in end of periodnet assets $ (223,211) $ (313,579) $ (3,416,513) $ (5,031,026) $ (117,983) $ (180,368)
SHARE TRANSACTIONS:Beginning of period 2,025,000 1,475,000 9,316,642 6,818,750 243,681 318,681
Issued 100,000 2,300,000 6,150,000 10,450,000 200,000 —
Issued in-kind — — — — — —
Redeemed (950,000) (1,750,000) (8,250,000) (7,952,108) — (75,000)
Redemption in-kind — — — — — —
Shares outstanding, end of period 1,175,000 2,025,000 7,216,642 9,316,642 443,681 243,681
(a) Capital share transactions may include transaction fees associated with Creation and Redemption transactions which occurred during the period.See Note 10 to the Financial Statements.
See accompanying notes to the financial statements.
Merrill Corp - Proshares Trust Geared Book [96 Funds] Annual Report [Funds] 333-089822 05-31-2017 ED [AUX] | eperez | 28-Jul-17 17:42 | 17-15159-3.ge | Sequence: 3CHKSUM Content: 17118 Layout: 51580 Graphics: No Graphics CLEAN
JOB: 17-15159-3 CYCLE#;BL#: 5; 0 TRIM: 8.25" x 10.75" COMPOSITECOLORS: Black, ~note-color 2, ~note-color 3 GRAPHICS: none V1.5
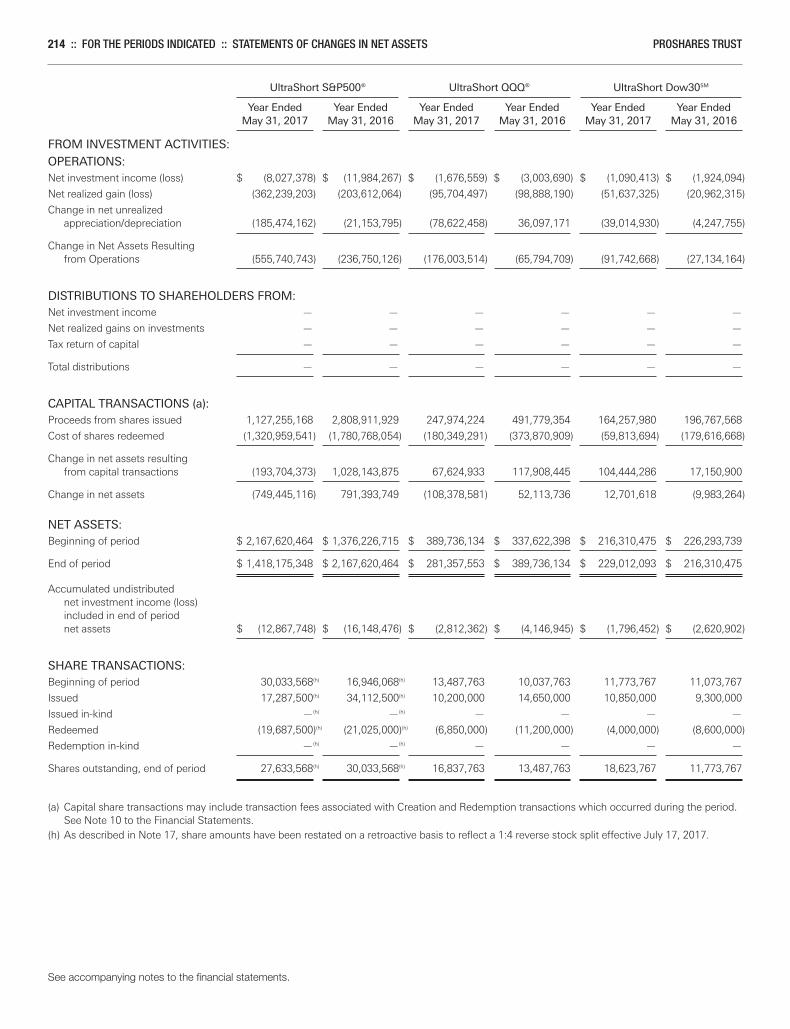
214 :: FOR THE PERIODS INDICATED :: STATEMENTS OF CHANGES IN NET ASSETS PROSHARES TRUST
UltraShort S&P500® UltraShort QQQ® UltraShort Dow30SM
Year Ended Year Ended Year Ended Year Ended Year Ended Year Ended May 31, 2017 May 31, 2016 May 31, 2017 May 31, 2016 May 31, 2017 May 31, 2016
FROM INVESTMENT ACTIVITIES:
OPERATIONS:Net investment income (loss) $ (8,027,378) $ (11,984,267) $ (1,676,559) $ (3,003,690) $ (1,090,413) $ (1,924,094)
Net realized gain (loss) (362,239,203) (203,612,064) (95,704,497) (98,888,190) (51,637,325) (20,962,315)
Change in net unrealizedappreciation/depreciation (185,474,162) (21,153,795) (78,622,458) 36,097,171 (39,014,930) (4,247,755)
Change in Net Assets Resultingfrom Operations (555,740,743) (236,750,126) (176,003,514) (65,794,709) (91,742,668) (27,134,164)
DISTRIBUTIONS TO SHAREHOLDERS FROM:Net investment income — — — — — —
Net realized gains on investments — — — — — —
Tax return of capital — — — — — —
Total distributions — — — — — —
CAPITAL TRANSACTIONS (a):Proceeds from shares issued 1,127,255,168 2,808,911,929 247,974,224 491,779,354 164,257,980 196,767,568
Cost of shares redeemed (1,320,959,541) (1,780,768,054) (180,349,291) (373,870,909) (59,813,694) (179,616,668)
Change in net assets resultingfrom capital transactions (193,704,373) 1,028,143,875 67,624,933 117,908,445 104,444,286 17,150,900
Change in net assets (749,445,116) 791,393,749 (108,378,581) 52,113,736 12,701,618 (9,983,264)
NET ASSETS:Beginning of period $ 2,167,620,464 $ 1,376,226,715 $ 389,736,134 $ 337,622,398 $ 216,310,475 $ 226,293,739
End of period $ 1,418,175,348 $ 2,167,620,464 $ 281,357,553 $ 389,736,134 $ 229,012,093 $ 216,310,475
Accumulated undistributednet investment income (loss)included in end of periodnet assets $ (12,867,748) $ (16,148,476) $ (2,812,362) $ (4,146,945) $ (1,796,452) $ (2,620,902)
SHARE TRANSACTIONS:Beginning of period 30,033,568(h) 16,946,068(h) 13,487,763 10,037,763 11,773,767 11,073,767
Issued 17,287,500(h) 34,112,500(h) 10,200,000 14,650,000 10,850,000 9,300,000
Issued in-kind —(h) —(h) — — — —
Redeemed (19,687,500)(h) (21,025,000)(h) (6,850,000) (11,200,000) (4,000,000) (8,600,000)
Redemption in-kind —(h) —(h) — — — —
Shares outstanding, end of period 27,633,568(h) 30,033,568(h) 16,837,763 13,487,763 18,623,767 11,773,767
(a) Capital share transactions may include transaction fees associated with Creation and Redemption transactions which occurred during the period.See Note 10 to the Financial Statements.
(h) As described in Note 17, share amounts have been restated on a retroactive basis to reflect a 1:4 reverse stock split effective July 17, 2017.
See accompanying notes to the financial statements.
Merrill Corp - Proshares Trust Geared Book [96 Funds] Annual Report [Funds] 333-089822 05-31-2017 ED [AUX] | eperez | 28-Jul-17 17:42 | 17-15159-3.ge | Sequence: 4CHKSUM Content: 36503 Layout: 50768 Graphics: No Graphics CLEAN
JOB: 17-15159-3 CYCLE#;BL#: 5; 0 TRIM: 8.25" x 10.75" COMPOSITECOLORS: Black, ~note-color 2, ~note-color 3 GRAPHICS: none V1.5
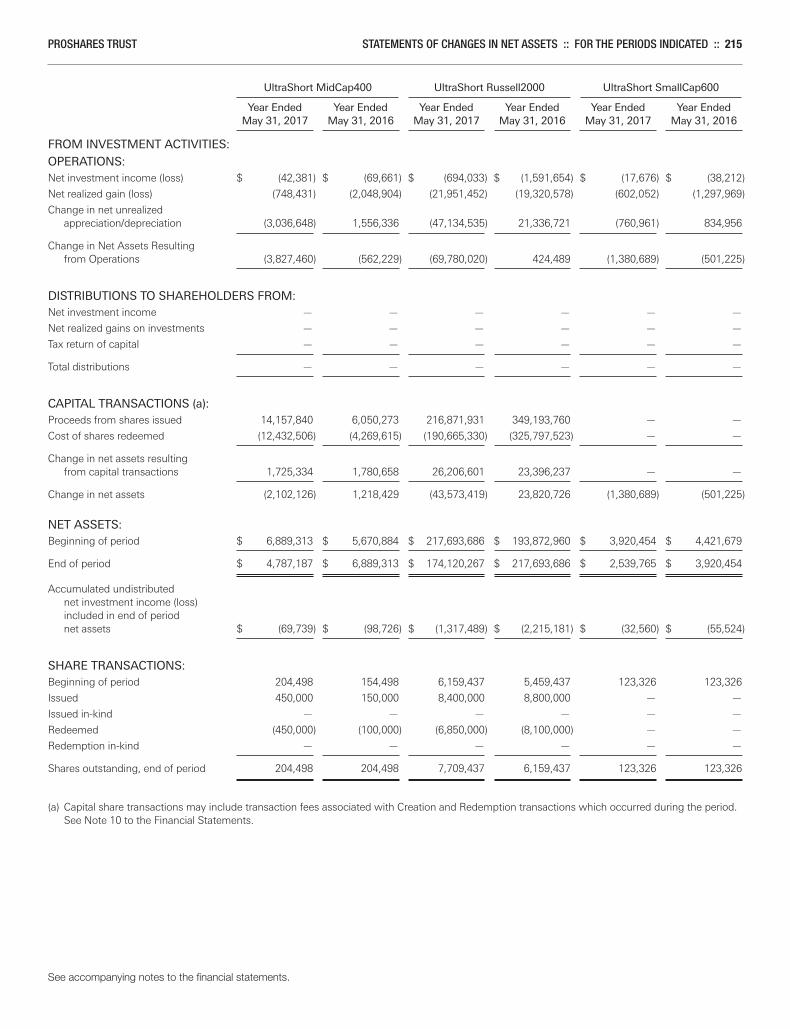
PROSHARES TRUST STATEMENTS OF CHANGES IN NET ASSETS :: FOR THE PERIODS INDICATED :: 215
UltraShort MidCap400 UltraShort Russell2000 UltraShort SmallCap600 Year Ended Year Ended Year Ended Year Ended Year Ended Year Ended May 31, 2017 May 31, 2016 May 31, 2017 May 31, 2016 May 31, 2017 May 31, 2016
FROM INVESTMENT ACTIVITIES:
OPERATIONS:Net investment income (loss) $ (42,381) $ (69,661) $ (694,033) $ (1,591,654) $ (17,676) $ (38,212)
Net realized gain (loss) (748,431) (2,048,904) (21,951,452) (19,320,578) (602,052) (1,297,969)
Change in net unrealizedappreciation/depreciation (3,036,648) 1,556,336 (47,134,535) 21,336,721 (760,961) 834,956
Change in Net Assets Resultingfrom Operations (3,827,460) (562,229) (69,780,020) 424,489 (1,380,689) (501,225)
DISTRIBUTIONS TO SHAREHOLDERS FROM:Net investment income — — — — — —
Net realized gains on investments — — — — — —
Tax return of capital — — — — — —
Total distributions — — — — — —
CAPITAL TRANSACTIONS (a):Proceeds from shares issued 14,157,840 6,050,273 216,871,931 349,193,760 — —
Cost of shares redeemed (12,432,506) (4,269,615) (190,665,330) (325,797,523) — —
Change in net assets resultingfrom capital transactions 1,725,334 1,780,658 26,206,601 23,396,237 — —
Change in net assets (2,102,126) 1,218,429 (43,573,419) 23,820,726 (1,380,689) (501,225)
NET ASSETS:Beginning of period $ 6,889,313 $ 5,670,884 $ 217,693,686 $ 193,872,960 $ 3,920,454 $ 4,421,679
End of period $ 4,787,187 $ 6,889,313 $ 174,120,267 $ 217,693,686 $ 2,539,765 $ 3,920,454
Accumulated undistributednet investment income (loss)included in end of periodnet assets $ (69,739) $ (98,726) $ (1,317,489) $ (2,215,181) $ (32,560) $ (55,524)
SHARE TRANSACTIONS:Beginning of period 204,498 154,498 6,159,437 5,459,437 123,326 123,326
Issued 450,000 150,000 8,400,000 8,800,000 — —
Issued in-kind — — — — — —
Redeemed (450,000) (100,000) (6,850,000) (8,100,000) — —
Redemption in-kind — — — — — —
Shares outstanding, end of period 204,498 204,498 7,709,437 6,159,437 123,326 123,326
(a) Capital share transactions may include transaction fees associated with Creation and Redemption transactions which occurred during the period.See Note 10 to the Financial Statements.
See accompanying notes to the financial statements.
Merrill Corp - Proshares Trust Geared Book [96 Funds] Annual Report [Funds] 333-089822 05-31-2017 ED [AUX] | eperez | 28-Jul-17 17:42 | 17-15159-3.ge | Sequence: 5CHKSUM Content: 352 Layout: 39442 Graphics: No Graphics CLEAN
JOB: 17-15159-3 CYCLE#;BL#: 5; 0 TRIM: 8.25" x 10.75" COMPOSITECOLORS: Black, ~note-color 2, ~note-color 3 GRAPHICS: none V1.5
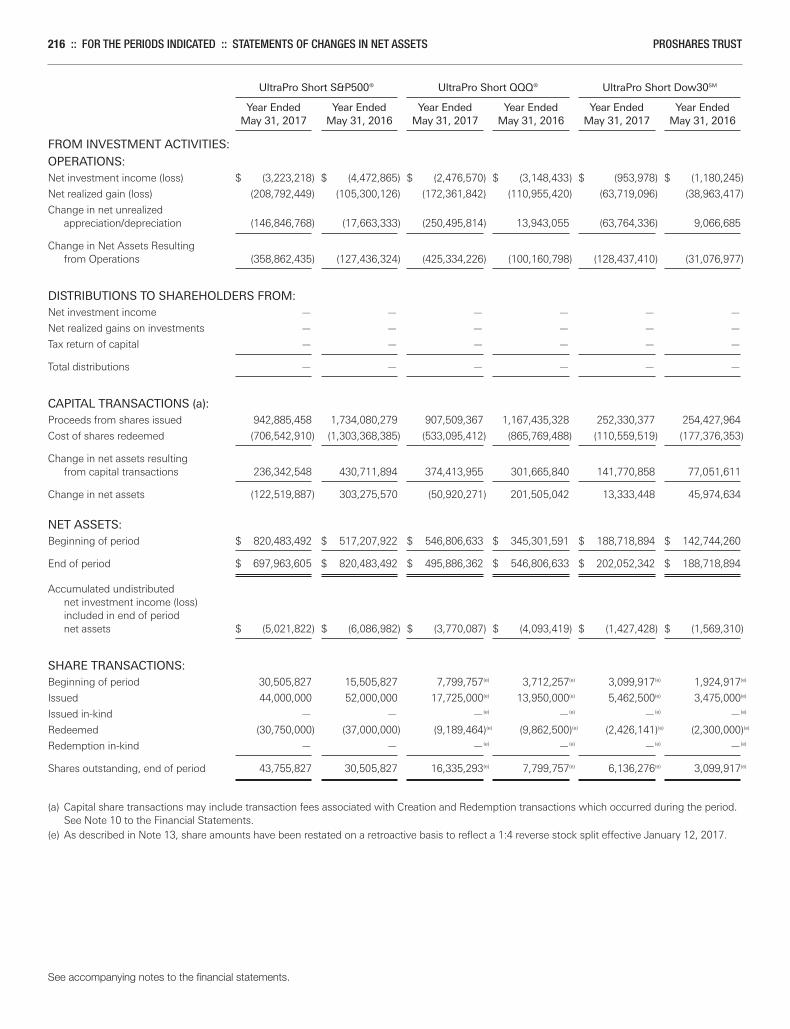
216 :: FOR THE PERIODS INDICATED :: STATEMENTS OF CHANGES IN NET ASSETS PROSHARES TRUST
UltraPro Short S&P500® UltraPro Short QQQ® UltraPro Short Dow30SM
Year Ended Year Ended Year Ended Year Ended Year Ended Year Ended May 31, 2017 May 31, 2016 May 31, 2017 May 31, 2016 May 31, 2017 May 31, 2016
FROM INVESTMENT ACTIVITIES:
OPERATIONS:Net investment income (loss) $ (3,223,218) $ (4,472,865) $ (2,476,570) $ (3,148,433) $ (953,978) $ (1,180,245)
Net realized gain (loss) (208,792,449) (105,300,126) (172,361,842) (110,955,420) (63,719,096) (38,963,417)
Change in net unrealizedappreciation/depreciation (146,846,768) (17,663,333) (250,495,814) 13,943,055 (63,764,336) 9,066,685
Change in Net Assets Resultingfrom Operations (358,862,435) (127,436,324) (425,334,226) (100,160,798) (128,437,410) (31,076,977)
DISTRIBUTIONS TO SHAREHOLDERS FROM:Net investment income — — — — — —
Net realized gains on investments — — — — — —
Tax return of capital — — — — — —
Total distributions — — — — — —
CAPITAL TRANSACTIONS (a):Proceeds from shares issued 942,885,458 1,734,080,279 907,509,367 1,167,435,328 252,330,377 254,427,964
Cost of shares redeemed (706,542,910) (1,303,368,385) (533,095,412) (865,769,488) (110,559,519) (177,376,353)
Change in net assets resultingfrom capital transactions 236,342,548 430,711,894 374,413,955 301,665,840 141,770,858 77,051,611
Change in net assets (122,519,887) 303,275,570 (50,920,271) 201,505,042 13,333,448 45,974,634
NET ASSETS:Beginning of period $ 820,483,492 $ 517,207,922 $ 546,806,633 $ 345,301,591 $ 188,718,894 $ 142,744,260
End of period $ 697,963,605 $ 820,483,492 $ 495,886,362 $ 546,806,633 $ 202,052,342 $ 188,718,894
Accumulated undistributednet investment income (loss)included in end of periodnet assets $ (5,021,822) $ (6,086,982) $ (3,770,087) $ (4,093,419) $ (1,427,428) $ (1,569,310)
SHARE TRANSACTIONS:Beginning of period 30,505,827 15,505,827 7,799,757(e) 3,712,257(e) 3,099,917(e) 1,924,917(e)
Issued 44,000,000 52,000,000 17,725,000(e) 13,950,000(e) 5,462,500(e) 3,475,000(e)
Issued in-kind — — —(e) —(e) —(e) —(e)
Redeemed (30,750,000) (37,000,000) (9,189,464)(e) (9,862,500)(e) (2,426,141)(e) (2,300,000)(e)
Redemption in-kind — — —(e) —(e) —(e) —(e)
Shares outstanding, end of period 43,755,827 30,505,827 16,335,293(e) 7,799,757(e) 6,136,276(e) 3,099,917(e)
(a) Capital share transactions may include transaction fees associated with Creation and Redemption transactions which occurred during the period.See Note 10 to the Financial Statements.
(e) As described in Note 13, share amounts have been restated on a retroactive basis to reflect a 1:4 reverse stock split effective January 12, 2017.
See accompanying notes to the financial statements.
Merrill Corp - Proshares Trust Geared Book [96 Funds] Annual Report [Funds] 333-089822 05-31-2017 ED [AUX] | eperez | 28-Jul-17 17:42 | 17-15159-3.ge | Sequence: 6CHKSUM Content: 29181 Layout: 29324 Graphics: No Graphics CLEAN
JOB: 17-15159-3 CYCLE#;BL#: 5; 0 TRIM: 8.25" x 10.75" COMPOSITECOLORS: Black, ~note-color 2, ~note-color 3 GRAPHICS: none V1.5
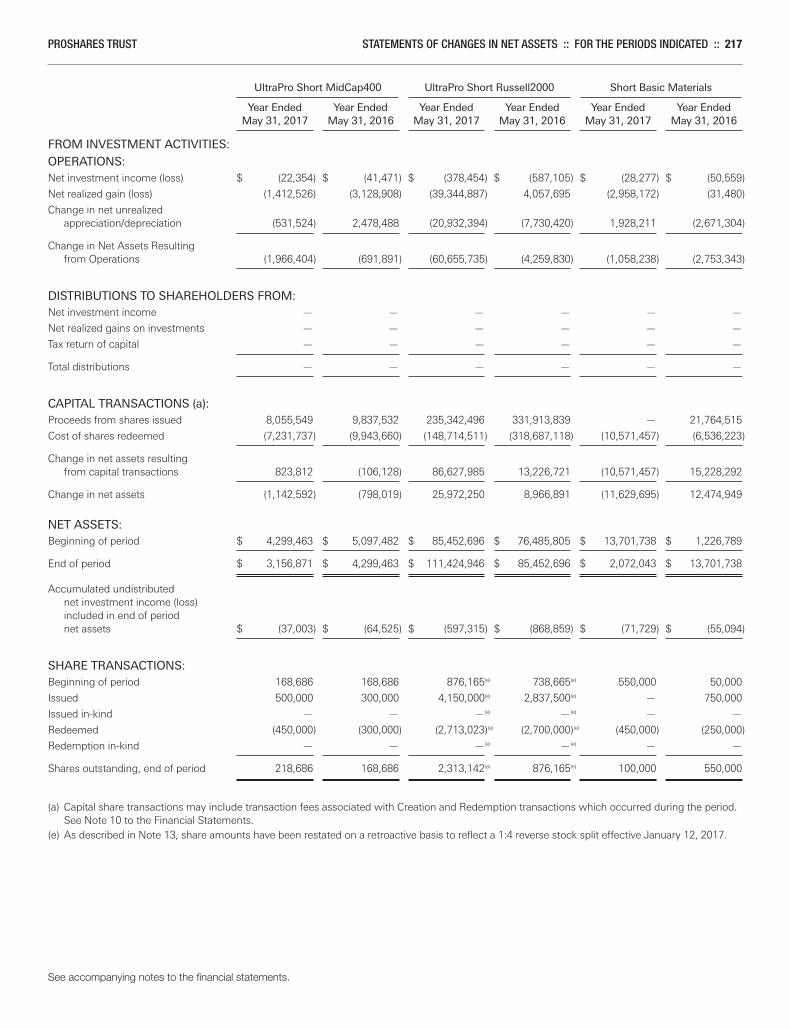
PROSHARES TRUST STATEMENTS OF CHANGES IN NET ASSETS :: FOR THE PERIODS INDICATED :: 217
UltraPro Short MidCap400 UltraPro Short Russell2000 Short Basic Materials Year Ended Year Ended Year Ended Year Ended Year Ended Year Ended May 31, 2017 May 31, 2016 May 31, 2017 May 31, 2016 May 31, 2017 May 31, 2016
FROM INVESTMENT ACTIVITIES:
OPERATIONS:Net investment income (loss) $ (22,354) $ (41,471) $ (378,454) $ (587,105) $ (28,277) $ (50,559)
Net realized gain (loss) (1,412,526) (3,128,908) (39,344,887) 4,057,695 (2,958,172) (31,480)
Change in net unrealizedappreciation/depreciation (531,524) 2,478,488 (20,932,394) (7,730,420) 1,928,211 (2,671,304)
Change in Net Assets Resultingfrom Operations (1,966,404) (691,891) (60,655,735) (4,259,830) (1,058,238) (2,753,343)
DISTRIBUTIONS TO SHAREHOLDERS FROM:Net investment income — — — — — —
Net realized gains on investments — — — — — —
Tax return of capital — — — — — —
Total distributions — — — — — —
CAPITAL TRANSACTIONS (a):Proceeds from shares issued 8,055,549 9,837,532 235,342,496 331,913,839 — 21,764,515
Cost of shares redeemed (7,231,737) (9,943,660) (148,714,511) (318,687,118) (10,571,457) (6,536,223)
Change in net assets resultingfrom capital transactions 823,812 (106,128) 86,627,985 13,226,721 (10,571,457) 15,228,292
Change in net assets (1,142,592) (798,019) 25,972,250 8,966,891 (11,629,695) 12,474,949
NET ASSETS:Beginning of period $ 4,299,463 $ 5,097,482 $ 85,452,696 $ 76,485,805 $ 13,701,738 $ 1,226,789
End of period $ 3,156,871 $ 4,299,463 $ 111,424,946 $ 85,452,696 $ 2,072,043 $ 13,701,738
Accumulated undistributednet investment income (loss)included in end of periodnet assets $ (37,003) $ (64,525) $ (597,315) $ (868,859) $ (71,729) $ (55,094)
SHARE TRANSACTIONS:Beginning of period 168,686 168,686 876,165(e) 738,665(e) 550,000 50,000
Issued 500,000 300,000 4,150,000(e) 2,837,500(e) — 750,000
Issued in-kind — — —(e) —(e) — —
Redeemed (450,000) (300,000) (2,713,023)(e) (2,700,000)(e) (450,000) (250,000)
Redemption in-kind — — —(e) —(e) — —
Shares outstanding, end of period 218,686 168,686 2,313,142(e) 876,165(e) 100,000 550,000
(a) Capital share transactions may include transaction fees associated with Creation and Redemption transactions which occurred during the period.See Note 10 to the Financial Statements.
(e) As described in Note 13, share amounts have been restated on a retroactive basis to reflect a 1:4 reverse stock split effective January 12, 2017.
See accompanying notes to the financial statements.
Merrill Corp - Proshares Trust Geared Book [96 Funds] Annual Report [Funds] 333-089822 05-31-2017 ED [AUX] | eperez | 28-Jul-17 17:42 | 17-15159-3.ge | Sequence: 7CHKSUM Content: 57783 Layout: 44900 Graphics: No Graphics CLEAN
JOB: 17-15159-3 CYCLE#;BL#: 5; 0 TRIM: 8.25" x 10.75" COMPOSITECOLORS: Black, ~note-color 2, ~note-color 3 GRAPHICS: none V1.5
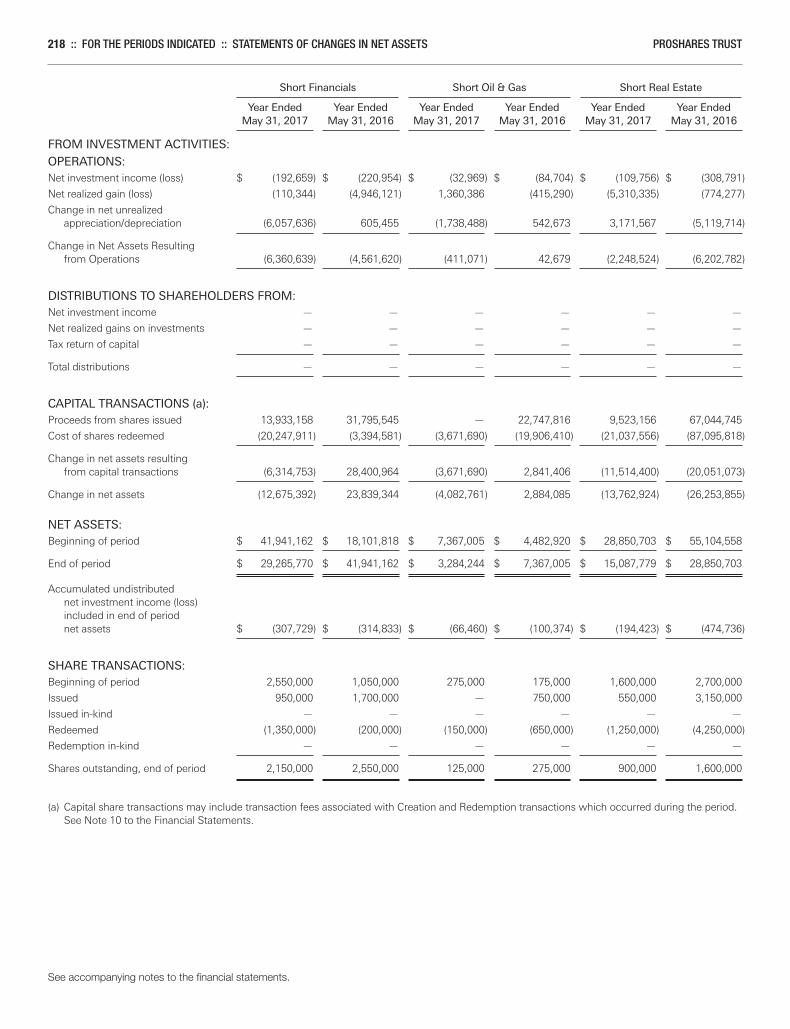
218 :: FOR THE PERIODS INDICATED :: STATEMENTS OF CHANGES IN NET ASSETS PROSHARES TRUST
Short Financials Short Oil & Gas Short Real Estate Year Ended Year Ended Year Ended Year Ended Year Ended Year Ended May 31, 2017 May 31, 2016 May 31, 2017 May 31, 2016 May 31, 2017 May 31, 2016
FROM INVESTMENT ACTIVITIES:
OPERATIONS:Net investment income (loss) $ (192,659) $ (220,954) $ (32,969) $ (84,704) $ (109,756) $ (308,791)
Net realized gain (loss) (110,344) (4,946,121) 1,360,386 (415,290) (5,310,335) (774,277)
Change in net unrealizedappreciation/depreciation (6,057,636) 605,455 (1,738,488) 542,673 3,171,567 (5,119,714)
Change in Net Assets Resultingfrom Operations (6,360,639) (4,561,620) (411,071) 42,679 (2,248,524) (6,202,782)
DISTRIBUTIONS TO SHAREHOLDERS FROM:Net investment income — — — — — —
Net realized gains on investments — — — — — —
Tax return of capital — — — — — —
Total distributions — — — — — —
CAPITAL TRANSACTIONS (a):Proceeds from shares issued 13,933,158 31,795,545 — 22,747,816 9,523,156 67,044,745
Cost of shares redeemed (20,247,911) (3,394,581) (3,671,690) (19,906,410) (21,037,556) (87,095,818)
Change in net assets resultingfrom capital transactions (6,314,753) 28,400,964 (3,671,690) 2,841,406 (11,514,400) (20,051,073)
Change in net assets (12,675,392) 23,839,344 (4,082,761) 2,884,085 (13,762,924) (26,253,855)
NET ASSETS:Beginning of period $ 41,941,162 $ 18,101,818 $ 7,367,005 $ 4,482,920 $ 28,850,703 $ 55,104,558
End of period $ 29,265,770 $ 41,941,162 $ 3,284,244 $ 7,367,005 $ 15,087,779 $ 28,850,703
Accumulated undistributednet investment income (loss)included in end of periodnet assets $ (307,729) $ (314,833) $ (66,460) $ (100,374) $ (194,423) $ (474,736)
SHARE TRANSACTIONS:Beginning of period 2,550,000 1,050,000 275,000 175,000 1,600,000 2,700,000
Issued 950,000 1,700,000 — 750,000 550,000 3,150,000
Issued in-kind — — — — — —
Redeemed (1,350,000) (200,000) (150,000) (650,000) (1,250,000) (4,250,000)
Redemption in-kind — — — — — —
Shares outstanding, end of period 2,150,000 2,550,000 125,000 275,000 900,000 1,600,000
(a) Capital share transactions may include transaction fees associated with Creation and Redemption transactions which occurred during the period.See Note 10 to the Financial Statements.
See accompanying notes to the financial statements.
Merrill Corp - Proshares Trust Geared Book [96 Funds] Annual Report [Funds] 333-089822 05-31-2017 ED [AUX] | eperez | 28-Jul-17 17:42 | 17-15159-3.ge | Sequence: 8CHKSUM Content: 38423 Layout: 40046 Graphics: No Graphics CLEAN
JOB: 17-15159-3 CYCLE#;BL#: 5; 0 TRIM: 8.25" x 10.75" COMPOSITECOLORS: Black, ~note-color 2, ~note-color 3 GRAPHICS: none V1.5
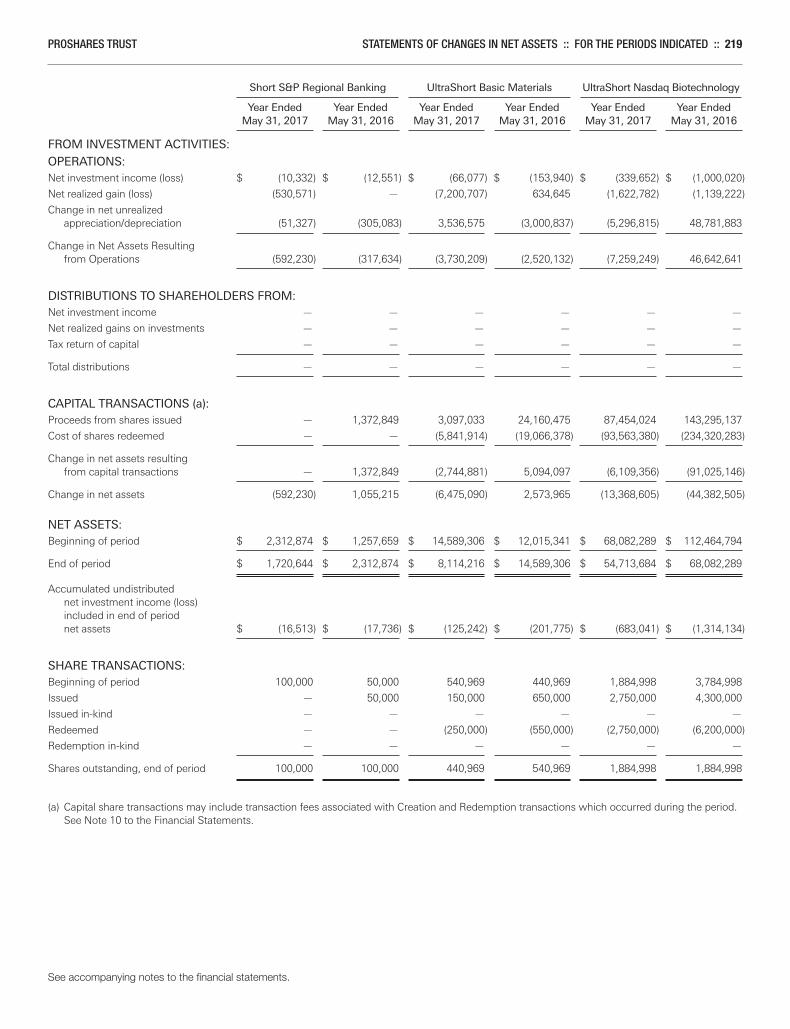
PROSHARES TRUST STATEMENTS OF CHANGES IN NET ASSETS :: FOR THE PERIODS INDICATED :: 219
Short S&P Regional Banking UltraShort Basic Materials UltraShort Nasdaq Biotechnology Year Ended Year Ended Year Ended Year Ended Year Ended Year Ended May 31, 2017 May 31, 2016 May 31, 2017 May 31, 2016 May 31, 2017 May 31, 2016
FROM INVESTMENT ACTIVITIES:
OPERATIONS:Net investment income (loss) $ (10,332) $ (12,551) $ (66,077) $ (153,940) $ (339,652) $ (1,000,020)
Net realized gain (loss) (530,571) — (7,200,707) 634,645 (1,622,782) (1,139,222)
Change in net unrealizedappreciation/depreciation (51,327) (305,083) 3,536,575 (3,000,837) (5,296,815) 48,781,883
Change in Net Assets Resultingfrom Operations (592,230) (317,634) (3,730,209) (2,520,132) (7,259,249) 46,642,641
DISTRIBUTIONS TO SHAREHOLDERS FROM:Net investment income — — — — — —
Net realized gains on investments — — — — — —
Tax return of capital — — — — — —
Total distributions — — — — — —
CAPITAL TRANSACTIONS (a):Proceeds from shares issued — 1,372,849 3,097,033 24,160,475 87,454,024 143,295,137
Cost of shares redeemed — — (5,841,914) (19,066,378) (93,563,380) (234,320,283)
Change in net assets resultingfrom capital transactions — 1,372,849 (2,744,881) 5,094,097 (6,109,356) (91,025,146)
Change in net assets (592,230) 1,055,215 (6,475,090) 2,573,965 (13,368,605) (44,382,505)
NET ASSETS:Beginning of period $ 2,312,874 $ 1,257,659 $ 14,589,306 $ 12,015,341 $ 68,082,289 $ 112,464,794
End of period $ 1,720,644 $ 2,312,874 $ 8,114,216 $ 14,589,306 $ 54,713,684 $ 68,082,289
Accumulated undistributednet investment income (loss)included in end of periodnet assets $ (16,513) $ (17,736) $ (125,242) $ (201,775) $ (683,041) $ (1,314,134)
SHARE TRANSACTIONS:Beginning of period 100,000 50,000 540,969 440,969 1,884,998 3,784,998
Issued — 50,000 150,000 650,000 2,750,000 4,300,000
Issued in-kind — — — — — —
Redeemed — — (250,000) (550,000) (2,750,000) (6,200,000)
Redemption in-kind — — — — — —
Shares outstanding, end of period 100,000 100,000 440,969 540,969 1,884,998 1,884,998
(a) Capital share transactions may include transaction fees associated with Creation and Redemption transactions which occurred during the period.See Note 10 to the Financial Statements.
See accompanying notes to the financial statements.
Merrill Corp - Proshares Trust Geared Book [96 Funds] Annual Report [Funds] 333-089822 05-31-2017 ED [AUX] | eperez | 28-Jul-17 17:42 | 17-15159-3.ge | Sequence: 9CHKSUM Content: 11911 Layout: 349 Graphics: No Graphics CLEAN
JOB: 17-15159-3 CYCLE#;BL#: 5; 0 TRIM: 8.25" x 10.75" COMPOSITECOLORS: Black, ~note-color 2, ~note-color 3 GRAPHICS: none V1.5
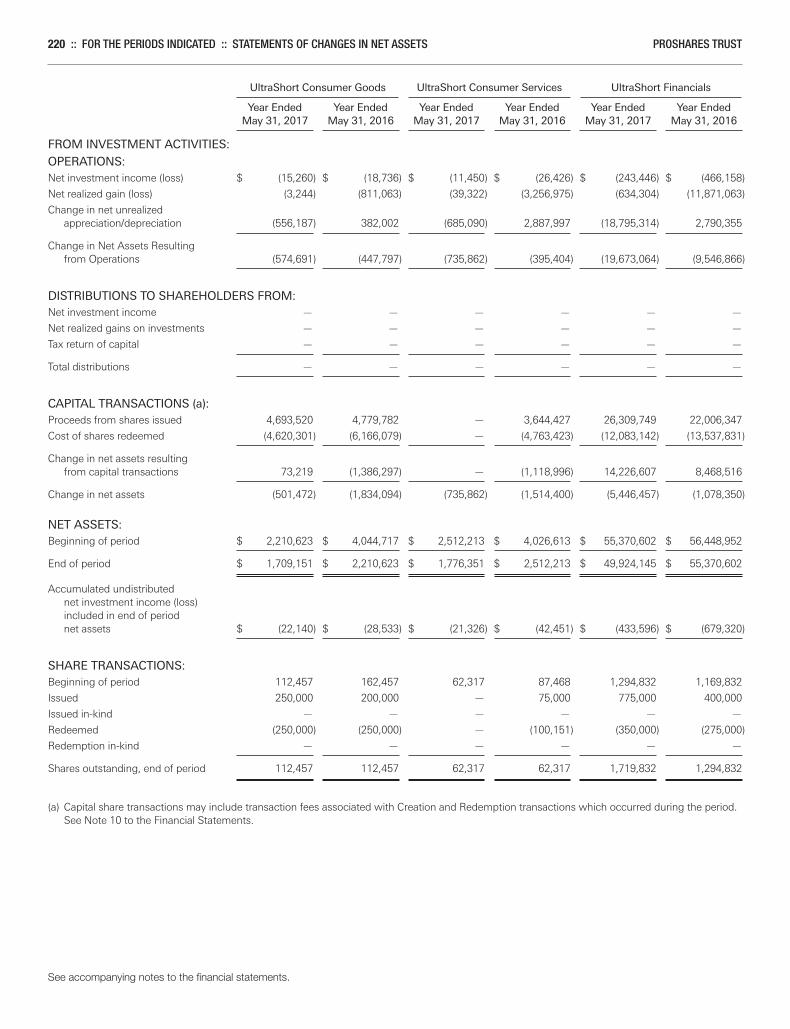
220 :: FOR THE PERIODS INDICATED :: STATEMENTS OF CHANGES IN NET ASSETS PROSHARES TRUST
UltraShort Consumer Goods UltraShort Consumer Services UltraShort Financials Year Ended Year Ended Year Ended Year Ended Year Ended Year Ended May 31, 2017 May 31, 2016 May 31, 2017 May 31, 2016 May 31, 2017 May 31, 2016
FROM INVESTMENT ACTIVITIES:
OPERATIONS:Net investment income (loss) $ (15,260) $ (18,736) $ (11,450) $ (26,426) $ (243,446) $ (466,158)
Net realized gain (loss) (3,244) (811,063) (39,322) (3,256,975) (634,304) (11,871,063)
Change in net unrealizedappreciation/depreciation (556,187) 382,002 (685,090) 2,887,997 (18,795,314) 2,790,355
Change in Net Assets Resultingfrom Operations (574,691) (447,797) (735,862) (395,404) (19,673,064) (9,546,866)
DISTRIBUTIONS TO SHAREHOLDERS FROM:Net investment income — — — — — —
Net realized gains on investments — — — — — —
Tax return of capital — — — — — —
Total distributions — — — — — —
CAPITAL TRANSACTIONS (a):Proceeds from shares issued 4,693,520 4,779,782 — 3,644,427 26,309,749 22,006,347
Cost of shares redeemed (4,620,301) (6,166,079) — (4,763,423) (12,083,142) (13,537,831)
Change in net assets resultingfrom capital transactions 73,219 (1,386,297) — (1,118,996) 14,226,607 8,468,516
Change in net assets (501,472) (1,834,094) (735,862) (1,514,400) (5,446,457) (1,078,350)
NET ASSETS:Beginning of period $ 2,210,623 $ 4,044,717 $ 2,512,213 $ 4,026,613 $ 55,370,602 $ 56,448,952
End of period $ 1,709,151 $ 2,210,623 $ 1,776,351 $ 2,512,213 $ 49,924,145 $ 55,370,602
Accumulated undistributednet investment income (loss)included in end of periodnet assets $ (22,140) $ (28,533) $ (21,326) $ (42,451) $ (433,596) $ (679,320)
SHARE TRANSACTIONS:Beginning of period 112,457 162,457 62,317 87,468 1,294,832 1,169,832
Issued 250,000 200,000 — 75,000 775,000 400,000
Issued in-kind — — — — — —
Redeemed (250,000) (250,000) — (100,151) (350,000) (275,000)
Redemption in-kind — — — — — —
Shares outstanding, end of period 112,457 112,457 62,317 62,317 1,719,832 1,294,832
(a) Capital share transactions may include transaction fees associated with Creation and Redemption transactions which occurred during the period.See Note 10 to the Financial Statements.
See accompanying notes to the financial statements.
Merrill Corp - Proshares Trust Geared Book [96 Funds] Annual Report [Funds] 333-089822 05-31-2017 ED [AUX] | eperez | 28-Jul-17 17:42 | 17-15159-3.ge | Sequence: 10CHKSUM Content: 22280 Layout: 9931 Graphics: No Graphics CLEAN
JOB: 17-15159-3 CYCLE#;BL#: 5; 0 TRIM: 8.25" x 10.75" COMPOSITECOLORS: Black, ~note-color 2, ~note-color 3 GRAPHICS: none V1.5
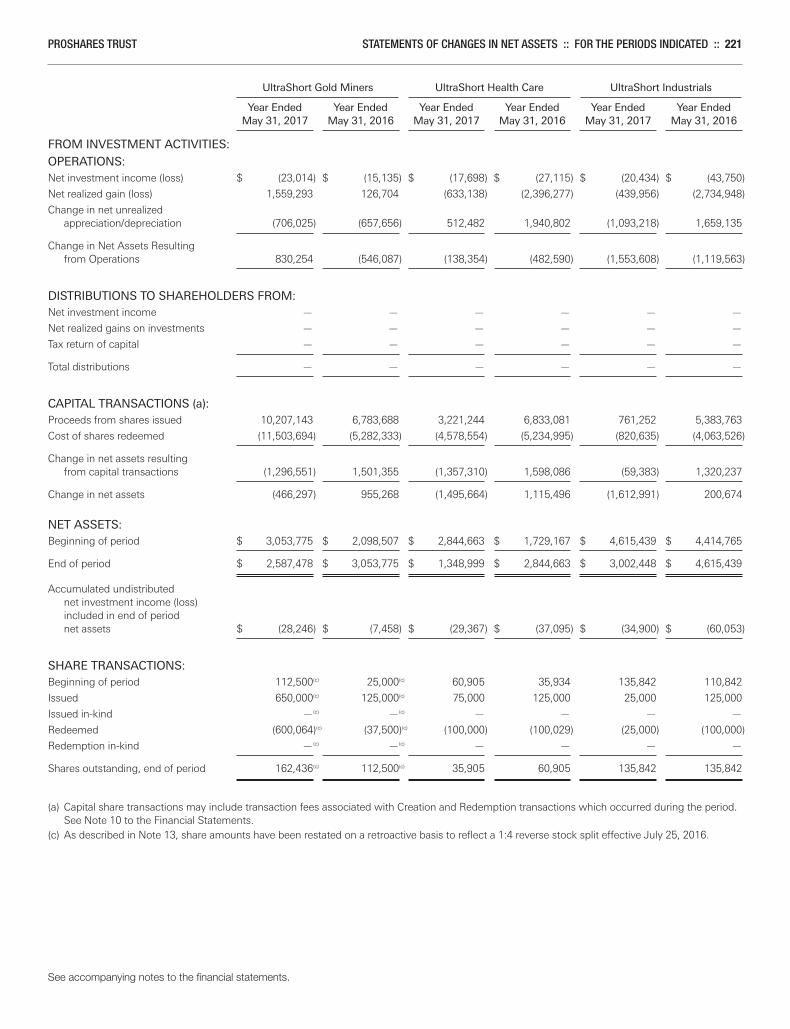
PROSHARES TRUST STATEMENTS OF CHANGES IN NET ASSETS :: FOR THE PERIODS INDICATED :: 221
UltraShort Gold Miners UltraShort Health Care UltraShort Industrials Year Ended Year Ended Year Ended Year Ended Year Ended Year Ended May 31, 2017 May 31, 2016 May 31, 2017 May 31, 2016 May 31, 2017 May 31, 2016
FROM INVESTMENT ACTIVITIES:
OPERATIONS:Net investment income (loss) $ (23,014) $ (15,135) $ (17,698) $ (27,115) $ (20,434) $ (43,750)
Net realized gain (loss) 1,559,293 126,704 (633,138) (2,396,277) (439,956) (2,734,948)
Change in net unrealizedappreciation/depreciation (706,025) (657,656) 512,482 1,940,802 (1,093,218) 1,659,135
Change in Net Assets Resultingfrom Operations 830,254 (546,087) (138,354) (482,590) (1,553,608) (1,119,563)
DISTRIBUTIONS TO SHAREHOLDERS FROM:Net investment income — — — — — —
Net realized gains on investments — — — — — —
Tax return of capital — — — — — —
Total distributions — — — — — —
CAPITAL TRANSACTIONS (a):Proceeds from shares issued 10,207,143 6,783,688 3,221,244 6,833,081 761,252 5,383,763
Cost of shares redeemed (11,503,694) (5,282,333) (4,578,554) (5,234,995) (820,635) (4,063,526)
Change in net assets resultingfrom capital transactions (1,296,551) 1,501,355 (1,357,310) 1,598,086 (59,383) 1,320,237
Change in net assets (466,297) 955,268 (1,495,664) 1,115,496 (1,612,991) 200,674
NET ASSETS:Beginning of period $ 3,053,775 $ 2,098,507 $ 2,844,663 $ 1,729,167 $ 4,615,439 $ 4,414,765
End of period $ 2,587,478 $ 3,053,775 $ 1,348,999 $ 2,844,663 $ 3,002,448 $ 4,615,439
Accumulated undistributednet investment income (loss)included in end of periodnet assets $ (28,246) $ (7,458) $ (29,367) $ (37,095) $ (34,900) $ (60,053)
SHARE TRANSACTIONS:Beginning of period 112,500(c) 25,000(c) 60,905 35,934 135,842 110,842
Issued 650,000(c) 125,000(c) 75,000 125,000 25,000 125,000
Issued in-kind —(c) —(c) — — — —
Redeemed (600,064)(c) (37,500)(c) (100,000) (100,029) (25,000) (100,000)
Redemption in-kind —(c) —(c) — — — —
Shares outstanding, end of period 162,436(c) 112,500(c) 35,905 60,905 135,842 135,842
(a) Capital share transactions may include transaction fees associated with Creation and Redemption transactions which occurred during the period.See Note 10 to the Financial Statements.
(c) As described in Note 13, share amounts have been restated on a retroactive basis to reflect a 1:4 reverse stock split effective July 25, 2016.
See accompanying notes to the financial statements.
Merrill Corp - Proshares Trust Geared Book [96 Funds] Annual Report [Funds] 333-089822 05-31-2017 ED [AUX] | eperez | 28-Jul-17 17:42 | 17-15159-3.ge | Sequence: 11CHKSUM Content: 64969 Layout: 56556 Graphics: No Graphics CLEAN
JOB: 17-15159-3 CYCLE#;BL#: 5; 0 TRIM: 8.25" x 10.75" COMPOSITECOLORS: Black, ~note-color 2, ~note-color 3 GRAPHICS: none V1.5
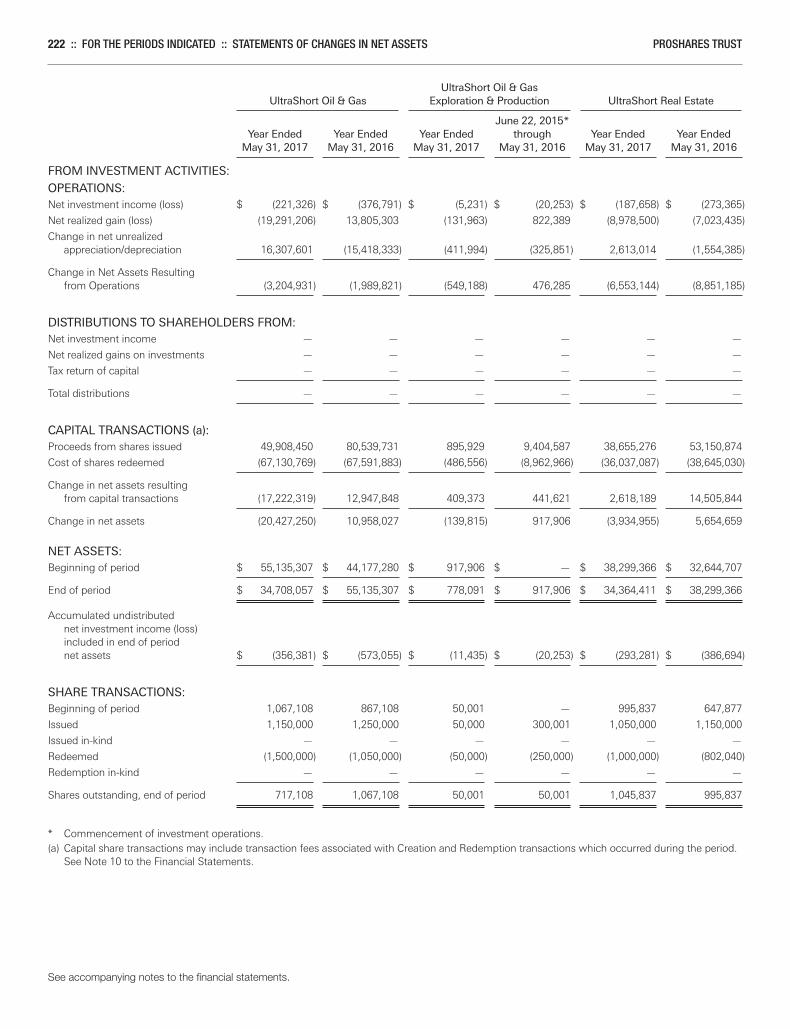
222 :: FOR THE PERIODS INDICATED :: STATEMENTS OF CHANGES IN NET ASSETS PROSHARES TRUST
UltraShort Oil & Gas UltraShort Oil & Gas Exploration & Production UltraShort Real Estate June 22, 2015* Year Ended Year Ended Year Ended through Year Ended Year Ended May 31, 2017 May 31, 2016 May 31, 2017 May 31, 2016 May 31, 2017 May 31, 2016
FROM INVESTMENT ACTIVITIES:
OPERATIONS:Net investment income (loss) $ (221,326) $ (376,791) $ (5,231) $ (20,253) $ (187,658) $ (273,365)
Net realized gain (loss) (19,291,206) 13,805,303 (131,963) 822,389 (8,978,500) (7,023,435)
Change in net unrealizedappreciation/depreciation 16,307,601 (15,418,333) (411,994) (325,851) 2,613,014 (1,554,385)
Change in Net Assets Resultingfrom Operations (3,204,931) (1,989,821) (549,188) 476,285 (6,553,144) (8,851,185)
DISTRIBUTIONS TO SHAREHOLDERS FROM:Net investment income — — — — — —
Net realized gains on investments — — — — — —
Tax return of capital — — — — — —
Total distributions — — — — — —
CAPITAL TRANSACTIONS (a):Proceeds from shares issued 49,908,450 80,539,731 895,929 9,404,587 38,655,276 53,150,874
Cost of shares redeemed (67,130,769) (67,591,883) (486,556) (8,962,966) (36,037,087) (38,645,030)
Change in net assets resultingfrom capital transactions (17,222,319) 12,947,848 409,373 441,621 2,618,189 14,505,844
Change in net assets (20,427,250) 10,958,027 (139,815) 917,906 (3,934,955) 5,654,659
NET ASSETS:Beginning of period $ 55,135,307 $ 44,177,280 $ 917,906 $ — $ 38,299,366 $ 32,644,707
End of period $ 34,708,057 $ 55,135,307 $ 778,091 $ 917,906 $ 34,364,411 $ 38,299,366
Accumulated undistributednet investment income (loss)included in end of periodnet assets $ (356,381) $ (573,055) $ (11,435) $ (20,253) $ (293,281) $ (386,694)
SHARE TRANSACTIONS:Beginning of period 1,067,108 867,108 50,001 — 995,837 647,877
Issued 1,150,000 1,250,000 50,000 300,001 1,050,000 1,150,000
Issued in-kind — — — — — —
Redeemed (1,500,000) (1,050,000) (50,000) (250,000) (1,000,000) (802,040)
Redemption in-kind — — — — — —
Shares outstanding, end of period 717,108 1,067,108 50,001 50,001 1,045,837 995,837
* Commencement of investment operations.(a) Capital share transactions may include transaction fees associated with Creation and Redemption transactions which occurred during the period.
See Note 10 to the Financial Statements.
See accompanying notes to the financial statements.
Merrill Corp - Proshares Trust Geared Book [96 Funds] Annual Report [Funds] 333-089822 05-31-2017 ED [AUX] | eperez | 28-Jul-17 17:42 | 17-15159-3.ge | Sequence: 12CHKSUM Content: 27931 Layout: 47005 Graphics: No Graphics CLEAN
JOB: 17-15159-3 CYCLE#;BL#: 5; 0 TRIM: 8.25" x 10.75" COMPOSITECOLORS: Black, ~note-color 2, ~note-color 3 GRAPHICS: none V1.5
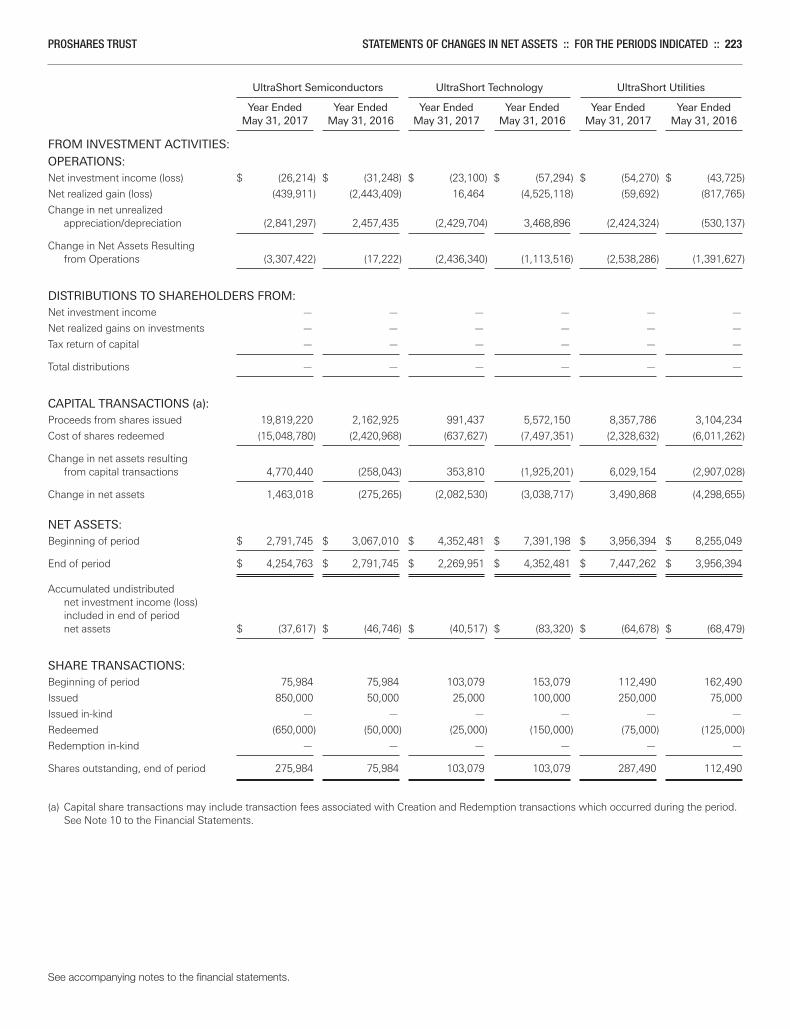
PROSHARES TRUST STATEMENTS OF CHANGES IN NET ASSETS :: FOR THE PERIODS INDICATED :: 223
UltraShort Semiconductors UltraShort Technology UltraShort Utilities Year Ended Year Ended Year Ended Year Ended Year Ended Year Ended May 31, 2017 May 31, 2016 May 31, 2017 May 31, 2016 May 31, 2017 May 31, 2016
FROM INVESTMENT ACTIVITIES:
OPERATIONS:Net investment income (loss) $ (26,214) $ (31,248) $ (23,100) $ (57,294) $ (54,270) $ (43,725)
Net realized gain (loss) (439,911) (2,443,409) 16,464 (4,525,118) (59,692) (817,765)
Change in net unrealizedappreciation/depreciation (2,841,297) 2,457,435 (2,429,704) 3,468,896 (2,424,324) (530,137)
Change in Net Assets Resultingfrom Operations (3,307,422) (17,222) (2,436,340) (1,113,516) (2,538,286) (1,391,627)
DISTRIBUTIONS TO SHAREHOLDERS FROM:Net investment income — — — — — —
Net realized gains on investments — — — — — —
Tax return of capital — — — — — —
Total distributions — — — — — —
CAPITAL TRANSACTIONS (a):Proceeds from shares issued 19,819,220 2,162,925 991,437 5,572,150 8,357,786 3,104,234
Cost of shares redeemed (15,048,780) (2,420,968) (637,627) (7,497,351) (2,328,632) (6,011,262)
Change in net assets resultingfrom capital transactions 4,770,440 (258,043) 353,810 (1,925,201) 6,029,154 (2,907,028)
Change in net assets 1,463,018 (275,265) (2,082,530) (3,038,717) 3,490,868 (4,298,655)
NET ASSETS:Beginning of period $ 2,791,745 $ 3,067,010 $ 4,352,481 $ 7,391,198 $ 3,956,394 $ 8,255,049
End of period $ 4,254,763 $ 2,791,745 $ 2,269,951 $ 4,352,481 $ 7,447,262 $ 3,956,394
Accumulated undistributednet investment income (loss)included in end of periodnet assets $ (37,617) $ (46,746) $ (40,517) $ (83,320) $ (64,678) $ (68,479)
SHARE TRANSACTIONS:Beginning of period 75,984 75,984 103,079 153,079 112,490 162,490
Issued 850,000 50,000 25,000 100,000 250,000 75,000
Issued in-kind — — — — — —
Redeemed (650,000) (50,000) (25,000) (150,000) (75,000) (125,000)
Redemption in-kind — — — — — —
Shares outstanding, end of period 275,984 75,984 103,079 103,079 287,490 112,490
(a) Capital share transactions may include transaction fees associated with Creation and Redemption transactions which occurred during the period.See Note 10 to the Financial Statements.
See accompanying notes to the financial statements.
Merrill Corp - Proshares Trust Geared Book [96 Funds] Annual Report [Funds] 333-089822 05-31-2017 ED [AUX] | eperez | 28-Jul-17 17:42 | 17-15159-3.ge | Sequence: 13CHKSUM Content: 52077 Layout: 14517 Graphics: No Graphics CLEAN
JOB: 17-15159-3 CYCLE#;BL#: 5; 0 TRIM: 8.25" x 10.75" COMPOSITECOLORS: Black, ~note-color 2, ~note-color 3 GRAPHICS: none V1.5
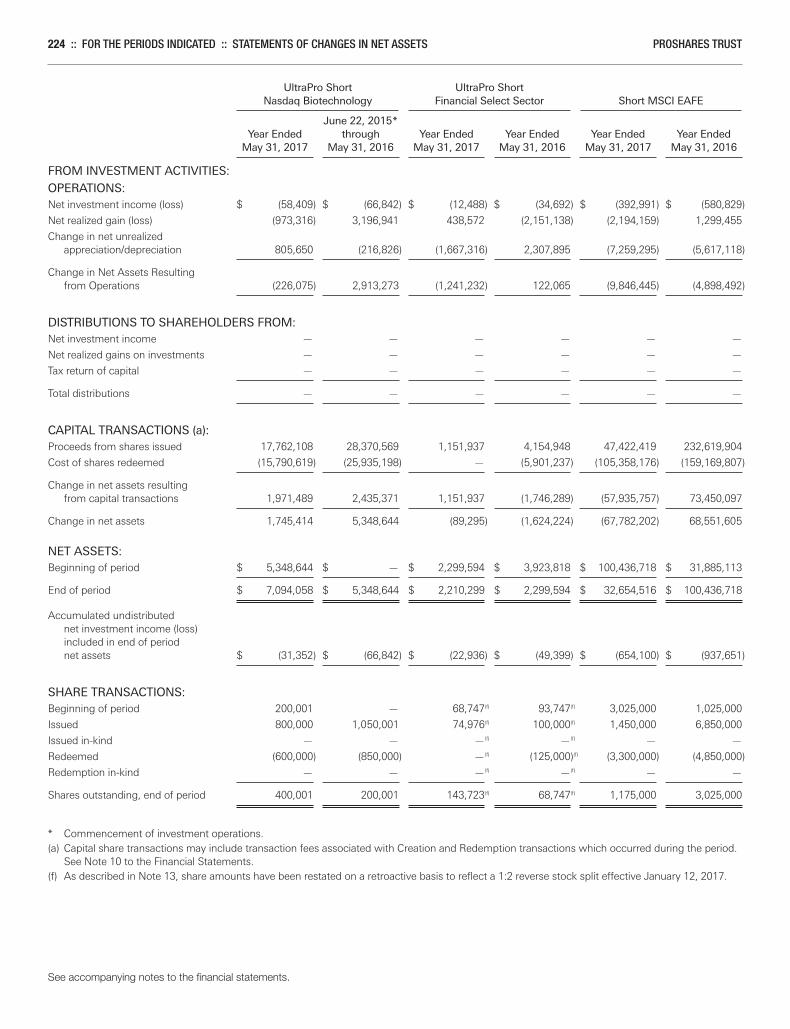
224 :: FOR THE PERIODS INDICATED :: STATEMENTS OF CHANGES IN NET ASSETS PROSHARES TRUST
UltraPro Short UltraPro Short Nasdaq Biotechnology Financial Select Sector Short MSCI EAFE June 22, 2015* Year Ended through Year Ended Year Ended Year Ended Year Ended May 31, 2017 May 31, 2016 May 31, 2017 May 31, 2016 May 31, 2017 May 31, 2016
FROM INVESTMENT ACTIVITIES:
OPERATIONS:Net investment income (loss) $ (58,409) $ (66,842) $ (12,488) $ (34,692) $ (392,991) $ (580,829)
Net realized gain (loss) (973,316) 3,196,941 438,572 (2,151,138) (2,194,159) 1,299,455
Change in net unrealizedappreciation/depreciation 805,650 (216,826) (1,667,316) 2,307,895 (7,259,295) (5,617,118)
Change in Net Assets Resultingfrom Operations (226,075) 2,913,273 (1,241,232) 122,065 (9,846,445) (4,898,492)
DISTRIBUTIONS TO SHAREHOLDERS FROM:Net investment income — — — — — —
Net realized gains on investments — — — — — —
Tax return of capital — — — — — —
Total distributions — — — — — —
CAPITAL TRANSACTIONS (a):Proceeds from shares issued 17,762,108 28,370,569 1,151,937 4,154,948 47,422,419 232,619,904
Cost of shares redeemed (15,790,619) (25,935,198) — (5,901,237) (105,358,176) (159,169,807)
Change in net assets resultingfrom capital transactions 1,971,489 2,435,371 1,151,937 (1,746,289) (57,935,757) 73,450,097
Change in net assets 1,745,414 5,348,644 (89,295) (1,624,224) (67,782,202) 68,551,605
NET ASSETS:Beginning of period $ 5,348,644 $ — $ 2,299,594 $ 3,923,818 $ 100,436,718 $ 31,885,113
End of period $ 7,094,058 $ 5,348,644 $ 2,210,299 $ 2,299,594 $ 32,654,516 $ 100,436,718
Accumulated undistributednet investment income (loss)included in end of periodnet assets $ (31,352) $ (66,842) $ (22,936) $ (49,399) $ (654,100) $ (937,651)
SHARE TRANSACTIONS:Beginning of period 200,001 — 68,747(f) 93,747(f) 3,025,000 1,025,000
Issued 800,000 1,050,001 74,976(f) 100,000(f) 1,450,000 6,850,000
Issued in-kind — — —(f) —(f) — —
Redeemed (600,000) (850,000) —(f) (125,000)(f) (3,300,000) (4,850,000)
Redemption in-kind — — —(f) —(f) — —
Shares outstanding, end of period 400,001 200,001 143,723(f) 68,747(f) 1,175,000 3,025,000
* Commencement of investment operations.(a) Capital share transactions may include transaction fees associated with Creation and Redemption transactions which occurred during the period.
See Note 10 to the Financial Statements.(f) As described in Note 13, share amounts have been restated on a retroactive basis to reflect a 1:2 reverse stock split effective January 12, 2017.
See accompanying notes to the financial statements.
Merrill Corp - Proshares Trust Geared Book [96 Funds] Annual Report [Funds] 333-089822 05-31-2017 ED [AUX] | eperez | 28-Jul-17 17:42 | 17-15159-3.ge | Sequence: 14CHKSUM Content: 56122 Layout: 40046 Graphics: No Graphics CLEAN
JOB: 17-15159-3 CYCLE#;BL#: 5; 0 TRIM: 8.25" x 10.75" COMPOSITECOLORS: Black, ~note-color 2, ~note-color 3 GRAPHICS: none V1.5
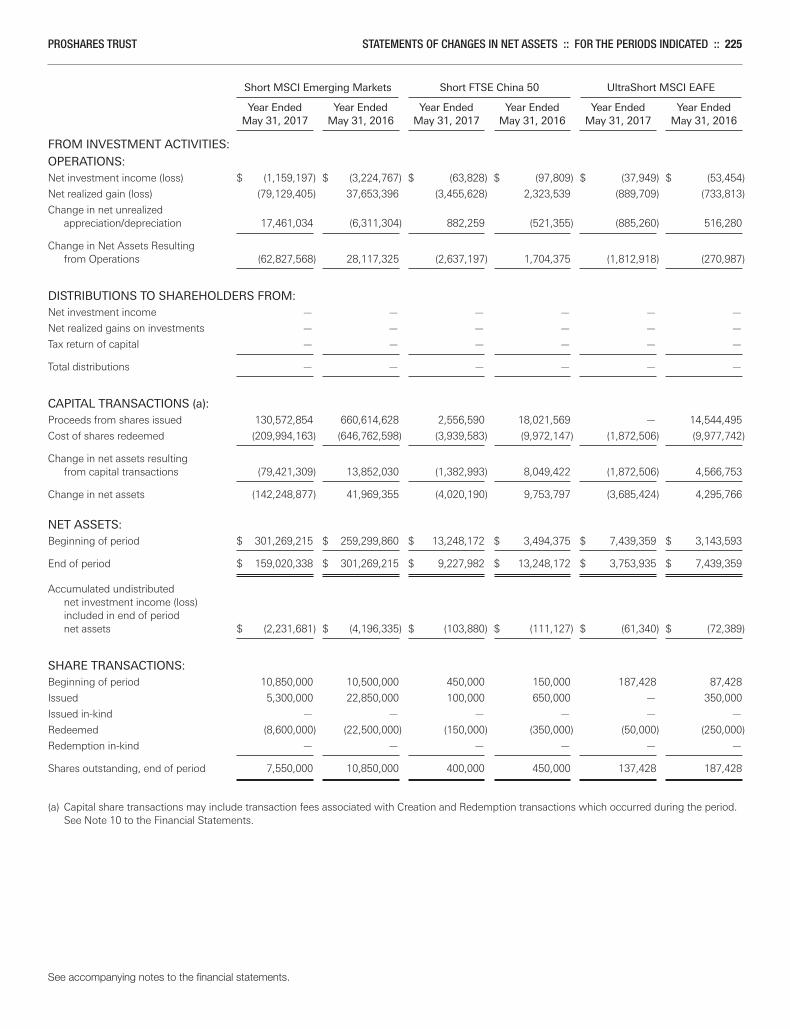
PROSHARES TRUST STATEMENTS OF CHANGES IN NET ASSETS :: FOR THE PERIODS INDICATED :: 225
Short MSCI Emerging Markets Short FTSE China 50 UltraShort MSCI EAFE Year Ended Year Ended Year Ended Year Ended Year Ended Year Ended May 31, 2017 May 31, 2016 May 31, 2017 May 31, 2016 May 31, 2017 May 31, 2016
FROM INVESTMENT ACTIVITIES:
OPERATIONS:Net investment income (loss) $ (1,159,197) $ (3,224,767) $ (63,828) $ (97,809) $ (37,949) $ (53,454)
Net realized gain (loss) (79,129,405) 37,653,396 (3,455,628) 2,323,539 (889,709) (733,813)
Change in net unrealizedappreciation/depreciation 17,461,034 (6,311,304) 882,259 (521,355) (885,260) 516,280
Change in Net Assets Resultingfrom Operations (62,827,568) 28,117,325 (2,637,197) 1,704,375 (1,812,918) (270,987)
DISTRIBUTIONS TO SHAREHOLDERS FROM:Net investment income — — — — — —
Net realized gains on investments — — — — — —
Tax return of capital — — — — — —
Total distributions — — — — — —
CAPITAL TRANSACTIONS (a):Proceeds from shares issued 130,572,854 660,614,628 2,556,590 18,021,569 — 14,544,495
Cost of shares redeemed (209,994,163) (646,762,598) (3,939,583) (9,972,147) (1,872,506) (9,977,742)
Change in net assets resultingfrom capital transactions (79,421,309) 13,852,030 (1,382,993) 8,049,422 (1,872,506) 4,566,753
Change in net assets (142,248,877) 41,969,355 (4,020,190) 9,753,797 (3,685,424) 4,295,766
NET ASSETS:Beginning of period $ 301,269,215 $ 259,299,860 $ 13,248,172 $ 3,494,375 $ 7,439,359 $ 3,143,593
End of period $ 159,020,338 $ 301,269,215 $ 9,227,982 $ 13,248,172 $ 3,753,935 $ 7,439,359
Accumulated undistributednet investment income (loss)included in end of periodnet assets $ (2,231,681) $ (4,196,335) $ (103,880) $ (111,127) $ (61,340) $ (72,389)
SHARE TRANSACTIONS:Beginning of period 10,850,000 10,500,000 450,000 150,000 187,428 87,428
Issued 5,300,000 22,850,000 100,000 650,000 — 350,000
Issued in-kind — — — — — —
Redeemed (8,600,000) (22,500,000) (150,000) (350,000) (50,000) (250,000)
Redemption in-kind — — — — — —
Shares outstanding, end of period 7,550,000 10,850,000 400,000 450,000 137,428 187,428
(a) Capital share transactions may include transaction fees associated with Creation and Redemption transactions which occurred during the period.See Note 10 to the Financial Statements.
See accompanying notes to the financial statements.
Merrill Corp - Proshares Trust Geared Book [96 Funds] Annual Report [Funds] 333-089822 05-31-2017 ED [AUX] | eperez | 28-Jul-17 17:42 | 17-15159-3.ge | Sequence: 15CHKSUM Content: 15998 Layout: 40199 Graphics: No Graphics CLEAN
JOB: 17-15159-3 CYCLE#;BL#: 5; 0 TRIM: 8.25" x 10.75" COMPOSITECOLORS: Black, ~note-color 2, ~note-color 3 GRAPHICS: none V1.5
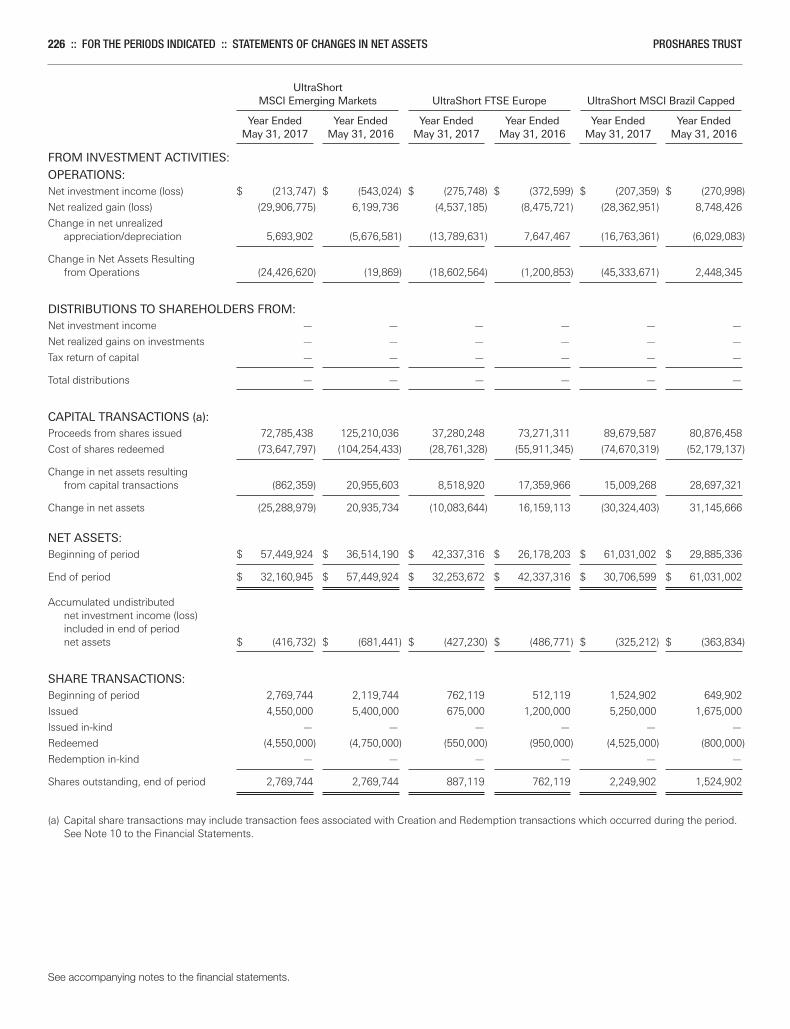
226 :: FOR THE PERIODS INDICATED :: STATEMENTS OF CHANGES IN NET ASSETS PROSHARES TRUST
UltraShort MSCI Emerging Markets UltraShort FTSE Europe UltraShort MSCI Brazil Capped Year Ended Year Ended Year Ended Year Ended Year Ended Year Ended May 31, 2017 May 31, 2016 May 31, 2017 May 31, 2016 May 31, 2017 May 31, 2016
FROM INVESTMENT ACTIVITIES:
OPERATIONS:Net investment income (loss) $ (213,747) $ (543,024) $ (275,748) $ (372,599) $ (207,359) $ (270,998)
Net realized gain (loss) (29,906,775) 6,199,736 (4,537,185) (8,475,721) (28,362,951) 8,748,426
Change in net unrealizedappreciation/depreciation 5,693,902 (5,676,581) (13,789,631) 7,647,467 (16,763,361) (6,029,083)
Change in Net Assets Resultingfrom Operations (24,426,620) (19,869) (18,602,564) (1,200,853) (45,333,671) 2,448,345
DISTRIBUTIONS TO SHAREHOLDERS FROM:Net investment income — — — — — —
Net realized gains on investments — — — — — —
Tax return of capital — — — — — —
Total distributions — — — — — —
CAPITAL TRANSACTIONS (a):Proceeds from shares issued 72,785,438 125,210,036 37,280,248 73,271,311 89,679,587 80,876,458
Cost of shares redeemed (73,647,797) (104,254,433) (28,761,328) (55,911,345) (74,670,319) (52,179,137)
Change in net assets resultingfrom capital transactions (862,359) 20,955,603 8,518,920 17,359,966 15,009,268 28,697,321
Change in net assets (25,288,979) 20,935,734 (10,083,644) 16,159,113 (30,324,403) 31,145,666
NET ASSETS:Beginning of period $ 57,449,924 $ 36,514,190 $ 42,337,316 $ 26,178,203 $ 61,031,002 $ 29,885,336
End of period $ 32,160,945 $ 57,449,924 $ 32,253,672 $ 42,337,316 $ 30,706,599 $ 61,031,002
Accumulated undistributednet investment income (loss)included in end of periodnet assets $ (416,732) $ (681,441) $ (427,230) $ (486,771) $ (325,212) $ (363,834)
SHARE TRANSACTIONS:Beginning of period 2,769,744 2,119,744 762,119 512,119 1,524,902 649,902
Issued 4,550,000 5,400,000 675,000 1,200,000 5,250,000 1,675,000
Issued in-kind — — — — — —
Redeemed (4,550,000) (4,750,000) (550,000) (950,000) (4,525,000) (800,000)
Redemption in-kind — — — — — —
Shares outstanding, end of period 2,769,744 2,769,744 887,119 762,119 2,249,902 1,524,902
(a) Capital share transactions may include transaction fees associated with Creation and Redemption transactions which occurred during the period.See Note 10 to the Financial Statements.
See accompanying notes to the financial statements.
Merrill Corp - Proshares Trust Geared Book [96 Funds] Annual Report [Funds] 333-089822 05-31-2017 ED [AUX] | eperez | 28-Jul-17 17:42 | 17-15159-3.ge | Sequence: 16CHKSUM Content: 64530 Layout: 43352 Graphics: No Graphics CLEAN
JOB: 17-15159-3 CYCLE#;BL#: 5; 0 TRIM: 8.25" x 10.75" COMPOSITECOLORS: Black, ~note-color 2, ~note-color 3 GRAPHICS: none V1.5
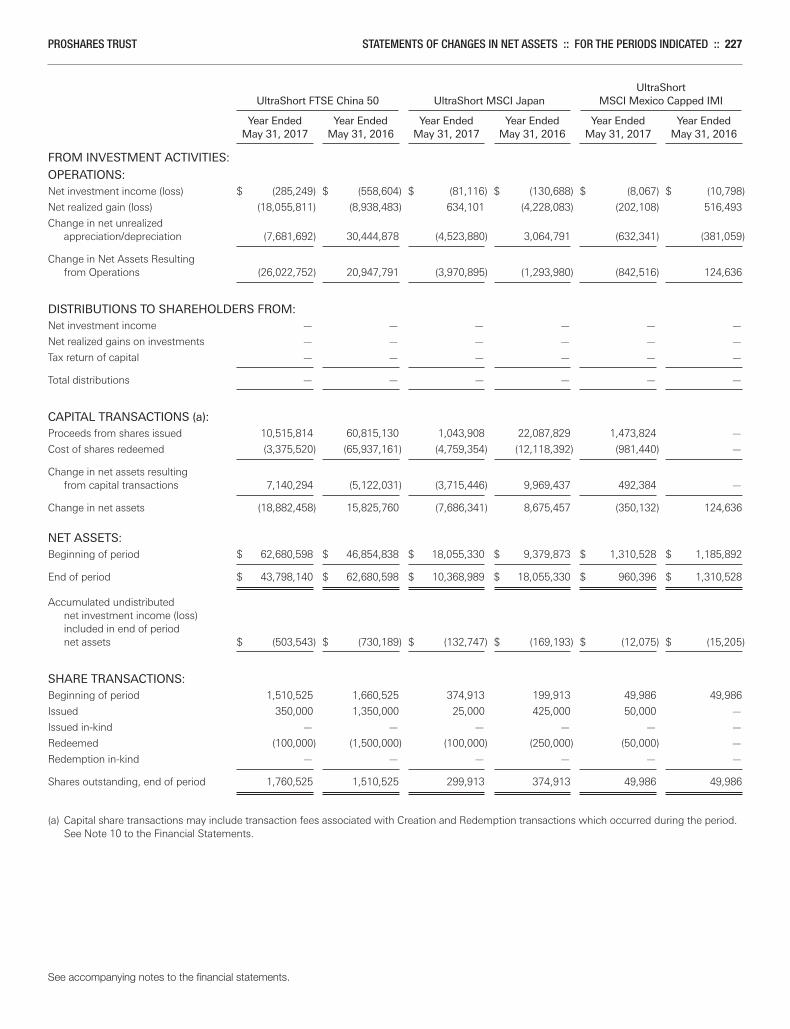
PROSHARES TRUST STATEMENTS OF CHANGES IN NET ASSETS :: FOR THE PERIODS INDICATED :: 227
UltraShort UltraShort FTSE China 50 UltraShort MSCI Japan MSCI Mexico Capped IMI Year Ended Year Ended Year Ended Year Ended Year Ended Year Ended May 31, 2017 May 31, 2016 May 31, 2017 May 31, 2016 May 31, 2017 May 31, 2016
FROM INVESTMENT ACTIVITIES:
OPERATIONS:Net investment income (loss) $ (285,249) $ (558,604) $ (81,116) $ (130,688) $ (8,067) $ (10,798)
Net realized gain (loss) (18,055,811) (8,938,483) 634,101 (4,228,083) (202,108) 516,493
Change in net unrealizedappreciation/depreciation (7,681,692) 30,444,878 (4,523,880) 3,064,791 (632,341) (381,059)
Change in Net Assets Resultingfrom Operations (26,022,752) 20,947,791 (3,970,895) (1,293,980) (842,516) 124,636
DISTRIBUTIONS TO SHAREHOLDERS FROM:Net investment income — — — — — —
Net realized gains on investments — — — — — —
Tax return of capital — — — — — —
Total distributions — — — — — —
CAPITAL TRANSACTIONS (a):Proceeds from shares issued 10,515,814 60,815,130 1,043,908 22,087,829 1,473,824 —
Cost of shares redeemed (3,375,520) (65,937,161) (4,759,354) (12,118,392) (981,440) —
Change in net assets resultingfrom capital transactions 7,140,294 (5,122,031) (3,715,446) 9,969,437 492,384 —
Change in net assets (18,882,458) 15,825,760 (7,686,341) 8,675,457 (350,132) 124,636
NET ASSETS:Beginning of period $ 62,680,598 $ 46,854,838 $ 18,055,330 $ 9,379,873 $ 1,310,528 $ 1,185,892
End of period $ 43,798,140 $ 62,680,598 $ 10,368,989 $ 18,055,330 $ 960,396 $ 1,310,528
Accumulated undistributednet investment income (loss)included in end of periodnet assets $ (503,543) $ (730,189) $ (132,747) $ (169,193) $ (12,075) $ (15,205)
SHARE TRANSACTIONS:Beginning of period 1,510,525 1,660,525 374,913 199,913 49,986 49,986
Issued 350,000 1,350,000 25,000 425,000 50,000 —
Issued in-kind — — — — — —
Redeemed (100,000) (1,500,000) (100,000) (250,000) (50,000) —
Redemption in-kind — — — — — —
Shares outstanding, end of period 1,760,525 1,510,525 299,913 374,913 49,986 49,986
(a) Capital share transactions may include transaction fees associated with Creation and Redemption transactions which occurred during the period.See Note 10 to the Financial Statements.
See accompanying notes to the financial statements.
Merrill Corp - Proshares Trust Geared Book [96 Funds] Annual Report [Funds] 333-089822 05-31-2017 ED [AUX] | eperez | 28-Jul-17 17:42 | 17-15159-3.ge | Sequence: 17CHKSUM Content: 41481 Layout: 26866 Graphics: No Graphics CLEAN
JOB: 17-15159-3 CYCLE#;BL#: 5; 0 TRIM: 8.25" x 10.75" COMPOSITECOLORS: Black, ~note-color 2, ~note-color 3 GRAPHICS: none V1.5
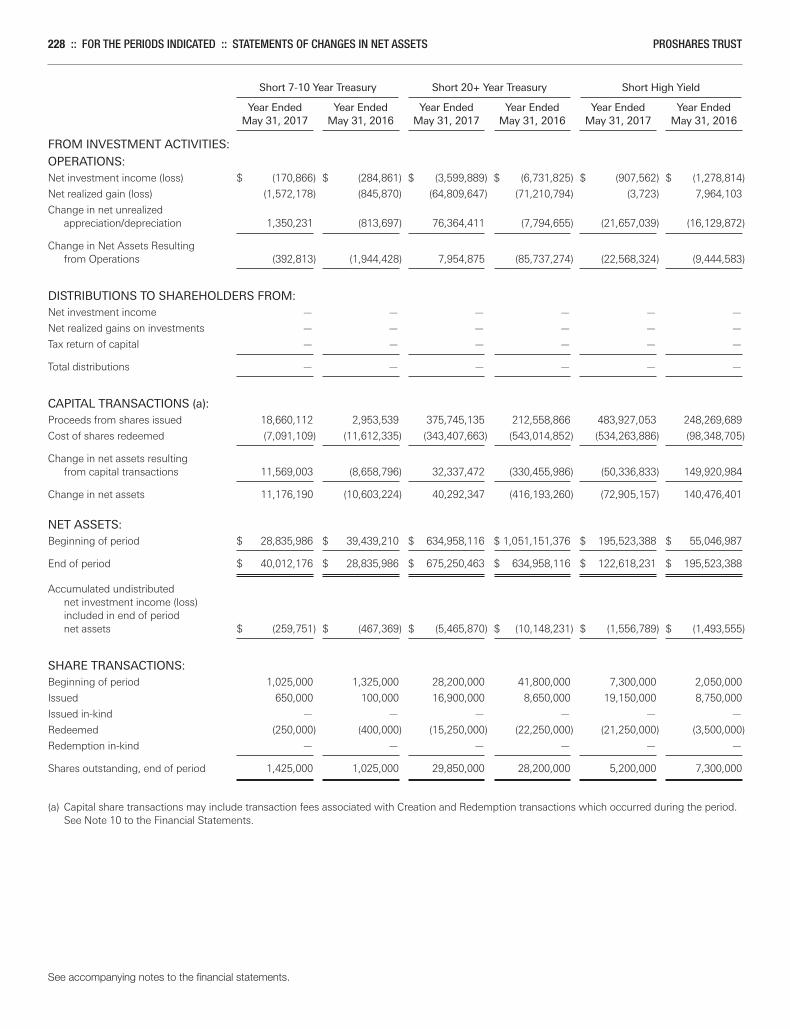
228 :: FOR THE PERIODS INDICATED :: STATEMENTS OF CHANGES IN NET ASSETS PROSHARES TRUST
Short 7-10 Year Treasury Short 20+ Year Treasury Short High Yield Year Ended Year Ended Year Ended Year Ended Year Ended Year Ended May 31, 2017 May 31, 2016 May 31, 2017 May 31, 2016 May 31, 2017 May 31, 2016
FROM INVESTMENT ACTIVITIES:
OPERATIONS:Net investment income (loss) $ (170,866) $ (284,861) $ (3,599,889) $ (6,731,825) $ (907,562) $ (1,278,814)
Net realized gain (loss) (1,572,178) (845,870) (64,809,647) (71,210,794) (3,723) 7,964,103
Change in net unrealizedappreciation/depreciation 1,350,231 (813,697) 76,364,411 (7,794,655) (21,657,039) (16,129,872)
Change in Net Assets Resultingfrom Operations (392,813) (1,944,428) 7,954,875 (85,737,274) (22,568,324) (9,444,583)
DISTRIBUTIONS TO SHAREHOLDERS FROM:Net investment income — — — — — —
Net realized gains on investments — — — — — —
Tax return of capital — — — — — —
Total distributions — — — — — —
CAPITAL TRANSACTIONS (a):Proceeds from shares issued 18,660,112 2,953,539 375,745,135 212,558,866 483,927,053 248,269,689
Cost of shares redeemed (7,091,109) (11,612,335) (343,407,663) (543,014,852) (534,263,886) (98,348,705)
Change in net assets resultingfrom capital transactions 11,569,003 (8,658,796) 32,337,472 (330,455,986) (50,336,833) 149,920,984
Change in net assets 11,176,190 (10,603,224) 40,292,347 (416,193,260) (72,905,157) 140,476,401
NET ASSETS:Beginning of period $ 28,835,986 $ 39,439,210 $ 634,958,116 $ 1,051,151,376 $ 195,523,388 $ 55,046,987
End of period $ 40,012,176 $ 28,835,986 $ 675,250,463 $ 634,958,116 $ 122,618,231 $ 195,523,388
Accumulated undistributednet investment income (loss)included in end of periodnet assets $ (259,751) $ (467,369) $ (5,465,870) $ (10,148,231) $ (1,556,789) $ (1,493,555)
SHARE TRANSACTIONS:Beginning of period 1,025,000 1,325,000 28,200,000 41,800,000 7,300,000 2,050,000
Issued 650,000 100,000 16,900,000 8,650,000 19,150,000 8,750,000
Issued in-kind — — — — — —
Redeemed (250,000) (400,000) (15,250,000) (22,250,000) (21,250,000) (3,500,000)
Redemption in-kind — — — — — —
Shares outstanding, end of period 1,425,000 1,025,000 29,850,000 28,200,000 5,200,000 7,300,000
(a) Capital share transactions may include transaction fees associated with Creation and Redemption transactions which occurred during the period.See Note 10 to the Financial Statements.
See accompanying notes to the financial statements.
Merrill Corp - Proshares Trust Geared Book [96 Funds] Annual Report [Funds] 333-089822 05-31-2017 ED [AUX] | eperez | 28-Jul-17 17:42 | 17-15159-3.ge | Sequence: 18CHKSUM Content: 29488 Layout: 45208 Graphics: No Graphics CLEAN
JOB: 17-15159-3 CYCLE#;BL#: 5; 0 TRIM: 8.25" x 10.75" COMPOSITECOLORS: Black, ~note-color 2, ~note-color 3 GRAPHICS: none V1.5
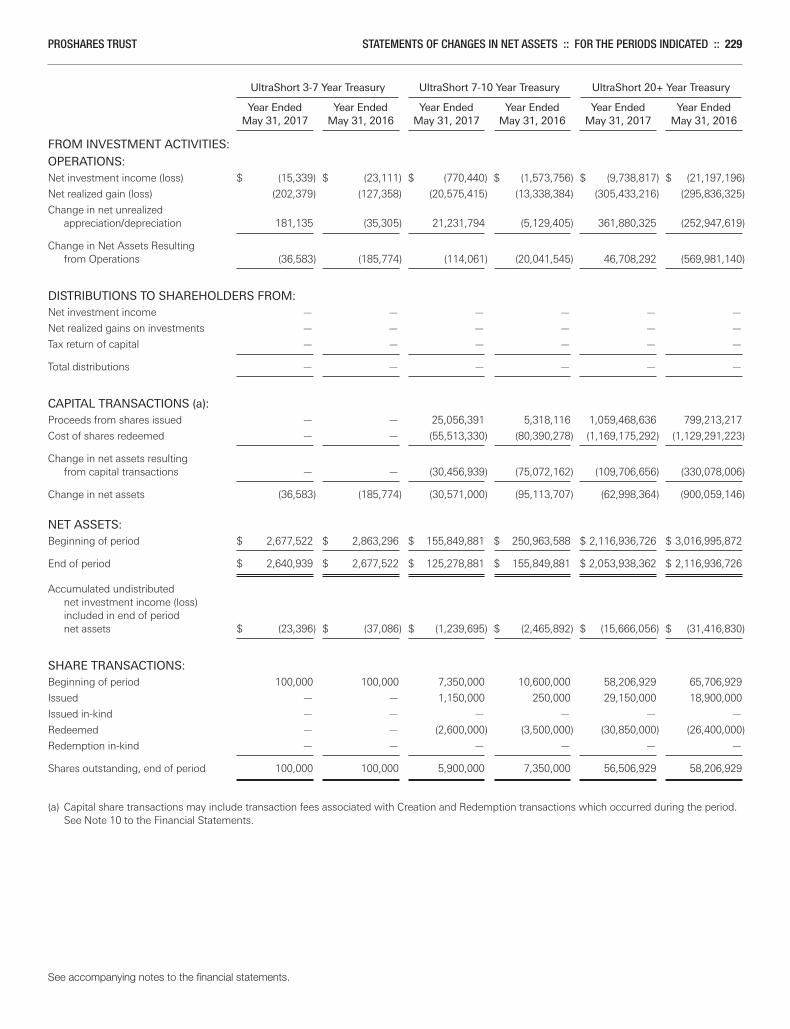
PROSHARES TRUST STATEMENTS OF CHANGES IN NET ASSETS :: FOR THE PERIODS INDICATED :: 229
UltraShort 3-7 Year Treasury UltraShort 7-10 Year Treasury UltraShort 20+ Year Treasury Year Ended Year Ended Year Ended Year Ended Year Ended Year Ended May 31, 2017 May 31, 2016 May 31, 2017 May 31, 2016 May 31, 2017 May 31, 2016
FROM INVESTMENT ACTIVITIES:
OPERATIONS:Net investment income (loss) $ (15,339) $ (23,111) $ (770,440) $ (1,573,756) $ (9,738,817) $ (21,197,196)
Net realized gain (loss) (202,379) (127,358) (20,575,415) (13,338,384) (305,433,216) (295,836,325)
Change in net unrealizedappreciation/depreciation 181,135 (35,305) 21,231,794 (5,129,405) 361,880,325 (252,947,619)
Change in Net Assets Resultingfrom Operations (36,583) (185,774) (114,061) (20,041,545) 46,708,292 (569,981,140)
DISTRIBUTIONS TO SHAREHOLDERS FROM:Net investment income — — — — — —
Net realized gains on investments — — — — — —
Tax return of capital — — — — — —
Total distributions — — — — — —
CAPITAL TRANSACTIONS (a):Proceeds from shares issued — — 25,056,391 5,318,116 1,059,468,636 799,213,217
Cost of shares redeemed — — (55,513,330) (80,390,278) (1,169,175,292) (1,129,291,223)
Change in net assets resultingfrom capital transactions — — (30,456,939) (75,072,162) (109,706,656) (330,078,006)
Change in net assets (36,583) (185,774) (30,571,000) (95,113,707) (62,998,364) (900,059,146)
NET ASSETS:Beginning of period $ 2,677,522 $ 2,863,296 $ 155,849,881 $ 250,963,588 $ 2,116,936,726 $ 3,016,995,872
End of period $ 2,640,939 $ 2,677,522 $ 125,278,881 $ 155,849,881 $ 2,053,938,362 $ 2,116,936,726
Accumulated undistributednet investment income (loss)included in end of periodnet assets $ (23,396) $ (37,086) $ (1,239,695) $ (2,465,892) $ (15,666,056) $ (31,416,830)
SHARE TRANSACTIONS:Beginning of period 100,000 100,000 7,350,000 10,600,000 58,206,929 65,706,929
Issued — — 1,150,000 250,000 29,150,000 18,900,000
Issued in-kind — — — — — —
Redeemed — — (2,600,000) (3,500,000) (30,850,000) (26,400,000)
Redemption in-kind — — — — — —
Shares outstanding, end of period 100,000 100,000 5,900,000 7,350,000 56,506,929 58,206,929
(a) Capital share transactions may include transaction fees associated with Creation and Redemption transactions which occurred during the period.See Note 10 to the Financial Statements.
See accompanying notes to the financial statements.
Merrill Corp - Proshares Trust Geared Book [96 Funds] Annual Report [Funds] 333-089822 05-31-2017 ED [AUX] | eperez | 28-Jul-17 17:42 | 17-15159-3.ge | Sequence: 19CHKSUM Content: 15078 Layout: 20521 Graphics: No Graphics CLEAN
JOB: 17-15159-3 CYCLE#;BL#: 5; 0 TRIM: 8.25" x 10.75" COMPOSITECOLORS: Black, ~note-color 2, ~note-color 3 GRAPHICS: none V1.5
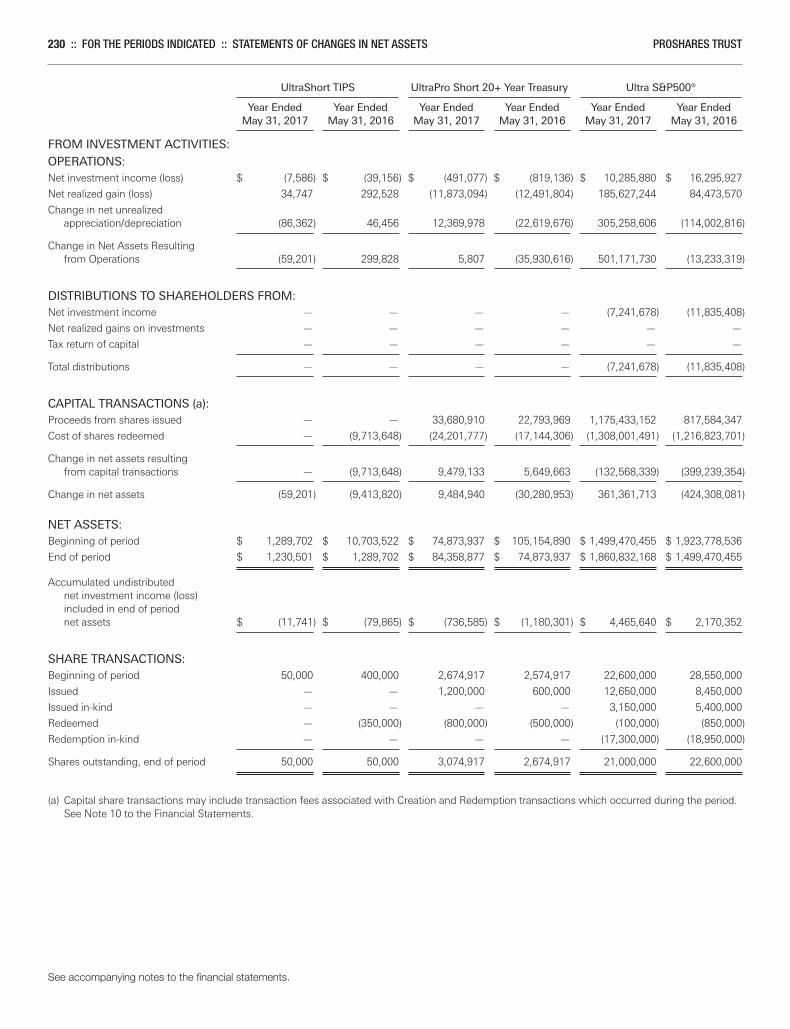
230 :: FOR THE PERIODS INDICATED :: STATEMENTS OF CHANGES IN NET ASSETS PROSHARES TRUST
UltraShort TIPS UltraPro Short 20+ Year Treasury Ultra S&P500® Year Ended Year Ended Year Ended Year Ended Year Ended Year Ended May 31, 2017 May 31, 2016 May 31, 2017 May 31, 2016 May 31, 2017 May 31, 2016
FROM INVESTMENT ACTIVITIES:
OPERATIONS:Net investment income (loss) $ (7,586) $ (39,156) $ (491,077) $ (819,136) $ 10,285,880 $ 16,295,927
Net realized gain (loss) 34,747 292,528 (11,873,094) (12,491,804) 185,627,244 84,473,570
Change in net unrealizedappreciation/depreciation (86,362) 46,456 12,369,978 (22,619,676) 305,258,606 (114,002,816)
Change in Net Assets Resultingfrom Operations (59,201) 299,828 5,807 (35,930,616) 501,171,730 (13,233,319)
DISTRIBUTIONS TO SHAREHOLDERS FROM:Net investment income — — — — (7,241,678) (11,835,408)
Net realized gains on investments — — — — — —
Tax return of capital — — — — — —
Total distributions — — — — (7,241,678) (11,835,408)
CAPITAL TRANSACTIONS (a):Proceeds from shares issued — — 33,680,910 22,793,969 1,175,433,152 817,584,347
Cost of shares redeemed — (9,713,648) (24,201,777) (17,144,306) (1,308,001,491) (1,216,823,701)
Change in net assets resultingfrom capital transactions — (9,713,648) 9,479,133 5,649,663 (132,568,339) (399,239,354)
Change in net assets (59,201) (9,413,820) 9,484,940 (30,280,953) 361,361,713 (424,308,081)
NET ASSETS:Beginning of period $ 1,289,702 $ 10,703,522 $ 74,873,937 $ 105,154,890 $ 1,499,470,455 $ 1,923,778,536
End of period $ 1,230,501 $ 1,289,702 $ 84,358,877 $ 74,873,937 $ 1,860,832,168 $ 1,499,470,455
Accumulated undistributednet investment income (loss)included in end of periodnet assets $ (11,741) $ (79,865) $ (736,585) $ (1,180,301) $ 4,465,640 $ 2,170,352
SHARE TRANSACTIONS:Beginning of period 50,000 400,000 2,674,917 2,574,917 22,600,000 28,550,000
Issued — — 1,200,000 600,000 12,650,000 8,450,000
Issued in-kind — — — — 3,150,000 5,400,000
Redeemed — (350,000) (800,000) (500,000) (100,000) (850,000)
Redemption in-kind — — — — (17,300,000) (18,950,000)
Shares outstanding, end of period 50,000 50,000 3,074,917 2,674,917 21,000,000 22,600,000
(a) Capital share transactions may include transaction fees associated with Creation and Redemption transactions which occurred during the period.See Note 10 to the Financial Statements.
See accompanying notes to the financial statements.
Merrill Corp - Proshares Trust Geared Book [96 Funds] Annual Report [Funds] 333-089822 05-31-2017 ED [AUX] | eperez | 28-Jul-17 17:42 | 17-15159-3.ge | Sequence: 20CHKSUM Content: 4280 Layout: 20613 Graphics: No Graphics CLEAN
JOB: 17-15159-3 CYCLE#;BL#: 5; 0 TRIM: 8.25" x 10.75" COMPOSITECOLORS: Black, ~note-color 2, ~note-color 3 GRAPHICS: none V1.5
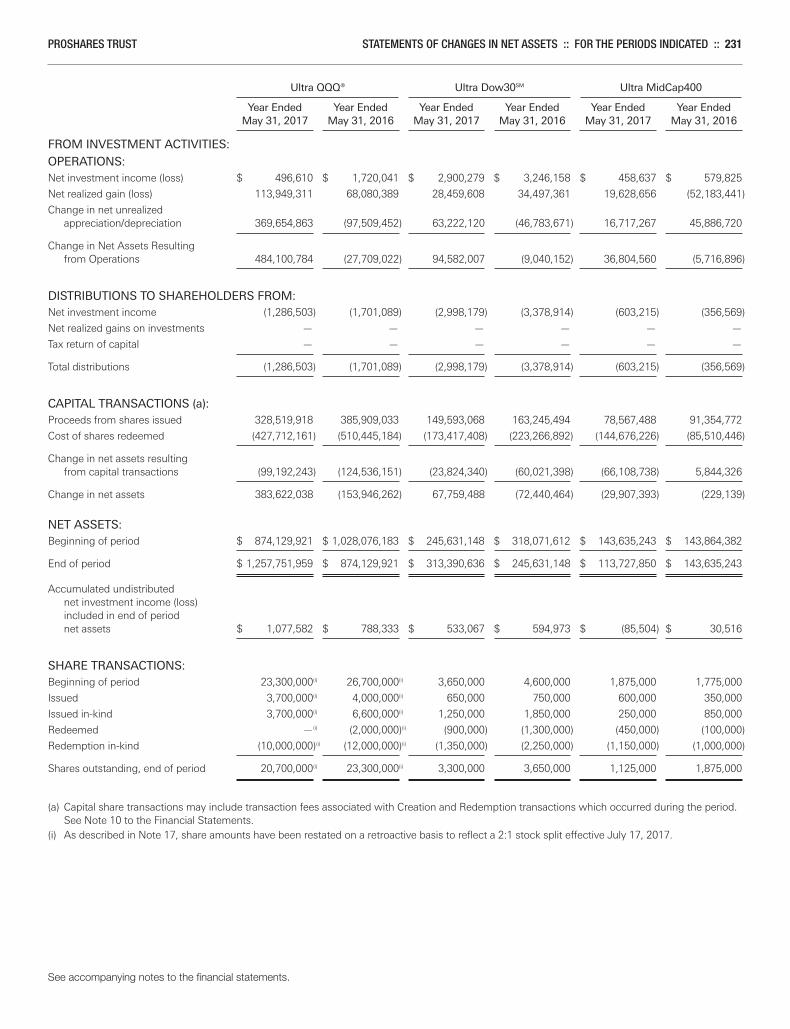
PROSHARES TRUST STATEMENTS OF CHANGES IN NET ASSETS :: FOR THE PERIODS INDICATED :: 231
Ultra QQQ® Ultra Dow30SM Ultra MidCap400 Year Ended Year Ended Year Ended Year Ended Year Ended Year Ended May 31, 2017 May 31, 2016 May 31, 2017 May 31, 2016 May 31, 2017 May 31, 2016
FROM INVESTMENT ACTIVITIES:
OPERATIONS:Net investment income (loss) $ 496,610 $ 1,720,041 $ 2,900,279 $ 3,246,158 $ 458,637 $ 579,825
Net realized gain (loss) 113,949,311 68,080,389 28,459,608 34,497,361 19,628,656 (52,183,441)
Change in net unrealizedappreciation/depreciation 369,654,863 (97,509,452) 63,222,120 (46,783,671) 16,717,267 45,886,720
Change in Net Assets Resultingfrom Operations 484,100,784 (27,709,022) 94,582,007 (9,040,152) 36,804,560 (5,716,896)
DISTRIBUTIONS TO SHAREHOLDERS FROM:Net investment income (1,286,503) (1,701,089) (2,998,179) (3,378,914) (603,215) (356,569)
Net realized gains on investments — — — — — —
Tax return of capital — — — — — —
Total distributions (1,286,503) (1,701,089) (2,998,179) (3,378,914) (603,215) (356,569)
CAPITAL TRANSACTIONS (a):Proceeds from shares issued 328,519,918 385,909,033 149,593,068 163,245,494 78,567,488 91,354,772
Cost of shares redeemed (427,712,161) (510,445,184) (173,417,408) (223,266,892) (144,676,226) (85,510,446)
Change in net assets resultingfrom capital transactions (99,192,243) (124,536,151) (23,824,340) (60,021,398) (66,108,738) 5,844,326
Change in net assets 383,622,038 (153,946,262) 67,759,488 (72,440,464) (29,907,393) (229,139)
NET ASSETS:Beginning of period $ 874,129,921 $ 1,028,076,183 $ 245,631,148 $ 318,071,612 $ 143,635,243 $ 143,864,382
End of period $ 1,257,751,959 $ 874,129,921 $ 313,390,636 $ 245,631,148 $ 113,727,850 $ 143,635,243
Accumulated undistributednet investment income (loss)included in end of periodnet assets $ 1,077,582 $ 788,333 $ 533,067 $ 594,973 $ (85,504) $ 30,516
SHARE TRANSACTIONS:Beginning of period 23,300,000(i) 26,700,000(i) 3,650,000 4,600,000 1,875,000 1,775,000
Issued 3,700,000(i) 4,000,000(i) 650,000 750,000 600,000 350,000
Issued in-kind 3,700,000(i) 6,600,000(i) 1,250,000 1,850,000 250,000 850,000
Redeemed —(i) (2,000,000)(i) (900,000) (1,300,000) (450,000) (100,000)
Redemption in-kind (10,000,000)(i) (12,000,000)(i) (1,350,000) (2,250,000) (1,150,000) (1,000,000)
Shares outstanding, end of period 20,700,000(i) 23,300,000(i) 3,300,000 3,650,000 1,125,000 1,875,000
(a) Capital share transactions may include transaction fees associated with Creation and Redemption transactions which occurred during the period.See Note 10 to the Financial Statements.
(i) As described in Note 17, share amounts have been restated on a retroactive basis to reflect a 2:1 stock split effective July 17, 2017.
See accompanying notes to the financial statements.
Merrill Corp - Proshares Trust Geared Book [96 Funds] Annual Report [Funds] 333-089822 05-31-2017 ED [AUX] | eperez | 28-Jul-17 17:42 | 17-15159-3.ge | Sequence: 21CHKSUM Content: 1872 Layout: 49646 Graphics: No Graphics CLEAN
JOB: 17-15159-3 CYCLE#;BL#: 5; 0 TRIM: 8.25" x 10.75" COMPOSITECOLORS: Black, ~note-color 2, ~note-color 3 GRAPHICS: none V1.5
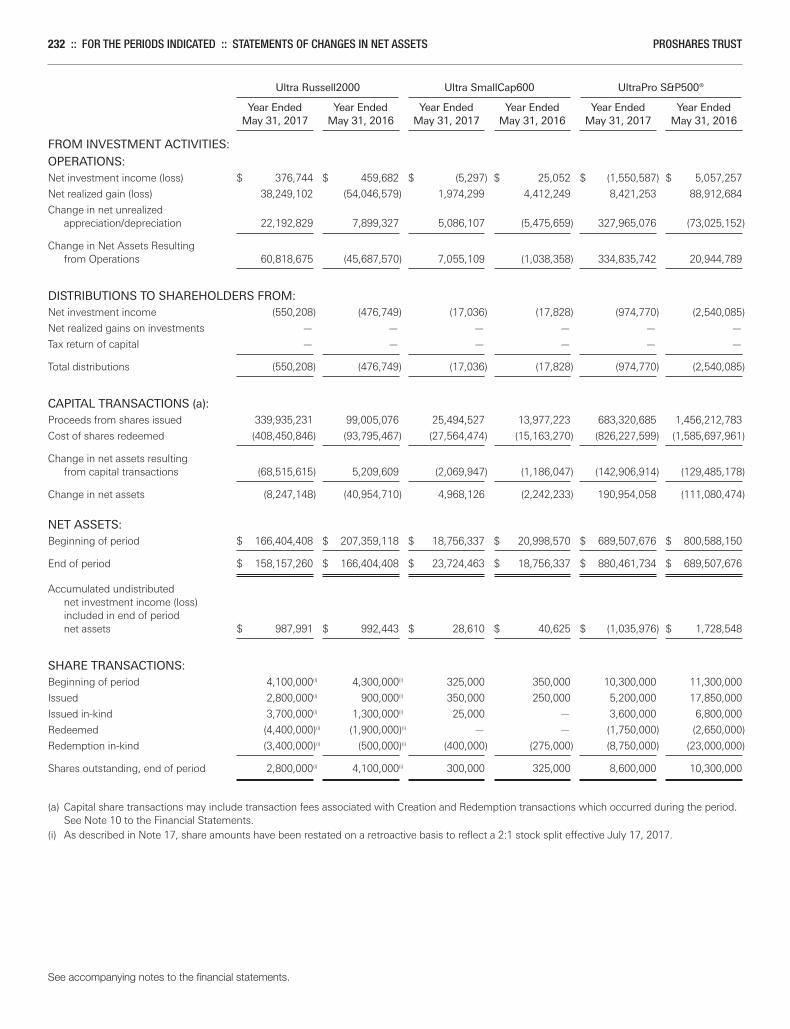
232 :: FOR THE PERIODS INDICATED :: STATEMENTS OF CHANGES IN NET ASSETS PROSHARES TRUST
Ultra Russell2000 Ultra SmallCap600 UltraPro S&P500® Year Ended Year Ended Year Ended Year Ended Year Ended Year Ended May 31, 2017 May 31, 2016 May 31, 2017 May 31, 2016 May 31, 2017 May 31, 2016
FROM INVESTMENT ACTIVITIES:
OPERATIONS:Net investment income (loss) $ 376,744 $ 459,682 $ (5,297) $ 25,052 $ (1,550,587) $ 5,057,257
Net realized gain (loss) 38,249,102 (54,046,579) 1,974,299 4,412,249 8,421,253 88,912,684
Change in net unrealizedappreciation/depreciation 22,192,829 7,899,327 5,086,107 (5,475,659) 327,965,076 (73,025,152)
Change in Net Assets Resultingfrom Operations 60,818,675 (45,687,570) 7,055,109 (1,038,358) 334,835,742 20,944,789
DISTRIBUTIONS TO SHAREHOLDERS FROM:Net investment income (550,208) (476,749) (17,036) (17,828) (974,770) (2,540,085)
Net realized gains on investments — — — — — —
Tax return of capital — — — — — —
Total distributions (550,208) (476,749) (17,036) (17,828) (974,770) (2,540,085)
CAPITAL TRANSACTIONS (a):Proceeds from shares issued 339,935,231 99,005,076 25,494,527 13,977,223 683,320,685 1,456,212,783
Cost of shares redeemed (408,450,846) (93,795,467) (27,564,474) (15,163,270) (826,227,599) (1,585,697,961)
Change in net assets resultingfrom capital transactions (68,515,615) 5,209,609 (2,069,947) (1,186,047) (142,906,914) (129,485,178)
Change in net assets (8,247,148) (40,954,710) 4,968,126 (2,242,233) 190,954,058 (111,080,474)
NET ASSETS:Beginning of period $ 166,404,408 $ 207,359,118 $ 18,756,337 $ 20,998,570 $ 689,507,676 $ 800,588,150
End of period $ 158,157,260 $ 166,404,408 $ 23,724,463 $ 18,756,337 $ 880,461,734 $ 689,507,676
Accumulated undistributednet investment income (loss)included in end of periodnet assets $ 987,991 $ 992,443 $ 28,610 $ 40,625 $ (1,035,976) $ 1,728,548
SHARE TRANSACTIONS:Beginning of period 4,100,000(i) 4,300,000(i) 325,000 350,000 10,300,000 11,300,000
Issued 2,800,000(i) 900,000(i) 350,000 250,000 5,200,000 17,850,000
Issued in-kind 3,700,000(i) 1,300,000(i) 25,000 — 3,600,000 6,800,000
Redeemed (4,400,000)(i) (1,900,000)(i) — — (1,750,000) (2,650,000)
Redemption in-kind (3,400,000)(i) (500,000)(i) (400,000) (275,000) (8,750,000) (23,000,000)
Shares outstanding, end of period 2,800,000(i) 4,100,000(i) 300,000 325,000 8,600,000 10,300,000
(a) Capital share transactions may include transaction fees associated with Creation and Redemption transactions which occurred during the period.See Note 10 to the Financial Statements.
(i) As described in Note 17, share amounts have been restated on a retroactive basis to reflect a 2:1 stock split effective July 17, 2017.
See accompanying notes to the financial statements.
Merrill Corp - Proshares Trust Geared Book [96 Funds] Annual Report [Funds] 333-089822 05-31-2017 ED [AUX] | eperez | 28-Jul-17 17:42 | 17-15159-3.ge | Sequence: 22CHKSUM Content: 50724 Layout: 50105 Graphics: No Graphics CLEAN
JOB: 17-15159-3 CYCLE#;BL#: 5; 0 TRIM: 8.25" x 10.75" COMPOSITECOLORS: Black, ~note-color 2, ~note-color 3 GRAPHICS: none V1.5
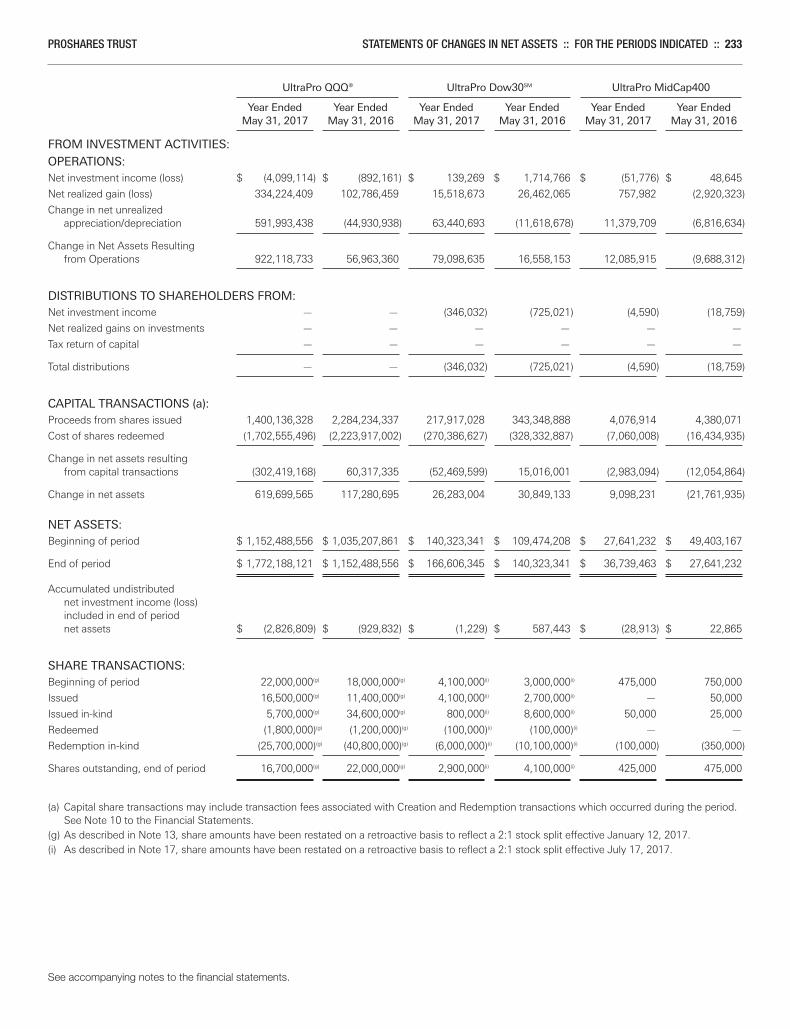
PROSHARES TRUST STATEMENTS OF CHANGES IN NET ASSETS :: FOR THE PERIODS INDICATED :: 233
UltraPro QQQ® UltraPro Dow30SM UltraPro MidCap400 Year Ended Year Ended Year Ended Year Ended Year Ended Year Ended May 31, 2017 May 31, 2016 May 31, 2017 May 31, 2016 May 31, 2017 May 31, 2016
FROM INVESTMENT ACTIVITIES:
OPERATIONS:Net investment income (loss) $ (4,099,114) $ (892,161) $ 139,269 $ 1,714,766 $ (51,776) $ 48,645
Net realized gain (loss) 334,224,409 102,786,459 15,518,673 26,462,065 757,982 (2,920,323)
Change in net unrealizedappreciation/depreciation 591,993,438 (44,930,938) 63,440,693 (11,618,678) 11,379,709 (6,816,634)
Change in Net Assets Resultingfrom Operations 922,118,733 56,963,360 79,098,635 16,558,153 12,085,915 (9,688,312)
DISTRIBUTIONS TO SHAREHOLDERS FROM:Net investment income — — (346,032) (725,021) (4,590) (18,759)
Net realized gains on investments — — — — — —
Tax return of capital — — — — — —
Total distributions — — (346,032) (725,021) (4,590) (18,759)
CAPITAL TRANSACTIONS (a):Proceeds from shares issued 1,400,136,328 2,284,234,337 217,917,028 343,348,888 4,076,914 4,380,071
Cost of shares redeemed (1,702,555,496) (2,223,917,002) (270,386,627) (328,332,887) (7,060,008) (16,434,935)
Change in net assets resultingfrom capital transactions (302,419,168) 60,317,335 (52,469,599) 15,016,001 (2,983,094) (12,054,864)
Change in net assets 619,699,565 117,280,695 26,283,004 30,849,133 9,098,231 (21,761,935)
NET ASSETS:Beginning of period $ 1,152,488,556 $ 1,035,207,861 $ 140,323,341 $ 109,474,208 $ 27,641,232 $ 49,403,167
End of period $ 1,772,188,121 $ 1,152,488,556 $ 166,606,345 $ 140,323,341 $ 36,739,463 $ 27,641,232
Accumulated undistributednet investment income (loss)included in end of periodnet assets $ (2,826,809) $ (929,832) $ (1,229) $ 587,443 $ (28,913) $ 22,865
SHARE TRANSACTIONS:Beginning of period 22,000,000(g) 18,000,000(g) 4,100,000(i) 3,000,000(i) 475,000 750,000
Issued 16,500,000(g) 11,400,000(g) 4,100,000(i) 2,700,000(i) — 50,000
Issued in-kind 5,700,000(g) 34,600,000(g) 800,000(i) 8,600,000(i) 50,000 25,000
Redeemed (1,800,000)(g) (1,200,000)(g) (100,000)(i) (100,000)(i) — —
Redemption in-kind (25,700,000)(g) (40,800,000)(g) (6,000,000)(i) (10,100,000)(i) (100,000) (350,000)
Shares outstanding, end of period 16,700,000(g) 22,000,000(g) 2,900,000(i) 4,100,000(i) 425,000 475,000
(a) Capital share transactions may include transaction fees associated with Creation and Redemption transactions which occurred during the period.See Note 10 to the Financial Statements.
(g) As described in Note 13, share amounts have been restated on a retroactive basis to reflect a 2:1 stock split effective January 12, 2017.(i) As described in Note 17, share amounts have been restated on a retroactive basis to reflect a 2:1 stock split effective July 17, 2017.
See accompanying notes to the financial statements.
Merrill Corp - Proshares Trust Geared Book [96 Funds] Annual Report [Funds] 333-089822 05-31-2017 ED [AUX] | eperez | 28-Jul-17 17:42 | 17-15159-3.ge | Sequence: 23CHKSUM Content: 63919 Layout: 45719 Graphics: No Graphics CLEAN
JOB: 17-15159-3 CYCLE#;BL#: 5; 0 TRIM: 8.25" x 10.75" COMPOSITECOLORS: Black, ~note-color 2, ~note-color 3 GRAPHICS: none V1.5
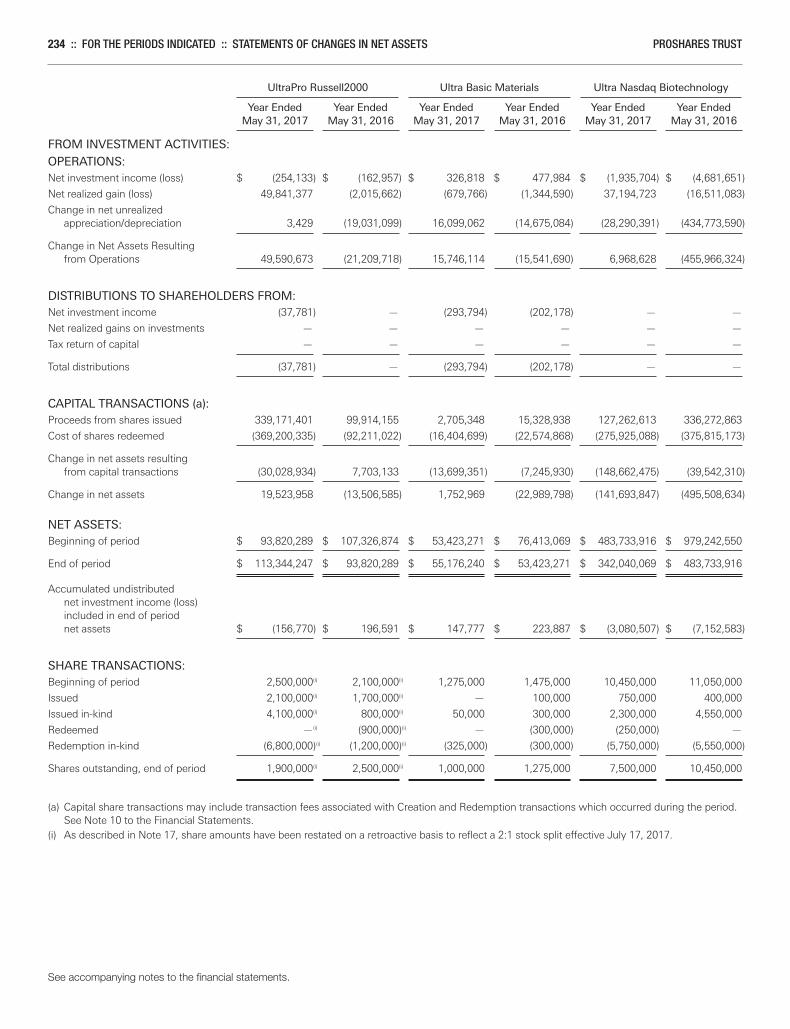
234 :: FOR THE PERIODS INDICATED :: STATEMENTS OF CHANGES IN NET ASSETS PROSHARES TRUST
UltraPro Russell2000 Ultra Basic Materials Ultra Nasdaq Biotechnology Year Ended Year Ended Year Ended Year Ended Year Ended Year Ended May 31, 2017 May 31, 2016 May 31, 2017 May 31, 2016 May 31, 2017 May 31, 2016
FROM INVESTMENT ACTIVITIES:
OPERATIONS:Net investment income (loss) $ (254,133) $ (162,957) $ 326,818 $ 477,984 $ (1,935,704) $ (4,681,651)
Net realized gain (loss) 49,841,377 (2,015,662) (679,766) (1,344,590) 37,194,723 (16,511,083)
Change in net unrealizedappreciation/depreciation 3,429 (19,031,099) 16,099,062 (14,675,084) (28,290,391) (434,773,590)
Change in Net Assets Resultingfrom Operations 49,590,673 (21,209,718) 15,746,114 (15,541,690) 6,968,628 (455,966,324)
DISTRIBUTIONS TO SHAREHOLDERS FROM:Net investment income (37,781) — (293,794) (202,178) — —
Net realized gains on investments — — — — — —
Tax return of capital — — — — — —
Total distributions (37,781) — (293,794) (202,178) — —
CAPITAL TRANSACTIONS (a):Proceeds from shares issued 339,171,401 99,914,155 2,705,348 15,328,938 127,262,613 336,272,863
Cost of shares redeemed (369,200,335) (92,211,022) (16,404,699) (22,574,868) (275,925,088) (375,815,173)
Change in net assets resultingfrom capital transactions (30,028,934) 7,703,133 (13,699,351) (7,245,930) (148,662,475) (39,542,310)
Change in net assets 19,523,958 (13,506,585) 1,752,969 (22,989,798) (141,693,847) (495,508,634)
NET ASSETS:Beginning of period $ 93,820,289 $ 107,326,874 $ 53,423,271 $ 76,413,069 $ 483,733,916 $ 979,242,550
End of period $ 113,344,247 $ 93,820,289 $ 55,176,240 $ 53,423,271 $ 342,040,069 $ 483,733,916
Accumulated undistributednet investment income (loss)included in end of periodnet assets $ (156,770) $ 196,591 $ 147,777 $ 223,887 $ (3,080,507) $ (7,152,583)
SHARE TRANSACTIONS:Beginning of period 2,500,000(i) 2,100,000(i) 1,275,000 1,475,000 10,450,000 11,050,000
Issued 2,100,000(i) 1,700,000(i) — 100,000 750,000 400,000
Issued in-kind 4,100,000(i) 800,000(i) 50,000 300,000 2,300,000 4,550,000
Redeemed —(i) (900,000)(i) — (300,000) (250,000) —
Redemption in-kind (6,800,000)(i) (1,200,000)(i) (325,000) (300,000) (5,750,000) (5,550,000)
Shares outstanding, end of period 1,900,000(i) 2,500,000(i) 1,000,000 1,275,000 7,500,000 10,450,000
(a) Capital share transactions may include transaction fees associated with Creation and Redemption transactions which occurred during the period.See Note 10 to the Financial Statements.
(i) As described in Note 17, share amounts have been restated on a retroactive basis to reflect a 2:1 stock split effective July 17, 2017.
See accompanying notes to the financial statements.
Merrill Corp - Proshares Trust Geared Book [96 Funds] Annual Report [Funds] 333-089822 05-31-2017 ED [AUX] | eperez | 28-Jul-17 17:42 | 17-15159-3.ge | Sequence: 24CHKSUM Content: 36554 Layout: 63385 Graphics: No Graphics CLEAN
JOB: 17-15159-3 CYCLE#;BL#: 5; 0 TRIM: 8.25" x 10.75" COMPOSITECOLORS: Black, ~note-color 2, ~note-color 3 GRAPHICS: none V1.5
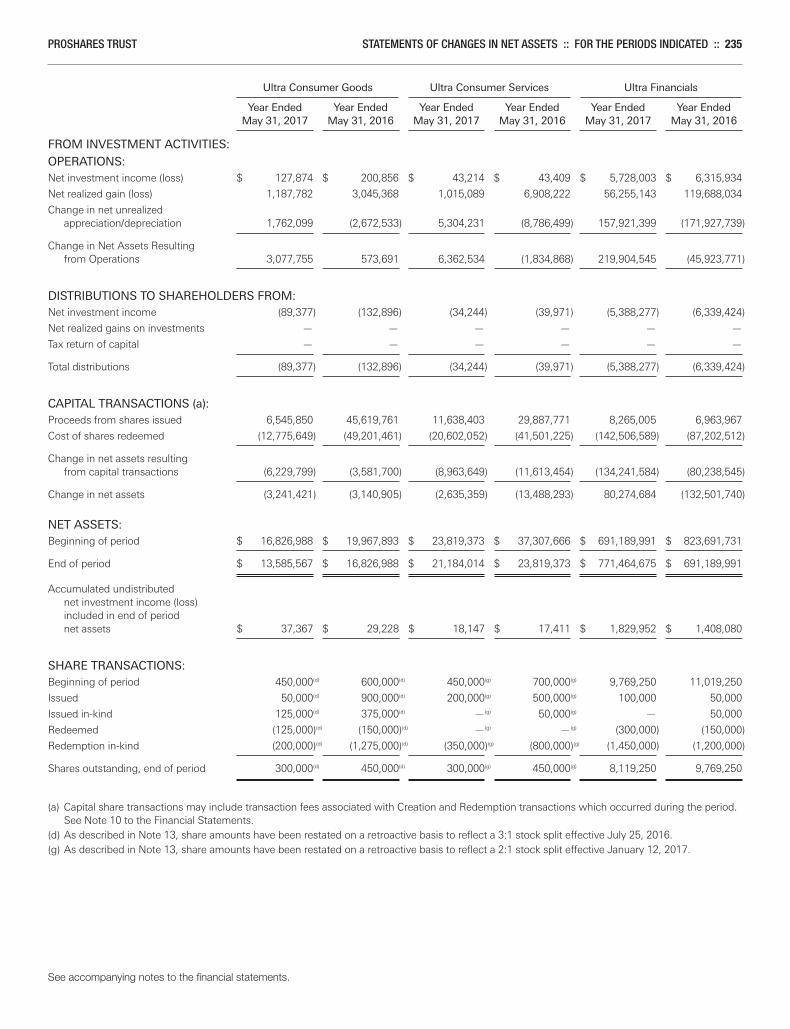
PROSHARES TRUST STATEMENTS OF CHANGES IN NET ASSETS :: FOR THE PERIODS INDICATED :: 235
Ultra Consumer Goods Ultra Consumer Services Ultra Financials Year Ended Year Ended Year Ended Year Ended Year Ended Year Ended May 31, 2017 May 31, 2016 May 31, 2017 May 31, 2016 May 31, 2017 May 31, 2016
FROM INVESTMENT ACTIVITIES:
OPERATIONS:Net investment income (loss) $ 127,874 $ 200,856 $ 43,214 $ 43,409 $ 5,728,003 $ 6,315,934
Net realized gain (loss) 1,187,782 3,045,368 1,015,089 6,908,222 56,255,143 119,688,034
Change in net unrealizedappreciation/depreciation 1,762,099 (2,672,533) 5,304,231 (8,786,499) 157,921,399 (171,927,739)
Change in Net Assets Resultingfrom Operations 3,077,755 573,691 6,362,534 (1,834,868) 219,904,545 (45,923,771)
DISTRIBUTIONS TO SHAREHOLDERS FROM:Net investment income (89,377) (132,896) (34,244) (39,971) (5,388,277) (6,339,424)
Net realized gains on investments — — — — — —
Tax return of capital — — — — — —
Total distributions (89,377) (132,896) (34,244) (39,971) (5,388,277) (6,339,424)
CAPITAL TRANSACTIONS (a):Proceeds from shares issued 6,545,850 45,619,761 11,638,403 29,887,771 8,265,005 6,963,967
Cost of shares redeemed (12,775,649) (49,201,461) (20,602,052) (41,501,225) (142,506,589) (87,202,512)
Change in net assets resultingfrom capital transactions (6,229,799) (3,581,700) (8,963,649) (11,613,454) (134,241,584) (80,238,545)
Change in net assets (3,241,421) (3,140,905) (2,635,359) (13,488,293) 80,274,684 (132,501,740)
NET ASSETS:Beginning of period $ 16,826,988 $ 19,967,893 $ 23,819,373 $ 37,307,666 $ 691,189,991 $ 823,691,731
End of period $ 13,585,567 $ 16,826,988 $ 21,184,014 $ 23,819,373 $ 771,464,675 $ 691,189,991
Accumulated undistributednet investment income (loss)included in end of periodnet assets $ 37,367 $ 29,228 $ 18,147 $ 17,411 $ 1,829,952 $ 1,408,080
SHARE TRANSACTIONS:Beginning of period 450,000(d) 600,000(d) 450,000(g) 700,000(g) 9,769,250 11,019,250
Issued 50,000(d) 900,000(d) 200,000(g) 500,000(g) 100,000 50,000
Issued in-kind 125,000(d) 375,000(d) —(g) 50,000(g) — 50,000
Redeemed (125,000)(d) (150,000)(d) —(g) —(g) (300,000) (150,000)
Redemption in-kind (200,000)(d) (1,275,000)(d) (350,000)(g) (800,000)(g) (1,450,000) (1,200,000)
Shares outstanding, end of period 300,000(d) 450,000(d) 300,000(g) 450,000(g) 8,119,250 9,769,250
(a) Capital share transactions may include transaction fees associated with Creation and Redemption transactions which occurred during the period.See Note 10 to the Financial Statements.
(d) As described in Note 13, share amounts have been restated on a retroactive basis to reflect a 3:1 stock split effective July 25, 2016.(g) As described in Note 13, share amounts have been restated on a retroactive basis to reflect a 2:1 stock split effective January 12, 2017.
See accompanying notes to the financial statements.
Merrill Corp - Proshares Trust Geared Book [96 Funds] Annual Report [Funds] 333-089822 05-31-2017 ED [AUX] | eperez | 28-Jul-17 17:42 | 17-15159-3.ge | Sequence: 25CHKSUM Content: 17399 Layout: 43893 Graphics: No Graphics CLEAN
JOB: 17-15159-3 CYCLE#;BL#: 5; 0 TRIM: 8.25" x 10.75" COMPOSITECOLORS: Black, ~note-color 2, ~note-color 3 GRAPHICS: none V1.5
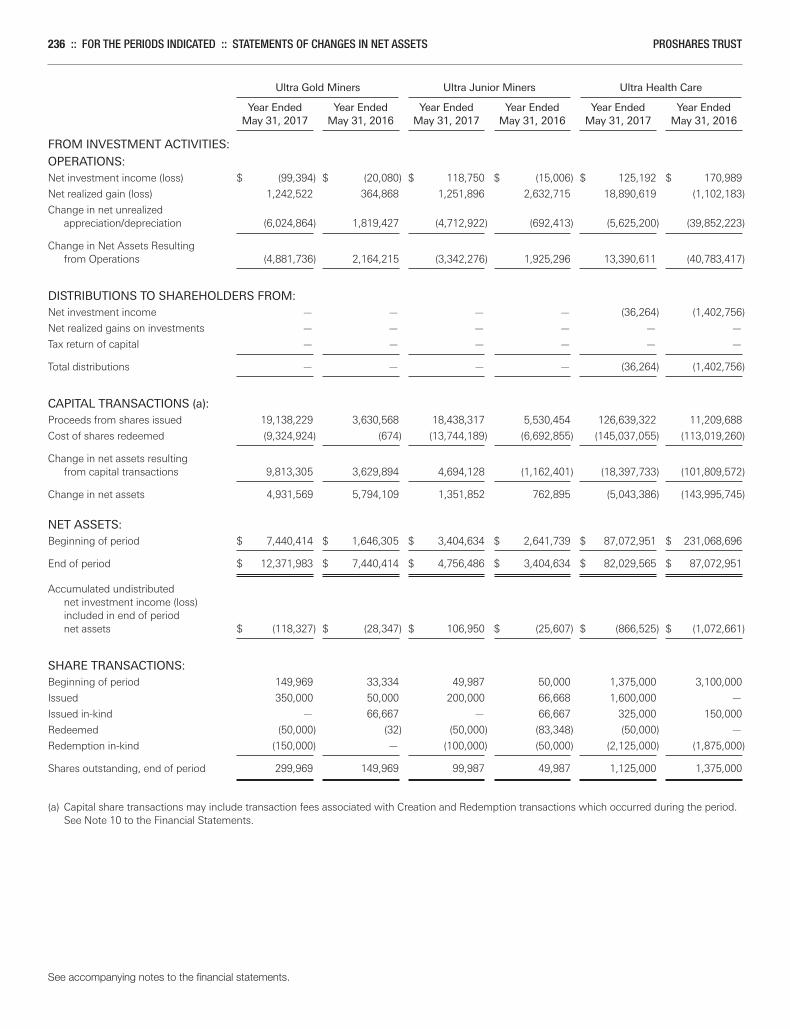
236 :: FOR THE PERIODS INDICATED :: STATEMENTS OF CHANGES IN NET ASSETS PROSHARES TRUST
Ultra Gold Miners Ultra Junior Miners Ultra Health Care Year Ended Year Ended Year Ended Year Ended Year Ended Year Ended May 31, 2017 May 31, 2016 May 31, 2017 May 31, 2016 May 31, 2017 May 31, 2016
FROM INVESTMENT ACTIVITIES:
OPERATIONS:Net investment income (loss) $ (99,394) $ (20,080) $ 118,750 $ (15,006) $ 125,192 $ 170,989
Net realized gain (loss) 1,242,522 364,868 1,251,896 2,632,715 18,890,619 (1,102,183)
Change in net unrealizedappreciation/depreciation (6,024,864) 1,819,427 (4,712,922) (692,413) (5,625,200) (39,852,223)
Change in Net Assets Resultingfrom Operations (4,881,736) 2,164,215 (3,342,276) 1,925,296 13,390,611 (40,783,417)
DISTRIBUTIONS TO SHAREHOLDERS FROM:Net investment income — — — — (36,264) (1,402,756)
Net realized gains on investments — — — — — —
Tax return of capital — — — — — —
Total distributions — — — — (36,264) (1,402,756)
CAPITAL TRANSACTIONS (a):Proceeds from shares issued 19,138,229 3,630,568 18,438,317 5,530,454 126,639,322 11,209,688
Cost of shares redeemed (9,324,924) (674) (13,744,189) (6,692,855) (145,037,055) (113,019,260)
Change in net assets resultingfrom capital transactions 9,813,305 3,629,894 4,694,128 (1,162,401) (18,397,733) (101,809,572)
Change in net assets 4,931,569 5,794,109 1,351,852 762,895 (5,043,386) (143,995,745)
NET ASSETS:Beginning of period $ 7,440,414 $ 1,646,305 $ 3,404,634 $ 2,641,739 $ 87,072,951 $ 231,068,696
End of period $ 12,371,983 $ 7,440,414 $ 4,756,486 $ 3,404,634 $ 82,029,565 $ 87,072,951
Accumulated undistributednet investment income (loss)included in end of periodnet assets $ (118,327) $ (28,347) $ 106,950 $ (25,607) $ (866,525) $ (1,072,661)
SHARE TRANSACTIONS:Beginning of period 149,969 33,334 49,987 50,000 1,375,000 3,100,000
Issued 350,000 50,000 200,000 66,668 1,600,000 —
Issued in-kind — 66,667 — 66,667 325,000 150,000
Redeemed (50,000) (32) (50,000) (83,348) (50,000) —
Redemption in-kind (150,000) — (100,000) (50,000) (2,125,000) (1,875,000)
Shares outstanding, end of period 299,969 149,969 99,987 49,987 1,125,000 1,375,000
(a) Capital share transactions may include transaction fees associated with Creation and Redemption transactions which occurred during the period.See Note 10 to the Financial Statements.
See accompanying notes to the financial statements.
Merrill Corp - Proshares Trust Geared Book [96 Funds] Annual Report [Funds] 333-089822 05-31-2017 ED [AUX] | eperez | 28-Jul-17 17:42 | 17-15159-3.ge | Sequence: 26CHKSUM Content: 19937 Layout: 4360 Graphics: No Graphics CLEAN
JOB: 17-15159-3 CYCLE#;BL#: 5; 0 TRIM: 8.25" x 10.75" COMPOSITECOLORS: Black, ~note-color 2, ~note-color 3 GRAPHICS: none V1.5
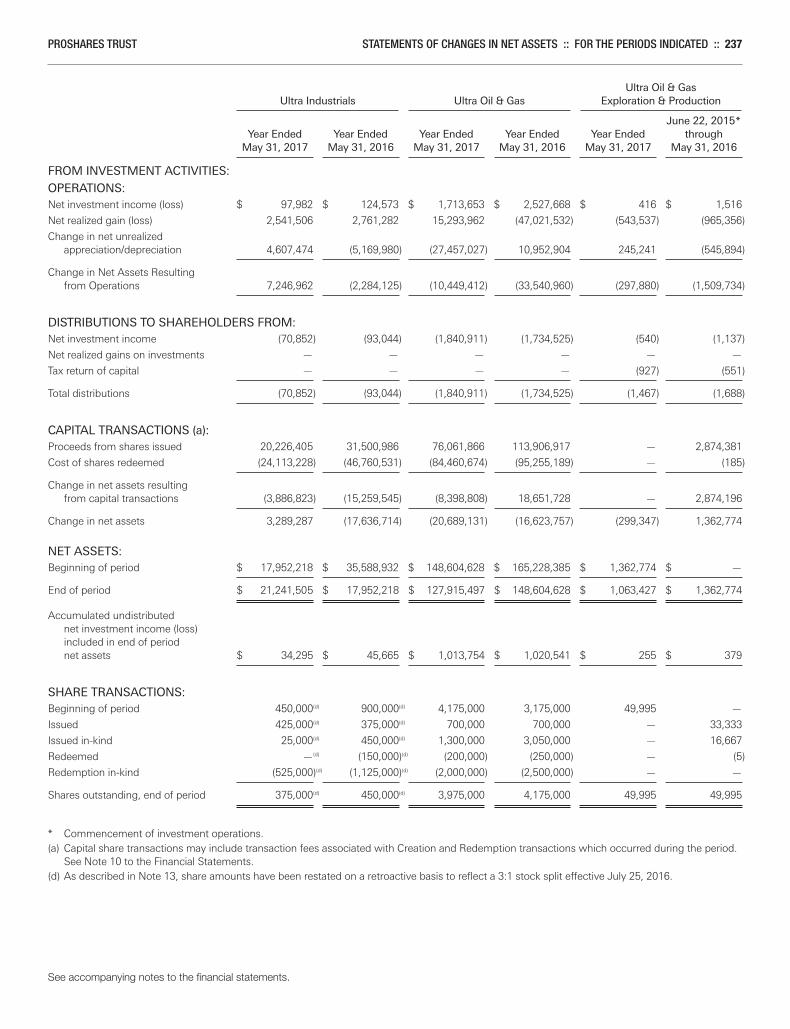
PROSHARES TRUST STATEMENTS OF CHANGES IN NET ASSETS :: FOR THE PERIODS INDICATED :: 237
Ultra Oil & Gas Ultra Industrials Ultra Oil & Gas Exploration & Production June 22, 2015* Year Ended Year Ended Year Ended Year Ended Year Ended through May 31, 2017 May 31, 2016 May 31, 2017 May 31, 2016 May 31, 2017 May 31, 2016
FROM INVESTMENT ACTIVITIES:
OPERATIONS:Net investment income (loss) $ 97,982 $ 124,573 $ 1,713,653 $ 2,527,668 $ 416 $ 1,516
Net realized gain (loss) 2,541,506 2,761,282 15,293,962 (47,021,532) (543,537) (965,356)
Change in net unrealizedappreciation/depreciation 4,607,474 (5,169,980) (27,457,027) 10,952,904 245,241 (545,894)
Change in Net Assets Resultingfrom Operations 7,246,962 (2,284,125) (10,449,412) (33,540,960) (297,880) (1,509,734)
DISTRIBUTIONS TO SHAREHOLDERS FROM:Net investment income (70,852) (93,044) (1,840,911) (1,734,525) (540) (1,137)
Net realized gains on investments — — — — — —
Tax return of capital — — — — (927) (551)
Total distributions (70,852) (93,044) (1,840,911) (1,734,525) (1,467) (1,688)
CAPITAL TRANSACTIONS (a):Proceeds from shares issued 20,226,405 31,500,986 76,061,866 113,906,917 — 2,874,381
Cost of shares redeemed (24,113,228) (46,760,531) (84,460,674) (95,255,189) — (185)
Change in net assets resultingfrom capital transactions (3,886,823) (15,259,545) (8,398,808) 18,651,728 — 2,874,196
Change in net assets 3,289,287 (17,636,714) (20,689,131) (16,623,757) (299,347) 1,362,774
NET ASSETS:Beginning of period $ 17,952,218 $ 35,588,932 $ 148,604,628 $ 165,228,385 $ 1,362,774 $ —
End of period $ 21,241,505 $ 17,952,218 $ 127,915,497 $ 148,604,628 $ 1,063,427 $ 1,362,774
Accumulated undistributednet investment income (loss)included in end of periodnet assets $ 34,295 $ 45,665 $ 1,013,754 $ 1,020,541 $ 255 $ 379
SHARE TRANSACTIONS:Beginning of period 450,000(d) 900,000(d) 4,175,000 3,175,000 49,995 —
Issued 425,000(d) 375,000(d) 700,000 700,000 — 33,333
Issued in-kind 25,000(d) 450,000(d) 1,300,000 3,050,000 — 16,667
Redeemed —(d) (150,000)(d) (200,000) (250,000) — (5)
Redemption in-kind (525,000)(d) (1,125,000)(d) (2,000,000) (2,500,000) — —
Shares outstanding, end of period 375,000(d) 450,000(d) 3,975,000 4,175,000 49,995 49,995
* Commencement of investment operations.(a) Capital share transactions may include transaction fees associated with Creation and Redemption transactions which occurred during the period.
See Note 10 to the Financial Statements.(d) As described in Note 13, share amounts have been restated on a retroactive basis to reflect a 3:1 stock split effective July 25, 2016.
See accompanying notes to the financial statements.
Merrill Corp - Proshares Trust Geared Book [96 Funds] Annual Report [Funds] 333-089822 05-31-2017 ED [AUX] | eperez | 28-Jul-17 17:42 | 17-15159-3.ge | Sequence: 27CHKSUM Content: 43865 Layout: 22823 Graphics: No Graphics CLEAN
JOB: 17-15159-3 CYCLE#;BL#: 5; 0 TRIM: 8.25" x 10.75" COMPOSITECOLORS: Black, ~note-color 2, ~note-color 3 GRAPHICS: none V1.5
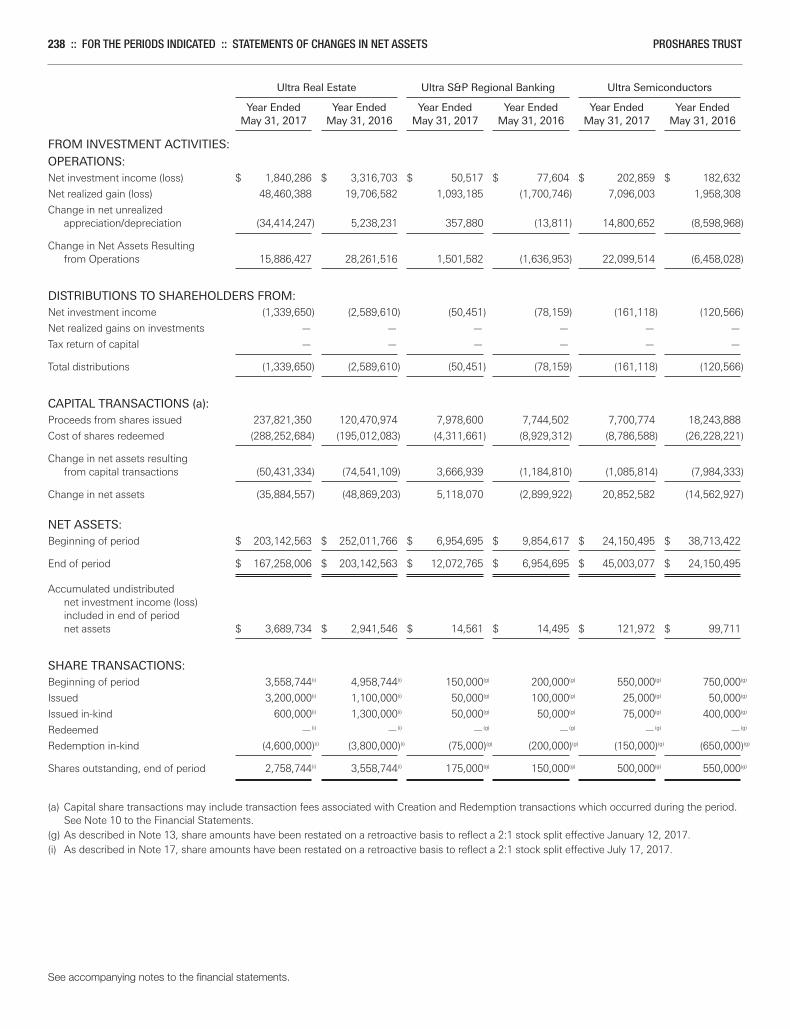
238 :: FOR THE PERIODS INDICATED :: STATEMENTS OF CHANGES IN NET ASSETS PROSHARES TRUST
Ultra Real Estate Ultra S&P Regional Banking Ultra Semiconductors Year Ended Year Ended Year Ended Year Ended Year Ended Year Ended May 31, 2017 May 31, 2016 May 31, 2017 May 31, 2016 May 31, 2017 May 31, 2016
FROM INVESTMENT ACTIVITIES:
OPERATIONS:Net investment income (loss) $ 1,840,286 $ 3,316,703 $ 50,517 $ 77,604 $ 202,859 $ 182,632
Net realized gain (loss) 48,460,388 19,706,582 1,093,185 (1,700,746) 7,096,003 1,958,308
Change in net unrealizedappreciation/depreciation (34,414,247) 5,238,231 357,880 (13,811) 14,800,652 (8,598,968)
Change in Net Assets Resultingfrom Operations 15,886,427 28,261,516 1,501,582 (1,636,953) 22,099,514 (6,458,028)
DISTRIBUTIONS TO SHAREHOLDERS FROM:Net investment income (1,339,650) (2,589,610) (50,451) (78,159) (161,118) (120,566)
Net realized gains on investments — — — — — —
Tax return of capital — — — — — —
Total distributions (1,339,650) (2,589,610) (50,451) (78,159) (161,118) (120,566)
CAPITAL TRANSACTIONS (a):Proceeds from shares issued 237,821,350 120,470,974 7,978,600 7,744,502 7,700,774 18,243,888
Cost of shares redeemed (288,252,684) (195,012,083) (4,311,661) (8,929,312) (8,786,588) (26,228,221)
Change in net assets resultingfrom capital transactions (50,431,334) (74,541,109) 3,666,939 (1,184,810) (1,085,814) (7,984,333)
Change in net assets (35,884,557) (48,869,203) 5,118,070 (2,899,922) 20,852,582 (14,562,927)
NET ASSETS:Beginning of period $ 203,142,563 $ 252,011,766 $ 6,954,695 $ 9,854,617 $ 24,150,495 $ 38,713,422
End of period $ 167,258,006 $ 203,142,563 $ 12,072,765 $ 6,954,695 $ 45,003,077 $ 24,150,495
Accumulated undistributednet investment income (loss)included in end of periodnet assets $ 3,689,734 $ 2,941,546 $ 14,561 $ 14,495 $ 121,972 $ 99,711
SHARE TRANSACTIONS:Beginning of period 3,558,744(i) 4,958,744(i) 150,000(g) 200,000(g) 550,000(g) 750,000(g)
Issued 3,200,000(i) 1,100,000(i) 50,000(g) 100,000(g) 25,000(g) 50,000(g)
Issued in-kind 600,000(i) 1,300,000(i) 50,000(g) 50,000(g) 75,000(g) 400,000(g)
Redeemed —(i) —(i) —(g) —(g) —(g) —(g)
Redemption in-kind (4,600,000)(i) (3,800,000)(i) (75,000)(g) (200,000)(g) (150,000)(g) (650,000)(g)
Shares outstanding, end of period 2,758,744(i) 3,558,744(i) 175,000(g) 150,000(g) 500,000(g) 550,000(g)
(a) Capital share transactions may include transaction fees associated with Creation and Redemption transactions which occurred during the period.See Note 10 to the Financial Statements.
(g) As described in Note 13, share amounts have been restated on a retroactive basis to reflect a 2:1 stock split effective January 12, 2017.(i) As described in Note 17, share amounts have been restated on a retroactive basis to reflect a 2:1 stock split effective July 17, 2017.
See accompanying notes to the financial statements.
Merrill Corp - Proshares Trust Geared Book [96 Funds] Annual Report [Funds] 333-089822 05-31-2017 ED [AUX] | eperez | 28-Jul-17 17:42 | 17-15159-3.ge | Sequence: 28CHKSUM Content: 13740 Layout: 63974 Graphics: No Graphics CLEAN
JOB: 17-15159-3 CYCLE#;BL#: 5; 0 TRIM: 8.25" x 10.75" COMPOSITECOLORS: Black, ~note-color 2, ~note-color 3 GRAPHICS: none V1.5
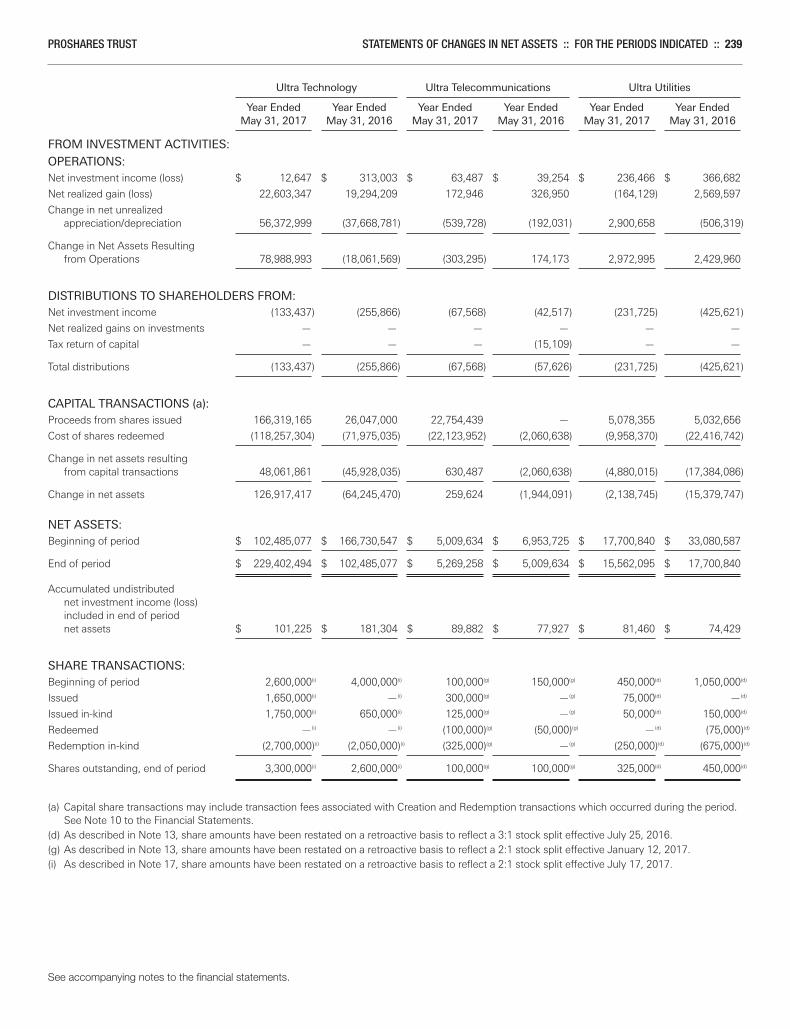
PROSHARES TRUST STATEMENTS OF CHANGES IN NET ASSETS :: FOR THE PERIODS INDICATED :: 239
Ultra Technology Ultra Telecommunications Ultra Utilities Year Ended Year Ended Year Ended Year Ended Year Ended Year Ended May 31, 2017 May 31, 2016 May 31, 2017 May 31, 2016 May 31, 2017 May 31, 2016
FROM INVESTMENT ACTIVITIES:
OPERATIONS:Net investment income (loss) $ 12,647 $ 313,003 $ 63,487 $ 39,254 $ 236,466 $ 366,682
Net realized gain (loss) 22,603,347 19,294,209 172,946 326,950 (164,129) 2,569,597
Change in net unrealizedappreciation/depreciation 56,372,999 (37,668,781) (539,728) (192,031) 2,900,658 (506,319)
Change in Net Assets Resultingfrom Operations 78,988,993 (18,061,569) (303,295) 174,173 2,972,995 2,429,960
DISTRIBUTIONS TO SHAREHOLDERS FROM:Net investment income (133,437) (255,866) (67,568) (42,517) (231,725) (425,621)
Net realized gains on investments — — — — — —
Tax return of capital — — — (15,109) — —
Total distributions (133,437) (255,866) (67,568) (57,626) (231,725) (425,621)
CAPITAL TRANSACTIONS (a):Proceeds from shares issued 166,319,165 26,047,000 22,754,439 — 5,078,355 5,032,656
Cost of shares redeemed (118,257,304) (71,975,035) (22,123,952) (2,060,638) (9,958,370) (22,416,742)
Change in net assets resultingfrom capital transactions 48,061,861 (45,928,035) 630,487 (2,060,638) (4,880,015) (17,384,086)
Change in net assets 126,917,417 (64,245,470) 259,624 (1,944,091) (2,138,745) (15,379,747)
NET ASSETS:Beginning of period $ 102,485,077 $ 166,730,547 $ 5,009,634 $ 6,953,725 $ 17,700,840 $ 33,080,587
End of period $ 229,402,494 $ 102,485,077 $ 5,269,258 $ 5,009,634 $ 15,562,095 $ 17,700,840
Accumulated undistributednet investment income (loss)included in end of periodnet assets $ 101,225 $ 181,304 $ 89,882 $ 77,927 $ 81,460 $ 74,429
SHARE TRANSACTIONS:Beginning of period 2,600,000(i) 4,000,000(i) 100,000(g) 150,000(g) 450,000(d) 1,050,000(d)
Issued 1,650,000(i) —(i) 300,000(g) —(g) 75,000(d) —(d)
Issued in-kind 1,750,000(i) 650,000(i) 125,000(g) —(g) 50,000(d) 150,000(d)
Redeemed —(i) —(i) (100,000)(g) (50,000)(g) —(d) (75,000)(d)
Redemption in-kind (2,700,000)(i) (2,050,000)(i) (325,000)(g) —(g) (250,000)(d) (675,000)(d)
Shares outstanding, end of period 3,300,000(i) 2,600,000(i) 100,000(g) 100,000(g) 325,000(d) 450,000(d)
(a) Capital share transactions may include transaction fees associated with Creation and Redemption transactions which occurred during the period.See Note 10 to the Financial Statements.
(d) As described in Note 13, share amounts have been restated on a retroactive basis to reflect a 3:1 stock split effective July 25, 2016.(g) As described in Note 13, share amounts have been restated on a retroactive basis to reflect a 2:1 stock split effective January 12, 2017.(i) As described in Note 17, share amounts have been restated on a retroactive basis to reflect a 2:1 stock split effective July 17, 2017.
See accompanying notes to the financial statements.
Merrill Corp - Proshares Trust Geared Book [96 Funds] Annual Report [Funds] 333-089822 05-31-2017 ED [AUX] | eperez | 28-Jul-17 17:42 | 17-15159-3.ge | Sequence: 29CHKSUM Content: 41541 Layout: 50448 Graphics: No Graphics CLEAN
JOB: 17-15159-3 CYCLE#;BL#: 5; 0 TRIM: 8.25" x 10.75" COMPOSITECOLORS: Black, ~note-color 2, ~note-color 3 GRAPHICS: none V1.5
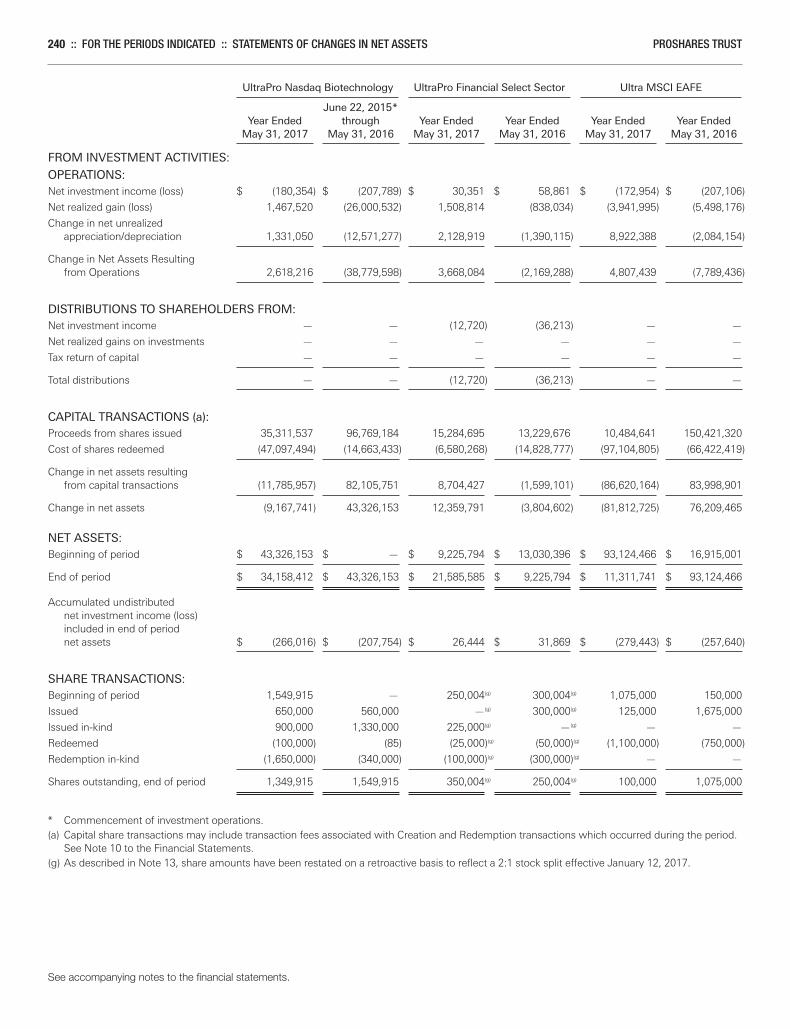
240 :: FOR THE PERIODS INDICATED :: STATEMENTS OF CHANGES IN NET ASSETS PROSHARES TRUST
UltraPro Nasdaq Biotechnology UltraPro Financial Select Sector Ultra MSCI EAFE June 22, 2015* Year Ended through Year Ended Year Ended Year Ended Year Ended May 31, 2017 May 31, 2016 May 31, 2017 May 31, 2016 May 31, 2017 May 31, 2016
FROM INVESTMENT ACTIVITIES:
OPERATIONS:Net investment income (loss) $ (180,354) $ (207,789) $ 30,351 $ 58,861 $ (172,954) $ (207,106)
Net realized gain (loss) 1,467,520 (26,000,532) 1,508,814 (838,034) (3,941,995) (5,498,176)
Change in net unrealizedappreciation/depreciation 1,331,050 (12,571,277) 2,128,919 (1,390,115) 8,922,388 (2,084,154)
Change in Net Assets Resultingfrom Operations 2,618,216 (38,779,598) 3,668,084 (2,169,288) 4,807,439 (7,789,436)
DISTRIBUTIONS TO SHAREHOLDERS FROM:Net investment income — — (12,720) (36,213) — —
Net realized gains on investments — — — — — —
Tax return of capital — — — — — —
Total distributions — — (12,720) (36,213) — —
CAPITAL TRANSACTIONS (a):Proceeds from shares issued 35,311,537 96,769,184 15,284,695 13,229,676 10,484,641 150,421,320
Cost of shares redeemed (47,097,494) (14,663,433) (6,580,268) (14,828,777) (97,104,805) (66,422,419)
Change in net assets resultingfrom capital transactions (11,785,957) 82,105,751 8,704,427 (1,599,101) (86,620,164) 83,998,901
Change in net assets (9,167,741) 43,326,153 12,359,791 (3,804,602) (81,812,725) 76,209,465
NET ASSETS:Beginning of period $ 43,326,153 $ — $ 9,225,794 $ 13,030,396 $ 93,124,466 $ 16,915,001
End of period $ 34,158,412 $ 43,326,153 $ 21,585,585 $ 9,225,794 $ 11,311,741 $ 93,124,466
Accumulated undistributednet investment income (loss)included in end of periodnet assets $ (266,016) $ (207,754) $ 26,444 $ 31,869 $ (279,443) $ (257,640)
SHARE TRANSACTIONS:Beginning of period 1,549,915 — 250,004(g) 300,004(g) 1,075,000 150,000
Issued 650,000 560,000 —(g) 300,000(g) 125,000 1,675,000
Issued in-kind 900,000 1,330,000 225,000(g) —(g) — —
Redeemed (100,000) (85) (25,000)(g) (50,000)(g) (1,100,000) (750,000)
Redemption in-kind (1,650,000) (340,000) (100,000)(g) (300,000)(g) — —
Shares outstanding, end of period 1,349,915 1,549,915 350,004(g) 250,004(g) 100,000 1,075,000
* Commencement of investment operations.(a) Capital share transactions may include transaction fees associated with Creation and Redemption transactions which occurred during the period.
See Note 10 to the Financial Statements.(g) As described in Note 13, share amounts have been restated on a retroactive basis to reflect a 2:1 stock split effective January 12, 2017.
See accompanying notes to the financial statements.
Merrill Corp - Proshares Trust Geared Book [96 Funds] Annual Report [Funds] 333-089822 05-31-2017 ED [AUX] | eperez | 28-Jul-17 17:42 | 17-15159-3.ge | Sequence: 30CHKSUM Content: 29852 Layout: 32921 Graphics: No Graphics CLEAN
JOB: 17-15159-3 CYCLE#;BL#: 5; 0 TRIM: 8.25" x 10.75" COMPOSITECOLORS: Black, ~note-color 2, ~note-color 3 GRAPHICS: none V1.5
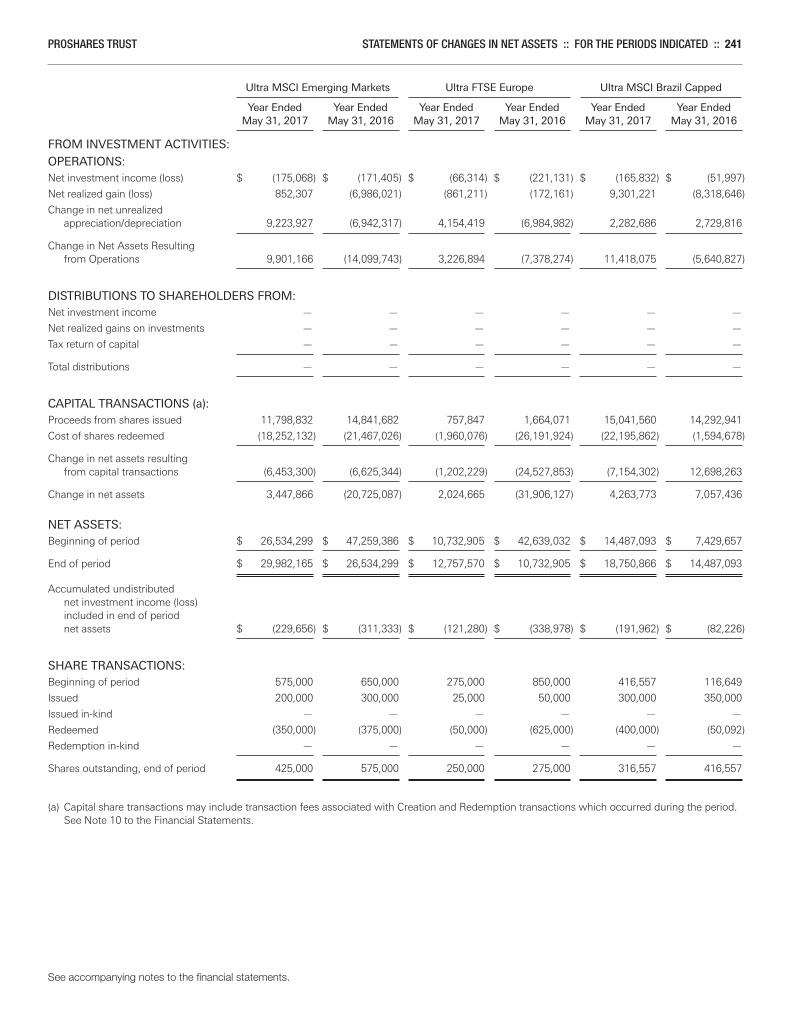
PROSHARES TRUST STATEMENTS OF CHANGES IN NET ASSETS :: FOR THE PERIODS INDICATED :: 241
Ultra MSCI Emerging Markets Ultra FTSE Europe Ultra MSCI Brazil Capped Year Ended Year Ended Year Ended Year Ended Year Ended Year Ended May 31, 2017 May 31, 2016 May 31, 2017 May 31, 2016 May 31, 2017 May 31, 2016
FROM INVESTMENT ACTIVITIES:
OPERATIONS:Net investment income (loss) $ (175,068) $ (171,405) $ (66,314) $ (221,131) $ (165,832) $ (51,997)
Net realized gain (loss) 852,307 (6,986,021) (861,211) (172,161) 9,301,221 (8,318,646)
Change in net unrealizedappreciation/depreciation 9,223,927 (6,942,317) 4,154,419 (6,984,982) 2,282,686 2,729,816
Change in Net Assets Resultingfrom Operations 9,901,166 (14,099,743) 3,226,894 (7,378,274) 11,418,075 (5,640,827)
DISTRIBUTIONS TO SHAREHOLDERS FROM:Net investment income — — — — — —
Net realized gains on investments — — — — — —
Tax return of capital — — — — — —
Total distributions — — — — — —
CAPITAL TRANSACTIONS (a):Proceeds from shares issued 11,798,832 14,841,682 757,847 1,664,071 15,041,560 14,292,941
Cost of shares redeemed (18,252,132) (21,467,026) (1,960,076) (26,191,924) (22,195,862) (1,594,678)
Change in net assets resultingfrom capital transactions (6,453,300) (6,625,344) (1,202,229) (24,527,853) (7,154,302) 12,698,263
Change in net assets 3,447,866 (20,725,087) 2,024,665 (31,906,127) 4,263,773 7,057,436
NET ASSETS:Beginning of period $ 26,534,299 $ 47,259,386 $ 10,732,905 $ 42,639,032 $ 14,487,093 $ 7,429,657
End of period $ 29,982,165 $ 26,534,299 $ 12,757,570 $ 10,732,905 $ 18,750,866 $ 14,487,093
Accumulated undistributednet investment income (loss)included in end of periodnet assets $ (229,656) $ (311,333) $ (121,280) $ (338,978) $ (191,962) $ (82,226)
SHARE TRANSACTIONS:Beginning of period 575,000 650,000 275,000 850,000 416,557 116,649
Issued 200,000 300,000 25,000 50,000 300,000 350,000
Issued in-kind — — — — — —
Redeemed (350,000) (375,000) (50,000) (625,000) (400,000) (50,092)
Redemption in-kind — — — — — —
Shares outstanding, end of period 425,000 575,000 250,000 275,000 316,557 416,557
(a) Capital share transactions may include transaction fees associated with Creation and Redemption transactions which occurred during the period.See Note 10 to the Financial Statements.
See accompanying notes to the financial statements.
Merrill Corp - Proshares Trust Geared Book [96 Funds] Annual Report [Funds] 333-089822 05-31-2017 ED [AUX] | eperez | 28-Jul-17 17:42 | 17-15159-3.ge | Sequence: 31CHKSUM Content: 32226 Layout: 52314 Graphics: No Graphics CLEAN
JOB: 17-15159-3 CYCLE#;BL#: 5; 0 TRIM: 8.25" x 10.75" COMPOSITECOLORS: Black, ~note-color 2, ~note-color 3 GRAPHICS: none V1.5
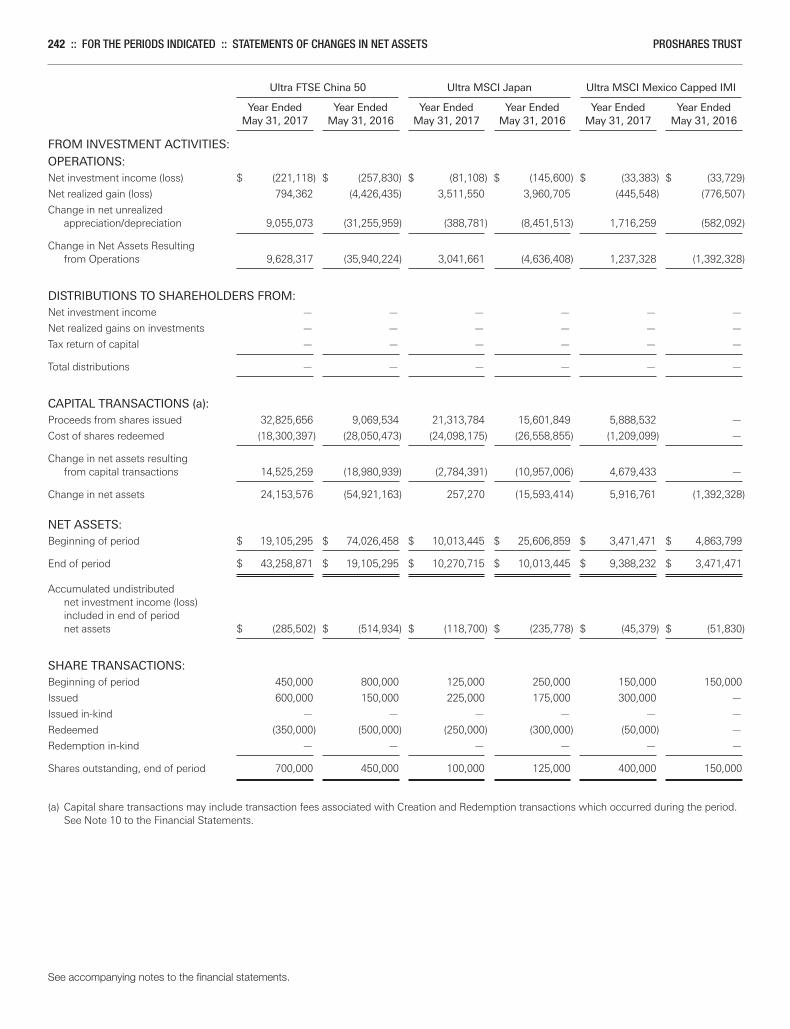
242 :: FOR THE PERIODS INDICATED :: STATEMENTS OF CHANGES IN NET ASSETS PROSHARES TRUST
Ultra FTSE China 50 Ultra MSCI Japan Ultra MSCI Mexico Capped IMI Year Ended Year Ended Year Ended Year Ended Year Ended Year Ended May 31, 2017 May 31, 2016 May 31, 2017 May 31, 2016 May 31, 2017 May 31, 2016
FROM INVESTMENT ACTIVITIES:
OPERATIONS:Net investment income (loss) $ (221,118) $ (257,830) $ (81,108) $ (145,600) $ (33,383) $ (33,729)
Net realized gain (loss) 794,362 (4,426,435) 3,511,550 3,960,705 (445,548) (776,507)
Change in net unrealizedappreciation/depreciation 9,055,073 (31,255,959) (388,781) (8,451,513) 1,716,259 (582,092)
Change in Net Assets Resultingfrom Operations 9,628,317 (35,940,224) 3,041,661 (4,636,408) 1,237,328 (1,392,328)
DISTRIBUTIONS TO SHAREHOLDERS FROM:Net investment income — — — — — —
Net realized gains on investments — — — — — —
Tax return of capital — — — — — —
Total distributions — — — — — —
CAPITAL TRANSACTIONS (a):Proceeds from shares issued 32,825,656 9,069,534 21,313,784 15,601,849 5,888,532 —
Cost of shares redeemed (18,300,397) (28,050,473) (24,098,175) (26,558,855) (1,209,099) —
Change in net assets resultingfrom capital transactions 14,525,259 (18,980,939) (2,784,391) (10,957,006) 4,679,433 —
Change in net assets 24,153,576 (54,921,163) 257,270 (15,593,414) 5,916,761 (1,392,328)
NET ASSETS:Beginning of period $ 19,105,295 $ 74,026,458 $ 10,013,445 $ 25,606,859 $ 3,471,471 $ 4,863,799
End of period $ 43,258,871 $ 19,105,295 $ 10,270,715 $ 10,013,445 $ 9,388,232 $ 3,471,471
Accumulated undistributednet investment income (loss)included in end of periodnet assets $ (285,502) $ (514,934) $ (118,700) $ (235,778) $ (45,379) $ (51,830)
SHARE TRANSACTIONS:Beginning of period 450,000 800,000 125,000 250,000 150,000 150,000
Issued 600,000 150,000 225,000 175,000 300,000 —
Issued in-kind — — — — — —
Redeemed (350,000) (500,000) (250,000) (300,000) (50,000) —
Redemption in-kind — — — — — —
Shares outstanding, end of period 700,000 450,000 100,000 125,000 400,000 150,000
(a) Capital share transactions may include transaction fees associated with Creation and Redemption transactions which occurred during the period.See Note 10 to the Financial Statements.
See accompanying notes to the financial statements.
Merrill Corp - Proshares Trust Geared Book [96 Funds] Annual Report [Funds] 333-089822 05-31-2017 ED [AUX] | eperez | 28-Jul-17 17:42 | 17-15159-3.ge | Sequence: 32CHKSUM Content: 33496 Layout: 23148 Graphics: No Graphics CLEAN
JOB: 17-15159-3 CYCLE#;BL#: 5; 0 TRIM: 8.25" x 10.75" COMPOSITECOLORS: Black, ~note-color 2, ~note-color 3 GRAPHICS: none V1.5
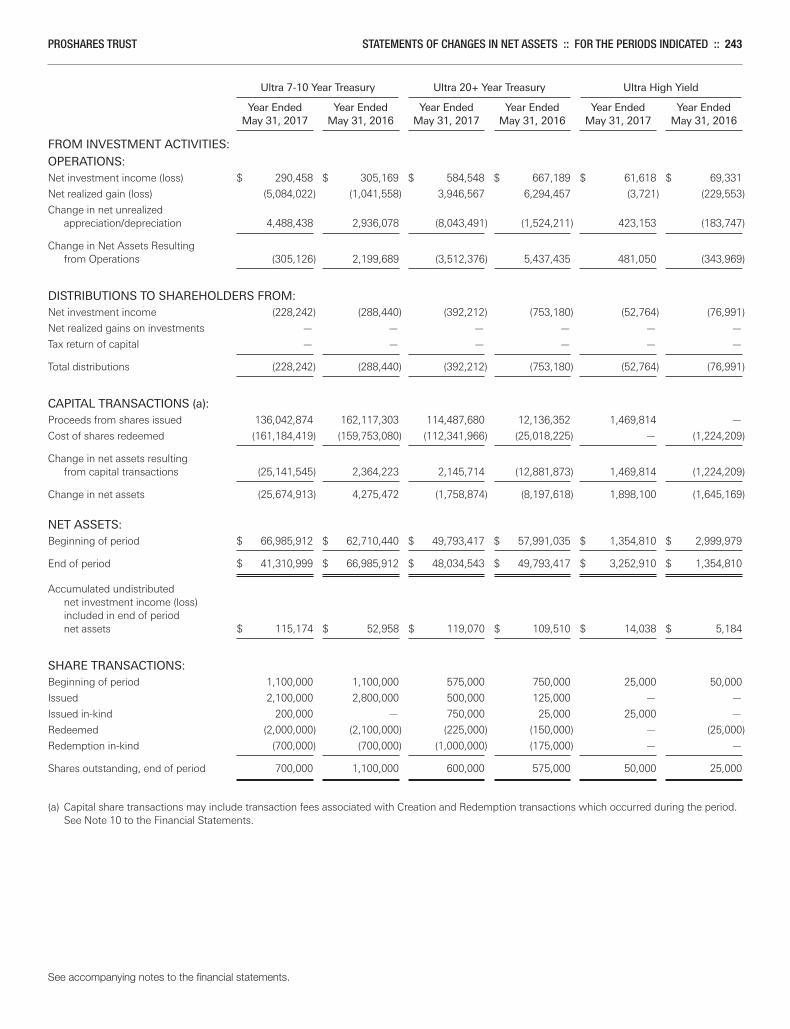
PROSHARES TRUST STATEMENTS OF CHANGES IN NET ASSETS :: FOR THE PERIODS INDICATED :: 243
Ultra 7-10 Year Treasury Ultra 20+ Year Treasury Ultra High Yield Year Ended Year Ended Year Ended Year Ended Year Ended Year Ended May 31, 2017 May 31, 2016 May 31, 2017 May 31, 2016 May 31, 2017 May 31, 2016
FROM INVESTMENT ACTIVITIES:
OPERATIONS:Net investment income (loss) $ 290,458 $ 305,169 $ 584,548 $ 667,189 $ 61,618 $ 69,331
Net realized gain (loss) (5,084,022) (1,041,558) 3,946,567 6,294,457 (3,721) (229,553)
Change in net unrealizedappreciation/depreciation 4,488,438 2,936,078 (8,043,491) (1,524,211) 423,153 (183,747)
Change in Net Assets Resultingfrom Operations (305,126) 2,199,689 (3,512,376) 5,437,435 481,050 (343,969)
DISTRIBUTIONS TO SHAREHOLDERS FROM:Net investment income (228,242) (288,440) (392,212) (753,180) (52,764) (76,991)
Net realized gains on investments — — — — — —
Tax return of capital — — — — — —
Total distributions (228,242) (288,440) (392,212) (753,180) (52,764) (76,991)
CAPITAL TRANSACTIONS (a):Proceeds from shares issued 136,042,874 162,117,303 114,487,680 12,136,352 1,469,814 —
Cost of shares redeemed (161,184,419) (159,753,080) (112,341,966) (25,018,225) — (1,224,209)
Change in net assets resultingfrom capital transactions (25,141,545) 2,364,223 2,145,714 (12,881,873) 1,469,814 (1,224,209)
Change in net assets (25,674,913) 4,275,472 (1,758,874) (8,197,618) 1,898,100 (1,645,169)
NET ASSETS:Beginning of period $ 66,985,912 $ 62,710,440 $ 49,793,417 $ 57,991,035 $ 1,354,810 $ 2,999,979
End of period $ 41,310,999 $ 66,985,912 $ 48,034,543 $ 49,793,417 $ 3,252,910 $ 1,354,810
Accumulated undistributednet investment income (loss)included in end of periodnet assets $ 115,174 $ 52,958 $ 119,070 $ 109,510 $ 14,038 $ 5,184
SHARE TRANSACTIONS:Beginning of period 1,100,000 1,100,000 575,000 750,000 25,000 50,000
Issued 2,100,000 2,800,000 500,000 125,000 — —
Issued in-kind 200,000 — 750,000 25,000 25,000 —
Redeemed (2,000,000) (2,100,000) (225,000) (150,000) — (25,000)
Redemption in-kind (700,000) (700,000) (1,000,000) (175,000) — —
Shares outstanding, end of period 700,000 1,100,000 600,000 575,000 50,000 25,000
(a) Capital share transactions may include transaction fees associated with Creation and Redemption transactions which occurred during the period.See Note 10 to the Financial Statements.
See accompanying notes to the financial statements.
Merrill Corp - Proshares Trust Geared Book [96 Funds] Annual Report [Funds] 333-089822 05-31-2017 ED [AUX] | eperez | 28-Jul-17 17:42 | 17-15159-3.ge | Sequence: 33CHKSUM Content: 9326 Layout: 33334 Graphics: No Graphics CLEAN
JOB: 17-15159-3 CYCLE#;BL#: 5; 0 TRIM: 8.25" x 10.75" COMPOSITECOLORS: Black, ~note-color 2, ~note-color 3 GRAPHICS: none V1.5

244 :: FINANCIAL HIGHLIGHTS PROSHARES TRUST
FINANCIAL HIGHLIGHTS
Merrill Corp - Proshares Trust Geared Book [96 Funds] Annual Report [Funds] 333-089822 05-31-2017 ED [AUX] | eperez | 28-Jul-17 17:43 | 17-15159-3.ha | Sequence: 1CHKSUM Content: 55174 Layout: 8249 Graphics: No Graphics CLEAN
JOB: 17-15159-3 CYCLE#;BL#: 5; 0 TRIM: 8.25" x 10.75" COMPOSITECOLORS: Black, ~note-color 2, ~note-color 3 GRAPHICS: none V1.5
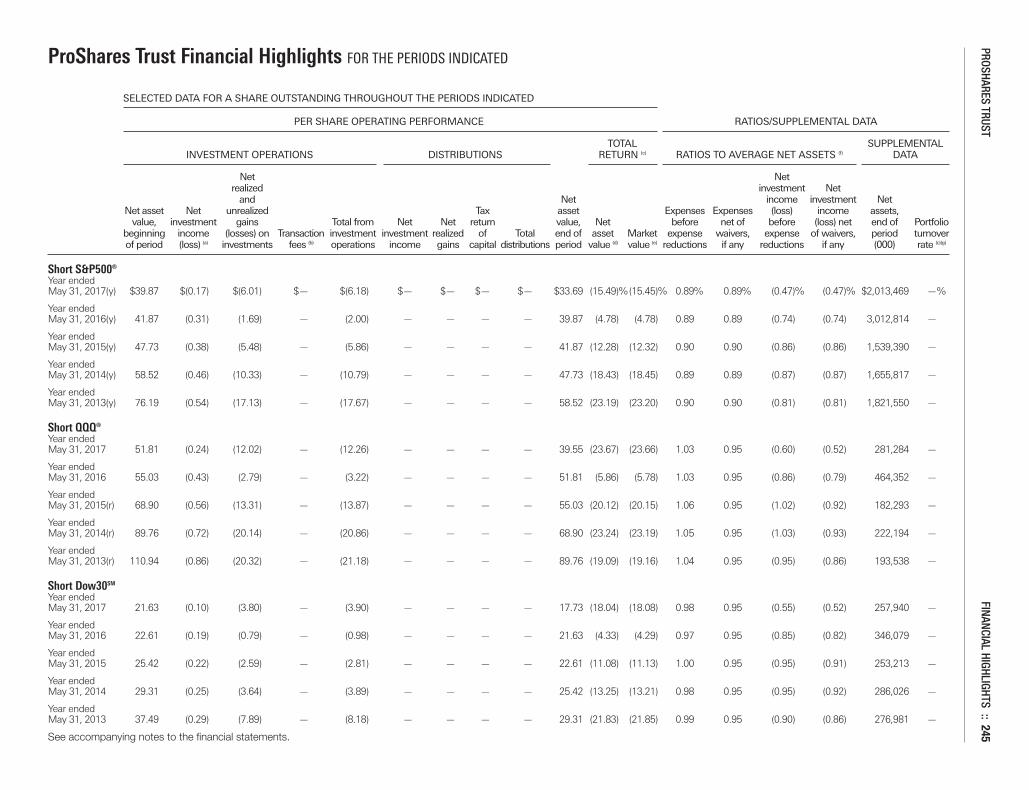
ProShares Trust Financial Highlights FOR THE PERIODS INDICATED
SELECTED DATA FOR A SHARE OUTSTANDING THROUGHOUT THE PERIODS INDICATED
PER SHARE OPERATING PERFORMANCE RATIOS/SUPPLEMENTAL DATA
TOTAL SUPPLEMENTAL INVESTMENT OPERATIONS DISTRIBUTIONS RETURN (c) RATIOS TO AVERAGE NET ASSETS (f) DATA
Net Net realized investment Net and Net income investment Net Net asset Net unrealized Tax asset Expenses Expenses (loss) income assets, value, investment gains Total from Net Net return value, Net before net of before (loss) net end of Portfolio beginning income (losses) on Transaction investment investment realized of Total end of asset Market expense waivers, expense of waivers, period turnover of period (loss) (a) investments fees (b) operations income gains capital distributions period value (d) value (e) reductions if any reductions if any (000) rate (c)(g)
Short S&P500®Year ended May 31, 2017(y) $39.87 $(0.17) $(6.01) $— $(6.18) $— $— $— $— $33.69 (15.49)%(15.45)% 0.89% 0.89% (0.47)% (0.47)% $2,013,469 —%
Year ended May 31, 2016(y) 41.87 (0.31) (1.69) — (2.00) — — — — 39.87 (4.78) (4.78) 0.89 0.89 (0.74) (0.74) 3,012,814 —
Year ended May 31, 2015(y) 47.73 (0.38) (5.48) — (5.86) — — — — 41.87 (12.28) (12.32) 0.90 0.90 (0.86) (0.86) 1,539,390 —
Year ended May 31, 2014(y) 58.52 (0.46) (10.33) — (10.79) — — — — 47.73 (18.43) (18.45) 0.89 0.89 (0.87) (0.87) 1,655,817 —
Year ended May 31, 2013(y) 76.19 (0.54) (17.13) — (17.67) — — — — 58.52 (23.19) (23.20) 0.90 0.90 (0.81) (0.81) 1,821,550 —
Short QQQ®Year ended May 31, 2017 51.81 (0.24) (12.02) — (12.26) — — — — 39.55 (23.67) (23.66) 1.03 0.95 (0.60) (0.52) 281,284 —
Year ended May 31, 2016 55.03 (0.43) (2.79) — (3.22) — — — — 51.81 (5.86) (5.78) 1.03 0.95 (0.86) (0.79) 464,352 —
Year ended May 31, 2015(r) 68.90 (0.56) (13.31) — (13.87) — — — — 55.03 (20.12) (20.15) 1.06 0.95 (1.02) (0.92) 182,293 —
Year ended May 31, 2014(r) 89.76 (0.72) (20.14) — (20.86) — — — — 68.90 (23.24) (23.19) 1.05 0.95 (1.03) (0.93) 222,194 —
Year ended May 31, 2013(r) 110.94 (0.86) (20.32) — (21.18) — — — — 89.76 (19.09) (19.16) 1.04 0.95 (0.95) (0.86) 193,538 —
Short Dow30SM
Year ended May 31, 2017 21.63 (0.10) (3.80) — (3.90) — — — — 17.73 (18.04) (18.08) 0.98 0.95 (0.55) (0.52) 257,940 —
Year ended May 31, 2016 22.61 (0.19) (0.79) — (0.98) — — — — 21.63 (4.33) (4.29) 0.97 0.95 (0.85) (0.82) 346,079 —
Year ended May 31, 2015 25.42 (0.22) (2.59) — (2.81) — — — — 22.61 (11.08) (11.13) 1.00 0.95 (0.95) (0.91) 253,213 —
Year ended May 31, 2014 29.31 (0.25) (3.64) — (3.89) — — — — 25.42 (13.25) (13.21) 0.98 0.95 (0.95) (0.92) 286,026 —
Year ended May 31, 2013 37.49 (0.29) (7.89) — (8.18) — — — — 29.31 (21.83) (21.85) 0.99 0.95 (0.90) (0.86) 276,981 —
See accompanying notes to the financial statements.
PROSHARES TRUST FINANCIAL HIGHLIGHTS :: 245
Merrill Corp - Proshares Trust Geared Book [96 Funds] Annual Report [Funds] 333-089822 05-31-2017 ED [AUX] | eperez | 28-Jul-17 17:43 | 17-15159-3.ia | Sequence: 1CHKSUM Content: 63295 Layout: 39303 Graphics: No Graphics CLEAN
JOB: 17-15159-3 CYCLE#;BL#: 5; 0 TRIM: 10.75" x 8.25" COMPOSITECOLORS: Black, ~note-color 2, ~note-color 3 GRAPHICS: none V1.5
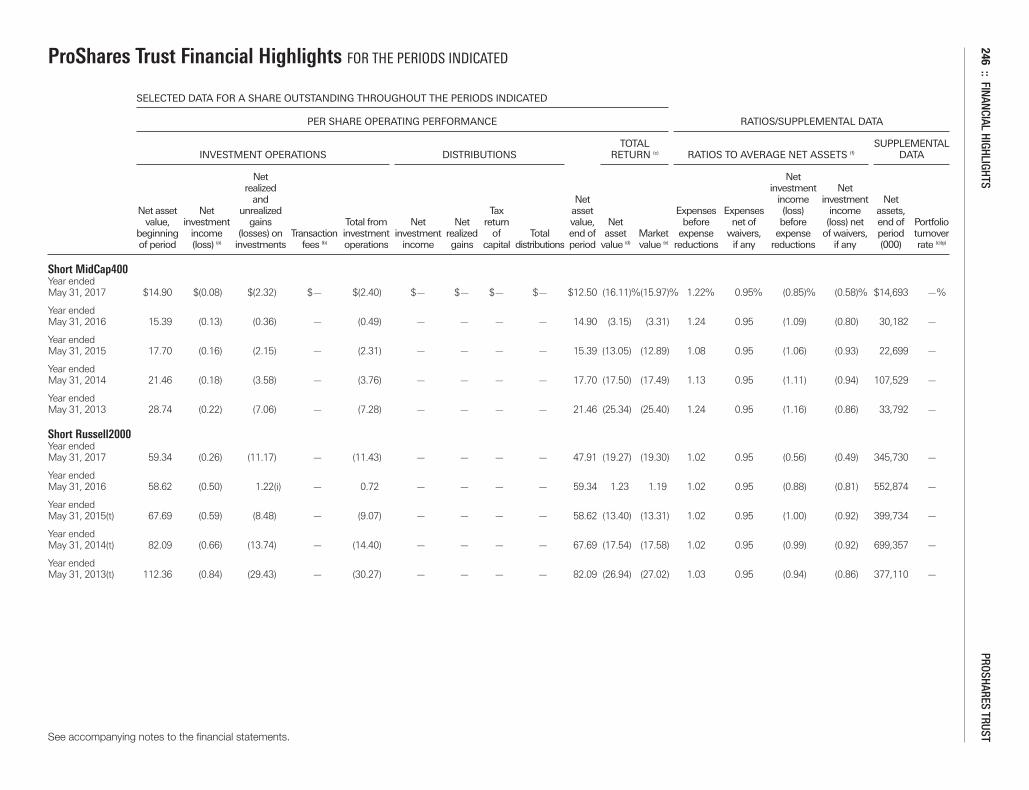
ProShares Trust Financial Highlights FOR THE PERIODS INDICATED
SELECTED DATA FOR A SHARE OUTSTANDING THROUGHOUT THE PERIODS INDICATED
PER SHARE OPERATING PERFORMANCE RATIOS/SUPPLEMENTAL DATA
TOTAL SUPPLEMENTAL INVESTMENT OPERATIONS DISTRIBUTIONS RETURN (c) RATIOS TO AVERAGE NET ASSETS (f) DATA
Net Net realized investment Net and Net income investment Net Net asset Net unrealized Tax asset Expenses Expenses (loss) income assets, value, investment gains Total from Net Net return value, Net before net of before (loss) net end of Portfolio beginning income (losses) on Transaction investment investment realized of Total end of asset Market expense waivers, expense of waivers, period turnover of period (loss) (a) investments fees (b) operations income gains capital distributions period value (d) value (e) reductions if any reductions if any (000) rate (c)(g)
Short MidCap400Year ended May 31, 2017 $14.90 $(0.08) $(2.32) $— $(2.40) $— $— $— $— $12.50 (16.11)%(15.97)% 1.22% 0.95% (0.85)% (0.58)% $14,693 —%
Year ended May 31, 2016 15.39 (0.13) (0.36) — (0.49) — — — — 14.90 (3.15) (3.31) 1.24 0.95 (1.09) (0.80) 30,182 —
Year ended May 31, 2015 17.70 (0.16) (2.15) — (2.31) — — — — 15.39 (13.05) (12.89) 1.08 0.95 (1.06) (0.93) 22,699 —
Year ended May 31, 2014 21.46 (0.18) (3.58) — (3.76) — — — — 17.70 (17.50) (17.49) 1.13 0.95 (1.11) (0.94) 107,529 —
Year ended May 31, 2013 28.74 (0.22) (7.06) — (7.28) — — — — 21.46 (25.34) (25.40) 1.24 0.95 (1.16) (0.86) 33,792 —
Short Russell2000Year ended May 31, 2017 59.34 (0.26) (11.17) — (11.43) — — — — 47.91 (19.27) (19.30) 1.02 0.95 (0.56) (0.49) 345,730 —
Year ended May 31, 2016 58.62 (0.50) 1.22(i) — 0.72 — — — — 59.34 1.23 1.19 1.02 0.95 (0.88) (0.81) 552,874 —
Year ended May 31, 2015(t) 67.69 (0.59) (8.48) — (9.07) — — — — 58.62 (13.40) (13.31) 1.02 0.95 (1.00) (0.92) 399,734 —
Year ended May 31, 2014(t) 82.09 (0.66) (13.74) — (14.40) — — — — 67.69 (17.54) (17.58) 1.02 0.95 (0.99) (0.92) 699,357 —
Year ended May 31, 2013(t) 112.36 (0.84) (29.43) — (30.27) — — — — 82.09 (26.94) (27.02) 1.03 0.95 (0.94) (0.86) 377,110 —
See accompanying notes to the financial statements.
246:: FINANCIAL HIGHLIGHTS
PROSHARES TRUST
Merrill Corp - Proshares Trust Geared Book [96 Funds] Annual Report [Funds] 333-089822 05-31-2017 ED [AUX] | eperez | 28-Jul-17 17:43 | 17-15159-3.ia | Sequence: 2CHKSUM Content: 14771 Layout: 16029 Graphics: No Graphics CLEAN
JOB: 17-15159-3 CYCLE#;BL#: 5; 0 TRIM: 10.75" x 8.25" COMPOSITECOLORS: Black, ~note-color 2, ~note-color 3 GRAPHICS: none V1.5
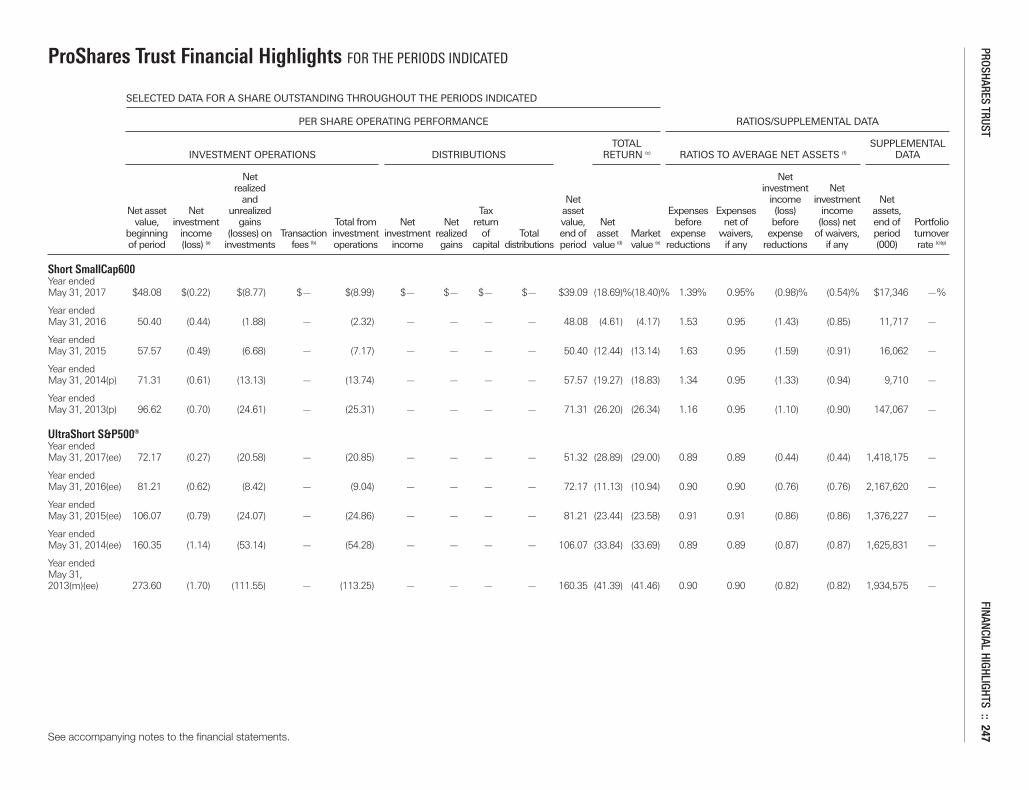
ProShares Trust Financial Highlights FOR THE PERIODS INDICATED
SELECTED DATA FOR A SHARE OUTSTANDING THROUGHOUT THE PERIODS INDICATED
PER SHARE OPERATING PERFORMANCE RATIOS/SUPPLEMENTAL DATA
TOTAL SUPPLEMENTAL INVESTMENT OPERATIONS DISTRIBUTIONS RETURN (c) RATIOS TO AVERAGE NET ASSETS (f) DATA
Net Net realized investment Net and Net income investment Net Net asset Net unrealized Tax asset Expenses Expenses (loss) income assets, value, investment gains Total from Net Net return value, Net before net of before (loss) net end of Portfolio beginning income (losses) on Transaction investment investment realized of Total end of asset Market expense waivers, expense of waivers, period turnover of period (loss) (a) investments fees (b) operations income gains capital distributions period value (d) value (e) reductions if any reductions if any (000) rate (c)(g)
Short SmallCap600Year ended May 31, 2017 $48.08 $(0.22) $(8.77) $— $(8.99) $— $— $— $— $39.09 (18.69)%(18.40)% 1.39% 0.95% (0.98)% (0.54)% $17,346 —%
Year ended May 31, 2016 50.40 (0.44) (1.88) — (2.32) — — — — 48.08 (4.61) (4.17) 1.53 0.95 (1.43) (0.85) 11,717 —
Year ended May 31, 2015 57.57 (0.49) (6.68) — (7.17) — — — — 50.40 (12.44) (13.14) 1.63 0.95 (1.59) (0.91) 16,062 —
Year ended May 31, 2014(p) 71.31 (0.61) (13.13) — (13.74) — — — — 57.57 (19.27) (18.83) 1.34 0.95 (1.33) (0.94) 9,710 —
Year ended May 31, 2013(p) 96.62 (0.70) (24.61) — (25.31) — — — — 71.31 (26.20) (26.34) 1.16 0.95 (1.10) (0.90) 147,067 —
UltraShort S&P500®Year ended May 31, 2017(ee) 72.17 (0.27) (20.58) — (20.85) — — — — 51.32 (28.89) (29.00) 0.89 0.89 (0.44) (0.44) 1,418,175 —
Year ended May 31, 2016(ee) 81.21 (0.62) (8.42) — (9.04) — — — — 72.17 (11.13) (10.94) 0.90 0.90 (0.76) (0.76) 2,167,620 —
Year ended May 31, 2015(ee) 106.07 (0.79) (24.07) — (24.86) — — — — 81.21 (23.44) (23.58) 0.91 0.91 (0.86) (0.86) 1,376,227 —
Year ended May 31, 2014(ee) 160.35 (1.14) (53.14) — (54.28) — — — — 106.07 (33.84) (33.69) 0.89 0.89 (0.87) (0.87) 1,625,831 —
Year ended May 31, 2013(m)(ee) 273.60 (1.70) (111.55) — (113.25) — — — — 160.35 (41.39) (41.46) 0.90 0.90 (0.82) (0.82) 1,934,575 —
See accompanying notes to the financial statements.
PROSHARES TRUST FINANCIAL HIGHLIGHTS :: 247
Merrill Corp - Proshares Trust Geared Book [96 Funds] Annual Report [Funds] 333-089822 05-31-2017 ED [AUX] | eperez | 28-Jul-17 17:43 | 17-15159-3.ia | Sequence: 3CHKSUM Content: 5473 Layout: 45210 Graphics: No Graphics CLEAN
JOB: 17-15159-3 CYCLE#;BL#: 5; 0 TRIM: 10.75" x 8.25" COMPOSITECOLORS: Black, ~note-color 2, ~note-color 3 GRAPHICS: none V1.5

ProShares Trust Financial Highlights FOR THE PERIODS INDICATED
SELECTED DATA FOR A SHARE OUTSTANDING THROUGHOUT THE PERIODS INDICATED
PER SHARE OPERATING PERFORMANCE RATIOS/SUPPLEMENTAL DATA
TOTAL SUPPLEMENTAL INVESTMENT OPERATIONS DISTRIBUTIONS RETURN (c) RATIOS TO AVERAGE NET ASSETS (f) DATA
Net Net realized investment Net and Net income investment Net Net asset Net unrealized Tax asset Expenses Expenses (loss) income assets, value, investment gains Total from Net Net return value, Net before net of before (loss) net end of Portfolio beginning income (losses) on Transaction investment investment realized of Total end of asset Market expense waivers, expense of waivers, period turnover of period (loss) (a) investments fees (b) operations income gains capital distributions period value (d) value (e) reductions if any reductions if any (000) rate (c)(g)
UltraShort QQQ®Year ended May 31, 2017 $28.90 $(0.11) $(12.08) $— $(12.19) $— $— $— $— $16.71 (42.17)% (42.27)% 1.03% 0.95% (0.56)% (0.48)% $281,358 —%
Year ended May 31, 2016 33.64 (0.27) (4.47) — (4.74) — — — — 28.90 (14.09) (14.04) 1.03 0.95 (0.91) (0.83) 389,736 —
Year ended May 31, 2015 53.18 (0.37) (19.17) — (19.54) — — — — 33.64 (36.75) (36.82) 1.04 0.95 (1.00) (0.90) 337,622 —
Year ended May 31, 2014(p) 91.05 (0.63) (37.24) — (37.87) — — — — 53.18 (41.59) (41.51) 1.02 0.95 (0.99) (0.92) 379,610 —
Year ended May 31, 2013(p) 141.16 (0.98) (49.13) — (50.11) — — — — 91.05 (35.50) (35.48) 1.03 0.95 (0.94) (0.86) 434,951 —
UltraShort Dow30SM
Year ended May 31, 2017 18.37 (0.07) (6.00) — (6.07) — — — — 12.30 (33.07) (33.08) 0.98 0.95 (0.50) (0.46) 229,012 —
Year ended May 31, 2016 20.44 (0.17) (1.90) — (2.07) — — — — 18.37 (10.10) (10.08) 0.99 0.95 (0.87) (0.83) 216,310 —
Year ended May 31, 2015 25.98 (0.21) (5.33) — (5.54) — — — — 20.44 (21.33) (21.29) 1.01 0.95 (0.97) (0.90) 226,294 —
Year ended May 31, 2014 34.64 (0.28) (8.38) — (8.66) — — — — 25.98 (25.01) (25.05) 0.99 0.95 (0.96) (0.93) 243,513 —
Year ended May 31, 2013 57.09 (0.38) (22.07) — (22.45) — — — — 34.64 (39.32) (39.28) 0.99 0.95 (0.89) (0.85) 277,973 —
See accompanying notes to the financial statements.
248:: FINANCIAL HIGHLIGHTS
PROSHARES TRUST
Merrill Corp - Proshares Trust Geared Book [96 Funds] Annual Report [Funds] 333-089822 05-31-2017 ED [AUX] | eperez | 28-Jul-17 17:43 | 17-15159-3.ia | Sequence: 4CHKSUM Content: 65320 Layout: 64878 Graphics: No Graphics CLEAN
JOB: 17-15159-3 CYCLE#;BL#: 5; 0 TRIM: 10.75" x 8.25" COMPOSITECOLORS: Black, ~note-color 2, ~note-color 3 GRAPHICS: none V1.5
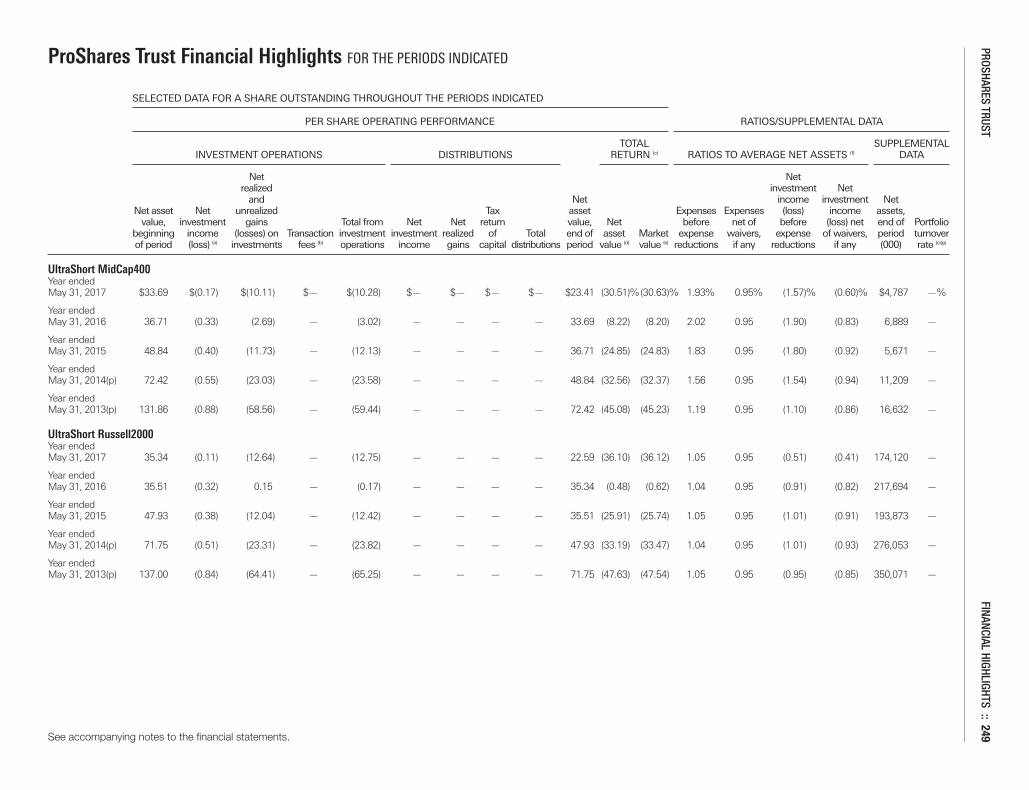
ProShares Trust Financial Highlights FOR THE PERIODS INDICATED
SELECTED DATA FOR A SHARE OUTSTANDING THROUGHOUT THE PERIODS INDICATED
PER SHARE OPERATING PERFORMANCE RATIOS/SUPPLEMENTAL DATA
TOTAL SUPPLEMENTAL INVESTMENT OPERATIONS DISTRIBUTIONS RETURN (c) RATIOS TO AVERAGE NET ASSETS (f) DATA
Net Net realized investment Net and Net income investment Net Net asset Net unrealized Tax asset Expenses Expenses (loss) income assets, value, investment gains Total from Net Net return value, Net before net of before (loss) net end of Portfolio beginning income (losses) on Transaction investment investment realized of Total end of asset Market expense waivers, expense of waivers, period turnover of period (loss) (a) investments fees (b) operations income gains capital distributions period value (d) value (e) reductions if any reductions if any (000) rate (c)(g)
UltraShort MidCap400Year ended May 31, 2017 $33.69 $(0.17) $(10.11) $— $(10.28) $— $— $— $— $23.41 (30.51)%(30.63)% 1.93% 0.95% (1.57)% (0.60)% $4,787 —%
Year ended May 31, 2016 36.71 (0.33) (2.69) — (3.02) — — — — 33.69 (8.22) (8.20) 2.02 0.95 (1.90) (0.83) 6,889 —
Year ended May 31, 2015 48.84 (0.40) (11.73) — (12.13) — — — — 36.71 (24.85) (24.83) 1.83 0.95 (1.80) (0.92) 5,671 —
Year ended May 31, 2014(p) 72.42 (0.55) (23.03) — (23.58) — — — — 48.84 (32.56) (32.37) 1.56 0.95 (1.54) (0.94) 11,209 —
Year ended May 31, 2013(p) 131.86 (0.88) (58.56) — (59.44) — — — — 72.42 (45.08) (45.23) 1.19 0.95 (1.10) (0.86) 16,632 —
UltraShort Russell2000Year ended May 31, 2017 35.34 (0.11) (12.64) — (12.75) — — — — 22.59 (36.10) (36.12) 1.05 0.95 (0.51) (0.41) 174,120 —
Year ended May 31, 2016 35.51 (0.32) 0.15 — (0.17) — — — — 35.34 (0.48) (0.62) 1.04 0.95 (0.91) (0.82) 217,694 —
Year ended May 31, 2015 47.93 (0.38) (12.04) — (12.42) — — — — 35.51 (25.91) (25.74) 1.05 0.95 (1.01) (0.91) 193,873 —
Year ended May 31, 2014(p) 71.75 (0.51) (23.31) — (23.82) — — — — 47.93 (33.19) (33.47) 1.04 0.95 (1.01) (0.93) 276,053 —
Year ended May 31, 2013(p) 137.00 (0.84) (64.41) — (65.25) — — — — 71.75 (47.63) (47.54) 1.05 0.95 (0.95) (0.85) 350,071 —
See accompanying notes to the financial statements.
PROSHARES TRUST FINANCIAL HIGHLIGHTS :: 249
Merrill Corp - Proshares Trust Geared Book [96 Funds] Annual Report [Funds] 333-089822 05-31-2017 ED [AUX] | eperez | 28-Jul-17 17:43 | 17-15159-3.ia | Sequence: 5CHKSUM Content: 2090 Layout: 39554 Graphics: No Graphics CLEAN
JOB: 17-15159-3 CYCLE#;BL#: 5; 0 TRIM: 10.75" x 8.25" COMPOSITECOLORS: Black, ~note-color 2, ~note-color 3 GRAPHICS: none V1.5

ProShares Trust Financial Highlights FOR THE PERIODS INDICATED
SELECTED DATA FOR A SHARE OUTSTANDING THROUGHOUT THE PERIODS INDICATED
PER SHARE OPERATING PERFORMANCE RATIOS/SUPPLEMENTAL DATA
TOTAL SUPPLEMENTAL INVESTMENT OPERATIONS DISTRIBUTIONS RETURN (c) RATIOS TO AVERAGE NET ASSETS (f) DATA
Net Net realized investment Net and Net income investment Net Net asset Net unrealized Tax asset Expenses Expenses (loss) income assets, value, investment gains Total from Net Net return value, Net before net of before (loss) net end of Portfolio beginning income (losses) on Transaction investment investment realized of Total end of asset Market expense waivers, expense of waivers, period turnover of period (loss) (a) investments fees (b) operations income gains capital distributions period value (d) value (e) reductions if any reductions if any (000) rate (c)(g)
UltraShort SmallCap600Year ended May 31, 2017 $31.79 $(0.14) $(11.06) $— $(11.20) $— $— $— $— $20.59 (35.22)% (34.72)% 3.22% 0.95% (2.86)% (0.59)% $2,540 —%
Year ended May 31, 2016 35.85 (0.31) (3.75) — (4.06) — — — — 31.79 (11.34) (10.55) 2.89 0.95 (2.78) (0.83) 3,920 —
Year ended May 31, 2015 47.35 (0.39) (11.11) — (11.50) — — — — 35.85 (24.27) (25.22) 2.44 0.95 (2.41) (0.93) 4,422 —
Year ended May 31, 2014(p) 73.84 (0.51) (25.98) — (26.49) — — — — 47.35 (35.88) (35.34) 2.33 0.95 (2.32) (0.94) 8,206 —
Year ended May 31, 2013(p) 138.09 (0.94) (63.31) — (64.25) — — — — 73.84 (46.53) (46.50) 1.64 0.95 (1.56) (0.86) 7,267 —
UltraPro Short S&P500®Year ended May 31, 2017 26.90 (0.09) (10.86) — (10.95) — — — — 15.95 (40.70) (40.88) 0.90 0.90 (0.41) (0.41) 697,964 —
Year ended May 31, 2016 33.36 (0.25) (6.21) — (6.46) — — — — 26.90 (19.37) (19.05) 0.91 0.91 (0.76) (0.76) 820,483 —
Year ended May 31, 2015 50.65 (0.36) (16.93) — (17.29) — — — — 33.36 (34.15) (34.27) 0.93 0.93 (0.88) (0.88) 517,208 —
Year ended May 31, 2014(p) 95.74 (0.62) (44.47) — (45.09) — — — — 50.65 (47.09) (46.80) 0.92 0.92 (0.89) (0.89) 600,540 —
Year ended May 31, 2013(p) 217.81 (1.18) (120.89) — (122.07) — — — — 95.74 (56.05) (56.28) 0.93 0.93 (0.85) (0.85) 582,305 —
See accompanying notes to the financial statements.
250:: FINANCIAL HIGHLIGHTS
PROSHARES TRUST
Merrill Corp - Proshares Trust Geared Book [96 Funds] Annual Report [Funds] 333-089822 05-31-2017 ED [AUX] | eperez | 28-Jul-17 17:43 | 17-15159-3.ia | Sequence: 6CHKSUM Content: 47595 Layout: 44844 Graphics: No Graphics CLEAN
JOB: 17-15159-3 CYCLE#;BL#: 5; 0 TRIM: 10.75" x 8.25" COMPOSITECOLORS: Black, ~note-color 2, ~note-color 3 GRAPHICS: none V1.5
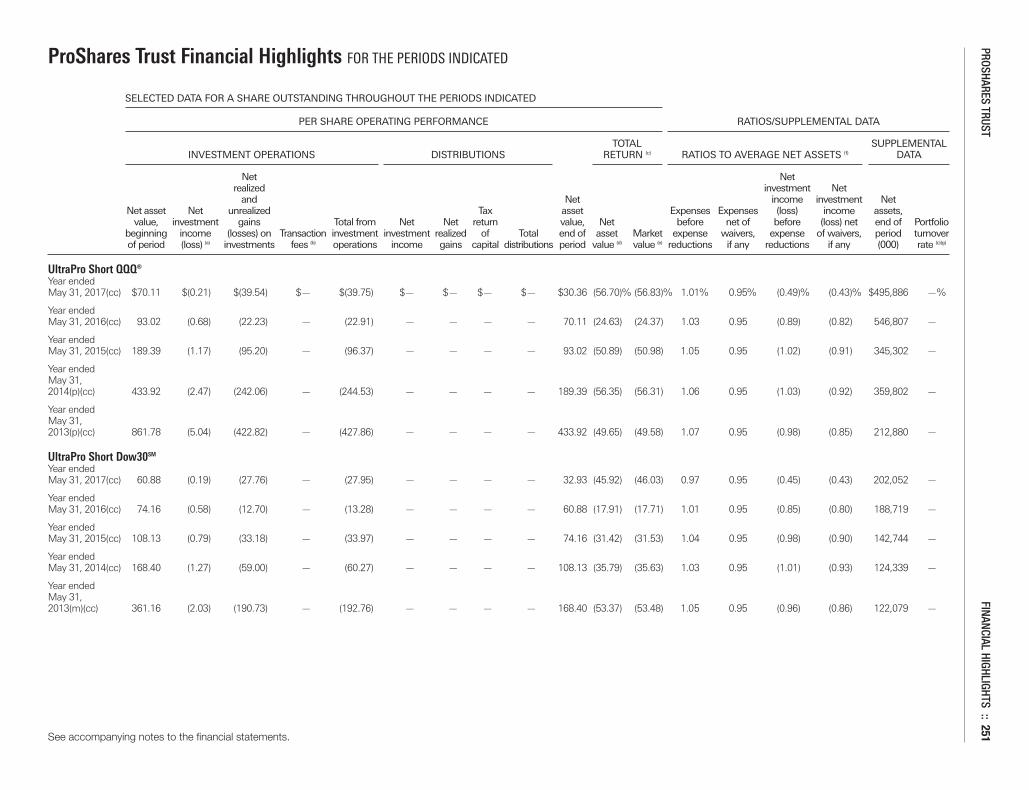
ProShares Trust Financial Highlights FOR THE PERIODS INDICATED
SELECTED DATA FOR A SHARE OUTSTANDING THROUGHOUT THE PERIODS INDICATED
PER SHARE OPERATING PERFORMANCE RATIOS/SUPPLEMENTAL DATA
TOTAL SUPPLEMENTAL INVESTMENT OPERATIONS DISTRIBUTIONS RETURN (c) RATIOS TO AVERAGE NET ASSETS (f) DATA
Net Net realized investment Net and Net income investment Net Net asset Net unrealized Tax asset Expenses Expenses (loss) income assets, value, investment gains Total from Net Net return value, Net before net of before (loss) net end of Portfolio beginning income (losses) on Transaction investment investment realized of Total end of asset Market expense waivers, expense of waivers, period turnover of period (loss) (a) investments fees (b) operations income gains capital distributions period value (d) value (e) reductions if any reductions if any (000) rate (c)(g)
UltraPro Short QQQ®Year ended May 31, 2017(cc) $70.11 $(0.21) $(39.54) $— $(39.75) $— $— $— $— $30.36 (56.70)% (56.83)% 1.01% 0.95% (0.49)% (0.43)% $495,886 —%
Year ended May 31, 2016(cc) 93.02 (0.68) (22.23) — (22.91) — — — — 70.11 (24.63) (24.37) 1.03 0.95 (0.89) (0.82) 546,807 —
Year ended May 31, 2015(cc) 189.39 (1.17) (95.20) — (96.37) — — — — 93.02 (50.89) (50.98) 1.05 0.95 (1.02) (0.91) 345,302 —
Year ended May 31, 2014(p)(cc) 433.92 (2.47) (242.06) — (244.53) — — — — 189.39 (56.35) (56.31) 1.06 0.95 (1.03) (0.92) 359,802 —
Year ended May 31, 2013(p)(cc) 861.78 (5.04) (422.82) — (427.86) — — — — 433.92 (49.65) (49.58) 1.07 0.95 (0.98) (0.85) 212,880 —
UltraPro Short Dow30SM
Year ended May 31, 2017(cc) 60.88 (0.19) (27.76) — (27.95) — — — — 32.93 (45.92) (46.03) 0.97 0.95 (0.45) (0.43) 202,052 —
Year ended May 31, 2016(cc) 74.16 (0.58) (12.70) — (13.28) — — — — 60.88 (17.91) (17.71) 1.01 0.95 (0.85) (0.80) 188,719 —
Year ended May 31, 2015(cc) 108.13 (0.79) (33.18) — (33.97) — — — — 74.16 (31.42) (31.53) 1.04 0.95 (0.98) (0.90) 142,744 —
Year ended May 31, 2014(cc) 168.40 (1.27) (59.00) — (60.27) — — — — 108.13 (35.79) (35.63) 1.03 0.95 (1.01) (0.93) 124,339 —
Year ended May 31, 2013(m)(cc) 361.16 (2.03) (190.73) — (192.76) — — — — 168.40 (53.37) (53.48) 1.05 0.95 (0.96) (0.86) 122,079 —
See accompanying notes to the financial statements.
PROSHARES TRUST FINANCIAL HIGHLIGHTS :: 251
Merrill Corp - Proshares Trust Geared Book [96 Funds] Annual Report [Funds] 333-089822 05-31-2017 ED [AUX] | eperez | 28-Jul-17 17:43 | 17-15159-3.ia | Sequence: 7CHKSUM Content: 57495 Layout: 28669 Graphics: No Graphics CLEAN
JOB: 17-15159-3 CYCLE#;BL#: 5; 0 TRIM: 10.75" x 8.25" COMPOSITECOLORS: Black, ~note-color 2, ~note-color 3 GRAPHICS: none V1.5

ProShares Trust Financial Highlights FOR THE PERIODS INDICATED
SELECTED DATA FOR A SHARE OUTSTANDING THROUGHOUT THE PERIODS INDICATED
PER SHARE OPERATING PERFORMANCE RATIOS/SUPPLEMENTAL DATA
TOTAL SUPPLEMENTAL INVESTMENT OPERATIONS DISTRIBUTIONS RETURN (c) RATIOS TO AVERAGE NET ASSETS (f) DATA
Net Net realized investment Net and Net income investment Net Net asset Net unrealized Tax asset Expenses Expenses (loss) income assets, value, investment gains Total from Net Net return value, Net before net of before (loss) net end of Portfolio beginning income (losses) on Transaction investment investment realized of Total end of asset Market expense waivers, expense of waivers, period turnover of period (loss) (a) investments fees (b) operations income gains capital distributions period value (d) value (e) reductions if any reductions if any (000) rate (c)(g)
UltraPro Short MidCap400Year ended May 31, 2017 $25.49 $(0.10) $(10.95) $— $(11.05) $— $— $— $— $14.44 (43.36)% (44.34)% 2.77% 0.95% (2.40)% (0.58)% $3,157 —%
Year ended May 31, 2016 30.22 (0.27) (4.46) — (4.73) — — — — 25.49 (15.66) (15.56) 2.73 0.95 (2.60) (0.82) 4,299 —
Year ended May 31, 2015 47.43 (0.36) (16.85) — (17.21) — — — — 30.22 (36.29) (36.47) 2.19 0.95 (2.17) (0.93) 5,097 —
Year ended May 31, 2014(p) 88.02 (0.57) (40.02) — (40.59) — — — — 47.43 (46.11) (45.41) 2.27 0.95 (2.26) (0.94) 8,001 —
Year ended May 31, 2013(p) 222.43 (1.29) (133.12) — (134.41) — — — — 88.02 (60.43) (60.93) 2.05 0.95 (1.96) (0.86) 6,050 —
UltraPro Short Russell2000Year ended May 31, 2017(cc) 97.53 (0.23) (49.13) — (49.36) — — — — 48.17 (50.61) (50.78) 1.06 0.95 (0.49) (0.38) 111,425 —
Year ended May 31, 2016(cc) 103.55 (0.93) (5.09) — (6.02) — — — — 97.53 (5.80) (5.70) 1.12 0.95 (0.97) (0.81) 85,453 —
Year ended May 31, 2015(cc) 167.81 (1.20) (63.06) — (64.26) — — — — 103.55 (38.30) (38.05) 1.12 0.95 (1.08) (0.91) 76,486 —
Year ended May 31, 2014(p)(cc) 318.04 (1.91) (148.32) — (150.23) — — — — 167.81 (47.23) (47.37) 1.13 0.95 (1.11) (0.93) 75,711 —
Year ended May 31, 2013(p)(cc) 868.90 (4.37) (546.49) — (550.86) — — — — 318.04 (63.40) (63.49) 1.14 0.95 (1.04) (0.85) 74,936 —
See accompanying notes to the financial statements.
252:: FINANCIAL HIGHLIGHTS
PROSHARES TRUST
Merrill Corp - Proshares Trust Geared Book [96 Funds] Annual Report [Funds] 333-089822 05-31-2017 ED [AUX] | eperez | 28-Jul-17 17:43 | 17-15159-3.ia | Sequence: 8CHKSUM Content: 50200 Layout: 54955 Graphics: No Graphics CLEAN
JOB: 17-15159-3 CYCLE#;BL#: 5; 0 TRIM: 10.75" x 8.25" COMPOSITECOLORS: Black, ~note-color 2, ~note-color 3 GRAPHICS: none V1.5
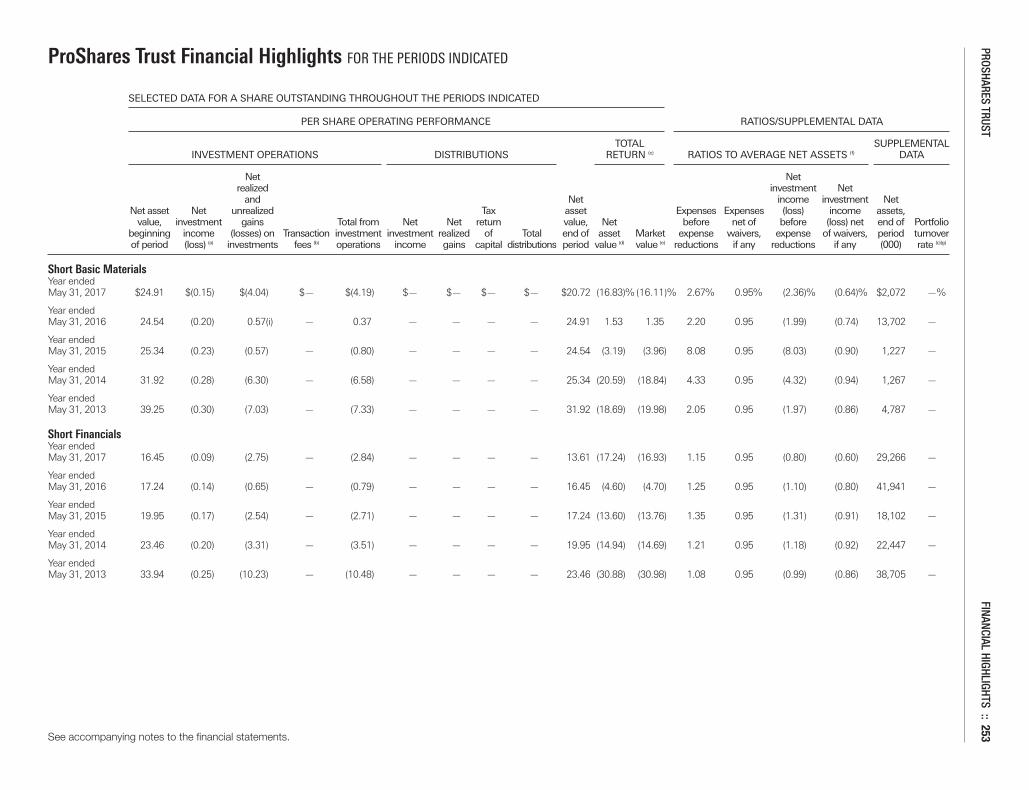
ProShares Trust Financial Highlights FOR THE PERIODS INDICATED
SELECTED DATA FOR A SHARE OUTSTANDING THROUGHOUT THE PERIODS INDICATED
PER SHARE OPERATING PERFORMANCE RATIOS/SUPPLEMENTAL DATA
TOTAL SUPPLEMENTAL INVESTMENT OPERATIONS DISTRIBUTIONS RETURN (c) RATIOS TO AVERAGE NET ASSETS (f) DATA
Net Net realized investment Net and Net income investment Net Net asset Net unrealized Tax asset Expenses Expenses (loss) income assets, value, investment gains Total from Net Net return value, Net before net of before (loss) net end of Portfolio beginning income (losses) on Transaction investment investment realized of Total end of asset Market expense waivers, expense of waivers, period turnover of period (loss) (a) investments fees (b) operations income gains capital distributions period value (d) value (e) reductions if any reductions if any (000) rate (c)(g)
Short Basic MaterialsYear ended May 31, 2017 $24.91 $(0.15) $(4.04) $— $(4.19) $— $— $— $— $20.72 (16.83)% (16.11)% 2.67% 0.95% (2.36)% (0.64)% $2,072 —%
Year ended May 31, 2016 24.54 (0.20) 0.57(i) — 0.37 — — — — 24.91 1.53 1.35 2.20 0.95 (1.99) (0.74) 13,702 —
Year ended May 31, 2015 25.34 (0.23) (0.57) — (0.80) — — — — 24.54 (3.19) (3.96) 8.08 0.95 (8.03) (0.90) 1,227 —
Year ended May 31, 2014 31.92 (0.28) (6.30) — (6.58) — — — — 25.34 (20.59) (18.84) 4.33 0.95 (4.32) (0.94) 1,267 —
Year ended May 31, 2013 39.25 (0.30) (7.03) — (7.33) — — — — 31.92 (18.69) (19.98) 2.05 0.95 (1.97) (0.86) 4,787 —
Short FinancialsYear ended May 31, 2017 16.45 (0.09) (2.75) — (2.84) — — — — 13.61 (17.24) (16.93) 1.15 0.95 (0.80) (0.60) 29,266 —
Year ended May 31, 2016 17.24 (0.14) (0.65) — (0.79) — — — — 16.45 (4.60) (4.70) 1.25 0.95 (1.10) (0.80) 41,941 —
Year ended May 31, 2015 19.95 (0.17) (2.54) — (2.71) — — — — 17.24 (13.60) (13.76) 1.35 0.95 (1.31) (0.91) 18,102 —
Year ended May 31, 2014 23.46 (0.20) (3.31) — (3.51) — — — — 19.95 (14.94) (14.69) 1.21 0.95 (1.18) (0.92) 22,447 —
Year ended May 31, 2013 33.94 (0.25) (10.23) — (10.48) — — — — 23.46 (30.88) (30.98) 1.08 0.95 (0.99) (0.86) 38,705 —
See accompanying notes to the financial statements.
PROSHARES TRUST FINANCIAL HIGHLIGHTS :: 253
Merrill Corp - Proshares Trust Geared Book [96 Funds] Annual Report [Funds] 333-089822 05-31-2017 ED [AUX] | eperez | 28-Jul-17 17:43 | 17-15159-3.ia | Sequence: 9CHKSUM Content: 28732 Layout: 15393 Graphics: No Graphics CLEAN
JOB: 17-15159-3 CYCLE#;BL#: 5; 0 TRIM: 10.75" x 8.25" COMPOSITECOLORS: Black, ~note-color 2, ~note-color 3 GRAPHICS: none V1.5
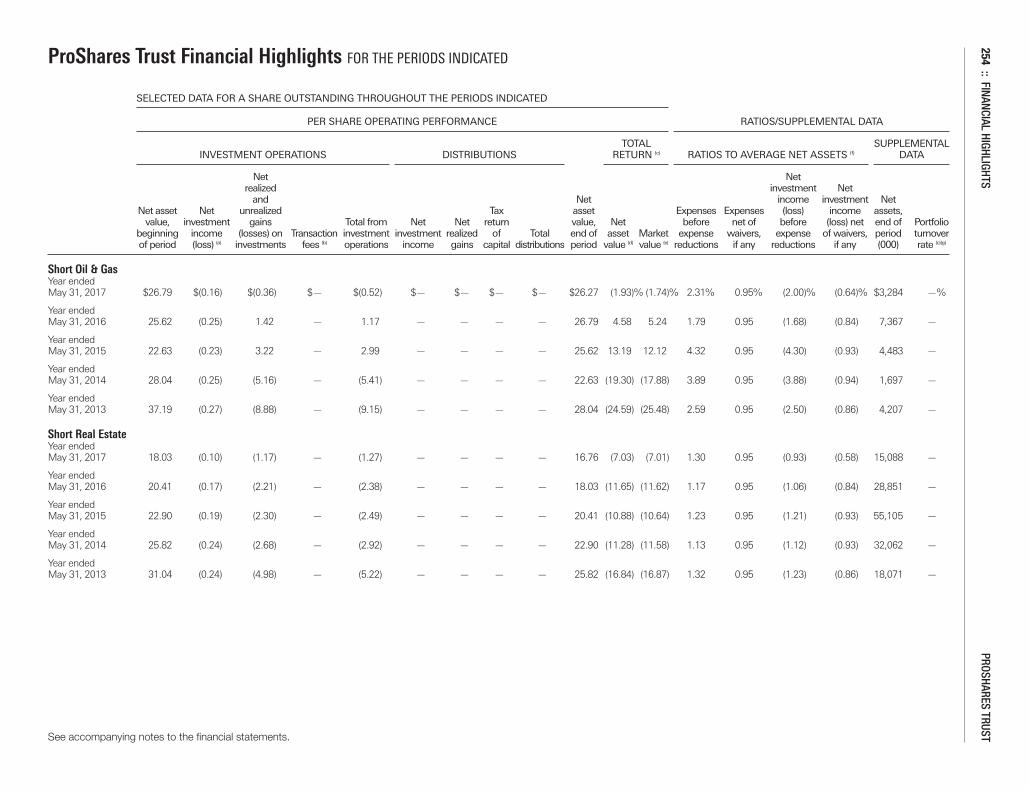
ProShares Trust Financial Highlights FOR THE PERIODS INDICATED
SELECTED DATA FOR A SHARE OUTSTANDING THROUGHOUT THE PERIODS INDICATED
PER SHARE OPERATING PERFORMANCE RATIOS/SUPPLEMENTAL DATA
TOTAL SUPPLEMENTAL INVESTMENT OPERATIONS DISTRIBUTIONS RETURN (c) RATIOS TO AVERAGE NET ASSETS (f) DATA
Net Net realized investment Net and Net income investment Net Net asset Net unrealized Tax asset Expenses Expenses (loss) income assets, value, investment gains Total from Net Net return value, Net before net of before (loss) net end of Portfolio beginning income (losses) on Transaction investment investment realized of Total end of asset Market expense waivers, expense of waivers, period turnover of period (loss) (a) investments fees (b) operations income gains capital distributions period value (d) value (e) reductions if any reductions if any (000) rate (c)(g)
Short Oil & GasYear ended May 31, 2017 $26.79 $(0.16) $(0.36) $— $(0.52) $— $— $— $— $26.27 (1.93)% (1.74)% 2.31% 0.95% (2.00)% (0.64)% $3,284 —%
Year ended May 31, 2016 25.62 (0.25) 1.42 — 1.17 — — — — 26.79 4.58 5.24 1.79 0.95 (1.68) (0.84) 7,367 —
Year ended May 31, 2015 22.63 (0.23) 3.22 — 2.99 — — — — 25.62 13.19 12.12 4.32 0.95 (4.30) (0.93) 4,483 —
Year ended May 31, 2014 28.04 (0.25) (5.16) — (5.41) — — — — 22.63 (19.30) (17.88) 3.89 0.95 (3.88) (0.94) 1,697 —
Year ended May 31, 2013 37.19 (0.27) (8.88) — (9.15) — — — — 28.04 (24.59) (25.48) 2.59 0.95 (2.50) (0.86) 4,207 —
Short Real EstateYear ended May 31, 2017 18.03 (0.10) (1.17) — (1.27) — — — — 16.76 (7.03) (7.01) 1.30 0.95 (0.93) (0.58) 15,088 —
Year ended May 31, 2016 20.41 (0.17) (2.21) — (2.38) — — — — 18.03 (11.65) (11.62) 1.17 0.95 (1.06) (0.84) 28,851 —
Year ended May 31, 2015 22.90 (0.19) (2.30) — (2.49) — — — — 20.41 (10.88) (10.64) 1.23 0.95 (1.21) (0.93) 55,105 —
Year ended May 31, 2014 25.82 (0.24) (2.68) — (2.92) — — — — 22.90 (11.28) (11.58) 1.13 0.95 (1.12) (0.93) 32,062 —
Year ended May 31, 2013 31.04 (0.24) (4.98) — (5.22) — — — — 25.82 (16.84) (16.87) 1.32 0.95 (1.23) (0.86) 18,071 —
See accompanying notes to the financial statements.
254:: FINANCIAL HIGHLIGHTS
PROSHARES TRUST
Merrill Corp - Proshares Trust Geared Book [96 Funds] Annual Report [Funds] 333-089822 05-31-2017 ED [AUX] | eperez | 28-Jul-17 17:43 | 17-15159-3.ia | Sequence: 10CHKSUM Content: 19634 Layout: 48231 Graphics: No Graphics CLEAN
JOB: 17-15159-3 CYCLE#;BL#: 5; 0 TRIM: 10.75" x 8.25" COMPOSITECOLORS: Black, ~note-color 2, ~note-color 3 GRAPHICS: none V1.5
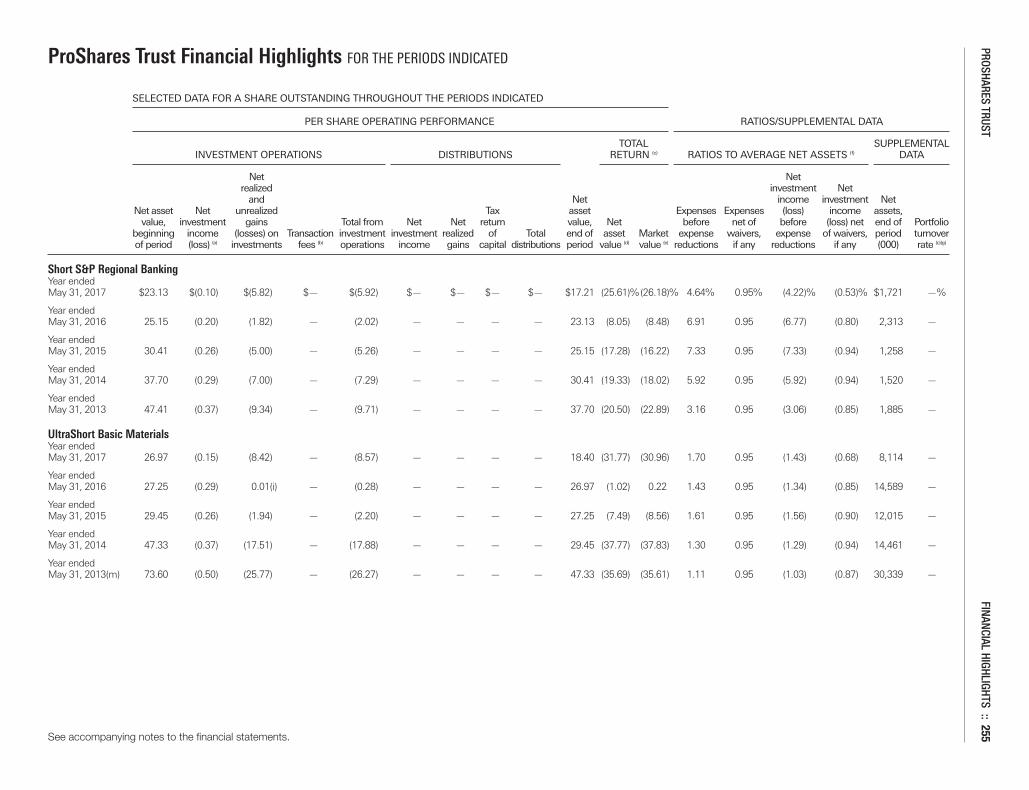
ProShares Trust Financial Highlights FOR THE PERIODS INDICATED
SELECTED DATA FOR A SHARE OUTSTANDING THROUGHOUT THE PERIODS INDICATED
PER SHARE OPERATING PERFORMANCE RATIOS/SUPPLEMENTAL DATA
TOTAL SUPPLEMENTAL INVESTMENT OPERATIONS DISTRIBUTIONS RETURN (c) RATIOS TO AVERAGE NET ASSETS (f) DATA
Net Net realized investment Net and Net income investment Net Net asset Net unrealized Tax asset Expenses Expenses (loss) income assets, value, investment gains Total from Net Net return value, Net before net of before (loss) net end of Portfolio beginning income (losses) on Transaction investment investment realized of Total end of asset Market expense waivers, expense of waivers, period turnover of period (loss) (a) investments fees (b) operations income gains capital distributions period value (d) value (e) reductions if any reductions if any (000) rate (c)(g)
Short S&P Regional BankingYear ended May 31, 2017 $23.13 $(0.10) $(5.82) $— $(5.92) $— $— $— $— $17.21 (25.61)%(26.18)% 4.64% 0.95% (4.22)% (0.53)% $1,721 —%
Year ended May 31, 2016 25.15 (0.20) (1.82) — (2.02) — — — — 23.13 (8.05) (8.48) 6.91 0.95 (6.77) (0.80) 2,313 —
Year ended May 31, 2015 30.41 (0.26) (5.00) — (5.26) — — — — 25.15 (17.28) (16.22) 7.33 0.95 (7.33) (0.94) 1,258 —
Year ended May 31, 2014 37.70 (0.29) (7.00) — (7.29) — — — — 30.41 (19.33) (18.02) 5.92 0.95 (5.92) (0.94) 1,520 —
Year ended May 31, 2013 47.41 (0.37) (9.34) — (9.71) — — — — 37.70 (20.50) (22.89) 3.16 0.95 (3.06) (0.85) 1,885 —
UltraShort Basic MaterialsYear ended May 31, 2017 26.97 (0.15) (8.42) — (8.57) — — — — 18.40 (31.77) (30.96) 1.70 0.95 (1.43) (0.68) 8,114 —
Year ended May 31, 2016 27.25 (0.29) 0.01(i) — (0.28) — — — — 26.97 (1.02) 0.22 1.43 0.95 (1.34) (0.85) 14,589 —
Year ended May 31, 2015 29.45 (0.26) (1.94) — (2.20) — — — — 27.25 (7.49) (8.56) 1.61 0.95 (1.56) (0.90) 12,015 —
Year ended May 31, 2014 47.33 (0.37) (17.51) — (17.88) — — — — 29.45 (37.77) (37.83) 1.30 0.95 (1.29) (0.94) 14,461 —
Year ended May 31, 2013(m) 73.60 (0.50) (25.77) — (26.27) — — — — 47.33 (35.69) (35.61) 1.11 0.95 (1.03) (0.87) 30,339 —
See accompanying notes to the financial statements.
PROSHARES TRUST FINANCIAL HIGHLIGHTS :: 255
Merrill Corp - Proshares Trust Geared Book [96 Funds] Annual Report [Funds] 333-089822 05-31-2017 ED [AUX] | eperez | 28-Jul-17 17:43 | 17-15159-3.ia | Sequence: 11CHKSUM Content: 63010 Layout: 51572 Graphics: No Graphics CLEAN
JOB: 17-15159-3 CYCLE#;BL#: 5; 0 TRIM: 10.75" x 8.25" COMPOSITECOLORS: Black, ~note-color 2, ~note-color 3 GRAPHICS: none V1.5
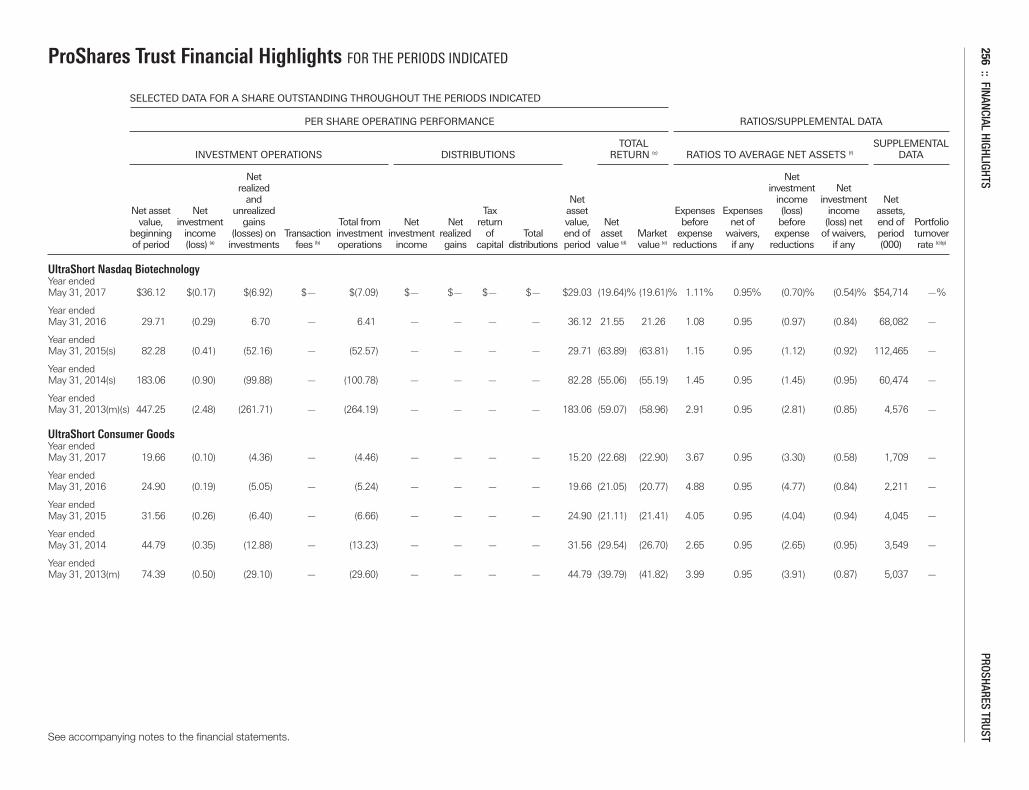
ProShares Trust Financial Highlights FOR THE PERIODS INDICATED
SELECTED DATA FOR A SHARE OUTSTANDING THROUGHOUT THE PERIODS INDICATED
PER SHARE OPERATING PERFORMANCE RATIOS/SUPPLEMENTAL DATA
TOTAL SUPPLEMENTAL INVESTMENT OPERATIONS DISTRIBUTIONS RETURN (c) RATIOS TO AVERAGE NET ASSETS (f) DATA
Net Net realized investment Net and Net income investment Net Net asset Net unrealized Tax asset Expenses Expenses (loss) income assets, value, investment gains Total from Net Net return value, Net before net of before (loss) net end of Portfolio beginning income (losses) on Transaction investment investment realized of Total end of asset Market expense waivers, expense of waivers, period turnover of period (loss) (a) investments fees (b) operations income gains capital distributions period value (d) value (e) reductions if any reductions if any (000) rate (c)(g)
UltraShort Nasdaq BiotechnologyYear ended May 31, 2017 $36.12 $(0.17) $(6.92) $— $(7.09) $— $— $— $— $29.03 (19.64)% (19.61)% 1.11% 0.95% (0.70)% (0.54)% $54,714 —%
Year ended May 31, 2016 29.71 (0.29) 6.70 — 6.41 — — — — 36.12 21.55 21.26 1.08 0.95 (0.97) (0.84) 68,082 —
Year ended May 31, 2015(s) 82.28 (0.41) (52.16) — (52.57) — — — — 29.71 (63.89) (63.81) 1.15 0.95 (1.12) (0.92) 112,465 —
Year ended May 31, 2014(s) 183.06 (0.90) (99.88) — (100.78) — — — — 82.28 (55.06) (55.19) 1.45 0.95 (1.45) (0.95) 60,474 —
Year ended May 31, 2013(m)(s) 447.25 (2.48) (261.71) — (264.19) — — — — 183.06 (59.07) (58.96) 2.91 0.95 (2.81) (0.85) 4,576 —
UltraShort Consumer GoodsYear ended May 31, 2017 19.66 (0.10) (4.36) — (4.46) — — — — 15.20 (22.68) (22.90) 3.67 0.95 (3.30) (0.58) 1,709 —
Year ended May 31, 2016 24.90 (0.19) (5.05) — (5.24) — — — — 19.66 (21.05) (20.77) 4.88 0.95 (4.77) (0.84) 2,211 —
Year ended May 31, 2015 31.56 (0.26) (6.40) — (6.66) — — — — 24.90 (21.11) (21.41) 4.05 0.95 (4.04) (0.94) 4,045 —
Year ended May 31, 2014 44.79 (0.35) (12.88) — (13.23) — — — — 31.56 (29.54) (26.70) 2.65 0.95 (2.65) (0.95) 3,549 —
Year ended May 31, 2013(m) 74.39 (0.50) (29.10) — (29.60) — — — — 44.79 (39.79) (41.82) 3.99 0.95 (3.91) (0.87) 5,037 —
See accompanying notes to the financial statements.
256:: FINANCIAL HIGHLIGHTS
PROSHARES TRUST
Merrill Corp - Proshares Trust Geared Book [96 Funds] Annual Report [Funds] 333-089822 05-31-2017 ED [AUX] | eperez | 28-Jul-17 17:43 | 17-15159-3.ia | Sequence: 12CHKSUM Content: 20643 Layout: 58804 Graphics: No Graphics CLEAN
JOB: 17-15159-3 CYCLE#;BL#: 5; 0 TRIM: 10.75" x 8.25" COMPOSITECOLORS: Black, ~note-color 2, ~note-color 3 GRAPHICS: none V1.5

ProShares Trust Financial Highlights FOR THE PERIODS INDICATED
SELECTED DATA FOR A SHARE OUTSTANDING THROUGHOUT THE PERIODS INDICATED
PER SHARE OPERATING PERFORMANCE RATIOS/SUPPLEMENTAL DATA
TOTAL SUPPLEMENTAL INVESTMENT OPERATIONS DISTRIBUTIONS RETURN (c) RATIOS TO AVERAGE NET ASSETS (f) DATA
Net Net realized investment Net and Net income investment Net Net asset Net unrealized Tax asset Expenses Expenses (loss) income assets, value, investment gains Total from Net Net return value, Net before net of before (loss) net end of Portfolio beginning income (losses) on Transaction investment investment realized of Total end of asset Market expense waivers, expense of waivers, period turnover of period (loss) (a) investments fees (b) operations income gains capital distributions period value (d) value (e) reductions if any reductions if any (000) rate (c)(g)
UltraShort Consumer ServicesYear ended May 31, 2017 $40.31 $(0.18) $(11.62) $— $(11.80) $— $— $— $— $28.51 (29.29)% (26.49)% 4.24% 0.95% (3.81)% (0.52)% $1,776 —%
Year ended May 31, 2016 46.04 (0.35) (5.38) — (5.73) — — — — 40.31 (12.43) (10.02) 3.56 0.95 (3.40) (0.79) 2,512 —
Year ended May 31, 2015(t) 69.80 (0.53) (23.23) — (23.76) — — — — 46.04 (34.04) (35.32) 2.41 0.95 (2.37) (0.91) 4,027 —
Year ended May 31, 2014(t) 108.47 (0.78) (37.89) — (38.67) — — — — 69.80 (35.65) (33.57) 2.47 0.95 (2.46) (0.94) 7,850 —
Year ended May 31, 2013(t) 203.13 (1.30) (93.36) — (94.66) — — — — 108.47 (46.60) (47.81) 2.13 0.95 (2.04) (0.86) 6,098 —
UltraShort FinancialsYear ended May 31, 2017 42.76 (0.17) (13.56) — (13.73) — — — — 29.03 (32.12) (31.82) 1.10 0.95 (0.64) (0.49) 49,924 —
Year ended May 31, 2016 48.25 (0.40) (5.09) — (5.49) — — — — 42.76 (11.38) (11.55) 1.10 0.95 (0.97) (0.82) 55,371 —
Year ended May 31, 2015(r) 65.00 (0.50) (16.25) — (16.75) — — — — 48.25 (25.76) (25.83) 1.13 0.95 (1.08) (0.90) 56,449 —
Year ended May 31, 2014(r) 90.90 (0.72) (25.18) — (25.90) — — — — 65.00 (28.49) (28.54) 1.03 0.95 (1.02) (0.94) 80,105 —
Year ended May 31, 2013(r) 193.50 (1.19) (101.41) — (102.60) — — — — 90.90 (53.02) (53.01) 1.01 0.95 (0.92) (0.86) 122,245 —
See accompanying notes to the financial statements.
PROSHARES TRUST FINANCIAL HIGHLIGHTS :: 257
Merrill Corp - Proshares Trust Geared Book [96 Funds] Annual Report [Funds] 333-089822 05-31-2017 ED [AUX] | eperez | 28-Jul-17 17:43 | 17-15159-3.ia | Sequence: 13CHKSUM Content: 25094 Layout: 7232 Graphics: No Graphics CLEAN
JOB: 17-15159-3 CYCLE#;BL#: 5; 0 TRIM: 10.75" x 8.25" COMPOSITECOLORS: Black, ~note-color 2, ~note-color 3 GRAPHICS: none V1.5
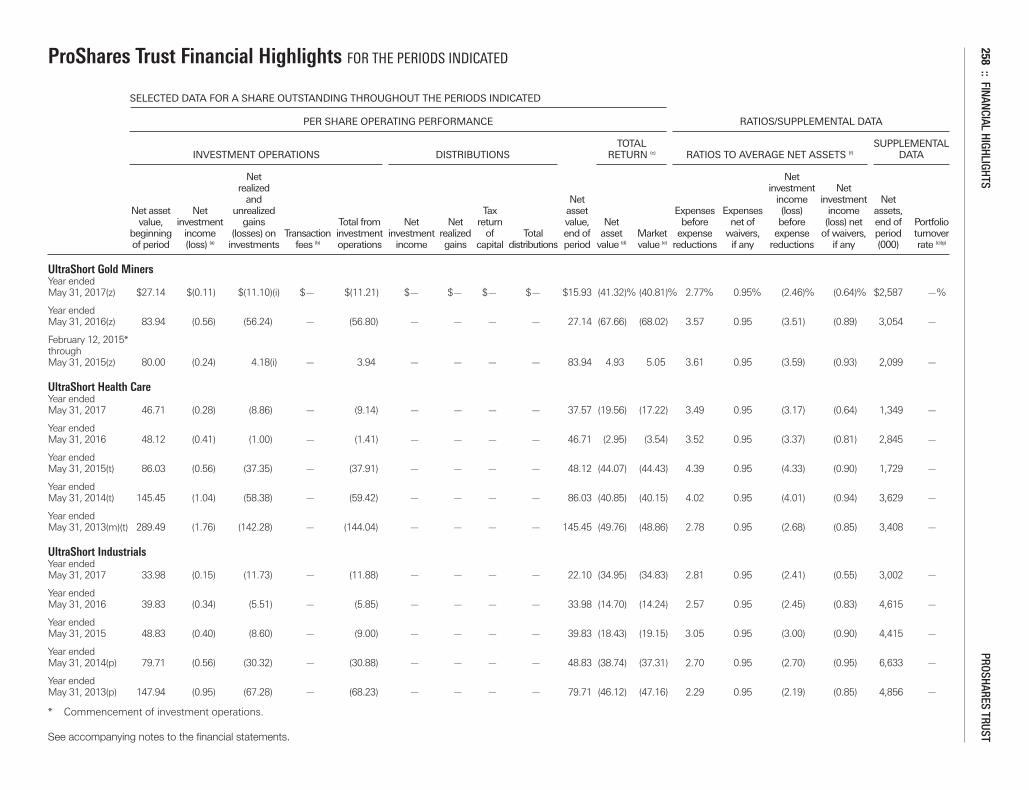
ProShares Trust Financial Highlights FOR THE PERIODS INDICATED
SELECTED DATA FOR A SHARE OUTSTANDING THROUGHOUT THE PERIODS INDICATED
PER SHARE OPERATING PERFORMANCE RATIOS/SUPPLEMENTAL DATA
TOTAL SUPPLEMENTAL INVESTMENT OPERATIONS DISTRIBUTIONS RETURN (c) RATIOS TO AVERAGE NET ASSETS (f) DATA
Net Net realized investment Net and Net income investment Net Net asset Net unrealized Tax asset Expenses Expenses (loss) income assets, value, investment gains Total from Net Net return value, Net before net of before (loss) net end of Portfolio beginning income (losses) on Transaction investment investment realized of Total end of asset Market expense waivers, expense of waivers, period turnover of period (loss) (a) investments fees (b) operations income gains capital distributions period value (d) value (e) reductions if any reductions if any (000) rate (c)(g)
UltraShort Gold MinersYear ended May 31, 2017(z) $27.14 $(0.11) $(11.10)(i) $— $(11.21) $— $— $— $— $15.93 (41.32)% (40.81)% 2.77% 0.95% (2.46)% (0.64)% $2,587 —%
Year ended May 31, 2016(z) 83.94 (0.56) (56.24) — (56.80) — — — — 27.14 (67.66) (68.02) 3.57 0.95 (3.51) (0.89) 3,054 —
February 12, 2015* through May 31, 2015(z) 80.00 (0.24) 4.18(i) — 3.94 — — — — 83.94 4.93 5.05 3.61 0.95 (3.59) (0.93) 2,099 —
UltraShort Health CareYear ended May 31, 2017 46.71 (0.28) (8.86) — (9.14) — — — — 37.57 (19.56) (17.22) 3.49 0.95 (3.17) (0.64) 1,349 —
Year ended May 31, 2016 48.12 (0.41) (1.00) — (1.41) — — — — 46.71 (2.95) (3.54) 3.52 0.95 (3.37) (0.81) 2,845 —
Year ended May 31, 2015(t) 86.03 (0.56) (37.35) — (37.91) — — — — 48.12 (44.07) (44.43) 4.39 0.95 (4.33) (0.90) 1,729 —
Year ended May 31, 2014(t) 145.45 (1.04) (58.38) — (59.42) — — — — 86.03 (40.85) (40.15) 4.02 0.95 (4.01) (0.94) 3,629 —
Year ended May 31, 2013(m)(t) 289.49 (1.76) (142.28) — (144.04) — — — — 145.45 (49.76) (48.86) 2.78 0.95 (2.68) (0.85) 3,408 —
UltraShort IndustrialsYear ended May 31, 2017 33.98 (0.15) (11.73) — (11.88) — — — — 22.10 (34.95) (34.83) 2.81 0.95 (2.41) (0.55) 3,002 —
Year ended May 31, 2016 39.83 (0.34) (5.51) — (5.85) — — — — 33.98 (14.70) (14.24) 2.57 0.95 (2.45) (0.83) 4,615 —
Year ended May 31, 2015 48.83 (0.40) (8.60) — (9.00) — — — — 39.83 (18.43) (19.15) 3.05 0.95 (3.00) (0.90) 4,415 —
Year ended May 31, 2014(p) 79.71 (0.56) (30.32) — (30.88) — — — — 48.83 (38.74) (37.31) 2.70 0.95 (2.70) (0.95) 6,633 —
Year ended May 31, 2013(p) 147.94 (0.95) (67.28) — (68.23) — — — — 79.71 (46.12) (47.16) 2.29 0.95 (2.19) (0.85) 4,856 —
* Commencement of investment operations.
See accompanying notes to the financial statements.
258:: FINANCIAL HIGHLIGHTS
PROSHARES TRUST
Merrill Corp - Proshares Trust Geared Book [96 Funds] Annual Report [Funds] 333-089822 05-31-2017 ED [AUX] | eperez | 28-Jul-17 17:43 | 17-15159-3.ia | Sequence: 14CHKSUM Content: 61857 Layout: 48421 Graphics: No Graphics CLEAN
JOB: 17-15159-3 CYCLE#;BL#: 5; 0 TRIM: 10.75" x 8.25" COMPOSITECOLORS: Black, ~note-color 2, ~note-color 3 GRAPHICS: none V1.5
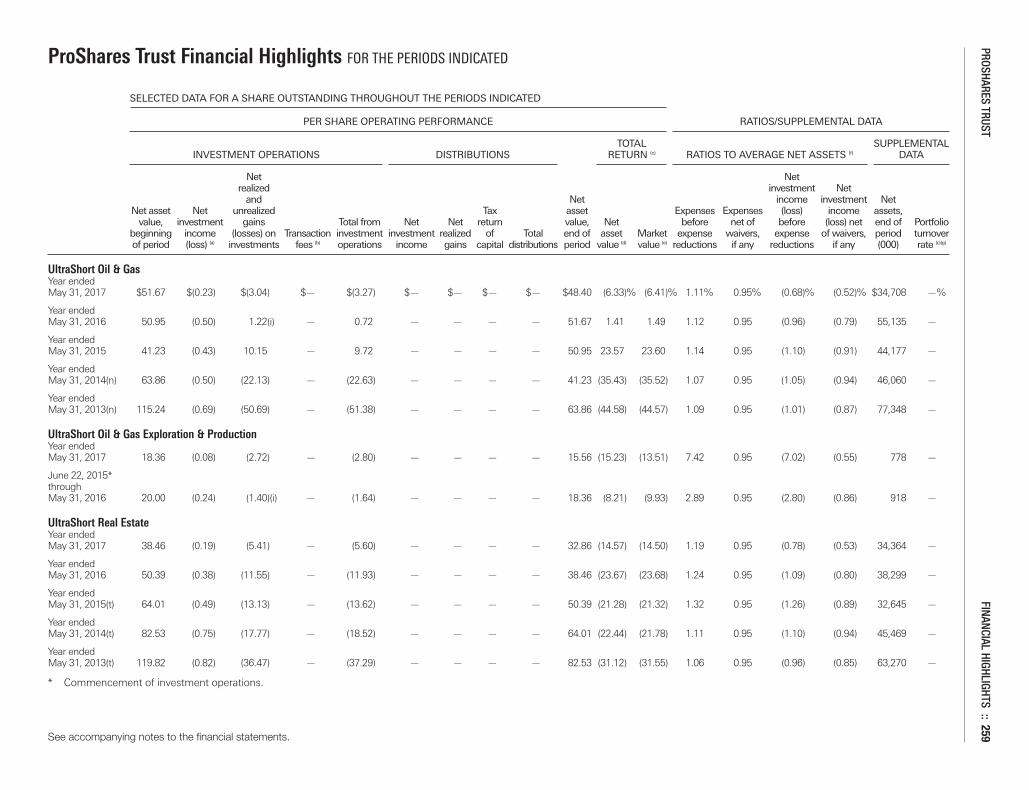
ProShares Trust Financial Highlights FOR THE PERIODS INDICATED
SELECTED DATA FOR A SHARE OUTSTANDING THROUGHOUT THE PERIODS INDICATED
PER SHARE OPERATING PERFORMANCE RATIOS/SUPPLEMENTAL DATA
TOTAL SUPPLEMENTAL INVESTMENT OPERATIONS DISTRIBUTIONS RETURN (c) RATIOS TO AVERAGE NET ASSETS (f) DATA
Net Net realized investment Net and Net income investment Net Net asset Net unrealized Tax asset Expenses Expenses (loss) income assets, value, investment gains Total from Net Net return value, Net before net of before (loss) net end of Portfolio beginning income (losses) on Transaction investment investment realized of Total end of asset Market expense waivers, expense of waivers, period turnover of period (loss) (a) investments fees (b) operations income gains capital distributions period value (d) value (e) reductions if any reductions if any (000) rate (c)(g)
UltraShort Oil & GasYear ended May 31, 2017 $51.67 $(0.23) $(3.04) $— $(3.27) $— $— $— $— $48.40 (6.33)% (6.41)% 1.11% 0.95% (0.68)% (0.52)% $34,708 —%
Year ended May 31, 2016 50.95 (0.50) 1.22(i) — 0.72 — — — — 51.67 1.41 1.49 1.12 0.95 (0.96) (0.79) 55,135 —
Year ended May 31, 2015 41.23 (0.43) 10.15 — 9.72 — — — — 50.95 23.57 23.60 1.14 0.95 (1.10) (0.91) 44,177 —
Year ended May 31, 2014(n) 63.86 (0.50) (22.13) — (22.63) — — — — 41.23 (35.43) (35.52) 1.07 0.95 (1.05) (0.94) 46,060 —
Year ended May 31, 2013(n) 115.24 (0.69) (50.69) — (51.38) — — — — 63.86 (44.58) (44.57) 1.09 0.95 (1.01) (0.87) 77,348 —
UltraShort Oil & Gas Exploration & ProductionYear ended May 31, 2017 18.36 (0.08) (2.72) — (2.80) — — — — 15.56 (15.23) (13.51) 7.42 0.95 (7.02) (0.55) 778 —
June 22, 2015* through May 31, 2016 20.00 (0.24) (1.40)(i) — (1.64) — — — — 18.36 (8.21) (9.93) 2.89 0.95 (2.80) (0.86) 918 —
UltraShort Real EstateYear ended May 31, 2017 38.46 (0.19) (5.41) — (5.60) — — — — 32.86 (14.57) (14.50) 1.19 0.95 (0.78) (0.53) 34,364 —
Year ended May 31, 2016 50.39 (0.38) (11.55) — (11.93) — — — — 38.46 (23.67) (23.68) 1.24 0.95 (1.09) (0.80) 38,299 —
Year ended May 31, 2015(t) 64.01 (0.49) (13.13) — (13.62) — — — — 50.39 (21.28) (21.32) 1.32 0.95 (1.26) (0.89) 32,645 —
Year ended May 31, 2014(t) 82.53 (0.75) (17.77) — (18.52) — — — — 64.01 (22.44) (21.78) 1.11 0.95 (1.10) (0.94) 45,469 —
Year ended May 31, 2013(t) 119.82 (0.82) (36.47) — (37.29) — — — — 82.53 (31.12) (31.55) 1.06 0.95 (0.96) (0.85) 63,270 —
* Commencement of investment operations.
See accompanying notes to the financial statements.
PROSHARES TRUST FINANCIAL HIGHLIGHTS :: 259
Merrill Corp - Proshares Trust Geared Book [96 Funds] Annual Report [Funds] 333-089822 05-31-2017 ED [AUX] | eperez | 28-Jul-17 17:43 | 17-15159-3.ia | Sequence: 15CHKSUM Content: 10765 Layout: 38168 Graphics: No Graphics CLEAN
JOB: 17-15159-3 CYCLE#;BL#: 5; 0 TRIM: 10.75" x 8.25" COMPOSITECOLORS: Black, ~note-color 2, ~note-color 3 GRAPHICS: none V1.5
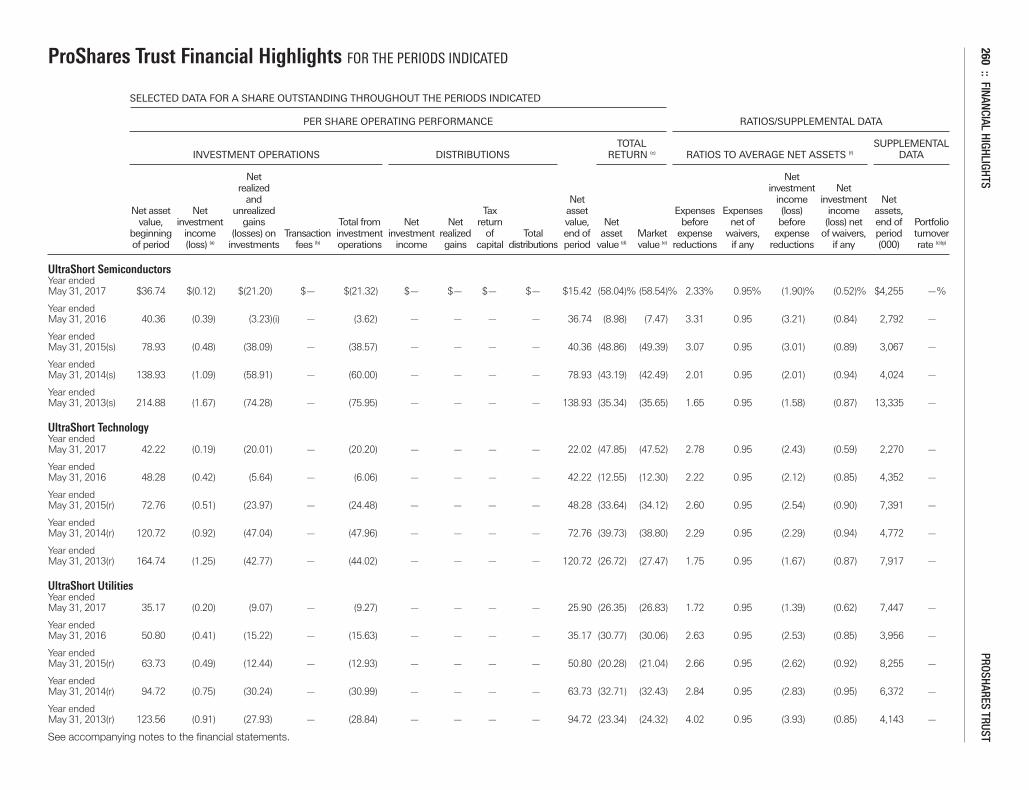
ProShares Trust Financial Highlights FOR THE PERIODS INDICATED
SELECTED DATA FOR A SHARE OUTSTANDING THROUGHOUT THE PERIODS INDICATED
PER SHARE OPERATING PERFORMANCE RATIOS/SUPPLEMENTAL DATA
TOTAL SUPPLEMENTAL INVESTMENT OPERATIONS DISTRIBUTIONS RETURN (c) RATIOS TO AVERAGE NET ASSETS (f) DATA
Net Net realized investment Net and Net income investment Net Net asset Net unrealized Tax asset Expenses Expenses (loss) income assets, value, investment gains Total from Net Net return value, Net before net of before (loss) net end of Portfolio beginning income (losses) on Transaction investment investment realized of Total end of asset Market expense waivers, expense of waivers, period turnover of period (loss) (a) investments fees (b) operations income gains capital distributions period value (d) value (e) reductions if any reductions if any (000) rate (c)(g)
UltraShort SemiconductorsYear ended May 31, 2017 $36.74 $(0.12) $(21.20) $— $(21.32) $— $— $— $— $15.42 (58.04)% (58.54)% 2.33% 0.95% (1.90)% (0.52)% $4,255 —%
Year ended May 31, 2016 40.36 (0.39) (3.23)(i) — (3.62) — — — — 36.74 (8.98) (7.47) 3.31 0.95 (3.21) (0.84) 2,792 —
Year ended May 31, 2015(s) 78.93 (0.48) (38.09) — (38.57) — — — — 40.36 (48.86) (49.39) 3.07 0.95 (3.01) (0.89) 3,067 —
Year ended May 31, 2014(s) 138.93 (1.09) (58.91) — (60.00) — — — — 78.93 (43.19) (42.49) 2.01 0.95 (2.01) (0.94) 4,024 —
Year ended May 31, 2013(s) 214.88 (1.67) (74.28) — (75.95) — — — — 138.93 (35.34) (35.65) 1.65 0.95 (1.58) (0.87) 13,335 —
UltraShort TechnologyYear ended May 31, 2017 42.22 (0.19) (20.01) — (20.20) — — — — 22.02 (47.85) (47.52) 2.78 0.95 (2.43) (0.59) 2,270 —
Year ended May 31, 2016 48.28 (0.42) (5.64) — (6.06) — — — — 42.22 (12.55) (12.30) 2.22 0.95 (2.12) (0.85) 4,352 —
Year ended May 31, 2015(r) 72.76 (0.51) (23.97) — (24.48) — — — — 48.28 (33.64) (34.12) 2.60 0.95 (2.54) (0.90) 7,391 —
Year ended May 31, 2014(r) 120.72 (0.92) (47.04) — (47.96) — — — — 72.76 (39.73) (38.80) 2.29 0.95 (2.29) (0.94) 4,772 —
Year ended May 31, 2013(r) 164.74 (1.25) (42.77) — (44.02) — — — — 120.72 (26.72) (27.47) 1.75 0.95 (1.67) (0.87) 7,917 —
UltraShort UtilitiesYear ended May 31, 2017 35.17 (0.20) (9.07) — (9.27) — — — — 25.90 (26.35) (26.83) 1.72 0.95 (1.39) (0.62) 7,447 —
Year ended May 31, 2016 50.80 (0.41) (15.22) — (15.63) — — — — 35.17 (30.77) (30.06) 2.63 0.95 (2.53) (0.85) 3,956 —
Year ended May 31, 2015(r) 63.73 (0.49) (12.44) — (12.93) — — — — 50.80 (20.28) (21.04) 2.66 0.95 (2.62) (0.92) 8,255 —
Year ended May 31, 2014(r) 94.72 (0.75) (30.24) — (30.99) — — — — 63.73 (32.71) (32.43) 2.84 0.95 (2.83) (0.95) 6,372 —
Year ended May 31, 2013(r) 123.56 (0.91) (27.93) — (28.84) — — — — 94.72 (23.34) (24.32) 4.02 0.95 (3.93) (0.85) 4,143 —
See accompanying notes to the financial statements.
260:: FINANCIAL HIGHLIGHTS
PROSHARES TRUST
Merrill Corp - Proshares Trust Geared Book [96 Funds] Annual Report [Funds] 333-089822 05-31-2017 ED [AUX] | eperez | 28-Jul-17 17:43 | 17-15159-3.ia | Sequence: 16CHKSUM Content: 58434 Layout: 23584 Graphics: No Graphics CLEAN
JOB: 17-15159-3 CYCLE#;BL#: 5; 0 TRIM: 10.75" x 8.25" COMPOSITECOLORS: Black, ~note-color 2, ~note-color 3 GRAPHICS: none V1.5
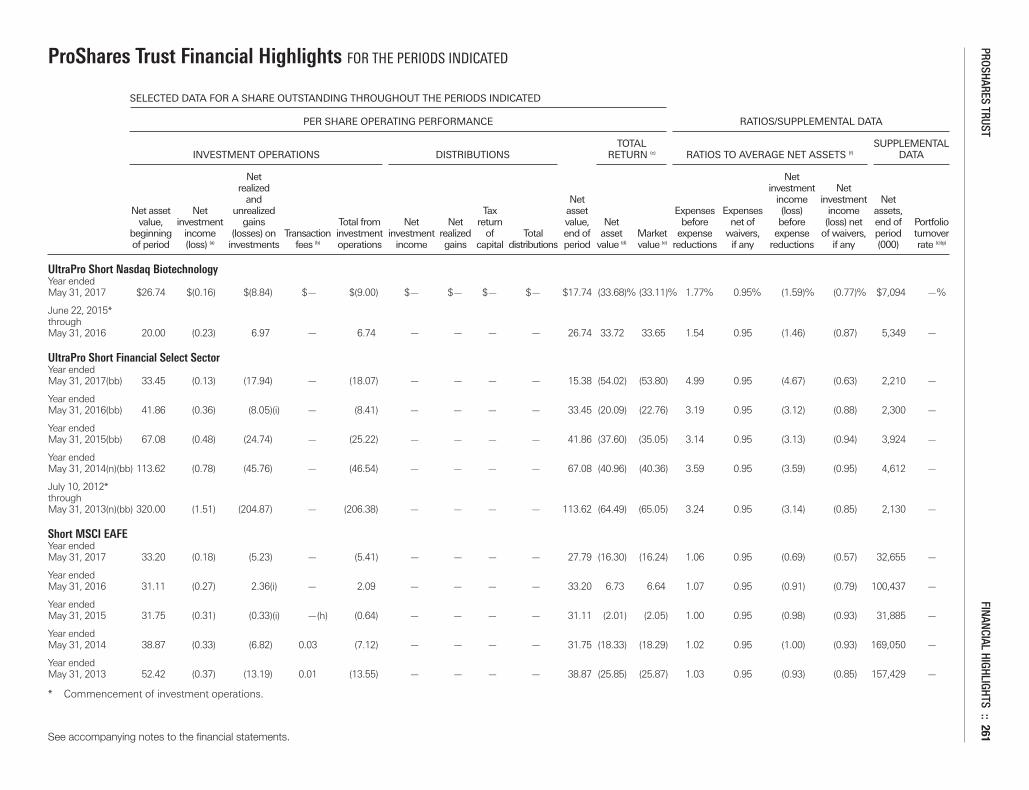
ProShares Trust Financial Highlights FOR THE PERIODS INDICATED
SELECTED DATA FOR A SHARE OUTSTANDING THROUGHOUT THE PERIODS INDICATED
PER SHARE OPERATING PERFORMANCE RATIOS/SUPPLEMENTAL DATA
TOTAL SUPPLEMENTAL INVESTMENT OPERATIONS DISTRIBUTIONS RETURN (c) RATIOS TO AVERAGE NET ASSETS (f) DATA
Net Net realized investment Net and Net income investment Net Net asset Net unrealized Tax asset Expenses Expenses (loss) income assets, value, investment gains Total from Net Net return value, Net before net of before (loss) net end of Portfolio beginning income (losses) on Transaction investment investment realized of Total end of asset Market expense waivers, expense of waivers, period turnover of period (loss) (a) investments fees (b) operations income gains capital distributions period value (d) value (e) reductions if any reductions if any (000) rate (c)(g)
UltraPro Short Nasdaq BiotechnologyYear ended May 31, 2017 $26.74 $(0.16) $(8.84) $— $(9.00) $— $— $— $— $17.74 (33.68)% (33.11)% 1.77% 0.95% (1.59)% (0.77)% $7,094 —%
June 22, 2015* through May 31, 2016 20.00 (0.23) 6.97 — 6.74 — — — — 26.74 33.72 33.65 1.54 0.95 (1.46) (0.87) 5,349 —
UltraPro Short Financial Select SectorYear ended May 31, 2017(bb) 33.45 (0.13) (17.94) — (18.07) — — — — 15.38 (54.02) (53.80) 4.99 0.95 (4.67) (0.63) 2,210 —
Year ended May 31, 2016(bb) 41.86 (0.36) (8.05)(i) — (8.41) — — — — 33.45 (20.09) (22.76) 3.19 0.95 (3.12) (0.88) 2,300 —
Year ended May 31, 2015(bb) 67.08 (0.48) (24.74) — (25.22) — — — — 41.86 (37.60) (35.05) 3.14 0.95 (3.13) (0.94) 3,924 —
Year ended May 31, 2014(n)(bb) 113.62 (0.78) (45.76) — (46.54) — — — — 67.08 (40.96) (40.36) 3.59 0.95 (3.59) (0.95) 4,612 —
July 10, 2012* through May 31, 2013(n)(bb) 320.00 (1.51) (204.87) — (206.38) — — — — 113.62 (64.49) (65.05) 3.24 0.95 (3.14) (0.85) 2,130 —
Short MSCI EAFEYear ended May 31, 2017 33.20 (0.18) (5.23) — (5.41) — — — — 27.79 (16.30) (16.24) 1.06 0.95 (0.69) (0.57) 32,655 —
Year ended May 31, 2016 31.11 (0.27) 2.36(i) — 2.09 — — — — 33.20 6.73 6.64 1.07 0.95 (0.91) (0.79) 100,437 —
Year ended May 31, 2015 31.75 (0.31) (0.33)(i) —(h) (0.64) — — — — 31.11 (2.01) (2.05) 1.00 0.95 (0.98) (0.93) 31,885 —
Year ended May 31, 2014 38.87 (0.33) (6.82) 0.03 (7.12) — — — — 31.75 (18.33) (18.29) 1.02 0.95 (1.00) (0.93) 169,050 —
Year ended May 31, 2013 52.42 (0.37) (13.19) 0.01 (13.55) — — — — 38.87 (25.85) (25.87) 1.03 0.95 (0.93) (0.85) 157,429 —
* Commencement of investment operations.
See accompanying notes to the financial statements.
PROSHARES TRUST FINANCIAL HIGHLIGHTS :: 261
Merrill Corp - Proshares Trust Geared Book [96 Funds] Annual Report [Funds] 333-089822 05-31-2017 ED [AUX] | eperez | 28-Jul-17 17:43 | 17-15159-3.ia | Sequence: 17CHKSUM Content: 25032 Layout: 8493 Graphics: No Graphics CLEAN
JOB: 17-15159-3 CYCLE#;BL#: 5; 0 TRIM: 10.75" x 8.25" COMPOSITECOLORS: Black, ~note-color 2, ~note-color 3 GRAPHICS: none V1.5
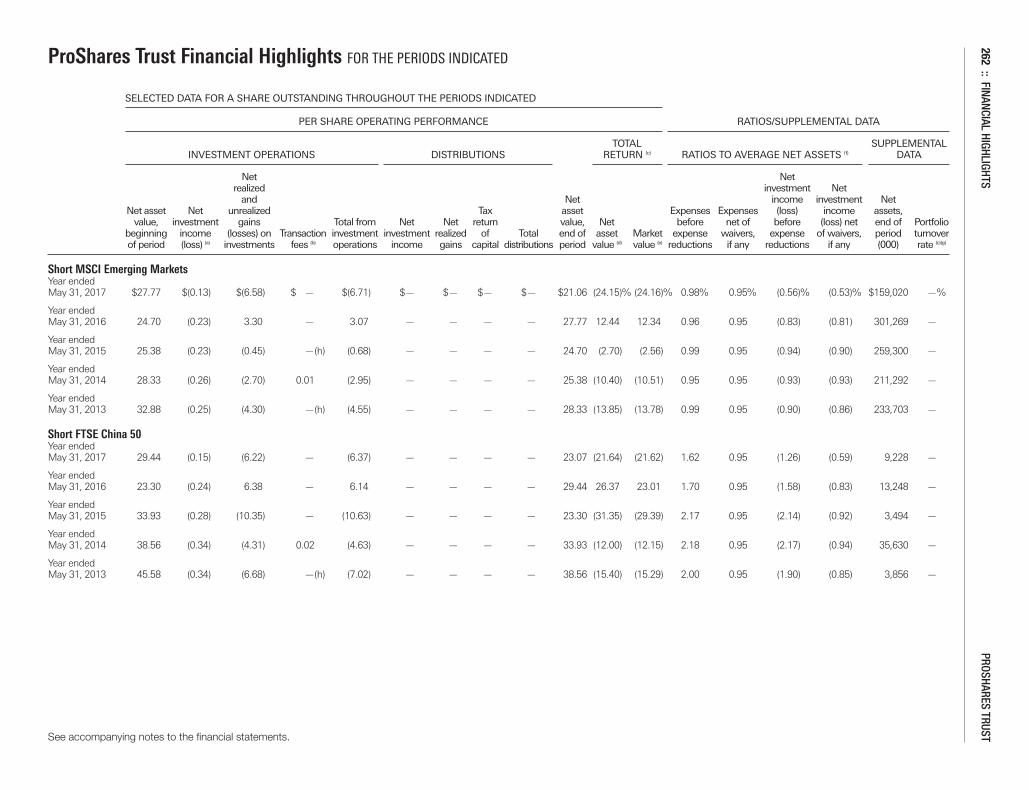
ProShares Trust Financial Highlights FOR THE PERIODS INDICATED
SELECTED DATA FOR A SHARE OUTSTANDING THROUGHOUT THE PERIODS INDICATED
PER SHARE OPERATING PERFORMANCE RATIOS/SUPPLEMENTAL DATA
TOTAL SUPPLEMENTAL INVESTMENT OPERATIONS DISTRIBUTIONS RETURN (c) RATIOS TO AVERAGE NET ASSETS (f) DATA
Net Net realized investment Net and Net income investment Net Net asset Net unrealized Tax asset Expenses Expenses (loss) income assets, value, investment gains Total from Net Net return value, Net before net of before (loss) net end of Portfolio beginning income (losses) on Transaction investment investment realized of Total end of asset Market expense waivers, expense of waivers, period turnover of period (loss) (a) investments fees (b) operations income gains capital distributions period value (d) value (e) reductions if any reductions if any (000) rate (c)(g)
Short MSCI Emerging MarketsYear ended May 31, 2017 $27.77 $(0.13) $(6.58) $ — $(6.71) $— $— $— $— $21.06 (24.15)% (24.16)% 0.98% 0.95% (0.56)% (0.53)% $159,020 —%
Year ended May 31, 2016 24.70 (0.23) 3.30 — 3.07 — — — — 27.77 12.44 12.34 0.96 0.95 (0.83) (0.81) 301,269 —
Year ended May 31, 2015 25.38 (0.23) (0.45) —(h) (0.68) — — — — 24.70 (2.70) (2.56) 0.99 0.95 (0.94) (0.90) 259,300 —
Year ended May 31, 2014 28.33 (0.26) (2.70) 0.01 (2.95) — — — — 25.38 (10.40) (10.51) 0.95 0.95 (0.93) (0.93) 211,292 —
Year ended May 31, 2013 32.88 (0.25) (4.30) —(h) (4.55) — — — — 28.33 (13.85) (13.78) 0.99 0.95 (0.90) (0.86) 233,703 —
Short FTSE China 50Year ended May 31, 2017 29.44 (0.15) (6.22) — (6.37) — — — — 23.07 (21.64) (21.62) 1.62 0.95 (1.26) (0.59) 9,228 —
Year ended May 31, 2016 23.30 (0.24) 6.38 — 6.14 — — — — 29.44 26.37 23.01 1.70 0.95 (1.58) (0.83) 13,248 —
Year ended May 31, 2015 33.93 (0.28) (10.35) — (10.63) — — — — 23.30 (31.35) (29.39) 2.17 0.95 (2.14) (0.92) 3,494 —
Year ended May 31, 2014 38.56 (0.34) (4.31) 0.02 (4.63) — — — — 33.93 (12.00) (12.15) 2.18 0.95 (2.17) (0.94) 35,630 —
Year ended May 31, 2013 45.58 (0.34) (6.68) —(h) (7.02) — — — — 38.56 (15.40) (15.29) 2.00 0.95 (1.90) (0.85) 3,856 —
See accompanying notes to the financial statements.
262:: FINANCIAL HIGHLIGHTS
PROSHARES TRUST
Merrill Corp - Proshares Trust Geared Book [96 Funds] Annual Report [Funds] 333-089822 05-31-2017 ED [AUX] | eperez | 28-Jul-17 17:43 | 17-15159-3.ia | Sequence: 18CHKSUM Content: 24029 Layout: 56372 Graphics: No Graphics CLEAN
JOB: 17-15159-3 CYCLE#;BL#: 5; 0 TRIM: 10.75" x 8.25" COMPOSITECOLORS: Black, ~note-color 2, ~note-color 3 GRAPHICS: none V1.5
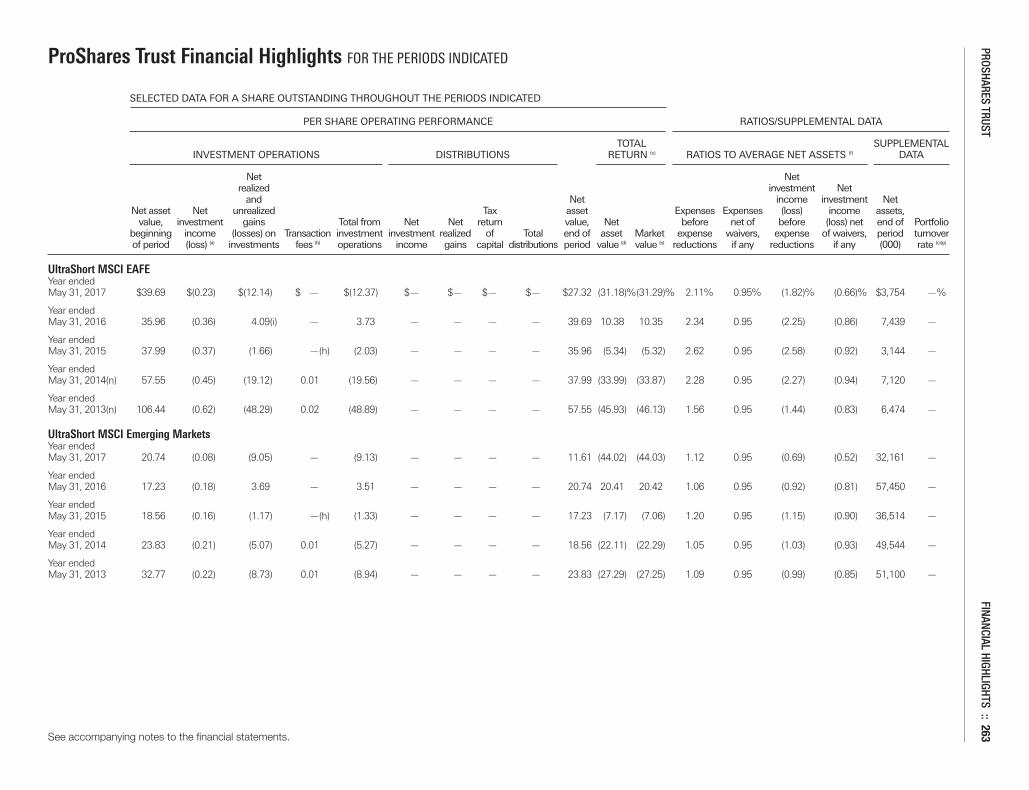
ProShares Trust Financial Highlights FOR THE PERIODS INDICATED
SELECTED DATA FOR A SHARE OUTSTANDING THROUGHOUT THE PERIODS INDICATED
PER SHARE OPERATING PERFORMANCE RATIOS/SUPPLEMENTAL DATA
TOTAL SUPPLEMENTAL INVESTMENT OPERATIONS DISTRIBUTIONS RETURN (c) RATIOS TO AVERAGE NET ASSETS (f) DATA
Net Net realized investment Net and Net income investment Net Net asset Net unrealized Tax asset Expenses Expenses (loss) income assets, value, investment gains Total from Net Net return value, Net before net of before (loss) net end of Portfolio beginning income (losses) on Transaction investment investment realized of Total end of asset Market expense waivers, expense of waivers, period turnover of period (loss) (a) investments fees (b) operations income gains capital distributions period value (d) value (e) reductions if any reductions if any (000) rate (c)(g)
UltraShort MSCI EAFEYear ended May 31, 2017 $39.69 $(0.23) $(12.14) $ — $(12.37) $— $— $— $— $27.32 (31.18)%(31.29)% 2.11% 0.95% (1.82)% (0.66)% $3,754 —%
Year ended May 31, 2016 35.96 (0.36) 4.09(i) — 3.73 — — — — 39.69 10.38 10.35 2.34 0.95 (2.25) (0.86) 7,439 —
Year ended May 31, 2015 37.99 (0.37) (1.66) —(h) (2.03) — — — — 35.96 (5.34) (5.32) 2.62 0.95 (2.58) (0.92) 3,144 —
Year ended May 31, 2014(n) 57.55 (0.45) (19.12) 0.01 (19.56) — — — — 37.99 (33.99) (33.87) 2.28 0.95 (2.27) (0.94) 7,120 —
Year ended May 31, 2013(n) 106.44 (0.62) (48.29) 0.02 (48.89) — — — — 57.55 (45.93) (46.13) 1.56 0.95 (1.44) (0.83) 6,474 —
UltraShort MSCI Emerging MarketsYear ended May 31, 2017 20.74 (0.08) (9.05) — (9.13) — — — — 11.61 (44.02) (44.03) 1.12 0.95 (0.69) (0.52) 32,161 —
Year ended May 31, 2016 17.23 (0.18) 3.69 — 3.51 — — — — 20.74 20.41 20.42 1.06 0.95 (0.92) (0.81) 57,450 —
Year ended May 31, 2015 18.56 (0.16) (1.17) —(h) (1.33) — — — — 17.23 (7.17) (7.06) 1.20 0.95 (1.15) (0.90) 36,514 —
Year ended May 31, 2014 23.83 (0.21) (5.07) 0.01 (5.27) — — — — 18.56 (22.11) (22.29) 1.05 0.95 (1.03) (0.93) 49,544 —
Year ended May 31, 2013 32.77 (0.22) (8.73) 0.01 (8.94) — — — — 23.83 (27.29) (27.25) 1.09 0.95 (0.99) (0.85) 51,100 —
See accompanying notes to the financial statements.
PROSHARES TRUST FINANCIAL HIGHLIGHTS :: 263
Merrill Corp - Proshares Trust Geared Book [96 Funds] Annual Report [Funds] 333-089822 05-31-2017 ED [AUX] | eperez | 28-Jul-17 17:43 | 17-15159-3.ia | Sequence: 19CHKSUM Content: 20258 Layout: 19573 Graphics: No Graphics CLEAN
JOB: 17-15159-3 CYCLE#;BL#: 5; 0 TRIM: 10.75" x 8.25" COMPOSITECOLORS: Black, ~note-color 2, ~note-color 3 GRAPHICS: none V1.5
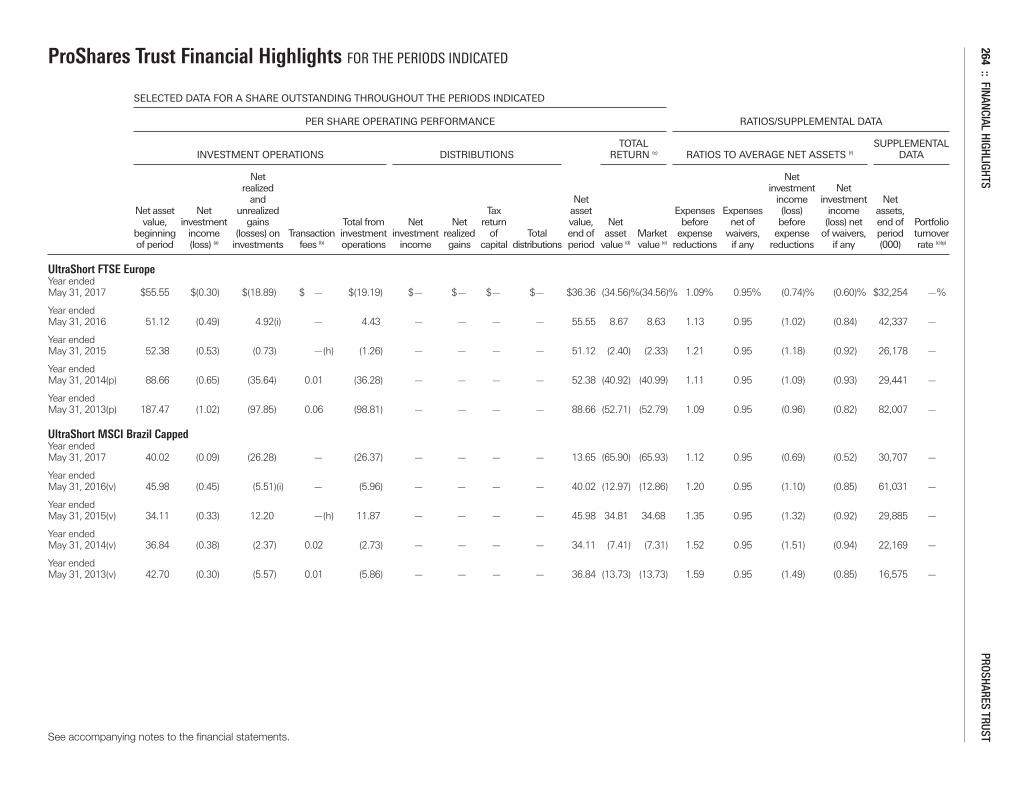
ProShares Trust Financial Highlights FOR THE PERIODS INDICATED
SELECTED DATA FOR A SHARE OUTSTANDING THROUGHOUT THE PERIODS INDICATED
PER SHARE OPERATING PERFORMANCE RATIOS/SUPPLEMENTAL DATA
TOTAL SUPPLEMENTAL INVESTMENT OPERATIONS DISTRIBUTIONS RETURN (c) RATIOS TO AVERAGE NET ASSETS (f) DATA
Net Net realized investment Net and Net income investment Net Net asset Net unrealized Tax asset Expenses Expenses (loss) income assets, value, investment gains Total from Net Net return value, Net before net of before (loss) net end of Portfolio beginning income (losses) on Transaction investment investment realized of Total end of asset Market expense waivers, expense of waivers, period turnover of period (loss) (a) investments fees (b) operations income gains capital distributions period value (d) value (e) reductions if any reductions if any (000) rate (c)(g)
UltraShort FTSE EuropeYear ended May 31, 2017 $55.55 $(0.30) $(18.89) $ — $(19.19) $— $— $— $— $36.36 (34.56)%(34.56)% 1.09% 0.95% (0.74)% (0.60)% $32,254 —%
Year ended May 31, 2016 51.12 (0.49) 4.92(i) — 4.43 — — — — 55.55 8.67 8.63 1.13 0.95 (1.02) (0.84) 42,337 —
Year ended May 31, 2015 52.38 (0.53) (0.73) —(h) (1.26) — — — — 51.12 (2.40) (2.33) 1.21 0.95 (1.18) (0.92) 26,178 —
Year ended May 31, 2014(p) 88.66 (0.65) (35.64) 0.01 (36.28) — — — — 52.38 (40.92) (40.99) 1.11 0.95 (1.09) (0.93) 29,441 —
Year ended May 31, 2013(p) 187.47 (1.02) (97.85) 0.06 (98.81) — — — — 88.66 (52.71) (52.79) 1.09 0.95 (0.96) (0.82) 82,007 —
UltraShort MSCI Brazil CappedYear ended May 31, 2017 40.02 (0.09) (26.28) — (26.37) — — — — 13.65 (65.90) (65.93) 1.12 0.95 (0.69) (0.52) 30,707 —
Year ended May 31, 2016(v) 45.98 (0.45) (5.51)(i) — (5.96) — — — — 40.02 (12.97) (12.86) 1.20 0.95 (1.10) (0.85) 61,031 —
Year ended May 31, 2015(v) 34.11 (0.33) 12.20 —(h) 11.87 — — — — 45.98 34.81 34.68 1.35 0.95 (1.32) (0.92) 29,885 —
Year ended May 31, 2014(v) 36.84 (0.38) (2.37) 0.02 (2.73) — — — — 34.11 (7.41) (7.31) 1.52 0.95 (1.51) (0.94) 22,169 —
Year ended May 31, 2013(v) 42.70 (0.30) (5.57) 0.01 (5.86) — — — — 36.84 (13.73) (13.73) 1.59 0.95 (1.49) (0.85) 16,575 —
See accompanying notes to the financial statements.
264:: FINANCIAL HIGHLIGHTS
PROSHARES TRUST
Merrill Corp - Proshares Trust Geared Book [96 Funds] Annual Report [Funds] 333-089822 05-31-2017 ED [AUX] | eperez | 28-Jul-17 17:43 | 17-15159-3.ia | Sequence: 20CHKSUM Content: 11399 Layout: 62964 Graphics: No Graphics CLEAN
JOB: 17-15159-3 CYCLE#;BL#: 5; 0 TRIM: 10.75" x 8.25" COMPOSITECOLORS: Black, ~note-color 2, ~note-color 3 GRAPHICS: none V1.5
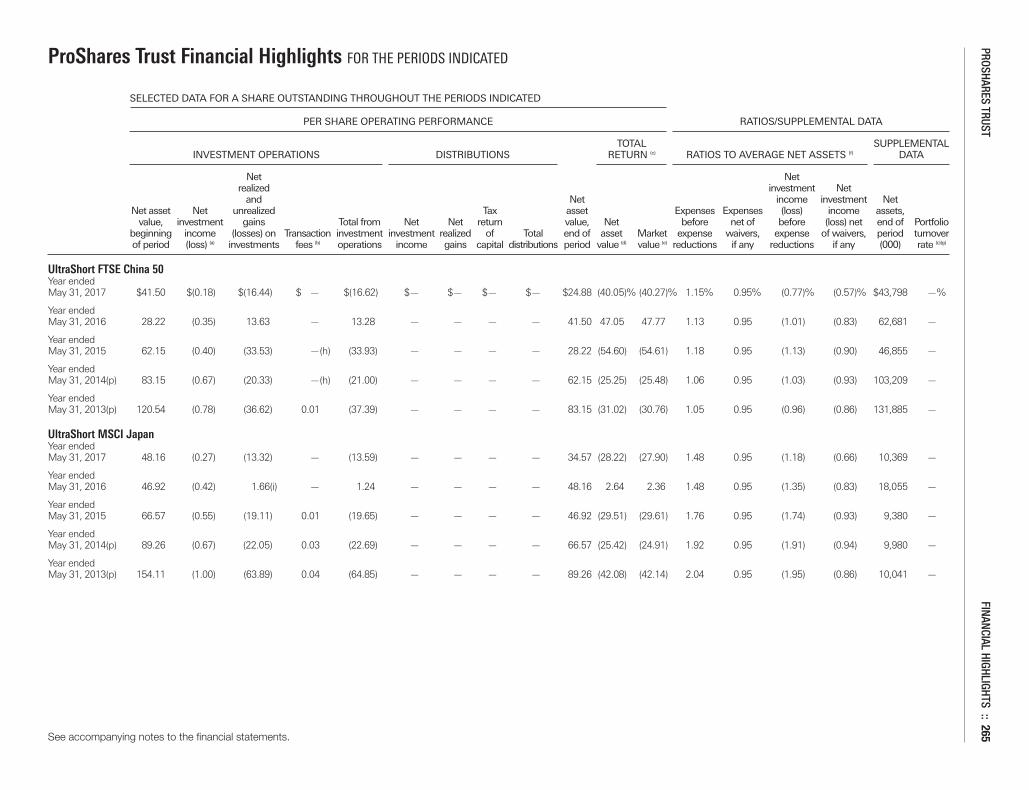
ProShares Trust Financial Highlights FOR THE PERIODS INDICATED
SELECTED DATA FOR A SHARE OUTSTANDING THROUGHOUT THE PERIODS INDICATED
PER SHARE OPERATING PERFORMANCE RATIOS/SUPPLEMENTAL DATA
TOTAL SUPPLEMENTAL INVESTMENT OPERATIONS DISTRIBUTIONS RETURN (c) RATIOS TO AVERAGE NET ASSETS (f) DATA
Net Net realized investment Net and Net income investment Net Net asset Net unrealized Tax asset Expenses Expenses (loss) income assets, value, investment gains Total from Net Net return value, Net before net of before (loss) net end of Portfolio beginning income (losses) on Transaction investment investment realized of Total end of asset Market expense waivers, expense of waivers, period turnover of period (loss) (a) investments fees (b) operations income gains capital distributions period value (d) value (e) reductions if any reductions if any (000) rate (c)(g)
UltraShort FTSE China 50Year ended May 31, 2017 $41.50 $(0.18) $(16.44) $ — $(16.62) $— $— $— $— $24.88 (40.05)% (40.27)% 1.15% 0.95% (0.77)% (0.57)% $43,798 —%
Year ended May 31, 2016 28.22 (0.35) 13.63 — 13.28 — — — — 41.50 47.05 47.77 1.13 0.95 (1.01) (0.83) 62,681 —
Year ended May 31, 2015 62.15 (0.40) (33.53) —(h) (33.93) — — — — 28.22 (54.60) (54.61) 1.18 0.95 (1.13) (0.90) 46,855 —
Year ended May 31, 2014(p) 83.15 (0.67) (20.33) —(h) (21.00) — — — — 62.15 (25.25) (25.48) 1.06 0.95 (1.03) (0.93) 103,209 —
Year ended May 31, 2013(p) 120.54 (0.78) (36.62) 0.01 (37.39) — — — — 83.15 (31.02) (30.76) 1.05 0.95 (0.96) (0.86) 131,885 —
UltraShort MSCI JapanYear ended May 31, 2017 48.16 (0.27) (13.32) — (13.59) — — — — 34.57 (28.22) (27.90) 1.48 0.95 (1.18) (0.66) 10,369 —
Year ended May 31, 2016 46.92 (0.42) 1.66(i) — 1.24 — — — — 48.16 2.64 2.36 1.48 0.95 (1.35) (0.83) 18,055 —
Year ended May 31, 2015 66.57 (0.55) (19.11) 0.01 (19.65) — — — — 46.92 (29.51) (29.61) 1.76 0.95 (1.74) (0.93) 9,380 —
Year ended May 31, 2014(p) 89.26 (0.67) (22.05) 0.03 (22.69) — — — — 66.57 (25.42) (24.91) 1.92 0.95 (1.91) (0.94) 9,980 —
Year ended May 31, 2013(p) 154.11 (1.00) (63.89) 0.04 (64.85) — — — — 89.26 (42.08) (42.14) 2.04 0.95 (1.95) (0.86) 10,041 —
See accompanying notes to the financial statements.
PROSHARES TRUST FINANCIAL HIGHLIGHTS :: 265
Merrill Corp - Proshares Trust Geared Book [96 Funds] Annual Report [Funds] 333-089822 05-31-2017 ED [AUX] | eperez | 28-Jul-17 17:43 | 17-15159-3.ia | Sequence: 21CHKSUM Content: 58524 Layout: 34842 Graphics: No Graphics CLEAN
JOB: 17-15159-3 CYCLE#;BL#: 5; 0 TRIM: 10.75" x 8.25" COMPOSITECOLORS: Black, ~note-color 2, ~note-color 3 GRAPHICS: none V1.5
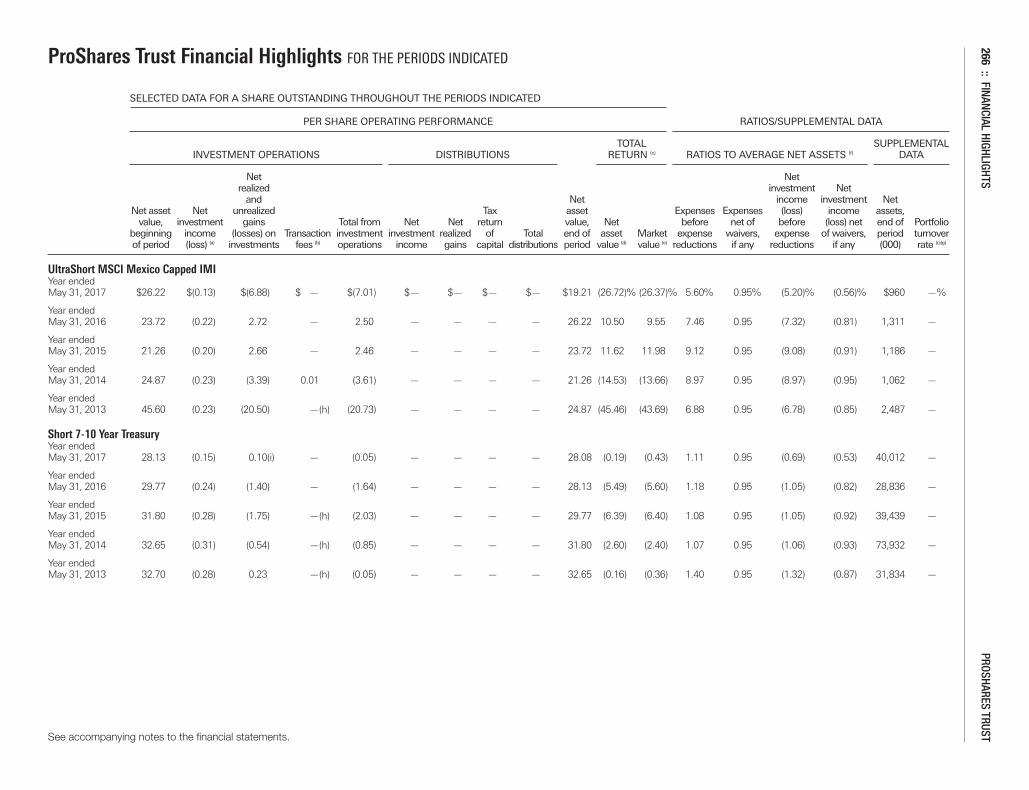
ProShares Trust Financial Highlights FOR THE PERIODS INDICATED
SELECTED DATA FOR A SHARE OUTSTANDING THROUGHOUT THE PERIODS INDICATED
PER SHARE OPERATING PERFORMANCE RATIOS/SUPPLEMENTAL DATA
TOTAL SUPPLEMENTAL INVESTMENT OPERATIONS DISTRIBUTIONS RETURN (c) RATIOS TO AVERAGE NET ASSETS (f) DATA
Net Net realized investment Net and Net income investment Net Net asset Net unrealized Tax asset Expenses Expenses (loss) income assets, value, investment gains Total from Net Net return value, Net before net of before (loss) net end of Portfolio beginning income (losses) on Transaction investment investment realized of Total end of asset Market expense waivers, expense of waivers, period turnover of period (loss) (a) investments fees (b) operations income gains capital distributions period value (d) value (e) reductions if any reductions if any (000) rate (c)(g)
UltraShort MSCI Mexico Capped IMIYear ended May 31, 2017 $26.22 $(0.13) $(6.88) $ — $(7.01) $— $— $— $— $19.21 (26.72)% (26.37)% 5.60% 0.95% (5.20)% (0.56)% $960 —%
Year ended May 31, 2016 23.72 (0.22) 2.72 — 2.50 — — — — 26.22 10.50 9.55 7.46 0.95 (7.32) (0.81) 1,311 —
Year ended May 31, 2015 21.26 (0.20) 2.66 — 2.46 — — — — 23.72 11.62 11.98 9.12 0.95 (9.08) (0.91) 1,186 —
Year ended May 31, 2014 24.87 (0.23) (3.39) 0.01 (3.61) — — — — 21.26 (14.53) (13.66) 8.97 0.95 (8.97) (0.95) 1,062 —
Year ended May 31, 2013 45.60 (0.23) (20.50) —(h) (20.73) — — — — 24.87 (45.46) (43.69) 6.88 0.95 (6.78) (0.85) 2,487 —
Short 7-10 Year TreasuryYear ended May 31, 2017 28.13 (0.15) 0.10(i) — (0.05) — — — — 28.08 (0.19) (0.43) 1.11 0.95 (0.69) (0.53) 40,012 —
Year ended May 31, 2016 29.77 (0.24) (1.40) — (1.64) — — — — 28.13 (5.49) (5.60) 1.18 0.95 (1.05) (0.82) 28,836 —
Year ended May 31, 2015 31.80 (0.28) (1.75) —(h) (2.03) — — — — 29.77 (6.39) (6.40) 1.08 0.95 (1.05) (0.92) 39,439 —
Year ended May 31, 2014 32.65 (0.31) (0.54) —(h) (0.85) — — — — 31.80 (2.60) (2.40) 1.07 0.95 (1.06) (0.93) 73,932 —
Year ended May 31, 2013 32.70 (0.28) 0.23 —(h) (0.05) — — — — 32.65 (0.16) (0.36) 1.40 0.95 (1.32) (0.87) 31,834 —
See accompanying notes to the financial statements.
266:: FINANCIAL HIGHLIGHTS
PROSHARES TRUST
Merrill Corp - Proshares Trust Geared Book [96 Funds] Annual Report [Funds] 333-089822 05-31-2017 ED [AUX] | eperez | 28-Jul-17 17:43 | 17-15159-3.ia | Sequence: 22CHKSUM Content: 38300 Layout: 36437 Graphics: No Graphics CLEAN
JOB: 17-15159-3 CYCLE#;BL#: 5; 0 TRIM: 10.75" x 8.25" COMPOSITECOLORS: Black, ~note-color 2, ~note-color 3 GRAPHICS: none V1.5
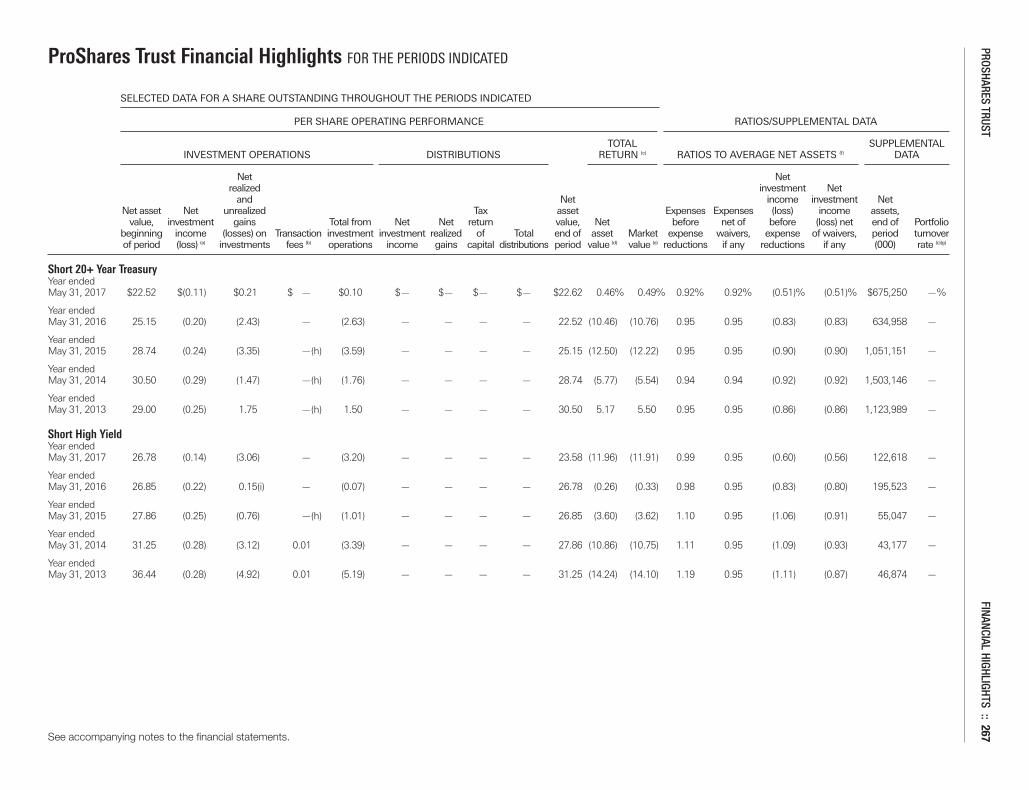
ProShares Trust Financial Highlights FOR THE PERIODS INDICATED
SELECTED DATA FOR A SHARE OUTSTANDING THROUGHOUT THE PERIODS INDICATED
PER SHARE OPERATING PERFORMANCE RATIOS/SUPPLEMENTAL DATA
TOTAL SUPPLEMENTAL INVESTMENT OPERATIONS DISTRIBUTIONS RETURN (c) RATIOS TO AVERAGE NET ASSETS (f) DATA
Net Net realized investment Net and Net income investment Net Net asset Net unrealized Tax asset Expenses Expenses (loss) income assets, value, investment gains Total from Net Net return value, Net before net of before (loss) net end of Portfolio beginning income (losses) on Transaction investment investment realized of Total end of asset Market expense waivers, expense of waivers, period turnover of period (loss) (a) investments fees (b) operations income gains capital distributions period value (d) value (e) reductions if any reductions if any (000) rate (c)(g)
Short 20+ Year TreasuryYear ended May 31, 2017 $22.52 $(0.11) $0.21 $ — $0.10 $— $— $— $— $22.62 0.46% 0.49% 0.92% 0.92% (0.51)% (0.51)% $675,250 —%
Year ended May 31, 2016 25.15 (0.20) (2.43) — (2.63) — — — — 22.52 (10.46) (10.76) 0.95 0.95 (0.83) (0.83) 634,958 —
Year ended May 31, 2015 28.74 (0.24) (3.35) —(h) (3.59) — — — — 25.15 (12.50) (12.22) 0.95 0.95 (0.90) (0.90) 1,051,151 —
Year ended May 31, 2014 30.50 (0.29) (1.47) —(h) (1.76) — — — — 28.74 (5.77) (5.54) 0.94 0.94 (0.92) (0.92) 1,503,146 —
Year ended May 31, 2013 29.00 (0.25) 1.75 —(h) 1.50 — — — — 30.50 5.17 5.50 0.95 0.95 (0.86) (0.86) 1,123,989 —
Short High YieldYear ended May 31, 2017 26.78 (0.14) (3.06) — (3.20) — — — — 23.58 (11.96) (11.91) 0.99 0.95 (0.60) (0.56) 122,618 —
Year ended May 31, 2016 26.85 (0.22) 0.15(i) — (0.07) — — — — 26.78 (0.26) (0.33) 0.98 0.95 (0.83) (0.80) 195,523 —
Year ended May 31, 2015 27.86 (0.25) (0.76) —(h) (1.01) — — — — 26.85 (3.60) (3.62) 1.10 0.95 (1.06) (0.91) 55,047 —
Year ended May 31, 2014 31.25 (0.28) (3.12) 0.01 (3.39) — — — — 27.86 (10.86) (10.75) 1.11 0.95 (1.09) (0.93) 43,177 —
Year ended May 31, 2013 36.44 (0.28) (4.92) 0.01 (5.19) — — — — 31.25 (14.24) (14.10) 1.19 0.95 (1.11) (0.87) 46,874 —
See accompanying notes to the financial statements.
PROSHARES TRUST FINANCIAL HIGHLIGHTS :: 267
Merrill Corp - Proshares Trust Geared Book [96 Funds] Annual Report [Funds] 333-089822 05-31-2017 ED [AUX] | eperez | 28-Jul-17 17:43 | 17-15159-3.ia | Sequence: 23CHKSUM Content: 54883 Layout: 1714 Graphics: No Graphics CLEAN
JOB: 17-15159-3 CYCLE#;BL#: 5; 0 TRIM: 10.75" x 8.25" COMPOSITECOLORS: Black, ~note-color 2, ~note-color 3 GRAPHICS: none V1.5
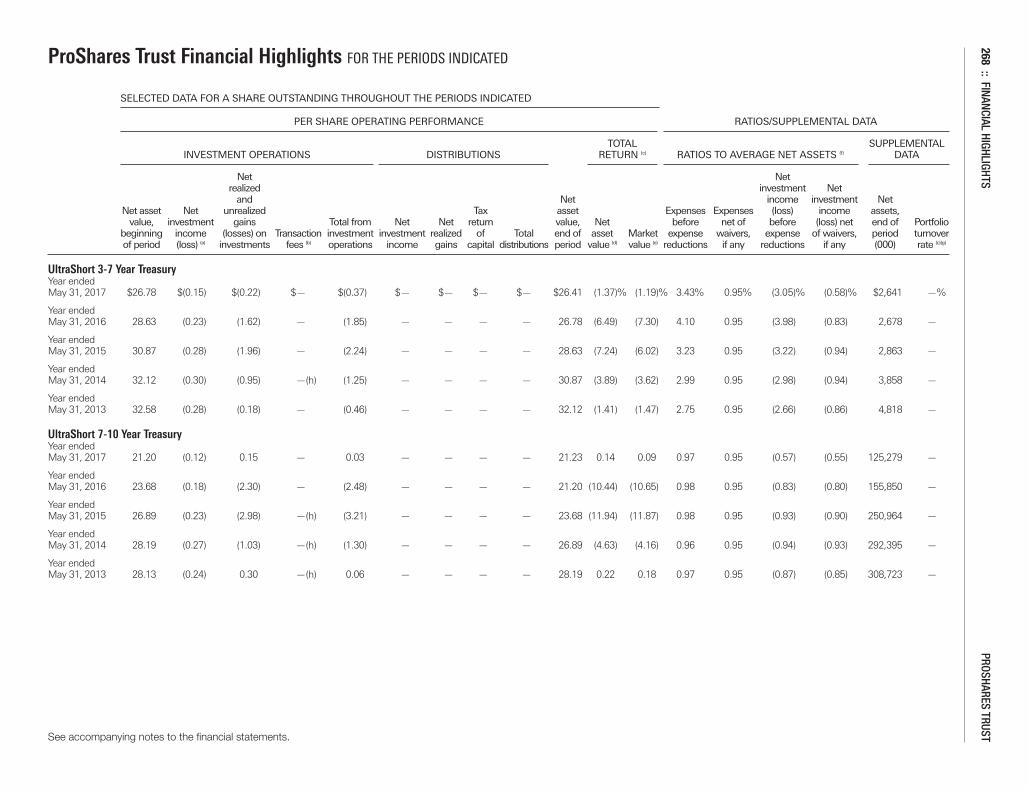
ProShares Trust Financial Highlights FOR THE PERIODS INDICATED
SELECTED DATA FOR A SHARE OUTSTANDING THROUGHOUT THE PERIODS INDICATED
PER SHARE OPERATING PERFORMANCE RATIOS/SUPPLEMENTAL DATA
TOTAL SUPPLEMENTAL INVESTMENT OPERATIONS DISTRIBUTIONS RETURN (c) RATIOS TO AVERAGE NET ASSETS (f) DATA
Net Net realized investment Net and Net income investment Net Net asset Net unrealized Tax asset Expenses Expenses (loss) income assets, value, investment gains Total from Net Net return value, Net before net of before (loss) net end of Portfolio beginning income (losses) on Transaction investment investment realized of Total end of asset Market expense waivers, expense of waivers, period turnover of period (loss) (a) investments fees (b) operations income gains capital distributions period value (d) value (e) reductions if any reductions if any (000) rate (c)(g)
UltraShort 3-7 Year TreasuryYear ended May 31, 2017 $26.78 $(0.15) $(0.22) $— $(0.37) $— $— $— $— $26.41 (1.37)% (1.19)% 3.43% 0.95% (3.05)% (0.58)% $2,641 —%
Year ended May 31, 2016 28.63 (0.23) (1.62) — (1.85) — — — — 26.78 (6.49) (7.30) 4.10 0.95 (3.98) (0.83) 2,678 —
Year ended May 31, 2015 30.87 (0.28) (1.96) — (2.24) — — — — 28.63 (7.24) (6.02) 3.23 0.95 (3.22) (0.94) 2,863 —
Year ended May 31, 2014 32.12 (0.30) (0.95) —(h) (1.25) — — — — 30.87 (3.89) (3.62) 2.99 0.95 (2.98) (0.94) 3,858 —
Year ended May 31, 2013 32.58 (0.28) (0.18) — (0.46) — — — — 32.12 (1.41) (1.47) 2.75 0.95 (2.66) (0.86) 4,818 —
UltraShort 7-10 Year TreasuryYear ended May 31, 2017 21.20 (0.12) 0.15 — 0.03 — — — — 21.23 0.14 0.09 0.97 0.95 (0.57) (0.55) 125,279 —
Year ended May 31, 2016 23.68 (0.18) (2.30) — (2.48) — — — — 21.20 (10.44) (10.65) 0.98 0.95 (0.83) (0.80) 155,850 —
Year ended May 31, 2015 26.89 (0.23) (2.98) —(h) (3.21) — — — — 23.68 (11.94) (11.87) 0.98 0.95 (0.93) (0.90) 250,964 —
Year ended May 31, 2014 28.19 (0.27) (1.03) —(h) (1.30) — — — — 26.89 (4.63) (4.16) 0.96 0.95 (0.94) (0.93) 292,395 —
Year ended May 31, 2013 28.13 (0.24) 0.30 —(h) 0.06 — — — — 28.19 0.22 0.18 0.97 0.95 (0.87) (0.85) 308,723 —
See accompanying notes to the financial statements.
268:: FINANCIAL HIGHLIGHTS
PROSHARES TRUST
Merrill Corp - Proshares Trust Geared Book [96 Funds] Annual Report [Funds] 333-089822 05-31-2017 ED [AUX] | eperez | 28-Jul-17 17:43 | 17-15159-3.ia | Sequence: 24CHKSUM Content: 28212 Layout: 27206 Graphics: No Graphics CLEAN
JOB: 17-15159-3 CYCLE#;BL#: 5; 0 TRIM: 10.75" x 8.25" COMPOSITECOLORS: Black, ~note-color 2, ~note-color 3 GRAPHICS: none V1.5
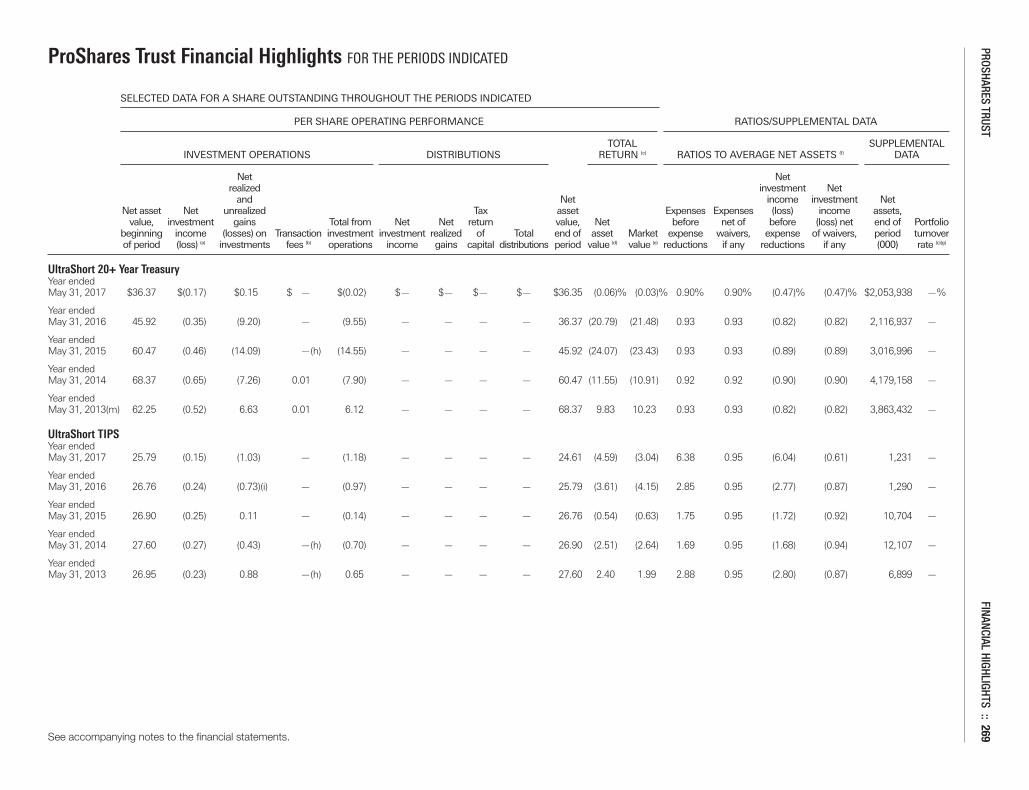
ProShares Trust Financial Highlights FOR THE PERIODS INDICATED
SELECTED DATA FOR A SHARE OUTSTANDING THROUGHOUT THE PERIODS INDICATED
PER SHARE OPERATING PERFORMANCE RATIOS/SUPPLEMENTAL DATA
TOTAL SUPPLEMENTAL INVESTMENT OPERATIONS DISTRIBUTIONS RETURN (c) RATIOS TO AVERAGE NET ASSETS (f) DATA
Net Net realized investment Net and Net income investment Net Net asset Net unrealized Tax asset Expenses Expenses (loss) income assets, value, investment gains Total from Net Net return value, Net before net of before (loss) net end of Portfolio beginning income (losses) on Transaction investment investment realized of Total end of asset Market expense waivers, expense of waivers, period turnover of period (loss) (a) investments fees (b) operations income gains capital distributions period value (d) value (e) reductions if any reductions if any (000) rate (c)(g)
UltraShort 20+ Year TreasuryYear ended May 31, 2017 $36.37 $(0.17) $0.15 $ — $(0.02) $— $— $— $— $36.35 (0.06)% (0.03)% 0.90% 0.90% (0.47)% (0.47)% $2,053,938 —%
Year ended May 31, 2016 45.92 (0.35) (9.20) — (9.55) — — — — 36.37 (20.79) (21.48) 0.93 0.93 (0.82) (0.82) 2,116,937 —
Year ended May 31, 2015 60.47 (0.46) (14.09) —(h) (14.55) — — — — 45.92 (24.07) (23.43) 0.93 0.93 (0.89) (0.89) 3,016,996 —
Year ended May 31, 2014 68.37 (0.65) (7.26) 0.01 (7.90) — — — — 60.47 (11.55) (10.91) 0.92 0.92 (0.90) (0.90) 4,179,158 —
Year ended May 31, 2013(m) 62.25 (0.52) 6.63 0.01 6.12 — — — — 68.37 9.83 10.23 0.93 0.93 (0.82) (0.82) 3,863,432 —
UltraShort TIPSYear ended May 31, 2017 25.79 (0.15) (1.03) — (1.18) — — — — 24.61 (4.59) (3.04) 6.38 0.95 (6.04) (0.61) 1,231 —
Year ended May 31, 2016 26.76 (0.24) (0.73)(i) — (0.97) — — — — 25.79 (3.61) (4.15) 2.85 0.95 (2.77) (0.87) 1,290 —
Year ended May 31, 2015 26.90 (0.25) 0.11 — (0.14) — — — — 26.76 (0.54) (0.63) 1.75 0.95 (1.72) (0.92) 10,704 —
Year ended May 31, 2014 27.60 (0.27) (0.43) —(h) (0.70) — — — — 26.90 (2.51) (2.64) 1.69 0.95 (1.68) (0.94) 12,107 —
Year ended May 31, 2013 26.95 (0.23) 0.88 —(h) 0.65 — — — — 27.60 2.40 1.99 2.88 0.95 (2.80) (0.87) 6,899 —
See accompanying notes to the financial statements.
PROSHARES TRUST FINANCIAL HIGHLIGHTS :: 269
Merrill Corp - Proshares Trust Geared Book [96 Funds] Annual Report [Funds] 333-089822 05-31-2017 ED [AUX] | eperez | 28-Jul-17 17:43 | 17-15159-3.ia | Sequence: 25CHKSUM Content: 62565 Layout: 16832 Graphics: No Graphics CLEAN
JOB: 17-15159-3 CYCLE#;BL#: 5; 0 TRIM: 10.75" x 8.25" COMPOSITECOLORS: Black, ~note-color 2, ~note-color 3 GRAPHICS: none V1.5
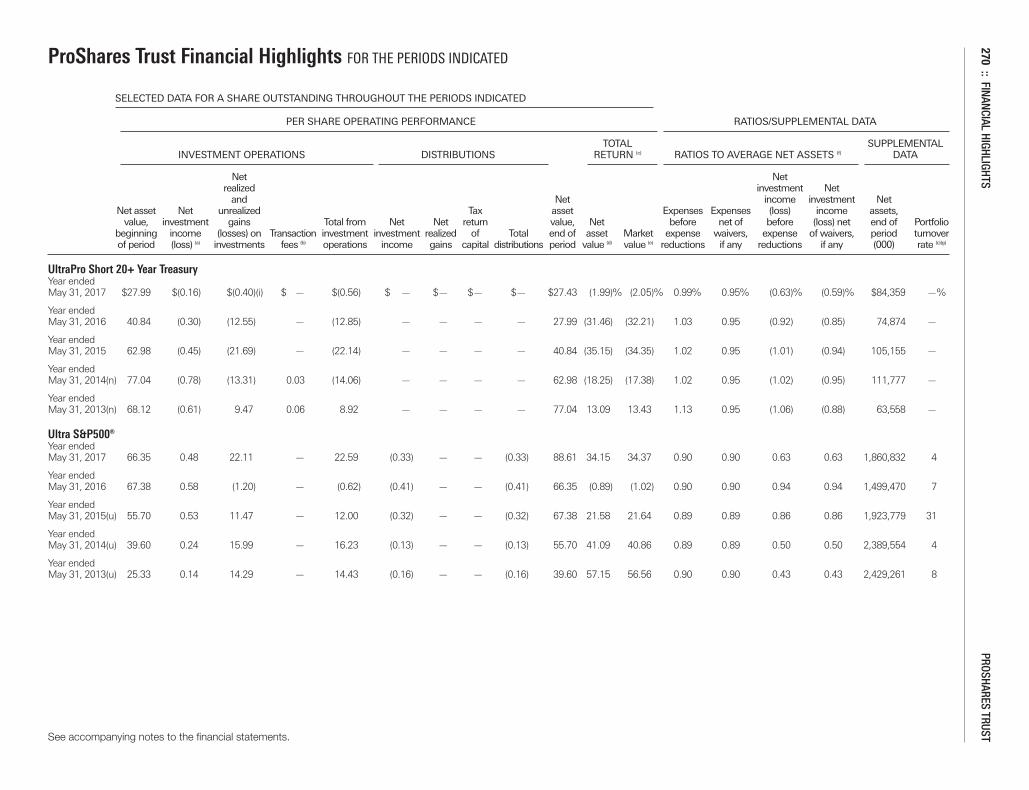
ProShares Trust Financial Highlights FOR THE PERIODS INDICATED
SELECTED DATA FOR A SHARE OUTSTANDING THROUGHOUT THE PERIODS INDICATED
PER SHARE OPERATING PERFORMANCE RATIOS/SUPPLEMENTAL DATA
TOTAL SUPPLEMENTAL INVESTMENT OPERATIONS DISTRIBUTIONS RETURN (c) RATIOS TO AVERAGE NET ASSETS (f) DATA
Net Net realized investment Net and Net income investment Net Net asset Net unrealized Tax asset Expenses Expenses (loss) income assets, value, investment gains Total from Net Net return value, Net before net of before (loss) net end of Portfolio beginning income (losses) on Transaction investment investment realized of Total end of asset Market expense waivers, expense of waivers, period turnover of period (loss) (a) investments fees (b) operations income gains capital distributions period value (d) value (e) reductions if any reductions if any (000) rate (c)(g)
UltraPro Short 20+ Year TreasuryYear ended May 31, 2017 $27.99 $(0.16) $(0.40)(i) $ — $(0.56) $ — $— $— $— $27.43 (1.99)% (2.05)% 0.99% 0.95% (0.63)% (0.59)% $84,359 —%
Year ended May 31, 2016 40.84 (0.30) (12.55) — (12.85) — — — — 27.99 (31.46) (32.21) 1.03 0.95 (0.92) (0.85) 74,874 —
Year ended May 31, 2015 62.98 (0.45) (21.69) — (22.14) — — — — 40.84 (35.15) (34.35) 1.02 0.95 (1.01) (0.94) 105,155 —
Year ended May 31, 2014(n) 77.04 (0.78) (13.31) 0.03 (14.06) — — — — 62.98 (18.25) (17.38) 1.02 0.95 (1.02) (0.95) 111,777 —
Year ended May 31, 2013(n) 68.12 (0.61) 9.47 0.06 8.92 — — — — 77.04 13.09 13.43 1.13 0.95 (1.06) (0.88) 63,558 —
Ultra S&P500®Year ended May 31, 2017 66.35 0.48 22.11 — 22.59 (0.33) — — (0.33) 88.61 34.15 34.37 0.90 0.90 0.63 0.63 1,860,832 4
Year ended May 31, 2016 67.38 0.58 (1.20) — (0.62) (0.41) — — (0.41) 66.35 (0.89) (1.02) 0.90 0.90 0.94 0.94 1,499,470 7
Year ended May 31, 2015(u) 55.70 0.53 11.47 — 12.00 (0.32) — — (0.32) 67.38 21.58 21.64 0.89 0.89 0.86 0.86 1,923,779 31
Year ended May 31, 2014(u) 39.60 0.24 15.99 — 16.23 (0.13) — — (0.13) 55.70 41.09 40.86 0.89 0.89 0.50 0.50 2,389,554 4
Year ended May 31, 2013(u) 25.33 0.14 14.29 — 14.43 (0.16) — — (0.16) 39.60 57.15 56.56 0.90 0.90 0.43 0.43 2,429,261 8
See accompanying notes to the financial statements.
270:: FINANCIAL HIGHLIGHTS
PROSHARES TRUST
Merrill Corp - Proshares Trust Geared Book [96 Funds] Annual Report [Funds] 333-089822 05-31-2017 ED [AUX] | eperez | 28-Jul-17 17:43 | 17-15159-3.ia | Sequence: 26CHKSUM Content: 64925 Layout: 14688 Graphics: No Graphics CLEAN
JOB: 17-15159-3 CYCLE#;BL#: 5; 0 TRIM: 10.75" x 8.25" COMPOSITECOLORS: Black, ~note-color 2, ~note-color 3 GRAPHICS: none V1.5
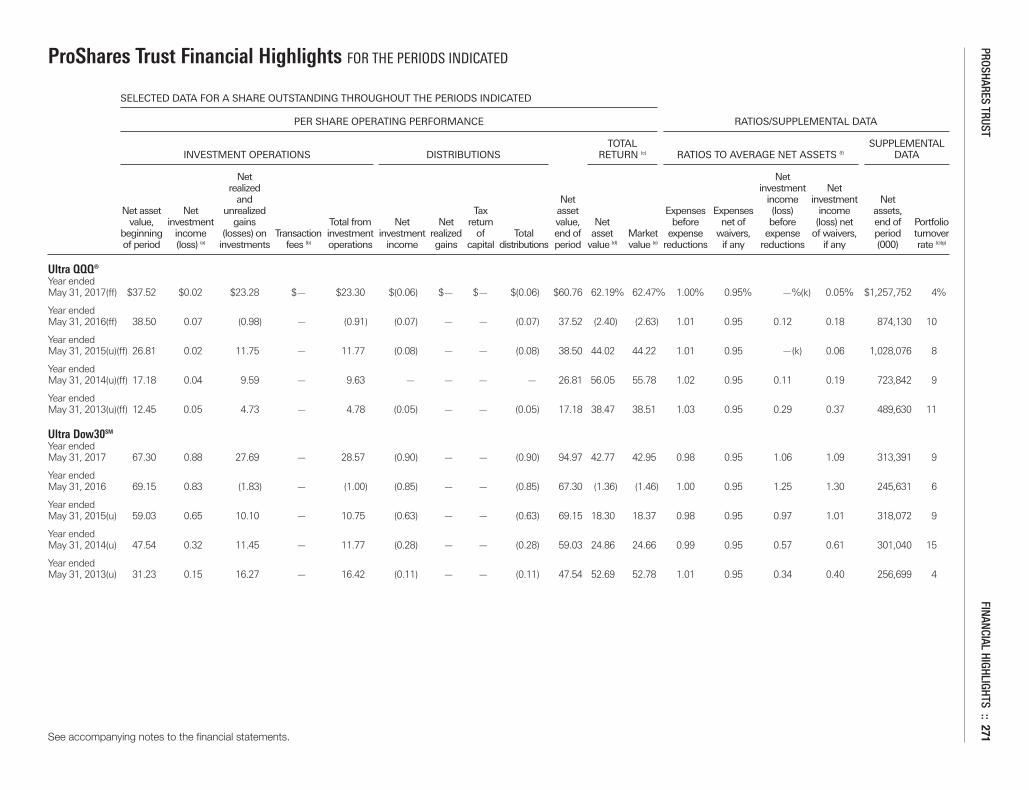
ProShares Trust Financial Highlights FOR THE PERIODS INDICATED
SELECTED DATA FOR A SHARE OUTSTANDING THROUGHOUT THE PERIODS INDICATED
PER SHARE OPERATING PERFORMANCE RATIOS/SUPPLEMENTAL DATA
TOTAL SUPPLEMENTAL INVESTMENT OPERATIONS DISTRIBUTIONS RETURN (c) RATIOS TO AVERAGE NET ASSETS (f) DATA
Net Net realized investment Net and Net income investment Net Net asset Net unrealized Tax asset Expenses Expenses (loss) income assets, value, investment gains Total from Net Net return value, Net before net of before (loss) net end of Portfolio beginning income (losses) on Transaction investment investment realized of Total end of asset Market expense waivers, expense of waivers, period turnover of period (loss) (a) investments fees (b) operations income gains capital distributions period value (d) value (e) reductions if any reductions if any (000) rate (c)(g)
Ultra QQQ®Year ended May 31, 2017(ff) $37.52 $0.02 $23.28 $— $23.30 $(0.06) $— $— $(0.06) $60.76 62.19% 62.47% 1.00% 0.95% —%(k) 0.05% $1,257,752 4%
Year ended May 31, 2016(ff) 38.50 0.07 (0.98) — (0.91) (0.07) — — (0.07) 37.52 (2.40) (2.63) 1.01 0.95 0.12 0.18 874,130 10
Year ended May 31, 2015(u)(ff) 26.81 0.02 11.75 — 11.77 (0.08) — — (0.08) 38.50 44.02 44.22 1.01 0.95 —(k) 0.06 1,028,076 8
Year ended May 31, 2014(u)(ff) 17.18 0.04 9.59 — 9.63 — — — — 26.81 56.05 55.78 1.02 0.95 0.11 0.19 723,842 9
Year ended May 31, 2013(u)(ff) 12.45 0.05 4.73 — 4.78 (0.05) — — (0.05) 17.18 38.47 38.51 1.03 0.95 0.29 0.37 489,630 11
Ultra Dow30SM
Year ended May 31, 2017 67.30 0.88 27.69 — 28.57 (0.90) — — (0.90) 94.97 42.77 42.95 0.98 0.95 1.06 1.09 313,391 9
Year ended May 31, 2016 69.15 0.83 (1.83) — (1.00) (0.85) — — (0.85) 67.30 (1.36) (1.46) 1.00 0.95 1.25 1.30 245,631 6
Year ended May 31, 2015(u) 59.03 0.65 10.10 — 10.75 (0.63) — — (0.63) 69.15 18.30 18.37 0.98 0.95 0.97 1.01 318,072 9
Year ended May 31, 2014(u) 47.54 0.32 11.45 — 11.77 (0.28) — — (0.28) 59.03 24.86 24.66 0.99 0.95 0.57 0.61 301,040 15
Year ended May 31, 2013(u) 31.23 0.15 16.27 — 16.42 (0.11) — — (0.11) 47.54 52.69 52.78 1.01 0.95 0.34 0.40 256,699 4
See accompanying notes to the financial statements.
PROSHARES TRUST FINANCIAL HIGHLIGHTS :: 271
Merrill Corp - Proshares Trust Geared Book [96 Funds] Annual Report [Funds] 333-089822 05-31-2017 ED [AUX] | eperez | 28-Jul-17 17:43 | 17-15159-3.ia | Sequence: 27CHKSUM Content: 24250 Layout: 33845 Graphics: No Graphics CLEAN
JOB: 17-15159-3 CYCLE#;BL#: 5; 0 TRIM: 10.75" x 8.25" COMPOSITECOLORS: Black, ~note-color 2, ~note-color 3 GRAPHICS: none V1.5

ProShares Trust Financial Highlights FOR THE PERIODS INDICATED
SELECTED DATA FOR A SHARE OUTSTANDING THROUGHOUT THE PERIODS INDICATED
PER SHARE OPERATING PERFORMANCE RATIOS/SUPPLEMENTAL DATA
TOTAL SUPPLEMENTAL INVESTMENT OPERATIONS DISTRIBUTIONS RETURN (c) RATIOS TO AVERAGE NET ASSETS (f) DATA
Net Net realized investment Net and Net income investment Net Net asset Net unrealized Tax asset Expenses Expenses (loss) income assets, value, investment gains Total from Net Net return value, Net before net of before (loss) net end of Portfolio beginning income (losses) on Transaction investment investment realized of Total end of asset Market expense waivers, expense of waivers, period turnover of period (loss) (a) investments fees (b) operations income gains capital distributions period value (d) value (e) reductions if any reductions if any (000) rate (c)(g)
Ultra MidCap400Year ended May 31, 2017 $76.61 $0.30 $24.53 $— $24.83 $(0.35) $— $— $(0.35) $101.09 32.49% 32.44% 1.02% 0.95% 0.26% 0.33% $113,728 40%
Year ended May 31, 2016 81.05 0.32 (4.56) — (4.24) (0.20) — — (0.20) 76.61 (5.21) (5.06) 1.06 0.95 0.33 0.44 143,635 38
Year ended May 31, 2015 66.35 0.15 14.55(i) — 14.70 — — — — 81.05 22.16 22.09 0.96 0.95 0.20 0.21 143,864 56
Year ended May 31, 2014(q) 49.62 (0.03) 16.76(i) — 16.73 — — — — 66.35 33.70 33.71 0.95 0.95 (0.05) (0.05) 159,236 358
Year ended May 31, 2013(q) 30.62 (0.03) 19.05 — 19.02 (0.02) — — (0.02) 49.62 62.17 62.04 0.95 0.95 (0.07) (0.07) 104,212 45
Ultra Russell2000Year ended May 31, 2017(ff) 40.59 0.10 15.93 — 16.03 (0.14) — — (0.14) 56.48 39.55 39.58 1.29 0.95 (0.14) 0.21 158,157 62
Year ended May 31, 2016(ff) 48.22 0.10 (7.63) — (7.53) (0.10) — — (0.10) 40.59 (15.63) (15.51) 1.18 0.95 0.02 0.25 166,404 37
Year ended May 31, 2015(ff) 40.24 0.06 7.98(i) — 8.04 (0.06) — — (0.06) 48.22 20.00 19.79 1.09 0.95 0.01 0.14 207,359 179
Year ended May 31, 2014(ff) 30.51 (0.05) 9.78 — 9.73 — — — — 40.24 31.90 32.11 1.06 0.95 (0.24) (0.13) 211,267 266
Year ended May 31, 2013(ff) 18.38 (0.06) 12.19 — 12.13 — — — — 30.51 65.98 66.27 1.06 0.95 (0.37) (0.26) 146,454 164
See accompanying notes to the financial statements.
272:: FINANCIAL HIGHLIGHTS
PROSHARES TRUST
Merrill Corp - Proshares Trust Geared Book [96 Funds] Annual Report [Funds] 333-089822 05-31-2017 ED [AUX] | eperez | 28-Jul-17 17:43 | 17-15159-3.ia | Sequence: 28CHKSUM Content: 64339 Layout: 62353 Graphics: No Graphics CLEAN
JOB: 17-15159-3 CYCLE#;BL#: 5; 0 TRIM: 10.75" x 8.25" COMPOSITECOLORS: Black, ~note-color 2, ~note-color 3 GRAPHICS: none V1.5
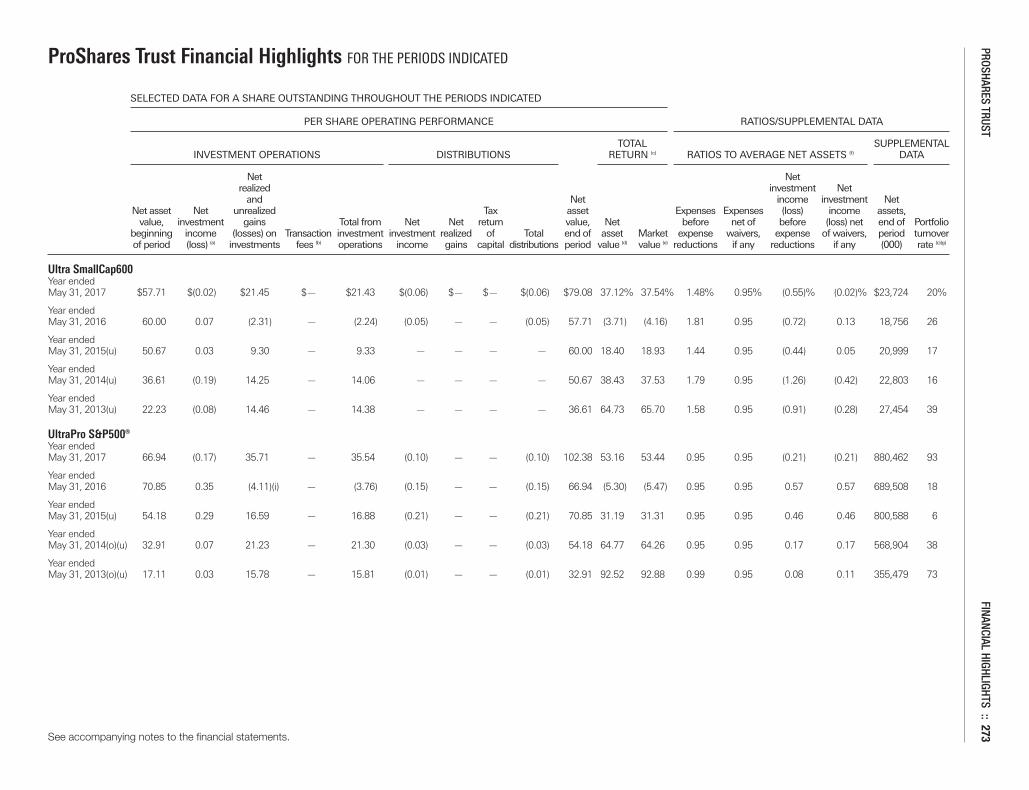
ProShares Trust Financial Highlights FOR THE PERIODS INDICATED
SELECTED DATA FOR A SHARE OUTSTANDING THROUGHOUT THE PERIODS INDICATED
PER SHARE OPERATING PERFORMANCE RATIOS/SUPPLEMENTAL DATA
TOTAL SUPPLEMENTAL INVESTMENT OPERATIONS DISTRIBUTIONS RETURN (c) RATIOS TO AVERAGE NET ASSETS (f) DATA
Net Net realized investment Net and Net income investment Net Net asset Net unrealized Tax asset Expenses Expenses (loss) income assets, value, investment gains Total from Net Net return value, Net before net of before (loss) net end of Portfolio beginning income (losses) on Transaction investment investment realized of Total end of asset Market expense waivers, expense of waivers, period turnover of period (loss) (a) investments fees (b) operations income gains capital distributions period value (d) value (e) reductions if any reductions if any (000) rate (c)(g)
Ultra SmallCap600Year ended May 31, 2017 $57.71 $(0.02) $21.45 $— $21.43 $(0.06) $— $— $(0.06) $79.08 37.12% 37.54% 1.48% 0.95% (0.55)% (0.02)% $23,724 20%
Year ended May 31, 2016 60.00 0.07 (2.31) — (2.24) (0.05) — — (0.05) 57.71 (3.71) (4.16) 1.81 0.95 (0.72) 0.13 18,756 26
Year ended May 31, 2015(u) 50.67 0.03 9.30 — 9.33 — — — — 60.00 18.40 18.93 1.44 0.95 (0.44) 0.05 20,999 17
Year ended May 31, 2014(u) 36.61 (0.19) 14.25 — 14.06 — — — — 50.67 38.43 37.53 1.79 0.95 (1.26) (0.42) 22,803 16
Year ended May 31, 2013(u) 22.23 (0.08) 14.46 — 14.38 — — — — 36.61 64.73 65.70 1.58 0.95 (0.91) (0.28) 27,454 39
UltraPro S&P500®Year ended May 31, 2017 66.94 (0.17) 35.71 — 35.54 (0.10) — — (0.10) 102.38 53.16 53.44 0.95 0.95 (0.21) (0.21) 880,462 93
Year ended May 31, 2016 70.85 0.35 (4.11)(i) — (3.76) (0.15) — — (0.15) 66.94 (5.30) (5.47) 0.95 0.95 0.57 0.57 689,508 18
Year ended May 31, 2015(u) 54.18 0.29 16.59 — 16.88 (0.21) — — (0.21) 70.85 31.19 31.31 0.95 0.95 0.46 0.46 800,588 6
Year ended May 31, 2014(o)(u) 32.91 0.07 21.23 — 21.30 (0.03) — — (0.03) 54.18 64.77 64.26 0.95 0.95 0.17 0.17 568,904 38
Year ended May 31, 2013(o)(u) 17.11 0.03 15.78 — 15.81 (0.01) — — (0.01) 32.91 92.52 92.88 0.99 0.95 0.08 0.11 355,479 73
See accompanying notes to the financial statements.
PROSHARES TRUST FINANCIAL HIGHLIGHTS :: 273
Merrill Corp - Proshares Trust Geared Book [96 Funds] Annual Report [Funds] 333-089822 05-31-2017 ED [AUX] | eperez | 28-Jul-17 17:43 | 17-15159-3.ia | Sequence: 29CHKSUM Content: 32594 Layout: 27478 Graphics: No Graphics CLEAN
JOB: 17-15159-3 CYCLE#;BL#: 5; 0 TRIM: 10.75" x 8.25" COMPOSITECOLORS: Black, ~note-color 2, ~note-color 3 GRAPHICS: none V1.5
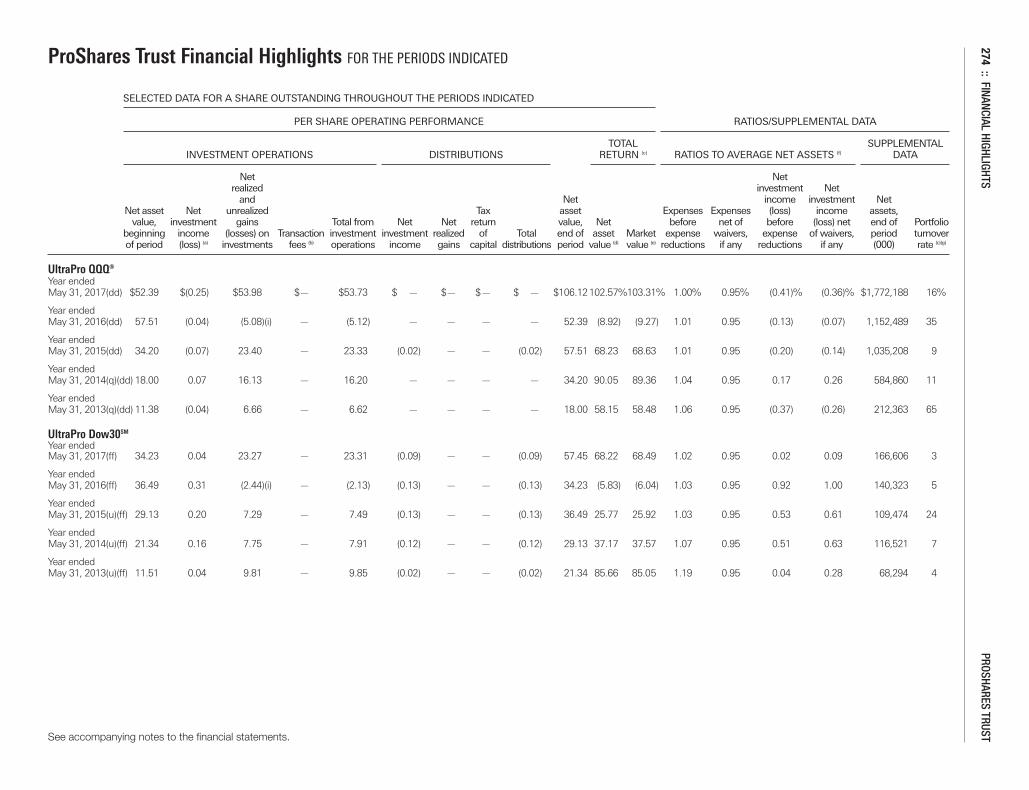
ProShares Trust Financial Highlights FOR THE PERIODS INDICATED
SELECTED DATA FOR A SHARE OUTSTANDING THROUGHOUT THE PERIODS INDICATED
PER SHARE OPERATING PERFORMANCE RATIOS/SUPPLEMENTAL DATA
TOTAL SUPPLEMENTAL INVESTMENT OPERATIONS DISTRIBUTIONS RETURN (c) RATIOS TO AVERAGE NET ASSETS (f) DATA
Net Net realized investment Net and Net income investment Net Net asset Net unrealized Tax asset Expenses Expenses (loss) income assets, value, investment gains Total from Net Net return value, Net before net of before (loss) net end of Portfolio beginning income (losses) on Transaction investment investment realized of Total end of asset Market expense waivers, expense of waivers, period turnover of period (loss) (a) investments fees (b) operations income gains capital distributions period value (d) value (e) reductions if any reductions if any (000) rate (c)(g)
UltraPro QQQ®Year ended May 31, 2017(dd) $52.39 $(0.25) $53.98 $— $53.73 $ — $— $— $ — $106.12102.57%103.31% 1.00% 0.95% (0.41)% (0.36)% $1,772,188 16%
Year ended May 31, 2016(dd) 57.51 (0.04) (5.08)(i) — (5.12) — — — — 52.39 (8.92) (9.27) 1.01 0.95 (0.13) (0.07) 1,152,489 35
Year ended May 31, 2015(dd) 34.20 (0.07) 23.40 — 23.33 (0.02) — — (0.02) 57.51 68.23 68.63 1.01 0.95 (0.20) (0.14) 1,035,208 9
Year ended May 31, 2014(q)(dd) 18.00 0.07 16.13 — 16.20 — — — — 34.20 90.05 89.36 1.04 0.95 0.17 0.26 584,860 11
Year ended May 31, 2013(q)(dd) 11.38 (0.04) 6.66 — 6.62 — — — — 18.00 58.15 58.48 1.06 0.95 (0.37) (0.26) 212,363 65
UltraPro Dow30SM
Year ended May 31, 2017(ff) 34.23 0.04 23.27 — 23.31 (0.09) — — (0.09) 57.45 68.22 68.49 1.02 0.95 0.02 0.09 166,606 3
Year ended May 31, 2016(ff) 36.49 0.31 (2.44)(i) — (2.13) (0.13) — — (0.13) 34.23 (5.83) (6.04) 1.03 0.95 0.92 1.00 140,323 5
Year ended May 31, 2015(u)(ff) 29.13 0.20 7.29 — 7.49 (0.13) — — (0.13) 36.49 25.77 25.92 1.03 0.95 0.53 0.61 109,474 24
Year ended May 31, 2014(u)(ff) 21.34 0.16 7.75 — 7.91 (0.12) — — (0.12) 29.13 37.17 37.57 1.07 0.95 0.51 0.63 116,521 7
Year ended May 31, 2013(u)(ff) 11.51 0.04 9.81 — 9.85 (0.02) — — (0.02) 21.34 85.66 85.05 1.19 0.95 0.04 0.28 68,294 4
See accompanying notes to the financial statements.
274:: FINANCIAL HIGHLIGHTS
PROSHARES TRUST
Merrill Corp - Proshares Trust Geared Book [96 Funds] Annual Report [Funds] 333-089822 05-31-2017 ED [AUX] | eperez | 28-Jul-17 17:43 | 17-15159-3.ia | Sequence: 30CHKSUM Content: 20338 Layout: 1630 Graphics: No Graphics CLEAN
JOB: 17-15159-3 CYCLE#;BL#: 5; 0 TRIM: 10.75" x 8.25" COMPOSITECOLORS: Black, ~note-color 2, ~note-color 3 GRAPHICS: none V1.5
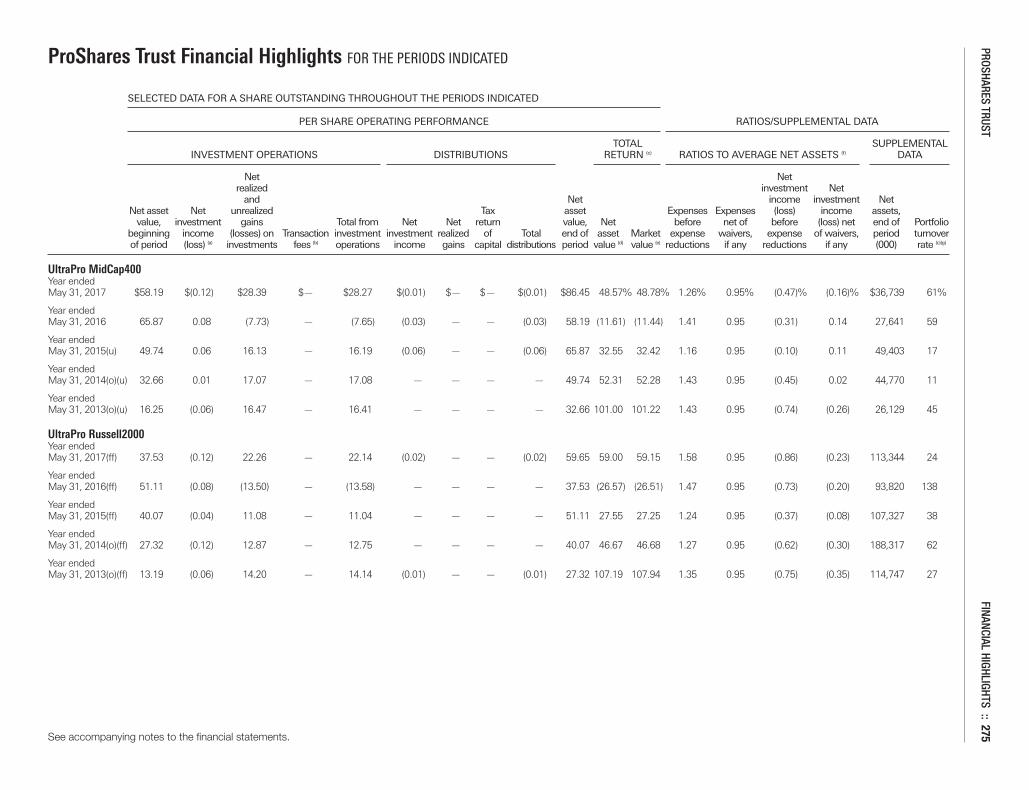
ProShares Trust Financial Highlights FOR THE PERIODS INDICATED
SELECTED DATA FOR A SHARE OUTSTANDING THROUGHOUT THE PERIODS INDICATED
PER SHARE OPERATING PERFORMANCE RATIOS/SUPPLEMENTAL DATA
TOTAL SUPPLEMENTAL INVESTMENT OPERATIONS DISTRIBUTIONS RETURN (c) RATIOS TO AVERAGE NET ASSETS (f) DATA
Net Net realized investment Net and Net income investment Net Net asset Net unrealized Tax asset Expenses Expenses (loss) income assets, value, investment gains Total from Net Net return value, Net before net of before (loss) net end of Portfolio beginning income (losses) on Transaction investment investment realized of Total end of asset Market expense waivers, expense of waivers, period turnover of period (loss) (a) investments fees (b) operations income gains capital distributions period value (d) value (e) reductions if any reductions if any (000) rate (c)(g)
UltraPro MidCap400Year ended May 31, 2017 $58.19 $(0.12) $28.39 $— $28.27 $(0.01) $— $— $(0.01) $86.45 48.57% 48.78% 1.26% 0.95% (0.47)% (0.16)% $36,739 61%
Year ended May 31, 2016 65.87 0.08 (7.73) — (7.65) (0.03) — — (0.03) 58.19 (11.61) (11.44) 1.41 0.95 (0.31) 0.14 27,641 59
Year ended May 31, 2015(u) 49.74 0.06 16.13 — 16.19 (0.06) — — (0.06) 65.87 32.55 32.42 1.16 0.95 (0.10) 0.11 49,403 17
Year ended May 31, 2014(o)(u) 32.66 0.01 17.07 — 17.08 — — — — 49.74 52.31 52.28 1.43 0.95 (0.45) 0.02 44,770 11
Year ended May 31, 2013(o)(u) 16.25 (0.06) 16.47 — 16.41 — — — — 32.66 101.00 101.22 1.43 0.95 (0.74) (0.26) 26,129 45
UltraPro Russell2000Year ended May 31, 2017(ff) 37.53 (0.12) 22.26 — 22.14 (0.02) — — (0.02) 59.65 59.00 59.15 1.58 0.95 (0.86) (0.23) 113,344 24
Year ended May 31, 2016(ff) 51.11 (0.08) (13.50) — (13.58) — — — — 37.53 (26.57) (26.51) 1.47 0.95 (0.73) (0.20) 93,820 138
Year ended May 31, 2015(ff) 40.07 (0.04) 11.08 — 11.04 — — — — 51.11 27.55 27.25 1.24 0.95 (0.37) (0.08) 107,327 38
Year ended May 31, 2014(o)(ff) 27.32 (0.12) 12.87 — 12.75 — — — — 40.07 46.67 46.68 1.27 0.95 (0.62) (0.30) 188,317 62
Year ended May 31, 2013(o)(ff) 13.19 (0.06) 14.20 — 14.14 (0.01) — — (0.01) 27.32 107.19 107.94 1.35 0.95 (0.75) (0.35) 114,747 27
See accompanying notes to the financial statements.
PROSHARES TRUST FINANCIAL HIGHLIGHTS :: 275
Merrill Corp - Proshares Trust Geared Book [96 Funds] Annual Report [Funds] 333-089822 05-31-2017 ED [AUX] | eperez | 28-Jul-17 17:43 | 17-15159-3.ia | Sequence: 31CHKSUM Content: 43499 Layout: 64083 Graphics: No Graphics CLEAN
JOB: 17-15159-3 CYCLE#;BL#: 5; 0 TRIM: 10.75" x 8.25" COMPOSITECOLORS: Black, ~note-color 2, ~note-color 3 GRAPHICS: none V1.5
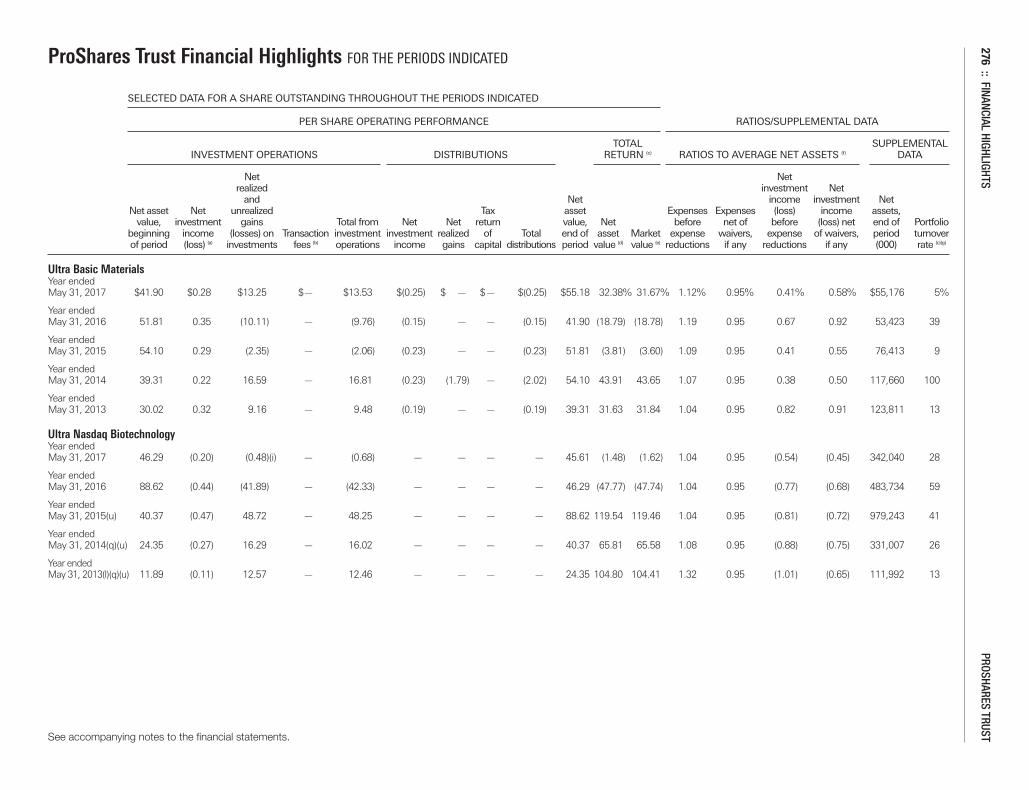
ProShares Trust Financial Highlights FOR THE PERIODS INDICATED
SELECTED DATA FOR A SHARE OUTSTANDING THROUGHOUT THE PERIODS INDICATED
PER SHARE OPERATING PERFORMANCE RATIOS/SUPPLEMENTAL DATA
TOTAL SUPPLEMENTAL INVESTMENT OPERATIONS DISTRIBUTIONS RETURN (c) RATIOS TO AVERAGE NET ASSETS (f) DATA
Net Net realized investment Net and Net income investment Net Net asset Net unrealized Tax asset Expenses Expenses (loss) income assets, value, investment gains Total from Net Net return value, Net before net of before (loss) net end of Portfolio beginning income (losses) on Transaction investment investment realized of Total end of asset Market expense waivers, expense of waivers, period turnover of period (loss) (a) investments fees (b) operations income gains capital distributions period value (d) value (e) reductions if any reductions if any (000) rate (c)(g)
Ultra Basic MaterialsYear ended May 31, 2017 $41.90 $0.28 $13.25 $— $13.53 $(0.25) $ — $— $(0.25) $55.18 32.38% 31.67% 1.12% 0.95% 0.41% 0.58% $55,176 5%
Year ended May 31, 2016 51.81 0.35 (10.11) — (9.76) (0.15) — — (0.15) 41.90 (18.79) (18.78) 1.19 0.95 0.67 0.92 53,423 39
Year ended May 31, 2015 54.10 0.29 (2.35) — (2.06) (0.23) — — (0.23) 51.81 (3.81) (3.60) 1.09 0.95 0.41 0.55 76,413 9
Year ended May 31, 2014 39.31 0.22 16.59 — 16.81 (0.23) (1.79) — (2.02) 54.10 43.91 43.65 1.07 0.95 0.38 0.50 117,660 100
Year ended May 31, 2013 30.02 0.32 9.16 — 9.48 (0.19) — — (0.19) 39.31 31.63 31.84 1.04 0.95 0.82 0.91 123,811 13
Ultra Nasdaq BiotechnologyYear ended May 31, 2017 46.29 (0.20) (0.48)(i) — (0.68) — — — — 45.61 (1.48) (1.62) 1.04 0.95 (0.54) (0.45) 342,040 28
Year ended May 31, 2016 88.62 (0.44) (41.89) — (42.33) — — — — 46.29 (47.77) (47.74) 1.04 0.95 (0.77) (0.68) 483,734 59
Year ended May 31, 2015(u) 40.37 (0.47) 48.72 — 48.25 — — — — 88.62 119.54 119.46 1.04 0.95 (0.81) (0.72) 979,243 41
Year ended May 31, 2014(q)(u) 24.35 (0.27) 16.29 — 16.02 — — — — 40.37 65.81 65.58 1.08 0.95 (0.88) (0.75) 331,007 26
Year ended May 31, 2013(l)(q)(u) 11.89 (0.11) 12.57 — 12.46 — — — — 24.35 104.80 104.41 1.32 0.95 (1.01) (0.65) 111,992 13
See accompanying notes to the financial statements.
276:: FINANCIAL HIGHLIGHTS
PROSHARES TRUST
Merrill Corp - Proshares Trust Geared Book [96 Funds] Annual Report [Funds] 333-089822 05-31-2017 ED [AUX] | eperez | 28-Jul-17 17:43 | 17-15159-3.ia | Sequence: 32CHKSUM Content: 35350 Layout: 24089 Graphics: No Graphics CLEAN
JOB: 17-15159-3 CYCLE#;BL#: 5; 0 TRIM: 10.75" x 8.25" COMPOSITECOLORS: Black, ~note-color 2, ~note-color 3 GRAPHICS: none V1.5
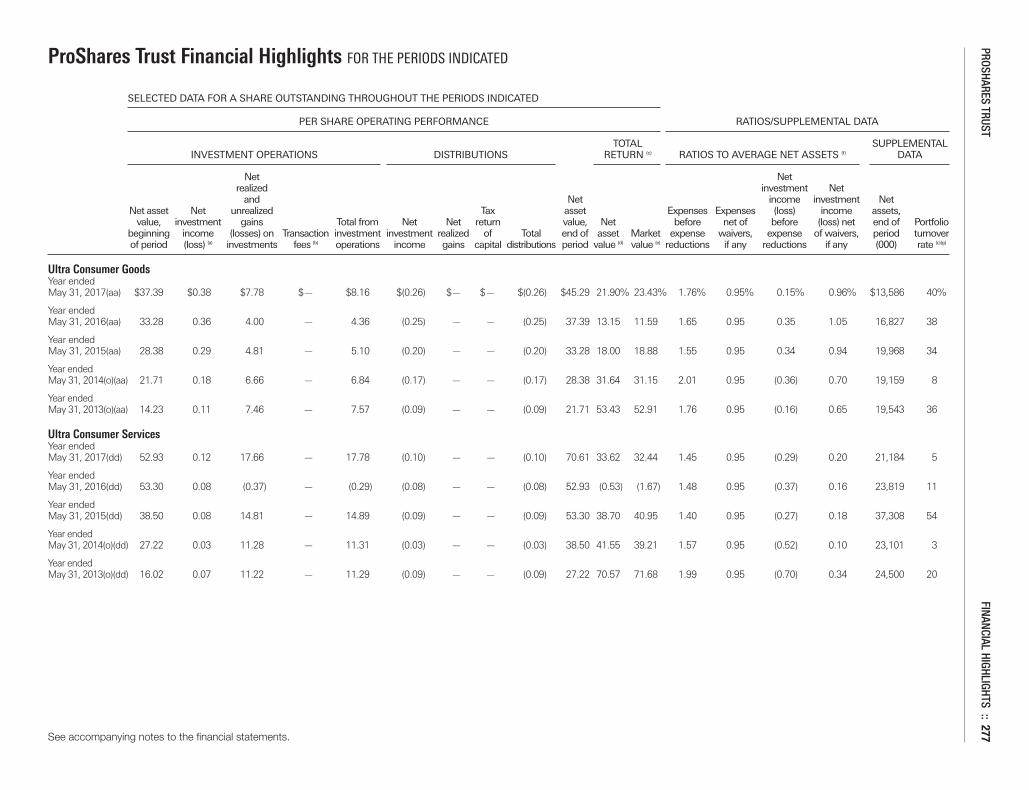
ProShares Trust Financial Highlights FOR THE PERIODS INDICATED
SELECTED DATA FOR A SHARE OUTSTANDING THROUGHOUT THE PERIODS INDICATED
PER SHARE OPERATING PERFORMANCE RATIOS/SUPPLEMENTAL DATA
TOTAL SUPPLEMENTAL INVESTMENT OPERATIONS DISTRIBUTIONS RETURN (c) RATIOS TO AVERAGE NET ASSETS (f) DATA
Net Net realized investment Net and Net income investment Net Net asset Net unrealized Tax asset Expenses Expenses (loss) income assets, value, investment gains Total from Net Net return value, Net before net of before (loss) net end of Portfolio beginning income (losses) on Transaction investment investment realized of Total end of asset Market expense waivers, expense of waivers, period turnover of period (loss) (a) investments fees (b) operations income gains capital distributions period value (d) value (e) reductions if any reductions if any (000) rate (c)(g)
Ultra Consumer GoodsYear ended May 31, 2017(aa) $37.39 $0.38 $7.78 $— $8.16 $(0.26) $— $— $(0.26) $45.29 21.90% 23.43% 1.76% 0.95% 0.15% 0.96% $13,586 40%
Year ended May 31, 2016(aa) 33.28 0.36 4.00 — 4.36 (0.25) — — (0.25) 37.39 13.15 11.59 1.65 0.95 0.35 1.05 16,827 38
Year ended May 31, 2015(aa) 28.38 0.29 4.81 — 5.10 (0.20) — — (0.20) 33.28 18.00 18.88 1.55 0.95 0.34 0.94 19,968 34
Year ended May 31, 2014(o)(aa) 21.71 0.18 6.66 — 6.84 (0.17) — — (0.17) 28.38 31.64 31.15 2.01 0.95 (0.36) 0.70 19,159 8
Year ended May 31, 2013(o)(aa) 14.23 0.11 7.46 — 7.57 (0.09) — — (0.09) 21.71 53.43 52.91 1.76 0.95 (0.16) 0.65 19,543 36
Ultra Consumer ServicesYear ended May 31, 2017(dd) 52.93 0.12 17.66 — 17.78 (0.10) — — (0.10) 70.61 33.62 32.44 1.45 0.95 (0.29) 0.20 21,184 5
Year ended May 31, 2016(dd) 53.30 0.08 (0.37) — (0.29) (0.08) — — (0.08) 52.93 (0.53) (1.67) 1.48 0.95 (0.37) 0.16 23,819 11
Year ended May 31, 2015(dd) 38.50 0.08 14.81 — 14.89 (0.09) — — (0.09) 53.30 38.70 40.95 1.40 0.95 (0.27) 0.18 37,308 54
Year ended May 31, 2014(o)(dd) 27.22 0.03 11.28 — 11.31 (0.03) — — (0.03) 38.50 41.55 39.21 1.57 0.95 (0.52) 0.10 23,101 3
Year ended May 31, 2013(o)(dd) 16.02 0.07 11.22 — 11.29 (0.09) — — (0.09) 27.22 70.57 71.68 1.99 0.95 (0.70) 0.34 24,500 20
See accompanying notes to the financial statements.
PROSHARES TRUST FINANCIAL HIGHLIGHTS :: 277
Merrill Corp - Proshares Trust Geared Book [96 Funds] Annual Report [Funds] 333-089822 05-31-2017 ED [AUX] | eperez | 28-Jul-17 17:43 | 17-15159-3.ia | Sequence: 33CHKSUM Content: 2829 Layout: 64083 Graphics: No Graphics CLEAN
JOB: 17-15159-3 CYCLE#;BL#: 5; 0 TRIM: 10.75" x 8.25" COMPOSITECOLORS: Black, ~note-color 2, ~note-color 3 GRAPHICS: none V1.5
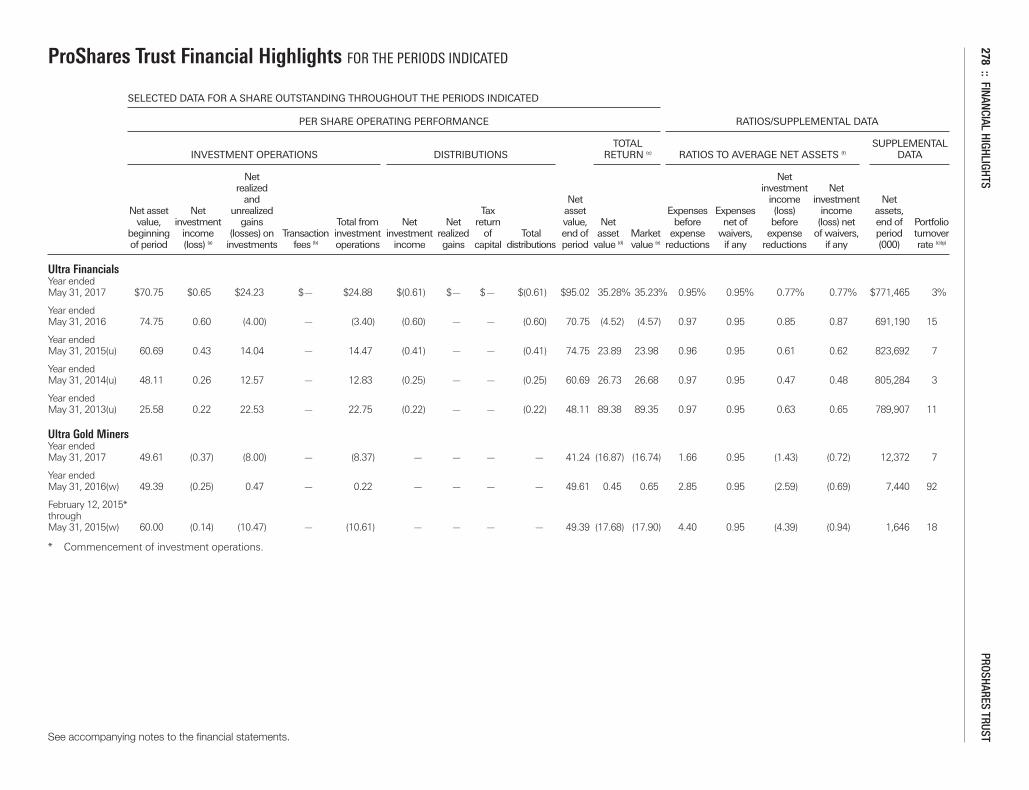
ProShares Trust Financial Highlights FOR THE PERIODS INDICATED
SELECTED DATA FOR A SHARE OUTSTANDING THROUGHOUT THE PERIODS INDICATED
PER SHARE OPERATING PERFORMANCE RATIOS/SUPPLEMENTAL DATA
TOTAL SUPPLEMENTAL INVESTMENT OPERATIONS DISTRIBUTIONS RETURN (c) RATIOS TO AVERAGE NET ASSETS (f) DATA
Net Net realized investment Net and Net income investment Net Net asset Net unrealized Tax asset Expenses Expenses (loss) income assets, value, investment gains Total from Net Net return value, Net before net of before (loss) net end of Portfolio beginning income (losses) on Transaction investment investment realized of Total end of asset Market expense waivers, expense of waivers, period turnover of period (loss) (a) investments fees (b) operations income gains capital distributions period value (d) value (e) reductions if any reductions if any (000) rate (c)(g)
Ultra FinancialsYear ended May 31, 2017 $70.75 $0.65 $24.23 $— $24.88 $(0.61) $— $— $(0.61) $95.02 35.28% 35.23% 0.95% 0.95% 0.77% 0.77% $771,465 3%
Year ended May 31, 2016 74.75 0.60 (4.00) — (3.40) (0.60) — — (0.60) 70.75 (4.52) (4.57) 0.97 0.95 0.85 0.87 691,190 15
Year ended May 31, 2015(u) 60.69 0.43 14.04 — 14.47 (0.41) — — (0.41) 74.75 23.89 23.98 0.96 0.95 0.61 0.62 823,692 7
Year ended May 31, 2014(u) 48.11 0.26 12.57 — 12.83 (0.25) — — (0.25) 60.69 26.73 26.68 0.97 0.95 0.47 0.48 805,284 3
Year ended May 31, 2013(u) 25.58 0.22 22.53 — 22.75 (0.22) — — (0.22) 48.11 89.38 89.35 0.97 0.95 0.63 0.65 789,907 11
Ultra Gold MinersYear ended May 31, 2017 49.61 (0.37) (8.00) — (8.37) — — — — 41.24 (16.87) (16.74) 1.66 0.95 (1.43) (0.72) 12,372 7
Year ended May 31, 2016(w) 49.39 (0.25) 0.47 — 0.22 — — — — 49.61 0.45 0.65 2.85 0.95 (2.59) (0.69) 7,440 92
February 12, 2015* through May 31, 2015(w) 60.00 (0.14) (10.47) — (10.61) — — — — 49.39 (17.68) (17.90) 4.40 0.95 (4.39) (0.94) 1,646 18
* Commencement of investment operations.
See accompanying notes to the financial statements.
278:: FINANCIAL HIGHLIGHTS
PROSHARES TRUST
Merrill Corp - Proshares Trust Geared Book [96 Funds] Annual Report [Funds] 333-089822 05-31-2017 ED [AUX] | eperez | 28-Jul-17 17:43 | 17-15159-3.ia | Sequence: 34CHKSUM Content: 40037 Layout: 42041 Graphics: No Graphics CLEAN
JOB: 17-15159-3 CYCLE#;BL#: 5; 0 TRIM: 10.75" x 8.25" COMPOSITECOLORS: Black, ~note-color 2, ~note-color 3 GRAPHICS: none V1.5
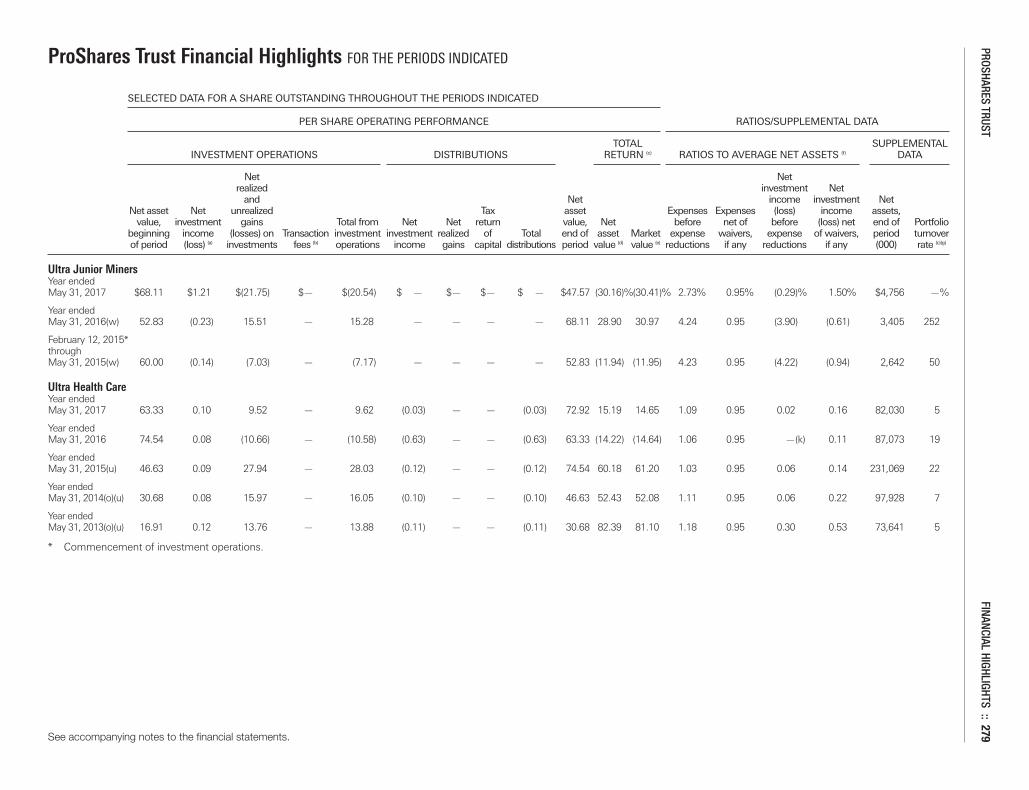
ProShares Trust Financial Highlights FOR THE PERIODS INDICATED
SELECTED DATA FOR A SHARE OUTSTANDING THROUGHOUT THE PERIODS INDICATED
PER SHARE OPERATING PERFORMANCE RATIOS/SUPPLEMENTAL DATA
TOTAL SUPPLEMENTAL INVESTMENT OPERATIONS DISTRIBUTIONS RETURN (c) RATIOS TO AVERAGE NET ASSETS (f) DATA
Net Net realized investment Net and Net income investment Net Net asset Net unrealized Tax asset Expenses Expenses (loss) income assets, value, investment gains Total from Net Net return value, Net before net of before (loss) net end of Portfolio beginning income (losses) on Transaction investment investment realized of Total end of asset Market expense waivers, expense of waivers, period turnover of period (loss) (a) investments fees (b) operations income gains capital distributions period value (d) value (e) reductions if any reductions if any (000) rate (c)(g)
Ultra Junior MinersYear ended May 31, 2017 $68.11 $1.21 $(21.75) $— $(20.54) $ — $— $— $ — $47.57 (30.16)%(30.41)% 2.73% 0.95% (0.29)% 1.50% $4,756 —%
Year ended May 31, 2016(w) 52.83 (0.23) 15.51 — 15.28 — — — — 68.11 28.90 30.97 4.24 0.95 (3.90) (0.61) 3,405 252
February 12, 2015* through May 31, 2015(w) 60.00 (0.14) (7.03) — (7.17) — — — — 52.83 (11.94) (11.95) 4.23 0.95 (4.22) (0.94) 2,642 50
Ultra Health CareYear ended May 31, 2017 63.33 0.10 9.52 — 9.62 (0.03) — — (0.03) 72.92 15.19 14.65 1.09 0.95 0.02 0.16 82,030 5
Year ended May 31, 2016 74.54 0.08 (10.66) — (10.58) (0.63) — — (0.63) 63.33 (14.22) (14.64) 1.06 0.95 —(k) 0.11 87,073 19
Year ended May 31, 2015(u) 46.63 0.09 27.94 — 28.03 (0.12) — — (0.12) 74.54 60.18 61.20 1.03 0.95 0.06 0.14 231,069 22
Year ended May 31, 2014(o)(u) 30.68 0.08 15.97 — 16.05 (0.10) — — (0.10) 46.63 52.43 52.08 1.11 0.95 0.06 0.22 97,928 7
Year ended May 31, 2013(o)(u) 16.91 0.12 13.76 — 13.88 (0.11) — — (0.11) 30.68 82.39 81.10 1.18 0.95 0.30 0.53 73,641 5
* Commencement of investment operations.
See accompanying notes to the financial statements.
PROSHARES TRUST FINANCIAL HIGHLIGHTS :: 279
Merrill Corp - Proshares Trust Geared Book [96 Funds] Annual Report [Funds] 333-089822 05-31-2017 ED [AUX] | eperez | 28-Jul-17 17:43 | 17-15159-3.ia | Sequence: 35CHKSUM Content: 17727 Layout: 64083 Graphics: No Graphics CLEAN
JOB: 17-15159-3 CYCLE#;BL#: 5; 0 TRIM: 10.75" x 8.25" COMPOSITECOLORS: Black, ~note-color 2, ~note-color 3 GRAPHICS: none V1.5
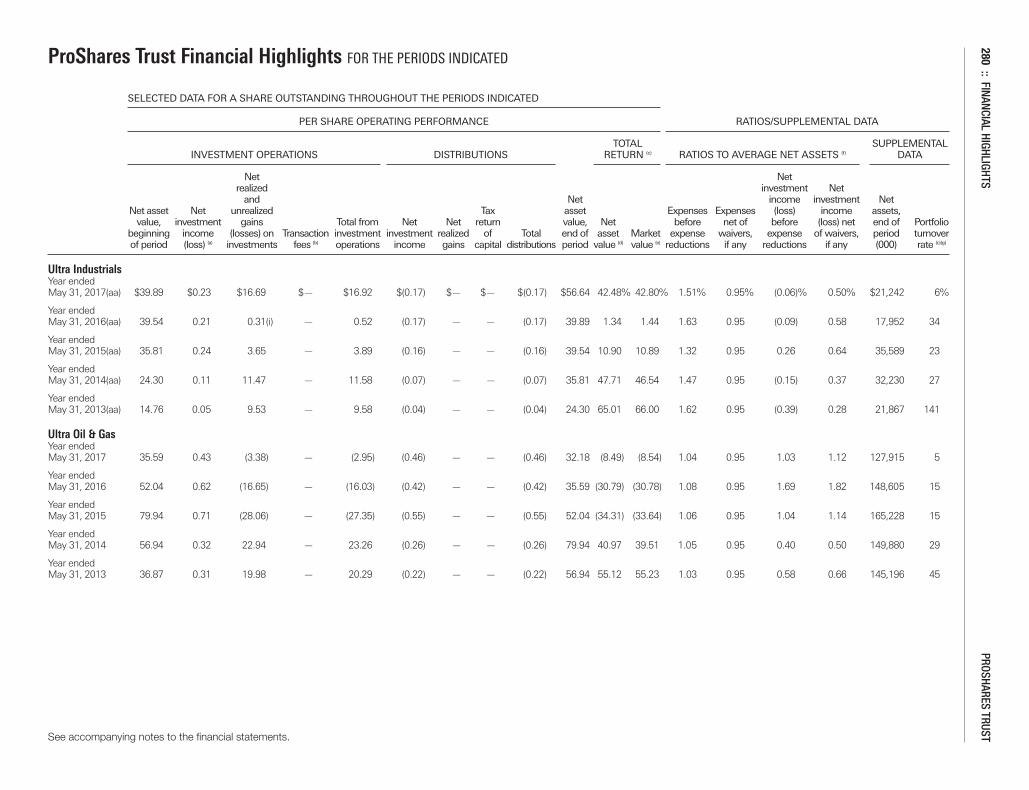
ProShares Trust Financial Highlights FOR THE PERIODS INDICATED
SELECTED DATA FOR A SHARE OUTSTANDING THROUGHOUT THE PERIODS INDICATED
PER SHARE OPERATING PERFORMANCE RATIOS/SUPPLEMENTAL DATA
TOTAL SUPPLEMENTAL INVESTMENT OPERATIONS DISTRIBUTIONS RETURN (c) RATIOS TO AVERAGE NET ASSETS (f) DATA
Net Net realized investment Net and Net income investment Net Net asset Net unrealized Tax asset Expenses Expenses (loss) income assets, value, investment gains Total from Net Net return value, Net before net of before (loss) net end of Portfolio beginning income (losses) on Transaction investment investment realized of Total end of asset Market expense waivers, expense of waivers, period turnover of period (loss) (a) investments fees (b) operations income gains capital distributions period value (d) value (e) reductions if any reductions if any (000) rate (c)(g)
Ultra IndustrialsYear ended May 31, 2017(aa) $39.89 $0.23 $16.69 $— $16.92 $(0.17) $— $— $(0.17) $56.64 42.48% 42.80% 1.51% 0.95% (0.06)% 0.50% $21,242 6%
Year ended May 31, 2016(aa) 39.54 0.21 0.31(i) — 0.52 (0.17) — — (0.17) 39.89 1.34 1.44 1.63 0.95 (0.09) 0.58 17,952 34
Year ended May 31, 2015(aa) 35.81 0.24 3.65 — 3.89 (0.16) — — (0.16) 39.54 10.90 10.89 1.32 0.95 0.26 0.64 35,589 23
Year ended May 31, 2014(aa) 24.30 0.11 11.47 — 11.58 (0.07) — — (0.07) 35.81 47.71 46.54 1.47 0.95 (0.15) 0.37 32,230 27
Year ended May 31, 2013(aa) 14.76 0.05 9.53 — 9.58 (0.04) — — (0.04) 24.30 65.01 66.00 1.62 0.95 (0.39) 0.28 21,867 141
Ultra Oil & GasYear ended May 31, 2017 35.59 0.43 (3.38) — (2.95) (0.46) — — (0.46) 32.18 (8.49) (8.54) 1.04 0.95 1.03 1.12 127,915 5
Year ended May 31, 2016 52.04 0.62 (16.65) — (16.03) (0.42) — — (0.42) 35.59 (30.79) (30.78) 1.08 0.95 1.69 1.82 148,605 15
Year ended May 31, 2015 79.94 0.71 (28.06) — (27.35) (0.55) — — (0.55) 52.04 (34.31) (33.64) 1.06 0.95 1.04 1.14 165,228 15
Year ended May 31, 2014 56.94 0.32 22.94 — 23.26 (0.26) — — (0.26) 79.94 40.97 39.51 1.05 0.95 0.40 0.50 149,880 29
Year ended May 31, 2013 36.87 0.31 19.98 — 20.29 (0.22) — — (0.22) 56.94 55.12 55.23 1.03 0.95 0.58 0.66 145,196 45
See accompanying notes to the financial statements.
280:: FINANCIAL HIGHLIGHTS
PROSHARES TRUST
Merrill Corp - Proshares Trust Geared Book [96 Funds] Annual Report [Funds] 333-089822 05-31-2017 ED [AUX] | eperez | 28-Jul-17 17:43 | 17-15159-3.ia | Sequence: 36CHKSUM Content: 32369 Layout: 42041 Graphics: No Graphics CLEAN
JOB: 17-15159-3 CYCLE#;BL#: 5; 0 TRIM: 10.75" x 8.25" COMPOSITECOLORS: Black, ~note-color 2, ~note-color 3 GRAPHICS: none V1.5
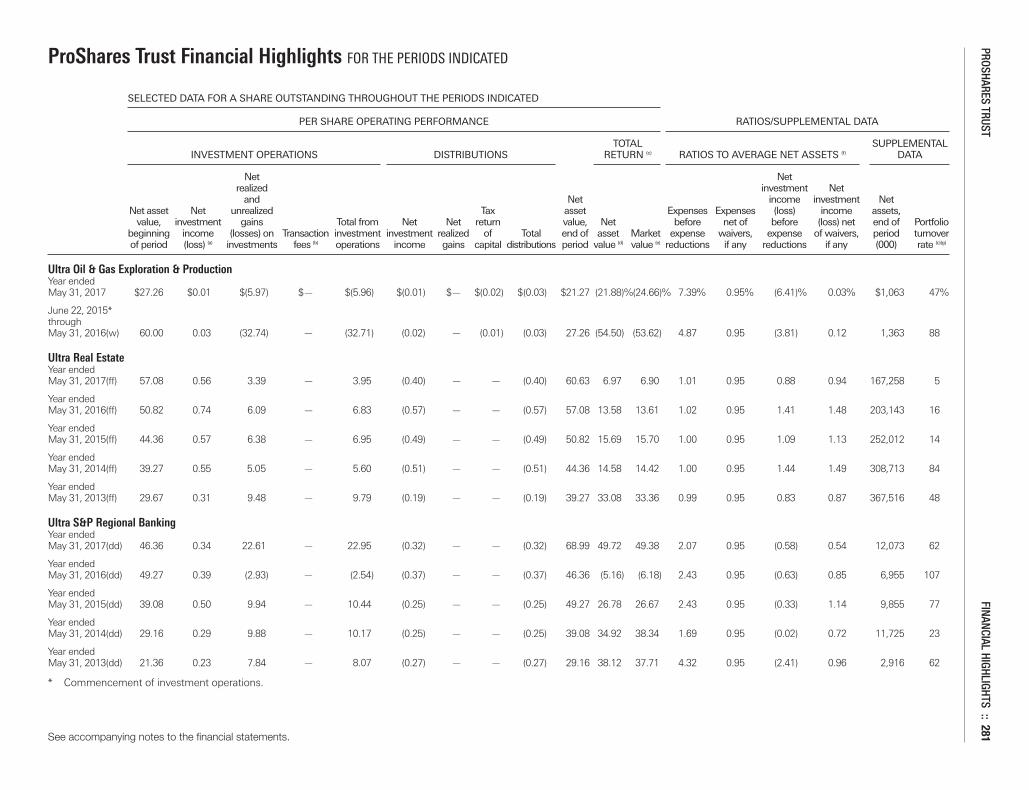
ProShares Trust Financial Highlights FOR THE PERIODS INDICATED
SELECTED DATA FOR A SHARE OUTSTANDING THROUGHOUT THE PERIODS INDICATED
PER SHARE OPERATING PERFORMANCE RATIOS/SUPPLEMENTAL DATA
TOTAL SUPPLEMENTAL INVESTMENT OPERATIONS DISTRIBUTIONS RETURN (c) RATIOS TO AVERAGE NET ASSETS (f) DATA
Net Net realized investment Net and Net income investment Net Net asset Net unrealized Tax asset Expenses Expenses (loss) income assets, value, investment gains Total from Net Net return value, Net before net of before (loss) net end of Portfolio beginning income (losses) on Transaction investment investment realized of Total end of asset Market expense waivers, expense of waivers, period turnover of period (loss) (a) investments fees (b) operations income gains capital distributions period value (d) value (e) reductions if any reductions if any (000) rate (c)(g)
Ultra Oil & Gas Exploration & ProductionYear ended May 31, 2017 $27.26 $0.01 $(5.97) $— $(5.96) $(0.01) $— $(0.02) $(0.03) $21.27 (21.88)%(24.66)% 7.39% 0.95% (6.41)% 0.03% $1,063 47%
June 22, 2015* through May 31, 2016(w) 60.00 0.03 (32.74) — (32.71) (0.02) — (0.01) (0.03) 27.26 (54.50) (53.62) 4.87 0.95 (3.81) 0.12 1,363 88
Ultra Real EstateYear ended May 31, 2017(ff) 57.08 0.56 3.39 — 3.95 (0.40) — — (0.40) 60.63 6.97 6.90 1.01 0.95 0.88 0.94 167,258 5
Year ended May 31, 2016(ff) 50.82 0.74 6.09 — 6.83 (0.57) — — (0.57) 57.08 13.58 13.61 1.02 0.95 1.41 1.48 203,143 16
Year ended May 31, 2015(ff) 44.36 0.57 6.38 — 6.95 (0.49) — — (0.49) 50.82 15.69 15.70 1.00 0.95 1.09 1.13 252,012 14
Year ended May 31, 2014(ff) 39.27 0.55 5.05 — 5.60 (0.51) — — (0.51) 44.36 14.58 14.42 1.00 0.95 1.44 1.49 308,713 84
Year ended May 31, 2013(ff) 29.67 0.31 9.48 — 9.79 (0.19) — — (0.19) 39.27 33.08 33.36 0.99 0.95 0.83 0.87 367,516 48
Ultra S&P Regional BankingYear ended May 31, 2017(dd) 46.36 0.34 22.61 — 22.95 (0.32) — — (0.32) 68.99 49.72 49.38 2.07 0.95 (0.58) 0.54 12,073 62
Year ended May 31, 2016(dd) 49.27 0.39 (2.93) — (2.54) (0.37) — — (0.37) 46.36 (5.16) (6.18) 2.43 0.95 (0.63) 0.85 6,955 107
Year ended May 31, 2015(dd) 39.08 0.50 9.94 — 10.44 (0.25) — — (0.25) 49.27 26.78 26.67 2.43 0.95 (0.33) 1.14 9,855 77
Year ended May 31, 2014(dd) 29.16 0.29 9.88 — 10.17 (0.25) — — (0.25) 39.08 34.92 38.34 1.69 0.95 (0.02) 0.72 11,725 23
Year ended May 31, 2013(dd) 21.36 0.23 7.84 — 8.07 (0.27) — — (0.27) 29.16 38.12 37.71 4.32 0.95 (2.41) 0.96 2,916 62
* Commencement of investment operations.
See accompanying notes to the financial statements.
PROSHARES TRUST FINANCIAL HIGHLIGHTS :: 281
Merrill Corp - Proshares Trust Geared Book [96 Funds] Annual Report [Funds] 333-089822 05-31-2017 ED [AUX] | eperez | 28-Jul-17 17:43 | 17-15159-3.ia | Sequence: 37CHKSUM Content: 13896 Layout: 43066 Graphics: No Graphics CLEAN
JOB: 17-15159-3 CYCLE#;BL#: 5; 0 TRIM: 10.75" x 8.25" COMPOSITECOLORS: Black, ~note-color 2, ~note-color 3 GRAPHICS: none V1.5

ProShares Trust Financial Highlights FOR THE PERIODS INDICATED
SELECTED DATA FOR A SHARE OUTSTANDING THROUGHOUT THE PERIODS INDICATED
PER SHARE OPERATING PERFORMANCE RATIOS/SUPPLEMENTAL DATA
TOTAL SUPPLEMENTAL INVESTMENT OPERATIONS DISTRIBUTIONS RETURN (c) RATIOS TO AVERAGE NET ASSETS (f) DATA
Net Net realized investment Net and Net income investment Net Net asset Net unrealized Tax asset Expenses Expenses (loss) income assets, value, investment gains Total from Net Net return value, Net before net of before (loss) net end of Portfolio beginning income (losses) on Transaction investment investment realized of Total end of asset Market expense waivers, expense of waivers, period turnover of period (loss) (a) investments fees (b) operations income gains capital distributions period value (d) value (e) reductions if any reductions if any (000) rate (c)(g)
Ultra SemiconductorsYear ended May 31, 2017(dd) $43.91 $0.42 $46.01 $— $46.43 $(0.33) $— $— $(0.33) $90.01 106.03%105.09% 1.25% 0.95% 0.36% 0.66% $45,003 24%
Year ended May 31, 2016(dd) 51.62 0.29 (7.80) — (7.51) (0.20) — — (0.20) 43.91 (14.53) (14.28) 1.47 0.95 0.23 0.75 24,150 54
Year ended May 31, 2015(dd) 32.42 0.28 19.33 — 19.61 (0.41) — — (0.41) 51.62 60.68 61.09 1.26 0.95 0.35 0.67 38,713 50
Year ended May 31, 2014(dd) 21.17 0.16 11.29 — 11.45 (0.20) — — (0.20) 32.42 54.33 53.24 1.36 0.95 0.25 0.65 29,174 31
Year ended May 31, 2013(dd) 16.77 0.13 4.39 — 4.52 (0.12) — — (0.12) 21.17 27.07 27.26 1.29 0.95 0.42 0.76 34,927 47
Ultra TechnologyYear ended May 31, 2017(ff) 39.42 —(h) 30.15 — 30.15 (0.05) — — (0.05) 69.52 76.56 76.97 1.04 0.95 (0.08) 0.01 229,402 16
Year ended May 31, 2016(ff) 41.68 0.10 (2.27) — (2.17) (0.09) — — (0.09) 39.42 (5.23) (5.31) 1.08 0.95 0.12 0.25 102,485 8
Year ended May 31, 2015(u)(ff) 31.03 0.07 10.67 — 10.74 (0.09) — — (0.09) 41.68 34.66 34.51 1.04 0.95 0.10 0.19 166,731 14
Year ended May 31, 2014(u)(ff) 20.64 0.05 10.36 — 10.41 (0.02) — — (0.02) 31.03 50.41 50.34 1.07 0.95 0.07 0.18 148,937 44
Year ended May 31, 2013(u)(ff) 17.32 0.02 3.31 — 3.33 (0.01) — — (0.01) 20.64 19.20 19.27 1.12 0.95 (0.08) 0.08 123,865 65
See accompanying notes to the financial statements.
282:: FINANCIAL HIGHLIGHTS
PROSHARES TRUST
Merrill Corp - Proshares Trust Geared Book [96 Funds] Annual Report [Funds] 333-089822 05-31-2017 ED [AUX] | eperez | 28-Jul-17 17:43 | 17-15159-3.ia | Sequence: 38CHKSUM Content: 4889 Layout: 42041 Graphics: No Graphics CLEAN
JOB: 17-15159-3 CYCLE#;BL#: 5; 0 TRIM: 10.75" x 8.25" COMPOSITECOLORS: Black, ~note-color 2, ~note-color 3 GRAPHICS: none V1.5
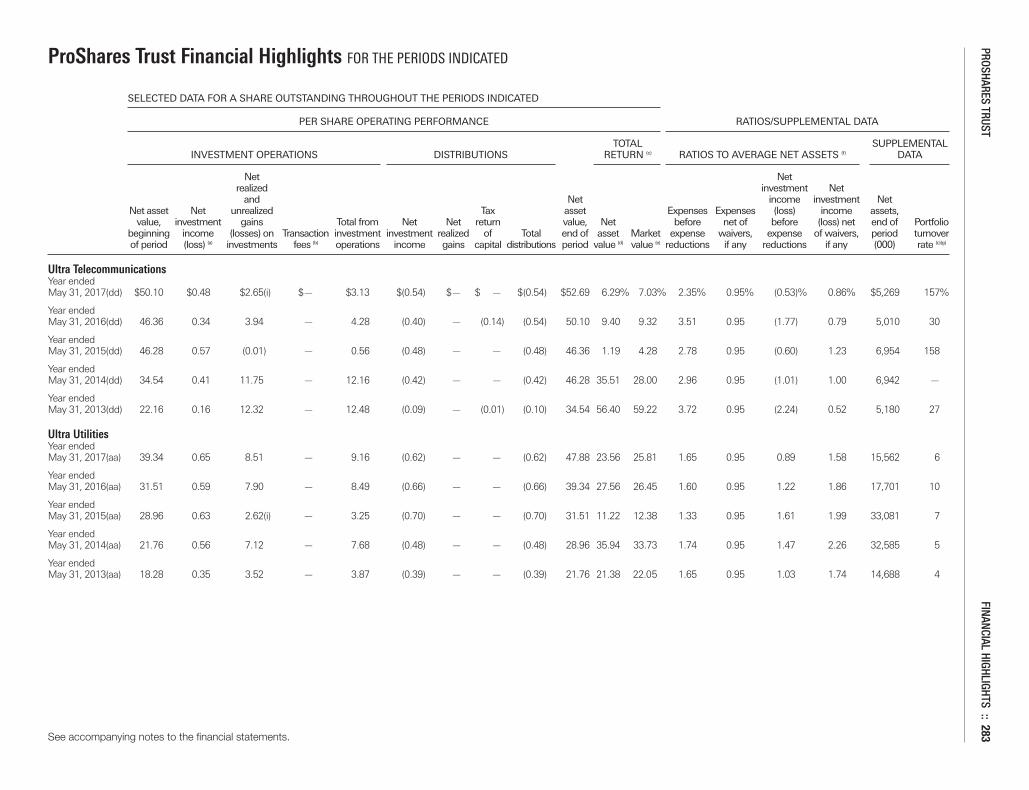
ProShares Trust Financial Highlights FOR THE PERIODS INDICATED
SELECTED DATA FOR A SHARE OUTSTANDING THROUGHOUT THE PERIODS INDICATED
PER SHARE OPERATING PERFORMANCE RATIOS/SUPPLEMENTAL DATA
TOTAL SUPPLEMENTAL INVESTMENT OPERATIONS DISTRIBUTIONS RETURN (c) RATIOS TO AVERAGE NET ASSETS (f) DATA
Net Net realized investment Net and Net income investment Net Net asset Net unrealized Tax asset Expenses Expenses (loss) income assets, value, investment gains Total from Net Net return value, Net before net of before (loss) net end of Portfolio beginning income (losses) on Transaction investment investment realized of Total end of asset Market expense waivers, expense of waivers, period turnover of period (loss) (a) investments fees (b) operations income gains capital distributions period value (d) value (e) reductions if any reductions if any (000) rate (c)(g)
Ultra TelecommunicationsYear ended May 31, 2017(dd) $50.10 $0.48 $2.65(i) $— $3.13 $(0.54) $— $ — $(0.54) $52.69 6.29% 7.03% 2.35% 0.95% (0.53)% 0.86% $5,269 157%
Year ended May 31, 2016(dd) 46.36 0.34 3.94 — 4.28 (0.40) — (0.14) (0.54) 50.10 9.40 9.32 3.51 0.95 (1.77) 0.79 5,010 30
Year ended May 31, 2015(dd) 46.28 0.57 (0.01) — 0.56 (0.48) — — (0.48) 46.36 1.19 4.28 2.78 0.95 (0.60) 1.23 6,954 158
Year ended May 31, 2014(dd) 34.54 0.41 11.75 — 12.16 (0.42) — — (0.42) 46.28 35.51 28.00 2.96 0.95 (1.01) 1.00 6,942 —
Year ended May 31, 2013(dd) 22.16 0.16 12.32 — 12.48 (0.09) — (0.01) (0.10) 34.54 56.40 59.22 3.72 0.95 (2.24) 0.52 5,180 27
Ultra UtilitiesYear ended May 31, 2017(aa) 39.34 0.65 8.51 — 9.16 (0.62) — — (0.62) 47.88 23.56 25.81 1.65 0.95 0.89 1.58 15,562 6
Year ended May 31, 2016(aa) 31.51 0.59 7.90 — 8.49 (0.66) — — (0.66) 39.34 27.56 26.45 1.60 0.95 1.22 1.86 17,701 10
Year ended May 31, 2015(aa) 28.96 0.63 2.62(i) — 3.25 (0.70) — — (0.70) 31.51 11.22 12.38 1.33 0.95 1.61 1.99 33,081 7
Year ended May 31, 2014(aa) 21.76 0.56 7.12 — 7.68 (0.48) — — (0.48) 28.96 35.94 33.73 1.74 0.95 1.47 2.26 32,585 5
Year ended May 31, 2013(aa) 18.28 0.35 3.52 — 3.87 (0.39) — — (0.39) 21.76 21.38 22.05 1.65 0.95 1.03 1.74 14,688 4
See accompanying notes to the financial statements.
PROSHARES TRUST FINANCIAL HIGHLIGHTS :: 283
Merrill Corp - Proshares Trust Geared Book [96 Funds] Annual Report [Funds] 333-089822 05-31-2017 ED [AUX] | eperez | 28-Jul-17 17:43 | 17-15159-3.ia | Sequence: 39CHKSUM Content: 28836 Layout: 64083 Graphics: No Graphics CLEAN
JOB: 17-15159-3 CYCLE#;BL#: 5; 0 TRIM: 10.75" x 8.25" COMPOSITECOLORS: Black, ~note-color 2, ~note-color 3 GRAPHICS: none V1.5
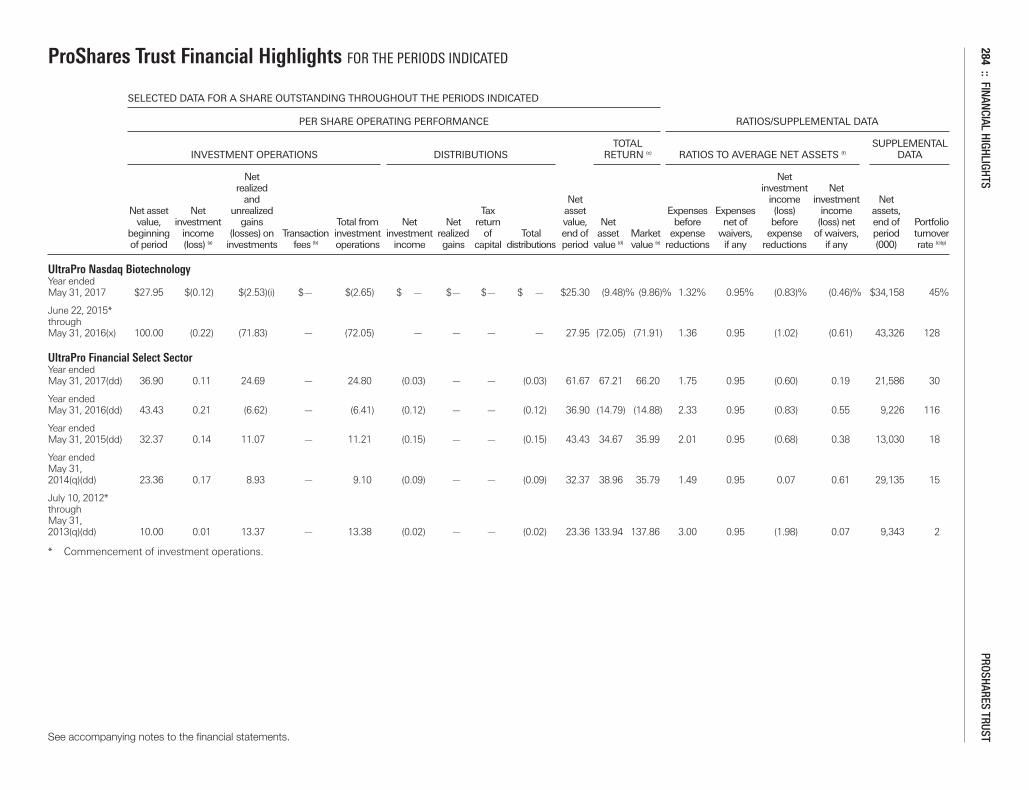
ProShares Trust Financial Highlights FOR THE PERIODS INDICATED
SELECTED DATA FOR A SHARE OUTSTANDING THROUGHOUT THE PERIODS INDICATED
PER SHARE OPERATING PERFORMANCE RATIOS/SUPPLEMENTAL DATA
TOTAL SUPPLEMENTAL INVESTMENT OPERATIONS DISTRIBUTIONS RETURN (c) RATIOS TO AVERAGE NET ASSETS (f) DATA
Net Net realized investment Net and Net income investment Net Net asset Net unrealized Tax asset Expenses Expenses (loss) income assets, value, investment gains Total from Net Net return value, Net before net of before (loss) net end of Portfolio beginning income (losses) on Transaction investment investment realized of Total end of asset Market expense waivers, expense of waivers, period turnover of period (loss) (a) investments fees (b) operations income gains capital distributions period value (d) value (e) reductions if any reductions if any (000) rate (c)(g)
UltraPro Nasdaq BiotechnologyYear ended May 31, 2017 $27.95 $(0.12) $(2.53)(i) $— $(2.65) $ — $— $— $ — $25.30 (9.48)% (9.86)% 1.32% 0.95% (0.83)% (0.46)% $34,158 45%
June 22, 2015* through May 31, 2016(x) 100.00 (0.22) (71.83) — (72.05) — — — — 27.95 (72.05) (71.91) 1.36 0.95 (1.02) (0.61) 43,326 128
UltraPro Financial Select SectorYear ended May 31, 2017(dd) 36.90 0.11 24.69 — 24.80 (0.03) — — (0.03) 61.67 67.21 66.20 1.75 0.95 (0.60) 0.19 21,586 30
Year ended May 31, 2016(dd) 43.43 0.21 (6.62) — (6.41) (0.12) — — (0.12) 36.90 (14.79) (14.88) 2.33 0.95 (0.83) 0.55 9,226 116
Year ended May 31, 2015(dd) 32.37 0.14 11.07 — 11.21 (0.15) — — (0.15) 43.43 34.67 35.99 2.01 0.95 (0.68) 0.38 13,030 18
Year ended May 31, 2014(q)(dd) 23.36 0.17 8.93 — 9.10 (0.09) — — (0.09) 32.37 38.96 35.79 1.49 0.95 0.07 0.61 29,135 15
July 10, 2012* through May 31, 2013(q)(dd) 10.00 0.01 13.37 — 13.38 (0.02) — — (0.02) 23.36 133.94 137.86 3.00 0.95 (1.98) 0.07 9,343 2
* Commencement of investment operations.
See accompanying notes to the financial statements.
284:: FINANCIAL HIGHLIGHTS
PROSHARES TRUST
Merrill Corp - Proshares Trust Geared Book [96 Funds] Annual Report [Funds] 333-089822 05-31-2017 ED [AUX] | eperez | 28-Jul-17 17:43 | 17-15159-3.ia | Sequence: 40CHKSUM Content: 35652 Layout: 42041 Graphics: No Graphics CLEAN
JOB: 17-15159-3 CYCLE#;BL#: 5; 0 TRIM: 10.75" x 8.25" COMPOSITECOLORS: Black, ~note-color 2, ~note-color 3 GRAPHICS: none V1.5
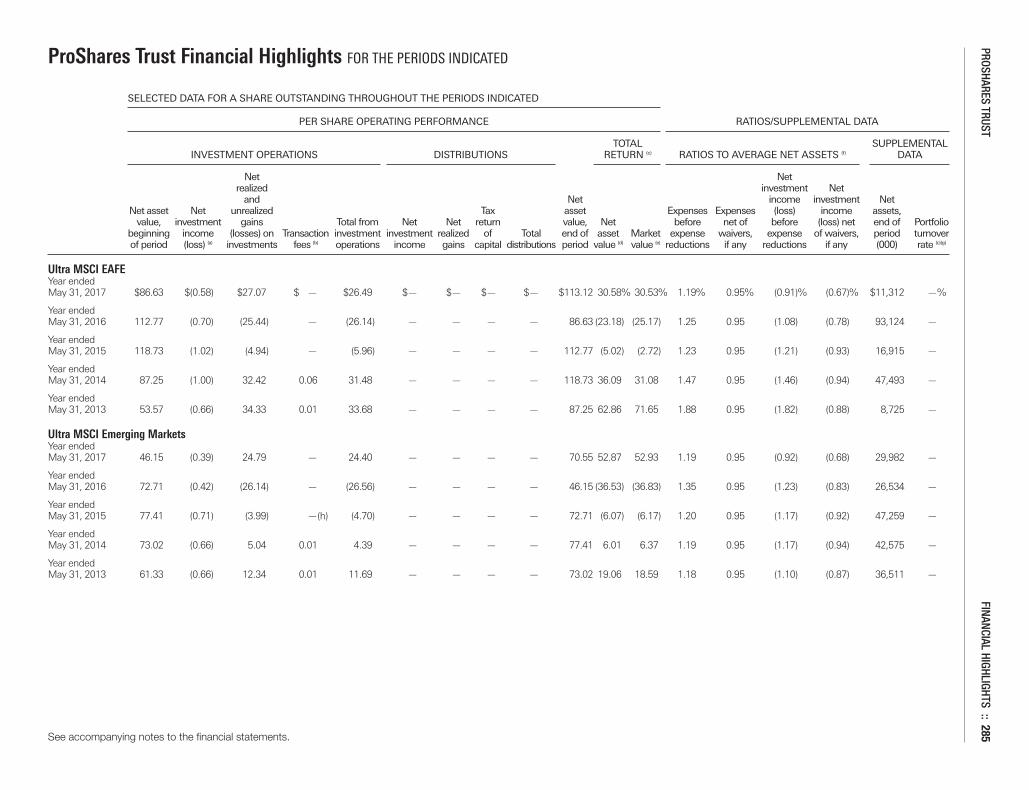
ProShares Trust Financial Highlights FOR THE PERIODS INDICATED
SELECTED DATA FOR A SHARE OUTSTANDING THROUGHOUT THE PERIODS INDICATED
PER SHARE OPERATING PERFORMANCE RATIOS/SUPPLEMENTAL DATA
TOTAL SUPPLEMENTAL INVESTMENT OPERATIONS DISTRIBUTIONS RETURN (c) RATIOS TO AVERAGE NET ASSETS (f) DATA
Net Net realized investment Net and Net income investment Net Net asset Net unrealized Tax asset Expenses Expenses (loss) income assets, value, investment gains Total from Net Net return value, Net before net of before (loss) net end of Portfolio beginning income (losses) on Transaction investment investment realized of Total end of asset Market expense waivers, expense of waivers, period turnover of period (loss) (a) investments fees (b) operations income gains capital distributions period value (d) value (e) reductions if any reductions if any (000) rate (c)(g)
Ultra MSCI EAFEYear ended May 31, 2017 $86.63 $(0.58) $27.07 $ — $26.49 $— $— $— $— $113.12 30.58% 30.53% 1.19% 0.95% (0.91)% (0.67)% $11,312 —%
Year ended May 31, 2016 112.77 (0.70) (25.44) — (26.14) — — — — 86.63 (23.18) (25.17) 1.25 0.95 (1.08) (0.78) 93,124 —
Year ended May 31, 2015 118.73 (1.02) (4.94) — (5.96) — — — — 112.77 (5.02) (2.72) 1.23 0.95 (1.21) (0.93) 16,915 —
Year ended May 31, 2014 87.25 (1.00) 32.42 0.06 31.48 — — — — 118.73 36.09 31.08 1.47 0.95 (1.46) (0.94) 47,493 —
Year ended May 31, 2013 53.57 (0.66) 34.33 0.01 33.68 — — — — 87.25 62.86 71.65 1.88 0.95 (1.82) (0.88) 8,725 —
Ultra MSCI Emerging MarketsYear ended May 31, 2017 46.15 (0.39) 24.79 — 24.40 — — — — 70.55 52.87 52.93 1.19 0.95 (0.92) (0.68) 29,982 —
Year ended May 31, 2016 72.71 (0.42) (26.14) — (26.56) — — — — 46.15 (36.53) (36.83) 1.35 0.95 (1.23) (0.83) 26,534 —
Year ended May 31, 2015 77.41 (0.71) (3.99) —(h) (4.70) — — — — 72.71 (6.07) (6.17) 1.20 0.95 (1.17) (0.92) 47,259 —
Year ended May 31, 2014 73.02 (0.66) 5.04 0.01 4.39 — — — — 77.41 6.01 6.37 1.19 0.95 (1.17) (0.94) 42,575 —
Year ended May 31, 2013 61.33 (0.66) 12.34 0.01 11.69 — — — — 73.02 19.06 18.59 1.18 0.95 (1.10) (0.87) 36,511 —
See accompanying notes to the financial statements.
PROSHARES TRUST FINANCIAL HIGHLIGHTS :: 285
Merrill Corp - Proshares Trust Geared Book [96 Funds] Annual Report [Funds] 333-089822 05-31-2017 ED [AUX] | eperez | 28-Jul-17 17:43 | 17-15159-3.ia | Sequence: 41CHKSUM Content: 37695 Layout: 63879 Graphics: No Graphics CLEAN
JOB: 17-15159-3 CYCLE#;BL#: 5; 0 TRIM: 10.75" x 8.25" COMPOSITECOLORS: Black, ~note-color 2, ~note-color 3 GRAPHICS: none V1.5
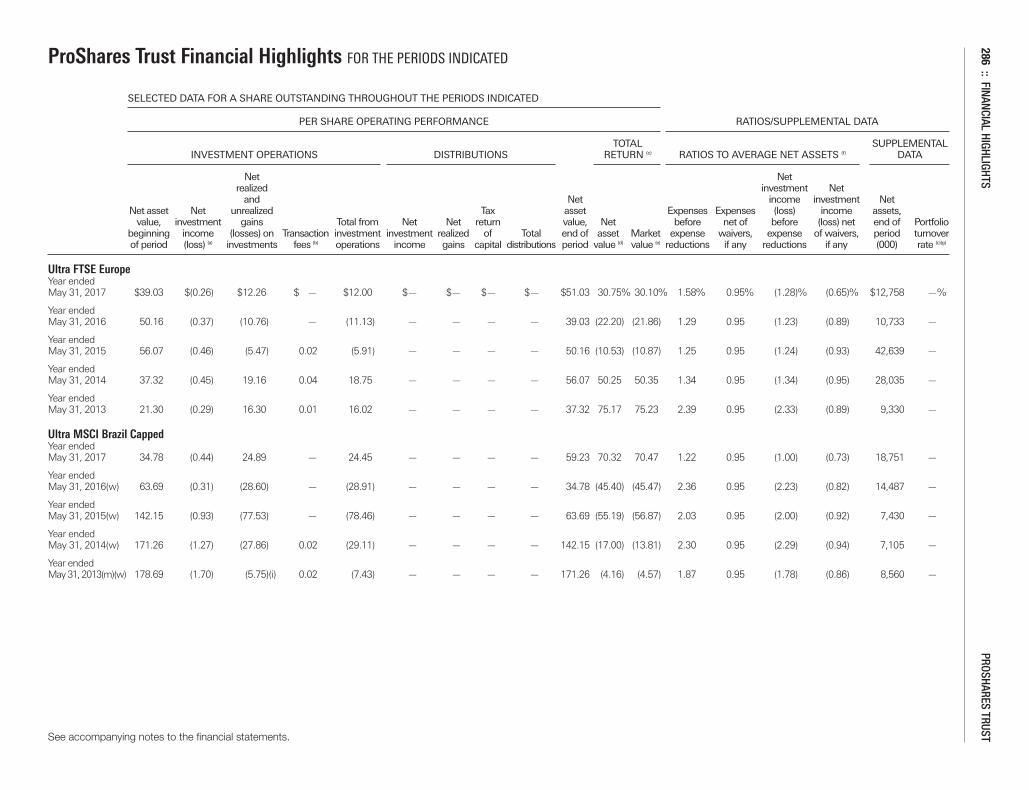
ProShares Trust Financial Highlights FOR THE PERIODS INDICATED
SELECTED DATA FOR A SHARE OUTSTANDING THROUGHOUT THE PERIODS INDICATED
PER SHARE OPERATING PERFORMANCE RATIOS/SUPPLEMENTAL DATA
TOTAL SUPPLEMENTAL INVESTMENT OPERATIONS DISTRIBUTIONS RETURN (c) RATIOS TO AVERAGE NET ASSETS (f) DATA
Net Net realized investment Net and Net income investment Net Net asset Net unrealized Tax asset Expenses Expenses (loss) income assets, value, investment gains Total from Net Net return value, Net before net of before (loss) net end of Portfolio beginning income (losses) on Transaction investment investment realized of Total end of asset Market expense waivers, expense of waivers, period turnover of period (loss) (a) investments fees (b) operations income gains capital distributions period value (d) value (e) reductions if any reductions if any (000) rate (c)(g)
Ultra FTSE EuropeYear ended May 31, 2017 $39.03 $(0.26) $12.26 $ — $12.00 $— $— $— $— $51.03 30.75% 30.10% 1.58% 0.95% (1.28)% (0.65)% $12,758 —%
Year ended May 31, 2016 50.16 (0.37) (10.76) — (11.13) — — — — 39.03 (22.20) (21.86) 1.29 0.95 (1.23) (0.89) 10,733 —
Year ended May 31, 2015 56.07 (0.46) (5.47) 0.02 (5.91) — — — — 50.16 (10.53) (10.87) 1.25 0.95 (1.24) (0.93) 42,639 —
Year ended May 31, 2014 37.32 (0.45) 19.16 0.04 18.75 — — — — 56.07 50.25 50.35 1.34 0.95 (1.34) (0.95) 28,035 —
Year ended May 31, 2013 21.30 (0.29) 16.30 0.01 16.02 — — — — 37.32 75.17 75.23 2.39 0.95 (2.33) (0.89) 9,330 —
Ultra MSCI Brazil CappedYear ended May 31, 2017 34.78 (0.44) 24.89 — 24.45 — — — — 59.23 70.32 70.47 1.22 0.95 (1.00) (0.73) 18,751 —
Year ended May 31, 2016(w) 63.69 (0.31) (28.60) — (28.91) — — — — 34.78 (45.40) (45.47) 2.36 0.95 (2.23) (0.82) 14,487 —
Year ended May 31, 2015(w) 142.15 (0.93) (77.53) — (78.46) — — — — 63.69 (55.19) (56.87) 2.03 0.95 (2.00) (0.92) 7,430 —
Year ended May 31, 2014(w) 171.26 (1.27) (27.86) 0.02 (29.11) — — — — 142.15 (17.00) (13.81) 2.30 0.95 (2.29) (0.94) 7,105 —
Year ended May 31, 2013(m)(w) 178.69 (1.70) (5.75)(i) 0.02 (7.43) — — — — 171.26 (4.16) (4.57) 1.87 0.95 (1.78) (0.86) 8,560 —
See accompanying notes to the financial statements.
286:: FINANCIAL HIGHLIGHTS
PROSHARES TRUST
Merrill Corp - Proshares Trust Geared Book [96 Funds] Annual Report [Funds] 333-089822 05-31-2017 ED [AUX] | eperez | 28-Jul-17 17:43 | 17-15159-3.ia | Sequence: 42CHKSUM Content: 1246 Layout: 42041 Graphics: No Graphics CLEAN
JOB: 17-15159-3 CYCLE#;BL#: 5; 0 TRIM: 10.75" x 8.25" COMPOSITECOLORS: Black, ~note-color 2, ~note-color 3 GRAPHICS: none V1.5
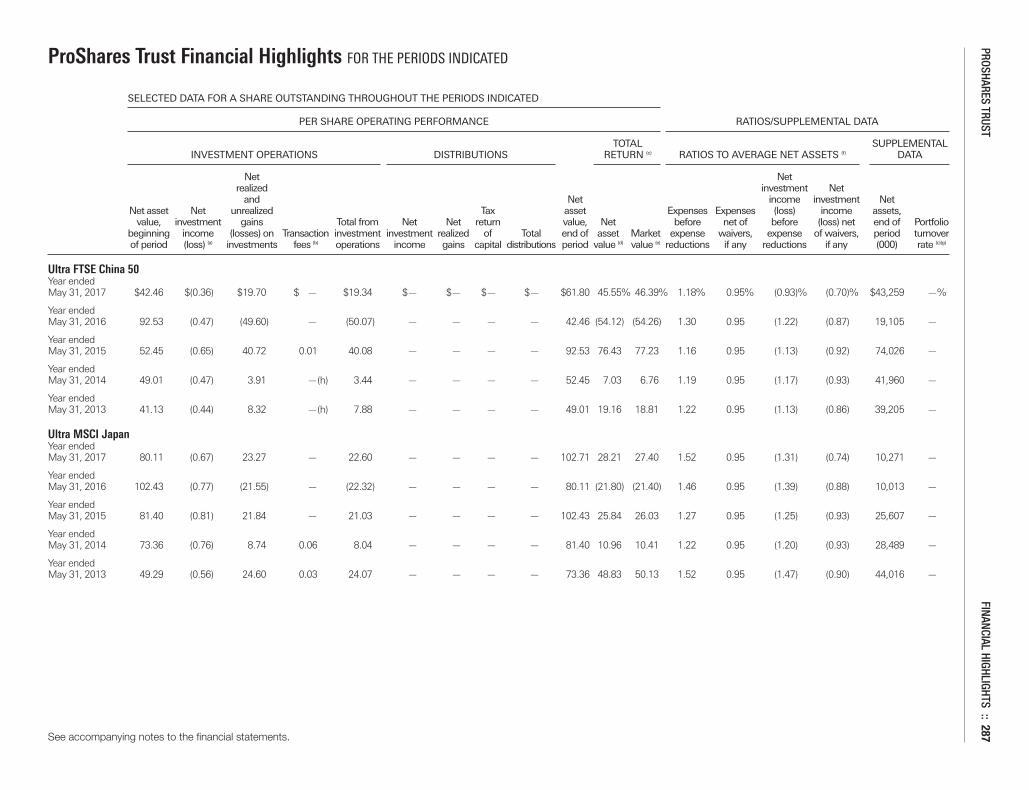
ProShares Trust Financial Highlights FOR THE PERIODS INDICATED
SELECTED DATA FOR A SHARE OUTSTANDING THROUGHOUT THE PERIODS INDICATED
PER SHARE OPERATING PERFORMANCE RATIOS/SUPPLEMENTAL DATA
TOTAL SUPPLEMENTAL INVESTMENT OPERATIONS DISTRIBUTIONS RETURN (c) RATIOS TO AVERAGE NET ASSETS (f) DATA
Net Net realized investment Net and Net income investment Net Net asset Net unrealized Tax asset Expenses Expenses (loss) income assets, value, investment gains Total from Net Net return value, Net before net of before (loss) net end of Portfolio beginning income (losses) on Transaction investment investment realized of Total end of asset Market expense waivers, expense of waivers, period turnover of period (loss) (a) investments fees (b) operations income gains capital distributions period value (d) value (e) reductions if any reductions if any (000) rate (c)(g)
Ultra FTSE China 50Year ended May 31, 2017 $42.46 $(0.36) $19.70 $ — $19.34 $— $— $— $— $61.80 45.55% 46.39% 1.18% 0.95% (0.93)% (0.70)% $43,259 —%
Year ended May 31, 2016 92.53 (0.47) (49.60) — (50.07) — — — — 42.46 (54.12) (54.26) 1.30 0.95 (1.22) (0.87) 19,105 —
Year ended May 31, 2015 52.45 (0.65) 40.72 0.01 40.08 — — — — 92.53 76.43 77.23 1.16 0.95 (1.13) (0.92) 74,026 —
Year ended May 31, 2014 49.01 (0.47) 3.91 —(h) 3.44 — — — — 52.45 7.03 6.76 1.19 0.95 (1.17) (0.93) 41,960 —
Year ended May 31, 2013 41.13 (0.44) 8.32 —(h) 7.88 — — — — 49.01 19.16 18.81 1.22 0.95 (1.13) (0.86) 39,205 —
Ultra MSCI JapanYear ended May 31, 2017 80.11 (0.67) 23.27 — 22.60 — — — — 102.71 28.21 27.40 1.52 0.95 (1.31) (0.74) 10,271 —
Year ended May 31, 2016 102.43 (0.77) (21.55) — (22.32) — — — — 80.11 (21.80) (21.40) 1.46 0.95 (1.39) (0.88) 10,013 —
Year ended May 31, 2015 81.40 (0.81) 21.84 — 21.03 — — — — 102.43 25.84 26.03 1.27 0.95 (1.25) (0.93) 25,607 —
Year ended May 31, 2014 73.36 (0.76) 8.74 0.06 8.04 — — — — 81.40 10.96 10.41 1.22 0.95 (1.20) (0.93) 28,489 —
Year ended May 31, 2013 49.29 (0.56) 24.60 0.03 24.07 — — — — 73.36 48.83 50.13 1.52 0.95 (1.47) (0.90) 44,016 —
See accompanying notes to the financial statements.
PROSHARES TRUST FINANCIAL HIGHLIGHTS :: 287
Merrill Corp - Proshares Trust Geared Book [96 Funds] Annual Report [Funds] 333-089822 05-31-2017 ED [AUX] | eperez | 28-Jul-17 17:43 | 17-15159-3.ia | Sequence: 43CHKSUM Content: 37923 Layout: 64083 Graphics: No Graphics CLEAN
JOB: 17-15159-3 CYCLE#;BL#: 5; 0 TRIM: 10.75" x 8.25" COMPOSITECOLORS: Black, ~note-color 2, ~note-color 3 GRAPHICS: none V1.5
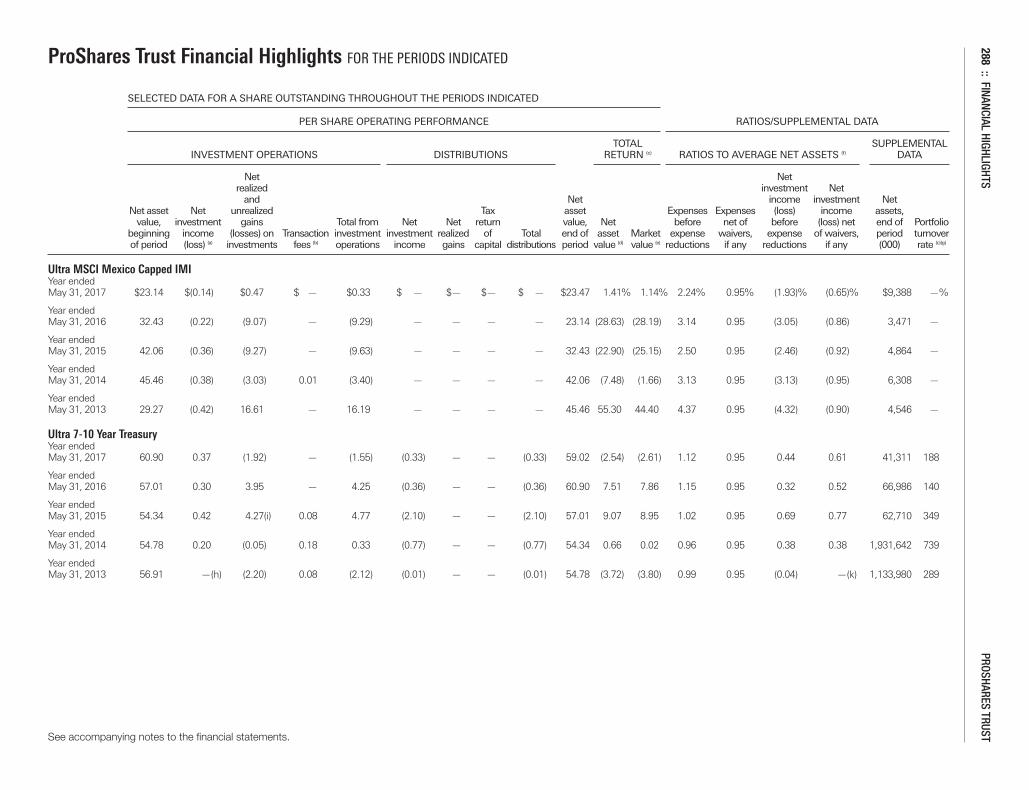
ProShares Trust Financial Highlights FOR THE PERIODS INDICATED
SELECTED DATA FOR A SHARE OUTSTANDING THROUGHOUT THE PERIODS INDICATED
PER SHARE OPERATING PERFORMANCE RATIOS/SUPPLEMENTAL DATA
TOTAL SUPPLEMENTAL INVESTMENT OPERATIONS DISTRIBUTIONS RETURN (c) RATIOS TO AVERAGE NET ASSETS (f) DATA
Net Net realized investment Net and Net income investment Net Net asset Net unrealized Tax asset Expenses Expenses (loss) income assets, value, investment gains Total from Net Net return value, Net before net of before (loss) net end of Portfolio beginning income (losses) on Transaction investment investment realized of Total end of asset Market expense waivers, expense of waivers, period turnover of period (loss) (a) investments fees (b) operations income gains capital distributions period value (d) value (e) reductions if any reductions if any (000) rate (c)(g)
Ultra MSCI Mexico Capped IMIYear ended May 31, 2017 $23.14 $(0.14) $0.47 $ — $0.33 $ — $— $— $ — $23.47 1.41% 1.14% 2.24% 0.95% (1.93)% (0.65)% $9,388 —%
Year ended May 31, 2016 32.43 (0.22) (9.07) — (9.29) — — — — 23.14 (28.63) (28.19) 3.14 0.95 (3.05) (0.86) 3,471 —
Year ended May 31, 2015 42.06 (0.36) (9.27) — (9.63) — — — — 32.43 (22.90) (25.15) 2.50 0.95 (2.46) (0.92) 4,864 —
Year ended May 31, 2014 45.46 (0.38) (3.03) 0.01 (3.40) — — — — 42.06 (7.48) (1.66) 3.13 0.95 (3.13) (0.95) 6,308 —
Year ended May 31, 2013 29.27 (0.42) 16.61 — 16.19 — — — — 45.46 55.30 44.40 4.37 0.95 (4.32) (0.90) 4,546 —
Ultra 7-10 Year TreasuryYear ended May 31, 2017 60.90 0.37 (1.92) — (1.55) (0.33) — — (0.33) 59.02 (2.54) (2.61) 1.12 0.95 0.44 0.61 41,311 188
Year ended May 31, 2016 57.01 0.30 3.95 — 4.25 (0.36) — — (0.36) 60.90 7.51 7.86 1.15 0.95 0.32 0.52 66,986 140
Year ended May 31, 2015 54.34 0.42 4.27(i) 0.08 4.77 (2.10) — — (2.10) 57.01 9.07 8.95 1.02 0.95 0.69 0.77 62,710 349
Year ended May 31, 2014 54.78 0.20 (0.05) 0.18 0.33 (0.77) — — (0.77) 54.34 0.66 0.02 0.96 0.95 0.38 0.38 1,931,642 739
Year ended May 31, 2013 56.91 —(h) (2.20) 0.08 (2.12) (0.01) — — (0.01) 54.78 (3.72) (3.80) 0.99 0.95 (0.04) —(k) 1,133,980 289
See accompanying notes to the financial statements.
288:: FINANCIAL HIGHLIGHTS
PROSHARES TRUST
Merrill Corp - Proshares Trust Geared Book [96 Funds] Annual Report [Funds] 333-089822 05-31-2017 ED [AUX] | eperez | 28-Jul-17 17:43 | 17-15159-3.ia | Sequence: 44CHKSUM Content: 34717 Layout: 7782 Graphics: No Graphics CLEAN
JOB: 17-15159-3 CYCLE#;BL#: 5; 0 TRIM: 10.75" x 8.25" COMPOSITECOLORS: Black, ~note-color 2, ~note-color 3 GRAPHICS: none V1.5
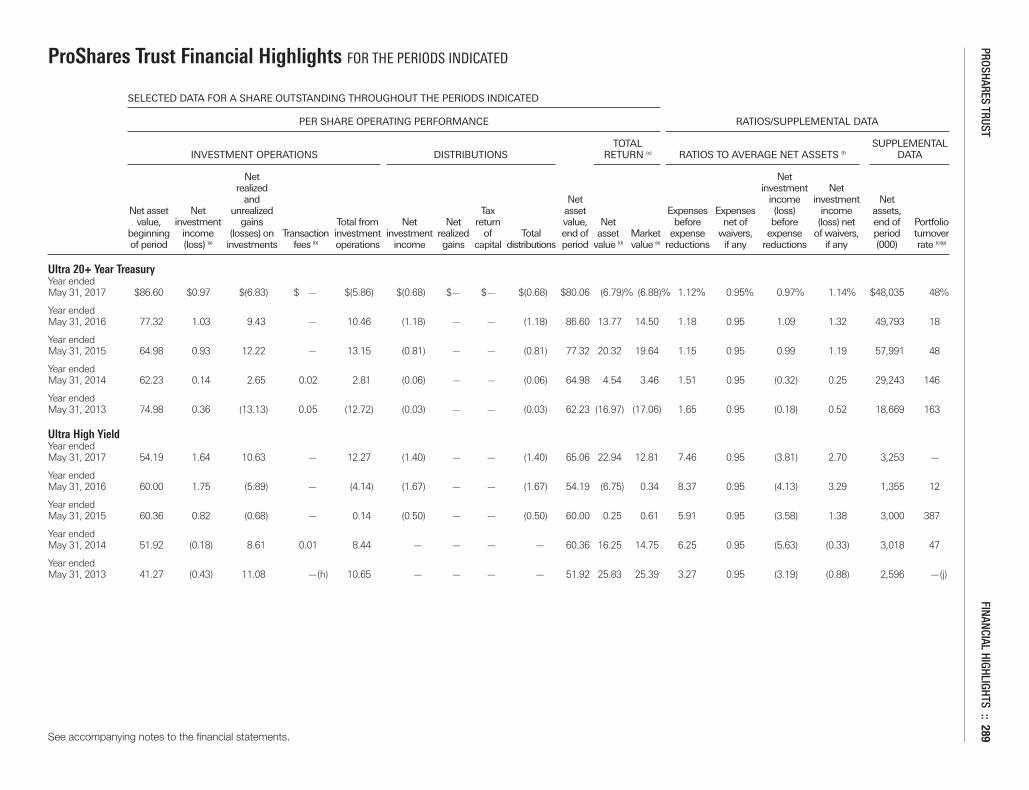
ProShares Trust Financial Highlights FOR THE PERIODS INDICATED
SELECTED DATA FOR A SHARE OUTSTANDING THROUGHOUT THE PERIODS INDICATED
PER SHARE OPERATING PERFORMANCE RATIOS/SUPPLEMENTAL DATA
TOTAL SUPPLEMENTAL INVESTMENT OPERATIONS DISTRIBUTIONS RETURN (c) RATIOS TO AVERAGE NET ASSETS (f) DATA
Net Net realized investment Net and Net income investment Net Net asset Net unrealized Tax asset Expenses Expenses (loss) income assets, value, investment gains Total from Net Net return value, Net before net of before (loss) net end of Portfolio beginning income (losses) on Transaction investment investment realized of Total end of asset Market expense waivers, expense of waivers, period turnover of period (loss) (a) investments fees (b) operations income gains capital distributions period value (d) value (e) reductions if any reductions if any (000) rate (c)(g)
Ultra 20+ Year TreasuryYear ended May 31, 2017 $86.60 $0.97 $(6.83) $ — $(5.86) $(0.68) $— $— $(0.68) $80.06 (6.79)% (6.88)% 1.12% 0.95% 0.97% 1.14% $48,035 48%
Year ended May 31, 2016 77.32 1.03 9.43 — 10.46 (1.18) — — (1.18) 86.60 13.77 14.50 1.18 0.95 1.09 1.32 49,793 18
Year ended May 31, 2015 64.98 0.93 12.22 — 13.15 (0.81) — — (0.81) 77.32 20.32 19.64 1.15 0.95 0.99 1.19 57,991 48
Year ended May 31, 2014 62.23 0.14 2.65 0.02 2.81 (0.06) — — (0.06) 64.98 4.54 3.46 1.51 0.95 (0.32) 0.25 29,243 146
Year ended May 31, 2013 74.98 0.36 (13.13) 0.05 (12.72) (0.03) — — (0.03) 62.23 (16.97) (17.06) 1.65 0.95 (0.18) 0.52 18,669 163
Ultra High YieldYear ended May 31, 2017 54.19 1.64 10.63 — 12.27 (1.40) — — (1.40) 65.06 22.94 12.81 7.46 0.95 (3.81) 2.70 3,253 —
Year ended May 31, 2016 60.00 1.75 (5.89) — (4.14) (1.67) — — (1.67) 54.19 (6.75) 0.34 8.37 0.95 (4.13) 3.29 1,355 12
Year ended May 31, 2015 60.36 0.82 (0.68) — 0.14 (0.50) — — (0.50) 60.00 0.25 0.61 5.91 0.95 (3.58) 1.38 3,000 387
Year ended May 31, 2014 51.92 (0.18) 8.61 0.01 8.44 — — — — 60.36 16.25 14.75 6.25 0.95 (5.63) (0.33) 3,018 47
Year ended May 31, 2013 41.27 (0.43) 11.08 —(h) 10.65 — — — — 51.92 25.83 25.39 3.27 0.95 (3.19) (0.88) 2,596 —(j)
See accompanying notes to the financial statements.
PROSHARES TRUST FINANCIAL HIGHLIGHTS :: 289
Merrill Corp - Proshares Trust Geared Book [96 Funds] Annual Report [Funds] 333-089822 05-31-2017 ED [AUX] | eperez | 28-Jul-17 17:43 | 17-15159-3.ia | Sequence: 45CHKSUM Content: 15887 Layout: 64083 Graphics: No Graphics CLEAN
JOB: 17-15159-3 CYCLE#;BL#: 5; 0 TRIM: 10.75" x 8.25" COMPOSITECOLORS: Black, ~note-color 2, ~note-color 3 GRAPHICS: none V1.5
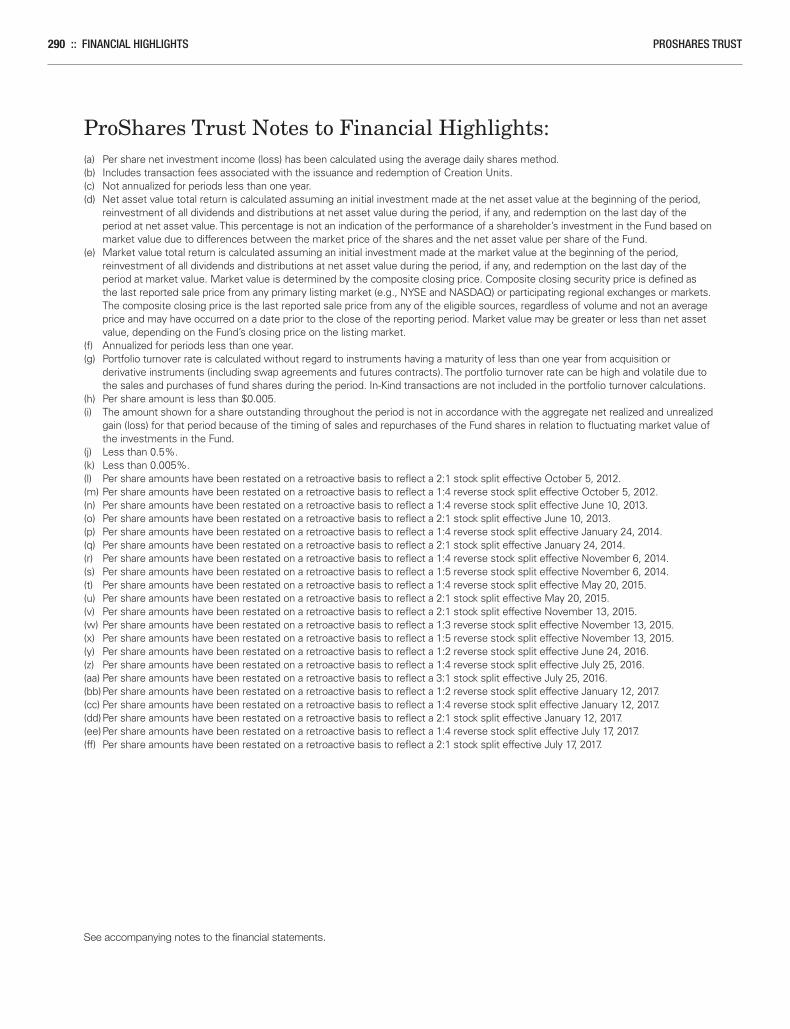
290 :: FINANCIAL HIGHLIGHTS PROSHARES TRUST
ProShares Trust Notes to Financial Highlights:(a) Per share net investment income (loss) has been calculated using the average daily shares method.(b) Includes transaction fees associated with the issuance and redemption of Creation Units.(c) Not annualized for periods less than one year.(d) Net asset value total return is calculated assuming an initial investment made at the net asset value at the beginning of the period,
reinvestment of all dividends and distributions at net asset value during the period, if any, and redemption on the last day of theperiod at net asset value. This percentage is not an indication of the performance of a shareholder’s investment in the Fund based onmarket value due to differences between the market price of the shares and the net asset value per share of the Fund.
(e) Market value total return is calculated assuming an initial investment made at the market value at the beginning of the period,reinvestment of all dividends and distributions at net asset value during the period, if any, and redemption on the last day of theperiod at market value. Market value is determined by the composite closing price. Composite closing security price is defined asthe last reported sale price from any primary listing market (e.g., NYSE and NASDAQ) or participating regional exchanges or markets.The composite closing price is the last reported sale price from any of the eligible sources, regardless of volume and not an averageprice and may have occurred on a date prior to the close of the reporting period. Market value may be greater or less than net assetvalue, depending on the Fund’s closing price on the listing market.
(f) Annualized for periods less than one year.(g) Portfolio turnover rate is calculated without regard to instruments having a maturity of less than one year from acquisition or
derivative instruments (including swap agreements and futures contracts). The portfolio turnover rate can be high and volatile due tothe sales and purchases of fund shares during the period. In-Kind transactions are not included in the portfolio turnover calculations.
(h) Per share amount is less than $0.005.(i) The amount shown for a share outstanding throughout the period is not in accordance with the aggregate net realized and unrealized
gain (loss) for that period because of the timing of sales and repurchases of the Fund shares in relation to fluctuating market value ofthe investments in the Fund.
(j) Less than 0.5%.(k) Less than 0.005%.(l) Per share amounts have been restated on a retroactive basis to reflect a 2:1 stock split effective October 5, 2012.(m) Per share amounts have been restated on a retroactive basis to reflect a 1:4 reverse stock split effective October 5, 2012.(n) Per share amounts have been restated on a retroactive basis to reflect a 1:4 reverse stock split effective June 10, 2013.(o) Per share amounts have been restated on a retroactive basis to reflect a 2:1 stock split effective June 10, 2013.(p) Per share amounts have been restated on a retroactive basis to reflect a 1:4 reverse stock split effective January 24, 2014.(q) Per share amounts have been restated on a retroactive basis to reflect a 2:1 stock split effective January 24, 2014.(r) Per share amounts have been restated on a retroactive basis to reflect a 1:4 reverse stock split effective November 6, 2014.(s) Per share amounts have been restated on a retroactive basis to reflect a 1:5 reverse stock split effective November 6, 2014.(t) Per share amounts have been restated on a retroactive basis to reflect a 1:4 reverse stock split effective May 20, 2015.(u) Per share amounts have been restated on a retroactive basis to reflect a 2:1 stock split effective May 20, 2015.(v) Per share amounts have been restated on a retroactive basis to reflect a 2:1 stock split effective November 13, 2015.(w) Per share amounts have been restated on a retroactive basis to reflect a 1:3 reverse stock split effective November 13, 2015.(x) Per share amounts have been restated on a retroactive basis to reflect a 1:5 reverse stock split effective November 13, 2015.(y) Per share amounts have been restated on a retroactive basis to reflect a 1:2 reverse stock split effective June 24, 2016.(z) Per share amounts have been restated on a retroactive basis to reflect a 1:4 reverse stock split effective July 25, 2016.(aa) Per share amounts have been restated on a retroactive basis to reflect a 3:1 stock split effective July 25, 2016.(bb)Per share amounts have been restated on a retroactive basis to reflect a 1:2 reverse stock split effective January 12, 2017.(cc) Per share amounts have been restated on a retroactive basis to reflect a 1:4 reverse stock split effective January 12, 2017.(dd)Per share amounts have been restated on a retroactive basis to reflect a 2:1 stock split effective January 12, 2017.(ee)Per share amounts have been restated on a retroactive basis to reflect a 1:4 reverse stock split effective July 17, 2017.(ff) Per share amounts have been restated on a retroactive basis to reflect a 2:1 stock split effective July 17, 2017.
See accompanying notes to the financial statements.
Merrill Corp - Proshares Trust Geared Book [96 Funds] Annual Report [Funds] 333-089822 05-31-2017 ED [AUX] | eperez | 28-Jul-17 17:44 | 17-15159-3.ja | Sequence: 1CHKSUM Content: 18270 Layout: 38867 Graphics: No Graphics CLEAN
JOB: 17-15159-3 CYCLE#;BL#: 5; 0 TRIM: 8.25" x 10.75" COMPOSITECOLORS: Black, ~note-color 2, ~note-color 3 GRAPHICS: none V1.5

PROSHARES TRUST NOTES TO FINANCIAL STATEMENTS :: MAY 31, 2017 :: 291
NOTES TO FINANCIAL STATEMENTS
Merrill Corp - Proshares Trust Geared Book [96 Funds] Annual Report [Funds] 333-089822 05-31-2017 ED [AUX] | eperez | 28-Jul-17 17:44 | 17-15159-3.ka | Sequence: 1CHKSUM Content: 64400 Layout: 45636 Graphics: No Graphics CLEAN
JOB: 17-15159-3 CYCLE#;BL#: 5; 0 TRIM: 8.25" x 10.75" COMPOSITECOLORS: Black, ~note-color 2, ~note-color 3 GRAPHICS: none V1.5
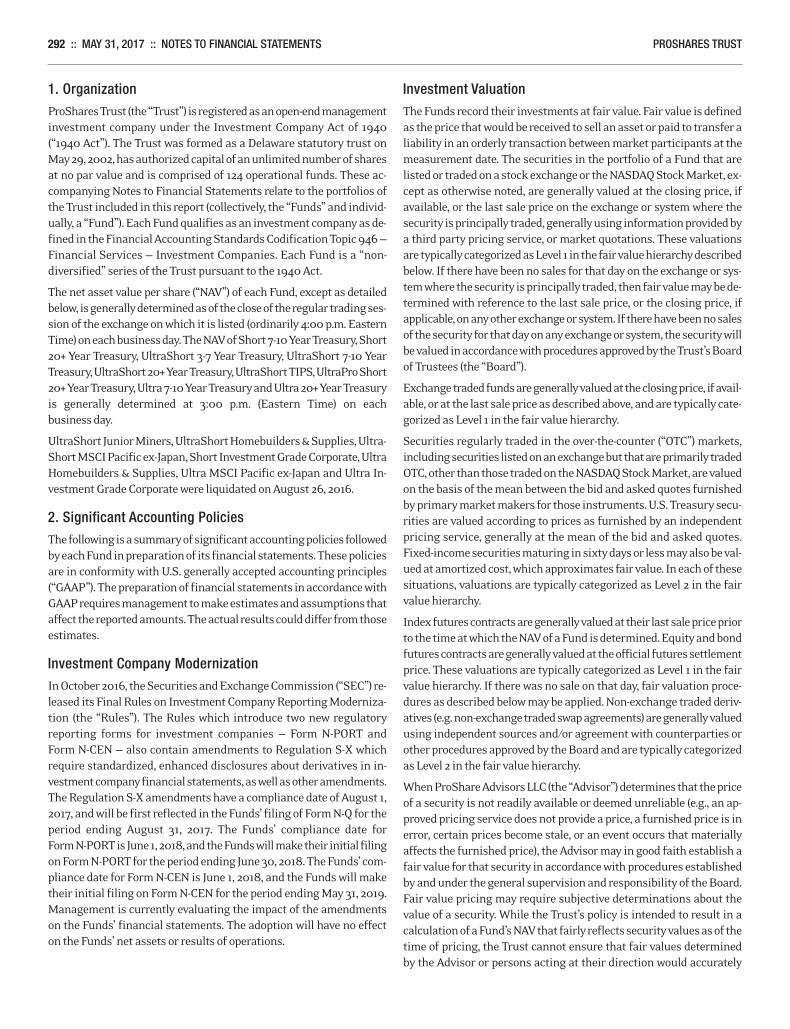
292 :: MAY 31, 2017 :: NOTES TO FINANCIAL STATEMENTS PROSHARES TRUST
1. OrganizationProShares Trust (the “Trust”) is registered as an open-end managementinvestment company under the Investment Company Act of 1940(“1940 Act”). The Trust was formed as a Delaware statutory trust onMay 29, 2002, has authorized capital of an unlimited number of sharesat no par value and is comprised of 124 operational funds. These ac-companying Notes to Financial Statements relate to the portfolios ofthe Trust included in this report (collectively, the “Funds” and individ-ually, a “Fund”). Each Fund qualifies as an investment company as de-fined in the Financial Accounting Standards Codification Topic 946 —Financial Services — Investment Companies. Each Fund is a “non-diversified” series of the Trust pursuant to the 1940 Act.
The net asset value per share (“NAV”) of each Fund, except as detailedbelow, is generally determined as of the close of the regular trading ses-sion of the exchange on which it is listed (ordinarily 4:00 p.m. EasternTime) on each business day. The NAV of Short 7-10 Year Treasury, Short20+ Year Treasury, UltraShort 3-7 Year Treasury, UltraShort 7-10 YearTreasury, UltraShort 20+ Year Treasury, UltraShort TIPS, UltraPro Short20+ Year Treasury, Ultra 7-10 Year Treasury and Ultra 20+ Year Treasuryis generally determined at 3:00 p.m. (Eastern Time) on eachbusiness day.
UltraShort Junior Miners, UltraShort Homebuilders & Supplies, Ultra-Short MSCI Pacific ex-Japan, Short Investment Grade Corporate, UltraHomebuilders & Supplies, Ultra MSCI Pacific ex-Japan and Ultra In-vestment Grade Corporate were liquidated on August 26, 2016.
2. Significant Accounting PoliciesThe following is a summary of significant accounting policies followedby each Fund in preparation of its financial statements. These policiesare in conformity with U.S. generally accepted accounting principles(“GAAP”). The preparation of financial statements in accordance withGAAP requires management to make estimates and assumptions thataffect the reported amounts. The actual results could differ from thoseestimates.
Investment Company ModernizationIn October 2016, the Securities and Exchange Commission (“SEC”) re-leased its Final Rules on Investment Company Reporting Moderniza-tion (the “Rules”). The Rules which introduce two new regulatoryreporting forms for investment companies — Form N-PORT andForm N-CEN — also contain amendments to Regulation S-X which require standardized, enhanced disclosures about derivatives in in-vestment company financial statements, as well as other amendments.The Regulation S-X amendments have a compliance date of August 1,2017, and will be first reflected in the Funds’ filing of Form N-Q for theperiod ending August 31, 2017. The Funds’ compliance date forFormN-PORT is June1, 2018, and the Funds will make their initial filingon Form N-PORT for the period ending June30, 2018. The Funds’ com-pliance date for Form N-CEN is June 1, 2018, and the Funds will maketheir initial filing on Form N-CEN for the period ending May 31, 2019.Management is currently evaluating the impact of the amendmentson the Funds’ financial statements. The adoption will have no effecton the Funds’ net assets or results of operations.
Investment ValuationThe Funds record their investments at fair value. Fair value is definedas the price that would be received to sell an asset or paid to transfer aliability in an orderly transaction between market participants at themeasurement date. The securities in the portfolio of a Fund that arelisted or traded on a stock exchange or the NASDAQ Stock Market, ex-cept as otherwise noted, are generally valued at the closing price, ifavailable, or the last sale price on the exchange or system where thesecurity is principally traded, generally using information provided bya third party pricing service, or market quotations. These valuationsare typically categorized as Level 1 in the fair value hierarchy describedbelow. If there have been no sales for that day on the exchange or sys-tem where the security is principally traded, then fair value may be de-termined with reference to the last sale price, or the closing price, ifapplicable, on any other exchange or system. If there have been no salesof the security for that day on any exchange or system, the security willbe valued in accordance with procedures approved by the Trust’s Boardof Trustees (the “Board”).
Exchange traded funds are generally valued at the closing price, if avail-able, or at the last sale price as described above, and are typically cate-gorized as Level 1 in the fair value hierarchy.
Securities regularly traded in the over-the-counter (“OTC”) markets,including securities listed on an exchange but that are primarily tradedOTC, other than those traded on the NASDAQ Stock Market, are valuedon the basis of the mean between the bid and asked quotes furnishedby primary market makers for those instruments. U.S. Treasury secu-rities are valued according to prices as furnished by an independentpricing service, generally at the mean of the bid and asked quotes.Fixed-income securities maturing in sixty days or less may also be val-ued at amortized cost, which approximates fair value. In each of thesesituations, valuations are typically categorized as Level 2 in the fairvalue hierarchy.
Index futures contracts are generally valued at their last sale price priorto the time at which the NAV of a Fund is determined. Equity and bondfutures contracts are generally valued at the official futures settlementprice. These valuations are typically categorized as Level 1 in the fairvalue hierarchy. If there was no sale on that day, fair valuation proce-dures as described below may be applied. Non-exchange traded deriv-atives (e.g. non-exchange traded swap agreements) are generally valuedusing independent sources and/or agreement with counterparties orother procedures approved by the Board and are typically categorizedas Level 2 in the fair value hierarchy.
When ProShare Advisors LLC (the “Advisor”) determines that the priceof a security is not readily available or deemed unreliable (e.g., an ap-proved pricing service does not provide a price, a furnished price is inerror, certain prices become stale, or an event occurs that materiallyaffects the furnished price), the Advisor may in good faith establish afair value for that security in accordance with procedures establishedby and under the general supervision and responsibility of the Board.Fair value pricing may require subjective determinations about thevalue of a security. While the Trust’s policy is intended to result in acalculation of a Fund’s NAV that fairly reflects security values as of thetime of pricing, the Trust cannot ensure that fair values determinedby the Advisor or persons acting at their direction would accurately
Merrill Corp - Proshares Trust Geared Book [96 Funds] Annual Report [Funds] 333-089822 05-31-2017 ED [AUX] | eperez | 28-Jul-17 17:44 | 17-15159-3.ka | Sequence: 2CHKSUM Content: 65420 Layout: 64896 Graphics: No Graphics CLEAN
JOB: 17-15159-3 CYCLE#;BL#: 5; 0 TRIM: 8.25" x 10.75" COMPOSITECOLORS: Black, ~note-color 2, ~note-color 3 GRAPHICS: none V1.5
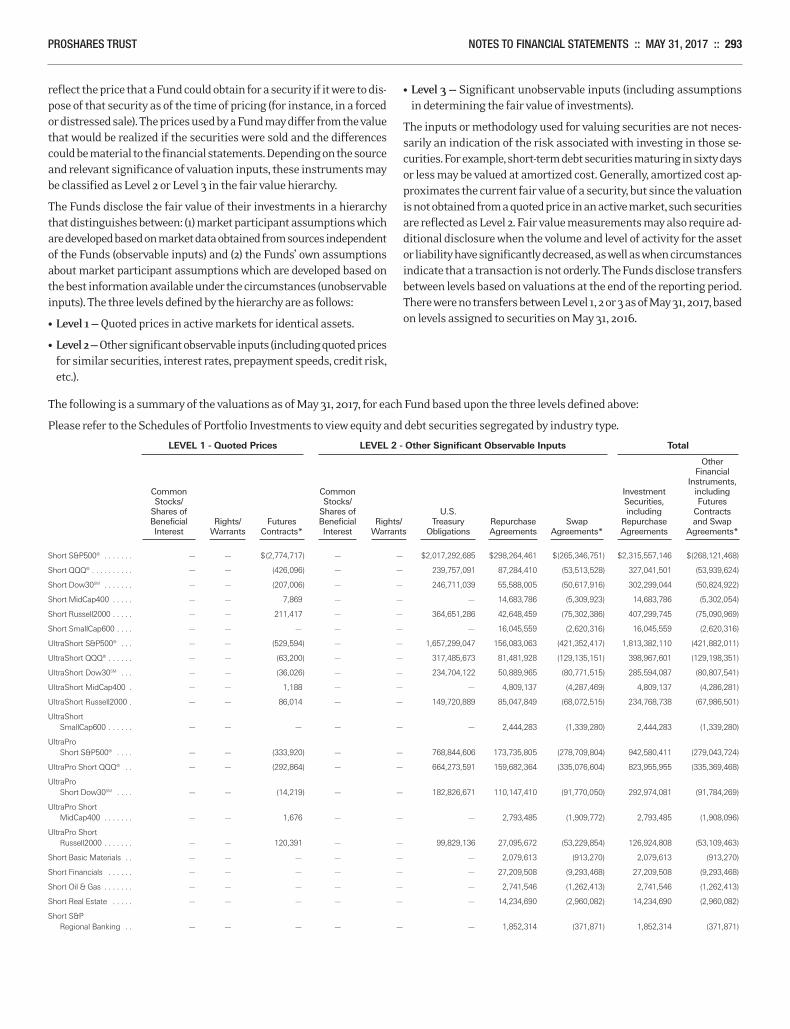
PROSHARES TRUST NOTES TO FINANCIAL STATEMENTS :: MAY 31, 2017 :: 293
reflect the price that a Fund could obtain for a security if it were to dis-pose of that security as of the time of pricing (for instance, in a forcedor distressed sale). The prices used by a Fund may differ from the valuethat would be realized if the securities were sold and the differencescould be material to the financial statements. Depending on the sourceand relevant significance of valuation inputs, these instruments maybe classified as Level 2 or Level 3 in the fair value hierarchy.
The Funds disclose the fair value of their investments in a hierarchythat distinguishes between: (1) market participant assumptions whichare developed based on market data obtained from sources independentof the Funds (observable inputs) and (2) the Funds’ own assumptionsabout market participant assumptions which are developed based onthe best information available under the circumstances (unobservableinputs). The three levels defined by the hierarchy are as follows:
• Level 1 — Quoted prices in active markets for identical assets.
• Level 2 —Other significant observable inputs (including quoted pricesfor similar securities, interest rates, prepayment speeds, credit risk,etc.).
• Level 3 — Significant unobservable inputs (including assumptionsin determining the fair value of investments).
The inputs or methodology used for valuing securities are not neces-sarily an indication of the risk associated with investing in those se-curities. For example, short-term debt securities maturing in sixty daysor less may be valued at amortized cost. Generally, amortized cost ap-proximates the current fair value of a security, but since the valuationis not obtained from a quoted price in an active market, such securitiesare reflected as Level 2. Fair value measurements may also require ad-ditional disclosure when the volume and level of activity for the assetor liability have significantly decreased, as well as when circumstancesindicate that a transaction is not orderly. The Funds disclose transfersbetween levels based on valuations at the end of the reporting period.There were no transfers between Level 1, 2 or 3 as of May 31, 2017, basedon levels assigned to securities on May 31, 2016.
The following is a summary of the valuations as of May 31, 2017, for each Fund based upon the three levels defined above:
Please refer to the Schedules of Portfolio Investments to view equity and debt securities segregated by industry type.
LEVEL 1 - Quoted Prices LEVEL 2 - Other Significant Observable Inputs Total Other Financial Instruments, Common Common Investment including Stocks/ Stocks/ Securities, Futures Shares of Shares of U.S. including Contracts Beneficial Rights/ Futures Beneficial Rights/ Treasury Repurchase Swap Repurchase and Swap Interest Warrants Contracts* Interest Warrants Obligations Agreements Agreements* Agreements Agreements*
Short S&P500® . . . . . . . — — $(2,774,717) — — $2,017,292,685 $298,264,461 $(265,346,751) $2,315,557,146 $(268,121,468)
Short QQQ® . . . . . . . . . . — — (426,096) — — 239,757,091 87,284,410 (53,513,528) 327,041,501 (53,939,624)
Short Dow30SM . . . . . . . — — (207,006) — — 246,711,039 55,588,005 (50,617,916) 302,299,044 (50,824,922)
Short MidCap400 . . . . . — — 7,869 — — — 14,683,786 (5,309,923) 14,683,786 (5,302,054)
Short Russell2000 . . . . . — — 211,417 — — 364,651,286 42,648,459 (75,302,386) 407,299,745 (75,090,969)
Short SmallCap600 . . . . — — — — — — 16,045,559 (2,620,316) 16,045,559 (2,620,316)
UltraShort S&P500® . . . — — (529,594) — — 1,657,299,047 156,083,063 (421,352,417) 1,813,382,110 (421,882,011)
UltraShort QQQ® . . . . . . — — (63,200) — — 317,485,673 81,481,928 (129,135,151) 398,967,601 (129,198,351)
UltraShort Dow30SM . . . — — (36,026) — — 234,704,122 50,889,965 (80,771,515) 285,594,087 (80,807,541)
UltraShort MidCap400 . — — 1,188 — — — 4,809,137 (4,287,469) 4,809,137 (4,286,281)
UltraShort Russell2000 . — — 86,014 — — 149,720,889 85,047,849 (68,072,515) 234,768,738 (67,986,501)
UltraShort SmallCap600 . . . . . . — — — — — — 2,444,283 (1,339,280) 2,444,283 (1,339,280)
UltraPro Short S&P500® . . . . — — (333,920) — — 768,844,606 173,735,805 (278,709,804) 942,580,411 (279,043,724)
UltraPro Short QQQ® . . — — (292,864) — — 664,273,591 159,682,364 (335,076,604) 823,955,955 (335,369,468)
UltraPro Short Dow30SM . . . . — — (14,219) — — 182,826,671 110,147,410 (91,770,050) 292,974,081 (91,784,269)
UltraPro Short MidCap400 . . . . . . . — — 1,676 — — — 2,793,485 (1,909,772) 2,793,485 (1,908,096)
UltraPro Short Russell2000 . . . . . . . — — 120,391 — — 99,829,136 27,095,672 (53,229,854) 126,924,808 (53,109,463)
Short Basic Materials . . — — — — — — 2,079,613 (913,270) 2,079,613 (913,270)
Short Financials . . . . . . — — — — — — 27,209,508 (9,293,468) 27,209,508 (9,293,468)
Short Oil & Gas . . . . . . . — — — — — — 2,741,546 (1,262,413) 2,741,546 (1,262,413)
Short Real Estate . . . . . — — — — — — 14,234,690 (2,960,082) 14,234,690 (2,960,082)
Short S&P Regional Banking . . — — — — — — 1,852,314 (371,871) 1,852,314 (371,871)
Merrill Corp - Proshares Trust Geared Book [96 Funds] Annual Report [Funds] 333-089822 05-31-2017 ED [AUX] | eperez | 28-Jul-17 17:44 | 17-15159-3.ka | Sequence: 3CHKSUM Content: 11042 Layout: 25596 Graphics: No Graphics CLEAN
JOB: 17-15159-3 CYCLE#;BL#: 5; 0 TRIM: 8.25" x 10.75" COMPOSITECOLORS: Black, ~note-color 2, ~note-color 3 GRAPHICS: none V1.5
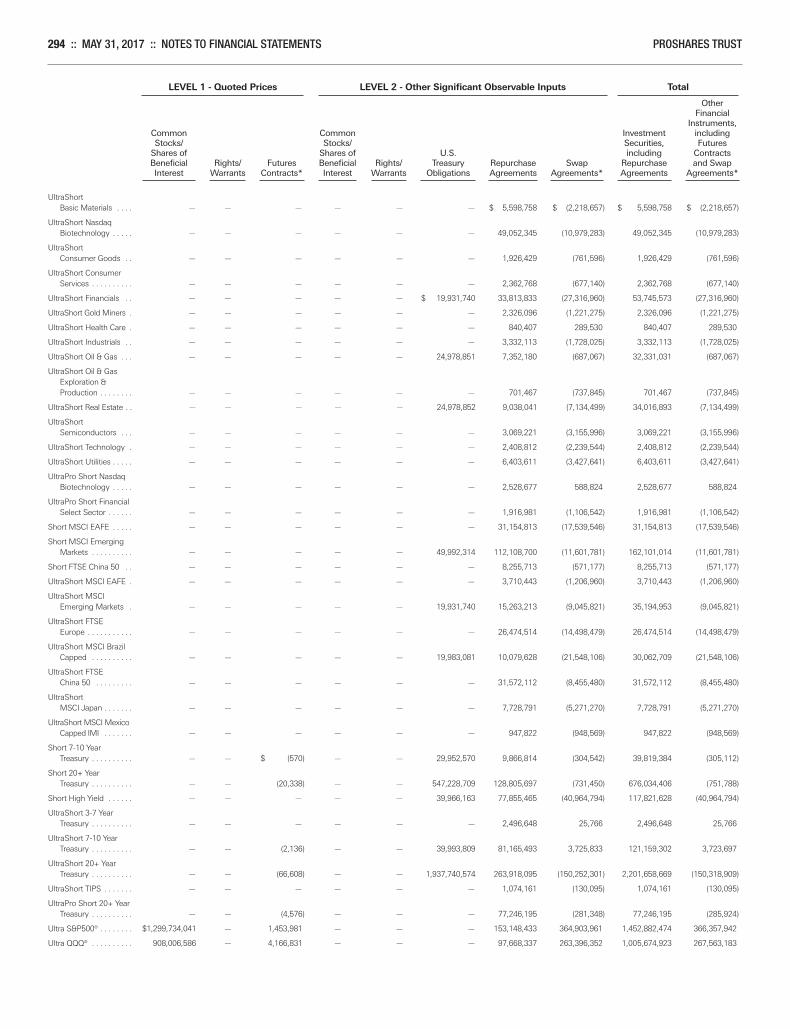
294 :: MAY 31, 2017 :: NOTES TO FINANCIAL STATEMENTS PROSHARES TRUST
LEVEL 1 - Quoted Prices LEVEL 2 - Other Significant Observable Inputs Total Other Financial Instruments, Common Common Investment including Stocks/ Stocks/ Securities, Futures Shares of Shares of U.S. including Contracts Beneficial Rights/ Futures Beneficial Rights/ Treasury Repurchase Swap Repurchase and Swap Interest Warrants Contracts* Interest Warrants Obligations Agreements Agreements* Agreements Agreements*
UltraShort Basic Materials . . . . — — — — — — $ 5,598,758 $ (2,218,657) $ 5,598,758 $ (2,218,657)
UltraShort Nasdaq Biotechnology . . . . . — — — — — — 49,052,345 (10,979,283) 49,052,345 (10,979,283)
UltraShort Consumer Goods . . — — — — — — 1,926,429 (761,596) 1,926,429 (761,596)
UltraShort Consumer Services . . . . . . . . . . — — — — — — 2,362,768 (677,140) 2,362,768 (677,140)
UltraShort Financials . . — — — — — $ 19,931,740 33,813,833 (27,316,960) 53,745,573 (27,316,960)
UltraShort Gold Miners . — — — — — — 2,326,096 (1,221,275) 2,326,096 (1,221,275)
UltraShort Health Care . — — — — — — 840,407 289,530 840,407 289,530
UltraShort Industrials . . — — — — — — 3,332,113 (1,728,025) 3,332,113 (1,728,025)
UltraShort Oil & Gas . . . — — — — — 24,978,851 7,352,180 (687,067) 32,331,031 (687,067)
UltraShort Oil & Gas Exploration & Production . . . . . . . . — — — — — — 701,467 (737,845) 701,467 (737,845)
UltraShort Real Estate . . — — — — — 24,978,852 9,038,041 (7,134,499) 34,016,893 (7,134,499)
UltraShort Semiconductors . . . — — — — — — 3,069,221 (3,155,996) 3,069,221 (3,155,996)
UltraShort Technology . — — — — — — 2,408,812 (2,239,544) 2,408,812 (2,239,544)
UltraShort Utilities . . . . . — — — — — — 6,403,611 (3,427,641) 6,403,611 (3,427,641)
UltraPro Short Nasdaq Biotechnology . . . . . — — — — — — 2,528,677 588,824 2,528,677 588,824
UltraPro Short Financial Select Sector . . . . . . — — — — — — 1,916,981 (1,106,542) 1,916,981 (1,106,542)
Short MSCI EAFE . . . . . — — — — — — 31,154,813 (17,539,546) 31,154,813 (17,539,546)
Short MSCI Emerging Markets . . . . . . . . . . — — — — — 49,992,314 112,108,700 (11,601,781) 162,101,014 (11,601,781)
Short FTSE China 50 . . — — — — — — 8,255,713 (571,177) 8,255,713 (571,177)
UltraShort MSCI EAFE . — — — — — — 3,710,443 (1,206,960) 3,710,443 (1,206,960)
UltraShort MSCI Emerging Markets . — — — — — 19,931,740 15,263,213 (9,045,821) 35,194,953 (9,045,821)
UltraShort FTSE Europe . . . . . . . . . . . — — — — — — 26,474,514 (14,498,479) 26,474,514 (14,498,479)
UltraShort MSCI Brazil Capped . . . . . . . . . . — — — — — 19,983,081 10,079,628 (21,548,106) 30,062,709 (21,548,106)
UltraShort FTSE China 50 . . . . . . . . . — — — — — — 31,572,112 (8,455,480) 31,572,112 (8,455,480)
UltraShort MSCI Japan . . . . . . . — — — — — — 7,728,791 (5,271,270) 7,728,791 (5,271,270)
UltraShort MSCI Mexico Capped IMI . . . . . . . — — — — — — 947,822 (948,569) 947,822 (948,569)
Short 7-10 Year Treasury . . . . . . . . . . — — $ (570) — — 29,952,570 9,866,814 (304,542) 39,819,384 (305,112)
Short 20+ Year Treasury . . . . . . . . . . — — (20,338) — — 547,228,709 128,805,697 (731,450) 676,034,406 (751,788)
Short High Yield . . . . . . — — — — — 39,966,163 77,855,465 (40,964,794) 117,821,628 (40,964,794)
UltraShort 3-7 Year Treasury . . . . . . . . . . — — — — — — 2,496,648 25,766 2,496,648 25,766
UltraShort 7-10 Year Treasury . . . . . . . . . . — — (2,136) — — 39,993,809 81,165,493 3,725,833 121,159,302 3,723,697
UltraShort 20+ Year Treasury . . . . . . . . . . — — (66,608) — — 1,937,740,574 263,918,095 (150,252,301) 2,201,658,669 (150,318,909)
UltraShort TIPS . . . . . . . — — — — — — 1,074,161 (130,095) 1,074,161 (130,095)
UltraPro Short 20+ Year Treasury . . . . . . . . . . — — (4,576) — — — 77,246,195 (281,348) 77,246,195 (285,924)
Ultra S&P500® . . . . . . . . $1,299,734,041 — 1,453,981 — — — 153,148,433 364,903,961 1,452,882,474 366,357,942
Ultra QQQ® . . . . . . . . . . 908,006,586 — 4,166,831 — — — 97,668,337 263,396,352 1,005,674,923 267,563,183
Merrill Corp - Proshares Trust Geared Book [96 Funds] Annual Report [Funds] 333-089822 05-31-2017 ED [AUX] | eperez | 28-Jul-17 17:44 | 17-15159-3.ka | Sequence: 4CHKSUM Content: 42667 Layout: 65156 Graphics: No Graphics CLEAN
JOB: 17-15159-3 CYCLE#;BL#: 5; 0 TRIM: 8.25" x 10.75" COMPOSITECOLORS: Black, ~note-color 2, ~note-color 3 GRAPHICS: none V1.5
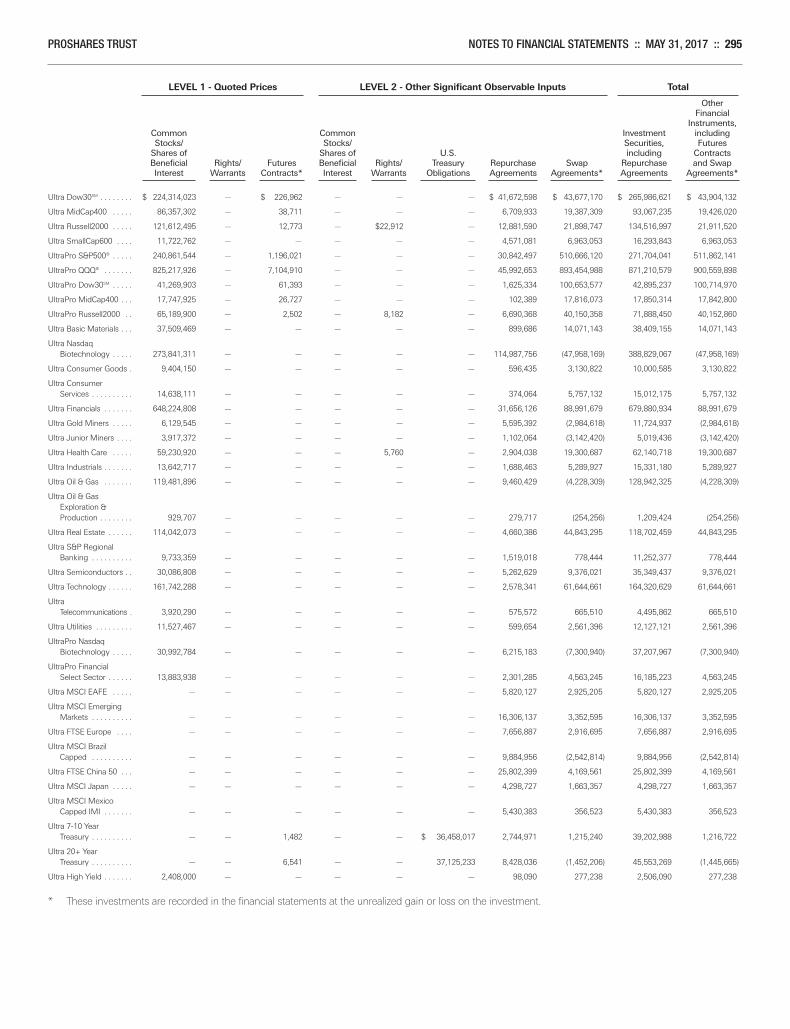
PROSHARES TRUST NOTES TO FINANCIAL STATEMENTS :: MAY 31, 2017 :: 295
LEVEL 1 - Quoted Prices LEVEL 2 - Other Significant Observable Inputs Total Other Financial Instruments, Common Common Investment including Stocks/ Stocks/ Securities, Futures Shares of Shares of U.S. including Contracts Beneficial Rights/ Futures Beneficial Rights/ Treasury Repurchase Swap Repurchase and Swap Interest Warrants Contracts* Interest Warrants Obligations Agreements Agreements* Agreements Agreements*
Ultra Dow30SM . . . . . . . . $ 224,314,023 — $ 226,962 — — — $ 41,672,598 $ 43,677,170 $ 265,986,621 $ 43,904,132
Ultra MidCap400 . . . . . 86,357,302 — 38,711 — — — 6,709,933 19,387,309 93,067,235 19,426,020
Ultra Russell2000 . . . . . 121,612,495 — 12,773 — $22,912 — 12,881,590 21,898,747 134,516,997 21,911,520
Ultra SmallCap600 . . . . 11,722,762 — — — — — 4,571,081 6,963,053 16,293,843 6,963,053
UltraPro S&P500® . . . . . 240,861,544 — 1,196,021 — — — 30,842,497 510,666,120 271,704,041 511,862,141
UltraPro QQQ® . . . . . . . 825,217,926 — 7,104,910 — — — 45,992,653 893,454,988 871,210,579 900,559,898
UltraPro Dow30SM . . . . . 41,269,903 — 61,393 — — — 1,625,334 100,653,577 42,895,237 100,714,970
UltraPro MidCap400 . . . 17,747,925 — 26,727 — — — 102,389 17,816,073 17,850,314 17,842,800
UltraPro Russell2000 . . 65,189,900 — 2,502 — 8,182 — 6,690,368 40,150,358 71,888,450 40,152,860
Ultra Basic Materials . . . 37,509,469 — — — — — 899,686 14,071,143 38,409,155 14,071,143
Ultra Nasdaq Biotechnology . . . . . 273,841,311 — — — — — 114,987,756 (47,958,169) 388,829,067 (47,958,169)
Ultra Consumer Goods . 9,404,150 — — — — — 596,435 3,130,822 10,000,585 3,130,822
Ultra Consumer Services . . . . . . . . . . 14,638,111 — — — — — 374,064 5,757,132 15,012,175 5,757,132
Ultra Financials . . . . . . . 648,224,808 — — — — — 31,656,126 88,991,679 679,880,934 88,991,679
Ultra Gold Miners . . . . . 6,129,545 — — — — — 5,595,392 (2,984,618) 11,724,937 (2,984,618)
Ultra Junior Miners . . . . 3,917,372 — — — — — 1,102,064 (3,142,420) 5,019,436 (3,142,420)
Ultra Health Care . . . . . 59,230,920 — — — 5,760 — 2,904,038 19,300,687 62,140,718 19,300,687
Ultra Industrials . . . . . . . 13,642,717 — — — — — 1,688,463 5,289,927 15,331,180 5,289,927
Ultra Oil & Gas . . . . . . . 119,481,896 — — — — — 9,460,429 (4,228,309) 128,942,325 (4,228,309)
Ultra Oil & Gas Exploration & Production . . . . . . . . 929,707 — — — — — 279,717 (254,256) 1,209,424 (254,256)
Ultra Real Estate . . . . . . 114,042,073 — — — — — 4,660,386 44,843,295 118,702,459 44,843,295
Ultra S&P Regional Banking . . . . . . . . . . 9,733,359 — — — — — 1,519,018 778,444 11,252,377 778,444
Ultra Semiconductors . . 30,086,808 — — — — — 5,262,629 9,376,021 35,349,437 9,376,021
Ultra Technology . . . . . . 161,742,288 — — — — — 2,578,341 61,644,661 164,320,629 61,644,661
Ultra Telecommunications . 3,920,290 — — — — — 575,572 665,510 4,495,862 665,510
Ultra Utilities . . . . . . . . . 11,527,467 — — — — — 599,654 2,561,396 12,127,121 2,561,396
UltraPro Nasdaq Biotechnology . . . . . 30,992,784 — — — — — 6,215,183 (7,300,940) 37,207,967 (7,300,940)
UltraPro Financial Select Sector . . . . . . 13,883,938 — — — — — 2,301,285 4,563,245 16,185,223 4,563,245
Ultra MSCI EAFE . . . . . — — — — — — 5,820,127 2,925,205 5,820,127 2,925,205
Ultra MSCI Emerging Markets . . . . . . . . . . — — — — — — 16,306,137 3,352,595 16,306,137 3,352,595
Ultra FTSE Europe . . . . — — — — — — 7,656,887 2,916,695 7,656,887 2,916,695
Ultra MSCI Brazil Capped . . . . . . . . . . — — — — — — 9,884,956 (2,542,814) 9,884,956 (2,542,814)
Ultra FTSE China 50 . . . — — — — — — 25,802,399 4,169,561 25,802,399 4,169,561
Ultra MSCI Japan . . . . . — — — — — — 4,298,727 1,663,357 4,298,727 1,663,357
Ultra MSCI Mexico Capped IMI . . . . . . . — — — — — — 5,430,383 356,523 5,430,383 356,523
Ultra 7-10 Year Treasury . . . . . . . . . . — — 1,482 — — $ 36,458,017 2,744,971 1,215,240 39,202,988 1,216,722
Ultra 20+ Year Treasury . . . . . . . . . . — — 6,541 — — 37,125,233 8,428,036 (1,452,206) 45,553,269 (1,445,665)
Ultra High Yield . . . . . . . 2,408,000 — — — — — 98,090 277,238 2,506,090 277,238
* These investments are recorded in the financial statements at the unrealized gain or loss on the investment.
Merrill Corp - Proshares Trust Geared Book [96 Funds] Annual Report [Funds] 333-089822 05-31-2017 ED [AUX] | eperez | 28-Jul-17 17:44 | 17-15159-3.ka | Sequence: 5CHKSUM Content: 50215 Layout: 54796 Graphics: No Graphics CLEAN
JOB: 17-15159-3 CYCLE#;BL#: 5; 0 TRIM: 8.25" x 10.75" COMPOSITECOLORS: Black, ~note-color 2, ~note-color 3 GRAPHICS: none V1.5
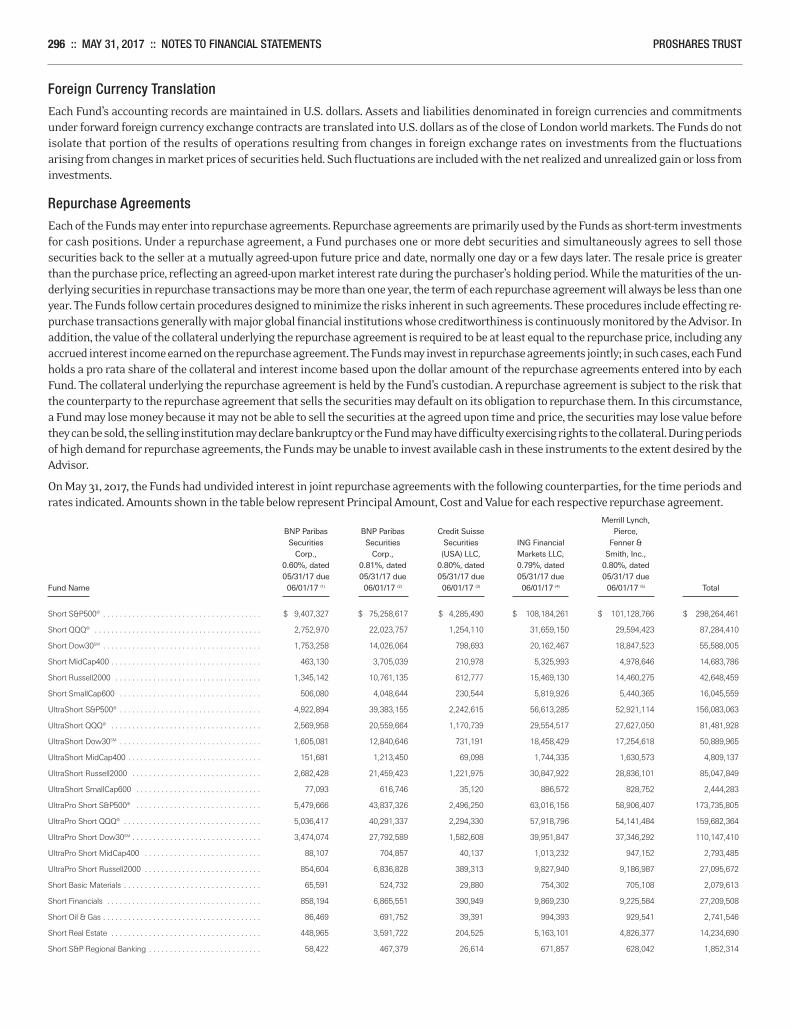
296 :: MAY 31, 2017 :: NOTES TO FINANCIAL STATEMENTS PROSHARES TRUST
Foreign Currency TranslationEach Fund’s accounting records are maintained in U.S. dollars. Assets and liabilities denominated in foreign currencies and commitmentsunder forward foreign currency exchange contracts are translated into U.S. dollars as of the close of London world markets. The Funds do notisolate that portion of the results of operations resulting from changes in foreign exchange rates on investments from the fluctuationsarising from changes in market prices of securities held. Such fluctuations are included with the net realized and unrealized gain or loss frominvestments.
Repurchase AgreementsEach of the Funds may enter into repurchase agreements. Repurchase agreements are primarily used by the Funds as short-term investmentsfor cash positions. Under a repurchase agreement, a Fund purchases one or more debt securities and simultaneously agrees to sell thosesecurities back to the seller at a mutually agreed-upon future price and date, normally one day or a few days later. The resale price is greaterthan the purchase price, reflecting an agreed-upon market interest rate during the purchaser’s holding period. While the maturities of the un-derlying securities in repurchase transactions may be more than one year, the term of each repurchase agreement will always be less than oneyear. The Funds follow certain procedures designed to minimize the risks inherent in such agreements. These procedures include effecting re-purchase transactions generally with major global financial institutions whose creditworthiness is continuously monitored by the Advisor. Inaddition, the value of the collateral underlying the repurchase agreement is required to be at least equal to the repurchase price, including anyaccrued interest income earned on the repurchase agreement. The Funds may invest in repurchase agreements jointly; in such cases, each Fundholds a pro rata share of the collateral and interest income based upon the dollar amount of the repurchase agreements entered into by eachFund. The collateral underlying the repurchase agreement is held by the Fund’s custodian. A repurchase agreement is subject to the risk thatthe counterparty to the repurchase agreement that sells the securities may default on its obligation to repurchase them. In this circumstance,a Fund may lose money because it may not be able to sell the securities at the agreed upon time and price, the securities may lose value beforethey can be sold, the selling institution may declare bankruptcy or the Fund may have difficulty exercising rights to the collateral. During periodsof high demand for repurchase agreements, the Funds may be unable to invest available cash in these instruments to the extent desired by theAdvisor.
On May 31, 2017, the Funds had undivided interest in joint repurchase agreements with the following counterparties, for the time periods andrates indicated. Amounts shown in the table below represent Principal Amount, Cost and Value for each respective repurchase agreement. Merrill Lynch, BNP Paribas BNP Paribas Credit Suisse Pierce, Securities Securities Securities ING Financial Fenner & Corp., Corp., (USA) LLC, Markets LLC, Smith, Inc., 0.60%, dated 0.81%, dated 0.80%, dated 0.79%, dated 0.80%, dated 05/31/17 due 05/31/17 due 05/31/17 due 05/31/17 due 05/31/17 due Fund Name 06/01/17 (1) 06/01/17 (2) 06/01/17 (3) 06/01/17 (4) 06/01/17 (5) Total
Short S&P500® . . . . . . . . . . . . . . . . . . . . . . . . . . . . . . . . . . . . . . $ 9,407,327 $ 75,258,617 $ 4,285,490 $ 108,184,261 $ 101,128,766 $ 298,264,461
Short QQQ® . . . . . . . . . . . . . . . . . . . . . . . . . . . . . . . . . . . . . . . . 2,752,970 22,023,757 1,254,110 31,659,150 29,594,423 87,284,410
Short Dow30SM . . . . . . . . . . . . . . . . . . . . . . . . . . . . . . . . . . . . . . 1,753,258 14,026,064 798,693 20,162,467 18,847,523 55,588,005
Short MidCap400 . . . . . . . . . . . . . . . . . . . . . . . . . . . . . . . . . . . . 463,130 3,705,039 210,978 5,325,993 4,978,646 14,683,786
Short Russell2000 . . . . . . . . . . . . . . . . . . . . . . . . . . . . . . . . . . . 1,345,142 10,761,135 612,777 15,469,130 14,460,275 42,648,459
Short SmallCap600 . . . . . . . . . . . . . . . . . . . . . . . . . . . . . . . . . . 506,080 4,048,644 230,544 5,819,926 5,440,365 16,045,559
UltraShort S&P500® . . . . . . . . . . . . . . . . . . . . . . . . . . . . . . . . . . 4,922,894 39,383,155 2,242,615 56,613,285 52,921,114 156,083,063
UltraShort QQQ® . . . . . . . . . . . . . . . . . . . . . . . . . . . . . . . . . . . . 2,569,958 20,559,664 1,170,739 29,554,517 27,627,050 81,481,928
UltraShort Dow30SM . . . . . . . . . . . . . . . . . . . . . . . . . . . . . . . . . . 1,605,081 12,840,646 731,191 18,458,429 17,254,618 50,889,965
UltraShort MidCap400 . . . . . . . . . . . . . . . . . . . . . . . . . . . . . . . . 151,681 1,213,450 69,098 1,744,335 1,630,573 4,809,137
UltraShort Russell2000 . . . . . . . . . . . . . . . . . . . . . . . . . . . . . . . 2,682,428 21,459,423 1,221,975 30,847,922 28,836,101 85,047,849
UltraShort SmallCap600 . . . . . . . . . . . . . . . . . . . . . . . . . . . . . . 77,093 616,746 35,120 886,572 828,752 2,444,283
UltraPro Short S&P500® . . . . . . . . . . . . . . . . . . . . . . . . . . . . . . 5,479,666 43,837,326 2,496,250 63,016,156 58,906,407 173,735,805
UltraPro Short QQQ® . . . . . . . . . . . . . . . . . . . . . . . . . . . . . . . . . 5,036,417 40,291,337 2,294,330 57,918,796 54,141,484 159,682,364
UltraPro Short Dow30SM . . . . . . . . . . . . . . . . . . . . . . . . . . . . . . . 3,474,074 27,792,589 1,582,608 39,951,847 37,346,292 110,147,410
UltraPro Short MidCap400 . . . . . . . . . . . . . . . . . . . . . . . . . . . . 88,107 704,857 40,137 1,013,232 947,152 2,793,485
UltraPro Short Russell2000 . . . . . . . . . . . . . . . . . . . . . . . . . . . . 854,604 6,836,828 389,313 9,827,940 9,186,987 27,095,672
Short Basic Materials . . . . . . . . . . . . . . . . . . . . . . . . . . . . . . . . . 65,591 524,732 29,880 754,302 705,108 2,079,613
Short Financials . . . . . . . . . . . . . . . . . . . . . . . . . . . . . . . . . . . . . 858,194 6,865,551 390,949 9,869,230 9,225,584 27,209,508
Short Oil & Gas . . . . . . . . . . . . . . . . . . . . . . . . . . . . . . . . . . . . . . 86,469 691,752 39,391 994,393 929,541 2,741,546
Short Real Estate . . . . . . . . . . . . . . . . . . . . . . . . . . . . . . . . . . . . 448,965 3,591,722 204,525 5,163,101 4,826,377 14,234,690
Short S&P Regional Banking . . . . . . . . . . . . . . . . . . . . . . . . . . . 58,422 467,379 26,614 671,857 628,042 1,852,314
Merrill Corp - Proshares Trust Geared Book [96 Funds] Annual Report [Funds] 333-089822 05-31-2017 ED [AUX] | eperez | 28-Jul-17 17:44 | 17-15159-3.ka | Sequence: 6CHKSUM Content: 57514 Layout: 55311 Graphics: No Graphics CLEAN
JOB: 17-15159-3 CYCLE#;BL#: 5; 0 TRIM: 8.25" x 10.75" COMPOSITECOLORS: Black, ~note-color 2, ~note-color 3 GRAPHICS: none V1.5
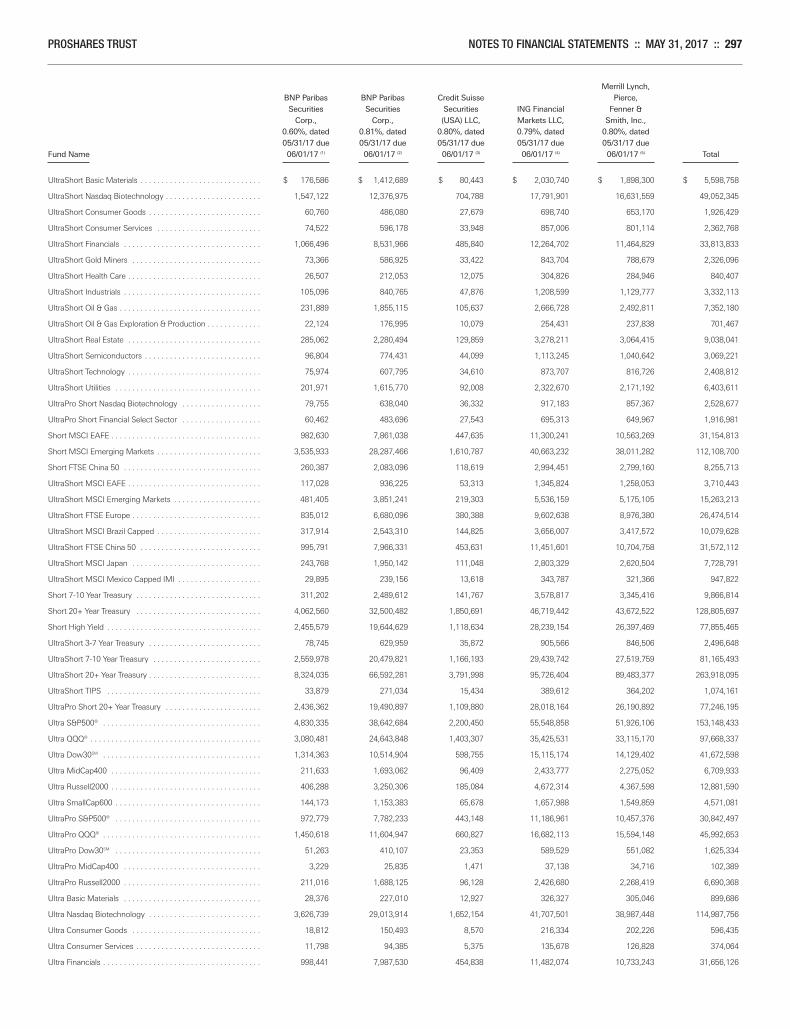
PROSHARES TRUST NOTES TO FINANCIAL STATEMENTS :: MAY 31, 2017 :: 297
Merrill Lynch, BNP Paribas BNP Paribas Credit Suisse Pierce, Securities Securities Securities ING Financial Fenner & Corp., Corp., (USA) LLC, Markets LLC, Smith, Inc., 0.60%, dated 0.81%, dated 0.80%, dated 0.79%, dated 0.80%, dated 05/31/17 due 05/31/17 due 05/31/17 due 05/31/17 due 05/31/17 due Fund Name 06/01/17 (1) 06/01/17 (2) 06/01/17 (3) 06/01/17 (4) 06/01/17 (5) Total
UltraShort Basic Materials . . . . . . . . . . . . . . . . . . . . . . . . . . . . . $ 176,586 $ 1,412,689 $ 80,443 $ 2,030,740 $ 1,898,300 $ 5,598,758
UltraShort Nasdaq Biotechnology . . . . . . . . . . . . . . . . . . . . . . . 1,547,122 12,376,975 704,788 17,791,901 16,631,559 49,052,345
UltraShort Consumer Goods . . . . . . . . . . . . . . . . . . . . . . . . . . . 60,760 486,080 27,679 698,740 653,170 1,926,429
UltraShort Consumer Services . . . . . . . . . . . . . . . . . . . . . . . . . 74,522 596,178 33,948 857,006 801,114 2,362,768
UltraShort Financials . . . . . . . . . . . . . . . . . . . . . . . . . . . . . . . . . 1,066,496 8,531,966 485,840 12,264,702 11,464,829 33,813,833
UltraShort Gold Miners . . . . . . . . . . . . . . . . . . . . . . . . . . . . . . . 73,366 586,925 33,422 843,704 788,679 2,326,096
UltraShort Health Care . . . . . . . . . . . . . . . . . . . . . . . . . . . . . . . . 26,507 212,053 12,075 304,826 284,946 840,407
UltraShort Industrials . . . . . . . . . . . . . . . . . . . . . . . . . . . . . . . . . 105,096 840,765 47,876 1,208,599 1,129,777 3,332,113
UltraShort Oil & Gas . . . . . . . . . . . . . . . . . . . . . . . . . . . . . . . . . . 231,889 1,855,115 105,637 2,666,728 2,492,811 7,352,180
UltraShort Oil & Gas Exploration & Production . . . . . . . . . . . . . 22,124 176,995 10,079 254,431 237,838 701,467
UltraShort Real Estate . . . . . . . . . . . . . . . . . . . . . . . . . . . . . . . . 285,062 2,280,494 129,859 3,278,211 3,064,415 9,038,041
UltraShort Semiconductors . . . . . . . . . . . . . . . . . . . . . . . . . . . . 96,804 774,431 44,099 1,113,245 1,040,642 3,069,221
UltraShort Technology . . . . . . . . . . . . . . . . . . . . . . . . . . . . . . . . 75,974 607,795 34,610 873,707 816,726 2,408,812
UltraShort Utilities . . . . . . . . . . . . . . . . . . . . . . . . . . . . . . . . . . . 201,971 1,615,770 92,008 2,322,670 2,171,192 6,403,611
UltraPro Short Nasdaq Biotechnology . . . . . . . . . . . . . . . . . . . 79,755 638,040 36,332 917,183 857,367 2,528,677
UltraPro Short Financial Select Sector . . . . . . . . . . . . . . . . . . . 60,462 483,696 27,543 695,313 649,967 1,916,981
Short MSCI EAFE . . . . . . . . . . . . . . . . . . . . . . . . . . . . . . . . . . . . 982,630 7,861,038 447,635 11,300,241 10,563,269 31,154,813
Short MSCI Emerging Markets . . . . . . . . . . . . . . . . . . . . . . . . . 3,535,933 28,287,466 1,610,787 40,663,232 38,011,282 112,108,700
Short FTSE China 50 . . . . . . . . . . . . . . . . . . . . . . . . . . . . . . . . . 260,387 2,083,096 118,619 2,994,451 2,799,160 8,255,713
UltraShort MSCI EAFE . . . . . . . . . . . . . . . . . . . . . . . . . . . . . . . . 117,028 936,225 53,313 1,345,824 1,258,053 3,710,443
UltraShort MSCI Emerging Markets . . . . . . . . . . . . . . . . . . . . . 481,405 3,851,241 219,303 5,536,159 5,175,105 15,263,213
UltraShort FTSE Europe . . . . . . . . . . . . . . . . . . . . . . . . . . . . . . . 835,012 6,680,096 380,388 9,602,638 8,976,380 26,474,514
UltraShort MSCI Brazil Capped . . . . . . . . . . . . . . . . . . . . . . . . . 317,914 2,543,310 144,825 3,656,007 3,417,572 10,079,628
UltraShort FTSE China 50 . . . . . . . . . . . . . . . . . . . . . . . . . . . . . 995,791 7,966,331 453,631 11,451,601 10,704,758 31,572,112
UltraShort MSCI Japan . . . . . . . . . . . . . . . . . . . . . . . . . . . . . . . 243,768 1,950,142 111,048 2,803,329 2,620,504 7,728,791
UltraShort MSCI Mexico Capped IMI . . . . . . . . . . . . . . . . . . . . 29,895 239,156 13,618 343,787 321,366 947,822
Short 7-10 Year Treasury . . . . . . . . . . . . . . . . . . . . . . . . . . . . . . 311,202 2,489,612 141,767 3,578,817 3,345,416 9,866,814
Short 20+ Year Treasury . . . . . . . . . . . . . . . . . . . . . . . . . . . . . . 4,062,560 32,500,482 1,850,691 46,719,442 43,672,522 128,805,697
Short High Yield . . . . . . . . . . . . . . . . . . . . . . . . . . . . . . . . . . . . . 2,455,579 19,644,629 1,118,634 28,239,154 26,397,469 77,855,465
UltraShort 3-7 Year Treasury . . . . . . . . . . . . . . . . . . . . . . . . . . . 78,745 629,959 35,872 905,566 846,506 2,496,648
UltraShort 7-10 Year Treasury . . . . . . . . . . . . . . . . . . . . . . . . . . 2,559,978 20,479,821 1,166,193 29,439,742 27,519,759 81,165,493
UltraShort 20+ Year Treasury . . . . . . . . . . . . . . . . . . . . . . . . . . . 8,324,035 66,592,281 3,791,998 95,726,404 89,483,377 263,918,095
UltraShort TIPS . . . . . . . . . . . . . . . . . . . . . . . . . . . . . . . . . . . . . 33,879 271,034 15,434 389,612 364,202 1,074,161
UltraPro Short 20+ Year Treasury . . . . . . . . . . . . . . . . . . . . . . . 2,436,362 19,490,897 1,109,880 28,018,164 26,190,892 77,246,195
Ultra S&P500® . . . . . . . . . . . . . . . . . . . . . . . . . . . . . . . . . . . . . . 4,830,335 38,642,684 2,200,450 55,548,858 51,926,106 153,148,433
Ultra QQQ® . . . . . . . . . . . . . . . . . . . . . . . . . . . . . . . . . . . . . . . . . 3,080,481 24,643,848 1,403,307 35,425,531 33,115,170 97,668,337
Ultra Dow30SM . . . . . . . . . . . . . . . . . . . . . . . . . . . . . . . . . . . . . . 1,314,363 10,514,904 598,755 15,115,174 14,129,402 41,672,598
Ultra MidCap400 . . . . . . . . . . . . . . . . . . . . . . . . . . . . . . . . . . . . 211,633 1,693,062 96,409 2,433,777 2,275,052 6,709,933
Ultra Russell2000 . . . . . . . . . . . . . . . . . . . . . . . . . . . . . . . . . . . . 406,288 3,250,306 185,084 4,672,314 4,367,598 12,881,590
Ultra SmallCap600 . . . . . . . . . . . . . . . . . . . . . . . . . . . . . . . . . . . 144,173 1,153,383 65,678 1,657,988 1,549,859 4,571,081
UltraPro S&P500® . . . . . . . . . . . . . . . . . . . . . . . . . . . . . . . . . . . 972,779 7,782,233 443,148 11,186,961 10,457,376 30,842,497
UltraPro QQQ® . . . . . . . . . . . . . . . . . . . . . . . . . . . . . . . . . . . . . . 1,450,618 11,604,947 660,827 16,682,113 15,594,148 45,992,653
UltraPro Dow30SM . . . . . . . . . . . . . . . . . . . . . . . . . . . . . . . . . . . 51,263 410,107 23,353 589,529 551,082 1,625,334
UltraPro MidCap400 . . . . . . . . . . . . . . . . . . . . . . . . . . . . . . . . . 3,229 25,835 1,471 37,138 34,716 102,389
UltraPro Russell2000 . . . . . . . . . . . . . . . . . . . . . . . . . . . . . . . . . 211,016 1,688,125 96,128 2,426,680 2,268,419 6,690,368
Ultra Basic Materials . . . . . . . . . . . . . . . . . . . . . . . . . . . . . . . . . 28,376 227,010 12,927 326,327 305,046 899,686
Ultra Nasdaq Biotechnology . . . . . . . . . . . . . . . . . . . . . . . . . . . 3,626,739 29,013,914 1,652,154 41,707,501 38,987,448 114,987,756
Ultra Consumer Goods . . . . . . . . . . . . . . . . . . . . . . . . . . . . . . . 18,812 150,493 8,570 216,334 202,226 596,435
Ultra Consumer Services . . . . . . . . . . . . . . . . . . . . . . . . . . . . . . 11,798 94,385 5,375 135,678 126,828 374,064
Ultra Financials . . . . . . . . . . . . . . . . . . . . . . . . . . . . . . . . . . . . . . 998,441 7,987,530 454,838 11,482,074 10,733,243 31,656,126
Merrill Corp - Proshares Trust Geared Book [96 Funds] Annual Report [Funds] 333-089822 05-31-2017 ED [AUX] | eperez | 28-Jul-17 17:44 | 17-15159-3.ka | Sequence: 7CHKSUM Content: 6274 Layout: 49304 Graphics: No Graphics CLEAN
JOB: 17-15159-3 CYCLE#;BL#: 5; 0 TRIM: 8.25" x 10.75" COMPOSITECOLORS: Black, ~note-color 2, ~note-color 3 GRAPHICS: none V1.5
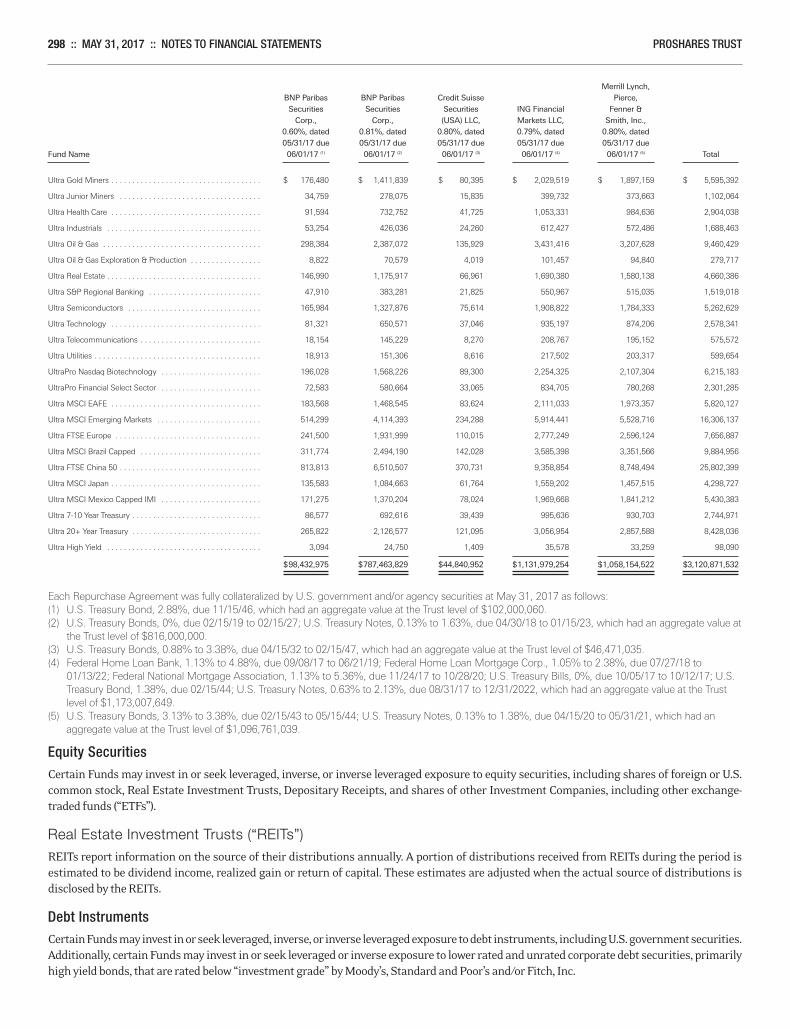
298 :: MAY 31, 2017 :: NOTES TO FINANCIAL STATEMENTS PROSHARES TRUST
Merrill Lynch, BNP Paribas BNP Paribas Credit Suisse Pierce, Securities Securities Securities ING Financial Fenner & Corp., Corp., (USA) LLC, Markets LLC, Smith, Inc., 0.60%, dated 0.81%, dated 0.80%, dated 0.79%, dated 0.80%, dated 05/31/17 due 05/31/17 due 05/31/17 due 05/31/17 due 05/31/17 due Fund Name 06/01/17 (1) 06/01/17 (2) 06/01/17 (3) 06/01/17 (4) 06/01/17 (5) Total
Ultra Gold Miners . . . . . . . . . . . . . . . . . . . . . . . . . . . . . . . . . . . . $ 176,480 $ 1,411,839 $ 80,395 $ 2,029,519 $ 1,897,159 $ 5,595,392
Ultra Junior Miners . . . . . . . . . . . . . . . . . . . . . . . . . . . . . . . . . . 34,759 278,075 15,835 399,732 373,663 1,102,064
Ultra Health Care . . . . . . . . . . . . . . . . . . . . . . . . . . . . . . . . . . . . 91,594 732,752 41,725 1,053,331 984,636 2,904,038
Ultra Industrials . . . . . . . . . . . . . . . . . . . . . . . . . . . . . . . . . . . . . 53,254 426,036 24,260 612,427 572,486 1,688,463
Ultra Oil & Gas . . . . . . . . . . . . . . . . . . . . . . . . . . . . . . . . . . . . . . 298,384 2,387,072 135,929 3,431,416 3,207,628 9,460,429
Ultra Oil & Gas Exploration & Production . . . . . . . . . . . . . . . . . 8,822 70,579 4,019 101,457 94,840 279,717
Ultra Real Estate . . . . . . . . . . . . . . . . . . . . . . . . . . . . . . . . . . . . . 146,990 1,175,917 66,961 1,690,380 1,580,138 4,660,386
Ultra S&P Regional Banking . . . . . . . . . . . . . . . . . . . . . . . . . . . 47,910 383,281 21,825 550,967 515,035 1,519,018
Ultra Semiconductors . . . . . . . . . . . . . . . . . . . . . . . . . . . . . . . . 165,984 1,327,876 75,614 1,908,822 1,784,333 5,262,629
Ultra Technology . . . . . . . . . . . . . . . . . . . . . . . . . . . . . . . . . . . . 81,321 650,571 37,046 935,197 874,206 2,578,341
Ultra Telecommunications . . . . . . . . . . . . . . . . . . . . . . . . . . . . . 18,154 145,229 8,270 208,767 195,152 575,572
Ultra Utilities . . . . . . . . . . . . . . . . . . . . . . . . . . . . . . . . . . . . . . . . 18,913 151,306 8,616 217,502 203,317 599,654
UltraPro Nasdaq Biotechnology . . . . . . . . . . . . . . . . . . . . . . . . 196,028 1,568,226 89,300 2,254,325 2,107,304 6,215,183
UltraPro Financial Select Sector . . . . . . . . . . . . . . . . . . . . . . . . 72,583 580,664 33,065 834,705 780,268 2,301,285
Ultra MSCI EAFE . . . . . . . . . . . . . . . . . . . . . . . . . . . . . . . . . . . . 183,568 1,468,545 83,624 2,111,033 1,973,357 5,820,127
Ultra MSCI Emerging Markets . . . . . . . . . . . . . . . . . . . . . . . . . 514,299 4,114,393 234,288 5,914,441 5,528,716 16,306,137
Ultra FTSE Europe . . . . . . . . . . . . . . . . . . . . . . . . . . . . . . . . . . . 241,500 1,931,999 110,015 2,777,249 2,596,124 7,656,887
Ultra MSCI Brazil Capped . . . . . . . . . . . . . . . . . . . . . . . . . . . . . 311,774 2,494,190 142,028 3,585,398 3,351,566 9,884,956
Ultra FTSE China 50 . . . . . . . . . . . . . . . . . . . . . . . . . . . . . . . . . . 813,813 6,510,507 370,731 9,358,854 8,748,494 25,802,399
Ultra MSCI Japan . . . . . . . . . . . . . . . . . . . . . . . . . . . . . . . . . . . . 135,583 1,084,663 61,764 1,559,202 1,457,515 4,298,727
Ultra MSCI Mexico Capped IMI . . . . . . . . . . . . . . . . . . . . . . . . 171,275 1,370,204 78,024 1,969,668 1,841,212 5,430,383
Ultra 7-10 Year Treasury . . . . . . . . . . . . . . . . . . . . . . . . . . . . . . . 86,577 692,616 39,439 995,636 930,703 2,744,971
Ultra 20+ Year Treasury . . . . . . . . . . . . . . . . . . . . . . . . . . . . . . . 265,822 2,126,577 121,095 3,056,954 2,857,588 8,428,036
Ultra High Yield . . . . . . . . . . . . . . . . . . . . . . . . . . . . . . . . . . . . . 3,094 24,750 1,409 35,578 33,259 98,090 $98,432,975 $787,463,829 $44,840,952 $1,131,979,254 $1,058,154,522 $3,120,871,532
Each Repurchase Agreement was fully collateralized by U.S. government and/or agency securities at May 31, 2017 as follows:
(1) U.S. Treasury Bond, 2.88%, due 11/15/46, which had an aggregate value at the Trust level of $102,000,060.
(2) U.S. Treasury Bonds, 0%, due 02/15/19 to 02/15/27; U.S. Treasury Notes, 0.13% to 1.63%, due 04/30/18 to 01/15/23, which had an aggregate value at
the Trust level of $816,000,000.
(3) U.S. Treasury Bonds, 0.88% to 3.38%, due 04/15/32 to 02/15/47, which had an aggregate value at the Trust level of $46,471,035.
(4) Federal Home Loan Bank, 1.13% to 4.88%, due 09/08/17 to 06/21/19; Federal Home Loan Mortgage Corp., 1.05% to 2.38%, due 07/27/18 to
01/13/22; Federal National Mortgage Association, 1.13% to 5.36%, due 11/24/17 to 10/28/20; U.S. Treasury Bills, 0%, due 10/05/17 to 10/12/17; U.S.
Treasury Bond, 1.38%, due 02/15/44; U.S. Treasury Notes, 0.63% to 2.13%, due 08/31/17 to 12/31/2022, which had an aggregate value at the Trust
level of $1,173,007,649.
(5) U.S. Treasury Bonds, 3.13% to 3.38%, due 02/15/43 to 05/15/44; U.S. Treasury Notes, 0.13% to 1.38%, due 04/15/20 to 05/31/21, which had an
aggregate value at the Trust level of $1,096,761,039.
Equity SecuritiesCertain Funds may invest in or seek leveraged, inverse, or inverse leveraged exposure to equity securities, including shares of foreign or U.S.common stock, Real Estate Investment Trusts, Depositary Receipts, and shares of other Investment Companies, including other exchange-traded funds (“ETFs”).
Real Estate Investment Trusts (“REITs”)REITs report information on the source of their distributions annually. A portion of distributions received from REITs during the period is estimated to be dividend income, realized gain or return of capital. These estimates are adjusted when the actual source of distributions is disclosed by the REITs.
Debt InstrumentsCertain Funds may invest in or seek leveraged, inverse, or inverse leveraged exposure to debt instruments, including U.S. government securities.Additionally, certain Funds may invest in or seek leveraged or inverse exposure to lower rated and unrated corporate debt securities, primarilyhigh yield bonds, that are rated below “investment grade” by Moody’s, Standard and Poor’s and/or Fitch, Inc.
Merrill Corp - Proshares Trust Geared Book [96 Funds] Annual Report [Funds] 333-089822 05-31-2017 ED [AUX] | eperez | 28-Jul-17 17:44 | 17-15159-3.ka | Sequence: 8CHKSUM Content: 3606 Layout: 61108 Graphics: No Graphics CLEAN
JOB: 17-15159-3 CYCLE#;BL#: 5; 0 TRIM: 8.25" x 10.75" COMPOSITECOLORS: Black, ~note-color 2, ~note-color 3 GRAPHICS: none V1.5
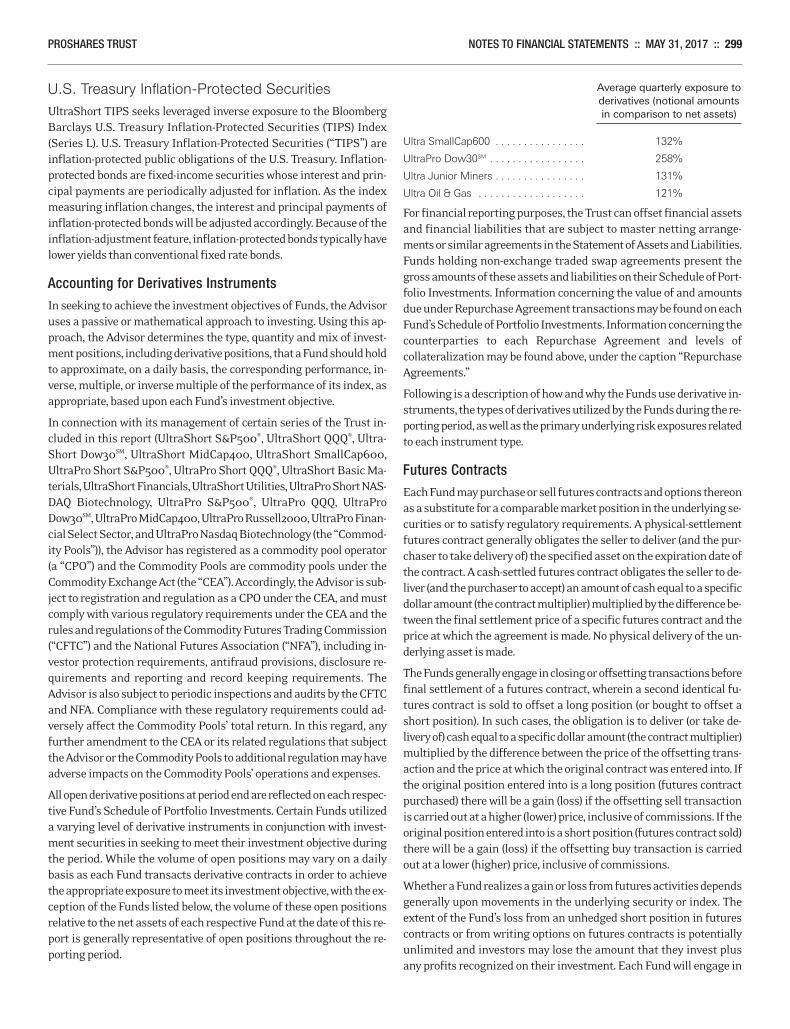
PROSHARES TRUST NOTES TO FINANCIAL STATEMENTS :: MAY 31, 2017 :: 299
U.S. Treasury Inflation-Protected SecuritiesUltraShort TIPS seeks leveraged inverse exposure to the BloombergBarclays U.S. Treasury Inflation-Protected Securities (TIPS) Index (Series L). U.S. Treasury Inflation-Protected Securities (“TIPS”) are inflation-protected public obligations of the U.S. Treasury. Inflation-protected bonds are fixed-income securities whose interest and prin-cipal payments are periodically adjusted for inflation. As the indexmeasuring inflation changes, the interest and principal payments ofinflation-protected bonds will be adjusted accordingly. Because of theinflation-adjustment feature, inflation-protected bonds typically havelower yields than conventional fixed rate bonds.
Accounting for Derivatives InstrumentsIn seeking to achieve the investment objectives of Funds, the Advisoruses a passive or mathematical approach to investing. Using this ap-proach, the Advisor determines the type, quantity and mix of invest-ment positions, including derivative positions, that a Fund should holdto approximate, on a daily basis, the corresponding performance, in-verse, multiple, or inverse multiple of the performance of its index, asappropriate, based upon each Fund’s investment objective.
In connection with its management of certain series of the Trust in-cluded in this report (UltraShort S&P500®, UltraShort QQQ®, Ultra-Short Dow30SM, UltraShort MidCap400, UltraShort SmallCap600,UltraPro Short S&P500®, UltraPro Short QQQ®, UltraShort Basic Ma-terials, UltraShort Financials, UltraShort Utilities, UltraPro Short NAS-DAQ Biotechnology, UltraPro S&P500®, UltraPro QQQ, UltraProDow30SM, UltraPro MidCap400, UltraPro Russell2000, UltraPro Finan-cial Select Sector, and UltraPro Nasdaq Biotechnology (the “Commod-ity Pools”)), the Advisor has registered as a commodity pool operator(a “CPO”) and the Commodity Pools are commodity pools under theCommodity Exchange Act (the “CEA”). Accordingly, the Advisor is sub-ject to registration and regulation as a CPO under the CEA, and mustcomply with various regulatory requirements under the CEA and therules and regulations of the Commodity Futures Trading Commission(“CFTC”) and the National Futures Association (“NFA”), including in-vestor protection requirements, antifraud provisions, disclosure re-quirements and reporting and record keeping requirements. TheAdvisor is also subject to periodic inspections and audits by the CFTCand NFA. Compliance with these regulatory requirements could ad-versely affect the Commodity Pools’ total return. In this regard, anyfurther amendment to the CEA or its related regulations that subjectthe Advisor or the Commodity Pools to additional regulation may haveadverse impacts on the Commodity Pools’ operations and expenses.
All open derivative positions at period end are reflected on each respec-tive Fund’s Schedule of Portfolio Investments. Certain Funds utilizeda varying level of derivative instruments in conjunction with invest-ment securities in seeking to meet their investment objective duringthe period. While the volume of open positions may vary on a dailybasis as each Fund transacts derivative contracts in order to achievethe appropriate exposure to meet its investment objective, with the ex-ception of the Funds listed below, the volume of these open positionsrelative to the net assets of each respective Fund at the date of this re-port is generally representative of open positions throughout the re-porting period.
Average quarterly exposure to derivatives (notional amounts in comparison to net assets)
Ultra SmallCap600 . . . . . . . . . . . . . . . . 132%
UltraPro Dow30SM . . . . . . . . . . . . . . . . . 258%
Ultra Junior Miners . . . . . . . . . . . . . . . . 131%
Ultra Oil & Gas . . . . . . . . . . . . . . . . . . . 121%
For financial reporting purposes, the Trust can offset financial assetsand financial liabilities that are subject to master netting arrange-ments or similar agreements in the Statement of Assets and Liabilities.Funds holding non-exchange traded swap agreements present thegross amounts of these assets and liabilities on their Schedule of Port-folio Investments. Information concerning the value of and amountsdue under Repurchase Agreement transactions may be found on eachFund’s Schedule of Portfolio Investments. Information concerning thecounterparties to each Repurchase Agreement and levels of collateralization may be found above, under the caption “Repurchase Agreements.”
Following is a description of how and why the Funds use derivative in-struments, the types of derivatives utilized by the Funds during the re-porting period, as well as the primary underlying risk exposures relatedto each instrument type.
Futures ContractsEach Fund may purchase or sell futures contracts and options thereonas a substitute for a comparable market position in the underlying se-curities or to satisfy regulatory requirements. A physical-settlementfutures contract generally obligates the seller to deliver (and the pur-chaser to take delivery of) the specified asset on the expiration date ofthe contract. A cash-settled futures contract obligates the seller to de-liver (and the purchaser to accept) an amount of cash equal to a specificdollar amount (the contract multiplier) multiplied by the difference be-tween the final settlement price of a specific futures contract and theprice at which the agreement is made. No physical delivery of the un-derlying asset is made.
The Funds generally engage in closing or offsetting transactions beforefinal settlement of a futures contract, wherein a second identical fu-tures contract is sold to offset a long position (or bought to offset ashort position). In such cases, the obligation is to deliver (or take de-livery of) cash equal to a specific dollar amount (the contract multiplier)multiplied by the difference between the price of the offsetting trans-action and the price at which the original contract was entered into. Ifthe original position entered into is a long position (futures contractpurchased) there will be a gain (loss) if the offsetting sell transactionis carried out at a higher (lower) price, inclusive of commissions. If theoriginal position entered into is a short position (futures contract sold)there will be a gain (loss) if the offsetting buy transaction is carriedout at a lower (higher) price, inclusive of commissions.
Whether a Fund realizes a gain or loss from futures activities dependsgenerally upon movements in the underlying security or index. Theextent of the Fund’s loss from an unhedged short position in futurescontracts or from writing options on futures contracts is potentiallyunlimited and investors may lose the amount that they invest plusany profits recognized on their investment. Each Fund will engage in
Merrill Corp - Proshares Trust Geared Book [96 Funds] Annual Report [Funds] 333-089822 05-31-2017 ED [AUX] | eperez | 28-Jul-17 17:44 | 17-15159-3.ka | Sequence: 9CHKSUM Content: 38536 Layout: 5222 Graphics: No Graphics CLEAN
JOB: 17-15159-3 CYCLE#;BL#: 5; 0 TRIM: 8.25" x 10.75" COMPOSITECOLORS: Black, ~note-color 2, ~note-color 3 GRAPHICS: none V1.5
300 :: MAY 31, 2017 :: NOTES TO FINANCIAL STATEMENTS PROSHARES TRUST
transactions in futures contracts and related options that are tradedon a U.S. exchange or board of trade or that have been approved for salein the U.S. by the CFTC.
Upon entering into a futures contract, each Fund will be required todeposit with the broker an amount of cash or cash equivalents in therange of approximately 5% to 10% of the contract amount for equity,index futures and in the range of approximately 1% to 3% of the con-tract amount for bond futures (these amounts are subject to changeby the exchange on which the contract is traded). This amount, knownas “initial margin,” is in the nature of a performance bond or good faithdeposit on the contract and is returned to the Fund upon terminationof the futures contract, assuming all contractual obligations have beensatisfied. Subsequent payments, known as “variation margin,” to andfrom the broker will be made as the price of the index underlying thefutures contract fluctuates, making the long and short positions in thefutures contract more or less valuable, a process known as “marking-to-market.” At any time prior to expiration of a futures contract, a Fundmay elect to close its position by taking an opposite position, whichwill operate to terminate the Fund’s existing position in the contract.
The primary risks associated with the use of futures contracts are im-perfect correlation between movements in the price of the futures andthe market value of the underlying assets, and the possibility of anilliquid market for a futures contract. Although each Fund intends tosell futures contracts only if there is an active market for such con-tracts, no assurance can be given that a liquid market will exist for anyparticular contract at any particular time. Many futures exchangesand boards of trade limit the amount of fluctuation permitted in fu-tures contract prices during a single trading day. Once the daily limithas been reached in a particular contract, no trades may be made thatday at a price beyond that limit, or trading may be suspended for spec-ified periods during the day. Futures contract prices could move to thelimit for several consecutive trading days with little or no trading,thereby preventing prompt liquidation of futures positions and poten-tially subjecting a Fund to substantial losses. If trading is not possible,or if a Fund determines not to close a futures position in anticipationof adverse price movements, the Fund will be required to make dailycash payments of variation margin. The risk that the Fund will be un-able to close out a futures position will be minimized by entering intosuch transactions on a national exchange with an active and liquidsecondary market. In addition, although the counterparty to a futurescontract is often a clearing organization, backed by a group of financialinstitutions, there may be instances in which the counterparty couldfail to perform its obligations, causing significant losses to a Fund.
Forward Currency ContractsEach Fund may invest in forward currency contracts for investmentor risk management purposes. A forward currency contract is an obli-gation to buy or sell a specific currency at a future date, which may beany fixed number of days from the date of the contract agreed upon bythe parties, at a price set at the time of the contract. These contractsare entered into on the interbank market conducted directly betweencurrency traders (usually large commercial banks) and their customers.
At or before the maturity of a forward currency contract, the Fundsmay either sell a portfolio security and make delivery of the currency,or retain the security and terminate its contractual obligation to deliver
the currency by buying an “offsetting” contract obligating them to buy,on the same maturity date, the same amount of the currency. If theFund engages in an offsetting transaction, it may later enter into a newforward currency contract to sell the currency.
If the Funds engage in offsetting transactions, the Funds will incur again or loss, to the extent that there has been movement in forwardcurrency contract prices. If forward prices go down during the periodbetween the date a Fund enters into a forward currency contract forthe sale of a currency and the date it enters into an offsetting contractfor the purchase of the currency, the Fund will realize a gain to the ex-tent that the price of the currency it has agreed to sell exceeds the priceof the currency it has agreed to buy. If forward prices go up, the Fundwill suffer a loss to the extent the price of the currency it has agreed tobuy exceeds the price of the currency it has agreed to sell.
Non-deliverable forward foreign currency exchange contracts are set-tled with the counterparty in U.S. dollars without the delivery of foreigncurrency.
Swap AgreementsEach Fund may enter into swap agreements to gain exposure to an un-derlying asset without actually purchasing such asset (or shortingsuch asset), or to hedge a position including in circumstances in whichdirect investment is restricted for legal reasons or is otherwise imprac-ticable. Swap agreements are two-party contracts entered into prima-rily by institutional investors for periods ranging from a day to morethan one year. In a standard “swap” transaction, two parties agree toexchange the return (or differentials in rates of return) earned or real-ized on a particular pre-determined investment or instrument. Thegross return to be exchanged or “swapped” between the parties is cal-culated with respect to a “notional amount,” e.g., the return on or in-crease in value of a particular dollar amount invested in a “basket” ofsecurities or an ETF representing a particular index or group of secu-rities. Most swap agreements entered into by a Fund calculate and set-tle the obligations of the parties to the agreement on a “net basis” witha single payment. Consequently, a Fund’s current obligations (or rights)under a swap agreement will generally be equal only to the net amountto be paid or received under the agreement based on the relative valuesof the positions held by each party to the agreement (the “net amount”).When investing in swap agreements, the Funds may hold or gain ex-posure to only a representative sample of the securities in an index, orto a component of the index.
On a typical long swap, the counterparty will generally agree to pay theFund the amount, if any, by which the notional amount of the swapagreement would have increased in value had it been invested in theparticular underlying assets (e.g., an ETF, or securities comprising abenchmark), plus any dividends or interest that would have been re-ceived on those assets. The Fund will agree to pay to the counterpartya floating rate of interest on the notional amount of the swap agree-ment plus the amount, if any, by which the notional amount would havedecreased in value had it been invested in such assets plus, in certaincircumstances, commissions or trading spreads on the notionalamount. Therefore, the return to the Fund on a long swap agreementshould be the gain or loss on the notional amount plus dividends or in-terest on the assets less the interest paid by the Fund on the notionalamount. As a trading technique, the Advisor may substitute physical
Merrill Corp - Proshares Trust Geared Book [96 Funds] Annual Report [Funds] 333-089822 05-31-2017 ED [AUX] | eperez | 28-Jul-17 17:44 | 17-15159-3.ka | Sequence: 10CHKSUM Content: 22282 Layout: 30008 Graphics: No Graphics CLEAN
JOB: 17-15159-3 CYCLE#;BL#: 5; 0 TRIM: 8.25" x 10.75" COMPOSITECOLORS: Black, ~note-color 2, ~note-color 3 GRAPHICS: none V1.5
PROSHARES TRUST NOTES TO FINANCIAL STATEMENTS :: MAY 31, 2017 :: 301
securities with a swap agreement having investment characteristicssubstantially similar to the underlying securities.
Some Funds may also enter into swap agreements that provide the op-posite return of their benchmark or a security. Their operations aresimilar to those of the swaps disclosed above except that the counter-party pays interest to each Fund on the notional amount outstandingand that dividends or interest on the underlying instruments reducethe value of the swap, plus, in certain instances, each Fund will agreeto pay to the counterparty commissions or trading spreads on the no-tional amount. These amounts are netted with any unrealized gain orloss to determine the value of the swap.
A Fund’s current obligations under most swap agreements (total returnswaps, equity/index swaps, interest rate swaps) will be accrued daily(offset against any amounts owed to the Fund) and any accrued butunpaid net amounts owed to a swap counterparty will be covered bysegregating or earmarking cash and/or securities determined to beliquid, but typically no payments will be made until the settlement date.
A Fund will not enter into non-exchange traded swap agreements un-less the Advisor believes that the counterparty to the transaction iscreditworthy. The counterparty to a non-exchange traded swap agree-ment will typically be a major global financial institution. A Fund bearsthe risk of loss of the amount expected to be received under a swapagreement in the event of the default or bankruptcy of a swap agree-ment counterparty. If such a default occurs, a Fund will have contrac-tual remedies pursuant to the swap agreements, but such remediesmay be subject to bankruptcy and insolvency laws that could affect theFund’s rights as a creditor.
In the normal course of business, a Fund enters into InternationalSwaps and Derivatives Association (“ISDA”) agreements with certaincounterparties for derivative transactions. These agreements contain,among other conditions, events of default and termination events, andvarious covenants and representations. Certain of the Fund’s ISDAagreements contain provisions that require the Fund to maintain apre-determined level of net assets, and/or provide limits regarding thedecline of the Fund’s NAV over specific periods of time, which may ormay not be exclusive of redemptions. If the Fund were to trigger suchprovisions and have open derivative positions at that time, counter-parties to the ISDA agreements could elect to terminate such ISDAagreements and request immediate payment in an amount equal tothe net liability positions, if any, under the relevant ISDA agreement.Pursuant to the terms of its ISDA agreements, the Fund will have al-ready collateralized its liability under such agreements, in some casesonly in excess of certain threshold amounts. The Funds seek to mitigaterisks by generally requiring that the counterparties for each Fund agreeto post collateral for the benefit of the Fund, marked to market daily,
in an amount approximately equal to what the counterparty owes theFund, subject to certain minimum thresholds, although the Funds maynot always be successful. To the extent any such collateral is insuffi-cient or there are delays in accessing the collateral, the Funds will beexposed to the risks described above, including possible delays in re-covering amounts as a result of bankruptcy proceedings.
The use of swaps is a highly specialized activity which involves invest-ment techniques and risks in addition to, and in some cases differentfrom, those associated with ordinary portfolio securities transactions.The primary risks associated with the use of swap agreements are mis-pricing or improper valuation, imperfect correlation between move-ments in the notional amount and the price of the underlyinginvestments, and the inability of counterparties or clearing organiza-tions to perform. A Fund may use a combination of swaps on an un-derlying index and swaps on an ETF that is designed to track theperformance of that index, or it may solely use swaps on an ETF toachieve its desired exposure. The performance of an ETF may not trackthe performance of its underlying index due to embedded costs andother factors. Thus, to the extent a Fund invests in swaps that use anETF as the reference asset, that Fund may be subject to greater corre-lation risk and may not achieve as high a degree of correlation with itsindex as it would if the Fund used only swaps on the underlying index.The Advisor, under supervision from the Board, is responsible for de-termining and monitoring the liquidity of the Funds’ transactions inswap agreements.
All of the outstanding swap agreements held by the Funds on May 31,2017 contractually terminate within 19 months but may be terminatedwithout penalty by either party daily. Upon termination, the Fund isentitled to receive or pay the “unrealized appreciation or depreciation”amount existing at the date of termination.
The Financial Accounting Standards Board, pursuant to AccountingStandards Codification 815-10 (“ASC 815-10”), requires companies (in-cluding the Trust) to disclose information intended to enable financialstatement users to understand how derivative instruments affect theStatements of Assets and Liabilities as well as the affect of derivativeinstruments on the Statements of Operations during the reporting pe-riod, in the context of each entity’s risk exposure. ASC 815-10 providesexamples of risk exposure, including interest rate, foreign exchange,equity and credit.
As the Funds’ investment objective is to approximate, on a daily basis,the corresponding performance, inverse, multiple, or inverse multipleof the performance of its index, the derivatives utilized are aligned tothe same primary risk. The primary risk exposure for those Fundsbenchmarked to an equity index is equity risk, for Funds benchmarkedto a fixed-income index the primary risk is interest rate risk.
Merrill Corp - Proshares Trust Geared Book [96 Funds] Annual Report [Funds] 333-089822 05-31-2017 ED [AUX] | eperez | 28-Jul-17 17:44 | 17-15159-3.ka | Sequence: 11CHKSUM Content: 54407 Layout: 42233 Graphics: No Graphics CLEAN
JOB: 17-15159-3 CYCLE#;BL#: 5; 0 TRIM: 8.25" x 10.75" COMPOSITECOLORS: Black, ~note-color 2, ~note-color 3 GRAPHICS: none V1.5
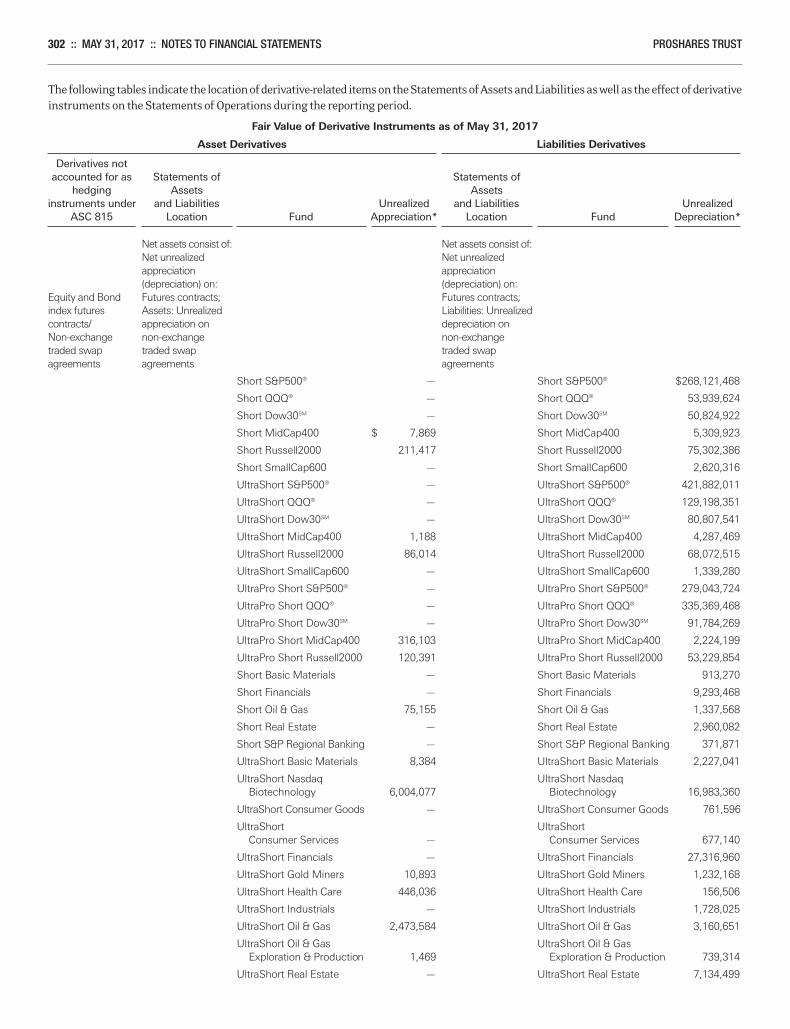
302 :: MAY 31, 2017 :: NOTES TO FINANCIAL STATEMENTS PROSHARES TRUST
The following tables indicate the location of derivative-related items on the Statements of Assets and Liabilities as well as the effect of derivativeinstruments on the Statements of Operations during the reporting period.
Fair Value of Derivative Instruments as of May 31, 2017
Asset Derivatives Liabilities Derivatives
Derivatives not accounted for as Statements of Statements of hedging Assets Assets instruments under and Liabilities Unrealized and Liabilities Unrealized ASC 815 Location Fund Appreciation* Location Fund Depreciation*
Net assets consist of: Net assets consist of: Net unrealized Net unrealized appreciation appreciation (depreciation) on: (depreciation) on: Equity and Bond Futures contracts; Futures contracts; index futures Assets: Unrealized Liabilities: Unrealized contracts/ appreciation on depreciation on Non-exchange non-exchange non-exchange traded swap traded swap traded swap agreements agreements agreements
Short S&P500® — Short S&P500® $268,121,468
Short QQQ® — Short QQQ® 53,939,624
Short Dow30SM — Short Dow30SM 50,824,922
Short MidCap400 $ 7,869 Short MidCap400 5,309,923
Short Russell2000 211,417 Short Russell2000 75,302,386
Short SmallCap600 — Short SmallCap600 2,620,316
UltraShort S&P500® — UltraShort S&P500® 421,882,011
UltraShort QQQ® — UltraShort QQQ® 129,198,351
UltraShort Dow30SM — UltraShort Dow30SM 80,807,541
UltraShort MidCap400 1,188 UltraShort MidCap400 4,287,469
UltraShort Russell2000 86,014 UltraShort Russell2000 68,072,515
UltraShort SmallCap600 — UltraShort SmallCap600 1,339,280
UltraPro Short S&P500® — UltraPro Short S&P500® 279,043,724
UltraPro Short QQQ® — UltraPro Short QQQ® 335,369,468
UltraPro Short Dow30SM — UltraPro Short Dow30SM 91,784,269
UltraPro Short MidCap400 316,103 UltraPro Short MidCap400 2,224,199
UltraPro Short Russell2000 120,391 UltraPro Short Russell2000 53,229,854
Short Basic Materials — Short Basic Materials 913,270
Short Financials — Short Financials 9,293,468
Short Oil & Gas 75,155 Short Oil & Gas 1,337,568
Short Real Estate — Short Real Estate 2,960,082
Short S&P Regional Banking — Short S&P Regional Banking 371,871
UltraShort Basic Materials 8,384 UltraShort Basic Materials 2,227,041
UltraShort Nasdaq UltraShort Nasdaq Biotechnology 6,004,077 Biotechnology 16,983,360
UltraShort Consumer Goods — UltraShort Consumer Goods 761,596
UltraShort UltraShort Consumer Services — Consumer Services 677,140
UltraShort Financials — UltraShort Financials 27,316,960
UltraShort Gold Miners 10,893 UltraShort Gold Miners 1,232,168
UltraShort Health Care 446,036 UltraShort Health Care 156,506
UltraShort Industrials — UltraShort Industrials 1,728,025
UltraShort Oil & Gas 2,473,584 UltraShort Oil & Gas 3,160,651
UltraShort Oil & Gas UltraShort Oil & Gas Exploration & Production 1,469 Exploration & Production 739,314
UltraShort Real Estate — UltraShort Real Estate 7,134,499
Merrill Corp - Proshares Trust Geared Book [96 Funds] Annual Report [Funds] 333-089822 05-31-2017 ED [AUX] | eperez | 28-Jul-17 17:44 | 17-15159-3.ka | Sequence: 12CHKSUM Content: 63471 Layout: 57004 Graphics: No Graphics CLEAN
JOB: 17-15159-3 CYCLE#;BL#: 5; 0 TRIM: 8.25" x 10.75" COMPOSITECOLORS: Black, ~note-color 2, ~note-color 3 GRAPHICS: none V1.5
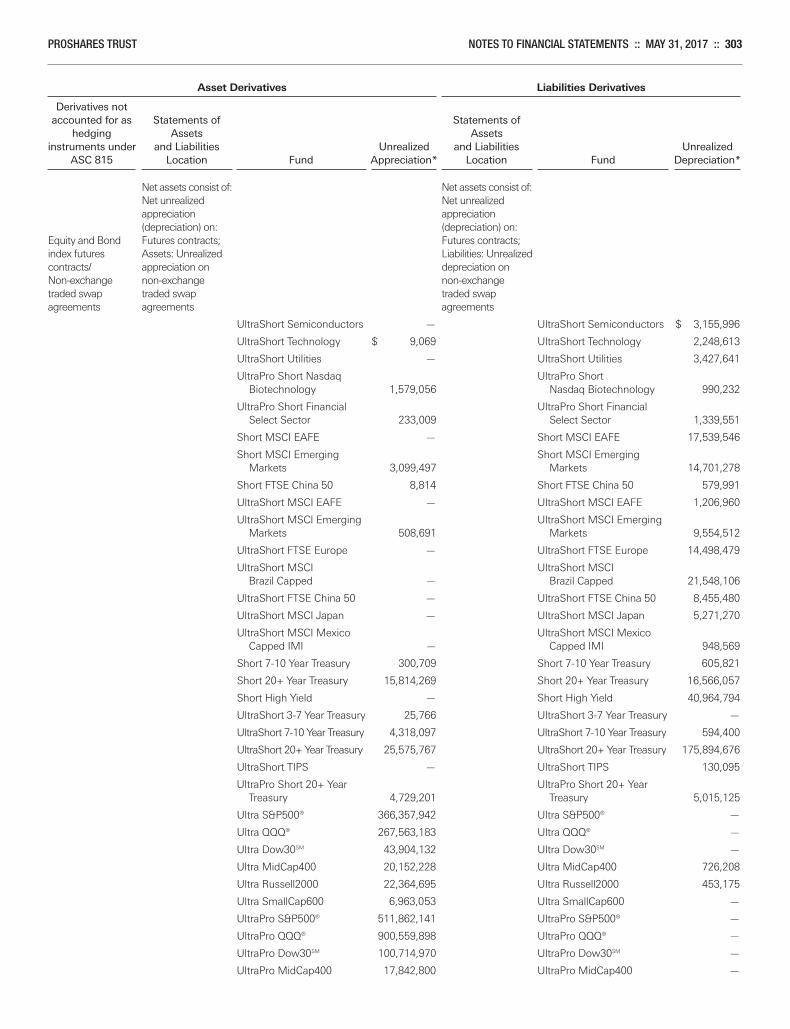
PROSHARES TRUST NOTES TO FINANCIAL STATEMENTS :: MAY 31, 2017 :: 303
Asset Derivatives Liabilities Derivatives
Derivatives not accounted for as Statements of Statements of hedging Assets Assets instruments under and Liabilities Unrealized and Liabilities Unrealized ASC 815 Location Fund Appreciation* Location Fund Depreciation*
Net assets consist of: Net assets consist of: Net unrealized Net unrealized appreciation appreciation (depreciation) on: (depreciation) on: Equity and Bond Futures contracts; Futures contracts; index futures Assets: Unrealized Liabilities: Unrealized contracts/ appreciation on depreciation on Non-exchange non-exchange non-exchange traded swap traded swap traded swap agreements agreements agreements
UltraShort Semiconductors — UltraShort Semiconductors $ 3,155,996
UltraShort Technology $ 9,069 UltraShort Technology 2,248,613
UltraShort Utilities — UltraShort Utilities 3,427,641
UltraPro Short Nasdaq UltraPro Short Biotechnology 1,579,056 Nasdaq Biotechnology 990,232
UltraPro Short Financial UltraPro Short Financial Select Sector 233,009 Select Sector 1,339,551
Short MSCI EAFE — Short MSCI EAFE 17,539,546
Short MSCI Emerging Short MSCI Emerging Markets 3,099,497 Markets 14,701,278
Short FTSE China 50 8,814 Short FTSE China 50 579,991
UltraShort MSCI EAFE — UltraShort MSCI EAFE 1,206,960
UltraShort MSCI Emerging UltraShort MSCI Emerging Markets 508,691 Markets 9,554,512
UltraShort FTSE Europe — UltraShort FTSE Europe 14,498,479
UltraShort MSCI UltraShort MSCI Brazil Capped — Brazil Capped 21,548,106
UltraShort FTSE China 50 — UltraShort FTSE China 50 8,455,480
UltraShort MSCI Japan — UltraShort MSCI Japan 5,271,270
UltraShort MSCI Mexico UltraShort MSCI Mexico Capped IMI — Capped IMI 948,569
Short 7-10 Year Treasury 300,709 Short 7-10 Year Treasury 605,821
Short 20+ Year Treasury 15,814,269 Short 20+ Year Treasury 16,566,057
Short High Yield — Short High Yield 40,964,794
UltraShort 3-7 Year Treasury 25,766 UltraShort 3-7 Year Treasury —
UltraShort 7-10 Year Treasury 4,318,097 UltraShort 7-10 Year Treasury 594,400
UltraShort 20+ Year Treasury 25,575,767 UltraShort 20+ Year Treasury 175,894,676
UltraShort TIPS — UltraShort TIPS 130,095
UltraPro Short 20+ Year UltraPro Short 20+ Year Treasury 4,729,201 Treasury 5,015,125
Ultra S&P500® 366,357,942 Ultra S&P500® —
Ultra QQQ® 267,563,183 Ultra QQQ® —
Ultra Dow30SM 43,904,132 Ultra Dow30SM —
Ultra MidCap400 20,152,228 Ultra MidCap400 726,208
Ultra Russell2000 22,364,695 Ultra Russell2000 453,175
Ultra SmallCap600 6,963,053 Ultra SmallCap600 —
UltraPro S&P500® 511,862,141 UltraPro S&P500® —
UltraPro QQQ® 900,559,898 UltraPro QQQ® —
UltraPro Dow30SM 100,714,970 UltraPro Dow30SM —
UltraPro MidCap400 17,842,800 UltraPro MidCap400 —
Merrill Corp - Proshares Trust Geared Book [96 Funds] Annual Report [Funds] 333-089822 05-31-2017 ED [AUX] | eperez | 28-Jul-17 17:44 | 17-15159-3.ka | Sequence: 13CHKSUM Content: 10661 Layout: 49320 Graphics: No Graphics CLEAN
JOB: 17-15159-3 CYCLE#;BL#: 5; 0 TRIM: 8.25" x 10.75" COMPOSITECOLORS: Black, ~note-color 2, ~note-color 3 GRAPHICS: none V1.5
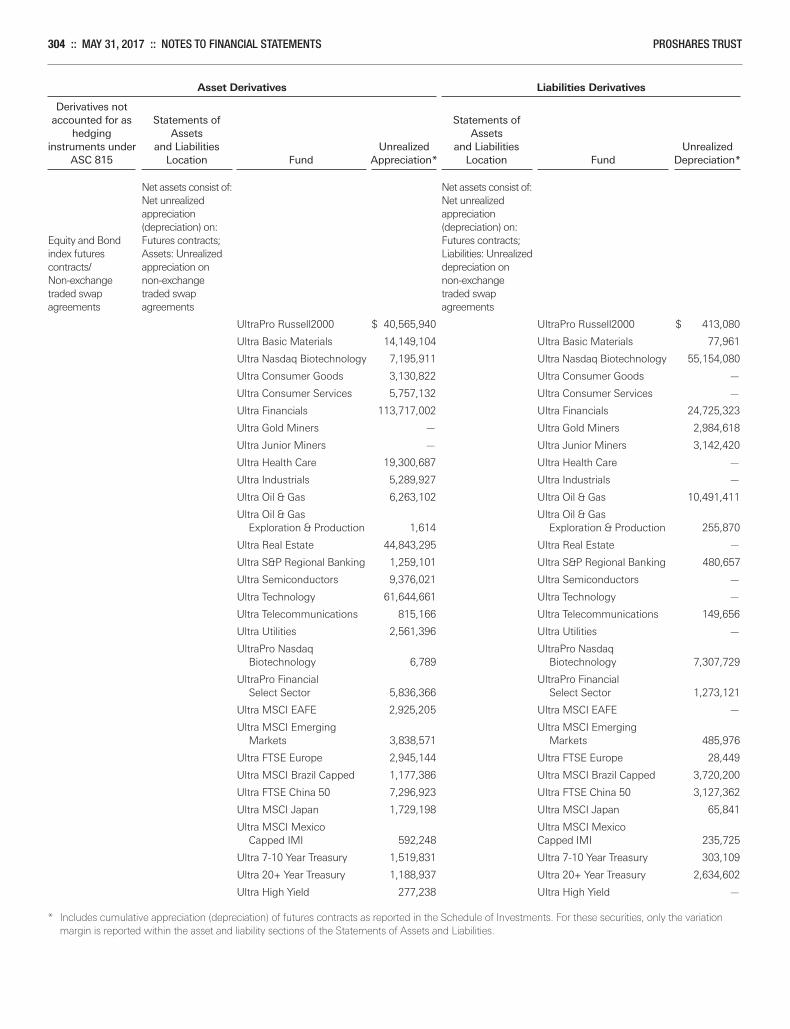
304 :: MAY 31, 2017 :: NOTES TO FINANCIAL STATEMENTS PROSHARES TRUST
Asset Derivatives Liabilities Derivatives
Derivatives not accounted for as Statements of Statements of hedging Assets Assets instruments under and Liabilities Unrealized and Liabilities Unrealized ASC 815 Location Fund Appreciation* Location Fund Depreciation*
Net assets consist of: Net assets consist of: Net unrealized Net unrealized appreciation appreciation (depreciation) on: (depreciation) on: Equity and Bond Futures contracts; Futures contracts; index futures Assets: Unrealized Liabilities: Unrealized contracts/ appreciation on depreciation on Non-exchange non-exchange non-exchange traded swap traded swap traded swap agreements agreements agreements
UltraPro Russell2000 $ 40,565,940 UltraPro Russell2000 $ 413,080
Ultra Basic Materials 14,149,104 Ultra Basic Materials 77,961
Ultra Nasdaq Biotechnology 7,195,911 Ultra Nasdaq Biotechnology 55,154,080
Ultra Consumer Goods 3,130,822 Ultra Consumer Goods —
Ultra Consumer Services 5,757,132 Ultra Consumer Services —
Ultra Financials 113,717,002 Ultra Financials 24,725,323
Ultra Gold Miners — Ultra Gold Miners 2,984,618
Ultra Junior Miners — Ultra Junior Miners 3,142,420
Ultra Health Care 19,300,687 Ultra Health Care —
Ultra Industrials 5,289,927 Ultra Industrials —
Ultra Oil & Gas 6,263,102 Ultra Oil & Gas 10,491,411
Ultra Oil & Gas Ultra Oil & Gas Exploration & Production 1,614 Exploration & Production 255,870
Ultra Real Estate 44,843,295 Ultra Real Estate —
Ultra S&P Regional Banking 1,259,101 Ultra S&P Regional Banking 480,657
Ultra Semiconductors 9,376,021 Ultra Semiconductors —
Ultra Technology 61,644,661 Ultra Technology —
Ultra Telecommunications 815,166 Ultra Telecommunications 149,656
Ultra Utilities 2,561,396 Ultra Utilities —
UltraPro Nasdaq UltraPro Nasdaq Biotechnology 6,789 Biotechnology 7,307,729
UltraPro Financial UltraPro Financial Select Sector 5,836,366 Select Sector 1,273,121
Ultra MSCI EAFE 2,925,205 Ultra MSCI EAFE —
Ultra MSCI Emerging Ultra MSCI Emerging Markets 3,838,571 Markets 485,976
Ultra FTSE Europe 2,945,144 Ultra FTSE Europe 28,449
Ultra MSCI Brazil Capped 1,177,386 Ultra MSCI Brazil Capped 3,720,200
Ultra FTSE China 50 7,296,923 Ultra FTSE China 50 3,127,362
Ultra MSCI Japan 1,729,198 Ultra MSCI Japan 65,841
Ultra MSCI Mexico Ultra MSCI Mexico Capped IMI 592,248 Capped IMI 235,725
Ultra 7-10 Year Treasury 1,519,831 Ultra 7-10 Year Treasury 303,109
Ultra 20+ Year Treasury 1,188,937 Ultra 20+ Year Treasury 2,634,602
Ultra High Yield 277,238 Ultra High Yield —
* Includes cumulative appreciation (depreciation) of futures contracts as reported in the Schedule of Investments. For these securities, only the variation
margin is reported within the asset and liability sections of the Statements of Assets and Liabilities.
Merrill Corp - Proshares Trust Geared Book [96 Funds] Annual Report [Funds] 333-089822 05-31-2017 ED [AUX] | eperez | 28-Jul-17 17:44 | 17-15159-3.ka | Sequence: 14CHKSUM Content: 48951 Layout: 29687 Graphics: No Graphics CLEAN
JOB: 17-15159-3 CYCLE#;BL#: 5; 0 TRIM: 8.25" x 10.75" COMPOSITECOLORS: Black, ~note-color 2, ~note-color 3 GRAPHICS: none V1.5
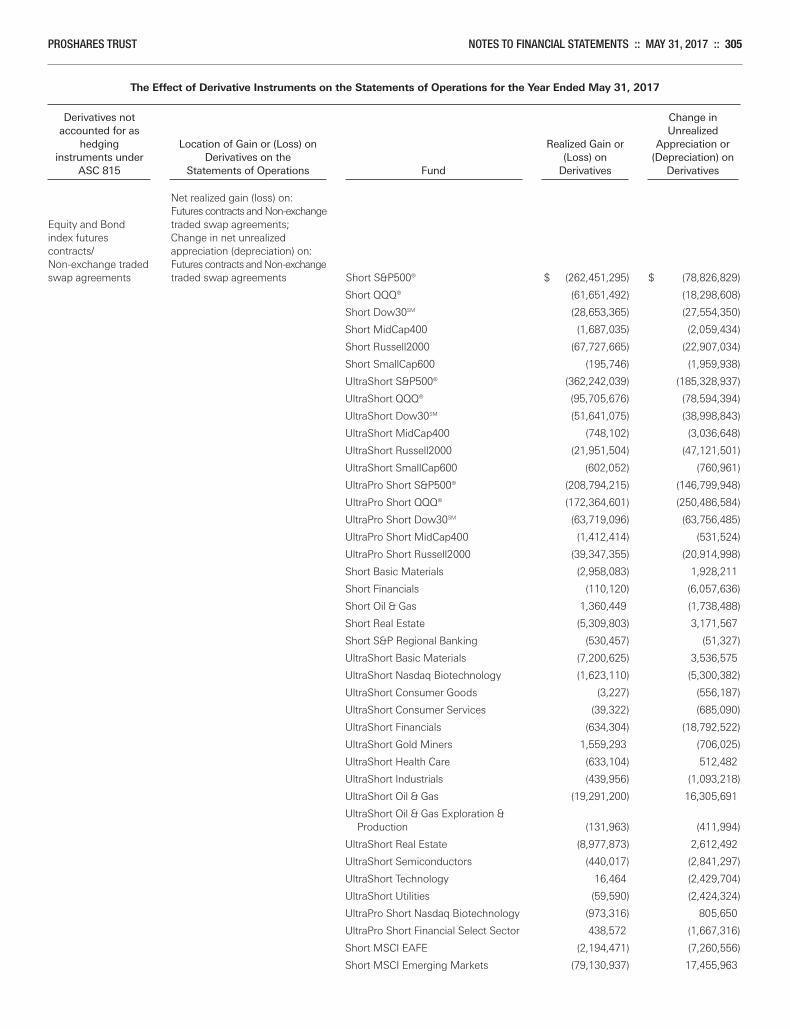
PROSHARES TRUST NOTES TO FINANCIAL STATEMENTS :: MAY 31, 2017 :: 305
The Effect of Derivative Instruments on the Statements of Operations for the Year Ended May 31, 2017
Derivatives not Change in accounted for as Unrealized hedging Location of Gain or (Loss) on Realized Gain or Appreciation or instruments under Derivatives on the (Loss) on (Depreciation) on ASC 815 Statements of Operations Fund Derivatives Derivatives
Net realized gain (loss) on: Futures contracts and Non-exchange Equity and Bond traded swap agreements; index futures Change in net unrealized contracts/ appreciation (depreciation) on: Non-exchange traded Futures contracts and Non-exchange swap agreements traded swap agreements Short S&P500® $ (262,451,295) $ (78,826,829)
Short QQQ® (61,651,492) (18,298,608)
Short Dow30SM (28,653,365) (27,554,350)
Short MidCap400 (1,687,035) (2,059,434)
Short Russell2000 (67,727,665) (22,907,034)
Short SmallCap600 (195,746) (1,959,938)
UltraShort S&P500® (362,242,039) (185,328,937)
UltraShort QQQ® (95,705,676) (78,594,394)
UltraShort Dow30SM (51,641,075) (38,998,843)
UltraShort MidCap400 (748,102) (3,036,648)
UltraShort Russell2000 (21,951,504) (47,121,501)
UltraShort SmallCap600 (602,052) (760,961)
UltraPro Short S&P500® (208,794,215) (146,799,948)
UltraPro Short QQQ® (172,364,601) (250,486,584)
UltraPro Short Dow30SM (63,719,096) (63,756,485)
UltraPro Short MidCap400 (1,412,414) (531,524)
UltraPro Short Russell2000 (39,347,355) (20,914,998)
Short Basic Materials (2,958,083) 1,928,211
Short Financials (110,120) (6,057,636)
Short Oil & Gas 1,360,449 (1,738,488)
Short Real Estate (5,309,803) 3,171,567
Short S&P Regional Banking (530,457) (51,327)
UltraShort Basic Materials (7,200,625) 3,536,575
UltraShort Nasdaq Biotechnology (1,623,110) (5,300,382)
UltraShort Consumer Goods (3,227) (556,187)
UltraShort Consumer Services (39,322) (685,090)
UltraShort Financials (634,304) (18,792,522)
UltraShort Gold Miners 1,559,293 (706,025)
UltraShort Health Care (633,104) 512,482
UltraShort Industrials (439,956) (1,093,218)
UltraShort Oil & Gas (19,291,200) 16,305,691
UltraShort Oil & Gas Exploration & Production (131,963) (411,994)
UltraShort Real Estate (8,977,873) 2,612,492
UltraShort Semiconductors (440,017) (2,841,297)
UltraShort Technology 16,464 (2,429,704)
UltraShort Utilities (59,590) (2,424,324)
UltraPro Short Nasdaq Biotechnology (973,316) 805,650
UltraPro Short Financial Select Sector 438,572 (1,667,316)
Short MSCI EAFE (2,194,471) (7,260,556)
Short MSCI Emerging Markets (79,130,937) 17,455,963
Merrill Corp - Proshares Trust Geared Book [96 Funds] Annual Report [Funds] 333-089822 05-31-2017 ED [AUX] | eperez | 28-Jul-17 17:44 | 17-15159-3.ka | Sequence: 15CHKSUM Content: 60197 Layout: 24479 Graphics: No Graphics CLEAN
JOB: 17-15159-3 CYCLE#;BL#: 5; 0 TRIM: 8.25" x 10.75" COMPOSITECOLORS: Black, ~note-color 2, ~note-color 3 GRAPHICS: none V1.5
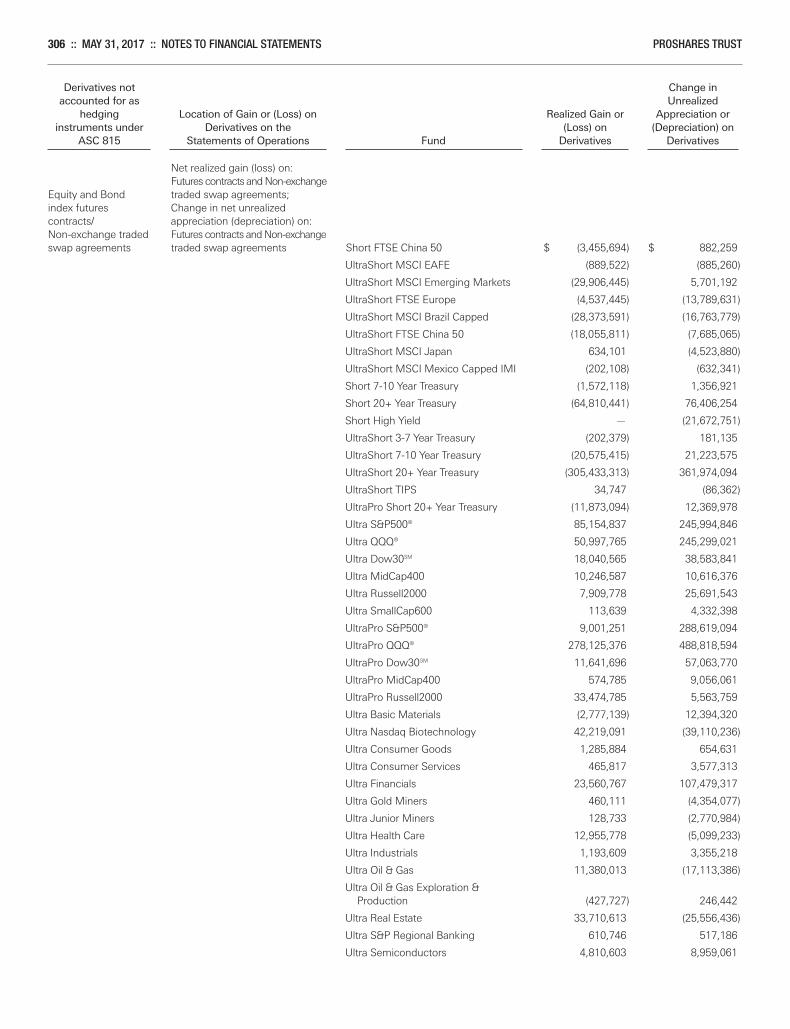
Derivatives not Change in accounted for as Unrealized hedging Location of Gain or (Loss) on Realized Gain or Appreciation or instruments under Derivatives on the (Loss) on (Depreciation) on ASC 815 Statements of Operations Fund Derivatives Derivatives
Net realized gain (loss) on: Futures contracts and Non-exchange Equity and Bond traded swap agreements; index futures Change in net unrealized contracts/ appreciation (depreciation) on: Non-exchange traded Futures contracts and Non-exchange swap agreements traded swap agreements Short FTSE China 50 $ (3,455,694) $ 882,259
UltraShort MSCI EAFE (889,522) (885,260)
UltraShort MSCI Emerging Markets (29,906,445) 5,701,192
UltraShort FTSE Europe (4,537,445) (13,789,631)
UltraShort MSCI Brazil Capped (28,373,591) (16,763,779)
UltraShort FTSE China 50 (18,055,811) (7,685,065)
UltraShort MSCI Japan 634,101 (4,523,880)
UltraShort MSCI Mexico Capped IMI (202,108) (632,341)
Short 7-10 Year Treasury (1,572,118) 1,356,921
Short 20+ Year Treasury (64,810,441) 76,406,254
Short High Yield — (21,672,751)
UltraShort 3-7 Year Treasury (202,379) 181,135
UltraShort 7-10 Year Treasury (20,575,415) 21,223,575
UltraShort 20+ Year Treasury (305,433,313) 361,974,094
UltraShort TIPS 34,747 (86,362)
UltraPro Short 20+ Year Treasury (11,873,094) 12,369,978
Ultra S&P500® 85,154,837 245,994,846
Ultra QQQ® 50,997,765 245,299,021
Ultra Dow30SM 18,040,565 38,583,841
Ultra MidCap400 10,246,587 10,616,376
Ultra Russell2000 7,909,778 25,691,543
Ultra SmallCap600 113,639 4,332,398
UltraPro S&P500® 9,001,251 288,619,094
UltraPro QQQ® 278,125,376 488,818,594
UltraPro Dow30SM 11,641,696 57,063,770
UltraPro MidCap400 574,785 9,056,061
UltraPro Russell2000 33,474,785 5,563,759
Ultra Basic Materials (2,777,139) 12,394,320
Ultra Nasdaq Biotechnology 42,219,091 (39,110,236)
Ultra Consumer Goods 1,285,884 654,631
Ultra Consumer Services 465,817 3,577,313
Ultra Financials 23,560,767 107,479,317
Ultra Gold Miners 460,111 (4,354,077)
Ultra Junior Miners 128,733 (2,770,984)
Ultra Health Care 12,955,778 (5,099,233)
Ultra Industrials 1,193,609 3,355,218
Ultra Oil & Gas 11,380,013 (17,113,386)
Ultra Oil & Gas Exploration & Production (427,727) 246,442
Ultra Real Estate 33,710,613 (25,556,436)
Ultra S&P Regional Banking 610,746 517,186
Ultra Semiconductors 4,810,603 8,959,061
306 :: MAY 31, 2017 :: NOTES TO FINANCIAL STATEMENTS PROSHARES TRUST
Merrill Corp - Proshares Trust Geared Book [96 Funds] Annual Report [Funds] 333-089822 05-31-2017 ED [AUX] | eperez | 28-Jul-17 17:44 | 17-15159-3.ka | Sequence: 16CHKSUM Content: 47794 Layout: 5517 Graphics: No Graphics CLEAN
JOB: 17-15159-3 CYCLE#;BL#: 5; 0 TRIM: 8.25" x 10.75" COMPOSITECOLORS: Black, ~note-color 2, ~note-color 3 GRAPHICS: none V1.5
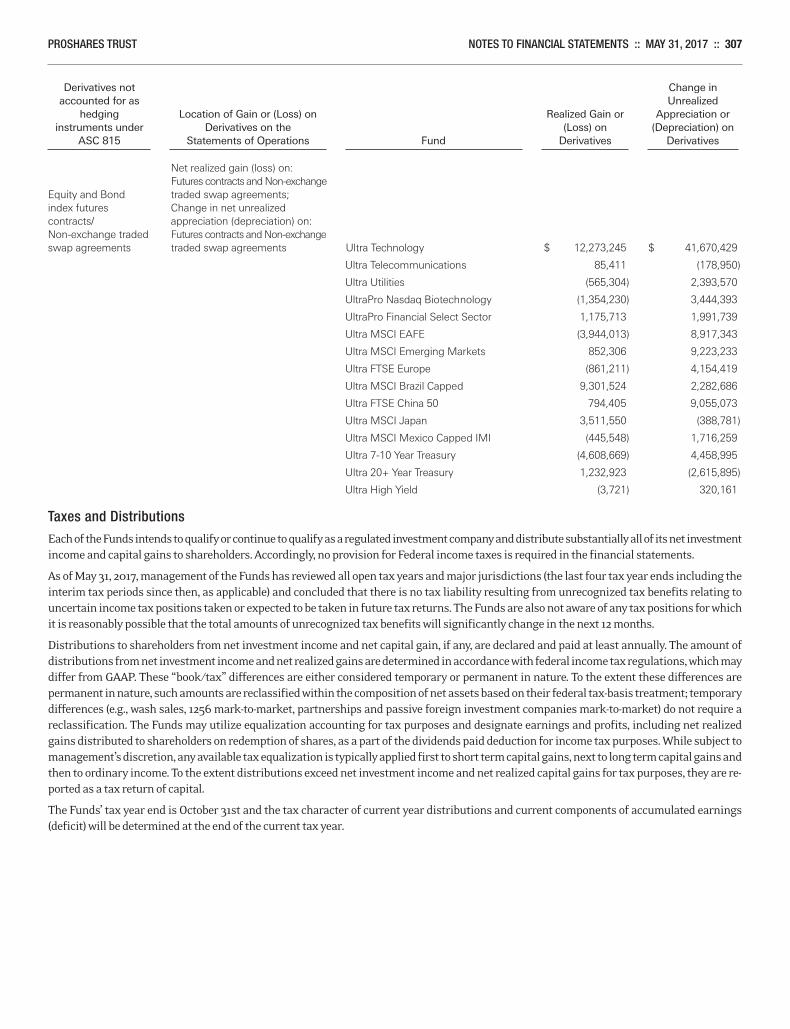
Derivatives not Change in accounted for as Unrealized hedging Location of Gain or (Loss) on Realized Gain or Appreciation or instruments under Derivatives on the (Loss) on (Depreciation) on ASC 815 Statements of Operations Fund Derivatives Derivatives
Net realized gain (loss) on: Futures contracts and Non-exchange Equity and Bond traded swap agreements; index futures Change in net unrealized contracts/ appreciation (depreciation) on: Non-exchange traded Futures contracts and Non-exchange swap agreements traded swap agreements Ultra Technology $ 12,273,245 $ 41,670,429
Ultra Telecommunications 85,411 (178,950)
Ultra Utilities (565,304) 2,393,570
UltraPro Nasdaq Biotechnology (1,354,230) 3,444,393
UltraPro Financial Select Sector 1,175,713 1,991,739
Ultra MSCI EAFE (3,944,013) 8,917,343
Ultra MSCI Emerging Markets 852,306 9,223,233
Ultra FTSE Europe (861,211) 4,154,419
Ultra MSCI Brazil Capped 9,301,524 2,282,686
Ultra FTSE China 50 794,405 9,055,073
Ultra MSCI Japan 3,511,550 (388,781)
Ultra MSCI Mexico Capped IMI (445,548) 1,716,259
Ultra 7-10 Year Treasury (4,608,669) 4,458,995
Ultra 20+ Year Treasury 1,232,923 (2,615,895)
Ultra High Yield (3,721) 320,161
Taxes and DistributionsEach of the Funds intends to qualify or continue to qualify as a regulated investment company and distribute substantially all of its net investmentincome and capital gains to shareholders. Accordingly, no provision for Federal income taxes is required in the financial statements.
As of May 31, 2017, management of the Funds has reviewed all open tax years and major jurisdictions (the last four tax year ends including theinterim tax periods since then, as applicable) and concluded that there is no tax liability resulting from unrecognized tax benefits relating touncertain income tax positions taken or expected to be taken in future tax returns. The Funds are also not aware of any tax positions for whichit is reasonably possible that the total amounts of unrecognized tax benefits will significantly change in the next 12 months.
Distributions to shareholders from net investment income and net capital gain, if any, are declared and paid at least annually. The amount ofdistributions from net investment income and net realized gains are determined in accordance with federal income tax regulations, which maydiffer from GAAP. These “book/tax” differences are either considered temporary or permanent in nature. To the extent these differences arepermanent in nature, such amounts are reclassified within the composition of net assets based on their federal tax-basis treatment; temporarydifferences (e.g., wash sales, 1256 mark-to-market, partnerships and passive foreign investment companies mark-to-market) do not require areclassification. The Funds may utilize equalization accounting for tax purposes and designate earnings and profits, including net realizedgains distributed to shareholders on redemption of shares, as a part of the dividends paid deduction for income tax purposes. While subject tomanagement’s discretion, any available tax equalization is typically applied first to short term capital gains, next to long term capital gains andthen to ordinary income. To the extent distributions exceed net investment income and net realized capital gains for tax purposes, they are re-ported as a tax return of capital.
The Funds’ tax year end is October 31st and the tax character of current year distributions and current components of accumulated earnings(deficit) will be determined at the end of the current tax year.
PROSHARES TRUST NOTES TO FINANCIAL STATEMENTS :: MAY 31, 2017 :: 307
Merrill Corp - Proshares Trust Geared Book [96 Funds] Annual Report [Funds] 333-089822 05-31-2017 ED [AUX] | eperez | 28-Jul-17 17:44 | 17-15159-3.ka | Sequence: 17CHKSUM Content: 23197 Layout: 63147 Graphics: No Graphics CLEAN
JOB: 17-15159-3 CYCLE#;BL#: 5; 0 TRIM: 8.25" x 10.75" COMPOSITECOLORS: Black, ~note-color 2, ~note-color 3 GRAPHICS: none V1.5
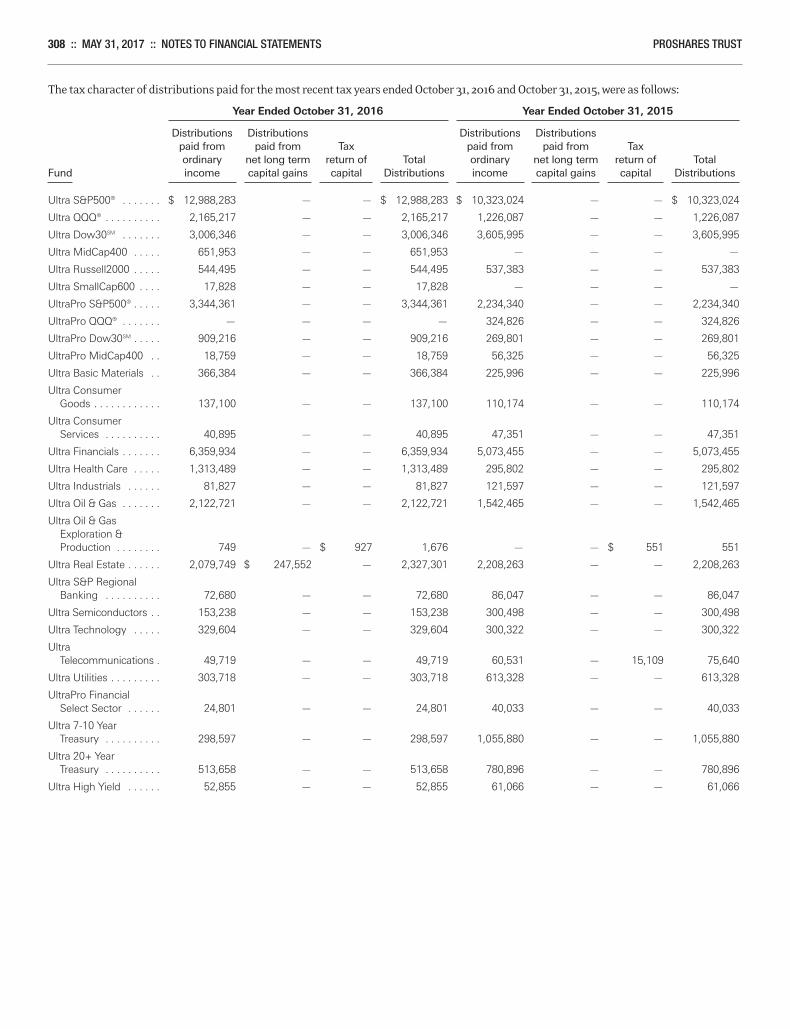
308 :: MAY 31, 2017 :: NOTES TO FINANCIAL STATEMENTS PROSHARES TRUST
The tax character of distributions paid for the most recent tax years ended October 31, 2016 and October 31, 2015, were as follows:
Year Ended October 31, 2016 Year Ended October 31, 2015
Distributions Distributions Distributions Distributions paid from paid from Tax paid from paid from Tax ordinary net long term return of Total ordinary net long term return of Total Fund income capital gains capital Distributions income capital gains capital Distributions
Ultra S&P500® . . . . . . . $ 12,988,283 — — $ 12,988,283 $ 10,323,024 — — $ 10,323,024
Ultra QQQ® . . . . . . . . . . 2,165,217 — — 2,165,217 1,226,087 — — 1,226,087
Ultra Dow30SM . . . . . . . 3,006,346 — — 3,006,346 3,605,995 — — 3,605,995
Ultra MidCap400 . . . . . 651,953 — — 651,953 — — — —
Ultra Russell2000 . . . . . 544,495 — — 544,495 537,383 — — 537,383
Ultra SmallCap600 . . . . 17,828 — — 17,828 — — — —
UltraPro S&P500® . . . . . 3,344,361 — — 3,344,361 2,234,340 — — 2,234,340
UltraPro QQQ® . . . . . . . — — — — 324,826 — — 324,826
UltraPro Dow30SM . . . . . 909,216 — — 909,216 269,801 — — 269,801
UltraPro MidCap400 . . 18,759 — — 18,759 56,325 — — 56,325
Ultra Basic Materials . . 366,384 — — 366,384 225,996 — — 225,996
Ultra Consumer Goods . . . . . . . . . . . . 137,100 — — 137,100 110,174 — — 110,174
Ultra Consumer Services . . . . . . . . . . 40,895 — — 40,895 47,351 — — 47,351
Ultra Financials . . . . . . . 6,359,934 — — 6,359,934 5,073,455 — — 5,073,455
Ultra Health Care . . . . . 1,313,489 — — 1,313,489 295,802 — — 295,802
Ultra Industrials . . . . . . 81,827 — — 81,827 121,597 — — 121,597
Ultra Oil & Gas . . . . . . . 2,122,721 — — 2,122,721 1,542,465 — — 1,542,465
Ultra Oil & Gas Exploration & Production . . . . . . . . 749 — $ 927 1,676 — — $ 551 551
Ultra Real Estate . . . . . . 2,079,749 $ 247,552 — 2,327,301 2,208,263 — — 2,208,263
Ultra S&P Regional Banking . . . . . . . . . . 72,680 — — 72,680 86,047 — — 86,047
Ultra Semiconductors . . 153,238 — — 153,238 300,498 — — 300,498
Ultra Technology . . . . . 329,604 — — 329,604 300,322 — — 300,322
Ultra Telecommunications . 49,719 — — 49,719 60,531 — 15,109 75,640
Ultra Utilities . . . . . . . . . 303,718 — — 303,718 613,328 — — 613,328
UltraPro Financial Select Sector . . . . . . 24,801 — — 24,801 40,033 — — 40,033
Ultra 7-10 Year Treasury . . . . . . . . . . 298,597 — — 298,597 1,055,880 — — 1,055,880
Ultra 20+ Year Treasury . . . . . . . . . . 513,658 — — 513,658 780,896 — — 780,896
Ultra High Yield . . . . . . 52,855 — — 52,855 61,066 — — 61,066
Merrill Corp - Proshares Trust Geared Book [96 Funds] Annual Report [Funds] 333-089822 05-31-2017 ED [AUX] | eperez | 28-Jul-17 17:44 | 17-15159-3.ka | Sequence: 18CHKSUM Content: 21442 Layout: 30644 Graphics: No Graphics CLEAN
JOB: 17-15159-3 CYCLE#;BL#: 5; 0 TRIM: 8.25" x 10.75" COMPOSITECOLORS: Black, ~note-color 2, ~note-color 3 GRAPHICS: none V1.5
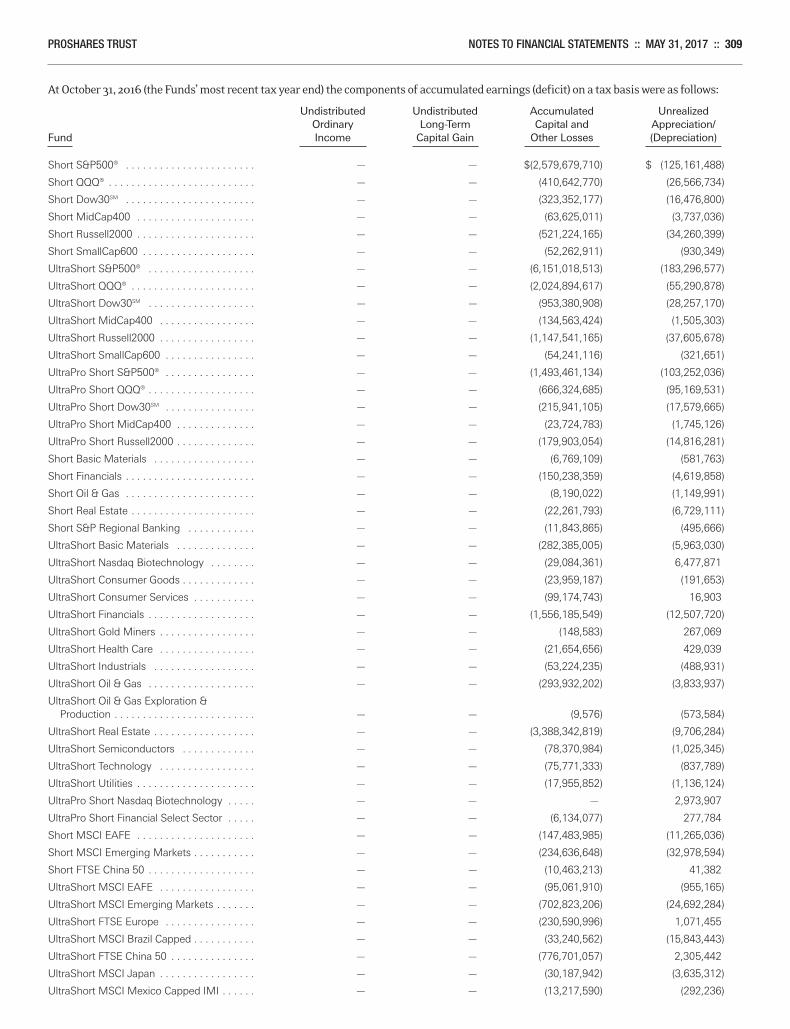
PROSHARES TRUST NOTES TO FINANCIAL STATEMENTS :: MAY 31, 2017 :: 309
At October 31, 2016 (the Funds’ most recent tax year end) the components of accumulated earnings (deficit) on a tax basis were as follows:
Undistributed Undistributed Accumulated Unrealized Ordinary Long-Term Capital and Appreciation/Fund Income Capital Gain Other Losses (Depreciation)
Short S&P500® . . . . . . . . . . . . . . . . . . . . . . . — — $(2,579,679,710) $ (125,161,488)
Short QQQ® . . . . . . . . . . . . . . . . . . . . . . . . . . — — (410,642,770) (26,566,734)
Short Dow30SM . . . . . . . . . . . . . . . . . . . . . . . — — (323,352,177) (16,476,800)
Short MidCap400 . . . . . . . . . . . . . . . . . . . . . — — (63,625,011) (3,737,036)
Short Russell2000 . . . . . . . . . . . . . . . . . . . . . — — (521,224,165) (34,260,399)
Short SmallCap600 . . . . . . . . . . . . . . . . . . . . — — (52,262,911) (930,349)
UltraShort S&P500® . . . . . . . . . . . . . . . . . . . — — (6,151,018,513) (183,296,577)
UltraShort QQQ® . . . . . . . . . . . . . . . . . . . . . . — — (2,024,894,617) (55,290,878)
UltraShort Dow30SM . . . . . . . . . . . . . . . . . . . — — (953,380,908) (28,257,170)
UltraShort MidCap400 . . . . . . . . . . . . . . . . . — — (134,563,424) (1,505,303)
UltraShort Russell2000 . . . . . . . . . . . . . . . . . — — (1,147,541,165) (37,605,678)
UltraShort SmallCap600 . . . . . . . . . . . . . . . . — — (54,241,116) (321,651)
UltraPro Short S&P500® . . . . . . . . . . . . . . . . — — (1,493,461,134) (103,252,036)
UltraPro Short QQQ® . . . . . . . . . . . . . . . . . . . — — (666,324,685) (95,169,531)
UltraPro Short Dow30SM . . . . . . . . . . . . . . . . — — (215,941,105) (17,579,665)
UltraPro Short MidCap400 . . . . . . . . . . . . . . — — (23,724,783) (1,745,126)
UltraPro Short Russell2000 . . . . . . . . . . . . . . — — (179,903,054) (14,816,281)
Short Basic Materials . . . . . . . . . . . . . . . . . . — — (6,769,109) (581,763)
Short Financials . . . . . . . . . . . . . . . . . . . . . . . — — (150,238,359) (4,619,858)
Short Oil & Gas . . . . . . . . . . . . . . . . . . . . . . . — — (8,190,022) (1,149,991)
Short Real Estate . . . . . . . . . . . . . . . . . . . . . . — — (22,261,793) (6,729,111)
Short S&P Regional Banking . . . . . . . . . . . . — — (11,843,865) (495,666)
UltraShort Basic Materials . . . . . . . . . . . . . . — — (282,385,005) (5,963,030)
UltraShort Nasdaq Biotechnology . . . . . . . . — — (29,084,361) 6,477,871
UltraShort Consumer Goods . . . . . . . . . . . . . — — (23,959,187) (191,653)
UltraShort Consumer Services . . . . . . . . . . . — — (99,174,743) 16,903
UltraShort Financials . . . . . . . . . . . . . . . . . . . — — (1,556,185,549) (12,507,720)
UltraShort Gold Miners . . . . . . . . . . . . . . . . . — — (148,583) 267,069
UltraShort Health Care . . . . . . . . . . . . . . . . . — — (21,654,656) 429,039
UltraShort Industrials . . . . . . . . . . . . . . . . . . — — (53,224,235) (488,931)
UltraShort Oil & Gas . . . . . . . . . . . . . . . . . . . — — (293,932,202) (3,833,937)
UltraShort Oil & Gas Exploration & Production . . . . . . . . . . . . . . . . . . . . . . . . . — — (9,576) (573,584)
UltraShort Real Estate . . . . . . . . . . . . . . . . . . — — (3,388,342,819) (9,706,284)
UltraShort Semiconductors . . . . . . . . . . . . . — — (78,370,984) (1,025,345)
UltraShort Technology . . . . . . . . . . . . . . . . . — — (75,771,333) (837,789)
UltraShort Utilities . . . . . . . . . . . . . . . . . . . . . — — (17,955,852) (1,136,124)
UltraPro Short Nasdaq Biotechnology . . . . . — — — 2,973,907
UltraPro Short Financial Select Sector . . . . . — — (6,134,077) 277,784
Short MSCI EAFE . . . . . . . . . . . . . . . . . . . . . — — (147,483,985) (11,265,036)
Short MSCI Emerging Markets . . . . . . . . . . . — — (234,636,648) (32,978,594)
Short FTSE China 50 . . . . . . . . . . . . . . . . . . . — — (10,463,213) 41,382
UltraShort MSCI EAFE . . . . . . . . . . . . . . . . . — — (95,061,910) (955,165)
UltraShort MSCI Emerging Markets . . . . . . . — — (702,823,206) (24,692,284)
UltraShort FTSE Europe . . . . . . . . . . . . . . . . — — (230,590,996) 1,071,455
UltraShort MSCI Brazil Capped . . . . . . . . . . . — — (33,240,562) (15,843,443)
UltraShort FTSE China 50 . . . . . . . . . . . . . . . — — (776,701,057) 2,305,442
UltraShort MSCI Japan . . . . . . . . . . . . . . . . . — — (30,187,942) (3,635,312)
UltraShort MSCI Mexico Capped IMI . . . . . . — — (13,217,590) (292,236)
Merrill Corp - Proshares Trust Geared Book [96 Funds] Annual Report [Funds] 333-089822 05-31-2017 ED [AUX] | eperez | 28-Jul-17 17:44 | 17-15159-3.ka | Sequence: 19CHKSUM Content: 47209 Layout: 57331 Graphics: No Graphics CLEAN
JOB: 17-15159-3 CYCLE#;BL#: 5; 0 TRIM: 8.25" x 10.75" COMPOSITECOLORS: Black, ~note-color 2, ~note-color 3 GRAPHICS: none V1.5
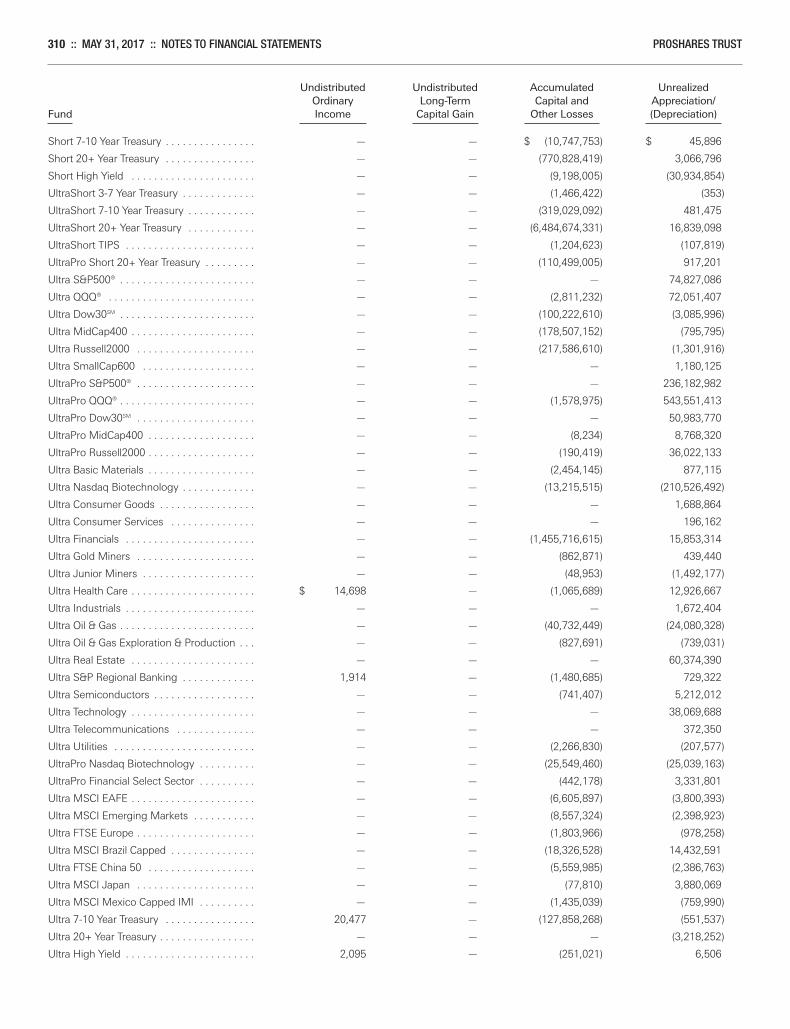
310 :: MAY 31, 2017 :: NOTES TO FINANCIAL STATEMENTS PROSHARES TRUST
Undistributed Undistributed Accumulated Unrealized Ordinary Long-Term Capital and Appreciation/Fund Income Capital Gain Other Losses (Depreciation)
Short 7-10 Year Treasury . . . . . . . . . . . . . . . . — — $ (10,747,753) $ 45,896
Short 20+ Year Treasury . . . . . . . . . . . . . . . . — — (770,828,419) 3,066,796
Short High Yield . . . . . . . . . . . . . . . . . . . . . . — — (9,198,005) (30,934,854)
UltraShort 3-7 Year Treasury . . . . . . . . . . . . . — — (1,466,422) (353)
UltraShort 7-10 Year Treasury . . . . . . . . . . . . — — (319,029,092) 481,475
UltraShort 20+ Year Treasury . . . . . . . . . . . . — — (6,484,674,331) 16,839,098
UltraShort TIPS . . . . . . . . . . . . . . . . . . . . . . . — — (1,204,623) (107,819)
UltraPro Short 20+ Year Treasury . . . . . . . . . — — (110,499,005) 917,201
Ultra S&P500® . . . . . . . . . . . . . . . . . . . . . . . . — — — 74,827,086
Ultra QQQ® . . . . . . . . . . . . . . . . . . . . . . . . . . — — (2,811,232) 72,051,407
Ultra Dow30SM . . . . . . . . . . . . . . . . . . . . . . . . — — (100,222,610) (3,085,996)
Ultra MidCap400 . . . . . . . . . . . . . . . . . . . . . . — — (178,507,152) (795,795)
Ultra Russell2000 . . . . . . . . . . . . . . . . . . . . . — — (217,586,610) (1,301,916)
Ultra SmallCap600 . . . . . . . . . . . . . . . . . . . . — — — 1,180,125
UltraPro S&P500® . . . . . . . . . . . . . . . . . . . . . — — — 236,182,982
UltraPro QQQ® . . . . . . . . . . . . . . . . . . . . . . . . — — (1,578,975) 543,551,413
UltraPro Dow30SM . . . . . . . . . . . . . . . . . . . . . — — — 50,983,770
UltraPro MidCap400 . . . . . . . . . . . . . . . . . . . — — (8,234) 8,768,320
UltraPro Russell2000 . . . . . . . . . . . . . . . . . . . — — (190,419) 36,022,133
Ultra Basic Materials . . . . . . . . . . . . . . . . . . . — — (2,454,145) 877,115
Ultra Nasdaq Biotechnology . . . . . . . . . . . . . — — (13,215,515) (210,526,492)
Ultra Consumer Goods . . . . . . . . . . . . . . . . . — — — 1,688,864
Ultra Consumer Services . . . . . . . . . . . . . . . — — — 196,162
Ultra Financials . . . . . . . . . . . . . . . . . . . . . . . — — (1,455,716,615) 15,853,314
Ultra Gold Miners . . . . . . . . . . . . . . . . . . . . . — — (862,871) 439,440
Ultra Junior Miners . . . . . . . . . . . . . . . . . . . . — — (48,953) (1,492,177)
Ultra Health Care . . . . . . . . . . . . . . . . . . . . . . $ 14,698 — (1,065,689) 12,926,667
Ultra Industrials . . . . . . . . . . . . . . . . . . . . . . . — — — 1,672,404
Ultra Oil & Gas . . . . . . . . . . . . . . . . . . . . . . . . — — (40,732,449) (24,080,328)
Ultra Oil & Gas Exploration & Production . . . — — (827,691) (739,031)
Ultra Real Estate . . . . . . . . . . . . . . . . . . . . . . — — — 60,374,390
Ultra S&P Regional Banking . . . . . . . . . . . . . 1,914 — (1,480,685) 729,322
Ultra Semiconductors . . . . . . . . . . . . . . . . . . — — (741,407) 5,212,012
Ultra Technology . . . . . . . . . . . . . . . . . . . . . . — — — 38,069,688
Ultra Telecommunications . . . . . . . . . . . . . . — — — 372,350
Ultra Utilities . . . . . . . . . . . . . . . . . . . . . . . . . — — (2,266,830) (207,577)
UltraPro Nasdaq Biotechnology . . . . . . . . . . — — (25,549,460) (25,039,163)
UltraPro Financial Select Sector . . . . . . . . . . — — (442,178) 3,331,801
Ultra MSCI EAFE . . . . . . . . . . . . . . . . . . . . . . — — (6,605,897) (3,800,393)
Ultra MSCI Emerging Markets . . . . . . . . . . . — — (8,557,324) (2,398,923)
Ultra FTSE Europe . . . . . . . . . . . . . . . . . . . . . — — (1,803,966) (978,258)
Ultra MSCI Brazil Capped . . . . . . . . . . . . . . . — — (18,326,528) 14,432,591
Ultra FTSE China 50 . . . . . . . . . . . . . . . . . . . — — (5,559,985) (2,386,763)
Ultra MSCI Japan . . . . . . . . . . . . . . . . . . . . . — — (77,810) 3,880,069
Ultra MSCI Mexico Capped IMI . . . . . . . . . . — — (1,435,039) (759,990)
Ultra 7-10 Year Treasury . . . . . . . . . . . . . . . . 20,477 — (127,858,268) (551,537)
Ultra 20+ Year Treasury . . . . . . . . . . . . . . . . . — — — (3,218,252)
Ultra High Yield . . . . . . . . . . . . . . . . . . . . . . . 2,095 — (251,021) 6,506
Merrill Corp - Proshares Trust Geared Book [96 Funds] Annual Report [Funds] 333-089822 05-31-2017 ED [AUX] | eperez | 28-Jul-17 17:44 | 17-15159-3.ka | Sequence: 20CHKSUM Content: 9106 Layout: 57141 Graphics: No Graphics CLEAN
JOB: 17-15159-3 CYCLE#;BL#: 5; 0 TRIM: 8.25" x 10.75" COMPOSITECOLORS: Black, ~note-color 2, ~note-color 3 GRAPHICS: none V1.5
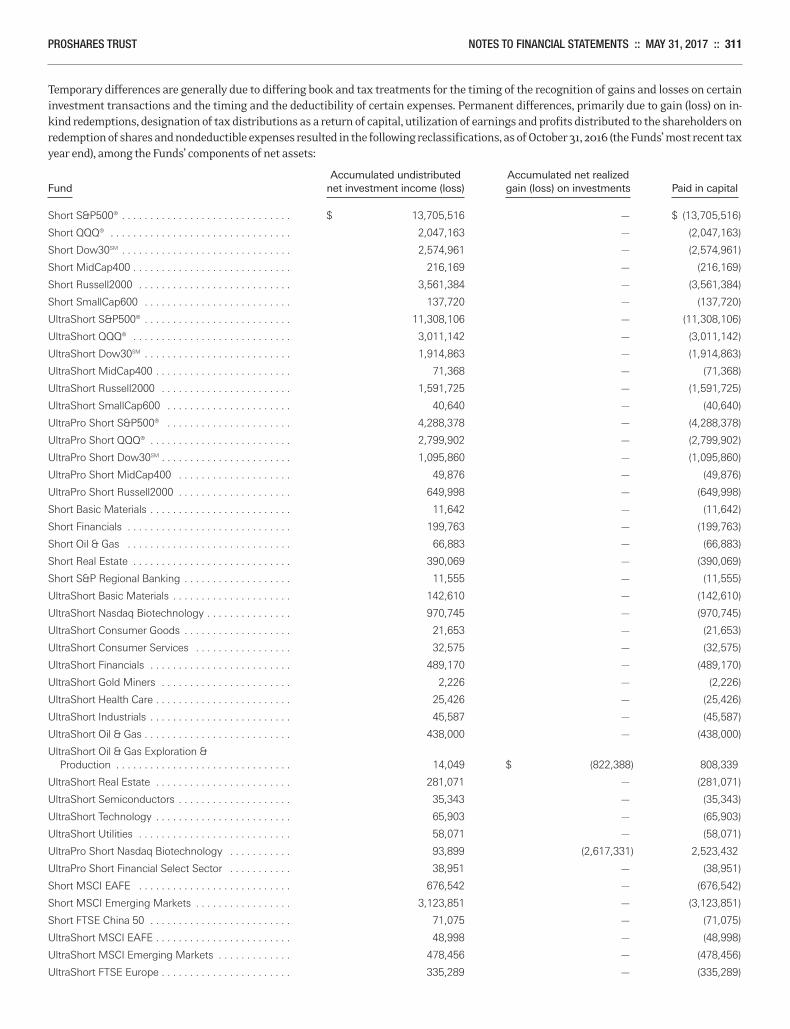
PROSHARES TRUST NOTES TO FINANCIAL STATEMENTS :: MAY 31, 2017 :: 311
Temporary differences are generally due to differing book and tax treatments for the timing of the recognition of gains and losses on certaininvestment transactions and the timing and the deductibility of certain expenses. Permanent differences, primarily due to gain (loss) on in-kind redemptions, designation of tax distributions as a return of capital, utilization of earnings and profits distributed to the shareholders onredemption of shares and nondeductible expenses resulted in the following reclassifications, as of October 31, 2016 (the Funds’ most recent taxyear end), among the Funds’ components of net assets:
Accumulated undistributed Accumulated net realizedFund net investment income (loss) gain (loss) on investments Paid in capital
Short S&P500® . . . . . . . . . . . . . . . . . . . . . . . . . . . . . . $ 13,705,516 — $ (13,705,516)
Short QQQ® . . . . . . . . . . . . . . . . . . . . . . . . . . . . . . . . 2,047,163 — (2,047,163)
Short Dow30SM . . . . . . . . . . . . . . . . . . . . . . . . . . . . . . 2,574,961 — (2,574,961)
Short MidCap400 . . . . . . . . . . . . . . . . . . . . . . . . . . . . 216,169 — (216,169)
Short Russell2000 . . . . . . . . . . . . . . . . . . . . . . . . . . . 3,561,384 — (3,561,384)
Short SmallCap600 . . . . . . . . . . . . . . . . . . . . . . . . . . 137,720 — (137,720)
UltraShort S&P500® . . . . . . . . . . . . . . . . . . . . . . . . . . 11,308,106 — (11,308,106)
UltraShort QQQ® . . . . . . . . . . . . . . . . . . . . . . . . . . . . 3,011,142 — (3,011,142)
UltraShort Dow30SM . . . . . . . . . . . . . . . . . . . . . . . . . . 1,914,863 — (1,914,863)
UltraShort MidCap400 . . . . . . . . . . . . . . . . . . . . . . . . 71,368 — (71,368)
UltraShort Russell2000 . . . . . . . . . . . . . . . . . . . . . . . 1,591,725 — (1,591,725)
UltraShort SmallCap600 . . . . . . . . . . . . . . . . . . . . . . 40,640 — (40,640)
UltraPro Short S&P500® . . . . . . . . . . . . . . . . . . . . . . 4,288,378 — (4,288,378)
UltraPro Short QQQ® . . . . . . . . . . . . . . . . . . . . . . . . . 2,799,902 — (2,799,902)
UltraPro Short Dow30SM . . . . . . . . . . . . . . . . . . . . . . . 1,095,860 — (1,095,860)
UltraPro Short MidCap400 . . . . . . . . . . . . . . . . . . . . 49,876 — (49,876)
UltraPro Short Russell2000 . . . . . . . . . . . . . . . . . . . . 649,998 — (649,998)
Short Basic Materials . . . . . . . . . . . . . . . . . . . . . . . . . 11,642 — (11,642)
Short Financials . . . . . . . . . . . . . . . . . . . . . . . . . . . . . 199,763 — (199,763)
Short Oil & Gas . . . . . . . . . . . . . . . . . . . . . . . . . . . . . 66,883 — (66,883)
Short Real Estate . . . . . . . . . . . . . . . . . . . . . . . . . . . . 390,069 — (390,069)
Short S&P Regional Banking . . . . . . . . . . . . . . . . . . . 11,555 — (11,555)
UltraShort Basic Materials . . . . . . . . . . . . . . . . . . . . . 142,610 — (142,610)
UltraShort Nasdaq Biotechnology . . . . . . . . . . . . . . . 970,745 — (970,745)
UltraShort Consumer Goods . . . . . . . . . . . . . . . . . . . 21,653 — (21,653)
UltraShort Consumer Services . . . . . . . . . . . . . . . . . 32,575 — (32,575)
UltraShort Financials . . . . . . . . . . . . . . . . . . . . . . . . . 489,170 — (489,170)
UltraShort Gold Miners . . . . . . . . . . . . . . . . . . . . . . . 2,226 — (2,226)
UltraShort Health Care . . . . . . . . . . . . . . . . . . . . . . . . 25,426 — (25,426)
UltraShort Industrials . . . . . . . . . . . . . . . . . . . . . . . . . 45,587 — (45,587)
UltraShort Oil & Gas . . . . . . . . . . . . . . . . . . . . . . . . . . 438,000 — (438,000)
UltraShort Oil & Gas Exploration & Production . . . . . . . . . . . . . . . . . . . . . . . . . . . . . . . 14,049 $ (822,388) 808,339
UltraShort Real Estate . . . . . . . . . . . . . . . . . . . . . . . . 281,071 — (281,071)
UltraShort Semiconductors . . . . . . . . . . . . . . . . . . . . 35,343 — (35,343)
UltraShort Technology . . . . . . . . . . . . . . . . . . . . . . . . 65,903 — (65,903)
UltraShort Utilities . . . . . . . . . . . . . . . . . . . . . . . . . . . 58,071 — (58,071)
UltraPro Short Nasdaq Biotechnology . . . . . . . . . . . 93,899 (2,617,331) 2,523,432
UltraPro Short Financial Select Sector . . . . . . . . . . . 38,951 — (38,951)
Short MSCI EAFE . . . . . . . . . . . . . . . . . . . . . . . . . . . 676,542 — (676,542)
Short MSCI Emerging Markets . . . . . . . . . . . . . . . . . 3,123,851 — (3,123,851)
Short FTSE China 50 . . . . . . . . . . . . . . . . . . . . . . . . . 71,075 — (71,075)
UltraShort MSCI EAFE . . . . . . . . . . . . . . . . . . . . . . . . 48,998 — (48,998)
UltraShort MSCI Emerging Markets . . . . . . . . . . . . . 478,456 — (478,456)
UltraShort FTSE Europe . . . . . . . . . . . . . . . . . . . . . . . 335,289 — (335,289)
Merrill Corp - Proshares Trust Geared Book [96 Funds] Annual Report [Funds] 333-089822 05-31-2017 ED [AUX] | eperez | 28-Jul-17 17:44 | 17-15159-3.ka | Sequence: 21CHKSUM Content: 16866 Layout: 30452 Graphics: No Graphics CLEAN
JOB: 17-15159-3 CYCLE#;BL#: 5; 0 TRIM: 8.25" x 10.75" COMPOSITECOLORS: Black, ~note-color 2, ~note-color 3 GRAPHICS: none V1.5
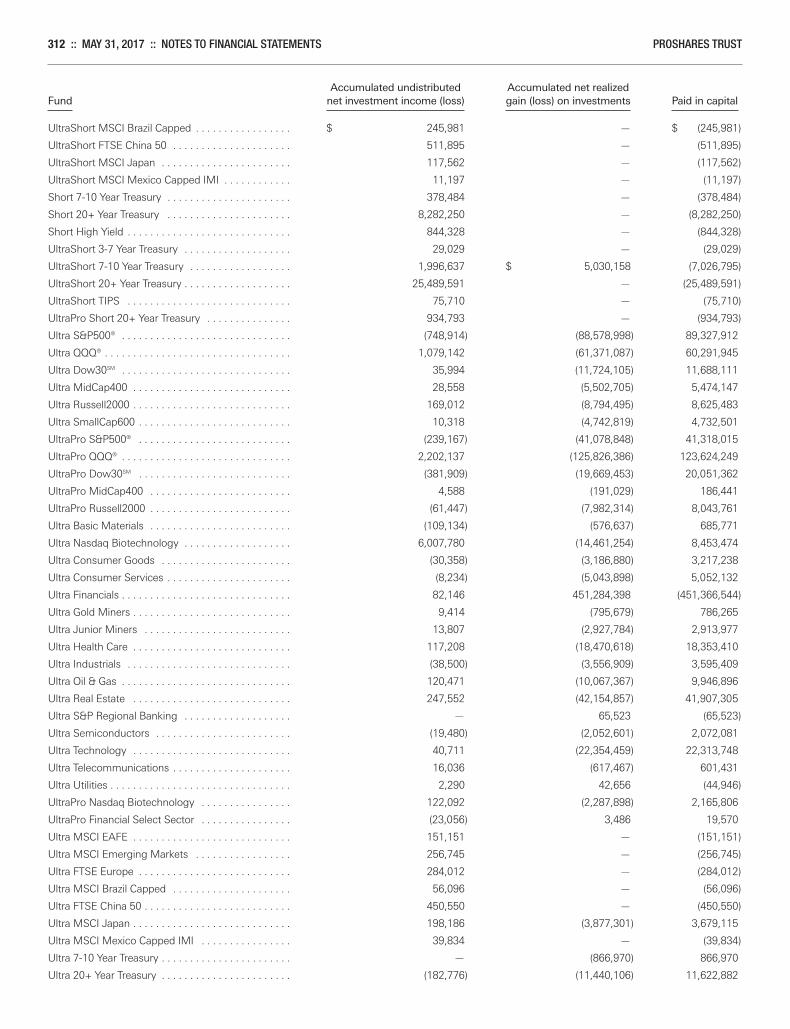
312 :: MAY 31, 2017 :: NOTES TO FINANCIAL STATEMENTS PROSHARES TRUST
Accumulated undistributed Accumulated net realizedFund net investment income (loss) gain (loss) on investments Paid in capital
UltraShort MSCI Brazil Capped . . . . . . . . . . . . . . . . . $ 245,981 — $ (245,981)
UltraShort FTSE China 50 . . . . . . . . . . . . . . . . . . . . . 511,895 — (511,895)
UltraShort MSCI Japan . . . . . . . . . . . . . . . . . . . . . . . 117,562 — (117,562)
UltraShort MSCI Mexico Capped IMI . . . . . . . . . . . . 11,197 — (11,197)
Short 7-10 Year Treasury . . . . . . . . . . . . . . . . . . . . . . 378,484 — (378,484)
Short 20+ Year Treasury . . . . . . . . . . . . . . . . . . . . . . 8,282,250 — (8,282,250)
Short High Yield . . . . . . . . . . . . . . . . . . . . . . . . . . . . . 844,328 — (844,328)
UltraShort 3-7 Year Treasury . . . . . . . . . . . . . . . . . . . 29,029 — (29,029)
UltraShort 7-10 Year Treasury . . . . . . . . . . . . . . . . . . 1,996,637 $ 5,030,158 (7,026,795)
UltraShort 20+ Year Treasury . . . . . . . . . . . . . . . . . . . 25,489,591 — (25,489,591)
UltraShort TIPS . . . . . . . . . . . . . . . . . . . . . . . . . . . . . 75,710 — (75,710)
UltraPro Short 20+ Year Treasury . . . . . . . . . . . . . . . 934,793 — (934,793)
Ultra S&P500® . . . . . . . . . . . . . . . . . . . . . . . . . . . . . . (748,914) (88,578,998) 89,327,912
Ultra QQQ® . . . . . . . . . . . . . . . . . . . . . . . . . . . . . . . . . 1,079,142 (61,371,087) 60,291,945
Ultra Dow30SM . . . . . . . . . . . . . . . . . . . . . . . . . . . . . . 35,994 (11,724,105) 11,688,111
Ultra MidCap400 . . . . . . . . . . . . . . . . . . . . . . . . . . . . 28,558 (5,502,705) 5,474,147
Ultra Russell2000 . . . . . . . . . . . . . . . . . . . . . . . . . . . . 169,012 (8,794,495) 8,625,483
Ultra SmallCap600 . . . . . . . . . . . . . . . . . . . . . . . . . . . 10,318 (4,742,819) 4,732,501
UltraPro S&P500® . . . . . . . . . . . . . . . . . . . . . . . . . . . (239,167) (41,078,848) 41,318,015
UltraPro QQQ® . . . . . . . . . . . . . . . . . . . . . . . . . . . . . . 2,202,137 (125,826,386) 123,624,249
UltraPro Dow30SM . . . . . . . . . . . . . . . . . . . . . . . . . . . (381,909) (19,669,453) 20,051,362
UltraPro MidCap400 . . . . . . . . . . . . . . . . . . . . . . . . . 4,588 (191,029) 186,441
UltraPro Russell2000 . . . . . . . . . . . . . . . . . . . . . . . . . (61,447) (7,982,314) 8,043,761
Ultra Basic Materials . . . . . . . . . . . . . . . . . . . . . . . . . (109,134) (576,637) 685,771
Ultra Nasdaq Biotechnology . . . . . . . . . . . . . . . . . . . 6,007,780 (14,461,254) 8,453,474
Ultra Consumer Goods . . . . . . . . . . . . . . . . . . . . . . . (30,358) (3,186,880) 3,217,238
Ultra Consumer Services . . . . . . . . . . . . . . . . . . . . . . (8,234) (5,043,898) 5,052,132
Ultra Financials . . . . . . . . . . . . . . . . . . . . . . . . . . . . . . 82,146 451,284,398 (451,366,544)
Ultra Gold Miners . . . . . . . . . . . . . . . . . . . . . . . . . . . . 9,414 (795,679) 786,265
Ultra Junior Miners . . . . . . . . . . . . . . . . . . . . . . . . . . 13,807 (2,927,784) 2,913,977
Ultra Health Care . . . . . . . . . . . . . . . . . . . . . . . . . . . . 117,208 (18,470,618) 18,353,410
Ultra Industrials . . . . . . . . . . . . . . . . . . . . . . . . . . . . . (38,500) (3,556,909) 3,595,409
Ultra Oil & Gas . . . . . . . . . . . . . . . . . . . . . . . . . . . . . . 120,471 (10,067,367) 9,946,896
Ultra Real Estate . . . . . . . . . . . . . . . . . . . . . . . . . . . . 247,552 (42,154,857) 41,907,305
Ultra S&P Regional Banking . . . . . . . . . . . . . . . . . . . — 65,523 (65,523)
Ultra Semiconductors . . . . . . . . . . . . . . . . . . . . . . . . (19,480) (2,052,601) 2,072,081
Ultra Technology . . . . . . . . . . . . . . . . . . . . . . . . . . . . 40,711 (22,354,459) 22,313,748
Ultra Telecommunications . . . . . . . . . . . . . . . . . . . . . 16,036 (617,467) 601,431
Ultra Utilities . . . . . . . . . . . . . . . . . . . . . . . . . . . . . . . . 2,290 42,656 (44,946)
UltraPro Nasdaq Biotechnology . . . . . . . . . . . . . . . . 122,092 (2,287,898) 2,165,806
UltraPro Financial Select Sector . . . . . . . . . . . . . . . . (23,056) 3,486 19,570
Ultra MSCI EAFE . . . . . . . . . . . . . . . . . . . . . . . . . . . . 151,151 — (151,151)
Ultra MSCI Emerging Markets . . . . . . . . . . . . . . . . . 256,745 — (256,745)
Ultra FTSE Europe . . . . . . . . . . . . . . . . . . . . . . . . . . . 284,012 — (284,012)
Ultra MSCI Brazil Capped . . . . . . . . . . . . . . . . . . . . . 56,096 — (56,096)
Ultra FTSE China 50 . . . . . . . . . . . . . . . . . . . . . . . . . . 450,550 — (450,550)
Ultra MSCI Japan . . . . . . . . . . . . . . . . . . . . . . . . . . . . 198,186 (3,877,301) 3,679,115
Ultra MSCI Mexico Capped IMI . . . . . . . . . . . . . . . . 39,834 — (39,834)
Ultra 7-10 Year Treasury . . . . . . . . . . . . . . . . . . . . . . . — (866,970) 866,970
Ultra 20+ Year Treasury . . . . . . . . . . . . . . . . . . . . . . . (182,776) (11,440,106) 11,622,882
Merrill Corp - Proshares Trust Geared Book [96 Funds] Annual Report [Funds] 333-089822 05-31-2017 ED [AUX] | eperez | 28-Jul-17 17:44 | 17-15159-3.ka | Sequence: 22CHKSUM Content: 5333 Layout: 50940 Graphics: No Graphics CLEAN
JOB: 17-15159-3 CYCLE#;BL#: 5; 0 TRIM: 8.25" x 10.75" COMPOSITECOLORS: Black, ~note-color 2, ~note-color 3 GRAPHICS: none V1.5
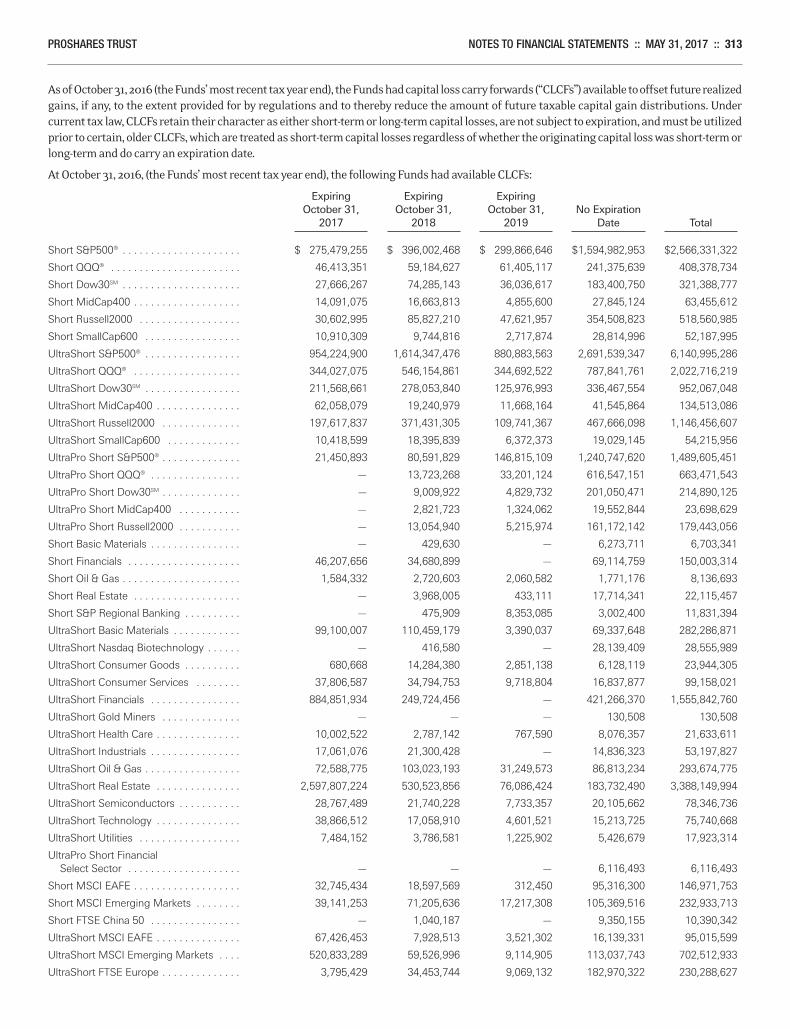
PROSHARES TRUST NOTES TO FINANCIAL STATEMENTS :: MAY 31, 2017 :: 313
As of October 31, 2016 (the Funds’ most recent tax year end), the Funds had capital loss carry forwards (“CLCFs”) available to offset future realizedgains, if any, to the extent provided for by regulations and to thereby reduce the amount of future taxable capital gain distributions. Undercurrent tax law, CLCFs retain their character as either short-term or long-term capital losses, are not subject to expiration, and must be utilizedprior to certain, older CLCFs, which are treated as short-term capital losses regardless of whether the originating capital loss was short-term orlong-term and do carry an expiration date.
At October 31, 2016, (the Funds’ most recent tax year end), the following Funds had available CLCFs:
Expiring Expiring Expiring October 31, October 31, October 31, No Expiration 2017 2018 2019 Date Total
Short S&P500® . . . . . . . . . . . . . . . . . . . . . $ 275,479,255 $ 396,002,468 $ 299,866,646 $1,594,982,953 $2,566,331,322
Short QQQ® . . . . . . . . . . . . . . . . . . . . . . . 46,413,351 59,184,627 61,405,117 241,375,639 408,378,734
Short Dow30SM . . . . . . . . . . . . . . . . . . . . . 27,666,267 74,285,143 36,036,617 183,400,750 321,388,777
Short MidCap400 . . . . . . . . . . . . . . . . . . . 14,091,075 16,663,813 4,855,600 27,845,124 63,455,612
Short Russell2000 . . . . . . . . . . . . . . . . . . 30,602,995 85,827,210 47,621,957 354,508,823 518,560,985
Short SmallCap600 . . . . . . . . . . . . . . . . . 10,910,309 9,744,816 2,717,874 28,814,996 52,187,995
UltraShort S&P500® . . . . . . . . . . . . . . . . . 954,224,900 1,614,347,476 880,883,563 2,691,539,347 6,140,995,286
UltraShort QQQ® . . . . . . . . . . . . . . . . . . . 344,027,075 546,154,861 344,692,522 787,841,761 2,022,716,219
UltraShort Dow30SM . . . . . . . . . . . . . . . . . 211,568,661 278,053,840 125,976,993 336,467,554 952,067,048
UltraShort MidCap400 . . . . . . . . . . . . . . . 62,058,079 19,240,979 11,668,164 41,545,864 134,513,086
UltraShort Russell2000 . . . . . . . . . . . . . . 197,617,837 371,431,305 109,741,367 467,666,098 1,146,456,607
UltraShort SmallCap600 . . . . . . . . . . . . . 10,418,599 18,395,839 6,372,373 19,029,145 54,215,956
UltraPro Short S&P500® . . . . . . . . . . . . . . 21,450,893 80,591,829 146,815,109 1,240,747,620 1,489,605,451
UltraPro Short QQQ® . . . . . . . . . . . . . . . . — 13,723,268 33,201,124 616,547,151 663,471,543
UltraPro Short Dow30SM . . . . . . . . . . . . . . — 9,009,922 4,829,732 201,050,471 214,890,125
UltraPro Short MidCap400 . . . . . . . . . . . — 2,821,723 1,324,062 19,552,844 23,698,629
UltraPro Short Russell2000 . . . . . . . . . . . — 13,054,940 5,215,974 161,172,142 179,443,056
Short Basic Materials . . . . . . . . . . . . . . . . — 429,630 — 6,273,711 6,703,341
Short Financials . . . . . . . . . . . . . . . . . . . . 46,207,656 34,680,899 — 69,114,759 150,003,314
Short Oil & Gas . . . . . . . . . . . . . . . . . . . . . 1,584,332 2,720,603 2,060,582 1,771,176 8,136,693
Short Real Estate . . . . . . . . . . . . . . . . . . . — 3,968,005 433,111 17,714,341 22,115,457
Short S&P Regional Banking . . . . . . . . . . — 475,909 8,353,085 3,002,400 11,831,394
UltraShort Basic Materials . . . . . . . . . . . . 99,100,007 110,459,179 3,390,037 69,337,648 282,286,871
UltraShort Nasdaq Biotechnology . . . . . . — 416,580 — 28,139,409 28,555,989
UltraShort Consumer Goods . . . . . . . . . . 680,668 14,284,380 2,851,138 6,128,119 23,944,305
UltraShort Consumer Services . . . . . . . . 37,806,587 34,794,753 9,718,804 16,837,877 99,158,021
UltraShort Financials . . . . . . . . . . . . . . . . 884,851,934 249,724,456 — 421,266,370 1,555,842,760
UltraShort Gold Miners . . . . . . . . . . . . . . — — — 130,508 130,508
UltraShort Health Care . . . . . . . . . . . . . . . 10,002,522 2,787,142 767,590 8,076,357 21,633,611
UltraShort Industrials . . . . . . . . . . . . . . . . 17,061,076 21,300,428 — 14,836,323 53,197,827
UltraShort Oil & Gas . . . . . . . . . . . . . . . . . 72,588,775 103,023,193 31,249,573 86,813,234 293,674,775
UltraShort Real Estate . . . . . . . . . . . . . . . 2,597,807,224 530,523,856 76,086,424 183,732,490 3,388,149,994
UltraShort Semiconductors . . . . . . . . . . . 28,767,489 21,740,228 7,733,357 20,105,662 78,346,736
UltraShort Technology . . . . . . . . . . . . . . . 38,866,512 17,058,910 4,601,521 15,213,725 75,740,668
UltraShort Utilities . . . . . . . . . . . . . . . . . . 7,484,152 3,786,581 1,225,902 5,426,679 17,923,314
UltraPro Short Financial Select Sector . . . . . . . . . . . . . . . . . . . . — — — 6,116,493 6,116,493
Short MSCI EAFE . . . . . . . . . . . . . . . . . . . 32,745,434 18,597,569 312,450 95,316,300 146,971,753
Short MSCI Emerging Markets . . . . . . . . 39,141,253 71,205,636 17,217,308 105,369,516 232,933,713
Short FTSE China 50 . . . . . . . . . . . . . . . . — 1,040,187 — 9,350,155 10,390,342
UltraShort MSCI EAFE . . . . . . . . . . . . . . . 67,426,453 7,928,513 3,521,302 16,139,331 95,015,599
UltraShort MSCI Emerging Markets . . . . 520,833,289 59,526,996 9,114,905 113,037,743 702,512,933
UltraShort FTSE Europe . . . . . . . . . . . . . . 3,795,429 34,453,744 9,069,132 182,970,322 230,288,627
Merrill Corp - Proshares Trust Geared Book [96 Funds] Annual Report [Funds] 333-089822 05-31-2017 ED [AUX] | eperez | 28-Jul-17 17:44 | 17-15159-3.ka | Sequence: 23CHKSUM Content: 47261 Layout: 53647 Graphics: No Graphics CLEAN
JOB: 17-15159-3 CYCLE#;BL#: 5; 0 TRIM: 8.25" x 10.75" COMPOSITECOLORS: Black, ~note-color 2, ~note-color 3 GRAPHICS: none V1.5
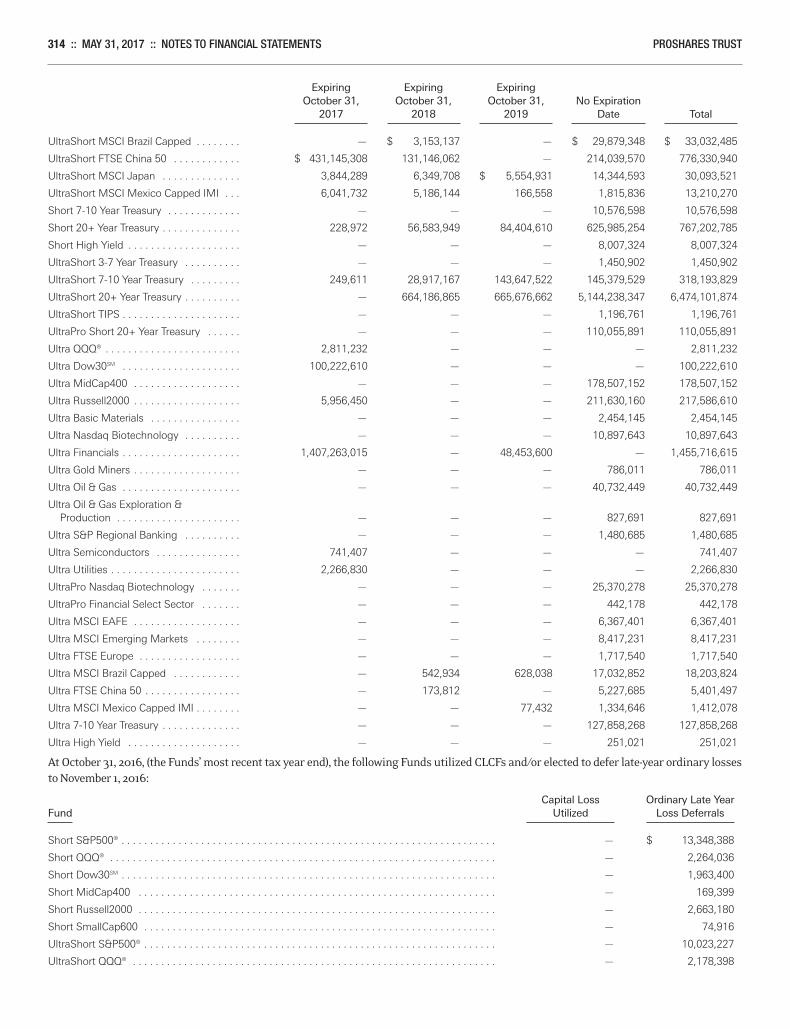
314 :: MAY 31, 2017 :: NOTES TO FINANCIAL STATEMENTS PROSHARES TRUST
Expiring Expiring Expiring October 31, October 31, October 31, No Expiration 2017 2018 2019 Date Total
UltraShort MSCI Brazil Capped . . . . . . . . — $ 3,153,137 — $ 29,879,348 $ 33,032,485
UltraShort FTSE China 50 . . . . . . . . . . . . $ 431,145,308 131,146,062 — 214,039,570 776,330,940
UltraShort MSCI Japan . . . . . . . . . . . . . . 3,844,289 6,349,708 $ 5,554,931 14,344,593 30,093,521
UltraShort MSCI Mexico Capped IMI . . . 6,041,732 5,186,144 166,558 1,815,836 13,210,270
Short 7-10 Year Treasury . . . . . . . . . . . . . — — — 10,576,598 10,576,598
Short 20+ Year Treasury . . . . . . . . . . . . . . 228,972 56,583,949 84,404,610 625,985,254 767,202,785
Short High Yield . . . . . . . . . . . . . . . . . . . . — — — 8,007,324 8,007,324
UltraShort 3-7 Year Treasury . . . . . . . . . . — — — 1,450,902 1,450,902
UltraShort 7-10 Year Treasury . . . . . . . . . 249,611 28,917,167 143,647,522 145,379,529 318,193,829
UltraShort 20+ Year Treasury . . . . . . . . . . — 664,186,865 665,676,662 5,144,238,347 6,474,101,874
UltraShort TIPS . . . . . . . . . . . . . . . . . . . . . — — — 1,196,761 1,196,761
UltraPro Short 20+ Year Treasury . . . . . . — — — 110,055,891 110,055,891
Ultra QQQ® . . . . . . . . . . . . . . . . . . . . . . . . 2,811,232 — — — 2,811,232
Ultra Dow30SM . . . . . . . . . . . . . . . . . . . . . 100,222,610 — — — 100,222,610
Ultra MidCap400 . . . . . . . . . . . . . . . . . . . — — — 178,507,152 178,507,152
Ultra Russell2000 . . . . . . . . . . . . . . . . . . . 5,956,450 — — 211,630,160 217,586,610
Ultra Basic Materials . . . . . . . . . . . . . . . . — — — 2,454,145 2,454,145
Ultra Nasdaq Biotechnology . . . . . . . . . . — — — 10,897,643 10,897,643
Ultra Financials . . . . . . . . . . . . . . . . . . . . . 1,407,263,015 — 48,453,600 — 1,455,716,615
Ultra Gold Miners . . . . . . . . . . . . . . . . . . . — — — 786,011 786,011
Ultra Oil & Gas . . . . . . . . . . . . . . . . . . . . . — — — 40,732,449 40,732,449
Ultra Oil & Gas Exploration & Production . . . . . . . . . . . . . . . . . . . . . . — — — 827,691 827,691
Ultra S&P Regional Banking . . . . . . . . . . — — — 1,480,685 1,480,685
Ultra Semiconductors . . . . . . . . . . . . . . . 741,407 — — — 741,407
Ultra Utilities . . . . . . . . . . . . . . . . . . . . . . . 2,266,830 — — — 2,266,830
UltraPro Nasdaq Biotechnology . . . . . . . — — — 25,370,278 25,370,278
UltraPro Financial Select Sector . . . . . . . — — — 442,178 442,178
Ultra MSCI EAFE . . . . . . . . . . . . . . . . . . . — — — 6,367,401 6,367,401
Ultra MSCI Emerging Markets . . . . . . . . — — — 8,417,231 8,417,231
Ultra FTSE Europe . . . . . . . . . . . . . . . . . . — — — 1,717,540 1,717,540
Ultra MSCI Brazil Capped . . . . . . . . . . . . — 542,934 628,038 17,032,852 18,203,824
Ultra FTSE China 50 . . . . . . . . . . . . . . . . . — 173,812 — 5,227,685 5,401,497
Ultra MSCI Mexico Capped IMI . . . . . . . . — — 77,432 1,334,646 1,412,078
Ultra 7-10 Year Treasury . . . . . . . . . . . . . . — — — 127,858,268 127,858,268
Ultra High Yield . . . . . . . . . . . . . . . . . . . . — — — 251,021 251,021
At October 31, 2016, (the Funds’ most recent tax year end), the following Funds utilized CLCFs and/or elected to defer late-year ordinary lossesto November 1, 2016:
Capital Loss Ordinary Late Year Fund Utilized Loss Deferrals
Short S&P500® . . . . . . . . . . . . . . . . . . . . . . . . . . . . . . . . . . . . . . . . . . . . . . . . . . . . . . . . . . . . . . . . . . — $ 13,348,388
Short QQQ® . . . . . . . . . . . . . . . . . . . . . . . . . . . . . . . . . . . . . . . . . . . . . . . . . . . . . . . . . . . . . . . . . . . . — 2,264,036
Short Dow30SM . . . . . . . . . . . . . . . . . . . . . . . . . . . . . . . . . . . . . . . . . . . . . . . . . . . . . . . . . . . . . . . . . . — 1,963,400
Short MidCap400 . . . . . . . . . . . . . . . . . . . . . . . . . . . . . . . . . . . . . . . . . . . . . . . . . . . . . . . . . . . . . . . — 169,399
Short Russell2000 . . . . . . . . . . . . . . . . . . . . . . . . . . . . . . . . . . . . . . . . . . . . . . . . . . . . . . . . . . . . . . . — 2,663,180
Short SmallCap600 . . . . . . . . . . . . . . . . . . . . . . . . . . . . . . . . . . . . . . . . . . . . . . . . . . . . . . . . . . . . . . — 74,916
UltraShort S&P500® . . . . . . . . . . . . . . . . . . . . . . . . . . . . . . . . . . . . . . . . . . . . . . . . . . . . . . . . . . . . . . — 10,023,227
UltraShort QQQ® . . . . . . . . . . . . . . . . . . . . . . . . . . . . . . . . . . . . . . . . . . . . . . . . . . . . . . . . . . . . . . . . — 2,178,398
Merrill Corp - Proshares Trust Geared Book [96 Funds] Annual Report [Funds] 333-089822 05-31-2017 ED [AUX] | eperez | 28-Jul-17 17:44 | 17-15159-3.ka | Sequence: 24CHKSUM Content: 376 Layout: 18704 Graphics: No Graphics CLEAN
JOB: 17-15159-3 CYCLE#;BL#: 5; 0 TRIM: 8.25" x 10.75" COMPOSITECOLORS: Black, ~note-color 2, ~note-color 3 GRAPHICS: none V1.5

PROSHARES TRUST NOTES TO FINANCIAL STATEMENTS :: MAY 31, 2017 :: 315
Capital Loss Ordinary Late Year Fund Utilized Loss Deferrals
UltraShort Dow30SM . . . . . . . . . . . . . . . . . . . . . . . . . . . . . . . . . . . . . . . . . . . . . . . . . . . . . . . . . . . . . . — $ 1,313,860
UltraShort MidCap400 . . . . . . . . . . . . . . . . . . . . . . . . . . . . . . . . . . . . . . . . . . . . . . . . . . . . . . . . . . . . — 50,338
UltraShort Russell2000 . . . . . . . . . . . . . . . . . . . . . . . . . . . . . . . . . . . . . . . . . . . . . . . . . . . . . . . . . . . — 1,084,558
UltraShort SmallCap600 . . . . . . . . . . . . . . . . . . . . . . . . . . . . . . . . . . . . . . . . . . . . . . . . . . . . . . . . . . — 25,160
UltraPro Short S&P500® . . . . . . . . . . . . . . . . . . . . . . . . . . . . . . . . . . . . . . . . . . . . . . . . . . . . . . . . . . — 3,855,683
UltraPro Short QQQ® . . . . . . . . . . . . . . . . . . . . . . . . . . . . . . . . . . . . . . . . . . . . . . . . . . . . . . . . . . . . . — 2,853,142
UltraPro Short Dow30SM . . . . . . . . . . . . . . . . . . . . . . . . . . . . . . . . . . . . . . . . . . . . . . . . . . . . . . . . . . — 1,050,980
UltraPro Short MidCap400 . . . . . . . . . . . . . . . . . . . . . . . . . . . . . . . . . . . . . . . . . . . . . . . . . . . . . . . . — 26,154
UltraPro Short Russell2000 . . . . . . . . . . . . . . . . . . . . . . . . . . . . . . . . . . . . . . . . . . . . . . . . . . . . . . . . — 459,998
Short Basic Materials . . . . . . . . . . . . . . . . . . . . . . . . . . . . . . . . . . . . . . . . . . . . . . . . . . . . . . . . . . . . . — 65,768
Short Financials . . . . . . . . . . . . . . . . . . . . . . . . . . . . . . . . . . . . . . . . . . . . . . . . . . . . . . . . . . . . . . . . . — 235,045
Short Oil & Gas . . . . . . . . . . . . . . . . . . . . . . . . . . . . . . . . . . . . . . . . . . . . . . . . . . . . . . . . . . . . . . . . . $ 945,158 53,329
Short Real Estate . . . . . . . . . . . . . . . . . . . . . . . . . . . . . . . . . . . . . . . . . . . . . . . . . . . . . . . . . . . . . . . . — 146,336
Short S&P Regional Banking . . . . . . . . . . . . . . . . . . . . . . . . . . . . . . . . . . . . . . . . . . . . . . . . . . . . . . . — 12,471
UltraShort Basic Materials . . . . . . . . . . . . . . . . . . . . . . . . . . . . . . . . . . . . . . . . . . . . . . . . . . . . . . . . . — 98,134
UltraShort Nasdaq Biotechnology . . . . . . . . . . . . . . . . . . . . . . . . . . . . . . . . . . . . . . . . . . . . . . . . . . . — 528,372
UltraShort Consumer Goods . . . . . . . . . . . . . . . . . . . . . . . . . . . . . . . . . . . . . . . . . . . . . . . . . . . . . . . — 14,882
UltraShort Consumer Services . . . . . . . . . . . . . . . . . . . . . . . . . . . . . . . . . . . . . . . . . . . . . . . . . . . . . — 16,722
UltraShort Financials . . . . . . . . . . . . . . . . . . . . . . . . . . . . . . . . . . . . . . . . . . . . . . . . . . . . . . . . . . . . . — 342,789
UltraShort Gold Miners . . . . . . . . . . . . . . . . . . . . . . . . . . . . . . . . . . . . . . . . . . . . . . . . . . . . . . . . . . . — 18,075
UltraShort Health Care . . . . . . . . . . . . . . . . . . . . . . . . . . . . . . . . . . . . . . . . . . . . . . . . . . . . . . . . . . . — 21,045
UltraShort Industrials . . . . . . . . . . . . . . . . . . . . . . . . . . . . . . . . . . . . . . . . . . . . . . . . . . . . . . . . . . . . . — 26,408
UltraShort Oil & Gas . . . . . . . . . . . . . . . . . . . . . . . . . . . . . . . . . . . . . . . . . . . . . . . . . . . . . . . . . . . . . — 257,427
UltraShort Oil & Gas Exploration & Production . . . . . . . . . . . . . . . . . . . . . . . . . . . . . . . . . . . . . . . . . 342,681 9,576
UltraShort Real Estate . . . . . . . . . . . . . . . . . . . . . . . . . . . . . . . . . . . . . . . . . . . . . . . . . . . . . . . . . . . . — 192,825
UltraShort Semiconductors . . . . . . . . . . . . . . . . . . . . . . . . . . . . . . . . . . . . . . . . . . . . . . . . . . . . . . . . — 24,248
UltraShort Technology . . . . . . . . . . . . . . . . . . . . . . . . . . . . . . . . . . . . . . . . . . . . . . . . . . . . . . . . . . . . — 30,665
UltraShort Utilities . . . . . . . . . . . . . . . . . . . . . . . . . . . . . . . . . . . . . . . . . . . . . . . . . . . . . . . . . . . . . . . — 32,538
UltraPro Short Nasdaq Biotechnology . . . . . . . . . . . . . . . . . . . . . . . . . . . . . . . . . . . . . . . . . . . . . . . 1,388,786 —
UltraPro Short Financial Select Sector . . . . . . . . . . . . . . . . . . . . . . . . . . . . . . . . . . . . . . . . . . . . . . . — 17,584
Short MSCI EAFE . . . . . . . . . . . . . . . . . . . . . . . . . . . . . . . . . . . . . . . . . . . . . . . . . . . . . . . . . . . . . . . — 512,232
Short MSCI Emerging Markets . . . . . . . . . . . . . . . . . . . . . . . . . . . . . . . . . . . . . . . . . . . . . . . . . . . . . — 1,702,935
Short FTSE China 50 . . . . . . . . . . . . . . . . . . . . . . . . . . . . . . . . . . . . . . . . . . . . . . . . . . . . . . . . . . . . . — 72,871
UltraShort MSCI EAFE . . . . . . . . . . . . . . . . . . . . . . . . . . . . . . . . . . . . . . . . . . . . . . . . . . . . . . . . . . . — 46,311
UltraShort MSCI Emerging Markets . . . . . . . . . . . . . . . . . . . . . . . . . . . . . . . . . . . . . . . . . . . . . . . . . — 310,273
UltraShort FTSE Europe . . . . . . . . . . . . . . . . . . . . . . . . . . . . . . . . . . . . . . . . . . . . . . . . . . . . . . . . . . — 302,369
UltraShort MSCI Brazil Capped . . . . . . . . . . . . . . . . . . . . . . . . . . . . . . . . . . . . . . . . . . . . . . . . . . . . . — 208,077
UltraShort FTSE China 50 . . . . . . . . . . . . . . . . . . . . . . . . . . . . . . . . . . . . . . . . . . . . . . . . . . . . . . . . . — 370,117
UltraShort MSCI Japan . . . . . . . . . . . . . . . . . . . . . . . . . . . . . . . . . . . . . . . . . . . . . . . . . . . . . . . . . . . — 94,421
UltraShort MSCI Mexico Capped IMI . . . . . . . . . . . . . . . . . . . . . . . . . . . . . . . . . . . . . . . . . . . . . . . . 314,385 7,320
Short 7-10 Year Treasury . . . . . . . . . . . . . . . . . . . . . . . . . . . . . . . . . . . . . . . . . . . . . . . . . . . . . . . . . . — 171,155
Short 20+ Year Treasury . . . . . . . . . . . . . . . . . . . . . . . . . . . . . . . . . . . . . . . . . . . . . . . . . . . . . . . . . . — 3,625,634
Short High Yield . . . . . . . . . . . . . . . . . . . . . . . . . . . . . . . . . . . . . . . . . . . . . . . . . . . . . . . . . . . . . . . . . 7,965,574 1,190,681
UltraShort 3-7 Year Treasury . . . . . . . . . . . . . . . . . . . . . . . . . . . . . . . . . . . . . . . . . . . . . . . . . . . . . . . — 15,520
UltraShort 7-10 Year Treasury . . . . . . . . . . . . . . . . . . . . . . . . . . . . . . . . . . . . . . . . . . . . . . . . . . . . . . — 835,263
UltraShort 20+ Year Treasury . . . . . . . . . . . . . . . . . . . . . . . . . . . . . . . . . . . . . . . . . . . . . . . . . . . . . . — 10,572,457
UltraShort TIPS . . . . . . . . . . . . . . . . . . . . . . . . . . . . . . . . . . . . . . . . . . . . . . . . . . . . . . . . . . . . . . . . . 292,397 7,862
UltraPro Short 20+ Year Treasury . . . . . . . . . . . . . . . . . . . . . . . . . . . . . . . . . . . . . . . . . . . . . . . . . . . — 443,114
Ultra QQQ® . . . . . . . . . . . . . . . . . . . . . . . . . . . . . . . . . . . . . . . . . . . . . . . . . . . . . . . . . . . . . . . . . . . . . 4,600,830 —
Ultra Dow30SM . . . . . . . . . . . . . . . . . . . . . . . . . . . . . . . . . . . . . . . . . . . . . . . . . . . . . . . . . . . . . . . . . . 33,556,896 —
Merrill Corp - Proshares Trust Geared Book [96 Funds] Annual Report [Funds] 333-089822 05-31-2017 ED [AUX] | eperez | 28-Jul-17 17:44 | 17-15159-3.ka | Sequence: 25CHKSUM Content: 6636 Layout: 49273 Graphics: No Graphics CLEAN
JOB: 17-15159-3 CYCLE#;BL#: 5; 0 TRIM: 8.25" x 10.75" COMPOSITECOLORS: Black, ~note-color 2, ~note-color 3 GRAPHICS: none V1.5
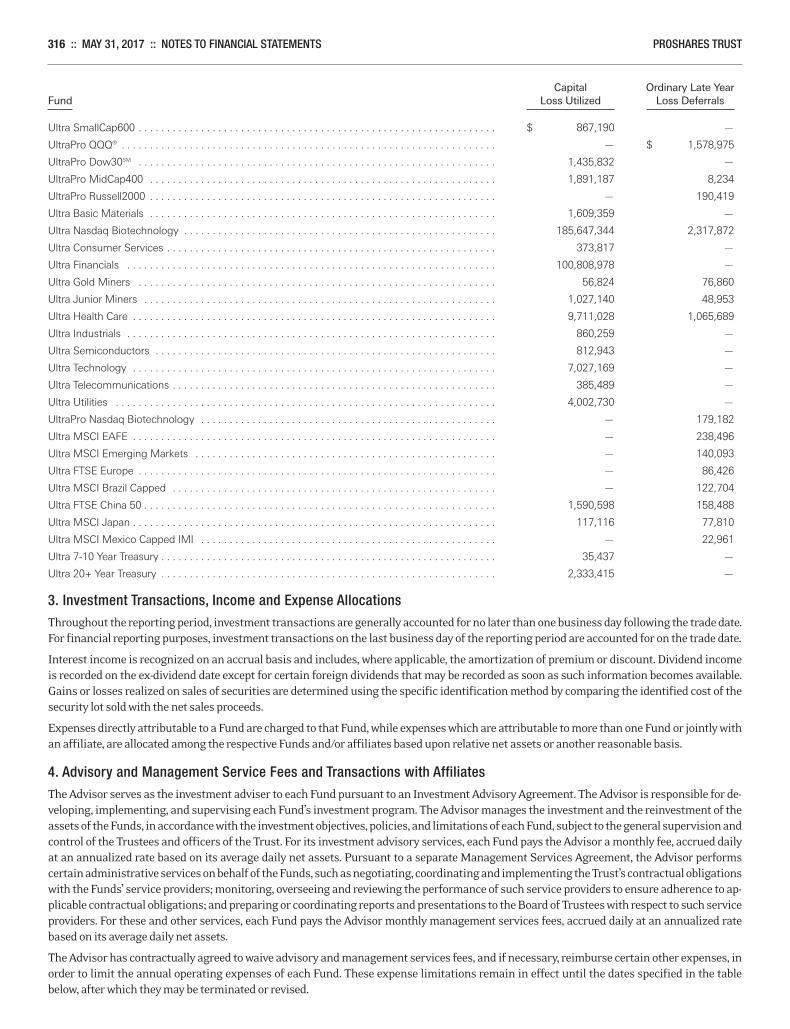
316 :: MAY 31, 2017 :: NOTES TO FINANCIAL STATEMENTS PROSHARES TRUST
Capital Ordinary Late Year Fund Loss Utilized Loss Deferrals
Ultra SmallCap600 . . . . . . . . . . . . . . . . . . . . . . . . . . . . . . . . . . . . . . . . . . . . . . . . . . . . . . . . . . . . . . . $ 867,190 —
UltraPro QQQ® . . . . . . . . . . . . . . . . . . . . . . . . . . . . . . . . . . . . . . . . . . . . . . . . . . . . . . . . . . . . . . . . . . — $ 1,578,975
UltraPro Dow30SM . . . . . . . . . . . . . . . . . . . . . . . . . . . . . . . . . . . . . . . . . . . . . . . . . . . . . . . . . . . . . . . 1,435,832 —
UltraPro MidCap400 . . . . . . . . . . . . . . . . . . . . . . . . . . . . . . . . . . . . . . . . . . . . . . . . . . . . . . . . . . . . . 1,891,187 8,234
UltraPro Russell2000 . . . . . . . . . . . . . . . . . . . . . . . . . . . . . . . . . . . . . . . . . . . . . . . . . . . . . . . . . . . . . — 190,419
Ultra Basic Materials . . . . . . . . . . . . . . . . . . . . . . . . . . . . . . . . . . . . . . . . . . . . . . . . . . . . . . . . . . . . . 1,609,359 —
Ultra Nasdaq Biotechnology . . . . . . . . . . . . . . . . . . . . . . . . . . . . . . . . . . . . . . . . . . . . . . . . . . . . . . . 185,647,344 2,317,872
Ultra Consumer Services . . . . . . . . . . . . . . . . . . . . . . . . . . . . . . . . . . . . . . . . . . . . . . . . . . . . . . . . . . 373,817 —
Ultra Financials . . . . . . . . . . . . . . . . . . . . . . . . . . . . . . . . . . . . . . . . . . . . . . . . . . . . . . . . . . . . . . . . . 100,808,978 —
Ultra Gold Miners . . . . . . . . . . . . . . . . . . . . . . . . . . . . . . . . . . . . . . . . . . . . . . . . . . . . . . . . . . . . . . . 56,824 76,860
Ultra Junior Miners . . . . . . . . . . . . . . . . . . . . . . . . . . . . . . . . . . . . . . . . . . . . . . . . . . . . . . . . . . . . . . 1,027,140 48,953
Ultra Health Care . . . . . . . . . . . . . . . . . . . . . . . . . . . . . . . . . . . . . . . . . . . . . . . . . . . . . . . . . . . . . . . . 9,711,028 1,065,689
Ultra Industrials . . . . . . . . . . . . . . . . . . . . . . . . . . . . . . . . . . . . . . . . . . . . . . . . . . . . . . . . . . . . . . . . . 860,259 —
Ultra Semiconductors . . . . . . . . . . . . . . . . . . . . . . . . . . . . . . . . . . . . . . . . . . . . . . . . . . . . . . . . . . . . 812,943 —
Ultra Technology . . . . . . . . . . . . . . . . . . . . . . . . . . . . . . . . . . . . . . . . . . . . . . . . . . . . . . . . . . . . . . . . 7,027,169 —
Ultra Telecommunications . . . . . . . . . . . . . . . . . . . . . . . . . . . . . . . . . . . . . . . . . . . . . . . . . . . . . . . . . 385,489 —
Ultra Utilities . . . . . . . . . . . . . . . . . . . . . . . . . . . . . . . . . . . . . . . . . . . . . . . . . . . . . . . . . . . . . . . . . . . 4,002,730 —
UltraPro Nasdaq Biotechnology . . . . . . . . . . . . . . . . . . . . . . . . . . . . . . . . . . . . . . . . . . . . . . . . . . . . — 179,182
Ultra MSCI EAFE . . . . . . . . . . . . . . . . . . . . . . . . . . . . . . . . . . . . . . . . . . . . . . . . . . . . . . . . . . . . . . . . — 238,496
Ultra MSCI Emerging Markets . . . . . . . . . . . . . . . . . . . . . . . . . . . . . . . . . . . . . . . . . . . . . . . . . . . . . — 140,093
Ultra FTSE Europe . . . . . . . . . . . . . . . . . . . . . . . . . . . . . . . . . . . . . . . . . . . . . . . . . . . . . . . . . . . . . . . — 86,426
Ultra MSCI Brazil Capped . . . . . . . . . . . . . . . . . . . . . . . . . . . . . . . . . . . . . . . . . . . . . . . . . . . . . . . . . — 122,704
Ultra FTSE China 50 . . . . . . . . . . . . . . . . . . . . . . . . . . . . . . . . . . . . . . . . . . . . . . . . . . . . . . . . . . . . . . 1,590,598 158,488
Ultra MSCI Japan . . . . . . . . . . . . . . . . . . . . . . . . . . . . . . . . . . . . . . . . . . . . . . . . . . . . . . . . . . . . . . . . 117,116 77,810
Ultra MSCI Mexico Capped IMI . . . . . . . . . . . . . . . . . . . . . . . . . . . . . . . . . . . . . . . . . . . . . . . . . . . . — 22,961
Ultra 7-10 Year Treasury . . . . . . . . . . . . . . . . . . . . . . . . . . . . . . . . . . . . . . . . . . . . . . . . . . . . . . . . . . . 35,437 —
Ultra 20+ Year Treasury . . . . . . . . . . . . . . . . . . . . . . . . . . . . . . . . . . . . . . . . . . . . . . . . . . . . . . . . . . . 2,333,415 —
3. Investment Transactions, Income and Expense AllocationsThroughout the reporting period, investment transactions are generally accounted for no later than one business day following the trade date.For financial reporting purposes, investment transactions on the last business day of the reporting period are accounted for on the trade date.
Interest income is recognized on an accrual basis and includes, where applicable, the amortization of premium or discount. Dividend incomeis recorded on the ex-dividend date except for certain foreign dividends that may be recorded as soon as such information becomes available.Gains or losses realized on sales of securities are determined using the specific identification method by comparing the identified cost of thesecurity lot sold with the net sales proceeds.
Expenses directly attributable to a Fund are charged to that Fund, while expenses which are attributable to more than one Fund or jointly withan affiliate, are allocated among the respective Funds and/or affiliates based upon relative net assets or another reasonable basis.
4. Advisory and Management Service Fees and Transactions with AffiliatesThe Advisor serves as the investment adviser to each Fund pursuant to an Investment Advisory Agreement. The Advisor is responsible for de-veloping, implementing, and supervising each Fund’s investment program. The Advisor manages the investment and the reinvestment of theassets of the Funds, in accordance with the investment objectives, policies, and limitations of each Fund, subject to the general supervision andcontrol of the Trustees and officers of the Trust. For its investment advisory services, each Fund pays the Advisor a monthly fee, accrued dailyat an annualized rate based on its average daily net assets. Pursuant to a separate Management Services Agreement, the Advisor performscertain administrative services on behalf of the Funds, such as negotiating, coordinating and implementing the Trust’s contractual obligationswith the Funds’ service providers; monitoring, overseeing and reviewing the performance of such service providers to ensure adherence to ap-plicable contractual obligations; and preparing or coordinating reports and presentations to the Board of Trustees with respect to such serviceproviders. For these and other services, each Fund pays the Advisor monthly management services fees, accrued daily at an annualized ratebased on its average daily net assets.
The Advisor has contractually agreed to waive advisory and management services fees, and if necessary, reimburse certain other expenses, inorder to limit the annual operating expenses of each Fund. These expense limitations remain in effect until the dates specified in the tablebelow, after which they may be terminated or revised.
Merrill Corp - Proshares Trust Geared Book [96 Funds] Annual Report [Funds] 333-089822 05-31-2017 ED [AUX] | eperez | 28-Jul-17 17:44 | 17-15159-3.ka | Sequence: 26CHKSUM Content: 22257 Layout: 5396 Graphics: No Graphics CLEAN
JOB: 17-15159-3 CYCLE#;BL#: 5; 0 TRIM: 8.25" x 10.75" COMPOSITECOLORS: Black, ~note-color 2, ~note-color 3 GRAPHICS: none V1.5
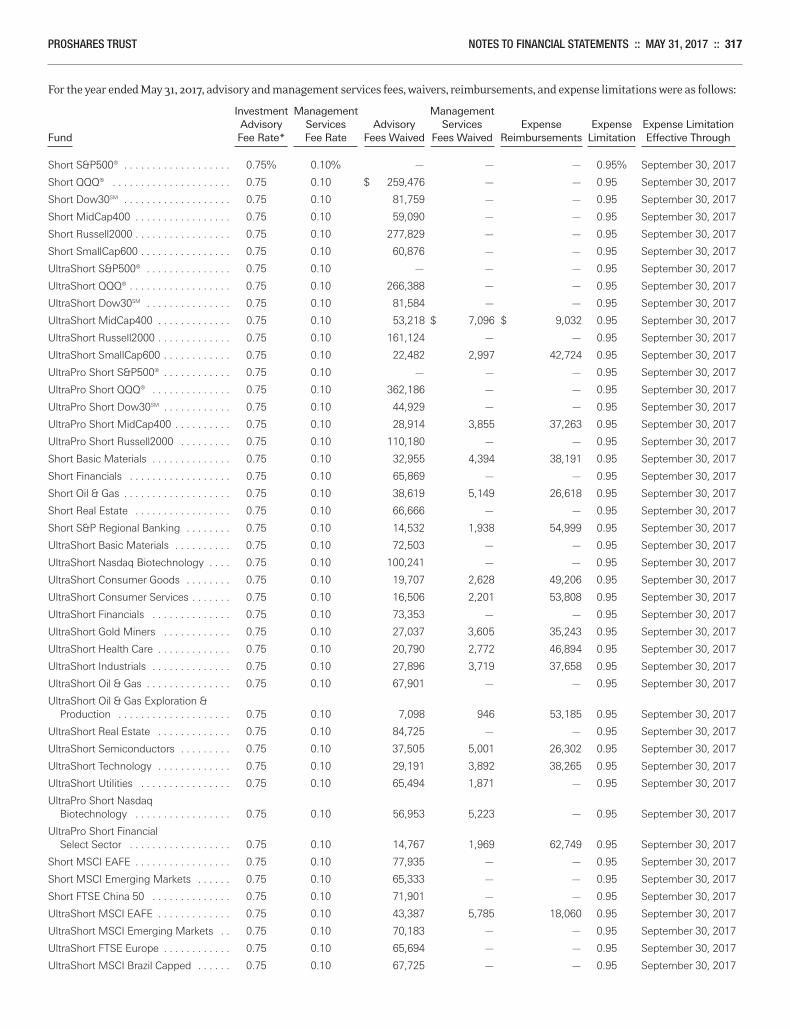
PROSHARES TRUST NOTES TO FINANCIAL STATEMENTS :: MAY 31, 2017 :: 317
For the year ended May 31, 2017, advisory and management services fees, waivers, reimbursements, and expense limitations were as follows:
Investment Management Management Advisory Services Advisory Services Expense Expense Expense LimitationFund Fee Rate* Fee Rate Fees Waived Fees Waived Reimbursements Limitation Effective Through
Short S&P500® . . . . . . . . . . . . . . . . . . . 0.75% 0.10% — — — 0.95% September 30, 2017
Short QQQ® . . . . . . . . . . . . . . . . . . . . . 0.75 0.10 $ 259,476 — — 0.95 September 30, 2017
Short Dow30SM . . . . . . . . . . . . . . . . . . . 0.75 0.10 81,759 — — 0.95 September 30, 2017
Short MidCap400 . . . . . . . . . . . . . . . . . 0.75 0.10 59,090 — — 0.95 September 30, 2017
Short Russell2000 . . . . . . . . . . . . . . . . . 0.75 0.10 277,829 — — 0.95 September 30, 2017
Short SmallCap600 . . . . . . . . . . . . . . . . 0.75 0.10 60,876 — — 0.95 September 30, 2017
UltraShort S&P500® . . . . . . . . . . . . . . . 0.75 0.10 — — — 0.95 September 30, 2017
UltraShort QQQ® . . . . . . . . . . . . . . . . . . 0.75 0.10 266,388 — — 0.95 September 30, 2017
UltraShort Dow30SM . . . . . . . . . . . . . . . 0.75 0.10 81,584 — — 0.95 September 30, 2017
UltraShort MidCap400 . . . . . . . . . . . . . 0.75 0.10 53,218 $ 7,096 $ 9,032 0.95 September 30, 2017
UltraShort Russell2000 . . . . . . . . . . . . . 0.75 0.10 161,124 — — 0.95 September 30, 2017
UltraShort SmallCap600 . . . . . . . . . . . . 0.75 0.10 22,482 2,997 42,724 0.95 September 30, 2017
UltraPro Short S&P500® . . . . . . . . . . . . 0.75 0.10 — — — 0.95 September 30, 2017
UltraPro Short QQQ® . . . . . . . . . . . . . . 0.75 0.10 362,186 — — 0.95 September 30, 2017
UltraPro Short Dow30SM . . . . . . . . . . . . 0.75 0.10 44,929 — — 0.95 September 30, 2017
UltraPro Short MidCap400 . . . . . . . . . . 0.75 0.10 28,914 3,855 37,263 0.95 September 30, 2017
UltraPro Short Russell2000 . . . . . . . . . 0.75 0.10 110,180 — — 0.95 September 30, 2017
Short Basic Materials . . . . . . . . . . . . . . 0.75 0.10 32,955 4,394 38,191 0.95 September 30, 2017
Short Financials . . . . . . . . . . . . . . . . . . 0.75 0.10 65,869 — — 0.95 September 30, 2017
Short Oil & Gas . . . . . . . . . . . . . . . . . . . 0.75 0.10 38,619 5,149 26,618 0.95 September 30, 2017
Short Real Estate . . . . . . . . . . . . . . . . . 0.75 0.10 66,666 — — 0.95 September 30, 2017
Short S&P Regional Banking . . . . . . . . 0.75 0.10 14,532 1,938 54,999 0.95 September 30, 2017
UltraShort Basic Materials . . . . . . . . . . 0.75 0.10 72,503 — — 0.95 September 30, 2017
UltraShort Nasdaq Biotechnology . . . . 0.75 0.10 100,241 — — 0.95 September 30, 2017
UltraShort Consumer Goods . . . . . . . . 0.75 0.10 19,707 2,628 49,206 0.95 September 30, 2017
UltraShort Consumer Services . . . . . . . 0.75 0.10 16,506 2,201 53,808 0.95 September 30, 2017
UltraShort Financials . . . . . . . . . . . . . . 0.75 0.10 73,353 — — 0.95 September 30, 2017
UltraShort Gold Miners . . . . . . . . . . . . 0.75 0.10 27,037 3,605 35,243 0.95 September 30, 2017
UltraShort Health Care . . . . . . . . . . . . . 0.75 0.10 20,790 2,772 46,894 0.95 September 30, 2017
UltraShort Industrials . . . . . . . . . . . . . . 0.75 0.10 27,896 3,719 37,658 0.95 September 30, 2017
UltraShort Oil & Gas . . . . . . . . . . . . . . . 0.75 0.10 67,901 — — 0.95 September 30, 2017
UltraShort Oil & Gas Exploration & Production . . . . . . . . . . . . . . . . . . . . 0.75 0.10 7,098 946 53,185 0.95 September 30, 2017
UltraShort Real Estate . . . . . . . . . . . . . 0.75 0.10 84,725 — — 0.95 September 30, 2017
UltraShort Semiconductors . . . . . . . . . 0.75 0.10 37,505 5,001 26,302 0.95 September 30, 2017
UltraShort Technology . . . . . . . . . . . . . 0.75 0.10 29,191 3,892 38,265 0.95 September 30, 2017
UltraShort Utilities . . . . . . . . . . . . . . . . 0.75 0.10 65,494 1,871 — 0.95 September 30, 2017
UltraPro Short Nasdaq Biotechnology . . . . . . . . . . . . . . . . . 0.75 0.10 56,953 5,223 — 0.95 September 30, 2017
UltraPro Short Financial Select Sector . . . . . . . . . . . . . . . . . . 0.75 0.10 14,767 1,969 62,749 0.95 September 30, 2017
Short MSCI EAFE . . . . . . . . . . . . . . . . . 0.75 0.10 77,935 — — 0.95 September 30, 2017
Short MSCI Emerging Markets . . . . . . 0.75 0.10 65,333 — — 0.95 September 30, 2017
Short FTSE China 50 . . . . . . . . . . . . . . 0.75 0.10 71,901 — — 0.95 September 30, 2017
UltraShort MSCI EAFE . . . . . . . . . . . . . 0.75 0.10 43,387 5,785 18,060 0.95 September 30, 2017
UltraShort MSCI Emerging Markets . . 0.75 0.10 70,183 — — 0.95 September 30, 2017
UltraShort FTSE Europe . . . . . . . . . . . . 0.75 0.10 65,694 — — 0.95 September 30, 2017
UltraShort MSCI Brazil Capped . . . . . . 0.75 0.10 67,725 — — 0.95 September 30, 2017
Merrill Corp - Proshares Trust Geared Book [96 Funds] Annual Report [Funds] 333-089822 05-31-2017 ED [AUX] | eperez | 28-Jul-17 17:44 | 17-15159-3.ka | Sequence: 27CHKSUM Content: 23855 Layout: 54421 Graphics: No Graphics CLEAN
JOB: 17-15159-3 CYCLE#;BL#: 5; 0 TRIM: 8.25" x 10.75" COMPOSITECOLORS: Black, ~note-color 2, ~note-color 3 GRAPHICS: none V1.5
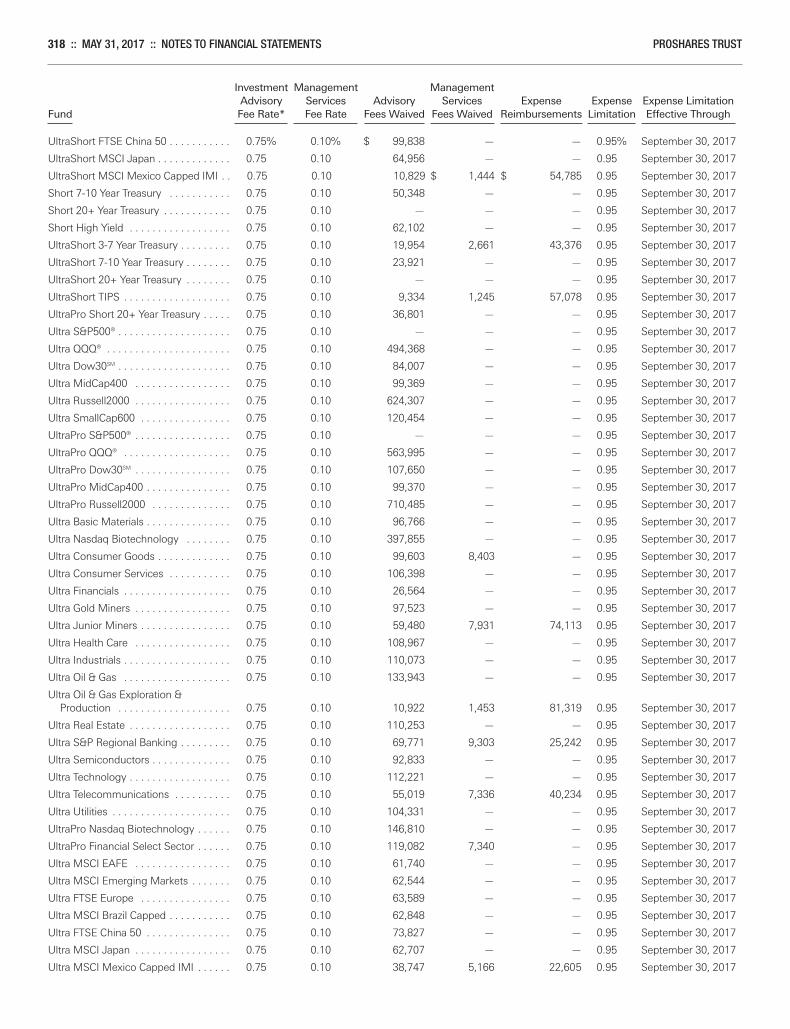
318 :: MAY 31, 2017 :: NOTES TO FINANCIAL STATEMENTS PROSHARES TRUST
Investment Management Management Advisory Services Advisory Services Expense Expense Expense LimitationFund Fee Rate* Fee Rate Fees Waived Fees Waived Reimbursements Limitation Effective Through
UltraShort FTSE China 50 . . . . . . . . . . . 0.75% 0.10% $ 99,838 — — 0.95% September 30, 2017
UltraShort MSCI Japan . . . . . . . . . . . . . 0.75 0.10 64,956 — — 0.95 September 30, 2017
UltraShort MSCI Mexico Capped IMI . . 0.75 0.10 10,829 $ 1,444 $ 54,785 0.95 September 30, 2017
Short 7-10 Year Treasury . . . . . . . . . . . 0.75 0.10 50,348 — — 0.95 September 30, 2017
Short 20+ Year Treasury . . . . . . . . . . . . 0.75 0.10 — — — 0.95 September 30, 2017
Short High Yield . . . . . . . . . . . . . . . . . . 0.75 0.10 62,102 — — 0.95 September 30, 2017
UltraShort 3-7 Year Treasury . . . . . . . . . 0.75 0.10 19,954 2,661 43,376 0.95 September 30, 2017
UltraShort 7-10 Year Treasury . . . . . . . . 0.75 0.10 23,921 — — 0.95 September 30, 2017
UltraShort 20+ Year Treasury . . . . . . . . 0.75 0.10 — — — 0.95 September 30, 2017
UltraShort TIPS . . . . . . . . . . . . . . . . . . . 0.75 0.10 9,334 1,245 57,078 0.95 September 30, 2017
UltraPro Short 20+ Year Treasury . . . . . 0.75 0.10 36,801 — — 0.95 September 30, 2017
Ultra S&P500® . . . . . . . . . . . . . . . . . . . . 0.75 0.10 — — — 0.95 September 30, 2017
Ultra QQQ® . . . . . . . . . . . . . . . . . . . . . . 0.75 0.10 494,368 — — 0.95 September 30, 2017
Ultra Dow30SM . . . . . . . . . . . . . . . . . . . . 0.75 0.10 84,007 — — 0.95 September 30, 2017
Ultra MidCap400 . . . . . . . . . . . . . . . . . 0.75 0.10 99,369 — — 0.95 September 30, 2017
Ultra Russell2000 . . . . . . . . . . . . . . . . . 0.75 0.10 624,307 — — 0.95 September 30, 2017
Ultra SmallCap600 . . . . . . . . . . . . . . . . 0.75 0.10 120,454 — — 0.95 September 30, 2017
UltraPro S&P500® . . . . . . . . . . . . . . . . . 0.75 0.10 — — — 0.95 September 30, 2017
UltraPro QQQ® . . . . . . . . . . . . . . . . . . . 0.75 0.10 563,995 — — 0.95 September 30, 2017
UltraPro Dow30SM . . . . . . . . . . . . . . . . . 0.75 0.10 107,650 — — 0.95 September 30, 2017
UltraPro MidCap400 . . . . . . . . . . . . . . . 0.75 0.10 99,370 — — 0.95 September 30, 2017
UltraPro Russell2000 . . . . . . . . . . . . . . 0.75 0.10 710,485 — — 0.95 September 30, 2017
Ultra Basic Materials . . . . . . . . . . . . . . . 0.75 0.10 96,766 — — 0.95 September 30, 2017
Ultra Nasdaq Biotechnology . . . . . . . . 0.75 0.10 397,855 — — 0.95 September 30, 2017
Ultra Consumer Goods . . . . . . . . . . . . . 0.75 0.10 99,603 8,403 — 0.95 September 30, 2017
Ultra Consumer Services . . . . . . . . . . . 0.75 0.10 106,398 — — 0.95 September 30, 2017
Ultra Financials . . . . . . . . . . . . . . . . . . . 0.75 0.10 26,564 — — 0.95 September 30, 2017
Ultra Gold Miners . . . . . . . . . . . . . . . . . 0.75 0.10 97,523 — — 0.95 September 30, 2017
Ultra Junior Miners . . . . . . . . . . . . . . . . 0.75 0.10 59,480 7,931 74,113 0.95 September 30, 2017
Ultra Health Care . . . . . . . . . . . . . . . . . 0.75 0.10 108,967 — — 0.95 September 30, 2017
Ultra Industrials . . . . . . . . . . . . . . . . . . . 0.75 0.10 110,073 — — 0.95 September 30, 2017
Ultra Oil & Gas . . . . . . . . . . . . . . . . . . . 0.75 0.10 133,943 — — 0.95 September 30, 2017
Ultra Oil & Gas Exploration & Production . . . . . . . . . . . . . . . . . . . . 0.75 0.10 10,922 1,453 81,319 0.95 September 30, 2017
Ultra Real Estate . . . . . . . . . . . . . . . . . . 0.75 0.10 110,253 — — 0.95 September 30, 2017
Ultra S&P Regional Banking . . . . . . . . . 0.75 0.10 69,771 9,303 25,242 0.95 September 30, 2017
Ultra Semiconductors . . . . . . . . . . . . . . 0.75 0.10 92,833 — — 0.95 September 30, 2017
Ultra Technology . . . . . . . . . . . . . . . . . . 0.75 0.10 112,221 — — 0.95 September 30, 2017
Ultra Telecommunications . . . . . . . . . . 0.75 0.10 55,019 7,336 40,234 0.95 September 30, 2017
Ultra Utilities . . . . . . . . . . . . . . . . . . . . . 0.75 0.10 104,331 — — 0.95 September 30, 2017
UltraPro Nasdaq Biotechnology . . . . . . 0.75 0.10 146,810 — — 0.95 September 30, 2017
UltraPro Financial Select Sector . . . . . . 0.75 0.10 119,082 7,340 — 0.95 September 30, 2017
Ultra MSCI EAFE . . . . . . . . . . . . . . . . . 0.75 0.10 61,740 — — 0.95 September 30, 2017
Ultra MSCI Emerging Markets . . . . . . . 0.75 0.10 62,544 — — 0.95 September 30, 2017
Ultra FTSE Europe . . . . . . . . . . . . . . . . 0.75 0.10 63,589 — — 0.95 September 30, 2017
Ultra MSCI Brazil Capped . . . . . . . . . . . 0.75 0.10 62,848 — — 0.95 September 30, 2017
Ultra FTSE China 50 . . . . . . . . . . . . . . . 0.75 0.10 73,827 — — 0.95 September 30, 2017
Ultra MSCI Japan . . . . . . . . . . . . . . . . . 0.75 0.10 62,707 — — 0.95 September 30, 2017
Ultra MSCI Mexico Capped IMI . . . . . . 0.75 0.10 38,747 5,166 22,605 0.95 September 30, 2017
Merrill Corp - Proshares Trust Geared Book [96 Funds] Annual Report [Funds] 333-089822 05-31-2017 ED [AUX] | eperez | 28-Jul-17 17:44 | 17-15159-3.ka | Sequence: 28CHKSUM Content: 36537 Layout: 3715 Graphics: No Graphics CLEAN
JOB: 17-15159-3 CYCLE#;BL#: 5; 0 TRIM: 8.25" x 10.75" COMPOSITECOLORS: Black, ~note-color 2, ~note-color 3 GRAPHICS: none V1.5
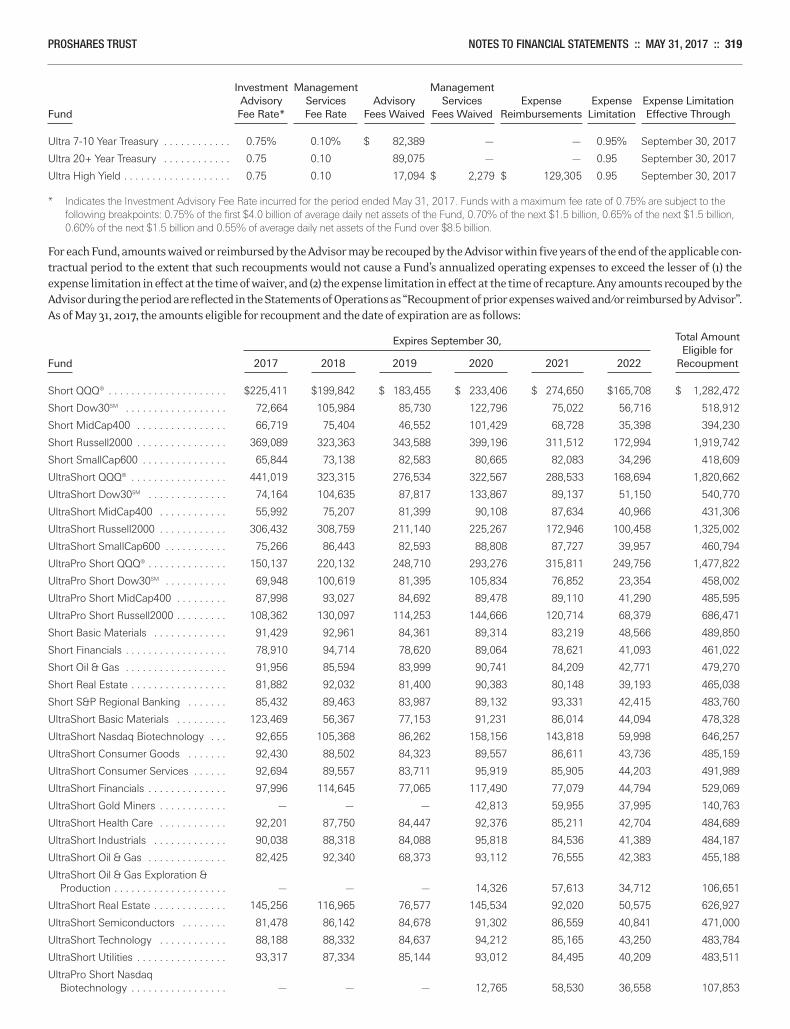
PROSHARES TRUST NOTES TO FINANCIAL STATEMENTS :: MAY 31, 2017 :: 319
Investment Management Management Advisory Services Advisory Services Expense Expense Expense LimitationFund Fee Rate* Fee Rate Fees Waived Fees Waived Reimbursements Limitation Effective Through
Ultra 7-10 Year Treasury . . . . . . . . . . . . 0.75% 0.10% $ 82,389 — — 0.95% September 30, 2017
Ultra 20+ Year Treasury . . . . . . . . . . . . 0.75 0.10 89,075 — — 0.95 September 30, 2017
Ultra High Yield . . . . . . . . . . . . . . . . . . . 0.75 0.10 17,094 $ 2,279 $ 129,305 0.95 September 30, 2017
* Indicates the Investment Advisory Fee Rate incurred for the period ended May 31, 2017. Funds with a maximum fee rate of 0.75% are subject to the
following breakpoints: 0.75% of the first $4.0 billion of average daily net assets of the Fund, 0.70% of the next $1.5 billion, 0.65% of the next $1.5 billion,
0.60% of the next $1.5 billion and 0.55% of average daily net assets of the Fund over $8.5 billion.
For each Fund, amounts waived or reimbursed by the Advisor may be recouped by the Advisor within five years of the end of the applicable con-tractual period to the extent that such recoupments would not cause a Fund’s annualized operating expenses to exceed the lesser of (1) theexpense limitation in effect at the time of waiver, and (2) the expense limitation in effect at the time of recapture. Any amounts recouped by theAdvisor during the period are reflected in the Statements of Operations as “Recoupment of prior expenses waived and/or reimbursed by Advisor”.As of May 31, 2017, the amounts eligible for recoupment and the date of expiration are as follows:
Expires September 30, Total Amount Eligible forFund 2017 2018 2019 2020 2021 2022 Recoupment
Short QQQ® . . . . . . . . . . . . . . . . . . . . . $225,411 $199,842 $ 183,455 $ 233,406 $ 274,650 $165,708 $ 1,282,472
Short Dow30SM . . . . . . . . . . . . . . . . . . 72,664 105,984 85,730 122,796 75,022 56,716 518,912
Short MidCap400 . . . . . . . . . . . . . . . . 66,719 75,404 46,552 101,429 68,728 35,398 394,230
Short Russell2000 . . . . . . . . . . . . . . . . 369,089 323,363 343,588 399,196 311,512 172,994 1,919,742
Short SmallCap600 . . . . . . . . . . . . . . . 65,844 73,138 82,583 80,665 82,083 34,296 418,609
UltraShort QQQ® . . . . . . . . . . . . . . . . . 441,019 323,315 276,534 322,567 288,533 168,694 1,820,662
UltraShort Dow30SM . . . . . . . . . . . . . . 74,164 104,635 87,817 133,867 89,137 51,150 540,770
UltraShort MidCap400 . . . . . . . . . . . . 55,992 75,207 81,399 90,108 87,634 40,966 431,306
UltraShort Russell2000 . . . . . . . . . . . . 306,432 308,759 211,140 225,267 172,946 100,458 1,325,002
UltraShort SmallCap600 . . . . . . . . . . . 75,266 86,443 82,593 88,808 87,727 39,957 460,794
UltraPro Short QQQ® . . . . . . . . . . . . . . 150,137 220,132 248,710 293,276 315,811 249,756 1,477,822
UltraPro Short Dow30SM . . . . . . . . . . . 69,948 100,619 81,395 105,834 76,852 23,354 458,002
UltraPro Short MidCap400 . . . . . . . . . 87,998 93,027 84,692 89,478 89,110 41,290 485,595
UltraPro Short Russell2000 . . . . . . . . . 108,362 130,097 114,253 144,666 120,714 68,379 686,471
Short Basic Materials . . . . . . . . . . . . . 91,429 92,961 84,361 89,314 83,219 48,566 489,850
Short Financials . . . . . . . . . . . . . . . . . . 78,910 94,714 78,620 89,064 78,621 41,093 461,022
Short Oil & Gas . . . . . . . . . . . . . . . . . . 91,956 85,594 83,999 90,741 84,209 42,771 479,270
Short Real Estate . . . . . . . . . . . . . . . . . 81,882 92,032 81,400 90,383 80,148 39,193 465,038
Short S&P Regional Banking . . . . . . . 85,432 89,463 83,987 89,132 93,331 42,415 483,760
UltraShort Basic Materials . . . . . . . . . 123,469 56,367 77,153 91,231 86,014 44,094 478,328
UltraShort Nasdaq Biotechnology . . . 92,655 105,368 86,262 158,156 143,818 59,998 646,257
UltraShort Consumer Goods . . . . . . . 92,430 88,502 84,323 89,557 86,611 43,736 485,159
UltraShort Consumer Services . . . . . . 92,694 89,557 83,711 95,919 85,905 44,203 491,989
UltraShort Financials . . . . . . . . . . . . . . 97,996 114,645 77,065 117,490 77,079 44,794 529,069
UltraShort Gold Miners . . . . . . . . . . . . — — — 42,813 59,955 37,995 140,763
UltraShort Health Care . . . . . . . . . . . . 92,201 87,750 84,447 92,376 85,211 42,704 484,689
UltraShort Industrials . . . . . . . . . . . . . 90,038 88,318 84,088 95,818 84,536 41,389 484,187
UltraShort Oil & Gas . . . . . . . . . . . . . . 82,425 92,340 68,373 93,112 76,555 42,383 455,188
UltraShort Oil & Gas Exploration & Production . . . . . . . . . . . . . . . . . . . . — — — 14,326 57,613 34,712 106,651
UltraShort Real Estate . . . . . . . . . . . . . 145,256 116,965 76,577 145,534 92,020 50,575 626,927
UltraShort Semiconductors . . . . . . . . 81,478 86,142 84,678 91,302 86,559 40,841 471,000
UltraShort Technology . . . . . . . . . . . . 88,188 88,332 84,637 94,212 85,165 43,250 483,784
UltraShort Utilities . . . . . . . . . . . . . . . . 93,317 87,334 85,144 93,012 84,495 40,209 483,511
UltraPro Short Nasdaq Biotechnology . . . . . . . . . . . . . . . . . — — — 12,765 58,530 36,558 107,853
Merrill Corp - Proshares Trust Geared Book [96 Funds] Annual Report [Funds] 333-089822 05-31-2017 ED [AUX] | eperez | 28-Jul-17 17:44 | 17-15159-3.ka | Sequence: 29CHKSUM Content: 26082 Layout: 39009 Graphics: No Graphics CLEAN
JOB: 17-15159-3 CYCLE#;BL#: 5; 0 TRIM: 8.25" x 10.75" COMPOSITECOLORS: Black, ~note-color 2, ~note-color 3 GRAPHICS: none V1.5
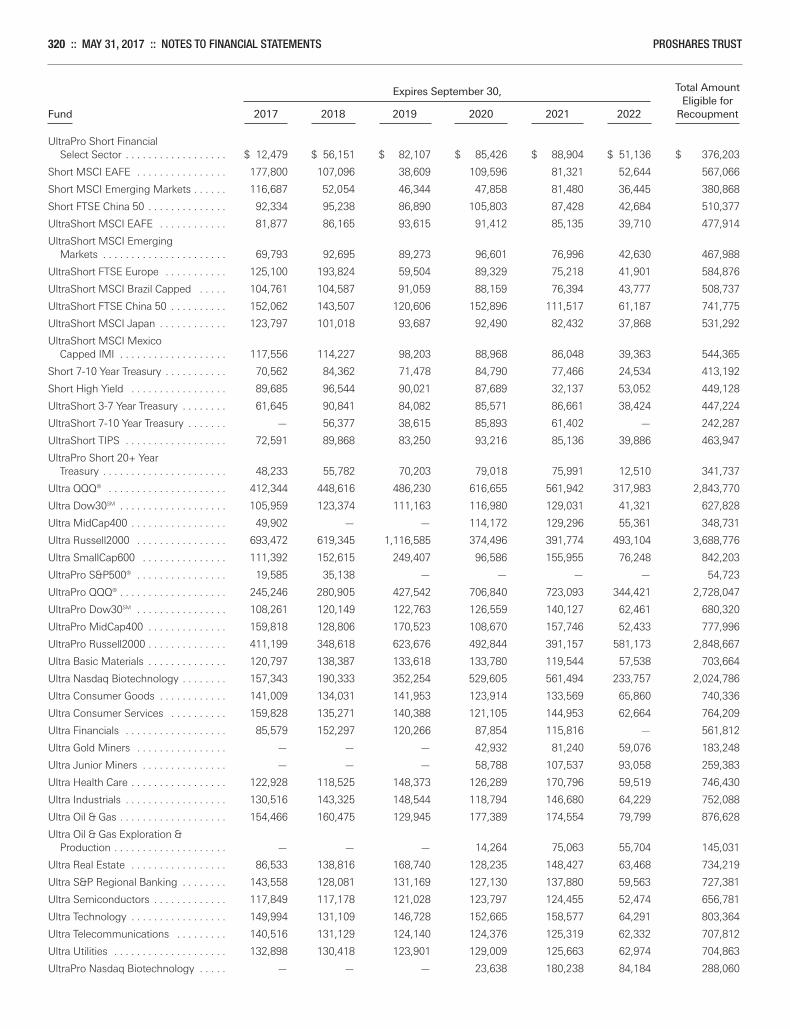
320 :: MAY 31, 2017 :: NOTES TO FINANCIAL STATEMENTS PROSHARES TRUST
Expires September 30, Total Amount Eligible forFund 2017 2018 2019 2020 2021 2022 Recoupment
UltraPro Short Financial Select Sector . . . . . . . . . . . . . . . . . . $ 12,479 $ 56,151 $ 82,107 $ 85,426 $ 88,904 $ 51,136 $ 376,203
Short MSCI EAFE . . . . . . . . . . . . . . . . 177,800 107,096 38,609 109,596 81,321 52,644 567,066
Short MSCI Emerging Markets . . . . . . 116,687 52,054 46,344 47,858 81,480 36,445 380,868
Short FTSE China 50 . . . . . . . . . . . . . . 92,334 95,238 86,890 105,803 87,428 42,684 510,377
UltraShort MSCI EAFE . . . . . . . . . . . . 81,877 86,165 93,615 91,412 85,135 39,710 477,914
UltraShort MSCI Emerging Markets . . . . . . . . . . . . . . . . . . . . . . 69,793 92,695 89,273 96,601 76,996 42,630 467,988
UltraShort FTSE Europe . . . . . . . . . . . 125,100 193,824 59,504 89,329 75,218 41,901 584,876
UltraShort MSCI Brazil Capped . . . . . 104,761 104,587 91,059 88,159 76,394 43,777 508,737
UltraShort FTSE China 50 . . . . . . . . . . 152,062 143,507 120,606 152,896 111,517 61,187 741,775
UltraShort MSCI Japan . . . . . . . . . . . . 123,797 101,018 93,687 92,490 82,432 37,868 531,292
UltraShort MSCI Mexico Capped IMI . . . . . . . . . . . . . . . . . . . 117,556 114,227 98,203 88,968 86,048 39,363 544,365
Short 7-10 Year Treasury . . . . . . . . . . . 70,562 84,362 71,478 84,790 77,466 24,534 413,192
Short High Yield . . . . . . . . . . . . . . . . . 89,685 96,544 90,021 87,689 32,137 53,052 449,128
UltraShort 3-7 Year Treasury . . . . . . . . 61,645 90,841 84,082 85,571 86,661 38,424 447,224
UltraShort 7-10 Year Treasury . . . . . . . — 56,377 38,615 85,893 61,402 — 242,287
UltraShort TIPS . . . . . . . . . . . . . . . . . . 72,591 89,868 83,250 93,216 85,136 39,886 463,947
UltraPro Short 20+ Year Treasury . . . . . . . . . . . . . . . . . . . . . . 48,233 55,782 70,203 79,018 75,991 12,510 341,737
Ultra QQQ® . . . . . . . . . . . . . . . . . . . . . 412,344 448,616 486,230 616,655 561,942 317,983 2,843,770
Ultra Dow30SM . . . . . . . . . . . . . . . . . . . 105,959 123,374 111,163 116,980 129,031 41,321 627,828
Ultra MidCap400 . . . . . . . . . . . . . . . . . 49,902 — — 114,172 129,296 55,361 348,731
Ultra Russell2000 . . . . . . . . . . . . . . . . 693,472 619,345 1,116,585 374,496 391,774 493,104 3,688,776
Ultra SmallCap600 . . . . . . . . . . . . . . . 111,392 152,615 249,407 96,586 155,955 76,248 842,203
UltraPro S&P500® . . . . . . . . . . . . . . . . 19,585 35,138 — — — — 54,723
UltraPro QQQ® . . . . . . . . . . . . . . . . . . . 245,246 280,905 427,542 706,840 723,093 344,421 2,728,047
UltraPro Dow30SM . . . . . . . . . . . . . . . . 108,261 120,149 122,763 126,559 140,127 62,461 680,320
UltraPro MidCap400 . . . . . . . . . . . . . . 159,818 128,806 170,523 108,670 157,746 52,433 777,996
UltraPro Russell2000 . . . . . . . . . . . . . . 411,199 348,618 623,676 492,844 391,157 581,173 2,848,667
Ultra Basic Materials . . . . . . . . . . . . . . 120,797 138,387 133,618 133,780 119,544 57,538 703,664
Ultra Nasdaq Biotechnology . . . . . . . . 157,343 190,333 352,254 529,605 561,494 233,757 2,024,786
Ultra Consumer Goods . . . . . . . . . . . . 141,009 134,031 141,953 123,914 133,569 65,860 740,336
Ultra Consumer Services . . . . . . . . . . 159,828 135,271 140,388 121,105 144,953 62,664 764,209
Ultra Financials . . . . . . . . . . . . . . . . . . 85,579 152,297 120,266 87,854 115,816 — 561,812
Ultra Gold Miners . . . . . . . . . . . . . . . . — — — 42,932 81,240 59,076 183,248
Ultra Junior Miners . . . . . . . . . . . . . . . — — — 58,788 107,537 93,058 259,383
Ultra Health Care . . . . . . . . . . . . . . . . . 122,928 118,525 148,373 126,289 170,796 59,519 746,430
Ultra Industrials . . . . . . . . . . . . . . . . . . 130,516 143,325 148,544 118,794 146,680 64,229 752,088
Ultra Oil & Gas . . . . . . . . . . . . . . . . . . . 154,466 160,475 129,945 177,389 174,554 79,799 876,628
Ultra Oil & Gas Exploration & Production . . . . . . . . . . . . . . . . . . . . — — — 14,264 75,063 55,704 145,031
Ultra Real Estate . . . . . . . . . . . . . . . . . 86,533 138,816 168,740 128,235 148,427 63,468 734,219
Ultra S&P Regional Banking . . . . . . . . 143,558 128,081 131,169 127,130 137,880 59,563 727,381
Ultra Semiconductors . . . . . . . . . . . . . 117,849 117,178 121,028 123,797 124,455 52,474 656,781
Ultra Technology . . . . . . . . . . . . . . . . . 149,994 131,109 146,728 152,665 158,577 64,291 803,364
Ultra Telecommunications . . . . . . . . . 140,516 131,129 124,140 124,376 125,319 62,332 707,812
Ultra Utilities . . . . . . . . . . . . . . . . . . . . 132,898 130,418 123,901 129,009 125,663 62,974 704,863
UltraPro Nasdaq Biotechnology . . . . . — — — 23,638 180,238 84,184 288,060
Merrill Corp - Proshares Trust Geared Book [96 Funds] Annual Report [Funds] 333-089822 05-31-2017 ED [AUX] | eperez | 28-Jul-17 17:44 | 17-15159-3.ka | Sequence: 30CHKSUM Content: 28500 Layout: 3050 Graphics: No Graphics CLEAN
JOB: 17-15159-3 CYCLE#;BL#: 5; 0 TRIM: 8.25" x 10.75" COMPOSITECOLORS: Black, ~note-color 2, ~note-color 3 GRAPHICS: none V1.5
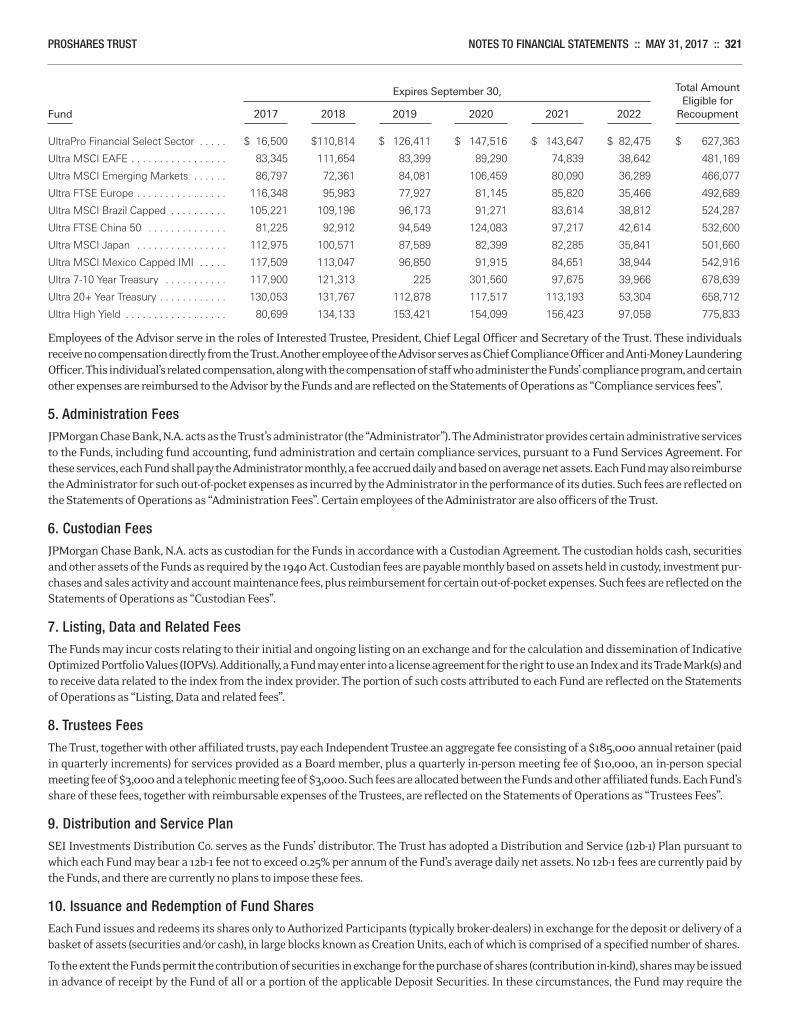
PROSHARES TRUST NOTES TO FINANCIAL STATEMENTS :: MAY 31, 2017 :: 321
Expires September 30, Total Amount Eligible forFund 2017 2018 2019 2020 2021 2022 Recoupment
UltraPro Financial Select Sector . . . . . $ 16,500 $110,814 $ 126,411 $ 147,516 $ 143,647 $ 82,475 $ 627,363
Ultra MSCI EAFE . . . . . . . . . . . . . . . . . 83,345 111,654 83,399 89,290 74,839 38,642 481,169
Ultra MSCI Emerging Markets . . . . . . 86,797 72,361 84,081 106,459 80,090 36,289 466,077
Ultra FTSE Europe . . . . . . . . . . . . . . . . 116,348 95,983 77,927 81,145 85,820 35,466 492,689
Ultra MSCI Brazil Capped . . . . . . . . . . 105,221 109,196 96,173 91,271 83,614 38,812 524,287
Ultra FTSE China 50 . . . . . . . . . . . . . . 81,225 92,912 94,549 124,083 97,217 42,614 532,600
Ultra MSCI Japan . . . . . . . . . . . . . . . . 112,975 100,571 87,589 82,399 82,285 35,841 501,660
Ultra MSCI Mexico Capped IMI . . . . . 117,509 113,047 96,850 91,915 84,651 38,944 542,916
Ultra 7-10 Year Treasury . . . . . . . . . . . 117,900 121,313 225 301,560 97,675 39,966 678,639
Ultra 20+ Year Treasury . . . . . . . . . . . . 130,053 131,767 112,878 117,517 113,193 53,304 658,712
Ultra High Yield . . . . . . . . . . . . . . . . . . 80,699 134,133 153,421 154,099 156,423 97,058 775,833
Employees of the Advisor serve in the roles of Interested Trustee, President, Chief Legal Officer and Secretary of the Trust. These individualsreceive no compensation directly from the Trust. Another employee of the Advisor serves as Chief Compliance Officer and Anti-Money LaunderingOfficer. This individual’s related compensation, along with the compensation of staff who administer the Funds’ compliance program, and certainother expenses are reimbursed to the Advisor by the Funds and are reflected on the Statements of Operations as “Compliance services fees”.
5. Administration FeesJPMorgan Chase Bank, N.A. acts as the Trust’s administrator (the “Administrator”). The Administrator provides certain administrative servicesto the Funds, including fund accounting, fund administration and certain compliance services, pursuant to a Fund Services Agreement. Forthese services, each Fund shall pay the Administrator monthly, a fee accrued daily and based on average net assets. Each Fund may also reimbursethe Administrator for such out-of-pocket expenses as incurred by the Administrator in the performance of its duties. Such fees are reflected onthe Statements of Operations as “Administration Fees”. Certain employees of the Administrator are also officers of the Trust.
6. Custodian FeesJPMorgan Chase Bank, N.A. acts as custodian for the Funds in accordance with a Custodian Agreement. The custodian holds cash, securitiesand other assets of the Funds as required by the 1940 Act. Custodian fees are payable monthly based on assets held in custody, investment pur-chases and sales activity and account maintenance fees, plus reimbursement for certain out-of-pocket expenses. Such fees are reflected on theStatements of Operations as “Custodian Fees”.
7. Listing, Data and Related FeesThe Funds may incur costs relating to their initial and ongoing listing on an exchange and for the calculation and dissemination of IndicativeOptimized Portfolio Values (IOPVs). Additionally, a Fund may enter into a license agreement for the right to use an Index and its Trade Mark(s) andto receive data related to the index from the index provider. The portion of such costs attributed to each Fund are reflected on the Statementsof Operations as “Listing, Data and related fees”.
8. Trustees FeesThe Trust, together with other affiliated trusts, pay each Independent Trustee an aggregate fee consisting of a $185,000 annual retainer (paidin quarterly increments) for services provided as a Board member, plus a quarterly in-person meeting fee of $10,000, an in-person specialmeeting fee of $3,000 and a telephonic meeting fee of $3,000. Such fees are allocated between the Funds and other affiliated funds. Each Fund’sshare of these fees, together with reimbursable expenses of the Trustees, are reflected on the Statements of Operations as “Trustees Fees”.
9. Distribution and Service PlanSEI Investments Distribution Co. serves as the Funds’ distributor. The Trust has adopted a Distribution and Service (12b-1) Plan pursuant towhich each Fund may bear a 12b-1 fee not to exceed 0.25% per annum of the Fund’s average daily net assets. No 12b-1 fees are currently paid bythe Funds, and there are currently no plans to impose these fees.
10. Issuance and Redemption of Fund SharesEach Fund issues and redeems its shares only to Authorized Participants (typically broker-dealers) in exchange for the deposit or delivery of abasket of assets (securities and/or cash), in large blocks known as Creation Units, each of which is comprised of a specified number of shares.
To the extent the Funds permit the contribution of securities in exchange for the purchase of shares (contribution in-kind), shares may be issuedin advance of receipt by the Fund of all or a portion of the applicable Deposit Securities. In these circumstances, the Fund may require the
Merrill Corp - Proshares Trust Geared Book [96 Funds] Annual Report [Funds] 333-089822 05-31-2017 ED [AUX] | eperez | 28-Jul-17 17:44 | 17-15159-3.ka | Sequence: 31CHKSUM Content: 11070 Layout: 19418 Graphics: No Graphics CLEAN
JOB: 17-15159-3 CYCLE#;BL#: 5; 0 TRIM: 8.25" x 10.75" COMPOSITECOLORS: Black, ~note-color 2, ~note-color 3 GRAPHICS: none V1.5
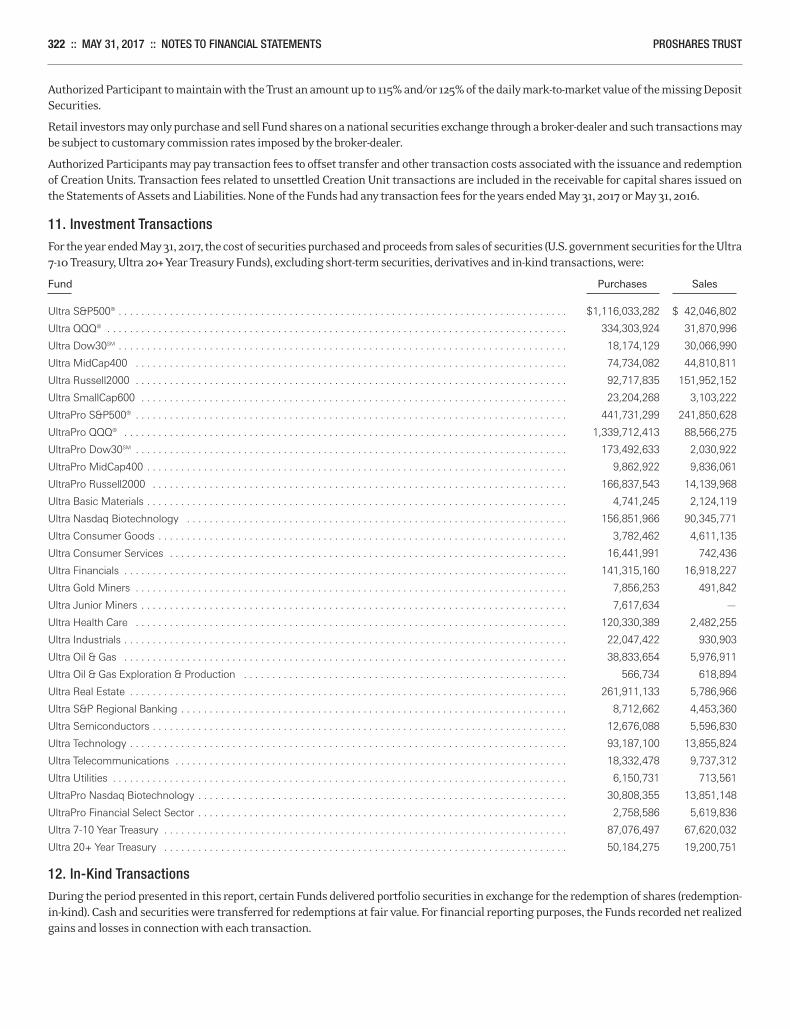
322 :: MAY 31, 2017 :: NOTES TO FINANCIAL STATEMENTS PROSHARES TRUST
Authorized Participant to maintain with the Trust an amount up to 115% and/or 125% of the daily mark-to-market value of the missing DepositSecurities.
Retail investors may only purchase and sell Fund shares on a national securities exchange through a broker-dealer and such transactions maybe subject to customary commission rates imposed by the broker-dealer.
Authorized Participants may pay transaction fees to offset transfer and other transaction costs associated with the issuance and redemptionof Creation Units. Transaction fees related to unsettled Creation Unit transactions are included in the receivable for capital shares issued onthe Statements of Assets and Liabilities. None of the Funds had any transaction fees for the years ended May 31, 2017 or May 31, 2016.
11. Investment TransactionsFor the year ended May 31, 2017, the cost of securities purchased and proceeds from sales of securities (U.S. government securities for the Ultra7-10 Treasury, Ultra 20+ Year Treasury Funds), excluding short-term securities, derivatives and in-kind transactions, were:
Fund Purchases Sales
Ultra S&P500® . . . . . . . . . . . . . . . . . . . . . . . . . . . . . . . . . . . . . . . . . . . . . . . . . . . . . . . . . . . . . . . . . . . . . . . . . . . . . . . $1,116,033,282 $ 42,046,802
Ultra QQQ® . . . . . . . . . . . . . . . . . . . . . . . . . . . . . . . . . . . . . . . . . . . . . . . . . . . . . . . . . . . . . . . . . . . . . . . . . . . . . . . . . 334,303,924 31,870,996
Ultra Dow30SM . . . . . . . . . . . . . . . . . . . . . . . . . . . . . . . . . . . . . . . . . . . . . . . . . . . . . . . . . . . . . . . . . . . . . . . . . . . . . . . 18,174,129 30,066,990
Ultra MidCap400 . . . . . . . . . . . . . . . . . . . . . . . . . . . . . . . . . . . . . . . . . . . . . . . . . . . . . . . . . . . . . . . . . . . . . . . . . . . . 74,734,082 44,810,811
Ultra Russell2000 . . . . . . . . . . . . . . . . . . . . . . . . . . . . . . . . . . . . . . . . . . . . . . . . . . . . . . . . . . . . . . . . . . . . . . . . . . . . 92,717,835 151,952,152
Ultra SmallCap600 . . . . . . . . . . . . . . . . . . . . . . . . . . . . . . . . . . . . . . . . . . . . . . . . . . . . . . . . . . . . . . . . . . . . . . . . . . . 23,204,268 3,103,222
UltraPro S&P500® . . . . . . . . . . . . . . . . . . . . . . . . . . . . . . . . . . . . . . . . . . . . . . . . . . . . . . . . . . . . . . . . . . . . . . . . . . . . 441,731,299 241,850,628
UltraPro QQQ® . . . . . . . . . . . . . . . . . . . . . . . . . . . . . . . . . . . . . . . . . . . . . . . . . . . . . . . . . . . . . . . . . . . . . . . . . . . . . . 1,339,712,413 88,566,275
UltraPro Dow30SM . . . . . . . . . . . . . . . . . . . . . . . . . . . . . . . . . . . . . . . . . . . . . . . . . . . . . . . . . . . . . . . . . . . . . . . . . . . . 173,492,633 2,030,922
UltraPro MidCap400 . . . . . . . . . . . . . . . . . . . . . . . . . . . . . . . . . . . . . . . . . . . . . . . . . . . . . . . . . . . . . . . . . . . . . . . . . . 9,862,922 9,836,061
UltraPro Russell2000 . . . . . . . . . . . . . . . . . . . . . . . . . . . . . . . . . . . . . . . . . . . . . . . . . . . . . . . . . . . . . . . . . . . . . . . . . 166,837,543 14,139,968
Ultra Basic Materials . . . . . . . . . . . . . . . . . . . . . . . . . . . . . . . . . . . . . . . . . . . . . . . . . . . . . . . . . . . . . . . . . . . . . . . . . . 4,741,245 2,124,119
Ultra Nasdaq Biotechnology . . . . . . . . . . . . . . . . . . . . . . . . . . . . . . . . . . . . . . . . . . . . . . . . . . . . . . . . . . . . . . . . . . . 156,851,966 90,345,771
Ultra Consumer Goods . . . . . . . . . . . . . . . . . . . . . . . . . . . . . . . . . . . . . . . . . . . . . . . . . . . . . . . . . . . . . . . . . . . . . . . . 3,782,462 4,611,135
Ultra Consumer Services . . . . . . . . . . . . . . . . . . . . . . . . . . . . . . . . . . . . . . . . . . . . . . . . . . . . . . . . . . . . . . . . . . . . . . 16,441,991 742,436
Ultra Financials . . . . . . . . . . . . . . . . . . . . . . . . . . . . . . . . . . . . . . . . . . . . . . . . . . . . . . . . . . . . . . . . . . . . . . . . . . . . . . 141,315,160 16,918,227
Ultra Gold Miners . . . . . . . . . . . . . . . . . . . . . . . . . . . . . . . . . . . . . . . . . . . . . . . . . . . . . . . . . . . . . . . . . . . . . . . . . . . . 7,856,253 491,842
Ultra Junior Miners . . . . . . . . . . . . . . . . . . . . . . . . . . . . . . . . . . . . . . . . . . . . . . . . . . . . . . . . . . . . . . . . . . . . . . . . . . . 7,617,634 —
Ultra Health Care . . . . . . . . . . . . . . . . . . . . . . . . . . . . . . . . . . . . . . . . . . . . . . . . . . . . . . . . . . . . . . . . . . . . . . . . . . . . 120,330,389 2,482,255
Ultra Industrials . . . . . . . . . . . . . . . . . . . . . . . . . . . . . . . . . . . . . . . . . . . . . . . . . . . . . . . . . . . . . . . . . . . . . . . . . . . . . . 22,047,422 930,903
Ultra Oil & Gas . . . . . . . . . . . . . . . . . . . . . . . . . . . . . . . . . . . . . . . . . . . . . . . . . . . . . . . . . . . . . . . . . . . . . . . . . . . . . . 38,833,654 5,976,911
Ultra Oil & Gas Exploration & Production . . . . . . . . . . . . . . . . . . . . . . . . . . . . . . . . . . . . . . . . . . . . . . . . . . . . . . . . . 566,734 618,894
Ultra Real Estate . . . . . . . . . . . . . . . . . . . . . . . . . . . . . . . . . . . . . . . . . . . . . . . . . . . . . . . . . . . . . . . . . . . . . . . . . . . . . 261,911,133 5,786,966
Ultra S&P Regional Banking . . . . . . . . . . . . . . . . . . . . . . . . . . . . . . . . . . . . . . . . . . . . . . . . . . . . . . . . . . . . . . . . . . . . 8,712,662 4,453,360
Ultra Semiconductors . . . . . . . . . . . . . . . . . . . . . . . . . . . . . . . . . . . . . . . . . . . . . . . . . . . . . . . . . . . . . . . . . . . . . . . . . 12,676,088 5,596,830
Ultra Technology . . . . . . . . . . . . . . . . . . . . . . . . . . . . . . . . . . . . . . . . . . . . . . . . . . . . . . . . . . . . . . . . . . . . . . . . . . . . . 93,187,100 13,855,824
Ultra Telecommunications . . . . . . . . . . . . . . . . . . . . . . . . . . . . . . . . . . . . . . . . . . . . . . . . . . . . . . . . . . . . . . . . . . . . . 18,332,478 9,737,312
Ultra Utilities . . . . . . . . . . . . . . . . . . . . . . . . . . . . . . . . . . . . . . . . . . . . . . . . . . . . . . . . . . . . . . . . . . . . . . . . . . . . . . . . 6,150,731 713,561
UltraPro Nasdaq Biotechnology . . . . . . . . . . . . . . . . . . . . . . . . . . . . . . . . . . . . . . . . . . . . . . . . . . . . . . . . . . . . . . . . . 30,808,355 13,851,148
UltraPro Financial Select Sector . . . . . . . . . . . . . . . . . . . . . . . . . . . . . . . . . . . . . . . . . . . . . . . . . . . . . . . . . . . . . . . . . 2,758,586 5,619,836
Ultra 7-10 Year Treasury . . . . . . . . . . . . . . . . . . . . . . . . . . . . . . . . . . . . . . . . . . . . . . . . . . . . . . . . . . . . . . . . . . . . . . . 87,076,497 67,620,032
Ultra 20+ Year Treasury . . . . . . . . . . . . . . . . . . . . . . . . . . . . . . . . . . . . . . . . . . . . . . . . . . . . . . . . . . . . . . . . . . . . . . . 50,184,275 19,200,751
12. In-Kind TransactionsDuring the period presented in this report, certain Funds delivered portfolio securities in exchange for the redemption of shares (redemption-in-kind). Cash and securities were transferred for redemptions at fair value. For financial reporting purposes, the Funds recorded net realizedgains and losses in connection with each transaction.
Merrill Corp - Proshares Trust Geared Book [96 Funds] Annual Report [Funds] 333-089822 05-31-2017 ED [AUX] | eperez | 28-Jul-17 17:44 | 17-15159-3.ka | Sequence: 32CHKSUM Content: 16347 Layout: 14786 Graphics: No Graphics CLEAN
JOB: 17-15159-3 CYCLE#;BL#: 5; 0 TRIM: 8.25" x 10.75" COMPOSITECOLORS: Black, ~note-color 2, ~note-color 3 GRAPHICS: none V1.5
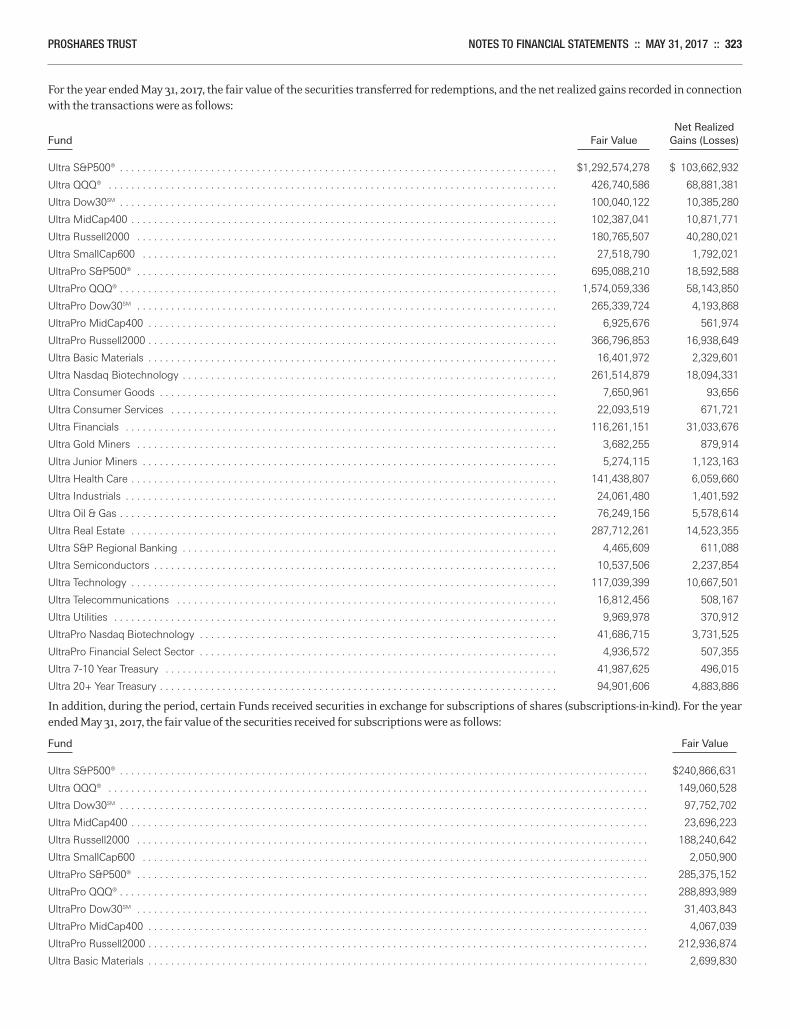
PROSHARES TRUST NOTES TO FINANCIAL STATEMENTS :: MAY 31, 2017 :: 323
For the year ended May 31, 2017, the fair value of the securities transferred for redemptions, and the net realized gains recorded in connectionwith the transactions were as follows:
Net RealizedFund Fair Value Gains (Losses)
Ultra S&P500® . . . . . . . . . . . . . . . . . . . . . . . . . . . . . . . . . . . . . . . . . . . . . . . . . . . . . . . . . . . . . . . . . . . . . . . . . . . . . $1,292,574,278 $ 103,662,932
Ultra QQQ® . . . . . . . . . . . . . . . . . . . . . . . . . . . . . . . . . . . . . . . . . . . . . . . . . . . . . . . . . . . . . . . . . . . . . . . . . . . . . . . 426,740,586 68,881,381
Ultra Dow30SM . . . . . . . . . . . . . . . . . . . . . . . . . . . . . . . . . . . . . . . . . . . . . . . . . . . . . . . . . . . . . . . . . . . . . . . . . . . . . 100,040,122 10,385,280
Ultra MidCap400 . . . . . . . . . . . . . . . . . . . . . . . . . . . . . . . . . . . . . . . . . . . . . . . . . . . . . . . . . . . . . . . . . . . . . . . . . . . 102,387,041 10,871,771
Ultra Russell2000 . . . . . . . . . . . . . . . . . . . . . . . . . . . . . . . . . . . . . . . . . . . . . . . . . . . . . . . . . . . . . . . . . . . . . . . . . . 180,765,507 40,280,021
Ultra SmallCap600 . . . . . . . . . . . . . . . . . . . . . . . . . . . . . . . . . . . . . . . . . . . . . . . . . . . . . . . . . . . . . . . . . . . . . . . . . 27,518,790 1,792,021
UltraPro S&P500® . . . . . . . . . . . . . . . . . . . . . . . . . . . . . . . . . . . . . . . . . . . . . . . . . . . . . . . . . . . . . . . . . . . . . . . . . . 695,088,210 18,592,588
UltraPro QQQ® . . . . . . . . . . . . . . . . . . . . . . . . . . . . . . . . . . . . . . . . . . . . . . . . . . . . . . . . . . . . . . . . . . . . . . . . . . . . . 1,574,059,336 58,143,850
UltraPro Dow30SM . . . . . . . . . . . . . . . . . . . . . . . . . . . . . . . . . . . . . . . . . . . . . . . . . . . . . . . . . . . . . . . . . . . . . . . . . . 265,339,724 4,193,868
UltraPro MidCap400 . . . . . . . . . . . . . . . . . . . . . . . . . . . . . . . . . . . . . . . . . . . . . . . . . . . . . . . . . . . . . . . . . . . . . . . . 6,925,676 561,974
UltraPro Russell2000 . . . . . . . . . . . . . . . . . . . . . . . . . . . . . . . . . . . . . . . . . . . . . . . . . . . . . . . . . . . . . . . . . . . . . . . . 366,796,853 16,938,649
Ultra Basic Materials . . . . . . . . . . . . . . . . . . . . . . . . . . . . . . . . . . . . . . . . . . . . . . . . . . . . . . . . . . . . . . . . . . . . . . . . 16,401,972 2,329,601
Ultra Nasdaq Biotechnology . . . . . . . . . . . . . . . . . . . . . . . . . . . . . . . . . . . . . . . . . . . . . . . . . . . . . . . . . . . . . . . . . . 261,514,879 18,094,331
Ultra Consumer Goods . . . . . . . . . . . . . . . . . . . . . . . . . . . . . . . . . . . . . . . . . . . . . . . . . . . . . . . . . . . . . . . . . . . . . . 7,650,961 93,656
Ultra Consumer Services . . . . . . . . . . . . . . . . . . . . . . . . . . . . . . . . . . . . . . . . . . . . . . . . . . . . . . . . . . . . . . . . . . . . 22,093,519 671,721
Ultra Financials . . . . . . . . . . . . . . . . . . . . . . . . . . . . . . . . . . . . . . . . . . . . . . . . . . . . . . . . . . . . . . . . . . . . . . . . . . . . 116,261,151 31,033,676
Ultra Gold Miners . . . . . . . . . . . . . . . . . . . . . . . . . . . . . . . . . . . . . . . . . . . . . . . . . . . . . . . . . . . . . . . . . . . . . . . . . . 3,682,255 879,914
Ultra Junior Miners . . . . . . . . . . . . . . . . . . . . . . . . . . . . . . . . . . . . . . . . . . . . . . . . . . . . . . . . . . . . . . . . . . . . . . . . . 5,274,115 1,123,163
Ultra Health Care . . . . . . . . . . . . . . . . . . . . . . . . . . . . . . . . . . . . . . . . . . . . . . . . . . . . . . . . . . . . . . . . . . . . . . . . . . . 141,438,807 6,059,660
Ultra Industrials . . . . . . . . . . . . . . . . . . . . . . . . . . . . . . . . . . . . . . . . . . . . . . . . . . . . . . . . . . . . . . . . . . . . . . . . . . . . 24,061,480 1,401,592
Ultra Oil & Gas . . . . . . . . . . . . . . . . . . . . . . . . . . . . . . . . . . . . . . . . . . . . . . . . . . . . . . . . . . . . . . . . . . . . . . . . . . . . . 76,249,156 5,578,614
Ultra Real Estate . . . . . . . . . . . . . . . . . . . . . . . . . . . . . . . . . . . . . . . . . . . . . . . . . . . . . . . . . . . . . . . . . . . . . . . . . . . 287,712,261 14,523,355
Ultra S&P Regional Banking . . . . . . . . . . . . . . . . . . . . . . . . . . . . . . . . . . . . . . . . . . . . . . . . . . . . . . . . . . . . . . . . . . 4,465,609 611,088
Ultra Semiconductors . . . . . . . . . . . . . . . . . . . . . . . . . . . . . . . . . . . . . . . . . . . . . . . . . . . . . . . . . . . . . . . . . . . . . . . 10,537,506 2,237,854
Ultra Technology . . . . . . . . . . . . . . . . . . . . . . . . . . . . . . . . . . . . . . . . . . . . . . . . . . . . . . . . . . . . . . . . . . . . . . . . . . . 117,039,399 10,667,501
Ultra Telecommunications . . . . . . . . . . . . . . . . . . . . . . . . . . . . . . . . . . . . . . . . . . . . . . . . . . . . . . . . . . . . . . . . . . . 16,812,456 508,167
Ultra Utilities . . . . . . . . . . . . . . . . . . . . . . . . . . . . . . . . . . . . . . . . . . . . . . . . . . . . . . . . . . . . . . . . . . . . . . . . . . . . . . 9,969,978 370,912
UltraPro Nasdaq Biotechnology . . . . . . . . . . . . . . . . . . . . . . . . . . . . . . . . . . . . . . . . . . . . . . . . . . . . . . . . . . . . . . . 41,686,715 3,731,525
UltraPro Financial Select Sector . . . . . . . . . . . . . . . . . . . . . . . . . . . . . . . . . . . . . . . . . . . . . . . . . . . . . . . . . . . . . . . 4,936,572 507,355
Ultra 7-10 Year Treasury . . . . . . . . . . . . . . . . . . . . . . . . . . . . . . . . . . . . . . . . . . . . . . . . . . . . . . . . . . . . . . . . . . . . . 41,987,625 496,015
Ultra 20+ Year Treasury . . . . . . . . . . . . . . . . . . . . . . . . . . . . . . . . . . . . . . . . . . . . . . . . . . . . . . . . . . . . . . . . . . . . . . 94,901,606 4,883,886
In addition, during the period, certain Funds received securities in exchange for subscriptions of shares (subscriptions-in-kind). For the yearended May 31, 2017, the fair value of the securities received for subscriptions were as follows:
Fund Fair Value
Ultra S&P500® . . . . . . . . . . . . . . . . . . . . . . . . . . . . . . . . . . . . . . . . . . . . . . . . . . . . . . . . . . . . . . . . . . . . . . . . . . . . . . . . . . . . . . . . . . . . . $240,866,631
Ultra QQQ® . . . . . . . . . . . . . . . . . . . . . . . . . . . . . . . . . . . . . . . . . . . . . . . . . . . . . . . . . . . . . . . . . . . . . . . . . . . . . . . . . . . . . . . . . . . . . . . 149,060,528
Ultra Dow30SM . . . . . . . . . . . . . . . . . . . . . . . . . . . . . . . . . . . . . . . . . . . . . . . . . . . . . . . . . . . . . . . . . . . . . . . . . . . . . . . . . . . . . . . . . . . . . 97,752,702
Ultra MidCap400 . . . . . . . . . . . . . . . . . . . . . . . . . . . . . . . . . . . . . . . . . . . . . . . . . . . . . . . . . . . . . . . . . . . . . . . . . . . . . . . . . . . . . . . . . . . 23,696,223
Ultra Russell2000 . . . . . . . . . . . . . . . . . . . . . . . . . . . . . . . . . . . . . . . . . . . . . . . . . . . . . . . . . . . . . . . . . . . . . . . . . . . . . . . . . . . . . . . . . . 188,240,642
Ultra SmallCap600 . . . . . . . . . . . . . . . . . . . . . . . . . . . . . . . . . . . . . . . . . . . . . . . . . . . . . . . . . . . . . . . . . . . . . . . . . . . . . . . . . . . . . . . . . 2,050,900
UltraPro S&P500® . . . . . . . . . . . . . . . . . . . . . . . . . . . . . . . . . . . . . . . . . . . . . . . . . . . . . . . . . . . . . . . . . . . . . . . . . . . . . . . . . . . . . . . . . . 285,375,152
UltraPro QQQ® . . . . . . . . . . . . . . . . . . . . . . . . . . . . . . . . . . . . . . . . . . . . . . . . . . . . . . . . . . . . . . . . . . . . . . . . . . . . . . . . . . . . . . . . . . . . . 288,893,989
UltraPro Dow30SM . . . . . . . . . . . . . . . . . . . . . . . . . . . . . . . . . . . . . . . . . . . . . . . . . . . . . . . . . . . . . . . . . . . . . . . . . . . . . . . . . . . . . . . . . . 31,403,843
UltraPro MidCap400 . . . . . . . . . . . . . . . . . . . . . . . . . . . . . . . . . . . . . . . . . . . . . . . . . . . . . . . . . . . . . . . . . . . . . . . . . . . . . . . . . . . . . . . . 4,067,039
UltraPro Russell2000 . . . . . . . . . . . . . . . . . . . . . . . . . . . . . . . . . . . . . . . . . . . . . . . . . . . . . . . . . . . . . . . . . . . . . . . . . . . . . . . . . . . . . . . . 212,936,874
Ultra Basic Materials . . . . . . . . . . . . . . . . . . . . . . . . . . . . . . . . . . . . . . . . . . . . . . . . . . . . . . . . . . . . . . . . . . . . . . . . . . . . . . . . . . . . . . . . 2,699,830
Merrill Corp - Proshares Trust Geared Book [96 Funds] Annual Report [Funds] 333-089822 05-31-2017 ED [AUX] | eperez | 28-Jul-17 17:44 | 17-15159-3.ka | Sequence: 33CHKSUM Content: 27263 Layout: 30169 Graphics: No Graphics CLEAN
JOB: 17-15159-3 CYCLE#;BL#: 5; 0 TRIM: 8.25" x 10.75" COMPOSITECOLORS: Black, ~note-color 2, ~note-color 3 GRAPHICS: none V1.5
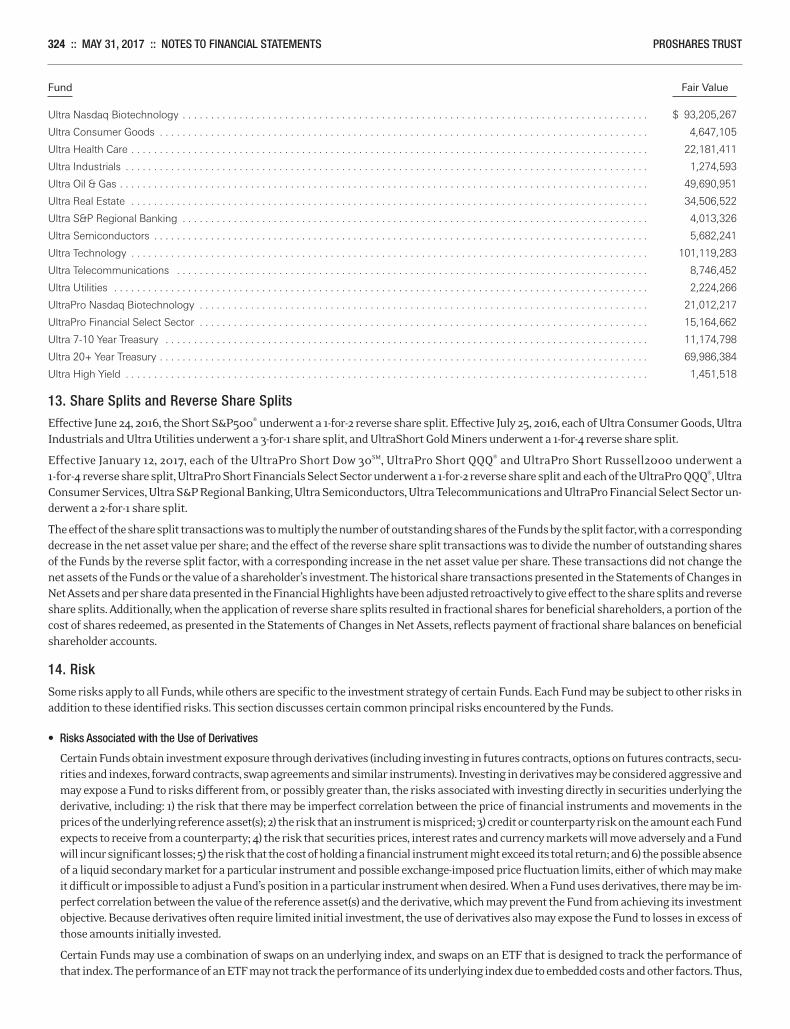
324 :: MAY 31, 2017 :: NOTES TO FINANCIAL STATEMENTS PROSHARES TRUST
Fund Fair Value
Ultra Nasdaq Biotechnology . . . . . . . . . . . . . . . . . . . . . . . . . . . . . . . . . . . . . . . . . . . . . . . . . . . . . . . . . . . . . . . . . . . . . . . . . . . . . . . . . . $ 93,205,267
Ultra Consumer Goods . . . . . . . . . . . . . . . . . . . . . . . . . . . . . . . . . . . . . . . . . . . . . . . . . . . . . . . . . . . . . . . . . . . . . . . . . . . . . . . . . . . . . . 4,647,105
Ultra Health Care . . . . . . . . . . . . . . . . . . . . . . . . . . . . . . . . . . . . . . . . . . . . . . . . . . . . . . . . . . . . . . . . . . . . . . . . . . . . . . . . . . . . . . . . . . . 22,181,411
Ultra Industrials . . . . . . . . . . . . . . . . . . . . . . . . . . . . . . . . . . . . . . . . . . . . . . . . . . . . . . . . . . . . . . . . . . . . . . . . . . . . . . . . . . . . . . . . . . . . 1,274,593
Ultra Oil & Gas . . . . . . . . . . . . . . . . . . . . . . . . . . . . . . . . . . . . . . . . . . . . . . . . . . . . . . . . . . . . . . . . . . . . . . . . . . . . . . . . . . . . . . . . . . . . . 49,690,951
Ultra Real Estate . . . . . . . . . . . . . . . . . . . . . . . . . . . . . . . . . . . . . . . . . . . . . . . . . . . . . . . . . . . . . . . . . . . . . . . . . . . . . . . . . . . . . . . . . . . 34,506,522
Ultra S&P Regional Banking . . . . . . . . . . . . . . . . . . . . . . . . . . . . . . . . . . . . . . . . . . . . . . . . . . . . . . . . . . . . . . . . . . . . . . . . . . . . . . . . . . 4,013,326
Ultra Semiconductors . . . . . . . . . . . . . . . . . . . . . . . . . . . . . . . . . . . . . . . . . . . . . . . . . . . . . . . . . . . . . . . . . . . . . . . . . . . . . . . . . . . . . . . 5,682,241
Ultra Technology . . . . . . . . . . . . . . . . . . . . . . . . . . . . . . . . . . . . . . . . . . . . . . . . . . . . . . . . . . . . . . . . . . . . . . . . . . . . . . . . . . . . . . . . . . . 101,119,283
Ultra Telecommunications . . . . . . . . . . . . . . . . . . . . . . . . . . . . . . . . . . . . . . . . . . . . . . . . . . . . . . . . . . . . . . . . . . . . . . . . . . . . . . . . . . . 8,746,452
Ultra Utilities . . . . . . . . . . . . . . . . . . . . . . . . . . . . . . . . . . . . . . . . . . . . . . . . . . . . . . . . . . . . . . . . . . . . . . . . . . . . . . . . . . . . . . . . . . . . . . 2,224,266
UltraPro Nasdaq Biotechnology . . . . . . . . . . . . . . . . . . . . . . . . . . . . . . . . . . . . . . . . . . . . . . . . . . . . . . . . . . . . . . . . . . . . . . . . . . . . . . . 21,012,217
UltraPro Financial Select Sector . . . . . . . . . . . . . . . . . . . . . . . . . . . . . . . . . . . . . . . . . . . . . . . . . . . . . . . . . . . . . . . . . . . . . . . . . . . . . . . 15,164,662
Ultra 7-10 Year Treasury . . . . . . . . . . . . . . . . . . . . . . . . . . . . . . . . . . . . . . . . . . . . . . . . . . . . . . . . . . . . . . . . . . . . . . . . . . . . . . . . . . . . . 11,174,798
Ultra 20+ Year Treasury . . . . . . . . . . . . . . . . . . . . . . . . . . . . . . . . . . . . . . . . . . . . . . . . . . . . . . . . . . . . . . . . . . . . . . . . . . . . . . . . . . . . . . 69,986,384
Ultra High Yield . . . . . . . . . . . . . . . . . . . . . . . . . . . . . . . . . . . . . . . . . . . . . . . . . . . . . . . . . . . . . . . . . . . . . . . . . . . . . . . . . . . . . . . . . . . . 1,451,518
13. Share Splits and Reverse Share SplitsEffective June 24, 2016, the Short S&P500® underwent a 1-for-2 reverse share split. Effective July 25, 2016, each of Ultra Consumer Goods, UltraIndustrials and Ultra Utilities underwent a 3-for-1 share split, and UltraShort Gold Miners underwent a 1-for-4 reverse share split.
Effective January 12, 2017, each of the UltraPro Short Dow 30SM, UltraPro Short QQQ® and UltraPro Short Russell2000 underwent a1-for-4 reverse share split, UltraPro Short Financials Select Sector underwent a 1-for-2 reverse share split and each of the UltraPro QQQ®, UltraConsumer Services, Ultra S&P Regional Banking, Ultra Semiconductors, Ultra Telecommunications and UltraPro Financial Select Sector un-derwent a 2-for-1 share split.
The effect of the share split transactions was to multiply the number of outstanding shares of the Funds by the split factor, with a correspondingdecrease in the net asset value per share; and the effect of the reverse share split transactions was to divide the number of outstanding sharesof the Funds by the reverse split factor, with a corresponding increase in the net asset value per share. These transactions did not change thenet assets of the Funds or the value of a shareholder’s investment. The historical share transactions presented in the Statements of Changes inNet Assets and per share data presented in the Financial Highlights have been adjusted retroactively to give effect to the share splits and reverseshare splits. Additionally, when the application of reverse share splits resulted in fractional shares for beneficial shareholders, a portion of thecost of shares redeemed, as presented in the Statements of Changes in Net Assets, reflects payment of fractional share balances on beneficialshareholder accounts.
14. RiskSome risks apply to all Funds, while others are specific to the investment strategy of certain Funds. Each Fund may be subject to other risks inaddition to these identified risks. This section discusses certain common principal risks encountered by the Funds.
• Risks Associated with the Use of Derivatives
Certain Funds obtain investment exposure through derivatives (including investing in futures contracts, options on futures contracts, secu-rities and indexes, forward contracts, swap agreements and similar instruments). Investing in derivatives may be considered aggressive andmay expose a Fund to risks different from, or possibly greater than, the risks associated with investing directly in securities underlying thederivative, including: 1) the risk that there may be imperfect correlation between the price of financial instruments and movements in theprices of the underlying reference asset(s); 2) the risk that an instrument is mispriced; 3) credit or counterparty risk on the amount each Fundexpects to receive from a counterparty; 4) the risk that securities prices, interest rates and currency markets will move adversely and a Fundwill incur significant losses; 5) the risk that the cost of holding a financial instrument might exceed its total return; and 6) the possible absenceof a liquid secondary market for a particular instrument and possible exchange-imposed price fluctuation limits, either of which may makeit difficult or impossible to adjust a Fund’s position in a particular instrument when desired. When a Fund uses derivatives, there may be im-perfect correlation between the value of the reference asset(s) and the derivative, which may prevent the Fund from achieving its investmentobjective. Because derivatives often require limited initial investment, the use of derivatives also may expose the Fund to losses in excess ofthose amounts initially invested.
Certain Funds may use a combination of swaps on an underlying index, and swaps on an ETF that is designed to track the performance ofthat index. The performance of an ETF may not track the performance of its underlying index due to embedded costs and other factors. Thus,
Merrill Corp - Proshares Trust Geared Book [96 Funds] Annual Report [Funds] 333-089822 05-31-2017 ED [AUX] | eperez | 28-Jul-17 17:44 | 17-15159-3.ka | Sequence: 34CHKSUM Content: 7835 Layout: 60074 Graphics: No Graphics CLEAN
JOB: 17-15159-3 CYCLE#;BL#: 5; 0 TRIM: 8.25" x 10.75" COMPOSITECOLORS: Black, ~note-color 2, ~note-color 3 GRAPHICS: none V1.5
PROSHARES TRUST NOTES TO FINANCIAL STATEMENTS :: MAY 31, 2017 :: 325
to the extent a Fund invests in swaps that use an ETF as the reference asset, that Fund may be subject to greater correlation risk and may notachieve as high a degree of correlation with its index as it would if the Fund used only swaps on the underlying index.
Moreover, with respect to the use of swap agreements, if a benchmark has a dramatic intraday move that causes a material decline in a Fund’snet assets, the terms of a swap agreement between the Fund and its counterparty may permit the counterparty to immediately close out thetransaction with the Fund. In that event, the Fund may be unable to enter into another swap agreement or invest in other derivatives to achievethe desired exposure consistent with the Fund’s investment objective. This, in turn, may prevent the Fund from achieving its investment ob-jective, even if the Index reverses all or a portion of its intraday move by the end of the day. Any costs associated with using derivatives willalso have the effect of lowering the Fund’s return.
• Leverage Risk
Certain Funds utilize leverage (i.e., obtain investment exposure in excess of their assets) in seeking to achieve their investment objective andwill lose more money in market environments adverse to their daily objective than similar funds that do not employ leverage.
Because the Funds that utilize leverage include either a -3x or 3x multiplier or a -2x or 2x multiplier, a single day adverse price movement approaching 33% or 50%, respectively, in a relevant benchmark, could result in the total loss of an investor’s investment.
• Concentration Risk
Certain Funds may typically concentrate their investments in issuers of one or more particular industries to the same extent that their un-derlying indexes are so concentrated and to the extent permitted by applicable regulatory guidance. There is a risk that those issuers (or in-dustry sectors) will perform poorly and negatively impact a Fund. Concentration risk results from maintaining exposure (long or short) toissuers conducting business in a specific industry. The risk of concentrating investments in a limited number of issuers in a particular industry is that a Fund will be more susceptible to the risks associated with that industry than a Fund that does not concentrate its investments.
• Correlation Risk
There is no guarantee that a Fund whose investment objective, before fees and expenses, seeks correlation with an index will achieve a highdegree of correlation with its index. Failure to achieve a high degree of correlation may prevent a Fund from achieving its investment objectiveand the percentage change of the Fund’s NAV each day may differ, perhaps significantly, from the percentage change of the Fund’s index onsuch day. This may be due, among other reasons, to the impact of a limited trading market in the underlying component securities on the cal-culation of the index. A number of other factors may adversely affect a Fund’s correlation with its benchmark, including material over- orunder-exposure, fees, expenses, transaction costs, financing costs associated with the use of derivatives, income items, valuation methodology,infrequent trading in the securities underlying its index, accounting standards and disruptions or illiquidity in the markets for the securitiesor financial instruments in which a Fund invests. While the Fund attempts to track the performance of the Index by investing all, or substan-tially all, of its assets in the securities that make up the Index in approximately the same proportion as their weighting in the Index, at timesa Fund may not have investment exposure to all securities in its benchmark, or its weighting of investment exposure to such securities,financial investments or industries may be different from that of the benchmark. In addition, a Fund may invest in securities or financial in-vestments not included in the benchmark or in financial instruments. Each Fund may take or refrain from taking positions in order to improvetax efficiency or comply with regulatory restrictions, either of which may negatively affect the Fund’s correlation with its index. A Fund mayalso be subject to large movements of assets into and out of the Fund, potentially resulting in the Fund being over- or underexposed to itsbenchmark and may be impacted by index reconstitutions and index rebalancing events. Additionally, a Fund’s underlying investments maytrade on markets that may or may not be open on the same day as the Fund. Furthermore, a Fund’s currency holdings may be valued at adifferent time than the level of its index. In addition, the Funds with a foreign currency hedging strategy may also be unable to perfectlymatch the Index and will introduce additional costs, both sources of additional correlation risk. Any of these factors could decrease correlationbetween performance of a Fund and may hinder a Fund’s ability to meet its investment objective.
• Counterparty Risk
Certain Funds will be subject to credit risk (i.e., the risk that a counterparty is unwilling or unable to make timely payments to meet its con-tractual obligations) with respect to the amount it expects to receive from counterparties to financial instruments and repurchase agreementsentered into by the Fund. The Funds generally structure the agreements such that either party can terminate the contract without penaltyprior to the termination date. A Fund may be negatively impacted if a counterparty becomes bankrupt or otherwise fails to perform its obligations.
At May 31, 2017, the ProShares UltraPro Short MidCap400, ProShares UltraShort Nasdaq Biotechnology, ProShares UltraShort HealthCare, ProShares UltraPro Short Nasdaq Biotechnology, ProShares UltraPro Short Financial Select Sector, ProShares Ultra S&P500®,ProShares Ultra QQQ®, ProShares Ultra Russell2000, ProShares Ultra SmallCap600, ProShares UltraPro S&P500®, ProShares UltraProQQQ®, ProShares UltraPro Dow30SM, ProShares UltraPro MidCap400, ProShares UltraPro Russell2000, ProShares Ultra Basic Materials,ProShares Ultra Consumer Goods, ProShares Ultra Consumer Services, ProShares Ultra Financials, ProShares Ultra Health Care, ProSharesUltra Industrials, ProShares Ultra Real Estate, ProShares Ultra S&P Regional Banking, ProShares Ultra Semiconductors, ProShares Ultra
Merrill Corp - Proshares Trust Geared Book [96 Funds] Annual Report [Funds] 333-089822 05-31-2017 ED [AUX] | eperez | 28-Jul-17 17:44 | 17-15159-3.ka | Sequence: 35CHKSUM Content: 16209 Layout: 43415 Graphics: No Graphics CLEAN
JOB: 17-15159-3 CYCLE#;BL#: 5; 0 TRIM: 8.25" x 10.75" COMPOSITECOLORS: Black, ~HTML color, ~note-color 2, ~note-color 3, ~watermark GRAPHICS: none V1.5
326 :: MAY 31, 2017 :: NOTES TO FINANCIAL STATEMENTS PROSHARES TRUST
Technology, ProShares Ultra Telecommunications, ProShares Ultra Utilities, ProShares UltraPro Financial Select Sector, ProShares UltraMSCI EAFE, ProShares Ultra MSCI Emerging Markets , ProShares Ultra FTSE Europe, ProShares Ultra FTSE China 50, ProShares UltraMSCI Japan and ProShares Ultra High Yield Funds had unrealized appreciation on swaps with a single counterparty which exceeded 5% ofeach Fund’s net assets.
• Geographic Concentration Risk
Certain Funds that focus their investments in companies economically tied to particular foreign countries or geographic regions may be par-ticularly susceptible to political, social, economic or regulatory events affecting those countries or regions. The performance of such Fundsmay be more volatile than a more geographically diversified fund.
• Foreign Currency Risk
Certain Funds may seek leveraged, inverse, or inverse leveraged exposure to investments denominated in foreign currencies. Investmentsdenominated in foreign currencies are exposed to more risk than those investments denominated in U.S. dollars. The value of an investmentdenominated in a foreign currency could change significantly as foreign currencies strengthen or weaken relative to the U.S. dollar. Foreigncurrency losses could offset or exceed any potential gains, or add to losses, in the related investments. Regulatory fees or higher custody feesmaybe imposed on foreign currency holdings.
• Liquidity Risk
In certain circumstances, such as the disruption of the orderly markets for the securities in which a Fund invests, the Fund might not be ableto acquire or dispose of certain holdings quickly or at prices that represent true market value in the judgment of the Advisor. Markets for thesecurities in which a Fund invests may be disrupted by a number of events, including but not limited to economic crises, natural disasters,new legislation, or regulatory changes inside or outside of the U.S. For example, regulation limiting the ability of certain financial institutionsto invest in certain securities would likely reduce the liquidity of those securities. These situations may prevent a Fund from limiting losses,realizing gains or achieving a high correlation with its benchmark.
• Debt Instrument Risk
Certain Funds invest in, or seek leveraged, inverse, or inverse leveraged exposure to, debt instruments. Debt instruments may have varyinglevels of sensitivity to changes in interest rates and other factors. In addition, changes in the credit quality of the issuer of a debt instrument(including a default) can also affect the price of a debt instrument, as can an issuer’s default on its payment obligations. These factors maycause the value of an investment in a Fund to change.
15. IndemnificationsUnder the Trust’s organizational documents, its officers and Trustees are indemnified against certain liabilities arising out of the performanceof their duties to the Trust. In addition, in the normal course of business the Trust enters into contracts that contain a variety of representationswhich provide general indemnifications. The Trust’s maximum exposure under these arrangements cannot be known; however, the Trustexpects any risk of loss to be remote.
16. Transactions with Lehman Brothers Holdings, Inc.On September 15, 2008, Lehman Brothers Holdings, Inc. filed a petition for Chapter 11 bankruptcy. Prior thereto, the Funds transacted businesswith subsidiaries of Lehman (together with Lehman Brothers Holdings, Inc., “Lehman”) whereby Lehman acted as a counterparty to certain de-rivative transactions and as a broker-dealer for certain investment transactions. All derivative and brokerage transactions with Lehman wereterminated and executed, respectively, prior to September 15, 2008, but certain settlement payments related to such transactions were not dueto be made until on or after September 15. Settlement of these transactions has been delayed due to Lehman’s bankruptcy proceedings.
To the extent that Lehman, the Securities Investor Protection Corporation (“SIPC”) and/or any clearing agency (the “Potential Paying Parties”)fail to pay the Funds in connection with the settlement of such transactions, the Advisor has agreed to reimburse the Funds for any such losses.Specifically, the Receivables Agreement among the Advisor, ProFund Advisors LLC (an investment adviser affiliated with the Advisor), ProFundsTrust, and the Trust (collectively, the “PF Trusts”) (each affiliated and under common controls with the other PF Trusts) provides that the invest-ment adviser to specified funds of the PF Trusts will contribute cash to any such fund, equal to the amounts owed to the fund from Lehman forbrokerage transactions and/or written over-the-counter derivatives agreements as of September 15, 2008 (the “Lehman Obligations”). The Re-ceivable Agreement will not terminate until all Lehman Obligations are paid. Payments under the Receivable Agreement are triggered if anyspecified fund of a PF Trust does not recover the full amounts owed to it by Lehman following conclusion of all bankruptcy, liquidation andSIPC proceedings relating to Lehman. Management has determined that the Advisor has a sufficient financial ability to cover any shortfall inpayments from the Potential Paying Parties, including the full amount of such outstanding balances if necessary. Accordingly, no loss is expectedto be realized by the Funds. The outstanding swap agreement and brokerage transaction balances due from Lehman are included in “Due from(to) counterparty” and “Receivable for investments sold”, respectively, on the Statements of Assets and Liabilities.
Merrill Corp - Proshares Trust Geared Book [96 Funds] Annual Report [Funds] 333-089822 05-31-2017 ED [AUX] | eperez | 28-Jul-17 17:44 | 17-15159-3.ka | Sequence: 36CHKSUM Content: 52942 Layout: 6850 Graphics: No Graphics CLEAN
JOB: 17-15159-3 CYCLE#;BL#: 5; 0 TRIM: 8.25" x 10.75" COMPOSITECOLORS: Black, ~note-color 2, ~note-color 3 GRAPHICS: none V1.5
PROSHARES TRUST NOTES TO FINANCIAL STATEMENTS :: MAY 31, 2017 :: 327
17. Subsequent EventsEffective July 17, 2017, each of ProShares Ultra QQQ®, ProShares Ultra Russell2000, ProShares UltraPro Dow30SM, ProShares UltraPro Russell2000, ProShares Ultra Real Estate and ProShares Ultra Technology underwent a 2-for-1 share split and ProShares UltraShort S&P500®
underwent a 1-for-4 reverse share split.
The effect of the share split transactions was to multiply the number of outstanding shares of the Funds by the split factor, with a correspondingdecrease in the net asset value per share; and the effect of the reverse share split transactions was to divide the number of outstanding sharesof the Funds by the reverse split factor, with a corresponding increase in the net asset value per share. These transactions did not change thenet assets of the Funds or the value of a shareholder’s investment. The historical share transactions presented in the Statements of Changes inNet Assets and per share data presented in the Financial Highlights have been adjusted retroactively to give effect to the share splits and reverseshare splits. Additionally, when the application of reverse share splits resulted in fractional shares for beneficial shareholders, a portion of thecost of shares redeemed, as presented in the Statements of Changes in Net Assets, reflects payment of fractional share balances on beneficialshareholder accounts.
The Board is currently considering a draft Plan of Liquidation and Termination (the “Plan”) which, if approved, would lead to the closure andliquidation of ProShares Short S&P Regional Banking, ProShares UltraShort Oil & Gas Exploration & Production, ProShares UltraShort MSCIMexico Capped IMI, ProShares UltraShort 3-7 Year Treasury, ProShares UltraShort TIPS, ProShares Ultra Junior Miners, ProShares Ultra Oil &Gas Exploration & Production, ProShares Ultra S&P Regional Banking, ProShares Ultra MSCI Mexico Capped IMI (together, the “LiquidatingFunds”).
Subject to the Board’s approval of the Plan, the Liquidating Funds are expected to halt trading in early September 2017. Any shareholders re-maining in the Liquidating Funds on the distribution date, also expected to occur in September 2017, will automatically have their shares re-deemed for cash at the net asset value per share as of the liquidation date.
Merrill Corp - Proshares Trust Geared Book [96 Funds] Annual Report [Funds] 333-089822 05-31-2017 ED [AUX] | eperez | 28-Jul-17 17:44 | 17-15159-3.ka | Sequence: 37CHKSUM Content: 23786 Layout: 60845 Graphics: No Graphics CLEAN
JOB: 17-15159-3 CYCLE#;BL#: 5; 0 TRIM: 8.25" x 10.75" COMPOSITECOLORS: Black, ~note-color 2, ~note-color 3 GRAPHICS: none V1.5
328 :: REPORT OF INDEPENDENT REGISTERED PUBLIC ACCOUNTING FIRM PROSHARES TRUST
Report of Independent Registered Public Accounting Firm
To the Board of Trustees of ProShares Trust and the Shareholders of each of the ninety-six funds listed below
In our opinion, the accompanying statements of assets and liabilities, including the schedules of portfolio investments (or summary schedulesof portfolio investments for the Funds indicated with an asterisk below), and the related statements of operations and of changes in net assetsand the financial highlights present fairly, in all material respects, the financial positions of each of the following ninety-six funds
(1) Statement of changes in net assets is presented for each of the two years in the period ended May 31, 2017
(2) Statement of changes in net assets is presented for the year ended May 31, 2017 and for the period June 22, 2015 (commencement of operations)
through May 31, 2016
(hereafter referred to as the “Funds”) as of May 31, 2017, the results of each of their operations for the year then ended, the changes in each oftheir net assets for the respective periods described in (1) and (2) above, and the financial highlights for each of the periods presented therein,in conformity with accounting principles generally accepted in the United States of America. These financial statements and financial highlights(hereafter referred to as “financial statements”) are the responsibility of the Funds’ management. Our responsibility is to express an opinion onthese financial statements based on our audits. We conducted our audits of these financial statements in accordance with the standards of thePublic Company Accounting Oversight Board (United States). Those standards require that we plan and perform the audit to obtain reasonableassurance about whether the financial statements are free of material misstatement. An audit includes examining, on a test basis, evidencesupporting the amounts and disclosures in the financial statements, assessing the accounting principles used and significant estimates madeby management, and evaluating the overall financial statement presentation. We believe that our audits, which included confirmation of secu-rities as of May 31, 2017 by correspondence with the custodian and brokers, provide a reasonable basis for our opinions.
PricewaterhouseCoopers LLP
Baltimore, MarylandJuly 28, 2017
Short S&P500® (1)Short QQQ® (1)Short Dow30SM (1)Short MidCap400 (1)Short Russell2000 (1)Short SmallCap600 (1)UltraShort S&P500® (1)UltraShort QQQ® (1)UltraShort Dow30SM (1)UltraShort MidCap400 (1)UltraShort Russell2000 (1)UltraShort SmallCap600 (1)UltraPro Short S&P500® (1)UltraPro Short QQQ® (1)UltraPro Short Dow30SM (1)UltraPro Short MidCap400 (1)UltraPro Short Russell2000 (1)Short Basic Materials (1)Short Financials (1)Short Oil & Gas (1)Short Real Estate (1)Short S&P Regional Banking (1)UltraShort Basic Materials (1)UltraShort Nasdaq Biotechnology (1)UltraShort Consumer Goods (1)UltraShort Consumer Services (1)UltraShort Financials (1)UltraShort Gold Miners (1)UltraShort Health Care (1)UltraShort Industrials (1)UltraShort Oil & Gas (1)UltraShort Oil & Gas Exploration &Production (2)
UltraShort Real Estate (1)UltraShort Semiconductors (1)UltraShort Technology (1)UltraShort Utilities (1)UltraPro Short Nasdaq Biotechnology (2)UltraPro Short Financial Select Sector (1)Short MSCI EAFE (1)Short MSCI Emerging Markets (1)Short FTSE China 50 (1)UltraShort MSCI EAFE (1)UltraShort MSCI Emerging Markets (1)UltraShort FTSE Europe (1)UltraShort MSCI Brazil Capped (1)UltraShort FTSE China 50 (1)UltraShort MSCI Japan (1)UltraShort MSCI Mexico Capped IMI (1)Short 7-10 Year Treasury (1)Short 20+ Year Treasury (1)Short High Yield (1)UltraShort 3-7 Year Treasury (1)UltraShort 7-10 Year Treasury (1)UltraShort 20+ Year Treasury (1)UltraShort TIPS (1)UltraPro Short 20+ Year Treasury (1)Ultra S&P500® (1)*Ultra QQQ® (1)Ultra Dow30SM (1)Ultra MidCap400 (1)*Ultra Russell2000 (1)*Ultra SmallCap600 (1)*UltraPro S&P500® (1)*UltraPro QQQ® (1)UltraPro Dow30SM (1)
UltraPro MidCap400 (1)*UltraPro Russell2000 (1)*Ultra Basic Materials (1)Ultra Nasdaq Biotechnology (1)Ultra Consumer Goods (1)Ultra Consumer Services (1)Ultra Financials (1)*Ultra Gold Miners (1)Ultra Junior Miners (1)Ultra Health Care (1)Ultra Industrials (1)*Ultra Oil & Gas (1)Ultra Oil & Gas Exploration & Production (2)Ultra Real Estate (1)Ultra S&P Regional Banking (1)Ultra Semiconductors (1)Ultra Technology (1)Ultra Telecommunications (1)Ultra Utilities (1)UltraPro Nasdaq Biotechnology (2)UltraPro Financial Select Sector (1)Ultra MSCI EAFE (1)Ultra MSCI Emerging Markets (1)Ultra FTSE Europe (1)Ultra MSCI Brazil Capped (1)Ultra FTSE China 50 (1)Ultra MSCI Japan (1)Ultra MSCI Mexico Capped IMI (1)Ultra 7-10 Year Treasury (1)Ultra 20+ Year Treasury (1)Ultra High Yield (1)
Merrill Corp - Proshares Trust Geared Book [96 Funds] Annual Report [Funds] 333-089822 05-31-2017 ED [AUX] | eperez | 28-Jul-17 17:44 | 17-15159-3.ka | Sequence: 38CHKSUM Content: 26621 Layout: 3496 Graphics: No Graphics CLEAN
JOB: 17-15159-3 CYCLE#;BL#: 5; 0 TRIM: 8.25" x 10.75" COMPOSITECOLORS: Black, ~note-color 2, ~note-color 3 GRAPHICS: none V1.5
Federal Tax Information
Funds with Short-Term Capital Gain Designation
For the tax year ended October 31, 2016, the Funds do not have any ordinary distributions paid during the Trust’s tax year that are from qualifiedshort-term capital gain. The Funds designate up to the maximum amount of Qualified Short-Term Gains.
Funds with Equalization
For the tax year ended October 31, 2016, the following Funds utilized equalization to offset long-term capital gains with the amounts statedbelow:
Fund Long-Term
Ultra Real Estate . . . . . . . . . . . . . . . . . . . . . . . . . . . . . . . . . . . . . . . . . . . . . . . . . . . . . . . . . . . . . . . . . . . . . . . . . . . . . . . . . . . . . . . . . . . . $1,008,823
Ultra 20+ Year Treasury . . . . . . . . . . . . . . . . . . . . . . . . . . . . . . . . . . . . . . . . . . . . . . . . . . . . . . . . . . . . . . . . . . . . . . . . . . . . . . . . . . . . . . 97,542
PROSHARES TRUST MISC. INFORMATION (UNAUDITED) :: 329
Merrill Corp - Proshares Trust Geared Book [96 Funds] Annual Report [Funds] 333-089822 05-31-2017 ED [AUX] | eperez | 28-Jul-17 17:44 | 17-15159-3.ka | Sequence: 39CHKSUM Content: 7567 Layout: 5016 Graphics: No Graphics CLEAN
JOB: 17-15159-3 CYCLE#;BL#: 5; 0 TRIM: 8.25" x 10.75" COMPOSITECOLORS: Black, ~note-color 2, ~note-color 3 GRAPHICS: none V1.5
330 :: MISC. INFORMATION (UNAUDITED) PROSHARES TRUST
Proxy Voting InformationA description of the Trust’s (1) proxy voting policies, (2) proxy voting procedures and (3) information regarding how the Trust voted any proxiesrelated to portfolio securities for the prior twelve-month period ended June 30, is available by August 31 of each year, without charge, uponrequest by contacting the Fund directly at 1-866-PRO-5125 or on the Securities and Exchange Commission (“SEC”) Website (http://www.sec.gov).
Quarterly Portfolio Holdings InformationThe Trust will file its complete schedule of portfolio holdings with the SEC for the first and third quarters of each fiscal year on Form N-Q. Trust’sForm N-Q will be available on the SEC’s Website at http://www.sec.gov. The Trust’s Form N-Q may also be reviewed and copied at the SEC’s PublicReference Room in Washington, DC. Information on the operation of the Public Reference Room may be obtained by calling 1-800-SEC-0330.
Premium/Discount InformationInformation about the differences between the daily market price on the secondary markets for shares of a Fund and the Fund’s net asset valuemay be found on the website at www.ProShares.com
Merrill Corp - Proshares Trust Geared Book [96 Funds] Annual Report [Funds] 333-089822 05-31-2017 ED [AUX] | eperez | 28-Jul-17 17:44 | 17-15159-3.ka | Sequence: 40CHKSUM Content: 25252 Layout: 39162 Graphics: No Graphics CLEAN
JOB: 17-15159-3 CYCLE#;BL#: 5; 0 TRIM: 8.25" x 10.75" COMPOSITECOLORS: Black, ~note-color 2, ~note-color 3 GRAPHICS: none V1.5
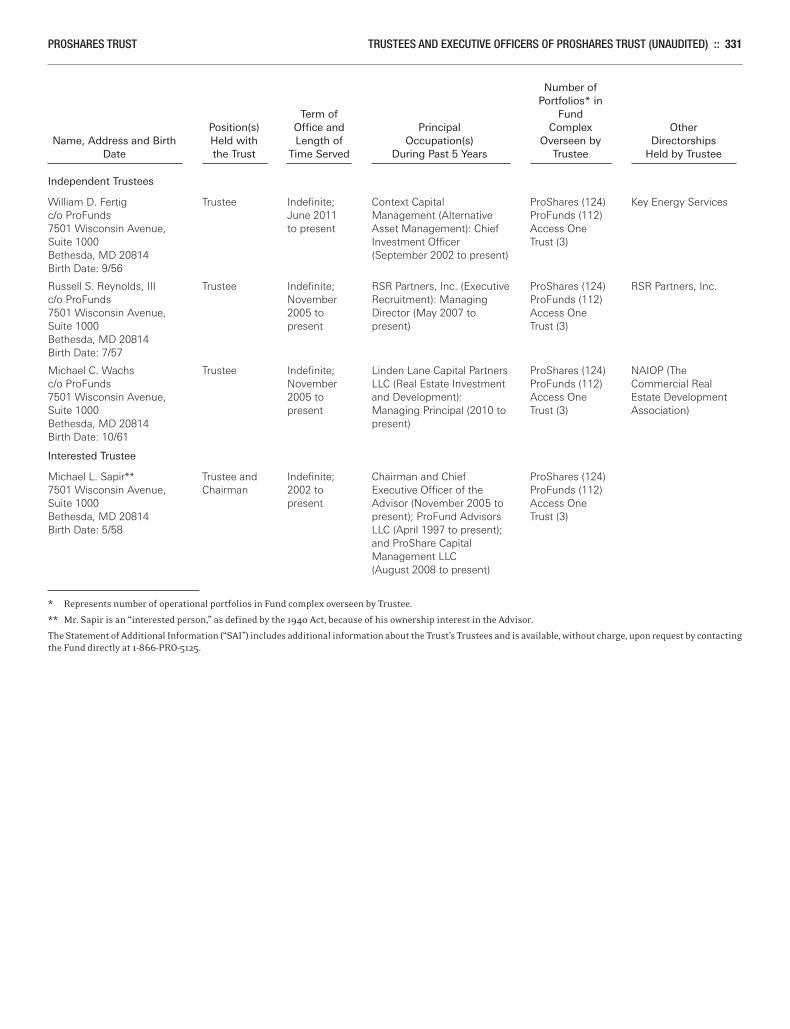
PROSHARES TRUST TRUSTEES AND EXECUTIVE OFFICERS OF PROSHARES TRUST (UNAUDITED) :: 331
Number of Portfolios* in Term of Fund Position(s) Office and Principal Complex Other Name, Address and Birth Held with Length of Occupation(s) Overseen by Directorships Date the Trust Time Served During Past 5 Years Trustee Held by Trustee
Independent Trustees
Interested Trustee
* Represents number of operational portfolios in Fund complex overseen by Trustee.
** Mr. Sapir is an “interested person,” as defined by the 1940 Act, because of his ownership interest in the Advisor.
The Statement of Additional Information (“SAI”) includes additional information about the Trust’s Trustees and is available, without charge, upon request by contactingthe Fund directly at 1-866-PRO-5125.
Key Energy ServicesProShares (124)ProFunds (112)Access OneTrust (3)
Context CapitalManagement (AlternativeAsset Management): ChiefInvestment Officer(September 2002 to present)
Indefinite;June 2011to present
TrusteeWilliam D. Fertigc/o ProFunds7501 Wisconsin Avenue,Suite 1000Bethesda, MD 20814Birth Date: 9/56
RSR Partners, Inc.ProShares (124)ProFunds (112)Access OneTrust (3)
RSR Partners, Inc. (ExecutiveRecruitment): ManagingDirector (May 2007 topresent)
Indefinite;November 2005 topresent
TrusteeRussell S. Reynolds, IIIc/o ProFunds7501 Wisconsin Avenue,Suite 1000Bethesda, MD 20814Birth Date: 7/57
NAIOP (TheCommercial RealEstate DevelopmentAssociation)
ProShares (124)ProFunds (112)Access OneTrust (3)
Linden Lane Capital PartnersLLC (Real Estate Investmentand Development):Managing Principal (2010 topresent)
Indefinite;November2005 topresent
TrusteeMichael C. Wachsc/o ProFunds7501 Wisconsin Avenue,Suite 1000Bethesda, MD 20814Birth Date: 10/61
ProShares (124)ProFunds (112)Access OneTrust (3)
Chairman and ChiefExecutive Officer of theAdvisor (November 2005 topresent); ProFund AdvisorsLLC (April 1997 to present);and ProShare CapitalManagement LLC(August 2008 to present)
Indefinite;2002 topresent
Trustee andChairman
Michael L. Sapir**7501 Wisconsin Avenue,Suite 1000Bethesda, MD 20814Birth Date: 5/58
Merrill Corp - Proshares Trust Geared Book [96 Funds] Annual Report [Funds] 333-089822 05-31-2017 ED [AUX] | eperez | 28-Jul-17 17:44 | 17-15159-3.ka | Sequence: 41CHKSUM Content: 31829 Layout: 9801 Graphics: No Graphics CLEAN
JOB: 17-15159-3 CYCLE#;BL#: 5; 0 TRIM: 8.25" x 10.75" COMPOSITECOLORS: Black, ~note-color 2, ~note-color 3 GRAPHICS: none V1.5
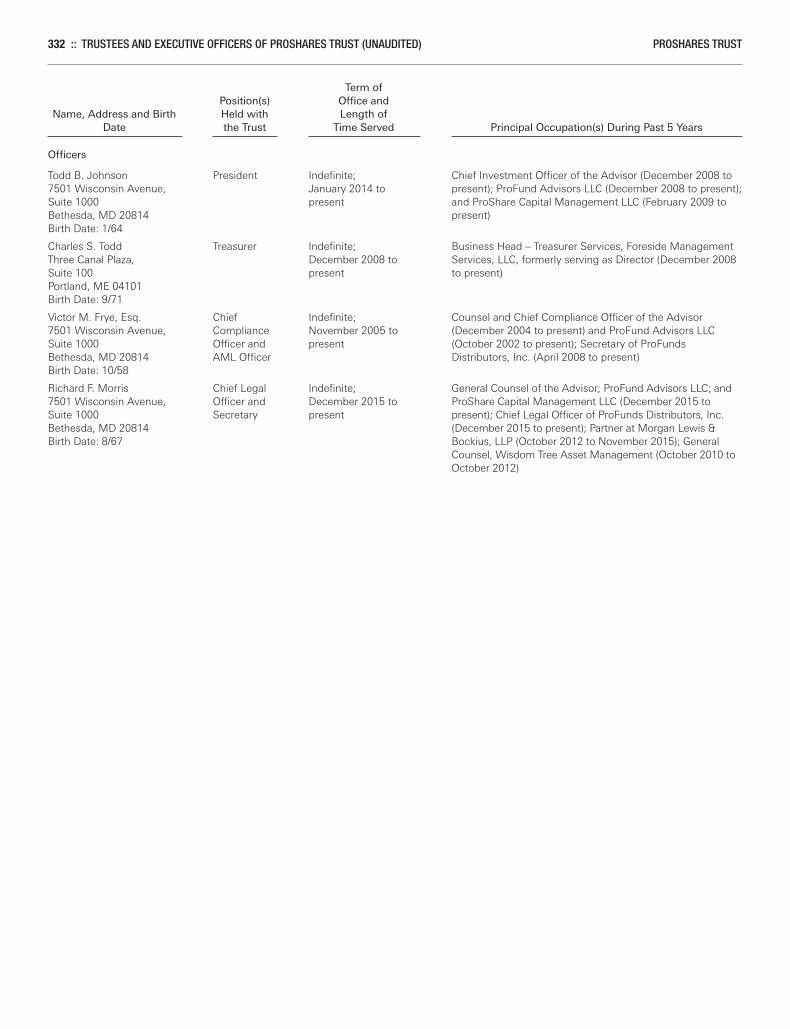
332 :: TRUSTEES AND EXECUTIVE OFFICERS OF PROSHARES TRUST (UNAUDITED) PROSHARES TRUST
Term of Position(s) Office and Name, Address and Birth Held with Length of Date the Trust Time Served Principal Occupation(s) During Past 5 Years
Officers
Todd B. Johnson7501 Wisconsin Avenue,Suite 1000Bethesda, MD 20814Birth Date: 1/64
President Indefinite;January 2014 topresent
Chief Investment Officer of the Advisor (December 2008 topresent); ProFund Advisors LLC (December 2008 to present);and ProShare Capital Management LLC (February 2009 topresent)
Charles S. ToddThree Canal Plaza,Suite 100Portland, ME 04101Birth Date: 9/71
Treasurer Indefinite;December 2008 topresent
Business Head – Treasurer Services, Foreside ManagementServices, LLC, formerly serving as Director (December 2008to present)
Victor M. Frye, Esq.7501 Wisconsin Avenue,Suite 1000Bethesda, MD 20814Birth Date: 10/58
ChiefComplianceOfficer andAML Officer
Indefinite;November 2005 topresent
Counsel and Chief Compliance Officer of the Advisor(December 2004 to present) and ProFund Advisors LLC(October 2002 to present); Secretary of ProFundsDistributors, Inc. (April 2008 to present)
Richard F. Morris7501 Wisconsin Avenue,Suite 1000Bethesda, MD 20814Birth Date: 8/67
Chief LegalOfficer andSecretary
Indefinite;December 2015 topresent
General Counsel of the Advisor; ProFund Advisors LLC; andProShare Capital Management LLC (December 2015 topresent); Chief Legal Officer of ProFunds Distributors, Inc.(December 2015 to present); Partner at Morgan Lewis &Bockius, LLP (October 2012 to November 2015); GeneralCounsel, Wisdom Tree Asset Management (October 2010 toOctober 2012)
Merrill Corp - Proshares Trust Geared Book [96 Funds] Annual Report [Funds] 333-089822 05-31-2017 ED [AUX] | eperez | 28-Jul-17 17:44 | 17-15159-3.ka | Sequence: 42CHKSUM Content: 23489 Layout: 34511 Graphics: No Graphics CLEAN
JOB: 17-15159-3 CYCLE#;BL#: 5; 0 TRIM: 8.25" x 10.75" COMPOSITECOLORS: Black, ~note-color 2, ~note-color 3 GRAPHICS: none V1.5

This page intentionally left blank.
Merrill Corp - Proshares Trust Geared Book [96 Funds] Annual Report [Funds] 333-089822 05-31-2017 ED [AUX] | eperez | 28-Jul-17 17:44 | 17-15159-3.ka | Sequence: 43CHKSUM Content: 25314 Layout: 54094 Graphics: No Graphics CLEAN
JOB: 17-15159-3 CYCLE#;BL#: 5; 0 TRIM: 8.25" x 10.75" COMPOSITECOLORS: Black, ~note-color 2 GRAPHICS: none V1.5

This page intentionally left blank.
Merrill Corp - Proshares Trust Geared Book [96 Funds] Annual Report [Funds] 333-089822 05-31-2017 ED [AUX] | eperez | 28-Jul-17 17:44 | 17-15159-3.ka | Sequence: 44CHKSUM Content: 25314 Layout: 56356 Graphics: No Graphics CLEAN
JOB: 17-15159-3 CYCLE#;BL#: 5; 0 TRIM: 8.25" x 10.75" COMPOSITECOLORS: Black, ~note-color 2 GRAPHICS: none V1.5
ProShares Trust7501 Wisconsin Avenue, Suite 1000E, Bethesda, MD 20814866.PRO.5125 866.776.5125ProShares.com
© 2017 ProShare Advisors LLC. All rights reserved. PSGAN0517
Geared ETFs seek returns that are either 3x, 2x, -1x, -2x or -3x the return of an index or other benchmark (target) for a single day, as measuredfrom one NAV calculation to the next. Due to the compounding of daily returns, ProShares’ returns over periods other than one day will likelydiffer in amount and possibly direction from the target return for the same period. These effects may be more pronounced in funds with largeror inverse multiples and in funds with volatile benchmarks. Investors should monitor their holdings consistent with their strategies, as frequentlyas daily. For more on correlation, leverage and other risks, please read the prospectus.
This report is submitted for the general information of the shareholders of ProShares. It is not authorized for distribution to prospective investorsunless preceded or accompanied by a current prospectus. To obtain the most recent month end performance information for each ETF,visit ProShares.com.
“QQQ®”, “NASDAQ-100®” and “NASDAQ Biotechnology Index®” are trademarks of The NASDAQ OMX Group, Inc. “Standard & Poor’s®”, “S&P®”,“S&P 500®”, “S&P MidCap 400®”, “S&P SmallCap 600®”, “Standard & Poor’s 500®”, “S&P 500® VIX® Short-Term Futures IndexTM”, “S&P 500®
VIX® Mid-Term Futures IndexTM”, certain “S&P Select Industry Indices”, “S&P Oil & Gas Exploration & Production Select Industry Index”, “DowJones Index”, “DJ”, “Dow Jones Industrial AverageSM”, “The Dow 30SM”, “Dow Jones U.S. Sector Indexes”, “Dow Jones Select Sector Indexes”are products of S&P Dow Jones Indices LLC and its affiliates. The “Russell 2000® Index” and “Russell®” are trademarks of Russell InvestmentGroup. “MSCI”, “MSCI Inc.”, “MSCI Index”and “EAFE” are service marks of MSCI. “ICE U.S. 3-7 Year Bond IndexTM”, “ICE U.S. 7-10 Year BondIndexTM” and “ICE U.S. 20+ Year Bond IndexTM” are trademarks of Intercontinental Exchange, Inc. “iBoxx®” is a registered trademark of MarkitIndices Limited. The “NYSE Arca Gold Miners IndexSM” is a service mark of NYSE or its affiliates. The “MVISTM Global Junior Gold Miners Index”is the exclusive property of Market Vectors Index Solutions GmbH. All have been licensed for use by ProShares. “VIX®” is a trademark of theChicago Board Options Exchange, Incorporated (“CBOE”) and CBOE has agreed that S&P Dow Jones Indices LLC may use the “VIX®” trademarkin the names of the Indexes as licensed to ProShares. “S&P®” is a registered trademark of Standard & Poor’s Financial Services LLC (“S&P”)and “Dow Jones®” is a registered trademark of Dow Jones Trademark Holdings LLC (“Dow Jones”) and have been licensed for use by S&P DowJones Indices LLC and its affiliates. “FTSE®” is a trademark of the London Stock Exchange plc and The Financial Times Limited and is used byFTSE International Limited (“FTSE”) under license. ProShares have not been passed on by these entities or their subsidiaries or affiliates as totheir legality or suitability. ProShares are not sponsored, endorsed, sold or promoted by these entities or their subsidiaries or affiliates, and theymake no representation regarding the advisability of investing in ProShares. THESE ENTITIES AND THEIR SUBSIDIARIES AND AFFILIATESMAKE NO WARRANTIES AND BEAR NO LIABILITY WITH RESPECT TO PROSHARES.
Merrill Corp - Proshares Trust Geared Book [96 Funds] Annual Report [Funds] 333-089822 05-31-2017 ED [AUX] | eperez | 28-Jul-17 17:45 | 17-15159-3.za | Sequence: 1CHKSUM Content: 29874 Layout: 58184 Graphics: 64408 CLEAN
JOB: 17-15159-3 CYCLE#;BL#: 5; 0 TRIM: 8.25" x 10.75" COMPOSITECOLORS: Black, ~note-color 2 GRAPHICS: proshares_k_logo.eps V1.5