Embed Size (px)
Citation preview

Propulsion of 46,000-50,000 dwtMR tankers
MR tankersModern two-stroke engine technology for a modern vessel type

MAN Energy SolutionsPropulsion of 46,000-50,000 dwt MR tankers2
Futurein the
making

3
ContentsEnergy efficiency design index 05Major propeller and engine parameters 08Main engine operating costs 15.1 knots 13Main engine operating costs 14.5 knots 19Main engine operating costs 14.0 knots 24Summary 29

MAN Energy SolutionsPropulsion of 46,000-50,000 dwt MR tankers4
The main ship particulars of 46,000-50,000 dwt MR tankers are normally as follows: the overall ship length is 183 m, breadth 32.2 m and design/scantling draught 11.0 m/12.2 m, see the opening page for an example of a typical vessel.
Development steps within engine technology since the mid-2000s have made it possible to offer solutions, which enable significantly lower transportation costs for and reduced emissions from MR tankers and similar sized bulk carriers.
With the increased focus on reducing CO2 emissions from ships, as governed by the International Maritime Organisation’s Energy Efficiency Design Index (EEDI), further reductions of the fuel consumption are required. Especially tankers must reduce emissions, in order to fulfil EEDI phase 2 from 2020 (20% reduction) and EEDI phase 3 from 2025 (30% reduction).
Some of the measures to reduce fuel consumption extending beyond the
installation of a modern fuel efficient engine is the optimisation of the aftbody and hull lines of the ship – also considering operation in ballast condition – in order to install a propeller with a larger than usual diameter. Hereby a higher propeller efficiency is obtained, at a reduced optimum propeller rpm. Additionally, high efficiency propellers of e.g. the Kappel design, along with other energy saving devices, provide substantial reduction potential.
The modern super-long-stroke S-type engines and ultra-long-stroke G-type engines have a lower than usual shaft speed. The reduced optimum propeller rpm of the larger propellers can hereby be contained within the layout diagrams of these modern engines.
As an alternative to or in combination with an optimisation of the hull, alternative fuels such as LNG, LPG, methanol or ethane, offered for a wide pallet of engine types, will also result in a significant reduction of the EEDI attained.
Through three case studies of a 47,000 dwt ton MR tanker, this paper will outline the effect of possible initiatives to reduce the environmental impact of such a vessel. It shows that such initiatives must be implemented to comply with EEDI phase 2 and 3, if the typical service speed of today, 14.5 knots, is to be maintained.
The effect of a speed reduction to a service speed of 14.0 knots is investigated, along with a comparison to the higher service speed of 15.1 knots of the past, still possible if alternative fuels are applied.
All the comparisons of the most recent engine technology in combinations with a larger propeller diameter, various energy saving devices and alternative fuels are performed with reference to a S50ME-C8.5 engine with a 5.9 m diameter propeller. This propulsion plant is included in many designs delivered in the mid 2010s, and as such, the savings presented in this paper are relative to recent designs.
The global trade is growing, increasing the demand for transportation of chemicals and refined products. As MR tankers carry these products around the globe the demand for such vessels is expected to increase, additionally driven by the high average age of the current fleet.
This paper will focus on reducing the environmental impact of MR tankers, and present solutions that will make designs capable of fulfilling EEDI phase 2 and 3. This is not only beneficial to the environment, but also to the owners, as the resulting super eco-ships see higher day rates in the market.

5
Energy efficiency design index
The EEDI guidelines are a mandatory instrument adopted by the International Maritime Organization (IMO) that ensures compliance with international requirements on CO2 emissions of new ships. The EEDI represents the amount of CO2 in gram emitted when transporting one deadweight tonnage of cargo for one nautical mile:
reduced in three steps. This leads to a final EEDI reduction of 30% compared to the reference value for a vessel built after 2025, see Fig. 1.
For a tanker vessel the reference and attained EEDI is calculated based on 100% utilisation of capacity (in dwt). The reference speed must be consistent with this loading of the vessel, at 75% SMCR (specified maximum continuous rating), and with the hull in a condition as on sea trial. The attained EEDI shall not exceed the required EEDI.
The EEDI is calculated on the basis of cargo capacity, propulsion power, ship speed, specific fuel consumption and fuel type. However, certain correction factors are applicable, as well as reduc-tions can be obtained by e.g. installing waste heat recovery systems (WHRS).
A reference index for a specific ship type is calculated based on data from ships built in the period from 2000 to 2010. According to the EEDI guidelines implemented on 1 January 2013, the required EEDI value for new ships is
EEDI ≈ CO2
Transport work
6.405.765.124.48
0
2
4
6
8
10
12
14
5,000 20,000 35,000 50,000 65,000 80,000 95,000 110,000 125,000 140,000 155,000 170,000 185,000 200,000
Phase 0
Phase 1
Phase 2
Phase 3
Example47,000 dwt
EEDI
Capacity [dwt]
Fig. 1: EEDI requirements for tanker vessels

MAN Energy SolutionsPropulsion of 46,000-50,000 dwt MR tankers6
There are a number of methods that can be applied to lower the attained EEDI value. By derating the engine, the specific fuel consumption (SFC) is lowered as the mean effective pressure is reduced relative to the maximum (firing) pressure, which remains constant.
Engine tuning methods such as e.g. exhaust gas bypass (EGB) or high-pressure tuning (HPT) can optimise the fuel curve at part-load thus reducing SFC at 75% load, the EEDI reference value. Part-load tuning will typically provide the lowest SFC at the EEDI reference value, whereas low-load tuning also will result in a reduction at this point compared to high-load tuning. In the present case studies, part-load optimisation of the is applied, except for cases where EcoEGR is applied. This reflects a good compromise considering the changing nature of the MR tanker trade, as well as ensures optimum prerequisites for EEDI compliance.
EcoEGR is a special option available for engines with EGR. Through activation of the EGR system also when in Tier II mode, it is possible to optimise the combustion parameters for optimum efficiency. The EGR plant reduces the emission of NOx and ensures Tier II compliance. Hereby can the fuel consumption be significantly lowered in Tier II mode, as illustrated by the inclusion of EcoEGR as an option in each of the case-studies.
The power installed is an additional parameter that can be reduced to achieve a lower EEDI value. This can be achieved by either lowering the vessel
speed, improving the hull design to minimise resistance, by optimising the propeller efficiency, or by installing energy saving devices. The propeller efficiency can be improved by the application of a Kappel propeller or other high-efficiency designs. Energy saving devices (ESD), typically alter the flow at the propeller, or fore or aft of it, in order to regain some of the losses on the propeller or to minimise the resistance i.e. through the application of a rudder bulb. The effect of such technologies is reflected throughout this paper. Each of the outlined propulsion plants is considered in an edition with a Kappel propeller and a Kappel propeller in combination with a rudder bulb - this combination is termed the optimised aft ship. In a third case, the former two technologies are combined with a PTO as well, and finally EcoEGR is included for the traditional fuel plants considered. The effect on EEDI is depicted for all cases, along with the positive economic impact of implementing these environmental-friendly solutions.
Additionally, the effect on EEDI of applying alternative fuels is considered for each specific case study through the application of LNG and LPG, both with and without the modified aft ship and PTO. Such fuels have a significant impact on EEDI, and will typically allow the design speed to be kept high at approx. 15 knots, as illustrated in the first case study.
Installation of green technologies, like waste heat recovery systems or similar will also lower the EEDI value.
For further information on the calculation of EEDI, further details on the reduction hereof, and other environ-mental regulations, see Chapter 4 of the separate paper “Basic principles of ship propulsion”.
Minimum propulsion power
While lowering a ship’s installed power has been acknowledged as a method to obtain a lower EEDI value, it has also raised a concern that it could result in underpowered ships with reduced manoeuvrability in heavy weather. As a result of this, the IMO has published an assessment method for determining the minimum propulsion power required to maintain the safe manoeuvrability of ships in adverse conditions.
It should be noted that this assessment method is currently valid for phase 0 and phase 1 of EEDI. It is expected that it will also be incorporated for EEDI phase 2 which will be in force from 1 January 2020.
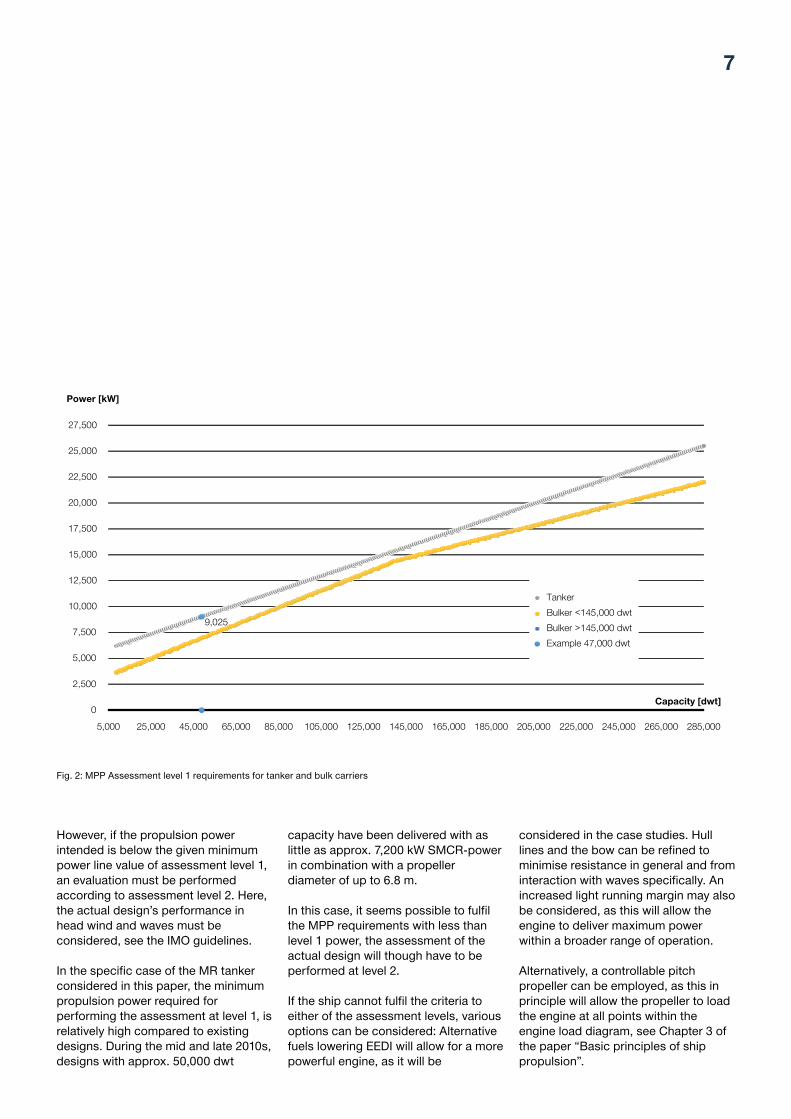
The minimum propulsion power required can be determined by assessment level 1 or 2. Assessment level 1 allows for calculation of the minimum power value required based on ship type and deadweight, with value a and b according to the IMO guidelines. For a tanker of 47,000 dwt, the equation below sets the minimum power required:
Minimum Power = a × dwt + b = 0.0652 × 47,000 + 5,960 = 9,025 kW
7
9,025
0
2,500
5,000
7,500
10,000
12,500
15,000
17,500
20,000
22,500
25,000
27,500
TankerBulker <145,000 dwtBulker >145,000 dwtExample 47,000 dwt
25,0005,000 45,000 65,000 85,000 105,000 125,000 145,000 165,000 185,000 205,000 225,000 245,000 265,000 285,000
Power [kW]
Capacity [dwt]
Fig. 2: MPP Assessment level 1 requirements for tanker and bulk carriers
However, if the propulsion power intended is below the given minimum power line value of assessment level 1, an evaluation must be performed according to assessment level 2. Here, the actual design’s performance in head wind and waves must be considered, see the IMO guidelines.
In the specific case of the MR tanker considered in this paper, the minimum propulsion power required for performing the assessment at level 1, is relatively high compared to existing designs. During the mid and late 2010s, designs with approx. 50,000 dwt
capacity have been delivered with as little as approx. 7,200 kW SMCR-power in combination with a propeller diameter of up to 6.8 m.
In this case, it seems possible to fulfil the MPP requirements with less than level 1 power, the assessment of the actual design will though have to be performed at level 2.
If the ship cannot fulfil the criteria to either of the assessment levels, various options can be considered: Alternative fuels lowering EEDI will allow for a more powerful engine, as it will be
considered in the case studies. Hull lines and the bow can be refined to minimise resistance in general and from interaction with waves specifically. An increased light running margin may also be considered, as this will allow the engine to deliver maximum power within a broader range of operation.
Alternatively, a controllable pitch propeller can be employed, as this in principle will allow the propeller to load the engine at all points within the engine load diagram, see Chapter 3 of the paper “Basic principles of ship propulsion”.

MAN Energy SolutionsPropulsion of 46,000-50,000 dwt MR tankers8
Major propeller and engine parameters
In general, the highest possible propulsive efficiency is obtained with the largest possible propeller diameter d, in combination with the corresponding optimum pitch/diameter ratio p/d.
As an example, this is illustrated for a 46,000-50,000 dwt MR tanker with a service ship speed of 15 knots, see the black curve on Fig. 3. The required propulsion SMCR power and rpm is shown for a given optimum propeller diameter d and p/d ratio.According to the black curve, a propeller diameter of 5.8 m may have the optimum pitch/diameter ratio of 0.72, and the lowest possible SMCR shaft power of about 9,900 kW at about 131 rpm.
The black curve shows that if a bigger propeller diameter of 6.8 m is possible, the necessary SMCR shaft power will be reduced to about 9,050 kW at about 95 rpm. In other words, the bigger the
propeller, the lower the optimum propeller speed, and required power.
The red curve illustrates that if the pitch for a given diameter (initially with optimum pitch/diameter ratio) is changed, the propulsive efficiency will be reduced, which means that the necessary SMCR shaft power will increase.
Fig. 3 also shows that propulsion-wise it will always be an advantage to choose the largest possible propeller diameter, even though the optimum pitch/diameter ratio would involve a too low propeller speed in relation to the speed of a possible main engine as defined by the engine’s layout diagram. When applying a somewhat lower pitch/diameter ratio, compared with the optimum ratio, the propeller/engine speed will increase, while the lower pitch will only cause a minor power increase. Through the introduction of
the ultra-long-stroke G-type engines, a change of pitch away from the optimum will typically not be relevant for tankers of MR dimensions, even if propeller diameters are extended beyond 6.8 meters.
The efficiency of a two-stroke main engine particularly depends on the ratio of the maximum (firing) pressure and the mean effective pressure (mep). The higher the ratio, the higher the engine efficiency, i.e. the lower the SFC. An engine with a lower mep (with an unchanged firing pressure) is termed a (mep) derated engine.
Furthermore, the higher the stroke/bore ratio of an uniflow scavenging two-stroke engine, the higher the engine efficiency in general. The effect of derating normally has a larger effect on the SFC, than to select an engine with a longer stroke.

9
Fig. 3: Influence of propeller diameter and pitch on SMCR for a MR tanker operating at 15 knots
8,500
9,000
9,500
10,000
70 8060 90 100 110 120 130 140 150 160 [rpm]Engine/propeller speed at SMCR
SMCR power [kW]
1.05
0.95
7.3 m
0.850.76
0.78
0.65
0.60
0.55
p/d
G50ME-C9.6
S50ME-C8.5
S50ME-C9.7
S50ME-C8.5
S50ME-C9.7
Power and speed curve for the given propeller diameter d = 6.8 m with different p/d ratios
Power and speed curve for various propeller diameters (d) with optimum p/d ratio
SMCR power andspeed includes:15% sea margin10% engine margin 5% propeller light running
4-bladed FP-propellersd = Propeller diameterp/d = Pitch/diameter ratio Design Ship Speed = 15.0 knDesign Draught = 11.0 m
6.8 m
6.3 m
5.8 m
p/dd
0.72
0.74
G50ME-C9.6

MAN Energy SolutionsPropulsion of 46,000-50,000 dwt MR tankers10
cylinders and the distance between those. If considering the same engine design, the shortest engine will have the lowest number of cylinders, but will also be the less derated engine. The ship designer must consider the number of cylinders in the light of this conflict of interests.
Fig. 5: Main dimension of possible main engines, all measurements in mm
On Fig. 4, the layout diagrams of possible engines for the three service speeds of 15.1, 14.5, and 14.0 knots considered in this paper are illustrated along with the required power depending on the propeller diameter.
As MR tankers are compact vessels, the dimensions of the main engine can be critical for the project. Dimensions of possible engines are shown in Fig. 5. Here the natural consequence of a longer stroke – a wider crankcase – are shown. The length of the engine is primarily determined by the number of
5,000
5,500
6,000
6,500
7,000
7,500
8,000
8,500
9,000
9,500
10,000
10,500
11,000
11,500
12,000
12,500
13,000
75 80 85 90 95 100 105 110 115 120 125 130
Engine speed [rpm]
D=6.7 mD=5.9 m
⍺, 14.5 kn
⍺, 15.1 kn
D=6.2 m
⍺, 14.0 kn
Power [kW]
6S50ME-C9.7
7S50ME-C9.7
5S60ME-C10.5
6G50ME-C9.6
7S50ME-C8.5
6S50ME-C8.5
7G50ME-C9.6
G50ME-C9.6S50ME-C8.5
8,75
2
8,13
0
7,55
3
1,19
057
5 620
3,7763,3503,150
1,20
5
1,08
557
5
S50ME-C9.7 S60ME-C10.5
8,52
5
650
3,520
1,30
0
Fig. 4: Propeller curves for a 4-bladed propeller and layout diagrams of possible engines for a service speed of 15.1, 14.5, and 14.0 knots with 5% light running margin
11
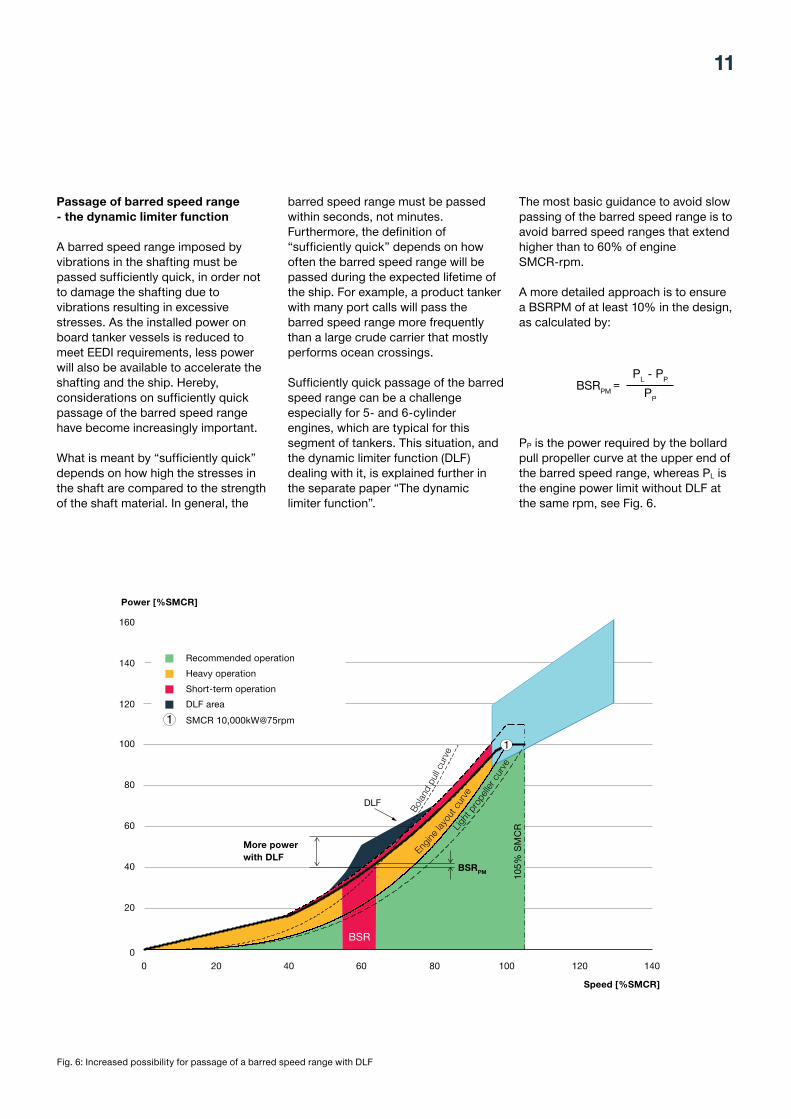
The most basic guidance to avoid slow passing of the barred speed range is to avoid barred speed ranges that extend higher than to 60% of engine SMCR-rpm.
A more detailed approach is to ensure a BSRPM of at least 10% in the design, as calculated by:
PP is the power required by the bollard pull propeller curve at the upper end of the barred speed range, whereas PL is the engine power limit without DLF at the same rpm, see Fig. 6.
barred speed range must be passed within seconds, not minutes.Furthermore, the definition of “sufficiently quick” depends on how often the barred speed range will be passed during the expected lifetime of the ship. For example, a product tanker with many port calls will pass the barred speed range more frequently than a large crude carrier that mostly performs ocean crossings.
Sufficiently quick passage of the barred speed range can be a challenge especially for 5- and 6-cylinder engines, which are typical for this segment of tankers. This situation, and the dynamic limiter function (DLF) dealing with it, is explained further in the separate paper “The dynamic limiter function”.
Fig. 6: Increased possibility for passage of a barred speed range with DLF
Passage of barred speed range - the dynamic limiter function
A barred speed range imposed by vibrations in the shafting must be passed sufficiently quick, in order not to damage the shafting due to vibrations resulting in excessive stresses. As the installed power on board tanker vessels is reduced to meet EEDI requirements, less power will also be available to accelerate the shafting and the ship. Hereby, considerations on sufficiently quick passage of the barred speed range have become increasingly important.
What is meant by “sufficiently quick” depends on how high the stresses in the shaft are compared to the strength of the shaft material. In general, the
BSRPM = PL - PP
PP
Recommended operation
Short-term operationHeavy operation
SMCR 10,000kW@75rpm1
20
40
60
80
100
120
140
160
Power [%SMCR]
00 20 40 60 80
105%
SM
CR
100 140120
Speed [%SMCR]
Engine
layo
ut c
urve
Bola
nd p
ull c
urve
Light
pro
pelle
r cur
ve
BSRPM
More power with DLF
DLF
BSR
1
DLF area
MAN Energy SolutionsPropulsion of 46,000-50,000 dwt MR tankers12
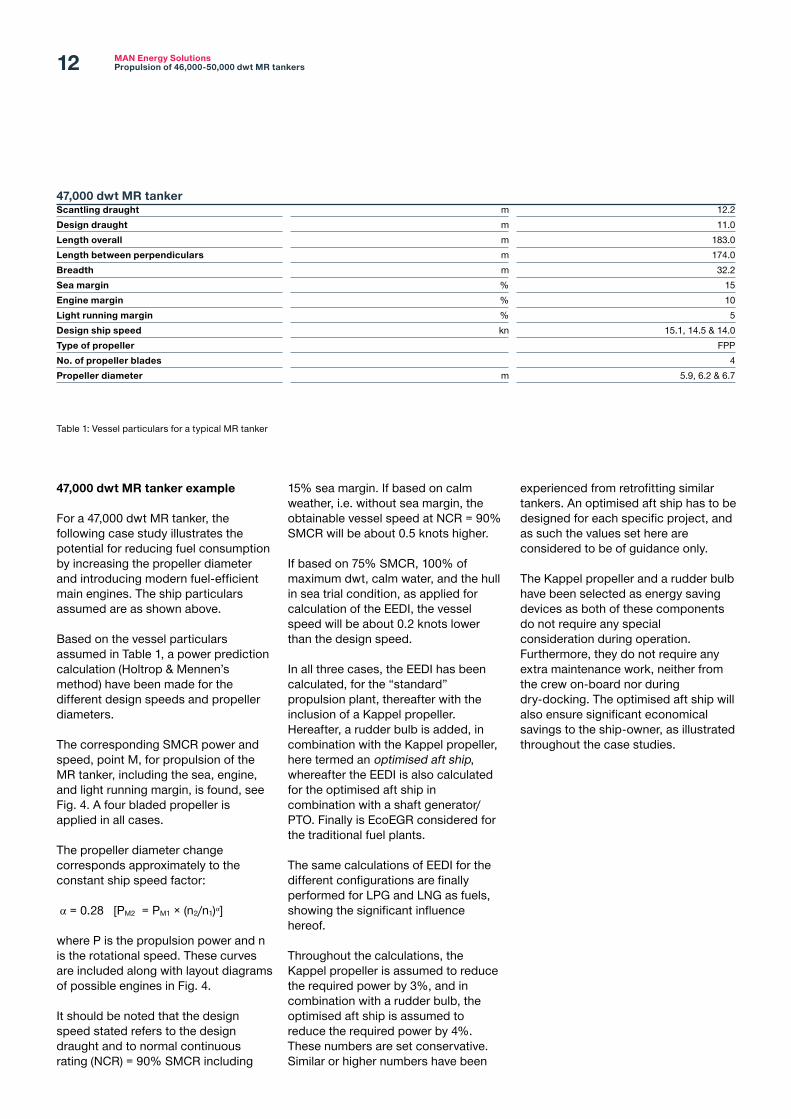
15% sea margin. If based on calm weather, i.e. without sea margin, the obtainable vessel speed at NCR = 90% SMCR will be about 0.5 knots higher.
If based on 75% SMCR, 100% of maximum dwt, calm water, and the hull in sea trial condition, as applied for calculation of the EEDI, the vessel speed will be about 0.2 knots lower than the design speed.
In all three cases, the EEDI has been calculated, for the “standard” propulsion plant, thereafter with the inclusion of a Kappel propeller. Hereafter, a rudder bulb is added, in combination with the Kappel propeller, here termed an optimised aft ship, whereafter the EEDI is also calculated for the optimised aft ship in combination with a shaft generator/PTO. Finally is EcoEGR considered for the traditional fuel plants.
The same calculations of EEDI for the different configurations are finally performed for LPG and LNG as fuels, showing the significant influence hereof.
Throughout the calculations, the Kappel propeller is assumed to reduce the required power by 3%, and in combination with a rudder bulb, the optimised aft ship is assumed to reduce the required power by 4%. These numbers are set conservative. Similar or higher numbers have been
47,000 dwt MR tanker example
For a 47,000 dwt MR tanker, the following case study illustrates the potential for reducing fuel consumption by increasing the propeller diameter and introducing modern fuel-efficient main engines. The ship particulars assumed are as shown above.
Based on the vessel particulars assumed in Table 1, a power prediction calculation (Holtrop & Mennen’s method) have been made for the different design speeds and propeller diameters.
The corresponding SMCR power and speed, point M, for propulsion of the MR tanker, including the sea, engine, and light running margin, is found, see Fig. 4. A four bladed propeller is applied in all cases.
The propeller diameter change corresponds approximately to the constant ship speed factor:
⍺ = 0.28 [PM2 = PM1 × (n2/n1)⍺]
where P is the propulsion power and n is the rotational speed. These curves are included along with layout diagrams of possible engines in Fig. 4.
It should be noted that the design speed stated refers to the design draught and to normal continuous rating (NCR) = 90% SMCR including
47,000 dwt MR tankerScantling draught m 12.2 Design draught m 11.0Length overall m 183.0Length between perpendiculars m 174.0Breadth m 32.2Sea margin % 15Engine margin % 10Light running margin % 5Design ship speed kn 15.1, 14.5 & 14.0Type of propeller FPPNo. of propeller blades 4Propeller diameter m 5.9, 6.2 & 6.7
Table 1: Vessel particulars for a typical MR tanker
experienced from retrofitting similar tankers. An optimised aft ship has to be designed for each specific project, and as such the values set here are considered to be of guidance only.
The Kappel propeller and a rudder bulb have been selected as energy saving devices as both of these components do not require any special consideration during operation. Furthermore, they do not require any extra maintenance work, neither from the crew on-board nor during dry-docking. The optimised aft ship will also ensure significant economical savings to the ship-owner, as illustrated throughout the case studies.
13
Main engine operating costs 15.1 knots
Engine SMCR point NCR Dprop
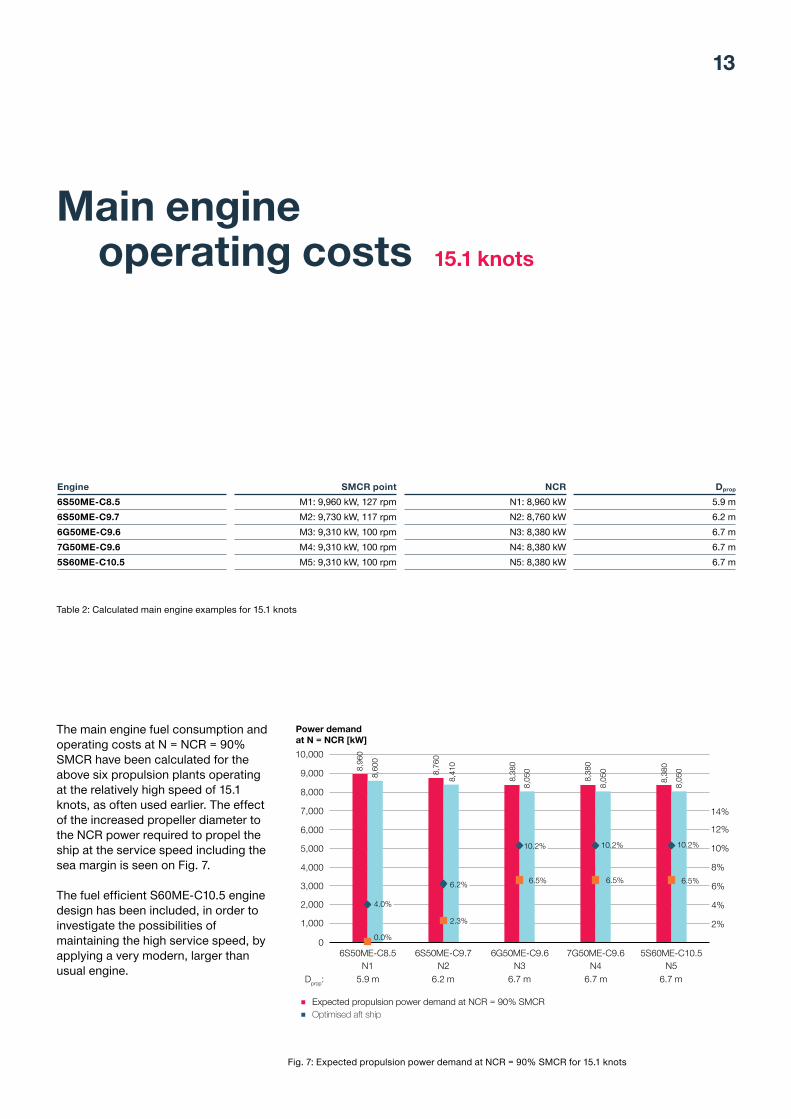
6S50ME-C8.5 M1: 9,960 kW, 127 rpm N1: 8,960 kW 5.9 m6S50ME-C9.7 M2: 9,730 kW, 117 rpm N2: 8,760 kW 6.2 m6G50ME-C9.6 M3: 9,310 kW, 100 rpm N3: 8,380 kW 6.7 m7G50ME-C9.6 M4: 9,310 kW, 100 rpm N4: 8,380 kW 6.7 m5S60ME-C10.5 M5: 9,310 kW, 100 rpm N5: 8,380 kW 6.7 m
Table 2: Calculated main engine examples for 15.1 knots
Fig. 7: Expected propulsion power demand at NCR = 90% SMCR for 15.1 knots
The main engine fuel consumption and operating costs at N = NCR = 90% SMCR have been calculated for the above six propulsion plants operating at the relatively high speed of 15.1 knots, as often used earlier. The effect of the increased propeller diameter to the NCR power required to propel the ship at the service speed including the sea margin is seen on Fig. 7. The fuel efficient S60ME-C10.5 engine design has been included, in order to investigate the possibilities of maintaining the high service speed, by applying a very modern, larger than usual engine.
8,96
0
8,76
0
8,38
0
8,38
0
8,38
0
8,60
0
8,41
0
8,05
0
8,05
0
8,05
0
0
1,000
2,000
3,000
4,000
5,000
6,000
7,000
8,000
9,000
10,000
6S50ME-C8.5N1
6S50ME-C9.7N2
6G50ME-C9.6N3
7G50ME-C9.6N4
5S60ME-C10.5N5
Power demandat N = NCR [kW]
Expected propulsion power demand at NCR = 90% SMCROptimised aft ship
Dprop: 6.7 m6.7 m6.7 m6.2 m5.9 m
0.0%
2.3%
6.5% 6.5% 6.5%
4.0%
6.2%
10.2% 10.2% 10.2%
2%
4%
6%
8%
10%
12%
14%

MAN Energy SolutionsPropulsion of 46,000-50,000 dwt MR tankers14
Fig. 8 shows the influence on the main engine efficiency, indicated by the specific fuel oil consumption (SFOC) of marine diesel oil (MDO) for the cases.
A significant reduction can be seen from the S50ME-C8.5 compared to the more modern engine designs. The effect of derating by adding an additional cylinder can be clearly identified: The 6G50ME-C9.7 has an SFOC of 161.3 g/kWh at NCR whereas the heavily derated 7G50ME-C9.6 with the same power output and an added cylinder shows an SFOC of 159.2 g/kWh. If EcoEGR is applied as exemplified through the 5S60ME-C10.5-EcoEGR, it is possible to attain a SFOC as low as 154.6 g/kWh at NCR.
The daily fuel consumption shown in Fig. 9 is found when multiplying the propulsion power demand at NCR = 90% (Fig. 7) with the SFOC (Fig. 8). The influence of the optimised aft ship (including a Kappel propeller and rudder bulb) on the daily fuel consumption is clearly seen as the blue columns. Furthermore, is the effect of the increased propeller diameter seen, all designs that employ a propeller of a diameter of 6.7 m, show a significant reduction compared to the original design. Again, the effect of derating can be seen when the 6G50ME-C9.6 engine is compared to the 7G50ME-C9.6. The inclusion of EcoEGR will reduce the daily fuel costs further. These savings are especially relevant if more expensive low-sulphur fuels are applied.
Despite the fact that the SFOC of N3 is higher than the SFOC of N2 (see Fig. 8), the daily fuel consumption at 90% SMCR of N3 will still be lower than N2, due to the increased propeller diameter. This illustrates that in some cases it can be beneficial to sacrifice some engine efficiency for a larger increase in propeller efficiency by increasing the propeller diameter, or select one of the other possible combinations. The ship designer must evaluate these options to ensure the best design, depending on the priorities of the project.
N = NCR
N1 (0.0%)
N2 (5.1%)N3 (4.1%)
N4/N5 (6.1%)
N5 w. EcoEGR (8.4%)
146148150152154156158160162164166168170172174176178180
25 30 35 40 45 50 55 60 65 70 75 80 85 90 95 100
SFOC[g/kWh]
Engine shaftpower [%SMCR]
M1 6S50ME-C8.5
M2 6S50ME-C9.7 M3 6G50ME-C9.6
M4 7G50ME-C9.6 M5 5S60ME-C10.5
M5 w. EcoEGR
IMO Tier IIISO ambient conditionsLCV = 42,700 kJ/kg
Part-load exhaust gasbypass optimised engines
DP= 5.9 m
DP= 6.7 m
DP= 6.7 mDP= 6.7 m
DP= 6.7 m
DP= 6.2 m
Fig. 8: SFOC for 15.1 knots as of 2019 with reductions relative to N1 stated in parenthesis. For reference, use the online calculation tool CEAS available on our homepage
34.0
32.5
31.8
31.5
30.1
29.5 30
.529
.128
.5 29.9
28.6
28.0 29
.928
.728
.0
0
5 2%
4%
6%
8%
10
15
20
25
30
35
40
6S50ME-C8.5N1
6S50ME-C9.7N2
6G50ME-C9.6N3
7G50ME-C9.6N4
5S60ME-C10.5N5
Fuel consumption [ton/24h]
Expected fuel consumption at NCR = 90% SMCROptimised aft shipEcoEGR
IMO Tier IIISO ambient conditionsLCV = 42,700 kJ/kg
Dprop: 6.7 m6.7 m6.7 m6.2 m5.9 m
50.0%
7.4%
10.4%
12.3% 12.2%
4.5%
11.4%
14.4%
15.9% 15.8%
6.6%
13.4%
16.3%17.8% 17.7%
10%
12%
14%
16%
18%45
Fig. 9: Expected daily fuel consumption at NCR for 15.1 knots

15
EEDI
The reference and the actual EEDI figures have been calculated for a part-load optimised engine including a 6% tolerance on the SFOC, and a SFOC of 200 g/kWh for the auxiliary engines, all operating on MDO. The results are seen in Fig. 10. The reference value is calculated based on the following equation given by the IMO, and reduced according to the EEDI phases (10, 20 and 30%) reduction.
(EEDIref-tanker = 1218.8 x dwt-0.488)
As it can be seen in Fig. 10, only a few of the propulsion plants attaining a speed of 15.1 knots fulfil EEDI phase 2 (20% reduction), namely M4 and M5. To do this, both a Kappel propeller, rudder bulb, PTO and EcoEGR must be applied. As, an alternative can fuels such as LPG and LNG be considered for which the results are shown in Figs. 11 and 12 respectively.
6.46
6.25
6.18
5.85
5.72
0
1
2
3
4
5
6
7
6S50ME-C8.5N1
6S50ME-C9.7N2
6G50ME-C9.6N3
7G50ME-C9.6N4
5S60ME-C10.5N5
EEDI
EEDI - MDO, 100% capacity and 75% SMCR, vref= 14.9 kn
EEDI - Kappel propeller
EEDI - rudder bulb
EEDI - PTO
EEDI - EcoEGR
Dprop: 6.7 m6.7 m6.7 m6.2 m5.9 m
6.03
5.83
5.76
5.44
5.31
5.82
5.63
5.57
5.25
5.13
5.72
5.54
5.49
5.17
5.05
5.70
5.53
5.47
5.16
5.04
6.40
5.765.12
4.48
Fig. 10: Phase 0, 1, 2, & 3 required and attained EEDI at 15.1 knots for MDO

MAN Energy SolutionsPropulsion of 46,000-50,000 dwt MR tankers16
The influence of alternative fuels on the attained EEDI is massive. If LPG is applied as fuel, all the designs that employ the 6.7 m propeller can fulfil EEDI phase 2 without the application of any energy saving devices.
When the optimised aft ship is included along with a PTO the designs with a 6.7 m propeller and a service speed of 15.1 knots are almost capable of fulfilling EEDI phase 3 as well (30% reduction).
It is expected that development within engine technology and further optimisations of the hull will make it possible to achieve compliance with EEDI phase 3 in 2025 by the application of LPG as fuel.
If LNG is applied, even further reductions of EEDI can be achieved, and EEDI phase 3 can be fulfilled only by applying the 6.7 m propeller and LNG as fuel.
At the moment the availability of LNG is more limited than LPG, and the ship designer must consider the availability of the alternative fuels in the area where the vessel is intended to operate.
Availability will be an important parameter when evaluating whether LNG is a better solution for the fulfilment of EEDI phase 3 than LPG in combination with an optimised aft ship, PTO and further reductions.
4.89
0
1
2
3
4
5
6
7
6S50ME-C8.5N1
6S50ME-C9.7N2
6G50ME-C9.6N3
7G50ME-C9.6N4
5S60ME-C10.5N5
EEDI
EEDI - LNG, 100% capacity and 75% SMCR, vref = 14.9 kn
EEDI - Kappel propeller
EEDI - rudder bulb
EEDI - PTO
Dprop: 6.7 m6.7 m6.7 m6.2 m5.9 m
4.73
4.68
4.35
4.30
4.20
4.17
3.854.
354.
224.
183.
86
4.42
4.28
4.23
4.04
4.57
4.43
4.38
4.35
6.40
5.765.12
4.48
Fig. 12: Phase 0, 1, 2, & 3 required and attained EEDI at 15.1 knots for LNG
5.67
0
1
2
3
4
5
6
7
6S50ME-C8.5N1
6S50ME-C9.7N2
6G50ME-C9.6N3
7G50ME-C9.6N4
5S60ME-C10.5N5
EEDI
EEDI - LPG, 100% capacity and 75% SMCR, vref = 14.9 kn
EEDI - Kappel propeller
EEDI - rudder bulb
EEDI - PTO
Dprop: 6.7 m6.7 m6.7 m6.2 m5.9 m
5.49
5.43
5.11 5.
305.
125.
064.
74 5.12
4.95
4.89
4.59 5.
034.
884.
834.
53
4.98
4.86
4.82
4.51
6.40
5.765.124.48
Fig. 11: Phase 0, 1, 2, & 3 required and attained EEDI at 15.1 knots for LPG

17
Operating costs
While the previous comparisons of engine fuel performance are based on a constant engine load of 90% (NCR), the yearly operational costs of the engine greatly depend on the engine’s load profile.
An example of a load profile for the engine of a MR-tanker, see Fig. 13, is applied to calculate the total main engine operating costs, including lubricating oil per year, assuming an operating profile of 250 days/year at sea. For this purpose, a fuel price of 500 USD/ton and a lubricating oil price of 2,000 USD/ton is assumed. The results are shown in Fig. 14.
The comparison of operational costs are only performed for fuel oil, as the price of LNG and LPG varies to a larger extend, depending on location and availability.
The savings in annual main engine costs by applying EcoEGR is relatively smaller than the resulting fuel saving of applying EcoEGR (see Fig. 8 & 9), as the cost of operating the EcoEGR has been included. A price of 200 USD/ton is assumed for the NaOH (in a 50% solution) required to operate the EGR, as well as a price for handling the discharged sludge of 100 USD/ton is assumed.
5%
30%
35%
15%
10%
5%
Load profile [%running hours]
100% SMCR
85% SMCR
65% SMCR
50% SMCR
35% SMCR
25% SMCR
Fig. 13: Load profile for the time at sea
3.32
0
0.5
1.0
1.5
2.0
2.5
3.0
3.5
6S50ME-C8.5N1
6S50ME-C9.7N2
6G50ME-C9.6N3
7G50ME-C9.6N4
5S60ME-C10.5N5
[Million USD/year]
Total annual main engine operating costsOptimised aft ship+ EcoEGR
IMO Tier IIISO ambient conditions250 days/yearFuel price: 500 USD/ton
Dprop: 6.7 m6.7 m6.7 m6.2 m5.9 m
3.17
3.14
3.08
2.95
2.92 2.98
2.83
2.83 2.
93
2.82
2.79 2.
93
2.81
2.78
7.0%
11.0%11.9%
10.0%13.9%14.8%
11.5%
15.1%16.0%
11.6%
15.3%16.2%
0.0%
4.4%
5.4%5%
10%
15%
20%
Fig. 14: Total annual main engine operating costs including fuel, cylinder and system lubricating oil for 15.1 knots
MAN Energy SolutionsPropulsion of 46,000-50,000 dwt MR tankers18
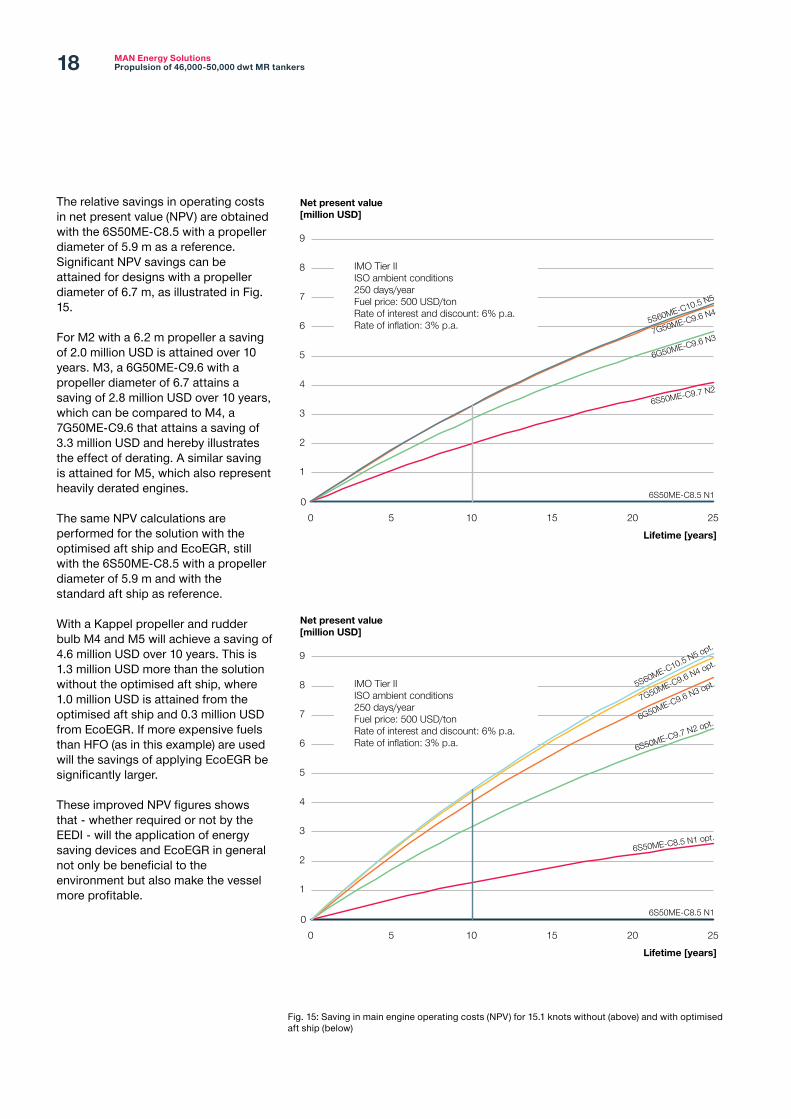
The relative savings in operating costs in net present value (NPV) are obtained with the 6S50ME-C8.5 with a propeller diameter of 5.9 m as a reference. Significant NPV savings can be attained for designs with a propeller diameter of 6.7 m, as illustrated in Fig. 15.
For M2 with a 6.2 m propeller a saving of 2.0 million USD is attained over 10 years. M3, a 6G50ME-C9.6 with a propeller diameter of 6.7 attains a saving of 2.8 million USD over 10 years, which can be compared to M4, a 7G50ME-C9.6 that attains a saving of 3.3 million USD and hereby illustrates the effect of derating. A similar saving is attained for M5, which also represent heavily derated engines.
The same NPV calculations are performed for the solution with the optimised aft ship and EcoEGR, still with the 6S50ME-C8.5 with a propeller diameter of 5.9 m and with the standard aft ship as reference.
With a Kappel propeller and rudder bulb M4 and M5 will achieve a saving of 4.6 million USD over 10 years. This is 1.3 million USD more than the solution without the optimised aft ship, where 1.0 million USD is attained from the optimised aft ship and 0.3 million USD from EcoEGR. If more expensive fuels than HFO (as in this example) are used will the savings of applying EcoEGR be significantly larger.
These improved NPV figures shows that - whether required or not by the EEDI - will the application of energy saving devices and EcoEGR in general not only be beneficial to the environment but also make the vessel more profitable.
0
1
2
3
4
5
6
7
8
9
0 5 10 15 20 25
Net present value[million USD]
Lifetime [years]
6S50ME-C8.5 N1
6S50ME-C9.7 N2
6G50ME-C9.6 N3
5S60ME-C10.5 N5
IMO Tier IIISO ambient conditions250 days/yearFuel price: 500 USD/tonRate of interest and discount: 6% p.a.Rate of inflation: 3% p.a. 7G50ME-C9.6 N4
0
1
2
3
4
5
6
7
8
9
0 5 10 15 20 25
Net present value[million USD]
Lifetime [years]
6S50ME-C8.5 N1
6S50ME-C8.5 N1 opt.
6S50ME-C9.7 N2 opt.6G50ME-C9.6 N3 opt.5S60ME-C10.5 N5 opt.
IMO Tier IIISO ambient conditions250 days/yearFuel price: 500 USD/tonRate of interest and discount: 6% p.a.Rate of inflation: 3% p.a.
7G50ME-C9.6 N4 opt.
Fig. 15: Saving in main engine operating costs (NPV) for 15.1 knots without (above) and with optimised aft ship (below)

19
Main engine operating costs 14.5 knots
Engine SMCR point NCR Dprop
6S50ME-C8.5 M1‘: 8,500 kW, 119 rpm N1‘: 7,650 kW 5.9 m6S50ME-C8.5 M2‘: 8,310 kW, 110 rpm N2‘: 7,480 kW 6.2 m6S50ME-C9.7 M3‘: 8,310 kW, 110 rpm N3‘: 7,480 kW 6.2 m6G50ME-C9.6 M4‘: 7,950 kW, 94 rpm N4‘: 7,155 kW 6.7 m7S50ME-C9.7 M5‘: 7,950 kW, 94 rpm N5‘: 7,155 kW 6.7 m
The main engine fuel consumption and operating costs at N = NCR = 90% SMCR have been calculated for the above five propulsion plants operating at the typical service speed of 14.5 knots. The effect of the increased propeller diameter to the NCR power required to propel the ship at the service speed including the sea margin is shown in Fig. 16.
7,65
0
7,34
5
7,48
0
7,18
0
7,48
0
7,18
0
7,15
5
6,86
5
7,15
5
6,86
5
0
1,000
2,000
3,000
4,000
5,000
6,000
7,000
8,000
9,000
10,000
6S50ME-C8.5N1
6S50ME-C8.5N2
6S50ME-C9.7N3
6G50ME-C9.6N4
7S50ME-C9.7N5
Power demand at N = NCR [kW]
Expected propulsion power demand at NCR = 90% SMCROptimised aft ship
Dprop: 6.7 m6.7 m6.2 m6.2 m5.9 m
0.0%
2.2%
6.5%
4.0%
6.1%
2.2%
6.1%
10.2%
6.5%
10.2%
1%
2%
3%
4%
5%
6%
7%
8%
9%
10%
Table 3: Calculated main engine examples for 14.5 knots
Fig. 16: Expected propulsion power demand at NCR = 90% SMCR for 14.5 knots

MAN Energy SolutionsPropulsion of 46,000-50,000 dwt MR tankers20
Fig. 17 shows the influence on the main engine efficiency, indicated by the specific fuel oil consumption (SFOC) of marine diesel oil (MDO) for the five cases.
As the cylinder number of the engines have been maintained compared to the 15.1 knots case, the lower power required for the lower service speed allows for the engines to be derated for this 14.5 knots case. This is reflected in an approximate reduction of 2 g/kWh for all the engine designs (compared to Fig. 8), further contributing to the savings achieved by reducing the service speed. Again, the modern engine designs outperform the traditional S50ME-C8.5 design.
The daily fuel consumption shown in Fig. 18 is found when multiplying the propulsion power demand at NCR = 90% (Fig. 16) with the SFOC (Fig. 17). The influence of the optimised aft ship (including a Kappel propeller and rudder bulb) on the daily fuel consumption is clearly demonstrated by the blue columns.
N1 (0.0%)N2 (-0.9%)
N3 (5.0%)N4 (4.0%)
N5 (5.6%)
N5 w. EcoEGR (7.7%)
146148150152154156158160162164166168170172174176178180
25 30 35 40 45 50 55 60 65 70 75 80 85 90 95 100
SFOC[g/kWh]
Engine shaftpower [%SMCR]
M1 6S50ME-C8.5M2 6S50ME-C8.5
M3 6S50ME-C9.7M4 6G50ME-C9.6
M5 7S50ME-C9.7
M5 w. EcoEGR
IMO Tier IIISO ambient conditionsLCV = 42,700 kJ/kg
Part load exhaust gasbypass optimised engines
N = NCR
DP= 6.2 mDP= 5.9 m
DP= 6.7 mDP= 6.7 mDP= 6.7 m
DP= 6.7 m
Fig. 17: SFOC for 14.5 knots as of 2019 with reductions relative to N1 stated in parenthesis. For reference, use the online calculation tool CEAS available on our homepage
28.6
27.2
26.6 28
.226
.926
.3
26.5
25.3
24.7 25
.624
.523
.9 25.2
24.1
23.6
0.0
5.0
10.0
15.0
20.0
25.0
30.0
35.0
6S50ME-C8.5N1’
6S50ME-C8.5N2’
6S50ME-C9.7N3’
6G50ME-C9.6N4’
7S50ME-C9.7N5’
Fuel consumption[ton/24h]
Expected fuel consumption at NCR = 90% SMCROptimised aft ship+ EcoEGR
Dprop: 6.7 m6.7 m6.2 m6.2 m5.9 m
IMO Tier IIISO ambient conditionsLCV =42,700 kJ/kg
0.0% 1.3%
7.2%10.3% 11.8%
4.8%
6.9%6.0%
8.1%11.5%13.5% 14.3%
16.3% 15.6%
17.5%
5%
10%
15%
20%
25%
Fig. 18: Expected daily fuel consumption at NCR for 14.5 knots

21
EEDI
The reference and the actual EEDI figures have been calculated for a part-load optimised engine including a 6% tolerance on the SFOC, and a SFOC of 200 g/kWh for the auxiliary engines, all operating on MDO, the results are seen on Fig. 19. The reference value is calculated based on the following equation given by the IMO, and reduced according to the EEDI phases (10, 20 and 30%) reduction.
(EEDIref-tanker = 1218.8 x dwt-0.488)
As it can be seen in Fig. 19, the propulsion plants for 14.5 knots with MDO as fuel fulfil EEDI phase 2 (20% reduction) if combined with a 6.7 m diameter propeller. A margin can be attained if energy saving devices are included. Fulfilling EEDI phase 3 (30% reduction) can still pose a challenge, but if EcoEGR is applied M4’ and M5’ attains an index lower than the required for EEDI phase 3.
If alternative fuels are applied, a massive impact is found once again. With the application of a 6.7 m diameter propeller, compliance with EEDI phase 2 can be achieved without further consideration, as e.g. for the lightly derated 6S50ME-C9.7, and if energy saving devices are applied fulfilment of phase 3 can also be achieved. For LNG, all the designs with a service speed of 14.5 knots fulfil phase 3, regardless of propeller diameter and energy saving devices.
A general remark on derating of engines operating on alternative fuels by adding a cylinder is that this is not as effective as on a traditional fuel engine, which is also reflected in Fig. 20. A minimum of pilot oil per cylinder is required to ensure that the alternative fuel ignites, and when a cylinder is added for the same power output, the relative amount of pilot oil required increases. Again, considerations on the availability of the alternative fuels are important. For LNG, see Fig. 21 next page.
4.77
0
1
2
3
4
5
6
7
6S50ME-C8.5N1'
6S50ME-C8.5N2'
6S50ME-C9.7N3'
6G50ME-C9.6N4'
7S50ME-C9.7N5'
EEDI
Dprop:
EEDI - LPG, 100% capacity and 75% SMCR, vref =14.3 knEEDI - Kappel propellerEEDI - rudder bulbEEDI - PTO
6.7 m6.7 m6.2 m6.2 m5.9 m
4.62
4.57
4.30 4.
714.
554.
504.
23 4.46
4.32
4.27
3.99
4.51
4.36
4.31
4.04 4.
444.
314.
273.
996.40
5.76
5.12
4.48
Fig. 20: Phase 0, 1, 2, & 3 required and attained EEDI at 14.5 knots for LPG
5.66
5.47
5.41
5.12
5.00
5.58
5.40
5.33
5.04
4.93 5.
285.
115.
054.
764.
65
5.11
4.95
4.88
4.60
4.50
5.03
4.88
4.83
4.55
4.44
0
1
2
3
4
5
6
7
6S50ME-C8.5N1’
6S50ME-C8.5N2’
6S50ME-C9.7N3’
6G50ME-C9.6N4’
7S50ME-C9.7N5’
EEDI
EEDI - MDO, 100% capacity and 75% SMCR, vref =14.3 knEEDI - Kappel propellerEEDI - rudder bulbEEDI - PTOEEDI - EcoEGR
Dprop: 6.7 m6.2 m6.2 m5.9 m 6.7 m
6.40
5.76
5.12
4.48
Fig. 19: Phase 0, 1, 2, & 3 required and attained EEDI at 14.5 knots for MDO

MAN Energy SolutionsPropulsion of 46,000-50,000 dwt MR tankers22
Operating costs
While the previous comparisons of engine fuel performance are based on a constant engine load of 90% (NCR), the yearly operational costs of the engine greatly depend on the engine’s load profile.
The same load profile as in the previous case is applied, see Fig. 13. A fuel price of 500 USD/ton and a lubricating oil price of 2,000 USD/ton is assumed along with 200 USD/ton for the NaOH (in a 50% solution) and 100 USD/ton for sludge discharge for the EcoEGR. The comparison of operational costs are only performed for fuel oil, see Fig. 22, as the price of LNG and LPG vary to a larger extend, depending on location and availability.
Fig. 21: Phase 0, 1, 2, & 3 required and attained EEDI at 14.5 knots for LNG
4.12
0
1
2
3
4
5
6
7
6S50ME-C8.5N1'
6S50ME-C8.5N2'
6S50ME-C9.7N3'
6G50ME-C9.6N4'
7S50ME-C9.7N5'
EEDI
Dprop:
EEDI - LNG, 100% capacity and 75% SMCR, vref =14.3 knEEDI - Kappel propellerEEDI - rudder bulbEEDI - PTO
6.7 m6.7 m6.2 m6.2 m5.9 m
3.99
3.94
3.65 4.
063.
933.
883.
60 3.86
3.73
3.69
3.40
3.90
3.77
3.73
3.44 3.
843.
733.
693.
40
6.40
5.76
5.12
4.48
2.79
2.66
2.63 2.
752.
632.
60
2.60
2.48
2.46 2.52
2.41
2.38 2.
482.
382.
35
0
0.5
1.0
1.5
2.0
2.5
3.0
3.5
6S50ME-C8.5N1'
6S50ME-C8.5N2'
6S50ME-C9.7N3'
6G50ME-C9.6N4'
7S50ME-C9.7N5'
[Million USD/year]
Total annual main engine operating costsOptimised aft ship+ EcoEGR
IMO Tier IIISO ambient condition250 days/yearFuel price: 500 USD/ton
Dprop: 6.7 m6.2 m6.2 m5.9 m 6.7 m
0.0% 1.4%
6.8%
9.9%11.2%
4.6%6.0%
11.0%13.8% 14.9%
5.6% 6.9%
11.9%
14.7% 15.7%
5%
10%
15%
20%
Fig. 22: Total annual main engine operating costs including fuel, cylinder and system lubricating oil for 14.5 knots

23
The relative savings in operating costs, (calculated in net present value, NPV) with the 6S50ME-C8.5 with a propeller diameter of 5.9 m used as reference, indicate significant NPV savings for designs with a propeller diameter of 6.7 m, as illustrated in Fig. 23.
Compared to the 15.1 knots case the savings of the more efficient vessels will be relatively smaller, as the energy consumption naturally is smaller at a lower speed. Nevertheless, a saving of 2.7 million USD is attained over 10 years for M5’, the heavily derated 7S50ME-C9.7 engine, and a saving of 2.4 million USD for M4’, the 6S50ME-C9.7 engine.
The same NPV calculations are performed for the solution with the optimised aft ship and EcoEGR. In general a saving of 1.1-1.2 million USD is attained over 10 years, savings that will be more significant if more expensive fuels than HFO as in this example are used.
0
1
2
3
4
5
6
7
8
9
0 5 10 15 20 25
Net present value[million USD]
Lifetime [years]
6S50ME-C8.5 N1’
6S50ME-C8.5 N2’
6S50ME-C9.7 N3’
6G50ME-C9.6 N4’7S50ME-C9.7 N5’
IMO Tier IIISO ambient conditions250 days/yearFuel price: 500 USD/tonRate of interest and discount: 6% p.a.Rate of inflation: 3% p.a.
0
1
2
3
4
5
6
7
8
9
0 5 10 15 20 25
Net present value[million USD]
Lifetime [years]
6S50ME-C8.5 N1’
6S50ME-C8.5 N1’ opt.6S50ME-C8.5 N2’ opt.
6S50ME-C9.7 N3’ opt.6G50ME-C9.6 N4’ opt.
7S50ME-C9.7 N5’ opt.IMO Tier IIISO ambient conditions250 days/yearFuel price: 500 USD/tonRate of interest and discount: 6% p.a.Rate of inflation: 3% p.a.
Fig. 23: Saving in main engine operating costs (NPV) for 14.5 knots without (above) and with optimised af ship (below)
MAN Energy SolutionsPropulsion of 46,000-50,000 dwt MR tankers24
in recent years. Hereby, the designs considered in this 14.0 knots-case are on the very limit of minimum power requirements and may not be permissible.
Compliance with the minimum propulsion power requirements will in any case have to be evaluated at assessment level 2, which require model tank tests. This case will not be combined with alternative fuels, as a higher speed is expected if such fuels are applied.
can be beneficial for such a low service speed, depending on the intended operational area and profile. This is further underlined, when the low power installed on board, is considered in the light of the IMO minimum propulsion power requirements (see Fig. 2) and passage of the barred speed range (see Fig. 6) as discussed in the beginning of this paper.
Designs with a SMCR of approx. 7,200 kW power in combination with a 6.8 m diameter propeller have been delivered
A typical option considered to achieve EEDI phase 3 (30% reduction) compliance for this type of vessels is to reduce the service speed even further. To illustrate the effect of this, a case with a service speed of 14.0 knots have been included in this paper as well.
In this case a sea margin of 15% has been included as in the other cases, but it is important to consider that the size of the waves and the vessel is not reduced even though the service speed is reduced. Therefore, an increase of the sea margin to a value above 15%
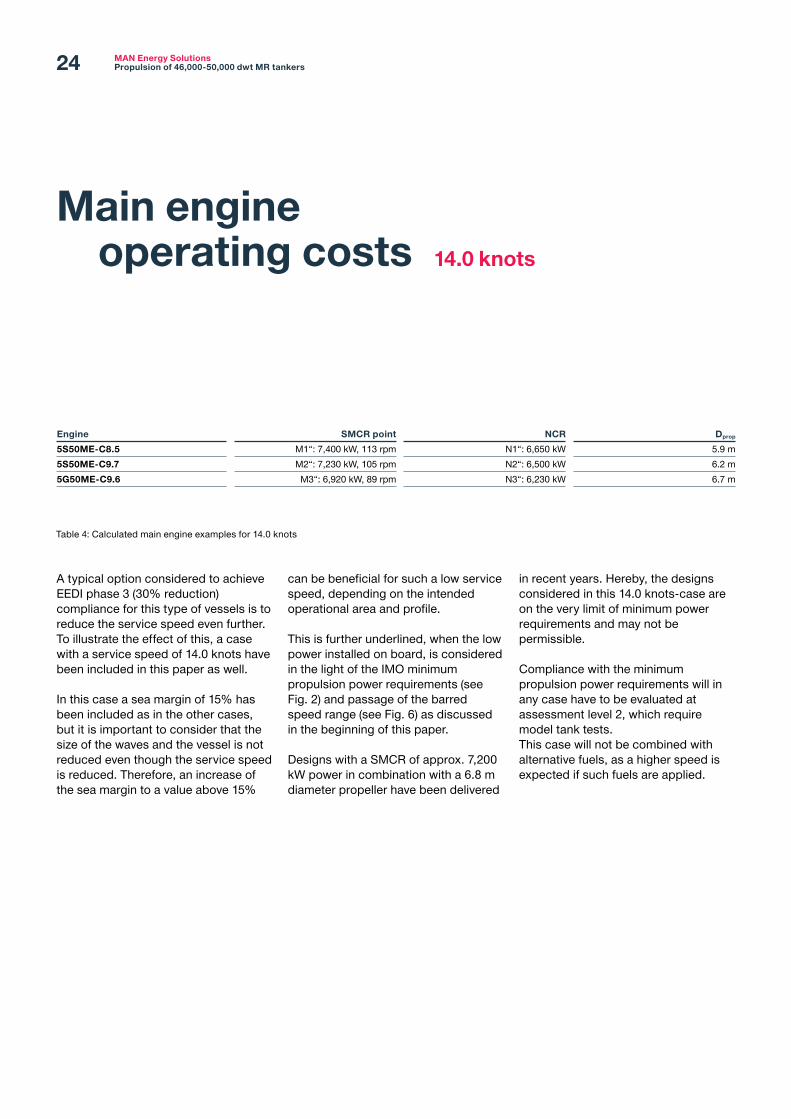
Main engine operating costs 14.0 knots
Engine SMCR point NCR Dprop
5S50ME-C8.5 M1“: 7,400 kW, 113 rpm N1“: 6,650 kW 5.9 m5S50ME-C9.7 M2“: 7,230 kW, 105 rpm N2“: 6,500 kW 6.2 m5G50ME-C9.6 M3“: 6,920 kW, 89 rpm N3“: 6,230 kW 6.7 m
Table 4: Calculated main engine examples for 14.0 knots

25
6,65
0
0
1,000
2,000
3,000
4,000
5,000
6,000
7,000
8,000
9,000
10,000
5S50ME-C8.5N1''
5S50ME-C9.7N2''
5G50ME-C9.6N3''
Power demandat N = NCR [kW]
Expected propulsion power demand at NCR = 90% SMCROptimised aft ship
Dprop: 6.7 m6.2 m5.9 m
6,39
0
6,50
0
6,25
0
6,23
0 5,97
5
0.0%
2.3%
6.5%
4.1%
6.2%
10.3%
1%
2%
3%
4%
5%
6%
7%
8%
9%
10%
Fig. 24: Expected propulsion power demand at NCR = 90% SMCR for 14.0 knots
The main engine fuel consumption and operating costs at N = NCR = 90% SMCR have been calculated for the above three propulsion plants operating at the low speed of 14.0 knots. The required power to propel the ship including the sea margin is seen on Fig. 24.
Fig. 25 shows the influence on the main engine efficiency, indicated by the specific fuel oil consumption (SFOC) of marine diesel oil (MDO) for the three cases. For this case, the cylinder number of the engine must be reduced to five cylinders to accommodate the SMCR point within the engine layout diagram (see Fig. 4). Hereby, the engines are not as derated as for the 14.5 knots case, why a higher SFOC is attained, see Fig. 17.
N1'' (0.0%)
N2'' (5.2%)N3'' (4.1%)
N3'' w. EcoEGR (6.1%)
146148150152154156158160162164166168170172174176178180
25 30 35 40 45 50 55 60 65 70 75 80 85 90 95 100
SFOC[g/kWh]
Engine shaftpower [%SMCR]
M1'' 5S50ME-C8.5
M2'' 5S50ME-C9.7M3'' 5G50ME-C9.6
M3'' w. EcoEGR
IMO Tier IIISO ambient conditionsLCV = 42,700 kJ/kgPart-load exhaust gasbypass optimised engines
N = NCR
DP= 5.9 m
DP= 6.7 mDP= 6.2 m
DP= 6.7 m
Fig. 25: Expected SFOC for 14.0 knots as of 2019 with reductions relative to N1 stated in parenthesis. Fore reference, use the online calculation tool CEAS available on our homepage
MAN Energy SolutionsPropulsion of 46,000-50,000 dwt MR tankers26
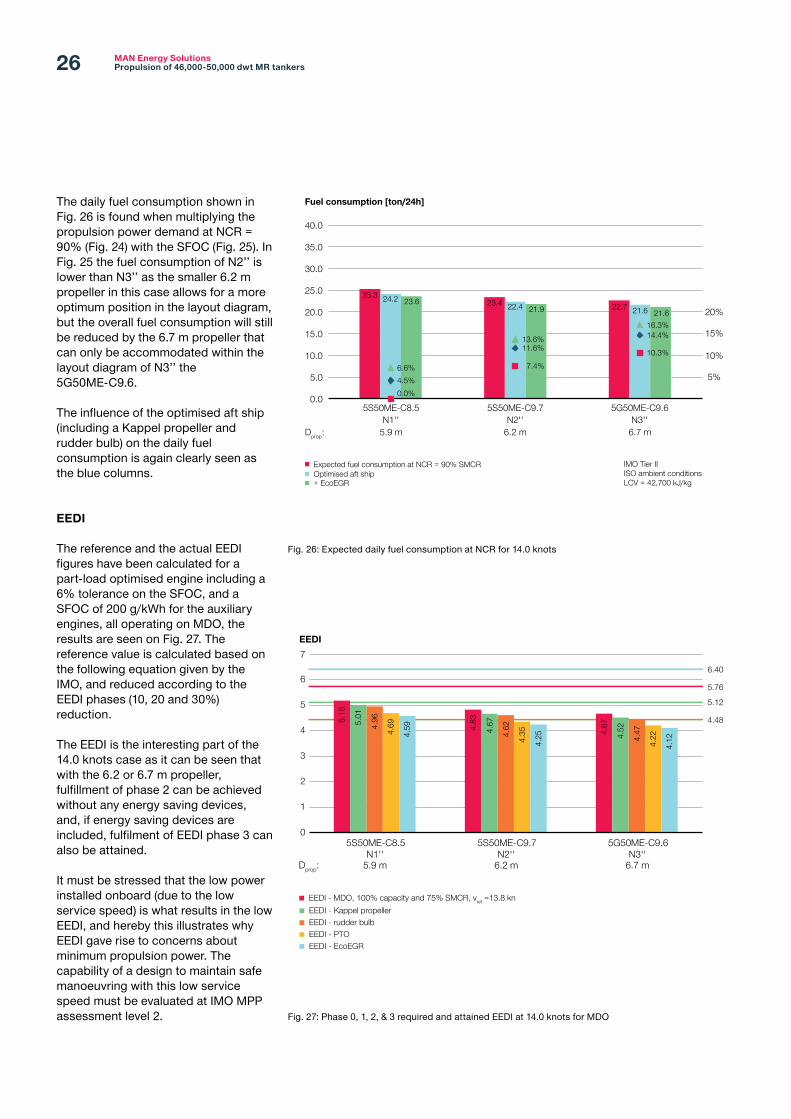
The daily fuel consumption shown in Fig. 26 is found when multiplying the propulsion power demand at NCR = 90% (Fig. 24) with the SFOC (Fig. 25). In Fig. 25 the fuel consumption of N2’’ is lower than N3’’ as the smaller 6.2 m propeller in this case allows for a more optimum position in the layout diagram, but the overall fuel consumption will still be reduced by the 6.7 m propeller that can only be accommodated within the layout diagram of N3’’ the 5G50ME-C9.6.
The influence of the optimised aft ship (including a Kappel propeller and rudder bulb) on the daily fuel consumption is again clearly seen as the blue columns.
EEDI
The reference and the actual EEDI figures have been calculated for a part-load optimised engine including a 6% tolerance on the SFOC, and a SFOC of 200 g/kWh for the auxiliary engines, all operating on MDO, the results are seen on Fig. 27. The reference value is calculated based on the following equation given by the IMO, and reduced according to the EEDI phases (10, 20 and 30%) reduction.
The EEDI is the interesting part of the 14.0 knots case as it can be seen that with the 6.2 or 6.7 m propeller, fulfillment of phase 2 can be achieved without any energy saving devices, and, if energy saving devices are included, fulfilment of EEDI phase 3 can also be attained.
It must be stressed that the low power installed onboard (due to the low service speed) is what results in the low EEDI, and hereby this illustrates why EEDI gave rise to concerns about minimum propulsion power. The capability of a design to maintain safe manoeuvring with this low service speed must be evaluated at IMO MPP assessment level 2.
25.3 24.2 23.6 23.4 22.4 21.9 22.7 21.6 21.6
0.0
5.0
10.0
15.0
20.0
25.0
30.0
35.0
40.0
5S50ME-C8.5N1''
5S50ME-C9.7N2''
5G50ME-C9.6N3''
6.7 m6.2 m5.9 m
Fuel consumption [ton/24h]
Expected fuel consumption at NCR = 90% SMCROptimised aft ship+ EcoEGR
IMO Tier IIISO ambient conditionsLCV = 42,700 kJ/kg
Dprop:
0.0%
7.4%10.3%
4.5%
11.6%14.4%
6.6%
13.6%
16.3%
5%
10%
15%
20%
Fig. 26: Expected daily fuel consumption at NCR for 14.0 knots
5.18
5.01
4.96
4.69
4.59 4.
83
4.67
4.62
4.35
4.25 4.
67
4.52
4.47
4.22
4.12
0
1
2
3
4
5
6
7
5S50ME-C8.5N1''
5S50ME-C9.7 5G50ME-C9.6
EEDI
EEDI - MDO, 100% capacity and 75% SMCR, vref =13.8 knEEDI - Kappel propellerEEDI - rudder bulbEEDI - PTOEEDI - EcoEGR
Dprop: 5.9 mN2''
6.2 mN3''
6.7 m
6.40
5.76
5.12
4.48
Fig. 27: Phase 0, 1, 2, & 3 required and attained EEDI at 14.0 knots for MDO

27
Opertating costs
While the previous comparisons of engine fuel performance are based on a constant engine load of 90% (NCR), the yearly operational costs of the engine greatly depend on the engine’s load profile.
The same load profile as in the previous case is applied, see Fig. 13. A fuel price of 500 USD/ton and a lubricating oil price of 2,000 USD/ton is assumed. The results are shown in Fig. 28
2.47
0
0.5
1.0
1.5
2.0
2.5
3.0
3.5
5S50ME-C8.5N1''
5S50ME-C9.7 5G50ME-C9.6
Million USD/year
Total annual main engine operating costsOptimisedEcoEGR
IMO Tier IIISO ambient conditions250 days/yearFuel price: 500 USD/ton
Dprop: 5.9 mN2''
6.2 mN3''
6.7 m
2.36
2.33
2.29
2.19
2.17 2.22
2.12
2.10
0.0%
7.0%9.9%
4.4%
11.2%13.9%
5.3%
12.0%14.8%
5%
10%
15%
20%
Fig. 28: Total annual main engine operating costs including fuel, cylinder and system lubricating oil for 14.0 knots

MAN Energy SolutionsPropulsion of 46,000-50,000 dwt MR tankers28
A comparison of the relative savings in operating costs in net present value (NPV), with the 6S50ME-C8.5 with a propeller diameter of 5.9 m used as reference are shown in Fig. 29.
Again, it is seen that the absolute size of the savings is reduced compared to the reduced energy consumption, but over 10 years a saving of more than 2.1 million USD is still achieved for the 6.7 m propeller. For the optimised aft ship with EcoEGR is a saving of up to 3.0 million USD achievable.
0
1
2
3
4
5
6
7
8
9
0 5 10 15 20 25
Net present value[million USD]
Lifetime [years]
6S50ME-C8.5 N1”
6S50ME-C9.7 N2”
6G50ME-C9.6 N3”
IMO Tier IIISO ambient conditions250 days/yearFuel price: 500 USD/tonRate of interest and discount: 6% p.a.Rate of inflation: 3% p.a.
0
1
2
3
4
5
6
7
8
9
0 5 10 15 20 25
Net present value[million USD]
Lifetime [years]
6S50ME-C8.5 N1”
5S50ME-C8.5 N1” opt.
5S50ME-C9.7 N2” opt.
IMO Tier IIISO ambient conditions250 days/yearFuel price: 500 USD/tonRate of interest and discount: 6% p.a.Rate of inflation: 3% p.a.
5G50ME-C9.6 N3” opt.
Fig. 29: Saving in main engine operating costs (NPV) for 14.0 knots without (above) and with optimised aft ship (below)

29
savings especially for vessels indented for operation on low-sulphur fuels.
The application of a larger than usual propeller, EcoEGR, energy saving devices along with alternative fuels, does not only ensure EEDI compliance but also provide good value for the ship owner, as the super eco-ships typically sees higher day rates.
If alternative fuels are applied, the typical service speed of today, approx. 14.5 knots, can be maintained in the future. Furthermore, alternative fuels provide an option to attain speeds as high as approx. 15 knots.
Besides offering the capability to use different fuels the MAN B&W S- and G-type engines also offer a significant variety of possible bores and stroke lengths for the 50,000 dwt segment. This ensures that an optimum fit always can be achieved for each individual project, and that the optimum rpm of a desired propeller always can be contained within the layout diagram of one of the many possible engine designs.
Modern designs of tankers in the 50,000 dwt segment (and similar sized bulk carriers) face numerous challenges: EEDI regulations govern the energy consumption of ships, and compliance with EEDI phase 2 and 3 requirements can pose a challenge to such vessels. At the same time the vessels must not be underpowered, and considerations on minimum propulsion power are important when evaluating the different options to ensure compliance with EEDI regulations.
Besides a larger than usual propeller, different possible paths to ensure compliance with EEDI phase 2 and 3 have been considered in this paper. Significant energy savings can be attained by the application of various energy saving devices. In the cases presented here, the high efficiency Kappel propeller shows valuable savings – savings that can be further enhanced if combined with a rudder bulb.
EcoEGR can furthermore contribute to lower the fuel consumption of the vessel, something that can ensure large
Summary

MAN Energy SolutionsPropulsion of 46,000-50,000 dwt MR tankers30

31

MAN Energy SolutionsPropulsion of 46,000-50,000 dwt MR tankers32

MAN Energy Solutions 2450 Copenhagen SV, DenmarkP +45 33 85 11 00F +45 33 85 10 [email protected]
All data provided in this document is non-binding. This data serves informational purposes only and is not guaranteed in any way. Depending on the subsequent specific individual projects, the relevant data may be subject to changes and will be assessed and determined individually for each project. This will depend on the particular characteristics of each individual project, especially specific site and operational conditions.
Copyright © MAN Energy Solutions. 5510-0224-00ppr Jan 2019 Printed in Denmark