Embed Size (px)
Citation preview

8/11/2019 Proptiger - Half Year (2014) Market Assessment
http://slidepdf.com/reader/full/proptiger-half-year-2014-market-assessment 1/18
Confidential - Private Circulation Only
Real Estate Review – Half Yearly ReportJuly 2014

8/11/2019 Proptiger - Half Year (2014) Market Assessment
http://slidepdf.com/reader/full/proptiger-half-year-2014-market-assessment 2/18
1Source: PropTiger DataLabs July 2014
Executive Summary
• First half of 2014 has been a disappointment for real estate. Taking cues from slowingsales, developers have put a strong break on new launches resulting in 73% drop in new
launches in Q2’CY14 over Q2’CY13
• Significant (~83%) drop seen in new unit launches in Noida in Q2’CY14 over Q1’CY14
• Despite high demand of affordable housing, ~47% of the new units launched in first half
of the year are in >50 Lakh budget range
• Sales continue to slow down and have dropped ~50% since Q2’CY13
• Mumbai and Noida have most unsold inventory amongst all key metros whereas Mumbai
and Gurgaon leads in most expensive (>1 crore) unsold inventory
• Price charts across cities are flat reflecting sluggish sales in markets; Discounts of 5 –
10% are common across markets over the published prices
• Positive budget for real estate is a good news for the industry. We expect market torevive in second half of the year

8/11/2019 Proptiger - Half Year (2014) Market Assessment
http://slidepdf.com/reader/full/proptiger-half-year-2014-market-assessment 3/18
2Source: PropTiger DataLabs July 2014
India – Market analysis and quarterly review
Outlook for H2 -CY’2014
Detailed market analysis
Agenda

8/11/2019 Proptiger - Half Year (2014) Market Assessment
http://slidepdf.com/reader/full/proptiger-half-year-2014-market-assessment 4/18
3Source: PropTiger DataLabs July 2014
160,625
130,562
102,64299,546
81,360
35,867
0
20,000
40,000
60,000
80,000
100,000
120,000
140,000
160,000
180,000
Q1-CY'13 Q2-CY'13 Q3-CY'13 Q4-CY'13 Q1-CY'14 Q2-CY'14
New launches in top 9 cities*
130,562
35,867
- 73 %
# of units
Notes: * Top 9 Cities are Mumbai (includes Navi Mumbai and Thane), Pune, Noida (includes Greater Noida and Yamuna Expressway), Gurgaon(includes Bhiwadi, Dharuhera and Sohna), Bangalore, Chennai, Hyderabad, Kolkata, Ahmedabad
Quarterly new unit launches dropped ~73% since Q2-CY’13
8/11/2019 Proptiger - Half Year (2014) Market Assessment
http://slidepdf.com/reader/full/proptiger-half-year-2014-market-assessment 5/184Source: PropTiger DataLabs July 2014
# of units
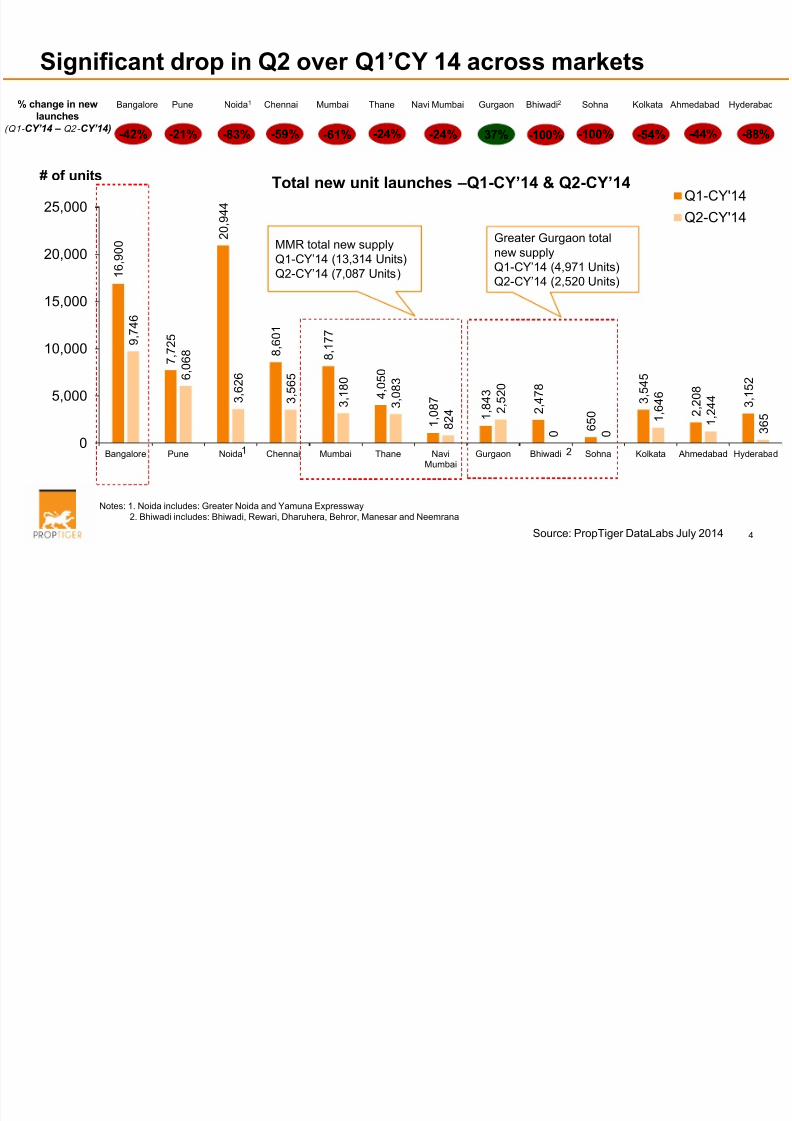
Notes: 1. Noida includes: Greater Noida and Yamuna Expressway2. Bhiwadi includes: Bhiwadi, Rewari, Dharuhera, Behror, Manesar and Neemrana
1
6 ,
9 0 0
7 ,
7 2 5
2 0 ,
9 4 4
8 ,
6 0 1
8 ,
1 7 7
4 ,
0 5 0
1 , 0
8 7
1
, 8 4 3
2 ,
4 7 8
6 5 0
3 ,
5 4 5
2
, 2 0 8
3 ,
1 5 2
9 ,
7 4 6
6 ,
0 6 8
3 ,
6 2 6
3 ,
5 6 5
3 ,
1 8 0
3 ,
0 8 3
8 2 4
2 ,
5 2 0
0
0
1 ,
6 4 6
1 , 2
4 4
3 6 5
0
5,000
10,000
15,000
20,000
25,000
Bangalore Pune Noida Chennai Mumbai Thane NaviMumbai
Gurgaon Bhiwadi Sohna Kolkata Ahmedabad Hyderabad
Total new unit launches –Q1-CY’14 & Q2-CY’14 Q1-CY'14
Q2-CY'14
1 2
MMR total new supplyQ1-CY’14 (13,314 Units)
Q2-CY’14 (7,087 Units)
Greater Gurgaon totalnew supplyQ1-CY’14 (4,971 Units)
Q2-CY’14 (2,520 Units)
-83% -59% -61% -24% -24% 37% -100% -100% -54% -44% -88%-42% -21%
% change in new
launches
(Q1- CY’14 – Q2- CY’14)
Bangalore Pune Noida1 Chennai Mumbai Thane Navi Mumbai Gurgaon Bhiwadi2 Sohna Kolkata Ahmedabad Hyderabad
Significant drop in Q2 over Q1’CY 14 across markets

8/11/2019 Proptiger - Half Year (2014) Market Assessment
http://slidepdf.com/reader/full/proptiger-half-year-2014-market-assessment 6/185Source: PropTiger DataLabs July 2014
28%
25%18%
7%
22%
<35 Lakhs
35-50 Lakhs
50-75 Lakhs
75-100 Lakhs
+1 crore
Budget wise breakup of new
launch units in H2-CY’13
Budget wise breakup of new
launch units in H1-CY’14
36%
24%
17%
7%
16%
~47% of new units launched in H1’CY14 costs >50 Lakh

8/11/2019 Proptiger - Half Year (2014) Market Assessment
http://slidepdf.com/reader/full/proptiger-half-year-2014-market-assessment 7/186Source: PropTiger DataLabs July 2014
Notes: ** Top 9 Cities are Mumbai (includes Navi Mumbai and Thane), Pune, Noida (includes Greater Noida and Yamuna Expressway), Gurgaon(includes Bhiwadi, Dharuhera and Sohna), Bangalore, Chennai, Hyderabad, Kolkata, Ahmedabad
113,213
106,306
99,18093,761
77,856
56,699
0
20,000
40,000
60,000
80,000
100,000
120,000
Q1-CY'13 Q2-CY'13 Q3-CY'13 Q4-CY'13 Q1-CY'14 Q2-CY'14
Absorption trend in top 9 cities**
- 27 %
77,856
56,699
106,306
- 47%
Quarterly new units sales dropped ~50% since Q2’CY14

8/11/2019 Proptiger - Half Year (2014) Market Assessment
http://slidepdf.com/reader/full/proptiger-half-year-2014-market-assessment 8/187Source: PropTiger DataLabs July 2014
Sales drop seen across cities; Thane seen the least drop
across cities
Notes: 1. Noida includes: Greater Noida and Yamuna Expressway2. Bhiwadi includes: Bhiwadi, Rewari, Dharuhera, Behror, Manesar and Neemrana
Quarterly new home sales (# of units)
City Q2-CY'13 Q2-CY'14
Absorption Change
(Q2-CY'13 – Q2-CY'14)
Mumbai 11,512 5,401 -53%
Navi Mumbai 4,379 2,362 -46%
Thane 5,447 4,465 -18%
Noida 17,834 7,758 -56%
Gurgaon 5,772 2,715 -53%
Bhiwadi 3,358 1,682 -50%
Bangalore 19,256 10,049 -48%
Chennai 9,567 5,257 -45%
Pune 12,111 7,563 -38%
Hyderabad 6,317 2,823 -55%
Kolkata 5,348 3,141 -41%
Ahmedabad 5,358 3,290 -39%
1
2

8/11/2019 Proptiger - Half Year (2014) Market Assessment
http://slidepdf.com/reader/full/proptiger-half-year-2014-market-assessment 9/188Source: PropTiger DataLabs July 2014
Mumbai and Noida have the most unsold inventory
0
20,000
40,000
60,000
80,000
100,000
120,000
Noida Bangalore Pune Mumbai Thane NaviMumbai
Chennai Hyderabad Ahmedabad Kolkata Gurgaon Bhiwadi Sohna
Unsold Inventory levels at the end of H1-CY’14 +4BHK
3BHK
2BHK
1BHK
# of units
1 2
101,635
Notes: 1. Noida includes: Greater Noida and Yamuna Expressway2. Bhiwadi includes: Bhiwadi, Rewari, Dharuhera, Behror, Manesar and Neemrana
92,862
54,608 51,081
34,588
17,757
46,442
25,892 24,624 19,583 19,724
2,026
16,525
Unsold Inventory = 103,426
Unsold Inventory = 38,134
8/11/2019 Proptiger - Half Year (2014) Market Assessment
http://slidepdf.com/reader/full/proptiger-half-year-2014-market-assessment 10/189Source: PropTiger DataLabs July 2014
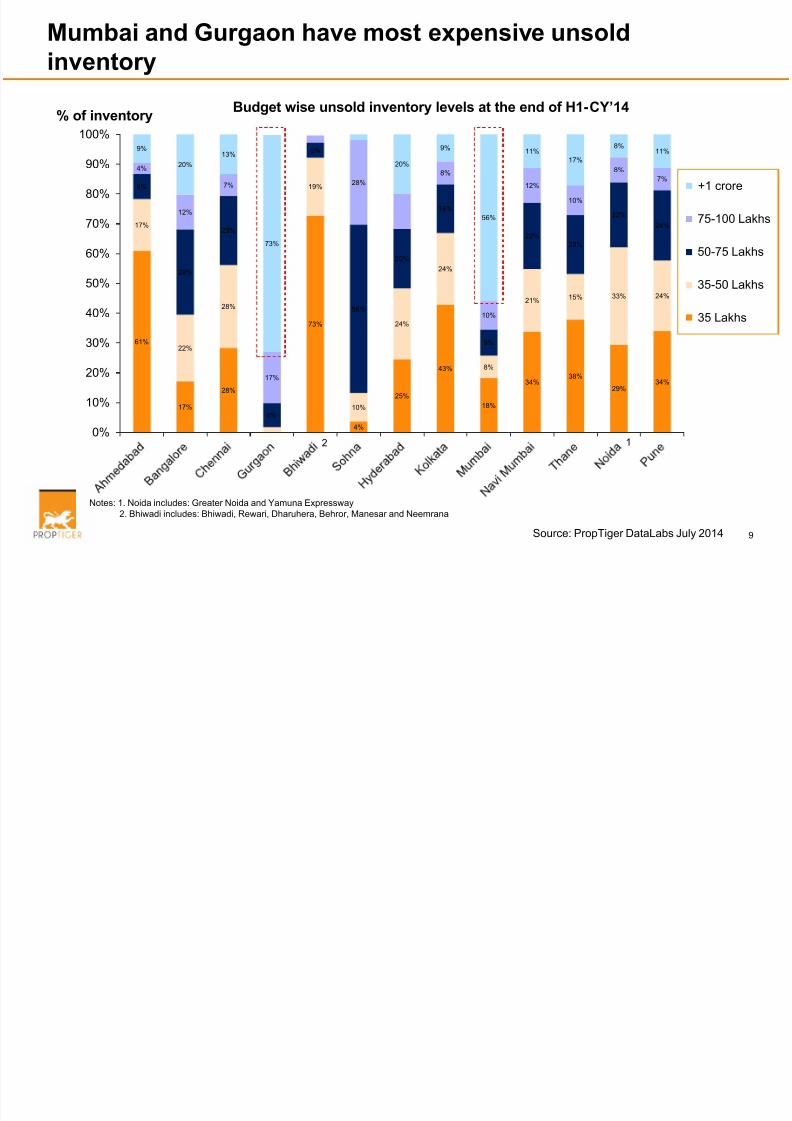
Mumbai and Gurgaon have most expensive unsold
inventory
61%
17%
28%
73%
4%
25%
43%
18%
34%38%
29%34%
17%
22%
28%
19%
10%
24%
24%
8%
21% 15% 33% 24%
8%
29%
23%
8%
5%
56%
20%
16%
9%
22%
20%
22%
24%
4%
12%
7%
17%
28%
8%
10%
12%
10%
8%
7%
9%
20%
13%
73%
20%
9%
56%
11%
17%
8%11%
0%
10%
20%
30%
40%
50%
60%
70%
80%
90%
100%
+1 crore
75-100 Lakhs
50-75 Lakhs
35-50 Lakhs
35 Lakhs
% of inventory
Notes: 1. Noida includes: Greater Noida and Yamuna Expressway2. Bhiwadi includes: Bhiwadi, Rewari, Dharuhera, Behror, Manesar and Neemrana
12
Budget wise unsold inventory levels at the end of H1-CY’14

8/11/2019 Proptiger - Half Year (2014) Market Assessment
http://slidepdf.com/reader/full/proptiger-half-year-2014-market-assessment 11/1810Source: PropTiger DataLabs July 2014
Lack of genuine demand continues in northern market as
large share of buyers are investors
51%60%
67% 70% 72%81%
86%91%
49%40%
33% 30% 28%19%
14%9%
Noida Gurgaon Pune Chennai Mumbai Ahmedabad Bangalore Kolkata
Investors End User
3500 35881800 3400 3800 6001400900
XXXX# of respondents in Survey
conducted in Q2’CY14

8/11/2019 Proptiger - Half Year (2014) Market Assessment
http://slidepdf.com/reader/full/proptiger-half-year-2014-market-assessment 12/1811Source: PropTiger DataLabs July 2014
Price continued to be flat, if not fallen across marketsWeighted average1 BSP (Rs /sq. ft.) of Apartment units as on quarter end
Notes: 1. Price weighed on number of units in respective projects in a city
City Q2-CY'13 Q3-CY'13 Q4-CY'13 Q1-CY'14 Q2-CY'14Price Change
(Q2-CY'13- Q2-CY'14)
Ahmedabad 2,692 2,718 2,742 2,782 2,790 4%
Bangalore 4,078 4,173 4,239 4,314 4,368 7%
Chennai 4,531 4,599 4,616 4,652 4,684 3%
Hyderabad 3,326 3,366 3,402 3,457 3,508 5%
Kolkata 3,973 3,956 3,967 3,866 3,913 -2%
Pune 4,615 4,678 4,739 4,763 4,816 4%
Noida 4,476 4,524 4,513 4,506 4,538 1%
Greater Noida 3,537 3,547 3,626 3,580 3,593 2%
Yamuna Expressway 3,009 2,962 2,944 2,893 2,824 -6%
Gurgaon 7,563 7,699 7,723 7,828 7,844 4%
Bhiwadi 2,766 2,730 2,814 2,795 2,801 1%
Mumbai 11,298 11,520 11,648 11,701 12,132 7%
Navi Mumbai 5,506 5,530 5,592 5,678 5,744 4%
Thane 5,861 5,992 5,977 6,095 5,961 2%

8/11/2019 Proptiger - Half Year (2014) Market Assessment
http://slidepdf.com/reader/full/proptiger-half-year-2014-market-assessment 13/18
12Source: PropTiger DataLabs July 2014
India – Market analysis and quarterly review
Outlook for H2 -CY’2014
Detailed market analysis
Agenda

8/11/2019 Proptiger - Half Year (2014) Market Assessment
http://slidepdf.com/reader/full/proptiger-half-year-2014-market-assessment 14/18
13Source: PropTiger DataLabs July 2014
Budget 204-15 have fulfilled 5 major demands of Industry
1. Relaxation of FDI Norms
• Minimum built up area reduced from 50,000 sq mts to 20,000 sq mts
• Minimum capital reduced from $10mn to $5mn
• No capital and area limitation if 30% of total project is affordable housing
2. Pass through tax status to REIT
• No double taxation of interest income received by REIT
3. Increased tax incentives to buyers
• Tax exemptions on interest paid on self occupied home loans increased to 2 Lakh from 1.5 Lakh
4. Budgetary allocation to affordable housing
• 4,000 crores have been allocated to NHB for provision of cheaper loans to affordable housing buyers
• 8,000 crores have been additionally allocated for Rural Housing
• Recently RBI also removed SLR and CRR requirements for loans upto 50 Lakh in metros and 40 Lakh inother cities
5. Focus on infrastructure development
• 7,060 crores have been allocated for building 100 smart cities across India
• ~50,000 crores have been allocated for highways and road development

8/11/2019 Proptiger - Half Year (2014) Market Assessment
http://slidepdf.com/reader/full/proptiger-half-year-2014-market-assessment 15/18
14Source: PropTiger DataLabs July 2014
Markets will see turnaround in second half of the year
FDI will improve liquidity of builders helping new launches in the market
• Many fund houses are raising money to invest in real estate projects• HDFC $250 mn, Amplus Capital $50 – 100 mn, Capri Global $400 mn
• Piramal Fund ~58 mn, IIFL~125 mn, IDFC ~125 mn
• Few builders have already raised FDI and many others will follow
• Shriram raised $80mn from Tata Opportunities Fund, $10 mn from Arvind Mills Realty PE
• Nirmal Group raised $50 mn from Kotak Realty fund and Omkar $25 mn from Piramal Fund
• Parsvanath, Omaxe etc. are looking to raise fund shortly
Buyer Sentiment
• Will improve with improvement in economy, arrival of festive season, improved taxincentives and ease of home loan availability
Political Situation
• Will stabilize post election in key states of Maharashtra, Haryana and Delhi

8/11/2019 Proptiger - Half Year (2014) Market Assessment
http://slidepdf.com/reader/full/proptiger-half-year-2014-market-assessment 16/18
15Source: PropTiger DataLabs July 2014
India – Market analysis and quarterly review
Outlook for H2 -CY’2014
Detailed market analysis
Agenda

8/11/2019 Proptiger - Half Year (2014) Market Assessment
http://slidepdf.com/reader/full/proptiger-half-year-2014-market-assessment 17/18
16Source: PropTiger DataLabs July 2014
Detailed market analysis for 9 cities available on request
1. Bangalore
2. Mumbai
3. Noida
4. Gurgaon
5. Pune
6. Chennai
7. Hyderabad
8. Ahmedabad
9. Kolkatta
On request

8/11/2019 Proptiger - Half Year (2014) Market Assessment
http://slidepdf.com/reader/full/proptiger-half-year-2014-market-assessment 18/18
17Source: PropTiger DataLabs July 2014
Contact PropTiger for:• Detailed analysis of Individual markets
• Micro market surveys
• Real estate data
Ankur Dhawan
+91-9873 9076 67