Embed Size (px)
Citation preview
PROPOSED WASTE MANAGEMENT FACILITY
AT
RINGASKIDDY, CO. CORK
WASTE LICENCE APPLICATION NO. 186-1
OUTLINE OF EVIDENCE TO
ENVIRONMENTAL PROTECTION AGENCY ORAL HEARING
CORK, 18TH
FEBRUARY 2005
AN EXAMINATION OF THE AIR QUALITY STUDY
ON BEHALF OF:
CHASE (MONKSTOWN)
MARCIA K. D’ALTON B.E., M.ENG.SC., M.I.E.I.,
MEMBER, PASSAGE WEST TOWN COUNCIL
1
SECTION 1: INTRODUCTION
My name is Marcia D’Alton. I am an environmental engineer. I qualified from civil engineering in University College Cork and subsequently obtained a Masters in Engineering
Science through research in waste management. My work focuses on waste management and
the associated fields of sludge management, nutrient management, catchment and water quality management, renewable energy development and wastewater treatment. I established
an independent consultancy, Integrated Biomass Solutions, over four years ago. I am here as
an elected member of Passage West Town Council, as a resident of Monkstown and as a life-long user and appreciator of Cork Harbour.
1.1 Scope of evidence
This evidence relates primarily to the suitability or otherwise of Cork Harbour for the establishment of a facility such as that proposed by Indaver Ireland at Ringaskiddy. In so
doing, it examines the air dispersion modelling undertaken by Indaver Ireland to determine
potential impacts of emissions to be released to atmosphere from the proposed facility. Section 2 provides an overview of the air modelling process. In Section 3, the choice of
appropriate model is discussed. Section 4 looks at procedures for the correct set-up of an air
dispersion model. Information inputs to the model are reviewed in Section 5, while a
discussion of meteorological data inputs is provided in Section 6. Presentation and review of results from the air dispersion model are dealt with in Section 7. Section 8 takes a brief look
at two additional model types employed by Indaver Ireland during the preparation of their
Environmental Impact Statement (EIS). Finally, Section 9 summarises the requirements of the Environmental Protection Agency with regard to air dispersion, while Section 10 outlines
briefly a suggested procedure for accurate and comprehensive air dispersion modelling.
2
1.2 Background to scope of evidence
1.2.1 Function of the Environmental Protection Agency with regard to protection of
health and the environment
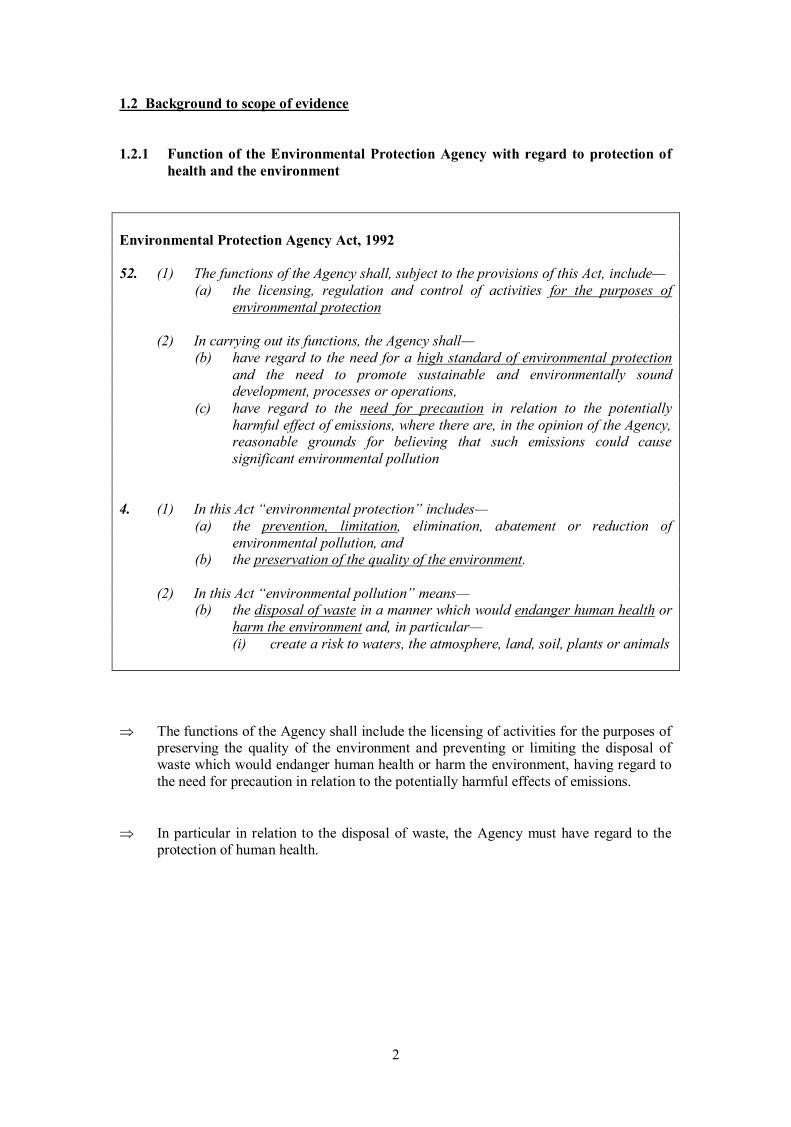
Environmental Protection Agency Act, 1992
52. (1) The functions of the Agency shall, subject to the provisions of this Act, include—
(a) the licensing, regulation and control of activities for the purposes of
environmental protection
(2) In carrying out its functions, the Agency shall—
(b) have regard to the need for a high standard of environmental protection
and the need to promote sustainable and environmentally sound development, processes or operations,
(c) have regard to the need for precaution in relation to the potentially
harmful effect of emissions, where there are, in the opinion of the Agency, reasonable grounds for believing that such emissions could cause
significant environmental pollution
4. (1) In this Act “environmental protection” includes—
(a) the prevention, limitation, elimination, abatement or reduction of
environmental pollution, and
(b) the preservation of the quality of the environment.
(2) In this Act “environmental pollution” means— (b) the disposal of waste in a manner which would endanger human health or
harm the environment and, in particular—
(i) create a risk to waters, the atmosphere, land, soil, plants or animals
The functions of the Agency shall include the licensing of activities for the purposes of preserving the quality of the environment and preventing or limiting the disposal of waste which would endanger human health or harm the environment, having regard to
the need for precaution in relation to the potentially harmful effects of emissions.
In particular in relation to the disposal of waste, the Agency must have regard to the protection of human health.

3
1.2.2 Objective of the World Health Organisation with regard to protection of health
and the environment
The principal objective of the World Health Organisation is for all people to attain the highest
possible state of health.
World Health Organisation definition of human health:
Constitution of the World Health Organisation
Health is a state of complete physical, mental and social well-being and not merely the
absence of disease or infirmity.
The enjoyment of the highest attainable standard of health is one of the fundamental
rights of every human being …
The health of all peoples is fundamental to the attainment of peace and security and is
dependent upon the fullest co-operation of individuals and States.
The achievement of any State in the promotion and protection of health is of value to all.
Unequal development in different countries in the promotion of health … is a common
danger.
Healthy development of the child is of basic importance …
The extension to all peoples of the benefits of medical, psychological and related
knowledge is essential to the fullest attainment of health.
Informed opinion and active co-operation on the part of the public are of the utmost
importance in the improvement of the health of the people.
Governments have a responsibility for the health of their peoples …
World Health Organisation (Air Quality Guidelines for Europe, 2000)
Human beings need a regular supply of food and water and an essential continuous supply of
air. The requirements for air and water are relatively constant. That all people should have
free access to air and water of acceptable quality is a fundamental human right.
… Evidence of the effects of pollutants on terrestrial vegetation [were] also considered …
because, in the long term, only a healthy total environment can guarantee human health and wellbeing.
World Health Organisation (Site Selection for New Hazardous Waste Management
Facilities, 1993):
[New hazardous waste incineration facilities should not be established] in areas prone to regular thermal inversions.
4
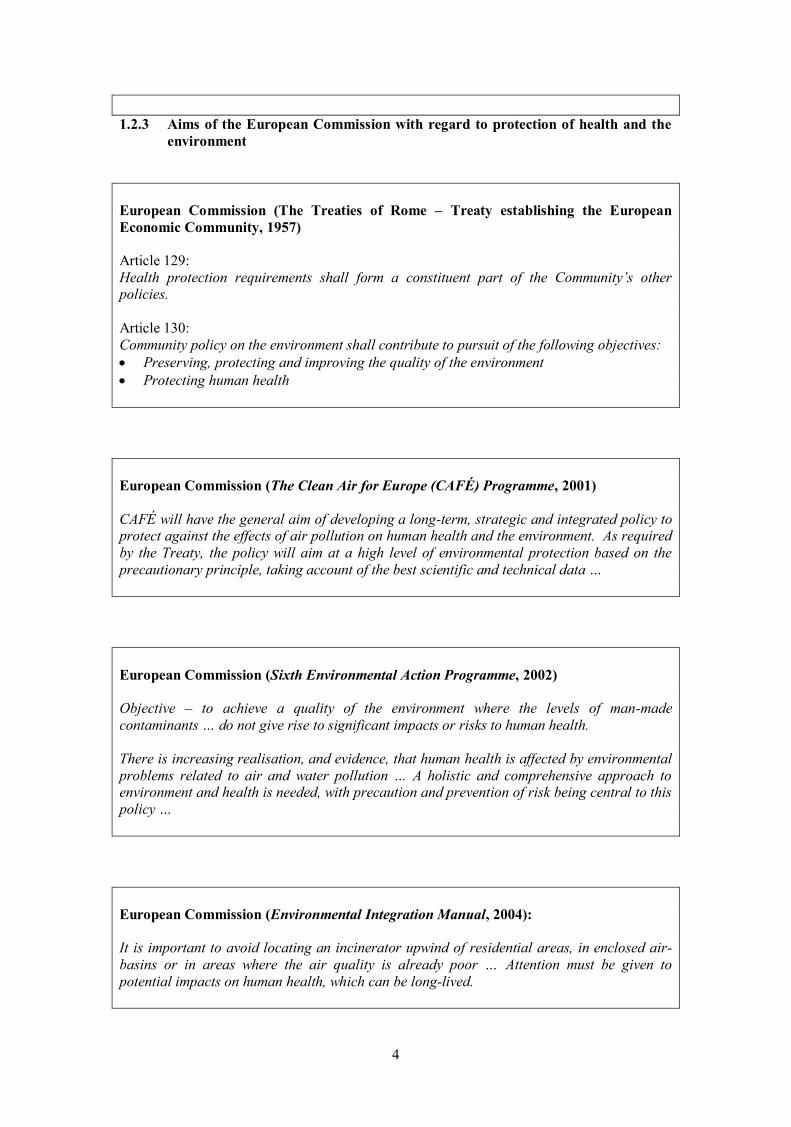
1.2.3 Aims of the European Commission with regard to protection of health and the
environment
European Commission (The Treaties of Rome – Treaty establishing the European
Economic Community, 1957)
Article 129:
Health protection requirements shall form a constituent part of the Community’s other policies.
Article 130:
Community policy on the environment shall contribute to pursuit of the following objectives:
Preserving, protecting and improving the quality of the environment
Protecting human health
European Commission (The Clean Air for Europe (CAFÉ) Programme, 2001)
CAFÉ will have the general aim of developing a long-term, strategic and integrated policy to protect against the effects of air pollution on human health and the environment. As required
by the Treaty, the policy will aim at a high level of environmental protection based on the
precautionary principle, taking account of the best scientific and technical data …
European Commission (Sixth Environmental Action Programme, 2002)
Objective – to achieve a quality of the environment where the levels of man-made
contaminants … do not give rise to significant impacts or risks to human health.
There is increasing realisation, and evidence, that human health is affected by environmental
problems related to air and water pollution … A holistic and comprehensive approach to environment and health is needed, with precaution and prevention of risk being central to this
policy …
European Commission (Environmental Integration Manual, 2004):
It is important to avoid locating an incinerator upwind of residential areas, in enclosed air-
basins or in areas where the air quality is already poor … Attention must be given to
potential impacts on human health, which can be long-lived.
5
1.2.4 Suitability of Cork Harbour for the proposed waste management facility
Indaver Ireland has proposed to establish a waste management facility at Ringaskiddy in
Cork Harbour.
Facility will comprise a hazardous waste transfer station, a co-incineration plant for
hazardous and non-hazardous industrial and commercial waste and a municipal solid waste incinerator.
Description of Cork Harbour with reference to the siting advice provided by the World
Health Organisation and the European Commission.
Indaver Ireland (Ringaskiddy Waste Management Facility Environmental Impact
Statement, 2001)
The site lies on the northern slope of the Ringaskiddy anticline. The site is located close to
the northern edge of the anticline and rises from a level of approximately 3 mOD close to the road to approximately 40 mOD at the southern boundary of the site. South of the site, the
land rises slightly to 43 mOD at the Martello Tower. To the north, beyond the Raffeen-
Monkstown Creek syncline, the ground rises to a level of 130 mOD to the north of Monkstown and almost 100 mOD on Great Island. To the south of Ringaskiddy, the crest of the hill at
Curraghbinny Wood rises to 74 mOD and the top of the ridge south of Crosshaven is at a
level of almost 100 mOD.
Cork Harbour is an enclosed air-basin.
Environmental Protection Agency (Office of Licensing and Guidance Memorandum,
2004)
Cllr. D’Alton’s claim that there is a high prevalence of thermal inversions is not supported by
any specific data …
Thermal inversion: When the temperature of the atmosphere increases with height for
comparatively short vertical distances
Three types of inversion relevant to pollutant dispersion:
o Radiation inversion – form on clear light wind nights due to strong radiation
cooling at the earth’s surface
o Frontal/sea-breeze inversion – form when a wedge of cold air underlies warmer air
o Valley inversions – form because cold air flows down the valley sides.
Formation exacerbated by thermal influences and certain topographical types
Both present in Cork Harbour:
o Sea heating and cooling rate is different from that of the surrounding land
o Steep-sided valley
Conditions in Cork Harbour are conducive to inversions
Cork Harbour has regular inversion occurrences
6
Local knowledge, anecdotal evidence and scientific theory and opinion all support the
occurrence of regular inversion events in Cork Harbour
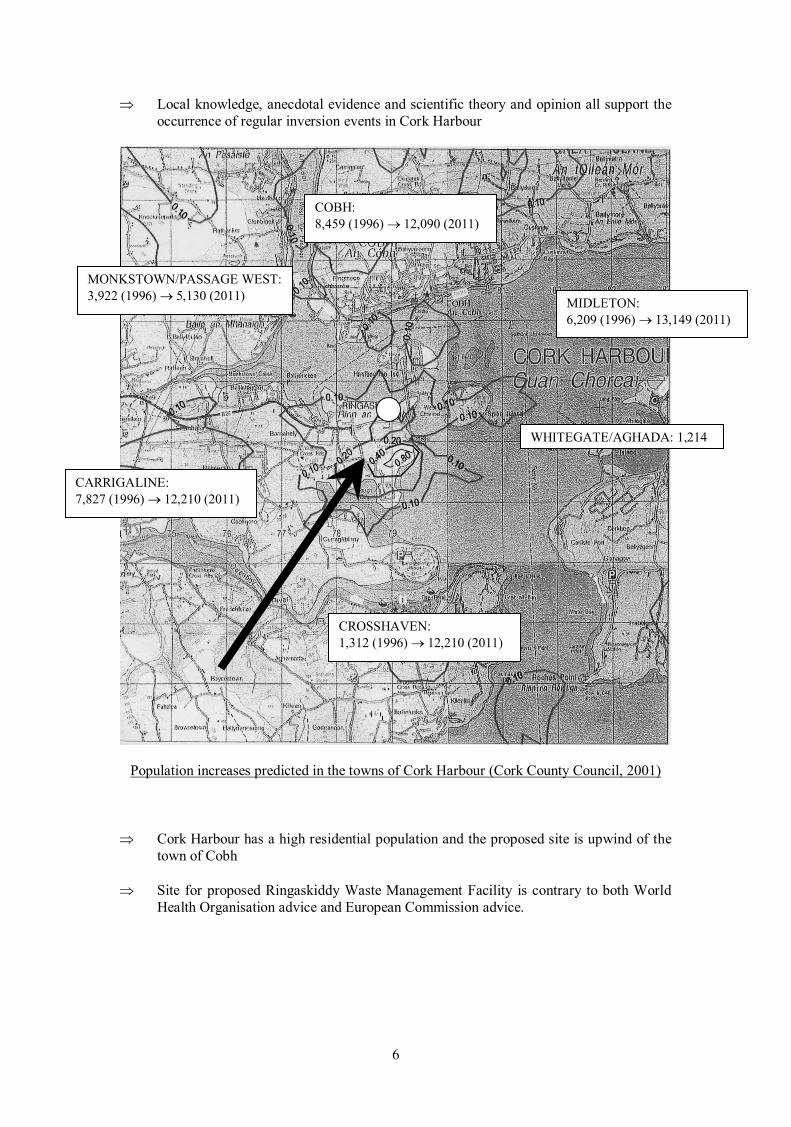
Population increases predicted in the towns of Cork Harbour (Cork County Council, 2001)
Cork Harbour has a high residential population and the proposed site is upwind of the
town of Cobh
Site for proposed Ringaskiddy Waste Management Facility is contrary to both World
Health Organisation advice and European Commission advice.
COBH:
8,459 (1996) 12,090 (2011)
MONKSTOWN/PASSAGE WEST:
3,922 (1996) 5,130 (2011)
CARRIGALINE:
7,827 (1996) 12,210 (2011)
WHITEGATE/AGHADA: 1,214
CROSSHAVEN:
1,312 (1996) 12,210 (2011)
MIDLETON:
6,209 (1996) 13,149 (2011)

7

8
1.4 Indaver site selection criteria
Initial site selection criteria:
Location within Co. Cork
Industrial zoned land
WHO Guidelines and Basle Convention
Sensitive locations
Utility services
Visual amenities, Natural Heritage Areas, Special Areas of Conservation
Site area
Indaver (Ireland) (Ringaskiddy Waste Management Facility Environmental Impact
Statement, 2001)
Because of the major industrial development in the lower Cork Harbour area, the initial
site selection process (phase 1) concentrated on available land in this area.
While some of the screening methods outlined in [the WHO Guidelines and the Basle
Convention] were used in the preliminary investigation of each potential site, the main selection criteria were utilised during the detailed investigation of the four preferred
sites.
While some of the sites investigated in phase 2 showed some potential for a detailed site
analysis, it was considered that none of them could be considered as a serious alternative to potential sites in the Ringaskiddy area.
Comparison of sites:
Land ownership
Availability of land
Approximate site area
Land zoning
Land description
Land accessibility
Site accessibility and road upgrade requirements
Electricity supply and substation availability
Natural gas supply
Water supply
Foul sewer
Emergency response
Site geology, hydrology, hydrogeology
Historical soil contamination
Distance to Ringaskiddy Village from site boundary
Distance to closest residential receptor
Distance to nearest house from site boundary
Estimate of no. of houses within 500 ft of the site boundary (WHO Guidelines)
Primary sind direction
Potential visual impact
9
Amenity areas
Habitat areas
Indaver did not follow either World Health Organisation guidelines or European
Commission advice in selecting Cork Harbour as the preferred site for its proposed
waste management facility.
Desk-based study
World Health Organisation guidelines applied after site was purchased
Choice of site justified on basis of air dispersion modelling
Indaver (Ireland) (Ringaskiddy Waste Management Facility Environmental Impact
Statement, 2001)
The modelling of the emissions to air from the Ringaskiddy waste management facility, based
on a number of conservative assumptions, indicates that the ambient ground level concentrations will be below the relevant air quality standards or guidelines for all
compounds emitted from the facility. The modelling results demonstrate that the maximum
concentrations occur at or near the site’s southern boundary. The results show that the impact of the emissions to air from the Ringaskiddy waste management facility will be minor
and limited to the immediate environs of the site.
This air dispersion modelling exercise is the basis for justification of ignoring both
global and national recommendations for the siting of such waste management
facilities.
These recommendations were given solely for the purposes of protection of human
health and protection of the environment.
In view of the potential effects of such facilities on health and the environment, it is
therefore essential that the air dispersion modelling undertaken by Indaver Ireland be subject to critical scrutiny with a view to determining its representativeness and
accuracy.
10
SECTION 2: INTRODUCTION TO AIR DISPERSION MODELLING
2.1 What is an air dispersion model?
An air dispersion model is a simplified picture of reality. It is:
a mathematical simulation of the physics and chemistry governing the transport,
dispersion and transformation of pollutants in the atmosphere
a means of estimating downwind air pollution concentrations.
Most modern air dispersion models are computer programs.
2.2 Role of the United States Environmental Protection Agency
Air dispersion modelling has been used by the United States Environmental Protection
Agency (USEPA) for regulatory verification of ambient air quality since the US Clean
Air Act was passed in 1970.
The 1977 amendment of the Clean Air Act required the USEPA to hold a conference on
air quality modelling at least every three years thereafter.
The USEPA’s first modelling guideline was published in 1977. This guideline covers all
modelling done for regulatory purposes in the United States. It is regularly revised and
updated and is now incorporated as Appendix W to Title 40, Code of Federal Regulations, Part 51 (2003).
Each model goes through a strict evaluation procedure before it can be considered for
regulatory approval. This evaluation includes peer review, performance evaluation and
sensitivity testing.
Because the statutory processes involved in model approval take time, current USEPA-
approved models may not always reflect state-of-the-art science.
2.3 Policy of the Irish Environmental Protection Agency
The Irish Environmental Protection Agency (EPA) relies on models developed for use by
the USEPA and the Environment Agency of the United Kingdom.
The Irish EPA advises that guidance on model application should be obtained from the
USEPA.
2.4 Are air dispersion models reliable?
When properly applied and with representative data, air dispersion models can produce
reasonably accurate results.
11
However, even the most sophisticated of models cannot make predictions with complete
accuracy.
The New Zealand Ministry for the Environment (2004) recommends that the “factor of
two” performance guideline is still applicable, i.e. if the model shows that the peak
concentration is lees than half the evaluation criteria, then it can be accepted with a good
degree of confidence that the criteria will not be exceeded.
USEPA (Appendix W to Part 51 – Guideline on Air Quality Models, 2003)
In addition to the known conditions [of an event], there are unmeasured or unknown
variations in the conditions of this event … As a result, deviations in … concentrations
estimated by the model are likely … This source of uncertainty alone may be responsible for a typical range of variation in concentrations of as much as 50%.
… Errors in highest estimated concentrations of +/-40% are found to be typical …
In all applications of models, an effort is encouraged to identify the reliability of the model
estimates for that particular area and to determine the magnitude and sources of error
associated with the use of the model.
The most significant factors which determine the quality and accuracy of results from an air dispersion model are:
the suitability of the model for the task
appropriate set-up of the model
the availability of accurate source information
the availability of accurate meteorological data.

12
SECTION 3: CHOOSING A SUITABLE MODEL
Choosing an appropriate tool to match the scale of impact and complexity of an atmospheric discharge and its receiving environment is one of the key elements of an effective dispersion
modelling study (New Zealand Ministry for the Environment, 2004).
The choice of model is affected by:
Complexity of terrain
Complexity of meteorological conditions
Proximity to water bodies.
3.1 General approach
Considerable range of models available, some with regulatory approval and some without
regulatory approval.
For regulatory purposes, there are two general types of dispersion models available:
- Gaussian plume models
- advanced models.
3.1.1 Gaussian plume models
Based on steady-state dispersion formulae
Take meteorological inputs from a single surface station
Assume that the atmosphere is uniform across the entire modelling domain
Assume transport and dispersion conditions exist unchanged long enough for the material
to reach the receptor
Generally applicable when
- pollutants are chemically inert - the terrain is not steep or complex
- the meteorology may be considered uniform spatially
- there are few periods of calm or light winds.
3.1.2 Advanced models
Advanced models need three dimensional meteorological fields rather than measurements
at a single point
Pollutant releases can be simulated either by a stream of particles, a series of puffs or
concentrations on a three-dimensional grid of points
Provide a more realistic representation of many atmospheric situations
Generally applicable when
- meteorological conditions vary across the modelling domain
- sources or receptors are located in complex terrain
- modelling domain experiences frequent calms or wind recirculations.

13
3.2 Choice of model for the Ringaskiddy Waste Management Facility
Indaver Ireland (Ringaskiddy Waste Management Facility Environmental Impact
Statement, 2001)
The main computer model used was the ISCST3 model. This model is approved for use for
dispersion modelling by the Irish EPA and is the regulatory model which is approved by the United States Environmental Protection Agency (USEPA).
Based on guidance from the USEPA, the most appropriate regulatory model for the current application is the ISCST3 model.
The ISCST3 model is capable of modelling most meteorological conditions likely to be
encountered in the region.
3.3 Characteristics of Cork Harbour relevant to model choice
Special characteristics of Cork Harbour accurately described by Indaver Ireland:
Indaver Ireland (Ringaskiddy Waste Management Facility Environmental Impact
Statement, 2001)
The harbour is located in a broad, east-west trending valley between high ridges. On the
valley floor, the Ringaskiddy peninsula is formed by a low ridge between Monkstown Creek
and the Owenboy River estuary. To the east is the broad expanse of the Lower Harbour. The high ridges to the north and south are intersected at right-angles by deep, steep-sided valleys
containing channels of Cork Harbour.
Unusual combination of narrow channelling, broad expanses of water and relatively steep
topography
Unusual conditions exacerbated by choice of site at 5.77 mOD
Stack height is at 55 mOD and is therefore below the level of hills above Cobh,
Monkstown, Crosshaven and Curraghbinny
Cork Harbour is defined as complex terrain for air dispersion modelling purposes
Complex terrain can cause significant vertical gradients in the vertical profiles of meteorological variables affecting plume transport and dispersion
Close land-sea interface generates circulating onshore and offshore breezes
Steep-sided valley restricts horizontal movement and dispersion and encourages
development of wind channelling
Air drains up and down valley sides in response to vertical temperature profiles
Heating and cooling during conditions of atmospheric calm can cause inversions
Heating and cooling and associated closed circulation patterns can trap or recirculate
pollutants.
14
USEPA (Guidelines on Air Quality Models, 2003:
Complex terrain is defined as terrain exceeding the height of the stack being modeled.
USEPA (Human Health Risk Assessment Protocol, 1998):
For air modelling purposes, terrain is referred to as complex if the elevation of the surrounding land within the assessment area – typically defined as anywhere within 50
kilometres from the stack – is above the top of the stack evaluated in the air modeling
analysis.
3.4 Issues arising
3.4.1 Availability of other models
ISCST3 is not the regulatory model which is approved by the USEPA.
Also preferred and approved are BLP, CALINE, CALPUFF, CTDMPLUS and OCD.
Alternative models which have been approved for use on a case-by-case basis include
ADAM, ADMS, AFTOX, ASPEN, CAMx, CMAQ, DEGADIS, HGSYSTEM,
HOTMAC, HYROAD, OZIPR, OBODM, Panache, PLUVUEII, REMSAD, SCIPUFF,
SDM, SLAB and UAM-V.
3.4.2 Simplicity of model
USEPA does not guide towards use of ISCST3 in the type of modelling situation
experienced in Cork Harbour.
ISCST3 is not capable of modelling many of the meteorological conditions regularly
experienced in Cork Harbour.
The Gaussian-based formulae on which ISCST3 is based cannot deal with the
complexities of an area such as Cork Harbour.
Because it is a steady-state model, ISCST3 assumes that the atmosphere is uniform across
the entire modelling domain.
ISCST3 assumes transport and dispersion conditions do not change between the time a
contaminant is discharged and the time it reaches a receptor.
It takes meteorological inputs from a single surface station
Because of these limitations, ISCST3 is generally applicable only within a radius less
than 10 km from the source.
Cannot deal adequately with inversion and fumigation conditions.
USEPA (Guidelines on Air Quality Models, 2003)
In all cases, the model applied to a given situation should be the one that provides the most accurate representation of atmospheric transport, dispersion and chemical transformations in
the area of interest.
15
Ministry for the Environment, New Zealand (Good Practice Guide for Atmospheric
Dispersion Modelling, 2004)
In situations of complex terrain or coastal boundaries, meteorological conditions such as calms, coastal fumigation, sea/land breeze recirculation and mountain/valley winds can
significantly affect the dispersion of pollutants. These meteorological conditions are highly
complex in a spatial and temporal sense. Gaussian plume models cannot account for these
conditions adequately because their steady-state formulation assumes uniform meteorological conditions and because they cannot remember the previous hour’s emissions.
USEPA (Guidelines on Air Quality Models, 2003)
ISC3 is appropriate for the following applications: … flat or rolling terrain. … For rolling terrain (terrain not above stack height), plume centreline is horizontal at
height of final rise above source.
… A constant, uniform stack-top wind is assumed for each hour.
… Straight-line plume transport is assumed to all downwind distances. … Vertical wind speed is assumed equal to zero.
3.4.3 Inadequate dealing with complex terrain
ISCST3 contains an algorithm to deal with complex terrain – COMPLEX1:
Steady-state algorithm
Takes account of the elevation of each receptor point but does not predict a change in
plume direction or spread due to the terrain.
Assumes that the mixing height is terrain-following
Takes an average sector approach to pollutant distribution.
3.4.4 Inability to deal with calms
ISCST3 does not calculate pollutant concentrations for wind speeds less than 1 m.s-1
,
referenced to the point of release.
For periods of wind speed lower than 1 m.s-1
, ISCST3 assumes a wind speed of 1 m.s-1
.
Worst case meteorological condition which this model can simulate is Stability Class F
and a wind speed of 2.5 m.s-1
at the stack top.
If worst-case conditions are Stability Class F with wind speeds of 1 m.s-1
or less at point
of measurement and 1% of the data is treated as invalid or missing, then the 99.5%ile
concentrations will be very much less than it would have been in reality.
Calms associated with Stability Class G and wind speeds of less than 1 m.s-1
are
frequently associated with conditions during which dispersion is at its worst.
Ignores inversions and cannot deal with fumigation.
16
USEPA (7th
Conference on Air Dispersion Modelling, 2000)
… We focused on ISC [because] it contains a number of outdated concepts and practices,
such as dispersion based on PGT system … in treating plume penetration of elevated
inversions, ISC assumes this is an all or nothing process … another is in dealing with
complex terrain. There is no treatment for intermediate terrain sites … Forecasting dispersion from a minimum set of meteorological variables … For some time it’s been known
that the vertical concentration distribution of pollution in the convective boundary layer is not
Gaussian … ISC treats it as Gaussian.
USEPA (Guidelines on Air Quality Models, 2003)
ISC3 is appropriate for the following applications: … flat or rolling terrain.
In many parts of the United States, the ground is neither flat nor is the ground cover (or land use) uniform. These geographical variations can generate local winds and circulations and
modify the prevailing ambient winds and circulations. Geographic effects are most apparent
when the ambient winds are light or calm. In general these geographically induced wind circulation effects are named after the source location of the winds, e.g. lake and sea breezes
and mountain and valley winds. In very rugged hilly or mountainous terrain, along
coastlines or near large land use variations, the characterisation of the winds is a balance of
various forces such that the assumptions of steady-state straight-line transport both in time and space are inappropriate. In the special cases described, the CALPUFF modelling system
may be applied on a case-by-case basis for air quality estimates in such complex non-steady-
state meteorological conditions.
USEPA (Meteorological Monitoring Guidance for Regulatory Applications, 2000)
Calms, periods with little or no air movement, require special consideration in air quality
evaluations; one of the more important considerations involves model selection. If the
limiting air quality conditions are associated with calms, then a non steady-state model such as CALPUFF should be used.
17
SECTION 4: SETTING UP THE MODEL CORRECTLY
4.1 General approach
1. Define land use for dispersion co-efficients
2. Specify model default option 3. Specify any additional algorithms required for the case under study
4.2 Setting up of the ISCST3 model for the Ringaskiddy waste management facility
Wind dispersion co-efficients were derived using the Auer method
Land use was categorised as being rural
Indaver Ireland (Ringaskiddy Waste Management Facility Environmental Impact
Statement, 2001)
If 50% of the land use within a 3km circumference of the source is classified as high density
residential, medium to heavy industry or commercial, urban dispersion co-efficients should be used … An examination of the land use types around the site indicated that rural dispersion
co-efficients were appropriate.
The regulatory default option was specified for all ISCST3 model runs:
o Use stack-tip downwash
o Use buoyancy-induced dispersion
o Do not use gradual plume rise, except for building downwash o Use the calms processing routine
o Use default wind profile exponents
o Use default vertical potential temperature gradients.
Neither the use of the ISC (simple terrain) or the COMPLEX1 (complex terrain)
algorithms was specified.
Flue discharge characteristics for both incinerators were considered in a combined
unitised emission rate of 1.0 g.s-1
in all model runs.
3.3 Issues arising
3.3.1 Defining land use category
USEPA specified methodology; water bodies not included in the calculations
Choice of rural and urban dispersion can make significant difference to model output.
No background data provided to explain choice of rural land use type around the site.
18
No indication as to whether the water body of Cork Harbour was included in the
calculation or otherwise.
No inclusion or description of maps, photographs, graphs used to determine land use.
USEPA (Human Health Risk Assessment Protocol, 1998)
Recommended information for risk assessment report –
Description of the methods used to determine land use surrounding the facility
Copies of any maps, photographs, or figures used to determine land use
Description of the source of any computer-based maps used to determine land use
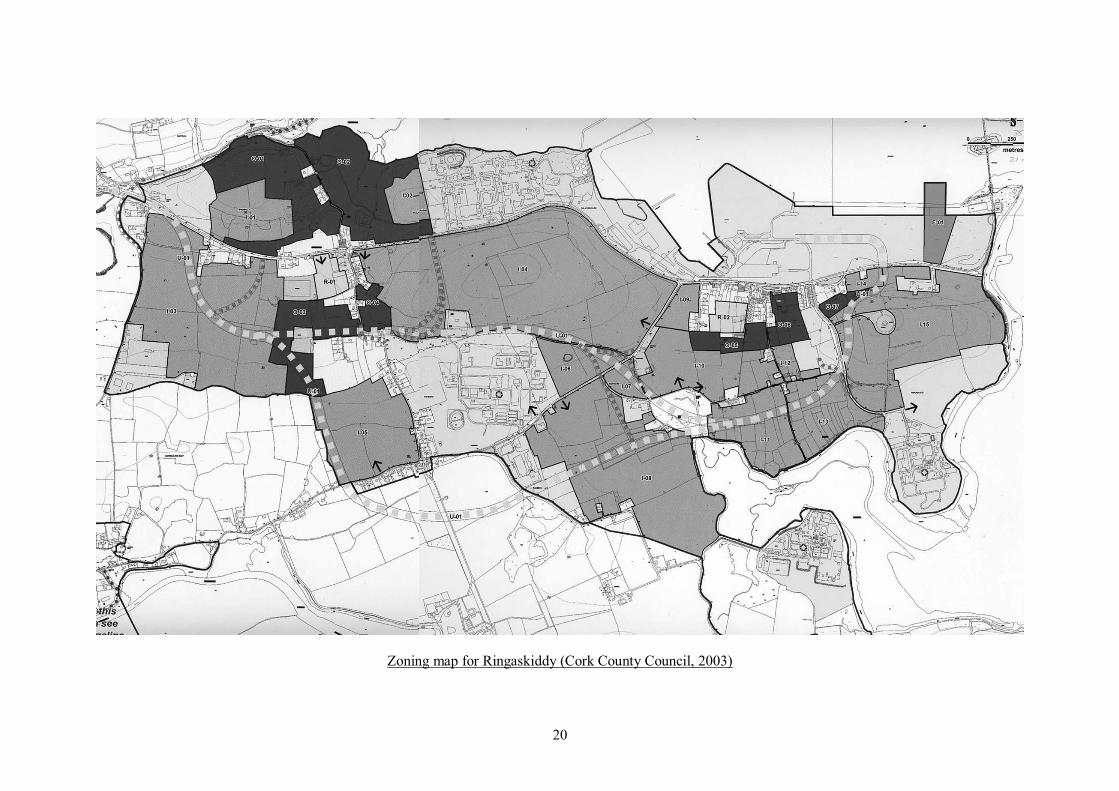
No sensitivity analysis has been performed to determine the effects of land zonings in the
County Development Plan on wind dispersion co-efficients determined by land use. Zonings illustrated at the end of this section are expected to be achieved by 2011.
No sensitivity analysis has been performed to determine the effects of the increase in
population planned for Cobh, Rushbrooke and Crosshaven.
A reasonable recommendation is made by the New Zealand Ministry for the
Environment:
Ministry for the Environment, New Zealand (Good Practice Guide for Atmospheric
Dispersion Modelling, 2004)
Where the surrounding area may have an equal mix of both urban and rural land use, the model should be run using both options. The actual effects are likely to be somewhere
between the two.
3.3.2 Regulatory default option
Although it is not specified within the EIS, examination of the air modelling input files
indicated that all ISCST3 modelling was done with the regulatory default option.
Significant implications of using the default option are that:
o all wind speeds registered in the input meteorological file as being less than 1
m.s-1
are considered to be 1 m.s-1
o effects of wind velocity turbulent fluctuations are ignored
o temperature gradients caused by proximity to major water body are ignored
o vertical gradients and/or discontinuities in the vertical profiles of meteorological variables are often significant in complex terrain (USEPA, 2000)
19
USEPA (Guidelines on Air Quality Models, 2003)
Gradual plume rise is generally recommended when its use is appropriate: (1) In complex
terrain screening procedures to determine close-in impacts and (2) when calculating the
effects of building wakes.
3.3.3 Emission rate
Running ISCST3 with a united emission rate of 1.0 g.s-1, is as recommended by the
USEPA
The combining of two flues within a single model run is not recommended by the
USEPA, particularly when each flue is connected to an entirely distinct combustion
facility.
This is important, particularly as only Phase 1 of the proposed incinerator element of the
project has obtained planning permission.
USEPA (Human Health Risk Assessment Protocol, 1998)
For facilities with multiple stacks or emission sources, each source must be modelled
separately. The key to not allowing more than one stack in a single run is the inability to
estimate stack-specific risks, which limits the ability of a permitting agency to evaluate which stack is responsible for the resulting risks.
20
Zoning map for Ringaskiddy (Cork County Council, 2003)

21
Zoning map for Cobh (Cork County Council, 2003)

22
\
SECTION 5: INFORMATION INPUT
5.1 General approach
1. Input own source data 2. Input background source data
3. Input parameter data from each source
4. Input terrain data 5. Input receptor data
5.2 Information input into ISCST3 model for Ringaskiddy waste management facility
5.2.1 Own source data
The following parameters were input for flues from both Phase 1 and Phase 2:
o Source description
o Contaminant emission rate
o Stack height o Temperature of stack release
o Exit velocity
o Internal stack diameter
Separate model runs were made for each contaminant under study for different loadings
of the incinerators (maximum, typical, 50% of maximum)
Under maximum operating conditions, contaminants were assumed to have a discharge
concentration equal to the limits of Directive 2000/76/EC.
Discharge concentration for Cd and Tl were based on two Indaver incinerators
operational in Belgium.
Maximum operating conditions were assumed to be 1.1 times design operating
conditions.
Indaver Ireland (Ringaskiddy Waste Management Facility Environmental Impact
Statement, 2001)
Maximum operating conditions will be 1.1 times typical operating conditions. Both these
above conditions, in addition to 50% loading, were modelled in order to confirm that the worst-case operating conditions were being modelled.
In relation to cadmium … modelling has been carried out at concentrations which would be considered upper levels based on existing similar waste management facilities.
5.2.2 Background source data
The same range of parameters were input for local industry with a similar sphere of
influence
23
Industries chosen were Pfizer, Novartis, Warner-Lambert, SmithKline Beecham, Aghada
(ESB) and ADM.
5.2.3 Parameter data
Building heights and widths for all sources were input.
For contaminants to be released in either the vapour or particulate phases, or both,
partitioning was evaluated:
o PCDD/F congeners were identified from a USEPA-published dioxin inventory. o Particle diameter was evaluated from standard USEPA tables
o Fractional distribution for the more volatile contaminants was calculated by
inputting standard USEPA surface area weighting distributions o Fractional distribution for contaminants of low volatility was calculated by
inputting standard USEPA mass fraction distributions
o Particle density was input for each particle size
o For wet precipitation model runs, scavenging co-efficients for distributed particles. Co-efficient values input were as recommended by ISCST3 (USEPA,
1995).
Indaver Ireland (Ringaskiddy Waste Management Facility, Environmental Impact
Statement, 2001)
In the absence of a site-specific particle-size distribution, a generalised distribution
recommended by the USEPA has been outlined… This distribution is suitable as a default for some combustion facilities equipped with either electrostatic precipitators or fabric filters.
[For PCDD/Fs and Hg] the particles are apportioned based on the fraction of available
surface area.
When modelling heavy metals (except Hg) the mass weighting rather than surface weighting
is used for deposition …
5.2.4 Terrain data
Although the EIS states that detailed terrain has been mapped into the ISCST3 model, no
terrain pathway is evident within the modelling code.
Indaver Ireland (Ringaskiddy Waste Management Facility, Environmental Impact
Statement, 2001)
Detailed terrain has been mapped into the model. The site is located adjacent to a hill which
is directly to the south of the plant. The surrounding area to the west and north is characterised by generally gentle changes in terrain which have been mapped into the model
out to a radius of 10 km with the site at the centre.
24
5.2.5 Receptor data
A near-field Cartesian grid was input into the model, extending to 6 km x 6 km and with
x and y co-ordinates at 100 m spacings.
A second Cartesian grid was overlaid on the first. This extended to 20 km x 20 km, with
x and y co-ordinates at 500 m spacings.
Terrain elevation at each of the nodes on both grids were specified.
The site was placed at the centre of both Cartesian grids.
Receptors and their associated elevations were placed at 100 m intervals along the site
boundary.
Co-ordinates for the most sensitive receptor locations, e.g. the nearest house, were input
into the file together with their associated elevations.
A flagpole height of 1.8 m was set for all receptors.
Indaver Ireland (Ringaskiddy Waste Management Facility, Environmental Impact
Statement, 2001)
Two nested receptor grids were identified at which concentrations would be modelled. The first grid extended to 6,000 m base on a Cartesian grid with the site at the centre.
Concentrations were calculated at 100 m intervals. The second grid extends to 20000 m
based on a Cartesian grid with the site at the centre. Concentrations were calculated at 500 m intervals. In addition, boundary receptors were placed along the boundary of the site.
5.3 Issues arising
5.3.1 Sizing and weighting of metal particulates
Standard USEPA particle size distribution data were used to evaluate emissions of non-
volatile heavy metals.
As the EIS claims Indaver to have both flue gas cleaning systems and incineration units
similar to those proposed for Ringaskiddy, then USEPA advice would be that emissions
from these comparable facilities would be used to determine real particle size distribution.
Indaver Ireland (Ringaskiddy Waste Management Facility, Environmental Impact
Statement, 2001)
Indaver Ireland has several flue gas cleaning systems similar to that proposed in the current
scheme in operation in Belgium.
In relation to cadmium (Cd) and nickel (Ni) and arsenic (As), modelling has been carried out
at concentrations which would be considered upper levels based on existing similar Waste
Management Facilities. Data is available from two similar Indaver sites in Belgium indicating low emission levels of these metals and thus the modelled emission scenarios
would be considered conservative upper emission levels.
25
USEPA (Human Health Risk Assessment Protocol, 1998)
USEPA OSW recommends that existing facilities perform stack tests to identify particle size
distribution. These data should represent actual operating conditions for the combustion unit and air pollution control device that remove particulate from the stack gas. A table of
particle size distribution data should be prepared using stack test data …
5.3.2 Comparison with existing Indaver sites
Emission rates for Cd, Ni and As were compared to “similar” Indaver sites in Belgium
and were found to be a conservative estimate.
Separate modelling for Ni and As was carried out at concentrations equivalent to upper-
level based on data from two
Emission rates for these compounds are directly related to particle size distribution.
Factors influencing particle size distribution have been identified by the USEPA.
Two “similar” incinerator sites in Belgium are those at Antwerp and Beveren.
o Antwerp: 2 rotary kilns burning industrial and hazardous waste (at the time of
EIS preparation) o Beveren: 2 grate incinerators burning municipal solid waste and sludge (at the
time of EIS preparation).
USEPA (Human Health Risk Assessment Protocol, 1998)
The distribution of particulate by particle diameter will differ from one combustion process to
another and is greatly dependent on (1) the type of furnace, (2) the design of the combustion chamber, (3) the composition of the feed fuel, (4) the particulate removal efficiency, (5) the
design of the APCs, (6) the amount of air … that is used to sustain combustion, and (7) the
temperature of combustion.
If these two facilities are not sufficiently similar to that proposed for Ringaskiddy to use
to determine real particle size distribution, then nor are they a suitable base for
determining predicted heavy metal releases from the proposed Ringaskiddy plant.
5.3.3 Particulate distribution of Cd
Surface area weighting distribution rather than mass weighting distribution was used in
error in modelling the emissions for Cd.
5.3.4 Particulate deposition modelling of metals (other than Hg, Cd and Tl)
The sum of Sb, As, Pb, Cr, Co, Cu, Mn, Ni and V was modelled with a limit value equal
to the maximum permitted under Directive 2000/76/EC.
Bearing in mind the metal exceedences evidenced in the background study, additional
model runs should have evaluated predicted emissions of these metals individually. They
should then have been compared to the relevant ambient air standard/guideline.
26
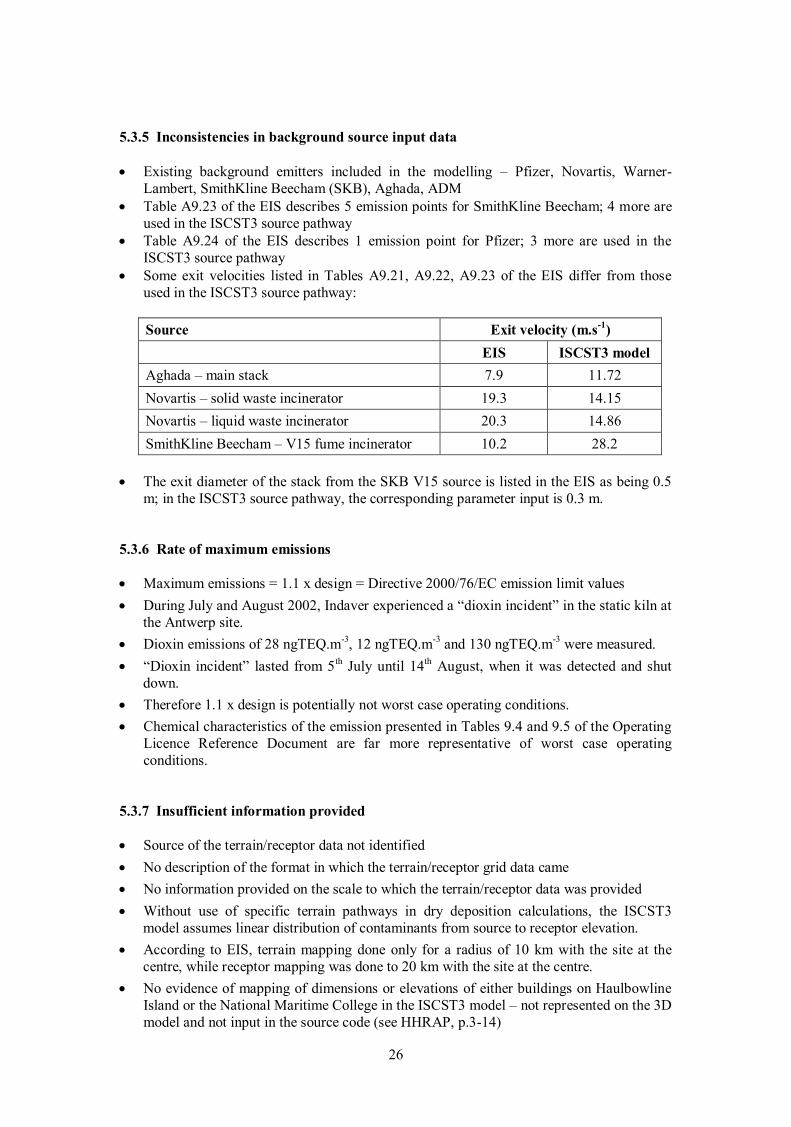
5.3.5 Inconsistencies in background source input data
Existing background emitters included in the modelling – Pfizer, Novartis, Warner-
Lambert, SmithKline Beecham (SKB), Aghada, ADM
Table A9.23 of the EIS describes 5 emission points for SmithKline Beecham; 4 more are
used in the ISCST3 source pathway
Table A9.24 of the EIS describes 1 emission point for Pfizer; 3 more are used in the
ISCST3 source pathway
Some exit velocities listed in Tables A9.21, A9.22, A9.23 of the EIS differ from those
used in the ISCST3 source pathway:
Source Exit velocity (m.s-1
)
EIS ISCST3 model
Aghada – main stack 7.9 11.72
Novartis – solid waste incinerator 19.3 14.15
Novartis – liquid waste incinerator 20.3 14.86
SmithKline Beecham – V15 fume incinerator 10.2 28.2
The exit diameter of the stack from the SKB V15 source is listed in the EIS as being 0.5
m; in the ISCST3 source pathway, the corresponding parameter input is 0.3 m.
5.3.6 Rate of maximum emissions
Maximum emissions = 1.1 x design = Directive 2000/76/EC emission limit values
During July and August 2002, Indaver experienced a “dioxin incident” in the static kiln at
the Antwerp site.
Dioxin emissions of 28 ngTEQ.m-3, 12 ngTEQ.m
-3 and 130 ngTEQ.m
-3 were measured.
“Dioxin incident” lasted from 5th July until 14
th August, when it was detected and shut
down.
Therefore 1.1 x design is potentially not worst case operating conditions.
Chemical characteristics of the emission presented in Tables 9.4 and 9.5 of the Operating
Licence Reference Document are far more representative of worst case operating
conditions.
5.3.7 Insufficient information provided
Source of the terrain/receptor data not identified
No description of the format in which the terrain/receptor grid data came
No information provided on the scale to which the terrain/receptor data was provided
Without use of specific terrain pathways in dry deposition calculations, the ISCST3
model assumes linear distribution of contaminants from source to receptor elevation.
According to EIS, terrain mapping done only for a radius of 10 km with the site at the
centre, while receptor mapping was done to 20 km with the site at the centre.
No evidence of mapping of dimensions or elevations of either buildings on Haulbowline
Island or the National Maritime College in the ISCST3 model – not represented on the 3D
model and not input in the source code (see HHRAP, p.3-14)

27
USEPA (Human Health Risk Assessment Protocol, 1998)
Recommended Information for Risk Assessment Report:
Summary of all information regarding the co-ordinates and placement of the receptor
grid node array.
Copies of any maps, figures or aerial photographs used to develop the receptor grid node
array
Map showing locations of receptor grid nodes …

28
SECTION 6: METEOROLOGICAL INPUT
Meteorology is one of the most important parameters in determining the dispersion of
pollutants because it is the primary factor determining the diluting effect of the atmosphere.
6.1 General approach
1. Choose suitable meteorological data taken at a representative monitoring site.
2. Identify meteorological information required by model. 3. Identify meteorological information required by pre-processor
4. Calculate various parameters
5. Input meteorological information
6.2 Modelling for the Ringaskiddy Waste Management Facility
6.2.1 Choice of monitoring site
Monitoring site chosen was the Met Eireann station at Cork Airport.
Data collected at the closer station of Roches Point was incomplete and in a format
unsuitable for insertion into the model.
Comparison of wind speeds and wind directions made between Cork Airport and Roches
Point.
Indaver Ireland (Ringaskiddy Waste Management Facility Environmental Impact
Statement, 2001)
Cork Airport is the nearest suitable meteorological station to the site and thus the weather
pattern experienced would be expected to be similar to the current site.
6.2.2 Input of meteorological data
Hourly values of the following meteorological parameters were identified as being
required by ISCST3:
o Wind direction (deg)
o Wind speed (m.s-1
) o Dry bulb temperature (K)
o Opaque cloud cover (tenths)
o Cloud ceiling height (m) o Surface pressure (mb)
o Precipitation amount (mm)
o Precipitation type (liquid or frozen)
Daily values of the following meteorological parameters were identified as being required
by ISCST3:
o Morning mixing height (m)
o Afternoon mixing height (m)
29
The following parameters were also identified as being required for the PCRAMMET
pre-processor:
o Monin-Obukhov length o Surface roughness length
o Noon time albedo
o Bowen ratio
o Fraction of net radiation absorbed at surface
All hourly meteorological parameters required are measured routinely at Cork Airport.
Relevant meteorological data was obtained for the years 1993 – 1997 inclusive.
Mixing heights are not measured at Cork Airport and were calculated by Indaver.
Indaver Ireland (Ringaskiddy Waste Management Facility Environmental Impact
Statement, 2001)
Mixing height measurements by radiosonde are only carried out by Met Eireann in Valentia and therefore the mixing heights used in this study have been inferred for each hour from the
fore-mentioned parameters.
Surface roughness length, noon-time albedo and Bowen ratio were calculated by Indaver.
All model runs were made using meteorological data from 1995 only.
Indaver Ireland (Ringaskiddy Waste Management Facility Environmental Impact
Statement, 2001)
The worst case year leads to annual average concentrations which are 30% higher than the five-year average. The year of meteorological data for the years between 1993 and 1997 that
gave rise to the highest predicted ground level concentrations of nitrogen dioxide has been
reported in this study (Year 1995).
6.3 Issues arising
According to the New Zealand Ministry of the Environment, lack of appropriate
meteorological information is often the single most important limiting factor in modelling accuracy.
6.3.1 Choice of meteorological station
Selection of the meteorological database is one of the most important decisions in
preparing to undertake an air dispersion model.
Factors which cause variations in meteorological conditions should be similar at both the
meteorological site and the site of application.

30
Meteorological data should be representative of conditions affecting the transport and
dispersion of pollutants in the area of interest as determined by the locations of the
sources and receptors being modelled (USEPA, 2000).
Cork Airport Indaver site
Simple terrain Complex terrain
Elevated site (104 mOD) Site at sea level (5.77 mOD)
Primarily agricultural land use Mix of agricultural, industrial and urban land uses
No adjacent water bodies Adjacent to major water body
Site characteristics Meteorological parameters affected
Terrain type Horizontal and vertical wind speed, horizontal and vertical wind stability, wind direction and
deflection, eddy formation, precipitation, stability
Height disparity Wind speed, precipitation, temperature, stability
Surrounding land use Surface roughness, mixing height, albedo, Bowen
ratio, Monin-Obukhov length
Proximity to water body Land-sea breeze formation, wind direction and speed, eddy formation, temperature, stability,
surface roughness, mixing height, albedo, Bowen
ratio, Monin-Obukhov length
Ground level concentrations of contaminants controlled by:
o Wind direction and speed
o Precipitation amount and type
o Cloud cover o Frequency of calms
1961 – 1990 Roches Point1
Cork Airport1
Mean monthly wind speed (knots) 12.2 11.1
Maximum gust (knots) 86 94
Mean no. of days with gales 33.3 16.4
Mean monthly rainfall total (mm) 935.7 1194.4
Mean no. of days with 0.2 mm 184 204
Mean no. of days with 5.0 mm 63 75
Mean no. of days with snow or sleet 8.7 16.4
Mean daily duration of sunshine 3.91 3.8
Mean no. of days with no sun 63 69
Occurrence of Stability Class G (%) 5.02
1.7
1 30-year average readings taken by Met Eireann 2 Cork County Council Chief Fire Officer (An Bord Pleanála Oral Hearing, September, 2003)
31
Unique meteorological conditions associated with local breeze circulations at coastal
locations. Considered by USEPA to warrant special consideration (USEPA, 2000)
Steady-state Gaussian-plume models such as ISCST3 require meteorology from a single
surface station. They assume that the single station data are applicable to the whole
modelling domain up to the top of the boundary layer and that conditions do not vary with
height.
USEPA (Guideline on Air Quality Models, 2003)
The representativeness of the data is dependent on: (1) The proximity of the site to the area
under consideration; (2) the complexity of the terrain; (3) the exposure of the meteorological monitoring site; (4) the period of time during which data are collected.
Site specific meteorological data are critical to dispersion modelling in complex terrain …
USEPA (Meteorological Monitoring Guidance for Regulatory Applications, 2000)
Sites should be selected such that factors which cause spatial variations in meteorological
conditions are invariant over the spatial domain of that application … Such factors would
include surface characteristics such as ground cover, surface roughness, the presence or absence of water bodies, etc.
6.3.2 Treatment of calms
A calm is a period where there is little or no air movement, i.e. when the atmosphere is at
its most stable. Includes conditions of inversion, fumigation and stagnation.
Generally periods during which pollution dispersion is worst.
Atmospheric stability is measured using Pasquill-Gifford indices.
Pasquill-Gifford indices calculated at Cork Airport.
Stability Class G not mentioned anywhere in Ringaskiddy Waste Management Facility
Environmental Impact Statement.
No distribution of Pasquill-Gifford classes presented in Ringaskiddy Waste Management
Facility Environmental Impact Statement, despite their importance to the ISCST3 model.
For steady-state models such as ISCST3, Stability Classes F and G are combined and
considered as category F.
Meteorological data pre-processed by PCRAMMET for input to ISCST3 may either be in
binary or ASCII format. If the former, PCRAMMET will set any wind speed identified
as being zero to 1.0 m.s-1
. If the data is in ASCII format, PCRAMMET does not modify wind speeds having a value of zero. Some of the meteorological files used in modelling
the Ringaskiddy waste management facility are in ASCII format, while others are in
binary.
Where maximum concentrations are predicted for low wind speeds, local meteorological
monitoring is highly desirable (New Zealand Ministry for the Environment, 2004).
32
USEPA (Guideline on Air Quality Models, 2003)
It is recommended that the P-G stability category be estimated using the Turner method with
site-specific wind speed … and representative cloud cover and ceiling height.
6.3.3 Mixing heights
Height of the atmospheric layer adjacent to the ground within which a contaminant is
uniformly mixed.
Critical parameter – guides to the pollution potential of an area.
Most accurate when obtained from radiosonde.
For this assessment, mixing heights calculated using parameters of atmospheric stability,
albedo, wind speed and surface roughness.
Should always be calculated using surface data and upper air data from the same site. No
description given in EIS of how mixing height calculations were carried out.
No indication in EIS of the year used to calculate mixing height.
Dispersion model predictions can be highly sensitive to changes in mixing height.
USEPA (Human Health Risk Assessment Protocol, 1998)
… USEPA OSW recommends that the selection of representative mixing height and surface
data be approved by the appropriate regulatory agency before preprocessing or air
modelling is conducted.
6.3.4 Wind speed and direction
Wind speed and wind direction are two of the most critical parameters in any air
dispersion model but particularly so in ISCST3.
ISCST3 model results at particular receptor locations are often quite sensitive to the
transport wind direction. (USEPA, 1995)
Gradients and discontinuities in the vertical profiles of meteorological measurements are
often significant in complex terrain.
Uncertainty of 5 – 10 degrees in the measured wind direction which transports the plume
can result in concentration errors of 20 – 70% for a particular time and location,
depending on stability and station location (USEPA, 2000)
ISCST3 model runs for this study were made without any wind direction alignment
(rotation correction factor).
USEPA (Guideline on Air Quality Models, 2003)
For simulation of plume rise and dispersion of a plume emitted from a stack, characterisation
of the wind profile up through the layer in which the plume disperses is required. This is
especially important in complex terrain and/or complex wind situations.

33
USEPA (Meteorological Monitoring Guidance for Regulatory Applications, 2000)
Measurements of the meteorological variables affecting transport and dispersion of a plume
(wind direction, wind speed and sigma) should be made at multiple levels [for sites in complex terrain] in order to ensure that data used for modelling are representative of
conditions at plume level.
For use in plume rise calculations [in complex terrain], wind speed should be measured at stack top … a 10 m tower generally will not be sufficient.
6.3.5 Bowen ratio
A measure of the amount of moisture at the surface of the earth.
Important because it affects the heat balance resulting from evaporative cooling and,
consequently, the Monin-Obukov length.
Calculated by Indaver for wet conditions.
USEPA advises specific co-efficients for calculations in climates such as that in Ireland.
USEPA (Human Health Risk Assessment Protocol, 1998)
For areas where annual rainfall is greater than 20 inches, USEPA OSW recommends a single
Bowen ratio value of 2.0 for urban areas and 0.7 for rural forests, grasslands and cultivated
lands.
6.3.6 Pre-modelling approval
No evidence documented within the EIS of any consultation or approval taken in the
calculation or assignment of important meteorological parameters.
USEPA (Human Health Risk Assessment Protocol, 1998)
[Surface roughness at the measurement site] should be considered in discussions with the appropriate agency modeller prior to air modelling.
The computed value of surface roughness height for the application site, along with maps or photographs illustrating land use, must be approved by the appropriate agency prior to use.
The permitting authority should review proposed values [of noon-time albedo] used in the processing of the meteorological data.
6.3.7 Lack of information provided
34
The EIS fails to identify values assigned to certain specific meteorological parameters:
Don’t know what the Monin-Obukhov length value is. Important, because it is a measure
of atmospheric stability. But if a value for agricultural land is entered, the turbulence
associated with air movements in the Inner Harbour will be lost.
Surface roughness at measurement site not mentioned. According to the USEPA
(USEPA, 2000), this parameter is important.
Significant failure to provide raw data and derivations/calculations of meteorological data
as required by the USEPA.
USEPA (Human Health Risk Assessment Protocol, 1998)
Recommended information for risk assessment report:
Identification of all sources of meteorological data
Electronic copy of the ISCST3 input code used to enter meteorological information
Description of he selection criteria and process used to identify representative years used
for meteorological data
Summary of the procedures used to compensate for any missing data
Missing or invalid data should be flagged or replaced as appropriate.
35
SECTION 7: RESULTS
7.1 General approach
1. Establish ambient concentrations of modelled parameters in local environment
2. Present model output for all modelled parameters
3. Present final predicted concentrations of modelled parameters in local environment 4. Examine final results to see if realistic
7.2 Results for the Ringaskiddy Waste Management Facility
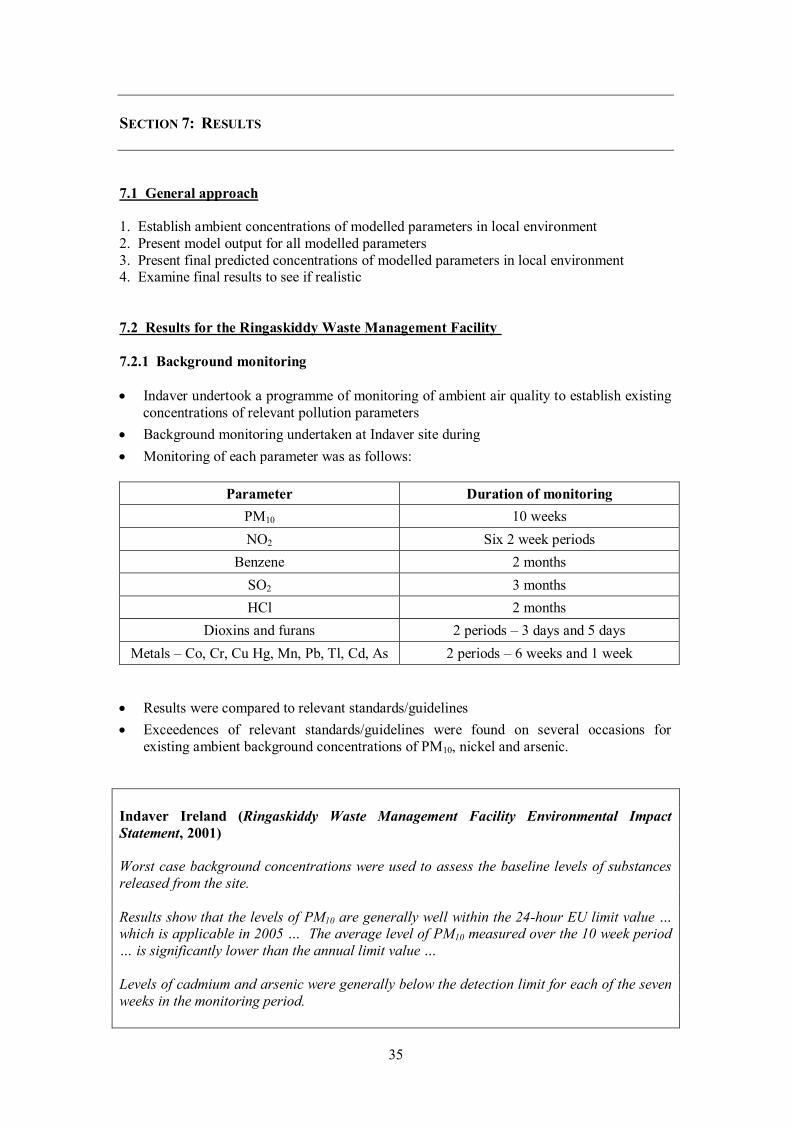
7.2.1 Background monitoring
Indaver undertook a programme of monitoring of ambient air quality to establish existing
concentrations of relevant pollution parameters
Background monitoring undertaken at Indaver site during
Monitoring of each parameter was as follows:
Parameter Duration of monitoring
PM10 10 weeks
NO2 Six 2 week periods
Benzene 2 months
SO2 3 months
HCl 2 months
Dioxins and furans 2 periods – 3 days and 5 days
Metals – Co, Cr, Cu Hg, Mn, Pb, Tl, Cd, As 2 periods – 6 weeks and 1 week
Results were compared to relevant standards/guidelines
Exceedences of relevant standards/guidelines were found on several occasions for
existing ambient background concentrations of PM10, nickel and arsenic.
Indaver Ireland (Ringaskiddy Waste Management Facility Environmental Impact
Statement, 2001)
Worst case background concentrations were used to assess the baseline levels of substances
released from the site.
Results show that the levels of PM10 are generally well within the 24-hour EU limit value … which is applicable in 2005 … The average level of PM10 measured over the 10 week period
… is significantly lower than the annual limit value …
Levels of cadmium and arsenic were generally below the detection limit for each of the seven
weeks in the monitoring period.

36
Indaver Ireland (Ringaskiddy Waste Management Facility Environmental Impact
Statement, 2001)
Background levels of nickel were detected at or above the proposed ambient air quality standard during the monitoring period. Although a source of heavy metals may have been
present during the monitoring period, future projections of emissions in the region did not
identify any significant sources of Ni … Thus it may be expected that background levels of
this compound are likely to be minor during operations of Indaver Ireland.
7.2.2 Presentation of modelling results
Tabular output for all modelled pollution parameters.
Presented in concentration (mg.m-3
) and as an emission rate (g.s-1
)
Presented for three modelled scenarios for most parameters – maximum, design and 50%
of maximum
Predicted PCDD/F deposition flux compared to measured levels in places other than
Ringaskiddy.
Combined metals (except Cd and Tl) compared to most limiting metal standard for both
maximum and typical operating conditions.
Predicted concentrations of modelled pollution parameters compared against the relevant
standard/guideline, taking existing background concentrations into account.
Indaver Ireland (Ringaskiddy Waste Management Facility Environmental Impact
Statement, 2001)
Modelling results indicate that the ambient ground level concentrations are below the relevant air quality standards or guidelines for all compounds under both typical and
maximum operations of the site. The modelling results indicate that this maximum occurs at
or near the site’s southern boundary.
The results indicate that the impact from Indaver Ireland is minor and limited to the
immediate environs of the site.
7.2.3 Examination of modelling results
Concentration contours beyond the site boundary – concentrations expressed as a % of
the relevant ambient air quality standard/guideline.
37
Indaver Ireland (Ringaskiddy Waste Management Facility Environmental Impact
Statement, 2001)
In the surrounding main population centres, Ringaskiddy, Cobh, Monkstown, Carrigaline and
Crosshaven, levels are significantly lower than background sources with the concentrations of emissions at Indaver Ireland accounting for less than 2% of the annual limit values for all
pollutants.
In relation to the maximum one-hour limit value, … modelling results indicate that the ambient ground level concentrations are below these ambient standards under both typical
and maximum operating conditions at or beyond the site boundary. Thus no adverse
environmental impact is envisaged to occur under these conditions at or beyond the site boundary.
7.3 Issues arising
7.3.1 Duration of background monitoring
The duration of the baseline monitoring study was too short and not in compliance with
USEPA requirements.
USEPA (Prevention of Significant Deterioration and Nonattainment Area Permitting,
1990)
Pre-application data generally must be gathered over a period of at least 1 year and the data
are to represent at least the 12 month period immediately preceding receipt of the PSD
application … The permitting agency has discretion to accept data collected over a shorter period of time (but in no case less than 4 months) if a complete and adequate analysis can be
accomplished with the resulting data.
7.3.2 Exceedences of parameters detected in ambient air
Concentrations of PM10 measured to be in excess of the relevant standards on three days
out of the 10 week monitoring period. One exceedence was 24% in excess of the limit
value.
With exceedences of this magnitude, no justification for calculating baseline as an annual
average represented by this 10 week period.
Measured concentrations of nickel in ambient air much higher than limit value in every
week of the six week monitoring period.
Exceedences of this magnitude cannot be ignored without further ambient testing.
Levels of arsenic could be confirmed as exceeding the limit value during the monitoring
period. This particular exceedence was more than 7 times the limit value.
Exceedences of this magnitude cannot be ignored without further ambient testing.
38
7.3.3 Detection limits of monitoring
The lowest limit of detection for arsenic in ambient air was more than three times the
limit value.
The lowest limit of detection for cadmium was more than 2.5 times the limit value.
7.3.4 Examination of results
Please see table at end of this section.
The concentration contours do not make sense:
- Peak concentrations should occur very near the source for low-level emissions. This
is a 55 m stack with a plume which is driven by momentum and buoyancy. - For taller stacks, peaks should occur further downwind.
- Peaks should be experienced on terrain features as plumes impinge on them.
No sensitivity analysis has been performed. Considered essential to getting a feel for the
accuracy of the model
No indication is given of what meteorological conditions give rise to peak concentrations.
Peak concentrations should be expected from tall stacks during convective or fumigation
conditions. No indication is given of concentrations of emitted pollutants during such
meteorological conditions.
No analysis made to determine whether pollution “events” may result.
USEPA (Guideline on Air Quality Models, 2003)
… Sensitivity analyses are encouraged since they can provide additional information on the effect of inaccuracies in the databases and on the uncertainty in model estimates … Where
possible, information from such sensitivity analyses should be made available to the decision-
maker with an appropriate interpretation of the effect on the critical concentrations.
39
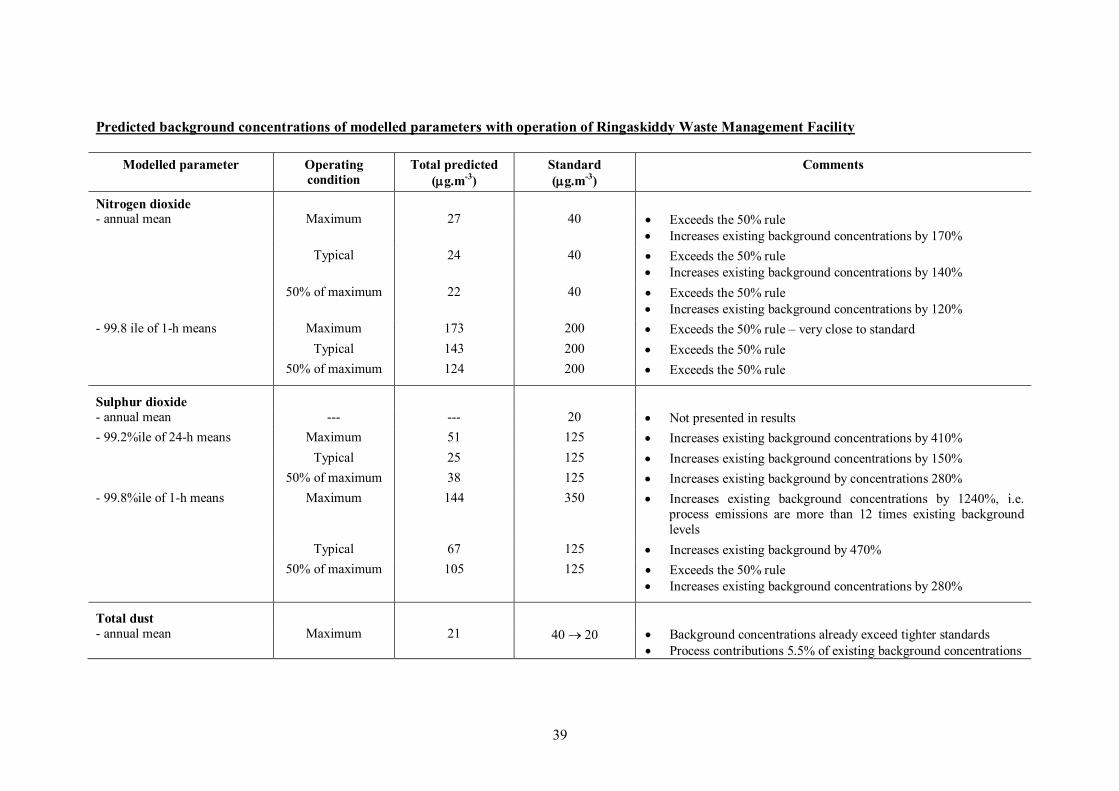
Predicted background concentrations of modelled parameters with operation of Ringaskiddy Waste Management Facility
Modelled parameter Operating
condition
Total predicted
(g.m-3
)
Standard
(g.m-3
)
Comments
Nitrogen dioxide - annual mean Maximum 27 40 Exceeds the 50% rule
Increases existing background concentrations by 170%
Typical 24 40 Exceeds the 50% rule
Increases existing background concentrations by 140%
50% of maximum 22 40 Exceeds the 50% rule
Increases existing background concentrations by 120%
- 99.8 ile of 1-h means Maximum 173 200 Exceeds the 50% rule – very close to standard
Typical 143 200 Exceeds the 50% rule
50% of maximum 124 200 Exceeds the 50% rule
Sulphur dioxide
- annual mean --- --- 20 Not presented in results
- 99.2%ile of 24-h means Maximum 51 125 Increases existing background concentrations by 410%
Typical 25 125 Increases existing background concentrations by 150%
50% of maximum 38 125 Increases existing background by concentrations 280%
- 99.8%ile of 1-h means Maximum 144 350 Increases existing background concentrations by 1240%, i.e.
process emissions are more than 12 times existing background
levels
Typical 67 125 Increases existing background by 470%
50% of maximum 105 125 Exceeds the 50% rule
Increases existing background concentrations by 280%
Total dust
- annual mean Maximum 21 40 20 Background concentrations already exceed tighter standards
Process contributions 5.5% of existing background concentrations

40
Existing environment cannot accommodate further PM10
Predicted background concentrations of modelled parameters with operation of Ringaskiddy Waste Management Facility (continued)
Modelled parameter Operating
condition
Total predicted
(g.m-3
)
Standard
(g.m-3
)
Comments
Typical 20 40 20 Background concentrations already at tighter standards
Process contributions 2% of existing background concentrations
Existing environment cannot accommodate further PM10
50% of maximum 21 40 20 Background concentrations already exceed tighter standards
Process contributions 4% of existing background concentrations
Existing environment cannot accommodate further PM10
- 90.5%ile of 24-h means Maximum 24 50 Process contributions 20% of existing background concentrations
Typical 20.4 50 Process contributions very low
50% of maximum 22 50 Process contributions very low
Carbon monoxide
- Maximum 8h Maximum 0.66 10 Process contributions 32% of existing background concentrations
Typical 0.53 10
50% of maximum 0.61 10 Process contributions 22% of existing background concentrations
Total Organic Carbon
- 98%ile of 1-h means Maximum 218 1000 (Class III)
Typical 202 1000 (Class III)
50% of maximum 212 1000 (Class III)
Hydrogen chloride
- 98%ile of 1-h means Maximum 19 100 Process contribution increases existing background concentration by a factor of 36
Typical 2.7 100 Process contribution more than doubles existing background
concentration
50% of maximum 13 100 Process contribution increases existing background concentration
41
by a factor of 36
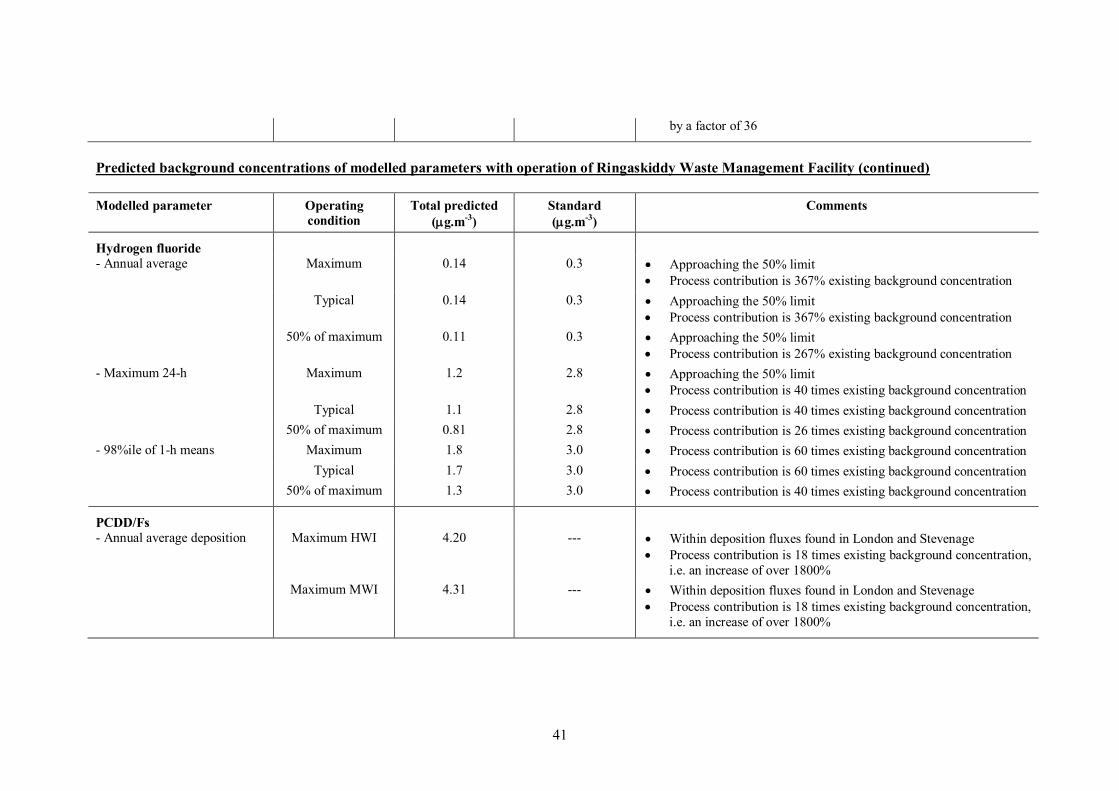
Predicted background concentrations of modelled parameters with operation of Ringaskiddy Waste Management Facility (continued)
Modelled parameter Operating
condition
Total predicted
(g.m-3
)
Standard
(g.m-3
)
Comments
Hydrogen fluoride
- Annual average Maximum 0.14 0.3 Approaching the 50% limit
Process contribution is 367% existing background concentration
Typical 0.14 0.3 Approaching the 50% limit
Process contribution is 367% existing background concentration
50% of maximum 0.11 0.3 Approaching the 50% limit
Process contribution is 267% existing background concentration
- Maximum 24-h Maximum 1.2 2.8 Approaching the 50% limit
Process contribution is 40 times existing background concentration
Typical 1.1 2.8 Process contribution is 40 times existing background concentration
50% of maximum 0.81 2.8 Process contribution is 26 times existing background concentration
- 98%ile of 1-h means Maximum 1.8 3.0 Process contribution is 60 times existing background concentration
Typical 1.7 3.0 Process contribution is 60 times existing background concentration
50% of maximum 1.3 3.0 Process contribution is 40 times existing background concentration
PCDD/Fs
- Annual average deposition
Maximum HWI 4.20 --- Within deposition fluxes found in London and Stevenage
Process contribution is 18 times existing background concentration,
i.e. an increase of over 1800%
Maximum MWI 4.31 --- Within deposition fluxes found in London and Stevenage
Process contribution is 18 times existing background concentration,
i.e. an increase of over 1800%

42
Mercury
- Annual average Maximum 0.0166 – 0.023 0.1 If existing background concentrations taken as being in lower
range, then process contributions are double background levels.
Predicted background concentrations of modelled parameters with operation of Ringaskiddy Waste Management Facility (continued)
Modelled parameter Operating
condition
Total predicted
(g.m-3
)
Standard
(g.m-3
)
Comments
Typical 0.0086 – 0.020 0.1 If existing background concentrations taken as being in lower
range, then process contributions increase background levels by
over 40%.
Sum of Sb, As, Pb, Cr, Co,
Cu, Mn, Ni and V
- Annual average Maximum 0.079 – 0.082 0.15 (limit for Mn) Metals analysed cumulatively rather than individually
Exceeds the 50% limit
Process contribution more than doubles background concentration
Typical 0.053 – 0.056 0.15 (limit for Mn) Metals analysed cumulatively rather than individually
Process contribution increases background concentration by 75%
- Maximum 1-h Maximum 1.43 – 1.44 5.0 (limit for Sb) Metals analysed cumulatively rather than individually
Will increase background concentrations by 85 – 159 times
Typical 0.68 – 0.69 5.0 (limit for Sb) Metals analysed cumulatively rather than individually
Will increase background concentrations by 40 – 75 times
Cd and Tl
- Annual average Maximum 0.0024 – 0.018 0.005 At 50% limit
At best, process emissions will double existing concentrations
Will increase background concentrations by 1 – 24 times
43
SECTION 8: OTHER MODELS USED IN EVALUATING THE IMPACT OF THE PROPOSED
RINGSKIDDY WASTE MANAGEMENT FACILITY
8.1 AERMOD
8.1.1 Model characteristics
AERMOD was developed in 1995 and formally proposed by the USEPA as a
replacement for ISCST3 in 2000.
Steady-state model which uses Gaussian distributions in the horizontal and vertical for
stable conditions and in the horizontal only for unstable conditions.
In the vertical in unstable conditions, it uses dispersion co-efficients that are not Gaussian
to represent the high concentrations that can be observed close to a stack under
convective conditions.
Superior to ISCST3 in almost every way:
o In stable conditions, it factors wind and temperature changes above stack-top.
o In unstable conditions, it factors in updrafts and downdrafts.
o It creates representative vertical profiles of wind, temperature and turbulence. o Accounts for meteorological changes as the plume travels downwind.
o Surface parameters are more accurately portrayed.
o In stable conditions with a mixing lid, it considers a mechanically mixed layer near the ground.
8.1.2 Model limitations
At present, AERMOD does not allow modelling of either wet or dry gas deposition.
Best applied when steady-state assumptions are applicable to pollutant transport
distances.
Representative meteorological input is a pre-requisite.
Does not consider the effect of lateral flow channelling.
Cannot model fumigation.
USEPA (Guideline on Air Quality Models – Proposed Rule, 2000):
AERMOD is appropriate for the following applications: … Transport distances over which steady-state assumptions are appropriate …
Measured profiles of wind, temperature, vertical and lateral turbulence may be required in certain applications (e.g. in complex terrain) to adequately represent the meteorology
affecting plume transport and dispersion.
Data used as input to AERMET should possess an adequate degree of representativeness to ensure that the wind, temperature and turbulence profiles derived by AERMOD are both
laterally and vertically representative of the source area. The adequacy of input data should
be judged independently for each variable.

44
Valid vertical meteorological profiles cannot be developed without representative
meteorological data.
AERMOD (Description of Model Formulation, USEPA, 2002)
AERMOD captures the effect of flow above and below the dividing streamline by weighting
the plume concentration associated with two possible extreme states of the boundary layer
(horizontal plume and terrain-following). As is discussed below, the relative weighting of the
two states depends on: 1) the degree of atmospheric stability, 2) the wind speed and 3) the plume height relative to terrain.
AERMOD accounts for the vertical variation of meteorology through the use of effective values of wind speed, turbulence, and the Langrangian time scale. Being a steady state
plume model, AERMOD uses a single value of each meteorological variable to represent the
state of the dispersive layer for each modelling period. The effective parameters are
determined by averaging values from the meteorological profile within the layer between the plume’s centre of mass and the receptor.
Still not suitable for very complex terrain conditions.
Still not able to treat fumigation.
Ontario Ministry for the Environment (Proposed Guidance for Air Dispersion Modeling,
2003)
AERMOD may also be inappropriate for some near-field modelling in cases where
the wind field is very complex due to terrain or a nearby shoreline.
AERMOD does not treat the effects of shoreline fumigation.
8.1.3 Application of AERMOD in evaluating emissions from the Ringaskiddy Waste
Management Facility
Same issues arise with application of AERMOD as arise with application of ISCST3.
Lack of data:
o 6 page description
o no indication of the datasets modelled using AERMOD
o no input files presented o no justification of input parameters
o inadequate justification of surface parameters
o no indication of how model was set up
No mention of AERMOD’s inability to model wet and dry particle deposition.
No sensitivity analysis performed.
Calms treatment inadequate for the area under examination.
45
Unrepresentative meteorological data input.
Does not have regulatory approval.
USEPA (7th
Conference on Air Dispersion Modelling, Vol.1, 2000)
Regulatory application of AERMOD requires careful consideration of the representativeness
of the meteorological data to be employed in the analysis.
The area where the meteorological data are collected should have surface characteristics
that are very similar to the surface characteristics in the vicinity of the sources of concern. It
is best, especially in complex terrain situations, if measurements of wind and temperature are available up through the height of the plume above the ground.
Case by case subjective judgements will be required to determine whether or not the
meteorological data available for a particular analysis are adequately representative and evaluation by experienced meteorologists will be necessary.
8.2 SCREEN3
8.2.1 Model characteristics
The original SCREEN model was released by the USEPA in 1988.
Is a screening version of the ICSCT3 model.
Enables users to prepare an initial screening analysis to establish a worst-case estimate of
short-term air quality impacts from a specific source.
Used to analyse single source releases in simple or complex terrain. It uses the VALLEY
algorithm to model in complex terrain.
Does not use hourly meteorological data, but user can input:
o a full meteorological data set that references all stability classes and associated
wind speeds
o single stability category and wind speed combination o single stability category with no wind speed specification. In this case,
SCREEN3 examines all wind speeds appropriate for that stability category.
Its output is a series of tables of highest predicted 1-h concentrations at each receptor
point along with accompanying meteorological conditions. Also outputs hourly values of
plume height as a function of distance from the emission point.
8.2.2 Model limitations
This is a screening model only which is good for preliminary assessments.
Steady-state Gaussian plume model which cannot be used for non-steady state conditions
and which assumes a single wind direction.
SCREEN3 will not consider downwash in any of its modes.
Cavity and fumigation effects can be evaluated only for inland sites.
Fumigation evaluations ignore the effects of elevated terrain.
46
Cannot model for discrete receptors in a complex terrain situation.
The VALLEY screening conditions assumes a wind speed of 2.5 m.s-1
in the stable layer
above the inversion.
8.3.3 Application of SCREEN3 in evaluating emissions from the Ringaskiddy Waste
Management Facility
Same issues as with ISCST3 and AERMOD, except even more so.
Two-page of description and analysis to inform on assessment of what are potentially the
most limiting conditions for pollution dispersion.
Lack of model data:
o No model input data presented
o No identification of source operational load (maximum or rypical)
o No meteorological data presented
o No description of the type of model meteorological input used o No indication of terrain data used
o No identification of contaminants modelled
o No identification of which shoreline is modelled.
No distances to shoreline noted; no identification of the analysed shoreline
No sensitivity analysis performed
USEPA (Screening Procedures for Estimating the Air Quality Impact of Stationary
Sources, 1992)
Sources located within 3 km of a large body of water should be evaluated for shoreline fumigation.
At a minimum, impact estimates should be made with source characteristics representative of
the design capacity (100% load). In addition, the impacts should be estimated based on source characteristics at loads of 50% and 75% of design capacity …
47
9.0 Conclusion
Indaver Ireland (Ringaskiddy Waste Management Facility Environmental Impact
Statement, 2001)
The USEPA has published a series of guidance documents on air emission dispersion
modelling and its methodology was followed in the modelling study for the Ringaskiddy plant.
Air dispersion modelling was used by Indaver to back up its choice of site and to evaluate the
potential impact of its proposed facility on the environment. The EIS claims to have followed USEPA guidance throughout this air dispersion modelling procedure. It did not. Several of
the instances where USEPA advice was either ignored or not followed are fundamental to the
representativeness and accuracy of the air dispersion model. In particular, the choice of model and the source of the meteorological data are not suitable for the inner Cork Harbour
basin.
This air dispersion modelling exercise does not justify Indaver’s disregard of both World Health Organisation and European Commission recommendations in its choice of site for this
proposed facility. Those recommendations were made solely for the purposes of the
protection of human health and the environment.
But protection of human health and the environment are also the obligations of the EPA with
regard to the disposal of waste, statutorily bestowed on them by the Environmental Protection
Agency Act, 1992.
The USEPA, whose guidance in relation to air dispersion modelling has been adopted by our
own EPA, has recognised the risks to human health and the environment from facilities such as those proposed by Indaver for Ringaskiddy. In 1998, it drafted a national guideline on how
the risks from such facilities to human health should be assessed. The Human Health Risk
Assessment Protocol is intended for use by permitting authorities. One of its aims is to present a user-friendly set of procedures for performing risk assessments. It includes
explanation of those procedures and a list of data required if those procedures are to be
carried out. That list of data is presented in the table overleaf. Although this is part of the
USEPA guidance to which it claims to have adhered, much of the required data has not been provided by Indaver. Although the requirement of this data is supposed to be EPA policy, the
data has not been requested.
This data is fundamental to the type of basic assessment of the proposed waste management
facility that the EPA should be carrying out as part of its statutory obligations under the EPA
Act, 1992.
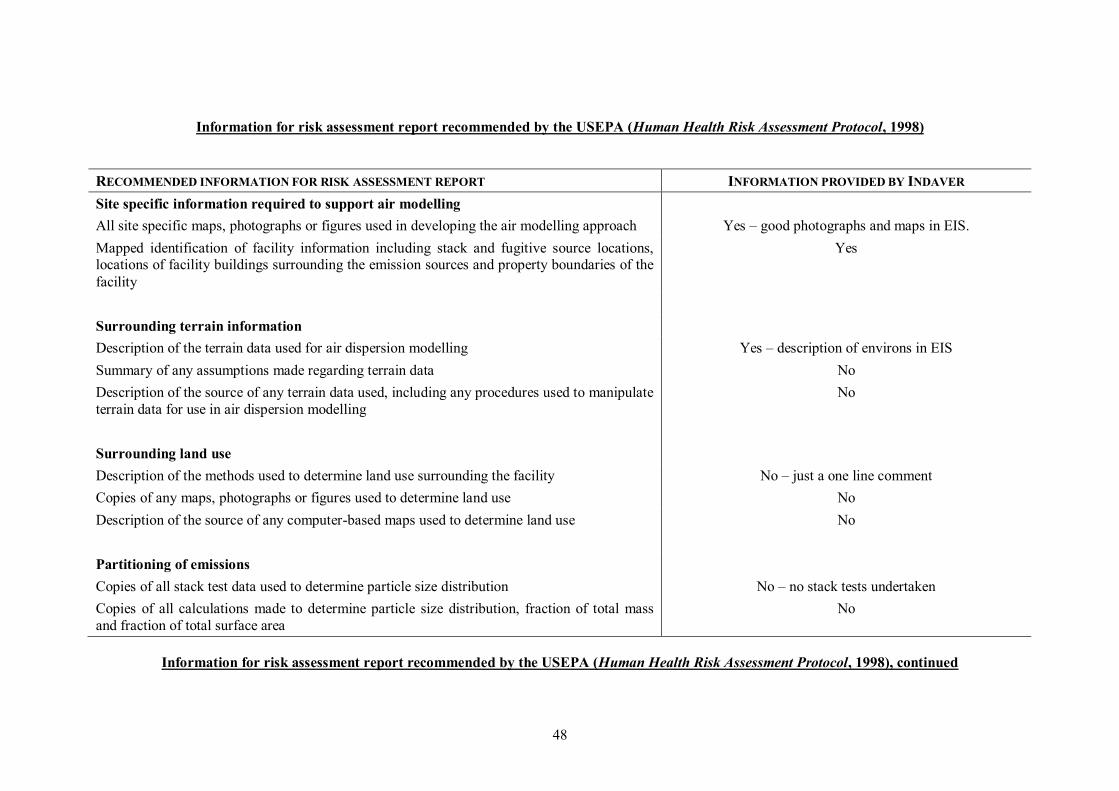
48
Information for risk assessment report recommended by the USEPA (Human Health Risk Assessment Protocol, 1998)
RECOMMENDED INFORMATION FOR RISK ASSESSMENT REPORT INFORMATION PROVIDED BY INDAVER
Site specific information required to support air modelling
All site specific maps, photographs or figures used in developing the air modelling approach Yes – good photographs and maps in EIS.
Mapped identification of facility information including stack and fugitive source locations, locations of facility buildings surrounding the emission sources and property boundaries of the
facility
Yes
Surrounding terrain information
Description of the terrain data used for air dispersion modelling Yes – description of environs in EIS
Summary of any assumptions made regarding terrain data No
Description of the source of any terrain data used, including any procedures used to manipulate
terrain data for use in air dispersion modelling
No
Surrounding land use
Description of the methods used to determine land use surrounding the facility No – just a one line comment
Copies of any maps, photographs or figures used to determine land use No
Description of the source of any computer-based maps used to determine land use No
Partitioning of emissions
Copies of all stack test data used to determine particle size distribution No – no stack tests undertaken
Copies of all calculations made to determine particle size distribution, fraction of total mass
and fraction of total surface area
No
Information for risk assessment report recommended by the USEPA (Human Health Risk Assessment Protocol, 1998), continued
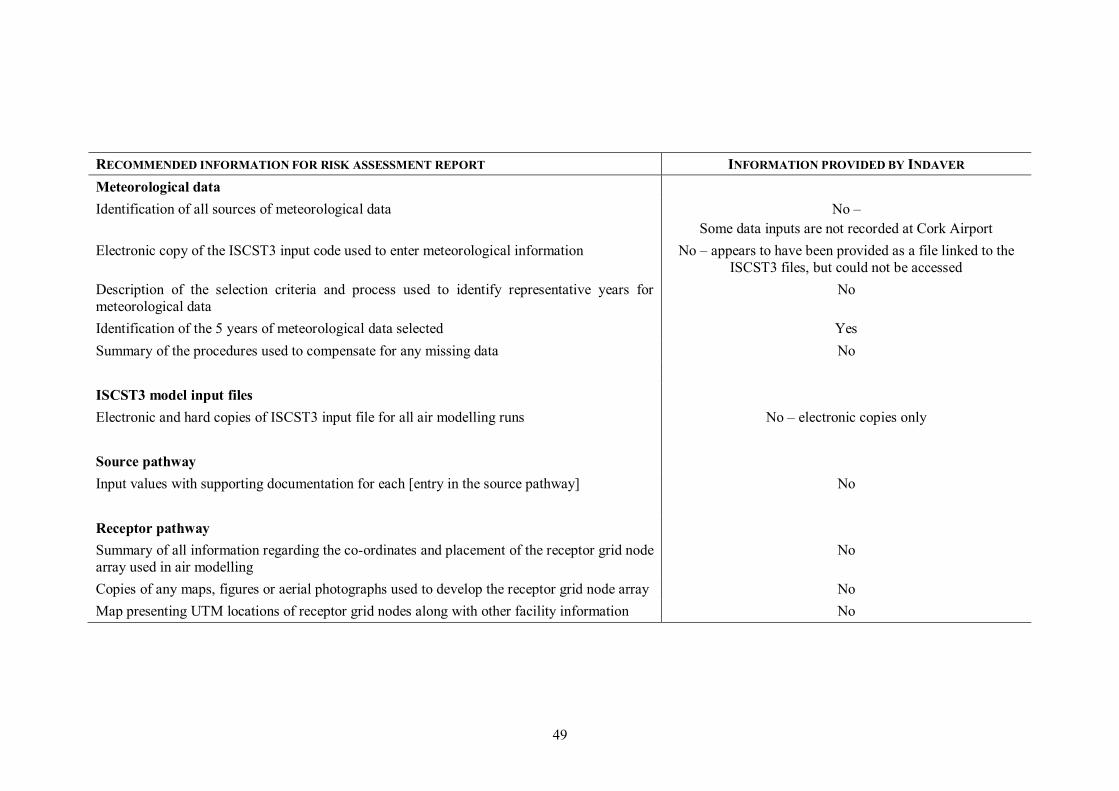
49
RECOMMENDED INFORMATION FOR RISK ASSESSMENT REPORT INFORMATION PROVIDED BY INDAVER
Meteorological data
Identification of all sources of meteorological data No –
Some data inputs are not recorded at Cork Airport
Electronic copy of the ISCST3 input code used to enter meteorological information No – appears to have been provided as a file linked to the
ISCST3 files, but could not be accessed
Description of the selection criteria and process used to identify representative years for
meteorological data
No
Identification of the 5 years of meteorological data selected Yes
Summary of the procedures used to compensate for any missing data No
ISCST3 model input files
Electronic and hard copies of ISCST3 input file for all air modelling runs No – electronic copies only
Source pathway
Input values with supporting documentation for each [entry in the source pathway] No
Receptor pathway
Summary of all information regarding the co-ordinates and placement of the receptor grid node
array used in air modelling
No
Copies of any maps, figures or aerial photographs used to develop the receptor grid node array No
Map presenting UTM locations of receptor grid nodes along with other facility information No