Embed Size (px)
Citation preview

October 2017
2018Transit Improvement Plan
Proposed

To request accommodations for persons with disabilities or to receive information in alternative formats, please call 1-888-889-6368, TTY Relay 711 or e-mail [email protected]
Contents Transit Improvement Plan Overview ............................................................................................. 1
Financial Plan .................................................................................................................................... 1 Project Budgeting .............................................................................................................................. 1
Transit Modes ..................................................................................................................................... 3
Projects1 .............................................................................................................................................. 4 Changes to Authorized Project Allocations from Adopted 2017 TIP to Proposed 2018 TIP ............. 5 Project Summaries and Detail Pages ................................................................................................ 9 System Expansion ........................................................................................................................... 11 System Expansion – Link Light Rail ................................................................................................ 12 System Expansion – Sounder Commuter Rail ................................................................................ 29 System Expansion – Regional Express .......................................................................................... 46 System Expansion – Other .............................................................................................................. 55 Enhancement Projects ..................................................................................................................... 69 State of Good Repair Projects ....................................................................................................... 116 Administrative Projects .................................................................................................................. 141
Reserves ......................................................................................................................................... 149
Appendices ..................................................................................................................................... 150 Appendix A – Sound Transit 2 and Sound Transit 3 Cost Estimates .......................................... 150 Appendix B – Sound Move Project Budgets ................................................................................ 152 Appendix C – State of Good Repair Forecast .............................................................................. 153 Appendix D – Subarea Allocations ............................................................................................... 154
1 Index of Project Details follows on next page
Alphabetical Index of Project Details by Mode LINK LIGHT RAIL
Access Control Card Upgrade ................................................................................................................ 125 Central Link Card Readers ....................................................................................................................... 87 Central Link HVAC – Instrument House and UPS Room ......................................................................... 86 Central Link Overhead Catenary System Tie Switch ............................................................................... 88 Convention Place Development Systems Retrofit ................................................................................. 119 Downtown Redmond Link Extension ........................................................................................................ 28 East Link Extension .................................................................................................................................. 27 Enhancements to Tacoma Link Extension ............................................................................................... 18 Federal Way Link Extension ..................................................................................................................... 26 First Hill Streetcar ..................................................................................................................................... 14 Link Bridge Repairs ................................................................................................................................ 127 Link CCTV System Upgrade .................................................................................................................. 120 Link Operating Segment Systems Enhancements and Upgrades ........................................................... 73 Link Operating Technology Upgrades .................................................................................................... 122 Link Operations & Maintenance Facility – East ........................................................................................ 16 Link LRV Overhaul ................................................................................................................................. 121 Link Radio Upgrade ................................................................................................................................ 126 Link SCADA System Support ................................................................................................................. 123 Link Station Braided Tile Replacement .................................................................................................. 129 LRV Between Car Barriers ....................................................................................................................... 81 LRV Fleet Expansion ................................................................................................................................ 17 LRV Overhaul ......................................................................................................................................... 130 LRV Wheel Flat Software ......................................................................................................................... 83 LRV Wireless Communication Upgrade ................................................................................................... 77 LRV Wash Bay Modifications ................................................................................................................... 84 Lynnwood Link Extension ......................................................................................................................... 22 Noise Abatement ...................................................................................................................................... 74 Non-revenue Support Vehicles ................................................................................................................ 89 Northgate Link Extension ......................................................................................................................... 21 Northgate Link Extension Project Reserve .............................................................................................. 23 OMF Energy Efficiency ............................................................................................................................. 82 Operations Maintenance Facility (OMF) – Expanded Parking ................................................................. 79 Operations Maintenance Facility (OMF) – Link Control Center (LCC) Upgrades .................................... 78 Operations & Maintenance Facility LRV Lift ............................................................................................. 85 Operations Maintenance Facility (OMF) – Renovations .......................................................................... 80 South 200th Link Extension ...................................................................................................................... 25 Signage Improvements ............................................................................................................................ 90

Tacoma Dome Link Extension ................................................................................................................. 19 Tacoma Link HVAC and Building Systems Upgrade ............................................................................. 124 Tacoma Link Light Rail Vehicle Overhaul .............................................................................................. 128 Tacoma Link Extension ............................................................................................................................ 15 Tacoma Link Fare Collection .................................................................................................................... 75 Tacoma Link Radio Upgrade .................................................................................................................... 76 University Link Extension ......................................................................................................................... 24 West Seattle & Ballard Link Extensions ................................................................................................... 20
SOUNDER COMMUTER RAIL
Auburn Station Access Improvement ....................................................................................................... 39 Customer Emergency Stations ................................................................................................................. 93 D St – M St Track & Signal ....................................................................................................................... 41 Kent Station Access Improvements ......................................................................................................... 38 Kent Station Parking Lot Paving ............................................................................................................... 99 Kent Station Platform Lighting .................................................................................................................. 98 King Street Station Platform Improvements ............................................................................................. 92 King Street Station Vertical Window Glazing ......................................................................................... 131 Lakewood Station Improvements ............................................................................................................. 34 Locomotive Inboard Cameras .................................................................................................................. 94 Mukilteo Station, S Platform ..................................................................................................................... 42 Point Defiance Bypass ............................................................................................................................. 37 Positive Train Control ............................................................................................................................... 91 Puyallup Station Improvements ................................................................................................................ 32 Puyallup Station LED Lighting .................................................................................................................. 96 Sounder Maintenance Base ..................................................................................................................... 31 Sounder Passenger Emergency Intercom ............................................................................................... 95 Sounder South Expanded Service ........................................................................................................... 44 Sounder Fleet Expansion ......................................................................................................................... 45 Sounder North Parking/Access ................................................................................................................ 40 Sounder Vehicle Overhaul Program ....................................................................................................... 132 Sounder Yard Expansion ......................................................................................................................... 36 Station Midlife Refurbishment Program .................................................................................................. 133 Sumner Station Improvements ................................................................................................................. 33 Sumner Station LED Lighting ................................................................................................................... 97 Tacoma Trestle Track & Signal ................................................................................................................ 35 Tukwila Station ......................................................................................................................................... 43

REGIONAL EXPRESS
Bellevue TC Security System ................................................................................................................. 104 Bothell Transit Related Improvements ..................................................................................................... 49 Bus Maintenance Facility ....................................................................................................................... 100 Bus on Shoulder Project ........................................................................................................................... 52 Community Transit – On-Board Communication Upgrade ..................................................................... 103 I-405 Bus Rapid Transit ............................................................................................................................ 50 I-90 Two-Way Transit & HOV Operations, Stage 3 .................................................................................. 53 Opensidewalks Data Development ........................................................................................................ 101 Pierce Transit – Global Positioning System Repeater ........................................................................... 102 SR 522 Bus Rapid Transit ........................................................................................................................ 51 ST Express Bus Base .............................................................................................................................. 48 ST Express Fleet Expansion .................................................................................................................... 54 ST Express Fleet Replacement .............................................................................................................. 134
OTHER
Administrative Capital ............................................................................................................................. 146 Agency Administration Operating ........................................................................................................... 144 Bike Locker Program .............................................................................................................................. 114 Bike Parking Program ............................................................................................................................ 105 Digital Passenger Information System ................................................................................................... 106 Downtown Seattle Transit Tunnel Mitigation .......................................................................................... 112 Efficiency & Sustainability Program .......................................................................................................... 65 Environmental Mitigation, Monitoring & Maintenance ............................................................................ 145 Everett Station Security Improvements .................................................................................................. 108 Fare Administration .................................................................................................................................. 59 Fare Collection ......................................................................................................................................... 57 Information Technology (IT) Infrastructure ............................................................................................. 139 Information Technology Program ........................................................................................................... 147 Innovation and Technology Program ........................................................................................................ 63 IT Transit Systems .................................................................................................................................. 140 LED Lighting Program ............................................................................................................................ 111 ORCA Next Generation ............................................................................................................................ 60 Othello Traction Power Substation Parking Lot ..................................................................................... 136 Research and Business Development Program ....................................................................................... 61 Research & Technology ........................................................................................................................... 58 Safety Oversight Approval Program ....................................................................................................... 135 Security Operations Center – Video Monitoring Improvements ............................................................. 110 Security Radio System ........................................................................................................................... 109
Small Works Program.............................................................................................................................. 138 SODO/MLK Hazard Mitigation ............................................................................................................... 107 ST3 Planning ............................................................................................................................................ 68 STart ......................................................................................................................................................... 66 STart Operations & Maintenance .............................................................................................................. 64 Surplus Property Disposition .................................................................................................................. 148 Tacoma Dome Station ............................................................................................................................ 137 Transit Oriented Development Planning Program ................................................................................... 67 Transit Oriented Development Property Disposition .............................................................................. 115 Transit System Access Program .............................................................................................................. 62 Union Station Garden Level Remodel .................................................................................................... 113
Transit Improvement Plan Overview
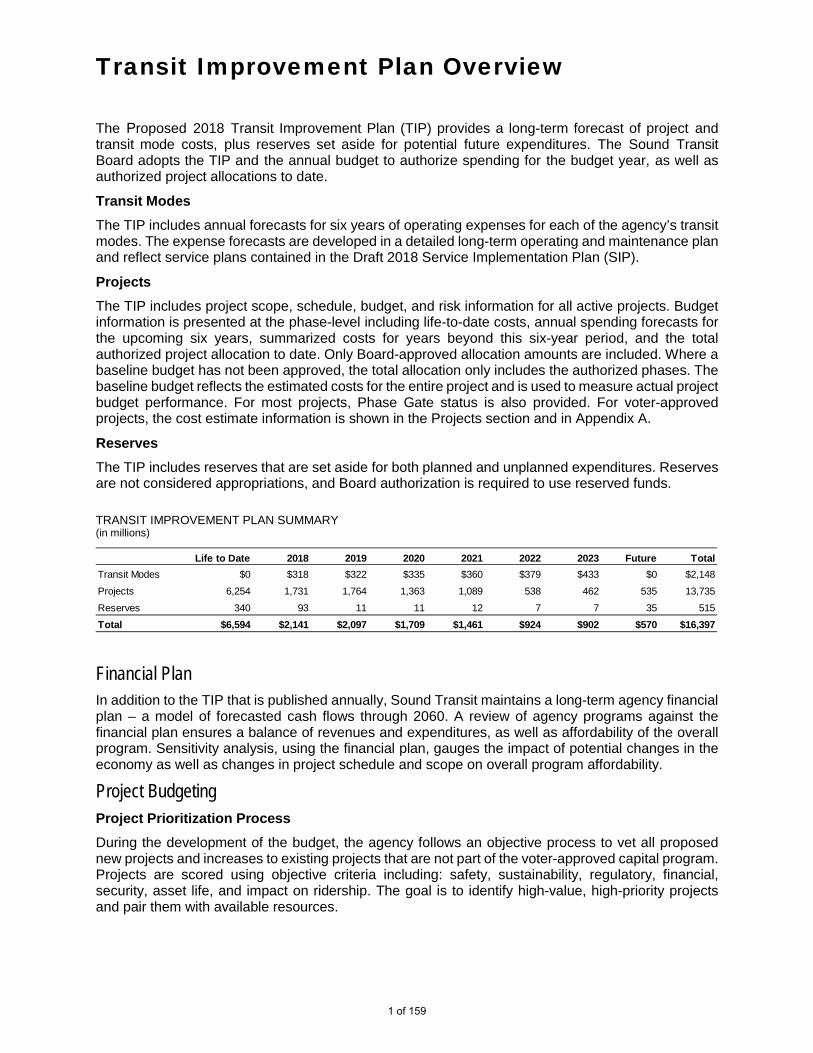
The Proposed 2018 Transit Improvement Plan (TIP) provides a long-term forecast of project and transit mode costs, plus reserves set aside for potential future expenditures. The Sound Transit Board adopts the TIP and the annual budget to authorize spending for the budget year, as well as authorized project allocations to date.
Transit Modes The TIP includes annual forecasts for six years of operating expenses for each of the agency’s transit modes. The expense forecasts are developed in a detailed long-term operating and maintenance plan and reflect service plans contained in the Draft 2018 Service Implementation Plan (SIP).
Projects The TIP includes project scope, schedule, budget, and risk information for all active projects. Budget information is presented at the phase-level including life-to-date costs, annual spending forecasts for the upcoming six years, summarized costs for years beyond this six-year period, and the total authorized project allocation to date. Only Board-approved allocation amounts are included. Where a baseline budget has not been approved, the total allocation only includes the authorized phases. The baseline budget reflects the estimated costs for the entire project and is used to measure actual project budget performance. For most projects, Phase Gate status is also provided. For voter-approved projects, the cost estimate information is shown in the Projects section and in Appendix A.
Reserves The TIP includes reserves that are set aside for both planned and unplanned expenditures. Reserves are not considered appropriations, and Board authorization is required to use reserved funds.
TRANSIT IMPROVEMENT PLAN SUMMARY (in millions)
Financial Plan In addition to the TIP that is published annually, Sound Transit maintains a long-term agency financial plan – a model of forecasted cash flows through 2060. A review of agency programs against the financial plan ensures a balance of revenues and expenditures, as well as affordability of the overall program. Sensitivity analysis, using the financial plan, gauges the impact of potential changes in the economy as well as changes in project schedule and scope on overall program affordability.
Project Budgeting Project Prioritization Process During the development of the budget, the agency follows an objective process to vet all proposed new projects and increases to existing projects that are not part of the voter-approved capital program. Projects are scored using objective criteria including: safety, sustainability, regulatory, financial, security, asset life, and impact on ridership. The goal is to identify high-value, high-priority projects and pair them with available resources.
Life to Date 2018 2019 2020 2021 2022 2023 Future TotalTransit Modes $0 $318 $322 $335 $360 $379 $433 $0 $2,148
Projects 6,254 1,731 1,764 1,363 1,089 538 462 535 13,735
Reserves 340 93 11 11 12 7 7 35 515
Total $6,594 $2,141 $2,097 $1,709 $1,461 $924 $902 $570 $16,397
1 of 159

Authorized Project Allocations and Phase Gate Process Prior to 2010, the Sound Transit Board approved project budgets at the outset of a capital project. Since 2010, our approach to project budgeting has been modified to provide greater Board oversight and control. As projects reach key milestones, requests for budget approval to complete the next project phase are presented for Board approval. Phase Gate, our project management oversight process, confirms that the project is ready to move forward to the next phase and triggers the request to the Board for additional budget. There are exceptions to having projects pass through each gate in sequence, such as procurement-only projects and when alternative contracting methods have been selected, as in design-build.
Typical budget requests include funding for:
Project development through preliminary engineering and environmental review;
Final design and right-of-way acquisition;
Baseline or total expected project budget.
The initial project development budget includes alternatives analysis to shape the scope of the project and selection of a preferred alternative, compliance with environmental requirements which may include an Environmental Impact Statement, development of operations and maintenance plans, and preliminary engineering for the preferred alternative.
A final design and right-of-way budget includes funding for all design work, including architectural, civil, structural, electrical, and HVAC systems through to construction procurement documentation, as well as purchase or lease of all property needed to build the project.
A baseline budget is established during final design when sufficient information is available to establish the cost of a project through construction. Project spending is benchmarked against the baseline through completion of the project. Projects are fully funded when the Board approves the baseline.
Cost Estimates Sound Move, ST2, and ST3 are voter-approved segments of the capital project. All voter-approved projects have a cost estimate that originated from one of the three (Sound Move, ST2, ST3) adopted plans. The original cost estimates, 2017 cost estimates, and 2018 cost estimates for ST2 and ST3 projects appear in Appendix A.
Our cost estimates are maintained on a current year, constant dollar basis. For instance, in the 2018 TIP, full project cost estimates are presented in constant 2017 dollars. The constant dollar presentation allows for comparison of estimated costs across multiple projects. However, the Board approves budgets in year-of-expenditure dollars to take into account the fact that project spending occurs over several years and so must be adjusted for inflation.
2 of 159

Transit Modes
The Proposed 2018 TIP contains forecasted expenses to operate and maintain the regional transit system from 2018 through 2023. Operating expenses include the costs of third-party operators for light rail, commuter rail, and bus services, as well as Sound Transit’s direct costs and administrative overhead for providing those services.
TRANSIT MODES SUMMARY (in millions)
As a part of the annual budget, the Sound Transit Board approves spending for each of these modal services for the following fiscal year. The agency also maintains a Service Implementation Plan (SIP) that includes service level and expenditure forecasts for a six-year period. The SIP provides the service plan on which the Proposed 2018 Budget is based. Reviewed and recommended by the Operations and Administration Committee, the Board adopts the 2018 SIP at the same time as adopting the budget and TIP for 2018. The TIP only includes summary spending information for the six-year period described in the SIP. The SIP may be read at www.soundtransit.org.
Service levels provided by two of Sound Transit’s four modes will be increasing:
In the fourth quarter of 2017, two additional round trips, one peak and one reverse commute, for Sounder commuter rail service are planned. These two trips will operate for the full year in 2018.
ST Express service levels will be increased by 17,332 service hours – 8,760 hours are forecasted overrun in 2017 that will roll into the 2018 baseline service, plus 8,572 more hours added as the result of annualizing 15,000 hours approved in 2017.
There are no changes planned for Link light rail or Tacoma Link light rail service.
In the next few years, buses will no longer operate in the Downtown Seattle Transit Tunnel and Link light rail operations will take over all costs. Operating underground stations, such as Capitol Hill and University of Washington, is more expensive than anticipated, so projections are higher than in the Adopted 2017 TIP. In 2020 the Link Operations & Maintenance Facility East will open with all costs attributed to Link operations. Vehicle maintenance costs are expected to increase over this six-year time period due to aging of the fleet. In 2021 the Northgate Link Extension will begin revenue service with a full year of operations in 2022, and the East Link Extension will begin revenue service in 2023.
Sounder costs will increase in 2018 due to the full year of the two roundtrips added in 2017. In 2021 the new Sounder Maintenance Base is scheduled to open, and we expect our costs to decrease with the close out of our contract with Amtrak.
ST Express costs are expected to rise in 2018 due to the full year of 2017 service hour additions.
The expansion of Tacoma Link to the Hilltop area of Tacoma is currently in final design with projected revenue service opening in 2022. Expansion of the Tacoma Link Operations & Maintenance Facility is expected to be complete in 2021 and will trigger hiring as early as 2019. Staff, maintenance, insurance, and other costs will increase substantially once the expansion opens.
2018 2019 2020 2021 2022 2023 TotalLink Light Rail $117 $117 $118 $142 $150 $198 $842Sounder Commuter Rail 54 59 63 58 60 63 358ST Express Bus 141 141 146 151 157 157 892Tacoma Link Light Rail 5 6 8 9 12 15 55Total $318 $322 $335 $360 $379 $433 $2,148
3 of 159

Projects
The Proposed 2018 TIP contains all Board-authorized project allocations for active projects. The majority of Sound Transit’s projects support the planning, design, and construction of light rail, commuter rail, and express bus transit infrastructure as described in the capital plans. The TIP uses project categories, which align with common industry practice and provide transparency into the agency’s investment in expanding service versus investment in existing assets. Projects are also reported by mode.
PROJECT DELIVERY SUMMARY BY PROJECT TYPE (in millions)
PROJECT DELIVERY SUMMARY BY MODE (in millions)
The Projects section of the TIP document displays authorized project allocations primarily in terms of cash flow – what year dollars will be spent and on which phase of a project. The total budget to complete a project is not necessarily included in the TIP because the agency’s Phase Gate process requires most project budgets be approved by the Board in phases, rather than all at once. There are a number of terms that require definition in order to clearly understand the following tables.
Authorized Project Allocation to Date: Current Board-authorized spending ceiling for a project.
Life to Date: Sum of all project expenditures prior to the budget year.
Cashflow: Annual projected expenditures are shown for six years beginning with the budget year.
Future: Refers to the sum of projected expenditures for years seven and beyond.
Total: The total Board-authorized project allocation to date. This may be just preliminary engineering, final design and right-of way, or it could be the budget for the entire project.
Life to Date 2018 2019 2020 2021 2022 2023 Future Total TIP
Link $4,652 $1,423 $1,474 $1,194 $948 $454 $376 $257 $10,780Sounder 681 35 88 3 2 0 0 0 809Regional Express 203 64 52 39 5 3 3 18 387Other 64 21 29 38 31 24 21 256 484Subtotal 5,600 1,543 1,643 1,274 986 481 400 532 12,459
76 58 19 3 1 0 0 0 158166 51 23 4 21 2 2 2 272412 78 80 82 80 54 60 1 847
$6,254 $1,731 $1,764 $1,363 $1,089 $538 $462 $535 $13,735
System Expansion
EnhancementState of Good AdministrativeTotal
Life to Date 2018 2019 2020 2021 2022 2023 Future Total TIP$4,673 $1,456 $1,484 $1,197 $948 $454 $377 $257 $10,846
746 44 98 3 2 0 0 0 894345 102 68 39 25 3 3 18 602490 129 113 123 114 81 83 259 1,393
$6,254 $1,731 $1,764 $1,363 $1,089 $538 $462 $535 $13,735Total
LinkSounderRegional Other
4 of 159

Changes to Authorized Project Allocations to Date from Adopted 2017 TIP to Proposed 2018 TIP The table below is a reconciliation of changes in authorized project allocations to date between the Adopted 2017 TIP and the Proposed 2018 TIP. Each change to a project is explained. CHANGES TO AUTHORIZED PROJECT ALLOCATIONS FROM 2017 TO 2018 (in millions)
2017 Closed Projects – Closed projects are excluded from the 2018 TIP.
Eight projects completed Phase Gate 8 and were closed in July 2017:
1. Regional Parking Pilot Project
2. Kirkland Transit Center/3rd
3. ST Express Mid-Day Bus Storage
4. M ST-Lakewood Track & Signal
5. Central & East HCT Study
6. LRV On-Board Energy Storage
7. OMF LRV Wash Heater System
8. Link Remote Switch Heaters
2018 New Projects – Newly created projects for the 2018 budget year.
Twenty-eight projects are new for 2018:
Tacoma Dome Link Extension will connect Federal Way to Tacoma and includes the Operations and Maintenance Facility South; $125.7 million has been allocated for preliminary engineering.
Sounder North Parking/Access will add parking and access improvements to Edmonds and Mukilteo Sounder Stations; $2.5 million has been allocated for preliminary engineering.
SR 522 Bus Rapid Transit will develop a bus rapid transit program along the SR 522 corridor; $18.6 million has been allocated for preliminary engineering.
Bus on Shoulder will enable buses to use shoulders on freeways during periods of congestion; $3.9 million has been allocated to begin preliminary engineering.
Project Type Adopted 2017 TIP
2017 Closed
Projects
2018 New
Projects
Transfers/ Increases/
(Decreases)2017 Board
ActionsProposed
2018 TIP System Expansion
Link Light Rail $9,684 $0 $126 $130 $840 $10,780Sounder Commuter Rail 859 (81) 3 10 18 809Regional Express Bus 290 (14) 22 42 46 387Other 161 (2) 336 (12) 0 484
Subtotal 10,994 (97) 487 171 903 12,459Enhancement 129 (3) 18 13 0 $157State of Good Repair 252 0 12 8 0 $272Administrative 844 0 0 3 0 $846Total $12,219 ($100) $517 $195 $903 $13,735
5 of 159
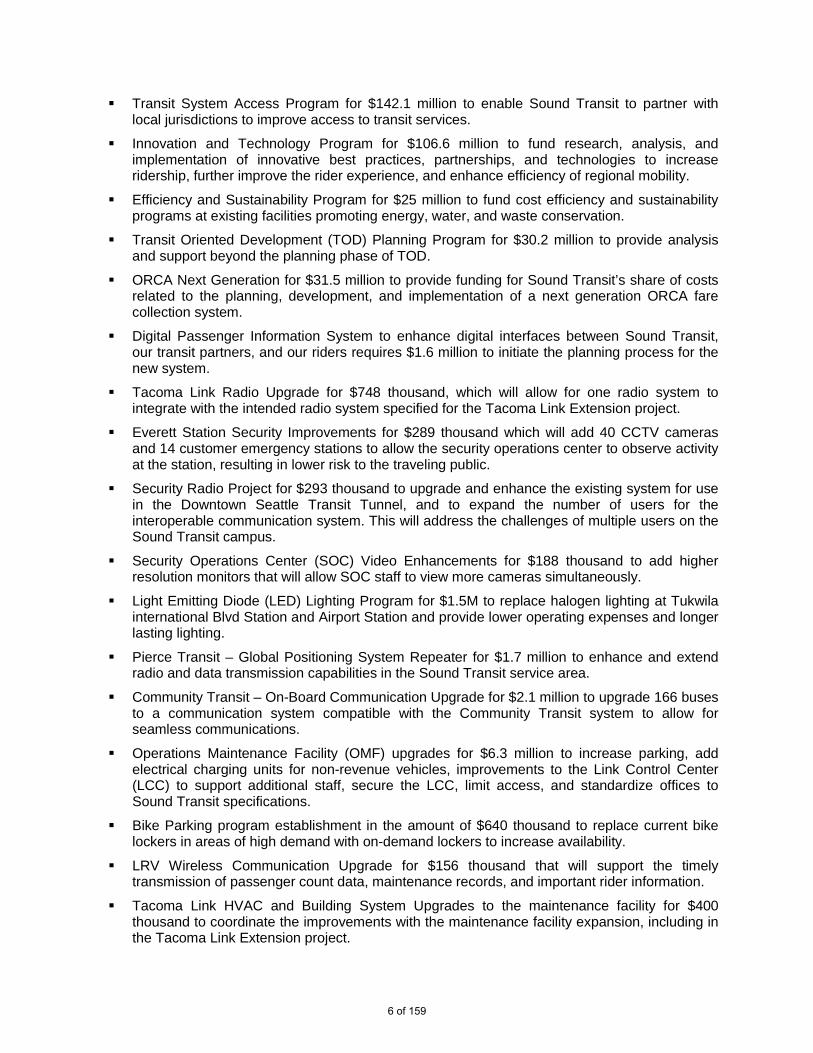
Transit System Access Program for $142.1 million to enable Sound Transit to partner withlocal jurisdictions to improve access to transit services.
Innovation and Technology Program for $106.6 million to fund research, analysis, andimplementation of innovative best practices, partnerships, and technologies to increaseridership, further improve the rider experience, and enhance efficiency of regional mobility.
Efficiency and Sustainability Program for $25 million to fund cost efficiency and sustainabilityprograms at existing facilities promoting energy, water, and waste conservation.
Transit Oriented Development (TOD) Planning Program for $30.2 million to provide analysisand support beyond the planning phase of TOD.
ORCA Next Generation for $31.5 million to provide funding for Sound Transit’s share of costsrelated to the planning, development, and implementation of a next generation ORCA farecollection system.
Digital Passenger Information System to enhance digital interfaces between Sound Transit,our transit partners, and our riders requires $1.6 million to initiate the planning process for thenew system.
Tacoma Link Radio Upgrade for $748 thousand, which will allow for one radio system tointegrate with the intended radio system specified for the Tacoma Link Extension project.
Everett Station Security Improvements for $289 thousand which will add 40 CCTV camerasand 14 customer emergency stations to allow the security operations center to observe activityat the station, resulting in lower risk to the traveling public.
Security Radio Project for $293 thousand to upgrade and enhance the existing system for usein the Downtown Seattle Transit Tunnel, and to expand the number of users for theinteroperable communication system. This will address the challenges of multiple users on theSound Transit campus.
Security Operations Center (SOC) Video Enhancements for $188 thousand to add higherresolution monitors that will allow SOC staff to view more cameras simultaneously.
Light Emitting Diode (LED) Lighting Program for $1.5M to replace halogen lighting at Tukwilainternational Blvd Station and Airport Station and provide lower operating expenses and longerlasting lighting.
Pierce Transit – Global Positioning System Repeater for $1.7 million to enhance and extendradio and data transmission capabilities in the Sound Transit service area.
Community Transit – On-Board Communication Upgrade for $2.1 million to upgrade 166 busesto a communication system compatible with the Community Transit system to allow forseamless communications.
Operations Maintenance Facility (OMF) upgrades for $6.3 million to increase parking, addelectrical charging units for non-revenue vehicles, improvements to the Link Control Center(LCC) to support additional staff, secure the LCC, limit access, and standardize offices toSound Transit specifications.
Bike Parking program establishment in the amount of $640 thousand to replace current bikelockers in areas of high demand with on-demand lockers to increase availability.
LRV Wireless Communication Upgrade for $156 thousand that will support the timelytransmission of passenger count data, maintenance records, and important rider information.
Tacoma Link HVAC and Building System Upgrades to the maintenance facility for $400thousand to coordinate the improvements with the maintenance facility expansion, including inthe Tacoma Link Extension project.
6 of 159
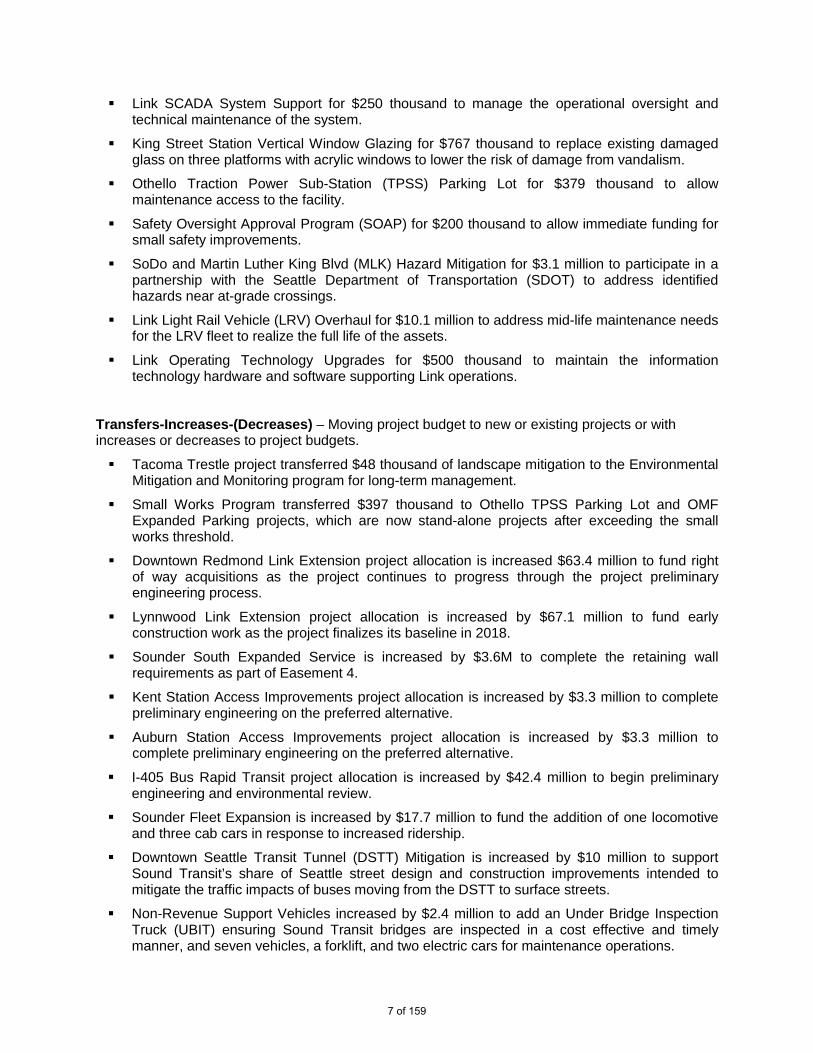
Link SCADA System Support for $250 thousand to manage the operational oversight and technical maintenance of the system.
King Street Station Vertical Window Glazing for $767 thousand to replace existing damaged glass on three platforms with acrylic windows to lower the risk of damage from vandalism.
Othello Traction Power Sub-Station (TPSS) Parking Lot for $379 thousand to allow maintenance access to the facility.
Safety Oversight Approval Program (SOAP) for $200 thousand to allow immediate funding for small safety improvements.
SoDo and Martin Luther King Blvd (MLK) Hazard Mitigation for $3.1 million to participate in a partnership with the Seattle Department of Transportation (SDOT) to address identified hazards near at-grade crossings.
Link Light Rail Vehicle (LRV) Overhaul for $10.1 million to address mid-life maintenance needs for the LRV fleet to realize the full life of the assets.
Link Operating Technology Upgrades for $500 thousand to maintain the information technology hardware and software supporting Link operations.
Transfers-Increases-(Decreases) – Moving project budget to new or existing projects or with increases or decreases to project budgets.
Tacoma Trestle project transferred $48 thousand of landscape mitigation to the Environmental Mitigation and Monitoring program for long-term management.
Small Works Program transferred $397 thousand to Othello TPSS Parking Lot and OMF Expanded Parking projects, which are now stand-alone projects after exceeding the small works threshold.
Downtown Redmond Link Extension project allocation is increased $63.4 million to fund right of way acquisitions as the project continues to progress through the project preliminary engineering process.
Lynnwood Link Extension project allocation is increased by $67.1 million to fund early construction work as the project finalizes its baseline in 2018.
Sounder South Expanded Service is increased by $3.6M to complete the retaining wall requirements as part of Easement 4.
Kent Station Access Improvements project allocation is increased by $3.3 million to complete preliminary engineering on the preferred alternative.
Auburn Station Access Improvements project allocation is increased by $3.3 million to complete preliminary engineering on the preferred alternative.
I-405 Bus Rapid Transit project allocation is increased by $42.4 million to begin preliminary engineering and environmental review.
Sounder Fleet Expansion is increased by $17.7 million to fund the addition of one locomotive and three cab cars in response to increased ridership.
Downtown Seattle Transit Tunnel (DSTT) Mitigation is increased by $10 million to support Sound Transit’s share of Seattle street design and construction improvements intended to mitigate the traffic impacts of buses moving from the DSTT to surface streets.
Non-Revenue Support Vehicles increased by $2.4 million to add an Under Bridge Inspection Truck (UBIT) ensuring Sound Transit bridges are inspected in a cost effective and timely manner, and seven vehicles, a forklift, and two electric cars for maintenance operations.
7 of 159

Small Works Program increased by $1.5 million to support the increase in projects and add an additional year to the program.
Link Access Control project will increase by $1.2 million to complete the upgrade of a universal system that controls access to Sound Transit facilities.
Tacoma Dome parking structure improvements increased by $3.1 million the agency’s proportional contribution to maintain the Pierce Transit parking facility.
Fare Administration will decrease by $8.4 million as much of the scope of this project will be accomplished by the OCRA Next Generation project established in 2018.
Research and Business Development Program was decreased by $369 thousand as a portion of the program scope will be managed in the Fare Administration project.
Information Technology Program increased by $2.9 million to support administrative hardware and software needs of the agency.
2017 Board Actions – Actions the Board took in 2017 to establish or change the Project Allocation for an amount that is within the cost estimate for the project.
Tacoma Link Extension was baselined, increasing the authorized project allocation by $182.7 million. The project will extend the current Tacoma Link system by 2.4 miles to the Hilltop neighborhood.
Light Rail Vehicle (LRV) Expansion project was increased by $7.3 million to exercise a contract option for an additional 30 LRVs at highly favorable pricing. The new LRVs will support of Federal Way and Downtown Redmond Extension projects.
Federal Way Link Extension increased the project allocation to date by $363.8 million to commence final design and begin the right-of-way procurement process.
West Seattle to Ballard Link Extension was established with a project allocation of $285.9 million to begin the preliminary engineering and environmental review for Ballard, the new Downtown Tunnel, and West Seattle segments.
I-405 Bus Rapid Transit project was initiated at $45.7 million to coordinate civil design with WSDOT established projects and to fund early property acquisition.
8 of 159

Project Summaries and Detail Pages In the Projects section, details pertaining to each project are provided as well as summaries of each program.
Cashflow by Budget Approval These summary tables include three views of the annual project cashflows of all authorized project allocations to date:
Authorized project allocations to date by project: Projects are grouped depending on thelevel of the allocation: Preliminary Engineering, Final Design & Right of Way and Baseline.Exceptions are programs and reserves that receive an authorized allocation for full fundingwhen initiated.
Subarea: Sound Transit’s five geographic subareas plus Systemwide.
Phase: Project cost groupings such as agency administration, preliminary engineering, finaldesign, construction, and system testing and startup.
Project Detail Pages Each active project has a full page that covers scope, authorized project allocation to date, budget year activities and cash flow detail, phase gate status, and project risk information. For ST2 and ST3 projects, cost estimate updates are included. The following is an explanation of terms used in the project pages.
Authorized Project Allocation to Date (in YOE dollars) Phase Gate Passed
The most recent gate passed indicates a project’s progress. Certain Sound Move projects pre-date implementation of our Phase Gate process and are not required to pass through gates that they would have if the process had been in place at that time.
Pending – Projects that will pass through Gate 1 before the end of the coming year.
Gate 1 – Enter Project Development Gate 2 – Identify Alternatives Gate 3 – Identify Preferred Alternative Gate 4 – Enter Final Design Gate 5 – Establish Baseline Gate 6 – Proceed to Construction
Gate 7 – Transition to Operations Gate 8 – Close Out Project None – Projects that advanced through project
development prior to implementation of Phase Gate (includes some Sound Move projects).
N/A – Projects not subject to the Phase Gate process, such as procurements, installation of equipment, etc.
Baseline Baseline budget is the authorized project allocation to date for the entire project in year of expenditure dollars. The baseline is established once the project scope and schedule are defined.
2017 TIP Authorized project allocation to date adopted by the Board in 2017 or prior.
2018 TIP Authorized project allocation to date adopted by the Board in 2018 or prior.
9 of 159

Completion Schedule Baseline Schedule
The year anticipated for completion of the project at the time the baseline was adopted.
2017
The year anticipated for completion of the budgeted phases of the project at the time the 2017 TIP is published.
2018
The year anticipated for completion of the budgeted phases of the project at the time the 2018 TIP is published.
Project Financial Plan Estimate (2017 $000) This section of the project detail page is for ST2 & ST3 projects only and provides a history of the funded cost estimate. Cost estimates are for the entire project scope and are periodically updated as new information becomes available. Estimates are also adjusted each year for inflation and stated in constant-year dollars. Cost estimates for 2008 (the year ST2 was adopted by voters), 2017, and 2018 are stated in constant-2017 dollars. A summary of ST2 and ST3 project cost estimates is provided in Appendix A. Cashflow (YOE $000) This portion of the project detail pages shows the life to date, six years of annual cashflow and then total authorized project allocation to date by subarea and then by phase.
Project Risk Assessment Explanation of the budget or schedule risk for the budgeted phases of the project.
10 of 159
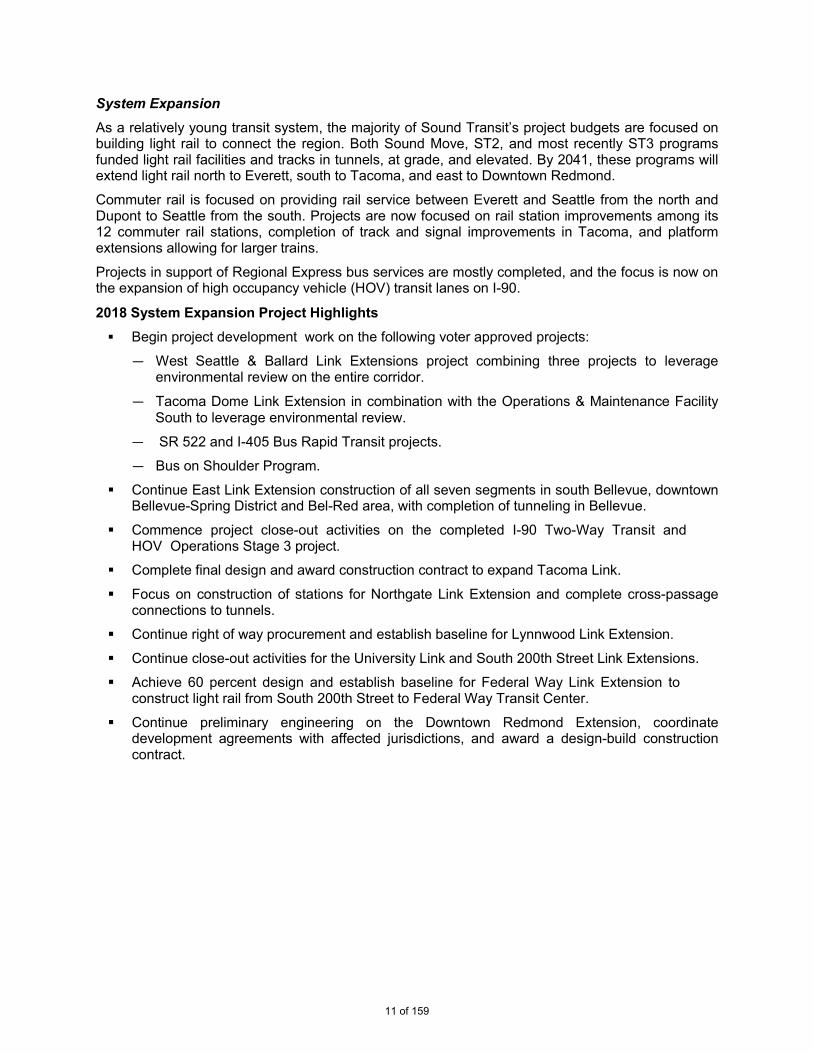
System Expansion As a relatively young transit system, the majority of Sound Transit’s project budgets are focused on building light rail to connect the region. Both Sound Move, ST2, and most recently ST3 programs funded light rail facilities and tracks in tunnels, at grade, and elevated. By 2041, these programs will extend light rail north to Everett, south to Tacoma, and east to Downtown Redmond.
Commuter rail is focused on providing rail service between Everett and Seattle from the north and Dupont to Seattle from the south. Projects are now focused on rail station improvements among its 12 commuter rail stations, completion of track and signal improvements in Tacoma, and platform extensions allowing for larger trains.
Projects in support of Regional Express bus services are mostly completed, and the focus is now on the expansion of high occupancy vehicle (HOV) transit lanes on I-90.
2018 System Expansion Project Highlights Begin project development work on the following voter approved projects:
— West Seattle & Ballard Link Extensions project combining three projects to leverageenvironmental review on the entire corridor.
— Tacoma Dome Link Extension in combination with the Operations & Maintenance Facility South to leverage environmental review.
— SR 522 and I-405 Bus Rapid Transit projects.
— Bus on Shoulder Program.
Continue East Link Extension construction of all seven segments in south Bellevue, downtownBellevue-Spring District and Bel-Red area, with completion of tunneling in Bellevue.
Commence project close-out activities on the completed I-90 Two-Way Transit andHOV Operations Stage 3 project.
Complete final design and award construction contract to expand Tacoma Link.
Focus on construction of stations for Northgate Link Extension and complete cross-passageconnections to tunnels.
Continue right of way procurement and establish baseline for Lynnwood Link Extension.
Continue close-out activities for the University Link and South 200th Street Link Extensions.
Achieve 60 percent design and establish baseline for Federal Way Link Extension toconstruct light rail from South 200th Street to Federal Way Transit Center.
Continue preliminary engineering on the Downtown Redmond Extension, coordinatedevelopment agreements with affected jurisdictions, and award a design-build constructioncontract.
11 of 159

2018
Cas
hfl
ow
by
Bu
dg
et A
pp
rova
l(in
thou
sand
s)
Sys
tem
Exp
ansi
on
LIN
K
Pro
ject
Nu
mb
er a
nd
Nam
eL
ife
to D
ate
2018
2019
2020
2021
2022
2023
Fu
ture
To
tal
Pre
limin
ary
En
gin
eeri
ng
4000
34E
nhan
cem
ents
to T
acom
a Li
nk E
xten
sion
$316
$1,6
84$0
$0$0
$0$0
$0$2
,000
4000
53T
acom
a D
ome
Link
Ext
ensi
on0
10,2
5015
,225
19,4
0039
,500
21,9
5019
,348
012
5,67
3
4000
66W
est S
eattl
e &
Bal
lard
Lin
k E
xten
sion
s4,
150
25,5
0032
,515
45,5
0058
,995
78,0
0041
,236
028
5,89
6
4X63
0D
ownt
own
Red
mon
d Li
nk E
xten
sion
8,31
168
,808
14,8
870
00
00
92,0
06
Su
bto
tal
12,7
7710
6,24
262
,627
64,9
0098
,495
99,9
5060
,584
050
5,57
5
Fin
al D
esig
n &
RO
W
4X11
5Ly
nnw
ood
Link
Ext
ensi
on21
4,54
514
8,02
685
,920
37,5
6028
,465
22,3
4215
,151
3,44
755
5,45
6
4X44
5F
eder
al W
ay L
ink
Ext
ensi
on76
,092
122,
533
140,
736
65,8
833,
160
2,08
31,
265
874
412,
625
Su
bto
tal
290,
637
270,
559
226,
656
103,
443
31,6
2524
,425
16,4
164,
321
968,
081
Bas
elin
e
4000
08T
acom
a Li
nk E
xten
sion
21,9
1420
,302
66,5
9055
,406
33,1
6419
,971
00
217,
346
4000
09Li
nk O
pera
tions
& M
aint
enan
ce F
acili
ty -
E
ast
136,
713
97,1
5611
6,18
552
,741
39,9
726,
453
00
449,
220
4000
32Li
ght R
ail V
ehic
le F
leet
Exp
ansi
on81
,982
37,5
7285
,965
126,
706
128,
050
92,5
9089
,833
98,0
2074
0,71
8
4X10
0N
orth
gate
Lin
k E
xten
sion
1,04
7,97
131
1,39
723
9,02
714
5,29
839
,802
19,3
7696
,885
01,
899,
756
4X20
0U
nive
rsity
Lin
k E
xten
sion
1,50
9,35
95,
454
5,62
365
,432
170,
139
00
01,
756,
007
4X42
0S
outh
200
th L
ink
Ext
ensi
on32
9,42
512
07,
440
46,2
560
00
038
3,24
1
4X60
0E
ast L
ink
Ext
ensi
on1,
088,
698
574,
491
663,
865
534,
155
407,
041
191,
293
112,
594
105,
013
3,67
7,15
0
Su
bto
tal
4,21
6,06
11,
046,
491
1,18
4,69
61,
025,
995
818,
167
329,
682
299,
313
203,
033
9,12
3,43
8
Res
erve
4X19
9N
orth
gate
Lin
k E
xten
sion
Pro
ject
Res
erve
0
00
00
00
50,0
0050
,000
Su
bto
tal
00
00
00
050
,000
50,0
00
Op
erat
ing
4000
07F
irst H
ill S
tree
tcar
132,
730
88
88
88
513
2,78
0
Su
bto
tal
132,
730
88
88
88
513
2,78
0
To
tal
$4,6
52,2
04$1
,423
,300
$1,4
73,9
86$1
,194
,345
$948
,294
$454
,065
$376
,321
$257
,359
$10,
779,
874
12 of 159

2018
Cas
hfl
ow
by
Su
bar
ea(in
thou
sand
s)
Sys
tem
Exp
ansi
on
LIN
K
Su
bar
eaL
ife
to D
ate
2018
2019
2020
2021
2022
2023
Fu
ture
To
tal
1 -
Sno
hom
ish
$155
,853
$105
,809
$81,
799
$47,
041
$39,
558
$24,
850
$19,
232
$13,
840
$487
,983
2 -
Nor
th K
ing
2,84
5,40
744
0,43
036
5,18
432
3,06
132
9,14
213
7,34
417
2,45
381
,410
4,69
4,43
2
3 -
Sou
th K
ing
442,
587
150,
336
187,
875
146,
693
43,4
1824
,258
20,8
0413
,813
1,02
9,78
3
4 -
Eas
t Kin
g1,
183,
258
697,
244
760,
348
606,
011
474,
711
231,
166
149,
020
144,
865
4,24
6,62
3
5 -
Pie
rce
25,0
9929
,482
78,7
7971
,539
61,4
6436
,447
14,8
113,
431
321,
052
To
tal
$4,6
52,2
04$1
,423
,300
$1,4
73,9
86$1
,194
,345
$948
,294
$454
,065
$376
,321
$257
,359
$10,
779,
874
2018
Cas
hfl
ow
by
Ph
ase
(in th
ousa
nds)
Ph
ase
# an
d D
escr
ipti
on
Lif
e to
Dat
e20
1820
1920
2020
2120
2220
23F
utu
reT
ota
l
10-A
genc
y A
dmin
istr
atio
n$2
61,6
12$6
4,33
9$6
4,31
1$7
6,08
5$7
3,71
4$6
6,74
6$8
0,89
3$1
3,70
6$7
01,4
06
20-P
relim
Eng
inee
ring/
Env
Rev
iew
201,
688
33,7
4140
,698
48,4
9578
,845
74,9
5030
,906
3,05
051
2,37
4
30-F
inal
Des
ign+
Spe
cific
atio
ns46
9,98
049
,963
30,0
1828
,432
16,1
9111
,552
14,8
6419
,043
640,
042
35-T
hird
Par
ty17
8,66
324
,539
19,0
4920
,945
19,2
7012
,320
7,24
62,
409
284,
441
40-R
ow A
cqui
sitio
n+P
erm
its74
1,33
921
7,04
613
9,93
755
,380
29,6
213,
633
8,21
711
,212
1,20
6,38
5
50-C
onst
ruct
ion
2,38
0,89
290
3,87
696
2,45
072
1,91
553
4,89
214
6,53
086
,898
47,8
395,
785,
292
55-C
onst
ruct
ion
Ser
vice
s22
9,31
588
,271
115,
205
97,8
1063
,466
39,0
8038
,994
15,2
6868
7,40
9
70-V
ehic
les
178,
810
41,5
2410
1,10
113
9,21
712
4,87
389
,139
86,1
0294
,831
855,
597
80-S
yste
m T
estin
g+S
tart
up9,
907
01,
216
6,06
77,
424
3,54
90
028
,163
90-C
ontin
genc
y0
00
00
6,56
522
,200
50,0
0078
,765
To
tal
$4,6
52,2
04$1
,423
,300
$1,4
73,9
86$1
,194
,345
$948
,294
$454
,065
$376
,321
$257
,359
$10,
779,
874
13 of 159

System Expansion LINK
400007 First Hill Streetcar Managed by: PEPD
Scope: Provide funding for planning, design and construction of a street car providing connections between Capitol Hill and International District/Chinatown stations via the First Hill neighborhood. Revenue operations began in 2015. Balance of activity supports potential third party work request items related to the operation of the project.
Changes to authorized project allocation since 2017: None.
Budget year activities: Continue ST administrative tasks related to project monitoring and agreement maintenance.
Authorized Project Allocation To Date(YOE $000s)
Completion Schedule Financial Plan Project Estimate(2017 $000s)
Phase Gate Passed: 7-Transition to Operations
Baseline: $132,780 Baseline: 2015 2008 Cost Estimate: $145,548
2017 TIP: $132,780 2017 : 2015 2017 Cost Estimate: $144,254
2018 TIP: $132,780 2018 : 2015 2018 Cost Estimate: $144,254
Cashflow (YOE $000s)
Subarea Life to Date 2018 2019 2020 2021 2022 2023 Future Total
North King $132,730 $8 $8 $8 $8 $8 $8 $5 $132,780
Total $132,730 $8 $8 $8 $8 $8 $8 $5 $132,780
Phase Life to Date 2018 2019 2020 2021 2022 2023 Future Total
10-Agency Administration $239 $8 $8 $8 $8 $8 $8 $5 $289
35-Third Party 132,491 0 0 0 0 0 0 0 132,491
Total $132,730 $8 $8 $8 $8 $8 $8 $5 $132,780
Project Risk Assessment
The project is complete and in operation.
14 of 159

System Expansion LINK
400008 Tacoma Link Extension Managed by: DECM
Scope: In cooperation with the city of Tacoma and Pierce Transit, design and construction of the preferred alternative to expand Tacoma Link from north downtown Tacoma to the Stadium District and Hilltop.
Changes to authorized project allocation since 2017: Increased by $187.2 million to establish the project baseline budget of $217.35 million by resolution of the ST Board (Resolution R2017-31, adopted 9/28/17).
Budget year activities: Complete final design, procurement for construction, begin construction work and execute phase 2 of construction management consultant contract.
Authorized Project Allocation To Date(YOE $000s)
Completion Schedule Financial Plan Project Estimate(2017 $000s)
Phase Gate Passed: 5-Establish Baseline
Baseline: $217,346 Baseline: 2022 2008 Cost Estimate: $109,255
2017 TIP: $217,346 2017 : 2018 2017 Cost Estimate: $145,248
2018 TIP: $217,346 2018 : 2022 2018 Cost Estimate: $145,248
Cashflow (YOE $000s)
Subarea Life to Date 2018 2019 2020 2021 2022 2023 Future Total
Pierce $21,914 $20,302 $66,590 $55,406 $33,164 $19,971 $0 $0 $217,346
Total $21,914 $20,302 $66,590 $55,406 $33,164 $19,971 $0 $0 $217,346
Phase Life to Date 2018 2019 2020 2021 2022 2023 Future Total
10-Agency Administration $4,616 $2,465 $2,342 $2,342 $2,245 $2,939 $0 $0 $16,948
20-Prelim Engineering/Env Review
5,559 0 0 0 0 0 0 0 5,559
30-Final Design+Specifications 7,324 1,650 500 500 500 357 0 0 10,830
35-Third Party 700 766 0 0 0 0 0 0 1,466
40-Row Acquisition+Permits 2,111 871 573 0 0 0 0 0 3,555
50-Construction 0 7,050 46,175 36,192 26,269 6,143 0 0 121,829
55-Construction Services 600 1,500 2,000 2,000 2,000 1,791 0 0 9,891
70-Vehicles 1,005 6,000 15,000 13,372 0 0 0 0 35,377
80-System Testing+Startup 0 0 0 1,000 2,150 2,176 0 0 5,326
90-Contingency 0 0 0 0 0 6,565 0 0 6,565
Total $21,914 $20,302 $66,590 $55,406 $33,164 $19,971 $0 $0 $217,346
Project Risk Assessment
Unidentified utility conflicts poses risk to project budget and schedule; Additional scope regarding roadway and street improvement may impact budget and schedule; Unprotected intersections along the alignment may require signals or other electronic devices impacting budget and schedule.
15 of 159

System Expansion LINK
400009 Link Operations & Maintenance Facility - East Managed by: DECM
Scope: Development, design, and construction of a light rail operations and maintenance facility in support of link system expansion.
Changes to authorized project allocation since 2017: None.
Budget year activities: Continue design-build contract of Operation and Maintenance Facility, focusing on several design packages and permitting activities followed by construction. Potential for final payment on one or more property acquisitions/relocations to carry over into 1st Quarter from prior year.
Authorized Project Allocation To Date(YOE $000s)
Completion Schedule Financial Plan Project Estimate(2017 $000s)
Phase Gate Passed: 6-Proceed to Construction
Baseline: $449,220 Baseline: 2020 2008 Cost Estimate: $329,862
2017 TIP: $449,220 2017 : 2020 2017 Cost Estimate: $419,655
2018 TIP: $449,220 2018 : 2020 2018 Cost Estimate: $413,922
Cashflow (YOE $000s)
Subarea Life to Date 2018 2019 2020 2021 2022 2023 Future Total
Snohomish $28,710 $20,403 $24,399 $11,076 $8,394 $1,355 $0 $0 $94,336
North King 22,831 16,225 19,403 8,808 6,675 1,078 0 0 75,020
South King 26,249 18,654 22,308 10,126 7,675 1,239 0 0 86,250
East King 58,923 41,874 50,076 22,731 17,228 2,781 0 0 193,614
Total $136,713 $97,156 $116,185 $52,741 $39,972 $6,453 $0 $0 $449,220
Phase Life to Date 2018 2019 2020 2021 2022 2023 Future Total
10-Agency Administration $3,720 $1,756 $1,820 $2,511 $1,313 $6,453 $0 $0 $17,573
20-Prelim Engineering/Env Review
8,677 100 759 0 0 0 0 0 9,536
30-Final Design+Specifications 0 135 140 54 57 0 0 0 386
35-Third Party 266 130 1,543 1,026 142 0 0 0 3,107
40-Row Acquisition+Permits 101,022 11,700 20,700 1,107 0 0 0 0 134,529
50-Construction 20,906 77,800 85,243 43,632 37,172 0 0 0 264,753
55-Construction Services 2,122 5,535 5,980 4,412 1,288 0 0 0 19,337
Total $136,713 $97,156 $116,185 $52,741 $39,972 $6,453 $0 $0 $449,220
Project Risk Assessment
Permitting challenges and coordination efforts with third parties, stakeholders, and jurisdictions have the potential to impact budget and schedule for completing design and beginning construction activities.
16 of 159
System Expansion LINK
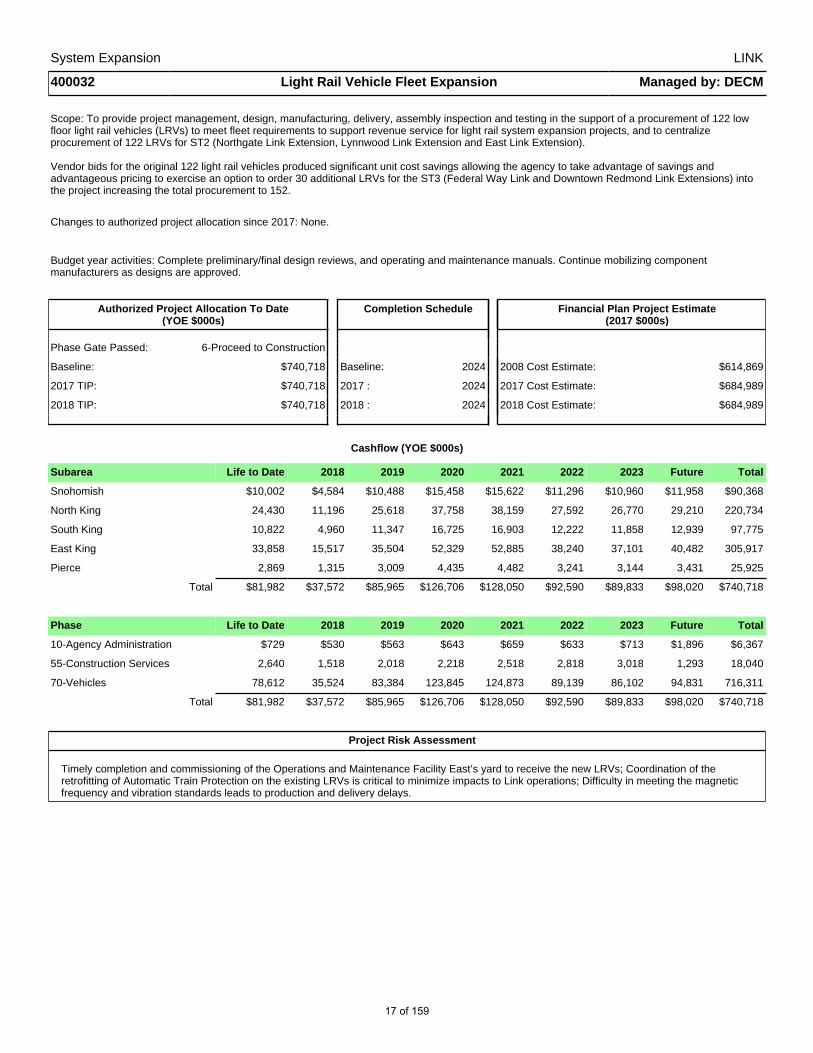
400032 Light Rail Vehicle Fleet Expansion Managed by: DECM
Scope: To provide project management, design, manufacturing, delivery, assembly inspection and testing in the support of a procurement of 122 low floor light rail vehicles (LRVs) to meet fleet requirements to support revenue service for light rail system expansion projects, and to centralize procurement of 122 LRVs for ST2 (Northgate Link Extension, Lynnwood Link Extension and East Link Extension).
Vendor bids for the original 122 light rail vehicles produced significant unit cost savings allowing the agency to take advantage of savings and advantageous pricing to exercise an option to order 30 additional LRVs for the ST3 (Federal Way Link and Downtown Redmond Link Extensions) into the project increasing the total procurement to 152.
Changes to authorized project allocation since 2017: None.
Budget year activities: Complete preliminary/final design reviews, and operating and maintenance manuals. Continue mobilizing component manufacturers as designs are approved.
Authorized Project Allocation To Date(YOE $000s)
Completion Schedule Financial Plan Project Estimate(2017 $000s)
Phase Gate Passed: 6-Proceed to Construction
Baseline: $740,718 Baseline: 2024 2008 Cost Estimate: $614,869
2017 TIP: $740,718 2017 : 2024 2017 Cost Estimate: $684,989
2018 TIP: $740,718 2018 : 2024 2018 Cost Estimate: $684,989
Cashflow (YOE $000s)
Subarea Life to Date 2018 2019 2020 2021 2022 2023 Future Total
Snohomish $10,002 $4,584 $10,488 $15,458 $15,622 $11,296 $10,960 $11,958 $90,368
North King 24,430 11,196 25,618 37,758 38,159 27,592 26,770 29,210 220,734
South King 10,822 4,960 11,347 16,725 16,903 12,222 11,858 12,939 97,775
East King 33,858 15,517 35,504 52,329 52,885 38,240 37,101 40,482 305,917
Pierce 2,869 1,315 3,009 4,435 4,482 3,241 3,144 3,431 25,925
Total $81,982 $37,572 $85,965 $126,706 $128,050 $92,590 $89,833 $98,020 $740,718
Phase Life to Date 2018 2019 2020 2021 2022 2023 Future Total
10-Agency Administration $729 $530 $563 $643 $659 $633 $713 $1,896 $6,367
55-Construction Services 2,640 1,518 2,018 2,218 2,518 2,818 3,018 1,293 18,040
70-Vehicles 78,612 35,524 83,384 123,845 124,873 89,139 86,102 94,831 716,311
Total $81,982 $37,572 $85,965 $126,706 $128,050 $92,590 $89,833 $98,020 $740,718
Project Risk Assessment
Timely completion and commissioning of the Operations and Maintenance Facility East’s yard to receive the new LRVs; Coordination of the retrofitting of Automatic Train Protection on the existing LRVs is critical to minimize impacts to Link operations; Difficulty in meeting the magnetic frequency and vibration standards leads to production and delivery delays.
17 of 159

System Expansion LINK
400034 Enhancements to Tacoma Link Extension Managed by: FIT
Scope: Engineering and streetscape design for transit access improvements and station area enhancements around the Tacoma Link Extension project. This project is also focused on job access needs and identifying barriers that currently limit the Tacoma Hilltop residents from participation in existing workforce training and apprenticeship programs. The City of Tacoma and Sound Transit received a $2.0 million grant from the Federal Transit Administration for this project. Sound Transit is the designated recipient and needs to administer the grant while the City of Tacoma will execute the scope and provide $500,000 in local matching funds.
The scope of this project is independent of the Tacoma Link Extension project.
Changes to authorized project allocation since 2017: None.
Budget year activities: Provide grant administration for a $2.0 million grant from the Federal Transit Administration. The City of Tacoma will manage the project and provide $500,000 in local matching funds.
Authorized Project Allocation To Date(YOE $000s)
Completion Schedule Financial Plan Project Estimate(2017 $000s)
Phase Gate Passed: N/A
Baseline: $0 Baseline: N/A 2008 Cost Estimate: N/A
2017 TIP: $2,000 2017 : 2018 2017 Cost Estimate: N/A
2018 TIP: $2,000 2018 : 2018 2018 Cost Estimate: N/A
Cashflow (YOE $000s)
Subarea Life to Date 2018 2019 2020 2021 2022 2023 Future Total
Pierce $316 $1,684 $0 $0 $0 $0 $0 $0 $2,000
Total $316 $1,684 $0 $0 $0 $0 $0 $0 $2,000
Phase Life to Date 2018 2019 2020 2021 2022 2023 Future Total
35-Third Party $316 $1,684 $0 $0 $0 $0 $0 $0 $2,000
Total $316 $1,684 $0 $0 $0 $0 $0 $0 $2,000
Project Risk Assessment
Although the risk is low in both schedule and budget, this project will be managed by a third party and Sound Transit will submit costs for reimbursement. In situations such as this, the risk of not recovering funds due to ineligibility or a delay in schedule always exists.
18 of 159
System Expansion LINK
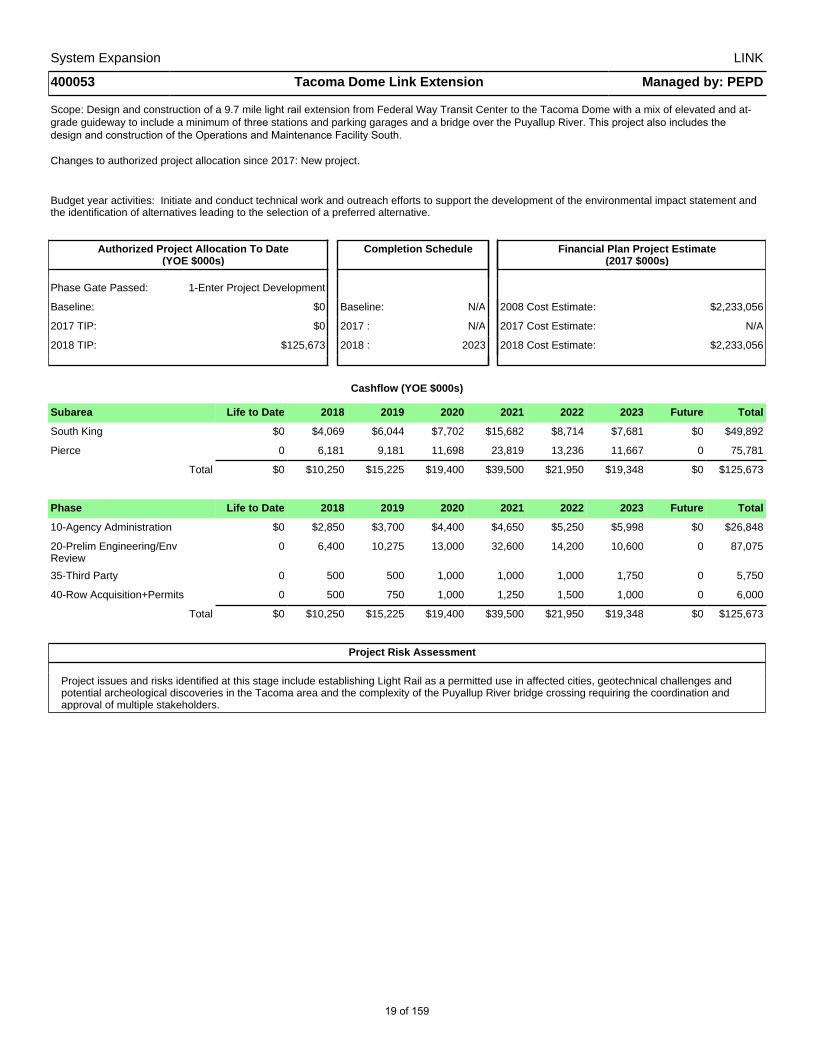
400053 Tacoma Dome Link Extension Managed by: PEPD
Scope: Design and construction of a 9.7 mile light rail extension from Federal Way Transit Center to the Tacoma Dome with a mix of elevated and at-grade guideway to include a minimum of three stations and parking garages and a bridge over the Puyallup River. This project also includes the design and construction of the Operations and Maintenance Facility South.
Changes to authorized project allocation since 2017: New project.
Budget year activities: Initiate and conduct technical work and outreach efforts to support the development of the environmental impact statement and the identification of alternatives leading to the selection of a preferred alternative.
Authorized Project Allocation To Date(YOE $000s)
Completion Schedule Financial Plan Project Estimate(2017 $000s)
Phase Gate Passed: 1-Enter Project Development
Baseline: $0 Baseline: N/A 2008 Cost Estimate: $2,233,056
2017 TIP: $0 2017 : N/A 2017 Cost Estimate: N/A
2018 TIP: $125,673 2018 : 2023 2018 Cost Estimate: $2,233,056
Cashflow (YOE $000s)
Subarea Life to Date 2018 2019 2020 2021 2022 2023 Future Total
South King $0 $4,069 $6,044 $7,702 $15,682 $8,714 $7,681 $0 $49,892
Pierce 0 6,181 9,181 11,698 23,819 13,236 11,667 0 75,781
Total $0 $10,250 $15,225 $19,400 $39,500 $21,950 $19,348 $0 $125,673
Phase Life to Date 2018 2019 2020 2021 2022 2023 Future Total
10-Agency Administration $0 $2,850 $3,700 $4,400 $4,650 $5,250 $5,998 $0 $26,848
20-Prelim Engineering/Env Review
0 6,400 10,275 13,000 32,600 14,200 10,600 0 87,075
35-Third Party 0 500 500 1,000 1,000 1,000 1,750 0 5,750
40-Row Acquisition+Permits 0 500 750 1,000 1,250 1,500 1,000 0 6,000
Total $0 $10,250 $15,225 $19,400 $39,500 $21,950 $19,348 $0 $125,673
Project Risk Assessment
Project issues and risks identified at this stage include establishing Light Rail as a permitted use in affected cities, geotechnical challenges and potential archeological discoveries in the Tacoma area and the complexity of the Puyallup River bridge crossing requiring the coordination and approval of multiple stakeholders.
19 of 159

System Expansion LINK
400066 West Seattle & Ballard Link Extensions Managed by: PEPD
Scope:The West Seattle Link Extension builds light rail from West Seattle’s Alaska Junction neighborhood to downtown Seattle.
The Ballard Link Extension and downtown Seattle Light Rail Tunnel build light rail from Ballard’s Market Street area through downtown Seattle.
Changes to authorized project allocation since 2017: New program.
Budget year activities: Begin alternatives development and evaluation; conduct feasibility studies on key project scope assumptions in the ST3 Plan, and begin stakeholders engagement.
Authorized Project Allocation To Date(YOE $000s)
Completion Schedule Financial Plan Project Estimate(2017 $000s)
Phase Gate Passed: 1-Enter Project Development
Baseline: $0 Baseline: N/A 2008 Cost Estimate: $6,474,597
2017 TIP: $285,896 2017 : N/A 2017 Cost Estimate: N/A
2018 TIP: $285,896 2018 : 2023 2018 Cost Estimate: $6,474,597
Cashflow (YOE $000s)
Subarea Life to Date 2018 2019 2020 2021 2022 2023 Future Total
North King $4,150 $25,500 $32,515 $45,500 $58,995 $78,000 $41,236 $0 $285,896
Total $4,150 $25,500 $32,515 $45,500 $58,995 $78,000 $41,236 $0 $285,896
Phase Life to Date 2018 2019 2020 2021 2022 2023 Future Total
10-Agency Administration $1,150 $5,500 $7,000 $9,000 $10,000 $12,000 $18,430 $0 $63,080
20-Prelim Engineering/Env Review
3,000 18,500 23,115 34,000 45,995 60,500 20,306 0 205,416
35-Third Party 0 1,000 1,400 1,500 2,000 4,000 1,500 0 11,400
40-Row Acquisition+Permits 0 500 1,000 1,000 1,000 1,500 1,000 0 6,000
Total $4,150 $25,500 $32,515 $45,500 $58,995 $78,000 $41,236 $0 $285,896
Project Risk Assessment
Project's issues and risks identified at this stage includes:• Reaching stakeholder consensus on a preferred alternative• Complexity of alignments in constrained environment with challenging topography• Two bridge crossings• Complexity associated with a tunnel through mature urban environment• Construction effects in constrained environment• Potential effect on Central Link operations during construction• ROW and property impacts
20 of 159
System Expansion LINK
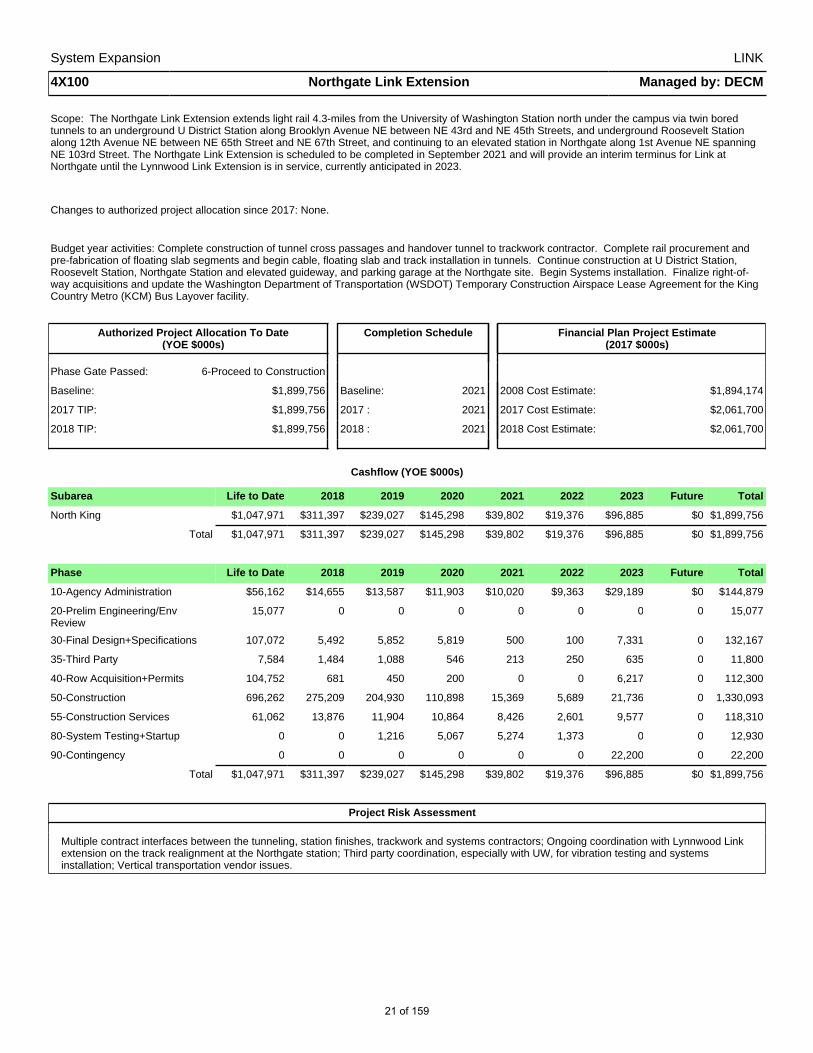
4X100 Northgate Link Extension Managed by: DECM
Scope: The Northgate Link Extension extends light rail 4.3-miles from the University of Washington Station north under the campus via twin bored tunnels to an underground U District Station along Brooklyn Avenue NE between NE 43rd and NE 45th Streets, and underground Roosevelt Station along 12th Avenue NE between NE 65th Street and NE 67th Street, and continuing to an elevated station in Northgate along 1st Avenue NE spanning NE 103rd Street. The Northgate Link Extension is scheduled to be completed in September 2021 and will provide an interim terminus for Link at Northgate until the Lynnwood Link Extension is in service, currently anticipated in 2023.
Changes to authorized project allocation since 2017: None.
Budget year activities: Complete construction of tunnel cross passages and handover tunnel to trackwork contractor. Complete rail procurement and pre-fabrication of floating slab segments and begin cable, floating slab and track installation in tunnels. Continue construction at U District Station, Roosevelt Station, Northgate Station and elevated guideway, and parking garage at the Northgate site. Begin Systems installation. Finalize right-of-way acquisitions and update the Washington Department of Transportation (WSDOT) Temporary Construction Airspace Lease Agreement for the King Country Metro (KCM) Bus Layover facility.
Authorized Project Allocation To Date(YOE $000s)
Completion Schedule Financial Plan Project Estimate(2017 $000s)
Phase Gate Passed: 6-Proceed to Construction
Baseline: $1,899,756 Baseline: 2021 2008 Cost Estimate: $1,894,174
2017 TIP: $1,899,756 2017 : 2021 2017 Cost Estimate: $2,061,700
2018 TIP: $1,899,756 2018 : 2021 2018 Cost Estimate: $2,061,700
Cashflow (YOE $000s)
Subarea Life to Date 2018 2019 2020 2021 2022 2023 Future Total
North King $1,047,971 $311,397 $239,027 $145,298 $39,802 $19,376 $96,885 $0 $1,899,756
Total $1,047,971 $311,397 $239,027 $145,298 $39,802 $19,376 $96,885 $0 $1,899,756
Phase Life to Date 2018 2019 2020 2021 2022 2023 Future Total
10-Agency Administration $56,162 $14,655 $13,587 $11,903 $10,020 $9,363 $29,189 $0 $144,879
20-Prelim Engineering/Env Review
15,077 0 0 0 0 0 0 0 15,077
30-Final Design+Specifications 107,072 5,492 5,852 5,819 500 100 7,331 0 132,167
35-Third Party 7,584 1,484 1,088 546 213 250 635 0 11,800
40-Row Acquisition+Permits 104,752 681 450 200 0 0 6,217 0 112,300
50-Construction 696,262 275,209 204,930 110,898 15,369 5,689 21,736 0 1,330,093
55-Construction Services 61,062 13,876 11,904 10,864 8,426 2,601 9,577 0 118,310
80-System Testing+Startup 0 0 1,216 5,067 5,274 1,373 0 0 12,930
90-Contingency 0 0 0 0 0 0 22,200 0 22,200
Total $1,047,971 $311,397 $239,027 $145,298 $39,802 $19,376 $96,885 $0 $1,899,756
Project Risk Assessment
Multiple contract interfaces between the tunneling, station finishes, trackwork and systems contractors; Ongoing coordination with Lynnwood Link extension on the track realignment at the Northgate station; Third party coordination, especially with UW, for vibration testing and systems installation; Vertical transportation vendor issues.
21 of 159

4X115
Phase Gate Passed:Baseline: N/A $1,797,7522017 TIP: 2017 : 2023 $1,531,8812018 TIP: 2018 : 2023 $1,531,881
System Expansion
Scope: Lynnwood Link Extension extends light rail 8.5 miles from Northgate Station in Seattle through Shoreline and Mountlake Terrace to the Lynnwood Transit Center. The project alignment is primarily along I-5 and includes at-grade, elevated and retained cut/fill segments, with stations at NE 145th Street, NE 185th Street, Mountlake Terrace Transit Center and Lynnwood Transit Center.
LINKLynnwood Link Extension Managed by: DECM
Changes to authorized project allocation since 2017: Increased by $67.1 million for pre-construction services.
Budget year activities: Continue final design, right of way, and pre-construction services activities in preparation for establishment of the project baseline.
$2,934,813YOE $000s
Funding Commitment ($000)
Financial Plan Project Estimate (2017 $000s)
2023 Future
4-Enter Final Design$0 $1,531,881
$8,272 $1,882
Cashflow (YOE $000s)
Subarea Life to Date 2018 2019 2020 2021 2022
6,879 1,565
TotalSnohomish $117,142 $80,822 $46,912 $20,508 $15,542 $12,199
$15,151 $3,447
$303,279
North King 97,404 67,204 39,008 17,052 12,923 10,143 252,177
Total $214,545 $148,026 $85,920 $37,560 $28,465 $22,342
2020 2021
$555,546
2022 2023 Future Total10-Agency Administration $19,179 $10,960 $12,110 $12,030 $11,910 $12,591 $9,526 $0 $88,305
20-Prelim Engineering/Env Review 39,053 0 0 0 0 0 0 2,947 42,000
30-Final Design+Specifications 56,077 29,906 8,970 5,000 5,000 4,000 2,500 0 111,453
35-Third Party 4,332 7,403 1,644 1,500 1,000 771 750 0 17,400
40-Row Acquisition+Permits 85,554 38,225 0 0 0 0 0 0 123,779
50-Construction 462 34,000 33,133 0 0 0 0 0 67,595
55-Construction Services 9,890 27,532 30,063 19,030 10,555 4,980 2,375 500 104,925
Total $214,545 $148,026 $85,920 $37,560 $28,465 $22,342
Project Risk Assessment
Differing site and underground utility conditions; third party approvals – cities, Washington State Department of Transportation (WSDOT), Federal Highway Administration (FHWA); Impacts to Intelligent Transportation Systems above what is assumed in 60% design; market conditions – price escalation, labor shortages; and Federal Transit Administration (FTA) requirements for New Starts grant application process has the potential to impact the schedule for completion of final design.
$15,151 $3,447 $555,546
Completion Schedule
$488,361$555,546
Authorized Project Allocation To Date(YOE $000s)
Baseline:
Phase Life to Date 2018 2019
On August 24, 2017 The Board was presented with a $2.9 billion trending cost estimate for this project, which was $516 million higher than the ST2 high cost estimate. This increase was due to property acquisition and construction market condtions, design evolution and scope changes and the use of a General Contractor/Construction Manager contract method. Staff is engaged in a value engineering effort to reduce project costs.
2008 Cost Estimate:2017 Cost Estimate:2018 Cost Estimate:
2017 $000s
22 of 159
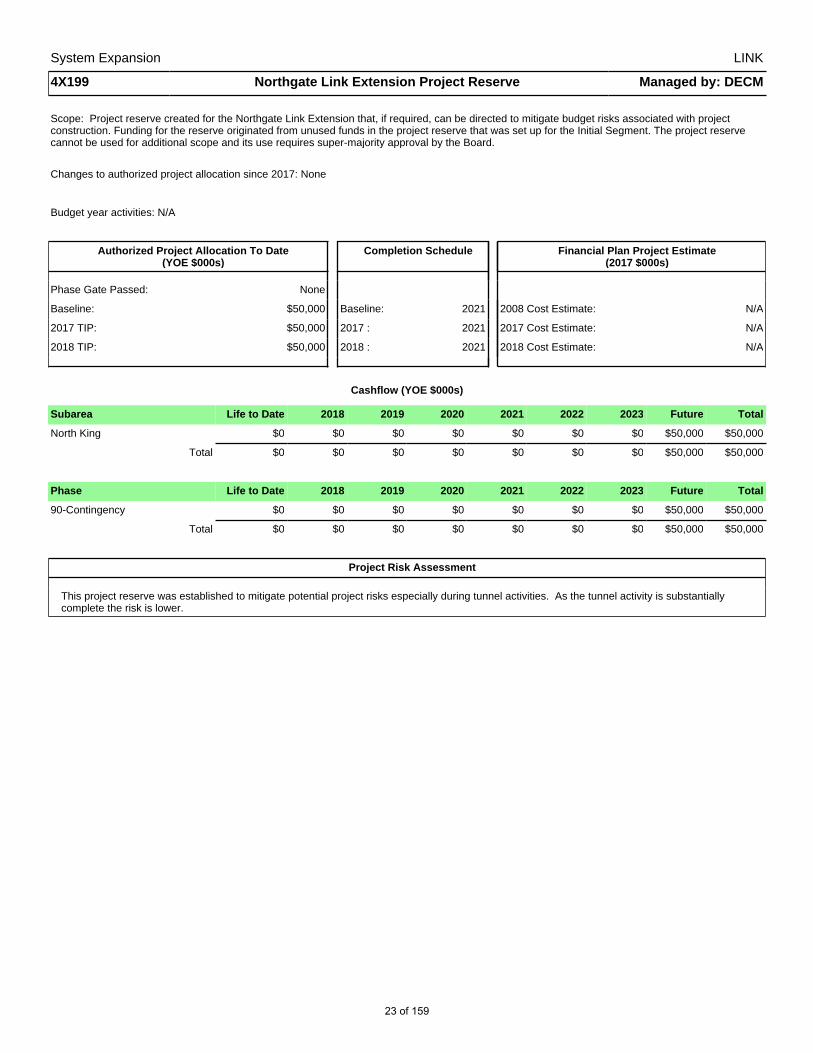
System Expansion LINK
4X199 Northgate Link Extension Project Reserve Managed by: DECM
Scope: Project reserve created for the Northgate Link Extension that, if required, can be directed to mitigate budget risks associated with project construction. Funding for the reserve originated from unused funds in the project reserve that was set up for the Initial Segment. The project reserve cannot be used for additional scope and its use requires super-majority approval by the Board.
Changes to authorized project allocation since 2017: None
Budget year activities: N/A
Authorized Project Allocation To Date(YOE $000s)
Completion Schedule Financial Plan Project Estimate(2017 $000s)
Phase Gate Passed: None
Baseline: $50,000 Baseline: 2021 2008 Cost Estimate: N/A
2017 TIP: $50,000 2017 : 2021 2017 Cost Estimate: N/A
2018 TIP: $50,000 2018 : 2021 2018 Cost Estimate: N/A
Cashflow (YOE $000s)
Subarea Life to Date 2018 2019 2020 2021 2022 2023 Future Total
North King $0 $0 $0 $0 $0 $0 $0 $50,000 $50,000
Total $0 $0 $0 $0 $0 $0 $0 $50,000 $50,000
Phase Life to Date 2018 2019 2020 2021 2022 2023 Future Total
90-Contingency $0 $0 $0 $0 $0 $0 $0 $50,000 $50,000
Total $0 $0 $0 $0 $0 $0 $0 $50,000 $50,000
Project Risk Assessment
This project reserve was established to mitigate potential project risks especially during tunnel activities. As the tunnel activity is substantially complete the risk is lower.
23 of 159

System Expansion LINK
4X200 University Link Extension Managed by: DECM
Scope: University Link Extension is a 3.15-mile light rail extension located entirely underground extending east from the Downtown Seattle Transit Tunnel, under I-5 to an underground Capitol Hill Station that will serve the First Hill/Capitol Hill urban center. The tunnel route crosses under the Lake Washington Ship Canal to an interim terminus in an underground University of Washington Station near Husky Stadium. University Link Extension will generate high ridership by connecting the three major population and employment centers of Downtown Seattle, Capitol Hill, and the University District.
University Link opened for revenue service on March 19, 2016, and project close-out is anticipated in 2019 with a projected budget surplus.
Changes to authorized project allocation since 2017: None
Budget year activities: Continue closeout activities. Optimization and fine tuning of Link operating systems. Resolve outstanding commercial items.
Authorized Project Allocation To Date(YOE $000s)
Completion Schedule Financial Plan Project Estimate(2017 $000s)
Phase Gate Passed: 7-Transition to Operations
Baseline: $1,756,007 Baseline: 2016 2008 Cost Estimate: N/A
2017 TIP: $1,756,007 2017 : 2016 2017 Cost Estimate: N/A
2018 TIP: $1,756,007 2018 : 2016 2018 Cost Estimate: N/A
Cashflow (YOE $000s)
Subarea Life to Date 2018 2019 2020 2021 2022 2023 Future Total
North King $1,509,359 $5,454 $5,623 $65,432 $170,139 $0 $0 $0 $1,756,007
Total $1,509,359 $5,454 $5,623 $65,432 $170,139 $0 $0 $0 $1,756,007
Phase Life to Date 2018 2019 2020 2021 2022 2023 Future Total
10-Agency Administration $81,929 $3,249 $1,658 $12,433 $14,286 $0 $0 $0 $113,554
20-Prelim Engineering/Env Review
24,261 0 0 0 0 0 0 0 24,261
30-Final Design+Specifications 86,598 380 1,037 2,292 0 0 0 0 90,308
35-Third Party 11,303 0 0 1,004 6,339 0 0 0 18,646
40-Row Acquisition+Permits 126,428 0 0 0 25,904 0 0 0 152,332
50-Construction 984,480 1,325 80 46,591 117,137 0 0 0 1,149,613
55-Construction Services 86,598 500 132 1,111 6,473 0 0 0 94,814
70-Vehicles 99,193 0 2,716 2,000 0 0 0 0 103,909
80-System Testing+Startup 8,570 0 0 0 0 0 0 0 8,570
Total $1,509,359 $5,454 $5,623 $65,432 $170,139 $0 $0 $0 $1,756,007
Project Risk Assessment
N/A - The project is complete and in operation.
24 of 159

System Expansion LINK
4X420 South 200th Link Extension Managed by: DECM
Scope: The South 200th Link Extension will extend light rail approximately 1.6 miles south from Sea-Tac/Airport Station to Angle Lake Station at South 200th Street. The design features an elevated light rail guide way, an elevated station, and detached park-and-ride facility at South 200th. The project is being delivered through a design-build (DB) delivery strategy.
South 200th Link Extension opened for revenue service on September 24, 2016. Project close-out is anticipated in 2019 with a projected surplus budget.
The funds in 2020 are considered surplus.
Changes to authorized project allocation since 2017: None
Budget year activities: Continue project closeout activities.
Authorized Project Allocation To Date(YOE $000s)
Completion Schedule Financial Plan Project Estimate(2017 $000s)
Phase Gate Passed: 7-Transition to Operations
Baseline: $383,241 Baseline: 2016 2008 Cost Estimate: $440,208
2017 TIP: $383,241 2017 : 2016 2017 Cost Estimate: $447,516
2018 TIP: $383,241 2018 : 2016 2018 Cost Estimate: $447,516
Cashflow (YOE $000s)
Subarea Life to Date 2018 2019 2020 2021 2022 2023 Future Total
South King $329,425 $120 $7,440 $46,256 $0 $0 $0 $0 $383,241
Total $329,425 $120 $7,440 $46,256 $0 $0 $0 $0 $383,241
Phase Life to Date 2018 2019 2020 2021 2022 2023 Future Total
10-Agency Administration $16,261 $120 $564 $197 $0 $0 $0 $0 $17,142
20-Prelim Engineering/Env Review
5,698 0 0 0 0 0 0 0 5,698
30-Final Design+Specifications 8,747 0 0 777 0 0 0 0 9,523
35-Third Party 3,820 0 0 3,265 0 0 0 0 7,085
40-Row Acquisition+Permits 37,992 0 0 5,557 0 0 0 0 43,549
50-Construction 238,471 0 6,876 36,239 0 0 0 0 281,585
55-Construction Services 17,099 0 0 222 0 0 0 0 17,322
80-System Testing+Startup 1,337 0 0 0 0 0 0 0 1,337
Total $329,425 $120 $7,440 $46,256 $0 $0 $0 $0 $383,241
Project Risk Assessment
N/A - The project is complete and in operation.
25 of 159

4X445
Phase Gate Passed:Baseline: N/A $1,121,8172017 TIP: 2017 : 2018 $476,3862018 TIP: 2018 : 2018 $1,617,253$412,625 2018 Cost Estimate:
$0 Baseline: 2017 $000s $1,617,253 2008 Cost Estimate:$412,625 YOE $000s $2,056,218
Project Risk Assessment
Given the experience of projects that are slightly ahead in cost estimate development the agency has experienced increasing cost trends in the areas of real estate and right of way acquisitions and construction market trends. Further, uncertainties exist in design and third party coordination that could present cost and schedule risks; such as – price escalation, labor shortages and contract method selection. Using value engineering reviews can contribute to address the cost pressures on scope schedule and budget.
Authorized Project Allocation To Date(YOE $000s)
Completion Schedule
Funding Commitment ($000)
Financial Plan Project Estimate (2017 $000s)
4-Enter Final Design
$1,265 $874 $412,625Total $76,092
0 0 45,672
$122,533 $140,736 $65,883 $3,160 $2,083
0 0 25,524
55-Construction Services 0 4,660 21,298 19,714 0 0
0 0 265,141
50-Construction 1,500 11,000 13,024 0 0 0
1,265 874 18,646
40-Row Acquisition+Permits 24,094 100,129 100,948 39,971 0 0
0 0 2,374
35-Third Party 2,229 2,240 3,518 3,278 3,160 2,083
0 0 40,353
30-Final Design+Specifications 621 700 418 635 0 0
$0 $0 $14,915
20-Prelim Engineering/Env Review 39,108 0 0 1,245 0 0
2023 Future Total10-Agency Administration $8,540 $3,804 $1,531 $1,041 $0 $0
Phase Life to Date 2018 2019 2020 2021 2022
$2,083 $1,265 $874 $412,625
$2,083 $1,265 $874 $412,625
Total $76,092 $122,533 $140,736 $65,883 $3,160
2022 2023 Future TotalSouth King $76,092 $122,533 $140,736 $65,883 $3,160
Cashflow (YOE $000s)
Subarea Life to Date 2018 2019 2020 2021
2017 Cost Estimate:
Budget year activities: Conclude the environmental process and preliminary engineering. Transition to final design and initiate right-of-way acquisition activities.
Managed by: DECM
Changes to authorized project allocation since 2017: None.
Scope: Design and construct approximately 7.8 miles of light rail and three stations from S. 200th Street in the city of SeaTac to the Federal Way Transit Center. The passage of the ST3 voter-approved program included funds for the expansion of the project to Federal Way Transit Center. The 2018 cost estimate includes and increase of $1.2 billion of additional funding from the ST3 program.
LINKFederal Way Link Extension
System Expansion
26 of 159
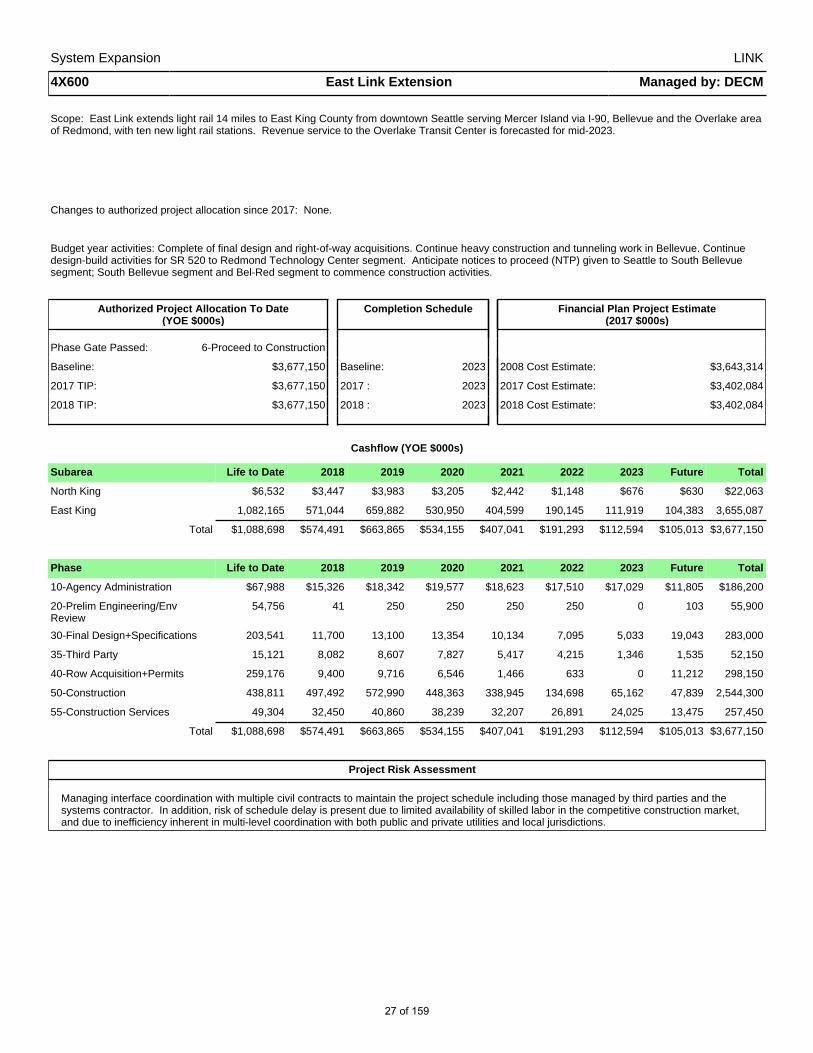
System Expansion LINK
4X600 East Link Extension Managed by: DECM
Scope: East Link extends light rail 14 miles to East King County from downtown Seattle serving Mercer Island via I-90, Bellevue and the Overlake area of Redmond, with ten new light rail stations. Revenue service to the Overlake Transit Center is forecasted for mid-2023.
Changes to authorized project allocation since 2017: None.
Budget year activities: Complete of final design and right-of-way acquisitions. Continue heavy construction and tunneling work in Bellevue. Continue design-build activities for SR 520 to Redmond Technology Center segment. Anticipate notices to proceed (NTP) given to Seattle to South Bellevue segment; South Bellevue segment and Bel-Red segment to commence construction activities.
Authorized Project Allocation To Date(YOE $000s)
Completion Schedule Financial Plan Project Estimate(2017 $000s)
Phase Gate Passed: 6-Proceed to Construction
Baseline: $3,677,150 Baseline: 2023 2008 Cost Estimate: $3,643,314
2017 TIP: $3,677,150 2017 : 2023 2017 Cost Estimate: $3,402,084
2018 TIP: $3,677,150 2018 : 2023 2018 Cost Estimate: $3,402,084
Cashflow (YOE $000s)
Subarea Life to Date 2018 2019 2020 2021 2022 2023 Future Total
North King $6,532 $3,447 $3,983 $3,205 $2,442 $1,148 $676 $630 $22,063
East King 1,082,165 571,044 659,882 530,950 404,599 190,145 111,919 104,383 3,655,087
Total $1,088,698 $574,491 $663,865 $534,155 $407,041 $191,293 $112,594 $105,013 $3,677,150
Phase Life to Date 2018 2019 2020 2021 2022 2023 Future Total
10-Agency Administration $67,988 $15,326 $18,342 $19,577 $18,623 $17,510 $17,029 $11,805 $186,200
20-Prelim Engineering/Env Review
54,756 41 250 250 250 250 0 103 55,900
30-Final Design+Specifications 203,541 11,700 13,100 13,354 10,134 7,095 5,033 19,043 283,000
35-Third Party 15,121 8,082 8,607 7,827 5,417 4,215 1,346 1,535 52,150
40-Row Acquisition+Permits 259,176 9,400 9,716 6,546 1,466 633 0 11,212 298,150
50-Construction 438,811 497,492 572,990 448,363 338,945 134,698 65,162 47,839 2,544,300
55-Construction Services 49,304 32,450 40,860 38,239 32,207 26,891 24,025 13,475 257,450
Total $1,088,698 $574,491 $663,865 $534,155 $407,041 $191,293 $112,594 $105,013 $3,677,150
Project Risk Assessment
Managing interface coordination with multiple civil contracts to maintain the project schedule including those managed by third parties and the systems contractor. In addition, risk of schedule delay is present due to limited availability of skilled labor in the competitive construction market, and due to inefficiency inherent in multi-level coordination with both public and private utilities and local jurisdictions.
27 of 159

System Expansion LINK
4X630 Downtown Redmond Link Extension Managed by: PEPD
Scope: The Downtown Redmond PE project performs preliminary engineering for a 3.7 mile extension of light rail from Overlake Transit Center to Redmond Terminal Station to establish route and station locations. In 2016 the Board has approved additional budget, Resolution No R2016-05 to complete preliminary engineering to Downtown Redmond for the future extension of East Link.
Changes to authorized project allocation since 2017: $63.4 million primarily for property acquisitions.
Budget year activities: Continue preliminary engineering, coordinate design and develop agreements with City of Redmond, Washington Department of Transportation (WSDOT) and King County.
Authorized Project Allocation To Date(YOE $000s)
Completion Schedule Financial Plan Project Estimate(2017 $000s)
Phase Gate Passed: 3-Identify Preferred Alternative
Baseline: $0 Baseline: N/A 2008 Cost Estimate: $22,952
2017 TIP: $28,617 2017 : 2018 2017 Cost Estimate: $28,377
2018 TIP: $92,006 2018 : 2018 2018 Cost Estimate: $28,377
Cashflow (YOE $000s)
Subarea Life to Date 2018 2019 2020 2021 2022 2023 Future Total
East King $8,311 $68,808 $14,887 $0 $0 $0 $0 $0 $92,006
Total $8,311 $68,808 $14,887 $0 $0 $0 $0 $0 $92,006
Phase Life to Date 2018 2019 2020 2021 2022 2023 Future Total
10-Agency Administration $1,100 $3,118 $1,088 $0 $0 $0 $0 $0 $5,306
20-Prelim Engineering/Env Review
6,501 8,700 6,299 0 0 0 0 0 21,500
35-Third Party 500 1,250 750 0 0 0 0 0 2,500
40-Row Acquisition+Permits 210 55,040 5,800 0 0 0 0 0 61,050
55-Construction Services 0 700 950 0 0 0 0 0 1,650
Total $8,311 $68,808 $14,887 $0 $0 $0 $0 $0 $92,006
Project Risk Assessment
Project is currently undergoing a refinement of the preferred alternative alignment and commencing preliminary engineering. Uncertainty persists in price escalation of right-of-way, and due to potential changes to the design, new environmental issues and an additional scope demand from third party that could present budget and schedule risks.
28 of 159
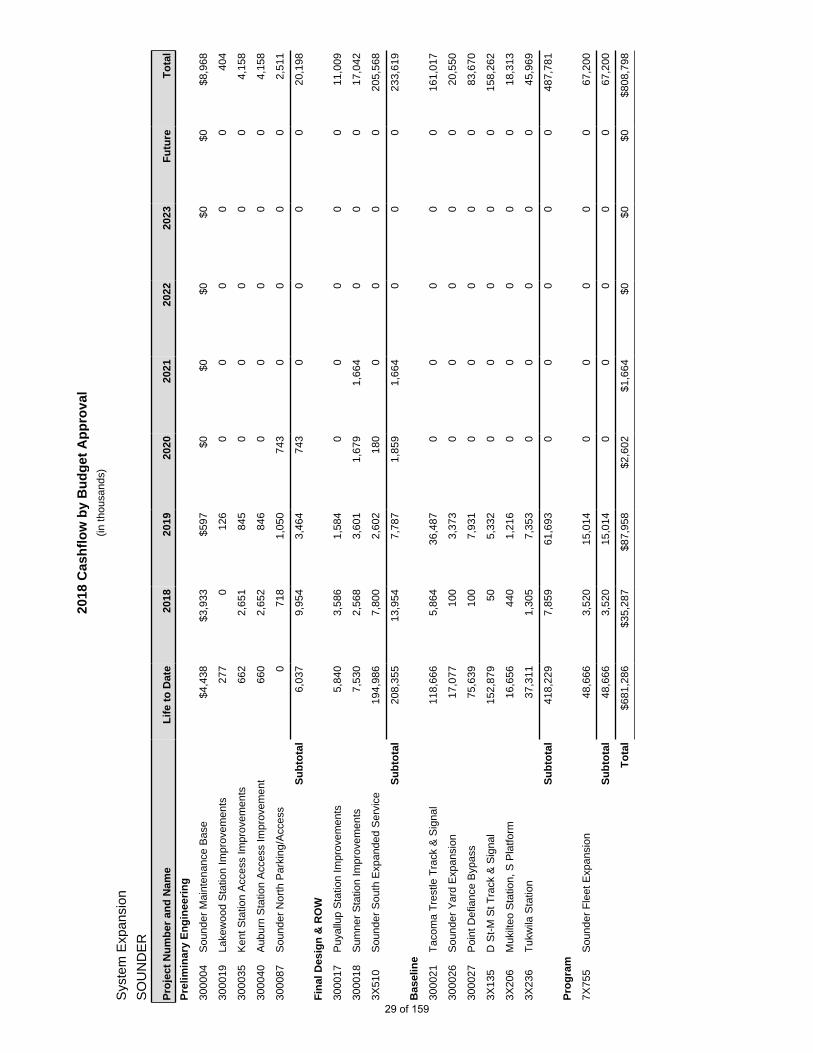
2018
Cas
hfl
ow
by
Bu
dg
et A
pp
rova
l(in
thou
sand
s)
Sys
tem
Exp
ansi
on
SO
UN
DE
R
Pro
ject
Nu
mb
er a
nd
Nam
eL
ife
to D
ate
2018
2019
2020
2021
2022
2023
Fu
ture
To
tal
Pre
limin
ary
En
gin
eeri
ng
3000
04S
ound
er M
aint
enan
ce B
ase
$4,4
38$3
,933
$597
$0$0
$0$0
$0$8
,968
3000
19La
kew
ood
Sta
tion
Impr
ovem
ents
277
012
60
00
00
404
3000
35K
ent S
tatio
n A
cces
s Im
prov
emen
ts66
22,
651
845
00
00
04,
158
3000
40A
ubur
n S
tatio
n A
cces
s Im
prov
emen
t66
02,
652
846
00
00
04,
158
3000
87S
ound
er N
orth
Par
king
/Acc
ess
071
81,
050
743
00
00
2,51
1
Su
bto
tal
6,03
79,
954
3,46
474
30
00
020
,198
Fin
al D
esig
n &
RO
W
3000
17P
uyal
lup
Sta
tion
Impr
ovem
ents
5,84
03,
586
1,58
40
00
00
11,0
09
3000
18S
umne
r S
tatio
n Im
prov
emen
ts7,
530
2,56
83,
601
1,67
91,
664
00
017
,042
3X51
0S
ound
er S
outh
Exp
ande
d S
ervi
ce19
4,98
67,
800
2,60
218
00
00
020
5,56
8
Su
bto
tal
208,
355
13,9
547,
787
1,85
91,
664
00
023
3,61
9
Bas
elin
e
3000
21T
acom
a T
rest
le T
rack
& S
igna
l11
8,66
65,
864
36,4
870
00
00
161,
017
3000
26S
ound
er Y
ard
Exp
ansi
on17
,077
100
3,37
30
00
00
20,5
50
3000
27P
oint
Def
ianc
e B
ypas
s75
,639
100
7,93
10
00
00
83,6
70
3X13
5D
St-
M S
t Tra
ck &
Sig
nal
152,
879
505,
332
00
00
015
8,26
2
3X20
6M
ukilt
eo S
tatio
n, S
Pla
tform
16,6
5644
01,
216
00
00
018
,313
3X23
6T
ukw
ila S
tatio
n37
,311
1,30
57,
353
00
00
045
,969
Su
bto
tal
418,
229
7,85
961
,693
00
00
048
7,78
1
Pro
gra
m
7X75
5S
ound
er F
leet
Exp
ansi
on48
,666
3,52
015
,014
00
00
067
,200
Su
bto
tal
48,6
663,
520
15,0
140
00
00
67,2
00
To
tal
$681
,286
$35,
287
$87,
958
$2,6
02$1
,664
$0$0
$0$8
08,7
98
29 of 159

2018
Cas
hfl
ow
by
Su
bar
ea(in
thou
sand
s)
Sys
tem
Exp
ansi
on
SO
UN
DE
R
Su
bar
eaL
ife
to D
ate
2018
2019
2020
2021
2022
2023
Fu
ture
To
tal
1 -
Sno
hom
ish
$17,
322
$1,7
48$2
,356
$743
$0$0
$0$0
$22,
169
3 -
Sou
th K
ing
47,6
156,
661
10,8
190
00
00
65,0
94
5 -
Pie
rce
616,
349
26,8
7974
,784
1,85
91,
664
00
072
1,53
5
To
tal
$681
,286
$35,
287
$87,
958
$2,6
02$1
,664
$0$0
$0$8
08,7
98
2018
Cas
hfl
ow
by
Ph
ase
(in th
ousa
nds)
Ph
ase
# an
d D
escr
ipti
on
Lif
e to
Dat
e20
1820
1920
2020
2120
2220
23F
utu
reT
ota
l
02-O
pera
tion+
Mai
nten
ance
-Age
ncy
$42
$0$0
$0$0
$0$0
$0$4
2
10-A
genc
y A
dmin
istr
atio
n25
,528
3,22
35,
712
332
00
00
34,7
94
20-P
relim
Eng
inee
ring/
Env
Rev
iew
15,6
118,
192
3,83
231
50
00
027
,951
30-F
inal
Des
ign+
Spe
cific
atio
ns36
,117
535
5,19
30
00
00
41,8
44
35-T
hird
Par
ty1,
659
4,99
34,
732
1,72
71,
664
00
014
,774
40-R
ow A
cqui
sitio
n+P
erm
its25
8,38
24,
272
5,31
833
00
00
268,
005
50-C
onst
ruct
ion
263,
613
9,30
041
,448
196
00
00
314,
558
55-C
onst
ruct
ion
Ser
vice
s21
,678
1,25
36,
709
00
00
029
,640
70-V
ehic
les
57,6
113,
520
15,0
140
00
00
76,1
46
80-S
yste
m T
estin
g+S
tart
up1,
046
00
00
00
01,
046
To
tal
$681
,286
$35,
287
$87,
958
$2,6
02$1
,664
$0$0
$0$8
08,7
98
30 of 159
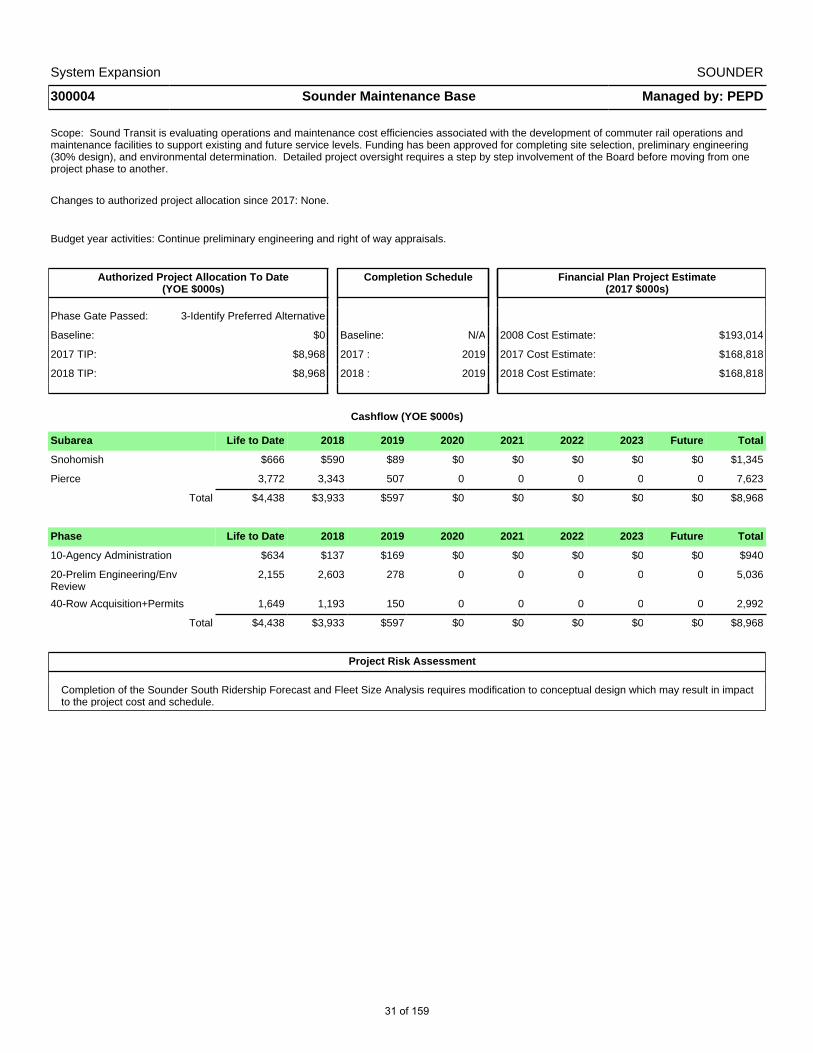
System Expansion SOUNDER
300004 Sounder Maintenance Base Managed by: PEPD
Scope: Sound Transit is evaluating operations and maintenance cost efficiencies associated with the development of commuter rail operations and maintenance facilities to support existing and future service levels. Funding has been approved for completing site selection, preliminary engineering (30% design), and environmental determination. Detailed project oversight requires a step by step involvement of the Board before moving from one project phase to another.
Changes to authorized project allocation since 2017: None.
Budget year activities: Continue preliminary engineering and right of way appraisals.
Authorized Project Allocation To Date(YOE $000s)
Completion Schedule Financial Plan Project Estimate(2017 $000s)
Phase Gate Passed: 3-Identify Preferred Alternative
Baseline: $0 Baseline: N/A 2008 Cost Estimate: $193,014
2017 TIP: $8,968 2017 : 2019 2017 Cost Estimate: $168,818
2018 TIP: $8,968 2018 : 2019 2018 Cost Estimate: $168,818
Cashflow (YOE $000s)
Subarea Life to Date 2018 2019 2020 2021 2022 2023 Future Total
Snohomish $666 $590 $89 $0 $0 $0 $0 $0 $1,345
Pierce 3,772 3,343 507 0 0 0 0 0 7,623
Total $4,438 $3,933 $597 $0 $0 $0 $0 $0 $8,968
Phase Life to Date 2018 2019 2020 2021 2022 2023 Future Total
10-Agency Administration $634 $137 $169 $0 $0 $0 $0 $0 $940
20-Prelim Engineering/Env Review
2,155 2,603 278 0 0 0 0 0 5,036
40-Row Acquisition+Permits 1,649 1,193 150 0 0 0 0 0 2,992
Total $4,438 $3,933 $597 $0 $0 $0 $0 $0 $8,968
Project Risk Assessment
Completion of the Sounder South Ridership Forecast and Fleet Size Analysis requires modification to conceptual design which may result in impact to the project cost and schedule.
31 of 159

System Expansion SOUNDER
300017 Puyallup Station Improvements Managed by: DECM
Scope: The Puyallup Station Access Improvement Project is evaluating potential capital improvements to facilitate access to Puyallup Station for pedestrians, bicyclists, and drivers. Improvements include additional parking facilities, pedestrian access improvements, bicycle route improvements, and secure bicycle storage.
Changes to authorized project allocation since 2017: None.
Budget year activities: Complete design-build bridging documents, right-of-way appraisals and acquisitions. Start the Request for Proposal (RFP) process for the design-build and design-build/project management contracts.
Authorized Project Allocation To Date(YOE $000s)
Completion Schedule Financial Plan Project Estimate(2017 $000s)
Phase Gate Passed: 4-Enter Final Design
Baseline: $0 Baseline: N/A 2008 Cost Estimate: $76,012
2017 TIP: $11,009 2017 : 2018 2017 Cost Estimate: $64,274
2018 TIP: $11,009 2018 : 2018 2018 Cost Estimate: $64,274
Cashflow (YOE $000s)
Subarea Life to Date 2018 2019 2020 2021 2022 2023 Future Total
Pierce $5,840 $3,586 $1,584 $0 $0 $0 $0 $0 $11,009
Total $5,840 $3,586 $1,584 $0 $0 $0 $0 $0 $11,009
Phase Life to Date 2018 2019 2020 2021 2022 2023 Future Total
10-Agency Administration $883 $280 $60 $0 $0 $0 $0 $0 $1,223
20-Prelim Engineering/Env Review
1,971 402 624 0 0 0 0 0 2,996
35-Third Party 0 100 5 0 0 0 0 0 105
40-Row Acquisition+Permits 2,986 2,679 890 0 0 0 0 0 6,555
55-Construction Services 0 125 5 0 0 0 0 0 130
Total $5,840 $3,586 $1,584 $0 $0 $0 $0 $0 $11,009
Project Risk Assessment
Uncertainties in right of way acquisition, third party and jurisdictional requirements present budget and schedule risks.
32 of 159

System Expansion SOUNDER
300018 Sumner Station Improvements Managed by: DECM
Scope: Evaluate, design and construct capital improvements to facilitate access to Sumner Station for pedestrians, bicyclists, and drivers. Improvements include additional parking facilities, pedestrian access improvements, bicycle route improvements, and secure bicycle storage.
Changes to authorized project allocation since 2017: None.
Budget year activities: Complete design-build bridging documents, right-of-way acquisitions. Start the Request for Proposal (RFP) process for the design-build contract and award the design-build/project management contract.
Authorized Project Allocation To Date(YOE $000s)
Completion Schedule Financial Plan Project Estimate(2017 $000s)
Phase Gate Passed: 4-Enter Final Design
Baseline: $0 Baseline: N/A 2008 Cost Estimate: $53,542
2017 TIP: $17,042 2017 : 2020 2017 Cost Estimate: $49,068
2018 TIP: $17,042 2018 : 2020 2018 Cost Estimate: $49,068
Cashflow (YOE $000s)
Subarea Life to Date 2018 2019 2020 2021 2022 2023 Future Total
Pierce $7,530 $2,568 $3,601 $1,679 $1,664 $0 $0 $0 $17,042
Total $7,530 $2,568 $3,601 $1,679 $1,664 $0 $0 $0 $17,042
Phase Life to Date 2018 2019 2020 2021 2022 2023 Future Total
10-Agency Administration $922 $456 $55 $0 $0 $0 $0 $0 $1,433
20-Prelim Engineering/Env Review
1,976 402 619 0 0 0 0 0 2,996
35-Third Party 350 1,172 2,810 1,664 1,664 0 0 0 7,658
40-Row Acquisition+Permits 4,186 131 98 0 0 0 0 0 4,414
50-Construction 97 0 0 16 0 0 0 0 113
55-Construction Services 0 408 20 0 0 0 0 0 428
Total $7,530 $2,568 $3,601 $1,679 $1,664 $0 $0 $0 $17,042
Project Risk Assessment
Uncertainties in right of way acquisition, third party and jurisdictional requirements present budget and schedule risks.
33 of 159

System Expansion SOUNDER
300019 Lakewood Station Improvements Managed by: DECM
Scope: Construction of a pedestrian bridge in the city of Lakewood connecting the community to the northwest of Lakewood Station with the station. This work is partly funded by a capped contribution from Sound Transit. Additional access improvements contemplated in ST2 and reflected in the ST2 cost estimate were evaluated through the Station Access and Demand Study project and may be proposed in the future.
Changes to authorized project allocation since 2017: None.
Budget year activities: Project on hold.
Authorized Project Allocation To Date(YOE $000s)
Completion Schedule Financial Plan Project Estimate(2017 $000s)
Phase Gate Passed: Pending
Baseline: $0 Baseline: N/A 2008 Cost Estimate: $47,625
2017 TIP: $404 2017 : 2016 2017 Cost Estimate: $40,512
2018 TIP: $404 2018 : 2016 2018 Cost Estimate: $40,512
Cashflow (YOE $000s)
Subarea Life to Date 2018 2019 2020 2021 2022 2023 Future Total
Pierce $277 $0 $126 $0 $0 $0 $0 $0 $404
Total $277 $0 $126 $0 $0 $0 $0 $0 $404
Phase Life to Date 2018 2019 2020 2021 2022 2023 Future Total
10-Agency Administration $26 $0 $14 $0 $0 $0 $0 $0 $40
35-Third Party 252 0 112 0 0 0 0 0 363
Total $277 $0 $126 $0 $0 $0 $0 $0 $404
Project Risk Assessment
N/A
34 of 159
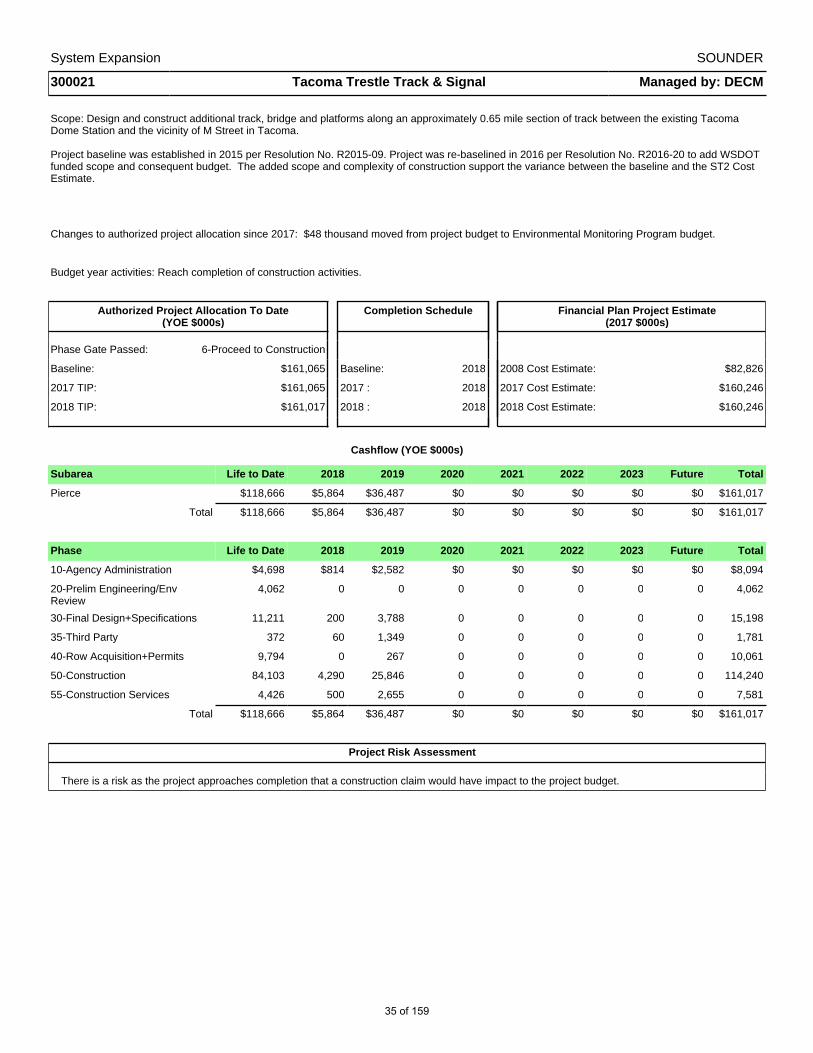
System Expansion SOUNDER
300021 Tacoma Trestle Track & Signal Managed by: DECM
Scope: Design and construct additional track, bridge and platforms along an approximately 0.65 mile section of track between the existing Tacoma Dome Station and the vicinity of M Street in Tacoma.
Project baseline was established in 2015 per Resolution No. R2015-09. Project was re-baselined in 2016 per Resolution No. R2016-20 to add WSDOT funded scope and consequent budget. The added scope and complexity of construction support the variance between the baseline and the ST2 Cost Estimate.
Changes to authorized project allocation since 2017: $48 thousand moved from project budget to Environmental Monitoring Program budget.
Budget year activities: Reach completion of construction activities.
Authorized Project Allocation To Date(YOE $000s)
Completion Schedule Financial Plan Project Estimate(2017 $000s)
Phase Gate Passed: 6-Proceed to Construction
Baseline: $161,065 Baseline: 2018 2008 Cost Estimate: $82,826
2017 TIP: $161,065 2017 : 2018 2017 Cost Estimate: $160,246
2018 TIP: $161,017 2018 : 2018 2018 Cost Estimate: $160,246
Cashflow (YOE $000s)
Subarea Life to Date 2018 2019 2020 2021 2022 2023 Future Total
Pierce $118,666 $5,864 $36,487 $0 $0 $0 $0 $0 $161,017
Total $118,666 $5,864 $36,487 $0 $0 $0 $0 $0 $161,017
Phase Life to Date 2018 2019 2020 2021 2022 2023 Future Total
10-Agency Administration $4,698 $814 $2,582 $0 $0 $0 $0 $0 $8,094
20-Prelim Engineering/Env Review
4,062 0 0 0 0 0 0 0 4,062
30-Final Design+Specifications 11,211 200 3,788 0 0 0 0 0 15,198
35-Third Party 372 60 1,349 0 0 0 0 0 1,781
40-Row Acquisition+Permits 9,794 0 267 0 0 0 0 0 10,061
50-Construction 84,103 4,290 25,846 0 0 0 0 0 114,240
55-Construction Services 4,426 500 2,655 0 0 0 0 0 7,581
Total $118,666 $5,864 $36,487 $0 $0 $0 $0 $0 $161,017
Project Risk Assessment
There is a risk as the project approaches completion that a construction claim would have impact to the project budget.
35 of 159

System Expansion SOUNDER
300026 Sounder Yard Expansion Managed by: DECM
Scope: Increase track capacity at the layover facility in Lakewood to store up to seven train sets. The project will also complete drainage improvements and increase electrical power to accommodate additional wayside power and yard lighting. The increase in capacity is needed for the additional ST2 Sounder South service that began in 2016 before the Sounder Yard & Shops Facility project is complete.
Changes to authorized project allocation since 2017: None.
Budget year activities: Project closeout.
Authorized Project Allocation To Date(YOE $000s)
Completion Schedule Financial Plan Project Estimate(2017 $000s)
Phase Gate Passed: 6-Proceed to Construction
Baseline: $20,550 Baseline: 2017 2008 Cost Estimate: N/A
2017 TIP: $20,550 2017 : 2017 2017 Cost Estimate: $22,563
2018 TIP: $20,550 2018 : 2017 2018 Cost Estimate: $22,563
Cashflow (YOE $000s)
Subarea Life to Date 2018 2019 2020 2021 2022 2023 Future Total
South King $8,982 $53 $1,774 $0 $0 $0 $0 $0 $10,809
Pierce 8,094 47 1,599 0 0 0 0 0 9,741
Total $17,077 $100 $3,373 $0 $0 $0 $0 $0 $20,550
Phase Life to Date 2018 2019 2020 2021 2022 2023 Future Total
10-Agency Administration $1,325 $100 $0 $0 $0 $0 $0 $0 $1,425
20-Prelim Engineering/Env Review
1,208 0 596 0 0 0 0 0 1,804
40-Row Acquisition+Permits 185 0 215 0 0 0 0 0 400
50-Construction 12,958 0 2,562 0 0 0 0 0 15,521
55-Construction Services 1,400 0 0 0 0 0 0 0 1,400
Total $17,077 $100 $3,373 $0 $0 $0 $0 $0 $20,550
Project Risk Assessment
N/A
36 of 159

System Expansion SOUNDER
300027 Point Defiance Bypass Managed by: DECM
Scope: Sound Transit will administer the construction of the Point Defiance Bypass Project which will construct a new second track adjacent to Sound Transit’s existing main line between South Tacoma (South 66th Street Bridge) and Lakewood (Bridgeport Way) and install new rails, ties, and ballast on Sound Transit’s existing track between Lakewood and Nisqually. Improvements will be made at the connection to BNSF’s main line near Nisqually and safety improvements will be made at some existing at-grade crossings within the project corridor.
Changes to authorized project allocation since 2017: None.
Budget year activities: Project closeout.
Authorized Project Allocation To Date(YOE $000s)
Completion Schedule Financial Plan Project Estimate(2017 $000s)
Phase Gate Passed: 7-Transition to Operations
Baseline: $83,670 Baseline: 2017 2008 Cost Estimate: N/A
2017 TIP: $83,670 2017 : 2017 2017 Cost Estimate: N/A
2018 TIP: $83,670 2018 : 2017 2018 Cost Estimate: N/A
Cashflow (YOE $000s)
Subarea Life to Date 2018 2019 2020 2021 2022 2023 Future Total
Pierce $75,639 $100 $7,931 $0 $0 $0 $0 $0 $83,670
Total $75,639 $100 $7,931 $0 $0 $0 $0 $0 $83,670
Phase Life to Date 2018 2019 2020 2021 2022 2023 Future Total
02-Operation+Maintenance-Agency
$42 $0 $0 $0 $0 $0 $0 $0 $42
10-Agency Administration 3,059 100 0 0 0 0 0 0 3,159
30-Final Design+Specifications 103 0 97 0 0 0 0 0 200
40-Row Acquisition+Permits 52 0 348 0 0 0 0 0 400
50-Construction 65,063 0 4,560 0 0 0 0 0 69,623
55-Construction Services 7,321 0 2,925 0 0 0 0 0 10,246
Total $75,639 $100 $7,931 $0 $0 $0 $0 $0 $83,670
Project Risk Assessment
N/A
37 of 159
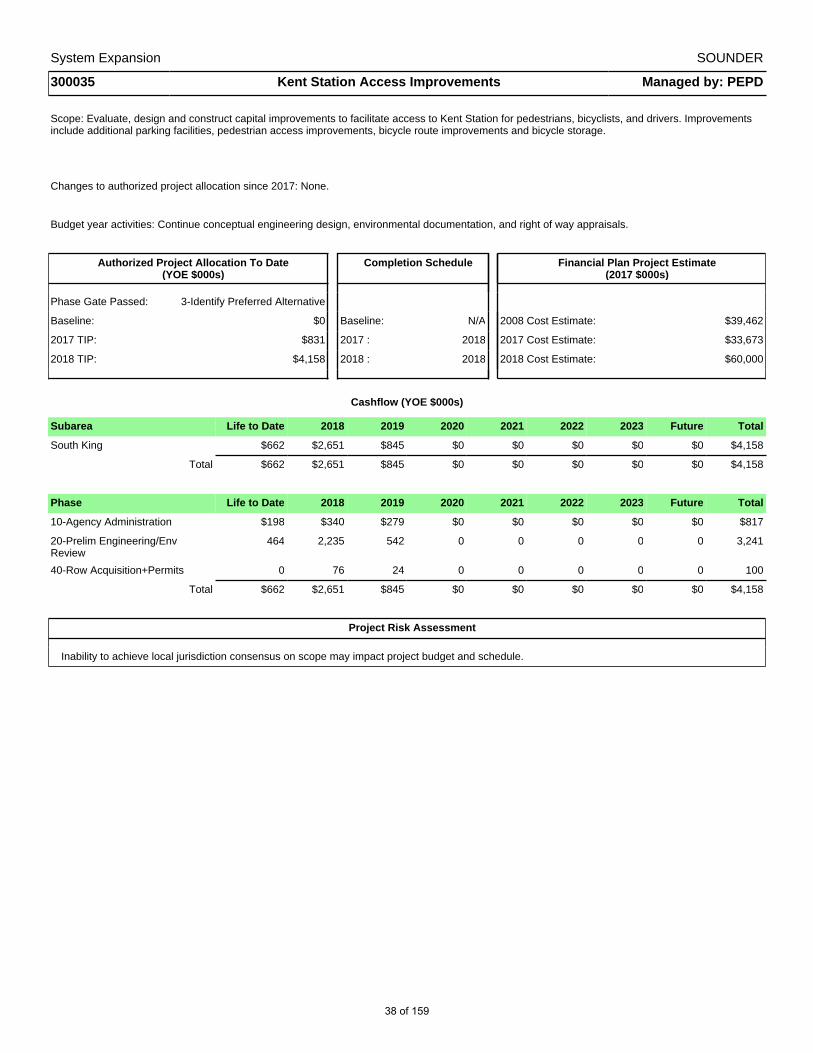
System Expansion SOUNDER
300035 Kent Station Access Improvements Managed by: PEPD
Scope: Evaluate, design and construct capital improvements to facilitate access to Kent Station for pedestrians, bicyclists, and drivers. Improvements include additional parking facilities, pedestrian access improvements, bicycle route improvements and bicycle storage.
Changes to authorized project allocation since 2017: None.
Budget year activities: Continue conceptual engineering design, environmental documentation, and right of way appraisals.
Authorized Project Allocation To Date(YOE $000s)
Completion Schedule Financial Plan Project Estimate(2017 $000s)
Phase Gate Passed: 3-Identify Preferred Alternative
Baseline: $0 Baseline: N/A 2008 Cost Estimate: $39,462
2017 TIP: $831 2017 : 2018 2017 Cost Estimate: $33,673
2018 TIP: $4,158 2018 : 2018 2018 Cost Estimate: $60,000
Cashflow (YOE $000s)
Subarea Life to Date 2018 2019 2020 2021 2022 2023 Future Total
South King $662 $2,651 $845 $0 $0 $0 $0 $0 $4,158
Total $662 $2,651 $845 $0 $0 $0 $0 $0 $4,158
Phase Life to Date 2018 2019 2020 2021 2022 2023 Future Total
10-Agency Administration $198 $340 $279 $0 $0 $0 $0 $0 $817
20-Prelim Engineering/Env Review
464 2,235 542 0 0 0 0 0 3,241
40-Row Acquisition+Permits 0 76 24 0 0 0 0 0 100
Total $662 $2,651 $845 $0 $0 $0 $0 $0 $4,158
Project Risk Assessment
Inability to achieve local jurisdiction consensus on scope may impact project budget and schedule.
38 of 159
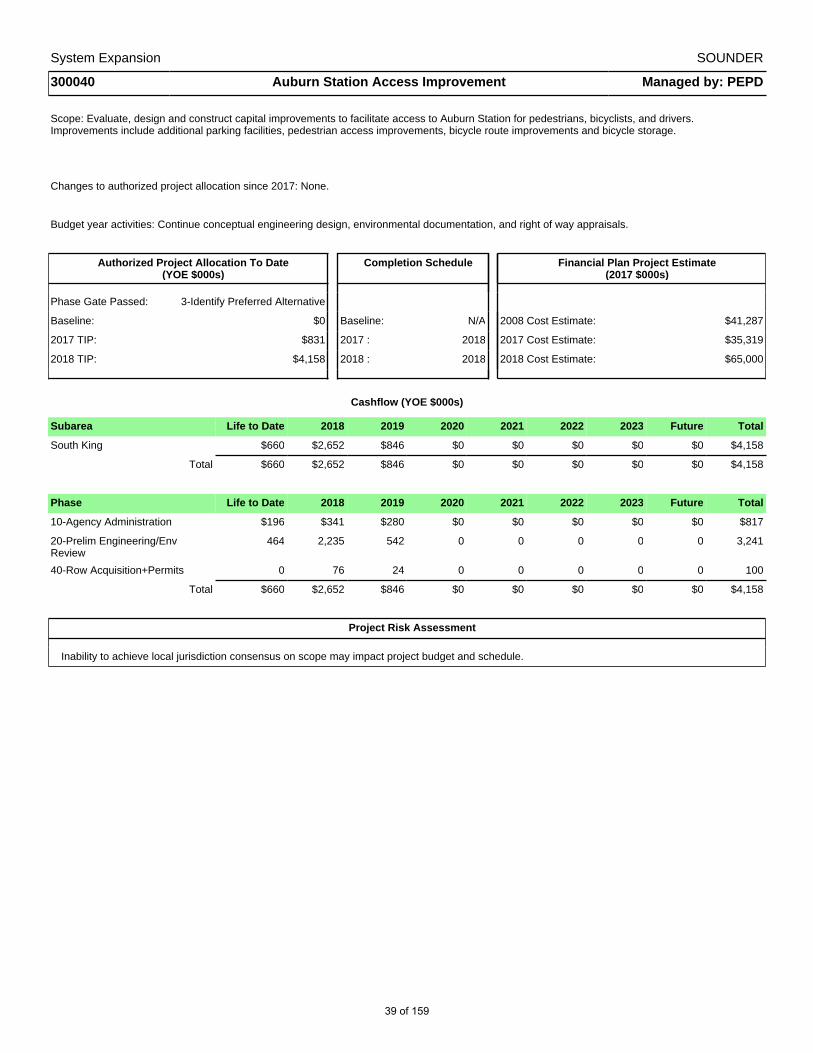
System Expansion SOUNDER
300040 Auburn Station Access Improvement Managed by: PEPD
Scope: Evaluate, design and construct capital improvements to facilitate access to Auburn Station for pedestrians, bicyclists, and drivers. Improvements include additional parking facilities, pedestrian access improvements, bicycle route improvements and bicycle storage.
Changes to authorized project allocation since 2017: None.
Budget year activities: Continue conceptual engineering design, environmental documentation, and right of way appraisals.
Authorized Project Allocation To Date(YOE $000s)
Completion Schedule Financial Plan Project Estimate(2017 $000s)
Phase Gate Passed: 3-Identify Preferred Alternative
Baseline: $0 Baseline: N/A 2008 Cost Estimate: $41,287
2017 TIP: $831 2017 : 2018 2017 Cost Estimate: $35,319
2018 TIP: $4,158 2018 : 2018 2018 Cost Estimate: $65,000
Cashflow (YOE $000s)
Subarea Life to Date 2018 2019 2020 2021 2022 2023 Future Total
South King $660 $2,652 $846 $0 $0 $0 $0 $0 $4,158
Total $660 $2,652 $846 $0 $0 $0 $0 $0 $4,158
Phase Life to Date 2018 2019 2020 2021 2022 2023 Future Total
10-Agency Administration $196 $341 $280 $0 $0 $0 $0 $0 $817
20-Prelim Engineering/Env Review
464 2,235 542 0 0 0 0 0 3,241
40-Row Acquisition+Permits 0 76 24 0 0 0 0 0 100
Total $660 $2,652 $846 $0 $0 $0 $0 $0 $4,158
Project Risk Assessment
Inability to achieve local jurisdiction consensus on scope may impact project budget and schedule.
39 of 159

System Expansion SOUNDER
300087 Sounder North Parking/Access Managed by: PEPD
Scope: Provide additional parking at Mukilteo and Edmonds Sounder Stations and an opportunity for access improvements prioritized per Sound Transit's Access Policy
Changes in project allocation since 2017: New project
Budget year activities: begin procurement process and issue request for proposal for preliminary engineering consultant to begin alternatives development and screening
Authorized Project Allocation To Date(YOE $000s)
Completion Schedule Financial Plan Project Estimate(2017 $000s)
Phase Gate Passed: Pending
Baseline: $0 Baseline: N/A 2008 Cost Estimate: N/A
2017 TIP: $0 2017 : N/A 2017 Cost Estimate: N/A
2018 TIP: $2,511 2018 : 2020 2018 Cost Estimate: $44,030
Cashflow (YOE $000s)
Subarea Life to Date 2018 2019 2020 2021 2022 2023 Future Total
Snohomish $0 $718 $1,050 $743 $0 $0 $0 $0 $2,511
Total $0 $718 $1,050 $743 $0 $0 $0 $0 $2,511
Phase Life to Date 2018 2019 2020 2021 2022 2023 Future Total
10-Agency Administration $0 $325 $325 $332 $0 $0 $0 $0 $982
20-Prelim Engineering/Env Review
0 315 632 315 0 0 0 0 1,262
35-Third Party 0 61 61 63 0 0 0 0 185
40-Row Acquisition+Permits 0 17 32 33 0 0 0 0 82
Total $0 $718 $1,050 $743 $0 $0 $0 $0 $2,511
Project Risk Assessment
The project is very early in the development process with potential challenges in city coordination on parking and access improvements to Sounder stations, in right of way acquisition, and coordination with BNSF for North Sounder Parking
40 of 159

System Expansion SOUNDER
3X135 D St-M St Track & Signal Managed by: DECM
Scope: Design and construct a 1.4 mile rail conneciton between Tacoma Dome Station and Sound Transit owned right-of-way at the Lakewood Subdivision Line. Construction included; rail work, an overpass at Pacific Avenue, roadway improvements, utility relocations and centralized traffic control for the rail line. The project completed construction and began Sounder service between Lakewood and Tacoma in October 2012. Follow-on work identified is complete. Legal issues need resolution prior to project completion anticipated by the end of 2018.
Funds cash flowed in 2019 are considered surplus.
Changes to authorized project allocation since 2017: None.
Budget year activities: Finalize completed improvements/follow-on work with local jurisdiction and closeout this project.
Authorized Project Allocation To Date(YOE $000s)
Completion Schedule Financial Plan Project Estimate(2017 $000s)
Phase Gate Passed: 7-Transition to Operations
Baseline: $161,581 Baseline: 2012 2008 Cost Estimate: N/A
2017 TIP: $158,262 2017 : 2016 2017 Cost Estimate: N/A
2018 TIP: $158,262 2018 : 2016 2018 Cost Estimate: N/A
Cashflow (YOE $000s)
Subarea Life to Date 2018 2019 2020 2021 2022 2023 Future Total
Pierce $152,879 $50 $5,332 $0 $0 $0 $0 $0 $158,262
Total $152,879 $50 $5,332 $0 $0 $0 $0 $0 $158,262
Phase Life to Date 2018 2019 2020 2021 2022 2023 Future Total
10-Agency Administration $8,936 $50 $621 $0 $0 $0 $0 $0 $9,606
20-Prelim Engineering/Env Review
1,733 0 0 0 0 0 0 0 1,733
30-Final Design+Specifications 17,308 0 804 0 0 0 0 0 18,112
35-Third Party 605 0 241 0 0 0 0 0 846
40-Row Acquisition+Permits 42,145 0 1,484 0 0 0 0 0 43,629
50-Construction 66,980 0 1,583 0 0 0 0 0 68,563
55-Construction Services 5,173 0 600 0 0 0 0 0 5,773
70-Vehicles 8,953 0 0 0 0 0 0 0 8,953
80-System Testing+Startup 1,046 0 0 0 0 0 0 0 1,046
Total $152,879 $50 $5,332 $0 $0 $0 $0 $0 $158,262
Project Risk Assessment
The project is complete and in operation.
41 of 159
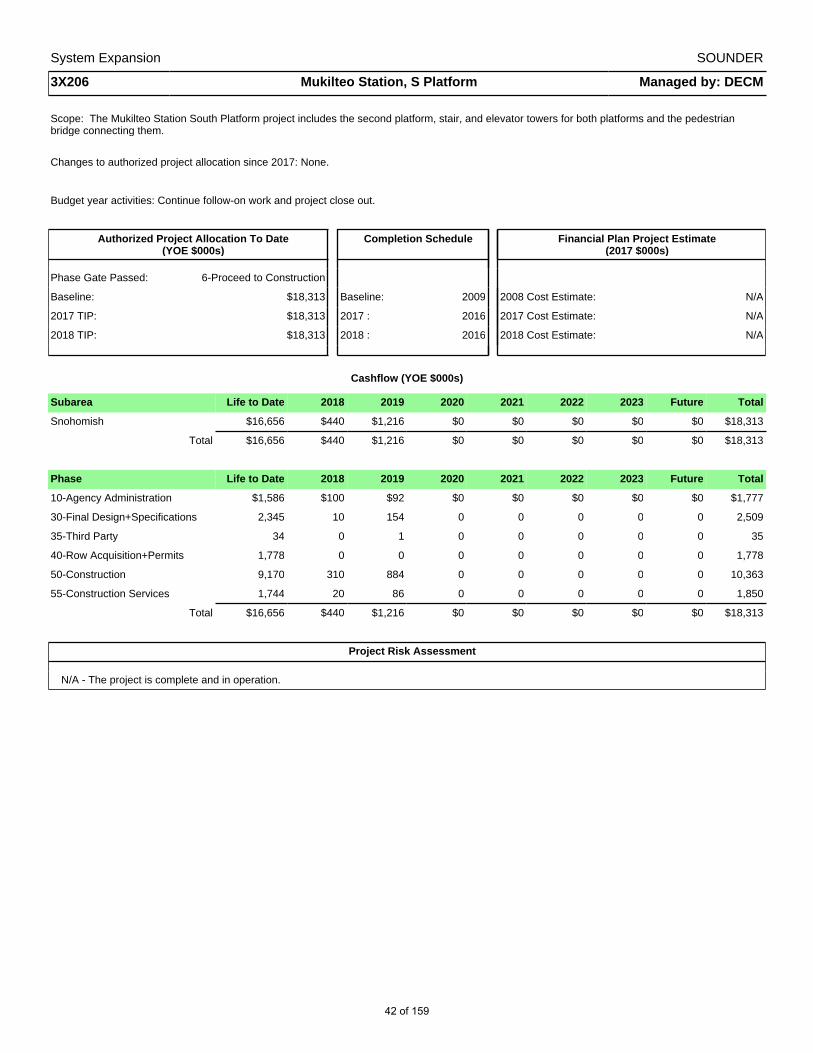
System Expansion SOUNDER
3X206 Mukilteo Station, S Platform Managed by: DECM
Scope: The Mukilteo Station South Platform project includes the second platform, stair, and elevator towers for both platforms and the pedestrian bridge connecting them.
Changes to authorized project allocation since 2017: None.
Budget year activities: Continue follow-on work and project close out.
Authorized Project Allocation To Date(YOE $000s)
Completion Schedule Financial Plan Project Estimate(2017 $000s)
Phase Gate Passed: 6-Proceed to Construction
Baseline: $18,313 Baseline: 2009 2008 Cost Estimate: N/A
2017 TIP: $18,313 2017 : 2016 2017 Cost Estimate: N/A
2018 TIP: $18,313 2018 : 2016 2018 Cost Estimate: N/A
Cashflow (YOE $000s)
Subarea Life to Date 2018 2019 2020 2021 2022 2023 Future Total
Snohomish $16,656 $440 $1,216 $0 $0 $0 $0 $0 $18,313
Total $16,656 $440 $1,216 $0 $0 $0 $0 $0 $18,313
Phase Life to Date 2018 2019 2020 2021 2022 2023 Future Total
10-Agency Administration $1,586 $100 $92 $0 $0 $0 $0 $0 $1,777
30-Final Design+Specifications 2,345 10 154 0 0 0 0 0 2,509
35-Third Party 34 0 1 0 0 0 0 0 35
40-Row Acquisition+Permits 1,778 0 0 0 0 0 0 0 1,778
50-Construction 9,170 310 884 0 0 0 0 0 10,363
55-Construction Services 1,744 20 86 0 0 0 0 0 1,850
Total $16,656 $440 $1,216 $0 $0 $0 $0 $0 $18,313
Project Risk Assessment
N/A - The project is complete and in operation.
42 of 159
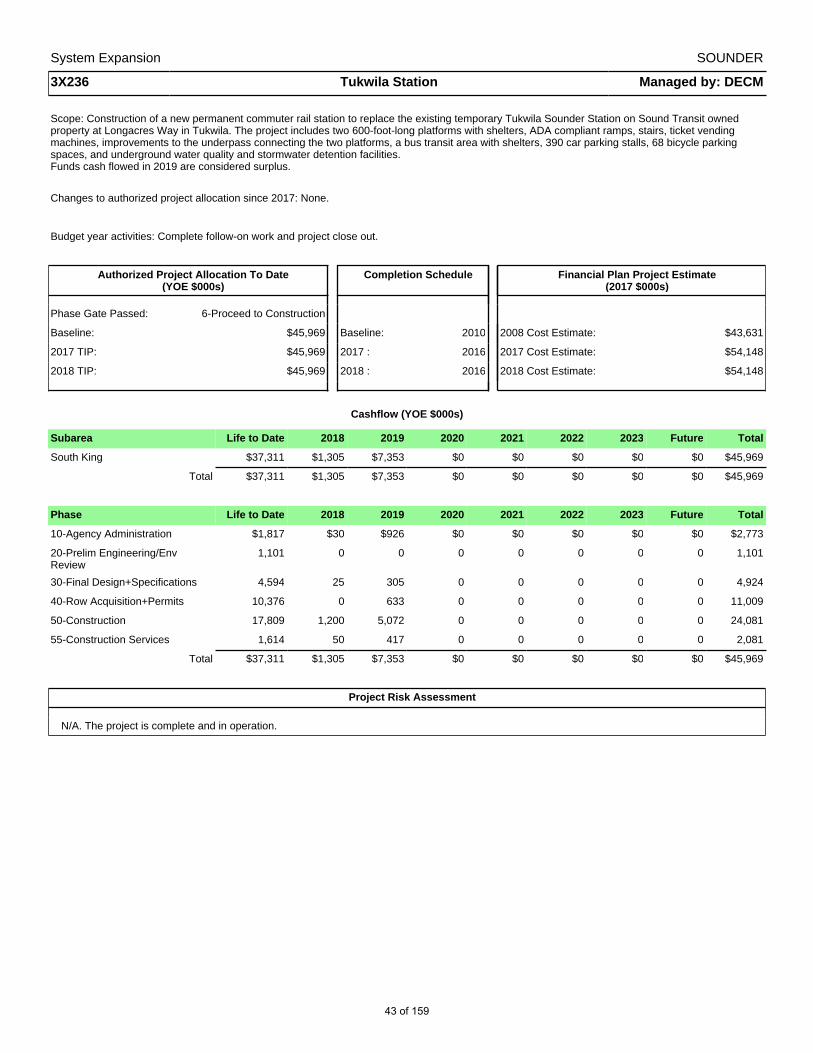
System Expansion SOUNDER
3X236 Tukwila Station Managed by: DECM
Scope: Construction of a new permanent commuter rail station to replace the existing temporary Tukwila Sounder Station on Sound Transit owned property at Longacres Way in Tukwila. The project includes two 600-foot-long platforms with shelters, ADA compliant ramps, stairs, ticket vending machines, improvements to the underpass connecting the two platforms, a bus transit area with shelters, 390 car parking stalls, 68 bicycle parking spaces, and underground water quality and stormwater detention facilities. Funds cash flowed in 2019 are considered surplus.
Changes to authorized project allocation since 2017: None.
Budget year activities: Complete follow-on work and project close out.
Authorized Project Allocation To Date(YOE $000s)
Completion Schedule Financial Plan Project Estimate(2017 $000s)
Phase Gate Passed: 6-Proceed to Construction
Baseline: $45,969 Baseline: 2010 2008 Cost Estimate: $43,631
2017 TIP: $45,969 2017 : 2016 2017 Cost Estimate: $54,148
2018 TIP: $45,969 2018 : 2016 2018 Cost Estimate: $54,148
Cashflow (YOE $000s)
Subarea Life to Date 2018 2019 2020 2021 2022 2023 Future Total
South King $37,311 $1,305 $7,353 $0 $0 $0 $0 $0 $45,969
Total $37,311 $1,305 $7,353 $0 $0 $0 $0 $0 $45,969
Phase Life to Date 2018 2019 2020 2021 2022 2023 Future Total
10-Agency Administration $1,817 $30 $926 $0 $0 $0 $0 $0 $2,773
20-Prelim Engineering/Env Review
1,101 0 0 0 0 0 0 0 1,101
30-Final Design+Specifications 4,594 25 305 0 0 0 0 0 4,924
40-Row Acquisition+Permits 10,376 0 633 0 0 0 0 0 11,009
50-Construction 17,809 1,200 5,072 0 0 0 0 0 24,081
55-Construction Services 1,614 50 417 0 0 0 0 0 2,081
Total $37,311 $1,305 $7,353 $0 $0 $0 $0 $0 $45,969
Project Risk Assessment
N/A. The project is complete and in operation.
43 of 159
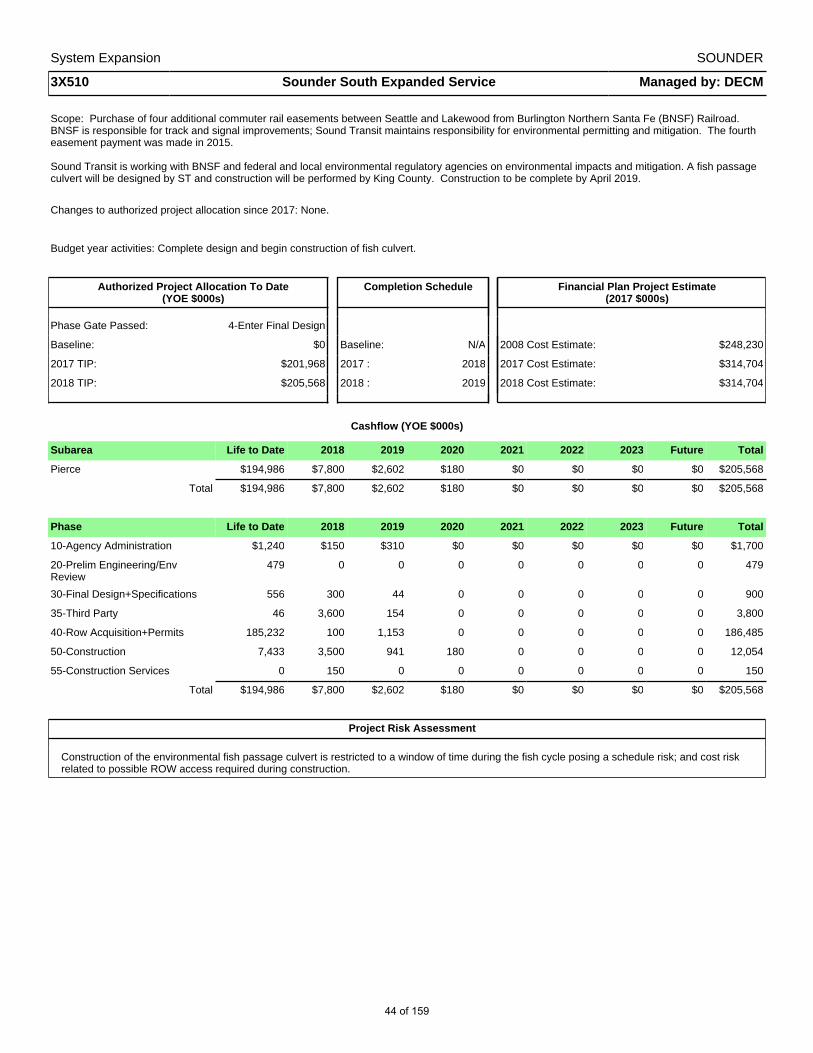
System Expansion SOUNDER
3X510 Sounder South Expanded Service Managed by: DECM
Scope: Purchase of four additional commuter rail easements between Seattle and Lakewood from Burlington Northern Santa Fe (BNSF) Railroad. BNSF is responsible for track and signal improvements; Sound Transit maintains responsibility for environmental permitting and mitigation. The fourth easement payment was made in 2015.
Sound Transit is working with BNSF and federal and local environmental regulatory agencies on environmental impacts and mitigation. A fish passage culvert will be designed by ST and construction will be performed by King County. Construction to be complete by April 2019.
Changes to authorized project allocation since 2017: None.
Budget year activities: Complete design and begin construction of fish culvert.
Authorized Project Allocation To Date(YOE $000s)
Completion Schedule Financial Plan Project Estimate(2017 $000s)
Phase Gate Passed: 4-Enter Final Design
Baseline: $0 Baseline: N/A 2008 Cost Estimate: $248,230
2017 TIP: $201,968 2017 : 2018 2017 Cost Estimate: $314,704
2018 TIP: $205,568 2018 : 2019 2018 Cost Estimate: $314,704
Cashflow (YOE $000s)
Subarea Life to Date 2018 2019 2020 2021 2022 2023 Future Total
Pierce $194,986 $7,800 $2,602 $180 $0 $0 $0 $0 $205,568
Total $194,986 $7,800 $2,602 $180 $0 $0 $0 $0 $205,568
Phase Life to Date 2018 2019 2020 2021 2022 2023 Future Total
10-Agency Administration $1,240 $150 $310 $0 $0 $0 $0 $0 $1,700
20-Prelim Engineering/Env Review
479 0 0 0 0 0 0 0 479
30-Final Design+Specifications 556 300 44 0 0 0 0 0 900
35-Third Party 46 3,600 154 0 0 0 0 0 3,800
40-Row Acquisition+Permits 185,232 100 1,153 0 0 0 0 0 186,485
50-Construction 7,433 3,500 941 180 0 0 0 0 12,054
55-Construction Services 0 150 0 0 0 0 0 0 150
Total $194,986 $7,800 $2,602 $180 $0 $0 $0 $0 $205,568
Project Risk Assessment
Construction of the environmental fish passage culvert is restricted to a window of time during the fish cycle posing a schedule risk; and cost risk related to possible ROW access required during construction.
44 of 159
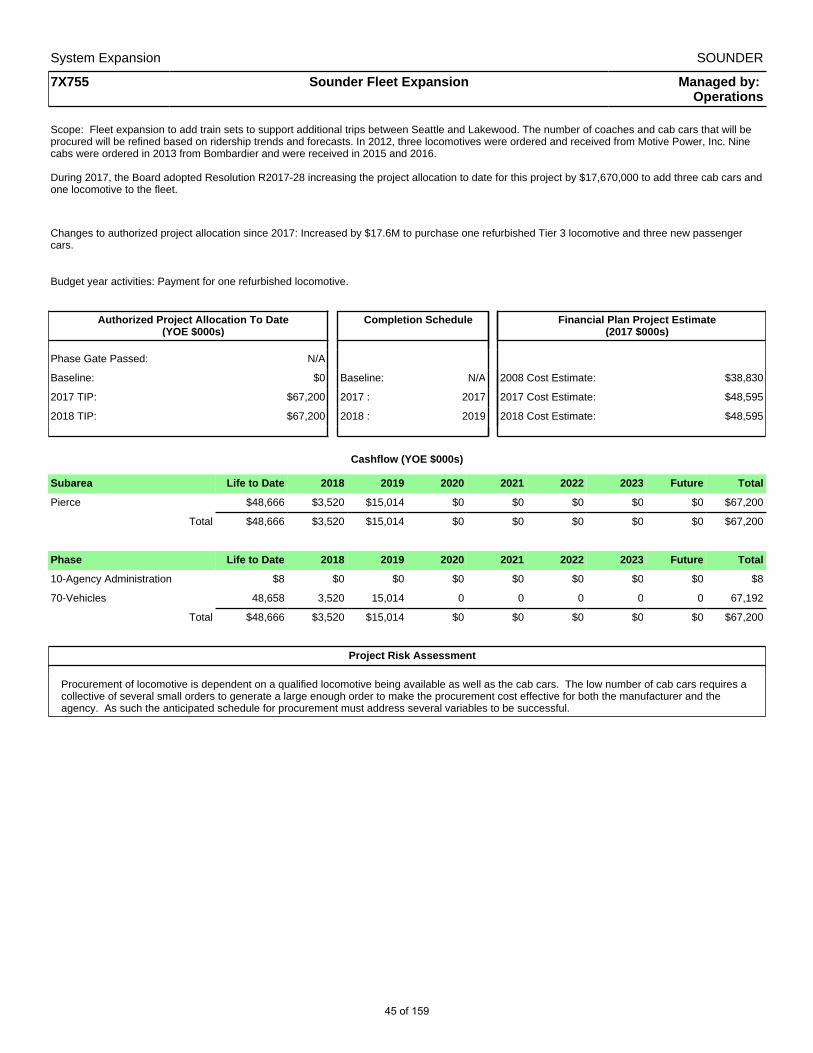
System Expansion SOUNDER
7X755 Sounder Fleet Expansion Managed by: Operations
Scope: Fleet expansion to add train sets to support additional trips between Seattle and Lakewood. The number of coaches and cab cars that will be procured will be refined based on ridership trends and forecasts. In 2012, three locomotives were ordered and received from Motive Power, Inc. Nine cabs were ordered in 2013 from Bombardier and were received in 2015 and 2016.
During 2017, the Board adopted Resolution R2017-28 increasing the project allocation to date for this project by $17,670,000 to add three cab cars and one locomotive to the fleet.
Changes to authorized project allocation since 2017: Increased by $17.6M to purchase one refurbished Tier 3 locomotive and three new passenger cars.
Budget year activities: Payment for one refurbished locomotive.
Authorized Project Allocation To Date(YOE $000s)
Completion Schedule Financial Plan Project Estimate(2017 $000s)
Phase Gate Passed: N/A
Baseline: $0 Baseline: N/A 2008 Cost Estimate: $38,830
2017 TIP: $67,200 2017 : 2017 2017 Cost Estimate: $48,595
2018 TIP: $67,200 2018 : 2019 2018 Cost Estimate: $48,595
Cashflow (YOE $000s)
Subarea Life to Date 2018 2019 2020 2021 2022 2023 Future Total
Pierce $48,666 $3,520 $15,014 $0 $0 $0 $0 $0 $67,200
Total $48,666 $3,520 $15,014 $0 $0 $0 $0 $0 $67,200
Phase Life to Date 2018 2019 2020 2021 2022 2023 Future Total
10-Agency Administration $8 $0 $0 $0 $0 $0 $0 $0 $8
70-Vehicles 48,658 3,520 15,014 0 0 0 0 0 67,192
Total $48,666 $3,520 $15,014 $0 $0 $0 $0 $0 $67,200
Project Risk Assessment
Procurement of locomotive is dependent on a qualified locomotive being available as well as the cab cars. The low number of cab cars requires a collective of several small orders to generate a large enough order to make the procurement cost effective for both the manufacturer and the agency. As such the anticipated schedule for procurement must address several variables to be successful.
45 of 159

2018
Cas
hfl
ow
by
Bu
dg
et A
pp
rova
l(in
thou
sand
s)
Sys
tem
Exp
ansi
on
RE
GIO
NA
L E
XP
RE
SS
Pro
ject
Nu
mb
er a
nd
Nam
eL
ife
to D
ate
2018
2019
2020
2021
2022
2023
Fu
ture
To
tal
Pre
limin
ary
En
gin
eeri
ng
5000
05S
T E
xpre
ss B
us B
ase
$1,1
61$5
87$3
,794
$266
$0$0
$0$0
$5,8
08
5000
50I-
405
Bus
Rap
id T
rans
it30
035
,553
35,2
9014
,314
2,59
60
00
88,0
53
5000
51S
R 5
22 B
us R
apid
Tra
nsit
05,
781
5,78
15,
807
1,18
70
00
18,5
56
5000
86B
us o
n S
houl
der
Pro
ject
01,
180
821
1,87
70
00
03,
878
Su
bto
tal
1,46
143
,101
45,6
8622
,263
3,78
30
00
116,
295
Fin
al D
esig
n &
RO
W
5000
30B
othe
ll T
rans
it R
elat
ed Im
prov
emen
ts6
05,
034
00
00
05,
040
Su
bto
tal
60
5,03
40
00
00
5,04
0
Bas
elin
e
5X38
7I-
90 T
wo-
Way
Tra
nsit
& H
OV
Ope
ratio
ns,
Sta
ge 3
193,
111
4,95
51,
450
1,05
01,
550
2,80
02,
750
17,9
8322
5,64
8
Su
bto
tal
193,
111
4,95
51,
450
1,05
01,
550
2,80
02,
750
17,9
8322
5,64
8
Pro
gra
m
7007
20S
T E
xpre
ss F
leet
Exp
ansi
on8,
350
15,4
580
15,9
480
00
039
,757
Su
bto
tal
8,35
015
,458
015
,948
00
00
39,7
57
To
tal
$202
,928
$63,
515
$52,
170
$39,
262
$5,3
33$2
,800
$2,7
50$1
7,98
3$3
86,7
40
46 of 159

2018
Cas
hfl
ow
by
Su
bar
ea(in
thou
sand
s)
Sys
tem
Exp
ansi
on
RE
GIO
NA
L E
XP
RE
SS
Su
bar
eaL
ife
to D
ate
2018
2019
2020
2021
2022
2023
Fu
ture
To
tal
1 -
Sno
hom
ish
$1,2
52$2
,442
$961
$2,6
85$0
$0$0
$0$7
,339
3 -
Sou
th K
ing
1,04
52,
158
722
2,41
30
00
06,
337
4 -
Eas
t Kin
g20
0,00
251
,973
43,5
3827
,034
4,14
62,
800
2,75
017
,983
350,
226
5 -
Pie
rce
629
1,16
11,
168
1,32
30
00
04,
281
To
tal
$202
,928
$57,
734
$46,
389
$33,
455
$4,1
46$2
,800
$2,7
50$1
7,98
3$3
68,1
84
2018
Cas
hfl
ow
by
Ph
ase
(in th
ousa
nds)
Ph
ase
# an
d D
escr
ipti
on
Lif
e to
Dat
e20
1820
1920
2020
2120
2220
23F
utu
reT
ota
l
10-A
genc
y A
dmin
istr
atio
n$2
,366
$6,2
36$6
,455
$6,2
81$2
,776
$50
$50
$1,4
83$2
5,69
8
20-P
relim
Eng
inee
ring/
Env
Rev
iew
2,34
715
,746
16,2
4413
,417
00
00
47,7
54
30-F
inal
Des
ign+
Spe
cific
atio
ns18
,038
400
00
00
4,04
322
,121
35-T
hird
Par
ty0
1,18
05,
412
412
208
00
07,
212
40-R
ow A
cqui
sitio
n+P
erm
its53
19,8
2422
,659
2,20
384
90
00
45,5
88
50-C
onst
ruct
ion
171,
774
5,03
01,
400
1,00
01,
500
2,75
02,
700
12,4
5719
8,61
0
70-V
ehic
les
8,35
015
,458
015
,948
00
00
39,7
57
To
tal
$202
,928
$63,
515
$52,
170
$39,
262
$5,3
33$2
,800
$2,7
50$1
7,98
3$3
86,7
40
47 of 159

System Expansion REGIONAL EXPRESS
500005 ST Express Bus Base Managed by: PEPD
Scope: Sound Transit is evaluating constructing an ST Express Bus Base for operating and maintaining the ST Express bus fleet. The Board has approved initial project development activities including confirmation of fleet operating assumptions, development of facilities and site programming evaluations and review of alternative project delivery methods.
Changes to authorized project allocation since 2017: None.
Budget year activities: Resume conceptual engineering and environmental documentation upon direction of the Board.
Authorized Project Allocation To Date(YOE $000s)
Completion Schedule Financial Plan Project Estimate(2017 $000s)
Phase Gate Passed: 1-Enter Project Development
Baseline: $0 Baseline: N/A 2008 Cost Estimate: $217,582
2017 TIP: $5,808 2017 : 2019 2017 Cost Estimate: $210,299
2018 TIP: $5,808 2018 : 2019 2018 Cost Estimate: $210,299
Cashflow (YOE $000s)
Subarea Life to Date 2018 2019 2020 2021 2022 2023 Future Total
Snohomish $208 $105 $679 $48 $0 $0 $0 $0 $1,040
South King 135 68 440 31 0 0 0 0 674
East King 540 273 1,764 124 0 0 0 0 2,701
Pierce 279 141 911 64 0 0 0 0 1,394
Total $1,161 $587 $3,794 $266 $0 $0 $0 $0 $5,808
Phase Life to Date 2018 2019 2020 2021 2022 2023 Future Total
10-Agency Administration $360 $72 $372 $40 $0 $0 $0 $0 $844
20-Prelim Engineering/Env Review
798 505 3,380 80 0 0 0 0 4,763
40-Row Acquisition+Permits 3 10 42 146 0 0 0 0 201
Total $1,161 $587 $3,794 $266 $0 $0 $0 $0 $5,808
Project Risk Assessment
Uncertainties exist in siting, design, environmental, third party and jurisdictional requirements that present budget and schedule risks.
48 of 159

System Expansion REGIONAL EXPRESS
500030 Bothell Transit Related Improvements Managed by: PEPD
Scope: Capital contribution to transit center/park-and-ride project near SR 527/Bothell Way NE and NE 185th Street in the downtown Bothell area. Sound Transit and the city of Bothell would enter into an memorandum of understanding to confirm the responsibilities of each party, the project capital component(s) to receive funding, and the financial participation schedule.
Changes to authorized project allocation since 2017: None.
Budget year activities: Provide fixed contribution funding to City of Bothell to improve rider access to transit service.
Authorized Project Allocation To Date(YOE $000s)
Completion Schedule Financial Plan Project Estimate(2017 $000s)
Phase Gate Passed: N/A
Baseline: $0 Baseline: N/A 2008 Cost Estimate: $6,495
2017 TIP: $5,040 2017 : 2018 2017 Cost Estimate: $6,195
2018 TIP: $5,040 2018 : 2019 2018 Cost Estimate: $6,195
Cashflow (YOE $000s)
Subarea Life to Date 2018 2019 2020 2021 2022 2023 Future Total
East King $6 $0 $5,034 $0 $0 $0 $0 $0 $5,040
Total $6 $0 $5,034 $0 $0 $0 $0 $0 $5,040
Phase Life to Date 2018 2019 2020 2021 2022 2023 Future Total
10-Agency Administration $6 $0 $34 $0 $0 $0 $0 $0 $40
35-Third Party 0 0 5,000 0 0 0 0 0 5,000
Total $6 $0 $5,034 $0 $0 $0 $0 $0 $5,040
Project Risk Assessment
N/A – This is a capped contribution project.
49 of 159

System Expansion REGIONAL EXPRESS
500050 I-405 Bus Rapid Transit Managed by: PEPD
Scope: Design and establish a Bus Rapid Transit (BRT) system from the Lynnwood Transit Center to the Burien Transit Center via I-5, I-405, and SR 518, to include new and upgraded transit centers, flyer stops, new park-and-ride capacity, and access improvements to the stations.
Changes to authorized project allocation since 2017: Increased by $42.4 million.
The 2017 budget and authorized project allocation to date were established in 2017 per Resolutions No R2017-22 and No R2017-25 at $45.7 million.
Budget year activities: Present a budget amendment request to increase the project allocation to date to develop and issue request for proposal for preliminary engineering consultant to begin alternatives analysis for station locations, transit centers, and parking garages.
Authorized Project Allocation To Date(YOE $000s)
Completion Schedule Financial Plan Project Estimate(2017 $000s)
Phase Gate Passed: Pending
Baseline: $0 Baseline: N/A 2008 Cost Estimate: $610,910
2017 TIP: $45,650 2017 : N/A 2017 Cost Estimate: N/A
2018 TIP: $88,053 2018 : 2024 2018 Cost Estimate: $610,910
Cashflow (YOE $000s)
Subarea Life to Date 2018 2019 2020 2021 2022 2023 Future Total
East King $300 $35,553 $35,290 $14,314 $2,596 $0 $0 $0 $88,053
Total $300 $35,553 $35,290 $14,314 $2,596 $0 $0 $0 $88,053
Phase Life to Date 2018 2019 2020 2021 2022 2023 Future Total
10-Agency Administration $250 $3,785 $3,785 $4,068 $1,784 $0 $0 $0 $13,673
20-Prelim Engineering/Env Review
0 11,704 8,988 8,288 0 0 0 0 28,980
35-Third Party 0 350 0 0 0 0 0 0 350
40-Row Acquisition+Permits 50 19,714 22,517 1,957 812 0 0 0 45,050
Total $300 $35,553 $35,290 $14,314 $2,596 $0 $0 $0 $88,053
Project Risk Assessment
This project is very early in the development process with right of way acquisition challenges, and the multi-jurisdiction coordination on stations and with WSDOT regarding dedicated lane for bus rapid transit usage.
50 of 159

System Expansion REGIONAL EXPRESS
500051 SR 522 Bus Rapid Transit Managed by: PEPD
Scope: Design and establish a Bus Rapid Transit (BRT) system from the South Shoreline light rail station at I-5 along the SR 522 corridor to UW Bothell with connecting service at lower frequencies to Woodinville, to include new and upgraded transit centers, new park-and-ride capacity, and access improvements to the stations
Changes in project allocation since 2017: This is a new project for 2018.
Budget year activities: continue procurement of preliminary engineering consultant to begin alternatives analysis for station locations, transit centers, and parking garages.
Authorized Project Allocation To Date(YOE $000s)
Completion Schedule Financial Plan Project Estimate(2017 $000s)
Phase Gate Passed: Pending
Baseline: $0 Baseline: N/A 2008 Cost Estimate: $436,053
2017 TIP: $0 2017 : N/A 2017 Cost Estimate: N/A
2018 TIP: $18,556 2018 : N/A 2018 Cost Estimate: $436,053
Cashflow (YOE $000s)
Phase Life to Date 2018 2019 2020 2021 2022 2023 Future Total
10-Agency Administration $0 $1,882 $1,882 $1,882 $942 $0 $0 $0 $6,588
20-Prelim Engineering/Env Review
0 3,437 3,437 3,438 0 0 0 0 10,312
35-Third Party 0 412 412 412 208 0 0 0 1,444
40-Row Acquisition+Permits 0 50 50 75 37 0 0 0 212
Total $0 $5,781 $5,781 $5,807 $1,187 $0 $0 $0 $18,556
Project Risk Assessment
The project is very early in the development process with challenges in multi-jurisdictional coordination on stations and dedicated lane for bus rapid transit usage, and in right of way acquisition
51 of 159
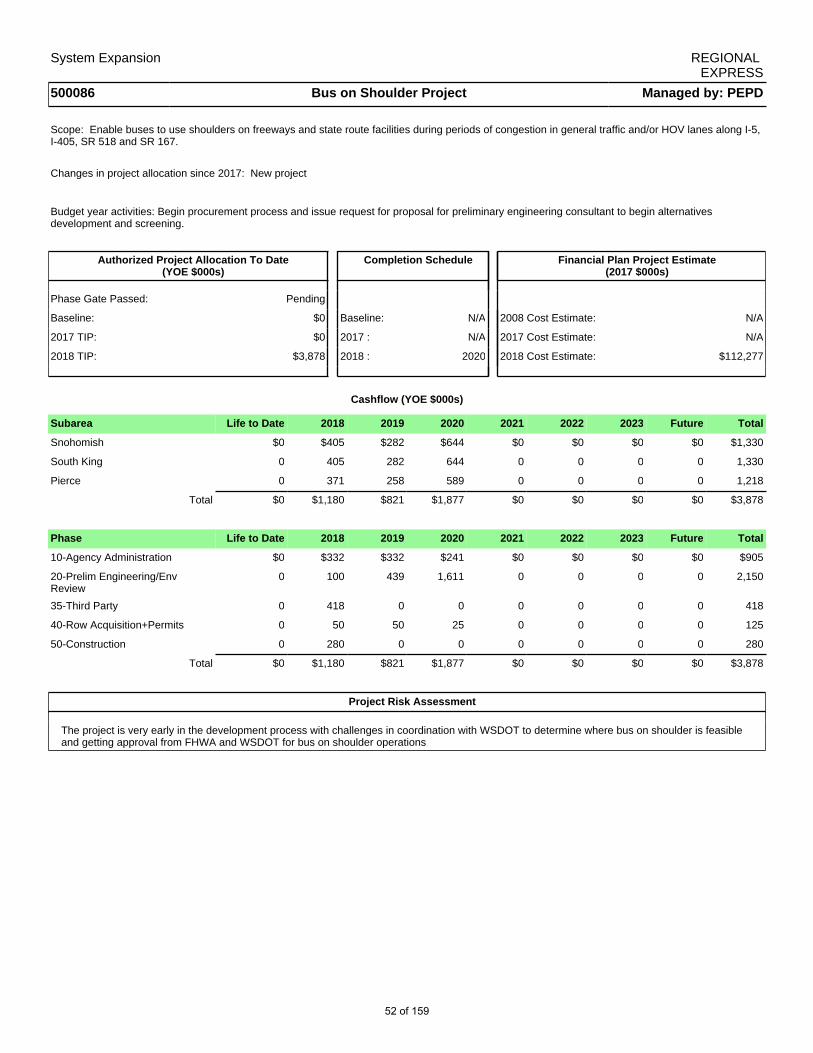
System Expansion REGIONAL EXPRESS
500086 Bus on Shoulder Project Managed by: PEPD
Scope: Enable buses to use shoulders on freeways and state route facilities during periods of congestion in general traffic and/or HOV lanes along I-5, I-405, SR 518 and SR 167.
Changes in project allocation since 2017: New project
Budget year activities: Begin procurement process and issue request for proposal for preliminary engineering consultant to begin alternatives development and screening.
Authorized Project Allocation To Date(YOE $000s)
Completion Schedule Financial Plan Project Estimate(2017 $000s)
Phase Gate Passed: Pending
Baseline: $0 Baseline: N/A 2008 Cost Estimate: N/A
2017 TIP: $0 2017 : N/A 2017 Cost Estimate: N/A
2018 TIP: $3,878 2018 : 2020 2018 Cost Estimate: $112,277
Cashflow (YOE $000s)
Subarea Life to Date 2018 2019 2020 2021 2022 2023 Future Total
Snohomish $0 $405 $282 $644 $0 $0 $0 $0 $1,330
South King 0 405 282 644 0 0 0 0 1,330
Pierce 0 371 258 589 0 0 0 0 1,218
Total $0 $1,180 $821 $1,877 $0 $0 $0 $0 $3,878
Phase Life to Date 2018 2019 2020 2021 2022 2023 Future Total
10-Agency Administration $0 $332 $332 $241 $0 $0 $0 $0 $905
20-Prelim Engineering/Env Review
0 100 439 1,611 0 0 0 0 2,150
35-Third Party 0 418 0 0 0 0 0 0 418
40-Row Acquisition+Permits 0 50 50 25 0 0 0 0 125
50-Construction 0 280 0 0 0 0 0 0 280
Total $0 $1,180 $821 $1,877 $0 $0 $0 $0 $3,878
Project Risk Assessment
The project is very early in the development process with challenges in coordination with WSDOT to determine where bus on shoulder is feasible and getting approval from FHWA and WSDOT for bus on shoulder operations
52 of 159

System Expansion REGIONAL EXPRESS
5X387 I-90 Two-Way Transit & HOV Operations, Stage 3 Managed by: DECM
Scope: Stage 3 of the I-90 Two-way Transit and HOV Operations project will provide reliable two-way transit and HOV operations eastbound and westbound on I-90 between 80th Avenue SE on Mercer Island and Rainier Avenue/I-5 in Seattle. This stage will also include the installation of screening on the shared pathway on the I-90 floating bridge. Upon completion of the Stage 3 project, the center roadway will be closed to allow the construction of East Link Extension to proceed.
Changes to authorized project allocation since 2017: None
Budget year activities: Continue to follow the administrative process to complete the closeout of all open contracts.
Authorized Project Allocation To Date(YOE $000s)
Completion Schedule Financial Plan Project Estimate(2017 $000s)
Phase Gate Passed: 6-Proceed to Construction
Baseline: $225,648 Baseline: N/A 2008 Cost Estimate: $109,222
2017 TIP: $225,648 2017 : 2017 2017 Cost Estimate: $225,648
2018 TIP: $225,648 2018 : 2017 2018 Cost Estimate: $225,648
Cashflow (YOE $000s)
Subarea Life to Date 2018 2019 2020 2021 2022 2023 Future Total
East King $193,111 $4,955 $1,450 $1,050 $1,550 $2,800 $2,750 $17,983 $225,648
Total $193,111 $4,955 $1,450 $1,050 $1,550 $2,800 $2,750 $17,983 $225,648
Phase Life to Date 2018 2019 2020 2021 2022 2023 Future Total
10-Agency Administration $1,750 $165 $50 $50 $50 $50 $50 $1,483 $3,648
20-Prelim Engineering/Env Review
1,549 0 0 0 0 0 0 0 1,549
30-Final Design+Specifications 18,038 40 0 0 0 0 0 4,043 22,121
50-Construction 171,774 4,750 1,400 1,000 1,500 2,750 2,700 12,457 198,330
Total $193,111 $4,955 $1,450 $1,050 $1,550 $2,800 $2,750 $17,983 $225,648
Project Risk Assessment
Completion of Supervisory control and data acquisition (SCADA) system implementation and final commissioning may delay substantial completion and project closeout.
53 of 159

System Expansion REGIONAL EXPRESS
700720 ST Express Fleet Expansion Managed by: Operations
Scope: Procure and accept 38 buses to support the increase in peak hour bus service with an additional 32,000 hours of annualized peak hours in 2016 and an additional 15,000 hours of peak service hours to meet service level demands as a result of East Link construction, route congestion, ridership demands and appropriate bus spare ratio in 2017.
Changes to authorized project allocation since 2017: None.
Budget year activities: Accept delivery of 16 buses in 2018.
Authorized Project Allocation To Date(YOE $000s)
Completion Schedule Financial Plan Project Estimate(2017 $000s)
Phase Gate Passed: None
Baseline: $0 Baseline: N/A 2008 Cost Estimate: $43,242
2017 TIP: $39,757 2017 : 2018 2017 Cost Estimate: $61,066
2018 TIP: $39,757 2018 : 2020 2018 Cost Estimate: $61,066
Cashflow (YOE $000s)
Subarea Life to Date 2018 2019 2020 2021 2022 2023 Future Total
Snohomish $1,044 $1,932 $0 $1,994 $0 $0 $0 $0 $4,970
South King 910 1,685 0 1,738 0 0 0 0 4,333
East King 6,046 11,192 0 11,546 0 0 0 0 28,784
Pierce 351 649 0 670 0 0 0 0 1,670
Total $8,350 $15,458 $0 $15,948 $0 $0 $0 $0 $39,757
Phase Life to Date 2018 2019 2020 2021 2022 2023 Future Total
70-Vehicles $8,350 $15,458 $0 $15,948 $0 $0 $0 $0 $39,757
Total $8,350 $15,458 $0 $15,948 $0 $0 $0 $0 $39,757
Project Risk Assessment
Some uncertainty exists with the composition of the fleet with bus type, size and fuel as well as our transit partners ability to base and maintain our buses as we approach base capacities.
54 of 159

2018
Cas
hfl
ow
by
Bu
dg
et A
pp
rova
l(in
thou
sand
s)
Sys
tem
Exp
ansi
on
OT
HE
R
Pro
ject
Nu
mb
er a
nd
Nam
eL
ife
to D
ate
2018
2019
2020
2021
2022
2023
Fu
ture
To
tal
Pre
limin
ary
En
gin
eeri
ng
6000
38O
RC
A N
ext G
ener
atio
n$5
92$1
,527
$3,6
51$1
2,38
4$7
,637
$4,0
35$1
,696
$0$3
1,52
3
8091
00S
T3
Pla
nnin
g22
,150
3,00
02,
290
2,00
02,
000
2,00
01,
648
17,5
6052
,648
Su
bto
tal
22,7
424,
527
5,94
114
,384
9,63
76,
035
3,34
417
,560
84,1
71
Bas
elin
e
6X66
8S
Tar
t18
,259
2,13
44,
900
5,45
53,
128
854
156
14,3
8249
,267
Su
bto
tal
18,2
592,
134
4,90
05,
455
3,12
885
415
614
,382
49,2
67
Op
erat
ing
6006
68S
Tar
t Ope
ratio
ns &
Mai
nten
ance
1,12
523
118
718
921
421
221
82,
552
4,92
7
Su
bto
tal
1,12
523
118
718
921
421
221
82,
552
4,92
7
Pro
gra
m
3X21
2F
are
Col
lect
ion
8,49
719
525
473
539
736
038
24,
051
14,8
70
5X41
0R
esea
rch
& T
echn
olog
y11
,303
613
464
00
00
7,62
020
,000
6000
16F
are
Adm
inis
trat
ion
1,84
11,
630
500
500
500
300
170
05,
441
6000
39R
esea
rch
and
Bus
ines
s D
evel
opm
ent
Pro
gram
9030
022
519
233
60
00
1,14
3
6000
73T
rans
it S
yste
m A
cces
s P
rogr
am0
6,00
011
,000
11,0
0011
,000
11,0
0011
,000
81,1
3914
2,13
9
6000
76In
nova
tion
and
Tec
hnol
ogy
Pro
gram
04,
000
4,00
04,
000
4,00
04,
000
4,00
082
,604
106,
604
6010
00E
ffici
ency
& S
usta
inab
ility
Pro
gram
01,
000
750
800
1,00
01,
000
1,00
019
,450
25,0
00
8043
00T
rans
it O
rient
ed D
evel
opm
ent P
lann
ing
Pro
gram
040
040
085
065
065
040
026
,821
30,1
71
Su
bto
tal
21,7
3214
,138
17,5
9318
,076
17,8
8217
,310
16,9
5222
1,68
534
5,36
9
To
tal
$63,
858
$21,
029
$28,
621
$38,
104
$30,
860
$24,
412
$20,
670
$256
,179
$483
,733
55 of 159

2018
Cas
hfl
ow
by
Su
bar
ea(in
thou
sand
s)
Sys
tem
Exp
ansi
on
OT
HE
R
Su
bar
eaL
ife
to D
ate
2018
2019
2020
2021
2022
2023
Fu
ture
To
tal
1 -
Sno
hom
ish
$3,7
86$2
75$5
55$7
16$4
15$1
84$1
21$2
,559
$8,6
12
2 -
Nor
th K
ing
4,53
655
31,
190
1,32
178
224
988
3,96
212
,681
3 -
Sou
th K
ing
6,73
151
71,
053
1,33
277
533
220
94,
663
15,6
11
4 -
Eas
t Kin
g8,
127
968
2,07
72,
318
1,37
144
416
37,
005
22,4
73
5 -
Pie
rce
4,70
124
646
569
239
521
717
62,
795
9,68
7
6 -
Sys
tem
wid
e35
,977
18,4
7023
,280
31,7
2527
,123
22,9
8519
,914
235,
194
414,
669
To
tal
$63,
858
$21,
029
$28,
621
$38,
104
$30,
860
$24,
412
$20,
670
$256
,179
$483
,733
2018
Cas
hfl
ow
by
Ph
ase
(in th
ousa
nds)
Ph
ase
# an
d D
escr
ipti
on
Lif
e to
Dat
e20
1820
1920
2020
2120
2220
23F
utu
reT
ota
l
01-O
pera
tion+
Mai
nten
ance
$364
$96
$100
$103
$106
$109
$112
$499
$1,4
88
02-O
pera
tion+
Mai
nten
ance
-Age
ncy
761
135
8786
108
103
106
2,05
33,
439
10-A
genc
y A
dmin
istr
atio
n7,
254
3,83
73,
503
4,05
14,
687
3,63
92,
564
30,6
8760
,222
20-P
relim
Eng
inee
ring/
Env
Rev
iew
21,4
455,
375
4,60
04,
667
4,53
64,
200
3,74
895
,231
143,
802
26-R
esea
rch+
Tec
hnol
ogy
9,13
03,
203
3,88
811
,763
6,38
43,
586
1,86
66,
074
45,8
93
30-F
inal
Des
ign+
Spe
cific
atio
ns0
100
150
150
150
150
150
2,91
83,
768
35-T
hird
Par
ty0
5,00
010
,000
10,0
0010
,000
10,0
0010
,000
79,3
8513
4,38
5
40-R
ow A
cqui
sitio
n+P
erm
its10
029
020
030
035
025
08,
189
9,58
9
50-C
onst
ruct
ion
7,92
51,
650
1,62
92,
160
1,99
71,
960
1,85
817
,231
36,4
11
61-A
rt16
,969
1,63
44,
375
4,92
52,
593
314
1613
,912
44,7
37
To
tal
$63,
858
$21,
029
$28,
621
$38,
104
$30,
860
$24,
412
$20,
670
$256
,179
$483
,733
56 of 159
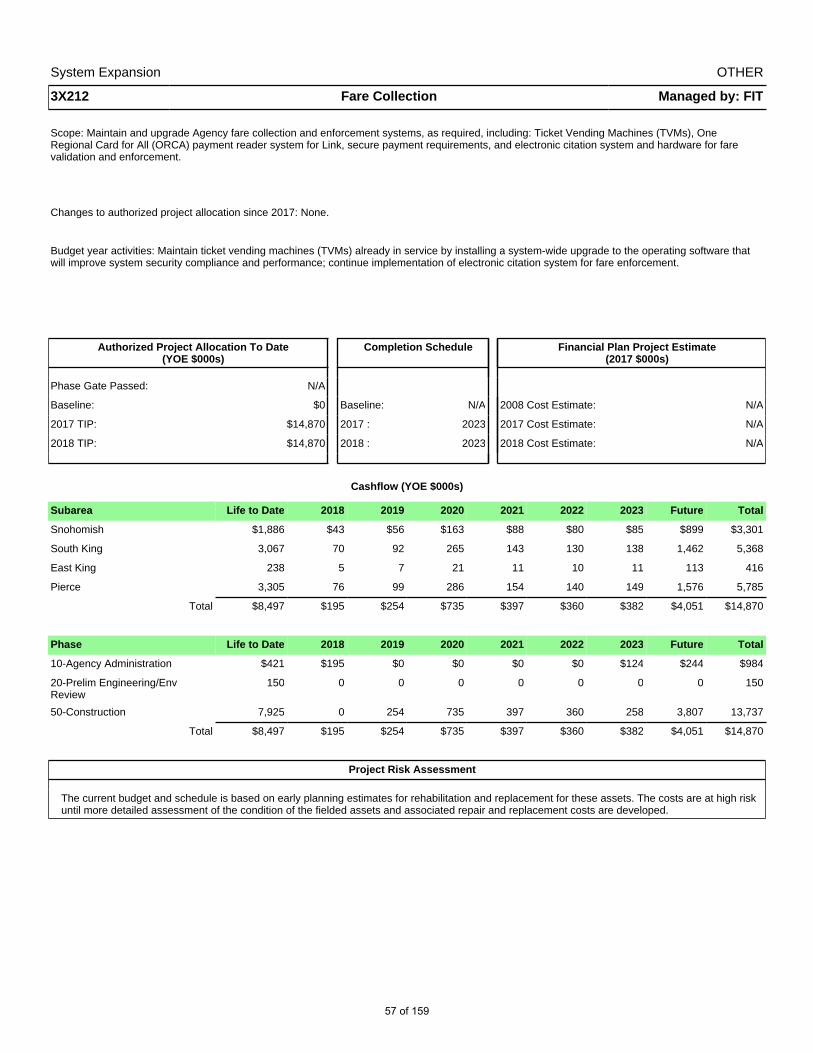
System Expansion OTHER
3X212 Fare Collection Managed by: FIT
Scope: Maintain and upgrade Agency fare collection and enforcement systems, as required, including: Ticket Vending Machines (TVMs), One Regional Card for All (ORCA) payment reader system for Link, secure payment requirements, and electronic citation system and hardware for fare validation and enforcement.
Changes to authorized project allocation since 2017: None.
Budget year activities: Maintain ticket vending machines (TVMs) already in service by installing a system-wide upgrade to the operating software that will improve system security compliance and performance; continue implementation of electronic citation system for fare enforcement.
Authorized Project Allocation To Date(YOE $000s)
Completion Schedule Financial Plan Project Estimate(2017 $000s)
Phase Gate Passed: N/A
Baseline: $0 Baseline: N/A 2008 Cost Estimate: N/A
2017 TIP: $14,870 2017 : 2023 2017 Cost Estimate: N/A
2018 TIP: $14,870 2018 : 2023 2018 Cost Estimate: N/A
Cashflow (YOE $000s)
Subarea Life to Date 2018 2019 2020 2021 2022 2023 Future Total
Snohomish $1,886 $43 $56 $163 $88 $80 $85 $899 $3,301
South King 3,067 70 92 265 143 130 138 1,462 5,368
East King 238 5 7 21 11 10 11 113 416
Pierce 3,305 76 99 286 154 140 149 1,576 5,785
Total $8,497 $195 $254 $735 $397 $360 $382 $4,051 $14,870
Phase Life to Date 2018 2019 2020 2021 2022 2023 Future Total
10-Agency Administration $421 $195 $0 $0 $0 $0 $124 $244 $984
20-Prelim Engineering/Env Review
150 0 0 0 0 0 0 0 150
50-Construction 7,925 0 254 735 397 360 258 3,807 13,737
Total $8,497 $195 $254 $735 $397 $360 $382 $4,051 $14,870
Project Risk Assessment
The current budget and schedule is based on early planning estimates for rehabilitation and replacement for these assets. The costs are at high risk until more detailed assessment of the condition of the fielded assets and associated repair and replacement costs are developed.
57 of 159

System Expansion OTHER
5X410 Research & Technology Managed by: FIT
Scope: Assess and implement new transit technologies to improve the agency's operational effectiveness, efficiency and customer experience. This program focuses on system wide security and safety technology, real-time service information and passenger communications, and deploying applications to manage operations better.
Changes to authorized project allocation since 2017: None
Budget year activities: Continue work on open transit data and customer facing applications. Improve rider alert systems and Sounder real-time arrival/departure information.
Authorized Project Allocation To Date(YOE $000s)
Completion Schedule Financial Plan Project Estimate(2017 $000s)
Phase Gate Passed: N/A
Baseline: $0 Baseline: N/A 2008 Cost Estimate: N/A
2017 TIP: $20,000 2017 : 2023 2017 Cost Estimate: N/A
2018 TIP: $20,000 2018 : 2023 2018 Cost Estimate: N/A
Cashflow (YOE $000s)
Subarea Life to Date 2018 2019 2020 2021 2022 2023 Future Total
Systemwide $11,303 $613 $464 $0 $0 $0 $0 $7,620 $20,000
Total $11,303 $613 $464 $0 $0 $0 $0 $7,620 $20,000
Phase Life to Date 2018 2019 2020 2021 2022 2023 Future Total
10-Agency Administration $1,552 $150 $0 $0 $0 $0 $0 $1,398 $3,100
20-Prelim Engineering/Env Review
1,952 0 0 0 0 0 0 148 2,100
26-Research+Technology 7,799 463 464 0 0 0 0 6,074 14,800
Total $11,303 $613 $464 $0 $0 $0 $0 $7,620 $20,000
Project Risk Assessment
Elements of this program are in various stages of design and include new technologies that require custom software development which creates budget and schedule risk while a project goes from an idea or concept to a fully scoped project. Extensive coordination with external agencies adds level of schedule risk.
58 of 159
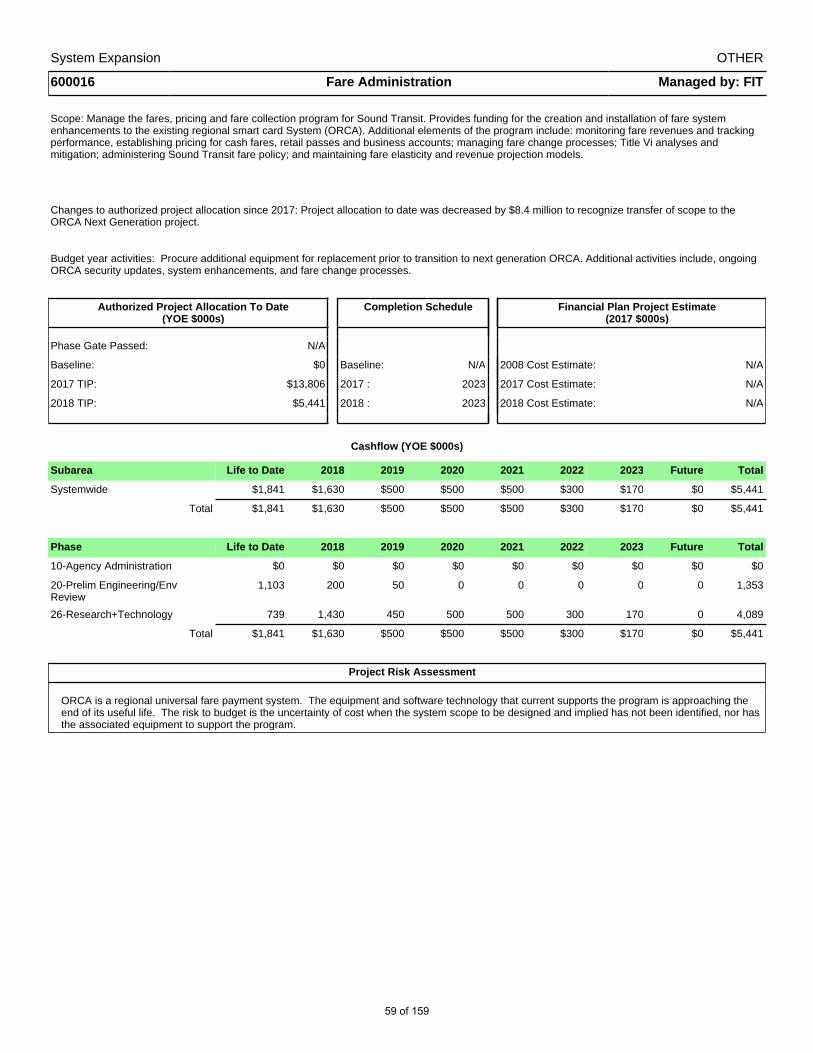
System Expansion OTHER
600016 Fare Administration Managed by: FIT
Scope: Manage the fares, pricing and fare collection program for Sound Transit. Provides funding for the creation and installation of fare system enhancements to the existing regional smart card System (ORCA). Additional elements of the program include: monitoring fare revenues and tracking performance, establishing pricing for cash fares, retail passes and business accounts; managing fare change processes; Title Vi analyses and mitigation; administering Sound Transit fare policy; and maintaining fare elasticity and revenue projection models.
Changes to authorized project allocation since 2017: Project allocation to date was decreased by $8.4 million to recognize transfer of scope to the ORCA Next Generation project.
Budget year activities: Procure additional equipment for replacement prior to transition to next generation ORCA. Additional activities include, ongoing ORCA security updates, system enhancements, and fare change processes.
Authorized Project Allocation To Date(YOE $000s)
Completion Schedule Financial Plan Project Estimate(2017 $000s)
Phase Gate Passed: N/A
Baseline: $0 Baseline: N/A 2008 Cost Estimate: N/A
2017 TIP: $13,806 2017 : 2023 2017 Cost Estimate: N/A
2018 TIP: $5,441 2018 : 2023 2018 Cost Estimate: N/A
Cashflow (YOE $000s)
Subarea Life to Date 2018 2019 2020 2021 2022 2023 Future Total
Systemwide $1,841 $1,630 $500 $500 $500 $300 $170 $0 $5,441
Total $1,841 $1,630 $500 $500 $500 $300 $170 $0 $5,441
Phase Life to Date 2018 2019 2020 2021 2022 2023 Future Total
10-Agency Administration $0 $0 $0 $0 $0 $0 $0 $0 $0
20-Prelim Engineering/Env Review
1,103 200 50 0 0 0 0 0 1,353
26-Research+Technology 739 1,430 450 500 500 300 170 0 4,089
Total $1,841 $1,630 $500 $500 $500 $300 $170 $0 $5,441
Project Risk Assessment
ORCA is a regional universal fare payment system. The equipment and software technology that current supports the program is approaching the end of its useful life. The risk to budget is the uncertainty of cost when the system scope to be designed and implied has not been identified, nor has the associated equipment to support the program.
59 of 159

System Expansion OTHER
600038 ORCA Next Generation Managed by: FIT
Scope: Provide funding for Sound Transit’s share of costs related to the planning, development and implementation of a next generation ORCA fare collection system. This system will be replacement to the current regional ORCA fare collection system, which is nearing end of life. The next gen ORCA system will be an account based system that will include new vending machines, introduction of mobile applications, new websites and the flexibility to allow for additional integrations to improve customer experience and adapt as technology changes.
Changes to authorized project allocation since 2017: Increased by $29.2 million.
Budget year activities: Issue contracts to System Integrator and QA Consultant, which will start the design phase of this project.
Authorized Project Allocation To Date(YOE $000s)
Completion Schedule Financial Plan Project Estimate(2017 $000s)
Phase Gate Passed: Pending
Baseline: $0 Baseline: N/A 2008 Cost Estimate: N/A
2017 TIP: $2,297 2017 : N/A 2017 Cost Estimate: N/A
2018 TIP: $31,523 2018 : 2023 2018 Cost Estimate: N/A
Cashflow (YOE $000s)
Subarea Life to Date 2018 2019 2020 2021 2022 2023 Future Total
Systemwide $592 $1,527 $3,651 $12,384 $7,637 $4,035 $1,696 $0 $31,523
Total $592 $1,527 $3,651 $12,384 $7,637 $4,035 $1,696 $0 $31,523
Phase Life to Date 2018 2019 2020 2021 2022 2023 Future Total
10-Agency Administration $0 $217 $678 $1,121 $1,752 $749 $0 $0 $4,518
26-Research+Technology 592 1,310 2,974 11,263 5,884 3,286 1,696 0 27,005
Total $592 $1,527 $3,651 $12,384 $7,637 $4,035 $1,696 $0 $31,523
Project Risk Assessment
Project is in early design and costs will be known with greater certainty when system integration vendor has been finalize in the summer of 2018.
60 of 159
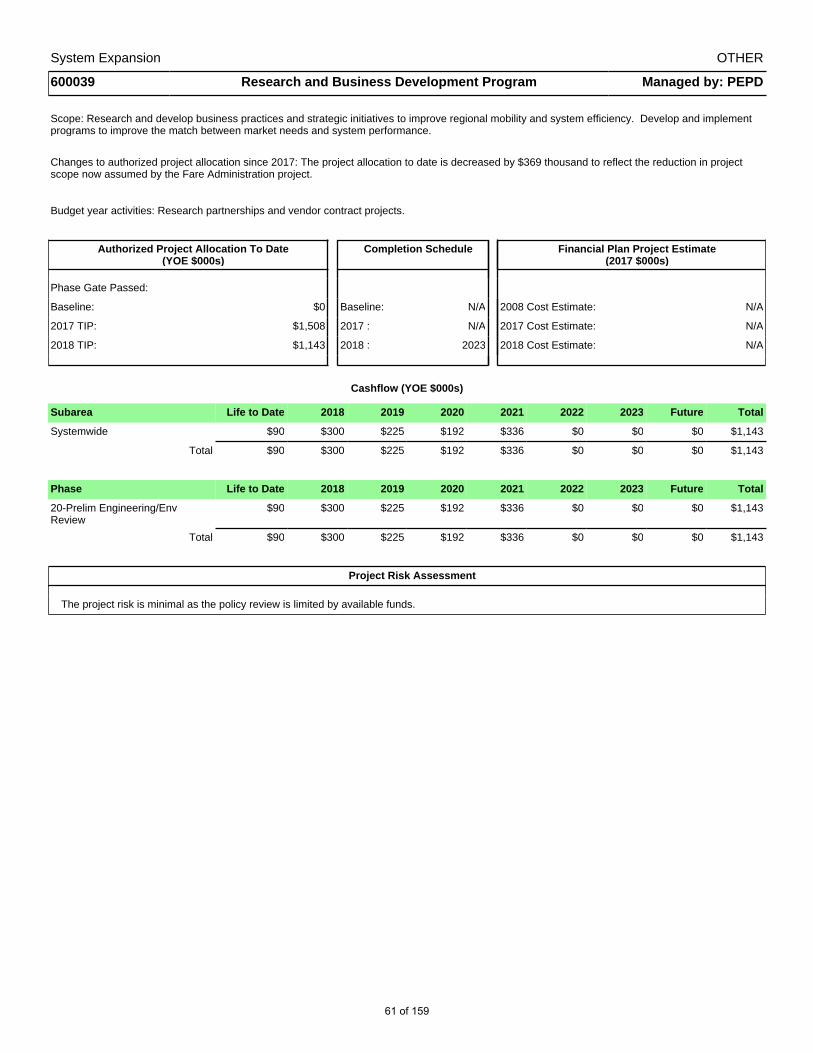
System Expansion OTHER
600039 Research and Business Development Program Managed by: PEPD
Scope: Research and develop business practices and strategic initiatives to improve regional mobility and system efficiency. Develop and implement programs to improve the match between market needs and system performance.
Changes to authorized project allocation since 2017: The project allocation to date is decreased by $369 thousand to reflect the reduction in project scope now assumed by the Fare Administration project.
Budget year activities: Research partnerships and vendor contract projects.
Authorized Project Allocation To Date(YOE $000s)
Completion Schedule Financial Plan Project Estimate(2017 $000s)
Phase Gate Passed:
Baseline: $0 Baseline: N/A 2008 Cost Estimate: N/A
2017 TIP: $1,508 2017 : N/A 2017 Cost Estimate: N/A
2018 TIP: $1,143 2018 : 2023 2018 Cost Estimate: N/A
Cashflow (YOE $000s)
Subarea Life to Date 2018 2019 2020 2021 2022 2023 Future Total
Systemwide $90 $300 $225 $192 $336 $0 $0 $0 $1,143
Total $90 $300 $225 $192 $336 $0 $0 $0 $1,143
Phase Life to Date 2018 2019 2020 2021 2022 2023 Future Total
20-Prelim Engineering/Env Review
$90 $300 $225 $192 $336 $0 $0 $0 $1,143
Total $90 $300 $225 $192 $336 $0 $0 $0 $1,143
Project Risk Assessment
The project risk is minimal as the policy review is limited by available funds.
61 of 159

System Expansion OTHER
600073 Transit System Access Program Managed by: PEPD
Scope: Invest in additional non-motorized, transit, and pick-up/drop-off access improvements at and around Sound Transit passenger facilities, in partnership with host jurisdictions and operating partners. This project was included in the voter-approved ST3 program.
Changes to authorized project allocation since 2017: New project.
Budget year activities: Establish a strategic plan for the system access program, program an initial list of investments and establish baseline access data from existing Sound Transit facilities.
Authorized Project Allocation To Date(YOE $000s)
Completion Schedule Financial Plan Project Estimate(2017 $000s)
Phase Gate Passed: N/A
Baseline: $0 Baseline: N/A 2008 Cost Estimate: $106,350
2017 TIP: $0 2017 : N/A 2017 Cost Estimate: N/A
2018 TIP: $142,139 2018 : 2041 2018 Cost Estimate: $106,350
Cashflow (YOE $000s)
Subarea Life to Date 2018 2019 2020 2021 2022 2023 Future Total
Systemwide $0 $6,000 $11,000 $11,000 $11,000 $11,000 $11,000 $81,139 $142,139
Total $0 $6,000 $11,000 $11,000 $11,000 $11,000 $11,000 $81,139 $142,139
Phase Life to Date 2018 2019 2020 2021 2022 2023 Future Total
35-Third Party $0 $5,000 $10,000 $10,000 $10,000 $10,000 $10,000 $79,385 $134,385
50-Construction 0 1,000 1,000 1,000 1,000 1,000 1,000 1,754 7,754
Total $0 $6,000 $11,000 $11,000 $11,000 $11,000 $11,000 $81,139 $142,139
Project Risk Assessment
The risk for this project is that over the intended service life of this project the resources requested will exceed the resources available possibly affecting the ability to support qualifying projects.
62 of 159

System Expansion OTHER
600076 Innovation and Technology Program Managed by: PEPD
Scope: Approximately one-half of this program funds research, analysis and implementation of innovative best practices, partnership and technologies to increase ridership, improve service, and enhance efficiency of regional mobility outside of new investments in large capital projects. The other half of the program improves and maintains rider information technology systems. The program was approved as part of the ST3 plan.
Changes to authorized project allocation since 2017: New project.
Budget year activities: Identify and initiate research on 3-5 pilot projects to test innovative approaches to improving agency performance, develop benchmark social equity performance measures of regional transit access and service quality and develop short term ridership forecasting tools for transit modes.
Authorized Project Allocation To Date(YOE $000s)
Completion Schedule Financial Plan Project Estimate(2017 $000s)
Phase Gate Passed: N/A
Baseline: $0 Baseline: N/A 2008 Cost Estimate: $79,763
2017 TIP: $0 2017 : N/A 2017 Cost Estimate: N/A
2018 TIP: $106,604 2018 : 2041 2018 Cost Estimate: $79,763
Cashflow (YOE $000s)
Subarea Life to Date 2018 2019 2020 2021 2022 2023 Future Total
Systemwide $0 $4,000 $4,000 $4,000 $4,000 $4,000 $4,000 $82,604 $106,604
Total $0 $4,000 $4,000 $4,000 $4,000 $4,000 $4,000 $82,604 $106,604
Phase Life to Date 2018 2019 2020 2021 2022 2023 Future Total
10-Agency Administration $0 $1,000 $1,000 $1,000 $1,000 $1,000 $1,000 $20,650 $26,650
20-Prelim Engineering/Env Review
0 3,000 3,000 3,000 3,000 3,000 3,000 61,954 79,954
Total $0 $4,000 $4,000 $4,000 $4,000 $4,000 $4,000 $82,604 $106,604
Project Risk Assessment
There is always some risk in developing a program that is forward looking trying to predict future technology trends.
63 of 159
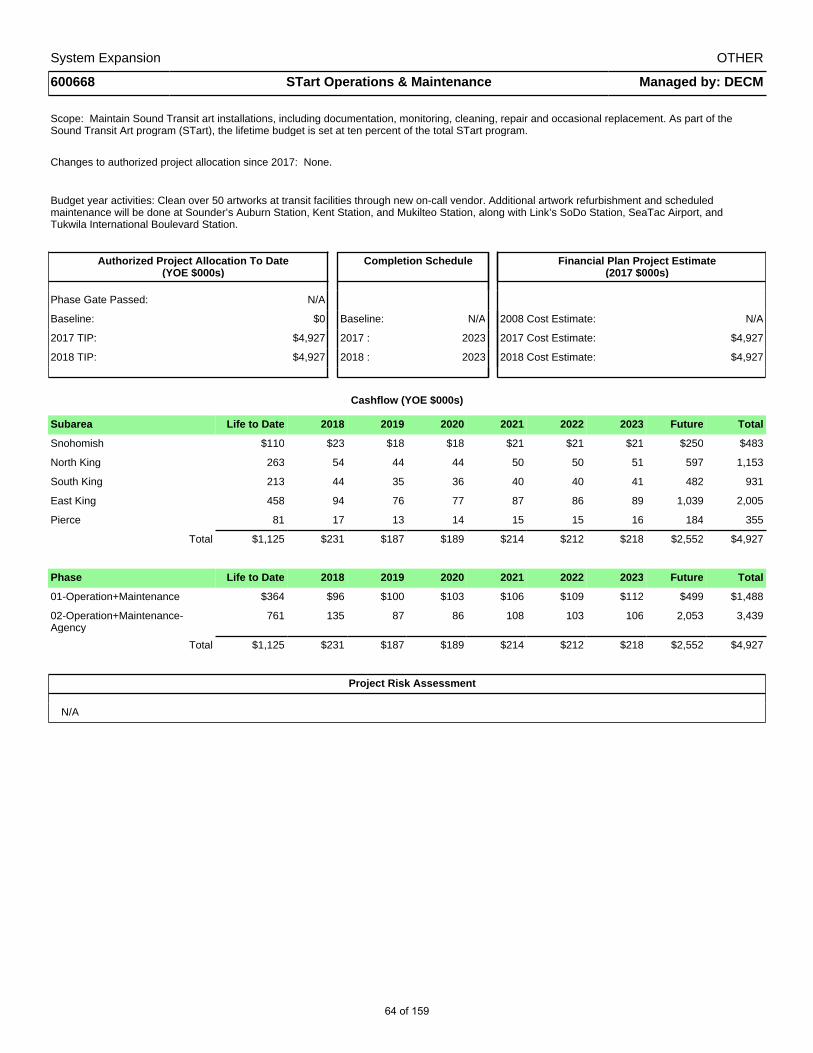
System Expansion OTHER
600668 STart Operations & Maintenance Managed by: DECM
Scope: Maintain Sound Transit art installations, including documentation, monitoring, cleaning, repair and occasional replacement. As part of the Sound Transit Art program (STart), the lifetime budget is set at ten percent of the total STart program.
Changes to authorized project allocation since 2017: None.
Budget year activities: Clean over 50 artworks at transit facilities through new on-call vendor. Additional artwork refurbishment and scheduled maintenance will be done at Sounder’s Auburn Station, Kent Station, and Mukilteo Station, along with Link’s SoDo Station, SeaTac Airport, and Tukwila International Boulevard Station.
Authorized Project Allocation To Date(YOE $000s)
Completion Schedule Financial Plan Project Estimate(2017 $000s)
Phase Gate Passed: N/A
Baseline: $0 Baseline: N/A 2008 Cost Estimate: N/A
2017 TIP: $4,927 2017 : 2023 2017 Cost Estimate: $4,927
2018 TIP: $4,927 2018 : 2023 2018 Cost Estimate: $4,927
Cashflow (YOE $000s)
Subarea Life to Date 2018 2019 2020 2021 2022 2023 Future Total
Snohomish $110 $23 $18 $18 $21 $21 $21 $250 $483
North King 263 54 44 44 50 50 51 597 1,153
South King 213 44 35 36 40 40 41 482 931
East King 458 94 76 77 87 86 89 1,039 2,005
Pierce 81 17 13 14 15 15 16 184 355
Total $1,125 $231 $187 $189 $214 $212 $218 $2,552 $4,927
Phase Life to Date 2018 2019 2020 2021 2022 2023 Future Total
01-Operation+Maintenance $364 $96 $100 $103 $106 $109 $112 $499 $1,488
02-Operation+Maintenance-Agency
761 135 87 86 108 103 106 2,053 3,439
Total $1,125 $231 $187 $189 $214 $212 $218 $2,552 $4,927
Project Risk Assessment
N/A
64 of 159

System Expansion OTHER
601000 Efficiency & Sustainability Program Managed by: PEPD
Scope: System wide resource conservation and pollution mitigation projects, with a focus on projects that reduce long-term operations & maintenance, utility and fuel costs. These projects will be focused on existing facilities and system wide improvements that provide resource conservation opportunities across new and existing facilities. The resource efficiency projects developed in this program will be managed by agency staff and planned, designed and constructed by consultants.
Changes to authorized project allocation since 2017: New program.
Budget year activities: Assess and prioritize energy efficiency audits and renewable energy assessments and resource efficiency improvements in the Planning, Environment and Project Department (PEPD) and the Operations Department.
Authorized Project Allocation To Date(YOE $000s)
Completion Schedule Financial Plan Project Estimate(2017 $000s)
Phase Gate Passed: N/A
Baseline: $0 Baseline: N/A 2008 Cost Estimate: $25,000
2017 TIP: $0 2017 : N/A 2017 Cost Estimate: N/A
2018 TIP: $25,000 2018 : 2041 2018 Cost Estimate: $25,000
Cashflow (YOE $000s)
Subarea Life to Date 2018 2019 2020 2021 2022 2023 Future Total
Systemwide $0 $1,000 $750 $800 $1,000 $1,000 $1,000 $19,450 $25,000
Total $0 $1,000 $750 $800 $1,000 $1,000 $1,000 $19,450 $25,000
Phase Life to Date 2018 2019 2020 2021 2022 2023 Future Total
10-Agency Administration $0 $150 $150 $150 $150 $150 $150 $2,918 $3,818
20-Prelim Engineering/Env Review
0 100 75 75 100 100 100 1,945 2,495
30-Final Design+Specifications 0 100 150 150 150 150 150 2,918 3,768
50-Construction 0 650 375 425 600 600 600 11,670 14,920
Total $0 $1,000 $750 $800 $1,000 $1,000 $1,000 $19,450 $25,000
Project Risk Assessment
N/A
65 of 159

System Expansion OTHER
6X668 STart Managed by: DECM
Scope: The Sound Transit Art Program (STart) incorporates art into Sound Transit facilities. The artwork is intended to reflect the communities served and contribute to a positive experience for customers. The Board supports a public art budget of one percent of construction costs excluding tunneling for all Sound Move and ST2 projects. In 2010, Resolution No. R2010-21 consolidated the Sound Move and ST2 Art programs and established an Art Policy. Ten percent of the total Art program funding is earmarked for the maintenance of the art collection (see project 600668).
Changes to authorized project allocation since 2017: None.
Budget year activities: Begin the fabrication and installation of art projects for East Link and Northgate Link. Continue with artwork design for Lynnwood Link and Tacoma Link. Begin artwork design for Federal Way Link and Redmond Link, begin artwork planning for Sumner and Puyallup parking garages.
Authorized Project Allocation To Date(YOE $000s)
Completion Schedule Financial Plan Project Estimate(2017 $000s)
Phase Gate Passed: N/A
Baseline: $0 Baseline: N/A 2008 Cost Estimate: N/A
2017 TIP: $49,267 2017 : 2023 2017 Cost Estimate: $56,280
2018 TIP: $49,267 2018 : 2023 2018 Cost Estimate: $56,280
Cashflow (YOE $000s)
Subarea Life to Date 2018 2019 2020 2021 2022 2023 Future Total
Snohomish $1,789 $209 $480 $535 $307 $84 $15 $1,409 $4,828
North King 4,273 499 1,146 1,277 732 200 37 3,365 11,529
South King 3,451 403 926 1,031 591 161 29 2,718 9,312
East King 7,432 868 1,994 2,220 1,273 348 63 5,853 20,052
Pierce 1,315 154 353 393 225 61 11 1,035 3,547
Total $18,259 $2,134 $4,900 $5,455 $3,128 $854 $156 $14,382 $49,267
Phase Life to Date 2018 2019 2020 2021 2022 2023 Future Total
10-Agency Administration $1,290 $500 $525 $530 $535 $540 $140 $470 $4,530
61-Art 16,969 1,634 4,375 4,925 2,593 314 16 13,912 44,737
Total $18,259 $2,134 $4,900 $5,455 $3,128 $854 $156 $14,382 $49,267
Project Risk Assessment
N/A
66 of 159

System Expansion OTHER
804300 Transit Oriented Development Planning Program Managed by: PEPD
Scope: Support Transit Oriented Development (TOD) planning and pre-development activities needed to identify, refine and shape the offering of TOD properties targeted by ST3 plan.
Changes to authorized project allocation since 2017: New program.
Budget year activities: Support the West Seattle-Ballard Link Extension, Downtown Redmond Link Extension, Federal Way Link Extension, Tacoma Dome Link Extension, I-405 BRT, and SR-522 BRT projects by funding the preparation of TOD implementation strategies and other pre-development activities for properties that may have joint development potential or that may become surplus to the agency.
Authorized Project Allocation To Date(YOE $000s)
Completion Schedule Financial Plan Project Estimate(2017 $000s)
Phase Gate Passed: N/A
Baseline: $0 Baseline: N/A 2008 Cost Estimate: $21,427
2017 TIP: $0 2017 : N/A 2017 Cost Estimate: N/A
2018 TIP: $30,171 2018 : 2041 2018 Cost Estimate: $21,427
Cashflow (YOE $000s)
Subarea Life to Date 2018 2019 2020 2021 2022 2023 Future Total
Systemwide $0 $400 $400 $850 $650 $650 $400 $26,821 $30,171
Total $0 $400 $400 $850 $650 $650 $400 $26,821 $30,171
Phase Life to Date 2018 2019 2020 2021 2022 2023 Future Total
10-Agency Administration $0 $125 $150 $250 $250 $200 $150 $5,009 $6,134
20-Prelim Engineering/Env Review
0 275 250 400 100 100 0 13,624 14,749
40-Row Acquisition+Permits 0 0 0 200 300 350 250 8,189 9,289
Total $0 $400 $400 $850 $650 $650 $400 $26,821 $30,171
Project Risk Assessment
N/A
67 of 159

System Expansion OTHER
809100 ST3 Planning Managed by: PEPD
Scope: Support system expansion activities that are not corridor specific, including but not limited to ridership forecasting, operations analysis and pre-project development for future projects.
Changes to authorized project allocation since 2017: None
Budget year activities: Update the regional ridership forecasting model to reflect current economic, transit system and demographic data, develop a light rail system operations plan and fleet forecasts for 2045 reflecting planned incremental system expansions and analyze the feasibility of bus-on-shoulder operation with Washington Department of Transportation (WSDOT)
Authorized Project Allocation To Date(YOE $000s)
Completion Schedule Financial Plan Project Estimate(2017 $000s)
Phase Gate Passed: N/A
Baseline: $0 Baseline: N/A 2008 Cost Estimate: $64,099
2017 TIP: $52,648 2017 : 2018 2017 Cost Estimate: $37,112
2018 TIP: $52,648 2018 : 2024 2018 Cost Estimate: $37,112
Cashflow (YOE $000s)
Subarea Life to Date 2018 2019 2020 2021 2022 2023 Future Total
Systemwide $22,150 $3,000 $2,290 $2,000 $2,000 $2,000 $1,648 $17,560 $52,648
Total $22,150 $3,000 $2,290 $2,000 $2,000 $2,000 $1,648 $17,560 $52,648
Phase Life to Date 2018 2019 2020 2021 2022 2023 Future Total
10-Agency Administration $3,990 $1,500 $1,000 $1,000 $1,000 $1,000 $1,000 $0 $10,490
20-Prelim Engineering/Env Review
18,150 1,500 1,000 1,000 1,000 1,000 648 17,560 41,858
40-Row Acquisition+Permits 10 0 290 0 0 0 0 0 300
Total $22,150 $3,000 $2,290 $2,000 $2,000 $2,000 $1,648 $17,560 $52,648
Project Risk Assessment
N/A
68 of 159

Enhancement Although the majority of Sound Transit’s projects are related to expanding the regional transit system, work is planned and ongoing to improve operating efficiency and effectiveness, improve the rider experience, increase system functionality, or reduce operating costs.
2018 Enhancement Project Highlights Install brighter, more energy efficient LED lighting and energy efficient upgrades at the Tukwila
International Boulevard and SeaTac Airport Stations. Continue partnership with King County and the City of Seattle to fund street and signal
improvements to mitigate the impact of buses moving from the Downtown Seattle TransitTunnel (DSTT) to surface streets.
Complete procurement and begin the installation of a second light rail vehicle lift at the LinkOperations & Maintenance Facility (OMF).
Partner with Pierce Transit to undertake a master planning process to determine the expansionof the Pierce Transit Maintenance Facility.
Renovate the Operations and Maintenance Facility to secure the Link Control Center, renovateexisting office spaces, increase onsite parking and add electric charge station capacity at thefacility.
Upgrade the on-board communication systems on all Sound Transit buses operated byCommunity Transit to improve data transfer between the bus and the maintenance facility.
Install a GPS Repeater to extend the radio and data communication range of Pierce Transitcommunication with Pierce Transit operated Sound Transit buses.
Install CCTV cameras and customer emergency stations at the Everett Transit Center.
69 of 159

2018
Cas
hfl
ow
by
Bu
dg
et A
pp
rova
l(in
thou
sand
s)
Enh
ance
men
t
ALL
MO
DE
S
Pro
ject
Nu
mb
er a
nd
Nam
eL
ife
to D
ate
2018
2019
2020
2021
2022
2023
Fu
ture
To
tal
Pre
limin
ary
En
gin
eeri
ng
4000
44Li
nk O
pera
ting
Seg
men
t Sys
tem
s E
nhan
cem
ents
and
Upg
rade
s$6
86$7
14$0
$0$0
$0$0
$0$1
,400
6000
45O
pens
idew
alks
Dat
a D
evel
opm
ent
600
00
00
00
60
6000
84D
igita
l Pas
seng
er In
form
atio
n S
yste
m0
1,61
70
00
00
01,
617
6000
85S
OD
O/M
LK H
azar
d M
itiga
tion
03,
136
00
00
00
3,13
6
7007
23D
ownt
own
Sea
ttle
Tra
nsit
Tun
nel M
itiga
tion
514
11,8
200
00
00
012
,334
7007
30O
pera
tions
& M
aint
enan
ce F
acili
ty L
ight
R
ail V
ehic
le L
ift
694
4,20
50
00
00
04,
898
7007
93S
igna
ge Im
prov
emen
ts51
761
50
00
00
01,
131
Su
bto
tal
2,47
122
,106
00
00
00
24,5
77
Bas
elin
e
3000
11P
ositi
ve T
rain
Con
trol
39,8
503,
055
10,1
490
00
00
53,0
54
4X34
0N
oise
Aba
tem
ent
9,02
561
03,
365
00
00
013
,000
6000
29T
acom
a Li
nk F
are
Col
lect
ion
640
00
00
382
6751
4
7007
74C
entr
al L
ink
HV
AC
- In
stru
men
t Hou
se a
nd
UP
S R
oom
1,23
20
00
00
00
1,23
2
Su
bto
tal
50,1
713,
665
13,5
140
00
382
6767
,800
Op
erat
ing
5X26
1B
us M
aint
enan
ce F
acili
ty11
,153
10,8
800
00
00
022
,033
7006
76T
acom
a Li
nk R
adio
Upg
rade
074
80
00
00
074
8
7006
85E
vere
tt S
tatio
n S
ecur
ity Im
prov
emen
ts0
289
00
00
00
289
7006
86S
ecur
ity R
adio
Sys
tem
029
30
00
00
029
3
7006
87S
ecur
ity O
pera
tions
Cen
ter
- V
ideo
M
onito
ring
Impr
ovem
ents
018
80
00
00
018
8
7006
88LE
D L
ight
ing
Pro
gram
01,
500
00
00
00
1,50
0
7006
89P
ierc
e T
rans
it -
Glo
bal P
ositi
onin
g S
yste
m
Rep
eate
r0
1,66
20
00
00
01,
662
7006
90C
omm
unity
Tra
nsit
- O
n-B
oard
C
omm
unic
atio
n U
pgra
de0
2,08
00
00
00
02,
080
7006
91O
pera
tions
Mai
nten
ance
Fac
ility
(O
MF
) -
Link
Con
trol
Cen
ter
(LC
C)
Upg
rade
s0
400
00
00
00
400
7006
92O
pera
tions
Mai
nten
ance
Fac
ility
(O
MF
) E
xpan
ded
Par
king
165
456
00
00
00
621
70 of 159
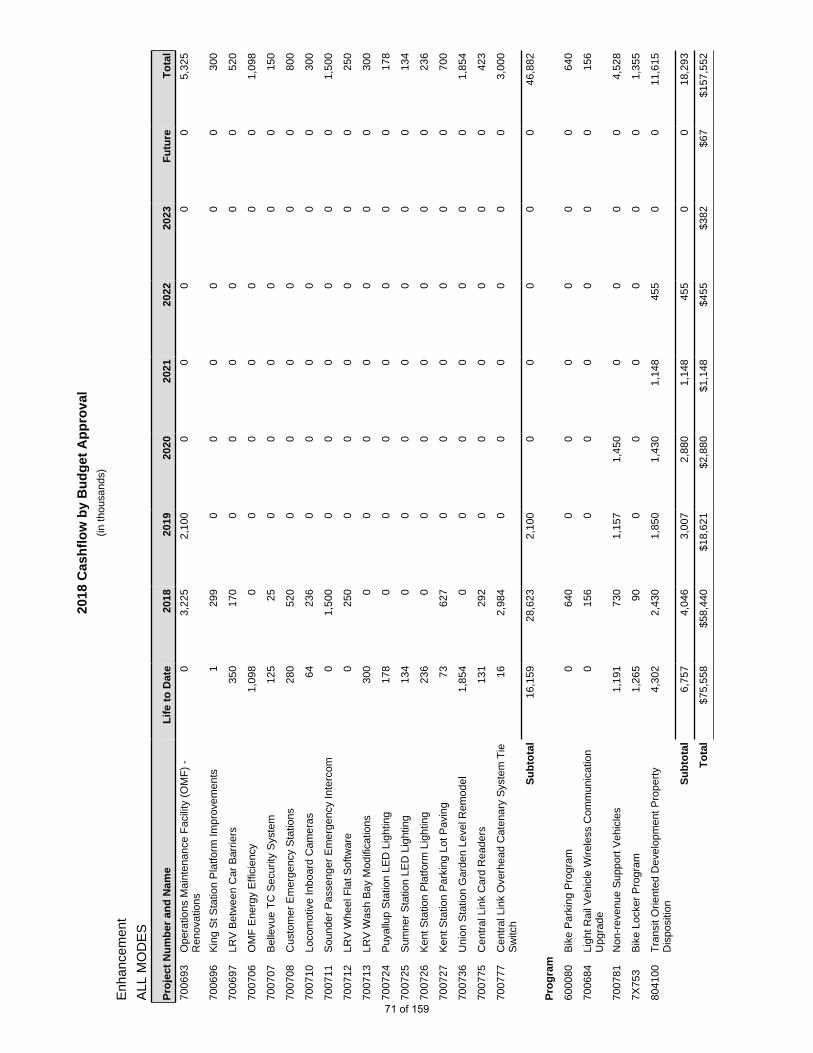
2018
Cas
hfl
ow
by
Bu
dg
et A
pp
rova
l(in
thou
sand
s)
Enh
ance
men
t
ALL
MO
DE
S
Pro
ject
Nu
mb
er a
nd
Nam
eL
ife
to D
ate
2018
2019
2020
2021
2022
2023
Fu
ture
To
tal
7006
93O
pera
tions
Mai
nten
ance
Fac
ility
(O
MF
) -
Ren
ovat
ions
03,
225
2,10
00
00
00
5,32
5
7006
96K
ing
St S
tatio
n P
latfo
rm Im
prov
emen
ts1
299
00
00
00
300
7006
97LR
V B
etw
een
Car
Bar
riers
350
170
00
00
00
520
7007
06O
MF
Ene
rgy
Effi
cien
cy1,
098
00
00
00
01,
098
7007
07B
elle
vue
TC
Sec
urity
Sys
tem
125
250
00
00
015
0
7007
08C
usto
mer
Em
erge
ncy
Sta
tions
280
520
00
00
00
800
7007
10Lo
com
otiv
e In
boar
d C
amer
as64
236
00
00
00
300
7007
11S
ound
er P
asse
nger
Em
erge
ncy
Inte
rcom
01,
500
00
00
00
1,50
0
7007
12LR
V W
heel
Fla
t Sof
twar
e0
250
00
00
00
250
7007
13LR
V W
ash
Bay
Mod
ifica
tions
300
00
00
00
030
0
7007
24P
uyal
lup
Sta
tion
LED
Lig
htin
g17
80
00
00
00
178
7007
25S
umne
r S
tatio
n LE
D L
ight
ing
134
00
00
00
013
4
7007
26K
ent S
tatio
n P
latfo
rm L
ight
ing
236
00
00
00
023
6
7007
27K
ent S
tatio
n P
arki
ng L
ot P
avin
g73
627
00
00
00
700
7007
36U
nion
Sta
tion
Gar
den
Leve
l Rem
odel
1,85
40
00
00
00
1,85
4
7007
75C
entr
al L
ink
Car
d R
eade
rs13
129
20
00
00
042
3
7007
77C
entr
al L
ink
Ove
rhea
d C
aten
ary
Sys
tem
Tie
S
witc
h16
2,98
40
00
00
03,
000
Su
bto
tal
16,1
5928
,623
2,10
00
00
00
46,8
82
Pro
gra
m
6000
80B
ike
Par
king
Pro
gram
064
00
00
00
064
0
7006
84Li
ght R
ail V
ehic
le W
irele
ss C
omm
unic
atio
n U
pgra
de0
156
00
00
00
156
7007
81N
on-r
even
ue S
uppo
rt V
ehic
les
1,19
173
01,
157
1,45
00
00
04,
528
7X75
3B
ike
Lock
er P
rogr
am1,
265
900
00
00
01,
355
8041
00T
rans
it O
rient
ed D
evel
opm
ent P
rope
rty
Dis
posi
tion
4,30
22,
430
1,85
01,
430
1,14
845
50
011
,615
Su
bto
tal
6,75
74,
046
3,00
72,
880
1,14
845
50
018
,293
To
tal
$75,
558
$58,
440
$18,
621
$2,8
80$1
,148
$455
$382
$67
$157
,552
71 of 159
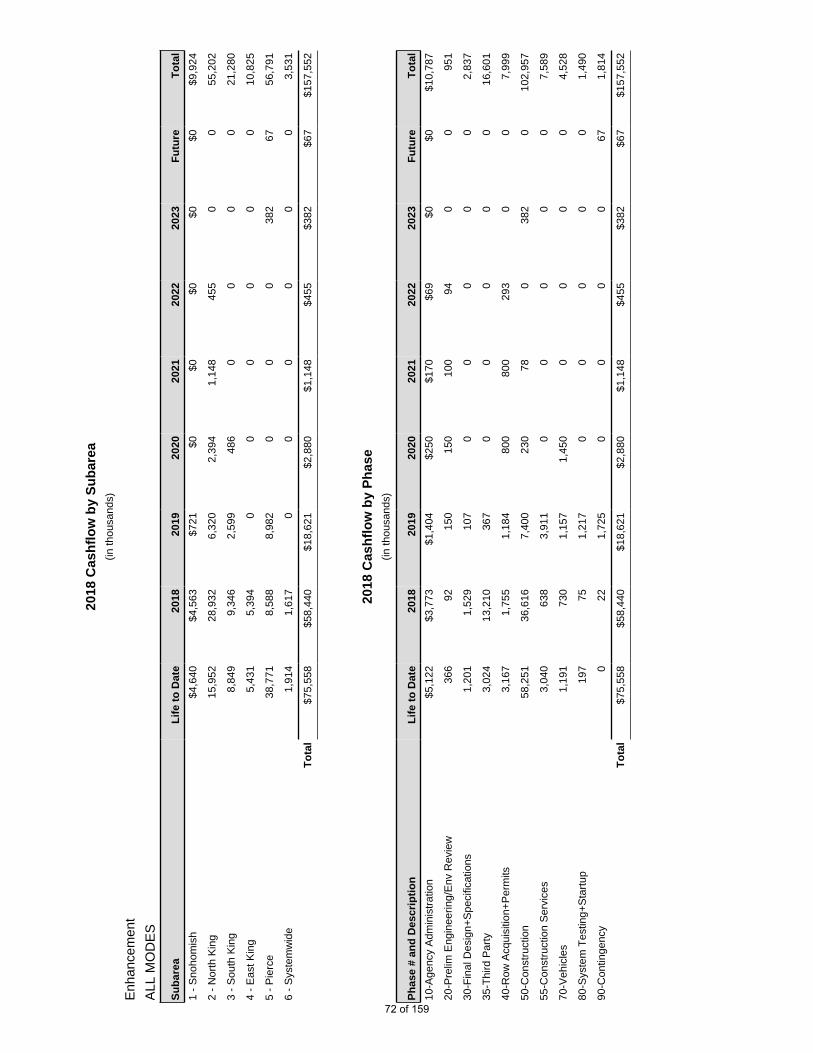
2018
Cas
hfl
ow
by
Su
bar
ea(in
thou
sand
s)
Enh
ance
men
t
ALL
MO
DE
S
Su
bar
eaL
ife
to D
ate
2018
2019
2020
2021
2022
2023
Fu
ture
To
tal
1 -
Sno
hom
ish
$4,6
40$4
,563
$721
$0$0
$0$0
$0$9
,924
2 -
Nor
th K
ing
15,9
5228
,932
6,32
02,
394
1,14
845
50
055
,202
3 -
Sou
th K
ing
8,84
99,
346
2,59
948
60
00
021
,280
4 -
Eas
t Kin
g5,
431
5,39
40
00
00
010
,825
5 -
Pie
rce
38,7
718,
588
8,98
20
00
382
6756
,791
6 -
Sys
tem
wid
e1,
914
1,61
70
00
00
03,
531
To
tal
$75,
558
$58,
440
$18,
621
$2,8
80$1
,148
$455
$382
$67
$157
,552
2018
Cas
hfl
ow
by
Ph
ase
(in th
ousa
nds)
Ph
ase
# an
d D
escr
ipti
on
Lif
e to
Dat
e20
1820
1920
2020
2120
2220
23F
utu
reT
ota
l
10-A
genc
y A
dmin
istr
atio
n$5
,122
$3,7
73$1
,404
$250
$170
$69
$0$0
$10,
787
20-P
relim
Eng
inee
ring/
Env
Rev
iew
366
9215
015
010
094
00
951
30-F
inal
Des
ign+
Spe
cific
atio
ns1,
201
1,52
910
70
00
00
2,83
7
35-T
hird
Par
ty3,
024
13,2
1036
70
00
00
16,6
01
40-R
ow A
cqui
sitio
n+P
erm
its3,
167
1,75
51,
184
800
800
293
00
7,99
9
50-C
onst
ruct
ion
58,2
5136
,616
7,40
023
078
038
20
102,
957
55-C
onst
ruct
ion
Ser
vice
s3,
040
638
3,91
10
00
00
7,58
9
70-V
ehic
les
1,19
173
01,
157
1,45
00
00
04,
528
80-S
yste
m T
estin
g+S
tart
up19
775
1,21
70
00
00
1,49
0
90-C
ontin
genc
y0
221,
725
00
00
671,
814
To
tal
$75,
558
$58,
440
$18,
621
$2,8
80$1
,148
$455
$382
$67
$157
,552
72 of 159

Enhancement LINK
400044 Link Operating Segment Systems Enhancements and Upgrades Managed by: DECM
Scope: Deliver enhancements and upgrades to systems on the existing Link operating segment, including AC power distribution, traction power, overhead catenary system, signals and communications systems upgrades, and enhancements to existing engineering infrastructure.
Changes to authorized project allocation since 2017: None
Budget year activities: Perform upgrades to Link operating systems including engineering infrastructure and power, signal, and communication systems
Authorized Project Allocation To Date(YOE $000s)
Completion Schedule Financial Plan Project Estimate(2017 $000s)
Phase Gate Passed: None
Baseline: Baseline: N/A 2008 Cost Estimate: N/A
2017 TIP: $1,400 2017 : 2017 2017 Cost Estimate: N/A
2018 TIP: $1,400 2018 : 2018 2018 Cost Estimate: N/A
Cashflow (YOE $000s)
Subarea Life to Date 2018 2019 2020 2021 2022 2023 Future Total
North King $459 $477 $0 $0 $0 $0 $0 $0 $935
South King 228 237 0 0 0 0 0 0 465
Total $686 $714 $0 $0 $0 $0 $0 $0 $1,400
Phase Life to Date 2018 2019 2020 2021 2022 2023 Future Total
10-Agency Administration $133 $52 $0 $0 $0 $0 $0 $0 $185
30-Final Design+Specifications 79 107 0 0 0 0 0 0 185
50-Construction 475 475 0 0 0 0 0 0 950
55-Construction Services 0 80 0 0 0 0 0 0 80
Total $686 $714 $0 $0 $0 $0 $0 $0 $1,400
Project Risk Assessment
Coordination with Link Operations to avoid impacts to light rail operations.
73 of 159

Enhancement LINK
4X340 Noise Abatement Managed by: DECM
Scope: Design and construct a noise wall along the Link elevated guideway in Tukwila. Funding for the completion of the Residential Sound Insulation Program (RSIP) for residences impacted by noise from operations of Central Link in the Rainier Valley is included in this project.
Construction of the noise wall was completed in 2013. Environmental noise and vibration testing is expected to complete in 2017. Potential construction in 2018. Budget cash flow in 2019 reflects projected surplus budget.
Changes to authorized project allocation since 2017: None.
Budget year activities: Complete monitoring of noise levels to ensure regulatory compliance along the Initial Segment alignment.
Authorized Project Allocation To Date(YOE $000s)
Completion Schedule Financial Plan Project Estimate(2017 $000s)
Phase Gate Passed: 6-Proceed to Construction
Baseline: $13,000 Baseline: N/A 2008 Cost Estimate: N/A
2017 TIP: $13,000 2017 : 2017 2017 Cost Estimate: N/A
2018 TIP: $13,000 2018 : 2018 2018 Cost Estimate: N/A
Cashflow (YOE $000s)
Subarea Life to Date 2018 2019 2020 2021 2022 2023 Future Total
North King $6,162 $417 $2,298 $0 $0 $0 $0 $0 $8,876
South King 2,863 193 1,067 0 0 0 0 0 4,124
Total $9,025 $610 $3,365 $0 $0 $0 $0 $0 $13,000
Phase Life to Date 2018 2019 2020 2021 2022 2023 Future Total
10-Agency Administration $1,029 $10 $161 $0 $0 $0 $0 $0 $1,200
30-Final Design+Specifications 5 0 55 0 0 0 0 0 60
40-Row Acquisition+Permits 16 0 84 0 0 0 0 0 100
50-Construction 5,887 500 2,063 0 0 0 0 0 8,450
55-Construction Services 2,088 100 1,002 0 0 0 0 0 3,190
Total $9,025 $610 $3,365 $0 $0 $0 $0 $0 $13,000
Project Risk Assessment
N/A
74 of 159

Enhancement LINK
600029 Tacoma Link Fare Collection Managed by: FIT
Scope: Install and commission ticket vending machines at Tacoma Link stations, establish a spare parts inventory, set up fare collection and fare enforcement support, and conduct public outreach. No planned budgeted activity until 2023.
Changes to authorized project allocation since 2017: None
Budget year activities: None.
Authorized Project Allocation To Date(YOE $000s)
Completion Schedule Financial Plan Project Estimate(2017 $000s)
Phase Gate Passed: N/A
Baseline: $0 Baseline: N/A 2008 Cost Estimate: N/A
2017 TIP: $514 2017 : 2016 2017 Cost Estimate: N/A
2018 TIP: $514 2018 : 2023 2018 Cost Estimate: N/A
Cashflow (YOE $000s)
Subarea Life to Date 2018 2019 2020 2021 2022 2023 Future Total
Pierce $64 $0 $0 $0 $0 $0 $382 $67 $514
Total $64 $0 $0 $0 $0 $0 $382 $67 $514
Phase Life to Date 2018 2019 2020 2021 2022 2023 Future Total
50-Construction $64 $0 $0 $0 $0 $0 $382 $0 $447
90-Contingency 0 0 0 0 0 0 0 67 67
Total $64 $0 $0 $0 $0 $0 $382 $67 $514
Project Risk Assessment
Key project risks include a further deferment of implementation. Additionally, next generation fare system changes across the region may affect contractor timelines for software and hardware development. Further complications may be driven by the ability to reach intergovernmental agreements for fare enforcement which may cause a delay once implementation is approved.
75 of 159

Enhancement LINK
700676 Tacoma Link Radio Upgrade Managed by: Operations
Scope: Design, install and commission a new low-power Simulcast DMR radio system installed at each station, linking the repeaters via fiber optic with local managed Ethernet switches. Also, install a passive repeater at the existing TPSS.To install and commission a new low-power Simulcast DMR radio system installed at each Tacoma Link station, linking the repeaters via fiber optic with local managed Ethernet switches. Also, install a passive repeater at the existing TPSS.
Changes to authorized project allocation since 2017: $748 thousand for new project.
Budget year activities: To install the new radio system.
Authorized Project Allocation To Date(YOE $000s)
Completion Schedule Financial Plan Project Estimate(2017 $000s)
Phase Gate Passed: N/A
Baseline: $0 Baseline: N/A 2008 Cost Estimate: N/A
2017 TIP: $0 2017 : N/A 2017 Cost Estimate: N/A
2018 TIP: $748 2018 : 2018 2018 Cost Estimate: N/A
Cashflow (YOE $000s)
Subarea Life to Date 2018 2019 2020 2021 2022 2023 Future Total
Pierce $0 $748 $0 $0 $0 $0 $0 $0 $748
Total $0 $748 $0 $0 $0 $0 $0 $0 $748
Phase Life to Date 2018 2019 2020 2021 2022 2023 Future Total
50-Construction $0 $748 $0 $0 $0 $0 $0 $0 $748
Total $0 $748 $0 $0 $0 $0 $0 $0 $748
Project Risk Assessment
Depending on the length of engineering work and the installation of new communication cabinets the schedule could extend beyond 2018.
76 of 159

Enhancement LINK
700684 Light Rail Vehicle Wireless Communication Upgrade Managed by: Operations
Scope: Implement new wireless solution that will support timely transmission of APC data, LRV maintenance information, and future signage data such as passage alerts, emergency notifications and other important rider alerts.
Changes to authorized project allocation since 2017: $156 thousand for new project.
Budget year activities: Consulting services and implementing the upgrades.
Authorized Project Allocation To Date(YOE $000s)
Completion Schedule Financial Plan Project Estimate(2017 $000s)
Phase Gate Passed: N/A
Baseline: $0 Baseline: N/A 2008 Cost Estimate: N/A
2017 TIP: $0 2017 : N/A 2017 Cost Estimate: N/A
2018 TIP: $156 2018 : 2018 2018 Cost Estimate: N/A
Cashflow (YOE $000s)
Subarea Life to Date 2018 2019 2020 2021 2022 2023 Future Total
North King $0 $104 $0 $0 $0 $0 $0 $0 $104
South King 0 52 0 0 0 0 0 0 52
Total $0 $156 $0 $0 $0 $0 $0 $0 $156
Phase Life to Date 2018 2019 2020 2021 2022 2023 Future Total
30-Final Design+Specifications $0 $30 $0 $0 $0 $0 $0 $0 $30
50-Construction 0 126 0 0 0 0 0 0 126
Total $0 $156 $0 $0 $0 $0 $0 $0 $156
Project Risk Assessment
It is unknown when the configuration of the wireless devise on LRV can be performed. The tasks need to be added to the delivery schedule of LRVs
77 of 159

Enhancement LINK
700691 Operations Maintenance Facility (OMF) - Link Control Center (LCC) Upgrades
Managed by: Operations
Scope: With buses now being forecasted to be removed from the tunnel end of Q1 2019, the OMF will become the new primary location for the LCC. This project will implement upgrades and enhancements for the OMF location to allow full functionality of the control center at the OMF.
Changes to authorized project allocation since 2017: $400 thousand for new project.
Budget year activities: Upgrades and enhancements will be made to the OMF Link Control Center to allow full functionality as the Link primary control center.
Authorized Project Allocation To Date(YOE $000s)
Completion Schedule Financial Plan Project Estimate(2017 $000s)
Phase Gate Passed: N/A
Baseline: $0 Baseline: N/A 2008 Cost Estimate: N/A
2017 TIP: $0 2017 : N/A 2017 Cost Estimate: N/A
2018 TIP: $400 2018 : 2018 2018 Cost Estimate: N/A
Cashflow (YOE $000s)
Subarea Life to Date 2018 2019 2020 2021 2022 2023 Future Total
North King $0 $267 $0 $0 $0 $0 $0 $0 $267
South King 0 133 0 0 0 0 0 0 133
Total $0 $400 $0 $0 $0 $0 $0 $0 $400
Phase Life to Date 2018 2019 2020 2021 2022 2023 Future Total
50-Construction $0 $400 $0 $0 $0 $0 $0 $0 $400
Total $0 $400 $0 $0 $0 $0 $0 $0 $400
Project Risk Assessment
N/A
78 of 159

Enhancement LINK
700692 Operations Maintenance Facility (OMF) Expanded Parking Managed by: Operations
Scope: Design and construct fourteen new parking spaces on the east side of the OMF, north of the 1st floor entry. Establish and install a suitable amount of electrical vehicle chargers in those spaces for use by agency vehicles only.
Changes to authorized project allocation since 2017: $621 thousand for new project. The project was previously in Small Work Program but has become a stand alone project. Costs from Small Work Program have been rolled into the new project.
Budget year activities: Design and construction of the parking area.
Authorized Project Allocation To Date(YOE $000s)
Completion Schedule Financial Plan Project Estimate(2017 $000s)
Phase Gate Passed: N/A
Baseline: $0 Baseline: N/A 2008 Cost Estimate: N/A
2017 TIP: $200 2017 : N/A 2017 Cost Estimate: N/A
2018 TIP: $621 2018 : 2018 2018 Cost Estimate: N/A
Cashflow (YOE $000s)
Subarea Life to Date 2018 2019 2020 2021 2022 2023 Future Total
North King $110 $305 $0 $0 $0 $0 $0 $0 $415
South King 55 151 0 0 0 0 0 0 206
Total $165 $456 $0 $0 $0 $0 $0 $0 $621
Phase Life to Date 2018 2019 2020 2021 2022 2023 Future Total
10-Agency Administration $26 $35 $0 $0 $0 $0 $0 $0 $61
20-Prelim Engineering/Env Review
25 0 0 0 0 0 0 0 25
30-Final Design+Specifications 114 0 0 0 0 0 0 0 114
50-Construction 0 421 0 0 0 0 0 0 421
Total $165 $456 $0 $0 $0 $0 $0 $0 $621
Project Risk Assessment
N/A
79 of 159

Enhancement LINK
700693 Operations Maintenance Facility (OMF) - Renovations Managed by: Operations
Scope: Reprogram the Link OMF in Seattle. Project includes efficiently sizing the enclosed offices, creating additional workstations, securing the area around the LCC (Link Control Center), and regrouping divisions to be co-located more efficiently.
Changes to authorized project allocation since 2017: $5.3 million for new project.
Budget year activities: Begin construction of the administrative space in the OMF.
Authorized Project Allocation To Date(YOE $000s)
Completion Schedule Financial Plan Project Estimate(2017 $000s)
Phase Gate Passed: N/A
Baseline: $0 Baseline: N/A 2008 Cost Estimate: N/A
2017 TIP: $0 2017 : N/A 2017 Cost Estimate: N/A
2018 TIP: $5,325 2018 : 2019 2018 Cost Estimate: N/A
Cashflow (YOE $000s)
Subarea Life to Date 2018 2019 2020 2021 2022 2023 Future Total
North King $0 $2,154 $1,403 $0 $0 $0 $0 $0 $3,557
South King 0 1,071 697 0 0 0 0 0 1,768
Total $0 $3,225 $2,100 $0 $0 $0 $0 $0 $5,325
Phase Life to Date 2018 2019 2020 2021 2022 2023 Future Total
10-Agency Administration $0 $225 $100 $0 $0 $0 $0 $0 $325
50-Construction 0 3,000 2,000 0 0 0 0 0 5,000
Total $0 $3,225 $2,100 $0 $0 $0 $0 $0 $5,325
Project Risk Assessment
Minimal project risk. Estimated completion date is 1st Quarter 2019.
80 of 159

Enhancement LINK
700697 LRV Between Car Barriers Managed by: Operations
Scope: Procure platform mounted barriers to be install at 21 Link stations. Federal Transit Authority Regulation 49 CFR 38.85 requires barriers on the platform to prevent visually impaired riders from mistaking the space between light rail vehicles as an open door.
Changes to authorized project allocation since 2017: None.
Budget year activities: Procure and install barriers for 21 Link stations to prevent access to space between light rail vehicles.
Authorized Project Allocation To Date(YOE $000s)
Completion Schedule Financial Plan Project Estimate(2017 $000s)
Phase Gate Passed: N/A
Baseline: $0 Baseline: N/A 2008 Cost Estimate: N/A
2017 TIP: $520 2017 : 2019 2017 Cost Estimate: N/A
2018 TIP: $520 2018 : 2018 2018 Cost Estimate: N/A
Cashflow (YOE $000s)
Subarea Life to Date 2018 2019 2020 2021 2022 2023 Future Total
North King $295 $143 $0 $0 $0 $0 $0 $0 $438
South King 55 27 0 0 0 0 0 0 82
Total $350 $170 $0 $0 $0 $0 $0 $0 $520
Phase Life to Date 2018 2019 2020 2021 2022 2023 Future Total
10-Agency Administration $1 $151 $0 $0 $0 $0 $0 $0 $152
50-Construction 350 18 0 0 0 0 0 0 368
Total $350 $170 $0 $0 $0 $0 $0 $0 $520
Project Risk Assessment
N/A
81 of 159
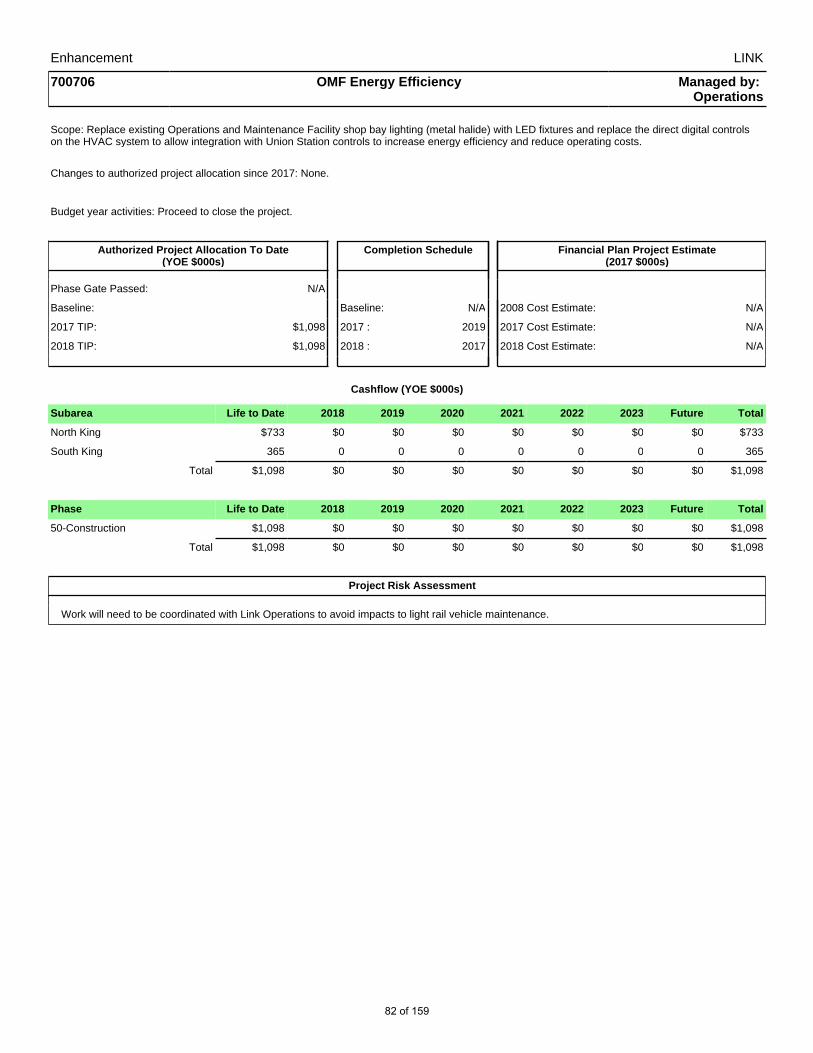
Enhancement LINK
700706 OMF Energy Efficiency Managed by: Operations
Scope: Replace existing Operations and Maintenance Facility shop bay lighting (metal halide) with LED fixtures and replace the direct digital controls on the HVAC system to allow integration with Union Station controls to increase energy efficiency and reduce operating costs.
Changes to authorized project allocation since 2017: None.
Budget year activities: Proceed to close the project.
Authorized Project Allocation To Date(YOE $000s)
Completion Schedule Financial Plan Project Estimate(2017 $000s)
Phase Gate Passed: N/A
Baseline: Baseline: N/A 2008 Cost Estimate: N/A
2017 TIP: $1,098 2017 : 2019 2017 Cost Estimate: N/A
2018 TIP: $1,098 2018 : 2017 2018 Cost Estimate: N/A
Cashflow (YOE $000s)
Subarea Life to Date 2018 2019 2020 2021 2022 2023 Future Total
North King $733 $0 $0 $0 $0 $0 $0 $0 $733
South King 365 0 0 0 0 0 0 0 365
Total $1,098 $0 $0 $0 $0 $0 $0 $0 $1,098
Phase Life to Date 2018 2019 2020 2021 2022 2023 Future Total
50-Construction $1,098 $0 $0 $0 $0 $0 $0 $0 $1,098
Total $1,098 $0 $0 $0 $0 $0 $0 $0 $1,098
Project Risk Assessment
Work will need to be coordinated with Link Operations to avoid impacts to light rail vehicle maintenance.
82 of 159

Enhancement LINK
700712 LRV Wheel Flat Software Managed by: Operations
Scope: Based on agreements with the University of Washington (UW), Link light rail trains operating in the vicinity of the University must remain within agreed-upon vibrational criteria. To enable vehicle maintenance staff to more accurately and efficiently identify and remedy sources of vibration in light rail vehicles (LRVs), an additional axle identifier (transponder) software module that will interface with the existing LRV wheel flat detection system will be purchased and installed, including selection of a contractor experienced with the software to oversee its installation.
Changes to authorized project allocation since 2017: None.
Budget year activities: Purchase and install additional software module to enhance the existing LRV wheel flat detection system, including selection of contractor to oversee installation.
Authorized Project Allocation To Date(YOE $000s)
Completion Schedule Financial Plan Project Estimate(2017 $000s)
Phase Gate Passed: N/A
Baseline: Baseline: N/A 2008 Cost Estimate: N/A
2017 TIP: $250 2017 : 2017 2017 Cost Estimate: N/A
2018 TIP: $250 2018 : 2018 2018 Cost Estimate: N/A
Cashflow (YOE $000s)
Subarea Life to Date 2018 2019 2020 2021 2022 2023 Future Total
North King $0 $167 $0 $0 $0 $0 $0 $0 $167
South King 0 83 0 0 0 0 0 0 83
Total $0 $250 $0 $0 $0 $0 $0 $0 $250
Phase Life to Date 2018 2019 2020 2021 2022 2023 Future Total
10-Agency Administration $0 $50 $0 $0 $0 $0 $0 $0 $50
30-Final Design+Specifications 0 150 0 0 0 0 0 0 150
50-Construction 0 50 0 0 0 0 0 0 50
Total $0 $250 $0 $0 $0 $0 $0 $0 $250
Project Risk Assessment
Careful planning is required so that installation does not impact daily train maintenance operations at the Operations and Maintenance Facility.
83 of 159

Enhancement LINK
700713 LRV Wash Bay Modifications Managed by: Operations
Scope: Modify the Link light rail vehicle (LRV) car wash system at the Link Operations and Maintenance Facility, including upgrades to electrical and mechanical equipment, to provide automatic LRV forehead cleaning and eliminate manual washing. The project will be completed in 2017.
Changes to authorized project allocation since 2017: None.
Budget year activities: Proceed to close out the project.
Authorized Project Allocation To Date(YOE $000s)
Completion Schedule Financial Plan Project Estimate(2017 $000s)
Phase Gate Passed: N/A
Baseline: Baseline: N/A 2008 Cost Estimate: N/A
2017 TIP: $300 2017 : 2017 2017 Cost Estimate: N/A
2018 TIP: $300 2018 : 2017 2018 Cost Estimate: N/A
Cashflow (YOE $000s)
Subarea Life to Date 2018 2019 2020 2021 2022 2023 Future Total
North King $200 $0 $0 $0 $0 $0 $0 $0 $200
South King 100 0 0 0 0 0 0 0 100
Total $300 $0 $0 $0 $0 $0 $0 $0 $300
Phase Life to Date 2018 2019 2020 2021 2022 2023 Future Total
10-Agency Administration $25 $0 $0 $0 $0 $0 $0 $0 $25
30-Final Design+Specifications 75 0 0 0 0 0 0 0 75
50-Construction 200 0 0 0 0 0 0 0 200
Total $300 $0 $0 $0 $0 $0 $0 $0 $300
Project Risk Assessment
Reduction in availability of the LRV wash system while modifications are installed.
84 of 159
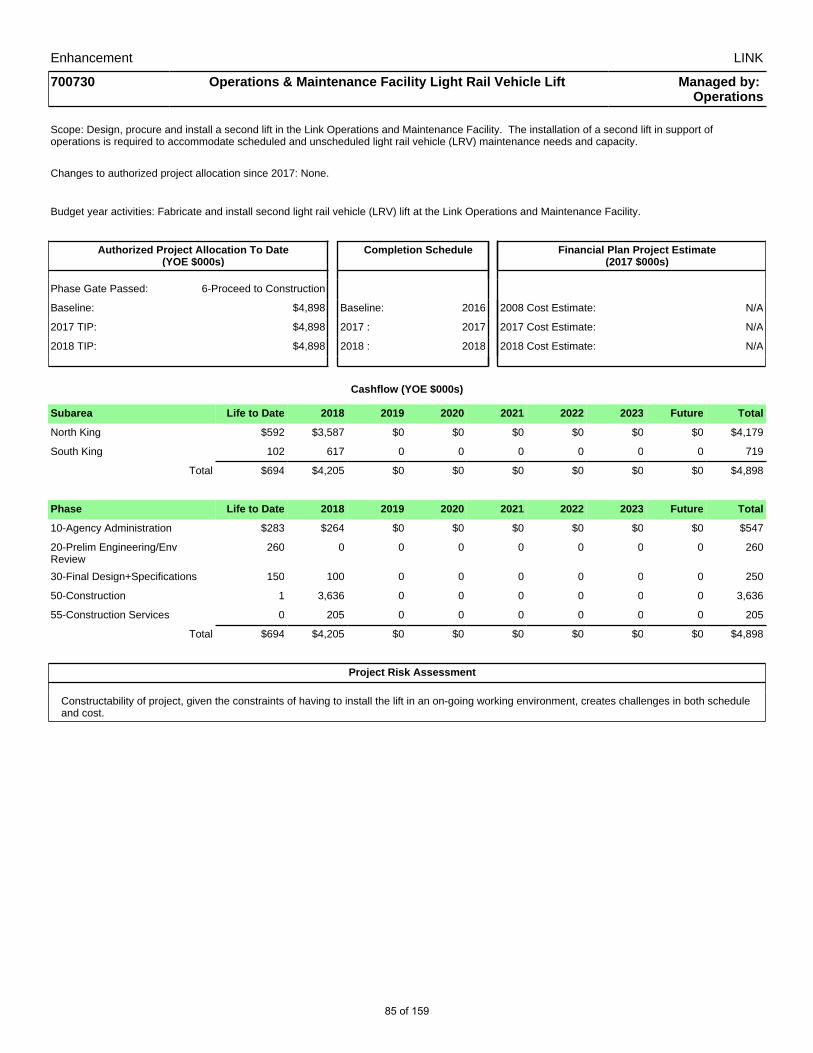
Enhancement LINK
700730 Operations & Maintenance Facility Light Rail Vehicle Lift Managed by: Operations
Scope: Design, procure and install a second lift in the Link Operations and Maintenance Facility. The installation of a second lift in support of operations is required to accommodate scheduled and unscheduled light rail vehicle (LRV) maintenance needs and capacity.
Changes to authorized project allocation since 2017: None.
Budget year activities: Fabricate and install second light rail vehicle (LRV) lift at the Link Operations and Maintenance Facility.
Authorized Project Allocation To Date(YOE $000s)
Completion Schedule Financial Plan Project Estimate(2017 $000s)
Phase Gate Passed: 6-Proceed to Construction
Baseline: $4,898 Baseline: 2016 2008 Cost Estimate: N/A
2017 TIP: $4,898 2017 : 2017 2017 Cost Estimate: N/A
2018 TIP: $4,898 2018 : 2018 2018 Cost Estimate: N/A
Cashflow (YOE $000s)
Subarea Life to Date 2018 2019 2020 2021 2022 2023 Future Total
North King $592 $3,587 $0 $0 $0 $0 $0 $0 $4,179
South King 102 617 0 0 0 0 0 0 719
Total $694 $4,205 $0 $0 $0 $0 $0 $0 $4,898
Phase Life to Date 2018 2019 2020 2021 2022 2023 Future Total
10-Agency Administration $283 $264 $0 $0 $0 $0 $0 $0 $547
20-Prelim Engineering/Env Review
260 0 0 0 0 0 0 0 260
30-Final Design+Specifications 150 100 0 0 0 0 0 0 250
50-Construction 1 3,636 0 0 0 0 0 0 3,636
55-Construction Services 0 205 0 0 0 0 0 0 205
Total $694 $4,205 $0 $0 $0 $0 $0 $0 $4,898
Project Risk Assessment
Constructability of project, given the constraints of having to install the lift in an on-going working environment, creates challenges in both schedule and cost.
85 of 159
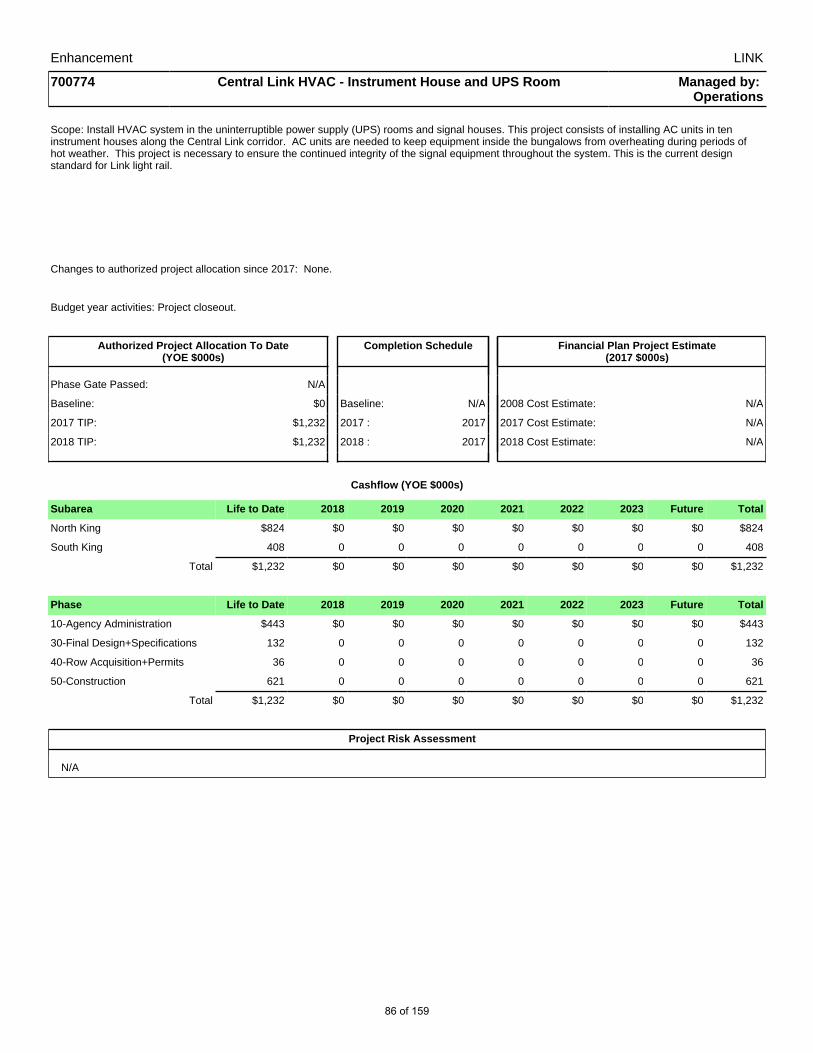
Enhancement LINK
700774 Central Link HVAC - Instrument House and UPS Room Managed by: Operations
Scope: Install HVAC system in the uninterruptible power supply (UPS) rooms and signal houses. This project consists of installing AC units in ten instrument houses along the Central Link corridor. AC units are needed to keep equipment inside the bungalows from overheating during periods of hot weather. This project is necessary to ensure the continued integrity of the signal equipment throughout the system. This is the current design standard for Link light rail.
Changes to authorized project allocation since 2017: None.
Budget year activities: Project closeout.
Authorized Project Allocation To Date(YOE $000s)
Completion Schedule Financial Plan Project Estimate(2017 $000s)
Phase Gate Passed: N/A
Baseline: $0 Baseline: N/A 2008 Cost Estimate: N/A
2017 TIP: $1,232 2017 : 2017 2017 Cost Estimate: N/A
2018 TIP: $1,232 2018 : 2017 2018 Cost Estimate: N/A
Cashflow (YOE $000s)
Subarea Life to Date 2018 2019 2020 2021 2022 2023 Future Total
North King $824 $0 $0 $0 $0 $0 $0 $0 $824
South King 408 0 0 0 0 0 0 0 408
Total $1,232 $0 $0 $0 $0 $0 $0 $0 $1,232
Phase Life to Date 2018 2019 2020 2021 2022 2023 Future Total
10-Agency Administration $443 $0 $0 $0 $0 $0 $0 $0 $443
30-Final Design+Specifications 132 0 0 0 0 0 0 0 132
40-Row Acquisition+Permits 36 0 0 0 0 0 0 0 36
50-Construction 621 0 0 0 0 0 0 0 621
Total $1,232 $0 $0 $0 $0 $0 $0 $0 $1,232
Project Risk Assessment
N/A
86 of 159
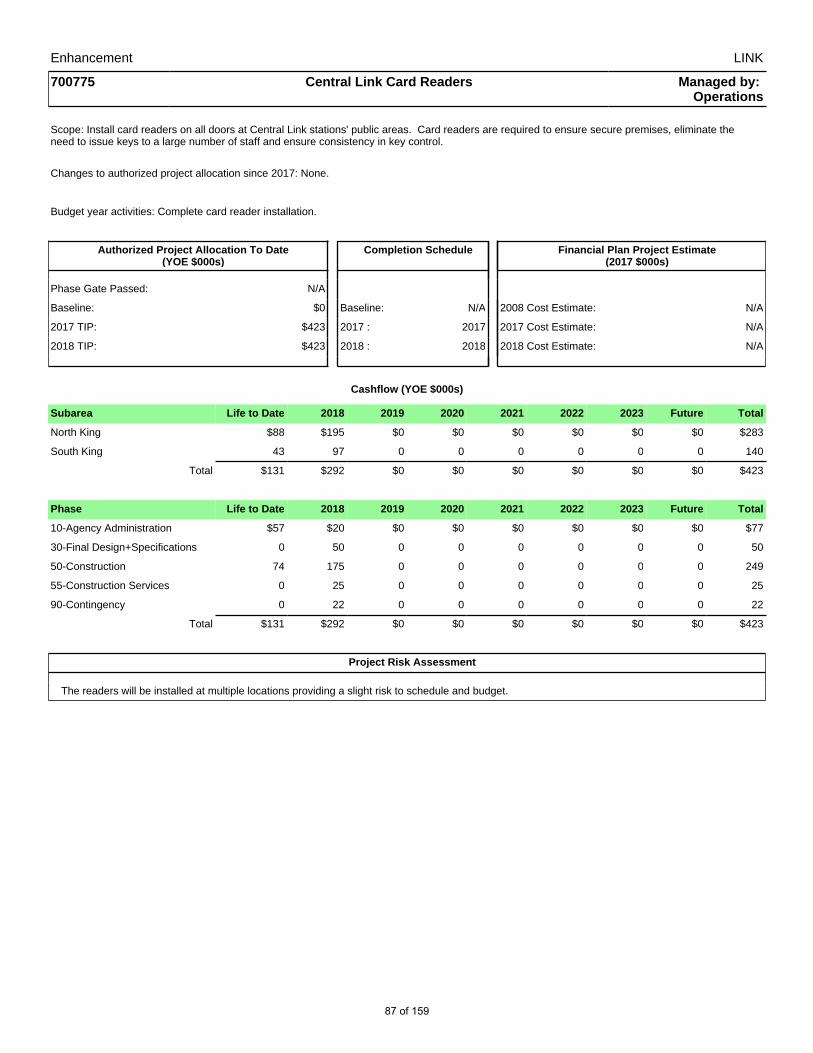
Enhancement LINK
700775 Central Link Card Readers Managed by: Operations
Scope: Install card readers on all doors at Central Link stations' public areas. Card readers are required to ensure secure premises, eliminate the need to issue keys to a large number of staff and ensure consistency in key control.
Changes to authorized project allocation since 2017: None.
Budget year activities: Complete card reader installation.
Authorized Project Allocation To Date(YOE $000s)
Completion Schedule Financial Plan Project Estimate(2017 $000s)
Phase Gate Passed: N/A
Baseline: $0 Baseline: N/A 2008 Cost Estimate: N/A
2017 TIP: $423 2017 : 2017 2017 Cost Estimate: N/A
2018 TIP: $423 2018 : 2018 2018 Cost Estimate: N/A
Cashflow (YOE $000s)
Subarea Life to Date 2018 2019 2020 2021 2022 2023 Future Total
North King $88 $195 $0 $0 $0 $0 $0 $0 $283
South King 43 97 0 0 0 0 0 0 140
Total $131 $292 $0 $0 $0 $0 $0 $0 $423
Phase Life to Date 2018 2019 2020 2021 2022 2023 Future Total
10-Agency Administration $57 $20 $0 $0 $0 $0 $0 $0 $77
30-Final Design+Specifications 0 50 0 0 0 0 0 0 50
50-Construction 74 175 0 0 0 0 0 0 249
55-Construction Services 0 25 0 0 0 0 0 0 25
90-Contingency 0 22 0 0 0 0 0 0 22
Total $131 $292 $0 $0 $0 $0 $0 $0 $423
Project Risk Assessment
The readers will be installed at multiple locations providing a slight risk to schedule and budget.
87 of 159
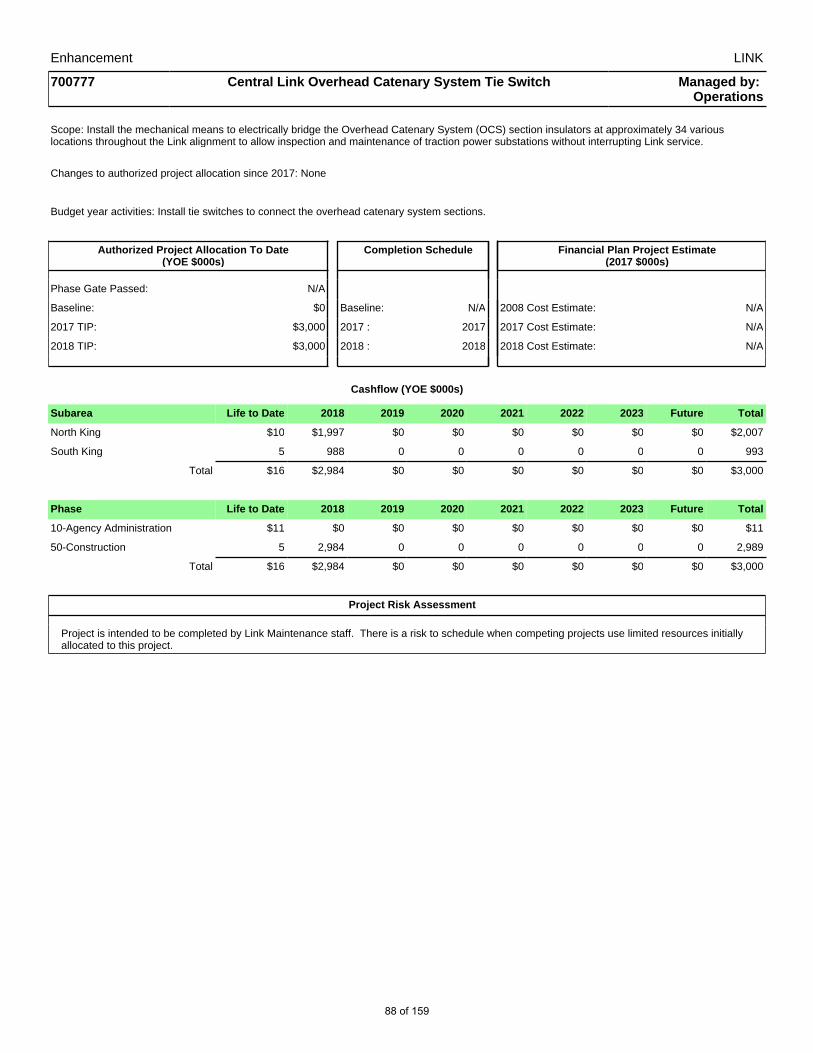
Enhancement LINK
700777 Central Link Overhead Catenary System Tie Switch Managed by: Operations
Scope: Install the mechanical means to electrically bridge the Overhead Catenary System (OCS) section insulators at approximately 34 various locations throughout the Link alignment to allow inspection and maintenance of traction power substations without interrupting Link service.
Changes to authorized project allocation since 2017: None
Budget year activities: Install tie switches to connect the overhead catenary system sections.
Authorized Project Allocation To Date(YOE $000s)
Completion Schedule Financial Plan Project Estimate(2017 $000s)
Phase Gate Passed: N/A
Baseline: $0 Baseline: N/A 2008 Cost Estimate: N/A
2017 TIP: $3,000 2017 : 2017 2017 Cost Estimate: N/A
2018 TIP: $3,000 2018 : 2018 2018 Cost Estimate: N/A
Cashflow (YOE $000s)
Subarea Life to Date 2018 2019 2020 2021 2022 2023 Future Total
North King $10 $1,997 $0 $0 $0 $0 $0 $0 $2,007
South King 5 988 0 0 0 0 0 0 993
Total $16 $2,984 $0 $0 $0 $0 $0 $0 $3,000
Phase Life to Date 2018 2019 2020 2021 2022 2023 Future Total
10-Agency Administration $11 $0 $0 $0 $0 $0 $0 $0 $11
50-Construction 5 2,984 0 0 0 0 0 0 2,989
Total $16 $2,984 $0 $0 $0 $0 $0 $0 $3,000
Project Risk Assessment
Project is intended to be completed by Link Maintenance staff. There is a risk to schedule when competing projects use limited resources initially allocated to this project.
88 of 159

Enhancement LINK
700781 Non-revenue Support Vehicles Managed by: Operations
Scope: Purchase and replace maintenance vehicles to improve maintenance efficiencies for the Link light rail system.
Changes to authorized project allocation since 2017: Budget increased by $2.4 million to purchase additional vehicles: three trucks for Maintenance of Way (MOW), four vans for Facilities, two electric cars for Rail Supervisors and a forklift. Additionally, the need for an Under Bridge inspection Truck (UBIT) was identified to support the requirement for bridge inspections.
Budget year activities: Replace four and purchase two additional maintenance vehicles. Take delivery of specialty Boom Truck.
Authorized Project Allocation To Date(YOE $000s)
Completion Schedule Financial Plan Project Estimate(2017 $000s)
Phase Gate Passed: N/A
Baseline: $0 Baseline: N/A 2008 Cost Estimate: N/A
2017 TIP: $2,130 2017 : 2019 2017 Cost Estimate: N/A
2018 TIP: $4,528 2018 : 2020 2018 Cost Estimate: N/A
Cashflow (YOE $000s)
Subarea Life to Date 2018 2019 2020 2021 2022 2023 Future Total
North King $792 $485 $770 $964 $0 $0 $0 $0 $3,011
South King 399 245 388 486 0 0 0 0 1,517
Total $1,191 $730 $1,157 $1,450 $0 $0 $0 $0 $4,528
Phase Life to Date 2018 2019 2020 2021 2022 2023 Future Total
70-Vehicles $1,191 $730 $1,157 $1,450 $0 $0 $0 $0 $4,528
Total $1,191 $730 $1,157 $1,450 $0 $0 $0 $0 $4,528
Project Risk Assessment
The growth of the agency and the potential for changing vehicle needs always exists and could have budget implications.
89 of 159
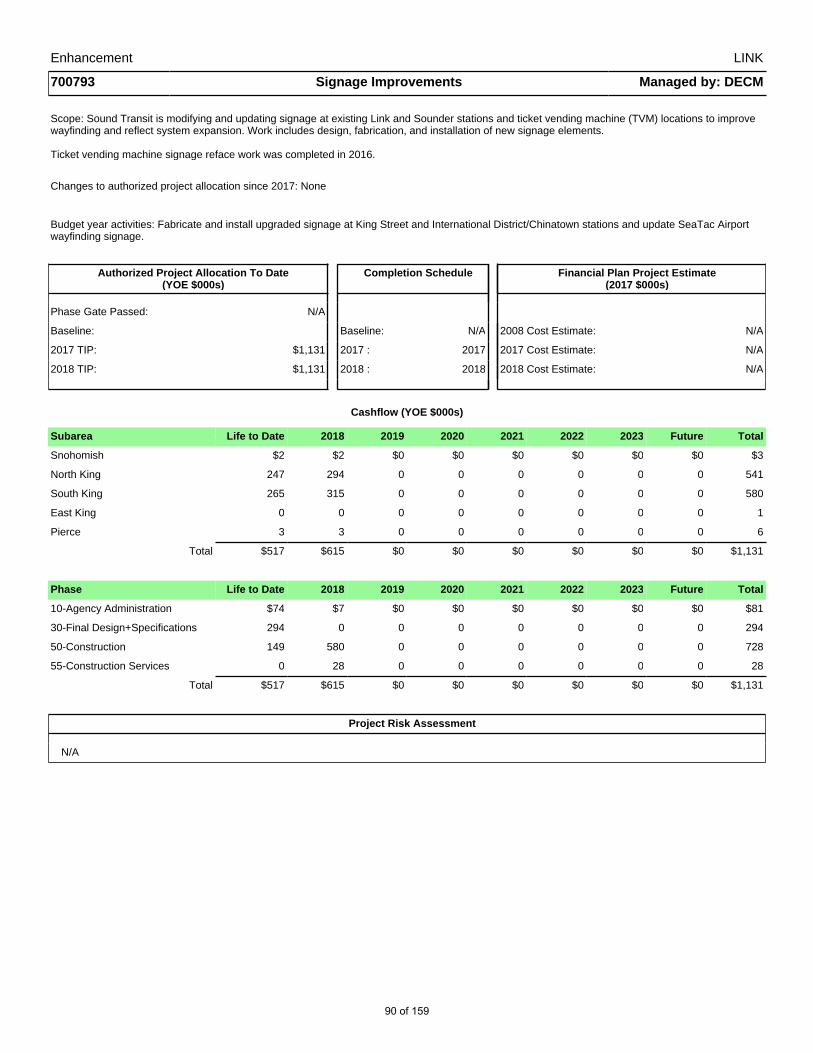
Enhancement LINK
700793 Signage Improvements Managed by: DECM
Scope: Sound Transit is modifying and updating signage at existing Link and Sounder stations and ticket vending machine (TVM) locations to improve wayfinding and reflect system expansion. Work includes design, fabrication, and installation of new signage elements.
Ticket vending machine signage reface work was completed in 2016.
Changes to authorized project allocation since 2017: None
Budget year activities: Fabricate and install upgraded signage at King Street and International District/Chinatown stations and update SeaTac Airport wayfinding signage.
Authorized Project Allocation To Date(YOE $000s)
Completion Schedule Financial Plan Project Estimate(2017 $000s)
Phase Gate Passed: N/A
Baseline: Baseline: N/A 2008 Cost Estimate: N/A
2017 TIP: $1,131 2017 : 2017 2017 Cost Estimate: N/A
2018 TIP: $1,131 2018 : 2018 2018 Cost Estimate: N/A
Cashflow (YOE $000s)
Subarea Life to Date 2018 2019 2020 2021 2022 2023 Future Total
Snohomish $2 $2 $0 $0 $0 $0 $0 $0 $3
North King 247 294 0 0 0 0 0 0 541
South King 265 315 0 0 0 0 0 0 580
East King 0 0 0 0 0 0 0 0 1
Pierce 3 3 0 0 0 0 0 0 6
Total $517 $615 $0 $0 $0 $0 $0 $0 $1,131
Phase Life to Date 2018 2019 2020 2021 2022 2023 Future Total
10-Agency Administration $74 $7 $0 $0 $0 $0 $0 $0 $81
30-Final Design+Specifications 294 0 0 0 0 0 0 0 294
50-Construction 149 580 0 0 0 0 0 0 728
55-Construction Services 0 28 0 0 0 0 0 0 28
Total $517 $615 $0 $0 $0 $0 $0 $0 $1,131
Project Risk Assessment
N/A
90 of 159

Enhancement SOUNDER
300011 Positive Train Control Managed by: DECM
Scope: Integrate command, control, communications, and information systems for controlling passenger train movements with safety, security, precision, and efficiency. These systems will improve railroad safety by significantly reducing the probability of collisions between trains, casualties to railway workers and damage to their equipment, and over speed accidents. Federal regulations had previously mandated that positive train control (PTC) be operational on all passenger rail systems by the end of December 2015, but this was recently extended by three years. The project was originally scheduled to be completed in 2015, however due to third party delays, it will now likely complete in third quarter of 2017. Budget displayed in 2019 is considered surplus.
Changes to authorized project allocation since 2017: None.
Budget year activities: Complete testing and commissioning of the positive train control (PTC) system.
Authorized Project Allocation To Date(YOE $000s)
Completion Schedule Financial Plan Project Estimate(2017 $000s)
Phase Gate Passed: 6-Proceed to Construction
Baseline: $53,054 Baseline: 2018 2008 Cost Estimate: N/A
2017 TIP: $53,054 2017 : 2016 2017 Cost Estimate: N/A
2018 TIP: $53,054 2018 : 2018 2018 Cost Estimate: N/A
Cashflow (YOE $000s)
Subarea Life to Date 2018 2019 2020 2021 2022 2023 Future Total
Snohomish $2,829 $217 $721 $0 $0 $0 $0 $0 $3,767
South King 1,753 134 447 0 0 0 0 0 2,334
Pierce 35,267 2,704 8,982 0 0 0 0 0 46,953
Total $39,850 $3,055 $10,149 $0 $0 $0 $0 $0 $53,054
Phase Life to Date 2018 2019 2020 2021 2022 2023 Future Total
10-Agency Administration $1,420 $25 $793 $0 $0 $0 $0 $0 $2,238
30-Final Design+Specifications 226 0 52 0 0 0 0 0 279
35-Third Party 2,510 1,390 367 0 0 0 0 0 4,267
50-Construction 34,543 1,365 3,087 0 0 0 0 0 38,995
55-Construction Services 953 200 2,909 0 0 0 0 0 4,062
80-System Testing+Startup 197 75 1,217 0 0 0 0 0 1,490
90-Contingency 0 0 1,725 0 0 0 0 0 1,725
Total $39,850 $3,055 $10,149 $0 $0 $0 $0 $0 $53,054
Project Risk Assessment
Schedule impacts due to limited availability of contactor technical staff and high demand for their services, availability of Federal Railroad Administration staff for final certification, and BNSF implementation delays of their positive train control (PTC) system on the Seattle sub-division.
91 of 159

Enhancement SOUNDER
700696 King St Station Platform Improvements Managed by: Operations
Scope: Participate in a local partnership to design and construct passenger access improvements at King Street Station, improving access to Century Link Field. The partnership is between Sound Transit, Washington State Department of Transportation, and Amtrak. Improvements to track 9 will reduce platform crowding and improve overall passenger safety. This will be partially funded by a grant from the Federal Railway Administration.
Changes to authorized project allocation since 2017: None.
Budget year activities: Design and construct passenger access improvements to King Street Station to improve access to Century Link Field.
Authorized Project Allocation To Date(YOE $000s)
Completion Schedule Financial Plan Project Estimate(2017 $000s)
Phase Gate Passed: N/A
Baseline: $0 Baseline: N/A 2008 Cost Estimate: N/A
2017 TIP: $300 2017 : 2019 2017 Cost Estimate: N/A
2018 TIP: $300 2018 : 2018 2018 Cost Estimate: N/A
Cashflow (YOE $000s)
Subarea Life to Date 2018 2019 2020 2021 2022 2023 Future Total
South King $1 $299 $0 $0 $0 $0 $0 $0 $300
Total $1 $299 $0 $0 $0 $0 $0 $0 $300
Phase Life to Date 2018 2019 2020 2021 2022 2023 Future Total
10-Agency Administration $1 $24 $0 $0 $0 $0 $0 $0 $25
20-Prelim Engineering/Env Review
0 25 0 0 0 0 0 0 25
30-Final Design+Specifications 0 50 0 0 0 0 0 0 50
40-Row Acquisition+Permits 0 75 0 0 0 0 0 0 75
50-Construction 0 125 0 0 0 0 0 0 125
Total $1 $299 $0 $0 $0 $0 $0 $0 $300
Project Risk Assessment
N/A
92 of 159
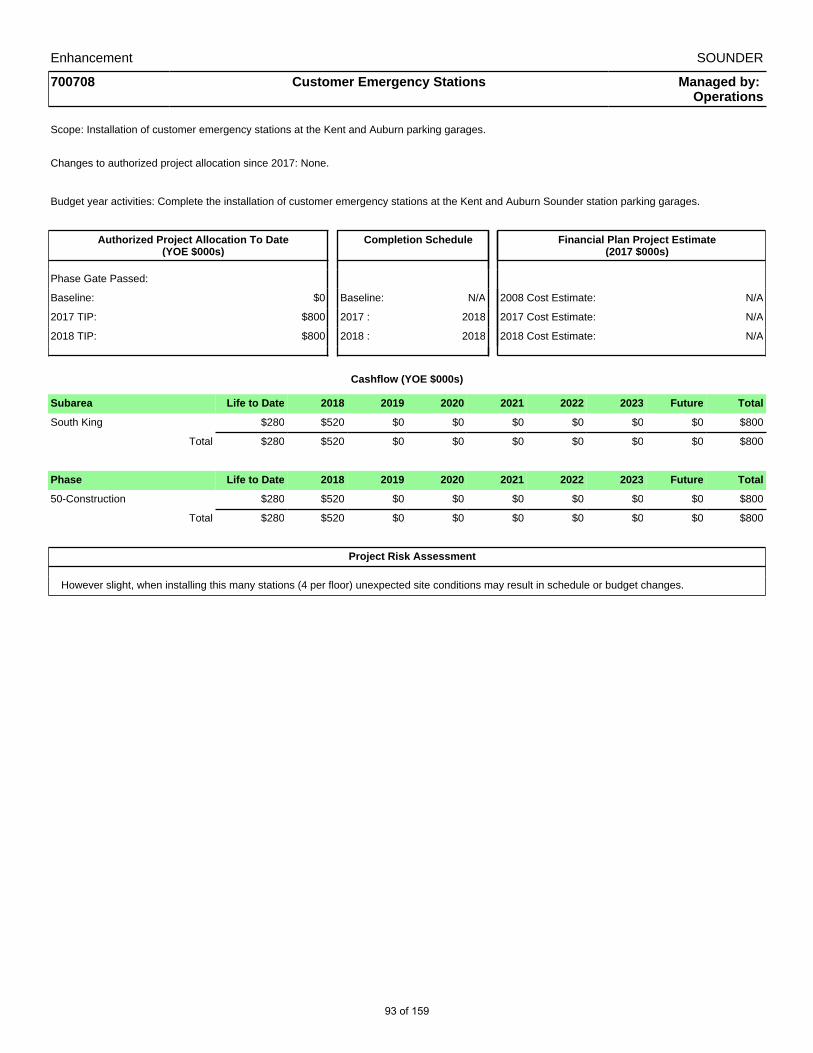
Enhancement SOUNDER
700708 Customer Emergency Stations Managed by: Operations
Scope: Installation of customer emergency stations at the Kent and Auburn parking garages.
Changes to authorized project allocation since 2017: None.
Budget year activities: Complete the installation of customer emergency stations at the Kent and Auburn Sounder station parking garages.
Authorized Project Allocation To Date(YOE $000s)
Completion Schedule Financial Plan Project Estimate(2017 $000s)
Phase Gate Passed:
Baseline: $0 Baseline: N/A 2008 Cost Estimate: N/A
2017 TIP: $800 2017 : 2018 2017 Cost Estimate: N/A
2018 TIP: $800 2018 : 2018 2018 Cost Estimate: N/A
Cashflow (YOE $000s)
Subarea Life to Date 2018 2019 2020 2021 2022 2023 Future Total
South King $280 $520 $0 $0 $0 $0 $0 $0 $800
Total $280 $520 $0 $0 $0 $0 $0 $0 $800
Phase Life to Date 2018 2019 2020 2021 2022 2023 Future Total
50-Construction $280 $520 $0 $0 $0 $0 $0 $0 $800
Total $280 $520 $0 $0 $0 $0 $0 $0 $800
Project Risk Assessment
However slight, when installing this many stations (4 per floor) unexpected site conditions may result in schedule or budget changes.
93 of 159
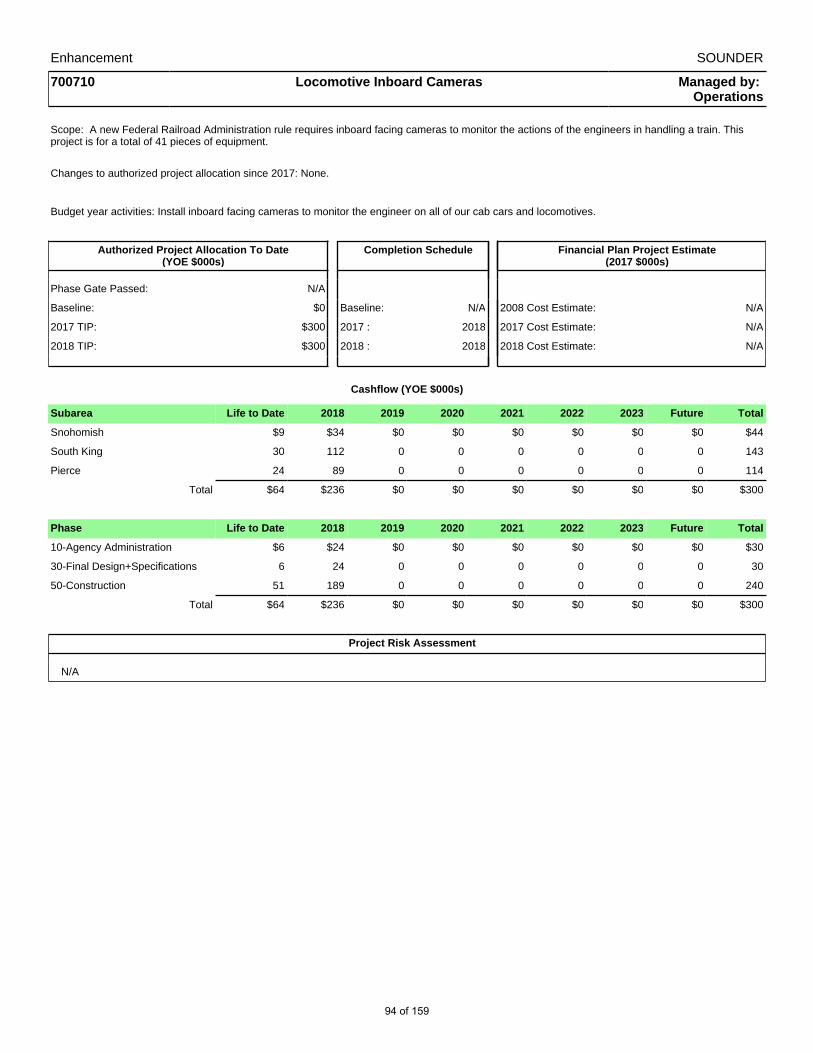
Enhancement SOUNDER
700710 Locomotive Inboard Cameras Managed by: Operations
Scope: A new Federal Railroad Administration rule requires inboard facing cameras to monitor the actions of the engineers in handling a train. This project is for a total of 41 pieces of equipment.
Changes to authorized project allocation since 2017: None.
Budget year activities: Install inboard facing cameras to monitor the engineer on all of our cab cars and locomotives.
Authorized Project Allocation To Date(YOE $000s)
Completion Schedule Financial Plan Project Estimate(2017 $000s)
Phase Gate Passed: N/A
Baseline: $0 Baseline: N/A 2008 Cost Estimate: N/A
2017 TIP: $300 2017 : 2018 2017 Cost Estimate: N/A
2018 TIP: $300 2018 : 2018 2018 Cost Estimate: N/A
Cashflow (YOE $000s)
Subarea Life to Date 2018 2019 2020 2021 2022 2023 Future Total
Snohomish $9 $34 $0 $0 $0 $0 $0 $0 $44
South King 30 112 0 0 0 0 0 0 143
Pierce 24 89 0 0 0 0 0 0 114
Total $64 $236 $0 $0 $0 $0 $0 $0 $300
Phase Life to Date 2018 2019 2020 2021 2022 2023 Future Total
10-Agency Administration $6 $24 $0 $0 $0 $0 $0 $0 $30
30-Final Design+Specifications 6 24 0 0 0 0 0 0 30
50-Construction 51 189 0 0 0 0 0 0 240
Total $64 $236 $0 $0 $0 $0 $0 $0 $300
Project Risk Assessment
N/A
94 of 159
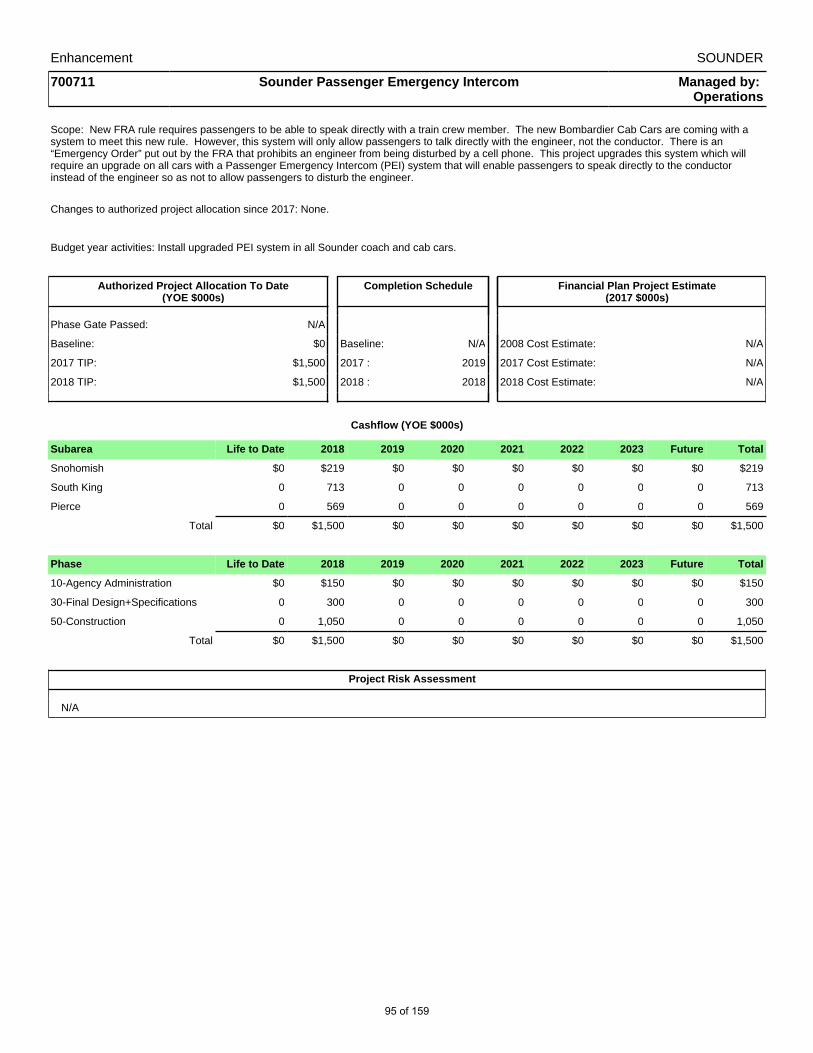
Enhancement SOUNDER
700711 Sounder Passenger Emergency Intercom Managed by: Operations
Scope: New FRA rule requires passengers to be able to speak directly with a train crew member. The new Bombardier Cab Cars are coming with a system to meet this new rule. However, this system will only allow passengers to talk directly with the engineer, not the conductor. There is an “Emergency Order” put out by the FRA that prohibits an engineer from being disturbed by a cell phone. This project upgrades this system which will require an upgrade on all cars with a Passenger Emergency Intercom (PEI) system that will enable passengers to speak directly to the conductor instead of the engineer so as not to allow passengers to disturb the engineer.
Changes to authorized project allocation since 2017: None.
Budget year activities: Install upgraded PEI system in all Sounder coach and cab cars.
Authorized Project Allocation To Date(YOE $000s)
Completion Schedule Financial Plan Project Estimate(2017 $000s)
Phase Gate Passed: N/A
Baseline: $0 Baseline: N/A 2008 Cost Estimate: N/A
2017 TIP: $1,500 2017 : 2019 2017 Cost Estimate: N/A
2018 TIP: $1,500 2018 : 2018 2018 Cost Estimate: N/A
Cashflow (YOE $000s)
Subarea Life to Date 2018 2019 2020 2021 2022 2023 Future Total
Snohomish $0 $219 $0 $0 $0 $0 $0 $0 $219
South King 0 713 0 0 0 0 0 0 713
Pierce 0 569 0 0 0 0 0 0 569
Total $0 $1,500 $0 $0 $0 $0 $0 $0 $1,500
Phase Life to Date 2018 2019 2020 2021 2022 2023 Future Total
10-Agency Administration $0 $150 $0 $0 $0 $0 $0 $0 $150
30-Final Design+Specifications 0 300 0 0 0 0 0 0 300
50-Construction 0 1,050 0 0 0 0 0 0 1,050
Total $0 $1,500 $0 $0 $0 $0 $0 $0 $1,500
Project Risk Assessment
N/A
95 of 159

Enhancement SOUNDER
700724 Puyallup Station LED Lighting Managed by: Operations
Scope: Install energy efficient lighting at Puyallup Station. Work will result in receiving a utility incentive based upon the energy reduction achieved and will reduce energy consumption on a ongoing basis.
Changes to authorized project allocation since 2017: None.
Budget year activities: Proceed to close out the project.
Authorized Project Allocation To Date(YOE $000s)
Completion Schedule Financial Plan Project Estimate(2017 $000s)
Phase Gate Passed: N/A
Baseline: $0 Baseline: N/A 2008 Cost Estimate: N/A
2017 TIP: $178 2017 : 2017 2017 Cost Estimate: N/A
2018 TIP: $178 2018 : 2017 2018 Cost Estimate: N/A
Cashflow (YOE $000s)
Subarea Life to Date 2018 2019 2020 2021 2022 2023 Future Total
Pierce $178 $0 $0 $0 $0 $0 $0 $0 $178
Total $178 $0 $0 $0 $0 $0 $0 $0 $178
Phase Life to Date 2018 2019 2020 2021 2022 2023 Future Total
50-Construction $178 $0 $0 $0 $0 $0 $0 $0 $178
Total $178 $0 $0 $0 $0 $0 $0 $0 $178
Project Risk Assessment
Risk is minimal for a straight procurement
96 of 159

Enhancement SOUNDER
700725 Sumner Station LED Lighting Managed by: Operations
Scope: Install energy efficient lighting at Sumner Station. Work will result in receiving a utility incentive based upon the energy reduction achieved and will reduce energy consumption on a ongoing basis.
Changes to authorized project allocation since 2017: None.
Budget year activities: Proceed to close out the project.
Authorized Project Allocation To Date(YOE $000s)
Completion Schedule Financial Plan Project Estimate(2017 $000s)
Phase Gate Passed: N/A
Baseline: $0 Baseline: N/A 2008 Cost Estimate: N/A
2017 TIP: $134 2017 : 2017 2017 Cost Estimate: N/A
2018 TIP: $134 2018 : 2017 2018 Cost Estimate: N/A
Cashflow (YOE $000s)
Subarea Life to Date 2018 2019 2020 2021 2022 2023 Future Total
Pierce $134 $0 $0 $0 $0 $0 $0 $0 $134
Total $134 $0 $0 $0 $0 $0 $0 $0 $134
Phase Life to Date 2018 2019 2020 2021 2022 2023 Future Total
50-Construction $134 $0 $0 $0 $0 $0 $0 $0 $134
Total $134 $0 $0 $0 $0 $0 $0 $0 $134
Project Risk Assessment
Risk is minimal for a straight procurement.
97 of 159

Enhancement SOUNDER
700726 Kent Station Platform Lighting Managed by: Operations
Scope: Install energy efficient lighting at Kent Station. In late 2012 lighting was upgraded in the Kent Garage, this project will extend the upgrades to the platform, surface lots, pedestrian bridge, and bus loop areas. Work will result in receiving a utility incentive based upon the energy reduction achieved and will reduce energy consumption on an ongoing basis.
Changes to authorized project allocation since 2017: None.
Budget year activities: Complete installation and proceed to close out the project.
Authorized Project Allocation To Date(YOE $000s)
Completion Schedule Financial Plan Project Estimate(2017 $000s)
Phase Gate Passed: N/A
Baseline: $0 Baseline: N/A 2008 Cost Estimate: N/A
2017 TIP: $236 2017 : 2017 2017 Cost Estimate: N/A
2018 TIP: $236 2018 : 2017 2018 Cost Estimate: N/A
Cashflow (YOE $000s)
Subarea Life to Date 2018 2019 2020 2021 2022 2023 Future Total
South King $236 $0 $0 $0 $0 $0 $0 $0 $236
Total $236 $0 $0 $0 $0 $0 $0 $0 $236
Phase Life to Date 2018 2019 2020 2021 2022 2023 Future Total
50-Construction $236 $0 $0 $0 $0 $0 $0 $0 $236
Total $236 $0 $0 $0 $0 $0 $0 $0 $236
Project Risk Assessment
Risk is minimal for a straight procurement.
98 of 159

Enhancement SOUNDER
700727 Kent Station Parking Lot Paving Managed by: Operations
Scope: Design and install paved and landscaped commuter parking to an additional 36 standard spaces, 1 compact space and 2 Americans with Disabilities Act (ADA) spaces.
Changes to authorized project allocation since 2017: None.
Budget year activities: Complete site survey, environmental review and pause pending the integration of ST3 projects into the transit improvement plan.
Authorized Project Allocation To Date(YOE $000s)
Completion Schedule Financial Plan Project Estimate(2017 $000s)
Phase Gate Passed: N/A
Baseline: $0 Baseline: N/A 2008 Cost Estimate: N/A
2017 TIP: $700 2017 : 2016 2017 Cost Estimate: N/A
2018 TIP: $700 2018 : 2018 2018 Cost Estimate: N/A
Cashflow (YOE $000s)
Subarea Life to Date 2018 2019 2020 2021 2022 2023 Future Total
South King $73 $627 $0 $0 $0 $0 $0 $0 $700
Total $73 $627 $0 $0 $0 $0 $0 $0 $700
Phase Life to Date 2018 2019 2020 2021 2022 2023 Future Total
10-Agency Administration $1 $1 $0 $0 $0 $0 $0 $0 $2
20-Prelim Engineering/Env Review
72 67 0 0 0 0 0 0 139
50-Construction 0 559 0 0 0 0 0 0 559
Total $73 $627 $0 $0 $0 $0 $0 $0 $700
Project Risk Assessment
The risk of a changing scope could effect the ultimate budget as requirements may change.
99 of 159

Enhancement REGIONAL EXPRESS
5X261 Bus Maintenance Facility Managed by: Operations
Scope: Fund expansion of Sound Transit's fleet maintenance capacity through contributions to facilities managed by third party service providers. The cash flow is flexible as often no projects are planned for a given year.
Changes to authorized project allocation since 2017: None.
Budget year activities: Contribute funds to Pierce Transit for Bus Base Master Plan.
Authorized Project Allocation To Date(YOE $000s)
Completion Schedule Financial Plan Project Estimate(2017 $000s)
Phase Gate Passed: N/A
Baseline: $0 Baseline: N/A 2008 Cost Estimate: N/A
2017 TIP: $22,033 2017 : 2017 2017 Cost Estimate: N/A
2018 TIP: $22,033 2018 : 2023 2018 Cost Estimate: N/A
Cashflow (YOE $000s)
Subarea Life to Date 2018 2019 2020 2021 2022 2023 Future Total
Snohomish $1,762 $1,719 $0 $0 $0 $0 $0 $0 $3,481
South King 1,238 1,208 0 0 0 0 0 0 2,446
East King 5,287 5,157 0 0 0 0 0 0 10,444
Pierce 2,866 2,796 0 0 0 0 0 0 5,662
Total $11,153 $10,880 $0 $0 $0 $0 $0 $0 $22,033
Phase Life to Date 2018 2019 2020 2021 2022 2023 Future Total
10-Agency Administration $24 $502 $0 $0 $0 $0 $0 $0 $527
20-Prelim Engineering/Env Review
8 0 0 0 0 0 0 0 8
40-Row Acquisition+Permits 59 0 0 0 0 0 0 0 59
50-Construction 11,062 10,378 0 0 0 0 0 0 21,439
Total $11,153 $10,880 $0 $0 $0 $0 $0 $0 $22,033
Project Risk Assessment
The schedule is flexible as it is predicated on partners to submit projects for participation. The schedules dates can change if no projects are planned.
100 of 159
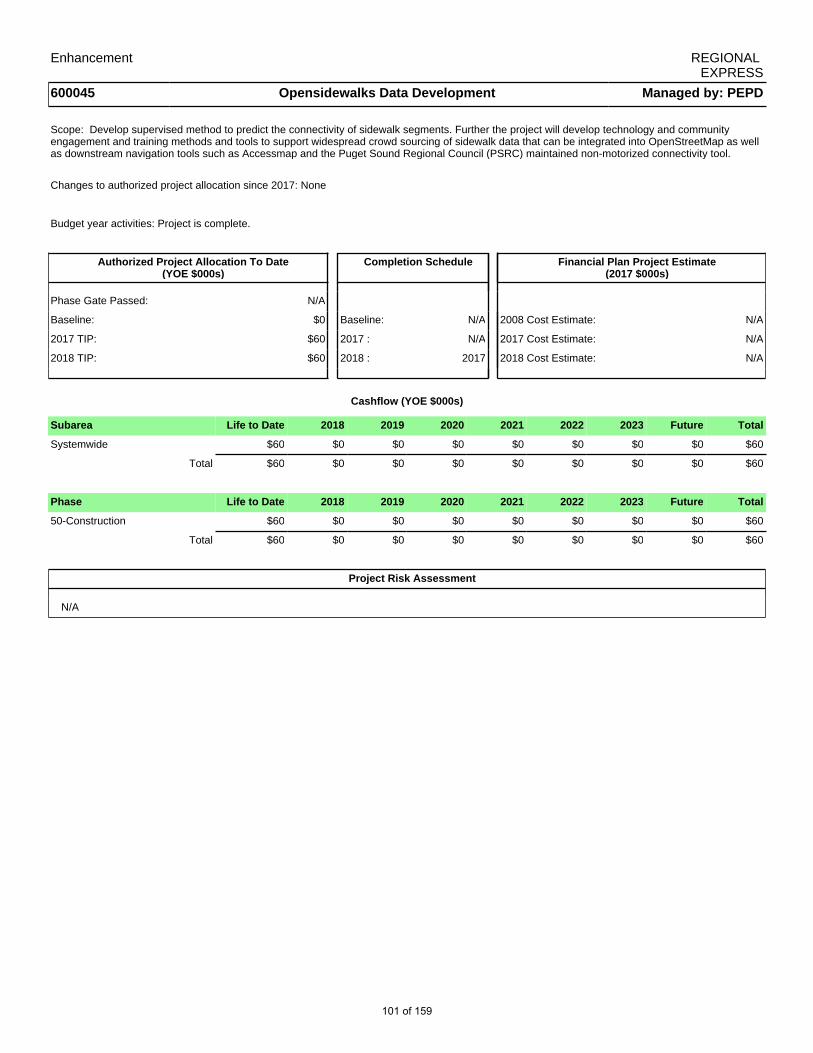
Enhancement REGIONAL EXPRESS
600045 Opensidewalks Data Development Managed by: PEPD
Scope: Develop supervised method to predict the connectivity of sidewalk segments. Further the project will develop technology and community engagement and training methods and tools to support widespread crowd sourcing of sidewalk data that can be integrated into OpenStreetMap as well as downstream navigation tools such as Accessmap and the Puget Sound Regional Council (PSRC) maintained non-motorized connectivity tool.
Changes to authorized project allocation since 2017: None
Budget year activities: Project is complete.
Authorized Project Allocation To Date(YOE $000s)
Completion Schedule Financial Plan Project Estimate(2017 $000s)
Phase Gate Passed: N/A
Baseline: $0 Baseline: N/A 2008 Cost Estimate: N/A
2017 TIP: $60 2017 : N/A 2017 Cost Estimate: N/A
2018 TIP: $60 2018 : 2017 2018 Cost Estimate: N/A
Cashflow (YOE $000s)
Subarea Life to Date 2018 2019 2020 2021 2022 2023 Future Total
Systemwide $60 $0 $0 $0 $0 $0 $0 $0 $60
Total $60 $0 $0 $0 $0 $0 $0 $0 $60
Phase Life to Date 2018 2019 2020 2021 2022 2023 Future Total
50-Construction $60 $0 $0 $0 $0 $0 $0 $0 $60
Total $60 $0 $0 $0 $0 $0 $0 $0 $60
Project Risk Assessment
N/A
101 of 159

Enhancement REGIONAL EXPRESS
700689 Pierce Transit - Global Positioning System Repeater Managed by: Operations
Scope: Purchase and install necessary radio infrastructure on radio towers owned or used by Pierce Transit necessary to communicate with ST Express buses operated by Pierce Transit outside of Pierce Transit’s standard data radio range.
Changes to authorized project allocation since 2017: $1.7 million for new project.
Budget Year Activities: Procure and install radio infrastructure on radio towers owned or used by Pierce Transit necessary to communicate with ST Express buses operated by Pierce Transit outside of Pierce Transit’s standard data radio range.
Authorized Project Allocation To Date(YOE $000s)
Completion Schedule Financial Plan Project Estimate(2017 $000s)
Phase Gate Passed: N/A
Baseline: $0 Baseline: N/A 2008 Cost Estimate: N/A
2017 TIP: $0 2017 : N/A 2017 Cost Estimate: N/A
2018 TIP: $1,662 2018 : 2018 2018 Cost Estimate: N/A
Cashflow (YOE $000s)
Subarea Life to Date 2018 2019 2020 2021 2022 2023 Future Total
Pierce $0 $1,662 $0 $0 $0 $0 $0 $0 $1,662
Total $0 $1,662 $0 $0 $0 $0 $0 $0 $1,662
Phase Life to Date 2018 2019 2020 2021 2022 2023 Future Total
50-Construction $0 $1,662 $0 $0 $0 $0 $0 $0 $1,662
Total $0 $1,662 $0 $0 $0 $0 $0 $0 $1,662
Project Risk Assessment
The agency does not have control over the project as it is being managed by Pierce Transit.
102 of 159

Enhancement REGIONAL EXPRESS
700690 Community Transit - On-Board Communication Upgrade Managed by: Operations
Scope: Purchase and install new on-board communications and data collection components, including base infrastructure, on buses based at Community Transit.
Changes to authorized project allocation since 2017: $2.1 million for new project.
Budget year activities: Procurement and installation of new on-board communications and data collection components, including base infrastructure, on buses based at Community Transit.
Authorized Project Allocation To Date(YOE $000s)
Completion Schedule Financial Plan Project Estimate(2017 $000s)
Phase Gate Passed: N/A
Baseline: $0 Baseline: N/A 2008 Cost Estimate: N/A
2017 TIP: $0 2017 : N/A 2017 Cost Estimate: N/A
2018 TIP: $2,080 2018 : 2018 2018 Cost Estimate: N/A
Cashflow (YOE $000s)
Subarea Life to Date 2018 2019 2020 2021 2022 2023 Future Total
Snohomish $0 $2,080 $0 $0 $0 $0 $0 $0 $2,080
Total $0 $2,080 $0 $0 $0 $0 $0 $0 $2,080
Phase Life to Date 2018 2019 2020 2021 2022 2023 Future Total
50-Construction $0 $2,080 $0 $0 $0 $0 $0 $0 $2,080
Total $0 $2,080 $0 $0 $0 $0 $0 $0 $2,080
Project Risk Assessment
N/A
103 of 159
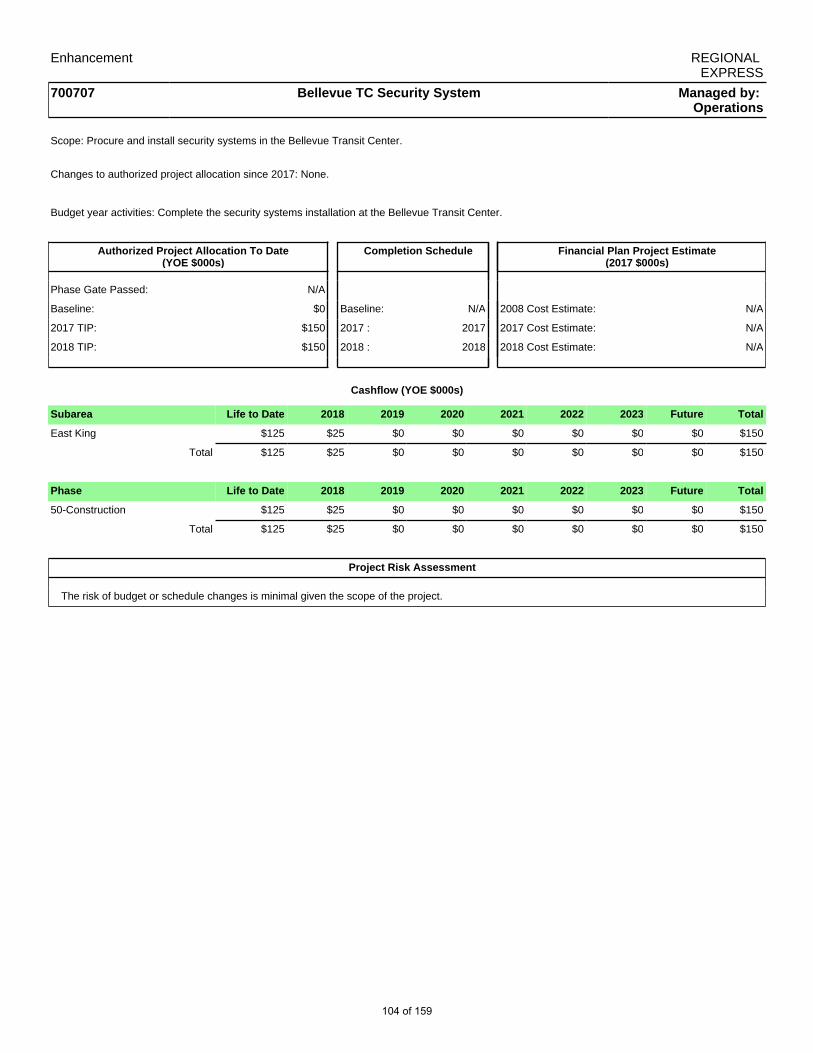
Enhancement REGIONAL EXPRESS
700707 Bellevue TC Security System Managed by: Operations
Scope: Procure and install security systems in the Bellevue Transit Center.
Changes to authorized project allocation since 2017: None.
Budget year activities: Complete the security systems installation at the Bellevue Transit Center.
Authorized Project Allocation To Date(YOE $000s)
Completion Schedule Financial Plan Project Estimate(2017 $000s)
Phase Gate Passed: N/A
Baseline: $0 Baseline: N/A 2008 Cost Estimate: N/A
2017 TIP: $150 2017 : 2017 2017 Cost Estimate: N/A
2018 TIP: $150 2018 : 2018 2018 Cost Estimate: N/A
Cashflow (YOE $000s)
Subarea Life to Date 2018 2019 2020 2021 2022 2023 Future Total
East King $125 $25 $0 $0 $0 $0 $0 $0 $150
Total $125 $25 $0 $0 $0 $0 $0 $0 $150
Phase Life to Date 2018 2019 2020 2021 2022 2023 Future Total
50-Construction $125 $25 $0 $0 $0 $0 $0 $0 $150
Total $125 $25 $0 $0 $0 $0 $0 $0 $150
Project Risk Assessment
The risk of budget or schedule changes is minimal given the scope of the project.
104 of 159
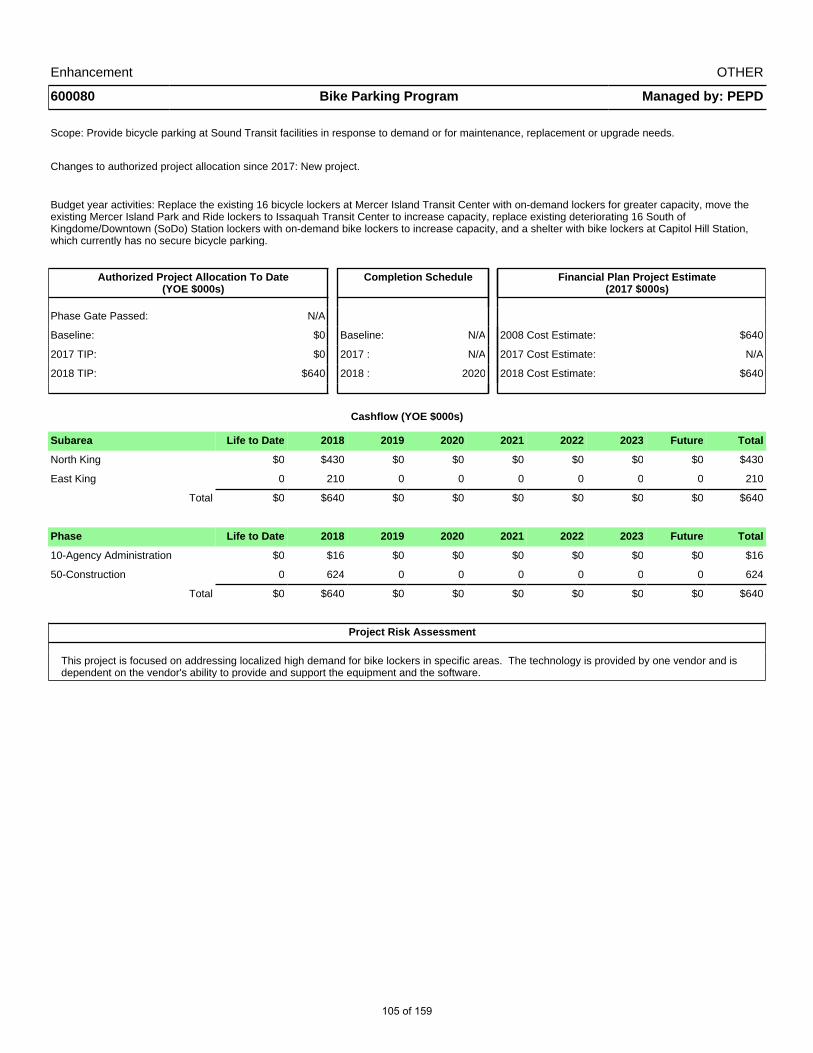
Enhancement OTHER
600080 Bike Parking Program Managed by: PEPD
Scope: Provide bicycle parking at Sound Transit facilities in response to demand or for maintenance, replacement or upgrade needs.
Changes to authorized project allocation since 2017: New project.
Budget year activities: Replace the existing 16 bicycle lockers at Mercer Island Transit Center with on-demand lockers for greater capacity, move the existing Mercer Island Park and Ride lockers to Issaquah Transit Center to increase capacity, replace existing deteriorating 16 South of Kingdome/Downtown (SoDo) Station lockers with on-demand bike lockers to increase capacity, and a shelter with bike lockers at Capitol Hill Station, which currently has no secure bicycle parking.
Authorized Project Allocation To Date(YOE $000s)
Completion Schedule Financial Plan Project Estimate(2017 $000s)
Phase Gate Passed: N/A
Baseline: $0 Baseline: N/A 2008 Cost Estimate: $640
2017 TIP: $0 2017 : N/A 2017 Cost Estimate: N/A
2018 TIP: $640 2018 : 2020 2018 Cost Estimate: $640
Cashflow (YOE $000s)
Subarea Life to Date 2018 2019 2020 2021 2022 2023 Future Total
North King $0 $430 $0 $0 $0 $0 $0 $0 $430
East King 0 210 0 0 0 0 0 0 210
Total $0 $640 $0 $0 $0 $0 $0 $0 $640
Phase Life to Date 2018 2019 2020 2021 2022 2023 Future Total
10-Agency Administration $0 $16 $0 $0 $0 $0 $0 $0 $16
50-Construction 0 624 0 0 0 0 0 0 624
Total $0 $640 $0 $0 $0 $0 $0 $0 $640
Project Risk Assessment
This project is focused on addressing localized high demand for bike lockers in specific areas. The technology is provided by one vendor and is dependent on the vendor's ability to provide and support the equipment and the software.
105 of 159
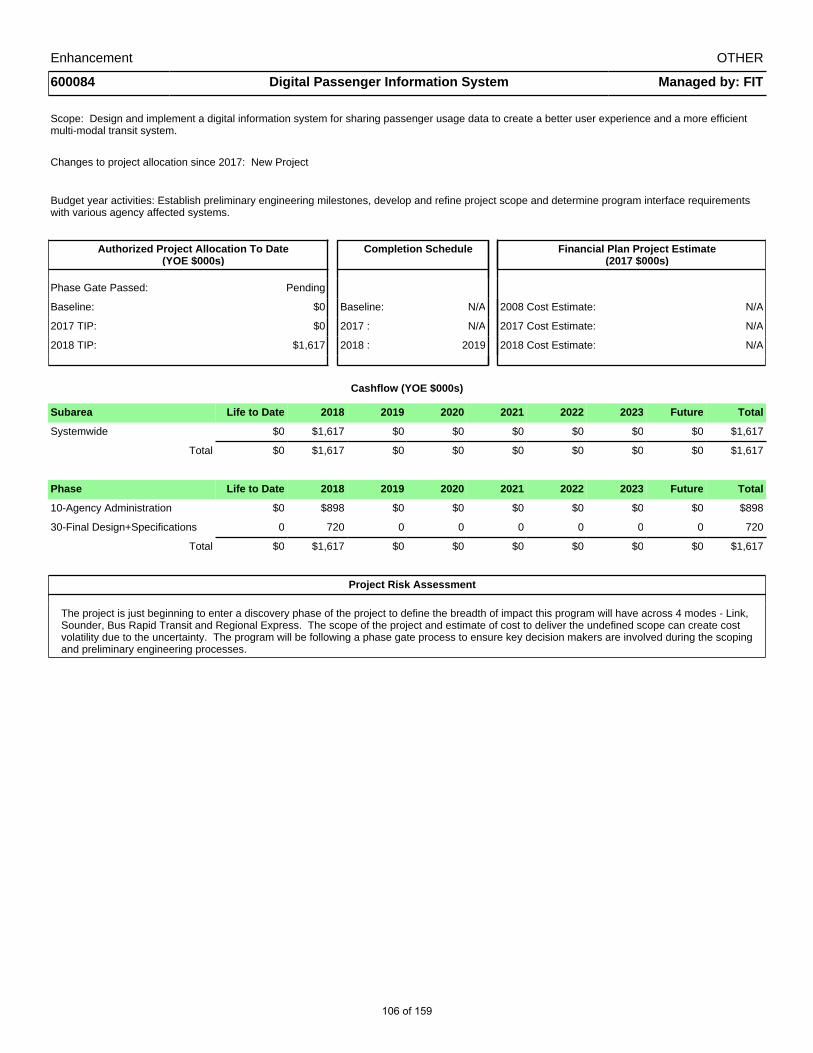
Enhancement OTHER
600084 Digital Passenger Information System Managed by: FIT
Scope: Design and implement a digital information system for sharing passenger usage data to create a better user experience and a more efficient multi-modal transit system.
Changes to project allocation since 2017: New Project
Budget year activities: Establish preliminary engineering milestones, develop and refine project scope and determine program interface requirements with various agency affected systems.
Authorized Project Allocation To Date(YOE $000s)
Completion Schedule Financial Plan Project Estimate(2017 $000s)
Phase Gate Passed: Pending
Baseline: $0 Baseline: N/A 2008 Cost Estimate: N/A
2017 TIP: $0 2017 : N/A 2017 Cost Estimate: N/A
2018 TIP: $1,617 2018 : 2019 2018 Cost Estimate: N/A
Cashflow (YOE $000s)
Subarea Life to Date 2018 2019 2020 2021 2022 2023 Future Total
Systemwide $0 $1,617 $0 $0 $0 $0 $0 $0 $1,617
Total $0 $1,617 $0 $0 $0 $0 $0 $0 $1,617
Phase Life to Date 2018 2019 2020 2021 2022 2023 Future Total
10-Agency Administration $0 $898 $0 $0 $0 $0 $0 $0 $898
30-Final Design+Specifications 0 720 0 0 0 0 0 0 720
Total $0 $1,617 $0 $0 $0 $0 $0 $0 $1,617
Project Risk Assessment
The project is just beginning to enter a discovery phase of the project to define the breadth of impact this program will have across 4 modes - Link, Sounder, Bus Rapid Transit and Regional Express. The scope of the project and estimate of cost to deliver the undefined scope can create cost volatility due to the uncertainty. The program will be following a phase gate process to ensure key decision makers are involved during the scoping and preliminary engineering processes.
106 of 159
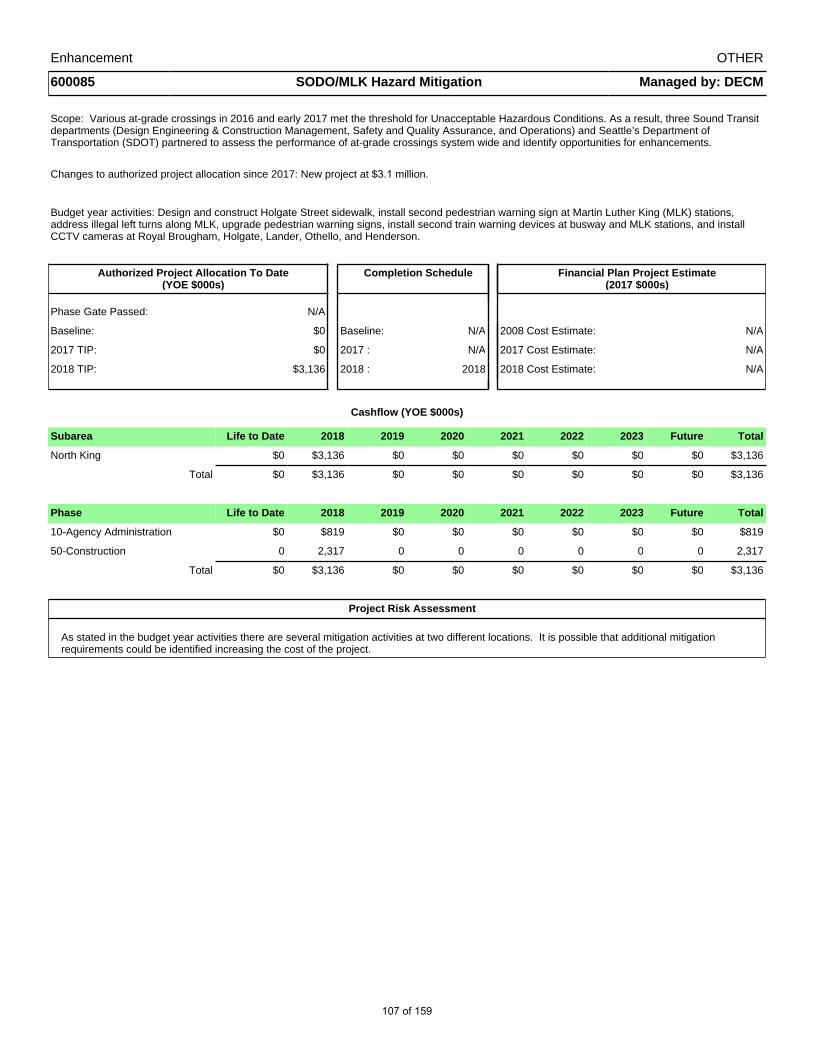
Enhancement OTHER
600085 SODO/MLK Hazard Mitigation Managed by: DECM
Scope: Various at-grade crossings in 2016 and early 2017 met the threshold for Unacceptable Hazardous Conditions. As a result, three Sound Transit departments (Design Engineering & Construction Management, Safety and Quality Assurance, and Operations) and Seattle’s Department of Transportation (SDOT) partnered to assess the performance of at-grade crossings system wide and identify opportunities for enhancements.
Changes to authorized project allocation since 2017: New project at $3.1 million.
Budget year activities: Design and construct Holgate Street sidewalk, install second pedestrian warning sign at Martin Luther King (MLK) stations, address illegal left turns along MLK, upgrade pedestrian warning signs, install second train warning devices at busway and MLK stations, and install CCTV cameras at Royal Brougham, Holgate, Lander, Othello, and Henderson.
Authorized Project Allocation To Date(YOE $000s)
Completion Schedule Financial Plan Project Estimate(2017 $000s)
Phase Gate Passed: N/A
Baseline: $0 Baseline: N/A 2008 Cost Estimate: N/A
2017 TIP: $0 2017 : N/A 2017 Cost Estimate: N/A
2018 TIP: $3,136 2018 : 2018 2018 Cost Estimate: N/A
Cashflow (YOE $000s)
Subarea Life to Date 2018 2019 2020 2021 2022 2023 Future Total
North King $0 $3,136 $0 $0 $0 $0 $0 $0 $3,136
Total $0 $3,136 $0 $0 $0 $0 $0 $0 $3,136
Phase Life to Date 2018 2019 2020 2021 2022 2023 Future Total
10-Agency Administration $0 $819 $0 $0 $0 $0 $0 $0 $819
50-Construction 0 2,317 0 0 0 0 0 0 2,317
Total $0 $3,136 $0 $0 $0 $0 $0 $0 $3,136
Project Risk Assessment
As stated in the budget year activities there are several mitigation activities at two different locations. It is possible that additional mitigation requirements could be identified increasing the cost of the project.
107 of 159
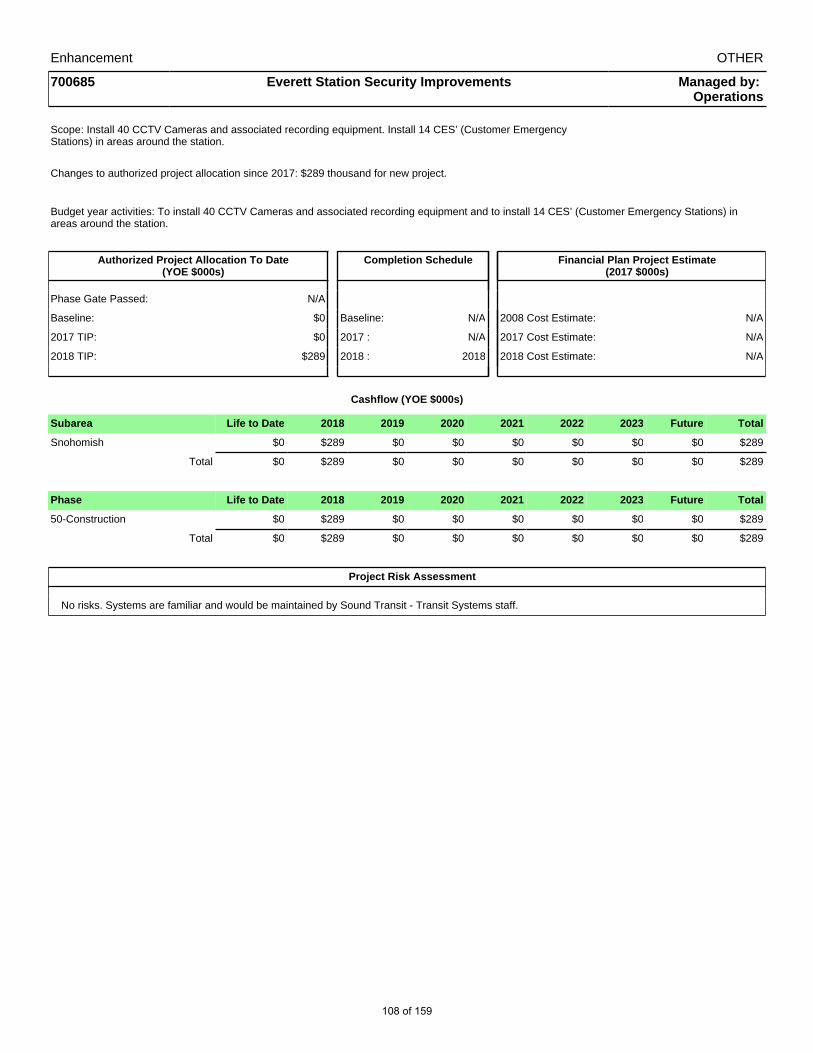
Enhancement OTHER
700685 Everett Station Security Improvements Managed by: Operations
Scope: Install 40 CCTV Cameras and associated recording equipment. Install 14 CES’ (Customer EmergencyStations) in areas around the station.
Changes to authorized project allocation since 2017: $289 thousand for new project.
Budget year activities: To install 40 CCTV Cameras and associated recording equipment and to install 14 CES’ (Customer Emergency Stations) in areas around the station.
Authorized Project Allocation To Date(YOE $000s)
Completion Schedule Financial Plan Project Estimate(2017 $000s)
Phase Gate Passed: N/A
Baseline: $0 Baseline: N/A 2008 Cost Estimate: N/A
2017 TIP: $0 2017 : N/A 2017 Cost Estimate: N/A
2018 TIP: $289 2018 : 2018 2018 Cost Estimate: N/A
Cashflow (YOE $000s)
Subarea Life to Date 2018 2019 2020 2021 2022 2023 Future Total
Snohomish $0 $289 $0 $0 $0 $0 $0 $0 $289
Total $0 $289 $0 $0 $0 $0 $0 $0 $289
Phase Life to Date 2018 2019 2020 2021 2022 2023 Future Total
50-Construction $0 $289 $0 $0 $0 $0 $0 $0 $289
Total $0 $289 $0 $0 $0 $0 $0 $0 $289
Project Risk Assessment
No risks. Systems are familiar and would be maintained by Sound Transit - Transit Systems staff.
108 of 159

Enhancement OTHER
700686 Security Radio System Managed by: Operations
Scope: Procure, upgrade and enhance Sound Transit 's security radio systems and equipment for expansion of security services into the Downtown Seattle Transit Tunnel.
Changes to authorized project allocation since 2017: $293 thousand for new project.
Budget year activities: Procure, upgrade and enhance Sound Transit’s security radio systems and equipment for expansion of security service into the Downtown Seattle Transit Tunnel.
Authorized Project Allocation To Date(YOE $000s)
Completion Schedule Financial Plan Project Estimate(2017 $000s)
Phase Gate Passed: N/A
Baseline: $0 Baseline: N/A 2008 Cost Estimate: N/A
2017 TIP: $0 2017 : N/A 2017 Cost Estimate: N/A
2018 TIP: $293 2018 : 2018 2018 Cost Estimate: N/A
Cashflow (YOE $000s)
Subarea Life to Date 2018 2019 2020 2021 2022 2023 Future Total
North King $0 $293 $0 $0 $0 $0 $0 $0 $293
Total $0 $293 $0 $0 $0 $0 $0 $0 $293
Phase Life to Date 2018 2019 2020 2021 2022 2023 Future Total
50-Construction $0 $293 $0 $0 $0 $0 $0 $0 $293
Total $0 $293 $0 $0 $0 $0 $0 $0 $293
Project Risk Assessment
N/A
109 of 159
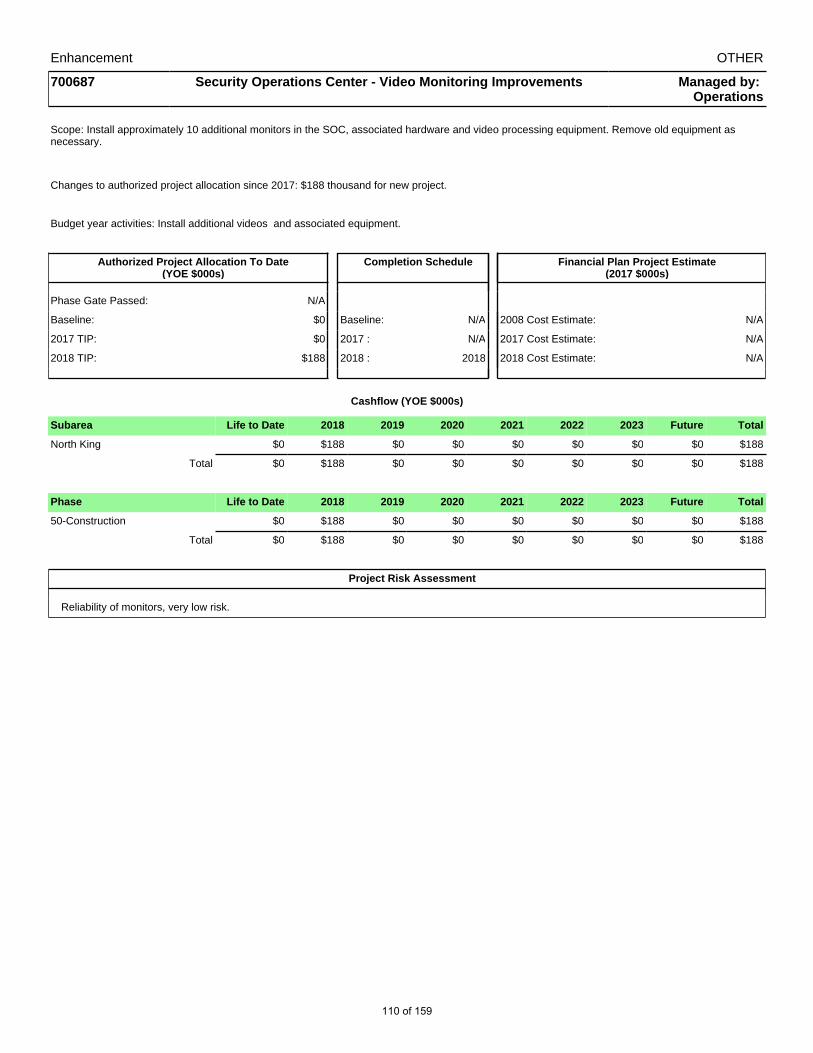
Enhancement OTHER
700687 Security Operations Center - Video Monitoring Improvements Managed by: Operations
Scope: Install approximately 10 additional monitors in the SOC, associated hardware and video processing equipment. Remove old equipment as necessary.
Changes to authorized project allocation since 2017: $188 thousand for new project.
Budget year activities: Install additional videos and associated equipment.
Authorized Project Allocation To Date(YOE $000s)
Completion Schedule Financial Plan Project Estimate(2017 $000s)
Phase Gate Passed: N/A
Baseline: $0 Baseline: N/A 2008 Cost Estimate: N/A
2017 TIP: $0 2017 : N/A 2017 Cost Estimate: N/A
2018 TIP: $188 2018 : 2018 2018 Cost Estimate: N/A
Cashflow (YOE $000s)
Subarea Life to Date 2018 2019 2020 2021 2022 2023 Future Total
North King $0 $188 $0 $0 $0 $0 $0 $0 $188
Total $0 $188 $0 $0 $0 $0 $0 $0 $188
Phase Life to Date 2018 2019 2020 2021 2022 2023 Future Total
50-Construction $0 $188 $0 $0 $0 $0 $0 $0 $188
Total $0 $188 $0 $0 $0 $0 $0 $0 $188
Project Risk Assessment
Reliability of monitors, very low risk.
110 of 159

Enhancement OTHER
700688 LED Lighting Program Managed by: Operations
Scope: The lighting systems at several Link Stations opened in 2009 have been identified to be upgraded to Light Emitting Diode (LED) based fixtures to reduce annual energy costs and maintenance. The two most beneficial upgrade sites would be Tukwila International Blvd Station and Airport Station. Both of these stations were constructed under older Design Criteria Manual editions which allowed less efficient metal halide lighting.
Changes to authorized project allocation since 2017: $1.5 million for new project.
Budget year activities: Project activities will begin 1st Quarter of 2018 and complete by year end.
Authorized Project Allocation To Date(YOE $000s)
Completion Schedule Financial Plan Project Estimate(2017 $000s)
Phase Gate Passed: N/A
Baseline: $0 Baseline: N/A 2008 Cost Estimate: N/A
2017 TIP: $0 2017 : N/A 2017 Cost Estimate: N/A
2018 TIP: $1,500 2018 : 2018 2018 Cost Estimate: N/A
Cashflow (YOE $000s)
Subarea Life to Date 2018 2019 2020 2021 2022 2023 Future Total
South King $0 $1,500 $0 $0 $0 $0 $0 $0 $1,500
Total $0 $1,500 $0 $0 $0 $0 $0 $0 $1,500
Phase Life to Date 2018 2019 2020 2021 2022 2023 Future Total
10-Agency Administration $0 $50 $0 $0 $0 $0 $0 $0 $50
50-Construction 0 1,450 0 0 0 0 0 0 1,450
Total $0 $1,500 $0 $0 $0 $0 $0 $0 $1,500
Project Risk Assessment
The current scope of work is focused on Airport Station and Tukwila Station. This is a contract award and install performed by an experienced contractor. This results in a low risk.
111 of 159

Enhancement OTHER
700723 Downtown Seattle Transit Tunnel Mitigation Managed by: Operations
Scope: This project reflects the Sound Transit contribution to the One Center City Plan partnership for a series of mitigation improvements, including street improvements in downtown Seattle, to mitigate impacts to bus operations as buses transition from the Downtown Seattle Transit Tunnel (DSTT) to surface streets to accommodate increased light rail activity in the tunnel.
Changes to authorized project allocation since 2017: Additional $10 million to support additional mitigation improvements required for transition of buses from the Downtown Seattle Transit Tunnel (DSTT).
Budget year activities: Finalize capital improvements and develop agreements with the City of Seattle and King County Metro for shared contributions for additional mitigation.
Authorized Project Allocation To Date(YOE $000s)
Completion Schedule Financial Plan Project Estimate(2017 $000s)
Phase Gate Passed: N/A
Baseline: Baseline: N/A 2008 Cost Estimate: N/A
2017 TIP: $2,334 2017 : 2017 2017 Cost Estimate: N/A
2018 TIP: $12,334 2018 : 2018 2018 Cost Estimate: N/A
Cashflow (YOE $000s)
Subarea Life to Date 2018 2019 2020 2021 2022 2023 Future Total
North King $514 $11,820 $0 $0 $0 $0 $0 $0 $12,334
Total $514 $11,820 $0 $0 $0 $0 $0 $0 $12,334
Phase Life to Date 2018 2019 2020 2021 2022 2023 Future Total
35-Third Party $514 $11,820 $0 $0 $0 $0 $0 $0 $12,334
Total $514 $11,820 $0 $0 $0 $0 $0 $0 $12,334
Project Risk Assessment
Project risk is low as Sound Transit's shared contributions will be determined based on agreements with other One Center City partners.
112 of 159

Enhancement OTHER
700736 Union Station Garden Level Remodel Managed by: Operations
Scope: Renovate Union Station's Garden Level: convert cubicle space from 8X8 to 6X8 configuration, add 7 enclosed offices, relocate 3 offices, create a new mailroom, install new carpet, purchase and install 132 cubicles, and install new data cabling to support additional staff and consultants.
Changes to authorized project allocation since 2017: None.
Budget year activities: The project is complete.
Authorized Project Allocation To Date(YOE $000s)
Completion Schedule Financial Plan Project Estimate(2017 $000s)
Phase Gate Passed: N/A
Baseline: $0 Baseline: N/A 2008 Cost Estimate: N/A
2017 TIP: $1,854 2017 : 2017 2017 Cost Estimate: N/A
2018 TIP: $1,854 2018 : 2017 2018 Cost Estimate: N/A
Cashflow (YOE $000s)
Subarea Life to Date 2018 2019 2020 2021 2022 2023 Future Total
Systemwide $1,854 $0 $0 $0 $0 $0 $0 $0 $1,854
Total $1,854 $0 $0 $0 $0 $0 $0 $0 $1,854
Phase Life to Date 2018 2019 2020 2021 2022 2023 Future Total
10-Agency Administration $3 $0 $0 $0 $0 $0 $0 $0 $3
30-Final Design+Specifications 21 0 0 0 0 0 0 0 21
50-Construction 1,831 0 0 0 0 0 0 0 1,831
Total $1,854 $0 $0 $0 $0 $0 $0 $0 $1,854
Project Risk Assessment
N/A
113 of 159
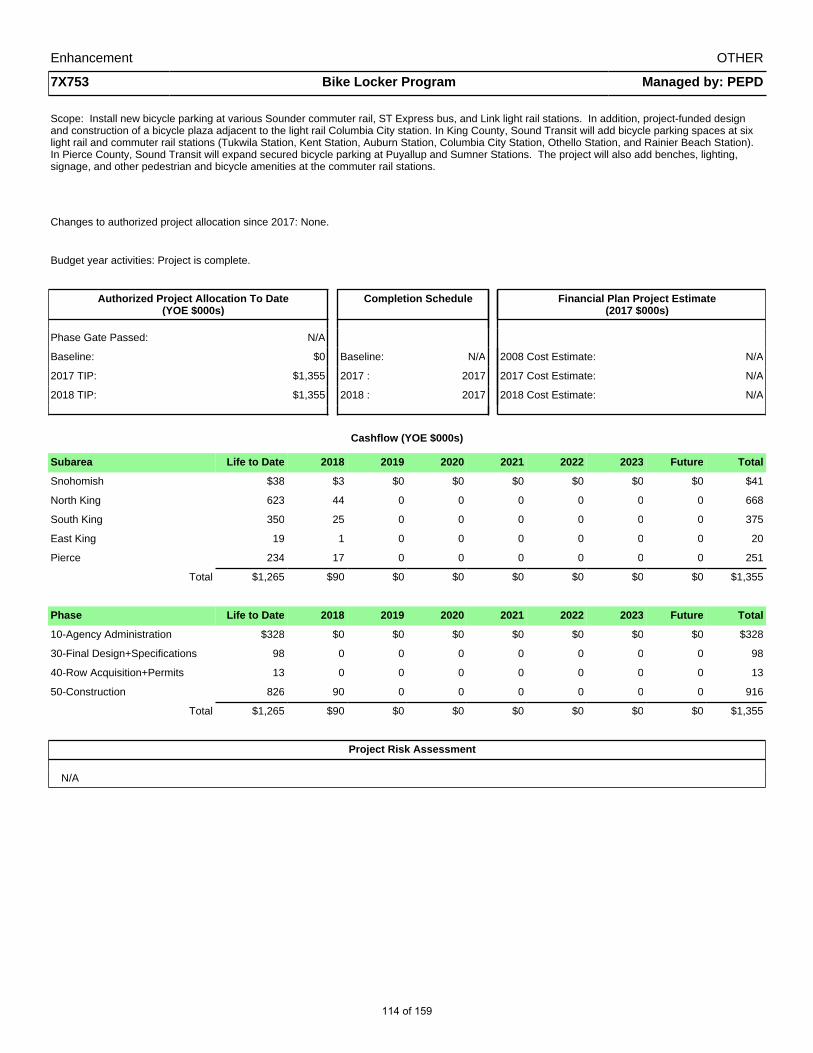
Enhancement OTHER
7X753 Bike Locker Program Managed by: PEPD
Scope: Install new bicycle parking at various Sounder commuter rail, ST Express bus, and Link light rail stations. In addition, project-funded design and construction of a bicycle plaza adjacent to the light rail Columbia City station. In King County, Sound Transit will add bicycle parking spaces at six light rail and commuter rail stations (Tukwila Station, Kent Station, Auburn Station, Columbia City Station, Othello Station, and Rainier Beach Station). In Pierce County, Sound Transit will expand secured bicycle parking at Puyallup and Sumner Stations. The project will also add benches, lighting, signage, and other pedestrian and bicycle amenities at the commuter rail stations.
Changes to authorized project allocation since 2017: None.
Budget year activities: Project is complete.
Authorized Project Allocation To Date(YOE $000s)
Completion Schedule Financial Plan Project Estimate(2017 $000s)
Phase Gate Passed: N/A
Baseline: $0 Baseline: N/A 2008 Cost Estimate: N/A
2017 TIP: $1,355 2017 : 2017 2017 Cost Estimate: N/A
2018 TIP: $1,355 2018 : 2017 2018 Cost Estimate: N/A
Cashflow (YOE $000s)
Subarea Life to Date 2018 2019 2020 2021 2022 2023 Future Total
Snohomish $38 $3 $0 $0 $0 $0 $0 $0 $41
North King 623 44 0 0 0 0 0 0 668
South King 350 25 0 0 0 0 0 0 375
East King 19 1 0 0 0 0 0 0 20
Pierce 234 17 0 0 0 0 0 0 251
Total $1,265 $90 $0 $0 $0 $0 $0 $0 $1,355
Phase Life to Date 2018 2019 2020 2021 2022 2023 Future Total
10-Agency Administration $328 $0 $0 $0 $0 $0 $0 $0 $328
30-Final Design+Specifications 98 0 0 0 0 0 0 0 98
40-Row Acquisition+Permits 13 0 0 0 0 0 0 0 13
50-Construction 826 90 0 0 0 0 0 0 916
Total $1,265 $90 $0 $0 $0 $0 $0 $0 $1,355
Project Risk Assessment
N/A
114 of 159

Enhancement OTHER
804100 Transit Oriented Development Property Disposition Managed by: PEPD
Scope: Provide planning and technical assistance to local jurisdictions and Sound Transit (ST) project teams to help identify and shape transit oriented development and joint development opportunities. Dispose of properties that have been declared surplus and are suitable for transit oriented development based on size and proximity to ST transit services.
Changes to authorized project allocation since 2017: None.
Budget year activities: Assess joint development and public/private or public/public partnerships opportunities to develop Sound Transit owned sites near transit stations.
Authorized Project Allocation To Date(YOE $000s)
Completion Schedule Financial Plan Project Estimate(2017 $000s)
Phase Gate Passed: N/A
Baseline: $0 Baseline: N/A 2008 Cost Estimate: N/A
2017 TIP: $11,615 2017 : 2023 2017 Cost Estimate: N/A
2018 TIP: $11,615 2018 : 2023 2018 Cost Estimate: N/A
Cashflow (YOE $000s)
Subarea Life to Date 2018 2019 2020 2021 2022 2023 Future Total
North King $4,302 $2,430 $1,850 $1,430 $1,148 $455 $0 $0 $11,615
Total $4,302 $2,430 $1,850 $1,430 $1,148 $455 $0 $0 $11,615
Phase Life to Date 2018 2019 2020 2021 2022 2023 Future Total
10-Agency Administration $1,257 $450 $350 $250 $170 $69 $0 $0 $2,546
20-Prelim Engineering/Env Review
0 0 150 150 100 94 0 0 494
40-Row Acquisition+Permits 3,042 1,680 1,100 800 800 293 0 0 7,715
50-Construction 2 300 250 230 78 0 0 0 860
Total $4,302 $2,430 $1,850 $1,430 $1,148 $455 $0 $0 $11,615
Project Risk Assessment
N/A
115 of 159

State of Good Repair State of Good Repair projects extend the life of existing system assets and replace those at the end of their useful life. As the transit system ages, investment in maintaining our assets in a state of good repair will rise.
2018 State of Good Repair Project Highlights
Accept delivery of 16 Sound Transit buses which will replace buses having reached the end of their useful life.
Upgrade and replace the hardware and software backbone of Sound Transit legacy information technology systems.
Procure seven link maintenance vehicles to provide specialized service repairs to the link alignment. Additionally, procure an Under Bridge Inspection Truck (UBIT) to enable maintenance staff and engineers to perform recurring on-site inspections of ST owned bridges.
Establish a Link Light Rail (LRV) vehicle overhaul program to address the mid-life rehabilitation and repair requirements of the LRV fleet.
Continue the process of refurbishing 58 passenger doors on Sounder passenger cars which have begun to fail due to repeated use.
Replace glass on three Sounder entrances at King Street Station platforms with acrylic windows to lower the risk of damage from vandalism.
Perform bridge repairs to two bridge segments supporting the Link system.
Establish a Safety Oversight Approval Program (SOAP) to provide funding for emergency or immediate need safety repairs as identified by the SOAP panel.
Partner with Pierce Transit to complete necessary improvements and repairs to the parking facility at the Tacoma Dome.
116 of 159
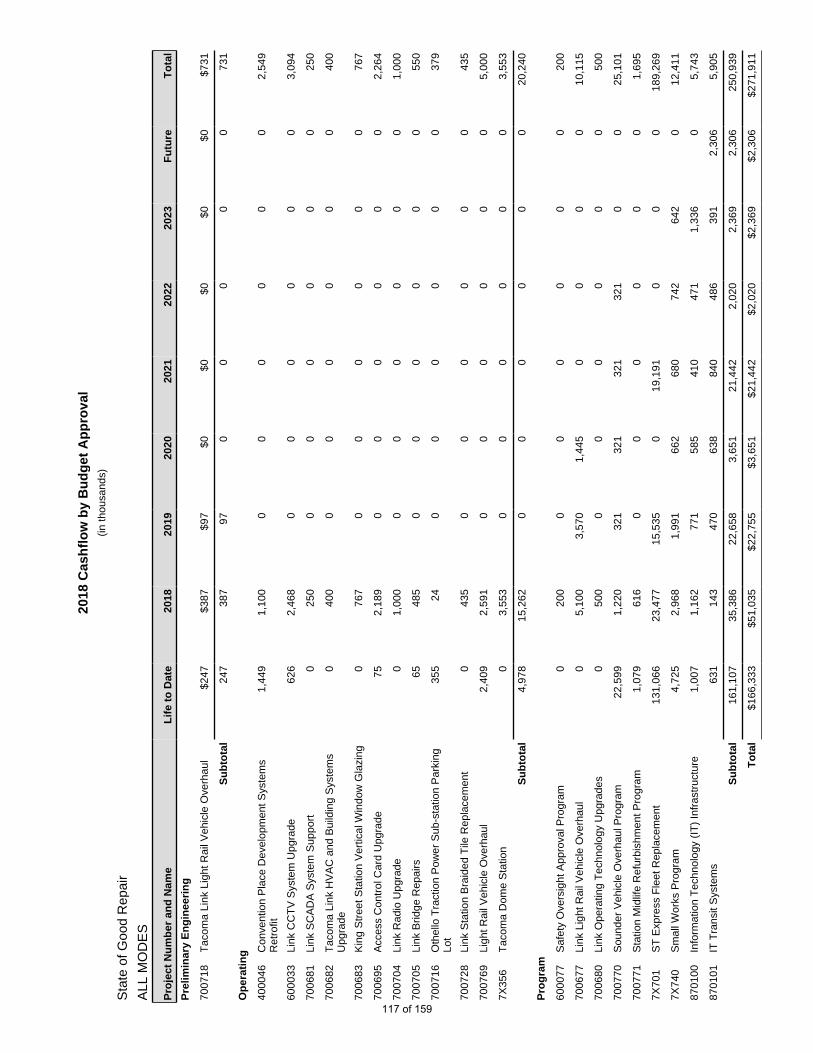
2018
Cas
hfl
ow
by
Bu
dg
et A
pp
rova
l(in
thou
sand
s)
Sta
te o
f Goo
d R
epai
r
ALL
MO
DE
S
Pro
ject
Nu
mb
er a
nd
Nam
eL
ife
to D
ate
2018
2019
2020
2021
2022
2023
Fu
ture
To
tal
Pre
limin
ary
En
gin
eeri
ng
7007
18T
acom
a Li
nk L
ight
Rai
l Veh
icle
Ove
rhau
l$2
47$3
87$9
7$0
$0$0
$0$0
$731
Su
bto
tal
247
387
970
00
00
731
Op
erat
ing
4000
46C
onve
ntio
n P
lace
Dev
elop
men
t Sys
tem
s R
etro
fit1,
449
1,10
00
00
00
02,
549
6000
33Li
nk C
CT
V S
yste
m U
pgra
de62
62,
468
00
00
00
3,09
4
7006
81Li
nk S
CA
DA
Sys
tem
Sup
port
025
00
00
00
025
0
7006
82T
acom
a Li
nk H
VA
C a
nd B
uild
ing
Sys
tem
s U
pgra
de0
400
00
00
00
400
7006
83K
ing
Str
eet S
tatio
n V
ertic
al W
indo
w G
lazi
ng0
767
00
00
00
767
7006
95A
cces
s C
ontr
ol C
ard
Upg
rade
752,
189
00
00
00
2,26
4
7007
04Li
nk R
adio
Upg
rade
01,
000
00
00
00
1,00
0
7007
05Li
nk B
ridge
Rep
airs
6548
50
00
00
055
0
7007
16O
thel
lo T
ract
ion
Pow
er S
ub-s
tatio
n P
arki
ng
Lot
355
240
00
00
037
9
7007
28Li
nk S
tatio
n B
raid
ed T
ile R
epla
cem
ent
043
50
00
00
043
5
7007
69Li
ght R
ail V
ehic
le O
verh
aul
2,40
92,
591
00
00
00
5,00
0
7X35
6T
acom
a D
ome
Sta
tion
03,
553
00
00
00
3,55
3
Su
bto
tal
4,97
815
,262
00
00
00
20,2
40
Pro
gra
m
6000
77S
afet
y O
vers
ight
App
rova
l Pro
gram
020
00
00
00
020
0
7006
77Li
nk L
ight
Rai
l Veh
icle
Ove
rhau
l0
5,10
03,
570
1,44
50
00
010
,115
7006
80Li
nk O
pera
ting
Tec
hnol
ogy
Upg
rade
s0
500
00
00
00
500
7007
70S
ound
er V
ehic
le O
verh
aul P
rogr
am22
,599
1,22
032
132
132
132
10
025
,101
7007
71S
tatio
n M
idlif
e R
efur
bish
men
t Pro
gram
1,07
961
60
00
00
01,
695
7X70
1S
T E
xpre
ss F
leet
Rep
lace
men
t13
1,06
623
,477
15,5
350
19,1
910
00
189,
269
7X74
0S
mal
l Wor
ks P
rogr
am4,
725
2,96
81,
991
662
680
742
642
012
,411
8701
00In
form
atio
n T
echn
olog
y (I
T)
Infr
astr
uctu
re1,
007
1,16
277
158
541
047
11,
336
05,
743
8701
01IT
Tra
nsit
Sys
tem
s63
114
347
063
884
048
639
12,
306
5,90
5
Su
bto
tal
161,
107
35,3
8622
,658
3,65
121
,442
2,02
02,
369
2,30
625
0,93
9
To
tal
$166
,333
$51,
035
$22,
755
$3,6
51$2
1,44
2$2
,020
$2,3
69$2
,306
$271
,911
117 of 159

2018
Cas
hfl
ow
by
Su
bar
ea(in
thou
sand
s)
Sta
te o
f Goo
d R
epai
r
ALL
MO
DE
S
Su
bar
eaL
ife
to D
ate
2018
2019
2020
2021
2022
2023
Fu
ture
To
tal
1 -
Sno
hom
ish
$26,
778
$4,6
85$3
,037
$130
$3,5
10$1
40$8
3$0
$38,
364
2 -
Nor
th K
ing
5,29
49,
580
870
533
406
461
1,08
60
18,2
28
3 -
Sou
th K
ing
27,9
097,
703
2,23
641
92,
315
401
443
041
,426
4 -
Eas
t Kin
g61
,188
11,3
637,
525
126
8,95
714
112
20
89,4
22
5 -
Pie
rce
44,5
3412
,261
5,04
836
05,
415
391
244
068
,252
6 -
Sys
tem
wid
e63
134
347
063
884
048
639
12,
306
6,10
5
To
tal
$166
,333
$45,
935
$19,
185
$2,2
06$2
1,44
2$2
,020
$2,3
69$2
,306
$261
,796
2018
Cas
hfl
ow
by
Ph
ase
(in th
ousa
nds)
Ph
ase
# an
d D
escr
ipti
on
Lif
e to
Dat
e20
1820
1920
2020
2120
2220
23F
utu
reT
ota
l
09-A
dmin
Cap
ital
$1,0
07$2
50$0
$0$1
90$0
$0$0
$1,4
47
10-A
genc
y A
dmin
istr
atio
n71
417
50
00
00
088
9
20-P
relim
Eng
inee
ring/
Env
Rev
iew
224
100
00
00
00
324
30-F
inal
Des
ign+
Spe
cific
atio
ns35
626
70
00
00
062
3
35-T
hird
Par
ty15
00
00
00
00
150
50-C
onst
ruct
ion
17,3
5622
,527
6,80
23,
330
1,74
01,
699
2,36
92,
306
58,1
30
55-C
onst
ruct
ion
Ser
vice
s80
400
00
00
012
0
70-V
ehic
les
146,
446
27,6
7515
,953
321
19,5
1232
10
021
0,22
7
To
tal
$166
,333
$51,
035
$22,
755
$3,6
51$2
1,44
2$2
,020
$2,3
69$2
,306
$271
,911
118 of 159

State of Good Repair LINK
400046 Convention Place Development Systems Retrofit Managed by: DECM
Scope: Install electrical distribution equipment that is necessary for the operation and integration of the Pine Street facility with the University Link and the Downtown Seattle Transit Tunnel (DSTT). This effort is in support of the deletion of the emergency generator necessary for the Convention Center project.
Changes to authorized project allocation since 2017: None
Budget year activities: Install electrical distribution equipment in the Convention Place/Pine Street area.
Authorized Project Allocation To Date(YOE $000s)
Completion Schedule Financial Plan Project Estimate(2017 $000s)
Phase Gate Passed: N/A
Baseline: Baseline: N/A 2008 Cost Estimate: N/A
2017 TIP: $2,549 2017 : 2017 2017 Cost Estimate: N/A
2018 TIP: $2,549 2018 : 2018 2018 Cost Estimate: N/A
Cashflow (YOE $000s)
Subarea Life to Date 2018 2019 2020 2021 2022 2023 Future Total
North King $1,449 $1,100 $0 $0 $0 $0 $0 $0 $2,549
Total $1,449 $1,100 $0 $0 $0 $0 $0 $0 $2,549
Phase Life to Date 2018 2019 2020 2021 2022 2023 Future Total
10-Agency Administration $79 $53 $0 $0 $0 $0 $0 $0 $133
30-Final Design+Specifications 98 22 0 0 0 0 0 0 120
50-Construction 1,192 985 0 0 0 0 0 0 2,177
55-Construction Services 80 40 0 0 0 0 0 0 120
Total $1,449 $1,100 $0 $0 $0 $0 $0 $0 $2,549
Project Risk Assessment
Coordination with Link Operations and King County Metro (KCM) to avoid impacts to existing Downtown Seattle Transit Tunnel (DSTT) operations will be challenging and may have schedule and cost impacts.
119 of 159

State of Good Repair LINK
600033 Link CCTV System Upgrade Managed by: Operations
Scope: Upgrade existing Link light rail Closed-Circuit Television (CCTV) NiceVision system at 16 stations and Link Operations and Maintenance Facility with digital cameras to be compatible with the new equipment installed for University Link and South 200th Link extensions.
Changes to authorized project allocation since 2017: None.
Budget year activities: Upgrade cameras in all Link stations and the Operations and Maintenance Facility.
Authorized Project Allocation To Date(YOE $000s)
Completion Schedule Financial Plan Project Estimate(2017 $000s)
Phase Gate Passed: N/A
Baseline: $0 Baseline: N/A 2008 Cost Estimate: N/A
2017 TIP: $3,094 2017 : 2018 2017 Cost Estimate: N/A
2018 TIP: $3,094 2018 : 2018 2018 Cost Estimate: N/A
Cashflow (YOE $000s)
Subarea Life to Date 2018 2019 2020 2021 2022 2023 Future Total
North King $418 $1,651 $0 $0 $0 $0 $0 $0 $2,070
South King 207 817 0 0 0 0 0 0 1,024
Total $626 $2,468 $0 $0 $0 $0 $0 $0 $3,094
Phase Life to Date 2018 2019 2020 2021 2022 2023 Future Total
10-Agency Administration $0 $20 $0 $0 $0 $0 $0 $0 $20
30-Final Design+Specifications 0 50 0 0 0 0 0 0 50
50-Construction 626 2,398 0 0 0 0 0 0 3,024
Total $626 $2,468 $0 $0 $0 $0 $0 $0 $3,094
Project Risk Assessment
Completion of the project in 2017 requires a Q1 2017 contract award to ensure all stations can be scheduled for installation of a large volume of cameras and integration into the agency CCTV system.
120 of 159

State of Good Repair LINK
700677 Link Light Rail Vehicle Overhaul Managed by: Operations
Scope:- Plan and implement a light rail vehicle overhaul program to perform required mid-life maintenance and component overhauls required to keep vehicles in a state of good repair and achieve full life expectancy.
Changes to authorized project allocation since 2017: $10.1 million for new project.
Budget year activities: Begin formulating schedule for light rail vehicle (LRV) component part overhaul and performance of overhauls as required.
Authorized Project Allocation To Date(YOE $000s)
Completion Schedule Financial Plan Project Estimate(2017 $000s)
Phase Gate Passed: N/A
Baseline: $0 Baseline: N/A 2008 Cost Estimate: N/A
2017 TIP: $0 2017 : N/A 2017 Cost Estimate: N/A
2018 TIP: $10,115 2018 : 2020 2018 Cost Estimate: N/A
Cashflow (YOE $000s)
Phase Life to Date 2018 2019 2020 2021 2022 2023 Future Total
50-Construction $0 $5,100 $3,570 $1,445 $0 $0 $0 $0 $10,115
Total $0 $5,100 $3,570 $1,445 $0 $0 $0 $0 $10,115
Project Risk Assessment
There are both schedule and budget risk: project delays could compromise light rail vehicles state of good repair and availability for use and have an affect on the budget requirements to fund the program.
121 of 159

State of Good Repair LINK
700680 Link Operating Technology Upgrades Managed by: Operations
Scope: Perform lifecycle related updates to operations technology system at or near the end of life for current hardware, software and firmware.
Changes to authorized project allocation since 2017: $500 thousand for new project.
Budget year activities: Install upgrades.
Authorized Project Allocation To Date(YOE $000s)
Completion Schedule Financial Plan Project Estimate(2017 $000s)
Phase Gate Passed: N/A
Baseline: $0 Baseline: N/A 2008 Cost Estimate: N/A
2017 TIP: $0 2017 : N/A 2017 Cost Estimate: N/A
2018 TIP: $500 2018 : 2018 2018 Cost Estimate: N/A
Cashflow (YOE $000s)
Subarea Life to Date 2018 2019 2020 2021 2022 2023 Future Total
North King $0 $334 $0 $0 $0 $0 $0 $0 $334
South King 0 166 0 0 0 0 0 0 166
Total $0 $500 $0 $0 $0 $0 $0 $0 $500
Phase Life to Date 2018 2019 2020 2021 2022 2023 Future Total
50-Construction $0 $500 $0 $0 $0 $0 $0 $0 $500
Total $0 $500 $0 $0 $0 $0 $0 $0 $500
Project Risk Assessment
Risk of discovering operation limitations or incompatibility of updated version of hardware, software and firmware.
122 of 159

State of Good Repair LINK
700681 Link SCADA System Support Managed by: Operations
Scope: Enhance and improve the LINK SCADA systems for ease of operation to link control center staff, facilities and other departments needing SCADA presented information. The current LINK SCADA systems need alarm cleanup and management, new graphical screens and key system training to allow future delivery in-house.
Changes to authorized project allocation since 2017: $250 thousand for new project. The project will be evaluated after the first year. Additional funds may be allocated if it deems necessary.
Budget year activities: Update the SCADA system.
Authorized Project Allocation To Date(YOE $000s)
Completion Schedule Financial Plan Project Estimate(2017 $000s)
Phase Gate Passed: N/A
Baseline: $0 Baseline: N/A 2008 Cost Estimate: N/A
2017 TIP: $0 2017 : N/A 2017 Cost Estimate: N/A
2018 TIP: $250 2018 : 2018 2018 Cost Estimate: N/A
Cashflow (YOE $000s)
Subarea Life to Date 2018 2019 2020 2021 2022 2023 Future Total
North King $0 $167 $0 $0 $0 $0 $0 $0 $167
South King 0 83 0 0 0 0 0 0 83
Total $0 $250 $0 $0 $0 $0 $0 $0 $250
Phase Life to Date 2018 2019 2020 2021 2022 2023 Future Total
50-Construction $0 $250 $0 $0 $0 $0 $0 $0 $250
Total $0 $250 $0 $0 $0 $0 $0 $0 $250
Project Risk Assessment
Proper coordination of change control process will have to be followed to maintain software configuration and keep both ST and vendor current.
123 of 159

State of Good Repair LINK
700682 Tacoma Link HVAC and Building Systems Upgrade Managed by: Operations
Scope: The Tacoma OMF was constructed approximately 15 years ago. The HVAC and Building Controls in the building are obsolete and nearing the end of their useful life. Facilities Division would like to coordinate with DECM to replace and upgrade the original systems during the construction of the new OMF Expansion Project.
Changes to authorized project allocation since 2017: $400 thousand for new project.
Budget year activities: Upgrade the HVAC system.
Authorized Project Allocation To Date(YOE $000s)
Completion Schedule Financial Plan Project Estimate(2017 $000s)
Phase Gate Passed: N/A
Baseline: $0 Baseline: N/A 2008 Cost Estimate: N/A
2017 TIP: $0 2017 : N/A 2017 Cost Estimate: N/A
2018 TIP: $400 2018 : 2018 2018 Cost Estimate: N/A
Cashflow (YOE $000s)
Subarea Life to Date 2018 2019 2020 2021 2022 2023 Future Total
Pierce $0 $400 $0 $0 $0 $0 $0 $0 $400
Total $0 $400 $0 $0 $0 $0 $0 $0 $400
Phase Life to Date 2018 2019 2020 2021 2022 2023 Future Total
30-Final Design+Specifications $0 $30 $0 $0 $0 $0 $0 $0 $30
50-Construction 0 370 0 0 0 0 0 0 370
Total $0 $400 $0 $0 $0 $0 $0 $0 $400
Project Risk Assessment
The project coordination with the DECM Tacoma OMF Expansion project is critical to obtaining an integrated fully functional building control and HVAC system for the new combined facility.
124 of 159
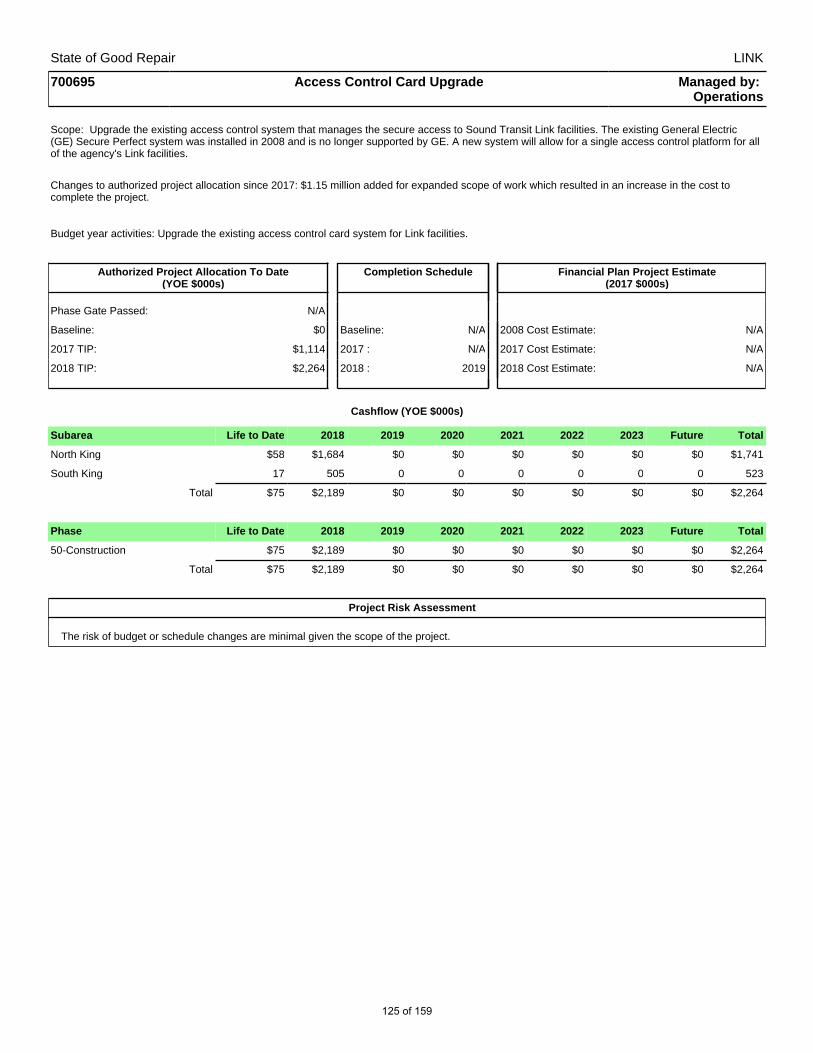
State of Good Repair LINK
700695 Access Control Card Upgrade Managed by: Operations
Scope: Upgrade the existing access control system that manages the secure access to Sound Transit Link facilities. The existing General Electric (GE) Secure Perfect system was installed in 2008 and is no longer supported by GE. A new system will allow for a single access control platform for all of the agency's Link facilities.
Changes to authorized project allocation since 2017: $1.15 million added for expanded scope of work which resulted in an increase in the cost to complete the project.
Budget year activities: Upgrade the existing access control card system for Link facilities.
Authorized Project Allocation To Date(YOE $000s)
Completion Schedule Financial Plan Project Estimate(2017 $000s)
Phase Gate Passed: N/A
Baseline: $0 Baseline: N/A 2008 Cost Estimate: N/A
2017 TIP: $1,114 2017 : N/A 2017 Cost Estimate: N/A
2018 TIP: $2,264 2018 : 2019 2018 Cost Estimate: N/A
Cashflow (YOE $000s)
Subarea Life to Date 2018 2019 2020 2021 2022 2023 Future Total
North King $58 $1,684 $0 $0 $0 $0 $0 $0 $1,741
South King 17 505 0 0 0 0 0 0 523
Total $75 $2,189 $0 $0 $0 $0 $0 $0 $2,264
Phase Life to Date 2018 2019 2020 2021 2022 2023 Future Total
50-Construction $75 $2,189 $0 $0 $0 $0 $0 $0 $2,264
Total $75 $2,189 $0 $0 $0 $0 $0 $0 $2,264
Project Risk Assessment
The risk of budget or schedule changes are minimal given the scope of the project.
125 of 159

State of Good Repair LINK
700704 Link Radio Upgrade Managed by: Operations
Scope: Install upgraded Distributed Antenna System (DAS) in two Link tunnel systems - Downtown Seattle Transit Tunnel and Beacon Hill Tunnel.
Changes to authorized project allocation since 2017: None.
Budget year activities: Procure and install a distributed antenna system.
Authorized Project Allocation To Date(YOE $000s)
Completion Schedule Financial Plan Project Estimate(2017 $000s)
Phase Gate Passed: N/A
Baseline: Baseline: N/A 2008 Cost Estimate: N/A
2017 TIP: $1,000 2017 : 2018 2017 Cost Estimate: N/A
2018 TIP: $1,000 2018 : 2018 2018 Cost Estimate: N/A
Cashflow (YOE $000s)
Subarea Life to Date 2018 2019 2020 2021 2022 2023 Future Total
North King $0 $668 $0 $0 $0 $0 $0 $0 $668
South King 0 332 0 0 0 0 0 0 332
Total $0 $1,000 $0 $0 $0 $0 $0 $0 $1,000
Phase Life to Date 2018 2019 2020 2021 2022 2023 Future Total
10-Agency Administration $0 $80 $0 $0 $0 $0 $0 $0 $80
20-Prelim Engineering/Env Review
0 100 0 0 0 0 0 0 100
30-Final Design+Specifications 0 120 0 0 0 0 0 0 120
50-Construction 0 700 0 0 0 0 0 0 700
Total $0 $1,000 $0 $0 $0 $0 $0 $0 $1,000
Project Risk Assessment
There is a low potential for a radio system failure during the installation of the upgraded system which would prevent Link operations in the tunnels until fixed.
126 of 159
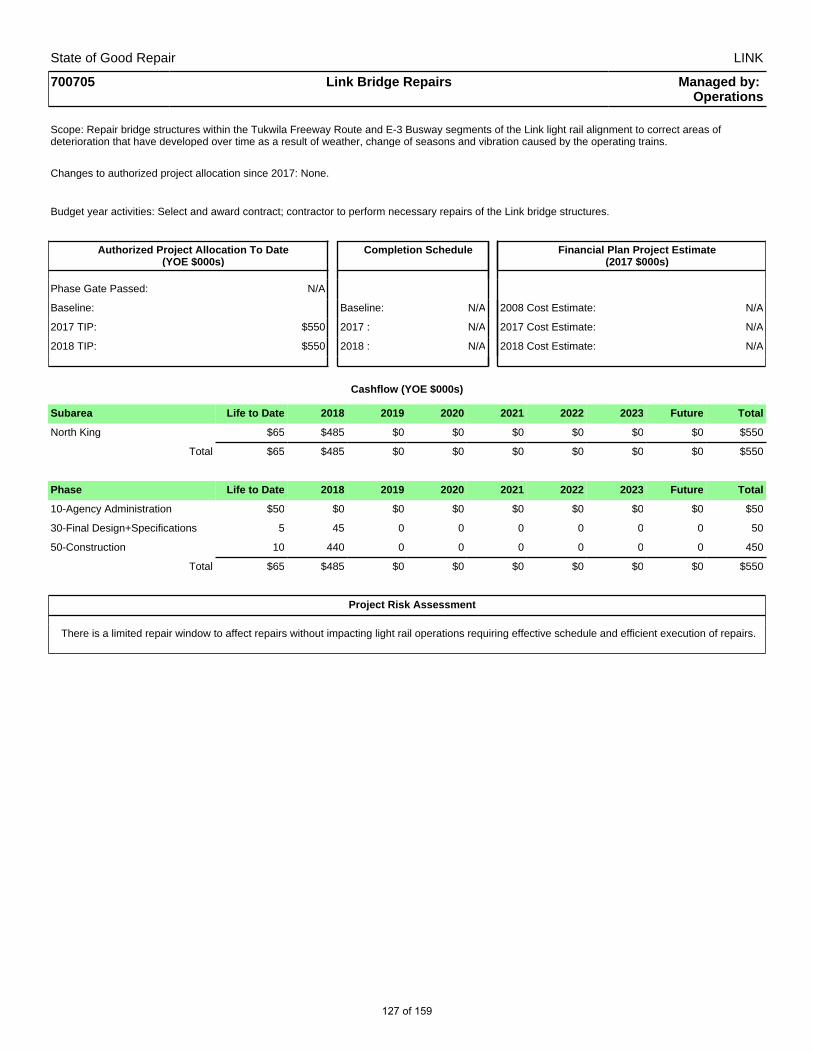
State of Good Repair LINK
700705 Link Bridge Repairs Managed by: Operations
Scope: Repair bridge structures within the Tukwila Freeway Route and E-3 Busway segments of the Link light rail alignment to correct areas of deterioration that have developed over time as a result of weather, change of seasons and vibration caused by the operating trains.
Changes to authorized project allocation since 2017: None.
Budget year activities: Select and award contract; contractor to perform necessary repairs of the Link bridge structures.
Authorized Project Allocation To Date(YOE $000s)
Completion Schedule Financial Plan Project Estimate(2017 $000s)
Phase Gate Passed: N/A
Baseline: Baseline: N/A 2008 Cost Estimate: N/A
2017 TIP: $550 2017 : N/A 2017 Cost Estimate: N/A
2018 TIP: $550 2018 : N/A 2018 Cost Estimate: N/A
Cashflow (YOE $000s)
Subarea Life to Date 2018 2019 2020 2021 2022 2023 Future Total
North King $65 $485 $0 $0 $0 $0 $0 $0 $550
Total $65 $485 $0 $0 $0 $0 $0 $0 $550
Phase Life to Date 2018 2019 2020 2021 2022 2023 Future Total
10-Agency Administration $50 $0 $0 $0 $0 $0 $0 $0 $50
30-Final Design+Specifications 5 45 0 0 0 0 0 0 50
50-Construction 10 440 0 0 0 0 0 0 450
Total $65 $485 $0 $0 $0 $0 $0 $0 $550
Project Risk Assessment
There is a limited repair window to affect repairs without impacting light rail operations requiring effective schedule and efficient execution of repairs.
127 of 159

State of Good Repair LINK
700718 Tacoma Link Light Rail Vehicle Overhaul Managed by: Operations
Scope: Maintain, preserve, and extend the life of the Tacoma Link fleet of three light rail vehicles. Repair, replace and overhaul traction motors and trucks, including wheel assemblies and gear boxes for the light rail vehicles per the manufacturer’s 375,000 mile overhaul guidelines.
Changes to authorized project allocation since 2017: None.
Budget year activities: Overhaul Tacoma Link light rail vehicle traction motors and trucks.
Authorized Project Allocation To Date(YOE $000s)
Completion Schedule Financial Plan Project Estimate(2017 $000s)
Phase Gate Passed: N/A
Baseline: $0 Baseline: N/A 2008 Cost Estimate: N/A
2017 TIP: $731 2017 : 2018 2017 Cost Estimate: N/A
2018 TIP: $731 2018 : 2019 2018 Cost Estimate: N/A
Cashflow (YOE $000s)
Subarea Life to Date 2018 2019 2020 2021 2022 2023 Future Total
Pierce $247 $387 $97 $0 $0 $0 $0 $0 $731
Total $247 $387 $97 $0 $0 $0 $0 $0 $731
Phase Life to Date 2018 2019 2020 2021 2022 2023 Future Total
70-Vehicles $247 $387 $97 $0 $0 $0 $0 $0 $731
Total $247 $387 $97 $0 $0 $0 $0 $0 $731
Project Risk Assessment
Although a small risk the length of time to perform the overhaul activities could have schedule impacts.
128 of 159

State of Good Repair LINK
700728 Link Station Braided Tile Replacement Managed by: Operations
Scope: Demolition and reinstallation of braided wayfinding tile at five Link light rail stations: Stadium, Sodo, Columbia City, Othello, and Rainier Beach.
Changes to authorized project allocation since 2017: None.
Budget year activities: Replace existing tiles as needed to complete project.
Authorized Project Allocation To Date(YOE $000s)
Completion Schedule Financial Plan Project Estimate(2017 $000s)
Phase Gate Passed: N/A
Baseline: Baseline: N/A 2008 Cost Estimate: N/A
2017 TIP: $435 2017 : 2017 2017 Cost Estimate: N/A
2018 TIP: $435 2018 : 2018 2018 Cost Estimate: N/A
Cashflow (YOE $000s)
Subarea Life to Date 2018 2019 2020 2021 2022 2023 Future Total
North King $0 $435 $0 $0 $0 $0 $0 $0 $435
Total $0 $435 $0 $0 $0 $0 $0 $0 $435
Phase Life to Date 2018 2019 2020 2021 2022 2023 Future Total
10-Agency Administration $0 $22 $0 $0 $0 $0 $0 $0 $22
50-Construction 0 413 0 0 0 0 0 0 413
Total $0 $435 $0 $0 $0 $0 $0 $0 $435
Project Risk Assessment
N/A
129 of 159

State of Good Repair LINK
700769 Light Rail Vehicle Overhaul Managed by: DECM
Scope: Complete repairs of the gear units and traction motors on light rail vehicles (LRVs), and purchase materials, equipment, services, and labor necessary to complete repairs.
Repairs to the LRV fleet were completed in 2016; work to repair spare equipment is scheduled for completion in 2017. Funds cash flowed in 2018 are considered surplus.
Changes to authorized project allocation since 2017: None.
Budget year activities: Complete repairs to spare traction power motors and gear boxes, including testing.
Authorized Project Allocation To Date(YOE $000s)
Completion Schedule Financial Plan Project Estimate(2017 $000s)
Phase Gate Passed: N/A
Baseline: $0 Baseline: N/A 2008 Cost Estimate: N/A
2017 TIP: $5,000 2017 : 2016 2017 Cost Estimate: N/A
2018 TIP: $5,000 2018 : 2017 2018 Cost Estimate: N/A
Cashflow (YOE $000s)
Subarea Life to Date 2018 2019 2020 2021 2022 2023 Future Total
North King $1,612 $1,733 $0 $0 $0 $0 $0 $0 $3,345
South King 797 858 0 0 0 0 0 0 1,655
Total $2,409 $2,591 $0 $0 $0 $0 $0 $0 $5,000
Phase Life to Date 2018 2019 2020 2021 2022 2023 Future Total
70-Vehicles $2,409 $2,591 $0 $0 $0 $0 $0 $0 $5,000
Total $2,409 $2,591 $0 $0 $0 $0 $0 $0 $5,000
Project Risk Assessment
Budget risk remains high given no agreement regarding the warranty coverage on repairs has been reached between manufacturer, supplier and Sound Transit.
130 of 159

State of Good Repair SOUNDER
700683 King Street Station Vertical Window Glazing Managed by: Operations
Scope: Remove and replace all vertical tempered glass wall panels at the three King Street Station stair towers. The existing glass panels will be replaced with transparent acrylic panels that are significantly stronger than glass and will not shatter in the event of vandalism or other failure.
Changes to authorized project allocation since 2017: $767 thousand for new project.
Budget year activities: Remove and replace all vertical tempered glass wall panels at the three King Street Station stair towers.
Authorized Project Allocation To Date(YOE $000s)
Completion Schedule Financial Plan Project Estimate(2017 $000s)
Phase Gate Passed: N/A
Baseline: $0 Baseline: N/A 2008 Cost Estimate: N/A
2017 TIP: $0 2017 : N/A 2017 Cost Estimate: N/A
2018 TIP: $767 2018 : 2018 2018 Cost Estimate: N/A
Cashflow (YOE $000s)
Subarea Life to Date 2018 2019 2020 2021 2022 2023 Future Total
South King $0 $767 $0 $0 $0 $0 $0 $0 $767
Total $0 $767 $0 $0 $0 $0 $0 $0 $767
Phase Life to Date 2018 2019 2020 2021 2022 2023 Future Total
50-Construction $0 $767 $0 $0 $0 $0 $0 $0 $767
Total $0 $767 $0 $0 $0 $0 $0 $0 $767
Project Risk Assessment
The risk is low. This project is not dependent on any other work. It creates a safer passenger environment and maintains passenger station access by eliminating a source of stairwell closures.
131 of 159

State of Good Repair SOUNDER
700770 Sounder Vehicle Overhaul Program Managed by: Operations
Scope: Maintain, preserve, and extend the life of Sounder locomotives and cab car fleet. This program overhauls 11 locomotives of the Sounder fleet while upgrading technologies and emisison efficiencies, truck overhauls of cab cars and HVAC upgrades to the same.
Changes to authorized project allocation since 2017: None.
Budget year activities: To rebuild 120 heating, ventilating and air conditioning units.
Authorized Project Allocation To Date(YOE $000s)
Completion Schedule Financial Plan Project Estimate(2017 $000s)
Phase Gate Passed: N/A
Baseline: $0 Baseline: N/A 2008 Cost Estimate: N/A
2017 TIP: $25,101 2017 : 2018 2017 Cost Estimate: N/A
2018 TIP: $25,101 2018 : 2023 2018 Cost Estimate: N/A
Cashflow (YOE $000s)
Subarea Life to Date 2018 2019 2020 2021 2022 2023 Future Total
Snohomish $3,096 $167 $44 $44 $44 $44 $0 $0 $3,439
South King 11,842 639 168 168 168 168 0 0 13,153
Pierce 7,661 414 109 109 109 109 0 0 8,509
Total $22,599 $1,220 $321 $321 $321 $321 $0 $0 $25,101
Phase Life to Date 2018 2019 2020 2021 2022 2023 Future Total
50-Construction $10,064 $0 $0 $0 $0 $0 $0 $0 $10,064
70-Vehicles 12,535 1,220 321 321 321 321 0 0 15,038
Total $22,599 $1,220 $321 $321 $321 $321 $0 $0 $25,101
Project Risk Assessment
Multiple Sounder vehicles being overhauled or under going major repairs continue to run the risk of cost overruns or schedule delays.
132 of 159

State of Good Repair SOUNDER
700771 Station Midlife Refurbishment Program Managed by: Operations
Scope: Provide rehabilitation and mid-life maintenance for Sound Transit facilities that have been in service for fifteen years or longer.
Changes to authorized project allocation since 2017: None.
Budget year activities: Rehabilitate Tukwila International Blvd Station bus loop.
Authorized Project Allocation To Date(YOE $000s)
Completion Schedule Financial Plan Project Estimate(2017 $000s)
Phase Gate Passed: N/A
Baseline: $0 Baseline: N/A 2008 Cost Estimate: N/A
2017 TIP: $1,695 2017 : 2017 2017 Cost Estimate: N/A
2018 TIP: $1,695 2018 : 2018 2018 Cost Estimate: N/A
Cashflow (YOE $000s)
Subarea Life to Date 2018 2019 2020 2021 2022 2023 Future Total
South King $720 $411 $0 $0 $0 $0 $0 $0 $1,131
Pierce 359 205 0 0 0 0 0 0 565
Total $1,079 $616 $0 $0 $0 $0 $0 $0 $1,695
Phase Life to Date 2018 2019 2020 2021 2022 2023 Future Total
10-Agency Administration $8 $0 $0 $0 $0 $0 $0 $0 $8
50-Construction 1,072 616 0 0 0 0 0 0 1,688
Total $1,079 $616 $0 $0 $0 $0 $0 $0 $1,695
Project Risk Assessment
Undefined scope of work at the various station locations could affect both the budget and schedule.
133 of 159

State of Good Repair REGIONAL EXPRESS
7X701 ST Express Fleet Replacement Managed by: Operations
Scope: Funds the bus fleet replacement program for ST Express.
FTA guidelines indicate that buses are to be replaced no earlier than either 12 years of service or 500,000 miles. Due to the unique service characteristics of the ST Express fleet, Sound Transit buses typically reach 500,000 miles after only 10 years of operations yet Sound Transit often keeps buses for several years past the minimal deadline. Replacement decisions are informed by specific fleet performance in consultation with our operating partner agencies. During the period from 2017-2022 150 buses will be replaced. The fleet size as of 2017 is 318.
Changes to authorized project allocation since 2017: None.
Budget year activities: Accept delivery of 18 replacement buses.
Authorized Project Allocation To Date(YOE $000s)
Completion Schedule Financial Plan Project Estimate(2017 $000s)
Phase Gate Passed: N/A
Baseline: $0 Baseline: N/A 2008 Cost Estimate: N/A
2017 TIP: $189,269 2017 : 2021 2017 Cost Estimate: N/A
2018 TIP: $189,269 2018 : 2021 2018 Cost Estimate: N/A
Cashflow (YOE $000s)
Subarea Life to Date 2018 2019 2020 2021 2022 2023 Future Total
Snohomish $23,068 $4,132 $2,734 $0 $3,378 $0 $0 $0 $33,311
South King 13,238 2,371 1,569 0 1,938 0 0 0 19,116
East King 60,290 10,799 7,146 0 8,828 0 0 0 87,064
Pierce 34,470 6,174 4,086 0 5,047 0 0 0 49,778
Total $131,066 $23,477 $15,535 $0 $19,191 $0 $0 $0 $189,269
Phase Life to Date 2018 2019 2020 2021 2022 2023 Future Total
50-Construction $47 $0 $0 $0 $0 $0 $0 $0 $47
70-Vehicles 131,019 23,477 15,535 0 19,191 0 0 0 189,222
Total $131,066 $23,477 $15,535 $0 $19,191 $0 $0 $0 $189,269
Project Risk Assessment
Budget risk is a concern as the cost estimates and vehicle types are annually reviewed as replacements are identified and the agency adopts on-board technologies to be included in future replacements.
134 of 159

State of Good Repair OTHER
600077 Safety Oversight Approval Program Managed by: EXE
Scope: This program covers remedial actions approved by the Safety Oversight Approval Panel (SOAP). The responsibility of the panel includes; evaluation of risk & exposures that propose liability to the agency, make decisions/recommendations regarding budget, coordinate closely with Capital Plan Change Board (CCB) and ensure decisions are consistent across Sound Transit.
Changes to authorized project allocation since 2017: New project.
Budget year activities: Remedial actions are dependent on issues flagged during the year.
Authorized Project Allocation To Date(YOE $000s)
Completion Schedule Financial Plan Project Estimate(2017 $000s)
Phase Gate Passed: N/A
Baseline: $0 Baseline: N/A 2008 Cost Estimate: N/A
2017 TIP: $0 2017 : N/A 2017 Cost Estimate: N/A
2018 TIP: $200 2018 : N/A 2018 Cost Estimate: N/A
Cashflow (YOE $000s)
Subarea Life to Date 2018 2019 2020 2021 2022 2023 Future Total
Systemwide $0 $200 $0 $0 $0 $0 $0 $0 $200
Total $0 $200 $0 $0 $0 $0 $0 $0 $200
Phase Life to Date 2018 2019 2020 2021 2022 2023 Future Total
50-Construction $0 $200 $0 $0 $0 $0 $0 $0 $200
Total $0 $200 $0 $0 $0 $0 $0 $0 $200
Project Risk Assessment
This is a program new for 2018. The initial budget is designed to fund immediate need safety mitigation requirements. As the funds are used it is expected they would be replenished. As the program matures some certainty in budget requirements should result.
135 of 159

700716
Phase Gate Passed:Baseline:2017 TIP:2018 TIP:
Project Risk Assessment
Low project risk.
$0 $0 $379
0 0 308
Total $380 $24 $0 $0 $0 $0
$0 $0 $71
50-Construction 284 24 0 0 0 0
2023 Future Total10-Agency Administration $71 $0 $0 $0 $0 $0
Phase Life to Date 2018 2019 2020 2021 2022
$0 $0 $0 $379
0 0 0 126
Total $355 $24 $0 $0 $0
$0 $0 $0 $253
South King 118 8 0 0 0
2022 2023 Future TotalNorth King $237 $16 $0 $0 $0
Cashflow (YOE $000s)
Subarea Life to Date 2018 2019 2020 2021
$379 2018 : 2018 2018 Cost Estimate: N/A
$0 Baseline: N/A 2008 Cost Estimate: N/A$379 2017 : N/A 2017 Cost Estimate: N/A
N/A
Authorized Project Allocation To Date
Completion Schedule Financial Plan Project Estimate
Budget year activities: Installation of the concrete parking lot, concrete curb, fencing, and lighting.
Changes to authorized project allocation since 2017: This project was under the Small Works Program but has been created as a stand alone project as the costs increased by $182K, from $197K to $379K.
Scope: Install concrete parking lot, concrete curb on the north property line, fencing and gating surrounding the lot, demolish part of the concrete masonry wall surrounding the traction power substation (TPSS), and add lighting for the parking area.
OTHEROthello Traction Power Substation Parking Lot Managed by: Operations
State of Good Repair
136 of 159

State of Good Repair OTHER
7X356 Tacoma Dome Station Managed by: Operations
Scope: Provide financial support to address major maintenance requirement at Tacoma Dome Station per agreement with Pierce Transit.
Changes to authorized project allocation since 2017: Budget increased by $3.14 million due to rehabilitation work cost increase.
Budget year activities: Provide cost share if Pierce Transit completes rehabilitation work.
Authorized Project Allocation To Date(YOE $000s)
Completion Schedule Financial Plan Project Estimate(2017 $000s)
Phase Gate Passed: N/A
Baseline: $0 Baseline: N/A 2008 Cost Estimate: N/A
2017 TIP: $414 2017 : 2018 2017 Cost Estimate: N/A
2018 TIP: $3,553 2018 : 2018 2018 Cost Estimate: N/A
Cashflow (YOE $000s)
Subarea Life to Date 2018 2019 2020 2021 2022 2023 Future Total
Pierce $0 $3,553 $0 $0 $0 $0 $0 $0 $3,553
Total $0 $3,553 $0 $0 $0 $0 $0 $0 $3,553
Phase Life to Date 2018 2019 2020 2021 2022 2023 Future Total
50-Construction $0 $3,553 $0 $0 $0 $0 $0 $0 $3,553
Total $0 $3,553 $0 $0 $0 $0 $0 $0 $3,553
Project Risk Assessment
The agency has agreed to fund a proportional share at completion. The budget represents the share of the cost estimate. It is possible that the agency would be responsible for the same share of cost overruns.
137 of 159
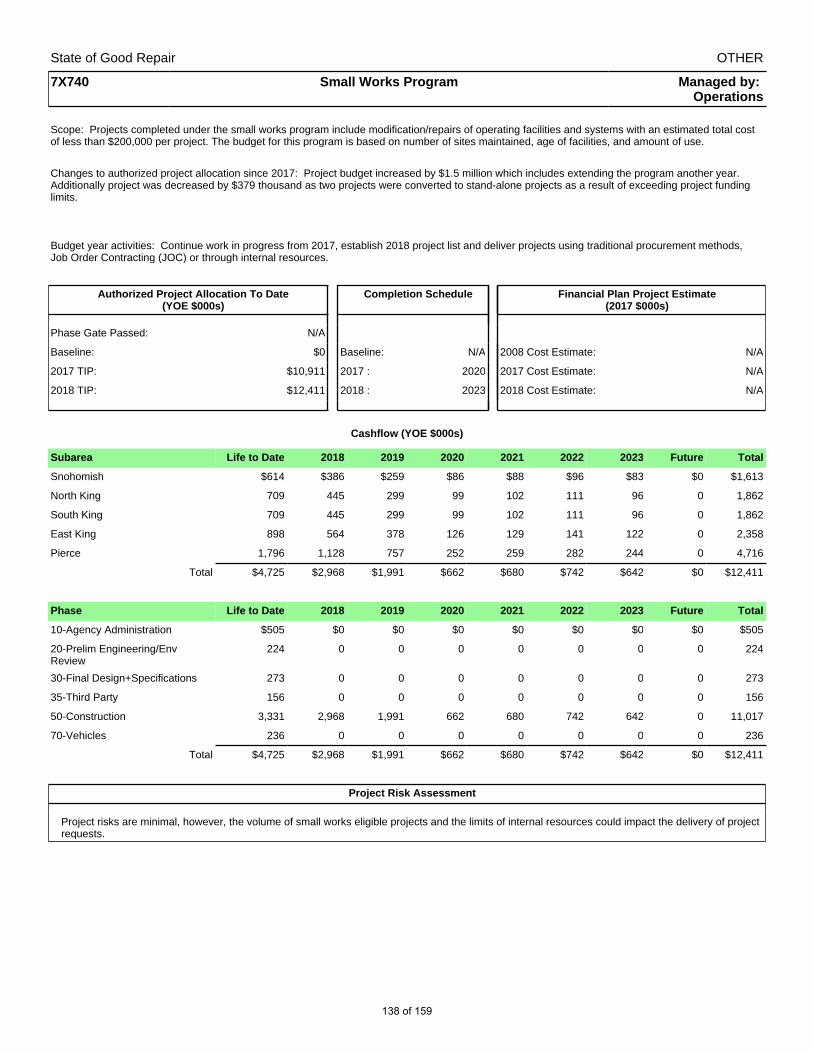
State of Good Repair OTHER
7X740 Small Works Program Managed by: Operations
Scope: Projects completed under the small works program include modification/repairs of operating facilities and systems with an estimated total cost of less than $200,000 per project. The budget for this program is based on number of sites maintained, age of facilities, and amount of use.
Changes to authorized project allocation since 2017: Project budget increased by $1.5 million which includes extending the program another year. Additionally project was decreased by $379 thousand as two projects were converted to stand-alone projects as a result of exceeding project funding limits.
Budget year activities: Continue work in progress from 2017, establish 2018 project list and deliver projects using traditional procurement methods, Job Order Contracting (JOC) or through internal resources.
Authorized Project Allocation To Date(YOE $000s)
Completion Schedule Financial Plan Project Estimate(2017 $000s)
Phase Gate Passed: N/A
Baseline: $0 Baseline: N/A 2008 Cost Estimate: N/A
2017 TIP: $10,911 2017 : 2020 2017 Cost Estimate: N/A
2018 TIP: $12,411 2018 : 2023 2018 Cost Estimate: N/A
Cashflow (YOE $000s)
Subarea Life to Date 2018 2019 2020 2021 2022 2023 Future Total
Snohomish $614 $386 $259 $86 $88 $96 $83 $0 $1,613
North King 709 445 299 99 102 111 96 0 1,862
South King 709 445 299 99 102 111 96 0 1,862
East King 898 564 378 126 129 141 122 0 2,358
Pierce 1,796 1,128 757 252 259 282 244 0 4,716
Total $4,725 $2,968 $1,991 $662 $680 $742 $642 $0 $12,411
Phase Life to Date 2018 2019 2020 2021 2022 2023 Future Total
10-Agency Administration $505 $0 $0 $0 $0 $0 $0 $0 $505
20-Prelim Engineering/Env Review
224 0 0 0 0 0 0 0 224
30-Final Design+Specifications 273 0 0 0 0 0 0 0 273
35-Third Party 156 0 0 0 0 0 0 0 156
50-Construction 3,331 2,968 1,991 662 680 742 642 0 11,017
70-Vehicles 236 0 0 0 0 0 0 0 236
Total $4,725 $2,968 $1,991 $662 $680 $742 $642 $0 $12,411
Project Risk Assessment
Project risks are minimal, however, the volume of small works eligible projects and the limits of internal resources could impact the delivery of project requests.
138 of 159

State of Good Repair OTHER
870100 Information Technology (IT) Infrastructure Managed by: FIT
Scope: Provide lifecycle maintenance of the IT infrastructure across all Agency and Revenue systems including but not limited to: servers, storage area networks, networking equipment, backend for customer-facing systems (i.e. Video Messaging System) and other computer-based infrastructure, plus enhancements and maintenance for IT network and data security, including firewalls and other related technology systems.
This project encompasses the infrastructure systems for the entirety of the Agency datacenters and network and the backend infrastructure systems for the Link light rail systems, including the SCADA backend systems. The project also includes integration and upgrades of legacy hardware/software at Link light rail stations and control centers with upcoming future light rail expansion.
Changes to authorized project allocation since 2017: Increased by $1.8 million.
Budget year activities: Perform lifecycle maintenance of agency and operational systems’ backend technology infrastructure which includes servers, storage area networks, networking equipment, and other computer-based infrastructure; IT SCADA backend security, and LRV wireless network.
Authorized Project Allocation To Date(YOE $000s)
Completion Schedule Financial Plan Project Estimate(2017 $000s)
Phase Gate Passed: None
Baseline: $0 Baseline: N/A 2008 Cost Estimate: N/A
2017 TIP: $3,935 2017 : 2023 2017 Cost Estimate: N/A
2018 TIP: $5,743 2018 : 2023 2018 Cost Estimate: N/A
Cashflow (YOE $000s)
Subarea Life to Date 2018 2019 2020 2021 2022 2023 Future Total
North King $746 $861 $571 $433 $304 $349 $990 $0 $4,254
South King 261 301 200 152 106 122 346 0 1,489
Total $1,007 $1,162 $771 $585 $410 $471 $1,336 $0 $5,743
Phase Life to Date 2018 2019 2020 2021 2022 2023 Future Total
09-Admin Capital $1,007 $250 $0 $0 $190 $0 $0 $0 $1,447
50-Construction 0 912 771 585 220 471 1,336 0 4,295
Total $1,007 $1,162 $771 $585 $410 $471 $1,336 $0 $5,743
Project Risk Assessment
Potential for risk of increased cost as system expands and integration and support require more resources to meet system compliance standards.
139 of 159
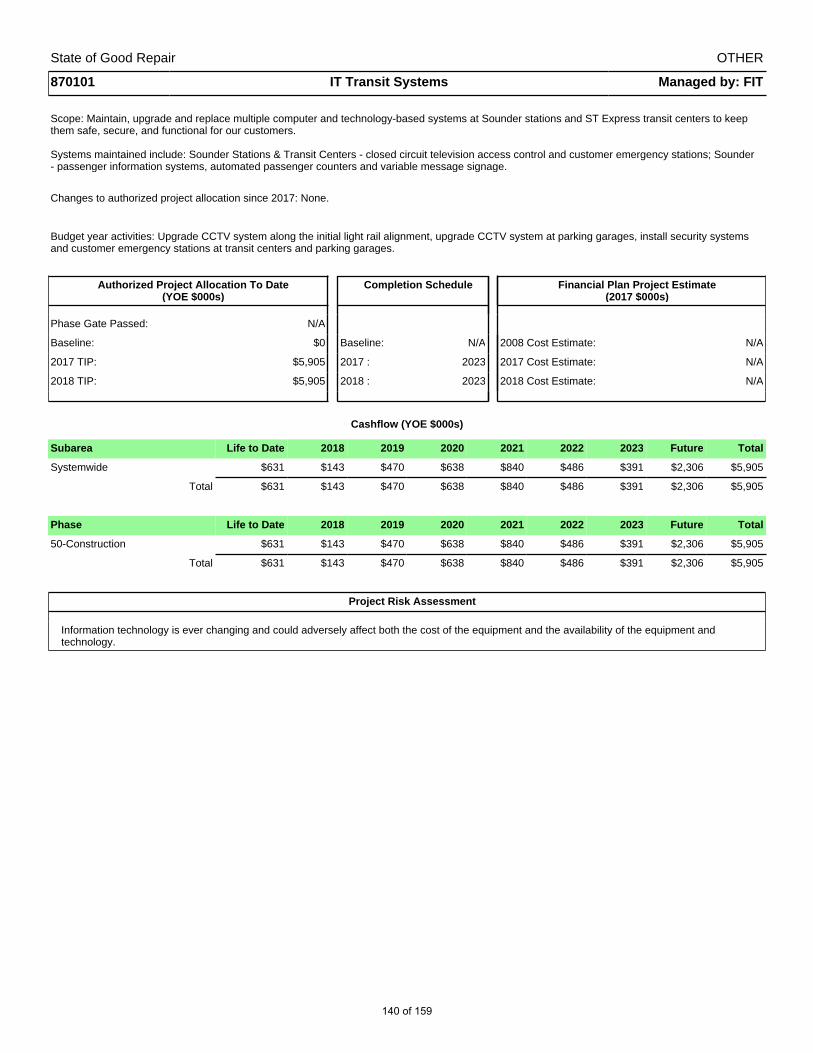
State of Good Repair OTHER
870101 IT Transit Systems Managed by: FIT
Scope: Maintain, upgrade and replace multiple computer and technology-based systems at Sounder stations and ST Express transit centers to keep them safe, secure, and functional for our customers.
Systems maintained include: Sounder Stations & Transit Centers - closed circuit television access control and customer emergency stations; Sounder - passenger information systems, automated passenger counters and variable message signage.
Changes to authorized project allocation since 2017: None.
Budget year activities: Upgrade CCTV system along the initial light rail alignment, upgrade CCTV system at parking garages, install security systems and customer emergency stations at transit centers and parking garages.
Authorized Project Allocation To Date(YOE $000s)
Completion Schedule Financial Plan Project Estimate(2017 $000s)
Phase Gate Passed: N/A
Baseline: $0 Baseline: N/A 2008 Cost Estimate: N/A
2017 TIP: $5,905 2017 : 2023 2017 Cost Estimate: N/A
2018 TIP: $5,905 2018 : 2023 2018 Cost Estimate: N/A
Cashflow (YOE $000s)
Subarea Life to Date 2018 2019 2020 2021 2022 2023 Future Total
Systemwide $631 $143 $470 $638 $840 $486 $391 $2,306 $5,905
Total $631 $143 $470 $638 $840 $486 $391 $2,306 $5,905
Phase Life to Date 2018 2019 2020 2021 2022 2023 Future Total
50-Construction $631 $143 $470 $638 $840 $486 $391 $2,306 $5,905
Total $631 $143 $470 $638 $840 $486 $391 $2,306 $5,905
Project Risk Assessment
Information technology is ever changing and could adversely affect both the cost of the equipment and the availability of the equipment and technology.
140 of 159
Administrative Administrative projects are not specific to any transit mode or capital program. Projects fund disposition of surplus real estate, procurement of administrative equipment, facilities, and technology, as well as administrative support critical to the successful operation of the agency. Administrative costs that support projects are charged to construction in progress and capitalized with the resulting assets.
2018 Administrative Project Highlights Replace seven non-revenue vehicles used by administrative staff and add eleven vehicles to
the fleet in support of increased pool usage and direct need due to increased program activity.
Continue the second year of a three year program to replace the roof top cooling towers and 98 variable air volume exchangers at Union Station.
Continue landscape and wetland hydrology mitigation and maintenance activities at selected Sound Transit properties.
Implementation of Contract Manager replacement.
Implementation of IT Service Delivery and Management platform.
Implementation of Real Property/ROW Management software platform.
141 of 159
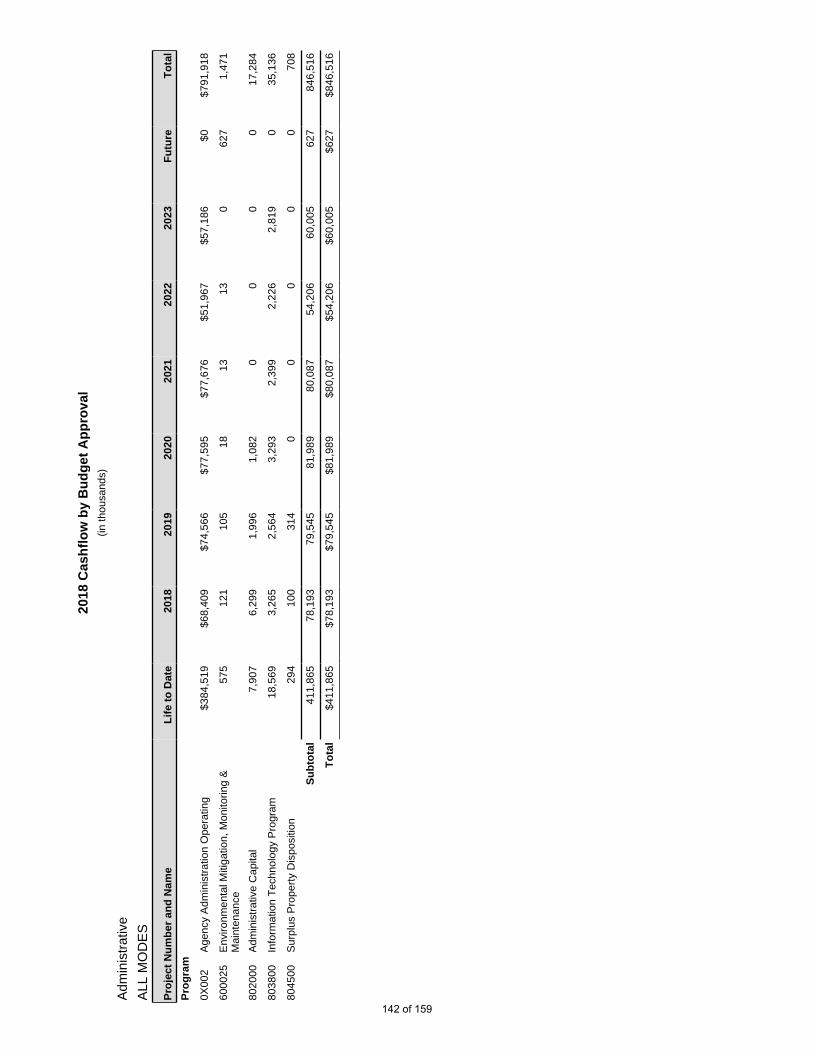
2018
Cas
hfl
ow
by
Bu
dg
et A
pp
rova
l(in
thou
sand
s)
Adm
inis
trat
ive
ALL
MO
DE
S
Pro
ject
Nu
mb
er a
nd
Nam
eL
ife
to D
ate
2018
2019
2020
2021
2022
2023
Fu
ture
To
tal
Pro
gra
m
0X00
2A
genc
y A
dmin
istr
atio
n O
pera
ting
$384
,519
$68,
409
$74,
566
$77,
595
$77,
676
$51,
967
$57,
186
$0$7
91,9
18
6000
25E
nviro
nmen
tal M
itiga
tion,
Mon
itorin
g &
M
aint
enan
ce57
512
110
518
1313
062
71,
471
8020
00A
dmin
istr
ativ
e C
apita
l7,
907
6,29
91,
996
1,08
20
00
017
,284
8038
00In
form
atio
n T
echn
olog
y P
rogr
am18
,569
3,26
52,
564
3,29
32,
399
2,22
62,
819
035
,136
8045
00S
urpl
us P
rope
rty
Dis
posi
tion
294
100
314
00
00
070
8
Su
bto
tal
411,
865
78,1
9379
,545
81,9
8980
,087
54,2
0660
,005
627
846,
516
To
tal
$411
,865
$78,
193
$79,
545
$81,
989
$80,
087
$54,
206
$60,
005
$627
$846
,516
142 of 159
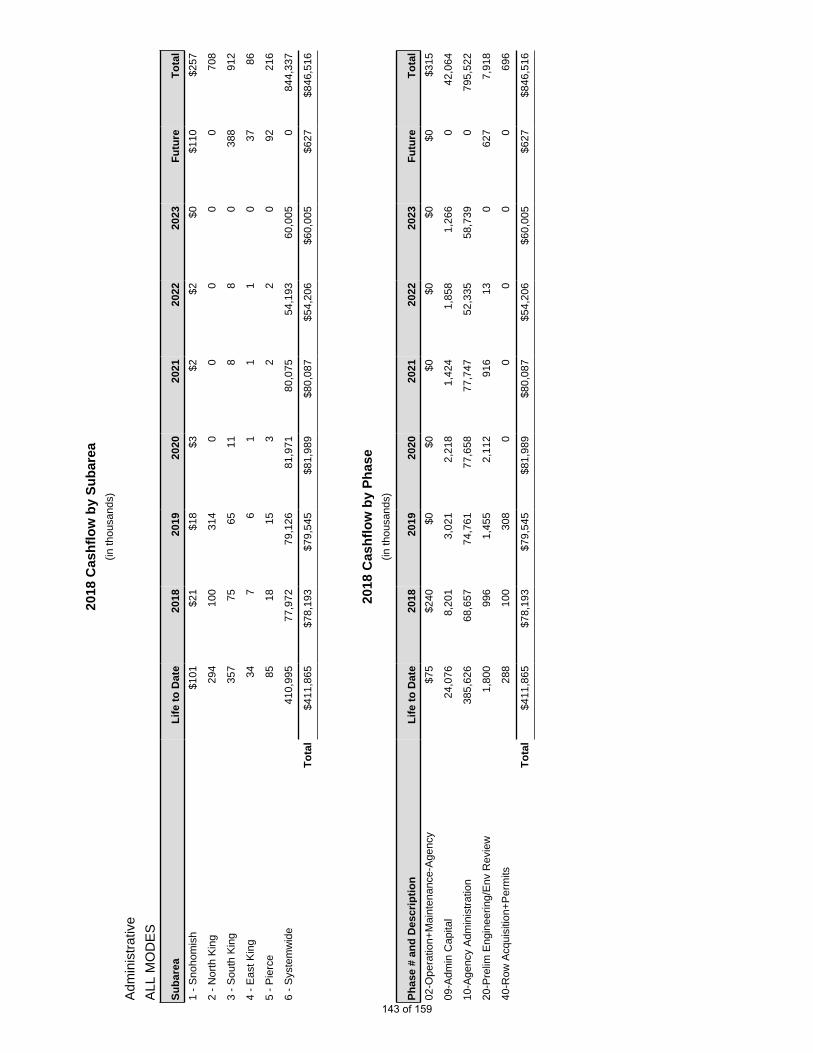
2018
Cas
hfl
ow
by
Su
bar
ea(in
thou
sand
s)
Adm
inis
trat
ive
ALL
MO
DE
S
Su
bar
eaL
ife
to D
ate
2018
2019
2020
2021
2022
2023
Fu
ture
To
tal
1 -
Sno
hom
ish
$101
$21
$18
$3$2
$2$0
$110
$257
2 -
Nor
th K
ing
294
100
314
00
00
070
8
3 -
Sou
th K
ing
357
7565
118
80
388
912
4 -
Eas
t Kin
g34
76
11
10
3786
5 -
Pie
rce
8518
153
22
092
216
6 -
Sys
tem
wid
e41
0,99
577
,972
79,1
2681
,971
80,0
7554
,193
60,0
050
844,
337
To
tal
$411
,865
$78,
193
$79,
545
$81,
989
$80,
087
$54,
206
$60,
005
$627
$846
,516
2018
Cas
hfl
ow
by
Ph
ase
(in th
ousa
nds)
Ph
ase
# an
d D
escr
ipti
on
Lif
e to
Dat
e20
1820
1920
2020
2120
2220
23F
utu
reT
ota
l
02-O
pera
tion+
Mai
nten
ance
-Age
ncy
$75
$240
$0$0
$0$0
$0$0
$315
09-A
dmin
Cap
ital
24,0
768,
201
3,02
12,
218
1,42
41,
858
1,26
60
42,0
64
10-A
genc
y A
dmin
istr
atio
n38
5,62
668
,657
74,7
6177
,658
77,7
4752
,335
58,7
390
795,
522
20-P
relim
Eng
inee
ring/
Env
Rev
iew
1,80
099
61,
455
2,11
291
613
062
77,
918
40-R
ow A
cqui
sitio
n+P
erm
its28
810
030
80
00
00
696
To
tal
$411
,865
$78,
193
$79,
545
$81,
989
$80,
087
$54,
206
$60,
005
$627
$846
,516
143 of 159

0X002
Phase Gate Passed:Baseline:2017 TIP:2018 TIP:
Project Risk Assessment
N/A
$57,186 $0 $791,918
$57,186 $0 $791,918
$51,967Total $384,519 $68,409 $74,566 $77,595 $77,676
2023 Future Total10-Agency Administration $384,519 $68,409 $74,566 $77,595 $77,676 $51,967Phase Life to Date 2018 2019 2020 2021 2022
$51,967 $57,186 $0 $791,918
$51,967 $57,186 $0 $791,918
Total $384,519 $68,409 $74,566 $77,595 $77,676
2022 2023 Future TotalSystemwide $384,519 $68,409 $74,566 $77,595 $77,676
Cashflow (YOE $000s)
Subarea Life to Date 2018 2019 2020 2021
$791,918 2018 : 2023 2018 Cost Estimate: N/A
$791,918 Baseline: 2023 2008 Cost Estimate: N/A$791,918 2017 : 2023 2017 Cost Estimate: N/A
N/A
Authorized Project Allocation To Date(YOE $000s)
Completion Schedule Financial Plan Project Estimate(2017 $000s)
Budget year activities: Fund department costs allocated to projects as administrative overhead that may be eligible for partial reimbursement from federal grants. Also, fund department costs that are unallocated.
Changes to authorized project allocation since 2017: None
Scope: Funds administrative overhead expenses that are charged to capital projects and overhead expenses that are not allocated to either projects or transit operations. Overhead expenses allocated to projects are included in the capitalized cost of the resulting assets. Unallocated overhead expenses are included in general and administrative expenses for the agency.
OTHERAgency Administration Operating Managed by: FIT
Administrative
144 of 159
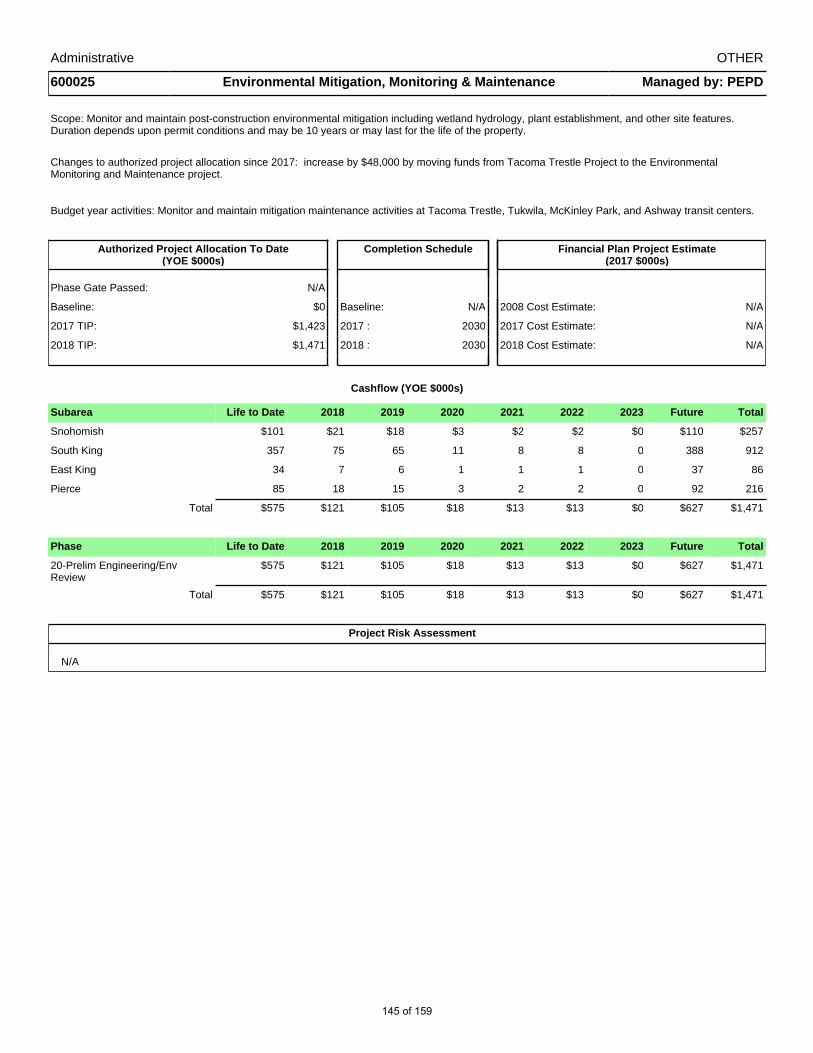
Administrative OTHER
600025 Environmental Mitigation, Monitoring & Maintenance Managed by: PEPD
Scope: Monitor and maintain post-construction environmental mitigation including wetland hydrology, plant establishment, and other site features. Duration depends upon permit conditions and may be 10 years or may last for the life of the property.
Changes to authorized project allocation since 2017: increase by $48,000 by moving funds from Tacoma Trestle Project to the Environmental Monitoring and Maintenance project.
Budget year activities: Monitor and maintain mitigation maintenance activities at Tacoma Trestle, Tukwila, McKinley Park, and Ashway transit centers.
Authorized Project Allocation To Date(YOE $000s)
Completion Schedule Financial Plan Project Estimate(2017 $000s)
Phase Gate Passed: N/A
Baseline: $0 Baseline: N/A 2008 Cost Estimate: N/A
2017 TIP: $1,423 2017 : 2030 2017 Cost Estimate: N/A
2018 TIP: $1,471 2018 : 2030 2018 Cost Estimate: N/A
Cashflow (YOE $000s)
Subarea Life to Date 2018 2019 2020 2021 2022 2023 Future Total
Snohomish $101 $21 $18 $3 $2 $2 $0 $110 $257
South King 357 75 65 11 8 8 0 388 912
East King 34 7 6 1 1 1 0 37 86
Pierce 85 18 15 3 2 2 0 92 216
Total $575 $121 $105 $18 $13 $13 $0 $627 $1,471
Phase Life to Date 2018 2019 2020 2021 2022 2023 Future Total
20-Prelim Engineering/Env Review
$575 $121 $105 $18 $13 $13 $0 $627 $1,471
Total $575 $121 $105 $18 $13 $13 $0 $627 $1,471
Project Risk Assessment
N/A
145 of 159

Administrative OTHER
802000 Administrative Capital Managed by: FIT
Scope: Funds capital expenditures for administrative assets that support agency staff, including administrative facilities, non-revenue administrative fleet, office equipment, space planning, and furnishings.
Changes to authorized project allocation since 2017: None
Budget year activities: Procure and replace eight non-revenue administrative vehicles, replace variable air exchangers and HVAC compressor at Union Station, and procure furnishings for additional leased space to accommodate growth.
Authorized Project Allocation To Date(YOE $000s)
Completion Schedule Financial Plan Project Estimate(2017 $000s)
Phase Gate Passed: N/A
Baseline: $0 Baseline: N/A 2008 Cost Estimate: N/A
2017 TIP: $17,284 2017 : 2023 2017 Cost Estimate: N/A
2018 TIP: $17,284 2018 : 2020 2018 Cost Estimate: N/A
Cashflow (YOE $000s)
Subarea Life to Date 2018 2019 2020 2021 2022 2023 Future Total
Systemwide $7,907 $6,299 $1,996 $1,082 $0 $0 $0 $0 $17,284
Total $7,907 $6,299 $1,996 $1,082 $0 $0 $0 $0 $17,284
Phase Life to Date 2018 2019 2020 2021 2022 2023 Future Total
09-Admin Capital $7,907 $6,299 $1,996 $1,082 $0 $0 $0 $0 $17,284
Total $7,907 $6,299 $1,996 $1,082 $0 $0 $0 $0 $17,284
Project Risk Assessment
N/A
146 of 159

Administrative OTHER
803800 Information Technology Program Managed by: FIT
Scope: Support agencywide hardware and software infrastructure, develop and implement technology solutions to improve administrative efficiency
through 2023.
Changes to authorized project allocation since 2017: Increased by $2.9 million.
Budget year activities: Implement the agency's enterprise asset management system, maintain agency IT infrastructure, implement information security controls, replace eBid (vendor solicitation) system, and develop a business intelligence program.
Authorized Project Allocation To Date(YOE $000s)
Completion Schedule Financial Plan Project Estimate(2017 $000s)
Phase Gate Passed: N/A
Baseline: $0 Baseline: N/A 2008 Cost Estimate: N/A
2017 TIP: $32,235 2017 : 2023 2017 Cost Estimate: N/A
2018 TIP: $35,136 2018 : 2023 2018 Cost Estimate: N/A
Cashflow (YOE $000s)
Subarea Life to Date 2018 2019 2020 2021 2022 2023 Future Total
Systemwide $18,569 $3,265 $2,564 $3,293 $2,399 $2,226 $2,819 $0 $35,136
Total $18,569 $3,265 $2,564 $3,293 $2,399 $2,226 $2,819 $0 $35,136
Phase Life to Date 2018 2019 2020 2021 2022 2023 Future Total
02-Operation+Maintenance-Agency
$75 $240 $0 $0 $0 $0 $0 $0 $315
09-Admin Capital 16,169 1,902 1,025 1,136 1,424 1,858 1,266 0 24,780
10-Agency Administration 1,101 248 189 63 71 368 1,553 0 3,593
20-Prelim Engineering/Env Review
1,224 875 1,350 2,094 904 0 0 0 6,447
Total $18,569 $3,265 $2,564 $3,293 $2,399 $2,226 $2,819 $0 $35,136
Project Risk Assessment
Future year forecasts reflect initial planning estimates so costs are subject to change. Schedules are dependent on staff capacity and the specific application or approach selected.
147 of 159

Administrative OTHER
804500 Surplus Property Disposition Managed by: DECM
Scope: Prepare surplus properties for sale that due to their size or location do not lend themselves to Transit-Oriented Development (TOD) opportunities. Surplus properties represent remnant properties that may have been used during construction or were acquired and no longer needed for transit use.
Changes to authorized project allocation since 2017: None.
Budget year activities: Prepare surplus properties for sale.
Authorized Project Allocation To Date(YOE $000s)
Completion Schedule Financial Plan Project Estimate(2017 $000s)
Phase Gate Passed: N/A
Baseline: $0 Baseline: N/A 2008 Cost Estimate: N/A
2017 TIP: $708 2017 : 2017 2017 Cost Estimate: N/A
2018 TIP: $708 2018 : 2019 2018 Cost Estimate: N/A
Cashflow (YOE $000s)
Subarea Life to Date 2018 2019 2020 2021 2022 2023 Future Total
North King $294 $100 $314 $0 $0 $0 $0 $0 $708
Total $294 $100 $314 $0 $0 $0 $0 $0 $708
Phase Life to Date 2018 2019 2020 2021 2022 2023 Future Total
10-Agency Administration $6 $0 $6 $0 $0 $0 $0 $0 $12
40-Row Acquisition+Permits 288 100 308 0 0 0 0 0 696
Total $294 $100 $314 $0 $0 $0 $0 $0 $708
Project Risk Assessment
N/A
148 of 159
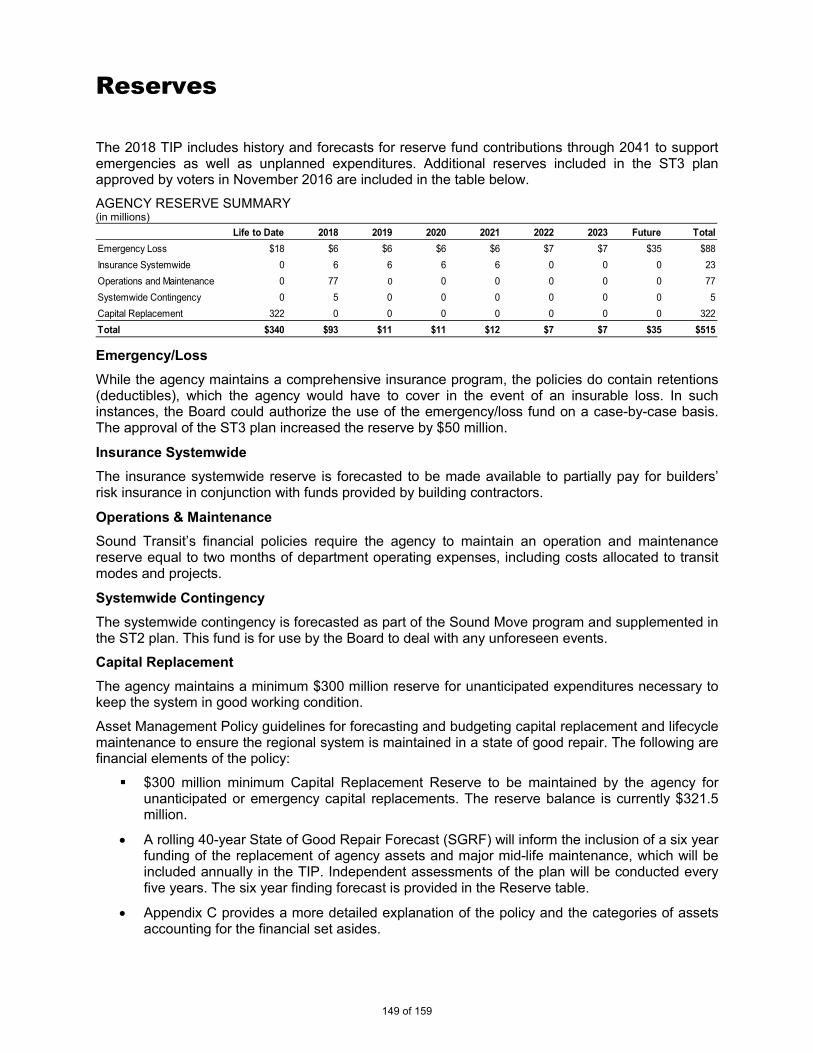
Reserves
The 2018 TIP includes history and forecasts for reserve fund contributions through 2041 to support emergencies as well as unplanned expenditures. Additional reserves included in the ST3 plan approved by voters in November 2016 are included in the table below.
AGENCY RESERVE SUMMARY (in millions)
Emergency/Loss While the agency maintains a comprehensive insurance program, the policies do contain retentions (deductibles), which the agency would have to cover in the event of an insurable loss. In such instances, the Board could authorize the use of the emergency/loss fund on a case-by-case basis. The approval of the ST3 plan increased the reserve by $50 million.
Insurance Systemwide The insurance systemwide reserve is forecasted to be made available to partially pay for builders’ risk insurance in conjunction with funds provided by building contractors.
Operations & Maintenance Sound Transit’s financial policies require the agency to maintain an operation and maintenance reserve equal to two months of department operating expenses, including costs allocated to transit modes and projects.
Systemwide Contingency The systemwide contingency is forecasted as part of the Sound Move program and supplemented in the ST2 plan. This fund is for use by the Board to deal with any unforeseen events.
Capital Replacement The agency maintains a minimum $300 million reserve for unanticipated expenditures necessary to keep the system in good working condition.
Asset Management Policy guidelines for forecasting and budgeting capital replacement and lifecycle maintenance to ensure the regional system is maintained in a state of good repair. The following are financial elements of the policy:
$300 million minimum Capital Replacement Reserve to be maintained by the agency forunanticipated or emergency capital replacements. The reserve balance is currently $321.5million.
• A rolling 40-year State of Good Repair Forecast (SGRF) will inform the inclusion of a six yearfunding of the replacement of agency assets and major mid-life maintenance, which will beincluded annually in the TIP. Independent assessments of the plan will be conducted everyfive years. The six year finding forecast is provided in the Reserve table.
• Appendix C provides a more detailed explanation of the policy and the categories of assetsaccounting for the financial set asides.
Life to Date 2018 2019 2020 2021 2022 2023 Future TotalEmergency Loss $18 $6 $6 $6 $6 $7 $7 $35 $88Insurance Systemwide 0 6 6 6 6 0 0 0 23Operations and Maintenance 0 77 0 0 0 0 0 0 77Systemwide Contingency 0 5 0 0 0 0 0 0 5Capital Replacement 322 0 0 0 0 0 0 0 322Total $340 $93 $11 $11 $12 $7 $7 $35 $515
149 of 159

Appendix A – Sound Transit 2 and Sound Transit 3 Cost Estimates The agency maintains cost estimates for all of its capital projects that are funded in the agency’s financial plan. These estimates are updated as new engineering, right-of-way, public outreach, and other project information are developed. Project cost estimates are updated prior to seeking Board authorization of budgets for preliminary engineering, final design and right-of-way acquisition, and baseline budget, which includes total project costs and construction.
ST2 cost estimates were initially developed and reported in 2007 constant-year dollars. ST3 cost estimates were initially developed and reported in 2015 constant-year dollars. To enable comparisons between cost estimates, the figures in this appendix have been updated to 2017 constant-year dollars based on the agency’s August 2017 inflation forecasts. The table on the next page includes the following information:
Voter-Approved cost estimates are from the initial ST2 and ST3 plans approved by voters in November 2008 (ST2) and November 2016 (ST3).
2017 cost estimates match the adopted 2017 TIP.
2018 cost estimates include all ST2 and ST3 projects currently funded in the agency’s financial plan.
All voter-approved ST3 projects were added to Appendix A.
The Federal Way Link Extension project is increased to reflect the addition of scope to extend the project to Federal Way Transit Center.
150 of 159

CAPITAL COST ESTIMATES (in thousands/constant 2017 dollars)
Voter Approved Estimate Inc / (Dec) 2017 Estimate Inc / (Dec) 2018 Estimate
Link Light RailEast Link 3,643,314$ (241,230)$ 3,402,084$ -$ 3,402,084$ Northgate Link Extension 1,894,174$ 167,496$ 2,061,670$ -$ 2,061,670$ Lynnwood Link Extension 1,797,752$ (265,872)$ 1,531,880$ -$ 1,531,880$ First Hill Link Connector 145,548$ (1,295)$ 144,254$ -$ 144,254$ South 200th Street Link Extension 440,208$ 7,308$ 447,516$ -$ 447,516$ South Corridor HCT - S200th to KDM Rd 537,731$ (61,345)$ 476,386$ -$ 476,386$ South Corridor HCT - KDM Rd to S 272nd St 584,086$ (584,086)$ -$ -$ -$ Federal Way Link Ext -$ -$ -$ 1,140,867$ 1,140,867$ HCC to Tacoma Dome - P/E & ROW 60,258$ (60,258)$ -$ -$ -$ South Corridor Alternatives Analysis 87,367$ (84,124)$ 3,242$ -$ 3,242$ Tacoma Link Expansion 109,255$ 35,993$ 145,248$ -$ 145,248$ Link Maintenance & Storage 329,862$ 89,793$ 419,655$ (5,733)$ 413,922$ Link Fleet Expansion 614,869$ 70,120$ 684,989$ -$ 684,989$ Downtown Seattle Light Rail tunnel -$ -$ -$ 1,925,943$ 1,925,943$ West Seattle to Downtown -$ -$ -$ 1,705,934$ 1,705,934$ Ballard to Downtown -$ -$ -$ 2,842,720$ 2,842,720$ Graham St Station -$ -$ -$ 79,540$ 79,540$ Boeing Access Road Station -$ -$ -$ 145,090$ 145,090$ Redmond Tech Center to Downtown Redmond -$ -$ -$ 1,128,425$ 1,128,425$ 130th Street Station -$ -$ -$ 73,199$ 73,199$ Everett Link Extension -$ -$ -$ 3,365,380$ 3,365,380$ Kirkland to Issaquah Link Extension -$ -$ -$ 2,105,787$ 2,105,787$ Operations and Maintenance Facility - North -$ -$ -$ 814,555$ 814,555$ Operations and Maintenance Facility - South -$ -$ -$ 594,046$ 594,046$ Tacoma Dome Link Extension -$ -$ -$ 2,233,056$ 2,233,056$ Tacoma Community College Extension -$ -$ -$ 529,322$ 529,322$ ST3 LRVs (except FW/ Redmond) -$ 1,229,554$ 1,229,554$
Total Link Light Rail 10,244,424$ (927,501)$ 9,316,923$ 19,907,685$ 29,224,608$ Sounder Commuter RailStation Access & Demand Study 161,077$ (25,744)$ 135,333$ -$ 135,333$ Sumner Station Improvements 53,542$ (4,474)$ 49,068$ -$ 49,068$ Puyallup Station Improvements 76,012$ (11,738)$ 64,274$ -$ 64,274$ Lakewood Station Improvements 47,625$ (7,113)$ 40,512$ -$ 40,512$ Kent Station Improvements 39,462$ (5,789)$ 33,673$ -$ 33,673$ Auburn Station Improvements 41,287$ (5,968)$ 35,319$ -$ 35,319$ South Sounder Parking and Access Improvements -$ -$ -$ 761,342$ 761,342$ Sounder Parking Edmonds & Mukilteo Stations -$ -$ -$ 44,030$ 44,030$ SR 162 Improvements -$ -$ -$ 36,880$ 36,880$ Lakewood to Dupont Track and Signal -$ -$ -$ 357,291$ 357,291$ Sounder Yard & Shop Facility 193,014$ (24,196)$ 168,818$ -$ 168,818$ Sounder Yard Expansion -$ 22,563$ 22,563$ -$ 22,563$ Tukwila Permanent Station 43,631$ 10,517$ 54,148$ -$ 54,148$ Edmonds Permanent Station 29,948$ (29,948)$ -$ -$ -$ Seattle to Lakewood - Expanded Service 248,230$ 66,474$ 314,704$ -$ 314,704$ Sounder Fleet Expansion 38,830$ 9,765$ 48,595$ -$ 48,595$ Reservation Junction - Track & Signal 82,826$ 77,419$ 160,246$ -$ 160,246$ Tacoma Track & Signal 32,642$ (326)$ 32,315$ -$ 32,315$ Platform Extensions - South King / Pierce 65,517$ (65,517)$ -$ 276,916$ 276,916$ Eastside Rail Partnership 60,671$ (60,670)$ 2$ -$ 2$
Total Sounder Commuter Rail 1,214,315$ (54,745)$ 1,159,570$ 1,476,459$ 2,636,029$ Bus Rapid TransitI-405 Bus Rapid Transit -$ -$ -$ 610,910$ 610,910$ Bus Rapid Transit Maintenance Base -$ -$ -$ 171,914$ 171,914$ SR 522 & 145th Bus Rapid Transit -$ -$ -$ 436,053$ 436,053$ Rapid Ride C&D and Madison Ave BRT Contribution -$ -$ -$ 71,549$ 71,549$ Kirkland to NE 85th -$ -$ -$ 338,056$ 338,056$
Total Bus Rapid Transit -$ -$ -$ 1,628,482$ 1,628,482$ Regional ExpressST Express Bus Base 217,582$ (7,283)$ 210,299$ -$ 210,299$ Mid-Day Bus Storage -$ 3,199$ 3,199$ -$ 3,199$ ST Express Fleet Expansion 43,242$ 17,824$ 61,066$ -$ 61,066$ North Sammamish Park & Ride -$ -$ -$ 22,096$ 22,096$ Tacoma Pacific Avenue Contribution -$ -$ -$ 65,987$ 65,987$ Bus On Shoulder - North -$ -$ -$ 38,526$ 38,526$ Bus On Shoulder - South King -$ -$ -$ 38,526$ 38,526$ Bus On Shoulder - Pierce -$ -$ -$ 35,224$ 35,224$ Capital Enhancements btwn East Pierce and Sumner Sounder Station 36,880$ 36,880$
STEX Fleet to support Interim STEX Service 20,445$ 20,445$ I-90 Contribution 58,755$ -$ 58,755$ -$ 58,755$ Burien - Parking Garage / Transit Center 17,463$ (909)$ 16,554$ -$ 16,554$ Bothell - Parking Garage / Transit Center 6,539$ (6,539)$ -$ -$ -$
Total Regional Express 343,581$ 6,292$ 349,873$ 257,683$ 607,556$ OtherST3 Planning 64,099$ (26,987)$ 37,112$ -$ 37,112$ Innovation and Technology Fund -$ -$ -$ 79,763$ 79,763$ Transit Oriented Development -$ -$ -$ 21,427$ 21,427$ System Access Program -$ -$ -$ 106,350$ 106,350$ Sumner to Orting Study -$ -$ -$ 5,318$ 5,318$ ST4 Planning -$ -$ -$ 69,395$ 69,395$ HCT Planning Studies -$ -$ -$ 47,993$ 47,993$ ST Art Program -$ 56,280$ 56,280$ -$ 56,280$
Total Other 64,099$ 29,293$ 93,392$ 330,245$ 423,637$
TOTAL Capital Plan Estimate 11,866,419$ (946,660)$ 10,919,758$ 23,600,554$ 34,520,312$
Note:The cost estimates included in the table above reflect the amount funded in the Agency's long-term Financial Plan. Projectsproposed to proceed with only limited engineering activity are funded only to the extend that activtiy requires. Projects proposed tobe suspended or deleted have no funding in the current Long-term Financial Plan.
151 of 159
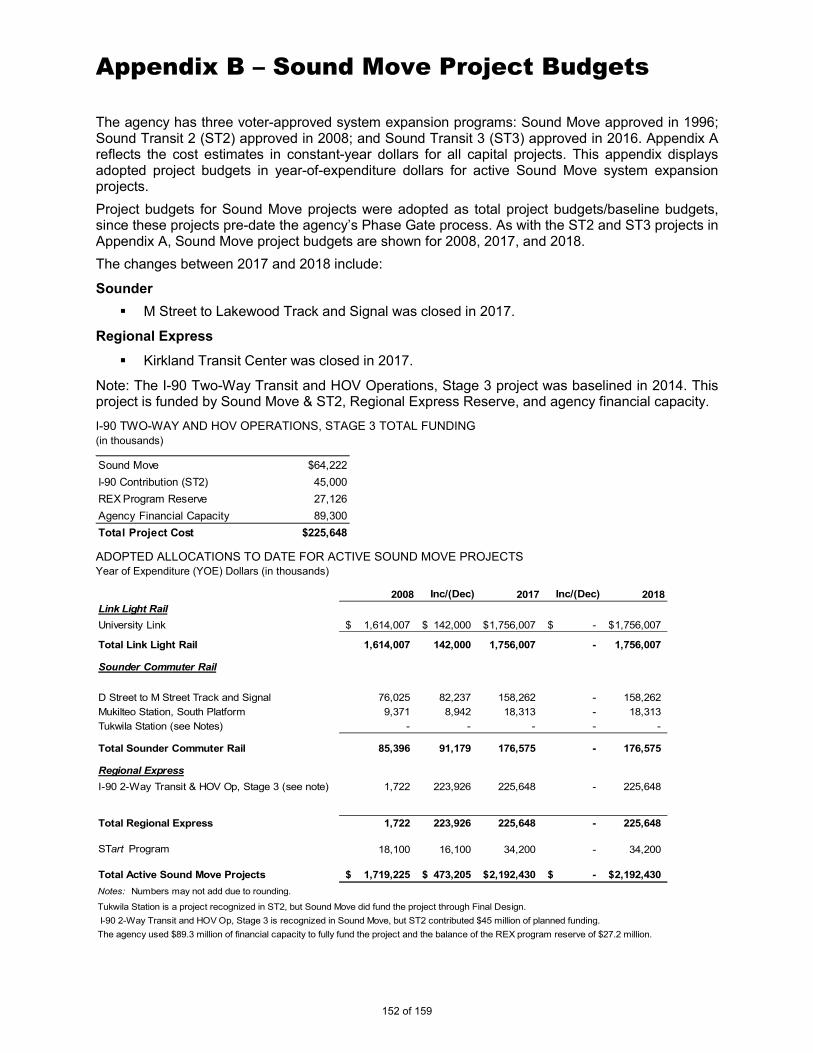
Appendix B – Sound Move Project Budgets The agency has three voter-approved system expansion programs: Sound Move approved in 1996; Sound Transit 2 (ST2) approved in 2008; and Sound Transit 3 (ST3) approved in 2016. Appendix A reflects the cost estimates in constant-year dollars for all capital projects. This appendix displays adopted project budgets in year-of-expenditure dollars for active Sound Move system expansion projects. Project budgets for Sound Move projects were adopted as total project budgets/baseline budgets, since these projects pre-date the agency’s Phase Gate process. As with the ST2 and ST3 projects in Appendix A, Sound Move project budgets are shown for 2008, 2017, and 2018. The changes between 2017 and 2018 include:
Sounder M Street to Lakewood Track and Signal was closed in 2017.
Regional Express
Kirkland Transit Center was closed in 2017.
Note: The I-90 Two-Way Transit and HOV Operations, Stage 3 project was baselined in 2014. This project is funded by Sound Move & ST2, Regional Express Reserve, and agency financial capacity.
I-90 TWO-WAY AND HOV OPERATIONS, STAGE 3 TOTAL FUNDING (in thousands)
ADOPTED ALLOCATIONS TO DATE FOR ACTIVE SOUND MOVE PROJECTS Year of Expenditure (YOE) Dollars (in thousands)
Sound Move $64,222I-90 Contribution (ST2) 45,000REX Program Reserve 27,126Agency Financial Capacity 89,300Total Project Cost $225,648
2008 Inc/(Dec) 2017 Inc/(Dec) 2018Link Light RailUniversity Link 1,614,007$ 142,000$ 1,756,007$ -$ 1,756,007$
Total Link Light Rail 1,614,007 142,000 1,756,007 - 1,756,007
Sounder Commuter Rail
D Street to M Street Track and Signal 76,025 82,237 158,262 - 158,262 Mukilteo Station, South Platform 9,371 8,942 18,313 - 18,313 Tukwila Station (see Notes) - - - - -
Total Sounder Commuter Rail 85,396 91,179 176,575 - 176,575
Regional ExpressI-90 2-Way Transit & HOV Op, Stage 3 (see note) 1,722 223,926 225,648 - 225,648
Total Regional Express 1,722 223,926 225,648 - 225,648
STart Program 18,100 16,100 34,200 - 34,200
Total Active Sound Move Projects 1,719,225$ 473,205$ 2,192,430$ -$ 2,192,430$ Notes: Numbers may not add due to rounding.
Tukwila Station is a project recognized in ST2, but Sound Move did fund the project through Final Design. I-90 2-Way Transit and HOV Op, Stage 3 is recognized in Sound Move, but ST2 contributed $45 million of planned funding.The agency used $89.3 million of financial capacity to fully fund the project and the balance of the REX program reserve of $27.2 million.
152 of 159

Appendix C – State of Good Repair Forecast In accordance with the agency asset management policy, the agency will maintain a rolling 40-year state of good repair forecast (SOGRF) for the purpose of advance funding for replacement of assets and major midlife maintenance. The full 40-year rolling forecast is included in the agency’s finance plan to account for the use of long term revenues for the replacement of assets which is intended to reduce net borrowing costs to the agency. Additionally, an annual SOGRF spending forecast for the period 2018 through 2023 is displayed below.
The Capital Replacement Reserve (CRR) will be maintained and serve as a funding source for emergency or unexpected capital replacements.
The CRR balance will be maintained at a minimum of $300 million and if used, must be replenished to the minimum level within 5 years. The current CRR balance is $321.5 million.
The following table represents the current year of the 40-year rolling forecast. STATE OF GOOD REPAIR FORECAST (in millions and in YOE)
The following table represents the annual state of good repair forecast for the period 2018-2023. STATE OF GOOD REPAIR (in millions)
An update of these forecasts will be performed in the fourth quarter of 2017 and included in the adopted budget.
40 Year Rolling Forecast 2016-2055Administrative Facilities $100Track and Power 588Transit Centers/Parking Lots 810Stations/Platforms/Ped Bridges/Garages 601O&M Facilities 425Infrastructure 1,537Rolling Stock 1,739Fare Collection 213Non-Revenue Fleet 16Other 42Total $6,071
2018 2019 2020 2021 2022 2023State of Good Repair Forecast 60.56 26.94 8.34 24.49 4.36 6.37
153 of 159

Appendix D – Subarea Allocations
The Central Puget Sound Regional Transit Authority (Sound Transit) has implemented an accounting and reporting system consistent with the financial policies approved in the ST2 and ST3 voter-approved programs. Annually, Sound Transit (the agency) prepares a Schedule of Sources and Uses of Funds by Subarea (the schedule) that is based on the agency’s audited financial statements and the agency’s long-term Financial Plan. The schedule reports actual tax revenues received by subarea and an allocation to each subarea of other sources and uses earned.
This system is integrated into the agency’s system of internal control over financial reporting, ensuring the integrity of the information reported and providing management, the Board, and the Citizen Oversight Panel required information to monitor progress against Sound Transit’s subarea commitments to its voters.
Annually, the agency’s financial statement auditors perform agreed upon procedures which look at the allocation of sources and uses of funds presented. These procedures were developed by management, reviewed by the Citizen Oversight Panel, and approved by the Audit and Reporting Committee of the Board. All results from independent examinations are presented to the Board.
This appendix provides the drivers that will be used to allocate sources and uses to subareas in 2016 as well as new projects for 2018. Any additional projects are added at the end of the year when subarea allocations are calculated.
Revenues and Financing Sources
SOURCES
Description Driver Bond Proceeds Financial Plan Capital Grants Project Costs or Board Designation Interest Earnings Financial Plan Property Tax Zip Code Location Motor Vehicle Excise Tax Zip Code Location Operating Grants Operating Uses by Mode
Other Revenue Location/Modal Operating Use Drivers (see Operating Uses section below)
Passenger Fares (see next section)
Rental Car Tax Department of Revenue Location Code/County Level
Sales & Use Tax Department of Revenue Location Code
PASSENGER FARES
Description Driver
Central Link Light Rail Fares Station Boardings
Sounder Fares Station Boardings
ST Express Fares Route Boardings/Platform Hours
Tacoma Link Light Rail Fares Station Boardings
154 of 159
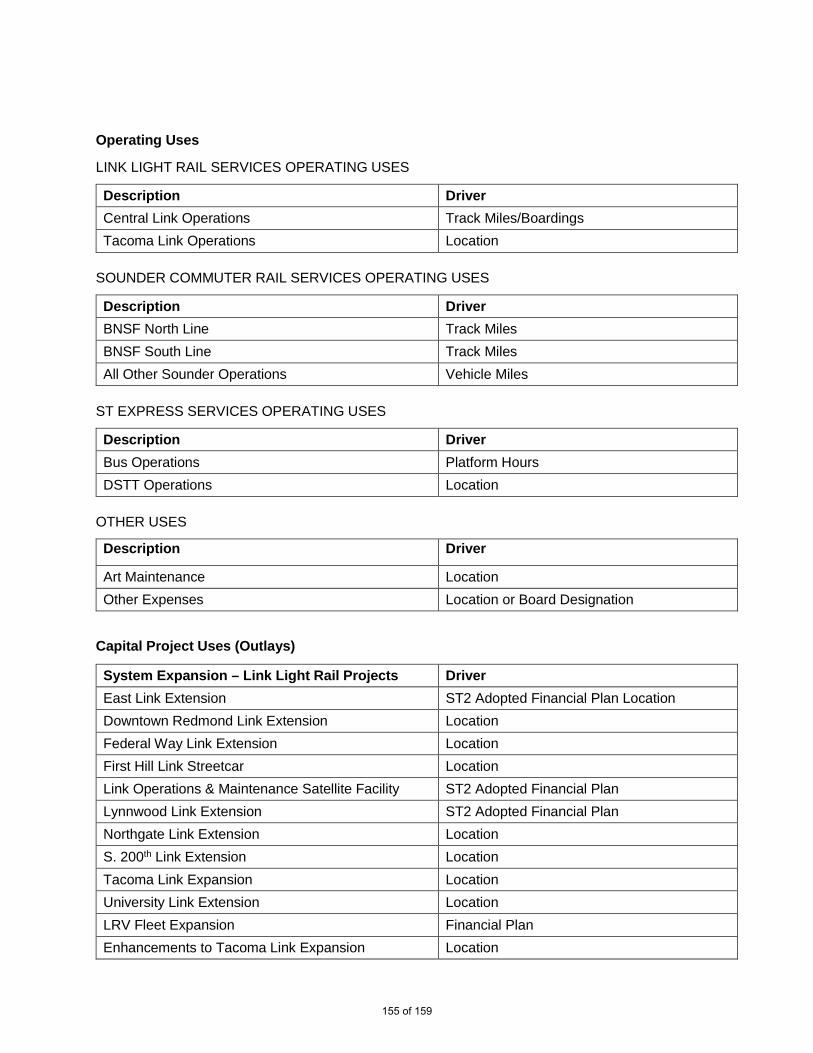
Operating Uses
LINK LIGHT RAIL SERVICES OPERATING USES
Description Driver Central Link Operations Track Miles/Boardings Tacoma Link Operations Location
SOUNDER COMMUTER RAIL SERVICES OPERATING USES
Description Driver BNSF North Line Track Miles BNSF South Line Track Miles All Other Sounder Operations Vehicle Miles
ST EXPRESS SERVICES OPERATING USES
Description Driver Bus Operations Platform Hours DSTT Operations Location
OTHER USES
Description Driver
Art Maintenance Location Other Expenses Location or Board Designation
Capital Project Uses (Outlays)
System Expansion – Link Light Rail Projects Driver East Link Extension ST2 Adopted Financial Plan Location Downtown Redmond Link Extension Location Federal Way Link Extension Location First Hill Link Streetcar Location Link Operations & Maintenance Satellite Facility ST2 Adopted Financial Plan Lynnwood Link Extension ST2 Adopted Financial Plan Northgate Link Extension Location S. 200th Link Extension Location Tacoma Link Expansion Location University Link Extension Location LRV Fleet Expansion Financial Plan Enhancements to Tacoma Link Expansion Location
155 of 159

System Expansion – Link Light Rail Projects Driver Tacoma Dome Link Extension Location Operations & Maintenance Facility ST3 Adopted Financial Plan West Seattle Link Extension ST3 Adopted Financial Plan Ballard Link Extension ST3 Adopted Financial Plan Downtown Tunnel ST3 Adopted Financial Plan
System Expansion – Sounder Commuter Rail Projects Driver
Auburn Station Access Improvements Location D St-M St Track & Signal Location Kent Station Access Improvements Location Lakewood Station Improvements Location Mukilteo Station, South Platform Location Point Defiance Bypass Location Puyallup Station Improvements Location Sounder South Expanded Service ST2 Adopted Financial Plan Sounder Fleet Expansion Financial Plan Sounder Maintenance Base ST2 Adopted Financial Plan Sounder Yard Expansion Track Miles Sumner Station Improvements Location Tacoma Trestle Track & Signal Location Tukwila Station Location Sounder North Parking/Access Location
System Expansion – ST Express Projects Driver Bothell Transit Related Improvements Location I-90 Two-Way Transit & HOV Operations, Stage 3 Location I-405 Bus Rapid Transit ST3 Adopted Financial Plan ST Express Bus Base ST2 Adopted Financial Plan SR 522 Bus Rapid Transit ST3 Adopted Financial Plan Bus On Shoulder ST3 Adopted Financial Plan
System Expansion – Other Driver Transit System Access Program ST3 Adopted Financial Plan Innovation and Technology Program ST3 Adopted Financial Plan Efficiency and Sustainability Program ST3 Adopted Financial Plan Transit Oriented Development Planning ST3 Adopted Financial Plan Fare Administration Financial Policies
156 of 159
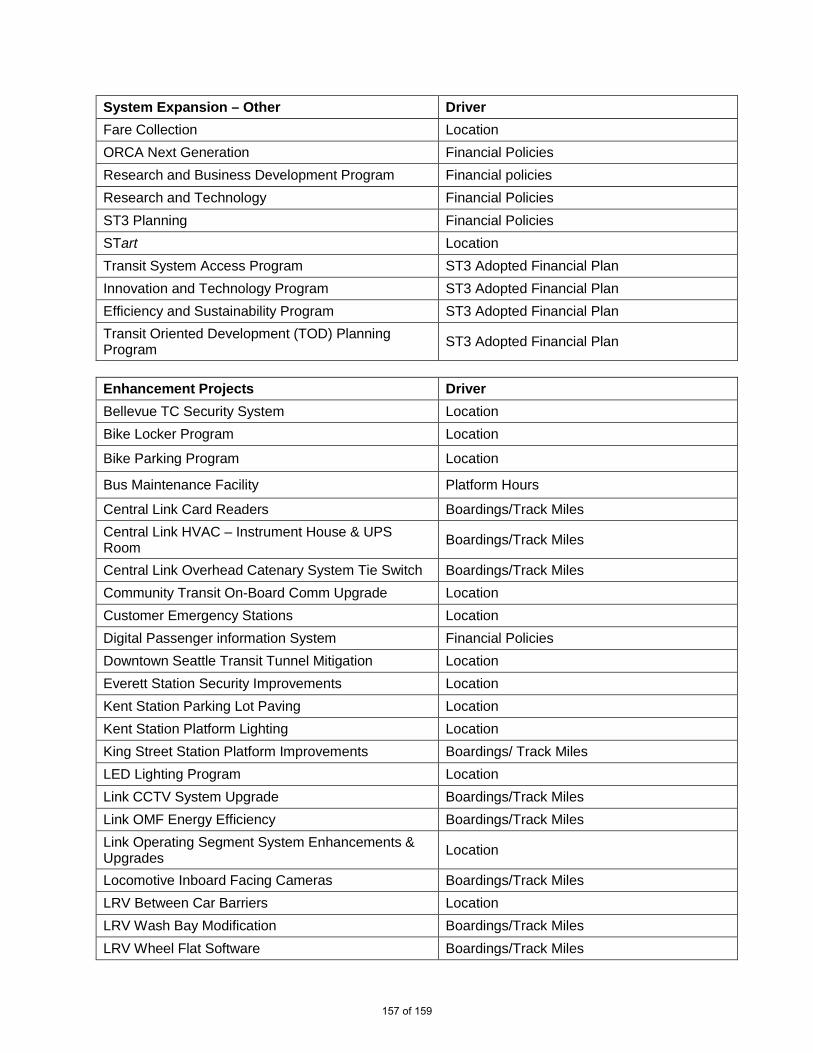
System Expansion – Other Driver Fare Collection Location ORCA Next Generation Financial Policies Research and Business Development Program Financial policies Research and Technology Financial Policies ST3 Planning Financial Policies STart Location Transit System Access Program ST3 Adopted Financial Plan Innovation and Technology Program ST3 Adopted Financial Plan Efficiency and Sustainability Program ST3 Adopted Financial Plan Transit Oriented Development (TOD) Planning Program ST3 Adopted Financial Plan
Enhancement Projects Driver Bellevue TC Security System Location Bike Locker Program Location
Bike Parking Program Location
Bus Maintenance Facility Platform Hours
Central Link Card Readers Boardings/Track Miles Central Link HVAC – Instrument House & UPS Room Boardings/Track Miles
Central Link Overhead Catenary System Tie Switch Boardings/Track Miles Community Transit On-Board Comm Upgrade Location Customer Emergency Stations Location Digital Passenger information System Financial Policies Downtown Seattle Transit Tunnel Mitigation Location Everett Station Security Improvements Location Kent Station Parking Lot Paving Location Kent Station Platform Lighting Location King Street Station Platform Improvements Boardings/ Track Miles LED Lighting Program Location Link CCTV System Upgrade Boardings/Track Miles Link OMF Energy Efficiency Boardings/Track Miles Link Operating Segment System Enhancements & Upgrades Location
Locomotive Inboard Facing Cameras Boardings/Track Miles LRV Between Car Barriers Location LRV Wash Bay Modification Boardings/Track Miles LRV Wheel Flat Software Boardings/Track Miles
157 of 159

Enhancement Projects Driver Noise Abatement Location Non-Revenue Support Vehicles Boardings/ Track Miles Opensidewalks Data Development Location Operations & Maintenance LRV Vehicle Lift Boardings/Track Miles Positive Train Control Location Puyallup Station LED Lighting Location Security Operations Center – Video Enhancements Financial Policies Security Radio Project Financial Policies Signage Improvements Location Sounder Passenger Emergency Intercom Boardings/Track Miles ST Express Mobile Communications Platform Hours Sumner Station LED Lighting Location Tacoma Link Fare Collection Location TOD Property Disposition Location Union Station Remodel – Renovation of Garden Level Remodel Location
State of Good Repair Driver Access Control System Upgrade Location Convention Place Development Systems Retrofit Location IT Infrastructure Financial Policies IT Transit Systems Financial Policies Link Bridge Repairs Location Link CCTV System Upgrade Boardings/Track Miles Link LRV Overhaul Boardings/Track Miles Link Operating Technology Upgrades Boardings/Track Miles Link Radio Upgrade Location Link SCADA System Support Boardings/Track Miles Link Station Braided Tile Replacement Location LRV Overhaul Boardings/Track Miles LRV Wireless Communication Upgrade Boardings/Track Miles King Street Station Vertical Window Glazing Location OMF Upgrades Boardings/Track Miles Othello TPSS Parking Lot Location Pierce Transit GPS Repeater Location Safety Oversight Approval Program Location Small Works Program Location
158 of 159
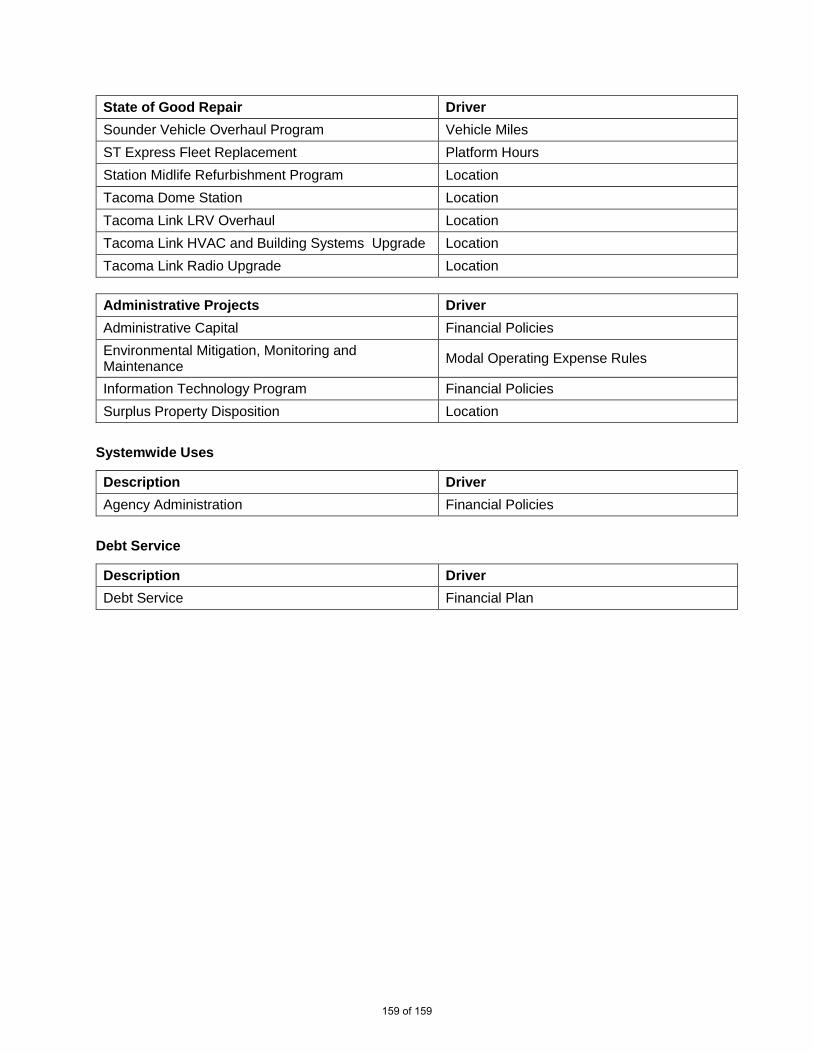
State of Good Repair Driver Sounder Vehicle Overhaul Program Vehicle Miles ST Express Fleet Replacement Platform Hours Station Midlife Refurbishment Program Location Tacoma Dome Station Location Tacoma Link LRV Overhaul Location Tacoma Link HVAC and Building Systems Upgrade Location Tacoma Link Radio Upgrade Location
Administrative Projects Driver Administrative Capital Financial Policies Environmental Mitigation, Monitoring and Maintenance Modal Operating Expense Rules
Information Technology Program Financial Policies Surplus Property Disposition Location
Systemwide Uses
Description Driver Agency Administration Financial Policies
Debt Service
Description Driver Debt Service Financial Plan
159 of 159

Union Station | 401 S. Jackson St., Seattle, WA 98104-2826 1-800-201-4900 | TTY Relay: 711 | soundtransit.org
Sound Transit plans, builds and operates regional transit systems and services to improve mobility for Central Puget Sound.