Embed Size (px)
Citation preview

Oklahoma School Testing Program
Oklahoma Core Curriculum Tests
Grades 3 to 8 Assessments
2012 Technical Report
Submitted toThe Oklahoma State Department of Education
August 2012

DRAFT OCCT 3-8 2012 Technical Report
Executive Summary
Introduction
The Oklahoma Core Curriculum Tests (OCCT) is one component of the Oklahoma School Testing Program (OSTP). The OCCT is a state-wide criterion referenced assessment program that includes tests of Mathematic and Reading in grades 3 through 8; Science in grades 5 and 8; Social Studies in grades 5, 7 (Geography), and 8 (U.S. History, Constitution, and Government); and Writing in grades 5 and 8. Each test is designed as a measure of a student’s knowledge relative to the Priority Academic Student Skills (PASS), Oklahoma’s content standards.
The OCCT tests of Writing were administered on February 21-22, 2012. Five tests—grade 7 Geography, grades 7 and 8 Mathematics, and grades 7 and 8 Reading are primarily computer delivery (a paper form is also available), and were administered during the online test window from April 10, 2012 to May 4, 2012. The remaining tests were administered via paper between April 10, 2012 and April 24, 2012. This report provides technical details of work accomplished through the end of 2012 on all of these tests.
Purpose
The purpose of this Technical Report is to provide objective information regarding technical aspects of the OSTP-OCCT 3-8 assessments. This volume is intended to be one source of information to Oklahoma K-12 educational stakeholders (including testing coordinators, educators, parents, and other interested citizens) about the development, implementation, scoring, and technical attributes of the OCCT 3-8 assessments. Other sources of information regarding this battery of tests include the administration manuals, interpretation manuals, student-, teacher-, and parent guides, implementation materials, and training materials.
The information provided here fulfills legal, professional, and scientific guidelines (AERA, APA, & NCME, 1999) for technical reports of large-scale educational assessments and is intended for use by qualified users within schools who use the OSTP-OCCT 3-8 assessments and interpret the results. Specifically, information was selected for inclusion in this report based on NCLB requirements and the following Standards for Educational and Psychological Testing:
Standards 6.1—6.15 Supporting Documentation for Tests Standards 10.1—10.12 Testing Individuals with Disabilities Standards13.1—13.19 Educational Testing and Assessment
This technical report provides accurate, complete, current, and clear documentation of the OSTP-OCCT 3-8 development methods, data analysis, and results as is appropriate for use by qualified users and technical experts. Section 1 provides an overview of the test design, test content, and content standards. Section 2 provides summary information about the test administration. Section 3 details the classical item analyses and reliability results, and Section 4 details the calibration, equating, scaling analyses, and results. Section 5 provides the results of the classification accuracy and classifications studies. Finally, Section 6 provides higher-level summaries of all the tests included in the OSTP-OCCT 3-8 testing program.
Pearson, Inc. and SDE Confidentialii

DRAFT OCCT 3-8 2012 Technical Report
Information provided in this report presents valuable information about the OSTP-OCCT 3-8 assessments regarding:
1. Content standards,2. Content of the tests,3. Test form design,4. Administration of the tests,5. Identification of ineffective items,6. Detection of item bias,7. Reliability of the tests,8. Calibration of the tests,9. Equating of tests,10.Scaling and scoring of the tests, and11.Decision accuracy and classification.
Each of these facets in the OSTP-OCCT 3-8 assessments development and use cycle is critical to the validity of test scores and interpretation of results. This technical report covers all of these topics for the 2011-12 testing year.
Pearson, Inc. and SDE Confidentialiii

DRAFT OCCT 3-8 2012 Technical Report
Table of Contents
Section 1 71.1 Content Assessed by the OCCT.........................................................................81.2 Summary of Test Development and Content Validity.......................................9
1.2.a Aligning Tests to PASS Content Standards...............................................101.2.b Additional Considerations in Item Selection.............................................101.2.c Configuration of Test Forms and Field-Test Design...................................11
Section 2 132.1 Packaging and Shipping..................................................................................132.2 Materials Return..............................................................................................132.3 Materials Discrepancies Process.....................................................................142.4 Processing Assessment Materials Returned by Schools..................................14
Section 3 153.1 Data Receipt Activities....................................................................................153.2 Classical Item Analyses...................................................................................18
3.2.a Test-Level Summaries of Classical Item Analyses....................................183.3 Procedures for Detecting Item Bias.................................................................193.4 Data Review....................................................................................................21
3.4.a Data Review Materials and Meetings........................................................223.4.b Results of Data Review.............................................................................22
3.5 Test Reliability................................................................................................233.6 Analysis of the Writing Tests...........................................................................24
3.6.a Prompt Scoring.........................................................................................253.6.b Adjustment for Rater-Year Effects............................................................253.6.c Inter-rater Reliability.................................................................................26
Section 4 294.1 Item Response Theory (IRT) Models................................................................294.2 Assessment of Item Fit to the IRT Model.........................................................294.3 Calibration and Equating.................................................................................304.4 Anchor Items and Anchor Stability Evaluation Methods..................................304.5 Scaling and Scoring Results............................................................................32
Section 5 465.1 Classification Consistency and Accuracy.........................................................46
Section 6 506.1 Descriptive Statistics......................................................................................506.2 Performance Level Distribution.......................................................................546.3 Conditional Standard Error of Measurement...................................................55
Pearson, Inc. and SDE Confidentialiv

DRAFT OCCT 3-8 2012 Technical Report
6.4 Standard Error of Measurement......................................................................56References 58Appendix A 59Appendix B 77
Pearson, Inc. and SDE Confidentialv

DRAFT OCCT 3-8 2012 Technical Report
List of Tables
Table 1-1. Testable Standards for OCCT Grades 3 to 8 8Table 1-2. Criteria for Aligning the Test with PASS Standards and Objectives. 10Table 1-3. Percentage of Items by Depth of Knowledge Levels 11Table 1-4. Configuration of the OSTP-OCCT 3-8 Tests for Spring 2012 12Table 3-1. Demographic Characteristics of the Student Subsample for Spring 2012
16Table 3-2. Demographic Characteristics of the Student Population for Spring 2012
17Table 3-3. Test-Level Summaries of Classical Item Analyses for Spring 2012 19Table 3-4. DIF Flag Incidence Across All OSTP-OCCT 3-8 Field Test Items for Spring
2012 21Table 3-5. Spring 2012 Data Review Flagging and Outcomes Summary 23Table 3-6. Test Reliability by Subgroup for Spring 2012 24Table 3-7. Writing Analytic Traits and Scoring Weights 25Table 3-8. Results of Grades 5 and 8 Writing Prompt Scoring and Scaling 26Table 3-9. Inter-rater Reliability for Grades 5 and 8 Writing Prompts for Spring 2012
28Table 4-1. Number of Anchor Items per Grade and Subject for Spring 2012 31Table 4-2. LOSS, HOSS, Scaling Constants, and Cut Scores by Subject 33Table 4-3. Raw Score to Scale Score Conversion Tables for Mathematics (grades 3 to
5) Spring 2012 34Table 4-4. Raw Score to Scale Score Conversion Tables for Mathematics (grades 6 to
8) Spring 2012 36Table 4-5. Raw Score to Scale Score Conversion Tables for Reading (grades 3 to 5)
Spring 2012 38Table 4-6. Raw Score to Scale Score Conversion Tables for Reading (grades 6 to 8)
Spring 2012 40Table 4-7.Raw Score to Scale Score Conversion Tables for Science Spring 2012
42Table 4-8. Raw Score to Scale Score Conversion Tables for Social Studies Spring
2012 44Table 5-1. Estimates of Accuracy and Consistency in Performance Classifications
47Table 5-2. Accuracy and Consistency Estimates and False Positive/False Negative
Rates by Cut Score 49Table 6-1. Descriptive Statistics of Scale Scores for Spring 2012 - Overall 50Table 6-2. Descriptive Statistics of Scale Scores for Spring 2012 by Gender 51
Pearson, Inc. and SDE Confidentialvi

DRAFT OCCT 3-8 2012 Technical Report
Table 6-3. Descriptive Statistics of Scale Scores for Spring 2012 by Race/Ethnicity52
Table 6-4. Descriptive Statistics of Scale Scores for Spring 2012 by Free/Reduced Lunch Status 54
Table 6-5. Percentage of Students by Performance Level for Spring 2012 55
Pearson, Inc. and SDE Confidentialvii

Section 1
Overview of the Oklahoma School Testing Program (OSTP)Oklahoma Core Curriculum Tests (OCCT) for Grades 3 to 8
The Oklahoma Core Curriculum Tests are state-mandated, criterion-referenced tests used to assess student proficiency. In the spring of 2012, the OCCT assessments were administered to all eligible public school students in grades 3 through 8. Currently, this assessment program includes tests of Mathematics and Reading in grades 3 through 8, Science and Writing in grades 5 and 8, and Social Studies in grades 5, 7, and 8. The 2012 administration of the OCCT was the 17th for students in grades 5 and 8 and the 7th for students in grades 3, 4, and grade 7 Social Studies (Geography). This was the 7th operational administration of the Reading and Mathematics tests in grades 6 and 7.
All 19 assessments are designed to measure student performance relative to a specific set of academic skills established by committees of Oklahoma educators. This set of skills—the Priority Academic Student Skills (PASS)—represents skills that students are expected to master by the end of each grade for each subject. The OCCT are untimed tests, and with the exception of the writing assessment, which is a single open-ended written response to a prompt, student performance is measured exclusively by multiple choice (MC) items. The MC tests in grades 3 through 5 are administered in two sessions. All tests in grades 6 through 8, as well as the grade 5 writing test, are administered in a single session. The grades 7 and 8 Mathematics and Reading tests, as well as the grade 7 Geography tests were primarily computer delivered (paper forms were available only for make-ups or for test test-takers with accommodations requiring a paper form). Tests for all other grades and subjects were administered exclusively in paper and pencil format.
Pearson content specialists and research scientists worked with the Oklahoma State Department of Education (SDE) to construct OCCT test forms aligned to the PASS standards. In each test, a form consisted of a set of operational items used to produce student test scores and a set of embedded field-test items. The two Writing assessments consisted of a single constructed-response (CR) item. The operational set of items for the Reading, Mathematics, Science, and Social Studies assessments were composed of Multiple-Choice (MC) items only. For each subject and grade, there were between eight and twelve forms consisting of a common set of operational items and a unique set of 10 field-test items. Responses to the operational items were used to produce student scores. Responses to the field-test items were used to evaluate the psychometric properties of these newly developed items for possible inclusion on future forms. In addition to the regular operational form, an equivalent form was designated for all Mathematics and Reading tests as well as grade 7 Geography, and a Braille version of each 2012 operational form was created as well. A student could receive an equivalent form for various reasons, including becoming ill during test administration or experiencing some kind of security breach. The State Department of Education Office of Accountability and Assessments determines eligibility for an equivalent form on a case-by-case basis. Responses for students who took an
Pearson, Inc. and SDE Confidential8

equivalent form were scored and reported using the scoring tables from the form’s previous administration.
1.1 Content Assessed by the OCCT
The OCCT is developed with the expressed purpose of measuring the Oklahoma PASS content standards. In some cases, the PASS standards contain objectives that are not easily assessed in a large-scale and standardized format (e.g., English-Language Arts PASS standards include listening, reviewing). Standards that are not assessed using the OCCT must be assessed by school districts locally. A complete listing of all standards and objectives for all subjects and grades (measured and unmeasured) can be found on the SDE website: http://www.ok.gov/sde/test-support-teachers-and-administrators.
A list of the testable standards for each subject is provided in Table 1-1. For Math1 and Reading2, the same testable standards appear in each grade level.
The tables in Appendix A provide information drawn from the 2012 PASS blueprints. These tables show the PASS standards, objectives, skills, and processes, as well as the number of items allocated to each standard, objective/skill and/or process according to the blueprint and actual number of items appearing on the 2012 operational form.
Table 1-1. Testable Standards for OCCT Grades 3 to 8Mathematics Grades 3 to 8
Standard 1. Algebraic Reasoning: Patterns and Relationships
Standard 2. Number Sense and OperationStandard 3. GeometryStandard 4. MeasurementStandard 5. Data Analysis
Reading Grades 4 to 8 (Grade 3)Standard 1. (Standard 2.) Vocabulary Standard 3. (Standard 4.) Comprehension/Critical Literacy Standard 4. (Standard 5.) Literature Standard 5. (Standard 6.) Research and Information
Science Grades 5 & 8PASS Process/Inquiry Standards and Objectives
1 The Mathematics PASS standards were revised in 2009-2010 and required significant changes to the test blueprints, and thus required significant changes to the OCCT Mathematics item bank. 2 While the Reading PASS standards that are assessed by OCCT are the same, the enumeration of these standards is slightly different in grade 3.
Pearson, Inc. and SDE Confidential9

Process 1. Observe and Measure Process 2. Classify Process 3. Experiment Process 4. Interpret and Communicate
Grade 5 PASS Content StandardsStandard 1. Properties of Matter and EnergyStandard 2. Organisms and EnvironmentsStandard 3. Structures of the Earth and the Solar
SystemGrade 8 PASS Content Standards
Standard 1. Properties and Chemical Changes in Matter Standard 2. Motion and Forces Standard 3. Diversity and Adaptations of Organisms Standard 4. Structures/Forces of the Earth/Solar
System Standard 5. Earth’s History
Social Studies Grade 5Standard 2. Early ExplorationStandard 3. Colonial AmericaStandard 4. American RevolutionStandard 5. Early Federal PeriodStandard 7. Geographic Skills
Social Studies Grade 7 (Geography)Standard 1./6. Geographic Tools/Geography SkillsStandard 2. RegionsStandard 3. Physical SystemsStandard 4. Human SystemsStandard 5. Human/Environment Interaction
Social Studies Grade 7 (U.S. History)Standard 1. Social Studies Process Skills Standard 3./4. Causes and Results of the American
RevolutionStandard 5. Governing Documents/Early Federal PeriodStandard 6./10. Moving Toward the Civil WarStandard 7./8. Early 19th Century AmericaStandard 9. Westward Movement
Pearson, Inc. and SDE Confidential10

1.2 Summary of Test Development and Content Validity
To ensure content validity of the OCCT tests, Pearson content specialists closely study the Oklahoma Priority Academic Student Skills (PASS) and work with Oklahoma content area specialists, teachers, and assessment experts to develop a pool of items that measure Oklahoma’s assessment frameworks (i.e., PASS) for each subject. Once the need for field test items was determined, based on the availability of items for future test construction, a pool of items that measured Oklahoma's PASS in each subject was developed. These items were developed under universal design guidelines set by the SDE and were carefully reviewed and discussed by content and bias/sensitivity review committees to evaluate not only content validity, but also plain language and the quality and appropriateness of the items. These committees were comprised of Oklahoma teachers and SDE staff. The committees’ recommendations were used to select and/or revise items from the item pool used to construct the field test portions of the Spring 2012 assessments.1.2.a Aligning Tests to PASS Content Standards
In addition to the test blueprints provided by SDE (see Appendix A), Table 1-2 describes five criteria for test alignment with the PASS Standards and Objectives.
Pearson, Inc. and SDE Confidential11

Table 1-2. Criteria for Aligning the Test with PASS Standards and Objectives.
1. Categorical Concurrence
The test is constructed so that there are at least six items measuring each PASS standard. The number of items is based on estimating the number of items that could produce a reasonably reliable estimate of a student’s mastery of the content measured.
2. Depth of Knowledge Consistency
The test is constructed using items from a variety of Depth of Knowledge levels that are consistent with the processes students need in order to demonstrate proficiency for each PASS objective.
3. Range of Knowledge Correspondence
The test is constructed so that at least 75% of the objectives for a PASS standard have at leastone corresponding assessment item.
4. Balance of Representation
The test is constructed according to the test blueprint, which reflects the degree of representation given on the test to each PASS standard and/or objective in terms of the percent of total test items measuring each standard and the number of test items measuring each standard and/or objective. The test construction shall yield a balance of representation with an index of 0.7 or higher of assessed objectives related to a standard.
5. Source of Challenge
Each test item is constructed in such a way that the major cognitive demand comes directly from the targeted PASS objective or concept being assessed, not from specialized knowledge or cultural background of the test-taker.
1.2.b Additional Considerations in Item Selection
The source of the operational items eligible for inclusion on the Spring 2012 form is a pool of previously field-tested or operationally-administered items ranging from the Spring 2005 through the Spring 2011 administrations. In each case, items were calibrated using live data from the operational administrations to estimate parameters for these items.
To equate the forms across years, a set of operational items served as anchors or links to the base scale. Equating is necessary to account for slight year-to-year differences in form difficulty and/or student achievement and to maintain comparability across years. Details of the equating procedures applied are provided in a subsequent section in this document. Content experts also targeted the percentage of items measuring various Depth of Knowledge (DOK) levels for assembling the tests. Table 1-3 provides the DOK level percentages for the Spring 2012 operational assessments.
Table 1-3. Percentage of Items by Depth of Knowledge LevelsSubje Grade DOK Level
Pearson, Inc. and SDE Confidential12

ct
1 2 3Target
Actual
Target
Actual
Target
Actual
Math
3 20-25 20 65-70 70 5-15 104 20-25 24 65-70 64 5-15 125 20-25 22 65-70 63 5-15 146 10-15 14 65-70 70 15-25 167 10-15 14 65-70 68 15-25 188 10-15 14 65-70 68 15-25 18
Reading
3 20-25 16 65-70 68 5-15 164 20-25 18 65-70 66 5-15 165 20-25 14 65-70 72 5-15 146 10-15 12 65-70 66 15-25 227 10-15 10 65-70 72 15-25 188 10-15 4 65-70 84 15-25 12
Science
5 20-25 18 65-70 67 5-15 168 10-15 11 60-70 69 15-30 20
Social Studie
s
5 20-25 23 65-70 67 5-15 107 10-15 11 65-70 69 15-25 208 10-15 13 65-70 67 15-25 20
Note: All values are in percentages.
1.2.c Configuration of Test Forms and Field-Test Design
Table 1-4 provides an overview of the number of operational and field test items for the Spring 2012 OSTP-OCCT 3-8 assessments. The Spring 2012 test is comprised of a single core of operational items on each form. For each of the MC tests, at least 20% of the operational items were designated as potential anchor items to be used in the equating process (the process for acceptance as an anchor item is detailed in Section 4). For the 17 MC tests, between eight and twelve field-test forms were created. Each field-test form included the operation core and 10 field-test items. These items are embedded in the operational test forms with the intent of building the item bank for future use. Each form of the assessment was spiraled within classrooms to obtain randomly-equivalent samples of examinees for the field test items.
New items are field-tested to build up the item bank for future high-stakes administrations. The overall field test design used by Pearson was an embedded field test design where newly-developed field test items were embedded throughout the test. The advantage of an embedded field test design is that test-takers do not know where the field test items are located and therefore will treat each item as a scored item. Ten multiple choice field test items were placed in common positions on each forms of each assessment. Field test items were prioritized for inclusion on forms based on current item bank analyses which revealed which particular
Pearson, Inc. and SDE Confidential13

standards and objectives would benefit most from field testing. The tables in Appendix A contain the counts of field-test items aligned with each PASS objective. Additional Common Core-aligned and vertical linking field test items for Mathematics and Reading are not included in the counts in this table.
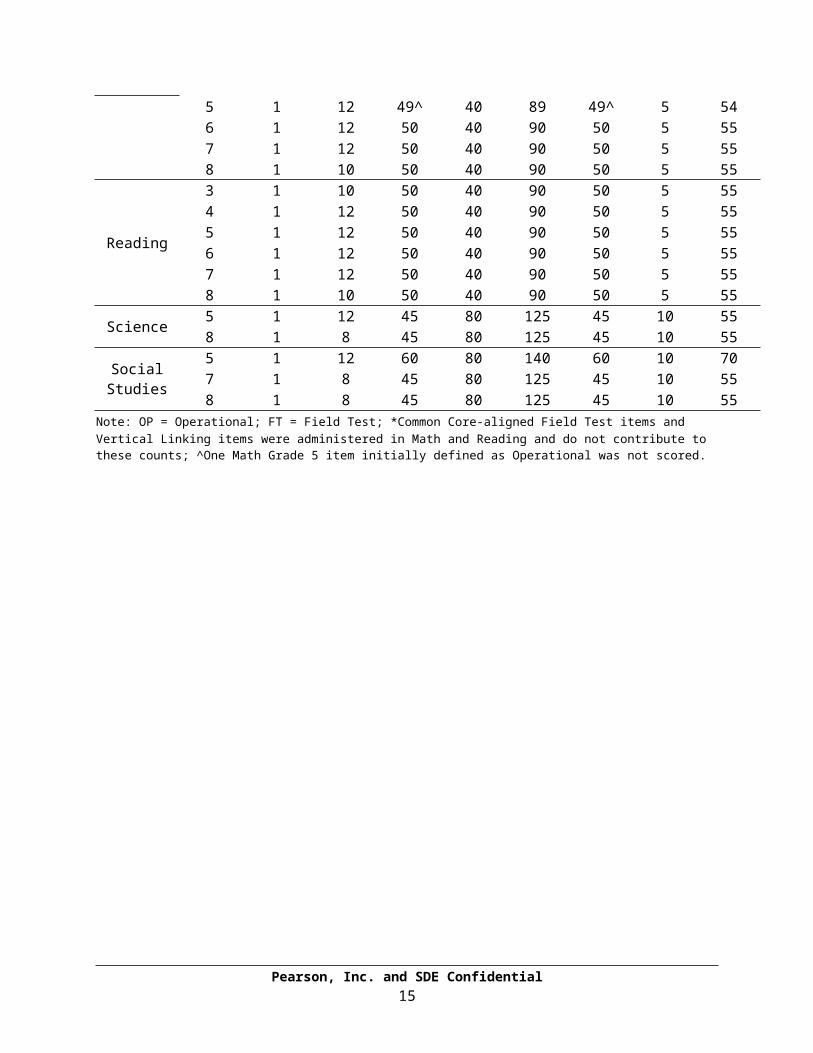
Table 1-4. Configuration of the OSTP-OCCT 3-8 Tests for Spring 2012
SubjectGrad
e
Counts Across Forms
Count of PASS-Aligned Items per FT
Form
Core Forms
FT Form
sOP
Items
FT Items
*Total Items OP FT* Total
Math
3 1 10 50 40 90 50 5 554 1 12 50 40 90 50 5 555 1 12 49^ 40 89 49^ 5 546 1 12 50 40 90 50 5 557 1 12 50 40 90 50 5 558 1 10 50 40 90 50 5 55
Reading
3 1 10 50 40 90 50 5 554 1 12 50 40 90 50 5 555 1 12 50 40 90 50 5 556 1 12 50 40 90 50 5 557 1 12 50 40 90 50 5 558 1 10 50 40 90 50 5 55
Science 5 1 12 45 80 125 45 10 558 1 8 45 80 125 45 10 55
Social Studies
5 1 12 60 80 140 60 10 707 1 8 45 80 125 45 10 558 1 8 45 80 125 45 10 55
Note: OP = Operational; FT = Field Test; *Common Core-aligned Field Test items and Vertical Linking items were administered in Math and Reading and do not contribute to these counts; ^One Math Grade 5 item initially defined as Operational was not scored.
Pearson, Inc. and SDE Confidential14
Section 2
Administration of the OCCT in Grades 3 to 8
Valid and reliable assessment requires that tests are first constructed in alignment with the Oklahoma content standards and then administered and scored according to sound measurement principles. Sound assessment practices require that schools administer all assessments in a consistent manner across the state so that all students have a fair and equitable opportunity to receive a score that accurately reflects their achievement in each subject. The schools play a key role in administering the OSTP-OCCT 3-8 assessments in a manner consistent with established procedures, monitoring the fair administration of the assessment, and working with the SDE office to address deviations from established assessment administration procedures. The role that district and school faculty members play is essential in the fair and equitable administration of the OCCT.
2.1 Packaging and Shipping
To provide OSTP-OCCT 3-8 with secure and dependable services for the shipping of the Oklahoma assessment materials, Pearson’s Warehousing and Transportation Department maintains the quality and security of material distribution and return by using such methods as sealed trailers and hiring reputable carriers with the ability to immediately trace shipments. Pearson uses all available tracking capabilities to provide status information and early opportunities for corrective action.
Materials are packaged by school and delivered to the district coordinators. Each shipment to a district contains a shipping document set that includes a packing list for each school’s materials and a pallet map that shows the identity and pallet assignment of each carton.
Materials are packaged using information provided by the Assessment Coordinators through the PearsonAccess™ website, and optionally with data received directly from Oklahoma. Oklahoma educators also use the PearsonAccess™ site to provide Pearson with the Pre-Identification information needed to print the student identification section on answer documents. Bar-coding of all secure materials during the pre-packaging effort allows for accurate tracking of these materials through the entire packing, delivery, and return process. It also permits Pearson to inventory all materials throughout the packaging and delivery process, along with the ability to provide the customer with status updates at any time. Use of handheld radio-frequency scanners in the packaging process help to eliminate the possibility of packing the wrong materials. The proprietary “pick-and-pack” process prompts packaging personnel as to what materials are to go in which shipping box. If the packer tries to pack the wrong item (or number of items into a shipping carton), the system signals an alert.
2.2 Materials Return
Test administration handbooks provide clear instructions on how to assemble, box, label, and return testing materials after test administration. Because of the criticality of used test materials and quantities often involved, safety is also a major
Pearson, Inc. and SDE Confidential15

concern, not only for the materials but for the people moving them. Only single-column boxes are used to distribute and collect test materials, so the weight of each carton is kept to a reasonable and manageable limit.
Paper bands are provided to group and secure used student response booklets for scoring. Color-coded return mailing labels with detailed return information (district address and code number, receipt address, box x of y, shipper’s tracking number, etc.) are also provided. These labels facilitate accurate and efficient sorting of each carton and its contents upon receipt by Pearson.
2.3 Materials Discrepancies Process
The image scanning process enables Pearson to concurrently capture optical mark read (OMR) responses, images, and security information electronically. All scorable material discrepancies are captured, investigated by our Oklahoma Call Center team, reported, and resolved prior to a batch passing through a clean post edit and images being released for scoring.
As scanning of materials progresses, any discrepancies in materials received versus shipped are reported immediately to the SDE, and scoring will begin on materials with no discrepancies. This system allows Pearson to proceed in scoring clean batches while any discrepant material issues are being resolved. As discrepant materials are received, they are processed. Data from discrepant material receipts are captured in the same database as all other material receipts, resulting in a complete record of materials for each school. As batches clear the clean post edit, clipped images are prepared and distributed for scoring. The Oklahoma Call Center Team notifies the SDE regarding unresolved material discrepancies within 24 hours of Pearson’s initial attempt to contact the school principal. Within one week after materials are returned, Pearson’s Service Center Team also notifies the SDE of any missing or incomplete shipments from schools that received testing materials.
Pearson provides updates to the initial discrepancy reports on a daily basis in response to SDE specifications and requests. The Oklahoma Call Center team makes every attempt to resolve all discrepancies involving secure test books and used answer booklets in a timely manner. Using daily, updated discrepancy reports, Pearson is in constant contact with the respective districts/schools. Pearson and the SDE work out details on specific approaches to resolution of material return discrepancies, and what steps will be taken if unaccounted for secure test books and/or used answer documents are not found and remain unreturned to Pearson.
2.4 Processing Assessment Materials Returned by Schools
Pearson’s receipt system provides for the logging of materials within 24 hours of receipt and the readiness of materials for scanning within 72 hours of receipt. District status is available from a web-based system accessible to SDE. In addition, the Oklahoma Call Center is able to provide receipt status information as required. The receipt notification website’s database is updated daily to allow for accurate information being presented to inquiring district/school personnel. As with initial shipping, the secure and accurate receipt of test materials is a priority with Pearson. Quality assurance procedures provide that all materials are checked in using pre-
Pearson, Inc. and SDE Confidential16

defined procedures. Materials are handled in a highly secure manner from the time of receipt until final storage and shredding. The receipt of all secure materials is verified through the scanning of barcodes and the comparison of these data to that in security files established during the initial shipment of Oklahoma test materials to the district assessment coordinators.
Pearson, Inc. and SDE Confidential17
Section 3
Classical Item Analysis and Results
This section provides an overview of the initial statistical analyses carried out for the 2012 administration of the OCCT. Following the administration of the OCCT, student demographic and item response data were transmitted to Pearson research scientists, who are responsible for all statistical analyses for the OCCT assessments. The classical analyses described in this section (as well the calibration and equating of each test) were conducted using carefully selected samples of approximately 15,000 students for each grade and subject.
3.1 Data Receipt Activities
After all tests were scored, a data clean-up process that removed invalid cases, ineligible responses, and absent students was preformed for each test. Additionally, a statistical key check was performed at this time. This ‘cleaned’ sample was used to create the subsample file to be used in subsequent classical item analyses, calibration, and equating. Upon receipt of data, a Pearson research scientist inspected several data fields to determine if the data met expectations. This included screening the following variables:
Student ID Demographic fields Form identification fields Raw item responses Scored item responses Total score and subscore fields Fields used to implement exclusion from analysis rules
Exclusion Rules. Following data inspection and clean-up, exclusionary rules were applied to form the final sample that was used for classical item analyses, calibration, and equating. Any student who had attempted at least five responses was eligible for inclusion in the data analyses.
Subsampling. Contractual requirements dictate that equated scale scores and performance levels be delivered to SDE within 48 hours of the close of the testing window for online tests and within 2 weeks of the close of paper-and-pencil tests. To meet this reporting schedule, student data were obtained prior to the close of the administration windows. To ensure that subsamples used for analyses and equating were representative of the population of Oklahoma students, Pearson research scientists pulled stratified subsamples of approximately 15,000 students for each grade and subject, conditioning on district representation, gender, and ethnicity. The sampling technique employed was approved by both the SDE and the Oklahoma Technical Advisory Committee (TAC), a panel of recognized experts in measurement and policy. The demographic breakdown of the students in Spring 2012 item analysis and calibration subsamples appears in Table 3-5 and for all students in Table 3-6. The subsamples used for analyses and equating were deemed to be appropriately representative of the test-taking population.
Pearson, Inc. and SDE Confidential18

Table 3-5. Demographic Characteristics of the Student Subsample for Spring 2012
Subject/GradeFemal
e Male
African America
n
Native America
n HispanicAsia
n
Pacific Islande
r WhiteOthe
r
Math
3 7587 7472 1466 2469 2109 295 31 7955 7434 7511 7579 1399 2523 2036 307 42 8077 7265 7474 7541 1367 2566 1952 293 31 8077 7456 7590 7584 1304 2647 1897 247 45 8363 6847 7567 7644 1249 2681 1876 266 33 8386 7208 7613 7591 1199 2783 1677 218 26 8543 760All 45342 45411 7984 15669 11547 1626 208 49401 4378
Reading
3 7644 7548 1478 2494 2130 298 38 8024 7454 7511 7566 1398 2514 2022 308 37 8081 7335 7459 7535 1364 2567 1931 294 32 8071 7466 7542 7452 1288 2617 1863 245 44 8286 6767 7670 7456 1366 2502 1854 316 50 8352 6868 7568 7573 1458 2429 1842 321 38 8275 784All 45394 45130 8352 15123 11642 1782 239 49089 4370
Science5 7496 7624 1402 2587 1960 292 35 8114 7428 7515 7675 1358 2595 1777 270 49 8467 694All 15011 15299 2760 5182 3737 562 84 16581 1436
Social Studies
5 7443 7679 1492 2610 1962 279 32 8060 7107 7467 7765 1529 2686 1714 252 37 8269 7458 7384 7731 1350 2650 1746 271 51 8422 660
Pearson, Inc. and SDE Confidential19

Subject/GradeFemal
e Male
African America
n
Native America
n HispanicAsia
n
Pacific Islande
r WhiteOthe
rAll 22294 23175 4371 7946 5422 802 120 24751 2115
Table 3-6. Demographic Characteristics of the Student Population for Spring 2012
Subject/GradeFemal
e Male
African America
n
Native America
n HispanicAsia
n
Pacific Islande
r WhiteOthe
r
Math
3 22622 22727 4132 7026 6773 852 127 23938 25354 21983 22049 4071 7096 6300 843 113 23173 24665 21663 21881 3919 7193 6017 876 117 23087 23756 21604 21642 4064 7211 5696 840 96 23079 22987 20958 20845 3885 7071 5161 792 117 22773 20048 20737 20782 3975 6937 5026 797 97 22660 2038
All12956
712992
6 24046 42534 34973 5000 66713871
01371
6
Reading
3 22740 22556 4167 6975 6765 853 128 23912 25334 22040 21819 4059 7030 6268 843 116 23102 24635 21819 21762 3957 7183 5989 869 119 23117 23776 21862 21828 4164 7271 5735 845 95 23282 23407 21116 20907 3918 7081 5191 799 114 22913 20078 20848 20873 3985 6959 5026 786 106 22807 2065
All13042
512974
5 24250 42499 34974 4995 67813913
31378
5Science 5 21892 22129 4012 7273 6055 878 117 23303 2411
Pearson, Inc. and SDE Confidential20

Subject/GradeFemal
e Male
African America
n
Native America
n HispanicAsia
n
Pacific Islande
r WhiteOthe
r8 21319 21642 4179 7126 5277 825 109 23292 2195All 43211 43771 8191 14399 11332 1703 226 46595 4606
Social Studies
5 23068 24180 4423 7891 6508 898 119 24837 26217 22193 22746 4330 7683 5593 811 118 24243 21618 22353 23495 4565 7686 5618 830 111 24732 2379All 67614 70421 13318 23260 17719 2539 348 73812 7161
Pearson, Inc. and SDE Confidential21

Statistical Key Check. Administering items that have only one key and are correctly scored is critical for accurate assessment of student performance. To screen for potentially problematic items, a statistical key check was conducted and items were flagged that met any of the following criteria:
Less than 200 students responded to the item Correct response p-value less than 0.25 Correct response uncorrected point-biserial correlation less than 0.20 Distractor p-value greater than or equal to 0.40 Distractor point-biserial correlation greater than or equal to 0.05
Any flagged operational items are submitted for key review by a Pearson content specialist. Any flagged items that are identified by content experts as having key issues are submitted to SDE for review before dropping the item from the operational scoring. There were no items identified in the Spring 2012 administrations as having a key issue. Once the keys were verified, classical item analyses were conducted.
3.2 Classical Item Analyses
Following completion of the data receipt activities and statistical key check, the following classical item analyses were conducted for operational and field test items:
Percentage of students endorsing each multiple choice response option (overall and broken down by gender and ethnicity)
Overall p-value for each item Point-biserial correlation (overall and broken down by gender and ethnicity) Point-biserial for distractor response options (overall and broken down by
gender and ethnicity) Omit percentage per item Mean score by response option (overall and broken down by gender and
ethnicity)
The classical analysis of operational items is used as an additional quality control step to ensure that operational items are not behaving in an unexpected or aberrant manner. The item analysis results of the operational items are reviewed by Pearson research scientists and, in the case of unexpected item performance, a course of action (e.g., retain item, drop from operational scoring) regarding the item(s) are recommended to SDE. In the 2012 administration, all operational items preformed adequately and were deemed appropriate for calibration and equating.
3.2.a Test-Level Summaries of Classical Item Analyses
The test-level raw score descriptive statistics for the calibration samples are shown in Table 3-7. The operational test results indicate that the omit rates were small for all assessments (grade 3, which is administered using a consumable booklet, is slightly higher). Across tests, the average p-value ranged from 0.60 to 0.77 and the average point biserial correlation ranged from 0.36 to 0.42. In tandem, these summary statistics indicate sets of operational items that are functioning appropriately.
Pearson, Inc. and SDE Confidential22

Table 3-7. Test-Level Summaries of Classical Item Analyses for Spring 2012
SubjectGrad
e
Sample
SizeMea
n
Mean
% ofMax
ItemsPoint
s
MeanP
Meanrpb
Omit
Min
Omit
Max
Math
315068 38.0
70.76 50 0.76 0.41 0.09 2.38
415110 37.9
90.76 50 0.76 0.41 0.01 0.89
515031 35.5
70.73 49 0.73 0.39 0.00 0.37
615187 33.0
80.66 50 0.66 0.41 0.03 0.39
715211 31.6
10.63 50 0.63 0.40 0.00 0.05
815206 32.0
80.64 50 0.64 0.41 0.00 0.07
Reading
315207 35.9
10.72 50 0.72 0.41 0.08 1.09
415093 37.1
70.74 50 0.74 0.39 0.01 0.19
515005 38.1
30.76 50 0.76 0.40 0.01 0.11
615019 35.2
20.70 50 0.70 0.41 0.01 0.23
715126 38.3
00.77 50 0.77 0.38 0.00 0.09
815147 38.3
80.77 50 0.77 0.36 0.00 0.05
Science5
15132 32.54
0.72 45 0.72 0.38 0.02 0.14
815210 29.6
90.66 45 0.66 0.38 0.01 0.19
Social Studies
515145 35.9
70.60 60 0.60 0.37 0.01 0.24
715232 30.8
30.69 45 0.69 0.37 0.00 0.05
815150 28.6
60.64 45 0.64 0.42 0.02 0.12
Pearson, Inc. and SDE Confidential23

rpb = point biserial correlation.
3.3 Procedures for Detecting Item Bias
One of the goals of the OSTP-OCCT 3-8 assessments is to assemble a set of items that provides a measure of a student’s achievement that is as fair and accurate as possible for all subgroups within the population. Differential item functioning (DIF) analysis refers to statistical procedures that assess whether items are differentially difficult for matched-achievement students across groups. DIF procedures typically control for overall between-group differences on a criterion, usually total test scores. Between-group performance on each item is then compared within sets of examinees having the same total test scores. If the item is differentially more difficult for an identifiable subgroup when conditioned on achievement, the item may be measuring something different from the intended construct. However, it is important to recognize that DIF-flagged items might be related to actual differences in relevant knowledge or skills or statistical Type I error. As a result, DIF statistics are used only to identify potential sources of item bias. Subsequent review by content experts and bias committees are required to determine the source and meaning of performance differences. For the OCCT DIF analyses, DIF statistics were estimated for all major subgroups of students with sufficient sample size: African American, Hispanic, Asian, Native American, and Female. Field test items with statistically-significant differences in performance were flagged so that items could be carefully examined for possible biased or unfair content that was undetected in earlier fairness and bias content review meetings held prior to form construction.
Pearson used the Mantel-Haenszel (MH) chi-square approach for detecting DIF. Pearson calculated the Mantel-Haenszel statistic (MH D-DIF; Holland & Thayer 1988) to measure the degree and magnitude of DIF. The student group of interest is the focal group, and the group to which performance on the item is being compared is the reference group. The reference groups for these DIF analyses were white students for race/ethnicity comparisons and male students for gender comparisons. The focal groups were members of minority racial groups and female students.
Items were separated into one of three categories on the basis of DIF statistics (Holland and Thayer 1988; Dorans and Holland 1993): negligible DIF (category A), intermediate DIF (category B), and large DIF (category C). The items in category C, which exhibit significant DIF, are of primary concern. The item classifications are based on the Mantel-Haenszel chi-square and the MH delta () value. Positive values of delta indicate that the item is easier for the focal group, and a negative value of delta indicates that the item is more difficult for the focal group. The item classifications are made as follows (Michaelides, 2008):
The item is classified into the C category if MH D-DIF is significantly different from zero (p < 0.05), and its absolute value is greater than or equal to 1.5.
The item is classified into the B category if MH D-DIF is significantly different from zero (p < 0.05), and its absolute value is between 1.0 and 1.5.
The item is classified into the A category if MH D-DIF is not significantly different from zero (p ≥ 0.05), or if its absolute value is less than 1.0.
The data in Table 3-8 summarize the number of field test items in DIF categories for the 17 multiple choice tests for the OCCT Spring 2012 administrations. Items
Pearson, Inc. and SDE Confidential24

flagged for DIF were placed before content experts during the Spring 2012 field test data review (described in Section 3.4.), and items that were determined to exhibit bias as a result of the content of the item were removed from the item bank, excluding them from future use.
Pearson, Inc. and SDE Confidential25

Table 3-8. DIF Flag Incidence Across All OSTP-OCCT 3-8 Field Test Items for Spring 2012
Subject/Grade
Total FT
itemsFemal
e
African America
n
Native America
nHispani
c Asian
Math
3 40 4 3 0 2 44 40 1 7 0 2 15 40 6 1 0 3 16 40 2 1 0 3 27 40 2 4 0 1 08 40 3 5 0 0 4
Reading
3 40 2 5 0 2 44 40 0 3 1 2 05 40 2 4 0 5 16 40 1 2 0 3 27 40 4 3 0 0 08 40 2 6 0 6 3
Science5 80 3 4 0 1 08 80 2 4 0 1 7
Social Studies
5 80 4 4 0 0 47 80 8 7 0 8 128 80 0 5 0 0 5
3.4 Data Review
Data review represents a critical step in the test development cycle. At the data review meeting, SDE and Pearson staff had the opportunity to review actual student performance on the newly-developed, field-tested multiple choice items across the 17 subjects and grades based on the Spring 2012 administration. The data review focused on the content validity, curricular alignment, and statistical functioning of field-tested items prior to selection for operational test forms. The field test results used in the data review provided evidence that the items were designed to yield valid results and were accessible for use by the widest possible range of students. The review of student performance should provide evidence regarding the fulfillment of requirement 200.2(b)(2)of NCLB. The purpose of the review meeting was to ensure that psychometrically-sound, fair, and aligned items are used in the construction of the OCCT 3-8 assessments and entered into the respective item banks. Pearson provided content and psychometric expertise to provide a clear explanation about the content of the items, the field test process, the scoring
Pearson, Inc. and SDE Confidential26

process, and the resulting field test data to ensure the success of these meetings and the defensibility of the program.
3.4.a Data Review Materials and Meetings
Data review meetings were undertaken as a collaborative effort between SDE and Pearson. SDE administrators and content specialists attended the meeting facilitated by Pearson content specialists and research scientists who trained the SDE staff on how to interpret and review the field test data. Meeting materials included a document explaining the flagging criteria and a binder containing item images and statistics. Pearson discussed with SDE the analyses performed and the criteria for flagging items. Flagged items were then reviewed and decisions were made on an item-by-item basis as to whether to accept the item, accept the item with revisions (which would require re-field-testing prior to operational use), or reject the item. Review of the data included presentation of the item’s p-value, point-biserial correlation, point-biserial correlation by response option, response distributions, mean overall score by response option, frequency distributions of response options by students in the lower, middle, and upper third of the score distribution, and indications of item DIF and IRT misfit. Items failing to meet the minimum performance requirements as set by the flagging criteria were carefully considered for rejection by the review panel, thereby enhancing the reliability and improving the validity of the items left in the bank for future use. While the panel used the data as a tool to inform their judgments, the panel (and not the data alone) made the final determination as to the appropriateness or fairness of the assessment items. The flagging criteria for the OCCT assessments are as follows:
p-value < .25 or > .90 point-biserial correlation < .20 distractor point-biserial correlation > .05 differential item functioning (DIF): test item biases for subgroups IRT misfit as flagged by the Q1 index (see Section 4.2)
Bias Review. One key goal of the data review meetings was to assess potential bias based on DIF results and item content. Although efforts were made to mitigate potential item bias through rigorous writer training and review processes, there remains potential for bias to be present in items, which may be detected through statistical analysis. It is important to include this step in the development cycle, because SDE and Pearson wish to avoid inclusion of an item that is biased in some way against a group, which may lead to inequitable test results. As described earlier, all field test items were analyzed statistically for DIF using the field test data. A Pearson research scientist explained the meaning, in terms of level, and the direction of the DIF flags. The data review panel reviewed the item content, the percentage of students selecting each response option, and the point-biserial correlation for each response option by subgroup for all items flagged for DIF. The data review panel was then asked if there was evidence of context (e.g., cultural barriers) or language in an item that might result in bias. The data review panel made the final determination regarding the presence of item bias.
Pearson, Inc. and SDE Confidential27

3.4.b Results of Data Review
The number of items inspected during data review as a result of employing the previously-described flagging criteria for the classical item analyses, DIF, and IRT procedures is presented in Table 3-9.
Pearson, Inc. and SDE Confidential28

Table 3-9. Spring 2012 Data Review Flagging and Outcomes Summary
SubjectGrad
eFT
Items
No. Flagge
dRejecte
dAccept
ed
Accepted with
Edits
Math
3 40 19 5 31 44 40 13 2 36 25 40 13 1 34 56 40 12 0 36 47 40 14 1 32 78 40 15 2 37 1
Reading
3 40 16 1 39 04 40 9 4 36 05 40 12 5 35 06 40 13 6 34 07 40 18 9 31 08 40 20 6 34 0
Science 5 80 19 4 69 78 80 29 9 68 3
Social Studies*
5 80 37 19 53 87 80 39 22 52 68 80 18 10 70 0
*Note. A large number of adequately-performing Social Studies items were rejected at data review due to a recent curriculum change, which resulted in these items no longer aligning to the content standards set to go into effect in 2012-13.
3.5 Test Reliability
The reliability of a test provides an estimate of the extent to which an assessment will yield the similar results when administered in different times, locations, or samples, when the two administrations do not differ in relevant variables. The reliability coefficient is an index of consistency of test results. Reliability coefficients are usually forms of correlation coefficients and must be interpreted within the context and design of the assessment and of the reliability study. Cronbach’s alpha is a commonly-used internal consistency measure, which is derived from analysis of the consistency of the performance of individuals on items in a test administration. Cronbach’s alpha is calculated as shown in equation (1). In this formula, si
2 denotes the estimated variance for each item, with items indexed i = 1, 2, …, k, and s2
sum denotes the variance for the sum of all k items:
. (1)
Pearson, Inc. and SDE Confidential29

Cronbach’s alpha was estimated for each of the content areas for the operational portion of the test.
Table 3-10 presents Cronbach’s alpha for the operational tests by subject area for the Spring 2012 OCCT administration. These reliability coefficients indicate that the OSTP-OCCT assessments had strong internal consistency and that the tests produce relatively stable scores. Additionally, Table 3-10 shows the reliability analysis results by the different reporting subgroups for the OSTP-OCCT assessments for Spring 2012 for the operational items. In all instances, the reliability coefficients are well above the accepted lower limit of .70, with most values near .90.
Table 3-10. Test Reliability by Subgroup for Spring 2012 Subjec
tGrad
e All F M AA NA HI AS PI WH OT
Math
3 0.90 0.90 0.90 0.91 0.89 0.90 0.91 0.93 0.89 0.904 0.90 0.90 0.90 0.91 0.89 0.90 0.91 0.93 0.89 0.905 0.89 0.88 0.89 0.89 0.88 0.88 0.88 0.91 0.88 0.886 0.90 0.90 0.90 0.89 0.89 0.89 0.91 0.91 0.89 0.897 0.89 0.89 0.90 0.89 0.88 0.88 0.90 0.87 0.89 0.908 0.90 0.89 0.90 0.90 0.89 0.89 0.91 - 0.90 0.89
Reading
3 0.90 0.89 0.90 0.90 0.88 0.90 0.91 0.90 0.89 0.904 0.89 0.88 0.89 0.90 0.87 0.88 0.92 - 0.87 0.895 0.89 0.89 0.90 0.90 0.89 0.89 0.89 0.87 0.88 0.896 0.90 0.89 0.91 0.90 0.89 0.89 0.89 0.93 0.89 0.907 0.88 0.87 0.89 0.89 0.87 0.89 0.90 0.89 0.87 0.878 0.86 0.86 0.86 0.88 0.84 0.88 0.90 0.93 0.84 0.85
Science
5 0.87 0.86 0.88 0.86 0.87 0.86 0.86 0.86 0.85 0.868 0.86 0.85 0.87 0.86 0.85 0.85 0.86 0.91 0.85 0.86
Social Studies
5 0.90 0.88 0.91 0.87 0.88 0.88 0.89 0.90 0.89 0.897 0.86 0.84 0.87 0.85 0.84 0.85 0.87 0.89 0.85 0.858 0.90 0.88 0.91 0.88 0.89 0.88 0.91 0.92 0.89 0.89
Note. Missing values in this table are reflective of subgroups with insufficient score variability for computation of reliability coefficients; F = Female, M = Male, AA = African American, NA = Native American, HI = Hispanic, AS = Asian, PI = Pacific Islander, WH = White, O = Other.
3.6 Analysis of the Writing Tests
The administration of the Spring 2012 Writing assessment took place on February 21 and 22, 2012. Students in grades 5 and 8 responded to one operational writing prompt. The following sections describe the statistical analyses conducted to place the 2012 operational writing prompts on the scale established in 2006.
Pearson, Inc. and SDE Confidential30

3.6.a Prompt Scoring
The writing score is a weighted composite of five analytic scores that focus on specific domains of writing skills. These skills are listed in Table 3-11. Each student’s response to a prompt is read by two independent raters; the raters’ scores for each domain are averaged. The domain scores range from 1 (the lowest score) to 4 (the highest score).
Table 3-11. Writing Analytic Traits and Scoring WeightsWriting Analytic Traits WeightIdeas and Development (ID) 30%Organization, Unity, and Coherence (OUC)
25%
Word Choice (WC) 15%Sentences and Paragraphs (SP) 15%Grammar, Usage, and Mechanics (GUM)
15%
The raw composite score (RCS) is calculated as a weighted composite of the average of two independent ratings for each of the five analytic traits:
(2)
3.6.b Adjustment for Rater-Year Effects
The baseline for each grade’s operational writing scale was 2006. To place the 2012 operational prompt scores on the 2006 scale, transformation constants were obtained to adjust RCS scores for prompt difficulty and for rater-year effects relative to a target distribution. All calculations were performed on the RCS prior to rounding. For reporting, the scaled composite scores (SCS) were then rounded to the nearest integer between 15 and 60. For each of the writing prompts field-tested in 2007, ETS provided a set of unique transformation constants to adjust for prompt difficulty. Based on ETS’ report, OCCT Writing: Scaling the 2007 Field-Test Prompts (ETS, 2007), the following equation was used to adjust the 2012 raw composite scores:
(3)
Where SCS12 represents the scaled composite score after adjusting the 2012 prompt to the 2007 scale.
In 2012, Pearson also performed a rater drift study to adjust for the difference in raters between the 2007 administration to the current administration. Pearson’s Performance Scoring Center (PSC) blindly rescored approximately 500 randomly-selected student responses from 2007 for each grade’s prompt. Only prompts with valid scored responses (i.e., no condition codes such as off-topic) from 2007 were selected to be rescored in 2012 as part of the rater drift study. The rescored prompts were then linked to their original 2007 scores and formed the basis for computation of a second set of linear scaling constants.
Pearson, Inc. and SDE Confidential31

The 2012 rater effect constants (C12 & D12) were determined by using the means (M) and standard deviations (S) of the 2007 raw composite scores and the 2012 rescored raw composite scores as calculated below for each grade.
(4)
(5)
Because both are corrected due to raters and a rescaling to the 2007 scale is desired, a compound adjustment—using both sets of constants—is required. Final scaled composite scores where computed using the formula below:
(6)
Table 3-12 provides the resulting score distribution statistics after performing the described compound adjustment. Final 2012 transformation constants are also provided within this table.
Table 3-12. Results of Grades 5 and 8 Writing Prompt Scoring and Scaling
Grade Statistic 2012 2011 2010 2009
5
N 45,427 46057 44994 43665 MIN 17 18 15 19 MAX 60 60 60 60 MEAN 42.39 46.21 43.67 44.57 SD 8.84 7.99 8.25 8.54
ConstantsA -0.7524B 1.0284C 1.7849D 1.0395
8
N 44,720 43051 40962 42271 MIN 17 15 19 18 MAX 60 60 60 60 MEAN 47.35 45.76 45.73 45.5 SD 8.09 7.28 7.42 7.04
ConstantsA 2.2187B 0.9770C -1.7106D 1.1107
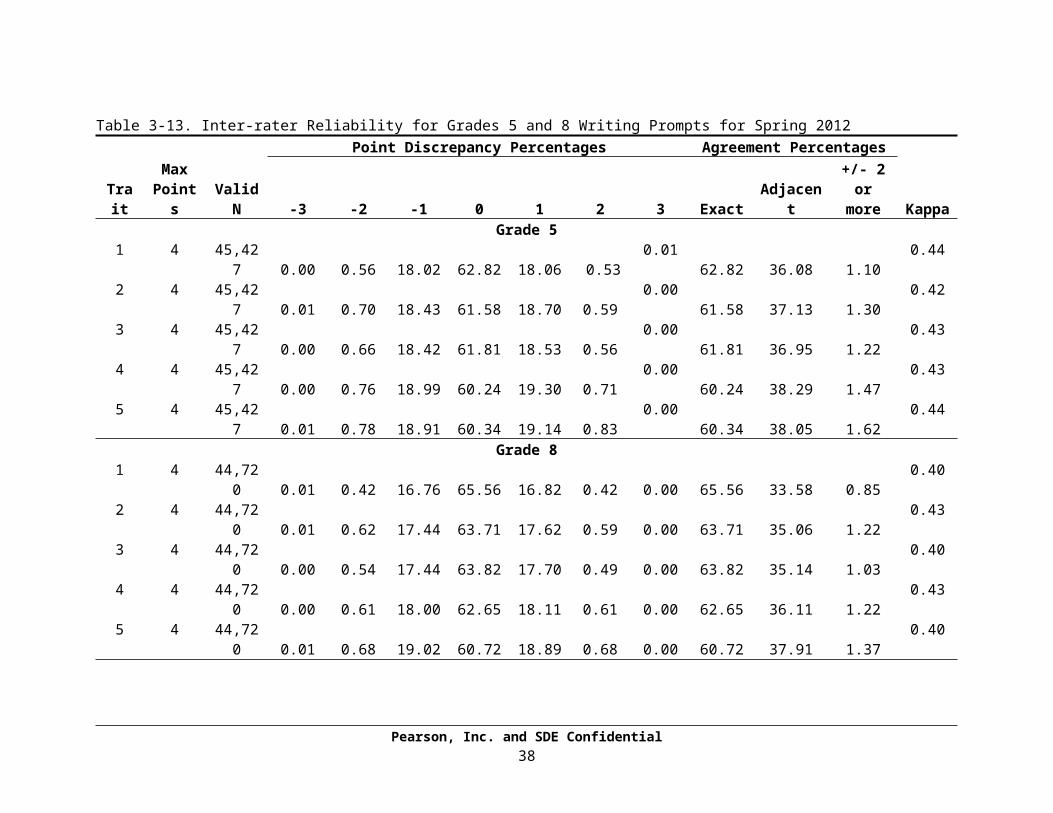
3.6.c Inter-rater Reliability
Inter-rater reliability is referred to as the degree of agreement among scorers that allows for the scores to be interpreted as reasonably intended by the test developer
Pearson, Inc. and SDE Confidential32

(AERA, APA and NCME, 1999). Raters for the grades 5 and 8 Writing assessments were trained to implement the scoring rubrics, anchor papers, check sets, and resolution reading. The items were analytically scored by two raters on five traits in both grades. The final writing score for a student in a given trait is the average of the two scores. The inter-rater reliability coefficients for the operational prompt are presented in Table 3-13. The results show that exact and adjacent rater agreement on trait scores for both the grades 5 and 8 operational writing prompts were reasonably high. The weighted Kappa statistic (Kraemer, 1982) is an indication of inter-rater reliability after correcting for chance. The Kappa values for the OCCT grades 5 and 8 Writing assessments’ writing prompts fall within the moderate range.
Pearson, Inc. and SDE Confidential33

Table 3-13. Inter-rater Reliability for Grades 5 and 8 Writing Prompts for Spring 2012
Trait
Max Point
sValid
N
Point Discrepancy Percentages Agreement Percentages
Kappa-3 -2 -1 0 1 2 3 Exact
Adjacent
+/- 2 or
moreGrade 5
1 4 45,427 0.00 0.56 18.02 62.82 18.06 0.53
0.0162.82 36.08 1.10
0.44
2 4 45,427 0.01 0.70 18.43 61.58 18.70 0.59
0.0061.58 37.13 1.30
0.42
3 4 45,427 0.00 0.66 18.42 61.81 18.53 0.56
0.0061.81 36.95 1.22
0.43
4 4 45,427 0.00 0.76 18.99 60.24 19.30 0.71
0.0060.24 38.29 1.47
0.43
5 4 45,427 0.01 0.78 18.91 60.34 19.14 0.83
0.0060.34 38.05 1.62
0.44
Grade 81 4 44,72
0 0.01 0.42 16.76 65.56 16.82 0.42 0.00 65.56 33.58 0.850.40
2 4 44,720 0.01 0.62 17.44 63.71 17.62 0.59 0.00 63.71 35.06 1.22
0.43
3 4 44,720 0.00 0.54 17.44 63.82 17.70 0.49 0.00 63.82 35.14 1.03
0.40
4 4 44,720 0.00 0.61 18.00 62.65 18.11 0.61 0.00 62.65 36.11 1.22
0.43
5 4 44,720 0.01 0.68 19.02 60.72 18.89 0.68 0.00 60.72 37.91 1.37
0.40
Pearson, Inc. and SDE Confidential34

Section 4
Calibration, Equating, and Scaling
4.1 Item Response Theory (IRT) Models
Dichotomous Item Response Theory Model. The three-parameter logistic (3-PL) item response theory (IRT) model (Lord & Novick, 1968) was used for calibrating the dichotomously-scored multiple choice items. In the 3-PL model (Lord, 1980), the probability that a student with an achievement level of θ responds correctly to item i is
, (7)
where ai is the item discrimination parameter, bi is the item difficulty parameter, ci is the lower asymptote parameter, and D is a scaling constant, which is traditionally equal to 1.7. With multiple-choice items it is assumed that, due to guessing, examinees with very low achievement levels have a non-zero probability of responding correctly to an item. This probability is represented in the 3-PL model by the ci parameter.
IRT models were fit to the 2012 assessment data using MULTILOG version 7.03 (Thissen, Chen, & Bock, 2003). MULTILOG estimates parameters simultaneously for dichotomous items via marginal maximum likelihood. All item and calibrations and scoring were independently conducted and verified by two Pearson research scientists.
4.2 Assessment of Item Fit to the IRT Model
Item fit was assessed using Yen’s (1981, 1984) Q1 item fit index, which approximately follows a 2 distribution:
, (8)
where Q1i is the fit of item i, Nr is the number of examinees per cell, Oir is the observed proportion of examinees in cell r that correctly answered item i, and Eir is the expected portion of examinees in cell r that correctly answered item i. The expected proportions are computed using achievement- and item parameter estimates in Equation (7) and summing over examinees in cell r:
. (9)
Because chi-square statistics are affected by sample size and associated degrees of freedom, the following standardization of the Q1 statistic was used:
Pearson, Inc. and SDE Confidential35

. (10)
The Z-statistic is an index of the degree to which observed proportions of item scores are similar to the proportions that would be expected, given the estimated ability- and item parameters. Large differences between expected and observed item performance may indicate poor item fit. To assess item fit, a critical Z-value is determined. Items with Z-values that are larger than this critical Z-value have poor item fit. The item characteristic curves, classical item statistics, and item content were reviewed for items flagged by Q1. An internally-developed software program, Q1Static, was used to compute the Q1 item fit index.
Operational items flagged by Q1 that were not flagged by the classical item statistics and had reasonable IRT parameter estimates were not reviewed further. If any operational items were also flagged by classical item statistics or had poor IRT parameter estimates (e.g., low a parameter), the items were reviewed by Pearson content specialists. Any item that was potentially mis-keyed was presented to SDE to make a decision regarding whether to keep or remove the item. A total of seven operational items (three in grade 3 Reading, and one each in grade 4 Mathematics, grade 8 Reading, grade 7 Geography, and grade 8 Science) were flagged as potentially misfitting, but showed no other evidence of aberrant behavior, and were not sent for further review.
Field Test Items. The field test items across all subjects were evaluated using the Q1 statistic to evaluate the extent to which the obtained proportions of item scores are close to the proportions that would be expected based on the estimated thetas and item parameters. Any field test items flagged by Q1 were included in the data review for review by contest specialists from Pearson and SDE (for more information on data review, see Section 3.4).
4.3 Calibration and Equating
The 3-PL model was used for calibration of all multiple choice items. A common item, non-equivalent groups (CINEG) design was used for all content areas to link the current test forms the base scale. Typically, for the CINEG design, common (anchor) items are selected to be representative of the test content in terms of difficulty and the test blueprint. The Stocking and Lord (1983) procedure, which estimates the equating transformation constants by minimizing the distance between the test characteristic curves of the common items, was used to equate the tests to the base year. Equating was conducted using freely-available software, STUIRT (Kim & Kolen, 2004). Prior to conducting the equating, anchor item stability checks were performed to eliminate the impact of item drift on equating.
4.4 Anchor Items and Anchor Stability Evaluation Methods
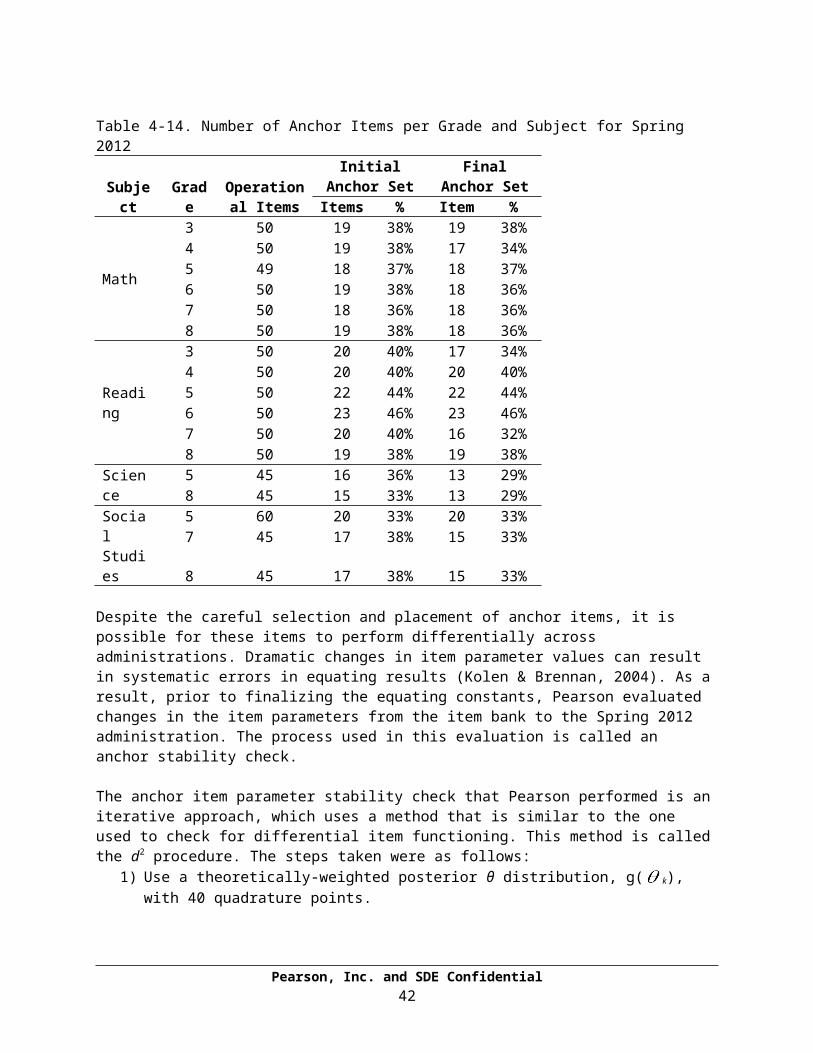
Table 4-14 presents the number and percentage of anchor items (before and after anchor stability checks) by subject and grade for the Spring 2012 administration. For each test, the anchor set was comprised of at least 20% of all operational items. The anchor set was proportionally representative of the total test in terms of content assessed, and it mimicked the difficulty of the overall test as well.
Pearson, Inc. and SDE Confidential36

Table 4-14. Number of Anchor Items per Grade and Subject for Spring 2012
Subject
Grade
Operational Items
Initial Anchor Set
Final Anchor Set
Items % Item %
Math
3 50 19 38% 19 38%4 50 19 38% 17 34%5 49 18 37% 18 37%6 50 19 38% 18 36%7 50 18 36% 18 36%8 50 19 38% 18 36%
Reading
3 50 20 40% 17 34%4 50 20 40% 20 40%5 50 22 44% 22 44%6 50 23 46% 23 46%7 50 20 40% 16 32%8 50 19 38% 19 38%
Science
5 45 16 36% 13 29%8 45 15 33% 13 29%
Social Studies
5 60 20 33% 20 33%7 45 17 38% 15 33%8 45 17 38% 15 33%
Despite the careful selection and placement of anchor items, it is possible for these items to perform differentially across administrations. Dramatic changes in item parameter values can result in systematic errors in equating results (Kolen & Brennan, 2004). As a result, prior to finalizing the equating constants, Pearson evaluated changes in the item parameters from the item bank to the Spring 2012 administration. The process used in this evaluation is called an anchor stability check.
The anchor item parameter stability check that Pearson performed is an iterative approach, which uses a method that is similar to the one used to check for differential item functioning. This method is called the d2 procedure. The steps taken were as follows:
1) Use a theoretically-weighted posterior θ distribution, g( k), with 40 quadrature points.
2) Place the current anchor item parameters on the baseline scale by computing Stocking & Lord (SL) constants using STUIRT and all (k) anchor items.
3) Apply the SL anchor constants to the current item parameters, and compute the current raw score to scale score table. The results based on all k anchor items comprise the original table.
4) For each item, calculate the weighted sum of the squared deviation (d2) between the two item characteristic curves—one ICC computed from each set of parameters.a) For each item, calculate a weighted sum of the squared deviation between
the ICCs based on old (x) and new (y) parameters at each point on this theta distribution.
Pearson, Inc. and SDE Confidential37
(11)
b) Review and sort the items in a descending (largest to smallest) fashion according to the d2 estimate.
c) Drop the items with the largest d2 item from inclusion in the anchor set.5) Repeat steps 2 through 4, dropping one item for each iteration, until 10 items
are dropped. This will result in 11 raw score to scale score tables.6) Compare each RSSS table with the RSSS based on the use of one less anchor
item. When two adjacent RSSS tables no longer differ in performance classification at each of the raw cut score points, the anchor set is considered stable. The constants used to generate the RSSS based on the largest number of anchor items when stability is achieved are retained as the final SL constants.
Before removing any item from the item parameter stability check, the following additional characteristics were examined: 1) prior and current year p-values and point-biserial correlations, 2) prior and current year IRT parameter estimates, 3) prior and current year item sequence, 4) standard and objective/skill of the item, 5) impact on blueprint representation, 6) passage ID/title for items linked to a stimulus, and 7) content review of the actual item. Decisions about whether to keep or remove an item were evaluated on a per item basis, and only one item was removed at a time.
Once the anchor set was finalized, the equating constants obtained from the final Stocking and Lord (1983) run were applied to the non-anchor operational items for computation of raw score to scale score tables. Table 4-14 shows the final number of anchor items used for equating each test. Any item removed from the anchor set during the parameter stability check set still contributed to student scores.
4.5 Scaling and Scoring Results
The lowest obtainable scale score (LOSS), highest obtainable scale score (HOSS), and final scaling constants for each of the subjects are shown in Table 4-15. The scaling constants, M1 (multiplicative) and M2 (additive), place the true scores associated with each raw score point onto the reporting (or operational) scale using a straightforward linear transformation:
Scale Score = (12)
where, = estimated true score.
The true-score equivalent corresponding to each raw score was estimated from equated parameter estimates using a freely-available software program, POLYEQUATE (Kolen, 2004). Each scale score on the assessment is associated with a performance level that describes the types of behavior, knowledge, and skill a student in this score level is expected to demonstrate. For the OCCT 3-8 assessments, there are three cut scores that divide scores into four performance
Pearson, Inc. and SDE Confidential38

levels: Unsatisfactory, Limited Knowledge, Proficient, and Advanced. The cut scores for each of the tests appear in Table 4-15. In addition, a conditional standard error of measurement (CSEM; see Section 6.3) was computed for each of the raw score points. The resulting raw score to scale score conversions, CSEMs, and performance levels for Spring 2012 are shown in Table 4-16 to Table 4-21. RSSS tables for grades 5 and 8 Writing are not included in these tables as the there no further transformation of the composite score beyond that described in Section 3.6. Table 4-15. LOSS, HOSS, Scaling Constants, and Cut Scores by Subject
Subject Grade M1 M2LOS
SHOS
SLimited Cut
Proficient Cut
Advanced Cut
Math
3 85708.93
9 400 990 633 700 798
4 85702.33
9 400 990 639 700 805
5 85680.60
4 400 990 638 700 791
6 85729.79
3 400 990 664 700 795
7 85723.18
3 400 990 674 700 800
8 85672.07
37 400 990 642 700 774
Reading
3 85707.01
3 400 990 649 700 891
4 85702.67
2 400 990 658 700 845
5 85696.83
6 400 990 641 700 830
6 85744.586 400 990 647 700 828
7 85749.59
3 400 990 668 700 802
8 85714.41
9 400 990 655 700 833
Science 5 70753.90
0 400 990 638 700 814
8 70745.50
0 400 990 647 700 829
Social Studies
5 70713.81
0 400 990 645 700 786
7 70759.77
7 400 990 595 700 847
8 70709.94
0 400 990 622 700 821Writing 5 NA NA 15 60 26 36 54
8 NA NA 15 60 25 36 54
Pearson, Inc. and SDE Confidential39

Pearson, Inc. and SDE Confidential40

Table 4-16. Raw Score to Scale Score Conversion Tables for Mathematics (grades 3 to 5) Spring 2012
Raw Score
Grade 3 Grade 4 Grade 5OPI
ScorePerf. Level CSEM
OPI Score
Perf. Level CSEM
OPI Score
Perf. Level CSEM
0 400 1 43 400 1 44 400 1 541 400 1 43 400 1 44 400 1 542 400 1 43 400 1 44 400 1 543 400 1 43 400 1 44 400 1 544 400 1 43 400 1 44 400 1 545 400 1 43 400 1 44 400 1 546 400 1 43 400 1 44 400 1 547 400 1 43 400 1 44 400 1 548 400 1 43 400 1 44 400 1 549 400 1 43 400 1 44 400 1 54
10 400 1 43 426 1 48 400 1 5411 435 1 49 459 1 52 408 1 5512 464 1 52 484 1 54 458 1 6213 487 1 54 504 1 54 492 1 6514 506 1 53 521 1 52 518 1 6515 523 1 50 535 1 49 538 1 6216 537 1 47 549 1 45 556 1 5717 550 1 43 561 1 41 571 1 5218 563 1 40 572 1 38 584 1 4719 574 1 37 583 1 36 596 1 4220 584 1 34 593 1 33 607 1 3921 594 1 32 602 1 31 617 1 3522 603 1 30 611 1 30 627 1 3323 612 1 29 619 1 29 636 1 3124 621 1 28 628 1 27 644 2 2925 629 1 27 636 1 26 653 2 2826 637 2 26 643 2 26 661 2 2727 645 2 25 651 2 25 668 2 2628 653 2 24 658 2 24 676 2 2529 660 2 24 666 2 24 683 2 2530 667 2 23 673 2 23 691 2 2431 675 2 23 680 2 23 698 2 2432 682 2 23 687 2 23 706 3 2433 689 2 23 694 2 22 713 3 24
Pearson, Inc. and SDE Confidential41
Raw Score
Grade 3 Grade 4 Grade 5OPI
ScorePerf. Level CSEM
OPI Score
Perf. Level CSEM
OPI Score
Perf. Level CSEM
34 697 2 23 701 3 22 721 3 2435 704 3 23 708 3 22 728 3 2436 712 3 23 715 3 22 736 3 2437 719 3 23 723 3 23 745 3 2538 728 3 24 730 3 23 753 3 2539 736 3 24 738 3 24 762 3 2640 745 3 25 747 3 25 772 3 2741 755 3 26 756 3 26 783 3 2942 765 3 28 766 3 28 794 4 3143 777 3 30 777 3 30 807 4 3444 789 3 32 790 3 33 822 4 3845 804 4 36 804 3 37 840 4 4346 821 4 41 821 4 43 863 4 4847 843 4 47 844 4 49 894 4 5048 873 4 52 874 4 53 951 4 4249 923 4 50 928 4 50 990 4 3450 990 4 38 990 4 39
Note: CSEM = Conditional Standard Error of Measure; Perf. Level = Performance Level; 1 = Unsatisfactory, 2 = Limited Knowledge, 3 = Proficient, 4 = Advanced
Pearson, Inc. and SDE Confidential42

Table 4-17. Raw Score to Scale Score Conversion Tables for Mathematics (grades 6 to 8) Spring 2012
Raw Score
Grade 6 Grade 7 Grade 8OPI
ScorePerf. Level CSEM
OPI Score
Perf. Level CSEM
OPI Score
Perf. Level CSEM
0 400 1 63 400 1 67 400 1 761 400 1 63 400 1 67 400 1 762 400 1 63 400 1 67 400 1 763 400 1 63 400 1 67 400 1 764 400 1 63 400 1 67 400 1 765 400 1 63 400 1 67 400 1 766 400 1 63 400 1 67 400 1 767 400 1 63 400 1 67 400 1 768 400 1 63 400 1 67 400 1 769 400 1 63 400 1 67 400 1 76
10 424 1 65 400 1 67 400 1 7611 483 1 71 471 1 74 400 1 7612 518 1 72 513 1 77 479 1 8013 543 1 70 542 1 76 529 1 8214 563 1 66 565 1 71 559 1 8015 579 1 60 584 1 65 580 1 7416 594 1 53 600 1 58 597 1 6617 607 1 47 614 1 51 610 1 5718 618 1 42 627 1 45 622 1 4919 629 1 37 638 1 40 633 1 4220 639 1 34 648 1 36 642 2 3721 648 1 31 658 1 33 651 2 3222 656 1 29 667 1 30 659 2 2923 664 2 27 676 2 29 667 2 2724 672 2 26 684 2 27 674 2 2525 680 2 25 691 2 26 681 2 2426 687 2 24 699 2 25 687 2 2327 694 2 23 706 3 24 694 2 2228 700 3 22 713 3 23 700 3 2129 707 3 22 720 3 22 707 3 2130 714 3 21 727 3 22 713 3 2031 720 3 21 734 3 21 719 3 2032 726 3 21 740 3 21 725 3 2033 733 3 20 747 3 21 731 3 20
Pearson, Inc. and SDE Confidential43

Raw Score
Grade 6 Grade 7 Grade 8OPI
ScorePerf. Level CSEM
OPI Score
Perf. Level CSEM
OPI Score
Perf. Level CSEM
34 739 3 20 754 3 20 737 3 2035 746 3 20 760 3 20 744 3 2036 752 3 20 767 3 20 750 3 2037 759 3 21 774 3 20 757 3 2038 766 3 21 781 3 20 764 3 2039 774 3 21 788 3 21 771 3 2140 781 3 22 796 3 21 778 4 2141 789 3 23 804 4 22 786 4 2242 798 4 24 812 4 23 794 4 2443 807 4 26 821 4 24 804 4 2544 818 4 28 831 4 27 814 4 2845 830 4 32 843 4 30 826 4 3146 844 4 36 856 4 34 840 4 3647 861 4 42 874 4 39 858 4 4148 887 4 46 898 4 42 883 4 4649 931 4 44 940 4 40 925 4 4650 990 4 34 990 4 31 990 4 34
Note: CSEM = Conditional Standard Error of Measure; Perf. Level = Performance Level; 1 = Unsatisfactory, 2 = Limited Knowledge,3 = Proficient, 4 = Advanced
Pearson, Inc. and SDE Confidential44

Table 4-18. Raw Score to Scale Score Conversion Tables for Reading (grades 3 to 5) Spring 2012
Raw Score
Grade 3 Grade 4 Grade 5OPI
ScorePerf. Level CSEM
OPI Score
Perf. Level CSEM
OPI Score
Perf. Level CSEM
0 400 1 54 400 1 47 400 1 511 400 1 54 400 1 47 400 1 512 400 1 54 400 1 47 400 1 513 400 1 54 400 1 47 400 1 514 400 1 54 400 1 47 400 1 515 400 1 54 400 1 47 400 1 516 400 1 54 400 1 47 400 1 517 400 1 54 400 1 47 400 1 518 400 1 54 400 1 47 400 1 519 409 1 55 406 1 48 400 1 51
10 466 1 61 455 1 54 400 1 5111 498 1 64 484 1 56 442 1 5512 522 1 63 505 1 56 479 1 5813 540 1 59 522 1 53 503 1 5914 556 1 54 536 1 49 521 1 5715 569 1 49 548 1 44 537 1 5316 581 1 44 559 1 40 550 1 4817 592 1 39 569 1 36 561 1 4418 602 1 36 579 1 33 572 1 3919 611 1 33 587 1 30 582 1 3620 619 1 30 596 1 28 591 1 3321 627 1 29 603 1 27 600 1 3022 635 1 27 611 1 26 608 1 2823 643 1 26 618 1 25 616 1 2724 650 2 25 625 1 24 623 1 2625 657 2 25 632 1 23 630 1 2526 664 2 24 639 1 23 637 1 2427 671 2 24 646 1 22 644 2 2328 678 2 23 652 1 22 651 2 2329 684 2 23 659 2 22 658 2 2230 691 2 23 665 2 21 664 2 2231 698 2 23 672 2 21 671 2 2232 705 3 23 679 2 21 678 2 2233 712 3 23 685 2 21 684 2 22
Pearson, Inc. and SDE Confidential45

Raw Score
Grade 3 Grade 4 Grade 5OPI
ScorePerf. Level CSEM
OPI Score
Perf. Level CSEM
OPI Score
Perf. Level CSEM
34 719 3 23 692 2 21 691 2 2235 727 3 24 699 2 22 698 2 2236 735 3 24 706 3 22 706 3 2337 743 3 24 714 3 22 713 3 2338 751 3 25 721 3 23 721 3 2439 760 3 26 729 3 23 729 3 2440 770 3 27 738 3 24 738 3 2541 780 3 28 747 3 26 747 3 2642 790 3 30 756 3 27 757 3 2843 802 3 32 767 3 30 769 3 3044 815 3 36 779 3 33 781 3 3345 830 3 40 794 3 37 795 3 3746 849 3 46 811 3 43 813 3 4247 873 3 51 832 3 49 834 4 4948 908 4 52 863 4 56 864 4 5549 975 4 39 915 4 55 914 4 5450 990 4 36 990 4 41 990 4 40
Note: CSEM = Conditional Standard Error of Measure; Perf. Level = Performance Level; 1 = Unsatisfactory, 2 = Limited Knowledge, 3 = Proficient, 4 = Advanced
Pearson, Inc. and SDE Confidential46

Table 4-19. Raw Score to Scale Score Conversion Tables for Reading (grades 6 to 8) Spring 2012
Raw Score
Grade 6 Grade 7 Grade 8OPI
ScorePerf. Level CSEM
OPI Score
Perf. Level CSEM
OPI Score
Perf. Level CSEM
0 400 1 54 400 1 58 400 1 461 400 1 54 400 1 58 400 1 462 400 1 54 400 1 58 400 1 463 400 1 54 400 1 58 400 1 464 400 1 54 400 1 58 400 1 465 400 1 54 400 1 58 400 1 466 400 1 54 400 1 58 400 1 467 400 1 54 400 1 58 400 1 468 400 1 54 400 1 58 400 1 469 446 1 58 400 1 58 400 1 46
10 489 1 61 428 1 60 443 1 5211 514 1 61 483 1 65 475 1 5612 533 1 58 514 1 66 498 1 5713 548 1 53 536 1 64 517 1 5514 560 1 47 553 1 59 533 1 5215 571 1 42 567 1 53 547 1 4816 581 1 37 579 1 47 559 1 4417 590 1 33 589 1 41 570 1 4018 598 1 31 598 1 36 580 1 3719 607 1 29 606 1 32 590 1 3420 615 1 27 614 1 28 598 1 3221 622 1 26 621 1 26 607 1 3022 630 1 25 628 1 24 615 1 2923 637 1 25 634 1 23 623 1 2824 644 1 24 640 1 21 630 1 2725 652 2 24 646 1 21 638 1 2626 659 2 23 652 1 20 645 1 2627 666 2 23 657 1 19 652 1 2528 673 2 23 663 1 19 659 2 2529 679 2 23 668 2 19 666 2 2530 686 2 22 674 2 19 674 2 2531 693 2 22 679 2 19 681 2 2532 700 3 22 685 2 19 688 2 2533 707 3 23 690 2 19 696 2 26
Pearson, Inc. and SDE Confidential47

Raw Score
Grade 6 Grade 7 Grade 8OPI
ScorePerf. Level CSEM
OPI Score
Perf. Level CSEM
OPI Score
Perf. Level CSEM
34 715 3 23 696 2 19 704 3 2635 722 3 23 702 3 20 712 3 2736 730 3 23 708 3 21 721 3 2737 737 3 24 715 3 21 729 3 2838 746 3 24 722 3 23 739 3 2939 754 3 25 730 3 24 749 3 3140 763 3 26 738 3 26 760 3 3241 773 3 27 748 3 28 771 3 3542 783 3 29 758 3 32 784 3 3843 795 3 31 770 3 36 799 3 4144 807 3 34 785 3 41 816 3 4645 822 3 38 802 4 49 836 4 5046 840 4 43 824 4 57 861 4 5447 862 4 49 856 4 63 894 4 5548 894 4 51 908 4 61 942 4 4949 952 4 42 990 4 48 990 4 3950 990 4 35 990 4 48 990 4 39
Note: CSEM = Conditional Standard Error of Measure; Perf. Level = Performance Level; 1 = Unsatisfactory, 2 = Limited Knowledge, 3 = Proficient, 4 = Advanced
Pearson, Inc. and SDE Confidential48

Table 4-20.Raw Score to Scale Score Conversion Tables for Science Spring 2012
Raw Score
Grade 5 Grade 8OPI
ScorePerf. Level CSEM
OPI Score
Perf. Level CSEM
0 400 1 76 400 1 801 400 1 76 400 1 802 400 1 76 400 1 803 400 1 76 400 1 804 400 1 76 400 1 805 400 1 76 400 1 806 400 1 76 400 1 807 400 1 76 400 1 808 400 1 76 457 1 839 494 1 83 533 1 88
10 541 1 85 570 1 8611 570 1 81 595 1 7912 591 1 73 614 1 7013 608 1 64 629 1 6014 622 1 55 642 1 5115 635 1 47 654 2 4416 646 2 41 664 2 3817 656 2 36 673 2 3318 665 2 32 682 2 3019 674 2 29 691 2 2820 682 2 28 699 2 2621 690 2 26 706 3 2522 698 2 25 714 3 2423 705 3 24 721 3 2324 713 3 24 728 3 2225 720 3 23 735 3 2226 727 3 23 742 3 2127 734 3 22 748 3 2128 741 3 22 755 3 2129 748 3 22 761 3 2030 755 3 22 768 3 2031 763 3 22 775 3 2032 770 3 23 781 3 2033 778 3 23 788 3 2134 786 3 24 796 3 21
Pearson, Inc. and SDE Confidential49

Raw Score
Grade 5 Grade 8OPI
ScorePerf. Level CSEM
OPI Score
Perf. Level CSEM
35 794 3 24 803 3 2236 803 3 25 812 3 2337 813 3 27 820 3 2438 823 4 29 830 4 2639 835 4 32 840 4 2840 849 4 35 853 4 3241 865 4 39 867 4 3642 886 4 43 886 4 4043 915 4 44 912 4 4144 966 4 34 958 4 3545 990 4 29 990 4 28
Note: CSEM = Conditional Standard Error of Measure; Perf. Level = Performance Level; 1 = Unsatisfactory, 2 = Limited Knowledge, 3 = Proficient, 4 = Advanced
Pearson, Inc. and SDE Confidential50

Table 4-21. Raw Score to Scale Score Conversion Tables for Social Studies Spring 2012
Raw Score
Grade 5 Grade 7 Grade 8OPI
ScorePerf. Level CSEM
OPI Score
Perf. Level CSEM
OPI Score
Perf. Level CSEM
0 400 1 75 400 1 58 400 1 731 400 1 75 400 1 58 400 1 732 400 1 75 400 1 58 400 1 733 400 1 75 400 1 58 400 1 734 400 1 75 400 1 58 400 1 735 400 1 75 400 1 58 400 1 736 400 1 75 400 1 58 400 1 737 400 1 75 400 1 58 400 1 738 400 1 75 400 1 58 400 1 739 400 1 75 442 1 64 431 1 75
10 400 1 75 487 1 69 507 1 8111 400 1 75 519 1 71 546 1 8112 400 1 75 545 1 69 571 1 7713 446 1 78 566 1 65 590 1 7014 510 1 82 584 1 60 606 1 6215 544 1 83 600 2 55 620 1 5316 568 1 80 615 2 50 632 2 4617 586 1 74 629 2 46 643 2 4018 601 1 67 642 2 43 653 2 3519 614 1 59 654 2 40 662 2 3220 626 1 52 666 2 38 671 2 2921 636 1 45 678 2 36 679 2 2722 645 2 40 689 2 35 687 2 2623 654 2 36 699 2 34 695 2 2524 662 2 32 709 3 33 702 3 2425 670 2 30 719 3 32 710 3 2326 677 2 28 729 3 32 717 3 2227 684 2 26 739 3 31 723 3 2228 690 2 25 749 3 31 730 3 2129 696 2 24 759 3 31 737 3 2130 702 3 23 769 3 31 744 3 2131 708 3 22 779 3 31 751 3 2132 714 3 21 789 3 31 758 3 2233 720 3 21 800 3 31 765 3 22
Pearson, Inc. and SDE Confidential51

Raw Score
Grade 5 Grade 7 Grade 8OPI
ScorePerf. Level CSEM
OPI Score
Perf. Level CSEM
OPI Score
Perf. Level CSEM
34 725 3 20 811 3 32 773 3 2235 730 3 20 823 3 33 781 3 2336 736 3 20 836 3 34 790 3 2437 741 3 19 849 4 35 799 3 2638 746 3 19 863 4 36 810 3 2839 752 3 19 879 4 38 821 4 3140 757 3 19 896 4 40 834 4 3541 763 3 19 916 4 40 850 4 4142 768 3 19 942 4 37 871 4 4643 774 3 19 977 4 29 901 4 4844 780 3 19 990 4 26 958 4 4045 786 4 20 990 4 26 990 4 3346 792 4 2047 798 4 2048 805 4 2149 812 4 2250 820 4 2251 828 4 2452 837 4 2553 847 4 2754 857 4 2955 870 4 3356 885 4 3757 904 4 4058 931 4 4059 982 4 2960 990 4 27
Note: CSEM = Conditional Standard Error of Measure; Perf. Level = Performance Level; 1 = Unsatisfactory, 2 = Limited Knowledge, 3 = Proficient, 4 = Advanced
Pearson, Inc. and SDE Confidential52

Section 5
Classification Consistency and Accuracy Studies
5.1 Classification Consistency and Accuracy
Every test administration will result in some error in classifying examinees. The concept of the standard error of measurement (SEM) has implications for the interpretation of cut scores used to classify students into different performance levels. For example, a given student may have a true performance level greater than a cut score; however, due to random variations (measurement error), the student’s observed test score may be below the cut score. As a result, the student would be classified as having a lower performance level. As discussed in Section 6.4, a student’s observed score is most likely to fall within a standard error band around his or her true score. Thus, the classification of students into different performance levels can be imperfect; especially for the borderline students whose true scores lie close to the performance level cut scores.
According to Livingston and Lewis (1995, p. 180), the accuracy of a classification is “the extent to which the actual classifications of the test takers… agree with those that would be made on the basis of their true score” and are calculated from cross-tabulations between “classifications based on an observable variable and classifications based on an unobservable variable.” Since the unobservable variable—the true score—is not available, Livingston and Lewis provide a method to estimate the true score distribution of a test and create the cross-tabulation of the true score and observed variable (raw score) classifications. Consistency is “the agreement between classifications based on two non-overlapping, equally-difficult forms of the test” (p. 180). Consistency is estimated using actual response data from a test and the test’s reliability to statistically model two parallel forms of the test and compare the classifications on those alternate forms. There are three types of accuracy and consistency indices that can be generated using Livingston and Lewis’ approach: overall, conditional on level, and by cut score.
The overall accuracy of performance level classifications is computed as a sum of the proportions on the diagonal of the joint distribution of true score and observed score levels. Essentially, overall accuracy is the proportion of correct classifications across all levels. The overall consistency index is computed as the sum of the diagonal cells in a consistency table. Another way to express overall consistency is to use the kappa coefficient, as used in the inter-rater reliability studies in Section 3. Like the inter-rater reliability studies, kappa provides an estimate of agreement or the proportion of consistent classifications between two different tests after taking into account agreement due to chance.
Consistency conditional on performance level is computed as the ratio between the proportion of correct classifications at the selected performance level (for example, proficient students who were classified as proficient) and the proportion of all the students classified into that level (total proportion of students who were considered proficient). Accuracy conditional on performance level is computed in a similar manner, except that in the consistency table where both row and column marginal
Pearson, Inc. and SDE Confidential53

sums are the same, the accuracy table uses the sum based on estimated status as the total for computing accuracy conditional on performance level.
To evaluate decisions at specific cut scores, the joint distribution of all the performance levels are collapsed into dichotomized distributions around that specific cut score (for example collapsing Unsatisfactory and Limited Knowledge and then Proficient and Advanced to assess decisions at the Proficient cut score). The accuracy index at a cut score is computed as the sum of the proportions of correct classifications around this selected cut score. The consistency at a specific cut score is obtained in a similar way, but by dichotomizing the distributions at the cut score performance level and between all other performance levels combined. Table 5-22 presents the overall accuracy and consistency indices for the Spring 2012 OCCT 3-8 tests.
Table 5-22. Estimates of Accuracy and Consistency in Performance Classifications
Subject
Grade
Accuracy
Consistency
Kappa (K)
False Positiv
e
False Negativ
e
Math
3 0.75 0.69 0.54 0.20 0.064 0.77 0.71 0.54 0.08 0.145 0.74 0.68 0.54 0.06 0.206 0.74 0.71 0.57 0.15 0.117 0.78 0.71 0.55 0.12 0.108 0.77 0.70 0.57 0.10 0.13
Reading
3 0.87 0.81 0.61 0.06 0.084 0.82 0.76 0.58 0.09 0.095 0.76 0.71 0.52 0.11 0.136 0.79 0.74 0.55 0.07 0.147 0.72 0.66 0.44 0.23 0.058 0.73 0.67 0.41 0.22 0.05
Science
5 0.80 0.75 0.54 0.10 0.118 0.82 0.77 0.50 0.06 0.12
Social Studies
5 0.77 0.71 0.57 0.06 0.177 0.80 0.73 0.53 0.09 0.118 0.78 0.73 0.57 0.10 0.12
As shown in Table 5-22, the overall accuracy indices range between 72 and 87 percent, and overall consistency ranges between 66 and 81 for the Spring 2012 OCCT administration. Kappa coefficients range from 0.41 and 0.61. The rate of estimated false positives ranges from 6 to 23 and estimated false negative rates range from 5 to 20 percent.
Table 5-23 provides the accuracy, consistency, false positive, and false negative rates by cut score for Spring 2012. The data in these tables reveal that the level of agreement for both accuracy and consistency is above 80 percent in all cases, with
Pearson, Inc. and SDE Confidential54

most above 90 percent. In general, the high rates of accuracy and consistency support the cut decisions made using these assessments. Similar to Table 5-22, the false positive and false negative rates are quite low.
The importance of the dichotomous categorization is particularly notable when they map onto proficient/not proficient decisions for the assessments. For the OCCT 3-8 tests, the U+L/P+A is the important dichotomization, because it directly translates to the proficient/not proficient decision point, which is important in computing Adequate Yearly Progress (AYP). Similar to other dichotomization distinctions, there are three main scenarios at this cut point: 1) observed performance is accurately reflective of the true ability level (i.e., the examinee is proficient and should have being proficient); 2) the true achievement level is below the standard, but the observed test score is above the standard (i.e., a false positive); and 3) the true achievement level is above the standard, but the observed test score is below the standard (i.e., a false negative). In examining Table 5-23, for example, we estimate that 90 percent of grade 3 Mathematics students were correctly classified as proficient or not proficient based on their performance (scenario 1), 8 percent were considered proficient but their true performance is below the standard (scenario 2), and 2 percent were not considered proficient although their true performance is above the standard (scenario 3). Overall, the estimated rates for accurate classification are above 85% for the administration of all subjects and grades – students are appropriately (more than 85% of the time) categorized into proficient/not proficient classifications based on their true ability using their observed score (raw score) as their classification score.
Pearson, Inc. and SDE Confidential55

Table 5-23. Accuracy and Consistency Estimates and False Positive/False Negative Rates by Cut Score
Subject Grade
Accuracy Consistency False Positive False Negative
U / (L+P+
A)
(U+L) / (P+A)
(U+L+P) / A
U / (L+P+
A)
(U+L) / (P+A)
(U+L+P) / A
U / (L+P+
A)
(U+L) / (P+A)
(U+L+P) / A
U / (L+P+
A)
(U+L) / (P+A)
(U+L+P) / A
MATH
3 0.95 0.90 0.89 0.94 0.89 0.86 0.04 0.08 0.08 0.01 0.02 0.034 0.95 0.91 0.91 0.94 0.89 0.87 0.03 0.01 0.04 0.01 0.08 0.055 0.95 0.91 0.88 0.93 0.88 0.87 0.01 0.03 0.02 0.04 0.06 0.106 0.92 0.90 0.91 0.91 0.88 0.90 0.06 0.08 0.01 0.02 0.02 0.077 0.93 0.91 0.93 0.90 0.87 0.91 0.03 0.05 0.04 0.04 0.04 0.038 0.94 0.90 0.92 0.93 0.88 0.89 0.04 0.02 0.05 0.02 0.09 0.03
READING
3 0.96 0.92 0.99 0.94 0.89 0.97 0.01 0.03 0.01 0.03 0.04 0.004 0.94 0.90 0.98 0.92 0.87 0.97 0.01 0.06 0.02 0.05 0.04 0.005 0.96 0.91 0.89 0.94 0.88 0.89 0.03 0.06 0.03 0.02 0.03 0.086 0.95 0.91 0.94 0.93 0.88 0.92 0.03 0.02 0.03 0.03 0.08 0.047 0.96 0.91 0.85 0.94 0.89 0.82 0.01 0.07 0.15 0.03 0.02 0.008 0.96 0.91 0.86 0.94 0.90 0.82 0.01 0.08 0.14 0.03 0.02 0.00
SCIENCE
5 0.98 0.94 0.88 0.98 0.93 0.84 0.01 0.05 0.04 0.01 0.01 0.088 0.97 0.94 0.91 0.97 0.91 0.89 0.01 0.02 0.03 0.01 0.05 0.06
SOCIAL STUDIE
S
5 0.95 0.89 0.92 0.92 0.88 0.90 0.02 0.01 0.03 0.03 0.09 0.057 0.98 0.93 0.89 0.97 0.90 0.85 0.01 0.03 0.05 0.01 0.04 0.058 0.94 0.91 0.92 0.93 0.88 0.91 0.01 0.02 0.07 0.05 0.06 0.01
Note: U =Unsatisfactory; L = Limited Knowledge; P = Proficient; and A = Advanced.Note: U / L+P+A = Unsatisfactory divided by Limited Knowledge plus Proficient plus Advanced; U+L / P+A = Unsatisfactory plus Limited Knowledge divided by Proficient plus Advanced; U+L+P / A = Unsatisfactory plus Limited Knowledge plus Proficient divided by Advanced.
Pearson, Inc. and SDE Confidential56
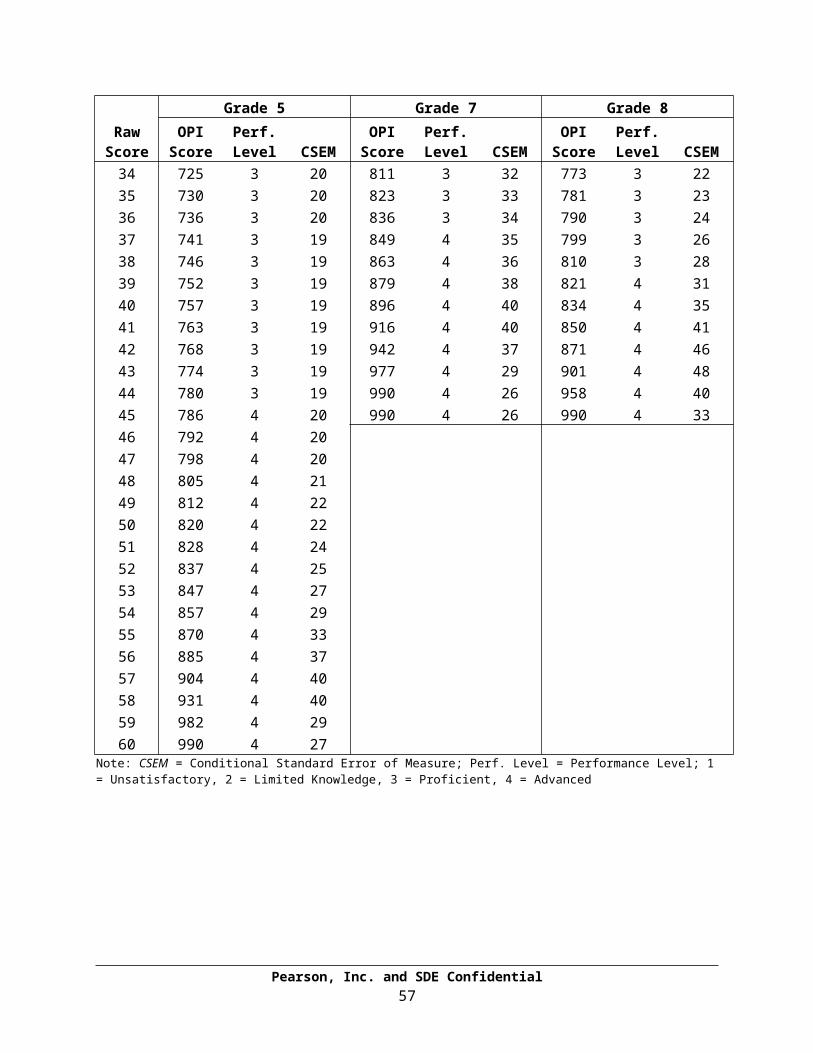
Section 6
Summary Statistics
6.1 Descriptive Statistics
The summary descriptive statistics of the scale scores for the Spring 2012 test-taking population appears in Table 6-24 through Table 6-27. The scales scores presented exclude invalid student cases.
Table 6-24. Descriptive Statistics of Scale Scores for Spring 2012 - Overall
Subject/GradeScale Score
N Mean SD Median
Math
3 45237 741 88 7454 43951 746 88 7475 43478 742 86 7456 43228 734 80 7397 41329 736 79 7408 41015 727 82 731
Reading
3 44542 743 82 7434 43183 725 73 7215 42925 734 79 7386 43009 731 79 7377 41541 740 69 7388 41226 759 81 760
Science5 43989 783 71 7868 42935 769 64 775
Social Studies
5 47169 730 77 7367 44890 783 90 7898 45794 736 85 737
Note: N = Sample size; SD = Standard Deviation.
Pearson, Inc. and SDE Confidential57

Table 6-25. Descriptive Statistics of Scale Scores for Spring 2012 by Gender
Subject GradeFemale Male
N Mean SD Med. N Mean SD Med.
Math
3 22550 739 88 736 22653 743 88 7454 21938 744 86 738 21986 748 89 7475 21608 740 83 736 21831 745 88 7456 21576 732 77 733 21614 737 82 7397 20758 735 77 740 20571 738 81 7408 20509 727 80 731 20495 728 84 731
Reading
3 22372 750 81 751 22136 735 82 7434 21738 728 71 729 21425 721 75 7215 21510 738 79 738 21388 731 79 7296 21541 735 75 737 21432 727 82 7307 20914 747 69 748 20627 733 70 7308 20618 767 82 760 20595 751 79 749
Science 5 21874 780 69 778 22088 786 73 7868 21290 767 61 768 21603 770 67 775
Social Studies
5 23017 727 72 730 24103 732 81 7367 22169 774 85 779 22721 792 93 8008 22305 730 79 730 23416 742 90 751
Note: N = Sample size; SD = Standard Deviation; Med. = Median.
Pearson, Inc. and SDE Confidential58

Table 6-26. Descriptive Statistics of Scale Scores for Spring 2012 by Race/Ethnicity
Subject
Grade
African American Native American Hispanic Asian
NMea
n SDMed
. NMea
n SDMed
. NMea
n SDMed
. NMea
n SDMed
.
Math
3 4087 698 91 704 7012 739 84 736 6746 715 86 719 852 780 94 7774 4027 703 88 708 7082 738 83 738 6287 725 86 723 843 798 98 7905 3883 701 86 706 7171 731 82 736 6007 722 86 721 876 796 91 7946 4063 695 85 700 7188 728 75 733 5693 715 77 720 840 786 88 7897 3836 701 84 706 6944 729 74 734 5108 711 79 720 790 790 83 7888 3928 693 90 707 6817 720 77 725 4973 703 85 707 794 786 90 778
Reading
3 4060 710 85 712 6888 742 77 743 6632 713 83 719 823 763 87 7604 3973 692 73 692 6957 718 69 721 6142 698 72 699 819 753 81 7565 3859 698 79 698 7083 726 76 729 5871 706 79 706 850 759 89 7576 4070 697 77 700 7140 725 76 730 5621 706 76 707 821 757 78 7637 3871 712 70 715 6958 735 65 730 5132 715 69 715 792 760 79 7588 3943 724 83 729 6845 756 76 760 4966 727 85 729 783 782 95 784
Science
5 4001 739 71 741 7257 777 69 778 6054 758 68 755 877 801 73 8038 4173 733 68 735 7077 765 59 768 5272 746 63 748 825 795 68 803
Social Studies
5 4409 687 81 696 7867 724 72 730 6483 706 77 714 897 759 83 7637 4330 733 95 739 7637 775 85 779 5590 756 89 759 811 826 89 8368 4547 698 85 702 7617 732 78 737 5605 712 83 710 830 780 92 781
Note: N = Sample size; SD = Standard Deviation; Med. = Median.
Pearson, Inc. and SDE Confidential59

Table 6-26. Descriptive Statistics of Scale Scores for Spring 2012 by Race/Ethnicity (cont.)
Subject
Grade
Pacific Islander White Other
NMea
n SDMed
. NMea
n SDMed
. NMea
n SDMed
.
Math
3 127 723 95 7192388
2 755 85 755 2531 741 87 745
4 113 717 90 7232314
3 760 85 756 2456 746 86 747
5 117 727 88 7282305
3 757 82 753 2371 740 84 736
6 96 727 79 7232305
1 747 77 746 2297 733 77 733
7 112 722 82 7342255
5 749 76 754 1984 737 79 740
8 94 719 91 7312239
3 739 77 737 2016 725 79 725
Reading
3 122 722 84 7192353
4 756 79 760 2483 745 80 751
4 110 707 75 7142276
8 738 71 738 2414 725 72 729
5 112 715 74 7172280
5 750 76 747 2345 736 78 738
6 95 720 86 7302296
3 744 77 746 2299 730 79 737
7 110 721 76 7222269
0 751 67 748 1988 744 68 738
8 104 713 106 7212254
0 772 76 771 2045 761 79 760
Science 5 117 754 67 7552327
9 798 67 794 2404 784 71 786
8 109 737 76 7482328
4 780 61 781 2195 769 63 775Social Studies 5 119 720 68 725
24787 744 72 746 2607 728 75 730
7 118 768 97 769 2424 800 85 800 2161 786 89 789
Pearson, Inc. and SDE Confidential60

3
8 111 717 99 7302470
8 749 83 751 2376 735 86 737Note: N = Sample size; SD = Standard Deviation; Med. = Median.
Pearson, Inc. and SDE Confidential61

Table 6-27. Descriptive Statistics of Scale Scores for Spring 2012 by Free/Reduced Lunch Status
Subject Grade
Free/Reduced Lunch = No Free/Reduced Lunch = Yes
N Mean SDMedian N Mean SD
Median
Math
3 18383 767 86 765 26854 724 85 7284 17945 772 87 766 26006 728 83 7305 18434 768 83 772 25044 724 83 7286 18632 757 77 759 24596 717 77 7207 18855 760 75 760 22474 717 77 7208 19271 749 78 750 21744 708 81 713
Reading
3 18212 768 78 770 26330 726 80 7274 17723 748 73 747 25460 708 69 7065 18283 760 77 757 24642 715 76 7136 18613 753 77 754 24396 714 76 7157 18979 759 68 758 22562 724 67 7228 19373 781 77 771 21853 739 79 739
Science 5 18578 805 68 803 25411 766 69 7708 20097 787 61 788 22838 753 62 755
Social Studies
5 19163 757 71 763 28006 711 75 7147 19676 814 82 811 25214 759 88 7698 20801 762 82 765 24993 715 81 717
Note: N = Sample size; SD = Standard Deviation; Med. = Median.
6.2 Performance Level Distribution
The distributions of students in the four performance levels based on the test-taking population’s performance in the Spring 2012 administration are presented in Table 6-28 (also, see Appendix B). The percentage distributions for each of the content areas are comparable to previous administrations (e.g., Spring 2011).
Pearson, Inc. and SDE Confidential62
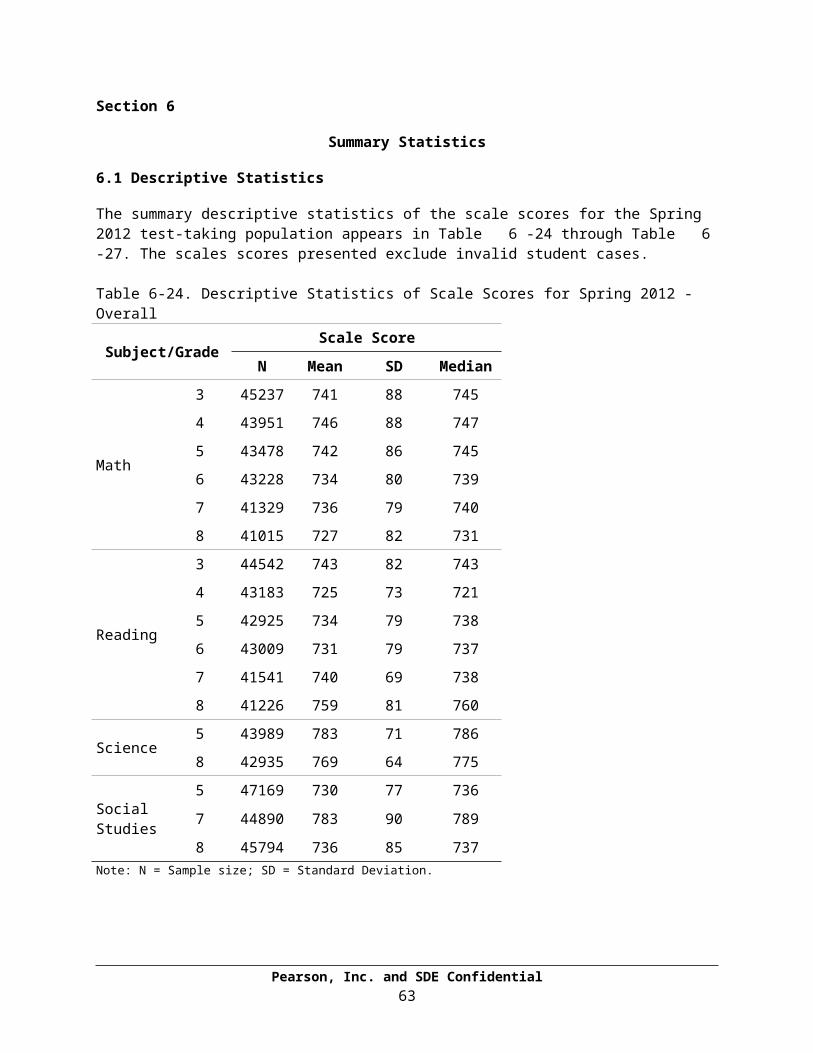
Table 6-28. Percentage of Students by Performance Level for Spring 2012
Subject/Grade NUnsatisfactor
y
Limited Knowledg
eProficien
tAdvance
d
Math
3 45237 10.1% 20.0% 45.3% 24.7%4 43951 9.8% 17.2% 53.2% 19.8%5 43478 10.4% 19.4% 42.5% 27.8%6 43228 15.5% 13.7% 50.3% 20.5%7 41329 17.1% 12.6% 51.6% 18.7%8 41015 10.8% 20.6% 42.7% 26.0%All 25823
8 12.2% 17.3% 47.6% 22.9%
Reading
3 44542 11.3% 16.7% 68.9% 3.1%4 43183 15.1% 21.5% 59.0% 4.5%5 42925 10.5% 21.8% 56.2% 11.5%6 43009 14.1% 17.0% 60.2% 8.7%7 41541 11.7% 13.5% 55.9% 18.9%8 41226 8.5% 12.1% 61.4% 18.0%All 25642
6 11.9% 17.1% 60.3% 10.6%
Science5 43989 2.6% 9.2% 58.5% 29.8%8 42935 3.5% 9.9% 70.0% 16.7%All 86924 3.0% 9.5% 64.2% 23.3%
Social Studies
5 47169 10.5% 20.2% 46.4% 22.9%7 44890 2.7% 14.1% 58.2% 25.0%8 45794 8.4% 21.6% 54.3% 15.7%All 13785
3 7.3% 18.7% 52.9% 21.2%
6.3 Conditional Standard Error of Measurement
The conditional standard error of measurement (CSEM) was computed for each reported scale score. CSEM was computed using an IRT-based approach based on the following formula:
(13)
Pearson, Inc. and SDE Confidential63

where OX is the observed scaled score for a particular number-correct score X, θ is the IRT achievement scale value conditioned on, and is the probability function. Pearson has implemented a computational approach for estimating CSEM(Ox | θ) in which p(X | θ ) is computed using a recursive algorithm given by Thissen, Pommerich, Billeaud, and Williams (1995). This algorithm is a polytomous generalization of the algorithm for dichotomous items given by Lord and Wingersky (1984). The values of θ used with the algorithm are obtained through the true score equating process (i.e., by solving for θ through the test characteristic curve for each number-correct score, X). There is one CSEM per number-correct score. The CSEMs by subject appear in Table 4-16 to Table 4-21 for the Spring 2012 administration of the OCCT.
6.4 Standard Error of Measurement
Measurement error is associated with every test score. A student’s true score is the hypothetical average score that would result if the student took the test repeatedly under similar conditions. The standard error of measurement (SEM), as an overall test-level measure of error, can be used to construct a range around any given observed test score that likely includes the student’s true score. SEM is computed by taking the square root of the average value of the variances of the error of measurement associated with each of the raw score or scales scores:
(14)
where,SEM = Standard Error of MeasurementCSEM = Conditional Standard of MeasurementNj = number of examinees obtaining score j in the populationNT = total number of students in test sample
SEM was computed for each of the OCCT assessments. Table 6-29 presents the overall estimates of SEM for each of the content areas for the Spring 2012 administration.
Pearson, Inc. and SDE Confidential64

Table 6-29. Overall Estimates of SEM by Test
Subject Grade
SEM in OPI
Units
Math
3 324 335 326 297 308 32
Reading
3 324 305 326 307 358 37
Science 5 308 28
Social Studies5 317 368 34
Pearson, Inc. and SDE Confidential65

References
American Educational Research Association (AERA), American Psychological Association (APA), & the National Council on Measurement in Education (NCME) (1999). Standards for educational and psychological testing. Washington, DC: AERA.
Dorans, N. J., & Holland, P. W. (1993). DIF detection and description: Mantel-Haenszel and standardization. In P. W. Holland & H. Wainer (Eds.), Differential item functioning (pp. 35-66). Hillsdale, NJ: Lawrence Erlbaum.
Holland, P. W., & Thayer, D.T. (1988). Differential Item Performance and the Mantel-Haenszel Procedure. (ETS RR-86-31). Princeton, NJ: Educational Testing Service.
Lord, F. M. (1980). Applications of item response theory to practical testing problems. Hillsdale, NJ: Lawrence Erlbaum.
Lord, F. M., & Novick, M. R. (1968). Statistical theories of mental test scores. Reading Massachusetts: Addison-Wesley Publishing Company.
Lord, F. M., & Wingersky, M. S. (1984). Comparison of IRT true-score and equipercentile observed-score “equatings.” Applied Psychological Measurement, 8, 453-461.
Kim, S. & Kolen, M. J. (2004). STUIRT: A computer program. Iowa City, IA: The University of Iowa. (Available from the web address: http://www.uiowa.edu/~casma).
Kolen, M.J. (2004). POLYEQUATE: A computer program. Iowa City, IA: The University of Iowa. (Available from the web address: http://www.uiowa.edu/~casma).
Kolen, M. J., & Brennan, R. L. (2004). Test equating, scaling, and linking: methods and practices (2nd ed.). New York: Springer.
Kraemer, H. C. (1982). Kappa coefficient. Encyclopedia of Statistical Sciences. Wiley.Livingston, S. A., & Lewis, C. (1995). Estimating the consistency and accuracy of
classifications based on test scores. Journal of Educational Measurement, 32, 179–197.
Michaelides, M. P. (2008). An Illustration of a Mantel-Haenszel Procedure to Flag Misbehaving Common Items in Test Equating. Practical Assessment Research & Evaluation, 13(7). Available online: http://pareonline.net/pdf/v13n7.pdf
Muraki, E. (1997). The generalized partial credit model. In W.J. van der Linden & R.K. Hambleton (Eds.), Handbook of Modern Item Response Theory (pp. 153-164). New York: Springer Verlag.
Stocking, M.L., & Lord, F.M. (1983). Developing a common metric in item response theory. Applied Psychological Measurement, 7, 201-210.
Thissen, D., Chen, W-H., & Bock, R. D. (2003). MUTILOG for Windows, Version 7 [Computer Software]. Lincolnwood, IL: Scientific Software International.
Thissen, D., Pommerich, M., Billeaud, K., & Williams, V.S.L. (1995). Item response theory for scores on tests including polytomous items with ordered responses. Applied Psychological Measurement, 19, 39-49.
Yen, W. M. (1981). Using simulation results to choose a latent trait model. Applied Psychological Measurement, 5, 245–262.
Yen, W. M. ( 1984). Effects of local item dependence on the fit and equating performance of the three-parameter logistic model. Applied Psychological Measurement, 8, 125-145.
Pearson, Inc. and SDE Confidential66
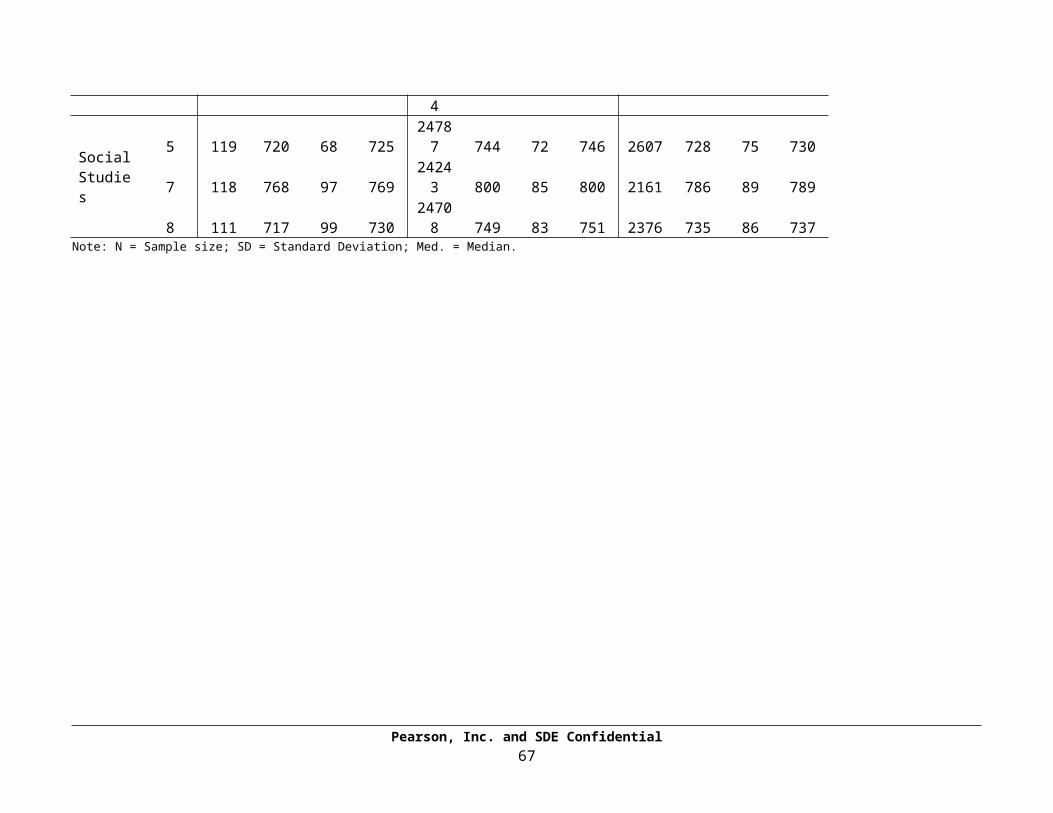
Pearson, Inc. and SDE Confidential67
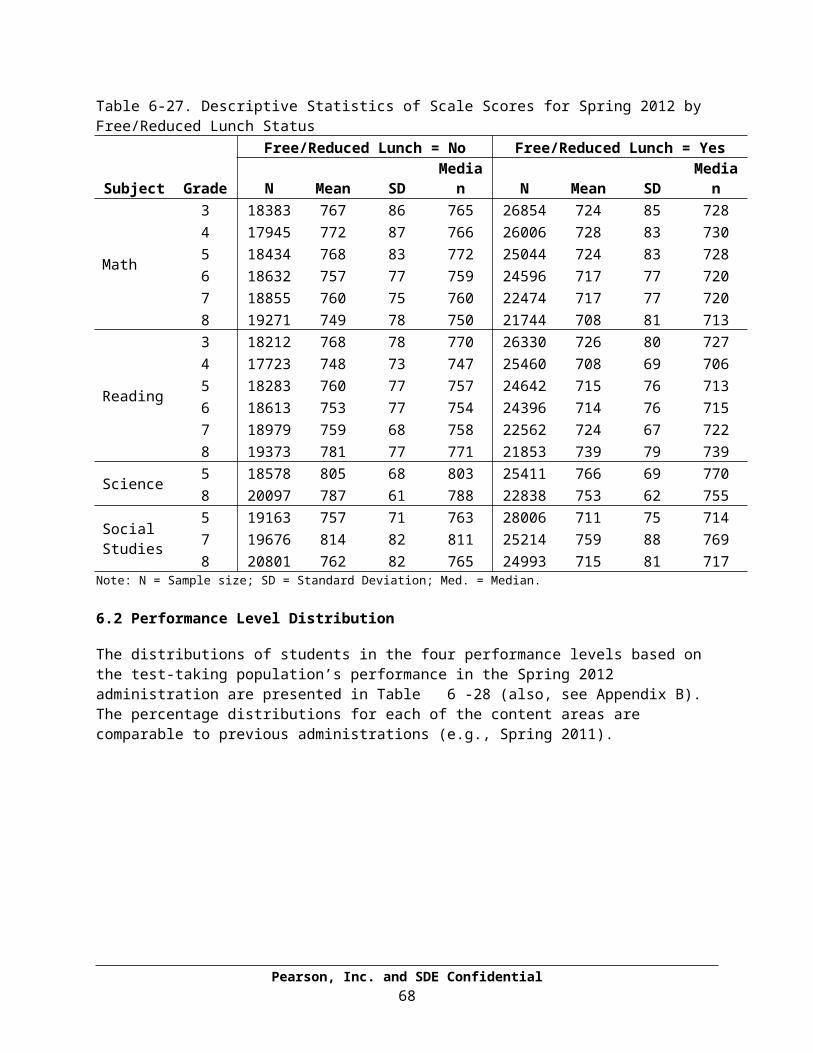
Appendix A
Standards, Objectives/Skills, and Processes Assessed by Subject
*Note: In 2012, field test sets in Mathematics and Reading included Common Core-aligned items as well as vertical linking items; these items are not included in the counts presented in this appendix.
Pearson, Inc. and SDE Confidential68
OCCT Test Blueprint and Actual Item Counts: Grade 3 Mathematics
Pass Standard and Objective
Ideal Number of Items
for Alignmen
t to PASS*
Actual Number of Items on 2012
Test
Number of Items
Field-Tested in
2012Algebraic Reasoning: Patterns and Relationships 7 7 6
Algebra Patterns (1.1) 2 2 1Equations (1.2) 2 2 3
Number Properties (1.3) 3 3 2Number Sense and Operation 20 20 17
Number Sense (2.1) 10 10 8 Number Operations (2.2) 10 10 9Geometry 7 7 4
Properties of shapes (3.1) 3 3 1Spatial Reasoning (3.2) 2 2 2
Coordinate Geometry (3.3) 2 2 1Measurement 9 9 9
Measurement (4.1) 4 4 3Time and Temperature (4.2) 2 2 3
Money (4.3) 3 3 3Data Analysis 7 7 4
Data Analysis (5.1) 4 4 2 Probability (5.2) 3 3 2Total Test 50 50 40
Pearson, Inc. and SDE Confidential69
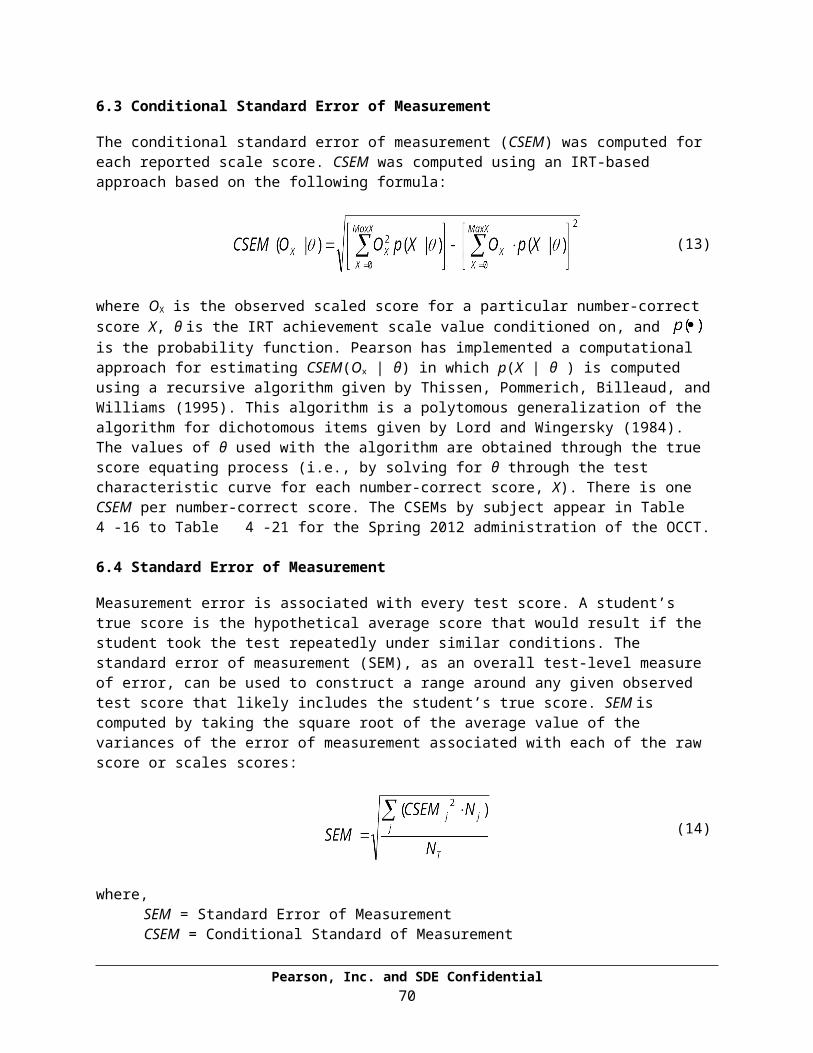
OCCT Test Blueprint and Actual Item Counts: Grade 4 Mathematics
Pass Standard and Objective
Ideal Number of Items
for Alignmen
t to PASS*
Actual Number of Items on 2012
Test
Number of Items
Field-Tested in
2012Algebraic Reasoning: Patterns and Relationships 7 7 6
Algebra Patterns (1.1) 3 3 2Equations (1.2) 2 2 0
Number Properties (1.3) 2 2 4Number Sense and Operation 18 18 13
Number Sense (2.1) 8 8 5 Number Operations (2.2) 10 10 8Geometry 9 9 7
Lines (3.1) 2 2 1Angles (3.2) 2 2 1Polygons (3.3) 3 3 5
Transformations (3.4) 2 2 0Measurement 9 9 7
Measurement (4.1) 5 5 4Time and Temperature (4.2) 2 2 1
Money (4.3) 2 2 2Data Analysis 7 7 7
Data Analysis (5.1) 2 2 1Probability (5.2) 2 2 2
Central Tendency (5.3) 3 3 4Total Test 50 50 40
Pearson, Inc. and SDE Confidential70

OCCT Test Blueprint and Actual Item Counts: Grade 5 Mathematics
Pass Standard and Objective
Ideal Number of Items
for Alignmen
t to PASS*
Actual Number of Items on 2012
Test
Number of Items
Field-Tested in
2012Algebraic Reasoning: Patterns and Relationships 13 13 5
Algebra Patterns (1.1) 5 5 1Equations (1.2) 4 4 1Number Properties (1.3) 4 4 3
Number Sense and Operation 16 16 15Number Sense (2.1) 8 8 8
Number Operations (2.2) 8 8 7Geometry 7 7 6
Circles and Polygons (3.1) 4 4 3 Angles (3.2) 3 3 3Measurement 7 7 8
Measurement (4.1) 5 5 4 Money (4.2) 2 2 4Data Analysis 7 6 6
Data Analysis (5.1) 3 3 1Probability (5.2) 2 2 3
Central Tendency (5.3) 2 1 2Total Test 50 49 40
Pearson, Inc. and SDE Confidential71

OCCT Test Blueprint and Actual Item Counts: Grade 6 Mathematics
Pass Standard and Objective
Ideal Number of Items
for Alignmen
t to PASS*
Actual Number of Items on 2012
Test
Number of Items
Field-Tested in
2012Algebraic Reasoning: Patterns and Relationships 13 13 10
Algebra Patterns (1.1) 4 4 2Expressions and Equations (1.2) 4 4 3Number Properties (1.3) 3 3 2
Solving Equations (1.4) 2 2 3Number Sense and Operation 15 15 12
Number Sense (2.1) 5 5 0 Number Operations (2.2) 10 10 12Geometry 8 8 7
Three Dimensional Figures (3.1) 2 2 2Congruent and Similar Figures (3.2) 2 2 1
Coordinate Geometry (3.3) 4 4 4Measurement 7 7 5
Circles (4.1) 4 4 5 Conversions (4.2) 3 3 0Data Analysis 7 7 6
Data Analysis (5.1) 3 3 1Probability (5.2) 2 2 3
Central Tendency (5.3) 2 2 2Total Test 50 50 40
Pearson, Inc. and SDE Confidential72
OCCT Test Blueprint and Actual Item Counts: Grade 7 Mathematics
Pass Standard and Objective
Ideal Number of Items
for Alignmen
t to PASS*
Actual Number of Items on 2012
Test
Number of Items
Field-Tested in
2012Algebraic Reasoning: Patterns and Relationships 15 15 14
Linear Relationships (1.1) 5 5 6Solving Equations (1.2) 5 5 4Solving and Graphing Inequalities (1.3) 5 5 4
Number Sense and Operation 11 11 8Number Sense (2.1) 5 5 5
Number Operations (2.2) 6 6 3Geometry 8 8 4
Classifying Figures (3.1) 1-3 2 1Lines and Angles (3.2) 1-3 2 2
Transformations (3.3) 4 4 1Measurement 9 9 7
Perimeter and Area (4.1) 5 5 2Circles (4.2) 2 2 2
Composite Figures (4.3) 2 2 3Data Analysis 7 7 7
Data Analysis (5.1) 2 2 3Probability (5.2) 2 2 1
Central Tendency (5.3) 3 3 3Total Test 50 50 40
Pearson, Inc. and SDE Confidential73

OCCT Test Blueprint and Actual Item Counts: Grade 8 Mathematics
Pass Standard and Objective
Ideal Number of Items
for Alignmen
t to PASS*
Actual Number of Items on 2012
Test
Number of Items
Field-Tested in
2012Algebraic Reasoning: Patterns and Relationships 16 16 14
Equations (1.1) 10-12 11 11 Inequalities (1.2) 4-6 5 3Number Sense and Operation 11 11 10
Number Sense (2.1) 3-4 4 3 Number Operations (2.2) 7-8 7 7Geometry 9 9 6
Three Dimensional Figures (3.1) 5 5 4 Pythagorean Theorem (3.2) 4 4 2Measurement 7 7 4
Surface Area and Volume (4.1) 3 3 1Ratio and Proportions (4.2) 2 2 1
Composite Figures (4.3) 2 2 2Data Analysis 7 7 6
Data Analysis (5.1) 3 3 2 Central Tendency (5.3) 4 4 4Total Test 50 50 40
Pearson, Inc. and SDE Confidential74

OCCT Test Blueprint and Actual Item Counts: Grade 3 Reading
Pass Standard and Objective
Ideal Number of Items
for Alignme
nt to PASS*
Actual Number of Items on 2012
Test
Number of Items
Field-Tested in 2012
Vocabulary 12 12 10Words in Context (2.1) 2-4 2 3Affixes, Roots, and Stems (2.2) 2-4 3 1Synonyms, Antonyms, and Homonyms (2.3) 2-4 3 3
Using Resource Materials (2.4) 2-4 4 3Comprehension/Critical Literacy 24 24 19
Literal Understanding (4.1) 5 5 4Inferences and Interpretation (4.2) 7 7 6Summary and Generalization (4.3) 6 6 5
Analysis and Evaluation (4.4) 6 6 4Literature 8 8 5
Literary Elements (5.2) 3-4 3 3 Figurative Language/Sound Devices (5.3) 4-5 5 2Research and Information 6 6 6 Accessing Information (6.1) 6 6 6Total Test 50 50 40
Pearson, Inc. and SDE Confidential75

OCCT Test Blueprint and Actual Item Counts: Grade 4 Reading
Pass Standard and Objective
Ideal Number of Items
for Alignme
nt to PASS*
Actual Number of Items on 2012
Test
Number of Items
Field-Tested in 2012
Vocabulary 12 12 9Words in Context (1.1) 4 4 3Affixes, Roots, and Stems (1.2) 4 4 3
Synonyms, Antonyms, and Homonyms (1.3) 4 4 3Comprehension/Critical Literacy 23 23 17
Literal Understanding (3.1) 4 4 4Inferences and Interpretation (3.2) 6 6 5Summary and Generalization (3.3) 7 7 4
Analysis and Evaluation (3.4) 6 6 4Literature 9 9 7
Literary Elements (4.2) 5 5 5 Figurative Language/Sound Devices (4.3) 4 4 2Research and Information 6 6 7 Accessing Information (5.1) 6 6 7Total Test 50 50 40
Pearson, Inc. and SDE Confidential76

OCCT Test Blueprint and Actual Item Counts: Grade 5 Reading
Pass Standard and Objective
Ideal Number of Items
for Alignme
nt to PASS*
Actual Number of Items on 2012
Test
Number of Items
Field-Tested in 2012
Vocabulary 12 12 9Words in Context (1.1) 4 4 3Affixes, Roots, and Stems (1.2) 4 4 3
Synonyms, Antonyms, and Homonyms (1.3) 4 4 3Comprehension/Critical Literacy 20 19 16
Literal Understanding (3.1) 4 4 1Inferences and Interpretation (3.2) 4-6 5 4Summary and Generalization (3.3) 4-6 5 6
Analysis and Evaluation (3.4) 4-6 5 5Literature 12 12 8
Literary Genre (4.1) 4 4 2Literary Elements (4.2) 4 4 3
Figurative Language/Sound Devices (4.3) 4 4 3Research and Information 6 7 7
Accessing Information (5.1) 2-4 4 3 Interpreting Information (5.2) 2-4 3 4Total Test 50 50 40
Pearson, Inc. and SDE Confidential77

OCCT Test Blueprint and Actual Item Counts: Grade 6 Reading
Pass Standard and Objective
Ideal Number of Items
for Alignme
nt to PASS*
Actual Number of Items on 2012
Test
Number of Items
Field-Tested in 2012
Vocabulary 8 8 6Words in Context (1.1) 4 4 4
Word Origins (1.2) 4 4 2Comprehension/Critical Literacy 20 19 15
Literal Understanding (3.1) 4 4 2Inferences and Interpretation (3.2) 4-6 5 5Summary and Generalization (3.3) 4-6 5 4
Analysis and Evaluation (3.4) 4-6 5 4Literature 14 15 12
Literary Genres (4.1) 4 4 4Literary Elements (4.2) 4-6 5 3
Figurative Language/Sound Devices (4.3) 4-6 6 5Research and Information 8 8 7
Accessing Information (5.1) 4 4 5 Interpreting Information (5.2) 4 4 2Total Test 50 50 40
Pearson, Inc. and SDE Confidential78

OCCT Test Blueprint and Actual Item Counts: Grade 7 Reading
Pass Standard and Objective
Ideal Number of Items
for Alignme
nt to PASS*
Actual Number of Items on 2012
Test
Number of Items
Field-Tested in 2012
Vocabulary 10 10 8Words in Context (1.1) 3-4 3 2Word Origins (1.2) 3-4 3 3
Idioms and Comparisons (1.3) 3-4 4 3Comprehension/Critical Literacy 20 20 14
Literal Understanding (3.1) 4-5 5 3Inferences and Interpretation (3.2) 4-6 5 4Summary and Generalization (3.3) 4-6 5 3
Analysis and Evaluation (3.4) 4-6 5 4Literature 12 12 12
Literary Genres (4.1) 4 4 4Literary Elements (4.2) 4 4 4
Figurative Language/Sound Devices (4.3) 4 4 4Research and Information 8 8 6
Accessing Information (5.1) 4 4 3 Interpreting Information (5.2) 4 4 4Total Test 50 50 40
Pearson, Inc. and SDE Confidential79

OCCT Test Blueprint and Actual Item Counts: Grade 8 Reading
Pass Standard and Objective
Ideal Number of Items
for Alignme
nt to PASS*
Actual Number of Items on 2012
Test
Number of Items
Field-Tested in 2012
Vocabulary 6 6 5Words in Context (1.1) 2 2 3Word Origins (1.2) 2 2 0
Idioms and Comparisons (1.3) 2 2 2Comprehension/Critical Literacy 21 21 17
Literal Understanding (3.1) 4-5 5 4Inferences and Interpretation (3.2) 4-6 5 5Summary and Generalization (3.3) 5-7 5 4
Analysis and Evaluation (3.4) 6-8 6 4Literature 15 15 10
Literary Genre (4.1) 4-5 5 3Literary Elements (4.2) 5-7 5 3
Figurative Language/Sound Devices (4.3) 4-6 5 4Research and Information 8 8 8
Accessing Information (5.1) 4 4 4 Interpreting Information (5.2) 4 4 4Total Test 50 50 40
Pearson, Inc. and SDE Confidential80

OCCT Test Blueprint and Actual Item Counts: Grade 5 Science
Pass Standard and Objective
Ideal Number of Items
for Alignme
nt to PASS*
Actual Number of Items on 2012
Test
Number of Items
Field-Tested in
2012Process Standards Observe and Measure 10 10 16
SI Metric (P1.1) 5 5 7 Similar/different characteristics (P1.2) 5 5 9Classify 10 10 20
Observable properties (P2.1) 5 5 10 Serial order (P2.2) 5 5 10Experiment 11 11 15
Experimental design (P3.2) 7 7 10 Hazards/practice safety (P3.4) 4 4 5Interpret and Communicate 14 14 29
Data tables/line/bar/trend and circle graphs (P4.2) 6 5 10Prediction based on data (P4.3) 4 5 9Explanations based on data (P4.4) 4 4 10
Total Test 45 45 80Content Standards Properties of Matter and Energy 18 18 30
Matter has physical properties (1.1) 6 6 9Physical properties can be measured (1.2) 6 6 8Energy can be transferred (1.3) 6 6 6
Potential/Kinetic Energy (1.4) 0 0 7Organisms and Environments 12 12 20
Dependence upon community (2.1) 6 6 11 Individual organism and species survival (2.2) 6 6 9Structures of the Earth and the Solar System 11 11 25
Properties of Soils (3.1) 0 0 6Weather patterns (3.2) 6 7 9
Earth as a planet (3.3) 5 4 10Total Test 41 41 75
* Items from the Safety Objective (P3.4) are not dual aligned to a content standard
Pearson, Inc. and SDE Confidential81
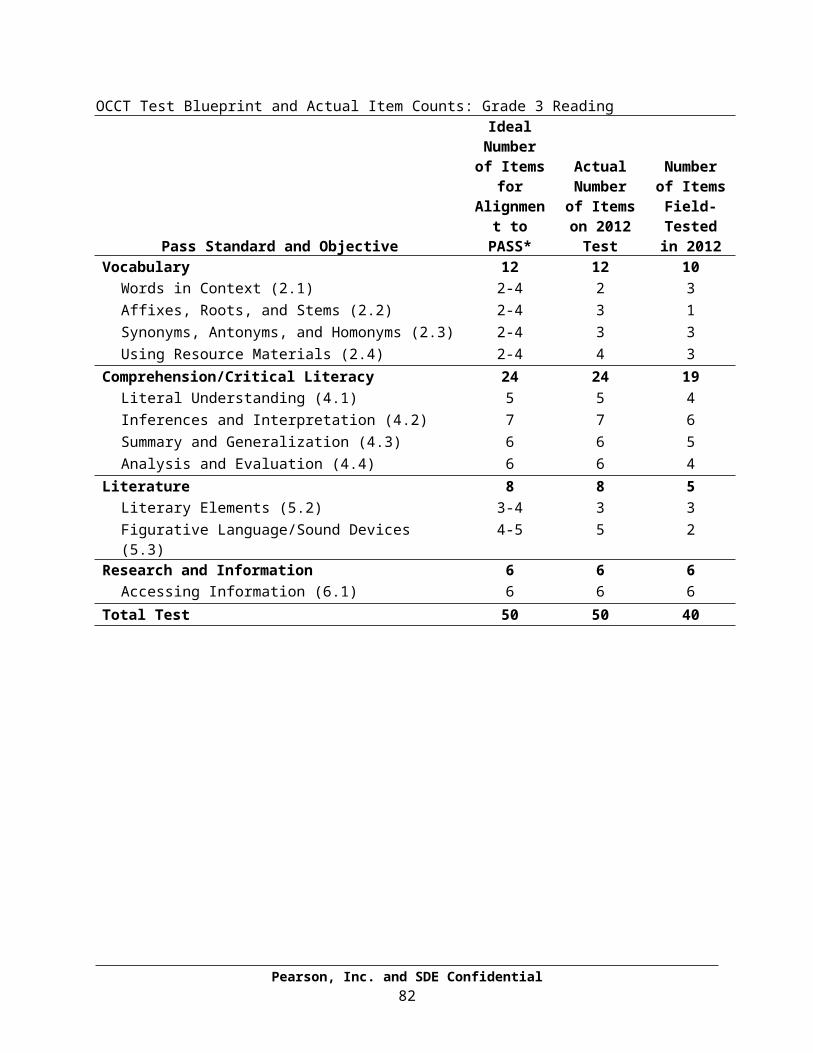
OCCT Test Blueprint and Actual Item Counts: Grade 8 Science
Pass Standard and Objective
Ideal Number of Items
for Alignme
nt to PASS*
Actual Number of Items on 2012
Test
Number of Items
Field-Tested in
2012
Process StandardsObserve and Measure 8 6 15
Qualitative/quantitative observations/changes (P1.1) 4 3 9
SI (metrics) units/appropriate tools (P1.2 and P1.3) 4 3 6
Classify 8 10 17Classification system (P2.1) 4 6 9
Properties ordered (P2.2) 4 4 8Experiment 16 16 26
Experimental design (P3.2) 6 6 10Identify variables (P3.3) 6 6 11
Hazards/practice safety (P3.6) 4 4 5Interpret and Communicate 13 13 22
Data tables/line/bar/trend and circle graphs (P4.2) 7 7 12
Explanations/prediction (P4.3) 6 6 10Total Test 45 45 80Content StandardsProperties and Chemical Changes in Matter 7-8 8 15
Chemical reactions (1.1) 3-4 4 8Conservation of matter (1.2) 3-4 4 7
Motion and Forces 8 8 14Motion of an object (2.1) 4 4 7
Object subjected to a force (2.2) 4 4 7Diversity and Adaptations of Organisms 9 9 13
Classification (3.1) 5 5 7 Internal and external structures (3.2) 4 4 6Structures/Forces of the Earth/Solar System 8 7 19
Landforms result from constructive and destructive forces (4.1) 4 4 7Rock cycle (4.2) 4 3 6
Global Weather Patterns (4.3) 0 0 6Earth’s History 7-8 9 14
Pearson, Inc. and SDE Confidential82

Catastrophic events (5.1) 3-4 5 6 Fossil evidence (5.2) 3-4 4 8Total Test 41 41 75
* Items from the Safety Objective (P3.4) are not dual aligned to a content standard OCCT Test Blueprint and Actual Item Counts: Grade 5 Social Studies
Pass Standard and Objective
Ideal Number of Items
for Alignmen
t to PASS*
Actual Number of Items on 2012
Test
Number of Items
Field-Tested in
2012Early Exploration 8 8 12
Expeditions (2.1) 4 4 4 Native American Reaction (2.2) 4 4 8Colonial America 12 12 8
Settlements and Migration (3.1) 4 4 1Colonial Life (3.2) 4 4 5Individuals and Groups (3.3) 4 4 2
American Revolution 12 12 10Causes and Results (4.1) 4 4 5Declaration of Independence (4.3) 4 4 1
Individuals (4.4) 4 4 4Early Federal Period 8 8 7
Constitutional Provisions (5.2) 4 4 4Ratification and Rights (5.3) 4 4 3
Geographic Skills 20 20 43Maps/Charts/Graphs Usage (7.1) 7 7 14Human/Environment Interaction (7.2) 5 5 11Historical Places (7.3) 4 4 9
Westward Movement (7.4) 4 4 9Total Test 60 60 80
Pearson, Inc. and SDE Confidential83

OCCT Test Blueprint and Actual Item Counts: Grade 7 Social Studies (Geography)
Pass Standard and Objective
Ideal Number of Items
for Alignmen
t to PASS*
Actual Number of Items on 2012
Test
Number of Items
Field-Tested in
2012Geographic Tools/Geography Skills 9 9 12
Map Concepts (1.2) 4 4 9 Maps/Charts/Graphs (6.1) 5 5 3Regions 12 12 20
Regional Characteristics (2.1) 4 4 6Conflict/Cooperation (2.2) 4 4 8
Locations (2.4) 4 4 6Physical Systems 8 8 13
Climate/Weather (3.2) 4 4 8 Natural Disasters (3.3) 4 4 5Human Systems 8 8 17
World Cultures (4.1) 4 4 8 Population Issues (4.5) 4 4 9Human/Environment Interaction 8 8 18
Natural Resources (5.1) 4 4 10 Human Modification (5.2) 4 4 8Total Test 45 45 80
Pearson, Inc. and SDE Confidential84

OCCT Test Blueprint and Actual Item Counts: Grade 8 Social Studies (U.S. History)
Pass Standard and Objective
Ideal Number of Items
for Alignmen
t to PASS*
Actual Number of Items on 2012
Test
Number of Items
Field-Tested in
2012Social Studies Process Skills (1.0) 6 6 13Causes and Results of the American Revolution (3.0/4.0) 10 10 12 Causes of the American Revolution (3.0) 5 5 8 Results of the American Revolution (4.0) 5 5 4Governing Documents/Early Federal Period (5.0) 6 6 10
Moving Toward the Civil War (6.0/10.0) 9 9 20 Northern/Southern Economic Growth (6.0) 4 4 7 Eve of War (10.0) 5 5 13Early 19th Century America (7.0/8.0) 8 8 14 Jacksonian Era (7.0) 4 4 10 Cultural Growth and Reform (8.0) 4 4 4Westward Movement (9.0) 6 6 11Total Test 45 45 80
Pearson, Inc. and SDE Confidential85

Appendix B
Scale Score Distributions for Spring 2012
Pearson, Inc. and SDE Confidential86

Mathematics Grade 3 Scale Score Distribution for Spring 2012
Scale Score
Frequency Percent
Cumulative
Frequency
Cumulative Percent
400 73 0.2 73 0.2435 48 0.1 121 0.3464 71 0.2 192 0.4487 106 0.2 298 0.7506 120 0.3 418 0.9523 161 0.4 579 1.3537 215 0.5 794 1.8550 227 0.5 1,021 2.3563 284 0.6 1,305 2.9574 319 0.7 1,624 3.6584 362 0.8 1,986 4.4594 389 0.9 2,375 5.3603 500 1.1 2,875 6.4612 517 1.1 3,392 7.5621 541 1.2 3,933 8.7629 634 1.4 4,567 10.1637 661 1.5 5,228 11.6645 717 1.6 5,945 13.1653 806 1.8 6,751 14.9660 937 2.1 7,688 17.0667 990 2.2 8,678 19.2675 1067 2.4 9,745 21.5682 1206 2.7 10,951 24.2689 1276 2.8 12,227 27.0697 1374 3.0 13,601 30.1704 1500 3.3 15,101 33.4712 1653 3.7 16,754 37.0719 1647 3.6 18,401 40.7728 1845 4.1 20,246 44.8736 2011 4.4 22,257 49.2745 2187 4.8 24,444 54.0755 2266 5.0 26,710 59.0765 2364 5.2 29,074 64.3777 2486 5.5 31,560 69.8789 2517 5.6 34,077 75.3
Pearson, Inc. and SDE Confidential87

Scale Score
Frequency Percent
Cumulative
Frequency
Cumulative Percent
804 2622 5.8 36,699 81.1821 2450 5.4 39,149 86.5843 2318 5.1 41,467 91.7873 1853 4.1 43,320 95.8923 1323 2.9 44,643 98.7990 594 1.3 45,237 100.0
Spring 2012 Math Grade 3 Scale Score Distribution
0.0
1.0
2.0
3.0
4.0
5.0
6.0
7.0
400
464
506
537
563
584
603
621
637
653
667
682
697
712
728
745
765
789
821
873
990
Scale Score
Perc
ent
Pearson, Inc. and SDE Confidential88

Mathematics Grade 4 Scale Score Distribution for Spring 2012
Scale Score
Frequency Percent
Cumulative
Frequency
Cumulative Percent
400 35 0.1 35 0.1426 33 0.1 68 0.2459 38 0.1 106 0.2484 55 0.1 161 0.4504 111 0.3 272 0.6521 124 0.3 396 0.9535 169 0.4 565 1.3549 188 0.4 753 1.7561 247 0.6 1,000 2.3572 252 0.6 1,252 2.8583 324 0.7 1,576 3.6593 332 0.8 1,908 4.3602 396 0.9 2,304 5.2611 473 1.1 2,777 6.3619 460 1.0 3,237 7.4628 503 1.1 3,740 8.5636 570 1.3 4,310 9.8643 670 1.5 4,980 11.3651 741 1.7 5,721 13.0658 823 1.9 6,544 14.9666 956 2.2 7,500 17.1673 1024 2.3 8,524 19.4680 1059 2.4 9,583 21.8687 1106 2.5 10,689 24.3694 1170 2.7 11,859 27.0701 1409 3.2 13,268 30.2708 1414 3.2 14,682 33.4715 1575 3.6 16,257 37.0723 1650 3.8 17,907 40.7730 1747 4.0 19,654 44.7738 1932 4.4 21,586 49.1747 1886 4.3 23,472 53.4756 2165 4.9 25,637 58.3766 2239 5.1 27,876 63.4777 2388 5.4 30,264 68.9
Pearson, Inc. and SDE Confidential89

Scale Score
Frequency Percent
Cumulative
Frequency
Cumulative Percent
790 2472 5.6 32,736 74.5804 2515 5.7 35,251 80.2821 2292 5.2 37,543 85.4844 2280 5.2 39,823 90.6874 1989 4.5 41,812 95.1928 1445 3.3 43,257 98.4990 694 1.6 43,951 100.0
Spring 2012 Math Grade 4 Scale Score Distribution
0.0
1.0
2.0
3.0
4.0
5.0
6.0
7.0
400
459
504
535
561
583
602
619
636
651
666
680
694
708
723
738
756
777
804
844
928
Scale Score
Perc
ent
Pearson, Inc. and SDE Confidential90

Mathematics Grade 5 Scale Score Distribution for Spring 2012
Scale Score
Frequency Percent
Cumulative
Frequency
Cumulative Percent
400 66 0.2 66 0.2408 48 0.1 114 0.3458 75 0.2 189 0.4492 133 0.3 322 0.7518 168 0.4 490 1.1538 213 0.5 703 1.6556 263 0.6 966 2.2571 295 0.7 1,261 2.9584 391 0.9 1,652 3.8596 429 1.0 2,081 4.8607 492 1.1 2,573 5.9617 630 1.4 3,203 7.4627 630 1.4 3,833 8.8636 686 1.6 4,519 10.4644 751 1.7 5,270 12.1653 824 1.9 6,094 14.0661 866 2.0 6,960 16.0668 1052 2.4 8,012 18.4676 1113 2.6 9,125 21.0683 1174 2.7 10,299 23.7691 1288 3.0 11,587 26.7698 1357 3.1 12,944 29.8706 1471 3.4 14,415 33.2713 1569 3.6 15,984 36.8721 1677 3.9 17,661 40.6728 1709 3.9 19,370 44.6736 1882 4.3 21,252 48.9745 1881 4.3 23,133 53.2753 1953 4.5 25,086 57.7762 2012 4.6 27,098 62.3772 2105 4.8 29,203 67.2783 2212 5.1 31,415 72.3794 2158 5.0 33,573 77.2807 2154 5.0 35,727 82.2822 2040 4.7 37,767 86.9
Pearson, Inc. and SDE Confidential91

Scale Score
Frequency Percent
Cumulative
Frequency
Cumulative Percent
840 1801 4.1 39,568 91.0863 1591 3.7 41,159 94.7894 1179 2.7 42,338 97.4951 813 1.9 43,151 99.2990 327 0.8 43,478 100.0
Spring 2012 Math Grade 5 Scale Score Distribution
0.0
1.0
2.0
3.0
4.0
5.0
6.0
400
458
518
556
584
607
627
644
661
676
691
706
721
736
753
772
794
822
863
951
Scale Score
Perc
ent
Pearson, Inc. and SDE Confidential92

Mathematics Grade 6 Scale Score Distribution for Spring 2012
Scale Score
Frequency Percent
Cumulative
Frequency
Cumulative Percent
400 107 0.2 107 0.2424 87 0.2 194 0.4483 95 0.2 289 0.7518 200 0.5 489 1.1543 247 0.6 736 1.7563 307 0.7 1,043 2.4579 408 0.9 1,451 3.4594 478 1.1 1,929 4.5607 596 1.4 2,525 5.8618 685 1.6 3,210 7.4629 739 1.7 3,949 9.1639 809 1.9 4,758 11.0648 932 2.2 5,690 13.2656 1022 2.4 6,712 15.5664 1077 2.5 7,789 18.0672 1165 2.7 8,954 20.7680 1196 2.8 10,150 23.5687 1262 2.9 11,412 26.4694 1202 2.8 12,614 29.2700 1406 3.3 14,020 32.4707 1405 3.3 15,425 35.7714 1492 3.5 16,917 39.1720 1553 3.6 18,470 42.7726 1513 3.5 19,983 46.2733 1527 3.5 21,510 49.8739 1622 3.8 23,132 53.5746 1617 3.7 24,749 57.3752 1618 3.7 26,367 61.0759 1534 3.5 27,901 64.5766 1632 3.8 29,533 68.3774 1603 3.7 31,136 72.0781 1636 3.8 32,772 75.8789 1581 3.7 34,353 79.5798 1454 3.4 35,807 82.8807 1367 3.2 37,174 86.0
Pearson, Inc. and SDE Confidential93

Scale Score
Frequency Percent
Cumulative
Frequency
Cumulative Percent
818 1328 3.1 38,502 89.1830 1164 2.7 39,666 91.8844 1103 2.6 40,769 94.3861 950 2.2 41,719 96.5887 710 1.6 42,429 98.2931 515 1.2 42,944 99.3990 284 0.7 43,228 100.0
Spring 2012 Math Grade 6 Scale Score Distribution
0.0
0.5
1.0
1.5
2.0
2.5
3.0
3.5
4.0
400
483
543
579
607
629
648
664
680
694
707
720
733
746
759
774
789
807
830
861
931
Scale Score
Perc
ent
Pearson, Inc. and SDE Confidential94

Mathematics Grade 7 Scale Score Distribution for Spring 2012
Scale Score
Frequency Percent
Cumulative
Frequency
Cumulative Percent
400 208 0.5 208 0.5471 146 0.4 354 0.9513 216 0.5 570 1.4542 263 0.6 833 2.0565 361 0.9 1,194 2.9584 436 1.1 1,630 3.9600 511 1.2 2,141 5.2614 620 1.5 2,761 6.7627 675 1.6 3,436 8.3638 789 1.9 4,225 10.2648 835 2.0 5,060 12.2658 955 2.3 6,015 14.6667 1059 2.6 7,074 17.1676 1162 2.8 8,236 19.9684 1235 3.0 9,471 22.9691 1377 3.3 10,848 26.2699 1445 3.5 12,293 29.7706 1451 3.5 13,744 33.3713 1555 3.8 15,299 37.0720 1525 3.7 16,824 40.7727 1531 3.7 18,355 44.4734 1532 3.7 19,887 48.1740 1678 4.1 21,565 52.2747 1605 3.9 23,170 56.1754 1561 3.8 24,731 59.8760 1571 3.8 26,302 63.6767 1603 3.9 27,905 67.5774 1545 3.7 29,450 71.3781 1386 3.4 30,836 74.6788 1462 3.5 32,298 78.1796 1320 3.2 33,618 81.3804 1221 3.0 34,839 84.3812 1119 2.7 35,958 87.0821 1058 2.6 37,016 89.6831 993 2.4 38,009 92.0
Pearson, Inc. and SDE Confidential95

Scale Score
Frequency Percent
Cumulative
Frequency
Cumulative Percent
843 876 2.1 38,885 94.1856 756 1.8 39,641 95.9874 658 1.6 40,299 97.5898 484 1.2 40,783 98.7940 364 0.9 41,147 99.6990 182 0.4 41,329 100.0
Spring 2012 Math Grade 7 Scale Score Distribution
0.0
0.5
1.0
1.5
2.0
2.5
3.0
3.5
4.0
4.5
400
513
565
600
627
648
667
684
699
713
727
740
754
767
781
796
812
831
856
898
990
Scale Score
Perc
ent
Pearson, Inc. and SDE Confidential96

Mathematics Grade 8 Scale Score Distribution for Spring 2012
Scale Score
Frequency Percent
Cumulative
Frequency
Cumulative Percent
400 426 1.0 426 1.0479 189 0.5 615 1.5529 291 0.7 906 2.2559 414 1.0 1,320 3.2580 467 1.1 1,787 4.4597 545 1.3 2,332 5.7610 635 1.5 2,967 7.2622 650 1.6 3,617 8.8633 794 1.9 4,411 10.8642 846 2.1 5,257 12.8651 859 2.1 6,116 14.9659 1000 2.4 7,116 17.3667 1007 2.5 8,123 19.8674 1109 2.7 9,232 22.5681 1129 2.8 10,361 25.3687 1233 3.0 11,594 28.3694 1275 3.1 12,869 31.4700 1280 3.1 14,149 34.5707 1390 3.4 15,539 37.9713 1414 3.4 16,953 41.3719 1544 3.8 18,497 45.1725 1486 3.6 19,983 48.7731 1483 3.6 21,466 52.3737 1521 3.7 22,987 56.0744 1507 3.7 24,494 59.7750 1498 3.7 25,992 63.4757 1479 3.6 27,471 67.0764 1478 3.6 28,949 70.6771 1424 3.5 30,373 74.1778 1385 3.4 31,758 77.4786 1362 3.3 33,120 80.8794 1320 3.2 34,440 84.0804 1237 3.0 35,677 87.0814 1171 2.9 36,848 89.8826 1101 2.7 37,949 92.5
Pearson, Inc. and SDE Confidential97

Scale Score
Frequency Percent
Cumulative
Frequency
Cumulative Percent
840 933 2.3 38,882 94.8858 802 2.0 39,684 96.8883 660 1.6 40,344 98.4925 438 1.1 40,782 99.4990 233 0.6 41,015 100.0
Spring 2012 Math Grade 8 Scale Score Distribution
0.0
0.5
1.0
1.5
2.0
2.5
3.0
3.5
4.0
400
529
580
610
633
651
667
681
694
707
719
731
744
757
771
786
804
826
858
925
Scale Score
Perc
ent
Pearson, Inc. and SDE Confidential98

Reading Grade 3 Scale Score Distribution for Spring 2012
Scale Score
Frequency Percent
Cumulative
Frequency
Cumulative Percent
400 56 0.1 56 0.1409 54 0.1 110 0.2466 73 0.2 183 0.4498 101 0.2 284 0.6522 168 0.4 452 1.0540 203 0.5 655 1.5556 262 0.6 917 2.1569 304 0.7 1,221 2.7581 325 0.7 1,546 3.5592 403 0.9 1,949 4.4602 417 0.9 2,366 5.3611 443 1.0 2,809 6.3619 503 1.1 3,312 7.4627 547 1.2 3,859 8.7635 565 1.3 4,424 9.9643 633 1.4 5,057 11.4650 689 1.5 5,746 12.9657 739 1.7 6,485 14.6664 798 1.8 7,283 16.4671 867 1.9 8,150 18.3678 950 2.1 9,100 20.4684 1057 2.4 10,157 22.8691 1109 2.5 11,266 25.3698 1210 2.7 12,476 28.0705 1362 3.1 13,838 31.1712 1439 3.2 15,277 34.3719 1477 3.3 16,754 37.6727 1659 3.7 18,413 41.3735 1877 4.2 20,290 45.6743 2006 4.5 22,296 50.1751 2130 4.8 24,426 54.8760 2224 5.0 26,650 59.8770 2243 5.0 28,893 64.9780 2346 5.3 31,239 70.1790 2456 5.5 33,695 75.6
Pearson, Inc. and SDE Confidential99

Scale Score
Frequency Percent
Cumulative
Frequency
Cumulative Percent
802 2283 5.1 35,978 80.8815 2198 4.9 38,176 85.7830 1899 4.3 40,075 90.0849 1729 3.9 41,804 93.9873 1340 3.0 43,144 96.9908 875 2.0 44,019 98.8975 401 0.9 44,420 99.7990 122 0.3 44,542 100.0
Spring 2012 Read Grade 3 Scale Score Distribution
0.0
1.0
2.0
3.0
4.0
5.0
6.0
400
466
522
556
581
602
619
635
650
664
678
691
705
719
735
751
770
790
815
849
908
990
Scale Score
Perc
ent
Pearson, Inc. and SDE Confidential100

Reading Grade 4 Scale Score Distribution for Spring 2012
Scale Score
Frequency Percent
Cumulative
Frequency
Cumulative Percent
400 29 0.1 29 0.1406 34 0.1 63 0.1455 37 0.1 100 0.2484 61 0.1 161 0.4505 70 0.2 231 0.5522 116 0.3 347 0.8536 125 0.3 472 1.1548 156 0.4 628 1.5559 193 0.4 821 1.9569 186 0.4 1,007 2.3579 260 0.6 1,267 2.9587 258 0.6 1,525 3.5596 317 0.7 1,842 4.3603 395 0.9 2,237 5.2611 405 0.9 2,642 6.1618 477 1.1 3,119 7.2625 496 1.1 3,615 8.4632 578 1.3 4,193 9.7639 695 1.6 4,888 11.3646 738 1.7 5,626 13.0652 888 2.1 6,514 15.1659 963 2.2 7,477 17.3665 1058 2.5 8,535 19.8672 1141 2.6 9,676 22.4679 1382 3.2 11,058 25.6685 1419 3.3 12,477 28.9692 1599 3.7 14,076 32.6699 1718 4.0 15,794 36.6706 1873 4.3 17,667 40.9714 1959 4.5 19,626 45.4721 2066 4.8 21,692 50.2729 2179 5.0 23,871 55.3738 2292 5.3 26,163 60.6747 2381 5.5 28,544 66.1756 2389 5.5 30,933 71.6
Pearson, Inc. and SDE Confidential101

Scale Score
Frequency Percent
Cumulative
Frequency
Cumulative Percent
767 2451 5.7 33,384 77.3779 2250 5.2 35,634 82.5794 2133 4.9 37,767 87.5811 1956 4.5 39,723 92.0832 1535 3.6 41,258 95.5863 1088 2.5 42,346 98.1915 629 1.5 42,975 99.5990 208 0.5 43,183 100.0
Spring 2012 Read Grade 4 Scale Score Distribution
0.0
1.0
2.0
3.0
4.0
5.0
6.0
400
455
505
536
559
579
596
611
625
639
652
665
679
692
706
721
738
756
779
811
863
990
Scale Score
Perc
ent
Pearson, Inc. and SDE Confidential102

Reading Grade 5 Scale Score Distribution for Spring 2012
Scale Score
Frequency Percent
Cumulative
Frequency
Cumulative Percent
400 72 0.2 72 0.2442 46 0.1 118 0.3479 75 0.2 193 0.4503 82 0.2 275 0.6521 117 0.3 392 0.9537 164 0.4 556 1.3550 186 0.4 742 1.7561 191 0.4 933 2.2572 247 0.6 1,180 2.7582 260 0.6 1,440 3.4591 286 0.7 1,726 4.0600 349 0.8 2,075 4.8608 365 0.9 2,440 5.7616 438 1.0 2,878 6.7623 500 1.2 3,378 7.9630 536 1.2 3,914 9.1637 595 1.4 4,509 10.5644 623 1.5 5,132 12.0651 739 1.7 5,871 13.7658 807 1.9 6,678 15.6664 893 2.1 7,571 17.6671 1043 2.4 8,614 20.1678 1126 2.6 9,740 22.7684 1250 2.9 10,990 25.6691 1340 3.1 12,330 28.7698 1524 3.6 13,854 32.3706 1602 3.7 15,456 36.0713 1737 4.0 17,193 40.1721 1868 4.4 19,061 44.4729 2016 4.7 21,077 49.1738 2219 5.2 23,296 54.3747 2324 5.4 25,620 59.7757 2434 5.7 28,054 65.4769 2525 5.9 30,579 71.2781 2598 6.1 33,177 77.3
Pearson, Inc. and SDE Confidential103

Scale Score
Frequency Percent
Cumulative
Frequency
Cumulative Percent
795 2479 5.8 35,656 83.1813 2332 5.4 37,988 88.5834 2065 4.8 40,053 93.3864 1570 3.7 41,623 97.0914 953 2.2 42,576 99.2990 349 0.8 42,925 100.0
Spring 2012 Read Grade 5 Scale Score Distribution
0.0
1.0
2.0
3.0
4.0
5.0
6.0
7.0
400
479
521
550
572
591
608
623
637
651
664
678
691
706
721
738
757
781
813
864
990
Scale Score
Perc
ent
Pearson, Inc. and SDE Confidential104

Reading Grade 6 Scale Score Distribution for Spring 2012
Scale Score
Frequency Percent
Cumulative
Frequency
Cumulative Percent
400 59 0.1 59 0.1446 53 0.1 112 0.3489 77 0.2 189 0.4514 139 0.3 328 0.8533 149 0.3 477 1.1548 200 0.5 677 1.6560 246 0.6 923 2.1571 295 0.7 1,218 2.8581 330 0.8 1,548 3.6590 385 0.9 1,933 4.5598 459 1.1 2,392 5.6607 465 1.1 2,857 6.6615 519 1.2 3,376 7.8622 590 1.4 3,966 9.2630 635 1.5 4,601 10.7637 696 1.6 5,297 12.3644 764 1.8 6,061 14.1652 763 1.8 6,824 15.9659 901 2.1 7,725 18.0666 927 2.2 8,652 20.1673 1000 2.3 9,652 22.4679 1126 2.6 10,778 25.1686 1254 2.9 12,032 28.0693 1326 3.1 13,358 31.1700 1445 3.4 14,803 34.4707 1510 3.5 16,313 37.9715 1614 3.8 17,927 41.7722 1716 4.0 19,643 45.7730 1837 4.3 21,480 49.9737 1858 4.3 23,338 54.3746 2067 4.8 25,405 59.1754 2074 4.8 27,479 63.9763 2054 4.8 29,533 68.7773 2073 4.8 31,606 73.5783 2088 4.9 33,694 78.3
Pearson, Inc. and SDE Confidential105

Scale Score
Frequency Percent
Cumulative
Frequency
Cumulative Percent
795 2060 4.8 35,754 83.1807 1889 4.4 37,643 87.5822 1616 3.8 39,259 91.3840 1400 3.3 40,659 94.5862 1139 2.6 41,798 97.2894 689 1.6 42,487 98.8952 421 1.0 42,908 99.8990 101 0.2 43,009 100.0
Spring 2012 Read Grade 6 Scale Score Distribution
0.0
1.0
2.0
3.0
4.0
5.0
6.0
400
489
533
560
581
598
615
630
644
659
673
686
700
715
730
746
763
783
807
840
894
990
Scale Score
Perc
ent
Pearson, Inc. and SDE Confidential106
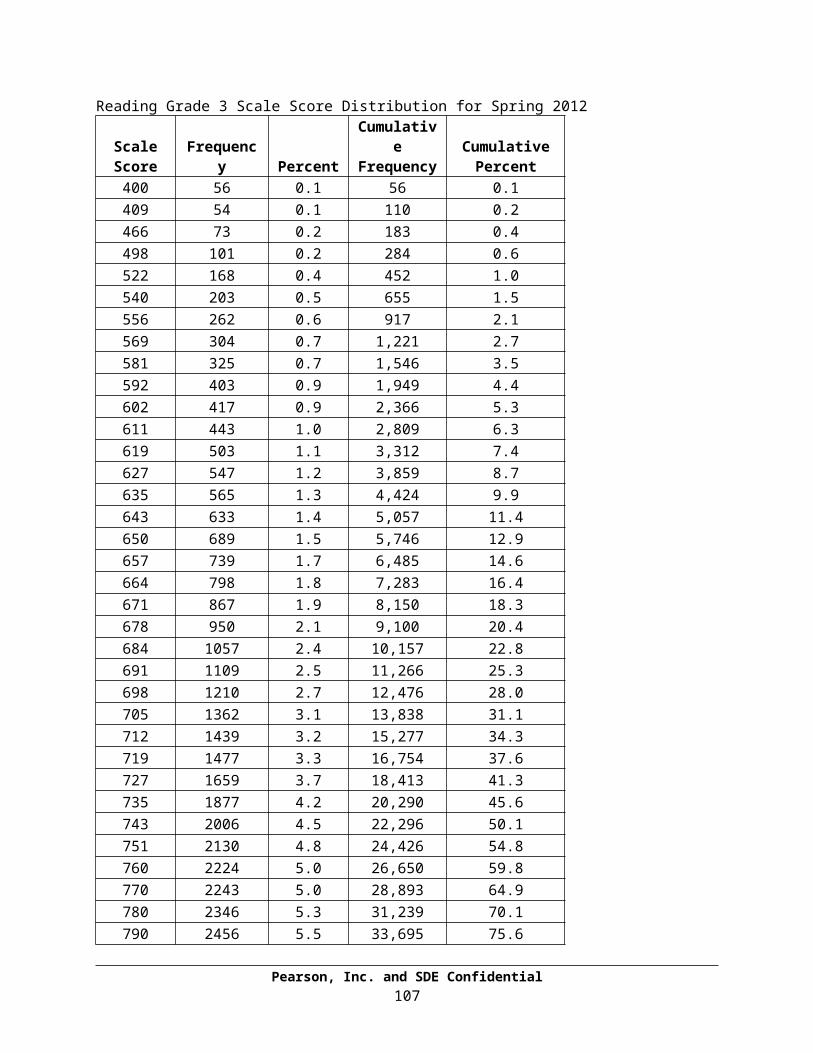
Reading Grade 7 Scale Score Distribution for Spring 2012
Scale Score
Frequency Percent
Cumulative
Frequency
Cumulative Percent
400 31 0.1 31 0.1428 25 0.1 56 0.1483 49 0.1 105 0.3514 58 0.1 163 0.4536 69 0.2 232 0.6553 98 0.2 330 0.8567 137 0.3 467 1.1579 141 0.3 608 1.5589 159 0.4 767 1.8598 185 0.4 952 2.3606 224 0.5 1,176 2.8614 276 0.7 1,452 3.5621 284 0.7 1,736 4.2628 312 0.8 2,048 4.9634 315 0.8 2,363 5.7640 408 1.0 2,771 6.7646 427 1.0 3,198 7.7652 529 1.3 3,727 9.0657 535 1.3 4,262 10.3663 591 1.4 4,853 11.7668 610 1.5 5,463 13.2674 759 1.8 6,222 15.0679 848 2.0 7,070 17.0685 968 2.3 8,038 19.3690 1158 2.8 9,196 22.1696 1258 3.0 10,454 25.2702 1363 3.3 11,817 28.4708 1543 3.7 13,360 32.2715 1750 4.2 15,110 36.4722 1983 4.8 17,093 41.1730 2168 5.2 19,261 46.4738 2526 6.1 21,787 52.4748 2878 6.9 24,665 59.4758 2917 7.0 27,582 66.4770 3125 7.5 30,707 73.9
Pearson, Inc. and SDE Confidential107

Scale Score
Frequency Percent
Cumulative
Frequency
Cumulative Percent
785 2984 7.2 33,691 81.1802 2780 6.7 36,471 87.8824 2350 5.7 38,821 93.5856 1508 3.6 40,329 97.1908 848 2.0 41,177 99.1990 364 0.9 41,541 100.0
Spring 2012 Read Grade 7 Scale Score Distribution
0.0
1.0
2.0
3.0
4.0
5.0
6.0
7.0
8.0
400
483
536
567
589
606
621
634
646
657
668
679
690
702
715
730
748
770
802
856
990
Scale Score
Perc
ent
Pearson, Inc. and SDE Confidential108

Reading Grade 8 Scale Score Distribution for Spring 2012
Scale Score
Frequency Percent
Cumulative
Frequency
Cumulative Percent
400 37 0.1 37 0.1443 37 0.1 74 0.2475 48 0.1 122 0.3498 52 0.1 174 0.4517 79 0.2 253 0.6533 87 0.2 340 0.8547 103 0.2 443 1.1559 121 0.3 564 1.4570 123 0.3 687 1.7580 142 0.3 829 2.0590 177 0.4 1,006 2.4598 199 0.5 1,205 2.9607 252 0.6 1,457 3.5615 217 0.5 1,674 4.1623 280 0.7 1,954 4.7630 312 0.8 2,266 5.5638 352 0.9 2,618 6.4645 390 0.9 3,008 7.3652 501 1.2 3,509 8.5659 575 1.4 4,084 9.9666 625 1.5 4,709 11.4674 738 1.8 5,447 13.2681 877 2.1 6,324 15.3688 1000 2.4 7,324 17.8696 1175 2.9 8,499 20.6704 1337 3.2 9,836 23.9712 1450 3.5 11,286 27.4721 1780 4.3 13,066 31.7729 1888 4.6 14,954 36.3739 2199 5.3 17,153 41.6749 2438 5.9 19,591 47.5760 2766 6.7 22,357 54.2771 2863 6.9 25,220 61.2784 2935 7.1 28,155 68.3799 2924 7.1 31,079 75.4
Pearson, Inc. and SDE Confidential109

Scale Score
Frequency Percent
Cumulative
Frequency
Cumulative Percent
816 2720 6.6 33,799 82.0836 2521 6.1 36,320 88.1861 2074 5.0 38,394 93.1894 1449 3.5 39,843 96.6942 891 2.2 40,734 98.8990 492 1.2 41,226 100.0
Spring 2012 Read Grade 8 Scale Score Distribution
0.0
1.0
2.0
3.0
4.0
5.0
6.0
7.0
8.0
400
475
517
547
570
590
607
623
638
652
666
681
696
712
729
749
771
799
836
894
990
Scale Score
Perc
ent
Pearson, Inc. and SDE Confidential110

Science Grade 5 Scale Score Distribution for Spring 2012
Scale Score
Frequency Percent
Cumulative
Frequency
Cumulative Percent
400 40 0.1 40 0.1494 40 0.1 80 0.2541 50 0.1 130 0.3570 107 0.2 237 0.5591 137 0.3 374 0.9608 178 0.4 552 1.3622 286 0.7 838 1.9635 282 0.6 1,120 2.5646 356 0.8 1,476 3.4656 428 1.0 1,904 4.3665 477 1.1 2,381 5.4674 569 1.3 2,950 6.7682 683 1.6 3,633 8.3690 744 1.7 4,377 10.0698 777 1.8 5,154 11.7705 877 2.0 6,031 13.7713 1015 2.3 7,046 16.0720 1112 2.5 8,158 18.5727 1281 2.9 9,439 21.5734 1336 3.0 10,775 24.5741 1353 3.1 12,128 27.6748 1561 3.5 13,689 31.1755 1749 4.0 15,438 35.1763 1855 4.2 17,293 39.3770 2002 4.6 19,295 43.9778 2073 4.7 21,368 48.6786 2292 5.2 23,660 53.8794 2291 5.2 25,951 59.0803 2441 5.5 28,392 64.5813 2486 5.7 30,878 70.2823 2520 5.7 33,398 75.9835 2424 5.5 35,822 81.4849 2364 5.4 38,186 86.8865 2080 4.7 40,266 91.5886 1721 3.9 41,987 95.4
Pearson, Inc. and SDE Confidential111

Scale Score
Frequency Percent
Cumulative
Frequency
Cumulative Percent
915 1162 2.6 43,149 98.1966 647 1.5 43,796 99.6990 193 0.4 43,989 100.0
Spring 2012 Scie Grade 5 Scale Score Distribution
0.0
1.0
2.0
3.0
4.0
5.0
6.0
7.0
400
541
591
622
646
665
682
698
713
727
741
755
770
786
803
823
849
886
966
Scale Score
Perc
ent
Pearson, Inc. and SDE Confidential112

Science Grade 8 Scale Score Distribution for Spring 2012
Scale Score
Frequency Percent
Cumulative
Frequency
Cumulative Percent
400 40 0.1 40 0.1457 55 0.1 95 0.2533 86 0.2 181 0.4570 121 0.3 302 0.7595 205 0.5 507 1.2614 245 0.6 752 1.8629 345 0.8 1,097 2.6642 383 0.9 1,480 3.4654 492 1.1 1,972 4.6664 549 1.3 2,521 5.9673 661 1.5 3,182 7.4682 747 1.7 3,929 9.2691 843 2.0 4,772 11.1699 950 2.2 5,722 13.3706 1034 2.4 6,756 15.7714 1249 2.9 8,005 18.6721 1262 2.9 9,267 21.6728 1443 3.4 10,710 24.9735 1538 3.6 12,248 28.5742 1650 3.8 13,898 32.4748 1767 4.1 15,665 36.5755 1857 4.3 17,522 40.8761 1908 4.4 19,430 45.3768 1957 4.6 21,387 49.8775 2095 4.9 23,482 54.7781 2028 4.7 25,510 59.4788 2106 4.9 27,616 64.3796 2107 4.9 29,723 69.2803 2049 4.8 31,772 74.0812 2076 4.8 33,848 78.8820 1939 4.5 35,787 83.4830 1735 4.0 37,522 87.4840 1566 3.6 39,088 91.0853 1293 3.0 40,381 94.1867 1017 2.4 41,398 96.4
Pearson, Inc. and SDE Confidential113

Scale Score
Frequency Percent
Cumulative
Frequency
Cumulative Percent
886 761 1.8 42,159 98.2912 493 1.1 42,652 99.3958 214 0.5 42,866 99.8990 69 0.2 42,935 100.0
Spring 2012 Scie Grade 8 Scale Score Distribution
0.0
1.0
2.0
3.0
4.0
5.0
6.0
400
533
595
629
654
673
691
706
721
735
748
761
775
788
803
820
840
867
912
990
Scale Score
Perc
ent
Pearson, Inc. and SDE Confidential114

Social Studies Grade 5 Scale Score Distribution for Spring 2012
Scale Score
Frequency Percent
Cumulative
Frequency
Cumulative Percent
400 265 0.6 265 0.6446 171 0.4 436 0.9510 274 0.6 710 1.5544 297 0.6 1,007 2.1568 414 0.9 1,421 3.0586 533 1.1 1,954 4.1601 628 1.3 2,582 5.5614 697 1.5 3,279 7.0626 794 1.7 4,073 8.6636 887 1.9 4,960 10.5645 949 2.0 5,909 12.5654 1023 2.2 6,932 14.7662 1089 2.3 8,021 17.0670 1175 2.5 9,196 19.5677 1249 2.6 10,445 22.1684 1259 2.7 11,704 24.8690 1373 2.9 13,077 27.7696 1406 3.0 14,483 30.7702 1323 2.8 15,806 33.5708 1459 3.1 17,265 36.6714 1487 3.2 18,752 39.8720 1499 3.2 20,251 42.9725 1494 3.2 21,745 46.1730 1524 3.2 23,269 49.3736 1535 3.3 24,804 52.6741 1477 3.1 26,281 55.7746 1504 3.2 27,785 58.9752 1489 3.2 29,274 62.1757 1439 3.1 30,713 65.1763 1494 3.2 32,207 68.3768 1398 3.0 33,605 71.2774 1455 3.1 35,060 74.3780 1310 2.8 36,370 77.1786 1243 2.6 37,613 79.7792 1283 2.7 38,896 82.5
Pearson, Inc. and SDE Confidential115

Scale Score
Frequency Percent
Cumulative
Frequency
Cumulative Percent
798 1147 2.4 40,043 84.9805 1114 2.4 41,157 87.3812 1006 2.1 42,163 89.4820 949 2.0 43,112 91.4828 842 1.8 43,954 93.2837 758 1.6 44,712 94.8847 645 1.4 45,357 96.2857 531 1.1 45,888 97.3870 455 1.0 46,343 98.2885 322 0.7 46,665 98.9904 243 0.5 46,908 99.4931 144 0.3 47,052 99.8982 84 0.2 47,136 99.9990 33 0.1 47,169 100.0
Spring 2012 Soci Grade 5 Scale Score Distribution
0.0
0.5
1.0
1.5
2.0
2.5
3.0
3.5
400
510
568
601
626
645
662
677
690
702
714
725
736
746
757
768
780
792
805
820
837
857
885
931
990
Scale Score
Perc
ent
Pearson, Inc. and SDE Confidential116

Social Studies Grade 7 Scale Score Distribution for Spring 2012
Scale Score
Frequency Percent
Cumulative
Frequency
Cumulative Percent
400 71 0.2 71 0.2442 58 0.1 129 0.3487 109 0.2 238 0.5519 148 0.3 386 0.9545 227 0.5 613 1.4566 270 0.6 883 2.0584 342 0.8 1,225 2.7600 404 0.9 1,629 3.6615 471 1.0 2,100 4.7629 535 1.2 2,635 5.9642 603 1.3 3,238 7.2654 644 1.4 3,882 8.6666 785 1.7 4,667 10.4678 821 1.8 5,488 12.2689 912 2.0 6,400 14.3699 1130 2.5 7,530 16.8709 1160 2.6 8,690 19.4719 1405 3.1 10,095 22.5729 1528 3.4 11,623 25.9739 1727 3.8 13,350 29.7749 1795 4.0 15,145 33.7759 2052 4.6 17,197 38.3769 2140 4.8 19,337 43.1779 2172 4.8 21,509 47.9789 2382 5.3 23,891 53.2800 2506 5.6 26,397 58.8811 2435 5.4 28,832 64.2823 2482 5.5 31,314 69.8836 2340 5.2 33,654 75.0849 2325 5.2 35,979 80.1863 2127 4.7 38,106 84.9879 1840 4.1 39,946 89.0896 1627 3.6 41,573 92.6916 1341 3.0 42,914 95.6942 952 2.1 43,866 97.7
Pearson, Inc. and SDE Confidential117

Scale Score
Frequency Percent
Cumulative
Frequency
Cumulative Percent
977 634 1.4 44,500 99.1990 390 0.9 44,890 100.0
Spring 2012 Soci Grade 7 Scale Score Distribution
0.0
1.0
2.0
3.0
4.0
5.0
6.0
400
487
545
584
615
642
666
689
709
729
749
769
789
811
836
863
896
942
990
Scale Score
Perc
ent
Pearson, Inc. and SDE Confidential118
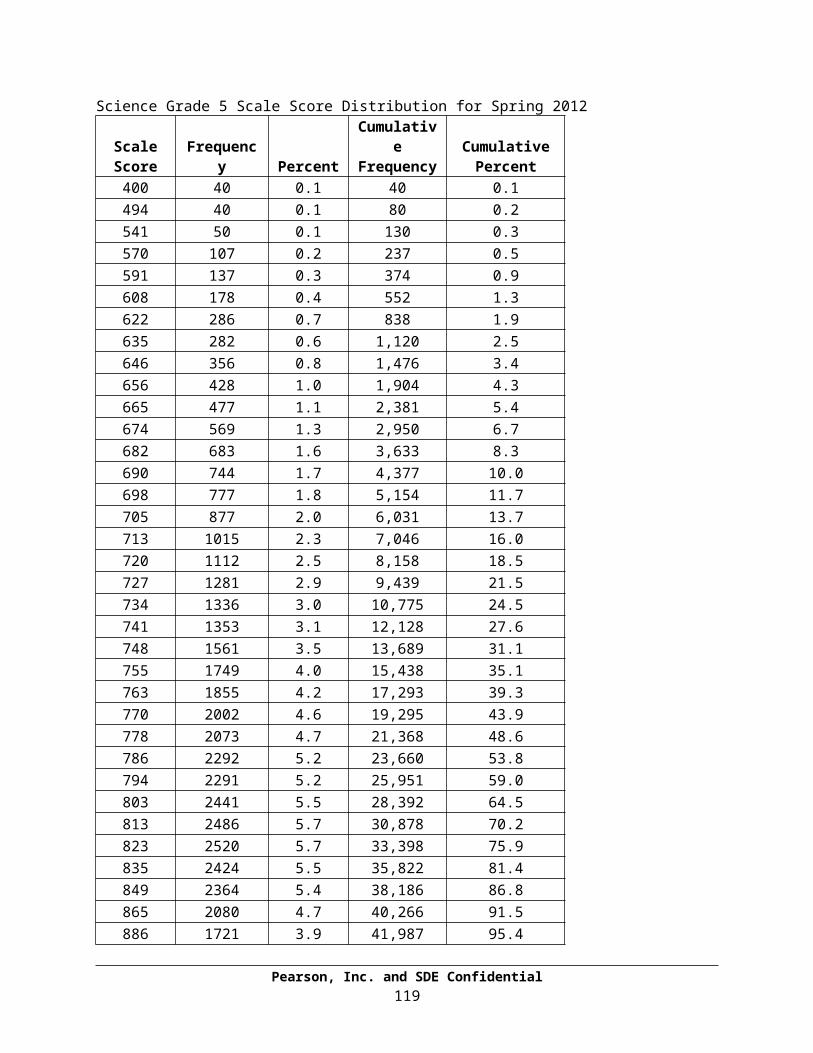
Social Studies Grade 8 Scale Score Distribution for Spring 2012
Scale Score
Frequency Percent
Cumulative
Frequency
Cumulative Percent
400 230 0.5 230 0.5431 183 0.4 413 0.9507 305 0.7 718 1.6546 394 0.9 1,112 2.4571 493 1.1 1,605 3.5590 613 1.3 2,218 4.8606 750 1.6 2,968 6.5620 881 1.9 3,849 8.4632 952 2.1 4,801 10.5643 1041 2.3 5,842 12.8653 1092 2.4 6,934 15.1662 1171 2.6 8,105 17.7671 1256 2.7 9,361 20.4679 1400 3.1 10,761 23.5687 1486 3.2 12,247 26.7695 1480 3.2 13,727 30.0702 1498 3.3 15,225 33.2710 1586 3.5 16,811 36.7717 1590 3.5 18,401 40.2723 1638 3.6 20,039 43.8730 1645 3.6 21,684 47.4737 1646 3.6 23,330 50.9744 1618 3.5 24,948 54.5751 1709 3.7 26,657 58.2758 1640 3.6 28,297 61.8765 1767 3.9 30,064 65.7773 1727 3.8 31,791 69.4781 1715 3.7 33,506 73.2790 1719 3.8 35,225 76.9799 1681 3.7 36,906 80.6810 1705 3.7 38,611 84.3821 1628 3.6 40,239 87.9834 1468 3.2 41,707 91.1850 1377 3.0 43,084 94.1871 1250 2.7 44,334 96.8
Pearson, Inc. and SDE Confidential119

Scale Score
Frequency Percent
Cumulative
Frequency
Cumulative Percent
901 852 1.9 45,186 98.7958 461 1.0 45,647 99.7990 147 0.3 45,794 100.0
Spring 2012 Soci Grade 8 Scale Score Distribution
0.0
0.5
1.0
1.5
2.0
2.5
3.0
3.5
4.0
4.5
400
507
571
606
632
653
671
687
702
717
730
744
758
773
790
810
834
871
958
Scale Score
Perc
ent
Pearson, Inc. and SDE Confidential120