Embed Size (px)
Citation preview

Test of Significant Toxicity (TST)Test of Significant Toxicity (TST)Proposed Statistical Approach Proposed Statistical Approach
forfor Analyzing Toxicity Test DataAnalyzing Toxicity Test Data
11

Run the Tests
Analyze Data and Make a Decision
Record the Biological Response (Data)
12
34
Take the Sample
TSTTST
Growth
5Reasonable Potential Determination
6 Permit Requirement(s) Decision
22

TST is TST is NOTNOT a Change to the WET a Change to the WET Test MethodsTest Methods
Labs still conduct the same Labs still conduct the same approved test methods:approved test methods:••Same organismsSame organisms••Same foodSame food••Same testing proceduresSame testing procedures••Same test acceptability criteriaSame test acceptability criteria
33

What is the question we want to What is the question we want to answer using WET testing?answer using WET testing?
Is the effluent or sample toxic? Is the effluent or sample toxic? WET is WET is notnot an experimental research program an experimental research program ––
WET is a regulatory program.WET is a regulatory program.
Statistics should give you a yes or no answer. Statistics should give you a yes or no answer.
TST is designed to give a yes or no answer TST is designed to give a yes or no answer using rigorous, peerusing rigorous, peer--reviewed statistics.reviewed statistics.
44

Data Analysis Using TST is More Data Analysis Using TST is More Straightforward, Streamlined, Straightforward, Streamlined, and Simpler to Use than Current and Simpler to Use than Current Approaches Approaches
55

66
EPA Chronic NOEC AnalysisEPA Chronic NOEC Analysis

Percent Minimum Significant Percent Minimum Significant Difference (PMSD)Difference (PMSD)
77
Calculate PMSD
Exceeds Upper Bound
Within Bounds
Less than Lower Bound
Adjust NOEC;Consider ONLY Effect Greater Than Lower
Bound
Report Calculated
NOEC
NOEC < IWC (Toxicity
Detected)
NOEC > IWC (No Toxicity Detected)
Test not accepted &
Repeat Test w/ New Sample

EPA Chronic IC25 AnalysisEPA Chronic IC25 AnalysisLinear interpolation method recommendedLinear interpolation method recommendedNot appropriate for nonNot appropriate for non--linear responseslinear responsesPoint estimate may not be correct Point estimate may not be correct depending on withindepending on within--test variabilitytest variabilityConfidence intervals may not be Confidence intervals may not be calculated due to inappropriate datacalculated due to inappropriate dataWide disagreement on the correct Wide disagreement on the correct model(s) to use for point estimatesmodel(s) to use for point estimates
88

99
EPA Acute LC50 AnalysisEPA Acute LC50 Analysis

1010
TST Analysis FlowchartTST Analysis FlowchartConduct WET test
Apply arcsine square root transformation for percent data
(e.g., survival)
Calculate t value using TST Welch’s t-test
Calculated t value > critical t value?
YES NO
Sample is NOT Toxic
Sample is Toxic

The tThe t--Test approach is Test approach is nothing new in WET analysisnothing new in WET analysis
1111
EPA recognized the t-test approach in its promulgated methods:
APPENDIX H of Chronic Manuals: “SINGLE CONCENTRATION TOXICITY TEST - COMPARISON OF CONTROL WITH 100% EFFLUENT OR RECEIVING WATERTo statistically compare a control with one concentration, such as 100% effluent or the instream waste concentration, a t-test is the recommended analysis. “
Welch’s t-test is a generalized form of the t-test that is robust when there are unequal variances or unequal sample sizes. Welch’s t-test has been around since 1947.

TST FormulaTST Formula
1212
Labs can control nLabs can control ntt and nand nccNumber of Control and Treatment ReplicatesNumber of Control and Treatment ReplicatesDoing more than the minimum required can helpDoing more than the minimum required can help
And SAnd Stt22 and Sand Scc
22
Control and Treatment VarianceControl and Treatment VarianceGood lab QA/QC helpsGood lab QA/QC helps
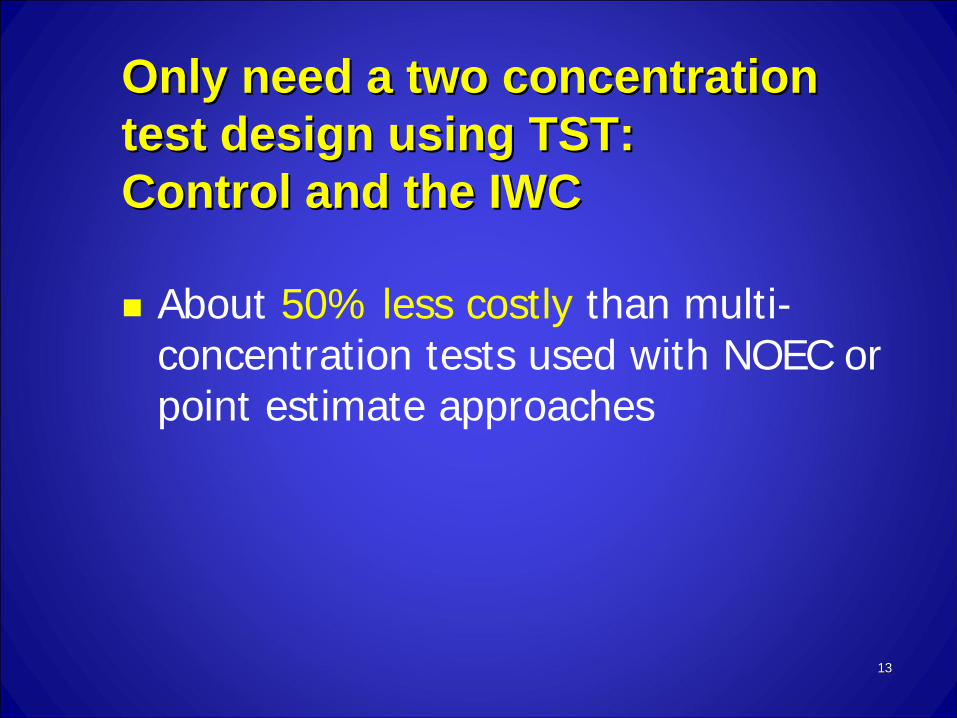
Only need a two concentration Only need a two concentration test design using TST: test design using TST: Control and the IWCControl and the IWC
About 50% less costly than multi-concentration tests used with NOEC or point estimate approaches
1313

Fathead minnow chronic testFathead minnow chronic test Current approachCurrent approach
240 fish total240 fish total
1414
Control1
2IWC
45

Fathead minnow chronic testFathead minnow chronic test TST approachTST approach
80 fish total80 fish total
1515
Control IWC

Fish Chronic Test Design Fish Chronic Test Design with greater test powerwith greater test power
2 more reps for the IWC and control2 more reps for the IWC and control 120 fish total120 fish total
1616
Control IWC

TST Addresses Error to the Permittee as well as Errors to
the Environment
Result is better decision- making for WET
18

TST rewards high quality TST rewards high quality WET dataWET data
7.6 % effect in the effluent.TST passes test (declared non toxic) Effect is biologically insignificant.Current approach fails test (declared toxic).
Red Abalone Larval Development Test

TST does not reward poor quality TST does not reward poor quality data if toxicity is unacceptabledata if toxicity is unacceptable
Ceriodaphnia reproduction test

Answers to Technical Answers to Technical Comments Regarding TSTComments Regarding TST
2020

Claim: False Positive Rate of TST is Claim: False Positive Rate of TST is > 5% (14.8%) based on EPA 1999 > 5% (14.8%) based on EPA 1999 ““BlankBlank”” StudyStudy
Need to distinguish Need to distinguish statisticsstatisticsfromfrom test performancetest performance
StatisticalStatistical error is error is NOTNOT the the same thing as same thing as measurementmeasurement
errorerror2121

2222
EPA Inter-lab Blank ResultsUSEPA Non-Toxic "Blank" Samples
Ceriodaphnia dubia Reproduction ResultsSeven-Day Termination (not 3-Brood)
Effe
ct R
elat
ive
to C
ontro
l (%
)
-20
0
20
40
60
80 TST Non-Toxic TST Toxic
Faile
d T
AC
ExceededUpperpMSD
Criterion

One test exhibited an 80% One test exhibited an 80% effect of the effect of the ““BlankBlank”” samplesample
2323
Mean control reproduction = 19.4 Mean sample reproduction = 4.1
NOEC = 12.5%
Either the lab received a really toxic sample, or there was some type of measurement error
No statistics will help this No statistics will help this situationsituation

A second test failed EPAA second test failed EPA’’s s test acceptability criteriatest acceptability criteria
Test is invalid Test is invalid –– Lab QA/QC issueLab QA/QC issueAlso indicated by extremely high Also indicated by extremely high control CV (variability)control CV (variability)
2424

EPA InterEPA Inter--lab Blank Results:lab Blank Results: Control VariabilityControl Variability
2525
USEPA Non-Toxic "Blank" Samples - 7-Day TerminationCeriodaphnia dubia Reproduction Results with Effects >10%
Con
trol C
V (%
)
0
20
40
60
80Fa
iled
TA
C

What about the remaining 2 What about the remaining 2 tests declared toxic using tests declared toxic using TST?TST?
2626

EPA InterEPA Inter--lab Blank Results:lab Blank Results: Sample CVSample CV
2727
USEPA Non-Toxic "Blank" Samples - 7-Day TerminationCeriodaphnia dubia Reproduction Results with Effects >10%
Trea
tmen
t CV
(%)
0
20
40
60
80These are well above the 95th
percentile CVs reported by labs in the test drive or nationally; QA/QC issues?

Conclusions regarding Conclusions regarding alleged false positive rate of alleged false positive rate of TSTTSTClaim is incorrect and overblown; 2 of the 4 Claim is incorrect and overblown; 2 of the 4 tests that would be declared toxic using TST tests that would be declared toxic using TST were either invalid or demonstrated high were either invalid or demonstrated high toxicity toxicity This is This is NotNot a statistical issuea statistical issueThe remaining 2 tests also had QA/QC issues The remaining 2 tests also had QA/QC issues and are suspect. and are suspect. Even so, 2 out of 27 blank tests = 7.4%, Even so, 2 out of 27 blank tests = 7.4%, well within the population error rate of 5% well within the population error rate of 5% given such a small sample size (27 tests)given such a small sample size (27 tests)
2828

Error rates refer to population Error rates refer to population statistics, statistics, notnot single testssingle tests
2929
“It may also be worthwhile to remind the readers that we erroneously tend to use these error rates (P-value) as some sort of statistical evidence obtained FROM A GIVEN TEST RESULT as applicable to THAT PARTICULAR TEST ALSO. The value of these error rates is only in the sense of "long run frequency" of repeated sampling (or WET testing in the present context) as envisaged by Neyman and Pearson in their classic paper on Testing of Hypothesis (also termed as Acceptance sampling).”
- From an anonymous reviewer for paper submitted to Integrated Environmental Assessment and Management

TST Test DriveTST Test Drive
3030

Purpose of Test DrivePurpose of Test Drive
Address concerns raised at the Address concerns raised at the November 2010 Board workshopNovember 2010 Board workshop
Determine whether TST would result in Determine whether TST would result in a significant change in WET data a significant change in WET data interpretation as compared to current interpretation as compared to current approach (NOEC)approach (NOEC)
3131

Who was involved in the Test Who was involved in the Test Drive?Drive?
18 dischargers in California18 dischargers in CaliforniaMore than 8 laboratoriesMore than 8 laboratoriesSeveral small, underprivileged Several small, underprivileged communitiescommunities
3232

What was evaluated in the What was evaluated in the Test Drive?Test Drive?
All of the WET methods commonly All of the WET methods commonly used in Californiaused in CaliforniaTotal of 775 valid WET tests Total of 775 valid WET tests Results compared using TST versus Results compared using TST versus the NOEC approach for each testthe NOEC approach for each testEffects of test performance on results Effects of test performance on results using TST and NOECusing TST and NOEC
3333

Test Drive ResultsTest Drive Results
3434

California labs tracked well California labs tracked well with the national findings with the national findings
3535
0.00
2.00
4.00
6.00
8.00
10.00
12.00
10 25 50 75 95
CA SD
National SD
C. dubia Reproduction

TST and NOEC Results TST and NOEC Results Agreed for most testsAgreed for most tests
3636
WET Method Type
Percent of Tests Declared Non-Toxic
Percent of Tests Declared Toxic
TST NOEC TST NOEC
Chronic Marine 89.4 83.6 10.6 16.4
Chronic Freshwater 80.1 82.3 19.9 17.7
Acute Marine 100 100 0 0
Acute Freshwater 96.8 98.9 3.2 1.1
All Methods 88.6 (687) 87.2 (676) 11.4 (88) 12.8 (99)

TST Declared Fewer Samples as TST Declared Fewer Samples as Toxic That Were Below the RMDsToxic That Were Below the RMDs
<< 25% Effect (chronic); 25% Effect (chronic); << 20% Effect (acute)20% Effect (acute)
3737

TST Declared More Samples As Toxic TST Declared More Samples As Toxic When the Mean Effect at the IWC was When the Mean Effect at the IWC was >> 25% (Chronic) or 25% (Chronic) or >> 20% (Acute)20% (Acute)
3838

For the few tests where results were For the few tests where results were uncertain due to high withinuncertain due to high within--test test variability, a few additional replicates variability, a few additional replicates would often make the difference would often make the difference using TSTusing TST
3939

Examples from chronic tests Examples from chronic tests observed in the Test Driveobserved in the Test Drive
4040
Test Percent Effect # Additional Reps Needed to Declare Test Not Toxic
Red Abalone 15.4% 1
Urchin fertilization 15.9% 2
Topsmelt 19.1% 2
Ceriodaphnia 20.6% 7
Fathead minnow 17.4 % 1

Additional Observations from Additional Observations from the Test Drivethe Test Drive
4141
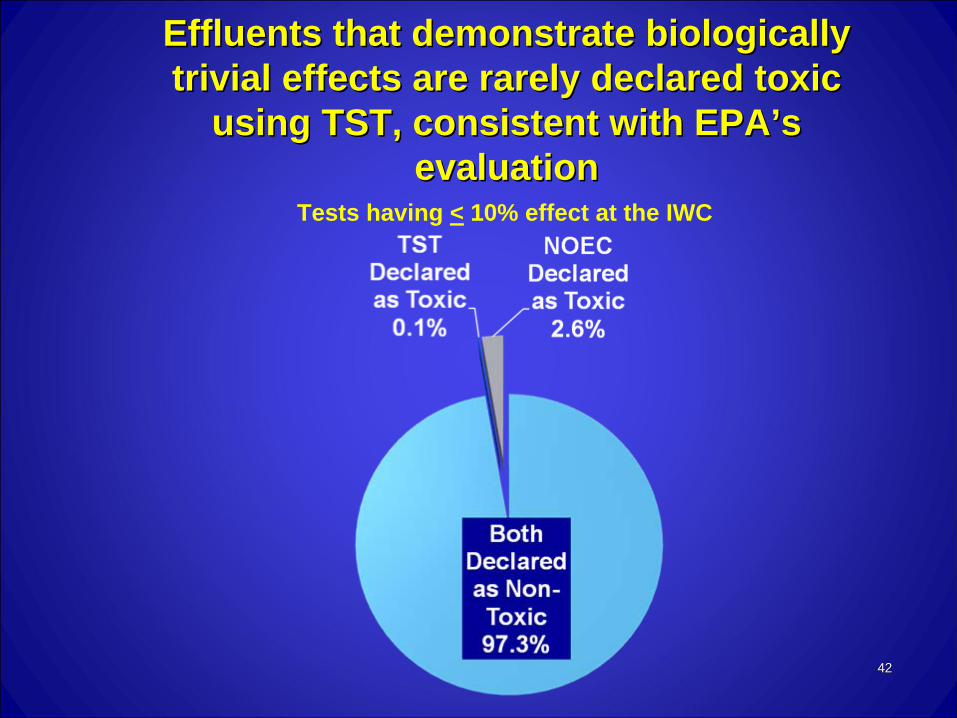
Effluents that demonstrate biologically Effluents that demonstrate biologically trivial effects are rarely declared toxic trivial effects are rarely declared toxic
using TST, consistent with EPAusing TST, consistent with EPA’’s s evaluationevaluation
4242
Tests having < 10% effect at the IWC

Summary of Test DriveSummary of Test DriveTest results using both TST and the current NOEC Test results using both TST and the current NOEC approach approach were very similarwere very similarSamples having biologically Samples having biologically trivial effects trivial effects were were declared nondeclared non--toxic more often using TST toxic more often using TST than the than the current approachcurrent approachSamples exhibiting Samples exhibiting significant toxicity effects significant toxicity effects at the at the IWC were IWC were declared toxic more often using TST declared toxic more often using TST than than the current approachthe current approachFor samples exhibiting effects in the For samples exhibiting effects in the ““gray areagray area””, , addition of a few extra replicates to these tests addition of a few extra replicates to these tests would likely result in the sample being declared would likely result in the sample being declared nonnon--toxic toxic
4343