Embed Size (px)
Citation preview
Minnesota Milestones 1998Proposed Revisions
FEBRUARY 1998
MINNESOTA PLANNING
Public Review
DRAFT
Minnesota Planning develops long-range plans for the state, stimulates public participation inMinnesota’s future and coordinates activities among state agencies, the Minnesota Legisla-ture and other units of government.
Minnesota Milestones 1998: Proposed Revisions was prepared by the following members ofthe Minnesota Planning staff: Mark Larson, Jay Fonkert, Tom Gillaspy, Marilyn Lundberg,John Wachtler, Christina Rich and Susan Roth, with assistance from Susan Eichhorst, RichardFong, Jonathan Hubschman, Ray Lewis, Jon Larsen, Rolf Nordstrom, Linda Oelker, MelissaPetrangelo, Jim Ramstrom, Barbara Ronningen, Jay Stroebel and Amy Walter.
Upon request, Minnesota Milestones 1998: Proposed Revisions will be made available in analternate format, such as Braille, large print or audio tape. For TTY, contact Minnesota RelayService at 800-627-3529 and ask for Minnesota Planning.
February 1998
For additional copies of this report, the original 1992 Minnesota Milestones or the MinnesotaMilestones 1996 Progress Report, contact:
658 Cedar St.St. Paul, MN 55155612-296-3985Fax 612-296-3698www.mnplan.state.mn.us
MINNESOTA PLANNING
Minnesota Milestones 1998Proposed RevisionsSummary ............................................................................ 2Vision .................................................................................... 2
Improving how wemeasure Minnesota’s progress ..................................... 3
Goals and indicators at a glance .................................. 4
Revised goals and indicators ........................................ 6Child poverty ........................................................................ 7
Stable, supportive families .................................................... 8
School readiness ................................................................. 10
Academic achievement ....................................................... 11
Health ................................................................................. 13
Safe, caring communities .................................................... 15
Help for those in need ........................................................ 16
People with disabilities ....................................................... 17
Inclusive communities......................................................... 18
Sustainable economic growth ............................................. 18
Skilled work force ............................................................... 19
Standard of living ............................................................... 21
Decent, affordable housing ................................................. 22
Viable rural and urban economies ...................................... 23
Conservation of natural resources ...................................... 24
Quality of the environment ................................................. 26
Healthy ecosystems ............................................................ 28
Outdoor recreation ............................................................. 29
Participation in democracy .................................................. 30
Responsive, efficient government ....................................... 31
Minnesota Milestones 1998: Public Review Draft 2
SummaryMinnesota Milestones is a set of widely shared goals for Minnesota's future and a tool to help citizens and policy-makers measure the state's progress. The 20 goals and 79 progress indicators were created in 1991 with the involvement of more than a thousand Minnesotans, at the invitation of Governor Arne H. Carlson.
The purpose of Minnesota Milestones is to put forth a shared vision and make government accountable for results. Many state agencies, local governments, nonprofit organizations and other states have used Minnesota Milestones to help create their own goals and progress measures. The Minnesota Legislature now requires state agencies to report on performance.
Minnesota Milestones 1998 is the first effort to improve the goals and indicators and take advantage of new data sources. Eight goals have been adjusted to reflect public comments, new state policies and public concerns, and to improve clarity. Indicators without data and weaker indicators have been dropped, 24 new indicators have been proposed and 23 have been revised. Many new indicators are measured every year and have information for local communities as well as the entire state.
Comment on this draftMinnesota Planning welcomes public comment on these revisions through the end of February 1998. The final report is to be released in early summer 1998.
Please consider the following questions as you review this draft: Are the goal statements clear expressions of your hopes for Minnesota? Do the indicators for each goal, as a package, give a good reading on progress toward the goal? Are the indicators useful to you and to your organization or community?
There are five ways to comment on this draft. Comments should be received by Feb. 27, 1998.■ Fill out and mail the enclosed response form■ Find Minnesota Milestones 1998: Proposed Revisions on the Internet at www.mnplan.state.mn.us and use the comment form included there■ Call the Minnesota Milestones message line toll-free at 888-345-4562 and leave a message with your comments. Ask for a return call if you wish.■ E-mail your comments to: [email protected]■ Send written comments to Minnesota Milestones, Minnesota Planning, 658 Cedar St., St. Paul, MN 55155
— From the original Minnesota Milestones, 1992
We Minnesotans like our state. We believe Minnesota is a good place to raise a family, go to school and enjoy life. We appreciate the natural beauty, the friendliness and sense of opportunity, the good government and the diverse economic opportunities. We believe strong values are important ó spiritual values, individual responsibility, volunteering, a strong work ethic and sharing with others. We appreciate our cultural diversity. These are the personal values we cherish and want to carry forward into the next century.
We do not want growth and change to overpower our quality of life. We want to plan for the future. Yet we recognize that we will have to make tough choices, as we have in the past. We want to deepen the values that have guided earlier generations and made Minnesota a leader in
the nation. We want to begin now to build an even better place to live, a Minnesota to pass on proudly to our children and grandchildren.
When we talk about our hopes for the future, we share a vision with these common themes:■ Minnesota will be a community of people who respect and care for one another■ Our economic activity will create wealth and provide a good standard of living for all our people■ Our citizens will be good thinkers, creative, always learning, with the skills to compete internationally■ We will protect and enjoy the natural world■ Our government will be responsive, effective and close to the people
A VISION FOR MINNESOTA’S FUTURE
42
Minnesota Planning 3
Improving how we measure Minnesota’s progressIn 1991, Governor Arne H. Carlson invited Minnesotans to set goals for the state’s future and measure the state’s progress. Since that beginning, Minnesota Milestones has taken root. It has helped stimulate a wave of interest in measurement, both inside and outside government. Many state agencies, local governments and nonprofit organizations have launched similar measurement efforts to help them set priorities.
Now, after six years of experience, it is time to update and strengthen Minnesota Milestones. Minnesota Planning thanks the many people who have given advice on changes. The purpose of this review draft is to give a broader group of Minnesotans an opportunity to make suggestions. The final version is to be released in early summer 1998.
Instructions for commenting on this draft can be found on page 2. Minnesota Planning is interested in comments from individuals, and also from other organizations involved in outcome measurement, in order to align Minnesota Milestones more closely with efforts of other groups.
What is Minnesota Milestones?Minnesota Milestones is a set of 20 long-range goals for Minnesota. Each goal has a package of indicators that measure progress toward the goal. Governor Carlson initiated Minnesota Milestones in the belief that a shared vision, clearly stated goals and measurement of results would lead to a better future for Minnesota.
As a first step toward developing a shared vision, Minnesota Planning asked thousands of Minnesotans from every region and many walks of life to describe what they wanted Minnesota to be like in 20 or 30 years. The resulting vision statement, found on page 2, painted a picture of the state’s future, vividly describing the hoped-for qualities and characteristics of Minnesota’s people, communities, economy, governments and environment.
The 20 Minnesota Milestones goals were distilled from this vision. Each goal describes an outcome that will move Minnesota toward the vision. Each indicator measures how Minnesota has moved toward or away from the goal.
Minnesota Milestones emphasizes outcomes. It asks people, policy-makers and public servants to focus on the ultimate goals of policies and services.
More than one approach may get Minnesota to its goals. Some may get us there faster, more cheaply or with fewer
negative side effects than others, but often it is not clear which strategy will work best.
The Minnesota Milestones goals are goals for all of Minnesota, not just for government. The actions of individuals, businesses, nonprofit organizations, religious groups and others can move Minnesota toward the future its citizens want. Government cannot do it alone.
Revising Minnesota MilestonesMinnesota Milestones was an ambitious first attempt to introduce outcome measurement to public policy in Minnesota. Minnesota Milestones 1998 is an effort to strengthen Milestones goals and indicators and make them more useful to citizens and policy-makers.
Primary emphasis in this revision was placed on improving the set of indicators for each goal to better measure progress. Eight of the 20 goals have also been reworded. The original Minnesota Milestones vision and goals were based on input gathered in public meetings in 15 communities around the state. The changes in wording — mostly minor — are intended to clarify meaning or to respond to shifts in state policy (such as new educational testing) and public concerns. A random, statewide survey is currently polling Minnesotans about several of the goal changes.
This draft proposes 24 new indicators. Another 23 have been slightly revised, while 26 remain unchanged. The total number of indicators is reduced from 79 to 73. The changes are designed to strengthen each set of indicators so that, as a package, they give a better reading on progress toward the goal. In some cases, a new indicator is recommended to replace one that has proven ineffective in measuring progress. For more than a dozen indicators, usable data has never become available. Data is available at least every three years for the new indicators, with a few exceptions.
All Minnesota Milestones goals are high priorities. The number of indicators for each goal in no way reflects the importance of the goal. Some goals are multi-dimensional and require more indicators for adequate measurement. In other cases, a smaller set of indicators means only that less data is available.
Minnesota Planning is developing an ongoing outcome measurement system that includes:■ Minnesota Milestones 1998 (the printed report, also available on the Internet)■ more detailed progress reports on selected topics, such as the Children's Services Report Card■ a continuously updated Internet version
The Internet version will make it possible to update indicators as data becomes available. It will also allow users to instantly link to outcome and performance information from other sources.
Welcome to the future. Welcome to a new way of thinking about government. Welcome to a new way to hold public officials accountable.
Minnesota Milestones, 1992
Minnesota Milestones 1998: Public Review Draft 4
Goals and indicators at a glance
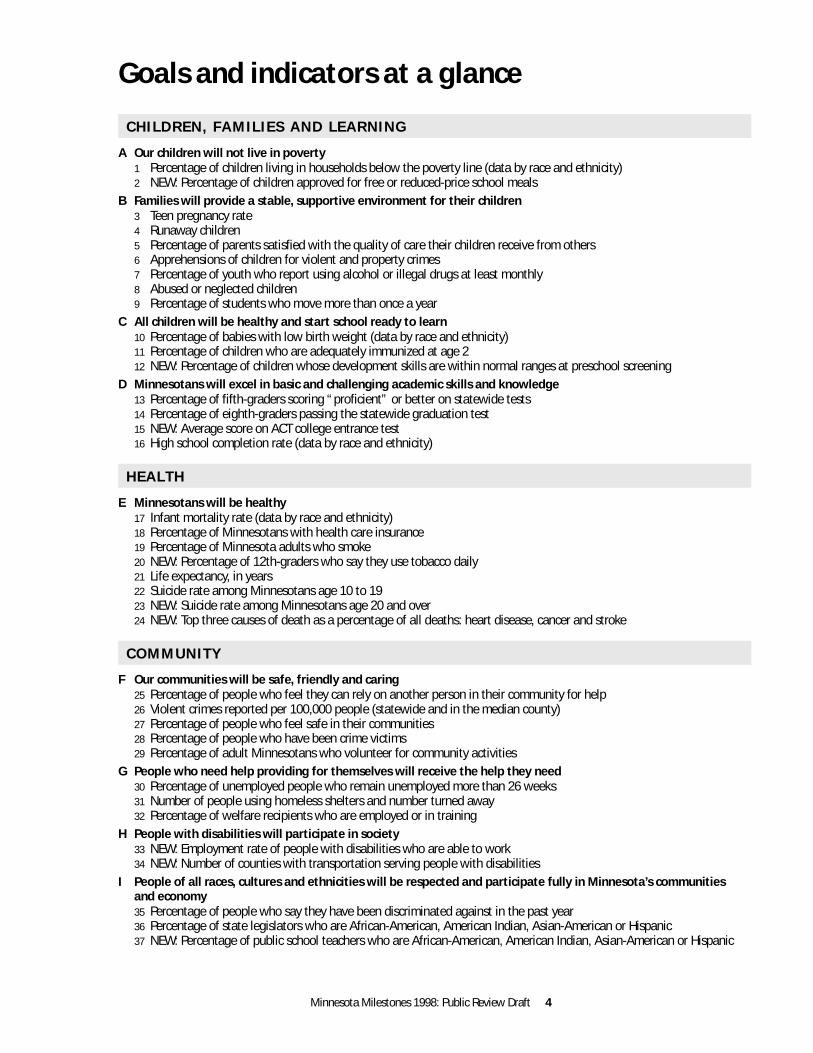
A Our children will not live in poverty1 Percentage of children living in households below the poverty line (data by race and ethnicity)2 NEW: Percentage of children approved for free or reduced-price school meals
B Families will provide a stable, supportive environment for their children3 Teen pregnancy rate4 Runaway children5 Percentage of parents satisfied with the quality of care their children receive from others6 Apprehensions of children for violent and property crimes7 Percentage of youth who report using alcohol or illegal drugs at least monthly8 Abused or neglected children9 Percentage of students who move more than once a year
C All children will be healthy and start school ready to learn10 Percentage of babies with low birth weight (data by race and ethnicity)11 Percentage of children who are adequately immunized at age 212 NEW: Percentage of children whose development skills are within normal ranges at preschool screening
D Minnesotans will excel in basic and challenging academic skills and knowledge13 Percentage of fifth-graders scoring “proficient” or better on statewide tests14 Percentage of eighth-graders passing the statewide graduation test15 NEW: Average score on ACT college entrance test16 High school completion rate (data by race and ethnicity)
E Minnesotans will be healthy17 Infant mortality rate (data by race and ethnicity)18 Percentage of Minnesotans with health care insurance19 Percentage of Minnesota adults who smoke20 NEW: Percentage of 12th-graders who say they use tobacco daily21 Life expectancy, in years22 Suicide rate among Minnesotans age 10 to 1923 NEW: Suicide rate among Minnesotans age 20 and over24 NEW: Top three causes of death as a percentage of all deaths: heart disease, cancer and stroke
F Our communities will be safe, friendly and caring25 Percentage of people who feel they can rely on another person in their community for help26 Violent crimes reported per 100,000 people (statewide and in the median county)27 Percentage of people who feel safe in their communities28 Percentage of people who have been crime victims29 Percentage of adult Minnesotans who volunteer for community activities
G People who need help providing for themselves will receive the help they need30 Percentage of unemployed people who remain unemployed more than 26 weeks31 Number of people using homeless shelters and number turned away32 Percentage of welfare recipients who are employed or in training
H People with disabilities will participate in society33 NEW: Employment rate of people with disabilities who are able to work34 NEW: Number of counties with transportation serving people with disabilities
I People of all races, cultures and ethnicities will be respected and participate fully in Minnesota’s communities and economy35 Percentage of people who say they have been discriminated against in the past year36 Percentage of state legislators who are African-American, American Indian, Asian-American or Hispanic37 NEW: Percentage of public school teachers who are African-American, American Indian, Asian-American or Hispanic
CHILDREN, FAMILIES AND LEARNING
HEALTH
COMMUNITY
Minnesota Planning 5
J Minnesota will have sustainable, strong economic growth38 Annual real growth in the gross state product39 NEW: Minnesota's share of the nation's employed people40 NEW: Percentage of Minnesotans age 16 to 64 who are employed41 NEW: Ratio of gross state product to energy consumption
K Minnesota's work force will have the education and training to make the state a leader in the global economy42 Percentage of high school graduates pursuing advanced education or training43 Percentage of recent two-year public college graduates employed in a job related to their training44 NEW: Percentage of Minnesota adults with college education
L All Minnesotans will have the economic means to maintain a reasonable standard of living45 Minnesota median family income as a percentage of U.S. median family income46 NEW: Poverty rate47 NEW: Percentage of Minnesotans who want to work full time who actually work full time
M All Minnesotans will have decent, safe and affordable housing48 Percentage of low-income renters paying more than 30 percent of their income for housing49 Home ownership rate (data by race and ethnicity)
N Rural areas, small cities and urban neighborhoods throughout the state will be economically viable places for people to live and work50 NEW: Highest unemployment rate of any Minnesota region51 NEW: Number of counties with declining population52 NEW: Number of counties where business births exceed business deaths
O Minnesotans will conserve natural resources to give future generations a healthy environment and a strong economy53 Average annual energy use per person54 NEW: Percentage of Minnesota's energy supplied from renewable sources within the state55 NEW: Vehicle miles traveled per person56 Estimated total of certain air pollutants emitted each year57 Gallons of water used each day per person58 NEW: Wood harvest from Minnesota timberlands59 Solid waste produced per person, and percentage recycled60 Toxic chemicals released into the air, water and earth
P Minnesotans will improve the quality of the air, water and earth61 Number of days per year that air pollution exceeds moderate levels62 Percentage of monitored waters suitable for swimming and for aquatic life63 NEW: Average mercury concentration in fish64 Percentage of monitored wells that exceed the health risk limit for nitrate65 Soil erosion per acre of cropland
Q Minnesotans will restore and maintain healthy ecosystems that support diverse plants and wildlife66 Trends in the population of birds that are “indicator species” for five habitat types67 Changes in land use
R Minnesotans will have opportunities to enjoy the state's natural resources68 Land in federal, state and regional parks, forests and wildlife refuges69 Miles of recreational trails
S People will participate in government and politics70 Percentage of eligible voters who vote in gubernatorial elections71 NEW: Percentage of income tax filers who check the box to contribute $5 to public campaign financing
T Government in Minnesota will be cost-efficient and services will be designed to meet the needs of the people who use them72 Percentage of Minnesotans satisfied with the amount and quality of services they get from state and local government73 NEW: “Price of government”
ECONOMIC PROSPERITY
ENVIRONMENT
DEMOCRACY
Minnesota Milestones 1998: Public Review Draft 6
Revised goals and indicatorsThis review draft is organized to allow readers to evaluate each goal as a package. It includes a sampling of data to help readers evaluate how useful each indicator may be. The final report will include more complete data.
The following information is provided for each goal:■ Statement of the goal, together with previous wording if the goal has changed.■ Numbered indicators in table form. These are the core indicators proposed for each goal. The table includes a sampling of data and information about data availability, to help reviewers weigh the usefulness of each indicator. When the table indicates that local data is available, in most cases this means all areas of the state could track local progress. However, in some cases local data may be limited to the county level or to larger cities.■ Indicators dropped from the original Minnesota Milestones, along with the reason for omitting them
■ Future indicators —important measurements that would qualify as core indicators, except that data is not yet available. The expected source of data is included, where known.■ Other available indicators include those that are not proposed as part of the core indicators, but do address progress toward the goal. These are provided so that reviewers can judge whether some are important enough to become core indicators. This set of additional indicators may also be used for more detailed progress reports on specific topic areas, such as the Children's Services Report Card.■ Explanation — reasons for the recommended changes in goals and indicators. Limitations of some indicators are also discussed in order to give the reviewer more background for judging the package of indicators.■ Sources of the data for each indicator.
Minnesota Planning 7
Indicator dropped■ Percentage of parents who receive full payment of awarded child support (no data)
Future indicator (no data yet)■ Payment of child support for children in poverty (new measure with annual data being developed by the Minnesota Department of Human Services)
Other available indicators■ Unemployment rates for households with children, by race and ethnicity and gender of household head■ Number of children (and rate per 1,000) receiving Temporary Assistance for Needy Families (formerly AFDC)■ Poverty rate for children under age 6■ Homeless shelter use and capacity for families with children■ Teen pregnancy rate
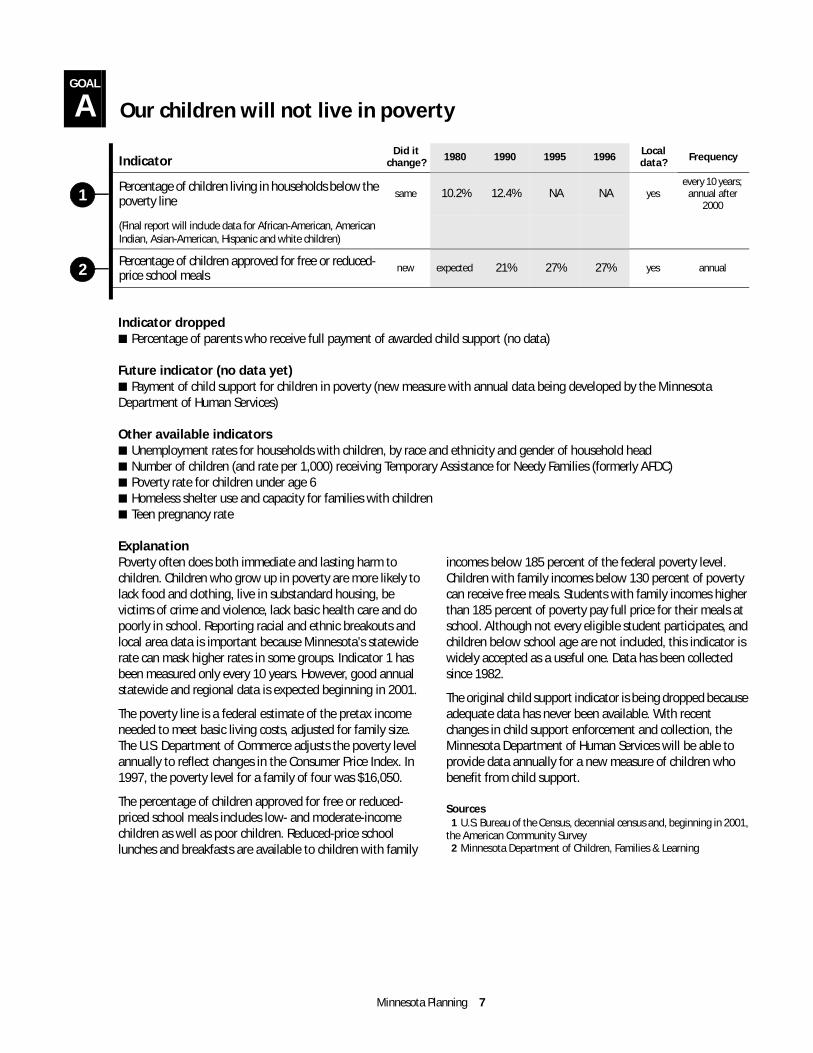
ExplanationPoverty often does both immediate and lasting harm to children. Children who grow up in poverty are more likely to lack food and clothing, live in substandard housing, be victims of crime and violence, lack basic health care and do poorly in school. Reporting racial and ethnic breakouts and local area data is important because Minnesota’s statewide rate can mask higher rates in some groups. Indicator 1 has been measured only every 10 years. However, good annual statewide and regional data is expected beginning in 2001.
The poverty line is a federal estimate of the pretax income needed to meet basic living costs, adjusted for family size. The U.S. Department of Commerce adjusts the poverty level annually to reflect changes in the Consumer Price Index. In 1997, the poverty level for a family of four was $16,050.
The percentage of children approved for free or reduced-priced school meals includes low- and moderate-income children as well as poor children. Reduced-price school lunches and breakfasts are available to children with family
incomes below 185 percent of the federal poverty level. Children with family incomes below 130 percent of poverty can receive free meals. Students with family incomes higher than 185 percent of poverty pay full price for their meals at school. Although not every eligible student participates, and children below school age are not included, this indicator is widely accepted as a useful one. Data has been collected since 1982.
The original child support indicator is being dropped because adequate data has never been available. With recent changes in child support enforcement and collection, the Minnesota Department of Human Services will be able to provide data annually for a new measure of children who benefit from child support.
Sources1 U.S. Bureau of the Census, decennial census and, beginning in 2001,
the American Community Survey2 Minnesota Department of Children, Families & Learning
GOAL
A Our children will not live in poverty
IndicatorDid it
change? 1980 1990 1995 1996 Local data? Frequency
Percentage of children living in households below the poverty line
same 10.2% 12.4% NA NA yesevery 10 years;
annual after 2000
(Final report will include data for African-American, American Indian, Asian-American, Hispanic and white children)
Percentage of children approved for free or reduced-price school meals
new expected 21% 27% 27% yes annual
1
2
Minnesota Milestones 1998: Public Review Draft 8
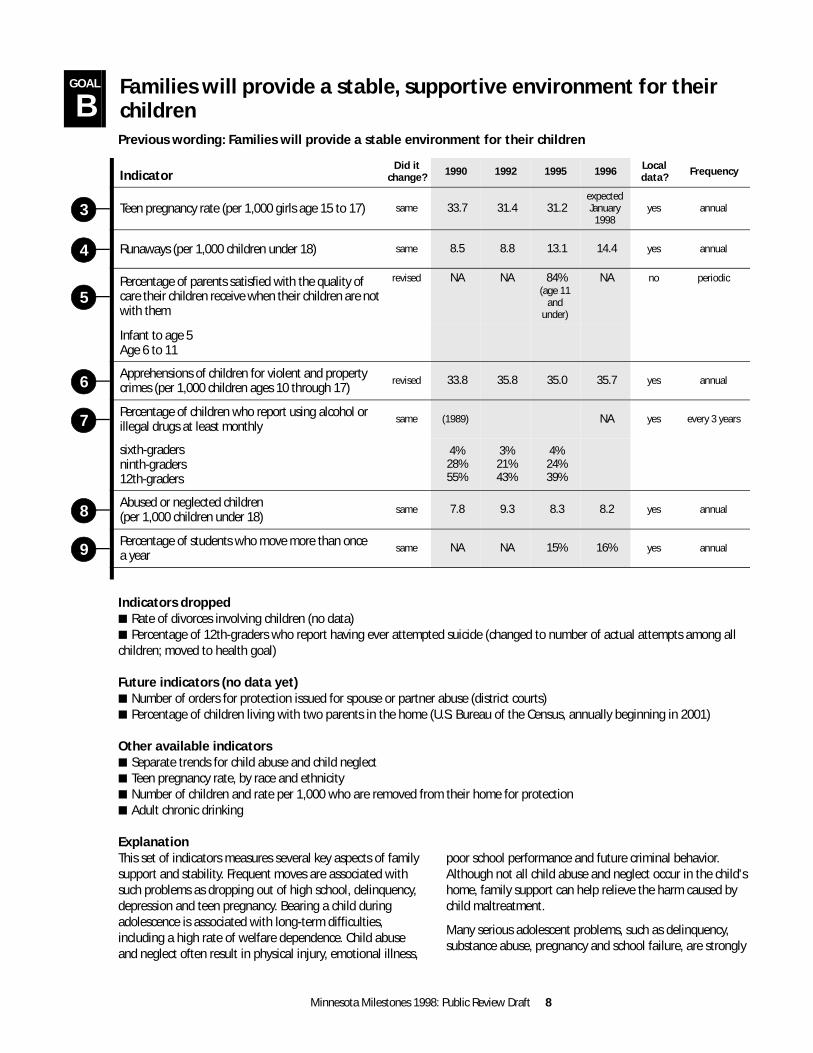
Previous wording: Families will provide a stable environment for their children
Indicators dropped■ Rate of divorces involving children (no data)■ Percentage of 12th-graders who report having ever attempted suicide (changed to number of actual attempts among all children; moved to health goal)
Future indicators (no data yet)■ Number of orders for protection issued for spouse or partner abuse (district courts)■ Percentage of children living with two parents in the home (U.S. Bureau of the Census, annually beginning in 2001)
Other available indicators■ Separate trends for child abuse and child neglect■ Teen pregnancy rate, by race and ethnicity■ Number of children and rate per 1,000 who are removed from their home for protection■ Adult chronic drinking
ExplanationThis set of indicators measures several key aspects of family support and stability. Frequent moves are associated with such problems as dropping out of high school, delinquency, depression and teen pregnancy. Bearing a child during adolescence is associated with long-term difficulties, including a high rate of welfare dependence. Child abuse and neglect often result in physical injury, emotional illness,
poor school performance and future criminal behavior. Although not all child abuse and neglect occur in the child's home, family support can help relieve the harm caused by child maltreatment.
Many serious adolescent problems, such as delinquency, substance abuse, pregnancy and school failure, are strongly
GOAL
BFamilies will provide a stable, supportive environment for their children
IndicatorDid it
change? 1990 1992 1995 1996 Local data? Frequency
Teen pregnancy rate (per 1,000 girls age 15 to 17) same 33.7 31.4 31.2expected January
1998yes annual
Runaways (per 1,000 children under 18) same 8.5 8.8 13.1 14.4 yes annual
Percentage of parents satisfied with the quality of care their children receive when their children are not with them
revised NA NA 84%(age 11
and under)
NA no periodic
Infant to age 5Age 6 to 11
Apprehensions of children for violent and property crimes (per 1,000 children ages 10 through 17)
revised 33.8 35.8 35.0 35.7 yes annual
Percentage of children who report using alcohol or illegal drugs at least monthly
same (1989) NA yes every 3 years
sixth-gradersninth-graders12th-graders
4%28%55%
3%21%43%
4%24%39%
Abused or neglected children (per 1,000 children under 18)
same 7.8 9.3 8.3 8.2 yes annual
Percentage of students who move more than oncea year
same NA NA 15% 16% yes annual
3
4
5
6
7
8
9
Minnesota Planning 9
associated with family discord or violence, poor family communication, lack of parental monitoring or inconsistent discipline. Use of alcohol and drugs is associated with many health and social problems for adolescents, both immediate and long-term. Drug use also can draw an adolescent into the criminal justice system. Running away from home is a strong measure of whether children feel they can get help for their problems within the family. A significant number of runaways come from families with abuse problems. Apprehensions of youth under age 18 for serious, violent or property crime is suggested as a revised measure. These offenses, called “Part I” offenses in Minnesota, include homicide, rape, robbery, aggravated assault, burglary, larceny, car theft and arson.
Indicator 5 has been reworded for clarity and to better reflect the survey question it is based on. The 1997 survey distinguishes between preschool and school-age children. The indicator includes not only formal child care settings, but also informal care from relatives, friends and neighbors.
Sources3 Minnesota Department of Health4 Minnesota Department of Public Safety, Bureau of Criminal
Apprehension5 Minnesota State Survey, Minnesota Center for Survey Research,
University of Minnesota6 Minnesota Department of Public Safety, Bureau of Criminal
Apprehension7 Department of Children, Families & Learning, Minnesota Student
Survey8 Minnesota Department of Human Services9 Minnesota Department of Children, Families & Learning*
Minnesota Milestones 1998: Public Review Draft 10
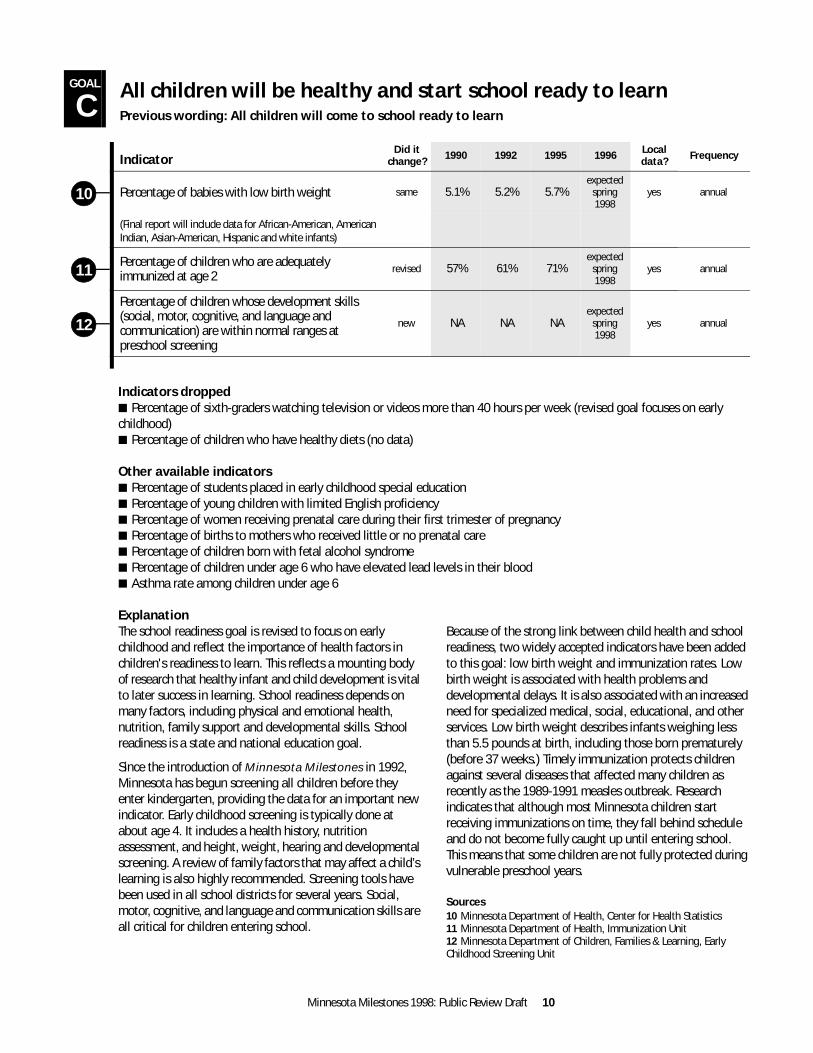
Indicators dropped■ Percentage of sixth-graders watching television or videos more than 40 hours per week (revised goal focuses on early childhood)■ Percentage of children who have healthy diets (no data)
Other available indicators■ Percentage of students placed in early childhood special education■ Percentage of young children with limited English proficiency■ Percentage of women receiving prenatal care during their first trimester of pregnancy■ Percentage of births to mothers who received little or no prenatal care■ Percentage of children born with fetal alcohol syndrome■ Percentage of children under age 6 who have elevated lead levels in their blood■ Asthma rate among children under age 6
ExplanationThe school readiness goal is revised to focus on early childhood and reflect the importance of health factors in children's readiness to learn. This reflects a mounting body of research that healthy infant and child development is vital to later success in learning. School readiness depends on many factors, including physical and emotional health, nutrition, family support and developmental skills. School readiness is a state and national education goal.
Since the introduction of Minnesota Milestones in 1992, Minnesota has begun screening all children before they enter kindergarten, providing the data for an important new indicator. Early childhood screening is typically done at about age 4. It includes a health history, nutrition assessment, and height, weight, hearing and developmental screening. A review of family factors that may affect a child’s learning is also highly recommended. Screening tools have been used in all school districts for several years. Social, motor, cognitive, and language and communication skills are all critical for children entering school.
Because of the strong link between child health and school readiness, two widely accepted indicators have been added to this goal: low birth weight and immunization rates. Low birth weight is associated with health problems and developmental delays. It is also associated with an increased need for specialized medical, social, educational, and other services. Low birth weight describes infants weighing less than 5.5 pounds at birth, including those born prematurely (before 37 weeks.) Timely immunization protects children against several diseases that affected many children as recently as the 1989-1991 measles outbreak. Research indicates that although most Minnesota children start receiving immunizations on time, they fall behind schedule and do not become fully caught up until entering school. This means that some children are not fully protected during vulnerable preschool years.
Sources10 Minnesota Department of Health, Center for Health Statistics11 Minnesota Department of Health, Immunization Unit12 Minnesota Department of Children, Families & Learning, Early Childhood Screening Unit
GOAL
C All children will be healthy and start school ready to learnPrevious wording: All children will come to school ready to learn
IndicatorDid it
change? 1990 1992 1995 1996 Local data? Frequency
Percentage of babies with low birth weight same 5.1% 5.2% 5.7%expected
spring 1998
yes annual
(Final report will include data for African-American, American Indian, Asian-American, Hispanic and white infants)
Percentage of children who are adequately immunized at age 2
revised 57% 61% 71%expected
spring 1998
yes annual
Percentage of children whose development skills (social, motor, cognitive, and language and communication) are within normal ranges at preschool screening
new NA NA NAexpected
spring 1998
yes annual
10
11
12
Minnesota Planning 11
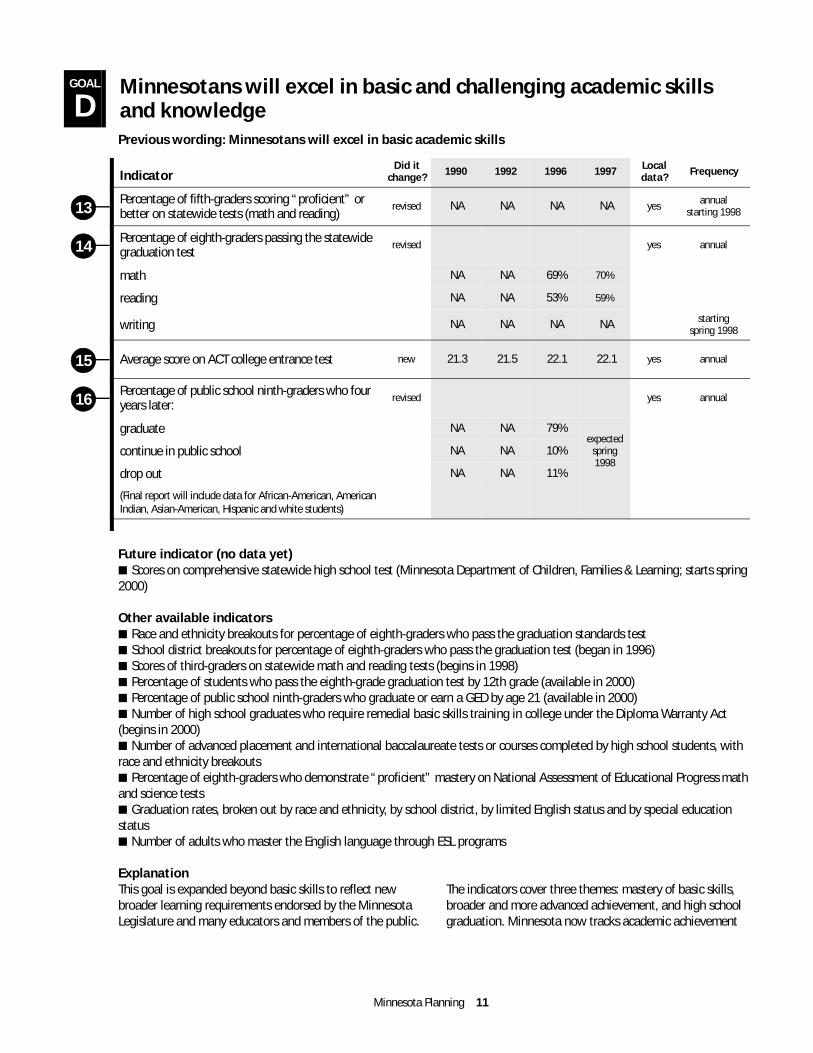
Previous wording: Minnesotans will excel in basic academic skills
Future indicator (no data yet)■ Scores on comprehensive statewide high school test (Minnesota Department of Children, Families & Learning; starts spring 2000)
Other available indicators■ Race and ethnicity breakouts for percentage of eighth-graders who pass the graduation standards test■ School district breakouts for percentage of eighth-graders who pass the graduation test (began in 1996)■ Scores of third-graders on statewide math and reading tests (begins in 1998)■ Percentage of students who pass the eighth-grade graduation test by 12th grade (available in 2000)■ Percentage of public school ninth-graders who graduate or earn a GED by age 21 (available in 2000)■ Number of high school graduates who require remedial basic skills training in college under the Diploma Warranty Act (begins in 2000)■ Number of advanced placement and international baccalaureate tests or courses completed by high school students, with race and ethnicity breakouts■ Percentage of eighth-graders who demonstrate “proficient” mastery on National Assessment of Educational Progress math and science tests■ Graduation rates, broken out by race and ethnicity, by school district, by limited English status and by special education status■ Number of adults who master the English language through ESL programs
ExplanationThis goal is expanded beyond basic skills to reflect new broader learning requirements endorsed by the Minnesota Legislature and many educators and members of the public.
The indicators cover three themes: mastery of basic skills, broader and more advanced achievement, and high school graduation. Minnesota now tracks academic achievement
GOAL
D Minnesotans will excel in basic and challenging academic skills and knowledge
IndicatorDid it
change? 1990 1992 1996 1997 Local data? Frequency
Percentage of fifth-graders scoring “proficient” or better on statewide tests (math and reading)
revised NA NA NA NA yes annual starting 1998
Percentage of eighth-graders passing the statewide graduation test
revised yes annual
math NA NA 69% 70%
reading NA NA 53% 59%
writing NA NA NA NA starting spring 1998
Average score on ACT college entrance test new 21.3 21.5 22.1 22.1 yes annual
Percentage of public school ninth-graders who four years later:
revised yes annual
graduate NA NA 79%expected
spring 1998
continue in public school NA NA 10%
drop out NA NA 11%
(Final report will include data for African-American, American Indian, Asian-American, Hispanic and white students)
13
14
15
16
Minnesota Milestones 1998: Public Review Draft 12
much better than when Minnesota Milestones first came out in 1992. Annual statewide tests for third-graders, fifth-graders, eighth-graders and high school students will all be in place by 2000. New graduation standards include both basic skills — reading, writing and math — and a “Profile of Learning,” a set of K-12 learning requirements covering 10 broad areas from science to the arts.
While standardized tests are not the only way to measure learning, they are used in most states and are now established in Minnesota law. Minnesota's eighth-grade test has been criticized for setting a low standard, but these test results are useful for measuring progress. They are understandable, they include the 90 percent of Minnesota children who attend public schools, and data is available promptly every year. Broader tools for measuring learning will be available in a few years.
The eighth-grade graduation standards test, begun in 1996, and the fifth-grade test that will start in 1998 measure trends in basic skills. Higher achievement is monitored using
statewide results on the ACT college entrance test, taken by about 60 percent of Minnesota high school graduates.
A new set of annual data from the Minnesota Department of Children, Families & Learning provides better state and local data on high school completion. The earlier indicator highlighted only a few school districts with high dropout rates.
Breaking out indicators by school district and by race and ethnicity is essential because of serious disparities within Minnesota. Good indicators are needed to measure the success of students with limited English skills and those with special education needs.
Sources13 Minnesota Department of Children, Families & Learning, Basic Standards Reading and Math Test Results14 Minnesota Department of Children, Families & Learning, Graduation Standards Reading and Math Test Results15 ACT, Inc.16 Minnesota Department of Children, Families & Learning, Completion Study for the Class of 1996
Minnesota Planning 13
Future indicators (no data yet)■ Percentage of Minnesota adults and children with mental disorders (Minnesota Department of Health)■ Percentage of Minnesotans who exercise regularly (Minnesota Department of Health)
Other available indicators■ Percentage of Minnesota adults who abuse alcohol■ Percentage of Minnesotans who use seat belts regularly■ Rates of infectious disease■ Percentage of Minnesotans who are significantly overweight■ Life expectancy by gender, race and ethnicity■ Annual cancer rate
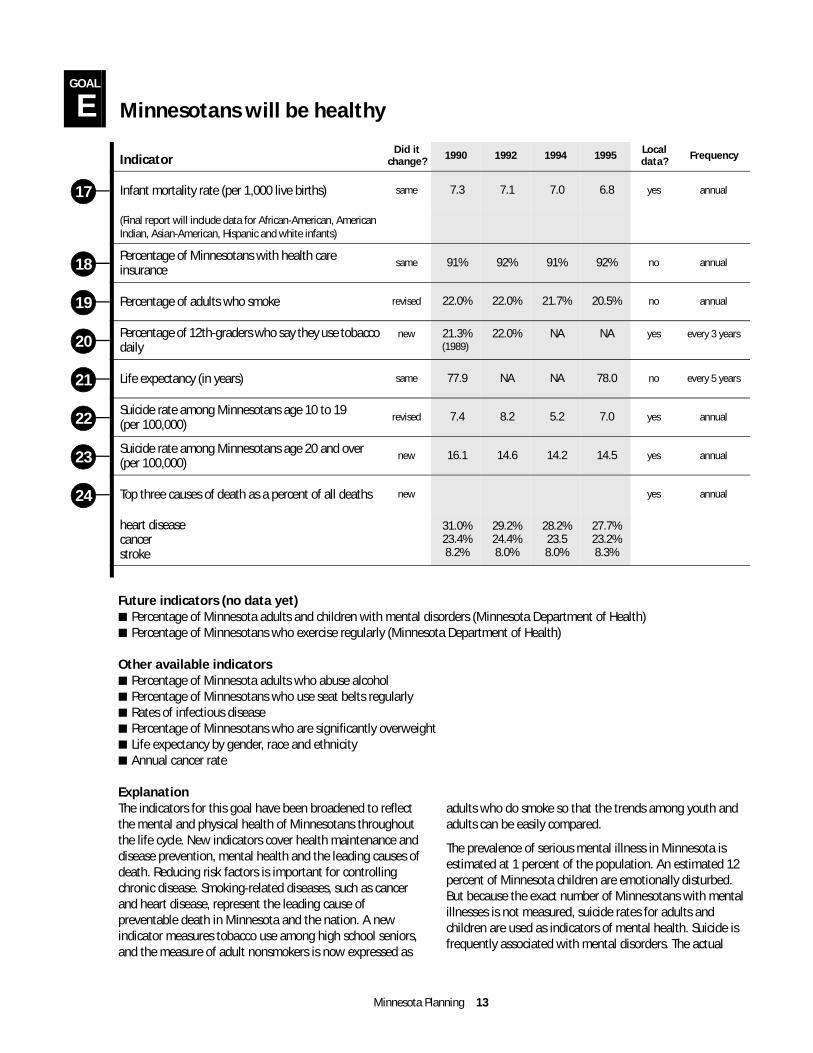
ExplanationThe indicators for this goal have been broadened to reflect the mental and physical health of Minnesotans throughout the life cycle. New indicators cover health maintenance and disease prevention, mental health and the leading causes of death. Reducing risk factors is important for controlling chronic disease. Smoking-related diseases, such as cancer and heart disease, represent the leading cause of preventable death in Minnesota and the nation. A new indicator measures tobacco use among high school seniors, and the measure of adult nonsmokers is now expressed as
adults who do smoke so that the trends among youth and adults can be easily compared.
The prevalence of serious mental illness in Minnesota is estimated at 1 percent of the population. An estimated 12 percent of Minnesota children are emotionally disturbed. But because the exact number of Minnesotans with mental illnesses is not measured, suicide rates for adults and children are used as indicators of mental health. Suicide is frequently associated with mental disorders. The actual
GOAL
E Minnesotans will be healthy
IndicatorDid it
change? 1990 1992 1994 1995 Local data? Frequency
Infant mortality rate (per 1,000 live births) same 7.3 7.1 7.0 6.8 yes annual
(Final report will include data for African-American, American Indian, Asian-American, Hispanic and white infants)
Percentage of Minnesotans with health care insurance
same 91% 92% 91% 92% no annual
Percentage of adults who smoke revised 22.0% 22.0% 21.7% 20.5% no annual
Percentage of 12th-graders who say they use tobacco daily
new 21.3%(1989)
22.0% NA NA yes every 3 years
Life expectancy (in years) same 77.9 NA NA 78.0 no every 5 years
Suicide rate among Minnesotans age 10 to 19(per 100,000)
revised 7.4 8.2 5.2 7.0 yes annual
Suicide rate among Minnesotans age 20 and over (per 100,000)
new 16.1 14.6 14.2 14.5 yes annual
Top three causes of death as a percent of all deaths new yes annual
heart diseasecancerstroke
31.0%23.4%8.2%
29.2%24.4%8.0%
28.2%23.58.0%
27.7%23.2%8.3%
17
18
19
20
21
22
23
24
Minnesota Milestones 1998: Public Review Draft 14
suicide rate for children replaces the self-reported percentage of Minnesota 12th-graders attempting suicide. Suicide is the second-most common cause of injury death in Minnesota, accounting for nearly one-fourth of all injury deaths. In 1995, suicide was the second leading cause of death for Minnesotans age 20 to 34. State agencies are exploring other ways to measure mental health.
Life expectancy is used worldwide as a broad snapshot of well-being. It is a good composite measure because it is heavily influenced by the health status and death rates among young and middle-aged people, not just the health of the elderly. It is also affected by many other factors, including migration patterns and advances in medical technology. A new measure reports the top three causes of death. The top three causes of death in the state — heart disease, cancer and cerebrovascular disease (stroke) —
account for nearly 60 percent of deaths each year. This indicator does not suggest a preferred trend, but simply highlights trends in certain diseases that affect the health of many Minnesotans. For this indicator as well as the life expectancy indicator, long-term trends are more significant than year-to-year variations.
Sources17 Minnesota Department of Health, Center for Health Statistics18 Minnesota Department of Health, Health Economics Program (survey data)19 Minnesota Department of Health, Minnesota Behavioral Risk Factor Surveillance System20 Minnesota Department of Children, Families & Learning, Minnesota Student Survey21 Minnesota Planning, Office of the State Demographer22 Minnesota Department of Health, Center for Health Statistics23 Minnesota Department of Health, Center for Health Statistics24 Minnesota Department of Health, Center for Health Statistics
Minnesota Planning 15
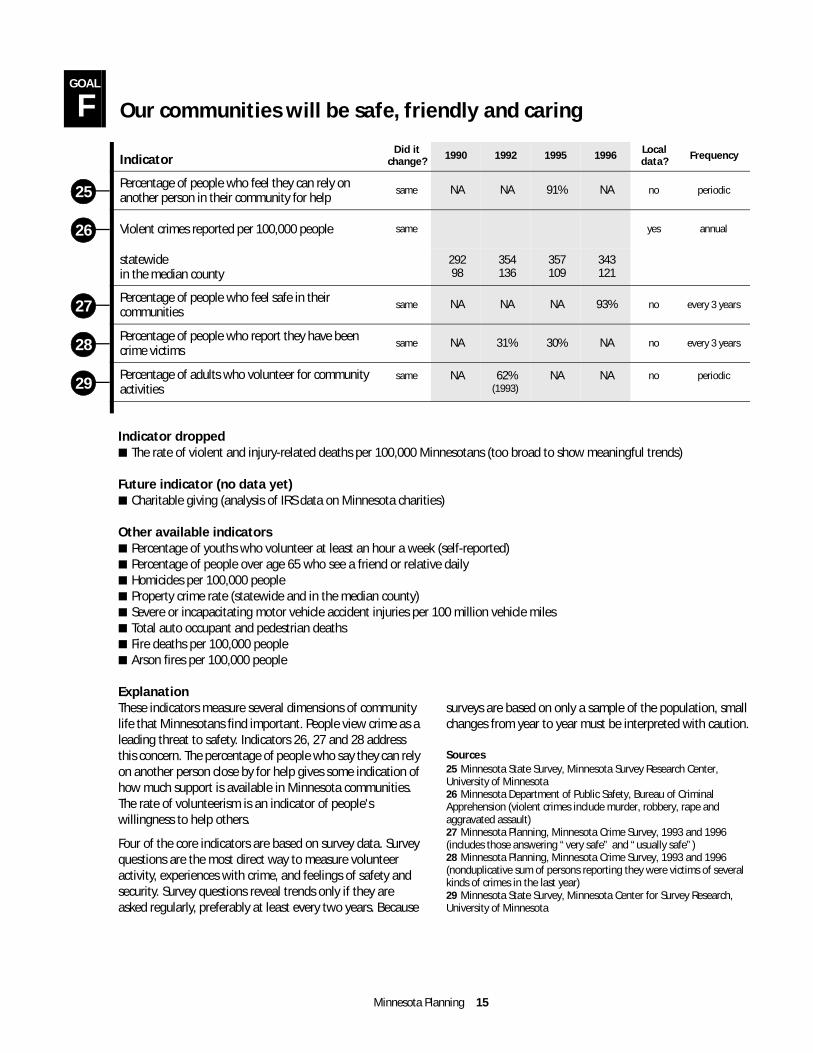
Indicator dropped■ The rate of violent and injury-related deaths per 100,000 Minnesotans (too broad to show meaningful trends)
Future indicator (no data yet)■ Charitable giving (analysis of IRS data on Minnesota charities)
Other available indicators■ Percentage of youths who volunteer at least an hour a week (self-reported)■ Percentage of people over age 65 who see a friend or relative daily■ Homicides per 100,000 people■ Property crime rate (statewide and in the median county)■ Severe or incapacitating motor vehicle accident injuries per 100 million vehicle miles■ Total auto occupant and pedestrian deaths■ Fire deaths per 100,000 people■ Arson fires per 100,000 people
ExplanationThese indicators measure several dimensions of community life that Minnesotans find important. People view crime as a leading threat to safety. Indicators 26, 27 and 28 address this concern. The percentage of people who say they can rely on another person close by for help gives some indication of how much support is available in Minnesota communities. The rate of volunteerism is an indicator of people's willingness to help others.
Four of the core indicators are based on survey data. Survey questions are the most direct way to measure volunteer activity, experiences with crime, and feelings of safety and security. Survey questions reveal trends only if they are asked regularly, preferably at least every two years. Because
surveys are based on only a sample of the population, small changes from year to year must be interpreted with caution.
Sources25 Minnesota State Survey, Minnesota Survey Research Center, University of Minnesota26 Minnesota Department of Public Safety, Bureau of Criminal Apprehension (violent crimes include murder, robbery, rape and aggravated assault)27 Minnesota Planning, Minnesota Crime Survey, 1993 and 1996 (includes those answering “very safe” and “usually safe”)28 Minnesota Planning, Minnesota Crime Survey, 1993 and 1996 (nonduplicative sum of persons reporting they were victims of several kinds of crimes in the last year)29 Minnesota State Survey, Minnesota Center for Survey Research, University of Minnesota
GOAL
F Our communities will be safe, friendly and caring
IndicatorDid it
change? 1990 1992 1995 1996 Local data? Frequency
Percentage of people who feel they can rely on another person in their community for help
same NA NA 91% NA no periodic
Violent crimes reported per 100,000 people same yes annual
statewidein the median county
29298
354136
357109
343121
Percentage of people who feel safe in their communities
same NA NA NA 93% no every 3 years
Percentage of people who report they have been crime victims
same NA 31% 30% NA no every 3 years
Percentage of adults who volunteer for community activities
same NA 62%(1993)
NA NA no periodic
25
26
27
28
29
Minnesota Milestones 1998: Public Review Draft 16
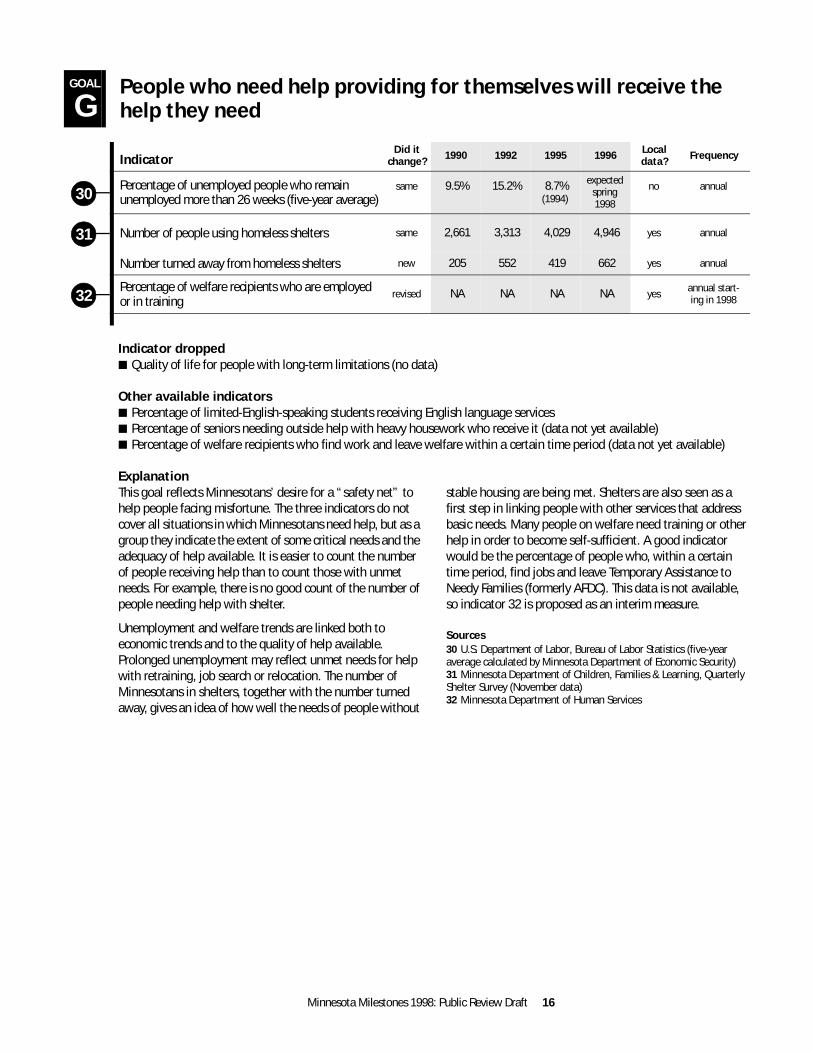
Indicator dropped■ Quality of life for people with long-term limitations (no data)
Other available indicators■ Percentage of limited-English-speaking students receiving English language services■ Percentage of seniors needing outside help with heavy housework who receive it (data not yet available)■ Percentage of welfare recipients who find work and leave welfare within a certain time period (data not yet available)
ExplanationThis goal reflects Minnesotans’ desire for a “safety net” to help people facing misfortune. The three indicators do not cover all situations in which Minnesotans need help, but as a group they indicate the extent of some critical needs and the adequacy of help available. It is easier to count the number of people receiving help than to count those with unmet needs. For example, there is no good count of the number of people needing help with shelter.
Unemployment and welfare trends are linked both to economic trends and to the quality of help available. Prolonged unemployment may reflect unmet needs for help with retraining, job search or relocation. The number of Minnesotans in shelters, together with the number turned away, gives an idea of how well the needs of people without
stable housing are being met. Shelters are also seen as a first step in linking people with other services that address basic needs. Many people on welfare need training or other help in order to become self-sufficient. A good indicator would be the percentage of people who, within a certain time period, find jobs and leave Temporary Assistance to Needy Families (formerly AFDC). This data is not available, so indicator 32 is proposed as an interim measure.
Sources30 U.S. Department of Labor, Bureau of Labor Statistics (five-year average calculated by Minnesota Department of Economic Security)31 Minnesota Department of Children, Families & Learning, Quarterly Shelter Survey (November data)32 Minnesota Department of Human Services
GOAL
GPeople who need help providing for themselves will receive the help they need
IndicatorDid it
change? 1990 1992 1995 1996 Local data? Frequency
Percentage of unemployed people who remain unemployed more than 26 weeks (five-year average)
same 9.5% 15.2% 8.7%(1994)
expectedspring 1998
no annual
Number of people using homeless shelters same 2,661 3,313 4,029 4,946 yes annual
Number turned away from homeless shelters new 205 552 419 662 yes annual
Percentage of welfare recipients who are employed or in training
revised NA NA NA NA yes annual start-ing in 1998
30
31
32
Minnesota Planning 17
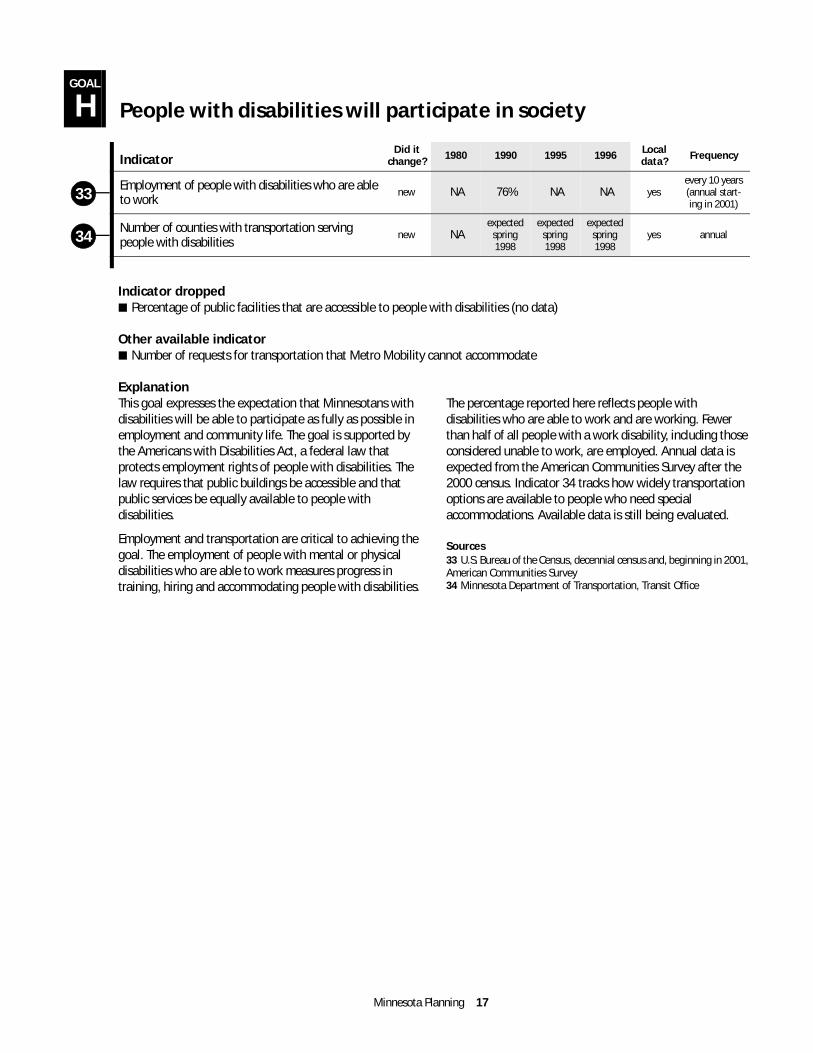
Indicator dropped■ Percentage of public facilities that are accessible to people with disabilities (no data)
Other available indicator■ Number of requests for transportation that Metro Mobility cannot accommodate
ExplanationThis goal expresses the expectation that Minnesotans with disabilities will be able to participate as fully as possible in employment and community life. The goal is supported by the Americans with Disabilities Act, a federal law that protects employment rights of people with disabilities. The law requires that public buildings be accessible and that public services be equally available to people with disabilities.
Employment and transportation are critical to achieving the goal. The employment of people with mental or physical disabilities who are able to work measures progress in training, hiring and accommodating people with disabilities.
The percentage reported here reflects people with disabilities who are able to work and are working. Fewer than half of all people with a work disability, including those considered unable to work, are employed. Annual data is expected from the American Communities Survey after the 2000 census. Indicator 34 tracks how widely transportation options are available to people who need special accommodations. Available data is still being evaluated.
Sources33 U.S. Bureau of the Census, decennial census and, beginning in 2001, American Communities Survey34 Minnesota Department of Transportation, Transit Office
GOAL
H People with disabilities will participate in society
IndicatorDid it
change? 1980 1990 1995 1996 Local data? Frequency
Employment of people with disabilities who are able to work
new NA 76% NA NA yesevery 10 years (annual start-ing in 2001)
Number of counties with transportation serving people with disabilities
new NAexpected
spring 1998
expected spring 1998
expected spring 1998
yes annual
33
34
Minnesota Milestones 1998: Public Review Draft 18
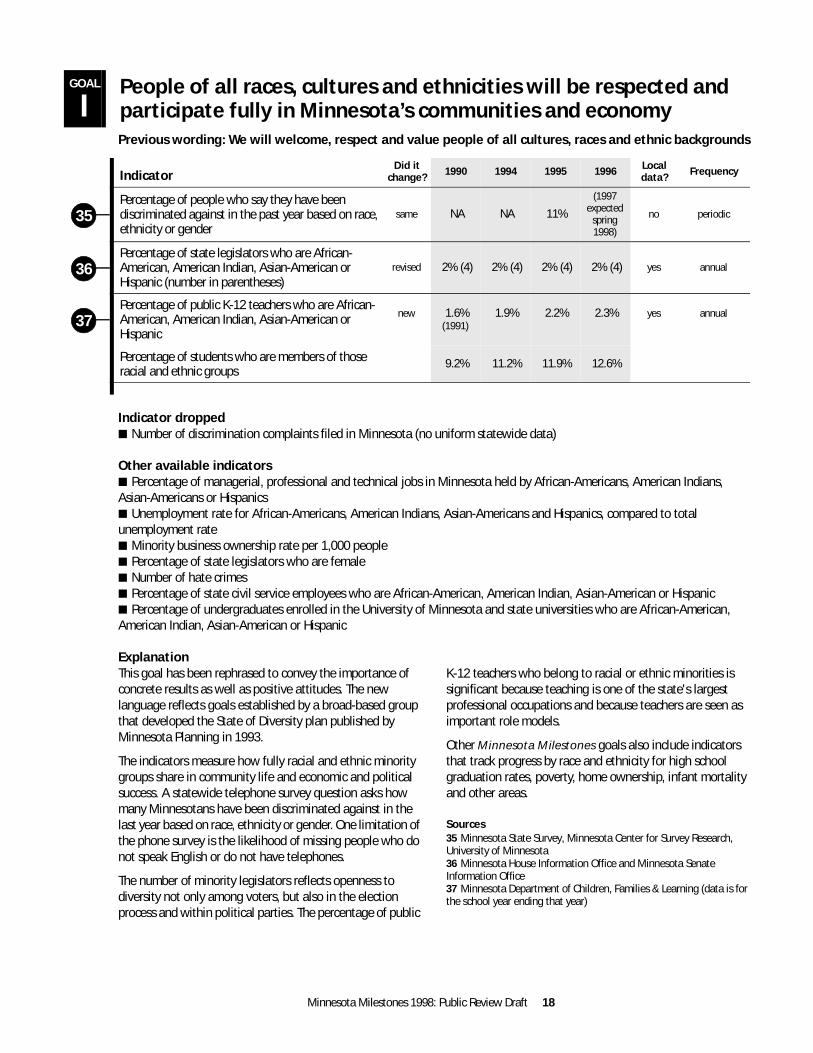
Previous wording: We will welcome, respect and value people of all cultures, races and ethnic backgrounds
Indicator dropped■ Number of discrimination complaints filed in Minnesota (no uniform statewide data)
Other available indicators■ Percentage of managerial, professional and technical jobs in Minnesota held by African-Americans, American Indians, Asian-Americans or Hispanics■ Unemployment rate for African-Americans, American Indians, Asian-Americans and Hispanics, compared to total unemployment rate■ Minority business ownership rate per 1,000 people■ Percentage of state legislators who are female■ Number of hate crimes■ Percentage of state civil service employees who are African-American, American Indian, Asian-American or Hispanic■ Percentage of undergraduates enrolled in the University of Minnesota and state universities who are African-American, American Indian, Asian-American or Hispanic
ExplanationThis goal has been rephrased to convey the importance of concrete results as well as positive attitudes. The new language reflects goals established by a broad-based group that developed the State of Diversity plan published by Minnesota Planning in 1993.
The indicators measure how fully racial and ethnic minority groups share in community life and economic and political success. A statewide telephone survey question asks how many Minnesotans have been discriminated against in the last year based on race, ethnicity or gender. One limitation of the phone survey is the likelihood of missing people who do not speak English or do not have telephones.
The number of minority legislators reflects openness to diversity not only among voters, but also in the election process and within political parties. The percentage of public
K-12 teachers who belong to racial or ethnic minorities is significant because teaching is one of the state's largest professional occupations and because teachers are seen as important role models.
Other Minnesota Milestones goals also include indicators that track progress by race and ethnicity for high school graduation rates, poverty, home ownership, infant mortality and other areas.
Sources35 Minnesota State Survey, Minnesota Center for Survey Research, University of Minnesota36 Minnesota House Information Office and Minnesota Senate Information Office37 Minnesota Department of Children, Families & Learning (data is for the school year ending that year)
GOAL
IPeople of all races, cultures and ethnicities will be respected and participate fully in Minnesota’s communities and economy
IndicatorDid it
change? 1990 1994 1995 1996 Local data? Frequency
Percentage of people who say they have been discriminated against in the past year based on race, ethnicity or gender
same NA NA 11%
(1997 expected
spring 1998)
no periodic
Percentage of state legislators who are African-American, American Indian, Asian-American or Hispanic (number in parentheses)
revised 2% (4) 2% (4) 2% (4) 2% (4) yes annual
Percentage of public K-12 teachers who are African-American, American Indian, Asian-American or Hispanic
new 1.6%(1991)
1.9% 2.2% 2.3% yes annual
Percentage of students who are members of those racial and ethnic groups
9.2% 11.2% 11.9% 12.6%
35
36
37
Minnesota Planning 19
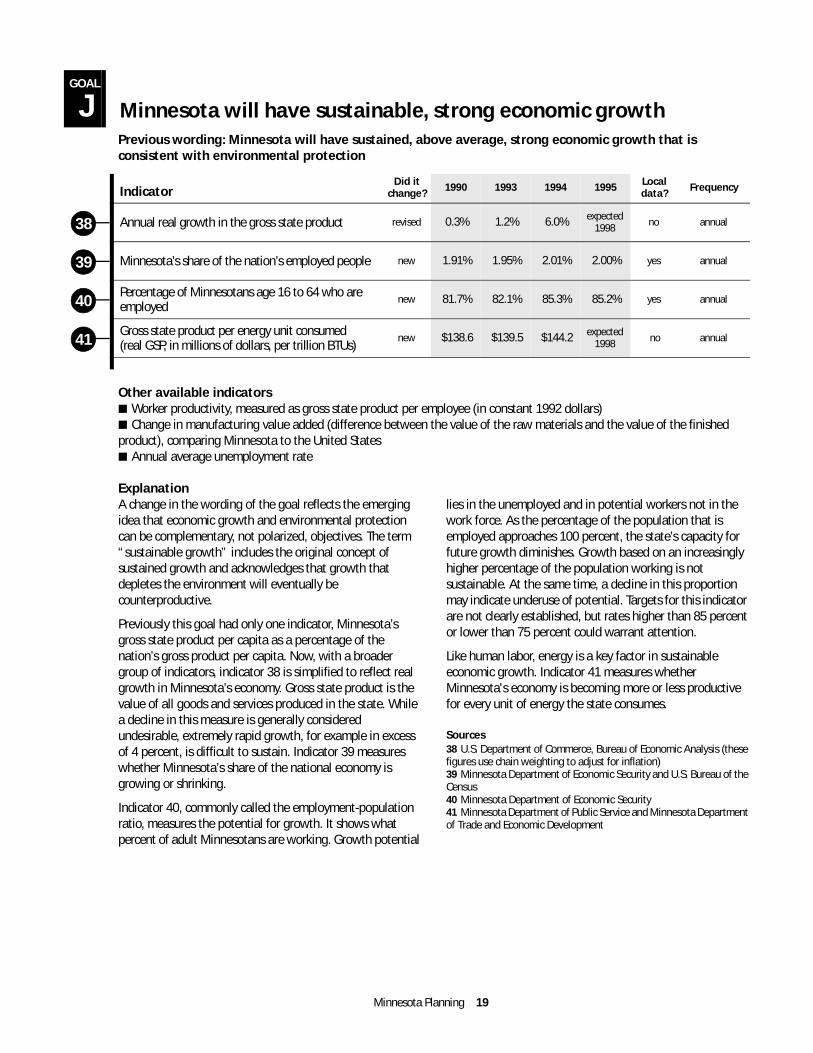
Previous wording: Minnesota will have sustained, above average, strong economic growth that is consistent with environmental protection
Other available indicators■ Worker productivity, measured as gross state product per employee (in constant 1992 dollars)■ Change in manufacturing value added (difference between the value of the raw materials and the value of the finished product), comparing Minnesota to the United States■ Annual average unemployment rate
ExplanationA change in the wording of the goal reflects the emerging idea that economic growth and environmental protection can be complementary, not polarized, objectives. The term “sustainable growth” includes the original concept of sustained growth and acknowledges that growth that depletes the environment will eventually be counterproductive.
Previously this goal had only one indicator, Minnesota’s gross state product per capita as a percentage of the nation’s gross product per capita. Now, with a broader group of indicators, indicator 38 is simplified to reflect real growth in Minnesota’s economy. Gross state product is the value of all goods and services produced in the state. While a decline in this measure is generally considered undesirable, extremely rapid growth, for example in excess of 4 percent, is difficult to sustain. Indicator 39 measures whether Minnesota’s share of the national economy is growing or shrinking.
Indicator 40, commonly called the employment-population ratio, measures the potential for growth. It shows what percent of adult Minnesotans are working. Growth potential
lies in the unemployed and in potential workers not in the work force. As the percentage of the population that is employed approaches 100 percent, the state’s capacity for future growth diminishes. Growth based on an increasingly higher percentage of the population working is not sustainable. At the same time, a decline in this proportion may indicate underuse of potential. Targets for this indicator are not clearly established, but rates higher than 85 percent or lower than 75 percent could warrant attention.
Like human labor, energy is a key factor in sustainable economic growth. Indicator 41 measures whether Minnesota's economy is becoming more or less productive for every unit of energy the state consumes.
Sources38 U.S. Department of Commerce, Bureau of Economic Analysis (these figures use chain weighting to adjust for inflation)39 Minnesota Department of Economic Security and U.S. Bureau of the Census40 Minnesota Department of Economic Security41 Minnesota Department of Public Service and Minnesota Department of Trade and Economic Development
GOAL
J Minnesota will have sustainable, strong economic growth
IndicatorDid it
change? 1990 1993 1994 1995 Local data? Frequency
Annual real growth in the gross state product revised 0.3% 1.2% 6.0% expected 1998 no annual
Minnesota’s share of the nation’s employed people new 1.91% 1.95% 2.01% 2.00% yes annual
Percentage of Minnesotans age 16 to 64 who are employed
new 81.7% 82.1% 85.3% 85.2% yes annual
Gross state product per energy unit consumed (real GSP, in millions of dollars, per trillion BTUs)
new $138.6 $139.5 $144.2 expected 1998 no annual
38
39
40
41
Minnesota Milestones 1998: Public Review Draft 20
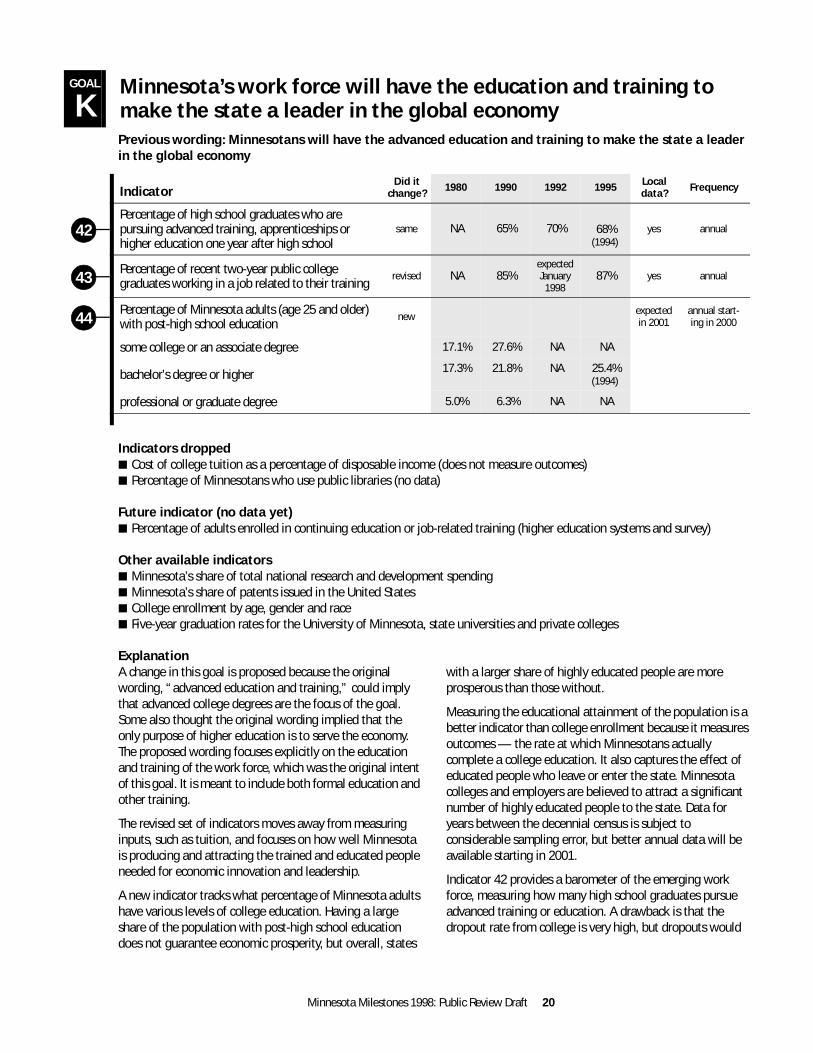
Previous wording: Minnesotans will have the advanced education and training to make the state a leader in the global economy
Indicators dropped■ Cost of college tuition as a percentage of disposable income (does not measure outcomes)■ Percentage of Minnesotans who use public libraries (no data)
Future indicator (no data yet)■ Percentage of adults enrolled in continuing education or job-related training (higher education systems and survey)
Other available indicators■ Minnesota’s share of total national research and development spending■ Minnesota’s share of patents issued in the United States■ College enrollment by age, gender and race■ Five-year graduation rates for the University of Minnesota, state universities and private colleges
ExplanationA change in this goal is proposed because the original wording, “advanced education and training,” could imply that advanced college degrees are the focus of the goal. Some also thought the original wording implied that the only purpose of higher education is to serve the economy. The proposed wording focuses explicitly on the education and training of the work force, which was the original intent of this goal. It is meant to include both formal education and other training.
The revised set of indicators moves away from measuring inputs, such as tuition, and focuses on how well Minnesota is producing and attracting the trained and educated people needed for economic innovation and leadership.
A new indicator tracks what percentage of Minnesota adults have various levels of college education. Having a large share of the population with post-high school education does not guarantee economic prosperity, but overall, states
with a larger share of highly educated people are more prosperous than those without.
Measuring the educational attainment of the population is a better indicator than college enrollment because it measures outcomes — the rate at which Minnesotans actually complete a college education. It also captures the effect of educated people who leave or enter the state. Minnesota colleges and employers are believed to attract a significant number of highly educated people to the state. Data for years between the decennial census is subject to considerable sampling error, but better annual data will be available starting in 2001.
Indicator 42 provides a barometer of the emerging work force, measuring how many high school graduates pursue advanced training or education. A drawback is that the dropout rate from college is very high, but dropouts would
GOAL
KMinnesota’s work force will have the education and training to make the state a leader in the global economy
IndicatorDid it
change? 1980 1990 1992 1995 Local data? Frequency
Percentage of high school graduates who are pursuing advanced training, apprenticeships or higher education one year after high school
same NA 65% 70% 68%(1994)
yes annual
Percentage of recent two-year public college graduates working in a job related to their training
revised NA 85%expected January
199887% yes annual
Percentage of Minnesota adults (age 25 and older) with post-high school education
new expected in 2001
annual start-ing in 2000
some college or an associate degree 17.1% 27.6% NA NA
bachelor’s degree or higher 17.3% 21.8% NA 25.4%(1994)
professional or graduate degree 5.0% 6.3% NA NA
42
43
44
Minnesota Planning 21
be counted under the new educational attainment indicator as having “some college.”
A proposed future indicator would use a statewide survey or other sources to measure adults’ participation in a variety of forms of continuing education and job-related training, whether sponsored by employers, colleges or other sources.
Better indicators are needed to track how well Minnesotans' educational preparation matches the needs of the economy. Indicator 43 now includes all public two-year colleges, not just technical colleges. An area still under investigation is the relationship between education and the economic
success of the state. New indicators could cover skilled labor shortages, the ability of Minnesota employers to fill jobs from within the state's work force, and concentration of high-technology jobs in the state.
Sources42 Minnesota Department of Children, Families & Learning, Annual High School Follow-Up Survey43 Minnesota State Colleges and Universities (1990 data is for technical colleges only)44 U.S. Bureau of the Census, decennial census, Current Population Survey and, beginning in 2001, the American Community Survey (bachelor’s degree data for 1994 is a three-year average based on sample data)
Future indicator (no data yet)■ Percentage of Minnesotans living in households with incomes at least 200 percent of the poverty line (U.S. Bureau of the Census; available annually starting in 2000)
Other available indicators■ Minnesota’s average weekly wage relative to the national weekly wage■ Annual change in Minnesota’s per capita income relative to the nation's per capita income
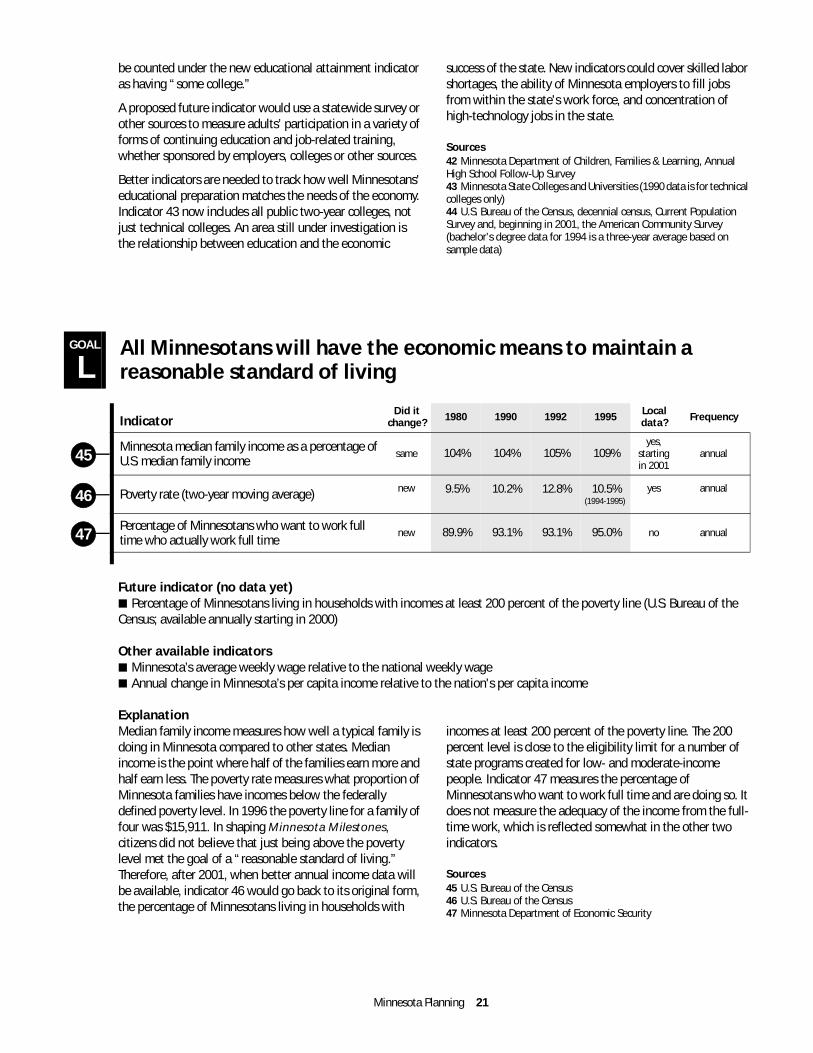
ExplanationMedian family income measures how well a typical family is doing in Minnesota compared to other states. Median income is the point where half of the families earn more and half earn less. The poverty rate measures what proportion of Minnesota families have incomes below the federally defined poverty level. In 1996 the poverty line for a family of four was $15,911. In shaping Minnesota Milestones, citizens did not believe that just being above the poverty level met the goal of a “reasonable standard of living.” Therefore, after 2001, when better annual income data will be available, indicator 46 would go back to its original form, the percentage of Minnesotans living in households with
incomes at least 200 percent of the poverty line. The 200 percent level is close to the eligibility limit for a number of state programs created for low- and moderate-income people. Indicator 47 measures the percentage of Minnesotans who want to work full time and are doing so. It does not measure the adequacy of the income from the full-time work, which is reflected somewhat in the other two indicators.
Sources45 U.S. Bureau of the Census46 U.S. Bureau of the Census47 Minnesota Department of Economic Security
GOAL
LAll Minnesotans will have the economic means to maintain a reasonable standard of living
IndicatorDid it
change? 1980 1990 1992 1995 Local data? Frequency
Minnesota median family income as a percentage of U.S. median family income
same 104% 104% 105% 109%yes,
starting in 2001
annual
Poverty rate (two-year moving average) new 9.5% 10.2% 12.8% 10.5%(1994-1995)
yes annual
Percentage of Minnesotans who want to work full time who actually work full time
new 89.9% 93.1% 93.1% 95.0% no annual
45
46
47
Minnesota Milestones 1998: Public Review Draft 22
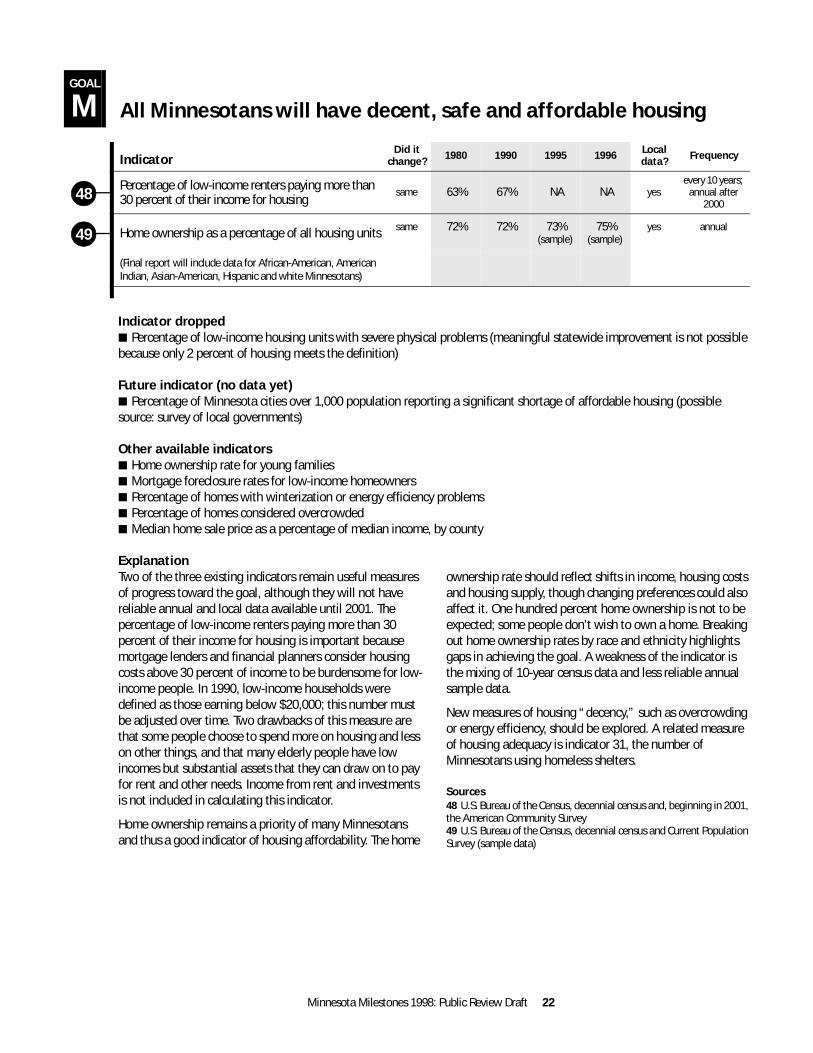
Indicator dropped■ Percentage of low-income housing units with severe physical problems (meaningful statewide improvement is not possible because only 2 percent of housing meets the definition)
Future indicator (no data yet)■ Percentage of Minnesota cities over 1,000 population reporting a significant shortage of affordable housing (possible source: survey of local governments)
Other available indicators■ Home ownership rate for young families■ Mortgage foreclosure rates for low-income homeowners■ Percentage of homes with winterization or energy efficiency problems■ Percentage of homes considered overcrowded■ Median home sale price as a percentage of median income, by county
ExplanationTwo of the three existing indicators remain useful measures of progress toward the goal, although they will not have reliable annual and local data available until 2001. The percentage of low-income renters paying more than 30 percent of their income for housing is important because mortgage lenders and financial planners consider housing costs above 30 percent of income to be burdensome for low-income people. In 1990, low-income households were defined as those earning below $20,000; this number must be adjusted over time. Two drawbacks of this measure are that some people choose to spend more on housing and less on other things, and that many elderly people have low incomes but substantial assets that they can draw on to pay for rent and other needs. Income from rent and investments is not included in calculating this indicator.
Home ownership remains a priority of many Minnesotans and thus a good indicator of housing affordability. The home
ownership rate should reflect shifts in income, housing costs and housing supply, though changing preferences could also affect it. One hundred percent home ownership is not to be expected; some people don’t wish to own a home. Breaking out home ownership rates by race and ethnicity highlights gaps in achieving the goal. A weakness of the indicator is the mixing of 10-year census data and less reliable annual sample data.
New measures of housing “decency,” such as overcrowding or energy efficiency, should be explored. A related measure of housing adequacy is indicator 31, the number of Minnesotans using homeless shelters.
Sources48 U.S. Bureau of the Census, decennial census and, beginning in 2001, the American Community Survey49 U.S. Bureau of the Census, decennial census and Current Population Survey (sample data)
GOAL
M All Minnesotans will have decent, safe and affordable housing
IndicatorDid it
change? 1980 1990 1995 1996 Local data? Frequency
Percentage of low-income renters paying more than 30 percent of their income for housing
same 63% 67% NA NA yesevery 10 years;
annual after 2000
Home ownership as a percentage of all housing units same 72% 72% 73%(sample)
75%(sample)
yes annual
(Final report will include data for African-American, American Indian, Asian-American, Hispanic and white Minnesotans)
48
49
Minnesota Planning 23
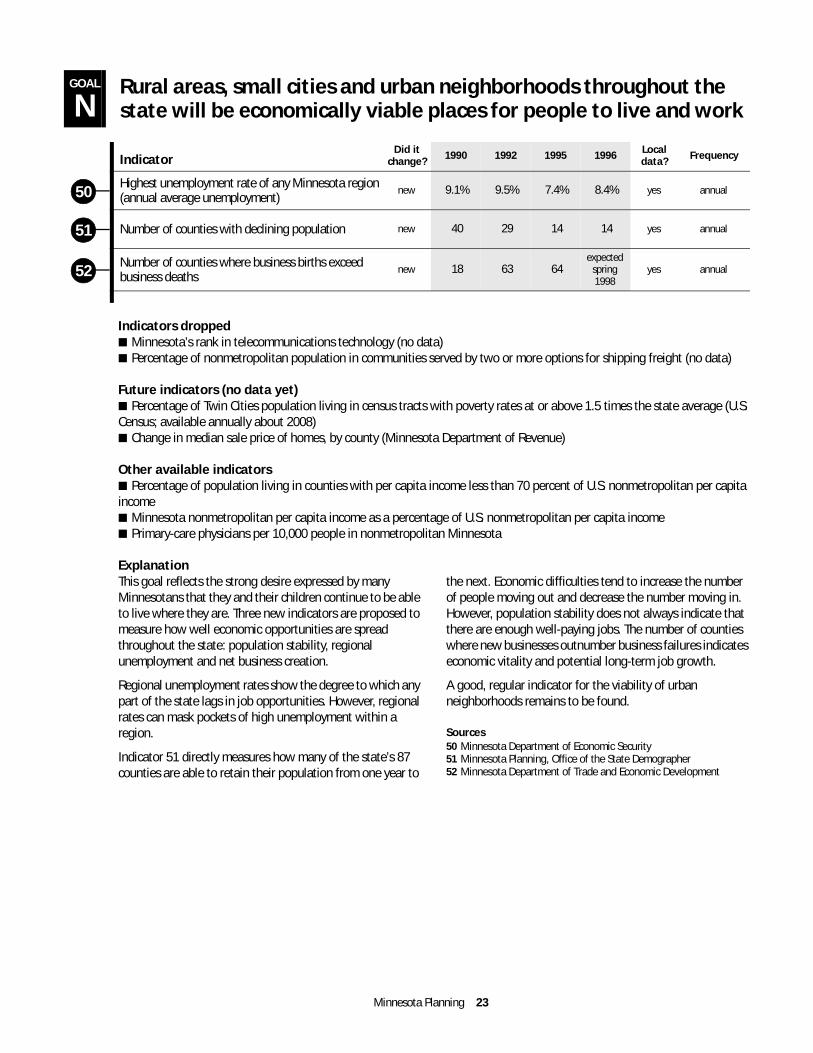
Indicators dropped■ Minnesota’s rank in telecommunications technology (no data)■ Percentage of nonmetropolitan population in communities served by two or more options for shipping freight (no data)
Future indicators (no data yet)■ Percentage of Twin Cities population living in census tracts with poverty rates at or above 1.5 times the state average (U.S. Census; available annually about 2008)■ Change in median sale price of homes, by county (Minnesota Department of Revenue)
Other available indicators■ Percentage of population living in counties with per capita income less than 70 percent of U.S. nonmetropolitan per capita income■ Minnesota nonmetropolitan per capita income as a percentage of U.S. nonmetropolitan per capita income■ Primary-care physicians per 10,000 people in nonmetropolitan Minnesota
ExplanationThis goal reflects the strong desire expressed by many Minnesotans that they and their children continue to be able to live where they are. Three new indicators are proposed to measure how well economic opportunities are spread throughout the state: population stability, regional unemployment and net business creation.
Regional unemployment rates show the degree to which any part of the state lags in job opportunities. However, regional rates can mask pockets of high unemployment within a region.
Indicator 51 directly measures how many of the state’s 87 counties are able to retain their population from one year to
the next. Economic difficulties tend to increase the number of people moving out and decrease the number moving in. However, population stability does not always indicate that there are enough well-paying jobs. The number of counties where new businesses outnumber business failures indicates economic vitality and potential long-term job growth.
A good, regular indicator for the viability of urban neighborhoods remains to be found.
Sources50 Minnesota Department of Economic Security51 Minnesota Planning, Office of the State Demographer52 Minnesota Department of Trade and Economic Development
GOAL
NRural areas, small cities and urban neighborhoods throughout the state will be economically viable places for people to live and work
IndicatorDid it
change? 1990 1992 1995 1996 Local data? Frequency
Highest unemployment rate of any Minnesota region (annual average unemployment)
new 9.1% 9.5% 7.4% 8.4% yes annual
Number of counties with declining population new 40 29 14 14 yes annual
Number of counties where business births exceedbusiness deaths
new 18 63 64expected
spring 1998
yes annual
50
51
52
Minnesota Milestones 1998: Public Review Draft 24
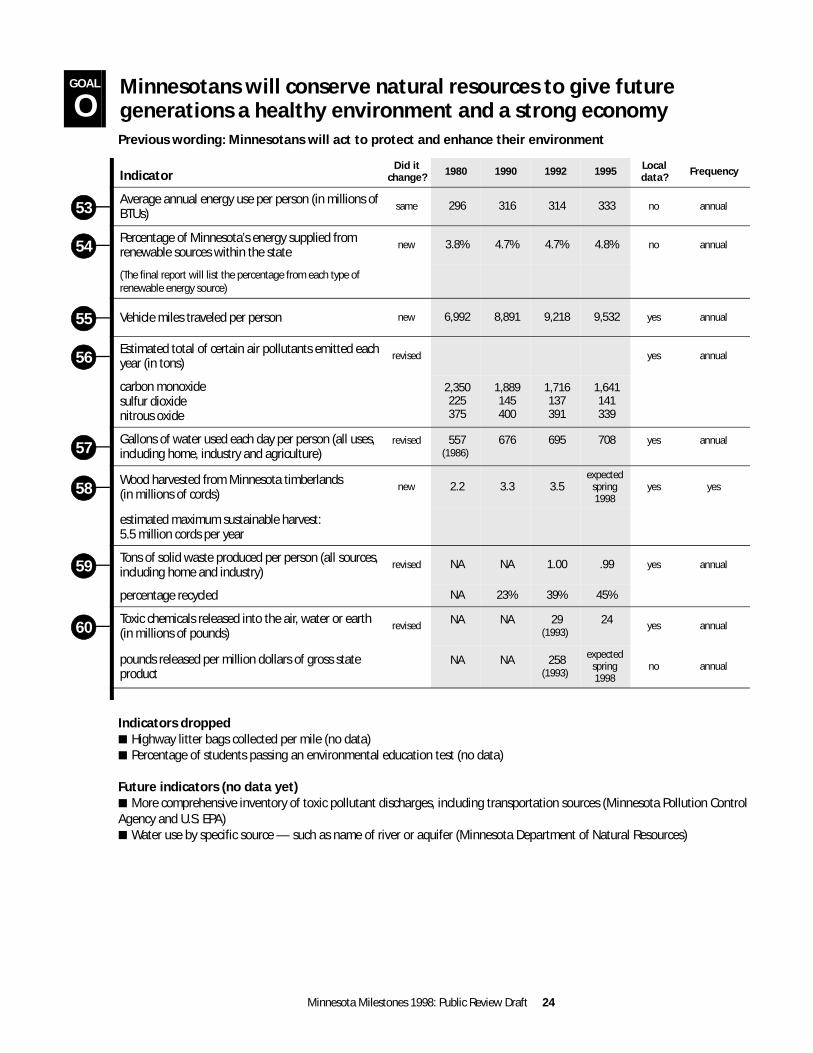
Previous wording: Minnesotans will act to protect and enhance their environment
Indicators dropped■ Highway litter bags collected per mile (no data)■ Percentage of students passing an environmental education test (no data)
Future indicators (no data yet)■ More comprehensive inventory of toxic pollutant discharges, including transportation sources (Minnesota Pollution Control Agency and U.S. EPA)■ Water use by specific source — such as name of river or aquifer (Minnesota Department of Natural Resources)
GOAL
OMinnesotans will conserve natural resources to give future generations a healthy environment and a strong economy
IndicatorDid it
change? 1980 1990 1992 1995 Local data? Frequency
Average annual energy use per person (in millions of BTUs)
same 296 316 314 333 no annual
Percentage of Minnesota’s energy supplied from renewable sources within the state
new 3.8% 4.7% 4.7% 4.8% no annual
(The final report will list the percentage from each type of renewable energy source)
Vehicle miles traveled per person new 6,992 8,891 9,218 9,532 yes annual
Estimated total of certain air pollutants emitted each year (in tons)
revised yes annual
carbon monoxidesulfur dioxidenitrous oxide
2,350225375
1,889145400
1,716137391
1,641141339
Gallons of water used each day per person (all uses, including home, industry and agriculture)
revised 557(1986)
676 695 708 yes annual
Wood harvested from Minnesota timberlands (in millions of cords)
new 2.2 3.3 3.5expected
spring 1998
yes yes
estimated maximum sustainable harvest: 5.5 million cords per year
Tons of solid waste produced per person (all sources, including home and industry)
revised NA NA 1.00 .99 yes annual
percentage recycled NA 23% 39% 45%
Toxic chemicals released into the air, water or earth (in millions of pounds)
revised NA NA 29(1993)
24 yes annual
pounds released per million dollars of gross state product
NA NA 258(1993)
expected spring 1998
no annual
53
54
55
56
57
58
59
60
Minnesota Planning 25
Other available indicators■ Use of ground water and surface water, by type of use■ Energy use by specific fuel or by renewable versus nonrenewable fuel■ Solid waste production by disposal technique (recycled, composted, incinerated, and so on)■ Rates of hazardous waste production, disposal and release■ Rates of timber harvest and regeneration by region and species■ Contaminated acres returned to productive use■ Estimated annual carbon dioxide emissions
ExplanationThe changed wording of this goal reflects Minnesotans' concern about depleting natural resources too quickly, causing unnecessary harm to the environment and jeopardizing future economic growth. Policy-makers in Minnesota and throughout the world are increasingly evaluating the sustainability of natural resource use.
The indicators cover different types of pressures on the environment. Most of the original indicators are now reported in units per capita or per gross state product. This shifts attention to individual behavior and provides numbers more meaningful to the average person. Annual vehicle miles traveled per person reflects increasing pressure on land use and air quality. Annual energy use per person reflects many pressures on the environment, including air quality. It indirectly measures the release of carbon dioxide, a key factor in global warming. Renewable energy is important for the state's future economy and environment. The final report will list renewable energy sources by type, because some types put more stress on the environment while others, such as wind or solar power, are more benign.
Measuring air pollution is important because of its potential effects on the environment and human health. Indicator 56 measures selected air pollutants from all sources, including those from motor vehicles and other sources that are minor individually, but important collectively. Minnesota Milestones 1998 may also include a ratio of total air pollution to total energy use. However, an even more useful indicator might be the ratio of air pollution to useful energy produced, which would factor in energy efficiency. The three pollutants tracked in this indicator do not necessarily reflect air pollution rates in general, but were selected because they are the ones created primarily by burning fossil fuels.
Using too much water from a vulnerable supply could cause lakes, rivers or wells to dry up. Indicator 57 measures both ground water and surface water used for any purpose. This data is collected from water appropriation permits. Not all water uses require a permit, and reporting is not always accurate. The amount and timing of rain and snow greatly influence the use of ground water and surface water from year to year.
Total annual wood harvest from Minnesota timberlands is compared to the 5.5 million cord harvest estimated to be a maximum sustainable yield in the 1993 Generic Timber Harvest Environmental Impact Statement. The estimate, however, is based on many assumptions regarding when, where, how, and what types of timber are harvested. Increasing annual timber harvests, even if below 5.5 million cords, could have many environmental effects, including reducing habitat for wildlife. Tree stands of a single age or species do not provide as rich a habitat as mixed forest.
The other proposed indicators, while they provide useful measurement, also have shortcomings. It is unclear to what extent increased recycling actually lowers stress on the environment. It is also not known whether the total amount of solid waste produced is, in itself, a meaningful indicator of environmental stress caused by such waste. The same is true of toxic waste.
Indicator 60 shows the relationship between the release of toxic chemicals and Minnesota's economic growth. The ratio of toxins to gross state product could, however, be affected more by economic trends than by efforts to reduce toxic releases. In addition, reporting requirements for the Toxic Release Inventory have changed considerably. Consistent data is available only since 1993. More importantly, the reporting requirements apply only to industrial sources, and thus do not include toxic releases from transportation or farming. Non-industrial sources release significant amounts of toxins into the environment.
Sources53 Minnesota Department of Public Service, Minnesota Energy Data Book: Energy Trends from 1965 through 199554 Minnesota Department of Public Service, Minnesota Energy Data Book: Energy Trends from 1965 through 199555 Minnesota Department of Transportation56 Minnesota Pollution Control Agency and U.S. Environmental Protection Agency57 Minnesota Department of Natural Resources, 1995 and 1996 Water Year Data Summary58 Minnesota Department of Natural Resources59 Minnesota Pollution Control Agency and Minnesota Office of Environmental Assistance60 Minnesota Pollution Control Agency
Minnesota Milestones 1998: Public Review Draft 26
Indicator dropped■ Number of polluted “Superfund” sites identified and cleaned up (measures activity, not the severity and extent of soil and water contamination)
Future indicators (no data yet)■ Comprehensive measure of toxic chemicals released or transferred (Minnesota Pollution Control Agency)■ Concentrations of selected air toxins monitored throughout the state (Minnesota Pollution Control Agency)■ Acres of contaminated soil presenting a potential threat to human or ecological health (Minnesota Pollution Control Agency)
Other available indicators■ Levels of atrazine (a common agricultural pesticide) in ground water, in sand plain areas and in southeast Minnesota■ Water quality in the following watershed basins: Minnesota River, Lake Superior, and Red River of the North■ Acres of cropland needing treatment for erosion■ Local nitrate levels in ground water■ Quantity of hazardous waste generated in Minnesota (dropped as a core indicator because generation rates do not necessarily reflect actual release)
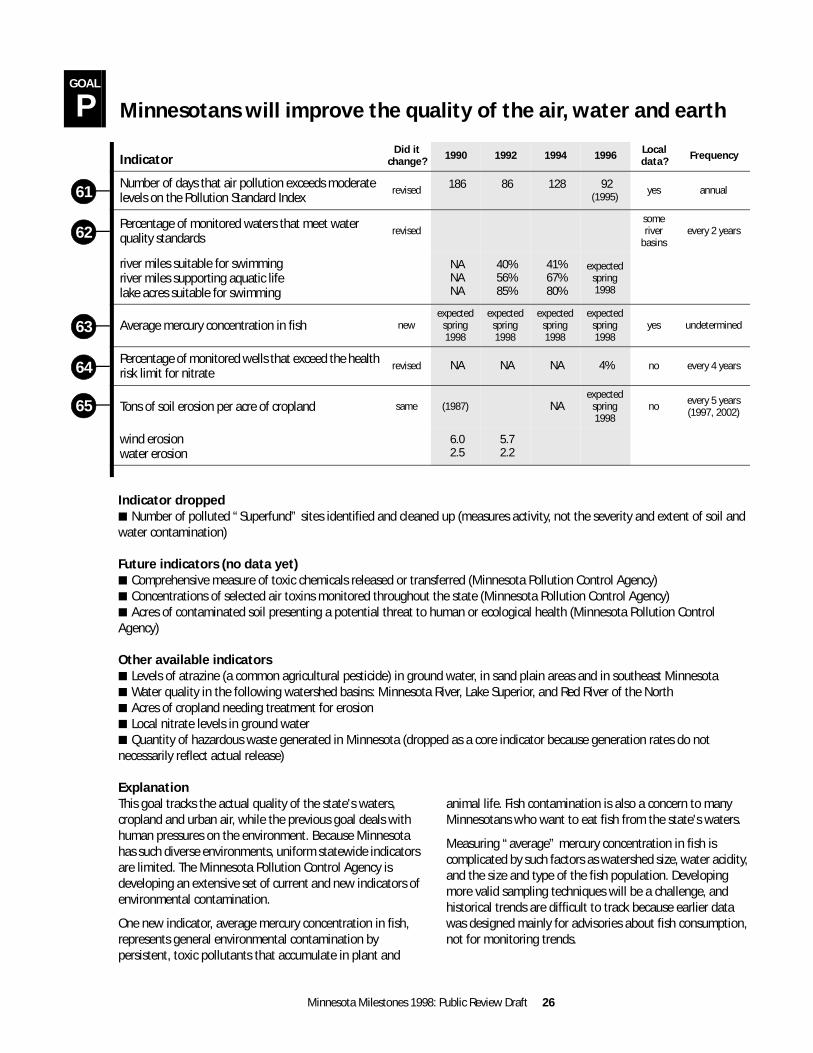
ExplanationThis goal tracks the actual quality of the state's waters, cropland and urban air, while the previous goal deals with human pressures on the environment. Because Minnesota has such diverse environments, uniform statewide indicators are limited. The Minnesota Pollution Control Agency is developing an extensive set of current and new indicators of environmental contamination.
One new indicator, average mercury concentration in fish, represents general environmental contamination by persistent, toxic pollutants that accumulate in plant and
animal life. Fish contamination is also a concern to many Minnesotans who want to eat fish from the state's waters.
Measuring “average” mercury concentration in fish is complicated by such factors as watershed size, water acidity, and the size and type of the fish population. Developing more valid sampling techniques will be a challenge, and historical trends are difficult to track because earlier data was designed mainly for advisories about fish consumption, not for monitoring trends.
GOAL
P Minnesotans will improve the quality of the air, water and earth
IndicatorDid it
change? 1990 1992 1994 1996 Local data? Frequency
Number of days that air pollution exceeds moderate levels on the Pollution Standard Index
revised 186 86 128 92(1995)
yes annual
Percentage of monitored waters that meet water quality standards
revisedsome river
basinsevery 2 years
river miles suitable for swimmingriver miles supporting aquatic lifelake acres suitable for swimming
NANANA
40%56%85%
41%67%80%
expected spring 1998
Average mercury concentration in fish newexpected
spring 1998
expected spring 1998
expected spring 1998
expected spring 1998
yes undetermined
Percentage of monitored wells that exceed the health risk limit for nitrate
revised NA NA NA 4% no every 4 years
Tons of soil erosion per acre of cropland same (1987) NAexpected
spring 1998
no every 5 years (1997, 2002)
wind erosionwater erosion
6.02.5
5.72.2
61
62
63
64
65
Minnesota Planning 27
Assessing overall water quality is difficult because of the state's vast number of lakes and streams and its complicated ground water system. The suitability of lakes and rivers for swimming and supporting aquatic life reflects many environmental factors. Data for indicator 62 is based on a sample of lakes and rivers that are monitored consistently from year to year, but the sample includes only 4 percent of the state’s river miles and 15 percent of its 3 million lake acres.
Nitrate levels in ground water are reported because high nitrate concentrations are a health threat, especially to infants. While the statewide nitrate indicator level appears low, the percentage of nitrate contamination is serious in parts of the state, such as in southwest Minnesota and sandy central regions, where aquifers close to the surface are highly susceptible to contamination.
Statewide information is not available for ground water contaminants such as pesticides, because use of specific chemicals varies across the state, as does the susceptibility of ground water.
A single, standardized indicator of urban air quality called the Pollution Standard Index replaces the former indicator, “days air pollution standards are not met.” The Pollution Standard Index, used by state and federal agencies, gives
the public a single indicator of air pollution in the Twin Cities area, Duluth, Rochester and St. Cloud.
Air quality standards are seldom violated in Minnesota, so this new index provides a more meaningful indication of the quality of urban air in the state. A limitation of this index is that it tracks only the highest single pollutant concentration monitored each day. It is not adjusted for long-term effects, nor does it take into account possible adverse effects of combined pollutants.
Soil erosion per acre of cropland is important not only because of the loss of fertile topsoil, but also as a major source of water pollution. Eroded soil carries nutrients and pesticides into lakes and streams and clouds the water. However, this indicator does not include soil erosion in urban areas, which can cause significant local water quality problems. In addition, the figures exclude stream bank and gully erosion. For this and other indicators, statewide averages may mask serious local problems.
Sources61 Minnesota Pollution Control Agency62 Minnesota Pollution Control Agency63 Minnesota Pollution Control Agency64 Minnesota Pollution Control Agency65 U.S. Department of Agriculture, Natural Resources Conservation Service, Natural Resources Inventory
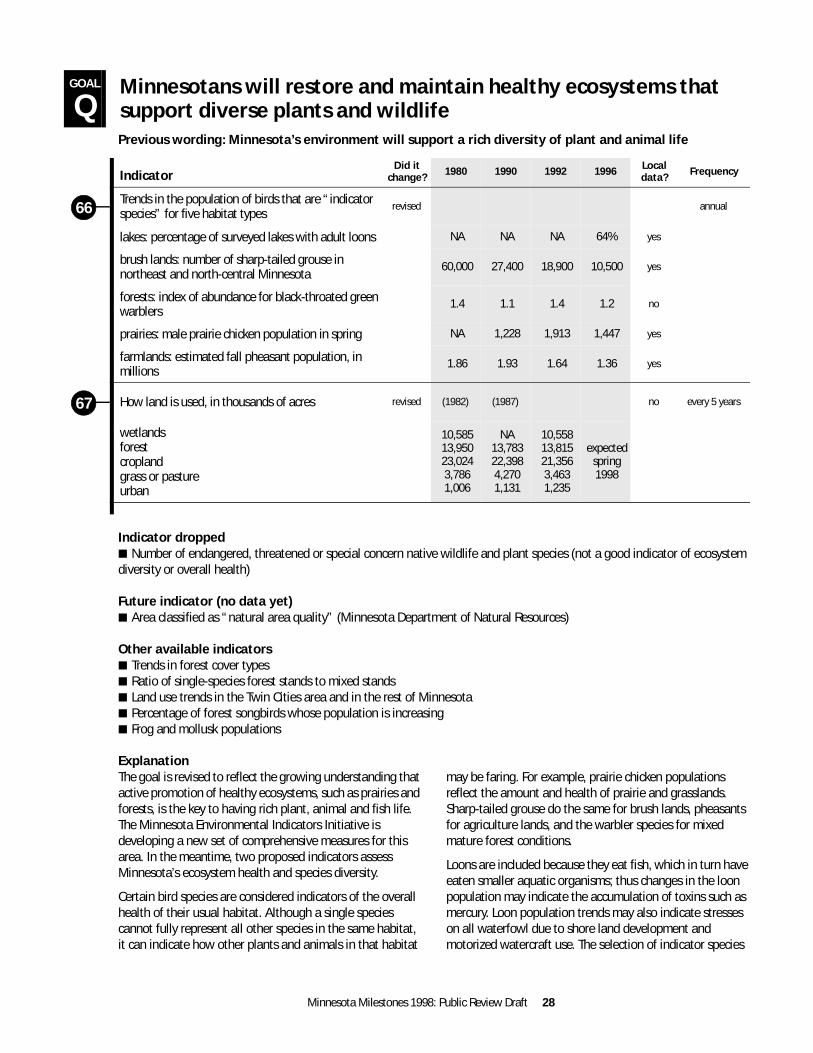
Minnesota Milestones 1998: Public Review Draft 28
Previous wording: Minnesota’s environment will support a rich diversity of plant and animal life
Indicator dropped■ Number of endangered, threatened or special concern native wildlife and plant species (not a good indicator of ecosystem diversity or overall health)
Future indicator (no data yet)■ Area classified as “natural area quality” (Minnesota Department of Natural Resources)
Other available indicators■ Trends in forest cover types■ Ratio of single-species forest stands to mixed stands■ Land use trends in the Twin Cities area and in the rest of Minnesota■ Percentage of forest songbirds whose population is increasing■ Frog and mollusk populations
ExplanationThe goal is revised to reflect the growing understanding that active promotion of healthy ecosystems, such as prairies and forests, is the key to having rich plant, animal and fish life. The Minnesota Environmental Indicators Initiative is developing a new set of comprehensive measures for this area. In the meantime, two proposed indicators assess Minnesota’s ecosystem health and species diversity.
Certain bird species are considered indicators of the overall health of their usual habitat. Although a single species cannot fully represent all other species in the same habitat, it can indicate how other plants and animals in that habitat
may be faring. For example, prairie chicken populations reflect the amount and health of prairie and grasslands. Sharp-tailed grouse do the same for brush lands, pheasants for agriculture lands, and the warbler species for mixed mature forest conditions.
Loons are included because they eat fish, which in turn have eaten smaller aquatic organisms; thus changes in the loon population may indicate the accumulation of toxins such as mercury. Loon population trends may also indicate stresses on all waterfowl due to shore land development and motorized watercraft use. The selection of indicator species
GOAL
QMinnesotans will restore and maintain healthy ecosystems that support diverse plants and wildlife
IndicatorDid it
change? 1980 1990 1992 1996 Local data? Frequency
Trends in the population of birds that are “indicator species” for five habitat types
revised annual
lakes: percentage of surveyed lakes with adult loons NA NA NA 64% yes
brush lands: number of sharp-tailed grouse in northeast and north-central Minnesota
60,000 27,400 18,900 10,500 yes
forests: index of abundance for black-throated green warblers
1.4 1.1 1.4 1.2 no
prairies: male prairie chicken population in spring NA 1,228 1,913 1,447 yes
farmlands: estimated fall pheasant population, in millions
1.86 1.93 1.64 1.36 yes
How land is used, in thousands of acres revised (1982) (1987) no every 5 years
wetlandsforestcroplandgrass or pastureurban
10,58513,95023,0243,7861,006
NA13,78322,3984,2701,131
10,55813,81521,3563,4631,235
expected spring 1998
66
67
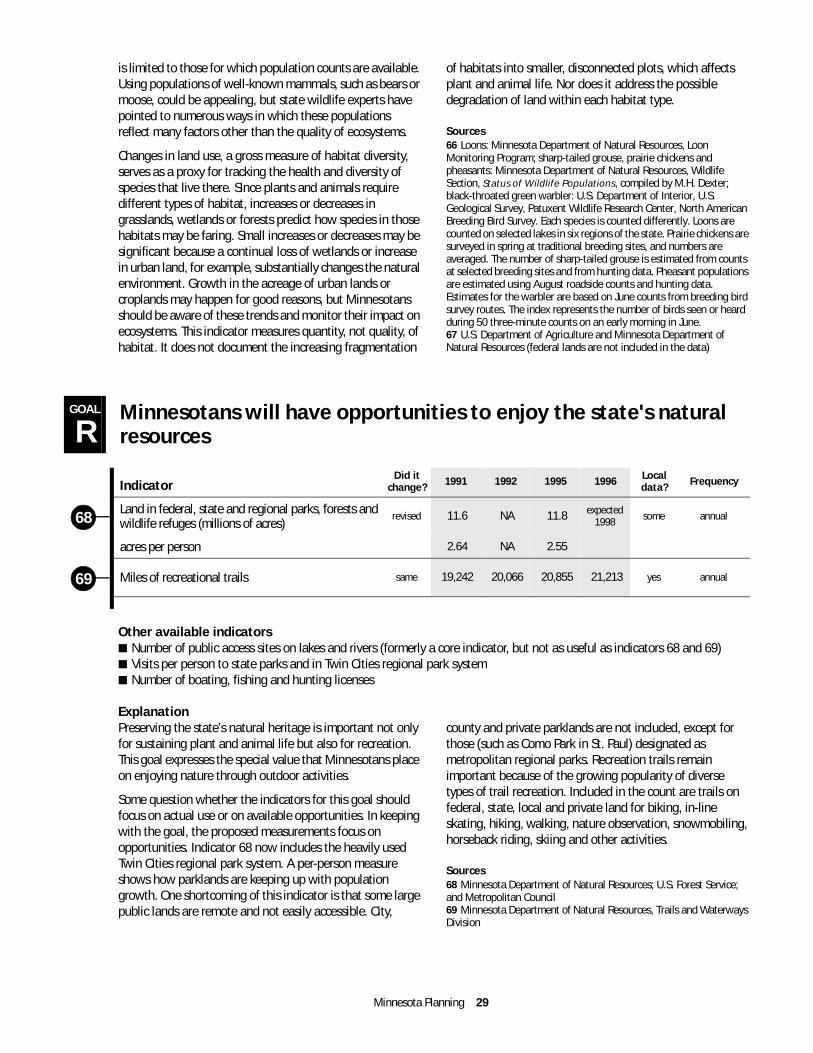
Minnesota Planning 29
is limited to those for which population counts are available. Using populations of well-known mammals, such as bears or moose, could be appealing, but state wildlife experts have pointed to numerous ways in which these populations reflect many factors other than the quality of ecosystems.
Changes in land use, a gross measure of habitat diversity, serves as a proxy for tracking the health and diversity of species that live there. Since plants and animals require different types of habitat, increases or decreases in grasslands, wetlands or forests predict how species in those habitats may be faring. Small increases or decreases may be significant because a continual loss of wetlands or increase in urban land, for example, substantially changes the natural environment. Growth in the acreage of urban lands or croplands may happen for good reasons, but Minnesotans should be aware of these trends and monitor their impact on ecosystems. This indicator measures quantity, not quality, of habitat. It does not document the increasing fragmentation
of habitats into smaller, disconnected plots, which affects plant and animal life. Nor does it address the possible degradation of land within each habitat type.
Sources66 Loons: Minnesota Department of Natural Resources, Loon Monitoring Program; sharp-tailed grouse, prairie chickens and pheasants: Minnesota Department of Natural Resources, Wildlife Section, Status of Wildlife Populations, compiled by M.H. Dexter; black-throated green warbler: U.S. Department of Interior, U.S. Geological Survey, Patuxent Wildlife Research Center, North American Breeding Bird Survey. Each species is counted differently. Loons are counted on selected lakes in six regions of the state. Prairie chickens are surveyed in spring at traditional breeding sites, and numbers are averaged. The number of sharp-tailed grouse is estimated from counts at selected breeding sites and from hunting data. Pheasant populations are estimated using August roadside counts and hunting data. Estimates for the warbler are based on June counts from breeding bird survey routes. The index represents the number of birds seen or heard during 50 three-minute counts on an early morning in June.67 U.S. Department of Agriculture and Minnesota Department of Natural Resources (federal lands are not included in the data)
Other available indicators■ Number of public access sites on lakes and rivers (formerly a core indicator, but not as useful as indicators 68 and 69)■ Visits per person to state parks and in Twin Cities regional park system■ Number of boating, fishing and hunting licenses
ExplanationPreserving the state’s natural heritage is important not only for sustaining plant and animal life but also for recreation. This goal expresses the special value that Minnesotans place on enjoying nature through outdoor activities.
Some question whether the indicators for this goal should focus on actual use or on available opportunities. In keeping with the goal, the proposed measurements focus on opportunities. Indicator 68 now includes the heavily used Twin Cities regional park system. A per-person measure shows how parklands are keeping up with population growth. One shortcoming of this indicator is that some large public lands are remote and not easily accessible. City,
county and private parklands are not included, except for those (such as Como Park in St. Paul) designated as metropolitan regional parks. Recreation trails remain important because of the growing popularity of diverse types of trail recreation. Included in the count are trails on federal, state, local and private land for biking, in-line skating, hiking, walking, nature observation, snowmobiling, horseback riding, skiing and other activities.
Sources68 Minnesota Department of Natural Resources; U.S. Forest Service; and Metropolitan Council69 Minnesota Department of Natural Resources, Trails and Waterways Division
GOAL
RMinnesotans will have opportunities to enjoy the state's natural resources
IndicatorDid it
change? 1991 1992 1995 1996 Local data? Frequency
Land in federal, state and regional parks, forests and wildlife refuges (millions of acres)
revised 11.6 NA 11.8 expected 1998 some annual
acres per person 2.64 NA 2.55
Miles of recreational trails same 19,242 20,066 20,855 21,213 yes annual
68
69
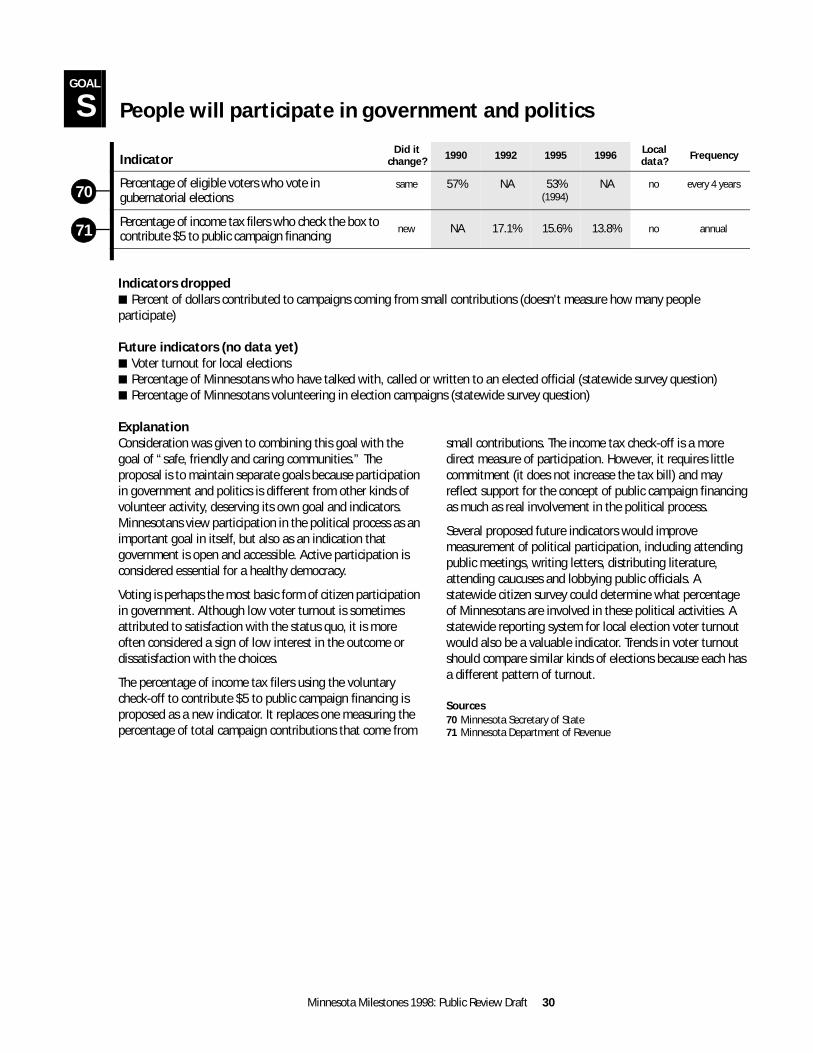
Minnesota Milestones 1998: Public Review Draft 30
Indicators dropped■ Percent of dollars contributed to campaigns coming from small contributions (doesn't measure how many people participate)
Future indicators (no data yet)■ Voter turnout for local elections■ Percentage of Minnesotans who have talked with, called or written to an elected official (statewide survey question)■ Percentage of Minnesotans volunteering in election campaigns (statewide survey question)
ExplanationConsideration was given to combining this goal with the goal of “safe, friendly and caring communities.” The proposal is to maintain separate goals because participation in government and politics is different from other kinds of volunteer activity, deserving its own goal and indicators. Minnesotans view participation in the political process as an important goal in itself, but also as an indication that government is open and accessible. Active participation is considered essential for a healthy democracy.
Voting is perhaps the most basic form of citizen participation in government. Although low voter turnout is sometimes attributed to satisfaction with the status quo, it is more often considered a sign of low interest in the outcome or dissatisfaction with the choices.
The percentage of income tax filers using the voluntary check-off to contribute $5 to public campaign financing is proposed as a new indicator. It replaces one measuring the percentage of total campaign contributions that come from
small contributions. The income tax check-off is a more direct measure of participation. However, it requires little commitment (it does not increase the tax bill) and may reflect support for the concept of public campaign financing as much as real involvement in the political process.
Several proposed future indicators would improve measurement of political participation, including attending public meetings, writing letters, distributing literature, attending caucuses and lobbying public officials. A statewide citizen survey could determine what percentage of Minnesotans are involved in these political activities. A statewide reporting system for local election voter turnout would also be a valuable indicator. Trends in voter turnout should compare similar kinds of elections because each has a different pattern of turnout.
Sources70 Minnesota Secretary of State71 Minnesota Department of Revenue
GOAL
S People will participate in government and politics
IndicatorDid it
change? 1990 1992 1995 1996 Local data? Frequency
Percentage of eligible voters who vote in gubernatorial elections
same 57% NA 53%(1994)
NA no every 4 years
Percentage of income tax filers who check the box to contribute $5 to public campaign financing
new NA 17.1% 15.6% 13.8% no annual
70
71
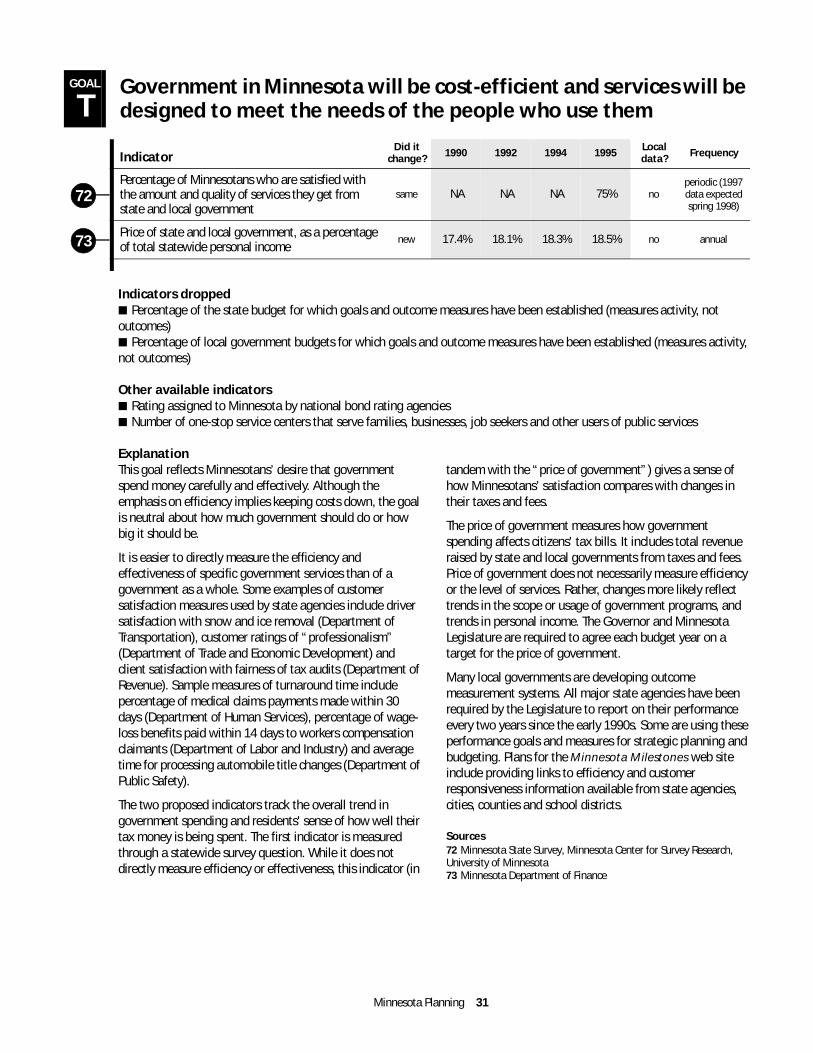
Minnesota Planning 31
Indicators dropped■ Percentage of the state budget for which goals and outcome measures have been established (measures activity, not outcomes)■ Percentage of local government budgets for which goals and outcome measures have been established (measures activity, not outcomes)
Other available indicators■ Rating assigned to Minnesota by national bond rating agencies■ Number of one-stop service centers that serve families, businesses, job seekers and other users of public services
ExplanationThis goal reflects Minnesotans’ desire that government spend money carefully and effectively. Although the emphasis on efficiency implies keeping costs down, the goal is neutral about how much government should do or how big it should be.
It is easier to directly measure the efficiency and effectiveness of specific government services than of a government as a whole. Some examples of customer satisfaction measures used by state agencies include driver satisfaction with snow and ice removal (Department of Transportation), customer ratings of “professionalism” (Department of Trade and Economic Development) and client satisfaction with fairness of tax audits (Department of Revenue). Sample measures of turnaround time include percentage of medical claims payments made within 30 days (Department of Human Services), percentage of wage-loss benefits paid within 14 days to workers compensation claimants (Department of Labor and Industry) and average time for processing automobile title changes (Department of Public Safety).
The two proposed indicators track the overall trend in government spending and residents' sense of how well their tax money is being spent. The first indicator is measured through a statewide survey question. While it does not directly measure efficiency or effectiveness, this indicator (in
tandem with the “price of government”) gives a sense of how Minnesotans’ satisfaction compares with changes in their taxes and fees.
The price of government measures how government spending affects citizens' tax bills. It includes total revenue raised by state and local governments from taxes and fees. Price of government does not necessarily measure efficiency or the level of services. Rather, changes more likely reflect trends in the scope or usage of government programs, and trends in personal income. The Governor and Minnesota Legislature are required to agree each budget year on a target for the price of government.
Many local governments are developing outcome measurement systems. All major state agencies have been required by the Legislature to report on their performance every two years since the early 1990s. Some are using these performance goals and measures for strategic planning and budgeting. Plans for the Minnesota Milestones web site include providing links to efficiency and customer responsiveness information available from state agencies, cities, counties and school districts.
Sources72 Minnesota State Survey, Minnesota Center for Survey Research, University of Minnesota73 Minnesota Department of Finance
GOAL
TGovernment in Minnesota will be cost-efficient and services will be designed to meet the needs of the people who use them
IndicatorDid it
change? 1990 1992 1994 1995 Local data? Frequency
Percentage of Minnesotans who are satisfied with the amount and quality of services they get from state and local government
same NA NA NA 75% noperiodic (1997 data expected spring 1998)
Price of state and local government, as a percentage of total statewide personal income
new 17.4% 18.1% 18.3% 18.5% no annual
72
73