Embed Size (px)
Citation preview
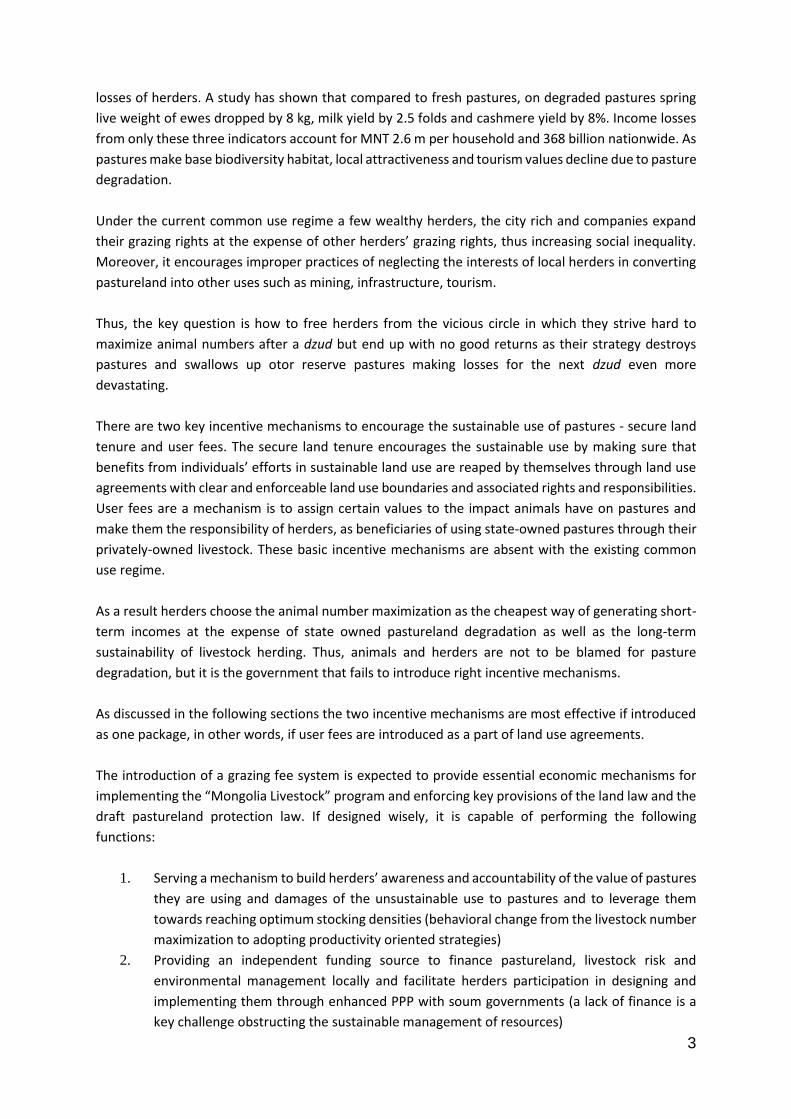
PROPOSED METHODOLOGY & INSTITUTIONAL
MECHANISMS TO DETERMINE PASTURE USE FEES
Feasibility Study on Pasture Use Fee
CENTRE FOR POLICY RESEARCH
2nd floor, Inter-office building, Prime Minister
Amar street 4, Sukhbaatar district 8, Ulaanbaatar 14200,
Phone: (+976) 70117044
Fax: (+976 ) 70119419, e-mail: [email protected]
Web: www.cpr.mn
22 December 2017
Ulaanbaatar

1
TABLE OF CONTENT
1. Rationale 2
2. Approach 4
2.1 Differentiating grazing fees across pastureland users based on pasture quality, location, animal type and the degree of overstocking 4
2.2 Grazing fee as a source of funding the integrated management of natural resources and livestock risks 7
2.3 Grazing fee being affordable, easily estimated and understood by local people, especially herders 9
2.4 Relying on the past experiences, best practices and lessons learnt to be feasible and easily acceptable 10
3. Methodology 11
3.1 Accounting for animal species 12
3.2 Accounting for grass yield and overgrazing 12
3.3 Accounting for location 15
3.4 Practical steps to estimate grazing fees 16
4. Adjusting grazing fees based on price changes 19
5. Recommendations on ways to spend grazing fee revenues 21
6. Note on TOR task for estimating grazing fees at geographical indexes/regions 22
Appendix 1.1 Model pastureland and Risk Management activities for a soum 23
Appendix 3.1 MS Excel sheet to estimate grazing fees 25
Appendix 5.1 Sample soum Livestock Risk Management Fund /LRMF/ Rules 26

2
1. Rationale
Pastures in Mongolia are used free of any fees. The policy may seem favorable for herders at first,
but in fact it encourages the misuse of pastures, thus contradicts the long term interest for securing
herders’ livelihoods by ensuring sustainable livestock sector development.
Natural causes such as global warming & dryness and human factors like unsustainable use lead to
pasture degradation. Long-term adaptation programs are needed to minimize the impact of
naturally caused pasture degradation. However, unsustainable use of pastureland has to be stopped
immediately to contribute to improved effectiveness of the long-term adaptation programs.
The most common type of unsustainable pastureland use in Mongolia is overstocking or increasing
animal numbers beyond pasture carrying capacities. This leads to pastureland degradation due to
animal pressures beyond vegetation recovery and absence of seasonal rotations. In addition,
overstocking eats up otor reserve areas leading to increased losses in emergencies.
Herders use pastures and the resources on them, such as water and salt licks, free of any charge and
without any accountability mechanisms for overgrazing and degradation. In this system, herders
rationally choose maximizing animal numbers as the dominant economic behavior. Herders do not
bother themselves with alternative methods promoted by the government and donor programs. "I’ll
take anything if programs give it to me for free, and as everybody helps us, there’s no need for
demanding dzud preparedness” – this is the dominant herder’s mentality. In other words, the
current way of livestock herding is so cheap that it discourages herders from being interested in
alternative ways of running livestock, and participating in government and donor programs aimed at
animal health, pastureland and risk management, and animal and livestock product quality.
Figure 1.1 Current economic behavior of herders The direct impact of pasture degradation is declined forage supply, increased malnutrition and
exposure to risks, decreased quality and productivity of animals leading to increased income and asset
3
losses of herders. A study has shown that compared to fresh pastures, on degraded pastures spring
live weight of ewes dropped by 8 kg, milk yield by 2.5 folds and cashmere yield by 8%. Income losses
from only these three indicators account for MNT 2.6 m per household and 368 billion nationwide. As
pastures make base biodiversity habitat, local attractiveness and tourism values decline due to pasture
degradation.
Under the current common use regime a few wealthy herders, the city rich and companies expand
their grazing rights at the expense of other herders’ grazing rights, thus increasing social inequality.
Moreover, it encourages improper practices of neglecting the interests of local herders in converting
pastureland into other uses such as mining, infrastructure, tourism.
Thus, the key question is how to free herders from the vicious circle in which they strive hard to
maximize animal numbers after a dzud but end up with no good returns as their strategy destroys
pastures and swallows up otor reserve pastures making losses for the next dzud even more
devastating.
There are two key incentive mechanisms to encourage the sustainable use of pastures - secure land
tenure and user fees. The secure land tenure encourages the sustainable use by making sure that
benefits from individuals’ efforts in sustainable land use are reaped by themselves through land use
agreements with clear and enforceable land use boundaries and associated rights and responsibilities.
User fees are a mechanism is to assign certain values to the impact animals have on pastures and
make them the responsibility of herders, as beneficiaries of using state-owned pastures through their
privately-owned livestock. These basic incentive mechanisms are absent with the existing common
use regime.
As a result herders choose the animal number maximization as the cheapest way of generating short-
term incomes at the expense of state owned pastureland degradation as well as the long-term
sustainability of livestock herding. Thus, animals and herders are not to be blamed for pasture
degradation, but it is the government that fails to introduce right incentive mechanisms.
As discussed in the following sections the two incentive mechanisms are most effective if introduced
as one package, in other words, if user fees are introduced as a part of land use agreements.
The introduction of a grazing fee system is expected to provide essential economic mechanisms for
implementing the “Mongolia Livestock” program and enforcing key provisions of the land law and the
draft pastureland protection law. If designed wisely, it is capable of performing the following
functions:
1. Serving a mechanism to build herders’ awareness and accountability of the value of pastures
they are using and damages of the unsustainable use to pastures and to leverage them
towards reaching optimum stocking densities (behavioral change from the livestock number
maximization to adopting productivity oriented strategies)
2. Providing an independent funding source to finance pastureland, livestock risk and
environmental management locally and facilitate herders participation in designing and
implementing them through enhanced PPP with soum governments (a lack of finance is a
key challenge obstructing the sustainable management of resources)

4
3. Changing the existing ineffective system of risk and disaster management where herders ask
for assistance from the government and the latter for international donors and aid funds are
used in inefficient ways into an effective system based on advance planning and sufficient
funding raised locally
The key relevant policy documents have set the following objectives:
State Policy on Food and Agriculture, 2015:
2.1.11. Introduce economic mechanisms to regulate stocking densities and herd structure based on
assessments of carrying capacity and conditions, ensure sustainable use, protection and recovery of
pastures
Mongolian Livestock Program, 2010:
3.4.1.3 Introduce economic incentives to reconcile animal numbers with pasture carrying
capacities and to enforce limits of animal numbers on degraded pastures
3.4.1.4. Create a legal framework to collect pasture use fees from herders and people with livestock,
based on regional characteristics and type of herd and use a part of revenues on pastureland
protection and improvement
2. Approach
Grazing fees need to be designed in consideration of the following principles in order to perform the
desirable functions specified in the previous section:
1. Grazing fees are differentiated across pastureland users based on pasture quality, location,
animal type and the degree of overstocking (Being easily estimated using the locally
available & unambiguous data is key requirement for this factor)
2. Revenues are used back locally on financing pastureland, livestock risk and environmental
management
3. Designed in such a way that does not make a financial burden on herders, especially the
poor
4. Relied on the past experiences, best practices and lessons learnt to be feasible and easily
acceptable
2.2 Differentiating grazing fees across pastureland users based on pasture quality,
location, animal type and the degree of overstocking
Pasture quality. Livestock benefits are different from good and poor pastures. Therefore, the state, as
owner of pastures, needs to collect higher fees from pastureland users utilizing good quality pastures.
The pasture quality depends on grass yield, vegetation composition, water availability and micro-
climate. All these factors are interrelated and their natural qualities change in response to animal
pressures. When pastureland is overgrazed grass yield declines, vegetation composition changes in
5
favor of unpalatable plant species to increase and water becomes polluted and exhausted. In terms of
data availability, the most available and more unambiguous data is grass yield. At present, pastureland
grass yield is estimated annually for each soum by the National Agency for Meteorology, Hydrology
and Environmental Monitoring (NAMHEM) and the Agency for Land Relations, Geodesy and
Cartography (ALRGC) keeps 1:100,000 scale vegetation maps with grass yield and vegetation
composition data for each soum and updates them every 5 years based on funding possibilities.
Moreover, the grass yield can be easily measured for every household or khot ail -the lowest level of
pastureland users. The vegetation composition in these 1:100,000 scale maps were first identified
properly in 1960-1980s and updated since then have been carried out using a fewer than required
samples due to budget constraint significantly eroding the quality of maps. Water availability of
pastures is changed by digging wells much decreasing natural differences. There are no differentiated
data available on micro-climate at the level of pastureland users. Moreover, differences in micro-
climate can be captured to some degree through grass yield data the latter depends most on
precipitation and temperature in any given area.
Thus, in consideration of unambiguous data availability at the lowest level of pastureland users we
recommend to use grass yield as key environmental variable to capture the geographical differences
in the pastureland quality.
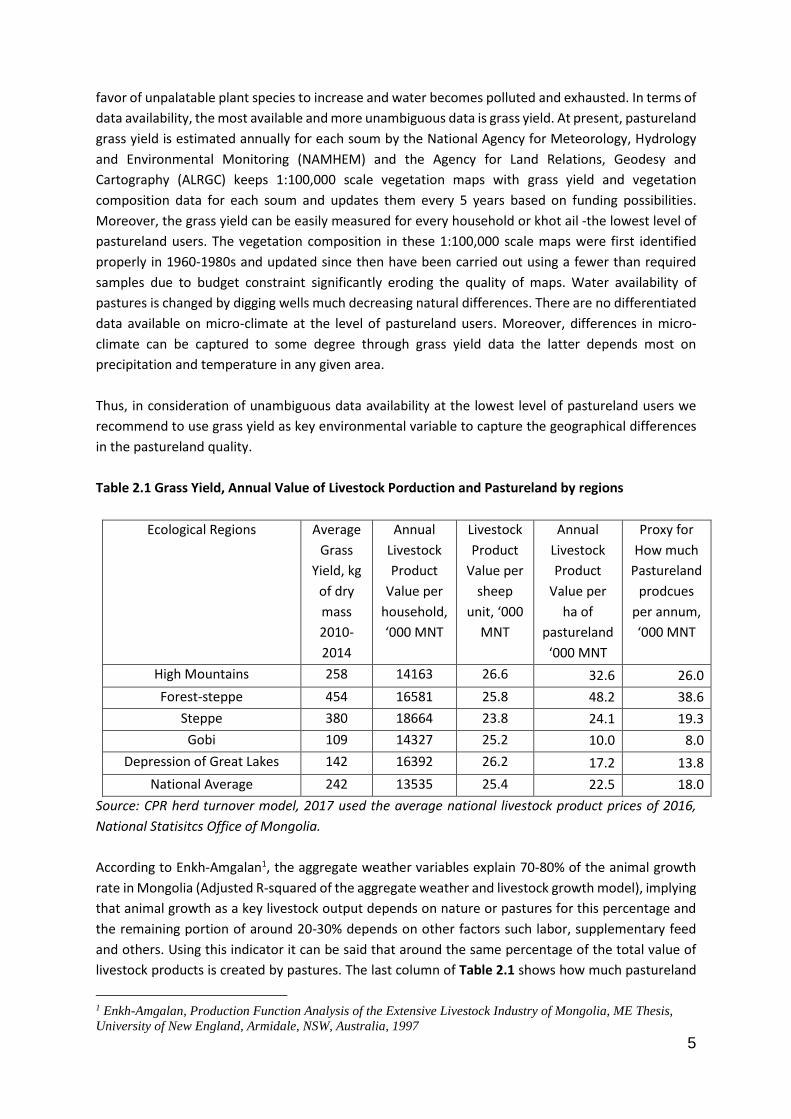
Table 2.1 Grass Yield, Annual Value of Livestock Porduction and Pastureland by regions
Ecological Regions Average
Grass
Yield, kg
of dry
mass
2010-
2014
Annual
Livestock
Product
Value per
household,
‘000 MNT
Livestock
Product
Value per
sheep
unit, ‘000
MNT
Annual
Livestock
Product
Value per
ha of
pastureland
‘000 MNT
Proxy for
How much
Pastureland
prodcues
per annum,
‘000 MNT
High Mountains 258 14163 26.6 32.6 26.0
Forest-steppe 454 16581 25.8 48.2 38.6
Steppe 380 18664 23.8 24.1 19.3
Gobi 109 14327 25.2 10.0 8.0
Depression of Great Lakes 142 16392 26.2 17.2 13.8
National Average 242 13535 25.4 22.5 18.0
Source: CPR herd turnover model, 2017 used the average national livestock product prices of 2016,
National Statisitcs Office of Mongolia.
According to Enkh-Amgalan1, the aggregate weather variables explain 70-80% of the animal growth
rate in Mongolia (Adjusted R-squared of the aggregate weather and livestock growth model), implying
that animal growth as a key livestock output depends on nature or pastures for this percentage and
the remaining portion of around 20-30% depends on other factors such labor, supplementary feed
and others. Using this indicator it can be said that around the same percentage of the total value of
livestock products is created by pastures. The last column of Table 2.1 shows how much pastureland
1 Enkh-Amgalan, Production Function Analysis of the Extensive Livestock Industry of Mongolia, ME Thesis,
University of New England, Armidale, NSW, Australia, 1997

6
produces per ha annually –MNT 8-38.6 thousand. It is common to estimate the value of asset as a
product of the annual return and the asset lifespan in years. However, as pastureland produces this
return in perpetuity some suggest to use 99 years as the present value of rents from a 99-year lease
is nearly numerically equivalent to the present value of perpetuity. The value of pastureland can be
estimated using this method simply multiplying the last column of Table 2.1 by 99. However, the
purpose of this assignment is not to estimate the land value, instead it focuses on estimating grazing
fee as a tool for promoting the sustainable of pastureland.
Weather yield model animal growth depends on nature.
Location. Herders located closer to urban areas gain extra benefits from the low costs of accessing
markets and services. Lower fees for remote pastures will also discourage herders from migrating to
peri-urban areas that lead to severe land degradation. As detailed data on differences in
transportation costs due to location of herders are not easily available and difficult to estimate due to
a range of factors such as herders mobility, mode of transportation etc. a simple way to capture this
difference is to estimate coefficients based on remoteness by pastureland users and modify the base
fee using these coefficients. These coefficients need to be differentiated based on not only
remoteness but also the significance of the attraction point as big cities are not comparable to soum
centers.
Animal species. Despite being a major source of cash income, goat is claimed to be a worst user of
pastures due to its preferences to eat grass roots and flowers. A higher fee for goat makes sense, also
in terms of payment capacities of herders with more goats as cashmere is a major cash income source.
It is worth noting that in the total increase of animal numbers since 1990s the goat number increase
accounts for a predominant share. Likewise, horse is also considered to have worst impacts on
pastures by tramping by hooves. Therefore, it is recommended that increased fee rate be established
for goat and horse. A simple way for doing this is to increase coefficients of these species into sheep
units. The most commonly used coefficients are 6.6 for horse and 0.9 for goat based on pasture forage
intake of animals meaning the pasture forage volume goat eats is equivalent to 90% of the forage
sheep eats. When grazing fees are based on sheep units then increasing these coefficients is identical
to increasing fees for these animal species.
Degree of overstocking. As explained in section 1, overstocking or increasing animal numbers beyond
pasture carrying capacities leads to pastureland degradation, eats up otor reserve areas leading to
increased losses in emergencies and leads to animal productivity and herders’ income declines.
Therefore, grazing fees need to be able to discourage overgrazing and encourage herders towards
reaching and keeping optimum stocking densities. This is ultimately about encouraging herders to shift
from their current economic behavior – animal number maximization – to more productivity-oriented
strategies. To do this, base grazing fees need to be increased at least proportionately to the degree of
overstocking.
The methodology to estimate grass yield is relatively well established and not mentioned here.
Instead, the issue of what kind of grass yield data should be used in estimating carrying capacities is
not clearly understood by everyone therefore is explained here in a more detail.
7
Grass yield is measured in August when forage biomass reaches a maximum. In a dry country like
Mongolia the precipitation is a key variable lying behind grass yield’s strong year-to-year variability. In
this situation the issue of what kind of grass yield data should be used in judging how herder
groups/partnerships perform in fulfilling their obligations to reconcile the animal numbers with
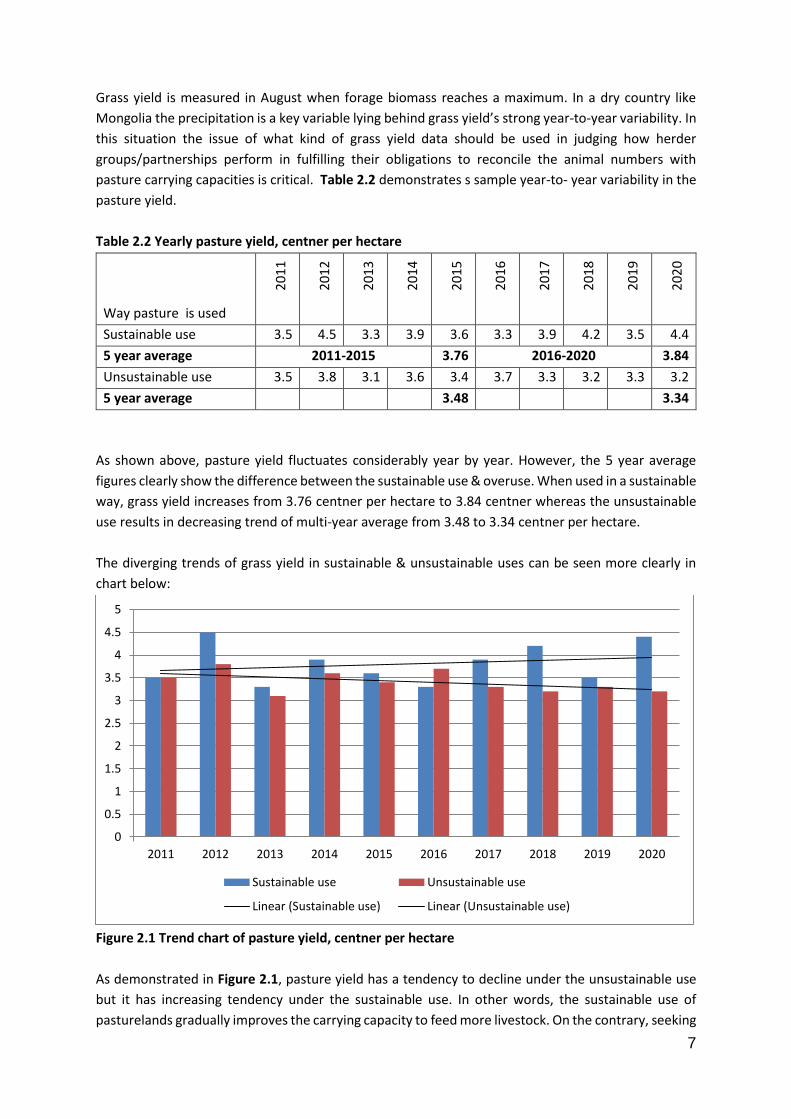
pasture carrying capacities is critical. Table 2.2 demonstrates s sample year-to- year variability in the
pasture yield.
Table 2.2 Yearly pasture yield, centner per hectare
Way pasture is used
20
11
20
12
20
13
20
14
20
15
20
16
20
17
20
18
20
19
20
20
Sustainable use 3.5 4.5 3.3 3.9 3.6 3.3 3.9 4.2 3.5 4.4
5 year average 2011-2015 3.76 2016-2020 3.84
Unsustainable use 3.5 3.8 3.1 3.6 3.4 3.7 3.3 3.2 3.3 3.2
5 year average 3.48 3.34
As shown above, pasture yield fluctuates considerably year by year. However, the 5 year average
figures clearly show the difference between the sustainable use & overuse. When used in a sustainable
way, grass yield increases from 3.76 centner per hectare to 3.84 centner whereas the unsustainable
use results in decreasing trend of multi-year average from 3.48 to 3.34 centner per hectare.
The diverging trends of grass yield in sustainable & unsustainable uses can be seen more clearly in
chart below:
Figure 2.1 Trend chart of pasture yield, centner per hectare
As demonstrated in Figure 2.1, pasture yield has a tendency to decline under the unsustainable use
but it has increasing tendency under the sustainable use. In other words, the sustainable use of
pasturelands gradually improves the carrying capacity to feed more livestock. On the contrary, seeking
0
0.5
1
1.5
2
2.5
3
3.5
4
4.5
5
2011 2012 2013 2014 2015 2016 2017 2018 2019 2020
Sustainable use Unsustainable use
Linear (Sustainable use) Linear (Unsustainable use)
8
to increase the herd size leads to long-term decline in the pasture carrying capacity and animal
productivity and herder incomes.
The key principle of the sustainable use is to fully utilize pasture resources without damaging
regeneration capacity of biomass. This principle means that the selection of appropriate grass yield
data to estimate pasture carrying capacity depends on whether the carrying capacity is exceeded or
not.
Steps for using grass yield data for estimating pasture carrying capacity and their rationale
1. Reach a general conclusion as to whether the pasture carrying capacity was exceeded in the
last 5 years, by average.
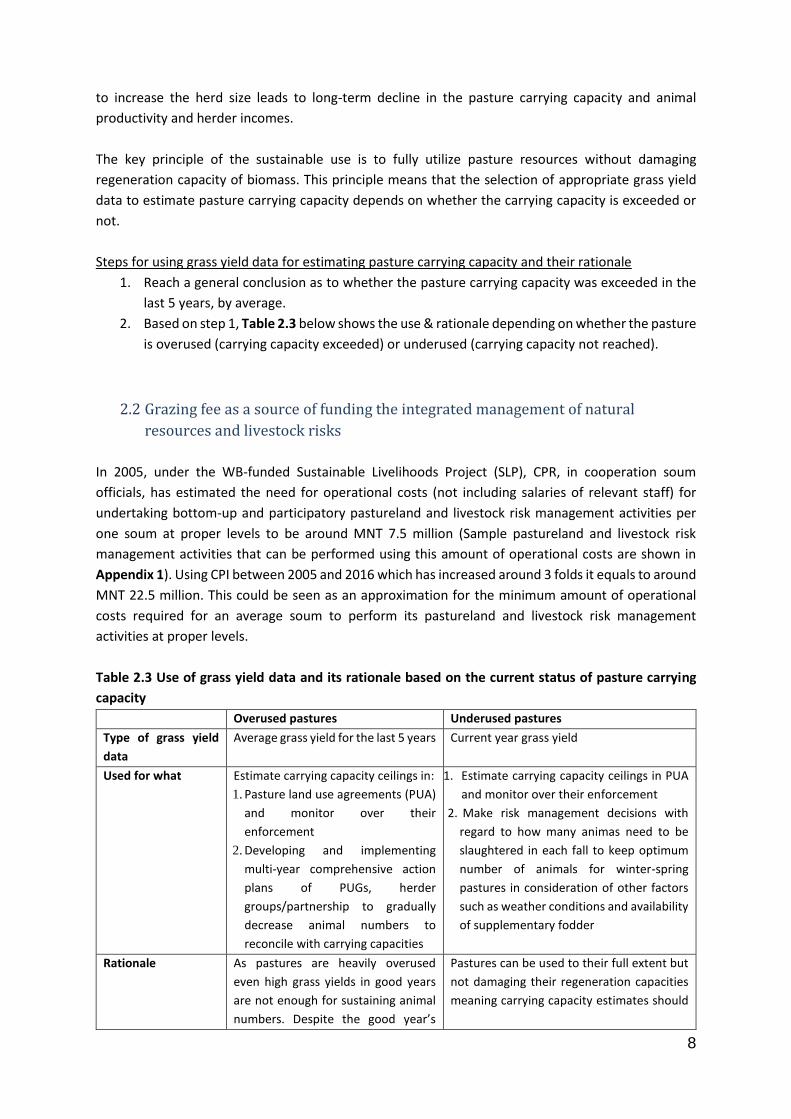
2. Based on step 1, Table 2.3 below shows the use & rationale depending on whether the pasture
is overused (carrying capacity exceeded) or underused (carrying capacity not reached).
2.2 Grazing fee as a source of funding the integrated management of natural
resources and livestock risks
In 2005, under the WB-funded Sustainable Livelihoods Project (SLP), CPR, in cooperation soum
officials, has estimated the need for operational costs (not including salaries of relevant staff) for
undertaking bottom-up and participatory pastureland and livestock risk management activities per
one soum at proper levels to be around MNT 7.5 million (Sample pastureland and livestock risk
management activities that can be performed using this amount of operational costs are shown in
Appendix 1). Using CPI between 2005 and 2016 which has increased around 3 folds it equals to around
MNT 22.5 million. This could be seen as an approximation for the minimum amount of operational
costs required for an average soum to perform its pastureland and livestock risk management
activities at proper levels.
Table 2.3 Use of grass yield data and its rationale based on the current status of pasture carrying
capacity
Overused pastures Underused pastures
Type of grass yield
data
Average grass yield for the last 5 years Current year grass yield
Used for what Estimate carrying capacity ceilings in:
1. Pasture land use agreements (PUA)
and monitor over their
enforcement
2. Developing and implementing
multi-year comprehensive action
plans of PUGs, herder
groups/partnership to gradually
decrease animal numbers to
reconcile with carrying capacities
1. Estimate carrying capacity ceilings in PUA
and monitor over their enforcement
2. Make risk management decisions with
regard to how many animas need to be
slaughtered in each fall to keep optimum
number of animals for winter-spring
pastures in consideration of other factors
such as weather conditions and availability
of supplementary fodder
Rationale As pastures are heavily overused
even high grass yields in good years
are not enough for sustaining animal
numbers. Despite the good year’s
Pastures can be used to their full extent but
not damaging their regeneration capacities
meaning carrying capacity estimates should

9
weather conditions, grasses cannot
regenerate because of high stocking
densities. In other words, there is no
way to use current year’s grass yield.
be based on the current year’s grass yield
that varies from year to year.
Pastureland use
strategy
As quickly as possible to reach
optimum stocking densities but
without compromising herders’
incomes
Allow pasture yield & composition to
improve by rotational use and minimize
losses during emergencies by ensuring
accesses to reserve pastures
As for herders’ need for livestock risk management, a key issue is the amount of supplementary
feeding in emergencies. The “National program to protect livestock against drought and dzud” and
subsequent Government Resolution No 47 (2001) has estimated that herders need to prepare 10 kg
of feed in the steppe region-an average ecological condition. CPR has estimated the amount of
subsistence feeding required to keep animals alive is 0.26 kg of feed unit per day or around 6.5 kg of
hay. As extreme emergencies such as severe drought and dzud do not happen every year herders do
not need to prepare the required amount of subsistence feeding every year. It can be roughly
estimated that extreme emergency conditions can happen every 6 year and herders need the amount
of feed to keep animals alive at least 30 days without grazing in an emergency year implying that if
herders have sufficient funding every year to stock subsistence feeding for 5 days then they will be
able to meet 30 days requirements. Using the average of price for a hay pack of MNT 3000 and the
weight of one pack of 22 kg, the amount of funding needed for an average soum was calculated in
Table 2.4.
Table 2.4 Estimate of funding per year for stocking the amount of subsistence feeding sufficient to
keep animals alive in emergencies, per average soum
Number
of
animals,
sheep
units, SU
Number of
days to
feed
animals in
an
emergency
year
Assumed
frequency
of
emergency
conditions
Number of
days to
feed
animals
converted
into annual
basis
Daily
amount
of hay
needed
per SU,
kg
Total
amount
of hay
needed
for
soum, kg
Total
amount
of hay
in
packs, 1
pack 22
kg
Price
of
hay
pack,
MNT
Total
price of
hay per
soum,
MNT
million
1 2 3 4
(2:3)
5 6 (1x4x5) 7
(6:22)
8 9
(7x8)
308813 30 Every 6 year 5 0.65 1003642 45620 3000 136.8
The total amount of subsistence feeding per average soum amounts to MNT 136.8 million. It is worth
noting this amount is based on assumption that herders will be using the entire amount of funding on
supplementary feeding only. However, as evidenced from experiences of piloting a proxy grazing fees
system by CPR under different projects herders prefer to use funds for variety of purposes in addition
to supplementary feeding. The purpose of estimating MNT 136.8 million was just to show an
approximation for the herders’ annual financial need for pastureland and livestock risk management
in case of an item herders spend most.
Thus, the total amount of funding for pastureland risk management need per an average soum
accounts for around MNT 160 million. It is worth noting that revenues collected from grazing fees are

10
not only source of funding for soum pastureland risk management. In contrary, the Budget Law
specifies that pastureland, livestock risk and environmental management should be funded from the
soum budget (Article 58.4). As evidenced by CPR experiences of promoting a proxy grazing fee system
since 2011 herders are best encouraged to fulfill pastureland and risk management activities if fees
they pay are augmented by a matching fund from other sources such as project and soum budget
support. This means that innovative mechanism is needed to design grazing fee system to encourage
herders best towards improved pastureland, livestock and environmental management instead of
introducing it as an ordinary tax or payment without encouraging by additional budget support.
2.3. Grazing fee being affordable, easily estimated and understood by local
people, especially herders
The issue whether paying grazing fee poses financial burden on herders especially, the poor is critical.
At present, the political situation with introducing grazing fee is that the collection of grazing fees as
a tax to increase budget revenues is not acceptable. There is increasing common agreement that the
introduction of grazing fees is acceptable only if the revenues collected are used back locally on
sustainable use, protection and improving pastures and related activities in participation of herders.
In this sense, the level of grazing fee acceptable for herders is different from ‘pure tax’ that goes to
general budget revenues. If spending of revenues from grazing fees are is designed in a way that most
of revenues comes to back herders so that they could decide on where to spend, then herders, even
the poor, are willing to accept relatively higher levels of fees. As evidenced from CPR experiences for
promoting a proxy grazing fee system, poor herders have even borrowed to pay fees as they knew
that the money paid would come back in an augmented size for them to spend in areas they want to
choose from an eligible list of activities. Under CPR-promoted pilots the latest level of fees in 2015-
2017 was MNT 500 per sheep units and there were suggestions from herders to increase this level
further. This means that this level of fee was not a financial burden as herders get back the money
paid within a few months (herders paid fees in April and those who paid were entitled to access the
soum Livestock Risk Management Fund /LRMF/ to fund own pastureland and risk management
activities from August to December). Another mechanism to ease a burden of proxy grazing fees on
the poor was to use informal social networks within herder groups to allow group members to
negotiate the amount of fees for each household to meet the overall fee requirement set on the
group, which often ended up with the poor paying less and the rich paying the balance. Also as noted
by participating herders in the previous pilots, making sure that herder pay grazing fees upon receiving
major cash incomes from cashmere in April-May is important to avoid difficulties associated with a
shortage of cash in other months.
2.4 Relying on the past experiences, best practices and lessons learnt to be feasible and
easily acceptable
In 2011, under the World Bank supported Sustainable Livelihoods Project (SLP)-II CPR has piloted a
proxy-grazing fee system to answer questions how herders would respond to grazing fees, is it possible
to design a grazing fee system in a way that is acceptable to herders. The pilot was undertaken in four
soums representing main ecological regions of Mongolia - Mankhan soum of Khovd aimag for the high
mountain region, Undur-Ulaan soum of Arkhangai aimag for the forest-steppe region, Tumentsogt

11
soum of Sukhbaatar aimag for the steppe region, and Khuvsgul soum of Dornogobi aimag for the Gobi
region for the period from February to August 2011.
The pilot was based on the following principles:
1. Given the absence of legal environment for grazing fee, design a proxy fee system that is
similar to a desirable grazing fee system in Mongolia in terms of economic impacts on herders,
ways to estimate fees and collect revenues, and disburse revenues
2. Be affordable, easily estimated and understood by local people, especially herders
3. Spend most revenues back on pastureland and risk management with both herders and local
governments being beneficiaries
4. In addition to herders as users, local governments as owners of pastures should contribute
and their contributions should be funded from the project during the pilot period
5. Herders should pay grazing fee on a voluntary basis
6. Ensure the herders’ and local governments’ participation in the pilot design and
implementation by building well awareness among them
7. Involve key ecological regions of Mongolia
8. Ensure transparency and openness
The principle No 1 was applied through establishing a soum “Livestock Risk Management Fund”
(LRMF) where herders pay contributions to (grazing fee proxy). The fund rules were discussed and
approved by soum Hurals of Citizens’ Representatives.
The principle No 2 was applied using the livestock numbers for each khot ail and herders’ group based
on the official animal census for 2010 and introducing grazing fee at the level of MNT 100 per sheep
unit. Animal numbers were converted into sheep units using the coefficients based on grazing
consumption but modified in consideration of damages animal species bring to pastures. The
coefficients were 1 for sheep, 2 for goat, 3 for camel, 4 for cattle, and 8 for horse. Herders were
entitled to pay their contributions to LRMF for absentee herds either getting contributions from
owners or paying them on behalf of owners.
The principles No 3 and 4 were applied through first, LRMF is composed of herders contributions for
40% and project funding for 60% which is hoped to be eventually replaced by local budget, second, by
paying contributions herders are entitled to get funding from LRMF in the amount the contributions
paid augmented by 75% for the purposes of financing annual pastureland and risk management
activities specified in a list, third, local governments are entitled to spend the remaining 30% of LRMF
on common soum and bag level pastureland and risk management activities using bottom-up and
participatory planning approach supported by SLP-II. For example, assuming that herders’
contributions make up MNT 10 m (40% of LRMF), the project pays MNT 15 m (60% of LRMF) with the
fund totaling MNT 25 m. Herders will get back MNT 17 m - MNT 10 m as their initial contributions
plus MNT 7.5 m as 75% augmentation of their contributions. The remaining 30% or MNT 7.5 m is
disbursed by soum governments.
Since 2015, CPR has been promoting LRMF by further improving its design under the SDC’s Green Gold
project, international environmental organizations WWF and TNC to launch its pilots in 3-8 soums
each. The contribution from herders increased to 62.5% (MNT 500 per sheep unit) and the total
contribution from other sources including projects and soum budget decreased to 37.5% (MNT 300
12
per sheep unit). Herders are entitled to access the fund in the amount of the fees increased by 30%
(650 per sheep unit or 81.25% of the total spending) to fund activities chosen from an eligible list. The
remaining 18.75% of the fund stays at the disposal of the soum government to decide which soum-
wide and bagh-wide pastureland and risk management activities to finance. LRMF was promoted as a
part of the integrated program called previously ‘Soum Livestock Sustainable Development Policy’
changed later to ‘Smart Herder’ program that consists of 3 other components in addition to LRMF to
gain synergy effects: Land use agreements between herder groups and the soum Governor; ‘Green
Herd’ sub-program aimed at addressing animal health, animal and product origin and certification
challenges; and Support to value chains.
3. Methodology
As discussed in the previous section, the grazing fee level of MNT 500 per sheep unit can be considered
a good indicator meeting bottom 3 out 4 requirements set at the beginning of the section:
1. Grazing fees are differentiated across pastureland users based on pasture quality, location,
animal type and the degree of overstocking
2. Revenues are used back locally on financing pastureland, livestock risk and environmental
management
3. Designed in such a way that does not make a financial burden on herders, especially the
poor
4. Relied on the past experiences, best practices and lessons learnt to be feasible and easily
acceptable
As of the end 2016, the livestock number in sheep units of an average soums is 381707. If MNT 500
fee is introduced then the average soum will collect MNT 191 million which is capable of meeting the
soum’s need of MNT 160 million for funding the pastureland, livestock and environmental
management activities.
As discussed earlier, MNT 500 per sheep unit was not considered a financial burden on even poorer
herders if they get back the money paid within the same year to finance their own pastureland and
risk management activities.
Experiences of the CPR-piloted proxy grazing system have proved that it is feasible to introduce the
grazing fee system that meets herders’ needs and expectations.
What is not answered now is the question of how to link the base rate of MNT 500 per sheep unit to
the pastureland quality variables discussed in section 2.1, namely animal species, grass yield,
overgrazing rate and location of pastureland users.
3.1 Accounting for animal species
The most commonly used coefficients for converting animal species into sheep units are 5.7 for camel,
6.6 for horse, 6 for cattle and 0.9 for goat based on intake of pasture forage. Despite claims by many
that goat and horse impact pastures worse than other species, there are no readily available

13
quantitative data comparing impacts of different animal species on pastures. Therefore, in 2011,
under the World Bank funded Sustainable Livelihoods Project CPR has used increased coefficients for
goat and horse as a part of the proxy grazing fee pilot and they were accepted by herders and local
governments that participated in the pilot. The modified coefficients were sheep 1, goat 2, camel 3,
cattle 4, and horse 8. Therefore, we propose to use these coefficients as a first choice for the time
being until other alternatives come in the future. This means that the base fee rate is MNT 500 for
sheep, MNT 1000 for goat, MNT 2000 for cattle, MNT 1500 for camel and MNT 4000 for horse.
3.2 Accounting for grass yield and overgrazing
As disused in section 2, the grass yield is a major variable to differentiate a grazing fee across users
and to estimate pasture carrying capacity and the degree overstocking. As grazing fee level varies in
response to stocking densities the explanation needs to be illustrated separately for scenarios of
optimum stocking density and overstocked cases. Table 3.1 shows 3 areas with different grass yield
under the optimum stocking density scenario.
Table 3.1 Grazing fee per ha and sheep unit (SU), optimum stocking density
Area,
ha
Grass
Yield,
kg
Forage
Supply,
kg
Forage
demand
per SU,
kg
Carrying
capacity,
SU
Animal
Number
SU
Fee Per
SU
MNT
Total Fee
MNT
Fee per ha
MNT
1 2 3
(1x2)
4 5
(3:4)
6 7 8
(6*7)
9
(8:1)
1000 150 150000 560 268 268 500 134000 134
1000 280 280000 560 500 500 500 250000 250
1000 450 450000 560 804 804 500 402000 402
In the above scenario, pasture carrying capacity equals to the number of animals and animals eat what
is required (560 kg per SU) and pays MNT 500 per SU for it. The difference in per ha fee reflects the
difference in the grass yield as й key pastureland quality indicator.
The situation changes when overgrazing occurs. Table 3.2 shows the same areas under the scenario
where pasture carrying capacity is exceeded by 50%.
Table 3.2 Grazing fee per ha and sheep unit (SU), 50% overgrazing
Area,
ha
Grass
Yield,
kg
Forage
Supply,
kg
Forage
demand
per SU,
kg
Carrying
capacity,
SU
Animal
Number
SU (50%
over-
grazing)
Fee Per
SU
MNT
Total Fee
MNT
Fee per ha
MNT
1 2 3
(1x2)
4 5
(3:4)
6 7 8
(6*7)
9
(8:1)
1000 150 150000 560 268 402 500 201000 201
1000 280 280000 560 500 750 500 375000 375
1000 450 450000 560 804 1206 500 603000 603
14
In the above scenario, the animal numbers exceed the pasture carrying capacity by 50% and the per
ha fee increased to the overgrazing rate of 50%, however, fee per SU remains the same as optimum
stocking density scenario – MNT 500 per SU. Although the amount forage animals eat decrease closer
to the rate of overgrazing rate (50%), the scenario has no clear message to herders about the
overgrazing problem as the per SU fee stays the same as the optimum stocking density scenario. More
importantly it has no financial incentive for herders to discourage their behavior for increasing animal
numbers beyond the pasture carrying capacity as they pay the same amount of fee per animal as with
the optimum stocking density scenario.
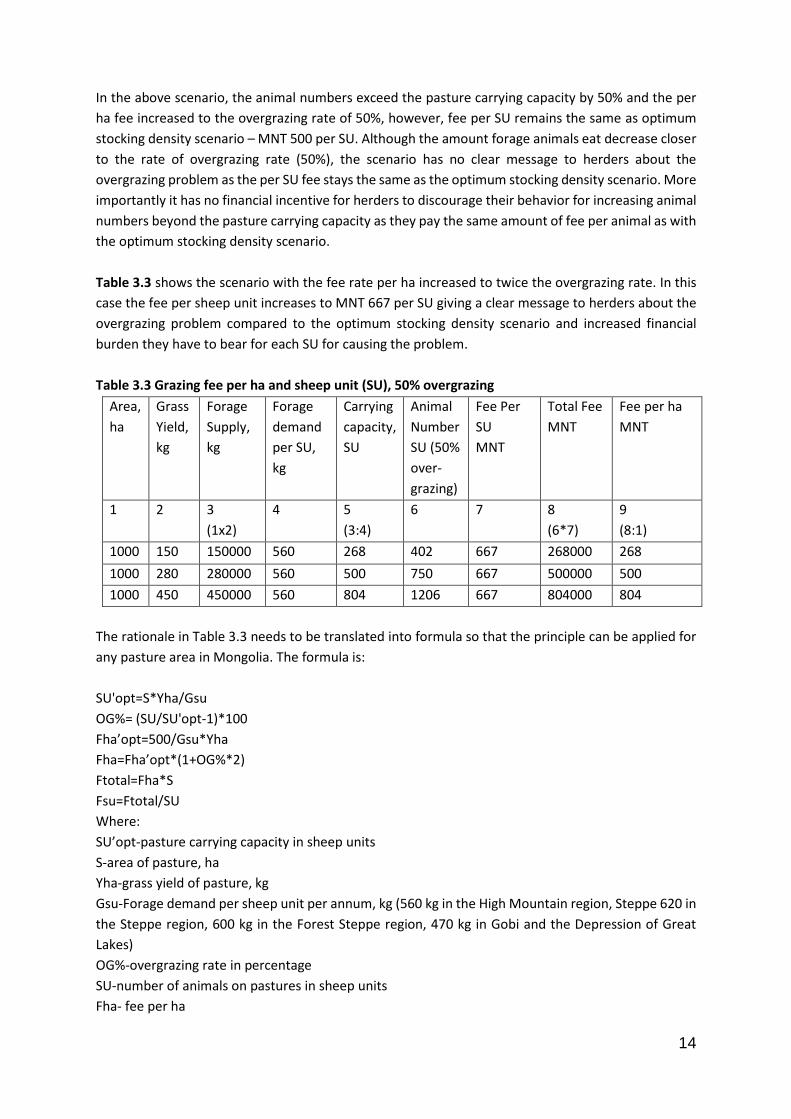
Table 3.3 shows the scenario with the fee rate per ha increased to twice the overgrazing rate. In this
case the fee per sheep unit increases to MNT 667 per SU giving a clear message to herders about the
overgrazing problem compared to the optimum stocking density scenario and increased financial
burden they have to bear for each SU for causing the problem.
Table 3.3 Grazing fee per ha and sheep unit (SU), 50% overgrazing
Area,
ha
Grass
Yield,
kg
Forage
Supply,
kg
Forage
demand
per SU,
kg
Carrying
capacity,
SU
Animal
Number
SU (50%
over-
grazing)
Fee Per
SU
MNT
Total Fee
MNT
Fee per ha
MNT
1 2 3
(1x2)
4 5
(3:4)
6 7 8
(6*7)
9
(8:1)
1000 150 150000 560 268 402 667 268000 268
1000 280 280000 560 500 750 667 500000 500
1000 450 450000 560 804 1206 667 804000 804
The rationale in Table 3.3 needs to be translated into formula so that the principle can be applied for
any pasture area in Mongolia. The formula is:
SU'opt=S*Yha/Gsu
OG%= (SU/SU'opt-1)*100
Fha’opt=500/Gsu*Yha
Fha=Fha’opt*(1+OG%*2)
Ftotal=Fha*S
Fsu=Ftotal/SU
Where:
SU’opt-pasture carrying capacity in sheep units
S-area of pasture, ha
Yha-grass yield of pasture, kg
Gsu-Forage demand per sheep unit per annum, kg (560 kg in the High Mountain region, Steppe 620 in
the Steppe region, 600 kg in the Forest Steppe region, 470 kg in Gobi and the Depression of Great
Lakes)
OG%-overgrazing rate in percentage
SU-number of animals on pastures in sheep units
Fha- fee per ha

15
Fsu-fee per sheep unit
MS Excel sheet to apply the above formulas and the sample results by key ecological zones are shown
is attached in Appendix 3.1.
Table 3.4 Grazing fee at the current level (2016) of overgrazing and grass yield
Regions Pasture
carrying
capacity in
sheep units
(SU’opt)
Over-
grazin
g rate
based
on
anima
l
intake
, %
Over-
grazing
rate for
grazing
fee, %
(OG%)
Fee per
ha under
optimum
stocking
density
MNT
(Fha'opt)
Fee per
ha
MNT
(Fha)
Fee total
million
MNT
(Ftotal)
Fee
per
sheep
unit
MNT
(Fsu)
Fee
per
sheep
-
mont
h
MNT
High
Mountain 7417883.4 166 210 230.3 1195.7
19,252,329
838.5 66
Forest
Steppe 10,784,396 147 180 378.3 1737.9
24,769,847
821.2 72
Steppe
16,712,550 65 104 306.5 942.1
25,690,292
754.6 68
Gobi
8,750,972 72 142 116.0 446.2
16,837,910
793.7 64
Depression
of Great
Lakes 5,915,710 118 197 151.1 746.8
14,622,344
831.8 65
National
51,989,244 96 142 226.2 869.8
99,968,848
793.6 67
It is worth noting that when overgrazing rate becomes 0 or optimum stocking density reached then
the base rate should applied and the application of the formula needs to be stopped. This is because
negative overgrazing will decrease the base rate, which is not desirable as pastureland users should
be paying the base rate. Also, the sum of regions does not exactly match with the national figures
because of rounding errors of Excel sheet.
As grass availability significantly decreases in the winter-spring season, the annual base grazing fee
needs to be also modified according to this change. Based on data in Appendix 3.1, Table 3.5 shows
grazing fees per sheep unit and per ha by seasons and for one sheep-month or 30 sheep-days.
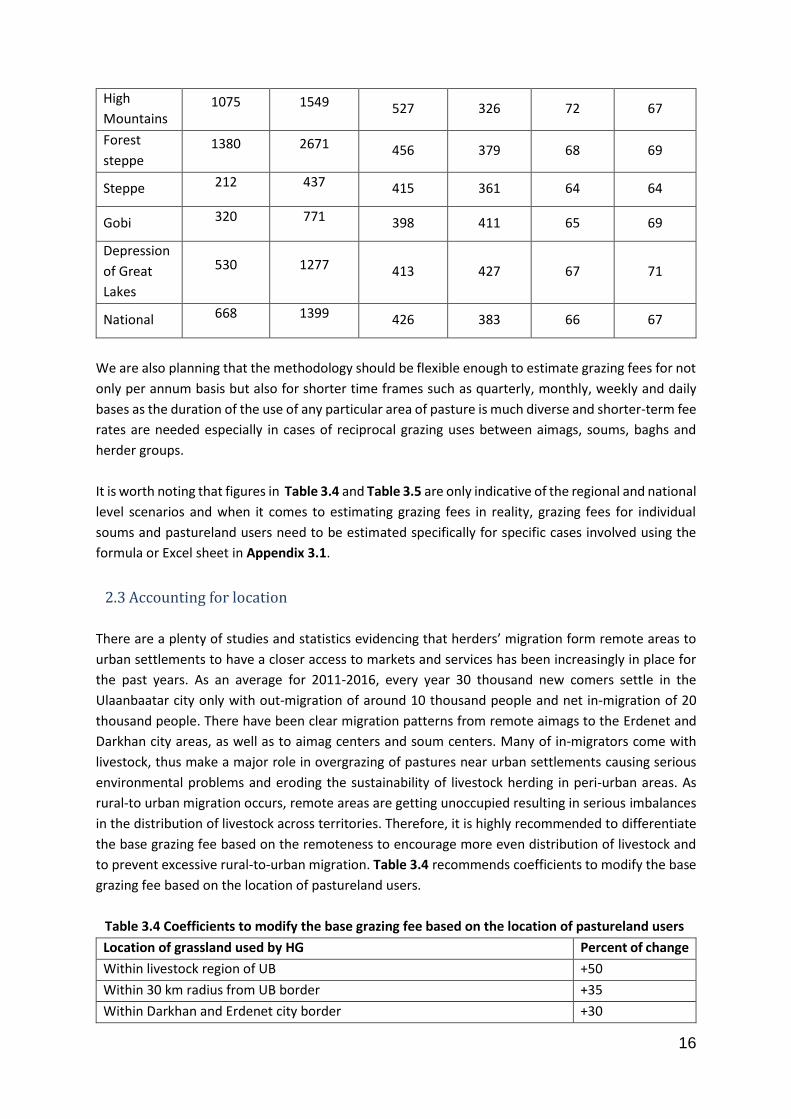
Table 3.5 Grazing fees per sheep unit and per ha by seasons and for sheep-month
Ecological
regions
Fee per ha
Winter-
Spring,
MNT
Fee per ha
Summer-
Autumn,
MNT
Fee per
Sheep Unit
Winter-
Spring, MNT
Fee per
Sheep Unit
Summer-
Autumn,
MNT
Fee per
Sheep-
month
Winter-
Spring,
MNT
Fee per
Sheep-
month
Summer-
Autumn,
MNT
16
High
Mountains 1075 1549 527 326 72 67
Forest
steppe 1380 2671 456 379 68 69
Steppe 212 437 415 361 64 64
Gobi 320 771 398 411 65 69
Depression
of Great
Lakes
530 1277 413 427 67 71
National 668 1399 426 383 66 67
We are also planning that the methodology should be flexible enough to estimate grazing fees for not
only per annum basis but also for shorter time frames such as quarterly, monthly, weekly and daily
bases as the duration of the use of any particular area of pasture is much diverse and shorter-term fee
rates are needed especially in cases of reciprocal grazing uses between aimags, soums, baghs and
herder groups.
It is worth noting that figures in Table 3.4 and Table 3.5 are only indicative of the regional and national
level scenarios and when it comes to estimating grazing fees in reality, grazing fees for individual
soums and pastureland users need to be estimated specifically for specific cases involved using the
formula or Excel sheet in Appendix 3.1.
2.3 Accounting for location
There are a plenty of studies and statistics evidencing that herders’ migration form remote areas to
urban settlements to have a closer access to markets and services has been increasingly in place for
the past years. As an average for 2011-2016, every year 30 thousand new comers settle in the
Ulaanbaatar city only with out-migration of around 10 thousand people and net in-migration of 20
thousand people. There have been clear migration patterns from remote aimags to the Erdenet and
Darkhan city areas, as well as to aimag centers and soum centers. Many of in-migrators come with
livestock, thus make a major role in overgrazing of pastures near urban settlements causing serious
environmental problems and eroding the sustainability of livestock herding in peri-urban areas. As
rural-to urban migration occurs, remote areas are getting unoccupied resulting in serious imbalances
in the distribution of livestock across territories. Therefore, it is highly recommended to differentiate
the base grazing fee based on the remoteness to encourage more even distribution of livestock and
to prevent excessive rural-to-urban migration. Table 3.4 recommends coefficients to modify the base
grazing fee based on the location of pastureland users.
Table 3.4 Coefficients to modify the base grazing fee based on the location of pastureland users
Location of grassland used by HG Percent of change
Within livestock region of UB +50
Within 30 km radius from UB border +35
Within Darkhan and Erdenet city border +30

17
Within 30 km radius from Darkhan and Erdenet city border +25
Within the border or 20 km radius of aimag centers and equivalent large
settlements as well as within 10 km from hard paved and rail roads
+20
Within the border or 10 km radius of soum centers and equivalent small
settlements
+10
Percentage of reducing the base fee in case of utilization of remote or unused
pastures
-30
Percentage of reducing the base fee for herders reside along the state border
outside the 30 km from the settlements such as border point and
infrastructure point
-50
3.4 Practical steps to estimate grazing fees
Based on the approach described in section 2 and the methodology in section 3, the following practical
steps are recommended to estimate and collect grazing fees:
1. Estimating annual grazing fee
1.1 Determine the area size of land users in ha- data source: for soums - pastureland area
reflected in the annual report of unified land funds administered by the ALRGC; for land users
within soum- pastureland area used by individual users as reflected in the pastureland use
agreements if these agreements available, if these agreements are not available, soum land
officer is responsible for estimating roughly land areas by individual users or herder groups in
consultation with them.
1.2 Prepare grass yield data for pastureland users, kg or centner (100 kg) per ha: for soums -
annual grass yield data by NAMHEM and 1:100,000 scale vegetation maps by ALRGC are key
sources; for pastureland users soum Governor is responsible for organizing grass yield
estimates for each pastureland user in participation of soum land officer, soum Animal Health
& Breeding Unit (AHBU) staff, soum meteorological post staff and pastureland users/herders
preferably arranging on site field estimates of vegetation samples and comparing them with
available secondary data sources such as ALRGC’s 1:100,000 scale vegetation maps and
NAMHEM’s annual grass yield estimates (as discussed in previous sections the introduction of
grazing fees shall generate enough revenues to finance these kinds of pastureland
management activities). Use the coefficient of 0.61 to convert the grass yield measured using
vegetation samples in August into the annual average grass yield
1.3 Estimate the number of animals from the animal census data at the end of the previous year
for pastureland users. The number of animals owned by absentee herders shall be included in
the total number of animals of a herder who is looking after these animals. Estimate the total
sheep units (SU) using the coefficients camel 3, horse 8, cattle 4, sheep 1, goat 2.
1.4 Estimate pasture carrying capacity:
SU'opt=S*Yha/Gsu
Where:
SU’opt-pasture carrying capacity in sheep units
S-area of pasture, ha
Yha-grass yield of pasture, kg

18
Gsu-Forage demand per sheep unit per annum, kg (560 kg in the High Mountain region, Steppe
620 in the Steppe region, 600 kg in the Forest Steppe region, 470 kg in Gobi and the Depression
of Great Lakes)
1.5 Estimate overgrazing rate:
OG%= (SU/SU'opt-1)*100
Where:
OG%-overgrazing rate in percentage. If pastureland is overgrazed then use the average grass
yield for previous 5 years instead of the grass yield in the year of measurement (See section
2.1 for details)
1.6 Estimate grazing fee under optimum stocking density:
Fha’opt=500/Gsu*Yha
Where:
500 – Annual base grazing rate per sheep unit, MNT
Fha’opt - Grazing fee under optimum stocking density
1.7 Estimate grazing fee per ha
Fha=Fha’opt*(1+OG%*2)
Where:
Fha- fee per ha
1.8 Estimate: Total grazing fee for the area of land user
Ftotal=Fha*S
Where:
Ftotal- Total grazing fee for the area of land user
1.9 Estimate grazing fee per sheep unit
Fsu=Ftotal/SU
Where:
Fsu- Grazing fee per sheep unit
2. Estimating grazing fee by seasons and months
2.1 Repeat steps in 1.1 for estimating the area size of pastures
2.2 Estimate grass yield of the area using the following coefficients to convert the annual grass
yield in 1.2 into seasonal averages
Coefficients to convert the annual grass yield to seasonal averages
Regions Winter-spring season Summer-autumn season
High mountains 0.65 1.52
Forest steppe 0.67 1.52
Steppe 0.65 1.52
Gobi 0.64 1.55
Depression of Great Lakes 0.67 1.53
2.3 Repeat 1.3 and 1.4 to estimate the number of animals, sheep units and pasture carrying
capacity for the season under consideration. Use the following base indicators:
Base grazing rate per sheep unit and forage demand per sheep unit by seasons
Regions Base grazing rate per sheep unit,
MNT
Total forage demand per
sheep unit in season, kg
19
Winter-spring Summer-
autumn
Winter-
spring
Summer-
autumn
High mountains 301 199 330 230
Forest steppe 274 226 300 300
Steppe 267 233 312 308
Gobi 253 247 200 270
Depression of Great Lakes 253 247 200 270
2.4 Repeat 1.5-1.9 to estimate relevant indicators
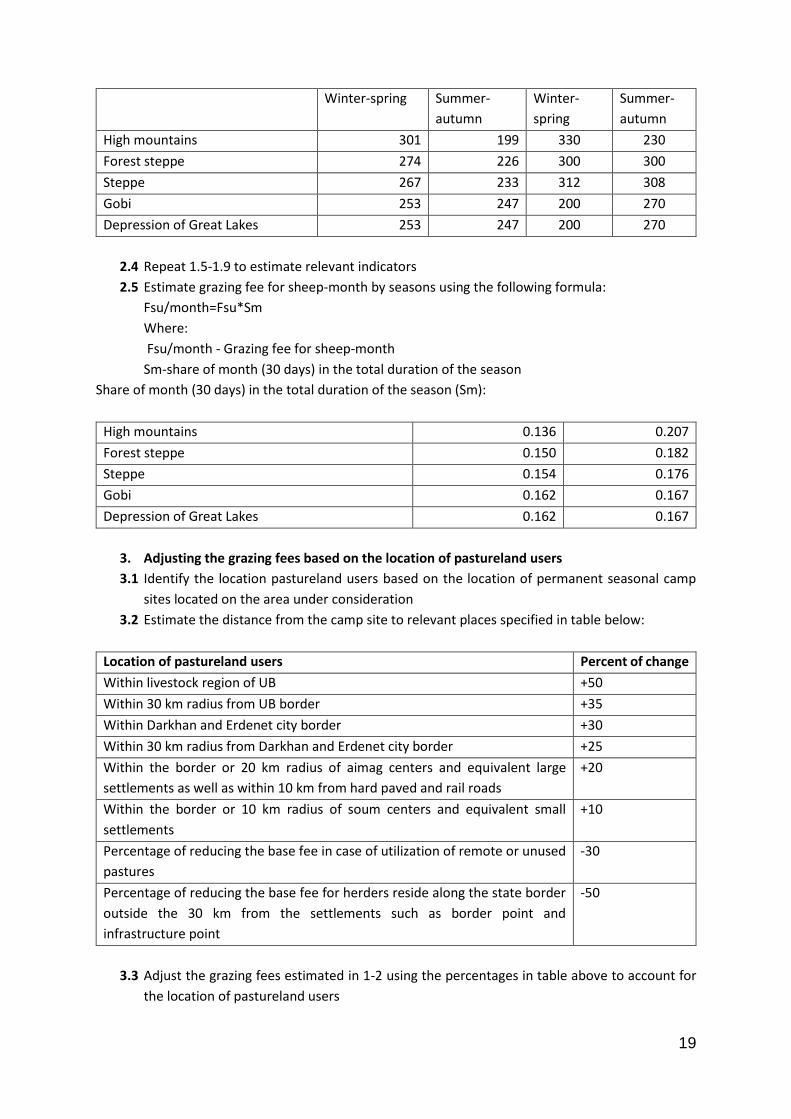
2.5 Estimate grazing fee for sheep-month by seasons using the following formula:
Fsu/month=Fsu*Sm
Where:
Fsu/month - Grazing fee for sheep-month
Sm-share of month (30 days) in the total duration of the season
Share of month (30 days) in the total duration of the season (Sm):
High mountains 0.136 0.207
Forest steppe 0.150 0.182
Steppe 0.154 0.176
Gobi 0.162 0.167
Depression of Great Lakes 0.162 0.167
3. Adjusting the grazing fees based on the location of pastureland users
3.1 Identify the location pastureland users based on the location of permanent seasonal camp
sites located on the area under consideration
3.2 Estimate the distance from the camp site to relevant places specified in table below:
Location of pastureland users Percent of change
Within livestock region of UB +50
Within 30 km radius from UB border +35
Within Darkhan and Erdenet city border +30
Within 30 km radius from Darkhan and Erdenet city border +25
Within the border or 20 km radius of aimag centers and equivalent large
settlements as well as within 10 km from hard paved and rail roads
+20
Within the border or 10 km radius of soum centers and equivalent small
settlements
+10
Percentage of reducing the base fee in case of utilization of remote or unused
pastures
-30
Percentage of reducing the base fee for herders reside along the state border
outside the 30 km from the settlements such as border point and
infrastructure point
-50
3.3 Adjust the grazing fees estimated in 1-2 using the percentages in table above to account for
the location of pastureland users
20
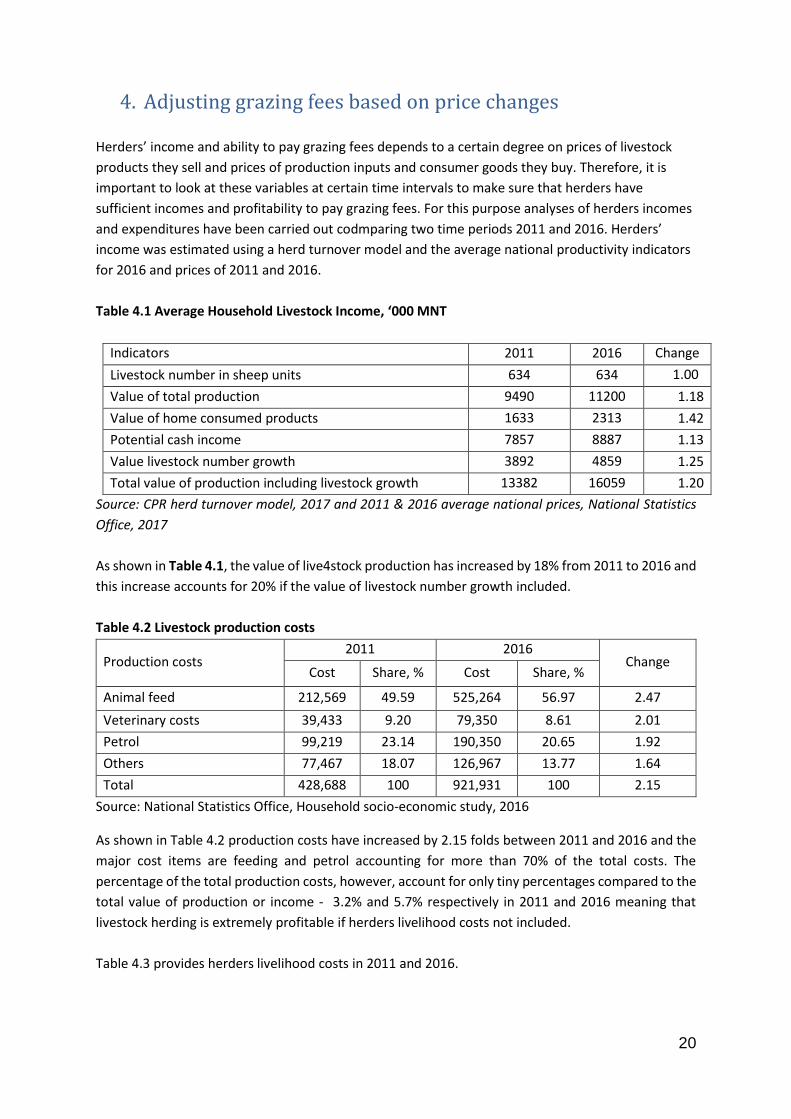
4. Adjusting grazing fees based on price changes
Herders’ income and ability to pay grazing fees depends to a certain degree on prices of livestock
products they sell and prices of production inputs and consumer goods they buy. Therefore, it is
important to look at these variables at certain time intervals to make sure that herders have
sufficient incomes and profitability to pay grazing fees. For this purpose analyses of herders incomes
and expenditures have been carried out codmparing two time periods 2011 and 2016. Herders’
income was estimated using a herd turnover model and the average national productivity indicators
for 2016 and prices of 2011 and 2016.
Table 4.1 Average Household Livestock Income, ‘000 MNT
Indicators 2011 2016 Change
Livestock number in sheep units 634 634 1.00
Value of total production 9490 11200 1.18
Value of home consumed products 1633 2313 1.42
Potential cash income 7857 8887 1.13
Value livestock number growth 3892 4859 1.25
Total value of production including livestock growth 13382 16059 1.20
Source: CPR herd turnover model, 2017 and 2011 & 2016 average national prices, National Statistics
Office, 2017
As shown in Table 4.1, the value of live4stock production has increased by 18% from 2011 to 2016 and
this increase accounts for 20% if the value of livestock number growth included.
Table 4.2 Livestock production costs
Production costs 2011 2016
Change Cost Share, % Cost Share, %
Animal feed 212,569 49.59 525,264 56.97 2.47
Veterinary costs 39,433 9.20 79,350 8.61 2.01
Petrol 99,219 23.14 190,350 20.65 1.92
Others 77,467 18.07 126,967 13.77 1.64
Total 428,688 100 921,931 100 2.15
Source: National Statistics Office, Household socio-economic study, 2016
As shown in Table 4.2 production costs have increased by 2.15 folds between 2011 and 2016 and the
major cost items are feeding and petrol accounting for more than 70% of the total costs. The
percentage of the total production costs, however, account for only tiny percentages compared to the
total value of production or income - 3.2% and 5.7% respectively in 2011 and 2016 meaning that
livestock herding is extremely profitable if herders livelihood costs not included.
Table 4.3 provides herders livelihood costs in 2011 and 2016.
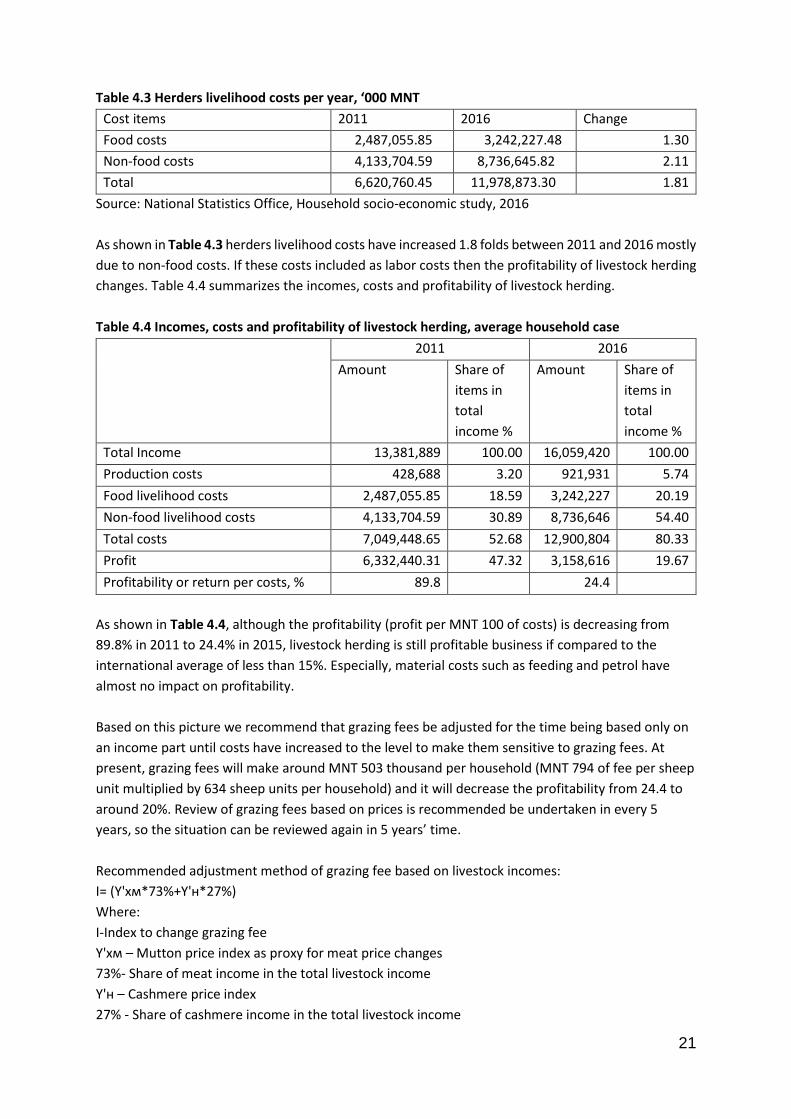
21
Table 4.3 Herders livelihood costs per year, ‘000 MNT
Cost items 2011 2016 Change
Food costs 2,487,055.85 3,242,227.48 1.30
Non-food costs 4,133,704.59 8,736,645.82 2.11
Total 6,620,760.45 11,978,873.30 1.81
Source: National Statistics Office, Household socio-economic study, 2016
As shown in Table 4.3 herders livelihood costs have increased 1.8 folds between 2011 and 2016 mostly
due to non-food costs. If these costs included as labor costs then the profitability of livestock herding
changes. Table 4.4 summarizes the incomes, costs and profitability of livestock herding.
Table 4.4 Incomes, costs and profitability of livestock herding, average household case
2011 2016
Amount Share of
items in
total
income %
Amount Share of
items in
total
income %
Total Income 13,381,889 100.00 16,059,420 100.00
Production costs 428,688 3.20 921,931 5.74
Food livelihood costs 2,487,055.85 18.59 3,242,227 20.19
Non-food livelihood costs 4,133,704.59 30.89 8,736,646 54.40
Total costs 7,049,448.65 52.68 12,900,804 80.33
Profit 6,332,440.31 47.32 3,158,616 19.67
Profitability or return per costs, % 89.8 24.4
As shown in Table 4.4, although the profitability (profit per MNT 100 of costs) is decreasing from
89.8% in 2011 to 24.4% in 2015, livestock herding is still profitable business if compared to the
international average of less than 15%. Especially, material costs such as feeding and petrol have
almost no impact on profitability.
Based on this picture we recommend that grazing fees be adjusted for the time being based only on
an income part until costs have increased to the level to make them sensitive to grazing fees. At
present, grazing fees will make around MNT 503 thousand per household (MNT 794 of fee per sheep
unit multiplied by 634 sheep units per household) and it will decrease the profitability from 24.4 to
around 20%. Review of grazing fees based on prices is recommended be undertaken in every 5
years, so the situation can be reviewed again in 5 years’ time.
Recommended adjustment method of grazing fee based on livestock incomes:
I= (Ү'хм*73%+Ү'н*27%)
Where:
I-Index to change grazing fee
Ү'хм – Mutton price index as proxy for meat price changes
73%- Share of meat income in the total livestock income
Ү'н – Cashmere price index
27% - Share of cashmere income in the total livestock income

22
Table 4.5 Prices of major livestock products
Products 2011 2016 Change
Camel meat 1.9 2.5 1.35
Horse meat 2.0 2.9 1.46
Beef 2.5 3.7 1.48
Mutton 2.3 3.2 1.41
Goat 1.9 2.7 1.39
Cashmere 52.0 48.0 0.92
As shown in Table 4.5, there is very high correlation between meat prices suggesting that mutton
price can be a good proxy for meat price changes. It has increased by 1.41 folds between 2011 and
2016 and cashmere has decreased by 8%. Using these data the grazing fee adjustment index can be
estimated as follows between 2011 and 2016:
I= (1.41*73%+0.92*27%) = 1.28
5. Recommendations on ways to spend grazing fee revenues
As discussed in section 2, the introduction of grazing fees is acceptable for herders and local
governments if the revenues collected are used back locally on sustainable use, protection and
improving pastures and related activities in participation of herders.
Therefore it is strongly recommended that local governments spend not less than 70% of the total
revenues from grazing fees in way that maximizes pastureland users/herders participation, in other
words, designing and implementing bottom-up proposals from herders. For this purpose, the CPR-
undertaken pilots of establishing livestock risk management fund to receive and finance herder
proposals can be used as a model. The pilot has recommended the following list of eligible activities
to be financed from the fund:
1. Manure hay making areas
2. Protect springs, fence its origins
3. Fight against pasture rodents and insects
4. Improve pastures and hay making areas by planting perennials
5. Protect wildlife on pastures under agreement
6. Repair deep well facilities (pump, generator, trough)
7. Build and repair water catchment facilities
8. Plant trees and shrubs for environmental protection purposes
9. Estimate pasture grass yield, carrying capacities
10. Monitoring by group/partnership leaders over the implementation of the pastureland use
agreements and sub-projects funded by LRMF
11. Prepare animal feed and establish its reserve fund
12. Repair and upgrade animal shelters
13. Repair hay and fodder storage facilities
14. Make small scale snow breaker
15. Dig and drain hand wells, repair hand well facilities
16. Purchase small-scale hay, fodder making equipment

23
17. Undertake horticulture activities for income diversification purposes
18. Repair and maintain fencing of hay making areas
19. Purchase breeding animals
20. Measures for animal health improvement
21. Measure for livestock product processing, improving its quality and market linkages
Procedures and forms used for implementing the soum livestock risk management fund are attached
in Appendix 5.1.
6. Note on TOR task for estimating grazing fees at geographical
indexes/regions
There are plenty of studies on zoning of Mongolia’s territory into different geographical regions
based on natural conditions such as climate, soils, vegetation, topography as well as land use such as
livestock zoning and economic zoning etc. For example, agricultural regions based largely on key
differences in physical geography have been widely used by economists and planners2. The
Government resolution #152 “Measures to enforce the Law on Land Use Payment” in 1997 has split
the country into 4 regions in terms of land valuation: Khangai-Khentii mountainous, Altai Mountain,
Gobi mountainous and Steppe and 21 sub-regions. The SDC Green Gold project has used 6 major
ecological regions – Meadow Steppe, Forest Steppe, Steppe, Semi-Desert Steppe, Desert Steppe and
Steppe - in applying the ecological site description (ESD) approach in estimating pastureland
degradation and recovery states. Despite differences in boundaries, regions under the above
mentioned zoning show differences in the pastureland quality from one and other perspective in
big-scale maps, one region covering at least a number of entire soums implying that the pastureland
quality is the same across soums included in one region.
Although these kinds of zoning provide useful general information on pastureland quality
differences, they are not much relevant for estimating grazing fees for pastureland users or herders
as the quality of pastures they use are unique and differ significantly across users. If grazing fees
established flat for a large area covering territories of several soums then grazing fees cannot play
it’s a role to incentivize the sustainable use of pastures. There is readily available database -
1:100,000 scale vegetation maps showing differences in the pastureland quality within soums.
Therefore, in order to make grazing fees an effective tool for encouraging sustainable use of
pastures, the proposed methodology should be able to establish grazing fees based on differences in
the pastureland quality across land users or herder groups.
2 Agricultural zoning map, National Atlas of Mongolia, Ulaanbaatar 1990