Embed Size (px)
Citation preview

Proposed changes to Clean Water Act Methods 608, 624, and 625
A great improvement in methodology, but issues with consistency, QC and reporting
Jerry L. ParrCatalyst Information Resources

600 Series Methods
Developed in the 1970s and reflected the best practice at the time, e.g. Analytes = priority pollutants Liquid-liquid extraction Packed columns Separate base/neutral and acid fractions because of
special column needed for phenols 3-point calibration
Methods were inter-laboratory validated

Since 1979
Other EPA Programs used these methods as a basis Contract Laboratory Program SOWs Drinking Water: 508, 524, 525 SW-846: 8080, 8081, 8082, 8240, 8250, 8260, 8270
Expanded analyte lists New technology Capillary columns Solid Phase Extraction (SPE) Selected Ion Monitoring (SIM) Hydrogen carrier gas
Additional QC
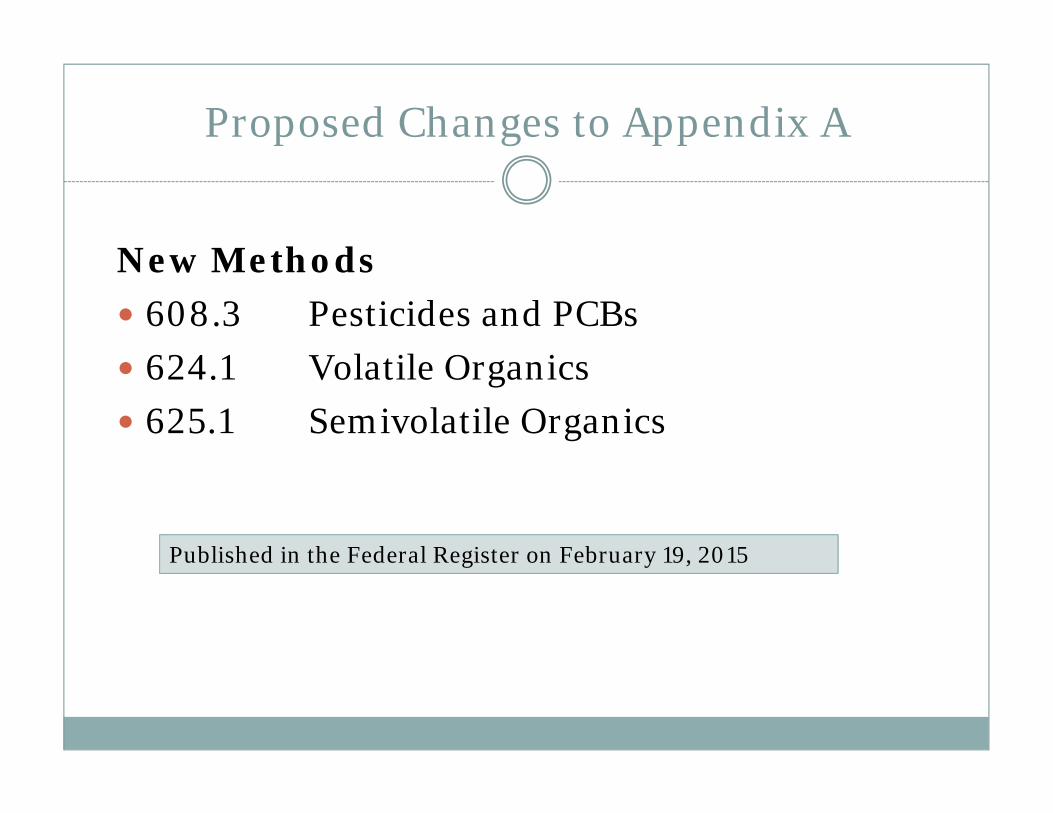
Proposed Changes to Appendix A
New Methods 608.3 Pesticides and PCBs 624.1 Volatile Organics 625.1 Semivolatile Organics
Published in the Federal Register on February 19, 2015
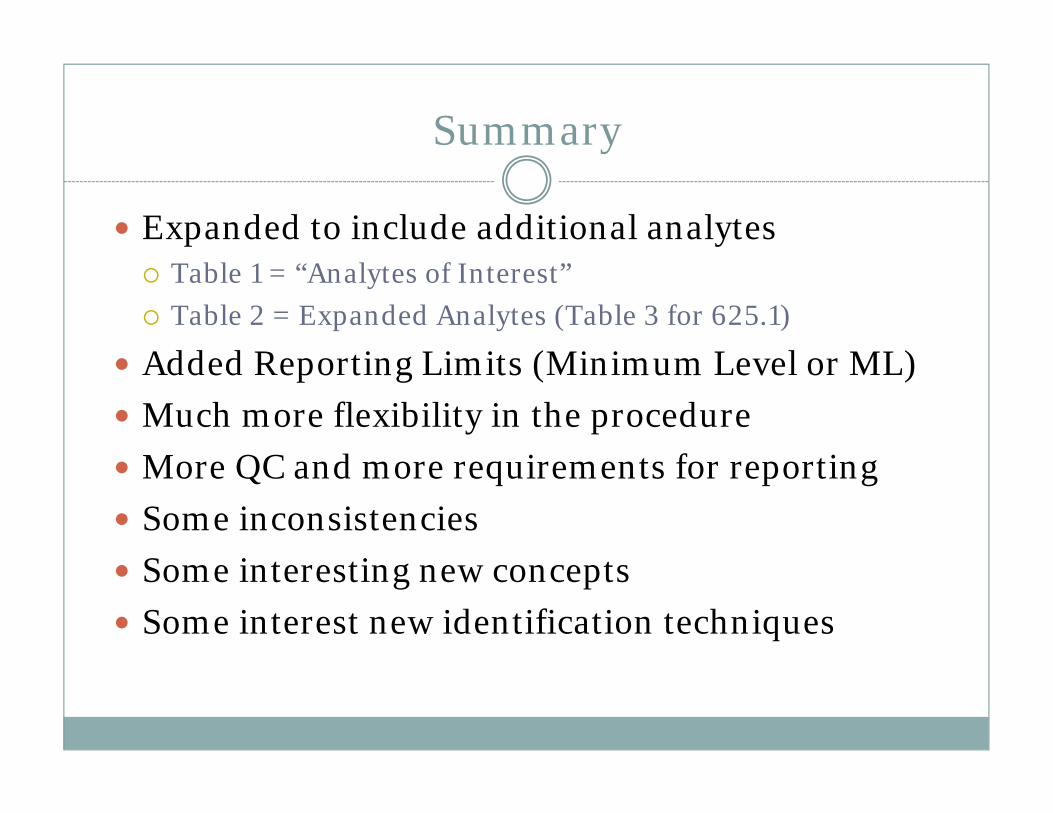
Summary
Expanded to include additional analytes Table 1 = “Analytes of Interest” Table 2 = Expanded Analytes (Table 3 for 625.1)
Added Reporting Limits (Minimum Level or ML) Much more flexibility in the procedure More QC and more requirements for reporting Some inconsistencies Some interesting new concepts Some interest new identification techniques

Analytes of Interest
Those required to be determined by a regulatory/control authority or in a permit, or by a client.
If a list of analytes is not specified, the analytesin Table 1 must be determined, at a minimum, and QC testing must be performed for these analytes.
MDLs and MLs provided for most analytes
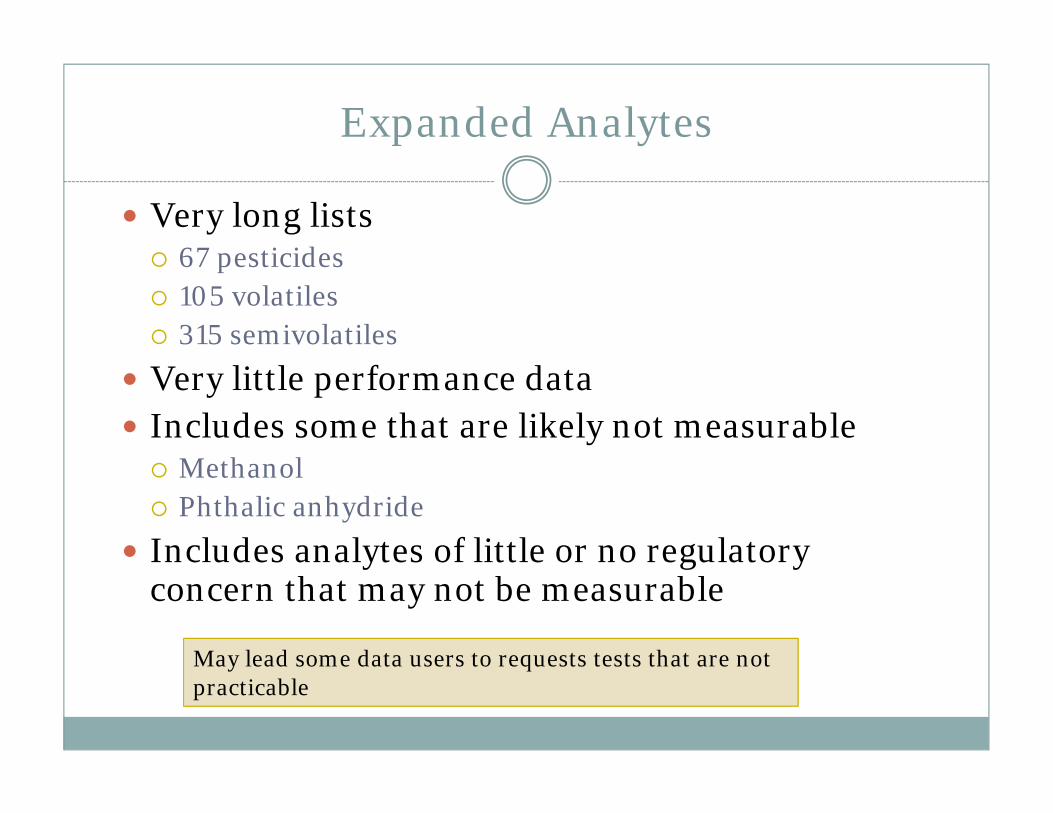
Expanded Analytes
Very long lists 67 pesticides 105 volatiles 315 semivolatiles
Very little performance data Includes some that are likely not measurable Methanol Phthalic anhydride
Includes analytes of little or no regulatory concern that may not be measurable
May lead some data users to requests tests that are not practicable

Minimum Level
EPA Concept that has existed for >20 years ML = MDL x 3.18 3.18 =10/3.14 = Curries LQ
Round to the nearest 1, 2 or 5 x 10n
So ML Values would be 1, 2, 5, 10, 20, 50, etc
MLs published in the method = MDL x 3 If MDL is wrong, 3 x MDL is also wrong

Inconsistencies
Storage and replacement of standards Standard traceability 608.3 = to a national standard, when available. 624.1/625.1 = to NIST or other national standard
Second Source standard Closing CCV 608.3 = Yes 624.1/625.1 = No
Batch definitions 608.3/625.1 = 20 samples 624.1 = 12 hours

Storage of Standards
608.3 Store neat standards or
single analytestandards in the dark at -20 to -10 °C.
Store multi-analytestandards at 4°C or per manufacturer’s recommendations.
Place a mark on the vial at the level of the solution so that solvent evaporation loss can be detected.
624.1 Store standard solutions at -
10 to -20°C, protected from light, in fluoropolymer-sealed glass containers with minimal headspace.
625.1 Store at <6 °C and protect
from light. Check frequently for
degradation or evaporation, especially just prior to preparing calibration standards from them.

Replacement of Standards
608.3 Stock standard solutions must
be replaced after 12 months or sooner if comparison with quality control check standards indicates a change in concentration.
Analyze all standard solutions within 48 hours of preparation. Replace purchased certified stock standard solutions per the expiration date. Replace stock standard solutions prepared by the laboratory or mixed with purchased solutions after one year, or sooner
624.1 Replace after one month, or
sooner if the concentration changes by more than 10 percent.
625.1 Replace purchased certified
stock standard solutions per the expiration date. Replace stock standard solutions after one year, or sooner if comparison with QC check samples indicates a problem.

Second Source Standard
608.3 different manufacturer or
different certified lot verify the accuracy of the
initial calibration concentrations must be
within 20% difference of the true value
624.1 Not listed in Reagents Not used to check ICAL = LCS Criteria = Table 7 May run 2 consecutive LCS
625.1 Not listed in Reagents Not used to check ICAL = CCV Criteria = Table 6 May run 2 consecutive

Calibration Curves
608.3 At least three levels (5
recommended, 6 for quadratic) Low point must be below
published ML External Standard
o If the RSD is less than 20%, linearity can be assumed
o If curve, must be inversely weighted to concentration
o Must have R2 of 0.99 or RSE of 20%
Internal Standardo If the RSD is less than 15%,
linearity can be assumed o If curve, must be inversely
weighted to concentrationo Must have R2 of 0.99 or RSE of
15%
624.1/625.1 At least five levels (6 for
quadratic) Average RF may be used if RSD
< 35% If curve, must be inversely
weighted to concentration Must have R2 of 0.92 or RSE of
35% Low point must be below
published ML ML can be rounded, but may
not be above published level; i.e., ML of 4.8 cannot be rounded to 5

Correlation Coefficients for Evaluation of Analytical Calibration Curves
Anal. Chem. 1981 (C.L. Grant) One practice which should be discouraged is the
use of the correlation coefficient as a means off evaluating goodness of fit of linear models.
Thorough statistical analysis of analytical calibration data should be used to provide optimal evaluation of results. The correlation coefficient is not an effective statistic for this purpose.

Calibration Verification
608.3 Verified at the beginning
and end of each 24-hour shift
Criteria published in Table 4, e.g. Aldrin =75-125 Dieldrin = 48-125
Table 4 criteria includes all sample processing steps
624.1 = LCS Criteria in Table 7, e.g.
Bromoform = 70-130 Bromomethane = 15-185
625.1 20% difference changed to
Table 6 (Q?) Values can be as high as
13-200%608 was once per day and 15%
This is the same as 624

Quality Control
Old Methods DOC per analyst
Precision and accuracy One time
Blank 10% MS 10% QC Check Statements of accuracy
New Methods DOC per laboratory
Precision, accuracy and MDL Initial and annually (should)
Blank 5% MS; 5% MSD LCS per batch Surrogates Internal standard areas (50-
200%) Statements of accuracy PT Samples (recommended)

IDC/DOC
4 replicate QC Check samples Concentration at or below mid-point Compare results to QC criteria (Tables 4, 6, or 7) For analytes with no criteria, use 136.6
Criteria from an “equivalent” method Default criteria (e.g., 60-140%)
MDL Study As described in Appendix B MDLs must be equal to or lower than those in the method, OR 1/3 the regulatory level

MS/MSD
Spike at least 5% of samples from each site Data user to identify samples and analytes If direction cannot be obtained, the laboratory must spike
at least one sample in duplicate per batch. Spiked sample results should be reported only to the data
user whose sample was spiked. If recovery falls outside the designated range, the
result for the analyte in the sample is suspect and may not be reported or used for permitting or regulatory compliance.
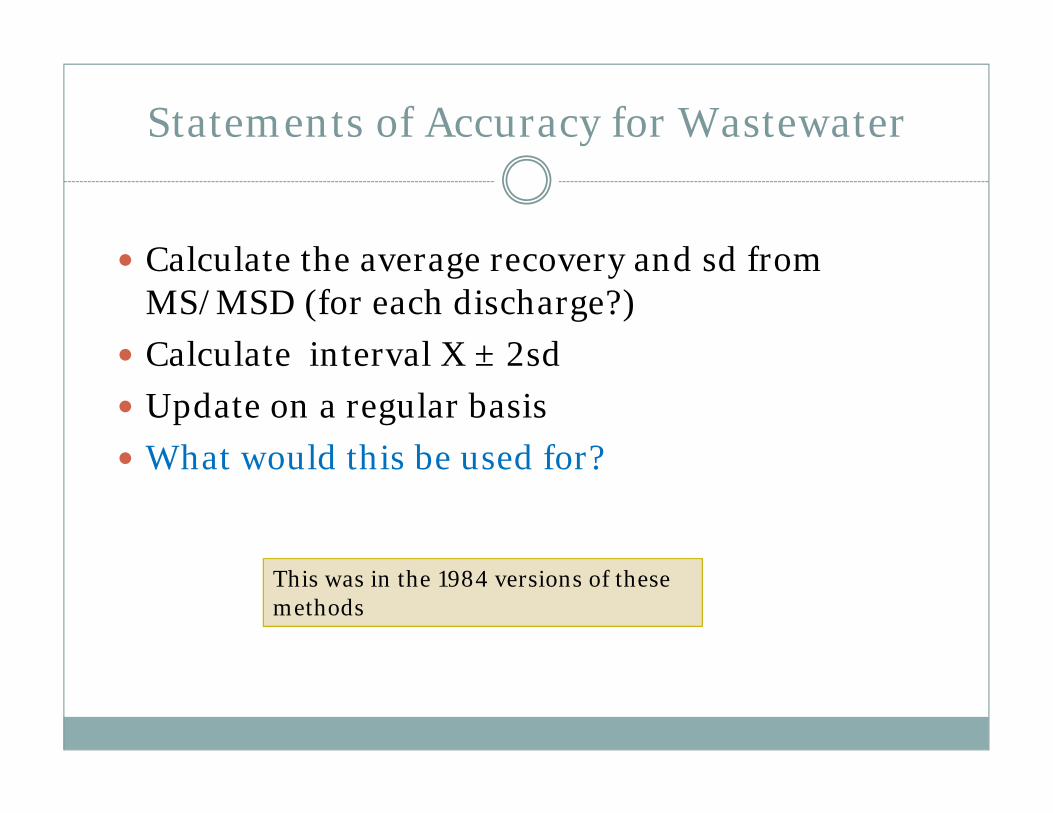
Statements of Accuracy for Wastewater
Calculate the average recovery and sd from MS/MSD (for each discharge?)
Calculate interval X ± 2sd Update on a regular basis What would this be used for?
This was in the 1984 versions of these methods

QC Limits for MS/MSD
Calculate new limits after 20 MS/MSD Update every two years 80% of limits better than QC Table QC Table are the maximum limits

LCS
One LCS per batch of 20 or less Use criteria in QC Table (Table 4, 6 or 7) Repeat the test for those analytes that failed to meet the
criteria. If these analytes now pass, system performance is acceptable and analysis of samples may proceed. If this occurs, repeat the test using a fresh LCS, or perform and document system repair.
Update criteria using same procedure as MS/MSD

Blanks
One blank per batch Re-extract if blank result is: Greater than MDL, or Greater than 1/3 compliance limit, or Greater than 1/10 sample concentration
If re-testing of blanks results in repeated failures, the laboratory should document the failures and report the problem and failures with the data.
NELAP: the concentration is at or above the reporting limit, AND greater than 1/10 of the amount measured in the sample

Surrogates
Must be spiked in every sample Laboratory develops limits; 60-140% can be
used as interim limits Any failure, re-analyze sample if available Surrogate recoveries from the blank and LCS may be
used as pass/fail criteria by the laboratory or as required by a regulatory authority, or may be used to diagnose problems with the analytical system.

Blank Subtraction
When subtracting two measurements, the uncertainty in the final measurement is equal to the sum of the uncertainties in the original measurements:
(A ± s) - (B ± s) = (A - B) ± (sA + sB) Dieldrin: MDL = 6; ML = 18; s = 42% C = (18 -6) ± (7.5+2.5) = 2 - 22
http://physicsed.buffalostate.edu/pubs/MeasurementAnalysis/MA1_9ed.pdf

Specific Method Issues

608.3 Second Column Confirmation
If values from two columns are in agreement within a factor of 2, analyte is present
If not within factor of 2 If interferent is detected on second column, report
result and advise data user of interference If no interferent is detected, report ND at the lower
concentration
Interesting concept. Do you agree?

624.2 Mass Spectrometer
Scan rate changed to 7 scans/second Mass range = 35-260 with suggestion to go to 25-
260 for: Acrolein (m/z 56, 55, 58) Acrylonitrile (m/z 53, 52, 51) Choloromethane (m/z 50, 52) Vinyl chloride (m/z 62, 64)
Interferences below m/z 35 Methanol (m/z 29, 31, 32) Nitrogen (m/z 28) Oxygen (m/z 32) Argon (m/z 40)

624.1 GC resolution
Valley between 1,2-dibromoethane and chlorobenzene must not exceed 25
1,2-dibromoethane is not listed as an analyte The two compounds have very different spectra 1,2-dibromoethane 107 (109, 188) chlorobenzene 112 (77, 114)

GC/MS Identification
Retention time: ±30 seconds changed to 0.06 RRT Relative intensities changed from ±20% to 50% to
200% New: “m/z’s present in the acquired mass
spectrum for the sample that are not present in the reference mass spectrum must be accounted for by contaminant or background m/z’s.”
Isomers must have peak resolution of 50% compared to 25% in Method 624/625 (and methods 524/525)
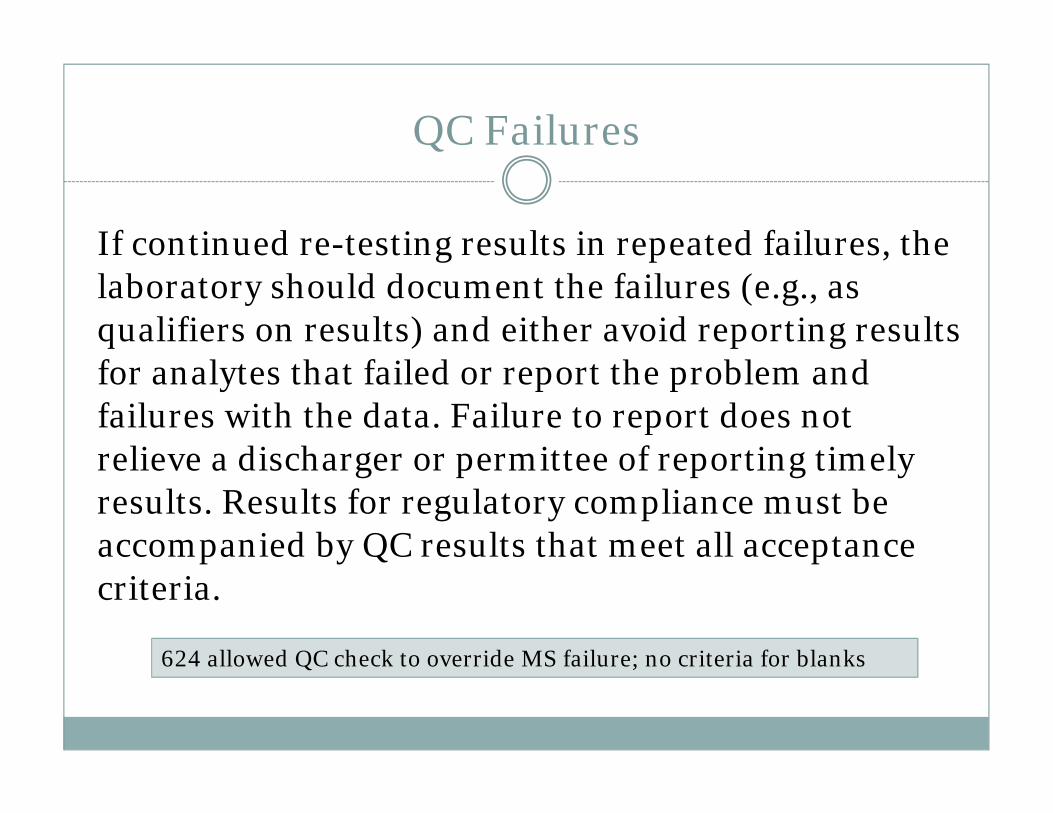
QC Failures
If continued re-testing results in repeated failures, the laboratory should document the failures (e.g., as qualifiers on results) and either avoid reporting results for analytes that failed or report the problem and failures with the data. Failure to report does not relieve a discharger or permittee of reporting timely results. Results for regulatory compliance must be accompanied by QC results that meet all acceptance criteria.
624 allowed QC check to override MS failure; no criteria for blanks

Reporting
Report quantitative data to ML to 3 significant figures Report the lower of two results from 608.3 Report results less than ML as < ML, “or as required by
the regulatory authority or permit” Allows for blank subtraction if requested or required Results from tests performed with an analytical system
that is not in control must not be reported or otherwise used for permitting or regulatory compliance purposes, but do not relieve a discharger or permittee of reporting timely results.

Reporting Caveat (1.7.1)
EPA has promulgated this method at 40 CFR Part 136 for use in wastewater compliance monitoring under the National Pollutant Discharge Elimination System (NPDES). The data reporting practices described in Section 15.2 are focused on such monitoring needs and may not be relevant to other uses of the method.

600s: Summary of Technical
Updated technology to current practice Much more flexibility Additional analytes Some inconsistencies between the methods

Summary: QC and Reporting
New concepts may be troublesome Making data user select samples to be spiked Establishing accuracy/precision per site/discharge Reporting rules for 608.3 Revised identification criteria for 624.1 and 625.1 Blank subtraction
Daily calibration checks are problematic Not consistent with current industry practice Will greatly increase error
QC section is problematic Not consistent with current industry practice Cannot realistically be done Will increase laboratory fraud The caveats help, but not enough

Jerry L. ParrCatalyst Information Resources
The Information Resource for Environmental Professionals817-598-1155


![608 Current Molecular Medicine 2010, 608-625 Medullary ... · variant of MEN-2A associated with lichen amyloidosis has an earlier onset [18]. Mutations in RET codon 634, and to a](https://img.pdfslide.us/doc/110x75/608676b8ee09145dd0662f7c/608-current-molecular-medicine-2010-608-625-medullary-variant-of-men-2a-associated.jpg)