Embed Size (px)
Citation preview

Proposed Annual Operating Budget Fiscal Years
2015 & 2016
July 14, 2014

Agenda • The Challenges • Budget Highlights
– Overview and Assumptions – Administrative and General – Energy Supply – Energy Delivery – Water/ Wastewater
• Proposed Budget and Financials • Forecasts and Rates • Staff Recommendations
2

THE CHALLENGES

Challenges • Electric rates are not competitive
– Projected increase of over $9 for a residential customer using 1,000 kWh
– Established a goal to reduce the proposed FY15 rate increase by half, or close a gap of $12 million
• Ongoing regulatory pressure in all systems • Desire to maintain/improve system reliability • Excellent customer value/customer service • Maintain financial strength • Need to improve employee morale
4

FY14 Sales Results Through June Actual
October - June FY2014 Budget
Absolute Difference
Percentage Difference
Electric - Retail MWh 1,194,870 1,195,285 -415 0.0% Electric - Wholesale MWh 83,814 87,033 -3,219 -3.7% Electric - Total (Native) MWh 1,278,685 1,282,318 -3,634 -0.3% Electric - Retail Base Rate Revenue ($000) $94,994 $95,471 -$477 -0.5% Electric - Wholesale Base Rate Revenue ($000) $2,120 $2,136 -$16 -0.7% Electric - Total Base Rate Revenue ($000) $97,115 $97,607 -$493 -0.5%
Natural Gas - Retail Therms 17,426,140 17,642,114 -215,974 -1.2% Natural Gas - Base Rate Revenue ($000) $10,087 $10,186 -$99 -1.0%
Water - Total kGal 5,031,836 5,440,172 -408,336 -7.5% Water - Total Revenue ($000) $22,114 $23,478 -$1,364 -5.8%
Wastewater - Total kGal 3,425,174 3,539,400 -114,226 -3.2% Wastewater - Total Revenue ($000) $26,596 $27,377 -$781 -2.9%
5

Impact of O&M and Capital on Rates
System Electric Gas Water Wastewater
1% O&M $1.1 Million $110,000 $280,000 $350,000
1% Capital $20.5 Million $2 Million $5 Million $6 Million
6

BUDGET HIGHLIGHTS

OVERVIEW AND ASSUMPTIONS

Budget Assumptions • No funding of Solar FIT for budget reduction of $929,000 • Includes $6 million for upgrade and reimplementation of
financial management system • Additional $250,000 in surcharge on connection fees
would be absorbed by General Government if it is eliminated
• Does not include costs to move infrastructure should 1 percent transportation system surtax be approved
• Two-year phase in of new multi-family water rate
9

Budget Highlights
10
• Reduced O&M from proposed FY15 budget
$10.6 million
• Reduced fuel expenses from proposed FY15 budget
$11.4 million
• Increased capital spending from proposed FY15 budget
$31.6 million
• Reduction in General Fund Transfer from proposed budget
$1.2 million
• Swap changes (2) $ 900,000

Budget Highlights (Personnel)
11
• Eliminated 2% employee pay increase
$800,000
• Unfunded 59 positions (52 regular/7 overfills)
$3.4 million
• Reduction in pension $2.1 million

Budget Highlights Revenue Increase
• Sale of Electric System Control building
$1.46 million
• Wholesale sales (Winter Park)
$ 495,000
• Union County property sale $ 73,000
12

Other Savings Examples • Purchasing review
– Adjustment to contracts and purchases resulting in $318,000 savings
• [email protected] (employee suggestions) – Take home vehicles reviewed and adjustments
under review – Evaluating changes to various rates – Performed analysis of lease/sale of downtown
Administration Building • Recommendation to lease part of building • Zoning change underway
13

Proposed FY15 Residential Rates
14

15
System/Class Usage Level Change to Bill
Electric - General Service Non-Demand 1,500 kWh 1.2%
Electric - General Service Demand 30,000 kWh, 75 kW 2.3%
Electric - Large Power 430,000 kWh, 1,000 kW 2.9%
Water 30,000 gallons *1.38% / 2.72%
Wastewater 30,000 gallons 3.57%
Gas - Small Commercial 50 therms 6.8%
Gas - Commercial 300 therms 9.4%
Gas - Large Volume 30,000 therms 9.9%
Proposed FY15 Business Rate Changes
*Assumes Multi-family Water Rate adopted

ADMINISTRATION

General Manager’s Office • O&M Increase of $527,000
– Elimination of Department 930 and transfer of dues and memberships expenses
– Added • General Manager search $55,000 • General Manager salary $69,558 • City Commission travel/training $3,000 • Support for City Commission Governance
Study Committee $24,000
17
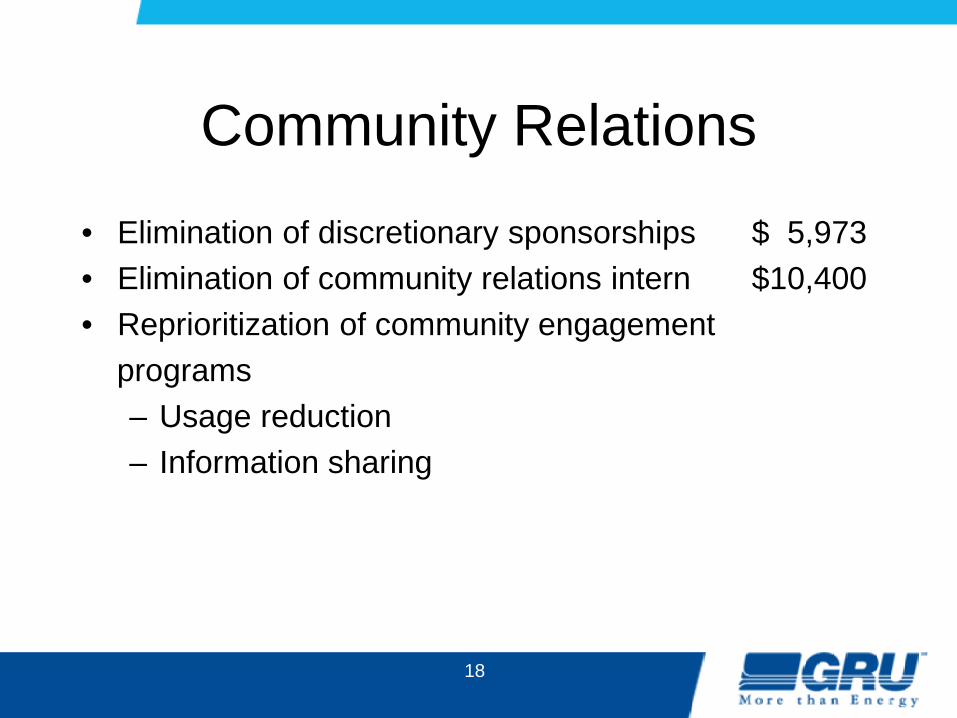
Community Relations
• Elimination of discretionary sponsorships $ 5,973 • Elimination of community relations intern $10,400 • Reprioritization of community engagement programs
– Usage reduction – Information sharing
18

CUSTOMER SUPPORT SERVICES

Customer Support Services FY15 Budget Reduction Summary
Non-Labor O&M $ 367,761 Labor $ 302,594
20
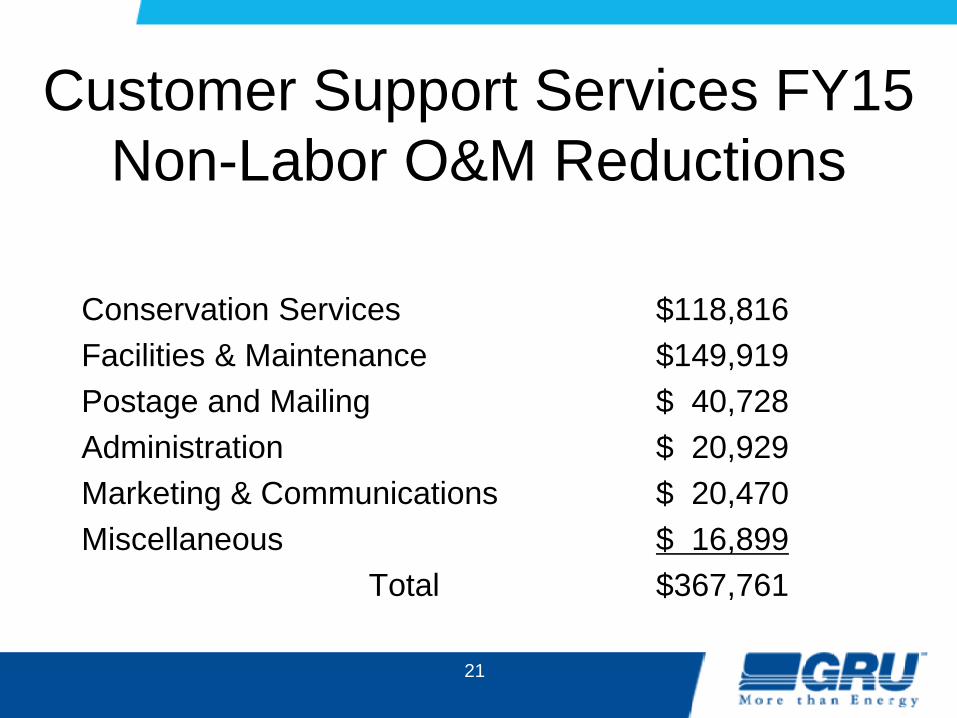
Customer Support Services FY15 Non-Labor O&M Reductions
Conservation Services $118,816 Facilities & Maintenance $149,919 Postage and Mailing $ 40,728 Administration $ 20,929 Marketing & Communications $ 20,470 Miscellaneous $ 16,899 Total $367,761
21

Customer Support Services FY15 Unfunded Positions
Marketing and Communications Specialist, Sr. 1.0 Utilities Materials Specialist, Sr. 1.0 Analyst, Sr. 1.0 Customer Account Rep. 2.0 Account Clerk 2 1.0 Customer Service Rep 2 (2 FT, 2 PT positions) 3.0 Total FTEs Unfunded 9.0
22

INFORMATION TECHNOLOGY

Information Technology FY15 Budget Reduction Summary
Non-Labor O&M $ 484,340 Labor $ 437,907 Capital $ 495,000
24

Information Technology FY15 Non-Labor O&M Reductions
Training and education $ 230,000 Deferred maintenance $ 100,000 Systems/infrastructure consolidation $ 50,000 Outside services $ 50,000 Other miscellaneous $ 54,340 Total $ 484,340
25

Information Technology FY15 Unfunded Positions
CIO/IT Director 1.0 Staff Specialist 1.0 IT Infrastructure Design & Administrator, Lead 1.0 Computer Systems Analyst 1.0 Total FTEs Unfunded 4.0
26

Information Technology CIO and Temp Positions
• Budget proposal does not include Chief Information Officer Position. Estimated (non-burdened) cost to fill this position is $135,000
• Budget proposal eliminates one temporary position from the User Support area, which will prevent complete coverage of combined GG/GRU regular office hours. Estimated cost to keep the position is $30,000
27

Information Technology FY15 Capital Reductions
Servers, data storage, and network hardware $ 495,000
28

FINANCE

Finance FY15 Budget Reduction Summary
Non-Labor O&M $ 63,858 Labor $243,620
30

Finance FY15 Non-Labor O&M Reductions
31
Reductions to annual external audit $ 60,000 Reductions (travel, training, supplies) $ 3,858
Total $ 63,858

Finance FY15 Unfunded Positions
32
Finance Director 1.0 Accounting Supervisor 1.0 Account Clerk, Sr. (Partial) 0.5 Total FTEs Unfunded 2.5

Finance FY15 Non-Labor O&M Additions
Cost of Service study $150,000 External investigative review $250,000 Tax application/bill review $100,000 Total $500,000
33

ENERGY SUPPLY

Energy Supply FY15 Budget Reduction Summary
Non-Labor O&M $ 1,114,693 Labor $ 786,875 Capital $ 3,740,300
35

Energy Supply FY15 Non-Labor O&M Reductions
DH CT1 outage deferred $405,000 DH repair/maintenance of equipment $328,000 DH materials and supplies $231,693 Other (includes contract services) $150,000 Total $1,114,693
36

Energy Supply FY15 Unfunded Positions
Staff Assistant 1.0 Staff Specialist 1.0 System Planning Director 1.0 Production Technician 7.0 Coal/Ash Equipment Operator 1.0 Process Plant Operator II 1.0 Principal Engineer 1.0 Power Plant Lab Technician 1.0 Total FTEs Unfunded 14.0 • Elimination of Temp Professional
37

Energy Supply FY15 Capital Reductions
Crystal River 3 improvements $ 1.75 million CR3 nuclear fuel $ 1 million New generation project $ 1 million
38

39
ENERGY SUPPLY
Fuel $171,649,910
CAPITAL $11,723,500
BASE O&M
$17,403,676
OUTAGE & MAJOR
MAINTENANCE $6,827,865
Energy Supply FY15 Major Budget Areas

Change from Previous Forecast $/Unit Volume Difference ($)
GREC Fuel + VOM $1.05 MW-h (3%) 26, 544 MW-h (5%) 1,486,510
GREC NFEC + FOM $79.15 77,490 MW-h (10%) (6,659,048)
GREC Ad Valorem Taxes
N/A N/A 544,892
Gas for Generation $.17 (3%) 238,148 MW-h (58%) (11,405,378)
Coal for Generation $.45 (11%) 296,826 MW-h (36%) 9,626,626
Solar FIT $6.20 (2.5%) 13,859 MW-h (35%) (3,275,715)
Winter Park N/A 65,700 MW-h 2,411,101
Non-firm Power Purchases
Varies 95,372 MW-h (58%) (3,704,356)
Other (452,082)
Total (11,427,450)
40

41
Energy Supply FY15 Outage & Major Maintenance O&M Cost
• Planned outage: when a unit is removed from service for a specified period of time for reliability maintenance.
• Planned Outage Labor and Non-Labor cost covers: – Preventative/predictive maintenance items – Replacement of selected equipment/components at end of
Remaining useful life (RUL) or refurbishments to extend RUL
– Corrective maintenance of failures that occurred between outages requiring an outage period to correct
– Equipment/component inspections – Testing of required protective devices
• Major maintenance: similar work that does not require the unit to be out of service
42
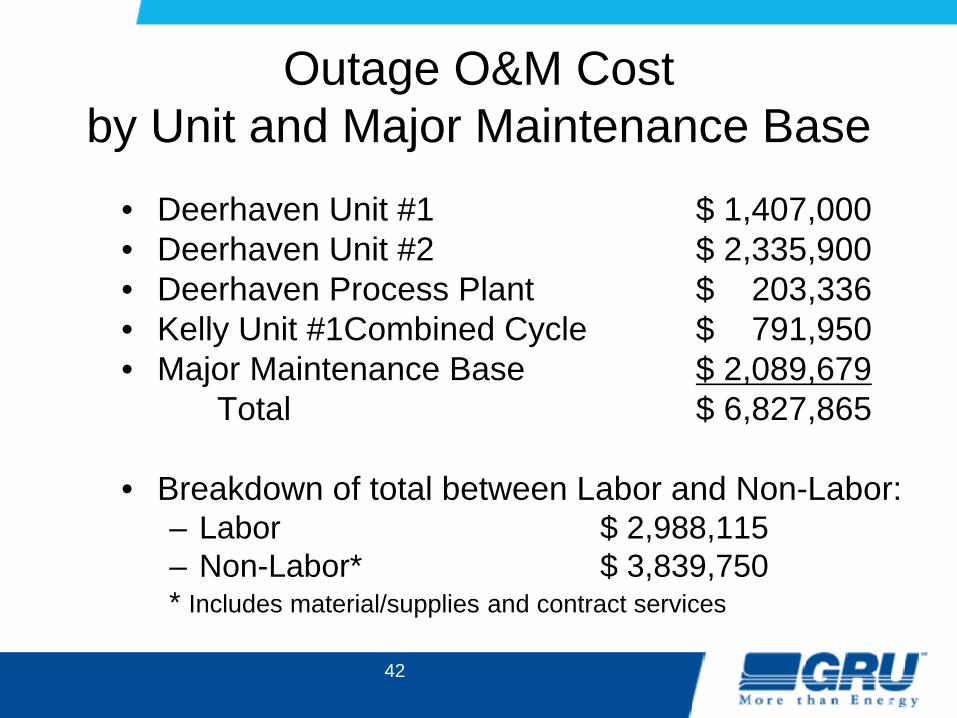
Outage O&M Cost by Unit and Major Maintenance Base
• Deerhaven Unit #1 $ 1,407,000 • Deerhaven Unit #2 $ 2,335,900 • Deerhaven Process Plant $ 203,336 • Kelly Unit #1Combined Cycle $ 791,950 • Major Maintenance Base $ 2,089,679 Total $ 6,827,865
• Breakdown of total between Labor and Non-Labor:
– Labor $ 2,988,115 – Non-Labor* $ 3,839,750 * Includes material/supplies and contract services

Capital Spares/Replacement of Components • Deerhaven CT3 spares $ 2,150,000 • Deerhaven 2 airheater baskets $ 300,000 • Kelly CC1 controls hardware $ 350,000
One-time Life Extension of Components Reaching Remaining Useful Life of Unit
• Deerhaven 2 high temperature superheat replacement $ 1,000,000 • Deerhaven 2 & JRK8 cooling towers work $ 850,000 • Deerhaven 2 air dampers $ 375,000
43

Budgeted Improvements
• Decrease cycling costs $ 1,200,000 • Unit 8 steam turbine controls $ 410,000
Regulatory Requirement/Responsibility
• Mercury air toxics standards compliance $ 1,000,000 • Air quality control system
– Catalyst and bags $ 700,000 • Decommissioned JRK Unit 7
– Cooling tower and asbestos assessment $ 200,000
44
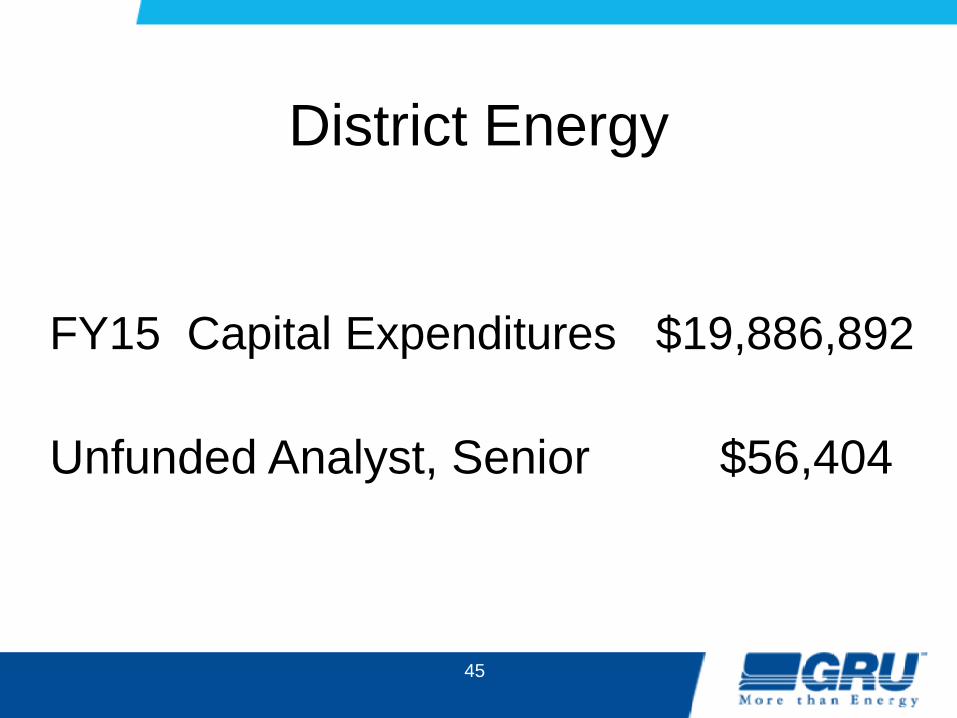
District Energy
FY15 Capital Expenditures $19,886,892 Unfunded Analyst, Senior $56,404
45

South Energy Center Expansion • UF Health slated to build new neurosurgery and cardiovascular
tower – $420 million project – 800 new jobs
• Tower will be served utilities (normal power, emergency power, chilled water, hot water, and medical gas infrastructure) from the SEC
• Contractual obligation for UF Health to connect to SEC and for GRU to serve UF Health
• SEC will need to double on-site power generation, emergency power generation, chillers, cooling towers, and utility infrastructure
46

South Energy Center Expansion Capital Investment • Capital cost estimates range from $17
million to $25 million, dependent upon technology and design
Return on Investment • Internal rate of return ~11%
47

South Energy Center Expansion Timeline • 9/14 – City Commission agenda item for SEC
expansion; will be pending final hospital approval by UF Health board of directors
• 10/14 – UF Health board vote on new hospital tower
• 11/14 – UF Health begins construction • 9/16 – GRU begins chilled water service • 12/17 – New tower opens
48

ENERGY DELIVERY - ELECTRIC

Energy Delivery FY15 Electric System
Budget Reduction Summary
Non-Labor O&M $ 85,684 Labor $196,541
50

Energy Delivery FY15 Electric System
Unfunded Positions
Electric T&D Lead Lineworker 2.0 Lineworker 1.0 Streetlight Worker 1.0 Operations Assistant 1.0 Total FTEs Unfunded 5.0
51

Energy Delivery FY15 Electric System
Non-Labor O&M Reductions
Fleet costs (fuel & repairs) $21,000 Maintenance materials & supplies, equipment & grounds maintenance $43,400 Training, software purchases, etc. $21,464 Total $85,684
52

Energy Delivery FY 15 Electric System
Capital Project Additions
Energy Mgmt System $791,000 Transmission System $225,000 Distribution System $230,000 Overheads $1.5 million
53

Energy Delivery FY 15 Electric System
Customer Focused Initiatives
Included in FY15 Recommendation • LED lighting
RUC referral requested for later implementation
• Redundant/Back-up system capacity rate
54

LED Lighting Public Street Lights – Utility Funded
Light Type * Proposed Monthly Rate *
Light Type 38 – LED Roadway (100 W HPS Equivalent)
$19.62
Light Type 39 – LED Roadway (150 W HPS Equivalent)
$20.83
Light Type 40 – LED Roadway (250 W HPS Equivalent)
$24.01
Light Type 41 – LED Roadway (400 W HPS Equivalent)
$28.72
* GRU Standard LED streetlight fixtures **In addition to monthly rate shown, the applicable retail fuel adjustment will be applied to all energy (kWh) billed.
55

LED Lighting Public Street Lights - Agency Funded
Light Type * Proposed Monthly Rate **
Light Type 38 – LED Roadway (100 W HPS Equivalent)
$1.07
Light Type 39 – LED Roadway (150 W HPS Equivalent)
$1.07
Light Type 40 – LED Roadway (250 W HPS Equivalent)
$3.01
Light Type 41 – LED Roadway (400 W HPS Equivalent)
$5.71
* GRU Standard LED streetlight fixtures **In addition to monthly rate shown, the applicable retail fuel adjustment will be applied to all energy (kWh) billed.
56

ENERGY DELIVERY GAS

Energy Delivery FY15 Gas System
Unfunded Positions
Gas T&D Gas Worker Lead 2.0 Field Services (distributed) Analyst 1.0 Total FTEs Unfunded 3.0
58

Energy Delivery FY15 Gas System
Budget Increase Summary
Non-Labor O&M $45,640 Labor $362,928
59

Energy Delivery FY15 Gas System
Non-Labor O&M Increases
Gas rebates $50,000 Misc. expenses ($4,360) Total $45,640
60

Energy Delivery FY15 Gas System
Labor O&M Increases Field Service allocation $327,000 Metering & Measurement allocation $58,000
61

Energy Delivery FY 15 Gas System
Capital Project Additions
Gate/regulating stations $66,000 Distribution mains $57,000 Overheads $445,000
62

Energy Delivery FY 15 Gas System
Customer Focused Initiatives
• Archer franchise • Hawthorne franchise • Compressed natural gas
63

ENERGY DELIVERY GRUCom
Energy Delivery FY15 GRUCom
Unfunded Position
Operations Telecommunications Specialist II 1.0
65

Energy Delivery FY15 GRUCom
Budget Reduction Summary
Non-Labor O&M $294,921 Labor $622,980
66

Energy Delivery FY15 GRUCom
Non-Labor O&M Reductions
Transport fees $181,000 Professional services $ 36,658 Materials, supplies and tools $ 21,554 Software purchases $ 13,000 Fleet, dues, uniforms, other $ 42,709 Total $278,474
67

Energy Delivery FY15 GRUCom
Capital Project Additions
Trunking radio system $1,000,000 Overheads $ 247,000
68

Energy Delivery FY15 GRUCom
Customer Focused Initiatives
• Superior broadband services
69

WATER

Water FY15 Budget Reduction Summary
Non-Labor O&M $ 200,035 Labor $ 405,303
71

Water FY15 Non-Labor O&M Reductions
Ground storage tank facilities $ 50,000 All other O&M items $150,035 (travel/training, transportation, tools/equipment, parts)
Total $200,035
72

Water FY15 Unfunded Positions
Plant Operator/Mechanic 2.0 Distribution Service Operator 1.0 Distribution Crew Leader 2.0 Technical Support Specialist 0.5 Total FTEs unfunded 5.5
73

WASTEWATER

Wastewater FY15 Budget Reduction Summary
Non-Labor O&M $ 342,940 Labor $ 128,523
75

Wastewater FY15 Non-Labor O&M Reductions
Odor control $ 60,900 All other O&M items $282,040 (travel/training, transportation, tools/equipment, parts)
Total $342,940
76

Wastewater FY15 Unfunded Positions
ICE Technician 1.0 Plant Supervisor 1.0 Collections Service Operator 4.0 Staff Specialist 1.5 Technical Support Specialist 0.5 Total FTEs unfunded 8.0
77

Wastewater FY15 Major Projects and Budget Drivers
• Repair/replace aging infrastructure
• Regulatory compliance – Consumptive use permit (CUP) and minimum flows
& levels (MFLs)
– Biosolids dewatering projects
– Roadway utility relocations
78

Water & Wastewater FY15 Repair/Replace Aging Infrastructure
• Targeted investment in rehabilitating and replacing aging infrastructure
• Water and Wastewater treatment plant facilities – 40 to 80 years old
• Piping infrastructure – 1900 miles of water & wastewater
pipe (Up to 100 years old)
– 170 Lift stations – 4 Elevated and ground storage water
tanks
79

Water FY15 Repair/Replace Aging Infrastructure
Water Projects – Renewal and replacement of
water mains • Service lines to home • Larger mains
– Renewal and replacement of plant facilities
• Production wells & equipment • High service pumps • Electrical building and motor
control centers
80

Wastewater FY15 Repair/Replace Aging Infrastructure
Wastewater Projects – Renewal and replacement
of sewer mains & manholes
• Sliplining gravity mains • Lining or replacing manholes • Valve assessment program
– Renewal and replacement of plant facilities
• Plant mechanical equipment • Lift stations
81
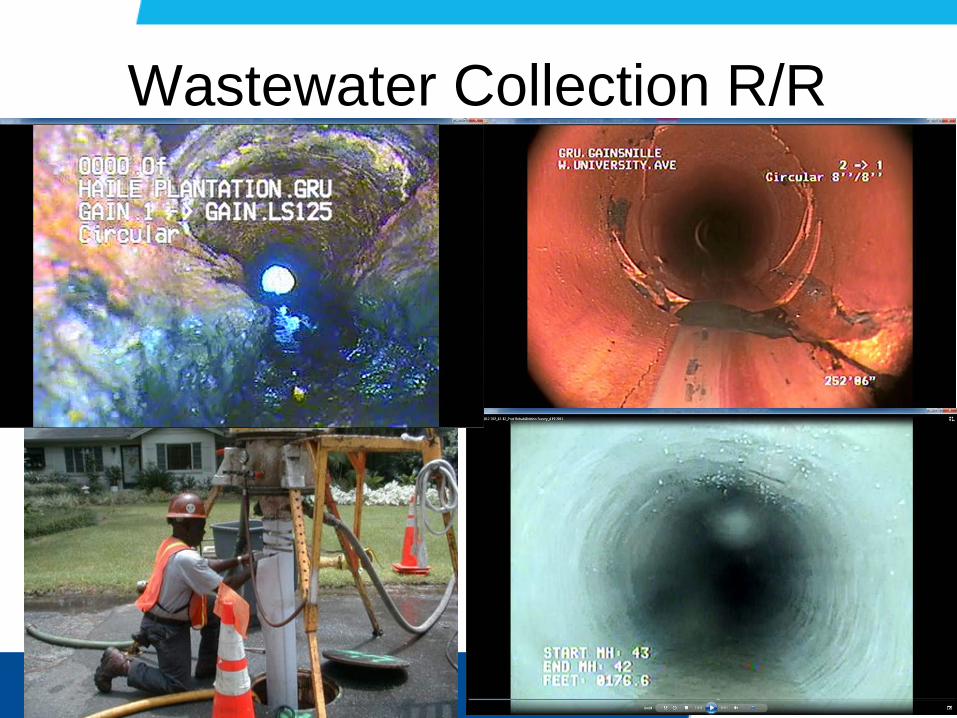
Wastewater Collection R/R
82

Water & Wastewater FY15 Regulatory Compliance
83
• Regulatory compliance requires significant investments in new infrastructure - CUP and MFLs - Biosolids dewatering - Roadway relocations

CUP & MFLs • 20 year – 30 mgd CUP requirements:
– Water conservation – Expansion of reclaimed water system – New recharge wetlands – Investigate hydrologic benefits of recharge wells – Participate in prevention/recovery plan for Lower Santa
Fe River and Lake Geneva • Uncertain future obligations to meet Lower Santa
Fe River & Lake Geneva MFL requirements
84

Wastewater FY15 Biosolids Dewatering
85
• Constructing dewatering facility and other associated treatment plant improvements – ~$23,000,000
• Issuing RFP for future reuse of biosolids – Increase in O&M budget

Roadway Utility Relocations • Utility relocations 15% to
25% of roadway improvement costs
• 1% Transportation
System Surtax
86

CONNECTFREE

Water & Wastewater FY15 ConnectFree Revenue and Expenditures
to Date
Total revenue* $1,848,469 Total spent $ 551,000 Total fund balance $1,297,469
*Surcharge collection started in 2002. Allocation of ½ of surcharge revenue to ConnectFree started in 2004. Revenue shown here is from 2004 through 2014.
88

• 64 Customers served to date – All 64 received water, 2 received WW
service • 10 additional customers being
evaluated
Water & Wastewater FY15 ConnectFree Current Status
89
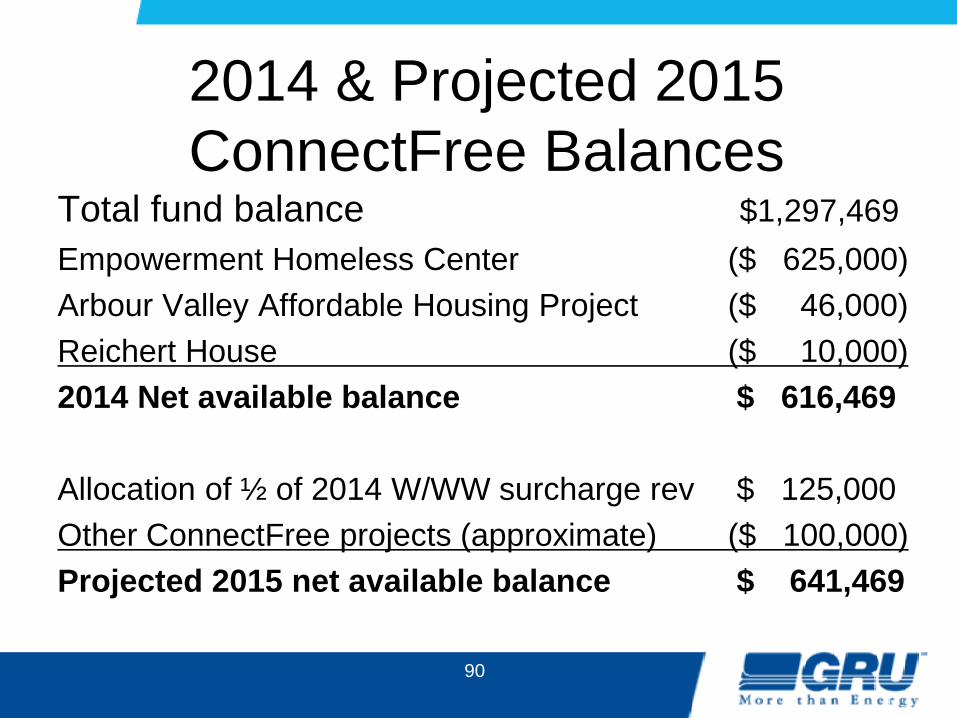
2014 & Projected 2015 ConnectFree Balances
Total fund balance $1,297,469 Empowerment Homeless Center ($ 625,000) Arbour Valley Affordable Housing Project ($ 46,000) Reichert House ($ 10,000) 2014 Net available balance $ 616,469 Allocation of ½ of 2014 W/WW surcharge rev $ 125,000 Other ConnectFree projects (approximate) ($ 100,000) Projected 2015 net available balance $ 641,469
90
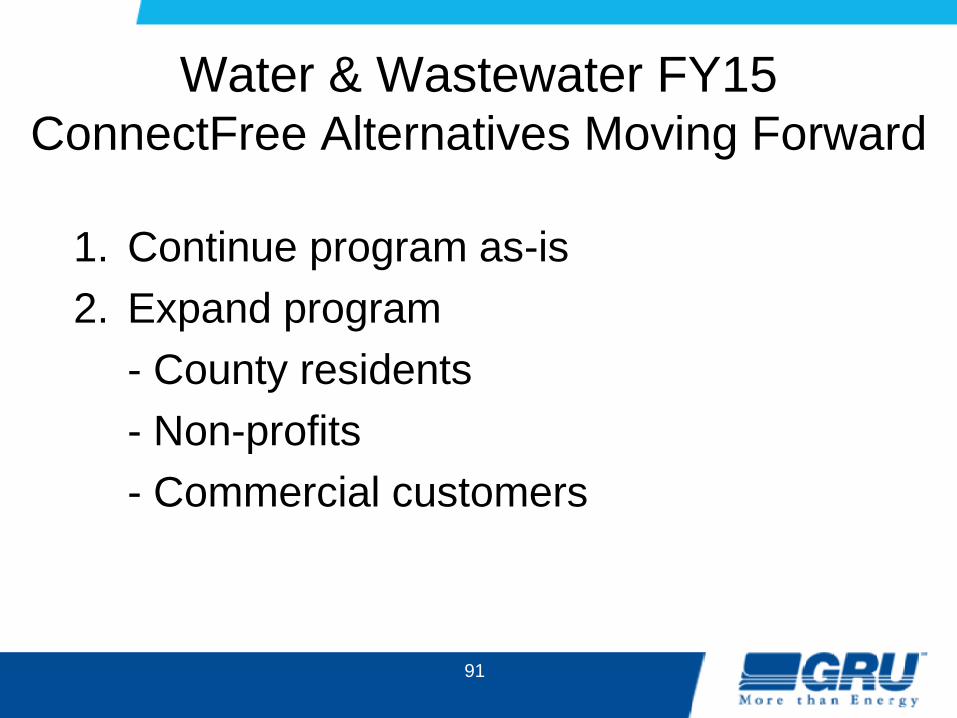
1. Continue program as-is 2. Expand program - County residents - Non-profits - Commercial customers
Water & Wastewater FY15 ConnectFree Alternatives Moving Forward
91

3. Use existing available balance and/or future revenues to mitigate 2015 GRU W/WW rates
4. Use 2014 available balance to mitigate GRU W/WW rates, and use future revenues for General Government designated programs
Water & Wastewater FY15 ConnectFree Alternatives Moving Forward
92

5. Sunset program, reduce or stop collecting surcharge, and cut GFT by $250,000
6. Sunset program, reduce or stop collecting surcharge, and not cut GFT
• $250,000 revenue reduction to GRU
Water & Wastewater FY15 ConnectFree Alternatives Moving Forward
93

Recommendation 5. Sunset program, stop collecting
surcharge, & cut GFT by $250,000 • Allocate $125,000 of available fund balance to
General Gov’t • Use remaining available balance (approx-
imately $516,000) to reduce 2015 water & wastewater rate increases
94

PROPOSED BUDGETS &
FINANCIALS
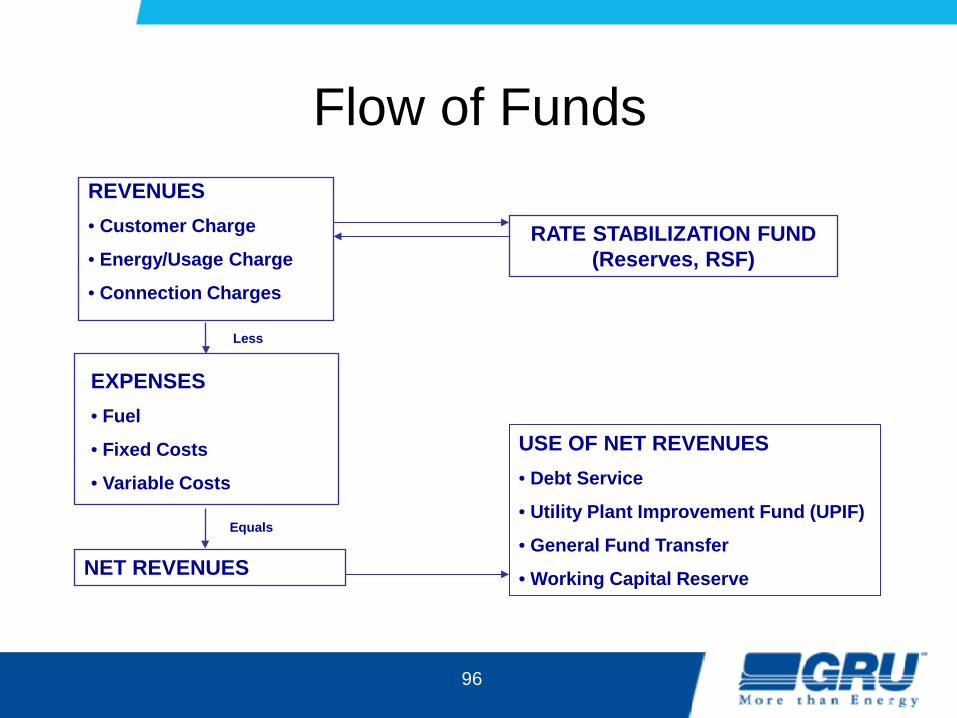
Flow of Funds REVENUES • Customer Charge
• Energy/Usage Charge
• Connection Charges
EXPENSES • Fuel
• Fixed Costs
• Variable Costs
NET REVENUES
Less
Equals
USE OF NET REVENUES • Debt Service
• Utility Plant Improvement Fund (UPIF)
• General Fund Transfer
• Working Capital Reserve
RATE STABILIZATION FUND (Reserves, RSF)
96

FY15 Revenue Classification Dollars in Thousands
97

FY15 Expense Classification Dollars in Thousands
98

FY15 Non-Labor Expense Detail
99

FY15 Capital Expenditure and Bond Issuance
• Increase capital spending from proposed FY15 budget by $31.6 million
• Bond issuance required in FY15
100

Days Liquidity on Hand
101
0
50
100
150
200
250
300
# of
Day
s
Fiscal Year
Days Liquidity on Hand Including Fuel DLOH AA- avg. Fitch DLOH AA avg. Fitch

Debt Service Coverage
102
0.00
0.50
1.00
1.50
2.00
2.50
3.00
3.50
Tim
es C
over
age
Fiscal Year
Total DSC -All Debt Total DSC AA- avg. Fitch Total DSC AA avg. Fitch

Fixed Charge Coverage
103
0.00
0.50
1.00
1.50
2.00
2.50
Tim
es C
over
age
Fiscal Year
Fixed Charge Coverage Fixed Charge Coverage AA- avg. Fitch Fixed Charge Coverage AA avg. Fitch

Reserves – Combined
104
$0
$20,000
$40,000
$60,000
$80,000
$100,000
$120,000
Bal
ance
s
Year
$(000s)
Rate Stabilization Fund Utility Plant Improvement Fund Total Reserves Required

Reserves – Electric
105
$0$10,000$20,000$30,000$40,000$50,000$60,000$70,000$80,000
Bal
ance
s
Year
$(000s)
Rate Stabilization Fund Utility Plant Improvement Fund Total Reserves Required

Reserves – Gas
106
$0
$2,000
$4,000
$6,000
$8,000
$10,000
$12,000
Bal
ance
s
Year
$(000's)
Rate Stabilization Fund Utility Plant Improvement Fund Total Reserves Required

Reserves – Water
107
$0
$2,000
$4,000
$6,000
$8,000
$10,000
$12,000
$14,000
Bal
ance
s
Year
$(000's)
Rate Stabilization Fund Utility Plant Improvement Fund Total Reserves Required

Reserves – Wastewater
108
$0$2,000$4,000$6,000$8,000
$10,000$12,000$14,000$16,000$18,000
Bal
ance
s
Year
$(000's)
Rate Stabilization Fund Utility Plant Improvement Fund Total Reserves Required

Reserves – GRUCom
109
$0
$2,000
$4,000
$6,000
$8,000
$10,000
Bal
ance
s
Year
$(000's)
Rate Stabilization Fund Utility Plant Improvement Fund Total Reserves Required

FORECASTS &
RATES

Forecast Data Sources • Population and household size – Bureau
of Economic and Business Research • Income and inflation – IHS Global Insight • Weather – NOAA station at Gainesville
Regional Airport, using 30 year history • Conservation forecast – developed
internally • Historical data
111

112
0
500,000
1,000,000
1,500,000
2,000,000
2,500,000
2004 2005 2006 2007 2008 2009 2010 2011 2012 2013 2014 2015 2016 2017 2018 2019 2020 2021 2022 2023
Fiscal Year
Electric Energy Sales MegaWatt-hours
Residential Non-Residential Sales for Resale 2014 Forecast
2004 - 2013 CAAGR = -0.87%/yr
2014 - 2023 CAAGR = 0.87%/yr

113
0
5,000,000
10,000,000
15,000,000
20,000,000
25,000,000
30,000,000
2004 2005 2006 2007 2008 2009 2010 2011 2012 2013 2014 2015 2016 2017 2018 2019 2020 2021 2022 2023
Fiscal Year
Natural Gas Energy Sales Therms
Residential Non-Residential 2014 Forecast
2004 - 2013 CAAGR = -2.14%/yr
2014 - 2023 CAAGR = 0.47%/yr

114
0
1,000,000
2,000,000
3,000,000
4,000,000
5,000,000
6,000,000
7,000,000
8,000,000
9,000,000
10,000,000
2004 2005 2006 2007 2008 2009 2010 2011 2012 2013 2014 2015 2016 2017 2018 2019 2020 2021 2022 2023
Fiscal Year
Water Sales Thousand Gallons (kgal)
Residential Non-Residential University of Florida 2014 Forecast
2004 - 2013 CAAGR = -2.50%/yr
2014 - 2023 CAAGR = 0.80%/yr

115
0
1,000,000
2,000,000
3,000,000
4,000,000
5,000,000
6,000,000
7,000,000
2004 2005 2006 2007 2008 2009 2010 2011 2012 2013 2014 2015 2016 2017 2018 2019 2020 2021 2022 2023
Fiscal Year
Wastewater Billings Thousand Gallons (kgal)
Residential Non-Residential 2014 Forecast
2004 - 2013 CAAGR = -1.56%/yr
2014 - 2023 CAAGR = 0.73%/yr

Baker Tilly Electric Cost of Service Study Results
February 2013
116

117
$0.00
$0.02
$0.04
$0.06
$0.08
$0.10
$0.12
$0.14
$0.16
250 500 750 1000 1250 1500 1750 2000 2250 2500 2750 3000
$/kW
h
kWh Billed
FY15 Proposed Residential Electric Rates Price Per kWh Including Fuel and
Excluding Customer Charge

118
$0.00
$0.02
$0.04
$0.06
$0.08
$0.10
$0.12
$0.14
$0.16
$0.18
250 500 750 1000 1250 1500 1750 2000 2250 2500 2750 3000
$/kW
h
kWh Billed
FY15 Proposed Residential Electric Rates Price Per kWh Including Fuel and Customer Charge

Proposed Residential Electric Rates
119
Monthly Customer Charge $11.90 to $12.90
Energy Charge ($/kWh)
– Tier 1 (0 to 250 kWh) $0.039 to $0.032
– Tier 2 (251 to 750 kWh) $0.050 to $0.045
– Tier 3 (Over 750 kWh) $0.094 to $0.080
Fuel Adjustment ($/kWh) $0.069 to $0.078

Residential Electric Bill Change by Usage Level
120
kWh Bill Change from July 2014 to FY15
0 $ 1.00 250 $ 1.50 500 $ 2.50 750 $ 3.50
1,000 $ 2.25 1,250 $ 1.00 1,500 $ (0.25) 1,750 $ (1.50) 2,000 $ (2.75)

Fuel Adjustment
• Proposed FY15 fuel adjustment rate $0.078/kWh • Levelization balance as of June 30, 2014 $11 M • Projected balance as of September 30, 2014 $9.1M • Projected balance as of September 30, 2015 $5.5M • 10% of FY15 Electric fuel budget $16 M • -5% of FY15 Electric fuel budget ($ 8 M)
121

Residential Electric Bill Comparison 1,000 KWh June 2014
$102.99 $105.12 $109.43 $110.26
$113.28 $115.94 $115.96 $118.50 $118.64 $122.84 $123.93
$129.49 $136.42
$139.15 $141.40
$0
$20
$40
$60
$80
$100
$120
$140
$160
122

Proposed General Service Non-Demand Electric Rates
Monthly Customer Charge $30.00 no change
Energy Charge ($/kWh)
– Tier 1 (0 to 1500 kWh) $0.076 to $0.069
– Tier 2 (over 1500 kWh) $0.106 to $0.100
Fuel Adjustment ($/kWh) $0.069 to $0.078
123

General Service Non-Demand Electric Bill Comparison
1,500 KWh June 2014
$144.80
$158.58 $162.68 $167.25 $170.74 $174.22 $175.92 $178.00 $180.05 $192.88 $193.43 $198.15
$227.46
$247.50 $250.50
$0
$50
$100
$150
$200
$250
$300
124

Proposed General Service Demand Electric Rates
Monthly Customer Charge $100 no change
Energy Charge ($/kWh) $0.045 to $0.0405
Demand Charge ($/kW-mo.) $9.25 to $8.75
Fuel Adjustment ($/kWh) $0.069 to $0.078
125

General Service Demand Electric Bill Comparison
30,000 KWh, 75 KW June 2014
$2,542 $2,643 $2,685 $2,722$2,898 $2,954 $2,962 $3,046 $3,048 $3,075
$3,351 $3,458 $3,539
$4,214 $4,311
$0
$500
$1,000
$1,500
$2,000
$2,500
$3,000
$3,500
$4,000
$4,500
$5,000
126

Proposed Large Power Electric Rates
Monthly customer charge $350 no change
Energy charge ($/kWh) $0.0405 to $0.0365
Demand charge ($/kW-mo.) $9.25 to $8.75
Fuel adjustment ($/kWh) $0.069 to $0.078
127

Large Power Electric Bill Comparison 430,000 KWh, 1,000 KW
June 2014
$32,446$35,063
$36,738 $37,315 $38,619 $39,160 $40,357 $41,515 $42,352 $42,660 $43,705
$49,169 $50,184
$56,685 $58,335
$0
$10,000
$20,000
$30,000
$40,000
$50,000
$60,000
$70,000
128

Electric FY 15 Proposed Time of Use Rates
Customer Class Rate Component July 2014 Rate Proposed FY15 Rate
Residential Customer Charge $17.60 $25.00
On Peak $/kWh Off-Peak $/kWh
$0.139 $0.035
$0.141 $0.037
General Service Non-Demand Customer Charge $35.00 $40.00
On Peak $/kWh Off-Peak $/kWh
$0.169 $0.042
$0.162 $0.038
General Service Demand Customer Charge $55.00 $100.00
On Peak $/kWh Off-Peak $/kWh Demand Charge $/kW
$0.064 $0.016
$9.25
$0.072 $0.023
$8.75
Large Power Customer Charge $305.00 $350.00
On Peak $/kWh Off-Peak $/kWh Demand Charge $/kW
$0.062 $0.016
$9.25
$0.066 $0.020
$8.75 Peak Hours: Weekdays, 6:00 am to 10:00 pm, excluding holidays. Off-peak Hours: All other hours. Fuel Adjustment Applies to All TOU kWh.
129

Proposed Residential Natural Gas Rates
Monthly Customer Charge $9.52 to $9.75
Energy Charge ($/therm) $0.482 to $0.502
Manufactured Gas Plant Cost Recovery Factor
(Depot Park) ($/therm) $0.0505 to $0.0556
Purchased Gas Adjustment ($/therm) $0.40 to $0.46
130

Residential Natural Gas Bill Comparison 25 Therms June 2014
$32.83 $35.19
$38.32 $41.62 $41.66 $42.81
$45.26 $47.68 $48.12
$50.97 $53.75
$0
$10
$20
$30
$40
$50
$60
131

Proposed Small Commercial Natural Gas Rates
Monthly Customer Charge $20.00 no change
Energy Charge ($/therm) $0.465 to $0.490
Manufactured Gas Plant Cost Recovery
Factor (Depot Park) ($/therm) $0.0505 to $0.0556
Purchased Gas Adjustment ($/therm) $0.40 to $0.46
132

Small Commercial Natural Gas Bill Comparison 50 Therms June 2014
$62.56 $65.78 $70.28 $73.30
$83.17 $87.87 $88.02
$91.75 $91.96
$107.12 $110.50
$0
$20
$40
$60
$80
$100
$120
133

Proposed Commercial Natural Gas Rates
Monthly Customer Charge $40.00 no change
Energy Charge ($/therm) $0.343 to $0.365
Manufactured Gas Plant Cost Recovery Factor
(Depot Park) ($/therm) $0.0505 to $0.0556
Purchased Gas Adjustment ($/therm) $0.40 to $0.46
134

Commercial Natural Gas Bill Comparison 300 Therms June 2014
$278.05 $291.14 $304.18 $321.39
$352.23 $378.37
$399.00 $402.23 $433.72
$471.30
$520.00
$0
$100
$200
$300
$400
$500
$600
135

Proposed Commercial Large Volume Natural Gas Rates
Monthly Customer Charge $375 no change
Energy Charge ($/therm) $0.20394 $0.20500
Manufactured Gas Plant Cost Recovery Factor (Depot Park) ($/therm) $0.0505 to $0.0556
Purchased Gas Adjustment ($/therm) $0.40 to $0.46
136

Large Volume Natural Gas Bill Comparison 30,000 Therms
June 2014
$18,687$20,008
$21,108 $21,993
$26,878$28,354 $28,721
$30,872 $31,251$33,363 $34,150
$0
$5,000
$10,000
$15,000
$20,000
$25,000
$30,000
$35,000
$40,000
137

Water Rates Proposed Multi-Family Rate
Monthly Customer Charge $9.20
Usage Charge ($/1,000 gallons) $3.05
• Rate to be phased in over two years • Rate shown reflects addition of 50% of difference
between proposed first tier residential and commercial rates
138

Proposed Residential Water Rates
139
2014 Rate 2015 Without Multi-Family
Recommended 2015 With
Multi-Family Monthly Customer Charge $9.00 $9.35 $9.20 Usage Charge ($/1,000 gallons) Tier 1 (0-6,000 gallons) $2.30 $2.40 $2.35 Tier 2 (7,000-20,000 gallons) $3.75 $3.80 $3.75 Tier 3 (over 20,000 gallons) $6.00 $6.00 $6.00

Water Rates Proposed Residential Irrigation
Residential Irrigation 2014 Rate 2015 Without Multi-Family
Recommended 2015 With
Multi-Family Monthly Customer Charge $9.00 $9.35 $9.20 Usage Charge ($/1,000 gallons) Tier 1 (0-14,000 gallons) $3.75 $3.80 $3.75 Tier 2 (over 14,000 gallons) $6.00 $6.00 $6.00
140

Residential Water Bill Comparison 7,000 gallons
June 2014
$13.71 $15.36 $15.94
$20.16 $21.04 $21.08 $21.10 $22.13 $23.31 $23.37
$25.94 $26.55 $27.05 $27.55 $29.96
$31.90
$36.54
$42.02
$0
$5
$10
$15
$20
$25
$30
$35
$40
$45
141
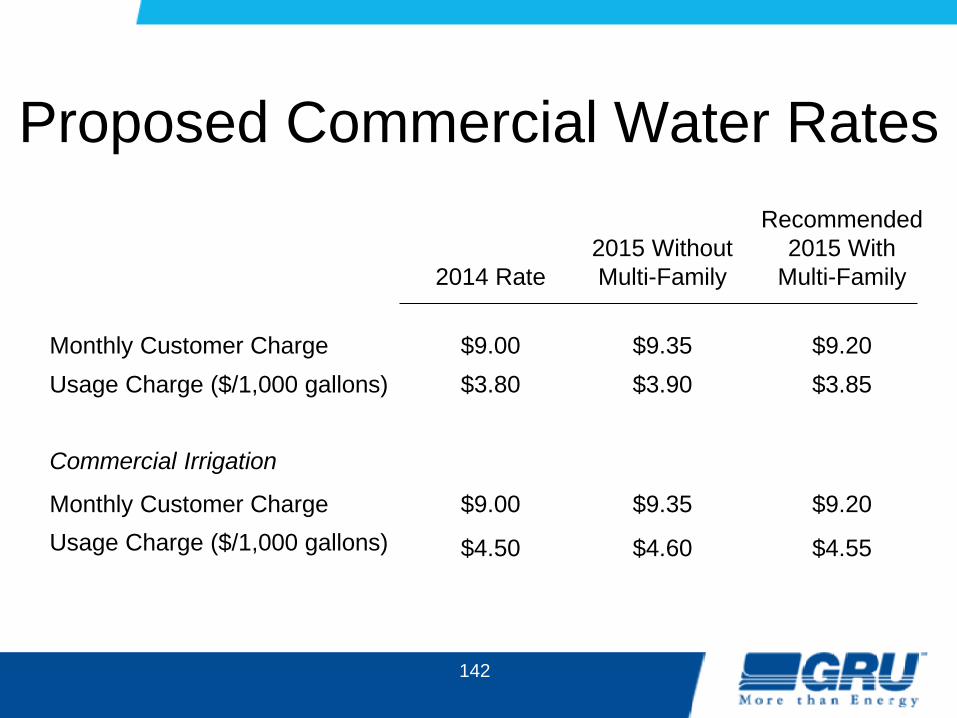
Proposed Commercial Water Rates
142
2014 Rate 2015 Without Multi-Family
Recommended 2015 With
Multi-Family
Monthly Customer Charge $9.00 $9.35 $9.20 Usage Charge ($/1,000 gallons) $3.80 $3.90 $3.85
Commercial Irrigation
Monthly Customer Charge $9.00 $9.35 $9.20 Usage Charge ($/1,000 gallons) $4.50 $4.60 $4.55

Commercial Water Bill Comparison 30,000 gallons
June 2014
$46.10
$55.97 $57.72 $63.93 $66.45 $68.40
$72.49 $78.75
$92.40
$105.83 $107.98
$122.24 $123.00 $124.70 $126.35 $128.76
$0
$20
$40
$60
$80
$100
$120
$140
143

Proposed Residential and Commercial Wastewater Rates
144
Monthly Customer Charge $7.85 to $8.40 Kgal (1,000 gallons) Charge $5.85 to $6.05 Reclaimed Water
– Customer Charge $7.85 to $8.40 – Kgal (1,000 gallons) Charge $0.65 to $0.70

Residential Wastewater Bill Comparison 7,000 gallons
June 2014
$31.15
$38.68 $39.41 $39.54 $39.84 $42.72 $43.48 $44.11 $45.02 $46.35 $48.01 $48.80
$50.75 $53.73 $54.20 $55.03 $56.40
$65.94
$0
$10
$20
$30
$40
$50
$60
$70
145

Commercial Wastewater Bill Comparison 30,000 gallons
June 2014
$116.82 $118.53 $119.35 $119.66$126.40
$131.15
$145.95 $147.14 $148.82
$177.25 $180.00 $183.35 $188.90 $189.90$191.17
$212.85$224.69
$236.52
$0
$50
$100
$150
$200
$250
146

Proposed Water Connection Charges
• Residential (5/8”) Water Connection – Meter Only $240 to $250 – Total Plant, T&D and Meter $1,550 to $1590
• Commercial (1”) Water Connection – Meter Only $440 to $450 – Total Plant, T&D and Meter $4,110 to 4,220
• Inspection Fees – Flat Fee $680 to $700 – $/Linear Foot $2.20 to $2.25
147

Proposed Wastewater Connection Charges
• Residential (5/8”) Wastewater Connection – Collection & Treatment Plant $3,680 to $3,780
• Commercial (1”) Wastewater Connection – Collection & Treatment Plant $12,360 to $12,690
• Inspection Fees – Flat Fee $1,220 to $1,250 – $/Linear Foot $5.41 to $5.55
• Temporary Wastewater Connection Charge – $/gpd ADF $0.3427 to $0.3519
148

Proposed FY15 Residential Rates
System Usage Level July 2014 Bill
Base Rate Change
Fuel Change
Total Change to
Bill
Proposed FY15 Bill
Electric 1,000 kWh $139.15 ($6.75) $ 9.00 $ 2.25 $141.40
Water* 7,000 gallons $ 26.55 $ 0.50 $ 0.50 $ 27.05
Water 7,000 gallons $ 26.55 $1.00 $ 1.00 $ 27.55
Wastewater 7,000 gallons $ 48.80 $ 1.95 $1.95 $ 50.75
Gas 25 therms $ 32.83 $ 0.86 $ 1.50 $ 2.36 $ 35.19
*Assumes recommended Multi-family Water Rate adopted July 2014 Electric and Gas Bills based on FA of $0.069/kWh and PGA of $0.40/therm. Proposed FY15 Electric and Gas Bills based on FA of $0.078/kWh and PGA of $0.46/therm
149

150
System/Class Usage Level Change to Bill
Electric - General Service Non-Demand 1,500 kWh 1.2%
Electric - General Service Demand 30,000 kWh, 75 kW 2.3%
Electric - Large Power 430,000 kWh, 1,000 kW 2.9%
Water 30,000 gallons *1.38% / 2.72%
Wastewater 30,000 gallons 3.57%
Gas - Small Commercial 50 therms 6.8%
Gas - Commercial 300 therms 9.4%
Gas - Large Volume 30,000 therms 9.9%
Proposed FY15 Business Rate Changes
*Assumes Multi-family Water Rate adopted

RECOMMENDATION

Direction from City Commission
• ConnectFree recommendation
• Referral to RUC of redundant/back-up system capacity rate
152

Recommendation
• The City Commission direct the City Attorney to draft, and the Clerk of the Commission to advertise an ordinance to adopt the recommended rates and charges for Electric, Water, Wastewater and Gas.
153