Embed Size (px)
Citation preview
Proposal of a Quality-Index or Metric for Soft Copy Display Systems:Contrast Sensitivity Study
Jihong Wang Ph.D.,1 Ken Compton,2 and Qi Peng1
In addition to the inherent qualities of a digital image,
the qualities of the monitor and graphics control card
as well as the viewing conditions will affect the per-
ceived quality of an image that is displayed on a soft
copy display (SD) system. With the implementation of
picture archiving and communication systems
(PACS), many diagnoses are being made based on
images displayed on SD devices, and consequently
SD quality may affect the accuracy of diagnosis. Un-
like the traditional film-on-lightbox display, optimal
SD system parameters are not well defined, and many
issues remain unsettled. In this article, the human
observer performance, as measured by contrast sen-
sitivity, for several SD devices including an active
matrix liquid crystal flat panel monitor is reported.
Contrast sensitivities were measured with various
display system configurations. Experimental results
showed that contrast sensitivity depends on many
factors such as the type of monitor, the monitor
brightness, and the gamma settings of the graphics
card in a complex manner. However, there is a clear
correlation between the measured contrast thresh-
olds and the gradient of the display device’s lumi-
nance response curve. Based on this correlation, it is
proposed to use the gradient of luminance response
curve as a quality-index or metric for SD devices.
KEY WORDS: Soft copy display, contrast sensitivity,
gradient of luminance response curve, display quality
index, human observer performance
ADISPLAY SYSTEM is the final link be-tween the acquired image data and the
eye–brain system of the human observer. Ob-viously the quality of a soft copy display (SD)system has a direct impact on the perceivedimage quality, and various components of anSD system can affect the performance of thehuman observer.1-15 An SD system typicallyincludes a monitor (either CRT or LCD flat-panel) and a graphics control card. An SD
system is more complex than a conventionalfilm/lightbox (the hard copy) display system,and it has many varieties. In radiology, the in-creasing number of picture archiving and com-munication system (PACS) implementationsworldwide has led to an increasing number ofdiagnostic decisions being made based on im-ages that are displayed on computer monitors.However, the quality of SD systems varies andthere is no common, easy-to-use quality indexto determine and to compare the quality of adisplay or to predict a user’s performance.Furthermore, image processing and manipula-tion may partially compensate for an SD sys-tem’s contrast and spatial resolutiondeficiency.7,16,17 For instance, zooming in on animage on an SD work station can compensatefor the spatial resolution limitations of themonitor. Also, it is possible to adjust imagecontrast by ‘‘windowing and leveling’’ of animage. However, these adjustments decrease auser’s performance efficiency. Thus, it is im-portant to ensure the optimization of the entireSD system so that unnecessary adjustments areminimized.
1From the Department of Radiology, University of Texas
Southwestern Medical Center in Dallas, Dallas, Texas 75390-
9071, USA; and 2Clinton Electronics Inc., Loves Park, Illi-
nois 61111, USA.
Correspondence to: JihongWang Ph.D., Associate Pro-
fessor, Department of Radiology, UT Southwestern Medical
School at Dallas, 5323 Harry Hines Blvd., Dallas, TX 75390-
9071; tel: 214-648-2621; fax: 214-648-7513; e-mail: Jihong.
Copyright � by 2003 SCAR (Society for Computer
Applications in Radiology)
Online publication 11 September 2003
doi: 10.1007/s10278-003-1657-8
Journal of Digital Imaging, Vol 16, No 2 (June), 2003: pp 185-202 185
To display a digital image on an SD systeminvolves multiple steps. It can be briefly de-scribed as follows. Once the image acquisitionmodalities (e.g., CR, DR, CT, and MR) acquirethe images, they are stored as digital data on acomputer. A digital image is represented in acomputer by a two-dimensional matrix of data.Each data point of the matrix is called a pixel.Pixels are normally represented by integer val-ues ranging from 0 to 4096 (12 bits). On acomputer, the pixel matrix can be processed ormanipulated to enhance certain features in animage. Modern imaging software offers a vari-ety of image-processing algorithms. One exam-ple of these algorithms is the familiar‘‘widowing and leveling,’’ where pixel valueswithin some data range are re-scaled to matchthe full output range of the display in order toenhance the contrast. A graphics card on thecomputer produces the analog signals requiredfor image display monitors. On the graphicscard, pixel values are scaled into digital drivinglevels (DDLs) matched to the acceptance rangeof the card’s digital-to-analog converter (DAC).Normal ranges are 8 bits for desktop comput-ers, and 10 bits for some specialized medicaldisplay devices. The DDL scaling process uti-lizes a conversion table, which is often referredto as the ‘‘look-up table’’ (LUT) on the graphicscard and can be adjusted on some cards. Theanalog output of the graphics card drives thedisplay monitor. The electronics in a monitoramplifies the analog signals to modulate theintensity of the electron beam for the CRTmonitors or the driving voltage for LCD mon-itors. Through fast scanning, the monitor gen-erates a visible pattern of luminancedistribution, i.e., the ‘‘image.’’ Signal amplifi-cation in the CRT monitor’s electronics is linearby design. However, the CRT cathode follows apower-law response, thus the CRT monitors’electronics inclusive of the cathode response isnonlinear. This adds another level of conversionin the image displaying process.Therefore, at least three steps of conversion
have been performed before an image datamatrix is displayed on a monitor. The first stepis the computerized image processing and en-hancement performed on the data, which isindependent of the display device. The secondconversion occurs when the post-processed
pixel data is scaled to DDLs on the graphicscard. The third happens when the output an-alog video voltage from the graphics card isconverted to a luminance pattern (i.e., thevisible image) on the monitor. Each of theseconversions will affect the final appearance ofan image. To explain the differences in imageappearance between SD systems, these multi-ple conversions must all be taken into account.In this article, however, the focus is on the lasttwo conversions, both of which happen withinthe display system. The combination of thesecond and the third conversion steps is re-ferred as the luminance response curvethroughout this article. The luminance re-sponse curve relates the pixel value of a digitalmatrix to the measured monitor luminanceoutput for that pixel value. An SD system’sluminance response curve will be affected bythe characteristics of monitor, graphics card,and viewing conditions.An SD system’s brightness, spatial resolu-
tion, number of distinct shades of gray, contrastratio, LUT, and viewing conditions are allmembers of the long list of factors affectingimage perception and the performance of ahuman observer. In radiology, these factorsusually affect human performance by influenc-ing the visibility of structures or abnormalitieswith respect to the background. Thus there is adirect effect on the sensitivity and specificity ofclinical diagnoses.1-4,7,9 Furthermore these fac-tors may affect the time taken to perform a taskas well as the observer’s level of fatigue. How-ever, the two most important aspects of anyimage-display device are the spatial and con-trast resolution. The higher the spatial resolu-tion, the better the display quality is. For SDsystems, the spatial resolution is limited bymonitor technology, and a compromise is usu-ally struck between spatial resolution, bright-ness, contrast ratio, and cost. Contrastresolution is more complex and can be adjustedin an SD system. The contrast resolution of anSD system may be different at different pixellevels (or different luminance levels) dependingon the configurations of the monitor and thegraphics card. It is partially constrained bythe monitor brightness range and the bit depthof the graphics card.18-20 Therefore, the qualityof two identical SD devices may differ because
186 WANG ET AL
of differences in configuration. In addition,image processing and manipulation can alsomodify image contrast. This is independent ofthe SD system but is often confused with thecontrast modification done by the display.Ideally an SD system should be adjusted toensure the optimal performance of a humanobserver. In this article we report the contrastsensitivity measurements of several monitorsdesigned for medical applications and severaldesktop computer monitors.In the past several years, the active matrix
liquid crystal display (AMLCD) based moni-tors have been introduced to the radiologycommunity for primary diagnostic usage inPACS by several vendors and have gainedbroader clinical acceptance. However, the un-derstanding of their characteristics, especiallythe contrast sensitivity, is not widely known. Asof today, the predominant component for theflat panels is the IBM 3 megapixel core. Theperformance attributes of the AMLCD coreform a common backdrop for the variouselectronic configurations of row/column driver,internal calibration LUT (if present), andgraphics card performance. The metrics thathave served the industry for decades with CRT-based displays must now be redefined to en-compass attributes such as off-axis viewing, la-tent image retention, and discontinuities inresponse inherent in the AMLCD. It is up tothe vendors to address the response character-istics so that they are transparent to the enduser, providing a display system that achievesdigital imaging and communication in medicine(DICOM) compliance.The responsiveness of the AMLCD to small
luminance signal changes has been a primaryweakness of the technology. In this study, wemeasured the contrast sensitivity of an AM-LCD monitor and compared it to that of theconventional CRT-based monitors.
METHODS
An interactive computer program was developed to
measure the observer’s contrast sensitivity for the SD de-
vices evaluated. During the experiments, a human observer
was presented with a series of test images. In each of the test
images, there was a single circular object randomly located
on a uniform background. If the observer pointed and
clicked the mouse at the correct location of the object, then
another object with decreased object contrast but the same
size appeared at another random location. The tests con-
tinued until the observer could no longer correctly locate the
object. The last visible contrast level was recorded auto-
matically as the contrast threshold for that particular object
size and that particular background level. More test images
with another object size were then presented to the observer.
This continued until the contrast thresholds for a pre-de-
fined range of object sizes and background levels were ob-
tained. Details about this interactive program and the data
acquisition can be found in a previous publication.21 The
computer program can be obtained for evaluation and re-
search purposes by contacting the authors directly.
Contrast thresholds were measured at various back-
ground luminance levels for a range of object sizes, from
small (2 mm diameter) to large (10 mm diameter). To sim-
ulate the clinical use of these monitors, observers were in-
structed to perform the testing from a comfortable viewing
distance (normally around 40-50 cm). No restrictions were
applied to their viewing distance or viewing angle.
Contrast threshold was defined as the pixel value differ-
ence of the object from that of its background. It was cal-
culated by subtracting the pixel value for the background
from that of the object. A lower contrast threshold means
that the observer can see an object with lower contrast, and
thus the display system has higher contrast sensitivity (or
better user performance). The test images were all 8-bit
gray-scale images. In other words, the maximum brightness
corresponded to a pixel value of 255 and the minimum
brightness corresponded to a pixel of zero.
To study the effect of room lighting on detection per-
formance, the contrast thresholds were also measured with
and without the fluorescent room light on. This resulted in a
measured value of 170 lux with the lights on 2 lux with the
lights off.
Several monitors were evaluated in the experiments,
which included a Clinton Electronics DL3000 AMLCD flat-
panel monochrome monitor, a Clinton Electronics
DMA373 CRT monochrome monitor, an Image Systems
M21HBMax CRT monochrome monitor, an Image System
M21Max CRT monochrome monitor, and several color
CRT monitors (ViewSonic GA771, NEC MultiSync XVI7,
and KDS XF9c). All monochrome monitors were designed
for medical imaging use. A computer running Microsoft NT
was used to generate digital test images used in this study.
The computer system had its own internal graphics adapter
that allowed the user to set the display matrix size and
gamma. The graphics adapter supported a 256 step gray-
scale (8-bit). The matrix size of the graphics adapter was set
to 1280 · 1024 for all displays except the AMLCD flat-panel
monitor. For the flat-panel monitor, a computer equipped
with a Matrox Med 3MP graphics card was used.
The monitor’s luminance outputs for a range of pixel
values were measured for each display with a calibrated
Minolta LS110 luminance meter (Minolta Corporation,
Ramsey, NJ). The measurement set-up followed the proto-
col recommended by AAPM TG18.27 The measurements
give the luminance response curve of each display system.
No additional conversion was applied at the software level.
The gradient of luminance response curve is defined as the
slope of the log (luminance) versus pixel value plots. Thus
QUALITY INDEX FOR SOFT COPY DISPLAY 187
the unit for the gradient of luminance response curve is log
(cd/m2)/(pixel value).
A total of 10 observers (age range: 25 years to 58 years)
participated in the studies, although not all observers par-
ticipated in all experiments. Their contrast threshold meas-
urements were repeated three times for intra- and inter-
observer repeatability assessment of contrast threshold
measurement.
RESULTS
The AMLCD Flat-Panel Monitor
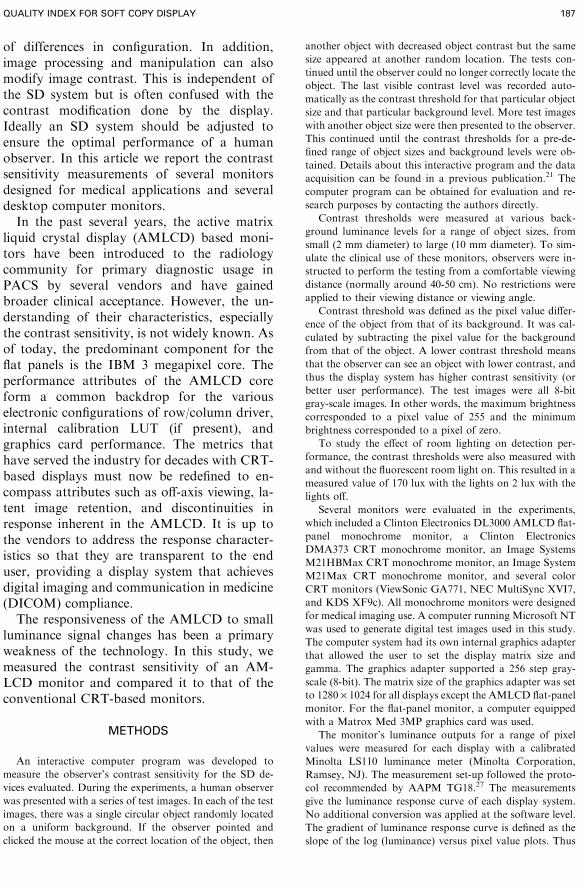
Figure 1a shows the luminance responsecurve of the Clinton Electronics DL3000 AM-LCD flat-panel monitor measured at 90 de-
Fig 1. Continued
188 WANG ET AL
grees (perpendicular to) and 45 degrees to themonitor surface. The x-axis represents the in-put pixel values, and the y-axis represents thecorresponding luminance levels in cd/m2 (logscale). Note that there is a slight luminancedecrease at the 45-degree angle, which is ex-pected because of the intrinsic angular-de-pendence of LCD luminance output. Inaddition, a close-up view of the luminance re-sponse curve (Fig 1b) reveals ‘‘step-like’’ fea-tures on the luminance response curve at some
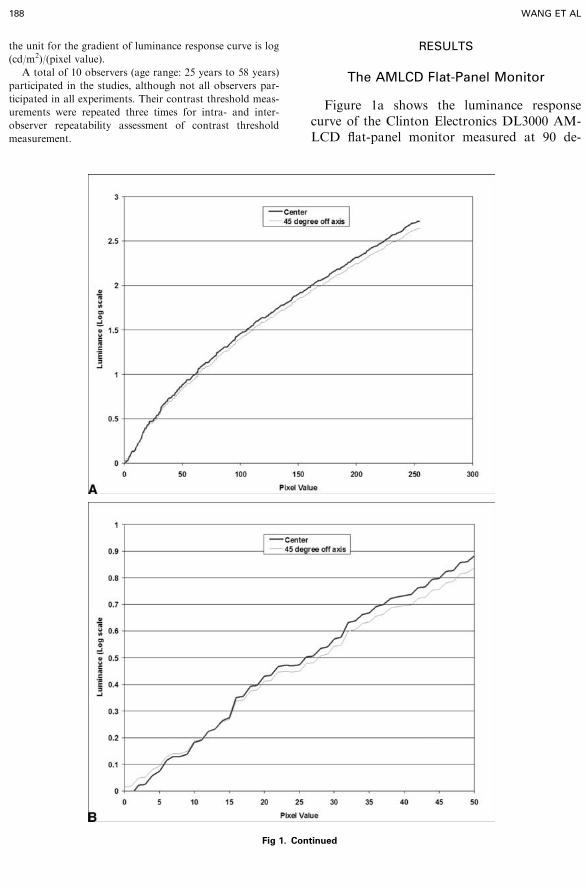
pixel values. Note that at these pixel values, anincrease in pixel value does not result in in-crease in output luminance level, and someeven have decreased luminance level. Figure 1cis a plot of the gradient of the luminance re-sponse curve in Figure 1a. The gradient of theluminance response curve is defined as theslope of the luminance response curve in Fig-ure 1a and has a unit of cd/m2 per pixel value(in log scale). Note the spikes and troughs onthe luminance response curve (Fig 1c), whichare the results of the step-like features from theluminance response curve. This step-like fea-ture in the luminance response curve is aproblem unique to the present AMLCD tech-nology, and it is a result of the intrinsic re-sponse of the liquid crystal material to appliedvoltage. The liquid crystals’ response to thetwo least significant bits of AMLCD is alsoproblematic, and often techniques such as‘‘dithering’’ are used to force a response thatwould otherwise not occur. For comparison,Figure 2 shows an example of the luminanceresponse curve for one of the CRT monitorsevaluated in the study. Note the absence of thestep-like features in the luminance responsecurve. Unlike the AMLCD flat-panel monitor,all CRT monitors evaluated in this study haverelatively smooth luminance response curves.
Fig 2. The luminance response curve for one of the CRT
monitors evaluated in the study. Note the absence of the
‘‘step-like’’ features in Figure 1a and 1b.
Fig 1. a. The luminance re-
sponse curves of the Clinton Elec-
tronics D13000 AMLCD flat panel
monitor measured at 90 and 45
degrees to the surface of the
monitor. b. The close-up view of
the luminance response curves in
Figure 1a. Note the ‘‘steps’’ on the
curves. c. The gradient of
luminance response curves for the
flat panel monitor. Note the spikes
and troughs in the gradient of
luminance response curves.
QUALITY INDEX FOR SOFT COPY DISPLAY 189
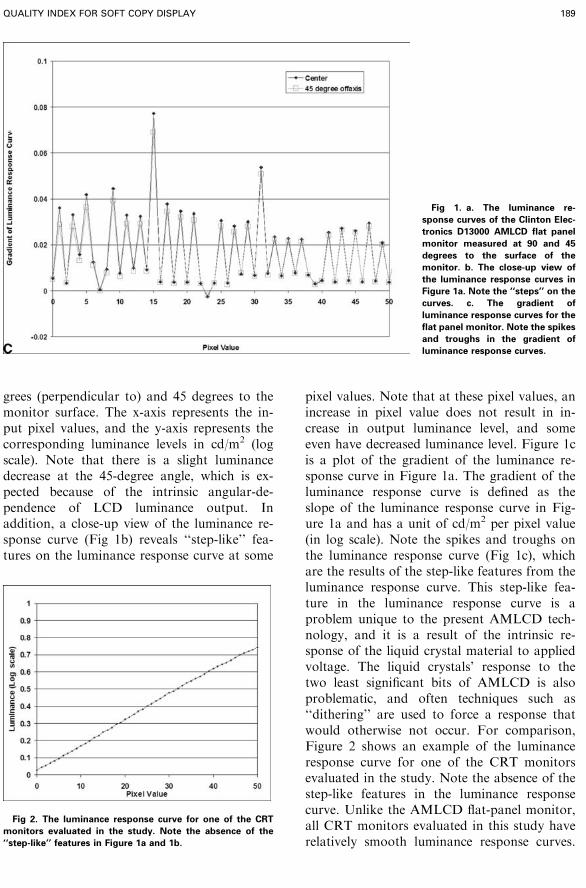
The discontinuities in the AMLCD monitor’sluminance response curve result in troughs andspikes in the gradient of luminance responsecurve. At the pixel values where some of thetroughs occur, the contrast threshold increases(contrast sensitivity decreases), as depicted inFigure 3a and 3b.In Figure 3a, the contrast thresholds of one
observer using the AMLCD monitor and the
gradient of luminance response curve is shownfor the entire 8-bit pixel values (from 0 to 255).The gradient is re-scaled (multiplied by 100) inorder to over-plot the contrast threshold on thesame graph. Figure 3b shows the close-up viewof figure 3a (for pixel value range from 1 to 50).It clearly shows that contrast thresholds of thisflat-panel monitor are correlated to the gradientof the luminance response curve. When the
Fig 3. a. The contrast threshold
and gradient of luminance
response curve for the AMLCD
flat panel monitor. b. Close-up
view of Figure 3a. Note that every
time the gradient is less than
0.01, the contrast threshold is
larger than the minimum, 1 pixel
level.
190 WANG ET AL
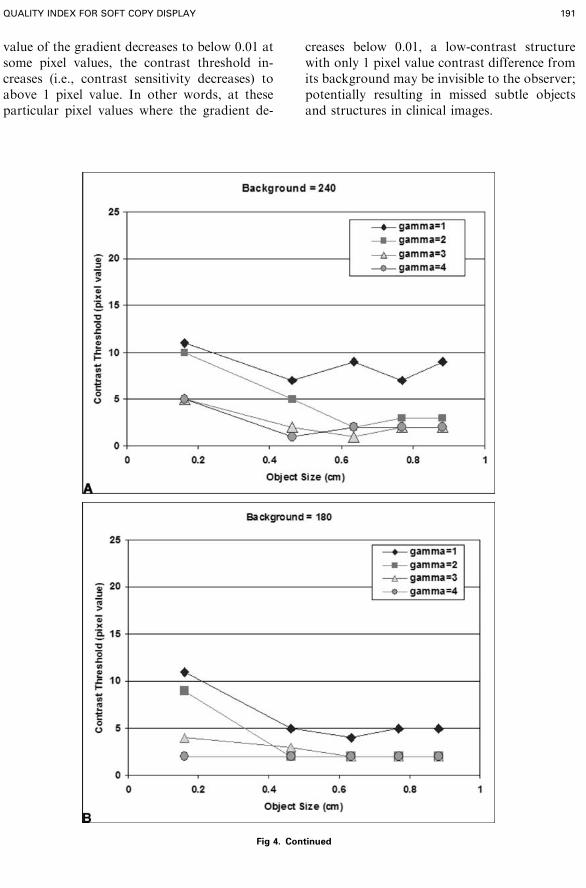
value of the gradient decreases to below 0.01 atsome pixel values, the contrast threshold in-creases (i.e., contrast sensitivity decreases) toabove 1 pixel value. In other words, at theseparticular pixel values where the gradient de-
creases below 0.01, a low-contrast structurewith only 1 pixel value contrast difference fromits background may be invisible to the observer;potentially resulting in missed subtle objectsand structures in clinical images.
Fig 4. Continued
QUALITY INDEX FOR SOFT COPY DISPLAY 191
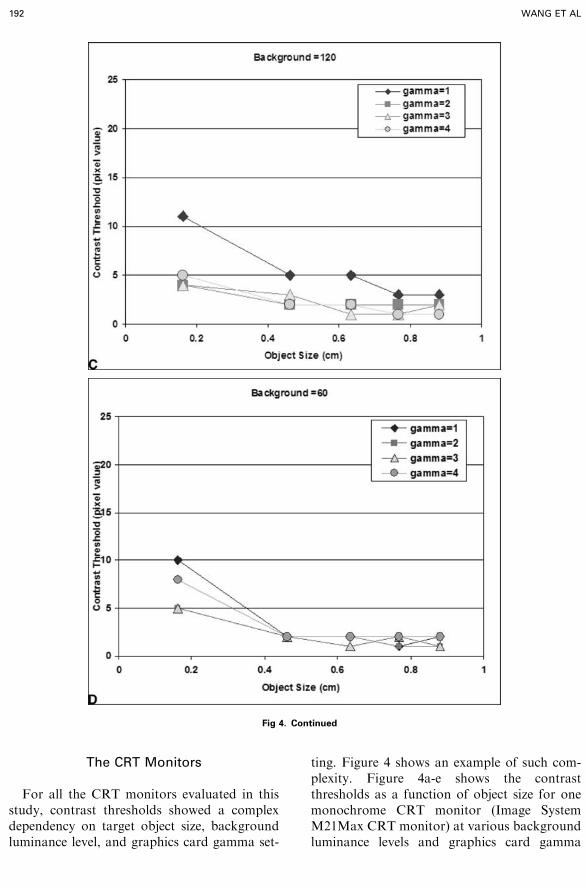
The CRT Monitors
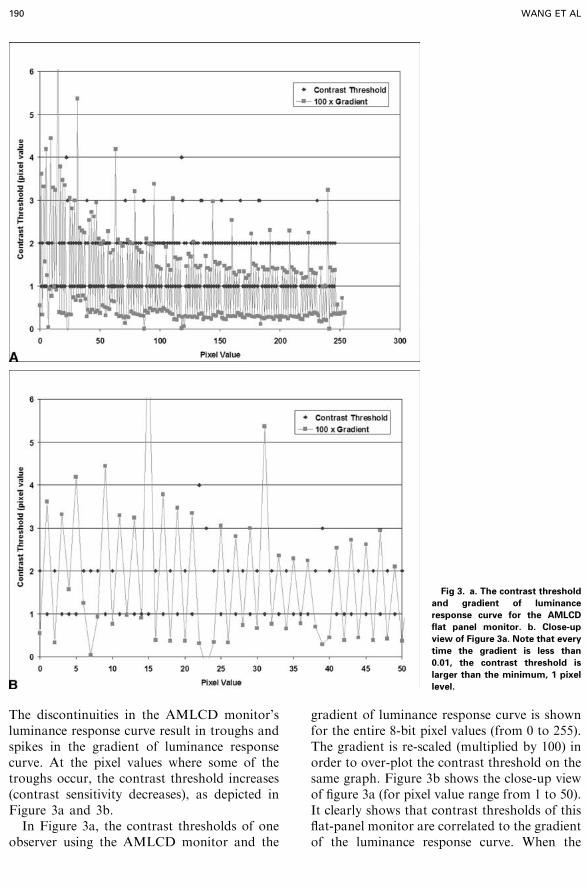
For all the CRT monitors evaluated in thisstudy, contrast thresholds showed a complexdependency on target object size, backgroundluminance level, and graphics card gamma set-
ting. Figure 4 shows an example of such com-plexity. Figure 4a-e shows the contrastthresholds as a function of object size for onemonochrome CRT monitor (Image SystemM21Max CRT monitor) at various backgroundluminance levels and graphics card gamma
Fig 4. Continued
192 WANG ET AL
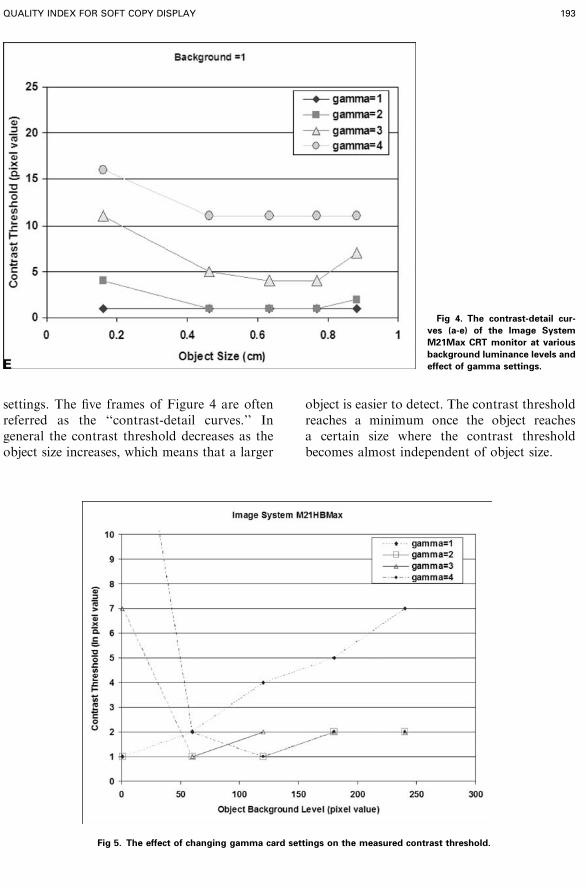
settings. The five frames of Figure 4 are oftenreferred as the ‘‘contrast-detail curves.’’ Ingeneral the contrast threshold decreases as theobject size increases, which means that a larger
object is easier to detect. The contrast thresholdreaches a minimum once the object reachesa certain size where the contrast thresholdbecomes almost independent of object size.
Fig 4. The contrast-detail cur-
ves (a-e) of the Image System
M21Max CRT monitor at various
background luminance levels and
effect of gamma settings.
Fig 5. The effect of changing gamma card settings on the measured contrast threshold.
QUALITY INDEX FOR SOFT COPY DISPLAY 193
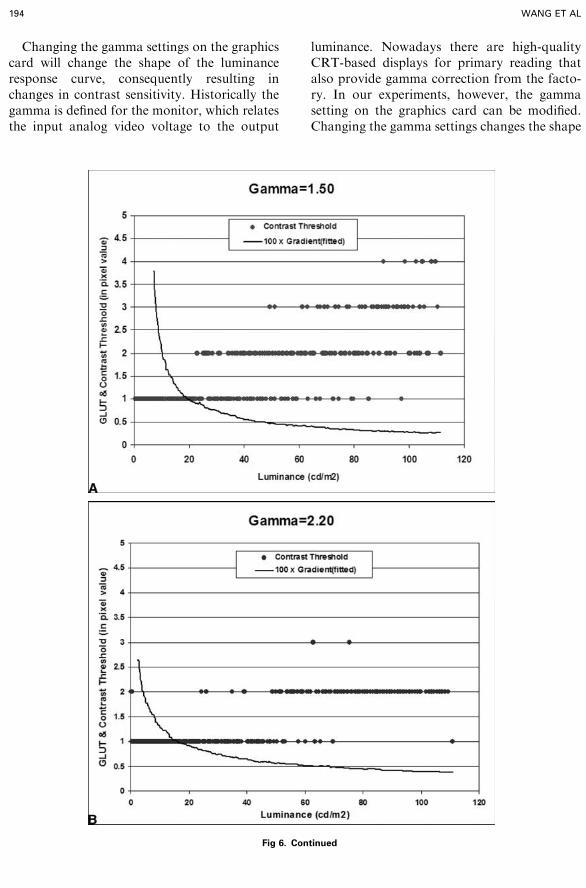
Changing the gamma settings on the graphicscard will change the shape of the luminanceresponse curve, consequently resulting inchanges in contrast sensitivity. Historically thegamma is defined for the monitor, which relatesthe input analog video voltage to the output
luminance. Nowadays there are high-qualityCRT-based displays for primary reading thatalso provide gamma correction from the facto-ry. In our experiments, however, the gammasetting on the graphics card can be modified.Changing the gamma settings changes the shape
Fig 6. Continued
194 WANG ET AL
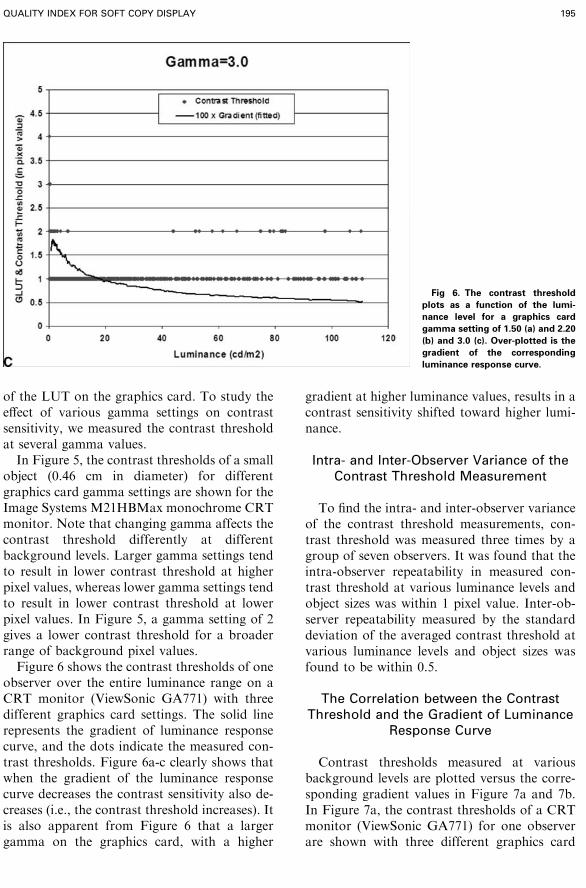
of the LUT on the graphics card. To study theeffect of various gamma settings on contrastsensitivity, we measured the contrast thresholdat several gamma values.In Figure 5, the contrast thresholds of a small
object (0.46 cm in diameter) for differentgraphics card gamma settings are shown for theImage Systems M21HBMax monochrome CRTmonitor. Note that changing gamma affects thecontrast threshold differently at differentbackground levels. Larger gamma settings tendto result in lower contrast threshold at higherpixel values, whereas lower gamma settings tendto result in lower contrast threshold at lowerpixel values. In Figure 5, a gamma setting of 2gives a lower contrast threshold for a broaderrange of background pixel values.Figure 6 shows the contrast thresholds of one
observer over the entire luminance range on aCRT monitor (ViewSonic GA771) with threedifferent graphics card settings. The solid linerepresents the gradient of luminance responsecurve, and the dots indicate the measured con-trast thresholds. Figure 6a-c clearly shows thatwhen the gradient of the luminance responsecurve decreases the contrast sensitivity also de-creases (i.e., the contrast threshold increases). Itis also apparent from Figure 6 that a largergamma on the graphics card, with a higher
gradient at higher luminance values, results in acontrast sensitivity shifted toward higher lumi-nance.
Intra- and Inter-Observer Variance of theContrast Threshold Measurement
To find the intra- and inter-observer varianceof the contrast threshold measurements, con-trast threshold was measured three times by agroup of seven observers. It was found that theintra-observer repeatability in measured con-trast threshold at various luminance levels andobject sizes was within 1 pixel value. Inter-ob-server repeatability measured by the standarddeviation of the averaged contrast threshold atvarious luminance levels and object sizes wasfound to be within 0.5.
The Correlation between the ContrastThreshold and the Gradient of Luminance
Response Curve
Contrast thresholds measured at variousbackground levels are plotted versus the corre-sponding gradient values in Figure 7a and 7b.In Figure 7a, the contrast thresholds of a CRTmonitor (ViewSonic GA771) for one observerare shown with three different graphics card
Fig 6. The contrast threshold
plots as a function of the lumi-
nance level for a graphics card
gamma setting of 1.50 (a) and 2.20
(b) and 3.0 (c). Over-plotted is the
gradient of the corresponding
luminance response curve.
QUALITY INDEX FOR SOFT COPY DISPLAY 195
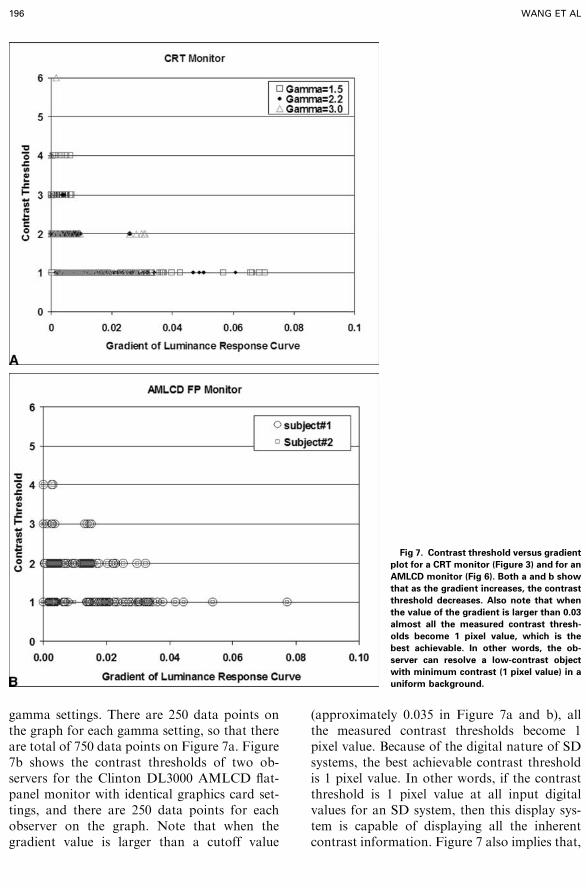
gamma settings. There are 250 data points onthe graph for each gamma setting, so that thereare total of 750 data points on Figure 7a. Figure7b shows the contrast thresholds of two ob-servers for the Clinton DL3000 AMLCD flat-panel monitor with identical graphics card set-tings, and there are 250 data points for eachobserver on the graph. Note that when thegradient value is larger than a cutoff value
(approximately 0.035 in Figure 7a and b), allthe measured contrast thresholds become 1pixel value. Because of the digital nature of SDsystems, the best achievable contrast thresholdis 1 pixel value. In other words, if the contrastthreshold is 1 pixel value at all input digitalvalues for an SD system, then this display sys-tem is capable of displaying all the inherentcontrast information. Figure 7 also implies that,
Fig 7. Contrast threshold versus gradient
plot for a CRT monitor (Figure 3) and for an
AMLCD monitor (Fig 6). Both a and b show
that as the gradient increases, the contrast
threshold decreases. Also note that when
the value of the gradient is larger than 0.03
almost all the measured contrast thresh-
olds become 1 pixel value, which is the
best achievable. In other words, the ob-
server can resolve a low-contrast object
with minimum contrast (1 pixel value) in a
uniform background.
196 WANG ET AL
fully display the inherent contrast informationin a digital image, the gradient of the luminanceresponse curve must be high enough to ensurethat it exceeds the cut-off value at all input pixelvalues.
Effect of Viewing Conditions on theGradient of Luminance Response Curve
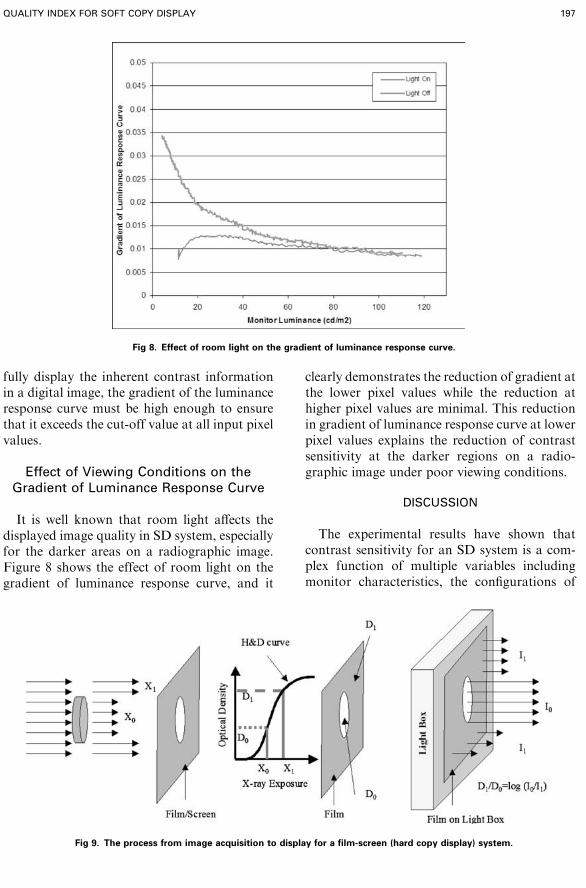
It is well known that room light affects thedisplayed image quality in SD system, especiallyfor the darker areas on a radiographic image.Figure 8 shows the effect of room light on thegradient of luminance response curve, and it
clearly demonstrates the reduction of gradient atthe lower pixel values while the reduction athigher pixel values are minimal. This reductionin gradient of luminance response curve at lowerpixel values explains the reduction of contrastsensitivity at the darker regions on a radio-graphic image under poor viewing conditions.
DISCUSSION
The experimental results have shown thatcontrast sensitivity for an SD system is a com-plex function of multiple variables includingmonitor characteristics, the configurations of
Fig 8. Effect of room light on the gradient of luminance response curve.
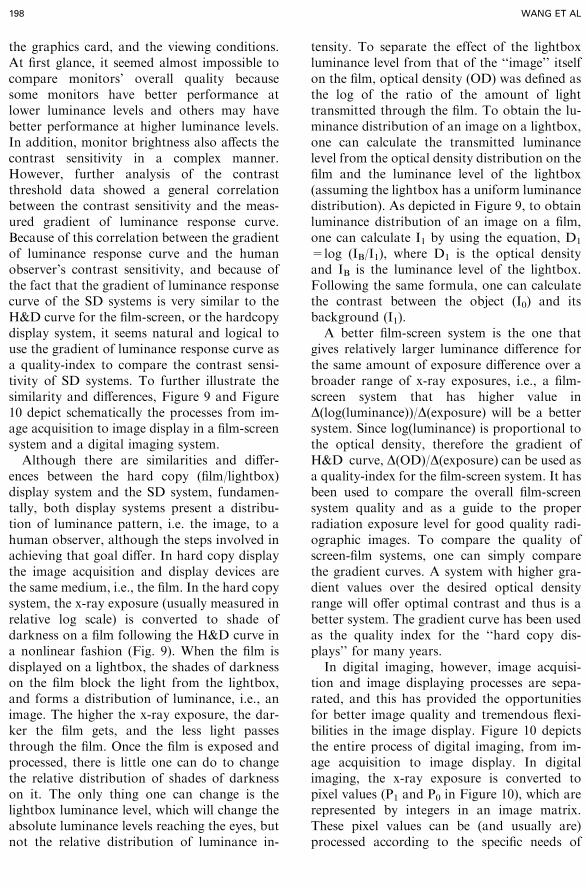
Fig 9. The process from image acquisition to display for a film-screen (hard copy display) system.
QUALITY INDEX FOR SOFT COPY DISPLAY 197
the graphics card, and the viewing conditions.At first glance, it seemed almost impossible tocompare monitors’ overall quality becausesome monitors have better performance atlower luminance levels and others may havebetter performance at higher luminance levels.In addition, monitor brightness also affects thecontrast sensitivity in a complex manner.However, further analysis of the contrastthreshold data showed a general correlationbetween the contrast sensitivity and the meas-ured gradient of luminance response curve.Because of this correlation between the gradientof luminance response curve and the humanobserver’s contrast sensitivity, and because ofthe fact that the gradient of luminance responsecurve of the SD systems is very similar to theH&D curve for the film-screen, or the hardcopydisplay system, it seems natural and logical touse the gradient of luminance response curve asa quality-index to compare the contrast sensi-tivity of SD systems. To further illustrate thesimilarity and differences, Figure 9 and Figure10 depict schematically the processes from im-age acquisition to image display in a film-screensystem and a digital imaging system.Although there are similarities and differ-
ences between the hard copy (film/lightbox)display system and the SD system, fundamen-tally, both display systems present a distribu-tion of luminance pattern, i.e. the image, to ahuman observer, although the steps involved inachieving that goal differ. In hard copy displaythe image acquisition and display devices arethe same medium, i.e., the film. In the hard copysystem, the x-ray exposure (usually measured inrelative log scale) is converted to shade ofdarkness on a film following the H&D curve ina nonlinear fashion (Fig. 9). When the film isdisplayed on a lightbox, the shades of darknesson the film block the light from the lightbox,and forms a distribution of luminance, i.e., animage. The higher the x-ray exposure, the dar-ker the film gets, and the less light passesthrough the film. Once the film is exposed andprocessed, there is little one can do to changethe relative distribution of shades of darknesson it. The only thing one can change is thelightbox luminance level, which will change theabsolute luminance levels reaching the eyes, butnot the relative distribution of luminance in-
tensity. To separate the effect of the lightboxluminance level from that of the ‘‘image’’ itselfon the film, optical density (OD) was defined asthe log of the ratio of the amount of lighttransmitted through the film. To obtain the lu-minance distribution of an image on a lightbox,one can calculate the transmitted luminancelevel from the optical density distribution on thefilm and the luminance level of the lightbox(assuming the lightbox has a uniform luminancedistribution). As depicted in Figure 9, to obtainluminance distribution of an image on a film,one can calculate I1 by using the equation, D1
=log (IB/I1), where D1 is the optical densityand IB is the luminance level of the lightbox.Following the same formula, one can calculatethe contrast between the object (I0) and itsbackground (I1).A better film-screen system is the one that
gives relatively larger luminance difference forthe same amount of exposure difference over abroader range of x-ray exposures, i.e., a film-screen system that has higher value inD(log(luminance))/D(exposure) will be a bettersystem. Since log(luminance) is proportional tothe optical density, therefore the gradient ofH&D curve, D(OD)/D(exposure) can be used asa quality-index for the film-screen system. It hasbeen used to compare the overall film-screensystem quality and as a guide to the properradiation exposure level for good quality radi-ographic images. To compare the quality ofscreen-film systems, one can simply comparethe gradient curves. A system with higher gra-dient values over the desired optical densityrange will offer optimal contrast and thus is abetter system. The gradient curve has been usedas the quality index for the ‘‘hard copy dis-plays’’ for many years.In digital imaging, however, image acquisi-
tion and image displaying processes are sepa-rated, and this has provided the opportunitiesfor better image quality and tremendous flexi-bilities in the image display. Figure 10 depictsthe entire process of digital imaging, from im-age acquisition to image display. In digitalimaging, the x-ray exposure is converted topixel values (P1 and P0 in Figure 10), which arerepresented by integers in an image matrix.These pixel values can be (and usually are)processed according to the specific needs of
198 WANG ET AL
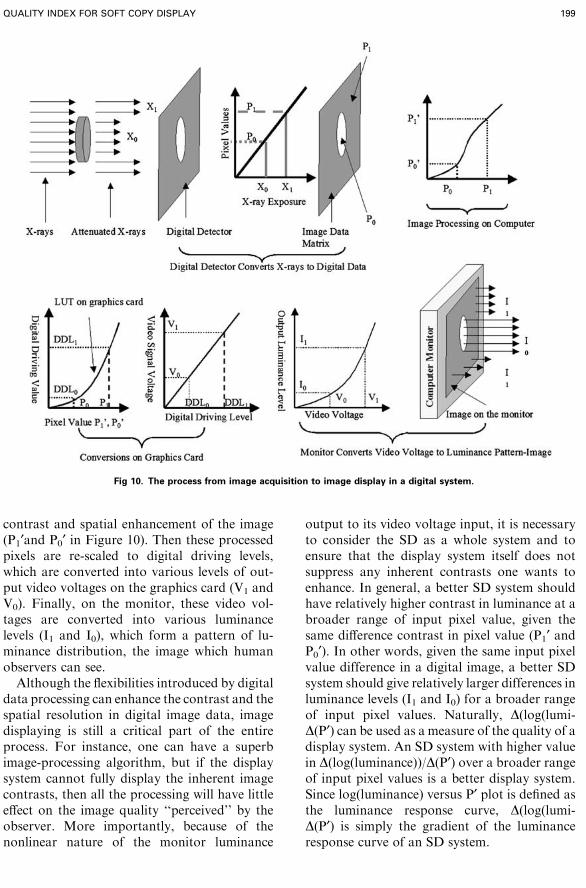
contrast and spatial enhancement of the image(P1¢and P0¢ in Figure 10). Then these processedpixels are re-scaled to digital driving levels,which are converted into various levels of out-put video voltages on the graphics card (V1 andV0). Finally, on the monitor, these video vol-tages are converted into various luminancelevels (I1 and I0), which form a pattern of lu-minance distribution, the image which humanobservers can see.Although the flexibilities introduced by digital
data processing can enhance the contrast and thespatial resolution in digital image data, imagedisplaying is still a critical part of the entireprocess. For instance, one can have a superbimage-processing algorithm, but if the displaysystem cannot fully display the inherent imagecontrasts, then all the processing will have littleeffect on the image quality ‘‘perceived’’ by theobserver. More importantly, because of thenonlinear nature of the monitor luminance
output to its video voltage input, it is necessaryto consider the SD as a whole system and toensure that the display system itself does notsuppress any inherent contrasts one wants toenhance. In general, a better SD system shouldhave relatively higher contrast in luminance at abroader range of input pixel value, given thesame difference contrast in pixel value (P1¢ andP0¢). In other words, given the same input pixelvalue difference in a digital image, a better SDsystem should give relatively larger differences inluminance levels (I1 and I0) for a broader rangeof input pixel values. Naturally, D(log(lumi-D(P¢) can be used as a measure of the quality of adisplay system. An SD system with higher valuein D(log(luminance))/D(P¢) over a broader rangeof input pixel values is a better display system.Since log(luminance) versus P¢ plot is defined asthe luminance response curve, D(log(lumi-D(P¢) is simply the gradient of the luminanceresponse curve of an SD system.
Fig 10. The process from image acquisition to image display in a digital system.
QUALITY INDEX FOR SOFT COPY DISPLAY 199
Therefore, this proposed quality-index, thegradient of luminance response curve, is similarto the gradient of H&D curve for the film-screen system. The only difference is that indigital imaging there is the added layer of di-gitization process, which converts x-ray ex-posure to digital pixel values. For most digitalradiographic systems, the relationship betweenthe log of x-ray exposure levels to the pixelvalues (P1 and P0 in Figure 10) is actually linear.Because of this linearity, in the digital dataprocessing step (from P1 and P0 to P1¢ and P0¢in Figure 10) a non-linear conversion is appliedin order to give a familiar ‘‘film-look’’ to theobservers.By studying the gradient of the luminance
response curve for an SD system, one cancompare and predict the contrast sensitivityperformance of an average observer using thisSD. For instance in Figure 8, the luminanceresponse curves with room lights on and offwere measured using a telescopic luminancemeter which took into account the combinedeffects of room lights and reflection off thesurface of the monitor. The reduction in thegradient of luminance response curve at thelower luminance range indicates an expecteddecrease in contrast sensitivity in darker imageregions under poor viewing conditions (roomlight on) while the decrease in the brighter re-gion of image will be minimal. The reduction inluminance response curve gradient is effectivelycaused by reflection of room light from themonitor’s glass surface, which results in de-creased contrast sensitivity. Ideally, to take intoaccount the effects of actual viewing conditions,gradient of luminance response curves shouldbe measured with a telescopic luminance meterin the actual ambient environment of an SDsystem’s usage to assess the ‘‘effective lumi-nance response curve.’’ On the other hand, theinherent contrast resolution characteristic of anSD system should be measured with a near-fo-cus (a shaded luminance meter with a suctioncup) right on the surface of the monitor.Unlike the film-screen systems, digital imag-
ing enables the separation of image acquisitionand image display. Thus, radiographic imagescan be preprocessed optimally according to theexam type and body part being imaged. Forinstance, the optimal processing algorithms for
the digital radiograph of AP chest and of ex-tremities are different. Furthermore, because ofthe adjustability of contrast by the SD system,object contrast can be modified on the fly asneeded during image viewing. However, the SDsystem should also be optimized such that itdoes not suppress any of the inherent contrastinformation of the postprocessed images. Inother words, ideally there should be no loss ofinformation in the image displaying process.One simple way to ensure that the SD systemdoes not suppress any inherent contrast infor-mation in a digital image is to ensure that anaverage user can resolve an object in a uniformbackground. But this requirement may be over-stringent because, for clinical images, becauseof the human eye’s dynamic adaptation to theluminance variations and complex backgroundin clinical images, the contrast sensitivity of thehuman visual system will be much lower thanthat measured from the images with uniformbackground. Unfortunately, contrast sensitivitydata for clinical images are difficult to obtain.More research using clinical images is needed.The general relationship between the contrast
sensitivity of human observer and the gradientof luminance response curve demonstrated inthis study may also have further implicationssuch as in the calculation of the minimum re-quirement for the luminance contrast ratio ofan SD system. Contrast threshold data showthat when the gradient of luminance responsecurve is greater than a cut-off value, the averagehuman observer can resolve an object that onlyhas one pixel value contrast difference from itsuniform background. One implication is that,to fully display all the inherent contrast infor-mation in a digital image, the gradient shouldbe sufficient to ensure that the luminance dif-ference between adjacent pixel values exceedsthe contrast threshold of an average observer.Based on such an assumption, one can estimatethe required monitor luminance ratio (Lmax/Lmin) to fully display all the inherent contrast ofa digital image simultaneously. However, wealso realize that clinical images are quite dif-ferent from a simple circular object in a uniformbackground, and the critical value in contrastthreshold for clinical images may be differ-ent.22,23 In fact, studies have suggested that ifthe gradient of luminance response is too high,
200 WANG ET AL
contouring artifacts may occur.22,23 Therefore,there may be an optimal value for the gradientof the luminance response curve for the SDsystem. Further studies using clinical images areneeded to find the contrast sensitivity require-ments for an SD system.Monitor performance deteriorates over time
and graphics card settings may change.25-27
Therefore quality assurance and quality controlof an SD system should be a vital part of theclinical operation in PACS.27-36 Committees ofACR/NEMA DICOM have been trying toaddress the display quality standard issues sinceDICOM’s inception. It has established astandard luminance response curve, based onprevious psychophysical research results.24 Toprovide guidance and to standardize the tech-nique for routine quality assurance and qualityassessment of an SD system, the AmericanAssociation of Physicists in Medicine has es-tablished a task group (TG18). It has publisheda report, which specifically addresses the qualitycontrol and quality assurance issues for medicalimage displays.27 The report discusses the im-portant factors in SD systems such as the lu-minance level, the spatial and contrastresolution, the uniformity, and the monitorglare, among other features. The report alsoincludes several test patterns, which can be usedto quickly assess the overall quality of a displaydevice. Detailed descriptions of the methodsand tools to access the particular characteristicsof an SD device are also presented.
CONCLUSIONS
The AMLCD flat-panel monitor based oncurrent technology still has some problems andissues that need to be resolved, such as thediscontinuity in luminance response curve. Thecontrast sensitivity of an SD system is a com-plex function of monitor characteristics andgraphics card configuration as well as viewingconditions. It can be measured with good rep-eatability and accuracy. The contrast sensitivityof the human observer correlates well with thegradient of the luminance response curve. Thusthe overall quality of an SD system can be as-sessed using the gradient curve of the luminanceresponse curve. Gradient of luminance response
curve can be used as a quality-index for SDsystems. The luminance response curve shouldbe measured under real viewing conditions, andat the actual location of the SD system usage sothat the effects of viewing condition on SDquality can also be taken into account.
ACKNOWLEDGMENTS
The authors thank Drs. Jon Anderson, Tim Blackburn,
and Gary Arbique for their insightful comments and sug-
gestions in preparing this manuscript, and Ms. J Xu for her
help in part of the experiment.
REFERENCES
1. Wang J, Langer S: A brief review of human perception
factors in Digital Display for PACS. J Digit Imaging 10:
158-168, 1997
2. Krupinski EA, Roehrig H: Influence of monitor lu-
minance and tone scale on observers’ search and dwell
patterns. Proc SPIE 3663:151-156, 1999
3. Carrino JA. "Image Quality: a clinical perspective" In:
Siegel E, Reiner BI, and Carrino J, editors. SCAR Univer-
sity Primer 3: Quality Assurance in the Digital Medical
Enterprise. Society for Computer Applications in Radiolo-
gy; 2002.
4. Carrino JA. "Image Quality: a clinical perspective" In:
Siegel E, Reiner BI, and Carrino J, editors. SCAR Univer-
sity Primer 3: Quality Assurance in the Digital Medical
Enterprise. Society for Computer Applications in Radiolo-
gy; 2002.
5. Roehrig H, Blume H, Ji TL, et al: Performance tests and
quality control of cathode ray tube displays. J Digit Imaging
3:134-45, 1990
6. Blume H, Roehrig H, Brown M, et al: Comparison of
the physical performance of high resolution CRT displays
and films recorded by laser image printers and displayed on
light-boxes and the need for a display standard. Proc SPIE
1232:97-114, 1990
7. Horii SC: Quality assurance for picture archiving and
communication systems (PACS) and PACS technology ap-
plications in radiology. J Digit Imaging 8:1-2, 1995
8. Roehrig H, Krupinski E: Image quality of CRT dis-
plays and the effect of brightness on diagnosis of mammo-
grams. J Digit Imaging 11(Suppl 1):187-188, 1998
9. Arenson RL, Chakraborty D, Seshadri SB, et al: The
digital imaging workstation. Radiology 176:303-315, 1990
10. Dwyer SJ, Stewart BK, Sayre JW, et al: Performance
characteristics and image fidelity of gray-scale monitors.
Radiographics 12:765-772, 1992
11. Roehrig H, Willis CE, Damento MA: Characteriza-
tion of monochrome CRT display systems in the field. J
Digit Imaging 12:152-165, 1999
12. Blume H, Hemminger BM: Image presentation in
digital radiology: perspectives on the emerging DICOM
display function standard and its application. Radiograph-
ics 17:769-777, 1997
QUALITY INDEX FOR SOFT COPY DISPLAY 201
13. Muka E, Mertelmeier T, Slone R, et al: Impact of
phosphor luminance noise on the specification of high-res-
olution CRT displays for medical imaging. Proc SPIE
3031:210-221, 1997
14. Pilgram TK, Slone RM, Muka E, et al: Perceived
fidelity of compressed and reconstructed radiological im-
ages: a preliminary exploration of compression, luminance,
and viewing distance. J Digit Imaging 11:168-175, 1998
15. Langer S, Wang J: User and system interface issues in
the purchase of imaging and information systems. J Digit
Imaging 9:113, 1996
16. Dwyer S: Soft copy displays and digitizers. In Frey G
Sprawls P (eds) Proceedings of 1997 AAPM Summer School
on Expanding Role of Medical Physics in Diagnostic
Imaging AAPM 1997, Medical Physics Publishing, Madi-
son, WI, 381
17. Cook LT, Cox GG, Insana MF, et al: Comparison of
a cathode-ray-tube and film for display of computed radi-
ographic images. Med Phys 25(7 Pt1):1132-1138, 1998
18. Wang J, Stetson C: Characteristic evaluations of
medical image displays using contrast-detail curve meas-
urements. Society for Information Display International
Symposium, SID Digest 172-175, 2000
19. Wang J, Anderson J, Lane L, et al: Contrast-detail
characteristic evaluations of several displays devices. J Digit
Imaging 13(Suppl l): 2000
20. Langer S, Wang J: An evaluation of ten digital image
review workstations. J Digit Imaging 10:65, 1997
21. Wang J, Peng Q: An interactive method of assessing
the characteristics of softcopy display using observer per-
formance tests. Proc SPIE 4686:189-197, 2002
22. Muka E, Whiting BR: On the human visual system in-
trascene luminance dynamic range. Proc SPIE 4686:169, 2002
23. Muka E, Reiker G: Reconsidering bit depth for radi-
ological images—is eight enough? Proc SPIE 4686:177, 2002
24. Hemminger BM, Johnston RE, Rolland JP, et al:
Introduction to perceptual linearization of video display
systems for medical image presentation. J Digit Imaging
8:21-34, 1995
25. Flynn MJ, Badano A: Image quality degradation by
light scattering in display devices. J Digit Imaging 12:50-59,
1999
26. Badano A, Flynn MJ: Image degradation by glare in
radiologic display devices. Proc SPIE: Int Soc Optical Eng
3031:222-231, 1997
27. Samei E, Badano A, Chakraborty D, et al: Assess-
ment of Display Performance for Medical Imaging Systems.
Draft Report of the American Association of Physicists in
Medicine (AAPM) Task Group 18, Version 9.0, October
2002
28. Wang J: Computer monitor QC issues. Categorical
Course at SCAR annual conference, 2001
29. Weibrecht M, Spekowius G, Quadflieg P, et al: Image
quality assessment of monochrome monitors for medical
soft copy display. Proc SPIE 3031:232-244, 1997
30. Roehrig H: Image quality assurance for CRT display
systems. J Digit Imaging 12:1-2, 1999
31. Roehrig H: Image quality assurance for CRT display
systems—Part II. J Digit Imaging 12:49, 1999
32. Hangiandreou NJ, Fetterly KA, Bernatz SN, et al:
Quantitative evaluation of overall electronic display quality.
J Digit Imaging 11(Suppl 1):180-186, 1998
33. Weiser JC, Drummond KT, Evans BD, et al:
Quality assurance for digital imaging. J Digit Imaging 10:7-
8, 1997
34. Hangiandreou NJ, Fetterly KA, Felmlee JP: Opti-
mization of a contrast-detail-based method for electronic
image display quality evaluation. J Digit Imaging 12:60-67,
1999
35. Reiker GG, Gohel N, Muka E, et al: Quality moni-
toring of soft-copy displays for medical radiography. J Digit
Imaging 5:161-167, 1992
36. Wang J: A Quality Index for the quality of softcopy
display in PACS. Med Phys 29:1219, 2002
202 WANG ET AL