Embed Size (px)
Citation preview
Proportionality and Turnout:
Evidence from French Municipalities
Andrew C. EggersLondon School of Economics
April 2013
Many studies find that voter turnout is higher in countries using PR than incountries using plurality, but because so many factors differ between the twosets of countries it is difficult to know precisely why. I focus on municipal elec-tions in France, where cities above a certain population threshold are requiredto use PR while those below use plurality; this setting allows me to comparepolitical outcomes across electoral systems while holding fixed a large set ofsocial and political features. I find that PR noticeably increases turnout com-pared to plurality, and it does so particularly in less competitive contexts. I alsofind evidence that PR encourages entry and raises the quality of competition.The findings highlight the importance of electoral proportionality in explainingcross-national differences in voter turnout.
Andrew Eggers, Lecturer, London School of Economics. Email: [email protected].
Thanks to Alexander Fouirnaies, Jean Chiche, Jean-Yves Nevers, and Aurelia Troupel for advice andsuggestions, to Brigitte Hazart of the French Ministry of the Interior (Bureau of Elections and PoliticalStudies) for data, and to various mayors and municipal councilors for useful discussions and information.
I. Introduction: voter turnout and electoral systems
What explains voter turnout? Few questions have attracted more attention, both theo-
retical and empirical, in political science. Early efforts to explain turnout from a rational
choice perspective (Downs 1957, Riker & Ordeshook 1968) treated voters as strategic actors
who vote in order to influence election outcomes. More recently, attention has shifted to
political parties as the locus of strategic activity: citizens’ voting decisions may be driven
largely by social norms such as a sense of duty, but strategic elites decide whether to acti-
vate those norms based in part on the probability that their mobilization efforts will tip the
outcome (Aldrich 1993, Cox 1999). Both approaches imply that turnout should be higher
when the marginal voter has a higher probability of casting the pivotal vote, a prediction
that has largely been borne out in studies showing higher turnout in smaller electorates
and in closer elections.1
The idea that turnout depends on pivotality has also been used to explain the consistent
finding that turnout is higher in systems using proportional representation (PR) than in
systems using plurality or majoritarian formulas.2 Intuitively, the idea is that voters in a
plurality election only stand a chance of affecting the outcome when the race is very nearly
a dead heat between the top two candidates, whereas voters in a multi-member PR district
can affect which party wins a seat in a variety of possible competitive scenarios.3 This
suggests that the ex ante probability of being pivotal may be higher on average under PR,
which would tend to boost the incentives for citizens to vote and for parties to mobilize
voters.4
1See Blais (2006) and Geys (2006) for references.2For reviews of the evidence linking higher turnout to PR, see Blais (2006) and Geys (2006). Higher
turnout in PR is attributed to pivotality most clearly in Cox (1999). Other studies tend to emphasizethat PR leads to fewer uncompetitive districts than plurality but do not specify whether this is due to thegreater number of chances to be pivotal in a PR election than in a plurality election or another factor suchas the (geographically) larger districts typical of PR systems (Powell 1986, Jackman 1987, Blais & Carty1990).
3For example, given two parties x and y in competition in a single-member plurality contest (SMP),a voter can only cast a decisive vote if party x’s vote share is 1/2; with the same two parties competingunder the Sainte-Lague electoral formula and four seats at stake, a voter can be pivotal if party x’s voteshare is 1/8, 3/8, 5/8, or 7/8.
4The criticism could be made that the probability of casting a pivotal vote is so low under both PR andplurality that we should not expect pivotality to affect strategic behavior: there may be more scenarios in
1
Although the higher probability of being pivotal under a more proportional electoral
formula may well account for higher turnout in PR, prior empirical studies leave consid-
erable doubt that proportionality is in fact an important part of the explanation. The
fundamental problem is that proportionality is typically just one of many factors that
differs between PR and plurality systems. PR elections typically involve voters choosing
among party lists that compete in geographically large districts (sometimes as large as the
entire country) within systems with multiple parties and frequent coalition governments;
plurality elections, by contrast, typically involve voters choosing among individual candi-
dates who compete in relatively small districts within systems with few parties and less
frequent coalition governments. With the two types of elections occurring in settings that
differ in these and other ways (including e.g. citizens’ attitudes toward the fairness of the
electoral system (Banducci et al. 1999)), it is difficult to know which specific factors explain
differences in turnout.5
More troubling still, there is reason to question the usual causal interpretation of the
positive correlation between the use of PR and voter turnout. It is widely appreciated
that electoral systems are chosen strategically (Rokkan 1970, Boix 1999, Colomer 2005)
and it is reasonable to think that voter turnout may be related to the factors (strategic
and otherwise) that affect a given political system’s electoral rules. This suggests that PR
and plurality systems may differ not just in ways that are either integral to the electoral
system (e.g. party lists vs. individual candidates, large vs. small districts) or effects of the
electoral system (e.g. many vs. few parties, frequent vs. infrequent coalition governments,
perceptions of fairness) but also in features that are fundamentally causes of the electoral
system (e.g. the nature of social cleavages, the type of party system, the prevalence of
which a voter could cast a pivotal vote under PR, but given a sizable electorate the probability of any ofthose scenarios is so small that differences in pivotality would be swamped by other factors in explainingthe turnout decision. (As Schwartz (1987, pg. 118) memorably wrote of the argument that the probabilityof being pivotal is higher in a close election, “Saying that closeness increases the probability of being pivotal. . . is like saying that tall men are more likely than short men to bump their head on the moon.”) The factthat turnout and closeness are consistently positively related suggests otherwise; an explanation based onstrategic voter mobilization seems to provide a satisfactory explanation.
5As Blais (2006) summarizes the literature on electoral systems and turnout, “Most of the literaturesupports the view that PR fosters turnout, but there is no compelling explanation of how and why, andthe pattern is ambiguous when the analysis moves beyond well-established democracies.”
2
norms of inclusion). The fact that it is difficult if not impossible to adequately control for
these factors, and that they all could affect turnout, casts doubt on our ability to infer
from observational data what would happen to turnout if a given system were to change
from plurality to PR, let alone which factor accounts for any effects we find.
In this paper I examine a setting in which I can address many of these problems and thus
provide unusually clear answers about how and why PR increases turnout. French electoral
law prescribes a PR electoral system for municipal council elections in municipalities of at
least 3,500 inhabitants and a plurality system for smaller municipalities. I use a regression
discontinuity design to compare turnout in municipalities near this threshold as a way of
measuring the effect of the electoral formula while holding other important factors constant.
This research design has two clear advantages compared to the usual observational study
of turnout and electoral systems. First, because the electoral system employed in each
municipality is imposed based on an arbitrary population cutoff, I can credibly estimate
the effect of the electoral system on turnout (for cities near the population threshold at
least) without worrying about factors that may have led one city to adopt PR while another
did not. Second, the plurality and PR systems used in these cities are similar to each other
in ways in which plurality and PR systems often differ (notably the arrangement of districts
and the prevalence of coalition government), which allows me to focus on a smaller set of
possible channels through which the electoral formula could affect turnout.
What I find is that the change from plurality to PR in small French municipalities
increases turnout in municipal elections by about one percentage point (from about 69%
to 70%), which is small in comparison to cross-national turnout differences but substantial
given how many factors are held constant and how recently most of the PR cities changed
over from plurality.6 Adopting PR for municipal elections does not appear to affect turnout
in higher-level elections, which is a reassuring sign of the fundamental similarity between
these sets of cities. Crucially, I find consistent evidence that PR increases municipal-
level turnout only in cities where elections are not very competitive, which is consistent
6Cities near the 3,500 population are generally growing slowly, such that very few of the cities justabove the threshold in the period I examine were using PR before 2001.
3
with the hypothesis that the proportionality of the electoral formula increases turnout
by encouraging mobilization efforts in elections that would be foregone conclusions under
plurality. Given the setting, the increase in turnout I find cannot be attributed to e.g.
a generalized sense that the PR system is more fair, stronger links between parties and
social groups in PR elections, or a difference in the number or arrangement of districts. To
be clear, these features may matter in explaining cross-national variation in turnout, but
my contribution is to highlight the role of proportionality in a setting where these other
features are held more or less fixed.
The proportionality of the electoral formula can affect turnout both directly (by encour-
aging mobilization) and indirectly (by encouraging entry), and I also find evidence of these
indirect effects. I show that, as might be expected based on the lower threshold required
to win seats, PR slightly increases the number of lists competing, which is consistent with
candidates being more willing to enter competition when the electoral system gives greater
rewards to minor lists. More surprisingly, I present some evidence that PR decreases not
only the share of the vote won by the top two lists (as would be expected based on Du-
verger (1954)’s “psychological effect”) but also the share of the vote won by the leading
list, which is consistent with competent candidates being more willing to compete on less
dominant lists when the electoral system ensures seats for more than one list. Both of
these changes could affect turnout in straightforward ways: the entry of new lists could
affect turnout by increasing the total amount of mobilization effort and by appealing to
previously unengaged voters; the increase in the quality of challengers could affect turnout
by improving the effectiveness of mobilization efforts and making competition closer.
Although the unusual setting I examine allows me to sidestep most of the typical prob-
lems of cross-sectional turnout studies, it does pose some idiosyncratic challenges that
require special attention. Most importantly, as is often the case in situations where a
policy changes at a municipal population threshold (Ade & Freier 2011, Gagliarducci &
Nannicini forthcoming), in French municipalities there are other policies that change at the
same population threshold at which the electoral system changes: the size of the council
4
and the mayor’s salary both increase slightly at the 3,500 threshold, and (since 2001) a
gender parity rule applies only to cities above the threshold as well. I address the first two
confounding factors by looking for jumps in turnout at other thresholds where the same
policies change, and I address all three confounding factors through subgroup analysis test-
ing predictions about where we might expect to find larger or small effects. I find that
the jump in turnout at the 3,500 threshold is largest where the effect of the gender parity
rule should be smallest – namely, those cities where women would be heavily represented
even in the absence of the gender parity rule. I find weak evidence of a jump in turnout at
other thresholds where the salary increases, but I show that the relationship between the
turnout jump and local competitiveness is consistent with the jump being caused by salary
at the other population thresholds but not at the 3,500 population threshold.7 Together,
these tests suggest that the jump in turnout I find at 3,500 is in fact due to the change in
the electoral formula rather than to other policies that change at the same threshold.
The findings of this study of are of most direct relevance to policymakers in France,
where there are periodic proposals to apply the PR system to smaller municipalities;8 my
estimates of the effect of PR on turnout suggest that lowering the population threshold
would encourage more people to vote in municipal elections and spur competition as well.
More broadly, the findings provide strong evidence that greater proportionality increases
turnout even in the absence of changes to the arrangement of districts and the format of the
ballot. I return in the conclusion to assessing how relevant these findings are for researchers
who are interested in explaining cross-country variation in political participation.
7To be more specific: as mentioned above, turnout at 3,500 jumps most in the set of cities where onelist wins handily; at other thresholds, turnout jumps most in the set of cities where competition is tight,which is more consistent with a story in which mayoral candidates mobilize more aggressively when theoffice is more valuable.
8Since the late-1990s, at least four proposals have surfaced to apply the list-PR system to smaller cities,with proposed thresholds including 2,500, 2,000, 1,500, and 500. See debates in the Senate on 1 March2000 for proposals to reduce the threshold to either 2000 or 2,500; a proposal “tendant a abaisser le seuild’application du scrutin proportionnel de liste aux communes de plus de 1 500 habitants” registered inthe Senate on 31 July 2012; and a proposal “relative au passage au scrutin proportionnel de liste pour lescommunes de 500 habitants et plus” registered on 10 October 2012 in the National Assembly.
5
II. French municipal electoral systems and implications for turnout
The commune, or municipality, is the lowest level of French government. Municipalities in
France maintain roads and schools, manage local development, and administer cultural pro-
grams and some social welfare functions (Loughlin 2007, pp. 90-91). They are responsible
for almost a quarter of all public expenditure, amounting to about 6% of GDP (Lough-
lin 2007, pp. 184-185). Each municipality is governed by a municipal council, ranging in
size from 9 in the smallest municipalities to 163 in Paris; the council is in turn led by a
mayor, who is a member of the council and ordinarily the leader of the party or list that
won the previous election. Municipal elections are held approximately once every six years
simultaneously in each of the more than 36,000 municipalities of France.9
Since 1946, French electoral law has specified a different system of elections for large and
small cities, with the population threshold that separates the two groups of cities varying
over time. The current electoral law, enacted in 1982, prescribes a single-district, multi-
member plurality system for municipalities with fewer than 3,500 inhabitants and a form of
proportional representation for those with 3,500 or more inhabitants. In particular, in the
larger cities the council is elected using a list-PR system with a 50% winner’s bonus: the list
with the most votes is awarded half of the seats on the council, and the remaining seats are
distributed proportionally among all of the lists including the winning list.10 In the smaller
cities, candidates appear on lists with as many members as there are seats on the council
and voters can vote for a whole list, a subset of the candidates from one list, or candidates
from more than one list;11 seats are awarded to the top individual vote-getters. In both
systems the election can take up to two rounds.12 From the standpoint of the electoral
9The 2008 election was held seven years after the 2001 elections in order to avoid coinciding with the2007 presidential elections. In both 2001 and 2008 the municipal elections coincided with cantonal elections.
10For example, given a 27-seat council and a narrow margin of victory of one list over a single otherlist, the winning list should win 21 seats a winner’s bonus of 14 plus 7 of the remaining 13 seats. Theproportional seats are distributed according to a quota system equivalent to the d’Hondt method.
11Given council size m, each voter can vote for only m candidates.12In the PR system, the election ends in the first round if one list wins more than 50% of the vote, and
otherwise parties receiving less than 10% of the vote are disqualified and others continue to the secondround; in the plurality system, any candidate winning the support of more than 50% of voters in the firstround is elected to the council, and if seats remain to be filled a second round is held in which the seatsare awarded to the top finishers.
6
rules, then, what differs between cities above and below the 3,500 population threshold is
whether voters are permitted to express candidate-level preferences (yes in smaller cities,
no in larger cities) and whether seats are allocated to candidates on a plurality basis (as is
the case in smaller cities) or to lists on a proportional basis (as is the case in larger cities).
As noted in the introduction, one of the prominent explanations for higher turnout in
PR systems is that, at the district level, the probability of a voter casting a decisive vote
may be higher under a more proportional electoral formula. One reason for this is simply
district magnitude: at the district level, there are typically many seats at stake in a PR
election while in a plurality election there is usually only one. The other reason is the
electoral formula itself: one can only cast a decisive vote in a plurality election when the
two leading candidates are effectively tied, whereas PR formulas ensure that, depending on
the district magnitude, a party can win additional seats at various vote share thresholds
ranging from, say, 20% to 80%. In the case of French municipal elections in cities near
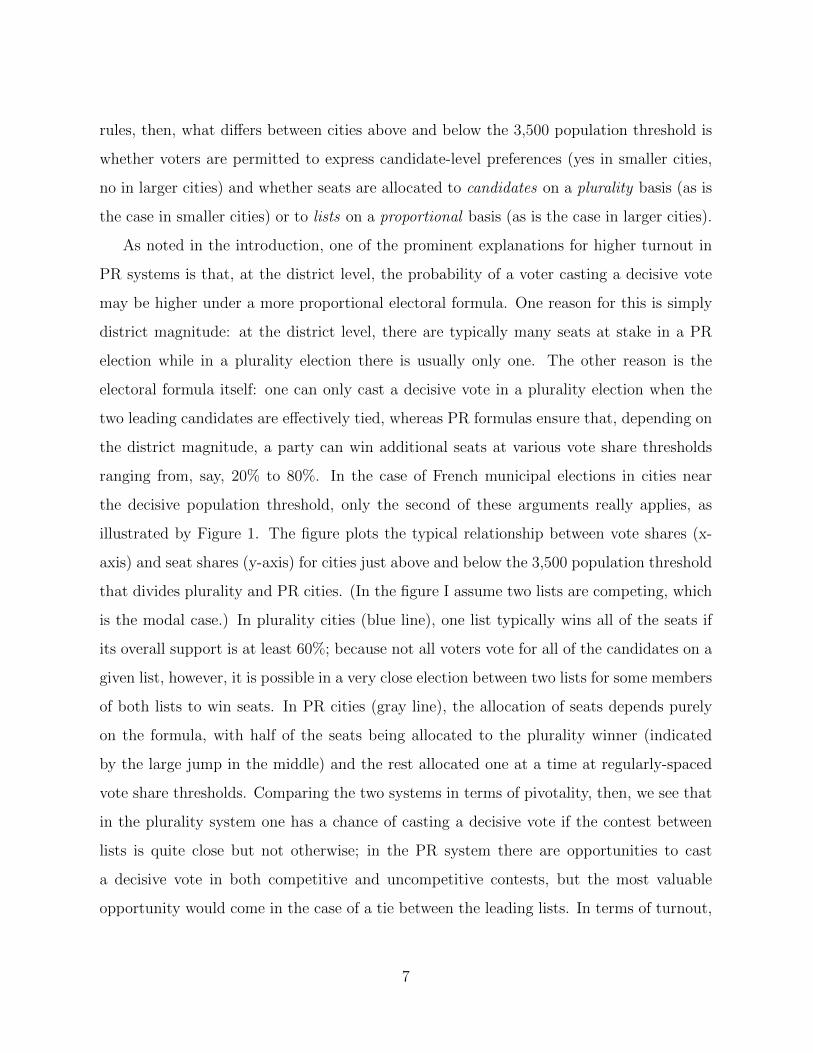
the decisive population threshold, only the second of these arguments really applies, as
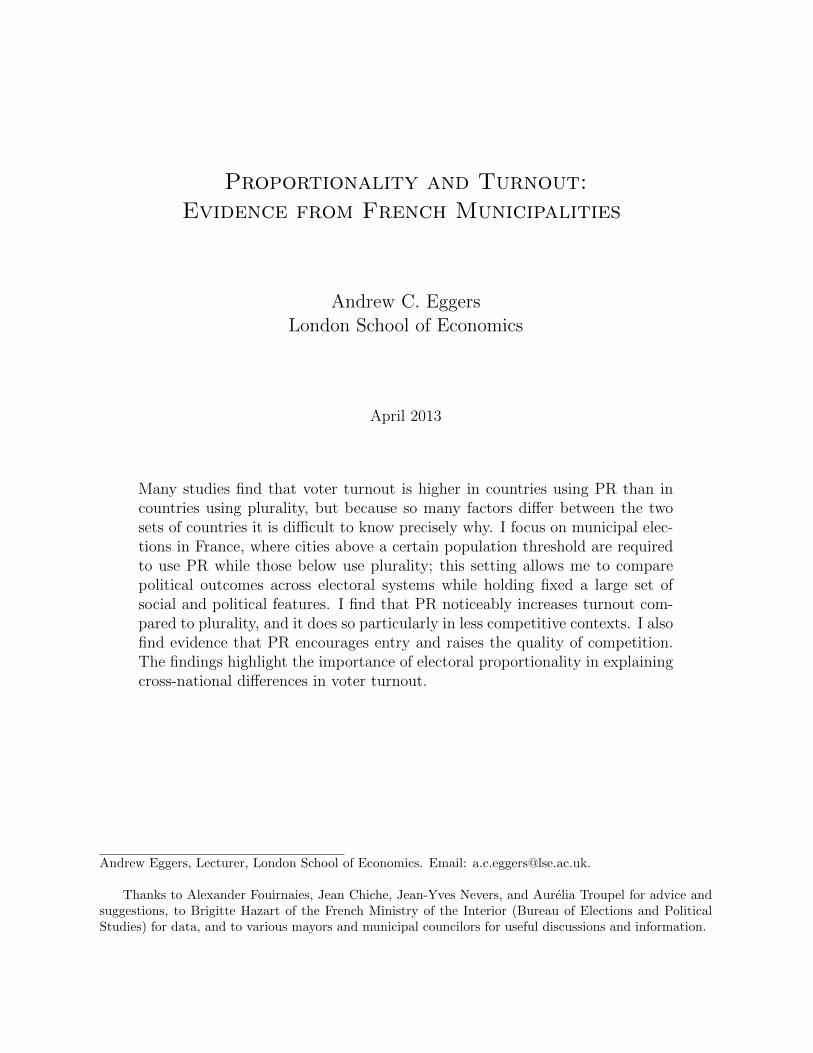
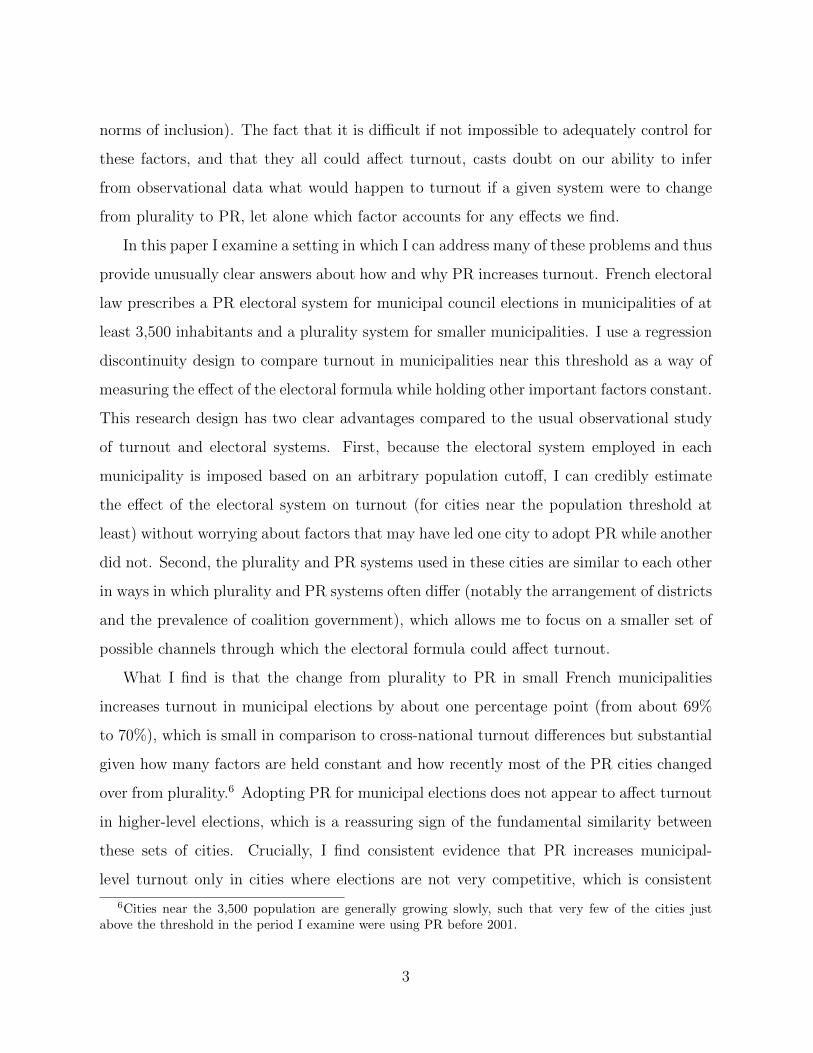
illustrated by Figure 1. The figure plots the typical relationship between vote shares (x-
axis) and seat shares (y-axis) for cities just above and below the 3,500 population threshold
that divides plurality and PR cities. (In the figure I assume two lists are competing, which
is the modal case.) In plurality cities (blue line), one list typically wins all of the seats if
its overall support is at least 60%; because not all voters vote for all of the candidates on a
given list, however, it is possible in a very close election between two lists for some members
of both lists to win seats. In PR cities (gray line), the allocation of seats depends purely
on the formula, with half of the seats being allocated to the plurality winner (indicated
by the large jump in the middle) and the rest allocated one at a time at regularly-spaced
vote share thresholds. Comparing the two systems in terms of pivotality, then, we see that
in the plurality system one has a chance of casting a decisive vote if the contest between
lists is quite close but not otherwise; in the PR system there are opportunities to cast
a decisive vote in both competitive and uncompetitive contests, but the most valuable
opportunity would come in the case of a tie between the leading lists. In terms of turnout,
7
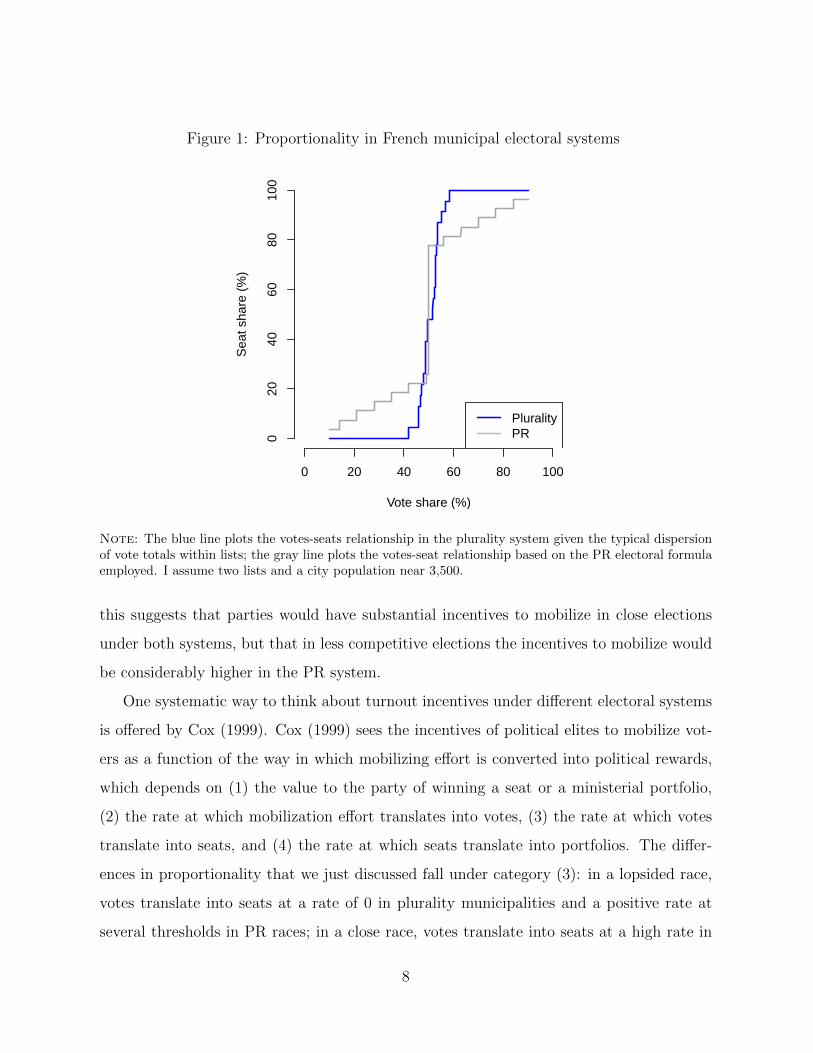
Figure 1: Proportionality in French municipal electoral systems
Vote share (%)
Sea
t sha
re (
%)
0 20 40 60 80 100
020
4060
8010
0
PluralityPR
Note: The blue line plots the votes-seats relationship in the plurality system given the typical dispersionof vote totals within lists; the gray line plots the votes-seat relationship based on the PR electoral formulaemployed. I assume two lists and a city population near 3,500.
this suggests that parties would have substantial incentives to mobilize in close elections
under both systems, but that in less competitive elections the incentives to mobilize would
be considerably higher in the PR system.
One systematic way to think about turnout incentives under different electoral systems
is offered by Cox (1999). Cox (1999) sees the incentives of political elites to mobilize vot-
ers as a function of the way in which mobilizing effort is converted into political rewards,
which depends on (1) the value to the party of winning a seat or a ministerial portfolio,
(2) the rate at which mobilization effort translates into votes, (3) the rate at which votes
translate into seats, and (4) the rate at which seats translate into portfolios. The differ-
ences in proportionality that we just discussed fall under category (3): in a lopsided race,
votes translate into seats at a rate of 0 in plurality municipalities and a positive rate at
several thresholds in PR races; in a close race, votes translate into seats at a high rate in
8
both systems. The key advantage of this setting is that, unlike in most comparisons of
electoral systems, the other factors identified in Cox (1999)’s framework should not differ
much between PR and plurality cases. Controlling for the size of the municipality, factor
(1) (the value of winning a seat on the council) would seem to be approximately the same
under PR and plurality, as non-executive municipal councilors enjoy the same powers and
responsibilities under both systems.13 There would also seem to be no major difference
in factor (2), the translation of mobilization effort into votes in the two systems. Accord-
ing to Cox (1999), mobilization efforts might generally be more effective in PR systems
because parties strategically adopt more distinct ideological positions and forge stronger
links with social groups (Powell Jr 1980). That argument would seem not to apply in
this setting, however, for two main reasons: first, politics in municipalities of this size is
primarily personal and competence-based, with a limited scope for ideological appeals;14
second, the large winner’s bonus of the PR system means that lists in both systems have
strong incentives to appeal to centrist voters.15 Campaign regulations that would affect the
effectiveness of mobilization efforts are also essentially the same in the two sets of munici-
palities.16 Finally, there is no basic difference in factor (4), the way in which seats translate
13As detailed below, mayors and their deputies are paid about 25% more the PR cities, but it is somewhatunclear whether the value of that “ministerial portfolio” is larger given that councils in PR cities are muchmore likely to include opposition members who can make life difficult for the mayor: my analysis showsthat the proportion of cities in which more than one list has members on the council roughly doubles at3,500, from 40% to over 80%. Non-executive members of municipal councils are unpaid.
14A sizable proportion of politicians and lists eschew partisan affiliations completely; in 2008, for example,only 35% of mayors in cities between 3,000 and 4,000 in population were listed by the Ministry of the Interioras UMP, Socialist, or Communist compared to 80% in cities above 20,000 in population; over 50% of themayors in the smaller cities were listed without a distinct party affiliation (“divers gauche” or “diversdroite”) compared to 12.5% in the larger cities. Typical list names in cities around 3,500 in population arecompletely un-ideological, e.g. “All together for [commune name]” or “List of [name of head of the list]”,whereas in larger cities list names like “Union of the Left for [commune name]” are common.
15A more plausible way in which Cox (1999)’s factor (2) might be affected by the electoral system inthis setting is that, as indicated by Figure 1, the PR electoral formula allows much less popular lists towin seats, which may lead to more and better lists entering and thus increase turnout through more andbetter mobilization efforts.
16As in higher-level elections in France, there are strict limits on the production and display of postersand the distribution of mailings in municipal campaigns: posters can only be hung in certain designatedplaces, for example, and mailings (limited to one per voter) must use a specified size, shape, and typeof paper. One exception is that the cost of printing posters, mailings, and ballot papers is reimbursablein municipalities above the threshold, but in a city of around 3,500 inhabitants the cost of printing themaximum allowable set of materials is small (conservatively, about 20 euros per list member).
9
into “portfolios”, i.e. the positions of mayor and deputy mayor. Given the winner’s bonus
in the PR system and the essentially winner-take-all nature of the multimember plurality
elections, coalition government in small municipalities is basically unknown. The list that
wins the plurality of votes is assured of producing the mayor and deputy mayors under the
PR system and almost assured of doing so under the plurality system.
Given these similarities between the two systems, a comparison of PR and plurality cities
near the 3,500 population threshold offers an unusually clear test of the hypothesis that
PR boosts turnout, and in particular that it does so in part by increasing elites’ incentives
to mobilize voters in less evenly-balanced contests. There are of course some differences
other than proportionality that are integral to the two systems and might affect turnout:
voters may value the opportunity to vote for individuals under the plurality system as
opposed to voting only for lists under PR, for example; candidates may also exert more
mobilizing effort when they receive an individual vote total in the plurality system than
when results are tabulated at the list level under PR.17 These differences would tend to
depress turnout under PR, making it more difficult to find an effect of the electoral formula
in the average municipality. There is little reason to expect these factors to depress turnout
differentially in competitive and uncompetitive places, however, suggesting that we may be
able to measure the effect of proportionality per se by measuring how turnout depends on
the electoral formula in more and less competitive environments.
III. Turnout and the 3,500 population threshold
In order to measure the effect of the electoral system on voter turnout in small French cities,
I apply a regression discontinuity design or RDD (Thistlethwaite & Campbell 1960, Hahn
et al. 2001, Lee 2008), taking advantage of the fact that the electoral system is determined
at a population cutoff.18 Before presenting results, I describe my implementation of RDD
17A candidate’s efforts to mobilize support under PR only benefit the marginal member of her listwhereas in the plurality system those efforts boost her own vote total and thus improve her chances ofwinning a seat, as well as her status among those who pay attention to the voting results.
18For other examples of the use of population thresholds in regression discontinuity designs, see Egger &Koethenbuerger (2010), Pettersson-Lidbom (2012), Fujiwara (2011), Gagliarducci & Nannicini (forthcom-ing), Brollo et al. (forthcoming).
10
and provide evidence that it will produce credible estimates in this setting.
A. Preliminaries
My implementation of the regression discontinuity design is standard and simple. I use local
linear regression to estimate the conditional expectation of the outcome at each point; in
order to estimate the discontinuity at the 3,500 threshold, I define a sample of cities close
to the threshold and regress the dependent variable on the log of population19 (recentered
at the population threshold) interacted with an indicator for whether the city is above
the threshold (Imbens & Lemieux 2008). In some specifications I include as covariates the
municipality’s turnout in a previous presidential election (1995 or 2002) as well as a set of
socioeconomic factors (proportion retired, proportion unemployed, proportion possessing
a baccalaureate degree, proportion employed in agriculture, population in the previous
census), the area of the municipality, and the region; given that cities just above or below the
3,500 threshold should be similar on average in these and other dimensions, the purpose of
including covariates is primarily to increase precision rather than to control for confounding
factors.
One key choice parameter is the window within which one conducts the local linear
regression. In principle the RDD should depend exclusively on cities very close to the
threshold, such that whether a given city holds its elections under PR or plurality might
be decided by arbitrary factors such as whether a new house is built before the census is
taken or whether the census enumerators count a family’s grown son as living in the village
or in Paris. In practice, using a wider window may improve estimates of the conditional
expectation at the threshold. One widely-used method for choosing a window is a cross-
validation procedure described by Imbens & Lemieux (2008) that searches for a window
that minimizes mean squared error in the vicinity of the threshold. Using this procedure
on my main outcomes I obtain surprisingly wide optimal windows, the majority of which
are above 50% of population (i.e. a window of 1,750 to 5,250 for a threshold of 3,500). The
19My analysis indicates that the turnout rate decreases roughly linearly in log population. Geys (2006)recommends using log population for turnout studies and provides examples.
11
reason why the optimal bandwidths are so large appears to be that most of the outcomes I
examine are quite linear in log population, such that the bias resulting from using a larger
bandwidth is minimal. As explained below, I present my results in a variety of ways in
order to show how my results depend on the bandwidth chosen.
The validity of the RDD could be called into question if mayors of cities near the
population threshold could manipulate their official population numbers (for example by
allowing or disallowing housing permits) and thus effectively choose their electoral system;
if that were the case, then cities on either side of the threshold may differ not just in their
electoral system but also in other (possibly unobservable) features such as their preferences
for one system or another. One standard way of checking the validity of the RDD, due to
McCrary (2008), involves testing for a jump in the density of the forcing variable at the
threshold; in this case, McCrary (2008)’s test fails to find a jump in (log) population at the
threshold where the electoral system changes (p = .127). Another standard validity check
is to carry out RDD analysis in which pre-treatment covariates serve as outcome variables.
Table 7 in the appendix reports RD effect estimates at varying population windows (25%,
50%, and 75%), showing that there is (as one would expect) no “effect” of crossing the
3,500 population threshold on the vast majority of placebo outcomes. These tests suggest
that cities just above and below the population threshold are indeed comparable in not
just observed but also unobservable features (e.g. local political culture). For robustness,
in the analysis that follows I show results both with and without covariates.
B. Results
Table 1 reports the first set of RD results, focusing on the 2008 municipal elections and
restricting attention to municipalities with a population within 50% of 3,500. Column
(1) reports a linear regression in which the running variable (log municipal population,
recentered around the threshold of 3,500) is interacted with “Treat”, an indicator for the
population being at least 3,500. The coefficient on “Treat” indicates that turnout in cities
just above the 3,500 population threshold is about 1 percentage point higher than that
in cities just below the 3,500 threshold. (Coefficients on the running variable and its
12
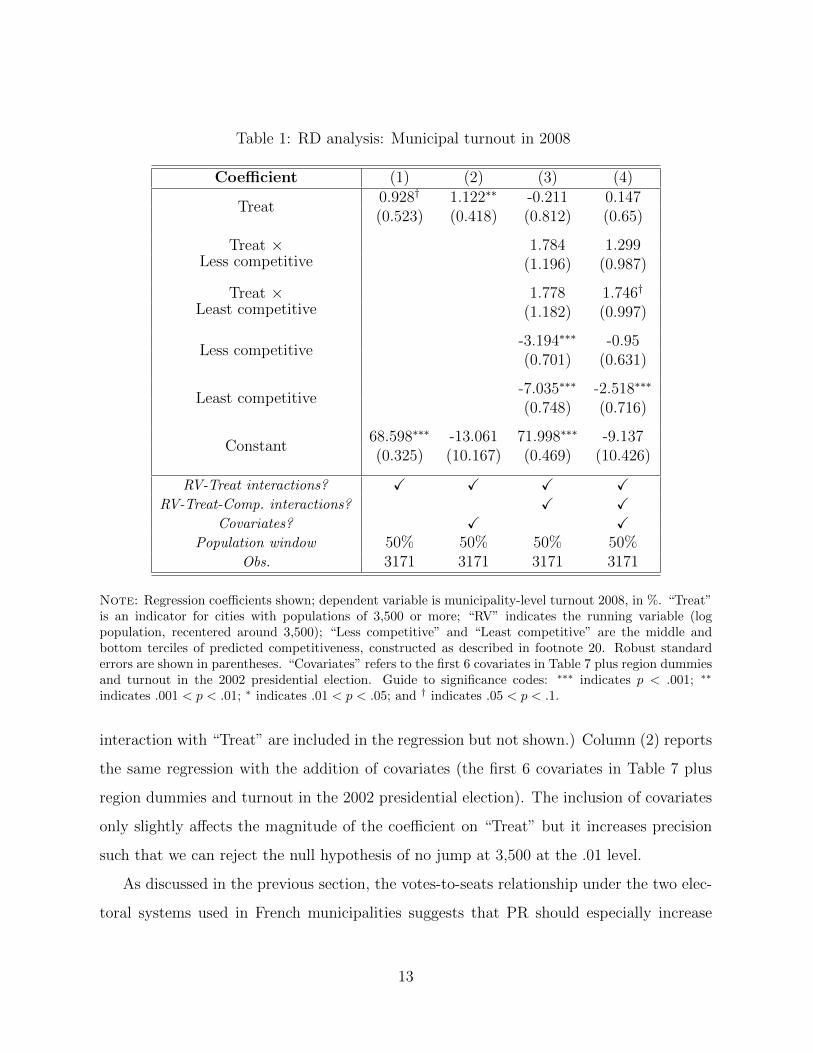
Table 1: RD analysis: Municipal turnout in 2008
Coefficient (1) (2) (3) (4)
Treat0.928† 1.122∗∗ -0.211 0.147(0.523) (0.418) (0.812) (0.65)
Treat ×Less competitive
1.784 1.299(1.196) (0.987)
Treat ×Least competitive
1.778 1.746†
(1.182) (0.997)
Less competitive-3.194∗∗∗ -0.95(0.701) (0.631)
Least competitive-7.035∗∗∗ -2.518∗∗∗
(0.748) (0.716)
Constant68.598∗∗∗ -13.061 71.998∗∗∗ -9.137(0.325) (10.167) (0.469) (10.426)
RV-Treat interactions? X X X XRV-Treat-Comp. interactions? X X
Covariates? X XPopulation window 50% 50% 50% 50%
Obs. 3171 3171 3171 3171
Note: Regression coefficients shown; dependent variable is municipality-level turnout 2008, in %. “Treat”is an indicator for cities with populations of 3,500 or more; “RV” indicates the running variable (logpopulation, recentered around 3,500); “Less competitive” and “Least competitive” are the middle andbottom terciles of predicted competitiveness, constructed as described in footnote 20. Robust standarderrors are shown in parentheses. “Covariates” refers to the first 6 covariates in Table 7 plus region dummiesand turnout in the 2002 presidential election. Guide to significance codes: ∗∗∗ indicates p < .001; ∗∗
indicates .001 < p < .01; ∗ indicates .01 < p < .05; and † indicates .05 < p < .1.
interaction with “Treat” are included in the regression but not shown.) Column (2) reports
the same regression with the addition of covariates (the first 6 covariates in Table 7 plus
region dummies and turnout in the 2002 presidential election). The inclusion of covariates
only slightly affects the magnitude of the coefficient on “Treat” but it increases precision
such that we can reject the null hypothesis of no jump at 3,500 at the .01 level.
As discussed in the previous section, the votes-to-seats relationship under the two elec-
toral systems used in French municipalities suggests that PR should especially increase
13
turnout in less closely-contested elections. In columns (3) and (4) of Table 1, I test that
prediction by dividing municipalities into terciles based on predicted competitiveness20 and
fully interacting the treatment effect with these competitiveness terciles.21 The coefficients
on “Less competitive” and “Least competitive” indicate that turnout is higher in more
competitive contexts, which is not surprising. More importantly, the interactions between
“Treat” and the competitiveness terciles suggest that crossing the population threshold
has a larger effect in less competitive contexts, which is consistent with the idea that PR
increases turnout in this setting by increasing the incentive to mobilize voters in elections
that would be foregone conclusions under plurality. The interaction term for “Least com-
petitive” cities is statistically significant at the .1 level once covariates are included in the
regression.
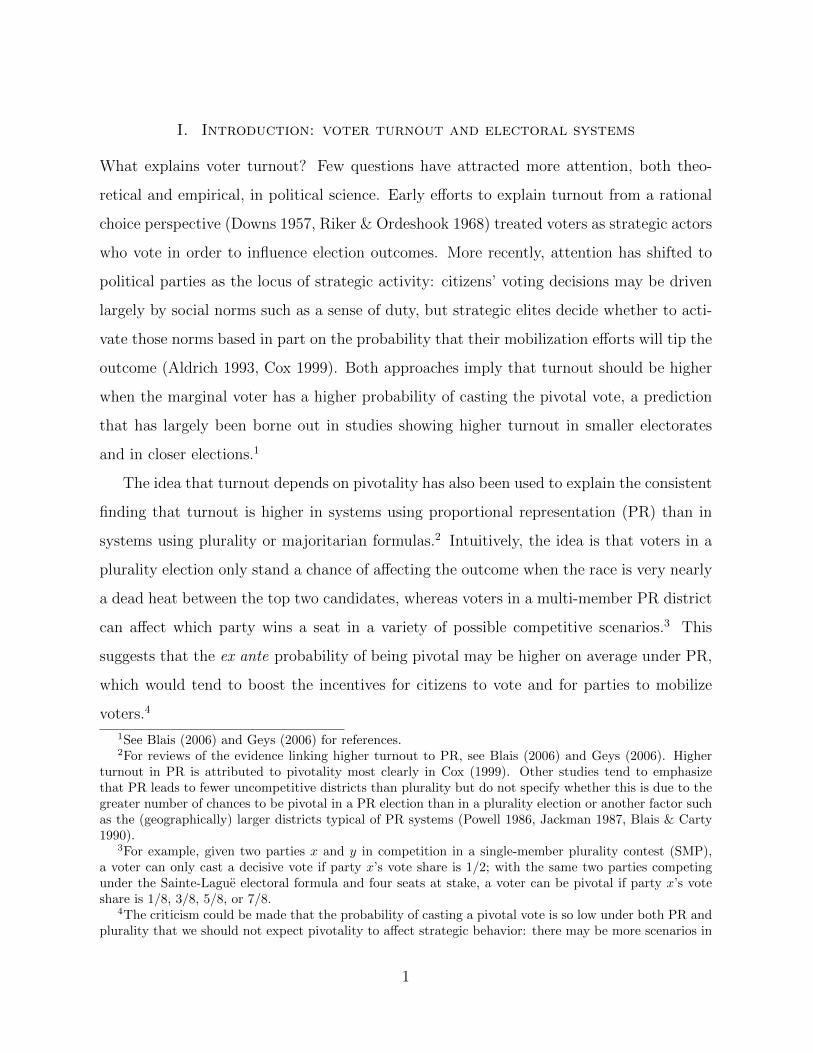
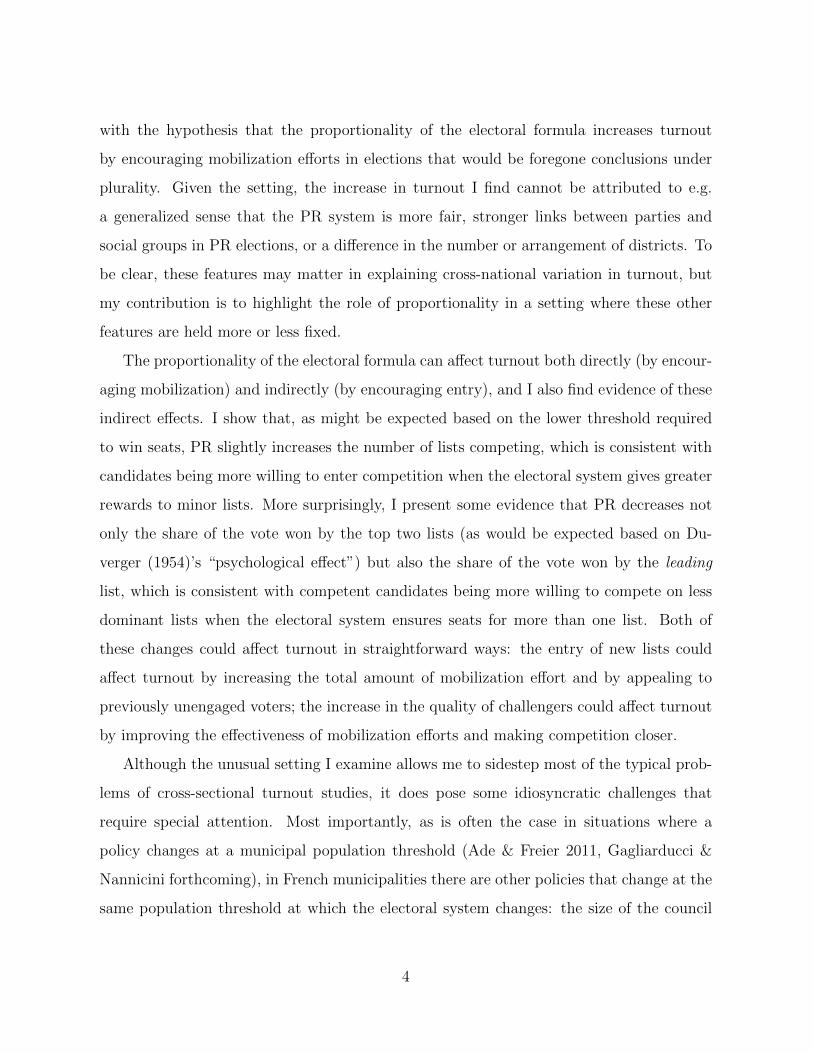
To give a sense of the robustness of these findings, Figure 2 depicts the regression
discontinuity plot (left) and the relationship between the effect estimate and the bandwidth
(right) separately for the most competitive (panel A, top) and least competitive (panel B,
bottom) terciles of municipalities. In the left plot of both panels, the black dots portray
average turnout for cities within a given population bin.22 A blue line depicts the local
linear regression separately on each side of the threshold, using a bandwidth of 50% of
population (the same bandwidth as the one used for Table 1); the dotted line shows the
robust .95 point-wise confidence interval. These plots visually confirm the findings reported
in Table 1: there is a clear level shift in turnout at 3,500 in less competitive municipalities
(bottom left) but not in the more competitive municipalities (top left). The right plot in
20In particular, I compute the average vote share of winning candidates in cities below the 3,500 thresholdin 2008 and regress that on socioeconomic indicators plus (categories of) the share of voters supportingSarkozy in the 2007 presidential election. The predictions from this model are then used to generate ameasure of competitiveness for cities on both sides of the 3,500 population threshold, where the lowestpredicted competitiveness is found in cities where the predicted support for winning candidates is highest.The measure is thus not based on municipal voting outcomes and, like the predictors on which it isbased, is continuous across the 3,500 threshold. Substantively similar results are obtained when I definecompetitiveness based on actual rather than predicted support for the winning list/candidates.
21Covariates are not interacted with the competitiveness terciles, but all other terms in the regressionare: the treatment indicator, the running variable, and the interaction of the two.
22The bins here are .06 in log population; for example, the first two bins to either side of the thresholdencompass cities from 3,296 to 3,500 and 3,500 to 3,716.
14
each panel shows how the estimated effect depends on the population window within which
the local linear regression is conducted. As shown in the top panel in Figure 2, the effect
of crossing the 3,500 threshold in competitive cities is about zero for most bandwidths and
it does not approach significance at any bandwidth. In the bottom panel we see that in
the least competitive cities the estimated effect is at or above 1 percentage point for all
bandwidths, with an effect that is at least borderline statistically significant (even without
covariates) for all bandwidths above 40%. In each of the plots on the right, the vertical gray
line indicates the optimal population window according to the cross-validation procedure
suggested by Imbens & Lemieux (2008). (See Table 8 in the appendix for the RD estimates
at the optimal bandwidths for this and all other analysis in the paper.)
As a further test of the effect of the electoral formula on turnout in this setting, Table
2 looks at the average effect of crossing the 3,500 threshold on turnout in the 2001 and
2008 municipal municipal elections as well as in higher-level elections between 2002 and
2007. Because the only electoral rule that changes at the 3,500 population threshold is the
municipal electoral rule, we would expect turnout to increase in the municipal elections but
not in higher level elections. This is in fact what we find. Each entry in Table 2 reports
the estimate from an RD regression at a given bandwidth (25%, 50%, and 75%) either
with or without covariates.23 The top three rows show estimates for municipal elections;
the average effects in 2001 appear even stronger than those in 2008, and unsurprisingly the
pooled estimates are strong and substantial as well. The bottom three rows show estimates
for higher-level elections. In the presidential elections of 2002 and 2007 and the regional
elections of 2004, we do not see higher turnout in cities just above the 3,500 population
threshold; when covariates are included none of the effects is significant.
The absence of a positive effect on turnout in higher-level elections is particularly note-
worthy in light of Ladner & Milner (1999), whose main finding is that turnout in municipal
elections is higher in Swiss municipalities that adopt PR than in those that use plurality
methods. Remarkably, Ladner & Milner (1999) also find that PR cities have higher turnout
23The entries in this and subsequent tables thus each report the coefficient on “Treat” in a regressionlike that in Table 1.
15
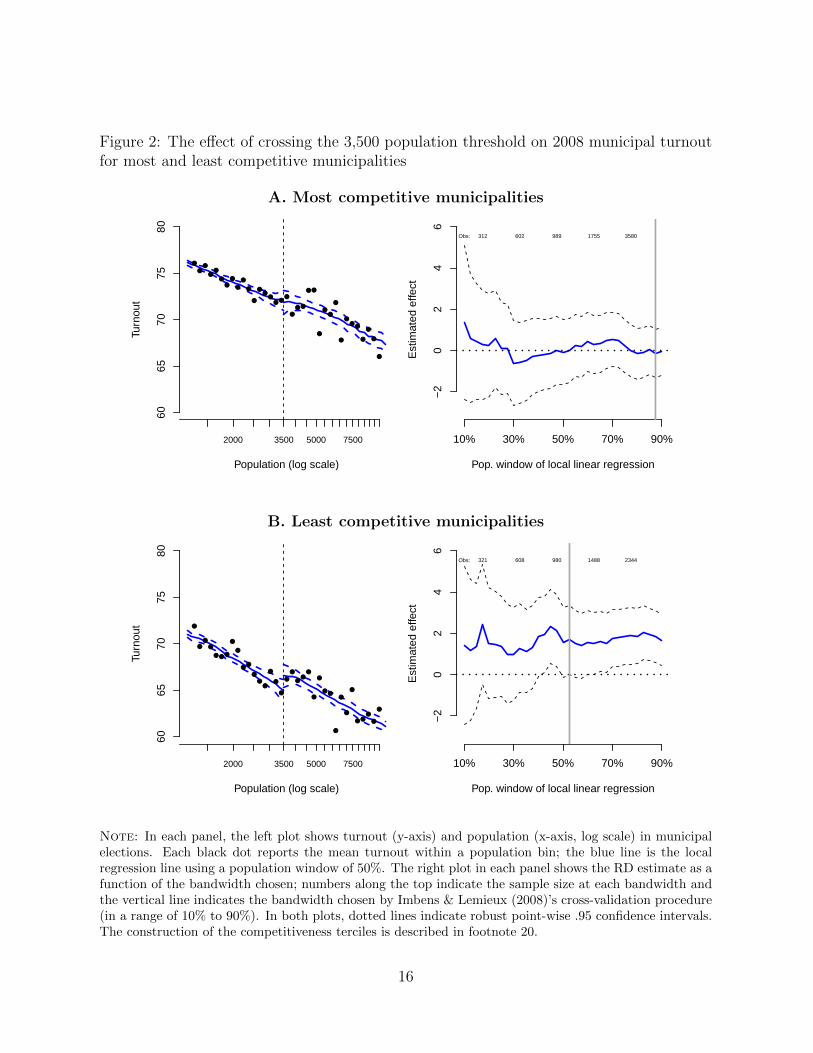
Figure 2: The effect of crossing the 3,500 population threshold on 2008 municipal turnoutfor most and least competitive municipalities
A. Most competitive municipalities
Population (log scale)
Turn
out
2000 3500 5000 7500
6065
7075
80
●
●●
●●
●●
●
●
●
●
●
●●
●● ●
●
●
● ●
● ●
●
●●
●
●
●●
●
●
●
●
●
Pop. window of local linear regression
Est
imat
ed e
ffect
10% 30% 50% 70% 90%−
20
24
6
Obs: 312 602 989 1755 3580
B. Least competitive municipalities
Population (log scale)
Turn
out
2000 3500 5000 7500
6065
7075
80
●
●●
●
● ● ●
●
●
●●
●
●●
●
●
●
●
●
●●
●
●
●
● ●
●
●
●
●
● ●●
●
●
Pop. window of local linear regression
Est
imat
ed e
ffect
10% 30% 50% 70% 90%
−2
02
46
Obs: 321 608 980 1488 2344
Note: In each panel, the left plot shows turnout (y-axis) and population (x-axis, log scale) in municipalelections. Each black dot reports the mean turnout within a population bin; the blue line is the localregression line using a population window of 50%. The right plot in each panel shows the RD estimate as afunction of the bandwidth chosen; numbers along the top indicate the sample size at each bandwidth andthe vertical line indicates the bandwidth chosen by Imbens & Lemieux (2008)’s cross-validation procedure(in a range of 10% to 90%). In both plots, dotted lines indicate robust point-wise .95 confidence intervals.The construction of the competitiveness terciles is described in footnote 20.
16
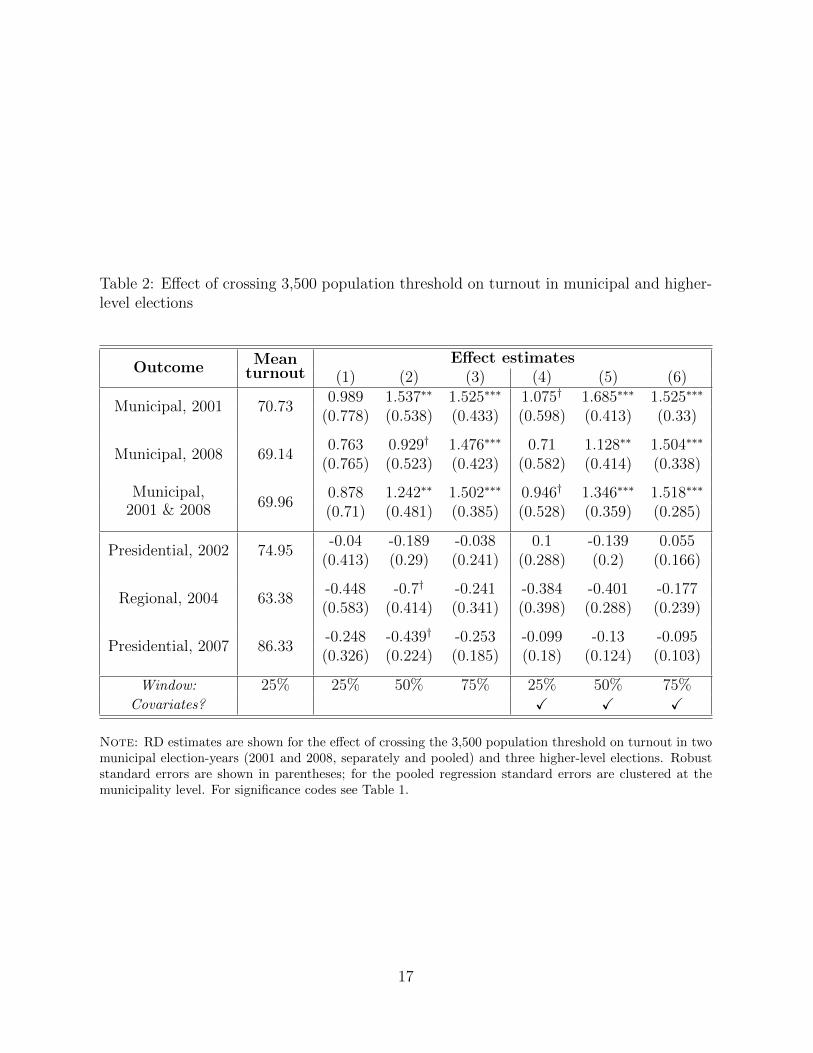
Table 2: Effect of crossing 3,500 population threshold on turnout in municipal and higher-level elections
OutcomeMean
turnoutEffect estimates
(1) (2) (3) (4) (5) (6)
Municipal, 2001 70.730.989 1.537∗∗ 1.525∗∗∗ 1.075† 1.685∗∗∗ 1.525∗∗∗
(0.778) (0.538) (0.433) (0.598) (0.413) (0.33)
Municipal, 2008 69.140.763 0.929† 1.476∗∗∗ 0.71 1.128∗∗ 1.504∗∗∗
(0.765) (0.523) (0.423) (0.582) (0.414) (0.338)
Municipal,2001 & 2008 69.96
0.878 1.242∗∗ 1.502∗∗∗ 0.946† 1.346∗∗∗ 1.518∗∗∗
(0.71) (0.481) (0.385) (0.528) (0.359) (0.285)
Presidential, 2002 74.95-0.04 -0.189 -0.038 0.1 -0.139 0.055
(0.413) (0.29) (0.241) (0.288) (0.2) (0.166)
Regional, 2004 63.38-0.448 -0.7† -0.241 -0.384 -0.401 -0.177(0.583) (0.414) (0.341) (0.398) (0.288) (0.239)
Presidential, 2007 86.33-0.248 -0.439† -0.253 -0.099 -0.13 -0.095(0.326) (0.224) (0.185) (0.18) (0.124) (0.103)
Window: 25% 25% 50% 75% 25% 50% 75%Covariates? X X X
Note: RD estimates are shown for the effect of crossing the 3,500 population threshold on turnout in twomunicipal election-years (2001 and 2008, separately and pooled) and three higher-level elections. Robuststandard errors are shown in parentheses; for the pooled regression standard errors are clustered at themunicipality level. For significance codes see Table 1.
17
in higher-level elections (even though all cities use the same system for these higher-level
elections), which they interpret as evidence that PR is adopted in municipalities that are
“culturally predisposed toward higher political participation” (pg. 248).24 The absence of
a higher-level “effect” of the electoral system in the French context makes sense given that,
unlike in the Swiss case, these cities do not choose their electoral system.
IV. Addressing Multiple Treatments
So far I have provided evidence that average municipal election turnout in cities just above
the 3,500 population threshold is slightly higher than that in cities just below the threshold.
Because the electoral system changes from plurality to PR at that threshold and because
the effect appears strongest in less competitive municipalities (as theory predicts), it seems
reasonable to attribute the jump in turnout at the 3,500 threshold to the electoral system.
There is, however, a complication. As in many cases in which policies depend on population
thresholds (Ade & Freier 2011), other features of municipal government change at the 3,500
population threshold: a gender parity rule is imposed on electoral lists, the number of
councillors increases from 23 to 27, and the mayor’s salary increases by about 25%. In this
section I consider whether these other treatments may also have contributed to the jump
in turnout I observe at the 3,500 threshold.
First, consider the gender parity rule that, since 2001, has applied to cities of 3,500 or
more inhabitants. The rule aims to achieve gender parity on municipal councils by requiring
that each list include an equal number of men and women, with gender alternating down
the list. The fact that the electoral system and the gender parity rule go into effect at the
same population threshold is not an accident; the assumption among policymakers seems
to be that parity would be much less effective under plurality rule because voters could
disproportionately cast votes for male candidates even if lists are gender-balanced.25
24As the authors suggest, it could also be that the habit of participating in municipality elections spillsover into higher-level elections.
25Given how commonly entire lists are elected currently in smaller cities, this assumption may beunwarranted. An article in the original gender parity proposal involved reducing the electoral rulethreshold from 3,500 to 2,000 explicitly in order to bring more cities under the parity rule; this ar-ticle was removed following opposition in the Senate. See debate of 1 March 2000, accessible at
18
In principle, the increase in average turnout at the 3,500 threshold could be explained
by the gender parity rule: perhaps the newly-included women are able to mobilize a new
set of voters, or perhaps their presence in politics spurs turnout by increasing the perceived
legitimacy of municipal politics.26 One can even think of a logic by which the effect of
the parity rule on turnout might be larger in less competitive elections: perhaps the set of
voters who would be mobilized by the parity rule in less competitive contests are already
mobilized in competitive contests. To test whether the parity rule might be responsible
for the increase in turnout I find at 3,500, I carry out subgroup analysis based on the idea
that, if the parity rule were in fact responsible, the jump in turnout would be largest in
places where the parity rule had the largest effect – cities where women would be most
under-represented in the absence of the parity rule. I use the observed level of female
representation in 2008 in cities below the 3,500 threshold to predict the level of female
representation for cities on both sides of the threshold (based on socioeconomic covariates
and voting outcomes in the 2007 presidential election). I then use the predicted level of
representation to divide cities into terciles based on the size of the predicted effect of the
parity rule (where the largest effect is predicted for those cities with the lowest predicted
level of female representation). After confirming that the actual effect of the gender parity
rule (estimated via RD) is in fact strongly related to the predicted effect, I estimate the
effect of crossing the 3,500 population threshold separately for the three groups of cities.
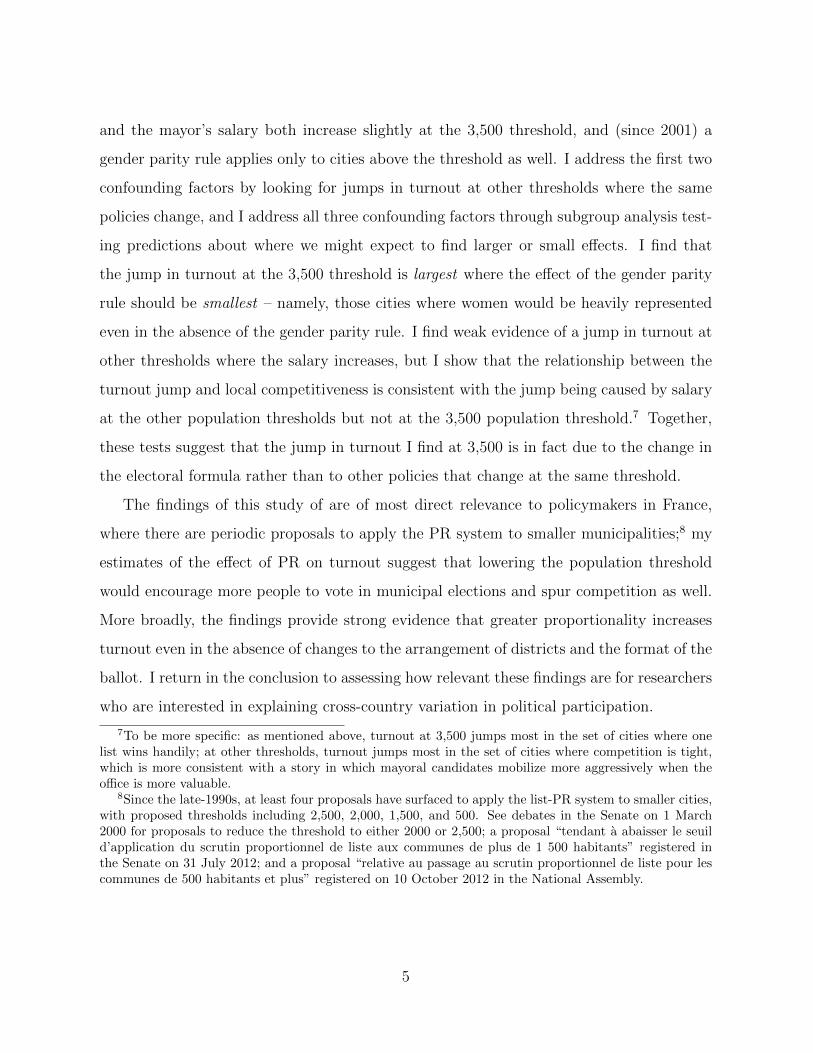
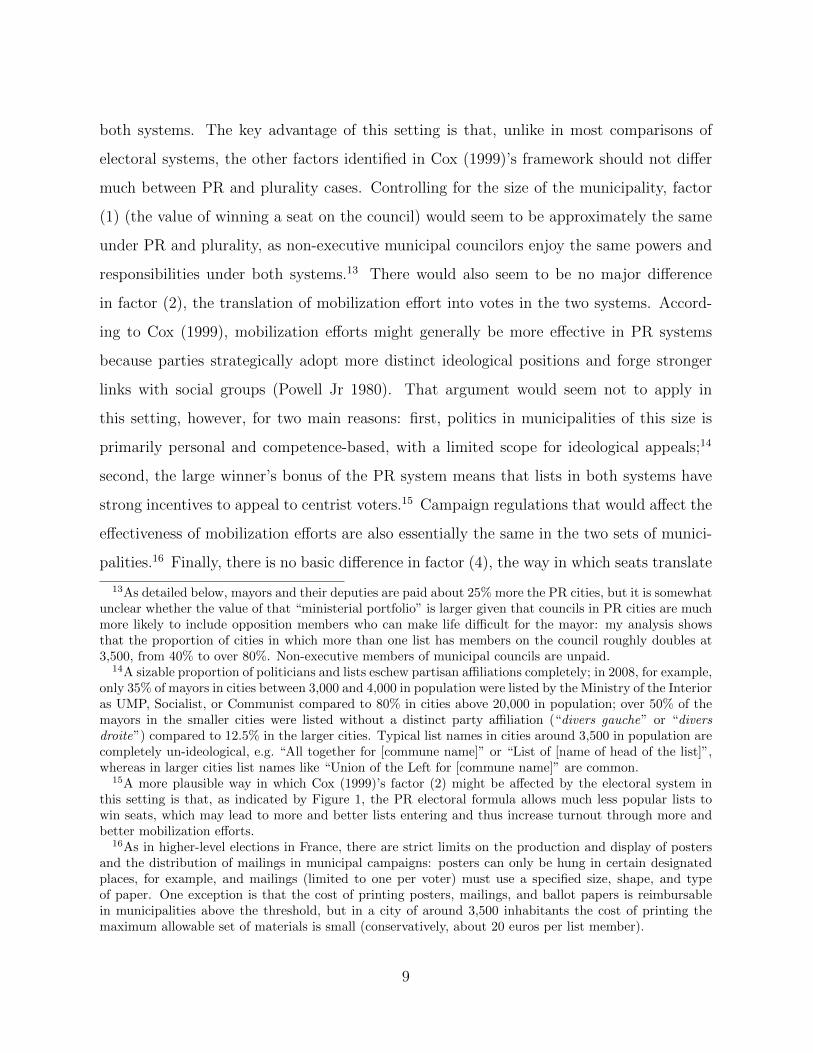
The results are reported in Table 3 and plotted in Figure 3. It does not appear to be the
case that the jump in turnout at 3,500 is largest where the gender parity law would have
the largest effect. If anything, turnout jumps more in places where the effect of the gender
parity rule would smaller, which suggests that the parity law is not responsible for the
turnout jump at the 3,500 threshold.
Two other important policies also change at the 3,500 threshold: the salary of the
mayor (from 1600 euros per month to 2058 euros per month27) and the size of the council
http://www.senat.fr/seances/s200003/s20000301/sc20000301009.html.26It is also of course possible to think of ways in which the gender parity rule may suppress turnout, for
example by reducing the average political experience of council candidates.27The salary of deputy mayors also increases by the same proportion.
19
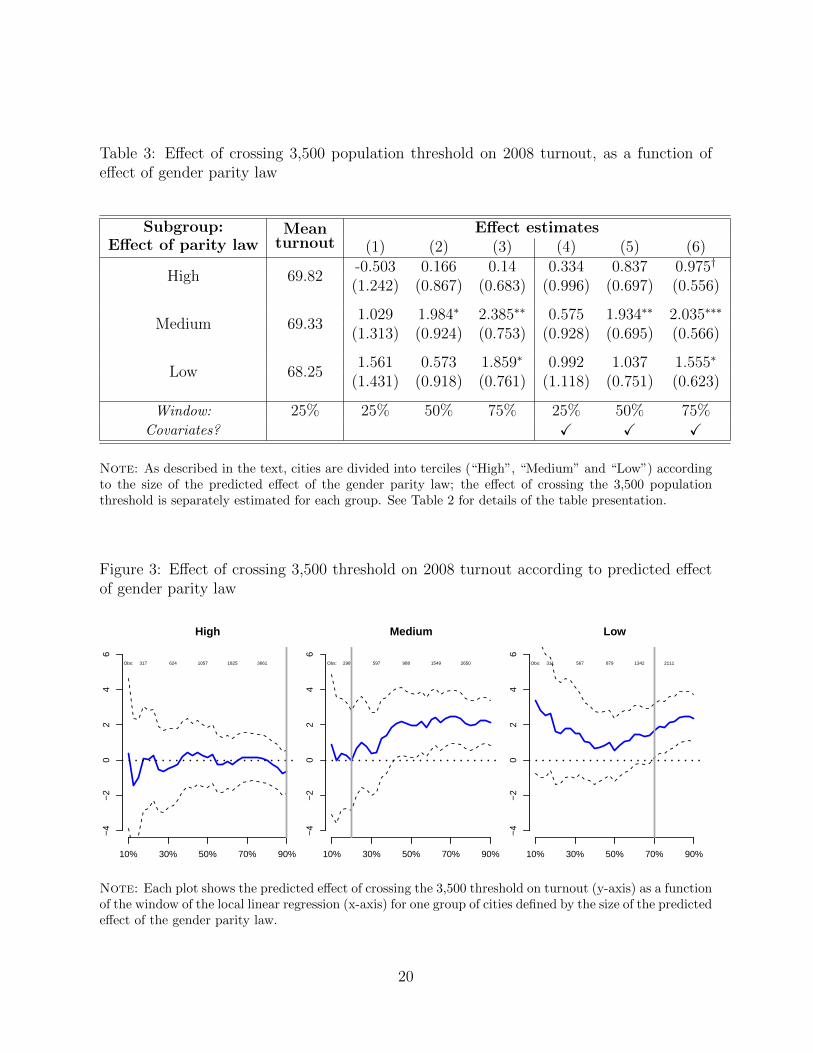
Table 3: Effect of crossing 3,500 population threshold on 2008 turnout, as a function ofeffect of gender parity law
Subgroup:Effect of parity law
Meanturnout
Effect estimates(1) (2) (3) (4) (5) (6)
High 69.82-0.503 0.166 0.14 0.334 0.837 0.975†
(1.242) (0.867) (0.683) (0.996) (0.697) (0.556)
Medium 69.331.029 1.984∗ 2.385∗∗ 0.575 1.934∗∗ 2.035∗∗∗
(1.313) (0.924) (0.753) (0.928) (0.695) (0.566)
Low 68.251.561 0.573 1.859∗ 0.992 1.037 1.555∗
(1.431) (0.918) (0.761) (1.118) (0.751) (0.623)
Window: 25% 25% 50% 75% 25% 50% 75%Covariates? X X X
Note: As described in the text, cities are divided into terciles (“High”, “Medium” and “Low”) accordingto the size of the predicted effect of the gender parity law; the effect of crossing the 3,500 populationthreshold is separately estimated for each group. See Table 2 for details of the table presentation.
Figure 3: Effect of crossing 3,500 threshold on 2008 turnout according to predicted effectof gender parity law
High
10% 30% 50% 70% 90%
−4
−2
02
46
Obs: 317 624 1057 1825 3661
Medium
10% 30% 50% 70% 90%
−4
−2
02
46
Obs: 298 597 988 1549 2650
Low
10% 30% 50% 70% 90%
−4
−2
02
46
Obs: 311 567 879 1342 2111
Note: Each plot shows the predicted effect of crossing the 3,500 threshold on turnout (y-axis) as a functionof the window of the local linear regression (x-axis) for one group of cities defined by the size of the predictedeffect of the gender parity law.
20
(from 23 to 27). In both cases one can imagine a mechanism by which the policy change
would increase turnout: a higher salary makes it more valuable to win office and should
thus induce greater mobilization efforts; a larger council means longer lists and thus more
people with direct involvement in the elections. I attempt to determine whether either or
both of these treatments could be responsible in two ways. First, I take advantage of the
fact that both the salary and the council size increase at other population thresholds (500
and 1000, for salary; 500 and 1500, for council size) where we can conduct RDD analysis.28
Under the assumption that the effect would be roughly similar at other thresholds where
the same policy changes, we can evaluate whether the change at 3,500 could be attributable
to one or both of these policies. In Table 4 I report RDD results for the effect of crossing
the 500, 1000, and 1500 population thresholds on turnout in 2001 and 2008 (pooled); I also
show the effect at three placebo thresholds (750, 2150, and 4520) where no policy change
takes place.
At none of the thresholds in Table 4 do I find an effect on turnout that is either as
large or as consistent as the effect of crossing the 3,500 threshold. There is some evidence,
however, of a jump in turnout at 500 and 1000, the two population thresholds where the
mayor’s salary increases. This suggests that mayor salary could play a role in the jump
at 3,500. A careful consideration of the way in which a higher mayor salary would affect
mobilization incentives suggests otherwise, however. If a higher salary increases turnout
by inducing greater mobilization effort by mayoral hopefuls, it would be most likely to do
so when it is most unclear which list will prevail – i.e. in elections expected to be close. In
Section III, however, it was seen that crossing the 3,500 threshold increased turnout the
most in the least competitive races. Table 5 reports the same subgroup analysis at the 500
and 1,000 population thresholds.29 The results depend on the specification but indicate a
different pattern from the one I find at 3,500: across the two thresholds, the evidence of a
28Council size also changes at 2,500, but at that threshold there is also a change in the rules aboutfielding incomplete candidate lists, which further complicates matters.
29Competitiveness terciles are constructed in the same was as described in footnote 20, but based ona model using municipalities with population between 250 and 1,250. The results using actual competi-tiveness rather than predicted competitiveness even more starkly show a jump in turnout in the most thecompetitive municipalities.
21
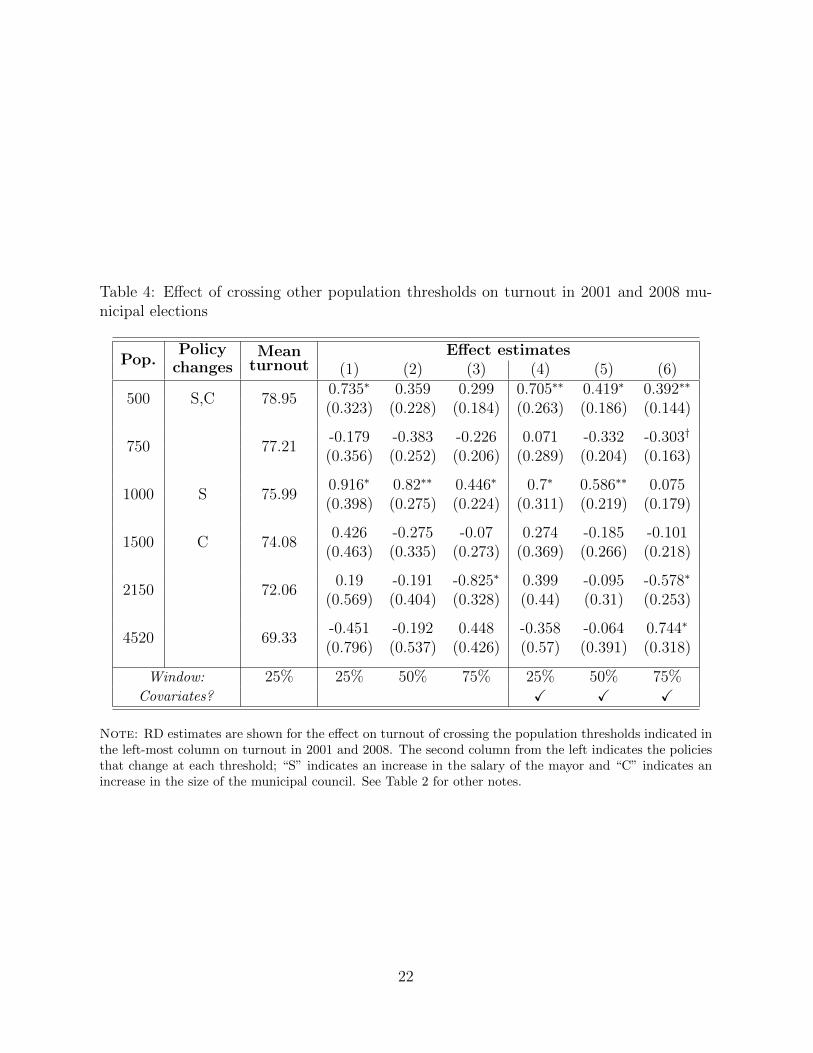
Table 4: Effect of crossing other population thresholds on turnout in 2001 and 2008 mu-nicipal elections
Pop.Policy
changesMean
turnoutEffect estimates
(1) (2) (3) (4) (5) (6)
500 S,C 78.950.735∗ 0.359 0.299 0.705∗∗ 0.419∗ 0.392∗∗
(0.323) (0.228) (0.184) (0.263) (0.186) (0.144)
750 77.21-0.179 -0.383 -0.226 0.071 -0.332 -0.303†
(0.356) (0.252) (0.206) (0.289) (0.204) (0.163)
1000 S 75.990.916∗ 0.82∗∗ 0.446∗ 0.7∗ 0.586∗∗ 0.075(0.398) (0.275) (0.224) (0.311) (0.219) (0.179)
1500 C 74.080.426 -0.275 -0.07 0.274 -0.185 -0.101
(0.463) (0.335) (0.273) (0.369) (0.266) (0.218)
2150 72.060.19 -0.191 -0.825∗ 0.399 -0.095 -0.578∗
(0.569) (0.404) (0.328) (0.44) (0.31) (0.253)
4520 69.33-0.451 -0.192 0.448 -0.358 -0.064 0.744∗
(0.796) (0.537) (0.426) (0.57) (0.391) (0.318)
Window: 25% 25% 50% 75% 25% 50% 75%Covariates? X X X
Note: RD estimates are shown for the effect on turnout of crossing the population thresholds indicated inthe left-most column on turnout in 2001 and 2008. The second column from the left indicates the policiesthat change at each threshold; “S” indicates an increase in the salary of the mayor and “C” indicates anincrease in the size of the municipal council. See Table 2 for other notes.
22
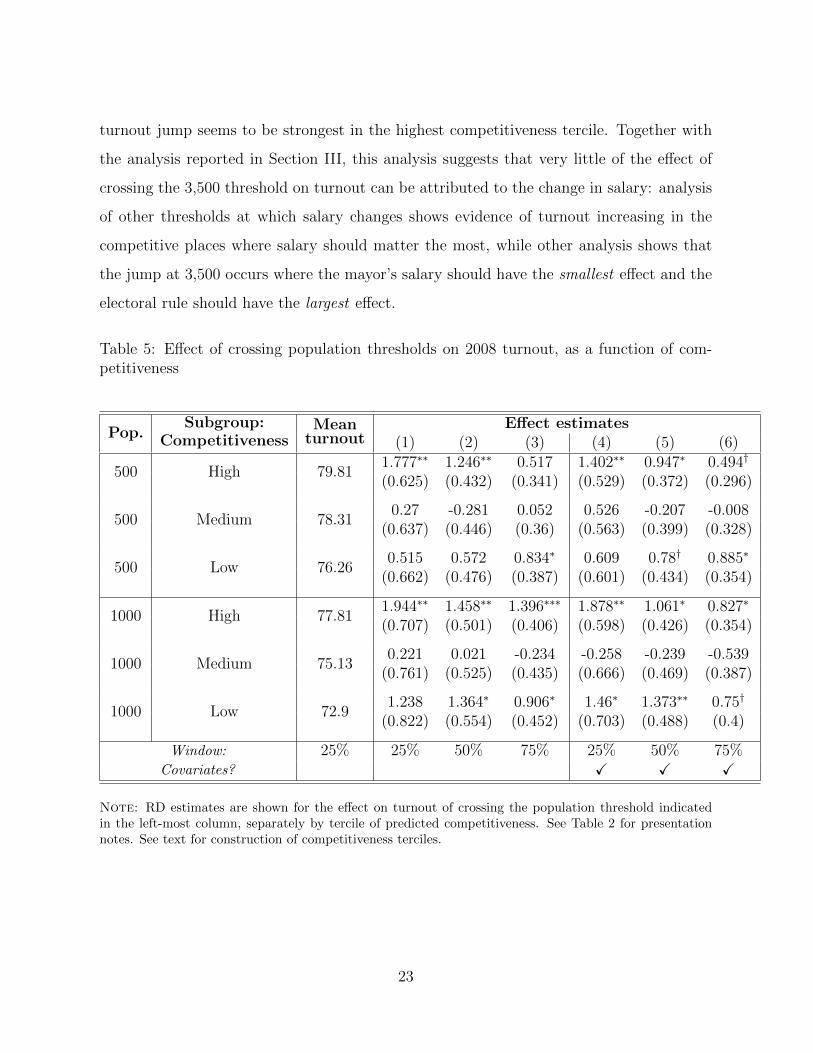
turnout jump seems to be strongest in the highest competitiveness tercile. Together with
the analysis reported in Section III, this analysis suggests that very little of the effect of
crossing the 3,500 threshold on turnout can be attributed to the change in salary: analysis
of other thresholds at which salary changes shows evidence of turnout increasing in the
competitive places where salary should matter the most, while other analysis shows that
the jump at 3,500 occurs where the mayor’s salary should have the smallest effect and the
electoral rule should have the largest effect.
Table 5: Effect of crossing population thresholds on 2008 turnout, as a function of com-petitiveness
Pop.Subgroup:
CompetitivenessMean
turnoutEffect estimates
(1) (2) (3) (4) (5) (6)
500 High 79.811.777∗∗ 1.246∗∗ 0.517 1.402∗∗ 0.947∗ 0.494†
(0.625) (0.432) (0.341) (0.529) (0.372) (0.296)
500 Medium 78.310.27 -0.281 0.052 0.526 -0.207 -0.008
(0.637) (0.446) (0.36) (0.563) (0.399) (0.328)
500 Low 76.260.515 0.572 0.834∗ 0.609 0.78† 0.885∗
(0.662) (0.476) (0.387) (0.601) (0.434) (0.354)
1000 High 77.811.944∗∗ 1.458∗∗ 1.396∗∗∗ 1.878∗∗ 1.061∗ 0.827∗
(0.707) (0.501) (0.406) (0.598) (0.426) (0.354)
1000 Medium 75.130.221 0.021 -0.234 -0.258 -0.239 -0.539
(0.761) (0.525) (0.435) (0.666) (0.469) (0.387)
1000 Low 72.91.238 1.364∗ 0.906∗ 1.46∗ 1.373∗∗ 0.75†
(0.822) (0.554) (0.452) (0.703) (0.488) (0.4)
Window: 25% 25% 50% 75% 25% 50% 75%Covariates? X X X
Note: RD estimates are shown for the effect on turnout of crossing the population threshold indicatedin the left-most column, separately by tercile of predicted competitiveness. See Table 2 for presentationnotes. See text for construction of competitiveness terciles.
23
V. Indirect channels: number and quality of lists
The evidence presented to this point is consistent with the hypothesis that PR increases
turnout in French municipalities because, under the more proportional electoral formula,
candidates mobilize voters in relatively uncompetitive situations in which they would not
bother to do so under plurality. This is the direct effect of proportionality on mobilization.
Proportionality may also indirectly affect turnout by increasing the number and quality of
lists in competition; I assess that possibility in this section.
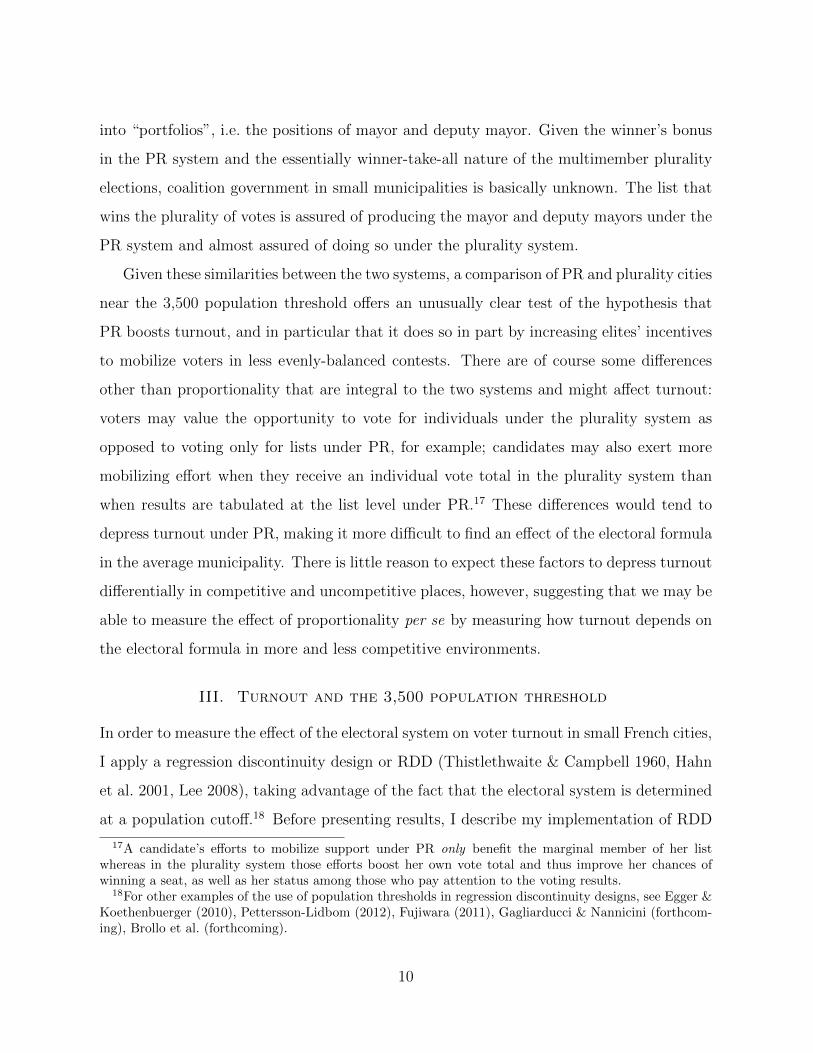
The idea that proportional representation favors the entry of more parties (compared
to plurality systems) has a long history; it is notably a component of the “psychological
effect” described by Duverger (1954). Given that lists can win seats with far less support
under the PR system (as indicated by Figure 1), we should expect more lists to enter
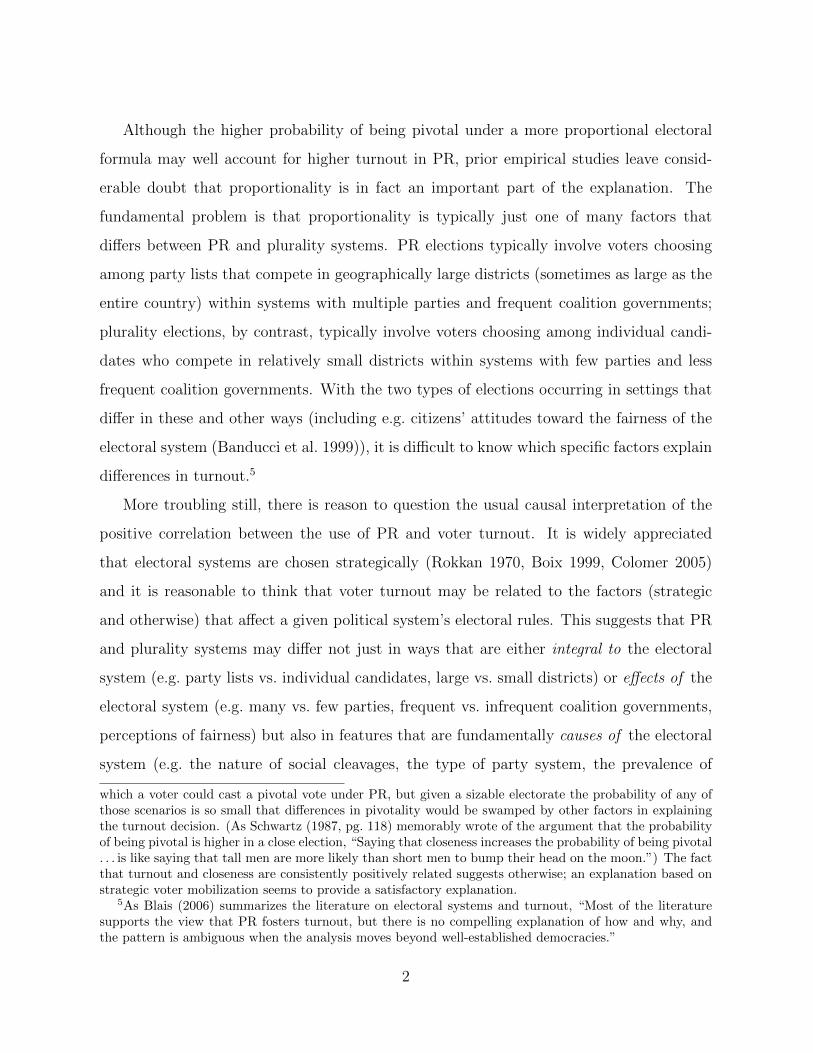
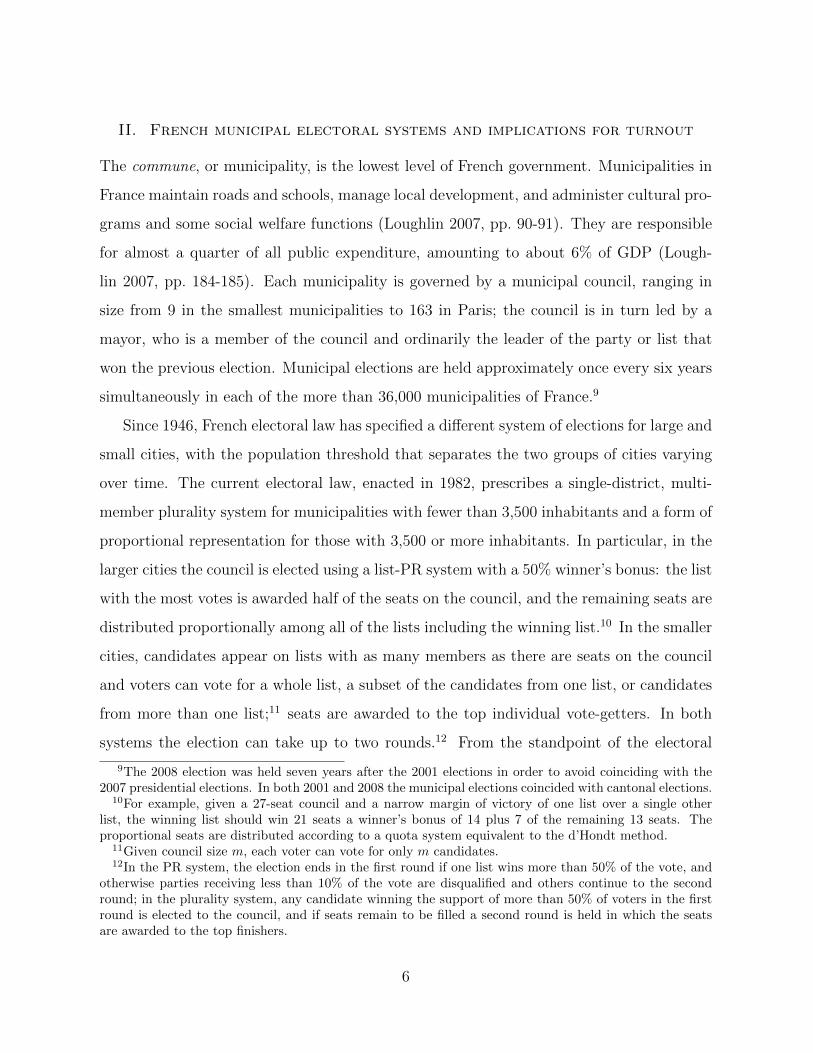
in cities just above the 3,500 population threshold. The top row of Table 6 and the top
panel of Figure 4 report RDD analysis of the effect of crossing the 3,500 threshold on the
number of lists in competition in the 2001 and 2008 elections. (Analysis here is restricted to
northwest France, because list-level results for sub-3,500 cities are not available elsewhere.)
The results suggest that the number of lists jumps by about 0.2 on average, from just
below 2 to just above 2. (Note however in Figure 4 that at the optimal window we cannot
reject the null of no effect.) The second row of Table 6 and the bottom panel of Figure
4 reports the effect of crossing 3,500 on the share of the vote (in %) won by the top two
lists. Consistent with the increase in the number of lists, the average share of support for
the top two lists drops by about 3% on average, from around 98% to around 95%. Both
findings suggest that the PR system may have increased turnout in part by encouraging
the entry of new lists that increase aggregate mobilization effort and appeal to previously
unengaged parts of the electorate.30
An additional reason why the support for the top two lists may decline at the 3,500
30Note that, at the cross-national level, the number of parties in competition does not seem to bepositively related to turnout (Blais 2006). Jackman (1987) attributes this to the fact that multipartyismmakes elections less decisive, a consideration that does not enter in my context because there are nocoalition governments. Grofman & Selb (2011) notes that two of the standard explanations for why moreparties should increase turnout do not withstand scrutiny, as a larger number of parties does not necessarilyimply more proportional results or more competition at the district level.
24
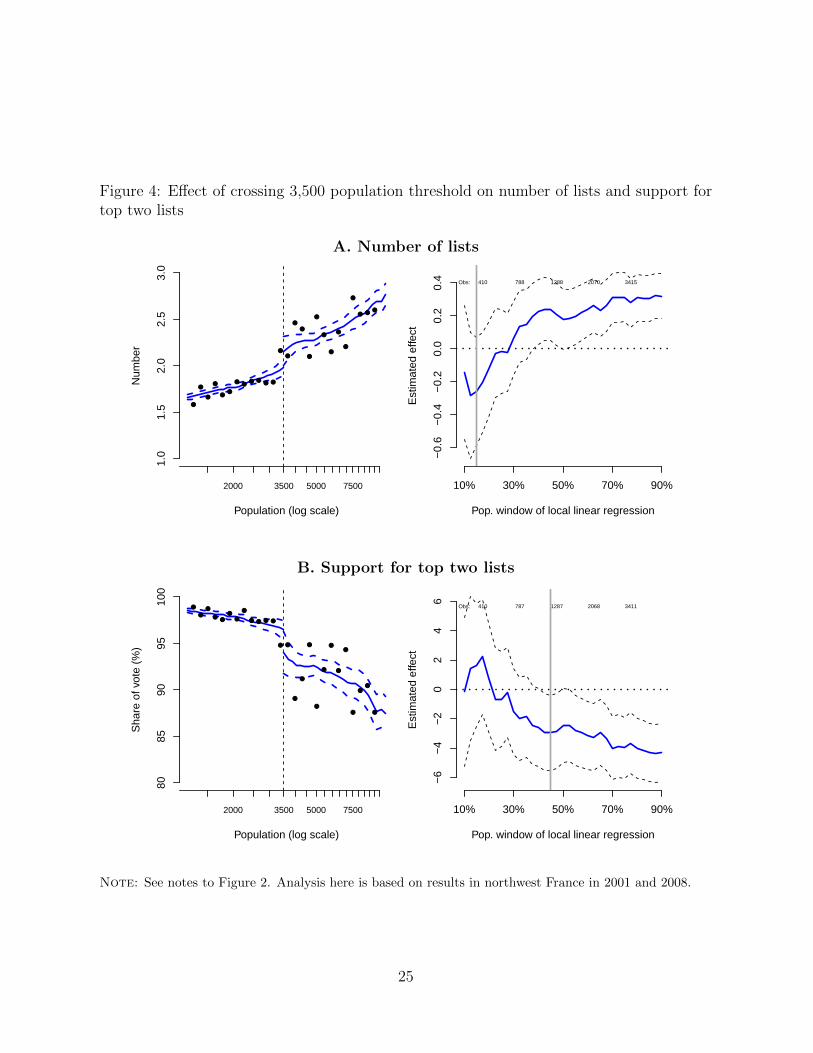
Figure 4: Effect of crossing 3,500 population threshold on number of lists and support fortop two lists
A. Number of lists
Population (log scale)
Num
ber
2000 3500 5000 7500
1.0
1.5
2.0
2.5
3.0
●
●
●
●
●●
● ●● ●
● ●
●●
●●
●
●
●
●
●
●
●
● ●●
Pop. window of local linear regression
Est
imat
ed e
ffect
10% 30% 50% 70% 90%
−0.
6−
0.4
−0.
20.
00.
20.
4 Obs: 410 788 1288 2070 3415
B. Support for top two lists
Population (log scale)
Sha
re o
f vot
e (%
)
2000 3500 5000 7500
8085
9095
100
●
●●
● ●●
●
●
● ● ● ●
● ●
●
●
●
●
●
●
●
●
●
●●
●
Pop. window of local linear regression
Est
imat
ed e
ffect
10% 30% 50% 70% 90%
−6
−4
−2
02
46
Obs: 410 787 1287 2068 3411
Note: See notes to Figure 2. Analysis here is based on results in northwest France in 2001 and 2008.
25
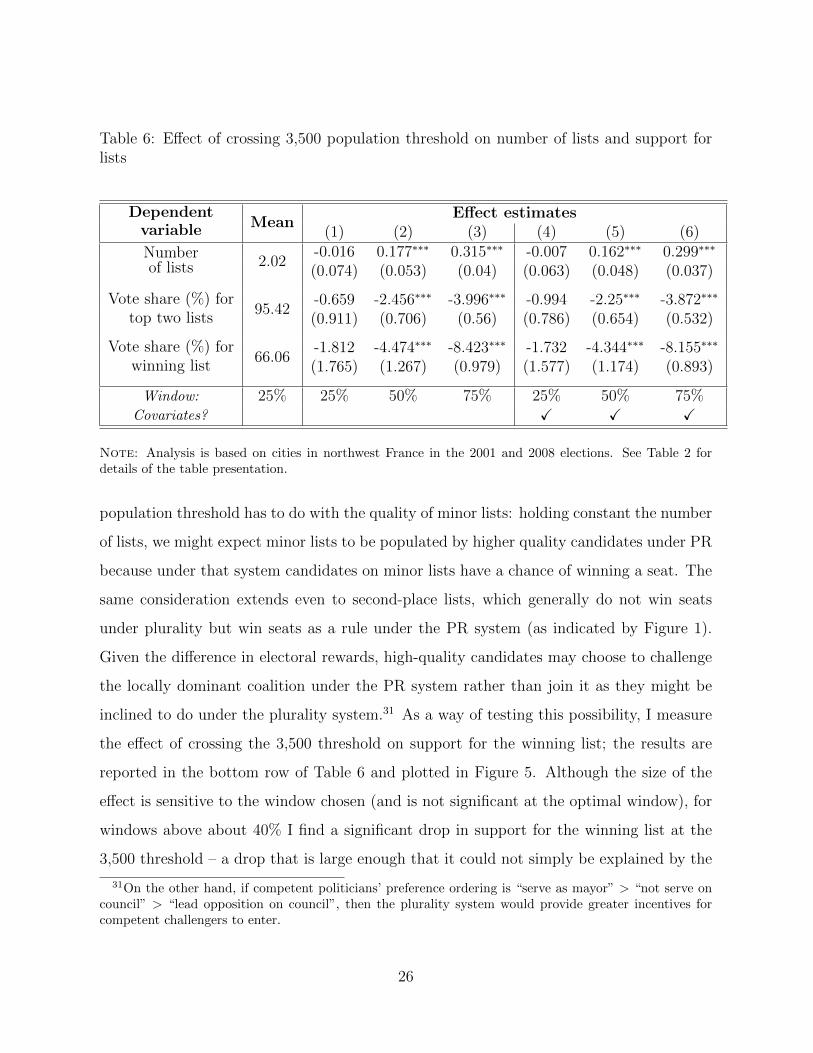
Table 6: Effect of crossing 3,500 population threshold on number of lists and support forlists
Dependentvariable Mean
Effect estimates(1) (2) (3) (4) (5) (6)
Numberof lists 2.02
-0.016 0.177∗∗∗ 0.315∗∗∗ -0.007 0.162∗∗∗ 0.299∗∗∗
(0.074) (0.053) (0.04) (0.063) (0.048) (0.037)
Vote share (%) fortop two lists
95.42-0.659 -2.456∗∗∗ -3.996∗∗∗ -0.994 -2.25∗∗∗ -3.872∗∗∗
(0.911) (0.706) (0.56) (0.786) (0.654) (0.532)
Vote share (%) forwinning list
66.06-1.812 -4.474∗∗∗ -8.423∗∗∗ -1.732 -4.344∗∗∗ -8.155∗∗∗
(1.765) (1.267) (0.979) (1.577) (1.174) (0.893)
Window: 25% 25% 50% 75% 25% 50% 75%Covariates? X X X
Note: Analysis is based on cities in northwest France in the 2001 and 2008 elections. See Table 2 fordetails of the table presentation.
population threshold has to do with the quality of minor lists: holding constant the number
of lists, we might expect minor lists to be populated by higher quality candidates under PR
because under that system candidates on minor lists have a chance of winning a seat. The
same consideration extends even to second-place lists, which generally do not win seats
under plurality but win seats as a rule under the PR system (as indicated by Figure 1).
Given the difference in electoral rewards, high-quality candidates may choose to challenge
the locally dominant coalition under the PR system rather than join it as they might be
inclined to do under the plurality system.31 As a way of testing this possibility, I measure
the effect of crossing the 3,500 threshold on support for the winning list; the results are
reported in the bottom row of Table 6 and plotted in Figure 5. Although the size of the
effect is sensitive to the window chosen (and is not significant at the optimal window), for
windows above about 40% I find a significant drop in support for the winning list at the
3,500 threshold – a drop that is large enough that it could not simply be explained by the
31On the other hand, if competent politicians’ preference ordering is “serve as mayor” > “not serve oncouncil” > “lead opposition on council”, then the plurality system would provide greater incentives forcompetent challengers to enter.
26
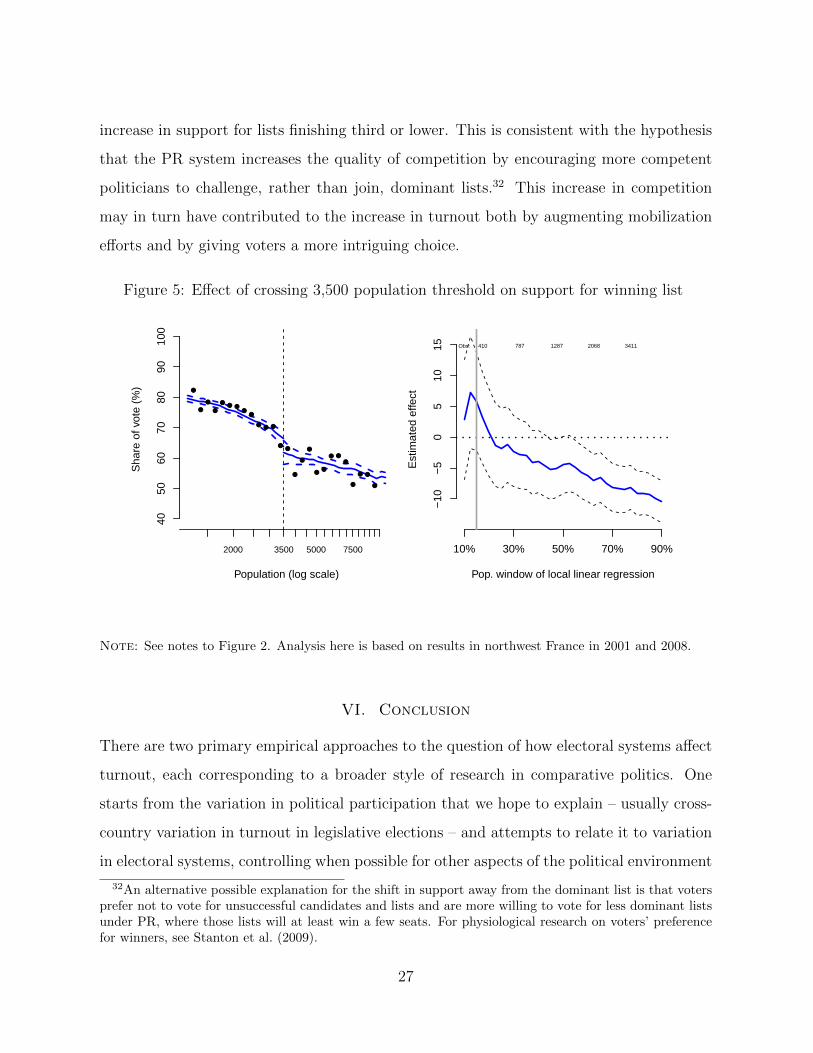
increase in support for lists finishing third or lower. This is consistent with the hypothesis
that the PR system increases the quality of competition by encouraging more competent
politicians to challenge, rather than join, dominant lists.32 This increase in competition
may in turn have contributed to the increase in turnout both by augmenting mobilization
efforts and by giving voters a more intriguing choice.
Figure 5: Effect of crossing 3,500 population threshold on support for winning list
Population (log scale)
Sha
re o
f vot
e (%
)
2000 3500 5000 7500
4050
6070
8090
100
●
●
●
●
●● ●
●●
● ● ●
●●
●
●
●
●●
● ●●
●
● ●
●
Pop. window of local linear regression
Est
imat
ed e
ffect
10% 30% 50% 70% 90%
−10
−5
05
1015 Obs: 410 787 1287 2068 3411
Note: See notes to Figure 2. Analysis here is based on results in northwest France in 2001 and 2008.
VI. Conclusion
There are two primary empirical approaches to the question of how electoral systems affect
turnout, each corresponding to a broader style of research in comparative politics. One
starts from the variation in political participation that we hope to explain – usually cross-
country variation in turnout in legislative elections – and attempts to relate it to variation
in electoral systems, controlling when possible for other aspects of the political environment
32An alternative possible explanation for the shift in support away from the dominant list is that votersprefer not to vote for unsuccessful candidates and lists and are more willing to vote for less dominant listsunder PR, where those lists will at least win a few seats. For physiological research on voters’ preferencefor winners, see Stanton et al. (2009).
27
that may vary across countries. The other approach starts from the possible explanations
of turnout and looks for settings in which the effect of one of those explanations may
be advantageously measured. The two approaches are complementary. The first approach
directly addresses the phenomena we find interesting, but it usually leaves us with concerns
about omitted variables and reverse causation; the second approach provides convincing
accounts of how a particular “treatment” affected turnout in a particular setting, but it
usually leaves us with questions about how well these accounts apply to other settings of
more general interest. In other words, the first approach is subject to criticisms about
internal validity while the second approach is subject to criticisms about external validity.
This study is decidedly of the second type. Although the results are of direct interest to
ongoing policy debates about local election systems in France, the primary goal of the study
is to complement cross-national studies seeking to understand how electoral formulas affect
political participation. Taking advantage of an unusual natural experiment in small French
cities, it documents an effect of the electoral formula on turnout, showing that (as predicted
by existing accounts of how mobilization incentives depend on electoral rules) PR increases
turnout most in less evenly-fought elections. Because many other features that usually
differ between PR and plurality systems are held constant here (notably the arrangement
of districts and the frequency of coalition government), the results provide confirmation
that turnout depends on the proportionality of the electoral formula. Of course, it is
difficult to know to what extent these results explain cross-national differences in turnout:
municipal council elections in small French cities differ from national legislative elections
in numerous ways, including such major factors as the nature of the electoral systems in
use and the role of political parties. Still, I argue that the effects of proportionality that I
document in this setting also operate at the national level where, for a variety of reasons,
these effects are much more difficult to measure.
28
References
Ade, F. & Freier, R. (2011), ‘When can we trust population thresholds in regression dis-continuity designs?’.
Aldrich, J. H. (1993), ‘Rational choice and turnout’, American Journal of Political Sciencepp. 246–278.
Banducci, S. A., Donovan, T. & Karp, J. A. (1999), ‘Proportional representation andattitudes about politics: results from new zealand’, Electoral Studies 18(4), 533–555.
Blais, A. (2006), ‘What affects voter turnout?’, Annu. Rev. Polit. Sci. 9, 111–125.
Blais, A. & Carty, R. K. (1990), ‘Does proportional representation foster voter turnout?’,European Journal of Political Research 18(2), 167–181.
Boix, C. (1999), ‘Setting the rules of the game: the choice of electoral systems in advanceddemocracies’, American Political Science Review pp. 609–624.
Brollo, F., Perotti, R., Tabellini, G. & Nannicini, T. (forthcoming), ‘The political resourcecurse’, American Economic Review .
Colomer, J. M. (2005), ‘It’s parties that choose electoral systems (or, Duverger’s laws upsidedown)’, Political Studies 53(1), 1–21.
Cox, G. (1999), ‘Electoral rules and the calculus of mobilization’, Legislative Studies Quar-terly pp. 387–419.
Downs, A. (1957), ‘An economic theory of democracy’.
Duverger, M. (1954), Political Parties: Their Organization and Activity in the ModernState, Wiley.
Egger, P. & Koethenbuerger, M. (2010), ‘Government spending and legislative organiza-tion: Quasi-experimental evidence from germany’, American Economic Journal: AppliedEconomics 2(4), 200–212.
Fujiwara, T. (2011), ‘A regression discontinuity test of strategic voting and duvergers law’,Quarterly Journal of Political Science 6(3-4), 197–233.
Gagliarducci, S. & Nannicini, T. (forthcoming), ‘Do better paid politicians perform better?disentangling incentives from selection’, Journal of the European Economic Association.
Geys, B. (2006), ‘Explaining voter turnout: A review of aggregate-level research’, ElectoralStudies 25(4), 637–663.
Grofman, B. & Selb, P. (2011), ‘Turnout and the (effective) number of parties at thenational and district levels: A puzzle-solving approach’, Party Politics 17(1), 93–117.
29
Hahn, J., Todd, P. & Van der Klaauw, W. (2001), ‘Identification and estimation of treat-ment effects with a regression-discontinuity design’, Econometrica pp. 201–209.
Imbens, G. & Lemieux, T. (2008), ‘Regression discontinuity designs: A guide to practice’,Journal of Econometrics 142(2), 615–635.
Jackman, R. (1987), ‘Political institutions and voter turnout in the industrial democracies’,The American Political Science Review pp. 405–423.
Ladner, A. & Milner, H. (1999), ‘Do voters turn out more under proportional than ma-joritarian systems? the evidence from swiss communal elections’, Electoral Studies18(2), 235–250.
Lee, D. (2008), ‘Randomized experiments from non-random selection in US House elec-tions’, Journal of Econometrics 142(2), 675–697.
Loughlin, J. (2007), Subnational Government: The French Experience, Palgrave McMillan.
McCrary, J. (2008), ‘Manipulation of the running variable in the regression discontinuitydesign: A density test’, Journal of Econometrics 142(2), 698–714.
Pettersson-Lidbom, P. (2012), ‘Does the size of the legislature affect the size of government?evidence from two natural experiments’, Journal of Public Economics 96(3), 269–278.
Powell Jr, G. B. (1980), ‘Voting turnout in thirty democracies: Partisan, legal, and socio-economic influences’, Electoral Participation: A Comparative Analysis 534.
Powell, Jr, G. B. (1986), ‘American voter turnout in comparative perspective’, The Amer-ican Political Science Review pp. 17–43.
Riker, W. H. & Ordeshook, P. C. (1968), ‘A theory of the calculus of voting’, AmericanPolitical Science Review 62(01), 25–42.
Rokkan, S. (1970), Citizens, Elections, Parties: Approaches to the Comparative Study ofthe Process of Development, Universitetsforlaget.
Schwartz, T. (1987), ‘Your vote counts on account of the way it is counted: An institutionalsolution to the paradox of not voting’, Public Choice 54(2), 101–121.
Stanton, S. J., Beehner, J. C., Saini, E. K., Kuhn, C. M. & LaBar, K. S. (2009), ‘Dominance,politics, and physiology: voters’ testosterone changes on the night of the 2008 UnitedStates presidential election’, PLoS One 4(10), e7543.
Thistlethwaite, D. & Campbell, D. (1960), ‘Regression-discontinuity analysis: An alterna-tive to the ex post facto experiment’, Journal of Educational Psychology 51, 309–317.
30
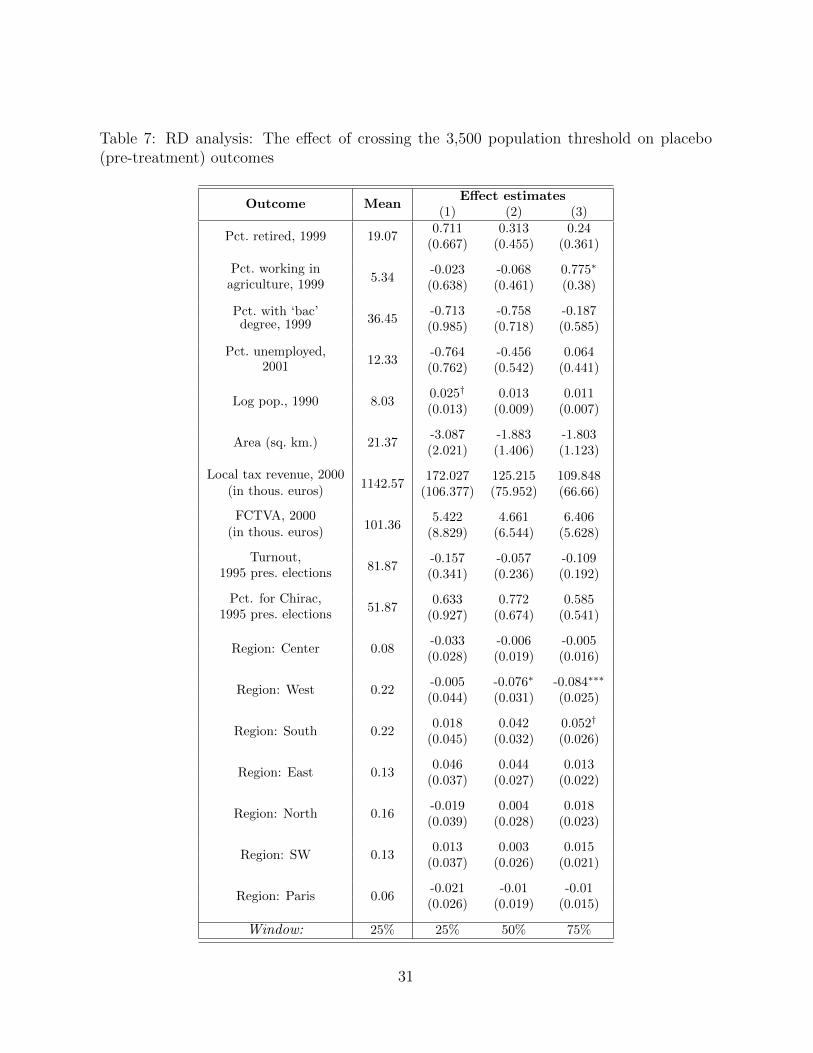
Table 7: RD analysis: The effect of crossing the 3,500 population threshold on placebo(pre-treatment) outcomes
Outcome MeanEffect estimates
(1) (2) (3)
Pct. retired, 1999 19.070.711 0.313 0.24
(0.667) (0.455) (0.361)
Pct. working inagriculture, 1999
5.34-0.023 -0.068 0.775∗
(0.638) (0.461) (0.38)
Pct. with ‘bac’degree, 1999 36.45
-0.713 -0.758 -0.187(0.985) (0.718) (0.585)
Pct. unemployed,2001 12.33
-0.764 -0.456 0.064(0.762) (0.542) (0.441)
Log pop., 1990 8.030.025† 0.013 0.011(0.013) (0.009) (0.007)
Area (sq. km.) 21.37-3.087 -1.883 -1.803(2.021) (1.406) (1.123)
Local tax revenue, 2000(in thous. euros)
1142.57172.027 125.215 109.848
(106.377) (75.952) (66.66)
FCTVA, 2000(in thous. euros)
101.365.422 4.661 6.406
(8.829) (6.544) (5.628)
Turnout,1995 pres. elections
81.87-0.157 -0.057 -0.109(0.341) (0.236) (0.192)
Pct. for Chirac,1995 pres. elections
51.870.633 0.772 0.585
(0.927) (0.674) (0.541)
Region: Center 0.08-0.033 -0.006 -0.005(0.028) (0.019) (0.016)
Region: West 0.22-0.005 -0.076∗ -0.084∗∗∗
(0.044) (0.031) (0.025)
Region: South 0.220.018 0.042 0.052†
(0.045) (0.032) (0.026)
Region: East 0.130.046 0.044 0.013
(0.037) (0.027) (0.022)
Region: North 0.16-0.019 0.004 0.018(0.039) (0.028) (0.023)
Region: SW 0.130.013 0.003 0.015
(0.037) (0.026) (0.021)
Region: Paris 0.06-0.021 -0.01 -0.01(0.026) (0.019) (0.015)
Window: 25% 25% 50% 75%
31
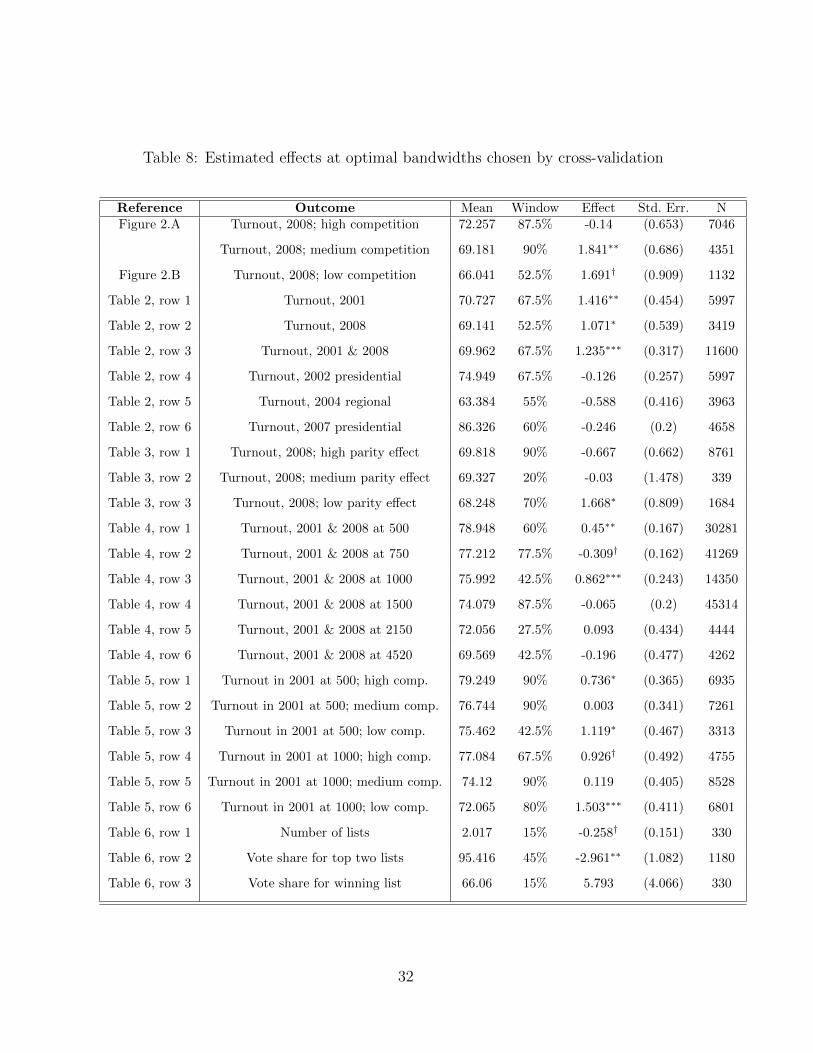
Table 8: Estimated effects at optimal bandwidths chosen by cross-validation
Reference Outcome Mean Window Effect Std. Err. NFigure 2.A Turnout, 2008; high competition 72.257 87.5% -0.14 (0.653) 7046
Turnout, 2008; medium competition 69.181 90% 1.841∗∗ (0.686) 4351
Figure 2.B Turnout, 2008; low competition 66.041 52.5% 1.691† (0.909) 1132
Table 2, row 1 Turnout, 2001 70.727 67.5% 1.416∗∗ (0.454) 5997
Table 2, row 2 Turnout, 2008 69.141 52.5% 1.071∗ (0.539) 3419
Table 2, row 3 Turnout, 2001 & 2008 69.962 67.5% 1.235∗∗∗ (0.317) 11600
Table 2, row 4 Turnout, 2002 presidential 74.949 67.5% -0.126 (0.257) 5997
Table 2, row 5 Turnout, 2004 regional 63.384 55% -0.588 (0.416) 3963
Table 2, row 6 Turnout, 2007 presidential 86.326 60% -0.246 (0.2) 4658
Table 3, row 1 Turnout, 2008; high parity effect 69.818 90% -0.667 (0.662) 8761
Table 3, row 2 Turnout, 2008; medium parity effect 69.327 20% -0.03 (1.478) 339
Table 3, row 3 Turnout, 2008; low parity effect 68.248 70% 1.668∗ (0.809) 1684
Table 4, row 1 Turnout, 2001 & 2008 at 500 78.948 60% 0.45∗∗ (0.167) 30281
Table 4, row 2 Turnout, 2001 & 2008 at 750 77.212 77.5% -0.309† (0.162) 41269
Table 4, row 3 Turnout, 2001 & 2008 at 1000 75.992 42.5% 0.862∗∗∗ (0.243) 14350
Table 4, row 4 Turnout, 2001 & 2008 at 1500 74.079 87.5% -0.065 (0.2) 45314
Table 4, row 5 Turnout, 2001 & 2008 at 2150 72.056 27.5% 0.093 (0.434) 4444
Table 4, row 6 Turnout, 2001 & 2008 at 4520 69.569 42.5% -0.196 (0.477) 4262
Table 5, row 1 Turnout in 2001 at 500; high comp. 79.249 90% 0.736∗ (0.365) 6935
Table 5, row 2 Turnout in 2001 at 500; medium comp. 76.744 90% 0.003 (0.341) 7261
Table 5, row 3 Turnout in 2001 at 500; low comp. 75.462 42.5% 1.119∗ (0.467) 3313
Table 5, row 4 Turnout in 2001 at 1000; high comp. 77.084 67.5% 0.926† (0.492) 4755
Table 5, row 5 Turnout in 2001 at 1000; medium comp. 74.12 90% 0.119 (0.405) 8528
Table 5, row 6 Turnout in 2001 at 1000; low comp. 72.065 80% 1.503∗∗∗ (0.411) 6801
Table 6, row 1 Number of lists 2.017 15% -0.258† (0.151) 330
Table 6, row 2 Vote share for top two lists 95.416 45% -2.961∗∗ (1.082) 1180
Table 6, row 3 Vote share for winning list 66.06 15% 5.793 (4.066) 330
32