Embed Size (px)
Citation preview

PROPOLIS
Planning and Research of Policies
for Land Use and Transport for Increasing Urban Sustainability
Contract No: EVK4-1999-00005
Final Report
Second Edition February, 2004
Authors:
Kari Lautso, Klaus Spiekermann, Michael Wegener, Ian Sheppard,
Philip Steadman, Angelo Martino, Roberto Domingo, Sylvie Gayda
Project Co-ordinator: Kari Lautso
LT Consultants, Finland
Partners: IRPUD Universität Dortmund, Germany/
Spiekermann & Wegener, Urban and Regional Research ME&P Marcial Echenique and Partners, United Kingdom
UCL University College London, United Kingdom TRT Trasporti e Territorio, Italy
MECSA Marcial Echenique y Compañía, Spain STRATEC, Belgium
Project Funded by the European Commission under the Energy, Environment and Sustainable Development
Thematic Programme of the Fifth RTD Framework Programme


DG Research
3
Foreword
PROPOLIS is a research project within the Fifth Framework Programme of the EC. It belongs to the Thematic Programme "Energy, Environment and Sustainable Devel-opment" and it’s Key Action "City of Tomorrow and Cultural Heritage". DG Re-search and national organizations from six countries – Finland, Germany, UK, Bel-gium, Italy and Spain – have funded it. The project started on 1.1.2000.
The objective of PROPOLIS was to research, develop and test integrated land use and transport policies, tools and comprehensive assessment methodologies in order to de-fine sustainable long-term urban strategies and to demonstrate their effects in Euro-pean cities.
The project objectives, for the most part, have been achieved. The project has further developed the comprehensive approach for the assessment of sustainable urban devel-opment. Also, new methodologies and tools have been developed and successfully applied for analysing potential urban transport and land use policies and their impacts in the project’s seven case cities of Helsinki, Dortmund, Naples, Vicenza, Inverness, Bilbao and Brussels.
The message from the project is clear. The results show that with the growing traffic volumes the sustainability of our cities is environmentally and socially deteriorating despite local plans designed to improve the situation. Only radical actions can main-tain the current level of sustainability. The land use and transport subsystems must be viewed as a whole. The sustainability of this entire system can be improved by offer-ing better public transport services while restricting car use and providing supportive land use policies. Following these lines will, as demonstrated in the seven PROPOLIS case cities, simultaneously enhance the environmental and social dimensions of sus-tainability while being also economically efficient – improve our cities of tomorrow.
I want to express my special gratitude to all consortium partners and research team members for their hard work and patience, all the local authorities involved for their help and guidance, and to Dr. Eric Ponthieu, Scientific Officer of EC, for his constructive and responsive attitude and actions which have helped and encouraged us in our work.
Helsinki, February 2004
Kari Lautso
Co-ordinator of PROPOLIS

DG Research
4
Abstract
PROPOLIS is a research project within the Fifth Framework Programme of the EC. It belongs to the "Energy, Environment and Sustainable Development" Thematic Programme’s Key Ac-tion "City of Tomorrow and Cultural Heritage". DG Research and national organizations from Finland, Germany, UK, Belgium, Italy and Spain have funded it.
The objective of PROPOLIS was to research, develop and test integrated land use and trans-port policies, tools and comprehensive assessment methodologies in order to find sustainable long-term urban strategies and to demonstrate their effects in European cities.
A set of indicators was developed for measuring the environmental, social and economic di-mensions of urban sustainability. Values for these indicators were calculated using advanced urban land use and transport models and new GIS and Internet based modules developed dur-ing the project. A decision support tool was used to evaluate the sets of indicator values in order to arrive at single aggregate environmental, social and economic indices describing the alternative policy options. To include the long-term land use effects, a time horizon of 20 years was used. In close contact with Client-Partners and international networks the system was used to systematically test and analyse policy options in 7 European cities using three different types of land use and transport models.
The main innovation of the project is the integrated and comprehensive but still transparent approach undertaken. Secondly, the approach applied has also produced innovative policy recommendations based on the system’s ability to forecast the indicator values into the future and to take into account the long-term land use effects.
The results show that, with growing traffic, the environmental sustainability deteriorates in all case cities compared with the current situation if no actions are taken. The trend is unlikely to change even if city specific reference scenarios, including local investment programmes, are adopted. Also, the social sustainability tends to deteriorate.
The aim of PROPOLIS was to find policies that could simultaneously improve all three di-mensions of sustainability compared with the reference solution and, if possible, even im-prove the current level of sustainability. This goal was reached in most of the case cities using the same type of package approach combining pricing, investment and land use policies. This indicates that the approach could be transferable and similar strategies could work also in other European cities.
The local investment plans, normally consisting of an investment programme for both public transport and road investments, performed in the right direction but could not maintain the current level of sustainability. The various elements of the programmes were often found to encourage development towards opposing goals. Investment programmes should be designed to be consistent with the general goals set for the transport-land use system.
Different car pricing methods were able to produce positive results. However, their effects on land use have to be separately assessed as the balance of services and vitality of different ar-eas may change too much.

DG Research
5
Also public transport policies, increasing speed and service and reducing fares, worked well. However, also here special attention has to be paid to the land use effects and to their possible contribution to city sprawl. Although intended to decrease travel demand they could in the long-term lead to increases in private car use.
Regulating car speeds had positive effects on traffic accidents, as intended, but the policy was not enough to compensate for the effects of the worsening opportunity, accessibility and air pollution related indicators. Thus, speed policies should be adopted on a case-by-case basis.
Different types of individual land use policies did not have significant positive effects on the overall sustainability indices. However, land use policies could successfully be used locally and to support the changes in demand caused by the car pricing and public transport policies.
Best results were achieved by using policy combinations, i.e. push and pull measures consist-ing of car pricing policies and simultaneous improvements of public transport through re-duced fares and better speed and service. The combination produced cumulative positive re-sults and the negative land use effects of the individual policies could be avoided.
Adopting the above policy packages lead to a 15-20% reduction in CO2 emissions, a 8-17% reduction in traffic accidents and often to at least small reductions in exposure to noise and pollutants and in the total time spent in traffic. In addition, the accessibility to the city centre and services was improved. The socio-economic benefits varied but were typically 1000 – 3000 euro/inhabitant for the assessment period. Searching and defining more optimal local levels for the actions could further improve the results, as demonstrated in some case cities.
The PROPOLIS research has demonstrated that a complete urban policy programme should be evaluated both policy by policy and as a whole. A good urban policy programme consists of co-ordinated elements that work together to produce cumulative long-term effects that at-tain a balanced set of environmental, social and economic goals. These elements may include:
− Combination of car and public transport pricing policies reflecting the external costs caused and with differentiation between peak and off-peak hours as well as congested and non-congested areas
− Targeted transport investment programmes meeting the changes in demand caused by the above policies and especially responding to the increased demand for better public trans-port speed and service
− A land use plan supporting the new need for people to live near central areas, in satellite cities or along well served public transport corridors, and the people’s increased need and opportunity to use public transport
PROPOLIS has demonstrated that in typical European cities this type of strategy is likely to improve all dimensions of urban sustainability compared with the continuation of existing policies and, in best cases, increase the current level of sustainability – improve our cities of tomorrow.

DG Research
6
Executive summary
The PROPOLIS approach
The objective of PROPOLIS is to research, develop and test integrated land use and transport policies, tools and comprehensive assessment methodologies in order to de-fine sustainable long-term urban strategies and to demonstrate their effects in Euro-pean cities.
PROPOLIS views urban sustainability from three perspectives – environmental, so-cial and economic. Each of these dimensions is divided into themes and each theme comprises a set of indicators. Indicators under each dimension and its themes are used to measure the state of sustainability for a set of policy options. In addition to indica-tors, a set of background variables is defined to help understand and illustrate the dif-ferent impacts of the tested policies.
Indicator values are based on integrated land use and transport model outputs which are further processed with tools developed for disaggregation of data, economic evaluation, decision-making support and presentation of results.
This PROPOLIS system is used to define and measure the effects of the policy op-tions offering the most potential. The policy options are mainly based on a literature review and the partners’ experience. Policy combinations have been successfully formed from the individual policy options in order to obtain cumulative positive ef-fects.
State of the art of land use, transport and environment modelling
That urban land use and transport are closely inter-linked is common wisdom among planners and the public. However, the reverse impact from transport to land use is less well known: how the development of the transport system influences the location de-cisions of landlords, investors, firms and households is not clearly understood even by many urban planners.
One method to better understand this two-way interaction and to predict the impacts of land use and transport policies is mathematical modelling which simulates the loca-tion and mobility behaviour of firms and households in urban regions. The urgency of the environmental debate has renewed the interest in integrated models of urban land use and transport.
A number of integrated urban land-use transport systems are in use today. There are significant variations among the models with respect to overall structure, comprehen-siveness and theoretical foundations, modelling techniques, dynamics, data require-ments and model calibration. The number of real-world applications of integrated urban land-use transport models has increased steadily over the last two decades.
However, urban modellers have for a long time ignored ecological aspects of the processes simulated in their models. Existing land-use transport (LT) models are be-

DG Research
7
ing augmented by environmental submodels to become land-use transport environ-ment (LTE) models. Yet today there exist no full-scale urban LTE models in the world. The first efforts to extend LT models to LTE models have concentrated on en-vironmental impacts of land use and transport and ignored the opposite direction, the impact of environmental variables on location decisions of investors, firms and households.
There are different approaches to incorporate environmental impacts and feedbacks into urban land-use transport models. Environmental submodels require a higher spa-tial resolution than zone-based land-use transport models. In PROPOLIS, the results of the land use models are spatially disaggregated for post-processing by the envi-ronmental submodels in the Raster module (see below).
PROPOLIS methodologies and tools
The analytical framework of PROPOLIS consists of the databases, models and tools of the PROPOLIS Modelling System.
Inputs to the modelling system are policy packages, GIS databases and model data-bases. Policy packages to be tested are transformed to 'model language' by changing some of the model parameters or the model database. GIS databases contain spatial data on zonal boundaries, road and public transport networks, land use categories etc. All land use transport models used are fully GIS-based, i.e. each model zone and each model link is represented in the GIS database.
In the modelling part, land use transport models are the driving engines of the system. In PROPOLIS there are three different land-use transport models, each somehow dif-ferent with respect to theory, issues modelled and output generated. The land use transport models simulate the effects of the policies in terms of changing zonal activi-ties such as population or employment and changing mobility pattern that result in different modal splits and different link loads.
A range of indicator modules receives the output of the land use transport models and calculates raw values of sustainability indicators.
Raster
The Raster module provides indicators for the environmental and social component of sustainability by introducing a disaggregate raster-based representation of space for those indicators that require a higher spatial resolution. In the Raster module the land use pattern within the zones is disaggregated to 100m x 100m raster cells using GIS information in order to permit the calculation of air quality, noise intrusion and other environmental indicators by raster cells. As the resident population of each raster cell is known –the percentage of population by zone and socio-economic group affected by environmental impacts can be calculated.

DG Research
8
Economic evaluation
The backbone of the economic assessment is represented by the application of a com-plete Cost Benefit Analysis on the transport side, further integrated by other indicators accounting for the distribution of costs and benefits and the regional change in com-petitiveness induced by adoption of the policy. The assessment is performed by the Economic Indicator Module software tool, which provides a coherent set of indicators summed up in a synthetic Economic Index (EEEI), which represents the net present value of the savings per capita.
Assessment of sustainability
The assessment of sustainability takes place in the USE-IT module, where the indica-tor values are weighted and the importance of change is valued. The weighting and valuing process results in a single sustainability index for each dimension of sustain-ability. This index summarises a vast amount of data from e.g. the 100m x 100m raster cells. The module also makes the comparisons between policies easy and illus-trative and can be operated through Internet, in case public involvement is needed.
Presentation
A strong focus on clear, graphical presentation of data runs throughout the tools de-veloped in PROPOLIS. The model-specific tools use GIS and three-dimensional mapping techniques to show spatial variations and highlight patterns and trends in background variables. The fine resolution mapping in the Raster module pinpoints very localised effects and interactions whereas the Analysis and Presentation Tool fa-cilitates rapid comparison between policies and between cities. The focus on graphical presentation helps to maximise productivity and to promote understanding throughout the PROPOLIS modelling and analysis process.
Policy testing using the PROPOLIS system
The PROPOLIS system has been used in the seven case cities of Helsinki, Dortmund, Inverness, Naples, Vicenza, Bilbao and Brussels. Three different land use and trans-port model types have been used (MEPLAN, Dortmund and Tranus) ensuring that the results are not model specific. All data used has been harmonised in order to produce comparable results.
The final list of policies tested in all case cities includes 17 individual policies and three policy combinations. In addition, each test city has a set of locally tested policies defined in co-operation with national authorities. The selection of the 17 common policies is mainly based on a literature review, the partners’ previous experience and the preliminary tests made by LT. The definition of the combinations is based on the properties of the individual policy run results. The policies tested are grouped under the following themes: base scenario, investment policies, car pricing, regulation, pub-lic transport, land use and policy combinations.

DG Research
9
Results: Approaching sustainable urban policies
PROPOLIS has maintained and further developed the general comprehensive ap-proach and the methodologies, originally developed in the SPARTACUS project, for studying sustainable urban policies. Most of the conclusions previously made can now be confirmed, specified in more detail and supported by more case cities and new types of models used.
The PROPOLIS system produces large amounts of information, but it also makes possible a drastic stepwise aggregation of the data — down to three sustainability in-dex values per policy based on the preferences of the user or client of the system. In this way also the transparency of the system is maintained.
The results demonstrate the types of policies, which are likely to give positive results and therefore merit further study. However, theoretical, methodological and data limi-tations mean that some care is required in their interpretation. Despite these reserva-tions many of the results in different types of cities, in different cultures and achieved using different types of models point in the same direction, are understandable and confirm the underlying theoretical considerations.
The main concept for further research builds on the premises that urban transport and land use form one integrated environmental, social and economic system that interacts with the surrounding region without a clear border. Thus the urban system and the ef-fects of alternative policies should be assessed by simultaneously studying the land use and transport systems and their interaction with the environmental, social and economic systems and with the surrounding region on which the urban system is de-pendent. Both short- and long-term effects have to be taken into account. Many of the methods developed in PROPOLIS merit further research. However, the PROPOLIS system even in its current state could be used for more detailed policy identification in the seven case cities for producing comparable and harmonised data from different types of European cities.
The results show that the environmental sustainability deteriorates in all case cities compared with the current situation if no actions are taken and even if city specific reference scenarios, including local investment programmes, are adopted. Also so-cially the majority of cities tend to deteriorate.
The aim of PROPOLIS was to find policies that could, in an ideal case, simultane-ously improve all dimensions of sustainability compared with the reference solution and, if possible, even improve the current level of sustainability. This goal was reached in most of the case cities using a same type of approach. This indicates that the approach could work in other European cities, as well, and that the results could thus be transferable.
The local investment plans, normally consisting of an investment programme for both public transport and road investments, performed in the right direction. However, they were not enough to maintain the current level of sustainability. It was found that the elements of the programmes are often contradictory and encourage development to-

DG Research
10
wards different goals. Investment programmes should thus be designed to be consis-tent with the general goals set for the transport-land use system.
Regulating car speed policies had positive effects on traffic accidents, as intended, but they were not enough to compensate for the effects of the worsening opportunity, ac-cessibility and air pollution related indicators. Thus, instead of applying general speed reduction policies, the locations for speed reductions should be considered case by case.
Different types of individual land use policies did not produce significant positive ef-fects. However, land use policies could successfully be used to support the changes in demand caused by the car pricing and public transport policies. Also locally the ef-fects of adopting land use policies may be significant.
Different car pricing methods were able to produce positive results. However, their effects on land use have to be separately assessed.
Also the tested public transport policies, increasing speed and service and reducing fares, worked well. In most cases they were environmentally, socially and economi-cally feasible. However, also here special attention has to be paid to the land use ef-fects and possible contribution to city sprawl.
Some measures intended to decrease travel demand could in the long-term lead to in-creases in private car mileage. This was especially the case in some public transport policies.
Best results are achieved by using policy combinations, i.e. push and pull measures consisting of car pricing policies and simultaneous improvements of public transport through reduced fares and better speed and service. The combination of public trans-port policies with car pricing policies produced cumulative positive results and the negative land use effects of the individual policies could be avoided or mitigated.
Adopting the above line of actions leads in the PROPOLIS case cities to a 15-20% reduction in CO2 emissions, 8-17% reduction in traffic accidents and often to at least small reductions in exposure to noise and pollutants and the total time spent in traffic. Also accessibility to the city centre and services is improved. The socio-economic benefits vary but are typically 1000 – 3000 euro/inhabitant (net present value). Searching and defining local optimum levels for the actions can further improve these results, as demonstrated in some case cities.
It is important to note that the optimum level of the pricing actions is city specific and that the optimum levels should be locally defined taking into account the cumulative effects of the individual actions.
The PROPOLIS research has demonstrated that it is insufficient to merely evaluate policies on a one by one basis. Instead a complete urban policy programme should be evaluated both policy by policy and as a whole.
DG Research
11
A good urban policy programme consists of co-ordinated elements that work together to produce cumulative long-term effects that attain a balanced set of environmental, social and economic goals. These elements may include:
− Combination of pricing policies directed at car users, with differentiation between peak and off-peak hours, as well as congested and non-congested areas, with ap-propriate level of pricing of public transport fares
− Investment programmes supporting the changes in demand caused by the above policies and especially responding to the increased demand for better public trans-port speed and service
− A land use plan supporting the new need for people to live near central areas, in satellite cities or along well served public transport corridors and the people’s in-creased need and opportunity to use public transport
This policy line is likely, as demonstrated by the PROPOLIS case cities, to improve all dimensions of urban sustainability in typical European cities compared with their reference scenarios or continuation of existing policies and, in best cases, increase the current level of sustainability - improve our cities of tomorrow. This can only be achieved through coordinated intervention of both local and national decision-making levels.

DG Research
12
Acknowledgements
The Consortium wishes to express its appreciation for the support and help of the fol-lowing persons and organisations.
Petri Jalasto Finnish Ministry of Transport and Communications Osmo Moisio Finnish Ministry of Transport and Communications Lauri Hakala Uusimaa Regional Council Pentti Tuovinen Uusimaa Regional Council Suoma Sihto Helsinki Metropolitan Area Council Raimo Valtanen Helsinki Metropolitan Area Council Reijo Teerioja Helsinki Metropolitan Area Council Leena Silfverberg Ministry of Environment Mauri Heikkonen Ministry of Environment Aulis Tynkkynen Ministry of Environment Ulla Priha Finnish Road Administration Dr. Bert Leerkamp The City of Dortmund Andreas Meissner The City of Dortmund Antje Pott The City of Dortmund Winfried Sagolla The City of Dortmund Mike Greaves Highland Council Jim Miller Highland Council Jon Shepherd Highland Council Neil McLean Highland Council Elena Camerlingo Municipality of Naples Carla Poloniato Municipality of Vicenza Carla Almirante EIM software engineering
Belgium - Service Public Fédéral Mobilité et Transport (Belgian Federal Trans-port Administration of the Federal Transport Ministry)
Administration de l'Equipement et des Déplacements de la Région de Bruxelles-Capitale (Administration of Equipment and Mobility of the Brussels-Capital Region)

DG Research
13
Authors and Contact information
Authors
Name Institution Main research area
Lic. Sc. Kari Lautso LT editor, the PROPOLIS approach, pol-icy testing and analysis
Prof. Dr. Michael Wegener IRPUD/S&W environmental feedback, the Dortmund model application
Dipl.-Ing. Klaus Spiekermann IRPUD/S&W PROPOLIS analytical framework, Raster application
Dr. Ian Sheppard WSP the analysis and presentation tools
Prof. Philip Steadman UCL Inverness application
Ing. Angelo Martino TRT Policy testing and analysis
M.Sc. Roberto Domingo MECSA Bilbao application
M. Ing. Sylvie Gayda STR Brussels application
Contributors Mr. Hannu Lehto LT USE-IT module M. Sc. Virpi Pastinen LT economic analysis M. Sc. Miia Lehmuskoski LT indicator development Dr. Silvia Maffii TRT Economic analysis Dr. Riccardo Parolin TRT Economic analysis Arch. Silvio Angelini TRT Vicenza and Naples application Arch. Carlo Andriolo TRT Vicenza application Ing. Enrico Pastori TRT EIM Economic Indicator Module Dr. Angel Gil MECSA Bilbao application M.Sc. Sonia Padilla MECSA Bilbao application M.Sc. Françoise Boon STR Brussels application M.Ing. Nathalie Schaillée STR Brussels application Mr. Steve Evans UCL Inverness application Dr. Peter Rickaby Rickaby- Inverness application Thompson Ltd Prof. Tomas de la Barra Modelistica Inverness application M.Sc. Paavo Moilanen Strafica Helsinki application, policy runs
Timo Flieger IRPUD Dortmund application Dipl.-Ing. Meinhard Lemke IRPUD Dortmund application Dipl.-Ing. Björn Schwarze IRPUD Dortmund application Dipl.-Ing. Carsten Schürmann IRPUD Dortmund application Dipl.-Ing. Ahmed Talaat IRPUD Dortmund application

DG Research
14
Contact information Scientific Officer of DG Research Dr. Eric Ponthieu, European Commission DG XII-D.1.4 (MO75 6/4) Rue de la Loi, 200, B-1049 Brussels tel. +32-2 2969945, fax. +32-2 2960588 e-mail: [email protected]
The Consortium LT Consultants Ltd (LT) – Co-ordinator Heikkiläntie 7, 00210 Helsinki, Finland Lic. Tech., M.Sc Kari Lautso – Co-ordinator +358 9 615811, +358 400 411030, +358 9 61581430 (fax) [email protected], http://www.ltcon.fi/
Universität Dortmund, Institut für Raumplanung (IRPUD) August-Schmidt-Strasse 4 , 44221 Dortmund, Germany Prof. Dr. Michael Wegener since 01.02.2003: + 49 231 1899 441, + 49 231 1899 443 (fax) [email protected] http://IRPUD.raumplanung.uni-dortmund.de/IRPUD/index_e.htm
Subcontractor to IRPUD Spiekermann & Wegener, Urban and Regional Research (S&W) Lindemannstrasse 10, 44137 Dortmund, Germany Dipl.-Ing. Klaus Spiekermann +49 231 1899 439, +49 231 1899 443 (fax) [email protected], http://www.spiekermann-wegener.de
WSP Policy & Research Unit (formerly ME&P) 49-51 High Street, Trumpington, CB2 2HZ Cambridge, United Kingdom Mrs. Lynn Devereux +44 1223 840704, +44 1223 840384 (fax) [email protected], http://www.meap.co.uk/
University College London, Institution incorporated by Royal Charter (UCL) The Bartlett School of Architecture, Building, Environmental Design and Planning Torrington Place 1-19 (Philips House), WC1E 6BT London, United Kingdom Prof. Philip Steadman +44 20 7679 1628, +44 20 7916 1887 (fax) [email protected], http://www.ucl.ac.uk http://www.casa.ucl.ac.uk/ Centre for Advanced Spatial Analysis (CASA)
TRT Trasporti e Territorio srl (TRT) Via Rutilia 10/8, 20141 Milan, Italy Ing. Angelo Martino +39 02 5741 0380, +39 02 5521 2845 (fax) [email protected], http://www.trttrasportieterritorio.it
Marcial Echenique y Compañía S.A. (MECSA) C/Cristobal Colon 8B, 48990 Getxo-Vizcaya, Spain Dr. Angel Gil + 34 94 430 4210, + 34 94 430 4204 (fax) [email protected], http://www.mecsa.es/
STRATEC S.A. (STR) Avenue A. Lacomblé 69-71 box 8, 1030 Bruxelles, Belgium Françoise Boon / Sylvie Gayda +32 2 735 0995, +32 2 735 4917 (fax) [email protected] / [email protected], http://www.stratec.be

DG Research
15
Table of Contents
Foreword 3 Abstract 4 Executive summary 6 Acknowledgements 12 Authors and Contact information 13 Table of Contents 15 Abbreviations 20
Part I: The PROPOLIS approach and methodology for as-sessing urban sustainability
1. The PROPOLIS approach 25 1.1. The problem 26 1.2. The point of departure 26 1.3. About sustainability 27
1.3.1. General 27 1.3.2. Dimensions of sustainability 29 1.3.3. Special urban characteristics 30
1.4. Land use and transport in the context of urban sustainability 31 1.4.1. Transport 31 1.4.2. Land use 32 1.4.3. Interaction 33
1.5. Indicators 33 1.5.1. Definitions 33 1.5.2. Targets 34 1.5.3. Main issues 34 1.5.4. Spatial Resolution of Indicators 37
1.6. Building sustainability indices 37 1.6.1. General 37 1.6.2. Valuation 38
1.7. Approaching justice and acceptability 43 1.7.1. General 43 1.7.2. Theories of justice 43 1.7.3. Acceptability 44
1.8. The PROPOLIS application: indicators, weighting, value functions 45 1.8.1. The PROPOLIS indicators and background variables 45 1.8.2. The PROPOLIS indicator weights and value functions 47
1.9. Using the PROPOLIS approach, system and process for policy testing 49 1.9.1. The PROPOLIS process and system 49 1.9.2. Potential policy options 49

DG Research
16
2. State of the art: land use, transport and environment 53 2.1 Land use transport interaction 54
2.1.1 Introduction 54 2.1.2 Theoretical approaches 55 2.1.3 Empirical studies of land-use transport interaction 56 2.1.4 Modelling studies of land-use transport interaction 56
2.2 Environmental feedback 58 2.2.1 Introduction 58 2.2.2 The urban environment in context 59 2.2.3 LTE – an asymmetric relationship 62 2.2.4 Review of empirical studies 63 2.2.5 Expert Interviews 63 2.2.6 Modelling environmental feedback 64 2.2.7 Environmental feedback in land-use transport models 65 2.2.8 Problems of spatial resolution 65
2.3 Outlook 68
3. The PROPOLIS methodology 71 3.1. The analytical framework 72 3.2. The transport and land use models 76
3.2.1. MEPLAN model 76 3.2.2. TRANUS model 78 3.2.3. IRPUD model 81
3.3. The PROPOLIS indicator tools 84 3.3.1. Model specific tools 84 3.3.2. Raster Module 92 3.3.3. Eeconomic indicator module 97 3.3.4. Justice indicator module 102
3.4. The PROPOLIS assessment and presentation tools 103 3.4.1. Assessment module USE-IT 103 3.4.2. Analysis and presentation tools 105
4. Implementation of the PROPOLIS system in case cities 111 4.1 Introduction 112 4.2 The integrated transport and land use models and the reference scenarios 116 4.3 General description of Helsinki case city 116
4.3.1 The Helsinki model Region 116 4.3.2 The Helsinki land use and transport model design 117 4.3.3 The Helsinki model reference solution 118
4.4 General description of the Dortmund case city 122 4.4.1 The Dortmund model Region 122 4.4.2 The Dortmund land use and transport model design 124 4.4.3 The Dortmund model reference solution 124
4.5 General description of the Inverness case city 125 4.5.1 The Inverness model Region 125 4.5.2 The Inverness land use and transport model desig 126 4.5.3 The Inverness model reference solution 128

DG Research
17
4.6 General description of the Naples case city 130 4.6.1 The Naples model Region 130 4.6.2 The Naples land use and transport model design 131 4.6.2 The Naples model reference solution 133
4.7 General description of the Vicenza case city 134 4.7.1 The Vicenza model Region 134 4.7.2 The Vicenza land use and transport model design 135 4.7.3 The Vicenza model reference solution 137
4.8 General description of the Bilbao case city 137 4.8.1 The Bilbao model Region 137 4.8.2 The Bilbao land use and transport model design 138 4.8.3 The Bilbao model reference solution 140
4.9 General description of the Brussels case city 141 4.9.1 The Brussels model Region 141 4.9.2 The Brussels land use and transport model design 142 4.9.3 The Brussels model reference solution 144
4.10 Case city model variables and zoning system harmonisation 145 4.11 Case cities models specific parameters 147
Part II: Approaching sustainable urban policies
5. Definition of policy options 155 5.1. Potential policy options 156
5.1.1 Introduction 156 5.1.2 The SPARTACUS experience 157 5.1.3 Literature review 158 5.1.4 International networks and Cluster activities 163
5.2. Policies tested in all case cities 165 5.2.1 General 165 5.2.2 Policy descriptions 166
5.3. Local policies 170 5.3.1 Helsinki 170 5.3.2 Dortmund 173 5.3.3 Inverness 175 5.3.4 Naples 175 5.3.5 Vicenza 176 5.3.6 Bilbao 176 5.3.7 Brussels 177
6. Analysis of policy testing results 181 6.1. City specific findings in Helsinki 182
6.1.1 General 182 6.1.2 Reference Scenario 184 6.1.3 Investment policies 184 6.1.4 Car pricing policies 186 6.1.5 Regulation policies 188 6.1.6 Public transport policies 188

DG Research
18
6.1.7 Land use policies 189 6.1.8 Policy combinations 189 6.1.9 Summary 192
6.2. City specific findings in Dortmund 195 6.2.1 General 195 6.2.2 Reference Scenario 196 6.2.3 Investment policies 199 6.2.4 Car pricing policies 199 6.2.5 Regulation policies 201 6.2.6 Public transport policies 201 6.2.7 Land use policies 201 6.2.8 Policy combinations 201 6.2.9 Summary 204
6.3. City specific findings in Inverness 208 6.3.1 General 208 6.3.2 Reference Scenario and Investment policies 210 6.3.3 Land use policies 212 6.3.4 Public transport policies 212 6.3.5 Car pricing policies 212 6.3.6 Summary 215
6.4. City specific findings in Naples 217 6.4.1 Reference Scenario 217 6.4.2 Investment policies 219 6.4.3 Car pricing policies 219 6.4.4 Regulation policies 221 6.4.5 Public transport policies 221 6.4.6 Land use policies 221 6.4.7 Policy combinations 221 6.4.8 Summary 222
6.5. City specific findings in Vicenza 225 6.5.1 Reference Scenario 225 6.5.2 Investment policies 227 6.5.3 Car pricing policies 227 6.5.4 Regulation policies 229 6.5.5 Public transport policies 229 6.5.6 Land use policies 229 6.5.7 Policy combinations 229 6.5.8 Summary 230
6.6. City specific findings in Bilbao 233 6.6.1 General 233 6.6.2 Reference Scenario 233 6.6.3 Investment policies 234 6.6.4 Car pricing policies 236 6.6.5 Regulation policies 241 6.6.6 Public transport policies 241

DG Research
19
6.6.7 Land use policies 241 6.6.8 Policy combinations 243 6.6.9 Summary 244
6.7. City specific findings in Brussels 246 6.7.1 Reference Scenario 246 6.7.2 Investment policies 246 6.7.3 Car pricing policies 248 6.7.4 Regulation policies and public transport policy 251 6.7.5 Common land use policies 252 6.7.6 City-specific land use policies 253 6.7.7 Policy combinations 253 6.7.8 Summary 254
7. Intercity comparisons 259 7.1 General 260 7.2 Behaviour of some key indicators in the key policy types 260 7.3 Intercity comparisons 263
7.3.1 Reference scenarios at horizon year 2021 263 7.3.2 Investment policies 264 7.3.3 Car pricing policies 264 7.3.4 Speed regulation policies 265 7.3.5 Public transport policies 265 7.3.6 Land use policies 265 7.3.7 Policy combinations 265
Part III: Conclusions and recommendations, further work
8. Conclusions and recommendations, further work 269 8.1 The PROPOLIS approach and methodology 270 8.2 Policy testing results and recommendations 271 8.3 Further work 274
Appendices Appendix I: Indicator description sheets and definition of value functions 279 Appendix II: Summary table of potential policy options 339 Appendix III: Result tables 345

DG Research
20
Abbreviations The following list describes the PROPOLIS project-specific abbreviations used
CDF Common data format
EIM Economic indicator module
HMA Helsinki Metropolitan Area
JIM Justice indicator module
LT Land use and transport model
LTE Land use, transport and environment model
NPV Net present value
PME PROPOLIS MEPLAN environment
PROPOLIS Planning and research of policies for land use and transport for increasing sustainability
PT Public transport
Raster A GIS-based tool to calculate and illustrate spatially disaggregated indicators
RS Reference Scenario
SEG Socio-economic group
USE-IT Urban sustainability and interpretation tool
VOC Volatile organic compounds
Indicator abbreviations
Environmental dimension/Global climate change EGGT Greenhouse gases from transport
Environmental dimension/Air pollution EAAT Acidifying gases from transport EAOC Volatile organic compounds from transport
Environmental dimension/Consumption of natural sources EROT Consumption of mineral oil products, transport ERLC Land coverage ERNC Need for new construction
Environmental dimension/Environmental quality EQFO Fragmentation of open space EQQO Quality of open space
Social dimension/Health SHEP Exposure to particulate matter from transport in the living environment SHED Exposure to nitrogen dioxide from transport in the living environment SHEN Exposure to traffic noise SHTD Traffic deaths SHTI Traffic injuries
Social dimension/Equity SEJE Justice of distribution of economic benefits SEJP Justice to exposure to particulates SEJD Justice of exposure to nitrogen dioxides SEJN Justice of exposure to noise SES Segregation

DG Research
21
Social dimension/Opportunities SOHS Housing standard SOVC Vitality of city centre SOVS Vitality of surrounding region SOPG Productivity gain from land use
Social dimension/Accessibility and traffic SATT Total time spent in traffic SAPT Level of service of PT and slow modes SAAC Accessibility to city centre SAAS Accessibility to services SAAO Accessibility to open space
Economic dimension/Total net benefit from transport ETIC Investment costs ETUB Transport user benefits ETOB Transport operator benefits ETGB Government benefits from transport ETAC Transport external accident costs ETEC Transport external emissions cost ETGG Transport external greenhouse gases ETNC Transport external noise costs EEEI Economic index
Partners
IRPUD Universität Dortmund, Institut für Raumplanung
LT LT Consultants Ltd
ME&P WSP Policy & Research Unit, formerly Marcial Echenique and Partners
MECSA Marcial Echenique y Compañía S.A.
S&W Spiekermann & Wegener, Urban and Regional Research
STR STRATEC S.A.
TRT TRT Trasporti e Territorio
UCL University College London, Institution incorporated by Royal Charter

DG Research
22

DG Research
23
Part I:
The PROPOLIS approach and
methodology for assessing
urban sustainability
1. The PROPOLIS approach
2. State of the art: land use, transport and envi-ronment
3. The PROPOLIS methodology
4. Implementation of the PROPOLIS system in case cities

24

25
I. The PROPOLIS approach
Summary
This chapter discusses, after describing the problem and the state-of-the-art, the theories, methods and problems related to appraisal of sustainable urban policies. It also presents a tested approach that fulfils most of the needs that an appraisal approach should ideally attain.
Firstly, as sustainable development is assumed to be the main common goal for all development, the problems inherent in defining sustainability are dis-cussed. Secondly, land use and transport issues are addressed in the con-text of urban sustainability. As part of this, indicators used to measure sus-tainability are developed. The problems related to indicators, their use and definitions are then examined. Finally, a valuation method is presented. The method summarises the different aspects of sustainability, measured with a set of indicators, using sustainability indices defined for the three dimensions of sustainability. The indices show, at least in theory, which one of the alter-native policies or strategies should be selected. In an ideal case all compo-nents of sustainability can simultaneously be improved. The issues of justice and acceptability and their role in the appraisal process are also briefly dis-cussed.
The approach presented is largely based on the approach first time devel-oped in the EC funded SPARTACUS project. This approach has been adopted and further developed in the PROPOLIS project.

The PROPOLIS approach
26
p r o p o l i s
1. The PROPOLIS approach
1.1 The problem
Eighty percent of Europeans live in cities facing increasing levels of traffic pollution and congestion. This creates, among others, environmental, health and social prob-lems, which also increase the economic burden on citizens. PROPOLIS aims at defin-ing long-term urban strategies that can simultaneously improve the environmental, social and economic components of urban sustainability.
According to a questionnaire sent by the European Environment Agency to EU cities with a population of more than half a million, major concerns aboutthe quality of the urban environment in Europe are air pollution, noise and traffic congestion. Increasing road traffic was identified as the most important source for these problems. Recent studies have shown that almost forty million Europeans are exposed at least once an-nually to air quality guidelines being exceeded. For noise, about 450 million people, or 65% of the population in Europe, live in areas where the 24-hour equivalent sound level exceeds 55 dB(A), and almost 10 million live in areas where it exceeds 75 dB(A). The problem is also reflected in the 40.000 yearly traffic fatalities, the 2% loss in GNP due to congestion and in the continuing growth in traffic. PROPOLIS ad-dresses these and other global, regional and local problems, such as greenhouse gas emissions, energy use, urban economy, environmental and social issues – all relating to urban sustainability.
1.2 The point of departure
Policies, including transport, land use, regulatory, investment, fiscal and pricing, have been planned and partly implemented to improve the situation. Results show that these policies have not been able to stop the decrease in sustainability of our cities. Even to maintain the existing sustainability level will require the adaptation of radical policy measures. This will not be possible if the effects of these policies cannot be clearly demonstrated including also the distribution of the effects between different socio-economic and other groups. It has also been shown that many of the policy op-tions may have negative unexpected side effects and that some policy options may work against each other while others reinforce one another. . Some policy options may improve the situation in part of the region, whereas in other parts the situation may get worse. Hence, the definition of sustainable urban policies is not a straight-forward task. The effects have to be identified and measured in a transparent way and this calls for advanced systems and methods.
Most cities have a transport model for policy planning. These models do not take into account the long-term interaction between land use and transport, which severely lim-its their usability for strategic long-term urban planning. Some cities have a combined land use and transport model for these purposes but, as strategic models, they do not produce information at the detailed spatial level and cannot, thus, deal with important effects such as exposure to emissions or noise. They also lack a coherent system for

The PROPOLIS approach
27
assessing the effects in a systematic, comprehensive and transparent way taking into account the environmental, social and economic dimensions of sustainability.
PROPOLIS addresses the above problems but not starting from scratch. It builds on state-of-the-art urban transport and land use models that operate at a scale, which al-lows one to investigate the long-term (20 years and more) policy impacts – taking into account the feedback between land use and transport. PROPOLIS is also based on a tested system composed of a set of relevant indicators and of an assessment method-ology for the evaluation of indicator values.
1.3 About sustainability
1.3.1 General
PROPOLIS aims at identifying sustainable urban policies. Therefore, the concept of sustainability in the urban context has to be analysed and defined.
The notion of each generation’s duty to its successors is at the heart of the concept of sustainable development and was captured by the Brundtland Commission (World Commission on Environment and Development, 1987) in its report Our Common Fu-ture. The report defined sustainable development as “development that meets the needs of the present generation without compromising the ability of future generations to meet their own needs”.
From a purely semantic viewpoint, a sustainable system can be defined as a system that does not destroy the preconditions of its own existence. However, in practice it is rather a question of various degrees of transformation (e.g. global warming with its most uncertain consequences) of the system, not about a straightforward destruction. Thus, as no system is static, it could be said that the definition of sustainability is de-pendent on what level of negative change is considered to be too much.
The question of what is too much could be approached from the direction of chaos theory by defining it as the level which, in breaching the dynamic steady state of the system, leads to unpredictable consequences. Many natural processes are in dynamic equilibrium in which negative feedback loops lead to them remaining in a relatively steady state in which fluctuations in the properties of the environment are absorbed or levelled off by counter-reactions by the system. When the extent of a change (e.g. pol-lution) exceeds nature’s capacity to assimilate the change or to influence the cause of the change, there is an inevitable deflection from the equilibrium. That drift may re-main latent until the final limits of the old steady state are reached. After that, a sud-den chaotic state results before the system settles into a new equilibrium (if it does). The properties of the new equilibrium are unpredictable unless all the laws governing the behaviour of the system are explicitly known. This is practically never the case in real-world systems, and so the exact prediction of under which conditions the system will remain stable, or sustainable, is not possible.
By definition, a city, as such, cannot be sustained unless all of its (relevant) compo-nents are sustainable. However, evaluating the sustainability of an urban system as a

The PROPOLIS approach
28
p r o p o l i s
whole does not fit within the scope of the present context. The mere fact that we are not looking at the totality of the urban system but parts thereof does not allow us to measure its degree of absolute sustainability, even in principle. And, it would not seem to make sense to judge the absolute sustainability of any subsystems (e.g. land use and transport) because they will not be sustained if the rest of the system col-lapses.
In the wider context, it is similarly unclear whether urban sustainability—again in ab-solute terms—is a meaningful concept. This is because, by definition, the sustainabil-ity of a system, which is dependent on an external system, cannot be evaluated with-out examining also the external system (which then loses its ‘externality’).
Despite these difficulties, the point of departure is that urban sustainability can and should be measured. As it is not possible in absolute terms, it must be done in relative terms. The impacts of urban policies on sustainability can be measured against targets set for the indicators, or policies can be compared against each other with the help of the indicators.
Many definitions have followed that of the Brundtland Commission. One common principle sees sustainable development as a situation in which future generations would be left with the same capacity for improving human well-being. Capacity is defined as the sum of all human, man-made and environmental assets. This definition allows trade-offs between different types of assets. But this concept may deflect atten-tion from the degradation of important ecological assets. To take this into account, a notion of “strong sustainability” has been developed. This requires that the overall stock of capital is maintained, but also that special attention is paid to those essential ecological assets, which are deemed to constitute “critical natural capital”. Often a distinction is drawn between major life or planet threatening concerns on the one hand and local concerns, which are more amenable to trade-offs, on the other (Report from the House of Lords Select Committee on Sustainable Development).
Broader definitions seek to extend the definition beyond environmental considerations and include issues of social equity and justice. Different weight is often also given to the importance of economic growth.
ICLEI has defined sustainable development as “development that delivers basic envi-ronmental, social and economic services to all residents of a community without threatening the viability of the natural, built and social systems upon which delivery of these systems depends” (quoted in European Commission, 1996).
Daly (1991) defines sustainable development as one that satisfies three basic condi-tions: (1) its rates of use of renewable resources do not exceed their rates of regenera-tion; (2) its rates of use of non-renewable resources do not exceed the rate at which sustainable renewable substitutes are developed; and (3) its rates of pollution do not exceed the assimilative capacity of the environment. However, there is agreement that a merely ecological definition of sustainability is not sufficient. There is consensus that a society that does not provide its members with minimum levels of subsistence

The PROPOLIS approach
29
and well-being, civil rights and justice will not be and cannot be called sustainable. The Charter of European Cities and Towns Towards Sustainability (The Aalborg Charter, 1994) states that the main basis for sustainable development is "to achieve social justice, sustainable economies, and environmental sustainability. Social justice will necessarily have to be based on economic sustainability and equity, which require environmental sustainability".
1.3.2 Dimensions of sustainability
The above considerations show that sustainable development must be viewed as con-sisting of three interconnected components: ecological or environmental, social or human, and economic (e.g. Munasinghe, 1993; Alberti, 1995; Hannequart & Schamp, 1995; Gardner & Carlsen, 1996; World Bank, 1996). The following interpretations can be given (Munasinghe, 1993):
• The economic approach to sustainability is based on the Hicks-Lindahl concept of the maximum flow of income while at least maintaining the stock of assets or capital that yields these benefits (Solow, 1986; Maler, 1990). Interpretation prob-lems arise with regard to the maintenance and mutual substitutability of the differ-ent kinds of capital (manufactured, human, natural etc.). Difficulties are also in-herent in considerations of uncertainty, irreversibility and catastrophic collapse (Pearce and Turner, 1990).
• The ecological view of sustainability focuses on preserving the resilience and dy-namic ability of biological and physical systems to adapt to change. These systems may be interpreted to include all aspects of the biosphere, including cities. Viabil-ity of subsystems critical to the global ecosystem (Perrings, 1991) and protection of biodiversity are of key importance.
• The socio-cultural concept involves both intra- and intergenerational equity. Elimination of poverty and defending the rights of future generations are of cen-tral importance. Maintaining the stability of social and cultural systems and reduc-ing destructive conflicts are sought (UNEP et al., 1991).
Institutional frameworkEnvironmentalsustainability
Economic efficiency
Socialsustainability
sustainabilityComprehensive
For a city to be sustainable it needs to use resources in an efficient and equitable way within the carrying capacities of the environmental and social systems it is dependent on.
Figure 1.1 The dimensions of sustainability

The PROPOLIS approach
30
p r o p o l i s
1.3.4 Special urban characteristics
According to the European Environment Agency’s (1995) survey on the state of the European environment, i.e. the Dobríš Assessment, the ecological aspect of urban sus-tainability can be expressed as meeting the inhabitants’ needs “without imposing un-sustainable demands on local, as well as global natural systems”. It is clear that the total area required to sustain a modern European city is much larger than the city it-self, and that the impacts of the functioning of the city are not confined to within its boundaries.
Five urban sustainability principles can be named (European Environment Agency, 1995):
1. Environmental capacity: Cities must be designed and managed within the limits imposed by the natural environment.
2. Reversibility: Planning interventions into the urban environment should be as re-versible as much as possible so as not to endanger the ability of the city to adapt to new demands from changes in population and economic activities without impair-ing environmental capacity.
3. Resilience: A resilient city is able to recover from external stresses.
4. Efficiency: Obtaining the maximum economic benefit for each unit of resources used (environmental efficiency) and the greatest human benefit from each unit of economic activity (welfare efficiency).
5. Equity: Equal access for urban inhabitants to resources and services is important to modify unsustainable behaviour exacerbated by inequitable distribution of wealth.
The second and third principles seem to be special cases of the first one thus reducing the actual principles into the three components of sustainability discussed above: envi-ronmental, economic and social. Abiding by the above principles leads to achieving the following goals that are necessary in making cities sustainable (European Envi-ronment Agency, 1995):
• minimising the consumption of space and natural resources
• rationalising and efficiently managing urban flows
• protecting the health of the urban population
• ensuring equal access to resources and services
• maintaining cultural and social diversity
These principles are not easy to operationalise. For example, if ‘minimising’ is under-stood as making a quantity as small as possible, then questions arise regarding what is possible and whether it is sufficient.
Haughton and Hunter (1994) set out three basic principles for sustainable develop-ment:
The PROPOLIS approach
31
• Inter-generational equity: taking account of the ability of future generations to meet their needs
• Social justice: because poverty causes degradation
• Transfrontier responsibility: environmental costs of urban areas should not simply be transferred
More specifically, considering sustainable urban development, the authors believe Breheney’s (1990) definition to be particularly helpful; namely, that: “the achieve-ment of urban development aspirations, subject to the condition that the natural and man made stock of resources are not so depleted that the long term future is jeopard-ised”.
This definition recognises that in the city, some loss and replacement of human made capital stock is inevitable and desirable. The authors consider why poverty matters in urban areas. They suggest poverty creates its own externalities, including deteriora-tion of the built environment. Poor quality urban areas not only encourage a shift of population to the suburbs and hence a spiral of decline in the centre, but they also dis-courage economic activity from locating in the city.
1.4 Land use and transport in the context of urban sus-tainability
1.4.1 Transport
Urban transport is one of the most crucial aspects of cities from the viewpoint of sus-tainability. The simultaneous demand for both reducing environmental impacts and securing a high level of accessibility for the residents highlight the need for co-ordinated action. Transport planning should be integrated with spatial planning, per-haps under the auspices of general sustainability management.
The main problems caused by urban transport are related to congestion, air pollution, energy consumption, accidents, noise, severance and land requirements. The air pol-lutants that are generally causing the most problems in European cities are particulate matter and nitrogen dioxide (NO2). Both are, to a large degree, emitted by transport directly into the breathing zone. Both have also very important secondary sources; exhaust gases contain large amounts of nitrogen monoxide (NO), which is readily oxidised into NO2, and a lot of the dust found in the urban air comes from the wearing down of tyres and pavement etc. The health impact of particles has been especially the subject of intense research during the past years. Epidemiological studies have proved there to be a significant impact of particle concentrations on mortality, even at con-centrations below guidelines (Pönkä et al., 1997).
Transport noise is also a serious problem in many cities around the world. The so called Dobríš Assessment by the European Environment Agency, 1995 showed that in Europe some 113 million people are affected by noise levels of over 65 dB(A) and 450 million by levels of over 55 dB(A) with road traffic being the most important source.

The PROPOLIS approach
32
p r o p o l i s
Transport infrastructure and motorised traffic flows also claim a significant portion of the urban space and thus cause barrier effects. Pedestrians and cyclists are the weaker party unless actively supported. Also, location values (biological, historical, cultural, scenic sites of value) may be threatened by infrastructure projects.
In the following, some of the main conclusions of the EU Expert Group on the Urban Environment concerning sustainable accessibility are summarised (European Com-mission, 1996):
• Urban transport is playing a significant part with regard to wider environmental problems such as global warming. Given that people in rural areas are relatively more dependent on the use of the private car, cities must contribute to the reduc-tion of transport more than their share of the population.
• It will be necessary, in the short run, to halt the forecast growth in the demand for transport, and, in the long run, to reduce transport in order to achieve a more sus-tainable form of urban mobility and to improve accessibility.
• Actions taken so far seem to have been mainly directed at reducing road traffic and congestion by e.g. encouraging people to shift to public transport. However, these are not sustainability measures as such but aimed at achieving transport-related goals. Further development of sustainability goals, indicators, target setting and monitoring is needed.
• Suburban travel and the involvement of local communities in formulating trans-port policies need more attention than at present.
• Emphasis should shift from facilitating movement to improving accessibility and from minimising travel time to reducing the demand for travel.
• Integration of environmental, transport, land use and economic policies could be furthered within the framework of citywide sustainability strategies.
• Environmental objectives should be incorporated into transport policies. This re-quires a dramatic re-orientation of political and public cultures and requires a large involvement of public and private interests.
1.4.2 Land use
European cities show differing trends in spatial development. In southern and Eastern Europe, cities are still growing in terms of population, while in the northern and west-ern parts of the continent they have, generally, either stopped growing or started to decline. However, a phenomenon independent of the population growth is the sprawl of the city area. People everywhere are moving from inner-city areas into the outer—a development for which growing car ownership and the modal shift from public trans-port to car act simultaneously as both causes and effects. In addition to land area, the amount of floor-space per person is growing. This, too, can be seen as both a cause and an effect of urban sprawl. These phenomena are being accompanied by separation of land uses, which increases the need for mobility.
Per capita land need is on the increase. Every ten years two percent of agricultural land in Europe is lost to urbanisation (European Environment Agency, 1995). Provid-ing the necessary infrastructure for dispersing conurbations is also costly and means a

The PROPOLIS approach
33
decreasing efficiency of resource use as e.g. growing lengths of street and sewage sys-tems are needed per inhabitant.
Land uses, clearly, have impacts on their environment e.g. in terms of emissions or noise. Loss of virgin land, green space, biodiversity and other location values (e.g. historical, esthetical) are important concerns. These assets are easily threatened by new development unless proper control systems are in place. There is now a wide variation within the EU in the level of control authorities have. Appropriate levers may be lacking altogether or they may remain unused (European Commission, 1996).
1.4.3 Interaction
The sustainability consequences of urban transport and land-use policies should not be looked at in isolation from each other but should take full account of their interaction. The ultimate impact may be very different from the initial response; the secondary and indirect impacts may either reinforce the initial effect or counterbalance it. What happens depends on e.g. the size, density and internal structure of the city as well as the characteristics of the transport system (Dasgupta & Webster, 1993).
Land use control, through its potential to affect the average trip length, can be seen as the factor determining the ‘basic level of energy use’ of a city. The average trip length increases more than at a linear rate in relation to the physical size of the city (Hayashi et al., 1993). For instance, allowing the development of out-of-town shopping centres may start a spiral of environmental and social decline by increasing car use and de-creasing the use of public transport as well as the vitality of the city centre. As the level of service of public transport deteriorates, the private car becomes an even more attractive alternative.
1.5 Indicators
1.5.1 Definitions
The function of environmental indicators can be defined as to “convey relevant, rec-ognizable information about complex interactions or theoretic constructs such as ‘en-vironmental quality’ that may not be immediately observable”. They are used for es-tablishing the extent, trends and gravity of environmental concerns (World Bank, 1994). Social and economic indicators, clearly, have corresponding roles in their do-mains.
Two classes of environmental indicators can be identified:
1. Descriptive indicators describe the state of the environment in absolute terms (e.g. concentrations of pollutants in soil, water or air).
2. Performance indicators are measured against a physical threshold or policy goal (e.g. compliance with international treaties or the highest allowable pollutant con-centration) (World Bank, 1994).

The PROPOLIS approach
34
p r o p o l i s
This classification is also applicable to social and economic indicators. Examples of descriptive indicators are e.g. the level of segregation or a change in vehicle operating costs whereas the extent of reaching a segregation target or a benefit-cost ratio could be performance indicators.
The OECD has adopted the pressure-state-response (PSR) model for the compilation of (environmental) performance indicators. The idea (World Bank, 1994) is to link the causes of (environmental) change (pressure) to their impacts (state) and to the poli-cies, actions and public reactions caused by these impacts (response). This approach is not, as such, always applicable since the indicators chosen for future policy testing describe impacts of (transport and land use) policies which are partly pressure and partly state indicators that offer no possibilities for either predicting public reactions or using response indicators. This highlights the distinction between retrospective (monitoring) and prospective (predicting) indicators. When the actual state of phe-nomena or the achievements of policies are described, retrospective indicators are used, whereas both types of indicators are needed in the planning of future actions and policies (Hannequart & Schamp, 1995).
1.5.2 Targets
Establishing the gravity of environmental concerns requires transparent and justifiable benchmark levels to facilitate interpretation (World Bank, 1994). The problem with these reference levels (limit or target values) is the, often not well enough grounded, assumption that they are known, exact, universal and accepted by all (Hannequart & Schamp, 1995). Even in cases where an acceptable level of e.g. an emission has been estimated with some confidence, the knowledge of the long term impacts is not com-plete, and a once acceptable level may become unacceptable or vice versa. This im-plies that there is a preference to focus on trends (relative sustainability) rather than on absolute levels. However, the sustainability of even a trend cannot always be de-termined, and thus any indicator needs to be used and interpreted with caution (Gard-ner and Carlsen, 1996).
1.5.3 Main issues
The main questions concerning indicators can be listed as follows:
• What underlying model is driving the use of indicators
• What criteria should be used to choose indicators
• Who chooses them
• What should be the main groupings
• How should the indicators be presented
• General issues
Models
Attempts to make sustainability an operational concept vary in the extent to which they draw upon an underlying model. Sometimes there is no explicit underlying

The PROPOLIS approach
35
model. Ecosystems models are often quoted in the literature but the extent to which they have actually influenced the development of indicators is not clear. The third main approach is a combination of ecosystems model and social factors. If the social factors are primarily about poverty then the rationale is reasonably clear (e.g. areas of urban deprivation make cities less attractive places to live and work, which can pro-voke a spiral of decline). But if the social factors are broader then there is usually little attempt to define an underlying framework.
In its indicators report (Department of Environment, 1996), the UK Government notes the difficulty of using the pressure-state-response concept in sustainable development indicator work, because the indicators extend beyond narrow environmental consid-erations. A variant is used, but the underlying concept only defines a loose structure to the subsequent presentation.
More generally, although the ecosystem approach gives a strong theoretical basis, there are problems from the sheer volume of indicator outputs produced and a lack of appeal to the public whose actions would need to be changed. It would also involve considerable resources in updating the model through time. It is likely that although this approach provides firm bedrock for analysis, more attention is needed to the pres-entation of results in policy terms.
Criteria
There is broad agreement on the criteria to be used, although the emphasis often dif-fers. The lists of criteria are ideal in the sense that it is acknowledged that few indica-tors will meet all the criteria. Nevertheless, they provide a useful discipline. For ex-ample, indicators attempting to measure community health may be constructed from underlying pollution variables, yet the causal chains between e.g. childhood asthma and air pollution are very complex.
Who chooses
This should depend to some extent on the level at which the indicators are designed to work. At the city level, those living in the city ought to be consulted, but there is clearly also a need for specialist involvement e.g. when trying to establish scientific validity.
Main groupings and individual indicators
A large number of groupings can be derived from the literature. In general, there seems to be more similarity between the sets of indicators than between the ways they are classified.
Presentation
The Indicators for Local Agenda 21 report (LGMB, 1995) stresses the importance of how indicators are presented. It suggests:
• Brief discussion of the issue

The PROPOLIS approach
36
p r o p o l i s
• Statement of policy objectives
• Indication of linkages with other issues and indicators
• Definition of the indicator
• Indication of the availability of data for the indicator
• Interpretation, including trends (and how the benchmark year was chosen)
• A rating of performance against any targets or milestones
• Ideas for action to achieve change and who is responsible
General issues
Many of the indicators suggested suffer from potential problems of ambiguity—e.g. local self sufficiency may be desirable from an environmental point of view, but basic economics would suggest it is likely to lower incomes per head. If both indicators are included in a package it would be far from clear whether such a strategy was improv-ing sustainability or not, unless weightings were used (these are rarely discussed in the literature).
As definitions of sustainability have broadened in scope over time, the number of pos-sible indicators has grown to an extent where virtually all aspects of life are covered. Some of these cannot be directly supported by modelling frameworks e.g. indicators of personal security (e.g. number of racial attacks). This is particularly difficult for social indicators, which have been widened beyond original ideas of poverty measures to broader quality of life concepts.
Often indicators are not related to any underlying model or framework. Measures of resource pressure e.g. sewage output, are used alongside the final impact of the re-source use e.g. polluted rivers, with little indication of which is the more important. It is arguable that relative importance can only be decided at the city level e.g. sewage output for cities with adequate treatment facilities might not be an issue.
This lack of context also causes problems in the analysis of urban form. City size, structure and shape are extensively debated, with few clear conclusions. Again the debate often reflects tensions between pure environmental considerations and wider social issues. For example, even if dense cities were efficient in transport terms, are they good places in which to live? On a similar theme, indicators are often not suscep-tible to local action. A measure of polluted waterway may be of little policy use to a city if the source of the pollution is outside the city boundary
Double counting is a general danger for indicator systems. Care must be taken that each impact, in the varying forms it may have, is only included once, otherwise, bi-ased results will follow. If one wishes to use closely correlated indicators, it must be made clear why they all are needed and what they stand for. For instance, carbon di-oxide emissions of transport can be derived from the amount of fuel consumed with a simple multiplication, but both may be incorporated, if the former represents only global warming and the latter using up of a scarce resource.

The PROPOLIS approach
37
1.5.4 Spatial resolution of indicators
There is a wide range of indicators that are considered important to describe urban sustainability. Many of the environmental and social indicators among them are rela-tively easy to measure, e.g. energy consumption, air pollution, noise, wildlife, vegeta-tion, water quality and water flow, exposure of population to air pollution and noise, but are difficult to treat in current urban land use / transport models. Some of the indi-cators cannot be modelled because they require information that is not provided by the model system. Other indicators are not influenced by policies that can be modelled. Another set of indicators might be included in urban models but would require addi-tional modules and partly a different treatment of spatial factors. The last issue will be dealt with in this section.
Urban models have always been spatially aggregate with zones of varying size such as boroughs or statistical districts as units of spatial reference. As the internal distribu-tion of activities and land uses within a zone is not known, a homogenous distribution across the area of the zones has to be assumed. Even though the number of zones of some models has increased substantially in recent years, the spatial resolution of zone-based models is much too coarse to represent other environmental phenomena than total resource use, energy consumption or CO2 emissions (for an overview, see We-gener, 1998). Many environmental processes and their social impacts at the urban scale can not be treated by those kinds of models, i.e. significant indicators for urban sustainability cannot be calculated.
In particular emission-concentration algorithms such as air dispersion, noise propaga-tion and surface and ground water flows, but also land coverage, biodiversity and mi-cro climate analyses or the exposure of population to pollutants and noise, require a much higher spatial resolution than large zones:
• Air dispersion models typically work with raster data of emission sources and to-pographic features such as elevation and surface characteristics such as green space, built-up area, high-rise buildings and the like.
• Noise propagation models require spatially disaggregate information on emission sources, topography and sound barriers such as dams, walls or buildings.
• Surface and ground water flow models require spatially disaggregate data on the river system and geological information on ground water conditions in the region.
• Land coverage, biodiversity and microclimate analyses depend on small-scale mapping of green spaces and built-up areas and their features.
• Due to the relatively small impact area, population exposure calculations require the exact locations of people, preferably their locations in space and time over the day.
1.6 Building sustainability indices
1.6.1 General
The problems of sustainable development in general and that of urban sustainability have been touched upon. The present aim has not been to measure urban sustainability

The PROPOLIS approach
38
p r o p o l i s
as an absolute quantity but to create a method with which the impact of urban policies on sustainability indicators can be summarised in a way that builds on the explicit values and preferences input to the system.
The construction of indices proceeds in three steps: (1) generation of the ‘raw’ indica-tor values, (2) valuing and (3) weighting them. The theoretical bases of the two latter steps are discussed in this section. Generation of the indicator values is based on land use and transport model runs.
The generation functions produce indicator values that do not have any common unit. They are both pressure and state indicators (e.g., emissions; the share of the popula-tion living in areas exceeding air quality standards). While it is possible to compare policies even without any further processing of the indicator values, this may have some drawbacks. The number of indicators to be taken into account may be unpracti-cal and second, the value judgements on which the results of the comparisons ulti-mately are based risk remaining implicit. Using indices avoids these problems by ag-gregating the results according to the values and weights explicitly given by the rele-vant people.
Each indicator must thus be assigned a weight that determines its importance in rela-tion to the other indicators in order to determine the effect on the index value caused by a change in the indicator value. In addition, to enable the weighting to take place, the various incommensurable indicator values must be standardised onto a common scale using value functions.
1.6.2 Valuation
Principles
Below, some of the basic issues of value measurement are discussed. For a fuller ac-count with useful references to basic literature, the reader is directed to von Winter-feldt and Edwards (1986) to which the following is in the main based.
A value function has to answer the question, what are the relative strengths of prefer-ence of any two ‘raw’ indicator values x, i.e. what are the corresponding values of the value function. The figure below shows an example of a value function v = v(x).
A value function must fulfil this basic condition: if the preference of a value x1 over x2 is at least as strong as that of x3 over x4, then
v(x1) – v(x2) ≥ v(x3) – v(x4)
The most important assumptions that must hold for the above condition to be fulfilled are:
Connectivity: A judgement on the preference of two x values must be able to be made in the first place.

The PROPOLIS approach
39
Transitivity: If x1 is preferred or equal to x2, and x2 to x3, then x1 is preferred or equal to x3.
Summation: If x1 is preferred or equal to x2 and x2 to x3, then v(x3) – v(x1) must be greater than either of the two differences v(x2) – v(x1) and v(x3) – v(x2).
Solvability: All equations concerning strengths of preference must have a solution.
Archimedean: There must not be values of x that would require an extremely large positive or negative value of v in comparison with other x values.
Value measurement
In the following, two main techniques, with some variations, for obtaining the values of v(x) needed for constructing the value function are introduced.
Figure 1.2 An example of a value function. v(x) is the value of the function and x is the indicator value.
Direct rating: First, the worst and best x values are defined and assigned the mini-mum and maximum values of the value functions (e.g. zero and unity, respectively). However, the best and worst ‘raw’ indicator values are not usually known beforehand. Still, the basic condition for value functions mentioned above must be satisfied. Thus, should x values outside the predefined range occur there are two alternatives:
1. Extrapolation. In cases where value functions are used for standardisation pur-poses, this is not feasible as it could result in v(x) values outside the standard range (e.g. [0…1]).
2. Redefining the value function so that the new value(s) are included in the x range.
Changing the scale repeatedly may be quite cumbersome, and should be avoided. Thus, the range should originally be defined allowing for some unexpected x values. However, if qualitative restraints are used, the x range may be confined to include only acceptable values. That is, an important indicator may have a threshold value
0
0,2
0,4
0,6
0,8
1
0 50 100 150 200 250 300
x
v(x)

The PROPOLIS approach
40
p r o p o l i s
that if exceeded leads automatically to the rejection of the policy in which case there is no need to apply the value function to the x value.
Consistency checks may be performed by comparing v(x) values. For instance, in the case of the Figure 1.2, are the differences in the strength of preference really equal when x changes from 0 to 10 and from 10 to 30, and, compared to that, is the change in the strength really two times as much when x changes from 70 to 310?
Two variations can be mentioned: (1) The category estimation method uses qualita-tive categories instead of x values and in (2) the ratio estimation method one x value is used as a standard (x0) or reference against which all the other values xi are com-pared in order to determine the ratios xi/x0.
A fourth method belonging to this group of numerical estimation methods is the curve drawing method in which respondents are asked to select a curve for the value func-tion. This method requires familiarity with such functions.
Indifference methods: These are based on determining equal differences in the strengths of preference. One can start from equally spaced v(x) values and estimate which x values they correspond to. These x values are called a standard sequence and the method the difference standard sequence technique.
Another indifference method is the bisection method in which xi’s that correspond to v(x) = 0 and v(x) = 1 (or whatever the maximum) are first defined. Subsequently, the xi whose v(x) value is halfway between the extremes is sought. Further subdivisions of the scale lead to a refinement of the value function.
Shape of the value function
An important question concerning a value function is, is it monotonic? In other words, is a greater x value within the range at hand either always better or always worse? If not, how many peaks does the function have?
Linearity should be the starting point for value functions. For it can be maintained that a value function is linear in that natural scale that most closely reflects the value con-cerns to which it is related. If alternative scales for x are available, the one leading to the most linear value function should be adopted.
For non-linear functions, rarely more than five points are required for the establish-ment of the function. After obtaining these points the curve can then be fitted into e.g. polynomial or exponential function.
Weighting
Nijkamp et al. (1990) present a good summary of different kinds of weighting meth-ods. The presentation below draws to a large extent on their book.
The general formula for the sustainability indices (SI) applied can be an additive one:

The PROPOLIS approach
41
SI = i
n
=∑
1
wi · vi(xi),
where n is the number of indicators; wi are the weights of the indicators, Σw = 1; vi are the indicator-specific value functions (see section 1.6.2); and xi are the ‘raw’ indicator values.
In the following, five types of method for obtaining the weights are presented.
Trade-off methods: All the ratios between the weights (i.e., in the case of three indi-cators, w1/w2, w2/w3, w1/w3) are estimated pair-wise using a question like “How large should the value of the ratio w1/w2 be in order that a change of one unit of x1 is equally significant as an improvement of w1/w2 units of x2?”
Rating methods: A constant number of points (e.g. 100) is distributed among the in-dicators to directly reflect their importance.
Ranking methods: First, the indicators are ranked in relation to each other on an ordi-nal scale. In the case of three indicators, the result is thus e.g., w1 ≤ w2 ≤ w3. It is as-sumed that Σw = 1 and wi ≥ 0 for all i. In a three-dimensional space where each axis represents the weight of one of the indicators, these relationships form a surface. The three co-ordinate values of the points belonging to this surface are the possible weight combinations. A range of methods not explained here can thereafter be applied in or-der to arrive at the weights of the individual indicators.
Verbal statements: A seven- of five-points scale may be used for deriving qualitative descriptions of the weights. The outcome can then be transformed into quantitative weights using some form of standardisation.
Pair-wise comparison (Analytical Hierarchy Process): The AHP method developed by Saaty (1977) is a three-stage process: building the hierarchy, weighting the attrib-utes locally and globally, and calculating the final values for the alternatives.
All the indicators for which it holds that their Σw = 1, are compared pair-wise. The respondent presents his/her views using the scale presented in the table below.
Criticism has been targeted to the way in which the weights are calculated from the matrix that is produced out of the comparisons (see e.g. Nijkamp et al. [1990]). How-ever, the criticism is not based on unsuccessful applications, but on the deficiencies in the mathematical foundations; therefore this criticism is of secondary importance from the viewpoint of practical decision support (Seppäläinen & Hämäläinen, 1986).

The PROPOLIS approach
42
p r o p o l i s
Table 1.1 Scale of relative preference (after Saaty, 1977).
Intensity of rela-tive importance
Definition Explanation
1 Equal importance Two activities contribute equally to the objective
3 Weak importance of one over another
Experience and judgement slightly fa-vour one activity over another
5 Essential or strong Experience and judgement strongly fa-vour one activity over another
7 Very strong importance An activity is strongly favoured and its dominance is demonstrated in practice
9 Absolute importance The evidence favouring one activity over another is of the highest possible order of affirmation
2, 4, 6, 8 Intermediate values between the two adjacent judgements
When compromise is needed
Reciprocals of above non-zero numbers
If activity i has one of the above non-zero numbers assigned to it when compared with activity j, then j has the reciprocal value when compared to i.
Nevertheless, there are inconsistencies that need to be taken account of. A totally con-sistent matrix would satisfy the condition rij · rjk = rik, where r’s are the relative im-portance of attribute (indicator) i against j, j against k and i against k. There is an up-per limit for all r (= 9), even though in principle the product rij · rjk may be as high as 81 (= 9 · 9). This problem can be circumvented by dividing the attributes into impor-tance groups so that, in the example above, attributes i and k would not belong to the same group.
A more problematic feature of the mathematics of the AHP is the change of prefer-ence problem: if policies A and B are compared against each other, their mutual order may be different from that arrived at if there is a third policy option C included in the comparison; this is because the introduction of a new alternative changes the weights of the attributes (Seppäläinen & Hämäläinen, 1986).
Saaty has proposed axioms for the AHP; among them is one that stipulates that the sets of the criteria and those of the attributes are complete and aims at removing the change of preference problem.
It should be noted that when applying the weights of many people, geometric means are better than arithmetic, as they maintain the inverse feature.
When using USE-IT, the decision support software the user can in principle use any technique of determining the weights for the indicators and assign them directly to the indicators. As a built-in method, however, the module features the AHP method of pair-wise comparison.

The PROPOLIS approach
43
1.7 Approaching justice and acceptability
1.7.1 General
The justice implications of the policies can be approached via the concept of equity. The term usually refers to the ethical desirability of distributing benefits or wealth be-tween groups and individuals and to the corresponding injustice caused by substantial uncompensated losses (Lichfield et al., 1975).
According to Miller (1976), at least three principles of justice can be used to distin-guish right from wrong in the context of distributing benefits: to each according to his rights, to each according to his deserts and to each according to his needs. Being based on different things, these may well be in conflict: rights derive from laws or other rules or established practices, deserts from a person’s capabilities, moral virtue etc., and needs range from those to food and shelter to higher social and cultural ones.
1.7.2 Theories of justice
Khisty (1996) presents six chosen theories of justice and defines them as attempts to answer certain questions about justice itself. According to Gunn and Vesilind (1987) they can be used as input in the development of decision making procedures. The six theories are described in the following.
Equal shares
This theory is followed for example in democratic elections: one person, one vote. According to Miller (1976), this theory is not motivated by a strive towards an undif-ferentiated society as sometimes suggested by critics, but it is a rough and ready way of achieving equal level of well-being, if scales of well-being cannot be relied upon.
Utilitarian approach
According to this theory, justice is done when the amount of utility is maximised, re-gardless of its distribution. Underlying is the idea that differences in well-being are quantitative, not qualitative, and that a common measure adequately trading off bene-fits and costs can be derived.
Maximisation of average net benefits with a minimum floor benefit
The objective of maximising the average benefit is constrained by defining a mini-mum amount that certain individuals or groups, notably the less well-off, should re-ceive.
Maximisation of average net benefits with a benefit range
This approach aims at limiting the contribution of a policy to the widening of the dif-ferences in well-being between groups or individuals. For example, it might be pre-scribed that the differences between the benefits to the higher income group must not exceed those to the lower group with more than X units.

The PROPOLIS approach
44
p r o p o l i s
Egalitarianism
The point of departure for this theory is that all human beings are equal and should be treated equally in all respects. The objective is to level any unevenness in the distribu-tion of well-being. Any policy delivering more benefits to the less advantaged would be regarded as egalitarian.
The Difference Principle
Rawls’ theory of justice consists of three principles (Rawls 1971):
1. Each person is to have an equal right to the most extensive total system of equal basic liberties compatible with a similar system of liberty for all.
2. Social and economic inequalities are to be arranged so that they are both:
(2a) To the greatest benefit of the least advantaged, consistent with the just sav-ings principle, and
(2b) Attached to offices and positions open to all under conditions of fair equal-ity of opportunity
Principle 1 shall be satisfied before 2 and 2b before 2a. In the present context, princi-ple 2a—also known as the Difference Principle—is of most interest. The basic as-sumption behind it is that everyone can be better off if some inequalities are allowed. For example, if more productive individuals are able to earn more, that will increase the total production leading to an increase in the total wealth of the economy and hence the wealth of the less well-off. The Difference Principle is not anti-egalitarian as such. It is concerned most about the absolute position of the least advantaged group rather than their relative position, and if strict egalitarian distribution of wealth maxi-mises the absolute wealth of the least advantaged, then that is what the Principle ad-vocates (Zalta).
1.7.3 Acceptability
Regarding the assessment of the justice implications of urban policies, one may ask if the measurement of justice of individual issues, such as exposure to noise or pollut-ants is relevant at all. It can be argued that unjust distribution of any individual effect should be allowed as long as care is taken to maintain an overall progress towards greater justice in society.
The answer to the question is that the measurement of justice of the distributions of individual impacts is relevant in any case from the point of view of the acceptability of a policy. A good policy where the distribution of negative (or positive) effects is very unjust is more likely be disapproved by the public and vice versa: if the distribu-tion of the effects is just the policy is more likely to be accepted. Naturally, also the extent of the net benefits affects the public reaction; it could even be maintained that the net benefits alone should reflect the acceptability, for those that gain will surely be in favour of and those who lose against a policy. However, as long as the net social benefits are concerned, this is not accurate, as the social benefits cannot be identified with the sum of private benefits.

The PROPOLIS approach
45
Although making only popular decisions should not be understood as the sole aim of the political system, information on the acceptability of policies does have its value in assisting the search for policies that are both sustainable and acceptable. Thus, it can be said that the theories of justice can be used for aiding the assessment of the accept-ability of a policy. This is a relevant issue even if one thinks that the justice of indi-vidual distributions of the effects of a policy is irrelevant from the point of view of overall justice in society.
1.8 The PROPOLIS application: indicators, weighting, value functions
1.8.1 The PROPOLIS indicators and background variables
The selection of the PROPOLIS indicators follows, as far as possible, the theoretical requirements described above. Especially the need to have a method to forecast the indicator value into the future has been a restricting condition. General relevance, pol-icy sensitiveness as well as the avoidance of double counting within the sustainability dimension have been other restricting factors. Attempts have also been made in order to be consistent with other sets of urban indicators, especially that of the European Environmental Agency.
In addition to indicators a set of background variables has been defined. Background variables (e.g. average travel speeds or modal shares) are used to understand and ex-plain the behaviour of the policies.
In addition to indicators and background variables a huge amount of data is available for the user based on the policy runs. This data includes the spatial distribution of the variables by zone or raster cell, the development of the value of the variable through time etc.
The PROPOLIS indicators and background variables are presented in the table below. The table also shows the themes used under each dimension of sustainability. The more detailed description of each indicator is presented in the Appendix I.

The PROPOLIS approach
46
p r o p o l i s
Table 1.2 List of PROPOLIS indicators THEME INDICATOR UNIT WEIGHT %
ENVIRONMENTAL DIMENSION Global climate change [21.6] Greenhouse gases from transport CO2 eq./1000 inh. / year. 21.6 Air pollution [22,5] Acidifying gases from transport acid eq./1000 inh. / year. 13.2 Volatile organic compounds from transport tons /1000 inh. / year. 9.3 Consumption of natural sources [34,3] Consumption of mineral oil products, transport tons /1000 inh. / year. 14.7 Land coverage percent of area 11.1 Need for new construction annual growth in % 8.5 Environmental quality [21,6] Fragmentation of open space index 13.4 Quality of open space index 8.2 SOCIAL DIMENSION Health [37.6] Exposure to particulate matter from transport in
the living environment percentage of population 7.5
Exposure to nitrogen dioxide from transport in the living environment
percentage of population 5.9
Exposure to traffic noise percentage of population 6.7 Traffic deaths deaths/1000000 inh./year 10.6 Traffic injuries injured/1000000 inh/year 7.0 Equity [23,0] Justice of distribution of economic benefits justice index 5.1 Justice to exposure to particulates justice index 4.4 Justice of exposure to nitrogen dioxides justice index 4.3 Justice of exposure to noise justice index 4.2 Segregation GINI-index 5.0 Opportunities [16.4] Housing standard % of overcrowded househ. 4.8 Vitality of city centre index 3.1 Vitality of surrounding region index 3.1 Productivity gain from land use percent / year 5.4 Accessibility and traffic [23.0] Total time spent in traffic hours/inhabitants/year 4.6 Level of service of PT and slow modes minutes/trip 5.8 Accessibility to city centre minutes/trip 4.0 Accessibility to services minutes/trip 4.6 Accessibility to open space minutes/trip 4.1 ECONOMIC DIMENSION Total net benefit from transport Investment costs Euro/capita Transport user benefits Euro/capita Transport operator benefits Euro/capita Government benefits from transport Euro/capita Transport external accident costs Euro/capita Transport external emissions cost Euro/capita Transport external greenhouse gases Euro/capita Transport external noise costs Euro/capita

The PROPOLIS approach
47
Table 1.3 List of PROPOLIS background variables
BACKGROUND VARIABLE UNIT
TRANSPORT STATISTICS Yearly travelled distance by mode * million pass. km/ a Yearly travel time by mode * million pass.h/ a Average travel distance / trip by mode * km/ trip Average travel time / trip by mode * minutes/trip Average travel speed by mode * km/h Modal share in peak by mode * share % Traffic volumes veh/hour Car trips as % of all trips, by zone %
LAND USE STATISTICS Floor space /capita, by zone m2/capita Residential rent, by zone euro/inh./month Number of inhabitants in SEG 1 by superzones ** # Number of inhabitants in SEG 2 by superzones ** # Number of inhabitants in SEG 3 by superzones ** # Total number of inhabitants by superzones ** # Total employment # Employment by sector and zone - Primary and industry # - Public services and administration # - Private services and commerce # ECONOMIC BACKGROUND VARIABLES Tax revenues from transport, passenger traffic MEuro/a Tax revenues from transport, goods traffic MEuro/a Revenues from road pricing, passenger cars MEuro/a Revenues from road pricing, goods vehicles MEuro/a Revenues from car parking MEuro/a Revenues of public transport operator MEuro/a Change of floor prices MEuro/a
* Modes: Public transport, private cars, walk & bike, (goods vehicles)
** Superzones: City centre, Inner urban, Outer urban, Rest of metropolitan, Rest of region/Urbanised, Rest of region/Rural
1.8.2 The PROPOLIS indicator weights and value functions
The weights for themes and indicators are presented in table 1.2. The process of ob-taining the weights is described below:
• Each PROPOLIS case city team member assigned weights for the indicators
• The weighting was discussed within the team and the members had the possibility to change their opinion after hearing new arguments
• The average rate of each team was calculated
• The ratings of individual teams were discussed in Consortium meetings and with the city authorities after which the teams still had the opportunity to change their opinions
• A common set of weights was calculated as the geometric mean of the team weightings

The PROPOLIS approach
48
p r o p o l i s
• The common set of weights was discussed with the city authorities of the case cit-ies.
The result of this process was two sets of weights for each case city:
− The local set of weights agreed upon between the expert group and the city au-thorities
− The common set of weights for all case cities to be used in reporting and intercity comparisons. This set was agreed upon with the city authorities and the expert teams to be used for this purpose
The direct weighting method was used. The persons involved first gave their weights for themes and secondly for the indicators within the theme. The relevant questions asked were formulated as follows:
− Give the relative weights of each theme within the sustainability dimension
− How important is it to gain a marginal improvement (10%) in the indicator value compared with other indicator values within this theme? Give the relative weights within each theme.
The direct rating method with linear value functions was chosen for valuation of the raw indicators. Other alternative methods are described in chapter 1.6.2. Theoreti-cally, only one function for each indicator should apply for all case cities, but regard-less of the harmonisation of the city models this requirement was not always feasible. One overall function could apply only for the relative indicators, which are defined as a percentage change from the present situation, e.g. accessibility to open space.
Thus, the value functions were defined separately for each city. The minimum and maximum values were defined for all the raw indicator values representing each pol-icy, year 2001 included. The value function was fitted so that the minimum and maximum argument values resulted to function values of 0.2 and 0.8, respectively, leaving room for possible exceptional policies within the limits 0 <= v(x) <= 1. How-ever, if the raw indicator value had a natural limit, like a base value 0 or 100, the cor-responding value function was defined to result to 0 or 1.0, respectively
With this weighting and function fitting method, the environmental and social sus-tainability indices should be considered as city specific and the absolute values of the indices are not comparable. However, intercity comparisons are possible by compar-ing the changes for a certain policy relative to the base year values.
Appendix I lists the parameters of the value functions for each indicator and for each case city.

The PROPOLIS approach
49
1.9 Using the PROPOLIS approach, system and process for policy testing
1.9.1 The PROPOLIS process and system
The PROPOLIS process to define urban strategies and the system used forpolicy as-sessment is illustrated in Figure 1.4. This system is developed and applied in order to:
− address the problem defined above;
− add to the state-of-the-art of theories, methodologies and tools;
− define integrated sustainable urban strategies;
− assess and demonstrate the effects of the strategies using a comprehensive ap-proach;
− determine the final conclusions and recommendations for European cities in gen-eral and for the case cities in particular.
1.9.2 Potential policy options
A comprehensive literature review has also been carried out in order to define poten-tial policy options, see section 5.1.
The PROPOLIS partners have also experience in testing a number of client defined policies in their own test cities. They have also experience in more general and theo-retical policy testing approaches especially from the SPARTACUS project. This ex-perience has been used to help indicate the way forward towards sustainable urban policies.
Potential policy options have also been defined using the external and national net-works of the project. Special emphasis is on policies, which have been implemented successfully in Europe.
After testing, analysing and understanding the effects of single policy options strate-gies were defined. Strategies are combinations of two or more single policies.
Part of the tests is the same for all case cities. However, as every city is distinct the best policy combinations are likely to differ. This is why optimum policy combina-tions were sought also individually for each city.
Sustainability
2000 2020
PROPOLIS goal
Continuation of existing policies
Do nothing
Time
Figure 1.3 The policies commonly used to control urban growth and traffic are not sufficient to reverse the trend of deteriorating sustainability in our cities. The PROPOLIS aim is to identify such policies and their combinations that could, in the long-term, achieve the goal of at least maintaining the current level of sustainability.

The PROPOLIS approach
50
p r o p o l i s
Alternative FuturesEconomic, Demographic
Lifestyles etc
Strategies, PoliciesLand use, transport,
pricing, fiscal, investment
EvaluationDecision support tool,Sustainability indices, analysis, presentation
and internet tools
The PROPOLIS
system
The PROPOLIS
process
Satisfactory results?Comparisons with
goals and benchmarks. Intercity comparisons.
Evidenced Recommendations and
ConclusionsGeneral and city-specific
Input from local city authorities
IndicatorsEnvironmental
Social, Economic
Databases
Models
GIS, model
3 types in 7 citiesRaster, GIS, Internet
Rep
lann
ing of p
olicies,strategies
Identification of negative
sideeffects,
combination and refinem
entof
policies
yes
no
Figure 1.4 The PROPOLIS process to define urban strategies and the system used for policy assessment

The PROPOLIS approach
51
References
Alberti, M. (1995) “Towards Urban Sustainability Indicators” in: J. Jäger, A. Liberatore and K. Grund-
lach (Eds.). Global environmental change and sustainable development in Europe. European Commis-
sion, Directorate-General for Science, Research and Development. Brussels.
Breheny, M (1990) “Strategic Planning and Urban Sustainability” Proceedings of the 1990 Town and
Country Planning Association Annual Conference. TCPA, London.
Daly, H. E. (1991). Steady State Economics. Island Press, Washington, D.C.
Dasgupta M. and V. Webster (1993) “Land use / transport interactions: Policy relevance of the IS-
GLUTI study” pp.255–266 in Land Use, Development and Globalisation. Selected Proceedings of the
Sixth World Conference on Transport Research. Volume I. WCTR, St-Just-la-Pendue.
Department of Environment (1996) Indicators of Sustainable Development for the United Kingdom.
HMSO. London.
European Commission (1996) European Sustainable Cities. EU Expert Group on the Urban Environ-
ment, DG XI. Brussels.
European Environment Agency (1995) Europe’s Environment: The Dobríš Assessment. Edited by
Stanners David & Bourdeau Philippe. Copenhagen.
Gardner, K. and J. Carlsen (1996) “Performance Indicators for Sustainable Transport in London.” Pro-
ceedings of the 24th European Transport Forum. London Planning Advisory Committee. London, 2 to
6 September 1996.
Haig, R. M. (1926) “Toward an Understanding of the Metropolis” Quarterly Journal of Economics 40:
421-433.
Hannequart, J-P. and E. Schamp, Eric (1995) “Bruxelles et le developpement durable” Les cahiers de
l’institute bruxellois pour la gestion de l’environnement 11.
Haughton, G. and C. Hunter (1994). Sustainable Cities. ISBN 1-85302-234-9
Hayashi Y., K. Doi, Y. Tomita and R. Suparat (1993) “An international comparative study on land use
– transport planning policies as control measures of the urban environment” pp. 255–266 in Land Use,
Development and Globalisation. Selected Proceedings of the Sixth World Conference on Transport
Research. Volume I.
ICLEI (International Council for Local Environmental Initiatives) (1993) The local agenda 21 initia-
tive. ICLEI guidelines for local and national LA21 campaigns. Toronto.
Khisty, C. J. (1996) “Operationalising Concepts of Equity for Public Project Investment” Proceedings
of the 75th Meeting of the Transportation Research Board, January 7-11, 1996. TRB, Washington, D.C.
LGMB (1995) Indicators for Local Agenda 21 – A Summary. Local Government Management Board.
Lichfield N., P. Kettle, and M. Whitbread (1975) Evaluation in the planning process. Pergamon Press,
Oxford. Quoted by Khisty.
Maler, K. G. (1990) “Economic Theory and Environmental Degradation: A Survey of Some Problems”
Revista de Analisis Economico, Vol. 5, No. 2, pp. 7-17. Quoted by Munasinghe.
Miller, D. (1976) Social justice. Clarendon Press, Oxford. Quoted by Khisty.

The PROPOLIS approach
52
p r o p o l i s
Munasinghe, M. (1993) “Environmental Economics and Sustainable Development” World Bank Envi-
ronment Paper No. 3. World Bank, Washington, D.C.
Nijkamp P., P. Rietveld and H. Voogd (1990) Multicriteria evaluation in physical planning. North-
Holland. Amsterdam.
Pearce, D. W. and R. K. Turner, (1990). The Use of Benefits Estimates in Environmental Decisionmak-
ing, report to the Environment Directorate. OECD, Paris. Quoted by Munasinghe.
Pönkä A., M. Savela and M. Virtanen (1997) “Ilmansaasteet ja kuolleisuus Helsingissä vuosina 1987–
1993” Helsingin kaupungin ympäristökeskuksen julkaisuja 2/97. Helsinki. (Air pollution and mortality
in Helsinki in 1987–1993. Publications of the Helsinki Environment Agency 2/97. In Finnish.)
“Report from the House of Lords Select Committee on Sustainable Development, Volume 1-Report”,
HL Paper 72, HMSO. London.
Saaty, T. L. (1980) The Analytic Hierarchy Process. McGraw Hill Company, New York.
Seppäläinen T. and R. Hämäläinen (1986) “Päätösanalyysi ja sen energiapoliittiset sovellukset“ Re-
search Reports B8. Helsinki University of Technology. Systems Analysis Laboratory. Espoo. (Deci-
sion analysis and it applications in energy policy, in Finnish)
Solow, R. (1986). “On the Intergenerational Allocation of Natural Resources” Scandinavian Journal of
Economics, vol. 88, no.1, pp. 141-149. Quoted by Munasinghe.
SPARTACUS (1998) Final Report. Project funded by the European Commission under the Environ-
ment and Climate RTD Programme of the 4th Framework Programme.
UNEP, IUCN, and WWF (1991). Caring for the Earth. Quoted by Munasinghe.
von Winterfeldt D. and W. Edwards (1986) Decision analysis and behavioural research. Cambridge
University Press. New York.
World Bank (1994) “Environmental Indicators: What Can They Tell Us?” Environment Dissemination
Notes 5. Washington, D.C.
World Bank (1996). “Sustainable Transport: Priorities for Policy Reform” Development in Practice
Series. Washington, D.C.
World Commission on Environment and Development (1987) Our Common Future. Oxford University
Press. Oxford and New York.
Zalta, E. N. (Ed.) Stanford Encyclopedia of Philosophy. A publication of the Center for the Study of
Language and Information. http://plato.stanford.edu/

53
2. State of the art: land use, transport and environment
Summary
This chapter summarises what is known today about the interactions and feedbacks between urban land use, transport and the environment.
That urban land use and transport are closely inter-linked is common wisdom among planners and the public. However, the reverse impact from transport to land use is less well known: how the development of the transport system influences the location decisions of landlords, investors, firms and house-holds is not clearly understood even by many urban planners.
One method to better understand this two-way interaction and to predict the impacts of land use and transport policies are mathematical models simulat-ing the location and mobility behaviour of firms and households in urban re-gions. The urgency of the environmental debate has renewed the interest in integrated models of urban land use and transport.
However, urban modellers have for a long time ignored ecological aspects of the processes simulated in their models. Existing land-use transport (LT) models are being augmented by environmental submodels to become land-use transport environment (LTE) models. Yet worldwide today there exist no full-scale urban LTE models. The first efforts to extend LT models to LTE models have concentrated on environmental impacts of land use and trans-port and ignored the opposite direction, the impact of environmental vari-ables on location decisions of investors, firms and households.
The chapter discusses different approaches to incorporate environmental impacts and feedbacks into urban land-use transport models. It points out that environmental submodels require a higher spatial resolution than zone-based land-use transport models, summarises the results of a comparison of modelling environmental impacts at different spatial resolutions and draws conclusions for the integration of environmental submodels into urban land-use transport models.

State of the art: land use, transport and environment
54
2. State of the art: land use, transport and envi-ronment
2.1 Land use transport interaction
2.1.1 Introduction
That urban land use and transport are closely inter-linked is common wisdom among planners and the public. That the spatial separation of human activities creates the need for travel and goods transport is the underlying principle of transport analysis and forecasting. Following this principle, it is easily understood that the suburbanisa-tion of cities is connected with increasing spatial division of labour and increasing mobility.
However, the reverse impact from transport to land use is less well known. There is some vague understanding that the evolution from the dense urban fabric of medieval cities, where almost all daily mobility was on foot, to the vast expansion of modern metropolitan areas with their massive volumes of intraregional traffic would not have been possible without the development of first the railway and later the private auto-mobile, which has made every corner of the metropolitan area almost equally suitable as a place to live or work. However, exactly how the development of the transport system influences the location decisions of landlords, investors, firms and households is not clearly understood even by many urban planners.
The recognition that trip and location decisions co-determine each other and that therefore transport and land use planning need to be co-ordinated led to the notion of the 'land-use transport feedback cycle'. The set of relationships implied by this term can be briefly summarised as follows (see Figure 2.1):
Figure 2.1 The 'land-use transport feedback cycle'

State of the art: land use, transport and environment
55
• The distribution of land uses such as residential, industrial or commercial, over the urban area determines the locations of human activities such as living, work-ing, shopping, education or leisure.
• The distribution of human activities in space requires spatial interactions or trips in the transport system to overcome the distance between the locations of activi-ties.
• The distribution of infrastructure in the transport system creates opportunities for spatial interactions and can be measured as accessibility.
• The distribution of accessibility in space co-determines location decisions and thereby results in changes to the land use system.
2.1.2 Theoretical approaches
The major theoretical approaches to explain the two-way interaction of land use and transport in metropolitan areas include technical theories (urban mobility systems), economic theories (cities as markets) and social theories (society and urban space):
• Impacts of land use on transport. The impact of high residential density in reduc-ing average trip length is likely to be minimal in the absence of travel cost in-creases, whereas a high density of employment is positively correlated with aver-age trip length. Attractive neighbourhood facilities can be seen as a 'pull' factor for reducing trip length. Since more peripheral locations usually have longer trips, trip length can be expected to be negatively correlated with city size. With regard to trip frequency, little or no impact is to be expected from land use policies accord-ing to the theory of travel budgets. Residential and employment density as well as large agglomeration size and good public transport accessibility of a location tend to be positively correlated with the share of public transport, while neighbourhood design and a mixture of workplaces and residences with shorter work trips are likely to increase the share of cycling and walking.
• Impacts of transport on land use. The impact of transport on land use is mediated by a change in the accessibility of a location. Higher accessibility increases the at-tractiveness of a location for all types of land uses thus influencing the direction of new urban development. If, however, accessibility throughout a city is increased, it results in a more dispersed settlement structure.
• Impacts of transport on transport. These impacts are included because they tend to be much stronger than those of land use on transport or of transport on land use. While travel cost and travel time have a negative impact on both trip length and trip frequency, accessibility has a positive impact on trip length and frequency. Mode choice is dependent upon the relative attractiveness of a mode compared to all other modes. The fastest and cheapest mode is likely to have the highest modal share.
In general, theoretical considerations support the conclusion that the impacts of 'pull' measures, e.g. of land use measures or of improvements in public transport, are much weaker than the impacts of 'push' measures, i.e. of increases in travel time or travel cost or other constraints on mobility.

State of the art: land use, transport and environment
56
2.1.3 Empirical studies of land-use transport interaction
There is a growing number of empirical studies of land-use transport interaction in urban areas. The most important factors identified in these studies are:
• Impacts of land use on transport. Residential density has been shown to be in-versely related to trip length. Centralisation of employment results in longer trips, while trip lengths are shorter in areas with a balanced residents-to-workers ratio. American studies confirm that attractive neighbourhood facilities also contribute to shorter average trip lengths. The theoretical insight that distance of residential locations to employment centres is an important determinant of average trip length has been confirmed empirically. The larger a city is, the shorter are mean travel distances with the exception of some of the largest metropolitan areas. None of the studies reported a significant impact of any factor on trip frequency. Residential and employment density as well as large agglomeration size and rapid access to public transport stops of a location were found to be positively correlated with the modal share of public transport. 'Traditional' neighbourhoods showed a higher share of non-car modes.
• Impacts of transport on land use. Accessibility is reported to be of varying impor-tance for different types of land uses. It is an essential location factor for retail, of-fice and residential uses. Locations with high accessibility tend to be developed faster than other areas. The value of accessibility to manufacturing industries var-ies considerably, depending mainly on the goods produced. In general, ubiquitous improvements in accessibility invoke a more dispersed spatial organisation of land uses.
• Impacts of transport on transport. These impacts are included because they tend to be much stronger than those of land use on transport or of transport on land use. Empirical studies largely agree on the impact of transport on transport. While travel cost and travel time tend to have a negative impact on trip length, high ac-cessibility of a location generates longer work and leisure trips. Studies on changes in trip frequency are only known for travel time improvements, where time savings were found to result in more trips being made. Mode choice depends on the relative attractiveness of a mode compared to all other modes. The fastest and cheapest mode is likely to have the highest modal share. However, offering public transport free of charge will not induce a significant mode switch of car drivers, rather of walkers and cyclists.
2.1.4 Modelling studies of land-use transport interaction
Predicting the impacts of integrated land-use transport policies is a difficult task due to the multitude of concurrent changes of pertinent system variables. There are princi-pally three methods to predict those impacts. The first is to ask people how they would change their location and mobility behaviour if certain parameters, such as land use regulations or transport costs, would change ('stated preference'). The second con-sists of drawing conclusions from observed decision behaviour of people under differ-ent conditions on how they would be likely to behave if these parameters would change ('revealed preference'). The third method is to simulate human decision behav-iour in mathematical models.

State of the art: land use, transport and environment
57
All three methods have their advantages and disadvantages. Surveys can reveal also subjective factors of location and mobility decisions, however, their respondents can only make conjectures about how they would behave in still unknown situations, and the validity of such conjectures is uncertain. Empirical studies based on observations produce detailed and reliable results; these, however, are valid only for existing situa-tions and are therefore not suited for the assessment of the impacts of novel yet un-tested policies. In addition it is usually not possible to associate the observed changes of behaviour unequivocally with specific causes, because in reality several determin-ing factors change at the same time.
Mathematical models of human behaviour are also based on empirical surveys or ob-servations. The difference is that the conclusions to be drawn from the survey and ob-servation data are quantified. Strictly speaking, the results of mathematical models are therefore no more universally valid than those of empirical studies but are only valid for situations, which are similar to those for which their parameters were estimated. Nevertheless is it possible to transfer human behaviour represented in mathematical models within certain limits to still unknown situations. In addition, mathematical models are the only method by which the effects of individual determining factors can be analysed by keeping all other determining factors fixed.
A number of integrated urban land-use transport systems are in use today. There are significant variations among the models as concerns overall structure, comprehen-siveness, theoretical foundations, modelling techniques, dynamics, data requirements and model calibration.
The number of real-world applications of integrated urban land-use transport models has increased steadily over the last two decades. There has been a continuous reflection of purpose, direction and theoretical basis of land-use transport modelling as witnessed by volumes edited by Hutchinson et al. (1985);Hutchinson and Batty (1986), Webster et al. (1988) and Webster and Paulley (1990) and by reviews by Harris (1985), Mackett (1985), Wegener (1986, 1987), Kain (1987), Boyce (1988), Berechman and Small (1988), Aoyama (1989), and Batty (1994), Harris (1994), Southworth (1995), Wilson (1997), Wegener (1994, 1995, 1998, 2003), Wegener and Fürst (1999) and EPA (2000).
Today there are many urban land-use transport modelling projects underway all over the world. In the United States, environmental legislation, such as the Clean Air Act amendment of 1990, the Intermodal Surface Transportation Efficiency Act (ISTEA) of 1991 and the Transportation Equity Act for the 21st Century (TEA-21) of 1998, gave a boost to the development and application of urban land-use transport models. ISTEA required cities to consider the likely effect of transportation policy decisions on land use development. In Europe, the European Commission has funded a number of studies employing land-use transport models. The SPARTACUS project applied the land-use transport model MEPLAN to three urban areas and connected the model with spatially disaggregate environmental submodels. There are several applications of the TRANUS model, among them the study of the Swiss Metro, a high-speed vac-uum-tube underground railway proposed to cross the whole of Switzerland, which is considered one single metropolitan area. The DELTA land-use/economic model is
State of the art: land use, transport and environment
58
applied to an increasing number of metropolitan areas in conjunction with various transport models. The PROPOLIS project has applied three of the most advanced land-use transport models existing today, MEPLAN, TRANUS and the IRPUD model, in seven urban regions in six European countries. These three model are pre-sented in Chapter 3.
2.2 Environmental feedback
2.2.1 Introduction
There is growing awareness that the way of life practised in the most affluent coun-tries of the world is not sustainable. People in the richest countries consume signifi-cantly more energy and other resources per capita than people in the poorest regions and by the same margin generate more noxious emissions and waste. And this imbal-ance is increasing due to the faster growth in income in the already richer regions and the subsequent changes in life styles and consumption and travel patterns. In more general terms, there is a close relationship between income development and basic life style decisions, which in turn determine housing choice and travel behaviour. The hy-pothesis is that – irrespective of advances in resource efficiency and pollution control – continued growth in income will lead to less and less sustainable life styles unless policies make resource consumption, pollution and car mobility less attractive.
The urgency of the environmental debate has renewed the interest in integrated mod-els of urban land use and transport. There is growing consensus that the negative envi-ronmental impacts of transport cannot be reduced by transport policies alone but that they have to be complemented by measures to reduce the need for mobility by pro-moting higher-density, mixed-use urban forms more suitable for public transport. As already indicated above, in the United States legislation inspired by growing environ-mental awareness such as the Intermodal Surface Transportation Efficiency Act of 1991 or the Clean Air Amendment of 1992 require that transport planning must con-sider the interaction between transport and land use in a consistent fashion – as it can be done only by land-use transport models.
However, urban modellers, have for a long time ignored ecological aspects of the proc-esses simulated in their models and have only recently been prompted to redirect their attention from economic to environmental impacts of land use and transport policies. Existing land-use transport (LT) models are being augmented by environmental sub-models to become land-use transport environment (LTE) models.
However, today there exist no full-scale urban LTE models in the world. The first pioneering efforts to extend LT models to LTE models have concentrated on envi-ronmental impacts of land use and transport and have ignored the opposite direction, the impact of environmental variables on location decisions of investors, firms and households. But it is increasingly becoming obvious that the quality of the environ-ment of urban locations strongly affects their attractiveness in the eyes of investors, firms and households.

State of the art: land use, transport and environment
59
2.2.2 The urban environment in context
The context of land-use transport modelling can be used to exclude from the analysis environmental aspects which may be important in their own right but are only little affected by the processes dealt with in the models. As these models are intended for forecasting the impacts of land use and transport policies, only those environmental impacts are relevant for them, which result from changes of the distribution of human activities, i.e. on physical layout and movements. For instance, the sewerage system and efficient wastewater treatment are important for a sustainable city; however, while the cost of the sewerage system depends on the topography and physical layout of the city, the cost of the treatment plant does not. Environmental subsystems rele-vant for urban land-use transport models can be classified under the headings of re-sources, emissions and immissions (Büttner et al., 2003):
Resources
Most human activities consume resources. Some of them are global resources, which are brought into the region such as energy; some are local resources such as water. Sustainable development aims at using non-renewable resources as little as possible in the interest of future generations. From the point of view of urban modelling the most important resources are energy, water and land:
• Energy. Energy is a global resource, which is imported to the urban region in the form of non-renewable fossil fuel or electricity. Renewable kinds of energy such as solar or wind energy presently play a minimum role. Energy is consumed for process heat, for the heating of buildings and for transport. Energy use for heating is affected by type of building and density. Transport energy consumption is af-fected by modal choice, number and length of trips, travel speed, vehicle occu-pancy or load factor and energy efficiency of vehicles. Choice of building type and density as well as travel and shipping behaviour are influenced by energy cost, however, this effect is today diluted by underpriced fuel. Energy consump-tion of land use and transport are therefore candidates for being included in urban models; the relationships to be modelled are straightforward.
• Water. Water cannot be easily transported over great distances and is therefore consumed close to the source. Modern agriculture, manufacturing techniques and life styles all tend to have higher water consumption. Water supply has therefore become a serious problem for many cities. There is a relationship between urban density and water consumption as suburban gardens and swimming pools tend to consume large quantities of water. There is no significant effect of urban transport on water consumption. However, both land use and transport affect water supply by sealing off land through buildings, paving and roadways and so impeding rain-fall from reaching the ground water. Because of this higher urban densities with smaller land coverage and less roads are environmentally preferable over disperse suburbs with one-storey buildings and a high percentage of paved road area. The effects of ground coverage on ground water supply can be modelled; so can the ef-fect of policies to reduce water consumption by utilisation of rainfall.
• Land. Land is the ultimate resource of cities. With growing affluence and increasing substitution of (renewable) human labour by (non-renewable) mechanical energy, all

State of the art: land use, transport and environment
60
human activities, from housing, manufacturing and services to transport tend to con-sume more land. The open space in and around cities is therefore continuously de-clining. This not only reduces ground water supply (see above) but has also serious negative effects on vegetation, wildlife and microclimate. Research on the impacts of size, shape and interconnectedness of open spaces on the number and variety of plant and animal species and the micro climate in adjacent areas is ongoing, however, there are sufficient results available to include these effects in urban models.
Emissions
Most human activities give rise to metabolisms producing obnoxious emissions. Emissions are produced locally but have local, remote or global effects. From the point of view of urban modelling the most important emissions are gases, wastewater, soil contamination, solid waste and noise:
• Gases: Most gaseous emissions originate from chemical or combustion processes in stationary or mobile sources. In cities stationary sources are chemical or manu-facturing plants, power stations and residential areas; mobile sources are cars, buses and lorries. Pollutants such as CO, NOx, HC, SO2 and dust particles affect the well-being of humans at points of immission (see below), whereas CO2 is a greenhouse gas with global effects. To predict the magnitude and composition of industrial emissions requires specific information about the type and quantity of processes and the efficacy of emission abatement technology. Reasonable assump-tions about the emissions by residential heating given a certain level of insulation and heating technology are possible. Transport emissions are a well-researched field. It is possible to predict road transport emissions as a function of link traffic volumes, composition of flow, vehicle duty cycles and prevailing emission abate-ment technology with any desired detail.
• Water quality. The amount of waste water produced in a city is a function of water consumption (see above), rainfall and irrigation; however, reasonable assumptions about waste water per capita or per worker by industry can be made. As indicated above, the amount of ground coverage through buildings and pavements affects the volume of rainwater in the sewerage system and hence the required capacity of water treatment plants. Urban density affects the length and cost of sewerage net-works. Intensive use of fertilisers or untreated industrial or domestic effluents lead to the degradation of ground water or streams and rivers and to the degeneration of aquatic habitats. However there is no causal relationship between type of land use or density and water quality. Therefore water quality is not a likely topic of urban models. Urban transport contributes to water pollution by oil and particles washed from roadways. This effect can be modelled, but is not likely to be signifi-cant compared with other sources of water contamination.
• Soil. Soil contamination through chemicals and obnoxious liquids by former manufacturing or extraction activities is a serious problem in old industrial or min-ing regions, but should be a thing of the past through stricter enforcement of emis-sion standards. However, existing contamination can be a strong deterrent for po-tential residential or industrial investors.

State of the art: land use, transport and environment
61
• Solid waste. The generation of solid waste is not a function of land use type or density or urban transport, but of manufacturing and packaging technologies and personal life styles and recycling legislation. Solid waste disposal generates traffic and requires land for disposal sites or incineration plants and so affects urban transport and land use. These effects might be modelled but are likely to be rela-tively insignificant compared with other urban activities. Faulty disposal sites may be the cause of soil contamination, and incineration plants are suspect of emitting dioxin, but these effects are not caused by land use or transport and are therefore not likely to be considered in urban models.
• Noise. Like air pollution, noise is emitted from stationary and mobile sources. Fixed sources are industrial processes and construction sites and mobile sources are vehicles. Noise from stationary sources (except construction sites) has been reduced by encapsulation of machinery and physical separation between industry and residences. Traffic noise, in contrast, is increasing and has become the most obnoxious and ubiquitous kind of emission in cities. Like industrial air pollution, industrial noise is difficult to predict without information about the processes at work. Traffic noise can be simulated as a function of traffic volume, composition of flow and speed. Noise propagation declines rapidly with distance, so calcula-tion of noise emissions without calculation of noise immissions is not sufficient (see below).
Immissions
Air pollution, noise and water contamination are environmental impacts of which points of emission and points of immission differ. As their effect is felt at points of immission, calculation of immissions from emissions is critical for these kinds of im-pacts. Three types of emission-to-immission models are candidates for being included in urban models:
• Air dispersion. Air pollution can be carried over long distances as the phenom-enon of acid rain thousands of kilometres from the emission source has demon-strated. Within urban areas air streams are important not only for the dispersal of pollutants but also as carriers of cool air from the countryside or mountains in the summer. Air dispersion models calculate immissions from emissions as a function of location and height of sources, topography and prevailing wind direction and speed. The use of these models can suggest which parts of the urban area should be left undeveloped as cold air ventilation corridors.
• Noise propagation. For the assessment of noise intrusion it is necessary to know the number of people affected by different noise levels. There exist several meth-ods of calculating noise immissions from simple distance buffers around point or line sources to sophisticated sound propagation models taking account of multiple reflection of noise from roadways, topography, buildings and the effects of sound protection measures such as protective dams or walls. The latter methods, how-ever, require spatially disaggregate information on topography, built form and dis-tribution of population.
• Surface/ground water flows. Hydrological modelling includes surface water mod-els such as rainfall-runoff or stream flow simulation models and groundwater

State of the art: land use, transport and environment
62
models such as groundwater flow and groundwater contamination transport mod-els. Hydrological modelling is a complex field requiring extensive information on rainfall probability, land cover and the geological formation and the river system of the urban region. However, with imminent depletion of water resources in many cities, this type of model may become more prominent in the future. Rain-water management policies designed to reduce water consumption and sewerage volumes require site-specific information on roof areas and ground coverage and appropriately spatially disaggregate models.
2.2.3 LTE – an asymmetric relationship
The relationships between the environment and urban land use and transport are not symmetric. Land use and transport affect almost all environmental indicators but the reverse is not the case. Land use changes, i.e. location decisions by investors, firms and households, are strongly affected by land availability, soil contamination, air pol-lution and noise; all other feedbacks from the environment are weak or potentially strong only in the case of a major change in the decision framework such as a substan-tial change in energy cost. Transport decisions are not affected by environmental indi-cators at all, except potentially by rising fuel costs. Nevertheless, as a minimum, feed-back from environment to land use, i.e. the impact of environmental indicators on lo-cation decisions, should be included in LTE models.
Most present urban models are still far from deserving the name land-use transport environment (LTE) models. The models have not taken up many environmental top-ics, which figure high on the list of controversial issues in contemporary cities, even though there exist suitable methods and data (Wegener, 1996). In the majority of cases the environmental indicators calculated are not fed back into the models and so have no impact on the behaviour of the model actors. This is particularly surprising in the case of land use, as environmental quality has become a more and more important component of location attractiveness not only for households but also for services and even for manufacturing. The little feedback from the environment to travel behaviour, on the other hand, is realistic and reflects one of the main problems of planning for sustainability: that the negative impacts of the automotive society are felt by every-body but are not linked to individual behaviour: it does not pay to behave environ-mentally. It is one of the key tasks of planning for sustainability to link the environ-mental indicators, through incentives and penalties, to the daily travel decisions of each individual. It is to be hoped that future urban LTE models will be able to model that kind of feedback.
In the long run, however, an even more ambitious objective will have to be met: to view urban systems as urban ecosystems in which land use and transport are just two subsystems (Alberti, 1999). This would require to model not only the interactions be-tween land use and transport and the urban environment but also the interactions within and between the environmental subsystems themselves. Ecological modelling has been an established field of scientific work long before the present debate about en-vironmental sustainability. Important pioneering insights into the nature of complex dy-namic systems originated in ecology. Goodchild et al. (1993) presents the impressive

State of the art: land use, transport and environment
63
state of the art of environmental modelling. Alberti (1999) reviews recent urban and regional ecosystem models focusing on environmental subsystems, such as biosphere, hydrology, trees, nutrient cycles or landscape, which explicitly include human interven-tions. There are integrated analyses of regional metabolism and material flows (e.g.. Brunner et al., 1994; Baccini and Bader, 1996).
2.2.4 Review of empirical studies
Evidence from empirical studies clearly confirms the hypothesis about the growing importance of environmental factors for location decisions of households and firms. There are, however, difficulties with the available literature. Only few studies make a serious attempt to isolate the relative contribution of environmental factors to location decisions in a quantified way. Most studies, in particular studies reporting on surveys among firms, present only qualitative evidence based on stated preference information in the form of ordinal rankings of factors or percentages of quotations or qualitative or categorical judgements. In addition, there are significant differences between the stud-ies with respect to the relative importance of individual environmental factors.
Nevertheless, there is sufficient agreement between the different studies to synthesise the results to a number of statements that can serve as guidelines for modelling envi-ronmental feedback in urban LTE models (Spiekermann and Wegener, 2003):
• There are two main factors, which have a significant impact on location decisions of households and firms: the environmental quality of an area and the quality of housing and the quality of the surroundings of an area.
• The environmental quality of an area for households is mostly represented by the indicators land, vegetation, air pollution and noise. For firms, the quality of hous-ing and the quality of the surroundings has a strong influence on the choice of a firm location.
• It is important to distinguish between different types of households and firms when modelling environmental feedback. Households with higher education and higher incomes tend to (and can afford to) place more emphasis on environmental factors when choosing a residential location. Firms with a larger proportion of highly skilled employees tend to (and can afford to) place more emphasis on envi-ronmental factors when choosing a firm location.
• However, the traditional location factors, such as accessibility, suitability of the site and availability of infrastructure and labour, continue to be important. Only when the requirements with respect to these 'hard' location factors are fulfilled, soft location factors such as environmental factors can be taken into account. However, with growing affluence of societies, decreasing work time and increas-ing leisure time, the relative importance of environmental factors has increased in the past and is likely to continue to grow in the future.
2.2.5 Expert Interviews
Expert interviews conducted in the PROPOLIS case study regions underlined the im-portance of the environment for location decision of households and firms and the need to include environmental quality as a factor when modelling urban development.
State of the art: land use, transport and environment
64
However, the expert interviews show that there is no simple relationship between households or firms on the one hand and environment on the other. Different house-hold types and different industries are concerned with environmental quality in a very distinct way. Also there is no perception of environmental quality as such, households and firms look out for certain components of the environment that influences their lo-cation behaviour (Spiekermann and Wegener, 2003):
• The socio-economic situation of a household is crucial for the importance of envi-ronmental quality. It plays a major role for location decision of medium and high-income households and for households with children and retired people by count-ing up to 25 percent. There does exist a variation of location factors by country which is however small.
• The most important environmental factors for the population are noise and the ex-istence of disturbing land uses nearby. Air pollution, access to open space and parks rank second.
• The type of industry is decisive whether environmental quality plays a role for lo-cation decision of firms. High-level service industries headquarter functions and high-tech industries put more emphasis on the environment than other industries. However, environmental quality contributes only to 15 percent of a location deci-sion, which is much lower than for households.
• Air pollution, noise and other disturbing activities nearby are the most important environmental factors considered by these industries.
2.2.6 Modelling environmental feedback
The theoretical analysis, the empirical studies end the expert interviews agree that en-vironmental factors have a significant influence on location decisions of investors, firms and households:
• The environmental quality of an area is mainly represented by the factors density, open space, air pollution and noise.
• Households with higher education and higher incomes place more emphasis on environmental factors when choosing a residential location. Firms with a larger proportion of highly skilled employees place more emphasis on environmental factors when choosing a firm location.
• Traditional location factors, such as accessibility, suitability of the site and avail-ability of infrastructure and labour, continue to be important. Only when the re-quirements with respect to these 'hard' location factors are fulfilled, soft location factors such as environmental factors are taken into account.
• With growing affluence of societies, decreasing work time and increasing leisure time, the relative importance of environmental factors is likely to increase in the future.
Other environmental impacts, such as energy consumption and emission of green-house gases (CO2), are important globally but do not affect location decisions of households and firms because they are not felt locally.

State of the art: land use, transport and environment
65
2.2.7 Environmental feedback in land-use transport models
Environmental factors affect the location behaviour of households and firms and hence indirectly also the behaviour of investors who choose locations for housing, in-dustrial, office or retail developments – as these anticipate the preferences of their cli-ents, households and firms. The preference functions determining the location behav-iour of households, firms and developers are therefore the points where environmental feedback enters land-use transport models.
These preference functions have different forms in the land-use transport models used in PROPOLIS. MEPLAN and TRANUS consider only preference functions of end users of floorspace, i.e. households and firms. The IRPUD model distinguishes be-tween the preferences of developers who invest in housing, offices or retail or indus-trial floorspace and the preferences of end users of housing, i.e. households, and the preferences of end users of industrial, office or retail floorspace, i.e. firms.
Mathematically, the preference functions are utility functions in which the total utility is an additive or multiplicative combination of relevant factors with the relative im-portance of the factors expressed by weights. The factors are either indicators ex-pressed in physical terms, such as, e.g. ppm for air pollution or db(A) for noise, or converted to a common utility metric by value functions based on multiattribute utility theory. The weights of the utility functions are determined by maximum-likelihood estimation based on discrete-choice or entropy-maximising theory, however, also weights derived from stated-preference techniques are used.
Integration of environmental feedback into land-use transport models therefore means to add environmental factors to the explanatory variables of the preference functions used in the models and re-calibrate the models.
2.2.8 Problems of spatial resolution
Location choice in the land-use transport models used in PROPOLIS is performed at the level of zones. This implies that the environmental factors for environmental feed-back need to be calculated at the zonal level. This, however, is not sufficient, as envi-ronmental effects are felt and perceived at much smaller scale than the average zone size in these models.
In particular air pollution and noise intrusion models require a much higher spatial resolution than large zones in which the internal distribution of activities and land uses is not known: Air distribution models typically work with raster data of emission sources and topographic features such as elevation and surface characteristics such as green space, built-up area or high-rise buildings. Noise propagation models require spatially disaggregate data on emission sources, topography and sound barriers such as dams, walls or buildings as well as the three-dimensional location of population.
This is the reason why for the calculation of environmental indicators in PROPOLIS the Raster Module, in which the land use pattern within zones is disaggregated to much smaller raster cells, was introduced. The Raster Module permits the calculation

State of the art: land use, transport and environment
66
of air quality, noise intrusion and other environmental indicators by raster cells and – as the resident population of each raster cell is known – the calculation of the percent-age of population by zone or socio-economic group affected by negative environ-mental impacts. In an ideal model environment, this information would be used for modelling environmental feedback.
However, in the modelling concept of PROPOLIS this is not possible because the land-use transport models used in PROPOLIS are based on zonal aggregates, and the disaggregation to raster cells is performed only after the simulation runs have been completed. To illustrate this situation, three ways to calculate environmental indica-tors in land-use transport models are presented in Figure 2.2:
Aggregate land-use
model
Zonal data
Aggregate land-use trans-port model
Zonal environmental impact model
Aggregate land-use
model
Zonal data
Aggregate land-use trans-port model
Spatial disaggregation
Spatial disaggregation
Zonal data
Microsimulation land-use trans-port model
Disaggregate environmental impact model
Disaggregate environmental impact model
No spatial disaggregation
Spatial disaggregation of output
Spatial disaggregation of input
Few impacts Limited feedback
All impacts Limited feedback
All impacts All feedbacks
Figure 2.2. Linking land-use transport and environmental models
• No spatial disaggregation. The left column represents zone-based land-use trans-port models, such as MEPLAN, TRANUS and the IRPUD model. Here model in-put, model equations and model output refer to zones as spatial units of reference. All model data and variables represent zonal averages, i.e. the spatial distribution of activities within the zones, is not considered. Environmental impacts can there-fore be attributed only to the whole zone. This is particularly misleading in the case of air pollution or noise propagation, which affects only areas close to their emission sources, whereas emissions generated in neighbouring zones are not con-sidered. In conclusion, in these models only few environmental factors can be cal-culated in a meaningful way so that environmental feedback can be implemented in these models in only a limited way.
• Spatial disaggregation of output. The centre column represents how disaggregate environmental indicators can be derived from zone-based land-use transport mod-els despite their insufficient spatial resolution. This is made possible by spatial
State of the art: land use, transport and environment
67
disaggregation of their output in the Raster Module. The Raster module converts the vector-based information about the land-use pattern and transport networks in each zone taken from a geographic information system into a raster representation where each land-use raster cell is associated with a land-use type and density and each transport network raster cell with a certain link of the rail or road network (Spiekermann, 1999; Spiekermann and Wegener, 2000; Spiekermann, 2003). In this way both emissions and immissions can be calculated for raster cells. As also the resident population is disaggregated to raster cells, environmental impacts can be associated with affected population by socio-economic group, which makes it possible to study equity issues. This is the method applied in PROPOLIS for the comparison between policy scenarios. However, as the spatial disaggregation is applied only ex-post to model output, it is difficult to feed the information on en-vironmental impacts back into the model simulation. To do this would require to disaggregate the model results to raster cells and to re-aggregate the raster-based environmental indicators back to the zonal level in each simulation period, which implies a loss of information. Perhaps more importantly, the method would in-volve an unwarranted computational effort.
• Spatial disaggregation of input. The right-hand column in Figure 2.2 represents the conclusion from this discussion: a completely spatially disaggregate land-use transport environment (LTE) model. If no spatially disaggregate database exists, the spatial disaggregation occurs already at the model input stage. The result of the spatial disaggregation are 'synthetic populations' of individual households and firms that live and work at 'microlocations' (i.e. raster cells) connected by trans-port networks stored both in vector form (for efficient travel and goods transport modelling) and in raster form (for spatially disaggregate calculation of emissions). In this type of model the disaggregate environmental model would be fully inte-grated with the land-use transport model as it would work at the same spatial reso-lution. This would make full environmental feedback both possible and efficient. However, such a fully integrated spatially disaggregate land-.use transport envi-ronment model currently does not exist worldwide.
The recognition that the way how in PROPOLIS the land-use transport and the envi-ronmental models are linked does not allow full environmental feedback was the rea-son for the decision not to insist on environmental feedback in each model. Instead it was decided to explore the possibility of implementing environmental feedback at the zonal level using the IRPUD model as an example, because in this model environ-mental feedback had been already used before PROPOLIS.
This exercise is presented in detail in PROPOLIS Deliverable 2 (Spiekermann and Wegener, 2003). That report provides a state-of-the-art review of empirical studies of the impact of environmental variables on the behaviour of households and firms, pre-sents results of interviews with experts on location behaviour of households and firms from local planning departments, real-estate investment companies, consultants and academia and explains how environmental feedback is implemented in the IRPUD model. It compares the environmental indicators calculated for the zones in the Dort-mund urban region with the spatially disaggregate environmental indicators produced

State of the art: land use, transport and environment
68
by the PROPOLIS Raster Module for the same study area aggregated to zones. The comparison shows that for some indicators, such as residential density and open space, measurement at the zonal level is acceptable, whereas for other indicators, such as air quality and traffic noise, significant differences between the zone-based and the raster-based indicators become apparent.
The conclusion for implementing environmental feedback in zone-based urban land-use transport models is that for some environmental impacts zone-based environ-mental indicators are satisfactory substitutes, but that for modelling all relevant envi-ronmental impacts and feedbacks more spatially disaggregate models such as the PROPOLIS Raster Module are indispensable.
2.3 Outlook
The review of theoretical approaches, empirical studies and expert interviews on the two-way interactions between urban land use and transport and the urban environment has shown that there exist a large number of methods and models to forecast and evaluate environmental impacts of land use and transport policies but that only little work has been done to establish a theoretical framework for environmental feedback, i.e. the effect of environmental variables on the spatial behaviour of households and firms. This can be explained in part by the fact that such effects are in general, with few exceptions, rather weak or do not exist at all, as in the case of travel behaviour.
The reason for the generally weak nature of environmental feedback is that environ-mental impacts of land use and transport decisions involve large externalities that are not felt by the originators of land use and transport decisions, i.e. by household, firms, investors and developers, and travellers, shippers and transport operators. The few exceptions are land availability, air quality and noise intrusion, which have a strong impact on location decisions of households and firms.
A consequence of this is that theorising about environmental issues has been largely normative, deducing the need for a change of lifestyles from ecological and equity postulates. However, it is necessary to identify policy options by which the external-ities mentioned above can be internalised into the preference functions of households, firms, investors and developers, and travellers, shippers and transport operators.
However, zone-based environmental indicators are only approximations of disaggre-gate environmental indicators. The ultimate solution to modelling environmental feedback is the fully spatially disaggregate microsimulation urban land-use transport environment (LTE) model in which the notion of zones has been abandoned and the spatial disaggregation occurs already at the model input stage. In this type of model the disaggregate environmental model would be fully integrated with the land-use transport model, and this would make full environmental feedback both possible and efficient.

State of the art: land use, transport and environment
69
References
Alberti, M. (1999) Modeling the urban ecosystem: a conceptual framework. Environment and Planning
B: Planning and Design 26, 605-630.
Aoyama, Y. (1989) A historical review of transport and land-use models in Japan. Transportation
Research 23 A, 53-61.
Baccini, P. and H.-P. Bader (1996): Regionaler Stoffhaushalt. Spektrum Akademischer Verlag,
Heidelberg.
Batty, M. (1994) A chronicle of scientific planning: the Anglo-American modeling experience. Journal of
the American Planning Association 60, 7-16.
Berechman, J. and K.A. Small (1988) Research policy and review 25: modeling land use and transpor-
tation: an interpretive review for growth areas. Environment and Planning A 20, 1283-1422.
Boyce, D.E. (1988) Renaissance of large-scale models. Papers of the Regional Science Association 65, 1-
10.
Brunner, P., H. Daxbeck and P.Baccini (1994): Industrial metabolism at the regional and local level. In:
R.U. Ayres and U.E. Simonis (eds.): Industrial Metabolism. United Nations University, Tokyo.
EPA (US Environmental Protection Agency) (2000) Projecting Land-Use Change: A Summary of
Models for Assessing the Effects of Community Growth and Change on Land-Use Patterns
EPA/600/R-00/098 US Environmental Protection Agency, Office of Research and Development, Cin-
cinnati, OH. http://www.epa. gov/ecocommunity/tools/reportfinal3.pdf.
Goodchild, M.F., B.O. Parks and L.T. Steyaert (Eds.) (1993): Environmental Modelling with GIS. Ox-
ford University Press, New York.
Harris, B. (1985) Urban simulation models in regional science. Journal of Regional Science 25, 545-567.
Harris, B. (1994) Science in planning: past, present, future. Journal of the American Planning Association
60, 31-34.
Hutchinson, B. and M. Batty (eds.) (1986) Advances in Urban Systems Modeling. North Holland, Amster-
dam.
Hutchinson, B., P. Nijkamp and M. Batty (eds.) (1985) Optimization and Discrete Choice in Urban Sys-
tems. Springer, Berlin/Heidelberg/New York.
Kain, J.F. (1987) Computer simulation models of urban location. In: E.S. Mills (ed.) Handbook of Regional
and Urban Economics, Vol. II, 847-75. Elsevier, Amsterdam.
Mackett, R.L. (1985) Integrated land use transport models. Transport Reviews 5, 325-343.
Southworth, F. (1995) A Technical Review of Urban Land Use-Transportation Models as Tools for
Evaluating Vehicle Travel Reduction Strategies. ORNL-6881. Oak Ridge National Laboratory, Oak
Ridge, TN. http://tmip.fhwa.dot.gov/clearinghouse/docs/landuse/compendium/ornl_toc.stm.
Spiekermann, K. (1999): Sustainable transport, air quality and noise intrusion - an urban modelling
exercise. Paper presented at the ESF/NSF Transatlantic Research Conference on Social Change and
Sustainable Transport, University of California at Berkeley, 10-13 March 1999.

State of the art: land use, transport and environment
70
Spiekermann, K. (2003): The PROPOLIS Raster Module. PROPOLIS Deliverable D4. Spiekermann &
Wegener, Dortmund.
Spiekermann K. and M. Wegener (2000): Freedom from the tyranny of zones: towards new GIS-based
models. In: Fotheringham, A.S. and M. Wegener M. (eds.): Spatial Models and GIS: New Potential
and New Models. GISDATA 7. Taylor & Francis, London, 45-61.
Spiekermann K. and M. Wegener (2003): Environment Land Use Feedback. PROPOLIS Deliverable
D2. Büttner, J., Spiekermann, K., Wegener, M. (2003)
Webster, F.V., P.H. Bly and N.J. Paulley (eds.) (1988) Urban Land-Use and Transport Interaction: Poli-
cies and Models. Report of the International Study Group on Land-Use/Transport Interaction (ISGLUTI).
Avebury, Aldershot.
Webster, F.V. and N.J. Paulley (1990) An international study on land-use and transport interaction.
Transport Reviews 10, 287-322.
Wegener, M. (1982) A multilevel economic-demographic model for the Dortmund region. Sistemi Ur-
bani 3, 371-401.
Wegener, M. (1986) Integrated forecasting models of urban and regional systems. In: P.W.J. Batey and M.
Madden (eds.) Integrated Analysis of Regional Systems. London Papers in Regional Science 15, 9-24.
Wegener, M. (1987) Transport and location in integrated spatial models. In: P. Nijkamp and S. Reichman
(eds.) Transportation Planning in a Changing World. Gower, Aldershot, 208-225.
Wegener, M. (1994) Operational urban models: state of the art. Journal of the American Planning Associa-
tion 60, 17-29.
Wegener, M. (1995) Current and future land use models. In: G.A. Shunk, P.L. Bass, C.A. Weatherby
and L.J. Engelke (eds.) Travel Model Improvement Program Land Use Modeling Conference Proceed-
ings. US Department of Transportation, Washington, DC, 13-40.
Wegener, M. (1996) Reduction of CO2 emissions of transport by reorganisation of urban activities. In: Y.
Hayashi and J. Roy (eds.) Transport, Land Use and the Environment. Kluwer, Dordrecht, 103-124.
Wegener, M. (1998) Applied models of urban land use, transport and environment: state-of-the-art and
future developments. In: L. Lundqvist, L.-G. Mattsson and T.J. Kim (eds.) Network Infrastructure and the
Urban Environment: Recent Advances in Land-Use/Transportation Modelling. Springer, Berlin/Hei-
delberg/New York. 245-267.
Wegener, M. and F. Fürst (1999) Land-Use Transport Interaction: State of the Art. Berichte aus dem
Institut für Raumplanung 46. Institut für Raumplanung, Universität Dortmund, Dortmund. http://www.
inro.tno.nl/transland/Deliverable%202a.pdf.
Wegener, M. (2003) Overview of land-use transport models. In: D.A. Hensher and K. Button, K. (eds.):
Transport Geography and Spatial Systems Handbooks in Transport , Vol. 5. Pergamon Press/Elsevier
Science, Oxford (forthcoming).
Wilson, A.G. (1997) Land use/transport interaction models - past and future. Journal of Transport
Economics and Policy 32, 3-23.

71
3. The PROPOLIS methodology
Summary
To attain the project's objective of a systematic evaluation of policies with re-spect to their long term sustainability impacts a modelling system was de-signed in which different models and tools are integrated.
Land-use transport models are the driving engines of the system. The land-use transport models simulate the effects of the policies in terms of changing zonal activities such as population or employment and changing mobility pat-tern resulting in different modal splits and different link loads. All land-use transport models used are fully GIS integrated and their GIS databases con-tain at least spatial data on zonal boundaries, road and public transport net-works and land use categories.
A number of indicator modules post-process the output of the land-use trans-port models to calculate raw values of sustainability indicators. This includes the Raster Module for environmental and social indicators that requirie a high spatial resolution, the Economic Indicator Module for an economic evaluation and the Justice Indicator Module addressing equity issues.
The sustainability indicator values are further processed in a sustainability evaluation module by using multicriteria evaluation. Finally, presentation tools depict results in a standardised form for each policy and have options to make comparisons between policies and cities.
This chapter presents the PROPOLIS methodology. It commences with an overview on the system developed and continues with brief presentations of the main models and tools that have been developed and integrated in the PROPOLIS modelling system.

The PROPOLIS methodology
72
3. The PROPOLIS methodology
3.1 The Analytical Framework
The analytical framework of PROPOLIS is a sequence of databases, models and tools that have been imbedded in the PROPOLIS Modelling System. Figure 3.1 illustrates the main components and data flows of the modelling system in an abstract manner. The analytical framework can be understood as a process stretching from inputs via behaviour modelling and sustainability impact modelling to outputs in terms of indi-cators and evaluation and presentation procedures.
The input part includes policy packages, GIS databases and model databases. Policy packages to be tested have to be transformed to 'model language' by changing some of the model parameters or the model database. GIS databases contain at least spatial data on zonal boundaries, road and public transport networks and land use categories. All land-use transport models used are fully GIS integrated, i.e. each model zone and each model link is represented in the GIS database.
In the modelling part land-use transport models are the driving engines of the system. The land-use transport models simulate the effects of the policies in terms of changing zonal activities such as population or employment and changing mobility pattern re-sulting in different modal splits and different link loads. A number of indicator mod-ules receive the output of the land-use transport models and calculate raw values of the sustainability indicators.
The output part consists of raw sustainability indicator values, which are further proc-essed in a sustainability evaluation module. In addition, other important information that helps to understand the behaviour of the system but is not used in the evaluation procedure is stored as background variables. Examples for background variables are zonal population and employment forecasts, modal split, car km etc. Finally, a web-based presentation tool shows the results in a standard form for each policy and has options to make comparisons between policies and cities.
To implement the analytical framework by a sequence of models, tools and appropri-ate data structures within the PROPOLIS project a number of pre-conditions had to be taken into account:
• Land-use transport models. There are three different land-use transport models, somehow different with respect to theory, issues modelled and standard output generated. In addition, there are seven different case cities. In each city one of the three land-use transport models has been implemented already before PROPOLIS. In fact this leads to seven different models with different factors modelled even if the same land-use transport model is applied. In addition, each model has its own GIS database defined in very distinct ways.

The PROPOLIS methodology
73
Figure 3.1 The PROPOLIS Analytical Framework
• Indicator, evaluation and presentation tools. There are modules and tools avail-able that have been developed in SPARTACUS such as the Raster Module, ME-PLUS or USE-IT. These software tools have been largely customised to the SPARTACUS system in terms of indicators and interfaces and are thus not capable to match the requirements of PROPOLIS.
These facts result in a number of principles and requirements to operationalise the analytical framework in the different case city environments:
• Acknowledgement of existing models. One of the advantages of PROPOLIS is that is does not have to start from scratch. Of particular importance is the existence of operational land-use transport models in the case study urban regions. Therefore, the existing differences between the different models and their implementations have been taken into account as a starting point.
• Harmonisation of model output. To overcome the differences between the differ-ent land-use transport models, the basic philosophy was to harmonise model out-put in terms of variables for the subsequent tools, i.e. to harmonise the interim variables of the several case cities as early as possible in order to guarantee com-parability of final results.

The PROPOLIS methodology
74
• Extended and new tools. The operationalisation of the sustainability indicator sys-tem and the evaluation procedures required the extension of existing tools as well as the development of new tools.
• Specific and general tools. The acknowledgement of the particularities of the case city models results in two kinds of tools, i.e. city or model specific tools and gen-eral tools available for all case cities.
• Common data format. In order to organise a smooth data flow between the differ-ent parts of the analytical framework, a common data format and the definition of interfaces was necessary.
Thus, the basic philosophy of the PROPOLIS modelling system is to start from rather individual modelling environments and to increase harmonisation via behaviour and impact modelling to the output in terms of similar indicators sets for sustainability and background information, sustainability evaluation and presentation.
Figure 3.2 presents the resulting PROPOLIS modelling system with its models, tools and interfaces for a case city. The colour of the boxes indicate whether that compo-nent is part of the city specific modelling environment (blue boxes) or whether it is common PROPOLIS software for all case cities. For the latter, red boxes indicate common PROPOLIS sustainability indicator modules, and beige boxes indicate com-mon PROPOLIS evaluation and presentation software. The PROPOLIS common data format (CDF) implemented in the interfaces allows smooth data exchange between city specific and common software (green boxes).
For the city specific modelling parts Figure 3.2 contains only the major components of the land-use transport models such as the input databases and a policy generation unit, the model as such and the standard model output data. There are five additional model specific tools of which some go beyond traditional land-use transport model-ling:
• Background Indicator Module. A set of background indicators is provided which will be used in the output section of the PROPOLIS modelling system for further analysis and presentation.
• Other Sustainability Indicator Module. Some of the sustainability indicators are calculated by tools developed by the individual model provider because they can be calculated straightforwardly by an add-on closely interfaced with or even inte-grated in the land-use transport models.
• Model Result Translator. Model output data requested by the sustainability indica-tor modules are translated into common data format.
• GIS Translator. The GIS database of the models is transformed into data formats accepted by other tools in the system (currently MapInfo and ArcGIS export files).
• Indicator Interface. Finally, there is one little tool, which is responsible for the data flow between the modelling and the output part of the PROPOLIS modelling system by collecting the raw indicator values and background variables.
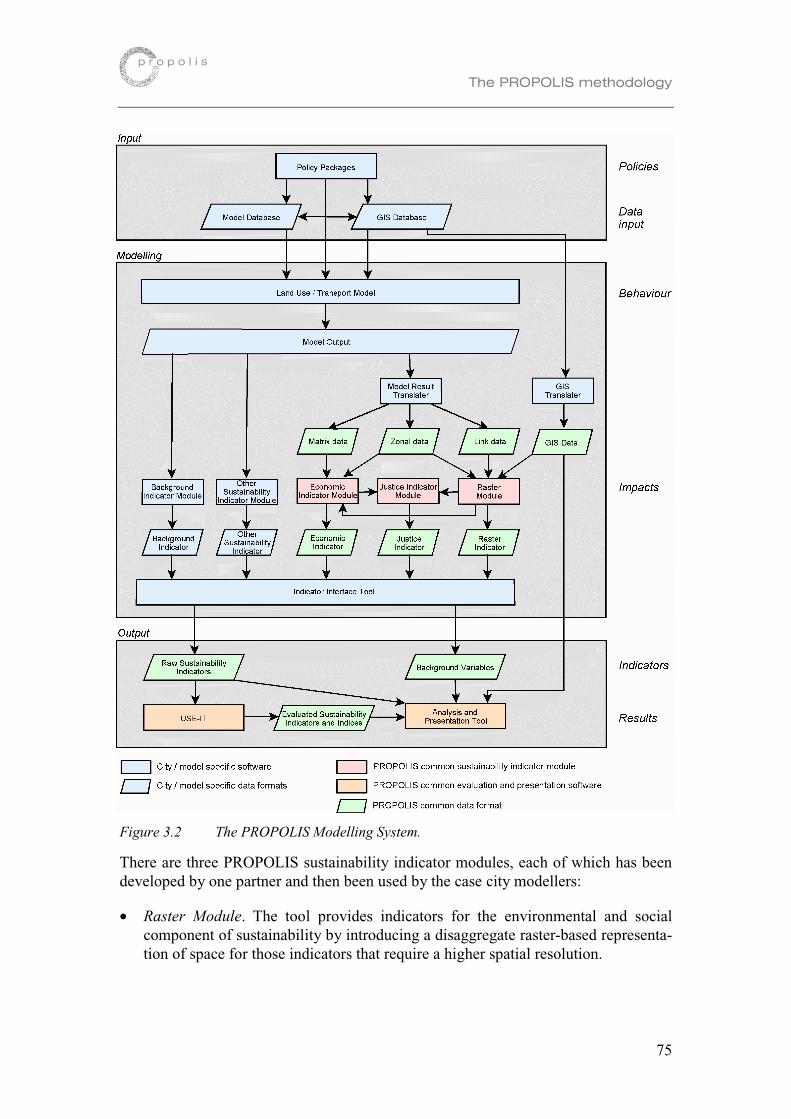
The PROPOLIS methodology
75
Figure 3.2 The PROPOLIS Modelling System.
There are three PROPOLIS sustainability indicator modules, each of which has been developed by one partner and then been used by the case city modellers:
• Raster Module. The tool provides indicators for the environmental and social component of sustainability by introducing a disaggregate raster-based representa-tion of space for those indicators that require a higher spatial resolution.

The PROPOLIS methodology
76
• Economic Indicator Module. The tool provides an economic evaluation approach and thus all indicators of the economic component of sustainability and one indi-cator for the social component.
• Justice Indicator Module. The tool addresses equity issues for the social compo-nent of sustainability by post-processing some of the health and economic indica-tors.
Finally, there are two PROPOLIS tools for evaluation and presentation of results:
• USE-IT. The tool provides a multi-criteria evaluation and includes indicator map-ping, weighting and aggregation functions and facilities to compare policies. It produces the final results in terms of the degree of sustainability of the different policies tested.
• Analysis and Presentation Tool. The tool is an Internet based analysis package and allows the presentation and comparison of PROPOLIS data in a central data re-pository.
The subsequent sections of the chapter will present the PROPOLIS modelling system in more detail. First, the land-use transport models are presented, then, the sustainabil-ity indicator tools, and eventually, the assessment and presentation tools.
3.2 The Transport and Land Use Models
3.2.1 MEPLAN Model
The MEPLAN Package
MEPLAN is a computer software package designed to inform decision-makers about planning and development. MEPLAN offers facilities to analyse the interactions be-tween economic activities and transport within a single, integrated framework. It also allows the analysis to be carried out at a variety of levels from the strategic to the lo-cal.
The MEPLAN model is based on the following principles (Figure 3.3):
• Transport is a derived demand resulting from economic interactions between ac-tivities; for example the transport of goods, services and labour from places of production to places of consumption.
• Transport is an influence on the location of activities over time. Hence transport changes make places more accessible to markets and sources of inputs increasing the demands for products, services and labour produced in those places.
• Transport and land use are treated as markets where the interaction between sup-ply (networks and land) and demand (flows and activities) establishes the price of transport and land.

The PROPOLIS methodology
77
Land-use
Land uses(activities)
Land, floorspace
Demandfor
transport
Accessibilities
Prices Demand
Transport
Travel, floorspace
Transportsystems
DemandTimes,Cost
Figure 3.3 The MEPLAN System
The theoretical structure is represented in practice by three interrelated MEPLAN modules which operate for each modelled time period (Figure 3.4). These are:
• The Land Use Submodel (LUS) models the spatial location of activities such as employment and population and produces a pattern of trades between zones.
• The Interface Module (FRED) converts land use trades into transport flows or vice versa.
• The Transport Module (TAS) assigns flows of different transport modes and routes. The resulting pattern of times and costs can then be passed on via the inter-face as influences on land use location in the following time period.
Land use/economicmodule
Land use/transportinterface
Transportmodel
Comparison and evaluation ofalternative policies
Figure 3.4 MEPLAN modules
MEPLAN also offers an economic evaluation module, which can be used to compare alternative development projects or investment scenarios (Figure 3.5). The purpose of this is to provide sufficient information to assist decisions about whether or not to proceed with a project as proposed, to modify, re-phase or re-time it or to reject it al-together. The evaluation is designed to be flexible and offers a choice of accounting framework to meet the requirements of most projects. It provides a measure of the distribution of both transport and land use benefits among the different groups af-fected by the proposed development (land owner/developer, firms, population etc). It also provides a measure of the overall benefit of a project and can be used to calculate the net present value and rate of return of an investment.

The PROPOLIS methodology
78
Land use Benefits
Rents
Travel Benefits
Tariffs
Land use Benefits
Rents
Travel Benefits
Fares
Firms
Households
Landowners/ Developers
Transport Operators
Additional Benefits
Outside the Study Area
Additional Benefits
Government and Others
Money Flow
Other benefit
Figure 3.5 Typical MEPLAN evaluation framework
3.2.2 TRANUS Model
TRANUS is an integrated land-use transport model developed by Modelistica based in Caracas, Venezuela. It can be applied at an urban or at a regional scale. The soft-ware has a double purpose: firstly, the simulation of the probable effects of applying particular land use and transport policies and projects, and secondly the evaluation of these effects from social, economic, financial and energy points of view. The advan-tages of integrating the modelling of land-use and transportation are well known and have been documented extensively in the literature (de la Barra, 1989). For the trans-port planner, land-use and transport integration provides a means of making medium and long-term demand estimates, which are impossible with transport-only models (where demand is a given input).
TRANUS has its roots in the tradition of spatial interaction theories, building on Wil-son (1970) who first showed how land use and transport could be represented in a common theoretical framework. It also draws heavily on the work of Domencich and McFadden (1975) in discrete choice analysis and random utility theory. Although these authors proposed a general model, most of their work and that which followed is centred on the problem of modal choice in transport, and no specific models were proposed and developed for other elements of the urban or regional system. In TRA-NUS, this theoretical backbone has been extended to all decision levels, from modal split to assignment, trip generation, the location of activities, and the behaviour of property developers (de la Barra, 1989; Modelistica, 1995).
In general terms, decision theory describes social processes as sets of decisions made by individuals. The main assumption is that individuals choose rationally between the options available to them. Each individual, faced with a number of options, will rank

The PROPOLIS methodology
79
them according to the degree of satisfaction or utility perceived in each case, and will choose the one that provides the greatest utility. On the other hand, utility is a subjec-tive phenomenon - its perception will vary from one individual to another and from one choice to another.
Mathematically, utility can be represented as a utility function for a particular individ-ual, which contains variables describing measured attributes of each option. Faced with a particular set of options, an individual may be assumed to evaluate each one with the same utility function, and will choose the option that yields the greatest util-ity. While this concept provides the basis of microeconomic theory, it is of little prac-tical value for the urban analyst. It would be impossible to keep track of utility func-tions for all individuals living in a city or region. There is the need, then, for aggrega-tion. Individuals may be grouped according to common socio-economic characteris-tics, and options into groups of similar types. Spatial aggregation is important: point locations of individuals or firms must be replaced by location in larger discrete areas or zones.
Aggregation introduces sources of variability, because individuals within a group are different and perceive utility in different ways. The same can be said about aggregated options and zones. Naturally, if groups are small, variability will be small also. In or-der to represent variability, random utility adds a random element to the utility func-tion. Utility functions will no longer apply to particular individuals; instead they will apply to populations of individuals relative to groups of options. A population-related utility function must not only contain the aggregate measurable characteristics of each option group, but also random elements.
In the individual case, the utility function is deterministic and produces a unique re-sult: the selection of a specific option (i.e. the one with greatest utility). In the aggre-gate case, since there are random elements, utility functions are probabilistic, produc-ing a distribution of individual choices among the available groups of options. Mathematically, the probabilistic model is obtained by integrating the joint distribu-tion. Hence, several models may be derived from the general one, according to the particular shape of the distribution. Domencich and McFadden (1975) explored sev-eral possible shapes, showing that the most appropriate was the Gumbel distribution, which after integration yields a multinomial logit model. If logit is the chosen model, then there is one and only one way of measuring the average utility of the population, the logarithmic average of the distribution, also called composite cost or log-sum. Fur-thermore, if such a model is applied in the context of two different scenarios of future conditions, the difference in utility will be equivalent to the consumers' surplus in tra-ditional economic theory. In TRANUS, this general formulation has been improved in several ways, introducing scaled utilities and an improved formulation of the log-sum.
So far we have discussed one particular choice situation. In an urban or regional sys-tem however, long and complex chains of decisions may be established. An example of a typical chain would be:
place of work → residence → shopping → transport mode
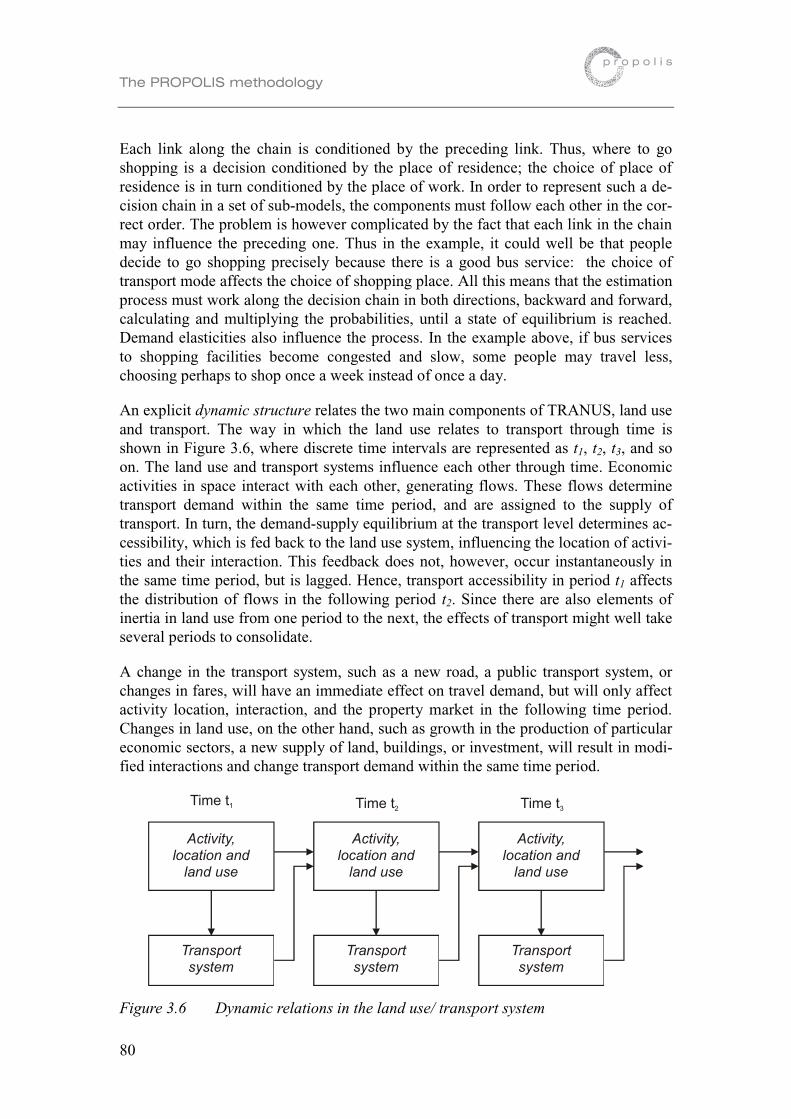
The PROPOLIS methodology
80
Each link along the chain is conditioned by the preceding link. Thus, where to go shopping is a decision conditioned by the place of residence; the choice of place of residence is in turn conditioned by the place of work. In order to represent such a de-cision chain in a set of sub-models, the components must follow each other in the cor-rect order. The problem is however complicated by the fact that each link in the chain may influence the preceding one. Thus in the example, it could well be that people decide to go shopping precisely because there is a good bus service: the choice of transport mode affects the choice of shopping place. All this means that the estimation process must work along the decision chain in both directions, backward and forward, calculating and multiplying the probabilities, until a state of equilibrium is reached. Demand elasticities also influence the process. In the example above, if bus services to shopping facilities become congested and slow, some people may travel less, choosing perhaps to shop once a week instead of once a day.
An explicit dynamic structure relates the two main components of TRANUS, land use and transport. The way in which the land use relates to transport through time is shown in Figure 3.6, where discrete time intervals are represented as t1, t2, t3, and so on. The land use and transport systems influence each other through time. Economic activities in space interact with each other, generating flows. These flows determine transport demand within the same time period, and are assigned to the supply of transport. In turn, the demand-supply equilibrium at the transport level determines ac-cessibility, which is fed back to the land use system, influencing the location of activi-ties and their interaction. This feedback does not, however, occur instantaneously in the same time period, but is lagged. Hence, transport accessibility in period t1 affects the distribution of flows in the following period t2. Since there are also elements of inertia in land use from one period to the next, the effects of transport might well take several periods to consolidate.
A change in the transport system, such as a new road, a public transport system, or changes in fares, will have an immediate effect on travel demand, but will only affect activity location, interaction, and the property market in the following time period. Changes in land use, on the other hand, such as growth in the production of particular economic sectors, a new supply of land, buildings, or investment, will result in modi-fied interactions and change transport demand within the same time period.
Activity,location and
land use
Time t1 Time t2 Time t3
Transportsystem
Transportsystem
Transportsystem
Activity,location and
land use
Activity,location and
land use
Figure 3.6 Dynamic relations in the land use/ transport system

The PROPOLIS methodology
81
The main components and relationships in the TRANUS model are shown in Figure 3.7. There is the activities system and there is the transport system. Within the activi-ties system there are the location and interaction processes and the supply of buildings and land. These two subsystems interact. Activities demand land and floor space from the property market. The interaction between the two gives rise to equilibrium prices in the form of rents. Apart from the property market, the transport system strongly influences activity location. The interaction of activities in space is the main source of travel demand. The transport model takes travel demand from the interactions be-tween activities and assigns it to two classes of supply, physical and operative. The physical supply is made of roads, railways, ports, and so on, while the operative sup-ply represents transport services, such as cars, bus routes, trucks or rail services (for details see Modelistica, 1995).
ACTIVITIES
Location and interaction between
activities
Equilibrium
Property and land supply market
TRANSPORT
Demand for transport services
Equilibrium
Physical and operative supply
of transport
Travel demand
Accessibility and cost
Figure 3.7 Main components in the TRANUS model
3.2.3 IRPUD Model
The IRPUD model is a simulation model of intraregional location and mobility deci-sions in a metropolitan area (Wegener, 1983; 1985; 1996; 1998; 1999). It receives its spatial dimension by the subdivision of the study area into zones connected with each other by transport networks containing the most important links of the public transport and road networks coded as an integrated, multimodal network including all past and future network changes. It receives its temporal dimension by the subdivision of time into periods of one or more years' duration.
The model predicts for each simulation period intraregional location decisions of in-dustry, residential developers and households, the resulting migration and travel pat-terns, construction activity and land-use development and the impacts of public poli-cies in the fields of industrial development, housing, public facilities and transport.

The PROPOLIS methodology
82
Figure 3.8 The IRPUD model
Figure 3.8 is a schematic diagram of the major subsystems considered in the model and their interactions and of the most important policy instruments.
The four square boxes in the corners of the diagram show the major stock variables of the model: population, employment, residential buildings (housing) and non-residential buildings (industrial and commercial workplaces and public facilities). The actors representing these stocks are individuals or households, workers, housing in-vestors and firms.
These actors interact on five submarkets of urban development. The five submarkets treated in the model and the market transactions occurring on them are:
• labour market: new jobs and redundancies,
• the market for non-residential buildings: new firms and firm relocations,
• the housing market: immigration, outmigration, new households and moves,

The PROPOLIS methodology
83
• the land and construction market: changes of land use through new construction, modernisation or demolition.
• the transport market: trips.
For each submarket, the diagram shows supply and demand and the resulting market transactions. Choice in the submarkets is constrained by supply (jobs, vacant housing, vacant land, vacant industrial or commercial floorspace) and guided by attractiveness, which in general terms is an actor-specific aggregate of neighbourhood quality, acces-sibility and price. The large arrows in the diagram indicate exogenous inputs: these are either forecasts of regional employment and population subject to long-term eco-nomic and demographic trends or policies in the fields of industrial development, housing, public facilities and transport.
The IRPUD model has a modular structure and consists of six interlinked submodels operating in a recursive fashion on a common spatio-temporal database:
(1). The Transport Submodel calculates work, shopping, service, and education trips for four socio-economic groups, and three modes, walking/cycling, public trans-port and car. The model determines a user-optimum set of flows where car owner-ship, trip rates, modal split and route choice are in equilibrium subject to conges-tion in the network.
(2). The Ageing Submodel computes all changes of the stock variables of the model which are assumed to result from biological, technological or long-term socio-economic trends originating outside the model (i.e. which are not treated as deci-sion-based). These changes are effected in the model by probabilistic ageing or updating models of the Markov type with dynamic transition rates. There are three such models, for employment, population and households/housing.
(3). The Public Programmes Submodel processes a large variety of public programmes specified by the model user in the fields of employment, housing, health, welfare, education, recreation and transport.
(4). The Private Construction Submodel considers investment and location decisions of private developers in the land and construction market, i.e. of enterprises erect-ing new industrial or commercial buildings, and of residential developers who build flats or houses for sale or rent or for their own use.
(5). The Labour Market Submodel models intraregional labour mobility as decisions of workers to change their job location in the regional labour market.
(6). The Housing Market Submodel simulates intraregional migration decisions of households as search processes in the regional housing market. Housing search is modelled in a stochastic microsimulation framework. The results of the Housing Market Submodel are intraregional migration flows by household category be-tween housing by category in the zones.
Figure 3.9 visualises the recursive processing of the six submodels. The Transport Submodel is an equilibrium model referring to a point in time. All other submodels are incremental and refer to a period of time. Submodels (2) to (6) are executed once in each simulation period, while the Transport Submodel (1) is processed at the begin-

The PROPOLIS methodology
84
ning and the end of each simulation period. Each submodel passes information to the next submodel in the same period and to its own next iteration in the following period.
Figure 3.9 Recursive processing of submodels
3.3 The PROPOLIS Indicator Tools
3.3.1 Model specific tools
The MEPLAN Tools
ME&P has developed a suite of tools to support the PROPOLIS analytical framework and to improve the productivity of users of the MEPLAN modelling package. The tools, called the PROPOLIS MEPLAN Environment (PME), cover the setting up of policies, running the simulations, capture and analysis of results, production of indica-tors of sustainability and export to other modules of the PROPOLIS system.

The PROPOLIS methodology
85
Set up and automated execution of runs is handled by the Run Manager (Figure 3.10). A tree of model runs is set up to establish the sequence of runs and their dependen-cies. Each run builds upon the output from its previous run using changes to land use quantities and/or to the transport network. The software determines which runs are up to date and which need to be rerun.
Figure 3.10 The PME Run Manager
The analysis tools allow the definition of custom aggregations, calculation methods and display formatting. The final display can be saved as a ‘bookmark’, which can then be recalled to analyse other runs. Comparisons can be defined between a series of runs. Displays can be tabular or by mapping.
A toolkit is provided for defining and calculating indicators (Figure 3.11). Once de-fined, indicators themselves can be used as terms in other indicator calculations (with certain restrictions caused by the need for consistent dimensions and to avoid cyclic definitions). Indicator definitions can be assigned to the variables required by the PROPOLIS Common Data Format (CDF) and CDF files can be produced to interface with other PROPOLIS modules.

The PROPOLIS methodology
86
Figure 3.11 PME Indicator Definition Wizard
The TRANUS tools
A TRANUS GIS Module has been developed to allow the automated transfer of files from TRANUS to a fully customised geographical information system (GIS) inter-face. The module comprises several inter-linked tools, which support the data struc-turing and visualisation of the TRANUS outputs. This way the user can examine re-sults from the TRANUS model in a map interface, in tabular format and as graphs.
The Module is built on Environmental Systems Research Institute, Inc. (ESRI) soft-ware, notably ArcObjects technology using the GIS package ArcGIS 8.1 as the basis for the GIS front end. Microsoft VisualBasic has been used to customise the interfaces and to develop any necessary software modules. The system has two main interfaces, a data management interface and a GIS/analysis interface. The data management in-terface is driven from the ESRI data management package, ArcCatalog™ and man-ages the structuring and translation of files from TRANUS into the GIS package. This interface also handles all the relationships between data entities from the TRANUS model and automatically creates a certain amount of meta-data (data about data) to enable the large number of files to be managed efficiently.

The PROPOLIS methodology
87
Figure 3.12 TRANUS GIS Interface, scenario selection.
The GIS/analysis interface is designed to create a map automatically once each data transfer has been run. This allows the user to make quick checks and comparisons of the model outputs. The interface can be used to analyse data cartographically, and to identify spatial implications from the TRANUS outputs. The setting up of the model and the preparation of individual year, scenario and policy combinations are managed within TRANUS (Figure 3.12). Binary files generated by each model run can either be output to the GIS via the data management interface described below, or they can be read back into the TRANUS User Shell in order to generate another run of the sce-nario for the next 5 year step. This process can be continued until the users have spe-cific results that they would like to see in the GIS interface. The data management in-terface can then be used to couple the model output to the GIS and also to ensure that it is correctly named, based on the combination of year, scenario and policy.
A series of automated procedures ‘grab’ the relevant TRANUS output files, reformat them where necessary, and generate meta-data where necessary. Finally the files are coupled to the relevant spatial data already stored within the GIS. Once the data have been correctly structured, a customised version of the ArcMap™ is launched with the data from the model pre-loaded. A TRANUS menu within the interface offers a range of options (Figure 3.13) for displaying the zones and transport network according to a range of outputs derived from the model. This menu allows the user to change the map interface dynamically to show zones as a choropleth map using any of the TRA-NUS outputs. Likewise the transport network can be displayed based on a number of TRANUS outputs. It can be shown in a map form with the different road types and railway lines displayed in a traditional cartographic style. Alternatively the routes can be displayed with widths proportional to their measured capacities. More importantly, the routes can be displayed according to predicted average traffic speed or by the vol-ume of vehicles that TRANUS predicts will travel along each link according to the chosen year, scenario and policy combination (see Figure 3.14). Once the model out-puts have been checked in the GIS, the TRANUS data can then be converted into the PROPOLIS Common Data Format.

The PROPOLIS methodology
88
Figure 3.13 TRANUS GIS interface, menu options available.
Figure 3.14 TRANUS GIS interface, predicted average speeds.

The PROPOLIS methodology
89
In addition, three dimensional plots of the study area that include building outlines and landscape contours give users familiar landmarks to help to relate the quantities being displayed back to the physical location to which they apply (Figure 3.15).
Figure 3.15 Three Dimensional Representation of Inverness
The IRPUD Model tools
The software environment for the application of the IRPUD model in PROPOLIS consists, besides the IRPUD Model itself, of five supporting software modules:
• The IRPUD Model Disaggregation Module disaggregates zonal data to raster cells using ancillary information in the form of GIS-based land-use information.
• The IRPUD Model Network Scenario Generation Module extracts regional trans-port networks from ArcInfo coverages and pre-processes them for efficient use in the IRPUD Model.
• The IRPUD Model Scenario Manager Module assists the user interactively in composing input data for IRPUD Model scenario simulations.
• The IRPUD Model Monitor Module displays output indicators selected by the user during a simulation run.
• The IRPUD Model Results Analysis and Presentation Modules analyses and dis-plays indicators from IRPUD Model results and stores them in the PROPOLIS Common Data Format.
Figure 3.16 shows a typical screen shot of the IRPUD Model Network Scenario Gen-eration Module. The IRPUD Model Network Scenario Generation Module facilitates the processes of capture, maintenance and updating of data (regional transport net-works) within ArcInfo. The module also converts spatial and non-spatial data needed for the IRPUD Model from ArcInfo coverages to the format accepted by the model.

The PROPOLIS methodology
90
Attribute menu
Selected link
Figure 3.16 The editing of links in the IRPUD Model Network Scenario Generator
Figure 3.17 shows a typical screen shot of the IRPUD Model Scenario Manager Module interactively composes input data for IRPUD Model scenario simulations. The definition of a scenario to be simulated with the IRPUD Model occurs by select-ing a combination of input files to be used by the model.
Figure 3.17 Dialog of the IRPUD Model Scenario Manager Module
Scenario number
Scenario number
Start and end of simulation

The PROPOLIS methodology
91
During a simulation run of the IRPUD Model the user may monitor the processes simulated in the model by observing trajectories of selected variables for all or a sub-set of zones at various levels of aggregation (e.g. super-zones) of interest. The user can observe how the model proceeds from the base year 1970 to the target year 2030 (Figure 3.18). Each coloured line of the diagram shows the development of population of one super-zone as percent of its base-year population. Figure 3.18 shows how the standard diagram looks at the year 2018.
Figure 3.18 Interactive graphical monitoring of Dortmund model runs
The IRPUD Model Results Analysis and Presentation Module analyses and displays indicators from IRPUD Model results after one or more simulation runs. The user can interactively select the scenario(s) to be examined, the indicator to be displayed, the zones or subregions for which indicators are to be displayed and the type of display. For zonal indicators, the following display options are available: time-series trajecto-ries for selected zones or subregions, choropleth maps, 3D surfaces, difference maps and difference 3D surfaces
Difference maps and difference 3D surfaces show the difference between the selected scenario and the base or reference scenario. There two ways of comparison:
• The 'Zones' option compares results of zones of one scenario with the base sce-nario in difference maps or 3D surfaces (Figure 3.19).
• The 'Scenarios' option compares the results of several scenarios. In this mode, the Presentation module displays a time-series graph in which the lines represent sce-narios.
CC City centre IU Inner urban OU Outer urban DO Dortmund (CC+IU+OU) RM Rest of metropolitan RR Rest of region TR Total region

The PROPOLIS methodology
92
In addition to screen output, the IRPUD Model Results Analysis and Presentation Module stores the indicators calculated in the PROPOLIS Common Data Format and/or produces a metafile in a common graphics format, which can be edited using standard graphics software.
Figure 3.19 Contour plots of scenarios for the Dortmund region
3.3.2 Raster Module
Urban models have always been spatially aggregate with zones of varying size such as boroughs or statistical districts as units of spatial reference. As the internal distribu-tion of activities and land uses within a zone is not known, a homogenous distribution across the area of the zones has to be assumed. Even though the number of zones of some models has increased substantially in recent years, the spatial resolution of zone-based models is much too coarse to represent other environmental phenomena than total resource use, energy consumption or CO2 emissions (see for an overview, Wegener, 1998). Many environmental processes and their social impacts at the urban scale can not be treated by that kind of models, i.e. significant indicators for urban sustainability cannot be calculated.
A combination of raster and vector representation of spatial elements as it is possible in GIS might lead to spatially disaggregate models that are able to overcome the dis-advantages of zonal models (Spiekermann and Wegener, 1998). Creating a GIS data-base and using spatial interpolation techniques, zonal data can be disaggregated from polygons to pixel to allow the calculation of micro-scale indicators meaningful for urban sustainability such as land coverage, biodiversity, air pollution or exposure to air pollution and noise (Wegener and Spiekermann, 1997)
Effect of compact city scenario on population distribution
Effect of compact city scenario on car-km per capita per day

The PROPOLIS methodology
93
In order to calculate such indicators in PROPOLIS the so-called Raster Module has been developed of which the methodology will be briefly introduced in this section (see for details Spiekermann, 2003). The Raster Module maintains the zonal organisa-tion of the land-use transport models and adds a disaggregate raster-based representa-tion of space for some specific environmental and social impact submodels.
As the Raster Module is based on the output of aggregate urban models, several steps have to be undertaken to arrive from the polygon-vector representation of zones and networks to small-scale environmental and social impacts and to a re-aggregation to indicators for assessing sustainability. Figure 3.20 shows the basic module structure.
Figure 3.20 The structure of the Raster Module.
There are two main sources of input for the Raster Module. On the one hand there is a spatial database containing zone boundaries and land use categories as polygons and the network coded as vectors. On the other hand there are the policy-dependent fore-casts by the land-use transport models for the location of households by socio-economic group, employment and floorspace in the zones and and the traffic flows on the links of the network.

The PROPOLIS methodology
94
This information is converted to raster cells. The main assumption concerning the dis-aggregation of activity locations is that population and employment are not equally distributed over the territory of a zone but that there are differentiations in density. The assumption of intra-zonal differentiation is reflected by weights assigned to the raster cells based on typical densities of land use categories (e.g. Bosserhof, 2000). These weights are converted to probabilities by dividing them by the zonal total of weights. This gives a probability distribution of households in a zone. Cumulating the weights over the cells of a zone one gets a range of numbers associated with each cell. Using a random number generator for each household a cell is selected as the house-hold's location. The allocation of households takes account of different weighting schemes for three socio-economic groups. The disaggregation of employment follows the same procedure but with different weights (Spiekermann and Wegener, 1998).
The result of the population and employment disaggregation are artificial micro data that are controlled by zonal totals and of which the intrazonal allocation follows em-pirical observed patterns and additional information, e.g. from land use planning. Figure 3.21shows as an example for the disaggregation a three-dimensional popula-tioin density surface for the Dortmund urban region.
Figure 3.21 Result of disaggregation, population density surface for the Dortmund region.
The raster representation of three socio-economic household groups and the employ-ment has several functions in the subsequent parts of the Raster Module. It is used for the localisation of intrazonal and access trips and the calculation of land coverage. In

The PROPOLIS methodology
95
addition, the raster representation serves as a proxy for barriers in the dispersion mod-els, where households are considered as recipients of pollutants and noise.
Raster disaggregation is also applied to network data. The transport flows forecast by the transport models (number of cars, trucks and buses, speed by link) is related to the information in the GIS database. The GIS database contains the alignment of each link. Because the transport models consider network links as straight lines between nodes, the alignment is required to localise the emission points for subsequent envi-ronmental modelling more precisely. The rasterisation of the networks is straightfor-ward: The raster grid overlaid over the network. Each raster cell traversed by a net-work link receives the information assigned to the link, i.e. number of cars, trucks and buses and speed. The result of the network disaggregation are five raster layers repre-senting urban traffic: three of them contain the number of cars, trucks and buses, the other contain the dominant link type and the average speed for each raster cell. In the environmental models the raster cells are considered as point sources of emission.
Using this information, environmental and social impact submodels are used to assess emissions, air quality for several pollutants and noise levels, population exposure, en-vironmental quality and accessibility in each raster cell:
• The emission submodel relates the information on traffic flows with speed-related emission functions (Hickman et al., 1999, Joumard, 1999). The emission functions used distinguish more disaggregate vehicle types than provided by the transport models. Future technological developments and foreseeable environmental regula-tions are taken into account by changing the vehicle fleet composition over time. The emission submodel calculates also the consumption of mineral oil products by transport (based on Ntziachristos and Samaras, 2000).
• The air pollution and exposure submodel has been set up in such a way that it models the chain from emissions to exposure for the whole study areas by apply-ing a Gaussian air dispersion model to the emissions and by relating the resulting concentration to the living places of population. The raster cells are considered point sources of emission. The air dispersion model is applied sequentially to all emission cells. The concentrations in a receptor raster cell from emission raster cells are summed up and related to population subject to European guideline val-ues for air quality.
• The noise submodel models the sequence from noise generation via noise propa-gation to noise levels for all raster cells of the study areas. It is based on the Ger-man guidelines for noise protection measures along roads, the so-called RLS-90 (BMV, 1990). For the implementation of this model in a raster framework some modifications and simplifications had to be made with respect to road surface, slope, meteorological conditions and intersections (Lee, 1998). The result is a raster layer that contains for each cell the traffic noise level in dB(A) which is then related to the population living in those cells.
• The environmental quality submodel calculates land coverage and two indicators related to open space. Open space is defined as raster cells without transport links and settlements. A fragmentation index is calculated as the average size of con-

The PROPOLIS methodology
96
tiguous open space areas. For assessing the quality of open space, the noise level is taken into account. High-quality open space is considered having a noise le vel of less than 45 dB(A) (see for an example Figure 3.22).
Figure 3.22 Raster Module, quality of open space in the Dortmund region.
• The accessibility to open space submodel assesses the living environment in terms of open space usable by the inhabitants. For this a potential indicator was devel-oped in which the attraction term is open space and the impedance is walking dis-tance (see for an example Figure 3.23).
The output of the Raster Module consists of eleven of the PROPOLIS sustainability indicators:
• Greenhouse gases from transport (tons per 1000 inhabitants per year),
• Acidifying gases from transport (Acid equivalents per 1000 inhabitants per year),
• Volatile organic compounds from transport (tons per 1000 inhabitants per year),
• Consumption of mineral oil products from transport (tons per 1000 inhabitants per year),
• Land coverage (percent of study area),
• Fragmentation of open space (index related to base year),
• Quality of open space (index related to base year),
• Exposure to PM in the living environment (% of population above limit values),

The PROPOLIS methodology
97
• Exposure to NO2 in the living environment (% of population above limit values),
• Exposure to traffic noise (% of population annoyed),
• Accessibility to open space (index related to base year).
Figure 3.23 Raster Module, accessibility of residential areas to open space in the Dortmund region.
In addition, the Raster Module generates graphical presentations in form of maps showing air quality, noise levels, environmental quality and accessibility (see exam-ples in Section 3.4.2). The Raster Module provides also data input for the Economic Indicator Module and the Justice Indicator Module.
3.3.3 Economic Indicator Module
Economic evaluation plays a key role in the assessment of the policies sustainability. To carry out the analysis in the most comprehensive way a coherent set of economic indicators was defined according to the framework of the overall evaluation in PRO-POLIS. The aim was to account for the whole economic impacts generated by the im-plementation of a given policy.
The backbone of the economic assessment of a transport policy is represented by the application of a complete Cost Benefit Analysis, further integrated by other indicators accounting for the distribution of the benefits and the productivity and competitive-ness changes induced by the adoption of the policy. Aiming at including as far as pos-

The PROPOLIS methodology
98
sible all the impact of the policies, consistently with the multi-dimension assessment approach of the PROPOLIS project, a selection of the main issues to be addressed was made taking into account the wide set of problems faced in local decision making process. The four main research areas were identified as a) timing, b) distribution, c) externalities, d) impacts on land use and local economies. The exploration on state-of-the-art approaches to economic evaluation was mainly based on literature review and information on existing practices in different countries.
The crucial question concerned the necessity of defining the further economic benefits that are not captured by the traditional application of the Cost Benefit Analysis. At this scope, two types of benefits are defined: the primary benefits, the benefits directly depending on the transportation investment (i.e. those deriving from the improved ac-cessibility) and the secondary benefits, which include externalities and multiplier ef-fects. Two main questions were raised during the theoretical analysis:
• which are the distortion effects of the current application of CBA, or rather what it is not taken into account (costs and/or benefits)?
• which are the impacts ignored that should be taken into account; that means how should be extended the analysis at spatial-territorial level, and how should be pos-sible to solve the problems of attribution of benefits?
It was then concluded that models for appraising the wider impacts on the economy, both in total at a national level and in terms of the distribution of the impacts between localities, involve many difficult questions. The answers to all of these are not obvi-ous or capable of resolution in the foreseeable future, through research and develop-ment, although some important and potentially useful relationships and linkages have been identified. At the same time it was recognised that the evidence available sug-gests that a fully specified and properly executed cost benefit analysis will often pro-vide a sufficiently good approximation for the magnitude of the total economic im-pacts.
On the basis of the above considerations, the Economic Indicator Module (EIM) was designed. Its main functions are:
• to seize data from the case city models output, from the raster output and from the user control files;
• to produce economic indicators for the PROPOLIS policy assessment framework as well as CBA standard output for a further detailed analysis of the calculations.
In order to harmonise and compare indicators of different case cities, the economic impact is computed per capita. All impacts are converted to economic values and benefits are discounted to the present year. The EIM module is designed with Micro-soft Excel. Its functioning is illustrated in Figure 3.24 where input and output data are clearly identified. The bulk of data is provided by the land-use transport models and by the raster model and there are two user files for case city and policy specific coefficients. All indicators are calculated as difference between the policy and the ref-erence solution, i.e. the base scenario, and this implies that, for each run of the Eco-

The PROPOLIS methodology
99
nomic Indicator Module, two set of input files are required, one related to base case and the other to the policy under assessment.
User
• country specific parameters• policy specific parameters
Raster model
• pollutant exposure
Land use and transport model
• zonal data• cost/times data
Input
Economic IndicatorModule
PROPOLIS framework
• economic indicators• background variables
User
• detailed CBA results
Output
Operations
• computing yearly economicimpacts per capita
• application of conversion factors
• discounting benefits
Figure 3.24 Structure of the Economic Indicator Module (EIM)
Indicators are summed up in Table 3.1 together with the indication of the level of dis-aggregation obtainable according to the methods of calculation. The maximum possi-ble disaggregation of benefits allows one to identify who gains more from the intro-duction of measures tested in the policies, e.g. which mode of transport, which area or which socio-economic group.
The first group of indicators represents the result of a complete Cost Benefit Analysis taking into account both the direct impacts on the transport sector and the externalities (noise, pollutants and accidents). The social surplus, which is usually accounted as a whole, is split into 3 different indicators (ETUB Transport User Benefits, ETOB Transport Operator Benefits and ETGB Government Benefits from Transport). In brief, the three indicators aim at distinguishing how benefits are subdivided among different actors: a positive value would be a benefit while negative values for these indicators represent a cost for the given subject (users, operators or government). As can be seen in the PROPOLIS analytical framework application, the three indicators

The PROPOLIS methodology
100
have different signs. Four indicators (ETAC Transport External Accident Costs, ETEC Transport External Emissions Costs, ETGG Transport External Greenhouse Gases and ETNC Transport External Noise Costs) show in detail the externalities im-pacts distinguishing between the main components. They also could have either posi-tive or negative signs.
Table 3.1 Disaggregation level of economic indicators
Acronym Title Level of disaggregation
ETIC Transport Investment Costs Single figure for the study area ETUB Transport User Benefits Single figure for the study area ETOB Transport Operator Benefits By mode of transport ETGB Government Benefits from Transport By mode of transport ETAC Transport External Accident Costs By mode of transport ETEC Transport External Emissions Costs By zone type ETGG Transport External Greenhouse Gases Single figure for the study area ETNC Transport External Noise Costs By zone type EEEI Economic Evaluation – Economic Index Single figure for the study area
TGC Transport Generalised Costs variation By socio-economic group SOPG Productivity Gain from Land Use Single figure for the study area
All these indicators can be summed up in a synthetic Economic Index (EEEI) that gives the overall economic impact as measured by means of a complete Cost-Benefit Analysis. Since all indicators are calculated as actualised benefits per inhabitant, the Economic Index represents the impact of the policies on every resident, while the sin-gle indicators show how the overall impact can be shared between different actors and different effects.
Two quite different indicators are gathered in the second group: the TGC (Transport Generalised Costs variation) and the SOPG (Productivity Gain from Land Use). The TGC indicator is used to assess the justice of impacts distribution and provides an in-dication of which SE group benefits more, or rather is more affected from the changes in mobility. The SOPG indicator measures the productivity and the change in com-petitiveness of the region. It aims at representing the quantification of two effects combined: the extent of the labour market and the changes expected in generalised costs for work trips. The indicator is a measure of the potentiality for the labour mar-ket, under the assumption that the larger the labour market, the more productive the region. Labour market size is measured on the basis of travel time between home and work place.
The Economic Indicator Module incorporates clear tabular data displays and charts for fast browsing of results. Figure 3.25 shows the economic indicator result screen for a policy.

The PROPOLIS methodology
101
Figure 3.25 The Economic Indicator Module result screen
Besides the calculation of the indicators, a number of background variables are pro-duced by the module: tax revenues from transport, revenues from road pricing, reve-nues from car parking, revenues of public transport operators and change of floor prices (by land use zone). Among these, the change of floor prices is relevant as it as-sesses how benefits are transferred in the land use market. The change of floor prices is indeed a proxy for the analysis of the indirect impacts of transport policies. Whether the benefit will remain internal to the land market or will be transferred to other users, for instance services located in the area, is out of the scope of the evaluation model. The variable is therefore only a first measure of the process of transferring benefits from transport to other markets (industry, offices/commercial, and residential floor-space).
The proper functioning of the Economic Indicator Module, requires the use of a set of policy specific input parameters (investment, maintenance and operating costs, in-vestment timing, etc.) and a set of case city model specific parameters (see Section 4.11):
• value of time, differentiated by trip purpose and related to the average income lev-els;
• external costs of gas emissions divided into local air pollutants (which vary ac-cording to the typology of zone and the country where they are produced) and greenhouse gas CO2 which has global effects on climate change;
• external costs of accidents estimated as distance-related average rates of accidents by mode of transport and by case city model;
• external costs of noise emissions, calculated as the “willingness to pay” for the reduction of noise levels by country.

The PROPOLIS methodology
102
3.3.4 Justice Indicator Module
The Justice Indicator Module in the PROPOLIS environment (PROJIM) is a central-ised module that mathematically calculates the justice indicator values for optional theories of justice presented in Section 1.7.2.
The module has three main parts (see Figure 3.26): Input section, where the data is read from PROPOLIS common data format (CDF) files; Calculation section, where the calculations are made using the optional theories of justice; and the Output sec-tion, where the results are written into the CDF output file.
The data files describe the development of the raw indicator values by socio-economic group and year, for example exposure to traffic noise, which expresses the percentage of population, by socio-economic group, disturbed by noise.
The exposure data is produced by the Raster Module. The transport economic data is from the Economic Indicator Module.
Thus, Raster Module input includes:
Exposure to particulate matter from transport (SHEP, share of population)
Exposure to nitrogen dioxide from transport (SHED, share of population)
Exposure to traffic noise (SHEN, share of population)
Population by three socio-economic groups (inhabitants)
and Economic Indicator Module input data includes:
Transport generalised costs (TGC, €/capita/year)
Data is provided for the years 2001, 2011 and 2021 and all the output variables are calculated for the same years applying the four different theories of justice.
The base scenario for the year 2001 is in the PROPOLIS framework the same for all policies, hence the output figures for this year are all zeros, expect for the Egualitari-anism method. According to the definition Egualitarianism is the only method, which is not dependent on the changes that take place through time. If this theory is used, indicator values can also be produced for the base year.
PROJIM Module supplies data to the USE-IT Module and to the Presentation Module. The following index data for each year and theory of justice is written on the CDF file:
Justice of distribution of economic benefits (SEJE, index)
Justice of exposure to particulates (SEJP, index)
Justice of exposure to nitrogen dioxides (SEJD, index)
Justice of exposure to noise (SEJN, index)
Technically the module is a standard MS Windows application, which can be used either interactively or by using DOS command line (batch mode).

The PROPOLIS methodology
103
Figure 3.26 The structure of the PROJIM Module
3.4 The PROPOLIS Assessment and Presentation Tools
3.4.1 Assessment Module USE-IT
The assessment of sustainability takes place in the USE-IT module. The theoretical basis of the evaluation of policies is described in Sections 1.6 – 1.8. The sustainability indicators’ changes are assessed using value functions and weighted using either common or local weights. The weighting and valuing process results in a single sus-tainability index for each dimension of sustainability. The module also facilitates comparisons between policies, illustrates the results and allows public participation through Internet applications. The tool helps in structuring the decision-making prob-lem and makes the decision-making more transparent. Additionally, the tool can be used for sensitivity testing whereby it helps in conflict resolution, when people or groups with different opinions and values try to solve a decision-making problem.
The tool with the predefined structure is designed to work in Internet environment. Thus, also the general public can approach it for viewing the results or for making as-sessments with user-defined weights. More specific available optional methods, for example using AHP in the weighting process, or alternative definitions of justice should be run with a standard application.
ECONOMIC INDICATOR MODULE· Transport generalised costs
RASTER MODULEIndicator variables· Exposure to traffic noise· Exposure to PM· Exposure to NO2Population by income segments
Input
Output
FOR USE-IT MODULEJustice indicators· Justice of exposure to particulates· Justice of exposure to noise· Justice of exposure to nitrogen dioxides· Justice of distribution of economic benefits
Calculations
Equal shares principle
Eqalitarianism Rawlsian difference principle
Utilitarian approach

The PROPOLIS methodology
104
The USE-IT module is composed of databases, one for each test city, and the applica-tions to process them at three different levels (Figure 3.27).
Equal shares principle
PREDEFINED STRUCTURE OF COMPONENTS· Environmental themes and indicators, weights· Social themes and indicators, weights· Economic theme
Definitions
OutputFOR PRESENTATION MODULEIndicators and weights· Environmental· Social· Economic
Cloning of the structures
Function fitting
Data Uploading and updating
DATABASE ACTIONS
Adm. user
Guest user
VISUAL PRESENTATION OF THE EVALUATION
Figure 3.27 Structure of the USE-IT Module
• Structural changes in databases are made at the server level with a database appli-cation that offers the possibility to predefine the evaluation components, e.g. indi-cators, themes and their relations and common weights. This phase is carried out only once during the project, after the evaluation structure has been defined.
• An administrative user can, via Internet at the test city level, prepare new evalua-tion structures for each policy run, upload the data, fit the value functions (with ei-ther common or local ones) and produce the output file for further use, if needed. Collections of different policies can be compiled.
• Via Internet, a guest user can view the data and results from all the cities. Multiple windows can be used for city comparisons.
A typical USE-IT result screen for the economic component of sustainability is dis-played in Figure 3.28.

The PROPOLIS methodology
105
Figure 3.28 The USE-IT Decision Support Module, result screen.
The Three-Tier Application Model has been used to support program development and achieve a more scalable solution. The Client, in his computer, runs a browser pro-gram and part of the ASP-code. This means that the browser program and the com-puter interprets and completes the HTML code and the JavaScript client side code. The code is not using cookies and is not automatically downloading any other mod-ules, other than the ASP-code for the browser. The COM module consists of a ‘pub-lic’ part, which is visible for the WEB server via User Control, and a privately acces-sible one. These User Controls have the following tasks:
• ADO data connections
• Connections to the decision process logic
• Charting services for results
The Server (Web Server) interprets the server side code, which in this application is written in VBScript. The on-demand server uses the COM module, which manages the database connections and the common rules of the decision-making process.
The database type is Access2000. The object module has been developed with Micro-soft Visual Basic 6 and User Controls have been introduced with ADO (ActiveX Data Objects) in MDAC (Microsoft Data Access Components). Microsoft NT 4 (service pack 6) with PWS (Personal Web Server) or IIS 4.0 (Internet Information Server) acts as the development platform and Internet server.

The PROPOLIS methodology
106
3.4.2 Analysis and Presentation Tools
Any planning tool or assessment system needs to consider the question of how to communicate its methods and its results. There are two distinct audiences: the profes-sional community and the public. For interested professionals, the methodology used must be open to scrutiny and comment. The results of the study must also be available to interested parties so that confidence in the methods can be established. For the pub-lic, there is a need to make the terminology and the processes of planning accessible. If people feel that they have been involved in the planning process and that their input is valuable then there will not be an ‘us and them’ situation where an unknown institu-tion is seen to impose a strategy upon the public.
The tools used to address the two audiences will typically be different. The profes-sional can be left to browse results or reports whereas the public needs to be guided. The exception to this general rule would be if a modelling system were sufficiently interactive and intuitive that a user with no specialist knowledge could operate it. Such a system would need to produce results in a matter of seconds and so would probably comprise a very simple simulation with only a few main variables. Users could alter the parameters using slider bars and quickly gain an understanding of the interactions of the main variables and gain some insight into the compromises that need to be made in working towards an effective and sustainable development strat-egy.
PROPOLIS has developed a set of tools for analysing and presenting the outputs of the analytical framework. The efforts have been focused on tools designed for meet-ing the primary project objectives. Thus, the tools fall into the first category described above. Nevertheless, much attention and effort has gone into producing high quality graphical output. Whatever the status and level of knowledge of the user, well-presented graphical representation is essential if the complicated interactions within urban systems are to be appreciated and understood.
The PROPOLIS tools for analysis and presentation cover the whole range of the mod-elling and assessment process. Examples for the presentation facilities of the tools were given in the previous sections .
Eventually, the Analysis and Presentation Tool (APT) provides a means of perform-ing graphical comparisons between indicators and background variables from differ-ent cities. Like USE-IT, the APT is also an Internet application where data files in the PROPOLIS Common Data Format (CDF) can be uploaded by any of the project part-ners. The APT displays comparisons of an indicator or background variable on a the-matic map (for pairs of runs) or as pie or bar charts for series of three or more values (Figure 3.29).

The PROPOLIS methodology
107
Figure 3.29 Analysis and Presentation Tool, comparison of floorspace usage changes over time in Naples and Vicenza

The PROPOLIS methodology
108
References
AFFORD Deliverable 2A, Economic and equity effects of marginal cost pricing in transport, 2000
Aschauer, DA, “Is Public Expenditure Productive?”, Journal of Monetary Economics,23, 1989.
Banister D. and Berechman J., “Transport Investment and Economic Development”, UCL Press, Lon-
don 2000
BMV - Bundesminister für Verkehr (1990): Richtlinien für den Lärmschutz an Straßen – RLS-90.
Bonn: BMV.
Bosserhoff, D. (2000): Integration von Verkehrsplanung und räumlicher Planung. Heft 42 der
Schriftenreihe der Hessischen Straßen- und Verkehrsverwaltung. Wiesbaden: Hessisches Landesamt für
Straßen- und Verkehrswesen.
CENSIS (Centro Studi Investimenti Sociali), “La sicurezza possibile. Rischi stradali e tecnologie dei
veicoli. Sintesi della ricerca”. Roma , July 1997.
CSERGE, The True Costs of Road Transport, 1996
David Simmons Consultancy (in collaboration with Marcial Echenique and Partners Ltd), Review of
Land Use/Transport Interaction Models, Report to Sactra, 1998.
De la Barra, T (1989) Integrated Land Use and Transport Modelling. Decision Chains and Hierarchies,
Cambridge University Press, Cambridge
DETR, “Review of Land-use/Transport Interaction Models”, London 1999.
DETR, “The Welfare implications of transport improvements in the presence of market failure”, Lon-
don 1999.
DETR, “Transport and the Economy”, London 2000
Domencich, T and McFadden, D (1975) Urban Travel Demand: a Behavioural Analysis, North-
Holland, Amsterdam
ECMT , Efficient Transport for Europe, 1998
ECMT, Efficient Transport for Europe: Policies for Internalisation of External Costs, Paris, 1998.
European Commission, CORINAIR, Working Group on Emission Factors, 1991
European Commission, “External Costs of Transport in ExternE”, “ExternE National implementation –
Italy, 1997
FEEM, ExternE National Implementation, Italy, 1997
Hickman, J., Hassel, D., Joumard, R., Samaras, Z., Sorenson, S. (1999): Methodology for Calculating
Transport Emissions and Energy Consumptions. MEET Deliverable 22. Crowthorne: TRL.
INFRAS-IWW, External Effects of Transport, 1994 and 2000
Joumard, R. (1999): Methods of Estimation of Atmospheric Emissions from Transport: European Scien-
tist Network and Scientific State-of-the-art. Action COST 319 Final Report. Bron: INRETS.
Khisty, C.J. (1996) “Operationalising Concepts of Equity for Public Project Investment” Proceedings
of the 75th Meeting of the Transportation Research Board, January 7-11, 1996, Washington D.C.
Lombard - Molocchi, I costi ambientali e sociali della mobilità in Italia, Franco Angeli 1998.
Lombard - Molocchi, Produzione, esercizio e smaltimento dei mezzi di trasporto: i costi ambientali e
sociali, Franco Angeli 2000.
The PROPOLIS methodology
109
Martinez, F and Araya, C. 1998, Land-use Impacts of Transport Projects: User Benefits, Rents and Ex-
ternalities, World Conference on Transport Research, Antwerp.
Miller, D. (1976) Social Justice. Clarendon Press, Oxford. Quoted by Khisty.
Modelistica (1995) 'TRANUS integrated land use and transport modelling system: technical descrip-
tion, version 5', at www.modelistica.com
Ntziachristos, L., Samaras, Z. (2000): COPERT III. Computer Programme to Calculate Emissions from
Road Transport. Methodology and Emission Factors (Version 2.1). Technical report No 49. Copenha-
gen: European Environment Agency.
Pearce D., Markandya A., Barbier E.B., Blueprint for a green economy, Earthscan Publications, Lon-
don 1989.
PETS, D7 Internalisation of externalities, 1998
Portney P.R., Weyant J.P., Discounting and Intergenerational Equity, Introduction, 1999.
Spiekermann K, Wegener M (2000): Freedom from the tyranny of zones: towards new GIS-based mod-
els. In: Fotheringham AS, Wegener M (Hg.): Spatial Models and GIS: New Potential and New Models.
GISDATA 7. Taylor & Francis, London: 45-61.
Spiekermann, K. (1999): Sustainable Transport, Air Quality and Noise Intrusion – An Urban Modelling
Exercise. Paper presented at the ESF/NSF Transatlantic Research Conference on Social Change and
Sustainable Transport, 10-13 March 1999. University of California at Berkeley.
Spiekermann, K. (2003): The PROPOLIS Raster Module. PROPOLIS Deliverable 4. Dortmund: S&W.
TA Luft (1986): Technische Anleitung zur Reinhaltung der Luft – TA Luft. Erste Allgemeine
Verwaltungsvorschrift zum Bundes-Immissionsschutzgesetz. Gemeinsames Ministerialblatt,
27.02.1986, 95-202.
Tinch (1995), “The valuation of environmental externalities”, HMSO, London
Venables, A. and Gasiorek, M. The Welfare Implications of Transport Improvements in the Presence of
Market Failure, report to SACTRA, 1998.
WCTR Society, “Transport Policy” Special Issue: International Comparison of Evaluation Processs of
Transport Projects, Vol.7 N° 1, January 2000.
Wegener, M., 1983, Description of the Dortmund Region Model. Working Paper 8. Dortmund Institut
für Raumplanung.
Wegener, M., 1985, The Dortmund housing market model: a Monte Carlo simulation of a regional
housing market. In: Stahl, K. (ed.): Microeconomic Models of Housing Markets. Lecture Notes in Eco-
nomics and Mathematical Systems 239. Berlin/Heidelberg/New York: Springer Verlag, 144-191.
Wegener, M., 1996, Reduction of CO2 emissions of transport by reorganisation of urban activities. In:
Hayashi, Y., Roy, J. (eds.): Land Use, Transport and the Environment. Dordrecht: Kluwer Academic
Publishers, 103-124.
Wegener, M., 1998, The IRPUD Model: Overview. http://irpud.raumplaung.uni-
dortmund.de/irpud/pro/mod/mod_e.htm
Wegener, M., 1999, Die Stadt der kurzen Wege - müssen wir unsere Städte umbauen? Berichte aus dem
Institut für Raumplanung 43. Dortmund: Institut für Raumplanung.
Wilson, A G (1970) Entropy in Urban and Regional Modelling, Pion, London
ZEW-ISI, External Quality Valuation – QUITS , 1997

The PROPOLIS methodology
110
111
4. Implementation of the PROPOLIS sys-tem in case cities
Summary
The land use and transport models in the seven case cities, where the PRO-POLIS analytical framework was tested are introduced in this chapter. The land use and transport models are the driving engines of the PROPOLIS system and, for the application of such a system, these models had to be properly up-dated, their databases needed to be extended to allow calculation of the indi-cators, and the relevant variables, both for the base and forecast years, had to be coherently harmonised.
Following a presentation of the main statistics and figures of the seven differ-ent cities (Helsinki, Dortmund, Inverness, Naples, Vicenza, Bilbao and Brus-sels), the text focuses on the characteristics of the modelled cities and on the land use and transport models applied. Model preparation activities are also il-lustrated. They covered a wide range of tasks: up-dating of the base year to 2001, extension of the horizon year model run to the long-term threshold (year 2021), increase in the spatial detailing of the zoning system, etc.
The last part of the text is devoted to the definition of the common aggregated zoning system and the harmonisation of the relevant variables, necessary for the cross-city comparisons in the policy results analysis. Six aggregated zone types were defined and the level of aggregation of the relevant model variables - socio-economic groups, employment sectors, land and floorspace, trip types, transport modes and link types - was governed by the most aggregate case city model.
Finally, a section is dedicated to the case city specific parameters adopted in the economic evaluation of the policies: values of time, unitary costs of exter-nalities, etc.

Implementation of the PROPOLIS system in case cities
112
4. Implementation of the PROPOLIS system in case cities
4.1 Introduction
PROPOLIS aims at analysing and systematically comparing the impacts of different kinds of policies in seven European cities (figure 4.1) evolving in very different socio-economic and environmental conditions: Helsinki (Finland), Dortmund (Germany), Inverness (Great Britain), Naples and Vicenza (Italy), Bilbao (Spain) and Brussels (Belgium). The settlement structure of the city regions is illustrated in the same scale in figure 4.2. Basic socio-economic statistical data of the seven cities are reported in table 4.1, whereas in table 4.2 the main model statistics are illustrated. It is worth to underline that:
• The population of the studied metropolitan areas range from 100.000 to over 3.000.000 inhabitants, some undergoing strong growth while others are old declin-ing cities, some in the process of being restructured;
• The economic profile is diversified: important polyvalent regional capitals, indus-trial cities, administrative centres, university and tourist cities;
• There are sharp contrasts in the population activity rate because some have a high unemployment rate, with a quite different gross regional product per capita (in these conditions it is not surprising to observe a wide spread in car ownership rates);
• The spatial structure ranges from highly compact and centralised to dispersed or multipolar patterns;
• The different conditions of transport supply is reflected in a variety of transport modal splits, still always dominated by the car;
• The resulting quality of the environment varies considerably.
Figure 4.1 The PROPOLIS case cities

Implementation of the PROPOLIS system in case cities
113
Figure 4.2 Settlement structure of the case city regions.

Implementation of the PROPOLIS system in case cities
114
Table 4.1 Key statistics of the PROPOLIS case cities
Helsinki Dortmund Inverness Naples Vicenza Bilbao Brussels
Total surface area (km2) 743 2 014 4 152 1 171 2 722 2 217 4 332 Surface area per land use zone (km2)
14 8 27 30 101 19 29
Total population 946 000 2 515 901 131 679 3 009 678 788 374 1 140 026 2 944 716 Main city population 546 000 585 153 42 137 1 004 500 107 223 358 875 964 405 Population density (inh./km2)
1 273 1 249 32 2 570 290 514 680
Population per land use zone (inh.)
17 849 10 186 861 79 471 29 161 9 580 19 373
Average amount of m2 of floorspace per person
31.6 36.1 49.1 24.5* 38.5* 34.0 n.a.
Average household size, persons
2.1 2.1 2.76 3.17 2.64 3.15 2.34
Portion of population under 15 years of age, %
17 19* 19 20 15 13 18
Portion of population over 65 years of age, %
11 18 13 12 16 16 17
Unemployment rate, % 6 12.6 8.1 26.4* 2.2* 25 7.2 Average income per person/month, EUR
1 100 1570 n.a. 804 1 211 750 1 169
Car ownership per 1000 inhabitants
345 492 332 538 597 418 515
Traffic deaths/year/1000 inhabitants
0.021 0.037 0.190 0.028 0.147 0.063 0.092
Note: Helsinki: Population data refer to 2000, housing to 1997, income to 1998 and car ownership and traffic deaths to 1999. The Figures in the table are for Helsinki Metropolitan Area, for the whole model area the total surface area is 13 827 km2 and the total population is 1 657 000 inhabitants,
Dortmund: Portion of population under 15 years of age not available, here is reported population under 18 yeas old.
Inverness: Figures derived from 1991 census corrected with 1996 survey data. Floorspace data derived from Ordnance Survey Landline data and Highland Council survey data. Traffic deaths supplied by Northern Constabulary;
Naples and Vicenza: data refer to the respective provinces in the year 2001 (Census data), except data about floorspace (1991) and income, car ownership and traffic deaths (2000);
Bilbao: all data refer to Bizkaia region except population density (Bilbao municipality);
Brussels: data refer to 2001; the unemployment rate in the study area has been estimated by Stratec, ac-cording to the definition of the International Labour Organisation; the average income in the study area has been estimated by Stratec, based on the national survey on households’ budget ; car ownership and traffic deaths refer to the Province Brabant (which is close to the study area).

Implementation of the PROPOLIS system in case cities
115
Table 4.2 Case city models background variables at base year
Unit Helsinki Dortmund Inverness Naples Vicenza Bilbao Brussels
Transport statistics Yearly pro capita public transport travelled distance
Km 5232 957 1533 911 816 1561 2933
Yearly pro capita private motorised travelled distance
Km 3128 4932 14092 7587 8476 6297 6415
Total yearly pro capita travelled distance
Km 8360 8360 15889 8498 9292 7858 9348
Yearly pro capita public transport travel time
Hours 262 66 45.0 79.4 20 132 49.4
Yearly pro capita private motorised travel time
Hours 84 159 192.7 168.0 207 272 153.9
Av. public transport travel distance
Km/trip 12.0 13.3 27.1 7.8 26.0 9.8 44
Av. private motorised travel distance
Km/trip 9.7 12.9 27.0 11.0 22.9 20 29
Av. public transport travel time
Min/trip 35.3 55.0 43.8 41.9 63.4 49.5 45
Av. private motorised travel time
Min/trip 15.6 25.0 28.3 26.4 35.7 51.8 41
Av. public transport travel speed
Km/h 19.9 14.5 41.7 8.8 24.6 11.8 59
Av. private motorised travel speed
Km/h 37,3 31.0 44.1 24.5 38.4 23.2 42
Modal share in peak
Private motorised % 31.0 77.4 88.7 60.8 82,1 38.9 67 Bus % 44.1 14.5 7.4 17.9 8,7 9.3 Rail & metro % 13.6 10.6 33 Slow modes % 24.8 8.1 1.7 7.8 9,2 41.2
Environmental statistics
Pro capita greenhouse gases Eq. tons / 1000 inh. / year
1406 2782 4851 1125 1572 758 1788
Pro capita acidifying gases Eq. tons / 1000 inh. / year
0.18 0.19 0.30 0.10 0.15 0.07 0.13
Pro capita volatile organic compounds
Tons / 1000 inh. / year
8.00 8.30 15.70 7.47 9.91 7.20 6.58
Pro capita consumption of mineral oil products
Tons / 1000 inh. / year
0.48 0.94 1.40 0.37 0.52 0.23 0.59
Economic statistics
Pro capita tax revenues from transport
Euro/inhabitant/a 430 0.90 3.20 332 376 1.13
Pro capita revenues from road pricing
Euro/inhabitant/a 0 0 0 0 0 0 0
Pro capita revenues from car parking
Euro/inhabitant/a 52 0.43 n.a. 130 1 1.04 10.7
Pro capita revenues of pub-lic transport operators
Euro/inhabitant/a 528 0.70 -3.05 219 35 0.77 121

Implementation of the PROPOLIS system in case cities
116
4.2 The integrated transport and land use models and the reference scenarios
The land use and transport models of the case cities are the driving engines of the PROPOLIS system. These models have previously been calibrated to correspond with the perceived behaviour in the test cities and are used to test the sustainable policies. It is important to note that the case city models belong to three different leading inte-grated urban land use and transport model types1: Helsinki (MEPLAN model), Dort-mund (IRPUD model), Inverness (TRANUS model), Naples (MEPLAN model), Vicenza (MEPLAN model), Bilbao (MEPLAN model) and Brussels (TRANUS model).
Starting from the base year 2001, the majority of the models are run in five-year time thresholds up to 20212. For each intermediate year - 2006, 2011 and 2016 - and for the horizon year, the models produce the travel demand resulting from the socio-economic forecasts and the accessibility provided by the transport network and ser-vices.
The comparison of the policy results both in terms of travel demand and of land use impacts will be carried out at the horizon year 2021 or at the intermediate year 2011. A reference scenario is run for each case city and it constitutes the basis for the quan-tification of the impacts of the different policies. Such a reference scenario includes only those projects under construction as well as those already approved and financed.
4.3 General description of Helsinki case city
4.3.1 The Helsinki model Region
The Helsinki model area is actually a large region that includes both urban and rural areas. At the heart of the region lies Helsinki, the capital of Finland, surrounded by three smaller cities. Together they form the Helsinki Metropolitan Area. Additionally, included in the model area is a relatively large surrounding region with smaller cities and towns lying within the Metropolitan Area’s commutershed. The total land area is 13 827 km2 of which the metropolitan region is 743 km2.
Helsinki region accounts for about one third of Finland’s GDP. In addition to its ad-ministrative status as the capital city and home for industry headquarters, the economy of the region is based on retail, wholesale and private services. The region, therefore, has a trade surplus with the rest of the country. While the traditional manufacturing industries have been declining, the share of high-technology industries and services has been growing. The large and concentrated traditional industries such as metal and
1 Accurate descriptions of the different modelling approaches are provided in chapter 3. 2 In the case of Brussels, the model does not provide the situation at horizon 2021 starting
from the base year 2001 situation. Instead, the 2021 reference scenario was built exogene-ously. This is further detailed in section 4.9.3.

Implementation of the PROPOLIS system in case cities
117
paper are not typically located in the region. Consequently, foreign exports are not so dominant as for the rest of the country. Consistent with its high population density, the level of imports is high.
A sign of the structural change in the 1990s is the stratification of population and re-gions. The spread in income levels has increased along with the demand for the less educated labour force diminishing. The Helsinki Metropolitan area and its surround-ings form a region that has been the most successful one in the country, but also within the region itself certain areas are prosperous while others are impoverished.
The Metropolitan Area faces a rapid population growth from the present 920000 to 1.1 million inhabitants by the year 2020. This increases the pressures of urban sprawl as well as the use of natural and other green areas. It is expected that Helsinki can only accommodate less than one-fourth of the forecast growth, the rest being directed to the other cities of the Metropolitan Area.
It is predicted that mobility will increase faster than the population. One reason for this is the decentralising land use, but also the number of trips is expected to grow. The share of public transport has been dropping significantly during the past few dec-ades, but this decline is now anticipated to have reached its low. If policies favouring public transport will be pursued, it is forecast that the share of collective transport will start slightly rising again. Traffic speed in the Metropolitan Area will continue its gradual downward trend unless the increase in the use of the private car can be curbed. The growing traffic will increase the noise nuisance experienced by the in-habitants. It has been estimated that the population living in areas where the daily av-erage noise level exceeds 55 dB(A) will increase by about 15% to more than 200 000 people by 2020.
Currently, the concentrations of nitrogen dioxide and particulate matter exceed the guidelines annually. The levels of nitrogen dioxide are expected to fall because of the technical development of the vehicle fleet, but high particulate concentrations are still expected in the busiest traffic environments. The air quality in general is improved due to the sea environs. Acidic fallout exceeds the critical load because of trans-boundary emissions.
4.3.2 The Helsinki land use and transport model design
The land use/transport model for the Helsinki Region has been developed in several phases. Development of the MEPLAN line of models for the Helsinki Region started in the early 90s when the interaction between land-use and transport policies became a topical issue. The current updated model is designed for carrying out practical tests of the transport and land-use policy proposals in the area. The model implementation is divided into three steps, modelling for the base year (2001) and forecasting for the time horizons (2011 and 2021). The model structure follows combines a traditional four-step transport modelling approach for simulating evening peak travel conditions with a land-use location model. The first stage has the objective to calibrate the model parameters in such a way as to reproduce the situation at the base year, whereas the

Implementation of the PROPOLIS system in case cities
118
following stages aim at forecasting the interaction of transport demand and supply at the Master Plan horizon year of 2020.
The model area includes the cities of Helsinki, Espoo, Vantaa and Kauniainen, which form the Helsinki metropolitan area. In addition to the metropolitan area, also the sur-rounding region is included in the model (the provinces of Uusimaa and Itä-Uusimaa as well as major parts of the provinces of Kanta-Häme, Päijät-Häme and Pirkanmaa).
The econometric models utilised are of the stochastic discrete choice type with a nested logit formulation. The hierarchical structure is adopted extensively in the transport model from trip distribution to modal split and generation of trip matrices. This gives a strong theoretical foundation of utility maximising and also leads to a consistent evaluation based on consumer surplus calculation considerations inherent in economic welfare theory.
Model factors are divided in three broad categories: employment factors (agriculture, industry, construction, wholesale, retail sale, private and public services), household categories (according to the social economic characteristics of the household head) and land use regulation (housing floorspace, agricultural, industrial, commercial and services). Households in each income group are further divided into two types: active (i.e. working) and inactive (non-working). For inactive households, accessibility to work is not a factor affecting their location selection process.
The description of the transport system is based on the Helsinki Metropolitan Area Council data. The road network includes the major arteries and the minor streets. The road network outside the Metropolitan area is a more coarse description of the con-nections between municipalities based on Finnish Road Administration data. The flow-delay functions have been calibrated to match the observed speed during periods of congestion. For public transport a 595-zone network of all bus and rail services within the Metropolitan area is used. The description of services includes the lines, stops, speeds/times, headways and the type of service (rail/metro/tram/bus). For the region outside the Metropolitan area a coarser model is used based on the services be-tween the municipalities and the Helsinki Metropolitan Area. The route assignment takes into account the in-vehicle, waiting, access and interchange times that are weighted according to the perceived time/inconvenience by the traveller. The dis-utility of travelling is also dependent on the type of service. The model has been cali-brated to roughly match the observed ridership on the lines.
The assigned travel times and costs between origin and destination zones are used in the travel demand model that estimates the modal split of the trips generated by the land-use model according to the theory described above.
4.3.3 The Helsinki model reference solution
The Helsinki Metropolitan Area Council has prepared a long-term transport plan for the year 2020. This plan and the projects included in the plan, their phasing and cost estimates are illustrated in the figure below. This plan forms the basis for local poli-

Implementation of the PROPOLIS system in case cities
119
cies, which are variations of the basic plan. The exact specification of the reference case in PROPOLIS is presented in table 4.3.
Figure 4.3 The Helsinki model external zoning system
Figure 4.4 The Helsinki model zoning system

Implementation of the PROPOLIS system in case cities
120
Figure 4.5 Map of the projects included in the Helsinki reference solution includ-ing cost estimates
Figure 4.6 shows the settlement structure of the Helsinki urban region for the refer-ence solution in terms of population density as forecast by the land- use transport model and further processed by the Raster Module
Figure 4.6 Helsinki reference scenario, population densities.
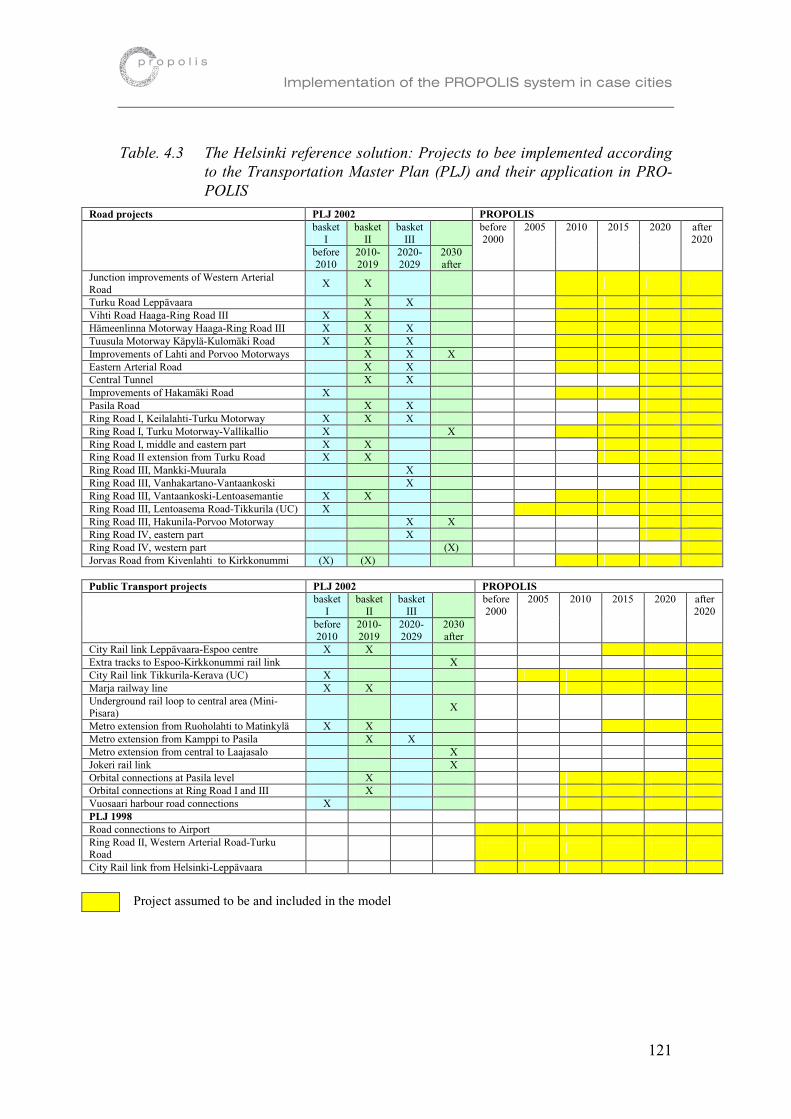
Implementation of the PROPOLIS system in case cities
121
Table. 4.3 The Helsinki reference solution: Projects to bee implemented according to the Transportation Master Plan (PLJ) and their application in PRO-POLIS
Road projects PLJ 2002 PROPOLIS basket
I basket
II basket
III
before 2010
2010-2019
2020-2029
2030 after
before 2000
2005 2010 2015 2020 after 2020
Junction improvements of Western Arterial Road
X X
Turku Road Leppävaara X X Vihti Road Haaga-Ring Road III X X Hämeenlinna Motorway Haaga-Ring Road III X X X Tuusula Motorway Käpylä-Kulomäki Road X X X Improvements of Lahti and Porvoo Motorways X X X Eastern Arterial Road X X Central Tunnel X X Improvements of Hakamäki Road X Pasila Road X X Ring Road I, Keilalahti-Turku Motorway X X X Ring Road I, Turku Motorway-Vallikallio X X Ring Road I, middle and eastern part X X Ring Road II extension from Turku Road X X Ring Road III, Mankki-Muurala X Ring Road III, Vanhakartano-Vantaankoski X Ring Road III, Vantaankoski-Lentoasemantie X X Ring Road III, Lentoasema Road-Tikkurila (UC) X Ring Road III, Hakunila-Porvoo Motorway X X Ring Road IV, eastern part X Ring Road IV, western part (X) Jorvas Road from Kivenlahti to Kirkkonummi (X) (X)
Public Transport projects PLJ 2002 PROPOLIS
basket I
basket II
basket III
before 2010
2010-2019
2020-2029
2030 after
before 2000
2005 2010 2015 2020 after 2020
City Rail link Leppävaara-Espoo centre X X Extra tracks to Espoo-Kirkkonummi rail link X City Rail link Tikkurila-Kerava (UC) X Marja railway line X X Underground rail loop to central area (Mini-Pisara)
X
Metro extension from Ruoholahti to Matinkylä X X Metro extension from Kamppi to Pasila X X Metro extension from central to Laajasalo X Jokeri rail link X Orbital connections at Pasila level X Orbital connections at Ring Road I and III X Vuosaari harbour road connections X PLJ 1998 Road connections to Airport Ring Road II, Western Arterial Road-Turku Road
City Rail link from Helsinki-Leppävaara
Project assumed to be and included in the model

Implementation of the PROPOLIS system in case cities
122
4.4 General description of the Dortmund case city
4.4.1 The Dortmund model Region
Dortmund is the most eastern of the cities in the Ruhr area, the largest industrial con-urbation in Germany. It developed rapidly from a small rural town in the early 19th century to a major industrial centre. Coal mining, steel making and breweries were the major industries of the city. Of these coal mining disappeared when in 1987 the last pit within the city closed down. Steel making in Dortmund has always been a syno-nym for the Hoesch Corporation. In 1966, Hoesch employed nearly 40,000 workers in its three steel works in the city. The take-over of Hoesch by the Krupp Corporation, which was then taken over by Thyssen during the last decade, marked the end of Dortmund's role as a leading steel city. Steel production was concentrated along the river Rhine location and all Dortmund steel works were closed down. Only few work places for post-processing of steel are left in Dortmund.
So it is not surprising that most economic trends for Dortmund are negative. From its maximum of 300,000 in the 1960s, total employment in the city dropped to 233,000 in 1985 and has only recently recovered to 260,000. In that period, the city lost 90,000 jobs in non-service industries, but gained only 50,000 new service jobs. Between 1980 and 1985 even service employment declined and unemployment in the city rose to 18 percent. Only the last years have brought a moderate growth in service employment, with manufacturing employment continuing to decline. With 77 percent of service employment Dortmund can hardly be called an industrial city any longer.
The population development of Dortmund reflects its economic difficulties. From its maximum population of 660,000 in the 1960s, it declined to 570,000 in 1985 and has after a short recovery to 605,000 in 1990 because of massive immigration before and after the German unification continued to decline to 585,000 today. Part of the decline has been due to employment-related long-distance out-migration, the remaining half to natural decline and suburbanisation.
The city still carries heavy burdens left over from its industrial past and at the same time has to face the same problems as any other city of its size: Having an unem-ployment rate of about 15 % Dortmund is still among the Ruhr cities with highest un-employment. Long-term unemployment tends to turn into poverty, so that a growing number of households in Dortmund subsist on welfare. Urban poverty and unem-ployment are concentrated in old worker housing areas in the northern part of Dort-mund. Housing scarcity and rising rents and land prices in the attractive southern parts of the city increase the spatial segregation between the poor northern and the affluent southern areas. In its effort to fight excessive land consumption and curb urban sprawl, the city has failed to provide sufficient land for residential and industrial de-velopment during the last two decades. This had the effect that households who insist on detached houses and firms who prefer greenfield sites move out to the suburbs.
Transport has developed into one of the major problem areas. There are about 420 cars per 1,000 population in Dortmund, and their number is still growing by 2 percent per year. The city's efforts to constrain the car (essentially speed limits and

Implementation of the PROPOLIS system in case cities
123
neighbourhood car restraint) show only little effect, while the large deficits of public transport make significant improvements of service difficult. Nevertheless, the rela-tively efficient public transport system and investments in underground and light rail lines have led to a clear growth in the number of public transport passengers since 1990. However, at the same time road congestion is rising beyond all expectations.
The inner city of Dortmund is facing a slow but visible erosion process. Retail turn-over is stagnating while greenfield shopping centres and retail in surrounding smaller towns are flourishing. High floorspace rents and lack of inner-city parking and a gen-eral lack of ambience of Dortmund's inner city are named as the primary reasons.
Perhaps the greatest problem for the city is its persistent negative image. Despite ex-tensive public relations campaigns, Dortmund continues to score poorly in opinion polls such as "Which is the most liveable city?", "Which is the city with the best envi-ronment?" or Which is the children-friendliest city in Germany?". When in a survey in southern Germany people were asked "Would you like to move to Dortmund?" nine out of ten said no.
Figure 4. 7 The Dormund model zoning system

Implementation of the PROPOLIS system in case cities
124
4.4.2 The Dortmund land use and transport model design
The Dortmund model is a model of intraregional location and mobility decisions in a metropolitan area. It receives its spatial dimension by the subdivision of the study area into zones. The previous implementation had 30 zones. For the PROPOLIS project, the study area has been slightly extended and the number of zones has been substan-tially increased to 246. Zones are connected with each other by transport networks containing the most important links of public transport and road networks coded as an integrated, multimodal network including walking and cycling and past and future network changes. The model receives its temporal dimension by the subdivision of time into fifteen time periods of three years duration.
The study area is the metropolitan area of Dortmund, i.e. the commuter catchment area of Dortmund containing Dortmund itself and 25 neighbouring communities with approximately 2.6 million inhabitants. The city of Dortmund is sub-divided into 62 zones, one forming the city centre, nine the inner urban and 52 the outer urban super-zone. A nearly complete ring of sixteen suburban communities form the rest of the metropolitan area, sub-divided into 84 zones. The rest of the region are nine munici-palities organised in 100 zones, most of them belonging to the high-density core re-gion of the Ruhr area. The region is relatively compact; most of its settlements lie within the 30-minute travel-time isochrone by car from central Dortmund. Model de-tails are presented in section 3.2.3.
4.4.3 The Dortmund model reference solution
The Dortmund reference solution implemented tries to represent a realistic future de-velopment of the transport infrastructure in the region. Therefore, it contains only those measures that have a very high chance of realisation. On the one hand, these are local project which are already under construction, for which the formal planning pro-cedures have been started or which have high priorities. On the other hand, these are projects that have high priorities in the transport infrastructure development plans for road and public transport of the state of North-Rhine Westphalia (MWMTV, 1998).
The new infrastructure development in the reference scenario is rather modest, in par-ticular for road infrastructure, because the region has already a well-developed road network:
• Road network development is restricted to some bypass roads, to new links con-necting new industrial estates and to increasing motorway capacity from four to six lane motorways.
• Public transport network development contains the conversion of tram lines to un-derground and light rail lines, the extension of existing underground and light rail lines, the construction of a small section of local rail and the reactivation of a rail line formerly out of use.
Figure 4.8 shows the settlement structure of the Dortmund urban region for the refer-ence solution in terms of population density as forecast by the land- use transport model and further processed by the Raster Module

Implementation of the PROPOLIS system in case cities
125
Figure 4.8 Dortmund reference scenario, population densities.
4.5 General description of the Inverness case city
4.5.1 The Inverness model Region: Inverness and the Inner Moray Firth
Inverness is the capital of the Highland region of Scotland, and its largest community. It grew originally as a port and market centre, and owes its prominence to its strategic position in the geography and transport system of the Highlands, where the Great Glen and the Moray Firth converge. Today it is well served by road, rail and air (with its own airport) as well as by sea, and acts as the gateway to the Highlands for interna-tional tourism. Strategic road improvements carried out over recent decades, in par-ticular the A9 bridge across the Moray Firth connecting Inverness to the north, have made the city the most accessible service place for the Highlands as a whole. The sur-rounding region comprises farmland, moorland and mountain landscape of great sce-nic beauty. Several small towns - Dingwall, Invergordon, Tain and Dornoch - are strung out along the coast to the north of Inverness, while others - Nairn, Forres and Elgin - follow the coast to the east. The deep-water harbour of the Cromarty Firth provides facilities for the maintenance and construction of North Sea oilrigs, at Inver-gordon and Nigg Bay. The region modelled in TRANUS - as described below - is centred on Inverness itself, but also takes in all these smaller towns, and covers a very large area of rural land.
The region as a whole has its problems, arising from the rugged terrain, the extreme dispersal of the population, an inadequate communications infrastructure and the sea-sonal nature of the tourism business. There is a constant threat of losing jobs and retail

Implementation of the PROPOLIS system in case cities
126
services to the larger Scottish cities to the south - Aberdeen, Glasgow and Edinburgh. In the 1980s a substantial proportion of local retail trade was lost, both to these com-peting centres and to the mail order trade. Despite this, the region has gained popula-tion (by 20% between 1971 and 1991), and there has been continued growth in tourist spending. Because of its relative accessibility, Inverness attracts shoppers and visitors from the entire region, some of whom make shopping trips by car over long distances on a weekly or monthly basis. The population of the region modelled in TRANUS is expected to grow from around 140,000 in 2001 to160,000 by 2021.
The challenge for the planners of the Highland Council is to channel this growth so as to sustain the vitality both of Inverness itself and its remote satellite communities. Growth must be accommodated without prejudicing the beauty of Inverness and the region, which is its principal asset in attracting tourists. The Council hopes to attract new information and high-technology businesses and retain them with high-quality services and housing. There are particular challenges in moving trips from car to pub-lic transport, given the extreme low density of much of the population; but new light rail services linking settlements in linear patterns along the coast seem to offer one potential solution.
4.5.2 The Inverness land use and transport model design
The model has been built primarily to allow the Highland Council to predict the im-pact of their Master Plan on the area over the next twenty years. The model has some 162 zones and 830 transport links. The input-output basis of the land-use model dis-tinguishes nine economic sectors: agriculture, fishing and forestry; energy and water supply; manufacturing; construction; distribution, hotels and restaurants; transport and communications; banking, finance and insurance; public administration, education and health; and other services. Eight types of urban land use are distinguished. The population is divided into five household types according to family composition.
A special feature of the land-use model is that the market in floor-space is represented explicitly in terms of a competition for different types of building. Domestic buildings are classified into detached houses, semi-detached houses, terraced houses and flats. Non-domestic buildings are classified as ‘framed’ structures or ‘sheds’. Certain com-mercial and retail uses are then allowed to compete for some domestic building types (as well as for ‘framed’ and ‘shed’ buildings). Figure 4.9 illustrates the structure of the land use and floor-space sub-model. Here it is simplified into three columns: ac-tivities, floor space, and land. The lines connecting activities to floor space types and to land represent the demand relationships that were assumed to take place. For in-stance, heavy manufacturing industry may choose between framed structures or sheds, commercial activities and light industry may also occupy terraced houses. Households may choose between only terraces, flats, semidetached and detached homes. Sheds and framed buildings cannot be built on residential land, while detached houses can only be built on residential land.

Implementation of the PROPOLIS system in case cities
127
Figure 4.9 Activities, floor space and land categories in the Inverness model.
The transport model divides transport demand into eight types of journey: five types of work trip, by household type; education; shopping; and other services. Road trans-port modes include: walking; cycling; car with single occupant; car with multiple oc-cupants; urban buses; rural buses, and minibuses. The rail network is separately repre-sented. A bus-based park-and-ride scheme is being introduced into some of the future scenarios.
The model was developed using multiple spatial and non-spatial data sources, includ-ing the 1991 Census of Population, to generate a base year simulation. Many of these data were loaded into the model software by hand, often sourced from the existing Highland Council GIS. Once the 1991 data were loaded, the model was run for a sin-gle projection to 1996, a year for which data also already existed. The model was then calibrated until it produced outputs to match the 1991 and 1996 data. A series of sce-narios, commissioned by the Highland Council, have been modelled in five-year steps, over a twenty-five year period, to the ‘scenario horizon’ in the year 2021.

Implementation of the PROPOLIS system in case cities
128
Figure 4.10 The Inverness model zoning system
4.5.3 The Inverness model reference solution
These scenarios were developed for the Highland Council by consultants Rickaby Thompson Associates Ltd and Modelistica, They are defined within a three-level structure. A context level deals with broader political, economic, demographic and environmental circumstances; a policy level deals with individual land use and trans-port policies; and a simulation level defines scenarios as combinations of policies, within contexts. Three different contexts are envisaged: ‘Business as Usual’, ‘High-land Renaissance’ and ‘Natural Change’. Each of these makes different assumptions about future economic growth, growth in population and households, land and trans-port costs, and external environmental policies and priorities. ‘Business as Usual’ is more or less self-explanatory as a title. ‘Natural Change’ is a worst-case, low-growth context. The ‘Highland Renaissance’ context envisages a future where strong empha-sis is placed on environmental priorities, but that these are compatible with, and in-deed contribute to, economic growth.
At the simulation level, six options are compared: 1. 'Intensification of Centres' 2. 'Development Corridor' 3. 'New Settlements' 4. 'Small Towns Dispersal'

Implementation of the PROPOLIS system in case cities
129
5. 'Rural Dispersal' 6. 'Current Policies'
‘Intensification of Centres’ confines new growth to existing developed areas. ‘Devel-opment Corridor’ distributes new development in a wide arc following the coast, from Nairn in the east to Tain in the north. ‘New Settlements’ introduces new small towns or villages along this same arc. ‘Small Town Dispersal’ directs all growth towards several selected existing centres. ‘Rural Dispersal’ distributes new housing at low densities across the region, and envisages that the occupants would be relatively self-sufficient and make major use of telecommunications. ‘Current Policies’ continues the Highland Council’s present directions and initiatives. Most of these scenarios embody transport policies that will greatly improve bus and rail services, discourage car use where feasible, and encourage walking and cycling at the local scale. Because not all six scenarios at the simulation level are compatible with all three contexts, the total number of permutations under consideration is not eighteen but ten.
So far as PROPOLIS is concerned, the combination of the Highland Council's 'Cur-rent Policies' with their 'Business as Usual' context serve for the PROPOLIS 'Business as Usual' scenario (policy 111). There are two further PROPOLIS scenarios based on changes in land uses. The first envisages increased densities in city centres and inner urban areas by the conversion of commercial floor-space, and a compensating conver-sion of residential floor-space in outer urban areas to commercial uses (policy 511). The Highland Council's 'Intensification of Centres' scenario has been adapted in PROPOLIS for this purpose. As mentioned, this scenario directs the majority of all new growth (of all types), from 2006, into existing urban centres including Inverness but also other towns in the arc from Nairn to Tain. This will inevitably involve some conversion of existing commercial floor-space in inner areas to residential use (al-though not the conversion of residential floor-space in the suburbs of Inverness and the smaller towns to commercial use). The second PROPOLIS land use scenario in-volves increasing the amount of residential and service floor-space in areas that have fixed public transport facilities (i.e. in the present case railway stations) (policy 521). For this purpose the Highland Council's 'Small Towns Dispersal' scenario has been used. This scenario directs 80% of all new development, from 2006, into existing sat-ellite towns along the coastal railway line (the remaining 20% going into Inverness), and provides new commuter railway and express bus services between these desig-nated growth towns. In both these land use scenarios, the background 'context' is again 'Business as Usual'.
As for the PROPOLIS transport scenarios, the car pricing policies (211, 212, 213) are modelled by running a variant of 'Business as Usual' in which distance-related costs are increased, for cars only, for all trip types. The scenarios in which the cost of park-ing is increased (policies 221, 222) make use of the definition within the model of three link types with varying levels of charging. These levels are raised in the 'inner urban' superzone areas of Inverness only. (There is no 'city centre' superzone in the model.) For the cordon charge scenarios (231, 232), charges are applied on all major links crossing into the 'inner urban' areas of Inverness. In the speed regulation scenar-ios (311, 321) the maximum allowed speeds on different link types are reduced; and

Implementation of the PROPOLIS system in case cities
130
those users whose speeds are then in excess of 50% of the speed restriction are se-lected, and their speeds reduced by 10% and 20% in the two scenarios respectively. Finally, scenario 411 specifies an increase in the average speed of public transport (buses in the Inverness case) by 10%. This is difficult to achieve as such in TRANUS, since buses and cars share the same road space and the modelled public transport speeds therefore depend on the level of congestion. What is done here is to increase the free-flow speeds of buses by 10% - i.e. the inverse, in effect, of scenarios 311 and 321.
Figure 4.11 shows the settlement structure of the Inverness urban region for the refer-ence solution in terms of population density as forecast by the land- use transport model and further processed by the Raster Module
Figure 4.11 Inverness reference scenario, population densities.
4.6 General description of the Naples case city
4.6.1 The Naples model Region
Naples, located on the sea, is the largest city in the southern part of Italy and the capi-tal of the Campania region. The study area includes nearly a hundred municipalities; a total of more than three million inhabitants; and a land area of more than 1,250 km2. It covers the metropolitan region and virtually all commuting flows to and from the city.
Most of the land in the study area is devoted to agriculture. Part of the industrial ac-tivities is concentrated in Naples (freight port, oil refineries etc.), while the rest is

Implementation of the PROPOLIS system in case cities
131
spread across the province (shipbuilding, car industries, electronic components, etc.). A huge steel plant, one of the largest of the country, was located within Naples and was closed in the early 1990s. A rehabilitation plan is being implemented and the area is being radically transformed in these years. The population density is remarkably high in the whole area (the provincial average is 2,575 inhabitants/m2 with peaks of more than 15,000 in some of neighbouring towns) and the average household size is 3.2 persons, which is the highest figure among Italian largest cities.
Naples suffers from road traffic congestion, even though the rail network in the study area is quite dense, and air quality is often poor. Traffic noise is a real issue (values are above the average for the 100 largest cities of the country), compounded by the canyon effect, due to high buildings and construction density in many parts of the area.
The local economy is affected by high unemployment rates, crime, and inefficiencies of the public administration. During the last years, the Campania Region and Naples Municipality have been trying to improve the situation, also encouraging private in-vestments from other regions of Italy as well as from abroad, with a special emphasis on tourist volumes. As a consequence, many efforts of the Administration have been devoted to a general improvement of the quality of the urban environment.
Important initiatives have been conducted by the Urban Planning Department – which put forward different proposals for the upgrading of peripheral and central areas of the city – and by the Transport Department, which launched the Transport Plan of the metropolitan area. Long term strategies favoured by the local transport Department are strongly orientated toward a better use of the existing dense rail and metro trans-port network (through the operating and fare integration, the lines extension and the construction of new interchange nodes and park&ride schemes), a more efficient use of resources in the public transport sector (for example the city is testing a new system of collective-taxi), the introduction of regulatory policies in the city centre (restricted access areas, park pricing), the introduction of ITS for traffic management, etc.
4.6.2 The Naples land use and transport model design
The integrated transport/land-use model was implemented as quantitative support to the Master Transport Plan of Naples and the metropolitan area in the year 1997, when an extended survey campaign was carried out in order to gather information about transport networks, traffic flows, transport demand, land-use patterns and employment and households characteristics.
The model study area includes the municipality of Naples, the Province of Naples and part of the Province of Caserta resulting in nearly a hundred municipalities. It was di-vided into 39 zones with homogeneous socio-economic characteristics and land use patterns (27 zones within the city and 12 in the metropolitan area). The detailed trans-port zoning was obtained dividing each land use zone into more zones for a total sum of 179: 145 transport zones in Naples and 34 in the metropolitan area.

Implementation of the PROPOLIS system in case cities
132
Model factors are divided in three broad categories: production sectors (agriculture, heavy industry, light industry, wholesale, retail sale, education and private and public services), household categories (according to the social economic characteristics of the household head) and land and floorspace (private and public housing, agricultural, industrial, commercial an services). As the production/consumption matrix links all modelled factors, any modification of one of its elements (i.e. the price of one factor in one zone) might imply, in a direct or indirect way, a readjustment process of the spatial allocation of all factors and the model reaches an equilibrium state after an it-erative process.
The supply of transport infrastructure is represented by a single integrated multimodal network, comprising different link types: physical links (urban roads, metropolitan roads, motorways, rail lines, funiculars, etc.) and notional links (access from centroids to the road network, access from centroids to rail stations, intermodal connections, etc.). The total road network includes 938 links for urban primary roads and 730 links for the urban secondary roads, whereas in the metropolitan area there are 239 links for motorways and 397 for other roads. Capacity restraint functions were applied on road network links in order to relate the speed to the actual flow and the capacity of the links. The rail network includes the RFI (Italian Railways) lines, the local lines (Cir-cumvesuviana, Circumflegrea, Cumana, etc.), the metro line and the four funiculars and is connected to the road network through a set of pedestrian links at rail stations.
Figure 4.12 The Naples model zoning system
User transport modes were: motorbike, car, bus, rail and walk. The choice model is a conventional multi-level logit model, where the generalised cost is a function of the travel time, cost and quality of service of the transport mode.

Implementation of the PROPOLIS system in case cities
133
The demand for travel is represented by a set of origin/destination matrices of flow volumes created by the land use economic module. Each matrix is for a specific flow type defined according to the trip purpose: high-income work, low-income work, edu-cation, shopping and other. Each flow type has its own specification of both the mode and the route assignment processes for a correct representation of different patterns of travel behaviour. Flow volumes modal split and route assignment is performed mak-ing reference to the morning peak time, 7:00 to 9:30, which means one fifth of the daily motorised trips in the study area.
4.6.3 The Naples model reference solution
The reference solution of the land use and transport model implementation for the Naples Transport Plan made reference to the time horizon of year 2011. In the PRO-POLIS project, the future time threshold was moved forward to 2021 in order to iden-tify longer-term impacts of the policies.
The reference solution includes projects under construction or already approved by the involved authorities. Such projects are implemented at such model time threshold when their physical implementation is assumed to be completed. The main elements included in the Naples reference solution are:
• Metro and rail system improvement: the further extension of the metro line and the rehabilitation of local railways through the introduction of new stations, the renovation of the rolling stock and increased frequencies;
• The introduction of new park&ride schemes;
• Road transport investment in the peripheral areas of the city;
• Park pricing policies in the city centre.
Figure 4.13 shows the settlement structure of the Naples urban region for the refer-ence solution in terms of population density as forecast by the land use transport model and further processed by the Raster Module.

Implementation of the PROPOLIS system in case cities
134
Figure 4.13 Naples reference scenario, population densities.
4.7 General description of the Vicenza case city
4.7.1 The Vicenza model Region
Vicenza, located in the in the north-east part of Italy, is a small city which because of its rich architectural heritage has a high amenity value. It is typical of the rich historic cities of the country that are attractive for people to live and to visit as tourists. The municipality (some 100.000 inhabitants) is the main town of a very dynamic industrial area of 650.000 inhabitants, in the core of one of the richest regions of the country. The city is located along the east-west multimodal corridor which connects two im-portant metropolitan areas: a highly congested motorway and a railway line (also con-gested) whose capacity will be doubled in the next future (the line is part of the planned high-speed network).
While the total population of the city was almost stable in the last years, households have moved from the historical centre to the peripheral areas. A similar negative trend has been observed for industry and retail employees in the historical centre, counter-balanced by a higher growth in the service sector.
Vicenza is under substantial development and traffic pressures, which threaten its sen-sitive environment. Private car is the main mode of transport (44% of the internal trips and 64% of trips entering in the city), while public transport accounts for 12% of ur-ban trips and 36% of trips entering from the surrounding area. Cycles and motorbikes (31% of the internal trips) then play a significant role, but their share is subject to variations according to the season and the weather conditions and surveys confirm

Implementation of the PROPOLIS system in case cities
135
that their alternative mode is the car and not public transport. Road congestion mainly occurs along the main road corridors that access to the city and on the urban ring. In general terms the public transport network offers a good level of service for passen-gers entering to the city centre, including also a park&ride service with minibuses
Specific attention is paid by the local authorities to tourist flows, which are very im-portant for the economy of Vicenza. Tourists are attracted by the city, as well as by the surrounding areas and the city is only at 60 kilometres from the sea. The objec-tives of long term strategies of the Administration include the construction of a light rail system across the historic centre (it was designed in the Transport Plan, but has never been definitely approved by the Administration), the reduction of emissions from transport and other sources, the reduction of free car-park spaces, the reorganisa-tion of circulation schemes in the historic centre in order to discourage the private car transit traffic, the improvement of the cycling network (with the creation of lanes to separate cycles for road traffic) together with traffic calming measures, etc.
4.7.2 The Vicenza land use and transport model design
The integrated land use-transport model was first implemented to support the Master Traffic Plan of the city of Vicenza in 1992/1993. The model was able to provide fore-casts about modifications on socio-economic structure, location of households and activities and loads on the transport network under different scenarios in the study area up to 2007, the horizon year of the Traffic Master Plan. Since then the model was updated for the purposes of the PROPOLIS project on the basis of data supplied by the Municipality and the Province of Vicenza. Particular attention was paid to the ex-tension of the modelled time horizon, the update of the urban road network and public transport lines system, the revision of households and employment data and the intro-duction of a GIS based graphical representation.
The study area includes the municipality of Vicenza and most of its province. The model has a two level zoning system: a coarse one with zones showing homogeneous socio-economic characteristics and land use patterns and a detailed one for transport purposes where each land use zone is divided into more zones with similar transport characteristics (access to road or rail network, etc.).
In the land use model each zone is described using factors that represent the economi-cal sector (agriculture, industry, building firms, commerce, banking and services to business, other services, lower education and upper education), the land and floor-space market (housing, industrial, commercial and services) and household categories (divided in three categories according to the profession/ income of the household head). The interrelations among these different factors, depending also on the output of the transport model (transport disutility to move one unit of each factor from a zone to another or inside the same zone), are able to represent the spatial allocation of all factors within the study area. Any modification of one of the factors (e.g. the price of one factor), as well as its transport costs, imply in a direct or indirect way a readjust-ment process of the spatial allocation of all factors (that means also a variation in the

Implementation of the PROPOLIS system in case cities
136
O/D matrix structure) and the model reaches an equilibrium state after an iterative process.
Figure 4.14 The Vicenza model zoning system
The land use economic module is able to describe the characteristics of the transport demand. This is represented by a set of O/D matrices, one for each flow type consid-ered according to the trip purpose. The trip purposes considered are work, education, shopping, other purpose in the simulated morning peak period.
The transport supply is described using a multimodal transport network connecting all the transport zones in the study area. The road network comprises 853 links represent-ing motorways, urban primary and secondary roads and, in a more aggregate way, ex-tra urban primary and secondary roads. Urban road links are classified in two different types according to the presence of traffic lights at the junction at the end of the single link. The supply of road public transport services is modelled by means of transit line coding frequencies, travel times and bus stops sequences. Effects of traffic congestion on road network are described using capacity restraint functions and the transport supply description is completed by modelling the parking characteristics of urban zones (differentiating between free and charged park spaces) and the park and ride services around the historical city centre of Vicenza. Transport modes are: walking, two wheels (bicycle and motorcycle), car and public services. The choice model is a conventional multi-level logit model of discrete choice based on travel disutility (the generalised cost which is a function of the travel time, cost and quality of service of the transport mode).
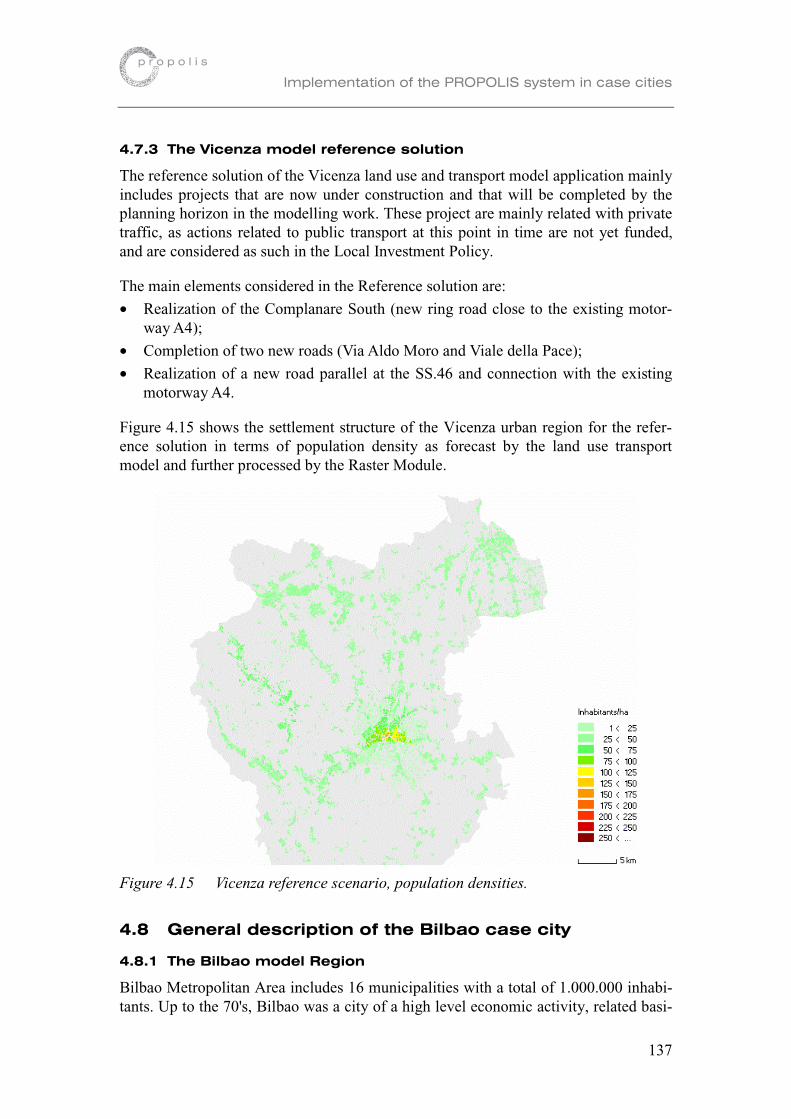
Implementation of the PROPOLIS system in case cities
137
4.7.3 The Vicenza model reference solution
The reference solution of the Vicenza land use and transport model application mainly includes projects that are now under construction and that will be completed by the planning horizon in the modelling work. These project are mainly related with private traffic, as actions related to public transport at this point in time are not yet funded, and are considered as such in the Local Investment Policy.
The main elements considered in the Reference solution are:
• Realization of the Complanare South (new ring road close to the existing motor-way A4);
• Completion of two new roads (Via Aldo Moro and Viale della Pace);
• Realization of a new road parallel at the SS.46 and connection with the existing motorway A4.
Figure 4.15 shows the settlement structure of the Vicenza urban region for the refer-ence solution in terms of population density as forecast by the land use transport model and further processed by the Raster Module.
Figure 4.15 Vicenza reference scenario, population densities.
4.8 General description of the Bilbao case city
4.8.1 The Bilbao model Region
Bilbao Metropolitan Area includes 16 municipalities with a total of 1.000.000 inhabi-tants. Up to the 70's, Bilbao was a city of a high level economic activity, related basi-

Implementation of the PROPOLIS system in case cities
138
cally to the heavy industry (iron mines, steel industry, shipyard, etc...). During the cri-sis of the iron and steel industry, Bilbao was involved in a serious decline process, from which it is emerging thanks to a set of long term strategies, with a wide ranging economic, social, environmental and urban scope.
Within the economic field, Bilbao has two major objectives: on one hand the recon-version of its industrial sector, and on the other, to turn to a regional service centre. The action undertaken for enhancing the creation of new industries and a more effi-cient use of resources improving competitiveness and employment is concentrated basically on the development of innovative industrial areas. Within the services, the biggest efforts are taking place in the field of transport (enlargement of the Port, new Airport, Intermodal Centres for passenger and freights) and Culture (Museum, Con-ferences Centre). In the social field, the major problem the city is facing concerns the lack of employment, with an unemployment rate of up to 25% in the areas most af-fected by the industrial crisis, and a mean rate of 12% in the city. The incorporation of this ceasing labour force into the emerging economic sectors is slowly taking place, due to an ambitious professional training plan, which affects the redefinition of the medium education and the special plans of retraining the long time unemployed.
Up to the 70's the industrial development had great priority over environmental issues, which were strongly neglected. At the present, the city faces serious soil, water and air pollution; therefore public administrations are nowadays seriously concerned about supporting environmental and energy polices for meeting European environmental objectives. In this sense, there are several plans running aimed at reducing mobile and fixed emission sources, with different levels of efficiency, and for the restoration of natural and artificial degraded zones. A convincing evidence that turning the former industrial city into an Eco-city is a great challenge that policymakers are facing.
The urban problems are strictly related to the above-mentioned features. Amongst others, the following action plans incorporated to the planning instruments could be mentioned: the incorporation of industrial abandoned soils to the urban structure, an increase of the present urban quality, the enhancement of urban expanding zones by improving their accessibility, the reduction of the negative effects of private transport furthering public transport an intermodality. Most of the above mentioned long term strategies will be analysed and evaluated during this project.
4.8.2 The Bilbao land use and transport model design
The basis for the policy analysis in Bilbao is the integrated Bilbao land use and trans-port model. The model was calibrated in 1988 and has been re-calibrated in 2000 us-ing housing and population census data. The 1996 register was used for population location, whereas the 1996 employment census was used for the location of the em-ployment demand. Further model adjustments have taken place using the information obtained from: 1997, 1998, 1999 and 2000 traffic counts, data on Basque Country ve-hicle fleet development, economic data on Basque Country, Mobility Survey 1999. The model has been applied for several land use studies. The most recent transport

Implementation of the PROPOLIS system in case cities
139
studies are related to the new underground line, the evaluation of the Metropolitan Road Plan and the Intermodal Station.
The study area includes the Bilbao Metropolitan Area and part of the province of Biz-kaia, which has been divided into zones with homogeneous socio-economic character-istics and land use patterns.
The metropolitan activities are described using specific factors for activity sectors (primary, industry, education, administration, commerce and services), socio-economic groups (low, medium-low, medium-high and high income households), land use factors (floorspace) and trip factors (education trips and other trips). The re-lations among these factors are represented by the coefficients (fixed or elastic in re-spect to prices) of a production/consumption matrix.
Figure 4.16 The Bilbao model zoning system
The Bilbao model defines five flow types, four related to passengers (journeys to work and other journeys, each for car-owners and non-car-owners) and one to goods movements. The transport model includes five transport modes (car, walk, bus, rail/underground and trucks) and a very detailed multimodal network of the urban area including the public transport lines, road and rail network, airport, port, etc (23 link types are used). Road congestion in the model is caused simultaneously by cars, buses and trucks and affects all of them in the same way (speed and cost looses). The rail network is also represented in the metropolitan area. The modal split is calculated using a logit model based on the trips disutility. The route assignment is calculated using the generalised cost for each mode in each link, which is a function of the dis-tance, time and operation cost in the link (time is dependent on capacity restraint func-tions).

Implementation of the PROPOLIS system in case cities
140
4.8.3 The Bilbao model reference solution
The reference solution for Bilbao takes the actions proposed in the Provincial Road Plan for the period 1996-2016 into account. The forecast to 2021 is based on the as-sumption that population changes in the model area will be very small in this period. The increase of households will imply a decrease in the average household size.
The reference solution includes projects under construction and those already ap-proved by the involved authorities. Such projects are implemented at the model time threshold when it is assumed that their physical implementation will be completed.
One of the main public transport projects is the construction of a second metro line along the western side of the estuary. It will markedly improve accessibility to the city centre from that area. Road investments include the completion of a metropolitan ave-nue (Avenida del Nervión) along the estuary with six transverse connections (five bridges and a sub-fluvial tunnel), which will reduce the barrier effect caused by the avenue and allow the incorporation of flows from both sides of the metropolitan area. Its construction is particularly beneficial for the existing highway that currently sup-ports local flows to and from the city centre as well as regional flows. Other road pro-jects included in the scenario improve accessibility to the centre from the northern ar-eas (Txoriherri road) and southern metropolitan areas (the connection between high-ways).
Figure 4.17 Bilbao reference scenario, population densities.

Implementation of the PROPOLIS system in case cities
141
Figure 4.17 shows the settlement structure of the Bilbao urban region for the reference solution in terms of population density as forecast by the land- use transport model and further processed by the Raster Module
4.9 General description of the Brussels case city
4.9.1 The Brussels model Region
Brussels is a metropolitan area of about 2.9 million inhabitants. Its central part, the so-called "Brussels-Capital Region", is an important administrative capital, grouping a little less than 1 million inhabitants. The Region has lost population for 30 years (about 120 000 inhabitants), while economic activities – with a rather stable total number of jobs (about 650 000) - were undergoing an important mutation: strong de-cline of industrial and heavy tertiary activities and strong growth of administrative functions. The result of this evolution is an increase in the number of daily commuters and traffic congestion.
The spatial structure of Brussels is quite typical. An old industrial axis along a canal surrounded by poor neighbourhoods of different ethnic communities with very few green spaces makes its way through the whole city, cutting it in two parts. Neglected during decades this area slowly begins to be renovated. On the other hand, the strong increase of administrative functions introduced a speculative pressure on higher status neighbourhoods making the cost of living increase. Emigration of middle class fami-lies to the suburbs encouraged urban sprawl, commuting by car and congestion. The decline of the population of the Brussels-Capital Region and the lowering of its aver-age income increases the scarcity of the resources, essentially based on income taxes of residents, while a lot of public works must be done to adapt the Region to its new important administrative functions. One of the major goals of the local Development Plan is to reinforce the residential attractiveness of the capital by all means. On the other hand, since the efficiency of the public transport networks is too low, especially between the periphery and the urban centre, the authorities decided to implement what could be called a “regional metro” on the existing railway tracks: this is the RER or “Regional Express Railway Network” (“Réseau Express Régional”), linking the sub-urbs to the central part of the metropolitan area.

Implementation of the PROPOLIS system in case cities
142
The effect expected from the implementation of the RER is a strong modal shift from private car towards public transport, shorter road travel times and a reduction of fuel consumption and of emissions of greenhouse gases and pollutants. However, the long-run effect could be an acceleration of the out-migration of households towards the pe-riphery. Therefore the authorities are interested in testing and evaluating policies to counterbalance the accelerating effect of RER on urban sprawl, as well as to reinforce the positive effect of RER on modal shares. The Belgian authorities co-funding the research (the federal Transport Administration (Service Public Fédéral Transport et Mobilité) and the Equipment and Transport Administration (Administration de l’Equipement et des Déplacements) of the Brussels-Capital Region) are expecting the demonstration of the adequacy of policies in a long-term strategy to reach the goals of a sustainable development.
Figure 4.18 Plan of the Regional Express Railway Network (RER)
4.9.2 The Brussels land use and transport model design
The initial integrated land-use/transport model for the Brussels metropolitan area has been developed in 1996 as part of the ESTEEM project, and has been used in several studies for federal, regional and local transport authorities, for the purpose of policy testing. The model has been designed to assess the major impacts of the future RER on the migrations of households and induced activities, and on the modal choice of people.
In the current version of the model, the study area covers the region that would be served by the future Regional Express Railway (about 30 km around Brussels) The area includes 19 administrative entities in Brussels-Capital Region and 116 munici-palities in the suburban area.

Implementation of the PROPOLIS system in case cities
143
Figure 4.19 The Brussels model zoning system
The Brussels land-use model is based on a spatial input-output model, where eco-nomic production sectors include private local services, retail trade and business ser-vices (not allowed to locate on industrial land), as endogenous sectors, and agricul-ture, industry, heavy tertiary, Belgian public administration, international public ad-ministration (EC, NATO), public local services, business services (allowed to locate on industrial land), and teaching sector (primary, secondary and high education), as exogenous sectors.
Household categories (classified according to the characteristics of the household's head) consist of white collars, blue collar, non-active people, people over 65 and stu-dents living in a campus (for some of these, further distinctions are made according to the number of persons in the household). Land categories consist of 3 types: low and high density residential land, and mixed economic activities land.
The interrelations between the different factors are characterised by the coefficients of an input - output matrix that were derived from the national census and national sur-veys on labour force and on household expenses. These coefficients are elastic for land consumed by economic sectors and households .
Transport supply is represented by a single integrated multimodal network, whose de-tails are adjusted to the scale of the zones under consideration. The modelled transport network consists of the primary road network (ca. 1300 links), the railway network serving the study area (ca. 500 links), the metro and pre-metro (i.e. tramway in tun-nels) networks (ca. 100 links), representing 85 different link types. Buses are not modelled explicitly: they are represented by links gathering zone centroïds to railways

Implementation of the PROPOLIS system in case cities
144
or metro stations. However, separate bus links have been designed for future policy test that will consider new express bus services running mainly in segregated lanes, from the suburban area to the central urban agglomeration.
The Brussels model considers passenger transport only. The multi-path search is based on a multimodal shortest path search procedure (i.e. a path between a given O-D pair may include several modes), and the assignment of demand on the paths is based on a conventional multinomial logit procedure based on the path generalised cost, considering travel time and cost (transfers included). Available modes in the ref-erence scenario are car (with a distinction between single-occupancy car and high-occupancy car), metro and pre-metro (i.e. tramways in tunnels), train, RER and ex-press buses.
The demand for travel is represented by a set of O-D matrices of flow volumes in the morning peak hour (7h00 - 9h00): high/medium income home-to-work trips, low in-come home-to-work trips, non-regular trips (i.e. other than home-to-work or home-to-school), as endogenous matrices, and home-to-school trips, commuting from outside the study area and transit trips, as exogenous matrices.
4.9.3 The Brussels model reference solution
In the Brussels case, the model does not provide the situation at horizon 2021 starting from the base year 2001 situation. The 2021 reference scenario was built exoge-nously. This results partly from the fact that the model is rather complex (7 household segments, 13 activity sectors) and that the part of endogenous actors is high (in the Brussels model, 72 % of the total number of households and 45 % of the total em-ployment are endogenous, i.e. their location is determined by the model). The 2021 reference scenario was built on the basis of various sources and data. These included the recent socio-economic tendencies observed in the study area between 1991 and 2001, demographic forecasts set up by the National Institute of Statistics, macro-economic forecasts set up by the National Planning Office, and the strategic planning objectives expressed in the Master Plans of the 3 Regions (Brussels-Capital Region, Flemish Region, Walloon Region), especially with regard to the spatial structure.
The Brussels model reference scenario includes the project of Regional Express Rail-way Network, which will provide high quality, rapid and frequent train services be-tween the periphery and the central area. Other transport investments, such as 19 new lines of express buses on radial highways giving access to the central area, are not in-cluded in the reference scenario. They make part of one of the policies tested, the so-called “local investment plans” policy.
All the policies were tested on this 2021 reference scenario (without popula-tion/employment growth). Results were provided for the intermediary year 2011 using sensible interpolation hypotheses between 2001 and 2021.
Figure 4.20 shows the settlement structure of the Brussels urban region for the refer-ence solution in terms of population density as forecast by the land- use transport model and further processed by the Raster Module

Implementation of the PROPOLIS system in case cities
145
Figure 4.20 Brussels reference scenario, population densities.
4.10 Case city model variables and zoning system har-monisation
All the case cities have a specific application of a different type of integrated land-use transport models that cover metropolitan areas of different extensions. As one of the main goals of the PROPOLIS project is to perform cross-city comparisons in order to evaluate policies and policy packages in the 7 different urban regions, a harmonisation of both the zoning system and the model variables is needed. Such harmonisation is performed through the definition of common homogeneous super-zones and the ag-gregation on a “lowest common denominator” of model relevant variables.
The definition of a common zoning system (see table 4.4) pertains to both transport and land-use zones (in some models the two systems of zones do not match). Six su-per-zones are identified - City centre, Inner urban, Outer urban, Rest of metropolitan, Urbanized rest of region and Rural rest of region – and these are used for the repre-sentation of results on GIS maps and tables. Some case cities do not present all the six super-zones, because of the different extensions of the modelled study areas.

Implementation of the PROPOLIS system in case cities
146
Table 4.4 Zoning systems of the case cities
Helsinki Dortmund Inverness Naples Vicenza Bilbao Brussels
Transport zones
City centre 3 1 46 21 9 Inner urban 6 9 26 99 53 20 23 Outer urban 18 52 30 17 12 39 Rest of metropolitan 26 84 17 66 90 Rest of region, urban-ised 12 100 35 16 16 Rest of region, rural 16 70
Total 81 246 161 179 102 111 152
Land use zones
City centre 3 1 9 4 9 Inner urban 6 9 26 18 14 20 23 Outer urban 18 52 30 5 3 39 Rest of metropolitan 26 84 7 66 90 Rest of region, urban-ised
11 100 35 6 16
Rest of region, rural 17 70
Total 81 246 161 39 27 111 152
Note: external zones are not considered
Table 4.5 PROPOLIS common model variables
Common variable PROPOLIS framework Helsinki Dortmund Inverness Naples Vicenza Bilbao Brussels
Socio-economic groups 3 8 3 5 5 3 4 7 Employment sectors 4 8 40 9 7 8 6 13 Land and floorspace types 3 3 9 9 6 4 n.a. 3 Trip types 5 6 4 6 5 4 5 8 Transport modes 5 5 9 17 6 4 5 7 Link types 10 18 17 23 49 27 23 85
The aggregation of model specific variables to PROPOLIS common variables is based on the “lowest common denominator”; i.e. the most aggregate case city model gov-erns the level of aggregation. In most cases the aggregation was quite straightforward, while there have been some cases where care was needed to identify the appropriate harmonised group. Aggregate variables are illustrated below (see also table 4.5):
• Socio-economic groups: 3 categories (High, Medium and Low income) were se-lected with household as the unit of measurement of the residential population. The aggregation of the socio-economic groups was quite straightforward for all models except Inverness, where households are ranked by the number of persons in the family (adults and children) according to the British Census classification. The socio-economic groups classification is extremely detailed in the Dortmund and Helsinki models: in the first one there are 30 housing market household types cross-classified with 30 housing market dwelling types, while in the second one each household group is the aggregation of three car-ownership sub-groups (for 0, 1 and 2+ car-owners).

Implementation of the PROPOLIS system in case cities
147
• Employment sectors: 4 common sectors (Primary, Industry, Public services and ad-ministration, and Private services and commerce) were identified, adopting the em-ployee as the unit of measurement. The division between public and private services is common to all models. The existing, “wholesale” sector has been assigned to the “Private services and commerce” common sector, so that the definition of com-merce is coherent in all models and includes both wholesale and retail (only a few models represent the two sectors separately).
• Land and floorspace: 3 common floorspace types (Residential, Industrial, Offices and commercial) were selected (measured in square meters). The Bilbao model has only a single variable for all land use types and therefore the floorspace common variable is not available for this case. In the Helsinki model the "Employment floor-space" is for both industrial and offices/commercial sectors; so a specific weight is used to disaggregate it. The Inverness model is unique among the PROPOLIS mod-els in considering floorspace separately from land use (the way in which activities consume floorspace is treated in a separate sub-model where a set of rules is used to control the types of activity allowable in different types of building and the types of building allowable on different classes of land).
• Trip types: 5 common trip types (Journeys to work, Journeys to school, Shopping, Other journeys and Freight transport) were considered relevant for the evaluation framework. It has to be noted that freight transport is explicitly modelled in two case cities only (Helsinki and Bilbao), nevertheless it is kept in the list as it is cer-tainly important to be considered.
• Transport modes: 5 common modes (Private motorised, Bus, Rail, Slow, and Goods vehicles) were considered. In the Vicenza model the mode "public transport" in-cludes both buses and rail and it has been assigned to the "bus" aggregate type, as the rail mode is less relevant. In the Inverness model, "Ferry service" has been in-cluded within the "Rail" aggregate mode.
• Link types: 10 relevant types were considered (Motorway, Major urban road, Other roads, Railway – metro, Bus and tram, Car park/access, Train & bus access/wait, Ferry service, Walk, and Intrazonal). Note that bus and tramlines are not explicitly modelled in the Brussels model.
4.11 Case cities models specific parameters
There is a set of model specific parameters that are used in the economic evaluation process and these include four main categories:
• Value of time: each country has a specific value of time that depends on the aver-age income level and on the local willingness to pay for saving time for different trip purposes. The relative figures used in the evaluation process are reported in table 4.6.
• External costs of gas emissions: gas emissions are divided into local effective pol-lutants and the greenhouse gas CO2 which has global effects on climate change (see table 4.7). The emissions of local pollutants have different external costs ac-cording to the typology of the zone and the country where they are produced. On

Implementation of the PROPOLIS system in case cities
148
the other side CO2, as it is a “global pollutant” has a unique value that is 0.1 Euro/Kg.
• External costs of accidents: in general, external costs of accidents are estimated as distance-related average rates of accidents by mode of transportation. As the num-ber and the effect of accidents depend on local behaviour and the corresponding economic costs on the conventional “values” of human life, such parameter varies from case-city to case-city. The figures are presented in table 4.8.
• External costs of noise emissions: The theoretical basis for the calculation of noise costs is the “willingness to pay” for the reduction of noise levels. The adopted values vary by country as shown in table 4.9.
Moreover, policy specific input parameters are used in the evaluation of the economic impact of policies. These parameters are related to the financial operating costs and are used to calculate two different variables affecting the value of the ETGB indicator:
• the fiscal components that are computed as a transfer to the Government (average financial cost and conversion factor are required)
• the total cost of supplying public transport services, calculated on the basis of the marginal cost of providing additional transport services.
The base year values are shown in table 4.10 for each case study. These values may vary over time according to the policy actions implemented.
Table 4.6 General value of time – Country specific parameters [Euro/h]
Helsinki Dortmund Inverness Naples Vicenza Bilbao Brussels
Journey to work 4.07 6.60 3.55 2.10 3.36 13.66 6.12Journey to school 4.07 5.00 3.55 0.97 1.55 4.07Shopping 4.07 4.25 3.55 2.41 1.55 4.38Other journeys 5.88 4.02 3.55 2.41 1.55 6.83 5.89

Implementation of the PROPOLIS system in case cities
149
Table 4.7 External costs of gas emissions – Country specific parameters[Euro/Kg]
Helsinki Dortmund Inverness Naples Vicenza Bilbao Brussels
SO2
City center 14.66 13.8 n.a. 87.3 13.8 46.4 10.2 Inner urban 14.66 13.8 13.8 87.3 13.8 46.4 10.2 Outer urban 14.66 13.8 13.8 87.3 13.8 46.4 10.2 Rest of metropolitan area 2.12 11.7 n.a. 13.3 13.3 13.3 8.3 Rest of region, urbanised N.A. 13.8 13.8 13.3 13.3 46.4 8.3 Rest of region, rural N.A. 11.7 11.7 13.3 13.3 13.3 8.3
Nox City centre 1.11 17.1 n.a. 13.4 17.1 21.7 6.5 Inner urban 1.11 17.1 17.1 13.4 17.1 21.7 6.5 Outer urban 1.11 17.1 17.1 13.4 17.1 21.7 6.5 Rest of metropolitan area 0.40 19 n.a. 22.4 22.4 22.4 8.3 Rest of urbanized region N.A. 17.1 17.1 22.4 22.4 21.7 8.3 Rest of rural region N.A. 19 19 22.4 22.4 22.4 8.3
CO City center 0.029 0.004 n.a 0.053 0.004 0.025 0.003 Inner urban 0.029 0.004 0.004 0.053 0.004 0.025 0.003 Outer urban 0.029 0.004 0.004 0.053 0.004 0.025 0.003 Rest of metropolitan area 0.001 0.003 n.a. 0.002 0.002 0.002 0.002 Rest of urbanized region N.A. 0.004 0.004 0.002 0.002 0.025 0.002 Rest of rural region N.A. 0.003 0.003 0.002 0.002 0.002 0.002
PM2.5 City center 113 480 n.a. 4840 480 2553 322 Inner urban 113 480 480 4840 480 2553 322 Outer urban 113 480 480 4840 480 2553 322 Rest of metropolitan area 3.53 268 n.a 173 173 173 158 Rest of urbanized region N.A. 480 480 173 173 2553 158 Rest of rural region N.A. 268 268 173 173 173 158
VOC City center 0.06 1.4 n.a. 3.5 1.4 2.6 0.7 Inner urban 0.06 1.4 1.4 3.5 1.4 2.6 0.7 Outer urban 0.06 1.4 1.4 3.5 1.4 2.6 0.7 Rest of metropolitan area 0.06 1.4 n.a. 1.1 1.1 2.6 0.7 Rest of urbanized region N.A. 1.4 1.4 1.1 1.1 2.6 0.7 Rest of rural region N.A. 1.4 1.4 1.1 1.1 2.6 0.7
Table 4.8 External costs of accidents – City specific parameters [Euro/pax-Km]
Helsinki Dortmund Inverness Naples Vicenza Bilbao Brussels
Car 0.04 0.052 0.04 0.0370 0.0370 0.06051 0.04Bus 0.01 0.0035 0.01 0.0024 0.0024 0.000272 0.01Rail 0.004 0.009 0.004 0.0019 0.0019 0.000325 0.004Slow 0 0 0 0 0 0 0Goods Vehicles 0.153 0.129 0.153 0.153

Implementation of the PROPOLIS system in case cities
150
Table 4.9 External costs of noise emissions – Country specific parameters[Euro]
Helsinki Dortmund Inverness Naples Vicenza Bilbao Brussels
55 – 60 db(A) 270 460 460 53 53 53 27060 – 66 db(A) 316 508 508 212 212 212 31665 – 70 db(A) 479 686 686 530 530 530 47970 – 75 db(A) 959 896 896 1060 1060 1060 959> 75 db(A) 1500 1228 1228 2000 2000 2000 1500
Table 4.10 Operating costs by mode – Base year policy specific parameters for each case city
Helsinki Dortmund Inverness Naples Vicenza Bilbao Brussels
Financial costs [Euro/v-km]
Car 0.1985 0.48 0.48 0.309 0.309 0.19 0.111 Bus average cost 0.1913 0.22 0.25 0.183 0.183 0.105
marginal cost 0.020 0.022 0.0875 0.064 0.064 0.037 Rail average cost 0.1913 0.25 0.25 0.153 0.153 0.0667 0.0421
marginal cost 0.020 0.022 0.0875 0.054 0.054 0.023 0.015 Goods vehicles 0.4681 1.00 1.00 - - 0.619 -
Conversion factors
Car 0.4407 0.708 0.708 0.681 0.681 0.62 0.539 Bus 0.7122 0.84 0.84 0.802 0.802 0.84 Rail 0.7122 0.84 0.84 0.802 0.802 0.84 0.943 Goods vehicles 0.6317 0.68 0.68 0.646 0.646 0.62

Implementation of the PROPOLIS system in case cities
151
References
Spartacus, 1998, Spartacus: System for Planning and Research In Towns and Cities for Urban Sustain-
ability - Final Report, CEC DG XII.
HELSINKI
Williams, H.C.W.L. On the Formation of Travel Demand Models and Economic Evaluation Measures
of User Benefit, in Environment and Planning, vol A9, pp. 258-344, 1997.
Williams, I.N. A model of London and the South East, Environment and Planning B, 1994 vol 21, pp
517-533, 1994.
NAPLES
Comune di Napoli, 1997, Piano Comunale dei Trasporti, Assessorato alle infrastrutture di trasporto,
Napoli.
Hunt J. D., 1994, Calibrating the Naples land use and transport model Environmental and Planning B:
Planning and design, vol. 21, Pion Limited, Great Britain.
Martino, S. Maffii, The integrated land-use and transport model of Naples: from the master transport
plan to the EU policy tests Proceedings of CUPUM 99, Computers in urban planning and urban man-
agement on the edge of the millennium, 6th International Conference, Venice 1999.
TRT Trasporti e Territorio, 1997, Piano Comunale dei Trasporti di Napoli Applicazione del modello
Meplan - Rapporto finale, Comune di Napoli.
VICENZA
Carlo Andriolo, 1998, Mobilità urbana e trasformazioni territoriali: una possibile integrazione in
chiave sostenibile – il progetto europeo “SPARTACUS” nel caso di Vicenza, Phd thesis in transport
engeneering.
TRT Trasporti e Territorio, 1993, Rapporto conclusivo di seconda fase – Calibrazione e messa a punto
del modello multimodale, Comune di Vicenza.
TRT Trasporti e Territorio, 1994, Rapporto conclusivo di terza fase – Definizione e valutazione degli
scenari alternativi di intervento, Comune di Vicenza.
BILBAO
Diputación Foral de Bizkaia, 1998, Plan de Carreteras de Bizkaia.
Diputación Foral de Bizkaia, 1999, Evolución del Trafico en las Carreteras de Bizkaia.
EUSTAT (Statistical Institute for the Basque Country), 1999, Del Barrio a la Comunidad. Censos y
Padrones de Población y Viviendas. 1986,1991,1996.
EUSTAT (Statistical Institute for the Basque Country), 1999, ERAIKIN’96 Base de Datos de Edificios
de la Estadística de Población y Viviendas 1996.
Gobierno Vasco, 1999, 2º Plan General de Carreteras del País Vasco 1999-2010.

Implementation of the PROPOLIS system in case cities
152
BRUSSELS
Boon, F. and Gayda, S., 2000, Quelques impacts du future RER sur la Région Bruxelloise et sa
périphérie, Quatorzième Congrès des économistes belges de langue française, Liège, 23-24 novembre
2000.
De la Barra Tomas, Integrated land-use and transport modelling. Decision chains and hierarchies,
Cambridge University Press,1989.
Ministry of the Region of Brussels-Capital, IRIS Plan. Regional Mobility Plan, Synopsis, 1996.
Stratec, ESTEEM, L'impact du RER sur les choix de localisation des ménages et de l'emploi induit sur
le choix des modes de transport par les usagers, Rapport final, february 1999.
INVERNESS AND THE HIGHLANDS
De La Barra, T, 2001, Integrated land-use and transport modeling: the TRANUS experience, in R K
Brail and R E Klosterman, eds, Planning Support Systems: Integrated Geographic Information Sys-
tems, Models, and Visualisation Tools, ESRI Press, Redlands, CA, 129-156
De La Barra, T, 1989, Integrated Land-use and Transport Modelling: Decision Chains and Hierar-
chies, Cambridge, Cambridge University Press
Full description of the Inverness and Inner Moray Firth Area modeling project (part of the Inner Moray
Firth Towns study funded by the Northern Periphery Programme) at www.highland.gov.uk
DORTMUND
MWMTV – Ministerium für Wirtschaft und Mittelstand, Technologie und Verkehr des Landes Nordrhein-Westfalen (1999): ÖPNV-Bedarfsplan 1998 des Landes Nordrhein-Westfalen – Programm für den Ausbau der ÖPNV-Infrastruktur bis 2015. Düsseldorf: MWMTV.
Wegener, M., 1983, Description of the Dortmund Region Model. Working Paper 8. Dortmund Institut
für Raumplanung.
Wegener, M., 1985, The Dortmund housing market model: a Monte Carlo simulation of a regional
housing market. In: Stahl, K. (ed.): Microeconomic Models of Housing Markets. Lecture Notes in Eco-
nomics and Mathematical Systems 239. Berlin/Heidelberg/New York: Springer Verlag, 144-191.
Wegener, M., 1996, Reduction of CO2 emissions of transport by reorganisation of urban activities. In:
Hayashi, Y., Roy, J. (eds.): Land Use, Transport and the Environment. Dordrecht: Kluwer Academic
Publishers, 103-124.
Wegener, M., 1998, The IRPUD Model: Overview.
http://irpud.raumplaung.uni-dortmund.de/irpud/pro/mod/mod_e.htm
Wegener, M., 1999, Die Stadt der kurzen Wege - müssen wir unsere Städte umbauen? Berichte aus
dem Institut für Raumplanung 43. Dortmund: Institut für Raumplanung.

153
Part II:
Approaching sustainable urban
policies
5. Definition of policy options
6. Analysis of policy testing results
7. Intercity comparisons

154

155
5. Definition of policy options
Summary
The definition of the potential policy options tested with the PROPOLIS system is based on a vast literature review with emphasis on the Fourth Framework Programme projects, the experience of the partners from earlier projects - es-pecially the SPARTACUS project - and on co-operation with international net-works.
Generally, it can be noted that, according to the most recent research, there seems to be a common understanding and consensus about the main lines of the potential policies. These main lines seem, however, to be somewhat differ-ent to those discussed and implemented on local levels.
In addition to the common policies tested in all case cities, a set of local poli-cies has been negotiated with the case city authorities. Some of these local policies were tested for theoretical reasons.
A total of 20 different policy options and policy combinations were eventually defined and tested in all case cities. They are included in the following catego-ries: reference scenario, investment policies, car pricing policies, regulation policies, public transport policies, land use policies and policy combinations.
This section summarises the literature review and defines the common test programme including a brief theoretical background and hypothesis for each policy together with a description of its model implementation. Thereafter, the local policies are defined in the same way.
Reference Scenario
PricingLand UseParking Speeds
InvestmentRegulation
Public Transport

Definition of policy options
156
5. Definition of policy options
5.1 Potential policy options
5.1.1 Introduction
The following sources have been used to identify potential policy options:
− The SPARTACUS experience
− Literature reviews
− International networks and Cluster activities
− Local City Authorities
The summary of identified potential policy options is presented in appendix II.
Generally, it can be noted that, according to the most recent research, there seems to be a common understanding and consensus about the main lines of the potential poli-cies. These main lines seem, however, to be somewhat different to those discussed and implemented on local levels.
Dr. Christian Patermann, Director of the Environment and Sustainable Development research programme (European Commission, DG Research) states that the challenge for the EU is to promote urban sustainability from a global perspective [Patermann, 2001]. He also reminds about the existence of certain barriers that limit the implemen-tation of sustainable development at city level. These barriers are presented below:
• A major barrier is the carrying out of too sectoral approaches to solve problems or plan new activities. This is often caused by the traditional separation of urban ac-tivities on the level of city authorities.
• Another cause of failure is the inability of stakeholders to make long-term plan-ning and to ensure consistency between the many projects carried out. Such prac-tises may be caused by cultural incapability to envisage long-term perspectives, or promotion of short-sighted political interests. Other explanation is that public au-thorities have progressively lost their prominent role in urban development, not by means of investment capabilities but increasingly to their inability to co-ordinate and to give consistency to various projects and initiatives taken up by a wider range of actors.
• Another important factor is the difficulty to make reliable forecasting of how the future of EU cities could evolve. The problems relate to globalisation of economy and information, growth of urban population and to changing family or household structures. It is unclear if cities will continue to remain the natural arenas for so-cial life, culture, business and politics. These parameters do depend on future poli-cies, but still many of them have an unpredictable character, which makes fore-casts particularly unreliable. The absence of clear and well-identified milestones is a disincentive to long-term planning.

Definition of policy options
157
• Finally, the acceptability of the newly designed measures or policies is not always optimal. Often, the decision-making process does not involve all the concerned ac-tors. There is an overall need to improve the transparency of the urban decision-making process.
The above points and principles have also guided and been kept in mind when select-ing the potential policy options.
5.1.2 The SPARTACUS experience
The SPARTACUS project tested and analysed about 70 different policy elements and policy combinations. The selection of policies was to a large extent based on policies tested in the ISGLUTI study [ISGLUTI 1988]. The SPARTACUS experience gives valuable guidance for the selection of policies in PROPOLIS. The relevant SPARTACUS conclusions are summarised below.
• Many policies meant to reduce car travel might in the long-term work in the oppo-site way. This was the case for example in the car-pooling policy, level down peak hour policy etc. The phenomenon was due to the fact that, if car drivers were re-moved from the road by some method, there always tended to be other people who filled the capacity supply that was generated and, as a result, the car mileage was not reduced.
• Some policies left their (negative) footprints outside the study area. This has to be taken into account in the overall evaluation.
• The most effective policies were the pricing policies
• Also some regulatory policies had positive effects, such as reducing car speeds
• Road investment programmes and land use policies did not have (alone) signifi-cant effects but they could be used in combination with other policies. Land use policies where both inhabitants and employment were located at the same time in order to balance the work place/inhabitant ratio were among the most efficient land use policies.
• It is possible to strengthen the positive effects of one policy by combining it with another policy that also has positive effects. It is utmost important to define poli-cies that have cumulative effects. It was found in many cases that local policies adopted didn’t fulfil this condition. Instead, some of the local programmes were designed to include elements that worked in opposite directions.
• Adoption of pricing policies was found to be the key element for increasing urban sustainability. Detailed studies are needed to define the optimum level and combi-nation of car pricing, parking and PT fares. Congestion pricing seems to be the most efficient method both theoretically and according to the tests.
• A good urban policy consists of co-ordinated elements that work together to pro-duce cumulative effects that attain balanced set of environmental, social and eco-nomic goals. These elements may include:
Definition of policy options
158
o Combination of pricing policies, near the optimum level, directed at car users with differentiation between peak and other hours combined with an appropri-ate level of pricing of public transport fares and parking
o Speed reductions taking into account the type, role and location of the street
o Investment programmes supporting the changes in demand caused by the above policies
o A land use plan supporting the new need for people to live near central areas or in satellite cities and their increased need and opportunity to use public transport
o Measures necessary to mitigate the negative side effects of the above policies
5.1.3 Literature review
General
The identification of policy elements was carried out in several phases. In the first phase, a draft list of potential policies was collected from previous experience docu-mented in a substantial number of EU projects, scientific journals and other literature and web sites. In the identification phase the suitability for modelling was not an im-portant criterion, whereas more weight was laid on the possible effectiveness to en-hance sustainability. With the SPARTACUS policy elements, over 60 single policy elements were identified. These elements were grouped into 17 more general policies, under six different categories.
The categories are:
− Scenario
− Land use
− Investment
− Management
− New technology
− Pricing
The 4th Framework Transport RTD programme presents valuable state-of-the-art knowledge on the effects of transport related policies on urban sustainability [EXTRA 2000]. This knowledge was used extensively in the further selection and development of PROPOLIS policies and policy combinations. In the following text, some of the key findings from the previous experience are discussed within the initial PROPOLIS categories.
Scenario elements
The policies in this category represent general changes in society. They are exogenous factors to the models and can mainly be used for sensitivity testing. The policies are:
− Population growth

Definition of policy options
159
− Teleworking
− GNP growth
Land use
The policies in this category have been drawn from a number of sources, of which the most important is the OECD/ECMT report Urban travel and sustainable development [OECD/ECMT 1995]. Common aims for most of the elements are to constrain further decentralisation of population, reduce car dependency and the number of trips made by personal cars by changing the land use pattern. Increase of densities, balance of employment/inhabitant ratio and location of trip-generating activities and public fa-cilities have been identified to have potential to increase the modal share of non-motorised modes and public transport. Regulations on out-of-town development or large company locations may also be effective. Important policies in this category are also the ones increasing the quality of urban space by pedestrianisation, safeguarding green belts and encouraging reuse of derelict brownfields.
The key findings in the 4th Framework Transport RTD Programme suggest that land use planning measures are important means influencing transport demand and trip-patterns in the long-term [EXTRA 2000]. The city case studies showed that combined land-use and transport policies are only successful in reducing travel distances and the share of car travel if they make the car less attractive, that is more expensive or slower. For example the Basel case study (TRANSLAND) showed, that the trends for increasing car ownership and car use are dominant, and the co-ordination of land-use and transport policies require several decades to influence the settlement pattern and further to influence travel behaviour. Land-use planning that increases urban density or mixed land-use without accompanying measures to discourage car use has only lit-tle effect, as people will continue to make longer trips to maximise opportunities within their travel-cost and travel-time budgets. However, these policies are important as they are a precondition for a less car-dependent urban way of life in the future. Large dispersed retail and leisure facilities increase the distances travelled by car. Land use policies to prevent development of such facilities have proved more effec-tive than policies aimed at promoting high-density mixed-use development. On the other hand it has not been proved in practise, that policies constraining the use of cars on city centres are detrimental to the viability of the centres, except in cases in where large peripheral retail developments have been approved at the same time. One impor-tant finding is that transport policies to improve the attractiveness of public transport have in general not led to a major reduction of car travel, but have contributed to fur-ther suburbanisation of the population. For example, in the Strasbourg case study the result of a policy combination (central area car ban, non-motorised mode improve-ments, PT re-organisation, parking policies) was, that dwelling rents raised more in fringe areas well served by public transport than in the city centre. Car traffic in the centre reduced by 17 %, but both the car modal share in the whole urban area and the volume of car traffic on urban motorways increased. [TRANSLAND].
The policies in this category are:
1. Residential land use
Definition of policy options
160
2. Business and service land use
3. Quality of urban space
The policy elements included in these categories address the location and densities of housing areas, the inhabitant/employment ratio in certain zones as well as the envi-ronmental quality of (central) urban areas.
Investment
In the 4th Framework Transport RTD Programme model methods were developed to assess urban transport strategies. It was found that optimal strategies involve a combi-nation of measures. General recommendations are [OPTIMA]:
− Economically efficient strategies can be expected to include low cost improve-ments to road capacity, improvements in public transport (increased service levels and reductions in fares) and increases in car costs.
− Public transport infrastructure investment is not likely, in majority of cases, to be a key element in these strategies. It has been concluded, that an increase in service level is the result of higher frequencies rather than a longer line length [SESAME]. However, when setting sustainability rather than economic efficiency as the primary goal, investments in public transport are likely to be justified.
− Reductions in the capacity to discourage car use are not likely to be economically efficient.
[Relevant 4. FWP projects: EUROMOS, HIPERTRANS, INTRAMUROS, OPTIMA, SESAME.]
The policy elements in this category are:
1. Road investment
2. Rail and PT investment
3. Slow modes programme
Management
The effects of transport demand management measures have been evaluated in the 4th Framework Transport RTD Programme modelling projects. The main findings are [EXTRA 2000]:
• Incentive “pull” measures alone are rather ineffective in stimulating modal shift, whereas “push” measures such as cordon or parking charges have altered modal split remarkably.
• Combinations of pull and push measures yielded the greatest reductions in car trips (e.g. park&ride, parking charges plus restricted access zones).
• Flexible working hours within companies decreased vehicle-kilometres and espe-cially the levels of exhaust pollution.
[Relevant 4th FWP projects: AIUTO, MUSIC, PRIVILEGE]

Definition of policy options
161
The policies that fall in this category are:
1. Speed regulation programme
2. Intermodality
3. Overall system management
These three policies consist of various elements. The speed regulation programme aims at improving safety, at reducing emissions by reducing car speeds as well as at articulation of the rational use of the road network. Also elements, such as using rec-ognition techniques for speed enforcement, are included. With several elements the intermodality policy aims at increasing the use of PT as a part of the trip chain. Over-all, a system management policy may consist of a variety of telematics applications, introduction of green commuter plans and tradable mobility credits.
New Technology
Clear environmental benefits can be attained if low-emission vehicles generate part of the vehicle mileage, especially in dense urban areas. Alternative energy sources, such as natural gas, alcohols, biofuels, electricity or fuel cells have proved effective in re-ducing both regulated and CO2-emissions. The problems hindering wider adaptation are in many cases related to higher car costs or expensive fuel distribution infrastruc-ture rather than problems in technology. The greatest potential in reducing environ-mental and health effects lies in replacing former heavy diesel engine vehicles with alternative fuel vehicles. Accordingly, many public transport operators in Europe are aiming at increasing their alternative fuel fleet in the near future. It must be noted, however, that diesel and gasoline vehicles are also becoming more environmentally friendly when reformulated fuels and exhaust after treatment devices become widely used. In gasoline engines the three-way catalyst cuts off a major part of regulated emissions. It has also been estimated that in 2005, when EURO4-exhaust regulations are introduced, some sort of emission after treatment will become mandatory for die-sel engines, as well.
With the help of fiscal incentives or regulation policies the share of cleaner vehicle technology can be increased.
The policy options in this category are:
1. Incentives for clean vehicle technology
The policy consists of different scenarios about the share of mileage produced by hy-brid or electric vehicles and other alternative technologies. It may also include other elements such as parking privileges, limited access to city centres and different pric-ing policies.
Pricing
In the 4th Framework Transport RTD Programme the effects of different pricing measures were demonstrated [EXTRA 2000]. In one city, charging for road use dur-ing peak periods according to the level of congestion reduced traffic levels by more

Definition of policy options
162
than 10 %. The primary reason was that drivers changed their time of travel, as the total number of trips or modal shift didn’t change as dramatically. In another city, 15-20% reduction in daily car travel was achieved through modal shift to public trans-port. Demonstrations and modelling work in another five cities confirmed that road pricing may reduce city centre traffic by 5-25 % (for charge levels of 1-3 EURO). Cordon pricing is particularly effective when applied to congested central areas during peak periods (25 % car trip reductions). Pricing of parking is also effective in restrain-ing car trips, provided that enforcement is maximised. Integrated ticketing and smart card payment systems have a small but significant impact on modal split on their own, more important is their effect in supporting trans-modal pricing measures. [TRANSPRICE].
The key conclusions about the effects of pricing on road user behaviour were [EUROTOLL]:
• If permitted by the pricing scheme, the most common reactions of travellers are trip re-timing and a change in route choice.
• Pricing also has a positive impact on the capacity usage of road infrastructure, as a result of spreading traffic across multiple routes.
• Pricing generally shows less impact on modal shift than mentioned before – the most significant modal shifts occur with corridor and network pricing in passenger transport.
• Changes in behaviour due to pricing scheme introduction take some time.
• Public acceptance can be improved if revenue hypothecation is offered.
Particular recommendations were:
• To combine road pricing with public transport alternatives.
• To integrate pricing measures and transport information applications.
• To use technology to provide a feedback loop for drivers on the financial implica-tions of their daily trip decisions and to support multi-modal payment systems.
Econometric models illustrate that [TRENEN II]
• Parking pricing can be very effective, as 1/3 to 2/3 of potential societal benefits can be achieved and congestion can be reduced.
• Emission taxes and standards can be effective in stimulating the use of cleaner cars in urban areas, but in rural areas these policies may not be cost-effective.
• Fuel tax policies may reduce car traffic in urban areas and for peak-period inter-urban trips, but other traffic may be unjustifiably inhibited. Fuel taxes are there-fore not viewed as an effective instrument for pricing.
• Once pricing of car transport is corrected, public transport fares should not be set below the marginal cost. They should also differ between peak and non-peak peri-ods.
• Cordon pricing in urban areas and congestion pricing on inter-urban highways can realise a substantial portion of the benefits of optimal pricing.
Definition of policy options
163
[Relevant 4. FWP projects: CONCERT-P, EUROTOLL, QUITS, TRANSPRICE, TRENEN]
The potential policies for PROPOLIS are: 1. Parking pricing policy 2. General car pricing 3. Congestion pricing 4. PT pricing 5. Purchase pricing
5.1.4 International networks and Cluster activities
BEQUEST
BEQUEST was a three-year, EU-funded Concerted Action under the Fourth Frame-work Programme, which ended in the summer of 2001. LT Consultants, co-financed by the Ministry for the Environment of Finland and the Finnish National Road Ad-ministration, was a partner of this project that aimed at facilitating common under-standing of sustainable urban development across both European countries and the actors involved in the built environment. The project held several international work-shops..In addition, a prototype web-based toolkit was developed for enhancing deci-sion-making for more sustainable urban development and linking the various urban scales from the city level down to the components and materials used in construction.
Policies aimed at increasing urban sustainability were presented in the workshops, although they were not a major focus of the project. Below are examples of the more innovative policies mentioned.
Transport
• Locating parking further away from homes, to at least the same distance from the houses as the nearest access to public transport, would lead to a significant reduc-tion in private car use (Knoflacher, 1999).
• Dorda (1999) presents the idea of making the sellers of bulky commodities, such as furniture, responsible for the delivery of the purchased goods in order to opti-mise the logistics involved and so to reduce transport. This kind of policy would also be compatible with the growing trend towards ordering goods via the Internet.
• Cities should be divided into “airtight” areas between which, in addition to pedes-trians and cyclists, only public transport vehicles are allowed to move. Car traffic from one such area to another is possible only through external areas, which sig-nificantly reduces the competitiveness of the private car in the intra-city traffic. (BEQUEST, 2001)
• While not a policy that could be tested in PROPOLIS, it is nevertheless interesting to note this empirical observation from Vienna: the higher the density of land use, the more transport fuels the residents use for getting out of the area on weekends and vacations (Gielge, 2000).
Definition of policy options
164
Land use
• If there is not enough market-driven motivation toward multifunctional develop-ment, authorities could consider stipulating a minimum degree of multifunctional-ity and building density for development projects. This would make developers more aware of complementary uses of space in their areas from the outset (Dorda, 2000). One reason for this not having happened before to a larger extent is spe-cialisation: a developer concentrates on property development and a company ex-tending its chain of shopping centres focuses on analysing the retail market and constructing new shopping centres in targeted locations.
Integrated transport and land use planning
• According to Dorda (2000), some monofunctional sources and destinations of sig-nificant traffic flows might be ideal candidates for major public transport nodes in addition to being suited for multifunctional use and a higher population density. Conversely, public transport operators could exploit the large passenger flows at the transport nodes and attract services thereto.
Economic instruments
• Authorities should use new kinds of measures to enhance sustainability in cities (Dorda, 2000). These could include incentives and subsidies for inner-city shop-ping and leisure infrastructure as well as penalties for out-of-town complexes by passing on the cost of infrastructure construction to them (e.g. as taxes for creating traffic flows). He points out, however, that these regulations must be based on a sound judicial basis in order to avoid court cases on the grounds of unfair compe-tition.
• Employers and employees could be granted tax-deductible benefits if employees live within a certain distance of the workplace (Dorda, 2000).
• BEQUEST also produced some general principles to be taken into account in at-tempts to increase the sustainability of cities. These include the following (BEQUEST, 1999):
• Short-term imperatives seem to be primary drivers in urban development, whether it is a question of regenerating run-down and polluted industrial areas or to solve a specific traffic problem. The consequent risk is an action-orientated, piecemeal agenda where the total sustainability implications of (re)development are not con-sidered systematically. It is important, therefore, to recognise the potential risks between:
− Urgent short-term actions to remedy urban decay; these are often driven by sources of regeneration funding;
− Adequate time for reflection, by all stakeholders, on the future nature of the urban district or city; it is important to stop to think that any solution for an acute problem will have impacts also beyond solving (or otherwise) the prob-lem;
− The short-time lifetime of political jurisdiction; and naturally

Definition of policy options
165
− Consideration of the long-term economic, social and environmental sustain-able urban development objectives.
• One of the BEQUEST workshops dealt specifically with public participation. Al-though it is not explicitly recorded in the workshop documentation, there was no consensus on more participation always leading to more sustainable development. Some of the participants took this to mean that participation as such should per-haps not be considered an element of sustainability, but rather of democracy, and that these, while both important, should not be confused. This discussion might have some implications on how collecting weights and/or value functions from the general public is seen in the PROPOLIS context.
5.2 Policies tested in all case cities
5.2.1 General
A common simulation period has been defined for all the models. The reference for the existing situation is the base year 2001 and the horizon year is 2021. A five-year time interval defines the intermediate year 2011 and the possible policy starting years 2006 and 2016. The comparison of the policy results both in terms of travel demand and of land use impacts is carried out alternatively at the horizon year 2021 or at the intermediate year 2011.
2001 2006 2011 2016 2021
Base year Intermediate year
Horizon year
Possible policy starting year
Possible policy starting year
Possible policy starting year
Possible policy starting year
The policies tested in all case cities are presented in table 5.1. The table also indicates the assumed years of implementation of the policies; some policies are implemented gradually.
The selection of policies is based mainly on the results of the literature review and the partners’ experience on the most potential policy options. These policies have first been tested in the Helsinki case and, based on the run results, a recommendation for the common policies was made. In addition to the common policies each case city has tested a set of local policy options defined in co-operation with the respective local authorities.
The common policy elements represent different types of actions: investment, pricing, regulation, public transport and land use policies.
The policy combinations are combinations of the most potential policy elements in each category. For car and PT pricing policies a city specific optimum level has been defined and this level has guided the selection of the pricing level used in the policy combinations. This pricing level varies between cities.
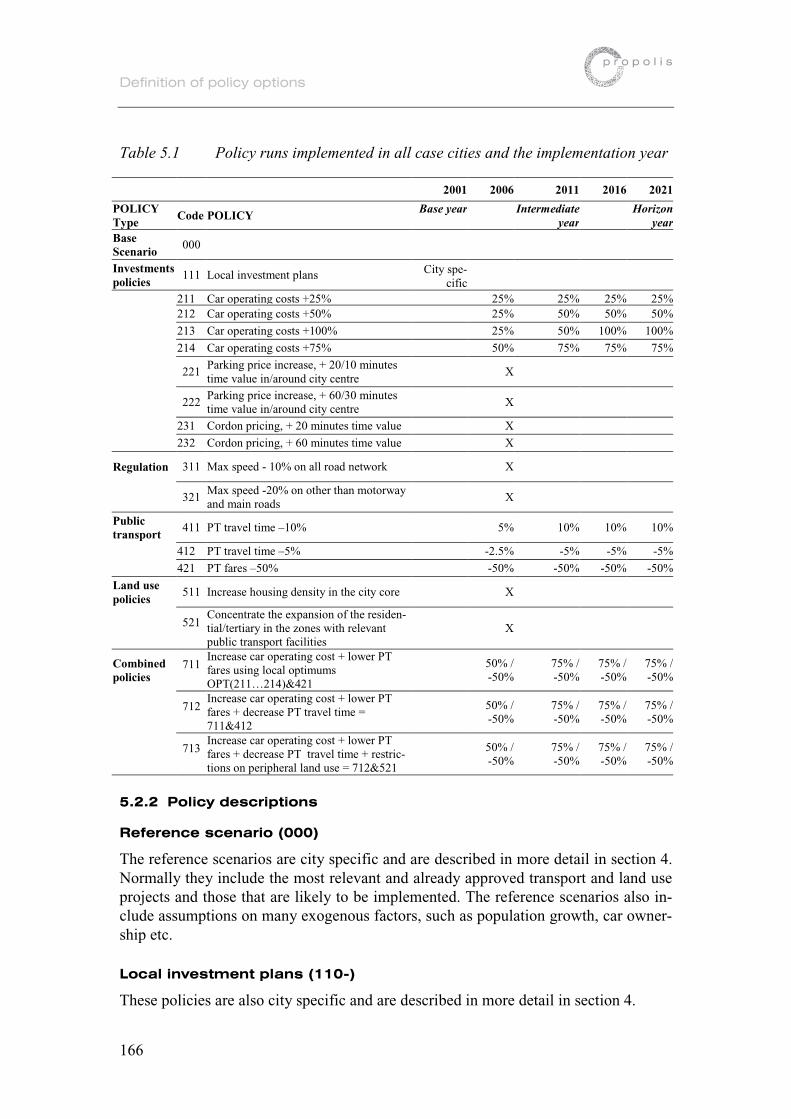
Definition of policy options
166
Table 5.1 Policy runs implemented in all case cities and the implementation year
2001 2006 2011 2016 2021
POLICY Type
Code POLICY Base year Intermediate
year Horizon
yearBase Scenario
000
Investments policies 111 Local investment plans City spe-
cific 211 Car operating costs +25% 25% 25% 25% 25% 212 Car operating costs +50% 25% 50% 50% 50%
213 Car operating costs +100% 25% 50% 100% 100%
214 Car operating costs +75% 50% 75% 75% 75%
221 Parking price increase, + 20/10 minutes time value in/around city centre
X
222 Parking price increase, + 60/30 minutes time value in/around city centre
X
231 Cordon pricing, + 20 minutes time value X
232 Cordon pricing, + 60 minutes time value X
Regulation 311 Max speed - 10% on all road network
X
321 Max speed -20% on other than motorway and main roads
X
Public transport 411 PT travel time –10%
5% 10% 10% 10%
412 PT travel time –5% -2.5% -5% -5% -5%
421 PT fares –50% -50% -50% -50% -50%
Land use policies 511 Increase housing density in the city core
X
521 Concentrate the expansion of the residen-tial/tertiary in the zones with relevant public transport facilities
X
Combined policies
711 Increase car operating cost + lower PT fares using local optimums OPT(211…214)&421
50% / -50%
75% / -50%
75% / -50%
75% / -50%
712 Increase car operating cost + lower PT fares + decrease PT travel time = 711&412
50% / -50%
75% / -50%
75% / -50%
75% / -50%
713 Increase car operating cost + lower PT fares + decrease PT travel time + restric-tions on peripheral land use = 712&521
50% / -50%
75% / -50%
75% / -50%
75% / -50%
5.2.2 Policy descriptions
Reference scenario (000)
The reference scenarios are city specific and are described in more detail in section 4. Normally they include the most relevant and already approved transport and land use projects and those that are likely to be implemented. The reference scenarios also in-clude assumptions on many exogenous factors, such as population growth, car owner-ship etc.
Local investment plans (110-)
These policies are also city specific and are described in more detail in section 4.

Definition of policy options
167
Pricing/car operating costs (211 – 214)
Background, underlying theory and hypotheses
An ideal pricing policy would balance the supply and demand of traffic by regulating the prices taking into account the time of the day (degree of congestion), the environ-mental conditions (road type and its surroundings) and the related external costs in the form of pollutants, noise, accidents etc. Technical solutions for this type of pricing system do not exist, yet, and instead more straightforward solutions are tested.
The policies may have many positive effects since they are likely to reduce car travel. The environmental effects are assumed to be positive but the policy may also reduce the total time spent in traffic and the frequency of traffic accidents while increasing accessibility. The user benefits for car owners are negative but the government bene-fits and external cost savings compensate for this disutility and socio-economically the policies may be viable. An optimum city specific level for an increase in operating costs exists. The number of car owning inhabitants in the city centre is likely to in-crease but some of the workplaces are likely to move to outer areas.
Model implementation
Several levels of pricing have been tested, 25%, 50%, 75% 100%, in order to find the optimum level. If necessary, also other levels were tested in some of the case cities. Car operating cost is defined as the perceived operating costs, which is about the same as the price of fuel including fuel tax and VAT.
Pricing/parking (221, 222)
Background, underlying theory and hypotheses
Increasing central-area-parking charges will make car trips to the central city less at-tractive and so induce more people to choose public transport on their way to the city centre for work or shopping. However, high central-city parking charges will also make city-centre shops less attractive compared with greenfield shopping centres where parking is free, and so endanger the viability of inner-city retail. This policy, then, may be a double-edged sword.
Model implementation
Parking charge levels are city specific. This is why the changes are related to value of time. An extra charge corresponding to the value of time for a work purpose trip of 20 minutes in the City centre zones, and of 10 minutes in the inner urban zones has been used in 211. The second policy 222 operates with an extra charge corresponding to a 60/30 minutes time value.
Pricing /cordon pricing (231, 232)
Background, underlying theory and hypotheses
The rationale behind this policy is similar to the one for increasing inner-city-parking charges. The idea is to reduce the number of car trips to the city centre and motivate people to take public transport instead. As with higher parking costs, this works fine in the case of necessary trips, such as work trips. However, discretionary trips, such as

Definition of policy options
168
shopping trips, might as well be redirected to other locations outside the cordon, such as greenfield shopping centres, and this may hurt city-centre retailers.
Model implementation
A cordon pricing charge on inner urban/city centre corresponding to the extra value of parking charges in City centre is introduced. The charge is equal to the value of time for work purpose trip of 20 and 60 minutes. The physical design of the cordon pricing is city specific.
Regulation (311, 321)
Background, underlying theory and hypotheses
There are two considerations connected with this policy. First, making car trips slower will increase the relative attractiveness of public transport and so reduce the number of trips made by car. Secondly, the consequences of traffic accidents become dramati-cally more serious when the car speeds exceed 40 km/h. Lower speed limits are found to be a very effective way to avoid fatal traffic accidents.
Lowering speed limits on main roads will increase traffic on secondary roads leading to environmental problems and to the fact that part of the net effects on traffic acci-dents are lost. A more effective way is to lower the speeds on other than main streets.
Model implementation
Regulation policies impose lower speeds on the road network. A policy decreasing maximum speed by 10% on the entire road network is introduced (311). Secondly, a policy decreasing maximum speed by 20% on other than motorways and main roads is introduced (321).
Public transport (411, 412, 421)
Background, underlying theory and hypotheses
Mode choice is based on a comparative evaluation of travel time, travel cost and com-fort of competing modes. Improving the speed, comfort and frequency of buses and trains will therefore contribute to increasing the share of public transport and reduce the number of car trips.
Following economic theory, making a commodity less expensive will increase its use. The hope behind this policy is therefore that, if public transport is made less expen-sive, more people will choose public transport than the car. However, the action space theory of time geography suggests that if the travel time or travel cost budgets people are willing to spend are not used up entirely, people will not enjoy the savings but will travel more in order to extend their range of activities and contacts. Thus, the trip lengths for both car and PT may increase. As a result there may be clear signs of city sprawl including workplaces and inhabitants moving to outer areas.

Definition of policy options
169
Model implementation
A way to take into account an increase in the quality of services is to take the increase in the speed of the service as a proxy. Two policies have been tested; a 10% increase in average speed (411) and a 5% increase (412). They are considered as an effect of both increasing the speed (due to an optimisation of the service, increasing and/or regularisation of service frequencies, implementation of priority lanes and/or priority traffic lights etc) and making it more comfortable (by some fleet renewals, increase in service frequencies, quality of information, bus stops and stations etc). The invest-ment and operation costs to achieve these improvements have been estimated sepa-rately for each case city.
The third policy (421) assumes a 50% decrease in PT fares. Some cities have also tested other levels of PT fare reductions.
Land use (511, 521)
Background, underlying theory and hypotheses
People moving to the peripheral areas of the cities mainly cause urban sprawl. The level of public transport services may be poor and distances to other services and workplaces long. This increases the need for car travel resulting in a variety of envi-ronmental problems. This phenomenon could be curtailed by restricting the use of pe-ripheral land or by making the more central areas more attractive.
The policy is widely used in different forms through applying building regulations, special taxes and greenbelt concepts. The impacts are assumed to be positive but, without model studies, it is difficult to say how the long-term effects would have been without the policy.
'Transit-oriented' development has a long history ever since the first garden-city de-velopments were linked by railway to the city centre. The rationale of transit-oriented development is the hypothesis that people living near well-served transit stops are more likely to use public transport on their way to work or shop in the city centre.
Land use patterns may have an influence by reducing the per capita vehicle travel and/or average travel distance. In particular the average inhabitant density, the pres-ence of mix-use settlement and a “transit-oriented” development is assumed to reduce the distances that residents must travel for some services, and to encourage the use of walking and cycling for such trips.
Model implementation
Policy 511 increases the average inhabitant density in the city core. Brownfields that are now surrounding the city centres can be converted to residential/tertiary areas. In detail, in the city centre and inner urban area 1%/year of industrial floorspace is con-verted into residential/tertiary floorspace, and consequently the same amount of resi-dential floorspace in the “outer urban” area is converted from residential/tertiary to industrial.
Definition of policy options
170
Policy 521 concentrates in the forecast years the expansion of the residential/tertiary activities to the zones that have adequate public transport facilities. The application of this principle is city specific. However, the total increase in floorspace is kept equal to the base case.
Policy combinations (711, 712, 713)
Background, underlying theory and hypotheses
While it is of interest to examine the contributions of individual policies to the achievement of planning goals such as efficiency, equity and sustainability, it is even more relevant to study their combined impacts. As urban areas are complex systems with multiple interactions between their subsystems, it is to be expected that policy packages, i.e. co-ordinated combinations of complementing policies, may lead to syn-ergy effects, i.e. to results that are more than the sums of the effects of the individual policies. Indeed there are good theoretical reasons to assume that land use policies alone, without supporting transport policies, will achieve little in reducing car mobil-ity. However, compact and mixed-use patterns of development are the necessary pre-requisite for the effectiveness and acceptability of transport policies to constrain car travel and promote public transport, walking and cycling.
Model implementation
The common policy combinations are composed of the most potential options in dif-ferent policy categories, as defined based on the preliminary run results.
First the car pricing policy is combined with the lowering PT fares policy (711). The optimum levels of the above policies are considered when defining the combination but, as the policies work in the same direction, a mitigated version of each policy is preferred. The idea is also to balance the money flows using the additional taxes from car pricing to support public transport, as well as to reduce the city sprawl effects re-sulting from the PT fare-reduction policy.
Secondly, the above policy is combined with the PT travel time reduction policy. Also here the idea behind is to use additional taxes/fares for PT investments (712).
Finally, the above policy is combined with the restrictions on peripheral land use pol-icy in order to influence the sprawl effects that low PT fares might have (713).
Some other policy combinations have also been locally tested; see the description of local policies in the next section.
5.3 Local policies
5.3.1 Helsinki
The Helsinki Metropolitan area has a transport plan and a corresponding investment programme, see section 4.6.1. This plan has been used as the reference scenario in the PROPOLIS work. The local policies for Helsinki are based on variations of the basic

Definition of policy options
171
transportation plan. The list of the main local policies not included in the testing pro-gramme for all PROPOLIS cities is:
• Advance the public transport projects and postpone the road investments (111)
This policy is based on the assumption that transport modes compete with each other, and that therefore increasing the attractiveness of public transport at the ex-pense of road improvements will enhance the competitive position of public trans-port and lead to a shift from car to public transport. In the model implementation the road projects are postponed by 5 years and PT projects advanced by 5 years. It also serves as a sensitivity test for the transport master plan.
• Postpone all investments (112)
This policy serves as a sensitivity test and a scenario for when public funding for transport investments may become limited. All investments are postponed by 5 years.
• Do not invest at all (113)
This policy serves as a theoretical sensitivity test and the do-nothing scenario.
• Develop tangential public transport (114)
In most urban areas suburbanisation of population is now increasingly followed by suburbanisation of offices and service industries that used to be in the city centre. In addition, there are more and more jobs in newly established suburban locations, such as 'office parks', 'technology parks' or roadside strip developments and greenfield shopping centres. Accordingly, the pattern of work trips gradually shifts from its radial orientation towards the city centre to a more dispersed 'many-to-many' pattern, with a large proportion of tangential 'suburb-to-suburb' trips. Or-bital public transport connections would take account of this development and may attract some of these trips.
Orbital connections have been enhanced by:
• An existing bus-based service near the inner Ring Road I is converted to rail ser-vice with a more rapid line speed and 5 minute headways
• A new rail connection in the northwest orbital (near Ring Road II) connecting the western metro and rail tracks with the northern circular track with 10 minutes headways
• A new rail connection in the northeast orbital (near Ring Road II) connecting the eastern (metro) track with the northern circular track with 10 minutes headways
All the current radial rail services would be connected with two full orbital ser-vices in parallel with the existing Ring roads. For illustrative purposes these tracks have been established already in year 2005, although some of the connected ser-vices (Marja-rail and metro extension to the west from Ruoholahti to Matinkylä) will not be operational according to the plans before 2010 and 2015, respectively. Therefore, the full impact of the orbital-radial connections should be seen in the years 2015 and 2020.
Definition of policy options
172
• Special pricing system for long work trips (121 )
This means in practise changing of a special Finnish tax rule compensating costs of long work trips. The tax relief is calculated from public transport fares. The pol-icy is implemented by defining the additional cost as a function of distance. The additional cost rises from 1 cent/km to 3 cents/km for trips below 100 kilometres and then decreases again towards approximately 1 cent/kilometre for 300 km trips.
• A new railway line from Helsinki to Lohja (116)
In most European countries the railway network was highly developed when rail-ways were the only mode of motorised transport, so that in many urban areas there are more rail lines than are in use for person travel today. So in many cases exist-ing tracks can be revitalised for public transport. In some cases, even new subur-ban rail lines may be introduced. The motivation most likely would be that fast and convenient rail service would attract more passengers than the existing slow busses and so reduce the number of car trips.
The above philosophy is tested by assuming a new railway been implemented and by assuming expansion of urban structure along the railway corridor. The head-way is 30 minutes. The land use regulations will allow (not force) the extra con-struction of:
− 100 000 sq-m2 of employment floorspace and 100 000 sq-m2 of housing floor-space in zone 38, Vanha-Espoo
− 100 000 sq-m2 of employment floorspace and 200 000 sq-m2 of housing floor-space in zone 58, Lohjan keskusta
− 50 000 sq-m2 of employment floorspace and 50 000 sq-m2 of housing floor-space in zone 60, Veikkola
• Congestion pricing (117)
The distance based charging divides the Metropolitan Area into three concentric zones around the city centre where the charges are 10 cents/km within the city centre, 7 cents/km in the inner suburbs and 3 cents/kilometre in the outer suburbs.
• Cordon pricing policies (231-233)
The policies use the same orbital zones as the distance based system (see above) where the charges are 0.85€/passage (test 231), 1.28 €/passage (test 233) or 1.7 €/passage (test 232). These orbital cordons are supplemented with three radial cordons (with prices) to control the problems of diverted traffic. The charge for radial cordons is half of the orbital ones.
• Increase/decrease PT fares (118, 119, 122, 124, 125)
These policies are variations of the basic PT fare-pricing policy 421 described in the previous chapter and are run in order to define the optimum level of PT fares.
In addition to the above main policies also a set of other policies and policy combina-tions have been run as sensitivity tests (see section 6.1).

Definition of policy options
173
In car pricing policies the car operating cost changes refer to the 2001 value of fuel of 6.3 cents/km. This base value is assumed to increase with time. Adoption of the policy additionally increases these values.
Figure 5.1 The two road toll systems considered in the Helsinki case are i) pas-sage based payment (X1 €/passage on the inner/outer links, X2 €/passage for diago-nal links) at zone borders (cordon tolls) and ii) distance-based payment (X1/X2/X3 €/km within inner/middle/outer border, where X gets different values in different tests) at zone borders (Progress 2002)
5.3.2 Dortmund
Two policy scenarios have been defined as local polices to be tested in PROPOLIS. The local policies are extensions of the reference scenario described in Section 4.4.3, but contain also assumptions about faster implementation of parts of the infrastruc-ture. Both local policies aim at improving the performance of public transport in the study region.
• Additional investments in public transport (111)
This policy assumes a substantial improvement of public transport services in the study region. Investments will mainly be devoted to underground, light rail and ordinary rail lines. Whereas the reference scenario contains only the most likely investments of the state of North-Rhine Westphalia's public transport plan (MWMTV, 1999), Scenario 111 contains also those links that have been given lower priority. Scenario 111 includes quite a number of substantial extensions of underground and light rail lines from the cities of Dortmund and Bochum towards suburban locations, new construction of local rail lines and the reactivation of closed down rail lines between suburban municipalities.

Definition of policy options
174
• Public transport infrastructure for the 'dortmund project' (112)
Dortmund's local government recently has developed a new economic and spatial strategy for the city. The so-called 'dortmund-project' is an attempt to put the city as a prime location for IT-technologies, E-commerce, micro system technologies and logistics on the map. This should foster the economic transformation from a former coal and steel town to a centre of the information and knowledge society (dortmund-project, 2000). The vision is to develop about 70,000 new jobs in the city of which 60,000 are expected in the new leading industries and 10,000 in ex-isting industries. The strategy comprises the mobilisation of entrepreneurship and investments, the qualification of people and the development of educational insti-tutions, and the provision of appropriate and attractive sites for working, housing and leisure within the city. So far, public transport development is not an integral part of the dortmund-project. Therefore, Scenario 112 contains proposals how to link the new development sites with the existing underground and light rail system of the city (Schließler, 2001).
Figures 5.2 and 5.3 show the assumed transport infrastructure changes for the policy scenarios (see Section 4.4.3). Figure 5.2 shows investments in road infrastructure and figure 5.3 shows investments in public transport infrastructure. The maps show those infrastructure developments that are already part of the reference scenarios and are used in all policy scenarios as well. In addition, the maps contain the changes for the local policy scenarios 111 and 112 as described above. The road infrastructure map indicates also the cordon pricing area to be used in scenarios 231 and 232.
Figure 5.2 Infrastructure scenarios for the Dortmund urban region, road infra-structure.

Definition of policy options
175
Figure 5.3 Infrastructure scenarios for the Dortmund urban region, public trans-port infrastructure.
5.3.3 Inverness
The Highland Council has supplied all the data for the ‘Business as Usual’ scenario linked with the ‘Current Policies’ policy and this has been used as the local policy. It includes the completion of the ‘southern distributor road’ around the south of Inver-ness (which is in effect a small ring road, which allows traffic to avoid travelling through Inverness itself.). Other transport policies are also introduced to encourage walking and cycling at the local scale. Bus and Rail services are greatly improved. Rail services are increased and ‘Express buses’ are introduced, which provide rela-tively fast links from Inverness to other towns in the model region and beyond. There is assumed to be a moderate increase in population in the area over the period along with an increase in tourism and other forms of employment. A certain amount of de-velopment land is made available in certain zones within the model in accordance with the predicted plans set out by the Highland Council.
5.3.4 Naples
Local investment policies in Naples are mainly oriented to the improvement of the public transport service by means of the extension of the dense railway network. In addition, investments for new roads and new minor pedestrian areas scattered in the city are considered. With reference to public transport, the investment policy in-cluded:
• Completion of the existing metro line ring (Metrò Collinare) through the city cen-tre;

Definition of policy options
176
• Rehabilitation and extension of the local railways network (Circumvesuviana, Cumana, Circumflegrea, Alifana);
• Completion of new tram lines from the city centre to the north and east areas of Naples municipality;
• Design of new interchange nodes for the rail network, including a large park&ride scheme.
5.3.5 Vicenza
The Vicenza local policy scenario is derived by a preliminary strategic plan prepared (Documento Programmatico Preliminare DPP) by the Municipality, which describes the future development of the city for the next 20 years. The DPP includes new road infrastructures although its core is the new design of the public transport network as a consequence of the new Milan-Venice High-Speed railway line, which will have a stop in Vicenza. Other than improving Vicenza accessibility from/to the rest of Italy and Europe, the High Speed project will free capacity on the existing congested rail lines, offering the possibility to significantly improve the quality of public transport services. The projects included in the local investment policy are:
• A new 6 km light-metro line connecting the airport, the High Speed rail station and the rail station of Vicenza;
• The development of the new regional railway service (SFMR Veneto) in the met-ropolitan area of Vicenza with improved service (increased frequencies) and new (and rehabilitated) stations;
• New park&ride lots connected with public transport lines and new parking areas around the city centre;
• The completion/addition of interurban road links.
5.3.6 Bilbao
This policy takes into account the main local investment plans for Bilbao in the period 2006-2021, subdividing the actions in periods of five years.
The main actions considered include the railway plans for the studied period plus a new ring road for the Bilbao Metropolitan Area, called Super Sur.
The projects included in the local investment policy are summarised below, along with the estimated period for completion and the total investment cost per period (in M€ 2001):
2006-2011: • New underground station in Iberberango • Access to airport terminal • Railway connection Etxebarri-Otxarkoaga-Casco Viejo • Tramway: Basurto-Rekalde-Abando, Autonomía-Hurtado Amezaga, Leioa-
Universidad • Track separation in Bedia-Lemoa

Definition of policy options
177
2011-2016: • Extension of underground line to Galdakao • Track separation in Balmaseda-Zaramillo • Tramway track separation in Pío Baroja-Atxuri • Tramway: Autonomía-San Francisco, San Mamés-Urbínaga, Leioa-Urbínaga
2016-2021: • Track separation in Bebida-Lemoa-Amorebieta-Durango • New railway station in Amorebieta • Track redefinition in Kobetas • Tramway: Urbínaga-Santurtzi, Urbínaga-Trápaga, Trápaga-Muskiz • Súper Sur Ring Road
Investment Costs: - Period 2006-2011: 271 M€ 2001
- Period 2011-2016: 209 M€ 2001
- Period 2016-2021: 513 M€ 2001
5.3.7 Brussels
Two local policies were simulated in the Brussels case study (numbered as 611 and 612 in the Brussels result table). Both of them are land-use policies targeted to com-panies of the tertiary sector.
Both policies are derived from the “ABC theory”. The ABC theory comes from The Netherlands. It consists of defining “mobility profiles” for the companies, “accessibil-ity profiles” (so-called “A”, ”B”, ”C” profiles) for the locations, and of making the adequate match between companies and locations. In particular, companies from the tertiary sector inducing large flows of commuters should be located in A-profile loca-tions, i.e. central urban locations well connected by public transport to the whole met-ropolitan area or even to the whole country (e.g. served by high quality inter-city/inter-region rail services).
Policy 611 consists of a regulatory measure: all jobs created in the sector “business services” between 2001 and 2021 (2021 scenario with the RER) must locate in so-called “A-zones”, that have convenient public transport facilities.
Policy 612 consists of a fiscal measure, which aims to incite companies from the “business services” sector to locate in “A-zones”. A tax amounting to 2 000 Euro/job/year is applied to all companies from this sector located in non-A zones. (The level of the tax approximately corresponds to the real cost of an annual public transport season ticket).
In both cases, the “A-zones” were defined as the zones served by InterCity-InterRegion railway stations. This definition of A-zones is rather restrictive: the A-zones are located mainly in the city-centre of Brussels, as well as in a couple of other municipalities that lie mostly in the macro-zone “Rest of the Region”. In all, the A-zones amount to only 19 zones (out of a total of 152).

Definition of policy options
178
References:
AFFORD (1999) Deliverable 1: Operationalisation of Marginal Cost Pricing within Urban Transport.
Project funded by the European Commission under the Transport RTD Programme of the 4th Frame-
work Programme.
AFFORD (2000) Deliverable 2A : Economic and equity effects of marginal cost pricing in transport.
Project funded by the European Commission under the Transport RTD Programme of the 4th Frame-
work Programme.
Banister, D. (2000) “Sustainable urban development and transport – a Eurovision for 2020”. Transport
Reviews, 20, (No 1): pp. 113-130. Taylor & Francis, UK.
Banister, D., D. Stead, P. Steen, J. Åkerman, K. Dreborg, P. Nijkamp and R. Schleicher-Tappeser
(2000) European Transport Policy and Sustainable Mobility. E & FN Spon, London and New York.
Banister, D., K. Dreborg, L. Hedberg, S. Hunhammer, P. Steen and J. Åkerman (2000) “Transport Pol-
icy Scenarios for the EU: 2020 Images of the Future”. Innovation, 13, (No. 1): pp. 27-45. Taylor &
Francis, UK.
BEQUEST (1999) Information sheet 4: Turin – Time and Space in the Evaluation of the Built Envi-
ronments for Sustainability. Available at http://www.surveying.salford.ac.uk/bqextra/. Concerted Ac-
tion funded by the European Commission under the Environment and Climate RTD Programme of the
4th Framework Programme.
BEQUEST (2001) A presentation given in the BEQUEST Lisbon Symposium. Information on the
event will be available at http://www.surveying.salford.ac.uk/bqextra/. Concerted Action funded by the
European Commission under the Environment and Climate RTD Programme of the 4th Framework
Programme.
BEQUEST (3/7/2001)
Christidis, P. (2000) “Economic Growth and Reduction of Transport Emissions: A Feasible Combina-
tion”. The IPTS Report, 47 (September): pp. 31-37. European Commission, Joint Research Centre,
Seville.
Dorda, A. (2000): Presentation at the BEQUEST Workshop in Vienna, based on Dorda, A. (1999)
“New approaches to land-use planning: transport policy and sustainable urban development.” The IPTS
Report, 35 (July): pp. 17–18 & 23–27, IPTS – JRC, Seville, Spain.
Dortmund-project (2000): Das Zukunftspaket. Dortmunds Sprung in die Informations- und
Wissensgesellschaft. Dortmund.
European Foundation for the Improvement of Living and Working Conditions (1996) Towards an Eco-
nomic Evaluation of Urban Innovative Projects- Micro Projects for Mega Change. Luxembourg: Of-
fice for Official Publications of the European Communities.
European Foundation for the Improvement of Living and Working Conditions (1997) Innovative and
Sustainable Cities. Luxembourg: Office for Official Publications of the European Communities.
EXPEDITE (2000) Proposition of policies. Draft version – November 20th 2000. Project funded by the
European Commission.

Definition of policy options
179
Expert Group on the Urban Environment (2000) Targeted summary of the European Sustainable Cities
Report for Local Authorities.
Expert Group on the Urban Environment / Working Group on Sustainable Land Use. (2000) Towards
more sustainable urban land use. Prepared for the group by Liz Mills. Interim Report July 2000.
EXTRA (2000) Project funded by the European Commission under Transport RTD Programme of the
4th Framework Programme.
Gayda, S. (2001) Policies of the Belgian Authorities accompanying the future implementation of a new
RER link. Stratec. Belgium.
Gielge, J. (2000): “Strategic Planning in Vienna.” Presentation at the BEQUEST Workshop in Vienna.
Concerted Action funded by the European Commission under the Environment and Climate RTD Pro-
gramme of the 4th Framework Programme.
http://europa.eu.int/comm/environment/urban/locsm-en.htm (18.3.2000).
http://www.surveying.salford.ac.uk/bqtoolkit/tkpages/protocol/action/planstact.htm
ISGLUTI (1988) International Study Group on Land-use and Transport Interaction. Urban Land-use
and Transport Interaction – policies and Models. Webster F.V. et al. (ed). Aldeshot. Avebury. 520s.
ISBN 0-566-05726-3. Reprinted 1990.
ISHTAR – Extract from the draft Description of work – version 1/09/2000. Project funded by the
European Commission.
Knoflacher, H. (1999): “Mobility and Quality of Life”. BEQUEST Information Sheet 3:
The Amsterdam Workshop – Quality of Life. Available at http://www.surveying.salford.ac.uk/bqextra/.
Concerted Action funded by the European Commission under the Environment and Climate RTD Pro-
gramme of the 4th Framework Programme.
Kungliga Tekniska Högskolan, Avdelning för trafik- och transportplanering (1999) Traffic in Major
cities – problems and prospects. Draft Final Report. Chapter 8, p. 174-191. KTH, Sweden.
LEDA (2000) Databank: http://www.ils.nrw.de/netz/leda/components.htm (7/3/01). Project funded by
the European Commission under the Transport RTD Programme of the 4th Framework Programme.
May, A. D., D. S. Milne (2000) The impact on network performance of driver’s response to alternative
road pricing regimes. Paper No 00-1493. Institute for Transportation Studies, The University of Leeds.
England.
Mayet, J. and M. Hansen (2000) “Congestion Pricing with Continuously Distributed Values of Time”.
Journal of Transport Economics and Policy, 34 (September): pp. 359-370, the London School of Eco-
nomics and the University of Bath, England.
MWMTV – Ministerium für Wirtschaft und Mittelstand, Technologie und Verkehr des Landes
Nordrhein-Westfalen (1999): ÖPNV-Bedarfsplan 1998 des Landes Nordrhein-Westfalen – Programm
für den Ausbau der ÖPNV-Infrastruktur bis 2015. Düsseldorf: MWMTV.
Organisation for Economic Co-operation and development (1999) Urban Policy in Germany, Towards
Sustainable Urban Development. OECD, Paris.
Organisation for Economic Co-operation and Development, European Conference of Ministers of
Transport (1995) Urban Travel and Sustainable Development. OECD/ECMC, Paris.

Definition of policy options
180
Patermann, C. Sustainable development in European Cities: How reaserch can contribute. Director of
the Environment and Sustainable Development research programme. European Commission, DG Re-
search.
Paulley, N. and A. Pedler (2000) Final Report (Draft). Deliverable D4, Integration of Transport and
Land Use Planning (TRANSLAND). Transport Research Laboratory, UK.
PROGRESS (2002), WP2 - Scheme Design and Development, Deliverable D3.2, Draft 25.3.2002
PROSPECTS (2001), Deliverable No. 4, Initial Policy Assessment, version 5.1., 30th October 2001
Schließler, O. (2001): Schienenpersonenverkehr und regionale Standortentwicklung an der Oberen
Emscher. Information des Infrastrukturdezernates der Stadt Dortmund zur Verkehrsentwicklung
Nummer 2. Dortmund: Stadtbahnbauamt.
SPARTACUS (1998) Final Report. Project funded by the European Commission under the Environ-
ment and Climate RTD Programme of the 4th Framework Programme.
The European Commission (2000) Targeted Summary of the European Sustainable Cities Report for
Local Authorities. The Expert Group on the Urban Environment.
TRANSLAND (2000) Final Report (draft). Deliverable D4 Transport and Land Use Planning. Project
funded by the European Commission under the Transport RTD Programme of the 4th Framework Pro-
gramme.
Working Paper generated as input to DETR’s Guidance on the Methodology for Multi Modal Studies
(GOMMMS). 46 pages.

181
6. Analysis of policy testing results
Summary
This section analyses and summarises the policy testing results of all policies, including local ones, separately for each of the case cities.
Different city specific methods have been used to illustrate the results regard-ing, for example, land use changes or development of some indicators through time. However, in order to make the comparisons between policies and between cities more evident, each section ends with a uniform summary table showing the environmental, social and economic indices by policy. In some cases local policies are designed to define the optimum level of car pric-ing or PT fares.
The detailed results by indicators and background variables by policy are pre-sented in the appendix.
It is important to note that each city is different and behaves in an individual way and that there is no one action that would be optimal for all the cities. However, general trends can be found revealing the lines to follow in order to increase the overall sustainability. These are analysed in more detail in section 7 “Intercity comparisons”.
The city specific results are, however, an important platform for further local studies. They also clearly show that it is possible to significantly improve all dimensions of sustainability in all case cities, from the level already established on the basis of local investment and other measures, by adopting selected policies and their combinations of the PROPOLIS test programme.

Analysis of policy testing results
182
6. Analysis of policy testing results
6.1 City specific findings in Helsinki
6.1.1 General
The main city specific policies that have been tested, including also the common poli-cies tested in all case cities, are presented in table 6.1. Detailed results are presented in the appendix and a summary of the environmental, social and economic indices is presented at the end of summary section 6.1.9. A brief description of the findings is presented below.
Table 6.1 Helsinki local policies and the year of implementation
2001 2006 2011 2016 2021 POLICY Type
Code POLICY Base year
Interme-diate year
Horizon year
Reference Scenario
000
Investments policies
111 Delay road network (RN) development 5 years, advance (PT) investments 5 years
RN 2001PT 2011
RN 2006 PT 2016
RN 2011 PT 2021
RN 2016PT 2021
112 Delay all transport investments 5 years RN 2001PT 2001
RN 2001 PT 2006
RN 2011 PT 2011
RN 2016PT 2011
113 Do not invest RN 2001PT 2001
RN 2001 PT 2001
RN 2001 PT 2001
RN 2001PT 2001
114 Develop orbital connections of PT X X X X 116 New railway connection to Lohja. X X X X 120 Delay PT investments 5 years, advance RN
investments 5 years RN 2011
PT 2001RN 2016 PT 2006
RN 2021 PT 2011
RN 2021PT 2016
Pricing 117 Congestion (peak) pricing +3 cent/7cent/ 10 cent/km, increasing towards centre.
X X X X
121 Reduce tax relief (add as cost) of long work trips
X X X X
211 car operating costs +25 % 1,5 cent/km 25 % 25 % 25 % 25 % 212 car operating costs +50 % 3,0 cent/km 25 % 50 % 50 % 50 % 213 car operating costs +100 % 6,3 cent/km 25 % 50 % 100 % 100 % 214 car operating costs +75 % 4,7 cent/km 50 % 75 % 75 % 75 % 216 car operating costs +150 % 9,5 cent/km 25 % 50 % 150 % 150 % 218 car operating costs +200 % 12,6 cent/km 25 % 50 % 200 % 200 % 221 Parking price + 20/10 minutes time value
(0,85/0,42 Euro) in/around city centre X
222 Parking price +60/30 minutes time value (2,55/1,3 Euro) in/around city centre
X
231 Cordon pricing +20 minutes time value (0,85 Euro)
X
232 Cordon pricing +60 minutes time value (2,55 Euro)
X
233 Cordon (peak) pricing +40 minutes of time value (1,7 Euro) in orbital cordons and 20 minutes of time value (0,85 Euro) in radial cordons
X X X X
Regulation 311 Max speed –10% on all road network X X X X 321 Max speed –20% on other than motorway
and main roads X X X X

Analysis of policy testing results
183
Public transport
118 PT fare +20 % +20 % +20 % +20 % +20 %
119 PT fare –20 % -20 % -20 % -20 % -20 % 122 PT fare –40 % -40 % -40 % -40 % -40 % 123 PT fare –60 % -60 % -60 % -60 % -60 % 124 PT fare –80 % -80 % -80 % -80 % -80 % 125 PT fare -100 % -100 % -100 % -100 % -100 % 411 PT travel speed/service +10% 5 % 10 % 10% 10 % 412 PT travel speed/service +5% 2.5 % 5 % 5 % 5 % 421 PT fares –50 % -50 % -50 % -50 % -50 % Land use policies
511 Increase the average housing density in the city core
Regulate No Change
No Change
No Change
521 Concentrate the expansion of the residen-tial/tertiary in the zones with relevant PT facilities
Regulate No Change
No Change
No Change
531 Restrict expansion of the residential con-struction in the non-metropolitan zones (54-81)
Regulate No Change
No Change
No Change
541 Deny new housing in the Rest of region, rural (zones 55,56,57, 60 ,61, 63, 67, 69, 70, 71, 73, 75, 76, 77, 78 ,80, 81), enable in the Metropolitan area (1-53) and in the urban areas of the Rest of region (54, 58, 59, 62, 64, 65, 66, 68, 72, 74, 79)
Regulate No Change
No Change
No Change
Combined policies
611 Car operating costs +75% (214) + Parking +60/30 minutes time value +2,55/1,3 euro (222)
25 % 50 % 75 % 75 %
612 PT fare –50 % (421), PT travel speed/service +5% (412)
-50 % -50 % -50 % -50 %
613 Reduce tax relief (add as a new cost) of long work trips (121), deny new housing in the Rest of region, rural (541)
X X X X
614 611 + 612 (private transport pricing & public transport package):
25 % / -50 %
50 % / -50 %
75 % / -50 %
75 % /-50 %
615 611 + 612 + 613 (private transport pricing, public transport and local package):
25 % / -50 %
50 % / -50 %
75 % / -50 %
75 % /-50 %
711 Car operating cost +75% (214), PT fares –50% (421)
50 % / -50 %
75 % / -50 %
75 % / -50 %
75 % /-50 %
712 Car operating cost +75% (214), PT fares –50% (421), PT speed/service+5% (412)
50 % / -50 %
75 % / -50 %
75 % / -50 %
75 % /-50 %
713 Car operating cost +75% (214), PT fares –50% (421), PT speed/service+5% (412), deny new housing in the Rest of region, rural (541).
50 % / -50 %
75 % / -50 %
75 % / -50 %
75 % /-50 %
714 PT fares –20% (119), PT speed/service+5% (412)
+5% -20 %
+5% -20 %
+5% -20 %
+5% -20 %
715 714 + dist. based congestion pricing (117) +5% -20 %
+5% -20 %
+5% -20 %
+5% -20 %
716 715 + concentrate the expansion in the zones with relevant PT facilities (521)
+5% -20 %
+5% -20 %
+5% -20 %
+5% -20 %
717 714 + car operating cost +75 % (214)
-20 % / +50 %
-20 % / + 75 %
-20 % / + 75 %
-20 % /+ 75 %
718 717 + concentrate the expansion in the zones with relevant PT facilities (521)
-20 % / +50 %
-20 % / + 75 %
-20 % / + 75 %
-20 % /+ 75 %
Common policy for all case cities

Analysis of policy testing results
184
6.1.2 Reference Scenario (000)
The reference scenario 2021 is compared with the existing situation 2001. During 2001 – 2021 the number of inhabitants is assumed to increase by 25% and the number of workplaces by 6% in the Helsinki Metropolitan Area. Also the road and PT pro-jects presented in section 4 are assumed implemented.
The growth in the annual travelled distance is 42% meaning that a 1% growth in population corresponds to a 1,7% growth in travel. Also the total travel time/person trip ratio grows by almost 10%. The modal share of PT modes decreases from 44% to 41%.
Due to technological development the emissions, except for CO2, decrease resulting also in decreasing exposure rates. The percentage of people exposed to noise remains at about the 2001 level. Land coverage, fragmentation and quality of open space indi-cators show a deteriorating development trend. Figure 6.1 illustrates the transport net-work and traffic noise in 2001 and the noise differences between 2021 and 2001 in the reference scenario.
As a whole, the environmental conditions deteriorate, which emphasises the need for additional policy actions. Social conditions improve mainly due to the positive health effects caused by a less polluting car fleet in the future.
6.1.3 Investment policies (111-114, 116, 120)
Policies 111-113 and 120 are variations in the timing of PT and road investments of the local transport master plan. They show differences in transport and land use be-haviour mainly in the intermediate year 2011.
Economically they are not as viable as the reference scenario, which indicates that the timing of the investments of the transport master plan is well balanced between PT and road investments. Also the 0-alternative - policy 113, do not invest at all – gives a negative value to the economic index which, on the other hand, shows that the whole investment package is economically viable.
Orbital PT connections have been improved in policy 114. The policy consists of a few new rail links and, thus, the overall effects on the whole system is small. Eco-nomically this PT investment package was not viable.
Policy 116 assumes the construction of a new 50-km railway link to the West of Hel-sinki. The project is supported with new land use opportunities along the new line. The main problem of the policy is that it, in fact, increases city sprawl, as people tend to move outside the Metropolitan area. This results in more car travel, CO2 emissions etc. Economically the policy was inefficient.

Analysis of policy testing results
185
Figure 6.1 Helsinki reference scenario, traffic noise 2001 (top), traffic noise dif-ference 2021 v. 2001(bottom).

Analysis of policy testing results
186
6.1.4 Car pricing policies
Increasing car operating costs policies (211-214, 216 and 218)
The major impacts on transport include improvements in many transport-related vari-ables. Increasing car operating costs by 25/100% will reduce total distance travelled by 4-10%, decrease total travel time by 1-2%, increase the modal share of PT modes by 2-7% and reduce travel speeds by 2-7%. Correspondingly, the share of car trips decreases by 2-8%.
The major impacts on land use include population growth in the Metropolitan area in the order of 0,5-2,2%, as well as a small growth in employment. Especially the city centre benefits from these growth trends, whereas the rural areas face a decreasing trend in population. The land use changes are illustrated in figure 6.1, which also shows the growing trend of the small cities surrounding the Metropolitan Region.
0 20 40
kilometres
0 5 10
kilometres
Absolute changePP214
5000 ...
2500 ... 5000500 ... 2500
-2500 ... -500-5000 ... -2500
... -5000
Relative changePP214
5 ...2,5 ... 50,5 ... 2,5
-0,5 ... 0,5-2,5 ... -0,5-5 ... -2,5... -5
0 20 40
kilometres
0 5 10
kilometres
Absolute changeEM214
5000 ...
2500 ... 5000500 ... 2500
-2500 ... -500-5000 ... -2500
... -5000
Relative change (%)EM214
5 ...2,5 ... 50,5 ... 2,5
-0,5 ... 0,5-2,5 ... -0,5-5 ... -2,5... -5
Figure 6.2 Change of inhabitants (left) and employment (right) when car operat-ing costs are increased by 75 %.
Also the environmental effects are positive. CO2 emissions decrease by 7-23%, acidi-fying gases by 13-25% and volatile organic compounds by 7-23%.
Socially the effects are ambiguous. Health (exposures and accidents) and accessibility indicators behave positively, whereas housing standard and the vitality of the sur-rounding region deteriorate. Also justice indicators show negative development.
Economically, when calculated for the metropolitan area, an optimum level (75% - 100 % increase) of car operating costs can be found, see figure 6.3. Most of the posi-tive effects can be reached already at the 50% cost increase level.

Analysis of policy testing results
187
As a summary, increasing car operating costs to the optimum level can simultaneously improve all the components of sustainability.
Economic Index- Car Pricing Policies
-100
0
100
200
300
400
500
600
+25% +50 % +75 % +100 % +150% +200%
NP
Veu
ro/c
aoit
a
Increase of car operating costs
Base
Figure 6.3 The economic index in different car pricing policies
Increasing parking fares (221, 222)
Generally the effects on transport for the 30/60 minutes time value (0.63/1,25 Euro) increase of parking costs and the car operating cost policies are very similar.
However, the effects on land use include loss of both inhabitants and employment from the Metropolitan area, especially from the central zones.
The environmental effects are mainly positive as well as the impacts on health and accessibility indicators of the social dimension. Economically the viability of these policies is questionable.
Cordon pricing policies (231-233, 117)
Economically the cordon peak pricing policies behave well. The optimum pricing level is around 0,85 Euro and 1,7 Euro on the two cordon rings. Inhabitants tend to move inside the cordon rings and employers outside the cordon rings. CO2 emissions and traffic accidents are reduced by around 20%. All the accessibility indicators im-prove and total time spent in traffic is reduced by 4%. Similar effects are obtained with the distance-based system (117), which would theoretically be the optimal pric-ing system. The optimum pricing level for this system has not been defined.
Pricing of long work trips (121)
Although this policy reduces car travel, emissions and the total travel times the bene-fits in economic terms are not enough to compensate the negative user benefits and other impacts.

Analysis of policy testing results
188
6.1.5 Regulation policies (311, 321)
The main aim of these policies is to reduce traffic accidents and noise by limiting car speeds. In this respect they work well, traffic accidents are reduced by 6-8% with si-multaneous positive effects on exposure to noise, which is reduced by 1-2%. How-ever, the policies have negative environmental side effects in the form of increased CO2 and VOC emissions. The positive external cost savings (accidents, noise) are not large enough to make the policies economically viable and to compensate the highly negative user benefits.
6.1.6 Public transport policies (118, 119, 122-125, 411, 412)
Several levels of PT fares have been tested. A clear economic optimum is at the level of –60%, see figure 6.4. The modal share of PT increases remarkably at the expense of slow and car modes. People move out from the Metropolitan Area whose popula-tion decreases by 8% and employment by 2% compared with the reference scenario. Total travelled distances by car and by PT increase. The policy thus contributes to ur-ban sprawl in a special way where all emissions, exposures and traffic accidents de-crease despite sprawling land use. The land use changes are illustrated in figure 6.5.
The 5-10% increase in PT travel speed/service in policies 411 and 412 also work through shifting travellers from slow modes and cars to PT with corresponding effects on emissions, exposures, accidents etc. However, the effects on land use are much smaller than in the policies where PT fares are lowered. Economically the policies are viable.
Economic Index- Public Transport Policies
-2000
-1500
-1000
-500
0
500
1000
1500
2000
+20% ± 0% -20% -40% -60% -80% -100%
NP
Veu
ro/c
aoit
a
Increase/decrease of public transport fares
Figure 6.4 The Economic index in different public transport pricing policies

Analysis of policy testing results
189
0 20 40
kilometres
0 5 10
kilometres
Absolute changeEM123
5000 ...
2500 ... 5000500 ... 2500
-2500 ... -500-5000 ... -2500
... -5000
Relative change (%)EM123
5 ...2,5 ... 50,5 ... 2,5
-0,5 ... 0,5-2,5 ... -0,5-5 ... -2,5... -5
0 20 40
kilometres
0 5 10
kilometres
Absolute changePP123
5000 ...
2500 ... 5000500 ... 2500
-2500 ... -500-5000 ... -2500
... -5000
Relative change (%)PP123
5 ...2,5 ... 50,5 ... 2,5
-0,5 ... 0,5-2,5 ... -0,5-5 ... -2,5... -5
Figure 6.5 Change of inhabitants and employment when PT fares are reduced by 60 %.
6.1.7 Land use policies (511, 521, 531, 541)
Increasing the number of inhabitants in central areas together with moving working places from central areas to outer areas (511) balances the operation of transport net-works with positive effects on emissions, exposures, travel times and travel distances. The policy contributes slightly to city sprawl, which balances out the otherwise posi-tive effects of the policy. Economically the policy is slightly negative.
Concentrating the growth in zones with good PT services (521) shows only minor changes in indicator values.
Limiting the growth to the metropolitan area only (531) is a theoretical option that shows, however, more clear changes than the above policies. As a whole the policy remains neutral.
A variation of the above policy is 541, where limitations on residential land use are in effect in the rural areas only.
6.1.8 Policy combinations (611-614, 711-718)
Policy combinations 711 -713
In the Helsinki case the policy combination 711 includes a 75% increase in car operat-ing costs and a 50% reduction in PT fares.
Radical changes in many indicator values take place. CO2 emissions decrease by 19%, traffic accidents by 21%, and The PT share increases by 15 %-points at the ex-

Analysis of policy testing results
190
pense of slow modes and car travel. Exposure indicators, except to noise, improve. Cheap PT and rising rents make people move from the Metropolitan area. Economi-cally the policy is very viable and the cumulative benefits are larger than the sum of the benefits of the individual policies.
In 712 an improvement of the PT speeds and service by 5% is assumed and this op-tion has been combined with the above policy 711. Slight additional improvements take place compared with policy 711 but the city sprawl effect (people moving out from the metropolitan area) continues.
When finally the “restrictions on peripheral land use” policy is combined with 712, a more balanced land use development takes place in policy 713.
Car share decreases by 10 %-points and PT share increase by 17 %-points. Travel speeds increase for both PT and cars. All emissions decrease, CO2 by 22%, VOC by 21% and acidifying gases by 13%. Traffic accidents decrease by 25% and environ-mental quality improves. Negative side effects include the need for additional con-struction and an increase in total travel times. Economically the policy is clearly vi-able and, again, the cumulative effects are larger than the effects of the individual policies.
Policy combinations 611 - 615
Another set of policy combinations has been tested locally. The car pricing package (611) includes an increase in operating cost by 75% and parking charges by 1,2/0,6 euro. The PT package (612) includes 50% a decrease in PT fares and a 5% increase in the speed/service level. The third package (613) includes restricting land use in rural areas and reducing the tax relief for long work trips. Policy 614 is a combination of the above car pricing and PT packages and policy 615 a combination of all the above packages. Thus policy 614 is similar to 712, as both include elements of car pricing and PT policies, and 613 is similar to 713, as both include car pricing, PT and land use elements.
Policies 614 and 615 are more radical than 712 and 713 and thus also the impacts are more articulated. For example the CO2 emissions and traffic accidents are reduced by 25-31% and 29 –35%, respectively. However, the economic efficiency remains at a lower level than in the policy combinations 712 and 713.
Land use changes are illustrated in Figure 6.6. The figure clearly shows how the city sprawl effect of implementing a PT policy only is balanced when the PT policy is combined with a car pricing policy (compare with Figure 6.5).

Analysis of policy testing results
191
0 20 40
kilometres
0 5 10
kilometres
Absolute changePP615
5000 ...
2500 ... 5000500 ... 2500
-2500 ... -500-5000 ... -2500
... -5000
Relative changePP615
5 ...2,5 ... 50,5 ... 2,5
-0,5 ... 0,5-2,5 ... -0,5-5 ... -2,5... -5
0 20 40
kilometres
0 5 10
kilometres
Absolute changeEM615
5000 ...
2500 ... 5000500 ... 2500
-2500 ... -500-5000 ... -2500
... -5000
Relative change (%)EM615
5 ...2,5 ... 50,5 ... 2,5
-0,5 ... 0,5-2,5 ... -0,5-5 ... -2,5... -5
Figure 6.6 Change in population and employment when the car pricing, PT pric-ing and land use restrictions on peripheral areas are combined, policy 615
Policy combinations 714 - 718
These local combinations are based on the results of all previous policies and aim at a balanced result between all dimensions of sustainability. The pricing changes are rela-tively modest in order to increase acceptability.
Economically the cordon peak pricing policy (117) takes the actual mobility demand into account in the best way: the higher the demand compared with the supply, the higher the pricing both spatially and throughout the day resulting in positive social and environmental impacts.
The car pricing policy creates new demand for PT. Better PT supply is provided by increasing speed/service (5% improvement) and by reduced fares (-20 %). This com-bination forms policy 714. The relatively low reduction in PT fares is mainly due to the aim of controlling urban sprawl.
Policy 715 is a combination of 117 and 714.
The funds collected by the cordon pricing policy can be used to support the PT fare reduction and the necessary investments to achieve the 5 % speed and service increase in PT.
Next, the above policies are further supported by the land use policy 521, where new housing is concentrated along the PT corridors (policy 716). The policy (717) in-volves a more radical car pricing policy (car operating costs +75%) but shows that this does not improve the economic efficiency. Policy 718 is a combination of the
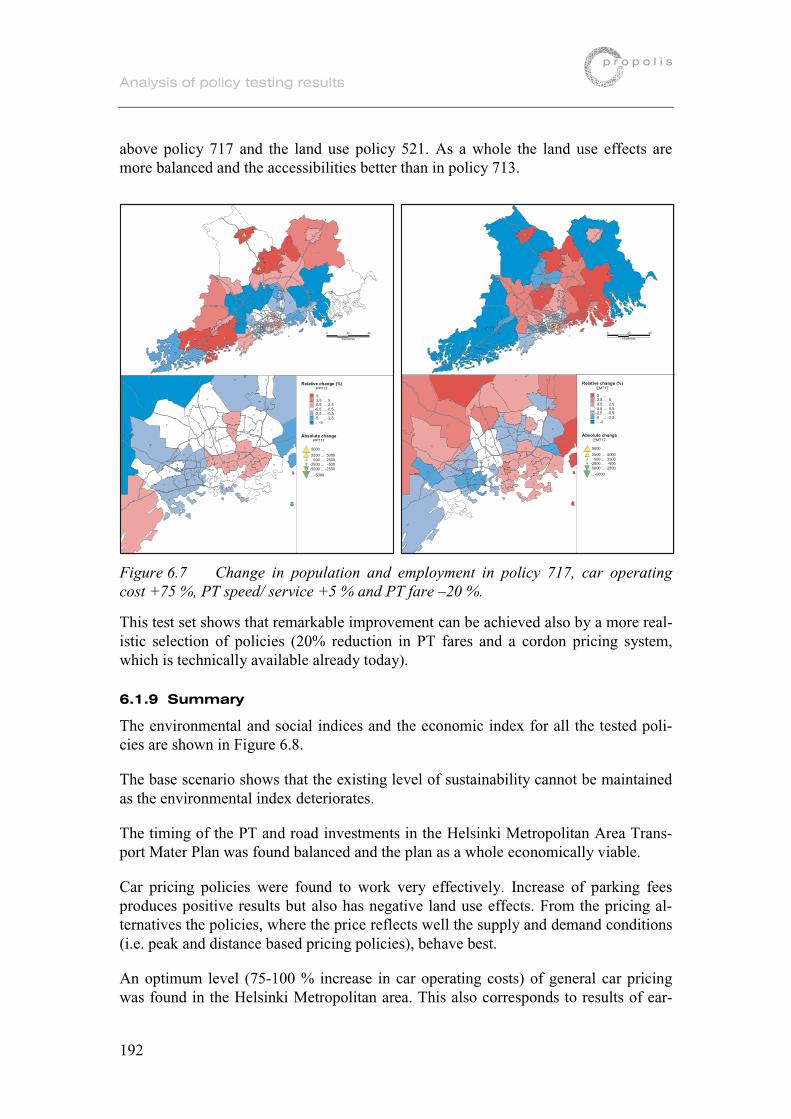
Analysis of policy testing results
192
above policy 717 and the land use policy 521. As a whole the land use effects are more balanced and the accessibilities better than in policy 713.
0 20 40
kilometres
Absolute changePP717
5000 ...
2500 ... 5000500 ... 2500
-2500 ... -500-5000 ... -2500
... -5000
Relative change (%)PP717
5 ...2,5 ... 50,5 ... 2,5
-0,5 ... 0,5-2,5 ... -0,5-5 ... -2,5... -5
0 20 40
kilometres
Absolute changeEM717
5000 ...
2500 ... 5000500 ... 2500
-2500 ... -500-5000 ... -2500
... -5000
Relative change (%)EM717
5 ...2,5 ... 50,5 ... 2,5
-0,5 ... 0,5-2,5 ... -0,5-5 ... -2,5... -5
Figure 6.7 Change in population and employment in policy 717, car operating cost +75 %, PT speed/ service +5 % and PT fare –20 %.
This test set shows that remarkable improvement can be achieved also by a more real-istic selection of policies (20% reduction in PT fares and a cordon pricing system, which is technically available already today).
6.1.9 Summary
The environmental and social indices and the economic index for all the tested poli-cies are shown in Figure 6.8.
The base scenario shows that the existing level of sustainability cannot be maintained as the environmental index deteriorates.
The timing of the PT and road investments in the Helsinki Metropolitan Area Trans-port Mater Plan was found balanced and the plan as a whole economically viable.
Car pricing policies were found to work very effectively. Increase of parking fees produces positive results but also has negative land use effects. From the pricing al-ternatives the policies, where the price reflects well the supply and demand conditions (i.e. peak and distance based pricing policies), behave best.
An optimum level (75-100 % increase in car operating costs) of general car pricing was found in the Helsinki Metropolitan area. This also corresponds to results of ear-

Analysis of policy testing results
193
lier studies. A similar optimum for cordon pricing was found at the level of 1,7 Euro and 0.85 Euro on the two cordon rings.
The regulation policies tested (lowering car speeds) attain their aim of decreasing traf-fic accidents. However, these benefits are not large enough to compensate the nega-tive, especially economic, side effects.
An optimum level for PT fares was found to be a 60% fee reduction. Generally the effects of lowering PT fares are positive but the disadvantages of these policies are that they contribute to city sprawl. In this respect the policy to increase PT speeds and level of service is better.
The effects of the tested land use policies are small compared with especially the pric-ing policies. Best results of the studied options were attained from the policy where rural land use was restricted and more housing provided in the central areas.
The policy and policy combination tests give a very clear, simple and understandable indication on the directions of policy formulation for increasing urban sustainability. The combination of car pricing measures and simultaneous measures to advance PT produce clear synergy effects with the potential to radically improve the environ-mental, social and economic qualities of the transport and land use system. Additional improvements can be gained by combining the above policy packages with a land use package where the restrictions for rural land use are introduced.
The best combinations are economically efficient producing socio-economic savings worth 2000 – 3000 Euro/inhabitant (net present value) simultaneously improving the environmental and social indices. More than 20% reductions in CO2 emissions and traffic accidents are examples of the radical positive effects related to the best policy combinations. In addition the total time spent in traffic and other accessibility meas-ures can be improved in policy combination 718, which consists of less radical policy elements with more potential for public acceptability. Also the land use effects of this policy are well balanced.

Analysis of policy testing results
194
Glo
bal c
limat
e ch
ange
Air
Pol
lutio
nC
onsu
mpt
ion
of n
atur
al s
ourc
esE
nviro
nmen
tal q
ualit
y
Ref
eren
ceLo
cal p
olic
ies
Car
ope
ratin
g co
sts
Oth
er c
ar p
ricin
gP
arki
ngP
T fa
reN
etw
ork
spee
dP
Tsp
eed
Land
Use
Com
bina
tions
716
715
+ 5
21 P
T or
iente
d lan
d us
e
000
Ref
eren
ce sc
enar
io 20
01
000
Ref
eren
ce sc
enar
io 20
11
000
Ref
eren
ce sc
enar
io 20
21
111
Dela
y roa
d, a
dv. r
ail in
v. 5
year
s
112
Dea
ly all
inv.
5 ye
ars
113
Do
noth
ing
114
Dev
elop
orbit
al PT
116
New
railw
ay L
ohja
120
Dela
y PT a
dv. r
oad
inv. 5
year
s
211
Car
cost
+25%
212
Car
cost
+50
%
214
Car
cost
+75
%
213
Car
cost
+100
%
216
Car
cost
+150
%
218
Car
cost
+200
%
231
Cor
don
prici
ng 0
.85€
232
Cor
don
prici
ng 2
,5 €
233
Cor
d. p
ric. 1
,7€
orbit
al, 0
,85€
radia
l
117
Con
gest.
pric
ing 3
/7/1
0 ce
nt/km
121
Pric
ing o
f long
wor
k trip
s
221
Par
king
+0,85
/0,4
2 €
222
Par
king
+2.5
/1.3
€
311
Spe
ed -
10%
, all n
etwor
k
321
Spe
ed -2
0%, s
econ
dary
net
work
411
PT sp
eed/
serv
ice +
10 %
412
PT sp
eed/
serv
ice +
5%
118
PT fa
re +
20%
119
PT fa
re -2
0 %
122
PT fa
re -4
0%
123
PT fa
re -6
0%
124
PT fa
re -8
0%
125
PT fa
re -1
00%
511
City
core
add
itiona
l hou
sing
521
PT o
rient
ed la
nd u
se
531
Restric
t non
-met
ropo
litan h
ousin
g
541
Res
trict
rura
l hou
sing
611
Car
+75
% &
par
king
+2,5/
1,3€
612
PT -5
0% &
PT sp
eed
+5%
613
Lon
g wor
k trip
s & re
str. r
ural
hous
.
614
611
+612
615
611
+61
2 +6
13
711
Car
+75
%, P
T fare
-50
%
712
711
+ P
T spee
d +5
%
713
712
+ P
T orie
nted
land
use
714
PT sp
eed
+5%
& P
T fare
-20%
715
714
+ 11
7 co
nges
t. pr
icing
718
717
+ 5
21 P
T or
iente
d lan
d us
e
717
714
+ 2
14 ca
r cos
t 75
%
0
0,2
0,4
0,6
0,81
-300
0
-200
0
-100
00
1000
2000
3000
4000
5000
0
0,2
0,4
0,6
0,81
Hea
lthE
quity
Opp
ortu
nity
Acc
essi
bilit
y
713
Com
mon
pol
icie
s fo
r al
l cas
e ci
ties
Figure 6.8 Helsinki policy comparisons

Analysis of policy testing results
195
6.2 City specific findings in Dortmund
6.2.1 General
All common policies listed in Table 5.1 were also tested for Dortmund. There were two policies with city-specific investment programmes, 111 and 112 (see 5.3.2). In addition, one additional pricing policy 219, one additional land use policy 541 and one additional combination policy 719 were tested. All of the policies tested for Dortmund are listed in table 6.2. Detailed results are presented in the appendix and a summary of the environmental, social and economic indices appear in section 6.1.9.
Table 6.2 Dortmund local policies and the year of implementation
2001 2006 2011 2016 2021
POLICY Type Code POLICY Base year Intermediate
year Horizon
yearBase 000 Reference scenario Investment policies 111 Additional investments in public trans-
port
112 Public transport infrastructure for the 'dortmund project'
Pricing 211 Car operating costs +25% 25% 25% 25% 25% 212 Car operating costs +50% 25% 50% 50% 50% 213 Car operating costs +100% 25% 50% 100% 100% 214 Car operating costs +75% 50% 75% 75% 75% 219 Car operating costs +300% 25% 50% 200% 300%
221 Parking price increase, + 20/10 minutes time value in/around city centre X
222 Parking price increase, + 60/30 minutes time value in/around city centre X
231 Cordon pricing, + 20 minutes time value X 232 Cordon pricing, + 60 minutes time value X Regulation 311 Max speed - 10% on all road network X
321 Max speed -20% on other than motor-way and main roads
X
Public transport 411 PT travel time –10%
5% 10% 10% 10%
412 PT travel time –5% -2.5% -5% -5% -5% 421 PT fares –50% -50% -50% -50% -50%Land use policies 511 Increase housing density in city centre
X
521 Concentrate the expansion of the resi-dential/tertiary at rail stations
X
541 Concentrate the expansion of the resi-dential/tertiary in Dortmund X
Combined policies
711 Increase car operating cost + lower PT fares = 214+421
50% / -50%
75% / -50%
75% / -50%
75% / -50%
712 Increase car operating cost + lower PT
fares and PT travel time = 214+412+421 50% / -50%
75% / -50%
75% / -50%
75% / -50%
713 Increase car operating cost + lower PT
fares and PT travel time + development at rail stations = 214+412+421+521
50% / -50%
75% / -50%
75% / -50%
75% / -50%
719 Increase car operating cost + lower PT
fares and PT travel time + development in Dortmund = 219+412+421+541
25% / -50%
50% / -50%
200% / -50%
300% / -50%

Analysis of policy testing results
196
6.2.2 Reference Scenario (000)
The reference scenario serves as the benchmark for comparing the policy scenarios. The reference scenario is defined as the most likely development, i.e. the development to be expected if no major policy changes are implemented. The reference scenario contains those transport network improvements that are either already in progress or are to be completed with certainty (see 4.4.3). Figure 6.9 illustrates the transport net-work and traffic noise in 2001 and the noise differences between 2021 and 2001 in the reference scenario.
Figures 6.10 to 6.15 show significant aspects of the reference scenario as a time series function of key variables. It can be seen that all simulations start in the year 1970 and continue until the year 2030. The forecasting period covered by PROPOLIS is from 2001 to 2021 (the area shaded in grey), i.e. only one third of the total simulation. The reasons for simulating a longer time period are (a) to demonstrate that the model is capable of replicating essential dynamics of spatial urban development in a known period in the past and (b) to place the PROPOLIS simulations into a broader context of long-term spatial developments of the metropolitan area.
Figures 6.10 and 6.11 show the development of population and housing in the super-zones of the Dortmund metropolitan area (see map in Figure 4.5). It can be seen that, while the population of the total metropolitan area stays about the same, the city cen-tre (CC) and the inner urban areas (IU) lose about half of their population between 1970 and 2030, whereas almost all population growth occurs at the periphery of the metropolitan area (RM). This is due to housing construction in the suburban commu-nities there, whereas the number of dwellings in the city centre and the inner urban areas even declines because of demolition and displacement by office buildings or conversion to office use. In the PROPOLIS forecasting period 2001-2021 the subur-ban communities in the metropolitan periphery grow by about 20 percent in popula-tion and about 30 percent in dwellings.
Figures 6.12 and 6.13 show a largely neglected aspect of urban development likely to receive more attention in the future, demography. Figure 6.12 depicts the share of children under five in the population, whereas Figure 6.13 shows the share of people over sixty. The two figures not only show the rapid progress towards a greying society but also the increasing generation divide between the ageing central area population and the relatively younger population of the suburban fringe.

Analysis of policy testing results
197
Figure 6.9 Dortmund reference scenario, traffic noise 2001 (top), traffic noise dif-ference 2021 v. 2001(bottom).
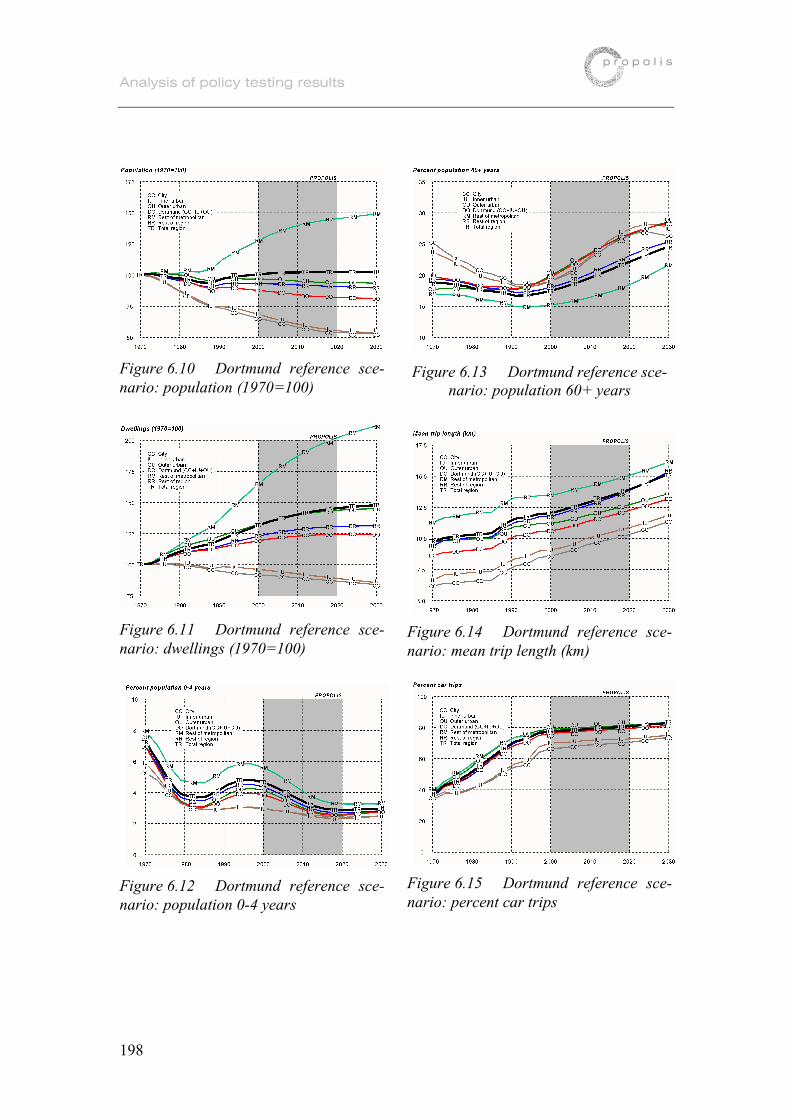
Analysis of policy testing results
198
Figure 6.10 Dortmund reference sce-nario: population (1970=100)
Figure 6.11 Dortmund reference sce-nario: dwellings (1970=100)
Figure 6.12 Dortmund reference sce-nario: population 0-4 years
Figure 6.13 Dortmund reference sce-nario: population 60+ years
Figure 6.14 Dortmund reference sce-nario: mean trip length (km)
Figure 6.15 Dortmund reference sce-nario: percent car trips

Analysis of policy testing results
199
Figures 6.14 and 6.15 present two aspects of mobility in the metropolitan area. Figure 6.14 shows the combined effect of increasing affluence, rising car ownership, exten-sive investment in road and rail infrastructure, and suburbanisation on average dis-tance travelled per trip in the metropolitan region. In the sixty years between 1970 and 2030, mean trip length increases from under 10 to over 15 kilometres. But it can also be seen that people living in the city centre and the inner urban areas make sig-nificantly shorter trips than people living in suburban rural communities. Figure 6.15 shows that inner-city residents also make more trips by public transport or by bicycle or on foot. Altogether, however, in the PROPOLIS forecasting period between 80 and 85 percent of all trips are made by car.
6.2.3 Investment policies (111, 112)
Figures 6.16 to 6.19 show similar time series diagrams for key indicators of the 23 policy scenarios. Now each line in the diagram represents one policy scenario. Until the year 2000, all policy scenarios are identical with the reference scenario 000 be-cause all policies start in the year 2001. To recall, policy scenarios 111 and 112 are local investment plans (see 5.3.2). Scenario 111 includes extensions of underground and light rail lines from the cities of Dortmund and Bochum towards suburban loca-tions, new construction of local rail lines and the reactivation of closed down rail lines between suburban municipalities. Scenario 112 contains assumptions on how to link the new development sites of the 'dortmund-project' with the existing underground and light rail system.
It can be seen from Figures 6.16-6.19 that the two policy scenarios do not contribute significantly to sustainable transport in terms of mean trip length, percent car trips, car ownership or car-km per capita as the lines representing the two scenarios are com-pletely covered by that of the reference scenario. In fact, as can be seen from the table of Dortmund results in Annex III, the increase in modal share of public transport is less than one tenth of a percent, and this is largely drawn from the slow modes. The reason for this is that the two investment programmes are small in relation to the rela-tively well developed public transport system of Dortmund
6.2.4 Car pricing policies (211-214, 219, 221, 222, 231, 232)
The car pricing policies (see 5.3.2) simulate different degrees of fuel taxation (211-214), parking price increases (221, 222) and cordon pricing (231, 232). The fuel taxa-tion scenarios increase out-of-pocket car operating costs. In addition to the four com-mon fuel taxation policies 211-214, one more radical fuel tax policy 219 was simu-lated, in which car operation costs gradually increase up to a factor of four in 2021.
Figures 6.16-6.19 show that the fuel taxation policies are very successful in constrain-ing car traffic. Even a modest increase of car operating cost by 25 percent leads to a reduction in average trip length of 6.7 percent, a reduction in the share of car trips by one percent and similar reductions in car ownership and car-km travelled. If the most radical fuel tax scenario 219 is be implemented, the reductions are 30 percent in mean travel distance, 14 percent in modal share of car, 30 percent in car ownership and more than 50 percent in car-km travelled.

Analysis of policy testing results
200
Figure 6.16 Dortmund policy compar-ison: mean trip length (km)
Figure 6. 17 Dortmund policy compar-ison: percent car trips
Figure 6.18 Dortmund policy compar-ison: car ownership
Figure 6.19 Dortmund policy compar-ison: car-km per capita per day
Increasing parking charges in and around the city centre has only a marginal effect for the whole region. There is a slight reduction in the share of car trips but average car trips become longer as some people now drive to outside shopping malls instead of the city centre, yet all these changes are less than one percent. However, as car driving becomes more expensive, total distance travelled declines by 2.5 percent (see Annex III). Remarkably, retail sales in the city centre, indicated by city centre employment, soon recover after a period of decline.
The two policy scenarios assuming a cordon charge levied on all cars entering the city centre and its immediate surroundings (231, 232) have only negligible effects on overall travel behaviour but a significant effect on the viability of the city centre. In the more moderate pricing scheme, in which 2 € are charged (231), employment in the city centre declines by 3.7 percent compared to the reference scenario, in the more rigorous scheme, in which 6 € are collected (232), the decline is 4.0 percent (see An-nex III).
Analysis of policy testing results
201
6.2.5 Regulation policies (311, 321)
Two policy scenarios assume the implementation of speed limits, which result in a reduction of average driving speeds on roads of 10 percent (311), or of 20 percent on local roads other than motorways and major thoroughfares (321). As expected, total time spent in traffic grows compared to the reference scenario, by 5 percent in the more moderate and by 10 percent in the more rigorous speed limit scenario (see An-nex III). As can be seen in Figure 6.16, average trip length drops a little, but the re-duction in total distance travelled remains less than two percent.
6.2.6 Public transport policies (411, 412, 421)
The three public transport policies are all 'push' policies, i.e. try to attract more travel-lers to public transport by making it faster (411, 412) or less expensive (421). Making public transport marginally faster as in policy scenarios 411 and 412 is not sufficient to make public transport competitive compared with the car. As can be seen from Fig-ures 6.16 and 6.18, only the fare reduction policy 421 has a visible effect, but proba-bly not one intended. Indeed, there is a small increase in the share of public transport trips (two percent), but this mainly at the expense of walking and cycling (see Annex III), whereas only few travellers shift from car to public transport. In addition, as pub-lic transport is now really inexpensive, people make not only more but also longer train and bus rides. Moreover, as Figure 6.18 demonstrates, some households even spend the money saved in public transport on buying a new car they can now afford in their travel budget.
6.2.7 Land use policies (511, 521, 541)
The three land use policies aim at promoting a less car-dependent settlement structure in the metropolitan area by concentrating the expansion of residential and tertiary ac-tivity in the city centre (511), at commuter rail stations (521) or in the core city of Dortmund at large (541). This is achieved by releasing additional land for develop-ment in these areas and constraining development in all other parts of the region.
The three policies are successful in achieving the intended redirection of urban growth (though in reality they might be very difficult to implement because of the competi-tion between core cities and suburban municipalities). Figure 6.20 shows the differ-ences in population density between the three scenarios. Scenario 511 is in fact a 'compact-city' scenario with nearly 80 percent more residents in the inner urban area in 2021 than in the reference scenario. Scenario 521 aims at generating polycentric development around commuter rail stations. Scenario 541 might be called an 'urban-growth-boundary' scenario, to borrow a currently popular term from North America. However, Figures 6.16-6.19 show that all three scenarios make only small contribu-tions to sustainable urban transport. The most successful scenario, the compact-city scenario, achieves a reduction in car-km travelled of no more than two percent.
6.2.8 Policy combinations (711-713, 719)
The preliminary conclusion from the policy tests so far is that, with the exception of the car pricing policies, none of the policies tested makes a significant contribution to

Analysis of policy testing results
202
sustainable urban transport. It is now examined whether there are policy combinations in which synergies between the policies can be exploited. For this test, four policy packages were defined. All of them combined 'push' policies making car travel less attractive with 'pull' measures making public transport more attractive. In policy sce-nario 711 a moderate increase in car operating costs (scenario 214) was combined with the reduction of public transport fares (scenario 421). In policy scenario 712 in addition public transport was made faster (scenario 412). In policy scenario 713 this was combined with development at commuter rail stations (scenario 521). Policy sce-nario 719 finally combined the same public transport policies with the more rigorous fuel taxation scenario 219 and the urban-growth-boundary scenario 541.
Figures 6.16-6.19 show that indeed the policies support each other but that without making car driving more expensive no policy combination has a deeper impact. In all cases the policy combination scenarios are more effective in reducing car-km trav-elled than their component policies if applied alone and, because they not only make car travel less attractive but offer a viable alternative through less expensive and faster public transport, they are also more politically acceptable.
In particular policy combinations 713 and 719, which include transport and land use policies, stand out. This indicates that land use policies promoting higher-density mixed land-use settlement structures become important in combination with transport policies promoting sustainable transport modes because they make people less car-dependent and enable them to take advantage of public transport and walking and cy-cling. This is most clearly demonstrated by a comparison between policy scenario 219 (in which only car driving is made more expensive) and policy combination scenario 719 (in which public transport is made more attractive and higher-density mixed land-use forms of living are provided). As can be seen from Figures 6.17 and 6.19, scenario 719 results in a lower share of car trips and less car-km travelled than scenario 219. However, as shown in Figures 6.16 and 6.18, people nevertheless enjoy more mobility (longer trips) and can even afford more cars than in scenario 219.

Analysis of policy testing results
203
Figure 6.20 Dortmund land use scenarios: compact-city scenario 511 (top), poly-centric scenario 521 (centre), urban-growth-boundary scenario 541 (bottom). The surfaces show relative differences in population between policy and reference sce-nario in 2021.

Analysis of policy testing results
204
6.2.9 Summary
The discussion of the policy tests for Dortmund has shown that, with the exception of car pricing policies, individual transport and land use policies have only little effect on sustainable urban development:
- Investment policies. The public transport improvement programmes modelled were too small to show significant effects in the already well developed public transport system of Dortmund.
- Pricing policies. Policies making car driving more expensive are most effective to reduce car-km travelled. Policies making inner-city parking more expensive have local effects without seriously hurting inner-city vitality. Cordon pricing policies aimed at reducing inner-city congestion, however, have a significant negative im-pact on the inner-city areas inside the cordon.
- Regulation policies. Policies making car driving slower have similar but lesser ef-fects than car pricing policies.
- Public transport policies. Policies aimed at making public transport faster attract additional passengers but mostly from walking and cycling and only little car driv-ers. Policies making public transport less expensive do the same but in addition en-able people to spend the money saved on extra car trips or even cars.
- Land use policies. Land use policies aimed at promoting higher-density mixed land use are difficult to implement and have little impact on mobility behaviour unless combined with accompanying transport measures.
However, if individual policies are combined to policy packages, synergies between policies come into effect, i.e. the total effect is larger than the sum of the effects of the component policies:
- Combined policies. Synergies between policies are very important. In particular policies combining 'push' policies making car travel less attractive and 'pull' policies making public transport more attractive are successful. All policy combinations tested are more successful in reducing car-km travelled than their component poli-cies. Particularly successful are policy packages consisting of transport and land use policies. They are also more politically acceptable because they offer attractive al-ternatives to a car-dependent way of urban life.
For a final comparison, the policy scenarios examined for Dortmund are evaluated with the PROPOLIS assessment tool USE-IT (see 3.4).
Figure 6.21 shows the environmental and social indices and the economic index for all tested policies. For the environmental and social indices, also the assessment of the base and mid-year of the reference scenario is indicated as well as the contribution of each theme to the total indicator value. For the economic index, per-capita total bene-fit in Euro is given.

Analysis of policy testing results
205
-4000
-2000
0
2000
713
712
+ PT
orien
ted l
and
use
719
Car +
300
%, P
T far
e -2
0%, P
T ...
712
711
+ PT sp
eed
+5 %
711
Car +
50 %
, PT fa
re -2
0%
521 P
T or
iented
land
use
541 L
and
use d
ev. in
Dor
tmun
d
511
City co
re a
dditio
nal h
ousin
g
411
PT sp
eed/
serv
ice +
10 %
412
PT sp
eed/
serv
ice +
5%
421
PT fa
re -5
0%
321
Speed
-20%
, sec
onda
ry n
etwor
k
311
Speed
-10
%, a
ll net
work
222
Parkin
g co
st +
60/30
min.
time
value
221 P
arkin
g co
st +
20/1
0 min.
time
value
231
Cordo
n pric
ing +
20 m
in. tim
e va
lue
232
Cordo
n pric
ing +
60 m
in. tim
e va
lue
213 C
ar co
st +1
00%
219 C
ar co
st +3
00%
212 C
ar co
st +5
0 %
214 C
ar co
st +7
5 %
211 C
ar co
st +2
5%
111
Loca
l inve
stmen
t plan
(PT)
112
Loca
l inve
stmen
t plan
(Dor
t.pro
j.)
Loca
l pol
icie
s
Car
ope
ratin
g co
sts
Oth
er c
ar p
ricin
g
Par
king
Net
wor
k sp
eed
PT
spee
d
Land
Use
Com
bina
tions
PT
fare
000 R
efer
ence
2001
scen
ario
000
Refere
nce
scen
ario
2021
000
Refer
ence
scen
ario
2011
Ref
eren
ce s
cena
rio
Global climate change
Air Pollution
Consumption of natural sources
Environmental quality
Health
Equity
Opportunity
Accessibility
0
0,2
0,4
0,6
0,8
1
0
0,2
0,4
0,6
0,8
1
Figure 6.21 Dortmund policy comparison: three indices
- Environmental evaluation. The environmental evaluation shows that, like in the other case study cities, the environmental quality in Dortmund in the reference sce-nario decreases between 2001 and 2021. The assessment confirms that only policies or policy combinations, in which car travel is made more expensive, make a signifi-cant contribution to sustainable urban development, and that this contribution in-creases with the level of car pricing. Policy 219, which assumes the strongest in-crease of fuel tax, scores best of all policies on the environmental index. The com-
Analysis of policy testing results
206
bination policies are always better then their policy components; policy combination 713, which includes accompanying land use policies, and policy combination 719, which in addition includes the high fuel tax increase of policy 219, score best.
- Social evaluation. The picture is similar. Here too, the index declines in the refer-ence scenario between 2001 and 2021, and only the car pricing policies or the policy combinations which include car pricing policies can halt or reverse this trend. It is interesting to note that higher fuel taxes score better and not worse in terms of op-portunity and equity, in contrast to fears that they would discriminate low-income households. It is also interesting to note that the high scores of the car pricing po-lices are partly caused by positive effects in the health component, such as less air pollution, noise and accidents. It is surprising that policy combination 719 scores worse than policy 219, even though it provides additional incentives. The reason is the choice of accessibility indicator which awards suppressed mobility.
- Economic evaluation. The economic indicator gives a different picture. Now the fuel tax policies 211-219 have a negative score increasing with the level of taxation. However, this may be due to the fact that not all government benefits, such as taxes on ticket sales, could be fully accounted for, whereas parking charges in scenarios 221 and 222 were. As to be expected, policies which make travel slower (311, 321) or faster (411, 412) score negatively or positively, respectively. The policy combi-nations with moderate fuel tax increase, as in policy 214, score positively, but when taxation exceeds a certain level, as in policy combination 719, it turns negative. Be-cause of the multitude of factors involved, the results of the economic evaluation should be viewed with caution.
To conclude, the results of the policy test for Dortmund are summarised in the corre-lation diagram of Figure 6.22
The diagram shows the 24 scenarios simulated for Dortmund in a two-dimensional space in which the score of the environmental index is presented on the horizontal axis and the score of the social index on the vertical axis. Each scenario is represented by a combination of environmental and social index scores. The score of the eco-nomic index is indicated by the colour and shape of the marker representing a sce-nario, where a green square indicates a positive and a red diamond a negative per-capita benefit. The three dark blue circles represent the reference scenario in the years 2001, 2011 and 2021. As already noted, the reference scenario decreases in both envi-ronmental and social quality over time.

Analysis of policy testing results
207
Figure 6.22 Dortmund policy comparison: three indicators correlated
The diagram shows that in general policies with a high score of the environmental in-dex are also socially sustainable. This is an important result as usually a goal conflict between environmental and social objectives is assumed. There is one exception, pol-icy combination 719, which contains 'pull' measures making public transport more attractive and strong 'push' measures making car travel less attractive and land use policies promoting higher-density mixed land use in Dortmund. Scenario 719 scores very high in terms of environment but not equally high in terms of the social index (though still higher than any other scenario except scenario 219 which it includes). As it was explained earlier, this is due to the accessibility indicator used in the social evaluation, which fails to recognise the benefit of increased mobility in the scenario.
Regrettably, most policy scenarios are not able to reverse the declining trend of the reference scenario in both the environmental and social dimension. Only few policies and policy combinations come close to or exceed the scores of the base year of the reference scenario, and all of these are car pricing scenarios.
There is little correlation between the economic index and the other two indices. With the caution with respect to the economic index recommended earlier it can be con-cluded that policies making car travel moderately more expensive tend to be also eco-nomically viable. However, this result is tentative and points to the need for further research.
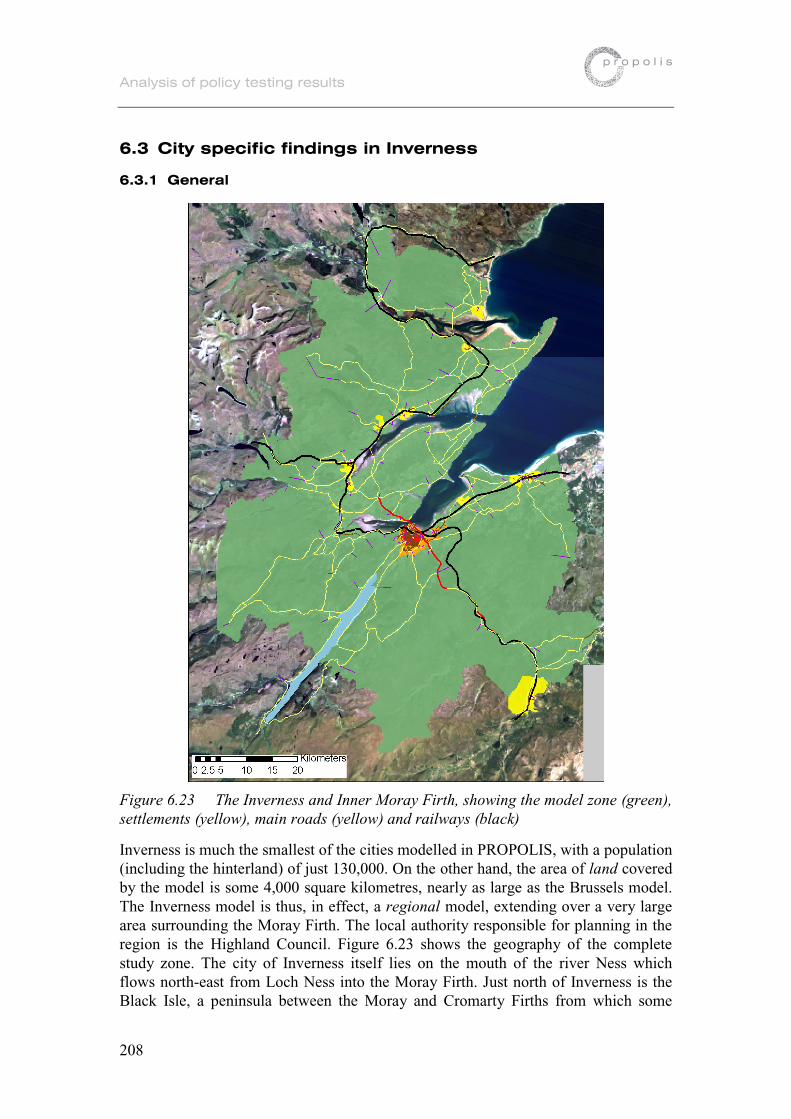
Analysis of policy testing results
208
6.3 City specific findings in Inverness
6.3.1 General
Figure 6.23 The Inverness and Inner Moray Firth, showing the model zone (green), settlements (yellow), main roads (yellow) and railways (black)
Inverness is much the smallest of the cities modelled in PROPOLIS, with a population (including the hinterland) of just 130,000. On the other hand, the area of land covered by the model is some 4,000 square kilometres, nearly as large as the Brussels model. The Inverness model is thus, in effect, a regional model, extending over a very large area surrounding the Moray Firth. The local authority responsible for planning in the region is the Highland Council. Figure 6.23 shows the geography of the complete study zone. The city of Inverness itself lies on the mouth of the river Ness which flows north-east from Loch Ness into the Moray Firth. Just north of Inverness is the Black Isle, a peninsula between the Moray and Cromarty Firths from which some

Analysis of policy testing results
209
residents commute into the city across a major road bridge built in the 1980s. This bridge carries the main coastal road, the A9, linking Inverness to a string of small towns to the north - Dingwall, Invergordon, Tain and Dornoch. A coastal railway runs north along much the same route, and runs east along the Moray Firth, past the city's airport and to the villages of Nairn, Forres and Elgin. Inverness and these outlying communities thus form an undulating linear development connected together by the coastal road and railway, like beads on a string. This pattern has important conse-quences for the results of the PROPOLIS scenarios.
The model region includes significant areas of agricultural land, but the majority is unpopulated moorland, forest and mountain landscape of great scenic beauty. Tourism is one of the principal businesses: skiing in the winter; golf, walking and fishing in the summer. Many tourists arrive through Inverness airport. Otherwise the region's in-dustries include whisky distilling, and the repair and maintenance of North Sea oil rigs at Nigg Bay on the Cromarty Firth. Inverness itself is the service and commercial centre for the region, with some shoppers making long trips to the city by car on a weekly or monthly basis. A large part of the region's far-flung population is indeed completely dependent on the car. On the other hand, because of its small size, there are no serious problems of traffic congestion in Inverness; and few problems of air pollution either, because of the seaside location (Figure 6.24).
Figure 6.24 Low levels of concentration of NO2 predicted by the RASTER module

Analysis of policy testing results
210
The Highland Council is concerned that jobs and retail services may be lost to the lar-ger cities in the south of Scotland - Aberdeen, Glasgow and Edinburgh. The Council hopes to resist these forces by attracting new employment in information and high technology businesses, and retaining them with high-quality services and housing.
6.3.2 Reference scenario, and investment policies
Figure 6.26 illustrates the transport network and traffic noise in 2001 and the noise differences between 2021 and 2001 in the reference scenario.
For the purposes of PROPOLIS, the 'Local Policies' scenario 111 corresponds to what the Highland Council designates as Business as Usual: Current Policies (see section 4.5.3). This has some significant effects by comparison with the 'Reference' scenario. (All numerical comparisons in what follows are for the scenario horizon in the year 2021 unless otherwise stated.) The Council's plans include the restriction of new de-velopment, in the main, to existing urban areas and brown-field sites, but allowing some new growth around the airport and between the airport and Inverness; rises in housing densities; some restrictions on parking in Inverness; measures to encourage walking and cycling; improved bus services; and new commuter rail services between Inverness and the small coastal towns.
0.000010.000020.000030.000040.000050.000060.000070.000080.000090.0000
100.0000
Mod
al sh
are i
n pe
ak,
priva
te m
otoris
ed
Mod
al sh
are i
n pe
ak,
bus
Mod
al sh
are i
n pe
ak,
rail
Mod
al sh
are i
n pe
ak,
slow m
odes
"000 2001"
"000 2011"
"000 2021"
"111 2011"
"111 2021"
Figure 6.25 Percentage modal share in peak taken by private motorised, bus, rail and slow modes in scenarios 000 and 111 at years 2001, 2011 and 2021
The result for transport modes (Figure 6.25) is an extremely large percentage growth in trips by train, although from a very low base, and a modest increases in the shares by walking and cycling. (Curiously however there is a slight drop in the modal share taken by bus.) The modal share taken by car is correspondingly reduced; but travel by car continues to dominate, taking 84% in 'Local Policies' as against 89% in the 'Refer-ence' scenario. Because of this modal shift there is 13% less fuel used in 'Local Poli-cies' than in the 'Reference' case, with corresponding reductions in air pollution and greenhouse gas emissions.

Analysis of policy testing results
211
Figure 6.26 Inverness reference scenario, traffic noise 2001 (top), traffic noise dif-ference 2021 v. 2001(bottom).

Analysis of policy testing results
212
6.3.3 Land use policies
By contrast the two PROPOLIS land use scenarios - which it should be emphasised are superimposed on top of 'Local Policies' - have practically no additional effects. Scenario 511 is intended to direct population growth into the city centre; and scenario 521 to concentrate residential and commercial growth in zones with relevant public transport facilities - which in the Inverness region means along the coastal road and around the railway stations. But both these goals are already inherent in the Highland Council's 'Local Policies'. It is debatable, in any case, as to whether constraints on the supply of new land can in themselves have much effect in the Inverness region - unless they are supported by complementary transport policies. This is because of the generally low densities, and the fact that there is much scope for increasing densities on land that has already been developed.
6.3.4 Public transport policies
The public transport scenarios 411 and 421, in which the average travel times are re-duced by 10% and fares are cut by 50% respectively, are again of marginal effect over and above 'Local Policies'. Indeed the modal share taken by buses is very slightly lower in these two scenarios.
6.3.5 Car pricing policies
Cordon pricing policies
The two 'Cordon Pricing' scenarios 231 and 232 do very much what they might be expected to do, given that Inverness is not especially congested, and the charge is not applied in the other towns. The modal share taken by car is indeed reduced, and there is more travel by bus and slow modes. There is a small effect (5% in the more ex-treme scenario 232) in directing new employment towards the satellite towns. So far as population growth goes, the effects (Figure 6.27) are to channel this into the inner urban area of Inverness (i.e. inside the cordon: yellow), away from the outer urban ar-eas (just outside the cordon: dark blue), and otherwise into the small towns (red) and rural areas - all of which makes perfect sense.
Figure 6.27 Percentage change in population by 2021 in 'Cordon Pricing' Scenario 232 compared to 'Reference' Scenario, inside cordon (yel-low), in urban areas outside cordon (dark blue), in small towns (red) and rural areas (orange)

Analysis of policy testing results
213
Increased parking charges
The two scenarios 221 and 222 in which 'Car Parking Charges' are increased are again predictable in their consequences. The most notable effects are on patterns of em-ployment, as illustrated in Figure 6.28. This shows a fall in employment in the centre of Inverness itself (red) (by 11% in the more extreme scenario 222), and a redirection of employment growth (up 12%) to the smaller towns (dark green), where there are no charges for parking. Population growth is similarly affected, going up by around 15% outside Inverness, with an actual fall of 3% relative to the 'Reference' scenario in the centre of the city. This dispersal of population has the effect of increasing the av-erage length of car trips, by 20%. There is the positive consequence, on the other hand, that because people are more widely spread, they are less exposed to NO2 and noise (down 53% and 12% respectively). Indeed scenario 222 is the most effective of all the scenarios in these particular respects.
Figure 6.28 Percentage change in employment by 2021 in 'Car Parking Charge' Scenario 222 compared to 'Reference' Scenario, in central Inverness (red), outer Inverness (yellow), in small towns (dark green) and in rural areas (light green)

Analysis of policy testing results
214
Increasing car operating costs
The scenario with much the biggest impact on both transport and land uses is the in-crease in 'Car Operating Costs' by 100% (scenario 213). The effect is to reduce total travel distance relative to the Reference scenario by 17%, and to cut the modal share taken by cars by 12%. This is compensated for by an increase in the modal share taken by buses, and a 120% increase in the share taken by slow modes.
However the most interesting effects are on the location of employment and popula-tion. Employment grows, in comparison to the 'Reference' scenario, only within In-verness itself, and declines in relative terms in the rest of the study region. This is paralleled by much higher rates of growth in population in Inverness, as shown in Figure 6.29 (18% and 13% in the inner and outer urban zones) (red and yellow), with lower growth of only 6% in the small towns (light blue). Here then are the desired ef-fects of the land use scenario 511, to increase population density in the city centre, but achieved through a transport policy. These same effects are illustrated for all model zones in Figure 6.30. Here the blues, greens and yellows indicate population losses in the rural zones, and the oranges and reds show population gains in Inverness and the coastal strip. The fact that densities can rise in Inverness in this way, with no increase in land coverage, must be because of the relatively low density of housing in the city to start with, and the opportunities for infilling - as mentioned previously.
Figure 6.29 Percentage change in population by 2021 in 'Car Op-erating Costs' Scenario 213, com-pared to 'Reference' Scenario, in central Inverness (red), outer In-verness (yellow), in small towns (light blue) and in rural areas (dark blue)

Analysis of policy testing results
215
Figure 6.30 Percentage change in population by 2021 in 'Car Op-erating Costs' Scenario 213, com-pared to 'Reference' Scenario, for all model zones. Blue and green show population losses; red and orange show population gains.
All this has some important effects on trips. The average trip distance by private car is reduced (by 10%), and the average length of trip by public modes also decreases, be-cause employment and residence are more concentrated. This scenario is much the most effective of all policies - not surprisingly, given the reduction in car use - in cut-ting greenhouse gas emissions from transport (by 37%) and in reducing air pollution. (On the other hand, because of the higher residential densities, exposure to NO2 is not reduced by as much as in the 'Parking Charge' scenarios.)
Despite these positive trends in terms of environmental sustainability, it should be emphasised that the Highland and Moray Firth region still remains highly dependent on road transport. The total distance travelled annually goes on increasing, and pri-vate cars still (in scenario 213) continue to take a modal share of nearly 80%.
6.3.6 Summary
In summary then, the PROPOLIS land use policies, as applied in Inverness and the study region, are largely ineffective in themselves, since their effects of concentrating new development in central urban areas and around transport nodes are already em-bodied in the Highland Council's own 'Local Policies', on which they are superim-posed. Reducing travel times and cutting fares in public transport are also marginal in their effects. The imposition of cordon charges in Inverness alone has the predictable consequence of channelling population growth away from the city, into the smaller towns and the rural hinterland. Increased parking charges have similar effects on both population and employment. Meanwhile the scenarios with the most marked effects

Analysis of policy testing results
216
are those in which car operating costs are raised. These serve, by contrast with the other car pricing policies, to pull population and jobs back into Inverness from the surroundings. The results are shorter trips, a shift from cars to public transport and slow modes, and a corresponding cut in fuel use and emissions. But car use neverthe-less still dominates in this very rural region, with its widely dispersed population.
0
10000
20000
30000
40000
521 P
T orie
nted l
and
use
511
City co
re a
dditio
nal h
ousin
g
411
PT spee
d/ser
vice +
10 %
321 S
peed
-20%
, sec
onda
ry n
etwor
k
421 P
T fare
s -50
%
311 S
peed
-10
%, a
ll net
work
213 C
ar co
st +1
00%
212
Car co
st +50
%
211
Car co
st +25
%
111 L
ocal
inves
tmen
t plan
(PT)
Loca
l pol
icie
s
Car
ope
ratin
g co
sts
Oth
er c
ar p
ricin
g
Par
king
Net
wor
k sp
eed
PT
spe
ed
Land
Use
222
Parkin
g + 60
/30 m
in. tim
e valu
e
221 P
arkin
g + 20
/10 m
in. tim
e valu
e
231
Cordo
n pric
ing +
20 m
in. tim
e va
lue
232
Cordo
n pric
ing +
60 m
in. tim
e va
lue
PT
fare
000
Refere
nce
2001
scen
ario
000
Refer
ence
scen
ario
2021
000 R
efer
ence
scen
ario
2011
Ref
eren
ce s
cena
rio
Global climate change
Air Pollution
Consumption of naturalsources
Environmental quality
Health
Equity
Opportunity
Accessibility
0
0,2
0,4
0,6
0,8
1
0
0,2
0,4
0,6
0,8
1
Figure 6.31 Inverness policy comparison

Analysis of policy testing results
217
6.4 City specific findings in Naples
6.4.1 Reference Scenario (000)
In the evolution of the reference scenario to the horizon year 2021 a growth of both population and employees can be observed: the number of study area residents is es-timated to grow by more than 10% and employment by 9,6%. Such growth is not uni-form in the study area and a trend similar to the one of Vicenza can be observed: population decreases in the city center, is almost stable in inner urban area and clearly increases in the outer urban area and in the rest of region (+16% and +14%, respec-tively). The city center employment decreases 3,4%, while the trend is positive for the other superzones, with a peak in the inner urban area (+16%).
Although the pro-capita mobility rate is stable, the private motorized modal share grows by 3% and thus congestion increases, which means that the average travel time is 4% higher in 2021 and the average travel distances are 1% shorter. Despite the re-newal of the vehicle fleet (whose positive impact can be seen in the air quality: NOX – 44%, VOC –70%, acidifying gases –70%), the environmental index shows a negative trend, which is related to the consumption of natural resources and to the general envi-ronmental quality.
Figure 6.33 illustrates the transport network and traffic noise in 2001 and the noise differences between 2021 and 2001 in the reference scenario.
The social index result is more ambiguous: average values are almost stable, while the components related to health and opportunity is increasing and, on the other hand, the components related to equity and accessibility show a deteriorating trend.
> 10%5% > 10%0% > 5%
Population
Employees
-5% > 0%-10% > -5%-15% -10%
2001 - 2021 % delta on average growth
Figure 6.32 2001 – 2021 Population and employees % variation compared with the respective average growth

Analysis of policy testing results
218
Figure 6.33 Naples reference scenario, traffic noise 2001 (top), traffic noise differ-ence 2021 v. 2001(bottom).

Analysis of policy testing results
219
6.4.2 Investment policies (111)
The local investment policy in Naples case city mainly includes new PT facilities (op-timization and completion of existing metropolitan railway lines, park&ride schemes, etc.). The impact of this policy is weak in the study area: the rail modal share in-creases by 3% (but as absolute values, it is still lower than in 2001), gaining from pri-vate modes and from bus and slow modes of transport. As a consequence, the envi-ronmental index does not have relevant improvement. The social index is slightly bet-ter, due to a more uniform distribution of the economic benefits and to the improved accessibility to the city center. The economic index, which only measures the viability of the investment, is above zero (+48 Euro/capita).
6.4.3 Car pricing policies
Increasing car operating costs policies (211, 212, 213)
Car pricing policies show the greatest impact in the study area. From the socio-economic point of view, they generate a densification of central areas: city center and inner urban areas always increase (in policy 213 city center gains 3% employees and 2,3% inhabitants) and the rest of region area loses.
The private modes share decrement is in the range of –1,8% (in the “smoothest” 211 policy) to –7% (in the strongest 213 policy) and, correspondingly, bus gains from +3,8 to 16% respectively. There is a visible improvement also for congestion: +7% increase of the car average travel speed. As a consequence, environmental indicators have very positive values and social ones behave in a similar way, except for those regarding equity. This is due to the fact that the zones that have the more positive ef-fects are the ones with a higher rate of upper class population.
The economic index is also very positive: from +553 Euro/inhabitants in policy 211 to +1156 in policy 213. Such a result is mainly due to the reduction of transport external-ities, while the indicator of distribution of economic benefits is negative.
The sustainability indices, as can be seen in Figure 6.34, have general positive trends that increase as the level of the car operating costs increase.

Analysis of policy testing results
220
Figure 6.34 Sustainability indices in the car operating cost increase policies
Increasing parking fares (221, 222)
The main effect of the increasing parking fare policies is a loss of both population and employees from the zones where the increased parking fares are implemented. In fact, employees decrease in the city center by -1,1% to -1,8% and in the inner urban area by -1,6% to –3,1%, respectively, in policies 221 and 222. The policies also have an impact on mobility patterns, with decreasing values for the private motorized modal share: -1,4% in policy 221 and –4,9% in policy 222. The environmental impact is consequently positive, and also the social one, whose behavior is similar to the base scenario one.
There are also positive signs for the economic indicators: absolute values are lower than in the “increasing car operating cost” policies, but both transport benefits and externalities are positive (policy 221 + 337 Euro/inhabitant, policy 222 +878 Euro/inhabitant).
Cordon pricing policies (231-232)
The impact of cordon pricing on the study area is very similar to the one of the in-creasing parking fare policies. The city center, which is closed by the toll cordon, shows a relevant decrease in the number of inhabitants (–4,6% in policy 231 and –7,3% in policy 232) and of employees (–2,9% and –7,6% respectively). Accordingly, the environmental and social performances of these two policies are in line with the increasing parking fare policies. The economic index is positive (+404 Euro/inhabitants and +867 Euro/inhabitants for policy 231 and 232) and, as for the policies aimed at increasing car operating cost, the weight of the externalities reduc-tion is determinant to make the economic benefits positive.
Car Pricing Policies
0.00
0.10
0.20
0.30
0.40
0.50
0.60
0.70
0.80B
ase
2021
Car
cos
t+
25%
Car
cos
t+
50 %
Car
cos
t+
100
%
0
200
400
600
800
1000
1200
1400
ENV
SOCIAL
EEEI

Analysis of policy testing results
221
6.4.4 Regulation policies (311, 321)
Regulation policies have a moderate impact on transport patterns. The private motor-ized modal share decreases (less than 1% in both policies) and this, in combination with the reduction of average road speeds, generates good performances of the envi-ronmental indicators as well as the health indicators. On the other hand, accessibility and opportunity components of the social index decrease and the economic impact is the worst of the tested policies (–420 and –410 euro/inhabitant respectively for 311 and 321 policies).
6.4.5 Public transport policies (411, 412,413)
Policy 413 - 50% decrease of the PT fares - has most relevant impacts in the study area. In the case of Naples employees and population concentrate in the city center and inner urban zones (inhabitants +3,3% and employees +3,6% in city center and +1,1% and +2,2%, respectively, in the inner urban area). Public modes shares have a consistent increase of about +9% for buses and +15% for rail and this has obviously a positive effect on air quality and greenhouse gases (a reduction of more than 4% for CO2 and VOC).
The concentration of inhabitants and employees means also that more people live in the most central and more polluted zones of the study area and thus, the health aspects of the social dimension are not so positive. Also opportunity and accessibility indica-tors have a negative trend, mainly due to the increase of travel time (public transport has lower performance than private transport in terms of speed). The economic results of the analysis are positive due to the impact of the reduced environmental external-ities: +150 Euro/inhabitant, and also equity aspects are very positive.
The policies concerning the decrease of the average PT times (411 and 412) have a very similar behavior, but generating lower scale impacts.
6.4.6 Land use policies (511, 521)
Land use policies have a very weak impact not revealing any relevant changes for the distribution of households and employees nor for the environmental and social indica-tors. Economically, the results are quite neutral: +5 and +62 Euro/inhabitant for poli-cies 511 and 521, respectively.
6.4.7 Policy combinations (711,712,713)
All policy combinations include a 50% increase of the car operating costs and show a concentration effect on population and workplaces: the number of inhabitants in-creases by abut 4,4% in the city center and by 3,4% in the inner urban area, while the number of employees increases from 5,9% to 7% in city center, and from 1,2% to 2,5% in the inner urban area. Synergic effects in the concentration of employees (but not of population) in the core area can be observed: i.e. the concentration effect of the policy combination in the city center is from 0,5% to 0,8% higher than the one ob-tained summing up the effects of the single policy elements.

Analysis of policy testing results
222
> 10%5% > 10%0% > 5%
Population
Employees
-5% > 0%-10% > -5%-15% -10%
RS - Policy 713 2021 % delta
Figure 6.35 Policy 713: population and employees % variation compared with the Reference Solution – Year 2021
At the same time the average travel distances and the modal share of private modes of transport decrease (generally more than 9%), with positive effects on congestion (–16% car travel times, far higher than the reduction of the travel distances). This is positive also for public modes of transport as their average travel speed increases by 5,3% in policy 711, and of 8,4% in the two policy combinations 712 and 713 (which include the “decrease PT travel time by 5%” policy element). Also in this case a slight synergic effect regarding congestion in general can be detected.
These changes have obviously relevant impacts on the environmental indicators: CO2, VOC, and “consumption of mineral oil product” diminish with about 20% in 2021, and also quality and fragmentation of open spaces have a good trend. On the other hand, the social components of sustainability - equity, opportunity and accessibility - deteriorate due to the combined side effects of the single policy elements. In eco-nomic terms, the policies produce positive values: the total economic indicator is al-ways positive, with values from +1020 euro/inhabitant in policy 711 to +1214 Euro/inhabitants in policy 713.
6.4.8 Summary
The base scenario shows that the existing level of sustainability cannot be maintained as the social aspects of equity and accessibility, and the overall environmental indica-tors deteriorate (except for the theme related to air pollution).
Concerning the environmental component, the tested policy elements have always better indices if compared with the 2021 base scenario, and the ones that best contrast the degrading situation are the “increasing car operating costs” policies; the two poli-cies with higher car cost increases (+50% and +100%) are able to improve the envi-

Analysis of policy testing results
223
ronmental sustainability index also compared with the current situation (base year 2001).
The situation is less linear when looking at the social component of sustainability, where policies do not have homogenous scores among the different themes. The “in-creasing car operating costs” policies behave better regarding the health theme (and good performances also related to accessibility and opportunity) but, as they tend to concentrate the urban development, they have the worst results in the equity indicators (the central zones are those where higher income households live). On the other hand, the policies that behave better regarding equity (policy 421: 50% decrease of PT fares) do not have positive trends in the other themes of sustainability.
From the economic point of view the best performances are obtained in the pricing policies (and this can be explained by the high level of traffic congestion of the city). PT oriented policies have positive results as well, but they produce lower values. As in other case cities, the regulation policies have the worst indices.
Policy by policy the main results were:
• The local investment policy does not show a relevant impact in the study area, de-spite slightly positive values for different components measuring sustainability.
• The best results among pricing policies are obtained by the “increasing car operat-ing cost” policies. Their main impacts include: the densification of central areas, more balanced modal shares, decreased road congestion and good results for the environmental, social (except equity aspects) and economic indices. The other pricing policies have similar, although less relevant, results and the side effect of accelerating the urban sprawl.
• Regulation policies have a moderate impact, which is the net result of the positive outcome for the environmental indicators and the health component of the social index and the negative performance of the other social indicators as well as of the economic index.
• Policies concerning the decrease of the PT fares have significant impacts in terms of population and employees concentration and of sustainable mobility,
• Land use policies seem to have poor effects on all the analyzed indicators.
• The combinations of policies restricting private traffic and at the same time en-couraging public transport services show positive synergetic effects. The effects are very positive in terms of environmental quality and economic performance, but some ambiguous effects on the social side of the overall sustainability have to be corrected by adopting additional, socially oriented, actions.

Analysis of policy testing results
224
0
0,2
0,4
0,6
0,8
1
0
0,2
0,4
0,6
0,8
1
-1000
-500
0
500
1000
1500
713 7
12 +
PT
orien
ted la
nd us
e
712 7
11 +
PT
spee
d +5
%
711 C
ar +
75 %
, PT
fare
-50
%
521 P
T orien
ted la
nd us
e
511 C
ity co
re a
dditio
nal h
ousin
g
421 P
T far
e -5
0%
412 P
T sp
eed/
serv
ice +
5%
411 P
T sp
eed/s
ervic
e +10
%
321 S
peed
-20%
, sec
onda
ry ne
twor
k
311 S
peed
-10
%, a
ll netw
ork
222
Parkin
g +2
.5/1.3
€
221
Parkin
g +0
,85/0,
42 €
232 C
ordo
n pr
icing
2,5 €
231 C
ordo
n pr
icing
0.85
€
213
Car co
st +1
00%
212 C
ar co
st +5
0 %
211
Car co
st +2
5%
111 P
T inv
estm
ent
Loca
l pol
icie
s
Car
ope
ratin
g co
sts
Oth
er c
ar p
ricin
g
Par
king
PT
fare
Net
wor
k sp
eed
PT
spe
ed
Land
Use
Com
bina
tions
000 R
efer
ence
scen
ario
2001
000
Refer
ence
scen
ario
2021
000 R
efere
nce s
cena
rio 2
011
Ref
eren
ce s
cena
rio
Global climate change
Air Pollution
Consumption of naturalsources
Environmental quality
Health
Equity
Opportunity
Accessibility
Figure 6.36 Naples policy comparisons
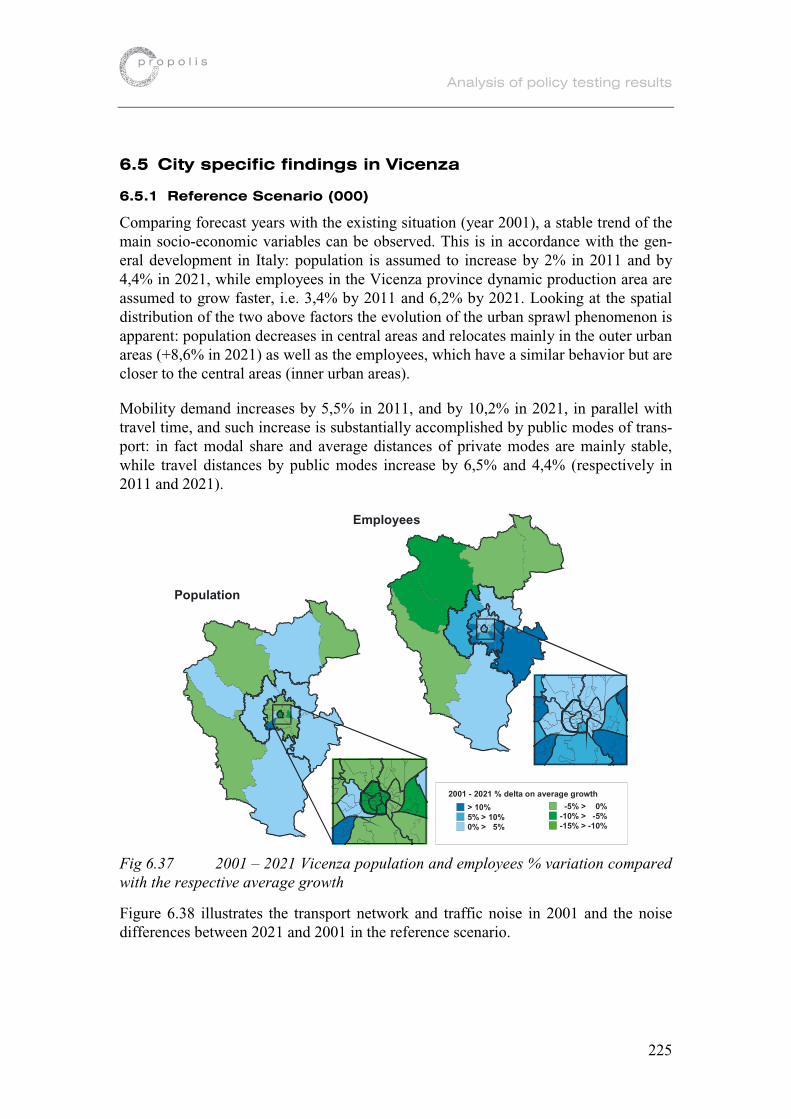
Analysis of policy testing results
225
6.5 City specific findings in Vicenza
6.5.1 Reference Scenario (000)
Comparing forecast years with the existing situation (year 2001), a stable trend of the main socio-economic variables can be observed. This is in accordance with the gen-eral development in Italy: population is assumed to increase by 2% in 2011 and by 4,4% in 2021, while employees in the Vicenza province dynamic production area are assumed to grow faster, i.e. 3,4% by 2011 and 6,2% by 2021. Looking at the spatial distribution of the two above factors the evolution of the urban sprawl phenomenon is apparent: population decreases in central areas and relocates mainly in the outer urban areas (+8,6% in 2021) as well as the employees, which have a similar behavior but are closer to the central areas (inner urban areas).
Mobility demand increases by 5,5% in 2011, and by 10,2% in 2021, in parallel with travel time, and such increase is substantially accomplished by public modes of trans-port: in fact modal share and average distances of private modes are mainly stable, while travel distances by public modes increase by 6,5% and 4,4% (respectively in 2011 and 2021).
2001 - 2021 % delta on average growth
Population
Employees
> 10%5% > 10%0% > 5%
-5% > 0%-10% > -5%-15% > -10%
Fig 6.37 2001 – 2021 Vicenza population and employees % variation compared with the respective average growth
Figure 6.38 illustrates the transport network and traffic noise in 2001 and the noise differences between 2021 and 2001 in the reference scenario.

Analysis of policy testing results
226
Figure 6.38 Vicenza reference scenario, traffic noise 2001 (top), traffic noise difference 2021 v. 2001(bottom).

Analysis of policy testing results
227
Air quality improves and the population exposure to pollutant emissions decrease over time, with the exception of greenhouses gases, mainly due to the technological devel-opment and the renewal of the vehicle fleet. At the same time, environmental indica-tors show that the urban sprawl increases open space fragmentation and land cover-age. In total, the environmental and social indices have negative trends and these ele-ments suggest that additional actions to increase sustainability are needed.
6.5.2 Investment policies (111)
The local investment policy in Vicenza case city essentially includes the provision of new infrastructure for public transport (both rail and bus) with new park&ride facili-ties. The impacts of such policy on environment and population are positive: some effect on concentration of population and activity along the improved public transport axes can be observed (with a benefit for the more central zones of the study area) to-gether with an overall reduction of travel times and distances.
Public modes of transport, that in the base scenario have a very low modal share, gain new passengers (year 2011 + 21%, year 2021 + 24%) and also the average distances by public mode rise of about +5%. As a consequence, environmental indicators have a general positive trend, except the one related to the fragmentation of open space (in-fluenced by the relocation of inhabitants and employees along the improved PT axes). Also social effects related to health, opportunity and accessibility are positive, apart from the ones accounting for pollutants exposure and the equity of distribution of economic effects, that can be explained with the fact that the zones with the more positive effects are the central ones, that also have the higher rate of upper class popu-lation. The economic index, which in this case only measures the impact of the in-vestment, is also positive: +370 euro/inhabitant.
6.5.3 Car pricing policies
Increasing car operating costs policies (211, 212, 213, 214)
The major impact of such policies is the decrease of private transport modal share by –2% (costs +25%) and by –11% (costs +100%) at the horizon year. Moreover, also the overall travel distances and average distances by private modes face a significant reduction. As a consequence, public modes’ modal share increases as well as the av-erage distances and also average speed (this can be explained by the fact that the rail mode, that is faster, grows more than bus and by the fact that road congestion de-creases).
In the three policies the distribution of economic benefits is negative, but this is coun-terbalanced in policy 211, 212 and 214 (costs +25%, +50%, +75%) by the benefits gained in the transport externalities sector. The overall results are +270 Euro/inhabitant for policy 211, +311 for policy 212 and +222 for policy 214. In policy 213 (costs + 100%), the benefit related to the reduction of externalities is not enough to make the overall economic evaluation positive.

Analysis of policy testing results
228
Environmental indices, due to the decrease of private mode, improve as the level of car operating costs increase. Social effects are more ambivalent: health, opportunity and accessibility indicators are positive except the ones related to the vitality of sur-rounding region and the level of service of public modes (that are slower than private ones). In total, the social indices are positive and increase with the increase of the car operating costs. As for policy 111, the equity indicators are negative due to the fact that the policy impacts are mainly in central areas. The behavior of the three sustain-ability indices is shown in the Figure 6.39.
Figure 6.39 Sustainability indices related to the increase of car operating costs policies
Increasing parking fares (221, 222)
The main effects of park pricing policies is the reinforcement of urban sprawl of both population (–5% and –6% in 2021 in the city center in policies 221 and 222) and em-ployees (-4,6% and –6%) and a shift in the modal share from private (-0,5 and -1,8%) to public mode of transport, accompanied with a slight reduction of travel distances.
Environmental impacts are positive with the exception of the “fragmentation of open space” influenced by the increasing urban sprawl. Social indicators are quite stable: the health component is positive, the equity one does not change but the opportunity and accessibility components show negative impacts, due to the sprawl of population and activities. Economic indicators are positive in the lower option (policy 221) and become negative in the highest one (policy 222).
Cordon pricing policies (231-232)
Both cordon pricing policies show results similar to the parking fares policies. The main effects are the relocation of work places and inhabitants outside the cordon bor-
Car Pricing Policies
0.00
0.10
0.20
0.30
0.40
0.50
0.60
0.70
0.80
Bas
e 20
21
Car
cos
t+
25%
Car
cos
t+
50 %
Car
cos
t+
75 %
Car
cos
t+
100%
-50
0
50
100
150
200
250
300
350
ENV
SOCIAL
EEEI

Analysis of policy testing results
229
ders (–6% and –9% inhabitants in the city center by year 2021 and, respectively, –12% and –18% employees in policies 231 and 232,).
Economically both policies are viable, but policy 231 has better results than 232 (+196 Euro/inhabitant vs. +110 Euro/inhabitant). Environmentally the effects are slightly positive except for the indicators related to land coverage and fragmentation and quality of open space. Health and equity components of the social index are posi-tive, but accessibility decreases.
6.5.4 Regulation policies (311, 321)
The main effect of regulation policies is the reduction of traffic impact on the envi-ronment and the population (CO2 – 3,1%, NOX – 4,2%, traffic deaths –2,5%), but the results in terms of accessibility and opportunities are negative. Moreover the eco-nomic index is the lowest among the tested policies: -557 euro/inhabitant in policy 311, -113 euro/inhabitant in policy 312.
6.5.5 Public transport policies (411, 412,413)
PT policies lead obviously to an increase of the use of public transport modes: the im-pact is +8% for policy 411 (improvement of average PT travel speed) and +40% for policy 413 (reduction of the PT fares). Employees and population tend to concentrate in the most central and more accessible areas: the effect is moderate for policies 411 and 412 (+0,3% employees in city center) and more evident for policy 413 (+4,6% employees and +1,1% inhabitants in the city center).
Economically they are all feasible and the best results are the one obtained by policy 412, with 462 euro/inhabitant. Environmental indicators increase due to the reduction in the private car use and the results of the social index show that the justice in the distribution of the policy impact is negative because of the most advantaged zones are the ones that actually have the best PT facilities and that are the ones where high in-come households are located.
6.5.6 Land use policies (511, 521)
Economically and socially the land use policies are quite neutral. The most relevant positive effect can be observed in the environmental indicators, in relation to the envi-ronmental quality (fragmentation and quality of open space).
6.4.7 Policy combinations (711,712,713)
The three policy combinations include a 25% increase of the car operating costs (pol-icy 211) and have the effect of concentrating employment in the city center (about +7% in city center and–5% in inner urban). Inhabitants have a similar concentration effect, but with a lower peak as the concentration phenomenon involves also the area surrounding the central zone.
Private cars modal share decreases from –6,5% in policy 711 to –7,3% in policy 713 and PT modal share grows consequently. Economically these policies have the best

Analysis of policy testing results
230
score thanks to the impact they have on the reduction of transport externalities: +716, +828, +813 euro/inhabitant for policies 711, 712 and 713.
From the environmental point of view, their impacts are always positive: the reduction of CO2 from transport is up to -14% in policies 712 and 713, acidifying gases and VOC reductions are around –20% and –14% respectively. From the social point of view, the effects of the combination policies have a positive trend, which is very close to the sum of the single policy elements. Health and opportunity impacts are clearly positive and, on the other hand, equity and accessibility impacts are ambiguous, as was the case in the single policy elements.
RS - Policy 713 2021 % delta
Population
Employees
> 10%5% > 10%0% > 5%
-5% > 0%-10% > -5%-15% > -10%
Figure 6.40 Vicenza case city - policy 713: population and employees % variation compared with the Reference Solution – Year 2021
6.4.8 Summary
The social aspects are critical because their trend is negative also in many tested poli-cies. The only policy presenting a clear positive social index is 213 (increasing car operating cost +100%), because of the very positive value of health indicators, but in some respects it also performs negatively as, for example, aspect related to equity and the economic performance. It is important to mention that also in the base scenario the social index deteriorates, as well as the environmental one, with the exception of the air pollution indicators that, due to the technological development, score better than in the base case.
The best results for environmental indicators are obtained by all the “increasing car operating cost” policies that also have, with the exception of policy 213, good eco-

Analysis of policy testing results
231
nomic performance. The worst environmental results are obtained by those policies reinforcing urban sprawl: the “increase of parking cost” policies and, at a lower scale, the “cordon pricing” ones. From the economic point of view the best performance is obtained by the “50% decrease of PT fares”, that also has a good performance regard-ing the other components of sustainability. Regulation policies generate the worst in-dices, due to the very negative user benefits not counterbalanced by the gain in the externalities.
Policy combinations are the ones that, combining in a synergic way the various as-pects of the single policy elements, have overall positive results.
Policy by policy the main results are:
• The local investment policy, concerning the re-use of the railway network, shows goods results except for the indicators related to the environmental quality and the equity of the distribution of the effects among socio-economic groups.
• Pricing policies in general have good performance: policies increasing car operat-ing costs have better impacts than the ones related to parking pricing or cordon pricing, also because the former ones are able to contrast urban sprawl. The opti-mum level for car pricing policies can be considered to be between +25% and +50% increase of car operating costs, while a higher increase will cause negative economic results.
• Regulation policies reduce the impact of traffic on environment and on popula-tion, but have negative effect on the accessibility and opportunity indicators, and very negative economic effects.
• Regarding the PT policies, best results are obtained by decreasing PT fares. These policies get the best economic results and very positive effects on environment; the general side effect is that they have a negative performance in terms of equity impacts.
• Land use policies seem to have a very low effect on all the analyzed indicators.
• The combination of policies restricting private traffic and, at the same time, en-couraging public transport services show positive effects. The effects are very positive regarding the environmental and economic qualities of the transport and land use system while producing neutral results on the social side.

Analysis of policy testing results
232
0
0,2
0,4
0,6
0,8
1
0
0,2
0,4
0,6
0,8
1
-800
-600
-400
-200
0
200
400
600
800
1000
713
712 +
PT o
riente
d lan
d use
712
711
+ PT
spee
d +5
%
711
Car +
75 %
, PT fa
re -5
0 %
521 P
T orien
ted la
nd us
e
511 C
ity co
re a
dditio
nal h
ousin
g
421 P
T fa
re -5
0%
412
PT sp
eed/
servi
ce +
5%
411 P
T sp
eed/
serv
ice +
10 %
321 S
peed
-20%
, sec
onda
ry ne
twor
k
311 S
peed
-10
%, a
ll net
work
222
Parkin
g +2.5
/1.3
€
221
Parkin
g +0
,85/0
,42 €
232 C
ordo
n pr
icing
2,5 €
231 C
ordo
n pric
ing 0
.85€
213
Car co
st +1
00%
214 C
ar co
st +7
5 %
212 C
ar co
st +5
0 %
211 C
ar co
st +25
%
111 P
T inv
estm
ent
Loca
l pol
icie
s
Car
ope
ratin
g co
sts
Oth
er c
ar p
ricin
g
Par
king
PT
fare
Net
wor
k sp
eed
PT
spe
ed
Land
Use
Com
bina
tions
Global climate change
Air Pollution
Consumption of naturalsources
Environmental quality
Health
Equity
Opportunity
Accessibility
000 R
efere
nce s
cena
rio 20
01
000
Refer
ence
scen
ario
202
1
000
Refere
nce s
cena
rio 2
011
Ref
eren
ce s
cena
rio
Figure 6.41 Vicenza policy comparisons

Analysis of policy testing results
233
6.6 City specific findings in Bilbao
6.6.1 General
The main city specific policies including also the common policies tested in all case cities are presented in table 6.3. A brief description of the findings is presented below.
Table 6.3 Bilbao local policies and the year of implementation
2001 2006 2011 2016 2021 POLICY Type
Code POLICY Base year
Interme-diate year
Horizon year
Reference Scenario
000
Investments policies
111 Railway plans + Super Sur ring road (see 5.3.6) (see 5.3.6) (see 5.3.6) (see 5.3.6)
Pricing 211 car operating costs +25 % 25 % 25 % 25 % 25 % 212 car operating costs +50 % 25 % 50 % 50 % 50 % 213 car operating costs +100 % 25 % 50 % 100 % 100 % 214 car operating costs +75 % 50 % 75 % 75 % 75 % 221 Parking price + 20/10 minutes time value
(1.76/0.88 €) in/around city centre X
222 Parking price +60/30 minutes time value (5.28/2.64 €) in/around city centre
X
231 Cordon pricing +20 minutes time value (1.76 €)
X
232 Cordon pricing +60 minutes time value (5.28 €)
X
Regulation 311 Max speed -10% on all road network X X X X 321 Max speed -20% on other than motorway
and main roads X X X X
Public transport
411 PT travel speed +10% 5 % 10 % 10% 10 %
412 PT travel time –5% -2.5 % -5 % -5 % -5 % 421 PT fares –50 % -50 % -50 % -50 % -50 % Land use policies
511 Increase the average housing density in the city core
Regulate No Change
No Change
No Change
521 Concentrate the expansion of the residen-tial/tertiary in the zones with relevant PT facilities
Regulate No Change
No Change
No Change
Combined policies
711 Increase car operating cost + lower PT fares OPT(211…214)&421
25 % / -50 %
25 % / -50 %
25 % / -50 %
25 % /-50 %
712 Increase car operating cost + lower PT fares + decrease PT travel time = 711&412
25 % / -50 %
25 % / -50 %
25 % / -50 %
25 % /-50 %
713 712 + PT oriented land use (policy 521). 25 % / -50 %
25 % / -50 %
25 % / -50 %
25 % /-50 %
Common policy for all case cities
6.6.2 Reference Scenario (000)
The reference scenario 2021 is compared with the existing situation 2001. According to regional statistic forecasts, the total population in the study area will stay more or less constant through the years but the average household size becomes smaller through time. The number of work places is increased by 25% from 2001 to 2021 in the reference scenario for the Bilbao Metropolitan Area.
Analysis of policy testing results
234
The road and railway infrastructure actions presented in section 4.8.3 are included in this base scenario. Figure 6.42 illustrates the transport network and traffic noise in 2001 and the noise differences between 2021 and 2001 in the reference scenario.
The growth of the yearly travelled distance is 39.5% and the yearly travelled time in-creases by 31%. The total time spent in traffic per inhabitant is about 9% higher in 2021 than in 2001.
The modal share of the private car increases by about 7%-points; the bus share is 3%-points lower. The rail mode is more used (+6%-points) due to the development of railway infrastructure and other actions included in the base scenario. Finally, walking trips decrease by 10%, in favour of other modes.
Most social and environmental indicators worsen in the base scenario from year 2001 to year 2021, which emphasises the need for additional policy actions.
6.6.3 Investment policies (111)
Policy 111 takes into account several actions planned for the period 2001-2021 in the Bilbao Metropolitan Area. They comprise mainly new railway infrastructures and the construction of a new ring road. For a list of the specific actions included in this pol-icy, see section 5.3.6.
This policy shows the best economic effect, mainly due to high transport user bene-fits.
Due to the new railway infrastructures the modal share of the rail increases by 3.7%-points. The main part of the growth comes from the slow modes and a little part from the bus and the private car modes.
Emissions are clearly reduced but fragmentation and quality of open space character-istics worsen slightly but generally the environmental effect is positive.
The main positive effect from the social point of view is the reduction of traffic deaths. The negative effects include the decrease in the level of service of public transport modes, which is due to more trips on PT modes leading also to more time spent in traffic.
The accessibility to the city centre improves leading to growth of employment in this area.

Analysis of policy testing results
235
Figure 6.42 Bilbao reference scenario, traffic noise 2001 (top), traffic noise difference 2021 v. 2001(bottom).
Analysis of policy testing results
236
6.6.4 Car pricing policies
Increasing car operating costs policies (211-213)
These policies show the most significant effects, especially the drastic action of in-creasing car-operating costs up to 100%.
Environmentally emissions are reduced in all policies almost proportionally to the car operating cost increase.
Socially the positive results are related to the reduction of traffic deaths and injuries as well as to improved accessibilities. Justice of exposure of population to pollutants be-comes, however, worse in these policies.
Economically there is an optimum found at the level of +25% increase of car operat-ing costs. With a bigger increase of the operating cost the economic index decreases. This is due to the fact that the transport users’ disbenefits grow faster than govern-ment benefits. Savings in externalities also grow together with increasing operating costs as, for example, the number of traffic accidents reduces. These savings are, however, not enough to compensate the growing user disbenefits in more extreme pricing policies.
The modal share of the private car is remarkably reduced in favour of slow modes es-pecially for trips made within the city centre. Due to the short distances people prefer to leave the car and walk instead of using public transportation.
These policies shift work places out from the city centre but, on the other hand, in-habitants tend to move to live in the centre of the city in order to avoid using the car. This implies that these policies work efficiently against city sprawl.
This effect is illustrated on the maps, which show the change in population (in abso-lute values) in the policy 231(+100% car operating costs) compared with the Refer-ence Scenario in the year 2021. The three maps show the increase or decrease of high income, medium income and low-income households. It can be clearly seen how, in order to avoid expensive long trips, people with high income tend to move to the city core. Medium income households move to inner urban areas around the city centre trying to get as close as possible to the city centre, which, however, may become too expensive for lower income groups.

Analysis of policy testing results
237
Figure 6.43 Change in population (high income). Comparison 000 2021 – 213 2021
Figure 6.44 Change in population (medium income). Comparison 000 2021 – 213 2021

Analysis of policy testing results
238
Figure 6.45 Change in population (low income). Comparison 000 2021 – 213 2021
Increasing parking fares (221, 222)
The effects of these policies are very similar to those of the policies consisting of in-creasing car operating costs, although more articulated.
Environmentally, there is a remarkable reduction of emissions of pollutants to the en-vironment. The reduction becomes even more remarkable with the higher parking fare policy.
Socially, almost all indicators are improved. Traffic deaths and injuries are clearly reduced mainly because the modal share of the car is reduced. More trips are made by slow modes, again due to shorter distances, which makes it possible for people to leave the car and walk. Also the accessibility, equity and health and health indicators show an improving trend.
Economically, policy 221 (increase of parking costs corresponding to 20/10 minutes time value (1.76/0.88 €) is neutral. This shows that the additional parking costs are in balance with the savings obtained (transport operator benefits, government benefits and savings in externalities).
However, additional increase of the parking costs (policy 222: 5.28/2.64 €) makes the policy economically unfeasible, as the transport users’ disbenefits grow faster than the overall benefits of the policy.
Employment tends to move out from the city and its metropolitan area. People tend to go either to the city centre or outside of the metropolitan area, while the number of inhabitants in the inner urban and metropolitan areas is reduced. This development slightly contributes to city sprawl.

Analysis of policy testing results
239
Figure 6.46 Change in population (high income). Comparison 000 2021 – 222 2021
Figure 6.47 Change in population (medium income). Comparison 000 2021 – 222 2021

Analysis of policy testing results
240
Figure 6.48 Change in employment. Comparison 000 2021 – 222 2021
The maps below (comparison between the Reference Scenario and Policy 222 in the year 2021) show how high income households are more willing to pay for a parking place in the city centre, and so tend to move out from the city core to the outer areas, whereas medium income people try to avoid paying additional parking costs by mov-ing to the city centre where they are able to leave the car at home and use public transport or slow modes as alternative travel modes. Inner urban areas lose popula-tion.
The last map shows how the city centre and inner urban areas lose work places and employment grows in the rest of the metropolitan and in rest of region areas, contrib-uting this way to city sprawl.
Cordon pricing policies (231-233)
These policies have positive results related to the emissions of pollutants but the envi-ronmental quality indicators show negative development.
From the social point of view the effects are negative, as was the case in the previous policies. Reduction in the modal share of the car is not achieved and, thus, no de-crease in the number of traffic deaths and injuries takes place. In addition, the acces-sibility to the city centre worsens, as there is more congestion caused by people using alternative routes when trying to get to the city centre without crossing the toll cor-dons.
From the economic point of view there is a positive result when applying the cordon pricing cost of 20 minutes time value (1.76 euro) resulting to the economic index value of 422 euro/inhabitant. However, the result becomes negative when using the cordon pricing policy corresponding to value of time of 60 minutes (5.28 euro). In this

Analysis of policy testing results
241
case the economic index is –226 euro/inhabitant. This shows that the economic effect would be neutral somewhere around 30 minutes time value for the Bilbao case. Cor-don costs higher than that would lead to negative socio-economic effects due to high users’ disbenefits.
Savings in externalities are always negative, mainly due to the increase in traffic acci-dents (deaths and injuries).
6.6.5 Regulation policies (311, 321)
The main aim of these policies is to reduce traffic accidents and noise by limiting car speeds. In this respect they work well, traffic accidents are reduced by 2-4%. How-ever, the policies have negative environmental side effects in the form of increased CO2 and VOC emissions. The positive external cost savings (accidents, noise) are not large enough to make the policies viable and to compensate the highly negative user benefits.
6.6.6 Public transport policies (411, 412 & 421)
The public transport pricing policies have only small effects in the Bilbao case al-though the local policy including many actions related to public transport resulted in positive development of many important indicators.
A small reduction in the emission of pollutants could be observed. Also from the economic point of view these policies show positive results.
6.6.7 Land use policies (511, 521)
Increasing the number of inhabitants in central areas together with movement of working places from central areas to outer areas (511) shows a small negative envi-ronmental and social development; especially negative development is related to the justice of exposure to noise. The economic index is positive. This policy also contrib-utes to city sprawl by shifting both work places and, as a result of their movement, also inhabitants from the city centre and inner urban areas to outer areas.
Concentrating the growth in zones with good PT services (521) shows only minor, mainly positive changes, in both environmental and social indicator values and indi-ces. The policy contributes slightly to city sprawl, but with less significantly than the policy 511. Also the economic index is positive although smaller than in the previous policy 511.
The maps below show the changes in population for policy 521 compared to the Ref-erence Scenario for the year 2021. The zones included in the urban and metropolitan areas tend to gain population, mainly in the left margin of the Bilbao estuary, due to the inclusion of new public transport infrastructure in this area during the study pe-riod.

Analysis of policy testing results
242
Figure 6.49 Change in population (high income). Comparison 000 2021 – 521 2021
Figure 6.50 Change in population (medium income). Comparison 000 2021 – 521 2021

Analysis of policy testing results
243
Figure 6.51 Change in population (low income). Comparison 000 2021 – 521 2021
6.6.8 Policy combinations (711-713)
In Bilbao case the policy combination 711 includes 25% increase of car operating costs and lowering of PT fares by 50%. The changes are set on a lower level than the optimum for the individual policies because of the synergy effects of the policies.
Policy 421 (lowering PT fares by 50%) showed very little effect, which is why the results, when combining the policy 421 with the car pricing policy, are very similar to the results of the single car pricing policy. A slight cumulative effect is found in some of the environmental indicators related to emissions of pollutants. Socially no signifi-cant changes are found. Economically the overall result is positive, not as high as for policy 211 alone (+25% car operating costs), but higher than for policy 421 (-50% PT fares).
In 712 an improvement of the PT speeds and service by 5% is assumed and this op-tion has been combined with the above policy 711. Slight additional improvements take place compared with policy 711 but the city sprawl effect (people moving out from the metropolitan area) continues.
When finally the “restrictions on peripheral land use” policy is combined with 712, a more balanced land use development takes place in policy 713.
All emissions decrease, traffic accidents decrease and environmental quality im-proves. Negative side effects include the decrease of housing standard, need for addi-tional construction and a worse justice of exposure to noise. Economically the policy is viable and the economic index higher than for policy 521 alone.
Analysis of policy testing results
244
6.6.9 Summary
The environmental and social indices and the economic index for the tested policies are shown in the figure 6.52.
The base scenario shows that the existing level of sustainability cannot be maintained as the environmental and social indices deteriorate.
The local policy tested shows that the planned future actions related to railway infra-structure and new ring road in Bilbao would have an overall positive effect for all the three dimensions of sustainability.
Best results are achieved by adopting car pricing policies. Cordon pricing systems, as well as increase of parking fees produce positive results for the environmental com-ponent. As regards the social component, parking pricing policies show better results than the cordon pricing ones.
Economically, increasing car operating costs shows a positive result (with a maximum at +25%), increasing parking costs has a positive effect up to the limit corresponding to the value of time of 20/10 minutes. The cordon pricing policies have positive eco-nomic effects till the point corresponding to 30 minutes value of time. In addition, the parking pricing policies have a negative land use effect, as they contribute to city sprawl.
The regulation policies tested (lowering car speeds) reach their aim to decrease traffic accidents. However, these benefits are not large enough to compensate the negative, especially economic, side effects.
The PT policies tested for the Bilbao metropolitan area show little or neutral effects. There could, however, be other PT policies that could work in a right direction, as was seen with the local policy tested.
The effects of the tested land use policies are small compared with especially the pric-ing policies. Increasing the average inhabitants density in the city core showed posi-tive economic results but negative environmental and social effects. For policy 521 (concentrating the expansion of residential and tertiary land uses in zones with rele-vant public transport facilities) small positive effects for the environmental and social indicators can be obtained. Also the economic index is positive, but smaller than for policy 511.
Policy combinations show that car pricing policies can be combined with other sets of policies in order to obtain cumulative positive effects. For the case of Bilbao and the selection of policies tested it was not possible to improve all components of sustain-ability simultaneously by using policy combinations. However, it was possible to identify policies where the development of all the sustainability dimensions is posi-tive, for example policy 713.

Analysis of policy testing results
245
0
0,2
0,4
0,6
1
0,8
0
0,2
0,4
0,6
1
0,8
-1000
-2000
0
1000
2000
3000
4000
713
712 +
CIT
Y orien
ted l
and
use
712
711
+ PT sp
eed
+5 %
711
Car +
25 %
, PT fa
re -5
0 %
521 P
T orie
nted
land u
se
511
City co
re a
dditio
nal h
ousin
g
411 P
T spee
d/ser
vice +
10 %
321
Speed
-20%
, sec
onda
ry ne
twor
k
311
Speed
-10
%, a
ll net
work
222
Parkin
g +5
.28/2
.64 €
221
Parkin
g +1,7
6/0,8
8 €
232 C
ordo
n pric
ing 5.
28 €
231
Cordo
n pr
icing
1,76
€
213
Car co
st +1
00%
212
Car co
st +5
0 %
211 C
ar co
st +2
5%
111 R
ailway
Plan
s+Ring
Roa
d
Loca
l pol
icie
s
Car
ope
ratin
g co
sts
Oth
er c
ar p
ricin
g
Par
king
Net
wor
k sp
eed
PT
spe
ed
Land
Use
Com
bina
tions
000 R
efer
ence
2001
scen
ario
000
Refer
ence
scen
ario
2021
000
Refer
ence
scen
ario
2011
Ref
eren
ce s
cena
rio
Global climate change
Air Pollution
Consumption of naturalsources
Environmental quality
Health
Equity
Opportunity
Accessibility
Figure 6.52 Bilbao policy comparison.

Analysis of policy testing results
246
6.7 City specific findings in Brussels
6.7.1 Reference Scenario (000)
The Reference Scenario 2021 includes the overall demographic and socio-economic trends to the horizon year 2021. It also includes two other elements, First, it assumes that the objectives of the regional Land Use Plans of the 3 Regions (Brussels-Capital Region, Flemish Region, Walloon Region) are mainly achieved. For the Flemish and Walloon Regions, the objective is to concentrate a major part of the population and employment growth in the urban areas. Secondly, the Reference Scenario includes the implementation of the new regional express railway network (Réseau Express Ré-gional - RER), without any accompanying measures.
The comparison of the Reference Scenario 2021 with the existing situation 2001 shows that the new high quality public transport service, which links the central area and the suburban area, will induce urban sprawl. This means out-migration of house-holds from the central agglomeration towards the periphery, and at the same time, re-concentration of employment (namely retail and services) in the central area. The im-plementation of the RER, of course, also induces a modal transfer from private car to public transport.
In this context the policies, which were tested in PROPOLIS, can be seen as accom-panying measures to the RER. They should be aimed at reducing the negative effects of the RER (out-migration of households and urban sprawl) or reinforce its positive effects (decrease vehicle-km travelled by car).
Figure 6.53 illustrates the transport network and traffic noise in 2001 and the noise differences between 2021 and 2001 in the reference scenario.
6.7.2 Investment policy (111)
The “local investment plans” scenario is equal to the Reference Scenario, completed with the following measures:
• Implementation of a new network of express buses (19 new lines in all), through-out the study area, that completes the RER railway network
• Within the Brussels-Capital Region (central urban area): increase of the commer-cial speed of surface public transport services
• In the periphery: increase of the commercial speed of the local buses which drive the users towards the RER railway stations
• In the city-centre: improvement of the quality of life in the residential neighbour-hoods through diversion of the transit traffic, traffic calming, greening, improving the safety for children
• In the whole territory of the Brussels-Capital Region: implementation of a hierar-chy of the road network, which goes together with the reduction of the network capacity by about 15 %. This is a necessary corollary of the previous measure (di-version of the transit traffic and traffic calming) and is also necessary in order to build dedicated lanes and rights-of-way for the public transport.

Analysis of policy testing results
247
Figure 6.53 Brussels reference scenario, traffic noise 2001 (top), traffic noise difference 2021 v. 2001(bottom).

Analysis of policy testing results
248
As regards the impacts on spatial structure and land use, the combination of better public transport services and the establishment of residential zones without through traffic results in a significant increase in population (+7.2 %) and employment (+2.2%) in the city-centre. Consequently, the need for new construction (ERNC) is reduced by 3.4% when compared with the Reference Scenario, and the fragmentation (EQFO) and quality (EQQO) of open space are slightly better than with this latter. When compared with the other policies tested in PROPOLIS, Policy 111 scores in the average.
Environmentally, the total distance travelled decreases by 8.6%, which is one of the best results obtained ; only Policies 212 and 213 (increasing the car use cost) score better. Consequently, environmental indicators (EGGT, EAOC and EROT) have good values related to a reduction of polluting emissions equal to approximately 10%.
Socially, as a consequence of the diminution of the total distance travelled, health in-dicators (SHED, SHEN, SHTD, SHTI) are all improved when compared with the Reference Scenario. SHED and SHEN values are better than the average of all other policies.
Vitality of city-centre (SOVC) is improved by 4.1%, which lies in the average, while the vitality of the surrounding region (SOVS) is slightly worsened when compared with the Reference Scenario. The combination of the increase of households and jobs in the city-centre results in a good value for the productivity gain indicator (SOPG : 4.2%, highest value among all policies, equally placed with policy 213).
As regards accessibility, SATT and SAPT indicators are significantly improved (re-spectively –5.1% and –6.8%), following the implementation of a new network of ex-press buses and the increase in travel speed of the public transport. Therefore, the ac-cessibilities to the city-centre (SAAC) and to services (SAAS) are significantly im-proved, by 6.6%, which represents the best score obtained among all policies that have been tested.
Economically, the economic index has a positive value representing about the average of all PROPOLIS policies. Externalities from transport are significantly reduced, and there is a transfer of benefit from the government to the user: transport user benefits strongly increase.
6.7.3 Car pricing policies
Increasing car operating costs (211-213)
Comments are mainly focused on Policy 213, which produces the strongest effects, among the three variants.
As regards the impacts on spatial structure and land use, policies 211-212-213 result in an increase in population and employment in the city-centre and inner-urban areas. Need for new construction (ERNC) is heavily reduced and the fragmentation of open

Analysis of policy testing results
249
space (EQFO) and quality of open space (EQQO) are improved when compared to the reference scenario.
Environmentally, increasing the car operating cost results in a diminution of the total travelled distance, therefore the environmental indicators EGGT, EAOC, EROT are improved. The values of these three indicators are strongly correlated. Regarding the environmental indicators, policy 213 is one of the most effective policies simulated in the PROPOLIS framework.
Socially, since Policies 211-212-213 reduce car use, health indicators (SHED, SHEN, SHTD, SHTI) are strongly improved. Policy 213 is the most effective among all poli-cies for all these indicators (except for the indicator SHEN Traffic Noise, where the policies 311 and 321, aiming at lowering car speed score better).
Vitality of city-centre (SOVC) is stimulated by the increase of population and em-ployment in the city of Brussels. Respectively, the vitality of surrounding regions (SOVS) is weakened. Since the average dwelling size is smaller in urban areas than in suburban or rural places, the housing standard (SOHS) is worse in policies 211 to 213 than in the Reference Scenario1. Productivity gains (SOPG) in Policy 213 show the best score among all tested policies, equally placed with Policy 111 (SOPG : 4.2 %).
All accessibility indicators are significantly improved with Policy 213 (SATT, SAPT, SAAC SAAS), except the accessibility to open spaces (SAAO), which is worsened as a consequence of the concentration of population in the city area.
Economically, the economic index of Policy 213 is positive and above the average. The most important impact of the increase in car operating cost is to transfer benefit from the user to the government. The transport operator benefits are improved, and the transport external costs are reduced.
Increasing parking fares (221-222)
Comments are mainly focused on Policy 222, which produces the strongest effects of the two variants.
As regards the impacts on spatial structure and land use the resident population in the city area (city-centre and inner urban) is hardly affected by policies 221 and 222. The employment reacts by leaving massively the city-centre and inner-urban areas, and settles in the outer urban area and in the rest of the region, where the public transport supply is not as good as in the city-centre. Therefore, the need for new construction (ERNC) is heavily increased (Policy 222 is the worst policy tested in this regard), and the quality (EQQO) and fragmentation (EQFO) of open spaces are worsened, com-pared to the Reference Scenario.
1 Note that in the Brussels case, the Housing Standard indicator (SOHS) is the average land surface (area) consumed per dwelling or per household.

Analysis of policy testing results
250
Environmentally, overall the average travel distance is hardly affected by these poli-cies (-1.5 % in policy 222, while this figure was equal to -20.2% in policy 213 dis-cussed above). Therefore, the value of environmental indicators (EGGT, EROT, EAOC) is hardly better than with the Reference Scenario.
Socially, health indicators (SHED, SHEN, SHTD and SHTI) are slightly improved compared to the Reference Scenario, but much less than with other policies that are more effective in this regard.
As a consequence of the moves in the population and employment, the vitality of the city-centre (SOVC) is strongly weakened, while the vitality of surrounding region (SOVS) is improved by +1.5% when compared with the Reference Scenario; this is anyway the most effective policy for this indicator.
Accessibility indicators are slightly improved (SATT, SAPT, SAAC, SAAO). How-ever, the accessibility to services is worsened due to the migration of jobs outside the city in places where public transport is less efficient and where services are less densely distributed than in the central agglomeration.
The economic indicator is positive, but the value is lower than the scores obtained with the policies increasing the car use cost (Policies 211-213).
Cordon pricing policies (231-232)
Comments are mainly focused on Policy 232, which produces the strongest effects of the two variants.
As regards the impacts on spatial structure and land use, the effect of the cordon pric-ing is to incite households to move towards the inner side of the toll cordon (Policy 232 : + 3.4 % households in the Centre and Inner Urban areas), while jobs move out-side it (-3.6 % jobs in the Inner Urban area). In this way, households and jobs react in order to avoid the toll charge and to lower the incoming commuter flows. Quality and fragmentation of open space are worsened compared to the Reference Scenario. This is due to the fact that many jobs now locate in the neighbourhoods of the toll cordon (outside the cordon), which lies mostly in areas that have a relatively low job and population density.
The land-use effect results in a diminution of the total travelled distance (Policy 232 : BVTYTDSA : -5.7 %). This effect combined with a positive modal shift towards the public transport induced by the toll charge leads to an improvement of the environ-mental indicators (EGGT, EAOC, EROT), compared to the Reference Scenario ; this improvement is slightly above the average.
Health indicators (SHED, SHEN, SHTD and SHTI) are improved, but less than with Policies 212 and 213 (increase in the car operating cost) discussed above.
Cordon pricing policies have no significant impact on opportunity indicators (SOHS : -1.1%; SOVC : +0.5%; SOVS : +0.2%). This results from the contradictory moves

Analysis of policy testing results
251
made by households - which tend to locate inside the toll cordon - and jobs - which locate outside it.
As regards accessibility, total time spent in traffic (SATT) is improved by 4.8% (Pol-icy 232), resulting from the shortening travel distances and the diminution of road congestion. The average travel time in public transport (SAPT) is hardly improved (-0.8%) : the jobs that have moved close to the toll cordon (outside the cordon) are less accessible than in their previous location in more central places. The accessibility to services (SAAS) is hardly affected by the toll charge. However, the accessibility to open space is severely reduced (Policy 232 : -2.7 %, one of the worst score for this indicator), as a consequence of the concentration of households in the central area and the amplified fragmentation of open space.
As regards the economic index, Policy 232 scores much better than all other policies. Transport externalities are reduced, but the economic index is particularly boosted by the rise in transport operator benefit (which is due to the toll revenue and to the in-creased revenue for public transport operators).
6.7.4 Regulation policies (311, 321) and public transport policy (411)
As regards the impacts on spatial structure and land use, travel speed policies have a weak effect on the location choices of households and employers. The lowering of the maximum travel speed for cars induces a slight (< 1%) increase in population and jobs in the city-centre, where the public transport is more efficient, The increase in travel speed or PT services incite employers to gather in the city centre and inner ur-ban areas, but at the same time stimulates the urban sprawl for households. These ef-fects illustrate the fact that, generally speaking, an increase in the generalised trans-port cost incite households to migrate towards the central urban area, i.e. closer to the jobs. Correspondingly, a decrease in the generalised transport cost incites them to out-migrate from the central agglomeration towards suburban areas, further from jobs. It should be noted that, although these effects are low, Policy 411 gives the worst result regarding the flee of households outside the city-centre and inner-urban areas (respec-tively –1.3% and –1.4%, compared to the Reference Scenario). This is because policy 411 is the only policy tested in which the generalised transport cost is reduced. For the 3 policies, the results of the land coverage indicator (ERLC) lie in the average. Need for new construction is heavily increased with Policy 411 (ERNC : +5.7%). Quality of open space (EQQO) is significantly improved with Policies 311 and (especially) 321, as a consequence of the reduction of noise.
Environmental indicators are all slightly improved (EGGT, EAOC, EROT). For these indicators, Policy 321 scores better than Policy 311, and Policy 411 is slightly more efficient than Policy 321.
Regarding the indicators related to health, Policies 311 and 321 (lowering the maxi-mum speed of cars) are the most efficient policies to reduce population exposure to traffic noise (SHEN : -8.4 % with Policy 321, and –6.7% with Policy 311). The other

Analysis of policy testing results
252
health indicators (SHED, SHTD, SHTI) are also improved, but this improvement lies in the average of all of the PROPOLIS policies.
Policy 411 is, with Policy 222 discussed above, the only policy that improves the housing standard indicator (SOHS : +0.7%). This results from the fact that increasing the average travel speed of public transport incites households to locate outside the city-centre, where the average dwelling size is higher. The other opportunity indica-tors (SOVC, SOVS, SOPG) are hardly affected by the travel speed policies, and the results of these indicators lie in the average of all other PROPOLIS policies.
As regards accessibility, total time spent in traffic (SATT) is severely deteriorated by the policies aiming at reducing the maximum travel speed of cars (311 and 321). Con-sequently, accessibility to the city-centre (SAAC) and to services (SAAS) are worse than in the Reference Scenario. Increasing the average travel speed of public transport (Policy 411) results in an increase in urban sprawl of households, as stated before, therefore the accessibility to the city-centre and to services is also worsened (by + 5.7% and + 3.0%), despite the improvement of the level of service of public transport modes (SAPT : -9.6%). Overall, Policies 311, 321 and 411 give the worst results of all PROPOLIS policies for indicators SAAC and SAAS; only the accessibility to open space (SAAO) performs better than the other policies.
Economically, the economic index has a negative value for Policy 311, a value close to zero for Policy 321 and a positive value for Policy 411, but this latter is much lower than for more efficient policies (road pricing). Externalities are improved, particularly the transport external accident costs (ETAC) for Policies 311 and 321, but the eco-nomic index is pushed down by a negative effect on the government benefit from transport (ETGB) and, in the case of Policies 311 and 321, by a negative effect on the transport user benefit (ETUB).
6.7.5 Common land use policies (511, 521)
As regards the impacts on spatial structure and land use, both policies result in an in-crease in population in the urban agglomeration (city-centre and inner-urban areas), but in the case of Policy 511, the effects are very low. Policy 521 also leads to an in-crease of employment in the city-centre. Need for new construction is slightly reduced when compared to the Reference Scenario (ERNC : -1.8 %).
Environmentally, the indicators related to the quality and the fragmentation of open space give quasi-neutral results or very low values. The yearly total travelled distance is hardly affected by Policies 511 and 521, and so are most of the environmental indi-cators (EGGT, EAOC, EROT).
Socially, the effects of Policies 511 and 521 on health and accessibility indicators are rather low too. As regards the productivity gains, the values for SOPG lie in the aver-age of all the other policies.

Analysis of policy testing results
253
Economically, these land use policies have very low effect on the transport user bene-fits and, low effect on most of the transport externalities. Consequently, the economic index is among the lowest ones, across the policies tested.
6.7.6 City-specific land use policies (611-612)
These city-specific policies have been defined in section 5.3.7.
The land-use impact of Policy 611 is by far the most important of all policies studied in PROPOLIS. As expected, Policies 611 and 612 lead to an important concentration in the number of jobs in the so-called A-zones: the number of employees is boosted in the city-centre area (+ 21.8% and + 4.5%, respectively). Households have a tendency to follow the jobs. Therefore the number of households in the city-centre is also sig-nificantly increased in the city-centre (+9.4% and +2.5%). Consequently, the need for new construction (ERNC) is heavily reduced with Policy 612. As another conse-quence, fragmentation of open space is improved when compared to the Reference Scenario (Policy 611: + 6.1% ; Policy 612: +3.7%).
The concentration of jobs in a limited number of zones results in a stagnation or slight increase in the total yearly travelled distance, while all the other tested policies (ex-cept Policy 521) resulted in a diminution of this figure. Therefore, the environmental indicators (EGGT, EAOC, EROT) show no improvement when compared to the Ref-erence Scenario: on this aspect, Policies 611 and 612 give the worst results.
Socially, since the total travelled distance is higher in Policies 611 and 612 than in the Reference Scenario, health indicators (SHED, SHTD, SHTI) are slightly less favour-able. Only the SHEN indicator (exposure to noise) gives a better result than in the Reference Scenario, probably due to the lowering of the car travel speed that comes from an increased congestion close to the city-centre.
Vitality of the city-centre (SOVC) is better in Scenarios 611 and 612 than in the Ref-erence Scenario, due to the concentration of households and jobs, but conversely the vitality of surrounding regions (SOVS) is decreased. In this regard, Policy 611 is the worst of all policies tested in PROPOLIS.
As regards accessibility, the SATT indicator (total time spent in traffic) is worse in Policies 611 and 612 than in the Reference Scenario as a consequence of the increase in the total travelled distance and the increase in congestion. Therefore, accessibility indicators (SAAC, SAAS, SAAO) are also worse than in the Reference Scenario.
Economically, these land use policies have low effect on the transport user benefits and on the transport externalities. The economic indices for Policies 611 and 612 are among the lowest ones among the policies tested.
6.7.7 Policy combinations (711-713)
The combination 711 is based on a policy (Policy 212 : increasing car use cost by 50%) that gave good results for most indicators.

Analysis of policy testing results
254
In the combination 712, the improvement of the public transport services (increase in speed) and the lowering of the PT fares further improves the modal shift from private car towards public transport, but just like in Policy 411, the better and cheaper public transport favours urban sprawl, that can lead to negative effects on some indicators, for example land coverage.
By combining Policy 712 with Policy 521, that induces a (slight) move of the house-holds towards the central area, one keeps the positive effects of the previous measures and one reinforces the residential attractiveness of the central urban area.
Indeed, Policy 713 gives good results for most of the PROPOLIS indicators:
• The total travelled distance is reduced by 13.6%, which is more than in most of the other policies (only Policy 213 scores better)
• Consequently, the environmental indicators (EGGT, EAOC, EROT) show a sig-nificant reduction of polluting emissions (approximately, -17%; again, only Policy 213 scores better)
• Need for new construction (ERNC) is reduced when compared to the Reference Scenario (only Policy 213 scores better)
• Fragmentation and quality of open space indicators (EQFO and EQQO) are im-proved by 8.6% and 3.5%
• The values of health indicators (SHED, SHEN, SHTD, SHTI) are better than in the Reference Scenario, and lie above the results obtained with most of the other policies
• Vitality of city-centre (SOVC) is also heavily increased (+ 7.3%), and conversely the score of the vitality of surrounding regions (SOVS) shows degradation when compared to the Reference Scenario (-1.8%)
• The Productivity Gain (SOPG) is equal to 4.1%, one of the best values
• Accessibility indicators (SATT, SAPT, SAAC, SAAS) are also heavily improved, only the accessibility to open space has a negative value (-2.8%, one of the worst score obtained for this indicator)
• The economic index is positive and has one of the highest values. It comprises a positive and relatively large contribution coming from the transport externalities.
Overall, it can be stated that the policy combination 713 is an efficient policy for promoting sustainable development.
6.7.8 Summary
Policies based on an increase of the car use cost (car use cost per km, parking cost, cordon pricing) are globally more efficient than the land use policies that were tested, and this is particularly true for the environmental indicators.
Among all the policies affecting the car use cost, the ranking (from the most effective to the less effective) is as follows: 1) increase of the car use cost per km, 2) cordon

Analysis of policy testing results
255
pricing 3) increase of parking cost. This is due in a large part to the fact that the first policy applies to all trips in the study area, whatever their origin and destination, while the 2 other apply only to a part of the flows. Of course the ranking also strongly depends on the level of the charge applied in each policy. In the case of Brussels, the additional charge tested in each policy (compared to the reference scenario) amounts to :
• Policy 213 : approximately 2.7 Euro/trip on average (calculated on the basis of the average distance travelled by private car in the Reference Scenario), i.e. 5.4 Euro/day
• Policy 222 : 2.7 Euro/day in the inner-city and 5.4 Euro/day in the city-centre
• Policy 232 : 5.4 Euro/day when crossing the cordon, which surrounds an area lar-ger than the inner-city.
Let us now first consider all the indicators correlated to the vehicle-km travelled by car (and in particular the environmental indicators: pollutant emissions, greenhouse gases, consumption, etc.). These indicators are dependent on the origin-destination distribution of the flows, the average distance travelled, and on the PT supply and road supply.
Consequently, for all these indicators, the ranking of the policies is globally as fol-lows :
• Policies 213-212 (and combinations 711-712-713)
• Policies 111, 232
• Policies 311, 321, 411, 222
• Land use policies 511, 521, 611, 612.
The ranking suggested above is confirmed by the ranking of the policies for the back-ground variable “yearly travelled distance”.
Secondly, let us consider indicators rather correlated to the spatial distribution of the population and of the employment, to the level of concentration in urban areas, to the average population density and job density. These indicators are for example the land coverage, the need for new construction, the housing standard, the vitality of the city centre, the fragmentation of open space, the accessibility to the city centre or to the open spaces. For these indicators, the land use policies sometimes score better than the other policies, but also on these indicators, the policy 213 and the combinations 711-712-713 score good results.
As said above, the general conclusion is that the combination 713 appears to be an efficient policy to favour a sustainable development.

Analysis of policy testing results
256
Brussels - Greenhouse gases from transport in the whole study area
-25.00%
-20.00%
-15.00%
-10.00%
-5.00%
0.00%
5.00%
111 211 212 213 221 222 231 232 311 321 411 511 521 611 621 711 712 713
Scenarios
Ch
ang
ein
gre
enh
ous
eg
asem
issi
on
sin
the
wh
ole
stu
dy
area
du
eto
the
polic
ym
easu
re
Brussels - Population in the Brussels-Capital Region*
-2.00%
-1.00%
0.00%
1.00%
2.00%
3.00%
4.00%
5.00%
111 211 212 213 221 222 231 232 311 321 411 511 521 611 621 711 712 713
Scenarios
Ch
ange
inth
ep
op
ulat
ion
inth
eB
CR
due
toth
ep
olic
ym
easu
re
Brussels - Employment in the Brussels-Capital Region*
-5.00%
-4.00%
-3.00%
-2.00%
-1.00%
0.00%
1.00%
2.00%
3.00%
4.00%
5.00%
111 211 212 213 221 222 231 232 311 321 411 511 521 611 621 711 712 713
Scenarios
Ch
ang
ein
the
nu
mb
ero
fjo
bs
inth
eB
CR
du
eto
the
po
licy
mea
sure
* For reference with the summary result table: the Brussels Capital Region includes the city centre and the inner urban zone.
Types of policies: Local investments plans Cordon pricing Land use policies
Increase in car use cost Decrease in maximum road speed Fiscal policies on companies
Increase in parking charge Increase in PT speed Combinations
Figure 6.54 Change in CO2 emissions, population and different policy options

Analysis of policy testing results
257
0
0,2
0,4
0,6
0,8
1
0
0,2
0,4
0,6
0,8
1
-2000
0
2000
4000
6000
000 R
efere
nce
2001
scen
ario
713
712 +
CIT
Y orie
nted l
and
use
712 7
11 +
PT sp
eed +
5 %
711
Car +
50 %
, PT fa
re -2
0 %
521 P
T orien
ted l
and
use
621 A
BC theo
ry, fis
cal a
ppro
ach
511
City co
re ad
dition
al ho
using
611 A
BC theo
ry. N
ew jo
bs in
A-zo
nes
411
PT spee
d/se
rvice
+10
%
321
Speed
-20%
, sec
onda
ry ne
twor
k
311
Speed
-10
%, a
ll netw
ork
213 C
ar co
st +1
00%
212 C
ar co
st +5
0 %
211 C
ar co
st +25
%
111 L
ocal
inves
tmen
t plan
000
Refere
nce s
cena
rio 20
21
000 R
efere
nce s
cena
rio 20
11
Ref
eren
ce s
cena
rio
Loca
l pol
icie
s
Car
ope
ratin
g co
sts
Oth
er c
ar p
ricin
g
Par
king
Net
wor
k sp
eed
PT
spe
ed
Land
Use
Com
bina
tions
222 P
arkin
g +
60/3
0 min.
time
value
221 P
arkin
g + 2
0/10
min. tim
e valu
e
231 C
ordo
n pr
icing
+20
min.
time
value
232 C
ordo
n pr
icing
+60
min.
time
value
Global climate change
Air Pollution
Consumption of naturalsources
Environmental quality
Health
Equity
Opportunity
Accessibility
Figure 6.55 Brussel policy comparison

Analysis of policy testing results
258

259
7. Inter-city comparisons
Summary
The inter-city comparisons are based on the policy scenarios that have been tested in all of the case cities. Similarities and differences in the results be-tween cities are identified. The unique tools and assumptions adopted for each city may cause differences but, more importantly, they may be caused by different sizes, transport and land use systems, growth and other base sce-nario characteristics. When, however, similarities are found, they are of special importance because they serve as the basis for generalised conclusions: if the different PROPOLIS case cities react in a similar way to a certain policy, then also other European cities are likely to behave in the same way. In other words, the results would be transferable from one city to another.
First, the behaviour of some key indicators in the different policy types are studied in order to understand the effects of policies in detail and in order to identify similarities in their behaviour. Secondly, the results of adopting differ-ent policies mainly in terms of environmental, social and economic indices are explored.
The results show that the environmental index deteriorates, compared with the current situation, in the reference scenarios in all cities. Also the social index deteriorates in the majority of cities.
This situation can be significantly improved by adopting some of the policies and policy combinations of the PROPOLIS test programme. Especially the car pricing policies and the policy combinations perform efficiently. For each city, policies are identified with the capability of being economically efficient while simultaneously improving both the environmental and social sustainability compared not only with the reference scenario but, in many cases, also with the current situation.
Helsinki Dortmund Inverness Naples Vicenza Bilbao Brussels
EnvSocEco
EnvSocEco
EnvSocEco
EnvSocEco

Inter-city comparisons
260
7. Inter-city comparisons
7.1 General
The inter-city comparisons presented in the following sections are based on the policy scenarios that have been tested in all of the case cities. Similarities and differences in the results between cities are identified. Differences may be caused by the unique tools and assumptions adopted for each city but, more importantly, because of differ-ent sizes, transport and land use systems, growth and other base scenario assumptions. When, however, similarities are found, they are of special importance because they serve as the basis for generalised conclusions: if the different PROPOLIS case cities react in a similar way to a certain policy, then also other European cities are likely to behave in the same way. In other words, the results would be transferable from one city to another. The final results in terms of the environmental, social and economic indices, compared with the city specific base scenario, are illustrated in figure 7.3 at the end of this section.
7.2 Behaviour of some key indicators in the key policy types
The behaviour of some selected key indicators in the key common policies compared with the reference scenario is illustrated in figure 7.1.
CO2 emissions are reduced in all cities and all policies except for the one in which the overall road network speed is decreased by 10 % and for the land use policy, where the emissions may also be increased in some cities. The best results are found in the car operating cost increase policy and in the policy combinations where the results are also uniform across different cities. In the combination policies the CO2 reduction is 15-20% except for Bilbao where it remains at the level of 2%.
Exposure to noise is most clearly affected by the speed reduction policy where the number of people disturbed by noise can be reduced by 1-7%. The effect of car pric-ing policies on exposure to noise is not as clear. Although the car traffic may be sig-nificantly reduced, the simultaneous land use effects (people moving towards city centres) have an opposite effect increasing the number of people exposed to noise. However, the overall effect is neutral (Helsinki, Dortmund, Bilbao) or positive with a 1-5% reduction (Inverness, Naples Vicenza, Brussels). The PT policies have a signifi-cant positive effect on noise only in Brussels and Inverness.
Adopting the car operating cost increase policy and the policy combinations can most effectively reduce traffic accidents. Accidents are reduced in all cities by 8-17%, ex-cept for Bilbao by 4%, in the car operating cost increase policy. In the policy combi-nations the results vary between 5-22%, except for Bilbao with only a 2% reduction. The 10% speed reduction on road network reduces accidents by 1-7%. Also the park-ing, PT and land use policies have mostly positive, although smaller effects.

Inter-city comparisons
261
Total time spent in traffic is an important opportunity indicator of the social dimen-sion of sustainability. The car operating cost increase policy affects also this indicator by reducing car traffic and congestion but also through land use changes. Similar uni-form results are achieved also through other car pricing policies. Decreasing the road network speed by 10% increases the time spent in traffic by 2-4% (by 5% in Dort-mund) and the PT fare reduction policy increases it by 2-6%. Increasing PT speed by 5% has a reducing effect of 0,5 – 4,0% on total travel times. The results in policy combinations vary among the case cities between –8% (Brussels) and +4% (Hel-sinki). This is caused by the varying effects of the policy elements included in the combinations.
Another opportunity indicator is the accessibility to city centre measured in travel time. The car operating cost increase policy improves also this indicator in all cities by reducing congestion and through the long-term land use effects. The effect can also be seen in the policy combinations where the travel time to city centre is reduced by 0-5% (combinations 712 and 713). In all other policies the results vary, being either positive or negative depending on the case city.
The modal share of car can be reduced through all car pricing policies, PT policies and the speed reduction policy. This effect can also be seen in the policy combina-tions. The direction of change is uniform in most policies in all cities but the amount of change is very much dependent on the starting level and also the elasticity between slow, PT and private motorised modes.
Land use changes are observed by studying the employment and population changes in the city centre and inner urban areas. The car operating cost policy increases in most cases both employment and population in the central areas, whereas the em-ployment in central areas is reduced in the parking and cordon pricing policies. The behaviour of the population in the last two policies depends very much on the respec-tive case city. The policy combinations behave almost uniformly with the city centre employment and population remaining at about the reference scenario level or in-creasing by up to 4%. Helsinki though is an exception with the central area popula-tion reducing by 7-10% due to the PT policy elements whose decentralising effect is more significant than the centralising effect of the car pricing policy.

Inter-city comparisons
262
BrusselsHelsinki Dortmund NaplesInverness Vicenza Bilbao
412 5% increase of PT speed/service
212 Car operating cost +50%
231 Cordon (peak) pricing 0.85 euro
311 Decreasing max speed by 10% on the whole road network
221 Parking cost +0.85/0.42 euro
511 Increase the residential density in the city core
711 Car operating cost +75%(214), PT fares - 50%(421)
712 Car operating cost +75%(214), PT fares - 50%(421), PT speed +5%(412)
Remarks: policy 412 is not available in Bilbao and Brussels, policies 711, 712 and 713 are not available in Inverness and indicators ‘total time spent in traffic‘ and accessibility to city centre are not available in Inverness.‘ ‘
421 PT fare - 50% (Helsinki -40%)
(Inverness, Bilbao,Brussels 10%)
Traffic deaths Total time spentin traffic (travel time
city centreAccessibility to
reduction)
Modal share in peak, private
motorised
Employment, city centre + inner
urban
Population, city centre + inner
urban
Greenhouse gases from transport
Exposure to traffic noise
-5 %
-4 %
-3 %
-2 %
-1 %
0 %
1 %
2 %
3 %
q
-1,5%
-1,0%
-0,5%
0,0%
0,5%
1,0%
1,5%
2,0%
2,5%
-8 %
-6 %
-4 %
-2 %
0 %
2 %
4 %
-10 %
-8 %
-6 %
-4 %
-2 %
0 %
2 %
-8 %-6 %-4 %-2 %0 %2 %4 %6 %8 %
-20 %
0 %
20 %
40 %
60 %
80 %
100 %
-3,0%
-2,5%
-2,0%
-1,5%
-1,0%
-0,5%
0,0%
0,5%
1,0%
-1 %
0 %
1 %
2 %
3 %
4 %
5 %
-10 %-8 %-6 %-4 %-2 %0 %2 %4 %6 %
-6 %
-5 %
-4 %
-3 %
-2 %
-1 %
0 %
-1 %
0 %
1 %
2 %
3 %
4 %
5 %
-15 %
-10 %
-5 %
0 %
5 %
-6 %
-5 %
-4 %
-3 %
-2 %
-1 %
0 %
-1 %
0 %
1 %
2 %
3 %
4 %
5 %
-8 %
-6 %-4 %-2 %
0 %2 %4 %
6 %
-6 %-5 %
-4 %-3 %-2 %-1 %0 %1 %
-10 %
-8 %
-6 %
-4 %
-2 %
0 %
2 %
0 %1 %
2 %3 %4 %5 %6 %7 %
-20 %
-15 %
-10 %
-5 %
0 %
-3,0%
-2,5%
-2,0%
-1,5%
-1,0%
-0,5%
0,0%
0,5%
1,0%
-7 %-6 %-5 %-4 %-3 %-2 %-1 %0 %1 %
-2,0%
-1,5%
-1,0%
-0,5%
0,0%
0,5%
-20 %
-15 %
-10 %
-5 %
0 %
5 %
-6 %-5 %-4 %-3 %-2 %-1 %0 %1 %
-25 %
-20 %
-15 %
-10 %
-5 %
0 %
-10 %
-5 %
0 %
5 %
10 %
-25 %
-20 %
-15 %
-10 %
-5 %
0 %
-6 %
-5 %-4 %-3 %-2 %-1 %0 %1 %
-25 %
-20 %
-15 %
-10 %
-5 %
0 %
-10 %
-5 %
0 %
5 %
10 %
-25 %
-20 %
-15 %
-10 %
-5 %
0 %
-6 %-5 %-4 %-3 %-2 %-1 %0 %1 %
-30 %
-25 %
-20 %
-15 %
-10 %
-5 %
0 %
-10 %
-5 %
0 %
5 %
-25 %
-20 %
-15 %
-10 %
-5 %
0 %
-6 %
-5 %
-4 %
-3 %
-2 %
-1 %
0 %
-20 %
-15 %
-10 %
-5 %
0 %
-10 %
-8 %
-6 %
-4 %
-2 %
0 %
-30 %
-25 %
-20 %
-15 %
-10 %
-5 %
0 %
-8 %
-6 %
-4 %
-2 %
0 %
2 %
-15 %
-10 %
-5 %
0 %
5 %
-3,5%
-3,0%
-2,5%
-2,0%
-1,5%
-1,0%
-0,5%
0,0%
-20 %
-15 %
-10 %
-5 %
0 %
-10 %
-8 %
-6 %
-4 %
-2 %
0 %
2 %
-20 %
-15 %
-10 %
-5 %
0 %
-2,5%
-2,0%
-1,5%
-1,0%
-0,5%
0,0%
-20 %
-15 %
-10 %
-5 %
0 %
5 %
-7 %
-6 %
-5 %
-4 %
-3 %
-2 %
-1 %
0 %
-8 %
-6 %
-4 %
-2 %
0 %
0 %
1 %
2 %
3 %
4 %
5 %
6 %
-15 %
-10 %
-5 %
0 %
5 %
10 %
-4,0%-3,5%-3,0%-2,5%-2,0%-1,5%-1,0%-0,5%0,0%0,5%1,0%
-7 %-6 %-5 %-4 %-3 %-2 %-1 %0 %1 %
-4,5%-4,0%-3,5%-3,0%
-2,5%-2,0%
-1,5%-1,0%
-0,5%0,0%
-20 %
-15 %
-10 %
-5 %
0 %
-10 %
-8 %
-6 %
-4 %
-2 %
0 %
-4 %
-2 %
0 %
2 %
4 %
6 %
8 %
-5 %
0 %
5 %
10 %
15 %
20 %
-10 %-5 %0 %5 %
10 %15 %20 %25 %
-4 %
-2 %
0 %
2 %
4 %
6 %
-4 %
-2 %
0 %
2 %
4 %
6 %
-6 %
-4 %
-2 %
0 %
2 %
4 %
-10 %
-8 %
-6 %
-4 %
-2 %
0 %
-5 %
-4 %
-3 %
-2 %
-1 %
0 %
1 %
-2 %
-1 %
0 %
1 %
2 %
3 %
4 %
-1,5%
-1,0%
-0,5%
0,0%
0,5%
1,0%
1,5%
-2 %
0 %
2 %
4 %
6 %
8 %
10 %
-6 %-4 %-2 %0 %2 %4 %6 %8 %
-0,6%
-0,4%
-0,2%
0,0%
0,2%
0,4%
0,6%
-2 %
0 %
2 %
4 %
6 %
8 %
-10,0 %
-8,0%
-6,0%
-4,0%
-2,0%
0,0%
-8 %-7 %-6 %-5 %-4 %-3 %-2 %-1 %0 %
-8 %-7 %-6 %-5 %-4 %-3 %-2 %-1 %0 %
-8,0%
-7,0%-6,0%-5,0%-4,0%-3,0%-2,0%-1,0%0,0%
-8,0%-7,0%-6,0%-5,0%-4,0%-3,0%-2,0%-1,0%0,0%
-10 %
-8 %
-6 %
-4 %
-2 %
0 %
-10,0%
-8,0%
-6,0%
-4,0%
-2,0%
0,0%
2,0%
4,0%
-30 %
-25 %
-20 %
-15 %
-10 %
-5 %
0 %
-30 %
-25 %
-20 %
-15 %
-10 %
-5 %
0 %
-30 %
-25 %
-20 %
-15 %
-10 %
-5 %
0 %
Figure 7.1 Selected key indicators’ changes in key policies by case city (Policy x 2021 versus Reference Scenario 2021)

Inter-city comparisons
263
7.3 Intercity comparisons
7.3.1 Reference scenarios at horizon year 2021
As stated above, the reference scenarios (presented in detail in sections 4.3 – 4.9) sig-nificantly vary between the different case cities. The current population of the study areas varies from 0,1 million (Inverness) to 2,5 - 3 million (Dortmund, Brussels and Naples). Helsinki, Vicenza and Bilbao are in the medium category with a population of 0,8 to 1,1 million inhabitants.
Considerable differences can also be found in, for example, the growth rates and mo-dal shares of the different case cities. The share of car traffic is lowest in Helsinki and Bilbao, less than 40%, while in other cities it varies from 60% up to 90%. It is also important to note, when comparing the results, that in Helsinki the reference scenario already includes a large set of PT and road investments, whereas in other cities the corresponding actions are included in the “local investment plans”.
Global climate change
Air Pollution
Consumption of naturalsources
Environmental quality
Health
Equity
Opportunity
Accessibility
0
0,2
0,4
0,6
0,8
1
0
0,2
0,4
0,6
0,8
1
Helsink
i -01
Helsink
i -21
Dortm
und
-01
Dortm
und
-21
Inver
ness
-01
Inver
ness
-21
Naples
-01
Naples
-21
Vicenz
a -0
1
Vicenz
a -2
1
Bilbao
-21
Bruss
els -0
1
Bruss
els -2
1
Figure 7.2 Development of environmental and social sustainability in the refer-ence scenario in PROPOLIS case cities
The main conclusion is (figure 7.2) that the environmental index deteriorates in all cities compared with the current situation. This is mainly due to the global climate change and the environmental quality indicators as well as the consumption of natural resources. Air quality indicators improve in line with future improvements in the car fleet. Also the social index deteriorates except in Helsinki, Naples and Brussels, where the current old polluting car fleet is expected to improve, thus improving the health indicators. Equity and accessibility indicators deteriorate in all cities.

Inter-city comparisons
264
7.3.2 Investment policies
In some cities a set of investment policies was tested.
In Helsinki the results did not improve environmentally, socially nor economically compared with the base scenario. This was due to the fact that the reference scenario already consisted of a balanced set of PT and road projects.
In other cities the local investment plans were designed to improve the situation com-pared with a situation where only a limited number of actions were included in the reference scenario. In general, the local investment plans, normally consisting of a set of actions for improving both PT and car traffic, worked well. In Bilbao and Inverness they were economically efficient although the impact on the environmental and social indices was small. In Brussels the local investment plan was efficient from the point of view of all of the dimensions of sustainability.
7.3.3 Car pricing policies
Car operating cost increase
The results are very uniform for all of the different types of PROPOLIS case cities. The environmental, social and economic indices can be simultaneously improved by adopting the car operating cost increase policy (except for Dortmund and Inverness from the economic point of view, in Inverness the economic optimum is at a lower level). Environmentally this is caused by improvements within all the themes, global climate change, air pollution, consumption of natural resources and environmental quality. Socially the health indicators improve in all cities, whereas the equity and op-portunity themes may in some cases deteriorate. From the socio-economic point of view the policies are efficient and a clear optimum level could be defined in Helsinki (+75% - +100%), Vicenza (+50%), Inverness (+25%) and Bilbao (+ 25%).
Cordon pricing policies
Environmentally and socially the cordon pricing policies do not perform as well as the car operating cost increase policies although the overall effect is mainly positive or neutral (negative only in Dortmund from the social point of view). Economically, however, they were found to be more efficient than the general car pricing policies in Helsinki, Inverness and Brussels. The land use effect was uniform in most of the cit-ies: people move towards the central areas in order to avoid the cordon toll, whereas employment moves out for the same reason.
Parking policies
Environmentally, socially and economically the result is neutral or, in some cases positive, in all cities. Environmentally positive effects were found in Inverness and Bilbao and socially positive in Inverness. Economically the results vary being neutral in Helsinki and Bilbao and positive in other cities. A general trend can be found re-garding the land use effects: employment tends to move out from the central areas in all cases, as does the population with the exception of Bilbao and Dortmund.
Inter-city comparisons
265
7.3.4 Speed regulation policies
Environmentally, socially and economically the results vary. The policy is economi-cally feasible only in Inverness. However, as expected, the policy has clear positive effects on traffic accidents but these are not enough to compensate for the effect of worsening opportunity, accessibility and some pollution indicators.
7.3.5 Public transport policies
Increase of PT speed/service
From the environmental point of view the PT speed policies behave in a uniform way. The environmental and social effects are neutral, except for Bilbao, where the social effect is negative and Inverness, where the social effect is positive. Economically the policies are at least slightly positive in all cities although a high investment is required in order to achieve the speed /service increase.
Reduction of PT fare
Also here the results are uniform for the different case cities. Environmentally and economically the results are positive. Socially Naples and Vicenza show a negative trend. However, the results very much depend on the level of reduction. An optimum level was searched for and found in Helsinki. The optimum level is likely to exist in other cities, as well. It was also noted in most cities that the PT policies have a con-tributing effect on city sprawl, as people tend to move out from the central areas. Ex-ternal cost for land use are not included in the economic assessment and they may have a negative effect on the feasibility of this policy.
7.3.6 Land use policies
The overall effect of land use policies was found to be small in most cities (partly be-cause the policies affect only part of the system) although there were considerable changes in the values of some individual indicators, for example quality and fragmen-tation of open space. Economically the results were neutral or positive. The role of land use policies is, however, important as part of policy combinations as explained below. On local level the changes may be considerable
7.3.7 Policy combinations
The policy combinations consist of push and pull measures, i.e. of simultaneously in-creasing the car operating cost by 75% and reducing PT fare by 50% (policy 711). In policy 712 also the PT speed/service is improved and in 713 it is supported with the PT oriented land use policy.
The policy combinations show very positive results, as they are able to simultaneously improve, compared with the reference scenario, all dimensions of sustainability in all PROPOLIS case cities (except for Bilbao and Naples, where their social effect re-mains negative in some combinations). Environmentally even the current level of sus-tainability is attained or exceeded in the majority of cities, namely in Helsinki, Dort-mund, Naples, Vicenza and Brussels. Socially the current level of sustainability is
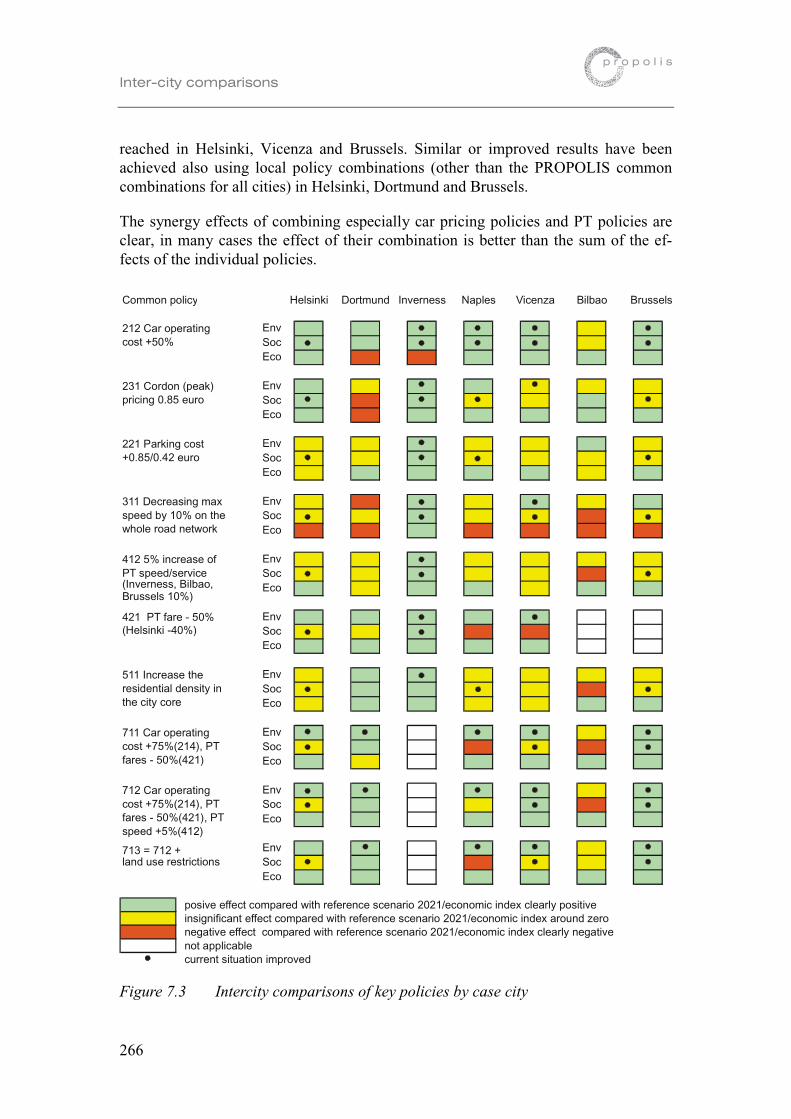
Inter-city comparisons
266
reached in Helsinki, Vicenza and Brussels. Similar or improved results have been achieved also using local policy combinations (other than the PROPOLIS common combinations for all cities) in Helsinki, Dortmund and Brussels.
The synergy effects of combining especially car pricing policies and PT policies are clear, in many cases the effect of their combination is better than the sum of the ef-fects of the individual policies.
Common policy Helsinki Dortmund Inverness Naples Vicenza Bilbao Brussels
EnvSocEco
EnvSocEco
EnvSocEco
EnvSocEco
EnvSocEco
EnvSocEco
EnvSocEco
EnvSocEco
EnvSocEco
EnvSocEco
posive effect compared with reference scenario 2021/economic index clearly positiveinsignificant effect compared with reference scenario 2021/economic index around zeronegative effect compared with reference scenario 2021/economic index clearly negativenot applicablecurrent situation improved
412 5% increase of PT speed/service
421 PT fare - 50%
511 Increase the residential density in the city core
711 Car operating cost +75%(214), PT fares - 50%(421)
212 Car operating cost +50%
231 Cordon (peak) pricing 0.85 euro
221 Parking cost +0.85/0.42 euro
311 Decreasing max speed by 10% on the whole road network
712 Car operating cost +75%(214), PT fares - 50%(421), PT speed +5%(412)
713 = 712 +land use restrictions
(Helsinki -40%)
(Inverness, Bilbao,Brussels 10%)
Figure 7.3 Intercity comparisons of key policies by case city

267
Part III:
Conclusions and recommen-
dations, further work
The PROPOLIS approach and methodology
Policy testing results and recommendations
Further work

268

269
8. Conclusions and recommendations, further work

Conclusions and recommendations
270
8. Conclusions and recommendations, further work
8.1 The PROPOLIS approach and methodology
• PROPOLIS has maintained and further developed the general comprehensive ap-proach and the methodologies, originally developed in the SPARTACUS project, for studying sustainable urban policies. Most of the conclusions previously made can now be confirmed. This time, however, they are confirmed by using also new types of land use and transport models and more and new types of case cities. This makes it possible to drop some previous reservations regarding the results and to make more general conclusions.
• The interactions between land use and transport are complex. PROPOLIS has modelled the behaviour of people and businesses in this complex system in terms of their location choice and travel behaviour, and estimated the respective conse-quences using a set of models, methodologies and indicators. The results are com-parable in the seven case cities, as the variables and assumptions as well as the tested policy options have been harmonised.
• The methodology is designed to take into account some important features of the urban land use and transport system. Many of the effects of adopting different pol-icy options are time dependent. The PROPOLIS methodology is able to distin-guish between the short-term and long-term effects and to follow the changes through time. The results of combining two or more policy options are not clear in advance. The policies may have cumulative positive effects or the policies may neutralise each other’s effects. It is important to be aware of and analyse the ef-fects of combining different options. A city is also dependent on and in interaction with its surroundings. It is equally important to be aware of the socio-economic footprints that a policy may cause in the surrounding region of a city.
• The PROPOLIS system produces large amounts of information, but it also makes possible a drastic stepwise aggregation of the data—down to three sustainability index values per policy based on the preferences of the user or client of the sys-tem. In this way also the transparency of the system is maintained. The aggrega-tion is of great help in analysing the great number of policies. However, more ex-perience is needed in applying this system, especially in setting the different weights and value functions to the different indicators.
• The PROPOLIS project has shown that it is possible to use urban land use and transport models as a platform for producing urban environmental, social and economic sustainability indicators and indices that can be used in assessing pol-icy options and when searching for new and effective ways to urban sustainability. The research has demonstrated what types of policies are likely to produce posi-tive results and has highlighted areas in which further work would be fruitful. General recommendations have been made based on the research and the new methodologies applied.

Conclusions and recommendations
271
• Theoretical, methodological and data limitations mean that some care is required in the interpretation of the results. In addition, any policy should always be exam-ined in relation to the local conditions before planning its implementation. It was also out of the scope of PROPOLIS to study the institutional and acceptability is-sues of implementing the policies. The interpretation of the results must also bear in mind that the model system can only give a partial view of reality as not all the factors affecting the urban land use and transport system are modelled. The indica-tor system only covers part of all the environmental, societal and economic as-pects of an urban system. The USE-IT module applies user-defined weights and value functions that do not necessarily reflect society's values and weights and that are likely to change with time. Finally, the policy testing process covers a wide range of different types of policies but does not go into the details of any. Despite these reservations many of the results in different types of cities, in different cul-tures and achieved using different types of models point in the same direction, are understandable and confirm the underlying theoretical considerations, thus mak-ing the conclusions more reliable.
8.2 Policy testing results and recommendations
• The results show that the environmental sustainability deteriorates in all case cit-ies compared with the current situation if no actions are taken and even if city specific reference scenarios, including local investment programmes, are adopted. This is mainly due to the deteriorating global climate change and the environ-mental quality indicators as well as the increased consumption of natural re-sources. Air quality indicators may improve together with the assumed future im-provements of the car fleet.
• Also the social index deteriorates, except in Helsinki, Naples and Brussels, where the current old polluting car fleet is expected to improve, thus improving the health indicators. However, equity and accessibility indicators deteriorate in all cities. The deteriorating trend is very much related to the growth of the cities, sprawling land use and the resulting growth of car traffic. A 1% growth in popula-tion leads to more than 1% growth in car traffic (Helsinki 1,7%).
• The aim of PROPOLIS was to find policies that could, in an ideal case, simulta-neously improve all dimensions of sustainability compared with the reference so-lution and, if possible, even improve the current level of sustainability. This goal was reached in most of the case cities using a same type of approach. This indi-cates that the approach could work in other European cities, as well, and that the results could thus be transferable.
• The local investment plans, normally consisting of an investment programme for both public transport and road investments, performed in the right direction. However, they were not enough to maintain the current level of sustainability al-though the situation was improved compared with the reference scenario.

Conclusions and recommendations
272
• Investment programmes should be designed to be consistent with the general goals set for the transport-land use system. The test results showed that the pro-grammes tested were not all as efficient as expected. This may be because the elements of the programmes encourage development towards different goals. This emphasises the need for co-ordination between different policies. If for example car pricing policies are considered they should be supported by investment pro-grammes which promote the use of public transport in order to manage the in-creased demand and in order to get cumulative, positive effects.
• Regulating car speed policies had positive effects on traffic accidents, as intended, but they were not enough to compensate the effects of the worsening opportunity, accessibility and air pollution related indicators. This points in the direction that, instead of general speed reduction policies, the locations for speed reductions should be considered case by case.
• Different types of individual land use policies did not produce significant positive effects. The rather limited effects result from the fact that land use has adapted to the transport system (and vice versa) and forced land use changes disturb the bal-ance of the total system. Also the extent of the tested policies was marginal com-pared with the total urban system. However, land use policies could successfully be used to support the changes in demand caused by the car pricing and public transport policies and locally they may have significant effects.
• Different car pricing methods were able to produce positive results. However, their effects on land use have to be separately assessed. Cordon pricing and park-ing policies make inhabitants and jobs move to locations where they can avoid paying extra charges. This might affect the vitality of central areas. Car operating cost increase policies work efficiently against urban sprawl concentrating inhabi-tants and jobs in central areas and in the smaller cities surrounding the metropoli-tan regions. This again could jeopardise the services and vitality of the rural areas of the surrounding regions and lead to additional new construction needs. An ideal pricing system would take, as far as possible, the changes in demand into account. Thus both the time of the day (peak periods) and the location should be reflected in the pricing level with highest levels in most congested (central) areas during peak periods and lower levels in rural areas and outside peak periods.
• Also the tested public transport policies, increasing speed and service and reduc-ing fares, worked well. In most cases they were environmentally, socially and eco-nomically feasible. However, also here special attention has to be paid to the land use effects. In most cases the public transport policies contributed to city sprawl. The optimum level for the public transport fares is city specific and should thus be locally defined.
• Some measures intended to decrease travel demand could in the long-term lead to increases in private car mileage. This was especially the case in some public transport policies. Part of the reason for this is that the policies resulted in less congestion in the transport network and made it possible for households to move

Conclusions and recommendations
273
to more peripheral areas still maintaining their travel budget. This resulted in in-creases in the average trip lengths and possibly in car ownership, and thus also in private car mileage.
• The combination of public transport policies with car pricing policies produced cumulative positive results and the negative land use effects of the individual poli-cies could be avoided or mitigated. With a few exceptions (social indices in Bil-bao and Naples) all dimensions of sustainability could be improved in all case cit-ies, compared with the reference scenario, by using these combinations. Even the current level of sustainability could be improved in the majority of cities (Hel-sinki, Dortmund, Naples, Vicenza and Brussels). It is also important to note that investing the additional fares, collected from car traffic, back in the transport sys-tem for providing better and cheaper public transport service could increase the acceptability of the above policy combination.
• Best results are achieved by using policy combinations, i.e. push and pull meas-ures consisting of car pricing policies and simultaneous improvements of public transport through reduced fares and better speed and service. Better supply of public transport services is needed to satisfy the increased demand caused by car pricing policies and the mobility needs of people. Adopting land use and invest-ment policies that satisfy the need for people to live along good public transport corridors and connections can further support this policy line in the long term.
• Adopting the above line of actions leads in the PROPOLIS case cities to a 15-20% reduction in CO2 emissions, 8-17% reduction in traffic accidents and often to at least small reductions in exposure to noise and pollutants and the total time spent in traffic. Also accessibility to the city centre and services is improved. The socio-economic benefits vary but are typically 1000 – 3000 euro/inhabitant (net present value). Searching and defining local optimum levels for the actions can further improve these results, as demonstrated in some case cities. Reduced congestion is especially beneficial for goods traffic as travel times and sizes of transport fleet reduce. By adopting a more severe pricing policy (car operating costs up 100%), a reduction of private car mileage and CO2 emissions of typically up to 30% could be achieved.
• It is important to note that the optimum level of the pricing actions is city specific and that the optimum levels should be locally defined taking into account the cu-mulative effects of the individual actions. Bigger, more congested cities seem to need more radical actions than smaller cities.
• The PROPOLIS research has demonstrated that it is insufficient to merely evalu-ate policies on a one by one basis. Instead a complete urban policy programme should be evaluated both policy by policy and as a whole in order to completely understand its effects and the mutual interactions of the policy elements. It is par-ticularly important to note that some combined policies reinforce each other but others may be incompatible to the extent that they may work against each other.

Conclusions and recommendations
274
• Urban sustainability could be improved only with the coordinated intervention of both local and national decision-making levels. The good results obtained by the combination policies emphasise the need of a close cooperation between the dif-ferent levels of authorities, as local authorities cannot implement all the policy measures. They may need decisions at national or even European levels.
• A good urban policy consists of co-ordinated elements that work together to pro-duce cumulative long-term effects that attain a balanced set of environmental, so-cial and economic goals. These elements may include:
− Combination of pricing policies directed at car users, with differentiation be-tween peak and other hours as well as congested and non-congested areas, with an appropriate level of pricing of public transport fares
− Investment programmes supporting the changes in demand caused by the above policies and especially responding to the increased demand for better public transport speed and service
− A land use plan supporting the new need for people to live near central areas, in satellite cities or along well served public transport corridors and the peo-ple’s increased need and opportunity to use public transport
This policy line is likely, as demonstrated by the PROPOLIS case cities, to im-prove all dimensions of urban sustainability in typical European cities compared with their reference scenarios or continuation of existing policies and, in best cases, enhance the current level of sustainability - improve our cities of tomorrow.
8.3 Further work
• The main concept for further development builds on the premises that urban transport and land use form one integrated environmental, social and economic system that interacts with the surrounding region without a clear border. Thus the urban system and the effects of alternative policies should be assessed by simulta-neously studying the land use and transport systems and their interaction with the environmental, social and economic systems and the surrounding region on which the sustainability of the urban system is dependent. Both short- and long-term ef-fects have to be taken into account.
• Theoretical research is still needed to better understand the reciprocal economic flows between land use activities and transport systems. The state-of-the-art meth-odology adopted for the economic evaluation is based on a complete cost-benefit analysis from the transport point of view and includes all the externalities gener-ated by the transport sector. It could be extended to internalise also the external-ities related to land use in accordance with the future development of the scientific literature.
• Similarly, more research is needed to better understand and model the interaction
between environmental quality and land use in order to have a fully integrated land use / transport / environment / economic model. Steps in this direction were taken in the PROPOLIS project by modelling a number of land use based envi-

Conclusions and recommendations
275
ronmental indicators but the feed-back system has still to be developed. The ulti-mate solution to modelling environmental feedback is the fully spatially disaggre-gate microsimulation urban land-use transport environment (LTE) model in which the notion of zones has been abandoned and the spatial disaggregation occurs al-ready at the model input stage. In this type of model the disaggregate environ-mental model would be fully integrated with the land-use transport model, and this would make full environmental feedback both possible and efficient.
• More efficient use of GIS and, in particular, a more radical move towards micro-simulation models would bring several benefits, including:
− Better presentation of transport and other activities in space and time
− New, more detailed policy types could be evaluated
− Better inputs into environmental models
− Better inputs to the exposure models as estimates could be made about where and when people are and what the air quality is there at that time
• The indicator system associated with the transport and land use modelling frame-work should be further developed in order to include additional important social and environmental indicators that had to be dropped from the PROPOLIS indica-tor set because of lack of supporting theory or data. For example, the relationships between urban and building forms and energy consumption would merit further study and the respective new indicator should be added to the PROPOLIS indica-tor set.
• Operationalised theories of justice have experimentally been introduced and used as part of the social sustainability assessment. They concentrated on the distribu-tion of some effects between different socio-economic groups. The choice of a theory of justice may affect the ranking of policy alternatives. It is, therefore, im-portant for the decision-maker to define what principles of justice he/she prefers. Justice of the distribution of the impacts also relates to the acceptability of a pol-icy. More experience is also needed from other features from the evaluation sys-tem. Are there systematic differences between weights, value functions and justice theories given by different groups? If so, how significant are they and what are their effects on the final policy assessment? To answer these types of questions real-life tests with authentic audiences should be made with the assessment sys-tem.
• Pricing policies were identified as having the most potential. More research is needed to define the optimum method and level of pricing policies and especially for their combinations, to carefully analyse the negative side effects of the pricing policies and, finally, to determine suitable countermeasures to mitigate these side effects. There are several alternative principles to implement the car pricing schemes (road pricing, distance-based, time-based, tolls etc.), and the choice is also connected to the technology of how the charges could be collected. Behav-ioural and technical research is needed in addition to research on the acceptability issues.

Conclusions and recommendations
276
• The PROPOLIS system is tested and operational and could be used for analysing a wider set of policies in the seven case cities when searching for new and more effective measures and especially for more complex policy combinations. The PROPOLIS analytical framework has shown its capability to effectively assess urban policies aimed at improving urban sustainability. It produces a huge amount of useful and comparable information in a harmonised way for diverse typologies of cities and at different levels of detail. This information can also be used for benchmarking purposes between the PROPOLIS cities but also between the PRO-POLIS and other European cities.

277
Appendices
Appendix I: Indicator description sheets and definition of value functions
Appendix II: Summary table of potential policy options
Appendix III: Result tables

278

Appendix I, Indicator description sheets
279
Appendix I Indicator description sheets and definition of value functions

Appendix I, Indicator description sheets
280
Environmental Dimension
Global climate change
Indicator Greenhouse Gases from Transport EGGT Component/Theme: Environmental/Global Climate Change
Indicator description
The indicator expresses the emissions of greenhouse gases caused by the combustion of petrol, gas and diesel in vehicle engines. The indicator is expressed in multiple tons of CO2 equivalents per thousand inhabitants a year.
The increasing concentration of carbon dioxide in the earth’s atmosphere is the main cause of global warming. In Europe, the consequences of climate change are likely to include more frequent or more intense storms, raised sea level, effects on agriculture productivity and changes in water availability.
Transport is a significant source of carbon dioxide. Its present share of CO2 emissions from fuel use within the EU is about 21 percent, but transport emissions did grow by 18 percent during the 1990s whereas emissions of other sectors have decreased (EEA, 2002).
At the 1997 Kyoto Conference 38 industrialised countries signed an agreement document that foresees a reduction of 5.7% in greenhouse gases (with respect to the 1990 level) by 2010. The European Union agreed on a reduction of 8%. In relation to this, different reduction quotas were defined for each EU member state. Without a major shift in the areas of energy consumption and transportation, world wide use and combustion of oil, coal and gas will continue to increase, causing the emissions of the most important greenhouse gas, CO2 to rise by 50% by the year 2010. However, to achieve 'sustainable' atmospheric greenhouse gas concentrations, a reduction of 50 to 70 % would be necessary, going far beyond the Kyoto targets (EEA, 2002).
Calculation method
CO2 emissions are calculated in the Raster Module with a harmonised method for all case cities. The emission submodel relates the information on traffic flows provided by the transport model with speed-related emission functions (Hickman et al., 1999, Joumard, 1999). The emission functions used distinguish many more vehicle types than contained in the transport models. Future technological developments and foreseeable environmental regulations are taken into account by changing the vehicle fleet composition over time.
The emissions are annualised and divided by the number of inhabitants (in thousands).

Appendix I, Indicator description sheets
281
References, notes
CO2 emissions are included in the sustainability indicator lists of e.g. European Commission, European Environment Agency and OECD.
• European Commission (2000): The Urban Audit, Towards the Benchmarking of Quality of Life in 58 European Cities. Luxembourg: European Commission, DGXVI.
• EEA - European Environment Agency (2000): Are we moving in the right direction? Indicators on transport and environment integration in the EU, TERM 2000. Copenhagen: EEA.
• EEA – European Environment Agency (2002): Environmental Signals 2002. Benchmarking the millennium. Environmental Assessment Report No 9. Copenhagen: EEA.
• Hickman, J., Hassel, D., Joumard, R., Samaras, Z., Sorenson, S. (1999): Methodology for Calculating Transport Emissions and Energy Consumptions. MEET Deliverable 22. Crowthorne: TRL.
• Joumard, R. (1999): Methods of Estimation of Atmospheric Emissions from Transport: European Scientist Network and Scientific State-of-the-art. Action COST 319 Final Report. Bron: INRETS.
• OECD, 1998: Towards Sustainable Development – Environmental Indicators. Organisation for Economic Co-operation and Development. Paris, France

Appendix I, Indicator description sheets
282
Indicator Acidifying Gases from Transport EAAT Component/Theme: Environmental/Air Pollution
Indicator description
Emissions of acidifying gases (NOx and SOx) are caused by the combustion of petrol, gas and diesel in vehicle engines. Most of the acidifying emissions from transport are oxides of nitrogen. Oxides of nitrogen and sulphur are the principal acidifying gases, which react with humidity in the atmosphere to form acids.
Emissions of nitrogen and sulphur oxides are converted into acid equivalents per 1000 inhabitants per year. One Meq (mega equivalent or one million equivalents) is equal to about 44 tonnes of nitrogen dioxide or 32 tonnes of sulphur dioxide.
Acid rain results in the leaching of several important plant nutrients and reductions in the availability of nutrients cause a decline in plant growth rates, flowering ability and yields. It also makes plants more vulnerable to diseases, insects, droughts and frosts.
Acid rain also affects sensitive bodies of water, that is, those that rest atop soil with a limited ability to neutralise acidic compounds. As a result lakes and streams suffer from chronic acidity, a condition in which water has a constant low pH level.
In urban areas, acid rain and the dry deposition of acidic particles are known to contribute to the corrosion of metals and deterioration of stone and paint on buildings, cultural objects, and cars. Dry deposition of acidic compounds can also soil buildings and other structures, leading to increased maintenance costs.
For the effects of NOx emission to human health see the indicator SHED.
The target of the EU acidification strategy is a 55% reduction in emissions of acidifying substances between 1990 and 2010 of which a 38 % reduction was already reached by 1999 (EEA, 2002). Particular attention will need to be paid to emissions from the transport sector if the target is to be met.
Calculation method
The emissions are calculated in the Raster Module with a harmonised method for all case cities. The emission submodel relates the information on traffic flows provided by the transport model with speed-related emission functions (Hickman et al., 1999, Joumard, 1999). The emission functions used distinguish much more disaggregate vehicle types than provided by the transport models. Future technological developments and foreseeable environmental regulations are taken into account by changing the vehicle fleet composition over time.
Emissions of nitrogen and sulphur oxides are converted into tons of acid equivalents, annualised and divided by thousand of inhabitants.
References, notes
NO2 and SO2 emissions are included in the sustainability indicator list of e.g. European Environment Agency and OECD.

Appendix I, Indicator description sheets
283
• EEA - European Environment Agency (2000): Are we moving in the right direction? Indicators on transport and environment integration in the EU, TERM 2000. Copenhagen: EEA.
• EEA – European Environment Agency (2002): Environmental Signals 2002. Benchmarking the millennium. Environmental Assessment Report No 9. Copenhagen: EEA.
• Hickman, J., Hassel, D., Joumard, R., Samaras, Z., Sorenson, S. (1999): Methodology for Calculating Transport Emissions and Energy Consumptions. MEET Deliverable 22. Crowthorne: TRL.
• Joumard, R. (1999): Methods of Estimation of Atmospheric Emissions from Transport: European Scientist Network and Scientific State-of-the-art. Action COST 319 Final Report. Bron: INRETS.
• OECD, 1998: Towards Sustainable Development – Environmental Indicators. Organisation for Economic Co-operation and Development. Paris, France

Appendix I, Indicator description sheets
284
Indicator Volatile Organic Compounds from Transport EAOC Component/Theme: Environmental/Air Pollution
Indicator description
The indicator takes account of the ozone forming capacity of transport emissions. Emissions of non-methane volatile organic compounds (NMVOC) are caused by the combustion of petrol, gas and diesel in vehicle engines. Non-methane volatile organic compounds (NMVOCs) are an important precursor of tropospheric ozone that has harmful effects on health and plants (e.g. crop losses). Ground level ozone is formed when volatile organic compounds react with nitrogen oxides in the presence of strong solar radiation. Emissions are expressed in multiple of tonnes per 1000 inhabitants per year.
A cocktail of NMVOCs are emitted from combustion sources and non-combustion sources such as solvents and aerosols. These compounds can combine with other pollutants such as nitrogen oxides to produce photochemical smog. Some individual volatile organic compounds, such as benzene are also particularly hazardous to health on their own.
Non-Methane Volatile Organic Compounds are emitted from both road transport and a range of process and solvent uses from metal degreasing to domestic painting. They include a wide range of species of differing reactivity.
The emission of ozone-forming gases have been reduced by 27 % between 1990 and 1999 in the EU, the target is a 51 % reduction by 2010.
Calculation method
VOC emissions are calculated in the Raster Module with a harmonised method for all case cities. The emission submodel relates the information on traffic flows provided by the transport model to the speed-related emission functions (Hickman et al., 1999, Joumard, 1999). The emission functions used distinguish many more disaggregate vehicle types than the transport models. Future technological developments and foreseeable environmental regulations are taken into account by changing the vehicle fleet composition over time.
The emissions are annualised, converted to tons and divided by the number of inhabitants (in thousands).
References, notes
VOC emissions are included in the sustainability indicator list of e.g. European Environment Agency.
• EEA - European Environment Agency (2000): Are we moving in the right direction? Indicators on transport and environment integration in the EU, TERM 2000. Copenhagen: EEA.
• Hickman, J., Hassel, D., Joumard, R., Samaras, Z., Sorenson, S. (1999): Methodology for Calculating Transport Emissions and Energy Consumptions. MEET Deliverable 22. Crowthorne: TRL.

Appendix I, Indicator description sheets
285
• Joumard, R. (1999): Methods of Estimation of Atmospheric Emissions from Transport: European Scientist Network and Scientific State-of-the-art. Action COST 319 Final Report. Bron: INRETS.
• OECD, 1998: Towards Sustainable Development – Environmental Indicators. Organisation for Economic Co-operation and Development. Paris, France
Appendix I, Indicator description sheets
286
Indicator Consumption of Mineral Oil Products from
Transport EROT
Component/Theme: Environmental/Consumption of Natural Resources
Indicator description
The indicator addresses one of the major policy concerns as it is not only connected with green house gas emission but also with the security of energy supply (EEA, 2002). The indicator is defined as consumption of mineral oil products from transport in tons per 1,000 inhabitants per year.
The transport sector is the fastest-growing energy consumer (17 % in the EU between 1992 and 1999). Of all transport modes, road transport accounts for most of the surface travel (95 % of road, rail and inland waterway transport). The efforts to improve energy efficiency of cars did not slow down the growth rate of transport energy consumption because of the overall growth of transport demand and the ongoing tendency towards larger engines.
Calculation method
The consumption of mineral oil products from transport is calculated in the Raster Module with a harmonised method for all case cities. The emission submodel relates the information on traffic flows provided by the transport model with speed-related energy consumption functions (Ntziachristos and Samaras, 2000). The energy consumption functions used distinguish many more vehicle types than the transport models. Future technological developments and foreseeable environmental regulations are taken into account by changing the vehicle fleet composition over time.
The emissions are annualised, converted to tons and divided by the number of inhabitants (in thousands).
References, notes
Energy consumption is included in the sustainability indicator list of e.g. European Environment Agency.
• EEA – European Environment Agency (2002): Paving the Way for EU Enlargement. Indicators of Transport and Environment Integration. TERM 2002. Copenhagen: EEA.
• Ntziachristos, L., Samaras, Z. (2000): COPERT III. Computer Programme to Calculate Emissions from Road Transport. Methodology and Emission Factors (Version 2.1). Technical report No 49. Copenhagen: European Environment Agency.

Appendix I, Indicator description sheets
287
Indicator Land Coverage ERLC Component/Theme: Environmental/Consumption of Natural Resources
Indicator description
The land coverage indicator reflects several issues. First, it shows the use of non-renewable and non-extendable resources, i.e. land take. Land coverage indicates space alotted to human use at the expense of vegetation and wildlife. The amount of land coverage is also important in terms of the amount of ground water generated. The sealing of land prevents the infiltration of precipitation that is then collected in the drainage or sewerage. This has different negative impacts such as a lower renewal rate for ground water and accordingly a lower potential for extracting potable water, change of vegetation and hence microclimatic changes and also higher flood risks due to the lower water accommodation capacity of the surface and soil.
The land coverage indicator is defined as the percentage of sealed land of the total study area.
Increasing land coverage is a development trend in all modern societies. In Germany for example, more than 100 ha per day are converted from open space to settlement areas or transport infrastructure, i.e. are converted from unsealed land to land covered by intensive human use. During the last ten years the settlement area in Germany grew by more than ten percent. In Austria, the annual increase in soil sealing is between 7 to 12 m2 per person. In a selection of European countries for which data exists the built-up area has grown on average by 20 percent during the last two decades and thus much faster than the population growth rate of 6 percent in the same period (EEA, 2002).
Guideline values for land coverage do no exist. However, many policy documents state that growth rates in land coverage should be drastically reduced, or even that no further net land take should take place.
Calculation method
The land coverage indicator is calculated in the Raster Module. The Raster Module disaggregates zonal population and zonal employment forecasts of the land use model to raster cells. For each raster cell the percentage of sealed land is calculated as a function of population and employment densities and the land use category of the cell. Finally, the land coverage figures of the raster cells are aggregated to the indicator value. The indicator is expressed as the percentage of sealed land of the study regions.
References, notes
Land consumption is a key indicator in many sustainability indicator lists, e.g. from the European Environmental Agency.
EEA – European Environment Agency (2002): Environmental Signals 2002. Benchmarking the millennium. Environmental Assessment Report No 9.

Appendix I, Indicator description sheets
288
Consumption of natural resources [35 %]
Indicator Need for additional new Construction ERNC Component/Theme: Environmental / Opportunities
Indicator description
The indicator expresses the potential need for new additional construction measured in annual increase rate in gross floor area.
Some policies create the need for households and employers to relocate. This may leave some buildings unused and create additional demand in other zones for more new housing and business floorspace. In this way some policies may use more natural resources, in the form of increased need for construction, than some other policies.
The indicator is derived from the results of the model runs. The indicator becomes policy relevant only if the need for floorspace reduces in some zones (compared with the existing situation) indicating that part of the buildings become unused. This means that the corresponding floorspace has to be built in other zones.
Calculation method
The calculation of the ERNC indicator is similar to the calculation of annual interest rate in finance. The zonal positive differences of the total floor area compared with the base year are summed up for the whole study area, and divided by the total floor area in the base year. This quotient is increased by one and then raised to a power equal to the inverse of the number of years. Finally, the expression is decreased by one.
Detailed description of the calculation method
11)0(
),0(
1
1 −+∆
=∑
∑
=
=t Z
ii
Z
ii
f
tfERNC
Where:
∆ fi(0,t) is the total zonal increase in residential, industrial, office and commercial floor space defined as
≤>−
=∆)0()(if,0
)0()(if),0()(),0(
ii
iiiii ftf
ftfftftf
fi(t) is the zonal amount of floorspace in the forecast year t, different policy by policy
fi(0) is the zonal amount of floorspace in the base year
t is the number of years
Z is the number of zones

Appendix I, Indicator description sheets
289
References, notes
If the general growth of the study area is strong and all zones are growing in the tested policies the indicator has the same value for all policies, as no additional new construction is needed.

Appendix I, Indicator description sheets
290
Indicator Fragmentation of Open Space EQFO Component/Theme: Environmental/Environmental Quality
Indicator description
The extension of the urban fabric in the form of settlement areas and new transport infrastructure has reduced the habitats of several species in urban agglomerations. Infrastructure and settlements thereby diminish the living space of species or act as barriers to movements and genetic interchange between populations, in particular for vertebrates.
In very broad terms, it can be stated that the greater the size of an interconnected area of open space the larger is the potential for biodiversity, i.e. the larger is the probability that rare species do settle in that area. Or, expressed the other way round: for each species there exists a minimum undisturbed habitat size. That means that fragmentation leads to too small and to too isolated areas to support local populations of certain species (e.g. Seiler, 2000; Thiel, 1985).
Without having additional information on the characteristics of open space in the PROPOLIS modelling system, the average size of areas of open space can therefore be considered as a proxy for the estimation of biodiversity. Therefore, the indicator is defined as the average size of areas (in ha) that are not dissected by settlement areas or transport infrastructure.
Comparable information on the fragmentation of urban areas is very scarce. However, at European scale it becomes apparent that most areas of the EU are rather fragmented. In the EU, the average size of continuous land parcels that are not dissected by major roads is about 130 km², the range is from only 20 km² in Belgium to about 600 km² in Finland (EEA, 2002).
There are no guideline values available for urban regions.
Calculation method
The fragmentation indicator is calculated by the Raster Module. It carries out a raster-based determination of connected areas of open space and a calculation of their average size in the study regions. For this, the raster cells that are considered as open space have to be defined first. This will be based on land use categories and population and employment densities generated in the disaggregation step of the Raster Module. At this point, neighbouring open space raster cells are treated as entities and their size is calculated. Finally, the average size of an open space area is calculated.
The fragmentation indicator is expressed as an index in which the average size of open space parcels at the base year is set to 100.

Appendix I, Indicator description sheets
291
References, notes
Fragmentation of open space by transport infrastructure is an indicator of the Transport and Environment Reporting Mechanism for the EU (TERM) (EEA, 2000).
• EEA - European Environment Agency (2000): Are we moving in the right direction? Indicators on transport and environment integration in the EU, TERM 2000. Copenhagen: EEA.
• EEA – European Environment Agency (2002): Environmental Signals 2002. Benchmarking the millennium. Environmental Assessment Report No 9. Copenhagen: EEA.
• Seiler, A., (2000): Effects of Infrastructure on Nature. Chapter 3 (draft) in: COST 341: Habitat fragmentation due to Transport infrastructure.
• Thiel, R.T. (1985): Relationship between road densities and wolf habitat suitability in Wisconsin. Am.Midl.Nat. , 113, 404-317.

Appendix I, Indicator description sheets
292
Indicator Quality of Open Space EQQO Component/Theme: Environmental/Environmental Quality
Indicator description
The indicator addresses the problem that many areas of open space are heavily disturbed by neighbouring activities and are not attractive for recreation or suitable for wildlife. The indicator is defined as the total area of open space in the study area meeting minimum quality criteria for open space.
Open space as such, i.e. the absence of transport infrastructure or settlement areas, is not a sufficient quality criterion. The quality of open space can be clearly diminished by human activities, e.g. pollution or noise stemming from traffic. This might have a strong negative impact on species that might settle in such areas and also on the attractiveness for recreational activities of people.
Because empirical work has demonstrated a clear correlation between noise load and density of a certain species of birds (Reijnen et al., 1995) the noise level is used to define the quality of open space. Without having other information on the type of open space in the PROPOLIS modelling system, the noise-based quality can be seen as a proxy showing the potential for biodiversity and environmental quality of a tract of land and not the biodiversity and environmental quality as such.
There are no guideline values available for this indicator.
Calculation method
The quality of open space indicator is calculated by the Raster Module. First, it has to be defined which raster cells of the study area are considered as open space. This will be based on land use categories as well as population and employment densities generated in the disaggregation step of the Raster Module. Then, the open space raster cells are assessed with respect to their noise level (as calculated for indicator SHEN). Open space raster cells having a noise level of below 45 dB(a) are considered high-quality. The total area that meets the open space quality criterion will be summed up.
The quality of the open space indicator is expressed as an index in which the total area of high-quality open space at the base year is set to 100.
References, notes
• Reijnen, R., Foppen, R., Terbraak, C.J., Thiessen, J. (1995): The effects of car traffic on breeding bird population in woodland. Reduction of density in relation to the proximity of main roads. Journal of Applied Ecology 32, 187-202.

Appendix I, Indicator description sheets
293
Social Dimension
Health
Indicator Exposure to PM from Transport SHEP Component/Theme: Social/Health
Indicator description
The indicator addresses one of the major effects of transport on human health, i.e. the increase in the frequency and severity of respiratory ailments with the risk of premature death. The indicator is defined as the share of the population that lives in areas in which EU guideline values for the concentration of particulate matter (PM) are exceeded
Air quality has improved significantly during the last decades in the European agglomerations due to technological developments, which are to a great extent an outcome of environmental legislation. However, nearly all urban citizens still experience occurrences of EU urban air quality standards being exceeded (EEA, 2000). The transport sector, particularly road traffic, is a major source of air pollution.
PM emissions mainly come from diesel motors. PM, especially those under 10 micrometres in diameter, have a clear influence on mortality. They can penetrate deeply into the lungs. Particles are a clear risk factor of cancer. Based on an estimation of population exposure to PM a recent study of the World Health Organisation (WHO) estimates that 6 % of all deaths in three sample countries (Austria, France, Switzerland) are attributable to air pollution, half of these can be linked to pollution from traffic (WHO, 1999). Air pollution kills more people than road deaths. Therefore, "traffic-related air pollution remains a key target for public-health action in Europe" (Künzli et al., 2000, 795).
"About 90% of the urban population experience exceedances of both the 24h and annual average EC objectives for particulate matter. (...) PM10 concentrations are expected to remain well above limit values in most urban areas of EEA member countries in the coming decade" (EEA, 2000, 28/29).
There are two guideline value in the European Union for PM concentration which differ by their way of averaging: for an averaging period of 24 hours, 50 micrograms/m³ not to be exceeded more than 36 times a calendar year; for the calendar year as averaging period the guideline value is 40 micrograms/m³ which should not be exceeded at all. The latter guideline value has been used in PROPOLIS:
Calculation method
The air pollution model models the chain from emission to exposure for the whole study areas by applying emission functions for different vehicle types, a Gaussian air dispersion model and by relating the resulting concentration to the living places of the population.

Appendix I, Indicator description sheets
294
The output of the transport model is disaggregated, i.e. for each raster cell the average speed and the number of cars, trucks and buses are calculated. The centres of the raster cells are considered as point sources of emission. The emission model relates the information on traffic characteristics for each raster cell with speed-related emission functions for PM (based on Hickman et al., 1999, Joumard, 1999). The composition of the vehicle fleet has been set individually for each case city and takes future technological developments and foreseeable environmental regulations into account. To meet annual guideline values, the emissions per raster cell are annualised. The output of the emission model is PM emission per raster cell for an average hour of the year.
The emission is then fed into the air dispersion model in order to calculate the concentration of air pollution. The air dispersion model is a Gaussian model (TA Luft, 1986) applied sequentially to all emission raster cells. The concentrations in a receptor raster cell from different emission raster cells are summed up. The result for each raster cell is the air quality in terms of PM concentration in micrograms/m³.
Finally, air quality is related to population and the EU concentration guidelines. From all raster cells in which the air quality is above the guideline level the number of persons living there are summed up. The numerical values for the exposure indicators are then normalised by the share of the population living in places in which the air quality standards for PM are exceeded. The measurement at the place of residence is in line with a recent WHO study on PM population exposure which uses the place of residence for calculating population exposure (Filliger et al., 1999).
References, notes
Exceedance of air quality standards is an indicator of the Transport and Environment Reporting Mechanism for the EU (TERM). PM is one of the pollutants considered (EEA, 2000).
• EEA - European Environment Agency (2000): Are we moving in the right direction? Indicators on transport and environment integration in the EU, TERM 2000. Copenhagen: EEA.
• Filliger, P., Puybonnieux-Texier, V., Schneider, J. (1999): PM10 Population Exposure. Technical Report on Air Pollution. Health Costs due to Road Traffic-related Air Pollution. An impact assessment project of Austria, France and Switzerland. Prepared for the WHO Ministerial Conference for Environment and Health London June 1999. Bern: Federal Department of Environment, Transport, Energy and Communications.
• Hickman, J., Hassel, D., Joumard, R., Samaras, Z., Sorenson, S. (1999): Methodology for Calculating Transport Emissions and Energy Consumptions. MEET Deliverable 22. Crowthorne: TRL.
• Joumard, R. (1999): Methods of Estimation of Atmospheric Emissions from Transport: European Scientist Network and Scientific State-of-the-art. Action COST 319 Final Report. Bron: INRETS.
• Künzli, N., Kaiser, R., Medina, S., Studnicka, M., Chanel, O., Filliger, P., Herry, M., Horak, F., Puybonnieux-Texier, V., Quénel, P., Schneider, J., Seethaler, R.,
Appendix I, Indicator description sheets
295
Vergnaud, J.-C., Sommer, H. (2000): Public-health impact of outdoor and traffic-related air pollution: a European assessment. The Lancet, 356, September 2, 795-801.
• TA Luft (1986): Technische Anleitung zur Reinhaltung der Luft - TA Luft. Erste Allgemeine Verwaltungsvorschrift zum Bundes-Immissionsschutzgesetz. Gemeinsames Ministerialblatt, 27.02.1986, 95-202.
• WHO - World Health Organization, Regional Office for Europe (1999): Health costs due to Road Traffic-related Air Pollution. An Impact assessment project of Austria, France and Switzerland. Prepared for the WHO Ministerial Conference on Environment and Health London June 1999. Bern: Federal Department of Environment, Transport, Energy and Communications.

Appendix I, Indicator description sheets
296
Indicator Exposure to NO2 from Transport SHED Component/Theme: Social/Health
Indicator description
The indicator addresses another aspect of the impact of transport on human health, in particular on reduced lung functions and airway responsiveness and increased risk of respiratory infections in children. The indicator is defined as the share of the population that lives in areas in which EU guideline values for NO2 concentration are exceeded
Air quality has improved significantly during the last decades in the European agglomerations due to technological developments, which are to a great extent an outcome of environmental legislation.
Nitrogen dioxide (NO2) is a result of chemical processes in which most oxides of nitrogen emitted from vehicles are transferred. NO2 causes symptoms in the respiratory tract such as increased susceptibility to inflammations, increased secretion of mucus and decreased oxygen-exchange capacity of the lungs.
The limit value for the European Union for short-term NO2 exposure is 200 microgram/m3 not to be exceeded more than 18 times a calendar year. The NO2 annual mean concentration is 40 microgram/m³ which should not be exceeded. For PROPOLIS, the annual mean concentration limit value has been used.
In most European cities, the EU air quality limit values for NO2 were exceeded. About 15 to 30 percent of the urban population is exposed to concentrations above the short-term limit value. The limit value for the annual mean seems to be more often exceeded than the short-term value (EEA, 2002) Peak concentrations are decreasing, however, there is no clear trend visible so far in the population exposure. Highest concentrations seem to occur in some cities in southern Europe (EEA, 2000).
Calculation method
The air pollution model models the chain from emission to exposure for the whole study areas by applying emission functions for different vehicle types, a Gaussian air dispersion model and by relating the resulting concentration to the places where the population lives.
The output of the transport model is disaggregated, i.e. for each raster cell the average speed and the number of cars, trucks and buses are calculated. The centres of the raster cells are considered as point sources of emission. The emission model relates the information on traffic characteristics for each raster cell with speed-related emission functions for NOx (based on Hickman et al., 1999, Joumard, 1999). The composition of the vehicle fleet has been set individually for each case city and takes future technological developments and foreseeable environmental regulations into account. To meet annual guideline values, the emissions per raster cell are annualised.

Appendix I, Indicator description sheets
297
The output of the emission model is NOx emission per raster cell for an average hour of the year.
The emission is converted to NO2 and fed into the air dispersion model in order to calculate the concentration of air pollution. The air dispersion model is a Gaussian model (TA Luft, 1986) applied sequentially to all emission raster cells. The concentrations in a receptor raster cell from different emission raster cells are summed up. The result for each raster cell is the air quality in terms of PM concentration in micrograms/m³.
Finally, air quality is related to the EU concentration guidelines. From all raster cells in which the air quality is above the EU guideline level the number of persons living there are summed up. The numerical values for the exposure indicators are then normalised by the share of the population living in places in which the air quality standards for NO2 are exceeded.
References, notes
Exceedance of air quality standards is an indicator of the Transport and Environment Reporting Mechanism for the EU (TERM), NO2 is one of the pollutants considered (EEA, 2000).
• EEA - European Environment Agency (2000): Are we moving in the right direction? Indicators on transport and environment integration in the EU, TERM 2000. Copenhagen: EEA.
• EEA – European Environment Agency (2002): Environmental Signals 2002. Benchmarking the millennium. Environmental Assessment Report No 9. Copenhagen: EEA.
• Filliger, P., Puybonnieux-Texier, V., Schneider, J. (1999): PM10 Population Exposure. Technical Report on Air Pollution. Health Costs due to Road Traffic-related Air Pollution. An impact assessment projekt of Austria, France and Switzerland. Prepared for the WHO Ministerial Conference for Environment and Health London June 1999. Bern: Federal Department of Environment, Transport, Energy and Communications.
• Hickman, J., Hassel, D., Joumard, R., Samaras, Z., Sorenson, S. (1999): Methodology for Calculating Transport Emissions and Energy Consumptions. MEET Deliverable 22. Crowthorne: TRL.
• Joumard, R. (1999): Methods of Estimation of Atmospheric Emissions from Transport: European Scientist Network and Scientific State-of-the-art. Action COST 319 Final Report. Bron: INRETS.
• Künzli, N., Kaiser, R., Medina, S., Studnicka, M., Chanel, O., Filliger, P., Herry, M., Horak, F., Puybonnieux-Texier, V., Quénel, P., Schneider, J., Seethaler, R., Vergnaud, J.-C., Sommer, H. (2000): Public-health impact of outdoor and traffic-related air pollution: a European assessment. The Lancet, 356, September 2, 795-801.

Appendix I, Indicator description sheets
298
• TA Luft (1986): Technische Anleitung zur Reinhaltung der Luft - TA Luft. Erste Allgemeine Verwaltungsvorschrift zum Bundes-Immissionsschutzgesetz. Gemeinsames Ministerialblatt, 27.02.1986, 95-202.
• WHO - World Health Organization, Regional Office for Europe (1999): Health costs due to Road Traffic-related Air Pollution. An Impact assessment project of Austria, France and Switzerland. Prepared for the WHO Ministerial Conference on Environment and Health London June 1999. Bern: Federal Department of Environment, Transport, Energy and Communications.

Appendix I, Indicator description sheets
299
Indicator Exposure to Traffic Noise SHEN Component/Theme: Social/Health
Indicator description
There is a growing number of persons complaining about being annoyed by traffic noise. The exposure to noise indicator is defined as the percentage of population annoyed by traffic noise.
Noise interferes with hearing and causes sleep disturbance even when not consciously disturbing, cardiovascular and psychoendocrine effects, clinical health effects, community annoyance, and behavioural effects.
Within the EU about 32 % of the population are exposed to noise levels from road traffic of more than 55 Ldn dB (day-night level) on the facade of their house, 10 % of the population are exposed to rail noise above 55 Ldn dB (EEA, 2000).
There are no guideline values available for the indicator as calculated in PROPOLIS, i.e. annoyance by noise. In TERM (EEA, 2000), the stated objective is to reduce the number of people that are exposed to and annoyed by high traffic noise levels. Precise noise guidelines for exposure exist nationally. In Germany for instance, there are guideline values to meet when new roads are constructed: in residential areas 59 dB(A), in mixed used areas 64 dB(A) and in industrial estates 69 dB(A), all during daytime.
Calculation method
The noise submodel in the Raster Module is set up similar to the air pollution model. It models the sequence from noise generation via noise propagation to noise levels for all locations of the study areas and relates this to the population living there.
The noise model implemented applies the segment-oriented approach of the German guidelines for noise protection measures along roads (BMV, 1990) in which a traffic link is divided into sections of equal length and characteristics. The centres of those sections are then considered as emissions points. In the raster implementation the centres of the raster cells are considered as such point sources of traffic noise.
The emission level of a raster cell is calculated as a function of traffic load, percentage of trucks and speed. This information is provided by the transport model for links and then transferred to raster cells in the network disaggregation step of the Raster Module. The resulting noise level at a receptor cell is calculated as a function of distance, air absorption, reflections and noise abatement measures.
The resulting noise level at a raster cell is related to the population living there to get the indicator value. In order to reflect that disturbance by noise depends on individual factors (Oliva and Hüttenmoser, 2000). A function based on the Finish practice for assessing noise disturbance has been implemented: in a location in which the day-time equivalent noise level is 55 dB(A) only 33 percent of the population are disturbed, in

Appendix I, Indicator description sheets
300
locations having 65 dB(A) 50 percent are disturbed and in areas beyond 70 dB(A) all people feel annoyed.
The indicator is expressed as the percentage of total population annoyed by traffic noise in their living environment.
References, notes
Exposure to and annoyance from traffic noise is one indicator of the Transport and Environment Reporting Mechanism for the EU (TERM), (EEA, 2000).
• BMV - Bundesminister für Verkehr (1990) Richtlinien für den Lärmschutz an Straßen – RLS-90. Bundesminister für Verkehr, Bonn.
• EEA - European Environment Agency (2000): Are we moving in the right direction? Indicators on transport and environment integration in the EU, TERM 2000. Copenhagen: EEA.
• Oliva, C., Hüttenmoser, C. (2000): Die Abhängigkeit der Schallbewertung vom Geräuschkontext. Das Beispiel der Lästigkeit von Straßenverkehrslärm im Vergleich zum Flugverkehrslärm. Zeitschrift für Lärmbekämpfung 47, 2, 47-56

Appendix I, Indicator description sheets
301
Indicator Traffic deaths SHTD Component/Theme: Social / Health
Indicator description
The indicator value is expressed as the number of traffic deaths/1.000.000 inhabitants/year
In 25% of European cities, more than one inhabitant per 10 000 (i.e. 0.1 per 1000 inhabitants) is killed every year in traffic accidents. More than 40.000 persons are annually killed in traffic accidents in Europe and accidents are viewed as one of the major traffic problems.
Calculation method
The indicator value is calculated based on traffic volumes derived from transport modelling and on road type. Statistical data has been used to derive coefficients for accident rates for different volumes and road types by national authority.
Detailed description of the calculation method
See above
References, notes
Traffic deaths are included in the sustainability indicator list of e.g. European Environment Agency and European Commission.
• EEA, 2000: Are we moving in the right direction? Indicators on transport and environment integration in the EU, TERM 2000. European Environment Agency. Copenhagen, Denmark
• EC, 2000: The Urban Audit, Towards the Benchmarking of Quality of Life in 58 European Cities. European Commission, DGXVI. Luxembourg.

Appendix I, Indicator description sheets
302
Indicator Traffic injuries SHTI Component/Theme: Social / Health
Indicator description
The indicator value is expressed as the number of traffic injuries/1.000.000 inhabitants/year.
In 25% of European cities, more than five persons/1000 inhabitants are injured every year in traffic accidents.
Calculation method
The indicator value is calculated based on traffic volumes derived from transport modelling and on road type. Statistical data has been used to derive coefficients for accident rates for different volumes and road types by national authorities.
Detailed description of the calculation method
See above
References, notes
Traffic deaths are included in the sustainability indicator list of e.g. European Environment Agency and European Commission.
• EEA, 2000: Are we moving in the right direction? Indicators on transport and environment integration in the EU, TERM 2000. European Environment Agency. Copenhagen, Denmark
• EC, 2000: The Urban Audit, Towards the Benchmarking of Quality of Life in 58 European Cities. European Commission, DGXVI. Luxembourg.

Appendix I, Indicator description sheets
303
Equity
Indicator Justice of distribution of economic SEJE Indicator Justice of exposure to nitrogen dioxide SEJD Indicator Justice of exposure to noise SEJN Indicator Justice of exposure to particulates SEJP Component/Theme: Social / Equity
Indicator description
The indicators are expressed as an index based on the achievement of a desired distribution of the exposure between different socio-economic groups. The desirability of a distribution is determined by choosing a theory of justice out of four alternative theories offered to the user:
Equal shares principle: The benefits are distributed among the groups in society as evenly as possible.
Utilitarian approach: The total net benefit is as large as possible regardless of its distribution.
Egalitarianism: The benefits are distributed in a way that reduces differences in welfare between groups/ individuals. The aim is to level out all inequalities.
Rawlsian Difference Principle: The absolute benefit to the most disadvantaged group should be maximised even if that implies an uneven distribution of the benefits.
The indicators reveal to the decision-maker if a given policy increases or decreases equity between socio-economic or any other groups. The relevance of exposure to noise or pollutants is described in connection with the health indicators. The distribution of economic benefits is based on TGC described in connection with the economic indicators.
Calculation method
The indicators are calculated based on information about the distribution of the impacts, provided by the Raster module and model runs, among the socio-economic groups. The justice indicator module calculates the indicator values based on theories of justice mentioned above.
Detailed description of the calculation method
Below are the corresponding formulas for each method.
1. Equal shares principle
J = )(
)()()(3,2,1
all
ialli
i
SEGP
SEGxSEGxSEGP ∆∆× −=∑

Appendix I, Indicator description sheets
304
2. Utilitarian approach
J = )( allSEGx∆ 3. Egalitarianism
J = )(
)()()(3,2,1
all
ialli
i
SEGP
SEGxSEGxSEGP −×∑=
4. Rawlsian Difference principle
J = )( wSEG∆ where:
J = justice indicator value for the policy
P(SEGi) = population of SEGi in the Reference year
P(SEGall) = total population in the Reference year
x(SEGi) = base indicator value for SEGi in the Reference year
x(SEGall) = base indicator value for all SEGs in the Reference year
∆x(SEGi) = base indicator change for SEGi from the year base year (2001) to Reference year
∆x(SEGall) = base indicator change for all SEGs from the base year to Reference year
∆x(SEGw) = base indicator change from the base year to Reference year for the SEG which was in the worst situation in the base year regarding this indicator (for instance, the SEG which had the highest portion of those living in areas where particulates guideline is exceeded)
References, notes
Khisty, C.J. ,1996: Operationalising Concepts of Equity for Public Project Investment”, Proceedings of the 75th Meeting of the Transportation Research Board, January 7-11, 1996. TRB, Washington, D.C.
Rawls, John, 1971: A Theory of Justice. Cambridge, Massachusetts

Appendix I, Indicator description sheets
305
Indicator Segregation SES Component/Theme: Social / Equity
Indicator description
Segregation is an unsatisfactory spatial accumulation of certain population groups.
The indicator is expressed as a GINI coefficient for the lowest socio-economic group’s zonal shares. The indicator value is expressed in percentage points and it measures the evenness of the distribution. 0% means that the distribution is even and the percentage of the lowest socio-economic group in all zones is constant.
The diversity of social interaction is best realised when the population is versatile not only socio-economically, but also for example with regards to age structure. An excess concentration of one socio-economic group in an area works against this. Still, areas will have their differing social profiles and it is not easy to determine what is excessive.
Calculation method
GINI coefficient is by definition “A measure of dispersion within a group of values, calculated as the average difference between every pair of values divided by two times the average of the sample. The larger the coefficient, the higher the degree of dispersion.”
The GINI coefficient is the share of the area between the Equality diagonal and the Lorenz curve, see below, from a half square. “Lorenz curve” means that these population shares are sorted by the slopes (in this case by zonal low income shares) so that the curve increases or decreases “monotonously”.

Appendix I, Indicator description sheets
306
Detailed description of the calculation method
SES = 1 - Σ [(Pn – Pn-1) * (In + In-1)]
Where:
SES = segregation – index, expressed in percentage
Pn = Cumulative total share for all households, zones 1…n, P0=0,PN=1
In = Cumulative total share for low income households, zones 1…n, I0=0,IN=1, where zones are sorted by zonal low income household share.
(Brown Formula)
References, notes
Indicators referring to shares of people in different socio-economic groups (income, disparities and poverty) are included in the sustainability indicator list of e.g. European Commission. These indicators do not specify the zonal distribution of different groups.
• EC, 2000: The Urban Audit, Towards the Benchmarking of Quality of Life in 58 European Cities. European Commission, DGXVI. Luxembourg.

Appendix I, Indicator description sheets
307
Opportunities
Indicator Housing Standard SOHS Component/Theme: Social / Opportunities
Indicator description
The indicator illustrates housing standard defined as the share of households having more than one person per room excluding kitchen.
Housing is one of the basic needs for a household. For example, some policies might reduce the urban sprawl, but at the same time the living space per household might reduce below a critical level and therefore, the policy has also negative effects.
Finland: In the Helsinki Metropolitan Area the share of households having less than one room per person (kitchen excluded) was 12% in 2001. The amount of floor space per person in Helsinki Metropolitan Area was in 1991 about 31 m2/person, in 1995 about 32 m2/person and in 2000 about 33 m2/person. This number is estimated to grow in the future.
Germany:
UK:
Belgium:
Italy: Data on the share of households having less than one room per person is not available in Italy. With reference to this type of information, the available data are the average number of rooms per person (1,5 rooms/inhabitants in the whole country, 2,0 in Vicenza and 1,1 in Naples) and the amount of floor space per person (33 m2/person in Italy, 39 in Vicenza and 24,5 in Naples). The share of households having less than one room per person was then estimated on the basis of the two above data sets and the following figures were obtained: Vicenza 17% and Naples 24%.
Spain: The data available from the National Institute of Statistics (INE) consists of the number of households according to the number of family members per household and number of rooms in the house, for the whole province of Bizkaia. The number of confined households in the metropolitan area will be a bit higher than the mean value for the whole province. Thus, those households where there is one or more members per room have been considered as confined dwellings. The result is about 14% of confined dwelllings in Bilbao for the year 2001.
Calculation method
The indicator is calculated from the average living space per household. From the statistics it is possible to define a function that defines the correspondence between the average living space and the share of households having less than a critical value of living space. The critical value is one person per room (kitchen not included).

Appendix I, Indicator description sheets
308
Detailed description of the calculation method
F(f)*100%
Where f is the average living space by zone (measured in gross floor area) per household (or inhabitant) and F is a function that defines the correspondence between the living space and share of households having less than critical value of living space.
Finland:
In the Helsinki model the function is:
F(f)= SUM(h*EXP(-0.02642*f))/sum(h)
Where f is the living space per inhabitant in a zone and h is total number of households in a zone.
In 2001 the indicator value for the whole study area is 12,7 % and 11,7 % for the Helsinki Metropolitan Area
Germany
UK
Belgium
Italy
Functions adopted for Vicenza and Naples are similar to the ones adopted in Helsinki:
Vicenza: F(f)= SUM(h*EXP(-0.0150*f))/sum(h)
Naples: F(f)= SUM(h*EXP(-0.0185*f))/sum(h)
Spain:
The function used in the Bilbao model is similar to the one adopted in Helsinki, in the following form:
F(f)= SUM(h*EXP(-0.0249927*f))/sum(h)
References, notes
The definition used here is identical to the definition used in the European Community Household Panel (Selected Indicators from the 1995 Wave).
Indicators referring to housing standard are also included in the sustainability indicator list of e.g. European Commission
EC, 2000: The Urban Audit, Towards the Benchmarking of Quality of Life in 58 European Cities. European Commission, DGXVI. Luxembourg.

Appendix I, Indicator description sheets
309
Accessibility and traffic
Indicator Total time spent in traffic per inhabitant SATT Component/Theme: Social / Accessibility
Indicator description
The indicator expresses the sum of travel times of all trips / year / inhabitant.
Transport, here, is seen as a means of achieving other goals, and not as an end in itself. In this sense time spent in traffic can be regarded as a lost opportunity. Travel times reflect the overall congestion, the city structure and its efficiency.
Calculation method
The travel times of all trips in the model runs are annualised and divided by the number of inhabitants.
Detailed description of the calculation method
See above
References, notes
Indicators referring to travel characteristics (length, time, purpose, mode) are included in the sustainability indicator list of e.g. European Environment Agency and European Commission.
• EEA, 2000: Are we moving in the right direction? Indicators on transport and environment integration in the EU, TERM 2000. European Environment Agency. Copenhagen, Denmark
• EC, 2000: The Urban Audit, Towards the Benchmarking of Quality of Life in 58 European Cities. European Commission, DGXVI. Luxembourg.

Appendix I, Indicator description sheets
310
Indicator Level of service of public transport and slow modes SAPT Component/Theme: Social / Accessibility
Indicator description
The indicator expresses the mean travel time (minutes/trip) of public transport and slow modes trips.
A good level of service of public transport is an important part of good city life together with the opportunity to cycle or walk. These are especially important issues to the elderly, handicapped, non-car-owning households and children. The indicator value is affected by e.g. the general congestion as well as by supply of public transport and its level of service.
Calculation method
The calculation of the mean travel time of public transport and slow modes trips is based on model run results. The indicator value is expressed in minutes /trip.
Detailed description of the calculation method
See above
References, notes
Indicators referring to travel characteristics (length, time, purpose, and mode) are included in the sustainability indicator list of e.g. European Environment Agency and European Commission.
• EEA, 2000: Are we moving in the right direction? Indicators on transport and environment integration in the EU, TERM 2000. European Environment Agency. Copenhagen, Denmark
• EC, 2000: The Urban Audit, Towards the Benchmarking of Quality of Life in 58 European Cities. European Commission, DGXVI. Luxembourg.

Appendix I, Indicator description sheets
311
Indicator Vitality of City centre SOVC Component/Theme: Social / Opportunities
Indicator description
The indicator is defined as an index that takes into account both the number of inhabitants and the number of service jobs that are assumed to reflect the vitality of a city centre.
Many European City centres suffer from a loss in their attractiveness caused by loss of inhabitants and/or services. This trend may be caused, for instance, by environmental, social and economic reasons.
Calculation method
The indicator definition is based on the concept that both the number of inhabitants and the number of service jobs reflect the vitality of a city centre with the same weight. The indicator value is an index.
I = (H/Ho + S/So)/2, where
H = number of households in the city centre in the forecast year
Ho = number of households in the city centre in the base year
S = number of service employment (=private services & commerce) in the city centre in the forecast year
So = number of service employment (=private services & commerce) in the city centre in the base year
Detailed description of the calculation method
See above
References, notes
Indicators referring to vitality of city centres (number of cinema showings, concerts, theatres etc.) are included in the sustainability indicator list of e.g. European Commission.
• EC, 2000: The Urban Audit, Towards the Benchmarking of Quality of Life in 58 European Cities. European Commission, DGXVI. Luxembourg.

Appendix I, Indicator description sheets
312
Indicator Vitality of Surrounding region SOVS Component/Theme: Social / Opportunities
Indicator description
The indicator is defined as an index that takes into account both the number of inhabitants and the number of service jobs that are assumed to reflect the vitality of the “surrounding region”.
Many rural areas suffer from a loss in their attractiveness through the loss of inhabitants and services. This trend may be caused by, for instance, social and economic reasons leading to emigration. As a result part of the existing social and physical infrastructure is not effectively used whereas new infrastructure is needed in growing cities. General conditions for living may deteriorate. The indicator works as a counterbalance for the “Vitality of City Centre” in the PROPOLIS system.
Calculation method
The indicator definition is based on the concept that both the number of inhabitants and the number of service jobs reflect the vitality of the surrounding region with the same weight. The indicator value is an index.
I = (H/Ho + S/So)/2, where
H = number of households in the surrounding region in the forecast year
Ho = number of households in the surrounding region in the base year
S = number of service employment (=private services & commerce) in the surrounding region in the forecast year
So = number of service employment (=private services & commerce) in the surrounding region in the base year
Detailed description of the calculation method
The indicator is not relevant is all PROPOLIS case cities as the study area of these cities does not cover the surrounding region.
References, notes
Indicators referring to the vitality of a region (number of cinema showings, concerts, theatres etc.) are included in the sustainability indicator list of e.g. European Commission.
• EC, 2000: The Urban Audit, Towards the Benchmarking of Quality of Life in 58 European Cities. European Commission, DGXVI. Luxembourg.

Appendix I, Indicator description sheets
313
Indicator Productivity Gain from Land Use SOPG Component/Theme: Social Opportunities
Indicator description
This indicator is the measure of the impact of policies on the economic efficiency of the city. As described in the theoretical description these impacts are calculated on the basis of the potential dimension of the labour market. In brief, the extension of the area of employment opportunities is a measure of the productivity and of the competitiveness of the area.
The indicator is relevant for the estimation on how policies can impact on the economy of the region and on the labour market.
The policy testing, by means of this indicator, would produce an indication on how sustainable transport policies could affect the competitiveness of the economic productive sector. This is relevant therefore for the applicability of the policy. The indicator is computed as a percent variation of the productivity of the city.
Calculation method
The calculation is based on the comparison of the variable L(t) which represents the Labour Market size. L is defined for a chosen time threshold t (e.g. 30 minutes). The variation of t, filtered through the application of the proper elasticity value provides the change in productivity, which is indeed the desired indicator.
The value of this indicator may vary a lot in the modelling applications when some relevant zones at the border are included, or excluded; a second threshold was considered in order to introduce a smoothing factor. The Labour Market size is then defined by all the workplaces that can be reached within the lower time threshold t1, and by a share of the ones that can be reached within the higher time threshold t2. This share should decrease more than proportionally from t1 to t2, and become null in t2. It is identified by the profile of a parabola that passes through the two points (X=1, Y=t1) and (X=0, Y=t2) and whose directrix is the line (X=t1). Graphically the total of the labour market can be represented as the integral of the function, and so the total area of the figure below.
0%
20%
40%
60%
80%
100%
120%
0 3 6 9 12 15 18 21 24 27
t1=3
0 33
36 39 42
t2=
45 48 51
54 57 60

Appendix I, Indicator description sheets
314
Detailed description of the calculation method
Considering a city or a region, divided into n zones, 3 variables can be defined:
Wi: the number of workers located in zone i with ΣiWi = W; Ji: the number of jobs located in zone i, with ΣiJi = J; Tij: the time it takes to go from zone i to zone j. Y(tij): the coefficient defined by the curve represented in the figure
The definition of L(t), where t1 and t2 are the time threshold chosen with t2=T1+10Min, is the average of the Li, the effective size of labour market for the workers of the zone i.
For a given zone i, Li(t) = Σj(Jj*Y) for j such that Tij<t2
The overall L(t) is obtained weighing the average of Li(t) by the number of workers in each zone:
L(t) = Σi Li(t) * Wi / W.
The variation in Labour market is therefore given by:
L(%) = (L(t)policy – L(t)RS)/ L(t)policy
The variation of labour market size is intended to induce changes in the overall productivity. The variation of productivity is obtained by the L(%) by applying a proper elasticity value
SOPG = L(%) * E
The value of E suggested is 0.18, as obtained by studies conducted in some French cities. It means for example that an increase of the labour market size by 10% induces an increase of productivity by 1.8%.
The application of the method in different cases does not show any particular problem as every model can produce the variables required.
References, notes
The theory has been developed on the basis of specific studies. A complete theoretical approach is reported in ECMT, Assessing the benefits from transport – Annex 4, “Size, sprawl, speed and the efficiency of cities” from Remy Prud’Homme and Chang-Woon Lee.

Appendix I, Indicator description sheets
315
Indicator Accessibility to the centre SAAC Component/Theme: Social / Accessibility
Indicator description
The indicator expresses the mean travel time of all trips (minutes/trip) to the city centre.
The city centre plays a distinct role in urban life. It is the common living room of the citizens and the only place in the region where some of the special services (e.g. cultural or administrative and speciality shops) are found. Thus, changes in its accessibility have a social bearing.
Calculation method
The indicator is calculated from the model run results as the mean travel time of all trips to the centre.
Detailed description of the calculation method
See above

Appendix I, Indicator description sheets
316
Indicator Accessibility to Services SAAS Component/Theme: Social / Accessibility
Indicator description
The indicator expresses the mean travel time of all journeys, other than work trips and those by goods vehicles. The indicator value is expressed in minutes /trip.
The indicator reflects the accessibility to everyday services. Accessibility to services is an important issue especially for those whose ability to move is lower than average. More generally, the indicator also represents the ease of everyday life.
Calculation method
The calculation of the mean travel time of all journeys, other than work trips and those by goods vehicles, is based on model run results. The indicator value is expressed in minutes /trip.
Detailed description of the calculation method
See above
References, notes
Access to basic services is included in the sustainability indicator list of e.g. European Environment Agency.
EEA, 2000: Are we moving in the right direction? Indicators on transport and environment integration in the EU, TERM 2000. European Environment Agency. Copenhagen, Denmark

Appendix I, Indicator description sheets
317
Indicator Accessibility to Open Space SAAO Component/Theme: Social/Accessibility
Indicator description
Average weighted accessibility of the population to open space. The indicator will be expressed as an accessibility index in a possible range between 0 and 100.
Urban regions, in particular their cores, are characterised by high densities and very often by a lack of open space. Settlement areas may offer a lot of attractions for the urban population, but for certain activities, mainly leisure activities, open space is a pre-requisite. Access to open space has therefore been chosen as an indicator describing opportunities in the urban environment.
There are no guidelines available for this indicator.
Calculation method
The accessibility to open space indicator is calculated by the Raster Module. The indicator reflects walking distances to open space. The indicator is calculated by a potential accessibility model
∑ −=j
ijji cWA )(exp β
in which the accessibility A to open space of a raster cell i is calculated by taking all raster cells j of the study region into account. The raster cells are characterised by their degree of open space W which is a function of population and employment densities of the cells. The inclusion of densities reflects the fact that low density neighbourhoods do have open space qualities, for instance gardens or pocket greens which might compensate for 'real' open space. The impedance cij is walking distance.
For each raster cell a value for accessibility to open space will be calculated. These values will be aggregated (weighted by population) to an average value for the whole study region.
The accessibility to open space indicator is expressed as an index in which the value of the base year is set to 100.
References, notes

Appendix I, Indicator description sheets
318
Economic Evaluation
Indicator Transport Investment Costs ETIC Component/Theme: Indicators for economic evaluation (E)
Indicator description
The ETIC indicator measures the costs needed for the policy implementation: the investment costs and, for the whole period of the analysis, the operation and maintenance costs. Costs, calculated in Euro per inhabitant, are discounted to the present year.
Calculation method
Investments and operational costs depend directly on the planned intervention: these costs have to be converted from financial to economic costs by subtracting the share of taxes (as, in economic terms, taxes are a mere transfer between different actors). Such a conversion is performed by splitting costs between personnel, materials and other costs and by then applying an appropriate conversion factor to each component. Economic investments and operational costs are calculated by the different case city modellers and are input in the Economic Indicator Module.
Detailed description of the calculation method
On the basis of the input data, the Economic Indicator Module calculates the investment and operational costs flow for the analysis period (from year 2001 to year 2021). The value of ETIC for a given policy is the discounted value (to the present year) of the investment and operational costs flow per inhabitants, obtained by applying the following formula:
Popr
cei
ETICi
in
)1(1 +=∑
where cei is the estimate of the economic costs per year, Pop is the population resident at the base year, r is the discount rate adopted and n is the time of the analysis.
The calculation method is the same in all case cities: differences among cities might arise in the translation of financial costs to economic costs, as taxation levels are different in each country.
References, notes
The entire calculation of this indicator is carried out on the basis of exogenous factors: investment costs, discount rate, and timing of the investment. All these data are input in specific files of the EIM software module, which calculates the indicator value.

Appendix I, Indicator description sheets
319
Indicator Transport User Benefits ETUB Component/Theme: Indicators for economic evaluation (E)
Indicator description
The ETUB indicator represents the variation in transport user surplus. The indicator is relevant as it provides information on how the direct economic benefits are perceived by transport users. It should be compared to other indicators defined later (ETOB, ETGB) in order to understand how benefits distribute among different actors. For the sake of homogeneity with the other indicators it is measured in Euro/capita, (whereas in general it is calculated per transport user).
Calculation method
The calculation is based on the variation in consumer surplus, which is related to the variation in cost and time spent for travelling.
Detailed description of the calculation method
The changes in the consumer surplus are directly calculated in the Economic Indicator Module by applying the standard formula, where transport demand volumes and transport cost data are provided by the case city models. The first part (A) of the formula reflects the benefit for the existing demand and the second part (B) the benefit for the generated traffic (see also the figure below):
Net Consumer Surplus = A + B
A= Q1 * (Cp1-Cp2)
B= (Q2-Q1) * (Cp1-Cp2)*(1/2)
where Q1 and Q2 are the total demand without and with the project and Cp1 and Cp2 are the user perceived costs (time, fares, operating costs, taxes) without and with the project.
C p 1
C p 2
Q 1 Q 2
N E T C O N S U M E R S U R P L U S
A B

Appendix I, Indicator description sheets
320
For all the users, perceived costs include time (quantified in money terms by applying proper values of time) and monetary costs. For car users, monetary costs are the perceived operating costs (the costs of fuel, lubricants and tyres) and the tolls; for public transport users the monetary costs are represented by the tariffs paid for the service. The surplus variation is calculated for the model threshold years and the benefits flow is then obtained by assuming a linear distribution between two consecutive threshold years.
The ETUB value for a given policy is the actualisation to the present year of the above flow per inhabitants and is calculated by the following formula, where Pop is the resident population in the base year, r is the discount rate adopted and n is the time (number of years) of the analysis.
Popr
pNetConsSur
ETUB
n
ii∑ += 1 )1(
It is important to mention that the indicator calculation is based on the generalised cost of transport and therefore it might be affected by any modification of operating costs and value of time values.
References, notes
ETUB and the following ETOB and ETGB represent an attempt at splitting the Social Economic Surplus, into three different components. In standard cost benefits analysis, these are kept together in order to assess the economic impact on society. The approach chosen in the PROPOLIS economic analysis aims at defining who benefits more from the policies tested.

Appendix I, Indicator description sheets
321
Indicator Transport Operator Benefits ETOB Component/Theme: Indicators for economic evaluation (E)
Indicator description
The ETOB indicator represents the transport operator benefits due to changes in transport revenues: fares for public transport and rail services, parking fees and tolls in case of road pricing measures. The indicator provides an estimate of the impact of pricing (or changes in tariffs) policies on transport revenues. Transport operator benefits are calculated in Euro/capita and are actualised to the present year.
Calculation method
The difference between the revenues from transport in the policy and in the reference scenario provides the total benefits for the operator. The calculation is carried out separately by mode of transport.
Detailed description of the calculation method
The input data to calculate the ETOB indicator are provided by the transport models results (network costs on specific links). The indicator value is obtained by discounting the future benefits flow to the initial year and assuming a linear distribution of benefits across the years between the different thresholds. The applied formulas are as follows (OB are Operator Benefits):
- For public transport modes: OBi = Pp2*Qp2- Pp1*Qp1
where Pp1 and Pp2 are the tariffs in the RS and in the policy and Qp1 and Qp2 are the corresponding traffic units who bear the cost
- For private transport modes: OBi = Ps2*Qp2 – Ps1*Qp1
where Ps1 and Ps2 are the tolls paid in the RS and in the policy scenario and Qp1 and Qp2 are the corresponding traffic units who bear the cost for toll motorway, road pricing and parking fees.
ETOB is obtained separately by means of transport, by discounting the future flow according to the formula:
ETOB = Σi=1,n[OBi/(1+r)n]/Pop
where Pop is the population resident at the base year, r is the discount rate adopted and n is the time of the analysis.
References, notes
The Operator balance is in fact influenced by the transport costs spent for the production of services. In the approach chosen the cost of production of public transport services is attributed to the government benefits (see ETGB). The Governments thus plays the role of producer.

Appendix I, Indicator description sheets
322
Indicator Government Benefits from Transport ETGB Component/Theme: Indicators for economic evaluation (E)
Indicator description
The ETGB indicator represents the net variation of economic costs for the government. It is the balance between taxes collected as a consequence of variation of traffic (and /or of variation of modal share distributions) and subsidies paid by the Government. ETGB is calculated in Euro/inhabitant, separately by mode of transport.
This indicator is important as it provides measures of how the government will benefit from the policies tested.
Calculation method
The indicator is the sum of the variation of tax components of private and public transport costs and the variation of financial costs for the supply of public transport services (which are assumed to be entirely subsidised by the Government).
Detailed description of the calculation method
Financial operational costs for the different modes of transport are estimated by multiplying the unitary costs for the corresponding traffic quantities. The tax component of transport costs in the reference and policy scenarios is derived by applying the appropriate conversion factor (a case city specific input) to the operational costs calculated by the land use and transport models. On the basis of such estimates, the formulas applied at each threshold year are as follows:
- For public transport modes: GBi = (Tp2-Cp2)*Qp2- (Tp1-Cp1)*Qp1
where Cp1 and Cp2 are the marginal financial cost of producing public transport services, Tp1 and Tp2 are the fiscal components of the financial costs in the RS and in the policy and Qp1 and Qp2 are the corresponding traffic units.
- For private transport modes: GBi = To2*Q2 – To1*Q1
where To1 and To2 are the fiscal components of the operating costs of private transport in the RS and in the policy scenario and Q1 and Q2 are the corresponding traffic units.
ETGB is then obtained separately by transport mode by assuming a linear distribution of benefits across the years between the different thresholds, by discounting the future benefits flow to the initial year and by dividing by the number of inhabitants as for the other indicators:
ETGB = Σi=1,n[GBi/(1+r)n]/Pop
where Pop is the population at the base year, r is the discount rate adopted and n is the time of the analysis.
Appendix I, Indicator description sheets
323
References, notes
The case cities specific parameters depend on the level of taxation in the transport sector, in different countries. The level of taxation may vary as a consequence of different policies. To estimate the marginal cost of producing additional public transport services, a common approach was agreed upon. It is estimated by applying to the average cost two reduction coefficients:
- the first, which is the same for all the cities, is set to 0,7; it means that the marginal cost is about the 70% of the total cost, that is a rough estimate but it is also confirmed by literature values;
- the second coefficient derives from the assumption that additional supply of public transport services is needed only in peak hours, since in off-peak hours additional capacity is still available. Such coefficients have been estimated at 30% for the Helsinki case, while, in Vicenza and Naples cases a 50% value was applied; it depends on the share of demand travelling in peak hours, and could be estimated individually by partners according to local knowledge of their case cities.
The same coefficients apply both to bus and rail services.
Marginal Cost = Average cost * 70% * 50% (or finer estimate if available)
In the Helsinki case a further 50% coefficient was applied in order to account for additional benefits to users not included in ETUB and due to more frequent transport services.

Appendix I, Indicator description sheets
324
Indicator Transport Generalised Costs TGC Component/Theme: Indicators for economic evaluation (E)
Indicator description
The TGC indicator provides the average generalised costs of transport as perceived by transport users. The calculation of the indicator is differentiated by socio-economic group, in order to single out winners and losers in relation to the policy under evaluation.
The indicator is relevant, as it is the only one in the economic analysis that provides estimates on benefits directly perceived by the different socio-economic groups.
Calculation method
The input data for the calculation of the total generalised cost paid by users are provided by the land use and transport models: the indicator is calculated, for each socio-economic group, adding up costs and valued travel times.
Detailed description of the calculation method
Land use and transport models provide the total time spent for travelling and the total money paid. The monetary value of travel time is obtained by multiplying the time spent for the corresponding value of time (which is a country specific input of the EIM) and then the monetary value of travel time is added to the travel cost separately for each socio-economic group. The generalised cost per inhabitant is then obtained as follows:
TGCi = GCi/inhabitantsi (Euro/person/year)
where i represents the different SE group
References, notes
This indicator is used as input for the SEJE indicator, justice of distribution of benefits.

Appendix I, Indicator description sheets
325
Indicator Transport External Accidents Costs ETAC Component/Theme: Indicators for economic evaluation (E)
Indicator description
The ETAC indicator represents the variation of the external cost of accidents. It is calculated on the basis of the average rate of accidents, which is a specific index of probability and severity of accidents by different modes of transport. The total cost is calculated in Euro per year. The indicator is then measured in Euro/inhabitant, as well as the other economic indicators.
Calculation method
The calculation method is based on an average value of accidents occurring, by vehicle-km. The total cost is obtained by multiplying the average cost and the total traffic by mode of transport.
Detailed description of the calculation method
The calculation of accidents costs takes into account a wide set of implications:
• deaths, • permanent and temporary invalidity, • time losses, • first aid, hospital and other medical costs.
The main component of the total costs is obviously represented by the costs of deaths. The difference in the accidents external costs is the result of the following formula:
∆ACi = Ca*Q2i – Ca*Q1i
where Ca is the unitary accident cost (in Euro/traffic unit) for a given mode of transport and Q2i and Q1i are the total traffic (expressed in traffic units) in the policy and reference scenarios. The unitary accident cost Ca is different in case cities and does not vary in different years.
The costs flow calculation is done in the usual way and ETAC is the actualisation to the present year of the variation per inhabitants of such flows, according to the formula:
ETAC = Σi=1,n[∆ACi /(1+r)n]/Pop
where n is the time of the analysis, r is the discount rate adopted and Pop is the population.
References, notes
The current application in France (suggested by SETRA) computes a different cost according to the type of road. Values vary in a range between 6.54 Euro/1000 veh-km on motorways and 21.27 Euro/1000 veh-km on express roads (1 carriageway). For the urban case, the TRENEN study suggests an average risk of about 33 Euro /1000 veh-km.

Appendix I, Indicator description sheets
326
Indicator Transport External Emissions Costs ETEC Component/Theme: Indicators for economic evaluation (E)
Indicator description
The ETEC indicator represents the variation of the air pollution external costs per inhabitant. The external cost of pollutants is related to human health, impacts on materials and buildings, agricultural crop losses and forest damages. Four different pollutants are considered: PM 2,5, SO2, COV, NOx, CO.
Calculation method
The total external cost of emission for a given policy in a given year is the sum of the pollutants emitted multiplied by the corresponding monetary unit values. The difference between transport external emissions costs in the policy scenario and in the reference scenario provides the measure of the benefits of that policy for one year.
Detailed description of the calculation method
The unit monetary values of air pollutants are expressed in Euro per ton of pollutant (CO, NOx, SO2, VOC and PM10) and are derived by the ExternE case studies (see below). These are differentiated between urban and inter-urban areas, as costs are influenced by population density and exposure.
Urban areas (Euro/kg of pollutant)
Helsinki Dortmund Inverness Naples Vicenza Bilbao Brussels PM 2,5 480 480 492 4 840 480 2 553 2 553 SO2 13.8 13.8 20.8 87.3 13.8 46.4 46.4 COV 1.4 1.4 2.0 3.5 1.4 2.6 2.6 NOx 17.1 17.1 8.7 13.4 17.1 21.7 21.7 CO 0.004 0.004 0.005 0.053 0.004 0.025 0.025
Inter–urban areas (Euro/kg of pollutant))
Helsinki Dortmund Inverness Naples Vicenza Bilbao Brussels PM 2,5 268 268 268 173 173 173 173 SO2 11.7 11.7 11.7 13.3 13.3 13.3 13.3 COV 1.4 1.4 1.4 1.1 1.1 1.1 1.1 NOx 19.0 19.0 19.0 22.4 22.4 22.4 22.4 CO 0.003 0.003 0.003 0.002 0.002 0.002 0.002
For each policy scenario and for the reference scenario, the Raster module provides the total emissions by pollutant and by zone type (urban and inter-urban). The sum of the total cost of each pollutant (total emissions multiplied by monetary unit values) provides the total external cost of the given policy.
Assuming EC1i as the total cost in the reference scenario and EC2i as the total cost in a given policy, the difference ∆ACi between EC2i and EC1i provides the measure of the

Appendix I, Indicator description sheets
327
benefits of that policy for one year. The flow of net benefits per inhabitant discounted to the present year represents the indicator value according to the formula:
ETEC = Σi=1,n[∆ECi /(1+r)n]/Pop
where n is the time of the analysis, r is the discount rate adopted and Pop is the population resident.
References, notes
CSERGE, 1996: The True Costs of Road Transport INFRAS-IWW, 2000: External Costs of Transport ECMT, 1998: Efficient Transport for Europe European Commission, 1997: ExternE

Appendix I, Indicator description sheets
328
Indicator Transport External Greenhouse Gases ETGG Component/Theme: Indicators for economic evaluation (E)
Indicator description
The ETGG indicator represents the variation of climate change economic costs.
This indicator represents the total cost of effect on climate change by greenhouse gases. The expected development is towards a diminution of emissions (according to the Kyoto Conference) and a consequent decrease of related costs. The diminution should primarily depend on the technological improvement of the vehicle fleet: it is obvious that, depending on the volume of traffic, a consistent reduction will be observed only in presence of a less growing motorization.
Calculation method
The land use and transport models calculate the greenhouse gas emissions on the basis of motorised traffic using appropriate formulas for the different vehicle types. The damage linked to climate change is still a bit uncertain, though it is really necessary to produce estimates of these costs. Approach chosen to estimate unit costs, is based on the costs of measures to be undertaken for a reduction of CO2 emissions.
The shadow value of emissions of greenhouse gases caused by the combustion of petrol, gas and diesel in vehicle engines is expressed in Euro per tons of CO2.
The economic value of each agent is then obtained by multiplying the total emission by the unit value of pollutants. The economic values will be reported in tables, comparing the total cost of CO2 emissions in the base case and in the different alternatives. If data is available, results will be split by mode of transport. The variation of the sum of the total cost of each pollutant/gas gives the total external cost of the given alternative.
Detailed description of the calculation method
The total Greenhouse Gases External costs (GGC) are calculated in each policy scenario and for every year of model runs. The cost is calculated as a global effect attributing a cost to the CO2 equivalent emitted. The value adopted in the Economic Indicator Module for the unitary cost of CO2 emitted is 0.100 Euro/kg for all case cities (as CO2 is a global pollutant); the value is an average figure derived from different estimates in the scientific international literature.
The difference (∆GGCi) between the total external cost in the policy scenario and the total external cost in the reference scenario represents the value of the indicator for that policy at a given year. The flow of benefits is then discounted to the initial year and divided by the population to obtain the measure of the indicator in Euro/person.
ETGG = Σi=1,n[∆GGCi /(1+r)n]/Pop

Appendix I, Indicator description sheets
329
where n is the time of the analysis, r is the discount rate adopted and Pop is the resident population.
References, notes
CSERGE, 1996: The True Costs of Road Transport INFRAS-IWW, 2000: External Costs of Transport ECMT, 1998: Efficient Transport for Europe European Commission, 1997: ExternE
Some examples of suggested values are as follows:
Finland Euro/kg 0.032 Italy- (IPCC) Euro/kg 0.023-0.121 Spain Euro/kg 0.034

Appendix I, Indicator description sheets
330
Indicator Transport External Noise Costs ETNC Component/Theme: Indicators for economic evaluation (E)
Indicator description
The ETNC indicator represents the variation of economic costs of noise. Noise imposes social disturbance and influences the individual well-being with possible consequences of physical and psychological health damages. The economic value of noise is calculated as willingness to pay for the reduction of noise emissions.
Calculation method
The theoretical basis of the calculation resides in the “willingness to pay” for the reduction of noise levels. The calculation is based on the results from the Raster Module that provides the data on population exposure levels.
Detailed description of the calculation method
The economic value of noise emission is estimated by attributing a monetary value to the damage of the single human being exposed to noise.
By applying the unit value of noise by thresholds to the number of people exposed is possible to calculate the total cost of noise.
The difference (∆NCi) between the total external cost in the policy scenario and the total external cost in the reference scenario represents the value of the indicator for that policy at a given year. The benefits flow (computed according to the usual linear assumption) is then actualised to the initial year and divided by the population to obtain the measure of the indicator in Euro/person.
ETNC = Σi=1,n[∆NCi /(1+r)n]/Pop
where n is the time of the analysis, r is the discount rate adopted and Pop is the population resident. The same calculation can be carried out by zone or zone type.
The values that are applied are not defined separately for each case city but are valid for all the cities as they are estimates of the physical damage perceived at a given noise threshold.
References, notes
INFRAS – IWW, External Cost of Transport, 2000
ECMT, Efficient Transport for Europe, Policies for Internalisation of External Costs.
The current practice in European countries suggests some reference values: in Belgium for metropolitan areas TRENEN II study suggests values varying from 1.9 to 7.3 Euro /1000 veh-km for cars and values 10 times higher for heavy passenger vehicles (bus and tram).

Appendix I, Indicator description sheets
331
Unit values suggested and applied for different noise thresholds in Italy are as follows (Euro/person exposed per year)
Noise External costs [Euro] 55 – 60 db(A) 53 60 – 65 db(A) 212 65 – 70 db(A) 530 70 – 75 db(A) 1060 > 75 db(A) 2000

Appendix I, Indicator description sheets
332
Indicator Economic evaluation – Economic Index EEEI Component/Theme: Indicators for economic evaluation (E)
Indicator description
The EEEI synthesises the results of the economic sustainability into a single value. It provides the measure of how additional resources are transferred to the society in terms of socio-economic benefits.
In Cost Benefit Analysis of single projects the Economic Index is represented by the economic NPV (Net Present Value) of the project. The economic evaluation carried out in the PROPOLIS project is in line with modern applications of CBA, where also external factors (such as noise, pollution, congestion, etc.) are taken into account, in order to assess all the economic factors - both perceived and not perceived by transport users - influenced by the projects.
Calculation method
EEEI is calculated by adding up all economic indicators in Euro/inhabitant. Results can show either positive or negative values. A positive value would mean a positive economic impact.
Detailed description of the calculation method
The detail of the calculation method is represented by the following formula:
EEEI = ETIC + ETUB + ETOB + ETGB + ETAC + ETEC + ETGG + ETNC
References, notes
As all the indicators are coherently calculated per inhabitant, the EEEI could be defined as an average individual NPV (Net Present Value) of the policy. This definition could help in understanding the importance of the indicator.

Appendix I, Indicator description sheets
333
Value Functions
Definition of value functions
The value function for each indicator is assumed to be linear between a pair of coordinates. Indicator x1 x2 y1 y2 SHTD 4.7902 25.0083 1.0000 0.0000
x1,y1
x2,y
eval
uate
d in
dica
tor
valu
e
raw indicator value
min
max
The coordinates are derived from the city specific maximum and minimum raw values for each indicator. The maximum and minimum raw indicator values result in evaluated indicator values 0.8 and 0.2, respectively, leaving thus room for possible new radical policies.
Example of value function definition
Helsinki Environmental Evaluation
Indicator x1 x2 y1 y2 ERLC 13.7300 31.2300 1.0000 0.0000 ERNC 0.0106 0.0277 1.0000 0.0000 EQFO 62.3867 109.4033 0.0000 1.0000 EQQO 54.3467 111.4133 0.0000 1.0000 EROT 0.2900 0.7400 1.0000 0.0000 EGGT 859.2766 2243.4930 1.0000 0.0000 EAAT 0.0200 0.2200 1.0000 0.0000 EAOC 0.8933 9.7767 1.0000 0.0000
Social Evaluation x1 x2 y1 y2 SOHS 7.8119 16.5406 1.0000 0.0000 SOVC 0.8575 1.5700 0.0000 1.0000 SOVS 0.8575 1.5700 0.0000 1.0000 SATT 7.9252 15.4345 1.0000 0.0000 SAPT 29.0943 45.9221 1.0000 0.0000 SHEP 0.0000 3.0933 1.0000 0.0000 SEJE 0.0000 1405.067 1.0000 0.0000 SEJP 0.0000 0.2800 1.0000 0.0000 SHED 7.2200 20.0200 1.0000 0.0000 SHEN 24.7433 30.2267 1.0000 0.0000 SHTD 4.7902 25.0083 1.0000 0.0000
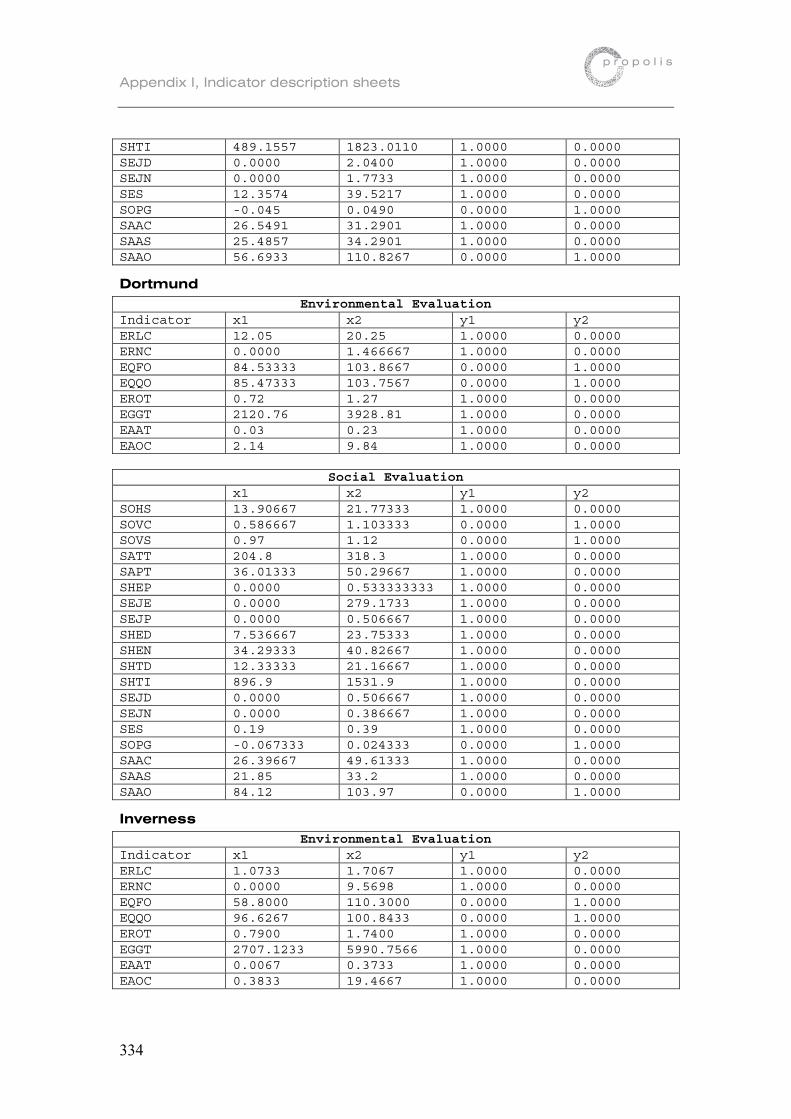
Appendix I, Indicator description sheets
334
SHTI 489.1557 1823.0110 1.0000 0.0000 SEJD 0.0000 2.0400 1.0000 0.0000 SEJN 0.0000 1.7733 1.0000 0.0000 SES 12.3574 39.5217 1.0000 0.0000 SOPG -0.045 0.0490 0.0000 1.0000 SAAC 26.5491 31.2901 1.0000 0.0000 SAAS 25.4857 34.2901 1.0000 0.0000 SAAO 56.6933 110.8267 0.0000 1.0000
Dortmund Environmental Evaluation
Indicator x1 x2 y1 y2 ERLC 12.05 20.25 1.0000 0.0000 ERNC 0.0000 1.466667 1.0000 0.0000 EQFO 84.53333 103.8667 0.0000 1.0000 EQQO 85.47333 103.7567 0.0000 1.0000 EROT 0.72 1.27 1.0000 0.0000 EGGT 2120.76 3928.81 1.0000 0.0000 EAAT 0.03 0.23 1.0000 0.0000 EAOC 2.14 9.84 1.0000 0.0000
Social Evaluation x1 x2 y1 y2 SOHS 13.90667 21.77333 1.0000 0.0000 SOVC 0.586667 1.103333 0.0000 1.0000 SOVS 0.97 1.12 0.0000 1.0000 SATT 204.8 318.3 1.0000 0.0000 SAPT 36.01333 50.29667 1.0000 0.0000 SHEP 0.0000 0.533333333 1.0000 0.0000 SEJE 0.0000 279.1733 1.0000 0.0000 SEJP 0.0000 0.506667 1.0000 0.0000 SHED 7.536667 23.75333 1.0000 0.0000 SHEN 34.29333 40.82667 1.0000 0.0000 SHTD 12.33333 21.16667 1.0000 0.0000 SHTI 896.9 1531.9 1.0000 0.0000 SEJD 0.0000 0.506667 1.0000 0.0000 SEJN 0.0000 0.386667 1.0000 0.0000 SES 0.19 0.39 1.0000 0.0000 SOPG -0.067333 0.024333 0.0000 1.0000 SAAC 26.39667 49.61333 1.0000 0.0000 SAAS 21.85 33.2 1.0000 0.0000 SAAO 84.12 103.97 0.0000 1.0000
Inverness Environmental Evaluation
Indicator x1 x2 y1 y2 ERLC 1.0733 1.7067 1.0000 0.0000 ERNC 0.0000 9.5698 1.0000 0.0000 EQFO 58.8000 110.3000 0.0000 1.0000 EQQO 96.6267 100.8433 0.0000 1.0000 EROT 0.7900 1.7400 1.0000 0.0000 EGGT 2707.1233 5990.7566 1.0000 0.0000 EAAT 0.0067 0.3733 1.0000 0.0000 EAOC 0.3833 19.4667 1.0000 0.0000

Appendix I, Indicator description sheets
335
Social Evaluation x1 x2 y1 y2 SOHS 0 20 1.0000 0.0000 SOVC .884974 1.460104 0.0000 1.0000 SOVS 0.91598 1.336061 0.0000 1.0000 SATT 0 60 1.0000 0.0000 SAPT 0 60 1.0000 0.0000 SHEP 0 10 1.0000 0.0000 SEJE 0 656.3467 1.0000 0.0000 SEJP 0 1 1.0000 0.0000 SHED 0 7.413333 1.0000 0.0000 SHEN 17.18333 22.166667 1.0000 0.0000 SHTD 131.30057 252.938233 1.0000 0.0000 SHTI 5407.3663 9893.77467 1.0000 0.0000 SEJD 0 0.2 1.0000 0.0000 SEJN 0 0.32 1.0000 0.0000 SES 0 0.5 1.0000 0.0000 SOPG -0.006 0.024 0.0000 1.0000 SAAC 0 60 1.0000 0.0000 SAAS 0 60 1.0000 0.0000 SAAO 91.10667 102.223333 0.0000 1.0000
Naples Environmental Evaluation
Indicator x1 x2 y1 y2 ERLC 12.77 21.37 1.0000 0.0000 ERNC 0.0000 0 1.0000 0.0000 EQFO 33.28 116.68 0.0000 1.0000 EQQO 83.84 104.04 0.0000 1.0000 EROT 0.233333 0.41667 1.0000 0.0000 EGGT 741.8433 1343.17667 1.0000 0.0000 EAAT 0.0066667 0.123333 1.0000 0.0000 EAOC 0.0000 9.433333 1.0000 0.0000
Social Evaluation x1 x2 y1 y2 SOHS 28.51634 30.35466 1.0000 0.0000 SOVC 0.858860 1.07460 0.0000 1.0000 SOVS 0.918076 1.32769 0.0000 1.0000 SATT 289.6234999 385.5710103 1.0000 0.0000 SAPT 28.02550 37.43213 1.0000 0.0000 SHEP 0.0000 1.86667 1.0000 0.0000 SEJE 0.0000 58.14667 1.0000 0.0000 SEJP 0.0000 0.06667 1.0000 0.0000 SHED 7.62667 26.79333 1.0000 0.0000 SHEN 23.74333 29.52667 1.0000 0.0000 SHTD 21.67356 32.20097 1.0000 0.0000 SHTI 1176.41369 1801.56665 1.0000 0.0000 SEJD 0.0000 1.74667 1.0000 0.0000 SEJN 0.0000 0.84 1.0000 0.0000 SES 0 0 1.0000 0.0000 SOPG -0.031333 0.035333 0.0000 1.0000 SAAC 38.29854 42.702351 1.0000 0.0000 SAAS 22.90464 32.480971 1.0000 0.0000 SAAO 80.26667 104.933333 0.0000 1.0000

Appendix I, Indicator description sheets
336
Vicenza Environmental Evaluation
Indicator x1 x2 y1 y2 ERLC 5.466667 8.58333 1.0000 0.0000 ERNC 0.0000 0 1.0000 0.0000 EQFO 94.13 101.83 0.0000 1.0000 EQQO 95.55667 102.723 0.0000 1.0000 EROT 0.28 0.58 1.0000 0.0000 EGGT 847.8367 1856.103 1.0000 0.0000 EAAT 0.0000 0.19 1.0000 0.0000 EAOC 0.0000 12.66333 1.0000 0.0000
Social Evaluation x1 x2 y1 y2 SOHS 14.24458 17.74782 1.0000 0.0000 SOVC 0.77036 1.16157 0.0000 1.0000 SOVS 0.927899915 1.207533873 0.0000 1.0000 SATT 351.0812286 406.5419139 1.0000 0.0000 SAPT 44.62268 75.57180 1.0000 0.0000 SHEP 0.0000 0.053333 1.0000 0.0000 SEJE 0.0000 30.01333 1.0000 0.0000 SEJP 0.0000 0.013333 1.0000 0.0000 SHED 0 16.2 1.0000 0.0000 SHEN 20.97 24.97 1.0000 0.0000 SHTD 123.589 168.440 1.0000 0.0000 SHTI 5503.900 7615.225 1.0000 0.0000 SEJD 0.0000 1.2 1.0000 0.0000 SEJN 0.0000 0.4133 1.0000 0.0000 SES 0 0 1.0000 0.0000 SOPG -0.033333333 0.058333333 0.0000 1.0000 SAAC 24.22913 43.95489 1.0000 0.0000 SAAS 25.96676 31.06594 1.0000 0.0000 SAAO 90.92 102.27 0.0000 1.0000
Bilbao Environmental Evaluation
Indicator x1 x2 y1 y2 ERLC 2.13 3.43 1 0 ERNC 0 0.0220886 1 0 EQFO 57.4933 110.6267 0 1 EQQO 48.84 112.79 0 1 EROT 0.1966 0.3633 1 0 EGGT 600.0833 1389.0667 1 0 EAAT 0.0167 0.0833 1 0 EAOC 2.0533 8.4867 1 0
Social Evaluation x1 x2 y1 y2 SOHS 13.88404 14.02451 1 0 SOVC 0.89781 1.40873 0 1 SOVS 0.90415 1.38337 0 1 SATT 172.50064 214.02897 1 0 SAPT 24.82134 32.56133 1 0 SHEP 0 0.46667 1 0 SEJE 0 162.2 1 0

Appendix I, Indicator description sheets
337
SEJP 0 0.08 1 0 SHED 7.543333 31.22667 1 0 SHEN 32.01333 39.44667 1 0 SHTD 79.01423 160.95647 1 0 SHTI 2519.99881 4280.50386 1 0 SEJD 0 0.58667 1 0 SEJN 0 0.32 1 0 SES 9.862806 30.10588 1 0 SOPG -0.03333 0.02833 0 1 SAAC 25.55083 36.63931 1 0 SAAS 33.67592 42.40081 1 0 SAAO 79.38667 105.15333 0 1
Brussels Environmental Evaluation
Indicator x1 x2 y1 y2 ERLC 9.49 15.29 1.0000 0.0000 ERNC 0 0.010667 1.0000 0.0000 EQFO 60.32 109.92 0.0000 1.0000 EQQO 87.62 103.27 0.0000 1.0000 EROT 0.4 0.65 1.0000 0.0000 EGGT 1241.407 1983.073 1.0000 0.0000 EAAT 0 0.163333 1.0000 0.0000 EAOC 0.326667 8.143333 1.0000 0.0000
Social Evaluation x1 x2 y1 y2 SOHS 4.189 4.534 1.0000 0.0000 SOVC 0.889 1.344 0.0000 1.0000 SOVS 0.941 1.236 0.0000 1.0000 SATT 176.8647 243.5513 1.0000 0.0000 SAPT 38.30033 46.50867 1.0000 0.0000 SHEP 0 0.16 1.0000 0.0000 SEJE 0 1595.333 1.0000 0.0000 SEJP 0 0.226667 1.0000 0.0000 SHED 2.123333 8.156667 1.0000 0.0000 SHEN 14.93333 19.96667 1.0000 0.0000 SHTD 35.161 96.521 1.0000 0.0000 SHTI 1544.925 4241.091 1.0000 0.0000 SEJD 0 0.226667 1.0000 0.0000 SEJN 0 0.106667 1.0000 0.0000 SES 0 0.103667 1.0000 0.0000 SOPG -0.01567 0.057667 0.0000 1.0000 SAAC 32.61267 42.73433 1.0000 0.0000 SAAS 48.555 57.515 1.0000 0.0000 SAAO 79.64 105.09 0.0000 1.0000

Appendix II, Table of potential policy options
338

Appendix II, Table of potential policy options
339
Appendix II Summary table of potential policy options

Appendix II, Table of potential policy options
340
NO Policy name
Elements Content Argument Source
Scenario 1 population
growth base + 5 %, -5 % Sensitivity to exogenous factors Spartacus
2 teleworking 10 % of employment Induces a shift in trip times acquired from flexible working times
Spartacus
3 GNP growth base +10%, -10% Sensitivity to exogenous factors Land use
4.1. Residential densities
Using additional construction (infilling) in residential areas to reduce car travel
Cycling and walking are dominating modes on trips with distance under 3.3 kilometres. Higher residential densities increase demand for a range of social activities, shopping and freetime facilities within a distance suitable for "soft" modes of transport.
Urban travel and sustainable development, 1995, ECMT
4.2. Urban sub-centres
Strenthening of the role of urban sub-centres where they exist Reduces car dependency
Urban travel and sustainable development, 1995, ECMT
4.3. Employment/ inhabitant ratio
Balancing employment/inhabitant ratio by moving employment and inhabitants
Reduces the amount of trips made by personal car, enhances the role of soft modes, improves the quality of these areas by creating a need for local services and other facilities
Spartacus
4 Residential land use
4.4. Attractive central housing
supplying attractive housing in the urban agglomeration
Impedes decentralisation (Accompanied by RER)
Belgian authorities (Stratec)
5.1. Trip-generating activities
Concentration of trip-generating activities in city centres or locations well served by PT in order to reduce car travel
Policy works especially well when car parking is regulated in same areas. Such activities may be discouraged to settle to areas with poor PT level-of-service.
Urban travel and sustainable development, 1995, ECMT
5.2. Developer contributions
Planning agreements can be used to help to finance road and rail improvements, and impact fees can be appointed to developments that increase traffic demand
Finding new ways for infrastructure financing, reduces transport demand
Urban travel and sustainable development, 1995, ECMT
5.3. Out-of-town development
Such policies may be adopted that all out-of-town shopping development proposals must pass test that show that development is not harmful for existing retail centres and, is accessible by PT and is not adding the overall level of car travel.
Preserves the role of existing retail centres, reduces car travel extensively
Urban travel and sustainable development, 1995, ECMT
5.4. Urban sub-centres
Strengthening of the role of urban sub-centres where they exist Reduces car dependency
Urban travel and sustainable development, 1995, ECMT
5.5. Employment/ inhabitant ratio
Balancing employment/inhabitant ratio by moving employment and inhabitants
Reduces the amount of trips made by personal car, enhances the role of soft modes, improves the quality of these areas by creating a need for local services and other facilities
Spartacus
5.6. Large company locations
Using tax or regulation policies aiming at encouraging the location of large companies in the vicinity of rail stations
Increases public transport demand (Accompanied by RER)
Belgian authorities (Stratec)
5.7. Public facilities
Sitting of public facilities to locations well served with public transport
Reduces car dependency
Urban travel and sustainable development, 1995, ECMT
5.8. Freight platforms
Building and operation of new international intermodal freight platforms. Concentration of production units in the heavy industry
Expected impacts: modification in the travel demand matrix structure, modification in the transport costs
EXPEDITE-project
5 Business and service land use
5.9. ABC policy
optimise business locations by classifying types of locations and types of companies and match the mobility needs with suitable accessibility
Reduces car dependency Transland final report

Appendix II, Table of potential policy options
341
NO Policy name
Elements Content Argument Source
Land use
6.1. Pedest-rianisation
Maintaining and developing the role of urban centres by restricting the use of urban space purely to pedestrian (and PT) flows
Reduces car travel, supports public transport. Enhances social activities.
Urban travel and sustainable development, 1995, ECMT
6.2. Quality of urban space
Improving the quality of residential areas
Impedes further suburbanisation (Accompanied by RER)
Belgian authorities (Stratec)
6.3. Green belts
Establish / extend green belts as city lungs
Safeguards and stabilises existing open spaces
Innovative and sustainable cities, Hall&Landry
6 Quality of urban space
6.4. Brownfields
Identifying brownfield and other derelict land and provide incentives to encourage its productive reuse as either new buildings or green space
Improves environmental quality and promotes infilling policy BEQUEST
Investment 7.1. Road investment program
Programme as specified in case cities (MEUR/inh/year) To increase mobility Spartacus
7.2. Capacity reductions
Reducing capacity of the main roads giving access to the agglomeration
Reduces car demand ; implementation together with 22. and 25. (Accompanied by RER)
Belgian authorities (Stratec)
7.3. Central tunnels
Introducing new links (preferably in tunnels) into areas sensitive to traffic or areas with pressures for pedestrianisation
Relieving central space for pedestrians, mitigating harmful effects of emissions
Urban travel and sustainable development, 1995, ECMT
7 Road investment
7.4. HOV lanes
High occupancy vehicle lanes on main arterials
Reduces congestion; implementation together with 20. And 25. (Accompanied by RER)
Belgian authorities (Stratec)
8.1. Rail investment program
Programme as specified in case cities (MEUR/inh/year)
To increase mobility and decrease car dependency Spartacus
8.2. PT speeds
Increase public transport speeds by 10 km/h.
Impedes modal shift from personal cars to public transport Spartacus
8.3. Express bus services
Express bus services on main roads to urban centre
Increases PT demand ; implementation together with 20. And 22. (Accompanied by RER)
Belgian authorities (Stratec)
8.4. Suppression of transit
Suppression of transit traffic across the residential districts of the agglomeration
Reduces harmful environmental impacts of transit; accompanied with the hierarchisation of the urban road network and RER
Belgian authorities (Stratec)
8 Rail and PT investment
8.5. New tramways
Building new tramways through existing residential areas, increasing densities in the vicinity of the stations and locating new traffic attractors near them
Reduces car dependency
Urban travel and sustainable development, 1995, ECMT
9.1. Pedestrians and cyclists
Giving priority to soft modes in traffic lights , building new routes, setting car prohibitions to residential areas, providing cycle parks, allowing cycling contra-flow or on bus lanes, obligations for future bicycle shortcuts in land developments
Makes cycling and walking safer and more attractive alternative for car
Urban travel and sustainable development, 1995, ECMT
9.2. Citybike
Introducing free-of-charge citybike scheme in the central areas Increases mobility in central areas e.g. Helsinki
9.3. Transport of bicycles
Allowing transport of bicycles in buses and trains
Increases the use of bicycle as a part in the trip chain
Sustainable Cities
9 Slow modes programme
9.4. Employee rewards
Employers can be encouraged to reward employees who cycle, walk or use PT on trips to work; and to provide washing facilities
Increases demand for soft modes and PT on trips to work; may be included in commuter plan - policies
Sustainable Cities
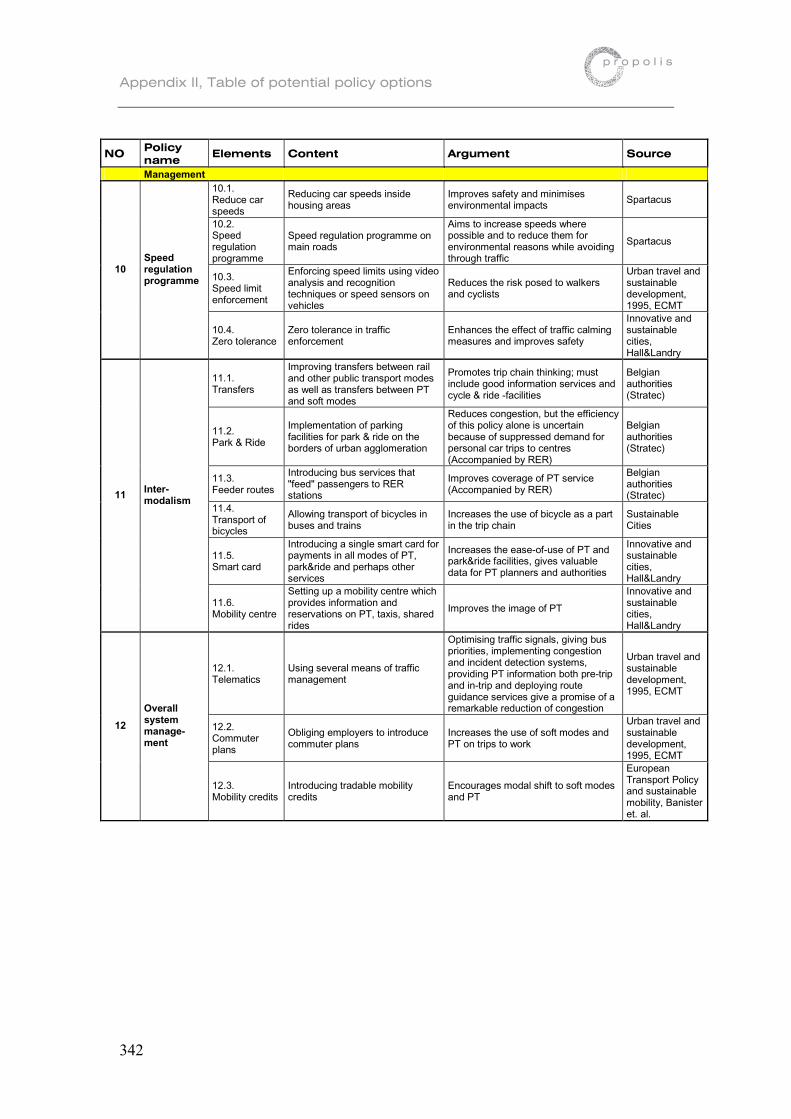
Appendix II, Table of potential policy options
342
NO Policy name
Elements Content Argument Source
Management 10.1. Reduce car speeds
Reducing car speeds inside housing areas
Improves safety and minimises environmental impacts Spartacus
10.2. Speed regulation programme
Speed regulation programme on main roads
Aims to increase speeds where possible and to reduce them for environmental reasons while avoiding through traffic
Spartacus
10.3. Speed limit enforcement
Enforcing speed limits using video analysis and recognition techniques or speed sensors on vehicles
Reduces the risk posed to walkers and cyclists
Urban travel and sustainable development, 1995, ECMT
10 Speed regulation programme
10.4. Zero tolerance
Zero tolerance in traffic enforcement
Enhances the effect of traffic calming measures and improves safety
Innovative and sustainable cities, Hall&Landry
11.1. Transfers
Improving transfers between rail and other public transport modes as well as transfers between PT and soft modes
Promotes trip chain thinking; must include good information services and cycle & ride -facilities
Belgian authorities (Stratec)
11.2. Park & Ride
Implementation of parking facilities for park & ride on the borders of urban agglomeration
Reduces congestion, but the efficiency of this policy alone is uncertain because of suppressed demand for personal car trips to centres (Accompanied by RER)
Belgian authorities (Stratec)
11.3. Feeder routes
Introducing bus services that "feed" passengers to RER stations
Improves coverage of PT service (Accompanied by RER)
Belgian authorities (Stratec)
11.4. Transport of bicycles
Allowing transport of bicycles in buses and trains
Increases the use of bicycle as a part in the trip chain
Sustainable Cities
11.5. Smart card
Introducing a single smart card for payments in all modes of PT, park&ride and perhaps other services
Increases the ease-of-use of PT and park&ride facilities, gives valuable data for PT planners and authorities
Innovative and sustainable cities, Hall&Landry
11 Inter-modalism
11.6. Mobility centre
Setting up a mobility centre which provides information and reservations on PT, taxis, shared rides
Improves the image of PT
Innovative and sustainable cities, Hall&Landry
12.1. Telematics
Using several means of traffic management
Optimising traffic signals, giving bus priorities, implementing congestion and incident detection systems, providing PT information both pre-trip and in-trip and deploying route guidance services give a promise of a remarkable reduction of congestion
Urban travel and sustainable development, 1995, ECMT
12.2. Commuter plans
Obliging employers to introduce commuter plans
Increases the use of soft modes and PT on trips to work
Urban travel and sustainable development, 1995, ECMT
12
Overall system manage-ment
12.3. Mobility credits
Introducing tradable mobility credits
Encourages modal shift to soft modes and PT
European Transport Policy and sustainable mobility, Banister et. al.

Appendix II, Table of potential policy options
343
NO Policy name
Elements Content Argument Source
New Technology
13.1. Cleaner vehicles
Electric cars account for 20 % of travel, cars 15-20 % lighter with feebates related to weight, busses and lorries are hybrid vehicles
Part of IMAGE 1: EU co-ordination of active citizens (2 other IMAGES present different scenarios in this field)
Transport Policy Scenarios for the EU; IMAGES; Banister et. al.
13.2. Cleaner vehicles 2
Combination of financial incentives to a remarkable shift to cleaner vehicles
Increases the market share of clean vehicle technology, decreases emissions and noise
Transport Reviews 2000, EUROVISION, Banister
13.3. Priority parking
Introducing parking priorities for environmentally friendly vehicles
Increases the demand for cleaner vehicles, decreases emissions
Sustainable Cities
13
Incentives for clean vehicle technology
13.4. City Access
Limiting access to cities to those with clean vehicles and high occupancy, also heavy goods vehicles may be restricted from urban areas
Decreases congestion and emissions in city centres
Transport Reviews 2000, EUROVISION, Banister; SUSTAINABLE CITIES
Pricing
14.1. New office developments
Limiting parking provision at new office developments.
Maintaining and developing the role of urban centres by improving pedestrian environment and reducing car travel. Works well with other policies improving urban centres. May cause problems with on street parking.
Urban travel and sustainable development, 1995, ECMT
14.2. Parking restrictions
Restricting parking facilities at urban centres
Reduces car trips to urban centres (Accompanied by RER)
Belgian authorities (Stratec)
14 Parking pricing policy
14.3. Parking costs
Parking costs at CBD's and central areas up 25, 50, 100 and 200 %.
Defining optimum parking pricing scheme at Central business districts and central areas.
Spartacus
15.1. Progressive fuel tax
Introduction of progressively increasing fuel tax designed to significantly reduce vehicle kilometrage and fuel usage
A seven per cent rise in fuel tax p.a. for 20 years period has been estimated to be able to reduce vehicle-km by 2/3 from the forecast level and the amount of fuel used by 1/2 of the forecast. Effects may be enhanced by introducing a mix of other policies
Urban travel and sustainable development, 1995, ECMT
15.2. Car costs
Car costs up 25, 50, 100 and 200 % Defining optimum pricing scheme Spartacus
15 General car pricing
15.3. Distance based charging
Introducing distance based charging in cities with the help of advanced technologies.
Distance based charging has proved to have the greatest potential in reducing total trips and travel times over other charging schemes. The total PCU-kilometres, however, was not reduced in the models.
May & Milne, Institute for Transport Studies, Leeds
16.1. Congestion pricing
Pricing up 25, 50, 100, 150 and 200 %
Defining optimum congestion pricing scheme of the mentioned Spartacus
16 Congestion pricing 16.2.
Progressive toll
Congestion pricing with continuous distributed values of time.
The standard toll road approach relies on a single value of time among all road users. This approach has proved to have limited success on polical arena. With heterogeneous values of time, imposing tolls may increase both user welfare and social welfare,
Mayet & Hansen/journal of transport economics and policy, Sep. 2000
17 PT Pricing 17.1. PT pricing
Public transport pricing - 100, -50, + 50 and + 100 %, FREE
Defining optimum PT fares change of the mentioned
Spartacus
18.1. Purchasing cost
Vehicle purchasing costs -50, -25, 0, +25 %
Renewing vehicle base towards more efficient and environmentally friendly vehicles; price increase would on the other hand create a modal shift to PT
European Transport Policy and sustainable mobility, Banister et. al.
18.2. cleaner vehicles
Electric cars account for 20 % of travel, cars 15-20 % lighter with feebates related to weight, busses and lorries are hybrid vehicles
Part of IMAGE 1: EU co-ordination of active citizens (2 other IMAGES present different scenarios in this field)
Transport Policy Scenarios for the EU; IMAGES; Banister et. al.
18 Purchase pricing
18.3. cleaner vehicles 2
combination of financial incentives to a remarkable shift to cleaner vehicles
Increases the market share of clean vehicle technology, decreases emissions and noise
Transport Reviews 2000, EUROVISION, Banister

Appendix II, Table of potential policy options
344
Prospective policies
freight efficiency on-board charging and measuring
of emissions REDEFINE (4. FWP)
freight efficiency tradable emission permits REDEFINE (4.
FWP)
telematics ramp metering - technology may reduce congestion on main carriageway on peak hours
DIATS (4. FWP)
low-emission zones
incentive for the market to select low emission vehicles POSSUM (4.
FWP)

Appendix III, Result tables
345
Appendix III Result tables
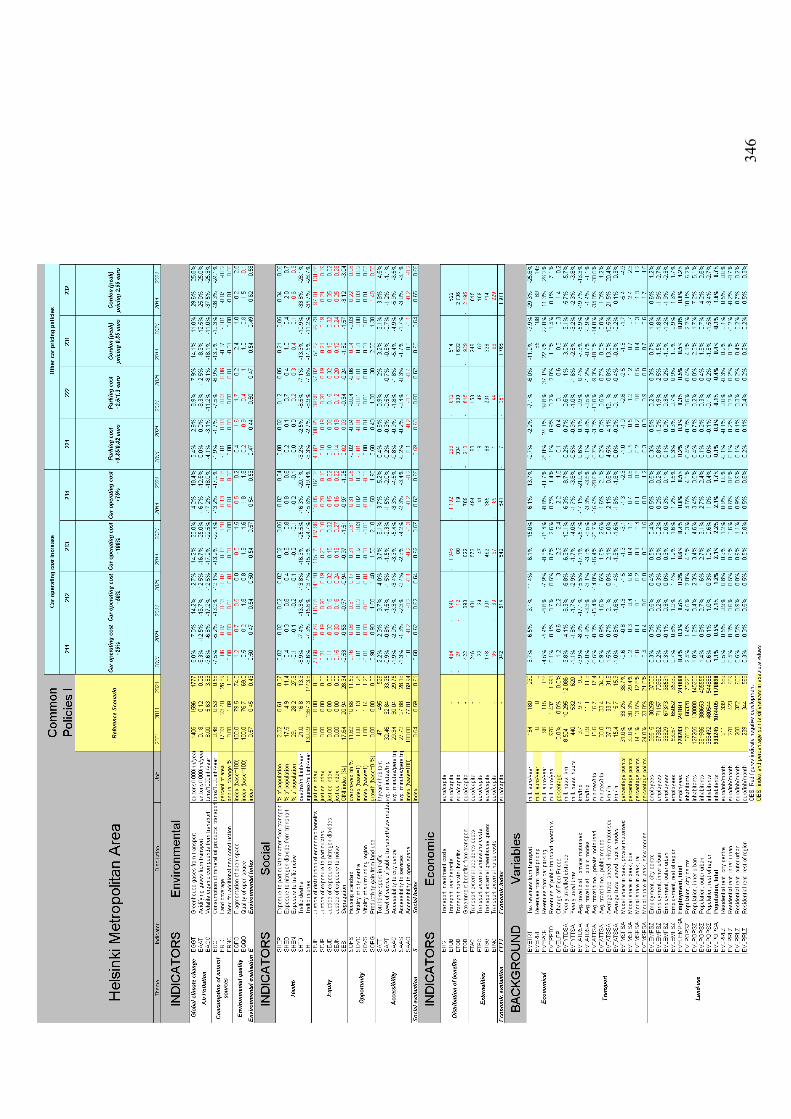
346

347

348

349

350

351

352

353

354

355

356

357
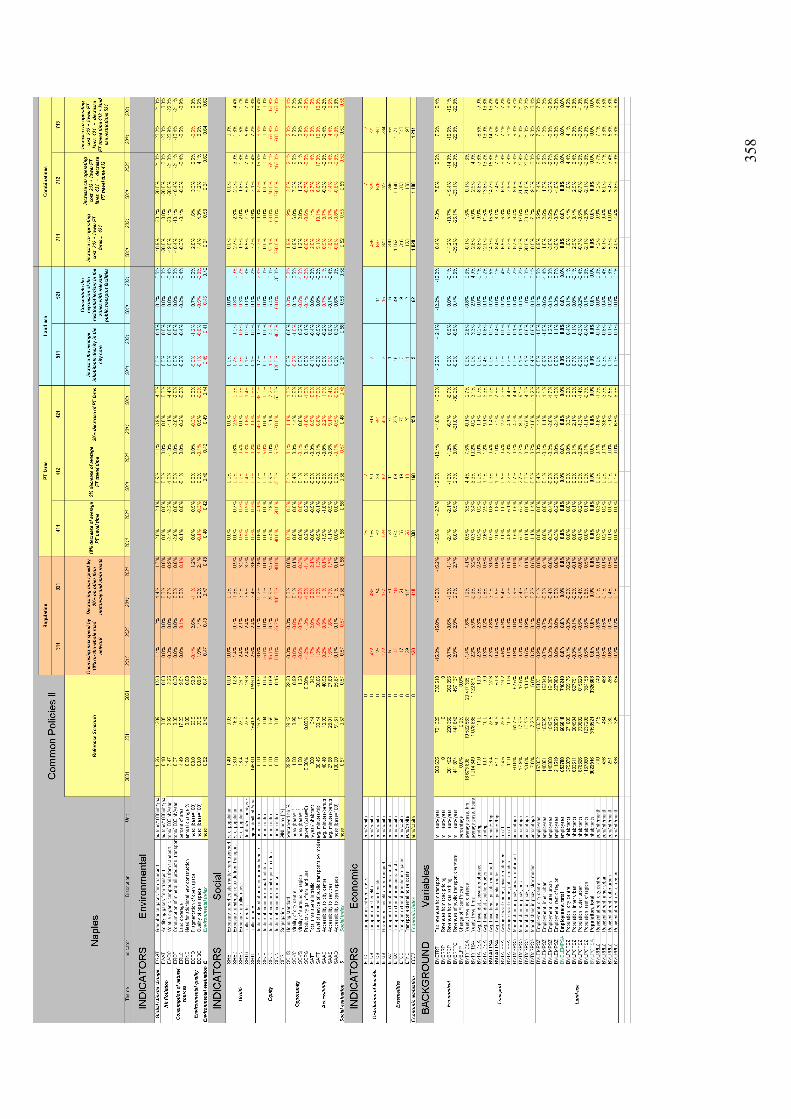
358

359
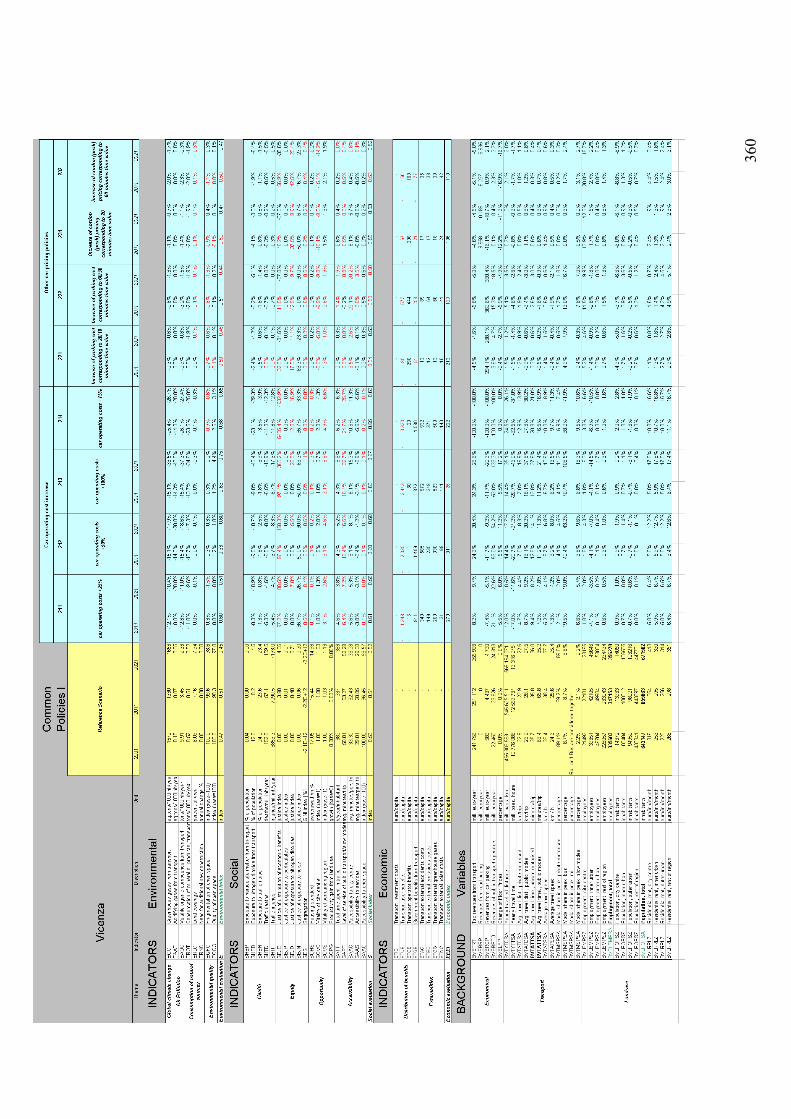
360

361

362

363

364

365

366

367

368