Embed Size (px)
DESCRIPTION
Public Policy Forum Report on Property Values and Taxes 2015
Citation preview

Property Values and Taxes
in Southeast Wisconsin

Property Values and
Taxes in Southeast
Wisconsin
September 2015
Rob Henken, President
Jeff Schmidt, Data & Technology Director
Mitch Harris, Research Intern
Sponsored by:

2
Table of Contents
Introduction .................................................................................................................................................. 3
Major Findings .......................................................................................................................................... 4
Methodology ................................................................................................................................................. 6
Property Values in Southeast Wisconsin .................................................................................................... 8
Property values rise in 2015, but at a slower rate ................................................................................ 8
Gains not equal throughout region ......................................................................................................... 8
Residential property values drive total values, show modest growth ............................................... 10
Commercial values return to pre-recession levels .............................................................................. 12
More municipalities experience increased values, but not Milwaukee............................................. 14
Property Taxes in Southeast Wisconsin ................................................................................................... 16
State action to limit technical college levies produces desired result .............................................. 16
Property tax rates decline as values increase and Act 145 takes effect .......................................... 19
School district levies down but still account for largest share of overall levies ................................ 22
Effects on Taxpayers ................................................................................................................................. 24
Property tax bills decline significantly .................................................................................................. 24
Conclusion ................................................................................................................................................. 26

3
Introduction
This report is an annual Public Policy Forum publication that analyzes property values and property
taxes within the seven-county southeast Wisconsin region. The report measures trends in property
values – an important indicator of our region’s economic health – and then examines how those
trends impact the capacity of local governments and school districts to generate local revenues.
This year’s report first examines recently-released 2015 regional data on property values, breaking
down the information by county and analyzing recent trends to determine whether values have
recovered to pre-recession levels. Our analysis also contains information on 2014 property values,
as those values were used to determine 2015 tax rates and levies, which are the focus of the
second part of the report. The discussion of 2015 values not only provides insight on the pace of
economic recovery in the region, but also sheds light on how this year’s property values might affect
next year’s tax rates.
After presenting data on property values in the region, we next examine 2015 budgeted tax levies
and tax rates in southeast Wisconsin. A particular focus this year is the changes to technical college
levies resulting from legislation adopted by the Wisconsin Legislature in 2014. Our examination also
explores the relationship between 2014 property valuations and 2015 taxes, and offers
observations on trends and policy implications.
In this year’s report, we find that property values have continued the upward trend that began in
2014, though the rate of growth slowed this year, from 2.6% to 2%. We also notice that property
value gains have not been shared equally across the region.
With regard to property tax levies, we find that the region’s overall gross levy declined by 3% in 2015.
Every county in the region experienced a decline in its aggregate gross levy, ranging from Milwaukee
County's 1.8% decrease to Washington County's 6.1%.
This decline in levies resulted largely from the passage of Wisconsin Act 145, which provided
additional state aid to the state's technical colleges with a corresponding requirement that property
taxes be reduced by a roughly equivalent amount. The significant drop in levies – combined with the
2014 increase in property values – produced a 5.4% decline in the aggregate gross property tax rate
for the region, to $22.63 per $1,000 of assessed value.
Chart 1 shows the aggregate equalized property values, gross tax levy, and gross tax rate for
southeast Wisconsin indexed to 100 in 2006. This chart illustrates how reduced levies and
increased values produced the substantial drop in the gross tax rate this year, which reverses
several successive years of aggregate rate increases in the region.

4
Chart 1: Ten-year southeast Wisconsin aggregate property valuation, aggregate gross tax rate and
aggregate gross tax levy, indexed to 100
Major Findings
In 2015, aggregate property values in southeast Wisconsin increased for the second consecutive
year, though at a slightly slower rate of 2%. Also for the second consecutive year, every county in
the region experienced an increase, though there were disparities in increases across the region.
For example, property values in Kenosha County increased by 4.8%, while those in Milwaukee
and Walworth counties increased by only 0.7%.
The City of Milwaukee was one of only 26 municipalities in the region that did not experience an
increase in overall property values from 2014 to 2015. Property values declined in Milwaukee by
0.6%
Residential values – which comprise the greatest share of overall property values in the region –
continued the growth observed in 2014, but again at a slower rate (1.9%). All counties in the
region experienced growth in residential values, led by Ozaukee County at 3.7%.
Commercial property values in the region grew by 2.9% (a slightly higher growth rate than in
2014), while manufacturing property values increased by 3.8%, marking the third consecutive
year of growth in that sector. The region’s manufacturing property values have returned to their
2008 peak.
The effects of Wisconsin Act 145 – legislation adopted in March 2014 that reduced the amount
of property taxes that could be levied by technical college districts – show up for the first time in
2015 property tax bills. We find that the legislation contributed heavily to a 3% decline in gross
levies across the region. In addition, we see that the percentage of the region's aggregate gross
levy that is derived from technical colleges decreased from 7% in 2014 to 3.5% this year.
For the first time since the recession hit in 2008, the aggregate hypothetical gross tax rate in the
region decreased. That rate is now $22.63 per $1,000 of assessed value, which is a decrease of
$1.30, or 5.4%.
0
50
100
150
2006 2007 2008 2009 2010 2011 2012 2013 2014 2015
Equalized value Gross tax levy Gross tax rate

5
The property taxes levied by school districts remain the largest component of the annual property
tax bill, accounting for 45.4% of the aggregate tax levy in southeast Wisconsin. In 2015, the
budgeted aggregate school district levy for southeast Wisconsin remained mostly unchanged
(decreasing by 0.06%), thus contributing slightly to the region’s overall decline in tax levies.
To calculate an average tax bill in southeast Wisconsin, we apply the average residential property
value in the region to the gross tax rate. The hypothetical average tax bill in the region declined
by $118 to $4,298 in 2015.

6
Methodology
This report focuses on annual changes in property values, total property tax levies, and property tax
rates in the seven-county southeast Wisconsin region.
Municipal tax rates are based on the total value of all taxable property in each municipality, also
known as the tax base. Because local assessors are responsible for determining the property values
for their jurisdictions, total assessed value across municipalities and counties is not a uniform
measure. To bring all values to a uniform level comparable across jurisdictions, the state equalizes
assessed values by using tools such as market sales analysis, random appraisals, and local
assessors’ reports. Equalized values, calculated yearly, are meant to reflect fair market value (the
most probable selling price).
Our analysis utilizes equalized values determined by the Wisconsin Department of Revenue (DOR) as
of January 1, 2015. Total property value has two categories: real estate and personal property. Real
estate makes up the overwhelming majority of the tax base and has eight classifications: residential,
commercial, manufacturing, agricultural, undeveloped, agricultural forest, forest, and other. The
three classifications analyzed by the Forum are residential, commercial, and manufacturing.
Changes in property value are classified in three ways. “Economic change” refers to remodeling of
existing properties or changes as a result of market conditions, such as during a recession. The other
classifications include changes “due to new construction” and “other” changes. The “other” category
includes technical corrections that were made to the value of the property, demolition or destruction
of property, and changes in the exempt status or classification of property. New construction drives
total value growth, as previously undeveloped parcels are used more intensively, generating a higher
land utility and a higher value.
This report also uses data from the Wisconsin Department of Revenue on 2014-15 municipal
property tax levies and tax rates in the seven counties of southeast Wisconsin. The data are not fully
audited and thus are considered preliminary.
The tax levy is the amount of money that each taxing jurisdiction (county, municipality, school district,
technical college district, tax increment finance district, special district and the state) expects to
receive from property taxes. To calculate a tax rate (also known as a mill rate), each government
divides the levy by the total property value (tax base) in its jurisdiction and multiplies the result by
1,000. This calculation allows property tax payments to be distributed evenly among taxpayers
according to individual property values.
Budgets for taxing jurisdictions for 2015 – including property tax levies – were adopted late in 2014,
and 2014 property values therefore were used to determine 2015 rates. Consequently, we look at
2014 property values in this report when we are analyzing the 2015 levies, as this allows us to
illustrate the connection between 2014 values and 2015 levies. As in last year’s report, we received
data on 2015 equalized values in mid-August and decided to include analysis of that data as well in
light of its availability and significance.
Because each property taxpayer lives within several taxing jurisdictions, we add the various tax rates
together to arrive at the gross tax rate. It is important to note that in this report, when the gross tax
rate or levy for a particular county is referenced, it does not refer to the rate or levy attributable to
county government in that county, but to the aggregate total of all taxing jurisdictions in the county
(including the county government).

7
Also, the net tax rate that determines each taxpayer’s tax bill differs from the gross rate in that the
net rate results from subtracting the state tax credit from the gross tax rate. Taxpayers can
determine their individual payment by dividing their property value by 1,000 and multiplying the
resulting number by the net tax rate. The report presents a hypothetical regional and county
aggregated gross tax rate calculated by summing each municipality’s gross tax rate into a rate for
southeast Wisconsin, or for a county, as a whole.
Finally, while it is important to note that the property tax is the most prominent revenue-raising tool
available to local governments and school districts, it is not the only tool. Local governments also
make use of a variety of fees on items ranging from garbage pick-up to snow removal, and most
school districts employ student fees for various activities. This report does not address trends in
local government and school district fee collections. Consequently, it should not be used to evaluate
overall local government revenue trends.

8
Property Values in Southeast Wisconsin
Property values rise in 2015, but at a slower rate
Aggregate property values in southeast Wisconsin increased by 2.0% to $173.6 billion in 2015.
While this marks the second consecutive year of property value growth after five consecutive years of
declines, the 2% rate of growth was slower than the 2.6% increase experienced in 2014. The region's
growth rate also lagged the 2.3% rate for the state as a whole. Chart 2 shows annual percentage
changes in property values for both the region and state for the past 10 years.
Chart 2: Annual change in aggregate property values in southeast Wisconsin and State
Gains not equal throughout region
Chart 3 breaks down the change in property values for each of the seven counties in southeast
Wisconsin during the past three years. (County-by-county 10-year trends in total, residential, and
commercial property values are available on our website at http://publicpolicyforum.org/2015-
county-county-property-values-taxes) For the second consecutive year, every county in the region
experienced property value growth. Kenosha County led the way with a 4.8% increase, while Ozaukee
and Racine counties also had growth rates that exceeded the previous year. Prior to increases in the
last two years, Kenosha County had experienced the largest post-recession five-year decline in
values in the region.
Milwaukee and Waukesha counties both saw their rate of property value growth diminish from 2014.
Milwaukee County (tied with Walworth) had the smallest growth rate in the region at 0.7%.
Waukesha County’s growth rate was much higher at 2.4%, but that rate still was 1.4 percentage
points lower than 2014, representing the largest year-over-year decline in rate growth in the region.
2.6%2.0%
-6%
-4%
-2%
0%
2%
4%
6%
8%
10%
12%
2006 2007 2008 2009 2010 2011 2012 2013 2014 2015
Southeast Wisconsin
State of Wisconsin

9
Chart 3: Annual change in aggregate property values, by county
Our observation that property value gains are not spread proportionally across the region prompted
us to explore whether wealthier parts of the region were growing faster than those with lower wealth,
or vice versa. Consequently, we looked at the 38 municipalities in southeast Wisconsin with
populations of more than 10,000 (those municipalities account for 79% of the region's total
population) and compared their equalized values per capita with the change in their property values
from 2014 to 2015.
The results of our analysis are shown in Chart 4. Generally speaking, those municipalities with a
higher equalized value per capita (on the right side of the chart) were more likely to have higher
growth rates, but the correlation was not substantial. 1
1 Our analysis shows that for every $1,000 of increase in equalized value per capita, the growth rate for that
municipality will increase by .03 percentage points. This equation can explain about 33% of the variation in
growth rates between municipalities. In addition, our analysis has found a 95% confidence interval, meaning
that equalized value per capita almost certainly produces some positive impact on a municipality’s growth rate.
-3.3%
-1.1% -1.2%
-4.8%
-3.9%
-2.9%
-1.1%
2.8%
2.0%
3.5%
1.4%0.7%
2.9%
3.8%
4.8%
0.7%
3.6%
2.1%
0.7%
2.9%2.4%
-6.0%
-4.0%
-2.0%
0.0%
2.0%
4.0%
6.0%
KenoshaCounty
MilwaukeeCounty
OzaukeeCounty
RacineCounty
WalworthCounty
WashingtonCounty
WaukeshaCounty
2013 2014 2015

10
Chart 4: Equalized value per capita against the 2015 equalized value growth rate.
Residential property values drive total values, show modest growth
Residential property makes up the largest portion of total property values in southeast Wisconsin at
71.3%. As shown in Chart 5, a sharp decline in the value of residential property was the main driver
in the decline of total property values prior to the rebound that began last year. Over the last two
years, the 4.5% increase in residential property values was comparable to the increase in
manufacturing growth rates (4.3%) but slower than commercial property growth rates (5.8%).
Chart 5: Residential, commercial, and manufacturing property values (2009-2015)
-6.00%
-4.00%
-2.00%
0.00%
2.00%
4.00%
6.00%
8.00%
10.00%
$0 $50 $100 $150 $200 $250
Pe
rce
nta
ge C
hn
age
in E
qu
aliz
ed
Val
ue
Equalized Value per Capita (Thousands)
$-
$20,000,000,000
$40,000,000,000
$60,000,000,000
$80,000,000,000
$100,000,000,000
$120,000,000,000
$140,000,000,000
$160,000,000,000
2009 2010 2011 2012 2013 2014 2015
Residential Commercial Manufacturing

11
When we focus on 2014 to 2015 changes, we see in Chart 6 that residential property values in
southeast Wisconsin increased by 1.9%, which was a slower rate of growth than the 2.5% increase
experienced from 2013 to 2014. Residential values in the state as a whole increased by 2.3% over
the past year, a slightly smaller gain than the 2.5% experienced last year, but faster than the growth
in the region.
Chart 6: Annual change in residential property values in southeast Wisconsin and State
Examining residential property value data by individual counties, we find that each of the region’s
seven counties saw an increase in its aggregate residential property values for the second
consecutive year, though some gained much more value than others. As shown in Chart 7, Ozaukee
County led the way with a 3.7% increase. At the lower end of the spectrum, Milwaukee County
experienced only a 0.7% increase, which was impacted by a decline of 1% in residential values in the
City of Milwaukee.
Chart 7: Annual change in residential property values, by county
2.5%1.9%
2.5% 2.3%
-8%
-6%
-4%
-2%
0%
2%
4%
6%
8%
10%
12%
2006 2007 2008 2009 2010 2011 2012 2013 2014 2015
Southeast Wisconsin
State of Wisconsin
-3.9%-3.3%
-1.0%
-4.3%
-3.6% -3.7%
-1.1%
2.3%
1.4%
4.1%
1.3%
0.4%
3.8% 3.9%
2.3%
0.7%
3.7%
1.0% 1.1%
2.7% 2.9%
-5.0%
-4.0%
-3.0%
-2.0%
-1.0%
0.0%
1.0%
2.0%
3.0%
4.0%
5.0%
KenoshaCounty
MilwaukeeCounty
OzaukeeCounty
RacineCounty
WalworthCounty
WashingtonCounty
WaukeshaCounty
2013
2014
2015

12
While the rebound in residential property values is encouraging, the increases over the last two years
have not been enough to bring residential values back to their pre-recession levels. As shown in
Chart 8, the region and the state are recovering at similar rates, which leaves southeast Wisconsin’s
residential property values 13% lower than in 2008 (the pre-recession peak), and residential values
in the state as a whole about 7% lower.
Chart 8: % change in residential property values since 2008 in the region and state
Commercial values return to pre-recession levels
In 2015, commercial property accounts for 22.7% of total property value in southeast Wisconsin. As
shown in Chart 9, the region’s total commercial value of $39.4 billion is a 2.9% increase from 2014.
Statewide, commercial values increased for the third straight year, though the 2014-15 increase of
2.9% was slightly lower than the previous year's 3.2% gain.
Chart 9: Annual change in commercial property values in southeast Wisconsin and State
-17%
-13%
-11%
-7%
-18%
-16%
-14%
-12%
-10%
-8%
-6%
-4%
-2%
0%
2008 2009 2010 2011 2012 2013 2014 2015
% c
han
ge in
re
sid
en
tial
eq
ual
ize
d
valu
es
sin
ce 2
00
8
Southeast Wisconsin Wisconsin
2.8% 2.9%3.2% 2.9%
-6%
-4%
-2%
0%
2%
4%
6%
8%
10%
12%
14%
2006 2007 2008 2009 2010 2011 2012 2013 2014 2015
Southeast Wisconsin
State of Wisconsin

13
Chart 10 shows that commercial values in the region remain about 4% below the pre-recession peak
(which occurred in 2009). Commercial values in the state as a whole, however, have now fully
recovered to slightly exceed 2009 levels.
Chart 10: % change in commercial property values since 2008 in the region and state
Chart 11 shows that the increase in commercial values in the region was far from uniform. Kenosha
County led the way for the second consecutive year with an impressive 10.8% increase in
commercial values, while three other counties experienced gains of greater than 3%. Conversely,
Walworth County experienced a 2.8% decrease in commercial values. Milwaukee County
experienced a third consecutive year of commercial value growth, though this year’s 2.3% increase
was slightly below the 2.7% increases experienced in each of the previous two years. Notably,
Milwaukee County is the only county in the region to experience three consecutive years of
commercial value growth.
Chart 11: Annual change in commercial property values, by county
-6%
0%
-9%
-4%
-10%
-8%
-6%
-4%
-2%
0%
2%
2009 2010 2011 2012 2013 2014 2015
% c
han
ge in
co
mm
eri
cal e
qu
aliz
ed
va
lue
sin
ce 2
00
8
Wisconsin Southeast Wisconsin
4.9%
2.7%
0.5%
3.3% 3.3%
-0.8%
3.3%
10.8%
2.3%3.6%
5.8%
-2.8%
5.0%
1.4%
-15.0%
-10.0%
-5.0%
0.0%
5.0%
10.0%
15.0%
KenoshaCounty
MilwaukeeCounty
OzaukeeCounty
RacineCounty
WalworthCounty
WashingtonCounty
WaukeshaCounty
2013
2014
2015

14
In 2015, manufacturing property accounts for only 2.7% of all property in southeast Wisconsin.
Manufacturing property values increased by 3.8% during the past year, marking the third
consecutive year of growth in those values. In fact, the $4.72 billion in manufacturing property value
in the region now matches the 2008 peak. Manufacturing property values in the state as a whole
grew 3.2%.
All seven counties in southeast Wisconsin saw increases in the value of their manufacturing property
in 2015. Kenosha County led the way at 14.3%, while Washington and Ozaukee counties also had
impressive growth of 7.3% and 6.9% respectively. Walworth County had the lowest manufacturing
property value growth rate at 0.4%, while Milwaukee County was able to make up for a decline the
previous year with 1.6% growth.
More municipalities experience increased values, but not Milwaukee
Chart 12 shows that 121 municipalities experienced an increase in overall property values in 2015 –
the most in a single year since 2007. Dover and Sturtevant (both in Racine County) had the largest
increase in values, both at 10.5%. Nine municipalities grew by more than 6% and 70 grew at a rate
above the state average of 2.3%.
Chart 12: Count of municipalities with increasing property values
As noted above, one municipality that is notably absent from the 121 that experienced property
value increases in 2015 is the City of Milwaukee, which saw a decline in values of 0.6%. This is the
third consecutive year that property value growth in the City of Milwaukee has failed to keep pace
with either regional or state growth. Chart 13 shows that as a result, Milwaukee's share of the
region's total property value is now 14.95%, which is down from 15.8% three years ago.
146 144
119
51
13
38
8
29
114121
0
20
40
60
80
100
120
140
160
2006 2007 2008 2009 2010 2011 2012 2013 2014 2015

15
Chart 13: Share of southeast region’s total value located in the City of Milwaukee
15.69% 15.80% 15.58% 15.34% 14.95%
0.00%
2.00%
4.00%
6.00%
8.00%
10.00%
12.00%
14.00%
16.00%
18.00%
2011 2012 2013 2014 2015
Milw
auke
e %
of
Re
gio
nal
Val
ue

16
Property Taxes in Southeast Wisconsin
State action to limit technical college levies produces desired result
Our analysis of regional property tax levy trends examines tax levies adopted late in 2014 for the
2015 budget year. In 2015, the aggregate gross tax levy in southeast Wisconsin declined by about
$121 million (3.04%) to $3.85 billion. As we will see, this decrease was impacted primarily by the
adoption of Wisconsin Act 145 by the Wisconsin Legislature and governor, which shifted much of the
responsibility for funding technical colleges away from the local property tax.
As shown in Chart 14, every county in the region experienced a decrease in its aggregate gross tax
levy in 2015. Washington County experienced the largest decrease with a decline of more than 6%,
while Milwaukee County saw the smallest decrease at 1.8%. (County-by-county 10-year trends in
property taxes are available on our website at http://publicpolicyforum.org/2015-county-county-
property-values-taxes)
Chart 14: Annual change in aggregate gross tax levy, by county
This year's decline in aggregate property tax levies among southeast Wisconsin counties continues a
three-year trend in which all counties saw a reduction in growth or a decline in their aggregate
property tax levies from the previous year (with the exception of Ozaukee County from 2013 to
2014). Several factors contribute to the annual property tax levies established by local officials, and
this trend can be linked to several circumstances, including property tax levy limits placed on local
governments by the state and decisions made by individual taxing jurisdictions.2 However, the
substantial reductions in 2015 can be linked mostly to Act 145.
2 Under current law, municipalities and counties generally are prohibited from increasing their annual property
tax levies by more than the greater of 0% or the percentage increase in equalized value from net new
construction. Levy limits for school districts generally are established as caps on the amount of combined
state aids and property tax levy that can be spent on a per-pupil basis. Act 145 changed the structure of
technical college funding to work much the same way. More information is available at the Wisconsin
Department of Revenue website, http://www.revenue.wi.gov/propertytax/index.html.
-3.1%
-1.8%
-3.8%-4.2%
-2.9%
-6.1%
-3.8%
-7.0%
-6.0%
-5.0%
-4.0%
-3.0%
-2.0%
-1.0%
0.0%
1.0%
2.0%
3.0%
4.0%
KenoshaCounty
MilwaukeeCounty
OzaukeeCounty
RacineCounty
WalworthCounty
WashingtonCounty
WaukeshaCounty
2013
2014
2015

17
When we examine the total decrease in property taxes in the seven southeast Wisconsin counties
combined, we find that the $137 million reduction in property taxes levied to support technical
colleges exceeded the overall $121 million decrease in gross tax levies across the region. That
means that the levies associated with other taxing jurisdictions increased by a combined $15 million
(still a very small amount), but the decrease in the technical college levies offset that increase and
created the sizable overall decline.
Wisconsin Act 145
Wisconsin Act 145 – signed into law in March 2014 – contained major adjustments to the state tax code,
including a reduction in income tax rates and other modifications. Most significant to property taxpayers was
its major change to the framework used to support the state's technical college districts. Act 145 used an
unexpected revenue surplus that had materialized during the 2013-15 biennium to substantially increase
the amount of state aids allocated to the technical college system. At the same time, the legislation capped
the amount of revenue that technical colleges can derive from the combination of property taxes and state
aid, thus ensuring that that the increased state support would translate into property tax relief for citizens.
Specifically, the state increased its allocation of state aid to technical colleges by $414 million for the 2014-
15 fiscal year, and designated $406 million of that amount as “property tax relief aid.” In other words,
technical colleges were required to reduce their property tax levies by $406 million under the new revenue
limits, producing an equivalent amount of property tax relief for Wisconsin property owners. This change in
the funding framework for technical colleges remains in effect in the 2015-17 biennium.
The chart below shows how the major technical college funding sources have shifted over the last two years
as a result of Act 145. This change has lowered local property tax rates by 0.89 ($89 for every $100,000 of
property value) statewide, though it also has required increased appropriations of state funds to support the
technical college system. It is beyond the scope of this analysis to determine whether the change has had a
positive or negative impact on the financial and programmatic health of technical colleges in the state.
Three Largest Funding Sources for State Technical Colleges, 2014 and 2015
Local68%
State 9%
Tuition23%
2014
Local33%
State 44%
Tuition23%
2015

18
While that was the case for the region as a whole, the experience among individual counties differed.
Chart 15 shows the percentage by which each county’s aggregate tax levy increased or decreased
when excluding the change in technical college funding. The three counties with negative
percentages had tax levies that decreased beyond the reduction in technical college levies, while the
other four would have experienced gross tax levy increases had it not been for the reductions that
were attributed largely to Act 145.
Chart 15: % of Total Tax Levy Change Excluding Technical College Changes
To further illustrate the impact of Act 145, Chart 16 shows the reduction in technical college tax levy
dollars collected by each county in 2015. The aggregate decline of $137 million across the seven
counties represents a 49% decrease from 2014, but because the formula used to distribute the
increased state aid for technical colleges is based on a district’s equalized value, some counties
received more property tax relief than others. Waukesha County experienced a technical college tax
levy drop of more than $41 million, or almost 70%. Milwaukee County had the largest overall decline
in the technical college tax levy ($45 million), but it also experienced the second smallest percentage
decline at 39%.
-0.23%
0.84%
0.28%
-0.93%
1.27%
-1.80%
0.68%
KENOSHA MILWAUKEE OZAUKEE RACINE WALWORTH WASHINGTON WAUKESHA

19
Chart 16: Change in technical college tax levy by county, 2014-2015
Finally, from a municipal perspective, 93% of municipalities (137 out of 147) saw a decrease in their
overall tax levy from 2014 to 2015, compared to 57% from 2013 to 2014. Five municipalities –
Kewaskum, Barton, Paris, Addison, and Somers – experienced overall levy decreases greater than
10%, while the largest increase belonged to the City of Elkhorn in Walworth County at 6.7%. The
overall gross levy for the City of Milwaukee decreased by 2%.
Property tax rates decline as values increase and Act 145 takes
effect
With both a major decline in the aggregate tax levy and an increase in equalized property values in
2014, the property tax rate in the region fell sharply in 2015. Overall, the aggregate property tax rate
dropped from $23.93 per $1,000 of equalized value to $22.63 – a decrease of 5.4%. This year’s
significant decline in tax rates is a reversal of seven consecutive years of increases, as shown in
Chart 17.
$19
$116
$21 $21 $21 $21
$60
$9
$71
$13 $10 $10 $10$19
$-
$20.00
$40.00
$60.00
$80.00
$100.00
$120.00
$140.00M
illio
ns
2014
2015
20
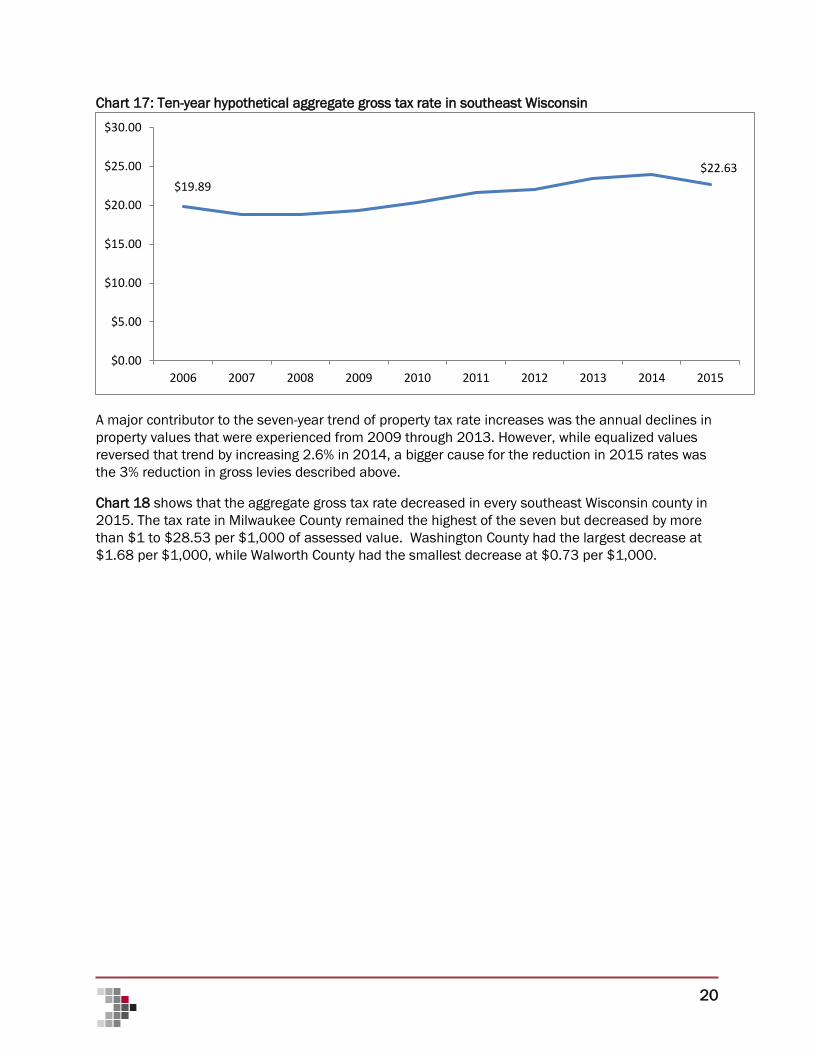
Chart 17: Ten-year hypothetical aggregate gross tax rate in southeast Wisconsin
A major contributor to the seven-year trend of property tax rate increases was the annual declines in
property values that were experienced from 2009 through 2013. However, while equalized values
reversed that trend by increasing 2.6% in 2014, a bigger cause for the reduction in 2015 rates was
the 3% reduction in gross levies described above.
Chart 18 shows that the aggregate gross tax rate decreased in every southeast Wisconsin county in
2015. The tax rate in Milwaukee County remained the highest of the seven but decreased by more
than $1 to $28.53 per $1,000 of assessed value. Washington County had the largest decrease at
$1.68 per $1,000, while Walworth County had the smallest decrease at $0.73 per $1,000.
$19.89
$22.63
$0.00
$5.00
$10.00
$15.00
$20.00
$25.00
$30.00
2006 2007 2008 2009 2010 2011 2012 2013 2014 2015

21
Chart 18: Aggregate gross tax rates, by county
Another means of assessing the impact of changes in tax rates and levies is to examine how they
played out on a per capita basis. In years such as 2015 when levies and rates are declining,
counties with higher average equalized values would be expected to experience more tax relief per
capita. Chart 19 shows that Walworth County had the highest tax relief per capita at $107.81,
followed closely by Waukesha and Ozaukee counties. Milwaukee County had the lowest per capita
tax relief at $47.88, less than half that of Walworth County. The City of Milwaukee had the fourth
lowest per capita tax relief among southeast Wisconsin municipalities at $35.86; only Sturtevant,
Racine, and Genoa City experienced less tax relief on a per capita basis.
Chart 19: Per capita property tax relief by county
$25.44
$28.53
$18.06
$23.43
$19.35$17.59
$17.87
$0.00
$5.00
$10.00
$15.00
$20.00
$25.00
$30.00
$35.00
KenoshaCounty
MilwaukeeCounty
OzaukeeCounty
RacineCounty
WalworthCounty
WashingtonCounty
WaukeshaCounty
2013
2014
2015
$57.78
$47.88
$94.06
$55.95
$107.81
$78.37
$104.47
KENOSHA MILWAUKEE OZAUKEE RACINE WALWORTH WASHINGTON WAUKESHA

22
School district levies down but still account for largest share of
overall levies
When we look at the different components of 2015 property tax levies, we find that school district
tax levies continue to represent the largest share of residents’ tax bills in southeast Wisconsin,
comprising 45% of the total. We also see that the $137 million decrease in technical college levies
throughout the region caused technical colleges' proportion of the overall tax bill to decrease from
7% to 3.5%. As shown in Chart 20, because of this dramatic drop in the technical college tax levy,
several of the other taxing jurisdictions saw their proportional shares increase.
Chart 20: Aggregate tax levy breakdown among taxing jurisdictions in southeast Wisconsin, 2014-15
In terms of dollars (as opposed to proportional shares), two additional taxing jurisdictions besides
technical colleges saw their levies decline in 2015: school districts ($1 million or 0.06%) and TIF
districts ($8 million or 5.5%).3 Municipal levies across the region increased by $17 million (1.7%) and
county levies increased by $6 million (0.9%). Chart 21 shows the amount that each type of taxing
jurisdiction contributes to the region's 2015 total aggregate property tax levy of $3.85 billion.
3 An additional impact associated with Act 145 and its role in lowering property tax rates is that lower rates
produce a decline in the property tax revenue generated to pay off debt associated with TIF districts. This
circumstance could extend the life of tax incremental districts beyond originally anticipated expiration dates.
44%
27%
15%
7%4% 2%
1%
45%
28%
16%
4% 4% 3%1%
School Distric Minicipal County Tech College TIF Special District State
2014 2015

23
Chart 21: Components by taxing jurisdiction of 2015 total aggregate tax levy in southeast Wisconsin
1,752
1,057
612
279149
96 28
1,751
1,075
617
142 141 98 29$0
$200
$400
$600
$800
$1,000
$1,200
$1,400
$1,600
$1,800
$2,000
School Distric Minicipal County Tech College TIF SpecialDistrict
State
Mill
ion
s2014 2015

24
Effects on Taxpayers
Property tax bills decline significantly
The property tax bill charged to an individual property owner reflects the aggregate of the tax levies
of the various taxing districts, which are then applied via the property tax rate to the property’s
assessed value. Annual changes to property tax bills received by property owners, therefore, reflect
not only the levying decisions of government bodies and changes in the property tax rate, but also
any change in the assessed value of the owner’s home or business.
While this dynamic prevents us from being able to assess impacts on individual property owners (as
we do not know how the value of individual properties changed), we can illustrate the connection
between values, levies, and rates by calculating changes to an average hypothetical tax bill for a
resident of each county in Southeast Wisconsin and for the region as a whole. Below, we do so by
using average 2014 residential equalized values, and applying 2015 aggregate gross tax rates to
those amounts.
In 2014, the average residential property in southeast Wisconsin increased by almost 3% to
$189,952. Ozaukee County and Waukesha County had the highest average residential property
values at $270,099 and $270,084 respectively. Milwaukee County continued to have the lowest
average residential property value, at $144,174. Only Walworth County experienced a decrease in its
average residential property value from 2013 to 2014.
Table 1 shows the hypothetical gross tax bill for every county in southeast Wisconsin – and for the
region as a whole – for the past three years. It shows that the hypothetical tax bill for residents in
each of the seven counties declined substantially, reflecting the fact that decreased rates in each
county outweighed the impact of increased property values in calculating each county's hypothetical
tax bill (Walworth County was the only one of the seven in which the average residential value
declined). For the region as a whole, the hypothetical tax bill declined by $118, or 2.7%.
Table 1: Average property values, aggregate gross tax rates, and hypothetical gross tax bills
2013 Averages 2014 Averages 2015 Averages
Value* Rate Bill Value* Rate Bill Value* Rate Bill
Kenosha Co $154,516 $25.85 $3,994 $149,416 $27.01 $4,036 $153,145 $25.44 $3,897
Milwaukee Co $144,101 $29.15 $4,201 $144,174 $29.64 $4,273 $146,514 $28.53 $4,180
Ozaukee Co $262,792 $18.83 $4,948 $259,690 $19.44 $5,048 $270,099 $18.06 $4,878
Racine Co $152,225 $23.98 $3,650 $145,659 $24.80 $3,612 $147,655 $23.43 $3,459
Walworth Co $217,682 $19.41 $4,225 $210,617 $20.08 $4,230 $209,693 $19.35 $4,058
Washington Co $220,429 $18.90 $4,166 $198,904 $19.27 $3,833 $205,998 $17.59 $3,624
Waukesha Co $263,912 $19.05 $5,028 $260,361 $19.28 $5,020 $270,084 $17.87 $4,826
SE WI $187,969 $23.42 $4,402 $184,497 $23.93 $4,416 $189,952 $22.63 $4,298
We also see that despite having the third-lowest tax rate, Ozaukee County, for the second
consecutive year, has the highest hypothetical gross tax bill at $4,874, followed by Waukesha
County at $4,826. This finding reflects the higher average residential values in each county. For the
tenth consecutive year, Racine County had the lowest tax bill in the region, at $3,459 (a decline of
4.4%).

25
Chart 22 shows the trend in the average tax bill, hypothetical gross tax rate, and average residential
property value for the region indexed to 100 in 2008. The chart shows how the average residential
values and the gross rate work together to affect the gross tax bill. As we noted above in our county-
by-county analysis, the substantial decrease in the gross tax rate for the region as a whole
outweighed the impact of increased residential value to produce a decline in the region’s
hypothetical gross tax bill.
Chart 22: Southeast Wisconsin hypothetical average tax bill, gross tax rate, and property value,
indexed to 100
70
80
90
100
110
120
130
140
2008 2009 2010 2011 2012 2013 2014 2015
Ave. property value
Gross tax rate
Gross tax bill

26
Conclusion
This year’s analysis of property values and taxes shows the state’s effort to provide property tax relief
via a change in the funding framework for technical colleges has succeeded. From 2014 to 2015,
property taxes levied across the state declined by more than $220 million, or just over 2%. Honing in
on the southeast Wisconsin region, we see a decline in the aggregate gross property tax levy of more
than $120 million (3%), thanks largely to a $137 million decrease in technical college levies. As a
result, the average hypothetical property tax bill in the region declined by $118.
It is important to note that while the change in the technical college funding framework produced
real property tax relief in 2015, it also has created a larger obligation for state taxpayers to finance
the state’s technical college system. This increased pressure on state resources contributed to the
substantial challenges faced by lawmakers during the recently concluded deliberations on the 2015-
17 state budget.
The region’s municipal and county governments, meanwhile, saw only modest growth in their levies
(1.7% and 0.9% respectively), while the aggregate levy for the region’s school districts decreased by
0.06%. In the case of those jurisdictions, strict state-imposed levy limits likely were a major
contributor. As we have noted in previous reports, while these levy limits are good news for property
taxpayers, they can present substantial challenges to local government and school district leaders,
who often must contend with annual increases in fixed costs that exceed the annual growth in the
levy allowed under state law.
Good news for all parties in the region is the second consecutive year of growth in property values,
which means local policymakers can generate more resources without increasing the property tax
rate. However, of some concern is the slower growth in values in 2015 as compared to the previous
year, as well as the slower growth rate in the region as compared to the state as a whole. While one
year does not make a trend, it would be disconcerting if growth in values again was on a downward
path, given that 2014 marked the first year of growth after several successive years of substantial
decline. Also of concern is the 2015 decline in values for the City of Milwaukee, which shows that an
important barometer of economic recovery still is not being felt in the state’s largest municipality.
Despite these issues, the overall message to taxpayers and citizens conveyed by this year’s analysis
of property values and taxes in southeast Wisconsin is a positive one. Not only were tax levies and
tax rates down for 2015, but 2015 property values are up, signaling less pressure on policymakers
to raise rates for 2016. While the expenditure pressures facing local governments and school
districts undoubtedly have not subsided, their ability to address those pressures going forward will
be enhanced – at least a bit – if property values continue to grow.