Embed Size (px)
Citation preview
Vol.:(0123456789)
SN Applied Sciences (2021) 3:262 | https://doi.org/10.1007/s42452-021-04283-3
Research Article
Property evaluations of coir fibres for use as reinforcement in composites
Chioma Ifeyinwa Madueke1 · Funsho Kolawole2 · Joseph Tile1
Received: 16 October 2020 / Accepted: 27 January 2021 / Published online: 3 February 2021 © The Author(s) 2021 OPEN
AbstractThe density, tensile properties at different gauge lengths, Weibull modulus, and water absorption at elevated tempera-tures of coir fibres of Sri Lanka are presented. The tensile strength and stiffness of these fibres were found to decrease by 51.0 and 68.0% respectively as the gauge length of the coir fibres increased from 20 to 100 mm at a constant cross-head displacement rate of 1 mm/minute. The elongation at break of these fibres increased from 33.3 to 62.5% as the gauge length increased from 20 to 100 mm. The porosity of the fibres is in the range of 32.9–48.1% with an average pore count of 130–475 and average cell diameter of 6.8–13.7 µm within the studied diameter range of 0.162–0.313 mm. The porosity of coir fibres was found to increase as the diameter increased. TGA and scanning electron microscopy of failed samples were conducted to analyse the failure modes and to observe the trend in changes in the mechanical properties.
Keywords Density · Porosity · Tensile properties · Water absorption
1 Introduction
One of the key attractions in the composites industries is the possibility of improving the properties of the compos-ites through fibre reinforcement. Engineers have kept on searching for materials capable of meeting certain designs and specific product requirements. The non-renewable nature of fossil resources and the environmental hazards associated with their extractions has led to awareness of potential uses of agricultural resources. Though natural fibres possess certain disadvantages such as high moisture ingress, high porosity and are susceptible to thermal deg-radation [1–3] yet they are making inroads into the com-posites industries. Some of the issues with natural fibres can be addressed by appropriate fibre treatments [4–9]. Natural fibres are cost effective, environmentally-friendly, sustainable and are much lighter than glass and most syn-thetic fibres and therefore offer significant weight savings and fuel efficiency when compared with synthetic fibres
[10–12]. The physical and chemical properties of coir fibre shown in Table 1, shows that coir is a natural lignocellulosic fibre. The global average annual production of coir stood at 998.3 × 10³ tonnes between 2012 and 2017, an increase of 0.17% was observed in 2019 leading to 10,00,000 tonnes being produced with Sri Lanka being the third largest pro-ducer of coir fibre [13, 14]. Coir is one of the cheapest natu-ral fibres [13] available for technical purposes. The tensile properties, surface treatments and chemical composition of coir fibre have been investigated however; the porosity and water absorption of coir at elevated temperature have been scarcely investigated. This is necessary for increased utilization of the fibre for technical purposes. The proper-ties of coir fibres have been reported to be affected by the origin of the fibre. This project is therefore centred on the evaluation of several properties of coir fibres of specific origin for use as reinforcement in composites. The prop-erties evaluated include: tensile properties at different gauge lengths, porosity at specified diameters. TGA, water
* Chioma Ifeyinwa Madueke, [email protected] | 1University of Birmingham, Birmingham, UK. 2University of Sao Paulo, Sao Paulo, Brazil.

Vol:.(1234567890)
Research Article SN Applied Sciences (2021) 3:262 | https://doi.org/10.1007/s42452-021-04283-3
absorption and diffusion coefficients at elevated temper-atures were investigated. Optical and scanning electron microscopy of these fibres were conducted to analyse their failure modes and to observe the trend in changes in the mechanical properties.
2 Materials and methods
2.1 Coir fibres
The retted, matured brown coir fibres were supplied by Hayleys Fibre Plc, Sri Lanka in three-tie bundles of non-uni-form lengths of 100–320 mm. The fibres were fumigated prior to dispatch to the UK. The coir fibres were cleaned using vacuum pump to remove the debris. They were washed five times using water at a temperature of 50 °C to remove dirt particles. The fibres were dried in the air-circulating oven for 2 h at 80 °C. The dried samples were stored in the desiccator at a temperature of 50 °C and humidity of 50% until the desired time.
2.2 Tensile tests on single coir fibres
The coir fibre samples for tensile tests were selected manually after careful visual inspection to ensure that the surfaces of the fibres were free of debris from the de-fiberising procedure. The presence of residual debris and defiberising procedures can affect the tensile properties. The gauge lengths for the tensile tests were taken from the middle of the selected fibres. The diameters measured using optical microscopy was taken at three points along this gauge length. For proper alignment and dimensional accuracy, coir fibre was end-tabbed on a graph paper (Fig. 1). Tensile tests were carried out on single coir fibres of average diameter 0.250 mm and of gauge lengths of 20, 60 and 100 mm (the coir lengths were arbitrarily chosen for comparison purposes with respect to ASTMD3822-07) using Instron universal testing machine model 5566 with load cell of 100 N and at a cross-head displacement rate of 1 mm/minute in accordance with ASTM D3822-07. In order to get meaningful results, a total of 30 fibres were tested for each gauge length. The relative humidity and temperature of the laboratory as at the time of the experi-ment were 45% and 21 °C respectively.
2.3 Scanning electron microscopy (SEM)
Coir fibre samples were sputter-coated with gold to ren-der them conductive for SEM. The morphological char-acterizations of the fibres were carried out using Table top scanning electron microscopy model TM 3030. Zeiss Axioskop-2 optical microscope was used to obtain good quality images of polished samples of coir fibre for poros-ity measurement. At this point, ImageJ software was intro-duced and used to determine the degree of porosity of coir fibres.
Table 1 Physical properties and chemical compositions of coir fiber. Sources [15, 16]
Chemical properties Physical properties
Properties % Composition Parameter Value
Lignin 45.84 Length ( mm) 60–80Cellulose 43.44 Density (g/cm3) 1.40Hemicellulose 00.25 Tenacity (g/Tex) 10.0Pectin’s and
related com-pounds
03.00 Moisture at 65% RH 10.50
Ash 02.22 Diameter (mm) 0.1–1.5
Fig. 1 Specimen preparations and tensile test of coir fibres
Vol.:(0123456789)
SN Applied Sciences (2021) 3:262 | https://doi.org/10.1007/s42452-021-04283-3 Research Article
2.4 Thermogravimetric analysis (TGA)
Thermogravimetric analysis (TGA) is a standard method used to study the overall thermal stability of natural fib-ers. Usually, the thermal degradation of natural fiber composites with increasing the temperature is studied along with numerical calculation of quality degradation. Raise in temperature, results in the weight of the fiber to drop slowly and at the point of glass transition the weight drops sharply over a narrow range and finally turns back to zero slopes as the reactant is exhausted. The degrada-tion process in TGA can be presented in the curve, which is dependent on the kinetic parameters of the pyrolysis such as frequency factor, reaction order, and activation energy. The value obtained in the curve depends on factors like sample mass, sample shape, atmosphere, flow rate, heat-ing rate, and the mathematical treatment applied. Major transition (α2 peak) at about 120 °C for brown coir and at about 130 °C for white coir which is most likely the lignin glass transition [15].
The thermal properties of coir fibres were studied using Netzsch instrument for thermogravimetry under Argon atmosphere. The sample weight for each test was 10 ± 2 mg. The temperature range was between 25 °C and 1000 °C at a heating rate of 10 °C/minute.
2.5 Water absorption of coir fibres
Coir fibres were cut to tensile lengths of 60 mm. Each fibre was placed in a glass vial. Each vial with known mass of pre-dried coir fibres was filled with distilled
water and the immersion time of the fibre was noted. The vials were placed in a 500 ml beaker and the beaker filled with distilled water. This assembly was placed in a temperature-regulated water bath that was set at 40 °C. Each vial was taken out and fibre was removed from the water-filled glass vial and dried with lint-free tissue. The fibre was weighed and returned to the vial filled with dis-tilled water and placed in the glass beaker and returned to the water bath.
The weight of the individual fibres was measured every 60 min until equilibrium was reached and the measurement frequency was every day. These experi-ments were repeated at 60 and 80 °C.
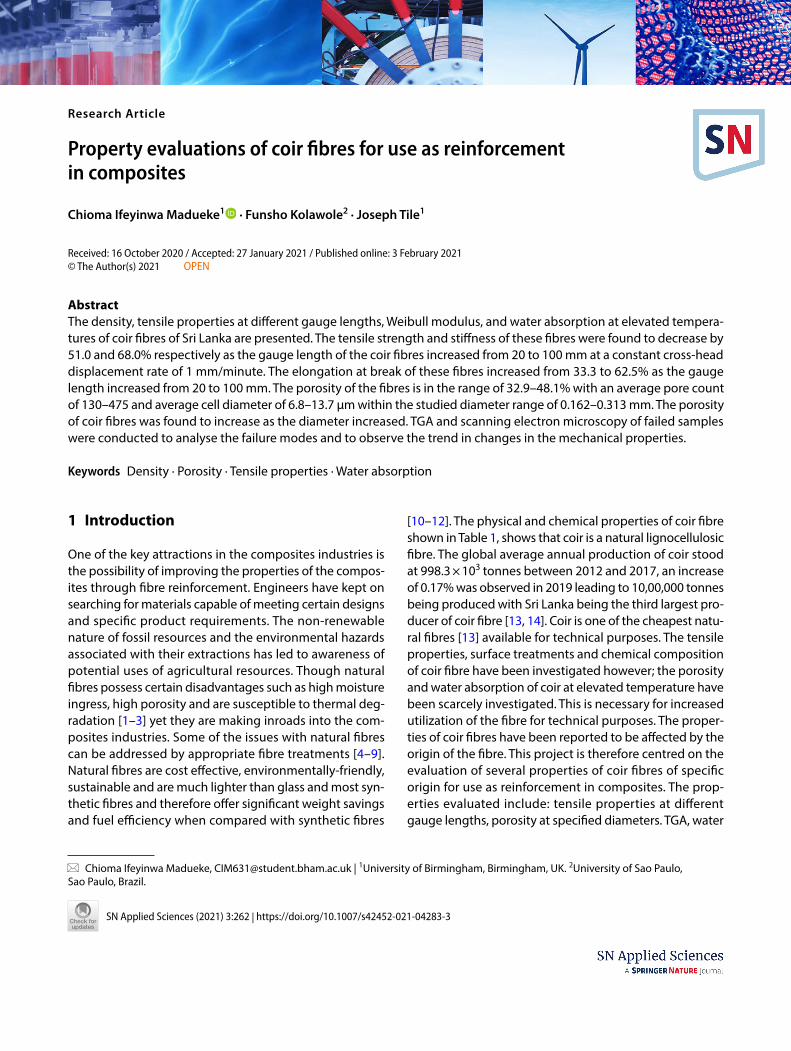
2.6 Density measurement
The density measurement of coir fibres was carried out using helium gas Pycnometer model: Micromerit-ics AccuPyc II 1340 with instrument schematics (Fig. 2a and b) in accordance with ASTM B923-10. The sample mass was 0.09 g. The repeat option was 5 purges and 5 cycles. Pycnometer measures the volume of the sample using gas displacement and Boyle’s law volume-pressure relationship (PV = K). The density was calculated from the measured volume and mass. The instrument schematic is as shown in Fig. 2.
Fig. 2 Density measurement of coir fibre set-up (a) pycnometer (b) instrument schematic

Vol:.(1234567890)
Research Article SN Applied Sciences (2021) 3:262 | https://doi.org/10.1007/s42452-021-04283-3
3 Results and discussions
3.1 Tensile properties of coir fibres
The tensile properties of the coir fibres were studied as a function of the gauge lengths. The tensile strength of thirty individual coir fibres per batch at gauge lengths of 20, 60 and 100 mm were determined.
3.1.1 Effect of gauge lengths on the tensile strength of coir fibres
Table 2 displays the result of the effect of the gauge lengths of 20. 60 and 100 mm of coir fibres of average diameter 0.25 mm on their tensile properties carried out at a cross-head displacement rate of 1 mm/minute. The results showed deviations in strength, modulus and elon-gation at break at all the gauge lengths. The average ten-sile strengths at 20, 60 and 100 mm gauge lengths of coir were 194.3, 110.4 and 95.4 MPa respectively. Increase in gauge length from 20 to 60 mm and from 20 to 100 mm led to decrease in strength and stiffness by 43 and 51 and by 52 and 68% respectively. The elongation at break was found to increase from 33.3 to 62.5% as the gauge length increased from 20 to 100%. The tensile strength was found to increase as the gauge length decreased. Studies by Tomzac et al. [17], on coir fibres of Brazil revealed decrease in strength from 142.6 to 118.3 MPa; decrease in elonga-tion from 23.8 to12.5% and increase in Young’s modulus from 1.27 to 2.7 GPa with increasing gauge length from 5 to 25 mm. Mir et al. [18] reported a steady decrease in the tensile strength as the gauge length increases from 5 to 35 mm. Similar trend was observed by [19–22]. As stated previously, the coir fibre samples were selected manually after careful visual inspection to ensure that the surface of the fibres were free of debris from the de-fiberising procedure. The presence of residual debris and defiberis-ing procedures can affect the tensile properties. Further-more, comparing tensile data of natural fibres from differ-ent labs is notoriously difficult as a result of the variability in the fibre distribution. The tensile strength obtained
experimentally can also be influenced by the alignment of the sample in the grips of the tensile test machine. Fibre slippage from within the end-tabbed region can also have a bearing on the data obtained. Previous authors have attributed the variations in the tensile data on differences in the fibre diameter, defect density, origin of the fibre, growing conditions, extraction method or level of maturity of the coir fibres.
3.1.2 Weibull distribution of coir fibres at gauge lengths of 20, 40 and 60 mm
The two-parameter Weibull equation was used to charac-terize the tensile strength results of the fibres. The Weibull parameters of coir fibres at the three specified gauge lengths are given in Table 3 and the Weibull plot shown in Fig. 3. The Weibull modulus for the selected gauge lengths is 3 to the nearest whole number. The results of the Weibull modulus are in accordance with the Weibull modulus for natural fibres (1–6). This trend has been observed by other authors [23–25]. However, the tensile properties of sisal fibres were evaluated for varying gauge lengths but at a constant strain rate, no effect on the tensile strength was observed rather a 35% decrease in Weibull modulus was observed with increase in gauge length [26]. Bamboo fibre
Table 2 Tensile properties of coir fibres at gauge lengths of 20, 60 and 100 mm and at constant cross-head displacement rate of 1 mm/minute
Gauge length (mm)
Sample size
Strength (MPa) Stiffness (MPa)
Elongation (%)
20 30 194.26 ± 76.03 1.95 ± 0.75 33.3 ± 10.9060 30 110.37 ± 37.17 0.94 ± 0.43 61.45 ± 24.29100 30 95.44 ± 40.71 0.63 ± 0.18 62.45 ± 31.56
Table 3 Weibull parameters on the tensile strength of coir fibres at varying gauge lengths and at a cross head displacement rate of 1 mm/minute
Gauge length (mm)
Weibull modulus, m
Weibull scale param-eter (MPa)
R2
20 2.92 217.96 0.9660 3.26 123.28 0.96100 2.70 107.38 0.95
Fig. 3 Weibull plot of coir fibres at 20 mm gauge length and at a cross-head displacement rate of 1 mm/minute

Vol.:(0123456789)
SN Applied Sciences (2021) 3:262 | https://doi.org/10.1007/s42452-021-04283-3 Research Article
has showed a very low strength variability with Weibull modulus of 7.6 when compared with coir fibre. The differ-ence in the level of scatter in the strength of natural fibres depends on the degree of flaws in the fibre. Several fac-tors have been noted to contribute to the level of flaw and flaw distribution in natural fibres, such factors include the degree of porosity of the fibre, the diameter of the fibre, processing conditions and fibre treatment [24, 27, 28].
3.2 Morphological characterization of coir fibre
The micrographs of coir fibre surface shows globular pro-trusions otherwise known as tylosis (Fig. 4a and b). The globular protrusions appear to be in an ordered form. A pit-like structures can be seen at intervals and in-between the tyloses making the surface of the fibre rough. These observations have also been made by other researchers on coir fibre [1, 27].
The micrograph of the transverse section of coir fibres shows that coir fibre consists of numerous lumens and a lacuna usually located at the centre making the fibre highly porous (Fig. 5). Similar observations have been made by other researchers on coir fibre [17, 29]. The size, shape and position of the lacuna differ even in fibres of the same origin and within the same species.
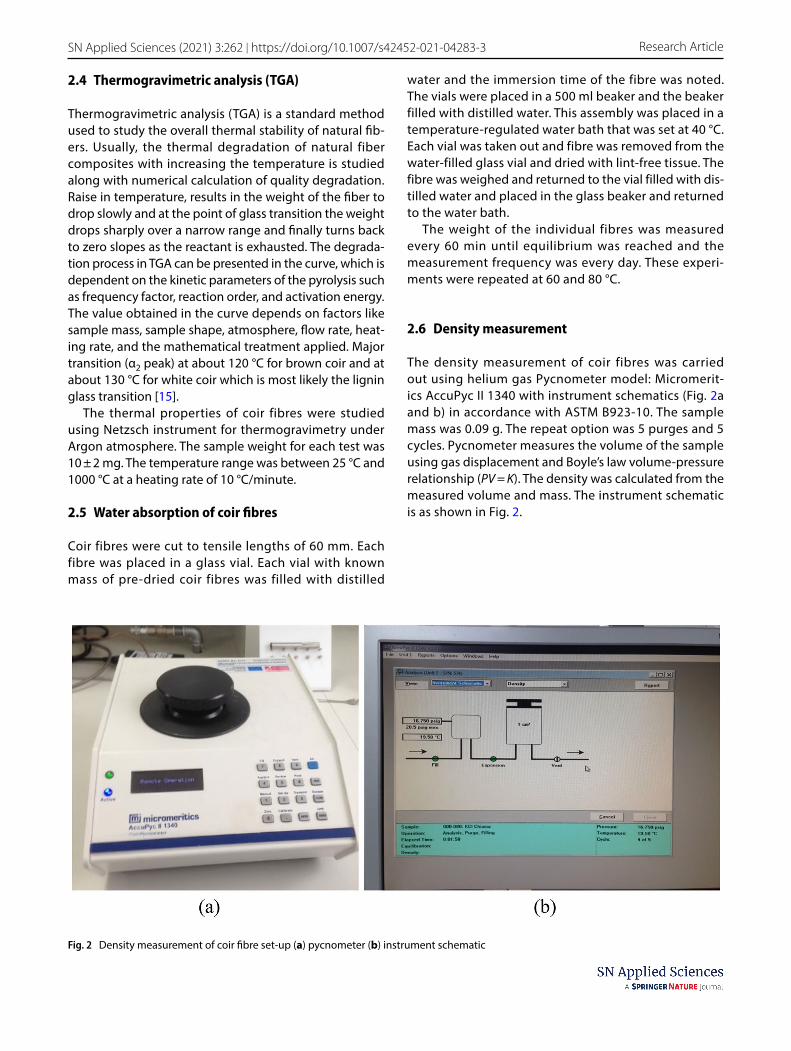
The SEM micrographs of the fractured surfaces of the fibres at the specified gauge lengths (Fig. 6) shows fail-ure of the fibers to be uneven and irregular. Defects were observed on the failed surfaces. Elongation of the helical structures after brittle failure of the fibres was observed. Pull out of the cellulose fibril is evident on the failed sur-faces. This is more noticeable at 100 mm gauge length hence influencing the tensile strength of the fibres. Similar
observations have been made by several authors on coir fibre [22, 30].
3.3 Optical microscopy of coir fibre for the determination of the porosity of the fibre
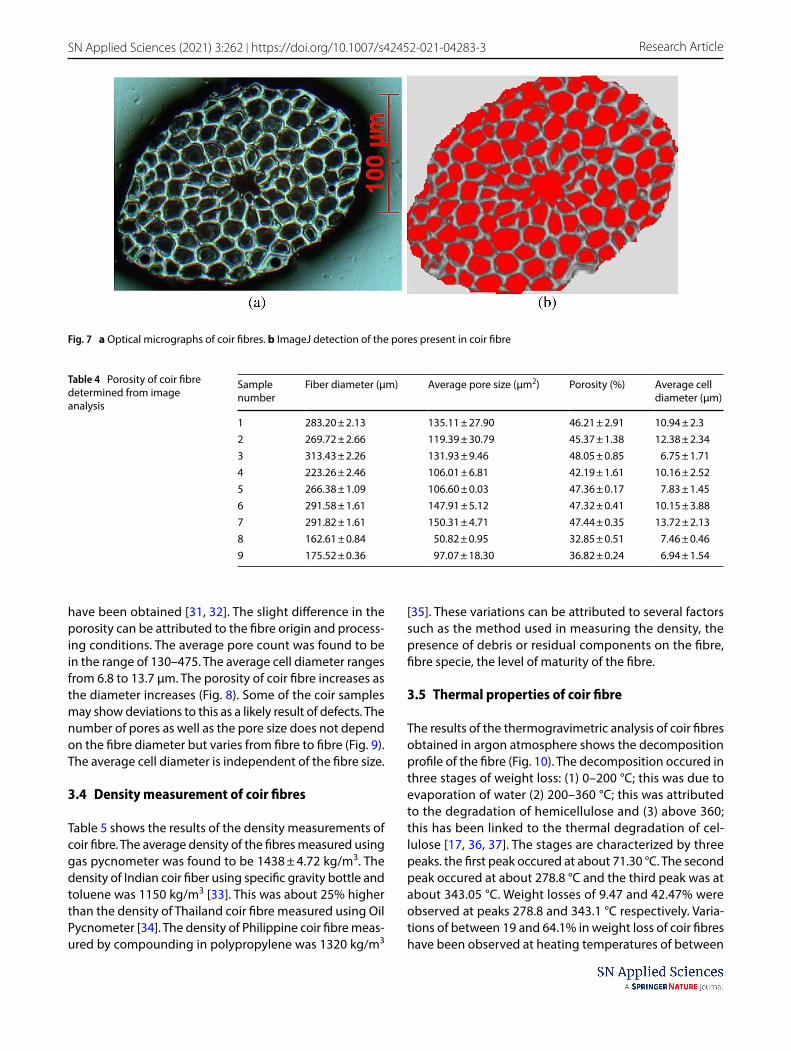
The optical micrograph of coir fibre and the ImageJ detec-tion of the pores shows that coir fibres are highly porous (Fig. 7a and b). The results of the analysed fibres are given in Table 4. The diameters of the tested fibres determined from the cross-sectional area of the fibre with the assump-tion that the cross-sectional area of the fibre is that of a circle were in the range of 0.162–0.313 mm. The results obtained showed that the porosity of these coir fibres is in the range of 32.9–48.1%. Porosity range of 21.1–46.3%
Fig. 4 SEM micrographs of coir fibre surface showing (a) pits and tyloses (b) tylosis on a closer look
Fig. 5 SEM micrograph of the transverse section of coir fibre
Vol:.(1234567890)
Research Article SN Applied Sciences (2021) 3:262 | https://doi.org/10.1007/s42452-021-04283-3
Fig. 6 Scanning electron micrographs of coir fiber showing failure surfaces at 1 mm/minute cross-head displacement rate and gauge lengths at; 20 mm (a and b), 60 mm (c and d) and 100 mm (e and f)
Vol.:(0123456789)
SN Applied Sciences (2021) 3:262 | https://doi.org/10.1007/s42452-021-04283-3 Research Article
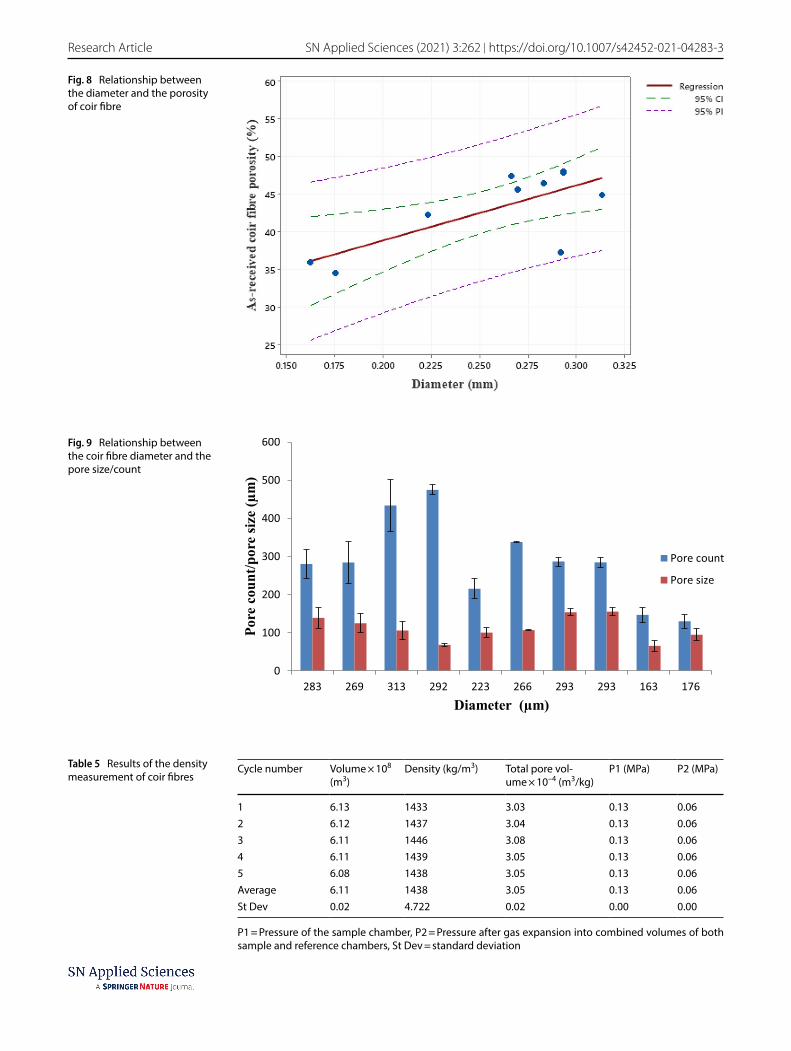
have been obtained [31, 32]. The slight difference in the porosity can be attributed to the fibre origin and process-ing conditions. The average pore count was found to be in the range of 130–475. The average cell diameter ranges from 6.8 to 13.7 µm. The porosity of coir fibre increases as the diameter increases (Fig. 8). Some of the coir samples may show deviations to this as a likely result of defects. The number of pores as well as the pore size does not depend on the fibre diameter but varies from fibre to fibre (Fig. 9). The average cell diameter is independent of the fibre size.
3.4 Density measurement of coir fibres
Table 5 shows the results of the density measurements of coir fibre. The average density of the fibres measured using gas pycnometer was found to be 1438 ± 4.72 kg/m3. The density of Indian coir fiber using specific gravity bottle and toluene was 1150 kg/m3 [33]. This was about 25% higher than the density of Thailand coir fibre measured using Oil Pycnometer [34]. The density of Philippine coir fibre meas-ured by compounding in polypropylene was 1320 kg/m3
[35]. These variations can be attributed to several factors such as the method used in measuring the density, the presence of debris or residual components on the fibre, fibre specie, the level of maturity of the fibre.
3.5 Thermal properties of coir fibre
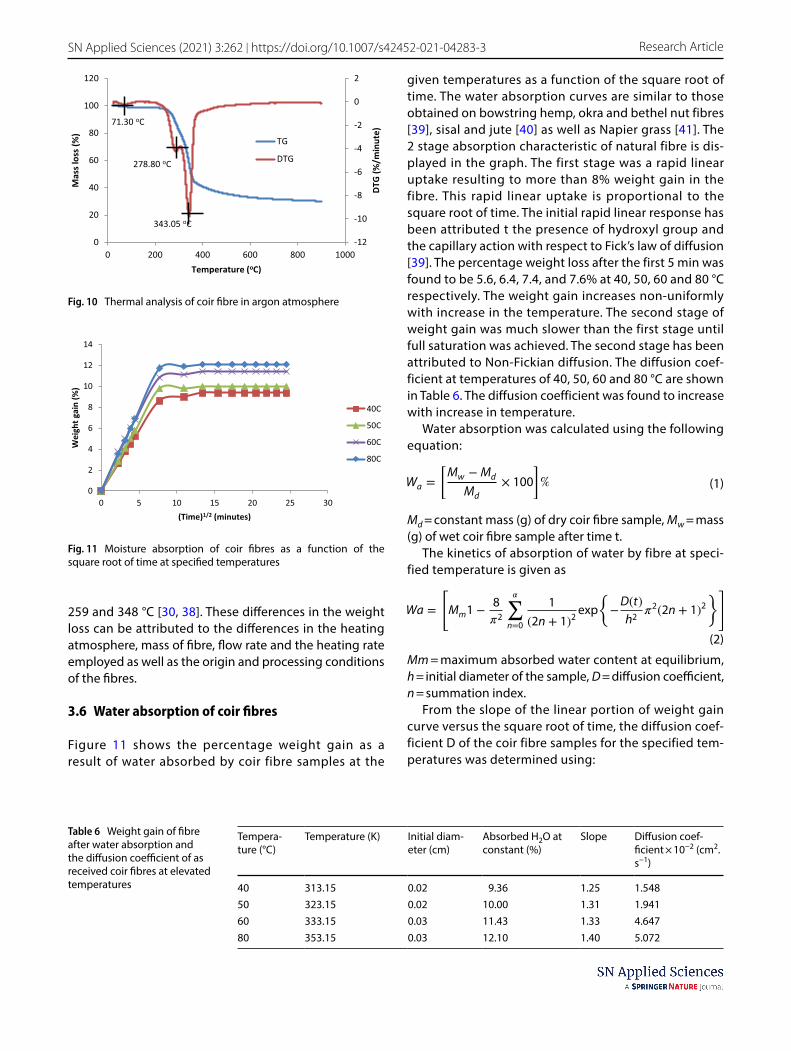
The results of the thermogravimetric analysis of coir fibres obtained in argon atmosphere shows the decomposition profile of the fibre (Fig. 10). The decomposition occured in three stages of weight loss: (1) 0–200 °C; this was due to evaporation of water (2) 200–360 °C; this was attributed to the degradation of hemicellulose and (3) above 360; this has been linked to the thermal degradation of cel-lulose [17, 36, 37]. The stages are characterized by three peaks. the first peak occured at about 71.30 °C. The second peak occured at about 278.8 °C and the third peak was at about 343.05 °C. Weight losses of 9.47 and 42.47% were observed at peaks 278.8 and 343.1 °C respectively. Varia-tions of between 19 and 64.1% in weight loss of coir fibres have been observed at heating temperatures of between
Fig. 7 a Optical micrographs of coir fibres. b ImageJ detection of the pores present in coir fibre
Table 4 Porosity of coir fibre determined from image analysis
Sample number
Fiber diameter (µm) Average pore size (µm2) Porosity (%) Average cell diameter (µm)
1 283.20 ± 2.13 135.11 ± 27.90 46.21 ± 2.91 10.94 ± 2.32 269.72 ± 2.66 119.39 ± 30.79 45.37 ± 1.38 12.38 ± 2.343 313.43 ± 2.26 131.93 ± 9.46 48.05 ± 0.85 6.75 ± 1.714 223.26 ± 2.46 106.01 ± 6.81 42.19 ± 1.61 10.16 ± 2.525 266.38 ± 1.09 106.60 ± 0.03 47.36 ± 0.17 7.83 ± 1.456 291.58 ± 1.61 147.91 ± 5.12 47.32 ± 0.41 10.15 ± 3.887 291.82 ± 1.61 150.31 ± 4.71 47.44 ± 0.35 13.72 ± 2.138 162.61 ± 0.84 50.82 ± 0.95 32.85 ± 0.51 7.46 ± 0.469 175.52 ± 0.36 97.07 ± 18.30 36.82 ± 0.24 6.94 ± 1.54
Vol:.(1234567890)
Research Article SN Applied Sciences (2021) 3:262 | https://doi.org/10.1007/s42452-021-04283-3
Fig. 8 Relationship between the diameter and the porosity of coir fibre
Fig. 9 Relationship between the coir fibre diameter and the pore size/count
Table 5 Results of the density measurement of coir fibres
P1 = Pressure of the sample chamber, P2 = Pressure after gas expansion into combined volumes of both sample and reference chambers, St Dev = standard deviation
Cycle number Volume × 108 (m3)
Density (kg/m3) Total pore vol-ume × 10–4 (m3/kg)
P1 (MPa) P2 (MPa)
1 6.13 1433 3.03 0.13 0.062 6.12 1437 3.04 0.13 0.063 6.11 1446 3.08 0.13 0.064 6.11 1439 3.05 0.13 0.065 6.08 1438 3.05 0.13 0.06Average 6.11 1438 3.05 0.13 0.06St Dev 0.02 4.722 0.02 0.00 0.00
Vol.:(0123456789)
SN Applied Sciences (2021) 3:262 | https://doi.org/10.1007/s42452-021-04283-3 Research Article
259 and 348 °C [30, 38]. These differences in the weight loss can be attributed to the differences in the heating atmosphere, mass of fibre, flow rate and the heating rate employed as well as the origin and processing conditions of the fibres.
3.6 Water absorption of coir fibres
Figure 11 shows the percentage weight gain as a result of water absorbed by coir fibre samples at the
given temperatures as a function of the square root of time. The water absorption curves are similar to those obtained on bowstring hemp, okra and bethel nut fibres [39], sisal and jute [40] as well as Napier grass [41]. The 2 stage absorption characteristic of natural fibre is dis-played in the graph. The first stage was a rapid linear uptake resulting to more than 8% weight gain in the fibre. This rapid linear uptake is proportional to the square root of time. The initial rapid linear response has been attributed t the presence of hydroxyl group and the capillary action with respect to Fick’s law of diffusion [39]. The percentage weight loss after the first 5 min was found to be 5.6, 6.4, 7.4, and 7.6% at 40, 50, 60 and 80 °C respectively. The weight gain increases non-uniformly with increase in the temperature. The second stage of weight gain was much slower than the first stage until full saturation was achieved. The second stage has been attributed to Non-Fickian diffusion. The diffusion coef-ficient at temperatures of 40, 50, 60 and 80 °C are shown in Table 6. The diffusion coefficient was found to increase with increase in temperature.
Water absorption was calculated using the following equation:
Md = constant mass (g) of dry coir fibre sample, Mw = mass (g) of wet coir fibre sample after time t.
The kinetics of absorption of water by fibre at speci-fied temperature is given as
Mm = maximum absorbed water content at equilibrium, h = initial diameter of the sample, D = diffusion coefficient, n = summation index.
From the slope of the linear portion of weight gain curve versus the square root of time, the diffusion coef-ficient D of the coir fibre samples for the specified tem-peratures was determined using:
(1)Wa =
[
Mw −Md
Md
× 100
]
%
(2)
Wa =
[
Mm1 −8
�2
�∑
n=0
1
(2n + 1)2exp
{
−D(t)
h2�2(2n + 1)2
}
]
Fig. 10 Thermal analysis of coir fibre in argon atmosphere
Fig. 11 Moisture absorption of coir fibres as a function of the square root of time at specified temperatures
Table 6 Weight gain of fibre after water absorption and the diffusion coefficient of as received coir fibres at elevated temperatures
Tempera-ture (°C)
Temperature (K) Initial diam-eter (cm)
Absorbed H2O at constant (%)
Slope Diffusion coef-ficient × 10−2 (cm2.s−1)
40 313.15 0.02 9.36 1.25 1.54850 323.15 0.02 10.00 1.31 1.94160 333.15 0.03 11.43 1.33 4.64780 353.15 0.03 12.10 1.40 5.072
Vol:.(1234567890)
Research Article SN Applied Sciences (2021) 3:262 | https://doi.org/10.1007/s42452-021-04283-3
Mm = maximum water content at constant, h = initial diam-eter. Slope: slope of weight gain versus SQRT (time).
4 Conclusion
The density of coir fibres of Sri Lanka was found to be 1438 kg/m3. At an average diameter of 0.250 mm, the tensile strength and stiffness of the fibres decreased by 51 and 68% respectively as the gauge length increased from 20 to 100 mm. The elongation at break increased from 33.3 to 62.5% as the gauge length increased from 20 to 100 mm. No significant difference was observed in the Weibull shape parameter at all the gauge lengths. The porosity of the fibres is in the range of 32.9–48.1% with an average pore count of 130 to 475. These were within the studied diameter range of 0.162–0.313 mm. The porosity of coir fibres increased as the diameter increased. Thermal analysis of coir fibres under argon atmosphere revealed weight losses of 9.47 and 42.47% at peaks of onset and endset degradation temperatures of 278.8 and 343.1 °C respectively. Water aborption of the fibres increased from 9.4 to 12.1% as the temperature increased from 40 to 80 °C. The diffusion coefficients of the fibre increased as the tem-perature increased.
The use of coir fibre as reinforcement in composites can be optimised with the above information on the density, water absorption at elevated temperatures, length and diameter of the fibre as well as the porosity of the fibre.
Compliance with ethical standards
Conflict of interest The authors declare that they have no known competing interests that could potentially influence or bias the sub-mitted work.
Open Access This article is licensed under a Creative Commons Attri-bution 4.0 International License, which permits use, sharing, adap-tation, distribution and reproduction in any medium or format, as long as you give appropriate credit to the original author(s) and the source, provide a link to the Creative Commons licence, and indicate if changes were made. The images or other third party material in this article are included in the article’s Creative Commons licence, unless indicated otherwise in a credit line to the material. If material is not included in the article’s Creative Commons licence and your intended use is not permitted by statutory regulation or exceeds the permitted use, you will need to obtain permission directly from the copyright holder. To view a copy of this licence, visit http://creat iveco mmons .org/licen ses/by/4.0/.
(3)D = �
(
h
4Mm
)2
(slope)2
References
1. Bismarck A, Aranberri-Askargorta I, Springer J, Mohanty AK, Misra M, Hinrichsen G et al (2001) Surface characterization of natural fibers; surface properties and the water up-take behav-ior of modified sisal and coir fibers. Green Chem 3(2):100–107
2. Ezekiel N, Ndazi B, Nyahumwa C, Karlsson S (2011) Effect of tem-perature and durations of heating on coir fibers. Ind Crop Prod 33(3):638–643
3. Van Dam JEG, Van Den Oever MJA, Teunissen W, Keijsers ERP, Peralta AG (2004) Process for production of high density/high performance binderless boards from whole coconut husk: part 1: lignin as intrinsic thermosetting binder resin. Ind Crops Prod 19(3):207–216
4. Arrakhiz FZ, El AM, Kakou AC, Vaudreuil S, Benmoussa K, Bouhfid R et al (2012) Mechanical properties of high density polyethyl-ene reinforced with chemically modified coir fibers : impact of chemical treatments. J Mater 37:379–383
5. Munirah Abdullah N, Ahmad I (2012) Effect of chemical treat-ment on mechanical and water-sorption properties coconut fiber-unsaturated polyester from recycled PET. ISRN Mater Sci 2012:1–8
6. Hemsri S, Grieco K, Asandei AD, Parnas RS (2012) Compos-ites : part A Wheat gluten composites reinforced with coconut fiber. Compos Part A Appl Sci Manuf 43(7):1160–8. https ://doi.org/10.1016/j.compo sites a.2012.02.011
7. Nam TH, Ogihara S, Tung NH, Kobayashi S (2011) Effect of alkali treatment on interfacial and mechanical properties of coir fiber reinforced poly(butylene succinate) biodegradable composites. Compos Part B Eng 42(6):1648–1656
8. ALRahmanRajaRahman LARIRA (2013) Experimental study on natural fibers for green acoustic absorption materials. Am J Appl Sci 10(10):1307–14
9. Javadi A, Srithep Y, Pilla S, Lee J, Gong S, Turng L (2010) Process-ing and characterization of solid and microcellular PHBV/coir fi ber composites. Mater Sci Eng C 30(5):749–757
10. Joshi SV, Drzal LT, Mohanty AK, Arora S (2004) Are natural fiber composites environmentally superior to glass fiber reinforced composites? Compos Part A Appl Sci Manuf 35(3):371–376
11. Götze U, Peças P, Salman HM, Kaufmann J, Schmidt A (2018) Risk-sensitive life cycle assessment of green composites for automotive applications. Green Compos Automot Appl. https ://doi.org/10.1016/B978-0-08-10217 7-4.00010 -0
12. Chauhan V, Kärki T, Varis J (2019) Review of natural fiber-rein-forced engineering plastic composites, their applications in the transportation sector and processing techniques. J Thermoplast Compos Mater. https ://doi.org/10.1177/08927 05719 88909 5
13. Food and agriculture organization corporate statistical data-base. (2018) List of countries by coconut production. Faostat [Internet]. 1–5. Available from: http://www.fao.org/faost at/en/#data/QC/
14. Rijavec T (2019) Natural fibres and the world economy: discover natural fibres initiative. Available from: http://dnfi.org/abaca /natur al-fibre s-and-the-world -econo my_1778/
15. Stelte W, Clemons C, Holm JK, Ahrenfeldt J, Henriksen UB, Sanadi AR (2011) Thermal transitions of the amorphous poly-mers in wheat straw. Ind Crops Prod 34(1):1053–6. https ://doi.org/10.1016/j.indcr op.2011.03.014
16. Ayrilmis N, Jarusombuti S, Fueangvivat V, Bauchongkol P, White RH (2011) Coir fiber reinforced polypropylene composite panel for automotive interior applications. Fibers Polym 12(7):919–926
17. Tomczak F, Sydenstricker THD, Satyanarayana KG (2007) Stud-ies on lignocellulosic fibers of Brazil: part II: morphology and properties of Brazilian coconut fibers. Compos Part A Appl Sci Manuf 38(7):1710–1721

Vol.:(0123456789)
SN Applied Sciences (2021) 3:262 | https://doi.org/10.1007/s42452-021-04283-3 Research Article
18. Mir SS, Hasan SMN, Hossain MJ, Hasan M (2012) Chemical modi-fication effect on the mechanical properties of coir fiber. Eng J 16(2):73–83
19. Mukherjee PS, Satyanarayana KG (1984) Structure and prop-erties of some vegetable fibres: part 1 sisal fibre. J Mater Sci 19(12):3925–3934
20. Defoirdt N, Biswas S, De VL, Quan L, Tran N, Van AJ (2010) Assess-ment of the tensile properties of coir, bamboo and jute fibre. Compos Part A 41(5):588–595
21. Alves Fidelis ME, Pereira TVC, Gomes ODFM, De Andrade Silva F, Toledo Filho RD (2013) The effect of fiber morphology on the tensile strength of natural fibers. J Mater Res Technol 2(2):149–57. https ://doi.org/10.1016/j.jmrt.2013.02.003
22. Mathura N, Cree D (2016) Characterization and mechanical property of Trinidad coir fibers. J Appl Polym Sci 133(29):1–9
23. Trujillo E, Moesen M, Osorio L, Van Vuure AW, Ivens J, Verpoest I (2014) Bamboo fibres for reinforcement in composite materi-als: strength weibull analysis. Compos Part A Appl Sci Manuf 61:115–25. https ://doi.org/10.1016/j.compo sites a.2014.02.003
24. Pickering KL, Beckermann GW, Alam SN, Foreman NJ (2007) Optimising industrial hemp fibre for composites. Compos Part A Appl Sci Manuf 38(2):461–468
25. Guo M, Zhang TH, Chen BW, Cheng L (2014) Tensile strength analysis of palm leaf sheath fiber with Weibull distribution. Com-pos Part A Appl Sci Manuf 62:45–51. https ://doi.org/10.1016/j.compo sites a.2014.03.018
26. Ramesh M, Palanikumar K, Reddy KH (2013) Comparative eval-uation on properties of hybrid glass fiber-sisal/jute reinforced epoxy composites. Proc Eng 51:745–50
27. Kulkarni G, Satyanarayana KG, Rohatgi PK (1983) Weibull analysis of strengths of coir fibres. Fibre Sci Technol 19:59–76
28. Zafeiropoulos NE, Baillie CA (2007) A study of the effect of sur-face treatments on the tensile strength of flax fibres: part ii—application of Weibull statistics. Compos Part A Appl Sci Manuf 38(2):629–38
29. Nam TH, Ogihara S, Tung NH, Kobayashi S (2011) Effect of alkali treatment on interfacial and mechanical properties of coir fiber reinforced poly(butylene succinate) biodegradable composites. Compos Part B Eng 42(6):1648–56. https ://doi.org/10.1016/j.compo sites b.2011.04.001
30. Tomczak F, Sydenstricker THD, Satyanarayana KG (2007) A stud-ies on lignocellulosic fibers of Brazil: part II—morphology and properties of Brazilian coconut fibers. Compos Part A Appl Sci Manuf 38:1710–21
31. Tran LQN, Minh TN, Fuentes CA, Chi TT, Van Vuure AW, Verpoest I (2015) Investigation of microstructure and tensile proper-ties of porous natural coir fibre for use in composite materials.
Ind Crops Prod 65:437–45. https ://doi.org/10.1016/j.indcr op.2014.10.064
32. da Luz FS, Paciornik S, Monteiro SN, da Silva LC, Tommasini FJ, Candido VS (2017) Porosity assessment for different diameters of coir lignocellulosic fibers. JOM 69(10):2045–2051
33. Satyanarayana KG, Sukumaran K, Mukherjee PS, Pillai SGK (1986) Materials science of some lignocellulosic fibers. Metallography 19(4):389–400
34. Muensri P, Kunanopparat T, Menut P, Siriwattanayotin S (2011) Effect of lignin removal on the properties of coconut coir fiber/wheat gluten biocomposite. Compos Part A Appl Sci Manuf 42(2):173–9. https ://doi.org/10.1016/j.compo sites a.2010.11.002
35. van Dam JEG, van den Oever MJA, Keijsers ERP, van der Putten JC, Anayron C, Josol F et al (2006) Process for production of high density/high performance binderless boards from whole coco-nut husk: part 2—coconut husk morphology, composition and properties. Ind Crops Prod 24(2):96–104
36. Claramunt J, Ardanuy M, García-hortal JA (2010) Effect of dry-ing and rewetting cycles on the structure and physicochemical characteristics of softwood fibres for reinforcement of cementi-tious composites. Carbohydr Polym 79(1):200–205
37. Santos EF, Moresco M, Rosa SML, Nachtigall SMB (2010) Extrusão de Compósitos de PP com Fibras Curtas de Coco : Efeito da Tem-peratura e Agentes de Acoplamento Extrusion of PP compos-ites with short coir fibers—effect of temperature and coupling agents. Polimeros 20:215–20
38. Brígida AIS, Calado VMA, Gonçalves LRB, Coelho MAZ (2010) Effect of chemical treatments on properties of green coconut fiber. Carbohydr Polym 79(4):832–8. https ://doi.org/10.1016/j.carbp ol.2009.10.005
39. Saikia D (2010) Studies of water absorption behavior of plant fibers at different temperatures. Int J Thermophys 31(4–5):1020–1026
40. Giridhar J, Kishore, Rao RMVGK (1986) Moisture absorption char-acteristics of natural fibre composites. J Reinf Plast Compos 5(2): 141–150
41. Haameem M, Abdul Majid MS, Afendi M, Marzuki HFA, Hilmi EA, Fahmi I et al (2016) Effects of water absorption on Napier grass fibre/polyester composites. Compos Struct 144:138–46. https ://doi.org/10.1016/j.comps truct .2016.02.067
Publisher’s Note Springer Nature remains neutral with regard to jurisdictional claims in published maps and institutional affiliations.


![COIR PITH - Krishna districtkrishna.nic.in/PDFfiles/MSME/Chemical/coir pith[1].pdfMushroom Coir pith blocks are being used by a lot of mushroom growers around the ... Coir dust in](https://img.pdfslide.us/doc/110x75/5aa91e107f8b9a9a188c6a23/coir-pith-krishna-pith1pdfmushroom-coir-pith-blocks-are-being-used-by-a-lot.jpg)