Embed Size (px)
Citation preview
This article was downloaded by: [University of Boras]On: 04 October 2014, At: 13:35Publisher: Taylor & FrancisInforma Ltd Registered in England and Wales Registered Number:1072954 Registered office: Mortimer House, 37-41 Mortimer Street,London W1T 3JH, UK
Communications in SoilScience and Plant AnalysisPublication details, including instructions forauthors and subscription information:http://www.tandfonline.com/loi/lcss20
Properties of Ultisolsand Oxisols related toMehlich‐3 phosphorusbuffer coefficientsB. F. Aquino a , L. F. Sobral b & F. R. Cox ca Universidade Federal do Ceará,Departamento de Ciéncias do Solo , Campus doPici, Fortaleza, CE, Brazilb Centro de Pesquias Agropecuaria dosTrabuleiros Costarios , EMBRAPA , Aracaju, SE,Brazilc Department of Soil Science , North CarolinaState University , Raleigh, NC, 27695–7619Published online: 11 Nov 2008.
To cite this article: B. F. Aquino , L. F. Sobral & F. R. Cox (1998) Propertiesof Ultisols and Oxisols related to Mehlich‐3 phosphorus buffer coefficients,Communications in Soil Science and Plant Analysis, 29:9-10, 1155-1166, DOI:10.1080/00103629809370016
To link to this article: http://dx.doi.org/10.1080/00103629809370016
PLEASE SCROLL DOWN FOR ARTICLE
Taylor & Francis makes every effort to ensure the accuracy of allthe information (the “Content”) contained in the publications on ourplatform. However, Taylor & Francis, our agents, and our licensorsmake no representations or warranties whatsoever as to the accuracy,completeness, or suitability for any purpose of the Content. Any

opinions and views expressed in this publication are the opinions andviews of the authors, and are not the views of or endorsed by Taylor& Francis. The accuracy of the Content should not be relied upon andshould be independently verified with primary sources of information.Taylor and Francis shall not be liable for any losses, actions, claims,proceedings, demands, costs, expenses, damages, and other liabilitieswhatsoever or howsoever caused arising directly or indirectly inconnection with, in relation to or arising out of the use of the Content.
This article may be used for research, teaching, and private studypurposes. Any substantial or systematic reproduction, redistribution,reselling, loan, sub-licensing, systematic supply, or distribution in anyform to anyone is expressly forbidden. Terms & Conditions of accessand use can be found at http://www.tandfonline.com/page/terms-and-conditions
Dow
nloa
ded
by [
Uni
vers
ity o
f B
oras
] at
13:
35 0
4 O
ctob
er 2
014
COMMUN. SOIL SCI. PLANT ANAL., 29(9&10), 1155-1166 (1998)
Properties of Ultisols and Oxisols Relatedto Mehlich-3 Phosphorus BufferCoefficients
B. F. Aquino,a L. F. Sobral,b and F. R. Coxc
aUniversidade Federal do Ceará, Departamento de Ciéncias do Solo, Campusdo Pici, Fortaleza, CE, BrazilbCentro de Pesquias Agropecuaria dos Trabuleiros Costarios, EMBRAPA,Aracaju, SE, BrazilcDepartment of Soil Science, North Carolina State University, Raleigh, NC27695-7619
ABSTRACT
The accuracy of phosphorus (P) fertilizer recommendations can be improvedby knowing the soil buffering capacity. Field estimates of the change inMehlich-3 P per unit of P applied after one year, termed the Field Mehlich-3P Buffer Coefficient (M3PBC), were available from five Ultisols and fiveOxisols. Specific surface area (SSA), clay content, and iron (Fe) and aluminum(Al) extractable by both citrate-bicarbonate-dithionite (CBD) and oxalate(Oxa) were determined on these soils and the results related to the FieldM3PBC. The Field M3PBC was highly correlated linearly with SSA andclay content. Also, Field M3PBC was related well with CBDFe, CBDA1,and their summation. Neither OxaFe, OxaAl, nor their summation wascorrelated with Field M3PBC. The relationship between Field M3PBC andthese factors was exponential. Specific surface area and clay gave the bestrelationships, but Field M3PBC could also be predicted from the CBDsummation of Fe and Al, CBDFe alone, or CBDAl alone, in that order.
1155
Copyright © 1998 by Marcel Dekker, Inc. www.dekker.com
Dow
nloa
ded
by [
Uni
vers
ity o
f B
oras
] at
13:
35 0
4 O
ctob
er 2
014
1156 AQUINO, SOBRAL, AND COX
Knowledge of CBD-extractable Fe and/or Al can be used to establish the rateof fertilizer required to increase the Mehlich-3 P to a sufficient level on Ultisolsand Oxisols. An estimate of CBDFe is available from soil survey data and itshould be applicable within a region.
INTRODUCTION
A properly calibrated soil test should identify not only the degree of deficiencyor sufficiency of an element, but also how much of the element should be appliedif it is deficient (Evans, 1987). These two calibration requirements will oftenchange if the soil properties vary, especially for the P soil test. Johnston et al.(1991) found that clay content was closely related to the P requirement factordefined by the authors as the inverse of the slope of the linear relationship betweenextractable P and P added. Cox (1994) showed that both the critical level and theamount of P required to change the soil test P concentration are influenced by theclay content of highly weathered soils. The clay content is indicative of the Pbuffer capacity of the soil, so knowledge of the P buffer capacity would allow soiltest interpretations to be made over a broader range of soil conditions.
The amount of P fertilizer required for maximum yield of a given crop willvary among soils that have the same P soil test level, but have different P buffercapacities (Holford and Mattingly, 1976; Holford, 1976). Studies have shownthat the soil P buffer capacity has a direct effect on both the soil test level andplant P uptake (Holford, 1976, 1980; Holford and Mattingly, 1979; Kuo, 1990).Moreover, it has been demonstrated that the use of buffer capacity indices hasincreased the efficacy of soil test interpretation in predicting fertilizer Prequirements (Moody, 1979; Holford and Cullis, 1985; Cajuste et al., 1992).
Clay percentage has been used to include the influence of the P buffer capacity(Cox and Lins, 1984; Johnstonetal., 1991; Lins and Cox, 1989). However, othersoil properties also are known to affect the P buffer capacity (Jones, 1981;Borggaard, 1983; Torrent et al., 1992; MesquitaFilho and Torrent, 1993). Ayodeleand Agboola (1981) found Al and Fe oxides to be the parameters most significantlycorrelated with P availability indices of Nigerian soils; lower correlations resultedfrom clay and organic matter contents, and pH. Sharpley et al. (1989) found thatchanges in a P availability index with time were not only correlated with claycontent but also with concentrations of calcium carbonate (CaCO3) and Fe and Aloxides.
Other studies have shown that when noncrystalline forms of Al extractable byammonium oxalate are present, clay is not as well related to the P buffering capacity(Bolland et al., 1996; Bainbridge et al., 1995). On soils with noncrystalline Alhydrous oxides, however, pH measurement in IM sodium fluoride (NaF) hasbeen a good indicator of the P buffering capacity (Gilkes and Hughes, 1994).Aluminum extracted by Mehlich-3 also has been proposed as an estimate of thebuffering capacity (Tran et al., 1990; Piha, 1993).
Dow
nloa
ded
by [
Uni
vers
ity o
f B
oras
] at
13:
35 0
4 O
ctob
er 2
014
PROPERTIES OF ULTISOLS AND OXISOLS 1157
An estimate of the P buffer capacity is given by the change in the soil test levelwith time after an application of P. We have field data showing the change inMehlich-3 P after one year, herein termed the Mehlich-3 P buffer coefficient.The objective of this investigation was to evaluate the relationship between selectedsoil properties and the Mehlich-3 P buffer coefficient derived from field data.
MATERIALS AND METHODS
Soils
Ten soils from the United States (North Carolina) and Brazil were used. Thesesoils were from fields where P studies had previously been conducted. The NorthCarolina soils were Ultisols from three sites of Cecil (fine, kaolinitic, thermicTypic Kanhaplüdult), one of Goldsboro (fine-loamy, siliceous subactive, thermicAquic Paleudult), and one of Portsmouth (fine-loamy over sandy or sandy-skeletal,mixed, thermic Typic Umbraquult). The Brazilian soils were Oxisols from foursites of kaolinitic Oxisols (very fine, kaolinitic, isohyperthermic Typic Haplustox)and one site of a gibbsitic Oxisol (very fine, gibbsitic, isohyperthermic TypicAcrustox).
Field Mehlich-3 Phosphorus Buffer Coefficient
Soybean [Glycine max (L.) Merr.] and corn (Zea mays L.) were grown for fiveto seven years on the five Ultisols in North Carolina after initial incorporation offour rates of P (Cox, 1994). Soybean was grown for five years on the five Oxisolsin Brazil after initial incorporation of five rates of P (Lins and Cox, 1989). Residualeffects were measured by extracting soil samples with the Mehlich-3 (Mehlich,1984) solution annually. The initial linear increase in soil test level due tofertilization and the subsequent exponential decrease in soil test level with timewere predicted by regression (Cox et al., 1981). Solution of the prediction equationfor each of these soils at a time of one year gave the Field Mehlich-3 P buffercoefficient (Field M3PBC).
Laboratory Methodology
All soil samples were dried at room temperature and passed through a 2-mmsieve. Clay content was determined by the hydrometer method. Free or crystallineFe and Al oxides were removed by buffered neutral citrate-bicarbonate-dithionite(CBD) (Mehra and Jackson, 1960). Noncrystalline or poorly crystalline forms ofFe and Al were removed by ammonium oxalate (Oxa) (Schwertmann, 1964).The Fe and Al analyses were conducted by each of the senior authors. The resultswere similar, so were averaged. Iron and Al were measured by atomic absorptionspectrophotometry.
Particle size was determined by the pipette method after removal of organicmatter and dispersion with sodium hexametaphosphate (Soil Survey Laboratory
Dow
nloa
ded
by [
Uni
vers
ity o
f B
oras
] at
13:
35 0
4 O
ctob
er 2
014
1158 AQUINO, SOBRAL, AND COX
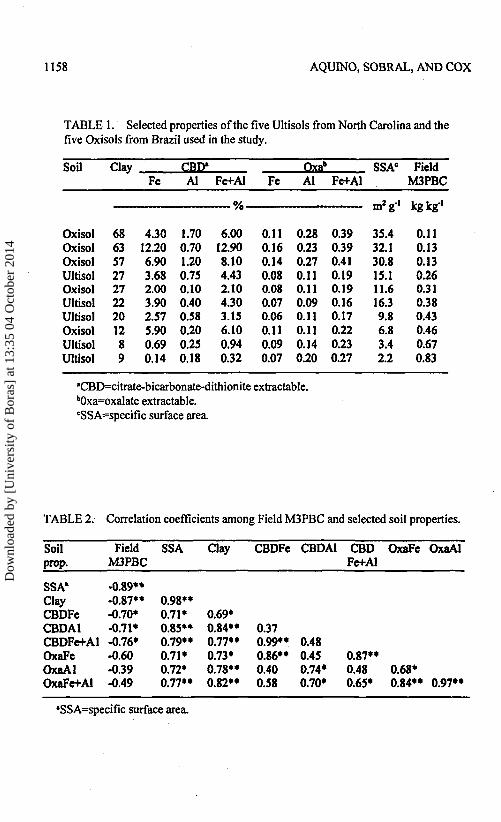
TABLE 1. Selected properties of the five Ultisols from North Carolina and thefive Oxisols from Brazil used in the study.
Soil
OxisolOxisolOxisolUltisolOxisolUltisolUltisolOxisolUltisolUltisol
Clay
686357272722201289
Fc
4.3012.206.903.682.003.902.575.900.690.14
CBD*Al
1.700.701.200.750.100.400.580.200.250.18
Fc+Al
0/
6.0012.908.104.432.104.303.156.100.940.32
Fc
0.110.160.140.080.080.070.060.110.090.07
Oxa"Al
0.280.230.270.110.110.090.110.110.140.20
Fe+Al
0.390.390.410.190.190.160.170.220.230.27
SSAe
mV
35.432.130.815.111.616.39.86.83.42.2
FieldM3PBC
kg kg1
0.110.130.130.260.310.380.430.460.670.83
"CBD=citrate-bicarbonate-dithioniteextractable.b0xa=oxalate extractable.cSSA=specific surface area.
TABLE 2. Correlation coefficients among Field M3PBC and selected soil properties.
Soilprop.
SSA1
ClayCBDFeCBDA1CBDFe+AlOxaFeOxaAlOxaFc+Al
FieldM3PBC
-0.89*»-0.87**-0.70*-0.71»-0.76»-0.60-0.39-0.49
SSA
0.98**0.71*0.85»*0.79**0.71*0.72*0.77**
Clay
0.69»0.84»*0.77**0.73*0.78**0.82**
CBDFc
0.370.99**0.86**0.400.58
CBDA1
0.480.450.74*0.70*
CBDFc+Al
0.87**0.480.65*
OxaFe OxaAl
0.68*0.84** 0.97**
•SSA=specific surface area.
Dow
nloa
ded
by [
Uni
vers
ity o
f B
oras
] at
13:
35 0
4 O
ctob
er 2
014
PROPERTIES OF ULTISOLS AND OXISOLS 1159
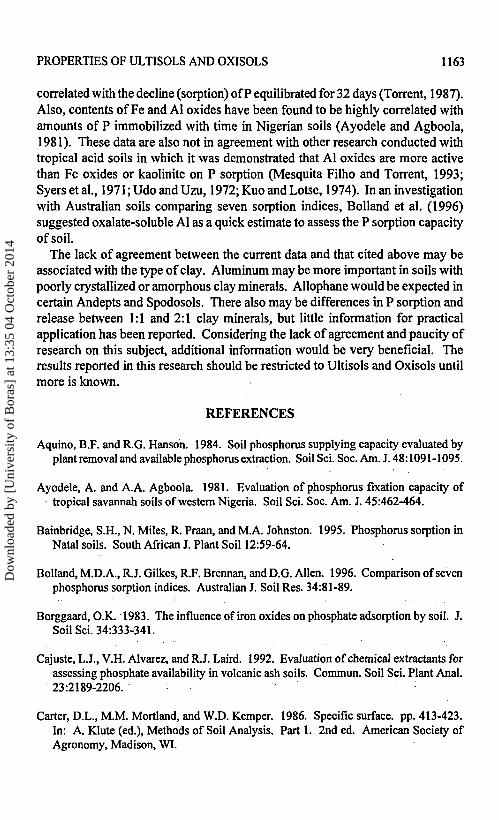
10 20 30 40
SSA (mV)
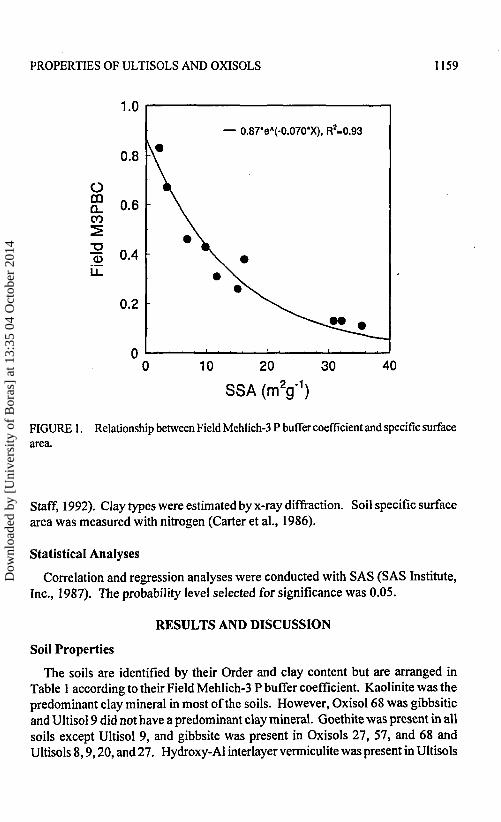
FIGURE 1. Relationship between Field Mehlich-3 P buffer coefficient and specific surfacearea.
Staff, 1992). Clay types were estimated by x-ray diffraction. Soil specific surfacearea was measured with nitrogen (Carter et al., 1986).
Statistical Analyses
Correlation and regression analyses were conducted with SAS (SAS Institute,Inc., 1987). The probability level selected for significance was 0.05.
RESULTS AND DISCUSSION
Soil Properties
The soils are identified by their Order and clay content but are arranged inTable 1 according to their Field Mehlich-3 P buffer coefficient. Kaolinite was thepredominant clay mineral in most of the soils. However, Oxisol 68 was gibbsiticand Ultisol 9 did not have a predominant clay mineral. Goethite was present in allsoils except Ultisol 9, and gibbsite was present in Oxisols 27, 57, and 68 andUltisols 8,9,20, and 27. Hydroxy-Al interlayer vermiculite was present in Ultisols
Dow
nloa
ded
by [
Uni
vers
ity o
f B
oras
] at
13:
35 0
4 O
ctob
er 2
014
1160 AQUINO, SOBRAL, AND COX
v13P
BC=i
eld
fI.U
0.8
0.6
0.4
0.2
n
»
-
<
—
\ •
• \
0.77*eA(-0.237*X), R2=0.70
•
5 10
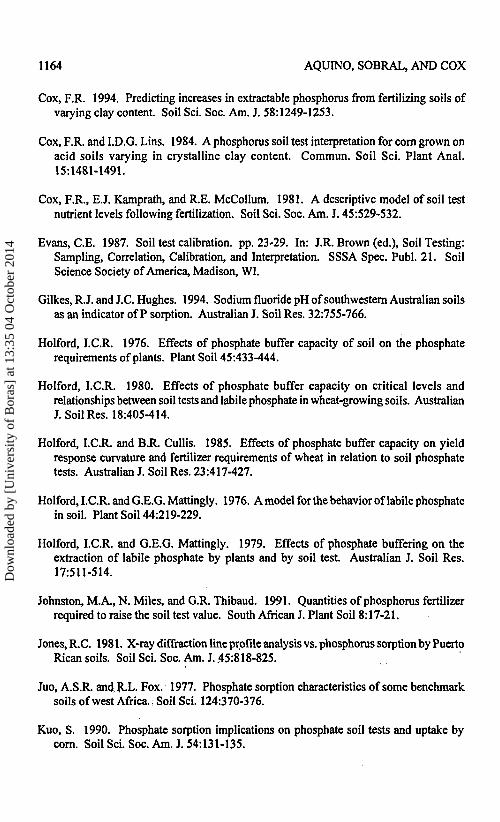
CBDFe(%)
15
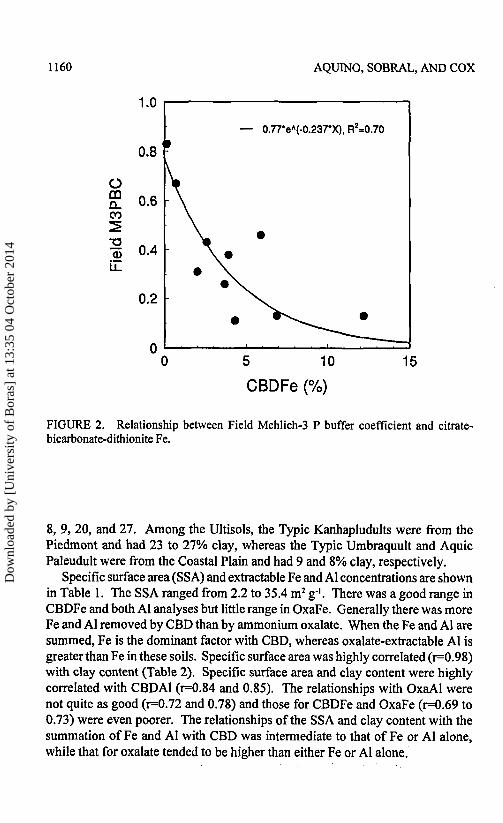
FIGURE 2. Relationship between Field Mehlich-3 P buffer coefficient and citrate-bicarbonate-dithionite Fe.
8, 9, 20, and 27. Among the Ultisols, the Typic Kanhapludults were from thePiedmont and had 23 to 27% clay, whereas the Typic Umbraquult and AquicPaleudult were from the Coastal Plain and had 9 and 8% clay, respectively.
Specific surface area (SSA) and extractable Fe and Al concentrations are shownin Table 1. The SSA ranged from 2.2 to 35.4 m2 g-'. There was a good range inCBDFe and both Al analyses but little range in OxaFe. Generally there was moreFe and Al removed by CBD than by ammonium oxalate. When the Fe and Al aresummed, Fe is the dominant factor with CBD, whereas oxalate-extractable Al isgreater than Fe in these soils. Specific surface area was highly correlated (r=0.98)with clay content (Table 2). Specific surface area and clay content were highlycorrelated with CBDA1 (r=0.84 and 0.85). The relationships with OxaAl werenot quite as good (r=0.72 and 0.78) and those for CBDFe and OxaFe (r=0.69 to0.73) were even poorer. The relationships of the SSA and clay content with thesummation of Fe and Al with CBD was intermediate to that of Fe or Al alone,while that for oxalate tended to be higher than either Fe or Al alone.
Dow
nloa
ded
by [
Uni
vers
ity o
f B
oras
] at
13:
35 0
4 O
ctob
er 2
014
PROPERTIES OF ULTISOLS AND OXISOLS 1161
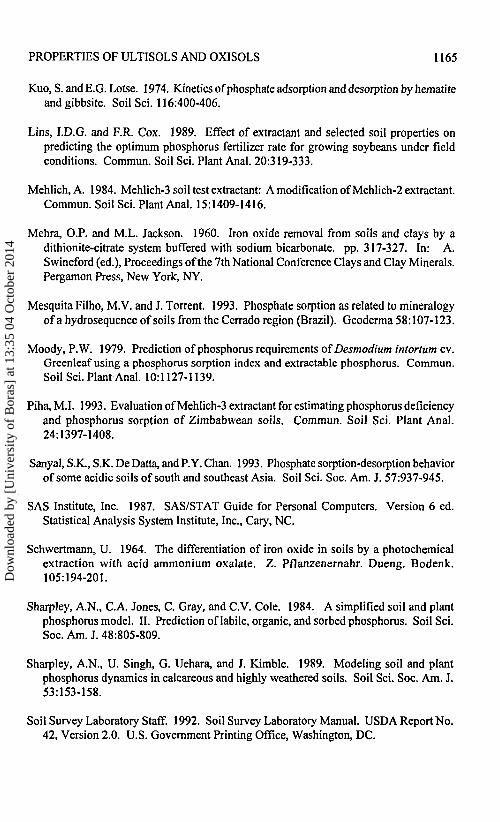
— 0.67*eA(-1.20*X), R'=0.54
0.5 1.0 1.5
CBDAI (%)
2.0
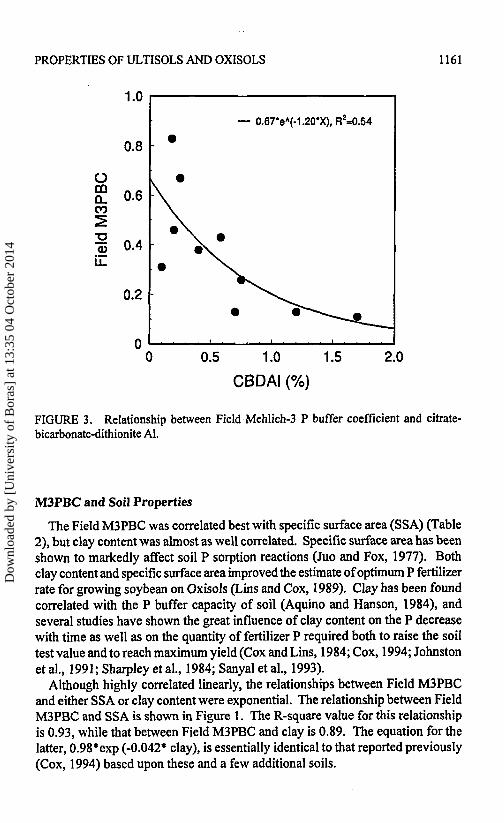
FIGURE 3. Relationship between Field Mehlich-3 P buffer coefficient and citrate-bicarbonate-dithionite Al.
M3PBC and Soil Properties
The Field M3PBC was correlated best with specific surface area (SSA) (Table2), but clay content was almost as well correlated. Specific surface area has beenshown to markedly affect soil P sorption reactions (Juo and Fox, 1977). Bothclay content and specific surface area improved the estimate of optimum P fertilizerrate for growing soybean on Oxisols (Lins and Cox, 1989). Clay has been foundcorrelated with the P buffer capacity of soil (Aquino and Hanson, 1984), andseveral studies have shown the great influence of clay content on the P decreasewith time as well as on the quantity of fertilizer P required both to raise the soiltest value and to reach maximum yield (Cox and Lins, 1984; Cox, 1994; Johnstonet al., 1991; Sharpley et al., 1984; Sanyal et al., 1993).
Although highly correlated linearly, the relationships between Field M3PBCand either SSA or clay content were exponential. The relationship between FieldM3PBC and SSA is shown in Figure 1. The R-square value for Ais relationshipis 0.93, while that between Field M3PBC and clay is 0.89. The equation for thelatter, 0.98*exp (-0.042* clay), is essentially identical to that reported previously(Cox, 1994) based upon these and a few additional soils.
Dow
nloa
ded
by [
Uni
vers
ity o
f B
oras
] at
13:
35 0
4 O
ctob
er 2
014
1162 AQUINO, SOBRAL, AND COX
5 10
CBDFe+AI (%'
15
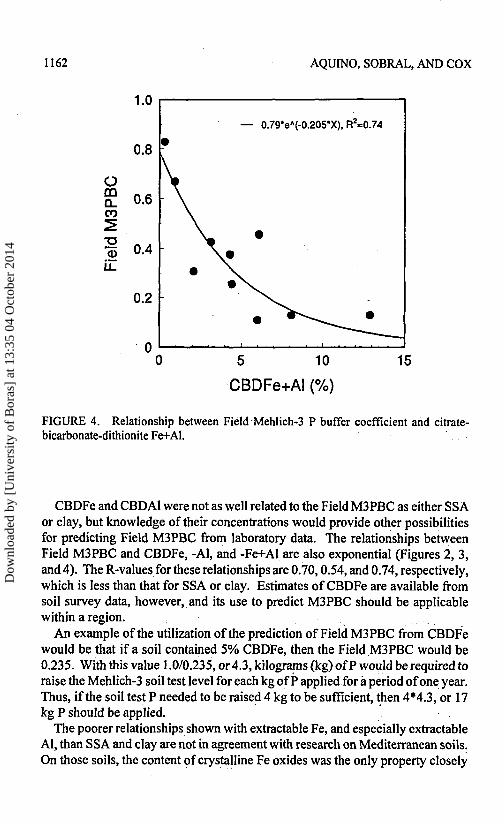
FIGURE 4. Relationship between Field Mehlich-3 P buffer coefficient and citrate-bicarbonate-dithionite Fe+Al.
CBDFe and CBDA1 were not as well related to the Field M3PBC as either SSAor clay, but knowledge of their concentrations would provide other possibilitiesfor predicting Field M3PBC from laboratory data. The relationships betweenField M3PBC and CBDFe, -Al, and -Fe+Al are also exponential (Figures 2, 3,and 4). The R-values for these relationships are 0.70,0.54, and 0.74, respectively,which is less than that for SSA or clay. Estimates of CBDFe are available fromsoil survey data, however, and its use to predict M3PBC should be applicablewithin a region.
An example of the utilization of the prediction of Field M3PBC from CBDFewould be that if a soil contained 5% CBDFe, then the Field M3PBC would be0.235. With this value 1.0/0.235, or 4.3, kilograms (kg) ofP would be required toraise the Mehlich-3 soil test level for each kg of P applied for à period of one year.Thus, if the soil test P needed to be raised 4 kg to be sufficient, then 4*4.3, or 17kg P should be applied.
The poorer relationships shown with extractable Fe, and especially extractableAI, than SSA and clay are not in agreement with research on Mediterranean soils.On those soils, the content of crystalline Fe oxides was the only property closely
Dow
nloa
ded
by [
Uni
vers
ity o
f B
oras
] at
13:
35 0
4 O
ctob
er 2
014
PROPERTIES OF ULTISOLS AND OXISOLS 1163
correlated with the decline (sorption) of P equilibrated for 32 days (Torrent, 1987).Also, contents of Fe and Al oxides have been found to be highly correlated withamounts of P immobilized with time in Nigerian soils (Ayodele and Agboola,1981). These data are also not in agreement with other research conducted withtropical acid soils in which it was demonstrated that Al oxides are more activethan Fe oxides or kaolinite on P sorption (Mesquita Filho and Torrent, 1993;Syers et al., 1971 ; Udo and Uzu, 1972; Kuo and Lotse, 1974). In an investigationwith Australian soils comparing seven sorption indices, Bolland et al. (1996)suggested oxalate-soluble Al as a quick estimate to assess the P sorption capacityof soil.
The lack of agreement between the current data and that cited above may beassociated with the type of clay. Aluminum may be more important in soils withpoorly crystallized or amorphous clay minerals. Allophane would be expected incertain Andepts and Spodosols. There also may be differences in P sorption andrelease between 1:1 and 2:1 clay minerals, but little information for practicalapplication has been reported. Considering the lack of agreement and paucity ofresearch on this subject, additional information would be very beneficial. Theresults reported in this research should be restricted to Ultisols and Oxisols untilmore is known.
REFERENCES
Aquino, B.F. and R.G. Hanson. 1984. Soil phosphorus supplying capacity evaluated byplant removal and available phosphorus extraction. Soil Sci. Soc. Am. J. 48:1091-1095.
Ayodele, A. and A.A. Agboola. 1981. Evaluation of phosphorus fixation capacity oftropical savannah soils of western Nigeria. Soil Sci. Soc. Am. J. 45:462-464.
Bainbridge, S.H., N. Miles, R. Praan, and M.A. Johnston. 1995. Phosphorus sorption inNatal soils. South African J. Plant Soil 12:59-64.
Bolland, M.D.A., R.J. Gilkes, R.F. Brennan, and D.G. Allen. 1996. Comparison of sevenphosphorus sorption indices. Australian J. Soil Res. 34:81-89.
Borggaard, O.K. 1983. The influence of iron oxides on phosphate adsorption by soil. J.Soil Sci. 34:333-341.
Cajuste, L.J., V.H. Alvarez, and R.J. Laird. 1992. Evaluation of chemical extradants forassessing phosphate availability in volcanic ash soils. Commun. Soil Sci. Plant Anal.23:2189-2206.
Carter, D.L., M.M. Mortland, and W.D. Kemper. 1986. Specific surface, pp. 413-423.In: A. Klute (ed.), Methods of Soil Analysis. Part 1. 2nd ed. American Society ofAgronomy, Madison, WI.
Dow
nloa
ded
by [
Uni
vers
ity o
f B
oras
] at
13:
35 0
4 O
ctob
er 2
014
1164 AQUINO, SOBRAL, AND COX
Cox, F.R. 1994. Predicting increases in extractable phosphorus from fertilizing soils ofvarying clay content. Soil Sci. Soc. Am. J. 58:1249-1253.
Cox, F.R. and I.D.G. Lins. 1984. A phosphorus soil test interpretation for corn grown onacid soils varying in crystalline clay content. Commun. Soil Sci. Plant Anal.15:1481-1491.
Cox, F.R., E.J. Kamprath, and R.E. McCollum. 1981. A descriptive model of soil testnutrient levels following fertilization. Soil Sci. Soc. Am. J. 45:529-532.
Evans, C.E. 1987. Soil test calibration, pp. 23-29. In: J.R. Brown (ed.), Soil Testing:Sampling, Correlation, Calibration, and Interpretation. SSSA Spec. Publ. 21. SoilScience Society of America, Madison, WI.
Gilkes, R.J. and J.C. Hughes. 1994. Sodium fluoride pH of southwestern Australian soilsas an indicator of P sorption. Australian J. Soil Res. 32:755-766.
Holford, I.C.R. 1976. Effects of phosphate buffer capacity of soil on the phosphaterequirements of plants. Plant Soil 45:433-444.
Holford, I.C.R. 1980. Effects of phosphate buffer capacity on critical levels andrelationships between soil tests and labile phosphate in wheat-growing soils. AustralianJ. Soil Res. 18:405-414.
Holford, I.C.R. and B.R. Cullis. 1985. Effects of phosphate buffer capacity on yieldresponse curvature and fertilizer requirements of wheat in relation to soil phosphatetests. Australian J. Soil Res. 23:417-427.
Holford, I.C.R. and G.E.G. Mattingly. 1976. A model for the behavior of labile phosphatein soil. Plant Soil 44:219-229.
Holford, I.C.R. and G.E.G. Mattingly. 1979. Effects of phosphate buffering on theextraction of labile phosphate by plants and by soil test. Australian J. Soil Res.17:511-514.
Johnston, M.A., N. Miles, and G.R. Thibaud. 1991. Quantities of phosphorus fertilizerrequired to raise the soil test value. South African J. Plant Soil 8:17-21.
Jones, R.C. 1981. X-ray diffraction line profile analysis vs. phosphorus sorption by PuertoRican soils. Soil Sci. Soc. Am. J. 45:818-825.
Juo, A.S.R. and R.L. Fox. 1977. Phosphate sorption characteristics of some benchmarksoils of west Africa. Soil Sci. 124:370-376.
Kuo, S. 1990. Phosphate sorption implications on phosphate soil tests and uptake bycorn. Soil Sci. Soc. Am. J. 54:131-135.
Dow
nloa
ded
by [
Uni
vers
ity o
f B
oras
] at
13:
35 0
4 O
ctob
er 2
014
PROPERTIES OF ULTISOLS AND OXISOLS 1165
Kuo, S. and E.G. Lotse. 1974. Kinetics of phosphate adsorption and desorption by hematiteand gibbsite. Soil Sci. 116:400-406.
Lins, I.D.G. and F.R. Cox. 1989. Effect of extractant and selected soil properties onpredicting the optimum phosphorus fertilizer rate for growing soybeans under fieldconditions. Commun. Soil Sci. Plant Anal. 20:319-333.
Mehlich, A. 1984. Mehlich-3 soil test extractant: A modification of Mehlich-2 extractant.Commun. Soil Sci. Plant Anal. 15:1409-1416.
Mehra, O.P. and M.L. Jackson. 1960. Iron oxide removal from soils and clays by adithionite-citrate system buffered with sodium bicarbonate, pp. 317-327. In: A.Swineford (ed.), Proceedings of the 7th National Conference Clays and Clay Minerals.Pergamon Press, New York, NY.
Mesquita Filho, M.V. and J. Torrent. 1993. Phosphate sorption as related to mineralogyof a hydrosequence of soils from the Cerrado region (Brazil). Geoderma 58:107-123.
Moody, P.W. 1979. Prediction of phosphorus requirements of Desmodium intortum cv.Greenleaf using a phosphorus sorption index and extractable phosphorus. Commun.Soil Sci. Plant Anal. 10:1127-1139.
Piha, M.I. 1993. Evaluation of Mehlich-3 extractant for estimating phosphorus deficiencyand phosphorus sorption of Zimbabwean soils. Commun. Soil Sci. Plant Anal.24:1397-1408.
Sanyal, S.K., S.K. DeDatta, and P.Y. Chan. 1993. Phosphate sorption-desorption behaviorof some acidic soils of south and southeast Asia. Soil Sci. Soc. Am. J. 57:937-945.
SAS Institute, Inc. 1987. SAS/STAT Guide for Personal Computers. Version 6 ed.Statistical Analysis System Institute, Inc., Cary, NC.
Schwertmann, U. 1964. The differentiation of iron oxide in soils by a photochemicalextraction with acid ammonium oxalate. Z. Pflanzenernahr. Dueng. Bodenk.105:194-201.
Sharpley, A.N., C.A. Jones, C. Gray, and C.V. Cole. 1984. A simplified soil and plantphosphorus model. II. Prediction of labile, organic, and sorbed phosphorus. Soil Sci.Soc. Am. J. 48:805-809.
Sharpley, A.N., U. Singh, G. Uehara, and J. Kimble. 1989. Modeling soil and plantphosphorus dynamics in calcareous and highly weathered soils. Soil Sci. Soc. Am. J.53:153-158.
Soil Survey Laboratory Staff. 1992. Soil Survey Laboratory Manual. USDA Report No.42, Version 2.0. U.S. Government Printing Office, Washington, DC.
Dow
nloa
ded
by [
Uni
vers
ity o
f B
oras
] at
13:
35 0
4 O
ctob
er 2
014
1166 AQUINO, SOBRAL, AND COX
Syers, J.K., T.D. Evans, J.D.H. Williams, and J.T. Murdock. 1971. Phosphate sorptionparameters of representative soils from Rio Grande do Sul, Brazil. Soil Sci. 112:267-275.
Torrent, J. 1987. Rapid and slow phosphate sorption by Mediterranean soils: Effect ofiron oxide. Soil Sci. Soc. Am. J. 51:78-82.
Torrent, J., U. Schwertmann, and V. Barron. 1992. Fast and slow phosphate sorption bygoethite-rich natural materials. Clays Clay Min. 40:14-21.
Tran, T., M. Giraux, J. Guilbeault, and P. Audesse. 1990. Evaluation of Mehlich-3 extractantto estimate the available P in Quebec soils. Commun. Soil Sci. Plant Anal. 21:1-28.
Udo, E. J. and F.O. Uzu. 1972. Characteristics of phosphorus adsorption by some Nigeriansoils. Soil Sci. Soc. Am. Proc. 36:879-883.
Dow
nloa
ded
by [
Uni
vers
ity o
f B
oras
] at
13:
35 0
4 O
ctob
er 2
014