Embed Size (px)
Citation preview

CHAPTER
2
Properties of Pure
Substances

Copyright © The McGraw-Hill Companies, Inc. Permission required for reproduction or display.
A Pure Substance
Is a substance that is chemically homogenous and fixed in chemical
composition.(e.g. water, nitrogen, air & etc.)
mixture of oil and water is not a pure substance.
a mixture of two or more phases of a pure substance is still a pure substance.
Phase of a Pure Substance
The phase of a substance is the homogeneous, chemical, and physical of
aggregation of its molecules.

Copyright © The McGraw-Hill Companies, Inc. Permission required for reproduction or display.
The molecules in a solid are kept at their positions
by the large spring like inter-molecular forces.
At high temperature, molecules overcome the
inter molecules forces and break away.
In the liquid phase the molecules are no longer at
fixed positions, and chunks of the molecules float
about each other.

Copyright © The McGraw-Hill Companies, Inc. Permission required for reproduction or display.
In the gas phase the molecules are far apart
from each other, irregular and move about at
random colliding with each other. Molecules
are higher energy level than they are in liquid
or solid phases.

Copyright © The McGraw-Hill Companies, Inc. Permission required for reproduction or display.
Phase Change of Pure Substances
Attention will be focused on liquid and vapor phases in this section. All
substances exhibit general behavior. Water will be used in the following
example.
compressed liquid or subcooled liquid
At 1 atm and 20°C, water exists in the liquid
phase(i.e. not about to vaporize).
As heat added the temperature increases
and water expands.(i.e. v increases)

Copyright © The McGraw-Hill Companies, Inc. Permission required for reproduction or display.
Saturated liquid
At 1 atm pressure and 100°C, water exists as
a liquid that is ready to vaporize.
Any addition of heat will cause the phase
change.

Copyright © The McGraw-Hill Companies, Inc. Permission required for reproduction or display.
Saturated liquid–vapor mixture
The state at which the liquid and vapor phases coexist in equilibrium.
Once boiling starts, the temperature will not rise until the liquid completely vaporizes.

Copyright © The McGraw-Hill Companies, Inc. Permission required for reproduction or display.
Saturated vapor
A vapor that is about to condense.
Superheated vapor
A vapor that is not about to condense (i.e., not a saturated vapor).

Copyright © The McGraw-Hill Companies, Inc. Permission required for reproduction or display.
FIGURE 2-1
T-v diagram for the
heating process of
water at constant
pressure.

Copyright © The McGraw-Hill Companies, Inc. Permission required for reproduction or display.
Holding the pressure constanta t 1 atm,
boiling takes place at 100C. By changing
the pressure we can change the boiling
temperature of water.
Saturation temperature Tsat
The temperature at which a pure substance
starts boiling.
Saturation pressure Psat
The pressure at which a pure substance
starts boiling.
FIGURE 2-2 Liquid-vapor saturation curve

Copyright © The McGraw-Hill Companies, Inc. Permission required for reproduction or display.
Property Diagrams for phase-Change Processes
FIGURE 2-3 T-V Diagram of a Pure Substance
Critical point
The point at which the
saturated liquid and
saturated vapor states are
identical.
is the maximum
temperature at which liquid
and vapor phases can co-
exist in equilibrium.

P-v diagram
of a pure
substance.
Copyright © The McGraw-Hill Companies, Inc. Permission required for reproduction or display.

Copyright © The McGraw-Hill Companies, Inc. Permission required for reproduction or display.
T-v diagram of
constant-
pressure
phase-change
processes of a
pure
substance at
various
pressures
(numerical values
are for water).

Copyright © The McGraw-Hill Companies, Inc. Permission required for reproduction or display.
P-v diagram of a
substance that
contracts on
freezing.

Copyright © The McGraw-Hill Companies, Inc. Permission required for reproduction or display.
P-v diagram
of a
substance
that expands
on freezing
(such as
water).

Copyright © The McGraw-Hill Companies, Inc. Permission required for reproduction or display.
When all three phases of a substance co-exist in equilibrium under some
conditions, it is called triple phase.
On P-v or T-v diagrams Triple line
On P-T or T-v diagrams Triple point

Copyright © The McGraw-Hill Companies, Inc. Permission required for reproduction or display.
P-T diagram
of pure
substances.
P-v-T surface of a
substance that
contracts on
freezing.
Copyright © The McGraw-Hill Companies, Inc. Permission required for reproduction or display.
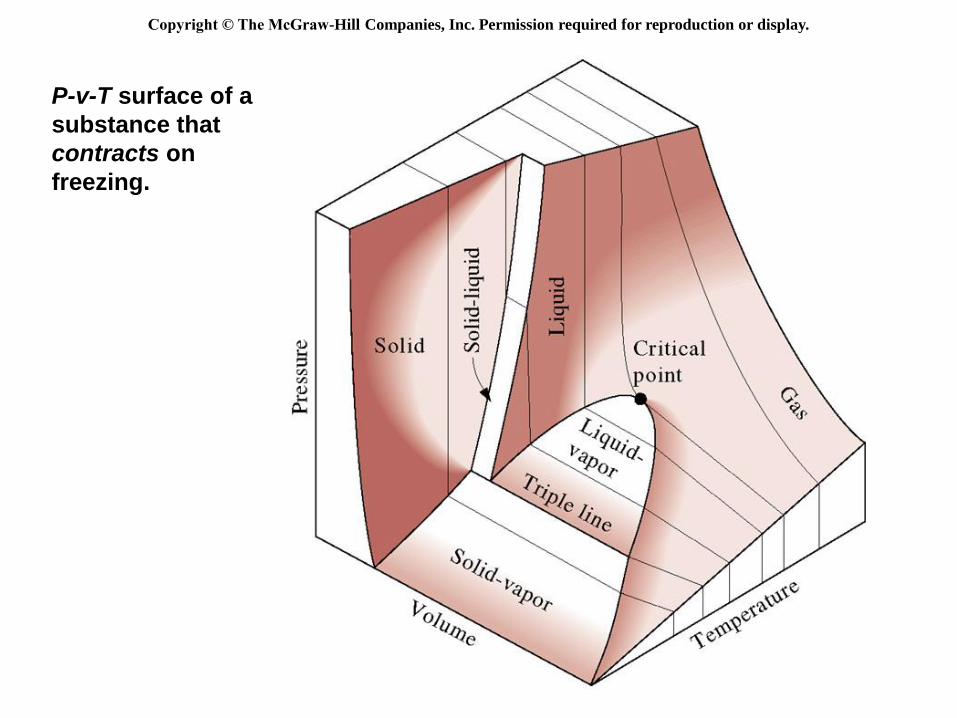
P-v-T surface of a
substance that
expands on freezing
(like water).
Copyright © The McGraw-Hill Companies, Inc. Permission required for reproduction or display.

Copyright © The McGraw-Hill Companies, Inc. Permission required for reproduction or display.
PROPERTY TABLES
Enthalpy or
Saturated Liquid and Saturated Vapor States (Tables A4 and A5 in Çengel)
Subscripts
f – saturated liquid
g – saturated vapor
fg – the difference between saturated vapor and saturated liquid
If 𝑢 is not listed → 𝑢 = ℎ − 𝑃𝑣
For example: 𝑣𝑓 = specific volume of saturated liquid
𝑣𝑔 = specific volume of saturated vapor
𝑣𝑓𝑔 = 𝑣𝑔 − 𝑣𝑓

A partial list
of Table A–4.
Copyright © The McGraw-Hill Companies, Inc. Permission required for reproduction or display.
v-value of
sat. liq.+vap
mixture

Enthalpy
kJ/kg
Press.
P kPa
Sat
temp.
Tsat oC
.......... Sat.
liquid
hf
Evap.
hfg
Sat.
Vapor
hg
20 60.06 251.42 2357.5 2608.9
25 64.94 271.96 2345.5 2617.5
30 69.09 289.27 2335.3 2624.6
40 75.86 317.62 2318.4 2636.1
50 81.32 340.54 2304.7 2645.2
75 91.76 384.44 2278.0 2662.4
Enthalpy of vaporization, hfg (Latent heat of
vaporization): The amount of energy needed to vaporize a
unit mass of saturated liquid at a given temperature or
pressure.
A partial list of Table A–5.
Copyright © The McGraw-Hill Companies, Inc. Permission required for reproduction or display.
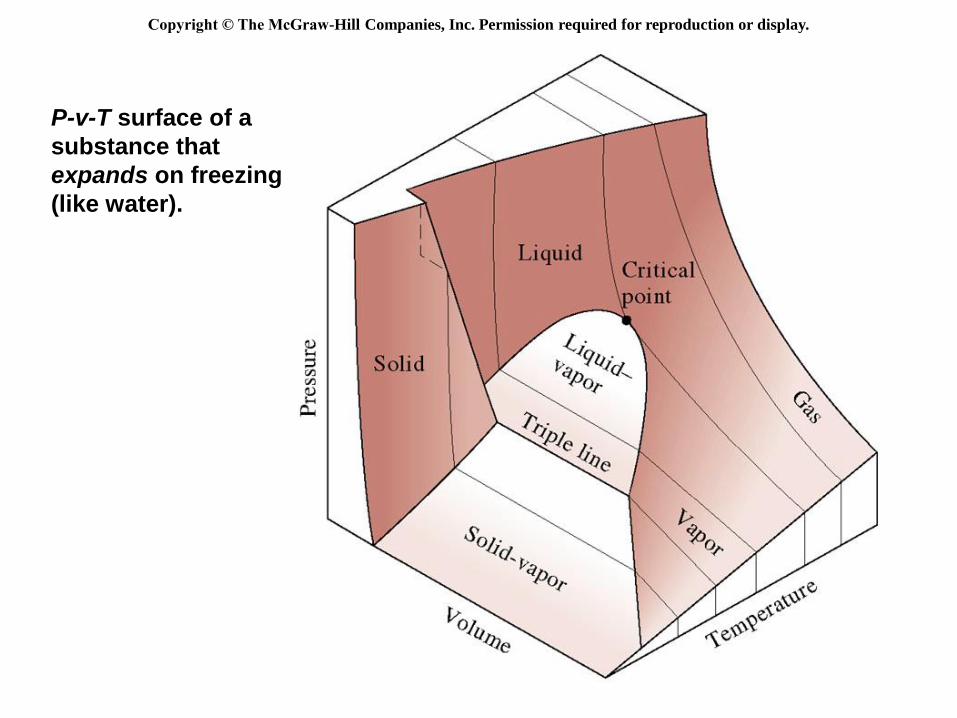
Saturated Liquid–Vapor Mixture
In order to know the properties of the liquid and vapor phase in the
mixture a new property is defined:
Quality, x : The ratio of the mass of vapor to the total mass of the mixture.
Quality is between 0 and 1 0: sat. liquid, 1: sat. vapor.
or
Copyright © The McGraw-Hill Companies, Inc. Permission required for reproduction or display.
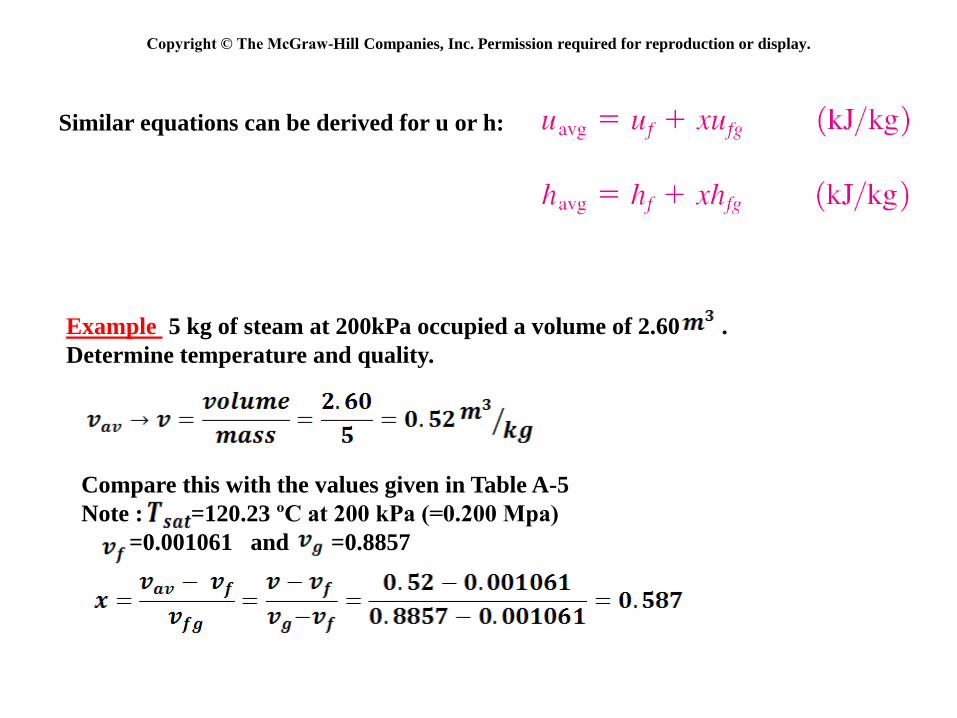
Similar equations can be derived for u or h:
Example 5 kg of steam at 200kPa occupied a volume of 2.60 .
Determine temperature and quality.
Compare this with the values given in Table A-5
Note : =120.23 ºC at 200 kPa (=0.200 Mpa)
=0.001061 and =0.8857

A partial listing
of Table A–6.
Copyright © The McGraw-Hill Companies, Inc. Permission required for reproduction or display.

Copyright © The McGraw-Hill Companies, Inc. Permission required for reproduction or display.
Superheated Vapor (Table A-6)
characterized by
Example
ºC
However at the same pressure,
if T= 200 ºC h= 2855.4

Copyright © The McGraw-Hill Companies, Inc. Permission required for reproduction or display.
Compressed Liquid
characterized by
In the absence of data a compressed liquid is approximated as a saturated liquid at
the given temperature.

Copyright © The McGraw-Hill Companies, Inc. Permission required for reproduction or display.
Example
at 80 ºC
If our pressure is 5 MPa then we have
compressed liquid.
For compressed liquid table(A-7):
From the saturation table(A-4):
If we make ,the error is:
T, oC
u, /kj kg
P =
47.3
9 k
Pa
80 Co
P =
5 M
Pa
u uf@80oC
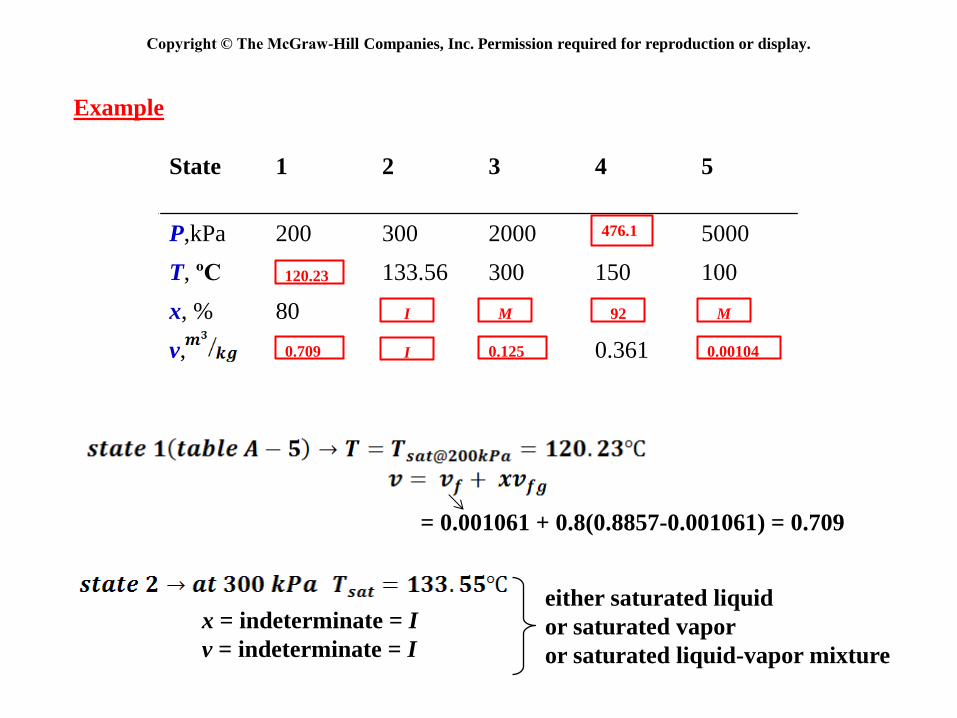
State
1 2 3 4 5
P,kPa 200 300 2000 5000
T, ºC 133.56 300 150 100
x, % 80
v, 0.361
476.1
Copyright © The McGraw-Hill Companies, Inc. Permission required for reproduction or display.
Example
120.23
I M 92 M
0.709 0.125 0.00104
= 0.001061 + 0.8(0.8857-0.001061) = 0.709
either saturated liquid
or saturated vapor
or saturated liquid-vapor mixture
x = indeterminate = I
v = indeterminate = I
I

Copyright © The McGraw-Hill Companies, Inc. Permission required for reproduction or display.
x=meaning less=M
v=012547
Compressed liquid x=meaningless=M

Copyright © The McGraw-Hill Companies, Inc. Permission required for reproduction or display.
The Ideal Gas Equation of State
Equation of State: any equation that relates the pressure, temperature, and
specific of a substance.
Ideal-gas equation of state
Absolute pressure Gas constant
Specific volume
Absolute temperature
Ideal gas is a gas which obeys the above relation. The gas constant R is
different for each gas.
=universal gas constant
M=molar mass(molecules weight)
= 8.314 or 1.986 (same for all substances)
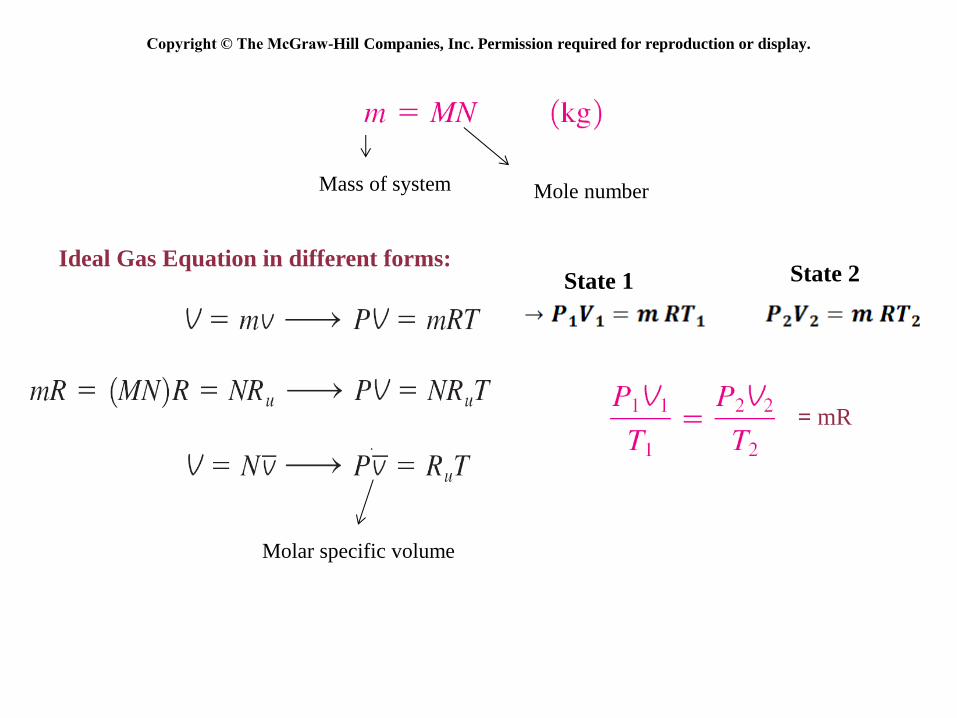
Copyright © The McGraw-Hill Companies, Inc. Permission required for reproduction or display.
Mass of system Mole number
Ideal Gas Equation in different forms: State 1 State 2
= mR
Molar specific volume

Copyright © The McGraw-Hill Companies, Inc. Permission required for reproduction or display.
Example
Determine the density and specific volume of air at room temperature.
Room temperature = 20ºC
273+20 = 293 K

Copyright © The McGraw-Hill Companies, Inc. Permission required for reproduction or display.
FIGURE 2-14
Percentage of
error
involved in
assuming steam to
be an ideal gas,
and the region
where steam can
be
treated as an ideal
gas with less than
1 percent error.

Copyright © The McGraw-Hill Companies, Inc. Permission required for reproduction or display.
COMPRESSIBILITY FACTOR
Gases deviate from ideal-gas behavior significantly at state near saturation region
and the critical point.
Hence a correction is introduced:
compressibility factor = (for ideal gases Z=1)
Z is an indication of deviation from ideal gas behavior.
Gases behave differently at a given temperature and pressure.
Reduced Pressure Reduced Temperature

Copyright © The McGraw-Hill Companies, Inc. Permission required for reproduction or display.
The Z – factor is approximately the same for all gases at the same reduced
temperature and pressure.
FIGURE 2-13
Comparison of
Z factors for
various gases.
1) , gases behave as an ideal gas regardless of T.
2) , ideal gas assumed regardless of P(except )
3) The deviation from ideal-gas is greatest around critical point
(i.e. )

Copyright © The McGraw-Hill Companies, Inc. Permission required for reproduction or display.
Example
Determine the specific volume of R-134-a at 1 MPa and 50ºC.
if ideal gas equation used
Z can be determined:
Z = 0.835
0.08149 0.02632
4.067
374.3
0.245
0.862 0.02632 0.835
0.02197
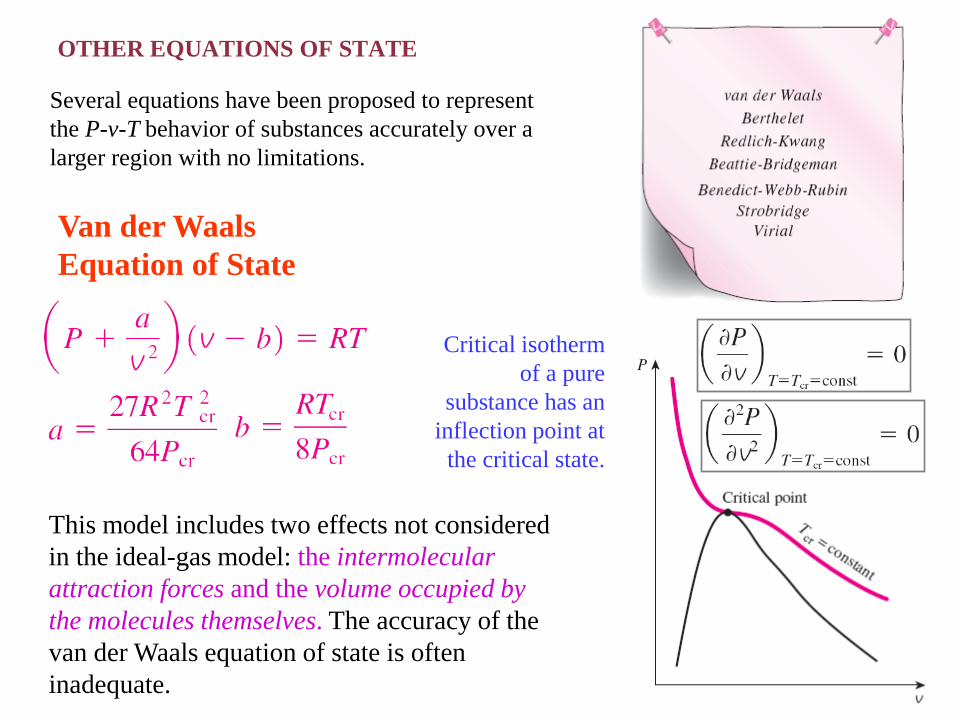
Several equations have been proposed to represent
the P-v-T behavior of substances accurately over a
larger region with no limitations.
Van der Waals
Equation of State
Critical isotherm
of a pure
substance has an
inflection point at
the critical state.
This model includes two effects not considered
in the ideal-gas model: the intermolecular
attraction forces and the volume occupied by
the molecules themselves. The accuracy of the
van der Waals equation of state is often
inadequate.
OTHER EQUATIONS OF STATE

Beattie-Bridgeman Equation of State
The constants are given in
Table 3–4 for various
substances. It is known to be
reasonably accurate for
densities up to about 0.8cr.
Benedict-Webb-Rubin Equation of State
The constants are given in Table 3–4. This equation can handle substances
at densities up to about 2.5 cr.
Virial Equation of State
The coefficients a(T), b(T), c(T), and so on, that are
functions of temperature alone are called virial coefficients.

Complex equations of
state represent the P-v-T
behavior of gases more
accurately over a wider
range. Percentage of error involved in various equations of
state for nitrogen
(% error = [(|vtable - vequation|)/vtable] 100).