Embed Size (px)
Citation preview
NIST Technical Note 1953
Propane Gas Fire Experiments in Residential Scale Structures
Joseph M. Willi
This publication is available free of charge from: https://doi.org/10.6028/NIST.TN.1953


NIST Technical Note 1953
Propane Gas Fire Experiments in Residential Scale Structures
Joseph M. Willi Fire Research Division
Engineering Laboratory
This publication is available free of charge from: https://doi.org/10.6028/NIST.TN.1953
February 2017
UN
ITE
DSTATES OF AM
ER
ICA
DE
PARTMENT OF COMMERC
E
National Institute of Standards and Technology Kent Rochford, Acting NIST Director and Under Secretary of Commerce for Standards and Technology
Certain commercial entities, equipment, or materials may be identified in this document in order to describe an experimental procedure or concept adequately.
Such identification is not intended to imply recommendation or endorsement by the National Institute of Standards and Technology, nor is it intended to imply that the entities, materials, or equipment are necessarily the best available for the purpose.
National Institute of Standards and Technology Technical Note 1953 Natl. Inst. Stand. Technol. Tech. Note 1953, 42 pages (February 2017)
CODEN: NTNOEF
This publication is available free of charge from: https://doi.org/10.6028/NIST.TN.1953

______________________________________________________________________________________________________ This publication is available free of charge from
: https://doi.org/10.6028/NIS
T.TN.1953
Contents
Contents i
List of Figures ii
List of Tables iii
List of Acronyms iv
1 Introduction 1
2 Experimental Setup 2 2.1 Test Structures . . . . . . . . . . . . . . . . . . . . . . . . . . . . . . . . . . . . . . 2
2.1.1 Construction . . . . . . . . . . . . . . . . . . . . . . . . . . . . . . . . . . . . 2 2.1.2 Layout . . . . . . . . . . . . . . . . . . . . . . . . . . . . . . . . . . . . . . . 5
2.2 Instrumentation . . . . . . . . . . . . . . . . . . . . . . . . . . . . . . . . . . . . . 7 2.2.1 East Structure . . . . . . . . . . . . . . . . . . . . . . . . . . . . . . . . . . . 8 2.2.2 West Structure . . . . . . . . . . . . . . . . . . . . . . . . . . . . . . . . . . . 14 2.2.3 Measurement Uncertainty . . . . . . . . . . . . . . . . . . . . . . . . . . . . . 21
3 Experimental Procedure 23 3.1 East Structure Tests . . . . . . . . . . . . . . . . . . . . . . . . . . . . . . . . . . . 23
3.1.1 Tests 2–4 . . . . . . . . . . . . . . . . . . . . . . . . . . . . . . . . . . . . . 23 3.1.2 Tests 5 & 6 . . . . . . . . . . . . . . . . . . . . . . . . . . . . . . . . . . . . 25
3.2 West Structure Tests . . . . . . . . . . . . . . . . . . . . . . . . . . . . . . . . . . . 28 3.2.1 Tests 22 & 23 . . . . . . . . . . . . . . . . . . . . . . . . . . . . . . . . . . . 28 3.2.2 Tests 24 & 25 . . . . . . . . . . . . . . . . . . . . . . . . . . . . . . . . . . . 28
4 Summary 31
Acknowledgments 32
References 33
i

______________________________________________________________________________________________________ This publication is available free of charge from
: https://doi.org/10.6028/NIS
T.TN.1953
List of Figures
2.1 North side of the East and West Structures. . . . . . . . . . . . . . . . . . . . . . . 3 2.2 Ceiling support of the West Structure. . . . . . . . . . . . . . . . . . . . . . . . . . 4 2.3 Dimensioned floor plan of the East Structure. . . . . . . . . . . . . . . . . . . . . . 5 2.4 Dimensioned floor plans of the West Structure. . . . . . . . . . . . . . . . . . . . . 6 2.5 Instrumentation legend. . . . . . . . . . . . . . . . . . . . . . . . . . . . . . . . . . 7 2.6 Three propane burners used as the fuel source. . . . . . . . . . . . . . . . . . . . . 8 2.7 Locations and labels of instrumentation in the East Structure. . . . . . . . . . . . . . 9 2.8 Bi-directional probe plus solid thermocouple arrays in East Structure. . . . . . . . . 10 2.9 Locations and labels of instrumentation in the West Structure. . . . . . . . . . . . . 20
3.1 Tests 2–4 layout and event times. . . . . . . . . . . . . . . . . . . . . . . . . . . . . 24 3.2 Test 5 layout and event times. . . . . . . . . . . . . . . . . . . . . . . . . . . . . . 26 3.3 Test 6 layout and event times. . . . . . . . . . . . . . . . . . . . . . . . . . . . . . 27 3.4 Tests 22–23 layout and event times. . . . . . . . . . . . . . . . . . . . . . . . . . . 29 3.5 Tests 24–25 layout and event times. . . . . . . . . . . . . . . . . . . . . . . . . . . 30
ii

______________________________________________________________________________________________________ This publication is available free of charge from
: https://doi.org/10.6028/NIS
T.TN.1953
List of Tables
2.1 East Structure Channel List . . . . . . . . . . . . . . . . . . . . . . . . . . . . . . . 11 2.2 West Structure Channel List . . . . . . . . . . . . . . . . . . . . . . . . . . . . . . 14
3.1 Heat Release Rates for Tests 5 and 6 . . . . . . . . . . . . . . . . . . . . . . . . . . 25 3.2 Heat Release Rates for West Structure Tests . . . . . . . . . . . . . . . . . . . . . . 28
iii

______________________________________________________________________________________________________ This publication is available free of charge from
: https://doi.org/10.6028/NIS
T.TN.1953
List of Acronyms
PPA Positive Pressure Attack PPV Positive Pressure Ventilation NIST National Institute of Standards and Technology OSB Oriented Strand Board TJI Truss Joist I-beams UL FSRI Underwriters Laboratories Firefighter Safety Research Institute
iv
______________________________________________________________________________________________________ This publication is available free of charge from
: https://doi.org/10.6028/NIS
T.TN.1953
Abstract
Nine full-scale fire experiments were conducted in two residential-scale structures to measure the effect of passive and forced ventilation on the fire conditions. The fires were fueled by three propane burners. Five of the experiments were conducted in a single-story structure, and four were conducted in a two-story structure. The structures were instrumented to measure temperature, gas velocity, heat flux, and oxygen, carbon dioxide, and carbon monoxide concentrations. Various doors and vents were opened and closed during the experiments to provide passive horizontal and vertical ventilation. A fan was used to provide forced ventilation. This report contains detailed descriptions of the setup and procedure used for each of the nine experiments.
v
______________________________________________________________________________________________________ This publication is available free of charge from
: https://doi.org/10.6028/NIS
T.TN.1953
Section 1
Introduction
The Fire Fighting Technology Group of the Fire Research Division at the National Institute of Standards and Technology (NIST) develops and applies technology, measurements, and standards to improve the understanding of fire behavior, prevention and suppression, which ultimately enables advances in fire fighting operations, firefighter equipment, fire suppression, fire investigations, and disaster response. One function of the group is to conduct research to enhance the understanding of fire fighting tactics and how they affect the fire environment.
The development and behavior of compartment fires, such as a fire inside a residential structure, depend greatly on the ventilation conditions within the compartment. There are a variety of tactics used by firefighters that can affect the ventilation of a fire environment. For example, firefighters may open different doors and windows within a structure or cut holes in the roof to remove hot gases and smoke. Additionally, firefighters sometimes employ a tactic known as “positive pressure attack” (PPA) or “positive pressure ventilation” (PPV) in an attempt to improve the tenability of the fire environment. PPA/PPV involves using a fan aimed at an opening of a structure and is intended to force fresh air into the structure and force hot gases and smoke out through a separate exterior vent.
Nine full-scale fire experiments were performed to study how the tactics described above affect ventilation and the fire environment within a structure. The experiments were conducted in two structures designed to replicate typical residential dwellings. During each experiment, propane was provided to three diffusion flame burners. Local measurements of temperature, gas velocity, heat flux, and gas concentrations were collected at various locations throughout the structure while the ventilation within the structure was varied by opening and closing certain doors and vents. During a number of the tests, a PPV fan was used in conjunction with the opening and closing of vents to further affect the ventilation conditions within the fire environment. This report contains in-depth descriptions of the setup and procedure used for each of the nine experiments.
1

______________________________________________________________________________________________________ This publication is available free of charge from
: https://doi.org/10.6028/NIS
T.TN.1953
Section 2
Experimental Setup
The series of field experiments described in this report were conducted in two structures of similar design located at the Delaware County Emergency Services Training Center in Sharon Hill, Pennsylvania. Three propane burners were used to fuel the fire for all experiments, and various sensors were used to collect gas temperature, gas velocity, heat flux, and gas concentration measurements throughout the structure.
2.1 Test Structures
2.1.1 Construction
Each test structure was built on a concrete slab as shown in Fig. 2.1. The East Structure was designed to simulate a single-story residential structure, and the West Structure was designed to simulate a two-story residential structure.
First Floor of Both Structures
The first floor of each structure had outer walls composed of interlocking concrete blocks measuring 0.6 m (2.0 ft) wide, 0.6 m (2.0 ft) high, and 1.2 m (4.0 ft) long. The joints and gaps between the blocks were filled with high temperature insulation. All doors along the outer walls were composed of steel.
The first floor interior walls of each structure were framed with steel studs set to 400 mm (16 in) centers and track. Two layers of 16 mm (0.63 in) Type X gypsum board lined the steel studs, and a layer of 13 mm (0.5 in) thick Durock cement board covered the gypsum board. The interior ceiling of each structure was covered by two layers of 13 mm (0.5 in) thick Durock cement board.
2

______________________________________________________________________________________________________ This publication is available free of charge from
: https://doi.org/10.6028/NIS
T.TN.1953
Figure 2.1: North side of the East Structure (top) and West Structure (bottom).
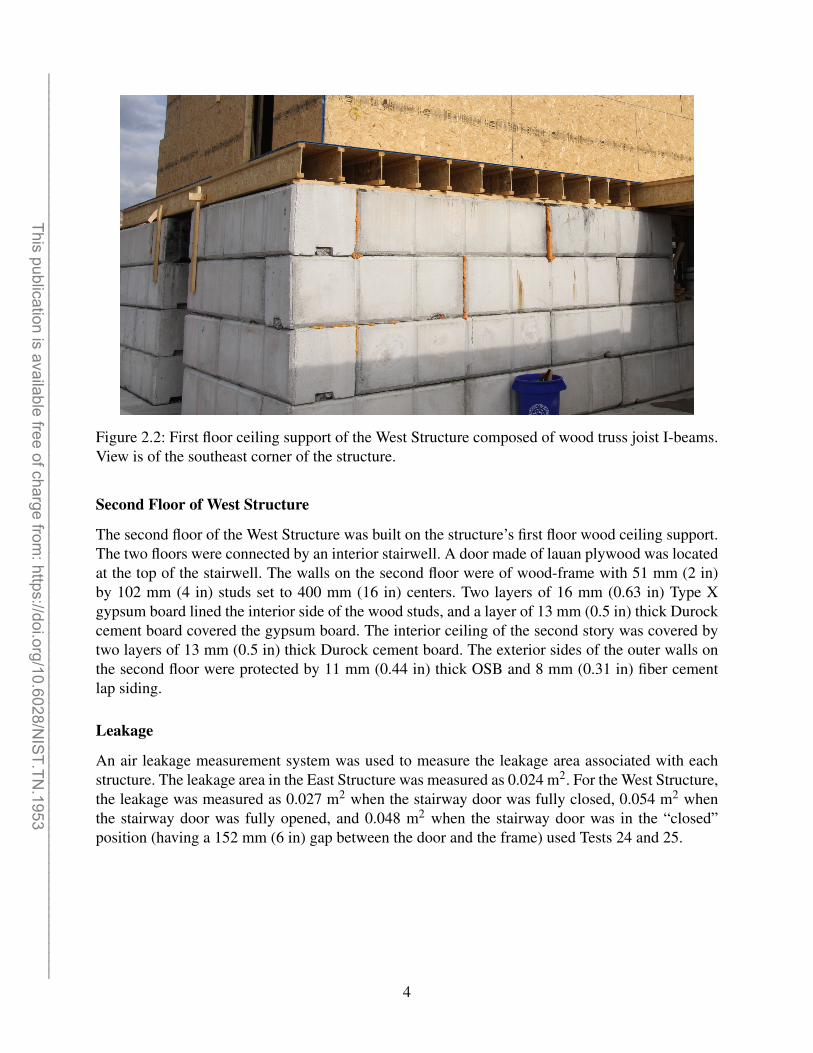
The first floor ceiling support of each structure was composed of wood truss joist I-beams (TJIs). Each TJI had a depth of 298 mm (11.75 in) and contained laminated veneer lumber flanges with a cross section of 29 mm (1.13 in) by 44 mm (1.75 in) and an 11 mm (0.43 in) thick oriented strand board (OSB) web as shown in Fig. 2.2. A layer of 18.3 mm (0.72 in) thick tongue and groove OSB was attached to the top of the TJIs.
3
______________________________________________________________________________________________________ This publication is available free of charge from
: https://doi.org/10.6028/NIS
T.TN.1953
Figure 2.2: First floor ceiling support of the West Structure composed of wood truss joist I-beams. View is of the southeast corner of the structure.
Second Floor of West Structure
The second floor of the West Structure was built on the structure’s first floor wood ceiling support. The two floors were connected by an interior stairwell. A door made of lauan plywood was located at the top of the stairwell. The walls on the second floor were of wood-frame with 51 mm (2 in) by 102 mm (4 in) studs set to 400 mm (16 in) centers. Two layers of 16 mm (0.63 in) Type X gypsum board lined the interior side of the wood studs, and a layer of 13 mm (0.5 in) thick Durock cement board covered the gypsum board. The interior ceiling of the second story was covered by two layers of 13 mm (0.5 in) thick Durock cement board. The exterior sides of the outer walls on the second floor were protected by 11 mm (0.44 in) thick OSB and 8 mm (0.31 in) fiber cement lap siding.
Leakage
An air leakage measurement system was used to measure the leakage area associated with each structure. The leakage area in the East Structure was measured as 0.024 m2. For the West Structure, the leakage was measured as 0.027 m2 when the stairway door was fully closed, 0.054 m2 when the stairway door was fully opened, and 0.048 m2 when the stairway door was in the “closed” position (having a 152 mm (6 in) gap between the door and the frame) used Tests 24 and 25.
4

______________________________________________________________________________________________________ This publication is available free of charge from
: https://doi.org/10.6028/NIS
T.TN.1953
2.1.2 Layout Dimensioned floor plans of the East and West Structures are presented in Figs. 2.3 and 2.4, respectively.
11.0 m
7.3 m
0.9 m x 2.0 m Door 0.9 m x 2.0 m
Door
2.4 m4.0 m
5.1 m
12.2 m
3.7 m
7.2 m
1.7 m
4.1 m
6.1 m
(All interior walls)0.1 m
0.9 m x 2.0 mOpen Doorway
0.9 m x 2.0 mOpen Doorway
1.2 m x 1.2 m Roof Vent
Ceiling height is 2.4 m throughout structure
N
Figure 2.3: Dimensioned floor plan of the East Structure. Structure dimensions are symmetric across horizontal centerline.
5

______________________________________________________________________________________________________ This publication is available free of charge from
: https://doi.org/10.6028/NIS
T.TN.1953
0.9 m x 2.0 m Door
0.9 m x 2.0 m Door
11.2 m
0.9 m1.9 m
2.8 m4.2 m
5.9 m10.9 m
6.4 m 6.1 m
4.6 m
0.8 m x 2.0 m Door0.9 m
1.2 m2.4 m
3.1 m
4.4 m4.0 m
0.1 m(All interior walls)
1.2 m x 2.4 mOpen Doorway
Ceiling height is 2.4 m throughout structure
11.9 m
10.7 m
0.9 m1.6 m
7.0 m 5.8 m
0.9 m1.5 m
2.0 m
4.3 m
0.1 m15 stairs
184 mm rise/191 mm run
0.9 m x 2.0 m Door
N
Figure 2.4: Dimensioned floor plan of the second floor (top) and first floor (bottom) of the West Structure.
The exterior doors of both structures, the stairwell door in the West Structure, and the square roof vent with a depth of 320 mm (12.75 in) in the East Structure were opened and closed at certain instances during the experiments to change the ventilation patterns within the structures.
6

______________________________________________________________________________________________________ This publication is available free of charge from
: https://doi.org/10.6028/NIS
T.TN.1953
2.2 Instrumentation
The structures were instrumented for temperature, gas velocity, heat flux, and gas concentration measurements. Gas temperatures in the burn rooms were measured with bare-bead, Chromel-Alumel (type K) thermocouples. Additional single thermocouples were installed in conjunction with bi-directional probes for gas velocity measurements. The single thermocouples were bare-bead, Chromel-Alumel (type K) thermocouples with a 1.0 mm (0.04 in) nominal diameter. The thermocouple wire was protected with a 3.2 mm (0.13 in) diameter inconel sheath. Schmidt-Boelter gauges were used to measure both total heat flux and radiant heat flux (radiometer). A radiometer is a total heat flux gauge with a zirconium window to prevent contributions from convective heat transfer. Calibrated pumps pulled gas samples through a sample conditioning system to eliminate moisture in the sample. Then, the dry gas samples were piped to a series of gas analyzers and the concentrations of oxygen, carbon monoxide, and carbon dioxide were measured. A legend is presented in Fig. 2.5 to clarify the instrumentation schematics presented in the follow sections.
Thermocouple Array
Bi-directional Probe Array
Heat Flux Gauge
Gas Measurement
0.6 m x 0.6 m Propane Burner
Figure 2.5: Legend used for schematics of instrumentation locations.
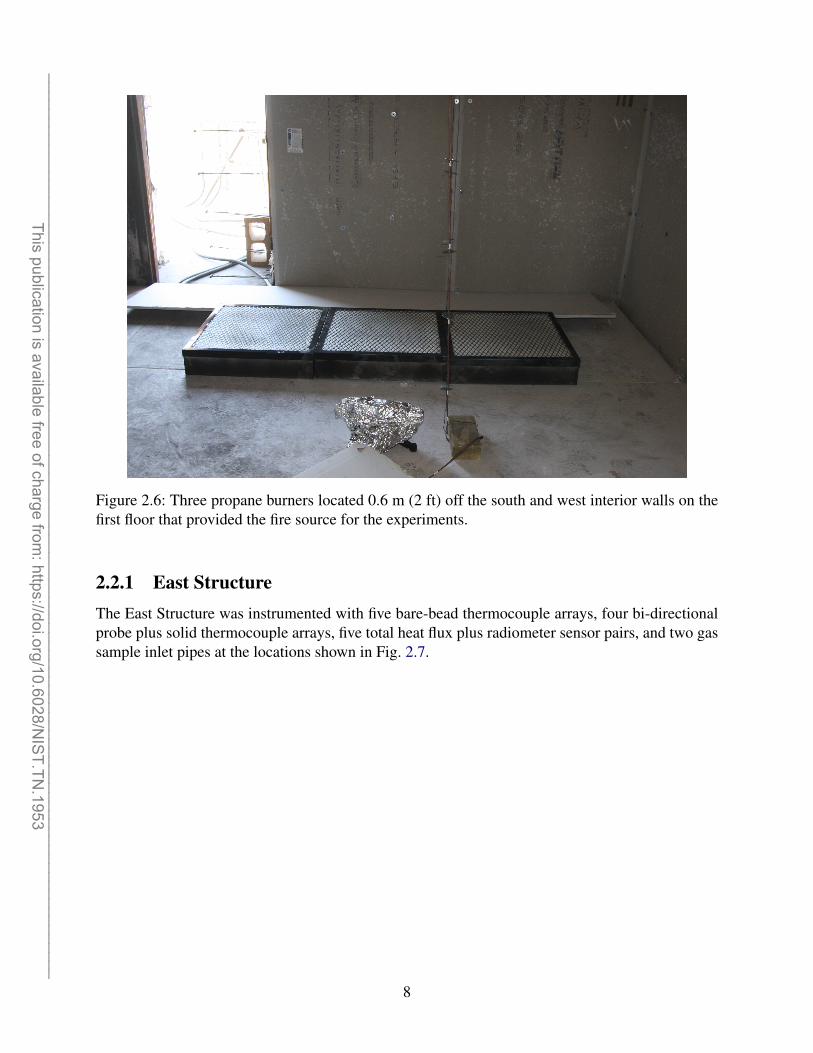
Three diffusion flame burners, pictured in Fig. 2.6, were used as the fuel source in each experiment. Each burner had a square opening of side length 0.6 m (2 ft) located 0.14 m (5.5 in) above the floor and were positioned 0.6 m (2 ft) from the south and west walls on the first floor of each structure. Propane was supplied to the burners during all experiments. The flow of propane to each burner was controlled by a high-precision turn valve, and the total displaced gas volume was measured using a rotary gas meter.
7
______________________________________________________________________________________________________ This publication is available free of charge from
: https://doi.org/10.6028/NIS
T.TN.1953
Figure 2.6: Three propane burners located 0.6 m (2 ft) off the south and west interior walls on the first floor that provided the fire source for the experiments.
2.2.1 East Structure
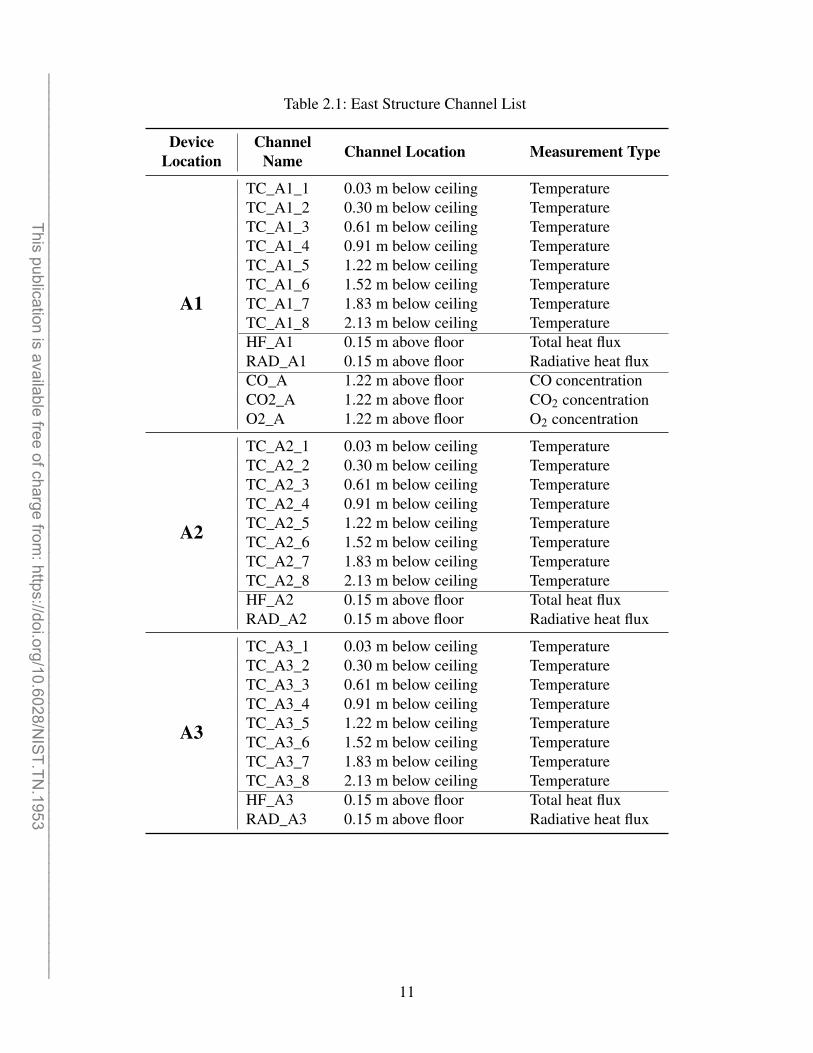
The East Structure was instrumented with five bare-bead thermocouple arrays, four bi-directional probe plus solid thermocouple arrays, five total heat flux plus radiometer sensor pairs, and two gas sample inlet pipes at the locations shown in Fig. 2.7.
8

______________________________________________________________________________________________________ This publication is available free of charge from
: https://doi.org/10.6028/NIS
T.TN.1953
7.3 m
12.2 m
0.6 m
1.8 m
1.3 m1.5 m1.6 m
1.5 m1.6 m
Roof Vent
5.5 m
4.6 m3.0 m
2.6 m
3.5 m
4.8 m
9.1 m
4.4 m
5.5 m
A10
A3
A2
A7
A1A5
A4
A8
A9
N
Figure 2.7: Locations and labels of instrumentation in the East Structure.
Each bare-bead thermocouple array was composed of eight thermocouples. Three bi-directional probe and solid thermocouple arrays (A7, A8, and A9) were centered in the exterior doorways of the structure and contained eight probes as shown in Fig. 2.8. The fourth bi-directional probe and solid thermocouple array (A10), also presented in Fig. 2.8, was located at the opening of the roof vent, 320 mm (12.75 in) above the compartment ceiling. The array contained three probes centered between the east and west sides of the vent. The position of each probe and thermocouple pair relative to the south wall of the vent is listed in the channel list presented in Table 2.1. The total heat flux gauge/radiometer pairs were aimed to view the ceiling. Gas samples were pulled through 9.5 mm (0.38 in) diameter stainless steel tubing. The height of each individual sensor in the sensor arrays is listed in Table 2.1.
9

______________________________________________________________________________________________________ This publication is available free of charge from
: https://doi.org/10.6028/NIS
T.TN.1953
Figure 2.8: Bi-directional probe plus solid thermocouple array at the south exterior doorway (top) and roof vent (bottom) of the East Structure.
10
______________________________________________________________________________________________________ This publication is available free of charge from
: https://doi.org/10.6028/NIS
T.TN.1953
Table 2.1: East Structure Channel List
Device Channel Channel Location Measurement Type Location Name
TC_A1_1 TC_A1_2 TC_A1_3 TC_A1_4 TC_A1_5 TC_A1_6 TC_A1_7 TC_A1_8
0.03 m below ceiling 0.30 m below ceiling 0.61 m below ceiling 0.91 m below ceiling 1.22 m below ceiling 1.52 m below ceiling 1.83 m below ceiling 2.13 m below ceiling
Temperature Temperature Temperature Temperature Temperature Temperature Temperature Temperature
HF_A1 RAD_A1
0.15 m above floor 0.15 m above floor
Total heat flux Radiative heat flux
CO_A CO2_A O2_A
1.22 m above floor 1.22 m above floor 1.22 m above floor
CO concentration CO2 concentration O2 concentration
TC_A2_1 0.03 m below ceiling Temperature TC_A2_2 0.30 m below ceiling Temperature TC_A2_3 0.61 m below ceiling Temperature TC_A2_4 0.91 m below ceiling Temperature TC_A2_5 1.22 m below ceiling Temperature TC_A2_6 1.52 m below ceiling Temperature TC_A2_7 1.83 m below ceiling Temperature TC_A2_8 2.13 m below ceiling Temperature HF_A2 RAD_A2
0.15 m above floor 0.15 m above floor
Total heat flux Radiative heat flux
A1
A2
A3
TC_A3_1 0.03 m below ceiling Temperature TC_A3_2 0.30 m below ceiling Temperature TC_A3_3 0.61 m below ceiling Temperature TC_A3_4 0.91 m below ceiling Temperature TC_A3_5 1.22 m below ceiling Temperature TC_A3_6 1.52 m below ceiling Temperature TC_A3_7 1.83 m below ceiling Temperature TC_A3_8 2.13 m below ceiling Temperature HF_A3 RAD_A3
0.15 m above floor Total heat flux 0.15 m above floor Radiative heat flux
11

______________________________________________________________________________________________________ This publication is available free of charge from
: https://doi.org/10.6028/NIS
T.TN.1953
Table 2.1: East Structure Channel List (continued)
Device Channel Channel Location Measurement Type Location Name
TC_A4_1 TC_A4_2 TC_A4_3 TC_A4_4 TC_A4_5 TC_A4_6 TC_A4_7 TC_A4_8
0.03 m below ceiling 0.30 m below ceiling 0.61 m below ceiling 0.91 m below ceiling 1.22 m below ceiling 1.52 m below ceiling 1.83 m below ceiling 2.13 m below ceiling
Temperature Temperature Temperature Temperature Temperature Temperature Temperature Temperature
HF_A4 RAD_A4
0.15 m above floor 0.15 m above floor
Total heat flux Radiative heat flux
CO_B CO2_B O2_B
1.22 m above floor 1.22 m above floor 1.22 m above floor
CO concentration CO2 concentration O2 concentration
TC_A5_1 0.03 m below ceiling Temperature TC_A5_2 0.30 m below ceiling Temperature TC_A5_3 0.61 m below ceiling Temperature TC_A5_4 0.91 m below ceiling Temperature TC_A5_5 1.22 m below ceiling Temperature TC_A5_6 1.52 m below ceiling Temperature TC_A5_7 1.83 m below ceiling Temperature TC_A5_8 2.13 m below ceiling Temperature HF_A5 RAD_A5
0.15 m above floor 0.15 m above floor
Total heat flux Radiative heat flux
A4
A5
A7
TC_A7_1 0.08 m below soffit Temperature TC_A7_2 0.34 m below soffit Temperature TC_A7_3 0.61 m below soffit Temperature TC_A7_4 0.88 m below soffit Temperature TC_A7_5 1.15 m below soffit Temperature TC_A7_6 1.42 m below soffit Temperature TC_A7_7 1.68 m below soffit Temperature TC_A7_8 1.95 m below soffit Temperature BDP_A7_1 0.08 m below soffit Velocity BDP_A7_2 0.34 m below soffit Velocity BDP_A7_3 0.61 m below soffit Velocity BDP_A7_4 0.88 m below soffit Velocity BDP_A7_5 1.15 m below soffit Velocity BDP_A7_6 1.42 m below soffit Velocity BDP_A7_7 1.68 m below soffit Velocity BDP_A7_8 1.95 m below soffit Velocity
12

______________________________________________________________________________________________________ This publication is available free of charge from
: https://doi.org/10.6028/NIS
T.TN.1953
Table 2.1: East Structure Channel List (continued)
Device Location
Channel Name
Channel Location Measurement Type
TC_A8_1 0.08 m below soffit Temperature TC_A8_2 0.34 m below soffit Temperature TC_A8_3 0.61 m below soffit Temperature TC_A8_4 0.88 m below soffit Temperature TC_A8_5 1.15 m below soffit Temperature TC_A8_6 1.42 m below soffit Temperature TC_A8_7 1.68 m below soffit Temperature TC_A8_8 1.95 m below soffit Temperature A8 BDP_A8_1 0.08 m below soffit Velocity BDP_A8_2 0.34 m below soffit Velocity BDP_A8_3 0.61 m below soffit Velocity BDP_A8_4 0.88 m below soffit Velocity BDP_A8_5 1.15 m below soffit Velocity BDP_A8_6 1.42 m below soffit Velocity BDP_A8_7 1.68 m below soffit Velocity BDP_A8_8 1.95 m below soffit Velocity
TC_A9_1 0.08 m below soffit TC_A9_2 0.34 m below soffit TC_A9_3 0.61 m below soffit TC_A9_4 0.88 m below soffit TC_A9_5 1.15 m below soffit TC_A9_6 1.42 m below soffit TC_A9_7 1.68 m below soffit TC_A9_8 1.95 m below soffit BDP_A9_1 0.08 m below soffit Velocity BDP_A9_2 0.34 m below soffit Velocity BDP_A9_3 0.61 m below soffit Velocity BDP_A9_4 0.88 m below soffit Velocity BDP_A9_5 1.15 m below soffit Velocity BDP_A9_6 1.42 m below soffit Velocity BDP_A9_7 1.68 m below soffit Velocity BDP_A9_8 1.95 m below soffit Velocity
TC_A10_1 0.91 m from S side of vent TC_A10_2 0.61 m from S side of vent TC_A10_3 0.30 m from S side of vent BDP_A10_1 0.91 m from S side of vent Velocity BDP_A10_2 0.61 m from S side of vent Velocity BDP_A10_3 0.30 m from S side of vent Velocity
A9
Temperature Temperature Temperature Temperature Temperature Temperature Temperature Temperature
A10
Temperature Temperature Temperature
13

______________________________________________________________________________________________________ This publication is available free of charge from
: https://doi.org/10.6028/NIS
T.TN.1953
2.2.2 West Structure
The first floor of the West Structure was instrumented with three bare-bead thermocouple arrays, two bi-directional probe plus solid thermocouple arrays, and one gas sample inlet pipe. The second floor was equipped with three bare-bead thermocouple arrays, four bi-directional probe plus solid thermocouple arrays, two total heat flux sensor pairs, and one gas sample inlet pipe. The location of the instrumentation in the West Structure is shown in Fig. 2.9.
The thermocouple arrays and the bi-directional probe plus solid thermocouple arrays contained eight sensors per array. Gas samples were pulled through 9.5 mm (0.38 in) diameter stainless steel tubing located 1.2 m (4 ft) above the floor. Each pair of total heat flux sensors was located 1.0 m (3.3 ft) above the floor. The pair at A16 contained one sensor facing the ceiling and another facing the north side of the room, and the pair at A17 contained one sensor facing the ceiling and another facing the stairway door. The height of each individual sensor in the sensor arrays is listed in the channel list found in Table 2.2.
Table 2.2: West Structure Channel List
Device Location
Channel Name
Channel Location Measurement Type
TC_A1_1 0.03 m below ceiling Temperature TC_A1_2 0.30 m below ceiling Temperature TC_A1_3 0.61 m below ceiling Temperature TC_A1_4 0.91 m below ceiling Temperature TC_A1_5 1.22 m below ceiling Temperature
A1 TC_A1_6 1.52 m below ceiling Temperature TC_A1_7 1.83 m below ceiling Temperature TC_A1_8 2.13 m below ceiling Temperature CO_A 1.22 m above floor CO concentration CO2_A 1.22 m above floor CO2 concentration O2_A 1.22 m above floor O2 concentration
TC_A2_1 0.03 m below ceiling Temperature TC_A2_2 0.30 m below ceiling Temperature TC_A2_3 0.61 m below ceiling Temperature TC_A2_4 0.91 m below ceiling Temperature TC_A2_5 1.22 m below ceiling Temperature TC_A2_6 1.52 m below ceiling Temperature TC_A2_7 1.83 m below ceiling Temperature TC_A2_8 2.13 m below ceiling Temperature
A2
14

______________________________________________________________________________________________________ This publication is available free of charge from
: https://doi.org/10.6028/NIS
T.TN.1953
Table 2.2: West Structure Channel List (continued)
Device Location
Channel Name
Channel Location Measurement Type
TC_A3_1 0.03 m below ceiling Temperature TC_A3_2 0.30 m below ceiling Temperature TC_A3_3 0.61 m below ceiling Temperature TC_A3_4 0.91 m below ceiling Temperature
A3 TC_A3_5 1.22 m below ceiling Temperature TC_A3_6 1.52 m below ceiling Temperature TC_A3_7 1.83 m below ceiling Temperature TC_A3_8 2.13 m below ceiling Temperature
TC_A5_1 0.08 m below soffit Temperature TC_A5_2 0.34 m below soffit Temperature TC_A5_3 0.61 m below soffit Temperature TC_A5_4 0.88 m below soffit Temperature TC_A5_5 1.15 m below soffit Temperature TC_A5_6 1.42 m below soffit Temperature TC_A5_7 1.68 m below soffit Temperature
A5 TC_A5_8 1.95 m below soffit Temperature BDP_A5_1 0.08 m below soffit Velocity BDP_A5_2 0.34 m below soffit Velocity BDP_A5_3 0.61 m below soffit Velocity BDP_A5_4 0.88 m below soffit Velocity BDP_A5_5 1.15 m below soffit Velocity BDP_A5_6 1.42 m below soffit Velocity BDP_A5_7 1.68 m below soffit Velocity BDP_A5_8 1.95 m below soffit Velocity
15

______________________________________________________________________________________________________ This publication is available free of charge from
: https://doi.org/10.6028/NIS
T.TN.1953
Table 2.2: West Structure Channel List (continued)
Device Location
Channel Name
Channel Location Measurement Type
TC_A6_1 0.08 m below soffit Temperature TC_A6_2 0.34 m below soffit Temperature TC_A6_3 0.61 m below soffit Temperature TC_A6_4 0.88 m below soffit Temperature TC_A6_5 1.15 m below soffit Temperature TC_A6_6 1.42 m below soffit Temperature TC_A6_7 1.68 m below soffit Temperature TC_A6_8 1.95 m below soffit Temperature A6 BDP_A6_1 0.08 m below soffit Velocity BDP_A6_2 0.34 m below soffit Velocity BDP_A6_3 0.61 m below soffit Velocity BDP_A6_4 0.88 m below soffit Velocity BDP_A6_5 1.15 m below soffit Velocity BDP_A6_6 1.42 m below soffit Velocity BDP_A6_7 1.68 m below soffit Velocity BDP_A6_8 1.95 m below soffit Velocity
A7
TC_A7_1 TC_A7_2 TC_A7_3 TC_A7_4 TC_A7_5 TC_A7_6 TC_A7_7 TC_A7_8
0.03 m below ceiling 0.30 m below ceiling 0.61 m below ceiling 0.91 m below ceiling 1.22 m below ceiling 1.52 m below ceiling 1.83 m below ceiling 2.13 m below ceiling
Temperature Temperature Temperature Temperature Temperature Temperature Temperature Temperature
A8
TC_A8_1 TC_A8_2 TC_A8_3 TC_A8_4 TC_A8_5 TC_A8_6 TC_A8_7 TC_A8_8
0.03 m below ceiling 0.30 m below ceiling 0.61 m below ceiling 0.91 m below ceiling 1.22 m below ceiling 1.52 m below ceiling 1.83 m below ceiling 2.13 m below ceiling
Temperature Temperature Temperature Temperature Temperature Temperature Temperature Temperature
16

______________________________________________________________________________________________________ This publication is available free of charge from
: https://doi.org/10.6028/NIS
T.TN.1953
Table 2.2: West Structure Channel List (continued)
Device Location
Channel Name
Channel Location Measurement Type
TC_A9_1 0.03 m below ceiling Temperature TC_A9_2 0.30 m below ceiling Temperature TC_A9_3 0.61 m below ceiling Temperature
A9 TC_A9_4 0.91 m below ceiling Temperature TC_A9_5 1.22 m below ceiling Temperature TC_A9_6 1.52 m below ceiling Temperature TC_A9_7 1.83 m below ceiling Temperature TC_A9_8 2.13 m below ceiling Temperature
TC_A10_1 TC_A10_2 TC_A10_3 TC_A10_4 TC_A10_5 TC_A10_6 TC_A10_7 TC_A10_8
0.08 m below soffit 0.34 m below soffit 0.61 m below soffit 0.88 m below soffit 1.15 m below soffit 1.42 m below soffit 1.68 m below soffit 1.95 m below soffit
Temperature Temperature Temperature Temperature Temperature Temperature Temperature Temperature
BDP_A10_1 BDP_A10_2 BDP_A10_3 BDP_A10_4 BDP_A10_5 BDP_A10_6 BDP_A10_7 BDP_A10_8
0.08 m below soffit 0.34 m below soffit 0.61 m below soffit 0.88 m below soffit 1.15 m below soffit 1.42 m below soffit 1.68 m below soffit 1.95 m below soffit
Velocity Velocity Velocity Velocity Velocity Velocity Velocity Velocity
CO_B CO2_B O2_B
1.22 m above floor 1.22 m above floor 1.22 m above floor
CO concentration CO2 concentration O2 concentration
A10
17

______________________________________________________________________________________________________ This publication is available free of charge from
: https://doi.org/10.6028/NIS
T.TN.1953
Table 2.2: West Structure Channel List (continued)
Device Location
Channel Name
Channel Location Measurement Type
TC_A11_1 0.08 m below soffit Temperature TC_A11_2 0.34 m below soffit Temperature TC_A11_3 0.61 m below soffit Temperature TC_A11_4 0.88 m below soffit Temperature TC_A11_5 1.15 m below soffit Temperature TC_A11_6 1.42 m below soffit Temperature TC_A11_7 1.68 m below soffit Temperature TC_A11_8 1.95 m below soffit Temperature A11 BDP_A11_1 BDP_A11_2 BDP_A11_3 BDP_A11_4 BDP_A11_5 BDP_A11_6 BDP_A11_7 BDP_A11_8
0.08 m below soffit 0.34 m below soffit 0.61 m below soffit 0.88 m below soffit 1.15 m below soffit 1.42 m below soffit 1.68 m below soffit 1.95 m below soffit
Velocity Velocity Velocity Velocity Velocity Velocity Velocity Velocity
A13
TC_A13_1 TC_A13_2 TC_A13_3 TC_A13_4 TC_A13_5 TC_A13_6 TC_A13_7 TC_A13_8 BDP_A13_1 BDP_A13_2 BDP_A13_3 BDP_A13_4 BDP_A13_5 BDP_A13_6 BDP_A13_7 BDP_A13_8
0.08 m below soffit 0.34 m below soffit 0.61 m below soffit 0.88 m below soffit 1.15 m below soffit 1.42 m below soffit 1.68 m below soffit 1.95 m below soffit 0.08 m below soffit 0.34 m below soffit 0.61 m below soffit 0.88 m below soffit 1.15 m below soffit 1.42 m below soffit 1.68 m below soffit 1.95 m below soffit
Temperature Temperature Temperature Temperature Temperature Temperature Temperature Temperature Velocity Velocity Velocity Velocity Velocity Velocity Velocity Velocity
18

______________________________________________________________________________________________________ This publication is available free of charge from
: https://doi.org/10.6028/NIS
T.TN.1953
Table 2.2: West Structure Channel List (continued)
Device Location
Channel Name
Channel Location Measurement Type
TC_A14_1 0.08 m below soffit Temperature TC_A14_2 0.34 m below soffit Temperature TC_A14_3 0.61 m below soffit Temperature TC_A14_4 0.88 m below soffit Temperature TC_A14_5 1.15 m below soffit Temperature TC_A14_6 1.42 m below soffit Temperature TC_A14_7 1.68 m below soffit Temperature TC_A14_8 1.95 m below soffit Temperature A14 BDP_A14_1 0.08 m below soffit Velocity BDP_A14_2 0.34 m below soffit Velocity BDP_A14_3 0.61 m below soffit Velocity BDP_A14_4 0.88 m below soffit Velocity BDP_A14_5 1.15 m below soffit Velocity BDP_A14_6 1.42 m below soffit Velocity BDP_A14_7 1.68 m below soffit Velocity BDP_A14_8 1.95 m below soffit Velocity
1 m above floor, HF_2_H Total heat flux facing N wall (horizontal) A16 1 m above floor, HF_2_V Total heat flux facing ceiling (vertical)
1 m above floor, HF_1_H Total heat flux facing doorway (horizontal) A17 1 m above floor, HF_1_V Total heat flux facing ceiling (vertical)
19

______________________________________________________________________________________________________ This publication is available free of charge from
: https://doi.org/10.6028/NIS
T.TN.1953
6.4 m
11.2 m
0.5 m 1.5 m
2.3 m
1.6 m
4.6 m
7.8 m
5.8 m
2.6 m
3.5 m
0.3 m
N
A10
A17
A9
A14
A13
A8A7
A16
A11
7.0 m
11.9 m
0.6 m
0.4 m 0.6 m
0.4 m
3.6 m
7.1 m 2.4 m
3.4 m
5.2 m
2.9 m
A2A6
A5A3
A1
N
Figure 2.9: Locations and labels of instrumentation in the second floor (top) and first floor (bottom) of the West Structure.
20

______________________________________________________________________________________________________ This publication is available free of charge from
: https://doi.org/10.6028/NIS
T.TN.1953
2.2.3 Measurement Uncertainty
This section lists the uncertainties in the reported length, mass, temperature, heat flux, gas concentration, gas velocity, and heat release rate measurements. Uncertainty estimates are based either on manufacturer literature or analyses performed by others for similar measurement devices and techniques. In accordance with NIST guidelines [1], measurement accuracy is reported as an expanded uncertainty or 95 % (2σ ) confidence interval. Most manufacturer specifications express accuracy in terms of a standard uncertainty or 68 % (1σ ) confidence interval.
Compartment Dimensions
Room dimensions and instrumentation array locations were made with a hand held laser measurement device with a standard uncertainty of ±6.0 mm (0.25 in) over a range of 0.6 m (2.0 ft) to 15 m (50.0 ft) according to the manufacturer [2]. Steel measuring tapes with a resolution of ±0.5 mm (0.02 in) were used to locate measurement devices. The steel measuring tapes were manufactured in compliance with NIST Manual 44, which specifies a tolerance of ±1.6 mm (0.06 in) for 9.1 m (30 ft) tapes and ±6.4 mm (0.25 in) for 30.5 m (100 ft) tapes [3]. These uncertainties are all well within the precision of the reported dimensions, which are typically rounded to the nearest 10 cm (4 in).
Thermocouples
The standard uncertainty in the temperature of the thermocouple wire itself as determined by the wire manufacturer, OMEGA Engineering, Inc., is ±2.2 ◦C at 277 ◦C and increases to ±9.5 ◦C at 871 ◦C [4]. The variation of the temperature in the environment surrounding the thermocouple is known to be much greater than that of the wire uncertainty. Expanded uncertainties as high as 20 % for upper layer temperatures measured by a 1 mm bare-bead type K thermocouple have been reported by NIST researchers [5, 6]. Small diameter thermocouples were used during these experiments to limit the impact of radiative heating and cooling. The estimated expanded uncertainty associated with the temperature measurements is ±15 %.
Heat Flux Gauges
Total heat flux measurements were made with water-cooled Schmidt-Boelter gauges. The manufacturer, MEDTHERM Corporation, reports a ±3 % calibration expanded uncertainty for these devices [7]. Results from an international study on total heat flux gauge calibration and response demonstrated that the expanded uncertainty of a Schmidt-Boelter gauge is typically ±8 % [8].
Gas Sampling
A gas sampling system from California Analytical Instruments, Inc. (model 602P) having a relative expanded uncertainty of ±1 % when compared to span gas volume fractions [9] was used to make gas concentration measurements. However, according to a study by Lock et al. [10], the non-uniformity and movement of exhaust gases contribute to an estimated expanded uncertainty of ±12 %.
21

______________________________________________________________________________________________________ This publication is available free of charge from
: https://doi.org/10.6028/NIS
T.TN.1953
Bi-Directional Probes
Bi-directional probes with Setra 264 pressure transducers from Setra Systems, Inc. were used to measure gas velocity in doorways. Bryant [11] calculated an expanded uncertainty ranging from ±14 % to ±22 % for bi-directional probes of similar design.
Heat Release Rate
A positive displacement rotary gas meter was used to measure the volume flow rate of propane into the gas burners. The manufacturer, Romet Limited, reports a relative standard uncertainty of ±2 % [12] for this type of meter (model RM-3000). A volumetric flow rate was calculated from the gas meter volume readings and used in conjunction with the heat of combustion of propane to calculate the heat release rate of the fire. The total expanded uncertainty for the heat release rate obtained from this method is estimated to be ±8 %.
22

______________________________________________________________________________________________________ This publication is available free of charge from
: https://doi.org/10.6028/NIS
T.TN.1953
Section 3
Experimental Procedure
A similar procedure was followed for all experiments described in this report. First, three propane burners were ignited in sequential order. Next, various actions, such as opening and closing doors and roof vents or turning on a fan, were performed to change the ventilation pattern within the structure. Finally, the burners were turned off and the fire was extinguished. The nine tests were conducted in series with a variety of other experiments. In order to be consistent with the original test numbering, the gas burner experiments presented in this report are referred to as Tests 2–6 and Tests 22–25.
3.1 East Structure Tests
Five different tests, Tests 2–6, were conducted in the East Structure. Table 3.1 lists the heat release rates for Tests 5 and 6. The time between the ignition of each gas burner for Tests 5 and 6 was on the order of seconds. As a result, a single heat release rate, one for all three burners ignited, is reported. The heat release rates for Tests 2–4 are not reported because they were not able to be accurately measured during the tests.
3.1.1 Tests 2–4
Tests 2–4 followed a nearly identical order of events. Fig. 3.1 includes a floor plan schematic and table of event times corresponding to the data files for each test. A 0.61 cm (2.0 ft) diameter PPV fan located 1.6 m (5.2 ft) away from the south exterior door was aimed at the center of the doorway and used during Tests 2–4. During these experiments, the south exterior door was not able to completely close due to an obstruction caused by the hoses used to transport the propane to the burners. So, when the south door was in the “closed” position, a 133 mm (5.25 in) opening was present between the door and its frame. For all other experiments, however, the south exterior door was not used and the doorway remained closed for the entirety of the test. To fully close the doorway during these tests, the hinged door was removed, and gypsum board was used to cover the doorway.
23

______________________________________________________________________________________________________ This publication is available free of charge from
: https://doi.org/10.6028/NIS
T.TN.1953
Event Times (s) for Tests 2–4 Data Files
Event Test 2 Test 3 Test 4
(1) Corner burner on 0 0 0 (2) Middle burner on 181 181 179 (3) Center burner on 361 361 360 (4) West double door opened 418 416 415 (5) East double door opened 538 536 535 (6) South exterior door opened 604 597 597 (7) Center burner off 720 778 778 (8) Middle burner off 840 898 897 (9) Corner burner off 961 1018 1019 (10) PPV fan on 1256 1316 1319 (11) PPV fan off 1892 N/A 1380 (12) PPV fan on N/A N/A 1487
6
123
N
4
5
789
10, 12
11
Figure 3.1: Tests 2–4 layout and event times.
24

______________________________________________________________________________________________________ This publication is available free of charge from
: https://doi.org/10.6028/NIS
T.TN.1953
3.1.2 Tests 5 & 6
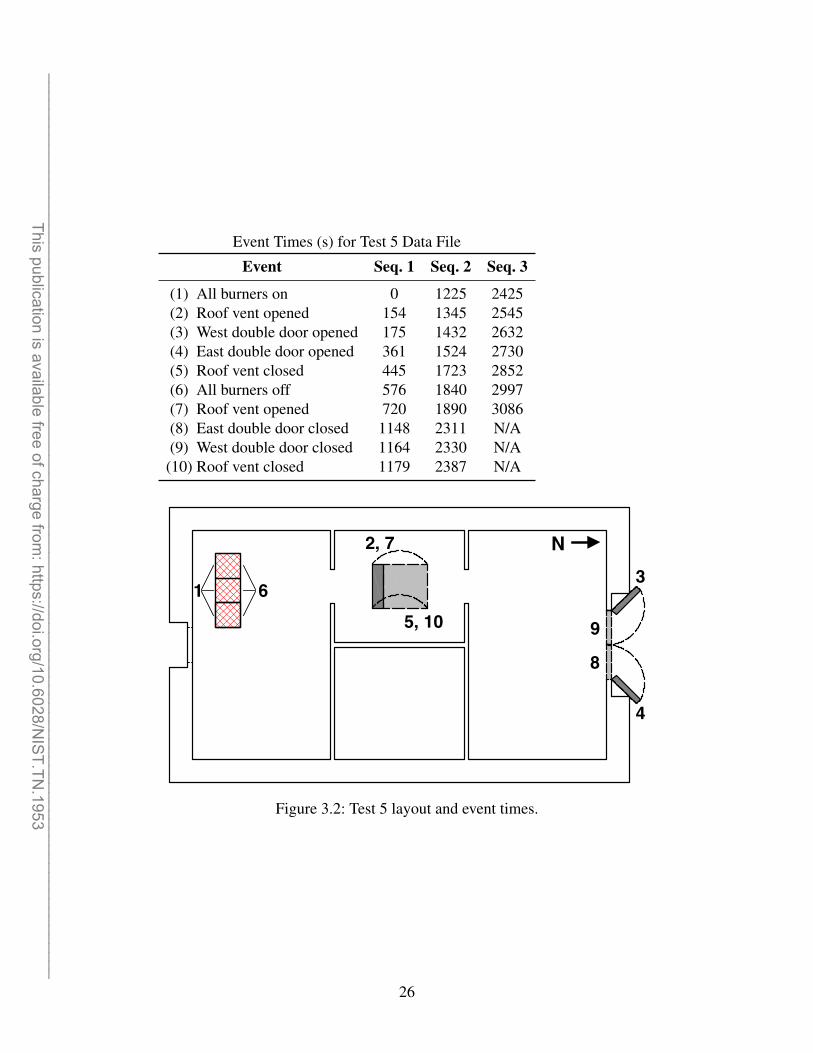
The procedures for Tests 5 and 6 are outlined in Figs. 3.2 and 3.3, respectively. Both tests involved repeating a specific set of events three times in a row. To avoid listing the identical actions three separate times in the “event” column of the tables, each repetition of events is denoted as a “sequence” (abbreviated as “seq.”), and each table contains three columns of times—one for each sequence.
Table 3.1: Heat Release Rates for Tests 5 and 6
Test Heat Release Rate (kW)
All Burners On
Test 5 - Seq. 1 Test 5 - Seq. 2 Test 5 - Seq. 3 Test 6 - Seq. 1 Test 6 - Seq. 2 Test 6 - Seq. 3
1190 1190 1190 1190 1190 1180
25
______________________________________________________________________________________________________ This publication is available free of charge from
: https://doi.org/10.6028/NIS
T.TN.1953
Event Times (s) for Test 5 Data File
Event Seq. 1 Seq. 2 Seq. 3
(1) All burners on 0 1225 2425 (2) Roof vent opened 154 1345 2545 (3) West double door opened 175 1432 2632 (4) East double door opened 361 1524 2730 (5) Roof vent closed 445 1723 2852 (6) All burners off 576 1840 2997 (7) Roof vent opened 720 1890 3086 (8) East double door closed 1148 2311 N/A (9) West double door closed 1164 2330 N/A
(10) Roof vent closed 1179 2387 N/A
N3
4
8
9
1 6
2, 7
5, 10
Figure 3.2: Test 5 layout and event times.
26

______________________________________________________________________________________________________ This publication is available free of charge from
: https://doi.org/10.6028/NIS
T.TN.1953
Event Times (s) for Test 6 Data File
Event Seq. 1 Seq. 2 Seq. 3
(1) All burners on 0 565 1075 (2) West double door opened 116 685 1195 (3) Roof vent opened 207 747 1287 (4) All burners off 327 868 1387 (5) East double door opened 369 911 1446 (6) Roof vent closed 494 1040 N/A (7) East double door closed 522 1012 N/A (8) West double door closed 538 1025 N/A
N2
5
7
8
1 4 3 6
Figure 3.3: Test 6 layout and event times.
27

______________________________________________________________________________________________________ This publication is available free of charge from
: https://doi.org/10.6028/NIS
T.TN.1953
3.2 West Structure Tests
Four different tests, Tests 22–25, were conducted in the West Structure. Table 3.2 lists the calculated heat release rate for each test. Similar to Tests 5 and 6, Tests 22–25 had a duration on the order of seconds between the ignition of each burner, so only the heat release rate for when all three burners were ignited is reported.
Table 3.2: Heat Release Rates for West Structure Tests
Heat Release Rate (kW) Test All Burners On
Test 22 1240 Test 23 1290 Test 24 1270 Test 25 1270
3.2.1 Tests 22 & 23
Tests 22 and 23 followed a nearly identical procedure. The starting configuration for Test 22 had the second story south exterior door in the opened position, while the starting configuration for Test 23 had the same door in the closed position. Fig. 3.4 includes a floor plan schematic and table of event times corresponding to the data files for Tests 22 and 23. A 0.61 m (2.0 ft) diameter PPV fan located 2.3 m (7.5 ft) away from the first level double doors and aimed at the center of the two doors was used during the tests to change the ventilation pattern within the structure.
3.2.2 Tests 24 & 25
Like Tests 22 and 23, Tests 24 and 25 followed a nearly identical procedure. The starting configuration for Test 24 had the south exterior door on the second level in the opened position, while the starting configuration for Test 25 had the same door in the closed position. During both tests, the stairwell door was unable to completely close. When it was in the “closed” position at the beginning of each test, there was a 152 mm (6.0 in) gap between the door and its frame. Fig. 3.5 includes a floor plan schematic and table of event times corresponding to the data files for Tests 24 and 25. A 0.61 m (2.0 ft) diameter PPV fan located 2.3 m (7.5 ft) away from the first level double doors and aimed at the center of the west double door was used during the tests to change the ventilation pattern within the structure.
28

Event Times (s) for Tests 22–23 Data Files
Event Test 22 Test 23
(1) All burners on 0 0 (2) 2nd floor west double door opened 194 130 (3) 1st floor west double door opened 314 252 (4) 1st floor east double door opened 450 371 (5) 2nd floor south exterior door closed 511 N/A (6) 2nd floor east double door opened 585 498 (7) PPV fan on 652 612 (8) PPV fan off 798 761 (9) All burners off 829 794
(10) 2nd floor south exterior door opened 899 849 (11) PPV fan on 1065 940 (12) 2nd floor south exterior door closed 1176 N/A
______________________________________________________________________________________________________ This publication is available free of charge from
: https://doi.org/10.6028/NIS
T.TN.1953
10
5, 126
2
1 93
4
7, 11
8
N
Figure 3.4: Tests 22–23 layout and event times.
29

______________________________________________________________________________________________________ This publication is available free of charge from
: https://doi.org/10.6028/NIS
T.TN.1953
Event Times (s) for Tests 24–25 Data Files
Event Test 24 Test 25
(1) All burners on 0 0 (2) Interior stairwell door opened 144 112 (3) 1st floor west double door opened 265 244 (4) 2nd floor west double door opened 383 353 (5) 2nd floor south exterior door closed 452 N/A (6) 2nd floor south exterior door opened 502 474 (7) PPV fan on 624 594 (8) All burners off 746 721 (9) 2nd floor east double door opened 877 N/A
(10) 1st floor east double door opened N/A 836
6 2
9
4
5
N
1 83
7
10
Figure 3.5: Tests 24–25 layout and event times.
30

______________________________________________________________________________________________________ This publication is available free of charge from
: https://doi.org/10.6028/NIS
T.TN.1953
Section 4
Summary
Nine full-scale fire tests were conducted in two residential-sized structures to examine how changing ventilation patterns within a structure affects the fire environment. The fire source for each experiment was provided by a set of three diffusion flame burners with propane as the fuel. Various doors and vents were opened and closed during each test to change ventilation within the structure. A PPV fan was also used during some of the experiments to change the ventilation patterns. Local measurements of temperature, gas velocity, heat flux, and gas concentrations were collected at various locations throughout the structure during the experiments. The total volume of propane delivered to the burners was measured by a positive displacement rotary gas meter and was used to calculate the heat release rate of the fire during each test.
31

______________________________________________________________________________________________________ This publication is available free of charge from
: https://doi.org/10.6028/NIS
T.TN.1953
Acknowledgments
The author would like to thank Daniel Madrzykowski, Roy McLane, Kristopher Overholt, Keith Stakes, and Craig Weinschenk for their contributions in preparing and conducting these experiments.
32
______________________________________________________________________________________________________ This publication is available free of charge from
: https://doi.org/10.6028/NIS
T.TN.1953
References
[1] B.N. Taylor and C.E. Kuyatt. Guidelines for Evaluating and Expressing the Uncertainty of NIST Measurement Results. NIST Technical Note 1297, National Institute of Standards and Technology, Gaithersburg, Maryland, 1994.
[2] Stanley Hand Tools, New Britain, Connecticut. User Manual TLM 100, 2013.
[3] T. Butcher, S. Cook, L. Crown, and R. Harshman. NIST Handbook 44: Specifications, Tolerances, and Other Technical Requirements for Weighing and Measuring Devices. National Institute of Standards, Gaithersburg, MD, 2012.
[4] Omega Engineering Inc., Stamford, Connecticut. The Temperature Handbook, 2004.
[5] L.G. Blevins. Behavior of bare and aspirated thermocouples in compartment fires. In National Heat Transfer Conference, 33rd Proceedings, pages 15–17, 1999.
[6] W.M. Pitts, E. Braun, R. Peacock, H. Mitler, E. Johnson, P. Reneke, and L.G. Blevins. Temperature uncertainties for bare-bead and aspirated thermocouple measurements in fire environments. ASTM Special Technical Publication, 1427:3–15, 2003.
[7] Medtherm Corporation, Huntsville, Alabama. 64 Series Heat Flux Transducers, 2003.
[8] W.M. Pitts, A.V. Murthy, J.L. de Ris, J. Filtz, K. Nygård, D. Smith, and I. Wetterlund. Round robin study of total heat flux gauge calibration at fire laboratories. Fire Safety Journal, 41(6):459–475, 2006.
[9] M. Bundy, A. Hamins, E.L. Johnsson, S.C. Kim, G.H. Ko, and D.B. Lenhart. Measurements of Heat and Combustion Products in Reduced-Scale Ventilated-Limited Compartment Fires. NIST Technical Note 1483, National Institute of Standards and Technology, Gaithersburg, MD, 2007.
[10] A. Lock, M. Bundy, E.L. Johnsson, A. Hamins, G.H. Ko, C. Hwang, P. Fuss, and R. Harris. Experimental study of the effects of fuel type, fuel distribution, and vent size on full-scale underventilated compartment fires in an ISO 9705 room. NIST Technical Note 1603, National Institute of Standards and Technology, Gaithersburg, MD, 2008.
[11] R.A. Bryant. A comparison of gas velocity measurements in a full-scale enclosure fire. Fire Safety Journal, 44:793–800, 2009.
[12] Romet Limited, East Mississauga, Ontario. Rotary Gas Meter RM3000 Technical Specification, 2014.
33