Embed Size (px)
Citation preview

Propagation ofPropagation ofElectromagnetic WavesElectromagnetic Waves
Zbynek RaidaZbynek Raida
Dept. of Radio ElectronicsDept. of Radio ElectronicsBrno University of TechnologyBrno University of TechnologyBrno, CzechiaBrno, Czechia

Communication chainCommunication chain
Frequency spectrumFrequency spectrum

Real EnvironmentReal Environment

• Over 1 GHz:– Hydrometeors attenuation– Molecule resonances– Atmospheric refraction
Direct WaveDirect Wave (1) (1)
• Up to 1 GHz:– Like propagation in vacuum
E P D ref 30

• Fresnelzones:
Direct WaveDirect Wave (2) (2)
• Connectioncondition:
r R h hp ef 2 1 2
r h hp 4 12 1 2,

Space WaveSpace Wave (1) (1)
• Direct + reflected:
• Mathematically:
rkr
DPeeEE rjkj
efef cos2130
1 21
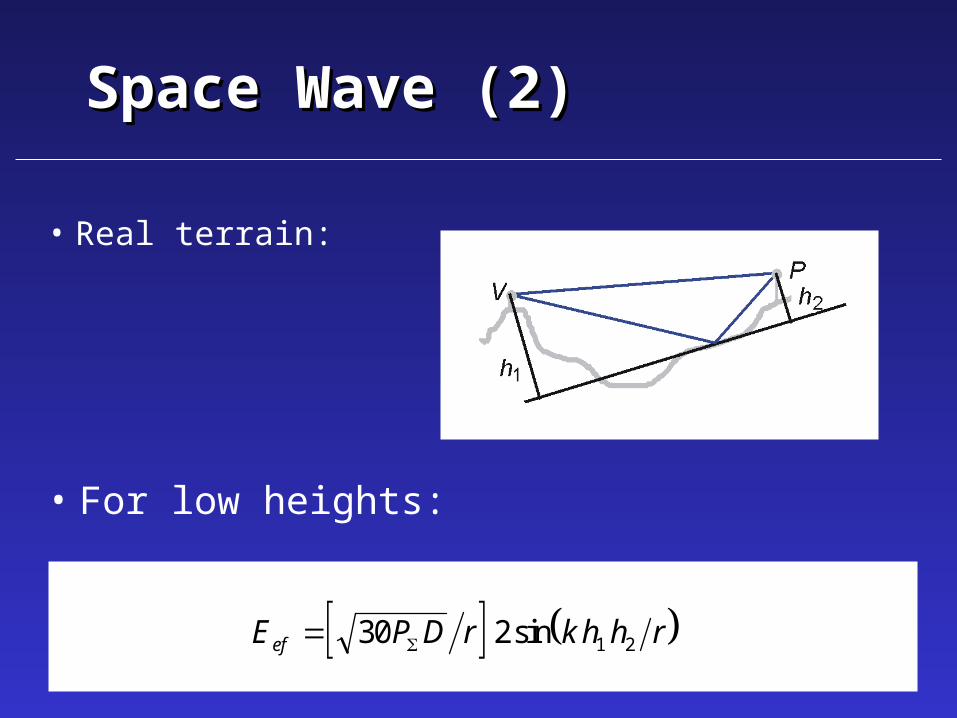
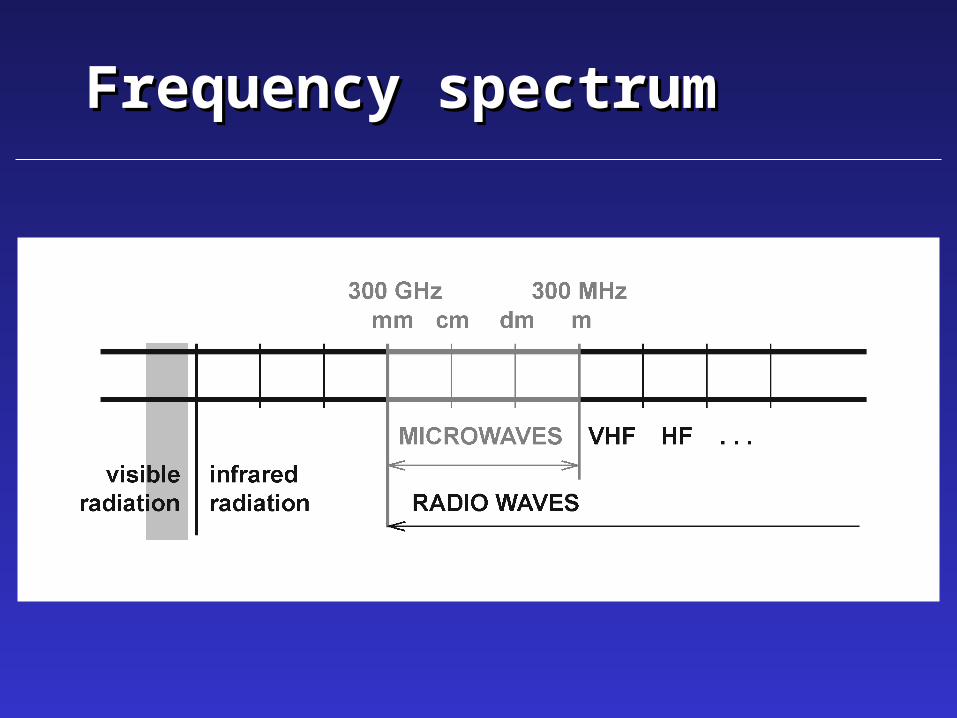
Space WaveSpace Wave (2) (2)
• Real terrain:
• For low heights:
E P D r k h h ref 30 2 1 2 sin

Space WaveSpace Wave (3) (3)
2
2
cos6060
cos6060~
jj
jj
rr
rrV
2
2
cos60sin60
cos60sin60~
jj
jj
rr
rrH
• Reflection coefficient:
rhh 21arctan

Space WaveSpace Wave (4) (4)
function [Ev,Eh] = spacwave( h1,h2,r,epr,gam,f,P,D)
lam = 3e+8/f; % wavelengthk = 2*pi/lam; % wave numberdelta = atan( (h1+h2)/r); % elevation angledel_r = 2*h1*h2 / r; % trajectory differenceE0 = sqrt( 30*P*D) / r; % direct wave intensityterm1 = epr - j*60*lam*gam; % auxiliary termsterm2 = sqrt( term1 - cos( delta)^2);term3 = term1*sin(delta);rhoh = (term3-term2) / (term3+term2); % horizont.rhov = (term1-term2) / (term1+term2); % vertical.Ev = E0 * abs( 1 + rhov*exp(j*k*del_r)); % vertical.pol.Eh = E0 * abs( 1 + rhoh*exp(j*k*del_r)); % horizont.pol.

Advanced Propagation ModelsAdvanced Propagation Models

Macro-cells (1)Macro-cells (1)
• Radius: tens of kilometers
• Height of base station antennas significantlyhigher than surrounding (trees, buildings)
• Area coverage dominantly influenced bydirectivity patter of base station antennas
• Environment: fading due to theshading effects
• Models: empirical and physical

Macro-cellsMacro-cells (2): (2): path losspath loss
• Model based on extensive set ofmeasured attenuation
• Searching for an appropriate function:
• the function meets measured data
• function parameters set for a given environment, frequency and antenna height to minimize the difference between measured and computed
• model can be used for designing communication system in similar environment

Macro-cellsMacro-cells (3): (3): path losspath loss
nT
R
r
k
LP
P
1
kK
dBKrnL
log10
log10
refref
Lr
rnL
log10
n = exponent of path lossk = inverted value of propagation attenuation for r = 1 m

Macro-cells (4): clutter factorMacro-cells (4): clutter factor
• Measurements in urban and sub-urban areas: path loss exponent 4
• the same like plane Earth surface
• absolute attenuation is higher clutter factor
• Models differ in values of parameters k and n
• Egli: method based on a number of measurements in various cities in USA

Macro-cells (5): Macro-cells (5): clutter factorclutter factor
mbc LhfRL log20log20log40
10forlog20376
10forlog103.76
mm
mmm hh.
hhL

Micro-cellsMicro-cells (1) (1)
• Reduced cell sizewhere access to thesystem required by high number of users
• The height of antennas typically 3 to 6 meters(lightning poles, building walls)
• Coverage (hundreds meters) given by electricproperties of buildings and area configuration

Micro-cells (2): Micro-cells (2): dual slopedual slope
b
nb
n
b
bn
rr
rrr
k
rrr
k
Lfor
for
1
1
2
1
12
1 1
1nn
b
n
rr
r
k
L

Pico-cellsPico-cells (1) (1)

Pico-cellsPico-cells (2) (2)
• Attenuation characterized by:
• fixed path loss exponent n = 2
• additional attenuation factors related to the number of floors nf and walls nw between stations
• where af and aw are attenuation coefficients per floor (wall), and L1 is attenuation in the distance 1 meter
wwff ananrLL log201
• FUJIMOTO, K., JAMES, J. R. Mobile Antenna Systems Handbook. 2nd Edition. Norwood: Artech House. 2001.
ReferencesReferences