Embed Size (px)
Citation preview

PROOF OF CONCEPT OF THE ION COLLIDER IN REFRIGERATION SYSTEMS
By
JASON Z. ALPHONSO
A THESIS PRESENTED TO THE GRADUATE SCHOOL OF THE UNIVERSITY OF FLORIDA IN PARTIAL FULFILLMENT
OF THE REQUIREMENTS FOR THE DEGREE OF MASTER OF SCIENCE
UNIVERSITY OF FLORIDA
2003

Copyright 2003
by
Jason Z. Alphonso

This document is dedicated to my dearest parents, Mr. Albert C. Alphonso and Mrs. Lalita T.Alphonso.

ACKNOWLEDGMENTS
I would like to thank my advisor and mentor, Dr. S.A. Sherif, for all his guidance,
patience and understanding. Special thanks go to my graduate supervisory committee
consisting of Dr. Ingley and Dr. Lear for their valuable input and suggestions. I would
like to especially thank my parents, Mr. Albert Cajetian. Alphonso and Mrs. Lalita
Theresa. Alphonso for the constant encouragement and blessings. Even though very far
away, my brother and sisters have always been a source of support and encouragement. I
thank them for being there for me.
I also wish to thank the staff of the Department of Mechanical and Aerospace
Engineering at the University of Florida. Special thanks go to my dear friends Navin,
Archit, Siddartha and Dhruv.
iv

TABLE OF CONTENTS page ACKNOWLEDGMENTS ................................................................................................. iv
LIST OF FIGURES .......................................................................................................... vii
NOMENCLATURE .......................................................................................................... ix
ABSTRACT....................................................................................................................... xi
CHAPTER 1 INTRODUCTION AND OBJECTIVES......................................................................1
2 REVIEW OF LITERATURE.......................................................................................3
3 EXPERIMENTAL PROGRAM...................................................................................7
Experimental Facility....................................................................................................7 Chilled/Heated Water Loop...................................................................................7 Data Acquisition System .......................................................................................8
Experimental Procedures ............................................................................................10 Post Data Analysis Note .............................................................................................11
4 ANALYSIS.................................................................................................................15
Analysis Based on the First Law of Thermodynamics...............................................15 Irreversibility Analysis on the Refrigeration System .................................................21
5 RESULTS AND DISCUSSION.................................................................................26
Tests Involving New Refrigerants ..............................................................................26 Instantaneous Refrigerating Capacity..................................................................26 Instantaneous Compressor Power........................................................................28 Instantaneous Coefficient of Performance ..........................................................28 Total Energy Consumption..................................................................................29
Tests Involving Old/Used Refrigerant........................................................................30 Instantaneous Refrigerating Capacity..................................................................30 Instantaneous Compressor Power........................................................................31
v
Instantaneous Coefficient of Performance ..........................................................31 Total Energy Consumption..................................................................................31
Irreversibility Analysis on the Refrigeration System .................................................47 6 CONCLUSIONS ........................................................................................................52
APPENDIX A PRESSURE-ENTHALPY DIAGRAMS FOR ACTUAL CYCLE............................55
B SAMPLE CALCULATIONS.....................................................................................58
LIST OF REFERENCES...................................................................................................65
BIOGRAPHICAL SKETCH .............................................................................................66
vi

LIST OF FIGURES
Figure page 1 Physical design of Ion Collider device ....................................................................6
2 Experimental setup.................................................................................................13
3 Ion Colliders (black and blue tubing) installed in the system................................13
4 Schematic diagram of experimental facility ..........................................................14
5 Ideal vapor compression cycle...............................................................................24
6 Schematic diagrams of actual vapor compression cycle........................................25
7 Instantaneous refrigerating capacity using new refrigerant in Standard mode .......................................................................................................33
8 Instantaneous refrigerating capacity using new refrigerant in Cut-Off mode .........................................................................................................34
9 Instantaneous compressor power using new refrigerant in the Standard mode .......................................................................................................35
10 Instantaneous compressor power using new refrigerant in the Cut-Off mode .........................................................................................................36
11 Instantaneous coefficient of performance using new refrigerant in the Standard mode .......................................................................................................37
12 Total energy consumption using new refrigerant in the Standard and Cut-Off modes .......................................................................................................38
13 Instantaneous refrigerating capacity using old/used refrigerant in the Standard mode .......................................................................................................39
14 Instantaneous refrigerating capacity using old/used refrigerant in the Cut-Off mode .........................................................................................................40
15 Instantaneous compressor power using old/used refrigerant in the Standard mode .......................................................................................................41
vii
16 Instantaneous compressor power using old/used refrigerant in the Cut-Off mode .........................................................................................................42
17 Instantaneous coefficient of performance using old/used refrigerant in the Standard mode .......................................................................................................43
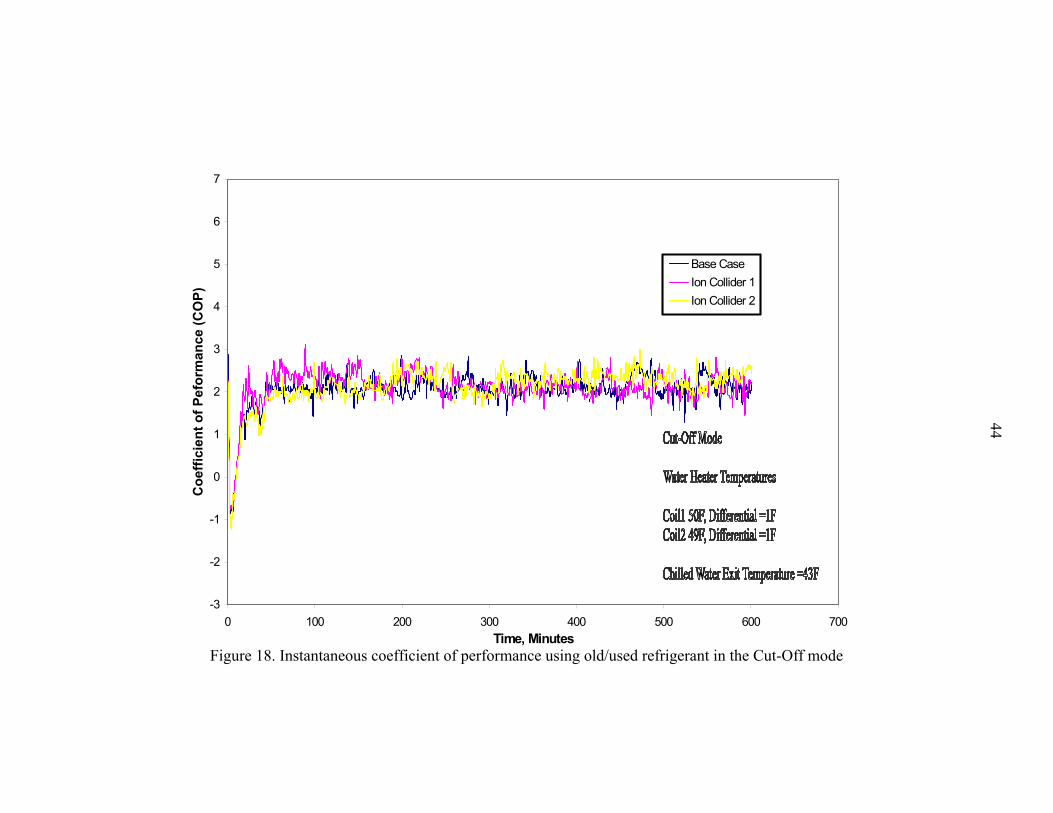
18 Instantaneous coefficient of performance using old/used refrigerant in the Cut-Off mode .........................................................................................................44
19 Total energy consumption using old/used refrigerant in the Standard and Cut-Off modes .......................................................................................................45
20 COP measured using new and old/used refrigerant in the Standard mode............46
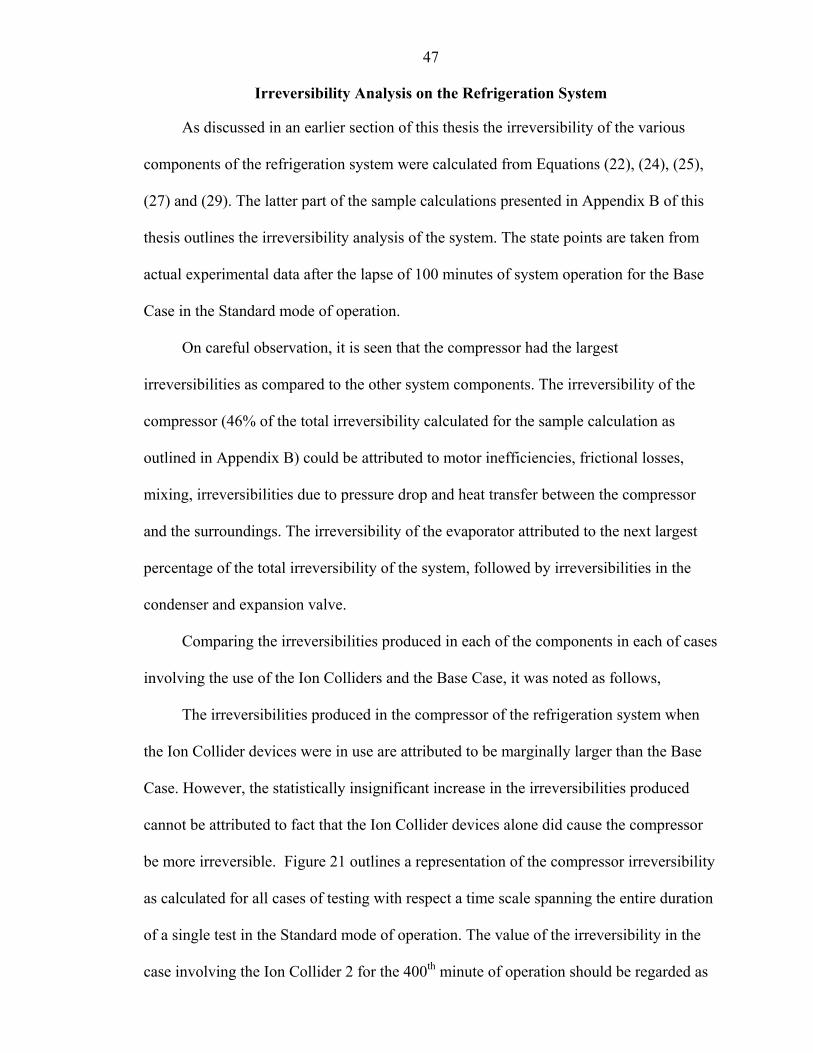
21 Compressor irreversibility using new refrigerant in the Standard mode ...............49
22 Condenser irreversibility using new refrigerant in the Standard mode .................49
23 Expansion valve irreversibility using new refrigerant in the Standard mode........50
24 Evaporator irreversibility using new refrigerant in the Standard mode.................50
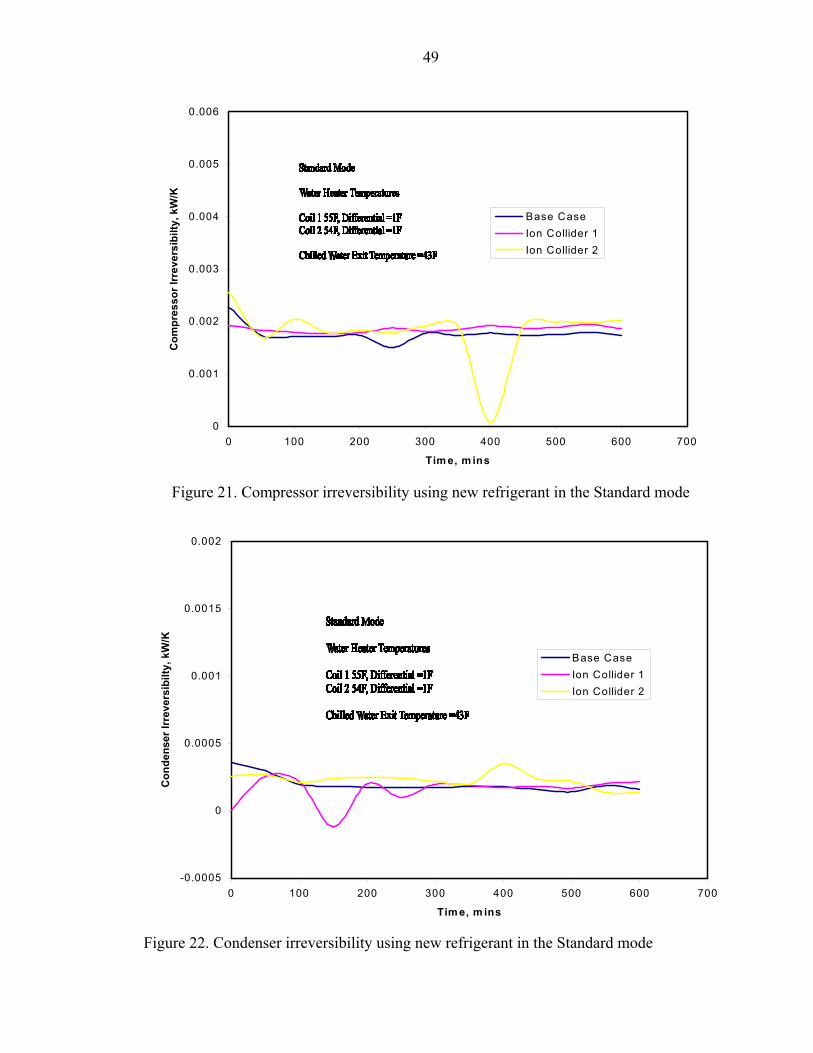
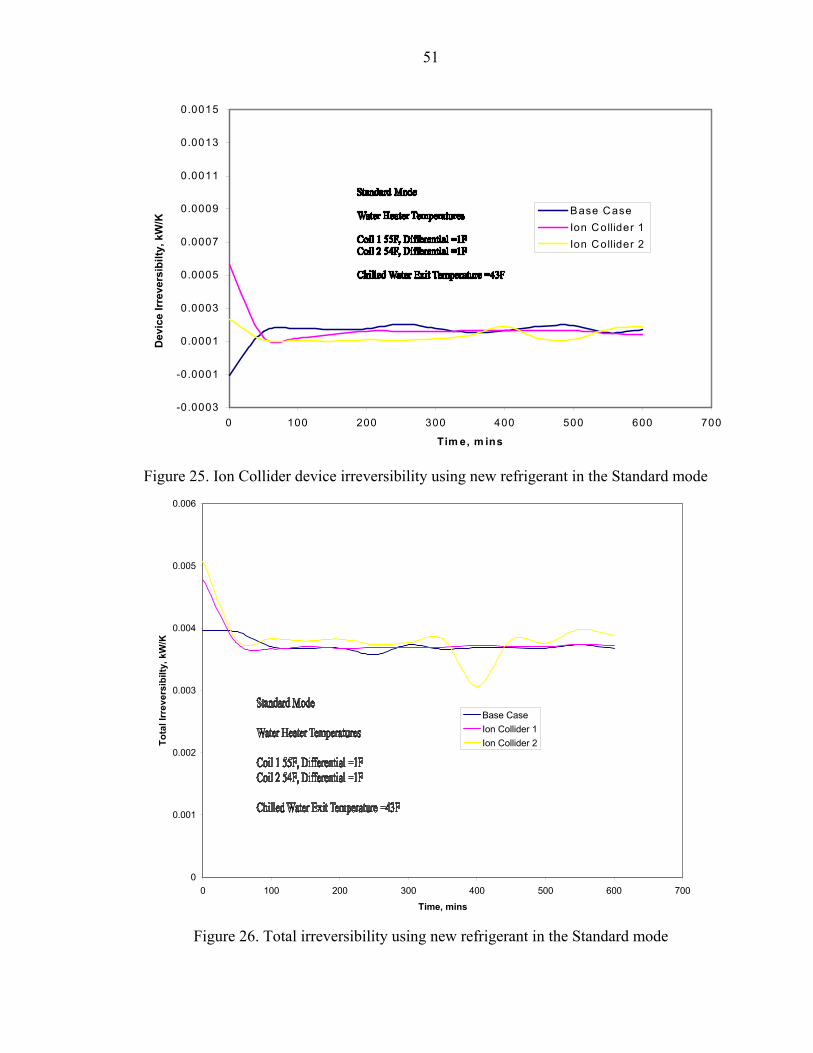
25 Ion Collider device irreversibility using new refrigerant in the Standard mode .......................................................................................................51
26 Total irreversibility using new refrigerant in the Standard mode ..........................51
27 Pressure-Enthalpy diagram for the Base Case .......................................................55
28 Pressure-Enthalpy diagram for the Ion Collider 1 .................................................56
29 Pressure-Enthalpy diagram for the Ion Collider 2 .................................................57
viii

NOMENCLATURE
Latin Symbols COP coefficient of performance, dimensionless Cp specific heat, kJ/(kg.°C) h specific enthalpy, kJ/kg I current, Amp I& irreversibility, kW/K m& mass flow rate, kg/s n polytropic exponent, dimensionless P pressure, Pascal Q& heat transfer rate, kW T temperature, K V voltage, V V volume, 3m v specific volume, /kgm3
W& power, Watts Greek Symbols φ power factor, dimensionless
eη electrical efficiency, dimensionless
mη mechanical efficiency, dimensionless
vη volumetric efficiency, dimensionless ρ density, 3kg/m Subscripts a air amb ambient calc calculated cond condenser comp compressor e evaporator exp expansion valve i inlet meas measured
ix

o outlet r refrigerant ref space refrigeration space total total w water
x
Abstract of Thesis Presented to the Graduate School
of the University of Florida in Partial Fulfillment of the Requirements for the Degree of Master of Science.
PROOF OF CONCEPT OF THE ION COLLIDER IN REFRIGERATION SYSTEMS
By
Jason Z. Alphonso
December 2003
Chair: Sherif A. Sherif Major Department: Mechanical and Aerospace Engineering.
The objective of this study was to examine and analyze the effects of employing a
device labeled the “Ion Collider” on the performance of a vapor compression
refrigeration system. Tests were conducted for two types of refrigerants; (1) new
refrigerants and (2) used refrigerants (at least five years old).
The Ion Collider was directly introduced into the vapor compression system and
data were collected using state-of-the-art data acquisition software. An analysis of the
acquired data was later conducted.
The study examined the effect of employing Ion Collider technology on key
performance parameters such as the coefficient of performance (COP), the refrigerating
capacity (Q ), and the compressor power (W ). A comparative study of the total
energy consumption (kW-hr) based on the energy inputted to the system in the form of
compressor power was also conducted and results were presented.
e&
comp&
xi
The study also examined the effects of employing Ion Collider technology with
respect to the second law of thermodynamics. The irreversibilities of the individual
refrigeration system components were studied, along with their effects on the total
irreversibility.
From the analysis performed, it was concluded that the Ion Collider technology had
no beneficial effects on the performance of the refrigeration system tested.
xii
CHAPTER 1 INTRODUCTION AND OBJECTIVES
The Ion Collider technology according to International Cavitation Technologies,
Inc. [1] brings out several beneficial effects in fluids as they flow through the Ion
Collider device. These effects include changes in the properties of the fluid such as
viscosity, molecular homogeneity, lubricity, combustion efficiency, and heat exchange
properties. The Ion Collider technology was also reported to bring about a reduction or
elimination of nonhomogenous materials and separation of dissimilar components in
mixtures [2]. Allen et al. [3] listed certain phenomena that are induced in the fluid as it
flows through the device. This includes hot spot chemistry, electric discharges, catalytic
chemistry, surfactant chemistry, and the propagation of acoustical waves.
The inventors of the Ion Collider, Rippetoe and Shroff [2], reported being able to
use the Ion Collider technology to separate immiscible solid or liquid particles such as
oil, from a liquid-based mixture or emulsion. In another application of the Ion Collider,
Rippetoe and Shroff [4] have patented the use of the Ion Collider to facilitate the
economical recovery of crude oil from an oil well. Furthermore, Rippetoe and Shroff [5]
reported using the technology to increase the amount of hydrocarbons in a crude oil
mixture. Other applications of the Ion Collider include water purification, altering the
physical characteristics of the fluids, and removal of hydrocarbons from soils [1].
To understand the principles involved in the Ion Collider technology, a study was
conducted by Allen et al. [3] who reported that cavitation-driven catalytic chemistries
were the most likely explanation for the phenomena taking place in the Ion Collider
1
2
device. The Ion Collider as reported by Allen et al. [3] is particularly capable of
promoting cavitation chemistry.
The objective of the experimental program described in this thesis is to investigate
the effects or lack thereof of employing the Ion Collider technology in a vapor
compression refrigeration system. This will be accomplished by employing two Ion
Colliders of different compositions. The first Ion Collider is made of 100% copper,
hereon referred to as Ion Collider 1, while the second collider is 80 % copper and 20%
nickel, hereon referred to as Ion Collider 2.
There will be two categories of tests. The first category involves testing the
technology employing a new refrigerant, while the second employs an already used
refrigerant whose age is at least five years old. Key performance parameters such as the
refrigerating capacity, compressor power, coefficient of performance, and the total
energy consumption will be computed and analyzed. The study also examined the effects
of employing Ion Collider technology with respect to a system irreversibility analysis.
To achieve an in-depth understanding of the effects of the Ion Collider on the
performance, samples of the refrigerant used in the various test runs will be stored in
sealed containers for possible future chemical and/or physical analysis.

CHAPTER 2 REVIEW OF LITERATURE
The patented Ion Collider technology [2,4,5] claims to affect the molecular charge
and structure of organic fluids [1]. Several beneficial effects are claimed to be reported,
which include separation of dissimilar components, reduction of non-homogeneous
materials in the medium, changes in viscosity, enhanced lubricity, enhanced heat
exchange properties, greater volatility, greater oxidation efficiencies and enhanced
molecular homogeneity.
The inventors of the Ion Collider technology have patented the use of the Ion
Collider device as a method of separating immiscible particles from a liquid mixture or
emulsion [2]. The scientific principle, which is claimed to be used in the working of this
device for this application, is the introduction of a similar charge to both the solid and
liquid particles as it flows through the device, thereby causing the particles to repel and
separate from each other.
In its simplest form, according to Allen et al. [3] and Rippetoe and Shroff [2, 4, 5],
the Ion Collider consists of two spaced-apart concentric and elongated metal cylinders.
The wall of the inner cylinder consists of a multiplicity of spaced-apart radially bored
perforations and its exit end is capped. The high-pressure fluid entering the Ion Collider
flows through the inner cylinder with small perforations. These perforations, coupled
with the high inlet pressure cause jets to emerge from the perforations. The outer surface
of the inner cylinder and the inner surface of the outer cylinder are flame coated with a
copper alloy. The high velocity jets impinge on the copper-alloy- coated surface, thus
3
4
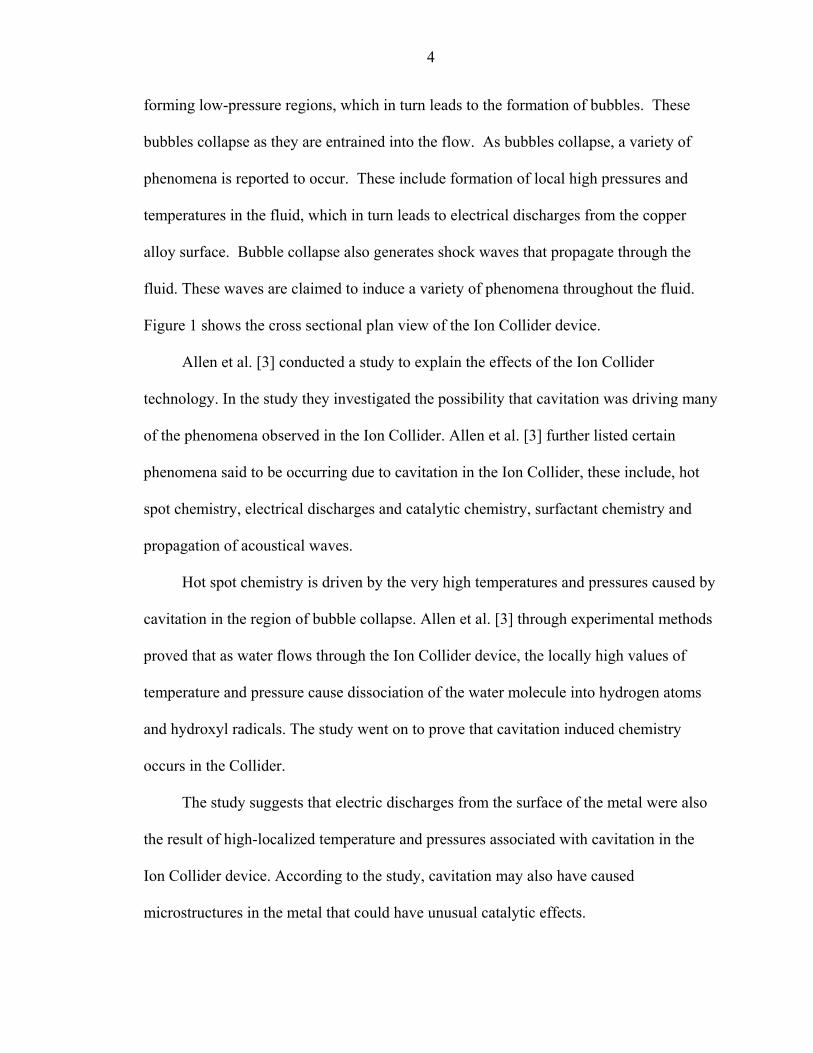
forming low-pressure regions, which in turn leads to the formation of bubbles. These
bubbles collapse as they are entrained into the flow. As bubbles collapse, a variety of
phenomena is reported to occur. These include formation of local high pressures and
temperatures in the fluid, which in turn leads to electrical discharges from the copper
alloy surface. Bubble collapse also generates shock waves that propagate through the
fluid. These waves are claimed to induce a variety of phenomena throughout the fluid.
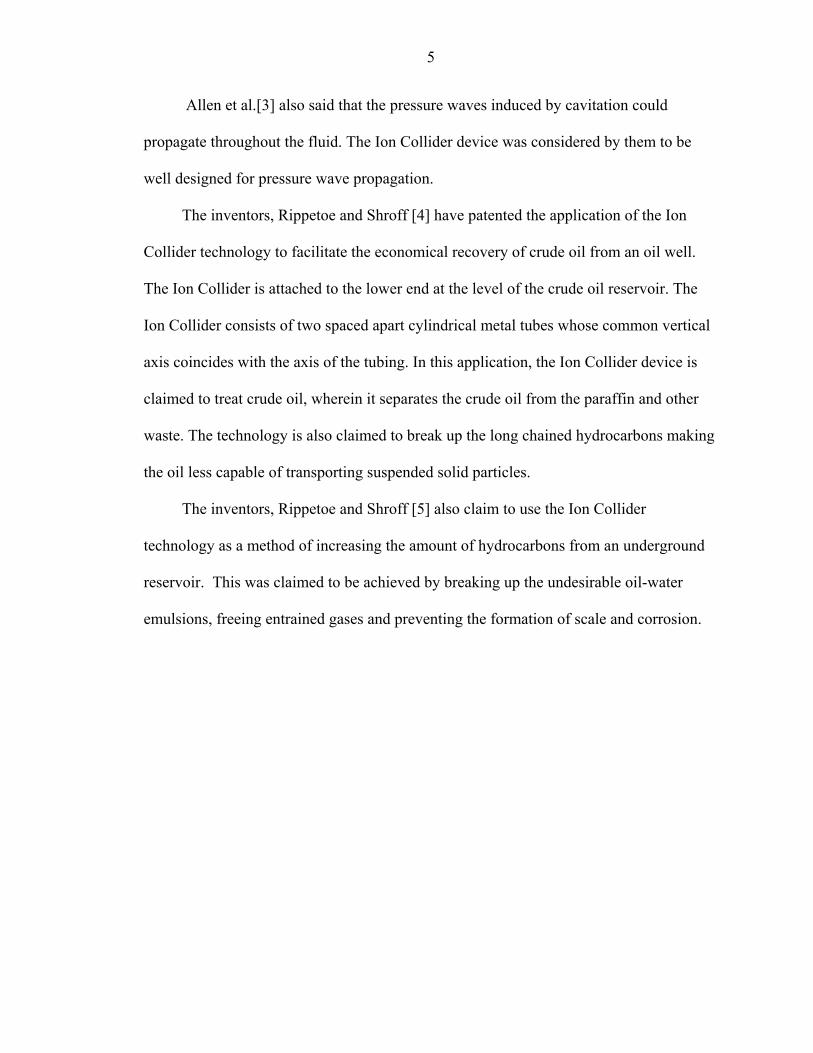
Figure 1 shows the cross sectional plan view of the Ion Collider device.
Allen et al. [3] conducted a study to explain the effects of the Ion Collider
technology. In the study they investigated the possibility that cavitation was driving many
of the phenomena observed in the Ion Collider. Allen et al. [3] further listed certain
phenomena said to be occurring due to cavitation in the Ion Collider, these include, hot
spot chemistry, electrical discharges and catalytic chemistry, surfactant chemistry and
propagation of acoustical waves.
Hot spot chemistry is driven by the very high temperatures and pressures caused by
cavitation in the region of bubble collapse. Allen et al. [3] through experimental methods
proved that as water flows through the Ion Collider device, the locally high values of
temperature and pressure cause dissociation of the water molecule into hydrogen atoms
and hydroxyl radicals. The study went on to prove that cavitation induced chemistry
occurs in the Collider.
The study suggests that electric discharges from the surface of the metal were also
the result of high-localized temperature and pressures associated with cavitation in the
Ion Collider device. According to the study, cavitation may also have caused
microstructures in the metal that could have unusual catalytic effects.
5
Allen et al.[3] also said that the pressure waves induced by cavitation could
propagate throughout the fluid. The Ion Collider device was considered by them to be
well designed for pressure wave propagation.
The inventors, Rippetoe and Shroff [4] have patented the application of the Ion
Collider technology to facilitate the economical recovery of crude oil from an oil well.
The Ion Collider is attached to the lower end at the level of the crude oil reservoir. The
Ion Collider consists of two spaced apart cylindrical metal tubes whose common vertical
axis coincides with the axis of the tubing. In this application, the Ion Collider device is
claimed to treat crude oil, wherein it separates the crude oil from the paraffin and other
waste. The technology is also claimed to break up the long chained hydrocarbons making
the oil less capable of transporting suspended solid particles.
The inventors, Rippetoe and Shroff [5] also claim to use the Ion Collider
technology as a method of increasing the amount of hydrocarbons from an underground
reservoir. This was claimed to be achieved by breaking up the undesirable oil-water
emulsions, freeing entrained gases and preventing the formation of scale and corrosion.

6
Figure 1. Physical design of Ion Collider device
Reference: Allen et al. [3] and Rippetoe and Shroff [2, 4, 5]

CHAPTER 3 EXPERIMENTAL PROGRAM
Experimental Facility
Chilled/Heated Water Loop
The experimental facility employed in this investigation consists of a R-22 water
chiller with an imposed heat load from a water heater. The system is designed in such a
way that the drop in water temperature because of cooling is equal to the rise in its
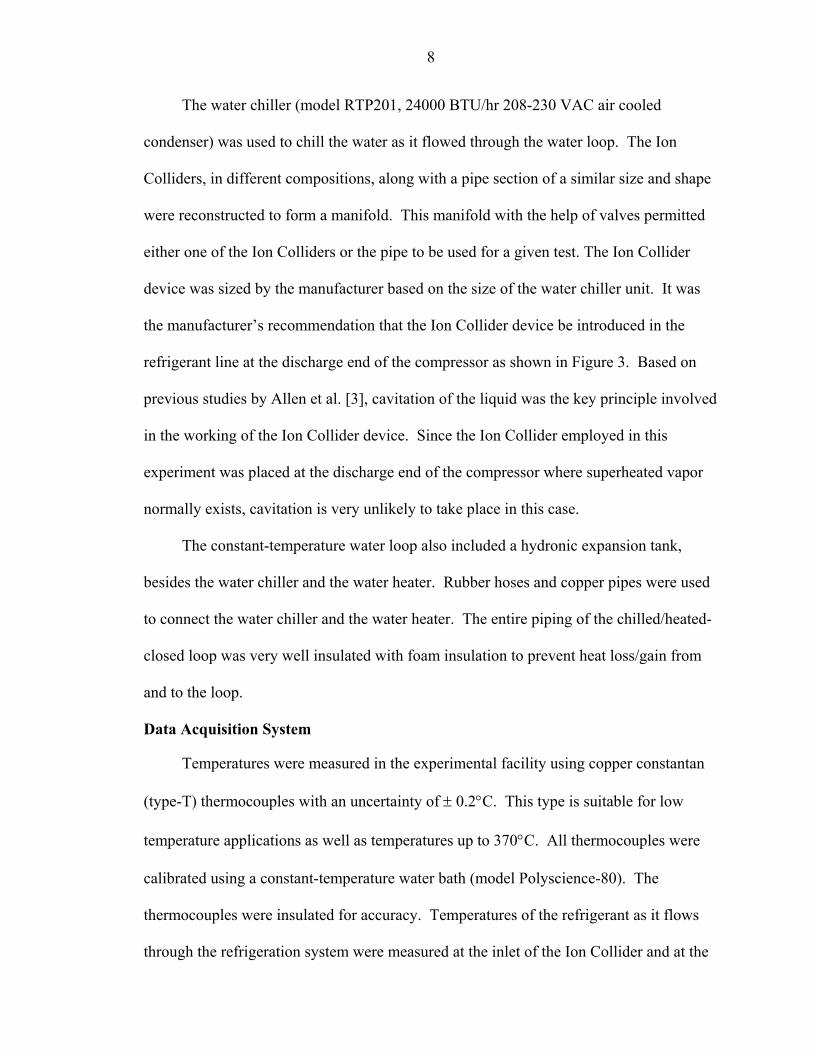
temperature because of heating. Figure 2 shows the system used in the experiments.
The water heater (Vanguard VG 0301C09767, model no. 6E725, wattage: 4500 /
3380, capacity: 119.9 US. gallons) was used to add an adjustable heating load to the
water loop. The water heater employs two electrically-heated coils to heat the water.
The coil temperature can be adjusted employing electronic thermostatic controls located
on the water heater control panel. The experimental procedure requires the water heater
to be used in two modes of operation. The first mode (called the Standard mode) was
structured in such a way that the water heater provides a larger heating load to the water
loop. This corresponds to preset upper and lower coil temperatures of 55°F and 54°F,
respectively, with a 1°F temperature differential applied to both coils. The second mode
(called the Cut-Off mode) was structured in such a way that the heater provides a
comparatively lower heating load to the water loop. This corresponds to preset upper and
lower coil temperatures of 50°F and 49°F, respectively, with a 1°F temperature
differential applied to both coils. The water heater was fitted with a blow-off safety valve
to guard against undesirable pressure buildup.
7
8
The water chiller (model RTP201, 24000 BTU/hr 208-230 VAC air cooled
condenser) was used to chill the water as it flowed through the water loop. The Ion
Colliders, in different compositions, along with a pipe section of a similar size and shape
were reconstructed to form a manifold. This manifold with the help of valves permitted
either one of the Ion Colliders or the pipe to be used for a given test. The Ion Collider
device was sized by the manufacturer based on the size of the water chiller unit. It was
the manufacturer’s recommendation that the Ion Collider device be introduced in the
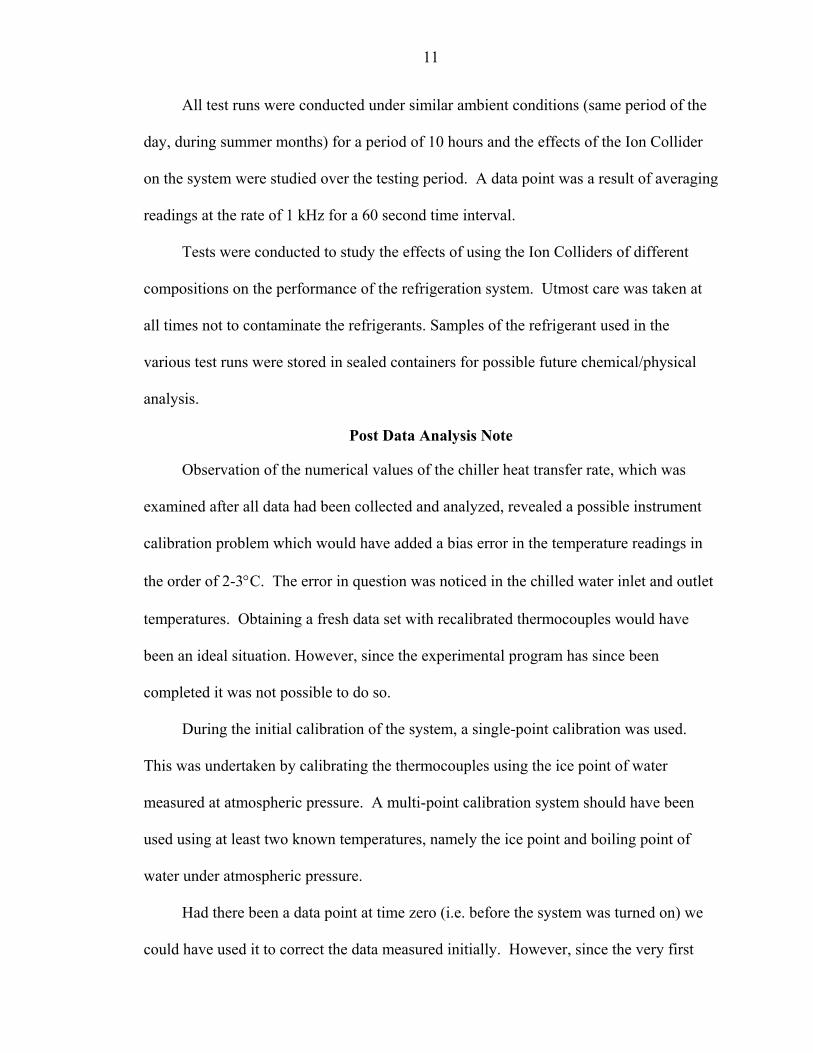
refrigerant line at the discharge end of the compressor as shown in Figure 3. Based on
previous studies by Allen et al. [3], cavitation of the liquid was the key principle involved
in the working of the Ion Collider device. Since the Ion Collider employed in this
experiment was placed at the discharge end of the compressor where superheated vapor
normally exists, cavitation is very unlikely to take place in this case.
The constant-temperature water loop also included a hydronic expansion tank,
besides the water chiller and the water heater. Rubber hoses and copper pipes were used
to connect the water chiller and the water heater. The entire piping of the chilled/heated-
closed loop was very well insulated with foam insulation to prevent heat loss/gain from
and to the loop.
Data Acquisition System
Temperatures were measured in the experimental facility using copper constantan
(type-T) thermocouples with an uncertainty of ± 0.2°C. This type is suitable for low
temperature applications as well as temperatures up to 370°C. All thermocouples were
calibrated using a constant-temperature water bath (model Polyscience-80). The
thermocouples were insulated for accuracy. Temperatures of the refrigerant as it flows
through the refrigeration system were measured at the inlet of the Ion Collider and at the

9
inlet and exit of the condenser and evaporator. The temperature of the air flowing
through the air-cooled condenser of the water chiller was also measured. In the constant-
temperature water loop, the temperature of the water was measured at the inlet and exit of
the water chiller tank and at the outlet of the pump.
Pressure transducers (Mamac Systems, model no. PR-264, accuracy ±1% of the full
scale) were used to measure the pressures of the refrigerant at five locations in the
refrigeration system. These transducers were calibrated to give an output of 0-5 VDC to
the data acquisition board corresponding linearly to a pressure range of 0-2000 kPa.
These transducers were used to measure the refrigerant pressures upstream in the Ion
Collider as well as at the inlet and outlet of the condenser and evaporator.
Air humidity at the inlet and exit of the air-cooled condenser was measured using a
humidity transducer (Mamac Systems, model no HU-225, accuracy ±3% of the full
scale). The transducers were calibrated to give an output of 0-5 VDC to the data
acquisition board corresponding linearly to a relative humidity range of 0-100%.
The refrigerant mass flow rate as it flows through the chiller was measured using a
flow rate transducer (Sponsler Co., Inc., model no SP711-3). This transducer was
calibrated to give an output of 0-5 VDC to the data acquisition system corresponding
linearly to a flow rate range of 0- 47.4293 lbm/min. The water loop mass flow rate was
measured using a flow rate indicator (Sponsler Co., Inc., model no. SP3/4-CB-PHL-A-
4X). The water flow rate was read off the digital display of the transducer.
Compressor power was measured employing the voltage and current transducers
across the compressor motor. The voltage was measured using a voltage transducer
(Flex-Core, model no. AVT-300CX5, accuracy ±0.25%), which was calibrated to give an
output voltage of 0-5 VDC to the data acquisition board corresponding linearly to a range

10
of 0-300 AC line voltage. The current flowing through the compressor motor coils was
measured using a current transducer (Flex-Core, model no. CTD-025A, accuracy ±0.5%),
which was calibrated to give an output voltage of 0-5 VDC to the data acquisition board
corresponding linearly to a current range of 0-25 Amps. A schematic diagram of the
experimental facility is shown in Figure 4, outlining the location of the Ion Collider
device and the location of the different transducers.
Experimental Procedures
Testing was divided into two categories; (1) testing with a new refrigerant, and, (2)
testing with an old/used refrigerant (at least five years old). The refrigeration system was
charged with 14.4 lbm (6.54 kg) of R-22 (Chlorodifluoromethane) for both categories of
testing.
Testing performed for both categories was done for (a) Standard mode conditions,
and, (b) Cut- Off mode conditions. The Standard mode conditions were structured in
such a way that the heater provides a larger heating load to the water loop. This
corresponds to a temperature setting in which the upper and lower coil temperatures are
55°F and 54°F respectively, with a 1°F temperature differential applied to both coils.
The Cut-Off mode conditions, on the other hand, were structured in such a way that the
heater provides a lower heating load to the water in the loop. This corresponds to a
temperature setting in which the upper and lower coil temperatures are set at 50°F and
49°F respectively, with a 1°F temperature differential applied to both coils. The chilled
water exit set point temperature was kept at 43°F throughout for all categories and modes
of testing.
The water flow rate in the loop was kept constant by regulating the flow using a
gate valve, which was preset to a flow rate of 4.5 gpm.
11
All test runs were conducted under similar ambient conditions (same period of the
day, during summer months) for a period of 10 hours and the effects of the Ion Collider
on the system were studied over the testing period. A data point was a result of averaging
readings at the rate of 1 kHz for a 60 second time interval.
Tests were conducted to study the effects of using the Ion Colliders of different
compositions on the performance of the refrigeration system. Utmost care was taken at
all times not to contaminate the refrigerants. Samples of the refrigerant used in the
various test runs were stored in sealed containers for possible future chemical/physical
analysis.
Post Data Analysis Note
Observation of the numerical values of the chiller heat transfer rate, which was
examined after all data had been collected and analyzed, revealed a possible instrument
calibration problem which would have added a bias error in the temperature readings in
the order of 2-3°C. The error in question was noticed in the chilled water inlet and outlet
temperatures. Obtaining a fresh data set with recalibrated thermocouples would have
been an ideal situation. However, since the experimental program has since been
completed it was not possible to do so.
During the initial calibration of the system, a single-point calibration was used.
This was undertaken by calibrating the thermocouples using the ice point of water
measured at atmospheric pressure. A multi-point calibration system should have been
used using at least two known temperatures, namely the ice point and boiling point of
water under atmospheric pressure.
Had there been a data point at time zero (i.e. before the system was turned on) we
could have used it to correct the data measured initially. However, since the very first

12
reading in the data set is one that has been averaged over a minute, it would not have
given us the correction that would have needed to be applied. The reading when
averaged over the minute consists not only of temperatures at the zero minute but also of
the effect caused by the cooling in that minute. Hence, we cannot use the first minute to
apply a correction to that reading.
The second method would be to check the calibration at the present moment,
however it was found out that there existed too much of a drift in the readings over time.
This was expected after the lapse of about a year since the thermocouples were originally
calibrated. Hence a decision was taken to present the data without correction as neither
of the available approaches would give satisfactory results.
Since there was very little time lapse between the test runs for the various cases
involved, the error in the calibration remained the same for all cases of testing, i.e. for the
Base Case and either of the cases pertaining to the Ion Colliders. The COP is directly
proportional to the difference in the water temperatures. Thus an equal error in the
measurement of temperature for all three cases would have resulted in the error canceling
out when the differences in the COP are examined. As outlined in the objectives of this
experimental program, the purpose of this study was to compare the relative effect of the
Ion Colliders on the system. This objective could still be met despite the above shift in
calibration.

13
Figure 2. Experimental setup
Figure 3. Ion Colliders (black and blue tubing) installed in the system

14
Figure 4. Schematic diagram of experimental facility
CHAPTER 4 ANALYSIS
Analysis Based on the First Law of Thermodynamics
The chiller used in the experimental setup employs a vapor compression
refrigeration system. The system consists of four main components; (1) compressor, (2)
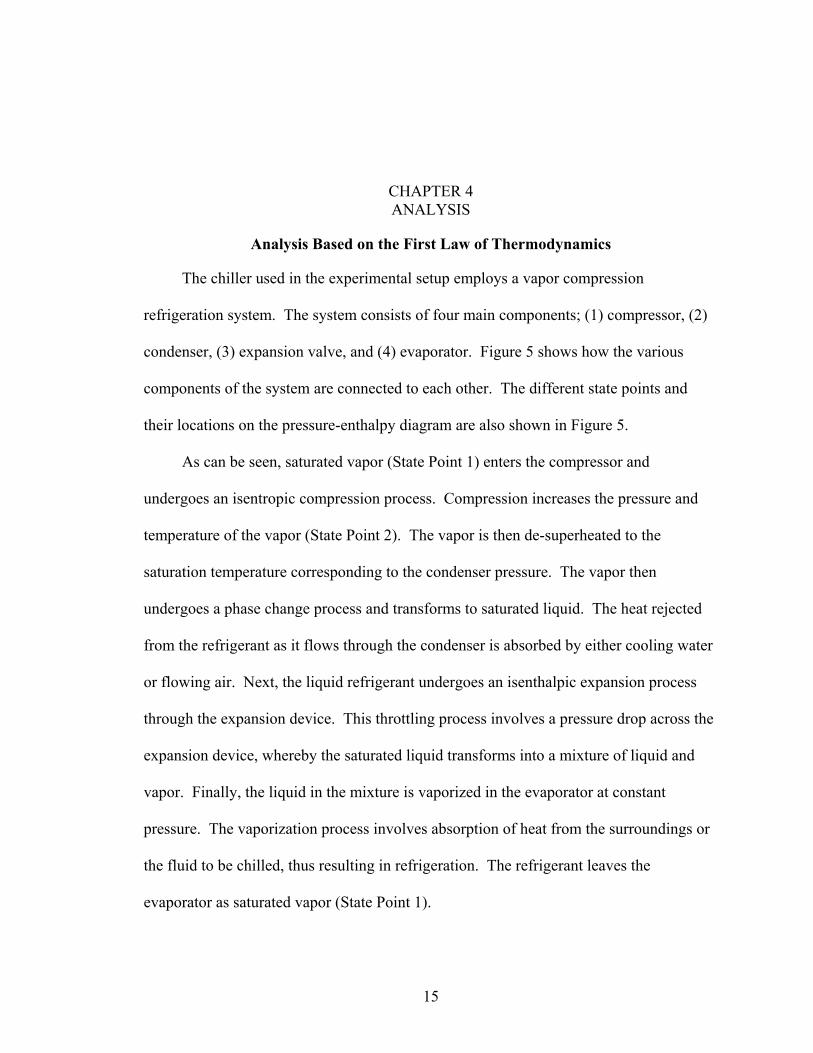
condenser, (3) expansion valve, and (4) evaporator. Figure 5 shows how the various
components of the system are connected to each other. The different state points and
their locations on the pressure-enthalpy diagram are also shown in Figure 5.
As can be seen, saturated vapor (State Point 1) enters the compressor and
undergoes an isentropic compression process. Compression increases the pressure and
temperature of the vapor (State Point 2). The vapor is then de-superheated to the
saturation temperature corresponding to the condenser pressure. The vapor then
undergoes a phase change process and transforms to saturated liquid. The heat rejected
from the refrigerant as it flows through the condenser is absorbed by either cooling water
or flowing air. Next, the liquid refrigerant undergoes an isenthalpic expansion process
through the expansion device. This throttling process involves a pressure drop across the
expansion device, whereby the saturated liquid transforms into a mixture of liquid and
vapor. Finally, the liquid in the mixture is vaporized in the evaporator at constant
pressure. The vaporization process involves absorption of heat from the surroundings or
the fluid to be chilled, thus resulting in refrigeration. The refrigerant leaves the
evaporator as saturated vapor (State Point 1).
15

16
The compressor power may be evaluated as the product of the refrigerant mass
flow rate and the refrigerant enthalpy difference between State Points 1 and 2 in Figure 5.
W (1) )- h( hm rompc 12&& =
The heat rejected by the refrigerant in the condenser may be calculated as the
product of the refrigerant mass flow rate and the refrigerant enthalpy difference across
the condenser (State Points 2 and 3 in Figure 5)
(2) )( 32 hhmQ rcond −= &&
Process 3-4 in Figure 4 is isenthalpic. Thus,
43 hh = (3)
The heat absorbed by the refrigerant in the evaporator is defined as the product of
the refrigerant mass flow rate and the refrigerant enthalpy difference between State Points
4 and 1 in Figure 5.
(4) )-h (hm Q re 41&& =
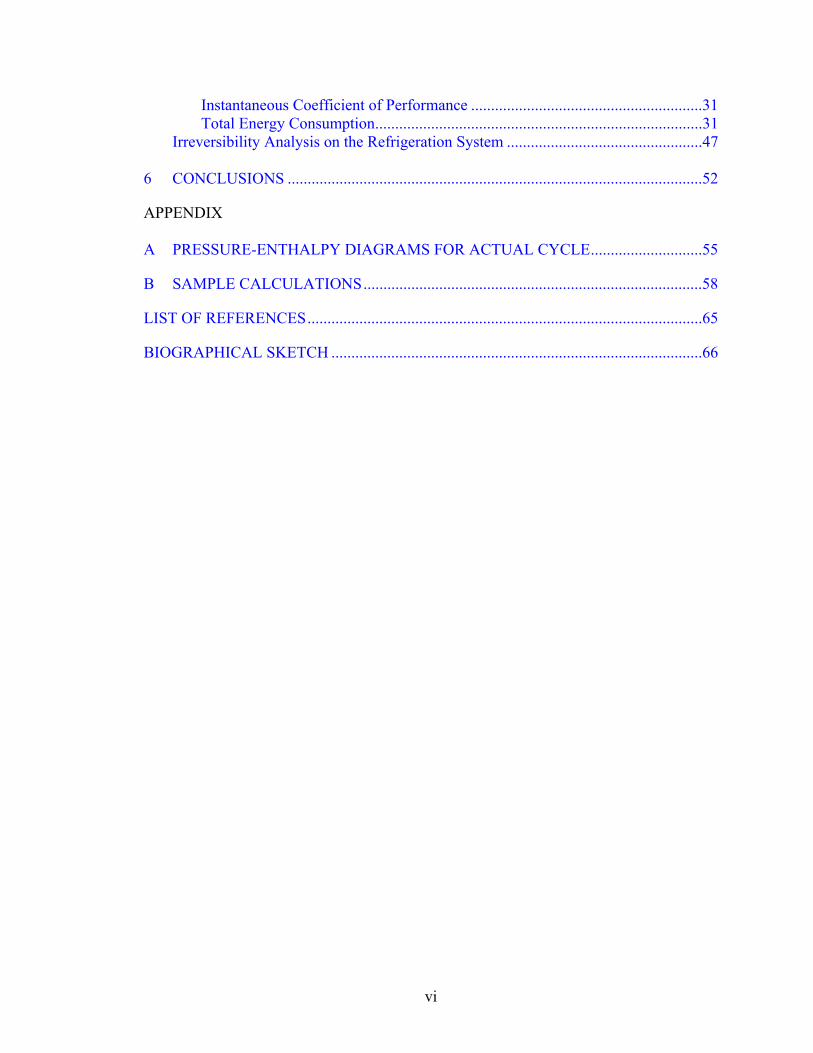
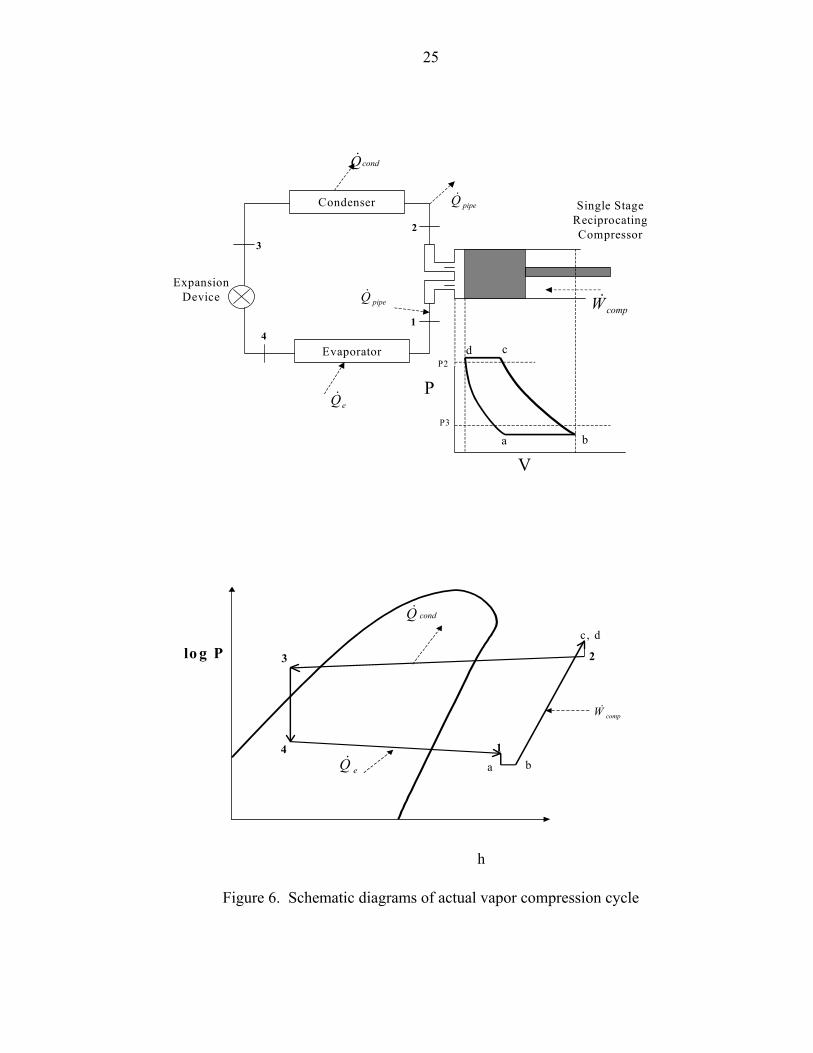
The above analysis deals only with the ideal vapor compression cycle. The actual
cycle deviates considerably from the ideal. These deviations are due to the pressure drop
associated with the flow of the working fluid through the pipes along with the heat
transfer to and from the surroundings. In an actual cycle (shown in Figure 6), State Point
1 is generally in the superheated region. The compression process (represented by 1-2 in
Figure 6) is not isentropic, unlike the ideal cycle, due to the addition and rejection of heat
to the refrigerant through the valves and walls of the compressor. In the condenser, the
heat rejection process (represented by 2-3 in Figure 6) is not isobaric as there is a
pressure drop associated with the condenser piping. Furthermore, the refrigerant may be
subcooled below the liquid saturation temperature in the condenser as represented by
17
State Point 3. The isenthalpic process (represented by 3-4 in Figure 6) in the expansion
valve could be safely assumed to apply for the actual cycle as well. Pressure drops due to
the piping in the evaporator coils and superheating of the refrigerant to State 1 are the
deviations seen in the actual cycle (represented by 4-1 in Figure 6) as compared to the
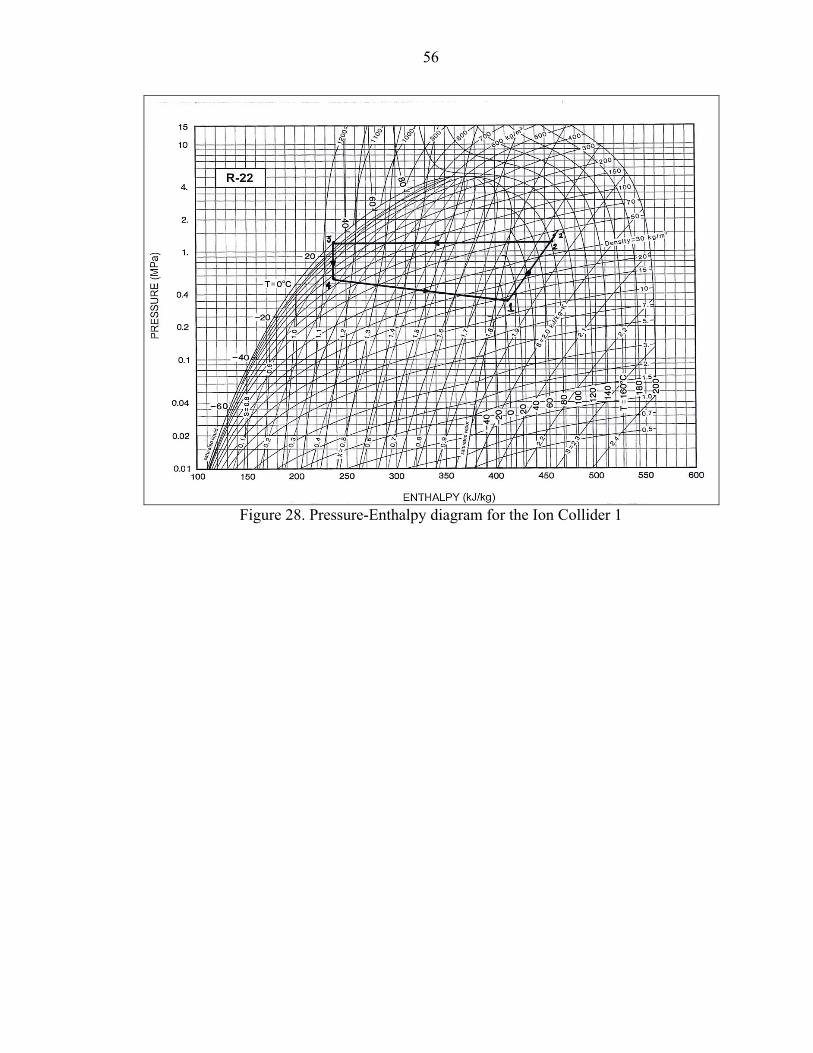
ideal cycle. The state points of the actual cycle plotted on a pressure-enthalpy chart for
R-22 for the Base Case as well as for the case representing Ion Colliders 1 and 2 is shown
in Figures 26, 27, and 28 in Appendix A. These state points are taken from the actual
experimental data after the lapse of 100 minutes of system operation. One of the striking
features of these figures is that the state points are almost the same whether or not the Ion
Colliders are used.
Figure 6 also shows the variation of pressure with the compressor piston position.
Due to the effect of the compressor inlet valves, the cylinder pressure during intake =
may be less than the pressure in the suction line . Similarly, due to the compressor
outlet valves the pressure = is greater than the discharge line pressure . The
difference between State Points a and b are due to the heat exchange between the vapor
and the cylinder walls. The same reason could be stated for difference in State Points c
and d.
aP
bP 1P
cP dP 2P
As mentioned earlier, the actual compression (Process b-c) is not isentropic, but
instead a polytropic process given by the expression
(5) ncc
nbb vPvP =
18
At the end of the intake stroke, the total mass of vapor in the cylinder is b
b
vV
. The
mass of the clearance vapor is b
a
vV
. Therefore,
b
a
b
b
vV
vV
−=cycleper intake Mass =b
ba
vVV −
(6)
The compressor volumetric efficiency is the mass of vapor actually pumped by the
compressor divided by the mass of vapor that the compressor could pump if it handled a
volume of vapor equal to its piston displacement ( )..DP . Volumetric efficiency may be
given by the expression
=vη( )( ) bdb
ab
vv
VVVV 2
−−
(7)
The term may also be written as ( ab VV − )
( ) ( )dadbab VVVVVV −−−=− (8)
n
b
cd
n
b
dda P
PV
PP
V/1/1
=
=V (9)
Let db
d
VVV−
=C be the clearance factor,
thus
−+=
−−
n
b
c
db
ab
PP
CCVVVV
/1
1 (10)
Substituting in Equation (7)
b
n
b
cv v
vPP
CC 2
/1
1
−+=η (11)
19
However, the volumetric efficiency can also be written as
..2
DPvmr
v&
=η (12)
Hence, the refrigerant mass flow rate could be given by the expression
b
n
b
cr v
DPPP
CCm ..1/1
−+=& (13)
The compressor work in a polytropic process may be expressed by
−
−
=
−
1)1(
1n
n
b
cbbcomp P
PvP
nnW (14)
em
comprcomp
Wmηη
&& =W (15)
For the purpose of this analysis, the refrigeration system will be evaluated based on
certain key performance parameters. This includes (1) the instantaneous refrigerating
capacity, (2) instantaneous compressor power, (3) instantaneous coefficient of
performance, and (4) total energy consumed.
The instantaneous refrigerating capacity ( ) is a measure of the cooling of the
water as it flows through the chiller. This can be calculated as the product of the water
mass flow rate, specific heat of water at constant pressure, and the difference in the water
inlet and outlet temperatures. This is expressed as
eQ&
(16) )-T ( T Cm Q w, ow, ip,wwe && =
The instantaneous compressor power is a measure of the amount of power inputted
to the compressor at any given instant, which could be calculated as the product of the
20
voltage, current, and the power factor ( φ ). The power factor is assumed equal to 0.85
throughout this study.
W (17) φ comp IV=&
The coefficient of performance (COP) expresses the effectiveness of the
refrigeration system. It is a dimensionless ratio defined by the expression
sources external from suppliedpower Net
capacity ingrefrigerat Useful COP =
The instantaneous coefficient of performance (COP) will be calculated for the
purpose of this analysis as the ratio of the instantaneous refrigerating capacity (Q ) to the
instantaneous compressor power (W )
e&
comp&
comp
e
WQ
COP &
&= (18)
The total energy consumed by the compressor over the duration of the test is
calculated as the area under the instantaneous compressor power-time curve.
An uncertainty analysis based on the work of Kline and McClintock [6] was
performed to compute the propagation of uncertainty in the derived quantities. The
uncertainty is calculated for the instantaneous refrigerating capacity (which is defined in
Equation (16)) by the following equation
1/ 22 22 2
, , ,, , ,
e e e ee p w w i w o
p w w i w o
Q Q Q QQ m C T Tm C T T
∂ ∂ ∂ ∂ ∆ = ∆ + ∆ + ∆ + ∆ ∂ ∂ ∂ ∂
& & & && &
& (19)
The values of ∆ ∆ can be obtained from the manufacturer’s data for
the respective data acquisition transducer. The uncertainty in the specific heat is assumed
zero since it is not a measured quantity, hence
,, , w i w om T T∆& ,
, 0p wC∆ = .

21
In the calculation of uncertainty of the instantaneous compressor power the
following equation may be used
1/ 22 2
VV Icomp comp
comp
W WW I
∂ ∂ ∆ = ∆ + ∆ ∂ ∂
& && (20)
Once again the values of V∆ and I∆ are obtained from the manufacturer’s data for
the voltage and current transducers, respectively.
The uncertainty in the coefficient of performance is given by the following
equation:
( ) ( )
1/ 222
ee comp
COP COPCOP Q W
Q W
∂ ∂ ∆ = ∆ + ∆ ∂ ∂
& && & comp (21)
The values of the uncertainty in the computed quantities of eQ∆ & and ∆ are
obtained from Equations 19 and 20. Thus, an uncertainty analysis of the various key
performance parameters can be achieved.
compW&
Irreversibility Analysis on the Refrigeration System
Availability is the maximum amount of work obtainable from a combined system
as the control mass is bought into equilibrium with the surroundings. The availability of
the system is an extensive thermodynamic property dependent only on the initial state of
the system and the final state of the environment. Unlike energy in the first law of
thermodynamics, availability of a system is never conserved, as some part of it is always
destroyed by irreversibilities. The destruction of the available energy is seen to be
proportional to the creation of entropy due to irreversibilities. In a vapor compression
refrigeration system irreversibilities could arise from the various components of the
system. Irreversibilities in the system could be caused by motor inefficiencies, frictional

22
losses, pressure drops, mixing, heat transfer between system and surroundings and
expansion in the throttling device. In performing an irreversibility analysis, one could
determine the percentage contribution of the individual component irreversibilities to the
total irreversibility of the system. Irreversibility analysis could also be used to compute
the additional irreversibilities resulting from the use of the Ion Collider. One of the
manufacturer’s claims was that the Ion Collider device altered the physical and chemical
structure of the organic fluid flowing through the device. For the purpose of this
irreversibility analysis we shall assume the properties of R-22 to remain unchanged. The
physical design of the Ion Collider and its promise for change could bring out a change in
the irreversibility of the system, which could be later compared to the Base Case.
In the irreversibility analysis of the refrigeration system, the irreversibilities of the
various components of the system could be calculated based on the following equations.
The evaporator irreversibility could be expressed as
1 4ref space
( ) ee r
QI m s sT
= − −&
& & (22)
Where T is the temperature of the refrigerating space, which was calculated by
the mean of the water inlet and outlet temperatures,
ref space
w,i w,o
ref space T +T
2=T (23)
The irreversibility of the Ion Collider could be calculated based on the following
equation:
2 ' 2(dev rI m s s )= −& & (24)
In the condenser irreversibility could be expressed as

23
3 2 '( ) condcond r
cond
QI m s sT
= − −&
& & (25)
Similarly, the temperature of the ambient air T is determined by the mean inlet
and outlet air temperatures,
cond
,
2a o a i
condT T ,T +
= (26)
The irreversibility of the compressor is calculated based on the following
equations, where Q is the heat losses from the compressor. comp&
2 1( ) compcomp r
amb
QI m s sT
= − −&
& & (27)
(28)
Irreversibility in the expansion valve is expressed as
2 1( )comp r compQ m h h W= − −& &&
exp 4 3(rI m s s )= −& & (29)
The total irreversibility of the system is calculated to be the summation of the
irreversibilities of the individual components.
(30) exptotal e cond comp devI I I I I I= + + + +& & & & & &

24
E x p a n s io n D e v ic e
C o n d e n se r
E v a p o ra to r
3
4
C o m p re s so r
2
1
compW&
condQ&
eQ&
log P
h
3 2
4 1
eQ&
condQ&
compW&
Figure 5. Ideal vapor compression cycle
25
Expansion Device
V
Condenser
Evaporator
Single Stage Reciprocating Compressor
a b
cdP2
P3
P
1
2
3
4
compW&
condQ&
eQ&
pipeQ&
pipeQ&
lo g P
h
a b
c, d
1
3
4
2
compW&
eQ&
condQ&
Figure 6. Schematic diagrams of actual vapor compression cycle

CHAPTER 5 RESULTS AND DISCUSSION
As discussed in the objectives, the purpose of this experimental program was to
investigate the effects or lack thereof of employing the Ion Collider device in
refrigeration systems. The results will be presented for two main categories of tests. The
first category deals with the effects of the Ion Collider device on new refrigerants, while
the second category deals with the effects on old/used refrigerants. Key performance
parameters discussed in the earlier chapters will be the focus of the discussion in this
chapter. These parameters will be investigated for both the Standard and Cut-Off modes
of operation as explained in the earlier chapters.
Tests Involving New Refrigerants
This section deals with the effect of installing Ion Colliders 1 and 2 on the system
performance when an unused (new) refrigerant is employed. Four key performance
measures are discussed below. These are the instantaneous refrigerating capacity, the
instantaneous compressor power, the instantaneous coefficient of performance, and the
total energy consumption.
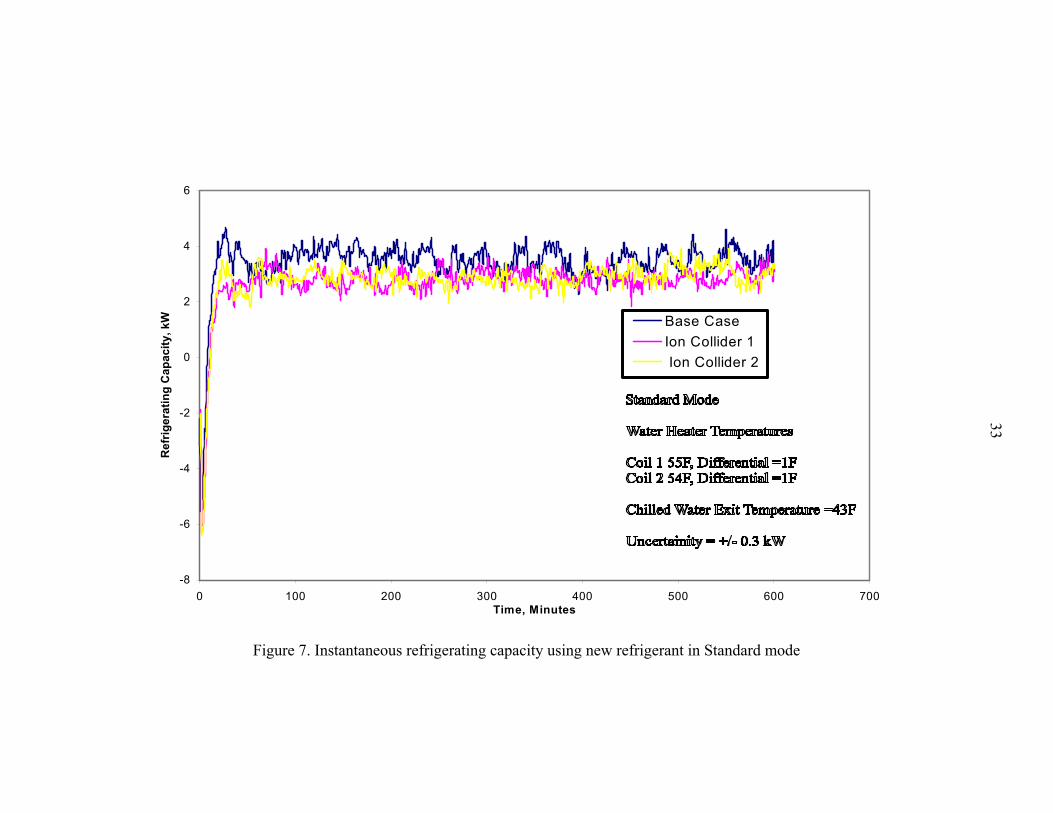
Instantaneous Refrigerating Capacity
As discussed before, the instantaneous refrigerating capacity is a measure of the
cooling achieved by the water as it flows through the chiller. Equation (16) was used to
evaluate the instantaneous refrigerating capacity, which was calculated as the product of
the water mass flow rate, specific heat of water at constant pressure, and the difference in
the water inlet and outlet temperatures. Equation (4), which calculates the instantaneous
26

27
refrigerating capacity based on the difference in the refrigerant enthalpy, could not be
used since it was impossible to determine the two-phase mixture quality from the
refrigerant pressure and temperature readings. The instantaneous refrigerating capacity
for the Standard and Cut-off modes of operation is shown in Figures 7 and 8,
respectively.
As seen from Figures 7 and 8, a negative refrigerating effect can be observed in the
first five minutes of the test runs. This may be explained by a possible instrument
calibration problem that would have added a bias error to the temperature readings.
While this error affected the numerical values of the temperature readings, the overall
trends of the instantaneous refrigerating capacity for all three cases of testing remain
unchanged and could still be used for comparison purposes.
As seen in Figure 7, the instantaneous refrigerating capacity for the Standard mode
is larger when no Ion Collider device is used (Base Case). Figure 7 also shows that Ion
Collider 2 produced a slightly larger instantaneous refrigerating capacity than that
produced by Ion Collider 1.
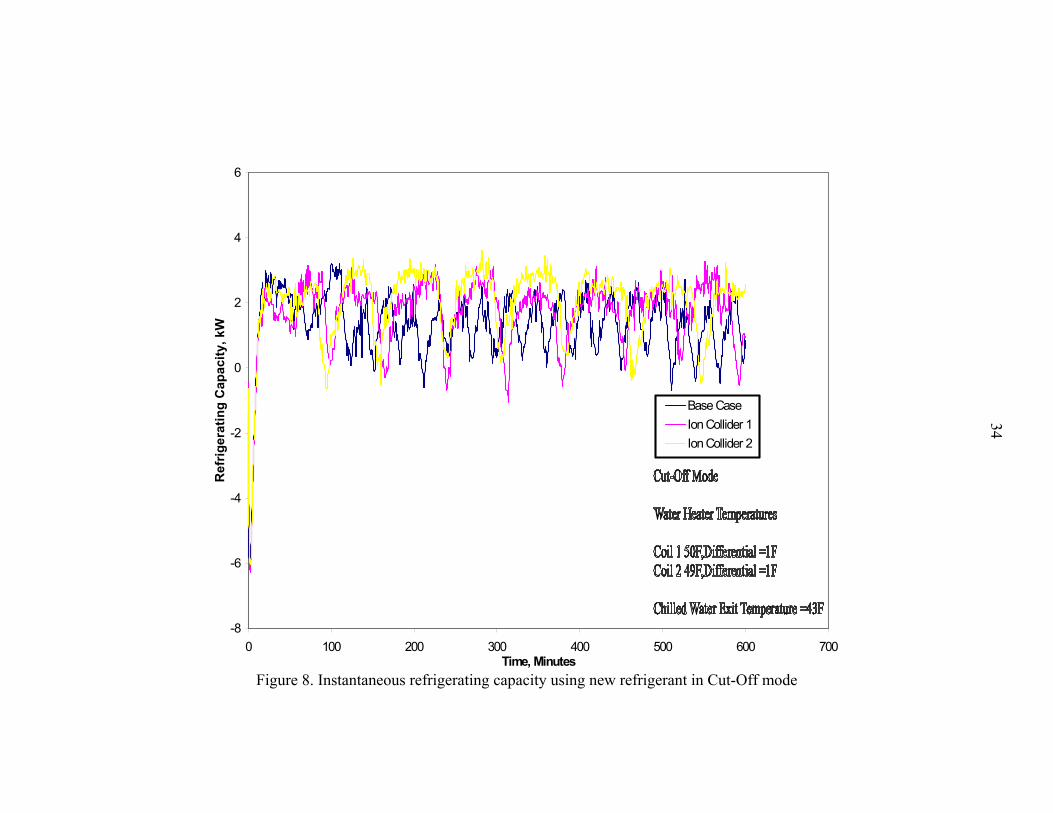
Figure 8 shows the instantaneous refrigerating capacity for the Cut-Off mode for
the three cases mentioned above. As explained in the earlier chapters, the Cut-Off mode
of operation was structured in such a way to allow the compressor to cycle off when the
chilled water exit set point temperature was reached. Figure 8 shows that there were
many more compressor off cycles associated with the Base Case than with operating
either Ion Colliders. This suggests that the chilled water exit set point temperature in the
Base Case was reached more often than with employing Ion Colliders. This simply

28
means that the instantaneous refrigerating capacity employing the Ion Colliders was
smaller than that of the Base Case.
Instantaneous Compressor Power
As discussed earlier, the instantaneous compressor power for the chiller was
calculated as the product of the voltage, amperage, and the electrical efficiency of the
motor ( )eη . Figures 9 and 10 show the instantaneous compressor power for the Standard
and Cut-Off modes of operation, respectively.
For the Standard mode, the use of Ion Colliders 1 and 2 produced slightly larger
instantaneous compressor power consumption. This may be attributed to the higher-
pressure drop across the Colliders. The physical design of the Colliders partially
accounts for the higher-pressure drop.
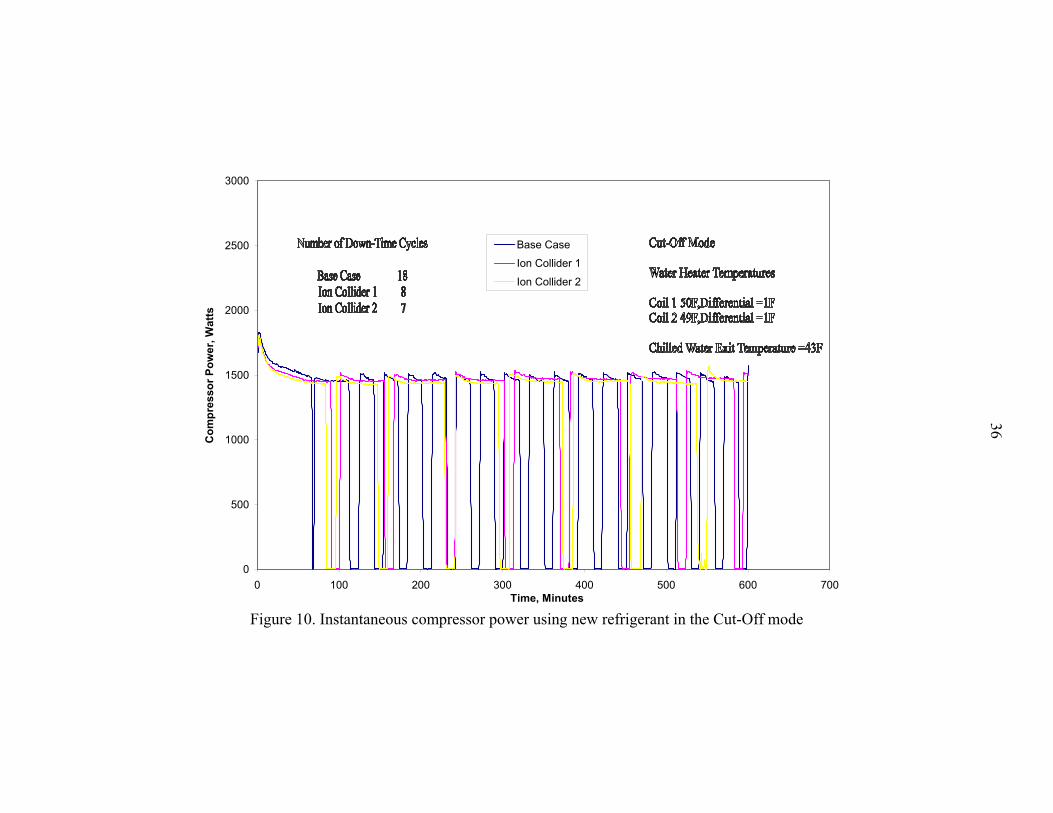
For the Cut-Off mode, whenever the compressor was on, the instantaneous
compressor power consumption could be seen to be almost the same for all cases (see
Figure 10). Figure 10 also shows that the Base Case had a compressor down-time of
eighteen cycles over the duration of the test. The corresponding numbers of down-time
cycles for Ion Colliders 1 and 2 are eight and seven, respectively, over an equal duration.
Evidently, the use of the Ion Colliders made it harder for the chiller to reach the desired
chilled water exit set point temperature, thus contributing to a fewer number of
compressor down time cycles.
Instantaneous Coefficient of Performance
The instantaneous coefficient of performance is a dimensionless quantity calculated
as the ratio of the instantaneous refrigerating capacity to the instantaneous compressor

29
power. The instantaneous coefficient of performance for the Standard mode is presented
in Figure 11.
As seen in Figure 11, a negative COP exists in the first five minutes of the test runs.
As was mentioned earlier, this may be attributed to a possible instrumentation calibration
problem that would have added a bias error in the temperature readings. While this error
would affect the numerical values of the temperature readings, the overall trends of all
test cases remain unchanged and results of comparisons among these cases are still valid.
As can be seen, the instantaneous coefficient of performance for the Standard mode
is higher for the Base Case than for the cases involving Ion Colliders. This may be
attributed to the fact that for the Base Case the instantaneous power consumption was
lower, while the instantaneous refrigerating capacity was higher. The higher
instantaneous coefficient of performance in the Base Case suggests that the use of the Ion
Colliders did not appear to have an overall positive effect on the chiller performance.
The coefficient of performance was not evaluated for the Cut-Off mode as the
compressor power, which is the denominator in the equation defining the coefficient of
performance, drops to zero during compressor down-times, thus rendering the coefficient
of performance inapplicable during down-times.
Total Energy Consumption
The total energy consumption is calculated as the area under the instantaneous
compressor power-time curve (Figures 9 and 10). The total energy consumption is the
energy supplied to the compressor over a single test run of ten hours. The total energy
consumption for both the Standard and Cut-Off modes is shown in Figure 12.
As can be seen, the total energy consumption in the Standard mode is almost equal
for all tests with and without the Colliders. The marginal increase in the energy
30
consumption when the Ion Colliders are used may be attributed to the larger compressor
power needed to overcome the increased pressure drop brought about by the physical
design of the Ion Colliders.
For the Cut-Off mode, there is higher total energy consumption when the Ion
Colliders are in use. This is due to the fact that the compressor run time cycle is longer,
with fewer cut-offs. This is because the chiller did not produce the required amount of
cooling to attain the desired chilled water exit set point temperature.
Tests Involving Old/Used Refrigerant
This section deals with the effect on the system performance of installing Ion
Colliders 1 and 2 in the refrigeration system when an old/used refrigerant is employed.
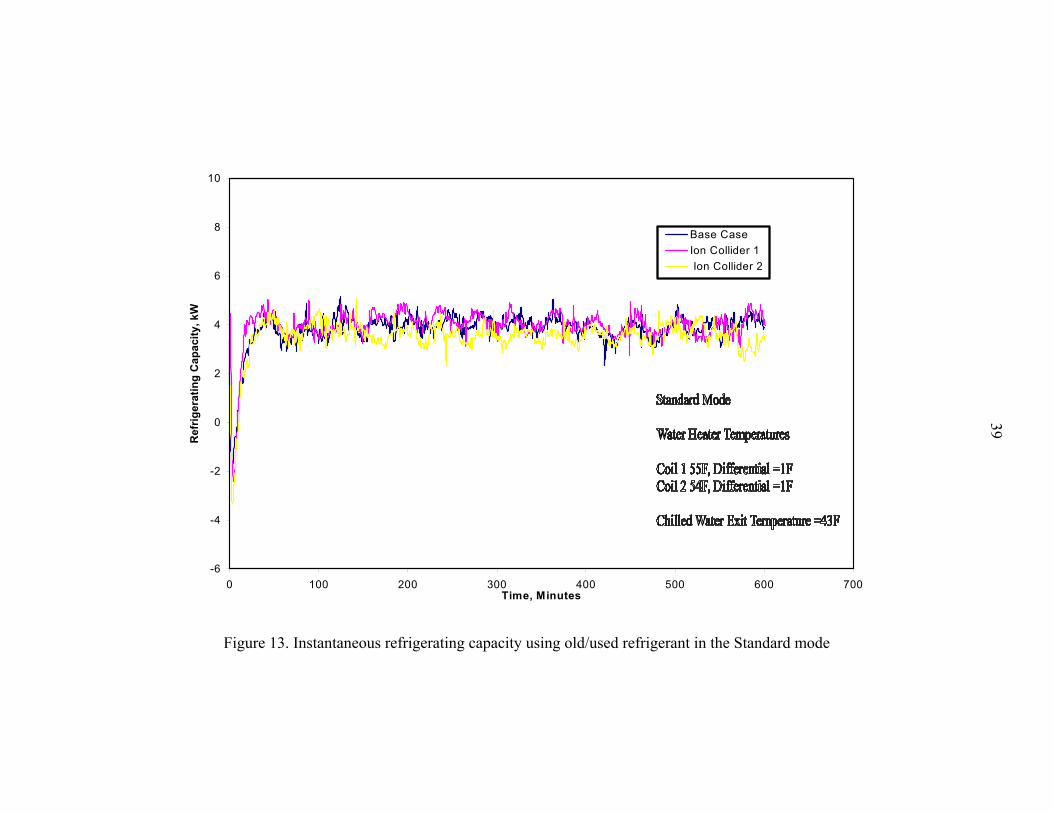
Instantaneous Refrigerating Capacity
The instantaneous refrigerating capacity for the Standard and Cut-Off modes of
operation is shown in Figures 13 and 14, respectively. As observed from Figures 13 and
14, a negative refrigerating effect can be observed in the first five minutes of test runs.
This may be explained by the error bias in the temperature readings as explained earlier
in this chapter. The refrigerating capacity produced when Ion Collider 2 was used in the
Standard mode was a bit smaller than either of the other two cases (see Figure 13). The
refrigerating capacity produced for the other cases appears to be nearly equal over the
duration of the tests. For the Cut-Off mode, all cases appear to have a similar
refrigerating capacity regardless of whether or not an Ion Collider was used (see Figure
14). It is important to observe here that the Cut-Off mode when a used refrigerant was
employed did not result in cycling off the compressor throughout the duration of the test
for all cases tested. This may suggest that the cooling performed in the chiller was not
sufficient to allow the chilled water exit set point temperature to be achieved. This
31
should be contrasted with the identical test performed employing a new refrigerant,
whereby the compressor cycled off eighteen times over the ten-hour test.
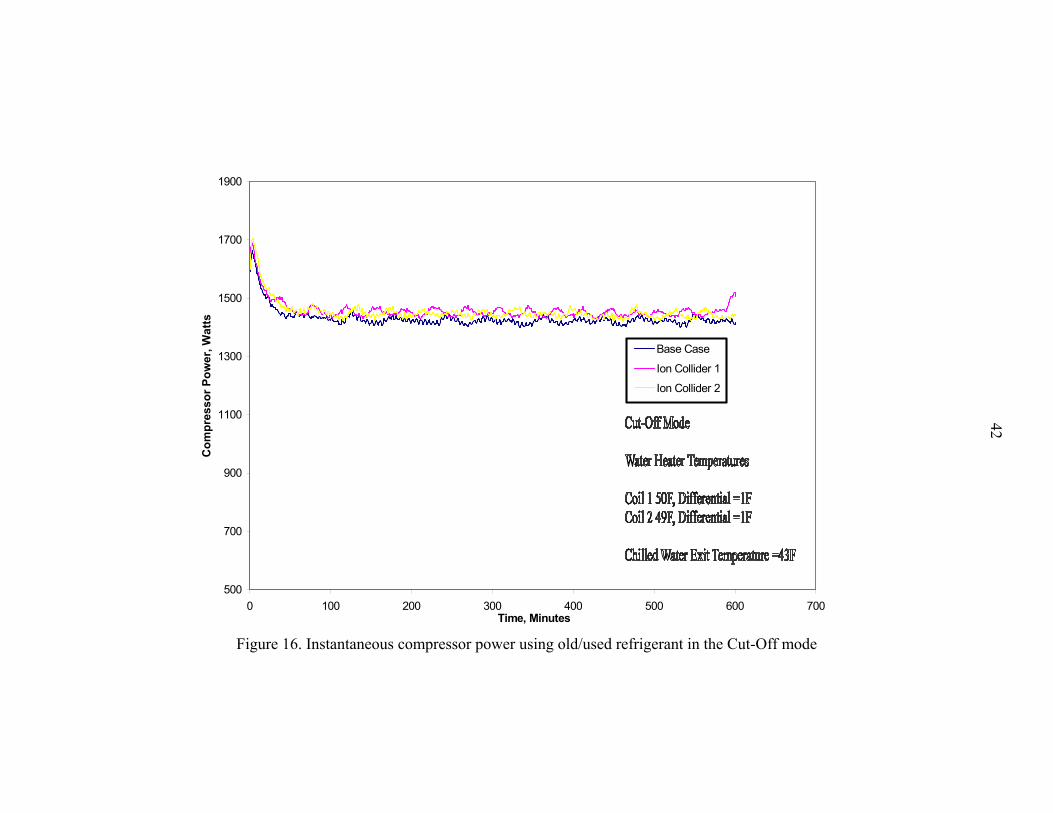
Instantaneous Compressor Power
Figures 15 and 16 show the instantaneous compressor power for the Standard and
Cut-Off modes of operation, respectively. The compressor power consumption for Ion
Collider 2 was marginally larger than either of the other two cases (see Figure 15). The
power consumption for the Base Case appears to be a bit smaller than that of Ion Collider
1. However, the differences among all the cases are believed to be marginal and
statistically insignificant. For the Cut-Off mode, on the other hand, Ion Collider 1 and
the Base Case appear to have an equal amount of power consumption (see Figure 16)
Instantaneous Coefficient of Performance
The instantaneous coefficient of performance for the Standard and Cut-Off modes
of operation is presented in Figures 17 and 18, respectively.
Figure 17 shows that the coefficient of performance in the Standard mode for both
the Base Case and Ion Collider 1 is nearly the same. Ion Collider 2 seems to have a
marginally lower coefficient of performance than either of the other two cases. Again,
the differences are statistically insignificant and, thus, should not be viewed as
constituting a meaningful trend. For the Cut-Off mode (see Figure 18), on the other
hand, all three test cases appear to have a near identical performance.
Total Energy Consumption
The total energy consumption is shown graphically in Figure 19. It is calculated as
the area under the instantaneous compressor power-time curves (Figures 15 and 16). As
seen in Figure 19, the total energy consumption for all three cases in both the Standard
and Cut-Off modes are remarkably similar over the duration of the test runs.

32
The comparison of the COP for the two cases of testing, i.e. the new refrigerant and
the old/used refrigerant is shown graphically in Figure 20. The comparison was done for
the Standard mode of testing. For the new refrigerant, it can be seen that the time
averaged COP is lower in the cases involving the use of the Ion Collider as compared to
the Base case. For the case involving the old/used refrigerant, the COP for the Base Case
and that of Ion Collider 1 can be seen to be nearly similar. Both of these values are seen
to be higher than the case involving Ion Collider 2.
-8
-6
-4
-2
0
2
4
6
0 100 200 300 400 500 600 700Time, Minutes
Ref
riger
atin
g C
apac
ity, k
W Base CaseIon Collider 1 Ion Collider 2
33
Figure 7. Instantaneous refrigerating capacity using new refrigerant in Standard mode
-8
-6
-4
-2
0
2
4
6
0 100 200 300 400 500 600 700Time, Minutes
Ref
riger
atin
g C
apac
ity, k
W
Base CaseIon Collider 1Ion Collider 2
34
Figure 8. Instantaneous refrigerating capacity using new refrigerant in Cut-Off mode

1400
1500
1600
1700
1800
1900
2000
0 100 200 300 400 500 600 700Tim e, Minutes
Com
pres
sor P
ower
, Wat
ts
Base CaseIon Collider 1Ion Collider 2
35
Figure 9. Instantaneous compressor power using new refrigerant in the Standard mode
0
500
1000
1500
2000
2500
3000
0 100 200 300 400 500 600 700Time, Minutes
Com
pres
sor P
ower
, Wat
ts
Base Case
Ion Collider 1
Ion Collider 2
36
Figure 10. Instantaneous compressor power using new refrigerant in the Cut-Off mode

-4
-3
-2
-1
0
1
2
3
4
0 100 200 300 400 500 600 700Time, Minutes
Coe
ffici
ent o
f Per
form
ance
(CO
P)
Base CaseIon Collider 1Ion Collider 2
37
Figure 11. Instantaneous coefficient of performance using new refrigerant in the Standard mode

0
1000
2000
3000
4000
5000
6000
7000
8000
9000
10000
Standard Mode Cut-Off Mode
Ener
gy C
onsu
med
, kW
-hr
38
Base Case
Ion Collider 1
Ion Collider 2
Figure 12. Total energy consumption using new refrigerant in the Standard and Cut-Off modes
-6
-4
-2
0
2
4
6
8
10
0 100 200 300 400 500 600 700Time, Minutes
Ref
riger
atin
g C
apac
ity, k
W
Base CaseIon Collider 1 Ion Collider 2
39
Figure 13. Instantaneous refrigerating capacity using old/used refrigerant in the Standard mode

-6
-4
-2
0
2
4
6
8
10
0 100 200 300 400 500 600 700Time, Minutes
Ref
riger
atin
g C
apac
ity, k
W
Base CaseIon Collider 1Ion Collider 2
40
Figure 14. Instantaneous refrigerating capacity using old/used refrigerant in the Cut-Off mode

500
700
900
1100
1300
1500
1700
1900
0 100 200 300 400 500 600 700Time, Minutes
Com
pres
sor P
ower
, Wat
ts
Base CaseIon Collider 1Ion Collider 2
41
Figure 15. Instantaneous compressor power using old/used refrigerant in the Standard mode
500
700
900
1100
1300
1500
1700
1900
0 100 200 300 400 500 600 700Time, Minutes
Com
pres
sor P
ower
, Wat
ts
Base Case
Ion Collider 1
Ion Collider 2
42
Figure 16. Instantaneous compressor power using old/used refrigerant in the Cut-Off mode

-3
-2
-1
0
1
2
3
4
5
6
7
0 100 200 300 400 500 600 700Time, Minutes
Coe
ffici
ent o
f Per
form
ance
(CO
P)
Base CaseIon Collider 1Ion Collider 2
43
Figure 17. Instantaneous coefficient of performance using old/used refrigerant in the Standard mode
-3
-2
-1
0
1
2
3
4
5
6
7
0 100 200 300 400 500 600 700Time, Minutes
Coe
ffici
ent o
f Pef
orm
ance
(CO
P)
Base CaseIon Collider 1Ion Collider 2
44
Figure 18. Instantaneous coefficient of performance using old/used refrigerant in the Cut-Off mode

0
1000
2000
3000
4000
5000
6000
7000
8000
9000
10000
Standard Mode Cut off Mode
Ener
gy C
onsu
med
, kW
-hr
45
Base Case
Ion Collider1Ion Collider 2
Figure 19. Total energy consumption using old/used refrigerant in the Standard and Cut-Off modes

0
0.5
1
1.5
2
2.5
3
3.5
4
New Refrigerant Old / Used Refrigerant
Coe
ffici
ent o
f Per
form
ance
(CO
P)
46
Base Case
Ion Collider 1
Ion Collider 2
Figure 20. COP measured using new and old/used refrigerant in the Standard mode
47
Irreversibility Analysis on the Refrigeration System
As discussed in an earlier section of this thesis the irreversibility of the various
components of the refrigeration system were calculated from Equations (22), (24), (25),
(27) and (29). The latter part of the sample calculations presented in Appendix B of this
thesis outlines the irreversibility analysis of the system. The state points are taken from
actual experimental data after the lapse of 100 minutes of system operation for the Base
Case in the Standard mode of operation.
On careful observation, it is seen that the compressor had the largest
irreversibilities as compared to the other system components. The irreversibility of the
compressor (46% of the total irreversibility calculated for the sample calculation as
outlined in Appendix B) could be attributed to motor inefficiencies, frictional losses,
mixing, irreversibilities due to pressure drop and heat transfer between the compressor
and the surroundings. The irreversibility of the evaporator attributed to the next largest
percentage of the total irreversibility of the system, followed by irreversibilities in the
condenser and expansion valve.
Comparing the irreversibilities produced in each of the components in each of cases
involving the use of the Ion Colliders and the Base Case, it was noted as follows,
The irreversibilities produced in the compressor of the refrigeration system when
the Ion Collider devices were in use are attributed to be marginally larger than the Base
Case. However, the statistically insignificant increase in the irreversibilities produced
cannot be attributed to fact that the Ion Collider devices alone did cause the compressor
be more irreversible. Figure 21 outlines a representation of the compressor irreversibility
as calculated for all cases of testing with respect a time scale spanning the entire duration
of a single test in the Standard mode of operation. The value of the irreversibility in the
case involving the Ion Collider 2 for the 400th minute of operation should be regarded as

48
a stray case, not reflecting the general trend of the compressor irreversibilities in the
system.
Figure 22 shows the irreversibilities produced in the condenser for the cases
involving use of Ion Colliders and the Base Case. It is observed that the irreversibilities
produced in the condenser is nearly similar for all cases, and that the Ion Collider did not
have much effect on the irreversibility produced in this component. The similar results
are noticeable in Figure 23, which shows the irreversibilities produced in the expansion
valve. Since the expansion valve does not have any heat interaction with the surroundings
and the irreversibilities are calculated only as difference in the inlet and exit entropies, a
nearly similar irreversibility was expected.
The case of evaporator irreversibility as seen from Figure 24, the irreversibility
involving the Base Case and Ion Colliders were found to be nearly equal. Once again, the
case involving the Ion Collider 2 for the 400th minute of operation should be regarded as
a stray case, not reflecting the general trend of the evaporator irreversibilities in the
system.
It was seen from the graph showing the total irreversibility of the system for the
duration of one test in the Standard mode of operation (Figure 26), the total
irreversibilities of the system for all cases are found to be remarkably similar. This brings
us to the conclusion that the Ion Colliders had no significant effect on the system. One
would have expected the Ion Colliders, because its design and effects on the refrigerant to
produce a marginally higher measure of irreversibilities as compared to the Base Case.
However, as shown in the above discussion this was not the case.
49
0
0.001
0.002
0.003
0.004
0.005
0.006
0 100 200 300 400 500 600 700
Tim e, m ins
Com
pres
sor I
rrev
ersi
bilty
, kW
/K
Base CaseIon Collider 1Ion Collider 2
Figure 21. Compressor irreversibility using new refrigerant in the Standard mode
-0.0005
0
0.0005
0.001
0.0015
0.002
0 100 200 300 400 500 600 700
Tim e, m ins
Con
dens
er Ir
reve
rsib
ilty,
kW
/K
Base CaseIon Collider 1Ion Collider 2
Figure 22. Condenser irreversibility using new refrigerant in the Standard mode

50
0
0.0001
0.0002
0.0003
0.0004
0.0005
0.0006
0.0007
0.0008
0.0009
0.001
0 100 200 300 400 500 600 700
Time, mins
Expa
nsio
n Va
lve
Irrev
ersi
bilty
, kW
/K
Base CaseIon Collider 1Ion Collider 2
Figure 23. Expansion valve irreversibility using new refrigerant in the Standard mode
0
0.0005
0.001
0.0015
0.002
0.0025
0.003
0.0035
0.004
0 100 200 300 400 500 600 700
Time, mins
Evap
orat
or Ir
reve
rsib
ilty,
kW
/K
Base CaseIon Collider 1Ion Collider 2
Figure 24. Evaporator irreversibility using new refrigerant in the Standard mode
51
-0.0003
-0.0001
0.0001
0.0003
0.0005
0.0007
0.0009
0.0011
0.0013
0.0015
0 100 200 300 400 500 600 700
Tim e, m ins
Dev
ice
Irrev
ersi
bilty
, kW
/K
Base CaseIon Collider 1Ion Collider 2
Figure 25. Ion Collider device irreversibility using new refrigerant in the Standard mode
0
0.001
0.002
0.003
0.004
0.005
0.006
0 100 200 300 400 500 600 700
Time, mins
Tota
l Irr
ever
sibi
lty, k
W/K
Base CaseIon Collider 1Ion Collider 2
Figure 26. Total irreversibility using new refrigerant in the Standard mode

CHAPTER 6 CONCLUSIONS
A study was conducted to investigate the effects or lack thereof of employing the
Ion Collider technology in refrigeration systems. The study covered two main categories
of tests. The first category dealt with the effects of using Ion Colliders in the presence of
new refrigerants, while the second category dealt with their effects in the presence of
old/used refrigerants. The study included testing of two types of colliders corresponding
to different collider compositions. Ion Collider 1 was made up of 100% copper, while
Ion Collider 2 was made up of 80% copper and 20% nickel.
In the category of tests involving a new refrigerant, the following are the main
conclusions:
1. The refrigerating capacity was a bit lower when the Ion Colliders were employed relative to the Base Case (which represents operating the system without the Ion Colliders). This was manifested in the fact that the chilled water exit set point temperature in the Base Case was reached more frequently than with employing either of the Colliders (for Cut-Off mode of operation).
2. The instantaneous compressor power was a bit higher for the tests employing the Ion Colliders than those for the Base Case.
3. The chiller coefficient of performance when the Ion Colliders were in use was a bit lower than that associated with the Base Case.
4. The total energy consumption of the compressor in the Standard mode of operation was similar for all cases. The total energy consumption of the compressor in the Cut-Off mode over the testing period was significantly larger for the cases involving the Ion Colliders than those of the Base Case (23.22% larger for Ion Collider 1 and 21.77% larger for Ion Collider 2). This was attributed to a fewer number of compressor down time cycles when the Ion Colliders were in use.
52

53
In the category of tests involving an old/used refrigerant, the following are the main
conclusions:
1. The Base Case and the cases involving the use of the Ion Colliders appear to have near similar refrigerating capacity.
2. The instantaneous compressor power for all cases with or without the Ion Colliders was found to be nearly similar.
3. The Base Case and the cases involving the use of the Ion Colliders appear to have similar coefficient of performance.
4. The total energy consumption of the compressor for all the cases involving use of Ion Colliders and the Base Case were nearly similar, within a specified mode of operation. This concludes that the Ion Colliders had a no effect on the total energy consumption.
It is important to emphasize that there were no significant differences in performance
between the old and new refrigerants for the Base Case in the Standard mode. In other
words, there was no deterioration in the performance of the system while employing
old/used refrigerant as compared to its performance when employing a new refrigerant.
This is evident by examining key performance parameters in the Standard mode. In the
Cut-Off mode, on the other hand, there were differences between the performance of the
system depending on whether a new or an old/used refrigerant were used. As indicated in
the main body of the thesis, the compressor cycled off 18 times over the duration of the
test in the Base Case with a new refrigerant, whereas it did not cycle off at all in the Base
Case with the old/used refrigerant. A similar behavior was observed when the Ion
Colliders were used; namely, the compressor cycled off with the new refrigerant, whereas
it did not cycle off at all with the old/used refrigerant.
It is worth observing that since test results showed virtually no change when the
Colliders were used relative to the Base Case, the refrigerant properties were probably
not altered as a result of introducing the Colliders in the refrigerant line. One indication

54
of the validity of this conclusion is the fact that the state points on the pressure-enthalpy
charts for the refrigerant in the Standard mode for all cases were remarkably close, thus
indicating a lack of change in properties.
Finally yet importantly, the effects or lacks thereof of the Ion Colliders are better
quantified in the Standard mode of operation (as opposed to the Cut-Off mode) for both
the new and old/used refrigerants. It may be safely concluded that the effect of the Ion
Colliders on the performance of the system in the Standard mode was marginal and
statistically insignificant. We firmly believe that the results as presented in the Standard
mode justify our conclusion that the Ion Colliders have no effect on the refrigeration
system.

APPENDIX A PRESSURE-ENTHALPY DIAGRAMS FOR ACTUAL CYCLE
Figure 27. Pressure-Enthalpy diagram for the Base Case
55
56
Figure 28. Pressure-Enthalpy diagram for the Ion Collider 1

57
Figure 29. Pressure-Enthalpy diagram for the Ion Collider 2

APPENDIX B SAMPLE CALCULATIONS
The purpose of this appendix is to provide sample calculations that can guide the
reader into understanding the analysis section of this report. In the process of performing
these calculations, comparisons between certain calculated and measured quantities were
made for the purpose of gaining confidence in the experimental results and thus
validating the experimental methods and techniques employed.
The following data were obtained from a test run with a new refrigerant for the
Base Case in the Standard mode of operation. Data reflect the conditions after the lapse
of 100 minutes of system operation.
( )( )
(85%) 0.85)(η(80%) 0.80)(η
/sm0023950/hrft53040.03C
2s8440
3751PFV)-0200-(CRD1
Amps 5928(I)V439205(V)
/kgm0710)(v
kPa350PkPa1344P
e
m
33
31
1
2
====
==
==
==
=
==
iciency trical effMotor eleciciency anical effMotor mech
. .placementPiston DisfactorClearance
ndersNo of cyli inche.Stroke
inches. Bore a presor Datpeland ComSource::Co
.Current .essor ross comprVoltage ac
. nlet mpressor iapor at coolume of vSpecific v
ressure rigerant p inlet refCompressor essure igerant pr exit refrCompressor
Polytropic exponent (R-22), n=1.12
58

59
The refrigerant mass flow rate is given by Equation (13), assuming for the
calculation the specific volume of the refrigerant before compression ( to be equal to
the specific volume of the refrigerant at the compressor inlet
)bv
( )1v
1
/1
,..1
vDP
PP
CCmn
b
ccalcr
−+=&
( ) kg/s 03130
07100023950
35013440300301
1211
..
...m./
r,calc =
−+=&
This calculated value of the mass flow rate could be compared to the measured
refrigerant mass flow rate
kg/s 02660.mr,meas =& which is a percentage difference of 17.67%.
From Equation (14), the compressor work can be calculated as
−
−
=
−
1)1(
1n
n
b
cbbcomp P
PvP
nnW
while the compressor power is expressed by
em
compcomp
WmW
ηη&
& =
( )( ) kW 658.11350
1344071.010350)112.1(
12.1)85.0)(80.0(
0313.0 12.1112.1
3 =
−
×
−=
−
compW&
From Equation (17), the compressor power can be calculated as the product of the
voltage, amperage, and the power factor (φ )
Amps5928V439205
.Current .Voltage
==
85.0=φ
φVI=compW&

60
kW 51 W3615005)8.592)(0.8(205.439)( . .Wcomp ===& The measured power of 1.5 kW compares very favorably with the calculated power of
1.658 kW (percent difference is 10.53%).
The refrigerating capacity as calculated from Equation (16) is
)-T ( T Cm Q w, ow, ip,wwe && =
GPM54 .teme flow raWater volu = (preset at this value for all experiments)
kg/s15860
GPM 1 wρ=
kg/s100828 2−×== .m flow rateWater mass w&
Ckg.kJ18.4, °
=wpC
C 6.69)(T C 10.08)(T
ow,
iw,
°=
°=
re temperatuter outletChilled waetemperaturter inlet Chilled wa
( )( ) kW 3.9766.69)(10.084.181028.08 2 =−×= −
eQ& From Equation (18) the coefficient of performance is calculated as
3.976 2.6511.5
e
comp
QCOPW
= = =&
&
Uncertainty Analysis to calculate the propagation of uncertainty in derived quantities
based on Equations (19), (20) and (21).
Instantaneous refrigerating capacity,
( )( ), , ,
2
1/ 22 22 2
, , ,, , ,
( )
28.08 10 4.18 (10.08 6.69) 3.976 kW
e w p w w i w o
e
e e e ee w p w w i w o
w p w w i w o
Q m C T T
Q
Q Q Q QQ m C T Tm C T T
−
= −
= × − =
∂ ∂ ∂ ∂ ∆ = ∆ + ∆ + ∆ + ∆ ∂ ∂ ∂ ∂
& &
&
& & & && &
&
61
( ) (( ) ( )
)1
2 2 2, , , , , ,
2 2, , , ,
( ) ( )p w w i w o w w w i w o p we
w p w w i w p w w o
C T T m m T T CQ
m C T m C T
− ∆ + − ∆ ∆ = + ∆ + − ∆
& &&
& &
( )( )( )( )( )( ) ( )( )( )( )
12 2-2
2 2-2 -2
4.18 (10.08-6.69)(28.08 10 0.01) 0
28.08 10 4.18 0.2 28.08 10 4.18 0.2eQ
× × + + ∆ = × + ×
&
0.3343 kWeQ∆ = ±&
0.3343%Uncertainity 100 100 8.40%3.976
e
e
QQ∆
= × = × = ±&
&
Instantaneous compressor power,
1/ 22 2
VI (205.439)(8.592)(0.85) 1500 36 W 1 5 kW
V IV I
comp
comp compcomp
W .
W WW
φ= = = =
∂ ∂ ∆ = ∆ + ∆ ∂ ∂
&
& &&
.
( ) ( )1
2 2 2I V V IcompW φ φ ∆ = ∆ + ∆ &
( )( )( )( ) ( )( )( )( )1
2 2 28.592 0.85 0.0025 205.439 205.439 0.85 0.005 8.592
8.388 W
0.008388 kW
comp
comp
comp
W
W
W
∆ = × + × ∆ =
∆ = ±
&
&
&
0.008388%Uncertainity 100 100 0.56%
1.5comp
comp
WW∆
= × = × = ±&
&
Instantaneous coefficient of performance,
( ) ( )1/ 222
3.976 2.6511.5
e
comp
e ce comp
QCOPW
COP COPCOP Q W
Q W
= = =
∂ ∂ ∆ = ∆ + ∆ ∂ ∂
&
&
& && & omp
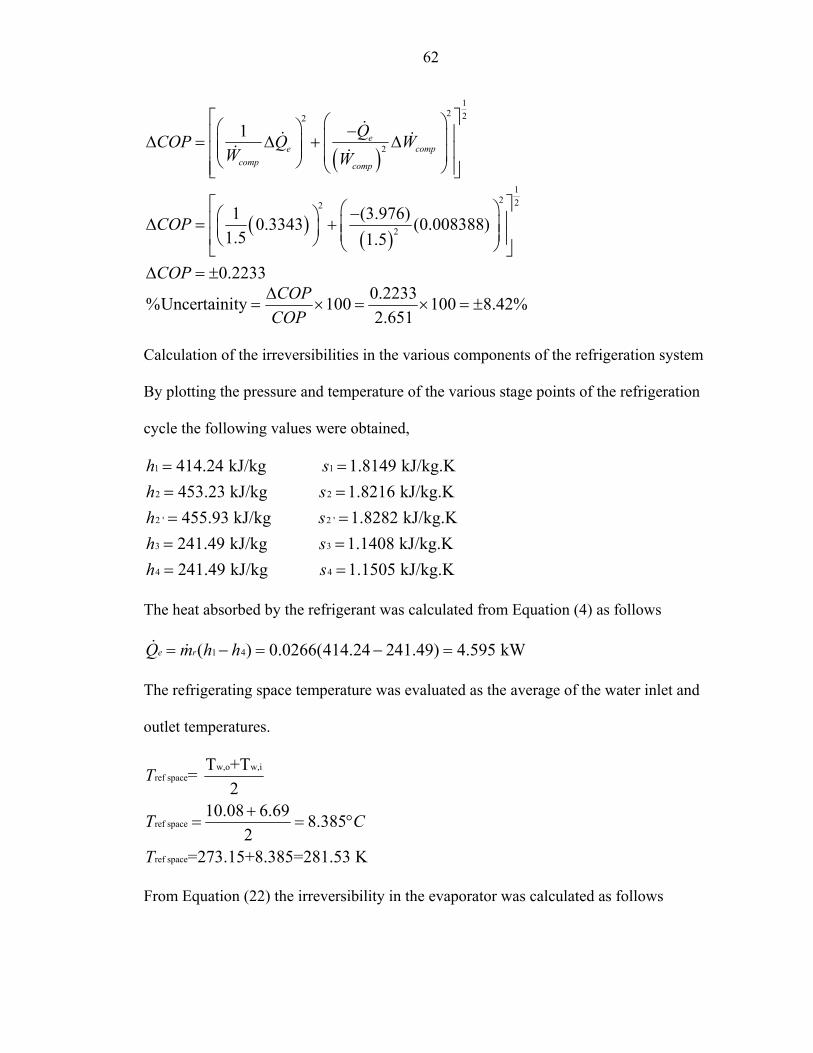
62
( )
12 22
2
1 ee c
comp comp
QCOP Q WW W
− ∆ = ∆ + ∆
&& &
& & omp
( )( )
12 22
2
1 (3.976)0.3343 (0.008388)1.5 1.5
0.2233
COP
COP
− ∆ = + ∆ = ±
0.2233%Uncertainity 100 100 8.42%2.651
COPCOP∆
= × = × = ±
Calculation of the irreversibilities in the various components of the refrigeration system
By plotting the pressure and temperature of the various stage points of the refrigeration
cycle the following values were obtained,
1 1
2 2
2 ' 2 '
3 3
4
414.24 kJ/kg 1.8149 kJ/kg.K453.23 kJ/kg 1.8216 kJ/kg.K455.93 kJ/kg 1.8282 kJ/kg.K241.49 kJ/kg 1.1408 kJ/kg.K241.49 kJ/kg
h sh sh sh sh
= == == == == 4 1.1505 kJ/kg.Ks =
The heat absorbed by the refrigerant was calculated from Equation (4) as follows
1 4( ) 0.0266(414.24 241.49) 4.595 kWe rQ m h h= − = − =& & The refrigerating space temperature was evaluated as the average of the water inlet and
outlet temperatures.
w,o w,iref space
ref space
ref space
T +T= 2
10.08 6.69 8.3852
=273.15+8.385=281.53 K
T
T C
T
+= = °
From Equation (22) the irreversibility in the evaporator was calculated as follows
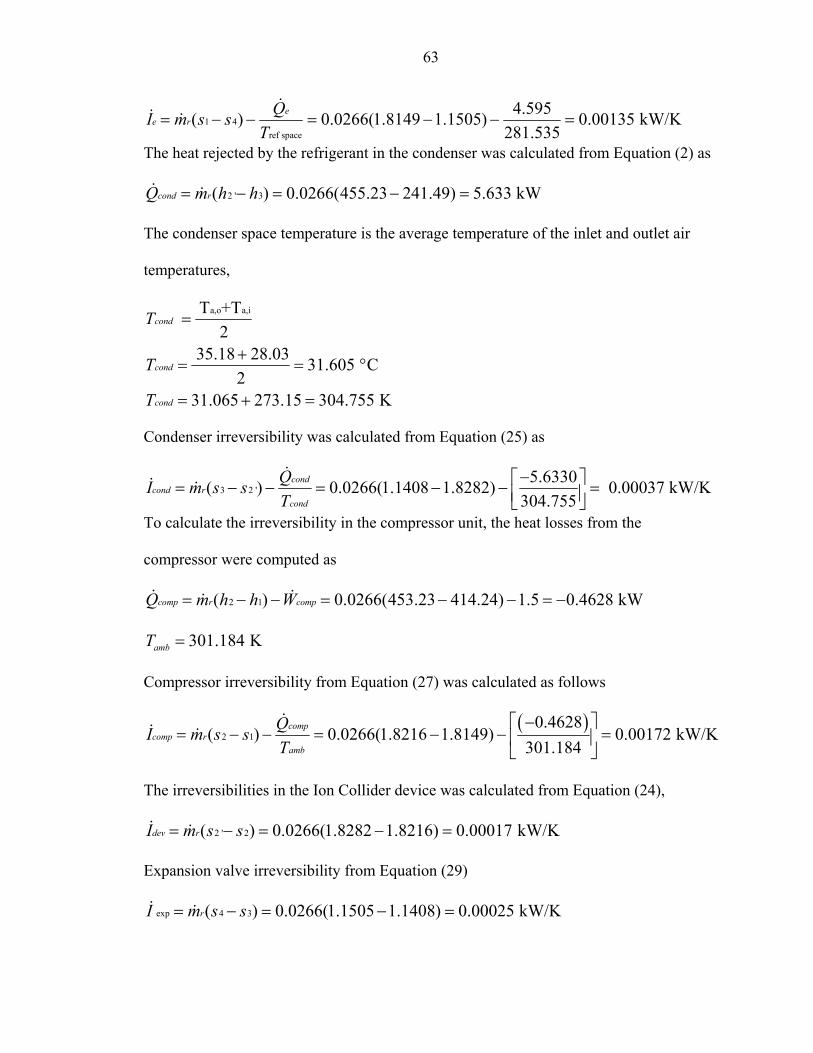
63
1 4ref space
4.595( ) 0.0266(1.8149 1.1505) 0.00135 kW/K281.535
ee r
QI m s sT
= − − = − − =&
& &
The heat rejected by the refrigerant in the condenser was calculated from Equation (2) as
2 ' 3( ) 0.0266(455.23 241.49) 5.633 kWcond rQ m h h= − = − =& & The condenser space temperature is the average temperature of the inlet and outlet air
temperatures,
a,o a,i
T +T2
35.18 28.03 31.605 C2
31.065 273.15 304.755 K
cond
cond
cond
T
T
T
=
+= =
= + =
°
Condenser irreversibility was calculated from Equation (25) as
3 2 '5.6330( ) 0.0266(1.1408 1.8282) 0.00037 kW/K
304.755cond
cond rcond
QI m s sT
− = − − = − − =
&& &
To calculate the irreversibility in the compressor unit, the heat losses from the
compressor were computed as
2 1( ) 0.0266(453.23 414.24) 1.5 0.4628 kWcomp r compQ m h h W= − − = − − = −& &&
301.184 KambT = Compressor irreversibility from Equation (27) was calculated as follows
( )2 1
0.4628( ) 0.0266(1.8216 1.8149) 0.00172 kW/K
301.184comp
comp ramb
QI m s sT
− = − − = − − =
&& &
The irreversibilities in the Ion Collider device was calculated from Equation (24),
2 ' 2( ) 0.0266(1.8282 1.8216) 0.00017 kW/Kdev rI m s s= − = − =& & Expansion valve irreversibility from Equation (29)
exp 4 3( ) 0.0266(1.1505 1.1408) 0.00025 kW/KrI m s s= − = − =& &

64
The total irreversibility of the system is given as by Equation (30) as the summation of
the irreversibilities of the individual components.
exp
0.00135 0.00037 0.00172 0.00025 0.00017 0.00387 kW/Ktotal e cond comp dev
total
I I I I I II
= + + + +
= + + + + =
& & & & & &
&
LIST OF REFERENCES
1. International Cavitation Technologies, Inc., ICTI, www.ioncollider.com, 08/25/2002.
2. Rippetoe, W.W. and Shroff, D.N., “Method and Apparatus for Separating Particles from Liquids,” United States Patent No. 5, 482,629, January 9, 1996.
3. Allen, D., Kim, D. and Quigley, C.,“Cavitation Driven Chemistry in Ion Collider,” Technical Report submitted to Falcon Seaboard, Department of Chemical Engineering and Center for Energy Studies, The University of Texas at Austin, Austin, Texas, 1998.
4. Rippetoe, W.W. and Shroff, D.N., “Method and Apparatus to Enhance the Recovery of Crude Oil,” United States Patent No. 5,485,883, January 23, 1996.
5. Rippetoe, W.W. and Shroff, D.N., “Method of Increasing the Amount of Hydrocarbons from an Underground Reservoir,” United States Patent No. 5,538,081, July 23, 1996.
6. Kline, S.J. and F.A. McClintock, “Describing Uncertainties in Single Sample Experiments,” Mechanical Engineering, Vol. 75, pp. 3-8, ASME International, New York, 1953.
65

BIOGRAPHICAL SKETCH
Mr. Jason Z.Alphonso was born in Mumbai, India, on October 29, 1978. He
received his undergraduate degree in mechanical engineering from the University of
Bombay in October 2000. He started graduate studies at the University of Florida in Fall
2001. His interests are in the field of refrigeration and air-conditioning.
In his early academic life, Mr. Alphonso always strived to maintain a very effective
balance between his studies and extra-curricular activities, which earned him the
prestigious Lady Jackson Trophy for all round development in his high school. He also
stood All-India first in mathematics at the Indian Council of Secondary Education [ICSE,
1994].
During his undergraduate studies, Mr.Alphonso was fortunate to serve as an elected
student body senate member for three consecutive terms [1997-2000]. He was also the
elected class representative for his undergraduate class, a liaison between the faculty and
the students of the department.
66