Embed Size (px)
Citation preview

Promotion RenaissancePromotion Renaissance
2005 NCH Symposium
Chicago, IL
September 13, 2005
8912 East Pinnacle Peak Road • Scottsdale, AZ 85255 Phone (480) 513-0547 • Fax (480) 513-0548 • E-Mail: [email protected] • [email protected]
www.hoytnet.com

NCHR2.ppt 2
Today
Hoyt & Company believes that a combination of diverse and seemingly unrelated circumstances is about to resuscitate consumer promotion as a major weapon in the differentiation arsenal.
We are here today to tell you why we think this and what you as promotion experts can do to help accelerate and capitalize on this opportunity.
What we will cover is:
The key change drivers relevant to consumer promotion
How the industry has responded to-date to these drivers
The role we think consumer promotion will play over the next five years and what it will take to get on top of the curve and remain in front

NCHR2.ppt 3
The Key Change Drivers – Trends and Facts of Life That Won’t Go Away
Population Fragmentation
Media Fragmentation
Touchpoint Marketing
Shopper Marketing
Retail Consolidation
Retail Branding
How to Differentiate
Retail as Media
Demand for ROI

NCHR2.ppt 4
It’s getting harder and harder to build brand share in the face of an atomized consumer market that seems to be growing increasingly impervious to traditional marketing.
Because everyone is already familiar with what is meant by “population fragmentation”, let’s skip the statistics and get right to the heart of the issue:
• “Demographic segmentation is no longer a reliable consumption predictor because four different people in the same household may use four different brands of toothpaste and consume as many as 10 different brands of beverages.”
Same thing applies to media fragmentation. It now takes 117 commercials to reach 80% of one’s target consumers versus three in 1965.
Meanwhile, an average of 70% of those who watch TV are typically only half-watching – meaning they have one eye on the tube and the other eye on a monitor or a newspaper at the same time.
Technology has enabled dedicated watchers to skip commercials entirely: Currently 20% of households own TiVo or DVRs and 70% of these routinely fast forward. By 2010, this 20% is expected to grow to 50%.

NCHR2.ppt 5
Source: Yankelovich Monitor, January 2005
Even when marketers do finally “get through” – they find a consumer all but “fed up” with the entire proposition. According to Yankelovich:
65% of consumers think they are “constantly bombarded with too much advertising”
59% think that, “Very little, if any, marketing and advertising has any relevance to me.”
61% feel that the quantity of advertising and marketing they are exposed to is “out of control”
60% report that their view of advertising is “much more negative than just a few years ago”
59% of consumers feel misunderstood by marketers

NCHR2.ppt 6
The result of this growing dissatisfaction is that between 1994 and 2003, prime time viewership has plunged from 45MM to 25MM HHs – a 45% drop in only 9 years:
Despite this – amazingly enough – ad spending during these years has actually increased in real dollars from $5 – $7 Billion or 40%.
What’s Wrong With This Picture?
20
25
30
35
40
45
50
1994 1997 2000 20034
5
6
7
8
9
10Viewers
Peak Ad Spending
Viewers2 (MM)Real ad Spending 3 ($B)Prime Time TV1 in the United States
1 Segment of broadcast day from 8pm - 10pm; includes 4 major networks (ABC, CBS, Fox, NBC)2 Estimated3 Adjusted for inflation to 2004 dollars
Source: Deutsche Bank: TV Program Investor. Kagan Research from the McKinsley Quarterly, “Boosting Returns on Marketing Investment” 2005 #2

NCHR2.ppt 7
When combined with a highly fragmented consumer market, this apparent contradiction has prompted leading manufacturers to seek out cost-effective alternatives that enable them to “Touch” the consumer all the way from home to shelf – what the industry now commonly refers to as “Touchpoint Marketing”
Oh, How Do I Touch Thee? Count The Ways!
RadioInternet Ads
FSPs
Direct Mail
FSIs
In-Store TV
Network TV
Newspapers
DVD Trailers
High Impact Product PlacementsRetailtainment
Outdoor Signage
Coupons
Movie Theater Ads
Customer Service
Content Implants
In-Store Sampling
Mega-EventSponsorship
Cable TV
Permission-Based E-mails

NCHR2.ppt 8
HOME
T.V. Print Internet Mail Radio Word of Mouth
STORE Shelf Displays Circulars T.V. Radio Kiosk Carts POS Events
Radio Billboards Cab Tops Transit Signs Events
Touchpoint Marketing requires a highly personalized, tightly integrated communications and promotion strategy that “touches” the target consumer every step of the way from home to and through the store to the shelf

NCHR2.ppt 9
Why the store? Because in all the flux of population fragmentation and media fragmentation, the one thing every marketer knows for sure is that the one place they can reach 100% of their target shoppers at least 2-3 x’s per month is in the retail store.

NCHR2.ppt 10
Another reason for “the store” is that consumers make approximately 70% of brand decisions and 60% of category decisions after they enter the store:
In other words, despite all of the advertising and other means manufacturers use to build awareness and loyalty, consumers are most heavily influenced by in-store stimuli.
Source: POPAI, 2005
Percentage of Purchase Decisions Made In-Store
70%
60%
54%56%58%60%62%64%66%68%70%72%
Brand Category

NCHR2.ppt 11
Source: Progressive Grocer, Drug Store News, Discount Store News, MVI
Reaching consumers in-store has now become manageable since 15-20 retailers now comprise 60% or more of most CPG manufacturers’ business:
2004 Concentration of Business By Principal CPG Trade Channel
Channel Accounts2004 Sales
($B)# Total
AccountsTotal $ Sales
Total Channel Sales ($B)
% Channel ACV
Clubs CostcoSAM’sBJ’s
$39.0$37.1$7.4
3 $83.5B $85.5B 97.7%
Super Centers
Wal-MartKmartMeijerFred MeyerTarget
$133.1$2.9
$11.5$5.3$5.5
5 $158.3B $176.0B 89.9%
Drug WalgreensCVS/EckerdRiteAidJean Coutu
$36.4$32.7$16.9$9.9
4 $95.9B $174.4B 55.0%
Traditional Discount
Wal-MartKmart/SearsTarget
$60.7$39.6$40.8
3 $141.0B $154.0B 91.6%
Total Grocery KrogerAlbertson’sSafewayAhold
$47.1$34.3$32.1$27.1
4 $140.6B $474.5B 29.6%
TOTALS 19 $619.3B $1,064B 58.1%

NCHR2.ppt 12
62%
84%
55%
60%
74%
28%
45%
60%
38%
26%
49%
60% 59%
86%
62%
48%
29%
66%
0%
10%
20%
30%
40%
50%
60%
70%
80%
90%
100%
Wal-Mart Trad Wal-Mart Total Wal-Mart SC Target Total Kmart Total CVS Walgreens
2001 2002 2003
Sample HH Penetration Levels of Leading National Retailers – 2001 - 2003
Source: IRI Panel Data, 2004
Some of these retailers are now national in scope and have achieved household penetration levels that exceed those of most national brands
NCHR2.ppt 13
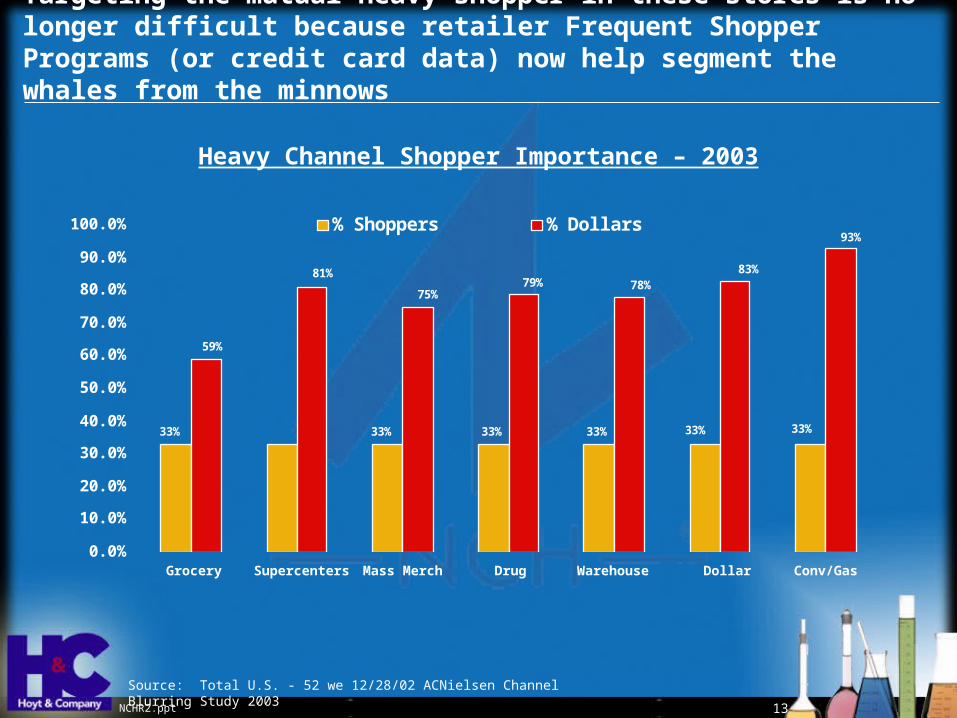
Targeting the mutual heavy shopper in these stores is no longer difficult because retailer Frequent Shopper Programs (or credit card data) now help segment the whales from the minnows
33% 33% 33% 33%33%33%33%
93%
83%78%79%
75%
81%
59%
0.0%
10.0%
20.0%
30.0%
40.0%
50.0%
60.0%
70.0%
80.0%
90.0%
100.0%
Grocery Supercenters Mass Merch Drug Warehouse Dollar Conv/Gas
% Shoppers % Dollars
Source: Total U.S. - 52 we 12/28/02 ACNielsen Channel Blurring Study 2003
Heavy Channel Shopper Importance – 2003

NCHR2.ppt 14
Perhaps, most importantly, Retailers also have a vested interest in anything that will help them differentiate. Take a look at some of their problems:
Outlet Saturation – Too many stores/too few consumers
SKU Proliferation – Too many items create “choice confusion”
Mass Availability of Same items in Different Channels – Virtually every CPG channel now uses fast-moving consumables to build traffic
Category Hijacking – One channel stealing destination items from another
Disintermediation – Competition from consumer direct alternatives like the Internet
Shopper Disloyalty
Price Competition from Value Discounters
There are more… but these are the most frequently mentioned.

NCHR2.ppt 15
Source: Retail Forward, Food Industry Outlook, February, 2004; ACNielsen, 2002 and 2003, Hoyt & Company, 2005
2001$63B
2002$82B
2003$95B
2004$112B
2007$162B
2010$195B 35%*35%*
Bigger than Kroger,
Albertsons, Safeway and
Ahold combined
Bigger than Kroger,
Albertsons, Safeway and
Ahold combined
Bigger than Kroger & Albertsons
Combined
Bigger than Kroger & Albertsons
Combined
Surpasses Kroger as the nation’s #1 food retailer
Surpasses Kroger as the nation’s #1 food retailer
+17.0%/Year C
ompounded
Vs. 4.0% For S
upermark
ets!
Wal-Mart’s March To The Top of the U.S. Food Chain: 2001 - 2010(Food & Drug Sales Only)
*Wal-Mart*SAM’s*Neighborhood Markets
Because Wal-Mart “owns” the low price space, all other retailers must now find ways to differentiate on a non-price basis.:

NCHR2.ppt 16
Some retailers, in fact, are striving to become household brand names in their own right: The big nationals have adopted brand slogans:
Retailers have also caught on to the fact that being expert merchandisers is no longer enough: The next phase in their development is to become expert marketers.
In line with this, retailers want “Fewer, Bigger, Better” customized promotions or “retail-tainment” events that help reinforce these positions and/or – in the case of supermarkets – clearly off-set them from their competitors, even if only for a short period.
“Expect More. Pay Less.”
“That’s Life. This is Walgreens.”
“Life To The Fullest”
NCHR2.ppt 17
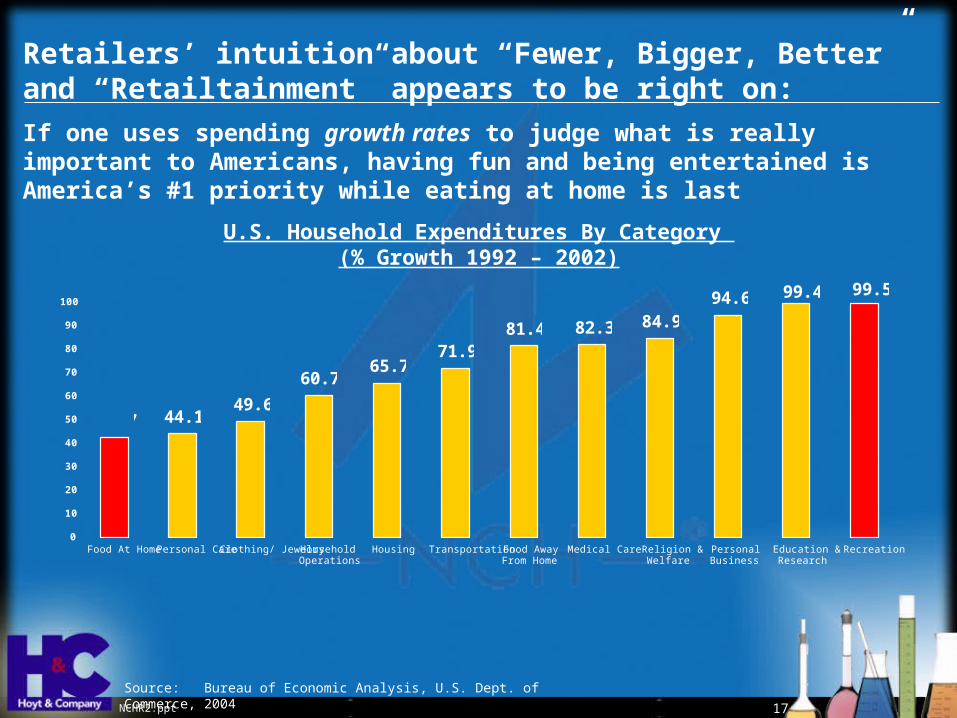
Source: Bureau of Economic Analysis, U.S. Dept. of Commerce, 2004
U.S. Household Expenditures By Category (% Growth 1992 – 2002)
42.7 44.149.6
60.765.7
71.981.4 82.3 84.9
94.6 99.4 99.5
0
10
20
30
40
50
60
70
80
90
100
Food At Home Personal Care Clothing/ Jewelry HouseholdOperations
Housing Transportation Food AwayFrom Home
Medical Care Religion &Welfare
PersonalBusiness
Education &Research
Recreation
Retailers’ intuition about “Fewer, Bigger, Better” and “Retailtainment” appears to be right on:
If one uses spending growth rates to judge what is really important to Americans, having fun and being entertained is America’s #1 priority while eating at home is last

NCHR2.ppt 18
Potential Advertising Reach – Top 10 Retailers vs. Major TV Networks
Last Four Weeks No. of U.S. Adults 18+ % of US Adults 18+
Shoppers at a top 10 retailer (Wal-Mart, Home Depot, Lowe’s, Kroger, Target, Albertsons, Costco, Safeway, JC Penney, or Walgreens)
176,512,000 85.5%
Watched ABC, CBS or NBC 172,860,000 83.7%
Watched NBC 136,912,000 66.3%
Watched CBS 133,833,000 64.8%
Watched ABC 123,582,000 59.9%
Source: Simmons Research Bureau, 2003
The investment in “Bigger, Better” promotions appears justified as recent research suggests that current cumulative retailer reach can be favorably compared to the major networks:

NCHR2.ppt 19
In addition, unaided in-store recall appears to be dramatically better than traditional media, perhaps because – once in the store – the consumer is now “shopping prone” and therefore more receptive
Source: McKinsey & Company Simmons Market Research, Morgan Stanley Dean Witter, CAB/Nielsen, TheStore.com
0% 10% 20% 30% 40% 50%
In-Store Net
Newspaper
Cable TV
Network TV
In-Store TV Potential - Un-Aided Brand Recall

NCHR2.ppt 20
Whereas formerly, promotions were uniformly structured to help sponsoring brands achieve certain consumer objectives, over the past two years, the state-of-the art has been taken to an entirely new plateau via the introduction of “shopper need states”:
The premise – for those who may not already be familiar with this – is that your brand’s consumer is a different person once she morphs into a shopping mind-set.
The needs that consumers bring to a particular shopping occasion strongly influence not only what channels and retailers they choose but where they go and what they do once inside a store:
• Saturday for a full stock-up at the Supermarket
• Monday for a quick run to the Drug Store to fill a prescription
• Thursday for a fill-in shop at the nearby Convenience Store
The motivations shoppers bring to their decisions are not always the motivations that brand marketing thinks they are when viewed only through a demographic lens.

NCHR2.ppt 21
Source: Amended from The World According to Shoppers, 2004, Coca-Cola Retail Research Council of North America. Percentages are based on grocery spending.
Current thinking on shopper need states is that there are nine different classifications of need states to explain the key purchase drivers of most shopping occasions.
Fun Trips21% of Spending
Fun Trips21% of Spending
Discovery
9% of Spending
Discovery
9% of Spending
Bargain Hunting
10% of Spending
Bargain Hunting
10% of Spending
Immediate Consumption
2% of Spending
Immediate Consumption
2% of Spending
Shopper Need StatesConsumer Packaged Goods
Shopper Need StatesConsumer Packaged Goods
Functional Trips61% of SpendingFunctional Trips61% of Spending
Care For Family
27% of Spending
Care For Family
27% of Spending
Efficient Stock-Up
16% of Spending
Efficient Stock-Up
16% of Spending
Smart Budget Shopping
18% of Spending
Smart Budget Shopping
18% of Spending
Fill-In Trips18% of Spending
Fill-In Trips18% of Spending
Small Basket Grab & Go
5% of Spending
Small Basket Grab & Go
5% of Spending
Specific Item
9% of Spending
Specific Item
9% of Spending
Reluctance
4% of Spending
Reluctance
4% of Spending

NCHR2.ppt 22
Awareness and understanding of consumers as shoppers has now become the Gold Standard for CPG marketers:
Brand Marketing Awareness Consumer/Shopper Insights
High – my brand marketers design programs with customer implementation and customer brand strategy firmly in mind
Shopping modes by category well understood across formats – shopper research and insight
a key priority for market research
Medium – brand marketers will talk the importance of
customers, but not consistently act – depends on the
person/relationship between sales & marketing
Medium – real understanding of retailer’s target market, and a
deep understanding of shopping occasions
Low – brand people still view retailers as points of
distribution only
Use consumer data to do overlays between my target consumer and retailer’s to
convince them of brand synergy
GoldStandard
GoldStandard
SilverStandard
SilverStandard
BronzeStandard
BronzeStandard
Excellence Hierarchy in Marketing Through Retailers – 2005
Source: MVI, 2004

Bottom line on all this as far as we are concerned
The Consumer Promotion Perfect Storm
NON-PRICEDIFFERENTIATION
RETAILER VS. RETAILER MANUFACTURER VS. MANUFACTURER
70%IN-STORE
DECISIONS
RETAILERS MANUFACTURERS
ConsumerPromotion
2005 &Beyond

NCHR2.ppt 24
How has the industry responded to-date to these changes?
Answer: Varies by company, but, in general, not very well
Reasons:
Budgets inadequate to the task
Misaligned priorities
Brand marketing myopia

NCHR2.ppt 25
Budgets inadequate to the task: How can one do “bigger, better” in the face of declining funding?
% CPG Manufacturer A&P Spending Trends: 1997 - 2004
1997 1998 1999 2000 2001 2002 2004% vs.
‘97
Consumer Promotion
24 19 17 16 15 17 16 (33.3%)
Trade Promotion 53 56 60 60 61 59 58 +15.1%
DTC Advertising 23 25 23 24 24 24 26 +13.0%
TOTALS 100 100 100 100 100 100 100 100
Source: Cannondale Associates, 2005 Trade Promotion Spending and Merchandising Study’
Between 1997 and 2004, CPG manufacturers have steadily chipped-away at consumer promotion budgets, reducing them from 24% to 16% of total marketing spending while simultaneously increasing spending on both trade promotion and DTC advertising

NCHR2.ppt 26
Misaligned priorities: While the increasing cost of DTC advertising explains the increase in Ad budgets, the Trade Promotion increase is harder to justify as payouts decline and less than 50% payout at all:
Percent of Trade Promotions That Manufacturers Say Pay Out
54%43%
33% 31% 30%34%40%
49%
0%10%20%30%40%50%60%
Feature/Display Account-Specific
Marketing
Price ReductionOnly
FrequentShopper Card
2003 2004
Source: Cannondale Associates, 2005 Trade Promotion Spending & Merchandising Study

NCHR2.ppt 27
Source: IBM Business Consulting Services – The Strategic Agenda for Consumer Products Customer Management, Dec, 2004
Marketing Myopia: Defined as siloed organizations and consequent failure of Marketing Departments to incorporate retail realities into the core brand planning process:
As IBM recently put it in a comprehensive December, 2004 study on silos & Customer Management:
“Many of the firms interviewed as a part of this survey still maintain siloed organizations with little collaboration between Sales and Marketing.”
“These companies cannot continue to do business as usual or else they will find themselves struggling to maintain growth and profitability.”
“Going forward, they must make a concerted effort to elevate Customer Management to a position of equal standing and competence as their traditional focus on products and brands.”
“Companies must continue to push further to complete the evolution to a fully integrated approach to the consumer and the retail customer.”

NCHR2.ppt 28
Hoyt & Company’s Contentions: Siloed brand groups do not have a sufficiently adequate grasp of what
is going on at retail to properly assess priorities or – in some cases – even know what the opportunities are.
Despite population fragmentation, media fragmentation, consolidation and the consequent growing influence of the retailer over the consumer’s decision-making process, some brand marketing departments even still believe that, “Marketing stops at the door of the store.”
As a result, promotion in these companies continues to be relatively parochial – focused on brand consumer objectives versus consumers as shoppers in specific retailers.
The fact that consumer promotion – the one device that offers truly great opportunities to help differentiate in intangible and measurable ways – remains so sublimated in these companies is an unfortunate result of these anachronistic and out-of-touch attitudes.

NCHR2.ppt 29
Happily, the indications are that all this is about to change:
A number of recent surveys confirm that the industry is on the verge of a breakthrough in terms of integrating retail considerations into the total marketing mix and adjusting spending allocations accordingly.
Leading companies like P&G, Unilever, Kimberly and Clorox have already reengineered their organizations to elevate Customer Marketing to the same level of importance and competence that these companies ascribe to Consumer Marketing.
Trade Promotion appears to be declining in effectiveness despite the spending increases over the past 7 years.

NCHR2.ppt 30
Why all this is about to change, cont’d
Even leading retailers are beginning to recognize that dependence on manufacturer’s trade allowances is no longer a sustainable business strategy.
As consolidation continues and the need for non-price differentiation continues to intensify, CPG manufacturers will be forced to fill this need with something more tangible than “insights”, no matter how incisive or electrifying these may be.
Since Trade Promotion clearly has little utility in this equation, it seems inescapable that leading companies will revive the blockbuster consumer promotion as the ideal tool to accomplish this.

NCHR2.ppt 31
Marketing Through The Retailer 50%
Buzz Marketing 45%
Internet 37%
Mass media 28%
PR 25%
Direct Mail 12%
Other 7%
Which of the following marketing vehicles are growing most in importance?
Source: The Hub, March/April 2005 . DX Manners Consulting Company, Westport, CT
Results of a November, 2004 joint Meridian Consulting/GMDC survey of senior and mid-level executives representing 180 CPG companies and related industries:
In response to the question, “Which of the following marketing vehicles are growing the most in importance?”, 50% of those surveyed ranked “Marketing Through The Retailer” as #1:

NCHR2.ppt 32
Brand is king Emergence of Wal-
Mart
Periods 1950’s – 1980’s 1990’s 2000 – 2005 2005 – 2010
ThemeBrand Marketing
ControlThe Power Shift
Trade and Consumer Shift
Marketing-At-Retail Full Shift
Go-To-Market Focus Consumer Consumer
Consumer Consumer
Trade Trade Trade Trade
Shopper Shopper
Comments
Retailer Consolidation Brands are challenged Category management
Retailer data insight Differentiation is key – brand
and retailer Retailer revenue needs increase
Consumer marketing and shopper marketing re-balance
Mass/national retailers balance better regionals
Source: Cannondale Associates, 2005
Cannondale Associates’ view of what marketers can expect in terms of resource allocation starting in 2005 and beyond:
Key Drivers Of Marketing Spending Patterns by Type and Period: 1950 - 2010

NCHR2.ppt 33
P&G, Unilever, Kimberly and Clorox have all converted from traditional silo to customer-centric full resource deployment organizations: While the details for each company may differ, the schematic below gives the general idea.
BEFORE (Traditional Silo)
Retailer Retailer Retailer
Retailer Retailer Retailer
Retailer Retailer Retailer
Team A Team B Team C
Retailer
Retailer
Retailer
Team D
Sales
Customer Marketing/Trade Marketing
MarketingAdv. Agency Cons. PromotionTeam Leader
Marketing
Customer Marketing
Sales
Consumer Promotion
Team Leader
Marketing
Customer Marketing
Sales
Consumer Promotion
Retailer ARetailer BRetailer C
Retailer DRetailer ERetailer F
AFTER (Full Resource Deployment)
Etc.Etc.
Source: P&G/Hoyt & Company, 2004

NCHR2.ppt 34
Source: Supermarket News 9/8/04 and 12/21/04
The Coup de Grace is that even Supermarkets now recognize that they have to change their business models to forego their dependency on trade promotion:
Recently, we got the following from Steve Burd, CEO of Safeway, when speaking to analysts in September and December, 2004 and then again in February & March of 2005
“Safeway expects vendor allowance income to decline in the next five years as it seeks dead-net pricing from vendors…”
“Our goal is to get down to a net cost so allowances go away and price reductions are reflected in the cost of goods.”
“We believe we can brand the shopping experience like a consumer packaged goods company brands a product…”
“We’re going to connect the dots for consumers and create enough “Aha’s” for them to ask themselves why they should shop anywhere else.”

NCHR2.ppt 35
So what do CPG marketers and their agencies need to do to get on top of this curve and remain in front as these changes accelerate, if they haven’t done so already?
Accept that the marketplace has permanently changed
Ensure that you have the right organization for the new marketplace
Throw out the old delineations of “Advertising, Consumer & Trade” both in your thinking and in your budgeting
Zero-base your allocations rather than perpetuating the status quo
Measure the results so you learn what works for your brands

Thank YouThank You
We appreciate the time you have spent with us today and hope you have found this to be both fun and informative.
Also, special thanks to Tim Hedrich and NCH for inviting us and giving us such a great platform and audience with
whom to share our thoughts.
8912 East Pinnacle Peak Road • Scottsdale, AZ 85255 Phone (480) 513-0547 • Fax (480) 513-0548 • E-Mail: [email protected] • [email protected]
www.hoytnet.com

A few words on the use of the material in this presentation
All material in this talk is copyrighted by Hoyt & Company, LLC.
You have Hoyt & Company’s permission to use any or all of this material as long as:
You do not change any words or alter the content of any text, charts or graphs in this presentation.
You will reference Hoyt & Company as the source of this material on every page or excerpt you use for either internal or external purposes.
You do not change, alter or eliminate the sources we cite as the authors of the source material we used to develop this presentation.
Thank You
8912 East Pinnacle Peak Road • Scottsdale, AZ 85255 Phone (480) 513-0547 • Fax (480) 513-0548 • E-Mail: [email protected] • [email protected]
www.hoytnet.com