Embed Size (px)
Citation preview
Disclaimer
i
This document has been prepared by NABARD Consultancy Services (NABCONS) Pvt. Ltd for the
Mechanization and Technology Division, Department of Agriculture & Cooperation, (MoA), New
Delhi based on the field study.
The views expressed in the report are advisory in nature. They do not represent or reflect the
policy or views of NABCONS/ National Bank for Agriculture & Rural Development (NABARD).
NABCONS/ NABARD accepts no financial liability or any other liability whatsoever to anyone in
using this report.
Table of Contents
Disclaimer............................................................................................................................................... i
Acknowledgement................................................................................................................................vi
List of Abbreviations............................................................................................................................vii
List of Tables.......................................................................................................................................viii
List of Figures.........................................................................................................................................x
List of Annexure....................................................................................................................................xi
Executive Summary..............................................................................................................................xii
4. Salient Features of the Scheme....................................................................................................xii
5. Need for the Study.......................................................................................................................xii
Chapter 1: Introduction.......................................................................................................................20
1.1 Challenges of Farm Mechanization......................................................................................20
1.2 Scope of Mechanization.......................................................................................................20
1.3 Components of the Scheme & Salient Feature....................................................................21
1.4 Need for the Study...............................................................................................................22
1.5 Term of Reference...............................................................................................................22
Chapter 2: Research Design & Methodology.......................................................................................24
2.1 Types of Data Used for the Study........................................................................................24
2.2 Sampling Design...................................................................................................................24
2.3 Selection of Institutions.......................................................................................................25
2.4 Limitations of the Study.......................................................................................................25
Chapter 3: Contextual Background and Implementation....................................................................27
3.1 Component of Scheme..............................................................................................................27
3.2 Fund Allocation under the PSAMTTD Scheme...........................................................................28
3.2.1 Year wise Fund Allocation...................................................................................................28
3.2.2 Institution wise fund allocation..........................................................................................30
3.2.3 Zone wise fund allocation...................................................................................................31
3.2.4 Zone wise shares of fund allocation....................................................................................32
3.2.5 Fund Utilization...................................................................................................................32
3.2.6 Zone wise Utilization of Fund..............................................................................................33
Chapter 4: Study Findings....................................................................................................................35
4.1 Study Coverage- Farm Mechanization Training and Testing Institutes......................................35
ii
4.2 Performance of the FMTTIs during the XI Five Year Plan (2007-08 to 2011-12) under Testing Activity.............................................................................................................................................35
4.2.1 Testing of Machinery/Equipments......................................................................................35
4.2.2 Availability of Testing Infrastructure with FMTTI’s.............................................................37
4.2.3 Quality Improvement in Major Machines Tested During Last Five Years............................42
4.2.4 Posers faced by FMTTI’s during the conduct of testing activities.......................................42
4.3 Performance of the FMTTIs during the XI Five Year Plan (2007-08 to 2011-12) under Training Programmes....................................................................................................................................43
4.3.1 Central Region Farm Mechanization Training and Testing Institutes-Budni (Madhya Pradesh).......................................................................................................................................43
4.3.1.1 Course wise number of Training Programs conducted in CRFMTTI.............................43
4.3.1.2 Course wise targets and achievements in training.......................................................44
4.3.1.3 Category Wise Participation in Training Courses.........................................................46
4.3.1.4 Regional Participation of Trainees...............................................................................46
4.3.1.5 Target & Achievements-Testing of Equipments in FMTTI- Budni.................................47
4.3.1.6 Number of Machines Tested by Types of Test.............................................................48
4.3.1.7 Training & Testing Infrastructures...............................................................................49
4.3.1.8 Revenue Generated by the Institute............................................................................50
4.3.1.9 Total Receipt and Expenditure.....................................................................................50
4.3.2. Northern Region Farm Mechanization Training and Testing Institute (NRFMTTI)- Hissar (Haryana).....................................................................................................................................51
4.3.2.1 Targets and Achievements in Training.........................................................................51
4.3.2.2 Category Wise Participation in Training Courses.........................................................52
4.3.2.3 Regional Participation in Training Programs................................................................53
4.3.2.4 Targets and Achievements- Testing of Equipments in NRFMTTI (Hissar).....................54
4.3.2.5 Number of Machine Tested by Types of Test...............................................................55
4.3.2.6 Training and Testing Infrastructure..............................................................................55
4.3.2.7 Revenue Generated by NRFMTTI- HIssar.....................................................................56
4.3.2.8 Total Receipt and Expenditure- NRFMTTI....................................................................56
4.3.3 Southern Region Farm Mechanization Training and Testing Institute (SRFMTTI)...............57
4.3.3.1 Course wise number of Training Program conducted in SRFMTTI...............................57
4.3.3.2 Course wise targets and Achievements in Training......................................................58
4.3.3.3 Category wise participation in Training Courses..........................................................59
4.3.3.4 Regional Participation of Trainees...............................................................................60
4.3.3.5 Target & Achievements- Testing of Equipment in SRFMTTI-Anantpur........................61
iii
4.3.3.6 Machines Tested by Types of Tests..............................................................................61
4.3.3.7 Training and Testing Infrastructure..............................................................................61
4.3.4 North Eastern Region Farm Mechanization Training and Testing Institute- Assam............62
4.3.4.1 Course wise number of Training Program Conducted by NERFMTTI-Assam................62
4.3.4.2 Year wise Target and Achievements in Training..........................................................62
4.3.4.3Regional Participation of Trainees................................................................................64
4.3.4.4 Targets and Achievements- Testing of Equipment in NERFMTTI-Guwahati.................65
4.3.4.5 Revenue Generated by NERFMTTI-Guwahati..............................................................66
4.3.4.6 Revenue Generated by NERFMTTI-Guwahati..............................................................66
4.4 Response of Trainees on Training Conducted by FMTTIs...........................................................67
4.4.1 Demographic Details of Respondents.................................................................................67
4.4.2 Education wise distribution Respondents...........................................................................68
4.4.3 Caste/Category wise Distribution of Respondents..............................................................69
4.4.4 Respondents Distribution Occupation wise........................................................................69
4.4.5 Sources of Information on Training Programs....................................................................70
4.4.6 Motivation for Attending Training Programs......................................................................70
4.4.7 Effectiveness of Training Program......................................................................................71
4.4.8 Appropriateness of Training Logistics.................................................................................73
4.4.8 Usefulness and Utilization of Training Program..................................................................73
4.4.8.1 Ex Post Use of Skills by Training beneficiaries..............................................................75
4.4.9 Impact of Training Program................................................................................................77
4.4.9.1 Impact of Training on different Impact Indicators.......................................................78
4.4.9.2 Overall Rating of the Training Program........................................................................80
4.4.9.3 Dissemination and Sharing of Knowledge....................................................................80
4.5 Outsourcing of Training and Demonstration.............................................................................81
4.5.1 Fund release and utilization pattern...................................................................................84
4.6 Beneficiary Response on Outsourcing of Training cum Demonstration Component under PSAMTTD.........................................................................................................................................91
4.6.1 Demographic Profile of Respondents.................................................................................91
4.6.2 Sources of Information.......................................................................................................92
4.6.3 Motivation for attending the training program..................................................................93
4.6.4 Effectiveness of training program.......................................................................................93
4.6.5 Appropriateness of Training Logistic...................................................................................94
4.6.6 Utilization of Training Skills post Attendance of Training Program.....................................95
iv
4.6.7 Types of Training Program cum demonstration..................................................................96
4.6.8 Impact of training on different Impact variables................................................................97
4.7 Beneficiaries Response on Demonstration Component under PSAMTTD...............................100
4.7.1 Area Coverage, Demonstration Time and Participation Rate............................................101
4.7.2 Beneficiaries Response on Organization of Demonstration..............................................103
4.7.3 Relative Preference of Equipments Demonstrated...........................................................103
4.7.4 Technology Use, Adoption, Availability of Equipments.....................................................105
4.7.5 Benefits of Equipments demonstrated as explained by the respondents.........................106
4.7.6 Regional wise specific requirement of machines for demonstration....................................108
4.8 Post Demonstration use of Machinery Purchased for Demonstration....................................109
Chapter 5: Insights and Recommendations.......................................................................................110
5.1 Recommendations for Effective and Efficient Implementation of Training at FMTTIs.............110
5.2 Recommendations for Effective and Efficient Implementation of Testing At FMTTIs..............112
5.3 Recommendations for Effective and Efficient Implementation of Outsourcing of Training.....113
5.4 Recommendations for Effective and Efficient Implementation of Demonstration of Equipments.......................................................................................................................................................114
Chapter 6 Conclusion.........................................................................................................................116
Annexure...........................................................................................................................................117
v
Acknowledgement
The Evaluation Study of Central Sector Scheme for Promotion and Strengthening of Agriculture Mechanization through Training Testing and Demonstration was undertaken by NABARD Consultancy Services (P) Ltd. on behalf of Mechanization & Technology Division, Dept. of Agriculture & Cooperation, Ministry of Agriculture, Govt. of India covering the period of XI Five Year Plan, with a view to assessing the scheme’s adequacy, effectiveness and its performance in addition to evaluating operational roles of various stakeholders, identifying constraints and bottlenecks and suggesting areas for improvement. NABCONS would like to offer special thanks to MoA for their financial support to this study.
We would also like to place on record, our special gratitude to Shri Narendra Bhushan, Joint Secretary, and Mechanization & Technology Division for extending his supports & cooperation. We also thank Shri. H.K. Suanthang, Deputy Secretary, Shri. V.N.Kale, Additional Commissioner, Shri. A. N. Meshram, Deputy Commissioner, and Shri. Himmat Singh Director, NRFMTTI for their valuable inputs and contribution during the course of the study..
The cooperation, support, valuable inputs and insights received from the following Senior Officials of NABCONS/NABARD and other distinguished persons in finalizing this study report, is gracefully acknowledged:
Shri Krishan Jindal, Chief Executive Officer, NABCONS, H.O. Mumbai Shri P V S Suryakumar, CGM NABARD and Principal Consultant, NABCONS, New DelhiShri C R. Lohi, Director, CRFMTTI, Budni, MPShri Himmat Singh, Director, NRFMTTI, Hissar, HaryanaShri M.K. Vishwakarma, Director, NERFMTTI, Sonitpur, AssamShri P.K. Pandey, Director, SRFMTTI, Gardalline, Andhra Pradesh
The study team would like to thank all the Directors of FMTTIs, Director of Agriculture of respective states, CIAE, and State Agriculture Universities without the support of whom the study would not have been completed. The cooperation received from the Nodal Officers and Consultants of NABCONS and other Officers of various Regional Offices of NABARD in conducting the study, especially in data collection and compilation of preliminary study observations is also duly acknowledged.
The study would not have been completed successfully but for the best efforts put in by the staff attached to the Zonal Office of NABCONS, New Delhi who deserves our appreciation.
vi
List of Abbreviations
AEDAgriculture Engineering Department
BIS Bureau of Indian StandardBT Batch TestCIAE Central Institute of Agriculture EngineeringCIPHET Central Institute of Post Harvest Engineering and Technology CMVR Central Motor Vehicle RuleCRFMTTI Central Region Farm Mechanization Training and Testing InstituteDoA Directorate of AgricultureDoAC Department of Agriculture and CoopertionFMC Field Management CommitteeFMTTI Farm Mechanization Training and Testing InstituteFYP Five Year PlanICAR Indian Council for Agriculture ResearchICT Initial Commercial TestKVK Krishi Vigyan KendraMoA Ministry of AgricultureMPUAT Maharana Pratap University of Agriculture and TechnologyNABARD National Bank for Agriculture and Rural DevelopmentNABCONS NABARD Consultancy Service Pvt. LtdNERFMTTI North Eastern Region Farm Mechanization Training and Testing InsituteNRFMTTI Northern Region Farm Mechanization Training and Testing InstituteOBC Other Backward ClassesOECD Office of Environmental Compliance and DocumentationPP Plan PeriodPSAMTTD Promotion and Strengthening of Agriculture Mechanization through Training
Testing and DemonstrationSAU State Agriculture UniversitySC Schedule CastesSFCI State Farm Corporation of India LtdSJGSY Swarn Jayanti Gram Swarojgar YojanaSRFMTTI Southern Region Farm Mechanization Training and Testing InstituteST Schedule TribesUT Union TerritorySFAC Small Farmers Agribusiness Consortium
vii

List of Tables
Table 1 Sample Coverage under PSAMTT&D Scheme.........................................................................26Table 2 Zone wise fund allocation for demonstration & outsourcing training programmes...............31Table 3 Year wise/ zone wise share of fund during the XI FYP.............................................................32Table 4 State wise extent of fund utilization.......................................................................................33Table 5 Trend in Zone wise utilization of allocated funds for demonstration and outsourcing training programmes........................................................................................................................................33Table 6 Salient Feature of FMTTIs.......................................................................................................36Table 7 Availability of testing infrastructure with FMTTI's..................................................................37Table 8 Types of training course and number of training programs organized in CRFMTTI................43Table 9 Course wise trainees participation in CRFMTTI.......................................................................44Table 10 Year wise category wise participation in training courses in CRFMTTI..................................46Table 11 Regional participation in training courses in CRFMTTI..........................................................47Table 12 Targets and Achievement of testing in CRFMTTI..................................................................47Table 13 Number of equipments by types of tests during the XI Five Year Plan in CRFMTTI..............49Table 14 Revenue generated during the XI Five Year Plan by CRFMTTI...............................................50Table 15 Receipts and Expenditure during the XI Five Year Plan by CRFMTTI.....................................50Table 16 Course wise number of trainees trained by NRFMTTI- Hissar...............................................52Table 17 Year wise categorical representation in training courses during XI PP in NRFMTTI..............53Table 18 Regional Participation in Training Program in NRFMTTI (Hissar)..........................................54Table 19 Year wise type of equipment tested in NRFMTTI (Hissar) during XI PP.................................54Table 20 Year wise types of tests performed in NRFMTTI-Hissar........................................................55Table 21 Revenue Receipts by NRFMTTI during XI FYP........................................................................56Table 22 Receipt and Expenditure by NRFMTTI during XI FYP.............................................................56Table 23 Number of training programs organized under different course structure by SRFMTTI.......57Table 24 Course wise targets and achievements in Training by SRFMTTI............................................58Table 25 Year wise attendance of trainees by different category........................................................60Table 26 Regional Participation in training program in SRFMTTI during XI PP.....................................60Table 27 Year wise type of equipments tested against the target by SRFMTTI during XI FYP.............61Table 28 Year wise types of tests conducted by SRFMTTI...................................................................61Table 29 Course wise number of trainings organized by NERFMTTI....................................................62Table 30 Course wise coverage of trainees by NERFMTTI...................................................................63Table 31 Types of machine tested in NERFMTTI during XI FYP............................................................65Table 32 Revenue generated by the NRFMTTI....................................................................................66Table 33 Receipts and Expenditure of NERFMTTI................................................................................66Table 34 Training sample covered across different courses and FMTTIs.............................................67Table 35 Distribution of respondents by age group.............................................................................67Table 36 Distribution of respondents based on education..................................................................68Table 37 Distribution of respondents based on the types of course attended....................................68Table 38 Caste wise distribution of respondents.................................................................................69Table 39 Land holding status of respondent farmers..........................................................................70Table 40 Beneficiaries response on Relevance of Training Program and Appropriate of content.......72
viii
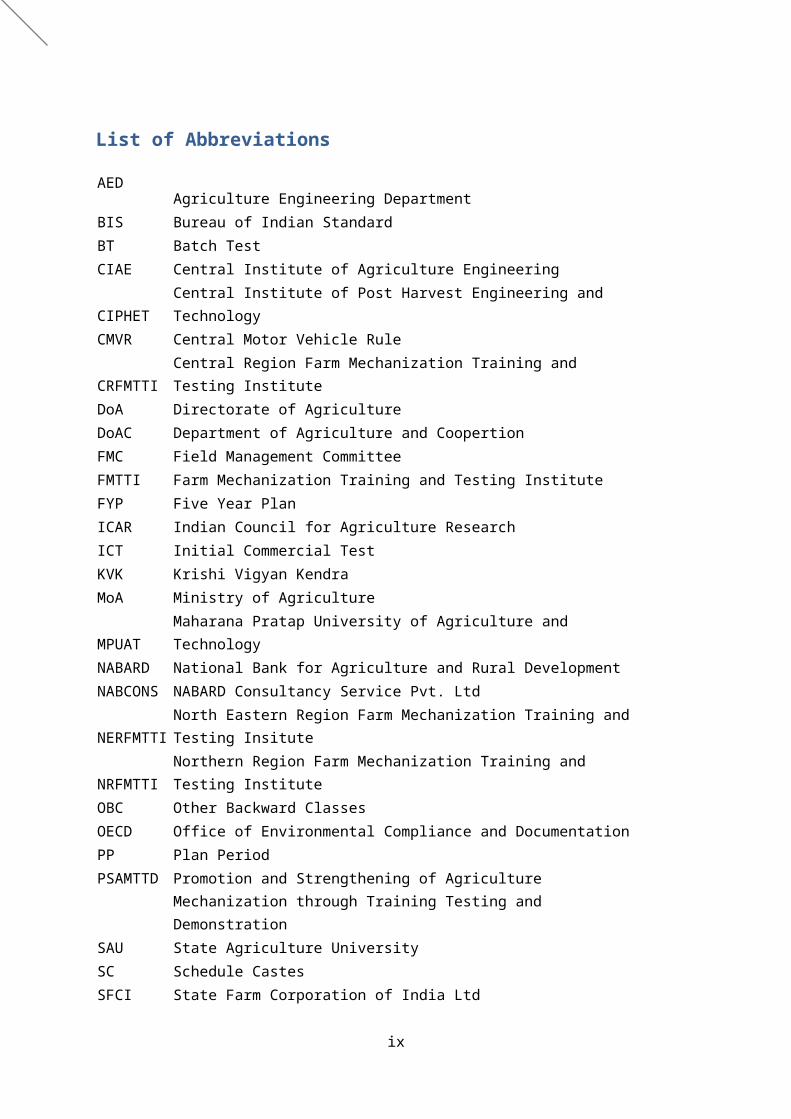
Table 41 Beneficiaries response on Course material, its usefulness and duration of training program.............................................................................................................................................................72Table 42 Response of beneficiaries on adequacy and appropriateness of logistic arrangements.......73Table 43 Beneficiaries response on use of training skills after attending training course...................74Table 44 Application of learning by the trainees post training at FMTTIs............................................76Table 45 Impact of Training program on selected parameters............................................................77Table 46 Impact of Training program on certain measurable parameters..........................................79Table 47 Overall rating of training by the respondents.......................................................................80Table 48 No of training, demonstration and introduction of New Implement being conducted by DoA.............................................................................................................................................................82Table 49 Fund allocation to sample states..........................................................................................83Table 50 Training programs organized by CIAE-Bhopal.......................................................................87Table 51 State wise types of implements procurement and demonstrated under the PSAMTTD Scheme................................................................................................................................................88Table 52 Demographic details of training beneficiaries of outsourcing training component..............91Table 53 Beneficiary's response relevance of training and appropriateness of Content.....................93Table 54 Beneficiaries response on Course material, usefulness and duration of Training.................94Table 55 Beneficiary's response on adequacy and appropriateness of logistic arrangement.............94Table 56 A - Post training use of training skills- outsourcing of training component...........................95Table 57 B- Post training use of training skills- outsourcing of training component............................96Table 58 Percentage response on impact indicators by trainees of outsourcing component.............97Table 59 Impact of training program (outsourcing component) on measurable parameters.............98Table 60 Demographic details of demonstration participant............................................................100Table 61 Average size and duration of demonstration......................................................................101Table 62 Area coverage, time and participation by types of equipment demonstrated...................102Table 63 Beneficiaries response on demonstration of Agriculture Equipments................................103Table 64 Relative Preference of Equipments demonstrated.............................................................104Table 65 Use, adoption, future prospects of beneficiary on equipments purchase..........................107Table 66 Benefits of equipments demonstrated and used by the beneficiaries................................108Table 67 Regional wise specific requirement of machines for demonstration..................................108
ix
List of Figures
Figure 1 Year wise financial allocation for demo and outsourcing of training in PSAMTTD.................29Figure 2 Year wise percentage fund allocation for demonstration and outsourcing training..............29Figure 3 Institution wise financial allocation during XI FYP..................................................................30Figure 4 State wise fund allocation for demonstration and outsourcing training during XI FYP..........30Figure 5 No of states allocated financial assistance during the XI FYP.................................................31Figure 6 State wise allocation and utilization under demonstration and outsourcing training programmes........................................................................................................................................34Figure 7 Trend of training program organized during the XI Five Year Plan -CRFMTTI........................44Figure 8 Targets and achievements in training program conducted by CRFMTTIs..............................45Figure 9 Percentage distribution of trainees according to training course-CRFMTTI..........................45Figure 10 Category wise distribution of trainees attended the program in CRFMTTI..........................46Figure 11 Percentage of Machines tested during XI Five Year Plan in CRFMTTI..................................48Figure 12 Distribution by types of tests of machine during XI Five Year Plan in CRFMTTI...................48Figure 13 Expenditure incurred and Revenue Generated by CRFMTTI................................................51Figure 14 Targets and Achievements of training program conducted by NRFMTTI- Hissar.................51Figure 15 Percentage distribution of trainees according to types of courses-NRFMTTI (Hissar).........52Figure 16 Category wise participation in training course in NRFMTTI (Hissar) during XI FYP..............53Figure 17 Percentage of machines tested during the XI Five Year Plan in NRFMTTI............................55Figure 18 Expenses made and revenue generated by NRFMTTI..........................................................57Figure 19 Trend in training program conducted during XI PP by SRFMTTI..........................................58Figure 20 Trainees participation trend in SRFMTTI during XI FYP........................................................59Figure 21 Course wise trainees participation in SRFMTTI during XI PP................................................59Figure 22 Category wise distribution of trainees- SRFMTTI.................................................................60Figure 23 Trainees targets and achievement of NERFMTTI during the XI PP.......................................63Figure 24 Trainees distribution by types of training courses...............................................................64Figure 25 Regional Participation of trainees in NERFMTTI in 2011-12.................................................64Figure 26 Percentage of machines tested by NERFMTTI during XI PP.................................................65Figure 27 Expenditure and revenue generated by NERFMTTI.............................................................66Figure 28 Distribution of respondents by education...........................................................................69Figure 29 Motivation for joining different courses in FMTTIs..............................................................71Figure 30 Sources of Information under Outsourcing of training component.....................................92Figure 31 Motivation for attending training program..........................................................................93
x
List of Annexure
Annexure 1 Year wise and State wise fund allocation in PSAMTTD Scheme.....................................117Annexure 2 Zone wise fund allocation in PSAMTTD Scheme.............................................................118Annexure 3 State wise/ Institution wise allocation of fund and utilization in PSAMTTD Scheme during XI FYP.................................................................................................................................................120Annexure 4 State wise course wise participation of trainees in CRFMTTI during XI FYP...................121Annexure 5 List of machines tested in CRFMTTI during XI FYP..........................................................122Annexure 6 List of machine tested under CMVR in CRFMTTI (Budni, MP) during XI FYP...................134Annexure 7 State wise coverage of trainees in NRFMTTI (Hissar, Haryana) during XI FYP................139Annexure 8 State wise coverage of trainees in SRFMTTI (Anantpur, AP) during XI FYP.....................140Annexure 9 List of equipment demonstrated by CIAE, Bhopal during XI FYP....................................141Annexure 10 List of machines tested in SRFMTTI (Anantpur, AP) during XI FYP................................144Annexure 11 List of machineries tested by NERFMTTI (Biswanath Chariali, Assam) during XI FYP. . .152
xi
Executive Summary
1. The country's agricultural production has stagnated at a time when the broader elements of the economy have grown. In order to sustain an overall growth rate of 9 per cent, it is imperative for the agricultural sector to grow at 4 per cent. Though India has achieved self sufficiency in food grain production, the last couple of decades have seen the growth rate of food grain production (1.5 per cent) lag behind that of population (1.9 per cent).
2. While efforts such as introduction of high yielding varieties and expansion of irrigated area have played a crucial role in achieving the goal of food self sufficiency in the past, rapidly growing demand for food has brought the need for building efficiencies in agriculture to the forefront. Towards this objective, it is imperative to focus on improving the intensity of farm mechanisation in the country. It facilitates timely, precise and scientific farm operations, increasing farm input and labour use efficiency. This would result in significant improvement of agricultural productivity
3. With this intent, the Department of Agriculture and Cooperation through its Mechanization and Technology Division is following a multi pronged strategy for promoting farm mechanization. The Ministry is implementing the Central Sector Scheme of Promotion and Strengthening of Agriculture Mechanization which was modified for more effective implementation, during the XI Five Year Plan period, while maintaining the funding pattern. The Scheme for Promotion and Strengthening of Agriculture Mechanization through Training Testing and Demonstration was implemented during the XI Five Year Plan period to promote agriculture mechanization by popularising new technology based equipment, human resource development in field of agriculture mechanization and quality improvement of machines and equipments.
4. Salient Features of the SchemeThe scheme has five embedded components:
i. Human resource development in the field of Farm Mechanization through existing Farm Mechanization Training and Testing Institutes (FMTTIs).
ii. Testing of Agriculture machines and equipments for their performance evaluation and quality up gradation through existing FMTTIs.
iii. Demonstration of newly developed agriculture/ horticulture equipments at farmer’s field. iv. Training of farmers by outsourcing the training.v. Establishment of parallel line for testing for tractors at Central Region Farm Mechanization
Training and Testing Institute (CRFMTTI), Budni MP.
5. Need for the StudyThe Scheme for “Promotion and Strengthening of Agriculture Mechanization through Training Testing and Demonstration (PSAMTT&D)” was implemented during the XI Five Year Plan through different implementing agencies such as FMTTIs, State Governments, Government sponsored Institutions such as ICAR, SFCI and State Agriculture Universities for promotion of agriculture mechanization and strengthening the scope of mechanization of agriculture. The scheme has been implemented in 27 states/Union territories with total financial outlay of Rs.41.29 crore. After
xii
completion of the XI Five Year Plan period, the Mechanization and Technology Division under the Department of Agriculture and Cooperation desired to know the status of actual implementation of the scheme with respect to physical and financial progress, availability of infrastructure for implementation of mechanization strategies, extent of adoption of technologies by the farmers and constraints and bottlenecks observed during the implementation of the scheme. Such critical inputs become necessary to further refine and improve the effectiveness of the scheme by improving the overall implementation management plan. Further, before the commencement of the XII Five Year Plan, it was felt essential to evaluate the progress effectiveness and impact of the PSAMTT&D Scheme against the set objectives with a view to carry out required policy change in the scope of activities, coverage, quantum of assistance and refinement in operational guidelines. Accordingly, NABCONS was commissioned to conduct an elaborate and comprehensive evaluation of the scheme.
6. NABCONS adopted a comprehensive approach for evaluation by analysing both primary as well as secondary information available on websites, annual reports and other documents provided by the Department of Agriculture and Cooperation, Farm Mechanization Training and Testing Institutes, Directorate of Agriculture and Central Institute of Agriculture Engineering. Primary information was gathered from the beneficiaries, who had attended the training program in FMTTIs and those organized under outsourcing components by the Directorate of Agriculture and ICAR coupled with interactions with the officials of FMTTIs, DoA and Government Sponsored Institutions (ICAR). The evaluation focussed on effectiveness of training, appropriateness of training program, utilization of training skills, adoption of technology and impact of training and demonstrations.
7. Study Findingsa. Fund allocation and utilizationi. The PSAMTTD Scheme has been implemented through four FMTTIs located in Hissar
(Haryana), Budni (Madhya Pradesh), Anantpur (Andhra Pradesh) and Biswanth Chariali (Sonitpur, Assam) and through State Governments and Government sponsored Institutions such as ICAR and SFCI. The FMTTIs conducted Training courses and Testing of the Agriculture Equipments while, in order to broad base the coverage of trainees, the training was also outsourced to State Governments and Government Sponsored Institutions (ICAR & SFCI). The State Government and ICAR also organized demonstration agriculture machineries and equipments.
ii. During the XI FYP (2007-2012), the total funds allocated to State Government and Government Sponsored Institutes was Rs.4139.00 lakh, of which the state Government received 88.4% (Rs.3657 lakh) while the Government Sponsored Institutions, viz., ICAR and SFCI received 11.7%.
iii. Out of Rs 3657 lakh, Manipur from North East region received the highest allocation of Rs 440 lakh, while Karnataka and Jammu & Kashmir received no allocation during the Plan period.
iv. North Eastern Region received 30% of the total funds, while the Western Region received only 7%. The Northern Region (Punjab, Haryana, Uttarakhand, Uttar Pradesh), Eastern Region (Jharkhand, Bihar, West Bengal and Odisha) and the Central Region (Madhya Pradesh and Chhattisgarh) received 20%, 22% and 12% of the total funds allocated to States.
v. It is also observed that only half of the number of States, on an average, received funds
xiii

each year. Funds were not allocated to Western Region (Gujarat, Maharashtra and Rajasthan) consecutively for two years (2009-10 and 2010-11). In case of Rajasthan and Maharashtra, funds were given only at the end year 2011-12. Thus both intra regional variation and inter state disparity in fund allocation was observed.
vi. Only 14 out of 26 states and SFCI utilized more than 60% of the funds received, while 8 states and ICAR utilized only 30% of the funds received.
vii. Andhra Pradesh, Tamil Nadu, Kerala utilized the 85% of the funds while the least was utilized by the Government Sponsored Institutions. ICAR utilized only 3% of the allocated funds. The SFCI utilized all the funds allocated to them.
viii. Arunachal, Manipur, Meghalaya and Nagaland from the North Eastern region, Tamil Nadu from the Southern region, Chhattisgarh and Madhya Pradesh from the Central region and Haryana, Uttar Pradesh and Uttarakhand from Northern region registered more than 90% fund utilisation.
b. Testing of Agriculture Machineries by FMTTIs.ix. The FMTTIs conduct 2 types of Tests, viz., Commercial and Confidential. The commercial
test is further sub categorised in Initial Commercial Test, Batch Teas and OECD.x. The Central Region Farm Mechanization Training and Testing Institute (Budni, MP),
conducted 256 tests of which 229 (89%) were under commercial category and 27 (11%) were under the confidential category.
xi. The Northern Region Farm Mechanization Training and Testing Institute (Hissar, Haryana), conducted 456 tests of which 83% were under commercial category while 17% were conducted under confidential category.
xii. Southern Region Farm Mechanization Training and Testing Institute (SRFMTTI), conducted 146 tests of which 141 (97%) were under commercial category while 5 (3%) were under confidential category.
xiii. The North Eastern Region Farm Mechanization Training and Testing Institute (NERFMTTI) conducted 99 tests.
xiv. The revenue generated from testing of equipments by CRFMTTI and NRFMTTI was Rs.811.95 and Rs.331.39, respectively. The NERFMTTI generated Rs.39.1 lakh from testing during the year 2011-12.
xv. With regards to testing of equipments, it was observed that under the Commercial Tests, negligible number of Batch Tests was conducted while a large number of Initial Commercial Tests were conducted.
c. Conduct of Training programmes by FMTTIs.xvi. The FMTTIs conducted training courses under 10 different categories under the scheme.
a) User Level Coursesb) Technician Level Coursesc) Management Level Coursesd) Academic Level Training Programmese) Awareness Courses through Multi Media Systemf) Technology Transfer Campsg) Training Programmes for Rural Youth Under Swarna Jayanti Grama Swarojgar Yojanah) Need Based Training Program on Farm Mechanization
xiv
i) Training Program for Foreign Nationalsj) Special Training Program.
xvii. The CRFMTTI trained 9507 beneficiaries against the target of 9200. The participation was more in courses such as Technician level, Academic level and User Level courses in comparison to other courses. A small number of technology transfer camps were organized reportedly due to staff constraints. Of the total trained, 77% belonged to SC and ST category.
xviii. The NRFMTTI trained 9744 beneficiaries against the target of 9000 under Need based (33%), Academic (35%) and User level (20%), respectively. Trainees belonging to the Scheduled Tribes accounted for a mere 1%.
xix. The SRFMTTI trained 7319 beneficiaries against the target of 6700 beneficiaries under the Need based (40%), Awareness through multimedia (22%) and Academic Level courses (18%), respectively. Of the total trained, 25% belonged to the SC category.
xx. The NERFMTTI, trained 3758 beneficiaries against a target of 3700 beneficiaries under the User Level courses (38%), Technology Transfer Camps (26%) and Academic course (15%), respectively. Participation under Technical, Management and Need based courses was low.
xxi. In case of SRFMTTI and NERFMTTI, it was observed that more number of programs of short duration of 1-2 days was conducted in order to meet the overall targets. There is, therefore, a need for fixing course wise targets to be reviewed at the end of each year.
xxii. Majority of the trainees (86%) who attended the training programs felt that the training programs were relevant while 11% felt it to be partially relevant. Only 3% felt that the training courses were not relevant. Majority of the trainees felt that the training programs were appropriately designed and the contents were relevant and the courses useful. Most of the (97%) of the trainees opined that the duration of training programs was adequate.
xxiii. More than 80% of the training beneficiaries felt that the training materials provided were adequate, boarding and lodging facilities were satisfactory, equipments provided were adequate and also use of the audio visual aids was effective.
xxiv. Post training, 62% reported that the skills and knowledge gained were put to use while 38% had not been able to do so. The use of training skill varied depending on the occupation profile of the trainee and has been presented in para 4.4.8 of the report.
xxv. The trainees reported positive impact of training courses by way of reduction in hours of field operations by 8% to 13%, reduction in water use by 16% to 40%, increase in production by 17% to 32% and increase in income by 4% to 11%. The technicians and operators reported increase in income by 8% to 20%. There was enhancement of skills level among the beneficiaries.
xxvi. On a scale of 10, the beneficiaries placed the overall impact of the training programs, on an average, at 7. The rating given depended on the occupational profile of the participants; highest being by students (7.21) followed by technicians/operators (7.17) and farmers (7.17).
d. Outsourcing of Training and Demonstrationxxvii. In order to improve the coverage of farmers and youth residing in rural areas, the State
xv

Agriculture Departments and the Government Sponsored Institutions organised training programs and demonstration of farm machineries and equipments. A total of 11 states were taken up for evaluating the performance of training programs and demonstration activities conducted by the Government Sponsored Institutions.
xxviii. More than 29 thousand demonstrations were organised by 11 sample states and 191 new implements were introduced under the PSAMTTD Scheme. The States conducted more of demonstration activities than training programs. In many cases, it was observed that the demonstration and awareness camps were also reported as training programs. A total of 560 training programs were organized by two states Tamil Nadu (493) and Madhya Pradesh (67). Among the sample states, Tamil Nadu, Uttarakhand, Madhya Pradesh and Uttarakhand had spent more than 90% of the allocated funds for demonstrations, while Punjab had spent only 12%, West Bengal 22% and Assam 39%. The performance of Assam, Rajasthan, Uttarkhand, and Odisha remained above average while in Andhra Pradesh, it was not significant. However, agriculturally developed state of Punjab failed to utilize the funds and refunded Rs 84.4 lakh out of total Rs 96 lakh back to DoAC after the end of XI FYP.
xxix. Maharashtra State had received Rs.100 lakh during the month of March 2012, and therefore activities on training or demonstrations were taken up during the year. Rs 6 lakh which was found to be allocated during the year 2008-09 as per the report provided by M&T Division. This was merely an allocation and no fund was actually disbursed as reported by the agriculture department of the state. This amount was provided to Maharashtra Agro Industries Development Corporations for purchase and supply of machineries to agriculture universities. The demonstration and training programs were reported to be in progress.
xxx. In Rajasthan, MPUAT demonstrated various equipments, of which the garlic planter was demonstrated on a large scale.
xxxi. Overall performance of the PSAMTTD implemented by the State Agriculture Department was satisfactory as the demonstrations played a significant role in popularising the newly developed agriculture machineries and creating awareness among the primary users of agriculture equipments/ machineries.
xxxii. Over 90% trainees found the training to relevant, 10% as partially relevant and 96% felt that the training inputs were appropriate. More than 90% of the participants received the training materials and felt that the training was useful and duration was adequate.
xxxiii. Out of 157 beneficiaries, 27% adopted the technology, 45% felt that they had better skills to operate and maintain agriculture equipments, 14% reported lesser breakdown, 38% changed certain farm management practices, 48% trained and helped other farmers in operation and maintenance of equipments and 16% generated additional income after attending the training programs.
xxxiv. Out of 157 beneficiaries, 51% reported increase in production, 59% reported reduction in hours of field operations, 54% reported reduction in water use, 46% reported increase in productivity/ income and 89% reported overall change in skill level. Increase in productivity ranged between 23% and 42%.
xxxv. There was, on an average, reduction of 6 hours, in time spent on field operations due to adoption of farm machines.
xxxvi. While conducting demonstrations, criteria of average plot size of 0.4 ha (0.98 acre) and
xvi
one hour, as prescribed in the guidelines, were overlooked in almost all the cases, except in West Bengal. In Uttarakhand, Tamil Nadu, Madhya Pradesh and Punjab the plot sizes were almost 2 to 3 times the prescribed area. In Haryana the average size was the biggest at 5 acres and the average duration was 7 hours. In Haryana, in the guise of demonstration, the laser land leveller was put to own use by farmers.
xxxvii. More than 90% of the participants/ host farmers were satisfied with the demonstration activities.
xxxviii. Different equipments demonstrated in different States had relative preferences based on the requirement and compatibility with the agricultural practices. The laser land levellers, rotavators, zero till drills are preferred in Haryana, rotavators and seed drill were preferred in Madhya Pradesh, while paddy transplanters were preferred in Punjab, Tamil Nadu and Odisha (see table 64).
xxxix. Out of 185 respondents, 42% reported full adoption mostly through hiring on custom basis and 37% purchased the machinery. Another 38% were inclined to purchase the machineries if the cost was subsidised. However, the farmers also responded that machineries were not readily available in the market and 68% were unaware of the place from where they could be purchased.
xl. Post demonstration, the machines remained idle for long period of time without proper protection leading to depreciation. In Uttarakhand, Rajasthan and Tamil Nadu, the machines were lent to farmers for their field operations free of cost. Tamil Nadu was the exception where charges were levied and transferred to the Central Government.
8. Recommendation for improving the effectiveness of the Schemea. Training at FMTTIs
xli. In view of the tendency on the part of the FMTTIs to organise short duration courses only to achieve over all targets, training program wise/ course wise targets should be fixed.
xlii. Separate targets for the technology transfer camps, which played a significant role in adoption of technology at grassroots, should be stipulated.
xliii. With a view to expand the reach of the Scheme, extension centres of FMTTIs may be established in the states where FMTTIs are not located.
xliv. The new course may be redesigned as a refresher or crash course in addition to the existing courses with shorter duration as majority of the trainees were already aware of the major portion of the training inputs of the Academic course.
xlv. The old equipments may be replaced and it should be ensured that machineries used for training are in good condition.
xlvi. Inputs of User Level courses need to be upgraded to provide appropriate inputs for upgrading the skills of the trainees. The training cell of FMTTIs may appropriately design a separate module as a hybrid of user and technical level courses.
xlvii. There is need to increase the duration of hands-on experience in training, repair, maintenance and operations.
xlviii. Logistic arrangements, particularly lodging, suitable to women trainees may be ensured to improve their participation. Separate targets may be given and seats may be reserved for women trainees.
xlix. Proper system of maintaining information relating to coverage of beneficiaries may be
xvii
instituted to obtain feedback from the trainees to analyse the impact of training and make improvements in training inputs, etc., if necessary.
b. Testing at FMTTIsl. Targets for undertaking Testing activities should be decided based on the testing
capacity of each testing centre of FMTTI and the types of equipments/ machineries to be tested. Proper staff strength and supporting infrastructure needed by the Institutes should be provided.
li. Number of confidential tests conducted by the FMTTIs was negligible as compared to commercial tests. Further, number of machines tested under commercial sub categories (ICT, BT and OECD) was not easily available from NRFMTTI, SRFMTTI and NERFMTTI. As per the information available from the CRFMTTI, under commercial category, most of the tests were done under Initial Commercial Test. Only 7% of the tests were conducted under Batch Test and OECD sub categories. Therefore, separate targets for testing of tractors for ICT, BT and OECD should be fixed.
lii. Formats for reporting post test results may be simplified for easy understanding of local manufacturers of agriculture equipments.
liii. In view of the views expressed by the institutes, adequacy of staff may be assessed, particularly with reference to off campus activities such as organizing Technology Transfer Camps, etc., and the required number of staff may be recruited.
liv. Keeping in view the fast changing technology scenario, it is recommended that the staff and engineers involved in testing of equipment and training may be given adequate opportunity to enhance their skills though advance training courses both within and outside the country.
lv. Conferences and workshops involving local manufacturers and large brand manufacturers may be organised to provide a platform for cross learning and creating conducive environment to enable the FMTTIs to get feedback from the manufacturers on the prevailing market demand for different farm equipments and their performance.
lvi. The testing equipments and test rigs used under different labs are brought and customized at FMTTIs which are too sophisticated for the local mechanics. These machines are prone to frequent breakdown and due to non availability of trained technical staffs at the institution, the machines are not repaired in time. A permanent cadre of trained mechanics at each FMTTI may be created to address the problems of such delays.
lvii. The replacement of old and obsolete test equipments and computers at FMTTI will improve the overall efficiency of the institution.
c. Outsourcing of Training and Demonstrationlviii. Disparity in fund allocation both inter region and interstate level was observed. It is
therefore, recommended that allocation of funds should be based on proper assessment of the requirements of various states taking into consideration the previous performance and future needs.
lix. The total allocation of funds made to ICAR and SFCI during the XI Five Year Plan period was Rs.482 lakh. As per the information provided by the Farm Mechanization and Technology Division, FMTTI, the utilization made by ICAR remained low at 3%, which is a matter of serious concern. The Mechanization and Technology Division, DoAC (MoA)
xviii
may put in place an effective monitoring mechanism to ensure that the funds allocated are utilised by the Institutions.
lx. In most of the cases the training programs were organized through the district units of State Agriculture Departments. These programmes appeared to be more in the nature of awareness campaigns than training programs due to lack of appropriate infrastructure and technical manpower support. It is therefore recommended that, proper advance planning may be made by the Department of Agriculture/ Agriculture Engineering for collaborating with SAUs and other eligible institutions who could conduct the training programs effectively. Also, the training facilities available with the existing KVKs at district level and other such institutions with appropriate infrastructure may be identified well in advance and used for organising training activities rather than making them mere demonstration and awareness camps.
lxi. Maharashtra, Haryana and Rajasthan received funding at the fag end of the financial year. This defeats the very purpose of training and demonstration as agriculture is a seasonal activity and the implementing agencies are left with little time to plan the activities to organise meaningful training or demonstration. Therefore, it is necessary that funds are released at the beginning of financial year, after obtaining information on the unspent funds of the previous years, to facilitate proper planning and implementation of activities in time.
lxii. During the interactions with the district level functionaries of the State Agriculture Department, it was observed that the guidelines governing the Centrally Sponsored Schemes are generally not adhered to in view of the fact that the State functionaries are more conversant and comfortable with the guidelines issued by the State Agriculture Departments for implementation of similar schemes implemented by the State Government. For example, the financial targets given for demonstration of agri-implements for the benefit of large section of farmers are met by way of release of subsidy for purchase of agri-implements by select farmers at the village level on the presumption that through them other farmers would come to know about the implements. This was more in tune with the similar scheme implemented by the State Governments. Hence there is a need for ensuring uniformity in the guidelines of the Central and State Government in respect of similar schemes, keeping in view the overall objectives of the Schemes.
lxiii. The machineries and equipments used for demonstration by the State Agriculture Departments are kept in open under the direct exposure of sun and rain resulting in faster depreciation. There is a need for additional infrastructure such as sheds for proper safekeeping of the machines and equipments.
lxiv. Provision towards contingency expenditure for hiring of prime movers to undertake demonstration of equipments/machineries is inadequate and becomes a constraining factor, particularly for hilly states. Hence, it is felt by the officials that provision for contingency should be enhanced suitably to meet the expenditure for hiring prime movers, travel of staff undertaking and monitoring the demonstration. For hilly states the contingency should accordingly be revised from the current level of 1.5 times of the limit for non hilly areas. For demonstration of heavy equipments, provision of prime movers along with loading and unloading devices would help carrying the equipments to distant places for demonstration.
xix
lxv. In most of the states, one common constraint reported was the lack of technical manpower/ operators required for conducting demonstration. It is suggested that competent technical manpower/ operators could be hired on contract basis. These contractual staff could also be used for providing services to farmers on custom hiring of equipment/ machineries.
lxvi. The scale of demonstrations could be increased more effectively through the Farmers’ Producer Organizations (FPOs) under the FPO Initiative Project (FPO-IP) of Small Farmer’s Agribusiness Consortium (SFAC). These FPOs can act as important medium for popularising farm mechanization among the small and medium scale farmers. Hence, a collaborative effort may be initiated between the M&T Division of MoA and SFAC.
lxvii. Government should encourage financial institutions to extend credit for setting up of centres for custom hiring of agriculture machineries . Such financing may be covered under the Credit Guarantee Scheme of the Credit Guarantee Fund Trust for Micro and Small Enterprises. MoA may evolve a Venture Capital Assistance Scheme to fund the shortfall in margin to be brought in by borrowers for availing such loans.
xx
20
Chapter 1: Introduction
Ministry of Agriculture, Government of India has estimated that the total food grain production of the country has increased from 196.8 million tonnes in year 2001-02 to 259.29 million tonnes by 2011-12, reflecting a compounded annual growth rate of 3%. The country has attained self sufficiency in food grain production, oil seeds, horticulture crops production, milk, poultry etc. Agriculture machineries have played a crucial role in increasing the productivity and overall production through mechanization of production and post production process of agriculture. The mechanization has adequately facilitated timely field operations, conservation and judicious application of water, appropriate post harvest operations to reduce losses, value addition to the produce for enhanced economic return and employment generation. Thus there is a strong linear relationship between farm power available and agriculture productivity.
1.1 Challenges of Farm MechanizationFarm mechanization has contributed in increased food production and improvement the overall living standards of farmers, though a number of arguments have also been advanced against farm mechanization such as, small and scattered land holding affecting the feasibility, lack of capacity of the small and marginal farmers to invest in mechanization, lack of proper knowledge of farmers to purchase, operate and maintain farm machinery properly, lack of repair and replacement facilities especially in remote rural areas etc. All these factors result in uneconomical use of farm machines and idling of machinery leading to depreciation. Investment in farm machinery becomes economical only if it is gainfully employed.
1.2 Scope of MechanizationFarm Mechanization, despite its existing challenges, has brought about significant improvement in agriculture productivity. There is therefore a strong need for mechanization of agriculture operations. Need for timeliness of operations, quality and precision of operations, achieving higher productivity of land and labour, reducing cost of production and increasing employment opportunities both on farm and non-farm sectors through increase in area under cultivation through, multiple cropping, development of agro industries and related services, justify the need for mechanization of agriculture in the country.
The adoption of machine in farming operation is increasing day by day as it is resulting in saving of cost of production and increase in income of the farmers. The farming operations in India are labour intensive. Despite high population in the country, there is acute shortage of man power for farming operations. The operational cost of human energy is more as compared to machine energy in farming (Karale et al. 2008, khambalkar et. al. 2010). The use of machine in farming operation has resulted in sustainable growth with lower cost of operations. There has been a realisation among the farmers, policy makers and development agencies that for increasing production and productivity and reduction of cost of production, agriculture mechanisation free of arduous labour input is essential.
With this intent, the Department of Agriculture and Cooperation through it Mechanization and Technology Division has adopted a multi pronged strategy for promoting farm mechanization. The
21
Department of Agriculture & Cooperation (MoA) is implementing the Central Sector Scheme of Promotion and Strengthening of Agriculture Mechanization through Training Testing and Demonstration which was modified for more effective implementation, during the XI Five Year Plan, while maintaining the existing funding pattern. The Scheme for Promotion and Strengthening of Agriculture Mechanization through Training Testing and Demonstration was implemented during the XI Five Year Plan to promote agriculture mechanization by popularising new technology based equipment, human resource development in the field of agriculture mechanization and quality improvement of machines and equipments.
1.3 Components of the Scheme & Salient Feature The scheme has five embedded components:
1. Human resource development in the field of Farm Mechanization through the Farm Mechanization Training and Testing Institutes (FMTTIs).
2. Testing of Agriculture machines and equipments for their performance evaluation and quality up-gradation through the FMTTIs.
3. Demonstration of newly developed agriculture/ horticulture equipments on the farmers’ fields.
4. Training of farmers by outsourcing the training.5. Establishment of parallel line for testing for tractors at Central Region Farm Mechanization
Training and Testing Institute (CRFMTTI), Budni MP.
A brief of each component of the Scheme is presented below:
1. Human Resource Development through FMTTIs: The four Farm Machinery Training and Testing Institutes were established in four states of Madhya Pradesh (Budni), Haryana (Hisar), Andhara Pradesh (Garladinne) and Assam (Biswanath Chariali). These four institutions are expected to play a lead role in the development of human resource through different training and academic courses. The training institutes have structured training courses that include User level courses, Technical Level courses, Earning while learning courses, Management Level Courses, Academic Level Training courses, Awareness Level courses through multimedia system and Technology Transfer Camps which are organized off campus. The training courses are designed to accommodate participants from varied backgrounds such as users, trainers, academicians, officials of state Governments, entrepreneurs, manufactures and apprentices from industries.
2. Testing of Agriculture Machines and Equipments: The four FMTTIs are set up to cater to the need of testing and evaluating the performance of agriculture machineries/ equipments and their quality up-gradation. The Central Farm Machinery Training and Testing Institute (CRFMTTI) at Budni tests tractors as per the Bureau of Indian Standards (BIS) and Office of Environmental Compliance and Documentation (OECD). The institute is also authorised to test combine harvesters for compliance under Central Motor Vehicle Rule (CMVR). The Northern Region Farm Mechanization Training and Testing Institute (NRFMTTI) at Hissar tests combine harvesters, plant protection equipments, irrigation pumps and diesel engines. The institute is also authorised to test combine harvesters and other crop production equipments. The Southern Region Farm Mechanization Training Testing Institute (SRFMTTI) located at Anantpur in Andhra Pradesh tests power tillers, self propelled crop production machines/equipments including power drawn agricultural machines and equipments. The
22
North Eastern Region Farm Mechanization Training and Testing Institute (NERFMTTI) at Biswanth Chariali (Assam) tests bullock drawn equipments and any other power driven agriculture machines in order to meet the requirements of manufacturers of Eastern and North Eastern Regions.
3. Demonstration of newly developed agriculture equipments: Demonstration of newly developed agriculture and horticulture equipments are carried out under the scheme with the objective of disseminating information on the technology and induction of these improved technology at the field level. Demonstration activities were included since the IX Five Year Plan. Funds for demonstrations are provided to the State Government and Government Organizations such as Indian Council for Agriculture Research (ICAR) and State Farm Corporation of India Ltd (SFCI) for the purpose of demonstration.
4. Training of Farmers through outsourcing: This component has been designed to supplement the efforts of FMTTIs in human resource development by including additional set of farmers/ users of agriculture implements to improve their technical knowhow on the use of agriculture implements and ensure their effective and efficient utilization.
5. A new component of establishment of parallel line for testing for testing for tractors at CFMTTI was added in order to upgrade and modernize the existing infrastructure to meet international standards, improve the capacity of testing and reduce the waiting time and testing time of tractors.
1.4 Need for the StudyThe Scheme for “Promotion and Strengthening of Agriculture Mechanization through Training Testing and Demonstration (PSAMTT&D)” has been implemented during the XI Five Year Plan (2007-12) through different implementing agencies such as FMTTIs, State Governments; Government sponsored Institutions such as ICAR, SFCI and State Agriculture Universities for promotion of agriculture mechanization and strengthening the scope of mechanization of agriculture. The scheme has been implemented in 26 states/Union territories with total financial outlay of Rs.41.29 crore. After completion of the XI Five Year Plan, the Mechanization and Technology Division under the Department of Agriculture and Cooperation desired to know the status of actual implementation of the scheme with respect to physical and financial progress, availability of infrastructure for implementation of mechanization strategies, extent of adoption of technologies by the farmers and constraints and bottlenecks observed during the implementation of the scheme. Such critical inputs become necessary to further refine and improve the effectiveness of the scheme by improving the overall implementation management plan. Further, before the commencement of the XII Five Year Plan, it was felt essential to evaluate the progress, effectiveness and impact of the PSAMTT&D Scheme against the set objectives with a view to carry out required policy changes in the scope of activities, coverage, quantum of assistance and refinement in operational guidelines. Accordingly, the Mechanization and Technology Division has assigned the responsibilities to NABCONS to conduct an elaborate and comprehensive evaluation of the scheme with specific Terms of Reference.
1.5 Term of ReferenceThe Terms of Reference of the Evaluation Study of the scheme for Promotion and Strengthening of Farm Mechanization through Training Testing and Demonstration has been categorised under three broad heads:-
I. Training and Testing at FMTTIs
23
a. To evaluate the training and testing programmes being conducted at the existing four FMTTIs located Budni (MP), Hisar (Haryana), Garladinne (Andhra Pradesh) and Biswanath Chariali (Assam) with respect to their adequacy, usefulness and effectiveness.
b. To assess the contribution of training and testing programmes in the development and modernization of agriculture.
c. To suggest restructuring of training programmes on agriculture mechanization on regional basis for the benefits of respective states/ UTs.
d. To suggest measures to improve the quality of implements/ equipments being manufactured locally.
II. Outsourcing of Traininga. To evaluate the usefulness and effectiveness of training programmes being conducted by
State Government/ ICAR under the Scheme and through identified institutions and to suggest possible improvements in all dimensions of the programme.
III. Demonstration of Newly Developed Agriculture Equipmenta. To study the impact of the demonstration programme towards the adoption of new
technology/ equipments in the demonstration area as well as in the states. b. To study the role of new equipments in enhancing the agriculture production and
productivity and reduction in drudgery associated with farm operations. c. To assess the opinion of the farmers about their area/ crop specific requirement of the
mechanization. d. To suggest any improvements that may be required in this component
24
Chapter 2: Research Design & Methodology
In order to evaluate the performance of the PSAMTTD Scheme, the study has adopted a holistic approach to collect data on select parameters such as Training, Testing, Demonstration and its type, adoption of technology and its impact on different variables such as production, drudgery reduction and opinion of farmers with respect to the technology demonstrated/ adopted and its usefulness.
Keeping in view the implantation modalities, all the three implementing agencies, viz., FMTTIs, State Governments and ICAR institutions, were covered in the study. Samples from each category of beneficiaries such as, trainees, entrepreneurs, manufacturer, host farmers of demonstration and demonstration participants were included which helped to consolidate their opinions on the impact of the scheme.
2.1 Types of Data Used for the StudyBoth primary and secondary data have been analysed in the study.
Primary Data: Primary data were collected from the project beneficiaries and implementers of the scheme from the sampled states and institutions. The primary data was collected using four separate structured questionnaires covering beneficiaries who attended training programs of different levels such as Management Level, Academic level, Technical Level and User level at FMTTIs and through State Agriculture Department and ICAR sponsored institution (which incidentally is Central Institute of Agriculture Engineering). A separate check list based questionnaire was administered for the head/ lead person of the implementing agencies to collect physical and financial progress and detailed qualitative responses.
Secondary Data: The secondary data were collected in the form of disbursement and utilization of funds, physical progress of training, testing and demonstration programmes, from Mechanization and Technology Division, Dept of Agriculture & Cooperation (MoA), Directorate of Agriculture (DoA), FMTTIs, and CIAE (Bhopal) The annual reports from FMTTIs and consolidated report from the website of MoA were analysed.
2.2 Sampling DesignThe scheme has been implemented in 27 states/ UTs with the help of respective State Governments, FMTTIs and Government Sponsored Institutions (ICAR and SAUs). Since the components of the Scheme mainly consist of training, testing and demonstration, the sampling framework involved the following approach:-
I. The coverage of scheme was spread across 26 states/UTs, to cover states from all the regions to get a comprehensive feedback. All the states and UTs covered under the scheme were grouped into six zones, i.e. North Eastern Region, Eastern Region, Central Region, Northern Region, Western Region and Southern Region.
II. Depending on the number of states falling under each region, the states were selected from each zone which varied from minimum 1 to maximum 3 state/s in a region. Data on allocation of funds provided by the Mechanization & Technology Division, DoAC (MoA) were also considered while selecting the states from each region so as to get a mixed sample.
25
III. A total of 1110 beneficiaries were sampled for administering the interviews keeping in view the total number of 30400 beneficiaries trained by the FMTTIs as per their Annual Reports, considering 95% confidence level and confidence interval of 3%.
IV. Since the number of actual demonstration conducted and number of participants was not available, the numbers of host farmers and those who participated during the demonstrations were selected in consultations with the staffs implementing the scheme on ground.
V. The total samples targeted for personal interviews under PSAMTT&D Scheme were 1470 across all the states comprising 1110 beneficiaries from training, 50 host farmers and 310 demonstration participants. The actual sample covered was 1071 beneficiaries.
2.3 Selection of InstitutionsBasically, there were three different types of institutions involved for training, testing and demonstration activities, viz., the FMTTIs, the Directorates of Agriculture and the CIAE (which falls under the purview of ICAR). Respondents were selected from each type of institutions so as get a comprehensive feedback on motivation of joining training, effectiveness of training courses, appropriateness of training logistic, utilization of training courses and impact of training of different variables. A separate questionnaire was developed to capture the details of implementation during the XI Five Year Plan at the level of each institutions, their insights, bottlenecks, constraints and ways forward towards improving the scheme interventions.
2.4 Limitations of the StudyThe study has the following limitations:
i) A sample of states where the scheme has been implemented has only been covered.
ii) Due to high asymmetry of information related to training, demonstration and types of demonstration at different levels and lack of maintenance of data in proper format by the respective FMTTIs, State Governments and the ICAR sponsored institutions considerable efforts and time had to be spent to compile the list with required details. Further the basic information on the status of mechanization, fund utilization and progress under the scheme was not made available on time to the study team. In certain cases the data was not made available to the study team at all. These factors resulted in serious impediments to the study and resulted in delay in completion of the study.
26
Table 1 Sample Coverage under PSAMTT&D SchemeRegion States Institutions Sample Targeted Actual
CoverageTraining11 Demonstration TotalUL TL ML AL NB Host Farmer Demo Participant
Southern Region
Andhra Pradesh
SRFMTTI 30 20 - 60 100 - - 210 210
DoA 20 - - - - 3 30 53 0Tamil Nadu DoA 30 5 30 65 85
North Eastern Region
Assam NERFMTTI 100 30 0 50 30 - - 210 158DoA 10 - - - - 2 20 32 22
Western Region
Maharashtra DoA 30 - - - - 5 30 65 0Rajasthan DoA 10 - - - - 2 20 32 43
Northern Region
Punjab DoA 10 - - - - 2 20 32 22Haryana NRFMTTI 50 10 2 90 80 - - 232 146
DoA 30 - - - - 5 30 65 41Uttarakhand DoA 10 - - - - 2 20 32 23
Central Region
Madhya Pradesh
CRFMTTI 50 70 18 80 10 - - 230 127CIAE 30 - - - - 5 30 65 79DoA 20 - - - - 4 20 44
Eastern Region
Orissa DoA - - - - 10 40 50 49West Bengal DoA 30 - - - - 5 20 55 66
Total 460 130 20 280 220 50 310 1470 1071
1 UL= User Level, TL= Technical Level, ML=Management Level, AL= Academic Level, NB=Need Based Training
27
Chapter 3: Contextual Background and Implementation
It is a well known fact that agriculture mechanization has played a very significant role in overall improvement of agriculture scenario in India, during the post Independence period particularly after the seventies. Mechanization has not only reduced the duration of agriculture operations but considerably contributed towards the overall production pattern in the country through conservation of inputs, reduction of drudgery and improvement of the overall efficiency in production process. There has been significant increase in adoption of agriculture machines over a period of time. The increased use of farm machines has found expression in the phenomenal expansion of cropped area and cropping intensity and country’s agricultural production on all fronts. The shift has also helped in diversification of agriculture from conventional crops to commercial crops. The programmes of farm mechanization has resulted in adoption of farm machinery such as tractors, power tillers, combine harvesters, irrigation equipment plants protection equipments, threshers, improved implements and hand tools.
While the progressive Indian farmers supported by agricultural machinery and tractor manufactures played key role in the growth of agricultural mechanization, an equally important contribution to this growth was made by Central and State Governments and various organizations under their fold through a large number of programmes to facilitate transformation of Indian agriculture. The Central Tractor Organization, Training and Testing Institutions, State Agro Industries Corporations, Agriculture Universities, Krishi Vigyan Kendras, Central Institute of Agriculture Engineering (CIAE), Central Institute of Post Harvest Engineering and Technology (CIPHET) and Indian Council of Agricultural Research (ICAR) contributed their share to the development and progressive acceptance of agricultural mechanisation in India.
The Scheme for Promotion of Agriculture Mechanization and Strengthening through Training, Testing and Demonstration has been implemented in the country across 27 states/UTs. The schemes has been implemented with the help Farm Mechanization Training and Testing Institutes which are located in four states viz., Haryana, Madhya Pradesh, Andhra Pradesh and Assam, State Directorate of Agriculture and Government sponsored institutes (ICAR and SFCI). The CIAE located at Bhopal has implemented the program across different states through Krishi Vigyan Kendras (KVKs). 3.1 Component of SchemeThere are three broad components of the schemes which are presented below:
Actors
Components
SchemePromotion and Strengthening of Agriculture Mechanization
Training
FMTTI SAUs, CIAE
Testing
FMTTI
Demonstraton
State Govt ICAR/SFCI
28
The Promotion and Strengthening of Agriculture Mechanization through Training, Testing and Demonstration Scheme includes components related to Training of Human Resources, Testing of equipments and Demonstration of newly developed equipments.
Training and Testing: Four Farm Mechanization Training and Testing Institutions (FMTTI) were set up to cater to the need of Training and Testing of Agriculture equipments and Machineries. These institutions are located in Madhya Pradesh (CRFMTTI, Budni), Andhra Pradesh (SRFMTTI, Garladinne, Anantpur), Haryana (NRFMTTI, Hissar) and Assam (NERFMTTI, Biswanath Chariali). These institutions train farmers, trainers, officials of State Governments and entrepreneurs/ manufacturers in the field of agriculture mechanization through their structured training programmes. These institutions play a lead role in development of human resources for agriculture mechanization and effect improvements in the quality of agricultural equipments through assigned mandate of Performance Testing and Evaluation. The training program designed by the institutions can be broadly categorised as under:
i. User Level Coursesii. Technician Level Coursesiii. Management Level Coursesiv. Academic Level Training Programmesv. Awareness Courses through Multi Media Systemvi. Technology Transfer Campsvii. Training Programmes for Rural Youth Under Swarna Jayanti Grama Swarojgar Yojanaviii. Need Based Training Program on Farm Mechanizationix. Training Program for Foreign Nationalsx. Special Training courses.
Outsourcing of Training: To enlarge the coverage of farmers and rural youth and supplement the efforts of FMTTIs, the training programmes are also arranged through certain indentified institutions such as State Agriculture Universities (SAUs), Agriculture Engineering Colleges/ Polytechnics and ICAR institutions such as Central Institute of Agriculture Engineering (CIAE) located at Bhopal. The duration of training programmes range from one week to a month and organized for a batch size of 20 to 25 farmers.
Demonstration of Newly Developed Agriculture Equipments: The demonstration component, largely focussing on dissemination of technology for popularisation and adoption by the farmers at the field level, positively impacts the efficiency and reduces wastage/ input costs. Under this component equipments developed for crop production, value addition and horticulture related activities are demonstrated with the objective of educating farmers with their utility and adoption. Funds are provided by the Ministry of Agriculture to the State Governments and Government Organizations such as ICAR, SFCI etc.
3.2 Fund Allocation under the PSAMTTD Scheme.3.2.1 Year wise Fund AllocationDuring the XI Five Year Plan, the scheme has been implemented across 27 states/union territories. The total financial allocation made during the XI Five Year Plan under the Centrally Sponsored Schemes (CSS) of PSAMTTD for demonstration of newly developed equipments and outsourcing of
29
training was Rs 4139 lakh. The year wise fund allocation during the XI Five Year Plan is given in figure 1 below.
2007-08 2008-09 2009-10 2010-11 2011-120
200
400
600
800
1000
1200
1400
626814
259
12801160Rs
in la
kh
Figure 1 Year wise financial allocation for demo and outsourcing of training in PSAMTTD
Allocation for demonstration of newly developed agriculture equipments and outsourcing of training component under the scheme was highest during the financial year 2010-11 and lowest during the year 2009-10. The years 2010-11 and 2009-10 accounted for 31% and 6% of the total fund released during the entire XI Five Year Plan, respectively. Year wise percentage of fund allocation under demonstration and outsourcing of trainings is presented in figure 2 below. The year wise state wise fund allocation can be seen in Annexure-1
2007-08; 15%
2008-09; 20%
2009-
10; 6%
2010-11; 31%
2011-12; 28%
Figure 2 Year wise percentage fund allocation for demonstration and outsourcing training.
As can be inferred from the above figure, the highest allocation of fund (31%) was made during the year 2010-11 followed by 28% during 2011-12, 20% during 2008-09, 15% during 2007-08 and only 6% during 2009-10. Thus there was no uniformity in fund allocation during the XI Five Year Plan. A higher percentage of fund allocations for the activities were allocated during the end years of XI Five Year Plan.
30
3.2.2 Institution wise fund allocationOut of the total fund of Rs. 4139 lakh allocated for the demonstration and outsourcing of training programmes, 88% (Rs. 3657) was released to State Governments and the rest 12% was allocated to Government Institutions such ICAR and SFCI at Rs. 384 lakh and Rs. 98 lakh, respectively.
State Govt; 88.4%
ICAR;
9.3%
SFCI; 2.4%
Figure 3 Institution wise financial allocation during XI FYP
Out of Rs 3657 which was allocated to States, Manipur received the highest at Rs 440 lakh accounting for 12% of the total funds allocated during the XI Five Year Plan. The median fund allocation estimated per state was Rs 122 lakh. However states such as Karnataka and Jammu & Kashmir received no fund for the activities. Figure 4 below gives a snapshot of fund allocated to states during the XI Five Year Plan.
Manipur
Orissa
Tamil N
adu
Haryan
a
Madhya
Pradesh
West Ben
gal
Chhatissg
arh
Himach
al Prad
esh
Arunach
al Prad
eshSik
kimGujar
at
MizoramBihar
Uttar Prad
esh
Tripura
Uttarakh
and
Jharkhan
d
Mahara
shtra
Punjab
Nagala
ndAssa
m
Meghala
ya
Rajasth
anKera
la
Andhra Prad
esh
Karnata
ka
Jammu &
Kashmir
0
50
100
150
200
250
300
350
400
450
500
440
383
313
248
232
193
189
141
140
137
135
132
128
122
116
111
108
106
96
63 57
19 19 18 11 0 0
Figure 4 State wise fund allocation for demonstration and outsourcing training during XI FYP
31
As evident from figure 4, the states with larger geographical area and number of farmers such as Rajasthan, Andhra Pradesh and Karnataka received comparatively lower fund allocation or even no allocation.
3.2.3 Zone wise fund allocationThe states were divided into six zones; North Zone (Haryana, Himachal Pradesh, J&K, Punjab, UP, UK), South Zone (AP, Karnataka, Kerala, Tamil Nadu), East Zone (Bihar Jharkhand, West Bengal, Odisha), West Zone (Gujarat, Maharashtra, Rajasthan), Central Zone (MP, Chhattisgarh), North East Zone (Arunachal Pradesh, Assam, Manipur, Mizoram, Meghalaya, Nagaland, Tripura & Sikkim). The zone wise allocation of fund also revealed an uneven distribution of fund for demonstration and training programmes across different geographic regions of the country, as indicated in the following table:
Table 2 Zone wise fund allocation for demonstration & outsourcing training programmesZone Fund Released Allocation (%)Northern Zone 718 20%Southern Zone 342 9%Eastern Zone 812 22%Western Zone 260 7%Central Zone 421 12%North Eastern Zone 1104 30%Total 3657 100%
As becomes evident from the table 2 above, Southern, Western and Central zones received allocation ranging from 7% to 12% of the total fund allocated to the states. North Eastern Region accounted for a major share at Rs. 1104 lakh, being 30% of the total allocation. Even within the regions, the financial allocation remained skewed as could be observed from the table 3.
Total States 2007-08 2008-09 2009-10 2010-11 2011-120
5
10
15
20
25
30
No.
of S
tate
Figure 5 No of states allocated financial assistance during the XI FYP
32
During the XI Five Year Plan only 50% of the 27 states, on an average received the financial allocations for demonstration and training programmes each year. Even within the zones, not all the states got the assistance in a year. There was no fund allocation to the states in Western Zone during two consecutive years 2009-10 and 2010-11. In contrast, the central zone comprising of Madhya Pradesh and Chhattisgarh were allocated funds every year during the XI Five Year Plan except in the year 2009-10. Thus an intra regional variation in fund allocation was observed during the XI Five Year Plan.
3.2.4 Zone wise shares of fund allocation It was also observed that the out of the total budgetary allocation, a significant share of 55% was allocated during the last two years of XI FYP. In contrast only 20% and 19% was allocated during the initial two years of XI FYP. Table 3 below gives the details of percentage of allocation of funds for demonstration and outsourcing training programme for each zone. A comprehensive picture for each state could be seen in Annexure-2.
Table 3 Year wise/ zone wise share of fund during the XI FYP
ZoneTotal fund allocated
(Rs lakh) 2007-08 2008-09 2009-10 2010-11 2011-12South Zone 342 23% 25% 18% 20% 15%North East Zone 1104 12% 13% 6% 34% 35%Eastern Zone 812 5% 12% 7% 24% 52%Central Zone 421 31% 22% 0% 20% 28%Western Zone 260 52% 2% 0% 0% 46%Northern Zone 718 14% 40% 10% 26% 10%Govt Institutions 482 2% 21% 0% 77% 0%Total/average 4139 20% 19% 6% 29% 26%
Though North East Zone received the highest share of the total financial allocation, nearly 70% of its share was received during 2010-11 and 2011-12. In case of Eastern Region as well as Government Institutions (ICAR and SFCI) too, similar allocations was observed. Western Region comprising of states of Maharashtra, Gujarat and Rajasthan having received more than 50% financial assistance of Rs135 lakh in 2007-08 received almost no assistance during the three consecutive years from 2008-09 to 2011-12. The rest 46% was allocated during the last financial year of XI Five Year Plan. Thus, there was no uniformity in allocating funds to states within the zone.
3.2.5 Fund UtilizationDuring the XI FYP period, out of Rs. 4139 lakh allocated for demonstration and outsourcing of training programmes, Rs.2667 lakh was utilized leaving Rs.1471.89 lakh unspent, accounting for 36% of the total fund allocation. Nine out of the 27 State Governments and one of the 2 Government Organizations (ICAR) utilized 30% of the allocated funds. In all 15 states as well as SFCI utilized 60% to 100% of the funds allocated (see Annexure-3 for state wise/ institution wise details). Only five states, viz., Arunachal Pradesh, Manipur, Meghalaya, Nagaland and Haryana utilized 100% of the allocated funds. SFCI which received funds during the first two years of XI Five Year Plan only also utilized 100% of the allocated funds. In contrast, the states like Rajasthan did not utilize even a small allocation of Rs 19 lakh during the year 2011-12. Karnataka did not receive any allocation during the XI FYP period. However it had an unspent balance of Rs 21.62 lakh out of the allocations made during the previous five year plans. The State, however, did not show any progress during the
33
XI FYP. Similar situation was observed the case of Jammu & Kashmir also. Table 4 below presents the extent of State wise fund utilization in demonstration and outsourcing of training programmes.
Table 4 State wise extent of fund utilizationPercent Utilized No of States Percent Cumulative (%)(0-30)% 9 31% 31%(30-60)% 5 17% 48%(60-100)% 15 52% 100%Total 29 100%
The figures provided by the Mechanization & Technology Division of Department of Agriculture and Cooperation (MoA) indicated unspent of Rs 3.26 lakh and Rs. 1468.63 lakh under training and demonstration component, respectively.
3.2.6 Zone wise Utilization of FundZone wise analysis of fund utilization is presented in table 5 below. The last row of the table also presents the total fund allocated to Government Organizations - ICAR and SFCI. Performance of the central zone consisting of states of Madhya Pradesh and Chhattisgarh was the best. Of the total Rs. 421 lakh allocated, 96% was utilized for the demonstration and training programmes. Utilisation by ICAR was poor at 3% of Rs.384 lakhs allocated to it. In contrast, SFCI utilised 100% of the Rs 98 lakh allocated to it.
Table 5 Trend in Zone wise utilization of allocated funds for demonstration and outsourcing training programmes
Zones
Fund Allocated (Rs. Lakh) (%)
Fund Utilized
(Rs. Lakh)Utilization
(%)
Fund Unutilized (Rs. Lakh)
Unutilized (%)
South Zone 342 8% 291.23 85% 50.77 15%North Eastern Zone 1104 27% 814.6 74% 289.4 26%Eastern Zone 812 20% 393.45 48% 418.55 52%Central Zone 421 10% 402.27 96% 18.73 4%Western Zone 260 6% 104.73 40% 155.27 60%Northern Zone 718 17% 549.43 77% 168.57 23%Institutions/Organization 482 12% 111.4 23% 370.6 77%
Total 4139100% 2667.11 64% 1471.89 36%
Eastern Zone comprising of the states of Bihar, West Bengal, Jharkhand and Odisha were able to utilize only 48% of the total fund allocated. Among these states, Bihar emerged as a leading state with an utilisation of 88% of the allocated funds followed by Odisha at 60%, while Jharkhand and West Bengal had utilized only 7% and 22% of their allocations. In the Western Region comprising Maharashtra, Gujarat and Rajasthan where the total utilization was 40%, Gujarat had received allocation of Rs 135 lakh during the year 2007-08 and utilized 73% of the total allocation, while Maharashtra utilized only 6% and no utilization was made by Rajasthan which had received Rs 19 lakh during the year 2011-12. Thus there was no uniformity in utilisation of allocated funds. The state wise allocation and utilization of fund under the demonstration and outsourcing training programmes to states and Government Organizations may be seen at Annexure-3.
34
Andhra Pra
desh
Karnat
aka
Kerala
Tam
il Nad
u
Arunach
al Pra
desh
Assam
Man
ipur
Mizo
ram
Meg
halaya
Nagala
nd
Trip
ura
Sikkim Bih
ar
Jhark
hand
Orissa
Wes
t Bengal
Chhatissgarh
Mad
hya Pra
desh
Gujarat
Mah
arash
tra
Rajasth
an
Harya
na
Himach
al Pra
desh
Jam
mu &
Kashm
ir
Punjab
Uttar Pra
desh
Uttarak
hand
ICAR
SFCI
-50
0
50
100
150
200
250
300
350
400
450
Total Allocation (Rs in Lakh) Utilization (Rs in Lakh)
Figure 6 State wise allocation and utilization under demonstration and outsourcing training programmes
Thus, it was observed that some states had not utilized the funds received by them for demonstration and outsourcing of training programmes and some utilized only a part of the funds received by them during the XI Five Year Plan. A large percentage of funds allocated to ICAR during 2008-09 and 2010-11 too remained unutilized, with mere 3% being utilized during the XI Five Year Plan. Highlights of achievements under the scheme, included utilisation of more than 60% of the allocated funds by 52% of the states and 100% fund utilisation by 8 states from the North Eastern Region.
With a view to assess the impact of the scheme, despite some impediments in its implementation, field data was collected from different stakeholders. The following chapter presents the finding from the field observations and data collected from the different stakeholders of the scheme which will reflect the overall performance of the scheme, investigate the appropriateness and its effectiveness in creating the intended impact on the targeted beneficiaries.
35
Chapter 4: Study Findings
4.1 Study Coverage- Farm Mechanization Training and Testing InstitutesAs already presented in Chapter 2, the present study covers 11 states from six zones. The study covered both primary beneficiaries of training and demonstration assisted under the scheme and implementers of scheme such as Directorate of Agriculture, Farm Mechanization Training and Testing Institutes and ICAR sponsored institutions such as CIAE. The study covered training beneficiaries from FMTTIs from each of the four centres, viz., NRFMTTI (Hissar, Haryana), SRFMTTI (Garladdine, Andhra Pradesh), CRFMTTI (Budni, Madhya Pradesh) and NERFMTTI (Biswanath Chariali, Assam). The study also covered host farmers and participant farmers who were trained/ given demonstration on improved machinery for agriculture mechanization under the demonstration and outsourcing training components conducted through State Government and Government Institutions. The study team also made use of secondary information in the form of reports and publications from lead institutions such as FMTTIs and CIAE and State Governments, wherever available, to study the physical and financial progress of the scheme. Detailed interactions and discussions were also held with the officers directly involved in the implementation of the program in each state/ institution and nodal officers supervising the programs, to capture in depth understanding of the operational and policy issues involved in the implementation of the Scheme. The present chapter deals with the detailed findings from lead agencies such as FMTTIs (Training and Testing Component), CIAE and State Governments and beneficiaries assisted under the training and demonstration components of the scheme.
4.2 Performance of the FMTTIs during the XI Five Year Plan (2007-08 to 2011-12) under Testing ActivityKeeping in view the need for acquiring capacity for sustained mechanization of agriculture and improving skills of users, entrepreneurs, scientists for proper use, maintenance and running of farm machineries and equipments and promoting production of agriculture machines, the Government of India established Farm Mechanization Training and Testing Institutes in four different locations covering each geographic location of the country. The mandate of these institutes are broadly categorised into training different categories of respondents and testing of equipments and machinery as per the guidelines of Bureau of Indian Standards (BIS) and Office of Environment Compliance and Documentation (OECD).
4.2.1 Testing of Machinery/EquipmentsAs per the Test Regulation, the testing of equipments is done under two categories:
Sub Category
Categories
Tests Nature of Tests
Commercial
Initial Commercial
TestsBatch Test
Test in accordance with
OECD codes
Confidential Tests
36
Three types of Commercial tests are carried out for establishing performance characteristics of machines that are under commercial production or ready for commercial production. First, the initial commercial tests are performed for indigenously developed or imported archetype machines which are ready for commercial production. Second, batch tests are performed for these machineries which have already undergone initial commercial test and are being manufactured commercially. Third type of tests are done on tractors which are manufactured for export purposes to meet the standard test regulations.
In contrast, the confidential tests are performed on equipments/ machines that are required for manufacturers and applicants before taking up commercial productions.
Salient features of the Institutes are presented in table 6 below:
Table 6 Salient Feature of FMTTIsName of Institutes Location Year of
EstablishmentTypes of Equipment Tested
Central Farm Machinery Training Testing Institute
Budni, Madhya Pradesh
1959 Test Tractor as per BIS & OECD Standard
Test Self propelled machines under CMVR
Northern Region Farm Machinery Training and Testing Institute
Hissar, Haryana 1963 Test Combine Harvesters as per BIS and CMRV
Test Plant protection equipments, irrigation pumps diesel engines under BIS and OECD standards
Southern Region Farm Machinery Training and Testing Institute
Anantpur, Andhra Pradesh
1983 Test power tillers Test self propelled crop
production machines
North Eastern Region Farm Machinery Training and Testing Institutes
Biswanath Chariali (Assam)
1990 Power driven agriculture equipments and bullock drawn equipments.
37
4.2.2 Availability of Testing Infrastructure with FMTTI’s
Table 7 Availability of testing infrastructure with FMTTI'sS. No. Parameter Name of Equipments/
InstrumentsRange Accuracy Frq. of
calibration
1. POWER MEASUREMENT
E-70 Eddy current Dynamometer with digital load & speed indicator (Electro-dyne)
At 1000 rpm=11 HPAt 1600 rpm=20 HPAt 6000 rpm=70 HP
±0.2% Before each in test
D-700-IE Hydraulic dynamometer At 1000 rpm=25 KWAt 500 rpm=40 KWAt 3500 rpmAt 7500 rpmPower-700 KW
±0.2% Before each in test
ESF-60 , Fuchino Eddy Current type Dynamometer
25 kW ±0.2% Before each in test
ESF-60s , Fuchino Eddy Current type Dynamometer
7 kW ±0.2% Before each in test
Digital hand tachometer 0-9900 rpm 1 rpm Once in a year
Non contact type digital tachometer 0-9900 rpm 1 rpm Once in a year
2. COMPRESSIVE AND TENSILE FORCE
Universal type load cell wth3½ digit digital display indicator
0-100 Kgf ±0.1% Before each in test
Load cell wth 4½ digit digital display indicator 0-5000 kgf ±0.1% Before each
38
S. No. Parameter Name of Equipments/Instruments
Range Accuracy Frq. of calibration
MEASUREMENTS test
Load cell wth3½ digit digital display indicator 0-3000 kgf ±0.1% Before each in test
Universal Testing Machine 0-20Tonne ±1% Proving Ring
3. MATERIAL TESTING
Rockwell-cum-Brinell Hardness testing machine
Of different Loading Range ±1% Before each test
4. METROLOGICAL INSTRUMENTS
Steel tape 3M, 15 ml, 30 M ±1% Once in 3 yearsOutside micrometer Dig. Type (Japan make) 0-25 mm, 25-50 mm, 50-75
mm, 75-100mm, 100-125mm, 125-150mm, 150-175mm, 175-200mm
±0.1% -do-
Digital Inside micrometer 5-30mm ±0.1% -do-
Digital Cylinder bore gauge 6-10mm, 18-35mm,35-60mm, 50-150mm
±0.1% -do-
Height gauge dial 0-600mm ±0.1% -do-Steel micrometer 0-25mm, Depth 0-600mm ±0.1% -do-‘U’ type throat micrometer 0-175-200mm ±0.1% -do-Point micrometer 0-25mm, 25-50mm ±0.1% -do-Disc micrometer 0-25mm ±0.1% -do-
39
S. No. Parameter Name of Equipments/Instruments
Range Accuracy Frq. of calibration
Spline micrometer 0-25mm, 25-50mm ±0.1% -do-Ball micrometer 0-25mm ±0.1% -do-Vernier caliper, dial type 0-150mm ±0.1% -do-Vernier caliper dial type 200mm, 300mm, 600mm &
1000mm±0.1% -do-
Vernier depth gauge 200mm ±0.1% -do-Universal vernier caliper 0-150mm ±0.1% -do-
5. ELECTRICAL POWER, VOLTAGE & CURRENT MEASUREMENT
Dimmer stat(Voltage Trnsformrer) 0-500 volts ±0.5% Once in 3 years
6. VACUUM & PRESSURE MEASUREMENT
Dead weight pressure gauge tester 0-70 Kg/cm2 0.1 Kg Once in 3 yearsVacuum gauge tester 0 to 1 Kg/ cm2 0.01 Kg Once in 3 yearsBourdon tube pressure gauges 0 to 1 Kg/ cm2
0 to 2.5 Kg/ cm2
0 to 4 Kg/ cm2
0 to 5 Kg/ cm2
0 to 7 Kg/ cm2
0 to 10 Kg/ cm2 0 to 16 Kg/ cm2
±0.1% Before each test
Exhaust gas pressure Indicator with pressure sensor
0-760mm of Hg ±0.1% 4-20mA current source
Intake air gas pressure Indicator with pressure sensor
0-200mm of Hg ±0.1% -do-
Engine oil pressure Indicator with pressure sensor
0-20kg/cm² ±0.1% -do-
40
S. No. Parameter Name of Equipments/Instruments
Range Accuracy Frq. of calibration
7. TEMPERATURE MEASUREMENT
Digital temp. indicator ( 10 channel RTD i/p) 0-200ºC resolution 0.1ºC ±0.1% Once in a year from NABL accreditated lab
Thermocouple indicator (‘J’ and ‘K’ type i/p) 0-1000ºC ±5ºC -do-Industrial thermometer 0-120ºC,
0-200ºC,0-300ºC
±0.5ºC±0.5ºC±0.5ºC
-do-
Temp. sensors(RTD) 0-200ºC range,Pt100 type
±1ºC -do-
K-Type thermocouple 0-1100ºC ±1ºC -do-Infra red temperature meter - - -
8. Other Instruments
Rockwell –cum- Brinell Hardness testing machine
HRC-HB-
±1% Standard calibration
blockDiesel Smoke Meter 0 to 100% Opacity ± 1% of FSD Before each
testNoise level meter 23-130 db(A) 0.1 db Noise level
calibratorMechanical Vibration meter 1 Hz to 1 KHz
Disp.-.01-100mm±1% Self calibration
Angle Protactor& Abney level 0 to 90ºC 0.1% --Anemometer 0-17kmph 0.5% --Fuel Consumption meter Digital fuel meter timer
0-999.9 sec±0.1 sec Before each
test
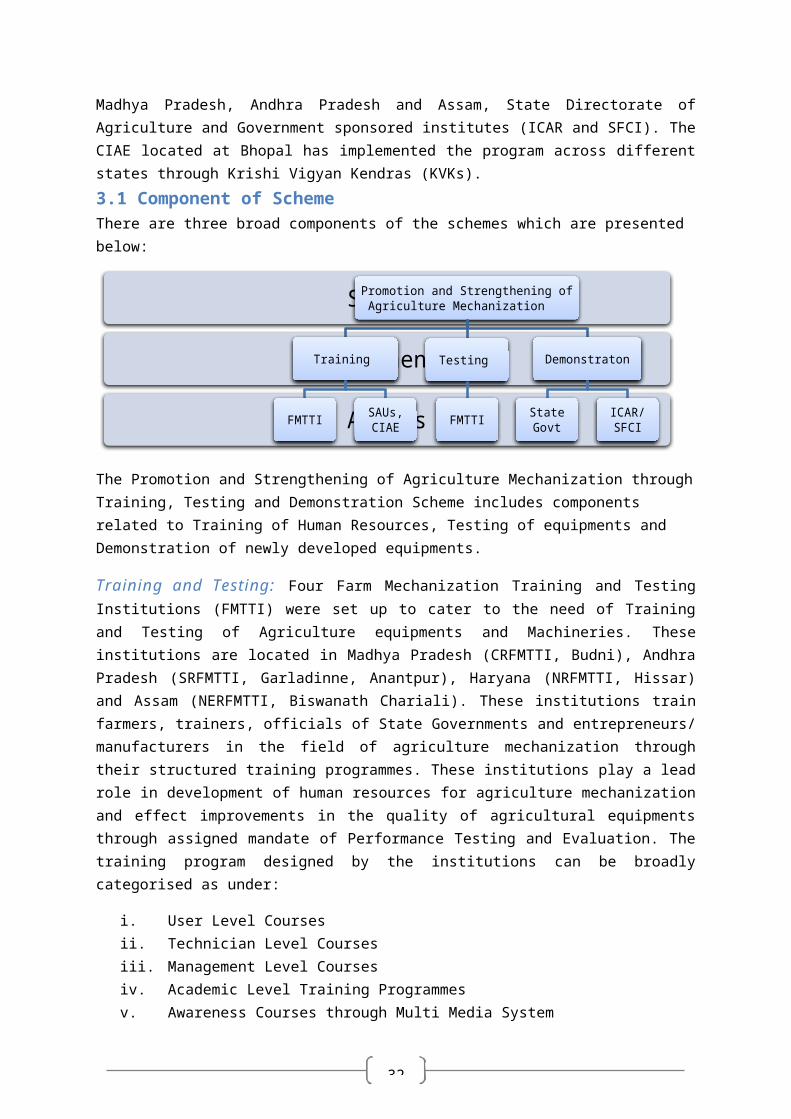
41
S. No. Parameter Name of Equipments/Instruments
Range Accuracy Frq. of calibration
Weights 100 gm to 1 Kg 0.1%Fuel 10 gm to 150 gm/s 0.1%
Steering Effort meter Effort-0-25kgmAngle-Endless
0.35% of FSD Self check
Digital Soil Moisture meter 0-50% ±5% Hot air ovenDigital Grain moisture meter(Paddy,wheat) 8-20% ±1% -do-Computerised Brake testing eqipment 0-225kgf(Pedal pressure) 0.1% Calibrated
weightsSpring testing machine Load-0-10kg
Displacement-0-100mm±1% Calibrated
weight and measuring scale
Lazer beam strength meter - - -Optical emission Spectro meter Metavision 1008i - - -
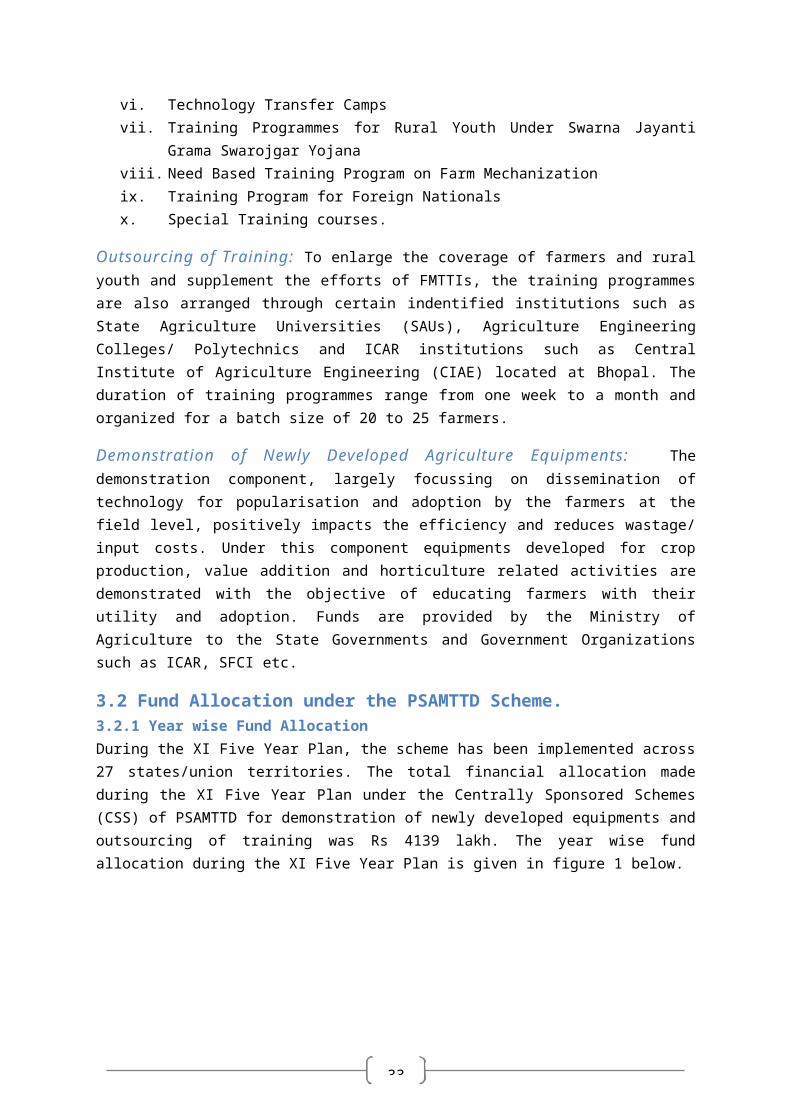
42
4.2.3 Quality Improvement in Major Machines Tested During Last Five YearsThe following quality improvements were observed in major machines which were tested at FMTTIs-
1. Combine harvester manufacturers develop their product to comply with the performance parameters stated in IS: 15806-2008. As regards the safety aspects, machines improvise the entire essential safety feature to comply with the requirements under respective test codes & CMVR Rules 1989.
2. Testing has led to awareness amongst users on compliance of the technical specification like safety provision of the critical components in machine like thresher, sugarcane crusher, chaff cutters, etc., which are covered under the dangerous machine act.
3. Testing has led to operator`s comfort and improvements in the ergonomics of the machines by keeping the vibration, steering, effort and noise level of the machine within the specified limits whereever applicable.
4. Testing has also led to improvement in durability, finishing & smooth functioning of combine harvester & other similar machines.
5. Traditionally combine harvesters & other harvesting machines were suitable only for wheat & paddy. However improvements through testing has lead to these machines being now used for other crops such as maize, soya bean, mustard, pulses etc.
6. Tractor powered combines are being provided with 4 wheel drive to make it suitable for paddy harvesting. Track type combines are being widely introduced in the paddy regions.
7. The combine harvester with an integrated attachment of straw reaper combine for preparation straw for animal feed or mulching have been also developed during testing of the machines.
8. Combine harvesters have been introduced for sugarcane while cotton picker is in the process of field testing.
9. Machines like balers and straw racks tested at the institutes are being widely introduced for straw management.
10. The manufacturers of the lazar leveller have applied for testing of their products at FMTTI Hissar and there has been a significant improvement in their performance and quality.
4.2.4 Issues faced by FMTTI’s during the conduct of testing activities1. The demand for testing of new machines at FMTTI’s are growing at an increasing rate.
However, the institute lacks the resource of trained man power to cater to the increasing need. Insufficient trained manpower and non-availability of requisite infrastructural facilities are key issues for the FMTTIs in general.
2. Most of the test equipments and test rigs used under different labs are bought and customized at the FMTTI which are too sophisticated for the local mechanics. These machines are prone to frequent breakdowns and due to non availability of adequate technical staff, these machines are not repaired in time. A permanent cadre of trained mechanics at each FMTTI may be created to address the problems of such issues. Non-availability of Test Codes for new machines.
3. FMTTI Hissar lacks sufficient land area for conduct of testing activity. There is an immediate need to purchase new land in nearby area of smooth conduct of testing activities by the institute.
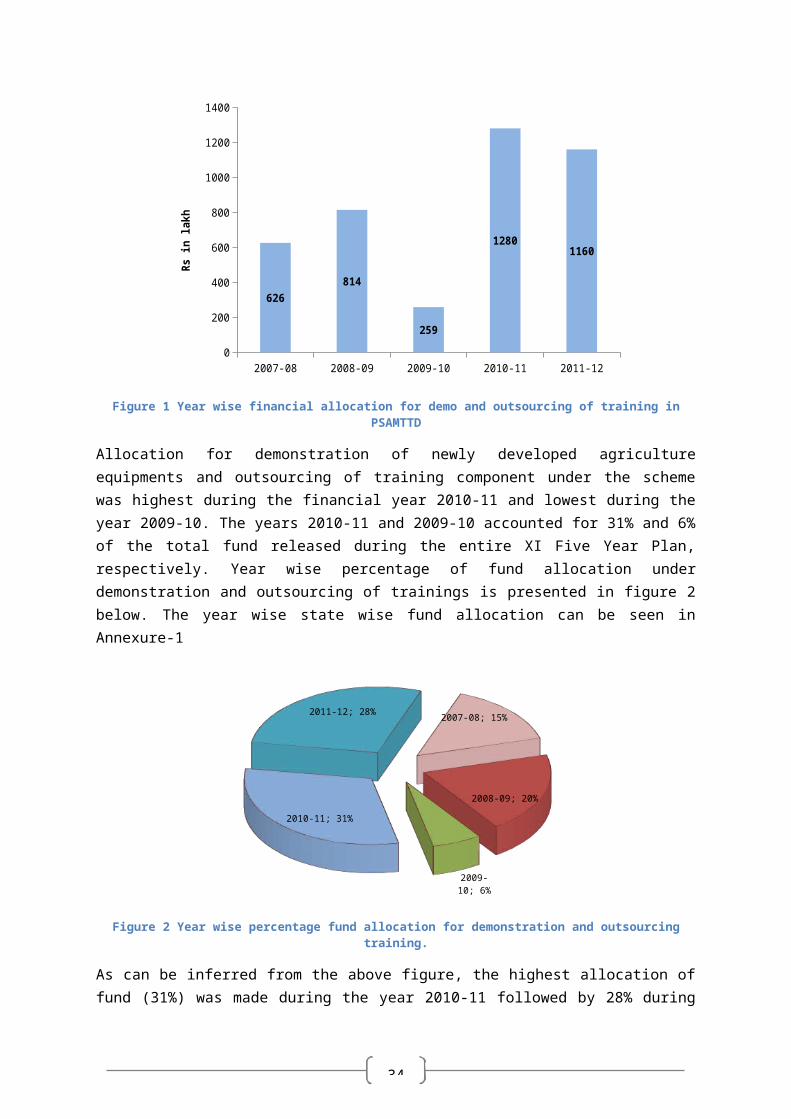
43
4. FMTTI Hissar also lacks availability of water at the institute which hinders the work to a large extent.
5. There is a need to bring in new computers and other relevant machines for all the FMTTIs. The old and obsolete nature of available resources has hindered the record keeping process to an extent.
4.3 Performance of the FMTTIs during the XI Five Year Plan (2007-08 to 2011-12) under Training Programmes
4.3.1 Central Region Farm Mechanization Training and Testing Institutes-Budni (Madhya Pradesh)
4.3.1.1 Course wise number of Training Programs conducted in CRFMTTIDuring the XI Five Year Plan, the FMTTI- Budni conducted training courses as per their course structure and covered every type of courses. A total of 310 training programs were organized under different courses comprising of User Level, Technician Level, Management Level, Academic level, Awareness, Technology Transfer Camps, Need based and Apprenticeship training. Year wise & course wise training programs organized is presented in table 8 below. A total 308 training courses were organized during the period 2007 to 2012 of which 33% was Technician Level courses followed by 19% Academic Level and 18% User Level courses. The need based training courses were organized as per the demand which is accounted for 9% of the total training programs. The detailed break up of number of training programmes and courses is presented in table 8 below.
Table 8 Types of training course and number of training programs organized in CRFMTTI
Course 2007-08 2008-09 2009-10 2010-11 2011-12Tota
lPercent
U- User's Level 13 14 6 12 10 55 18%T- Technician's Level 17 22 15 24 23 101 33%M- Management Level 0 0 9 12 22 43 14%A- Academic Level 7 9 11 18 15 60 19%
AW- Awareness through Multimedia system 0 0 3 0 0 3 1%TT- Technology Transfer Camps 0 0 5 0 0 5 2%NB- Need Based Training 12 5 4 3 3 27 9%APP- Apprenticeship Training 2 2 2 3 5 14 5%Total 51 52 55 72 78 308 100%
The number of training programs organized has shown an increasing trend with addition of approximately 5 training programs per year. Figure 7 below gives the trend of training program organized during the XI Five Year Plan.
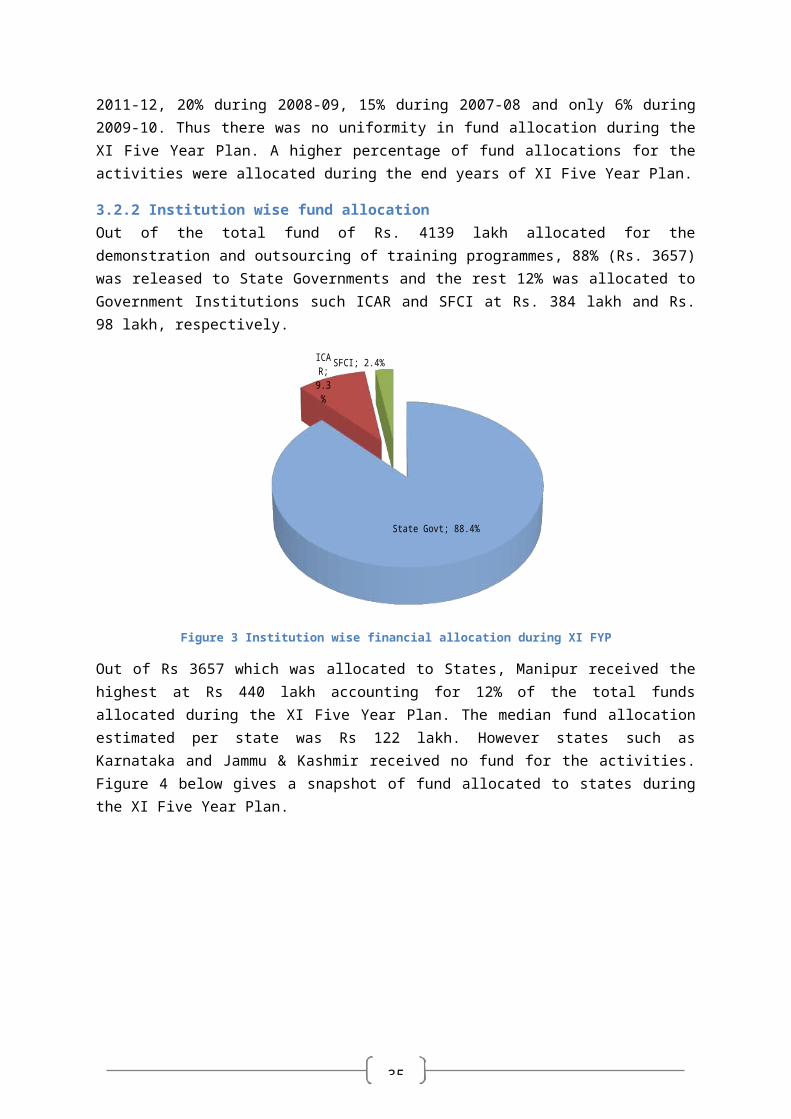
44
2007-08 2008-09 2009-10 2010-11 2011-1245
50
55
60
65
70
75
80
No. o
f Tra
inin
g
Figure 7 Trend of training program organized during the XI Five Year Plan -CRFMTTI
4.3.1.2 Course wise targets and achievements in training From inception till the end of XI Five Year Plan, FMTTI Budni has trained 48,309 persons. The annual target of the training programmes stood at 1800 persons from 2007-08 till 2009-10 and then increased to 1900 persons for the last two years of the XI Five Year Plan. The institute achieved the targets every year. The participation rate in the training courses showed a compounded annual growth rate of 2.5%. During the XI FYP period the total numbers of persons trained were 9507 against the target of 9200 thus achieving 103% of the targets. It is also observed that the number of persons participated in Academic Level courses was the highest (35%) followed by 28% in Technician Level course and 20% in User Level courses. Number of courses conducted and number of trainees trained by the institute, year wise, is presented in table 9 below:
Table 9 Course wise trainees participation in CRFMTTITraining/Course 2007-08 2008-09 2009-10 2010-11 2011-12 Total
Targ
et
Achi
evem
ent
Targ
et
Achi
evem
ent
Targ
et
Achi
evem
ent
Targ
et
Achi
evem
ent
Targ
et
Achi
evem
ent
Targ
et
Achi
evem
ent
U- User's Level 550 533 550 544 225 226 350 345 320 320 1995 1968T- Technician Level 520 512 520 557 400 398 620 622 550 568 2610 2657M- Management Level 0 0 0 0 275 280 150 168 380 465 805 913A- Academic Level 550 567 550 586 650 690 750 785 630 668 3130 3296
AW- Awareness through Multimedia 0 0 0 0 35 37 0 0 0 0 35 37TT- Technology Transfer Camps- off campus 0 0 0 0 50 61 0 0 0 0 50 61NB- Need Based Training 170 200 170 117 150 148 20 23 0 37 510 525FN- Foreign National Training 0 0 0 0 0 0 0 0 20 0 20 0APP- Apprenticeship Training 10 7 10 18 15 16 10 9 0 0 45 50Total 1800 1819 1800 1822 1800 1856 1900 195 1900 2058 9200 9507
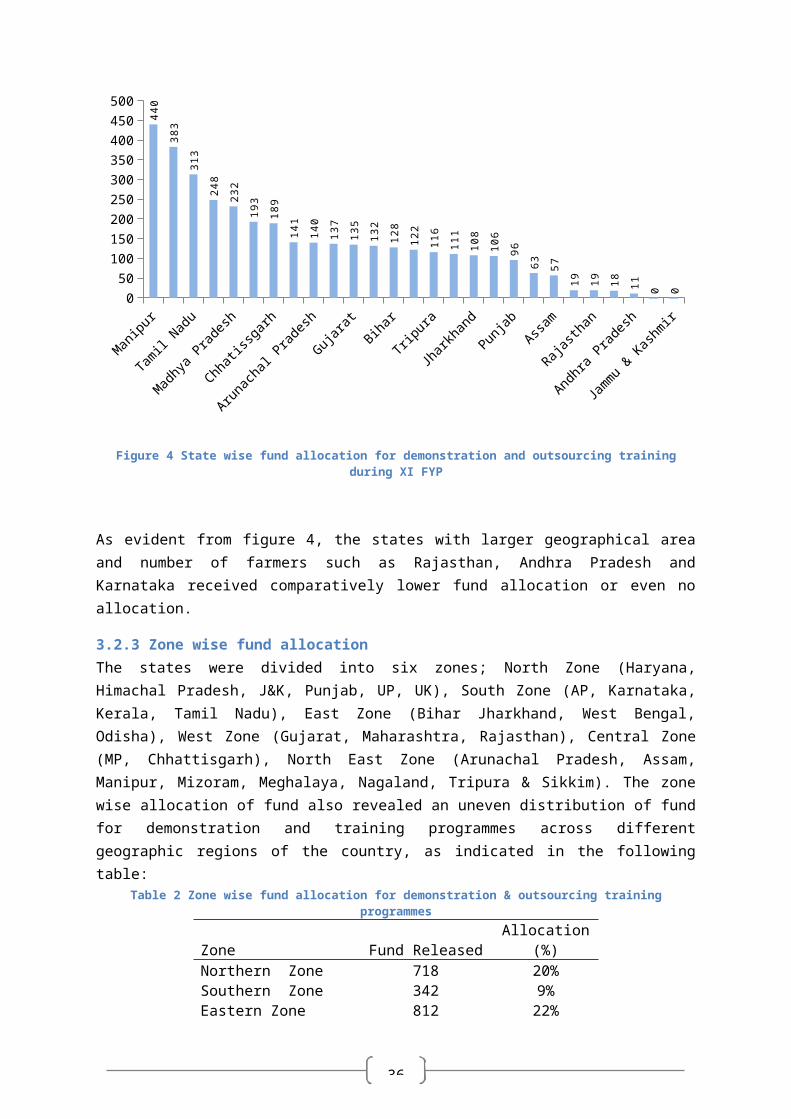
45
2
Figure 8 below also presents the trend of trainees targeted and achieved during each year of XI Five Year Plan.
2007-08 2008-09 2009-10 2010-11 2011-121650
1700
1750
1800
1850
1900
1950
2000
2050
2100
Target Achievement
No o
f Tra
inee
s
Figure 8 Targets and achievements in training program conducted by CRFMTTIs
The total participation in the training programs at 103% of the target indicated a good performance in terms of coverage of trainees by the institute during the XI Five Year Plan. The percentage distribution according to the training courses is presented in figure 9 below.
21%
28%10%
35%
0%1%
6%1% U- User's Level
T- Technician LevelM- Management LevelA- Academic LevelAW- Awareness through Mul-timediaTT- Technology Transfer Camps- off campusNB- Need Based TrainingFN- Foreign National TrainingAPP- Apprenticeship Training
Figure 9 Percentage distribution of trainees according to training course-CRFMTTI
As can be inferred from figure 9 above, out of total 9507 trainees who participated in different training courses, the Academic Level courses accounted for the largest share (35%) followed by Technician Level courses (28%) and User Level courses (21%). This indicated the popularity and
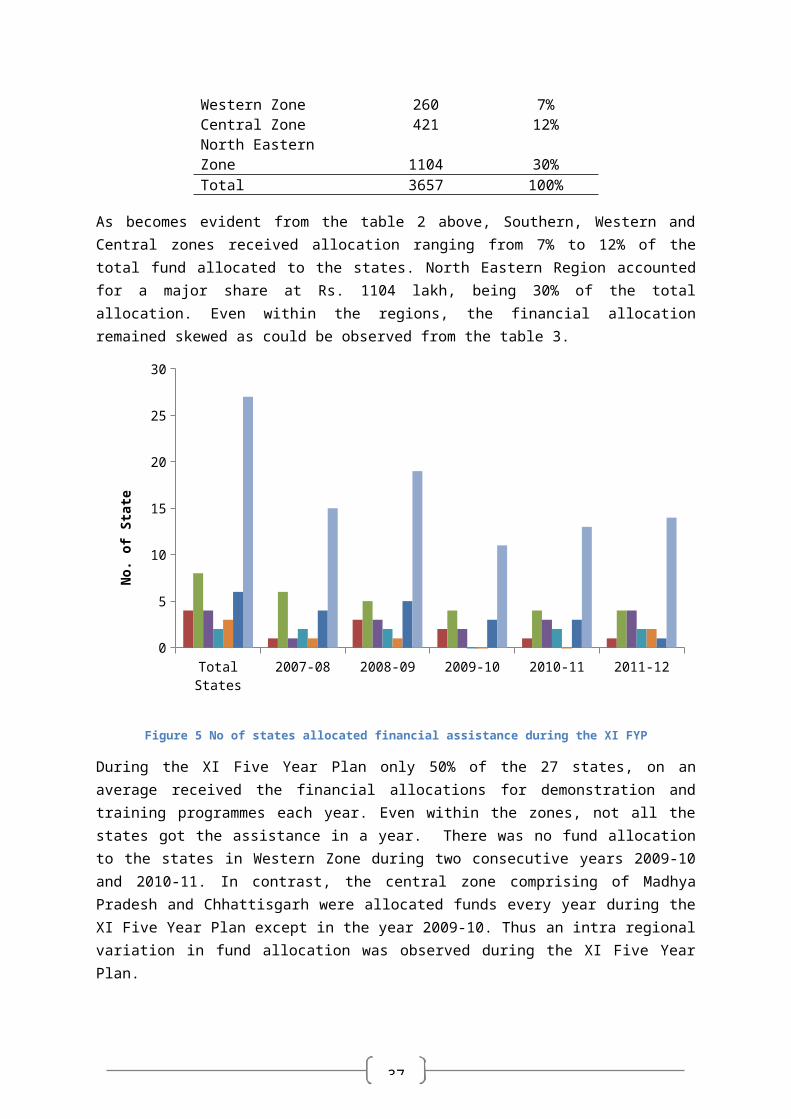
46
usability of Academic Level courses. The participation under Technology Transfer, Management Level, Awareness through Multimedia, etc., was low.
4.3.1.3 Category Wise Participation in Training CoursesOf all the 9500 training participants, the number of trainees belonging to Schedule Tribes, Schedule Castes and Other Backward Classes was 43%, 35% and 14%, respectively. This indicated the efforts of the Institute in encouraging the trainees from these categories to participate in the training programmes. Figure 10 below reflects the percentage distribution of the category wise trainees attending the training programmes.
SC; 35%
ST; 43%
OBC; 14%
General; 8%
Figure 10 Category wise distribution of trainees attended the program in CRFMTTI
The year wise category wise number of trainees attending the training program can be seen in table 10.
Table 10 Year wise category wise participation in training courses in CRFMTTICategory Year
2007-08 2008-09 2009-10 2010-11 2011-12Tota
lSC 812 501 783 522 708 3326ST 572 959 723 953 880 4085OBC 265 259 257 260 335 1373General 170 103 93 217 135 716Total 1819 1822 1856 1952 2058 9507
As evident from the table above, the numbers of trainees showed an increasing trend over the years under the XI FYP which is a good indicator of performance. The CRFMTTI Budni appeared to have put in efforts for covering trainees belonging to Schedule Tribe category which also has shown an increasing trend. The SCs and General Category participation has shown a marginal decrease in number while the there has been an overall increase in numbers of trainees belonging to ST and OBC category. Almost 10% of the total trainees were female.
4.3.1.4 Regional Participation of TraineesDuring the XI Five Year Plan, participants from 27 states were covered under the different training courses in CRFMTTI- Budni. Out of the total participants, nearly 58% belonged to Madhya Pradesh and the rest 29% were from neighbouring states of Rajasthan, Gujarat, Maharashtra, Uttar Pradesh and Chhattisgarh sharing geographical boundary with Madhya Pradesh. Out of these states, the
47
largest participation was from Maharashtra (16%) followed by Uttar Pradesh (6.20%), Chhattisgarh (2.45%), Gujarat (2.30%) and Rajasthan (1.85%). An interesting observation was that Chhattisgarh which got separated from MP had a lower participation in terms of number of trainees.
Table 11 Regional participation in training courses in CRFMTTIStates
2007-08 2008-09 2009-10 2010-11 2011-12During XI
FYPTo
tal
Perc
ent
Tota
l
Perc
ent
Tota
l
Perc
ent
Tota
l
Perc
ent
Tota
l
Perc
ent
Tota
l
Perc
ent
Madhya Pradesh
1103 60%
1120 62% 958 51%
1304 67%
1037 51%
5522 58%
Neighbouring States2 593 32% 500 27% 576 31% 385 20% 719 35%
2773 29%
Other States 137 7% 198 11% 228 18% 254 13% 295 14%121
2 13%
Total183
3 100%182
0100
%186
4100
%194
5100
%205
1100
%950
7 100%Table 11 above presents year wise number of participants during the XI Five Year Plan and share of different regions. From the remaining 20 states, the participation ranged between 7% during 2007-08 and 18% during 2009-10. The number of trainees participating from different states and their percent distribution can be seen in Annexure-4.
4.3.1.5 Target & Achievements-Testing of Equipments in FMTTI- BudniThe annual target of testing is set by the Central Government. The achievements against target for testing of equipment are presented in table 12 below.
Table 12 Targets and Achievement of testing in CRFMTTIYear Total
TargetTypes of Machine and No of Machines Tested
Tractor
Power Tillers
Combine Harvester
Components
Total
Percent to
total2007-08 35 36 6 0 1 43 17%2008-09 35 44 0 0 0 44 17%2009-10 35 50 0 0 1 51 20%2010-11 38 52 0 0 1 53 21%2011-12 38 61 0 1 0 62 25%Total 181 243 6 1 3 253 100%
Against a target of testing 181 machines/equipments during the XI Five Year Plan, the institution has tested 253 equipments/machines recording an achievement of 39% higher than the target. Out of total 253 machines tested during the XI Five Year Plan, 96% were tractors and the rest were power tillers, combine harvester and various other farm equipments.
2 Comprise of states Rajasthan, Gujarat, Maharashtra, Uttar Pradesh and Chhattisgarh.
48
96%
2%
0%
1%
TractorPower TillersCombine Components
Figure 11 Percentage of Machines tested during XI Five Year Plan in CRFMTTI
It was also observed that against the annual capacity of testing 35 machines of the Institute, actual number of tractors tested varied from 36 to 61 reaching almost twice the capacity, while the number of other machines such as power tillers, combines, and other components was almost negligible. The testing capacity with respect to each equipment might not have been estimated and therefore it is not possible to assess the adequacy of tests conducted with respect to each type of equipments.
4.3.1.6 Number of Machines Tested by Types of TestOut of 256 machines tested during the XI Five Year Plan (2007-08 to 2012-13), 89% were tested under the Commercial Category of which 50% (128) were tested under the Initial Commercial Testing, 7% under Batch test and OECD requirements. Remaining 26% falls in variant sub category.
Confidential ; 11%
Commercial ; 89%
ICT; 50%
OECD; 7%
BT; 7%
Varient; 26%
Figure 12 Distribution by types of tests of machine during XI Five Year Plan in CRFMTTI
Table 13 gives a glimpse of number of tests under each category carried out during the XI Five Year Plan.
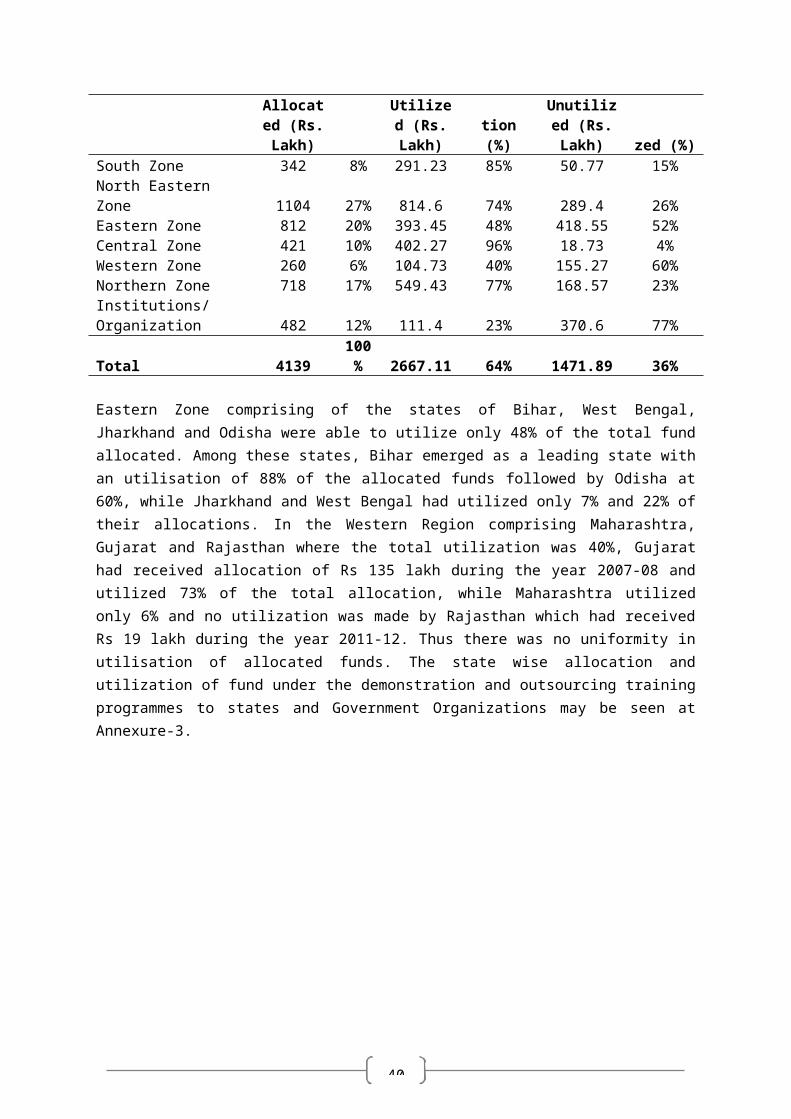
49
Table 13 Number of equipments by types of tests during the XI Five Year Plan in CRFMTTI.Types of Test 2007-08 2008-09 2009-10 2010-11 2011-12 TotalCommercial 35 40 46 49 56 229
ICT 22 28 29 26 20 128OECD 5 1 1 3 7 17
BT 6 3 1 5 3 18Variant 2 8 15 15 26 66
Confidential 8 4 5 4 6 27Total 43 44 51 53 62 253
Of these total tests conducted, 96% were for tractors as indicated above in table 13 above. Five percent of the tests remained incomplete, 5 machines remained under incomplete test schedule during 2007-08. The number reduced to 1 during 2008-09 and 2009-10 and the last incomplete test was reported during the year 2010-11. No incomplete test was reported during the year 2011-12. A complete list of Machines tested during the XI FYP may be seen in Annexure- 5.
In addition to the above tests, the CRFMTTI has also conducted tests according to the Central Motor Vehicle Rules (CMVR). The information was available from 2010-11 onwards. From 2010-11 till 2011-12 a total of 177 machineries were tested which largely included tractors and also few power tillers and combine harvesters. The list may be seen in Annexure- 6.
4.3.1.7 Training & Testing InfrastructuresThe CRFMTTI has two wings; Training Wing and Testing Wing. The training wing has a building well equipped with different laboratories to cater to the needs of demonstrations, on the job training, etc. The training hall is well equipped with modern Audio Visual aids for imparting training/ lectures. The campus has 500 acre farm where the trainees learn practical operations of different farm machineries. The training centre has more than 225 training equipments and machineries which the trainees use during their course of study. The machineries include wheel tractor, crawler tractor, transport vehicle, stationery, transport vehicle, stationary engines, irrigation pump, farm equipments, plant protection equipment, harvesting and threshing machine.
The Testing Wing is also well equipped with two sets of labs spread over an area of 3600 sq meters, 600 meter long oval shaped concrete test track of and 5km long haulage test track with varying gradient. The testing wing has also modern infrastructure and facilities for conducting computerised tests as indicated by the Institute. It is evident from the figures presented above that the institute has performed well during the XI Five Year Plan both in terms of training and testing.
The institute is facing challenges in terms of human resources required to operate the functions effectively. There is a shortage of staff resulting in pressure of work for the existing staff. At present there are 38 staffs in testing wing against the required 58 staffs as reported by the officials of CRFMTTI. Shortage of staff has restricted the ability of the Institute to use its full testing potential.
4.3.1.8 Revenue Generated by the InstituteDespite the staff shortage, the institute has been able to generate revenue of Rs 9.36 crore during the entire XI Five Year Plan, of which Rs. 8.1 crore was from testing alone. The details of revenue generated during the XI Five Year Plan from different activities are presented in table 14 below.
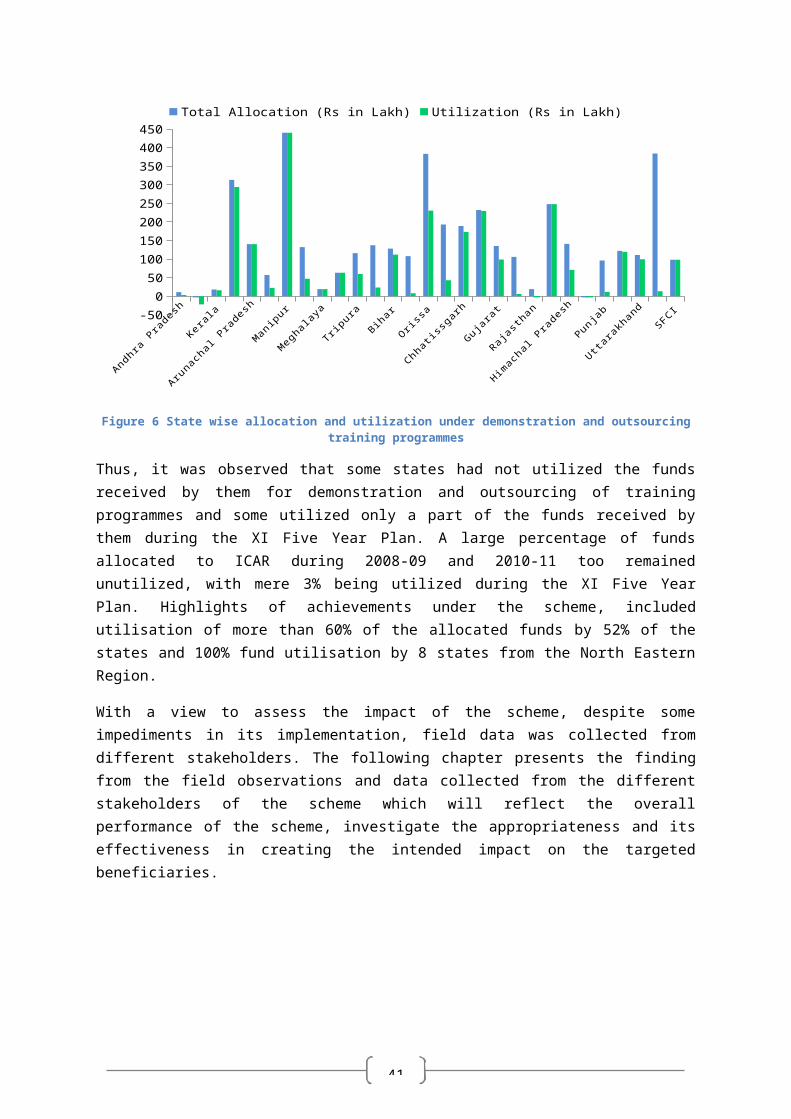
50
Table 14 Revenue generated during the XI Five Year Plan by CRFMTTI(Rs in lakh)
Activity 2007-08 2008-09 2009-10 2010-11 2011-12 Total PercentTesting 129.28 147.22 195.21 179.7 160.54 811.95 87%Training 3.67 3.33 4.05 4.09 6.87 22.01 2%Farm 10.23 11.15 8.93 16.57 16.06 62.94 7%Other 5.28 7.3 2.72 4.5 19.69 39.49 4%Total 148.46 169 210.91 204.86 203.16 936.39 100%
During the XI FYP period, the revenue generated was higher at Rs.936.39 lakh as compared to Rs.678.18 lakh, during the X FYP period, thus recording increase of 38%. The revenue from each component has recorded an increase over the period during the XI Five Year Plan.
4.3.1.9 Total Receipt and ExpenditureDuring the XI Five Year Plan, the Institute received Rs 46.64 crore as grant from the MoA towards expenditure under Planned, Non Planned components and for meeting administrative expenditure. Against this, the total expenditure was Rs 29.85 crore (64%). The details of receipts and expenditure under each head are given below in table 15.
Table 15 Receipts and Expenditure during the XI Five Year Plan by CRFMTTI.(Rs in lakh)
Budget Heads
2007-08 2008-09 2009-10 2010-11 2011-12 Total
Rece
ipt
Expe
nditu
re
Rece
ipt
Expe
nditu
re
Rece
ipt
Expe
nditu
re
Rece
ipt
Expe
nditu
re
Rece
ipt
Expe
nditu
re
Rece
ipt
Expe
nditu
re
Admin 366.25 318.09 463.61 403.86 606.55 485.43 536.27 506.86 632.29 553.81 2604.97 2268.05
Non Plan 49.00 21.00 42.00 30.30 32.50 20.47 16.00 13.91 30.33 22.30 169.83 107.98
Plan 195.00 181.88 270.00 64.60 360.00 97.94 565.00 55.28 500.00 210.19 1890.00 609.89
Total 610.25 520.97 775.61 498.769 999.05 603.84 1117.27 576.05 1162.6 786.3 4664.8 2985.9
The maximum fund utilization was made in the year 2007-08 at 85% of the total receipts. During the year 2010-11 expenditure decreased to 51% of the total allocated funds received. A closer examination of Non Plan and Plan Head Component, however, revealed a different picture. On an average, utilization was 32% of the funds receive for Plan Expenditure covering major works, purchase of machinery and equipments. During the initial years of the five year plan, the utilization was at 93% of the funds received which decreased to 10% in the year 2010-11. The utilization under Non Plan budget head, on the other hand, which was 43% during the year 2010-11 increased to 74% by the end of the XI Five Year Plan. Separate funds are not allocated for training and testing activities and same has to be met out of the funds allocated grant for Plan Expenditure.
51
Total Expenditure Revenue Generated0
500
1000
1500
2000
2500
3000
3500
2985.9
936.39
Rs in
lakh
Figure 13 Expenditure incurred and Revenue Generated by CRFMTTI
Against the total expenditure of Rs 29.85 crore during the XI Five Year Plan, CRFMTTI has been able to generate revenue of Rs 9.36 crore only accounting for 31% of the total expenditure incurred. However, revenue generated, in fact, recorded an increase of Rs 2.5 crore from the previous XI Five Year Plan, which is a significant achievement.
4.3.2. Northern Region Farm Mechanization Training and Testing Institute (NRFMTTI)- Hissar (Haryana)
4.3.2.1 Targets and Achievements in TrainingDuring the XI Five Year Plan, NRFMTTI exceeded the annual target of 9000 trainees to be trained, with target of training 1800 trainees for each year from 2007-08 to 2011-12. 9744 trainees were trained during the entire XI Five Year Plan, covering highest number of trainees (2048) during the year 2009-10. The number of persons trained, however, showed a decreasing trend in the later years of 2009-10 till 2011-12. Figure 14 below gives a snapshot of training programs conducted by the NRFMTTI- Hissar, during the XI Five Year Plan.
2007-08 2008-09 2009-10 2010-11 2011-121650
1700
1750
1800
1850
1900
1950
2000
2050
2100
Target Achievement
No
of T
rain
ees
Figure 14 Targets and Achievements of training program conducted by NRFMTTI- Hissar
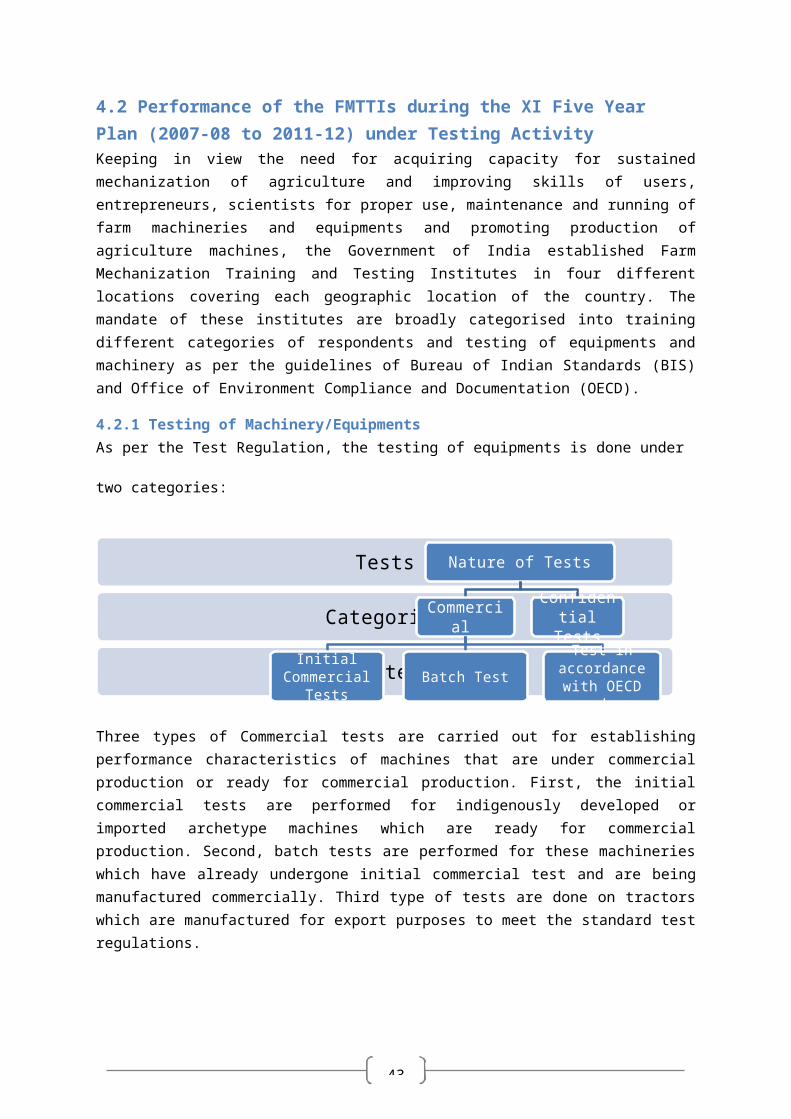
52
Table 16 below presets the course wise number of persons trained during the XI Five Year Plan.
Table 16 Course wise number of trainees trained by NRFMTTI- HissarTraining/Course 2007-08 2008-09 2009-10 2010-11 2011-12 TotalUser Level- U 164 485 655 408 284 1996Technician Level- T 48 50 86 50 81 315Management Level-M 33 8 0 2 42 85Academic Level- A 707 422 521 784 942 3376Technology Transfer- TT 287 0 0 266 225 778Need Based- NB 727 1083 696 376 312 3194Total 1966 2048 1958 1886 1886 9744
Out of 9744 trainees trained during the XI Five Year Plan in different courses, the highest participation was in Academic Level course with 3376 (35%) trainees, followed by Need Based training course with 3194 (33%) trainees. An interesting observation during the XI Five Year Plan is that the participation in Academic Level and Technician Level courses increased during 2009-10 to 2011-12. In contrast, though Need Based training programs accounted for the second highest number of trainees, the numbers covered during 2011-12 decreased drastically to 1/3rd of trainees covered during 2008-09. Percentage wise distribution of trainees who have attended the training programs is presented in shown in figure 15 below.
20%
3%
1%
35%
8%
33%
User Level- UTechnician Level- TManagement Level-MAcademic Level- ATechnology Transfer- TTNeed Based- NB
Figure 15 Percentage distribution of trainees according to types of courses-NRFMTTI (Hissar)
4.3.2.2 Category Wise Participation in Training CoursesOut of 9744 trainees who participated in different training courses, 51% belonged to the General Category, 30% to the Other Backward Classes and 18% were Scheduled Castes. Only 1% of the total beneficiaries were Scheduled Tribes. It was observed that while the number of general category trainees decreased over the period, the number of participants belonging to Schedule Castes increased. The number of OBC participants also increased over the period during the XI Five Year Plan. Figure 16 presents the category wise participation in various training courses during the XI Five Year Plan. Table 17 presents the year wise category wise number of farmers covered in various training courses.
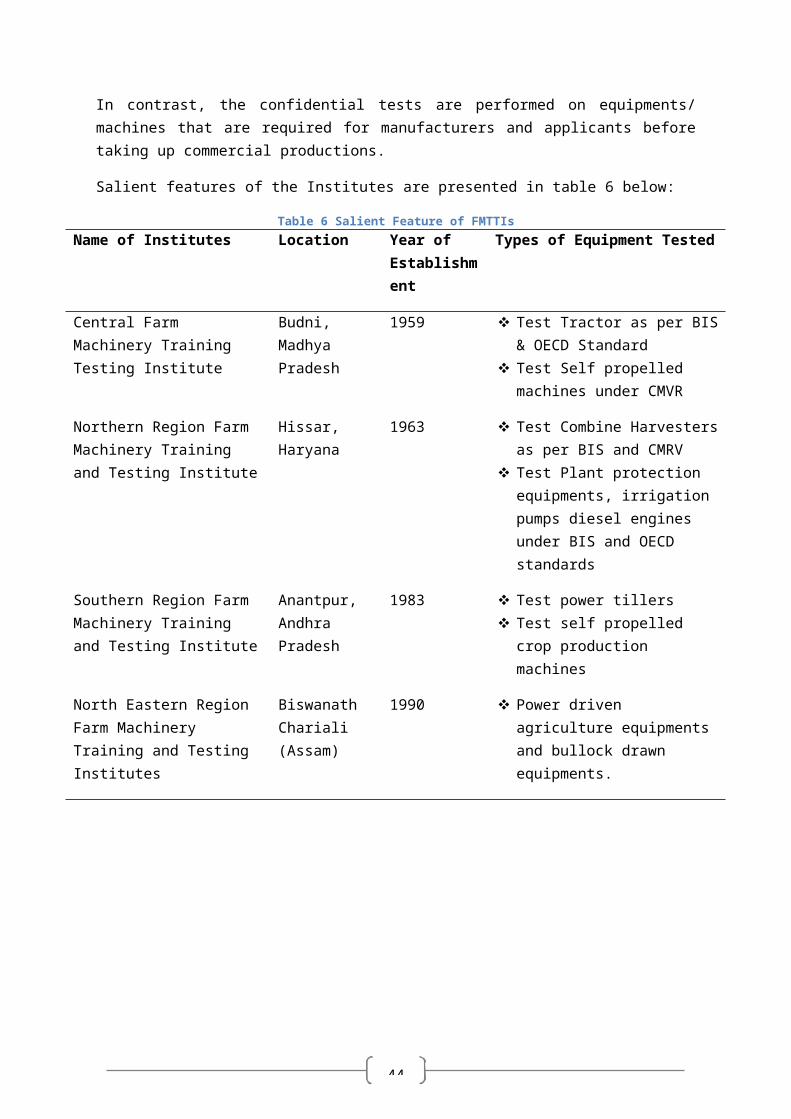
53
SC; 18%
ST; 1%
OBC; 30%
General; 51%
Figure 16 Category wise participation in training course in NRFMTTI (Hissar) during XI FYP
Table 17 Year wise categorical representation in training courses during XI PP in NRFMTTICategory Year
2007-08 2008-09 2009-10 2010-11 2011-12 TotalSC 256 293 394 357 474 1774ST 20 10 9 11 16 66OBC 590 487 494 630 690 2891General 1100 1258 1061 888 706 5013Total 1966 2048 1958 1886 1886 9744
4.3.2.3 Regional Participation in Training ProgramsThe NRFMTTI at Hissar was established to facilitate the Farm Mechanization process with special focus on Northern Region though other states of India were not excluded. The NRFMTTI has been able to cater to the training needs of farmers from all parts of the country and more specifically from Rajasthan, Punjab, Uttar Pradesh, Himachal Pradesh, Uttarakhand and Delhi which share their boundaries with Haryana.
During the XI Five Year Plan, participants from 26 states participated in different training courses in NRFMTTI- Budni. Out of these, nearly 53% were from Haryana, 16% were from the neighbouring states/UTs, comprising Delhi, Punjab, Chandigarh, Himachal Pradesh, Uttarakhand, Rajasthan and Uttar Pradesh and the rest 31% were from other states. The state wise coverage in training courses can be seen in Annexure- 7. From among the states neighbouring Haryana, the largest representation was from Uttar Pradesh (11%) followed by Rajasthan (3%), while the rest shared less than 1% each. Among other states, the share of Goa which is much smaller in size had the largest share (13%), even exceeding those of the neighbouring states, followed by Bihar and Maharashtra, at 9% and 4%, respectively.
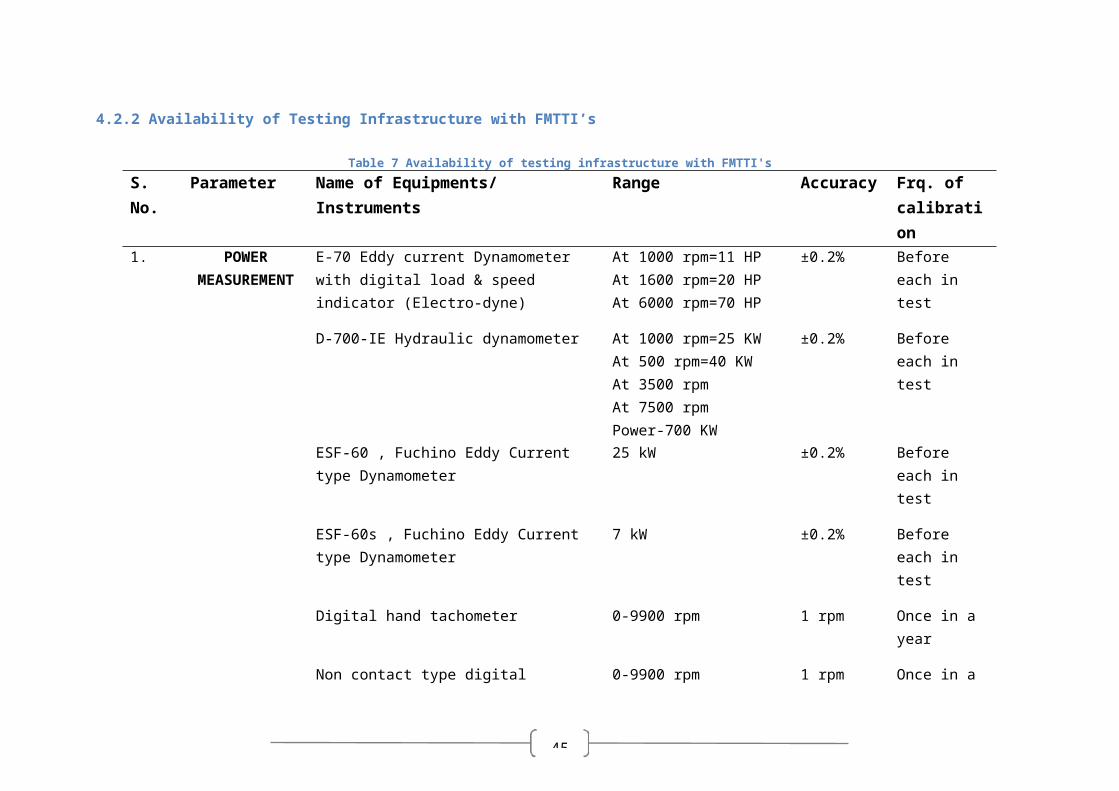
54
Table 18 Regional Participation in Training Program in NRFMTTI (Hissar)
States
2007-08 2008-09 2009-10 2010-11 2011-12 During XI PP
Tota
l
Perc
ent
Tota
l
Perc
ent
Tota
l
Perc
ent
Tota
l
Perc
ent
Tota
l
Perc
ent
Tota
l
Perc
ent
Haryana 1425 72% 3 0% 1460 75% 1116 59% 1150 61% 5154 53%Neighbouring States3 313 16% 293 14% 319 16% 308 16% 280 15% 1513 16%Other States 218 11% 1752 86% 179 9% 462 24% 456 24% 3067 31%Total 1966 100% 2048 100% 1958 100% 1886 100% 1886 100% 9744 100%
During the year 2008-09, the share of Haryana was negligible as compared other states. The data got skewed due to participation of 1303 trainees in the training programs during the year. Interestingly, farmers from Goa participated in the training programs only during 2008-2009.
In addition to training of beneficiaries, the institution has also conducted demonstration activities of improved and newly developed machineries and equipments during the year 2007-08, 2010-11 and 2011-12. A total of 778 demonstration activities with 287, 266 and 225 were organized during the year 2007-08, 2010-11 and 2011-12, respectively.
4.3.2.4 Targets and Achievements- Testing of Equipments in NRFMTTI (Hissar)Two sets of tests, commercial and confidential, were carried out as a part of the testing activities with the objectives of verifying the claims/ declaration of manufacturers with respect to the performance characteristics of the machines and, whether they are ready for commercial production. During the XI five year plan, a total of 456 machines were tested, almost twice the annual target of 244.
Table 19 Year wise type of equipment tested in NRFMTTI (Hissar) during XI PPYear
Tota
l Tar
get
Types of Machine and No of Machines Tested
PercentWhe
eled
Tr
acto
r
IC E
ngin
e
Tilla
ge
Impl
emen
t
PP E
quip
men
t
Harv
estin
g &
Th
resh
ing
Equi
p
Seed
Dril
Pl
ante
r
Irrig
ation
Pu
mps
Com
pone
nts
Total2007-08 40 0 12 13 5 5 4 1 15 55 12%2008-09 40 0 0 18 6 16 6 0 31 77 17%2009-10 45 0 0 41 31 29 17 0 12 130 29%2010-11 45 0 0 62 12 22 18 0 5 119 26%2011-12 74 0 0 20 17 28 7 0 3 75 16%Total 244 0 12 154 71 100 52 1 66 456 100%
The number of equipments/ machineries tested during the year 2009-10 was the highest at 130 accounting for 29% of the total equipments tested during the XI Five Year Plan. In the year 2010-11, 119 machines were tested. From year 2008-09 till 2010-11, the performance in terms of testing was significant achieving almost 3 times of the target. Of all the types of machineries, tillage implements accounted for the largest share at 34 % followed by harvesting equipments at 22%. Figure 17 below
3 Comprise of Punjab, Chandigarh, Rajasthan, Himachal Pradesh, Uttarakhand and Uttar Pradesh.
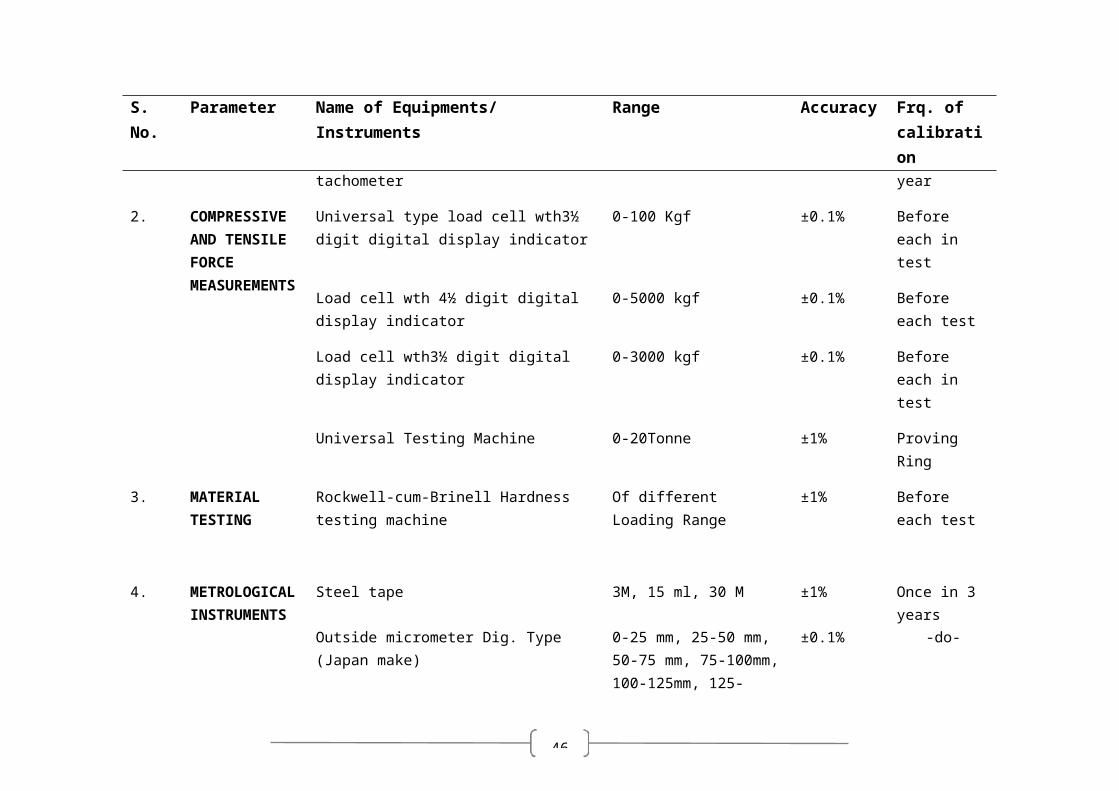
55
presents the percentage distribution by machines tested during the XI FYP period.
3%
34%
16%
22%
11%
0% 14%
Wheeled Tractor
IC Engine
Tillage Implement
PP Equipment
Harvesting & Threshing Equip
Seed Dril Planter
Irrigation Pumps
Components
Figure 17 Percentage of machines tested during the XI Five Year Plan in NRFMTTI.
4.3.2.5 Number of Machine Tested by Types of TestDuring the XI Five Year Plan, 456 machines were tested against the target of 244. Of these, 83% (377) tests were commercial while 17% (79) tests were confidential. During the first two years of the XI Five Year Plan, the difference between the number of implements tested under commercial and confidential was low but from 2009-10 onwards, the machines tested under commercial categories tests exceeded significantly. Table 20 below presents the year wise types of tests performed during the XI Five Year Plan by the NRFMTTI- Hissar.
Table 20 Year wise types of tests performed in NRFMTTI-HissarTypes of Test 2007-08 2008-09 2009-10 2010-11 2011-12 Total PercentCommercial 20 42 123 116 73 377 83%Confidential 35 35 7 3 4 79 17%Total 55 77 130 119 77 456 100%
During the XI Five Year Plan, the institute has also tested 14 Combine Harvesters with regards to CMVR certification to comply with Bharat Stage III and Term III emission norms. Out of 14, 10 were self propelled combine harvesters and rest 4 were power operated.
4.3.2.6 Training and Testing InfrastructureWith regards to infrastructure set up, the institute has two wings, the training wings and the testing wing. Both the wings are well equipped with modern facilities and amenities to facilitate conduct of training programs as well as testing equipments. On the testing front, the institute is well equipped with modern technologies and computerised systems to carry out tests on wide range of agriculture machineries. The testing wing has following laboratories:
i. Engine test laboratoryii. Plant protection equipment test laboratory
iii. Irrigation pump test laboratory iv. Fuel filter test laboratoryv. Design and drawing section
vi. Instrumentation cellvii. Computer cell and reprographic section.
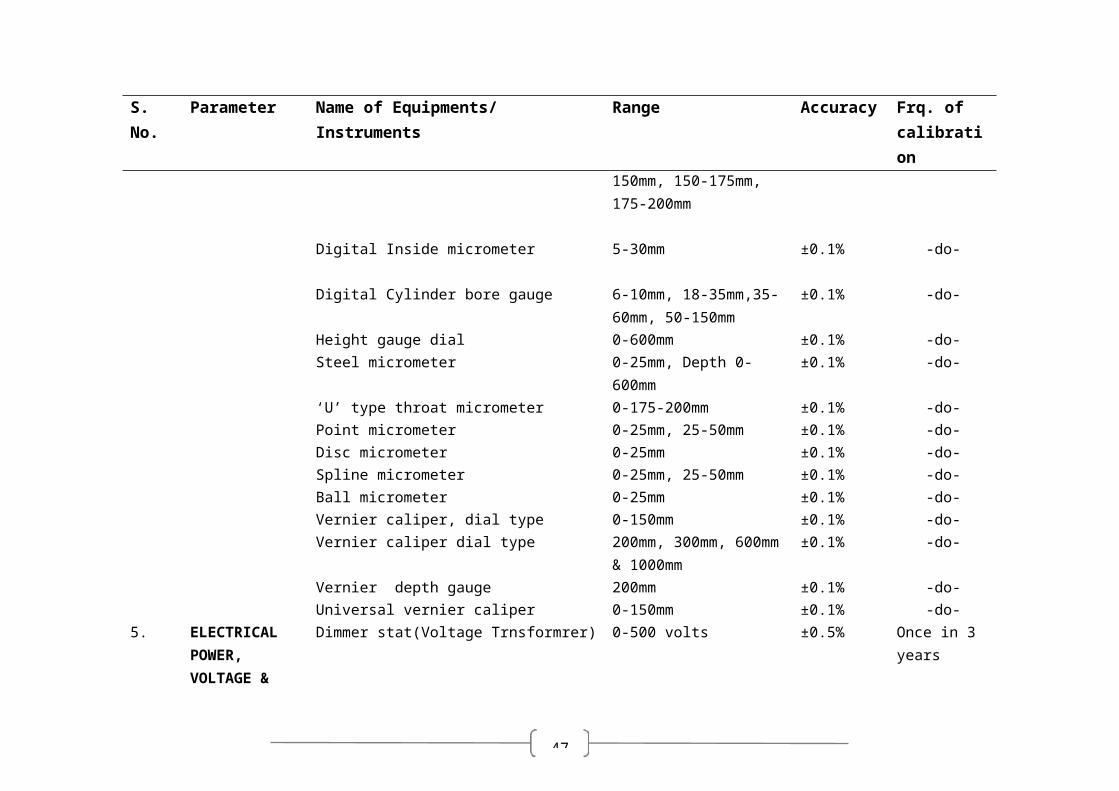
56
Apart from above regular testing activities, the testing wing also undertakes evaluation of samples under Consumer Protection Act through the District Consumer Redressal Forum.
4.3.2.7 Revenue Generated by NRFMTTI- HIssarThe institute generated revenue of Rs 3.31 crore during the XI FYP period from Training, Testing, and Farm activities. Table 21 below presents the details of the revenue generated by the institute during the XI Five Year Plan.
Table 21 Revenue Receipts by NRFMTTI during XI FYP(Rs. In lakh)
Activity 2007-08 2008-09 2009-10 2010-11 2011-12 Total PercentTraining 1.86 2.11 2.31 2.99 2.73 12.00 4%Testing 29.26 43.22 53.22 48.8 78.59 253.09 76%Farm 5.15 10.86 5.16 6.81 17.48 45.46 14%Other 0.87 1.35 2.47 13.53 2.62 20.84 6%Total 37.14 57.54 63.16 72.13 101.42 331.39 100%
As can be seen from the above table, the revenue generated almost trebled from Rs 37.14 lakh during the year 2007-08 to 101.42 lakh during the year 2011-12. Of this, Rs 253.09 lakh (76%) was generated from testing activity and Rs 45.46(14%) from farm level activities. Only 4% of the revenue was generated from Training Programs.
4.3.2.8 Total Receipt and Expenditure- NRFMTTITable 22 below presents the snapshot of total receipts and expenditure of the NRFMTTI during the XI Five Year plan. The institute received Rs 20.12 crore as per the revised estimates out of which 17.53 crore was spent under different heads accounting to 86% of the total receipts of Rs 20.12 crore.
Table 22 Receipt and Expenditure by NRFMTTI during XI FYP(Rs. In lakh)
Budget Heads
2007-08 2008-09 2009-10 2010-11 2011-12 Total
Rece
ipt
Expe
nditu
re
Rece
ipt
Expe
nditu
re
Rece
ipt
Expe
nditu
re
Rece
ipt
Expe
nditu
re
Rece
ipt
Expe
nditu
re
Rece
ipt
Expe
nditu
re
Admin 228.6 213.84 292.79 276.11 348.71 340.53 342.58 332.4 407.65 351.71620.3
3 1514.58Non Plan 33 26.15 35 34.03 32.5 11.7 23 9.4 29.6 13.65 153.1 94.93Plan 9.57 8.92 25 22.24 39 5.5 65 30.79 100 58.37 238.57 125.82
Total 271.17 248.91352.7
9332.3
8420.2
1 357.73430.5
8372.5
9537.2
5 423.72 20121735.3
3The maximum proportion of fund was used during the year 2008-09. The second highest utilization was made during 2007-08. During these two years of implementation more than 90% of the receipts was spent. The average spending under Non Plan and Plan head was 60% .The highest expenditure under Non Plan head (97%) was during the year 2008-09. During the subsequent years, the expenditure varied between 36% and 46% of the total revised expenditure. Under Plan Head too, 93% of the total revised expenditure was incurred during 2007-08 which was only 14% during 2009-10. During the subsequent years, the expenditure increased, reaching a maximum of 58% during the year 2011-12.
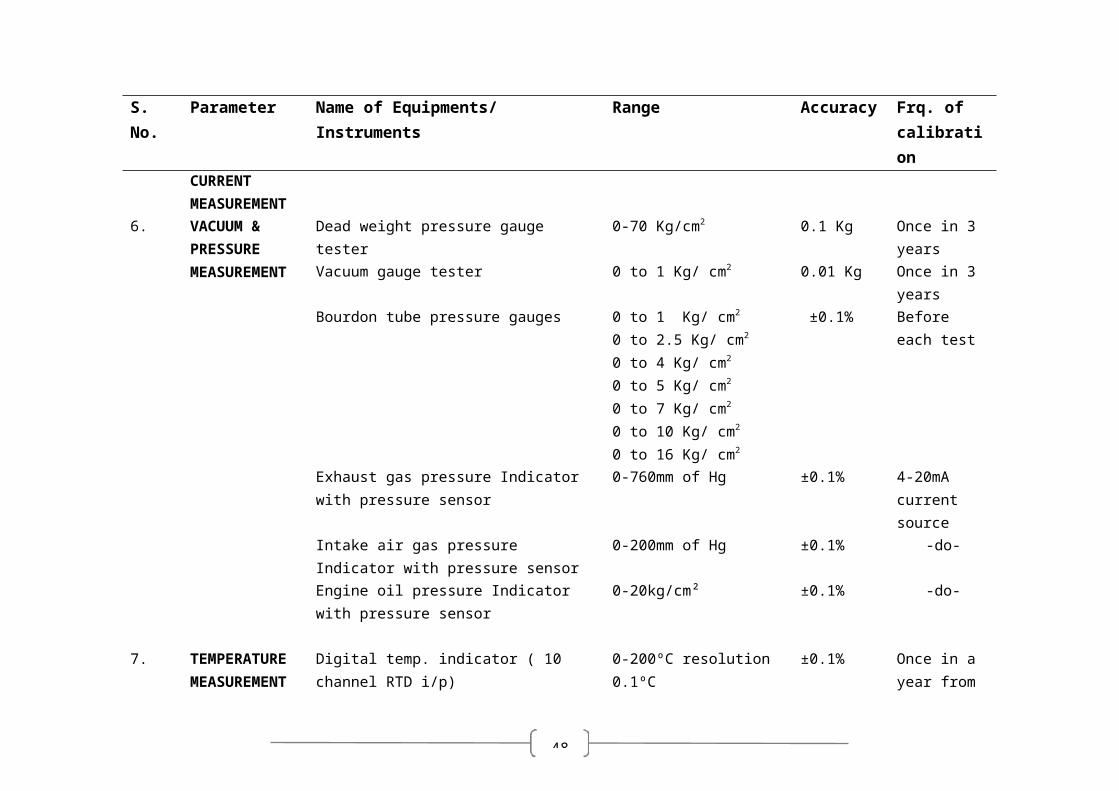
57
NRFMTTI could generate revenue of Rs.3.31crore only, being 19% of the expenditure of Rs 17.35 crore during the XI Five Year Plan.
Total Expenditure Revenue Generated0
200
400
600
800
1000
1200
1400
1600
1800
2000
1735.33
331.39
Rs. I
n la
kh
Figure 18 Expenses made and revenue generated by NRFMTTI
4.3.3 Southern Region Farm Mechanization Training and Testing Institute (SRFMTTI)The Southern Region Farm Mechanization Training and Testing Institute were established in the year 1983 at Anantpur in Andhra Pradesh to promote and strengthen agriculture mechanization through training, testing and demonstration in the Southern Region. During the XI FYP, the institute has carried out both training and testing activities as envisaged.
4.3.3.1 Course wise number of Training Program conducted in SRFMTTIThe SRFMTTI has conducted a total of 290 different training programs as per their course structures. Table 23 below gives a comprehensive picture of number of training courses organized by the institute during the XI FYP period.
Table 23 Number of training programs organized under different course structure by SRFMTTICourses No of Training Program Organized
Percent2007-08 2008-09 2009-10 2010-11 2011-12 TotalU- User's Level 7 5 7 8 6 33 11%T- Technician's Level 7 6 8 3 5 29 10%M- Management Level 0 0 0 0 0 0 0%A- Academic Level 7 8 8 5 5 33 11%AW- Awareness through Multimedia system 4 12 11 13 9 49 17%TT- Technology Transfer Camps 0 0 0 0 3 3 1%NB- Need Based Training 29 24 24 36 30 143 49%Total 54 55 58 65 58 290 100%Need Based training programmes accounted for the largest share of 49% of the total training programmes during the XI Five Year Plan. User Level and Technical Level courses accounted for 11 and 10% of the total training programmes, respectively. Management Level courses were not organized by the Institute during the XI FYP period. Hence, it appears from the data that Needs Based training programs were organized to achieve the target during the XI Five Year Plan. An
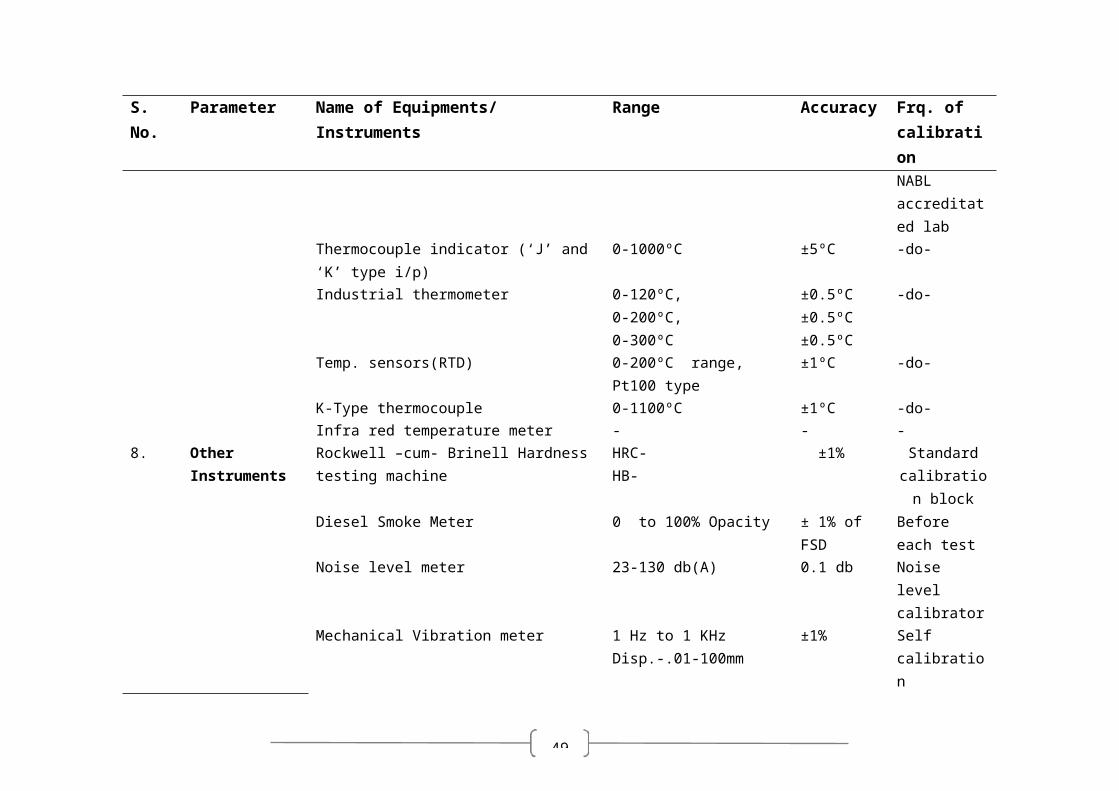
58
increasing trend in the number of training program in all the years during the XI Five Year Plan is observed except during the year 2011-12.
2007-08 2008-09 2009-10 2010-11 2011-1250
52
54
56
58
60
62
64
66N
o of
Tra
inin
g
Figure 19 Trend in training program conducted during XI PP by SRFMTTI
4.3.3.2 Course wise targets and Achievements in TrainingThe SRFMTTI has conducted 290 training programs during the XI Five Year Plan. In all 7319 persons were trained under their course modules. Table 24 below gives the details of targets and achievements in respect of no of trainees to be covered under the training courses.
Table 24 Course wise targets and achievements in Training by SRFMTTITraining/Course 2007-08 2008-09 2009-10 2010-11 2011-12 Total
Targ
et
Achi
evem
ent
Targ
et
Achi
evem
ent
Targ
et
Achi
evem
ent
Targ
et
Achi
evem
ent
Targ
et
Achi
evem
ent
Targ
et
Achi
evem
ent
U- User's Level 225 113 250 80 250 211 250 175 200 189117
5 768T- Technician Level 125 114 125 88 125 125 125 84 125 104 625 515M- Management Level 10 0 10 0 10 0 10 0 10 0 50 0
A- Academic Level 200 256 225 293 225 231 275 263 275 304120
0 1347
AW- Awareness through Multimedia 250 106 250 425 250 465 250 401 300 181
1300 1578
TT- Technology Transfer Camps- off campus NA - NA - NA - NA - NA 211 0 211
NB- Need Based Training 450 711 400 414 400 419 450 683 450 673215
0 2900DF- Special Training for Defence Personal 40 0 40 0 40 0 40 0 40 0 200 0
Total 1300130
0 1300130
0 1300 1451140
0 1606140
0 1662670
0 7319From the table above, it is observed that under User Level and Technical Level training courses the coverage of trainees was 35% and 18% of the targets, respectively, while the targets were achieved under the Academic Level, Awareness Level and Need Based training courses. The Institute did not
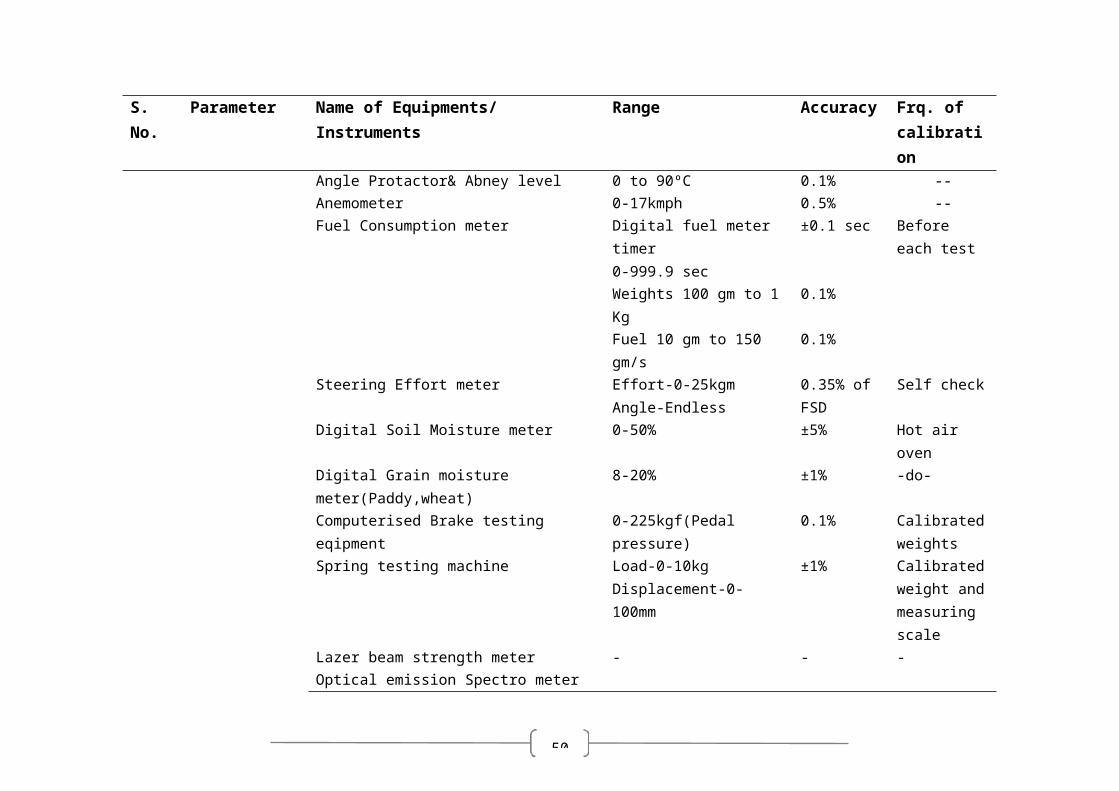
59
organise any Management Level or Defence Personal training programmes. One Technology Transfer Camp was organized as a demonstration activity during the last year of XI Five Year Plan. Figure 20 below presents the trend of participation against the targets by SRFMTTI.
2007-08 2008-09 2009-10 2010-11 2011-120
200
400
600
800
1000
1200
1400
1600
1800
Target Achievement
No o
f Tra
inee
s
Figure 20 Trainees participation trend in SRFMTTI during XI FYP
During the first two years of the XI Five Year Plan, the targets were met. However during the remaining 3 years of the XI FYP, the Institute covered more than the targets. Out of the total trainees covered, 40% attended the Need Based Training course followed by Awareness (20%) and Academic Level Course (18%), respectively. Figure 21 below gives the course wise participation of trainees.
10%7%
18%
22%3%
40%U- User's LevelT- Technician LevelM- Management LevelA- Academic LevelAW- Awareness through MultimediaTT- Technology Transfer Camps- off campusNB- Need Based TrainingDF- Special Training for Defence Personal
Figure 21 Course wise trainees participation in SRFMTTI during XI PP
4.3.3.3 Category wise participation in Training CoursesOf the total 7319 trainees who attended different courses in SRFMTTI, 31% were from the Other Backward Classes, 35% from the General Category, 25% from the Scheduled Castes and the rest 8% were from the Scheduled Tribes.
60
25%
8%
31%
35%
SCSTOBCGeneral
Figure 22 Category wise distribution of trainees- SRFMTTI
Category wise participation of farmers is presented in Table 25 below:
Table 25 Year wise attendance of trainees by different categoryCategory 2007-08 2008-09 2009-10 2010-11 2011-12 TotalSC 550 507 250 269 281 1857ST 162 211 130 60 53 616OBC 56 57 612 768 775 2268General 532 525 459 509 553 2578Total 1300 1300 1451 1606 1662 7319
It is interesting to note that the share of Schedule Caste category decreased from 42% to 17% from the first two years of the XI FYP. Similarly the share of Scheduled Tribe trainees too decreased to 3% by the end of XI Five Year Plan from 12% during 2007-08. During the corresponding period, the share of the OBC category increased from 4% to 46%. It appears that participants from the General Category were covered to meet the overall targets during the later years of the XI FYP.
4.3.3.4 Regional Participation of TraineesParticipants from Andhra Pradesh accounted for 48% of the total participants with 41 % share being accounted for by neighbouring states including Orissa, Chhattisgarh, Karnataka and Tamil Nadu. The share of other states was mere 10% of the total. Among the neighbouring states, the Karnataka accounted for the maximum share at 22% (1591) followed by Tamil Nadu at 13% (954).
Table 26 Regional Participation in training program in SRFMTTI during XI PPStates 2007-08 2008-09 2009-10 2010-11 2011-12 During XI PP
Tota
l
Perc
ent
Tota
l
Perc
ent
Tota
l
Perc
ent
Tota
l
Perc
ent
Tota
l
Perc
ent
Tota
l
Perc
ent
Andhra Pradesh 424 33% 441 34% 826 57% 900 56% 919 56% 3510 48%Neighbouring States4 713 55% 674 52% 495 34% 586 36% 560 34% 3028 41%Other States 162 12% 185 14% 130 9% 120 7% 170 10% 767 10%Total 1299 100% 1300 100% 1451 100% 1606 100% 1649 100% 7305 100%
4 Comprise of states Orissa, Chhattisgarh, Maharashtra, Karnataka & Tamil Nadu
61
Among all other states, Kerala with 323 trainees accounted for the highest number, followed by Uttar Pradesh with 184 trainees. State wise participation of trainees in training program organized by SRFMTTI can be seen in Annexure-8.
4.3.3.5 Target & Achievements- Testing of Equipment in SRFMTTI-AnantpurDuring the XI Five Year Plan, the SRFMTTI at Garladinne conducted 146 tests against the target of 145 machines to be tested. Tillage Implements accounted for the largest share during the XI FYP period. Out of 146 implements tested, 58% were tillage implements, 16% were power tillers and 14% were post harvest machines. The components were tested only during 2010-11. Table 27 gives the details of equipments tested by the SRFMTTI during the XI Five Year Plan.
It may be observed from the table 27 that actual testing of tillage implements often exceeded the capacity of the Institute at 15, except for year 2011-12, which indicated good demand for testing such equipments.
Table 27 Year wise type of equipments tested against the target by SRFMTTI during XI FYPYear
Total Target
Types of Machine and No of Machines Tested
Total PercentPow
er T
iller
Tilla
ge
Impl
emen
t
Sow
ing
&
Plan
ting
Post
Har
vest
M
achi
nes
Com
pone
nts
Misc
ella
neou
s2007-08 25 4 15 2 3 0 1 25 17%2008-09 25 4 18 0 3 0 0 25 17%2009-10 25 2 17 0 2 0 4 25 17%2010-11 35 5 22 1 4 2 2 36 25%2011-12 35 8 12 0 8 0 7 35 24%Total 145 23 84 3 20 2 14 146 100%
4.3.3.6 Machines Tested by Types of TestsOut of 146 machines tested during the XI FYP period, 97% (141) machines/ equipments were tested under Commercial category and the remaining 3% (5) machines were tested under confidential category.
Table 28 Year wise types of tests conducted by SRFMTTITypes of Test 2007-08 2008-09 2009-10 2010-11 2011-12 Total PercentCommercial 22 25 25 35 34 141 97%Confidential 3 0 0 1 1 5 3%Total 25 25 25 36 35 146 100%
During the years 2008-09 and 2009-10 only Commercial category tests were undertaken indicating good demands for testing of such tests. No tests under confidential category were conducted during these years.
4.3.3.7 Training and Testing InfrastructureThe training wing of the Institute is well equipped with infrastructure including demonstration labs, training equipments, library, audio visual aids, etc. The demonstration lab consists of tractor system, tractor hydraulic system, plant protection demonstration, irrigation pump and auto electric
62
demonstration laboratories. In addition, the centre also has a museum which has agriculture machineries of varied nature from different time periods.
The equipments such as tractors, bull dozers, vehicles, pumps, plant protection equipments, power tillers, combine harvesters and various different forms of agriculture implements are available to provide the trainees with hands-on experience of operations and maintenance of these equipments. The audio visual aids supplement the training programs. The hostel facility available can accommodate 100 participants at a time and lodging facility is provided to the trainees at a nominal charge. 4.3.4 North Eastern Region Farm Mechanization Training and Testing Institute- Assam4.3.4.1 Course wise number of Training Program Conducted by NERFMTTI-AssamDuring the XI Five Year Plan, the North Eastern Region Farm Mechanization Training and Testing Institute (NERFMTTI) conducted 115 training programs under different courses. Table 29 gives the course wise number of training programs organized by the NERFMTTI.
Table 29 Course wise number of trainings organized by NERFMTTICourses 2007-08 2008-09 2009-10 2010-11 2011-12 Total PercentU- User's Level 12 7 14 18 15 66 57%T- Technician's Level 3 1 2 3 10 19 17%M- Management Level 0 0 0 0 0 0 0%A- Academic Level 3 3 5 2 4 17 15%AW- Awareness through Multimedia system 1 0 0 0 0 1 1%TT- Technology Transfer Camps 0 0 0 0 0 0 0%NB- Need Based Training 0 1 3 2 2 8 7%SJGSY 3 1 0 0 0 4 3%APP- Apprenticeship Training 0 0 0 0 0 0 0%Total 22 13 24 25 31 115 100%
Out of 115 training programs organized by the institute, 57% were User’s Level followed by 17% Technical Training and 15% Academic Level. It is interesting to note that in contrast to other FMTTIs, the NERFMTTI organized four training programmes under Swarn Jayanti Gram Swarojgar Yojana (SJGSY) during the years 2007-08 and 2008-09. However, the Institution did not conduct any training programs under Management Level Training Course. Awareness Generation training programmes were conducted during the first year of the XI FYP Period only.
4.3.4.2 Year wise Target and Achievements in TrainingUnder different courses the target for coverage of trainees during the XI Five Year Plan was 3700. The NERFMTTI achieved the targets during XI FYP period except during the year 2009-10 when 672 trainees were trained against the target of 700 trainees. Table 30 below shows the course wise coverage of trainees during the XI Five Year Plan.
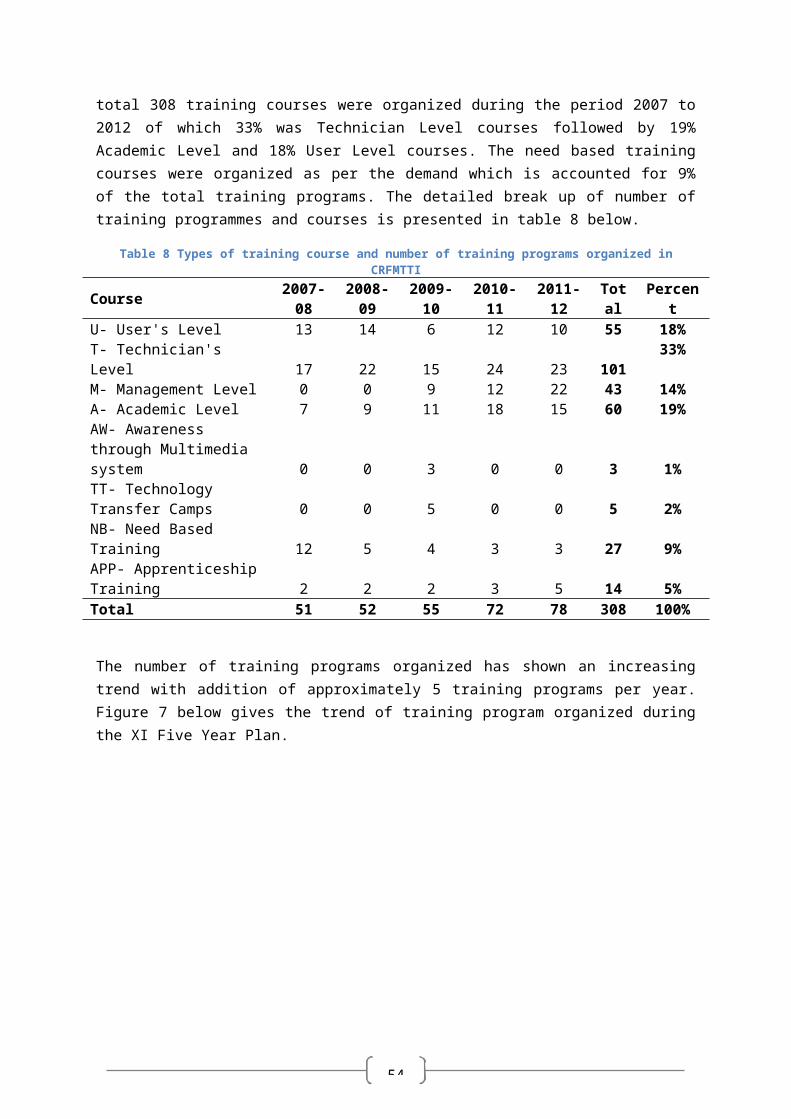
63
Table 30 Course wise coverage of trainees by NERFMTTIYear Target Courses Total
Use
r Lev
el
Tech
nici
an
Leve
l
Man
agem
ent L
evel
Acad
emic
Le
vel
Awar
enes
s
Tech
nolo
gy
Tran
sfer
Nee
d Ba
sed
SGJS
Y
Appr
entic
e
2007-08 700 155 58 0 123 11 320 0 67 1 7352008-09 700 136 12 0 72 0 471 10 18 5 7242009-10 700 296 36 0 114 0 92 133 0 1 6722010-11 800 467 63 0 85 0 99 97 0 0 8112011-12 800 357 171 0 167 0 0 119 0 2 816Total 3700 1411 340 0 561 11 982 359 85 9 3758
Figure 23 below shows the targets vs. achievements trainees’ coverage by NERFMTTI during the XI Five Year Plan.
2007-08 2008-09 2009-10 2010-11 2011-120
100
200
300
400
500
600
700
800
900
Targets Achievements
No. o
f Tra
inee
s
Figure 23 Trainees targets and achievement of NERFMTTI during the XI PP
As evident from the table above, the highest number of trainees were covered under the User Level Course (38%) followed by 26% under Technology Transfer Camps. Ten percent (10%) and 9% of the trainees were covered under the Need based and Technical Level courses respectively. It may be mentioned here that the Institute did not organise any Management Level training programs s. Though no separate course structures were provided for covering apprenticeship, 9 apprentices joined the training courses during the XI FYP period. Further, Awareness Level training course were not organized after 2007-08. Figure 24 below gives the percentage distribution of trainees covered under different courses.
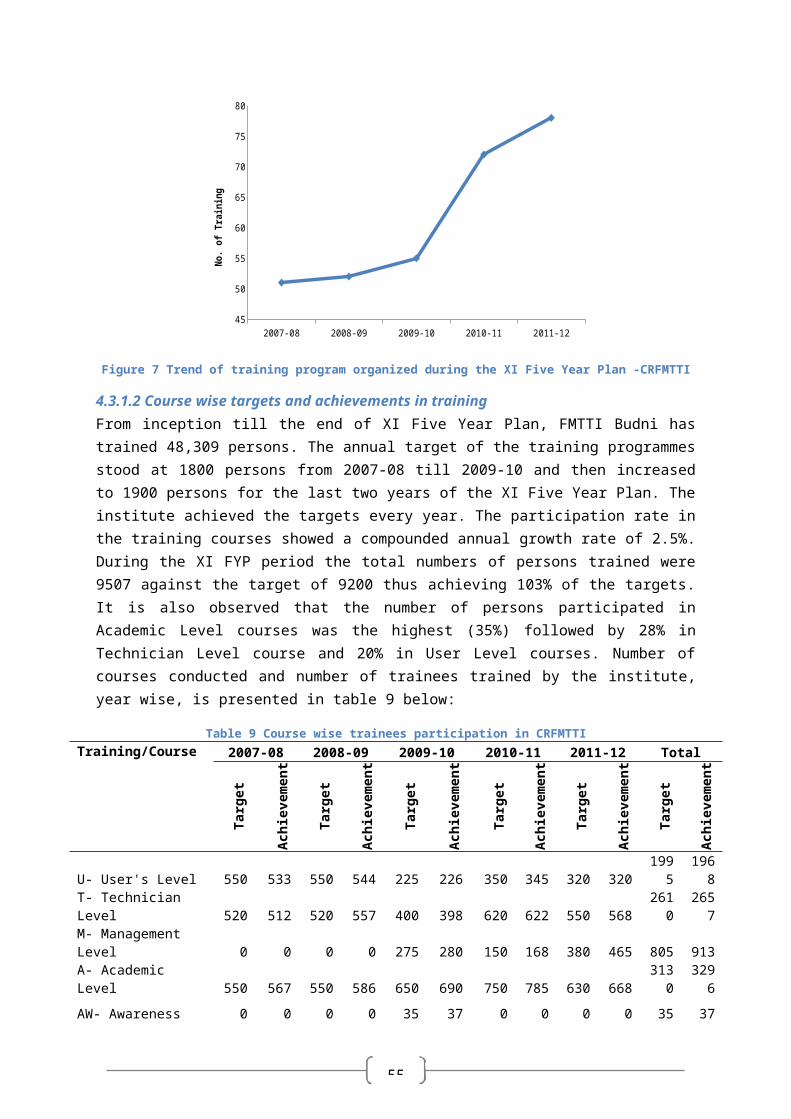
64
38%
9%
15%
0%
26% 10%
2%0%
User LevelTechnician LevelManagement LevelAcademic LevelAwarenessTechnology TransferNeed BasedSGJSYApprentice
Figure 24 Trainees distribution by types of training courses.
Although, demonstration of new technology equipment does not fall under the mandate of the Institute, a total of 38 demonstrations were organized by the institute on its own initiative based on demand. The institute is also making their in updating and upgrading the latest technology required for testing agriculture implements/ machines.
4.3.4.3Regional Participation of TraineesDue to non availability of data on training participation for the XI FYP, the state wise percentage participation in the training programs of NERFMTTI were calculated solely based available data of 2011-12. Out of the 816 participants, 552 (68%) were from Assam followed by 17% (137) from Nagaland, Tripura, Arunachal Pradesh and Sikkim. From among the States of the North Eastern Region excluding Assam, Tripura accounted for the largest share of 36% (77 participants) during the year 2011-12.
The participation from the remaining states was low. Participants from Maharashtra and Uttar Pradesh were 67 and 22, respectively. Shares of various states are presented in figure 25 below.
68%
1%
9%3% 3%
0%3%
0%1%
8%1%
2%AssamNagalandTripuraArunachal PradeshSikkimWest BengalUttar PradeshJharkhandBiharMaharashtraMadhya PradeshGujarat
Figure 25 Regional Participation of trainees in NERFMTTI in 2011-12
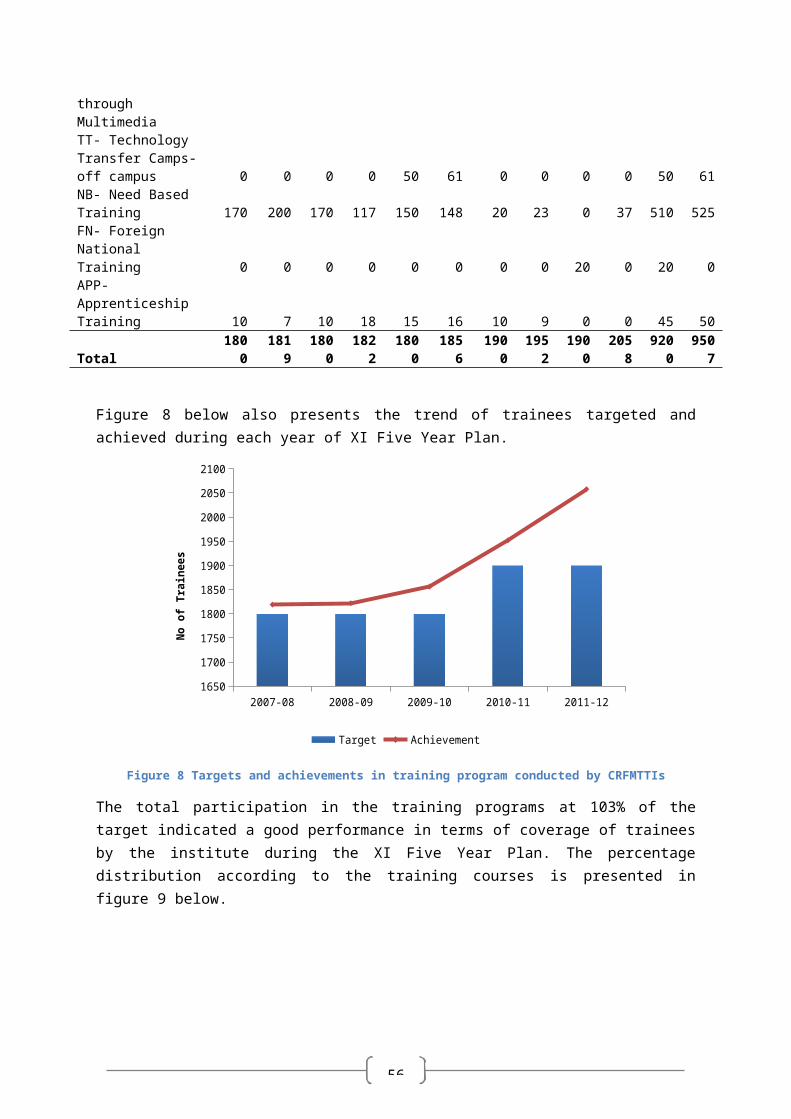
65
As per the information provided by the officials of NERFMTTI, the institute intends to increase the number of training programs to disseminate knowledge on Farm Mechanization to a larger number of farmers, but this will require additional support from the State Government for creating publicity of the courses and its benefits among the farmers/ rural youths. The man power and infrastructure facilities at the Institute also need to be strengthened.
4.3.4.4 Targets and Achievements- Testing of Equipment in NERFMTTI-GuwahatiThe performance of the NERFMTTI under their testing mandate has been satisfactory during the XI FYP period. A total of 99 equipments were tested during the XI Five Year Plan which is more than 50% of the target of 66 machines. The highest 27 machines were tested during the year 2010-11 and lowest (11) during the year 2007-08.
As evident from the table 30 below, among the different machines, 46 machines were Rotavators accounting for 47% of all the machines tested during the XI FYP period followed by Seed cum Fertilizer drills at 11% and Reversible/ Plough and Threshers at (9%) each. Figure 26 gives the percentage of equipments tested during the XI FYP.
Table 31 Types of machine tested in NERFMTTI during XI FYPYear Total
TargetTypes of Machine and No of Machines Tested Tota
lPercent
TD C
ultiv
ator
s
Seed
/Fer
tilize
r Dril
l
Reve
rsib
le M
B Pl
ough
Rota
vato
r
Tille
r/Ha
rrow
Padd
y cu
m W
eed
Cutt
er/R
eape
r
Pota
to P
lant
er
Wee
der
Thre
sher
/ M
ulti
crop
thre
sher
Misc
ella
neou
s2007-08 10 1 3 2 3 0 0 0 0 1 1 11 11%2008-09 10 2 0 0 6 2 0 0 0 7 0 17 17%2009-10 10 3 2 4 12 1 2 1 0 0 0 25 25%2010-11 18 0 4 2 15 0 0 0 2 1 3 27 27%2011-12 18 0 2 1 10 1 1 0 3 0 1 19 19%Total 66 6 11 9 46 4 3 1 5 9 5 99 100%
6%11%
9%
46%
4%
3%
1%
5%
9%5%
TD Cultivators
Seed/Fertilizer Dril
Reversible MB Plough
Rotavator
Tiller/Harrow
Paddy cum Weed Cutter/Reaper
Potato Planter
Weeder
Thresher/ Multi crop thresher
Miscelleneous
Figure 26 Percentage of machines tested by NERFMTTI during XI PP
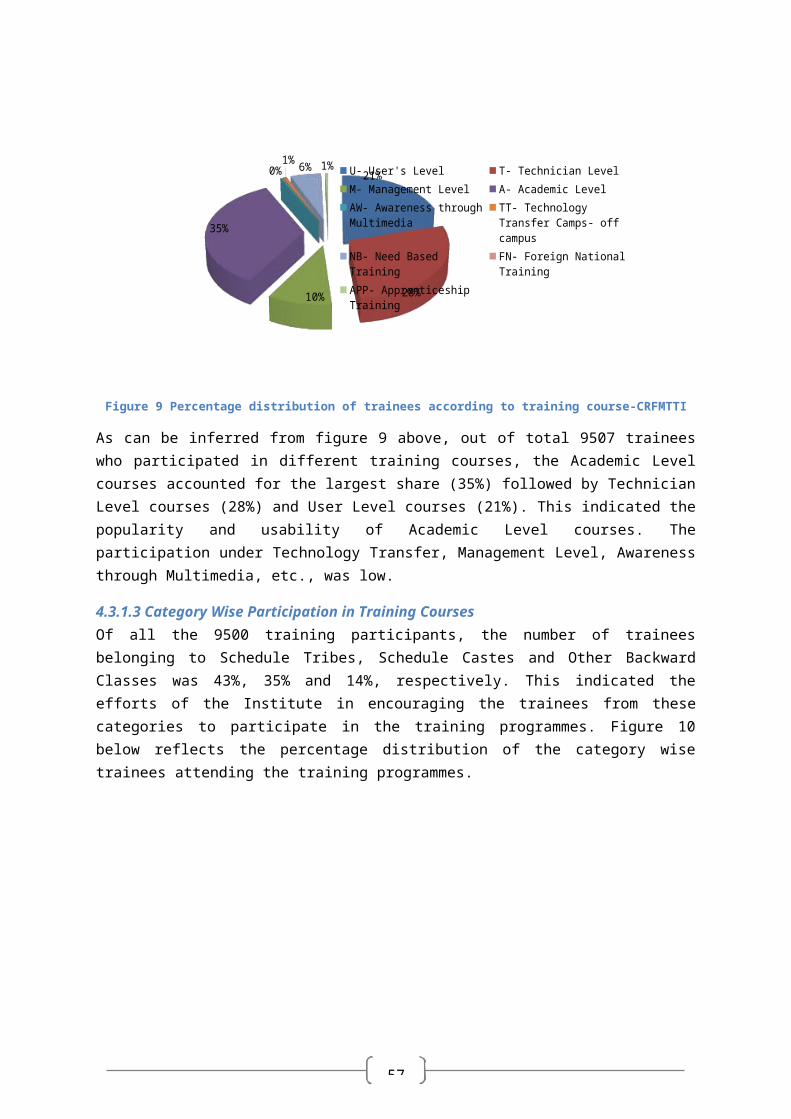
66
4.3.4.5 Revenue Generated by NERFMTTI-GuwahatiThe institute generated revenue worth Rs 0.4 crore during the XI Five Year Plan. The total revenue increased over the XI Five Year Plan from Rs 5.7 lakh during the year 2007-08 to 13.29 lakh during the year 2011-12. Among all the different components, testing cell contributed the maximum revenue as can be seen from the table 32 below.
Table 32 Revenue generated by the NRFMTTIActivity 2007-08 2008-09 2009-10 2010-11 2011-12 TotalTraining NA5 NA NA NA 0.71 0.71Testing NA NA NA NA 8.23 8.23Farm NA NA NA NA 3.95 3.95Other NA NA NA NA 0.4 0.40Total 5.7 4.18 11.35 8.39 13.29 42.91
4.3.4.6 Revenue Generated by NERFMTTI-GuwahatiThe institution received Rs 7.9 crore during the XI FYP period, of which Rs 6.29 crore was spent for various activities. The institution did not face any funds constraints for meeting the expenditure.
Table 33 Receipts and Expenditure of NERFMTTI(Rs. In lakh)
Particulars 2007-08 2008-09 2009-10 2010-11 2011-12 TotalReceipts 82 133 173 194 209 791Expenditure 69 99 127 151 181 627% Expenditure 84% 74% 73% 78% 87% 79%
The Institute could generate only 6% of its expenditure by way of revenue which is the lowest among all the FMTTIS. Figure below presents the expenditure made by the institution and revenue generated during XI Five Year Plan.
Expenditure Revenue Generated0
100
200
300
400
500
600
700
627
42.91
Rs in
Lakh
Figure 27 Expenditure and revenue generated by NERFMTTI
5 Not Available
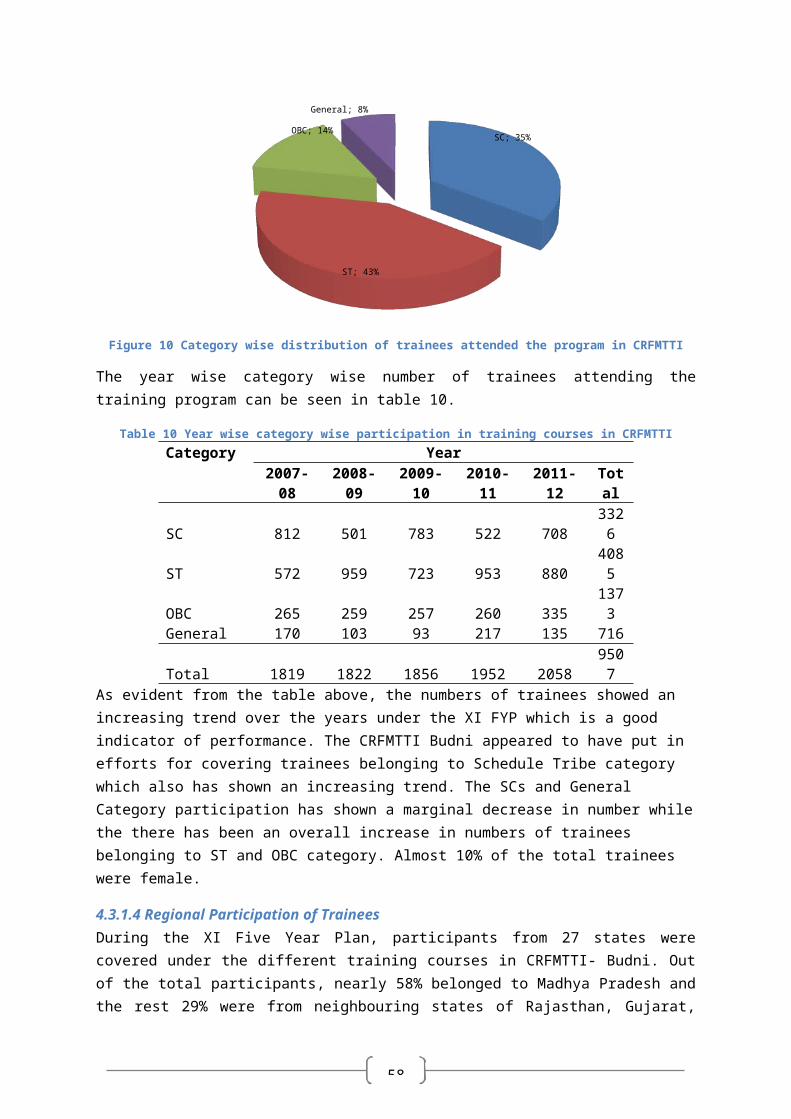
67
4.4 Response of Trainees on Training Conducted by FMTTIsTo assess the adequacy, usefulness and effectiveness of training programs conducted by four FMTTIs located at Budni (Madhya Pradesh), Garladinne (Andhra Pradesh), Hissar (Haryana) and Biswanath Chariali (Assam), and their subsequent contribution to the development of agriculture through their direct and indirect impact, trainees from different institutes were covered through structured set of questionnaires to capture their response. The training beneficiaries were covered across different courses. A total of 571 training beneficiaries were covered against the target of 882 which resulted in confidence interval of approximately ±4%.
Table 34 below indicates the samples covered under training programs conducted by different FMTTIs for assessing their adequacy, usefulness, effectiveness and contribution to the development of agriculture.
Table 34 Training sample covered across different courses and FMTTIsState
InstituteProposed Sample
Sample Covered
Actual
User Level
Management Level
Academic Level
Technical Level
Need based
Madhya Pradesh CRFMTTI 210 61 4 44 18 - 127Haryana NRFMTTI 232 56 - 40 - 50 146Andhra Pradesh SRFMTTI 230 30 - 60 20 100 210Assam NERFMTTI 210 119 - 20 19 - 158Total 882 266 4 164 57 150 641The details of state wise respondents interviewed presented in the table above shows variations from the proposed sample, on account of non traceability of the trainees indicated in the list obtained from the institutes due to lack of proper contact details.
4.4.1 Demographic Details of RespondentsA total of 641 training beneficiaries were interviewed who attended the training programs in four different FMTTIs. Out of total beneficiaries covered, 77% (491) were males and rest 23% (150) were females. Further, 63% of the beneficiaries were in the age group of 20 to 30 years. The minimum and the maximum age were 17 years and 72 years with median and average age of 22 and 24 years. This indicates a positively skewed age group which indicate that most of the values are in the lower portion of the distribution while a few of the data is large enough to increase the average age. In total, 83% of the respondents were in the age group of 17 to 30 years. Table 35 below gives the age wise and sex wise distribution of samples covered from different FMTTIs:
Table 35 Distribution of respondents by age groupAge Group CRFMTTI NRFMTTI SRFMTTI NERFMTTI Total Gran
d Total
Male
Female
Male
Female
Male
Female
Male
Female
Male
Female
Less than equal to 20 Year 37 12 31 9 35 0 11 3 114 24 13820-30 Year 33 25 87 0 118 14 91 38 330 77 40730-40 Year 7 2 16 0 0 24 8 7 31 33 6440-50 Year 0 6 0 0 0 10 0 0 0 16 16Greater than 4 0 3 0 9 0 1 0 17 0 17
68
50 YearTotal 81 46 137 9 162 48 111 47 491 150 641
The largest share of female respondents was accounted for by Andhra Pradesh (32%) while the least were from Haryana with only 6%.
4.4.2 Education wise distribution RespondentsTable 36 below presents the distribution of respondents based on their educational qualifications. Most of the training beneficiaries were found to be educated and having some qualifications except 6% who had no educational qualification. Forty one percent of the total respondents were educated up to higher secondary followed by 34% with a graduate degree.
Table 36 Distribution of respondents based on educationEducation SRFMTTI NERFMTTI NRFMTTI CRFMTTI Total
Number %
Number %
Number %
Number %
Number %
Graduation & Above 90
41% 13 6% 64
29% 54
24% 221 34%
Higher Secondary 70
27% 72
28% 68
26% 51
20% 261 41%
Primary 1328% 29
63% 2 4% 2 4% 46 7%
Secondary 1013% 43
57% 12
16% 10
13% 75 12%
None 2771% 1 3% 0 0% 10
26% 38 6%
Grand Total 21033% 158
25% 146
23% 127
20% 641
100%
A cross tabulation was done between the types of courses and education status of the beneficiaries to understand the distribution of respondents based on the types of courses. Table 37 below illustrates the educational background of the trainees and the courses attended.
Table 37 Distribution of respondents based on the types of course attended
Education Acad
emic
Le
vel
% Man
agem
ent
Leve
l
% Nee
d Ba
sed
% Tech
nici
an
Leve
l
% Use
r Lev
el
% Gran
d To
tal
%Graduation & Above 153 24% 2 0.3% 23
4% 17 3% 26 4%
221 34%
Higher Secondary 47 7% 2 0.3% 91% 52 8%
151
24%
261 41%
Secondary 0 0% 1 0.2% 00% 9 1% 64
10% 74 12%
Primary 0 0% 0 0.0% 00% 9 1% 37 6% 46 7%
None 0 0% 0 0.0% 00% 0 0% 39 6% 39 6%
Grand Total 200 31% 50.8% 32
5% 87
14%
317
49%
641
100%
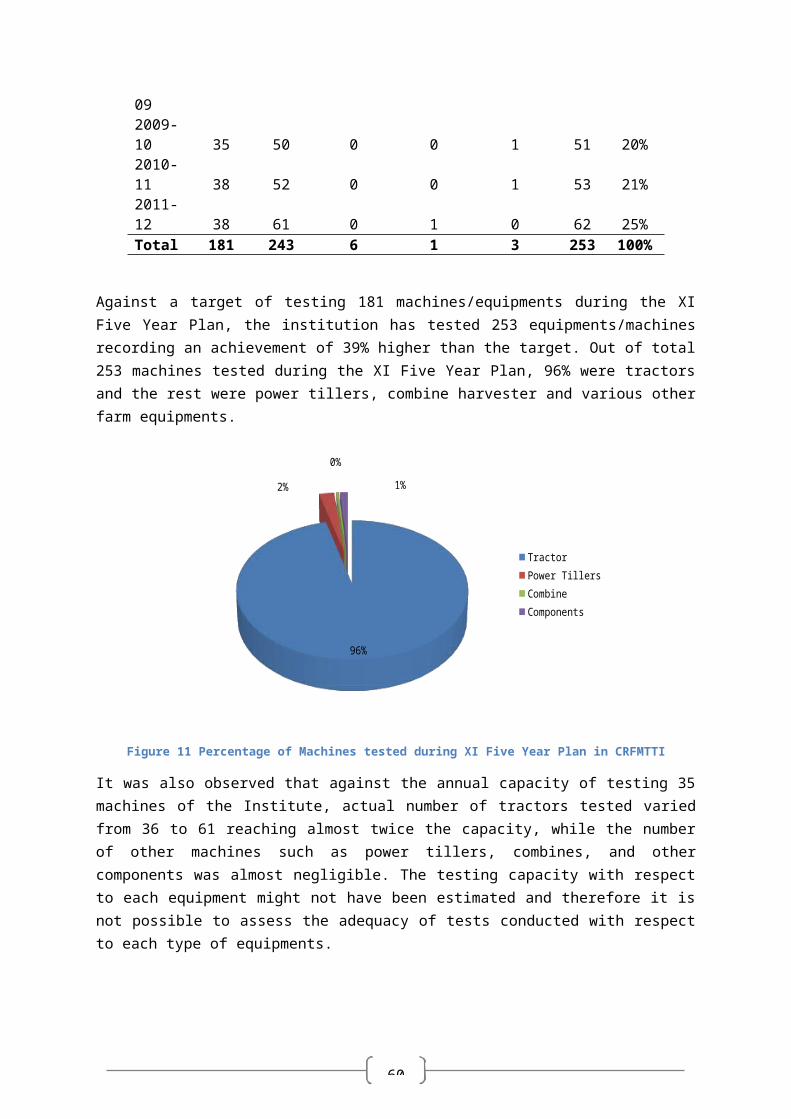
69
It is evident from the table 37 above, that 31% of the total respondents who attended the Academic Level training had education of higher secondary and above. Of them 24% were graduates and above, some of whom were also undergoing M.Tech degree. The participation in Management Level course was low as compared to other courses. The training programs under the Need Based courses mostly accommodate candidates sponsored by industries and institutions. Most of them had held graduate degrees and above. The only course which catered to beneficiaries from all educational backgrounds was the User Level and Technician Level course. This is due to the fact that in these two training programs, either the farmers or the practitioners’ technicians who desired to enhance their technical skills and awareness of new technology participated.
4.4.3 Caste/Category wise Distribution of RespondentsOut of 641 respondents, 36% each belonged to General Category and Other Backward Classes each while 21% of the respondents were from Schedule Castes and rest 7% from Schedule Tribes. It could also be observed from the data that no Scheduled Caste respondents were covered by Northern Region FMTTI (Hissar). As per the data provided by the Institute only 66 candidates belonging to ST category participated in the training programs.
Table 38 Caste wise distribution of respondents
FMTTIsGenera
l % OBC % SC % ST %Grand Total %
SRFMTTI 15 2% 32 5% 26 4% 15 2% 88 14%NERFMTTI 112 17% 95 15% 61 10% 6 1% 274 43%NRFMTTI 35 5% 36 6% 17 3% 0 0% 88 14%CRFMTTI 70 11% 65 10% 32 5% 24 4% 191 30%Grand Total 232 36% 228 36% 136 21% 45 7% 641 100%
Of all the trainees, the largest share (17%) was from NERFMTTI followed by 11% from CRFMTTI. The lowest was from SRFMTTI (2%). Among the trains belonging to the OBCs, 15% were from NERFMTTI followed by 10% from CRFMTTI. Among the under privileged category belonging to the SCs, 10% were from NERFMTTI followed by 5% from CRFMTTI. Among ST category, 4% were from CRFMTTI and 2% from SRFMTTI.
4.4.4 Respondents Distribution Occupation wiseOut of 641 respondents administered 280 (44%) were farmers, followed by students (18%) who attended the Academic, Management and Need Based training. Further 15% of the respondents were driver/operators of various farm equipments such as tractors, power tillers, combines harvesters etc. Unemployed youth with an intention to enhance their skill level and increase their employability accounted for 5% of the beneficiaries. Figure 28 below illustrates the distribution of respondent’s by their occupation.
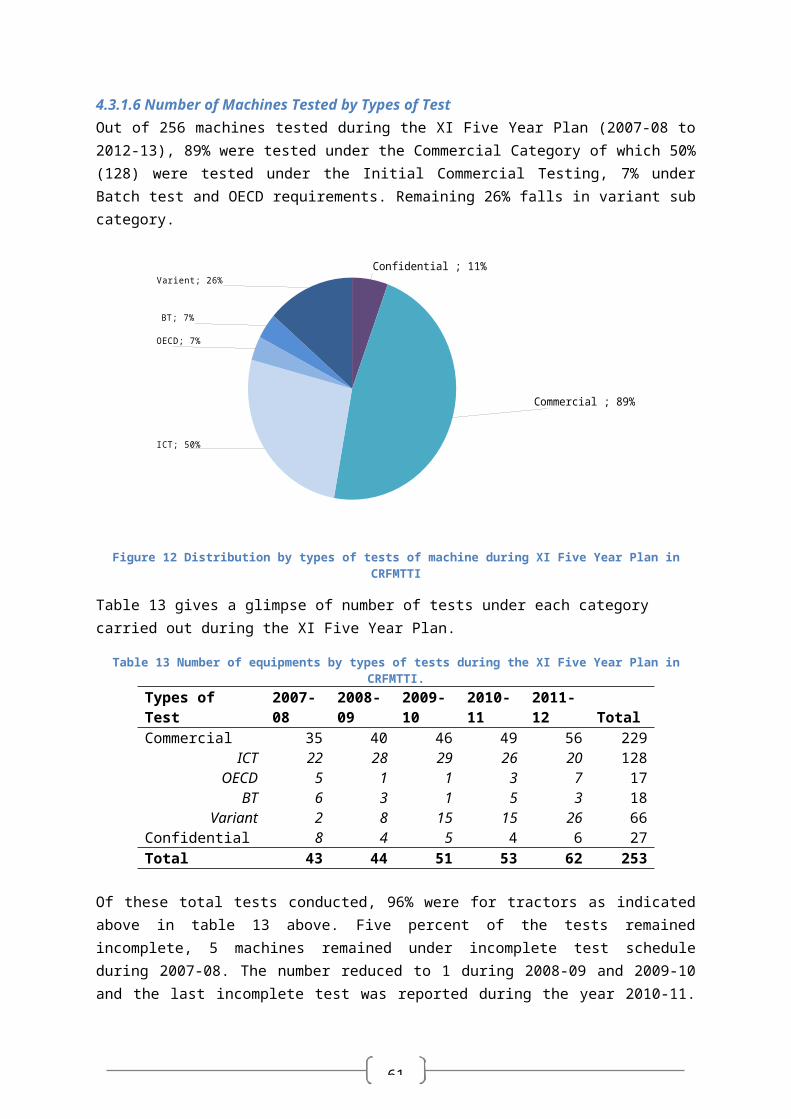
70
44%
18%
15%
8% 5% 3% 3% 2%1%1%
FarmersStudentDriver/OperatorsTechniciansUnemployed YouthServiceAgriculture LabourBusinessHandloomHousewife
Figure 28 Distribution of respondents by education
Though 1% of the total trainees were housewives and engaged in handloom, they were also engaged in farming activities which is their primary occupation.
Details of respondents with primary occupation of engaged in agriculture and attended training program in four FMTTIs, are provided in table 39 below.
Table 39 Land holding status of respondent farmers
Institute
Small/Marginal (≤ 2
ha) %Medium
(2 to 5ha) %Large (>
5 ha) % Total %SRFMTTI 9 6% 20 20% 3 19% 32 11%NERFMTTI 112 69% 53 52% 6 38% 171 61%NRFMTTI 10 6% 10 10% 3 19% 23 8%CRFMTTI 31 19% 19 19% 4 25% 54 19%Total 162 100% 102 100% 16 100% 280 100%
It can be seen from the table above that, 58% of the total respondents were Small and Marginal Farmers (Landholding upto 2 ha), 36% were medium farmers (landholding 2-5 ha) and 6% were large farmers (landholding more than 5 ha). This indicates that the largest percentage of farmers who attended the mechanization training in FMTTIs were from small and medium category who face the challenge of smaller scale of operations while going in for farm mechanisation. Another 36% were medium farmers and rest 5% only were large farmers. Hence, the FMTTIs have played a significant role in popularizing the mechanization and enhancing skills among small, marginal and medium category farmers.
Among 162 small/marginal farmers, 69% were trained by North Eastern Region FMTTI followed by 19% in Central Region FMTTI and 6% each by SRFMTTI and NRFMTTI.
4.4.5 Sources of Information on Training ProgramsRespondents reported various sources from where they received information about the training courses. Majority (37%) of the respondents reported Friends and other students who underwent the training courses earlier. Sixteen percent (16%) became aware of the training programs due its popularity among the manufacturers and dealers of the equipments. For students who accounted
71
for 23% either the academic institutes or the sponsorers were the sources of information. In addition, the State Government have also played significant role in disseminating the information of the training courses among the farmers through their extension officers in the field. As such, 19% of the respondents indicated that they received the information about the training programs from the State Agriculture departments, State Agriculture Universities, KVKs, etc. FMTTIs on their own have done very little to popularise the programs and hence their involvement in publicity of programs appeared to be low. None of the respondents revealed newspaper as a source of information.
4.4.6 Motivation for Attending Training ProgramsWith a view to understand the motivation for attending various training courses in FMTTIs, the responses have been compiled below. A total of six options were provided to the respondents to indicate the reason for attending the training courses in FMTTI. They were multiple which showed a correlation with type of training courses attended. Figure 29 below gives the comprehensive picture of motivation for attending the courses by trainees across all the FMTTIs. The total responses under each course were converted to percentage because of the multiple responses by each individual, as one exclusive choice was difficult to opt.
Academic Need Based Technician Level User Level Management0%
10%
20%
30%
40%
50%
60%
48%
30%
17%
28%
50%
45%
19%
38%
18%
50%
1%
23%
13%
5%9%
45%
20%
1%
19%
12%9%
Enhance Skill & Improve Efficiency Increased Awareness of Improved Tech Improve Farm Productivity
For Improved employment Opportunity Subsidised Course Utilize Spare Time
Other
Figure 29 Motivation for joining different courses in FMTTIs
From the figure 29 above, it becomes evident that need for Enhancement Skill and Increased Awareness of Improved Technological Innovations of Farm Machinery were major motivators accounting for 48% and 45% responses, respectively. Similarly among the management category students, Enhance Skills and Increased Awareness accounted for equal shares of 50%. While, among those attending the Technical Level course, the strongest motivating factor was Increased Awareness of Improved Farm Technology (38%) followed by “Improved Employment/ Earning Opportunity” (45%). Enhancing skills & Improve efficiency at 28% followed by Employment Opportunities at 20% were the major motivating factors for those who attended User Level programs. A good number of respondents under this category were farmers, 18% of who indicated Increased Awareness and 13% Improving Farm Productivity as the motivating factors. A small percentage (9%) attended to utilize
72
their spare time and learn new technological innovations in the area of farm mechanization. Similarly for Need Based training Enhancing the Skill Level and Improve Farm Productivity were the major motivating factors.
Thus Enhancing Skills & Improving Efficiency and Increase of awareness of improved technology were leading motivating factors for attending the training courses, although their relative importance have varied depending on the types of courses attended. It can also be interpreted that ‘subsidised courses’ was not a major motivating factors for trainees to attend the training programs. Majority have expectations to learn and improve their skills with the exception of certain numbers of trainees from Need based and User Level Courses who attended as the course was free.
4.4.7 Effectiveness of Training ProgramTo measure the extent of effectiveness of training courses organized by the FMTTIs, the trainees were administered the questionnaire in person on the 5 different factors; Training Program’s relevance to the need of trainees, Appropriateness of content, Provision for course material, Usefulness of course materials and Length of training program. Majority of the respondents did not mind the long duration of 3 days to 6 months for in house training programs; most of the beneficiaries expressed their agreement on the designed length, except 3% belonging to Need Based training and User Level training, felt the duration of training to be increased.
With respect to relevance of training programs and their suitability, 86% of the trainees indicated that the training was relevant, 11% opined partially relevant and merely 3% felt it irrelevant (2% from NERFMTTI and 1% from CRFMTTI). Hence in total 97% felt that training programs suit their needs and were relevant for them.
Table 40 Beneficiaries response on Relevance of Training Program and Appropriate of contentInstitutes
Training Program Relevance to Need of TraineesAppropriateness of
Content
Relevant %
Partially Relevan
t %Not
Relevant % Yes % No %SRFMTTI 210 33% 0 0% 0 0% 210 33% 0 0%NERFMTTI 116 18% 30 5% 12 2% 144 22% 14 2%NRFMTTI 131 20% 12 2% 3 0% 140 22% 6 1%CRFMTTI 95 15% 28 4% 4 1% 113 18% 14 2%Overall 552 86% 70 11% 19 3% 607 95% 34 5%
The course content ensures exhaustive coverage on various aspects like orientation, topic coverage, theme related to operational aspects, field operation, repair & maintenance and even sources of availability of spare parts, cost of economics while selecting an equipments, etc. With regards to the appropriateness of contents of the training programs, 95% expressed that the contents of the training program were appropriately designed with only 5% expressing dissatisfaction. Table 41 below indicates trainees’ responses on Provision of course material, its usefulness and duration of training programs.
Table 41 Beneficiaries response on Course material, its usefulness and duration of training programInstitutes Provision of Course
Material Usefulness of Course MaterialAdequate Length of Training Program.
Yes % No % Usefu % Partially % Not % Yes % N %
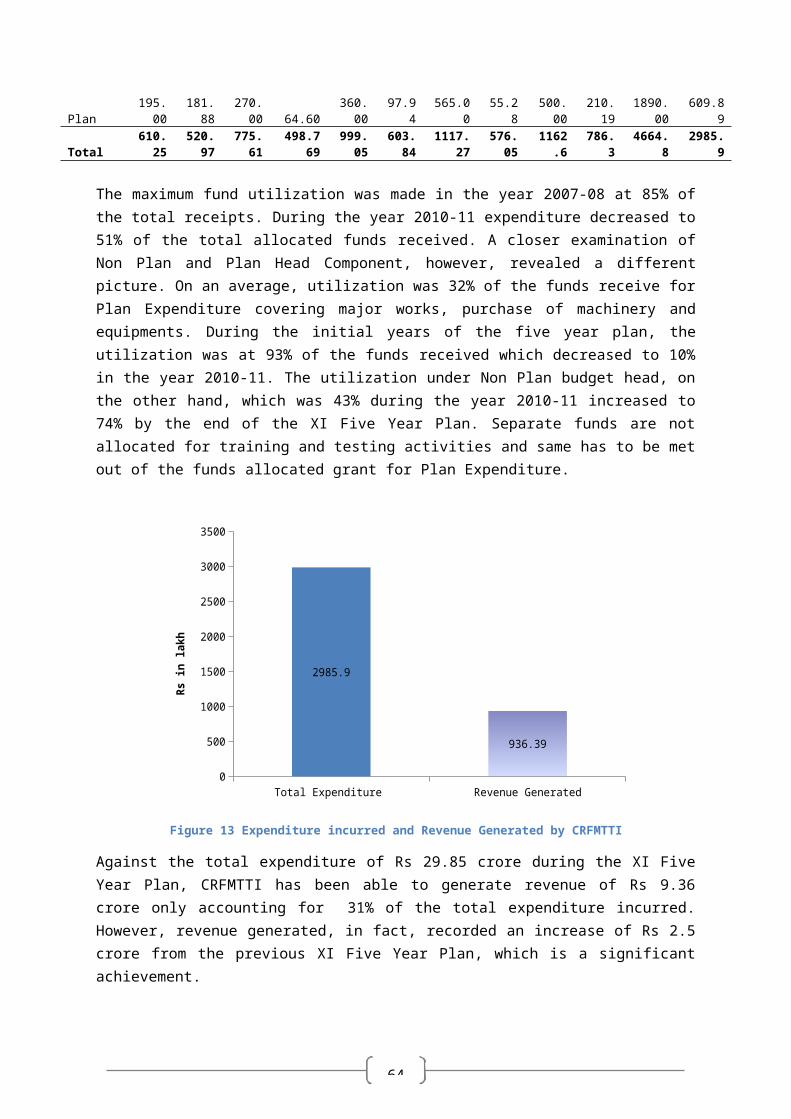
73
l UsefulUsefu
l o
SRFMTTI 210 33% 0 0% 201 31% 9 1% 0 0%191 30% 19 3%
NERFMTTI 157 24% 1 0% 142 22% 16 2% 0 0%
158 25% 0 0%
NRFMTTI 143 22% 3 0% 127 20% 19 3% 0 0%143 22% 3 0%
CRFMTTI 121 19% 6 1% 105 16% 20 3% 2 0%127 20% 0 0%
Overall 631 98% 102% 575
90% 64
10% 2
0.3%
619
97% 22 3%
Ninety eight percent of trainees received the training materials while attending the training course. The remaining 2% had not received any training material. A majority of the trainees (90%) indicated that the course material provided during the training was useful and was used during the post training period for the purpose of learning and understanding the operations and concepts. However, 10% felt that course material was partially useful and did not suit their need and expectations. As regards the duration of the training courses, 97% felt that it was adequate while only 3% felt that it was not adequate. These 3% were mostly those attending the training courses on crop specific equipment operation of 2-3 days, who advocated increase of duration from the present 2-3 days to atleast 5 days to enable better understanding of operating procedure as well as repair and maintenance issues in detail, particularly in case of machineries which are sensitive. Also, learning to operate and maintain new equipment initially takes more time. Among all four FMTTIs, 19 respondents from SRFMTTI felt that the duration was inadequate followed by 3 respondents on NRFMTTI. Though these numbers are very less compared to the total sample, but the respective institutions may take note of this aspect.
4.4.8 Appropriateness of Training LogisticsAll the respondents were asked about the logistic arrangements to make an assessment of the arrangements and availability of logistics in the institutions. Almost all the respondents felt satisfied with the provision of training materials and said to be adequate to cater the training purpose, except 3 respondents form NRFMTTI who felt that training material were inadequate and more material on practical aspects of the training could be added. Regarding boarding and lodging arrangements and canteen facility, 88% of the respondents were satisfied, while 12% of the participants felt the boarding arrangements to be partially satisfactory and felt that food quality may be improved. The highest percentages of such respondents were found from NRFMTTI (Hissar, 7%). With regards to availability of equipments/ machinery to trainees during the course of training, 80% felt that machineries and equipments were adequate in number while 20% said it to be inadequate as the equipments/machines had to be shared by more number of trainees and making it difficult to get equal chance during the training. There were incidents of some trainees dominating the session or even keeping the machine under their control. Hence, trainees felt that number of machines may be increased to provide adequate chance and time to each trainee during the training course. The trainees also felt that operational aspects are very important for comprehensive understanding and absence of field operations and lack of enough chance and time during practical session’s hindered learning.

74
Table 42 Response of beneficiaries on adequacy and appropriateness of logistic arrangementsInstitution
Training Materials Boarding/Lodging Facilities
No. of Equipment/Machinery
provided Audio/Visual Aids UsedAd
equa
te
%
Inad
equa
te
%
Satis
fact
ory
%
Parti
ally
Sa
tisfa
ctor
y
%
Not
Sa
tisfa
ctor
y
%
Adeq
uate
%
Inad
equa
te
%
Yes
%
No
%
SRFMTTI21
0 33% 0 0% 197 31% 13 2% 0 0% 147 23% 63 10% 174 27% 36 6%
NERFMTTI15
8 25% 0 0% 146 23% 11 2% 0 0% 125 20% 33 5% 149 23% 9 1%
NRFMTTI14
3 22% 3 0% 103 16% 44 7% 0 0% 137 21% 9 1% 109 17% 37 6%
CRFMTTI12
7 20% 0 0% 115 18% 12 2% 0 0% 105 16% 22 3% 112 17% 15 2%
Overall63
8 100% 3 0% 561 88% 80 12% 0 0% 514 80%12
7 20% 544 85% 97 15%Similarly, 85% of the trainees indicated that audio visual aids were used during the training course which is a better interactive media contributing to effective training methods. However, 15% revealed non use of any audio visual aid during training. It was however difficult to say which cadre of beneficiaries they belong, but majority of them attended the User Level training.
4.4.8 Usefulness and Utilization of Training ProgramOut of 641 respondents interviewed, 403 (63%) felt that they have been able to utilize the skills gained from training in some way or the other. The remaining 37% felt that they have not been able to utilize the training skills. The highest percentage of the beneficiary who utilized the skills gained on Farm Machinery were from NRFMTTI (Hissar) followed by 15 in Andhra Pradesh, However, 17% in Andhra Pradesh also felt they have not been able to use the skills gained.
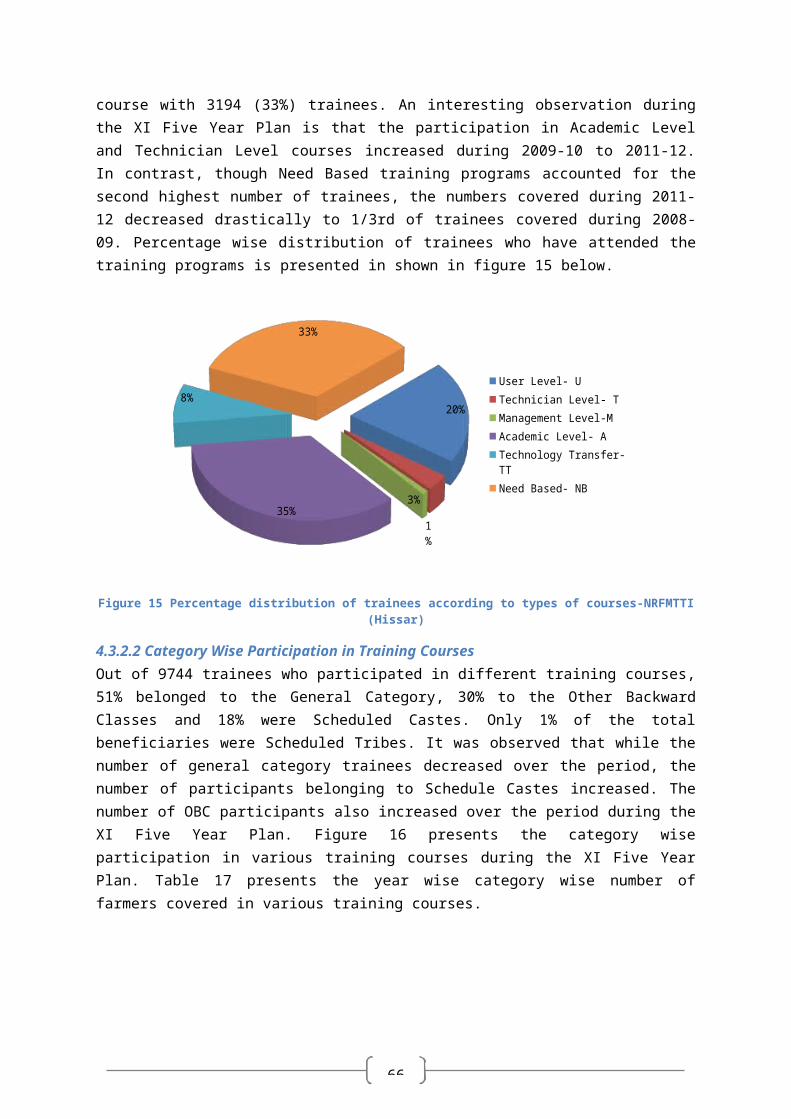
75
Table 43 Beneficiaries response on use of training skills after attending training courseInstitute
TotalFarmers & Related
Activity Technicians Students Others
Use
d
% Not
Use
d
% Use
d
% Not
Use
d
% Use
d
% Not
Use
d
% Use
d
% Not
Use
d
% Use
d
% Not
Use
d
%
SRFMTTI103
16%
107
17% 20 8% 47
18% 46
62% 13
18% 10 6% 27
17% 27
18% 20
13%
NERFMTTI 82
13% 76
12% 42
16% 41
16% 14
19% 3 4% 10 6% 6 4% 16
10% 26
17%
NRFMTTI
108
17% 38 6% 38
15% 0 0% 6 8% 0 0% 44
28% 23
15% 20
13% 15
10%
CRFMTTI
104
16% 23 4% 33
13% 10 4% 6 8% 1 1% 40
25% 10 6% 25
16% 3 2%
Total397
62%
244
38%
133
58% 98
42% 72
81% 17
19%
104
61% 66
39% 88
58% 64
42%

76
Among different categories of trainees; Farmers, Technicians, Students and Others, the highest numbers were among the farmers who have utilized their skills in some way or other; the details will be discussed later in this section. 81% of all the technicians and 66% percent of the students who have attended the training courses felt to be more skilled and utilizing gained skills. Hence a larger portion of the trainees from all the categories felt they have benefitted from the training courses.
4.4.8.1 Ex Post Use of Skills by Training beneficiariesTo gain an insight on how the respondents felt they have been using the training inputs after completing the courses, the respondents were interviewed using structured questionnaire on different aspects of utilization of skills gained after completion of courses from the FMTTIs. Table 44 in the next page gives the details of how different categories of trainees used skills gained after training. Of all the responses, 24% of the beneficiaries felt that they are now well equipped with skills of operations and maintenance of equipments. 12% of the respondents purchased equipments/ machinery after attending the training course. Therefore, the institutes have not only played a significant role in dissemination of information, but have also in adoption of new technology for mechanization of farming activity. All the respondents who purchased the machineries were farmers. Twelve percent beneficiaries also gained skills and utilized them in sourcing additional income by providing services for repairs, maintenance and operations. The most significant gainer from the scheme are the farmers who have utilized the skills in multiple forms as evident from the table 44 below. Students have also been benefitted from the training courses as a few of them used the skill and knowledge for imparting training and advising other users, some of them also used it for generating additional income. However, most of the students have used the knowledge gained through training for their ongoing academic activities. 5% of the students have also got a better placement after completing their courses and 8% have successfully completed their Agriculture Engineering course from the university. Hence, the benefits of the training have shown multiple effects.
77
Table 44 Application of learning by the trainees post training at FMTTIsSl Ex-post Use by Training
Beneficiaries Farmers Technicians Students Other Total %1 Brought New Machinery for own
use 60 0 0 2 62 12%2 Enhanced skills in operation and
maintenance 78 27 0 15 120 24%3 Used training to improve efficiency
of input use on agriculture machinery (Fuel Saving) 15 16 0 9 40 8%
4 Influenced/ change in farm management practice 16 6 0 9 31 6%
5 Lesser frequency in breakdown of machinery 21 4 0 4 29 6%
6 Training/advising/helping other farmers towards effective & efficient use of machinery/equipments and maintenance 25 10 4 15 54 11%
7 Used training to get additional income generation opportunity 21 13 12 12 58 12%
8 Took up additional job as technician/ mechanic 5 0 0 1 6 1%
9 Left Farming and took jobs as technician/operators 4 0 0 0 4 1%
10 Used knowledge & skills to support ongoing academic activities 0 0 37 0 37 7%
11 Better Placement 0 0 24 0 24 5%Opened new Workshop 0 0 0 0 0 0%
12 Successfully completed the Course credit 0 0 38 0 38 8%Total 245 76 115 67 5036 100%
The training programs have not only helped the trainees to update, increase their knowledge and skills opening up new opportunities to generate additional income from the technical skills gained. Such training among the farmers has resulted in multi fold benefits which are evident from the range of options on which they have responded positively.
A majority of the respondents who have not been able to use the skills indicated constraints of finance for purchasing equipments/ machinery or setting up workshops (43%), lack of opportunities due to insufficient mechanization in the neighbourhoods and adjacent localities (26%). Another 22% indicated stiff competition in the markets of repair and maintenance due to existing influential players as the reason for not utilising the skills gained.
6 Trainees specific to FMTTI who were interviewed during the study.
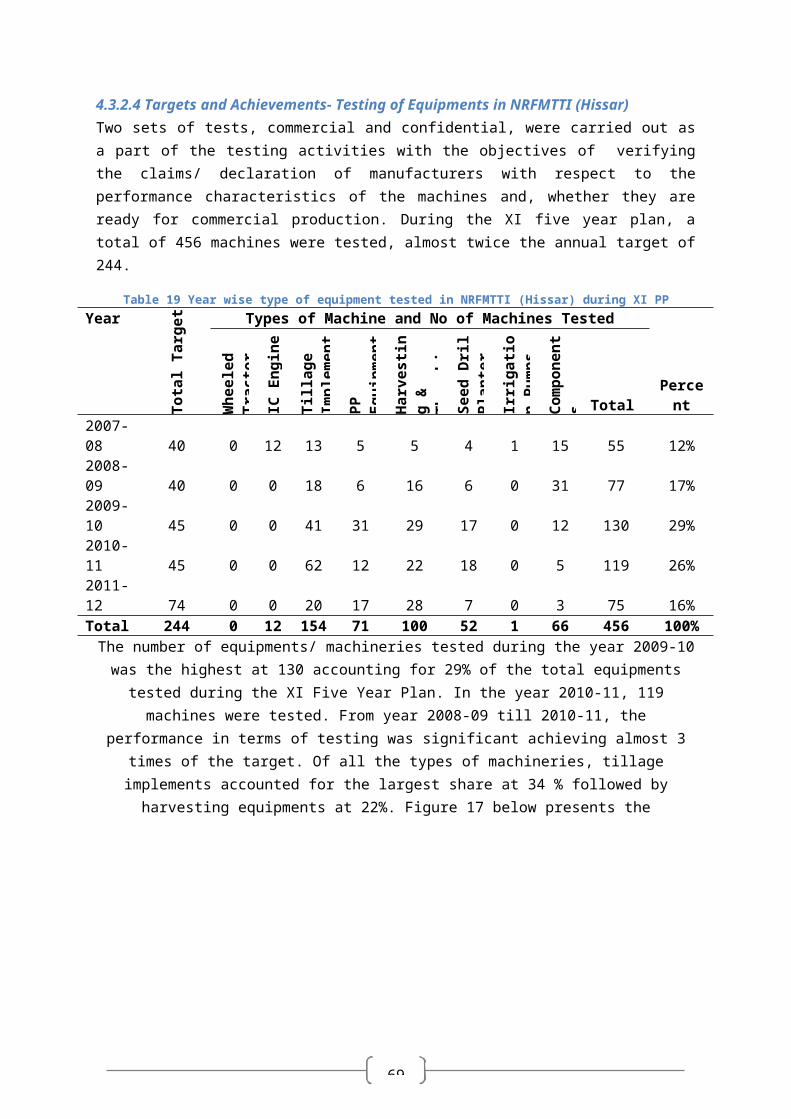
78
4.4.9 Impact of Training ProgramTable 45 Impact of Training program on selected parameters
Institutes/Types of Respondents
Purchased of New Technology/Equipmen
tReduction in Hrs of
Field OperationReduction in
Wastage of WaterUse of Irrigation
DevicesChange in
Production Change in IncomeChange in
Occupation
Pre
Trai
ning
Post
Tr
aini
ng
Cha
nge
Pre
Trai
ning
Po
st
Trai
ning
Cha
nge
Pre
Trai
ning
Post
Tr
aini
ng
Cha
nge
Pre
Trai
ning
Post
Tr
aini
ng
Cha
nge
Pre
Trai
ning
Post
Tr
aini
ng
Cha
nge
Pre
Trai
ning
Post
Tr
aini
ng
Cha
nge
Pre
Trai
ning
Po
st
Trai
ning
Cha
nge
SRFMTTIFarmers 32 49 17 20 23 3 10 12 2 57 62 5 20 28 8 20 28 8 0 0 0Technician/Operator 0 0 0 0 4 4 0 0 0 0 0 0 0 0 0 0 2 2 0 0 0
Students 0 0 0 0 0 0 0 0 0 0 0 0 0 0 0 0 4 4 0 4 4
Others 0 0 0 0 0 0 0 0 0 0 0 0 0 0 0 0 0 0 0 0 0NERFMTTI
Farmers 69 91 22 25 28 3 23 25 2 67 73 6 65 83 18 65 83 18 0 0 0Technician/Operator 0 0 0 0 5 5 0 0 0 0 0 0 0 0 0 0 5 5 0 0 0
Students 0 0 0 0 0 0 0 0 0 0 0 0 0 0 0 0 4 4 0 4 4
Others 0 1 1 0 0 0 0 0 0 0 0 0 0 0 0 1 1 0 0 0NRFMTTI
Farmers 23 33 10 10 13 3 30 34 4 38 38 0 21 38 17 21 38 17 0 1 1Technician/Operator 0 0 0 0 3 3 0 0 0 0 0 0 0 0 0 0 3 3 0 0 0
Students 0 0 0 0 0 0 0 0 0 0 0 0 0 0 0 0 6 6 0 6 6
Others 0 0 0 0 0 0 0 0 0 0 0 0 0 0 0 0 0 0 0 0 0CRFMTTI
Farmers 54 65 11 13 15 2 15 21 6 43 50 7 25 33 8 25 33 8 1 3 2Technician/Operator 0 0 0 0 4 4 0 0 0 0 0 0 0 0 0 0 3 3 0 0 0
Students 0 0 0 0 0 0 0 0 0 0 0 0 0 0 0 0 10 10 0 10 10
Others 0 1 1 0 0 0 0 0 0 0 0 0 0 0 0 0 1 1 0 0 0Overall
Farmers 178 238 60 68 79 11 78 92 14 205 223 18 131182 51 131
182 51 0 4 4
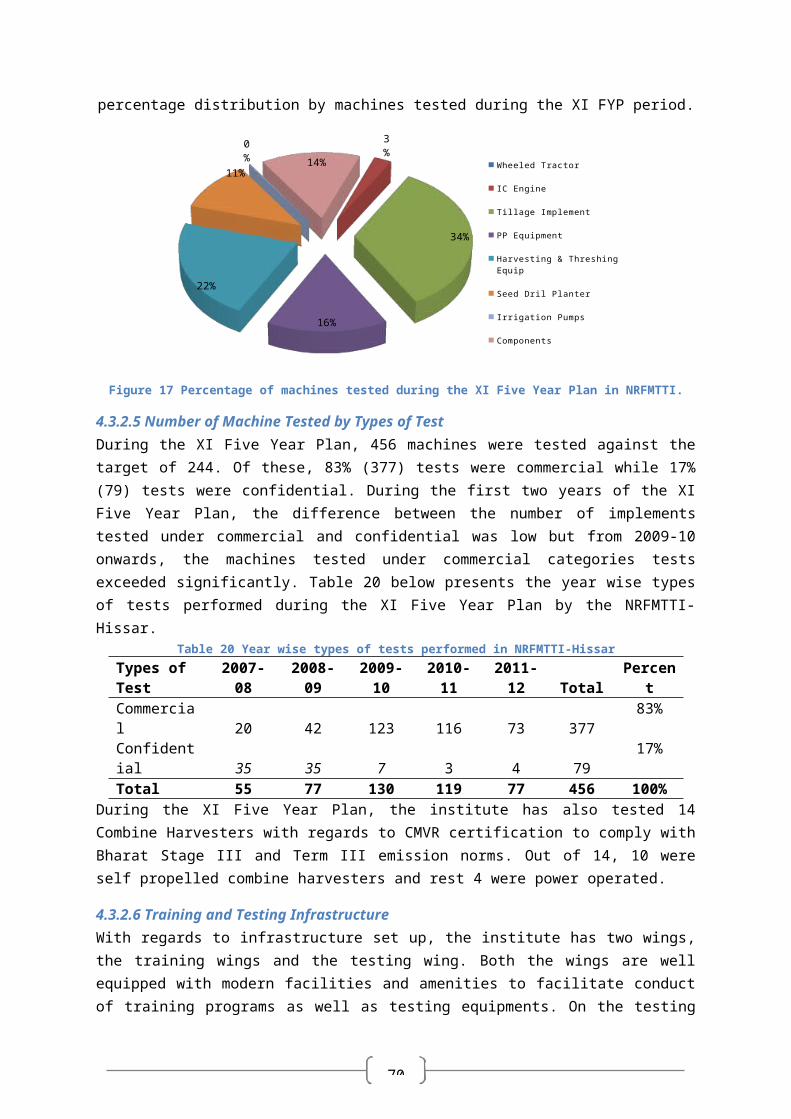
79
Technician/Operator 0 0 0 0 16 16 0 0 0 0 0 0 0 0 0 0 13 13 0 0 0
Students 0 0 0 0 0 0 0 0 0 0 0 0 0 0 0 0 24 24 0 24 24
Others 0 2 2 0 0 0 0 0 0 0 0 0 0 0 0 0 2 2 0 0 0
80
From table 45 above, the multiple benefits of training program as responded by the beneficiaries can be seen. The Farm Mechanization training covered varied topics catering to different categories of trainees and therefore the impact of training program also varied at the field level such as increase in productivity, reduction of water usage, reduction in hours of field operations to even change in occupation. However it is difficult to quantify usage of machinery and its impact. However an effort has been made to understand the impact on certain variables in association with different equipments.
Table 45 above presents the details of beneficiary who have responded to different impact parameters. Overall, 178 farmers from all the different centres were using some equipments and machineries even before attending the training program. After attending, 60 farmers purchased the equipments/ machineries which represent an adoption rate of 33%. The highest percentage change in adoption is found to be associated with SRFMTTI at 53% followed by NRFMTTI (44%). 32% of the farmers from NERFMTTI have also adopted new machineries after attending the training program. 20% of the farmers who attended the training programs in CRFMTTI also purchased new equipments subsequent to training.
Apart from adoption, application of training also resulted in other benefits such as reduction in duration of field operations, efficient use of water, use of irrigation devices. Overall there has been a 16% increase in number of farmers after attending the training course who have reported reduction in hours of field operations. Farmers who attended their training course in NRFMTTI, Hissar reported the highest increase followed by SRFMTTI, Anantpur (15%), CRFMTTI, Bundni (15%) and NERFMTTI, Assam (12%). The training also reported reduction in usage of irrigation water after attending the course. On an average 18% more farmers have reported this phenomenon whereas there is an 8% increase in the numbers of farmers adopting irrigation devices.
The most significant of all the impacts is seen in case of change in production and income. There has been a 39% increase in farmers who have reported increase in production and its impact on overall income. Quantifying the change in production, income and reduction in wastage of water was difficult due to adoption of different technologies and application of training inputs of different courses and therefore the evaluation of change in production and income per acre basis and average change in income has been attempted, whereas reduction in wastage of water has been measured on likert scale both for pre and post production scenario.
4.4.9.1 Impact of Training on different Impact IndicatorsImpact of training on outcome level variables has been quantified with regard to indicators such as reduction in hours of field preparation, average reduction in water use, and change in production and change in income and skill levels which are presented in table 46 below. It may be noted that indicators such as reduction in field operations, change in production and income may not be appropriate estimations; however it represents the outlook of beneficiaries. As indicators such as reduction in water use and change in skill levels are difficult to quantify therefore and attempt has been made to measure the changes on likert scale based on trainee’s perceptions.
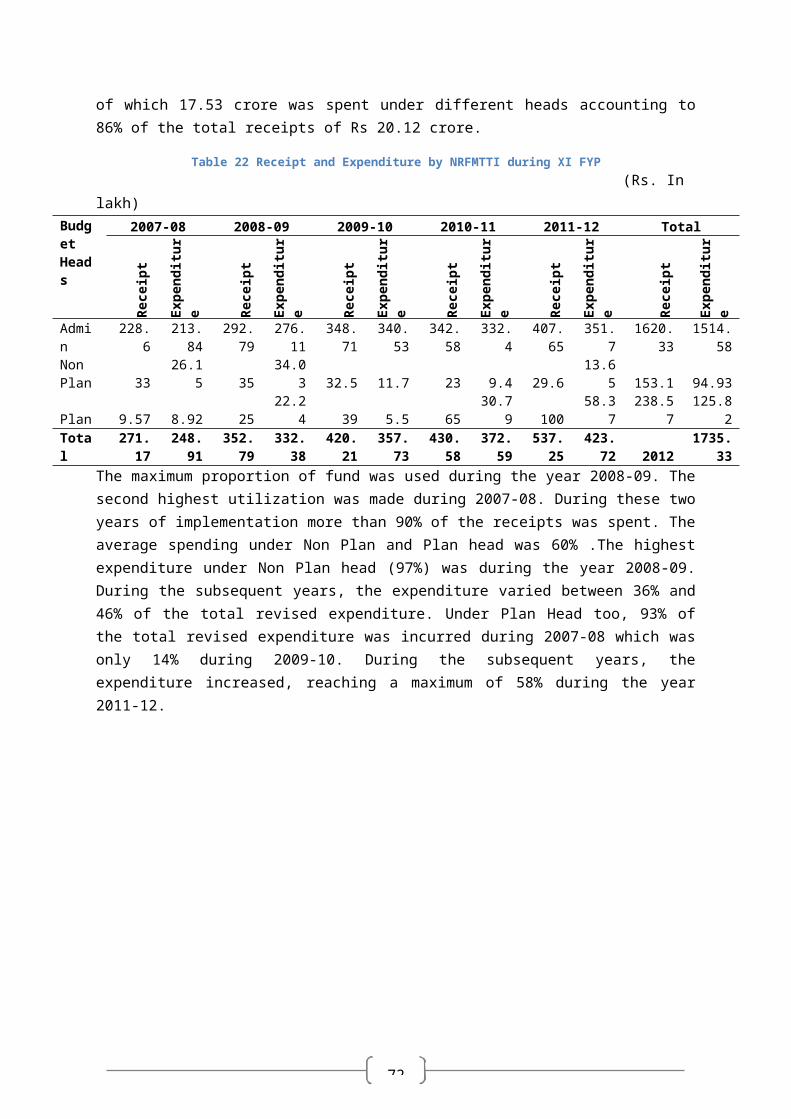
81
Table 46 Impact of Training program on certain measurable parametersImpact parameters SRFMTTI NERFMTTI NRFMTTI CRFMTTI
Pre
Trai
ning
Post
Tr
aini
ng
% C
hang
e
Pre
Trai
ning
Post
Tr
aini
ng
% C
hang
e
Pre
Trai
ning
Post
Tr
aini
ng
% C
hang
e
Pre
Trai
ning
Post
Tr
aini
ng
% C
hang
e
Average Reduction in hours of Field preparation. (Hour/Acre) 12.11 10.56
13% 16.59 15.22 8% 5.4 4.5
17% 6.32 5.69
10%
Average Reduction in Wastage of Water (%age point) 3.74 3.15
16% 5 4
20% 3.66 2.67
27% 3.81 2.27
40%
Change in production (Qts/Acre) 10.81 13.5
25% 9.7 12.76
32% 11.75 13.75
17% 11 14
27%
Change in Income in Farming activity (Rs per acre.)7
13100
14600
11% 9800
10200 4%
10200
13000
27%
11200
12000 7%
Change in Income as Technician/operators (Rs. P.a)8 NA NA NA
11500
13500
17%
25000
30000
20%
51000
55000 8%
Change in Skill Level (%age point) 2.11 3.64
73% 2.23 3.67
65% 2.06 3.93
91% 1.92 3.72
94%
It can be observed from the table above that on an average reduction of hours required for field preparation has been in range of 8-17% due to use of machinery and change in skill levels post training. The highest reduction of 17% was reported by farmer/operators having attended the program in NRFMTTI followed by 13% from the respondents who have attended training in SRFMTTI. It was also seen that the farmers from NERFMTTI had the highest operational time compared to farmers at other institutes. The water use on an average decreased from 4.05 percentage points to 3.02 percentage points. The highest reduction of 1.57 points (40%) has been reported by the respondents from CRFMTTI which is a significant 40% less than the ex-ante use of water. The second highest reduction from 3.66 point to 2.67 point which is almost 27% reduction was reported by the respondents from NRFMTTI (Hissar).
The production per acre on an average has increased from 11 quintal to 13 quintal which corresponds to an 18% increase in yield. The immediate impact of this was seen in the income of beneficiaries which has increased by approximately 12% per acre on an average The maximum increase has been reported by the beneficiaries from NERFMTTI while the lowest 17% from NRFMTTI ( Hissar).
The technicians and operators from all the FMTTIs except SRFMTTI reported an increase in income as additional skills have helped them to improve on their productivity. On an average there is an increase of Rs 3667 per annum in the income of every technician who have been either practicing or took up operations and maintenance of farm machineries and equipment as an additional source of income.
7 Specifically estimated for farming Activities.8 Specifically estimated for Technicians and Operators operating Farm Machineries.
82
The skill level as reported by the beneficiaries from all across the FMTTI increased by 1.66 points from 2.08 points to 3.74 points. The highest increase in skill levels of 1.8 points was observed among the beneficiaries of CRFMTTI and NRFMTTI.
4.4.9.2 Overall Rating of the Training ProgramConsidering all the parameters for assessing the training courses including the quality, training logistics, infrastructure support for training program and utility of training courses, the respondents were asked to rate the training program organized at FMTTIs on 10 point scale (0-9) where 0 indicates the least and 9 indicates the best. The average rated score for each FMTTI is presented in the table 47 below.
Table 47 Overall rating of training by the respondentsInstitutes Average Score Farmers Technician/Operators Students OthersSRFMTTI 7.3 7.31 7.4 7.77 7.01NERFMTTI 6.33 6.37 6.89 6.33 5.68NRFMTTI 7.56 7.77 7.87 6.89 7.57CRFMTTI 7.57 7.59 7.44 7.45 7.4Overall 6.97 6.98 7.17 7.21 6.5
On the basis of average score, CRFMTTI (Budni) and NRFMTTI (Hissar) have emerged as the best rated institutes whereas NERFMTTI is the least. The institute runs different courses for different types of participants therefore the average rating was calculated to understand the differential rating across the farmers, technicians, students and others. It is evident from the averages that the score given by students were highest (7.21) followed by the technician/ operators (7.17) and farmers (6.97). The lowest score was given by others who mostly comprise of trainees from service class, unemployed persons, and others whose primary jobs are different from what the course was intended for. On the popularity of institute among the beneficiaries, the highest score was obtained by SRFMTTI whereas in all the other categories i.e. technicians, operators and farmers the highest score was obtained by NRFMTTI. Among the four apex institutes, NERFMTTI has scored the lowest on an average among the different segments of audiences. The institute should revamp its courses and study material to bring out an improvement in future.
4.4.9.3 Dissemination and Sharing of KnowledgeTo understand the multiplier effect of training activity, it is important to analyse the respondent’s feedback on how the knowledge and skills gained by them are being utilized for the benefits of the society. It is estimated that almost 58% of the respondents had the opportunity to share their knowledge and skills with other colleagues and fellow farmers, while 9% had demonstrated activities either on their farm or workshops towards better operations and maintenance. It is heartening to find the fact that the knowledge and skills gained has not been limited only to the beneficiaries who primarily attended the training course but was also disseminated to other who did not have the opportunity to attend it. However, due to the constraints faced by small and marginal farmers in the form of capital, investment, and land holding, it was seen that approximately 20% of the beneficiaries felt that their scope of adoption is limited to a very large extent.
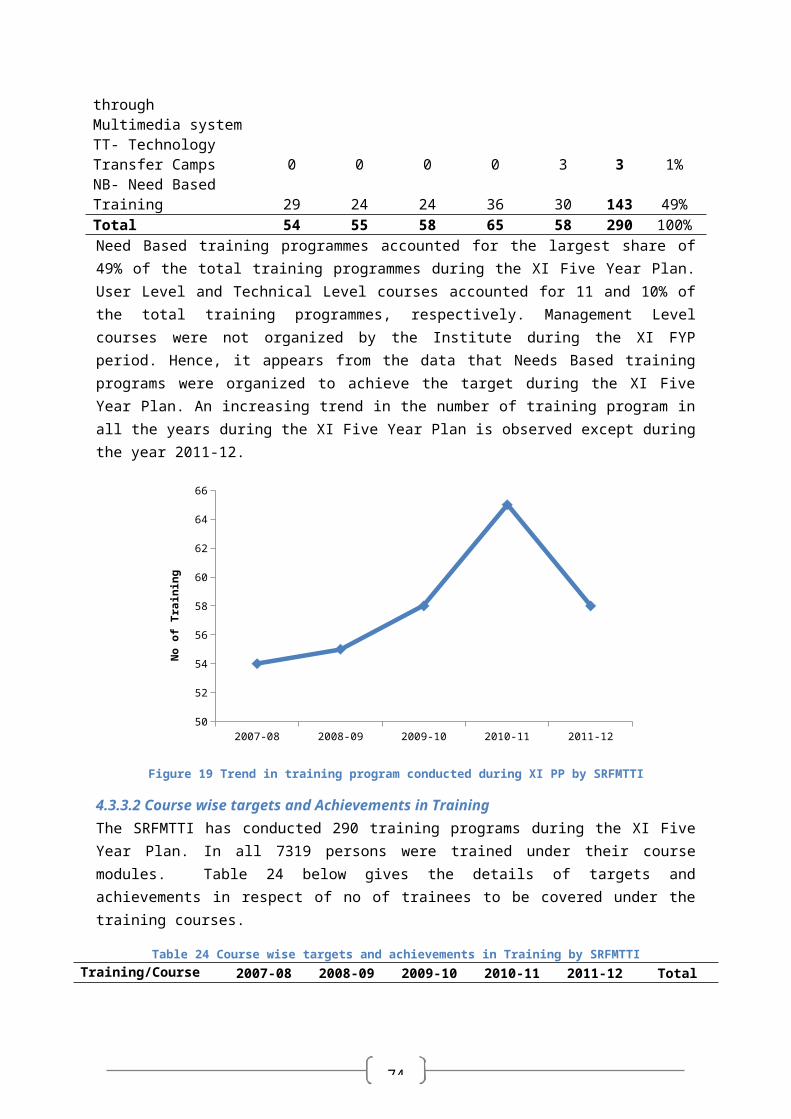
83
4.5 Outsourcing of Training and Demonstration In addition to training and testing program conducted through four designated Farm Mechanization Training and Testing Institutes located at four different regions, the component of Outsourcing of Training and Demonstrations’ was included to supplement the training and demonstration activities being conducted by FMTTIs to increase scale of adoption of the farm machineries. The objectives were not only to increase the adoption rate but also to pass on the benefits to remote areas where mechanizations in farming activities were minimal. Under this component of the program, training needs were identified on specific requirements of farmers primarily through State Agriculture Department, State Agriculture Universities, KVKs and other Government sponsored institutions such as CIAE Bhopal. Apart from the four FMTTIs located in four different states, a total of 9 additional states were covered to assess overall performance of the scheme. The samples covered in the additional 9 states are presented in table 1 of Chapter 2.
While conducting the study, two different stakeholders were interviewed consisting of officials of institutions which have carried on the training and demonstration and the beneficiaries who have been part of training and demonstration. Among the demonstration participants, the host farmers as well as the observant were administered to get their feedback on quality, adequacy and perception on the usefulness of the activities being conducted as a part of program and its impact on the actual users of the equipments and machineries.
Table 48 below gives the details of activities being organized under the PSAMTTD’s outsourcing of training and demonstration component of the scheme. As evident from the table, the prominent activity remains the demonstration of agriculture equipment/ machineries. Over 29000 demonstrations are reported to have been organized in these sample states, of which the highest numbers (30%) were organized during the last year of the XI Five Year Plan (2011-12). No activities were reported to have been conducted by the DoA in Andhra Pradesh during the XI Five Year Plan. Apart from Tamil Nadu, Punjab and Madhya Pradesh, no other states organized the activities in all the years of the XI Five Year Plan. Maharashtra, Rajasthan, Haryana and Uttarakhand conducted the activities only once in the entire XI Five Year Plan. Among all the sample states, Punjab emerged as a leading state which has organized more than 11000 first line demonstrations during the entire XI Five Year Plan followed by Madhya Pradesh with more than 10000 demonstrations. Only 560 training programs are reported to be organized by the State Agriculture Department and around 191 new implements were introduced in the states as a part of the farm mechanization program.
Table 49 gives the details of fund released to the sample states followed by the detailed analysis for each state:

84
Table 48 No of training, demonstration and introduction of New Implement being conducted by DoAState 2007-08 2008-09 2009-10 2010-11 2011-12 Total
Training Demo INI Training Demo
INI Training
Demo INI
Training Demo INI Training Demo INI Training Demo INI
Andhra Pradesh - - - - - - - - - - - - - - - 0 0 0Tamil Nadu 90 1002 60 1671 120 587 118 431 - 105 501 493 4192 0Assam - 5 21 - 225 17 - - - - - - - 0 230 38
Maharashtra - - - - - - - - - - - - - -153 0 0 153
Rajasthan - - - - 170 - - - - - - - - 20 0 190 0Punjab - 908 - - 2179 - - 2949 - - 2610 - - 2439 0 11085 0Haryana - - - - 1040 - - - - - - - - 0 1040 0Uttarakhand - - - - - - - - - - - - 646 0 646 0Madhya Pradesh 6 873 - 61 1069 - - 1378 - - 2112 - - 4588 67 10020 0Orissa - - - - 160 1060 685 0 1905 0
West Bengal9 NA NANA NA NA
NA NA NA
NA NA NA
NA NA NA NA NA NA
Total 96 2788 21 121 6514 17 120 4914 0 118 6213 0 105 8879153 560 29308 191
9 Training and Demonstrations were conducted; however actual numbers were not available. Verified from the filed visits and interaction with beneficiaries of program.
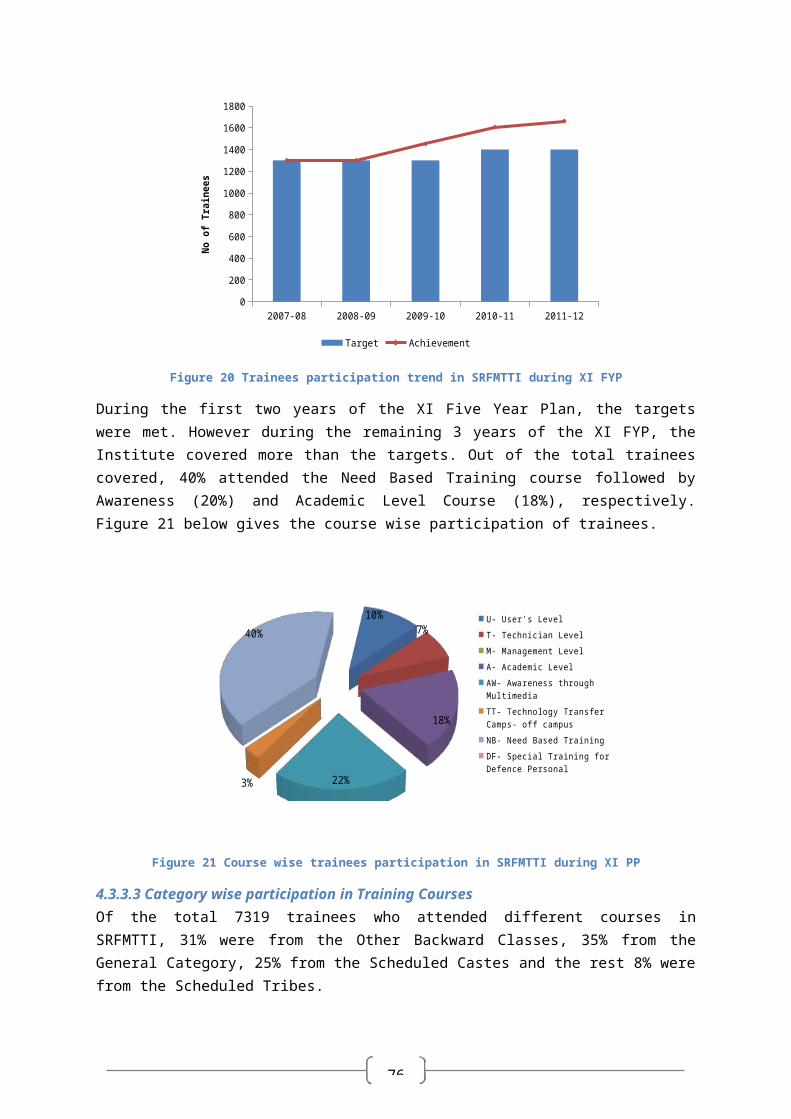
85
Table 49 Fund allocation to sample states
Zone State 2007-08 2008-09 2009-10 2010-11 2011-12 TotalUtilization %
to total allocationSouth Zone Andhra Pradesh 0 11 0 0 0 11 NR NA
Tamil Nadu 77 65 53 68 50 313 294.12 94%North Eastern Zone
Assam 22 35 0 0 0 57 22.5 39%
Western Zone Maharashtra 0 6 0 0 100 106 Nil NARajasthan 0 0 0 0 19 19 19 100%
Northern Zone Punjab 0 96 0 0 0 96 11.64 12%Uttarakhand 29 82 0 0 0 111 99.52 90%Haryana 45 45 20 138 0 248 248 100%
Central Zone Madhya Pradesh 35 36 0 61 100 232 229.27 99%Eastern Zone Orissa 44 29 48 109 153 383 230.45 60%
West Bengal 0 30 0 13 150 193 43 22%Total 207 390 101 251 572 1521
Percentage 14% 26% 7% 17% 38% 100%
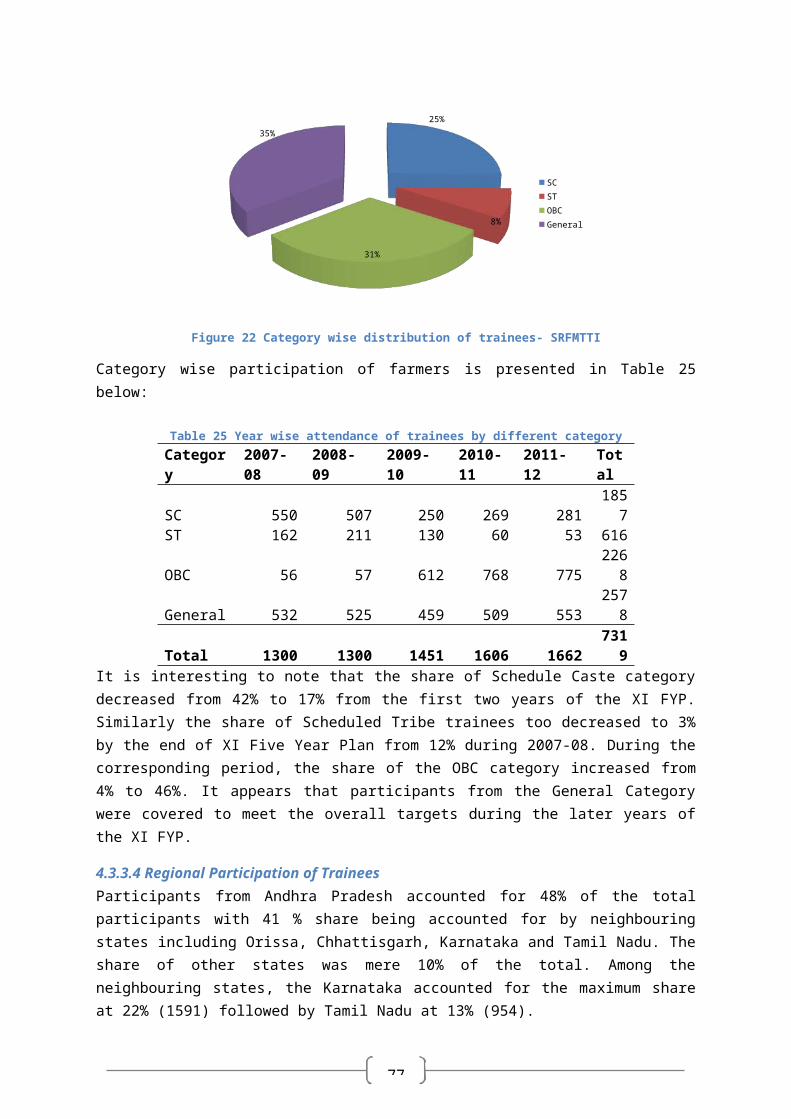
86
4.5.1 Fund release and utilization patternAndhra Pradesh: It may be noted that funds amounting to Rs 11 lakh was released to Andhra Pradesh during the year 2008-09. The fund was released to carry out the demonstration of newly developed agriculture equipment at farmers’ field. Out of Rs 11 lakh, Rs 7.66 lakh remained unspent by the end of the financial year 2012. Hence, only 3.34 lakh was utilized for the purpose of demonstration. During the field survey, the nodal officer of NABCONS tried to gather information on the activities demonstrated however despite repeated efforts, the concerned department did not provide any information on the progress.
Tamil Nadu: During the XI Five Year Plan Rs 313 lakh was released to Tamil Nadu of which 94% (Rs 294.12 lakh) are reported to be utilized. As per the information collected from the Department of Agriculture Engineering, Chennai, and Rs. 137. 11 lakh was utilized under the training component and Rs 96.7 lakh was utilized under the demonstration component. It may also be noted that during the last year (2011-12) against the targeted 503 demonstration activities, 501 were completed during the year 2012-13 and not during the XI Five Year Plan. Among the four states in South Zone, Andhra Pradesh, Karnataka, Kerala and Tamil Nadu; Tamil Nadu is the best performing state in implementation of the schemes. The funding for training has been utilized for payment of stipend, institutional charges, boarding, lodging and travel charges. Under the demonstration component, expenditure was incurred for hiring of prime movers wherever necessary, transporting equipment and attachments and to meet the cost of inputs, publicity, printing handout containing technical information of equipments selected for demonstration. As per the information provided by the DoAE, training and demonstrations are conducted in all the districts, except Chennai.
Both theoretical and practical sessions were organized during the training programs using experienced persons from Agri. Engg Dept and even resource persons from outside the Department. The practical sessions were conducted in AED and in reputed firms. Overall, the program was received well by both the training and demonstration participants, not only in terms of theoretical understanding about the machineries and its benefits but also practical aspects of its operations and maintenance.
Assam: As per the information made available by the Chief Engineer’s Office of Directorate of Agriculture, Govt of Assam, training programs have not been conducted for the farmers under PSAMTTD scheme of GoI. However, the Agriculture Engineering Wing has conducted demonstration of newly developed agriculture equipment/ machineries through demonstrations camps at various locations in the state. A total of 230 demonstration camps were organised during the XI Five Year Plan i.e. 5 demonstrations in the year 2007-08 and 225 demonstrations in the year 2008-09. The main aim was to increase adoption of mechanization resulting in enhanced production, reduce time of operations and encourage multiple cropping. As reported, only 580 farmers participated during the demonstration camps. The demonstrations were organized through Field Management Committees (FMC) which is organized throughout the state encompassing most of the villages of the plains of Assam. Hence, in order to gain feedback on demonstrations, the investigating team also visited three FMC clusters; Bhurbhanha DB in Morigaon, Bengenaati PPs under Pakhimaria DB and Mukundaati under Juria DB of Nagaon district.

87
It is evident that the activities were undertaken whenever the funds were provided to the state, i.e. during 2007-08 and 2008-09. As no financial assistance was provided from 2009-10 to 2011-12, no activities were organized. A total of Rs 57 lakh were provided during the XI Five Year Plan of which only Rs. 22.5 lakh were utilized accounting for 39% use.
Maharashtra: As per the information provided by Mechanization and Technology Division, a DoAC (MoA) fund to an extent of Rs. 6 lakh was not released. Only Rs 100 lakh was released during the 2011-12 in the month of March 2012. However no progress during the entire XI Five Year Plan was reported. The released amount of Rs 100 lakh was allocated to Maharashtra Agro Industries Development Corporation. It was informally gathered that the Maharashtra Agro Industries Development Corporation had already supplied 80% of the implement to Agriculture Universities within the state in recent past for organizing the activities. Since, the agriculture season was over by the time the Universities received the equipments no progress could be made.
Rajasthan: Only Rs 19 lakh was given to Rajasthan Agriculture Department under PSAMTTD Scheme for implementation of Training and Demonstration. However upon enquiry, it came to light that the department had not carried out any of programs during the XI Five Year Plan. Instead the funds were allocated to the Maharana Pratap University of Agriculture Technology for demonstration activity which has also not implemented any program under training component. The information provided by MPUAT indicates that 20 demonstrations of garlic seed planter and spice seed planters were organized during the year 2011-12 and two new implements were introduced with expenditure of Rs 19 lakh and Rs. 2.00 lakh respectively. This needs to be cross checked with the Department because the information provided by the MoA, Mechanization and Technology Division indicated an unutilized amount of Rs 19 lakh by the end of financial year 2011-12. Along with the demonstration activities, informal training sessions were reportedly organized for the beneficiaries. It is pertinent to note here that project allocation by the Government should be made well in advance as agriculture activities are seasonal in nature and any delay results in a cyclical lag.
Punjab: Under the PSAMTTD an amount of Rs 96 lakh was allocated during the year 2008-09 and with no allocation in later years. The training component was not implemented in the states. However frontline demonstrations were organised. Different farm machineries were demonstrated across 20 districts of Punjab. The Department has revalidated the unspent balance of Rs 28.17 pertaining to the year 2006-07 to be utilized during the year 2007-08 and was utilized for the purchase of machineries and front line demonstrations. A fresh sanction of Rs 96.04 lakh was given during 2008-09, out of which Rs 11.64 lakh was spent for organizing front line demonstrations. The unspent balance of Rs 84.40 lakh was refunded to the Dept of Agriculture and Cooperation, GoI after the XI Five Year Plan.
Out of total funding made available, only 12% was utilized. A total of 11085 demonstrations were organized covering area of 7500 ha. The total hours of demonstration amounted to 21,926 hours with an average time of 3 hours per ha of land which is significant.
The Officials of the Department indicated that the scheme has provided additional funds for purchase of farm machineries/equipment and therefore more demos have become possible. However the paucity of staff such as drivers and operators had resulted in inefficient utilization of machinery and capacity. Also, the machinery once used remains unattended for a long period of
88
time under the direct exposure of sun and rain which leads to higher rate of depreciation. It was also found during the interaction that machineries like Happy Seeder, Paddy Transplanter and Bed Planter were not adopted in adequate numbers either through purchase or custom hiring as they required additional skills to operate and maintain. For increasing the adoption rate of these machineries, intensive training on operations and maintenance will be required.
Uttarakhand: A total of Rs 111 lakh was allocated to the state during the first two years of the XI Five Year Plan with no allocations during the subsequent years. Funds amounting to Rs 29.41 lakh was allocated to Uttarakhand Seed and Tarai Development Corporations for demonstration of Laser Land Leveller during the year 2007-08 and Rs 82.33 lakh were allocated during the year 2008-09 for demonstration of other agriculture equipments such as Power Tiller, Raised Bed Planter, Weeder and Marker, Hauzrill etc. The allocated fund of 2008-09 was utilized for purchasing the machinery during the year 2009-10 and demonstration were mostly organized during the year 2011-12. Total 551 demonstrations were organized during the last year of XI Five Year Plan. The fund was utilized to the extent of 90% while 10% remain unutilized.
Madhya Pradesh: . In terms of physical progress, as reported by the Directorate of Agriculture Engineering, more than 10000 demonstrations were organized in addition to 61 training programs that too during the first two years of XI Five Year Plan. In case of financial allocation to the state, some discrepancies in respect of claims made by Directorate of Agri Engineering and Ministry of Agriculture were observed. As per the information provided by the Directorate of Agri Engineering, total available fund to be utilized during the XI Five Year Plan was Rs 298.47 lakh while the information from the Ministry of Agriculture, Mechanization and Technology Division indicates a total allocation of Rs 232 lakh. This needs to be revalidated. Going by the estimates of DoA, it was observed that out of total available fund amount of Rs 298 lakh, Rs 232.66 lakh was spent for training and demonstration of activities.
Odisha: Funds for demonstration of agriculture equipments were provided during each of the five years of the XI Five Year Plan. The total funds allocated during the period were Rs 383 lakh, out of which 60% (Rs.230.45 lakh) are reported to have been utilized. As per the information provided by the Directorate of Agriculture (Engineering Dept), from the year 2010-11 onwards, funds were utilised for two components i.e. procurement of agriculture machineries and organizing demonstration programs at the field level. As per the report, expenditure incurred in procurement of equipments/machineries during 2010-11 and 2011-12 were Rs.44.58 lakh and Rs.73.96 lakh, respectively, and for organizing demonstration during the same years were Rs.64.51 and Rs.18.14 lakh, respectively. Thus a total amount of Rs.211.12 was used for procurement and demonstration during the last two years of the XI FYP. The data needs to be revalidated at the level of department because of the differences in expenditure statements.
The Directorate has taken good initiatives to popularize newly developed equipments in the State. The Directorate has reported that it organised 2473 and 685 demonstrations during the years 2010-11 and 2011-12, respectively, totalling to 3158 demonstrations. Thirty districts were covered across three zones; North Zone, Central Zone and South Zone of the State.
West Bengal: During the XI FYP Period, the State was allocated Rs.193 lakh for demonstration of agriculture equipments for Promotion and Strengthening of Agriculture Mechanization. The
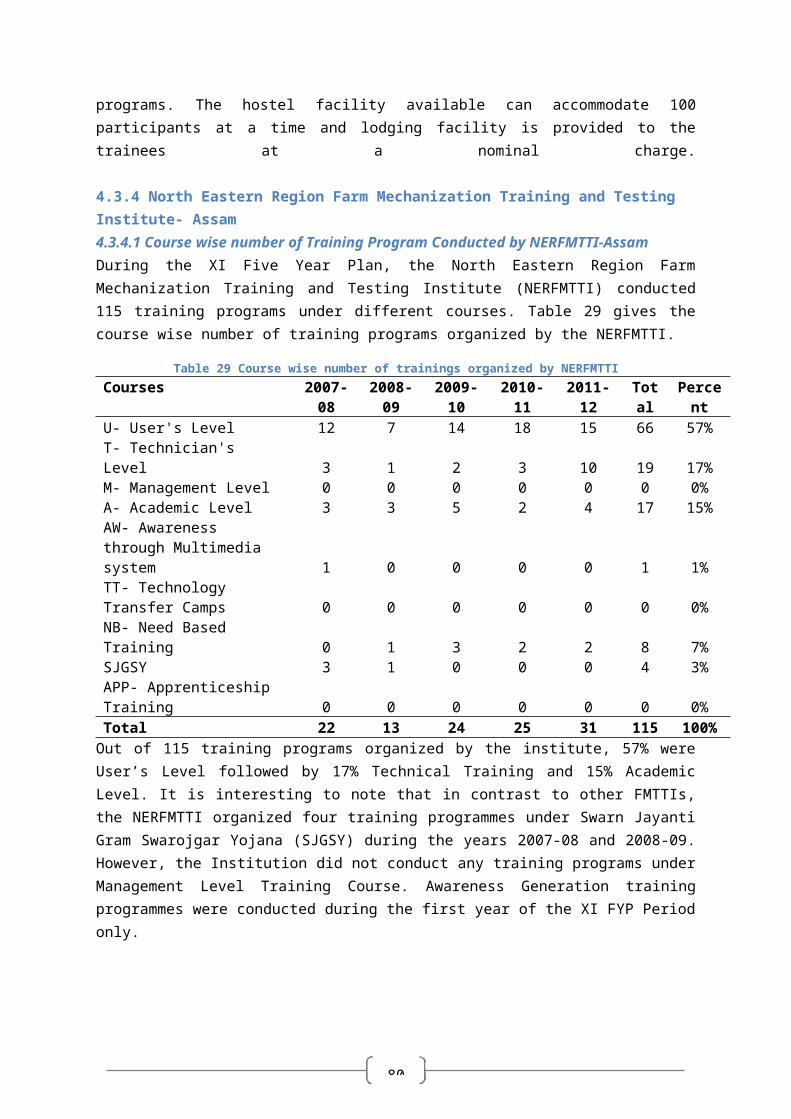
89
information provided by the Mechanization and Technology Division, MoA, reveals that Rs.43 lakh constituting merely 22% of the allotted funds were utilised during the entire XI Five Year Plan.
Central Institute of Agriculture Engineering (CIAE, Bhopal): Central Institute of Agriculture Engineering located at Bhopal has also conducted training programmes through Krishi Vigyan Kendras. The Institute has conducted 20 courses of agriculture engineering during the entire XI Five Year Plan covering a total of 418 participants. In addition to the specific course on agriculture engineering, the institute has also conducted several training programme covering a range of topics which are presented in table 50 below:
Table 50 Training programs organized by CIAE-BhopalContent Training (No) Duration (days) Participants (no)
Repair and maintenance of farm machinery 8 29 80Water Management 8 2 224Micro Irrigation System for Orchard 3 2 48Income Generation for rural women 9 6 225Drudgery reduction for women through technology
19 4 479
Value Addition 35 6 766Training on improved implements and its matching equipments
27 2 536
Electric Motor rewinding 3 25 38Total 112 2390In all 112 training programs were organised covering 2390 participants during the XI Five Year Plan. Field Level Demonstrations were also organized for different farm implements. The list of equipments under Field Level Demonstrations and their impact may be seen in Annexure- 9
Overall Performance: Overall performance of the scheme implemented by the State Government is found to be satisfactory. Out of 11 sample states, 5 states have utilized more than 90% of the funds for demonstration activities and also made significant progress at the field level for popularising the newly developed machinery and equipments and creating awareness among the primary users of the equipments. Uttarakhand and Haryana in the Northern Region performed exceedingly well during the XI Five Year Plan utilising more than 90% of the allocated fund. However, Punjab, one of the most developed States of the region utilized only 12% of the allocated fund. In terms of physical progress though, the state has done highest number of front line demonstrations when compared to other States in the sample. One of the reasons for low utilisation of the funds in Punjab could be that, being agriculturally developed state, the agriculture equipments used under demonstrations are already well known to farmers and the adoption rate is also higher than other states. The States in the Eastern and North Eastern States need to improve their performance which is indicated by the data presented in table 48 above.
Table 51 below gives the details of equipments purchased, demonstrated and training programs conducted in different sample states covered under the study.
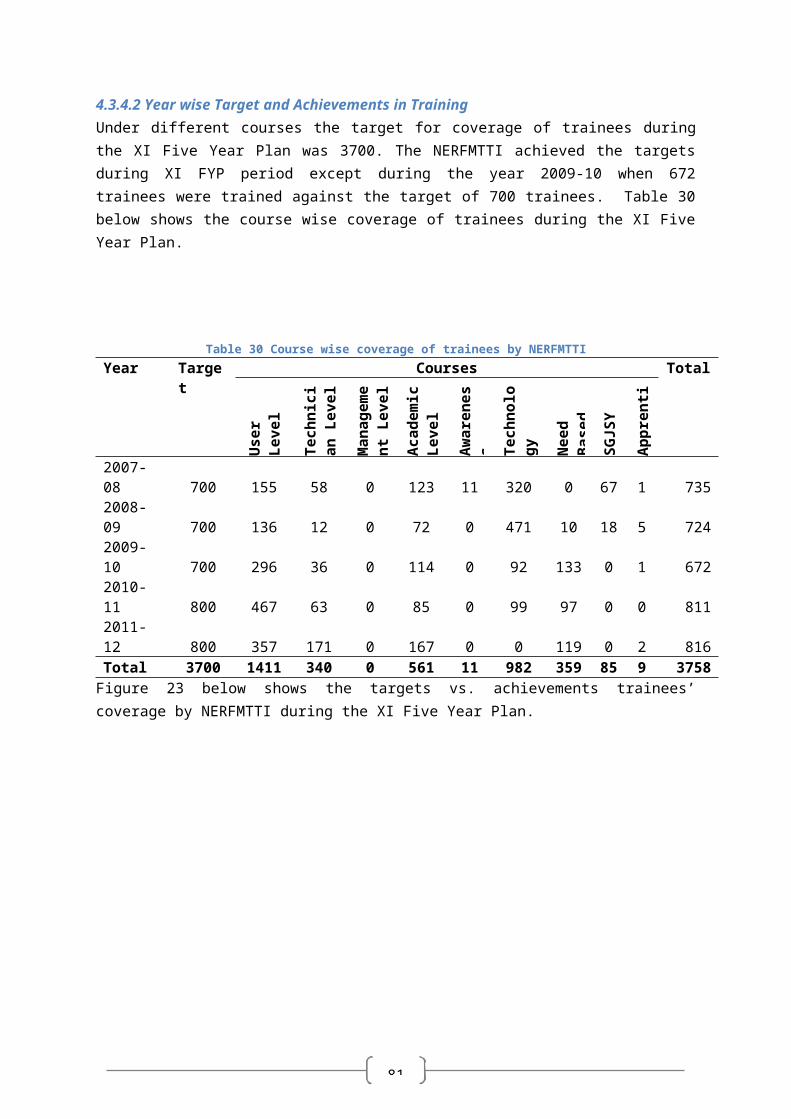
90
Table 51 State wise types of implements procurement and demonstrated under the PSAMTTD SchemeState Types of Implement Procured Types of Implement
DemonstratedTopics of Training Program Remark
Andhra Pradesh Not Reported Not Reported Not Reported Not applicable Tamil Nadu 1. Self Propelled Paddy
Transplanter2. Rotavator3. Offset Disc Harrow4. Sub soiler5. Post Holde digger6. Raised bed planter7. Laser land leveller
1. Package of Agriculture Machinery for paddy cultivation
2. Package of agriculture machinery for sugarcane cultivation
3. Water management through sprinkler and drip irrigation and water saving devices
4. Selection Operations and maintenance of Plant protection equipment
Govt provide 100% assistance for training and demonstration, for procurement of machineries and contingency expenditure, however extra assistance are given for infrastructure development.Conducting training in all the districts is a laborious activity for section officers as they are handling several projects at a time. Establishment of training centres in every district with staff component who will intensively work on training and promotion of farm machineries. The contingency expenditure towards demonstration is insufficient because transporting machineries at field level varies from place and approachability. This may be taken into consideration.
Assam 1. Potato Planter2. Tractor drawn
rotavator3. Zero till drill4. Potato digger5. Self propelled reaper
Not applicable
Maharashtra 1. Paddy Transplanter2. Paddy Reaper/ harvester3. Paddy Thresher4. Weeder/ Brush Cutter5. Self Propelled Cotton
Slasher6. Power Weeder7. Cycle operated Pump set8. Cycle Operated Spray pump
Nil Not Available. No demonstrations were conducted during the period. Earlier this program was not implemented however; trainings were organized at SAUs. The equipments such as Zero Till Dril could not get popularised because of its non suitability to soil type of the state. The equipments like Combine harvester and laser land leveller has not been adopted due to its cost factor.
Rajasthan Not Available 1. Self Propelled Reaper-10 Not Applicable Timely allotment of funding is necessary to
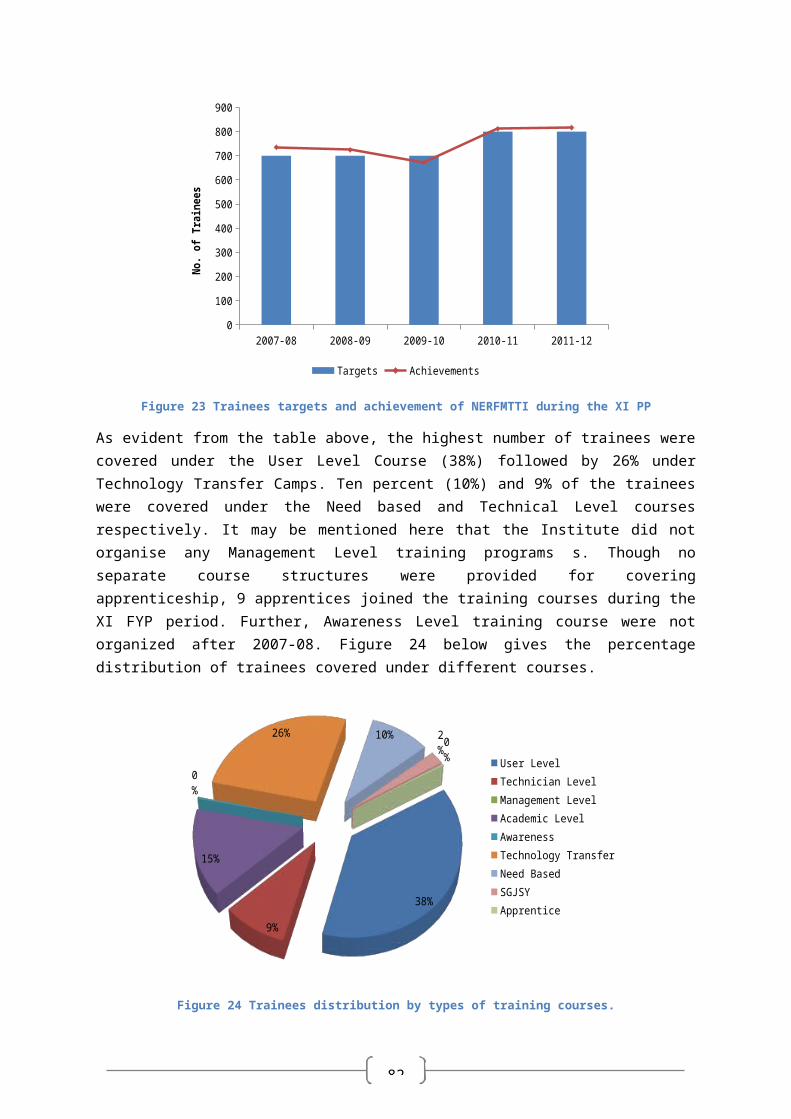
91
State Types of Implement Procured Types of Implement Demonstrated
Topics of Training Program Remark
2. Reaper Binder-73. Multi crop thresher-224. Rotavator-205. Roto till drill-96. Post hole digger- 197. Aero blast sprayer- 28. Seed spices planter- 149. Garlic Planter- 4810. Seed spices thresher- 1611. Air sleeves boom
sprayer- 6
implement the project on time. Any delay results in time lag of at least 1 year.
Punjab Not Available 1. Raised bed planter2. Happy seeder3. Rotavator4. Forage Chopper Cum
loader5. Forage reaper6. Zero till drill7. Paddy transplanter8. Laser Land leveller9. Zero Till Drill
Not applicable The paucity of staff members such as drivers and operators is resulting in inefficient utilization of the capacity. The adoption of machineries such as happy seeders, paddy transplanter and bed planter due to deep rooted agriculture practices as well as additional skills required in operations and maintenance o f these equipments.
Uttarakhand 1. Laser Land Leveller-32. Tractor- 33. Plain Leveller-24. Harrow-35. Power Tiller-66. Ragi Thresher-407. Seed Drill- 358. Weeder and Marker-959. Mini Rotary Tiller-1110. Straw Reaper-1011. Raised Bed Planter-1012. Houzrill Irrigator-2
1. Power Tiller- 402. Ragi Thresher- 1603. Seed Drill- 1404. Weeder- 1905. Straw Reaper- 406. Mini Rotary Tiller- 687. Haus reed irrigator- 8
Not Applicable Performance of demonstration of machinery is better in plain area vis a vis hilly area. In hilly areas, Smaller land holding and only 25% subsidy on the equipment farmers are disinterested in accepting advanced and bigger equipments such as power tiller could not be used.
Madhya Pradesh 1. Rotavator
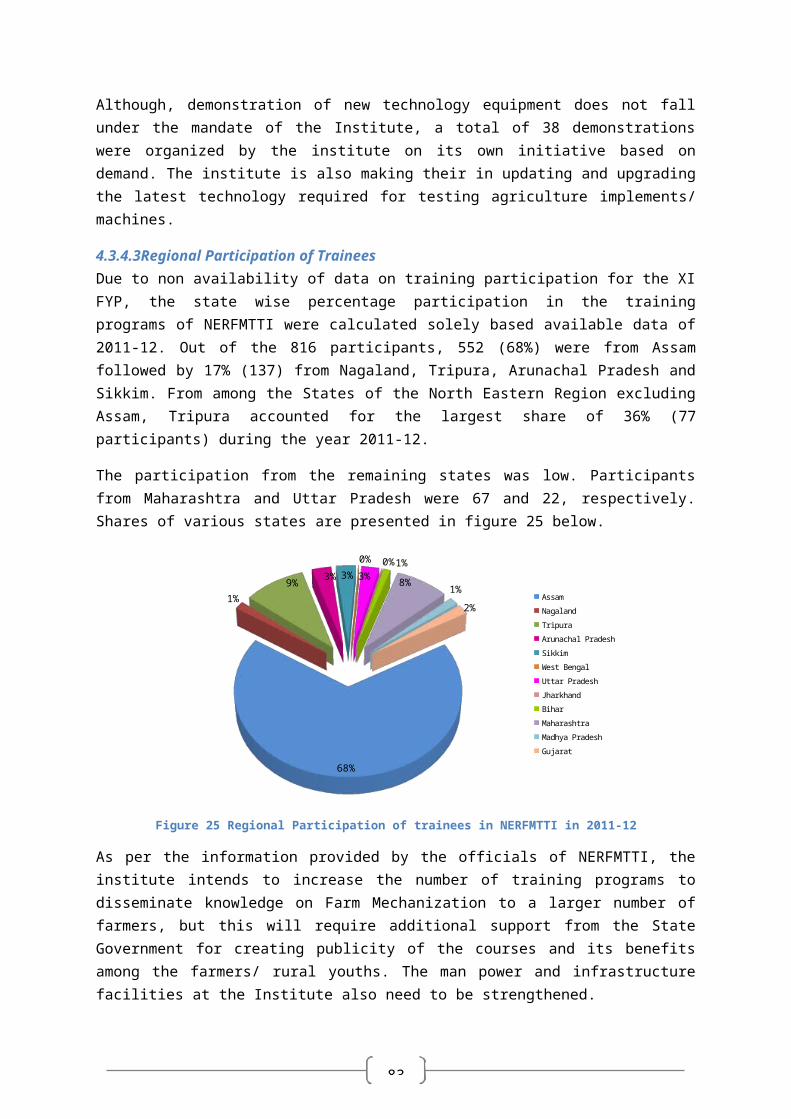
92
State Types of Implement Procured Types of Implement Demonstrated
Topics of Training Program Remark
2. Seed Drill3. Tractor4. Wheat Seeder5. Soyabean seeder6. Cultivator7. Reaper
Orissa 1. Seed cum fertilizer drill2. SRI Weeder3. Zero Till drill4. Maize sheller5. Laser guided leveller6. Rotavator7. Self Propelled transplanter8. Brush cutter9. Power Weeder10. SP Rice Transplanter11. Potato Planter12. Bund former13. Sugarcane ridger14. Cono weeder15. Paddy Reaper16. Brush cutter17. Drum seeder
1. SP Paddy Transplanter2. AF Paddy Thresher3. Power Weeder4. Potato Planter5. Seed Cum fertilizer Drill6. Inclined Plate planter7. Brush cutter8. Rotavator9. S. Flower thresher10. Laser leveller11. Cono/ Ragi Weeder12. Drum Seeder13. Groundnut thresher14. SRI Weeder15. Potato Planter

93
4.6 Beneficiary Response on Outsourcing of Training cum Demonstration Component under PSAMTTDTo evaluate the usefulness, effectiveness and adequacy of Training and Demonstration Programs being organized by Directorate of Agriculture through their extension wings, interactions were held with beneficiaries using a structured questionnaire. The states like Tamil Nadu, West Bengal, Odisha and Madhya Pradesh have organized training programs in addition to demonstration activities. The findings are presented separately for both training and demonstration activities in the subsequent paragraphs.
4.6.1 Demographic Profile of RespondentsThe demographic details of the sample beneficiaries surveyed under Outsourcing of Training Component are presented in table 52 below.
Table 52 Demographic details of training beneficiaries of outsourcing training componentState
Tamil Nadu West BengalMadhya Pradesh Odisha Total
No % No % No % No % No %Total Samples 42 100% 42 100% 24 100% 49 100% 157 100%Male (No) 36 86% 20 48% 19 79% 49 100% 124 79%Female (No) 6 14% 22 52% 5 21% 0 0% 33 21%Age (Years)
Average10 49 (12.17) 36.28 (10.12) 27.15(13.79
) 44.93 (10.57) 40.9 (13.59)Minimum 28 - 19 - 18 - 29 - 18 -Maximum 76 - 60 - 68 - 72 - 76 -CategorySC 3 7% 18 43% 1 4% 9 18% 31 20%ST 0 0% 0 0% 3 13% 3 6% 6 4%OBC 36 86% 8 19% 13 54% 17 35% 74 47%General 3 7% 16 38% 7 29% 20 41% 46 29%EducationPrimary 10 24% 6 14% 5 21% 11 22% 32 20%Secondary 21 50% 22 52% 1 4% 18 37% 62 39%Higher Secondary 9 21% 5 12% 15 63% 3 6% 32 20%Graduate & Higher 2 5% 3 7% 0 0% 10 20% 15 10%None 0 0% 6 14% 3 13% 7 14% 16 10%Land Holding (Acre)Average 6 (9.45) 2.39 (2.59) 4.95 (6.51) 18.03 (16.65) 8.53 (12.83)Minimum 1 - 1 - 1 - 1 - 1 -Maximum 50 - 14 - 32 - 70 - 70 -SC 3 - 1.1 - 7 - 19.33 - 9.46 -ST NA - NA - 2.67 - 9.66 - 6.16 -OBC 5.26 - 1.5 - 5.93 - 13.91 - 6.92 -General 17.33 - 3.25 - 3.86 - 22.44 - 12.38 -
10 Figures in parentheses indicates the standard deviation.
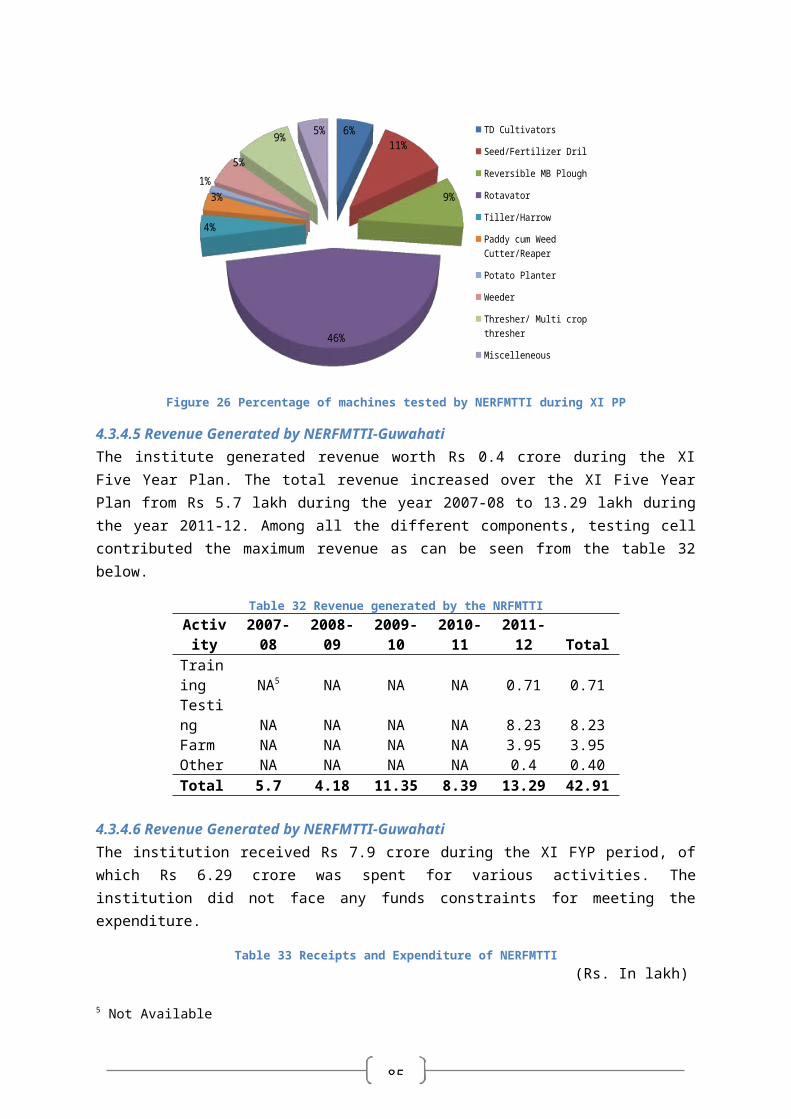
94
In the 4 States covered by the study, 157 beneficiaries were covered under the training programs, of the Outsourcing Training Component. Of the total respondents, 79% were males while 21% were females. The maximum number of responses of female beneficiaries was from West Bengal, with 52% female respondents. No female respondents were found in Odisha.
The average age of the beneficiaries was 41 years, lowest being in Madhya Pradesh and highest being in Tamil Nadu. Out of 157 respondents, 47% belongs to OBC, 29% to General Category, 20% Schedule Castes and only 4% to Scheduled Tribes. The responses from tribal beneficiaries were from West Bengal and Odisha. No tribal beneficiaries were found in Tamil Nadu and West Bengal. With regards to literacy, 60% of the total beneficiaries have education up to primary and secondary level while 10% of the beneficiaries had no formal education at all.
The average land holding of the farmers was 8.54 acres, highest being in case of Odisha (18.03 acre) and the lowest being in West Bengal (2.39 acre). The average holding among the farmers belonging to General Category was the highest at 12.38 acres, for all the states surveyed.
The average duration of training was 4 days ranging from 1 day to 15 days.
4.6.2 Sources of InformationThe primary sources of information on Training Programs to beneficiaries were friends/ fellows, agriculture institutes/ training institutes and Government Officials of the concerned department. Of the total 157 respondents, 57% got the information of training program from Government Officials, 23% from their friend/ fellows and 17% from institutes such as KVKSs, IITs, Polytechnic Institutes, etc. Figure below presents the sources from which the beneficiaries have received the information under outsourcing component.
West Bengal Madhya Pradesh Odisha Tamil Nadu Overall0%
10%
20%
30%
40%
50%
60%
70%
40%38%
24% 23%
60%
50% 51%
64%
57%
8%
2% 2%4%
47%
5%
17%
7%2%
Fellow & Friends Print & Web Media Being Popular ProgramInsitutions Government Officials
Figure 30 Sources of Information under Outsourcing of training component
As evident from the figure 30 above, being a Government Sponsored Program, in all the sampled states, the major source of information was the Government Officials who disseminated the information for training program which in turn was disseminated to other beneficiaries through their relatives and friends. In Odisha, the trainees were selected by the Government officials and the sponsoring institutions.
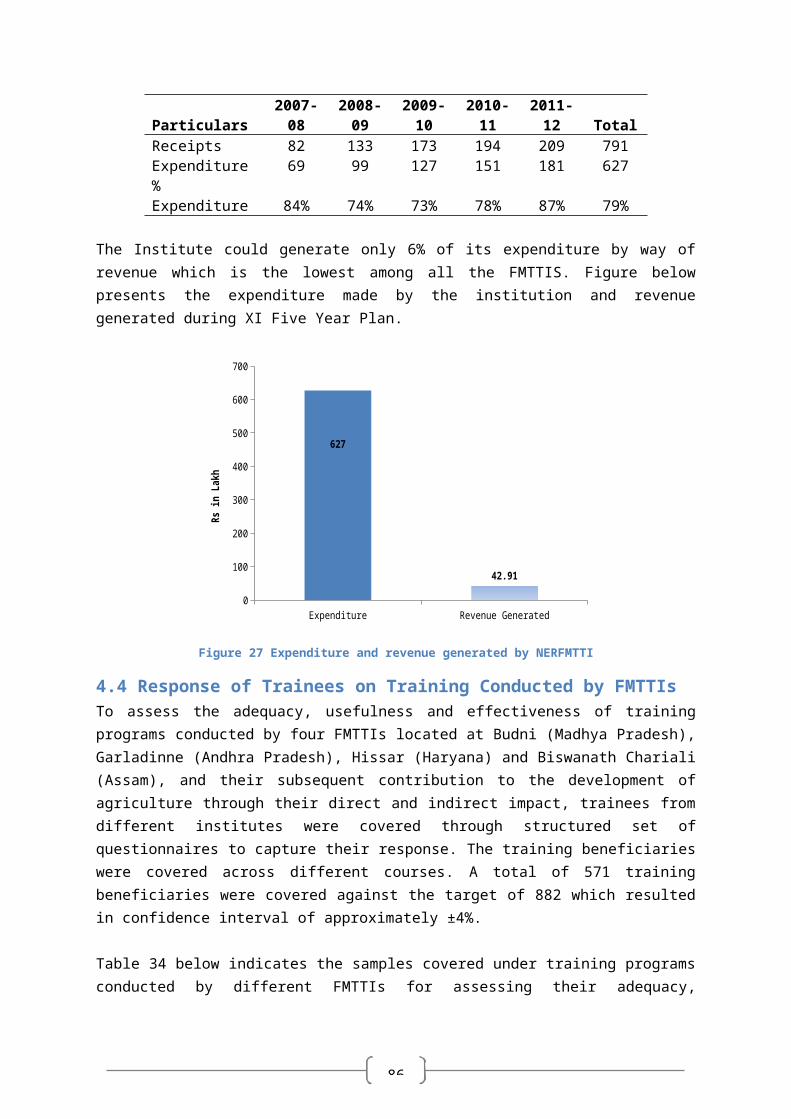
95
4.6.3 Motivation for attending the training programThe motivation for attending the training/ training cum demonstration program among the beneficiaries has been evaluated on six options and the findings are presented in figure 31 below.
West Bengal Madhya Pradesh Odisha Tamil Nadu Overall0%
10%
20%
30%
40%
50%
60%54%
28% 28%29% 32%
25%20%
29% 28% 27%
8% 9%
24%
2%
13%14%
37%
3% 4%9%
6%
16%
33%
17%
6%1%
3% 2%
Enahnce Skills and Improve Efficiency Increased Awareness of Improved Access to Tech Improve Farm Productivity
Addional Employment Opprotunity Subsidized Course Utilize Spare Time
Figure 31 Motivation for attending training program.
From the above figure it can be seen that, most of them being farmers (32%), the most important motivation was to improve on their skill base and subsequently improve production (27%). Interestingly, in case of Madhya Pradesh most of the beneficiary responses (37%) indicated ‘Free Training’ followed by Improving Skills. In Tamil Nadu, Improving Productivity is the most important motivator for joining the training course. Thus, overall, the motivating factor for joining the training courses was Increasing Skill and Awareness which can help increase the farm productivity.
4.6.4 Effectiveness of training programTable 53 and table 54 present the beneficiaries response on relevance, appropriateness, provision of training material, usefulness of course material and Length of training programs.
Table 53 Beneficiary's response relevance of training and appropriateness of ContentStates
Relevance of Training ProgramAppropriateness of
Training Content
Relevant %Partially Relevant %
Not Relevant % Yes %
No %
West Bengal 38 24% 4 3% 0 0% 42 27% 0 0%Madhya Pradesh 22 14% 2 1% 0 0% 23 15% 1 1%Odisha 49 31% 0 0% 0 0% 45 29% 4 3%Tamil Nadu 33 21% 9 6% 0 0% 40 25% 2 1%
Overall 14290% 15
10% 0
0% 150 96% 7 4%
Of the total number of beneficiaries who attended the training programs 90% opined that the Training cum Demonstration Programs conducted were relevant and 10 percent felt it to be partially relevant considering the duration of the training. On an average, the duration of the training was 5 days and the respondents felt that it could be increased to at least 10 to 14 days. None of the

96
participants felt that the training program was not relevant. Therefore, the training programs had met the desired objectives of disseminating the information about new machineries to the farmers and prime operators. With regards to appropriateness of training content, 96% of the beneficiaries felt it to be appropriate and properly designed according to the training program. Only 4% of the beneficiaries felt that the training contents were not appropriate.
Table 54 Beneficiaries response on Course material, usefulness and duration of TrainingStates Provision of Training
Material Usefulness of Course MaterialLength of Training
Program
Yes %No %
Useful %
Partially Useful %
Not Useful % Yes %
No %
West Bengal 4227% 0
0% 41
26% 1
1% 0
0% 36
23% 6 4%
Madhya Pradesh 22
14% 2
1% 23
15% 1
1% 0
0% 24
15% 0 0%
Odisha 4931% 0
0% 49
31% 0
0% 0
0% 46
29% 3 2%
Tamil Nadu 4126% 1
1% 40
25% 2
1% 0
0% 35
22% 7 4%
Overall154
98% 3
2% 153
97% 4
3% 0
0%
141
90% 16
10%
As a part of training program, reading materials were also distributed to the trainees. However 2% of the trainees indicated that they did not receive the reading material. Of the total beneficiaries who received the training material, 97% considered it to be useful while 3% considered it to be partially useful. It is possible that they found them difficult to understand, on account of literacy factors as well. Of the total beneficiaries, 90% felt that the length of training programs was adequate while 10% felt that the duration could be extended to ranging from 10 to 30 days. However majority of them opined that the duration could be extended to 2 weeks.
4.6.5 Appropriateness of Training LogisticBeneficiaries perception on appropriateness of training logistics were evaluated on four parameters, viz, adequacy of training material, boarding and lodging facilities provided, equipment/ machineries provided/ demonstrated during the training and presence/use of audio visual aids during training.
Table 55 Beneficiary's response on adequacy and appropriateness of logistic arrangementState
Training Material Boarding/lodging facilitiesEquipment/
machinery provided Audio/Visual Aids
Adeq
uate
% Inad
equa
te
% Satis
fact
ory
% Parti
ally
Sa
tisfa
ctor
y
% Not
Sa
tisfa
ctor
y
% Adeq
uate
% Inad
equa
te
% Yes
% No %
West Bengal 42
27% 0
0% 42
27% 0 0% 0
0% 39
25% 3
2% 36
23% 6 4%
Madhya Pradesh 24
15% 0
0% 23
15% 1 1% 0
0% 24
15% 0
0% 24
15% 0 0%
Odisha 4931% 0
0% 35
22% 13 8% 1
1% 47
30% 2
1% 34
22% 15
10%
Tamil 34 22 8 5 30 19 7 4% 5 3 40 25 2 1 31 20 11 7%
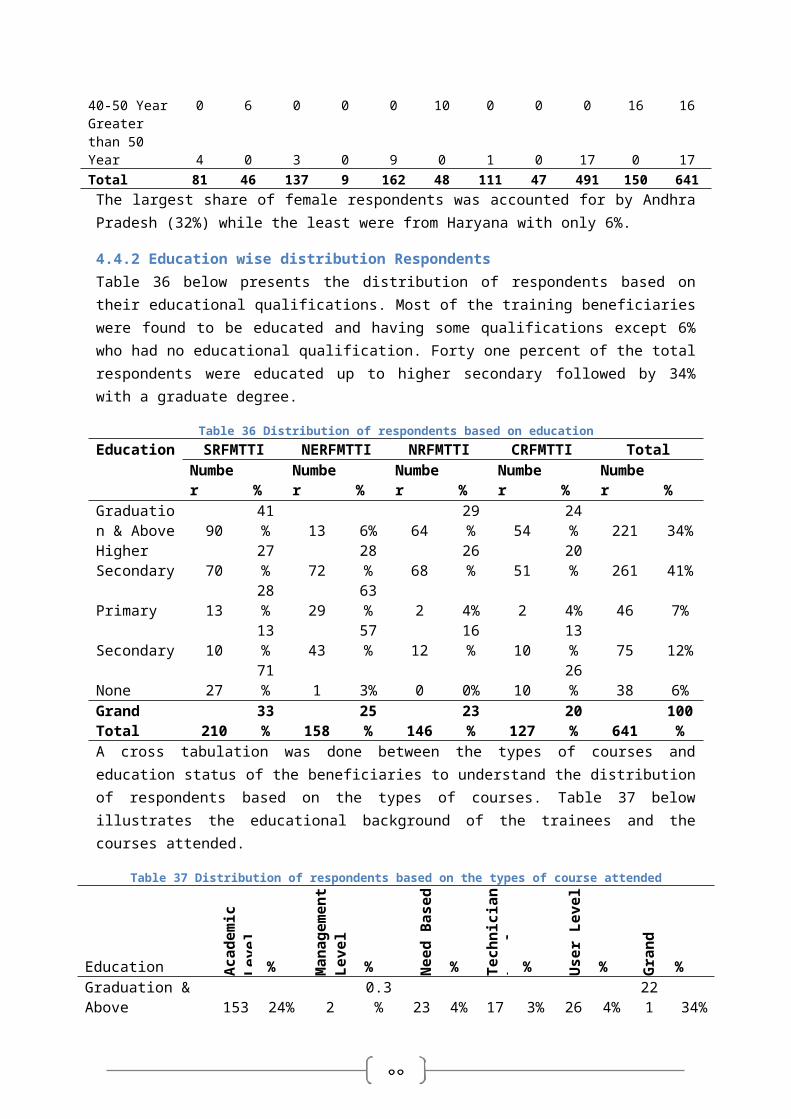
97
Nadu % % % % % % %
Overall14
995% 8
5%
130
83% 21
13% 6
4%
150
96% 7
4%
125
80% 32
20%
As evident from the table 55 above, 95% of the beneficiaries indicated that material provided during the training programs was adequate to help them to understand the process of operations and only 5% indicated it to be inadequate. These 5% were from Tamil Nadu. With respect to boarding and lodging facilities provided during the training and demonstration, 83% were satisfied with the facilities while 13% were partially satisfied and 4% indicated as not satisfied. The basic reasons indicated were quality of food and inappropriate lodging arrangements. The highest percentage of such response was recorded from Tamil Nadu. Highest proportion of partially satisfied beneficiaries belonged to Odisha indicating the need for improvement in facilities.
Of the total beneficiaries, 96% indicated that they got adequate exposure to usage of machinery and equipment during the training/ demonstration session while 4% indicated that exposure was inadequate. This calls for a need for the facilitator of the training program to be attentive observer during demonstration and training to ensure active participation of all during the practical sessions. Eighty percent of the participants opined that they were exposed to audio visual sessions during the training program while 20% indicated that audio visual aids were not used. Hence, the overall perception of the beneficiaries with regards to appropriateness of training is positive and multiple methods where used during the training programs. Care may have to be taken to improve boarding and lodging arrangements in future.
4.6.6 Utilization of Training Skills post Attendance of Training ProgramOut of 157 respondents from four different States who have undergone training courses organized by State Governments 129 (82%) indicated that they have utilized the skills and knowledge gained from the training in some way or the other. Around 27% of the total sample indicated that they have adopted the technology either by purchasing or custom hiring the equipments/ machineries after attending the training program. The post training adoption rate was highest in Odisha at 63% followed by Tamil Nadu at 19%.
Table 56 A - Post training use of training skills- outsourcing of training componentState
TotalAdoption of New
Equipment/machineryBetter Operation and
MaintenanceEfficient use of
Machinery
Use
d
% Not
Use
d
% Yes
% No % Yes
% No % Yes
% No %
West Bengal 22 14% 20
13% 2 1% 40 25% 13 8% 29
18% 0
0% 42
27%
Madhya Pradesh 24 15% 0 0% 2 1% 22
14% 10 6% 14 9% 0
0% 24
15%
Odisha 49 31% 0 0% 3120% 18
11% 35
22% 14 9% 3
2% 46
29%
Tamil Nadu 34 22% 8 5% 8 5% 34
22% 13 8% 29
18% 4
3% 38
24%
Overall12
9 82% 2818% 43
27%
114
73% 71
45% 86
55% 7
4%
150
96%
Out of 157 beneficiaries, 71 (45%) stated that they are in a better position to operate and maintain the equipments and machinery after attending the training program. However, 4% of the
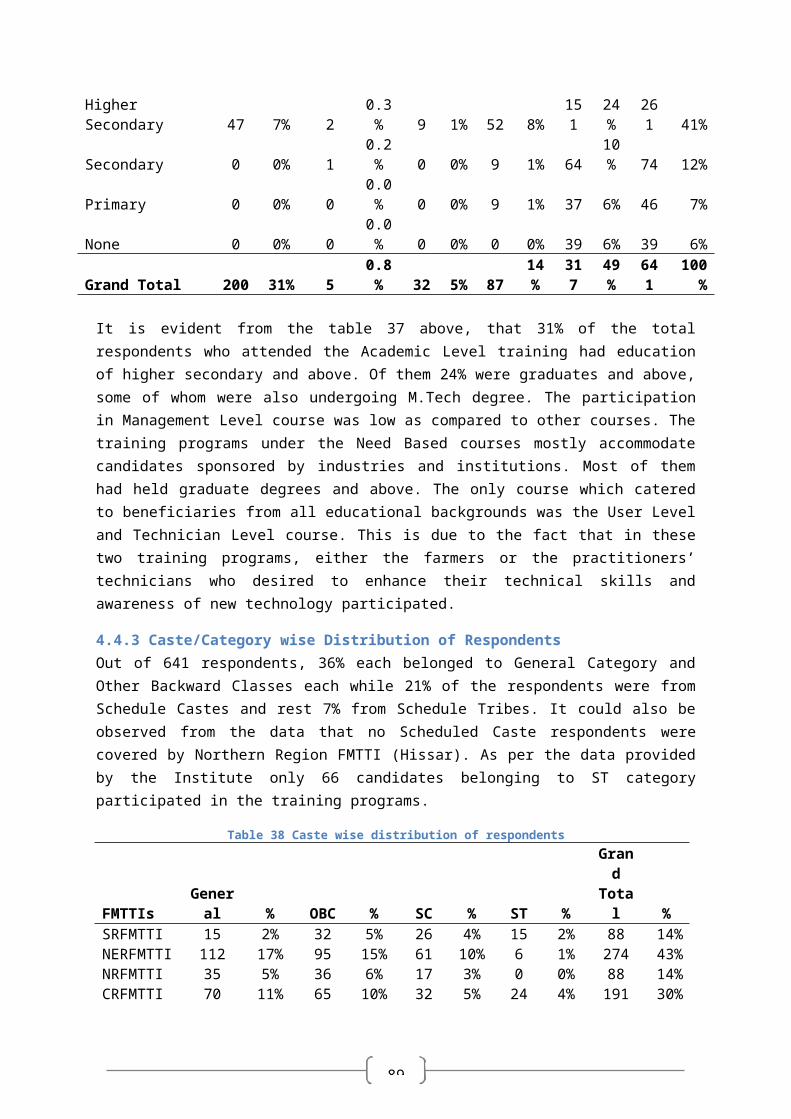
98
beneficiaries also indicated that the training inputs have helped them to use equipments more efficiently, reducing fuel consumption. The remaining 96% did not make any observation on this factor. The highest proportion of beneficiaries who adopted the new equipment/machineries belonged to Odisha.
Table 57 B- Post training use of training skills- outsourcing of training componentState
Lesser frequency of Breakdown
Change in farm management
practicesTraining/ Helping
other farmersAdditional
Employment
Yes
% No
% Yes
% No
% Yes
% No
% Yes
% No
%
West Bengal 1 1% 4126% 7 4% 35 22% 0 0% 0 0% 1 1% 41
26%
Madhya Pradesh 5 3% 19
12% 10 6% 14 9% 14 9% 10 6% 12 8% 12 8%
Odisha 10 6% 3925% 23
15% 26 17% 42
27% 6 4% 8 5% 41
26%
Tamil Nadu 6 4% 3623% 19
12% 23 15% 20
13% 22
14% 4 3% 38
24%
Overall 2214%
135
86% 59
38% 98 62% 76
48% 38
24% 25
16%
132
84%
Of the total beneficiaries, 14% reported lesser breakdown of the machineries as compared to pre training period. Further, 38% of the beneficiaries reported change in overall farm management practices. Out of the participants claiming change in farm management practices, 15% belonged to Odisha, 12% to Tamil Nadu while the lowest 4% were from West Bengal. The multiplier effect is largely observed in Odisha where 27% of the total 76 respondents said they have helped and trained other farmers followed by Tamil Nadu (13%). None of the samples in West Bengal responded to have shared the leanings with other farmers. Around 16% of the farmers, after attending training courses also reported that they are able to generate additional income, the largest among them being from Madhya Pradesh (8%). Hence the overall achievement in terms of utilization of skill gained after attending the training program organized by DOA is significant with results in Odisha and Tamil Nadu being better than the other two states. Those who have not adopted farm mechanisation, post training indicated that lower subsidy and lack of finance to procure/ purchase such equipments as the constraints. Equipments such as laser land leveller require longer training duration to improve post training adoption. Since these equipments are expensive and not easily available in adequate numbers in the market, Custom hiring is more prevalent. Increase in subsidy for purchase of equipment/ machinery can be thought of to encourage outright purchase by more service providers which would improve the price competitiveness and improve adoption of farm mechanisation. Another constraint in case of laser land leveller as indicated by the beneficiaries is lack of properly trained operators. In Rohtak during the study period, it was found, that there are four laser levellers available with Agriculture Department which are lying idle for want of repairs and even when these were operational, the Department faced problems in providing services to farmers on time due lack of trained operators.
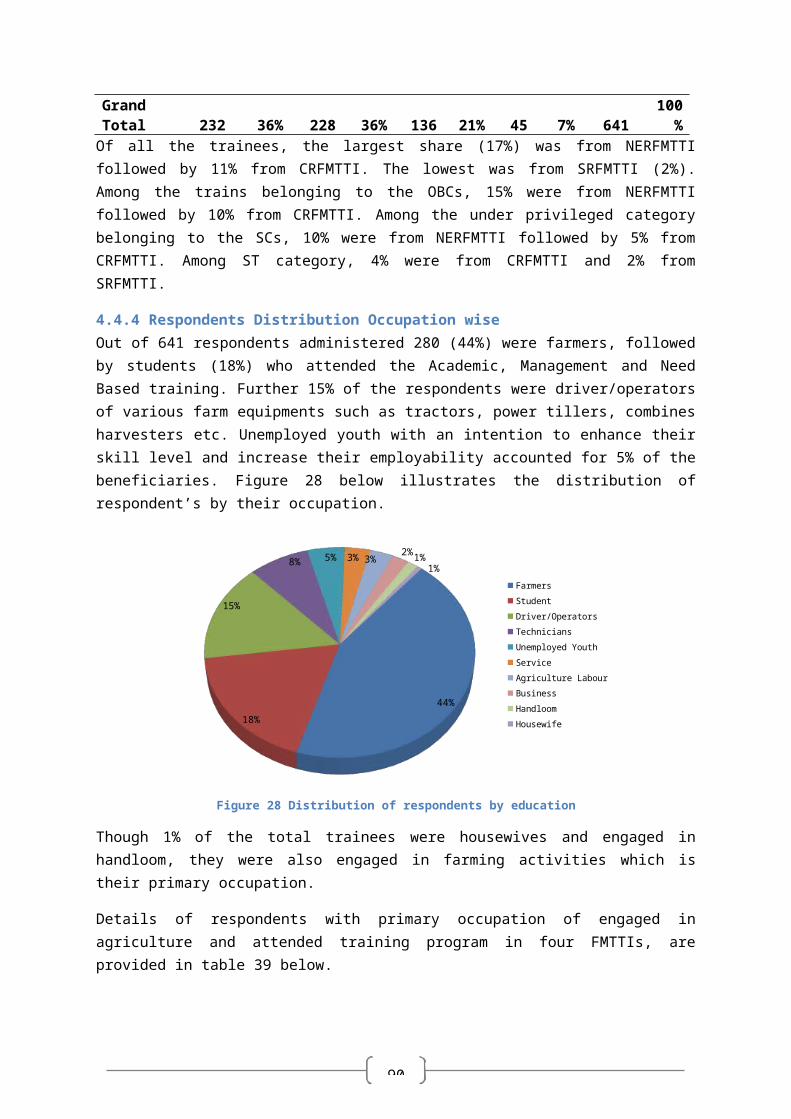
99
Repairing is also a time consuming process as it involves sanctioning procedure from the Centre and machinery parts have to be carried to Gurgaon as repairing facilities are not available in the district.
4.6.7 Types of Training Program cum demonstrationTable below presents the types of training programs organized by State Governments in sample states. This section will complement the later section on impact of machineries on different variables.
State Types of training program/demonstration/machineries
West Bengal Various Agriculture Implements &Water saving technology using sprinkler and drip
Women Friendly Equipment
Madhya Pradesh
Laser land leveller & Rotavators Self Propelled Transplanter
Odisha Laser land leveller Rotavator
Tamil Nadu Package of ag. Machine for paddy cultivation Water management through drip and sprinkler irrigation Selection Operation and maintenance of plant protection equipment
4.6.8 Impact of training on different Impact variables.Impact of the training conducted under the component of ‘Outsourcing of Training’ has been quantified on select variables such as change in production, reduction in time spent on field operations, reduction in duration of irrigation, reduction in volume of irrigation, change in income from farm due to increased production, opportunities created for additional income, reduced of time spent in intercultural operations and change in skill levels. Table 58 below presents the beneficiaries’ response who attended the training cum demonstrations on different impact variables.
Table 58 Percentage response on impact indicators by trainees of outsourcing componentState Tota
lIncreased Productio
n
Reduction in Time of
field preparatio
n (Hrs)
Reduction in Volume of Water
for Irrigation
Increased Income
from Farm
Reduced Time for
Interculture
OperationsChange in Skill Level
Post
Tr
aini
ng
% Post
Tr
aini
ng
% Post
Tr
aini
ng
% Post
Tr
aini
ng
% Post
Tr
aini
ng
% Post
Tr
aini
ng
%
West 42 11 26% 15 36% 29 69% 2 5% 2 5% 39 93%
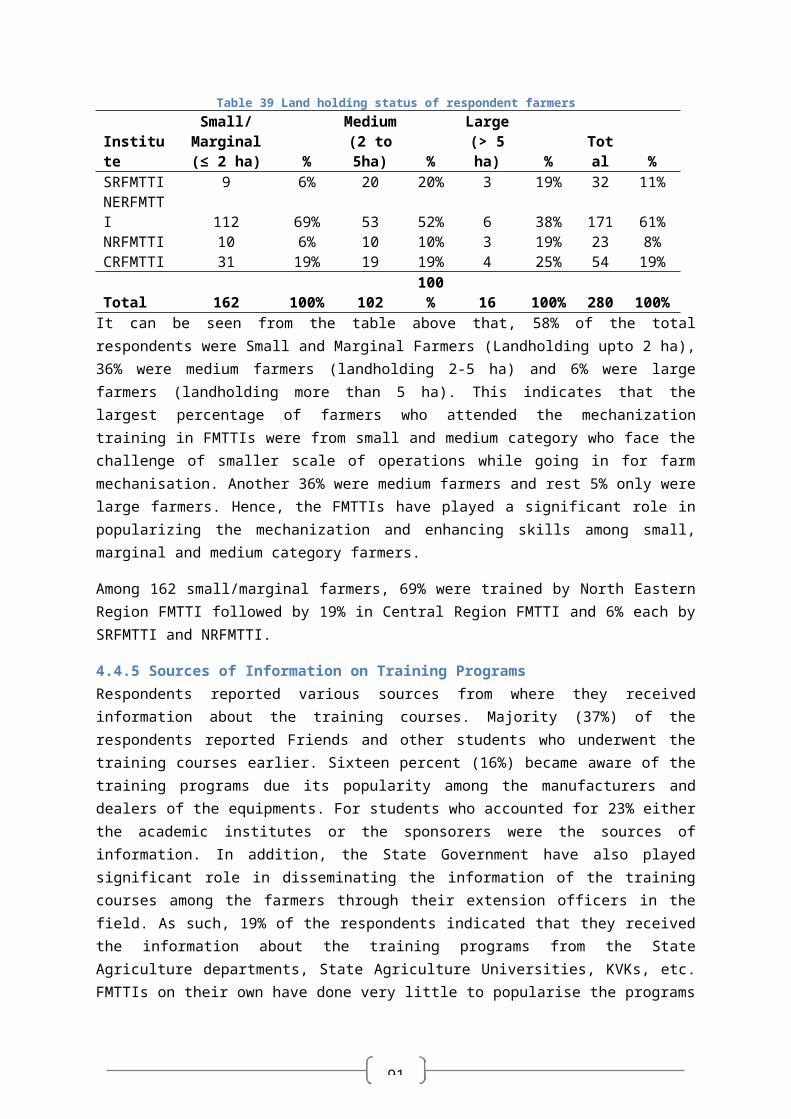
100
BengalMadhya Pradesh 24 14 58% 9 38% 21 88% 8
33% 7 29% 22 92%
Odisha 49 32 65% 43 88% 8 16% 3776% 45 92% 47 96%
Tamil Nadu 42 23 55% 25 60% 26 62% 2662% 9 21% 31 74%
Overall 157 80 51% 92 59% 84 54% 7346% 63 40%
139 89%
Out of 157 respondents who attended the Training cum Demonstration program organized by the State Departments, 51% claimed increase in production after adoption of technology, 59% indicated reduction in time spent on field operations (preparation of field for cultivation), 54% reported reduction in quantum of water used for irrigation using sprinkler and drip method compared to flood irrigation, 46% reported increase in production, 40% reported reduction in time spent on interculture operations while 69% reported enhanced skills and knowledge after attending the training program. It may be noted that different equipments have been tested in different states and hence the beneficiaries response depends on the type of equipments used. The highest proportion of respondents reporting increase in production are from Odisha (65 %) followed by Madhya Pradesh (58%) and Tamil Nadu (55%).
Similarly 88% of the respondents in Odisha reported reduction in time required for field preparation after adopting farm mechanisation followed by Tamil Nadu (60%).
With regards to increase in farm income, 76 % of the respondents were from Odisha followed by Tamil Nadu (62%). Similarly, with regard to reduction in time required for interculture operations 92% of the respondents were from Odisha.
One of the most important factors is the change in skill level among the participants who attended training cum demonstration programs. Of the total respondents, 89% felt that they have enhanced their skills and awareness about the equipments and machineries after attending the training programs.
An impact analysis has been attempted to quantify the changes in production, time required for field operations, intercultural practices and overall change in income/ skill levels.
Table 59 Impact of training program (outsourcing component) on measurable parametersImpact Parameters West Bengal Madhya Pradesh Odisha Tamil Nadu
Pre
Trai
ning
Post
Tr
aini
ng
% C
hang
e
Pre
Trai
ning
Post
Tr
aini
ng
% C
hang
e
Pre
Trai
ning
Post
Tr
aini
ng
% C
hang
e
Pre
Trai
ning
Post
Tr
aini
ng
% C
hang
e
Average Time Required for Field Preparation (Hour/ha) 12.5 5.25 -58% 14.8 7.27
-51% 14.1 6.76
-52% 9.8 2.41
-75%
Average Water Use (% point) 3.92 2.47 -37% 3.21 2.28
-29% 3.5 2.13
-39% 3.32 3.07 -8%
Change in Production (Qts/Acre)11 8.2 11 34% 8.31 10.21 23% 6.68 9.51 42% 13.36 18.87 41%Change in Income 9391 12100 29% 930 11336 22% 7682. 9990 30% 15864 2484 57%
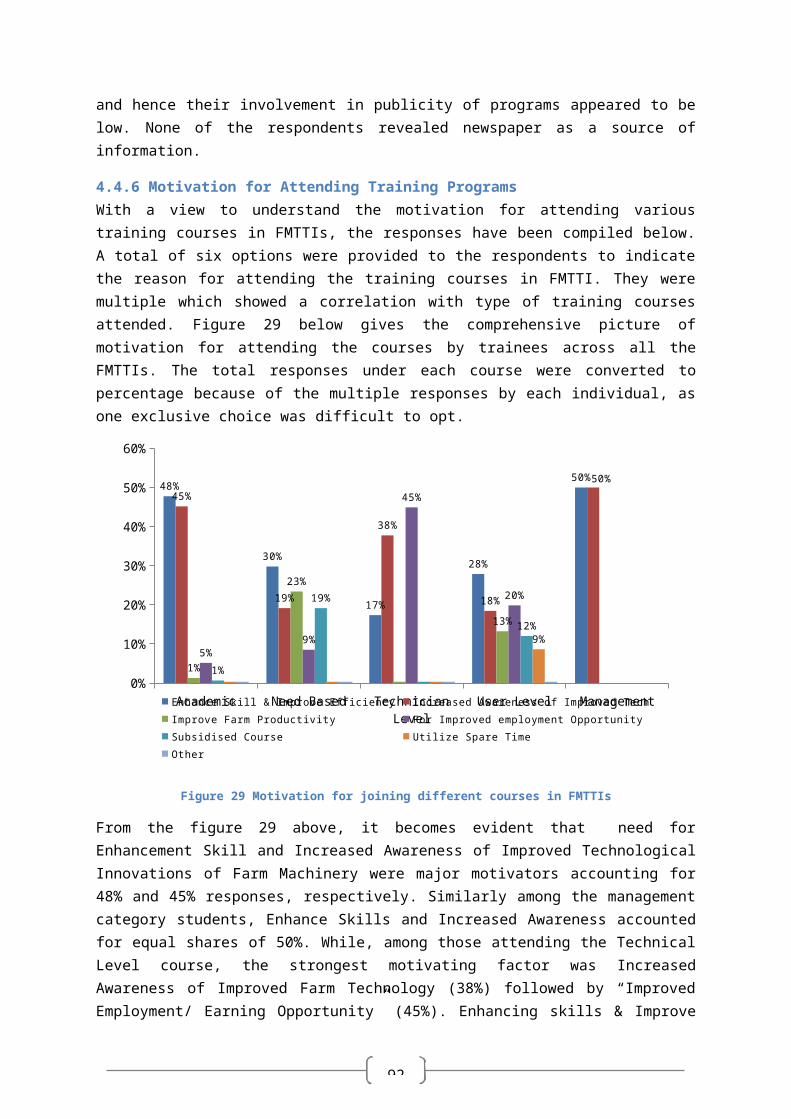
101
from farming (Rs/Acre) 9 2 0Change in Skill Level (% Point) 1.32 3.39 157% 1.9 3.54 86% 2.22 4.29 93% 2.29 3.83 67%
As observed from table 59 above, there has been positive impact of training cum demonstration of equipments as the beneficiaries have utilized the equipments and technology during their farming operations. On an average, there is reduction in time spent on field preparation ranging from 51% in Madhya Pradesh to 75% in Tamil Nadu. In West Bengal and Odisha, the reduction is reported to be 58% and 52%, respectively. Since equipments like water saving devices were demonstrated and beneficiaries were trained, those who used the devices, post training, reported reduction in water use ranging from 8% to 39%. Productivity of rice in Odisha, West Bengal and Tamil Nadu recorded an increase of 23% to 42%. The maximum increase has been reported by the beneficiaries of Odisha (42%) followed by Tamil Nadu (41%), respectively. In Madhya Pradesh, the productivity of wheat increased by almost 23%.In terms of skill levels, the respondents reported that they were more aware of the technology after attending the training program, than earlier. The skill levels on an average increased from 1.91 point to 3.7 points on a scale of five points. The maximum change was in the case of beneficiaries from West Bengal (157%) followed by Odisha (93% point), Madhya Pradesh (86%) and Tamil Nadu (67%).
11 Estimated for Rice in West Bengal, Odisha and Tamil Nadu while for Wheat in Madhya Pradesh
102
4.7 Beneficiaries Response on Demonstration Component under PSAMTTDTable 60 Demographic details of demonstration participant
States Madhya Pradesh Rajasthan Uttarakhand Haryana Punjab Assam West Bengal Tamil Nadu TotalNo. % No. % No. % No. % No. % No. % No. % No. % No. %
Total Samples 55 100% 43 100% 23 100% 41 100% 22 100% 22 100% 24 100% 43 100% 273 100%Male (No) 55 100% 43 100% 23 100% 41 100% 22 100% 22 100% 24 100% 42 98% 272 100%Female (No) 0 0% 0 0% 0 0% 0 0% 0 0% 0 0% 0% 1 2% 1 0%Age (Years)
Average 46.94 (12.68) 43.16(13.75
) 39.52 (4.71) 40.36(10.64
) 47.85 (13.86) 41.38 (12.11) 34.33(9.04
) 47.79 (10.9) 43.45 (12.21)Minimum 20 - - 30 - 25 - 25 21 - 19 29 19 -Maximum 74 - - 49 - 83 - 75 70 - 52 73 83 -CategorySC 2 4% 2 5% 0 0% - 0% 6 27% - - 8 33% 3 7% 21 8%ST - 0% - 0% - 0% - 0% 0 0% - - 3 13% 0 0% 3 1%OBC 39 71% 41 95% 12 52% 4 10% 7 32% 2 9% 11 46% 34 79% 150 55%General 14 25% - 0% 11 48% 37 90% 9 41% 20 91% 2 8% 6 14% 99 36%EducationPrimary 28 51% 16 37% 7 30% 10 24% 15 68% 3 14% 9 38% 11 26% 99 36%Secondary 15 27% 17 40% 7 30% 16 39% 3 14% 11 50% 13 54% 14 33% 96 35%Higher Secondary 1 2% 2 5% 9 39% 9 22% 2 9% 5 23% 1 4% 7 16% 36 13%Graduate & Higher 10 18% 4 9% 0 0% 4 10% 2 9% 3 14% 1 4% 9 21% 33 12%None 1 2% 4 9% 0 0% 2 5% 0 0% 0 0% 0 0% 2 5% 9 3%Land Holding (Acre)
Average/Median 10.82 (12.13) 15.97(14.37
) 3.08 (1.68) 11.89(16.15
) 12 (10.12) 5.17 (5.43) 2.48 (1.3) 9.95 (11.03) 9.87 (12.10)Minimum 1 - 3.5 - 1.5 - 1.5 - 2 0.25 - .33 0.65 0.25 -Maximum 60 - 70 - 10 - 100 - 40 20 - 5 56 100 -SC 14 - 12.18 - - - - 5 - - 2.78 1.91 4.92 -ST - - - - - - - - 1.31 - 3.93 -
103
OBC 9.08 - 16.15 - 3.5 - 6.5 - 12.71 5 - 2.63 10.55 10.85 -General 16.15 - - - 2.63 - 9.97 - 17.05 5 - 2.25 10.56 10.33 -
104
Feedback from 273 respondents including host farmers was obtained on demonstration of agriculture machineries and equipments organized under the PSAMTTD Scheme by the State Departments and ICAR sponsored Institutes such as CIAE. These participants were interviewed across eight States.
One interesting observation from the demographic distribution analysis is that only 9% of the participants were from SC and ST category. This could be attributed to a biased approach while selecting the location for organizing the demonstration activities. Only 1% of the participants belonged to ST category. In Madhya Pradesh and Rajasthan with significant proportion of ST farmers, their participation remained nil.
The average land holding of participants was 9.87 acre, the highest being in Rajasthan (16 acre) and lowest in West Bengal (2.5 acre). Thus most the farmers who participated or carried out the role of host farmers were medium to large category.
4.7.1 Area Coverage, Demonstration Time and Participation RateTable 61 below presents the important equipments demonstrated, area coverage per demonstration, and average hours of demonstration and participation rate per demonstration across different states.
Table 61 Average size and duration of demonstration
StateAverage Size
(acre)Average Time
(Hrs)Participation/ demonstration
Assam 1.15 1.78 30Haryana 4.91 7 14Madhya Pradesh 2.09 4.37 10Punjab 1.79 2.88 62Rajasthan 4.6 3.69 13Tamil Nadu 2.16 2.97 46Uttarakhand 2.87 1.12 10West Bengal 1 1 30
As per the guidelines of PSAMTTD issued by MoA for demonstration of agricultural equipments, each demonstration shall cover a minimum of 0.4 ha (0.98 acre) or one hour depending on the case. For hilly region, the minimum area shall be 0.2 ha (0.5 acre). From table 60, it is evident that average area per demonstration by type of equipment exceeds this cap in most of the cases. The average duration of demonstration conducted has exceeded the limits set in the guidelines in all the states under sample except in West Bengal. The average size of demonstration is found to be maximum in case of Haryana (4.91 acre) followed by Rajasthan (4.6 acre). Even in hilly regions such as Assam and Uttarakhand, the size of demonstration exceeded area specified in the guidelines. The time allocation for demonstration has been found to be in range of minimum 1 hour in West Bengal to maximum 7 hours in Haryana. Hence, it appears that the criteria of average plot size and time duration was not followed and adhered. The participation of farmers per demonstration was lower in Haryana, Madhya Pradesh, Rajasthan and Uttarakhand as compared to Punjab and Tamil Nadu. Hence the very objective of catering large number of users of equipments and raising awareness of modern agriculture equipment has not been met adequately. Table 62 below presents the average area coverage and average time of demonstration based on the equipments demonstrated.
105
Table 62 Area coverage, time and participation by types of equipment demonstratedState
Equipments Demonstrated
Average area (acre)
Average time (Hrs)
Average Time
(Hrs/acre)Participation
/demoAssam Potato Planter 1.15 1.78 1.69 30Haryana Laser Land Leveller 6.91 8.73 2.01 14
Zero Till Drill 2.72 3.27 1.45 12Madhya Pradesh
Seeder/Seed Drill 1.8 2.8 1.2 8Cultivator 1 1 1 19Grain Grader 5 3 0.6 15Harvester/Thresher 1.2 5.1 4.8 6Rotavator 2.08 6.7 3.7 12Straw Reaper 3.3 4.3 1.5 16Pyas Seed Chena 0.75 0.65 1.15 10
Punjab Happy Seeder 1.75 3 1.8 63Paddy Transplanter 1.71 3.07 1.89 67
Rajasthan Garlic Planter 4.41 3.54 0.97 13Rotavator 5.83 4.66 0.87 15
Tamil Nadu Shredder 20 2 0.1 27Disc Plough/Reversible Plough/Harrow etc 2.96 3.12 2.61 45
Uttarakhand Power Tiller 2.87 1.13 0.39 10Seed Drill 1.69 1.23 0.73 25
West Bengal 1.39 1 0.72 30
The demonstration area in case of equipments such as laser land leveller, rotavator, garlic planter and shredder was found to be much higher than specified in the guidelines. During the interactions with beneficiaries in Haryana, it was also observed that beneficiaries were custom hiring the laser levellers and rotavators at subsidized rates in the name of demonstrations for their personal use. Moreover in Haryana and Punjab with high level of awareness on use of farm equipments and machineries, demonstration of equipments such as rotavators, laser levellers, and zero till drill has become redundant. Interaction with the officials realised that minimum stipulation of 0.4 ha or one hour of demonstration of advanced equipments is not sufficient in field situations due to socio political constraints which arise during the demonstration. It was also gathered that the guidelines with regards to demonstration duration and methodology is not well conceived in view of complexity of equipments and level of awareness of farmers.
During the study, difficulties were faced in obtaining the information on progress made by the implementing agencies due to absence of standard practices in maintaining records and monitoring mechanism. Although many different forms of equipments were demonstrated on the field, the focus was more on achieving the targets without much emphasis on advance planning, ensuring publicity and organizing the demonstration at appropriate time. None of the agencies made any efforts in documenting the progress in structured formats and capturing feedback from the farmers.
106
4.7.2 Beneficiaries Response on Organization of DemonstrationTo evaluate the quality of demonstration being organized by the Directorate of Agriculture, the participants and host farmers on whose field demonstrations were conducted, were interviewed, the results of which are presented in table 63 below.
Table 63 Beneficiaries response on demonstration of Agriculture EquipmentsState
Tota
l Sam
ple Size of Demonstration
Duration of Demonstration Organization of Demonstration
Adeq
uate
% Inad
equa
te% Ad
equa
te
% Inad
equa
te
% Very
wel
l O
rgan
ized
%
Wel
l O
rgan
ized
% Not
so w
ell
Org
aniz
ed
%Assam 22 21 8% 1 0% 21 8% 1 0% 11 4% 10 4% 1 0%Haryana 41 41 15% 0 0% 41 15% 0 0% 29 11% 12 4% 0 0%Madhya Pradesh 55 55 20% 0 0% 55 20% 0 0% 13 5% 42 15% 0 0%Punjab 22 22 8% 0 0% 21 8% 1 0% 15 5% 7 3% 0 0%Rajasthan 43 42 15% 1 0% 43 16% 0 0% 41 15% 1 0% 1 0%Tamil Nadu 43 39 14% 4 1% 38 14% 5 2% 37 14% 6 2% 0 0%Uttarakhand 23 16 6% 7 3% 12 4% 11 4% 10 4% 2 1% 11 4%West Bengal 24 24 9% 0 0% 24 9% 0 0% 18 7% 6 2% 0 0%Total 273 260 95% 13 5% 255 93% 18 7% 174 64% 86 32% 13 5%
As evident from the above, 95% of the participants indicated that the size of demonstration was adequate which is also corroborated by the information in tables 61 and 62 that the average acreage was higher than stipulated in the guidelines. Only 5% percent felt the size of demonstration was inadequate. Similarly, with regards to the hours of demonstration, 93% of the participants opined that the duration was adequate and the remaining 7% felt it to be inadequate and that the duration may be increased. This opinion does not appear to hold ground as in most of the cases the duration exceeded the stipulated time of 1 hour in all states except in West Bengal. The highest proportion of participants who wanted the duration of demonstration time to be increased belonged to the hilly state of Uttarakhand.
Majority of the total participants (96%), were satisfied with the logistic arrangements of demonstrations. However 4% of the participants belonging to Uttarakhand felt that there is scope of improving the logistic arrangements while organizing the demonstrations.
4.7.3 Relative Preference of Equipments DemonstratedTable 64 below presents the relative preference of the equipments demonstrated on the field. The relative preferences have been calculated based on the total response rate obtained from the sample respondents.
In Assam, out of total 24 responses, 67% opined that the potato planter was a useful implement because of its capability to reduce the drudgery associated with potato planting. It also helped solving the problem of labour shortage during the potato sowing period. However 8% of the responses were not in favour of potato planter because of the high cost of the machinery.
107
Table 64 Relative Preference of Equipments demonstrated
State Equipments DemonstratedVery
Useful %Not so useful %
Assam Potato Planter 16 67% 2 8%Rotavator 6 25% 0 0%
Sub Total 22 92% 2 8%Haryana Laser Land Leveller 41 100% 0 0%
Zero Till Drill 41 100% 0 0%Sub Total 82 100% 0 0%Madhya Pradesh Cultivator 10 8% 0 0%
Grain Grader 1 1% 0 0%Harvester 2 2% 0 0%Rotavator 29 25% 1 1%Seed Drill 34 29% 0 0%Straw Combine Reaper cum binder 12 10% 4 3%Thresher 19 16% 0 0%Tractor 4 3% 0 0%Raised Bed Planter 1 1% 0 0%Zero Till Drill 1 1% 0 0%
Sub Total 113 96% 5 4%Punjab Happy Seeder 6 21% 3 10%
Paddy Transplanter 15 52% 5 17%Sub Total 21 72% 8 28%Rajasthan Garlic Planter 37 76% 4 8%
Rotavator 6 12% 2 4%Sub Total 43 88% 6 12%Tamil Nadu Laser Land Leveller 9
Plough/Reversible Plough/Harrow etc 12 32% 0 0%Paddy Transplanter 9 24% 0 0%Power Weeder 3 8% 0 0%Post Hole Digger 2 5% 0 0%Rotavator 3 8% 0 0%
Sub Total 38 100% 0 0%Uttarakhand Not reportedWest Bengal Power Reaper 21 26% 3 4%
Rotavator 18 22% 5 6%Paddy Transplanter 11 14% 7 9%seed Grader 8 10% 8 10%
Sub Total 58 72% 23 28%
In Haryana, the machineries, laser land leveller and zero till drill have become very popular as they helped to reduce the water use time required for irrigating the land and also ensured uniformity in irrigation, helping the crop to attain uniform growth. The zero till drill has become popular in the region because of the intensive cropping pattern. Farmers have become aware of the advantage of

108
zero till drill as it not only reduces the labour and cost for ploughing but also helps in increasing the organic matters in the soil and growing crop in the residual moisture of the land. However, the cost of machineries is high and farmers are less reluctant to invest on these machineries. It was observed that the Agriculture Department is providing these machineries on custom hiring basis to farmers though at subsidized rates.
In Punjab, out of 29 responses, the paddy transplanter is more preferred than Happy Seeder. However, nearly 17% of the total respondents felt that the transplanters were not as useful as it is viable only in case of large land holding. The host farmers also opined that it does not have any significant effect on yield.
In Rajasthan, the garlic planter was found to be very useful by the farmers. Similarly, in Tamil Nadu, almost all equipment demonstrated was found useful. Plough, disc harrow, reversible plough and harrow were more preferred followed by laser land leveller and paddy transplanter.
In West Bengal, the power reaper and rotavator were found to be more preferred than paddy tranplanter and grain grader. Overall, a large percentage of participants and host farmers were convinced about the usefulness of agriculture machinery and equipments demonstrated by the Directorate of Agriculture.
4.7.4 Technology Use, Adoption, Availability of EquipmentsTable 65 presents the technology use, adoption and future prospects of purchasing the equipments demonstrated by the Directorate of Agriculture.
Technology use on own Field: Of the total respondents, 68% used the technology/ equipments in their own field, while 32% did not. Of the total 273 samples who have used the technology in their field, the highest proportion is from Madhya Pradesh (18%) followed by Haryana (14%)
Adoption of Technology: Out of 273 participants surveyed under demonstration component, nearly 42% have adopted the technology fully while 58% have adopted the technology partially. The highest adoption rate is observed in Haryana followed by Tamil Nadu. 78% of the sample from Haryana reported to have adopted the technology fully while the remaining 22% adopted it partially. In Tamil Nadu, 70% of the respondents adopted the demonstrated technology fully while 30% have adopted them partially. Similarly, in Rajasthan, where a good number of demonstrations on garlic transplanters were organized, 51% of the respondents had adopted the technology fully while the remaining 49% adopted it partially. The data for other states can be seen in the table 65.
Purchased the Machinery: Purchase of the farm machines depend on the type, its usability and capital investment. The equipments such as laser land leveller, rotavator, combine straw reaper, etc., require significant investment and hence, unless the returns from the equipments purchased are assured, the farmers are reluctant to purchase those equipments. The respondents from Haryana, Rajasthan, Madhya Pradesh and Tamil Nadu constituting 14% of total respondents purchased the equipments for their own use or for giving it on custom hiring basis in their areas of operation. Of all the participants from Tamil Nadu, Haryana, Madhya Pradesh and Rajasthan, 37%, 17%, 9% and 19%, respectively had purchased the equipments.
109
Future Prospects of Purchase of Machinery demonstrated: Nearly 62% of the participants were found to be reluctant in purchasing the machinery while 38% showed inclination to purchase. The maximum number of respondents inclined to purchase the equipments were from Assam, Madhya Pradesh, Rajasthan and Haryana ranging from 2-6%. Hence it is expected that 25% of persons who attended the demonstration programs and realized the usability and importance of the equipments may purchase the equipments in the near future, depending upon availability of equipments, availability of subsidy and information on the place from where to purchase the equipments. Of the total respondents, 68% were unaware of the place from where to purchase the equipments and nearly 71% felt that the machines demonstrated are not readily available in the market.
Another significant fact that emerged during the survey was that the farmers desired to have subsidy for the newly developed equipments and machineries. However, most of the farmers found to be unaware of the availability of subsidy. Most of the participants were unaware of the cost the equipments demonstrated.
4.7.5 Benefits of Equipments demonstrated as explained by the respondentsIn order to understand the benefits of equipments demonstrated and adopted in actual field conditions on responses from 185 beneficiaries were analysed different variables such as reduction in drudgery level, overcome labour shortage, reduction in time of operations, reduction in wastage, and change in production.
Reduction in Drudgery: Out of 185 beneficiaries who used the demonstrated machinery in their own field accepted that the machinery was helpful in reduction of drudgery. Overall, 52% indicated full reduction of drudgery level while 48% indicated partial reduction. All the beneficiaries from Assam who used and tested the potato planter and rotavator opined that potato planting was completely tireless activity when machines were used.
Resolve Labour Problem: Overall 45% of the beneficiaries felt that machinery and equipment demonstrated and subsequently used in field could be helpful in sorting out labour problems fully. However, 45% felt that labour problems could be sorted only partially as many other tasks require labour and hence it is not possible to do away with labour completely from agriculture.
Reduction in Time of Operations: One significant factor which has been impacted is the reduction in duration of time of agricultural operations which is very critical in high intensity agriculture on account of short interval between harvesting and sowing the crop. Almost 88% of the beneficiaries believed that equipments demonstrated and used reduced the time of operations significantly while only 12% felt that the reduction was not so significant.
110
Table 65 Use, adoption, future prospects of beneficiary on equipments purchaseState Use of
Demonstrated Equipments on
own Field Adoption of Technology Bought the MachinePlan to buy the
machine
Machines Readily available in
MarketAware where to
get the machinery
Yes % No % Full
Adop
tion
% Parti
al
Adop
tion
% Yes % No % Yes % No % Yes % No % Yes % No %
Assam 16 6% 6 2% 3 1% 19 7% 0 0% 22 8% 16 6% 6 2% 2 1% 19 7% 0 0% 22 8%
Haryana 38 14% 3 1% 32 12% 9 3% 7 3% 34 12% 12 4% 29 11% 14 5% 27 10% 23 8% 18 7%
Madhya Pradesh 50 18% 5 2% 15 5% 40 15% 5 2% 50 18% 21 8% 34 12% 18 7% 37 14% 5 2% 50 18%
Punjab 13 5% 9 3% 2 1% 20 7% 0 0% 22 8% 4 1% 18 7% 8 3% 15 5% 4 1% 18 7%
Rajasthan 36 13% 7 3% 22 8% 21 8% 8 3% 35 13% 24 9% 19 7% 15 5% 28 10% 31 11% 12 4%
Tamil Nadu 19 7% 24 9% 30 11% 13 5% 16 6% 27 10% 18 7% 25 9% 18 7% 25 9% 15 5% 28 10%
Uttarakhand 5 2% 18 7% 3 1% 20 7% 1 0% 22 8% 0 0% 23 8% 1 0% 22 8% 0 0% 23 8%
West Bengal 8 3% 16 6% 8 3% 16 6% 0 0% 24 9% 10 4% 14 5% 2 1% 22 8% 10 4% 14 5%
Total 185 68% 88 32% 115 42% 158 58% 37 14% 236 86% 105 38% 168 62% 78 29% 195 71% 88 32% 185 68%
111
As quite a significant number of trainee and participants of demonstrations have adopted the technology either through purchase and custom hiring, it has ultimately resulted in significant increase in the farm power availability at the individual farm level
Table 66 Benefits of equipments demonstrated and used by the beneficiaries.
State Total Reduction in drudgery
Help sort Labour problems
Reduction in Time of Operation Improve Production
Fully
% Parti
ally
% Fully
% Parti
ally
% Sign
ifica
ntly
% Not
sig
nific
antly
% Yes
% No
%
Assam 16 16100% 0 0% 16
100% 0 0% 16
100% 0 0% 4
25% 12 75%
Haryana 38 19 50% 1950% 19 50% 19
50% 38
100% 0 0% 21
55% 17 45%
Madhya Pradesh 50 29 58% 2 4% 30 60% 15
30% 45 90% 5
10% 29
58% 21 42%
Punjab 13 2 15% 1185% 0 0% 0 0% 2 15% 11
85% 0 0% 13
100%
Rajasthan 36 14 39% 2261% 11 31% 25
69% 34 94% 2 6% 2 6% 34 94%
Tamil Nadu 19 11 58% 842% 3 16% 16
84% 15 79% 4
21% 12
63% 8 42%
Uttarakhand 5 1 20% 4
80% 1 20% 4
80% 5
100% 0 0% 0 0% 0 0%
West Bengal 8 5 63% 3
38% 3 38% 5
63% 8
100% 0 0% 6
75% 2 25%
Total 185 97 52% 6937% 83 45% 84
45%
163 88% 22
12% 74
40%
107 58%
Improve Production: Forty percent of the beneficiaries who used the equipments and machineries felt that they observed overall improvement in production. The highest proportion of beneficiaries responding positively were from West Bengal (75%), followed by Tamil Nadu (63%), Madhya Pradesh (58%) and Haryana (55%).
4.7.6 Regional wise specific requirement of machines for demonstrationTable 67 Regional wise specific requirement of machines for demonstration
S.No States List of Equipments1 Assam Light Weight Power Triller, Animal Drawn 3 Tyne Cultivator, Low Cost Weeder,
Bund Former, Power Sprayer, Sprinkler, Fruit Grader, Tabular Maize Sheller, Foot Pump, Horticulture Tools.
2 Haryana Raised Bed Planter, Power Weeder, Rice Transplantor, Vegetable Transplantor, Sprayer With Long Boom, Fodder Harvester.
3 Madhya Pradesh
Soyabean Reaper, Rice Transplanter, Zero Till Fertilizer Drill, Raised Bed Planter, Power Weeder, Garlic/Onion Harvester, Straw Reaper And Shedder, Inclined Plate Planter.
4 Punjab Pneumatic Seed Drill, Sub Soiler, Aero Blast Sprayer, Fodder Harvester, Vegetable transplanter, Sprayer with Long Boom.
5 Rajasthan Cotton Picker, Cotton Planter, Seasamum Planter, Groundnut Digger, Groundnut Harvester, Groundnut Decorticator.
6 Tamil Nadu Electromagnetic Sprayer, Groundnut Thresher, Sub Soiler, Auger, Long Handle Weeder, Groundnut Planter, Sugarcane Planter
7 Uttrakhand Light Weight Power Tiller, Post Hole Digger, Long Handle Weeder, Power
112
Weeder, Aero Blast Sprayer.8 West Bengal Drum Seeder, Zero Till Seed Cum Fertilizer Drill, Subsoiler, Vegetable
Transplanter, Wet Land Weeder, Dry Land Weeder, Vertical Conveyor Reaper, Groundnut Planter.
4.8 Post Demonstration use of Machinery Purchased for DemonstrationThe post demonstration use of machinery usually purchased by the concerned departments varied from state to state. Summary of post demonstration use of machinery purchased for each State is provided in the following section.
1. The equipments purchased by the FMTTIs for training and demonstration for training courses were used optimally as a number of in house training programs are organized regularly by these institutions. In addition, these equipments are also used for carrying out field operations in their own farm. The older and used machines are utilized for practicing by the trainees.
2. In Maharashtra, although no progress was made during the XI Five Year Plan under the said scheme, as per the information provided by the Department of Agriculture, the equipments purchased were placed at the Govt. owned Taluk Seed Farms and used for farm operations. These equipments were also shared with farmers’ groups for their use and understand their operations.
3. In Haryana, the post demonstration use of implements depended on the type of equipments demonstrated. Special crop implements usually remained idle while multipurpose implements such as laser land leveller, zero till drill, etc., were used in field operations on farmers demand. In Sirsa and Fatehabad, as per the information provided by the Agriculture Department, the equipments usually remained idle after conducting the demonstration. However in Rohtak, the equipments such as laser land leveller were reported to have been provided to farmers on custom hiring basis. Though the laser land leveller has become very popular in the region, the department has not been able to meet the demand due to lack of operators and repairing facilities locally.
4. In Uttarakhand, as per the information provided by the Directorate of Agriculture, the machines are provided to the farmers for their use on their demand. However, the costs of operating the machines are to be met by the farmers themselves. The Directorate, however, does not charge the farmers for the usage.
5. Similarly, in Rajasthan, the MPUAT has organized the demonstration program. Post demonstration, MPUT provided the equipments to farmers for their use without levying any charges, though the operational cost has to be met by farmers themselves.
6. In Madhya Pradesh, CIAE usually conducted the demonstration of equipments through KVKs and subsequently the equipments remained with KVKs for future demonstration activities. As per the information provided by the DoA, there is no system of follow up on demonstration and post demonstration use of equipment. It either remained idle or used by farmers as and when required at their own cost.
7. In Tamil Nadu, the machineries are used for demonstration at farmers field every year. Post demonstration, the equipments are hired out to the farmers along with tractors and the income is transferred to the Government.
8.
113
Chapter 5: Insights and Recommendations
Based on the findings of both primary and secondary research, interactions and feedback received from the stakeholders comprising, officials of the institutions such as; FMTTIs, CIAE, SAUs from sample states, Directorate of Agriculture and participants of training, testing and demonstration activities, the recommendation with objectives to strengthen the scheme by appropriate policy changes are enlisted below under three broad categories.
5.1 Recommendations for Effective and Efficient Implementation of Training at FMTTIs5.1.1 Although, the FMTTIs have consistently achieved the annual targets of training it was observed in case of SRFMTTI (Anantpur, AP) and NERFMTTI (Biswanath Chariali, Assam), that a significant number of candidates were covered under Awareness Level , Technology Transfer Camps and Need Based Training programs which are short duration courses ranging from 1-2 days. It appears that participants were covered under shorter duration courses, mainly to achieve the targets. Hence, FMTTIs may review the annual targets under various courses periodically and accordingly strategise the coverage with minimum overlapping across courses.
5.1.2 Technology Transfer Camps have significant impact on actual use of technology at the field level. It was observed that Technology transfer Camps were not organized by NRFMTTI (Hissar) during the XI Five Year Plan and very few were organized by CRFMTTI (Budni). These camps could act as an important vector for adoption of technology at the field level. Therefore, separate targets may be stipulated for each FMTTI to organize such camps in addition to the usual courses which is now being done now. Progress may be reviewed periodically. The results of such camps should also be documented.
5.1.3 The participation of trainees remained concentrated in a few States with their shares ranging between 48% and 68%, while neighbouring states accounted for 16% to 29% of the total. In case of states not sharing boundary with state where FMTTIs are located, the participation ranged between 10-31% (see table 11, 18, 26). Convenient location and logistic arrangements for reaching appeared to be a major factor contributing to larger participation in some FMTTIs like NRFMTTI (Hissar). Since, a large proportion of participants were from the same state where the FMTTI is located, the impact was more localized to the State. In addition to the logistic arrangements, language appeared to be a major constraint for the beneficiaries. In order to broaden impact area of the training and improve the adoption rate, extension centres may be set up by the FMTTIs in the neighbouring States. Such extension centres could function under the administrative control of existing FMTTIs.
Increasing the number of these institutes from the present four and opening up Extension Centres will also enhance their intake capacity facilitating coverage of larger area of the State.
5.1.4 Interaction with participants of User Level Courses indicated the need for a refresher course of shorter duration. It was found that many trainees were already aware of the major portion of the course curriculum and therefore a refresher course or a crash course may be more appropriate and beneficial for many of the trainees.
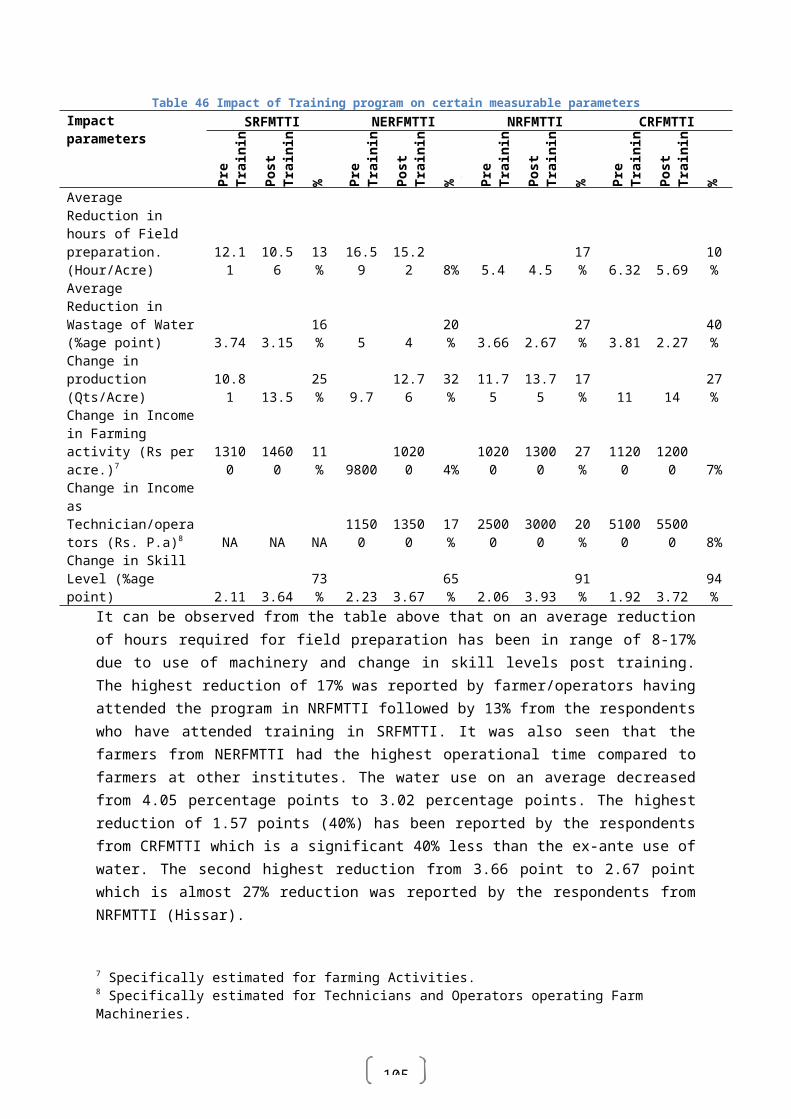
114
5.1.5 It was also found while interacting with the participants of the training program being organized at the FMTTIs, that many of the equipment and machineries were old and not in good condition. This is due to poor maintenance and machineries being kept in open space under direct exposure of sun and rain. It is therefore recommended that old machineries should be either repaired or new machines should be purchased to make them worthwhile for training.
5.1.6 Most of the trainees who attended the User Level programs felt that the course was incomplete as they did not impart adequate technical skills. There is a need for introducing T1 and T2 level course thereafter to be technically honed. The beneficiaries indicated that these programs may be merged into a new program, which will optimize the resources use and maximize value addition.
Despite the fact that User Level course does not impart all the required skills and a trainee is required to go through the T1 and T2 level courses subsequently, it was seen that only a few of the trainees only opted for the other two courses. One key reason for this seems to be lack of assured employment on completion of the course. Trainees expect placement assistance after the program. This may popularize the T1 and T2 level courses and increase the number of people taking up these courses.
5.1.7 There is a need for starting a separate new course for ITI (tractor mechanic) on the lines of A1 course. There is also a greater need to increase the training capacity under the course as more and more number of students are interested in taking up these specialized training programs.
5.1.8 Training programmes lacked practical inputs to a certain extent. The trainees opined that there is a need for increase in duration for hands-on experience for training in repair/ maintenance and field operations. Practical sessions, therefore, may be increased.
5.1.9 Representation of women in structured courses other than off campus training programs of one or two days' duration was very low. Lack of appropriate hostel facilities suitable to women appears to be the reason for low level of participation by women. FMTTIs, therefore may create separate hostel facilities suitable for women to encourage their participation.
5.1.10 Technology Transfer Camps assumes to have a significant role in increasing the adoption rate of agriculture machineries. However, NRFMTTI has not conducted a single Technology Transfer Camp during the entire XI Five Year Plan. NERFMTTI and CRFMTTI too have not conducted such programs in adequate numbers. Shortage of adequate staff due to ongoing on campus training and testing activities was quoted as the reason for non conduct of the Camps. Hence, provision of adequate staff and infrastructure support may be ensured to enable these institutes to conduct the Camps.
5.1.11 There was absence of a system of maintaining information relating to coverage of beneficiaries under various training programs. In the absence of such information, it was not only difficult to identify beneficiaries to solicit their opinion or obtain feedback but also prevented the Institutes from assessing post training impact and adoption. Such valuable feedback may be useful to analyse the replication of training, adoption of technology and assessing the need for incorporating midterm course correction in the training modules. It is therefore suggested that a system of maintaining information of trainees may be instituted.
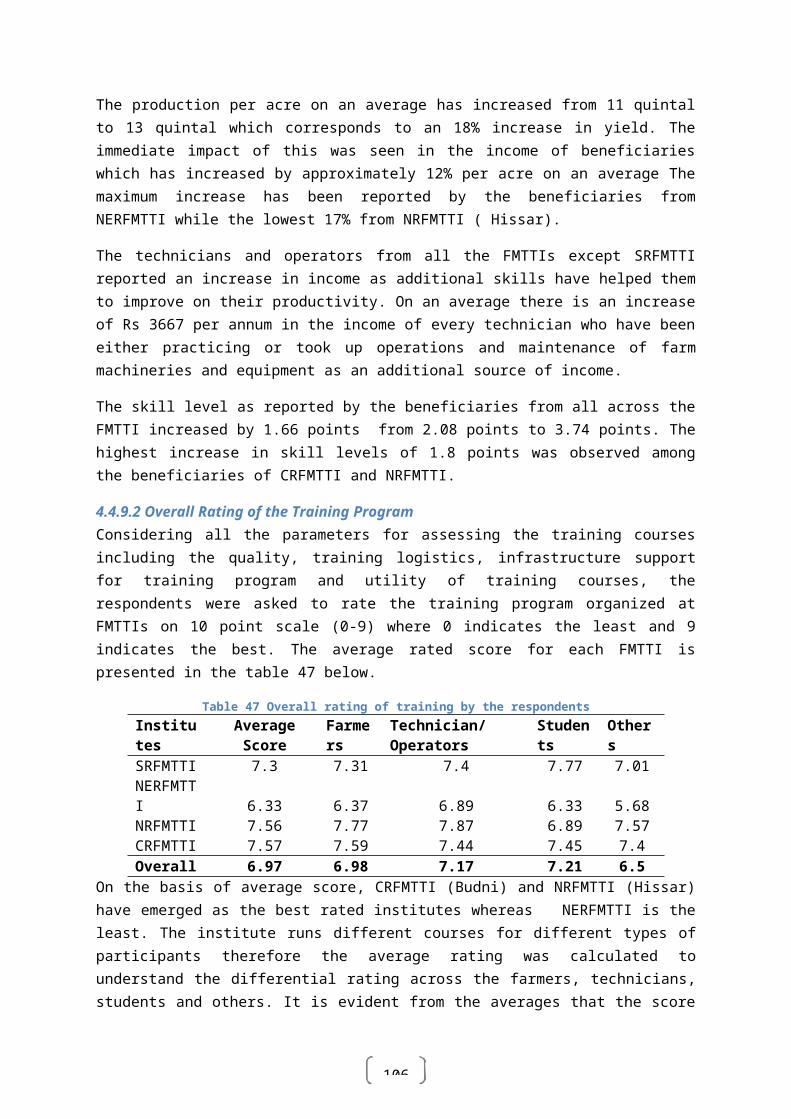
115
5.1.12 A significant number trainees (30-40%) failed to use the skills acquired during the training either due to smaller land holding, lack of resources to purchase equipments or limited scope for custom hiring in the region. Under such circumstances, Government support by way of provision of tool kits and assistance through placement services will be necessary. The FMTTIs may explore the possibilities of networking with the private sector to provide placement services to the needy trainees.
5.2 Recommendations for Effective and Efficient Implementation of Testing At FMTTIs5.2.1 Though the institutions have been meeting the annual targets regularly, there was no system of internal assessment in any of the FMTTIs with respect to testing of various equipments. It may be indicated here that the time required for testing equipments/ machineries vary according to their type. It is recommended that the annual testing capacity of each testing centre of FMTTI based on the types of equipments/ machineries to be tested should be assessed and targets to be fixed accordingly. The staff strength and infrastructure needed by the Institutes may also be determined based on the types of equipments/ machineries tested.
5.2.2 The number of confidential tests conducted by the FMTTIs were negligible as compared to commercial tests. Information on the number of machines tested under commercial sub categories (ICT, BT and OECD) was not easily available from NRFMTTI, SRFMTTI and NERFMTTI. As per the information available from the CRFMTTI, under commercial category, most of the tests were done under Initial Commercial Test. Only 7% of the tests were conducted under Batch Test and OECD sub categories. Therefore, it is recommended that separate targets for testing of tractors for ICT, BT and OECD should be fixed.
5.2.3 The reports being after testing of the equipments are too technical in nature for easy understanding/ comprehension by the local/ small scale industries. Hence, it is suggested that the formats of the report format may be simplified to make them easy to understand.
5.2.4 Income earned from testing of equipment goes to revenue account of the Government of India and is not allowed to be utilized by the Institute. The institution desire to use certain percentage of revenue generated in case of contingencies.
5.2.5 The institute also facing staff shortage for undertaking testing activities, particularly in view of increase in numbers of machines to be tested, 20% reduction in direct recruitment of technical staffs which was invoked earlier may be removed.
5.2.6 The technical staff and engineers imparting training lacked the technical expertise in light of new advancement in technological innovation in the field of agriculture that has been made in the recent past. No efforts have been made towards upgrading their skill and knowledge. Keeping in view the requirements of the changing scenario with the technology becoming more sophisticated day by day, it is recommended that the staff and engineers involved in testing of equipment and training should also be given adequate opportunity to enhance their skills through advanced training courses both within and outside the country.
5.2.6 The equipments being manufactured at the local level lack standardization in specification, quality material, and durability of parts besides being inferior in performance compared to the

116
standard and branded equipments. Efforts therefore should be made to improve the quality of locally manufactured equipments by creating awareness among the local manufacturers and also providing them necessary training. Exposure to new technological development and constant interface with the local manufacturers may bring in desired change in quality of equipments.
5.2.7 Organizing conferences and workshops involving local manufacturers and large brand manufacturers will provide a platform for cross learning and create conducive environment to bring in the desired improvement in quality of the equipments. Such conferences and workshops could also become an important tool for FMTTIs to get feedback from the manufacturers on the prevailing market demand ford different farm equipments and their performance.
5.2.8 The test equipments and test rigs used under different labs are brought and customized at FMTTI which are too sophisticated for the local mechanics. These machines are prone to frequent breakdown and due to non availability of adequate and trained technical staff, machines are not repaired in time resulting in delay and time lag. Thus a permanent cadre of quality mechanic needs to be created at each FMTTI.
5.2.9 The replacement of old and obsolete test equipments and computers at the FMTTI will improve the overall efficiency of testing and record keeping.
5.3 Recommendations for Effective and Efficient Implementation of Outsourcing of Training 5.3.1 Under the outsourcing of training, the guidelines of PSAMTTD envisage organizing training programs with the help of State Agriculture Universities, Engineering Colleges, Polytechnics, etc., but it was found that in most of the cases the training programs were organized through the district units of State Agriculture Departments. These programmes appeared to be more in the nature of awareness campaigns rather than training programs due to lack of appropriate infrastructure and technical manpower support. It is therefore recommended that, proper advance planning may be made by the Department of Agriculture/ Agriculture Engineering for collaborating with SAUs and other eligible institutions who could conduct the training programs effectively. Also, the training facilities available with the existing KVKs at the district level and other such institutions with appropriate infrastructure may be identified well in advance and used for organising training activities rather than making them mere demonstration and awareness camps.
5.3.2 During interaction with the district level functionaries of the State Agriculture Department it was observed that the instructions/guidelines governing the Centrally Sponsored Schemes are generally not adhered to in view of the fact that the State functionaries are more conversant and comfortable with the guidelines issued by the State Agriculture Departments for implementation of similar schemes implemented by the State Government. For example, the financial targets given for various demonstrations of agri-implements for the benefit of large section of farmers are met by way of release of subsidy for purchase of agri-implements by the select identified farmers at the village level with the presumption that through them the other farmers would come to know about the implements. This was more in tune with the similar scheme implemented by the State Governments. Hence there is a need for ensuring uniformity in the guidelines of the Central and State Government in respect of similar schemes, keeping in view the overall objectives of the schemes.
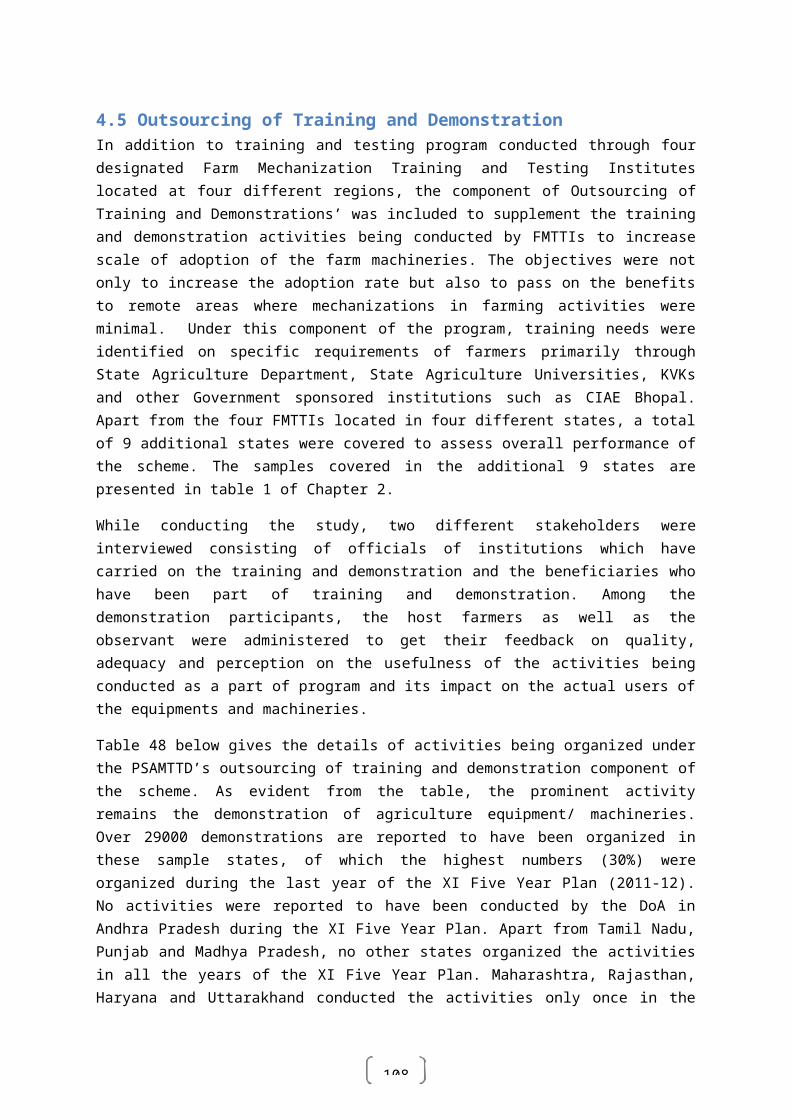
117
5.3.3 A proportion of training participants were not satisfied with the duration of the training programs organized by the State Agriculture Departments, which, on an average worked out to 2.5 days. Therefore, the State Governments may consider increasing the duration of training programs to at least a week, depending on the type of courses designed.
5.3.4 The course curriculum prescribed at present pertained to various user level courses organized at FMTTIs. Since, the nature of training depends on the local environment and types of equipments used; the states should have the autonomy to develop course modules in accordance with the mechanization requirement of the local area.
5.4 Recommendations for Effective and Efficient Implementation of Demonstration of Equipments5.4.1 The pattern of fund allocation indicated not only regional and interstate disparity but also disparity among states. For example, during the entire XI Five Year Plan, the North Eastern Zone (Arunachal Pradesh, Assam, Manipur, Mizoram, Meghalaya, Nagaland, Tripura & Sikkim) had received 30% of the total allocations, as compared to Western (Gujarat, Maharashtra and Rajasthan) and Southern Zone (Andhra Pradesh, Karnataka, Kerala and Tamil Nadu) at 7% and 9% of the total allocation, respectively. The Central Zone (Chhattisgarh and Madhya Pradesh) received 12% of the total allocations. Rajasthan and Maharashtra received the allocation only during the last year of XI Five Year Plan while Gujarat received the allocation only in the first year with no further allocations during the remaining years. The maximum utilization of the funds allocated was observed in Central Zone at 95% whereas the lowest utilization was in Western Region (26%). Even the North Eastern Zone consisting of 8 states which received the largest allocation was able to utilize only 68% of the total allocations. This indicates lack of proper assessment of the requirements both at the state and central level. It is therefore, recommended that fund allocations should be based on proper assessment of the requirements of various states taking into consideration the previous performance and also the requirement of region/ states.
5.4.2 The total allocation made to institutions such as ICAR and SFCI during the XI Five Year Plan was Rs. 482 lakh. As per the information provided by the Farm Mechanization and Technology Division, FMTTI, the utilization made by ICAR remained low at 3%, which is a matter of serious concern. The Mechanization and Technology Division, Doan (MoA) may put in place an effective monitoring mechanism to ensure that the allocations are utilised properly by the Institutions.
5.4.3 Demonstration alone is not a sufficient tool to promote mechanization in agriculture. The beneficiaries suggested that financial incentives by way of subsidy may also be provided to incentivize them to adopt the machinery.
5.4.4 Provision towards contingency expenditure for hiring of prime movers to undertake demonstration of equipments/machineries is inadequate and becomes a constraining factor, particularly for the hilly states. Hence, it is felt by the officials that provision for contingency should be enhanced suitably to meet the expenditure for hiring prime movers, travel of staff undertaking and monitoring the demonstration. For hilly states the contingency should accordingly be revised from the current level of 1.5 times of the limit for non hilly areas. For demonstration of heavy equipments, provision of prime movers along with loading and unloading devices would help

118
carrying the equipments to distant places of demonstration as well as organizing the demonstration on large scale.
5.4.5 In most of the states, one common constraint reported was the lack of technical manpower/ operators required for conducting demonstrations. It is suggested that competent technical manpower/ operators could also be hired on contract basis. These contractual staff could also be used for providing services to farmers on custom hiring of equipment/ machineries.
5.4.6 The machineries in most of the states after demonstration either remained idle or lent to farmers free of cost for their use due to lack of operators in the Department. The machineries such as laser land levellers zero till drills and combine straw reapers which have become popular in states like Haryana and Punjab can be lent to farmers on custom hiring basis to generate additional revenue for the Government. It was also found that advanced machineries such as laser land leveller were required to be sent to distant places (e.g Gurgaon in Haryana) for repairs due to non availability of trained technical manpower and workshops in the district. Therefore course on repair and maintenance of laser land leveller and similar sophisticated machinery/ equipments may be designed and incorporated under the training course programs of both FMTTIs as well as by the State Governments. This provides not only the entrepreneurial skills but also faster local solutions. State Governments may also explore the possibilities of establishing 2-3 workshops at the district level for instant repair maintenance of such machineries.
5.4.7 Maharashtra, Haryana and Rajasthan received funding at the fag end of the financial year. This defeats the very purpose of demonstration as agriculture is a seasonal activity and the implementing agencies are left with little time to plan the activities and actually carrying out training or demonstration in time. Therefore, it is necessary that funds are released at the beginning of financial year after obtaining information on the unspent funds of the previous years to facilitate proper planning and implementation of activities in time.
5.4.8 The scale of demonstrations could be increased more effectively through the Farmers’ Producer Organizations (FPOs) under the FPO Initiative Project (FPO-IP) of Small Farmer’s Agribusiness Consortium (SFAC). These FPOs can act as important medium for popularising farm mechanization among the small and medium scale farmers. These FPOs can be provided equipments at subsidized rates to enable them to undertake custom hiring. This would enable them to reach large number of small and medium farmers through common cost sharing. Hence, a collaborative effort may be initiated between the M&T Division of MoA and SFAC.
5.4.9 Government should encourage financial institutions to extend credit for setting up of centres for custom hiring of agriculture machneries. Such financing may be covered under the Credit Guarantee Scheme of the Credit Guarantee Fund Trust for Micro and Small Enterprises. MoA may evolve a Venture Capital Assistance Scheme to fund the shortfall in margin to be brought in by borrowers for availing such loans.
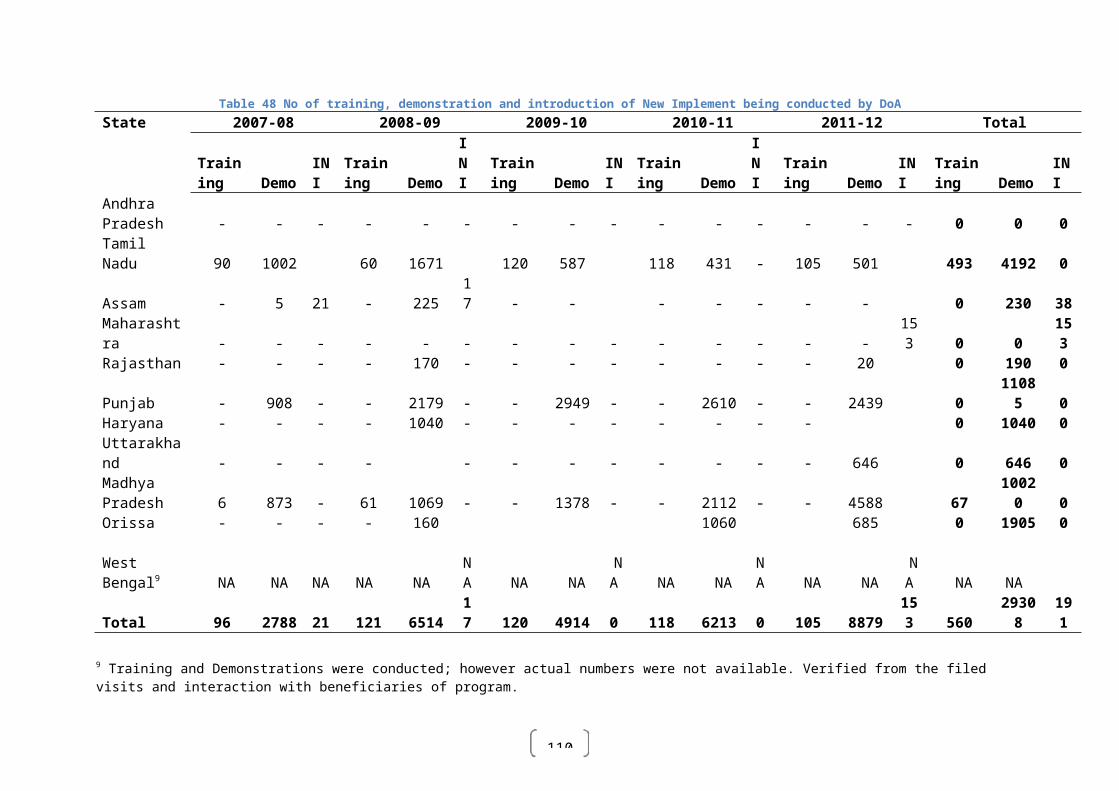
119
Chapter 6 Conclusion
All the three component of the schemes were able to showcase a satisfactory performance in terms of physical and financial achievements. Although certain skewness in pattern of funding is also observed and needs to be rectified. All the implementing agencies, FMTTI, DoA, the Government sponsored institutions have contributed significantly in the achieving the objectives of the scheme. The adoption of technology due to satisfactory implementation of Scheme component has resulted in the significant increase in farm power availability at the individual farm level. The most significant are beneficiaries who have responded positively with regards to program and its outcome which further support the effectiveness of the scheme.
It is thus recommended that the scheme should continue in the next fiscal years for greater coverage and betterment of larger number of farmers through mechanization of farm level operation suitably incorporating the recommendations as suggested in chapter 5.

120
Annexure
Annexure 1 Year wise and State wise fund allocation in PSAMTTD Scheme(Rs. Lakh)
Sl. No. States 2007-08 2008-09 2009-10 2010-11 2011-12 Tota
l Percentage
1 Manipur 0 49 7 210 174 440 12%2 Orissa 44 29 48 109 153 383 10%3 Tamil Nadu 77 65 53 68 50 313 9%4 Haryana 45 45 20 138 0 248 7%5 Madhya Pradesh 35 36 0 61 100 232 6%6 West Bengal 0 30 0 13 150 193 5%7 Chhattisgarh 95 56 0 22 16 189 5%8 Himachal Pradesh 10 22 12 27 70 141 4%9 Arunachal Pradesh 32 33 26 49 0 140 4%10 Sikkim 2 0 21 0 114 137 4%11 Gujarat 135 0 0 0 0 135 4%12 Mizoram 47 0 0 0 85 132 4%13 Bihar 0 37 0 75 16 128 4%14 Uttar Pradesh 17 44 42 19 0 122 3%15 Tripura 0 0 0 116 0 116 3%16 Uttarakhand 29 82 0 0 0 111 3%17 Jharkhand 0 0 8 0 100 108 3%18 Maharashtra 0 6 0 0 100 106 3%19 Punjab 0 96 0 0 0 96 3%20 Nagaland 21 13 13 3 13 63 2%21 Assam 22 35 0 0 0 57 2%22 Meghalaya 3 16 0 0 0 19 1%23 Rajasthan 0 0 0 0 19 19 1%24 Kerala 0 9 9 0 0 18 0%25 Andhra Pradesh 0 11 0 0 0 11 0%26 Karnataka 0 0 0 0 0 0 0%27 Jammu & Kashmir 0 0 0 0 0 0 0%
121
122
Annexure 2 Zone wise fund allocation in PSAMTTD Scheme
(Rs. Lakh)Zone States 2007-08 2008-09 2009-10 2010-11 2011-12 Total Percentage
South Zone Andhra Pradesh 0 11 0 0 0 11 0.27%
Karnataka 0 0 0 0 0 0 0.00%Kerala 0 9 9 0 0 18 0.43%
Tamil Nadu 77 65 53 68 50 313 7.56%Sub Total 77 85 62 68 50 342 8.26%
North Eastern Zone Arunachal Pradesh 32 33 26 49 0 140 3.38%
Assam 22 35 0 0 0 57 1.38%
Manipur 0 49 7 210 174 440 10.63% Mizoram 47 0 0 0 85 132 3.19% Meghalaya 3 16 0 0 0 19 0.46% Nagaland 21 13 13 3 13 63 1.52% Tripura 0 0 0 116 0 116 2.80% Sikkim 2 0 21 0 114 137 3.31%
Sub Total 127 146 67 378 386 1104 26.67%Eastern Zone Bihar 0 37 0 75 16 128 3.09% Jharkhand 0 0 8 0 100 108 2.61% Orissa 44 29 48 109 153 383 9.25% West Bengal 0 30 0 13 150 193 4.66%
Sub Total 44 96 56 197 419 812 19.62%Central Zone Chhattisgarh 95 56 0 22 16 189 4.57% Madhya Pradesh 35 36 0 61 100 232 5.61%
Sub Total 130 92 0 83 116 421 10.17%Western Zone Gujarat 135 0 0 0 0 135 3.26% Maharashtra 0 6 0 0 100 106 2.56%
123
Zone States 2007-08 2008-09 2009-10 2010-11 2011-12 Total Percentage Rajasthan 0 0 0 0 19 19 0.46%
Sub Total 135 6 0 0 119 260 6.28%Northern Zone Haryana 45 45 20 138 0 248 5.99% Himachal Pradesh 10 22 12 27 70 141 3.41% Jammu & Kashmir 0 0 0 0 0 0 0.00% Punjab 0 96 0 0 0 96 2.32% Uttar Pradesh 17 44 42 19 0 122 2.95% Uttarakhand 29 82 0 0 0 111 2.68%
Sub Total 101 289 74 184 70 718 17.35%Institutions ICAR 0 14 0 370 0 384 9.28% SFCI 12 86 0 0 0 98 2.37%
Sub Total 12 100 0 370 0 482 11.65%Grand Total 626 814 259 1280 1160 4139 100%
124
Annexure 3 State wise/ Institution wise allocation of fund and utilization in PSAMTTD Scheme during XI FYP(Rs. Lakh)
States Total Allocation (Rs in Lakh)
Utilization(Rs. in Lakh)
% utilization
Andhra Pradesh 11 3.34 30%Karnataka# 0 -22.12 0%Kerala 18 15.89 88%Tamil Nadu 313 294.12 94%Arunachal Pradesh 140 140 100%Assam 57 22.48 39%Manipur 440 440 100%Mizoram 132 46.95 36%Meghalaya 19 19 100%Nagaland 63 63 100%Tripura 116 59.8 52%Sikkim 137 23.37 17%Bihar 128 112 88%Jharkhand 108 8 7%Orissa 383 230.45 60%West Bengal 193 43 22%Chhattisgarh 189 173 92%Madhya Pradesh 232 229.27 99%Gujarat 135 98.73 73%Maharashtra 106 6 6%Rajasthan 19 0 0%Haryana 248 248 100%Himachal Pradesh 141 71 50%Jammu & Kashmir 0 -0.02 0%Punjab 96 11.6 12%Uttar Pradesh 122 119.33 98%Uttarakhand 111 99.52 90%ICAR 384 13.4 3%SFCI 98 98 100%
#No allocations were made to Karnataka during the XI-FYP. The negative figure indicates available balance of X FYP.

125
Annexure 4 State wise course wise participation of trainees in CRFMTTI during XI FYP
States ALC % Tech Level Percent User Level Percent Manag. Level Percent Need Based Percent Total Percent
Andhra Pradesh 33 0.99% 0 0 1 0.05% 33 3.60% 2 0.38% 69 0.73%
Arunachal Pradesh 3 0.09% 0 0.00% 0 0.00% 0 0.00% 0 0.00% 3 0.03%
Andman 0 0.00% 0 0.00% 0 0.00% 1 0.11% 0 0.00% 1 0.01%
Assam 10 0.30% 0 0.00% 0 0.00% 10 1.09% 0 0.00% 20 0.21%
Bihar 50 1.50% 70 2.57% 19 0.95% 19 2.07% 5 0.94% 163 1.71%
Chhattisgarh 120 3.60% 57 2.09% 20 1.00% 22 2.40% 14 2.63% 233 2.45%
Delhi 0 0.00% 0 0.00% 0 0.00% 7 0.76% 0 0.00% 7 0.07%
Gujarat 81 2.43% 45 1.65% 5 0.25% 76 8.29% 12 2.26% 219 2.30%
Haryana 129 3.87% 4 0.15% 2 0.10% 16 1.74% 4 0.75% 155 1.63%
Himachal 1 0.03% 0 0.00% 0 0.00% 4 0.44% 0 0.00% 5 0.05%
Jharkhand 141 4.23% 19 0.70% 19 0.95% 9 0.98% 0 0.00% 188 1.98%
J&K 4 0.12% 0 0.00% 0 0.00% 3 0.33% 0 0.00% 7 0.07%
Karnatak 72 2.16% 0 0.00% 0 0.00% 25 2.73% 0 0.00% 97 1.02%
Kerala 1 0.03% 0 0.00% 0 0.00% 16 1.74% 0 0.00% 17 0.18%
Madhya Pradesh 1300 38.99% 2175 79.70% 1678 83.86% 122 13.30% 247 46.43% 5522 58.05%
Maharashtra 596 17.88% 254 9.31% 134 6.70% 349 38.06% 222 41.73% 1555 16.35%
Manipur 2 0.06% 0 0.00% 0 0.00% 2 0.22% 0 0.00% 4 0.04%
Orissa 56 1.68% 5 0.18% 3 0.15% 19 2.07% 2 0.38% 85 0.89%
Punjab 58 1.74% 2 0.07% 0 0.00% 38 4.14% 0 0.00% 98 1.03%
Pandicherry 0 0.00% 0 0.00% 0 0.00% 1 0.11% 0 0.00% 1 0.01%
Rajasthan 94 2.82% 5 0.18% 46 2.30% 23 2.51% 8 1.50% 176 1.85%
Tamil Nadu 28 0.84% 0 0.00% 0 0.00% 56 6.11% 9 1.69% 93 0.98%
Tripura 0 0.00% 0 0.00% 0 0.00% 2 0.22% 0 0.00% 2 0.02%
Uttar Pradesh 377 11.31% 90 3.30% 74 3.70% 43 4.69% 6 1.13% 590 6.20%
Uttarakhand 107 3.21% 1 0.04% 0 0.00% 5 0.55% 1 0.19% 114 1.20%
West Bengal 71 2.13% 2 0.07% 0 0.00% 16 1.74% 0 0.00% 89 0.94%Grand Total 3334 100.00% 2729 100.00% 2001 100.00% 917 100.00% 532 100.00% 9513 100.00%
126
Annexure 5 List of machines tested in CRFMTTI during XI FYP
Machines tested in the Financial Year 2007-08Sl. No.
Make & Model of Machines/ Implements
Nature of Test Report Month & Year ofrelease
1 Powertrac 445 XL Tractor Comm. (ICT) 03/20072 Shrachi Kubota DF 12L PT Comm. (ICT) 03/20073 Same 603 Euro-W Comm. (Variant) 03/20074 Powertrac 455 XL tractor Comm.(ICT) 04/20075 Preet 4049 tractor Comm.. (ICT) 04/20076 Indo Farm 3040 DI tractor Comm.. (ICT) 04/20077 Indo Farm 3035 DI tractor Comm.. (ICT) 05/20078 Balwan 450 tractor Comm (BT) (Incomp.) 05/20079 Agni 18 DI Power tiller Confidential (Converted to
Commercial)05/2007
10 Sun GN-151 DI Power Tiller Confidential(Converted toCommercial)
05/2007
11 Indo Farm 3050 DI tractor Comm. (ICT) 05/200712 Indo Farm 3065 DI tractor Comm. (ICT) 05/200713 Preet 3549 tractor Comm. (ICT) 06/200714 Sonalika International DI-60 CM
Series tractorComm. (ICT) 06/2007
15 Sonalika International DI 60(4 WD) tractor
Comm. (OECD) 06/2007
16 Sonalika International DI 75(4 WD) tractor
Comm. (OECD) 06/2007
17 MF 1035 DI J Mahashakti tractor Comm. (Variant) 06/200718 Same 503-W tractor Comm. (Variant) 06/200719 Powertrac 4455 tractor Comm. (ICT) 06/200720 Kavi GN 15L PT Confidential (Converted to
Commercial)07/2007
21 Farmtrac-50 EPI Shakti Rotary Comm. (Variant) 08/200722 Sonalika International DI-35 CM
Series tractorComm. (Incomplete) 08/2007
23 Sonalika International DI 75 tractor turbo CM Series
Comm. (ICT) 08/2007
24 Mahindra 265 DI tractor Comm. (BT) 08/200725 Mahindra Arjun 605 DI Ultra-1
tractorComm. (ICT) 08/2007
26 Angad 240 D tractor Comm. (BT) 09/200727 Sonalika International DI 75 CM
Series TractorComm. (ICT) 09/2007
28 Samrat power tiller Confidential 09/200729 Mahindra Gujarat Shaktimaan
353 tractorComm. (ICT) 09/2007
30 Escort Jawan Plus MPT Comm. (Variant) 10/200731 Sonalika International DI-740
Super CM SeriesComm.(ICT) 11/2007
127
Sl. No.
Make & Model of Machines/ Implements
Nature of Test Report Month & Year ofrelease
32 Sonalika International DI-745 III CM Series
Comm.(ICT) 11/2007
33 Mahindra Gujarat Shaktimaan 35 tractor
Confidential 11/2007
34 KAVI DF 15L PT Confidential (Converted to Commercial)
12/2007
35 Apollo agricultural tractor tyres 14.9-28, 12PR
Confidential(Incomplete)
12/2007
36 Mahindra 475 DI MKM Tractor Comm. (Variant) 01/200837 Sonalika International DI 730 II
TractorComm. (ICT) 01/2008
38 Swaraj 843 FE Tractor Comm.(ICT) 01/200839 Swaraj 724 FE Orchard tractor Comm. (ICT) 01/200840 SAME 40 tractor Comm. (ICT) 01/200841 Preet 5049-I tractor Comm. (ICT) Incompl. 01/200842 HMT 2522 Edi tractor Comm. (BT) 01/200843 Mahindra Gujarat Shaktimaan 30
tractorConf. (Incompl) 01/2008
44 Shifeng Angad 150 PT Suppl. (Comm.) 03/200845 Mahindra B-275 High speed
tractorComm.(ICT) 03/2008
46 Standard 335 tractor Comm. (BT) 03/2008

128
Machines tested in the Financial Year 2008-09
Sl. No.
Make & Model of Machines/ Implements Nature of Test Report Month & Year of
release
1 Indo farm 3055 DI tractor Comm.. (ICT) 04/2008
2Preet 6049-I tractor Comm.(ICT
(Incomplete.)04/2008
3 John Deere 5104 tractor Conf. 04/20084 John Deere 5204 tractor Conf. 04/20085 Green Field 35 tractor Comm. (Variant) Incomplete. 04/20086 ACE – DI – 350 tractor Comm. (ICT) Incomplete. 04/20087 SAME 50 tractor Comm. (ICT) 04/2008
8Mahindra China Yuvraj 225 tractor
Comm. (ICT) 05/2008
9 John Deere 5410 tractor Comm. (ICT) 05/200810 SAME 70 tractor Comm. (ICT) 05/2008
11Zimidara Bharat trac 3035 tractor
Comm. (ICT) 06/2008
12Zimidara Bharat trac 3045 tractor
Comm. (ICT) 06/2008
13 Preet 3549-I tractor Comm. (ICT) 06/0814 Standard 345 tractor Comm. (ICT) 06/0815 Captain DI 2600 tractor Comm. (BT) 07/08
16MF 5245 DI Planetary drive tractor
Comm. (Variant) 07/08
17Mahindra 295 DI Super Turbo tractor
Comm. (ICT) 07/08
18 Farmtrac champion tractor Comm. (ICT) 07/0819 Balwan 450 tractor Comm. (ICT) 08/0820 TAFE MF 7245 tractor Comm. (ICT) 09/0821 Powertrac 4455 tractor Comm. (Suppl) 09/08
22Mahindra Shaktimaan 30 Tractor
Comm. Variant 09/08
23International DI-30 Baagban Tractor
Comm. (ICT) 09/08
24 Mahindra 6500 4WD tractor Comm. OECD 09/08
25 Farmtrac 60XT tractor Comm. (ICT) 09/0826 Preet 4049-I tractor Comm. (ICT) 09/0827 TAFE MF 7250 tractor Comm. (ICT) 10/0828 Panther 350 tractor Comm. (Conf) 10/0829 ACE DI 450 tractor Comm. (ICT) 10/08
30Escorts Farmtrac 45XT tractor
Comm. (ICT) 10/08
31Sonalika International DI-60 III tractor
Comm. (ICT) 10/08
32 New Holland 4510 tractor Comm. (ICT) 11/0833 New Holland 3037 tractor Comm. (Variant) 11/0834 Standard 460 tractor Comm. (BT) 11/08
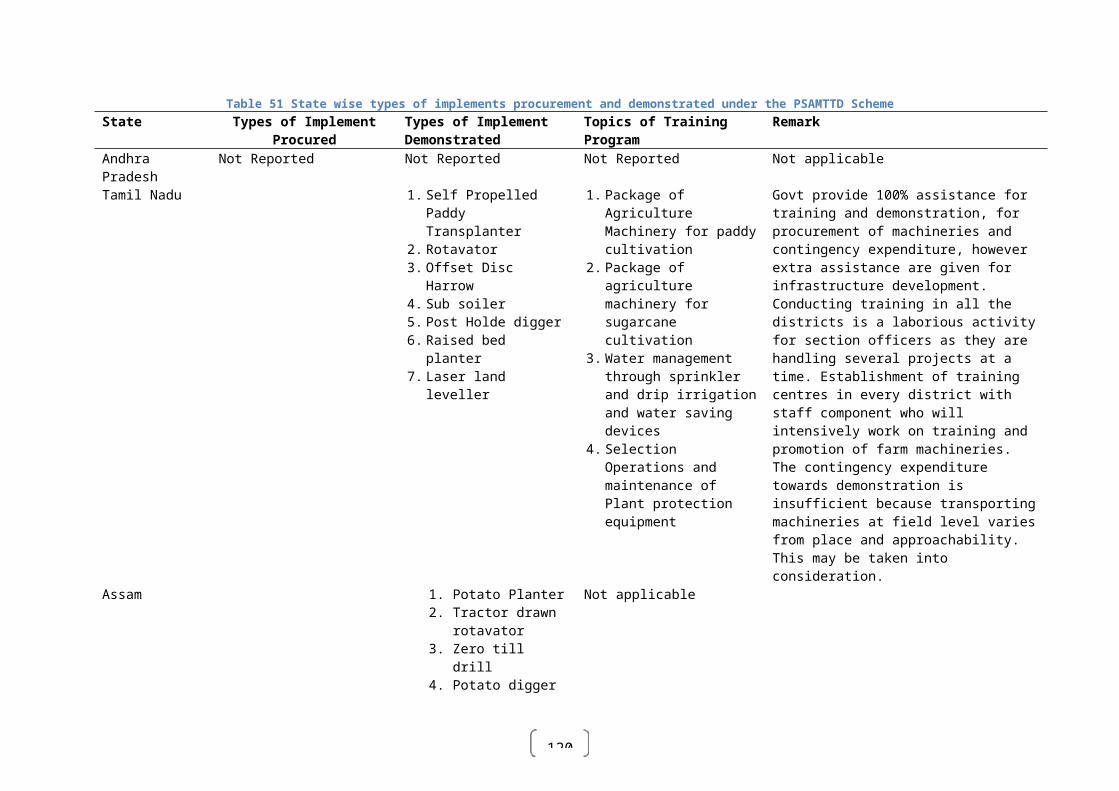
129
Sl. No.
Make & Model of Machines/ Implements Nature of Test Report Month & Year of
release35 Standard 450 tractor Comm. (BT) Incompl. 11/0836 Indofarm 2042 DI tractor Comm. (ICT) 11/0837 TAFE, MF 4410 tractor Comm. Variant 01/09
38Sonalika International DI-734 tractor
Comm. Variant 01/09
39Mahindra 295 DI Super Turbo LT tractor
Comm. Variant 01/09
40Mahindra Gujarat Shaktimaan-40 tractor
Comm.(ICT) 02/09
41 EICHER 5150 tractor Comm.(Suppl) 02/09
42Sonalika International DI-35 II DS tractor
Comm. (Variant) 03/09
43 Farmer DI 1200 tractor Conf, 03/0944 Shaktimaan-45 tractor Comm.(ICT) 03/09
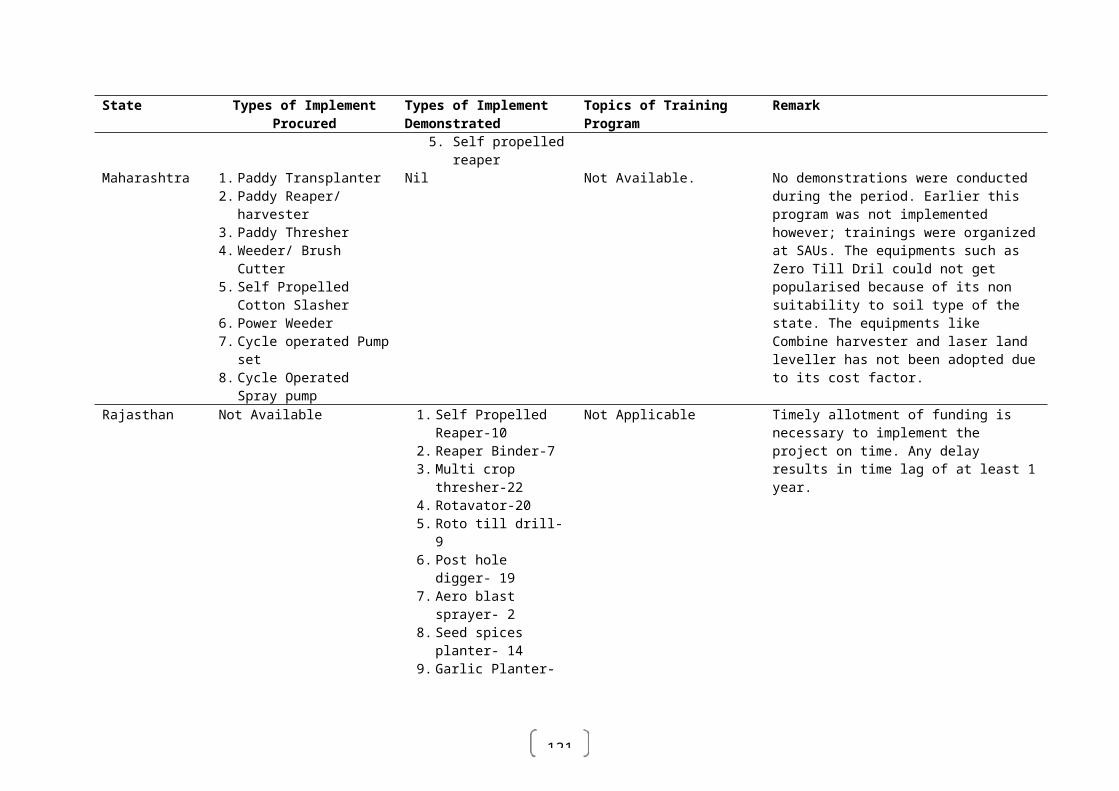
130
Machines tested in the Financial Year 2009-10
Sl. No.
Make & Model of Machines/ Implements
Nature of Test Report Month & Year ofrelease
1 Mahindra 295 DI super turbo DLX tractor
Comm.(ICT) 04/09
2 New Holland 4710 tractor Comm.(ICT) 04/09
3 New Holland 3510 tractor Comm.(ICT) 04/094 Balwan 330 tractor Comm.(ICT) 04/095 ACE DI 350 tractor Comm.(ICT) 04/096 Deutz-Fahr Agrolux 70E
tractorComm.(ICT) 04/09
7 Deutz-Fahr Agrolux 60E tractor
Comm.(ICT) 04/09
8 Standard 124 DO tractor Comm.(ICT) 04/099 TAFE, MF 5245 DI
Mahamahaan TractorComm.(ICT) 04/09
10 Preet 5049-I tractor Comm.(ICT) 05/0911 Preet 6049-I tractor Comm.(ICT) 05/0912 Mahindra Gujarat,
Shaktimaan-35Commercial
(Initial)05/09
13 Mahindra –B-275 DI (High Torque)
Commercial(B.T.)
05/09
14 John Deere – 5038 D Commercial(Initial)
06/09
15 Kubota B-2420 Commercial(Initial)
06/09
16 Powertrac-439 DX Commercial(Variant)
06/09
17 Agrolux -50 E Commercial(Initial)
06/09
18 Swaraj 735 XM Commercial(Variant)
06/09
19 Kubota L-3408 DD Commercial(Initial)
06/09
20 Swaraj 843 XM Commercial(Initial)
06/09
21 TAFE, MF 241 DI Planetary Drive Tractor
Commercial(Variant)
07/09
22 Deutz-Fahr, Agrolux 40E Tractor
Commercial(Initial)
07/09
23 Swaraj 834 XM tractor Commercial(Variant)
07/09
24 TAFE, MF 241 DI ‘J’ Mahashakti tractor
Commercial(Variant)
07/09
25 Sonalika International DI-39 RX tractor
Commercial(Initial)
08/2009
26 New Holland 4010 tractor Commercial(Initial)
08/2009
27 Swaraj 724 XM tractor Commercial 08/2009
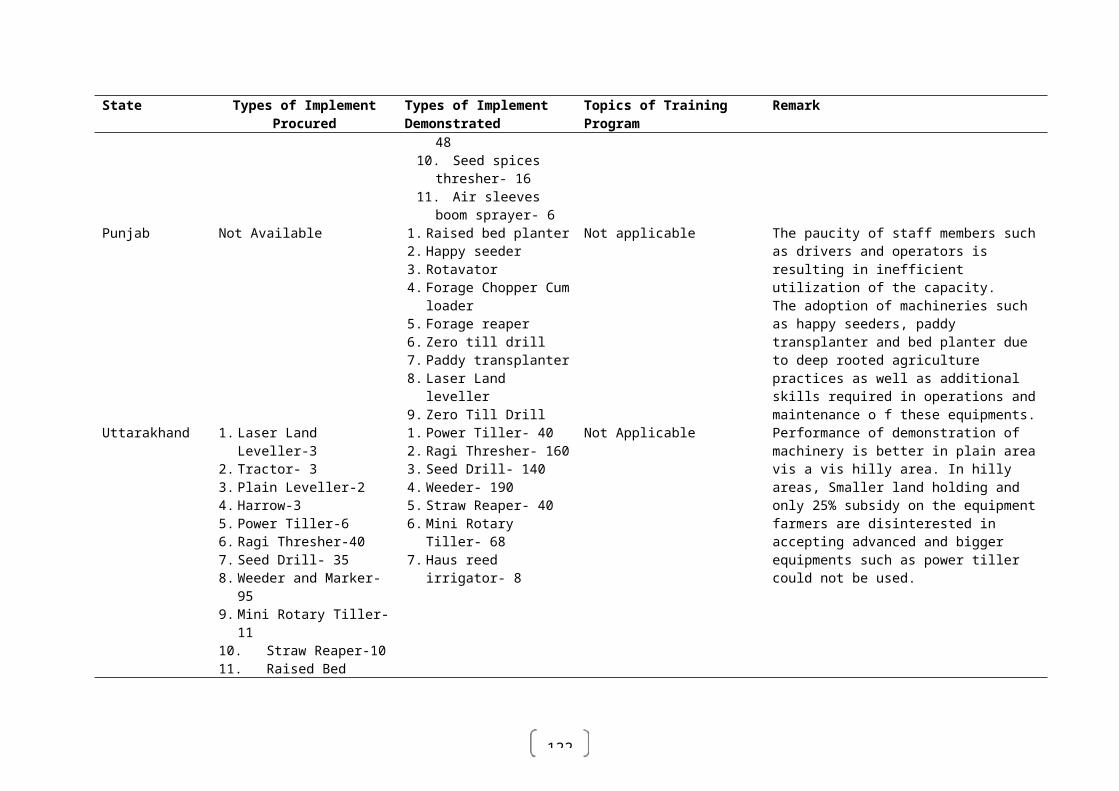
131
Sl. No.
Make & Model of Machines/ Implements
Nature of Test Report Month & Year ofrelease
(Variant)28 John Deere 5036 C tractor Confidential 08/200929 Powertrac -4455 DX tractor Commercial
(Initial)09/2009
30 Standard 335-I tractor Commercial(Initial)
09/2009
31 New Holland 6500 tractor Commercial(Initial)
09/2009
32 Mahindra 475 DI MKM Total tractor
Commercial(Initial)
10/2009
33 Sonalika International DI-35 RX tractor
Commercial(Variant) - Incomplet
10/2009
34 TAFE, MF 1035 DI V1 tractor Commercial(Variant)
10/2009
35 TAFE, MF 1035 DI Mahashakti-V1 tractor
Commercial(Initial)
10/2009
36 Sonalika International DI-47 RX tractor
Commercial(Initial)
10/2009
37 John Deere 5041 C Tractor Confidential 11/200938 Preet- 4549 Tractor Commercial
(Initial)11/2009
39 TAFE, ME 9000 ID Planetary Drive Tractor
Commercial(Variant)
11/2009
40 Sonalika International DI-745 III Power plusTractor
Commercial(Variant)
11/2009
41 ACE DI-450 Tractor Confidential 12/200942 ACE DI-350 Tractor Commercial
(Suppli.)12/2009
43 Sonalika International DI-42 RX Tractor
Commercial(Variant)
12/2009
44 New Holland 3032 MU Tractor
Commercial(Variant)
01/2010
45 New Holland 3032 Tractor Commercial(Variant)
01/2010
46 New Holland 3600-2 Tractor Commercial(Variant)
01/2010
47 New Holland 3710 Tractor Commercial(Variant)
02/2010
48 John Deere 5041C Tractor Commercial(ICT)
02/2010
49 Agri King 20-55 Tractor Conf. 03/201050 Sonalika International DI-750
II 2WD TractorOECD 03/2010
51 Sealing components of front axle assembly
Conf. 03/2010
Machines tested in the Financial Year 2010-11
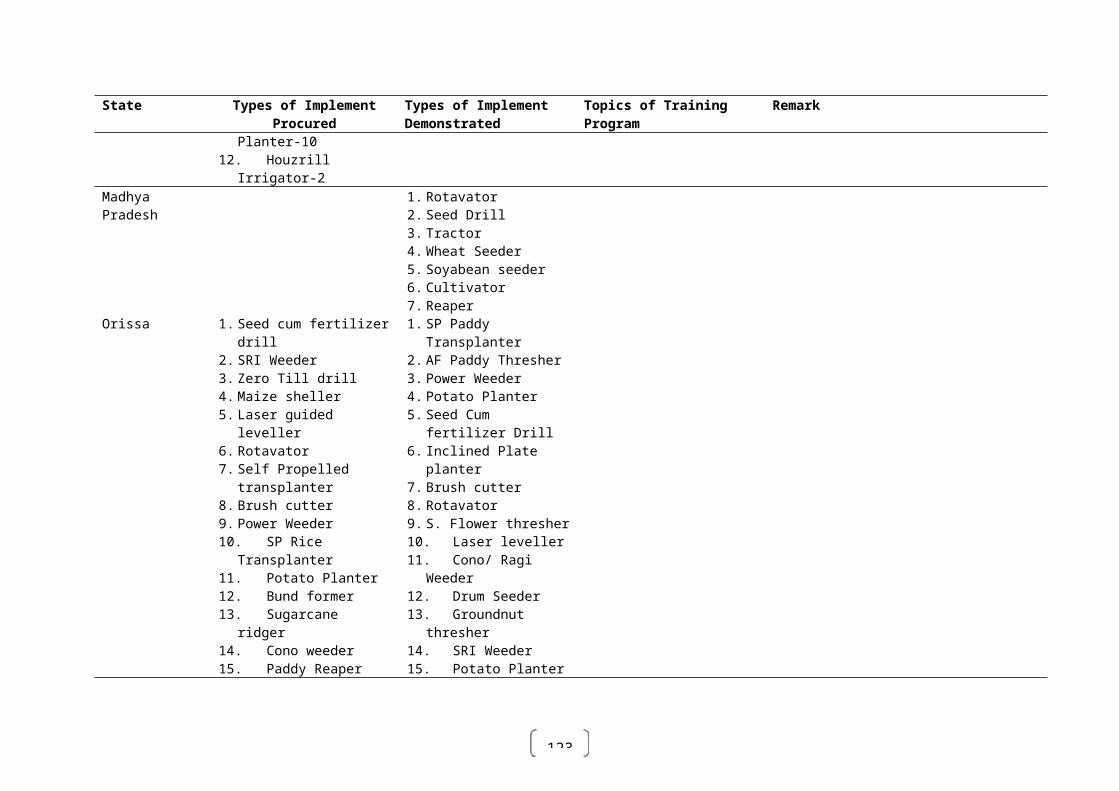
132
Sl No.
Make & Model ofMachines / Implements
Nature of Test Report Month & Year ofrelease
1 John Deere 5036 C Tractor Commercial(Initial)
04/2010
2 Mahindra 475 MKM TOTAL LT Tractor
Commercial(Variant)
04/2010
3 Kubota L-4508 DD Tractor Commercial(Initial)
04/2010
4 Sonalika International DI-55 RX Turbo Tractor
Commercial(Initial)
04/2010
5 Indo Farm, 3052 DI Tractor Commercial(Initial)
04/2010
6 Sonalika International DI-60 2WD Tractor
OECD Code-2 04/2010
7 Deutz-Fahr, Agrolux-50 E 2WD Tractor
Commercial(Variant)
04/2010
8 Deutz-Fahr, Agrolux-70 E 2WD Tractor
Commercial(Variant)
04/2010
9 Deutz-Fahr, Agrolux-60 E 2WD Tractor
Commercial(Variant)
05/2010
10 ACE DI 450 Tractor Comm. (Suppl.) 05/201011 Indo farm 2030 DI HS Tractor Comm. (Initial) 05/201012 Mahindra, 215
(Brand Name : Yuvraj 215 ) Tractor
Conf.Converted to
ICT
05/2010
13 Sonalika International DI -90 (4 WD) Tractor
OECD 06/2010
14 Indo farm 2035 DI DX Tractor Comm. (Variant) 06/201015 HMT 4922 Tractor Comm. (BT) 06/201016 John Deere 5075 E Tractor Conf. 06/201017 Harig, Panther 335 Tractor Comm. (ICT) 07/201018 Mahindra, B 275 DI MKM
(Brand Name: Bhoomiputra) Tractor
Comm. (ICT) 07/2010
19 Harig, Panther345 Tractor Comm. (ICT) 07/201020 Sonalika International DI 60
RX TurboComm. (Variant) 07/2010
21 Mahindra, 575 DI (Brand Name: Bhoomiputra) Tractor
Comm. ( ICT) 08/2010
22 Mahindra, 475 DI Tractor ( Brand Name: Bhoomiputra)
Comm. ( ICT) 08/2010
23 Indo Farm, 3048 Tractor Comm. (Variant) 08/201024 HMT, 5022 RX Tractor Comm. (Variant) 08/201025 Sonalika International DI 750
III Super TractorComm. (ICT) – Incomplete 08/2010
26 Thrishul MT 625 DI Tractor Comm. (BT) (incomplete) 08/201027 Standard 235 DI Tractor Comm. (ICT) (Incomaplete) 08/201028 Mahindra 265 DI Tractor Comm. (ICT) 08/2010
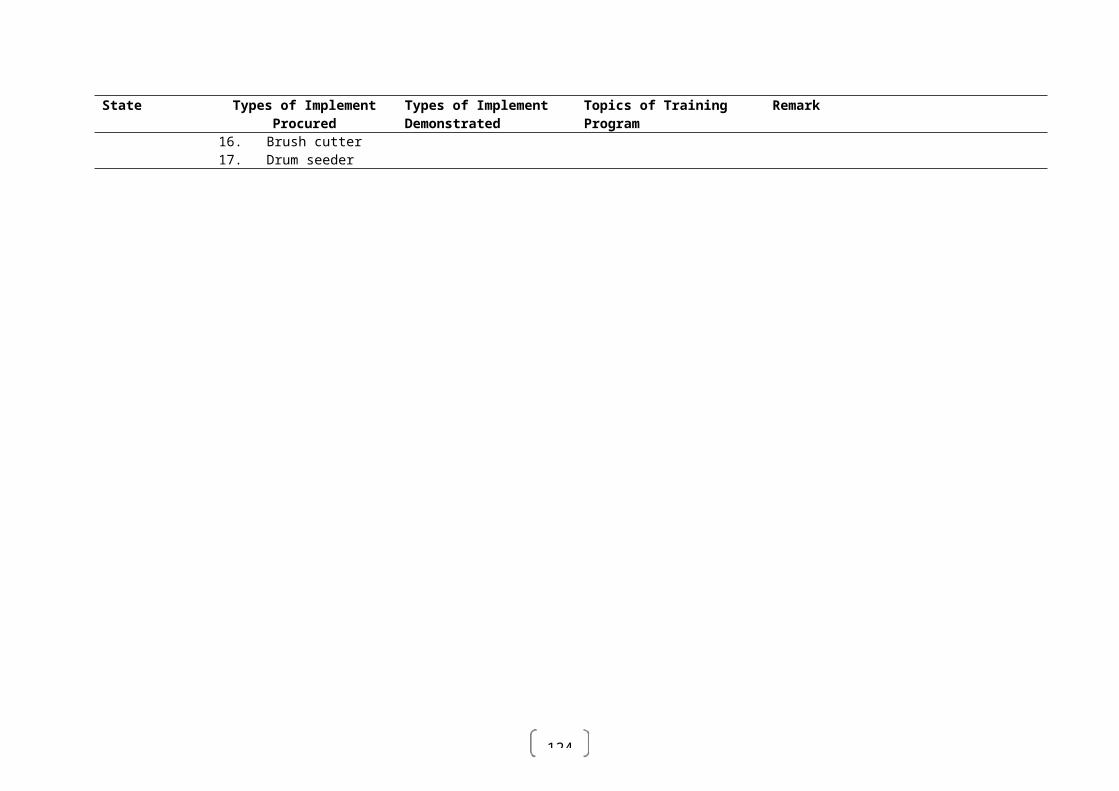
133
Sl No.
Make & Model ofMachines / Implements
Nature of Test Report Month & Year ofrelease
(Brand Name: Bhoomiputra)29 Sealing Components of Front
Axle AssemblyConfidential 09/2010
30 Mahindra, B-275 DI TU Tractor (Brand Name: Bhoomiputra)
Comm. (ICT) 09/2010
31 New Holland 3030 Tractor Comm. (BT) 09/201032 Powertrac – 429 Tractor Comm. (ICT) 09/201033 New Holland 3630 Tractor Comm. (BT) 09/201034 Escort Powertrac 455 XL PS
Tractor (NoiseLevel Test only)
Confidential 10/2010
35 Field Marshal FM 625 DI Tractor
Comm. (BT) 10/2010
36 New Holland 3630 Tx Plus 12+3 UG Tractor
Comm. (ICT) 10/2010
37 Eicher, 5150 Rotary Tractor Comm. (ICT) 10/201038 Mahindra Gujrat, Shaktiman
– 60 TractorComm. (ICT) 10/2010
39 TAFE, MF 1030 Mahashakti Tractor
Comm.(ICT) 11/2010
40 Captain DI 2600 4WD Tractor Comm. (ICT) 11/201041 Mahindra, 475 DI MKM
Tractor(Brand Name: Sarpanch)
Comm. (Variant) 12/2010
42 Mahindra, 575 DI MKM Tractor(Brand Name: Sarpanch)
Comm. (Variant) 12/2010
43 Mahindra, 255 DI MKM Tractor
Comm. (ICT) 12/2010
44 New Holland 5500 12+3 UG Tractor
Comm. (Variant) 01/2011
45 Mahindra, 575 DI MKM Tractor(Brand Name: Sarpanch)
Comm. (Variant) February,2011
46 Sonalika International DI-90, 2WD (8 speeds,40kmph, ZM)
OECD Code-2 February,2011
47 Escorts, Power track-455 XL PS
Comm. (intial) February,2011
48 Mahindra, 475 DI MKM DLX (Brand Name: Sarpanch)
Comm. (Variant) February,2011
49 DEUTZ –FAHAR , Agrolux 55 E(4 WD)
Comm. (intial) February,2011
50 Trishul MT-9.5 Comm. (intial) March,201151 Mahindra Gujrat Saktiman-
31Comm. (intial) March,2011
52 TAFE LIMITED, TAFE 30DI Orchard Plus
Comm. (Variant) March,2011
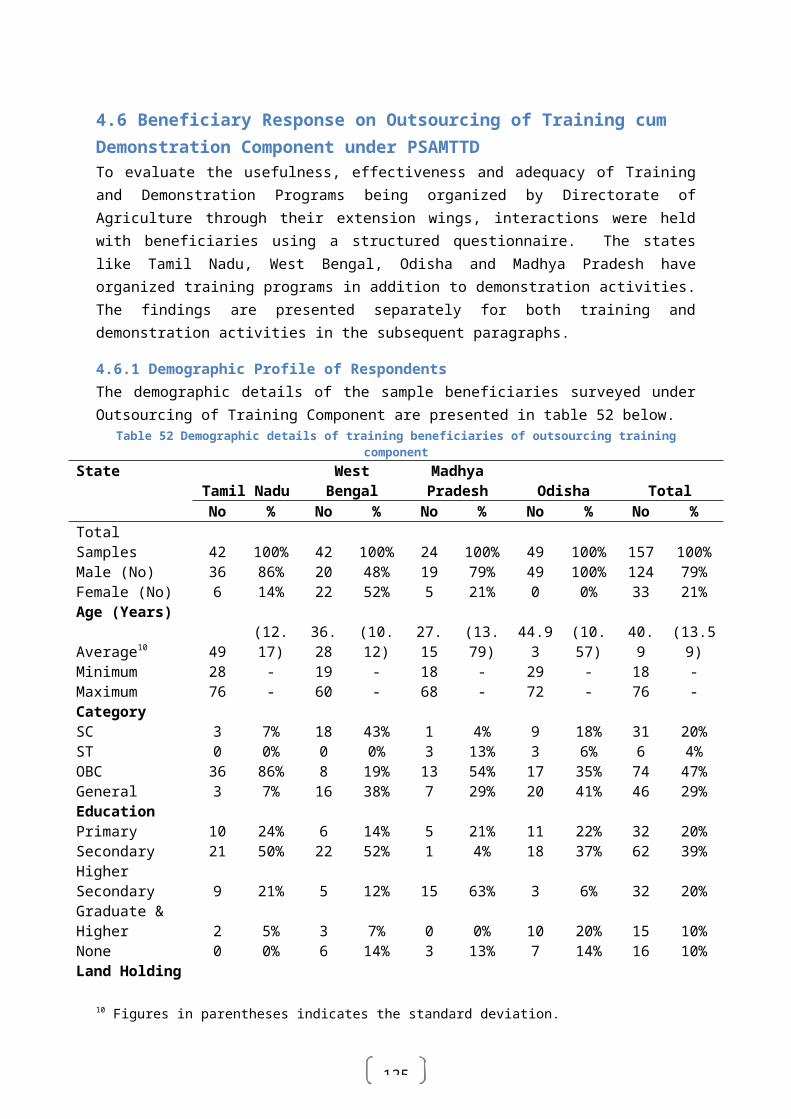
134
Sl No.
Make & Model ofMachines / Implements
Nature of Test Report Month & Year ofrelease
53 Sonalika International DI-60 CM Series 2WD
Comm. (Variant) March,2011
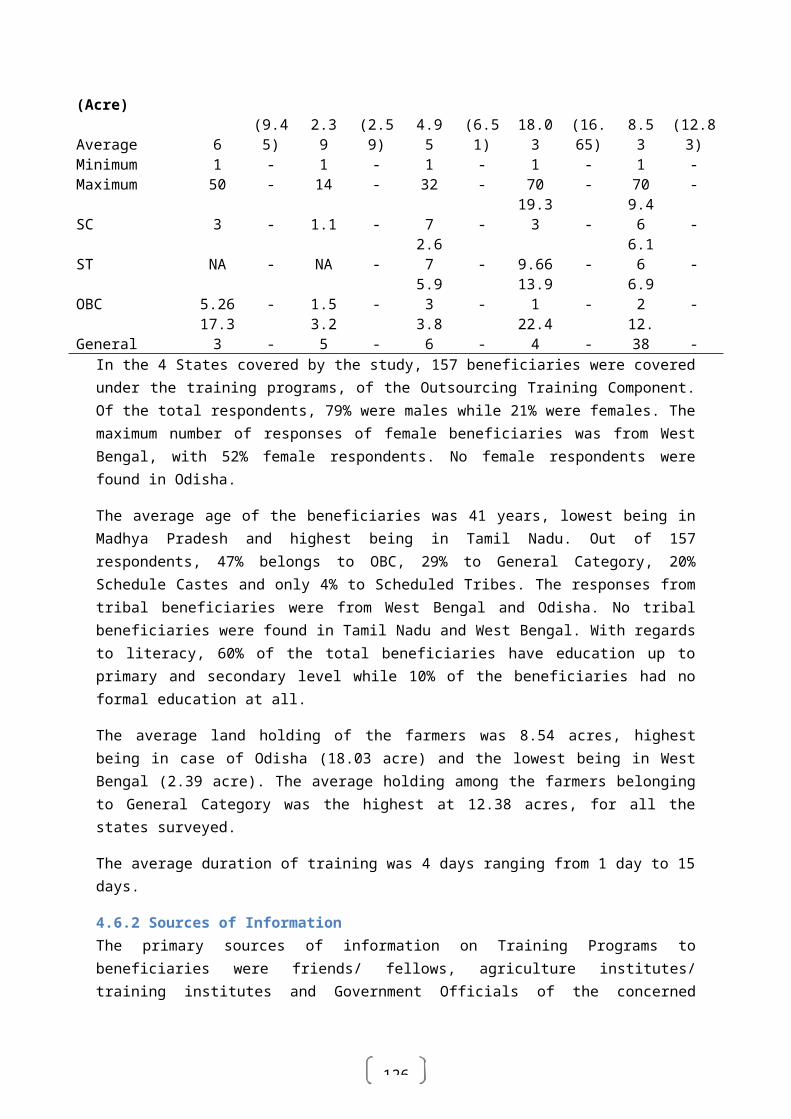
135
Machines tested in the Financial Year 2011-12
Sl. No.
Make & Model ofMachines / Implements
Nature of Test Report Month & Year ofrelease
1 Mahindra 575 DI MKM (Brand Name: Bhoomiputra)
Comm. (Variant) April,2011
2 Mahindra 475 DI MKM (Brand Name: Bhoomiputra)
Comm. (Variant) April,2011
3 Mahindra 265 DI MKM (Brand Name: Bhoomiputra)
Comm. (Variant) April,2011
4 Indo Farm 3055 NV Comm. (Variant) April,20115 Indo Farm 3055 NV DX Comm. (Variant) April,20116 Royal Tractor Comm. (intial) May, 20117 Swaraj 735 FE Tractor Comm. (intial) May, 20118 Sonalika International DI –
75(2WD)OECD Code -2 May, 2011
9 Mahindra Gujrat, Shaktiman-55
Comm. (Variant) May, 2011
10 Mahindra,B-275 DI TU MKM (Brand Name : Bhoomiputra)
Comm. (Variant) May, 2011
11 Sonalika International DI -730 III FE
Comm. (Intial) June,2011
12 New Holland 3210 Comm. (Variant) June,201113 Standard 450 Comm. (Batch) June,201114 John Deer 5104 Confidentiel
(Limited Test)June,2011
15 john Deer 5310 Confidentiel(Limited Test)
June,2011
16 Swaraj 735 XM Comm. (Variant) July,201117 Swaraj 724 XM Orchard Comm. (Intial) July,201118 Barieri, Tera Track 4WD Confidentiel July,201119 Kubota 2420, 4WD Commercial
(Supplimentary)July,2011
20 White Wagon, Vaibhav Tractor
Confidentiel Converted to Commercial
July,2011
21 Force Moters,Balwan 450 Commercial(Supplimentary)
July,2011
22 Mahindra,575 DI MKM Rotary(Brand Name : Sarpanch)
Comm. (Variant) July,2011
23 Mahindra, Shaktimaan – 30 (Brand Name: Shaktimaan)
Comm. (Variant) August, 2011
24 John Deere 5055 E Commercial(Initial)
August, 2011
25 John Deere 5055 E Version-2 Commercial(Initial)
August, 2011
26 Eicher 312 P Confidential(Limited test)
August, 2011
27 Eicher 485 H Confidential(Limited test)
August, 2011
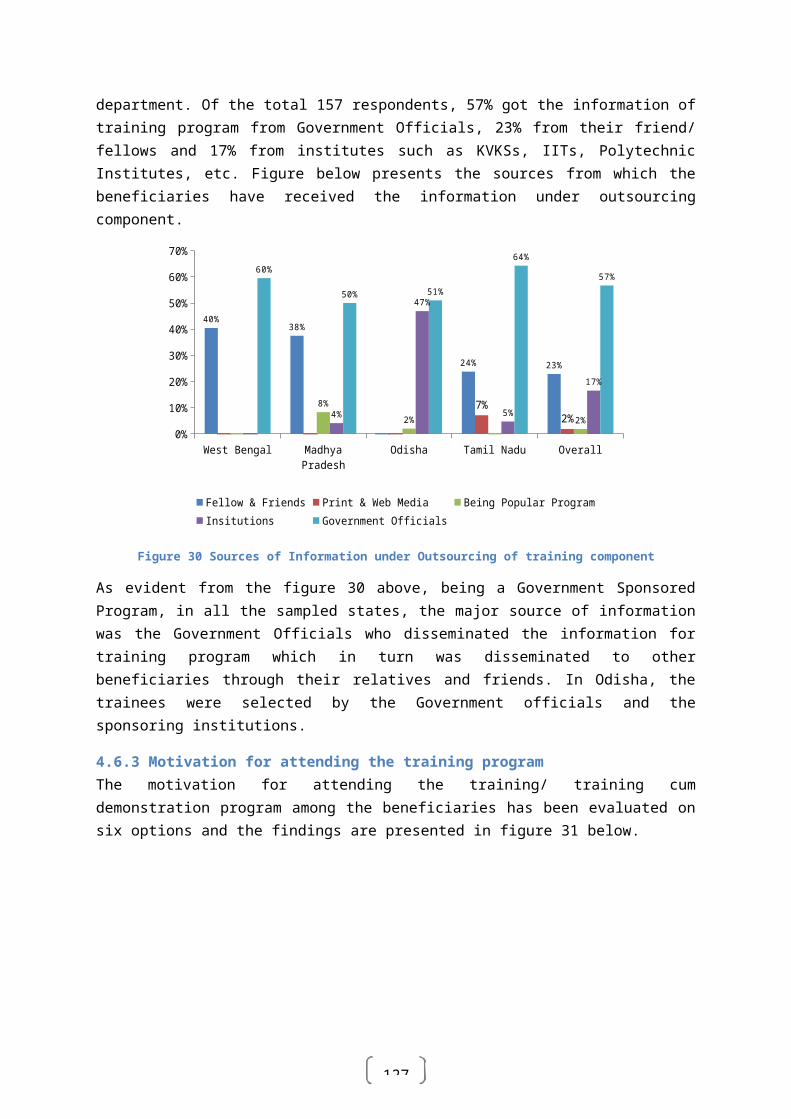
136
Sl. No.
Make & Model ofMachines / Implements
Nature of Test Report Month & Year ofrelease
28 Eicher 242 XTRAC Commercial(Initial)
August, 2011
29 TAFE, MF 9500 Commercial(Initial)
August, 2011
30 Force Motors, OX-25 Orchard DLX
Commercial(Initial)
August, 2011
31 Escorts, Powertrac- 434 Commercial(Batch)
September,2011
32 Escorts, Powertrac- 439 Commercial(Batch)
September,2011
33 Indo Farm 3055 NV VX Commercial(Variant)
September,2011
34 DEUTZ-FAHR, AGROLUX – 55 e (12+3 )2WD
Commercial(Variant)
September,2011
35 DEUTZ-FAHR, AGROLUX – 55 e 2WD
Commercial(Variant)
September,2011
36 Indo Farm 3035 DI Commercial(Initial)
September,2011
37 John Deere 5042 D Commercial(Initial)
September,2011
38 Mahindra B-275 DI TU MKM DLX (BrandName: Bhoomiputra)
Commercial(Variant)
September,2011
39 Mahindra B-265 DI MKM DLX (Brand Name: Bhoomiputra)
IncompleteCommercial
(Variant)
October,2011
40 Farmtrac 60 (2WD) OECD Code-2 October,2011
41 John Deere 5060 E Commercial(Initial)
October,2011
42 Sonalika International RX MM Super
Commercial(Initial)
October,2011
43 Eicher 242 XTRC PREMIUM Commercial(Variant)
November,2011
44 New Holland 5500 Turbo Super 12+3 UG
IncompleteCommercial (Initial)
November,11
45 Sonalika International DI-60 RX
Commercial(Variant)
December,2011
46 John Deere 5045 D Commercial(Variant)
December,2011
47 Mahindra, 475 DI MKM DLX (Brand Name: Bhoomiputra)
Commercial(Variant)
December,2011
48 Mahindra, 575 DI MKM DLX (BrandName:Bhoomiputra)
Commercial(Variant)
December,2011
49 Sonalika International DI-35 DS CM Series
Commercial(Variant)
December,2011
50 Sonalika International DI-740 CM Series
Commercial(Variant)
December,2011
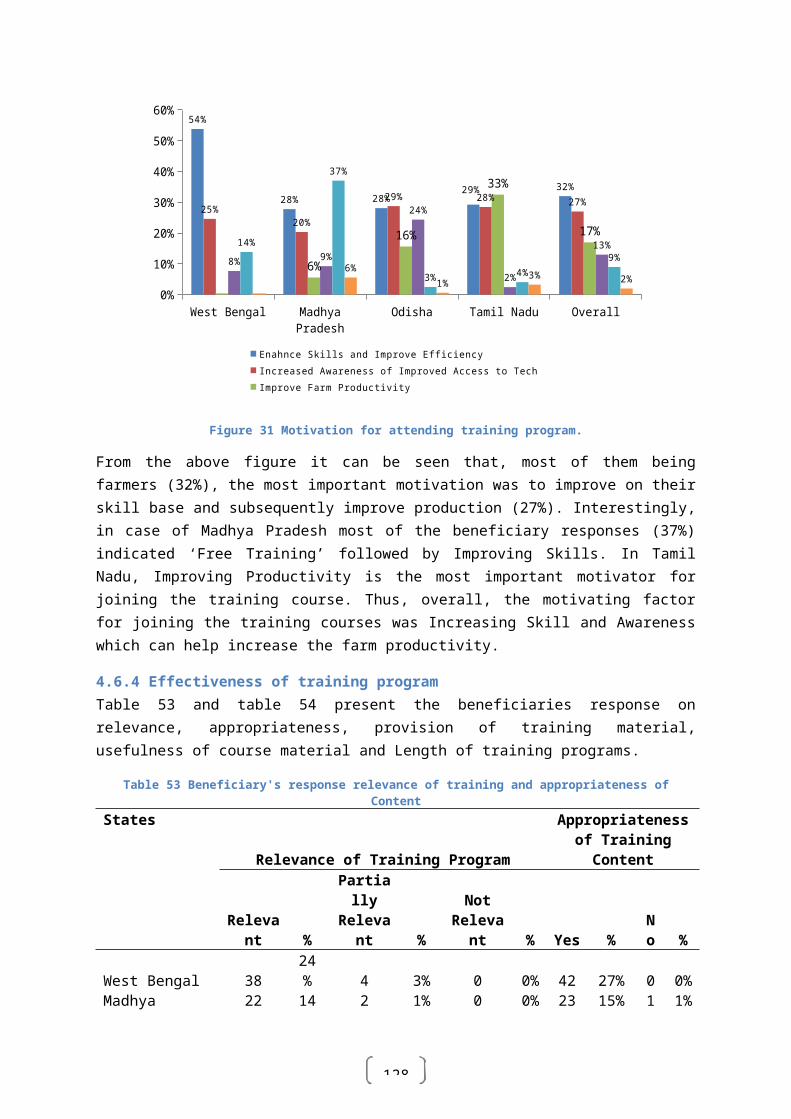
137
Sl. No.
Make & Model ofMachines / Implements
Nature of Test Report Month & Year ofrelease
51 Sonalika International DI-734 FE
Commercial(Variant)
January,2012
52 Escorts, Farmtrac 6060 Commercial(Initial)
February,2012
53 Indo power 48 DI (2WD) Tractor
OECD 02/12
54 Mahindra 8000-4WD Tractor OECD 02/12
55 Mahindra 7030-4WD Tractor OECD 02/12
56 Mahindra, 265, DI MKM DLX Tractor
Variant 02/12
57 MF, 245 DI J Mahashakti Rotary Pump
Variant 02/12
58 Bull Crop AV-20 Combine Harvester
Combine 03/2012
59 Sonalika International 90 RX 4WD Tractor
OECD 03/12
60 Sonalika International Worldtrac 75 RX 4 WD Tractor
OECD 03/12
61 Eicher 241 Xtrac Tractor Commercial(Initial)
03/12
62 TAFE, MF 5245 DI Planetary Drive PowerSteering Tractor
Commercial 03/12
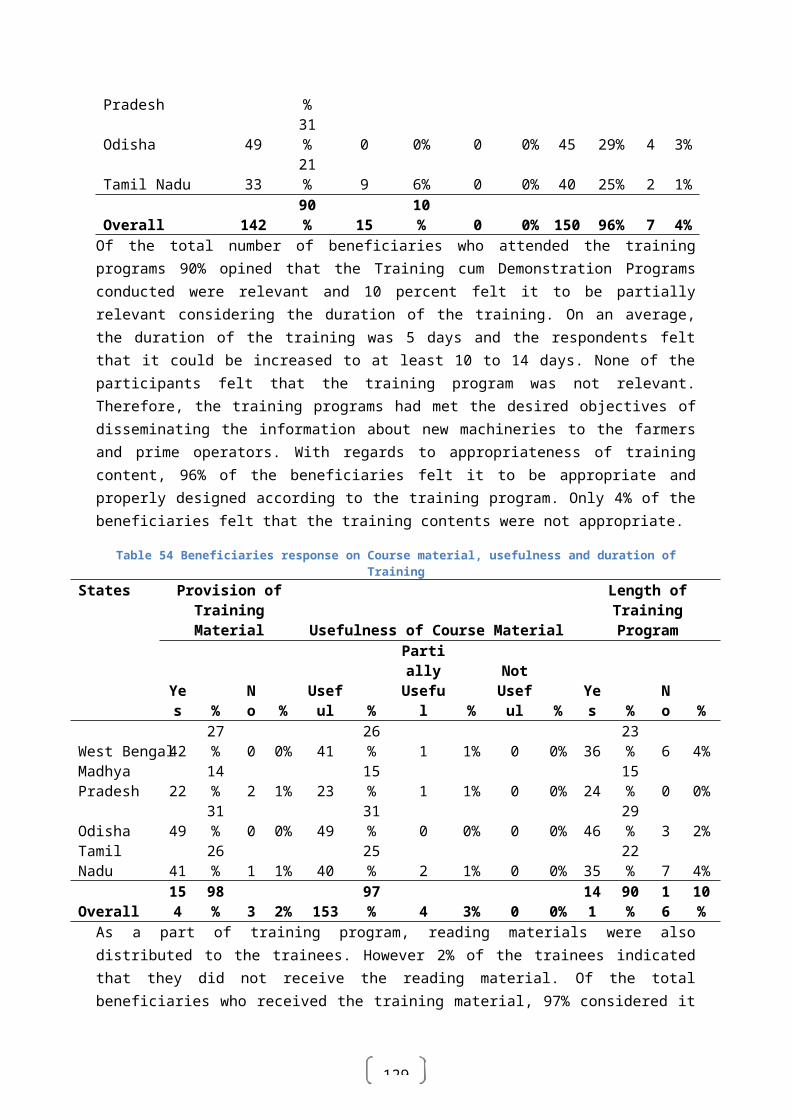
138
Annexure 6 List of machine tested under CMVR in CRFMTTI (Budni, MP) during XI FYP
Machine tested during 2010-11SNo Name of machine Date of Certificate
1 Mahindra Sactor (Brand Shaan) Tractor 07.04.20102 Vaibhav Tractor 12.04.20103 Eicher 368 Tractor 13.04.20104 Eicher 380 Tractor 15.04.20105 Eicher 242 NC Tractor (Variant: Eicher 242XTRAC
&Eicher 242 XTRAC Premium Tractor)15.04.2010
6 Eicher 241 NC Tractor (Variant : Eicher 241 XTRAC Tractor)
15.04.2010
7 Eicher 312 Tractor (Variant: Eicher 312P Tractor) 15.04.20108 Eicher 333 Tractor 16.04.20109 Eicher 480 Tractor 16.04.2010
10 John deere 5310Cr tractor 16.04.201011 John deere 5410 creeper tractor 16.04.201012 John deere 5204 tractor 16.04.201013 John deere 5104 tractor 16.04.201014 John deere 5038D tractor 16.04.201015 John deere 5103s version 2 tractor 16.04.201016 John deere 5310 version 2 tractor 16.04.201017 John deere 5103 version 2 tractor 16.04.201018 John deere 5203 version 2 tractor 16.04.201019 John deere 5203s tractor 16.04.201020 John deere 5103 economy tractor 16.04.201021 John deere 5036c tractor 16.04.201022 John deere 5041c tractor 16.04.201023 John deere 5610 tractor 16.04.201024 John deere 5310 4WD tractor 16.04.201025 Kubota L3408DD Tractor 20.04.201026 Kubota B2420 Tractor 20.04.201027 Kubota L4508DD Tractor 20.04.201028 Mahindra Sactor Shaan (Brand name: Shaan) Tractor 20.04.201029 Mahindra 235 DI Airflow Tractor 20.04.201030 Indo Farm 3052 DI Tractor 21.04.201031 Mahindra 265 DI MKM DLX (Brand: Bhoomiputra)
Tractor22-04-2010
32 Mahindra 255 DI MKM Tractor 26-04-201033 Kubota L 3609 DD Tractor 03.05.201034 Dragon Shakti 150 DI Power Tiller 03.05.201035 Swaraj 855 FE Tractor 10.05.201036 Swaraj 855 FE GX Tractor 10.05.201037 John Deere 5725 Tractor 10.05.201038 GS 14 DIL Power Tiller 19.05.201039 Mahindra Shaktimaan 30 Tractor 21.05.201040 Swaraj 744 FE tractor (Amendment No.2) 02.06.2010
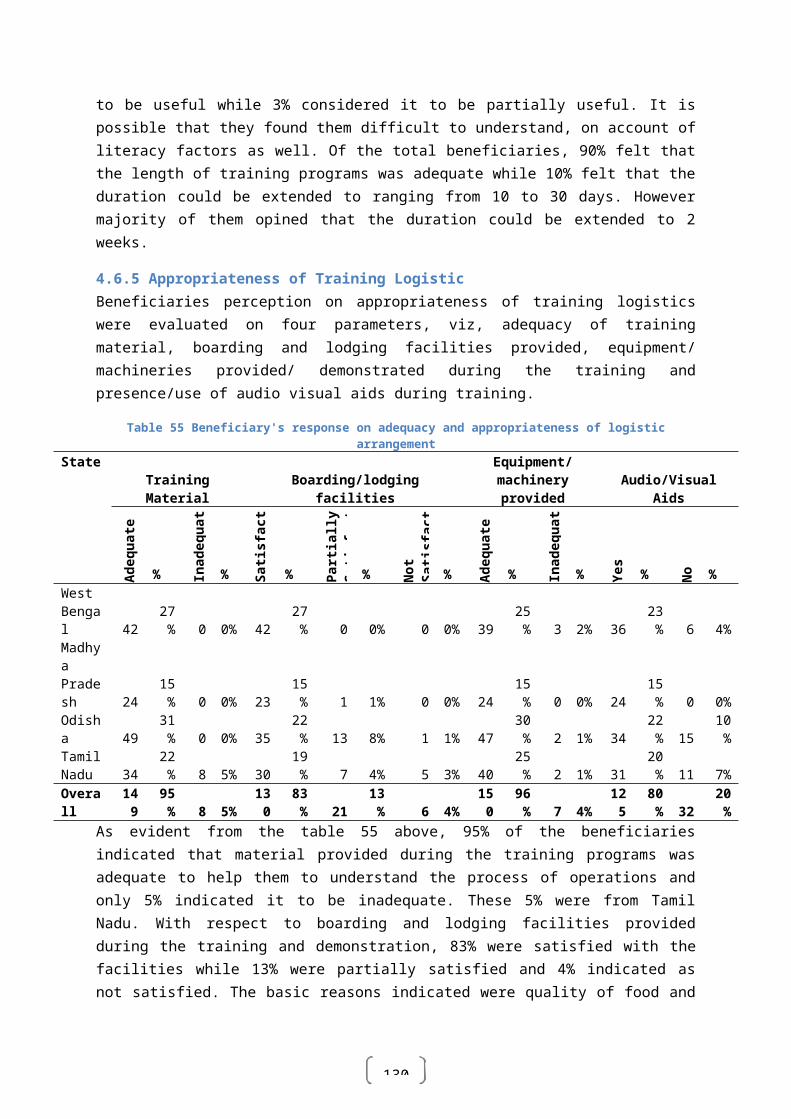
139
41 Sonalika International DI-732 III Deluxe tractor 03.06.201042 Field Marshal FM 625 DI Tractor 14.06.201043 Captain DI 2600 4WD tractor (Amendment No.1) 18.06.201044 John Deere 5310 RS tractor 21.06.201045 Balwan 450 tractor 06.07.201046 Balwan 500 tractor 06.07.201047 Balwan 330 tractor 06.07.201048 Balwan 400 tractor 06.07.201049 Powertrac 455 XL PS tractor 06.07.201050 Escort Jawan Plus MPT tractor 09.07.201051 Indo Farm 3035 DI tractor 12.07.201052 Indo Farm 3040 DI tractor 12.07.201053 Eicher 485 tractor 16.07.201054 Kubota-RT140DI-RP80 Power Tiller 22.07.201055 New Holland 3230 tractor 05.08.201056 New Holland 3130 tractor 05.08.201057 New Holland 3037 tractor 05.08.201058 John Deere 5036 C tractor 06.08.201059 John Deere 5041 C tractor 06.08.201060 John Deere 5041 PS tractor 12.08.201061 John Deere 5036 PS tractor 12.08.201062 Indofarm 2030 DI HS tractor 16.08.201063 Indofarm 2035 DI DX tractor 16.08.201064 Indofarm 2042 DI tractor 16.08.201065 Balram 950 DI tractor 17.08.201066 OX 25 Orchard DLX tractor 25.08.201067 Angad 150 D tractor 26.08.201068 TAFE 30 DI Orchard Plus tractor 27.08.201069 Indofarm 3048 DI tractor 09.09.201070 MF 1035 DI Mahashakti V1 tractor 10.09.201071 MF 1035 DI J Mahashakti Power Steering tractor 10.09.201072 Eicher 5150 Rotary Tractor 13.09.201073 Captain DI 2600 Mini Tractor 15.09.201074 Captain DI 2600 4 WD Tractor 23.09.201075 Powertrac – 445 Tractor (Variants: Powertrac – 445
XLT & Powertrac – 445 XL DC )27.09.2010
76 Powertrac – 429 Tractor 27.09.201077 HMT 3522 DX Tractor 27.09.201078 HMT 3522 Tractor 27.09.201079 Mahindra Gujarat Shaktimaan-55 tractor 27.09.201080 Sonalika International DI-740 III CM Series Tractor 29.09.201081 Sonalika International DI-30 Baagban Tractor 29.09.201082 Swaraj 735 FE Tractor 01.10.201083 Farmtrac 50 EPI (Shakti) Tractor 05.10.201084 Sunrise DI Power Tiller 05.10.201085 Panther 345 Tractor 07.10.2010
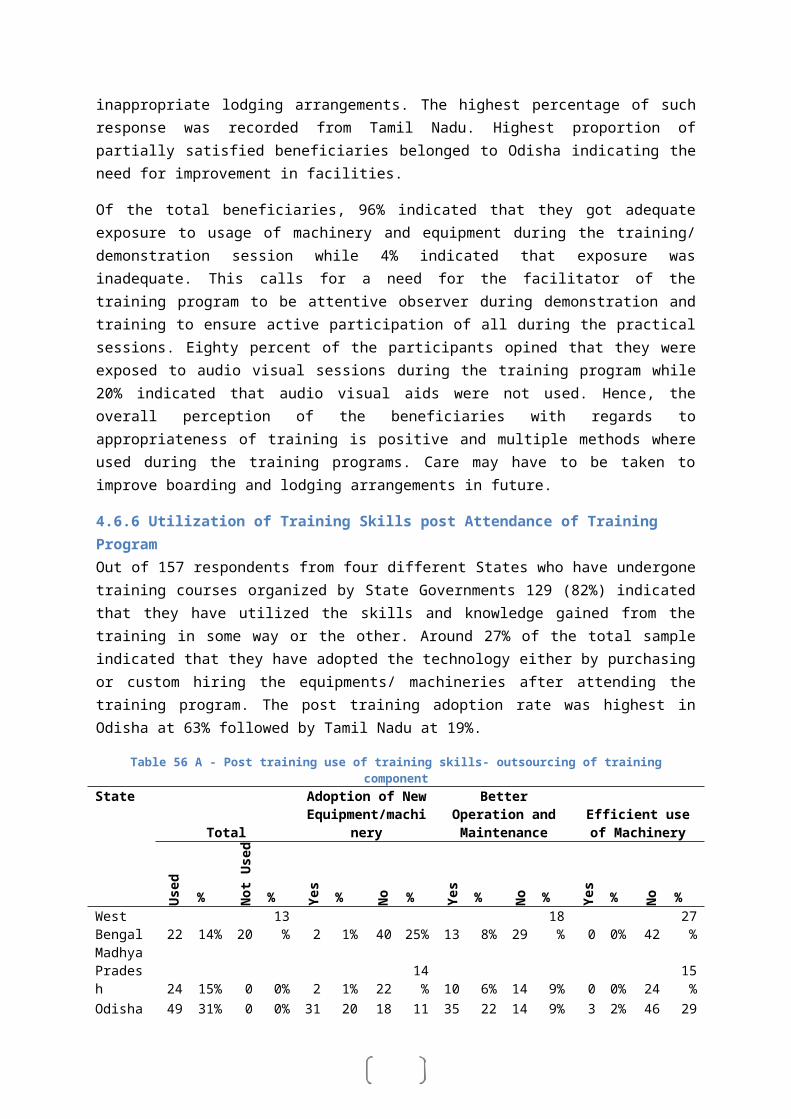
140
86 Swaraj 724 XM Orchard Tractor 13.10.201087 Preet 4549 Tractor 18.10.201088 Mitsubishi Shakti 180 D Tractor 28.10.201089 Stallion 17 DI tractor 28.10.201090 ACE DI 450 tractor 29.10.201091 ACE DI 350 tractor 29.10.201092 Sigma Plus V2 EM Power Tiller 15.11.201093 ACE DI 550 DC Tractor 25.11.201094 Trishul MT 9.5 DI Tractor 31.12.201095 Indo Farm 3055 NV Tractor 31.12.201096 Bull LD V2 1000 EX Front end loader mounted on
Agrolux 60 e (12+3) 2 WD tractor04.01.2011
97 John Deere 5204 V2 tractor 21.01.201198 Farmer DI 1200 tractor 21.01.201199 HMT 5022 RX Tractor 25.01.2011
100 HMT 4922 Tractor 25.01.2011101 John Deere 5310 Cr. Tractor 25.01.2011102 Mahindra 8085 – 4 WD (Brand name – Arjun
International)Tractor24.02.2011
103 John Deere 5055E V2 Tractor 28.02.2011104 John Deere 5055E Tractor 28.02.2011105 Sonalika International DI 60 RX Turbo Tractor 09.03.2011106 Indo Farm 4175 DI Tractor 14.03.2011107 Preet 3549 Challenger tractor 16.03.2011108 Preet 3049 Challenger tractor 16.03.2011109 John Deere 5060 E tractor 16.03.2011110 Panther 335 Tractor 29.03.2011111 John Deere 5060 E V2 Tractor 30.03.2011112 John Deere 5065 E Tractor 31.03.2011
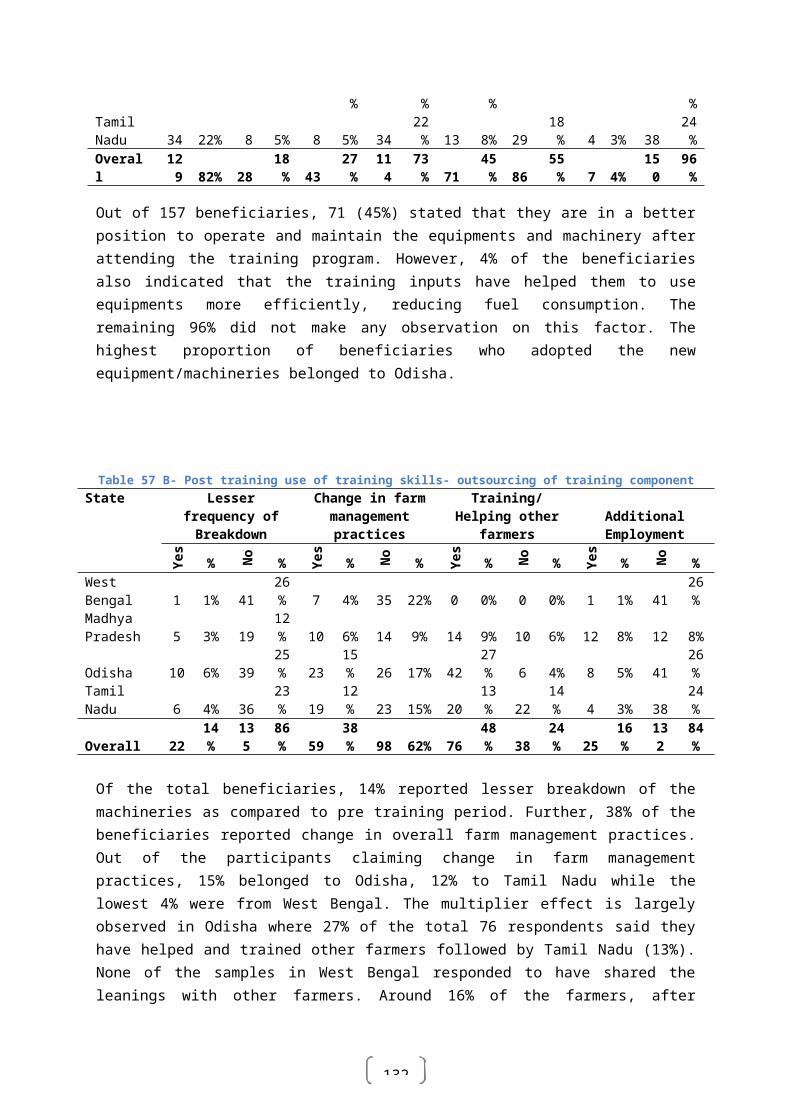
141
Machines tested during 2011-12SNo Name of machine Date of Certificate113 Sonalika International DI 35 RX Tractor 05.04.2011114 John Deere 5075 E Tractor 07.04.2011115 MF 9000 DI Planetary Drive Tractor 08.04.2011116 Sonalika International DI-60 4WD CM Series Tractor 08.04.2011117 Sonalika International DI-60 CM Series 2 WD Tractor 08.04.2011118 Garuda 3 PT 1200 D Power Tiller 11.04.2011119 MF 5245 DI Mahamahaan Tractor 13.04.2011120 Powertrac 4455 DX Tractor 27.04.2011121 John Deere 5055E V3 Tractor 27.04.2011122 Sonalika International DI-75 Turbo CM Series 11.05.2011123 John Deere 5038 D V2 Tractor 11.05.2011124 John Deere 5103S V2 PS Tractor 11.05.2011125 Mahindra Shaktimaan 35 MX (Brand name -
Shaktimaan) Tractor13.05.2011
126 Swaraj 855 XM Tractor 20.05.2011127 Indofarm 3055 NV DX Tractor 20.05.2011128 Mahindra Gujarat Shaktimaan - 614 Tractor 01.06.2011129 SEC RJMT S 2212 Loader and SEC RJMT S 2216
Backhoe mounted on Swaraj 855 FE GX Tractor.06.06.2011
130 MF 9500 Tractor 07.06.2011131 VT Balaji Compressor mounted on Farmtrac 60
Tractor.14.06.2011
132 VT Balaji Compressor mounted on Farmtrac 45 XT Tractor.
14.06.2011
133 John Deere 5041 C V2 PS Tractor 29.06.2011134 Mahindra Gujarat Shaktimaan 31 Tractor 06.07.2011135 John Deere 5042 D Tractor 08.07.2011136 New Holland 3630 TX Tractor and its variant New
Holland 3600-2 Tractor14.07.2011
137 Swaraj 744 XM Tractor 20.07.2011138 MF 7250 DI Power Drive Tractor 02.08.2011139 Mahindra Gujarat Shaktimaan 50 Tractor 29.08.2011140 Eicher 5660 Tractor 28.09.2011141 MF 2635 – 2WD Tractor 28.09.2011142 John Deere 5050 D Tractor 29.09.2011143 Indo Farm 3055 NV VX Tractor 05.10.2011144 John Deere 5045 D Tractor 10.10.2011145 Sonalika International DI 35 RX CM Series tractor 14.10.2011146 Royal Tractor 20.10.2011147 HMT 6522 Tractor 21.10.2011148 John Deere 5065E 4WD Tractor 21.10.2011149 John Deere 5042D PS Tractor 21.10.2011150 Standard 340 tractor 25.10.2011151 Standard 345 tractor 25.10.2011
142
152 John Deere 5055 E 4WD Tractor 02.11.2011153 Mahindra 8065 4WD (Brand name – Arjun
International) Tractor11.11.2011
154 TAFE MF 2635 4WD Tractor 28.11.2011155 SHB DI Power Tiller 05.12.2011156 Sonalika International DI-745 III RX Tractor 14.12.2011157 John Deere 5038 D Tractor 19.12.2011158 John Deere 5038 D V2 Tractor 19.12.2011159 Tafe MF 7250 DI Power Drive Power Steering Tractor 11.01.2012
160 Divya Shakti Power Tiller 12.01.2012161 Standard TSC 513, Tractor Driven, Combine
Harvester(John Deere 5310 tractor)12.01.2012
162 Standard TSC 513, Tractor Driven, Combine Harvester(New Holland 3630 TX Tractor)
12.01.2012
163 Standard TSC 513, Tractor Driven, Combine Harvester(Same 603 DX Euro Tractor)
12.01.2012
164 Standard TSC 513, Tractor Driven, Combine Harvester (Mahindra 605 DI SS Tractor)
12.01.2012
165 Standard TSC 513, Tractor Driven, Combine Harvester (Swaraj 855 Tractor)
12.01.2012
166 Mahindra Gujarat Shaktimaan 55 ELX Tractor 16.01.2012167 Standard TSC 513, Tractor Driven, Combine
Harvester20.01.2012
168 Indo Farm 3035 DI Tractor 02.02.2012169 John Deere 5055E CR Tractor 06.02.2012170 PM Diesels FM 900 DI Tractor 09.02.2012171 John Deere 5055E V3 Tractor 10.02.2012172 John Deere 5075E V2 Tractor 16.02.2012173 John Deere 5055E 4WD Tractor 17.02.2012174 John Deere 5055E Tractor 17.02.2012175 Mahindra Gujarat Shaktimaan 614 ELX Tractor 22.02.2012176 John Deere 5055E V2 Tractor 29.02.2012177 Swaraj 825 XM Tractor 16.03.2012
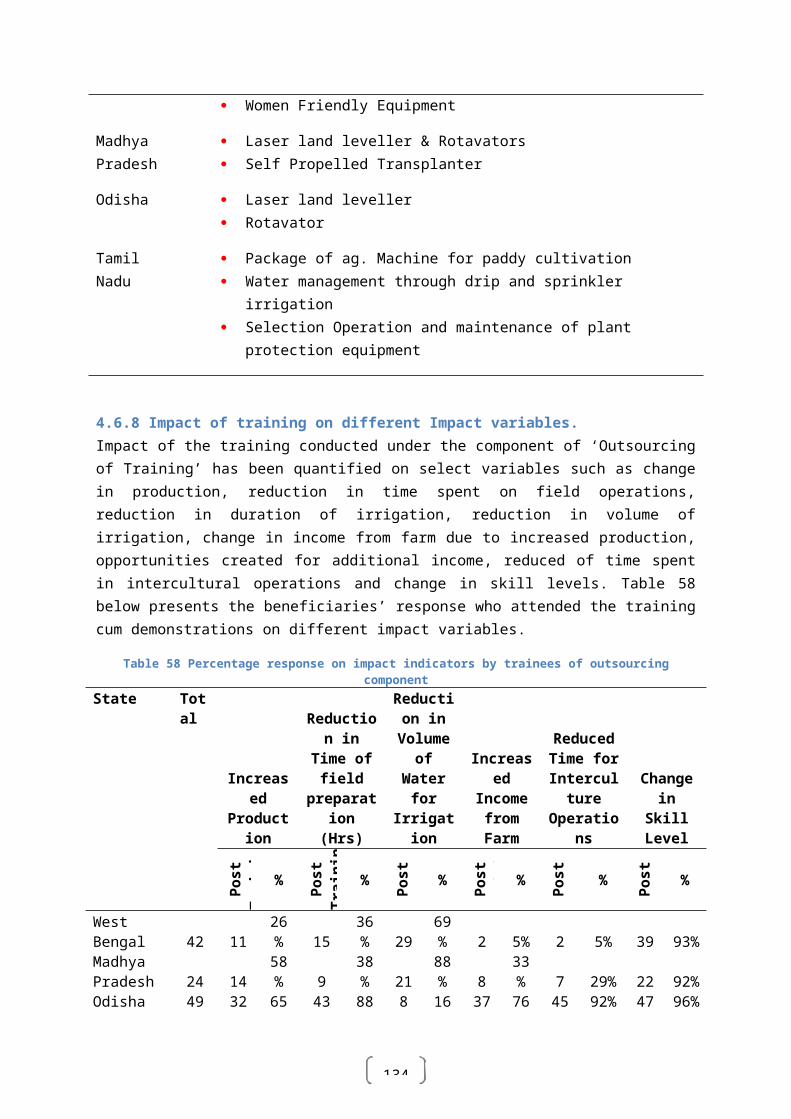
143
Annexure-VIIAnnexure 7 State wise coverage of trainees in NRFMTTI (Hissar, Haryana) during XI FYP
State 2007-08 2008-09 2009-10 2010-11 2011-12 TotalArunachal Pradesh 15 -- -- -- -- 15Andhra Pradesh -- 2 -- -- -- 2Assam -- -- 4 7 1 12A & N Islands -- -- -- -- -- 0Bihar 13 285 71 280 237 886Chandigarh 3 4 -- -- -- 7Chhattisgarh 1 15 8 1 -- 25Delhi 2 8 65 3 10 88Gujarat 12 -- 10 6 27 55Goa -- 1303 -- -- -- 1303Haryana 1435 3 1460 1116 1150 5164Himachal Pradesh -- -- 1 -- 1 2Jammu & Kashmir -- 1 7 6 1 15Jharkhand 1 -- 8 2 1 12Kerala -- 10 -- -- 1 11Karnataka 2 104 -- -- 106Madhya Pradesh 15 -- 7 52 40 114Maharashtra 145 -- 46 88 114 393Manipur -- -- -- -- -- 0Mizoram -- -- -- -- -- 0Meghalaya -- -- -- -- -- 0Nagaland -- -- -- -- -- 0Orissa 15 27 15 13 18 88Punjab 7 41 13 1 3 65Pondicherri -- -- -- -- -- 0Rajasthan 14 130 53 34 24 255Tripura -- -- -- -- 3 3Tamil Nadu -- -- -- -- 3 3Uttar Pradesh 282 103 177 244 241 1047West Bengal 4 4 3 7 10 28Sikkim -- -- -- -- -- 0Uttarakhand 15 7 10 26 1 59Foreigner -- -- -- -- -- 0Total 1981 2047 1958 1886 1886 9758
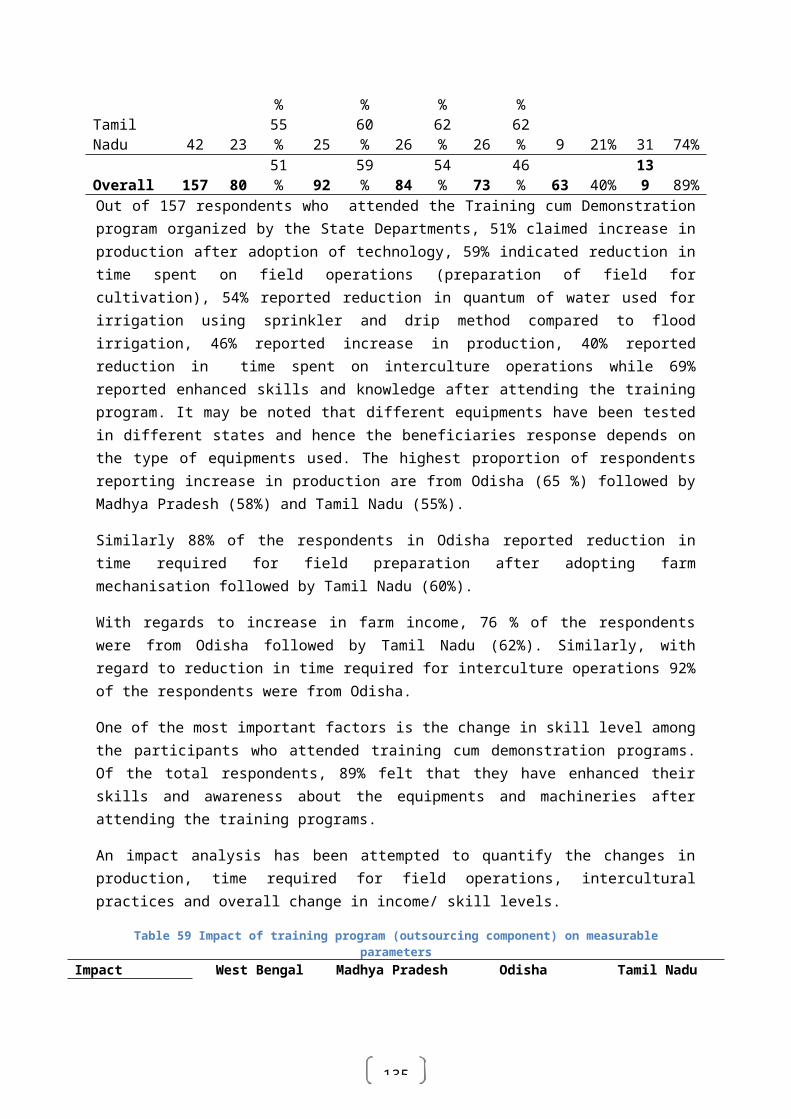
144
Annexure 8 State wise coverage of trainees in SRFMTTI (Anantpur, AP) during XI FYP
STATE 2007-08 2008-09 2009-10 2010-11 2011-12 TotalAndhra Pradesh 424 441 826 900 919 3510Tamil Nadu 62 366 167 165 194 954Karnataka 563 192 256 316 264 1591Maharashtra 46 66 48 84 102 346Orissa 10 33 23 11 -- 77Bihar 5 13 14 14 17 63Uttar Pradesh 36 23 31 25 69 184West Bengal 6 19 6 6 1 38Rajasthan 6 -- 2 5 7 20Kerala 77 98 61 62 25 323Madhya Pradesh 7 20 3 1 1 32Uttarakhand 6 -- 3 5 11 25Gujarat 11 9 5 -- 19 44Punjab 4 -- -- 1 15 20Assam 1 -- 1 -- -- 2Chhattisgarh 32 17 1 10 -- 60Delhi 1 1 -- -- 1 3Jammu & Kashmir 1 -- -- -- -- 1Jharkhand 1 1 1 1 4 8Arunachal Pradesh -- 1 -- -- -- 1Goa -- -- 2 -- -- 2Haryana -- -- 1 -- 13 14TOTAL 1299 1300 1451 1606 1662 7318
145
Annexure 9 List of equipment demonstrated by CIAE, Bhopal during XI FYP
Equipment No. of trail
Area Covered
Crop Net Profit (Rs./Ha)
FP RP Profit (%)Surface Drainage (V- Shape)
22 36 Soyabean Pigeon pea
12300 13750 11.7
Till Plant machine 4 6 Soyabean Gram
892510800
1255013200
40.622.2
Roto-till drill 10 11.5 Wheat 12430 14253 14.6Package of practise
(Duck foot cultivator+ clod crusher + compaction unit with rotary)
3 9 Wheat 20250 21250 4.9
Plastic Culture 2.0 2.0 Guava Orchard
32500 34300 5.5
T.O Ridger 15 25 Sugarcane, Vegetable
117900 121400 2.9
Aero-blast sprayer in orchard
5 5 Orchard 94100 114830 2.2
Zero till drill 46 225 Wheat 15640 17080 9.2Serrated sickle 151 79.8 Soybean &
Wheat3250
Rotavator 17 23.5 Tillage Operation
3200 2300
Walk behind reaper 5 5 Harvesting of Paddy and Wheat
2600 1250
Laser guided land leveller
5 2.5 Levelling -- --
M.B Plough 49 176 Summer Tillage
-- 3500
Other EquipmentsSeed treatment drumWheel hoeMaize ShellerPeg type puddlerCage wheel type puddlerSprinkler systemDrip SystemSource: CIAE, Bhopal
146
Nameof
implement/Machine
Crop No. of Farmers
Area (ha)1
Performance Parameters/indicators/Data on parameters Capacity (ha/h) Output Labour Man(hrs/ha) Time
Taken (hr/ha)Cost of Operation
(Rs/ha)
Demo Local Check Demo Local
Check Demo Local Check Demo Local
Check Improved seed Soybean 94 225,6 0,58 0.50 4.0 4.0 2.0 2,0 800 800 cum - fert. Drill Wheat Gram,
Lenti. Inclined plate Soybean 36 46 OA OAO 5.0 5.0 2.0 2,0 880 1100
planter Pigeon pea Power weeder Soybean, 57 65.0 0.16 0,008 06 125 06 125 560 1250
pigeon pea Groundnut Groundnut 198 342 q 35 2 kg/h 3 h/q 50 h/q 3 h/q 50 h/q 30 Iq 480 Iq Decorticator Self propelled vert. Soybean 39 126 ha 0.2 0.005 05 200 05 200 850 1500 con, reaper Wheat High capacity multi Soybean 48 1065 q 8 q/h 8 q/h 1,O/q 1/q 10/q 1/q 50 Iq 50/q crop thresher (TD) Wheat 14q/h 14 q/h O,5/q 0.5/q 0.5/q 0.5/q 25/q 25/q
Gram Power operated Soybean 175 4620 q 6 q/h 1 q/h OA/q 3/q OA/q 3/q 4,O/q 30/q
grain cleaner Wheat 6 q/h 1_glh O.4/q 3/q O.4/q 3/q 4,O/q 30/q
Gram 6 q/h 1 q/h O.4/q 3/q OA/q 3/q 4,O/q 30/q
Ditcher (TD) Soybean 27 25,5 t.Oha/h - 2 - 1 - 700 - Pigeon Rea
Rotavator Wheat 28 .0 0,5 0.5 2.0 4.0 2,0 4,0 1000 1600 Soy Gram
Sickle Maize Wheat 76 14 Sheller maize
Aero blast sprayer Citrus 04 6.5 15 0,5 0.066 4.0 0.066 4.0 26 50 Source: CIAE, Bhopal
147
Impact of machines demonstrated
Name of Implement/Machine
Crop No. of farmers Area (Ha) % Change in parameters/Techno-Economic advantage Labour Saving (%)
Time Saving (%)
Cost Saving (%)
Remarks
Improved seed cum-fert. Drill
Soybean Wheat
17 35.2 10 10-15 5-10 About 10% yield difference due to better germination
Inclined Plate Planter Pigeon Pea Groundnut
10 10 5-10 10-12 25 Cost of seed is reduced by 30%
Power weeder Soybean Arhar 10 12 95 95 55Pigeon pea 11 14 95 95 55
Groundnut Decorticator Groundnut 38 32.5 94 94 94 Local Check = Hand ShellingSelf propelled vertical con. reaper
Wheat 42 48 97 97 43 Local Check = Harvesting by sickle
High capacity multi crop thresher
Soybean Wheat
12 520 NilNil
NilNil
NilNil
Grain damage is reduced from 7.5 to 2.5%
Power operated grader Soybean WheatGram
46 2280 89 83 86
Rotavator Wheat 4 28 50 50 37.5 Local Check=Duck Foot cultivation
Aero Blast Sprayer Citrus, Sugarcane,Pigeon Pea
8 5 98 98 50 Local Check=Knapsack Sprayer
Source: CIAE Bhopal
148
Annexure 10 List of machines tested in SRFMTTI (Anantpur, AP) during XI FYP
Sl Machines Tested Type of Test Date of Release1. Manam Power Tiller
MCF-121Confidential 05/2007
2. Bharat Groundnut ThresherB-9 (Power Operated)
Commercial 05/2007
3. Jaihind Multicrop ThresherJumbo (Tractor Operated)
Commercial 07/2007
4. Jayant Multicrop Thresher(Tractor Operated)
Commercial 07/2007
5. Dharti Automatic SeedPlanter(Drill) (TractorMounted)
Commercial 09/2007
6. Vinayaka Nine Tyne SpringLoaded Cultivator (TractorMounted)
Commercial 09/2007
7. Vinayaka Two Bottom DiscPlough (Tractor Mounted)
Commercial 09/2007
8. Dharanee Nine Tyne SpringLoaded Cultivator (TractorMounted)
Commercial 09/2007
9. Dharanee Five Tyne RigidCultivator (Tractor Mounted)
Commercial 09/2007
10. Lakshmi Five Tyne RigidCultivator (Tractor Mounted)
Commercial 09/2007
11. Vinayaka Two Bottom FixedMB Plough (Tractor Mounted)
Commercial 09/2007
12. Lakshmi Nine Tyne SpringLoaded Cultivator (TractorMounted)
Commercial 09/2007
13. Lakshmi Rotavator LR-36(Chain Drive)(TractorOperated)
Commercial 10/2007
14. Dharanee Rotavator DA/42MSG (Chain Drive)(TractorOperated)
Commercial 10/2007
15. Users’ Survey Report Angad240D Tractor
Confidential 10/2007
16. Lakshmi Rotavator LR-42(Chain Drive)(TractorOperated)
Commercial 10/2007
17. Dharanee Rotavator DA/36SS(Chain Drive)(TractorOperated)
Commercial 10/2007
18. Dharti Automatic Planter(Drill) Animal Drawn
Commercial 11/2007
19. LCT SH Power TillerSH-151 DI
Confidential 12/2007
20. KAMCO Power TillerKMB-200
Commercial 12/2007
21. Sonalika Rotavator Commercial 12/2007
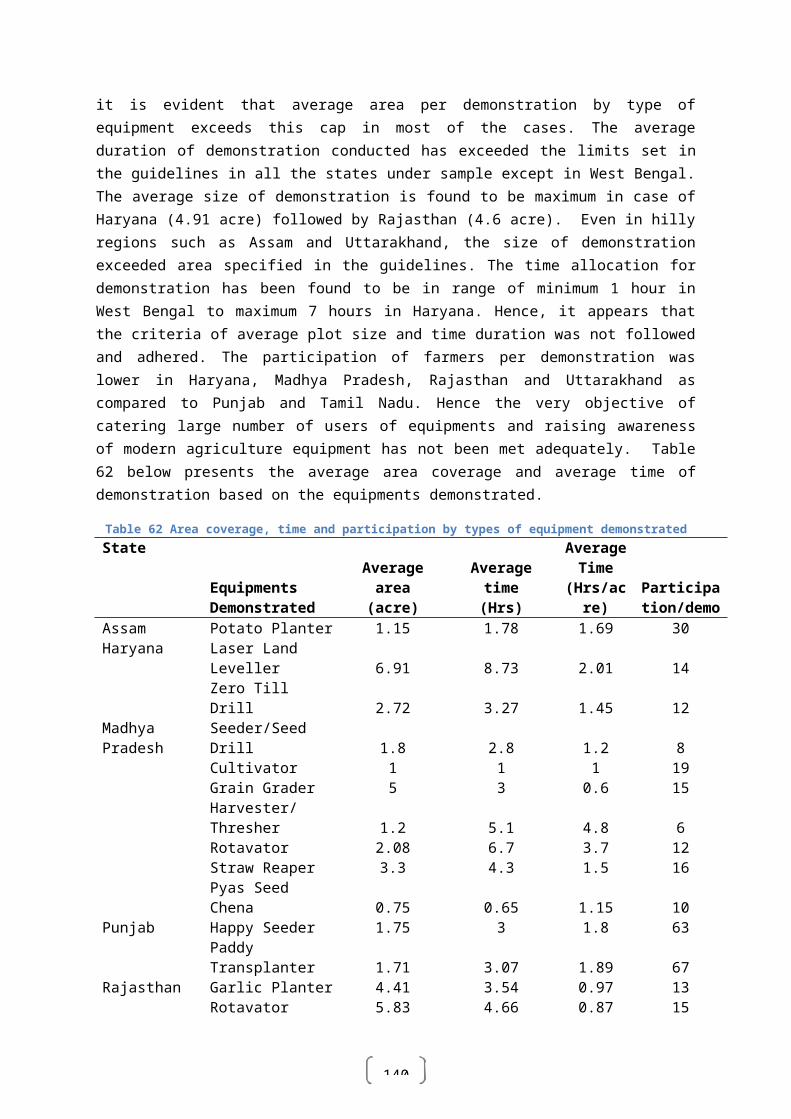
149
SL-150 (Gear Drive) (TractorOperated)
22. Sonalika RotavatorSL-175 (Gear Drive)(TractorOperated)
Commercial 12/2007
23. Soharr Power TillerGN-121 DI
Commercial 01/2008
24. Chakra RotavatorCAT-369 (ChainDrive)(Tractor Operated)
Commercial 03/2008
25. Chakra RotavatorCAT-424 (ChainDrive)(Tractor Operated)
Commercial 03/2008
26. Chakra Five Tyne RigidArrow Type CultivatorCAT-0500(Tractor Drawn)
Commercial 04/2008
27. Chakra Nine Tyne SpringLoaded CultivatorCAT-0900 Tractor Drawn)
Commercial 04/2008
28. VIJAY Power TillerVR-15L
Commercial 05/2008
29. SHAKTI Two BottomMechanically Reversible MBPlough (Tractor Operated)
Commercial 05/2008
30. SHAKTI RotavatorSH-7 (Gear Drive) (TractorOperated)
Commercial 05/2008
31. SHAKTI RotavatorSH-9 (Gear Drive) (TractorOperated)
Commercial 05/2008
32. SANTKRUPA Two BottomMechanically ReversiblePlough (Tractor Operated)
Commercial 05/2008
33. SANTKRUPA Nine Tyne RigidCultivator (Tractor Operated)
Commercial 05/2008
34. DHEV RotavatorDK-36 (ChainDrive) (Tractor Operated)
Commercial 06/2008
35. DHEV RotavatorDK-42 (Chain Drive) (TractorOperated)
Commercial 06/2008
36. BIRLA Power TillerBirla Harit
Commercial 07/2008
37. SHREENATH Trash CuttingMachine 540 rpm
Commercial 9/2008
38. SHRI RAM Nine Tyne RigidType Cultivator SR-9R
Commercial 09/2008
39. LAKSHMI Multicrop Thresher(Tractor Operated)
Commercial 9/2008
40. KUMAR Multicrop Thresher(Tractor Operated)
Commercial 09/2008
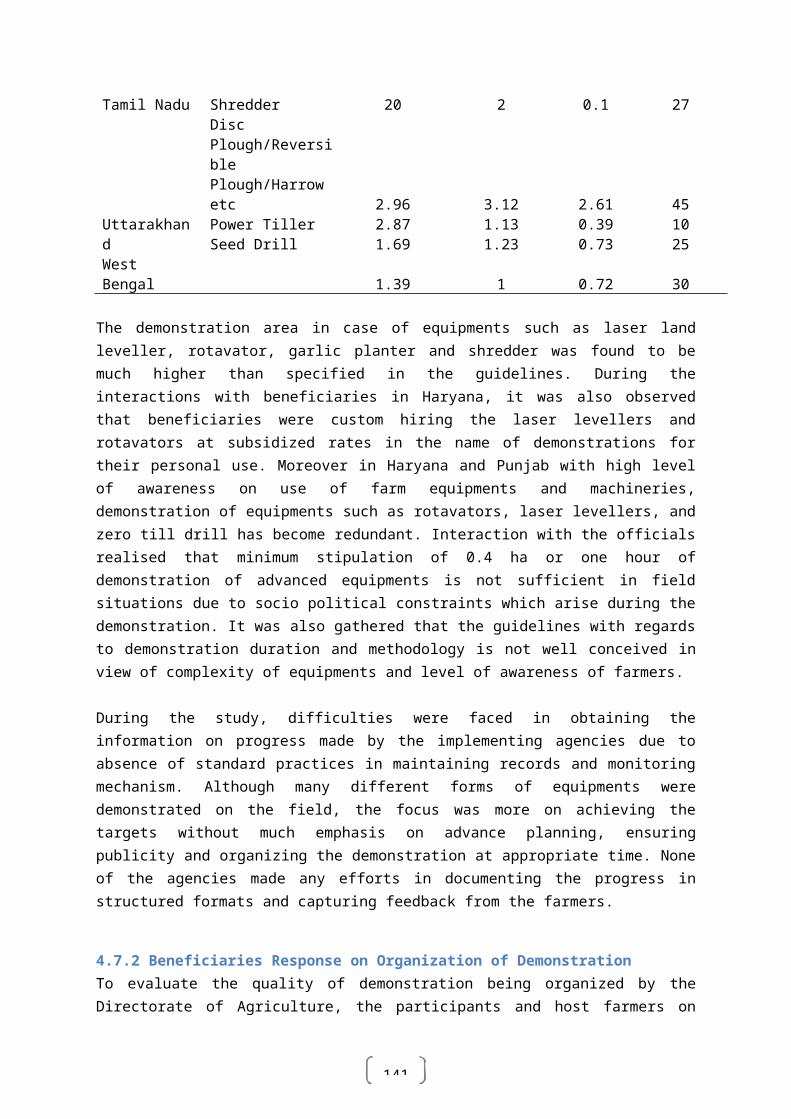
150
41. RHINO Power Tiller15 DI
Commercial 10/2008
42. GREAVES Power TillerGS-15 DIL
Commercial 10/2008
43. RI Agri Rice Transplanter 2Z445
Commercial 03/2009
44. Valasumani Modern MultiCrop ThresherVMMT Standard
Commercial 3/2009
45. Sai Offset Disc Harrow 14Discs (Tractor Mounted)
Commercial 03/2009
46. Sai two Bottom Fixed MouldBoard PloughAryan (Tractor Mounted)
Commercial 3/200
47. Devakane Five Tyne RigidArrow Type Cultivator(Tractor Mounted) 5 TR
Commercial 03/2009
48. Devekane Spring LoadedNine Tyne /cultivator(Tractor Mounted) 9TS
Commercial 03/2009
49. Sai Two Bottom Fixed M BPloughMayur
Commercial 03/2009
50. Sai Two Bottom fixed MoundBoard Plough(Tractor Mounted) Prince
Commercial 03/2009
51. Kumar Roravator (TractorOperated)
Commercial 05/2009
52. Shaktiman Semi ChampionStandard Rotavator (TractorOperated) SRT-8/1000
Commercial 05/2009
53. Shaktiman Semi ChampionStandard Rotavator (TractorOperated) SRT-6/540
Commercial 5/2009
54. Shaktiman Semi ChampionStandard Rotavator (TractorOperated) SRT-5/540
Commercial 05/2009
55. Kumara GroundnutDecorticator(Power Operated)
Commercial 06/2009
56. Shaktiman RotavatorSRT-5/550Standard (Chain Drive),(Tractor Operated)
Commercial 06/2009
57. Shaktiman RotavatorSRT-6/540Standard (Chain Drive),(Tractor Operated)
Commercial 06/2009
58. Shaktiman RotavatorSRT-7/1000Semi Champion (Gear
Commercial 06/2009
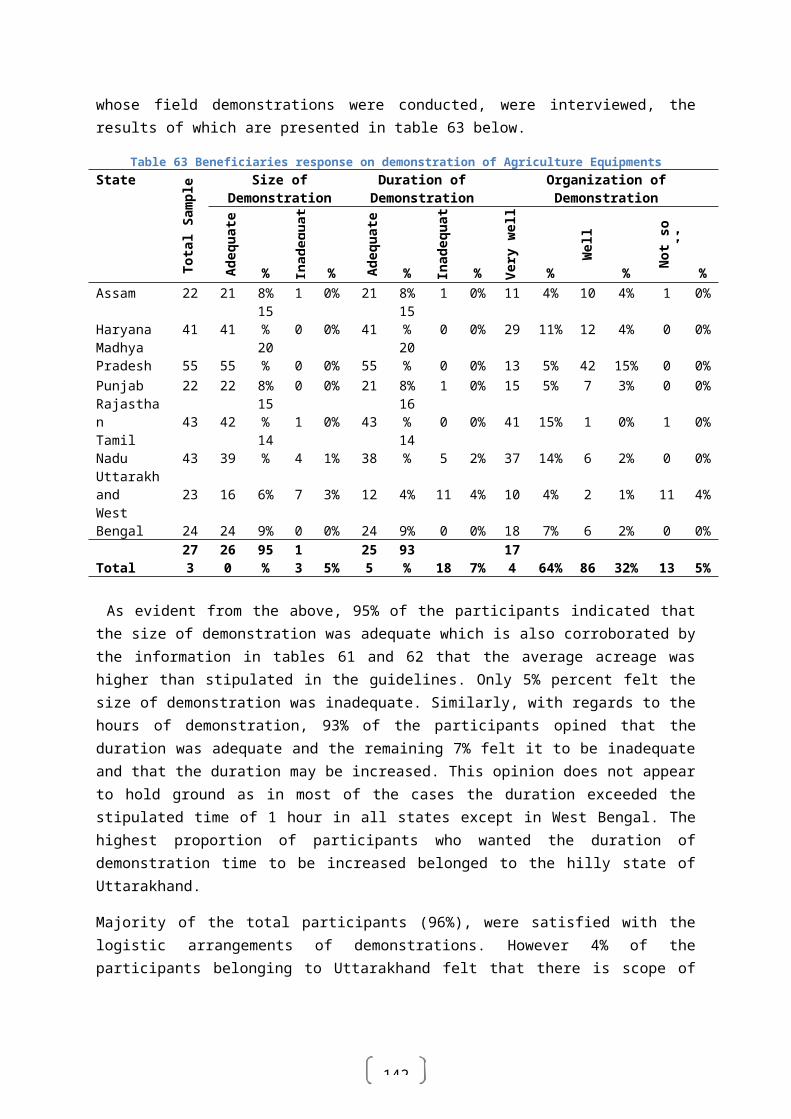
151
Drive), (Tractor Operated)59. Vijay Urea Briquetting
Machine (Power Operated)Kranti Vijay
Commercial 09/2009
60. Bhaktraj Urea BriquettingMachine (Power Operated)Kranti Bhaktraj
Commercial 09/2009
61. Shriram Urea BriquettingMachine (Power Operated)Kranthi Shriram
Commercial 09/2009
62. Valasamani five type rigidarm type Cultivater
Commercial 10/2009
63. Valsamani spring levelernine type cultivator
Commercial 10/2009
64. Star Rotavator FL-165 SingleSpeed, Chain Drive (TractorDrive)
Commercial 11/2009
65. Star Rotavator FLM-185,Multi Speed, Chain Drive(Tractor Drive)
Commercial 11/2009
66. Star Rotavator FHM-185,Multi Speed, Chain Drive(Tractor Drive)
Commercial 11/2009
67. Star Rotavator FH-165 SingleSpeed, Chain Drive (TractorDrive)
Commercial 11/2009
68. Divya Shakti Power TillerDivya Shakti
Commercial 12/2009
69. 9 Tyne Spring LoadedCultivator9 tyne -HD
Commercial 12/2009
70. 9 Tyne Rigid Cultivator,9 tyne With Shovel HeavyDuty
Commercial 12/2009
71. Greaves ReaperMY4G-120 Self Propelled
Commercial 12/2009
72. Kuhn RotavatorEL-42-155
Commercial 12/2009
73. SAI Single BottomMechanically Reversible M.B. Plough (Tractor Mounted),Royal – 25
Commercial 01/10
74. Aum Sai Chaff Cutter1 HP Forward Gear (powerOperated)
Commercial 03/2010
75. Greaves Power TillerGS 14 DIL
Commercial 03/2010
76. Dragon Shakti Power Tiller150 DI
Commercial 04/2010
77. Aum Sai Chaff Cutter3 HP Rervese Forward Gear
Commercial 05/2010
152
(Power Operated)78. Omkar Chaff Cutter
1 HP RF Tiger Safety (PowerOperated)
Commercial 05/2010
79. Omkar Chaff Cutter3 HP RF Tiger Safety (PowerOperated)
Commercial 05/2010
80. Dashmesh Chaff CutterPHV 8 B Payal (PowerOperated)
Commercial 05/2010
81. Raina RotavatorRAPL / GR – 180 (GearDrive)
Commercial 05/2010
82. Raina RotavatorRAPL / CH – 180 ( ChainDrive)
Commercial 05/2010
83. Raina RotavatorRAPL / GR – 150 (GearDrive)
Commercial 05/2010
84. Mahindra Rice TransplanterPF 455 (Walk behind Type)(Incomplete)
Commercial 06/2010
85. Raina 9 Tyne RigidCultivator
Commercial 08/2010
86. Raina 9 Tyne Spring loadedCultivator
Commercial 08/2010
87. Popular make two furrowreversible MB plough,Popular Bhoomi DLX, 50 to60 HP
Commercial 08/2010
88. Popular make two furrowreversible MB plough,Popular Bhoomi DLX, 40 to47 HP
Commercial 8/2010
89. Greaves Power TillerGS 14 DIL (SupplementaryTest) – Commercial
Commercial 09/2010
90. Krushivator (Rotavator)1.25 Mtr.
Commercial 09/2010
91. Krushivator (Rotavator)1.50 Mtr.
Commercial 09/2010
92. Krushivator (Rotavator)1.75 Mtr.
Commercial 09/2010
93. Shaktiman RotavatorSRT-5/540 Regular Delta(CD) (45 to 47 HP)
Commercial 09/2010
94. Shaktiman RotavatorSRT-6/1000(GD)CHAMPION
Commercial 10/2010
95. Shaktiman RotavatorSRT-5/1000
Commercial 11/2010
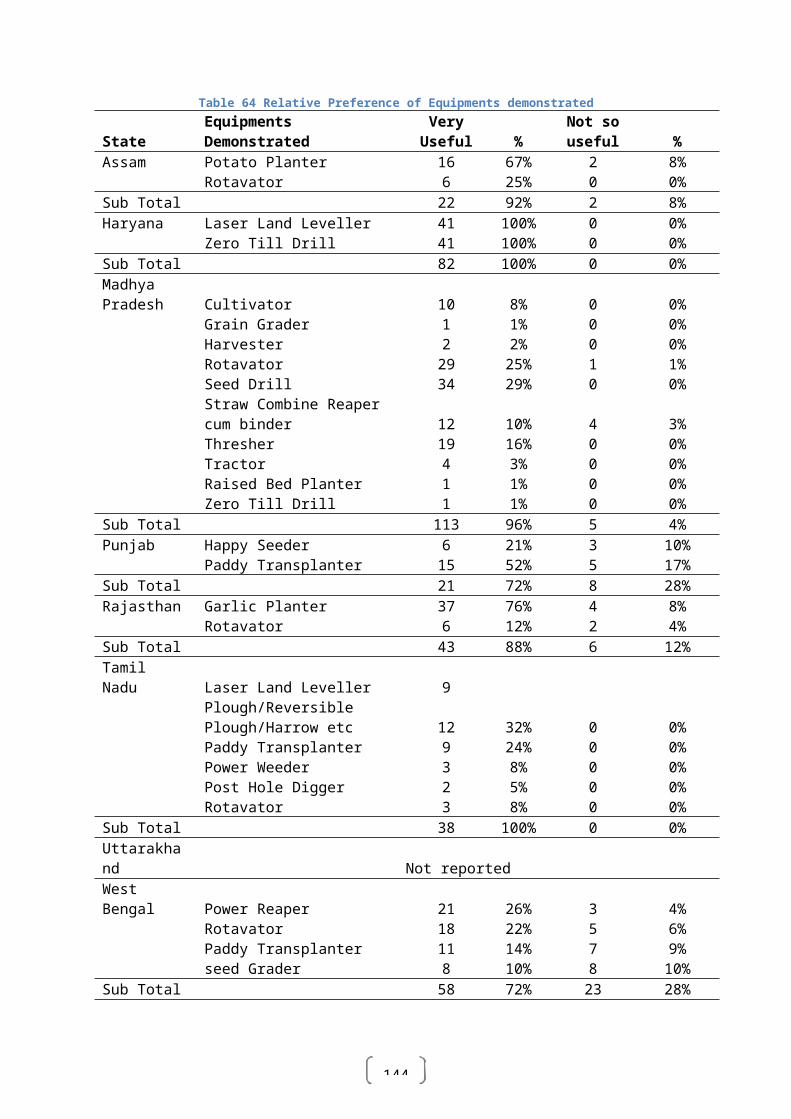
153
SEMICHAMPION (GD)96. Shaktiman Rotavator
SRT-6/540 RegularDelta(CD)
Commercial 11/2010
97. Shaktiman RotavatorSRT-7/1000(CD) Champion/multispeed
Commercial 11/2010
98. Shaktiman RotavatorSRT-6/1000(GD) SEMICHAMPION
Commercial 11/2010
99. Pushpak RotavatorPB-MS-G 1.25(G ear Drive)
Commercial 12/2010
100. Pushpak RotavatorPB-MS-G 1.5 (G ear Drive)
Commercial 12/2010
101. Pushpak RotavatorPB-MS-G1.8 (G ear Drive )
Commercial 12/2010
102. Pushpak RotavatorPB-MS-G 2.1 (G ear Drive)
Commercial 12/2010
103. Pushpak RotavatorRB 1.5(Chain Drive)
Commercial 12/2010
104. Macson (Power Tiller)MS 15L
Confidential 03/2011
105. Yanmar Shakti 121 DI(Power Tiller)
Commercial 03/2011
106. Roto Tiller 320 F(Weeder) [Incomplete]
Commercial 03/2011
107. Roto TillerI 216-C(Weeder) [Incomplete]
Commercial 03/2011
108. Greaves PaddyTransplanter2Z-CZ8(Machine)
Commercial 03/2011
109. Feeding Hopper G1 Commercial 03/2011110. Feeding Chute G2 Commercial 03/2011111. Greaves Power Tiller
GS-14 DLX(variant)Commercial 03/2011
112. Feeding Chute GuatamDivella ThresherG-3 (Tractor Operated)
Commercial 04/2011
113. Feeding Hopper SeemaDevela Mekka Thresher,S1 (Tractor Operated)
Commercial 04/2011
114. Feeding Hopper Jai KishanGroundnut MuticropThresher,J1 (Tractor Operated)
Commercial 04/2011
115. Feeding Hopper Untti develaMekka Thresher,U1 (Tractor Operated)
Commercial 04/2011
116. Feeding Hopper Bharat Commercial 04/2011
154
Super Devela MekkaThresher,Model BS1(TractorOperated)
117. Feeding Hopper ShaktiDevela Mekka Thresher,S1(Tractor Operrated)
Commercial 04/2011
118. Feeding Chute ApolloMulticrop Thresher,A1 (Tractor Operated)
Commercial 04/2011
119. Pragati Nine Tyne Rigid TypeCultivator (Tractor Mounted)
Commercial 06/2011
120. Pragati Two Bottom FixedMould Board Plough,PAI (TractorMounted)
Commercial 08/2011
121. Yanmar Rice Transplanter,VP8D (Riding Type)
Commercial 08/2011
122. Sai (Mayur)Two BottomMechanically ReversibleM.B.Plough (TractorMounted)
Commercial 08/2011
123. Sai (Mayur) Single BottomMechanically ReversibleM.B.Plough (TractorMounted)
Commercial 08/2011
124. Sri Manju Five Tyne RigidArrow Tyne Cultivator(Tractor Mounted)
Commercial 08/2011
125. Sri Manju Spring LoadedNine Tyne Cultivator(Tractor Mounted)
Commercial 09/2011
126. Siam Kubota Power TillerRT140DI-RP-80
Commercial 09/2011
127. Sai (Mayur) RotavatorSai Rotavator OriginalDeluxe (Chain Drive)(Tractor Operated)
Commercial 09/2011
128. Raina RotavatorRAPL/GR-1.25 (Gear Drive)(Tractor Operated)
Commercial 09/2011
129. Sunrise Power TillerSUNRISE DI
Commercial 10/2011
130. Yanmar Shakti Power Tiller121 DI
Commercial 10/2011
131. Ganga Power TillerGM-16
Commercial 10/2011
132. Ganga Power TillerARJUN-GM-15
Commercial 10/2011
133. Diamond Rotavator DA 27(Tractor Operated)
Commercial 10/2011
134. Diamond Rotavator DA225 Commercial 10/2011
155
(Tractor Operated)135. Mahindra Rice Transplanter,
MP46(Walking type)
Commercial 11/2011
136. Greaves Power Tiller,GS 12 DLX (Incomplete)
Commercial 12/2011
137. Redlands Rice Transplanter,Champion RP 824 (SelfPropelled) (Riding Type)(INCOMPLETE)
Commercial 12/2011
138. NIPHA Groundnut DiggerShaker Windrower2R DSW 1 (TractorOperated)
Commercial 12/2011
139. Sigma Power TillerSIGMA PLUS V2 EM
Confidential 01/2012
140. LANDKING Rotavator,LRT-4 (GearDrive) (TractorOperated)
Commercial 02/2012
141. LANDKING Rotavator,LRT-6 (Gear Drive) (TractorOperated)
Commercial 02/2012
142. Ganga Sifang Power TillerBHIM
Commercial 02/2012
143. Balaji Two BottomReversible M.B.Plough(45HP) (Tractor Mounted)
Commercial 03/2012
144. Dhartiputra RotavatorDRT-7 feet (Gear Drive)(Tractor Operated)
Commercial 03/2012
145. Premier Rice TransplanterGARUDA 3PT350 (Walkbehind type)
Commercial 03/2012
146. Fortune Rice TransplanterFAI-2ZT-4(Walk behind type)
Commercial 03/2012
156
Annexure 11 List of machineries tested by NERFMTTI (Biswanath Chariali, Assam) during XI FYP
2007-2008
1 Paras Seed cumFertilizer Drill
Imp.25/52/2007 April, 2007 M/s Bothara Foundary and Machine Works,Nagar-Pune Road, Ahmednagar-414005(M.S.)
2 Paras Two BottomMechanically Reversible MB Plough
Imp.26/53/2007 May, 2007 M/s Bothara Foundary and Machine Works,Nagar-Pune Road, Ahmednagar-414005(M.S.)
3 Khedut Seed cumFertilizer Drill(Tractor Drawn)
Imp.27/54/2007 June, 2007 M/s R.K. Agro Industries, Junagadh (Gujarat)-362003
4 Paras Single BottomReversible MB Plough
Imp.28/55/2007 Aug, 2007 M/s Bothara Foundary and Machine Works,Nagar-Pune Road, Ahmednagar-414005(M.S.)
5 Greenfield Rotavator Imp.29/56/2007 Aug, 2007 M/s Nabha Agro Works, Patiala Road, Nabha,Distt.- Patiala (Punjab) Pin-147201
6 Golden PunjabRotavator
Imp.30/57/2007 Sept, 2007 M/s Punjab Engineering Works, G.T. Road,Talwandi Bhai (Ferzepur) Punjab-142050
7 Khedut Seed Drill(Bullock Operated)
Imp.31/58/2007 October,2007
M/s R.K. Agro Industries, Junagadh (Gujarat)-362003
8 Sahu Rotavator Imp.32/59/2007 Oct, 2007 M/s Sahu Agrotech, Nagar Parishad Road,Vardha-442001
9 Sahu Post HoleDigger
Imp.33/60/2007 Nov, 2007 M/s Sahu Agrotech, Nagar Parishad Road,Vardha-442001
10 Sahu 2-BottomReversible Plough
Imp.34/61/2008 Jan, 2008 M/s Sahu Agrotech, Nagar Parishad Road,Vardha-442001
11 Feeding Chute ofKhodiyar MulticropThresher
C-1/62 March, 2008 Khodiyar Agro Industries, Visnagar, Mehsana(North Gujarat) Pin – 384315
2008-2009
1 Feeding Chute of BestMulticrop Thresher
C-2/63 April, 2008 Best Engineering Works,At post – Elol, Ta:-Himatnagar, Dist.-Sabarkantha (Gujarat)
2 Feeding Chute ofShakti MulticroThresher
C-3/64 May, 2008 Shakti Agrl. Industries, Khenalu Road, Nr.Span Mega Mall, Visnagar (North Gujarat)
3 Feeding Chute ofMarshal MulticropThresher
C-4/65 May, 2008 M/s Marshal Agro, Urja - SiddhampurHighway Centre, Mehsana (Gujarat)
4 Feeding Chute ofVinod MulticropThresher
C-5/66 June, 2008 M/s Vinod Engineering Works, At: Urjha,Dist.- Mehsana (Gujarat)
5 ‘Baba’ Rotavator Imp.35/67 June, 2008 M/s Baba Farm Equipments, J-1, IndustrialArea, Behind Parag Diary, Begrajpur, Muzaffarnagar (UP)
6 S. Kumar Rotavator Imp.36/68 July, 2008 M/s Gobind Industries Pvt. Ltd., NearSafejabad Railway Crossing, Lucknow Road, Barabanki (UP) -225001
7 Hoque PaddyThresher
TH-1/69 July, 2008 M/s Madina Engineering Workshop, Vill + PO– Moirabari, Dist.- Morigaon (Assam)
8 Sikhar Paddywinnowing fan
Equip-7/70 Aug, 2008 M/s Jyoti Industries, New Gory Mandi Road,Pandri, Tarai, Raipur (CG)-492004
9 Dashmesh-642Rotavattor
Imp.37/71 Sept, 2008 M/s Dashmesh Agricultural Industries, RaikotRoad, Malerkotla, Dist.- Sangrur (Punjab)-148023
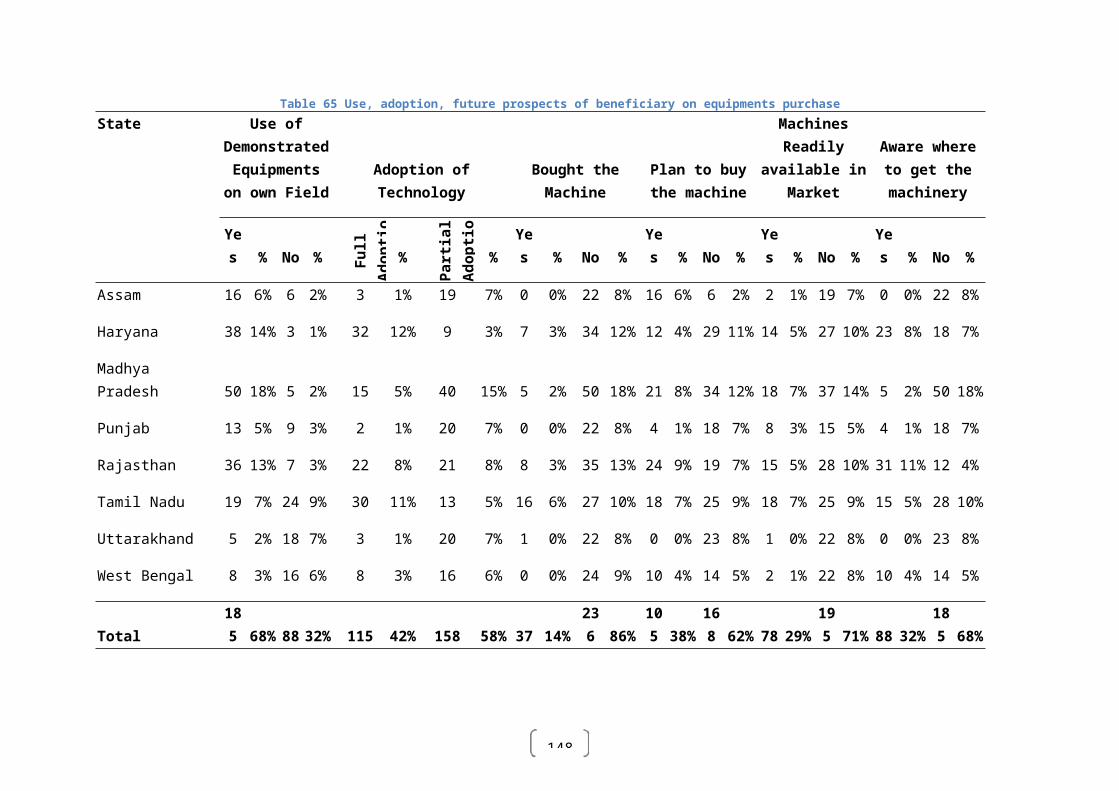
157
10 Avtar-513 Imp.38/72 Oct, 2008 M/s Avtar Singh & Sons, Bus Stand Road,Ahmedgarh, Dist.- Sangrur (Punjab)-148021
11 Maxtill F-38 RotaryTiller
RT-1/73 Nov, 2008 M/s Maxtone Petrochemicals, 1A, MerlinBasera, 13B, Ramesh Mitra Road, Kolkata-700025
12 Feeding Chute of‘Devarshi’ MulticropThresher
C-6/74 Jan, 2009 M/s Devarshi Agro Industries, At & Ta –Visnagar, Dist.- Mehsana (North Gujarat)
13 Feeding Chute of‘Supertech’ Multicrop Thresher
C-7/75 Feb, 2009 M/s Supertech Agro Industries, Ahmedabad(Gujarat)
14 S. Kumar Disc harrow Imp.39/76 March, 2009 M/s Gobind Industries Pvt. Ltd., NearSafedabad Raiway Crossing, Lucknow Road,Barabanki (UP)-22500115 Ganesh Cultivator Imp.40/77 March, 2009 M/s Ganesh Agro Equipments, At Post- Vadpura, Kalol – Mehsana Highway, Ta.-Kadi, Dist.- Mehsana (Gujarat)16 Bhumi Cultivator Imp.41/78 March, 2009 M/s Bhumi Agriculture, NearBij NigamOffice, B/h. Vaishali Cinema, Himmatnagar(Gujarat)17 Jagatjit Rotavator Imp.42/79 March, 2009 M/s Modern Engineering Company,MansaRoad,Cheema Mandi,Dist: Sangrur (Punjab),
2009-2010
1 Dharti Seed Drill Imp.43/80 May, 2009 M/s Dharti Agro Industries, Motipura,Himmatnagar, (North Gujarat) – 383001
2 Dharti Seed cumFertilizer Drill
Imp.44/81 May, 2009 M/s Dharti Agro Industries, Motipura,Himmatnagar, (North Gujarat) – 383001
3 S. Kumar Cultivator Imp.45/82 June, 2009 M/s Gobind Industries Pvt. Ltd., NearSafedabad Raiway Crossing, Lucknow Road, Barabanki (UP)-225001
4 S. Kumar 2 bottomMB Plough
Imp.46/83 July, 2009 M/s Gobind Industries Pvt. Ltd., NearSafedabad Raiway Crossing, Lucknow Road, Barabanki (UP)-225001
5 MB RT -61 Rotavator(Tractor Drawn)
Imp.47/84 July, 2009 M/s MB Exports Ltd., 2224 Dashmeshnagar,Street No. 16, Gill Road, Ludhiana (Punjab) -141003
6 Oleo-Mac Paddy-cum- Weeds CutterModel- Sparta- 44
Equip.-8/85 Nov, 09 Ratnagiri Impex Pvt. Ltd., New Guddadahalli,Mysore Road, Banlore- 560026
7 OM Rotavator Imp.48/86 Nov, 09 Shri Venkateshwara Industries KalmanaMarket Road, NAGPUR-440035
8 OM 9 Tyne Cultivator Imp.49/87 Nov, 09 -do-9 Chetak Rotavator Imp. 50/88 Nov, 09 Chetak Agro Industries, S-17-18, Industrial
Area, Site No.-1 (U.P)10 Bharat BRB 1.50
rotavatorImp. 51/89 Nov, 09 Trans-Mech Systems, C-13,14 MIDC,
Bhigwan Road, Baramati- 41311311 OM Two Bottom
Reversible PloughImp. 52/90 Nov, 09 Shri Venkateshwara Industries Kalmana
Market Road, NAGPUR-44003512 Bharat BRB-C-1.25
rotavatorImp. 53/91 Nov, 09 Trans-Mech Systems, C-13,14 MIDC,
Bhigwan Road, Baramati- 41311313 Ganesh Potato Planter
(automatic)Imp. 54/92 Dec, 09 M/s Ganesh Agro Equipment, At Post-
Vadpura, Kalol- Mehsana Highway, Ta. Kadi, Distt Mehsana (Gujarat)
14 Vijeta RotavatorGRT-155
Imp. 55/93 January, 10 Farm Tek Implements, Continental IndustryComplex, Pune- (M.S)
15 Vijeta RotavatorGRT-180
Imp. 56/94 January, 10 Farm Tek Implements, Continental IndustryComplex, Pune- (M.S)
16 Oleomac RotaryTiller MT-180 GT
RT-2/95 March, 10 Ratnagiri Impex Pvt. Ltd., New Guddadahalli,Mysore Road, Banlore- 560026

158
17 PopularPRB-5Rotavator
Imp. 57/96 March, 10 Popular Steel Works & AgricultureImplements Pvt.Ltd., Kolhapur – 416008 (Maharashtra)
18 PopularPRB-6Rotavator
Imp. 58/97 March, 10 Popular Steel Works & AgricultureImplements Pvt.Ltd., Kolhapur – 416008 (Maharashtra)
19 Shrachi Reaper RP-1/100 March, 10 Bengol Tools Ltd. (Agro Divn.). 2, JessoreRoad, Dumdum, KOLKATA- 700028
20 Raina RAPL/ CH-150Rotavator
Imp. 59/99 March, 10 Raina Agri.Co.Pvt. Ltd.,AgriculturalImplements Farm Machinery, U-155,MIDC,Nagpur.
21 Paras Two bottom hydraulic reversible
Imp. 60/100 March, 10 M/s Bothara Foundary and Machine Works, Nagar-Pune Road, Ahmednagar-414005(M.S.)plough
22 Varsha 2009 M. B.Plough
Imp. 61/101 March, 10 Shree Bharat Electric Welding Works, Budha,Dist- Mandsur (M.P)
23 Varsha 2009 9- tynerigid cultivator
Imp. 62/102 March, 10 Shree Bharat Electric Welding Works, Budha,Dist- Mandsur (M.P)
24 MB RT-4 Rotavator Imp. 32/103 March, 10 M.B Exports Ltd.,2224- Deshmeshnagar StreetNo.-16, Gill Road,Ludhiana- 141003 Punjab.
25 MB RT-5 Rotavator Imp. 63/104 March, 10 -do-
2010-2011
1 ‘Jagatjit JR-424’Rotavator(Tractor Operated)
Imp. 65/105 April,2010 M/s Saron Mechanical Works, Mansa Road,Cheema Mandi,Dist: Sangrur (Punjab) 148 029
2 ‘Jagatjit JR-530’Rotavator(Tractor operated)
Imp. 66/106 April,2010 -do-
3 ‘Mousam Model: T-1Seed cum fertilizerdrill’ (Tractor Drawn)
Imp. 67/107 June, 2010 M/s Mausam Agro Pvt. Ltd., Dist- Rajkot(Gujrat) - 360 024
4 ‘Paras 14” TwoBottom MechanicallyReversible Plough’(Tractor operated)
Imp. 68/108 June, 2010 M/s Bothara Foundary and Machine Works, Nagar-Pune Road, Ahmednagar-414005(M.S.)
5 ‘SWAN NSE– RT200’ Rotavator(Tractor operated)
Imp. 69/109 June, 2010 M/s New Swan Enterprises (Agro TechDivision), C-213, Phase VIII Focal Point, Ludhiana (Punjab) 141 010
6 ‘Paras P.R.V. 1.25 ’Rotavator (Tractor operated)
Imp. 70/110 June, 2010 M/s Bothara Foundary and Machine Works,Nagar-Pune Road, Ahmednagar-414005(M.S.)
7 ‘Ankita Pradhan TwoBottom Mechanically. Reversible M.B. Plough’(Tractor operated)
Imp. 71/111 June, 2010 M/s Ankita Agro Engg., K-37, M.I.D.C.,Waluj, Aurangabad, Maharashtra 431 136
8 ‘Farmking Model: FKRT-17542Rotavator’
Imp. 72/112 June, 2010 Shri Kanhaiyal Ramratan krishi Yantra LaghuUdyog, Rampura, Dabari,Jaipur(Rajasthan)303 704
9 ‘Om Urea BriquettingMachine’
Imp. 73/113 July, 2010 Shri Venkateshwara Industries KalmanaMarket Road, NAGPUR-440035
10 ‘Farmking FKRT12530’ Rotavator
Imp. 74/114 Oct., 2010 Shri Kanhaiyal Ramratan krishi Yantra LaghuUdyog, Rampura, Dabari,Jaipur(Rajasthan)303 704
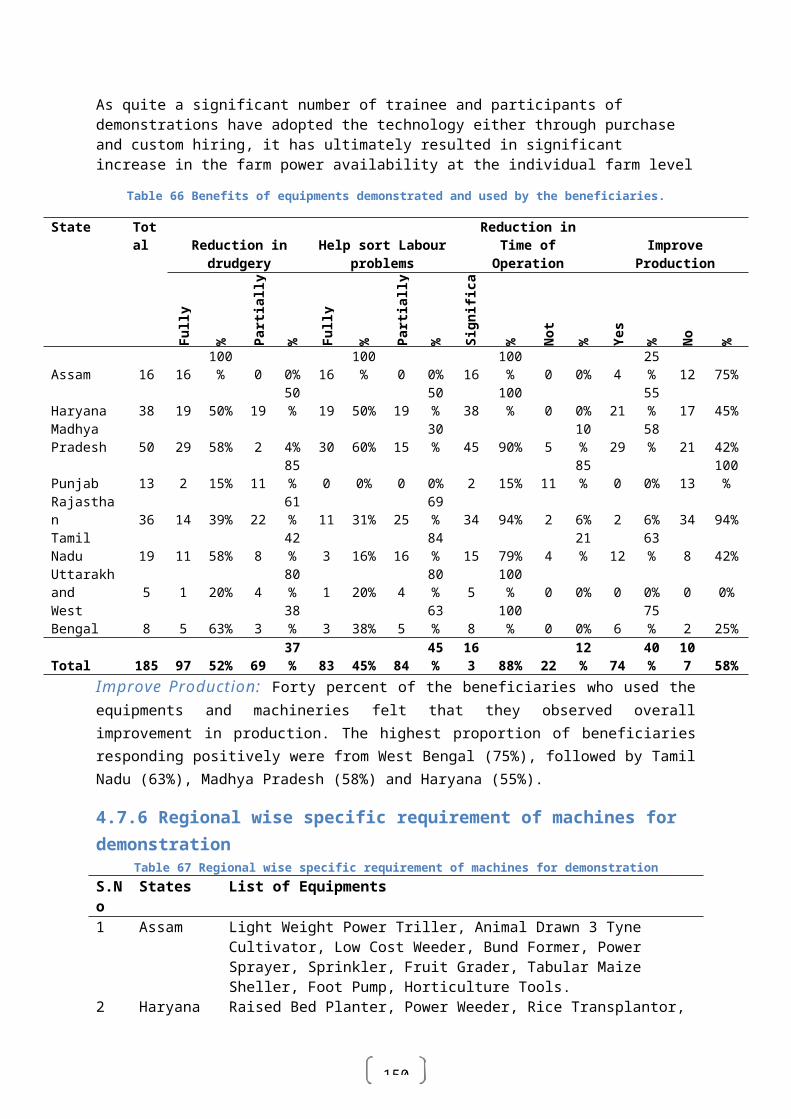
159
11 ‘Farmking FKRT15036’ Rotavator
Imp. 75/115 Oct., 2010 -do-
12 ‘Farmking FKRT20048’ Rotavator
Imp. 76/116 Oct., 2010 -do-
13 ‘New Swan RotavatorModel:6 ft’
Imp. 77/117 Dec., 2010 M/s New Swan Enterprises (Agro TechDivision), C-213, Phase VIII Focal Point, Ludhiana (Punjab) 141 010
14 ‘Swan Rotavator 5 ft’ Imp. 78/118 Dec., 2010 -do-15 ‘Swan Rotavator 4 ft’ Imp. 79/119 Dec., 2010 -do-16 ‘Paras Automatic
Seed cum Fertilizer Drill’ (Animal Drawn)
Imp. 80/120 Feb.,2011 M/s Bothara Foundary and Machine Works,Nagar-Pune Road, Ahmednagar-414005(M.S.)
17 ‘Paras Seed cumFertilizer Drill’(Tractor Drawn)
Imp. 81/121 Feb.,2011 -do-
18 ‘Shivaji ConoWeeder’
Imp. 82/122 Mar, 2011 M/s Ramteke Agricultural works, At and PostKhandala, Sakoli, Bhandara (MS) – 441 802
19 ‘Om Cono Weeder’ Imp. 83/123 Mar, 2011 Shri Venkateshwara Industries KalmanaMarket Road, NAGPUR-440035
20 ‘Landking RotavatorModel : 500’
Imp. 84/124 Mar, 2011 M/s A.T. Fluid Power Pvt. Ltd., KalawadRoad, Vajadi-Vad, Dist: Rajkot.
21 ‘Om Seed cumfertilizer drill’(Bullock Drawn)
Imp. 85/125 Mar, 2011 Shri Venkateshwara Industries KalmanaMarket Road, NAGPUR-440035
22 ‘Om Serrated Sickle’ HT. 22/126 Mar, 2011 -do-23 ‘Om Pedal Operated
Paddy Thresher’Equip. 09/127 Mar, 2011 -do-
24 ‘Om Winnowing Fan’(Manual)
Equip. 10/128 Mar, 2011 -do-
25 ‘Fieldking FK-150Rotavator’ (Tractormounted)
Imp. 86/129 Mar, 2011 M/s Beri Udyog Pvt. Ltd.Plot No.-100-101,HSIDC, Sector-3, Karnal (Haryana) – 132 001
26 ‘SHAKTI SKT-03GL Rotavator’(Tractor mounted)
Imp. 87/130 Mar, 2011 M/s Pace Agro Pvt. Ltd., 401-Ratan EsquireBuilding, 14/43 Chunniganj, Kanpur (U.P.) –208 001
27 ‘SHAKTI SKT-04GL Rotavator’(Tractor mounted)
Imp. 88/131 March, 2011 -do-
2011-2012
1 Nipha NP-1500Rotavator (Tractor mounted)
Imp. 89/132 May, 2011 M/s Nipha Exprot (P) Ltd, Regt. Office, 28/1Shakelpare, Sarani Kolkata -17
2 Multi-Row Jute SeedDrill (Manually- Operated)
Imp. 90/133 May, 2011 Central Research Institute for Jute and AlliedFibres, Barrackpore, Kolkata
3 Paras Chaff Cutter(Power-operated)
Equip. 11/134 July, 2011 M/s Bothara Foundaru & Machine Works,Industrial Estate Nagar Pune, Ahmednagar(MS)
4 Fieldking FK 200Rotavator (Tractor-mounted)
Imp. 91/135 July, 2011 M/s Beri Udyog Pvt. Ltd., Regd. Office 100-101, Sector-3, HSIIDC, Karrnal (Haryana)
5 NIPHA NP 1750Rotavator (Tractor - mounted)
Imp. 92/136 Aug, 2011 M/s Nipha Exprot (P) Ltd, Regt. Office, 28/1Shakelpare, Sarani Kolkata -17
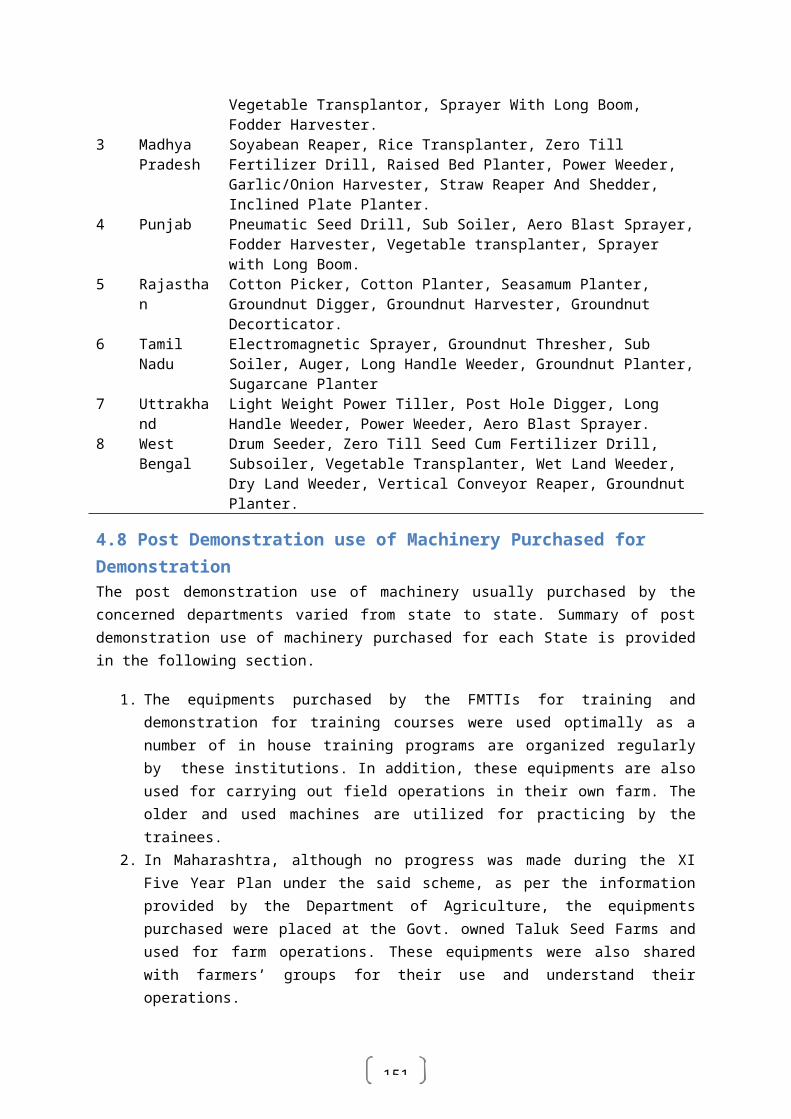
160
6 Krishi Usha HHP-1Weeder
Imp. 93/137 Aug, 2011 Krishi Gram Vikas Kendra, M/S Usha MartinLtd., Tatisilwai, Ranchi, Jharkhand
7 BABA BRTG - 175rotavator (Tractor- mounted)
Imp. 94/138 Aug, 2011 BABA FARM EQUIPMENTS, J-1 IndustrialArea, Begrajpur -251 203, Muzaffar Nagar(U.P.)
8 TATA RT-MG-748L-540Rotavator (TractorMounted)
Imp. 95/139 Sept, 2011 TATA STEEL LTD, Agrico Division,Bistupur,Jamshedpur – 831 001
9 BABA BRTG - 150Rotavator (Tractor mounted)
Imp. 96/140 Sept, 2011 BABA FARM EQUIPMENTS, J-1 IndustrialArea, Begrajpur -251 203, Muzaffar Nagar(U.P.)
10 TATA RT-MG-642L-540 Rotavator(Tractor Mounted)
Imp. 97/141 Oct, 2011 TATA STEEL LTD, Agrico Division,Bistupur,Jamshedpur – 831 001
11 BABA BRTG - 125Rotavator (Tractor mounted)
Imp. 98/142 Oct, 2011 TATA STEEL LTD, Agrico Division,Bistupur,Jamshedpur – 831 001
12 Om seed drill (TractorMounted)
Imp. 99/143 Oct, 2011 Shri Venkateshwara Industries KalmanaMarket Road, NAGPUR-440035
13 TATA RT – MG -536L- 540 Rotavator(Tractor Mounted)
Imp. 100/144 Nov, 2011 TATA STEEL LTD, Agrico Division,Bistupur,Jamshedpur – 831 001
14 TATA RT – MG -430L- 540 Rotavator(Tractor Mounted)
Imp. 101/145 Nov, 2011 -do-
15 Jai KisanMechanically Reversible Two- Bottom MB Plough
Imp. 102/146 Dec, 2011 M/s Balaji Engineering WorksPlot no. 683, MIDC Ahmednagar (MS)414111
16 Krishi Usha HHP-1Paddy Weeder
Imp. 103/147 Dec. 2011 Krishi Gram Vikas Kendra,M/S Usha Martin Ltd., Tatisilwai, Ranchi,Jharkhand
17 Mahan Primo 2010Self Propelled RotaryTiller
RT-3/148 Feb, 2012 M.N. Agro Industires, Nava Falia, Velanja,Taluka: kamrej, Distt. Surat (Gujrat)- 394 150
18 Honda UMK435TU2ST Brush Cum Paddy Cutter (self- Propelled)
Equip. 12/149 Feb, 2012 Honda Siel Power Products Ltd., GreaterNoida Industrial Development Area, DisttlGautam Budh Nagar (U.P.)-201 306
19 TAS ProfessionalWeeder/ Bush Cutter And Accessories (Self Propelled)
Equip. 13/150 Mar, 2012 Tilak Akriti Service Agro, Division 2, Groundfloor, Kolkata 700001