Embed Size (px)
Citation preview
• PRIME’s main activity is to work with manufacturing companies to assist them in improving equipment performance
• The best measure for machine performance is OEE (Overall Equipment Effectiveness)
• PRIME was unable to find a simple set of tools that would measure OEE performance, present the results at both strategic and operational levels, provide an effective means to drive and manage a continuous improvement programme, and provide tools for managing a maintenance function in a manufacturing business (ie CMMS functionality)
• The PRIME “OEE Manager” was designed to fill the gap that exists for a simple-to-use, fully-functioning piece of software that would carry out all of these functions. It is based on Microsoft Access 2000 and can, therefore, be extended and modified by individual users to meet their precise needs
(Please Left-Click when ready to move to the next slide)
Background to the PRIME “OEE Manager”
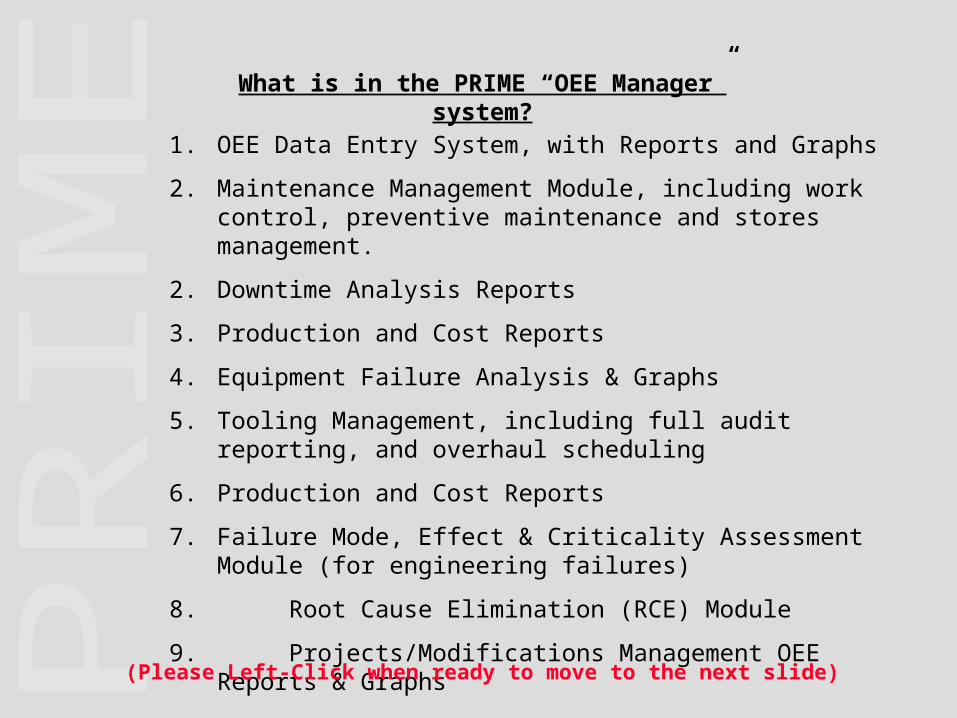
1. OEE Data Entry System, with Reports and Graphs
2. Maintenance Management Module, including work control, preventive maintenance and stores management.
2. Downtime Analysis Reports
3. Production and Cost Reports
4. Equipment Failure Analysis & Graphs
5. Tooling Management, including full audit reporting, and overhaul scheduling
6. Production and Cost Reports
7. Failure Mode, Effect & Criticality Assessment Module (for engineering failures)
8. Root Cause Elimination (RCE) Module
9. Projects/Modifications Management OEE Reports & Graphs
(Please Left-Click when ready to move to the next slide)
What is in the PRIME “OEE Manager” system?
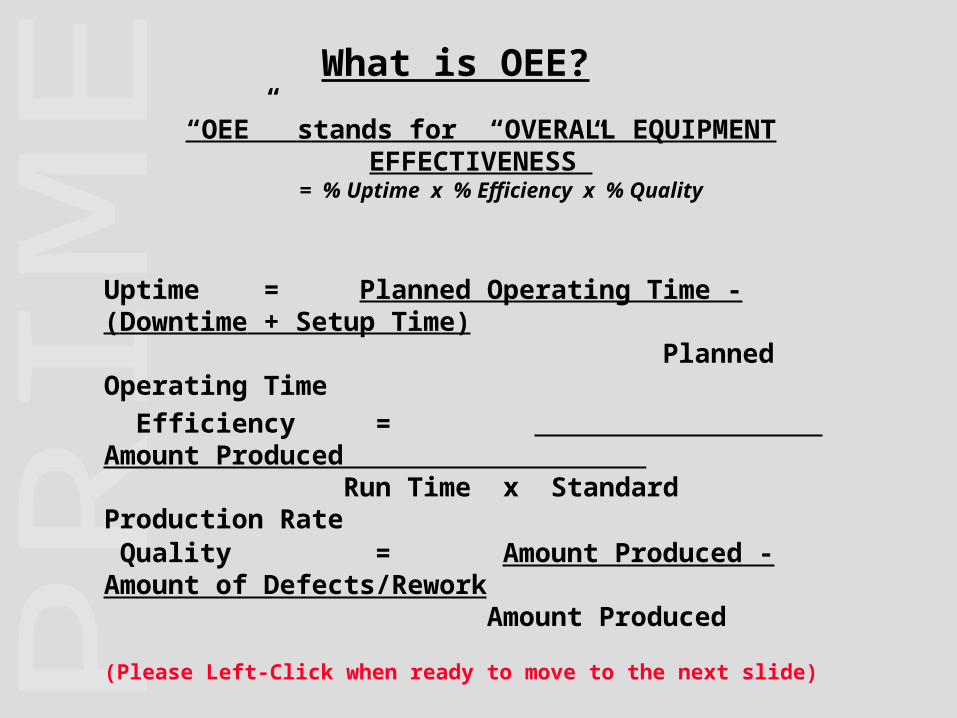
What is OEE?
“OEE” stands for “OVERALL EQUIPMENT EFFECTIVENESS”
= % Uptime x % Efficiency x % Quality
Uptime = Planned Operating Time - (Downtime + Setup Time) Planned Operating Time
Efficiency = Amount Produced .Run Time x Standard Production Rate
Quality = Amount Produced - Amount of Defects/Rework Amount Produced
(Please Left-Click when ready to move to the next slide)
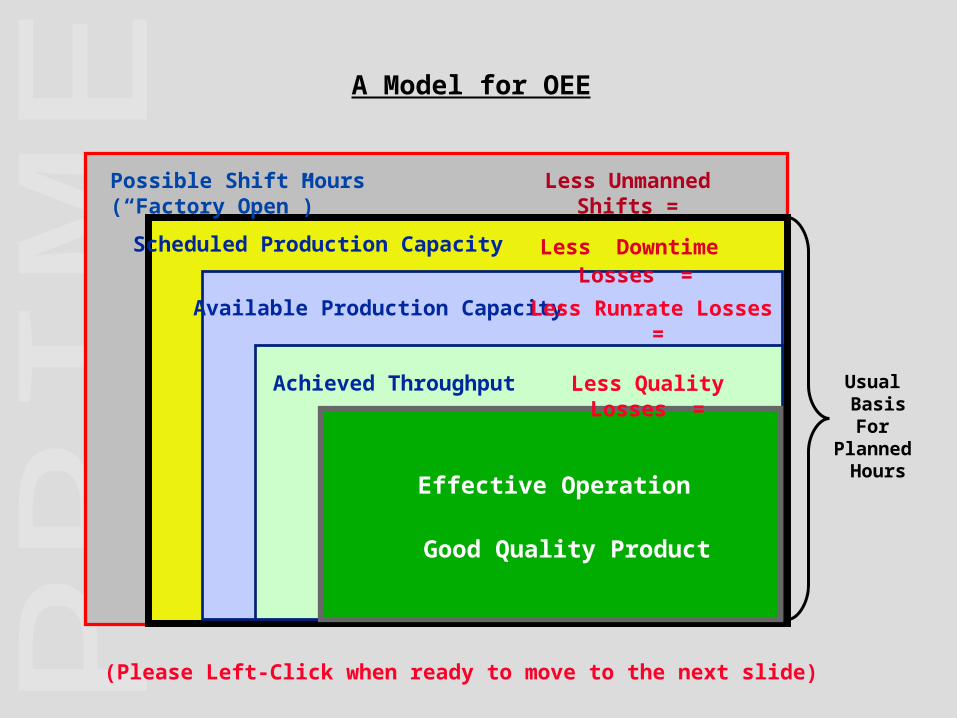
Scheduled Production Capacity
Available Production Capacity
Achieved Throughput
Effective Operation
Good Quality Product
Less Downtime Losses =
Less Runrate Losses =
Less Quality Losses =
Possible Shift Hours (“Factory Open”) Less Unmanned Shifts =
Usual BasisFor
Planned Hours
(Please Left-Click when ready to move to the next slide)
A Model for OEE
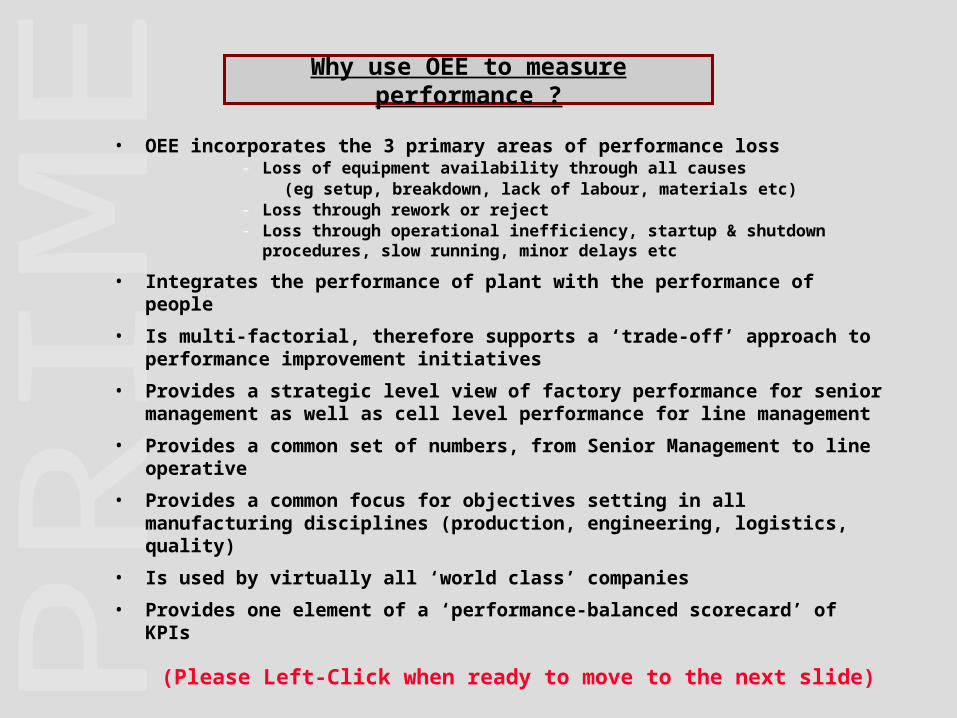
Why use OEE to measure performance ?
• OEE incorporates the 3 primary areas of performance loss- Loss of equipment availability through all causes
(eg setup, breakdown, lack of labour, materials etc)- Loss through rework or reject- Loss through operational inefficiency, startup & shutdown
procedures, slow running, minor delays etc
• Integrates the performance of plant with the performance of people
• Is multi-factorial, therefore supports a ‘trade-off’ approach to performance improvement initiatives
• Provides a strategic level view of factory performance for senior management as well as cell level performance for line management
• Provides a common set of numbers, from Senior Management to line operative
• Provides a common focus for objectives setting in all manufacturing disciplines (production, engineering, logistics, quality)
• Is used by virtually all ‘world class’ companies
• Provides one element of a ‘performance-balanced scorecard’ of KPIs
(Please Left-Click when ready to move to the next slide)
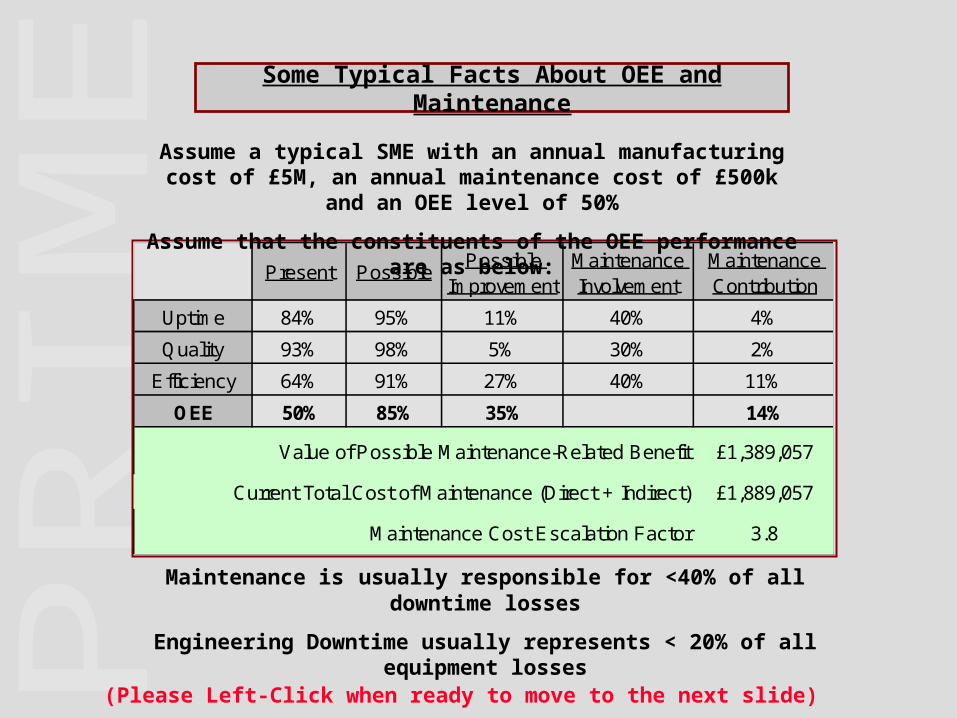
Some Typical Facts About OEE and Maintenance
Present PossiblePossible
ImprovementMaintenance Involvement
Maintenance Contribution
Uptime 84% 95% 11% 40% 4%
Quality 93% 98% 5% 30% 2%
Efficiency 64% 91% 27% 40% 11%
OEE 50% 85% 35% 14%
Value of Possible Maintenance-Related Benefit £1,389,057
Current Total Cost of Maintenance (Direct + Indirect) £1,889,057
MANUFACTURING COST STRUCTURE Maintenance Cost Escalation Factor 3.8
Maintenance is usually responsible for <40% of all downtime losses
Engineering Downtime usually represents < 20% of all equipment losses
Assume a typical SME with an annual manufacturing cost of £5M, an annual maintenance cost of £500k and
an OEE level of 50%
Assume that the constituents of the OEE performance are as below:
(Please Left-Click when ready to move to the next slide)
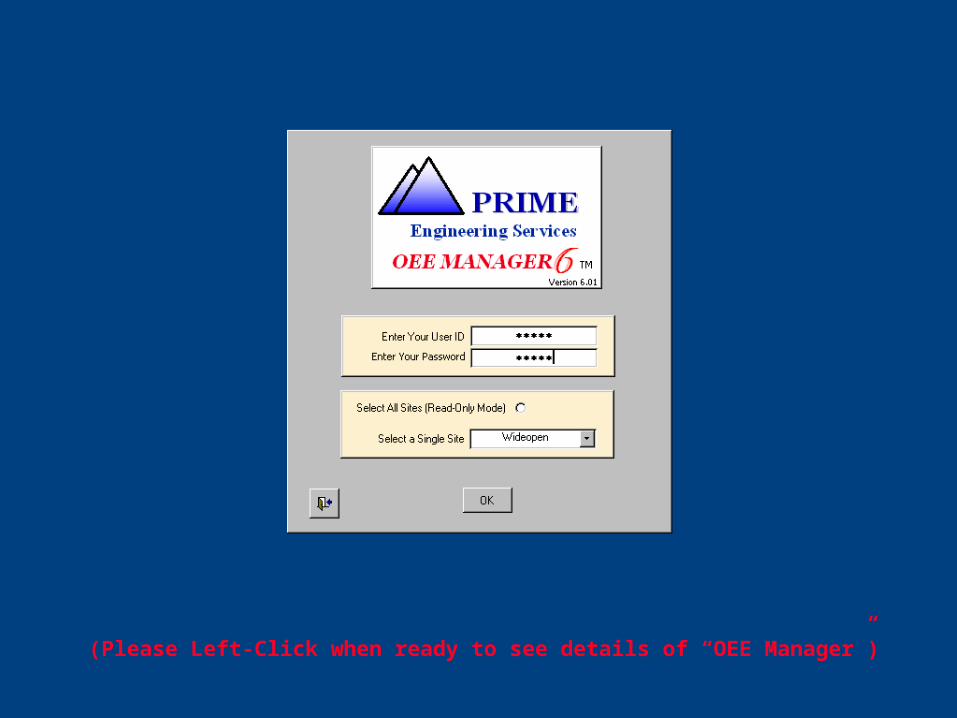
(Please Left-Click when ready to see details of “OEE Manager”)
• On logging on to “OEE Manager”, you are offered the Selection Menu. Users can run “OEE Manager” in an integrated manner, or operate any of the modules in standalone mode.
(Please left-click your mouse)
(Please Left-Click when ready to look at the System Navigator)
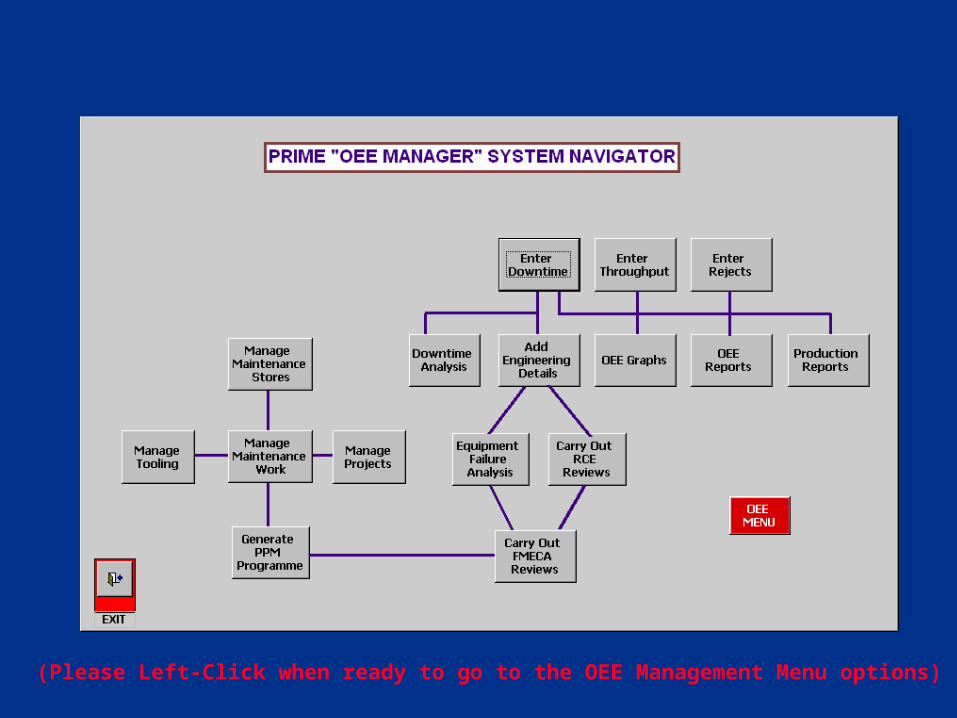
• The System Navigator offers a schematic look at how the modules are related. You can move to any module from this view, or go directly from the Selection Menu.
(Please left-click your mouse)
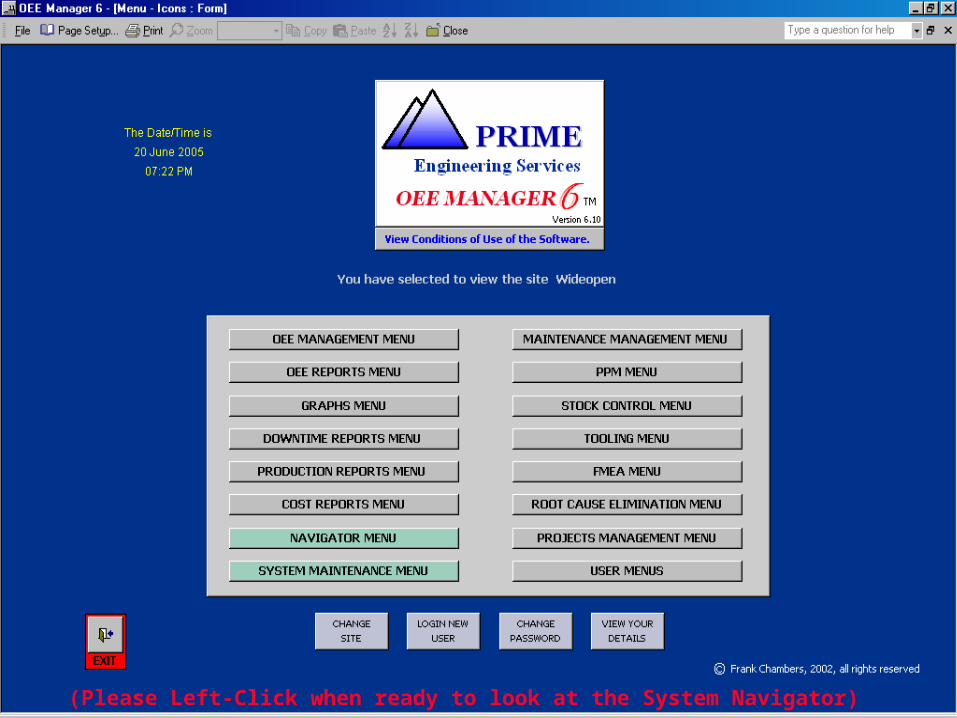
(Please Left-Click when ready to go to the OEE Management Menu options)
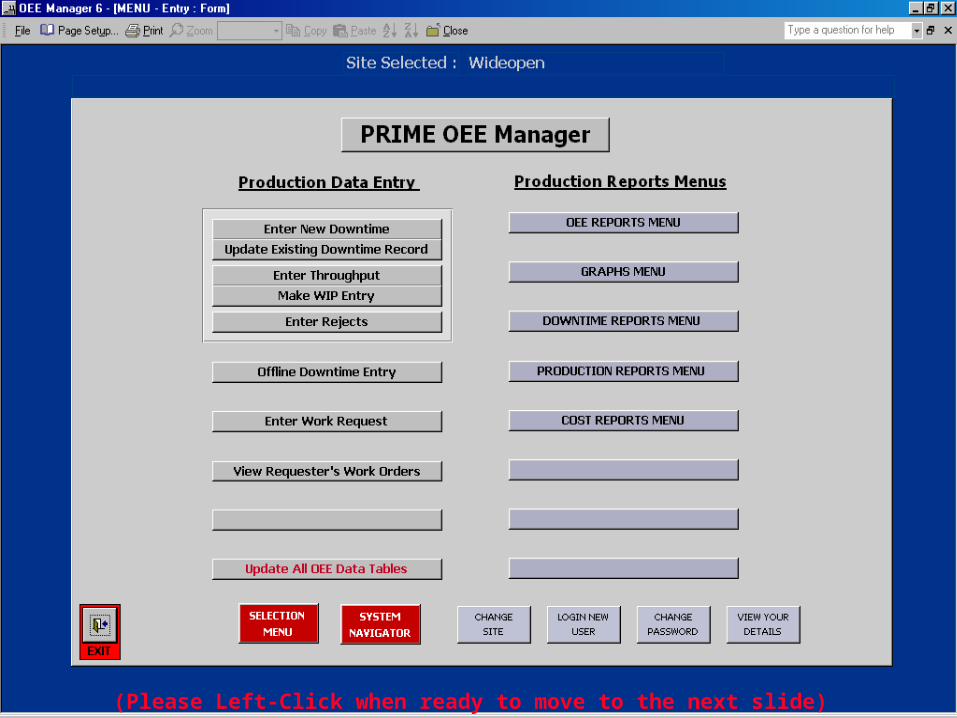
•The OEE Management Menu comprises a data entry section, and a number of sets of reports and charts.
(Please left-click your mouse)
(Please Left-Click when ready to move to the next slide)
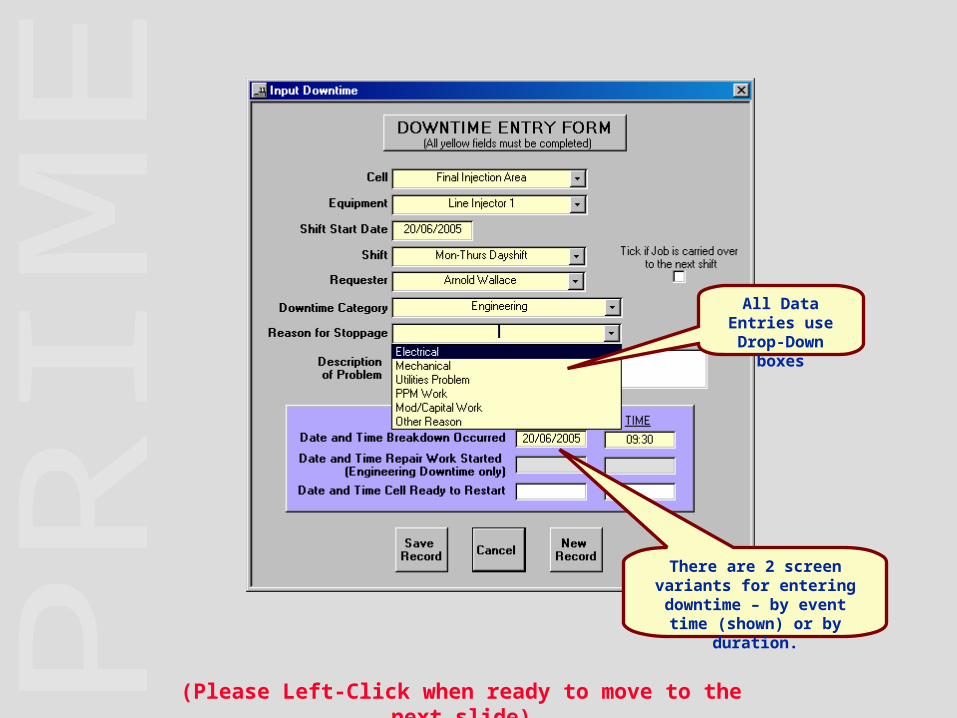
All Data Entries use Drop-Down
boxes
There are 2 screen variants for entering downtime – by event time (shown) or by
duration.
(Please Left-Click when ready to move to the next slide)
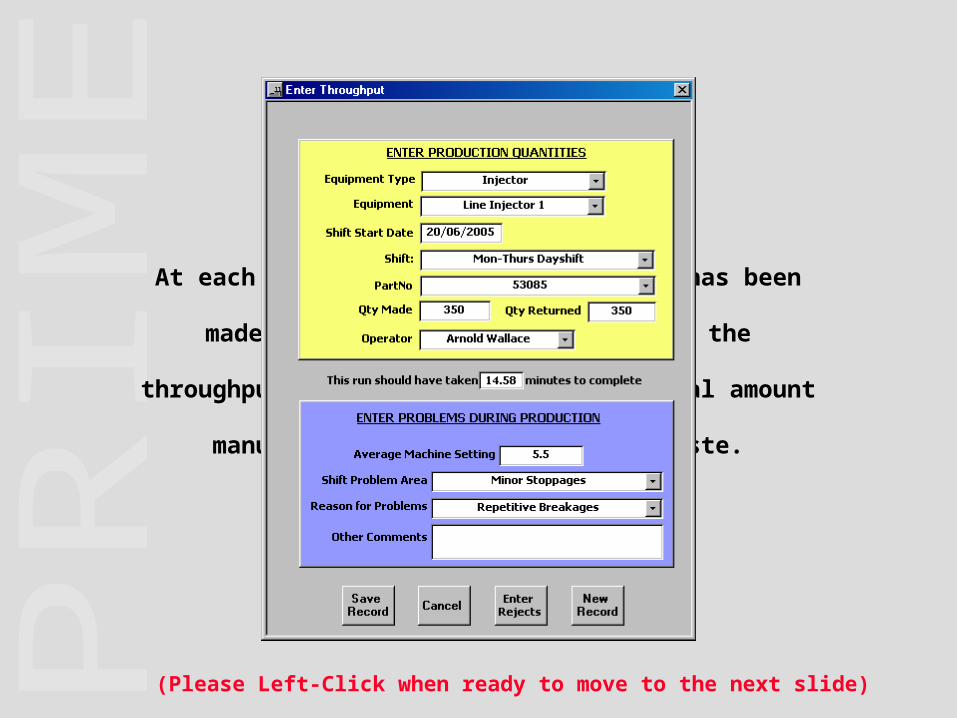
At each point where a batch of parts has been
made, or at the end of each shift, the throughput
is entered. This is the total amount manufactured,
including reject/waste.
(Please Left-Click when ready to move to the next slide)
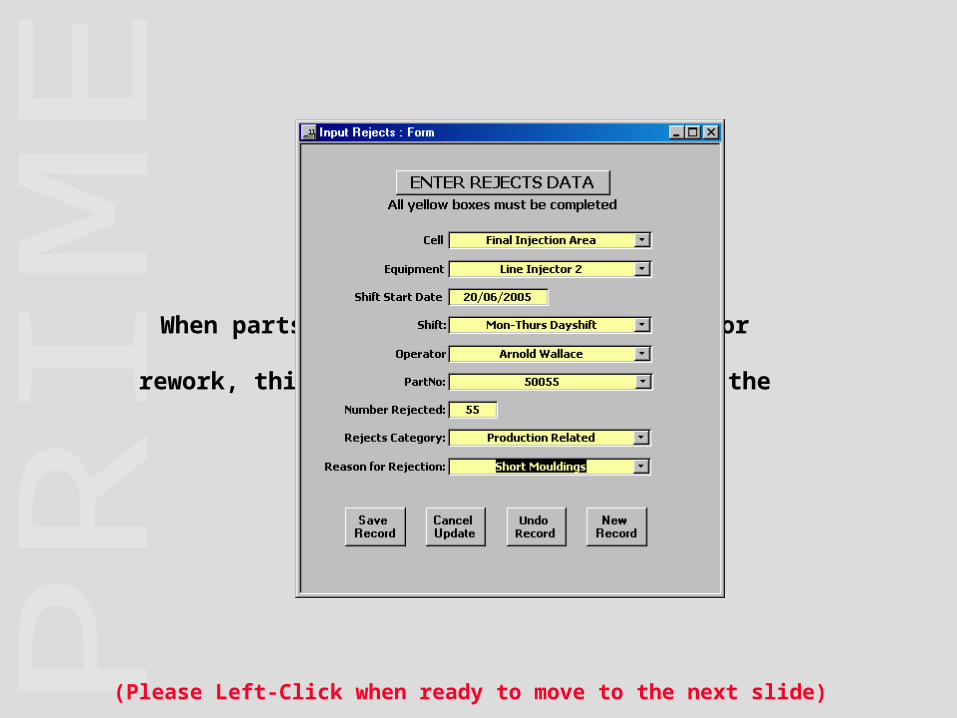
When parts are rejected, or committed for rework,
this data needs to be entered in the system
(Please Left-Click when ready to move to the next slide)
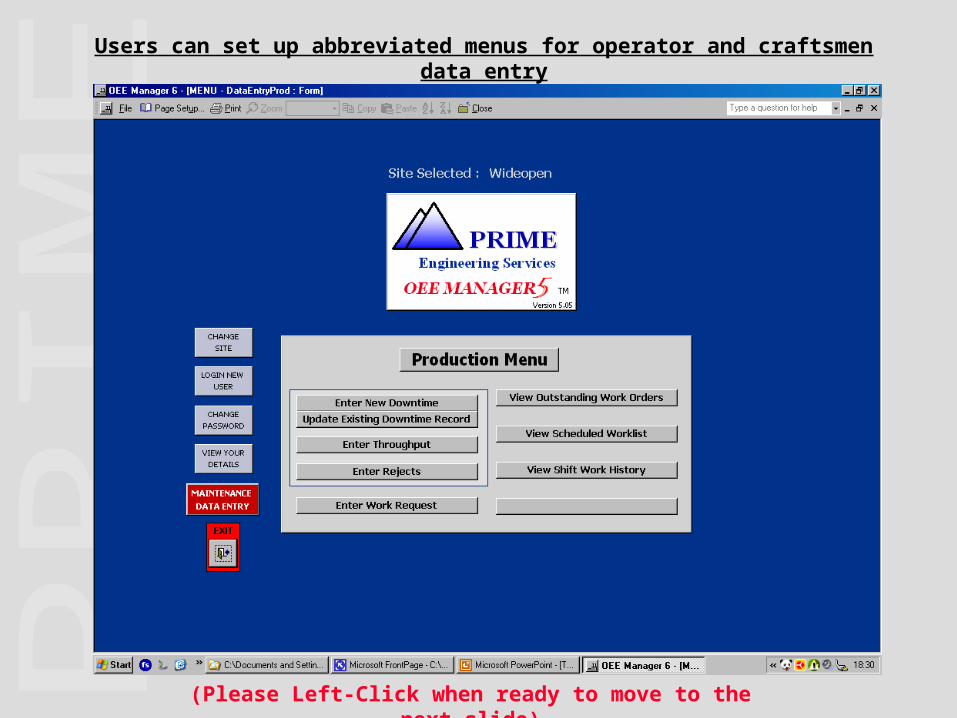
Users can set up abbreviated menus for operator and craftsmen data entry
(Please Left-Click when ready to move to the next slide)
(Please Left-Click when ready to view the OEE Reports menu)
THIS IS ALL OF THE DATA REQUIRED TO SUPPORT THE GENERATION OF OEE REPORTS, AND TO
CARRY OUT CONTINUOUS IMPROVEMENT.
WE WILL FIRST LOOK AT SOME TYPICAL REPORTS FROM THE SYSTEM
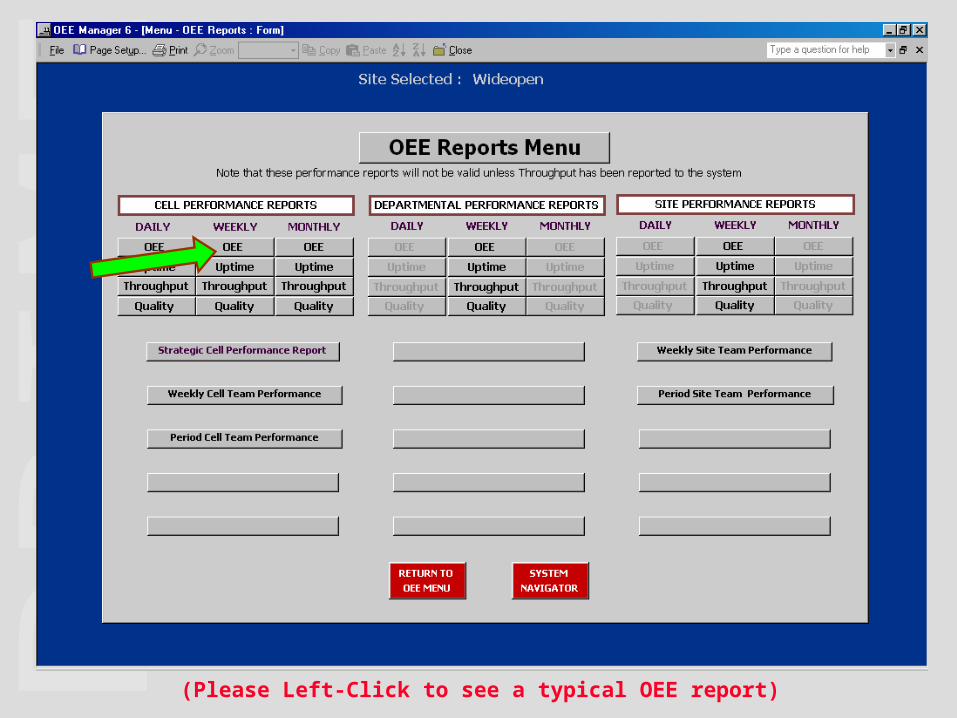
There is a top level Strategic Performance Report
that presents top level data for Senior
Management.
The next level of data is based on daily, weekly or
monthly views of OEE, Uptime, Throughput or
Quality Performance.
The next slide shows the standard OEE Reports
Menu, followed by a typical Weekly OEE report(Please Left-Click to see the OEE Reports Menu)
(Please Left-Click to see a typical OEE report)
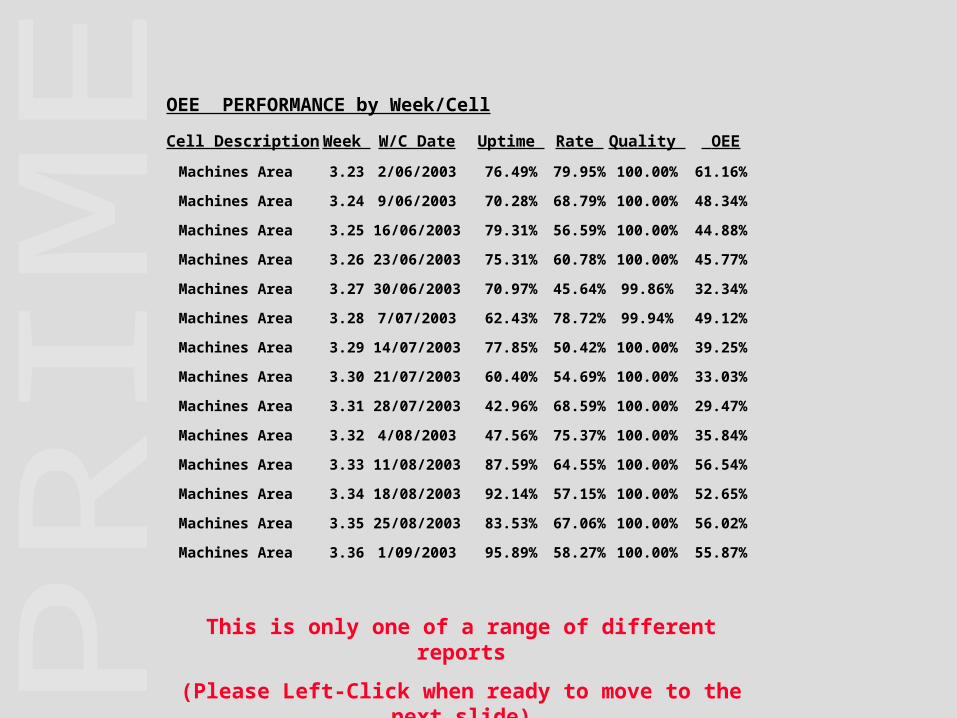
OEE PERFORMANCE by Week/Cell
Cell Description Week W/C Date Uptime Rate Quality OEE
Machines Area 3.23 2/06/2003 76.49% 79.95% 100.00% 61.16%
Machines Area 3.24 9/06/2003 70.28% 68.79% 100.00% 48.34%
Machines Area 3.25 16/06/2003 79.31% 56.59% 100.00% 44.88%
Machines Area 3.26 23/06/2003 75.31% 60.78% 100.00% 45.77%
Machines Area 3.27 30/06/2003 70.97% 45.64% 99.86% 32.34%
Machines Area 3.28 7/07/2003 62.43% 78.72% 99.94% 49.12%
Machines Area 3.29 14/07/2003 77.85% 50.42% 100.00% 39.25%
Machines Area 3.30 21/07/2003 60.40% 54.69% 100.00% 33.03%
Machines Area 3.31 28/07/2003 42.96% 68.59% 100.00% 29.47%
Machines Area 3.32 4/08/2003 47.56% 75.37% 100.00% 35.84%
Machines Area 3.33 11/08/2003 87.59% 64.55% 100.00% 56.54%
Machines Area 3.34 18/08/2003 92.14% 57.15% 100.00% 52.65%
Machines Area 3.35 25/08/2003 83.53% 67.06% 100.00% 56.02%
Machines Area 3.36 1/09/2003 95.89% 58.27% 100.00% 55.87%
This is only one of a range of different reports
(Please Left-Click when ready to move to the next slide)
The Uptime, Throughput and Quality reports have
a similar layout but show more detail.
The same information can be available in
graphical form, that can be either viewed on
screen, or printed.
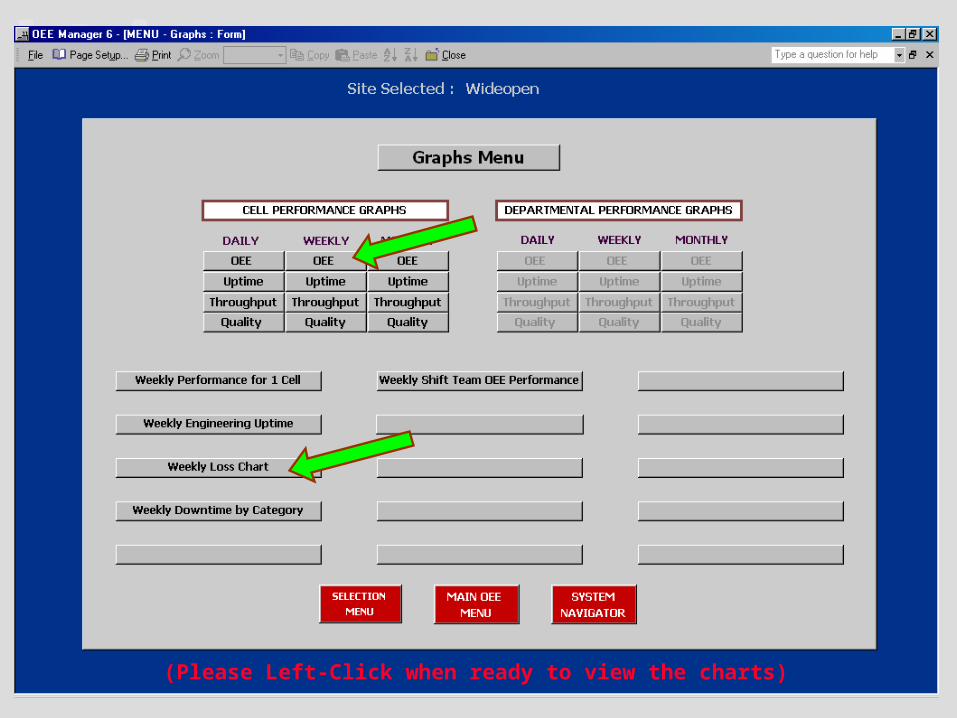
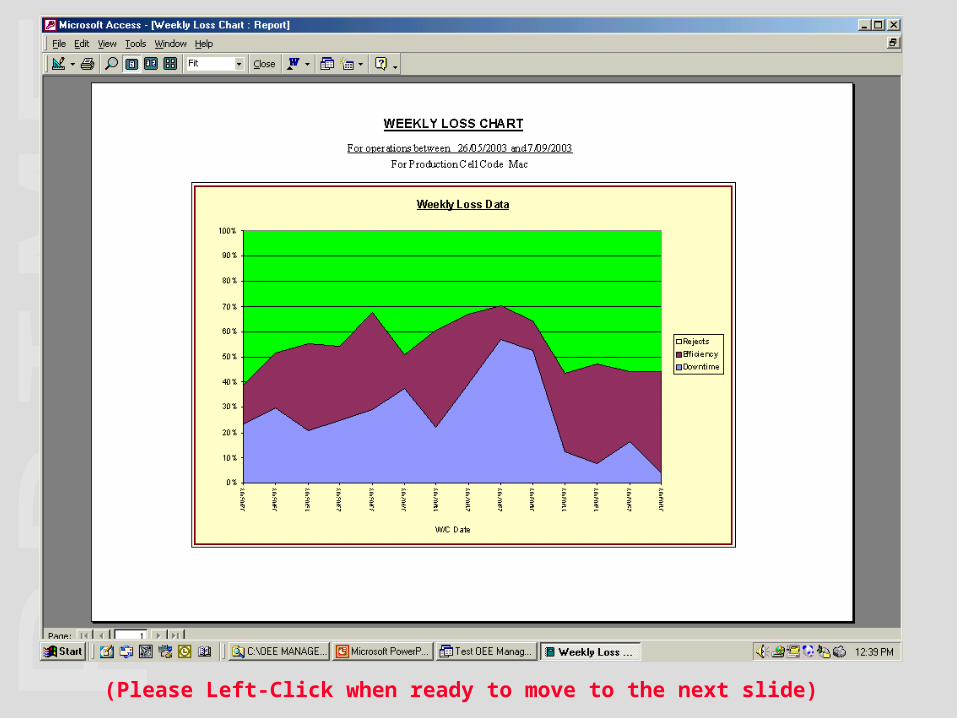
The slide shows the standard Graphs Menu,
followed by typical Weekly OEE Graphs and
Weekly Loss Charts(Please Left-Click when ready to view the Graphs menu)
(Please Left-Click when ready to view the charts)
(Please Left-Click when ready to move to the next slide)
There are a suite of reports for the following:
• Downtime Reports, presented in either summary
or detail
• Engineering Reports, again in summary or detail
form, that provide analysis of fault types, fault
causes, MTBF, Response Time ratios etc
• Production Reports, presenting summaries and
detail of production and reject quantities by shift,
day or week.
• Reports for Cost of Downtime and Cost of Failure
(Please Left-Click when ready to view some typical reports)
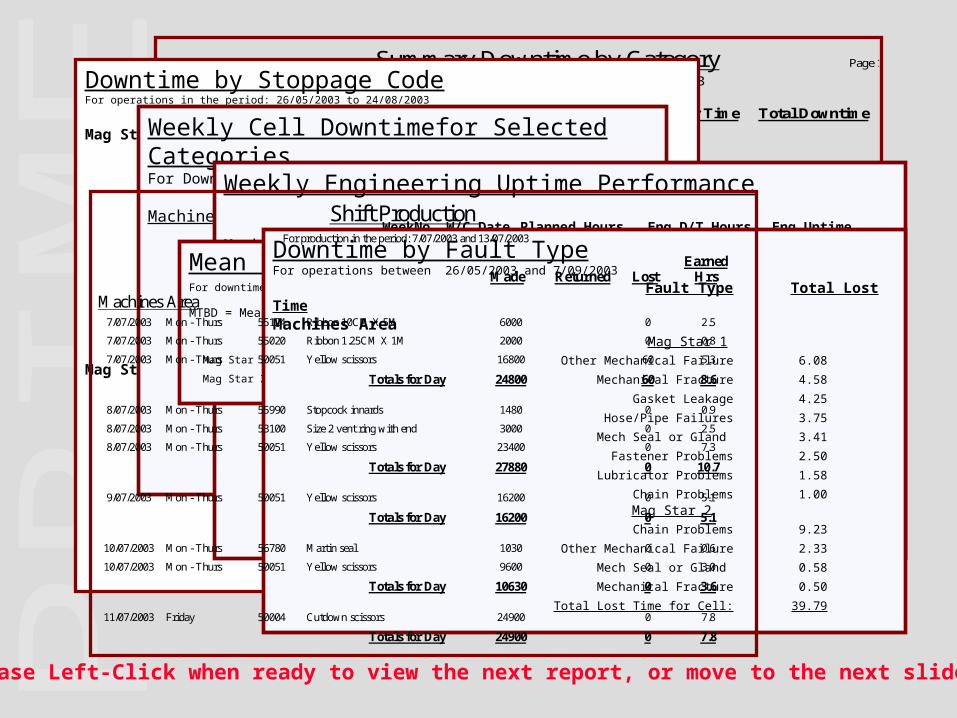
Summary Downtime by Category Page 1 of 1 For operations between 26/05/2003 and 20/12/2003
Equipment Downtime Category Response Time Repair Time Total Downtime
Mag Star 1 Production 0.0 94.2 94.2 Production Changeover 0.0 30.0 30.0 Engineering 0.5 26.7 27.2 No Production Planned 0.0 10.4 10.4 Internal Raw Mats 0.0 7.7 7.7 Packing Team Not Ready 0.0 5.9 5.9 Awaiting QA 0.0 3.4 3.4 Total Downtime for Equipment 178.8
Mag Star 2 Production 0.0 40.4 40.4 Production Changeover 0.0 18.9 18.9 Engineering 0.3 14.4 14.6 No Production Planned 0.0 5.1 5.1 Packing Team Not Ready 0.0 5.1 5.1 Awaiting QA 0.0 2.6 2.6 Internal Raw Mats 0.0 1.3 1.3 External Raw Mats 0.0 0.5 0.5 Total Downtime for Equipment 88.4
(Please Left-Click when ready to view the next report, or move to the next slide)
Downtime by Stoppage CodeFor operations in the period: 26/05/2003 to 24/08/2003
Stoppage Type D’time HrsMag Star 1
Changeover/Set-Up 84.8
Production Problem 29.0
Mech Breakdown 25.4
Other Reason 15.3
Shortage of Labour 6.0
Lack of Parts 4.0
Awaiting QA 2.4
Packing Problem 2.1
PPM Work 1.8
Parts Problems 1.3
Total 172.1
Mag Star 2Production Problem 23.8
Changeover/Set-Up 18.8
Other Reason 16.8
Mech Breakdown 11.3
Packing Problem 4.1
Shortage of Labour 4.0
Parts Problems 2.4
Awaiting QA 2.0
Lack of Parts 0.6
Total 83.8
Weekly Cell Downtimefor Selected CategoriesFor Downtime Categories between aa and zz
W/C Date WeekNo Downtime HrsMachines Area
26/05/2003 3.22 0.82/06/2003 3.23 13.69/06/2003 3.24 21.7
16/06/2003 3.25 15.123/06/2003 3.26 18.030/06/2003 3.27 20.67/07/2003 3.28 27.4
14/07/2003 3.29 15.421/07/2003 3.30 28.928/07/2003 3.31 41.64/08/2003 3.32 38.2
11/08/2003 3.33 9.018/08/2003 3.34 5.7
Weekly Engineering Uptime Performance
WeekNo W/C Date Planned Hours Eng D/T Hours Eng UptimeMachines Area
3.22 26/05/2003 14.84 0.0 100.00%
3.23 2/06/2003 58.02 1.3 97.71%
3.24 9/06/2003 72.86 0.0 100.00%
3.25 16/06/2003 72.86 13.1 82.06%
3.26 23/06/2003 72.86 3.8 94.85%
3.27 30/06/2003 70.86 3.8 94.59%
3.28 7/07/2003 72.86 4.2 94.29%
3.29 14/07/2003 72.86 2.8 96.23%
3.30 21/07/2003 72.86 7.7 89.38%
3.31 28/07/2003 72.86 1.4 98.06%
3.32 4/08/2003 72.86 1.8 97.60%
3.33 11/08/2003 72.86 0.0 100.00%
3.34 18/08/2003 72.86 0.0 100.00%
3.35 25/08/2003 58.02 2.0 96.55%
3.36 1/09/2003 44.52 0.0 100.00%
Mean Time Between Downtime EventsFor downtime events in the period: 26/05/2003 and 20/12/2003
MTBD = Mean Time between Downtime Events MTTR = Mean Time to Repair
Planned HrsD’time Hrs No.B'downsMTBD(Hrs) MTTR(Hrs)Eng.UptimeMag Star 1 525 23.7 13 40 1.8 95.5%
Mag Star 2 525 12.1 6 87 2.0 97.7%
Downtime by Fault TypeFor operations between 26/05/2003 and 7/09/2003
Fault Type Total Lost TimeMachines Area Mag Star 1
Other Mechanical Failure 6.08
Mechanical Fracture 4.58
Gasket Leakage 4.25
Hose/Pipe Failures 3.75
Mech Seal or Gland 3.41
Fastener Problems 2.50
Lubricator Problems 1.58
Chain Problems 1.00 Mag Star 2
Chain Problems 9.23
Other Mechanical Failure 2.33
Mech Seal or Gland 0.58
Mechanical Fracture 0.50
Total Lost Time for Cell: 39.79
Shift Production For production in the period: 7/07/2003 and 13/07/2003
Earned Made Returned Lost Hrs
Machines Area 7/07/2003 Mon - Thurs 55124 Ribbon 10CM X 5M 6000 0 2.5 7/07/2003 Mon - Thurs 55020 Ribbon 1.25CM X 1M 2000 0 0.8 7/07/2003 Mon - Thurs 50051 Yellow scissors 16800 60 5.3
Totals for Day 24800 60 8.6
8/07/2003 Mon - Thurs 55990 Stopcock innards 1480 0 0.9 8/07/2003 Mon - Thurs 53100 Size 2 vent ring with end 3000 0 2.5 8/07/2003 Mon - Thurs 50051 Yellow scissors 23400 0 7.3
Totals for Day 27880 0 10.7
9/07/2003 Mon - Thurs 50051 Yellow scissors 16200 0 5.1
Totals for Day 16200 0 5.1
10/07/2003 Mon - Thurs 56780 Martin seal 1030 0 0.6 10/07/2003 Mon - Thurs 50051 Yellow scissors 9600 0 3.0
Totals for Day 10630 0 3.6
11/07/2003 Friday 50004 Cutdown scissors 24900 0 7.8
Totals for Day 24900 0 7.8
There is also a range of operational reports covering production performance, equipment slow-running, production and maintenance costs, and operator & craftsmen efficiency, etc.
The PRIME “OEE Manager” also incorporates all of the tools required to manage an engineering workload, and implement continuous improvement to achieve high levels of equipment performance. These additional, standard features comprise:
Work Order ManagementPreventive Maintenance SchedulingManagement of Maintenance Spares
Tooling ManagementFailure Mode, Effect and Criticality Assessment
(Designed specifically for Maintenance operations)
Root Cause EliminationManagement of Modifications and small Projects
Any of these sub-systems can be run in isolation of the OEE features (eg a client can use the work order and PPM management features alone, or only the FMEA module etc).
For more information about these system features, select the “Key Features” tab in one of the OEE web pages
(Please Left-Click when ready to move to the next slide)
This short presentation has given you a very brief insight into the PRIME OEE Manager system.
The PRIME “OEE Manager” is available free of charge to any PRIME client
You can obtain an onsite demonstration of the software, or a fully-functional demonstration disc by contacting Frank Chambers by e-mail on
“[email protected]” or by phone on 044 (0)191 2364150
I hope that you have found the presentation informative.
On the next mouse click you will exit the presentation