Embed Size (px)
Citation preview

Promoting Instructional Improvement: Promising Evidence of Coaching That Benefits
Teachers’ Practice
by
Kiel Michael McQueen
A dissertation submitted in partial fulfillment of the requirements for the degree of
Doctor of Philosophy (Educational Studies)
in The University of Michigan 2018
Doctoral Committee:
Associate Professor Matthew S. Ronfeldt, Chair Associate Professor Gina N. Cervetti Associate Professor Andrew C. Grogan-Kaylor Assistant Professor Christina Weiland

ii ii
Dedication
This is dedicated to my parents, Michael and Lynn McQueen. Your sacrifices made this
opportunity possible.

iii iii
Acknowledgements
I am blessed to have received unconditional support from a cadre of individuals who helped
make this day possible. My dissertation is influenced by all who helped shape me into the person I
am today. I am not here without you.
I want to first thank my advisor, Dr. Matthew Ronfeldt, for your academic advising, personal
mentorship, and friendship. Your time, thoughtfulness, and expertise significantly influenced the
researcher, man, and husband I am today. You believed in me when I did not necessarily believe in
myself, you advocated for me when you did not necessarily have to, and you pushed me to exceed
the expectations I set for myself. Thank you for first taking a meeting with me on Friday, September
10, 2011 and then taking a chance on me as an advisee. Working with you has been and always will
be an honor. I look forward to many more Tigers games in the future.
To my committee members, I am incredibly fortunate to have been guided by an exceptional
group of scholars. Dr. Andrew Grogan-Kaylor, thank you for your willingness to come along for
this journey. Whether serving as a committee member or multi-level model professor, your door has
always been open, and for that I am grateful. Dr. Gina Cervetti, thank you for pushing my thinking
from the onset. Much of my evolution as a researcher is attributed to your honest, thoughtful, and
helpful feedback. You always pushed me to raise the bar. Dr. Christina Weiland, thank you for
helping make this experimental study possible. Your teaching and personal mentorship has
profoundly impacted my professional trajectory. Without you, I would not have discovered a
passion for experimental methods or intervention fidelity.

iv iv
To the teachers and coaches at the heart of this study, without you my work is not possible.
I appreciate you opening your professional practice to exploration. Your tireless dedication to
advancing our profession is inspiring.
To the other faculty and staff at the School of Education, I am grateful for the opportunity
to have learned from and worked with you. I want to specifically thank Dr. Kendra Hearn for her
mentorship and friendship. Your generosity and support throughout my time at the School of
Education is deeply appreciated. I cannot thank you enough for the opportunities you provided,
including a venue to bring this study to life. I will, and already do, miss working with you. I also
want to thank Dr. Donald Freeman, who held a high bar for writing quality, but provided every
support needed to exceed it. Finally, thank you to Dr. Rachel Klingelhofer and Dr. Jean Mrachko
for assisting me throughout this process.
In addition to an excellent education, the University of Michigan afforded the opportunity to
work with a group of incredibly talented educators and researchers. To Angela Lyle, Blair Beuche,
Sylvie Kademian, Nick Orlowski, Kevin Lyle, Jared Aumen, Hillary Greene, Stacey Brockman, and
Sarah Thomson, I admire your scholarship and appreciate your friendship. I will always cherish my
memories of finishing a problem set at the Brown Jug, tailgating at the Treehouse, celebrating the
birth of a new child, or playing broomball in Yost at 12AM, amongst others.
I am also appreciative of the influence several others had on my professional work. To Dr.
Rohit Setty and Dr. Andy Kwok, thank you for your mentorship and modeling what is possible as a
graduate student. Lastly, Dr. Shaynce Campbell played an important role in the early iterations of
this study. Thank you for listening to my ideas, offering yours, investigating different STATA
challenges, but most importantly, always making me laugh.

v v
To the tiny corner coffee shop formerly known as “Real Baked Goods”, thank you for
providing the space to write the majority of my dissertation. I miss the days talking with Alan “The
Baker” while enjoying a warm cup of coffee and cinnamon roll. Sitting in your coffee shop made
this dissertation process more tolerable.
To Desmond Howard, thank you for your four-touchdown effort against Boston College on
September 7, 1991. You helped “kick-off” an interest in and devotion to the University of Michigan
for a young boy sitting in the stands that day. Experiences like these no doubt played a role in
leading me to Ann Arbor.
I am indebted to the teachers and coaches who helped shape me into the person I am today.
To all my former teachers and administrators at Gates Elementary School, RJ Grey Middle School,
and Acton-Boxborough Regional High School, I realized the value and importance of education
because of you. To my coaches – Ray Gallant, Larry Spiller, Mark Smith, Bill Maver, Lou Abare,
Henry Morris, Rick Kilpatrick – thank you for instilling a mindset that success is only born through
hard work. Your influence was felt in the final days of completing this dissertation.
I am also thankful to a group of lifelong friends whose support has spanned the course of
my lifetime. The Acton community has produced some of the highest character individuals I have
met and I am blessed to call them friends. In particular, my best friend Kevin Gallant was incredibly
supportive throughout this entire process.
I am also deeply appreciative of the influence the students of Sierra Vista Elementary School
had on my professional career. Serving as your teacher are still some of my most cherished
professional memories.
Finally, I am here today because of my family. To my mother- and father-in-law, Mary and
Frank, thank you for your support throughout this entire process. Most importantly, thank you for

vi vi
welcoming me into your family. I also want to thank my brother-in-laws, Louis, Frank, and Albert,
for their friendship, support, and willingness to share a drink throughout this process.
To my extended McQueen and Bergren family, thank you for your unwavering love and
support. I wish my grandparents (Roy W. Bergen, Anna Bergren, and Dr. Thomas McQueen) could
see this day, but I believe they are proudly smiling in heaven.
To my brother Adam, you are and always will be my role model. Growing up, you set the
bar for what academic excellence looks like. Now, you set the bar for what pursuing your dreams
looks like. I am incredibly proud to share the distinction of an alumnus of the University of
Michigan with you. When I think of “leaders and best”, I think of you.
To my parents, this dissertation is for you. Adam and I are who we are because of you. You
sacrificed much of yourselves so Adam and I could pursue our dreams. Thank you for advocating
for my education, for teaching me how to think through challenges, and helping me believe in what
is possible. I am incredibly proud to be your son.
Finally and most importantly, I want to thank my beautiful and loving wife, Francesca. You
are my comfort, my strength, and my motivation. Observing your resiliency, commitment, and
toughness on a daily basis willed me to the finish line. Simply put, you the best gift the University of
Michigan will ever give me.
vii vii
Table of Contents
Dedication…………………………………………………………………............. ii
Acknowledgements……………………………………………………………....... iii
List of Tables…………………………………………………………………......... ix
List of Figures…………………………………………………………………........ xi
List of Appendices…………………………………………………………………. xii
Abstract………………………………………………………………….................. xiii
Chapter 1: Introduction……………………………………………………………. 1
Research Questions……………………………………………………………….. 3
Chapter 2: Literature Review and Conceptual Framework……………………… 6
Inclusion Criteria…………………………………………………………………. 6
The Impact of Coaching on Teacher Performance………………………………... 7
Promising Features of Coaching……………………………….................................. 12
Influences Behind Implementation of Coaching Content…………………………. 20
Conceptual Framework……………………………….................................................. 24
Chapter 3: Methodology…………………………………………………………… 31
Setting………………………………...………………………………...................... 31
Study Context………………………………...…………………………………... 37
Research Design………………………………...………………………………… 38
Sample………………………………...………………………………………….. 49
Data Sources………………………………...……………………………………. 59
Measures………………………………...………………………………………... 66
Analytic Strategy………………………………...………………………………… 82
Chapter 4: Results………………………………………………………………….. 92
viii viii
Chapter 5: Discussion and Implications………………………………………….. 112
Discussion of Findings………………………………...………………………….. 112
Revision of Conceptual Framework………………………………...…………….. 121
Study Limitations………………………………...………………………………... 125
Implications………………………………...…………………………………….. 130
Appendices…………………………………………………………………............ 137
References………………………………………………………………….............. 171

ix ix
List of Tables
Table
3.1: Overview of 2015-2016 Field Instruction Structure……………………………... 34 3.2: Intervention and Control Conditions……………………………………………. 45 3.3: Distribution of Selected Rubric Competencies…………………………………... 47 3.4: Coach Characteristics At Randomization………………………………………... 50 3.5: Teacher Characteristics At Randomization……………………………………… 53 3.6: School Characteristics At Randomization……………………………………….. 55 3.7: Teacher and Coach Attrition……………………………………………………. 57 3.8: Teacher and Coach Attrition Balance Check……………………………………. 58 3.9: Descriptions of Data Sources…………………………………………………… 60
3.10: ICP Program Outcomes and Competencies…………………………………….. 62 3.11: Logic Model for Coaching Intervention………………………………………… 68 3.12: Intervention Core Components and Subcomponents…………………………… 70 3.13: Number of Fidelity Indicators Per Component………………………………….. 71 3.14: Rotated and Un-Rotated Exploratory Factor Analysis Loadings……...…………. 73 3.15: Core Component Fidelity Indicators……………………………………………. 75 3.16: Methods for Standardizing Scores………………………………………………. 76 3.17: Teachers' Sense of Preparedness to Teacher…………………………………….. 79 3.18: Teachers' Perceptions of the Coaching Received………………………………... 81 3.19: Initial Coding Categories………………………………………………………... 87 3.20: Initial Coding Categories Around Why Certain Practices Matter………………… 88 4.1: Post-Intervention Survey: Teacher Results………………………………………. 93 4.2: Written Feedback Analysis………………………………………………………. 94 4.3: Achieved Relative Strength Value Across Core Components of the Intervention... 95 4.4: Compared to teachers whose coaches received no training, did teachers whose
coaches received the training have better observation ratings?…………………... 97 4.5: Compared to teachers whose coaches received no training, did teachers whose
coaches received the training report feeling more prepared? …………...………... 100 4.6: Compared to teachers whose coaches received no training, did teachers whose
coaches received the training report better quality coaching? ...…………...……... 102 4.7: What coaching practices influence first-year teachers’ receptivity to coaching and
implementation of the coaching content? ……………………………………….. 104 E: Coach Characteristics Balance Check At Randomization………………………... 150 F: Teacher Characteristics Balance Check At Randomization………………………. 151 G: School Characteristics Balance Check At Randomization………………………... 152 H: Coach Characteristics Balance Check Post-Attrition…………………………….. 153 I: Teacher Characteristics Balance Check Post-Attrition…………………………… 154 J: School Characteristics Balance Check Post-Attrition…………………………….. 155
N: Compared to teachers whose coaches received no training, did teachers whose coaches received the training have better observation ratings?.................................... 162

x x
O: Compared to teachers whose coaches received no training, did teachers whose coaches received the training have better observation ratings?.................................... 163
P: Compared to teachers whose coaches received no training, did teachers whose coaches received the training report feeling more prepared?....................................... 164
Q: Compared to teachers whose coaches received no training, did teachers whose coaches received the training report better quality coaching?...................................... 165
xi xi
List of Figures
Figure 2.1: Coaching That Leads to Instructional Improvement………………………………….. 26 3.1: ICP Teacher Training & Support……………………………………………………... 32 3.2: Research Design……………………………………………………………………… 40 3.3: Flow Chart Connecting Data Sources with Analayses and Research Questions……….. 83 5.1: Revised Conceptual Framework……………………………………………………… 122

xii xii
List of Appendices
Appendix A: 2015-2016 ICP Program Rubric……………………………………………... 137 B: Intervention-Professional Development (IPD) #1…………………………... 142 C: Intervention-Professional Development (IPD) #2…………………………... 146 D: Sample Intervention Email…………………………...……………………… 149 E: Coach Characteristics Balance Check…………………………...…………… 150 F: Teacher Characteristics Balance Check…………………………..…………... 151 G: School Characteristics Balance Check………………………….......................... 152 H: Coach Characteristics Post-Attrition Balance Check…………………………. 153 I: Teacher Characteristics Post-Attrition Balance Check……………………….. 154 J: School Characteristics Post-Attrition Balance Check ………………………... 155 K: Teacher Mid- and End-of-Year Surveys…………………………...…………. 156 L: Post-Intervention Fidelity Survey (PIFS) …………………………...………... 158 M: Sample Interview Protocol…………………………...……………………… 160 N: Robustness Check: Multi-Level Models (MLM)…….………………………... 162 O: Robustness Check: Multiple Imputation. …….…...…………………………. 163 P: Robustness Check: MLM (Preparedness) …………………………...……….. 164 Q: Robustness Check: MLM (Quality) …………………………...……………... 165 R: Initial Coding Scheme…………………………...………………………….... 166

xiii xiii
Abstract
Existing experimental literature provides evidence that coaching paired with additional
supports facilitates teachers’ instructional improvement, but we cannot discern whether the coaching
or other supports (e.g., professional development workshops, video resources) spurred the observed
change. Other research isolating the effect of coaching suggests it leads to instructional
improvement, but it does not provide a clear understanding about whether different features of
coaching demonstrate promise for improving instruction more than others, despite evidence
suggesting variation exists in the coaching teachers receive. Given the prevalence of coaching as
form of professional development, it is critical to understand whether different features of coaching
are more promising than others.
This experimental, mixed methods study designed a professional development intervention
employing two features of coaching – teachers choosing the content of coaching and focusing coaching
on a single instructional practice – within a teacher preparation program. I investigate whether
coaches trained in the intervention use this type of coaching and whether the intervention
demonstrates promise for improving teachers’ instruction and perceptions of preparedness and
coaching quality. Additionally, I explore whether certain coaching practices influence teachers’
receptivity to coaching and why these practices matter.
Results suggest the intervention demonstrates promise for improving teachers’ instruction.
While not statistically significant, results indicate intervention teachers scored, on average, between
24 to 36 percent of a standard deviation better than control teachers. Additionally, results suggest
the intervention can be implemented in an authentic educational setting and has promise for
xiv xiv
strengthening teachers’ perceptions of preparedness and post-observation conference quality. Lastly,
this study also indicates that certain pedagogical coaching practices – including concrete feedback,
creating a welcoming environment, limiting the focus, and modeling practice – might influence
teachers’ receptivity to coaching.
These findings have implications for the practice of teacher coaching. Evidence of the
intervention’s promise suggest pre-service and in-service teacher preparation programs might
consider developing a coaching model where teachers choose certain competencies to address and
coaches focus their support on the selected competencies. Finally, identifying four potentially
influential coaching practices indicates that teacher preparation programs might consider supporting
coaches in learning more about these practices.

1
Chapter 1: Introduction
Teacher coaching is quickly becoming a common form of teachers’ professional
development (Darling-Hammond, Wei, Andree, Richardson, & Orphanos, 2009). Coaching’s
prevalence is typically attributed to its emphasis on job-embedded practice, active learning (Blazar &
Kraft, 2015; Desimone, 2009), and focus on instructional improvement (Cornett & Knight, 2009).
In an era where coaching is becomingly increasingly common (Gibbons & Cobb, 2017), it is critical
to understand its impact on teachers’ instruction.
Recent large-scale experimental studies suggest coaching paired with additional supports –
that include workshops, supplemental curricular materials, or video resources – can facilitate
instructional improvement (Allen, Pianta, Gregory, Mikami, & Lun, 2011; Dee & Wyckoff, 2015)
and enhance student achievement (Kraft, Blazar, & Hogan, 2016). Though these results suggest
coaching can improve teacher quality, we cannot be certain because the additional supports provided
(e.g., workshops, curricular materials) could also explain observed effects.
Other experimental studies focusing more specifically on the impact of coaching apart from
additional supports indicate coaching can facilitate instructional improvement (Neuman &
Cunningham, 2009; Sailors & Price, 2010). These studies suggest that receiving coaching is more
beneficial than receiving no coaching at all. While providing critical evidence for a causal relationship
between coaching and instructional improvement, we do not know whether some forms or features
of coaching are better than others. In an era where coaching is becoming increasingly common and
the types of coaching teachers receive varies significantly (Cornett & Knight, 2009), investigating
this unaddressed area of the literature is particularly important.

2
While prior literature on teacher coaching has not addressed promising features of coaching,
the extensive literature on professional learning has identified two features of effective professional
learning experiences that could be applied to the context of coaching. First, teachers having choice
over the content of coaching seems particularly promising. Prior literature suggests choice is
important because it affords teachers the opportunity to direct the content of their learning
(Merriam, 2001), actively engages them in the learning experience (Knowles, Houlton, & Swanson,
2005), and leverages their prior experience as the basis for learning (Garet et al., 2001). Second, more
focused coaching –targeting a specific aspect of instruction or observational rubric competency – also
seems promising. Prior literature implies narrowing the scope of professional learning experiences
allocates necessary time to wrestle with new problems and ideas (Little, 1993), affords greater
opportunity to deliberately practice a particular skill (Ericsson, Krampe, Tesch-Romer, 1993), and
focuses the attention of the learner by setting boundaries to the experience (Schon, 1983).
Since a broader base of literature on professional learning suggests choice and focus may have
promise, I designed a professional development intervention that incorporated choice and focus into
the context of coaching and used an experimental design to investigate whether these two features
demonstrate promise for improving teachers’ instruction. In order to conduct this developmental
study, I partnered with a teacher preparation program to design a randomized control trial (RCT)
where I randomly assigned 22 coaches by content area and 46 first-year teachers by content area to
intervention and control conditions. Randomization resulted in 10 coaches assigned to 25 first-year
teachers in the intervention condition, in comparison to 12 coaches assigned to 21 first-year teachers
in the control condition. I then trained intervention coaches to incorporate teacher choice and focus
coaching around a specific rubric outcome across two observations; control coaches received the

3
training the teacher preparation program typically provided and were instructed to engage in the
program’s typical form of coaching. The research questions guiding my study are:
1. Were coaches trained in the intervention more likely to offer teachers’ choice and focused coaching as compared to coaches who received no training?
2. Compared to teachers whose coaches received no training, did teachers whose coaches received the training:
a. Have better observation ratings? b. Report feeling more prepared? c. Report better quality coaching?
While prior literature suggests certain features of coaching – such as choice and focus – may
matter, less is known about what influences teachers’ implementation of the content discussed.
Understanding the influences behind uptake and implementation are particularly important
considering the relationship between implementation and success of a particular intervention or
initiative (Power, Blom-Hoffman, Clarke, Riley-Tillman, Kelleher, & Manz, 2005). Moreover, prior
literature identified teachers’ responsiveness to coaching as a likely influential factor because of the
relationship between responsiveness, uptake, and implementation (Wanless, Rimm-Kaufman, Abry,
Larsen, & Patton, 2014; Wong, Ruble, McGrew, & Yu, 2017). While providing suggestive evidence
responsiveness influences implementation, the different pedagogical practices coaches might employ
to enhance teachers’ responsiveness to coaching remains unaddressed. Therefore, we have less of an
understanding of what likely influences teachers’ receptivity to coaching and subsequent
implementation of the content discussed. Thus, following the intervention I interviewed 13 teachers
across conditions to try and uncover certain pedagogical coaching practices that teachers might be
amenable to. The additional research question guiding my study is:
3. What coaching practices influence first-year teachers’ receptivity to coaching and implementation of the coaching content? Why do these coaching practices matter?
4
To address these research questions, I used a mixed methodological approach to allow for
different means of data collection to investigate the promise of this intervention (Greene, 2007). I
gathered information about coaches’ implementation of the intervention, teachers’ beginning and
end of year observation scores, teachers’ sense of preparedness to teach across different domains of
practice, and teachers’ perspectives on the types of coaching received. I collected these sources of
data through post-intervention surveys, coaches’ written feedback provided to teachers, beginning
and end of year teacher surveys, and coaches’ observation scores for all first-year teachers.
Moreover, I used a semi-structure interview protocol to gather more information about different
coaching practices that might influence teachers’ receptivity to coaching and implementation of the
coaching content. I also used the interview protocol to try and uncover why these coaching practices
might influence receptivity and implementation.
This dissertation contributes to the literature on teacher coaching in at least three ways. First,
I leverage a broad base of literature suggesting choice and focus are important features of effective
professional learning experiences and apply these broader principles to the context of teacher
coaching. Second, I incorporate these two features of efficacious professional learning in a coaching
intervention and test whether they demonstrate promise for improving teachers’ instruction. This
study is, to my knowledge, the first to use an experimental design to test whether choice and focus
demonstrate promise for improving teachers’ instruction. Furthermore, I provide suggestive
evidence this particular intervention (a) can be implemented with fidelity in an authentic educational
setting and (b) demonstrates promise for improving teachers’ instruction. Finally, I investigate
whether certain pedagogical coaching practices influence teachers’ receptivity to coaching. In
particular, I make progress in identifying potentially promising pedagogical practices coaches might
use to influence teachers’ implementation of the content discussed.

5
In the next chapter, I review existing literature to identify relevant research concerning teacher
coaching and its effect on classroom instruction. The literature reveals coaching, in general, has a
positive impact on teachers’ instruction, but less is known about whether different features of
coaching demonstrate more or less promise. I conclude the chapter by presenting my conceptual
framework to explain why a particular type of coaching has promise for improving first-year
teachers’ instruction. In Chapter 3, I describe the mixed methodological approaches that guide my
study. I discuss the research design, the process of randomization, the sample being studied, the data
sources, and analytic methods I used to answer my research questions. Chapter 4 presents findings
for each research question. First, I focus on intervention fidelity analyses, specifically addressing
measures of adherence, dosage, and quality. Then, I draw on teachers’ observation ratings and self-
reported perceptions of preparedness and coaching quality to discuss whether choice and focus
demonstrate promise for improving instruction. Afterwards, I discuss teachers’ perceptions about
coaching practices that influence responsiveness to coaching and why these practices mattered.
Finally, in Chapter 5, I present a discussion of my findings, synthesizing how the results can
strengthen this particular intervention, inform practitioners working with novice teachers, and future
research on teacher coaching.
6
Chapter 2: Literature Review and Conceptual Framework
Before describing my study, I review existing literature on the impact of coaching on
teachers’ instruction. Next, I examine the extensive literature base on professional learning, of which
teacher coaching is situated in, suggesting choice and focus warrant inclusion in this particular
intervention. Then, I briefly discuss existing literature on coaches’ pedagogical practices and how we
know little about which practices teachers report influence receptivity to coaching and
implementation of the coaching content. Finally, I draw upon existing literature to conceptualize
why a particular coaching intervention integrating choice and focus might demonstrate promise for
improving teachers’ instruction. Rather than provide a comprehensive review of existing literature,
the purpose of this section is to offer background and motivation for the design of my professional
development intervention.
Inclusion Criteria
Prior to my review of relevant literature, I describe the inclusion criteria I used to identify
studies for my three sections: (1) the impact of coaching on teachers’ instruction, (2) promising
features of coaching, and (3) influences behind implementation of coaching content. For my first
and third sections, I restricted the sample of studies using three primary criteria pertaining to
predictors, outcomes, and research design to identify empirical studies warranting inclusion. First, I
required that studies use coaching (section one) or responsiveness (section three) as a predictor of a
particular outcome. I chose to focus on coaching and responsive as the predictors of interest given
the applicability to my research questions. Second, I limited my review to studies that included as an

7
outcome either a direct measure for instructional quality – either observational evaluations or value-
added to student achievement – in section one or implementation of coaching content in section
three. I chose these outcomes because I was concerned with whether coaching impacts teachers’
instruction or whether responsiveness influences implementation of the coaching content. Third, I
required that studies employed an experimental or quasi-experimental research design. I made this
decision given my desire to review studies with either similar research designs (e.g., experimental
design) or studies making similar claims to the present study (e.g., suggestive evidence of promise).
In an effort to build a strong case for why certain features of coaching demonstrate promise
(e.g., second section of literature review), I used two inclusion criteria. First, I broadened the scope
of my review to include literature addressing professional learning. Addressing professional learning,
as opposed to a singular focus on coaching, allowed me to leverage an extensive literature base on
professional development, adult learning theory, and expert performance amongst others. Second, I
included both empirical (e.g., quantitative and qualitative) and conceptual literature in my review. I
sought to include both types of literature because I wanted to identify promising features of
professional learning that had strong conceptual and empirical support for either why a certain
feature demonstrates promise or suggestive evidence that a particular feature does matter. This
inclusion criteria yielded considerable literature suggesting choice and focus are likely promising
features of coaching.
The Impact of Coaching On Teachers’ Instruction
A number of quantitative studies suggest that teacher coaching – typically comprising a
classroom observation and post-observation feedback conference with a more experienced or
knowledgeable other – can improve classroom instruction (Cornett & Knight, 2009; Davis &
8
Higdon, 2008; Evertson & Smithy, 2000; Ingersoll & Strong, 2011; Stanulis & Floden, 2009) and
student achievement (Kraft et al., 2016). For my review here, the literature suggests I focus on two
categories of research: coaching paired with additional supports and isolating the impact of coaching
on instruction. I now turn to a discussion of each.
Coaching Paired With Additional Supports. Recent quantitative evidence suggests
coaching paired with additional supports improves teachers’ instruction. The most compelling
evidence to date suggests coaching has a significant effect on teachers’ instruction (Kraft et al.,
2016). In a meta-analysis of 37 experimental studies examining the effects of coaching, Kraft et al.
(2016) detected a pooled effect size of approximately 56 percent of standard across studies analyzing
the effect of coaching on instruction. Additionally, 25 of the studies revealed a 71 percent of a
standard deviation effect size when coaching focused exclusively on teachers’ instruction (e.g.,
general pedagogical strategies). In contrast, when coaching addressed a particular content area (e.g.,
literacy, math, science), results revealed a 51 percent of standard deviation effect of coaching on
teachers’ instruction. Given how this meta-analysis only included experimental studies, Kraft et al.
(2016) provide the strongest causal evidence to date around the effect of coaching on teachers’
instruction and student achievement.
While prior literature suggests coaching can spur teachers’ instructional improvement, other
literature suggests coaching is particularly impactful for certain kinds of teachers. In a longitudinal
study examining the effects of D.C.’s IMPACT evaluation system, Dee and Wyckoff (2015) found
that certain teachers improved as a result of participating in this system. In this particular system,
teachers participated in rubric-based observational evaluations, received instructional coaching, and
enticed with incentives (e.g. performance bonuses) or threatened with consequences (e.g. dismissal
threats) according to their performance. The authors employed a regression discontinuity (RD)
9
design to compare performance outcomes among low-performing and high-performing teachers
near the respective thresholds that triggered either a dismissal threat or a monetary incentive. RD
estimates suggest low-performing teachers – those receiving dismissal threats – and high-performing
teachers – those receiving performance bonuses – improved their performance by 24 to 27 percent
of a standard deviation, respectively, compared to those who near the thresholds but did not receive
either a threat or incentive.
While the articles reviewed in this section highlight the impact of coaching on instruction,
other studies have also examined whether the delivery of coaching (e.g., web-based) matters. Allen,
Pianta, Gregory, Mikami, and Lun (2011) tested whether My Teaching Partner-Secondary (MTP-S) –
a web-based coaching program that includes initial workshop-based training, a year of personalized
coaching, a video library resource, and additional skill booster workshops – improved teachers’
instruction. By randomly assigning 78 secondary school teachers across content areas to either the
intervention of MTP-S or regular in-service training, they found a significant positive effect of the
program on teachers’ instruction and students’ end-of-year test scores. Intervention teachers
improved by 0.37 standard deviations more than control teachers on observed teacher-student
interactions, as measured by the Classroom Assessment Scoring System – Secondary (CLASS-S)
rubric. Additionally, students assigned to teachers receiving MTP-S had a net gain of 0.22 standard
deviations compared to students assigned to control teachers, which equates to moving a student
from the 50th to 59th percentile. The authors mentioned, though, several important limitations. First,
the study had significant attrition, resulting in 33-percent of teachers dropping out of the study
following randomization. Additionally, the authors cited the intensity of coaching – 10 to 12
coaching cycles occurring over a one year period – as a programmatic feature that is likely not
sustainable in larger, more urban school districts.

10
Given these limitations and the need to test the efficacy of promising education
interventions (Forman, Shapiro, Codding, Gonzales, Reddy, Rosenfield, & Stoiber, 2013), Allen,
Hafen, Gregory, Mikami, and Pianta (2015) replicated this study by randomly assigning 86 secondary
(middle and high school) classrooms serving 1,194 students to a modified MTP-S intervention. The
more recent iteration of the MTP-S included the same core components (e.g., personalized coaching
addressing a single CLASS-S rubric domain), but decreased in intensity with five to six observation
cycles per year, over two years. The authors claimed the lower-intensity coaching model distributed
over time was more suitable to the realities and demands of an urban, under-resourced school
district. Results revealed students assigned to intervention teachers scored approximately 31 to 48
percent of a standard deviation better than students assigned to control teachers, which would likely
move a typical student in the intervention condition from the 50th to 59th percentile. The authors
concluded these results mirrored the effects from their initial study.
Although the studies reviewed in this section provide causal evidence that coaching paired
with additional supports can improve instruction, each study had a common limitation. Namely, we
cannot be certain other features provided – additional workshops, incentives, consequences,
annotated resources, etc. – might also explain the observed effects. For example, the MTP-S
intervention included a year of personalized coaching, a video library resource, and additional skill
booster workshops, thus making it difficult to discern whether it is the coaching or the additional
supports that explain teachers’ instructional improvement. In an era where coaching is becomingly
an increasingly common support offered to teachers, it is critical to understand whether coaching
directly benefits teacher performance apart from other supports.
Isolating The Impact of Coaching on Instruction. Other experimental research isolated
the causal effect of coaching by providing any additional supports given to intervention
11
teachers/coaches also to control teachers/coaches, thus ensuring that the only difference between
conditions was the kinds of coaching received. Leveraging the stratified random assignment of 304
early childhood caregivers, Neuman and Cunningham (2009) sought to examine the effects of
professional development coursework and coaching on teachers’ early language and literacy
practices. The researchers randomly assigned teachers to one of three groups: a professional
development course paired with coaching, a professional development course, or no professional
development course or coaching. Two-way ANCOVA tests revealed that caregivers who had
received both types of supports (n=86) scored significantly higher on Early Language and Literacy
Classroom Observation (ELLCO) and the Child/Home Early Language and Literacy Observation
(CHELLO) instruments, as compared to those only receiving coursework (n=85), and those
receiving no professional development courses or coaching (n=133).
While Neuman and Cunningham (2009) focused on the impact of coaching on early
childhood caregivers, other studies have examined whether coaching is impactful at the elementary
level. In a study of 44 elementary teachers, Sailors and Price (2010) examined the effects of coaching
on teachers’ instruction, as measured by the Comprehension Instruction Observation Protocol
System (CIOPS). Teachers who were randomly assigned (n=17) to attend a two-day summer in-
service training and receive classroom-based support from a reading coach improved by 0.64 and
0.78 standard deviations on reading and comprehension strategies respectively, as compared to
teachers (n=27) who attended the same in-service training but did not receive any classroom-based
support.
While these studies provide causal evidence for the impact of coaching on teachers’
instruction, some important issues remain unanswered in the research on teacher coaching.

12
Namely, we do not know whether different features of coaching are more or less beneficial on
teachers’ instruction. Understanding whether different features of coaching show promise is
particularly important to address because great variation exists in the kinds of coaching teachers
receive (Blakely, 2001; Cornett & Knight, 2008; Joyce & Showers, 1995; Norwood & Burke, 2011).
Given coaching’s prevalence as a form of professional learning, it is critical to understand whether
different features of coaching are more promising than others. Thus, this development study
examining a subtle, but important treatment contrast – more choice and focus versus less choice and
focus – will begin to explore this unanswered, yet important area in the literature on teacher
coaching.
Promising Features of Coaching
In this section, I describe two features of teacher coaching –choice and focus – that prior
literature suggests are particularly promising and warrant inclusion as integral parts of the
intervention at the center of this study. Choice refers to teachers having control over the content of
their professional learning, which in this case, is the coaching they receive. Focus on the other hand,
refers to limiting the scope of a professional learning experience, which I classify as addressing a
single observational rubric competency (e.g., behavior management) in the coaching context. These
two features are far from exhaustive, but I include them in the intervention because the extensive
literature base on professional learning suggests choice and focus have promise for improving teachers’
instruction.
Choice. Prior literature on professional learning suggests choice demonstrates promise for
three reasons. First, choice provides teachers the autonomy to self-direct the content of a learning
experience. Second, choice allows teachers to actively participate in the learning experience. Finally,

13
choice establishes a sense of coherence between the coaching content and teachers’ goals and
experiences. I elaborate on each below.
Autonomy. Adults are self-directed individuals capable of autonomous learning and desire
opportunities to make choices aligning to personal goals (Knowles, 1984; Merriam, 2001). In
particular, adults need discretion in planning and directing personal learning because discretion
recognizes adults’ ability to make decisions aligned to professional interests (Knowles, Houlton, &
Swanson, 2005). Thus, when teachers choose the content on which to focus their coaching on, they
have the autonomy to self-direct their own learning and identify content relevant to individual needs
and goals (Merriam, 2001).
Moreover, prior research suggests teachers provided who have more opportunities to self-
direct their own learning are more likely to report greater satisfaction with professional learning.
Specifically, results from a survey of 1,300 teachers across different districts and states revealed
teachers who choose all or most of their professional learning experiences are approximately twice
as satisfied with professional learning as compared to teachers who have less choice (Gates
Foundation, 2014).
Other research has moved beyond perceptions of satisfaction to provide suggestive evidence
that greater autonomy might improve teachers’ instruction. In a study of 26 middle school teachers,
Grossman (2015) sought to measure the relationship of targeted professional development on
teachers’ instruction. The author, who led the professional development, showed participating
teachers aggregate diagnostic data (PLATO rubric scores) on their beginning of the year observation
scores to help them choose which elements of PLATO their professional development would
address. Participating teachers selected the two lowest scored items: classroom discourse and
strategy use and instruction. The authors then provided professional development on these two

14
practices that included opportunities to 1) observe high quality examples of these practices as well as
different components of complex practices, 2) try out these practices multiple times, and 3) receive
coaching from trained observers on their efforts to enact the targeted practices. Teachers who
attended the professional development improved significantly more on the targeted instructional
domains as compared to teachers who did not receive any professional development. While other
factors of the intervention might explain the observed effects, this study provides suggestive
evidence that having greater autonomy over the content of a professional learning experience could
improve instruction.
Active Participation. Choice might actively involve teachers in the professional learning
experience through an analysis of teaching and learning (Knowles, 1984). Specifically, choosing the
content of professional learning requires teachers to actively reflect on individual teaching and
student learning in order to determine the focus of the learning experience. In doing so, teachers
articulate a problem of practice to address while also articulating individual learning needs (Feiman-
Nemser, 2001; Hawley & Valli, 1999). Moreover, new experiences without reflection contribute little
to the conceptual development of the teacher (Dewey, 1938). Thus, actively analyzing teaching and
learning can contribute to a balanced interplay between experience (action) and guided analysis
(reflection) within a professional learning experience.
Prior research on professional learning also suggests that active participation in professional
learning is particularly promising. One of the most noteworthy studies on professional development
(Garet, Porter, Desimone, Birman, & Yoon, 2001) used a probability sample of 1,027 mathematics
and science teachers to analyze how certain structural features of professional development
influenced changes in teachers’ knowledge, skill, and practice. Results from ordinary least squares
regression (OLS) models suggest professional development emphasizing teachers’ active participation

15
in the analysis of teaching and learning promoted increases in knowledge and skill and changes in
instruction.
Coherence. Choice can also facilitate a sense of coherence between professional learning activities
and teachers’ goals and experiences (Knowles et al., 2005). In particular, having autonomy over the
content of professional learning activities (e.g., coaching) provides teachers with the opportunity to
create a learning experience that is grounded in their goals and experiences (Garet et al., 2001). For
example, if a teacher notices students struggling to support arguments with textual evidence, then
the teacher can leverage this prior experience or problem of practice to inform what she addresses
with her coach. Fostering coherence is particularly important because teachers’ learning must be
interconnected with ongoing classroom practice (Putnam & Borko, 2000). Additionally, teachers
need the opportunity to discuss and locate new ideas in the context of teachers’ knowledge, prior
experience, and individual goals for professional learning (Little, 1993).
Moreover, prior research examining effective features of teachers’ professional learning
provides suggestive evidence that coherence likely matters. In a study of 454 science teachers, Penuel,
Fishman, Yamaguchi, and Gallagher (2007) employed hierarchical linear modeling (HLM) to
examine the effects of different features of professional development on teachers’ knowledge and
implementation of an inquiry science program, as measured by teacher surveys. The authors found
perceived coherence of professional development activities with individual goals was a strong predictor
of implementation of a particular program. Consequently, the authors suggest professional
development experiences might be more effective when they align to teachers’ goals for individual
learning.
Focus. Prior literature on professional learning also suggests that focus – which I
conceptualize as limiting the scope of a coaching conversation to a single instructional practice or

16
observation rubric competency – demonstrates promise for two reasons. First, focus can allocate the
necessary time to acquire new knowledge and skills. Second, focus can address a problem of practice that
might enable opportunities for learning. I elaborate on each below.
Time. Focus provides the opportunity for a coach and teacher to spend longer amounts of
time addressing a single instructional practice. Thus, focus recognizes the important relationship
between time and acquisition of new knowledge and skill, which is particularly important for three
reasons. First, professional learning that facilitates teachers’ learning must offer adequate time for
grappling with problems, ideas, and materials (Little, 1993). In particular, Little’s (1993) critique of
traditional forms of professional learning (e.g., single workshops) implies they do not offer
substantive depth or sufficient time for teachers to interact with problems of practice or new
knowledge and skill, thus closing down opportunities for learning. Therefore, focus might enable a
coach and teacher to spend the necessary time needed to wrestle with new knowledge and ideas
because this particular feature privileges exploring a single topic or problem in depth. For example,
if a teacher and coach focus on question quality for the entirety of a 45-minute interaction, they
create an opportunity to discuss and explore a single instructional practice in depth.
Second, sufficient time in professional learning experiences help mitigate the detrimental
effects of task complexity. Prior literature suggests task complexity – the number of distinct acts
needed to perform a task – inhibits individuals from engaging in a task because of the demand it
places on individuals’ knowledge and skill (Wood, 1986). Moreover, Wood (1986) suggests one way
to mitigate task complexity is taking the time to break down the task into small, manageable steps
and provide continuous support and reinforcement over an extended period of time. Thus, focus
could allocate the requisite time to mitigate task complexity. Specifically, attending to a single
competency allows a coach to break down the complexity of a particular practice into bite-sized

17
steps and provide detailed advice for each step, which could make it easier for a teacher to integrate
into her practice.
Third, practitioners need the opportunity to deliberately focus on or practice the same task
or set of skills for an extended period of time in a repetitive way. Prior literature on expert
performance suggests the amount of time an individual is engaged in deliberate practice, when
paired with feedback, is related tot hat individual’s acquired practice (Ericsson, Krampe, Tesch-
Romer, 1993). Therefore, focus might allocate extended time for a teacher to deliberately practice a
particular skill while receiving feedback from a coach. For example, the same 45-minute conference
attending to question quality could have a teacher scripting out questions (e.g., practice), receiving
feedback from a coach on the questions, and then integrating the feedback back into her scripting of
each question.
Moreover, prior research on teachers’ professional learning also suggests that the amount of
time focused on a specific instructional practice likely predicts changes in teachers’ knowledge and
skill. Intended to build on and extend the findings from Garet et al.’s (2001) study previously
discussed, Desimone, Porter, Garet, Yoon, and Birman (2002) examined the effects of professional
learning activities on the instruction of 207 teachers, in 30 schools, in 10 districts across five states
over a three year time period. Specifically, the authors used three waves of survey data to document
teaching practice before and after a professional learning activity and examine the relationship
between changes in teaching practice and participation in the activity. Estimates from hierarchical
linear modeling (HLM) suggest extensive and sustained professional development focused on
specific instructional practices increased the likelihood teachers employed these practices in their
daily work. Based on their findings, the authors argue that change in teacher practice will occur if
teachers experience sustained professional development focused on the specific content or

18
instructional practices teachers must enact. These results confirm findings from Garet et al. (2001)
who also found the duration of a professional development activity as having a significant, positive
effect on self-reported increases in knowledge and skill.
Addressing A Problem of Practice. Limiting the scope of a coaching conversation to a single
instructional practice or rubric competency provides the opportunity to engage a specific problem of
practice. Specifically, focus offers teachers the opportunity to deliberately address a problem of
practice, which is important for three reasons. First, conversations about problems’ of practice help
develop teachers’ capacities to manage the complex work of teaching (Lampert, 2003). Specifically,
addressing a problem of practice demands teachers learn to grapple with the inherent complexity of
teaching. Second, discussing a problem of practice challenges teachers to develop the orientation
and capacity to learn in and from their practice (Ball & Cohen, 1999). In particular, discussing
problems of practice requires teachers to inquire into their practice, thus presenting the opportunity
to analyze the situation, the moves, and the decisions made. Ball and Cohen (1999) argue it is the
unique combination of these three – situation, moves, and decisions – that facilitates the
development of professional learning. Finally, discussing problems of practice might stimulate
teachers’ instructional improvement. Addressing challenging or confusing experiences assists
teachers in reconceptualizing the problems they encountered (Horn & Little 2010). In doing so,
teachers are exposed to new ways of thinking that help build principles of practice. According to
Horn and Little (2010), this new way of thinking can facilitate teachers’ learning and stimulate
instructional improvement.
Moreover, prior research provides suggestive evidence that addressing a problem of practice
might facilitate instructional improvement. Allen et al.’s (2011) experimental study, described above,
could imply focusing coaching conversations around specific problems of practice might improve

19
teacher performance. Trained MTP-S observers selected clips of intervention teachers’ practice to
illustrate strengths and areas for growth in a limited number of the dimensions on the CLASS-S
rubric. Once intervention teachers had the opportunity to review their clips, they participated in a
20- to 30-minute phone conversation with MTP-S consultants to discuss specific ways they could
improve on the targeted CLASS-S rubric dimensions. Given the significantly greater instructional
improvement of MTP-S teachers as compared to non-MTP-S teachers, it is possible focusing
coaching on a problem of practice (e.g., areas for growth on rubric) influenced teachers’
instructional improvement.
Likewise, recent experimental evidence suggests pairing high-performing and low-
performing teachers together to address specific areas for growth improves teachers’ instruction and
student achievement. For example, Papay et al.’s (2016) randomized controlled trial study examined
the effects of pairing 90 “low performing” teachers, identified as those who had low evaluation
scores on one or more instructional domains, with 117 “high-performing” teachers, those who were
highly rated in any of the same instructional domain(s), to collectively work on the practice of
teaching. Results revealed students of low performing intervention teachers improved their reading
and math test scores, on average, 12 percent of a standard deviation greater than control teachers.
The authors concluded improvements were likely the results of low-performing intervention
teachers refining their skills in certain instructional domains that, in turn, improved student learning
and achievement. While Allen et al. (2011) and Papay et al. (2016) cannot isolate the effect of a clear
focus on problems of practice1, taken together they provide some additional support for the claim
1 Horn and Little’s (2010) conception of a problem of practice focuses more broadly on the instructional triangle and the relationship between teacher, student(s), and content. Moreover, Little (2012) also thinks about problems of practice in terms of the complex nature of teaching where teachers are balancing multiple problems at once. In contrast, this study focuses a problem of practice on discrete teaching skills from an observational rubric. While conceptually distinct, both articulations can help identify an area of focus for teachers to potentially address.

20
that one likely contribution of focus as a feature of coaching is that is creates opportunities for
teachers to address a problem of practice.
Finally, qualitative research on coach-teacher interactions also suggests focusing on a
problem of practice might enable opportunities for learning. In a study examining the conversational
moves used by two coaches in post-observation conferences, McQueen (2015) found the content of
the conversation influenced the types of moves that coaches used. Results suggest coaches used
different conversational moves when discussing a problem of practice as opposed to all other topics.
Specifically, during conversations about a problem of practice, coaches used certain conversational
moves known to promote opportunities for learning – reflective questioning and paraphrasing – at
greater rates compared to conversations unrelated to problems of practice. The author suggests a
promising approach to coaching is focusing on problems of practice in coaching conferences with
teachers.
Given that the extensive literature base on professional learning suggesting that choice and
focus demonstrate promise, this study integrates choice and focus into the context of a coaching
intervention and tests whether these two features demonstrate promise for improving instruction.
Thus, this study is, to my knowledge, the first to use an experimental design to provide pilot data on
whether coaching that includes choice and focus demonstrates promise.
Influences Behind Implementation of Coaching Content
While prior literature suggests two features of coaching – choice and focus – might have
promise for potential to improve teachers’ instruction, it does not specify exactly what influences
teachers’ incorporation of the content, including strategies or suggestions, of a conversation where
choice and focus are present. Understanding potential influences behind uptake and implementation

21
are particularly important because a critical factor for success of any intervention or initiative is the
extent to which the intervention or content is delivered or implemented as intended (Power et al.,
2005; Wong et al., 2017). In other words, if teachers do not implement the content (e.g., strategies or
suggestions) of coaching conversations, then it is plausible coaching will not improve teachers’
instruction. One influence prior literature suggests might matter is teachers’ responsiveness to
coaching because of its possible relationship to implementation of an intervention’s core
components or the content of coaching (Wanless et al., 2014; Wong et al., 2017). In particular, prior
research suggests teachers who are more responsive – commonly viewed as participants’
engagement, participation, or attentiveness during coaching or training – during professional
development, of which coaching is considered a form of, are more likely to incorporate strategies or
information offered during the professional development into their practice as compared to teachers
who were disengaged or non-responsive (Reinke et al, 2013). Moreover, professional growth will not
occur if a teacher is unwilling or unable to enact changes in her professional practice (Kraft &
Gilmour, 2016).
Teacher Responsiveness and Implementation. Some recent experimental research has
sought to determine if teacher responsiveness predicts implementation of a particular intervention’s
core components. Reinke et al. (2013) analyzed whether teachers’ trained in the Incredible Years
Teacher Classroom Management (IY TCM) program – a school wide intervention including 6 days
of group-based professional development for teachers working with students with disruptive
behavior problems – implemented the intervention as intended. Specifically, the authors randomly
assigned 34 elementary teachers from six urban schools to the IY TCM intervention and measured
the relationship between teachers’ responsiveness to IY TCM professional development – based on
professional development leaders ratings of teachers’ engagement during the session – and teachers’
22
use of practices (e.g., positive praise) discussed during the professional development. Ordinary least
squares (OLS) regression results revealed teachers’ responsiveness to the training session predicted
observed changes in teachers’ use of the intervention’s core components following the professional
development. For example, teachers who were more responsive to the second professional
development, which addressed providing students with attention and praise, offered 34 percent of a
standard deviation (p>0.05) more praise compared to those who were less responsive to the
professional development after controlling for baseline usage of positive praise and other teacher
covariates.
Other research suggests responsiveness also predicts implementation of non-classroom
management related interventions. In a secondary study of 126 fourth and fifth grade teachers
assigned to treatment conditions of a larger randomized control trial, Wanless, Rimm-Kaufman,
Abry, Larsen, and Patton (2014) examined the relationship between responsiveness an uptake of the
Responsive Classroom (RC) approach. The authors found intervention teachers’ engagement in the
one-week RC training – as measured by trainers’ ratings of teachers on an eight item instrument –
was positively associated with teachers’ uptake of the RC core components in respective classrooms.
Teacher Responsiveness and Student Outcomes. While Reinke et al. (2013) and Wanless
et al. (2014) addressed the relationship between responsiveness and uptake, other studies have
examined whether responsiveness influences student outcomes. In a study of 79 special education
teachers, Wong and colleagues (2017) examined the effect of the Collaborative Model for Promoting
Competence and Success (COMPASS) intervention on autistic students’ Individualized Education
Program (IEP) outcomes. Special education teachers assigned to the COMPASS intervention
condition (n=47) participated in five researcher led sessions, including an initial 3-hour consultation
with one of the co-developers of COMPASS and four additional 1-hour coaching sessions across

23
the school year. Following the initial consultation and subsequent coaching sessions, the co-
developers rated intervention teachers’ responsiveness to the intervention using a nine-item
Consultation/Coaching Impression Scale (CIS) that demonstrated a high level of internal
consistency across sessions. Results from a serial mediation analysis revealed teachers’
responsiveness during initial and ongoing consultation had significant indirect effects of student IEP
outcomes.
Despite offering suggestive evidence for a positive relationship between responsiveness and
implementation, the quantitative nature of these studies did not allow for identifying the practices
coaches or professional development trainers employed to facilitate teachers’ responsiveness to
coaching or professional learning. Thus, we know less about what coaches could do in coaching
conversations to improve the likelihood teachers implement the content discussed during coaching
conversations. Uncovering certain practices is particularly important because it may increase the
likelihood the content of the conversation is implemented as intended (Peterson, 2013). Given that
we know less about which coaching practices might facilitate responsiveness, my study addresses
this limitation by interviewing several first-year teachers to try and uncover what these coaching
practices might be. This is one of the first studies, to my knowledge, that seeks to uncover what
coaching practices influence teachers’ responsiveness and likelihood teachers implement the content
of coaching conversations.
Summary, Research Foci, and Contribution to the Literature
Existing literature provides evidence that coaching is associated with instructional improvement.
However, it does not yet provide a clear understanding about (1) features of coaching that
demonstrate promise, (2) whether different features of coaching demonstrate promise for improving

24
instruction more than others, or (3) different pedagogical coaching practices influencing teachers’
responsiveness to coaching.
This study, then, contributes to the literature on teacher coaching in a number of important
ways. First, I leverage a broad base of literature identifying two features of promising professional
learning opportunities that could be applied to the context of coaching. Specifically, I integrate choice
and focus into the development of a coaching intervention. In doing so, I provide some clarity to the
literature on different features of coaching that demonstrate promise. Second, I test whether choice
and focus when applied to the context of coaching, improve teachers’ instruction. This study is, to my
knowledge, one of the first to test whether certain features of coaching demonstrate promise for
improving teachers’ instruction. Finally, I investigate whether certain pedagogical coaching practices
might influence first-year teachers’ receptivity to coaching and implementation of the content
discussed, which has important implications for the practice of teacher coaching moving forward.
Conceptual Framework In this section, I draw on the literature previously discussed to develop a conceptual
framework for the professional development intervention used in this study. First, I explain the core
constructs that guide my conceptual framework. Then, I incorporate literature previously cited to
articulate a framework for why a professional development intervention comprised of choice and
focus demonstrates promise for improving teachers’ instruction.
Core Constructs of Conceptual Framework My conceptual framework for this study, illustrated in Figure 2.1, depicts a particular
professional development intervention and the underlying logic around why it might demonstrate
25
promise for improving classroom instruction. Before elaborating on the details of this framework, I
begin by defining five main constructs.
Instruction. Drawing on the conceptual framework established by Cohen, Raudenbush, and
Ball (2003), I operationalize instruction as the interaction of a teacher, students, and content within
the classroom context. Moreover, this particular operationalization captures the multifaceted nature
of classroom instruction, including teachers’ pedagogical practices, teacher-student interactions, and
student-content interactions, amongst others (Kraft et al., 2016). Additionally, incorporating a
multidimensional conceptualization of instruction is important because the observation instrument
used in this study, discussed in the third chapter, attempts to capture the different aspects of Cohen,
Raudenbush, and Ball’s (2003) conceptualization of instruction.
Coaching. Coaching develops specific knowledge and skills to improve teachers’ instruction
(Lofthouse, Leat, Towler, Hall, & Cumming, 2010) and increase student achievement (Desimone,
2009). Improved instruction is often viewed as the product of an instructional expert and teacher
engaging in a classroom observation and related post-observation conference (Vasquez & Reppen,
2007) to examine, alter, and construct new knowledge (Sanford & Hopper, 2000). Moreover, Kraft
et al. (2016) conceptualize the coaching process in the following way:
“(a) individualized – coaching sessions are one-on-one; (b) intensive – coaches and teachers interact at least every couple of weeks; (c) sustained – teachers receive coaching over an extended period of time; (d) context-specific – teachers are coached on their practices within the context of their own classroom; and (e) focused – coaches work with teachers to engage in deliberate practice of specific skills.” (Kraft et al, 2016, p. 8)
While Kraft et al. (2016) conceptualize coaching in a somewhat idealized fashion, their
conceptualization has several similarities to the coaching model used in this study. In particular,
coaching in the present study included one-to-one coaching conferences, occurred over an extended
period of time, and intended to focus on the practice of specific skills within the context of teachers’

26
classrooms. The only difference from the idealized coaching process was its intensity. Rather than
interacting at least every couple of weeks, teachers and coaches typically interacted bi-monthly. This
conceptualization is consistent with prior literature on coaching and with the perspectives of leaders
in the program with whom I partnered.
Figure 2.1: Coaching That Leads to Instructional Improvement
Choice. As conceptualized in this study, choice consists of teachers having control over the
content they receive coaching on. Specifically, teachers choose a single dimension or component of
an observational rubric they wish to receive coaching on. Therefore, choice initiates the process of
teachers receiving coaching on a single competency of an observational rubric.
Moreover, I chose to include observational rubric competencies, as opposed to selecting a
problem of practice, because prior research suggests a focus on competencies might yield a different,
and possibly a better quality, type of coaching. Specifically, observational rubrics establish a shared
vision of effective practice, thus allowing coaches and teachers to focus on practices or dimensions
that make a difference for students (Stuhlman, Hamre, Downer, & Pianta, 2014). A shared vision of
effective practice affords coaches the opportunity to focus on improvement in a targeted practice or

27
dimension that matters to instruction and achievement (Archer, Cantrell, Holtzman, Tocci, and
Wood, 2016). In contrast, teachers selecting a problem of practice absent of an observational rubric
might focus the coaching on practices that are not based on a conceptualization of effective practice.
Focus. In the context of this study, focus, which I also label as “focused coaching” at times,
refers to coaches and first-year teachers addressing a single competency in a post-observation
conference. This conceptualization is similar to Allen et al. (2011, 2015) articulation of narrowing
focus in the MTP-S program where coaches chose a specific element on the CLASS-S rubric to
address with each teacher. Similarly, all MATCH teacher coaches focusing on behavior management
in every coaching session during the second year of Blazar and Kraft’s (2014) study is another
relevant example of what focus might look like in practice.
Influential Coaching Practices. Grossman et al.’s (2009) conceptualized pedagogy and
professional practice as the “intellectual and technical activities” (p. 2059) a teacher educator
employs to assist novices preparing for professional practice. Thus, this study draws on this
conceptualization to define a coaching practice as any intellectual or technical activity a coach
employs to prepare and improve a first-year teacher’s professional practice. Moreover, drawing on
Reinke et al. (2013), influential refers to any practice, as previously defined, that enhances teachers’
engagement, participation, or attentiveness. Taken together, influential coaching practices refer to
any intellectual or technical activity that increases teachers’ engagement or participation in a post-
observation conference.
A Model of Coaching That Improves Instruction Prior literature suggests quality professional learning is influential in strengthening teachers’
knowledge, skill, and instruction (Cohen & Hill, 2000; Scher & O’Reilly, 2009). Thus, in this section

28
I discuss why a particular coaching model featuring choice and focus will likely yield a promising
coaching experience for beginning teachers. While I draw on literature previously discussed, this
section moves beyond rehashing why choice and focus warrant inclusion to focusing more broadly
on how the constituent parts of a particular coaching model interact to yield a promising learning
experience teachers.
My conceptual framework, illustrated in Figure 2.1, represents how coaching that integrates
choice and focus, when paired with certain influential coaching practices, and implemented with a
high degree of fidelity yields certain immediate (change in teachers’ knowledge and beliefs),
intermediate (change in instruction), and long-term outcomes (changes in students’ attitudes and
beliefs). As it relates to Figure 2.1, influential practices are depicted by the blue-dash rectangle in
Figure 2.1; however, since prior literature has not unearthed potential influential practices that might
enhance teachers’ receptivity to coaching, I purposely leave the blue-dashed rectangle blank, nor do
I elaborate on potential practices below, to imply that this study attends to this unaddressed area.
Additionally, training and ongoing support, which prior literature argues supports high levels of
fidelity, are depicted in the middle black rectangle. Moreover, the arrows pointing back from the
black rectangle to choice and focus imply what the content of the initial training and ongoing support
could address. Below I explore the left hand side of Figure 2.1 – choice, focus, and initial training
and ongoing support – to propose why this coaching model demonstrates promise for achieving
intended outcomes. I also discuss why choice and focus must work in tandem to maximize promise.
Choice. In my previous review of relevant literature, three prominent reasons emerged
across the literature indicating why choice demonstrates promise. First, choice provides teachers the
autonomy to self-direct the content of a learning experience (e.g., Merriam, 2001). Second, choice
allows teachers to actively participate in the analysis of their teaching and learning when selecting the

29
content to address (e.g., Garet et al., 2001). Third, choice allows teachers to leverage prior experience
to guide current and future learning experiences. Specifically, teachers can draw on prior experience
to select the appropriate content (e.g., Putnam & Borko, 2000) which, in turn, establishes a sense of
coherence between the content and teachers’ goals and experiences (e.g., Penuel et al., 2001).
Focus. Prior literature suggests two reasons why focus is likely a promising feature of
coaching. First, focus provides the opportunity to allocate sufficient time to acquire new knowledge
and skills (Desimone et al., 2002). Second, focus can provide opportunities for teachers to engage
problems of practice that support their learning (Allen et al., 2011).
Working In Tandem. Although choice and focus individually demonstrate promise, the
arrow connecting them in Figure 2.1 symbolizes my belief that they cannot occur in isolation of each
other. For example, asking a teacher to choose several instructional competencies to discuss might
increase her sense of empowerment and trust but will likely yield a conference that is broad in scope
and absent of specific and actionable feedback. On the other hand, focusing coaching on a single
competency without any input from the teacher might yield specific and actionable feedback but the
teacher might feel less inclined to take that feedback up. Thus, choice and focus must work in
tandem to maximize the potential impact of this intervention on teachers’ instruction.
Initial Training & Ongoing Support. Prior research on the implementation of
educational interventions suggests that initial trainings without any additional support are unlikely to
maximize and sustain implementation fidelity (Kretlow, Cooke, & Wood, 2012). Initial trainings may
increase a particular practice’s frequency of use, but will not yield high and stable levels of
implementation without additional support (DiGennaro, Martens, & Kleinmann, 2007; Kretlow,
Wood, and Cooke, 2011). Moreover, training and support around implementing any new practice
needs to account for the challenges encountered in an authentic environment (Elmore, 2006).
30
The literature suggests one way of improving intervention fidelity is by exposing participants
to individualized follow-up support after initial training (Wenz-Gross & Upshurt, 2012) or coaching
(Kretlow & Bartholomew, 2010; Stitcher, Lewis, Richter, Johnson, & Bradley, 2006). Therefore, the
development and implementation of an educational intervention should include both initial training
and some component of ongoing support for participants (Kretlow & Barthlomew, 2010; Wenz-
Gross & Upshurt, 2012).
Moreover, prior research suggests improving and sustaining a high level of intervention
fidelity is particularly important to achieving desired results. In their theoretical sequence showing
how features of professional development influence certain outcomes, Scher & O’Reilly (2009)
suggest professional development implemented with a high degree of fidelity will help facilitate
change in teacher knowledge, attitude, and beliefs. Thus, prior research provides strong evidence
that a professional development intervention needs to provide sufficient initial training and ongoing
support to improve accuracy of implementation and sustain a high level of implementation. Given
this, the arrows in Figure 2.1 stretching back from training and ongoing support to the intervention
core components – choice and focus –represent this study’s attempt to provide initial training and
ongoing support in an attempt to ensure a high level of fidelity for these two components.
Conceptual Framework Summary In this section, I elaborated on the conceptual framework that guides my study. This
framework suggests that a particular coaching model including two specific features – choice and
focus – working in tandem and implemented as intended have promise for enhancing teachers’
knowledge, skill, and instruction. In the next chapter I discuss my methodology to determine
whether the intervention demonstrates promise for achieving intended outcomes.

31
Chapter 3: Methodology
This chapter describes the methods used to collect data for this study and the analytic process
used to understand the data associated with each research question. I begin this chapter by
describing the setting and research design, including the randomization process and the intervention
and control conditions. Then, I discuss the sample, including the sample of all field instructors,
henceforth called coaches, and first year teachers in the program. Afterwards, I discuss each data
source associated with my research questions and how it was collected. Finally, I describe my
analytic strategy, including my process of developing measures associated with different research
questions and the analyses I used to derive my results. This study asks the following:
1. Were coaches trained in the intervention more likely to offer teachers’ choice and focused coaching as compared to coaches who received no training?
2. Compared to teachers whose coaches received no training, did teachers whose coaches received the training:
a. Have better observation ratings? b. Report feeling more prepared? c. Report better quality coaching?
3. What coaching practices influence first-year teachers’ receptivity to coaching and implementation of the coaching content? Why do these coaching practices matter?
Setting
This study took place during the 2015-2016 academic year and included coaches and
teachers from a two-year (four semester) interim certification program (ICP) for alternatively
certified teachers within a large public university in the Midwest. One hundred and fourteen enrolled
first- and second-year teachers were concurrently participating in an alternative certification program
(ACP), which required teachers to work full-time in an underserved urban K-12 school and make
adequate progress in the ICP. This study included the 46 first-year teachers enrolled in the ICP at

32
the beginning of the 2015-2016 academic year. I elaborate why I included only first-year teachers in
forthcoming paragraphs.
ICP Context
Figure 3.1 summarizes the pre-service and in-service training and support first-year teachers
received within the ICP context. For this particular study, pre-service refers to a five week period of
time (e.g., July-June, 2015), where ICP teachers learn to teach through coursework and student
teaching, but are not legally responsible for students. In contrast, in-service refers to a four-semester
period (e.g., Fall 2015-Winter 2017) where ICP teachers are instructionally and legally responsible
for students’ education. I discuss each dimension of pre-service and in-service training below.
Figure 3.1: ICP Teacher Training & Support
33
Pre-Service Training
Prior to enrolling in the ICP, each first-year teacher participated in the same five-week
summer training program administered by the ACP. Training included four weeks of student
teaching, supervision from ACP alumni and local mentor teachers, general content methods courses,
and varying amounts of content-specific methods instruction.
In-Service Training
The ICP included two core programmatic components: content seminars and field
instruction. Content seminars covered the knowledge and skills the ICP suspected beginning
teachers needed for success in a particular discipline. Field instruction, henceforth called coaching,
provided beginning teachers with ongoing classroom support from experienced content-based
educators. I elaborate on each component below. I conclude this section a description of the ICP
program team overseeing the content seminars and coaching.
Content Seminars. Content-specific instructors2 facilitated bi-weekly content seminars, each
lasting for three hours and occurring following the school day. The seminar curriculum covered five
modules focusing on important knowledge and skills for beginning teachers. Module one attended
to beginning teachers’ understanding of best practices for teaching and learning the discipline. In
module two, beginning teachers focused on planning for engaging and effective instruction. The
third module addressed strategies for delivering effective content instruction. Module four covered
motivating beginning teachers’ students to learn the discipline. Lastly, beginning teachers explored
the knowledge and skills needed to teach all children in module five, with a particular emphasis on
2 Five of the twelve seminar instructors also serve as coaches. Seminar instructors not serving as coaches are full-time
teachers or administrators.
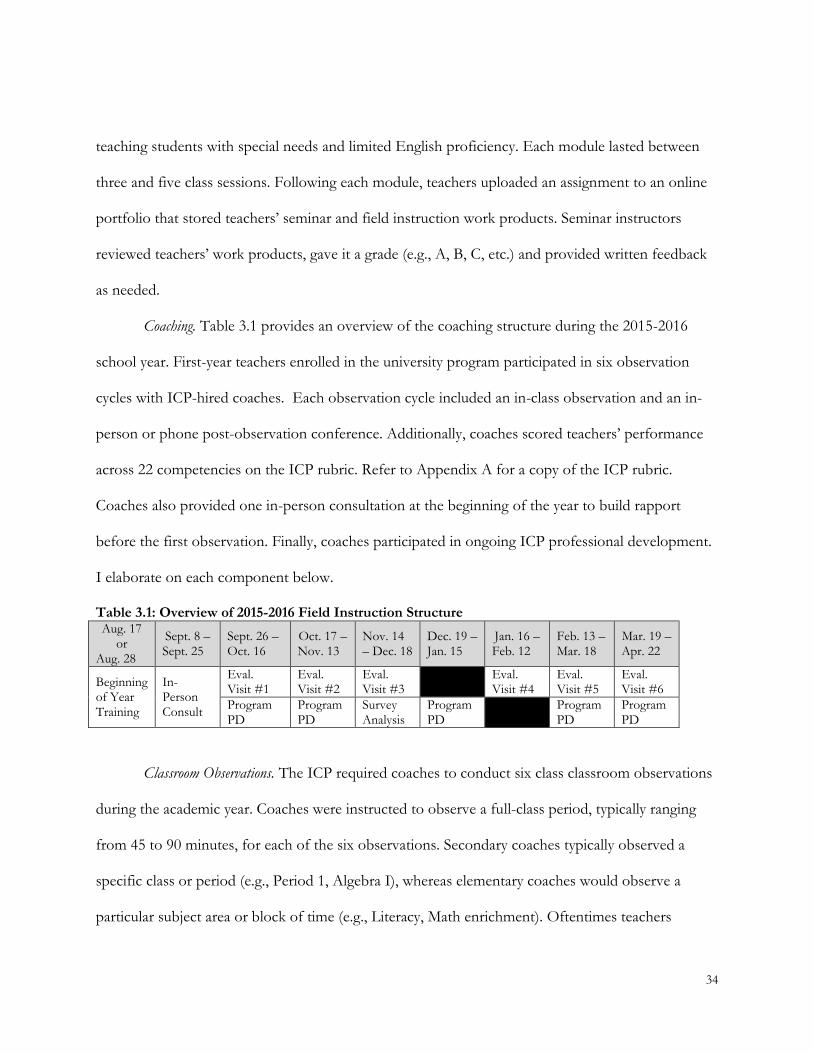
34
teaching students with special needs and limited English proficiency. Each module lasted between
three and five class sessions. Following each module, teachers uploaded an assignment to an online
portfolio that stored teachers’ seminar and field instruction work products. Seminar instructors
reviewed teachers’ work products, gave it a grade (e.g., A, B, C, etc.) and provided written feedback
as needed.
Coaching. Table 3.1 provides an overview of the coaching structure during the 2015-2016
school year. First-year teachers enrolled in the university program participated in six observation
cycles with ICP-hired coaches. Each observation cycle included an in-class observation and an in-
person or phone post-observation conference. Additionally, coaches scored teachers’ performance
across 22 competencies on the ICP rubric. Refer to Appendix A for a copy of the ICP rubric.
Coaches also provided one in-person consultation at the beginning of the year to build rapport
before the first observation. Finally, coaches participated in ongoing ICP professional development.
I elaborate on each component below.
Table 3.1: Overview of 2015-2016 Field Instruction Structure Aug. 17
or Aug. 28
Sept. 8 – Sept. 25
Sept. 26 – Oct. 16
Oct. 17 – Nov. 13
Nov. 14 – Dec. 18
Dec. 19 – Jan. 15
Jan. 16 – Feb. 12
Feb. 13 – Mar. 18
Mar. 19 – Apr. 22
Beginning of Year Training
In-Person Consult
Eval. Visit #1
Eval. Visit #2
Eval. Visit #3
Eval. Visit #4
Eval. Visit #5
Eval. Visit #6
Program PD
Program PD
Survey Analysis
Program PD
Program PD
Program PD
Classroom Observations. The ICP required coaches to conduct six class classroom observations
during the academic year. Coaches were instructed to observe a full-class period, typically ranging
from 45 to 90 minutes, for each of the six observations. Secondary coaches typically observed a
specific class or period (e.g., Period 1, Algebra I), whereas elementary coaches would observe a
particular subject area or block of time (e.g., Literacy, Math enrichment). Oftentimes teachers

35
selected the time period or subject block they wished the coach to observe. The ICP did not require
coaches to operate in a certain manner during the observation. However, in my observations of
seven ICP coaches, I saw them take field notes on teacher and student actions and collect evidence
around the 22 competencies on the ICP rubric. Additionally, some coaches took notes using a Word
document on their computer while others hand scripted notes.
Post-Observation Conferences. Post-observation conferences typically lasted between 25 and 45
minutes and occurred in-person after the observation or over the phone depending on coaches’ and
teachers’ schedules. The ICP required post-observation conferences to occur within 24-hours of an
observation. The ICP requested that coaches ask teachers to reflect on their lesson, offer opinions
around teachers’ strengths and weaknesses, and suggest how they might get scored across all
competencies. However, in my observations of ICP post-observation conferences unrelated to this
study, I observed variation in how the conference was structured and facilitated. For example, some
field instructors provided a running record of what they observed during the observation, whereas
other field instructors prompted teachers to reflect on the observed lesson and consider
improvements they might make moving forward.
Teacher Evaluation. An ICP administrator submitted all six teachers’ evaluations rubrics to
coaches’ online portfolio accounts before the start of the year. Coaches evaluated teachers’
performance using the evaluation rubric (see Appendix A) that corresponded to the visit number
(e.g., rubric one for observation one). The content of the rubric was the same for each visit.
Teachers’ evaluation included two core components: an evaluation score and written feedback.
Coaches scored teachers from 0 to 3 on 20 of 22-rubric competencies. Two of the competencies
(7A: Communication with Families and Community and 8C: Professional Development) were
optional to score because the ICP suspected coaches might not observe them during an observation.

36
The ICP averaged the 20 competencies to calculate an overall score for each observation.
Additionally, the ICP required coaches to provide written feedback on three (minimum) to six
(maximum) rubric competencies. The program provided coaches with a handout of exemplar
feedback, but did not require feedback to be structured in a specific manner. Moreover, coaches did
not receive much training, outside of the handouts, on how to draft effective written feedback.
Finally, the ICP did not provide any requirements for which competencies coaches’ feedback should
address.
Teacher Consults. The program expected coaches to complete one in-person consult outside of
the six observations. Coaches conducted the in-person consult at teachers’ orientation in early
September. The in-person consult was intended to build rapport between teachers and coaches
before the first observation. Coaches met with each of the teachers assigned to them for about
fifteen minutes to introduce themselves and discuss any successes or challenges the teacher
previously experienced in the classroom.
Coach Professional Development. The ICP required coaches to attend a 4-hour beginning of the
year orientation and a monthly professional development session. The coach coordinator planned
and designed each professional development. ICP professional development typically addressed one
of two topics. Either coaches learned about Teach Like A Champion (Lemov, 2011) strategies and
discussed how they might use them when conferencing with teachers or coaches learned about
different data gathering techniques (Dunne & Villani, 2007) and how they might use them during
observations. Finally, the professional development paid less attention to how coaches might engage
teachers in the conference process or how to best complete teachers

37
ICP Program Team
The ICP program team overseeing the entire program comprised seven individuals. The
team included a program director, assistant program director, coach coordinator, a teacher support
coordinator, and two graduate student research assistants. The team collectively constructed the ICP
curriculum, professional development for coaches and seminar instructors, and oversaw the daily
operation of the program. In addition to serving as the primary researcher on this study, I also
served on the program team as a graduate student research assistant (GSRA) overseeing the online
portfolio and seminar curriculum. This allowed me to contribute to the design of the survey,
including the questions on coaching experiences and preparedness to teach across domains of
practice. I discuss the potential problems of my dual role in the limitations section.
Study Context The Institute of Education Sciences (IES) uses a five goal structure – exploration,
development and innovation, efficacy and replication, effectiveness, and measurement – to classify
where a study falls along a continuum of research and what expected outcomes should be. The
present study falls within the “Development and Innovation” goal, otherwise known as goal two,
because I developed an intervention, implemented in an authentic education setting, and collected pilot
data examining potential for impact on particular outcomes (IES, 2016). Moreover, IES expects a
development and innovation study to yield at least three outcomes (Buckley & Doolittle, 2013).
First, a study must provide evidence the intervention can be implemented with fidelity in an
authentic education setting. Specifically, IES expects projects to assess whether the intervention is
delivered as intended using at least one measure of intervention fidelity. Second, developmental
studies must collect pilot regarding the intervention’s promise for generating intended outcomes.

38
Since IES does not expect development and innovation studies to yield statistically significant
results, promise is classified as whether the intervention changes targeted outcomes in the
appropriate direction (Buckley & Doolittle, 2013). Moreover, development and innovation studies
typically employ underpowered efficacy studies in order to “provide unbiased estimates of practical
consequence which can stand as evidence of promise while not statistically significant” (IES, 2016,
p. 50). Third, goal two studies should produce a fully developed version of the proposed
intervention. IES expects a fully developed intervention at the conclusion of this phase might result
in an Efficacy and Replication study to test whether the intervention actually improved participant
outcomes.
Finally, situating this study within the context of an IES goal two study serves two purposes.
First, presenting IES expectations for a developmental study provides rationale for the research
design, sample, and methodological approaches discussed in this chapter. Second, it helps frame how
I should interpret and discuss my results. I now turn to a discussion of how I designed this
development study and the methodological approaches I employed.
Research Design
This study, illustrated in Figure 3.2, is a randomized control trial (RCT). The ICP hired coaches
to support a specific content area. I used administrative data provided by the ICP to create content
groups, henceforth called strata, and placed each field instructor in the content specific strata they
supported. I randomly assigned coaches within each strata to either the intervention or control
condition.
School sites hired first year teachers to teach a specific content area. I assigned teachers to
corresponding strata using the same process discussed above. I then randomly selected teachers to

39
each condition and assigned them to a coach in the same strata and condition. I describe the
randomization process in more detail in a forthcoming section.
As previously indicated in Figure 3.1, all teachers and coaches participated in six observation
cycles. Intervention and control conditions shared the same characteristics except for the third and
fourth observation cycles. During these two cycles, depicted as the purple and orange rectangles in
Figure 3.2, I trained intervention coaches to review teachers’ first and second evaluation scores to
determine four rubric competencies each teacher needed to demonstrate improve in. I then trained
intervention coaches to provide teachers with the four competencies each teacher could improve in
and allow each teacher to choose one of the competencies to address. Additionally, I trained
intervention coaches to coach and provide feedback around the selected competency for the third
and fourth observation. Coaches in the control conditions continued observing and coaching
around all rubric competencies. I then tested whether intervention teachers received better
observation at the end of year (observation cycles #5 & #6) after controlling for beginning of year
scores (observation cycles #1 & #2) and other important teacher characteristics. I elaborate on each
component of my research design below.
Randomization Coaches. All coaches (n=22) during the 2015-2016 academic year supported the content they
had most experience teaching. For example, a coach with 20 years of teaching experience consisting
of 14 years of social studies and 6 years of mathematics teaching supported social studies. I first
grouped all coaches into the six strata (e.g., strata) they supported. I then sorted coaches
alphabetically within each strata, assigned a number in chronological order, and randomly assigned
to either intervention or control conditions using a random number generator. I assigned the first

40
coach selected within each strata to the control condition and the second coach to the intervention
condition. To ensure equal distribution of coaches across conditions, I repeated this process until I
assigned every coach within each strata to a condition. I assigned 10 coaches to the intervention
condition and 12 coaches to the control condition.
Figure 3.2: Research Design
Teachers. A district or school hired ICP first-year teachers (n=46) to a subject area based on
the content area they pursued for their interim certification. I employed the same process for
grouping and assigning teachers previously discussed in the coach section. For each teacher placed
in the intervention or control condition, I randomly assigned them to a coach in the same strata and
condition. For example, I assigned Teacher A who taught English/ELA and selected for the
intervention to Coach A hired to support English/ELA and selected for the intervention. I repeated
this process until I assigned every teacher to a coach in the same strata and condition. I assigned
each coach between one to three teachers depending on the number of teachers in each strata. Some

41
coaches only supported one teacher because they indicated to the ICP a preference to support a
single first-year teacher. While six coaches supported three teachers, the majority of coaches
supported two first year teachers. I assigned 25 and 21 teachers to the intervention and control
conditions respectively.
Intervention and Control Conditions
Treatment Contrast. Weiss, Bloom, and Brock (2014) argue a treatment contrast – difference in
services experienced under the intervention and counterfactual condition – is necessary for a
program effect to occur. Without a treatment contrast, you cannot detect an intervention effect
because program participants would have the same experience as they would if assigned to the
existing services. Given the importance of the treatment contrast, it is important to identify the
contrast between conditions as comprehensively as possible in order to explain what might cause
program effects. A treatment contrast consists of four dimensions: content, quantity, quality, and
conveyance. Content refers to the features or components of a program, whereas quantity refers to
the prevalence, intensity, and duration of services received. Finally, quality refers to how well the
program is received, while conveyance is how, when, and by whom the service is provided (Weiss,
Bloom, & Brock, 2014).
The treatment contrast in this particular study is subtle, but important. Specifically, the content
of coaching for teachers’ third and fourth observation cycles is the only dimension of the treatment
contrast designed to be different across conditions. This subtle treatment contrast stands in stark
contrast to prior experimental studies examining the effects of coaching versus no coaching (Allen et
al., 2011; Blazar & Kraft, 2015). In these prior studies, the treatment contrast had differences across
all four dimensions because the counterfactual received no existing services. For instance, providing

42
coaching immediately changes participants’ experience in a program when the control condition is
absent of the same service. The strength of the treatment contrast, as I discuss in the fourth and
fifth chapters, is important to consider when interpreting the findings of this study within the
context of prior literature. I now turn to a discussion of the single dimension of the treatment
contrast different across conditions: content.
Content Differences. All coaches participated in the same beginning of the year training and
completed the same program-administered beginning-of-year (BOY) survey. The BOY survey
collected coaches’ demographic information, including years of teaching experience, years of
coaching experience, years of experience in different school types (public, charter, private, etc.),
years with the ICP, highest degree attained, and whether coaches had interest in supporting first-year
teachers. Additionally, all coaches followed the same guidelines for observations one, two, five, and
six. As described above, these guidelines included observing a full class period, conducting a post-
observation conference, evaluating teacher performance on all ICP rubric competencies, providing a
minimum of three and maximum of six comments, and attending program delivered professional
development.
However, the services provided across conditions (content), as summarized in Table 3.2,
differed across seven components for visits three and four: professional development, competency
focus, teacher evaluation, pre-observation communication, observation process, conference process,
and post-conference process. Below I describe each of these components comprising the treatment
contrast.
Professional Development. All coaches received the same amount of professional development –
six 120-minute sessions – on the same monthly schedule. However, the intervention group received
a different kind of training for two of their six professional development sessions. Intervention

43
coaches attended a separate professional development in November and January. The November
professional development occurred in person and was held on the same day and time as the control
professional development. Eight of the ten (80 percent) intervention coaches attended the
November professional development. I provided a virtual professional development covering the
same content for one of the two-intervention coaches who was unable to attend the in-person
professional development. The one remaining coach did not reply to any communication
concerning attending a follow-up professional development. The ICP held all January professional
development virtually due to budgetary constraints. The virtual intervention professional
development occurred on the same day and time as the ICP virtual professional development for
control coaches. Eight of the ten (80 percent) intervention coaches attended the January
professional development. I also discussed the contents of the professional development with the
one of the two-intervention coaches who did not attend the virtual professional development. The
same coach who did not attend the November professional development was also absent from the
January professional development. I removed the coach who missed both professional development
and the teachers she supported from the sample. I further discuss this case in forthcoming pages.
I then designed the second intervention professional development to assist coaches in
strengthening their implementation of the intervention’s core components: choice and focus. I
intentionally focused on implementation given the call from prior research to focus additional
trainings or support on the intervention’s core component as a means of strengthening
implementation (Kretlow & Bartholomew, 2010). The second intervention professional
development addressed coaches’ experiences implementing the intervention thus far, making
connections between the third and fourth observation, and coaches’ next steps after the intervention
concluded. Specifically, I asked coaches to discuss with a partner their general thoughts and
44
impressions of focusing coaching around a single competency for each teacher. Afterwards, I had
each pair synthesize their discussion and share with the group. Teacher pairs commonly referenced
how removing the evaluation component afforded them the opportunity to discuss in more detail
how to address a particular competency as opposed to having to address a multitude of
competencies. Next, I prompted coaches to review a copy of each first-year teacher’s written
feedback from the third observation. Afterwards, I tasked coaches to consider, based on the written
feedback, what they might look for during the fourth observation to continue narrowing the focus
of the conference. Coaches then reengaged with their initial partner to discuss insights gleaned from
analyzing each teacher’s written feedback. Finally, I provided post-intervention next steps to coaches
at the completion of the professional development. Appendix C provides a detailed session design
for the second intervention professional development.
The two intervention professional developments differed from the control professional
developments in at least three meaningful ways. First, the content of the respective professional
development differed. During the first control professional development, coaches read about
different Teach Like A Champion (Lemov, 2011) strategies and discussed how they might
incorporate them into their practice. The first intervention professional development did not
consider or discuss Teach Like A Champion strategies or their applicability in post-observation
conferences. In the next control professional development, coaches learned about different data
gathering strategies (Dunne & Villani, 2007) and reflected on strategies they might use with teachers.
However, in the second control professional development, coaches did not discuss how these data
gathering techniques might apply to different rubric competencies. In contrast, the intervention
professional development allocated considerable time to discussing how to collect evidence around a
single competency. For example, intervention coaches in the first professional development

45
discussed how they might collect evidence and coach around behavior management (e.g.,
Competency 2A). Additionally, the intervention professional development did not discuss any of the
data gathering strategies discussed in the control professional development.
Table 3.2: Intervention & Control Conditions
ICP Component Intervention Condition Control Condition
Pro
fess
ion
al D
evel
op
men
t
Professional Development #1
120-Minute In-Person PD
Overview of Intervention.
Identified four competencies each teacher struggled with.
Discussed how to observe and coach teachers around a single competency.
120-Minute In-Person PD
Focused on Teach Like A Champion (Lemov, 2011) strategies and how to incorporate into conference process.
Professional Development #2
120-Minute Virtual PD
Reflected on experiences thus far with intervention.
Reviewed written feedback provided to each teacher.
Identified what they might look for in the fourth observation for each teacher.
120-Minute Virtual PD
Focused on data gathering strategies (Dunne & Villani, 2007) and how to incorporate into conference process.
Competency Focus Focused on one ICP rubric competency each teacher chose.
Focused on 20 of 22 ICP rubric competencies.
Teacher Evaluation Coaches withheld evaluation scores for Visits #3 & #4
Evaluated teachers on 20 of 22 ICP rubric competencies for Visits 3 & #4
Pre-Observation Communication
Coaches provided list of four competencies to potentially focus on.
Teachers chose one of the four competencies to address.
Determine date and time of observation and conference.
Determine date and time of observation and conference.
Observation Process Collect evidence on the competency the teacher chose.
No requirements around what to collect evidence or focus on.
Conference Process Focus on single competency teacher chose.
No requirements around how to facilitate conference.
No requirements around what to focus on.
No requirements around how to facilitate conference.
Post-Conference Process
Provide written feedback for the competency each teacher chose.
Provide written feedback for 3 to 6 competencies.

46
Second, neither control professional development reviewed or analyzed any evidence from
previous observations to consider how they might support teachers in future observations. In both
intervention professional developments, coaches used teachers’ observation scores and written
feedback to inform their practice. Specifically, intervention coaches analyzed teachers’ first and
second observation scores to identify four potential competencies to address with each teacher.
Additionally, intervention coaches reviewed teachers’ written feedback to consider what evidence
they might collect in the fourth observation.
Finally, the facilitator for the control professional development did not incorporate research
on professional development into the session design. In contrast, the intervention professional
development’s mode of delivery included three of Desimone’s (2009) five components of effective
professional development: active learning, duration, and collective participation. In particular,
intervention coaches analyzed teachers’ observation scores and reviewed written feedback (active
participation), had ample time to discuss how teachers might observe and coach around a single
competency (duration), and engaged in learning with other members of the intervention condition
(collective participation).
Competency Focus. As described above, each intervention teacher chose one of four
competencies to receive coaching on across the third and fourth observation cycles. Table 3.3
indicates the distribution of rubric competencies intervention teachers chose prior to the third
observation. Approximately 36 percent of intervention teachers chose to address behavior
management (Competency 2A). The remaining 64 percent of teachers were somewhat evenly
distributed amongst nine other competencies selected.

47
Control coaches continued to focus their observations, post-observation conferences,
evaluative scores, and written feedback on 20 of the 22 rubric competencies. The program left it to
the discretion of each control coach to identify the rubric competencies they wanted to discuss with
each teacher. Therefore, the competencies addressed in the third and fourth post-observation
conferences and affiliated written feedback varied by teacher and coach.
Table 3.3: Distribution of Selected Rubric Competencies*
Competency Description # of Teachers % of Group
1C Preparation To Teach 1 0.045
1D Lesson Structure 3 0.136
2A Behavior Management 8 0.364
2B Physical Space 1 0.045
2C Norms, Routines, Procedures 1 0.045
2E Student Engagement 1 0.045
3A Positive Interpersonal Relationships 1 0.045
5A Modified Instruction 1 0.045
5B Scaffolded Instruction 2 0.091
6A Multiple Forms of Assessment 3 0.136
*22 of the 25 teachers randomized to the intervention condition selected a competency to focus on. The three teachers who did not select a competency were assigned to the one intervention instructor who did not show up to the first and second intervention professional development. I discuss this more in my attrition analysis below.
Teacher Evaluation. Intervention coaches withheld evaluating teachers during the third and
fourth observations. I made this decision based on prior research suggesting the need to consider
the procedures, methods, and activities that enable implementation of the intervention’s core
components, otherwise referred to as implementation fidelity (Hulleman, Rimm-Kaufman, & Arby,
2013, Mendive et al., 2015). I suspected if intervention coaches still evaluated teachers, they would
not be able to devote the majority of time, evidence collection, and focus around a single
competency. Rather, intervention coaches might feel the need to collect evidence around multiple
competencies in order to accurately evaluate teachers’ performance. Moreover, intervention coaches
might feel the need to address multiple competencies in the post-observation conferences to justify

48
how they might evaluate teachers. Thus, I intentionally removed the evaluation component because
I assumed this enabled coaches to focus on a single competency, both in the observation and post-
observation conference. Control coaches continued to provide first-year teachers with evaluation
scores for the third and fourth observations. Thus, they provided teachers with a score of zero to
three across 20 of the 22 rubric competencies.
Pre-Observation Communication. Intervention coaches allowed first-year teachers to choose one
of four competencies to focus on for the third and fourth observation. See Appendix D for the
sample email I provided intervention coaches during the first intervention professional
development. In addition, coaches determined the date and time of the observation and post-
observation conference in the same email provided in Appendix D.
The ICP required control coaches to communicate in advance with teachers about the day
and time the observation and post-observation conference would occur. However, the ICP did not
have any specific requirements for how control coaches should communicate over email.
Observation Process. I instructed intervention coaches to only collect evidence on the rubric
competency each teacher chose. Given that prior research suggests focused coaching and feedback
can benefit teacher practice (Grossman, 2015), I suspected focusing attention and evidence
collection around one competency might assist intervention coaches in developing more in-depth
hypotheses about what and how to improve instruction.
In contrast, the control coaches did not have any requirements for how they should observe
teachers’ lessons. Therefore, control coaches focused on as few or as many competencies deemed
necessary. However, based on observations of control teachers, for purposes unrelated to the
present study, I suspect control coaches might try and collect evidence on as many competencies as
possible since they evaluated teachers on 20 of the 22 competencies.

49
Conference Process. I informed intervention coaches to focus the majority of the post-
observation conference around the competency each teacher chose. Specifically, intervention
coaches should provide verbal feedback (e.g., evidence collected, opinion of performance) and
suggestions for improvement around a single competency. How the intervention coaches facilitated
the conference, however, was left to their discretion.
The ICP did not have any requirements for what coaches should discuss or how they should
facilitate a conference. A prior study of the same ICP revealed much variation in the competencies
discussed and the conversational moves used to facilitate the conference (McQueen, 2015). The
typical conference included teachers reflecting on the lesson, discussing what went well, what could
improve, and how to improve in the areas discussed.
Post-Observation Process. Given that intervention coaches focused the observation and
conference on a single competency, I also instructed intervention coaches to provide written
feedback, an ICP requirement, on the single competency each teacher chose. The content of the
feedback, such as communicating performance or providing suggestions – was left to the discretion
of each coach. In contrast, the ICP instructed control coaches to provide written feedback on a
minimum of three rubric competencies. The coach also had discretion over the content of the
feedback. Both intervention and control teachers uploaded written feedback to teachers’ online
portfolio.
Sample
Coach Characteristics
The ICP hired 25 coaches during the 2015-2016 school year. The program surveyed coaches
during the summer of 2015 to determine assignment preferences. The survey gauged coaches’

50
willingness to work with teachers previously assigned to their caseload, willingness to work with low-
performing second and third-year teachers, and willingness to work with first-year teachers. Three
coaches indicated they did not want first-year teachers assigned to their caseloads. Thus, the analytic
sample initially included 22 coaches who indicated a willingness to work with first-year teachers. I
randomly assigned 10 coaches to the intervention condition and 12 coaches to the control condition.
Table 3.4: Coach Characteristics At Randomization
Variables Intervention Control Difference p-value on Difference
Education Experience 28.10 27.50 0.6 0.92
Coaching Experience 12.70 13.00 -0.3 0.95 ICP Experience 2.30 2.83 -0.53 0.22 Female 0.90 0.83 0.07 0.67 Male 0.10 0.17 -0.07 0.67 African-American 0.60 0.58 0.02 0.94 White 0.40 0.42 -0.02 0.94 Bachelors Degree 0.10 0.00 0.1 0.26 Masters Degree 0.40 0.42 -0.02 0.94 Specialist Certificate 0.40 0.50 -0.1 0.65 PhD 0.10 0.08 0.02 0.85 K-Gr. 5 0.30 0.33 -0.03 0.87 Gr. 6–8 0.30 0.17 0.13 0.48 Gr. 9-12 0.30 0.42 -0.12 0.59 K-Gr. 8 0.10 0.08 0.02 0.89 Elementary 0.40 0.33 0.07 0.76 English/ELA 0.30 0.25 0.05 0.80 Mathematics 0.10 0.25 -0.15 0.39 Science 0.10 0.08 0.02 0.89 Public School 1.00 0.83 0.17 0.19 Charter School 0.00 0.08 -0.08 0.37 Non-ICP School 0.30 0.17 0.13 0.48 ICP School Experience 0.70 0.83 -0.13 0.48
F-statistic from Joint Test 0.80 p-value 0.67
n (coaches) 10 12
Note: A balance check was conducted to ensure no significant differences existed across conditions. I regressed the intervention variable on each coach covariate. Analyses for coach characteristics yielded no statistically significant differences at the 0.05-level across conditions. Results (See Appendix E) suggest random assignment of coaches was successful in yielding comparable groups.

51
In Table 3.4, I present descriptive statistics on participating coaches. On average, coaches
had approximately 27 years of education experience, including almost 13 years of coaching
experience. Eighty-five percent were female, 58-percent were Afircan-American, and 42-percent
were white. Eighty-seven percent held either a Master’s Degree or Specialist Certificate. Ninety-two
percent taught in public schools, with over three-quarters having taught in similar schools ICP
teachers worked in.
I regressed the intervention variable on each coach covariate and included covariates for the
strata (or block fixed effects) to check for balance across groups. I included covariates for the strata
(e.g., content area) because I randomized coaches within the different strata blocks. Analyses yielded
no statistically significant differences at the 0.05-level across the 24 covariates measured (See
Appendix E). Given how no statistically significant differences existed, I concluded randomization
produced comparable groups of coaches across conditions. Moreover, a joint-test of significance
fails to reject the null hypothesis that coach characteristics do not differ between treatment and
control groups (F=0.80, p=0.67).
Teacher Characteristics
Forty-six first-year teachers began the year enrolled in the ICP and eligible to participate in
my study. I assigned 25 teachers to 10 intervention coaches at the beginning of the year. In contrast,
I assigned 20 teachers to 12 control coaches. Table 3.5 provides basic descriptive statistics for
teachers in the full sample, the intervention condition, and the control condition.
Of the 46 randomly assigned teachers, approximately two-thirds were female, 57 percent
white, and 37 percent were African-American. Approximately 50 percent taught elementary, and 65
percent worked in charter schools. Fifty-five percent did not take any education courses in college,
52
and 63 percent had no teaching experience prior to pre-service training. Lastly, over 70 percent
wanted to teach between one and five years, while approximately 50 percent indicated wanting to
remain in education for over a decade, likely outside of classroom teaching.
I also regressed the intervention variable on each teacher covariate and included covariates
for the strata (or block fixed effects) to check for balance across groups. Analyses yielded one
statistically significant difference at the 0.05-level across 43 covariates measured (See Appendix F for
complete results) - significantly more likely teachers in the control group had taken no
undergraduate education courses (e.g., Ed. Cred.: None, p<0.05). Consequently, I controlled for
having taken no undergraduate education courses in the models comparing end of year evaluation
scores, amongst other covariates. Moreover, a joint-test of significance fails to reject the null
hypothesis that teacher characteristics do not differ between treatment and control groups (F=0.87,
p=0.63). Finally, randomization literature (What Works Clearninghouse, 2008) suggests having less
than five-percent of statistically significant variables produces comparable groups. Thus, I concluded
randomization yieled comparable groups across conditions.

53
Table 3.5: Teacher Characteristics At Randomization
Variables Intervention Control Difference p-value on Difference
Age 24 23.90 0.1 0.94 Visit 1 Eval. Score 1.30 1.45 -0.15 0.30 Visit 2 Eval. Score 1.54 1.62 -0.08 0.56 BOY Eval. Score 1.42 1.53 -0.11 0.40 Female 0.64 0.71 -0.07 0.60 Male 0.36 0.29 0.07 0.60 Asian 0.04 0.05 -0.01 0.90 African-American 0.36 0.38 -0.02 0.89 White 0.56 0.57 -0.01 0.94 K-Gr. 5 0.48 0.48 0 0.98 Gr. 6-8 0.20 0.24 -0.04 0.76 Gr. 9-12 0.32 0.29 0.03 0.81 Elementary 0.48 0.48 0 0.98 English/ELA 0.16 0.14 0.02 0.88 Math 0.12 0.14 -0.02 0.82 Science 0.12 0.19 -0.07 0.52 Social Studies 0.08 0.00 0.08 0.19 World Languages 0.04 0.05 -0.01 0.90 Charter 0.72 0.57 0.15 0.30 State Run School 0.20 0.24 -0.04 0.76 Public School 0.08 0.19 -0.11 0.28 Ed. Cred.: Non-Resp. 0.04 0.00 0.04 0.37 Ed. Cred.: None 0.40 0.71 -0.31 0.03* Ed. Cred.: 1-3 0.20 0.05 0.15 0.13 Ed. Cred.: 4-6 0.04 0.00 0.04 0.36 Ed. Cred.: 7-9 0.00 0.10 -0.1 0.12 Ed. Cred.: 10-12 0.04 0.00 0.04 0.37 Ed. Cred.: 13-15 0.04 0.00 0.04 0.37 Ed. Cred.: 16+ 0.24 0.14 0.1 0.42 Prev. Teach Exp.: No 0.60 0.67 -0.07 0.65 Prev. Teach Exp.: Yes 0.40 0.33 0.07 0.65 Ed. Pers.: 1-2 Yrs. 0.12 0.19 -0.07 0.52 Ed. Pers.: 3-5 Yrs. 0.32 0.19 0.13 0.33 Ed. Pers.: 6-10 Yrs. 0.08 0.00 0.08 0.19 Ed. Pers.: 11+ Yrs. 0.48 0.62 -0.14 0.36 Tch Pers.: 0 Yrs. 0.16 0.19 -0.03 0.79 Tch. Pers.: 1-2 Yrs. 0.24 0.19 0.05 0.69 Tch. Pers.: 3-5 Yrs. 0.32 0.38 -0.06 0.67 Tch. Pers.: 6-10 Yrs. 0.16 0.05 0.11 0.23 Tch Pers.: 11+ Yrs. 0.12 0.19 -0.07 0.52
F-statistic from Joint Test 0.87 p-value 0.63
n (teachers) 25 21

54
School Characteristics
Table 3.6 summarizes descriptive statistics for ICP teachers’ schools (n=27). I averaged
schools characteristics at the condition level. Across schools, the majority of students were Black (76
percent), Hispanic (14 percent) or White (9 percent) and eligible for free or reduced price lunch (82
percent). 10 percent of students received Special Education (SPED) services while 15 percent were
classified as limited English proficient (LEP). The majority of teachers were either Black (45
percent) or White (45 percent). Additionally, most teachers were female (72 percent) and had
evaluation ratings of either highly effective of effective (74 percent).
I also regressed the intervention indicator on each school covariate and included covariates
for the strata (or block fixed effects) to check for balance across groups. Thus, this analysis yielded
one statistically significant difference at the 0.05-level across 21 covariates measured (See Appendix
G). Schools in the control condition had, on average, larger student enrollments3 (p<0.01).
Moreover, a joint-test of significance fails to reject the null hypothesis that school characteristics do
not differ between treatment and control groups (F=2.14, p=0.11). Since less than 5-percent of
school characteristics were statistically significantly different, I concluded that randomization was
successful (What Works Clearinghouse, 2008).
3 I intended to control for enrollment in the models I ran with end of year evaluation scores amongst other covariates. However, but due to multicollinearity issues, I dropped enrollment from my main models. I discuss further in my discussion of measures.

55
Table 3.6: School Characteristics At Randomization
Variables Intervention Control Difference p-value on Difference
Enrollment 517.8 858.9 -341.1 0.01** % Black Students 0.67 0.77 -0.1 0.35 % Hispanic Students 0.19 0.11 0.08 0.33 % White Students 0.14 0.12 0.02 0.73 % Other Students 0.01 0.01 0 0.98 % Male Students 0.50 0.50 0 0.81 % Female Students 0.50 0.50 0 0.81 % Economic Disadvantaged 0.87 0.80 0.07 0.07~ % LEP 0.20 0.14 0.06 0.44 % SPED 0.09 0.09 0 0.71 % Attendance 0.88 0.89 -0.01 0.68 % Black Teachers 0.32 0.44 -0.12 0.15 % Hispanic Teachers 0.03 0.02 0.01 0.21 % White Teachers 0.59 0.49 0.1 0.23 % Other Teachers 0.05 0.05 0 0.96 % Male Teachers 0.26 0.28 -0.02 0.37 % Female Teachers 0.74 0.72 0.02 0.38
F-statistic from Joint Test 2.14 p-value 0.11
n(teachers) 25 21
Participant Attrition
The primary concern with participant attrition pertains to bias. If the type of treatment
participants leaving the study are steadily different than the control participants leaving in a manner
related to the outcomes of interest, then results will be biased such that differences in the outcomes
cannot be attributed solely to the intervention (What Works Clearinghouse, 2015) Thus, What Works
Clearinghouse (2015) recommends examining two kinds of attrition – overall and differential – to
determine if the number of participants leaving a study limits bias. Specifically, WWC suggests
examining the attrition for all participants (overall attrition) and between conditions (differential
attrition) to determine if the combination of overall and differential attrition infers bias. Additionally,
WWC uses two attrition standards – conservative or liberal – to determine if the combination of
56
overall and differential attrition is considered “low” or “high”. For this study, I employed
conservative standards because I suspected attrition is likely related to the intervention (What Works
Clearinghouse, 2015). For example, a teacher receiving poor quality coaching might feel less
supported and decide to resign from her teaching position as a result. A study with low attrition is
expected to have less bias and receives WWC’s highest rating of Meets WWC Group Design Standards
Without Reservations; in contrast, a study with high attrition does not receive the highest rating due to
the threat of possible bias and must show that after attrition, remaining participants across
conditions are similar on demographic characteristics at baseline. A study with high attrition, but
equivalent groups in the analytic sample receives a rating of Meet WWC Group Design Standards with
Reservations.
Coach Attrition
Table 3.7 displays the total number of coaches and teachers across conditions at different
points during 2015-2016 academic year. Following the second evaluation, I withdrew a control
coach from the study because her only first-year teacher resigned from the program (See Table 3.7,
Column 5). Additionally, one intervention coach did not attend the first intervention professional
development due to a family illness. This particular coach did not respond to my attempts to make
up the professional development. Because this coach observed and evaluated her teachers across
competencies in the third visit and was unaware of her status as an intervention participant, I made
the decision to remove her from the study (See Table 3.7, Column 4). Thus, at the end of the
intervention, nine coaches remained in the intervention condition (90-percent) as compared to
eleven control coaches (92-percent). Finally, Table 3.8 indicates coaches had nine-percent overall
attrition and 2 percent differential attrition. The WWC conservative attrition standard indicates this

57
particular combination of overall and differential attrition is considered “low”. A balance of
remaining coaches, using the same approach previously discussed, revealed no significant differences
across conditions existed at the p<0.05-level (See Appendix H).
Table 3.7: Teacher & Coach Attrition
Randomization Evaluation 1 Score
Evaluation 2 Score
Mid Year Survey
End-Of-Intervention
Time Sept., 2015 Sept.-Oct. Oct.-Nov. Nov.-Dec. Feb., 2016
Int. Teachers 25 25 25 22 21 Int. Coaches 10 10 10 9 9
Ctrl. Teachers 21 19 19 15 15 Ctrl. Coaches 12 12 12 11 11
Finally, I sought to understand whether attrition was a function of assignment to either
intervention or control conditions. Thus, I regressed coaches’ attrition status on assignment to the
intervention condition. I also included covariates for the strata (e.g., content area) because I
randomized coaches within the different strata blocks. As evidenced in Table 3.8, Column 4, the
difference in attrition of 0.02 between conditions was not significant (p<0.05), suggesting attrition
was not significantly related to condition.
Teacher Attrition
All 46 first-year teachers enrolled in the program were still teaching at the time of
randomization (Table 3.7, Column 2). Before the first evaluation period (Table 3.7, Column 3), a
control coach alerted the ICP program team a desire to support one less first-year teacher.
Consequently, the ICP assigned a member of the program team to support this one first-year
teacher. Since this request occurred after randomization, I did not include the member of the ICP
program to the control condition. Thus, I removed the teacher originally assigned to a control coach
from the analytic sample. Additionally, I removed one teacher from the control group before the

58
first evaluation period ended (Table 3.7, Column 3) because she resigned from her teaching position.
All remaining teachers continued in the program for both the first and second evaluation period
(Table 3.7, Column 3 & 4). In the time between the second evaluation period (Oct.-Nov.) and the
Mid-Year Survey window (Nov.-Dec.), four control teachers resigned from their positions (Table
3.7, Column 5). Additionally, the three teachers assigned to the intervention coach who did not
attend either intervention professional development were removed from the sample. Then, from
December 2015 to the end of the intervention window (February 2016), I removed one teacher
from the intervention condition because she resigned from her teaching position. Thus, at the end
of the intervention, 21 teachers remained in the intervention group (84 percent) compared to 15
control teachers (71 percent).
Table 3.8: Teacher & Coach Attrition Balance Check
Overall Attrition
Intervention Group Mean
Control Group Mean
Difference p-Value
Attrited Coaches 0.09 0.10 0.08 0.02 0.85
Attrited Teachers 0.22 0.16 0.29 0.13 0.24
Finally, Table 3.8 indicates teachers had 22-percent overall attrition and 13-percent differential
attrition. The WWC conservative attrition standard indicates this particular combination of overall
and differential attrition is considered “high”. While attrition is “high”, a balance check of remaining
teachers discussed, revealed no significant differences across conditions existed at the p<0.05-level
(See Appendix I). I also detected similar results across condition for school characteristics (See
Appendix J). Moreover, Table 3.8, Row 2, Column 5 indicates attrition was not a function of
assignment to either control or intervention conditions. Additionally, I employ multiple imputation
for missing data as a robustness check to determine if attrition biased estimated effects of the
intervention. I discuss this robustness check in Chapter 4.
59
Data Sources
I organized my data sources into two categories: ICP programmatic data and researcher
collected data. ICP programmatic data included all data sources the ICP required participants to
submit. The ICP required coaches to upload teachers’ written feedback and observation scores to
the online portfolio. Additionally, the ICP administered two programmatic surveys in November
and April to all teachers. Finally, I collected two additional data sources from teachers in the form of
a post-intervention survey and interviews. Table 3.9 provides an overview of the data sources used
in this study, which I describe in more detail below.
ICP Programmatic Data. Written Feedback. I analyzed all written feedback provided to
teachers after the third and fourth observation to test whether differences existed between
conditions. As an ICP program administrator, I had access to all coaches’ written feedback in
teachers’ online portfolio. I only downloaded written feedback of intervention and control teachers
who also completed a Post-Intervention Fidelity Survey (PIFS). I made this decision to ensure I only
included teachers with complete data – written feedback and PIFS – in my analytic sample. Thus, I
downloaded 56 copies of written feedback, equating to two written feedback transcripts for 28
teachers. Of the 28 teachers with complete written feedback, I compiled 16 from the intervention
condition and 12 from the control condition. I uploaded all copies of the written feedback into
Microsoft Word. I then developed and applied a series of codes to all copies of written feedback and
entered code counts into Microsoft Excel. I then uploaded the Microsoft Excel file into STATA to
do a quantitative analysis of code counts. I discuss my analysis of written feedback in further detail
in forthcoming sections.
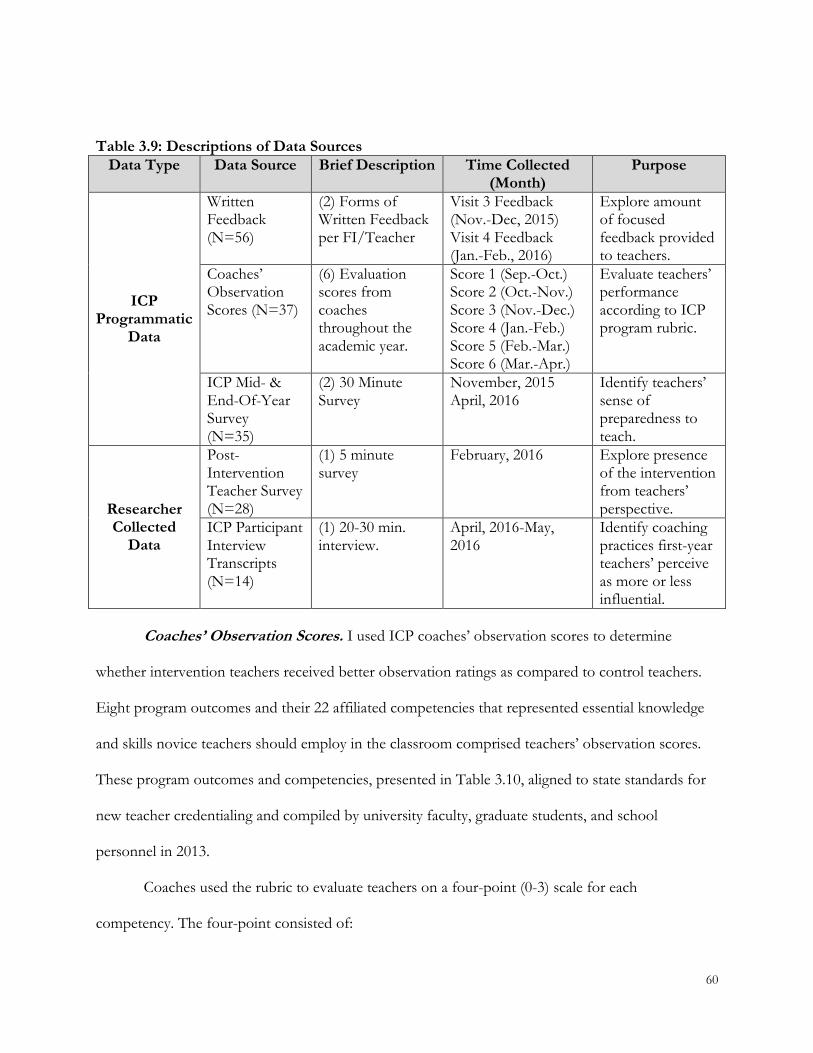
60
Table 3.9: Descriptions of Data Sources
Data Type Data Source Brief Description Time Collected (Month)
Purpose
ICP Programmatic
Data
Written Feedback (N=56)
(2) Forms of Written Feedback per FI/Teacher
Visit 3 Feedback (Nov.-Dec, 2015) Visit 4 Feedback (Jan.-Feb., 2016)
Explore amount of focused feedback provided to teachers.
Coaches’ Observation Scores (N=37)
(6) Evaluation scores from coaches throughout the academic year.
Score 1 (Sep.-Oct.) Score 2 (Oct.-Nov.) Score 3 (Nov.-Dec.) Score 4 (Jan.-Feb.) Score 5 (Feb.-Mar.) Score 6 (Mar.-Apr.)
Evaluate teachers’ performance according to ICP program rubric.
ICP Mid- & End-Of-Year Survey (N=35)
(2) 30 Minute Survey
November, 2015 April, 2016
Identify teachers’ sense of preparedness to teach.
Researcher Collected
Data
Post-Intervention Teacher Survey (N=28)
(1) 5 minute survey
February, 2016 Explore presence of the intervention from teachers’ perspective.
ICP Participant Interview Transcripts (N=14)
(1) 20-30 min. interview.
April, 2016-May, 2016
Identify coaching practices first-year teachers’ perceive as more or less influential.
Coaches’ Observation Scores. I used ICP coaches’ observation scores to determine
whether intervention teachers received better observation ratings as compared to control teachers.
Eight program outcomes and their 22 affiliated competencies that represented essential knowledge
and skills novice teachers should employ in the classroom comprised teachers’ observation scores.
These program outcomes and competencies, presented in Table 3.10, aligned to state standards for
new teacher credentialing and compiled by university faculty, graduate students, and school
personnel in 2013.
Coaches used the rubric to evaluate teachers on a four-point (0-3) scale for each
competency. The four-point consisted of:

61
0: Insufficient: There is little to no evidence that the teacher is employing the practices associated with this outcome.
1: Beginning: The teacher is beginning to show evidence of incorporating the practices associated with this outcome into his/her instruction and/or records of practice. The observed practices are employed too ineffectively or inconsistently to successfully demonstrate the target outcome.
2: Developing: The teacher shows evidence of regularly incorporating the practices associated with the program outcome into his/her instruction and/or records of practice. The observed practices are employed somewhat effectively; however more skillful, deliberate execution is needed to successfully demonstrate the target outcome.
3: Embedded: There is evidence that the teacher routinely and skillfully incorporates the practices associated with this outcome into his/her instruction and/or records of practice.
Coaches used the above descriptions to collect evidence for each competency and make a
determination regarding the appropriate score. A teacher’s observation score represented the average
score of 20 competencies. The ICP made two of the competencies – 7A: Communicating with
Families and 8C: Professional Development –optional for coaches to score because these
competencies might not be directly observed in a classroom observation or conference. Refer to
Appendix A for the 2015-2016 ICP program rubric.
The evaluation rubric served two purposes. First, the rubric served as a tool to guide
coaches’ verbal and written feedback around improving teachers’ instruction. From this feedback –
in both the post-observation conference and written feedback provided in their online portfolio–
teachers learned about their strengths as an educator and areas of their practice in need of
improvement. Second, the rubric evaluated teacher performance. Given the ICPs standing as a
recommender for provisional certification with a Midwestern state, teachers’ observation scores
helped determine whether they received a recommendation for certification. Evaluation scores also
allowed for the ICP to identify teachers in need of additional assistance from coaches or program
staff.

62
Table 3.10: ICP Program Outcomes and Competencies
Field Instruction Rubric
Outcome 1: Plan and Prepare for Effective Instruction
1B Lesson Planning
1C Preparation to Teach
1D Lesson Structure
Outcome 2: Facilitate an Environment that Supports Student Engagement
2A Behavior Management
2B Physical Space
2C Norms, Routines, and Procedures
2D Active Facilitation
2E Student Engagement
Outcome 3: Build Rapport and Relationship with Students to Support Learning
3A Positive Interpersonal Relationships
3B Student Investment, Interest and Autonomy
Outcome 4: Use Disciplinary Literacy to Teach Content
4A Effective Reading & Interpretive Strategies
4B Academic Language
4C Disciplinary Resources
Outcome 5: Enact Instruction to Meet Student Needs
5A Modified Instruction
5B Scaffolded Instruction
Outcome 6: Assess Student
6A Multiple forms of Assessment
6B Criteria for Assessment
6C Data Tracking
Outcome 7: Relate and Communicate Effectively with Parents, Families, and Community
7A* Communication with Families and Community
Outcome 8: Reflect on Practice and Contribute Professionally to the Learning Community
8A Reflection on Lessons and Practice
8B Building Relationships
8C* Professional Development
ICP Mid- & End-of-Year Survey. The ICP program team created the mid- and end-of-
year survey to study teachers’ perceptions around types and quality of support received from
seminar and coaches. The ICP program team administered surveys following the conclusion of the
second (November, 2015) and sixth observation window (April, 2016) to all ICP teachers. The ICP
administered the survey electronically through teachers’ online portfolio.
63
The ICP program team created the mid- and end-of-year surveys to gather teachers’
perspectives around three primary areas: coaching experiences, seminar experiences, and
preparedness to teach across different domains of practice. Coaching questions addressed
experiences in post-observation conferences, types and helpfulness of feedback, and investment in
the field instruction process. Preparedness questions addressed managing the classroom, assessing
students, and adapting curriculum and instruction, amongst others. The ICP program team also
created several questions about teachers’ seminar experiences. Refer to Appendix K for the entire
mid- and end-of-year surveys.
My analyses focused on all questions about field instruction experiences and preparedness to
teach across different domains of practice. The program allowed me to include identical questions
on both surveys, allowing me to investigate changes in teachers’ responses from before and after the
intervention. Once I downloaded survey responses from teachers’ online portfolio, I transformed
them into STATA format for quantitative analyses. Out of a total of 37 teachers remaining in the
sample at the end of the intervention, 35 teachers completed both the mid- and end-of-year of
survey, resulting in a 95-percent response rate.
Researcher Collected Data. I collected two additional data sources from first-year ICP
teachers to better understand teachers’ experience with and exposure to the interventions’ core
components and teachers’ perceptions of influential coaching practices. Administering a teacher
survey immediately following the intervention allowed me to gather more detail and information
about teachers’ coaching experiences and perceptions of these experiences during their third and
fourth observation cycles (e.g., intervention window). Moreover, interviewing a subset of first-year
ICP teachers following their sixth observation provided information about coaching practices first-

64
year teachers felt influenced their receptivity to coaching. I provide a detailed description of each
researcher collected data source below.
Post-Intervention Teacher Survey. I created a Post-Intervention Fidelity Survey (PIFS) to
measure the presence of the interventions’ core components in teachers’ interactions with coaches
across conditions. I administered the PIFS in-person to first-year ICP teachers at most bi-weekly
seminar classes in February, 2016 (e.g., the end of the intervention window). I also electronically
administered the PIFS through teachers’ online portfolio to two seminar classes who canceled
seminar sessions in February due to inclement weather.
I created the PIFS to gather information on the presence of the intervention’s core
components – choice, focus, and conference quality – during first-year teachers’ third and fourth
observations. The first three survey questions used a 2-point scale (e.g., yes or no) to solicit
information about whether teachers were allowed to choose specific rubric competencies they
wanted to address. In contrast, the next 12 questions used a 4-point scale (e.g., “To what extent do
you agree/disagree with the following statement about your 3rd & 4th observation”, 1: Strongly
Disagree, 2: Disagree, 3: Agree, 4: Strongly Agree) to address focused coaching and conference
quality. Refer to Appendix L for the administered PIFS.
Of the 37 first year teachers enrolled in the program at the time of administration, 28
completed the PIFS for a 76 percent response rate. Of the 21 first-year teachers assigned to the
intervention condition, 16 completed the PIFS for a 76 percent response rate. Finally, of the 16 first-
year teachers assigned to the control condition, 12 completed the PIFS for a 75 percent response
rate.
ICP Participant Interview Transcripts. In order to gather information about teachers’
perceptions of influential coaching practices, I conducted a semi-structured interview with 13 first-

65
year teachers. I asked all first-year teachers on the end of year survey if they had interest in
participating in an interview about their coaching experiences. I also publicized that teachers would
receive monetary compensation, in the form of a gift card, if they participated in a recorded
interview.
Thirty-three of the thirty-seven (89 percent) first-year teachers indicated a willingness to
participate in an audio-recorded interview. I randomly selected participants from the 33 interested
parties by condition and content area, but the number of teachers responding to set up an interview
was low. Consequently, I made the decision to use a convenience sample to try and solicit more
participation than previously generated. Thus, I opened up the opportunity for any interested first-
year teacher who (a) indicated a willingness to participate in an interview and (b) I had not
previously contacted.
Thirteen teachers (39 percent) agreed to participate in an audio-recorded interview. Six
intervention teachers participated in an interview as compared to seven control teachers. I
conducted a series of t-tests to compare 13 participants against the 24 non-participants across all
coach, teacher, or school characteristics. Results revealed participating teachers did not significantly
differ on any demographic characteristics as compared to non-participating teachers. The interviews
occurred immediately following teachers’ final observation and conference in mid-April 2016. I
chose to conduct interviews following the final observation, as opposed to immediately after the
intervention, because I wanted teachers to have the entirety of their coaching experiences to draw
from in the interview.
I used a semi-structured interview protocol (see Appendix M) to learn more about teachers’
experiences with coaches’ observations and conferences, what coaching practices teachers’ perceived
influencing their responsiveness to coaching, and why these practices mattered. I chose a semi-

66
structured format to ensure all interviews focused on these common elements but also allow for
more open dialogue about other topics that emerge. Finally, I repeated the same questions across
interviews so I could compare responses within and between conditions.
I conducted a phone interview with each teacher, ranging in length from 15 minutes to 25
minutes. The average length of each interview was approximately 20 minutes. Interviews with
intervention and control teachers I previously observed with their respective coaches were slightly
longer, likely due to feeling more at ease speaking with me. I audio-recorded interviews and
transcribed verbatim.
Measures
In this section, I discuss the measures I constructed and used in my analysis of each research
question. I discuss the measures used by research question and then transition to a discussion of the
methods used to answer the questions guiding this study.
Were coaches trained in the intervention more likely to offer teachers’ choice and focus coaching as compared to coaches who received no training? This particular research questions addressed the extent to which participants implemented
the intervention as intended, otherwise known as intervention fidelity (IF) (Mendive et al., 2015).
Specifically, this question addressed the degree to which coaches implemented the teacher choice
and focused coaching. IF is a multidimensional construct consisting of at least five dimensions:
adherence, exposure or dosage, quality of implementation or delivery, participant responsiveness,
and differentiation (Century, Rudnick, & Freeman, 2010; Durlak, 2010, Hulleman et al., 2013;
Mendive et al., 2016; O’Donnell, 2008). Adherence is the extent to which participants’ implement
the intervention as designed, whereas dosage refers to the amount of participants’ exposure to the

67
intervention. Additionally, quality addresses how well the intervention was implemented. Finally,
responsiveness focuses on participants’ engagement in the intervention, while differentiation
concerns differences between intervention and control conditions (Hulleman et al., 2013).
I analyzed three dimensions of IF – adherence, dosage, and quality of implementation – to
answer this research question. Rather than address all five dimensions of intervention fidelity, I
focused on these three dimensions because I felt these measures could be measured better with the
available data sources. For this study, I adopted a widely accepted model of intervention fidelity
assessment (Hulleman et al., 2013; Nelson, Cordray, Hulleman, Darrow, & Sommer, 2012) to
evaluate whether coaches trained in the intervention used this type of coaching. The model included
the following components:
1. Specify core components; 2. Identify appropriate fidelity indicators; 3. Determine index validity (including reliability); 4. Combine indices where appropriate; 5. Link fidelity to outcomes where possible.
Below, I elaborate on the first four steps before discussing the fifth in a subsequent section.
Additionally, I discuss how each step was integrated into my study.
Step 1: Specifying Core Components
Measuring intervention fidelity begins with delineating the implementation drivers –
otherwise known as core components – that have a direct effect on the expected outcomes of the
intervention (Fixsen, Blasé, Naoom, & Wallce, 2009). Delineating the core components of an
intervention can then determine how best to measure different dimensions of fidelity. Table 3.11
presents an integrated conceptual (i.e., intervention’s theory of change) and operational (i.e.,
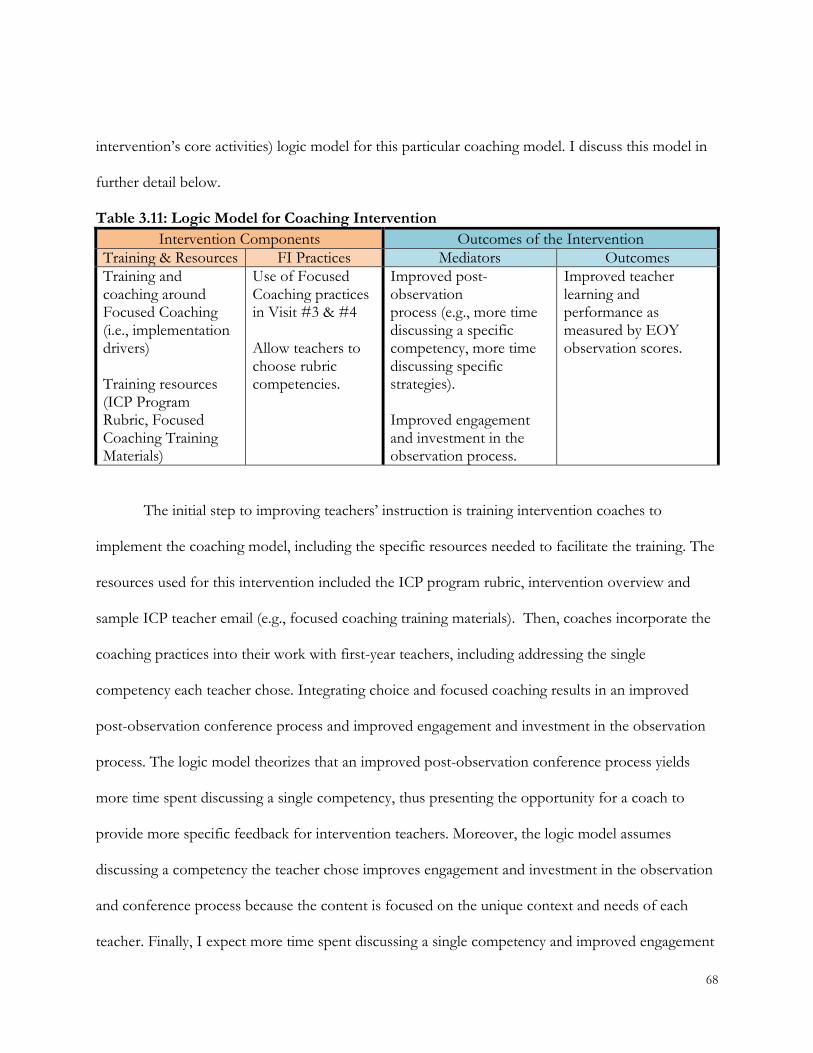
68
intervention’s core activities) logic model for this particular coaching model. I discuss this model in
further detail below.
Table 3.11: Logic Model for Coaching Intervention
Intervention Components Outcomes of the Intervention
Training & Resources FI Practices Mediators Outcomes
Training and coaching around Focused Coaching (i.e., implementation drivers) Training resources (ICP Program Rubric, Focused Coaching Training Materials)
Use of Focused Coaching practices in Visit #3 & #4 Allow teachers to choose rubric competencies.
Improved post-observation process (e.g., more time discussing a specific competency, more time discussing specific strategies). Improved engagement and investment in the observation process.
Improved teacher learning and performance as measured by EOY observation scores.
The initial step to improving teachers’ instruction is training intervention coaches to
implement the coaching model, including the specific resources needed to facilitate the training. The
resources used for this intervention included the ICP program rubric, intervention overview and
sample ICP teacher email (e.g., focused coaching training materials). Then, coaches incorporate the
coaching practices into their work with first-year teachers, including addressing the single
competency each teacher chose. Integrating choice and focused coaching results in an improved
post-observation conference process and improved engagement and investment in the observation
process. The logic model theorizes that an improved post-observation conference process yields
more time spent discussing a single competency, thus presenting the opportunity for a coach to
provide more specific feedback for intervention teachers. Moreover, the logic model assumes
discussing a competency the teacher chose improves engagement and investment in the observation
and conference process because the content is focused on the unique context and needs of each
teacher. Finally, I expect more time spent discussing a single competency and improved engagement

69
and investment in the process yields improved teacher knowledge and skill (e.g., learning), thus
leading to improved instruction and better classroom performance as measured by end of year
observation scores.
I then identified the core components of the intervention (e.g., choice, focus, quality) that
encompassed the integrated conceptual and operation logic model discussed above. Table 3.12
provides an overview of the specific actions – subcomponents – that capture that core components
of the intervention. For example, the subcomponents affiliated with focused coaching included
spending most of the conference discussing a single competency (e.g., duration) and providing
feedback and suggestions aligned to the competency teachers’ chose to address (e.g., focused
feedback and suggestions, alignment).
Step 2: Identifying Fidelity Indicators
I then identified different indicators I could potentially use to measure each of three core
components specified in Table 3.12. This is particularly important considering prior literature
recommends the intervention’s core components should include multiple dimensions of fidelity to
present a comprehensive assessment of implementation. Common methods of measuring fidelity
include participant surveys, direct observation of implementation, or participant interviews
(Hulleman et al., 2013). For the purposes of this study, I used a participant survey and written
feedback provided to each teacher to identify different measures of fidelity.

70
Table 3.12: Intervention core components and subcomponents
Core Components
Subcomponents Definitions
Competency Choice
Pre-Visit Choice Coach allows the teacher to choose one rubric competency on which to focus the third and fourth visits.
Choice & Alignment
What the teacher chooses as the focus for the third and fourth visits is a rubric competency on which the teacher believes he/she needs to improve.
Focused Coaching
Duration The amount of time the teacher and coach spend discussing a specific competency.
Focused Feedback
The coaches’ feedback (performance feedback, constructive criticism, evidence based statement, coach observations, etc.) addresses a single rubric competency.
Feedback Dosage
The amount of time feedback focuses on a single rubric competency.
Alignment The feedback and suggestions address the competency on which the teacher chose prior to the visit.
Focused Suggestions
The coaches’ suggestions address a single rubric competency.
Suggestions Dosage
The amount of time suggestions focus on a single rubric competency.
Improved Conference Quality
Helpfulness The extent to which teachers found the feedback useful and will likely incorporate into practice.
Empowerment The extent to which teachers felt empowered as professionals.
Learning The extent to which teachers felt they learned a great deal about their practice.
Table 3.13 presents the total number of indicators I measured for each individual
subcomponent and the total number of indicators per overarching core component. For example,
the core component of improved conference quality included three subcomponents: helpfulness,
empowerment, and learning. I then determined the number of indicators I could measure for each
subcomponent. In this instance, helpfulness included a single indicator, whereas empowerment
included two indicators. Four indicators were used to collectively measure improved conference
quality.
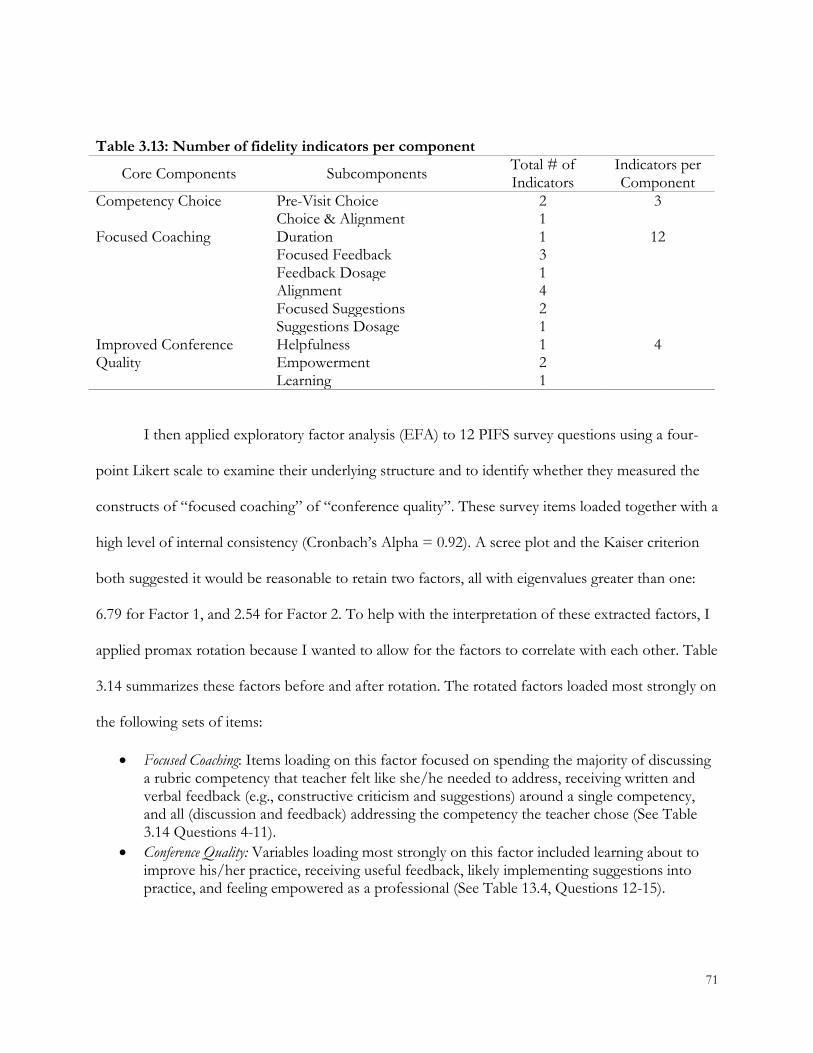
71
Table 3.13: Number of fidelity indicators per component
Core Components Subcomponents Total # of Indicators
Indicators per Component
Competency Choice Pre-Visit Choice 2 3 Choice & Alignment 1
Focused Coaching Duration 1 12 Focused Feedback 3 Feedback Dosage 1 Alignment 4 Focused Suggestions 2 Suggestions Dosage 1
Improved Conference Quality
Helpfulness 1 4 Empowerment 2 Learning 1
I then applied exploratory factor analysis (EFA) to 12 PIFS survey questions using a four-
point Likert scale to examine their underlying structure and to identify whether they measured the
constructs of “focused coaching” of “conference quality”. These survey items loaded together with a
high level of internal consistency (Cronbach’s Alpha = 0.92). A scree plot and the Kaiser criterion
both suggested it would be reasonable to retain two factors, all with eigenvalues greater than one:
6.79 for Factor 1, and 2.54 for Factor 2. To help with the interpretation of these extracted factors, I
applied promax rotation because I wanted to allow for the factors to correlate with each other. Table
3.14 summarizes these factors before and after rotation. The rotated factors loaded most strongly on
the following sets of items:
Focused Coaching: Items loading on this factor focused on spending the majority of discussing a rubric competency that teacher felt like she/he needed to address, receiving written and verbal feedback (e.g., constructive criticism and suggestions) around a single competency, and all (discussion and feedback) addressing the competency the teacher chose (See Table 3.14 Questions 4-11).
Conference Quality: Variables loading most strongly on this factor included learning about to improve his/her practice, receiving useful feedback, likely implementing suggestions into practice, and feeling empowered as a professional (See Table 13.4, Questions 12-15).

72
Results from the exploratory factor analysis suggested I could use the survey questions to
address two different core components of the intervention: focused coaching and conference
quality. Specifically, focused coaching items gauged the extent coaches’ enacted the intervention as
intended (adherence). Lastly, survey items addressing conference quality gauged how well coaches
implemented the intervention (implementation quality). I standardized factor scores for each teacher
for ease of interpretation.
Additionally, I analyzed teachers’ written feedback across the third and fourth observations
(e.g., the intervention window). Although I had complete written feedback from all participants, I
restricted my analysis to include only the 28 teachers who completed the PIFS and had complete
written feedback. I deliberately made this choice because I sought to measure intervention fidelity
only with participants who had complete data. Moreover, I reviewed two randomly selected
transcripts from each condition to determine what core components could be measured through an
analysis of written feedback. After reviewing the four transcripts, I concluded this data source
limited my ability to detect choice or conference quality for two reasons. First, I could not determine
if coaches’ written feedback addressed the competency each teacher chose. For intervention
teachers, I could match the competency they chose prior to the start of the intervention with the
competency addressed in the written feedback; however, I had no way of determining if control
coaches’ written feedback addressed a competency teachers selected prior to post-observation
conferences. Thus, I decided written feedback was not a valid data source for this core component
because I could not adequately measure choice in both conditions. Second, no criteria exists, to my
knowledge, to assess the quality of coaches’ written feedback. I considered determining quality using
my own criteria, but considered my opinion too subjective to accurately assess the quality of written
feedback. Thus, I used written feedback exclusively to measure indicators of focused coaching.

73
Table 3.14: Rotated and Un-Rotated Exploratory Factory Analysis Loadings Rotated (Promax) Un-Roated
Variable Factor 1 Factor 2 Factor 1 Factor 2
Q4. We (coach and myself) spent the majority of our debrief time discussing a single rubric competency.
0.88 -0.02 0.83 -0.26
Q5. We spent the majority of time discussing a rubric competency I felt I needed assistance with.
0.84 0.13 0.89 -0.15
Q6. The verbal feedback (e.g., constructive criticism, evidence from observation) I received addressed a single rubric competency.
0.48 0.52 0.81 0.25
Q7. The verbal feedback I received addressed the rubric competency I chose to address with my coach.
0.84 0.23 0.97 -0.07
Q8. The written feedback I received in [Online Portfolio Name] addressed a single rubric competency.
0.88 0.05 0.87 -0.22
Q9 The written feedback I received in [Online Portfolio Name] addressed the competency I chose to address with my coach.
0.91 0.07 0.92 -0.21
Q10. The suggestions I received in either my verbal or written feedback focused on how to improve in a specific rubric competency.
0.94 -0.26 0.72 -0.46
Q11. The suggestions I received in either my verbal or written feedback focused on how to improve in the specific rubric competency I chose to address.
0.99 -0.12 0.88 -0.38
Q12. I learned a great deal about how to improve my teaching as a result of my last two observations (i.e., Visit #3 & #4)
-0.10 0.96 0.54 0.74
Q13. I found the feedback I received from my coach useful.
0.04 0.94 0.67 0.68
Q14. I will put some of the ideas discussed in the debrief into practice.
-0.13 0.80 0.41 0.63
Q15. I felt empowered as a professional in my last two observations.
0.31 0.50 0.64 0.28
Of the 12 focused coaching indicators presented in Table 3.13, I derived four from my
analysis of written feedback. These included the number of competencies addressed in the feedback,
number of competencies with suggestions provided, amount of feedback provided per competency,
and amount of suggestions provided per competency.
74
Steps 3 and 4: Determining Index Validity and Reliability
Next, I sought to determine how best to combine items across different data sources (e.g.,
teacher survey and written feedback) and dimensions of fidelity. Following the suggestions of
Hulleman et al. (2013), I combined fidelity indicators across data sources for each core component.
Prior research recommends adopting this approach because creating indices by core component
helps identify components of the intervention that were more or less difficult to implement.
Additionally, this approach allows for the examination of construct validity of the intervention’s core
components rather than providing an overall fidelity indicator (Abry et al., 2012).
Table 3.15 depicts my process of combining fidelity indicators across two different data
sources. Specifically, this table presents the number of indicators from the different data sources, the
dimension of fidelity to which items align, and their affiliated core components. Each core
component of the coaching intervention was further delineated into respective subcomponents. For
example, focused coaching included six subcomponents – duration, focused feedback, feedback
dosage, alignment, focused suggestions, and suggestions dosage – measuring two different
dimensions of fidelity (e.g., adherence and dosage). Moreover, I considered providing focused
suggestions, a subcomponent of focused coaching (e.g., subcomponent five), an indicator of
adherence because I expected coaches to provide suggestions around the specific competency
addressed. In contrast, I classified the amount of focused feedback provided (e.g., feedback
addressing a single competency) as an indicator of dosage because the amount of feedback could
quantify teachers’ exposure to the intervention.
As Table 3.15 indicates, not all core components had the same amount of items (e.g. four
items for conference quality compared to 24 for focused coaching). Hulleman et al. (2013) suggest
measures for each core component should include multiple dimensions of fidelity. However, some

75
core components (e.g., competency choice and conference quality) could only measure a single
fidelity component. For example, I felt adherence was the only fidelity component captured within
competency choice. Because I was only concerned about learning whether coaches offered choice
rather than “how much” choice teachers had (e.g., dosage) or “how well” coaches offered choice
(e.g., quality), adherence was the only applicable fidelity indicator. Additionally, certain core
components (e.g., conference quality) were teacher level outcomes and best captured using only a
single data source (e.g., teacher survey). I now turn to a more detailed presentation of data sources
presented in Table 3.15.
Table 3.15: Core Component Fidelity Indicators
Core Components Subcomponents Fidelity Components
Total # of Indicators Indicators Per Comp. PIFS C&W
WF
Competency Choice
Pre-Visit Choice Choice & Alignment
Adherence Adherence
2 1
0 0
3
Focused Coaching Duration Focused Feedback Feedback Dosage Alignment Focused Suggestions Suggestions Dosage
Adherence Adherence Dosage Adherence Adherence Dosage
1 2 0 4 1 0
0 1 1 0 1 1
12
Quality of Implementation
Teacher Learning Helpfulness Empowerment
Quality Quality Quality
1 2 1
0 0 0
4
To gauge intervention fidelity, I used a single observation measure (e.g., online portfolio
written feedback) and one teacher self-report (PIFS). Since these data sources used different types of
variables (e.g., binary, ordinal, and continuous) and scales (e.g., 4-point likert scale), I standardized
some items first. Each teacher had four separate standardized scores.
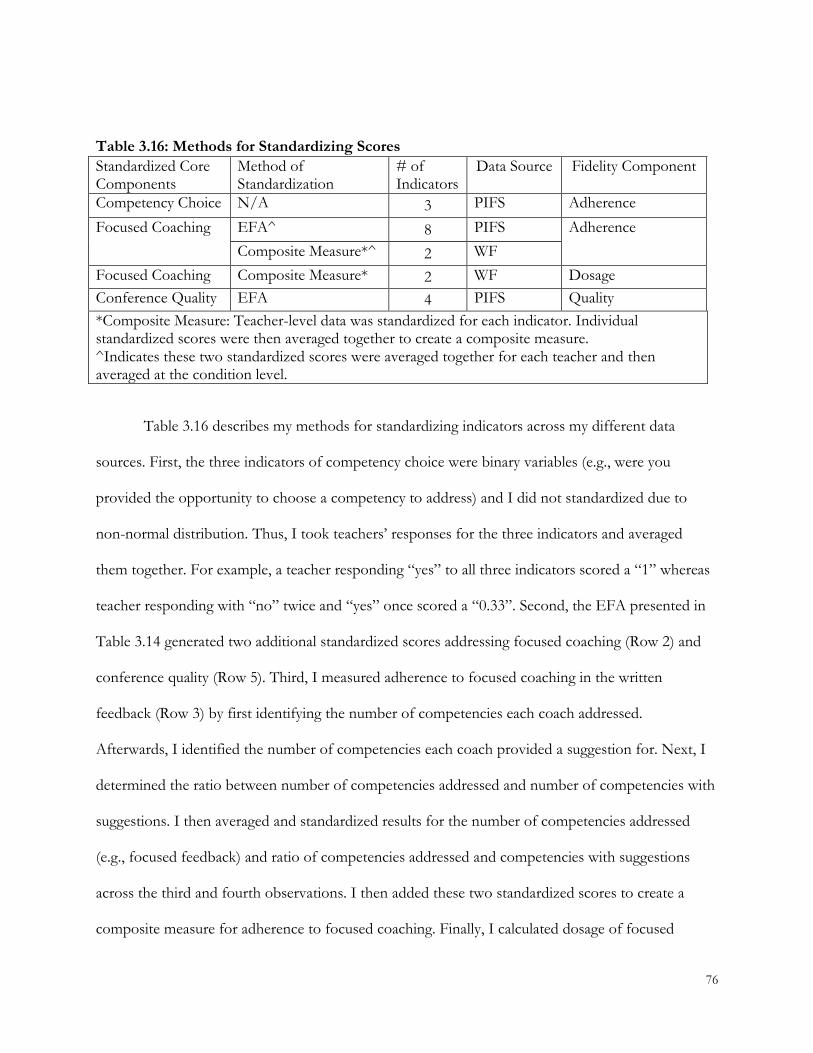
76
Table 3.16: Methods for Standardizing Scores
Standardized Core Components
Method of Standardization
# of Indicators
Data Source Fidelity Component
Competency Choice N/A 3 PIFS Adherence
Focused Coaching
EFA^ 8 PIFS Adherence Composite Measure*^ 2 WF
Focused Coaching Composite Measure* 2 WF Dosage
Conference Quality EFA 4 PIFS Quality
*Composite Measure: Teacher-level data was standardized for each indicator. Individual standardized scores were then averaged together to create a composite measure. ^Indicates these two standardized scores were averaged together for each teacher and then averaged at the condition level.
Table 3.16 describes my methods for standardizing indicators across my different data
sources. First, the three indicators of competency choice were binary variables (e.g., were you
provided the opportunity to choose a competency to address) and I did not standardized due to
non-normal distribution. Thus, I took teachers’ responses for the three indicators and averaged
them together. For example, a teacher responding “yes” to all three indicators scored a “1” whereas
teacher responding with “no” twice and “yes” once scored a “0.33”. Second, the EFA presented in
Table 3.14 generated two additional standardized scores addressing focused coaching (Row 2) and
conference quality (Row 5). Third, I measured adherence to focused coaching in the written
feedback (Row 3) by first identifying the number of competencies each coach addressed.
Afterwards, I identified the number of competencies each coach provided a suggestion for. Next, I
determined the ratio between number of competencies addressed and number of competencies with
suggestions. I then averaged and standardized results for the number of competencies addressed
(e.g., focused feedback) and ratio of competencies addressed and competencies with suggestions
across the third and fourth observations. I then added these two standardized scores to create a
composite measure for adherence to focused coaching. Finally, I calculated dosage of focused

77
feedback and focused suggestions (Row 4). I first calculated the number of words used and the
number of competencies addressed in the written feedback. Next, I divided the number of words
used by the number of competencies addressed to determine the number of words used per
competency. Then, I determined the number of words used for all suggestions provided. I coded
suggestions as any text providing feedback around how a teacher could improve in a particular
competency. For each suggestion provided, I identified where it began and concluded in the written
feedback. I then added all of the words across suggestions. Finally, I divided the total number of
words containing suggestions by the number of competencies addressed. In some cases, a coach
might address five competencies and provide suggestions for one. Since I was concerned about
identifying the amount of suggestive words for each competency, I divided by the number of
competencies addressed rather than the number of competencies containing suggestions. I chose
this approach because I speculated coaches focusing on fewer competencies would provide more
detailed suggestions (e.g., more words per competency) as opposed to coaches addressing multiple
competencies. I now turn to a discussion of how I combined these standardized into a composite
score for each core component.
As presented in Table 3.16, each teacher had either an average score or a standardized score
– derived from the PIFS and written feedback – for the respective fidelity construct and affiliated
intervention core component. I aggregated teachers’ average or standardized score for each fidelity
construct at the group level, resulting in the intervention and control conditions having average
scores. This method was consistent for adherence to competency choice, dosage of focused
coaching, and quality of implementation. In the one instance where teachers had two separate
standardized scores (e.g., adherence to focused coaching), I determined the mean of the two
standardized scores for each teacher and then aggregated teachers’ average standardized scores at the

78
group level. In forthcoming paragraphs I describe how I measured the achieved relative strength
(ARS) to determine the salience of the intervention’s core components across conditions.
Compared to teachers whose coaches received no training, did teachers whose coaches received the training have better observation ratings?
Teachers’ (n=36) observation scores are the focus of my analyses measuring whether
intervention teachers had better observation ratings. I used four observation scores in this study4 –
two prior to the intervention and two following the intervention. I also included scores for each
competency across all four observations scores in the same file and imported into STATA for
quantitative analysis. Next, I merged observation scores with teacher and school demographic
information. For each teacher, I averaged individual competencies for observation one and two and
then five and six at the program outcome level and standardized5. For example, I averaged the
teachers’ scores for competency 1B, 1C, and 1D and then standardized to get a standardized score
for Outcome 1. Afterwards, I added each outcome together to create a teachers’ standardized
evaluation score. This resulted in a beginning of the year observation score (visit one and two) and
end of year observations core (visit five and six) calculated on the same scale.
While coaches’ observation scores offered insight into teachers’ instruction, I describe in
more detail in Chapter 5 the important limitation that existed with these measures. I also introduced
a potential source of bias in intervention coaches’ final two observation scores because they were no
longer blind to conditions. It is possible coaches could have scored intervention teachers higher at
the end of the year to positively influence the results of this study.
4 Since the program requires first-year teachers to receive six scores, using the first and last two visits is the best option
to measure the effect of the intervention given the constraints of the program. Although prior research (Kane et al., 2013) suggests three observations should be used to determine teacher performance at a given point, averaging the first two and last two visits should still provide a good representation of teacher performance. 5 I made the decision to standardize after I averaged scores at the program outcome level because I noticed a more normal distribution as opposed to before.
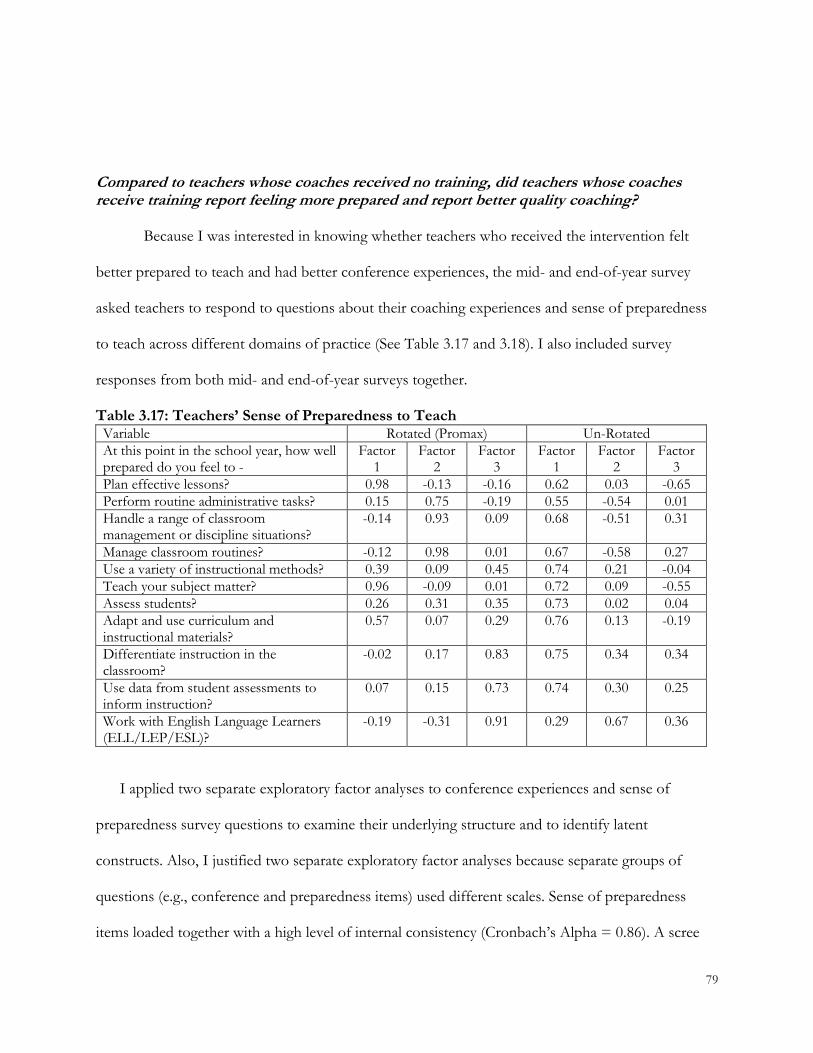
79
Compared to teachers whose coaches received no training, did teachers whose coaches receive training report feeling more prepared and report better quality coaching?
Because I was interested in knowing whether teachers who received the intervention felt
better prepared to teach and had better conference experiences, the mid- and end-of-year survey
asked teachers to respond to questions about their coaching experiences and sense of preparedness
to teach across different domains of practice (See Table 3.17 and 3.18). I also included survey
responses from both mid- and end-of-year surveys together.
Table 3.17: Teachers’ Sense of Preparedness to Teach Variable Rotated (Promax) Un-Rotated
At this point in the school year, how well prepared do you feel to -
Factor 1
Factor 2
Factor 3
Factor 1
Factor 2
Factor 3
Plan effective lessons? 0.98 -0.13 -0.16 0.62 0.03 -0.65
Perform routine administrative tasks? 0.15 0.75 -0.19 0.55 -0.54 0.01
Handle a range of classroom management or discipline situations?
-0.14 0.93 0.09 0.68 -0.51 0.31
Manage classroom routines? -0.12 0.98 0.01 0.67 -0.58 0.27
Use a variety of instructional methods? 0.39 0.09 0.45 0.74 0.21 -0.04
Teach your subject matter? 0.96 -0.09 0.01 0.72 0.09 -0.55
Assess students? 0.26 0.31 0.35 0.73 0.02 0.04
Adapt and use curriculum and instructional materials?
0.57 0.07 0.29 0.76 0.13 -0.19
Differentiate instruction in the classroom?
-0.02 0.17 0.83 0.75 0.34 0.34
Use data from student assessments to inform instruction?
0.07 0.15 0.73 0.74 0.30 0.25
Work with English Language Learners (ELL/LEP/ESL)?
-0.19 -0.31 0.91 0.29 0.67 0.36
I applied two separate exploratory factor analyses to conference experiences and sense of
preparedness survey questions to examine their underlying structure and to identify latent
constructs. Also, I justified two separate exploratory factor analyses because separate groups of
questions (e.g., conference and preparedness items) used different scales. Sense of preparedness
items loaded together with a high level of internal consistency (Cronbach’s Alpha = 0.86). A scree

80
plot and the Kaiser criterion both suggested I could retain three factors, all with eigenvalues greater
than one: 4.98 for Factor 1, 1.62 for Factor 2, and 1.24 for Factor 3. I also applied promax rotation
to these three factors. Table 3.17 summarizes sense of preparedness factors before and after
rotation. The three rotated factors loaded most strongly on the following sets of items:
Teaching Subject Matter Content: Variables loading most strongly on this factor addressed
teachers’ perceptions around effectively planning and delivering content-specific lessons (see
Table 3.17, column 2, rows 1, 6, and 8).
Managing The Classroom: Items loading on this factor addressed teachers’ perceived
preparedness to handle a range of classroom situations, manage classroom procedures, and
perform administrative routines (see Table 3.17, column 3, rows 2-4).
Teaching All Students: Variables loading most strongly on this factor addressed teachers’
capacity to deliver instruction in ways all students can understand (see Table 3.17, column 4,
rows 9-11).
Conference experience items also loaded together with a high level of internal consistency
(Cronbach’s Alpha = 0.92). A scree plot and the Kaiser criterion both suggested it would be
reasonable to retain three factors, all with eigenvalues greater than one: 8.89 for Factor 1, 3.54 for
Factor 2, and 1.08 for Factor 3. To help with the interpretation of these extracted factors, I applied
promax rotation because I wanted to allow for the factors to correlate with each other. Table 3.18
summarizes the factors before and after rotation. The three rotated factors loaded most strongly on
the following set of items:
Quality Coaching: Variables loading most strongly on this factor focused on post-observation
conferences offering a lively give and take, a thorough analysis of performance, feedback
aligned to teachers’ goals, and useful suggestions around instructional strategies (see Table
3.18, column 2, rows 1-6, 9, 11-13).
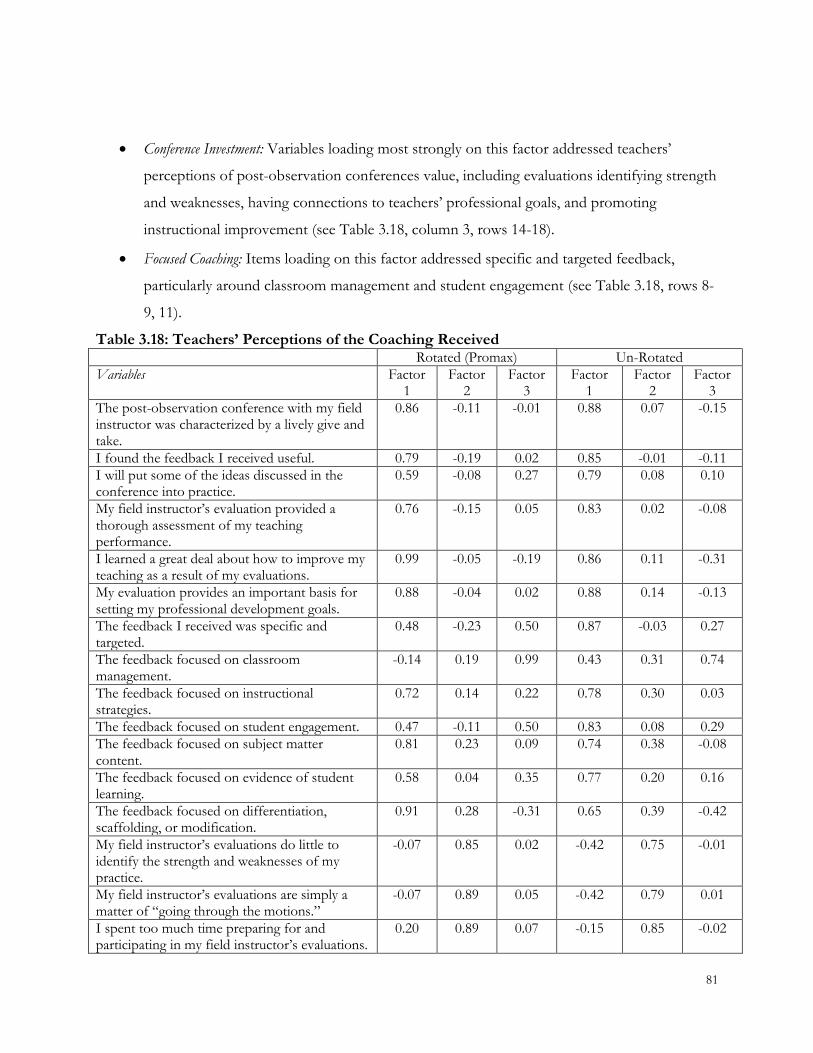
81
Conference Investment: Variables loading most strongly on this factor addressed teachers’
perceptions of post-observation conferences value, including evaluations identifying strength
and weaknesses, having connections to teachers’ professional goals, and promoting
instructional improvement (see Table 3.18, column 3, rows 14-18).
Focused Coaching: Items loading on this factor addressed specific and targeted feedback,
particularly around classroom management and student engagement (see Table 3.18, rows 8-
9, 11).
Table 3.18: Teachers’ Perceptions of the Coaching Received
Rotated (Promax) Un-Rotated
Variables Factor 1
Factor 2
Factor 3
Factor 1
Factor 2
Factor 3
The post-observation conference with my field instructor was characterized by a lively give and take.
0.86 -0.11 -0.01 0.88 0.07 -0.15
I found the feedback I received useful. 0.79 -0.19 0.02 0.85 -0.01 -0.11
I will put some of the ideas discussed in the conference into practice.
0.59 -0.08 0.27 0.79 0.08 0.10
My field instructor’s evaluation provided a thorough assessment of my teaching performance.
0.76 -0.15 0.05 0.83 0.02 -0.08
I learned a great deal about how to improve my teaching as a result of my evaluations.
0.99 -0.05 -0.19 0.86 0.11 -0.31
My evaluation provides an important basis for setting my professional development goals.
0.88 -0.04 0.02 0.88 0.14 -0.13
The feedback I received was specific and targeted.
0.48 -0.23 0.50 0.87 -0.03 0.27
The feedback focused on classroom management.
-0.14 0.19 0.99 0.43 0.31 0.74
The feedback focused on instructional strategies.
0.72 0.14 0.22 0.78 0.30 0.03
The feedback focused on student engagement. 0.47 -0.11 0.50 0.83 0.08 0.29
The feedback focused on subject matter content.
0.81 0.23 0.09 0.74 0.38 -0.08
The feedback focused on evidence of student learning.
0.58 0.04 0.35 0.77 0.20 0.16
The feedback focused on differentiation, scaffolding, or modification.
0.91 0.28 -0.31 0.65 0.39 -0.42
My field instructor’s evaluations do little to identify the strength and weaknesses of my practice.
-0.07 0.85 0.02 -0.42 0.75 -0.01
My field instructor’s evaluations are simply a matter of “going through the motions.”
-0.07 0.89 0.05 -0.42 0.79 0.01
I spent too much time preparing for and participating in my field instructor’s evaluations.
0.20 0.89 0.07 -0.15 0.85 -0.02

82
My field instructor’s evaluations are more about making decisions regarding my certification status than promoting my professional improvement.
-0.00 0.94 0.04 -0.39 0.85 -0.01
There is little connection between my field instructor’s evaluation and my goals for improvement.
-0.09 0.86 0.02 -0.45 0.76 -0.01
Analytic Strategy
In this section, I discus the analytic methods I used to answer my research questions; Figure
3.3 details the analytical process I engaged in to explore my data sources (rectangular outline). First, I
begin by explaining the quantitative analyses (oval outline) I conducted to answer my first through
fourth research questions (dashed outline). Then, I detail the qualitative analyses (oval outline) I
undertook to answer my fifth research question (dashed outline). Specifically, I detail my process of
creating and revising a coding rubric and applying these codes in order to find patterns in my
interview data. Afterwards, I discuss how I derived findings from the coded data.
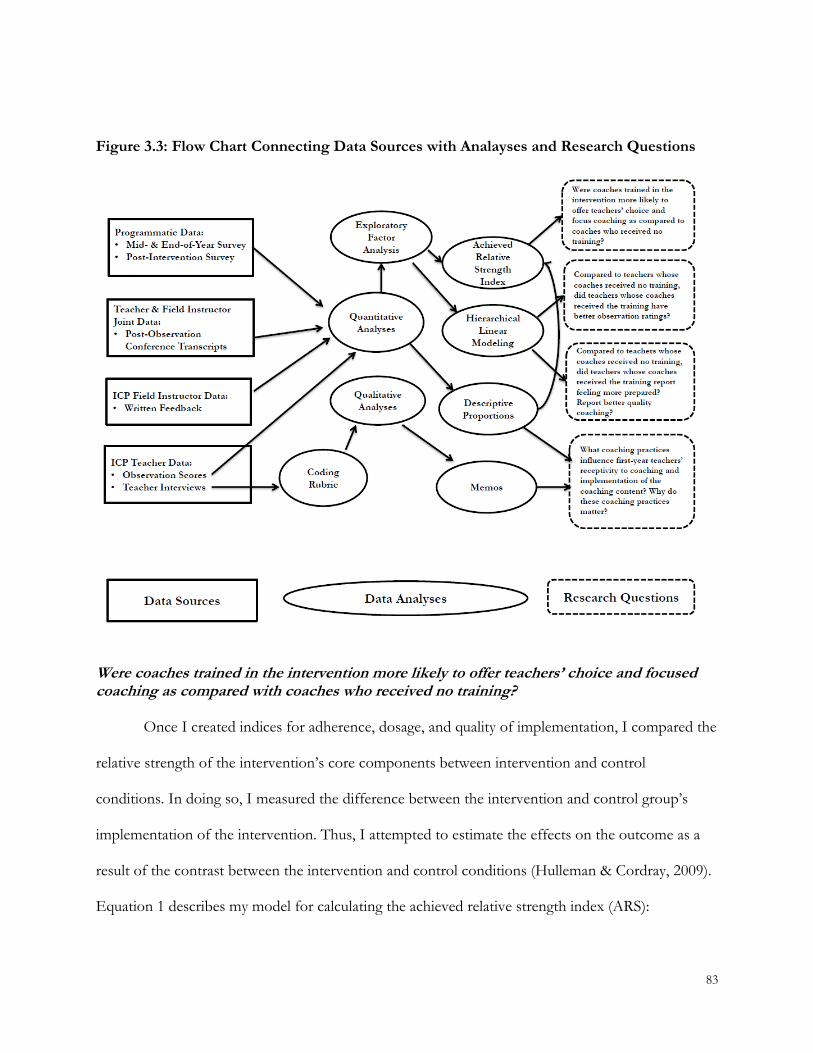
83
Figure 3.3: Flow Chart Connecting Data Sources with Analayses and Research Questions
Were coaches trained in the intervention more likely to offer teachers’ choice and focused coaching as compared with coaches who received no training? Once I created indices for adherence, dosage, and quality of implementation, I compared the
relative strength of the intervention’s core components between intervention and control
conditions. In doing so, I measured the difference between the intervention and control group’s
implementation of the intervention. Thus, I attempted to estimate the effects on the outcome as a
result of the contrast between the intervention and control conditions (Hulleman & Cordray, 2009).
Equation 1 describes my model for calculating the achieved relative strength index (ARS):

84
ARS = 𝑀𝑒𝑎𝑛𝑇𝑟𝑒𝑎𝑡𝑚𝑒𝑛𝑡−𝑀𝑒𝑎𝑛𝐶𝑜𝑛𝑡𝑟𝑜𝑙
√(n𝟏−1)S1
2+ (n𝟐−1)S22
n1+ n2−2
(1)
Here, I computed the ARS by standardizing the average difference across conditions for each core
component (Hulleman et al., 2013). Specifically, I subtracted mean scores for each condition and
then divided by the pooled standard deviation. The pooled standard deviation comprised the sample
size (n) and squared standard deviation (S2) for both intervention (n1, S12) and control (n2, S2
2)
conditions.
Compared to teachers whose coaches received no training, did teachers whose coaches received the training have better observation ratings?
To answer this question, I ran a series of ordinary least squares regression (OLS) models
estimating teachers’ end of year observation ratings as a function of receiving the coaching
intervention. Equation 2 describes my general model:
𝐸𝑂𝑌_𝑂𝑏𝑠𝑒𝑟𝑣𝑎𝑡𝑖𝑜𝑛𝑆𝑐𝑜𝑟𝑒𝑖𝑠𝑏
= 𝛽0 + 𝛽1𝐼𝑛𝑡𝑒𝑟𝑣𝑒𝑛𝑡𝑖𝑜𝑛_𝑃𝑎𝑟𝑡𝑖𝑐𝑖𝑝𝑎𝑡𝑖𝑜𝑛𝑖 + 𝛽2𝑋𝑖 + 𝛽2𝑍𝑠 + 𝜃𝑏 + 𝑒𝑖𝑠𝑏(2)
In this specification, the end of year observation scores for teacher i, in school s, in randomization
block b, is modeled as a function of a fixed intercept 𝛽0, a dummy variable for whether teachers
participated in the intervention 𝐼𝑛𝑡𝑒𝑟𝑣𝑒𝑛𝑡𝑖𝑜𝑛_ 𝑃𝑎𝑟𝑡𝑖𝑐𝑖𝑝𝑎𝑡𝑖𝑜𝑛𝑖 , a vector of teacher characteristics
𝑋𝑖, a vector of school characteristics 𝑍𝑠, an indicator variable for the subject area (randomization)
block 𝜃𝑏, and a random error term 𝑒𝑖𝑠𝑏. I also clustered standard errors at the coach level to account
for coaches possibly rating teachers differently. Summarized in Table 3.5, teacher characteristics
included beginning of the year observation scores, an indicator for gender, race/ethnicity,
preparation features (e.g., whether they received any college education credits or had prior teaching

85
experience), and prospective longevity in the profession (e.g., length teachers planned on remaining
in education). School characteristics, summarized in Table 3.6, included percent of African-
American students, percent of white students, and school type (charter/public school). Additionally,
I examined multicollinearity (vif) and found percent limited English proficient (LEP) students,
percent black teachers, percent white teachers, enrollment, and percent economically disadvantaged
students were collinear with other covariates. I removed these predictors from my final models.
Finally, as robustness checks, I employed two different approaches. First, I used an alternative
model specification – two level multilevel (MLM) regression models to account for the nesting of
teachers within coaches. Next, I employed multiple imputation to determine if teacher attrition
biased estimates of the intervention’s effect. Specifically, I imputed attrited teachers’ end of year
observation scores. Estimates for each robustness check are included in Appendix N and Appendix
O respectively. I discuss results from both robustness checks in the next chapter.
Compared to teachers whose coaches received no training, did teachers whose coaches received the training report feeling more prepared or report better quality coaching? I also ran a series of ordinary least squares regression (OLS) models estimating teachers’
preparedness and perceptions of conference quality as a function of receiving the coaching
intervention; Equation 3 describes my general model:
𝐸𝑂𝑌_𝐹𝑎𝑐𝑡𝑜𝑟𝑆𝑐𝑜𝑟𝑒𝑖𝑠𝑏
= 𝛽0 + 𝛽1𝐼𝑛𝑡𝑒𝑟𝑣𝑒𝑛𝑡𝑖𝑜𝑛_𝑃𝑎𝑟𝑡𝑖𝑐𝑖𝑝𝑎𝑡𝑖𝑜𝑛𝑖 + 𝛽2𝑋𝑖 + 𝛽2𝑍𝑠 + 𝜃𝑏 + 𝑒𝑖𝑠𝑏(3)
Here, end of year factor score (e.g., sense of preparedness to teach) for teacher i, in school s, in
randomization block b, is modeled as a function of a fixed intercept 𝛽0, a dummy variable for
whether teachers participated in the intervention 𝐼𝑛𝑡𝑒𝑟𝑣𝑒𝑛𝑡𝑖𝑜𝑛_ 𝑃𝑎𝑟𝑡𝑖𝑐𝑖𝑝𝑎𝑡𝑖𝑜𝑛𝑖 , a vector of

86
school characteristics 𝑍𝑠, an indicator variable for the subject area (randomization) block 𝜃𝑏, and a
random error term 𝑒𝑖𝑠𝑏. I continued clustering standard errors at the coach level and included the
same teacher and school covariates described above except for one. I replaced teachers’ beginning of
the year observation score with teachers’ mid-year factor score. The survey questions I used to
construct each factor were only asked on the mid- and end-of-year survey. Thus, I included teachers’
mid-year factor score as a teacher characteristic across models. I also used the same alternative
model specification discussed above as a robustness check (Appendix P & Q). Finally, I did not
employ multiple imputation as a robustness check because I was unable to impute estimates for
teachers’ end of year factor scores because 90 percent of attrited teachers did not have a mid-year
factor score because they left the ICP prior to taking the mid-year survey window.
What coaching practices influence first-year teachers’ receptivity to coaching and implementation of the coaching content? Why do these coaching practices matter? Generating Codes. Following each interview, I drafted analytic memos addressing emerging
themes and potential codes emanating from the data. Specifically, I drafted analytic memos with
potential coding categories (e.g., specific influential practices, reasons why specific practices
mattered) and representative sub-codes based on my recollections of the interview. After completing
and transcribing all interviews, I re-listened and re-read my interview transcripts to further refine and
revise the analytic memos I drafted following each live interview. At the conclusion of this process, I
drafted an initial coding rubric of influential practices and the reasons why these practices mattered
to first-year teachers. I decided to track on influential practices and associated reasons for why they
mattered because these two aspects addressed my final research question. Table 3.19 summarizes the
initial codes I developed based upon my analytic memos.

87
Table 3.19: Initial Coding Categories Coding Category Definition
Actionable Feedback Feedback a teacher can immediately act upon in an upcoming lesson.
Decomposing Practice Breaking a practice or suggestion into its constituent parts. Contextual Suggestions
Providing suggestions that can be implemented within the context of the classroom or school.
Incorporating Teacher Choice
A coach allows a teacher to choose the specific rubric competency she wants to address in the post-observation conference.
Responsive to Feedback
A coach alters or adjusts her practice as a result of the feedback received from a teacher in prior conferences or earlier communications.
Sharing Perspectives Coach shares her perspectives about what she did during her tenure as a teacher.
Modeling Practice A coach demonstrates how a certain practice might be implemented. Explaining Rationale Coach explains her rationale behind why she chose to address a particular
competency. Collaborative Dialogue
Coach invites teacher into the discussion through questioning that prompts reflection or asking teacher to share perspectives on areas of improvement
Addressing The Positive
Coach initiates the conference with a discussion around the positive aspects of the teacher’s practice.
Immediacy of Debrief Scheduling the conference immediately following the observed lesson. Rehearsing Practices Teacher practices the suggestions/strategies addressed/modeled by the
coach.
Narrowing Focus A coach chooses to address a smaller number of competencies in the conference.
General Focus A coach chooses to address many competencies in the conference. Directing Resources Coach directs teacher to different resources (e.g., books, articles, video
clips, manipulatives) aligned to competencies discussed in the conference. Running Record of Evidence
A coach collects real-time or minute-by-minute record of what occurred during the observation.
Follow Through Coach follows-up on the action items discussed in the previous conference.
Coach Identified Competencies
A coach chooses the competencies to discuss with the teacher during the conference.
In terms of influential practices, my analytic memos suggested 19 coaching practices might
matter to first-year teachers. Additionally, analyses of these memos suggested teachers had some
common reasons why each coaching practice was particularly influential to teachers’ receptivity to
coaching. Table 3.20 displays the common reasons why teachers said certain coaching practices
mattered to them. For example, teachers commonly cited having a lack of knowledge (Row 1,

88
Column 2) as a reason why actionable feedback (Row 1, Column 2) influenced their receptivity to
coaching. Other common reasons across different coaching practices included: needing strategies
teachers could implement the next day (e.g., actionable), desiring some positive praise due to
consistent failure (e.g., consistent disappointment), and facilitating a sense of trust (e.g., following
through). See Appendix R for my detailed initial coding scheme with relevant examples provided.
Revision of Codes. I applied my initial codes to two randomly selected interview transcripts to
check whether the coding categories sufficed or needed revision. I applied codes to only instances of
influential practices, my initial unit of analysis. I distinguished something as influential by
determining whether a particular practice preceded or followed by an explicit reference to an
affirmative comment. For example, a teacher could remark, “I liked when my coach modeled a
particular practice” or “modeling helped me see the components of a particular practice”. In these
two examples, referencing liked in the former and helped in the latter suggested modeling was an
influential practice.
Table 3.20: Initial Coding Categories Around Why Certain Practices Matter Coaching Practice Reason Definition
Actionable Feedback (AF)
Lack of Knowledge AF mitigates first-year teachers’ insufficient knowledge and experience.
Ease of Incorporation AF appear to be easier for a teacher to implement the following day.
Decomposing Practice (DP)
Lack of Knowledge DP mitigates first-year teachers’ insufficient knowledge and experience.
Contextual Suggestions (CS)
Actionable CS makes teachers feel like they act on this feedback the following day.
Valued CS makes teachers feel valued because the coach understands the context or culture of the school.
Achievable CS presents itself as achievable because it fits within the expectations of the school.
Incorporating Teacher Choice (ITC)
Meaningfulness ITC allows teacher to feel invested in the coaching process and more likely to implement feedback.
Responsive to Feedback (RF)
Valued RF make teachers feel like their opinion matters to their coaches.

89
Sharing Perspectives (SP)
Similar Contexts SP made teachers feel like suggestion might work because teachers taught in similar school environments.
Modeling Practice (MP)
Lack of Knowledge MP mitigates first-year teachers’ insufficient knowledge and experience.
Explaining Rationale (ER)
Establishing Alignment
ER helped teachers understand why coaches chose to address what they did.
Collaborative Dialogue (CD)
Less Formal Environment
CD created a less formal environment because the teacher felt included in the conversation.
Addressing The Positive (AP)
Consistent Disappointment
AP focused attention away from disappointments first-year teachers continually experience.
Welcoming Environment
AP establishes a welcoming environment for teachers.
Maintain Motivation AP makes teachers feel successful and motivates them to continually focus on improving.
Immediacy of Debrief (ID)
Recency ID affords teachers have fresh memory around what occurred during the observation.
Rehearsing Practices (RP)
Validate Understanding
RP allows coach to validate whether teacher enacted a practice correctly.
Narrowing Focus (NF)
See Improvement First-year teachers felt like they could see problems being fixed as a result of NF.
Expedited Implementation
NF allowed teachers to feel like they could implement a specific practice immediately.
Building Blocks NF made teachers feel like they were addressing the constituent part of a larger, more-complex practice.
Sense of Possibility NF made teachers feel like change or improvement in practice was possible because they didn’t feel overwhelmed.
Facilitates Focus NF helped teachers focus attention a single practice to improve upon.
Time NF allowed coach and teacher to spend more time discussing a single element of practice.
General Focus (GF) Address Complexities GF made teachers feel like they were addressing teaching complexities by addressing many topics.
Multiple Actions GF made teachers feel like they could take multiple actions in upcoming lessons.
Directing Resources (DR)
Expedites Time DR limits the amount of time teachers must spend seeking out their own resources.
Running Record of Evidence (RRE)
Mitigates Bias RRE offers only evidence of classroom occurrences and removes coach’s opinions.
Follow Through (FT) Trust FT makes teachers feel like coach cares about development.
Accountability FT makes teacher feel responsible for implementing suggestions provided.

90
Coach Identified Competencies(CIC)
Lack of Knowledge First-year teachers suggest they have insufficient knowledge and experience.
I chose influential practices as my unit of analysis for two reasons: first, my research
question only addressed influential practices; second, I found in the data that teachers often
mentioned why this particular practice mattered when they perceived it as influencing their
receptivity to coaching. I then coded each instance of an influential practice with either a zero or
one. A zero indicated this instance did not include a reason why the practice was influential whereas
a one included a reason. I then focused only on instances with a one so that I could further explore
why certain practices influenced teachers’ responsiveness to coaching. Moreover, I dropped codes
from my initial coding scheme (presented in Table 3.19) never or rarely present in the data. These
included collecting a running record of evidence, immediacy of the debrief, and rehearsing particular
practices.
My second level of analysis – reasons why a particular coaching practice influenced teachers
receptivity to coaching – focused on identifying teachers’ perspectives around why a particular
practice influenced their instruction. I reviewed only influential practices coded with a one to
identify the reason why this particular practice mattered. I applied multiple codes within each
practice if a teacher provided more than one reason. Additionally, I coded all transcripts the same
way. Finally, to conduct this analysis, I used interview transcripts as my primary data source.
Analyzing Codes. I analyzed data in three stages: 1) calculating frequency of influential
coaching practices, 2) comparing frequency of influential coaching practices across conditions, and
3) investigating why teachers perceived these practices as more or less influential.
After coding all data for influential coaching practices, I calculated the relative frequency of
all influential coaching practices cited by first-year teachers. Because I was interested in whether

91
these practices differed across conditions, I then calculated frequency distributions separately for
intervention and control teachers. This allowed me to investigate whether teachers in different
conditions found certain coaching practices more or less influential to their responsiveness to
coaching.
Because I was also interested in learning more about why certain practices influenced first-
year teachers, I investigated teachers’ perceptions around why they influenced receptivity to
coaching. First, I identified the most commonly cited practices coded with a one (i.e., had a reason
attached to it). Then, I analyzed the excerpts within each practice to determine the reasons most
commonly cited by first-year teachers. Results from these three analyses are presented in the next
section.

92
Chapter 4: Results
Introduction
In this findings chapter, I first discuss whether coaches trained in the intervention offered
teachers more choice and focused coaching. Afterwards, I describe whether intervention teachers
had better observation ratings, reported feeling more prepared, and reported receiving better quality
coaching in comparison to control teachers. Lastly, I report on coaching practices teachers report
influenced their receptivity to coaching and why these practices mattered.
Were coaches trained in the intervention more likely to offer teachers’ choice and focused coaching compared to coaches who received no training?
4.1 Descriptive Statistics
Teacher Surveys
Table 4.1 provides basic descriptive statistics from the Post-Intervention Fidelity Survey
(PIFS) for teachers (n=28) who completed the survey and had written feedback from both the third
and fourth observations. Additionally I conducted paired t-tests to determine if the difference in
responses were statistically significant across conditions. Intervention teachers were more likely than
control teachers to report receiving a list of potential rubric competencies to address in an upcoming
observation (p<0.001, Question 1) and having the opportunity to select a rubric competency to
address (p<0.001, Question 2&3). Additionally, intervention teachers were more likely to report
spending the majority of their debrief discussing a single competency (p<0.001, Question 4 & 5),
and receiving both written and verbal feedback around the competency they chose to address

93
(p<0.001, Question 7 & 9). Although intervention teachers reported better quality implementation
(Questions 12-15), the estimated differences were not statistically significant.
Table 4.1: Post-Intervention Survey – Teacher Results
Question Construct
(Component)
Overall (N=28)
Intervention (N=16)
Control (N=12)
Mean (SD)
Mean (SD)
Mean (SD)
Before my third or fourth observation, my field instructor (over email or phone) identified a couple (3-4) rubric competencies he/she thought we could work on.
Adherence (Choice)
0.71 (0.46)
0.88*** (0.34)
0.50 (0.52)
I got to choose one rubric competency to focus both observations on (i.e., focus on Competency 2A for Visits #3 & #4).
0.71 (0.46)
0.94*** (0.25)
0.42 (0.51)
The rubric competency I chose was an area of practice I wanted to improve in.
0.71 (0.46)
0.94*** (0.25)
0.42 (0.51)
We (coach and myself) spent the majority of our debrief time discussing a single rubric competency.
Adherence (Focused Coaching)
2.71 (0.89)
3.25*** (0.58)
2.00 (0.74)
We spent the majority of time discussing a rubric competency I felt I needed assistance with.
2.89 (0.91)
3.38*** (0.50)
2.25 (0.97)
The verbal feedback (e.g., constructive criticism, evidence from observation) I received addressed a single rubric competency.
2.64 (0.89)
3.06** (0.57)
2.08 (0.90)
The verbal feedback I received addressed the rubric competency I chose to address with my coach.
2.82 (0.90)
3.31*** (0.60)
2.16 (0.83)
The written feedback I received in [Online Portfolio Name] addressed a single rubric competency.
2.60 (0.96)
3.13*** (0.62)
1.92 (0.90)
The written feedback I received in [Online Portfolio Name] addressed the competency I chose to address with my coach.
2.78 (0.92)
3.25*** (0.57)
2.16 (0.94)
The suggestions I received in either my verbal or written feedback focused on how to improve in a specific rubric competency.
2.89 (0.88)
3.19* (0.66)
2.50 (1.00)
The suggestions I received in either my verbal or written feedback focused on how to improve in the specific rubric competency I chose to address.
2.78 (0.92)
3.25*** (0.58)
2.16 (0.94)
I learned a great deal about how to improve my teaching as a result of my last two observations (i.e., Visit #3 & #4)
Quality Impelement.
2.75 (0.84)
2.81 (0.65)
2.67 (1.07)
I found the feedback I received from my coach useful. 3.11 (0.92)
3.38~ (0.62)
2.75 (1.13)
I will put some of the ideas discussed in the debrief into practice.
3.25 (0.75)
3.31 (0.60)
3.16 (0.93)
I felt empowered as a professional in my last two observations.
3.07 (0.89)
3.25 (0.77)
2.83 (1.03)

94
Written Feedback
Table 4.2 provides basic descriptive statistics for all written feedback (n=28) uploaded to
teachers’ online portfolio after the third and fourth observations. Similar to my analysis of teachers’
survey responses, I conducted paired t-tests to determine if a statistically significant difference in
written feedback existed across conditions.
Analyses of written feedback presented in Column 4-5 indicate intervention coaches were
more likely than control coaches to address fewer competencies (p<0.001, Row 2), but provide
more written feedback per competency (p<0.01, Row 4). Additionally, intervention coaches were
more likely to provide suggestions for the different competencies address (P<0.05, Row 3) and
provide more written text around suggestions per competency (P<0.01, Row 5).
Table 4.2: Written Feedback Analysis
Variable Construct Overall (n=28)
Control Group (n=12)
Intervention Group (n=16)
Mean (SD) Mean (SD) Mean (SD)
# Comp. Addressed Adherence
3.17 (2.13) 5.25 (1.28) 1.65*** (1.01)
# Comp: # Sugg. Comp 0.64 (0.31) 0.51 (0.27) 0.74* (0.30)
Feedback Per Comp. Dosage
164.99 (128.24) 80.50 (53.53) 228.36** (132.30)
Suggestion Per Comp. 60.12 (66.46) 23.96 (23.86) 87.25** (75.52)
4.2 Achieved Relative Strength Index
I used teacher surveys and coaches’ written feedback to determine if coaches trained in the
intervention were more likely to offer teachers’ choice, narrow the focus of conversations, and
engage in better quality post-observation conferences. Table 4.3 summarizes the achieved relative
strength index (ARS) for three different constructs of intervention fidelity: adherence, dosage, and
implementation quality. I also used paired t-tests to determine if the ARS was statistically
significantly different across conditions. Results suggest coaches trained in the intervention were
significantly more likely to offer teachers’ choice (p<.001, Row1) and focus coaching (p<0.001, Row

95
2) as compared to coaches in the control condition. In particular, intervention teachers reported
greater opportunities to choose and receive coaching around a single competency and had
significantly more exposure to coaching around a single competency (p<0.01, Row 3).
Adherence. The first core component of the intervention was choice – giving teachers the
opportunity to choose a single rubric competency. Choice included coaches identifying three to four
competencies for each teacher, the teacher selecting one of the identified competencies, and the
teacher believing she needed to improve in this selected competency. As shown in Table 4.3, Row 1,
Column 4 & 5, intervention teachers were likely to choose a single rubric competency to focus
coaching around (p<0.001). Moreover, the ARS was substantially different between intervention and
control conditions, corresponding to almost one and one-third of a standard deviation (Row 1,
Column 8).
Table 4.3: Achieved Relative Strength Values Across Core Components of the Intervention
Core Component
Construct N Interv. Control Min Max ARSI Mean (SD) Mean (SD)
CC Adherence 28 0.92*** (0.26) 0.44 (0.26) 0 1 1.29
FC Adherence 28 1.61*** (1.48) -2.15 (1.22) -4.60 3.64 2.74
FC Dosage 28 0.90** (2.21) -1.20 (0.72) -1.97 5.84 1.25
Q Quality 28 0.23 (0.71) -0.30 (1.27) -2.52 1.34 0.54
Key: CC, Competency Choice; FC, Focused Coaching; Q, Quality Note: N = 16 (Intervention), 12 (Control)
A second core component of the intervention was teachers receiving coaching around the
rubric competency they chose. This component included a teacher receiving feedback – written and
verbal – around the competency she chose prior to the observation. The focused coaching
component in Table 4.3, Row 2, Column 4 & 5, revealed intervention teachers were more likely to
receive coaching on this particular competency (p<0.001). Additionally, the claim of teachers
receiving more coaching on a particular competency is further supported by an ARS of
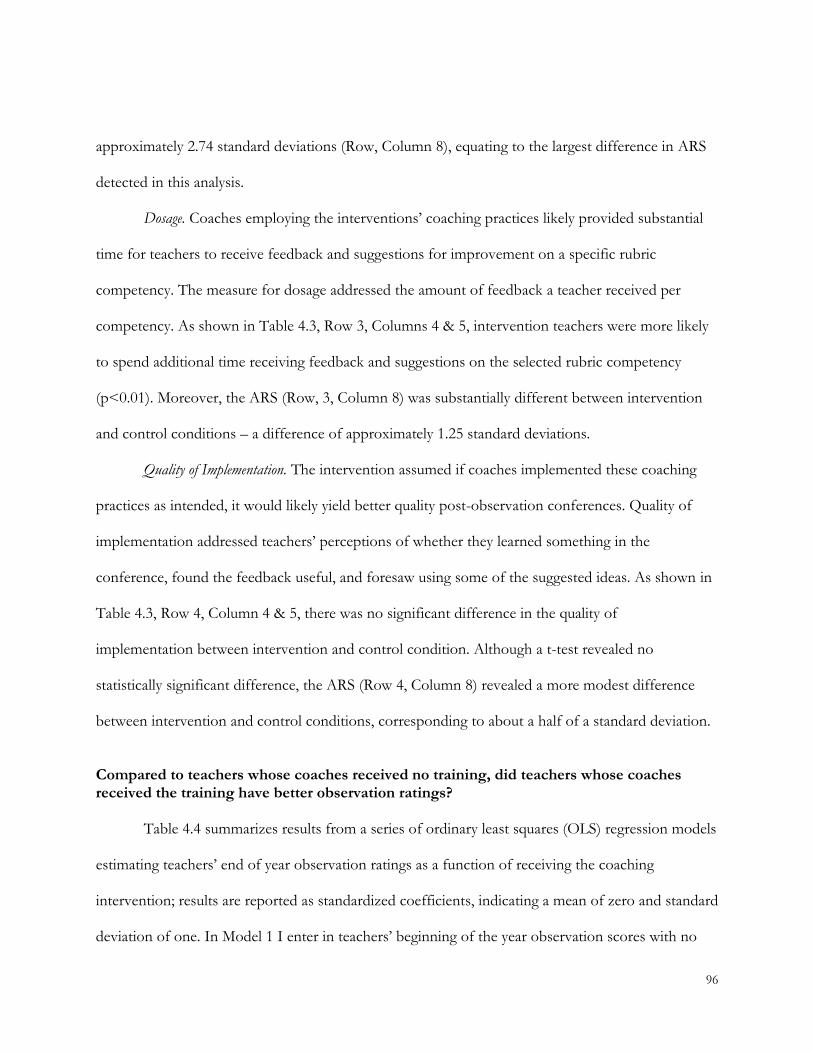
96
approximately 2.74 standard deviations (Row, Column 8), equating to the largest difference in ARS
detected in this analysis.
Dosage. Coaches employing the interventions’ coaching practices likely provided substantial
time for teachers to receive feedback and suggestions for improvement on a specific rubric
competency. The measure for dosage addressed the amount of feedback a teacher received per
competency. As shown in Table 4.3, Row 3, Columns 4 & 5, intervention teachers were more likely
to spend additional time receiving feedback and suggestions on the selected rubric competency
(p<0.01). Moreover, the ARS (Row, 3, Column 8) was substantially different between intervention
and control conditions – a difference of approximately 1.25 standard deviations.
Quality of Implementation. The intervention assumed if coaches implemented these coaching
practices as intended, it would likely yield better quality post-observation conferences. Quality of
implementation addressed teachers’ perceptions of whether they learned something in the
conference, found the feedback useful, and foresaw using some of the suggested ideas. As shown in
Table 4.3, Row 4, Column 4 & 5, there was no significant difference in the quality of
implementation between intervention and control condition. Although a t-test revealed no
statistically significant difference, the ARS (Row 4, Column 8) revealed a more modest difference
between intervention and control conditions, corresponding to about a half of a standard deviation.
Compared to teachers whose coaches received no training, did teachers whose coaches received the training have better observation ratings? Table 4.4 summarizes results from a series of ordinary least squares (OLS) regression models
estimating teachers’ end of year observation ratings as a function of receiving the coaching
intervention; results are reported as standardized coefficients, indicating a mean of zero and standard
deviation of one. In Model 1 I enter in teachers’ beginning of the year observation scores with no

97
other covariates; in Model 2 I include teachers’ beginning of the year observe scores and add school
characteristics; in Model 3 I include covariates from Model 2 and add remaining teachers
characteristics. Across models I adjust for teachers’ randomization block and cluster standard errors
at the coach level to account for the possibility that different coaches might rate teachers differently.
Table 4.4: Compared to teachers whose coaches received no training, did teachers whose coaches received the training have better observation ratings?
VARIABLES Model 1 Model 2 Model 3
Intervention 0.3544 0.3642 0.2420
(0.328) (0.335) (0.232)
BOY Score 0.7135*** 0.7156*** 0.8143***
(0.129) (0.192) (0.169)
% Black Students
0.5119 0.3261
(0.507) (0.522)
% White Students
0.7285 1.3864~
(1.001) (0.693)
Charter School
0.0090 -0.0007
(0.488) (0.318)
Male Teacher
0.6727~
(0.283)
White Teacher
0.5541~
(0.334)
No College Education Credits
-0.6017~
(0.332)
Previous Teaching Experience
0.2969
(0.339)
Remain In Education 11+ Years
0.7539*
(0.297)
Constant 0.1913 -0.6266 -1.2518~
(0.327) (0.598) (0.581)
Observations 36 36 36
R-Squared 0.43 0.45 0.70
Number of Strata 6 6 6
Results reveal no statistically significant difference in teachers’ end of year observation
ratings between intervention and control conditions. Although not statistically significant, results
suggest intervention teachers, on average, received better end of year observation ratings compared

98
to control teachers. Specifically, intervention teachers scored between 24 to 35 percent of a standard
deviation better than control teachers. Beyond intervention status, teachers with better beginning of
the year observation ratings scored, on average, 71 to 81 percent of a standard deviation better than
teachers with lower initial ratings; results were statistically significant (p<.001) across models.
Additionally, teachers who suspect they might make a career in education (e.g., remain in education
11+ years), on average, scored 75 percent of a standard deviation (p<0.05) better than teachers who
might remain in education for a shorter duration of time. All other remaining teacher characteristics
were not statistically significant at the p<0.05 level.
Results from separate robustness checks also support estimates detected in my focal models.
Estimates from an alternative model specification – multilevel level models to account for the
nesting of teachers in coaches – suggest intervention teachers, on average, had 24 to 31 percent of a
standard deviation better observation ratings as compared to control teachers. Thus, I interpret
these results as evidence the estimates from my OLS models are not being driven by model
specification. Additionally, estimates from focal models incorporating multiple imputation imply
intervention teachers, on average, received 18 to 33 percent of a standard deviation better
observation ratings. Obtaining similar estimates to my focal models after using multiple imputation
suggests results are not overly influenced by participant attrition; however, somewhat lower
estimates implies attrition slightly biases estimates upward. Appendix N and O include estimates
from my separate robustness checks.
The current development study, per IES, is expected to provide pilot data regarding the
intervention’s promise for generating intended outcomes. Evidence of promise, in the context of an
underpowered efficacy study, is typically classified as unbiased, non-statistically significant effect size
estimates of change in the inappropriate direction (Buckley & Doolittle, 2013; IES, 2017). In light of

99
the expectations of promise for a development study, a 24 to 36 percent of a standard deviation
estimate suggests the intervention does demonstrate promise for improving teachers’ instruction. As I
elaborate in the next chapter, prior literature also suggests that these effect sizes are practically
meaningful.
Compared to teachers whose coaches received no training, did teachers whose coaches received the training report feeling more prepared? Table 4.5 summarizes results from a series of ordinary least squares (OLS) regression models
estimating teachers’ end-of-year preparedness as a function of receiving the coaching intervention,
beginning-of-year preparedness, and teacher characteristics. As indicated by the column titles, I used
three factors – preparedness in teaching subject matter, preparedness in managing the classroom,
and preparedness to teach all students – as the outcome measure for each of the models presented
in this table. I also used the same model progression, discussed in the results for the preceding
research question.
Results revealed no statistically significant difference between intervention and control
teachers’ preparedness across different domains of practice. While not statistically significant, results
suggest intervention teachers felt better prepared to handle a range of classroom management issues
(27 to 32 percent of a standard deviation) and teach all students (19 to 41 percent of a standard
deviation). By contrast, control teachers reported feeling better prepared to teach their subject
matter content (17 to 22 percent of a standard deviation) despite not resulting in a statistically
significant estimate. Beyond intervention status, teachers with higher beginning of the year factors
scores reported, on average, feeling better prepare to manage the classroom (55 to 59 percent of a
standard deviation, p<0.01 ) in my most robust models. Additionally, first-year teachers employed
in schools with higher percentages of African-American students reported feeling less prepared to
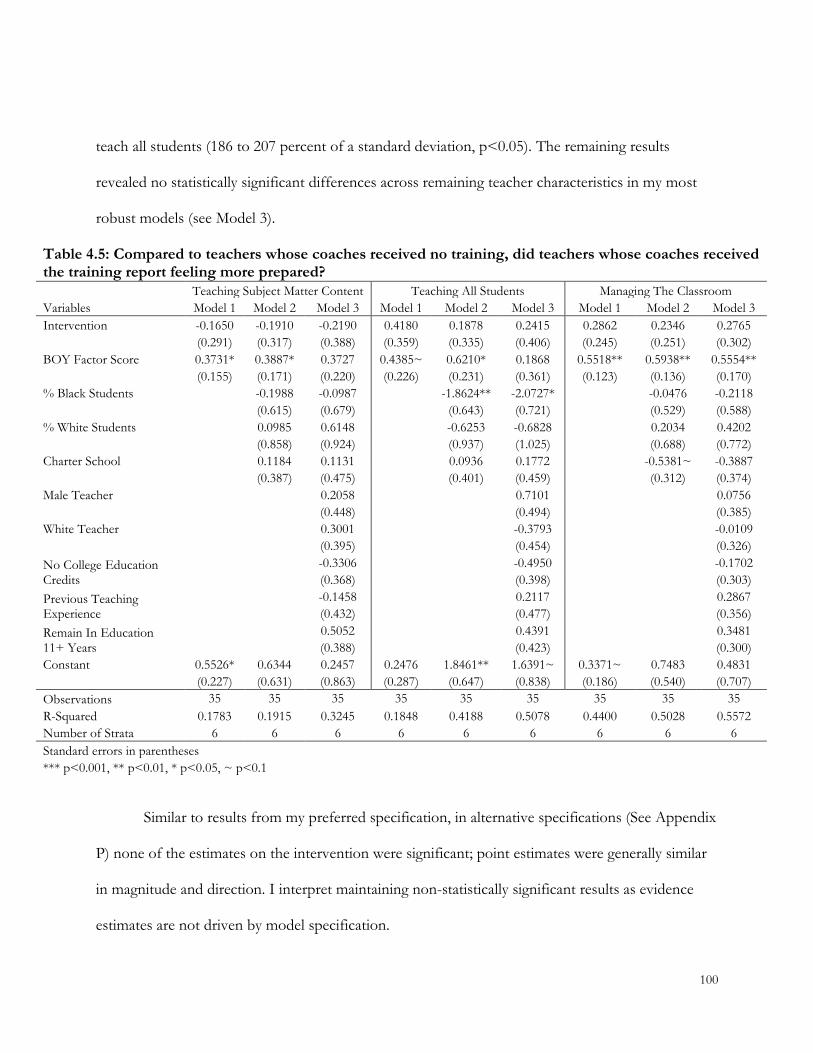
100
teach all students (186 to 207 percent of a standard deviation, p<0.05). The remaining results
revealed no statistically significant differences across remaining teacher characteristics in my most
robust models (see Model 3).
Table 4.5: Compared to teachers whose coaches received no training, did teachers whose coaches received the training report feeling more prepared?
Teaching Subject Matter Content Teaching All Students Managing The Classroom
Variables Model 1 Model 2 Model 3 Model 1 Model 2 Model 3 Model 1 Model 2 Model 3
Intervention -0.1650 -0.1910 -0.2190 0.4180 0.1878 0.2415 0.2862 0.2346 0.2765
(0.291) (0.317) (0.388) (0.359) (0.335) (0.406) (0.245) (0.251) (0.302)
BOY Factor Score 0.3731* 0.3887* 0.3727 0.4385~ 0.6210* 0.1868 0.5518** 0.5938** 0.5554**
(0.155) (0.171) (0.220) (0.226) (0.231) (0.361) (0.123) (0.136) (0.170)
% Black Students
-0.1988 -0.0987
-1.8624** -2.0727*
-0.0476 -0.2118
(0.615) (0.679)
(0.643) (0.721)
(0.529) (0.588)
% White Students
0.0985 0.6148
-0.6253 -0.6828
0.2034 0.4202
(0.858) (0.924)
(0.937) (1.025)
(0.688) (0.772)
Charter School
0.1184 0.1131
0.0936 0.1772
-0.5381~ -0.3887
(0.387) (0.475)
(0.401) (0.459)
(0.312) (0.374)
Male Teacher
0.2058
0.7101
0.0756
(0.448)
(0.494)
(0.385)
White Teacher
0.3001
-0.3793
-0.0109
(0.395)
(0.454)
(0.326)
No College Education Credits
-0.3306
-0.4950
-0.1702
(0.368)
(0.398)
(0.303)
Previous Teaching Experience
-0.1458
0.2117
0.2867
(0.432)
(0.477)
(0.356)
Remain In Education 11+ Years
0.5052
0.4391
0.3481
(0.388)
(0.423)
(0.300)
Constant 0.5526* 0.6344 0.2457 0.2476 1.8461** 1.6391~ 0.3371~ 0.7483 0.4831
(0.227) (0.631) (0.863) (0.287) (0.647) (0.838) (0.186) (0.540) (0.707)
Observations 35 35 35 35 35 35 35 35 35
R-Squared 0.1783 0.1915 0.3245 0.1848 0.4188 0.5078 0.4400 0.5028 0.5572
Number of Strata 6 6 6 6 6 6 6 6 6
Standard errors in parentheses *** p<0.001, ** p<0.01, * p<0.05, ~ p<0.1
Similar to results from my preferred specification, in alternative specifications (See Appendix
P) none of the estimates on the intervention were significant; point estimates were generally similar
in magnitude and direction. I interpret maintaining non-statistically significant results as evidence
estimates are not driven by model specification.
101
Compared to teachers whose coaches received no training, did teachers whose coaches received the training report better quality coaching? Table 4.6 summarizes results from ordinary least squares (OLS) regression models estimating
end-of-year conference quality as a function of receiving the coaching intervention, beginning-of-
year conference quality, and teacher characteristics. As indicated by the column titles, I used three
factors – coaching quality, conference investment, and focused coaching – as the outcome measure
for each of the models presented in this table. I also used the same model progression, discussed in
the preceding the research questions.
Results revealed no statistically significant difference between intervention and control
teachers’ perceptions of conference quality. While not statistically significant, intervention teachers
reported receiving, on average, better quality coaching (6 to 11 percent of a standard deviation) and
more focused coaching in the post-observation conference (21 to 31 percent of a standard
deviation). In contrast, intervention teachers reported having less investment in the conference
process (17 to 38 percent of a standard deviation), however results were non-significant. Beyond
intervention status, teachers with higher beginning of the year factor scores reported, on average,
better conference quality (78 to 87 percent of a standard deviation, p<0.001), greater investment in
the conference (27 to 43 percent of a standard deviation, p<0.05), and more focused coaching (60 to
65 percent of a standard deviation, p<0.001).
Results also revealed different kinds of teachers had different experiences with coaching
received during post-observation conferences. Teachers working in schools with a greater
percentage of black students reported being less invested in the conference process (158 to 168
percent of a standard deviation, p<0.05). Additionally, teachers working in schools with a greater

102
percentage of white students teachers reported receiving worse quality coaching (205 percent of a
standard deviation, p<0.01) and less focused coaching (168 percent of a standard deviation, p<0.05)
in my most robust models (Model 3). Finally, teachers who took zero undergraduate education
courses reported receiving more coaching focused on a single competency (80 percent of a standard
deviation, p<0.001)
Table 4.6: Compared to teachers whose coaches received no training, did teachers whose coaches received the training report better quality coaching?
Coaching Quality Conference Investment Focused Coaching
VARIABLES Model 1 Model 2 Model 3 Model 1 Model 2 Model 3 Model 1 Model 2 Model 3
Intervention 0.1141 0.2242 0.0625 -0.1749 -0.3801~ -0.3803 0.2125 0.2690 0.3149
(0.279) (0.240) (0.275) (0.275) (0.211) (0.262) (0.281) (0.282) (0.302)
BOY Factor Score 0.8571*** 0.8744*** 0.7818*** 0.4275* 0.2768* 0.2744* 0.6492*** 0.6589*** 0.6006***
(0.155) (0.135) (0.152) (0.132) (0.111) (0.128) (0.160) (0.159) (0.165)
% Black Students
-0.4736 -0.3245
-1.5841** -1.6818**
-0.4682 -0.9067
(0.477) (0.516)
(0.467) (0.575)
(0.547) (0.566)
% White Students
-2.1704** -2.0530**
0.1961 0.2652
-1.5028~ -1.6951*
(0.651) (0.690)
(0.614) (0.714)
(0.749) (0.766)
Charter School
0.5204~ 0.4018
-0.1042 -0.0551
0.3181 0.4815
(0.298) (0.329)
(0.265) (0.324)
(0.337) (0.356)
Male Teacher
0.5364
-0.0282
0.1444
(0.323)
(0.303)
(0.352)
White Teacher
-0.2635
-0.0972
0.3905
(0.280)
(0.270)
(0.307)
No College Education Credits
-0.0472
-0.1526
0.3430
(0.280)
(0.265)
(0.308)
Previous Teaching Experience
-0.2975
0.0962
0.7977*
(0.314)
(0.316)
(0.346)
Remain In Education 11+ Years
-0.1989
0.1356
-0.0890
(0.278)
(0.260)
(0.306)
Constant -0.1067 0.0632 0.2943 0.4275** 0.2768* 0.2744* -0.4929* -0.2324 -0.6597
(0.207) (0.466) (0.576) (0.132) (0.111) (0.128) (0.215) (0.553) (0.655)
Observations 35 35 35 35 35 35 35 35 35
R-Squared 0.5353 0.7058 0.7646 0.2878 0.6434 0.6633 0.3794 0.4767 0.6195
Number of Strata 6 6 6 6 6 6 6 6 6
Standard errors in parentheses
*** p<0.001, ** p<0.01, * p<0.05, ~ p<0.1

103
Results from a separate robustness check (See Appendix Q) were also consistent with the
estimates from my focal models. Similar to results from my preferred specification, all estimates on
effects of the intervention were non-significant; point estimates were generally similar in magnitude
and direction.
What coaching practices influence first-year teachers’ receptivity to coaching and implementation of the coaching content? Why do these coaching practices matter?
While results from the prior research questions offer important insights into the effects of
this particular intervention, the quantitative nature of these analyses do not allow for unpacking
what coaches could do in post-observation conferences to enhance their impact. In light of the null
effects detected in this study, understanding what coaches could do to improve their impact is
particularly important. Specifically, this study seeks to explore what coaching practices coaches could
employ to enhance teachers’ responsiveness to coaching. Moreover, prior literature suggests
understanding influences behind responsiveness is a promising starting point given suggestive
evidence that responsiveness influences implementation (Wanless, Rimm-Kaufman, Abry, Larsen, &
Patton, 2014; Wong, Ruble, McGrew, & Yu, 2017) and intervention success (Power, Blom-
Hoffman, Clarke, Riley-Tillman, Kelleher, & Manz, 2005). Thus, this study interviewed 13 first-year
teachers across conditions to understand what pedagogical coaching practices influence teachers
receptivity to coaching and implementation of the coaching content.
Table 4.7 summarizes results from my analysis of 13 first-year teacher interview transcripts.
As described in the Methods chapter, the interviews focused on gathering teachers’ perceptions
about coaching practices that influenced their receptivity to coaching and why these practices
mattered. Column two presents the frequencies and percentages of different coaching practices
across all interview transcripts; columns three and four are organized in the same way as column two

104
but summarize frequencies and percentages across different conditions. I coded 82 instances of
coaching practices across all interview transcripts; 42 instances occurred within control teacher
interview transcripts as compared to 40 for intervention teachers.
Table 4.7: What coaching practices influence first-year teachers’ receptivity to coaching and implementation of the coaching content? Overall (n=13)^ Control (n=7)^ Intervention (n=6)^
# Instances (%) # Instances (%) # Instances (%)
Concrete Feedback 27 (33%) 13 (31%) 14 (35%) Decomposing Practice 18* (67%) 8* (62%) 10* (71%) Actionable Feedback 15* (56%) 8* (62%) 7* (50%)
Creating A Welcoming Environment 16 (19%) 10 (24%) 6 (15%) Addressing The Positive 7 (44%) 4 (40%) 3 (50%) Collaborative Dialogue 4 (25%) 2 (20%) 2 (33%) Explaining Rationale 2 (12.5%) 1 (10%) 1(17%) Sharing Perspectives 1 (6%) 1 (10%) 0 (0%) Responsive to Teacher Feedback 2 (12.5%) 2 (20%) 0 (0%)
Limiting The Focus 13 (16%) 5 (12%) 8 (20%) Modeling Practice 10 (12%) 7 (17%) 3 (8%) Directive Coaching 6 (7%) 2 (5%) 4 (10%) Coach Identified Competencies 2 (33%) 1 (50%) 1 (25%) Directing Resources 3(50%) 1 (50%) 2 (50%) Follow Through 1 (17%) 0 (0%) 1 (25%)
General Focus 5 (6%) 2 (5%) 3 (8%) Incorporating Teacher Choice 5 (6%) 3 (7%) 2 (5%)
Note: The values in parentheses represent the percentage of a particular code to the total number of instances across all interviews. Italicized percentages represent the percentage of a particular sub-code to the number of parent codes cited. ^ I checked average number of instances identified per transcript to determine if a small number of teachers dominated the comments. Since participating teachers contributed, on average, approximately 6 instances with a 0.2 standard deviation, I concluded the instances were fairly representative of the interviewees. *Some instances of concrete feedback (n=7) included references to both action oriented and decomposing practice. These instances of concrete feedback were double coded, thus resulting in instances of action oriented and decomposing practice codes exceeding the total number of concrete feedback instances.
Analysis of interview transcripts revealed that four main coaching practices – concrete feedback,
creating a welcoming environment, narrow focus, and modeling practices – dominated first-year teachers’
responses. Concrete feedback refers to feedback that was broken down into its individual parts (i.e.,
decomposing practice) and was perceived as something that could be implemented immediately (i.e.,

105
actionable). Creating a welcoming environment involves engaging teachers in the conference process,
addressing positive aspects of teachers’ practice, and being responsive to teachers’ feedback. Finally,
narrowing focus refers to instances where coaches addressed a limited number of rubric competencies,
while modeling practices involves physically demonstrating for teachers how to implement or execute a
particular practice. Table 4.6 reveals concrete feedback was cited most frequently, while the other three
coaching practices were less commonly mentioned but still mentioned somewhat frequently. I first
discuss results for concrete feedback, followed by establishing a welcoming environment, narrowing focus, and
modeling practice. Additionally, I include the reasons why first-year teachers perceived these practices
as influencing their receptivity to coaching.
Concrete Feedback
Providing concrete feedback was most commonly cited across first-year teacher interviews. I
coded 27 instances of concrete feedback across 13 interviews, which equated to approximately one third
of all teachers’ responses for influential coaching practices. Specifically, teachers cited benefitting
from feedback that could improve practice immediately (actionable feedback) and having feedback
broken down into its constituent parts (decomposing practice) at relatively similar rates. Within these
instances of concrete feedback, decomposing practice was cited 18 times while actionable feedback was cited 15
times. Additionally, teachers cited both decomposing practice and actionable feedback seven times
within the same response. Control and intervention teachers reported concrete feedback with similar
frequency. Intervention teachers cited concrete feedback approximately 35 percent of the time as
compared to 31 percent for control teachers were code. Thus, teachers across conditions held
similar beliefs around the importance of coaching providing concrete feedback to promote instructional
improvement.

106
When asked to address why concrete feedback influenced their receptivity to coaching, teachers
revealed three common reasons – immediacy of incorporation, lack of knowledge, and expedited success.
Immediacy of incorporation: First-year teachers commonly cited concrete feedback as
suggestions, resources, or tools that could be implemented immediately into the classroom. Given
the demand for practicing teachers to quickly learn and apply certain strategies, concrete feedback
assisted first-year teachers in meeting the demands of their classroom. For example, one first-year
teacher noted needing “little things that I can actually implement the next day, as opposed to a
bunch of theory because I’m not in school, I’m actually practicing. I need things I can practice the
next day” (Interview #4, 04/13/2016). This example highlights the need of practicing teachers to
receive written or verbal feedback that assists teachers in immediately using a specific strategy or
skill. Considering the challenge first-year teachers face trying to independently lead a classroom of
students while also learning to teach, concrete feedback seemed responsive to these dual needs.
Lack of knowledge: First-year teachers also cited their lack of knowledge as common reason
for why they felt concrete feedback influenced their receptivity to coaching. In particular,
interviewees indicated that they lacked adequate knowledge of teaching as a result of their limited
education backgrounds and abbreviated pre-service training. For instance, one first-year teacher
commented, “[R]eally, you don’t exactly know how to teach, in your first year, especially not having
an education background” (Teacher Interview #4, 04/13/2016). Another said, “I think one of the
things, especially with [ACP] is, [ACP] first-year teachers who did not student teach, we don’t know
anything” (Teacher Interview #1, 04/11/2016). In these instances, teachers cited concrete feedback,
specifically around its emphasis on how to implement a particular practice, as helping them address
some of the knowledge gaps resulting from limited pre-service training.

107
Expedited success: Additionally, first-year teachers cited expedited success as another reason
why concrete feedback mattered. Interviewees frequently mentioned experiencing considerable
disappointment and limited success during their first-year of teaching. However, concrete feedback
helped them implement a strategy and experience some immediate success with it because they were
aware of what strategy to incorporate and how to implement it. Thus, teachers felt like this type of
feedback allowed them to procure some smaller successes that could potentially build momentum
for more consistent success over time.
Creating A Welcoming Environment
I also coded 16 instances (19 percent of all teachers’ responses) of interviewees mentioning
responsiveness to coaching when coaches created a welcoming environment, including such practices as
addressing the positive, engaging in collaborative dialogue, explaining rationale, sharing perspectives, and being
responsive to teacher feedback. Among the respective practices comprising creating a welcoming environment,
addressing the positive (7 instances) and collaborative dialogue (4 instances) were most frequently cited. This
means teachers were more likely to feel a part of a welcoming environment when coaches discussed
positive aspects of teachers’ instruction and asked questions that prompted teachers to feel like they
were engaging in a collaborative dialogue with their coach.
Although creating a welcoming environment was mentioned in almost 20 percent of all references
to influential coaching practices, control teachers reported this practice more often than intervention
teachers. Control teachers cited practices associated with creating a welcoming environment approximately
a quarter of the time as compared to 15 percent for intervention teachers. Although control and
intervention teachers reported instances of addressing the positive and collaborative dialogue with similar

108
frequency, control teachers reported more instances of coaches sharing perspectives and responding to
teacher feedback.
When asked to consider why creating a welcoming environment influenced receptivity to coaching,
teachers revealed two common reasons – feeling successful and sense of partnership.
Feeling successful: Teachers who mentioned creating a welcoming environment as an influential
practice indicated that coaches addressing the positive allowed teachers to feel successful, despite feeling, at
times, like they were not living up to expectations. For example, a teacher noted “I'm already hard
on myself so it's important to have someone kind of say like hey, you might be hard on yourself but
this is what you did really well and you should keep doing this” (Teacher Interview #2,
04/12/2016). Although this teacher knew she had room for improvement, feeling successful helped her
believe she could leverage aspects of her teaching in the future and that her practice might not be as
dismal as s/he perceived.
Sense of partnership: Additionally, first-year teachers cited having a sense of partnership as
another reason why creating a welcoming environment mattered. Specifically, through collaborative dialogue
teachers felt involved in the conference process and a part of a joint pursuit for teacher
development. For example, one teacher noted about her coach:
Just [her] entering it as this just a conversation that we’re going to have. How do you think it went? What do you need me to help you do it? Instead of being like, this what I saw, I’m an expert at this, so I’m going to tell you what you need to do. Of course, she still gave me her expert advice but I asked for it (Teacher Interview #4, 04/13/2016).
By asking questions that prompted the teacher to reflect on both her classroom performance and
professional needs, the coach provided an opportunity for the teacher to play an active role in the
conference. Additionally, recognition that a coach and teacher jointly pursue the teacher’s
development coach likely established an environment where a teacher felt comfortable asking for the
coach’s advice. Although it is not represented in this particular passage, teachers also mentioned

109
being more receptive to coaches’ feedback because teachers did not perceive the feedback as being
forced on when they felt actively involved in the conference and a part of joint pursuit of
development.
Limiting The Focus
I also coded 13 instances (16 percent of all coded instances of influential practices) of
interviewees mentioning coaches addressing a smaller number of competencies (limiting the focus) as a
practice that influenced their responsiveness to coaching. Moreover, intervention teachers cited this
practice more often (8 instances) than control teachers (5 instances). I suspect two reasons might
explain this difference. First, results from my analysis of adherence to focused coaching suggest
intervention teachers had more exposure to coaches narrowing the scope of conferences. Thus,
intervention teachers likely had more opportunities to experience this particular practice and
determine its benefit. Second, intervention teachers had experienced both more typical coaching
(e.g., general scope) and focused coaching, thus providing them a contrast. It is possible exposure to
this contrast influenced how intervention teachers responded.
According to interviewed teachers, addressing a limited number of competencies was
particularly influential because it facilitated focus, prompted inquiry into and refinement of practice, and
addressed the building blocks of more complex practices.
Facilitated Focus: Most teachers who cited limiting the focus as an influential practice
indicated that addressing a single competency helped teachers focus their attention – both time and
energy – on a single topic to improve on. Limiting the focus was particularly helpful because some first-
year teachers cited not knowing how to prioritize their time or what practices to address. For
example, one teacher commented, “I keep forgetting [what to address] because I’m just so

110
consumed with other stuff. Where if I had to deal with just that one thing, there’s no way I’m going
to forget that that’s the one thing I’m working on” (Teacher Interview #11, 04/19/2016).
Addressing a single competency helped first-year teaches identify what they needed to prioritize,
thus allowing them more time to address certain practices that might spur instructional
improvement.
Prompted Inquiry Into and Refinement Of Practice. Moreover, teachers mentioning the
utility of limiting the focus suggested that it prompted inquiry into and further refinement of
professional practice. Specifically, limiting the focus signaled to the teacher the importance of inquiry
into practice as the basis for refining practice. For instance, one teacher mentioned, “I like the idea
of really, really trying to hone in on one thing at a time, learn about it, try it out, and adjust [my
practice]” (Teacher Interview #8, 04/15/2016). In this example, limiting the focus afforded the teacher
the opportunity to identify a limitation in her practice, explore and integrate possible actions, and
refine practice based on outcomes.
Building Blocks of More Complex Practices: Additionally, interviewees mentioned
addressing the building blocks of more complex practices as another reason why limiting the focus mattered.
Specifically, teachers felt limiting the focus instilled a belief of working towards more complex, long-
term goals. For example, one teacher noted, “figuring out how to have teenagers not be
disrespectful to one another is not something that I can fix in a week, but I can focus on something
that is a building block to the longer-term goal [of having students be more respectful to each
other]” (Teacher Interview #13, 04/26/2016). In this case, focusing on a single practice allowed the
teacher to address something that was presently manageable while also working towards a longer-
term goal. Moreover, focusing on the building blocks of a more complex practice allowed teachers
to notice more immediate success, despite knowing it takes time to master a more complex practice.

111
Modeling Practice
Lastly, I coded 10 instances (approximately 12 percent of all instances coded) of teachers
referencing receptivity to coaching when coaches modeled practice by physically enacting or
demonstrating how to execute a particular practice. Additionally, teachers in the control condition (7
instances) cited this practice more often than intervention teachers (3 instances). While it is unclear
why this difference existed, it is possible that control coaches engaged in this practice more often
than intervention coaches or enacted it with better quality. This hypothesis might be plausible
considering four control coaches assigned to three different coaches cited this practice. In contrast,
two intervention teachers assigned to the same coach cited modeling practice.
Image of the Possible: Teachers expressed appreciation for when their coaches modeled
practices as it provided them with an image of the possible. Specifically, teachers mentioned broadly
knowing of a particular practice or technique (e.g., checking for understanding), but did not
necessarily know how to enact it in the classroom. Thus, coaches’ demonstration of a particular
practice filled in some of the knowledge gaps teachers sometimes attributed to limited pre-service
coursework and field experiences.

112
Chapter 5: Discussion and Implications
Discussion of Findings
In this section, I discuss three key findings and how these findings contribute to the practice
of teacher coaching, research on teacher coaching, and refinement of the intervention. First, fidelity
analyses revealed the core components of the intervention – teacher choice, focused coaching – had
a stronger presence in the intervention condition as opposed to the control. Second, estimated
differences between intervention and control teachers’ observation ratings, perceptions of
preparedness, and coaching quality, while not statistically significant, demonstrate the intervention’s
promise for generating intended outcomes. Finally, I discuss the importance of concrete feedback,
creating a welcoming environment, narrowing focus, and modeling practice as coaching practices that might
enhance teachers’ responsiveness to coaching.
Finding I: Coaching was different across conditions. A central finding of this study was
the coaching that occurred in the intervention condition was significantly different from the
coaching that occurred in the control condition. Specifically, intervention coaches were significantly
more likely to offer teachers’ choice (p<0.001, ARS=1.29 SD), focus the coaching on a single
competency (p<0.001, ARS=2.74), and provide more coaching (p<0.01, ARS=1.25 SD), in the form
of time spent addressing a single competency and extensiveness of feedback, around the chosen
competency. Detecting a significant difference in coaching across conditions demonstrates the
intervention’s promise for generating intended outcomes in two ways. First, implementation of the
intervention should change activity and behavior in a manner consistent with the overall theory of

113
change (Buckley & Doolittle, 2013). Results indicating intervention coaches offered teachers more
choice, spent more time focusing on a single competency, and provided more extensive coaching
suggests implementation did change coaching activities and behaviors in a manner consistent with
my theory of change (see Logic Model, Table 3.11). Second, results demonstrate the feasibility of
this particular intervention to be delivered as intended in an authentic educational context. This
finding is particularly important considering development studies should provide evidence the
intervention can be implemented with fidelity in an authentic setting before scaling up to an efficacy
and replication study (IES, 2016).
Results also align with prior literature suggesting intervention participants engaging in initial
training and receiving ongoing support improve the likelihood participants accurately implement an
intervention’s core practices (Kretlow and Bartholomew, 2010). Additionally, results align with Kraft
and Blazar’s (2015) finding that coaches trained in a certain type of coaching tend to implement the
original coaching plan with close fidelity.
Moreover, the simplicity of the intervention, in terms of amount of requirements, could have
contributed to the strength of core components in the intervention condition. Specifically, I
designed the intervention to be manageable for intervention coaches to implement within the
context of the ICP. In fact, the intervention reduced the number of requirements coaches had to
follow during the observation and post-observation conference process as compared to the control
condition. This hypothesis is consistent with the notion that the complexity of the intervention
influences the degree to which it is implemented as intended (Gresham, 2016).
Additionally, the ARS differential across conditions might attest to the attention placed on
implementation fidelity. Whereas intervention fidelity analyzes the extent to which the program was
implemented as designed, implementation fidelity addresses certain contextual factors that create

114
essential conditions for the implementation of the intervention’s core components (Hulleman et al.,
2013). These factors, otherwise known as implementation core components (Fixsen et al., 2005),
indirectly effect the intervention’s impact, but provide the facilitative condition for implementation.
In this study, it is possible that removing the evaluation component of typical observation cycles
enabled an environment where intervention coaches could implement a core component (e.g.,
focused coaching). Thus, removing the evaluation requirement might have allowed intervention
coaches the opportunity to focus on fewer competencies as opposed to addressing multiple
competencies within a single post-observation conference.
Finally, this study makes three important contributions as it relates to experimental research
analyzing intervention fidelity within a coaching program. First, this is one of the first experimental
coaching studies to thoroughly assess intervention fidelity. Most experimental research on teacher
coaching has looked exclusively at the effectiveness of such programs without exploring the extent
to which the intervention was implemented as intended (Allen et al., 2011). While the majority of
experimental studies yielded positive results, if studies do not address intervention fidelity and detect
null effects, they run the risk of committing a Type III error, whereby results are attributed to an
ineffective intervention rather than limited implementation (Mendive et al., 2016).
Second, studies analyzing intervention fidelity only examined implementation in the
intervention condition. For example, Kraft & Blazar (2015) found the Match Teacher Coaching
program was implemented with a high degree of fidelity whereby each teacher in the intervention
received between four to five weeks of coaching and addressed the core components of the MTC
coaching plan. Although this analysis is helpful when interpreting their results, it is possible control
teachers received informal mentoring or additional professional development that could have
influenced some of the variation in results across conditions. Thus, if control teachers received some

115
form of informal mentoring or support, then this study might have underestimated the true effect of
the intervention by not capturing program elements in both conditions (Hulleman & Cordray, 2009).
Third, this is one of the first experimental coaching studies to analyze multiple dimensions
of intervention fidelity. Whereas most prior literature explored either adherence (Neuman &
Cunningham, 2009) or dosage (Kraft & Blazar, 2015), this study attempted to look at adherence, dosage,
and quality of implementation. Thus, I attempted to fulfill prior literature’s call to provide rigorous
evidence of implementation fidelity (Desimone, 2009; Wayne, Yoon, Zhu, Cronen & Garet, 2008)
and offer more practical guidance on the nature of implementation fidelity in experimental settings
(Cordray, 2007).
Finding II: The intervention demonstrated promise for producing intended
outcomes. In the context of an underpowered efficacy study, un-biased effect size estimates of
change in the appropriate or hypothesized direction demonstrate promise for generating intended
outcomes (Buckley & Doolittle, 2013). While non-significant, intervention teachers, on average,
received better observation ratings compared to control teachers. Specifically, intervention teachers
scored between 24 to 36 percent of a standard deviation better than control teachers. Thus,
estimated effects in the appropriate (e.g., positive) direction indicate the intervention’s promise for
generating improved classroom instruction.
Prior research also suggests that these results are promising. First, findings from my study
are within range of estimates from Kraft et al.’s (2016) meta-analysis of experimental coaching
studies. Moreover, there are reasons why estimates in the Kraft et al. (2016) analysis would be larger
than those in my work. In particular, most of the studies included in the meta-analysis had much
stronger treatment contrasts because the intervention teachers typically received coaching plus
additional professional development supports (e.g., training workshops, video resources) as

116
compared to no coaching or professional development supports in the control condition. In
contrast, my study had a more subtle, but important treatment contrast where the content of coaching
was the only difference across conditions. Specifically, intervention and control teachers received
coaching and the same professional development supports (e.g., bi-weekly ICP seminar instruction)
with the only difference being the content – choice plus focus compared to less choice and focus – of
the coaching received. Given the subtlety of the treatment contrast in the present study, it makes
sense why estimates are towards the bottom of Kraft et al. (2016) effect size range (14 to 92 percent
of standard deviation).
Second, Ronfeldt and Campbell’s (2016) evaluation of teacher education programs (TEP)
offers the strongest evidence results from the present study are meaningful. Drawing on observation
ratings from 9,500 TEP graduates across 183 TEP programs, the authors found TEP programs in
the top-quartile had observation ratings that were, on average, 31 percent of a standard deviation
better than TEP programs in the bottom-quartile. The difference in magnitude is comparable to the
average difference in observation ratings between a first- and second-year teachers (𝛽=0.33, p=0.11),
an amount the authors argue is meaningful. Thus, it is reasonable to conclude the estimated effects
of the present study, ranging from 24 to 36 percent of a standard deviation, not only show promise,
but are meaningful in light of prior research.
I also considered whether the intervention demonstrates promise for improving teachers’
perceptions of preparedness and coaching quality. Results from this underpowered efficacy study
with a subtle, but important treatment contrast revealed the intervention yielded null effects.
Specifically, teachers across conditions reported no statistically significant difference in preparedness
to teach across instructional domains and the quality of coaching received. However, two non-
significant trends provide additional suggestive evidence in support of the intervention’s promise.

117
First, estimates trended in the positive direction concerning intervention teachers’ preparedness to
differentiate and teach all students (18 to 42 percent of standard deviation) and manage the
classroom (23 to 28 percent of a standard deviation). It is notable that intervention teachers
favorably reported on preparedness to teach all students and manage the classroom because over
half of intervention teachers (54 percent) chose and received coaching on a rubric competency
addressing one of these two constructs. Additionally, estimates for coaching quality (6 to 11 percent
of a standard deviation) and focused coaching (21 to 31 percent of a standard deviation) also
trended in a positive direction. These results provide additional support for the intervention’s promise
for strengthening perceptions of preparedness and coaching quality (Buckley & Doolittle, 2013).
Prior research provides additional insight into why non-significant, yet positive estimates for
the effects of the intervention on perceptions of preparedness and coaching quality suggest the
intervention has promise. Specifically, having greater autonomy over instructional decisions might
improve teachers’ perceptions of preparedness and self-efficacy (Ronfeldt et al., 2013) and increase
the likelihood teachers report greater satisfaction with professional development (Gates Foundation,
2014). Moreover, positive estimates for the effects of the intervention on feelings of preparedness
and coaching quality align to prior research suggesting focusing on a specific competency enhances
teachers’ perceptions of self-efficacy (Archer et al., 2016) and receptivity to coaching and feedback
(Reinke et al., 2013). Finally, I suspected intervention teachers would report better quality coaching
because I assumed more focused coaching would yield more specific and actionable feedback (Hill
& Grossman, 2013), a form of feedback which prior research has found teachers to favor because it
supports implementation in the classroom (Biancarosa, G., Bryk, A., & Dexter, E., 2010). Though
not significant, intervention teachers tended to report better quality coaching, as expected.

118
It is not entirely clear why intervention teachers’ perceptions of preparedness to teach
subject matter content or investment in the conference process trended in a negative direction. It is
possible intervention teachers were better prepared to teach subject matter content and were more
invested in the conference process, but my method for measuring subject matter preparedness and
investment (e.g., teachers’ perceptions) did not capture these differences. One could also imagine
some teachers in the intervention were disappointed by the shift in coaching from the fourth to the
fifth and sixth observation and reacted negatively to the change. However, I am less confident in the
latter scenario given how intervention teachers’ perceptions of conference quality, which I suspect
are related to conference investment, trended in a positive direction. Regardless, understanding why
results did not trend in a positive direction is particularly important since one goal of a development
study is refining the intervention in preparation for scaling up to an efficacy study. Understanding
how coaches might enhance teachers’ investment in the conference process is especially important
in light of Wanless et al.’s (2014) argument that engagement in and responsiveness to coaching
influences implementation of the content discussed. I now turn to a discussion of specific
pedagogical practices coaches could use to potentially influence investment.
Finding III: Certain practices might influence teachers’ responsiveness to coaching.
While quantitative findings suggest the intervention demonstrates promise for generating intended
outcomes, they do not provide much insight into what coaches could do in post-observation
conferences to improve their impact. Since refining the intervention is expected after pilot data
collection and before scaling up to an efficacy study, understanding what coaches could do to
strengthen their impact is particularly important. Thus, this study also explored what pedagogical
practices coaches could employ to influence teachers’ responsiveness to coaching and improve the
likelihood teachers implement the content discussed. Understanding influences behind
119
responsiveness is particularly promising given the relationship between responsiveness,
implementation (Wanless, Rimm-Kaufman, Abry, Larsen, & Patton, 2014; Wong, Ruble, McGrew,
& Yu, 2017) and intervention success (Power, Blom-Hoffman, Clarke, Riley-Tillman, Kelleher, &
Manz, 2005).
First-year teachers mostly agreed upon coaching practices likely influencing their receptivity
to coaching. Although some differences existed across conditions, there was considerable agreement
around the importance of coaches providing concrete feedback during post-observation
conferences. This finding confirms prior research on teachers’ professional learning suggesting that
it’s more successful when feedback is explicit or concrete and uses multiple sources of data
(Desimone & Pak, 2017). However, prior research has not clarified what constitutes concrete
feedback. Thus, my explication of concrete feedback attempts to name specific components of this
particular practice. Specifically, teachers cited two components – actionable feedback and
decomposing practice – that contribute to concrete feedback. Actionable feedback typically refers to
feedback individuals can incorporate or act upon immediately in their practice (Wiggins, 2016). First-
year teachers valued actionable feedback because they felt like they could address a relevant problem
of practice immediately. However, feeling like you can immediately act does necessarily equate to a
teacher knowing how to implement the feedback. Therefore, concrete feedback comprises a second
component, decomposing practice, to assist teachers in learning how to implement a particular
practice. Decomposition refers to breaking a practice into its constituent parts, thus making aspects
of a practice visible to a novice teacher (Grossman et al., 2009). Thus, making a practice visible
might assist a novice in learning how to implement the actionable feedback.
Moreover, first-year teachers cited three other influential coaching practices that are
consistent with promising approaches described in previous research on positive psychology, new

120
teacher induction, and teacher coaching. First, creating a welcoming environment was the most
commonly cited influential coaching practice outside of providing concrete feedback. This makes
sense given what prior research says about its two core components: addressing the positive and
collaborative dialogue. Prior research on positive psychology suggests positive experiences or
encouragement can promote important traits such as engagement, satisfaction, and perseverance,
while also combating the detrimental effects of negative experiences (Seligman & Csikszentmihalyi,
2000). Moreover, new research exploring the effects of new teacher induction suggests supportive
communication from an administrator is the most consistent predictor of a new teacher staying in
her current school (Ronfeldt & McQueen, 2017). Additionally, research on teacher professional
development suggests interactions through collective participation create a productive learning
environment (Little, 1993; Ronfedlt et al., 2015) and can facilitate teacher learning (Desimone, 2009).
In sum, coaches addressing the positive and engaging in collaborative dialogue likely create a
coaching environment that is both engaging and conducive to learning.
Finally, narrowing the focus and modeling, although less commonly cited, coincides with
previous studies suggesting these practices might matter. In particular, addressing fewer
competencies in a post-observation conference might allow coaches to work at a smaller grain size
and provide more specific and actionable feedback (Hill & Grossman, 2013). Specifically, focusing
on a single competency enables coaches to take a broad teaching practice (e.g., facilitate a classroom
discussion), decompose it into its constituent parts, and offer more specific and actionable feedback
to a teacher. Modeling practice, on the other hand, allows for a teacher to observe an expert engage
in a particular practice (Desimone & Pak, 2017). Although modeling can be beneficial, prior research
suggests that, in isolation, forces the teacher to serve as a passive agent in the conference (Putnam &
Borko, 2000). Thus, modeling is likely beneficial when it occurs in tandem with opportunities for a

121
teacher to practice what the coach modeled. Some first-year teachers mentioned rehearsal as an
influential coaching practice, but it was not as frequently mentioned as other practices previously
discussed. Therefore, modeling and rehearsal working in tandem might enhance teachers’ capacity to
successfully enact a particular practice in an authentic setting.
Revision of Conceptual Framework
Findings from this development study suggest a number of revisions to my initial conceptual
framework, shown in Figure 5.1. I begin this section describing the aspects of my initial conceptual
framework reaffirmed by this study. I then describe three main revisions I made to the initial
conceptual framework based upon my findings. First, the initial conceptual framework did not
consider programmatic features enabling this type of coaching. Second, my framework includes
pedagogical coaching practices that might influence teachers’ responsiveness to coaching and
improve the likelihood coaching content is implemented. Finally, I emphasize how initial training
and ongoing support could address both coaching structure and pedagogical practices (e.g., process).
Findings from this study reaffirm several aspects of my original conceptual framework in
Chapter 2 (see Figure 2.1). Achieved Relative Strength (ARS) analyses revealed the presence of two
core components – choice and focused coaching – were stronger in the intervention condition. This
suggests initial training and ongoing support sustained implementation throughout the duration of
the intervention. This finding, presented as the black rectangle towards the top right of Figure 5.1,
affirms previous studies suggesting initial training and ongoing support improves overall
implementation of an educational intervention (Kretlow & Bartholomew, 2010). Next, results
provide some suggestive evidence that intervention teachers had stronger observation ratings,
perceptions of preparedness, and perceptions of coaching quality. Though non-significant, there is

122
reason to believe results are meaningful; specifically, average differences in observation ratings
between intervention and control conditions (a) fell within the range of results included in Kraft et
al.’s (2016) meta-analysis and (b) were comparable to differences in average observation ratings
between first and second year teachers. Thus, results from this study seem to reaffirm the notion
that the structure of the intervention – choice (Grossman, 2015) and focused coaching (Allen et al.,
2011, 2015) – show promise for improving teacher knowledge, skill, and instruction. The
intervention’s core components (e.g., choice and focus) remain depicted on the left of Figure 5.1,
while the intended outcomes (e.g., knowledge, skill, instruction) are presented towards the right of
the conceptual framework.
Figure 5.1: Revised Conceptual Framework
Although some findings support aspects of my initial conceptual framework, other findings
suggest revisions are needed. The preliminary conceptual framework focused on initial training and
ongoing support as levers for sustaining a high level of intervention fidelity. While the initial training

123
and subsequent support helped sustain a high level of intervention fidelity, other factors likely
contributed to these results. Specifically, results indicated intervention coaches were significantly
more like to focus on a single competency in the conference and in teachers’ written feedback. One
possible contributing factor was removing the evaluation component for intervention teachers’ third
and fourth visit to allow coaches to focus the observation and post-observation conference on the
competency each teacher chose. The influence of initial training, ongoing support, and removing
evaluation on implementation of the intervention’s core components supports prior literature
advocating the importance of attending to implementation fidelity (Hulleman et al., 2013). Specifically,
implementation fidelity refers to contextual factors (e.g., removing the evaluation component) or
programmatic supports (e.g., initial training) that enable implementation (Fixsen et al., 2005). Thus, I
added a black rectangular dash line – encompassing training, ongoing support, and removing the
evaluation component – to the perimeter of Figure 5.1 to highlight the importance of attending to
contextual factors and programmatic supports enabling implementation.
Findings from this study suggest certain coaching practices – concrete feedback, creating a
welcoming environment, and modeling practice – might influence teachers’ receptivity to coaching.
However, my original conceptual framework did not attend to or consider whether certain coaching
practices might influence teachers’ receptivity to coaching or implementation of the content
discussed. Thus, another revision to the framework, depicted as the blue dash rounded rectangle in
Figure 5.1, addresses the different pedagogical coaching practices cited as influencing teachers’
receptivity to a particular type or model of coaching. Specifically, including certain influential
coaching practices suggests the process (e.g., what practices coaches could employ) of the post-
observation conference might improve teachers’ responsiveness to coaching and influence teachers’
implementation of the content discussed. Addressing pedagogical approaches is particularly

124
important given prior literature suggesting post-observation conference are typically facilitated in
ways that likely close down opportunities for teacher learning (McQueen, 2015).
The final revision I made to my conceptual framework addressed the initial training and
ongoing support provided to coaches, shown as the black arrows at the top of Figure 5.1. Findings
from interviews with first-year teachers suggest certain coaching practice (e.g., process of the post-
observation conference) might influence teachers’ receptivity to coaching and implementation of the
content discussed. Specifically, several first-year teachers reported that certain coaching practices –
concrete feedback, creating a welcoming environment, narrowing focus, and modeling practice –
influenced their receptivity to coaching. These results led me to change my framework from initial
training and ongoing support focusing solely on the structure of the intervention to attending to both
structure and process. In my earlier framework, initial training and ongoing support attended to the
intervention’s core components, but did not attend to different pedagogical practices coaches could
employ to enhance teachers’ receptivity to coaching on a single competency. Thus, I kept the arrow
pointing from the initial training and ongoing support towards the structure (e.g., black dash line
outside intervention’s core components) of the post-observation conference and added an arrow
pointing towards the process (e.g., blue dash line outside of influential practices) of the post-
observation conference. With more of a focus on what coaches are supposed to do and what
practices they might employ, I suspect, coaches will enhance teachers’ receptivity to coaching on a
single competency, and, in doing so, improve the likelihood teachers implement the content
discussed. I discuss this further in my Implications section.

125
Study Limitations
This study had several strengths including randomization to intervention and control
conditions, investigating different dimensions of intervention fidelity, and a mixed-methods
approach to answering the research questions. However, my findings should be interpreted within
the context of a development study, which had several notable limitations that could have influenced
results; I elaborate below.
First, I question the reliability of coaches’ observation ratings. The ICP attempted to
measure inter-rater reliability at the final professional development, but the workshop was poorly
attended. Given the absence of several members from both conditions, the ICP did not have an
accurate sense of whether different coaches would consistently score an episode of practice. Thus, I
cannot rule out the possibility teachers in both conditions may have performed similarly but coaches
in the intervention condition were more lenient. Greater leniency in the intervention condition could
bias estimates upward. Second, intervention coaches were no longer blind to their condition when
they completed their fifth and sixth evaluations of teachers in the intervention group. Thus, it is
possible intervention coaches scored teachers higher than their true performance, for instance,
because of an expectation for the intervention to be successful. In other words, it is possible an
intervention coach scored a teacher higher than what her practice warranted. If this were the case,
the intervention coach would have inflated teachers’ evaluation scores and biased estimates upward.
Future evaluation studies on teacher coaching should include independent raters to evaluate
teachers’ instruction to mitigate potential sources of bias.
Second, the conservative attrition standards from the What Works Clearinghouse (2015)
suggest the combination of overall (22 percent) and differential (13 percent) teacher attrition to be
high. While a post-attrition balance check of teachers remaining in the analytic sample indicates

126
balance on different characteristics at baseline, high attrition could still introduce bias on unobserved
characteristics for instance. Finding estimates to be slightly lower in magnitude in robustness checks
using multiple imputation may further concerns over bias due to attrition, and raises questions about
whether it is possible to attribute differences in the outcomes solely to the intervention (What Works
Clearinghouse, 2015). Third, several of the measures used to answer the different research questions
relied on self-reported teacher data. Self-reported data limited my ability to identify whether coaches
actually implemented the intervention’s core components as intended, whether teachers received
better quality coaching, and whether teachers were better prepared to teach across different domains
of practices. Moreover, I could not triangulate self-reported data with observational data on
implementation (e.g., adherence, dosage, quality), conference quality (e.g., evaluation of post-
observation conference), or sense of preparedness (e.g., evaluation of teachers’ practice across
different instructional domains). While teachers did comment on implementation, conference
quality, and preparedness, I could not verify whether these constructs occurred in practice. How
teachers responded across surveys could have been more indicative of what they perceived at the
time. Therefore, I cannot rule out the possibility teachers’ responses do not reflect what actually
happened; rather, results must only apply to teachers’ perceptions of implementation, conference
quality, and sense of preparedness. For example, during a post-observation conference, a coach
modeled for a teacher how she might better elicit students’ thoughts during a whole class discussion.
In doing so, the teacher received what I constitute as quality coaching because she was able to
observe a visual enactment of a particular practice that could be implemented in the classroom.
However, the teacher hoped she might see the coach model this practice in front of live students
rather than in the post-observation conference. Thus, the teacher does not know, in regards to the
practice modeled, how applicable it will be in her classroom. Consequently, the teacher’s perception
127
of a lack of applicability might leave her feeling slighted by the coaching she received. This could
lead the teacher to report worse quality coaching, despite receiving better quality coaching in practice.
Fourth, the absence of observational conference data limits the quality of my fidelity
analysis. Measuring adherence, dosage, and quality are most reliable when observational data is
analyzed (Gresham, 2016). Initially, I planned to observe and audio-record the majority of post-
observation conference so I could gauge whether coaches adhered to the intervention’s core
components, teachers’ exposure to the core components, and how well coaches facilitated the
conference. In particular, observational data would afford me the opportunity to check whether
coaches offered teachers’ choice, addressed a single competency, and the amount of time spent
focusing on a single competency. However, only eight coach-teacher pairs consented to observing
and audio-recording the conference. Because I needed to measure fidelity using the same sample size
across data sources, I determined adherence, dosage, and quality mostly from the self-reported data
discussed above. Although I included written feedback in my analysis of adherence and dosage, this
data source is still limited because there was no way to determine if these results mirrored what
occurred in post-observation conferences. For example, an intervention field instructor could have
addressed a single competency in the written feedback, but addressed multiple competencies during
the post-observation conference. Including fidelity analyses with observation data could significantly
strengthen future impact studies on coaching interventions. Moreover, observational data, in
addition to gauging adherence and dosage, could help measure how well the conference was
facilitated. This type of data would have complemented the self-reported teacher data and placed
less reliance on how teachers’ felt about their conference experiences.
Furthermore, fidelity analyses around quality of implementation might not reflect this
particular construct. Specifically, the construct of quality, as it relates to intervention fidelity, gauges

128
how well the intervention was implemented (Hulleman et al., 2013). However, questions reflecting
quality in my fidelity analyses addressed teachers’ learning, usefulness of feedback, putting
suggestions into practice, and feeling empowered as a professional. While important, these questions
do not necessarily address how well the teacher implemented the intervention’s core components;
rather, these questions are more likely the result of quality implementation of the core components.
Moreover, my dual role as both the lead investigator and ICP program team member poses
two potential problems. First, serving as the lead investigator and as an ICP program member might
have influenced intervention coaches’ implementation of the intervention. Specifically, my dual role
might have put undue pressure on intervention coaches to implement the intervention as intended.
For example, an intervention coach might have felt pressure to offer teachers’ choice and focus on a
single competency because she knew the person monitoring implementation was a member of the
ICP program team. Second, my dual role presented a conflict of interest. Specifically, I had a vested
interest in the success of the intervention and might have advocated against any programmatic
decision or policy that could have negatively impacted the intervention. For example, the ICP
program team wanted to bring all coaches together after the first professional development for the
intervention and control conditions. However, in an effort to prevent intervention coaches from
sharing what they learned with control coaches, I advocated to keep all coaches separate for the
entirety of the PD. I recognize, intervention and control coaches could have discussed the
intervention at another point, but I sought to close down one potential opportunity where this could
happen. Thus, it possible my dual role could have influenced the results of this study.
Additionally, limiting my qualitative analysis to a single data source is problematic. In
particular, I could not triangulate findings across different sources to verify the claims I make. It is
likely the case that during an interview, teachers will not recall all pedagogical coaching practices that
129
would likely be present in observational data. Thus, different data sources may privilege different
kinds of pedagogical coaching practices, which triangulation helps guard against. Moreover, it is
likely other influential coaching practices exist, but I failed to uncover them. In particular,
observational data might provide evidence of moments in a conference where a teacher was
particularly engaged or receptive. These instances could be used to (a) uncover what pedagogical
practice coaches used to solicit this response and (b) discuss with teachers why this particular practice
solicited a particular response from them.
Finally, I cannot rule out the possibility the intervention’s core components spilled over into
the control condition. I randomized intervention and control teachers at the coach level as opposed
to the school level. Consequently, I assigned some teachers working in the same school to different
field instructors and separate conditions. It is possible intervention teachers discussed with control
teachers the structure and process of the intervention which, in turn, influenced the control teachers
to ask their field instructors to engage in a similar process. For example, a control teacher could have
discussed with a treatment teacher the helpfulness of addressing a single competency in the post-
observation conference. This conversation could have influenced the control teacher to ask her
coach to address a single competency for subsequent observation cycles. Thus, I cannot rule out that
some components of the intervention spilled over into the control condition and changed control
coaches’ practices. If spillover did occur, then intervention effects are likely biased. Specifically, if a
control coach started addressing a single competency for consecutive observations, then it is
possible her instruction improved and she received better observation ratings than she would have
had spillover not occurred. This form of bias likely reduced the estimated effect, whereby the true
effect would be greater than the estimated effect. If so, this suggests my estimates are conservative.
130
Implications
Despite these limitations, the suggestive and promising evidence from this study, while not
conclusive, offer several potential implications for the practice of teacher coaching, research on
teacher coaching, and revision of the intervention. In this section, I begin by discussing two
important considerations for the practice of teacher coaching. I then discuss three potential
implications for future research on teacher coaching. Finally, I conclude this section with
recommendations for a potential redesign of the intervention.
Potential Implications for the Practice of Teacher Coaching. This study has two
potential implications for the practice of teacher coaching. First, teacher education programs could
implement choice and focused coaching. Second, teacher education programs could also support
coaches in learning to provide concrete feedback, create welcoming environments, narrow focus,
and model practice. I discuss each in more detail below.
Integrating Choice and Focus. Though not statistically significant, positive results suggest
the intervention demonstrates promise for improving teachers’ instruction and their perceptions of
preparedness, and for promoting coaching quality. In particular, the estimated difference between
intervention and control teachers’ observation ratings teachers is comparable to the average
difference in observation ratings between first and second year teachers (Ronfeldt & Campbell,
2016). Additionally, results from this study are consistent with the broader literature which indicates
choice and focus to be important characteristics of promising professional learning experiences
(Garet et al., 2001; Merriam, 2001).
Given the intervention’s promise, one potential implication is pre-service and in-service
teacher education programs consider developing a coaching model where teachers choose certain
competencies to address and coaches focus their work together on the selected competencies. For

131
example, programs might consider having coaches conduct two to three baseline observations to
gather evidence on four competencies a teacher might need to improve in. Then, coaches could
provide teachers with the four potential competencies to address and the teacher selects one of the
four to address in subsequent observation cycles. The remaining competencies could eventually be
taken up after the coach sees sufficient growth in the initial selected competency.
Supporting coaches learning of influential practices. Qualitative results from this study
suggest four pedagogical coaching practices might influence teachers’ receptivity to coaching:
offering concrete feedback, creating a welcoming environment, narrowing focus, and modeling
practice. Thus, one possible implication is for teacher preparation programs to focus the initial
training and ongoing support on coaches learning about these four potentially influential coaching
practices. For example, in the initial training, coaches could listen to a brief presentation on the two
elements of concrete feedback – actionable and decomposed – and then watch a brief video of a
first-year teacher asking questions to a small group of students. After watching this instance of
practice, coaches could practice providing concrete feedback, both written and verbal, to a partner
who assumes the role of the teacher in the video. In this example, coaches have the opportunity to
not only learn about an influential practice, but to also practice incorporating concrete feedback into
a simulated post-observation conference.
Recommendations for Future Research on Teacher Coaching. Based upon the results
and limitations of this study, I offer three recommendations for future research on teacher coaching.
The first is to further explore the relationship between intervention fidelity constructs and outcomes
of interest. The second is to further investigate whether choice and focus demonstrate promise for
generating intended results. The third is to further examine whether certain pedagogical coaching

132
practices actually influence teachers’ receptivity to coaching and implementation of the coaching
content.
Learning more about intervention fidelity. As described in my findings, the coaching that
intervention teachers received was significantly different from the coaching control teachers
received. While providing suggestive evidence the intervention can be implemented in an authentic
educational setting, my study did not disentangle the relationship between different fidelity measures
(e.g., choice, focus, and quality of implementation) and my outcome of interest (e.g., teachers’
instruction). Thus, we do not know which components of the intervention had more or less of an
impact on teachers’ instruction. For example, this study does not investigate the relationship
between receiving more written feedback addressing a single competency (e.g., dosage) and teachers’
instruction. Therefore, future studies should attempt to link intervention fidelity measures to the
outcome of interest by modeling teachers’ instruction as a function of adherence, dosage, or
implementation quality. Ideally, these analyses would help identify which measures of fidelity are
more promising for improving teachers’ instruction,
Learning more about the promise of choice and focus. The current research design focused exclusively
on the intervention’s influence on teachers’ instruction. However, development studies, according to
IES, should address whether the intervention demonstrates promise for improving student outcomes.
Thus, future research should consider connecting a coaching intervention, like the one used in this
study, to student performance. One possible approach to measuring student performance is to use
the accountability assessments already collected in most states. To yield a more precise estimate for
the effect of the intervention, it would be advisable to adjust for students’ prior assessment scores.
Learning more about the influence of certain coaching practices. In this study, first-year teachers
identified several pedagogical coaching practices – concrete feedback, creating a welcoming

133
environment, narrowing focus, and modeling practice – that they felt influenced their receptivity to
coaching. While teachers’ perceptions offer important insight into what could influence teachers’
receptivity, this study did not uncover whether certain coaching practices actually influence teachers’
implementation of the coaching content. For example, it is possible that teachers are particularly
receptive to coaching when offered concrete feedback, but do not implement the content discussed
when returning to the classroom. Thus, a future study could extend the work discussed in the
preceding paragraph by observing teachers’ instruction following the post-observation conference,
whether live or recorded, to determine whether teachers implemented the coaching content. This
line of research would not only provide insight into whether certain practices influence teachers’
receptivity to coaching, but also reveal whether certain practices influence teachers practice.
Refining the Intervention. One expectation of a development study is to engage in an
iterative process of revising the pilot intervention in order to fully develop a promising intervention
capable of scaling up to a sufficiently powered efficacy study. Based on limitations in the present
study, I recommend that future research consider three revisions – improving reliability of measures,
conceptualizing quality of implementation, and mitigating teacher attrition – to the research design
to address these limitations. I elaborate on each below.
Improving reliability of measures. One limitation of the current research design – reliability of
ratings – could be addressed in a future study of this intervention. In particular, I question the
reliability of teachers’ end-of-year evaluation ratings because coaches were no longer blind to
condition and the ICP did not test for inter-rater reliability (IRR). Thus, an improved research
design could include independent observers evaluating all participating teachers’ instruction. If this
occurs, then teacher preparation program implementing the intervention could first calibrate
independent observers’ IRR to ensure reliable estimates of teacher performance across the program.

134
Once an acceptable level of IRR is calibrated, independent observers blind to condition might
observe, either in person or watching a video recording of a full class period, and evaluate teachers’
instruction. While I still advocate for coaches continuing to observe, coach, and evaluate teachers
for internal purposes (e.g., program planning, certification recommendations), I recommend only
including independent observers’ evaluations of teachers’ instruction when estimating effects of the
intervention.
Conceptualizing quality of implementation. The current research design did not have a clear
articulation of what quality implementation is for a particular type of coaching. Thus, it is possible
that analyses about the quality of implementation did not adequately reflect this particular construct.
Given this, an improved research design could address this limitation in two ways. First, a future
study might consider conceptualizing what quality implementation looks like for a coaching model
incorporating choice and focus. Specifically, the intervention could conceptualize what ideal
implementation looks like when a teacher chooses a rubric competency to address and receives
coaching targeted on the specific competency selected. In doing so, a future iteration of the
intervention could (a) assist coaches in understanding what this intervention might look like in
practice and (b) yield fidelity analyses more accurately measuring this particular construct.
Second, by conceptualizing implementation quality, future research can develop ways to
measure this construct during implementation. For example, independent observers blind to
condition could evaluate implementation quality during post-observation conferences. Such
evaluations, whether in-person or via recorded video, would push research beyond perceptions of
implementation quality to measuring this construct in practice. Additionally, measuring this
construct will provide future research the opportunity to analyze whether better quality
implementation predicts better teacher instruction.

135
Mitigating teacher attrition. Finally, the present study had high attrition. This is particularly
problematic because if treatment teachers who leave are systematically different than control
teachers who leave in a way that is related to observation ratings, then results are likely biased. One
possible revision is a teacher preparation program implementing the intervention requires a set
amount of first-year teachers assigned to coaches’ caseload. In the current study, the ICP asked,
prior to assignment, if coaches had a limit on the number of first-year teachers they wished to
support. Two coaches desired to support a single first-year teacher. Consequently, randomization
placed these coaches in the control condition, resulting in more teachers assigned to the intervention
condition as compared to the control condition. If these two coaches had a caseload of two first-
year teachers, the number of teachers assigned to each condition at randomization would have been
equal. Thus, if attrition occurred at the same rate, differential attrition using conservative standards
from the What Works Clearinghouse would have moved from a red designation to a yellow
designation. Therefore, balancing coaches’ caseload is a possible revision to mitigate attrition bias in
future iterations of the intervention.
While results from this study suggest the intervention has promise for generating intended
outcomes and might warrant a future efficacy study, I recommend conducting a second
development study after incorporating the revisions previously discussed. I am concerned that I
permitted a considerable source of bias by allowing coaches no longer blind to their condition to
evaluate teachers after the intervention concluded. This limitation, in addition to others concerning
the research design, might have influenced the results. Thus, revising the intervention with the
present study’s limitations in mind and retesting in a future development study would offer more
credible evidence concerning the promise of the intervention.

136
Such a follow-up efficacy study should seek to partner with a teacher education program
with enough coaches (~182) and first-year teachers (~364)6 to detect a statistically significant effect
with an effect size of 24 percent of standard deviation7. While this number might not be reasonable
for most teacher education programs, reducing the number of coaches employed and increasing the
number of first-year teachers supported might diminish the quality of the intervention. Moreover, a
future efficacy study should continue randomizing participants at the coach or teacher level to
increase statistical power. While sampling at the school-level might mitigate against potential
spillover effects, it would further contribute to the underpowered natured of coaching studies.
Moreover, prior research suggests increased statistical power is more important than potential
disadvantages from spillover effects (Kraft et al., 2016).
6 I used PowerUp to determine the sample size required to detect a significant effect for the estimated differences found in this study. The basic assumptions for this 2-level stratified random sample included: alpha equaling 0.05, target power equals 0.80, rho (ICC) equaling 0.05, average teacher cluster equaling two, P (proportion of sample randomized to treatment) equaling 0.50, r-squared one equals 0.40, r-squared two equals 0.10, and 5 level 2 covariates. 7 I selected an effect size of 24 percent of a standard deviation because this was the estimate I detected in my most robust ordinary least squares (OLS) regression models.

137
Appendix A: 2015-2016 ICP Program Rubric
Program Outcome 1: Plan and Prepare for Effective Instruction
1A: Unit Planning (Not assessed by coaches)
Teacher makes overt references to essential questions or big ideas of the unit
Students are able to identify the essential questions or big ideas of the unit Teacher makes connections between lesson activities and unit objectives
1B: Lesson Planning Lesson fits clearly into a larger learning trajectory
Lesson activities are age- or grade-appropriate
Lesson includes a variety of frequent informal assessments and checks for understanding
Lesson activities encourage disciplinary thinking and doing
Lesson activities are logically sequenced and connect to each other
Lesson activities build upon one another, allowing for increasingly complex thinking and doing
Students have access to multiple resources and/or manipulatives throughout the lesson
1C: Teacher Preparation Teacher has all necessary materials to enact the lesson, including a detailed lesson plan, student handouts, technologies, and manipulatives
Teacher demonstrates fluency in explaining content
Teacher readily and effectively responds to student questions or other learning needs
Teacher reteaches material when needed, using a different delivery or method
1D: Lesson Structure Class activities support the objective and are tied to unit goals
Teacher seeks student contributions in explaining key ideas
Students engage with the content in a variety of ways during the lesson
Learning activities build upon each other throughout the lesson
Directions and procedures are clearly communicated to students
Teacher checks for student understanding of directions and procedures before an activity
Students ask one another for clarification of directions and procedures
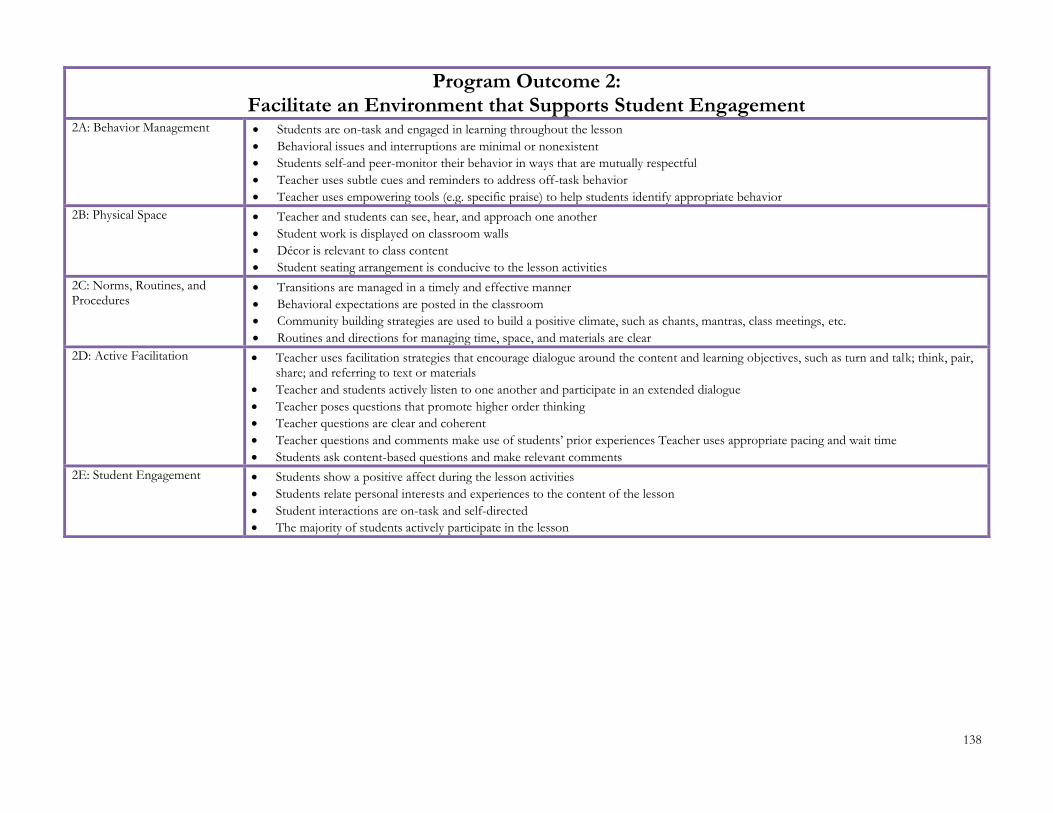
138
Program Outcome 2: Facilitate an Environment that Supports Student Engagement
2A: Behavior Management Students are on-task and engaged in learning throughout the lesson
Behavioral issues and interruptions are minimal or nonexistent
Students self-and peer-monitor their behavior in ways that are mutually respectful
Teacher uses subtle cues and reminders to address off-task behavior
Teacher uses empowering tools (e.g. specific praise) to help students identify appropriate behavior
2B: Physical Space Teacher and students can see, hear, and approach one another
Student work is displayed on classroom walls
Décor is relevant to class content
Student seating arrangement is conducive to the lesson activities
2C: Norms, Routines, and Procedures
Transitions are managed in a timely and effective manner
Behavioral expectations are posted in the classroom
Community building strategies are used to build a positive climate, such as chants, mantras, class meetings, etc.
Routines and directions for managing time, space, and materials are clear
2D: Active Facilitation Teacher uses facilitation strategies that encourage dialogue around the content and learning objectives, such as turn and talk; think, pair, share; and referring to text or materials
Teacher and students actively listen to one another and participate in an extended dialogue
Teacher poses questions that promote higher order thinking
Teacher questions are clear and coherent
Teacher questions and comments make use of students’ prior experiences Teacher uses appropriate pacing and wait time
Students ask content-based questions and make relevant comments
2E: Student Engagement Students show a positive affect during the lesson activities
Students relate personal interests and experiences to the content of the lesson
Student interactions are on-task and self-directed
The majority of students actively participate in the lesson

139
Program Outcome 3: Build Positive Rapport and Relationships with Students to Support Learning
3A: Positive Interpersonal Relationships
Teacher greets every student
Teacher calls students by name
Teacher holds brief side conversations with students
Teacher shares relevant personal stories
Students and teacher smile, laugh, and/or otherwise demonstrate enjoyment in their work together
Students are consistently supportive of each other
3B: Student investment, interest and autonomy
Teacher uses class mantras/chants
Teacher uses affirmative praise
Teacher references students interests, experiences, and prior knowledge in connection with the content
Teacher identifies and takes advantage of “teachable moments”
Teacher provides students with choices
Teacher uses a community problem, need, or resource as a basis for teaching and learning content
Program Outcome 4: Use Disciplinary Literacy to Teach Content
4A: Effective Reading & Interpretive Strategies
Teacher provides students with opportunities to interpret disciplinary materials
Students are active in the process of interpreting disciplinary related content and/or texts
Students explain the content and purpose of disciplinary texts in their own terms
4B: Academic Language Disciplinary vocabulary is purposefully integrated throughout the lesson
Key vocabulary needed to understand content is appropriately discussed during the lesson
Teacher uses disciplinary language throughout the lesson
Students use, or attempt to use, the language of the discipline during discussions and activities
4C: Disciplinary Resources Teacher provides students with exemplary models of disciplinary texts
Students have the opportunity to create disciplinary texts
Teacher uses a diverse array of technologies, materials, and tools that encourage disciplinary thinking
Teacher asks students questions that encourage disciplinary thinking

140
Program Outcome 5: Enact Instruction to Meet Student Needs
5A: Modified Instruction Teacher constantly monitors students’ learning
Teacher offers extra assistance or support to students in need
Teacher acknowledges and directly addresses common misconceptions
Teacher adjusts instruction as appropriate to accommodate student misconceptions, questions, engagement, or interests
Teacher draws from multiple strategies and/or uses external resources to adjust instruction
All students are included in the educational process
5B: Scaffolded Instruction Lesson includes multiple and varied strategies that match the intended learning outcome
Students work together surrounding the development of their understanding of content
Teacher provides students with frequent and specific feedback
Teacher offers students extensions to student thinking
Teacher consistently provides students with appropriate assistance in order to scaffold their learning of content
Teacher provides both encouragement and affirmation for students to progress their learning
Students have structured opportunities to reflect on their own learning
Program Outcome 6: Assess Student Learning
6A: Multiple forms of Assessment
Teacher checks for understanding throughout the lesson, using various assessment strategies such as questions, white board responses, and monitoring individual work
Teacher’s ongoing informal assessments gauge the learning of all students
6B: Criteria for Assessment Teacher previews upcoming assessment tasks with students, including their alignment with the learning objectives and the criteria under which they will be evaluated
6C: Data Tracking Teacher uses data to communicate progress to individual students and to the class as a whole
Teacher invites students to assist in planning next steps for improvement based on assessment data
Teacher and students are well-versed in reading and interpreting data and converse fluently about progress monitoring and goal setting

141
Program Outcome 7: Relate and Communicate Effectively with Parents, Families & Community
7A: Communication with Families and Community
Teacher involves parents and community members in the classroom
Teacher refers to or draws upon resources gathered from the community during teaching Students are actively encouraged to communicate about classroom activities with their families
Program Outcome 8: Reflect on Practice and Contribute Professionally to the Learning Community
8A: Reflection on Lessons and Practice
During observation debriefings, teacher makes an accurate assessment of a lesson’s effectiveness, citing specific examples to support his/her claim
Teacher incorporates ideas generated through his/her reflections and the observation debriefing conversation into upcoming lessons
8B: Building Relationships Teacher is open to developing his/her practice and is receptive to feedback and suggestions
Teacher actively engages in debriefing conversations with the Field Instructor
Teacher is prompt, courteous, and professional in interactions with the Field Instructor
Teacher complies with program policies for Field Instruction
8C: Professional Development
Teacher attends all program seminars, workshops, etc.
Teacher seeks out and uses feedback from colleagues, supervisors, and instructors to enhance his/her practice
Teacher pursues practice-based professional development opportunities
Teacher applies what s/he has learned through professional development into his/her practice
Teacher demonstrates knowledge of, or interest in, resources available through local, state, and/or national professional organizations Teacher uses resources from local, state, and/or national professional organizations to enhance his/her practice

142
Appendix B: Intervention-Professional Development (IPD) #1 Intervention Professional Development Session #1 November 10, 2015 1:00PM – 3:00PM Design Rationale The first Intervention Professional Development (IPD) is designed with the intention of meeting the following objectives:
1. Orient field instructors to the purposes and goals of Visits #3 & #4. 2. Orient field instructors to the processes and structures of their coaching visits.
a. Discuss the timeline of coaching visits. b. Discuss the resources provided for coaching visits. c. Discuss the follow-up from coaching visits (e.g. submitting to Chalk and Wire). d. Discuss the communication process for identifying struggling corps members.
3. Develop field instructors’ capacity to observe and facilitate a post-observation conference around a single competency.
To Do Print Out Analysis Forms (Yellow Paper) Print Out Handouts (Light Blue Paper) Print Out Survey/PD #2 Interest Form (Green Paper) Print Out List of FIs for PD (2 attendance forms) Reserve & Pick-Up Audio Recorder Bring Teach Like A Champion 2.0 Copies Create Field Instructor Folders (to include documents) Print Out TLC 2.0 Rubric Alignment
Session Component Talking Points Welcome and Overview
1:05-1:12 Minutes Welcome
Thank field instructors for attending today’s professional development Overview
As a program, we are constantly thinking about what types of support work best for our field instructors and our corps members.
Ideally, we want to develop a support structure that a) is well received by teachers, b) helps improve their practice, and c) is both manageable and effective for our field instructors.
In order for our program to make progress towards these goals, we want to try a modified visit structure for the next two visits to see if this is something we can adopt as a program.
In particular, we want to see if a) non-scored visits, b) reducing the number of outcomes to observe, and c) adding in CM choice about what they need assistance on is an effective direction to move (Kiel will speak more about is this momentarily).
In order to answer these questions, we had to randomly select field instructors to try out these non-scored/focused visits so that we could compare CM survey results and observation scores across our program to see if one model is better for our CMs.
Thus, we are excited to welcome you here because we have randomly selected you all to try out this model for the next two visits with your 1st year CMs.
We know this will provide helpful insight around what direction to move forward in the future that works best for our teachers and our field instructors.
I’ll now turn it over to Kiel to provide more in-depth information around what we want you to address in the next (2) visits.
Goal: Field instructors understand the purposes and goals of focused coaching. Specifically, field instructors will know WHAT they are doing and WHY they are doing it.
Focused Coaching 1:12-1:25
Focused Coaching
As Jean mentioned, our goal as a program is to create a field instruction system that makes both your job

143
more manageable and is well received by corps members.
A common theme I have noticed in both corps member and field instructor feedback across the years addresses the challenges associated with observing, evaluating, and coaching on 22 rubric competencies combined with having limited face-to-face time to conference with corps members about the practices they struggle with.
We also know that adding in the element of choice* for corps members to decide what the focus coaching on might strengthen their willingness to integrate feedback into their practice
*An asterisk is placed next to choice because, as I describe in a little bit, choice needs to be grounded in field instructors’ impressions of what CMs need to improve in. Choice is not corps members choosing whatever they want to focus on. This is more of “informed choice”.
Taken this all together our program has spent a lot of time thinking about a system of support that might be most helpful both you and corps.
Thus, we want to pilot or “test” whether this system of support is well received by field instructors and corps members and helps improve corps members’ performance.
Thus, as Jean mentioned, we want to try (a) condensing the amount of competencies you observe and coach corps members on, (b) include an element of informed corps member choice, and (c) implement in a non-evaluative setting.
Specifically this will look like…. Overarching Structure
Field instructors will observe and coach first-year corps members on (1) selected competency for Visit #3 & #4.
This will occur in a non-evaluative setting (e.g. non-scored visit). Specific Details Informed Choice
You (in this PD today) will identify (4) competencies you believe each of your first-year teachers needs the most assistance with.
It’s important to note here we wanted these competencies to specific to the needs of each teacher versus picking one competency to address for all teachers.
In your upcoming scheduling email to first-year corps members, we want you to list these (4) competencies and have CMs choose (1) to focus visit #3 & #4 on.
To address potential questions you have about this, (a) Jean will be sending an email to your first-year CMs to alert them to this structure for Visit #3 & #4 and (b) we have also provided some sample text for you to include in an email if it’s easier for you.
Post-Conference Next Steps
In Chalk and Wire, we want you to select “N/A” for ALL rubric competencies.
In regards to written feedback, provide the “normal” amount of feedback you provide. Instead of providing it across multiple competencies, please focus your written feedback around the (1) competency you discuss.
In the google spreadsheet, rather than providing a score, please input the competency you address with the CM (e.g., 2A, 4A, etc.)
Additional Notes/Addressing Potential Questions (Create Separate Slide For This)
Review FAQ Handout Goal: Field Instructors clearly understand what they will be doing during visits #3 & #4.
Identifying CM Needs 1:25-1:45
5 Min – Overview 15 Min - Analysis
As I mentioned before, one beneficial element of this design is offering coaching and support to CMs that is unique to their individual situation.
In order for this to work, we need to identify a range of competencies that CMs need to make significant improvement in based on your evaluations from Visit #1 & #2.
In other words, what competencies do you believe if CMs show significant improvement in, their practice as a whole will significantly improve?
To identify these practices, I have gone ahead and created a CM analysis form that includes each CMs observation ratings and comments.
What we would like for you to do is for each corps member, (a) review the observation ratings and

144
comments across visits and (b) identify (4) competencies for each CM YOU BELIEVE if improved will significantly impact CMs instructional practices.
If you haven’t yet observed/evaluated CMs a second time, please base your analysis off the first visit and then update/revise as needed once you have visited CMs a second time.
We will spend the next (15) minutes conducting this analysis (or shorten it if needed) and then come back together as a group afterwards.
Goal: Field Instructors identify (4) competencies CMs could significantly improve in.
Observing (1) Competency 1:45-1:58
3 Min – Overview
5 Min – Partner Discuss 5 Min – Group Discuss
Since we will significantly reduce the amount of competencies you focus on in your next two observations with first year teachers, I think it will be helpful for us to discuss how this might shape your practice as field instructor.
More specifically, how might you observe around a single competency and how might this be different compared to looking across 22 competencies?
We will spend the next (5) minutes discussing with our neighbor our thoughts to these questions and then we will come back and share out together as a group for (5) minutes.
Goal: Field Instructors have a better idea about how to observe around a single competency based on collaborative discussion.
Coaching Around (1) Competency
1:58-2:10
2Min – Overview 5 Min – Partner Discuss 5 Min – Group Discuss
Thank you all for that discussion. Your insight was incredibly helpful and I trust this helped you consider how you might approach observing corps members around a single competency.
Now I think it will be helpful to transition our conversation to how a focus on a single competency will shape how we lead a conference with our first-year Corps Members.
Specifically, (a) how might you coach (e.g., verbal and written feedback) around a single competency, (b) how might this be different from coaching across multiple competencies?
We will spend the next (5) minutes discussing with our neighbor our thoughts to these questions and then we will come back and share out together as a group for (5) minutes.
Note: KIEL make sure you address both verbal and written feedback. Goal: Field Instructors have a better idea about how to coach around a single competency based on collaborative discussion.
Observing & Coaching Around 2A 2:10-2:30
2Min – Overview
3Min – Review 2A 8Min – Partner Discuss 7Min – Group Discuss
Thank you again for a very helpful and insightful discussion.
Now that we’ve contemplated and discussed more broadly about how to observe and coach around a single competency, I would like to apply these new insights into a specific competency.
I have chosen competency 2A: Behavior Management because I know it is something most, if not all of you, have observed and coached first-year Corps Members on at this point in the year.
Specifically, let’s address the following questions (1) how might you observe around 2A: Behavior Management if your CM chose to address this competency, and (2) how might you coach (verbal & written feedback) around 2A: Behavior Management if your CM chose to address this competency.
Let’s spend the next (3) minutes reviewing Competency 2A on Handout C, looking specifically at the competency description and observable practices.
Now that we have reviewed Competency 2A, let’s spend the next (8) minutes with our partner discussing the (2) questions presented on the PowerPoint.
Lets take the next (7) minutes to share out as a group. Note: KIEL make sure you synthesis the discussion at the end. Goal: Field Instructors have a better idea about how to coach around a specific competency based on collaborative discussion.
Next Steps 2:30-2:40
Thank you all for engaging in this discussion both with your partner and as a group.
I hope this discussion has helped you consider ways in which you might observe and coach teachers around a single competency.
I do want mention the book in front of you, Teach Like A Champion 2.0, and its alignment to the program rubric might be a helpful resource for you if you want to discuss some specific practices CMs might use that address the competency they have chosen to address.
Note: KIEL make sure you reference this is what Field Instructors in the upstairs PD have been addressing today (i.e., learning more about these practices).

145
To recap our PD and next steps, I want to quickly reference Handout D on Page 4 titled “Next Steps”
Go Over Each Component
Are there any questions? Goal: Field Instructors have full understand of what is expected of them following this Professional Development.
Success Coaching (Jean) 2:40-2:55
I would now like to turn it over to Jean to discuss the “Success Coaching” initiative and what it might mean to you.
Jean Presents
As a follow-up to Jean, this is why I have listed in the next steps a section about what to do if you have a concerned CM.
Also, if you HAVE A CMC in your group, you will be still providing a non-scored coaching visit and a member of the program team will be the one providing the score for your CM. We want to provide you the opportunity to provide the coaching without it being in an evaluative setting for the CM.
Closeout 2:55-3:00
Lastly I have a quick reflection/survey that I would like to ask.
This will help provide our program team with some additional insight into your thoughts about this structure.
These are also anonymous so please speak candidly about this.
Also, there is a PD form in your folder that asks you about which date for the next PD works well. My plan is to conduct (2) separate PDs so it makes it easier for you all. Please fill out your name on this one so I know who prefers which date.
Once you are done you are free to go. If you have any questions that arise, please feel free to email or call Kiel.
References Desimone, L. M. (2009). Improving impact studies of teachers’ professional development: Toward better conceptualizations and
measures. Educational researcher, 38(3), 181-199. Garet, M. S., Porter, A. C., Desimone, L., Birman, B. F., & Yoon, K. S. (2001). What makes professional development effective?
Results from a national sample of teachers. American educational research journal, 38(4), 915-94

146
Appendix C: Intervention-Professional Development (IPD) #2 Intervention Professional Development Session #2 January 7, 2016 Virtual Session 1:00-3:00 PM Design Rationale The second Intervention Professional Development is designed with the intention of meeting the following objectives:
4. Debrief field instructors’ experiences with the first coaching visit. 5. Discuss how to build coherence between the first and second coaching visit.
a. Identify what FIs should look for in their second visit. b. Determine how to use feedback from the first visit to facilitate second coaching conference.
6. Orient field instructors to EOY process.
To Do Send Out Reflection Form Send Out Interview Request Print Out FI Analysis Forms Create Google Form for FI Reflection & Interview Request
Session Component Talking Points
Welcome, Overview, & Process
1:05-1:10
Goal: Field instructors understand the progress they have made since CSPD #1 (e.g. number of visits, observations from the field). Welcome
Thank field instructors for attending our second and last coaching specific professional development.
Mention how I am excited about what can be learned from our first coaching visits and how we can work together to establish connections between our first and second visits.
Overview
Our final coaching/non-evaluative visit will occur during the 4th visit with ALL FIRST-YEAR corps members.
During this visit we will continue focus on the competency you and your CM addressed in your first coaching/non-evaluative visit.
You will continue with the same process from the first coaching visit o Address the single competency in the post-observation conference and in your written
feedback. o In Chalk and Wire, we want you to select “N/A” for ALL rubric competencies. o In the google spreadsheet, continue inputting the competency you address with the CM
(e.g., 2A, 4A, etc.)
Debriefing Coaching Visit #1
25 Minutes 1:10-1:35
5-7 Min Individual 15-18 Min. Group
Set-Up Debrief
I want to spend some time both individually and collectively to consider our (and our CMs) experiences with the focused coaching/non-evaluative visits.
Specifically, I want us to consider the following questions: o How would you assess (pros/cons) your first focused coaching visit? o How was this focused coaching visit different, if any, from your previous visits this year
with your first-year CMs? o How do you think CMs responded/reacted to this focused coaching visit (consider
receptivity to choosing a competency before the visit, addressing only one competency in visit, etc.)?
Let’s spend the next (5-7) minutes considering this individually. Afterwards we’ll come back together as a group and share out.
Goal: Field instructors collectively debrief their first coaching visit to discuss strengths and areas of

147
improvement of coaching and common topics or areas were discussed.
Making Connections Between Visits: Collecting
Evidence 25 Minutes 1:35-2:00
5-7 Min. Group
4-5 Min. Indiv. Analysis 5 Min. Group
10 Min Analysis
One of the benefits of this coaching pilot is the opportunity to address a single competency across two visits with your first-year CMs.
Thus, the potential exists to assist CMs in improving in this competency because you have more time than usual to focus on one competency.
In order for us to maximize our time coaching CMs around a single competency of focus, I’d like for us to consider how we can connect what was discussed/addressed in your first coaching visit to this upcoming visit.
In other words, how might we build off of coaching visit #1 in coaching visit #2?
Thus, I’d like us to consider the following: o Based of what was discussed/addressed in your last visit, what might you look for in your
upcoming visit?
I’d like for us now to review an example of the written feedback provided to a first-year corps member in the first coaching visit.
o Please spend the next 4-5 minutes reviewing the written feedback provided to this corps member.
o Afterwards, we will come back as a group to discuss what we might want to look for with this corps member.
Now let’s consider question A posed at the bottom of the attachment. Based on this written feedback, what might this FI look for in his/her next observation with this particular CM?
Lastly, I’ve prepared for you the written feedback each of you provided to your first year CM during the first focused coaching observation.
o Going through a similar process as a our first example, I’d like for you to a) review the feedback provided and b) consider what you might be looking for in the next observation.
o We will spend between 8-10 minutes on this particular task. Goal: Field Instructors collectively discuss how to make connections between visits and develop an idea of what to look for/what to do in Focused Coaching Visit #2.
Making Connections Between Visits:
What to Address 2:00-2:15
3-4 Min Indiv. Reflection
12 Min Group Discuss (4 Min per Q)
Now that we’ve had a chance to consider what might be looking for in our CMs classroom during the next observation, I’d like for us to consider what we might choose to address with the CMs in our verbal and written feedback.
I’d like for us to consider the following three questions: o How might you address what you discussed/addressed in the first coaching visit? o What might you address if the CM has made improvement in this competency (based on
what you addressed in the first visit)? o What might you address if the CM is continuing to struggle in the competency you
addressed in the first coaching visit? Goal: Field Instructors collectively discuss what how they a) might address what was discussed in coaching visit #1 and b) what they might address if significant improvement has been made.
Next Steps: After Coaching Visit #2 & Beyond
2:15-2:25
We will spend the next 5 minutes reviewing the next steps for Coaching Visits #2 and Evaluation Visit #5 & #6
The Next Steps Are As Follows: o Address the single competency in the post-observation conference and in your written
feedback. o In Chalk and Wire, we want you to select “N/A” for ALL rubric competencies. o In the google spreadsheet, continue inputting the competency you address with the CM
(e.g., 2A, 4A, etc.) o We (Jean or myself) will communicate with your CMs towards the end of 4th cycle to let
them know they will be evaluated again during Visit #5 & #6 o Assess CMs across all competencies in Visit #5 & #6 and provide comments for at least 3
competencies (e.g. what you did for visit #1 & #2) o Return to whole group PDs in March & April.
Goal: Field instructors will understand what they need to do following the second coaching visit.
Q&A 2:25-2:30
I will now spend the remaining time answering any questions. Goal: Allow field instructors to offer any relevant questions.

148
Close Out 2:30-2:40
To close our PD, I’d like to spend the next 10 minutes reflecting on a couple of questions I have typed into a google form. The form is provided in the individual email I sent you this morning.
After 10 minutes we will close out as a group.
I want to thank you all for your participation in this pilot. The program really appreciates the effort you have put into this. We look forward to reviewing the results and digging deeper with both you and CMs about your experiences. We will likely report on these results over the summer/towards the beginning of next year. Ultimately your participation in this pilot will strengthen the support we provide to all of our CMs in the field. Thank you.

149
Appendix D: Sample Intervention Email Sample Email Text Dear XX, It was great seeing you a couple weeks ago during your second observation. I’m happy with the progress you’ve made thus far and look forward to our continued work together. You recently received an email from [ICP Direction Name], about how my next two observations will be non-scored visits focusing on (1) rubric competency that you choose. I have identified (4) competencies I think we could possibly work on based on my evaluation from the first two observations. The (4) competencies I have identified are: Competency ##: Competency ##: Competency ##: Competency ##: Please let me know which competency you want me to focus on during Visit #3 & #4. As Jean mentioned, it is our hope that by focusing on (1) competency we will make significant improvement in this area. If you have any questions about this, please let me know. [Text About Scheduling Observation]

150
Appendix E: Coach Characteristics Balance Check
Table E: Coach Characteristics Balance Check At Randomization Education Experience
2.1000
(6.197)
Coaching Experience
0.4692
(4.994)
Program Experience
-0.3923
(0.439)
Female 0.0538
(0.148)
Male -0.0538
(0.148)
Black 0.0615
(0.218)
White -0.0615
(0.218)
Bachelors 0.1000
(0.087)
Masters -0.0615
(0.218)
Specialist -0.0615
(0.218)
PhD 0.0231
(0.124)
Non-Education Degree
-0.0769
(0.088)
Education Degree
0.0769
(0.088)
K-Grade 5 -0.0846
(0.209)
Grade 6-8 0.1462
(0.179)
Grade 9-12 -0.0846
(0.209)
K-Grade 8 0.0231
(0.124)
Elementary 0.0154
(0.215)
ELA 0.0692
(0.193)
Math -0.1308
(0.164)
Science 0.0231
(0.124)
Public 0.1538
(0.119)
Charter -0.0769
(0.088)
Religious -0.0769
(0.088)
Same School Teaching Exp.
0.1462
(0.179)
Non. Same Sch Teaching Exp.
-0.1462
(0.179)

151
Appendix F: Teacher Characteristics Balance Check
Table F: Teacher Characteristics Balance Check At Randomization
Age 0.0952
(1.179)
Visit 1 Score -0.1425
(0.154)
Visit 2 Score -0.0781
(0.165)
Tch. Pers. 6-10 Years
0.1124
(0.081)
BOY Score -0.1103
(0.155)
Female -0.0743
(0.173)
Male 0.0743
(0.173)
Tch. Pers. 11-Plus Years
-0.0705
(0.098)
Asian -0.0076
(0.059)
Black -0.0210
(0.145)
White -0.0114
(0.145)
K-Grade 5 0.0038
(0.220)
Grade 6-8 -0.0381
(0.155)
Grade 9-12 0.0343
(0.180)
Elementary 0.0038
(0.220)
English 0.0171
(0.151)
Math -0.0229
(0.155)
Science -0.0705
(0.149)
Social Studies
0.0800
(0.080)
World Language
-0.0076
(0.063)
Charter 0.1486
(0.187)
State Run Auth.
-0.0381
(0.154)
Pubic School -0.1105
(0.097)
Ed. Credits No Response
0.0400
(0.040)
Ed. Credits None
-0.3143*
(0.149)
Ed. Credits 1-3
0.1524
(0.100)
Ed. Credits 4-6
0.0400
(0.040)
Ed. Credits 7-9
-0.0952
(0.062)
Ed. Credits 10-12
0.0400
(0.038)
Ed. Credits 13-15
0.0400
(0.040)
Ed. Credits 16-plus
0.0971
(0.110)
Masters Deg. No Resp.
0.0400
(0.040)
No Prev. Teaching
-0.0667 (0.154)
Previous Teaching
0.0267
(0.149)
Ed. Pers. 1-2 Years
-0.0705
(0.110)
Ed. Pers. 3-5 Years
0.1295
(0.135)
Ed. Pers. 6-10 Years
0.0800
(0.053)
Ed. Pers. 11-Plus Years
-0.1390
(0.126)
Tch. Pers. None
-0.0305
(0.097)
Tch. Pers. 1-2 Years
0.0495
(0.131)
Tch. Pers. 3-5 Years
-0.0610
(0.126)
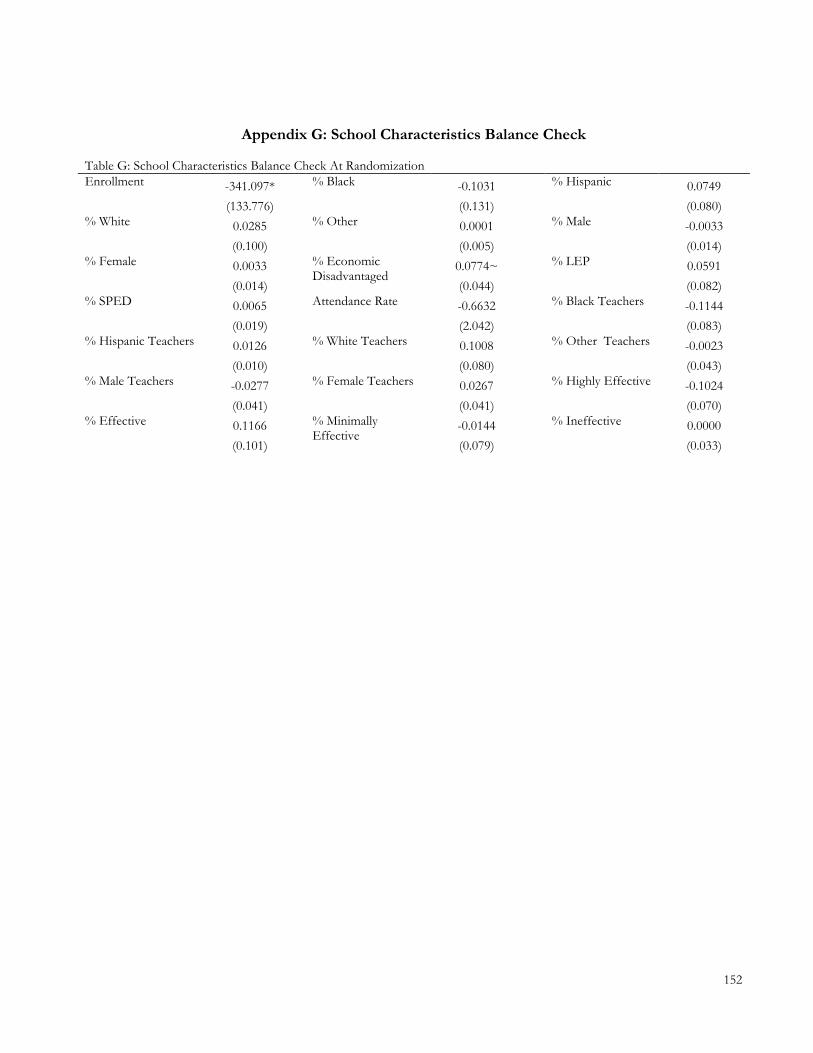
152
Appendix G: School Characteristics Balance Check Table G: School Characteristics Balance Check At Randomization Enrollment -341.097*
(133.776)
% Black -0.1031
(0.131)
% Hispanic 0.0749
(0.080)
% White 0.0285
(0.100)
% Other 0.0001
(0.005)
% Male -0.0033
(0.014)
% Female 0.0033
(0.014)
% Economic Disadvantaged
0.0774~
(0.044)
% LEP 0.0591
(0.082)
% SPED 0.0065
(0.019)
Attendance Rate -0.6632
(2.042)
% Black Teachers -0.1144
(0.083)
% Hispanic Teachers 0.0126
(0.010)
% White Teachers 0.1008
(0.080)
% Other Teachers -0.0023
(0.043)
% Male Teachers -0.0277
(0.041)
% Female Teachers 0.0267
(0.041)
% Highly Effective -0.1024
(0.070)
% Effective 0.1166
(0.101)
% Minimally Effective
-0.0144
(0.079)
% Ineffective 0.0000
(0.033)

153
Appendix H: Coach Characteristics Post-Attrition Balance Check
Table H: Coach Characteristics Balance Check Post-Attrition
Education Experience
-0.5000
(6.526)
Coaching Experience
1.2778
(5.280)
Program Experience
-0.6111
(0.444)
Female 0.0556
(0.162)
Male -0.0556
(0.162)
Black 0.0556
(0.231)
White -0.0556
(0.231)
Bachelors 0.1111
(0.095)
Masters 0.0278
(0.229)
Specialist -0.1667
(0.226)
PhD 0.0278
(0.136)
Non-Education Degree
-0.0833
(0.097)
Education Degree
0.0833
(0.097)
K-Grade 5 -0.0833
(0.224)
Grade 6-8 0.1389
(0.159)
Grade 9-12 -0.0833
(0.224)
K-Grade 8 0.0278
(0.136)
Elementary 0.0278
(0.229)
ELA -0.0278
(0.197)
Math -0.0556
(0.162)
Science 0.0278
(0.136)
Public 0.1667
(0.131)
Charter -0.0833
(0.097)
Religious -0.0833
(0.097)
ICP School 0.1667
(0.194)
Non-ICP School
-0.1667
(0.194)
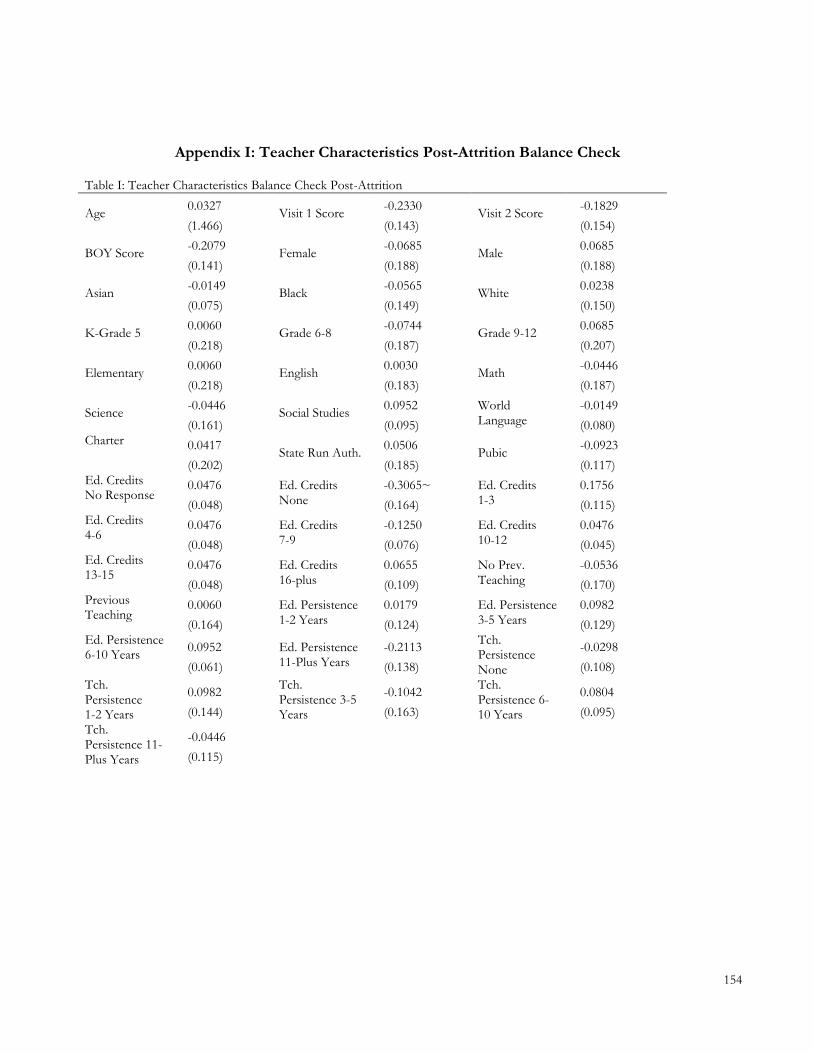
154
Appendix I: Teacher Characteristics Post-Attrition Balance Check
Table I: Teacher Characteristics Balance Check Post-Attrition
Age 0.0327
(1.466)
Visit 1 Score -0.2330
(0.143)
Visit 2 Score -0.1829
(0.154)
BOY Score -0.2079
(0.141)
Female -0.0685
(0.188)
Male 0.0685
(0.188)
Asian -0.0149
(0.075)
Black -0.0565
(0.149)
White 0.0238
(0.150)
K-Grade 5 0.0060
(0.218)
Grade 6-8 -0.0744
(0.187)
Grade 9-12 0.0685
(0.207)
Elementary 0.0060
(0.218)
English 0.0030
(0.183)
Math -0.0446
(0.187)
Science -0.0446
(0.161)
Social Studies 0.0952
(0.095)
World Language
-0.0149
(0.080)
Charter 0.0417
(0.202)
State Run Auth. 0.0506
(0.185)
Pubic -0.0923
(0.117)
Ed. Credits No Response
0.0476
(0.048)
Ed. Credits None
-0.3065~
(0.164)
Ed. Credits 1-3
0.1756
(0.115)
Ed. Credits 4-6
0.0476
(0.048)
Ed. Credits 7-9
-0.1250
(0.076)
Ed. Credits 10-12
0.0476
(0.045)
Ed. Credits 13-15
0.0476
(0.048)
Ed. Credits 16-plus
0.0655
(0.109)
No Prev. Teaching
-0.0536
(0.170)
Previous Teaching
0.0060
(0.164)
Ed. Persistence 1-2 Years
0.0179
(0.124)
Ed. Persistence 3-5 Years
0.0982
(0.129)
Ed. Persistence 6-10 Years
0.0952
(0.061)
Ed. Persistence 11-Plus Years
-0.2113
(0.138)
Tch. Persistence None
-0.0298
(0.108)
Tch. Persistence 1-2 Years
0.0982
(0.144)
Tch. Persistence 3-5 Years
-0.1042
(0.163)
Tch. Persistence 6-10 Years
0.0804
(0.095)
Tch. Persistence 11-Plus Years
-0.0446
(0.115)
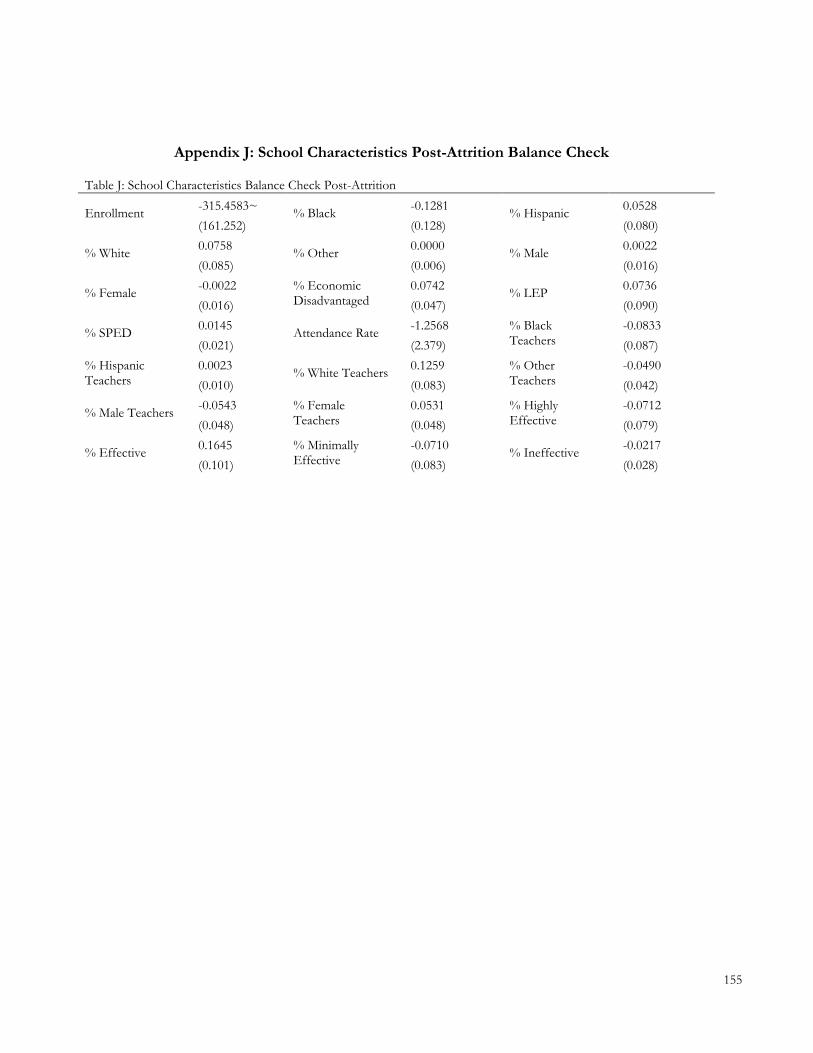
155
Appendix J: School Characteristics Post-Attrition Balance Check
Table J: School Characteristics Balance Check Post-Attrition
Enrollment -315.4583~
(161.252)
% Black -0.1281
(0.128)
% Hispanic 0.0528
(0.080)
% White 0.0758
(0.085)
% Other 0.0000
(0.006)
% Male 0.0022
(0.016)
% Female -0.0022
(0.016)
% Economic Disadvantaged
0.0742
(0.047)
% LEP 0.0736
(0.090)
% SPED 0.0145
(0.021)
Attendance Rate -1.2568
(2.379)
% Black Teachers
-0.0833
(0.087)
% Hispanic Teachers
0.0023
(0.010)
% White Teachers 0.1259
(0.083)
% Other Teachers
-0.0490
(0.042)
% Male Teachers -0.0543
(0.048)
% Female Teachers
0.0531
(0.048)
% Highly Effective
-0.0712
(0.079)
% Effective 0.1645
(0.101)
% Minimally Effective
-0.0710
(0.083)
% Ineffective -0.0217
(0.028)
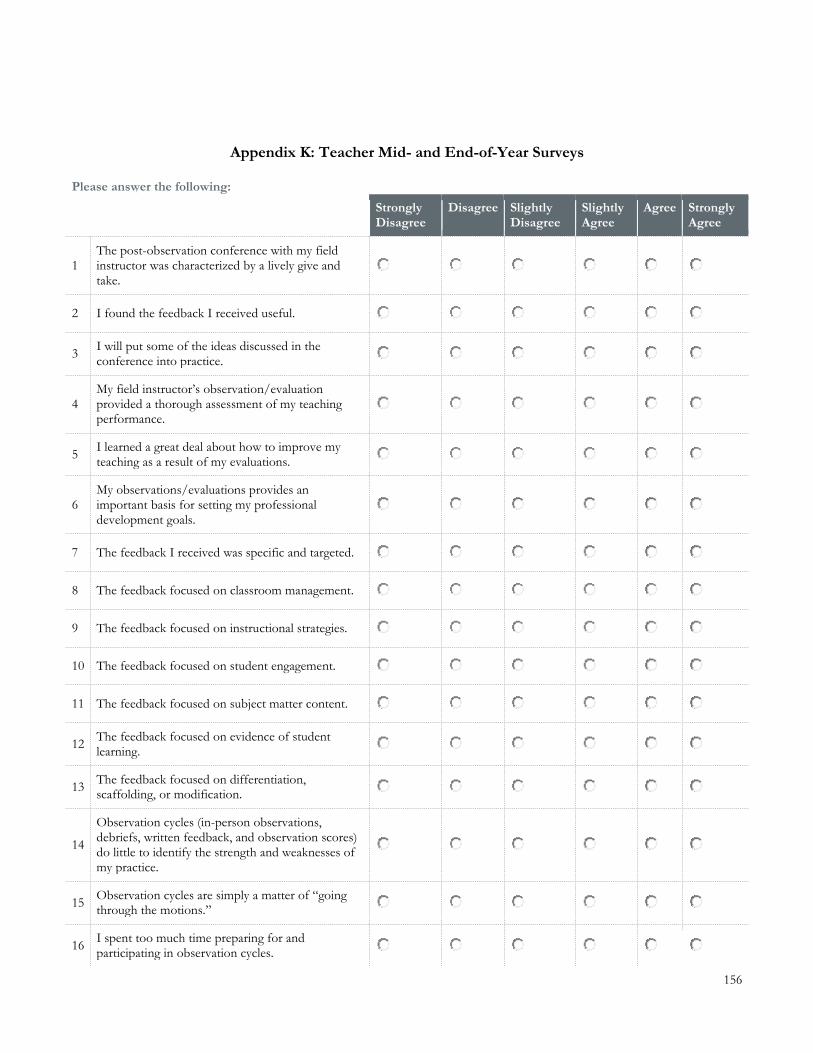
156
Appendix K: Teacher Mid- and End-of-Year Surveys Please answer the following:
Strongly Disagree
Disagree Slightly Disagree
Slightly Agree
Agree Strongly Agree
1 The post-observation conference with my field instructor was characterized by a lively give and take.
2 I found the feedback I received useful.
3 I will put some of the ideas discussed in the conference into practice.
4 My field instructor’s observation/evaluation provided a thorough assessment of my teaching performance.
5 I learned a great deal about how to improve my teaching as a result of my evaluations.
6 My observations/evaluations provides an important basis for setting my professional development goals.
7 The feedback I received was specific and targeted.
8 The feedback focused on classroom management.
9 The feedback focused on instructional strategies.
10 The feedback focused on student engagement.
11 The feedback focused on subject matter content.
12 The feedback focused on evidence of student learning.
13 The feedback focused on differentiation, scaffolding, or modification.
14
Observation cycles (in-person observations, debriefs, written feedback, and observation scores) do little to identify the strength and weaknesses of my practice.
15 Observation cycles are simply a matter of “going through the motions.”
16 I spent too much time preparing for and participating in observation cycles.
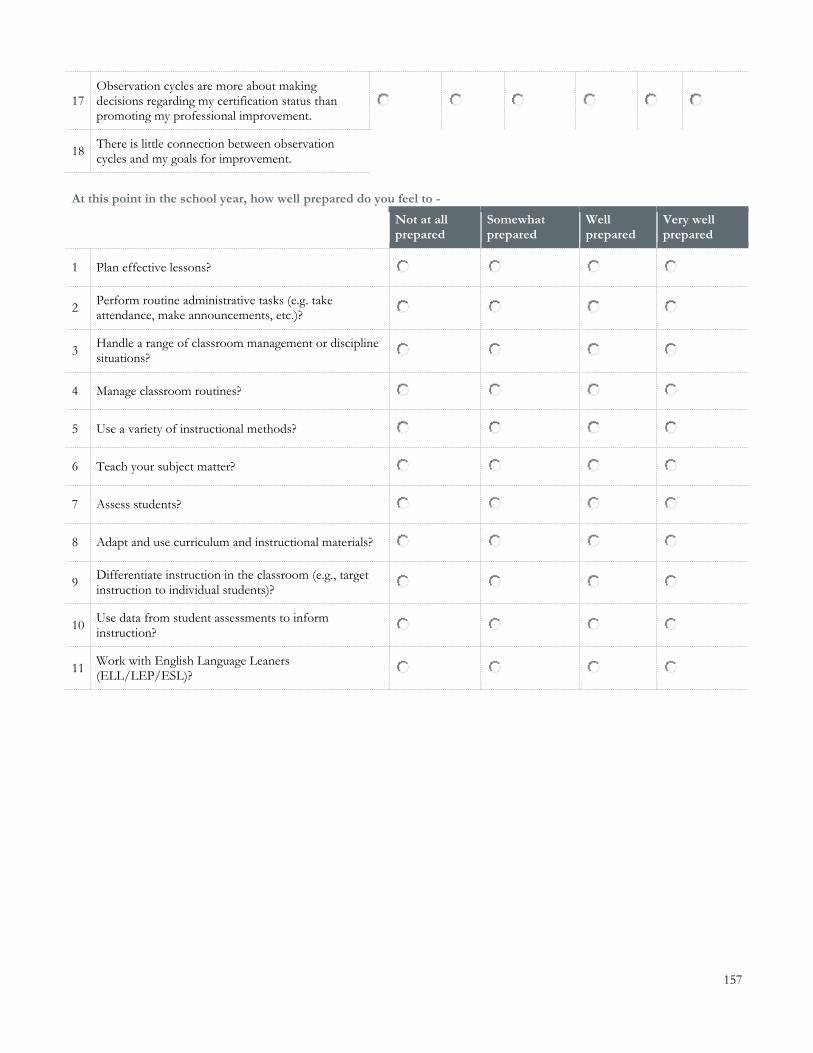
157
17 Observation cycles are more about making decisions regarding my certification status than promoting my professional improvement.
18 There is little connection between observation cycles and my goals for improvement.
At this point in the school year, how well prepared do you feel to -
Not at all prepared
Somewhat prepared
Well prepared
Very well prepared
1 Plan effective lessons?
2 Perform routine administrative tasks (e.g. take attendance, make announcements, etc.)?
3 Handle a range of classroom management or discipline situations?
4 Manage classroom routines?
5 Use a variety of instructional methods?
6 Teach your subject matter?
7 Assess students?
8 Adapt and use curriculum and instructional materials?
9 Differentiate instruction in the classroom (e.g., target instruction to individual students)?
10 Use data from student assessments to inform instruction?
11 Work with English Language Leaners (ELL/LEP/ESL)?

158
Appendix L: Post-Intervention Fidelity Survey (PIFS) Name: ______________________________________________ The following questions ask about your field instruction experiences during your third and fourth observations (i.e., the last two visits from November-Present Day). The [ICP Name] program team has provided field instructors with different coaching approaches and strategies to use during these last two visits with first-year CMs. The purpose of this survey is to determine which coaching approaches and strategies were/were not helpful to your practice. Please circle either Yes or No for the next three questions.
1. Before my third or fourth observation, my field instructor (over email or phone) identified a couple (3-4) rubric competencies he/she thought we could work on.
Yes No
2. I got to choose one rubric competency to focus both observations on (i.e., focus on Competency 2A for Visits #3 & #4).
Yes No
3. The rubric competency I chose was an area of practice I wanted to improve in. Yes No
Note: If you circled “No” for #2, please circle “No” for #3.
To what extent do you agree or disagree with the following statements regarding your 3rd and 4th observations. Please circle you level of agreement.
1=Strongly Disagree 2=Disagree 3=Agree 4=Strongly Agree
4. We (field instructor and myself) spent the majority of our debrief time discussing a single rubric competency (e.g., 1D: Lesson Structure, 2A: Behavior Management, 5A: Scaffold Instruction)
1 2 3 4
5. We spent the majority of time discussing a rubric competency I felt I needed assistance with.
1 2 3 4
6. The verbal feedback (e.g., constructive criticism, evidence from observation) I received addressed a single rubric competency.
1 2 3 4
7. The verbal feedback I received addressed the rubric competency I chose to address with my field instructor.
1 2 3 4
8. The written feedback I received in Chalk & Wire addressed a single rubric competency.
1 2 3 4
9. The written feedback I received in Chalk & Wire addressed the competency I chose to address with my field instructor.
1 2 3 4
10. The suggestions I received in either my verbal or written feedback focused on how to improve in a specific rubric competency.
1 2 3 4
11. The suggestions I received in either my verbal or written feedback focused on how to improve in the specific rubric competency I chose to address.
1 2 3 4
12. I learned a great deal about how to improve my teaching as a result of my last two observations (i.e., Visit #3 & #4)
1 2 3 4
13. I found the feedback I received from my field instructor useful. 1 2 3 4

159
14. I will put some of the ideas discussed in the debrief into practice. 1 2 3 4
15. I felt empowered as a professional in my last two observations. 1 2 3 4

160
Appendix M: Sample Interview Protocol
Teacher Post-End of Year Survey Interview
Purpose: I appreciate your willingness to speak over the phone and participate in this interview today. This study seeks to learn more about the features of coaching you receive from your field instructor. Specifically, I am interested in the different forms and features of coaching that you found beneficial during your first-year in the classroom. Obviously, there are no right or wrong answers for any of the questions we discuss; I am just interested in hearing your perspective. Please know your insights will go a long way to helping me understand the support the program provides to first-year teachers. These interviews will only be available to me after we conclude today. If at any point, you feel uncomfortable and do not wish to continue participating, you may skip a question or stop the interview. I will be following a script to ensure I ask you all of the questions I have prepared. I am happy to clarify or rephrase questions. If you care for my opinions about certain questions, please hold off until the end of the interview and I will (selectively) answer them at that point. Do you have questions before we begin? Recording: I am going to audiotape the interview because I am interested in your ideas and want to make sure that I have a good record of everything you say. Do I have your permission to do this? Thank you. Do you have any questions before we get started with the interview questions? A little bit about the structure of this interview: I’ll start off by asking you some questions about your experiences with your field instructor this past year. Then I will ask you about some of your end-of-year survey responses. I may also ask some questions based on your responses provided in this interview. Note: Blue text refers to questions from the end-of-year survey. They are meant to build on the teachers’ answers they provided. explore what types or features of coaching were more or less beneficial to intervention and control teachers Relevant RQ Construct Measured Question Overarching Question
Background questions to initiate the conversation and develop rapport.
Could you please tell me your name and what content/grade level you supported this year?
When you think about this past year, how would you describe your experiences with your field instructor?
Transition: I’d like to discuss more about your perceptions around the support and coaching you received this year. In doing so, I might ask you more about your responses on the end of year survey. In case you forgot how you responded, I have your answers with me and will read them back to you. RQ 2 Teachers’ perceptions
around the quality of support received.
In your opinion, how would define “quality” support and coaching for first-year teachers?
Given this, how would you assess the support you received from your field instructor this past year?

161
As it relates to this assessment, you mentioned “XX” in your end-of-year survey, could please tell me a little bit more about this?
Allow for follow-up based on teachers’ responses.
RQ 3 Teachers’ perceptions of coaching practices that influence responsiveness to coaching?
When you think about your definition of “quality” support and coaching for first-year teachers, take me through what a coach/field instructor would be doing?
(Based on response above) Could you fill in what this might encompass before the field instructor observers you, during the observation, during the debrief, and afterwards?
In regards to these responses, what could your field instructor have done more of? What could she/he done less of?
In regards to this, you mentioned “XX” in your end-of-year survey, could please tell me a little bit more about this?
Allow for follow-up based on teachers’ responses.
Conclude: I really appreciate your candor in responding to my questions. These are all of the questions I had planned for us today. Do you have any questions for me? I will be mailing your compensation in the mail this afternoon/tomorrow morning so hopefully you receive it in the coming days. Thanks again for your participation, I greatly appreciate it.
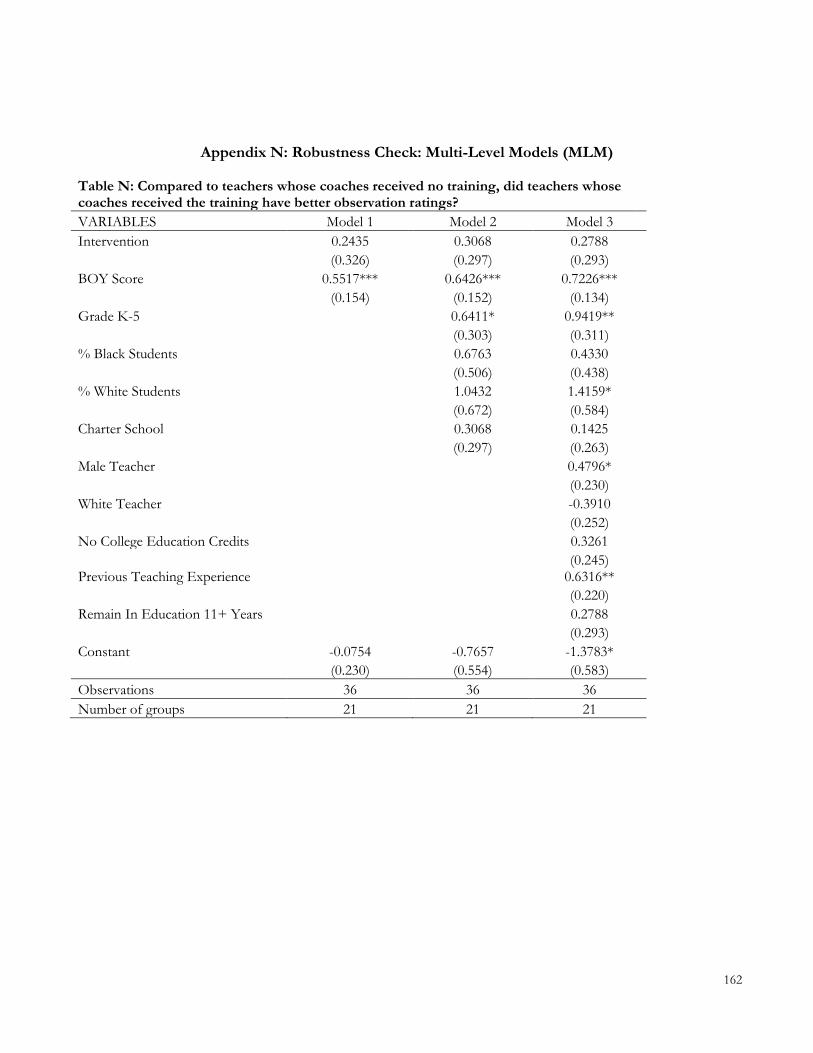
162
Appendix N: Robustness Check: Multi-Level Models (MLM) Table N: Compared to teachers whose coaches received no training, did teachers whose coaches received the training have better observation ratings?
VARIABLES Model 1 Model 2 Model 3
Intervention 0.2435 0.3068 0.2788
(0.326) (0.297) (0.293)
BOY Score 0.5517*** 0.6426*** 0.7226***
(0.154) (0.152) (0.134)
Grade K-5
0.6411* 0.9419**
(0.303) (0.311)
% Black Students
0.6763 0.4330
(0.506) (0.438)
% White Students
1.0432 1.4159*
(0.672) (0.584)
Charter School
0.3068 0.1425
(0.297) (0.263)
Male Teacher
0.4796*
(0.230)
White Teacher
-0.3910
(0.252)
No College Education Credits
0.3261
(0.245)
Previous Teaching Experience
0.6316**
(0.220)
Remain In Education 11+ Years
0.2788
(0.293)
Constant -0.0754 -0.7657 -1.3783*
(0.230) (0.554) (0.583)
Observations 36 36 36
Number of groups 21 21 21

163
Appendix O: Robustness Check: Multiple Imputation Table O: Compared to teachers whose coaches received no training, did teachers whose coaches received the training have better observation ratings?
VARIABLES Model 1 Model 2 Model 3
Intervention 0.3301 0.3164 0.1754
(0.352) (0.350) (0.349)
BOY Score 0.8267*** 0.8665*** 0.7663**
(0.220) (0.225) (0.213)
% Black Students
0.1345 0.4072
(0.703) (0.625)
% White Students
0.6723 1.4451~
(0.922) (0.834)
Charter School
0.0229 -0.0720
(0.433) (0.397)
Male Teacher
0.6073
(0.394)
White Teacher
0.5603
(0.345)
No College Education Credits
-0.6210~
(0.336)
Previous Teaching Experience
0.3090
(0.353)
Remain In Education 11+ Years
0.6678~
(0.342)
Constant -0.0311 -0.2191 -1.0036
(0.269) (0.697) (0.711)
Observations 45 45 45
R-Squared 0.28 0.29 0.57
Number of Strata 6 6 6

164
Appendix P: Robustness Check: MLM (Preparedness) Table P: Compared to teachers whose coaches received no training, did teachers whose coaches received the training report feeling more prepared?
Teaching Subject Matter Content Teaching All Students Managing The Classroom
Variables Model 1 Model 2 Model 3 Model 1 Model 2 Model 3 Model 1 Model 2 Model 3
Intervention -0.1522 -0.1587 -0.2929 0.2248 0.0636 -0.0796 0.2982 0.3150 0.2685
(0.290) (0.275) (0.289) (0.340) (0.290) (0.328) (0.253) (0.219) (0.241)
BOY Factor Score 0.4245** 0.4185** 0.5000*** 0.4637* 0.5560** 0.5248* 0.5466*** 0.5215*** 0.5144***
(0.133) (0.139) (0.143) (0.204) (0.180) (0.249) (0.113) (0.118) (0.127)
Grade K-5
-0.2161 0.1492
-0.2173 -0.0643
-0.1827 -0.1117
(0.293) (0.356)
(0.298) (0.391)
(0.237) (0.303)
% Black Students
0.1811 0.2907
-1.6657** -1.6977**
0.3007 0.2286
(0.518) (0.506)
(0.544) (0.582)
(0.449) (0.451)
% White Students
0.2425 0.6698
-0.3859 -0.3000
0.0218 0.2777
(0.739) (0.732)
(0.812) (0.844)
(0.611) (0.629)
Charter School
-0.1587 -0.0974
-0.3025 -0.4104
0.3150 0.0041
(0.275) (0.306)
(0.301) (0.333)
(0.219) (0.274)
Male Teacher
0.5324~
0.1153
-0.0466
(0.279)
(0.378)
(0.241)
White Teacher
-0.4192
0.0209
-0.2802
(0.291)
(0.353)
(0.245)
No College Education Credits
-0.1701
-0.3260
0.0960
(0.319)
(0.326)
(0.269)
Previous Teaching Experience
0.3110
-0.0031
0.2613
(0.270)
(0.361)
(0.228)
Remain In Education 11+ Years
-0.2929
-0.0736
0.5050
(0.289)
(0.323)
(0.567)
Constant 0.5703** 0.7090 0.0341 0.3666 1.7904** 1.8112* 0.3385~ 0.3162 0.2685
(0.220) (0.581) (0.722) (0.274) (0.610) (0.792) (0.190) (0.515) (0.241)
Observations 35 35 35 35 35 35 35 35 35
Number of groups 20 20 20 20 20 20 20 20 20
Standard errors in parentheses *** p<0.001, ** p<0.01, * p<0.05, ~ p<0.1

165
Appendix Q: Robustness Check: MLM (Quality)
Table Q: Compared to teachers whose coaches received no training, did teachers whose coaches received the training report better quality coaching?
Coaching Quality Conference Investment Focused Coaching
VARIABLES Model 1 Model 2 Model 3 Model 1 Model 2 Model 3 Model 1 Model 2 Model 3
Intervention -0.0660 -0.0705 -0.1760 -0.1686 -0.2827 -0.3321 0.1461 0.1066 0.2355
(0.307) (0.290) (0.299) (0.260) (0.213) (0.234) (0.335) (0.329) (0.264)
BOY Factor Score 0.7515*** 0.7153*** 0.5761*** 0.5052*** 0.4218*** 0.4566*** 0.5744*** 0.5312** 0.4433**
(0.148) (0.145) (0.156) (0.118) (0.101) (0.101) (0.157) (0.164) (0.135)
Grade K-5
0.0328 0.1824
-0.0487 -0.0166
0.1311 0.1237
(0.307) (0.373)
(0.223) (0.287)
(0.346) (0.322)
% Black Students
-0.3379 -0.2361
-1.1083* -0.9880*
-0.5367 -1.2552**
(0.516) (0.520)
(0.433) (0.459)
(0.577) (0.483)
% White Students
-1.3500~ -1.6570*
0.4000 0.6856
-0.9626 -1.5404*
(0.722) (0.738)
(0.608) (0.635)
(0.787) (0.694)
Charter School
-0.0113 -0.1198
-0.1648 -0.2480
-0.0694 0.3275
(0.301) (0.308)
(0.227) (0.245)
(0.339) (0.280)
Male Teacher
0.3560
-0.0396
-0.0332
(0.340)
(0.253)
(0.286)
White Teacher
-0.0816
-0.1680
0.5806*
(0.287)
(0.232)
(0.261)
No College Education Credits
0.2506
-0.2715
0.5738*
(0.301)
(0.238)
(0.271)
Previous Teaching Experience
-0.0998
-0.1776
1.1691***
(0.309)
(0.259)
(0.282)
Remain In Education 11+ Years
-0.5293~
0.1712
-0.2049
(0.274)
(0.222)
(0.251)
Constant 0.0020 0.5458 2.2427*** 0.1274 1.1525* 1.4818* -0.4254~ 0.3777 -0.0051
(0.226) (0.562) (0.501) (0.197) (0.466) (0.577) (0.248) (0.593) (0.630)
Observations 35 35 35 35 35 35 35 35 35
Number of groups 20 20 20 20 20 20 20 20 20
Standard errors in parentheses
*** p<0.001, ** p<0.01, * p<0.05, ~ p<0.1

166
Appendix R: Initial Coding Scheme Coaching Practice (CC) Coaching Practice Sub-Codes Reasoning (SC) Reasoning (SC) Directive Coaching Coach Identified Competencies Lack of Knowledge
Directing Resources Expedites Time Follow Through Trust
Accountability Creating Welcoming Envir. Addressing The Positive Consistent Disappointment
Develop Rapport
Maintain Motivation Collaborative Dialogue Less Formal Environment Open To Feedback
Address Insecurities Explain Rationale Establishing Alignment
Sharing Perspectives Similar Contexts Responsive to Teacher Feedback Valued
Valuing Teacher As Professional Contextual Suggestions Actionable Valued Achieveable
Incorporating Teacher Choice Meaningfulness Investment Likely Implementation
Explicit Feedback constituent parts (could combine with decomposing practice).
Actionable Lack of Knowledge Insufficient Training Experience Gap
Ease of Incorporation Likely Implementation
Concrete/Decomposed Expedite Success Collaboration Lack of Knowledge Build Toolbelt
Model Practice Lack of Knowledge Implementation Narrow Focus Expedite Improvement Feel Successful
Build Momentum Expedited Implementation Clarity Building Blocks (Grain Size) Addressing Long Term Goal Sense of Possibility Less Overwhelmed Facilitates Focus

167
Time Break Down Focus
General Focus Address Complexities Multiple Actions
Coaching Practice Definition/Example Actionable Feedback Feedback a teacher can immediately act upon (it’s easy to understand). A hallmark of actionable feedback is a teacher
feeling like they can use this the following lesson OR day. Concrete/Explicit Feedback Teacher feels like she/he can implement the feedback provided the next lesson or day to improve the area of concern
observed. The teacher likely feels she/he can implement the feedback because the teacher understands WHAT she/he needs to do but also HOW to do it. Feeling like they know HOW to do it is likely the result of breaking down a practice into its
NOTE: decomposing practice does not necessarily mean a coach will model the practice.
Contextual Suggestions Providing suggestions (not necessarily actionable or concrete) that fit OR can be implemented within the context of the classroom or the school.
Work within the confines of what the school prioritizes Decomposing Practice Breaking a specific suggestion into it’s constituent parts (e.g., Grossman/Ronfeldt piece) to allow teacher a) understand
what constituents this suggestion and b) see how it might look in practice
Modeling Practice A coach provides a visualization for HOW a certain practice should be implemented into practice. Modeling would include a coach breaking a practice (e.g., facilitating a discussion) into its constituent parts whereby he/she names the parts so a teacher can SEE how the practice should be done. Edit: Modeling could also be a visual resource modeling the practice. Edit 2: Modeling DOES NOT necessarily mean doing this in front of live students.
See quote about “what does differentiation look like” from Transcript #2 Rehearsal Teacher practices the suggestions/competencies addressed/modeled by the coach.
Narrow Focus Coach chooses to address a smaller set or number of competencies with the beginning teacher. These may/may not lead up to a larger/more complex practice (e.g., serving as building blocks)
Incorporating Teacher Choice Coach allows teacher to choose what [specific competency] is the focus of the post-observation conference Address The Positive Coach chooses to initiate the conference with a discussion of the positive aspects of the teachers’ practice previously
observed.
Explain Rationale Coach explains the rationale for why she/he chose to address a particular topic, likely grounded in evidence collected during the observation.
Follow Through A coach follows-up on the action items she/he set forth during the conference. This might include sending a resource or following-up via email like the coach said she/he would.
Collaborative Dialogue Coach invites the teacher into the discussion by prompting the teacher reflect on his/her own practice (e.g., what went well, what did not go well) OR asking teacher his/her thoughts about what improvements need to be made.
Directing Resources Coach assists the teacher towards resources (paper source or visual source) to address the area of concern. Running Record of Evidence Coach collects real-time OR minute-by-minute record of what is occurring during the observation. Sharing Perspectives Coach shares perspectives about what she/he did during her tenure as a teacher OR what she/he has observed other
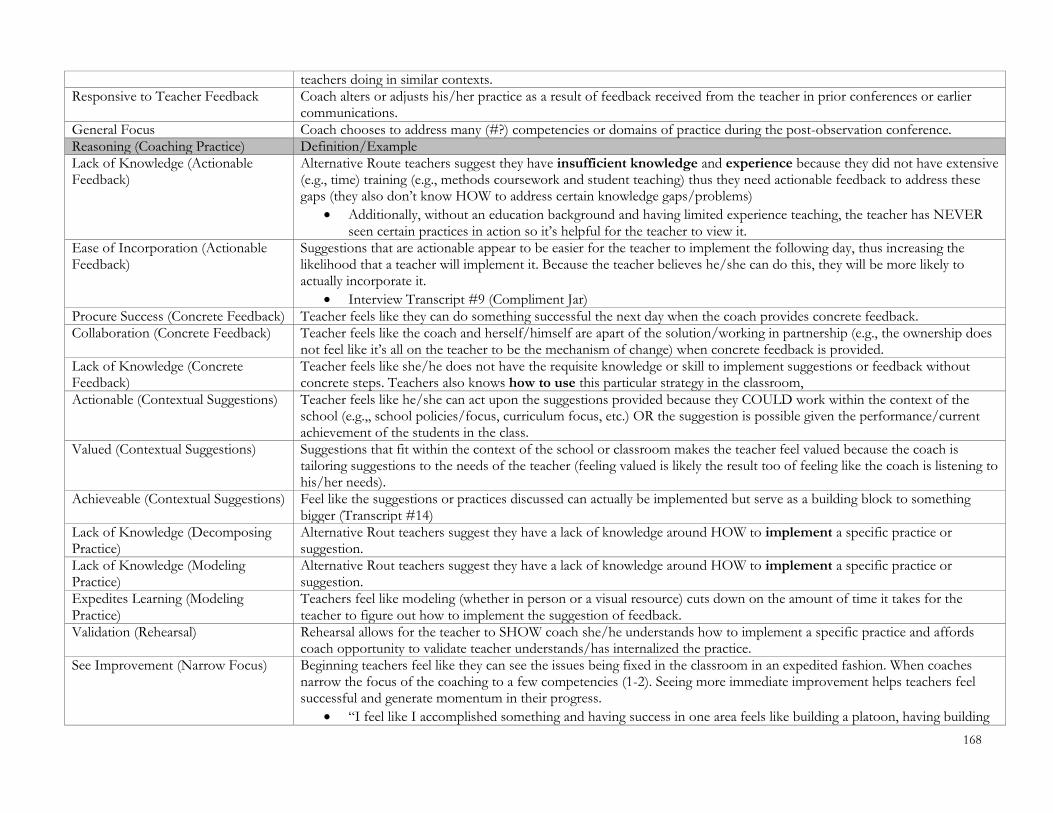
168
teachers doing in similar contexts. Responsive to Teacher Feedback Coach alters or adjusts his/her practice as a result of feedback received from the teacher in prior conferences or earlier
communications.
General Focus Coach chooses to address many (#?) competencies or domains of practice during the post-observation conference. Reasoning (Coaching Practice) Definition/Example Lack of Knowledge (Actionable Feedback)
Alternative Route teachers suggest they have insufficient knowledge and experience because they did not have extensive (e.g., time) training (e.g., methods coursework and student teaching) thus they need actionable feedback to address these gaps (they also don’t know HOW to address certain knowledge gaps/problems)
Additionally, without an education background and having limited experience teaching, the teacher has NEVER seen certain practices in action so it’s helpful for the teacher to view it.
Ease of Incorporation (Actionable Feedback)
Suggestions that are actionable appear to be easier for the teacher to implement the following day, thus increasing the likelihood that a teacher will implement it. Because the teacher believes he/she can do this, they will be more likely to actually incorporate it.
Interview Transcript #9 (Compliment Jar)
Procure Success (Concrete Feedback) Teacher feels like they can do something successful the next day when the coach provides concrete feedback. Collaboration (Concrete Feedback) Teacher feels like the coach and herself/himself are apart of the solution/working in partnership (e.g., the ownership does
not feel like it’s all on the teacher to be the mechanism of change) when concrete feedback is provided. Lack of Knowledge (Concrete Feedback)
Teacher feels like she/he does not have the requisite knowledge or skill to implement suggestions or feedback without concrete steps. Teachers also knows how to use this particular strategy in the classroom,
Actionable (Contextual Suggestions) Teacher feels like he/she can act upon the suggestions provided because they COULD work within the context of the school (e.g.,, school policies/focus, curriculum focus, etc.) OR the suggestion is possible given the performance/current achievement of the students in the class.
Valued (Contextual Suggestions) Suggestions that fit within the context of the school or classroom makes the teacher feel valued because the coach is tailoring suggestions to the needs of the teacher (feeling valued is likely the result too of feeling like the coach is listening to his/her needs).
Achieveable (Contextual Suggestions) Feel like the suggestions or practices discussed can actually be implemented but serve as a building block to something bigger (Transcript #14)
Lack of Knowledge (Decomposing Practice)
Alternative Rout teachers suggest they have a lack of knowledge around HOW to implement a specific practice or suggestion.
Lack of Knowledge (Modeling Practice)
Alternative Rout teachers suggest they have a lack of knowledge around HOW to implement a specific practice or suggestion.
Expedites Learning (Modeling Practice)
Teachers feel like modeling (whether in person or a visual resource) cuts down on the amount of time it takes for the teacher to figure out how to implement the suggestion of feedback.
Validation (Rehearsal) Rehearsal allows for the teacher to SHOW coach she/he understands how to implement a specific practice and affords coach opportunity to validate teacher understands/has internalized the practice.
See Improvement (Narrow Focus) Beginning teachers feel like they can see the issues being fixed in the classroom in an expedited fashion. When coaches narrow the focus of the coaching to a few competencies (1-2). Seeing more immediate improvement helps teachers feel successful and generate momentum in their progress.
“I feel like I accomplished something and having success in one area feels like building a platoon, having building

169
blocks where confidence is developed so teacher can move onto next area of growth” (Transcript #7) Expedited Implementation (Narrow Focus)
Beginning teachers feel like they can implement the suggestions immediately because they know exactly WHAT (clarity) to focus on when coaches narrow the focus of the coaching to a few competencies (1-2). Focusing on many competencies might leave teachers less clear on what they should address.
Building Blocks (Narrow Focus) Beginning teachers feel like when you address a narrow set of competencies (what seem deem as “building blocks”) they feel like they are addressing the constituent parts of more complex practices OR longer term goals that they want to work towards. Additionally, the larger goals or tasks take time to see movement/improvement BUT focusing on the building blocks (of the larger goals) allow you to accomplish smaller goals AND see change happen. This also allows the teacher to feel better about his/her performance as a teacher/builds momentum.
“Figuring out how to have teenagers not be disrespectful to one another is not something that I can fix in a week, but I can focus on something that is a building block to the longer term goal [of having students be more respectful]”
Sense of Possibility (Narrow Focus) A coach choosing to have a narrower focus within a conference helps the teacher feel like change/improvement is possible because he/she does not feel overwhelmed with everything that could be addressed in the classroom. Also helps break the complexity of teaching into more manageable chunks that helps a beginning teacher feel like she/he can improve.
“I am much better when I can address one problem at a time rather than try to fix everything at once” (Transcript #8)
Facilitates Focus (Narrow Focus) Assists the teacher in becoming focused around a single element of practice AND helps teacher focus attention (both time and energy) around one thing to improve on. Beginning teachers cite not knowing to prioritize time and narrowing focus assist teachers in knowing exactly what to focus on.
“I keep forgetting because I’m just so consumed with other stuff. Where if I had to deal with just that one thing, there’s no way I’m going to forget that that’s the one thing I’m working on”
“I can check it and people can check it.” Time (Narrow Focus) Addressing a single competency allows for a teacher and coach to spend more time during the conference breaking down a
specific practice, getting clear on HOW to address the competency (break down). Moreover (as it relates to time) “time” allows you to go into more detail about the problem or the suggestions (and learn WHY we’re doing it). Additionally, focusing on a single competency allows for the beginning teacher to focus on one practice so she/he can put their time, thinking, and energy into one area of practice until they feel comfortable and positive about it.
Congruence (Incorporating Teacher Choice)
When a coach addresses a competency a teacher does not necessarily agree should be the focus, the feedback is less likely to be received favorably and the likelihood of implementation decreases. Teacher choice helps ensure the competencies addressed in the conference are meaningful to the teacher. This results in the teacher feeling invested in the coaching process and more likely to implement the practice/feedback offered.
Consistent Disappointment (Address The Positive)
First-year teachers working in a challenging context (e.g., Detroit) face considerable challenges on a daily basis. Having a coach recognize positive aspects of a teacher’s performance helps them feel like they are not consistently underperforming or failing.
Welcoming Environment (Address The Positive)
Initiating the conference with the positive creates a more welcoming environment where the teacher does not feel judged or pressured to begin to conversation.
Maintain Motivation (Address The Positive)
Teachers are already self-critical of their practice and know they have deficiencies so addressing the positive in the conference helps teachers stay motivated to improve over time. Helps teacher feel positive about some aspects of his/her

170
classroom practice. Establishing Alignment (Explain Rationale)
Teacher might feel like it’s the best use of time when the coach discusses/explains her rationale for choosing what she/he did. When evidence is provided as to WHY this competency is selected, then the teacher establishes alignment around what and why will be discussed.
Trust (Follow-Through) Following through makes the teacher feel like you care about their growth and development as a teacher, but also want to serve as a facilitator of their improvement.
Accountability (Follow-Through) Follow-through with what teacher was SUPPOSED to do holds the teacher accountable where they feel like they are responsible for doing and helps teacher remember the context of the previous discussion.
Less Formal Environment (Collaborative Dialogue)
Inviting the teacher into the conference / share his or her thoughts created a less formal environment. Make teachers receptive/open to the feedback because she/he didn’t feel like everything was mandated to her. Also assists in addressing the teachers insecurities because inviting her into the conversation makes the teacher like she wasn’t completely wrong about she did.
Expedites Time (Resource Sharing) With limited experience, teachers don’t necessarily know where to go for solutions and resource sharing cuts down on the amount of time to vet resources
Lack of Knowledge (Chosen Competencies)
As first-year teachers with limited professional knowledge and experience, having competencies chosen by the coach helps focus the teacher on areas of practice in need of improvement.
Mitigates Bias (Running Record of Evidence)
Non-objective feedback allows for the teacher to see and read what was occurring during the observation without the coach interjecting his/her opinion, thus mitigating potential bias. Also allows for the teacher to further refine his/her impressions of the observed lesson.
Similar Contexts (Sharing Perspectives)
Beginning teachers feel receptive to coaches sharing their perspectives on what might work or has worked because most coaches worked in the same geographic location with similar students, so teacher might be more inclined OR receptive to this feedback.
Valued (Responsive to Feedback) Coaches receptive to teacher’s feedback AND/OR altering practice based on teacher’s feedback makes the teacher feel supported/feel like the coach genuinely wants teacher to develop and improve.
Address Complexities (General Focus)
Teachers believe so much is going on in teaching that a general focus helps address a multitude of domains of instructional practice, thus allowing teachers to potentially improve across domains.
Multiple Actions (General Focus) Teacher feels like if the practice (action) is something that she/he can change the next day, it’s helpful to have a bunch of these action items because they can expedite improvement
171
References
Allen, J. P., Hafen, C. A., Gregory, A., Mikami, A., & Pianta, R. C. (2015). Enhancing secondary school instruction and student achievement: Replication and extension of the My Teaching Partner—Secondary Intervention. Journal of Research on Educational Effectiveness, 8, 475–489.
Allen, J. P., Pianta, R. C., Gregory, A., Mikami, A. Y., & Lun, J. (2011). An interaction-based
approach to enhancing secondary school instruction and student achievement. Science, 333(6045), 1034-1037.
Arby, T., Rimm-Kaufman, S., Hulleman, C., Thomas, J., and Ko, M. (2012). The How and for Whom
of Program Effectiveness: Dissecting the Responsive Classroom Approach in Relation to Academic Achievement. Paper presented at the Spring Conferencce for the Society of Research on Educational Effectiveness, Washington, D.C.
Archer, J., S. Cantrell, S. L. Holtzman, J. N. Joe, C. M. Tocci, and J. Wood. Better Feedback for
Better Teaching: A Practical Guide to Improving Classroom Observations. Jossey-Bass, 2016
Ball, D., & Cohen, D. (1999). Toward a Practice-Based Theory of Professional Education. Teaching
as the learning profession. San Francisco: Jossey-Bass.
Biancarosa, G., Bryk, A. S., & Dexter, E. R. (2010). Assessing the value-added effects of lit¬eracy collaborative professional development on student learning. Elementary School Journal, 111(1), 7–34.
Bill & Melinda Gates Foundation. (2014). Teachers Know Best: Teachers’ Views on Professional
Development. Retrieved from http://collegeready.gatesfoundation.org/article/teachers-know-best-teachers-viewsprofessional-development.
Blakely, M. R. (2001). A survey of levels of supervisory support and maintenance of effects
reported by educators involved in direct instruction implementation. Journal of Direct Instruction, 1, 73-83.
Blazar, D., & Kraft, M. A. (2015). Exploring mechanisms of effective teacher coaching: A tale of
two cohorts from a randomized experiment. Educational Evaluation and Policy Analysis, 37(4), 542-566.
Buckley, J. & Doolittle, E. (2013). IES Grant Writing Workshop for Development & Innovations
Projects. Retried from: https://ies.ed.gov/funding/webinars/pdf/WODdevelopment_FY2013.pdf

172
Century, J., Rudnick, M., & Freeman, C. A. (2010). Framework for measuring fidelity of implementation: A foundation for shared language and accumulation of knowledge. The American Journal of Evaluation, 31, 199 –218.
Clotfelter, C., Ladd, H. , and Vigdor, L. (2007a). “How and Why Do Teacher Credentials Matter
for Student Achievement?” CALDER Working Paper 2. Washington, DC: The Urban Institute
Clotfelter, C., Ladd, H. , and Vigdor, L. (2007b). “Teacher Credentials and Student Achievement
in High School: A Cross-Subject Analysis with Student Fixed Effects.” CALDER Working Paper 11. Washington, DC: The Urban Institute
Cohen, D.K and Hill, H.C. (2000). Instructional policy and classroom performance: The
mathematics reform in California. Teachers College Record 102(2), 294-343. Cohen, D. K., Raudenbush, S. W., & Ball, D. L. (2003). Resources, instruction, and research.
Educational evaluation and policy analysis, 25(2), 119-142. Cordray, D. (2007). Fidelity of intervention implementation. Presentation at The IES Summer
Training Institute on Cluster Randomized Control Trials, 17-29. June, Nashville, TN. Available onlne at https://ies.ed.gov/ncer/whatsnew/conferences/rct_traininginstitute
Cornett, J., & Knight, J. (2009). Research on coaching. Coaching: Approaches and perspectives, 192-216.
Darling-Hammond, L., Wei, R. C., Andree, A., Richardson, N., & Orphanos, S. (2009). Professional learning in the learning profession: A status report on teacher development in the United States and abroad. Dallas, TX: National Staff Development Council.
Davis, B., & Higdon, K. (2008). The effects of mentoring /induction support on beginning teachers. Journal of Research in Childhood Education, 22(3), 261-274.
Dee, T. S., & Wyckoff, J. (2015). Incentives, selection, and teacher performance: Evidence from
IMPACT. Journal of Policy Analysis and Management, 34(2), 267-297. Desimone, L. M. (2009). Improving impact studies of teachers’ professional development: Toward
better conceptualizations and measures. Educational researcher, 38(3), 181-199.
Desimone, L., Porter, A., Garet, M., Yoon, K., & Birman, B. (2002) Effects of professional development on teachers’ instruction: Results from a three-year longitudinal study. Education evaluation and policy analysis, 24(2), 81-112.
Desimone, L.M. & Pak, K. (2017) Instructional coaching as high-quality professional
development. Theory Into Practice, 56(1), 3-12.
173
Dewey, J. (1938). Experience and education. New York, N.Y.: Macmillan Publishing Company.
DiGennaro, F. D., Martens, B. K., & Kleinmann, A. E.(2007). A comparison of performance feedback procedures on teachers’ treatment implementation integrity and students’ inappropriate behavior in special education classrooms. Journal of Applied Behavior Analysis, 40, 447-461.
Dunne, K., & Villani, S. (2007). Mentoring new teachers through collaborative coaching: Linking teacher and
student learning. WestEd. Durlak, J. A. (2010). The importance of doing well in whatever you do: A commentary on the
special section “Implementation Research in Early Childhood Education.” Early Childhood Research Quarterly, 25, 348 – 357.
Elmore, R. F. (2006). Bridging the gap between standards and achievement: The imperative for professional development in education. Washington, DC: The Albert Shanker Institute.
Elmore, R. F. (2006). School reform from the inside out: Policy, practice, and performance.
Cambridge, MA: Harvard Education Press. Ericsson, K. A., Krampe, R. T., & Tesch-Römer, C. (1993). The role of deliberate practice in the
acquisition of expert performance. Psychological review, 100(3), 363.
Evertson, C. M., & Smithey, M. W. (2000). Mentoring effects on protégés’ classroom practice: An experimental field study. Journal of Educational Research, 93(5), 294-304.
Feiman-Nemser, S. (2001). Helping novices learn to teach: Lessons from an exemplary support
teacher. Journal of teacher education, 52(1), 17-30. Fixsen, D. L., Naoom, S. F., Blase, K. A., Friedman, R. M. & Wallace, F. (2005). Implementation
research: A synthesis of the literature. Tampa, FL: University of South Florida, Louis de la Parte Florida Mental Health Institute, The National Implementation Research Network.
Fixsen, D.L., Blasé, K.A., Naoom, S.F., & Wallace, F. (2009). Core implementation components. Research on Social Work in Practice, 19, 531-540.
Forman, S.G., Shapiro, E.S., Codding, R.S., Gonzales, J.E., Reddy, L.A., Rosenfield, S.A., Stoiber,
K.C. (2013). Implementation science and school psychology. School Psychology Quarterly, 28(2), 77-100.
Garet, M., Porter, A., Desimone, L., Birman, B., & Yoon., S (2001). What makes professional
development effective? Results from a national sample of teachers. American education research journal, 38(4), 915-945.
Gibbons, L. K., & Cobb, P. (2017). Focusing on Teacher Learning Opportunities to Identify
Potentially Productive Coaching Activities. Journal of Teacher Education, 0(0)

174
Gresham, F. (2016). Features of fidelity in schools and classrooms: constructs and Measurment. Treatment Fidelity in Studies of Educational Intervention, 22-39.
Grossman, P. (2015). From Measurement to Improvement: Evidence from the PLATO Professional Development. Educational Studies Colloquium, University of Michigan, March 26, 2015.
Grossman, P., Compton, C., Igra, D., Ronfeldt, M., Shahan, E., & Williamson, P. (2009). Teaching practice: A cross-professional perspective. Teachers College Record, 111(9), 2055-2100.
Hare, D., & Heap, J. (2001). Effective teacher recruitment and retention strategies in the Midwest. Naperville, IL: North Central Regional Laboratory. Retrieved June 26, 2002, from www.ncrel.org/policy/pubs/html/strategy/ index.html
Hawley, W. D., & Valli, L. (1999). The essentials of effective professional development: A new
consensus. Teaching as the learning profession: Handbook of policy and practice, 127-150.
Hill, H., & Grossman, P. (2013). Learning from teacher observations: Challenges and opportunities posed by new teacher evaluation systems. Harvard educational review, 83(2), 371-384.
Horn, I. S., & Little, J. W. (2010). Attending to problems of practice: Routines and resources for
professional learning in teachers’ workplace interactions.American Educational Research Journal, 47(1), 181-217.
Hulleman, C. S., Rimm-Kaufman, & Abry, T. (2013). Innovative methodologies to explore
implementation: Whole-part-whole – construct validity, measurement, and analytical issues for intervention fidelity assessment in education research. In T. Halle, A. Metz, & I. Martinez-Beck (Eds.), Applying Implementation Science in Early Childhood Programs and Systems, Baltimore, MD: Brookes Publishing, pp. 65-93.
Hulleman, C.S. and Cordray, D.S. (2009). Moving from lab to the field: The role of fidelity and
achieved relative intervention strength. Journal of Research on Educational Effectiveness, 2(1), 88-110.
Ingersoll, R. M., & Strong, M. (2011). The impact of induction and mentoring programs for
beginning teachers a critical review of the research. Review of educational research, 81(2), 201-233.
Institute for Education Science (2017). Request for Applications: Education Research Grants.
Retrieved from https://ies.ed.gov/funding/pdf/2018_84305A.pdf.
Joyce, B., & Showers, B. (1995). Student achievement through staff development: Fundamentals of School Renewal. New York, NY: :Longman
175
King, M. B., & Newmann, F. M. (2001). Building school capacity through professional development: Conceptual and empirical considerations. International journal of educational management, 15(2), 86-94.
Knowles, M. S. (1984). Andragogy in action (pp. 1-21). San Francisco: Jossey-Bass. Knowles, M., Holton, E., & Swanson, R. (2005). The Adult Learning. Burlington, MA. Kraft, M. A., & Gilmour, A. F. (2016). Can principals promote teacher development as evaluators?
A case study of principals’ views and experiences. Educational Administration Quarterly, 52(5), 711-753.
Kraft, M.A., Blazar, D., Hogan, D. (2016). The effect of teaching coaching on instruction and
achievement: A meta-analysis of the causal evidence. Brown University Working Paper.
Kretlow, A. G., & Bartholomew, C. C. (2010). Using coaching to improve the fidelity of evidence-based practices: A review of studies. Teacher Education and Special Education, 33(4), 279-299.
Kretlow, A. G., Wood, C. L., & Cooke, N. L. (2011). Using in-service and coaching to increase kindergarten teachers’ accurate delivery of group instructional units. The Journal of Special Education, 44(4), 234-246.
Kretlow, A. G., Cooke, N. L., & Wood, C. L. (2012). Using in-service and coaching to increase
teachers’ accurate use of research-based strategies. Remedial and Special Education, 33(6), 348-361.
Ramey, S., Ramey, C. T., Crowell, N. A., Grace, C., Timraz, N., & Davis, L. E. (2011). The
dosage of professional development for early childhood professionals: How the amount and density of professional development may influence its effectiveness. In The Early Childhood Educator Professional Development Grant: Research and Practice (pp. 11-32). Emerald Group Publishing Limited.
Lampert, M. (2003). Teaching problems and the problems of teaching. Yale University Press.
Lemov, D. (2010). Teach like a champion: 49 techniques that put students on the path to college (K-12). John Wiley & Sons.
Little, J. W. (1993). Teachers’ professional development in a climate of educational reform.
Educational Evaluation and Policy Analysis, 15, 129 – 151. doi:10.3102/01623737015002129.
Little, J. W. (2012). Professional community and professional development in the learning-
centered school. Teacher learning that matters: International perspectives, 22-46.
Lofthouse, R., Leat, D., Towler, C., Hallet, E., & Cummings, C. (2010). Improving coaching: evolution not revolution, research report.

176
McQueen, K. (2015). Promoting Opportunities For Teacher Learning: How Field Instructors Use Conversational Moves To Address Problems of Practice . Working Paper.
Mendive, S., Weiland, C., Yoshikawa, H., & Snow, C. (2016). Opening the black box: Intervention
fidelity in a randomized trial of a preschool teacher professional development program. Journal of Educational Psychology, 108(1), 130.
Merriam, S. (2001). Andragogy and Self-Directed Learning: Pillars of Adult Learning Theory. New
Directions for Adult and Continuing Education, 2001(89), 3-14.
Nelson, M. C., Cordray, D. S., Hulleman, C. S., Darrow, C. L., & Sommer, E. C. (2012). A procedure for assessing intervention fidelity in experiments testing educational and behavioral interventions. The Journal of Behavioral Health Services & Research, 39(4), 374-396.
Nelson, M.C., Cordray, D.S., Hulleman, C.S., Darrow, C.L., & Sommer, E.C. (2012). A procedure for assessing intervention fidelity in experiments testing educational and behavioral interventions. Journal of Behavior Health Services and Research, 39(4), 374-396.
Neuman, S. B., & Cunningham, L. (2009). The impact of professional development and coaching
on early language and literacy instructional practices. American educational research journal, 46(2), 532-566.
Norwood, K., & Burke, M. A. (2011). Education. In L. Wildflower & D. Brennan (Eds.), The
handbook of knowledge-based coaching: From theory to practice (pp. 211– 220). San Francisco: Jossey-Bass.
O’Donnell, C. (2008). Defining, conceptualizing, and measuring fidelity of implementation and its
relationship to outcomes in K–12 curriculum intervention research. Review of Educational Research, 78, 33– 84
Papay, J. P., Taylor, E. S., Tyler, J. H., & Laski, M. (2016). Learning job skills from colleagues at work:
Evidence from a field experiment using teacher performance data (No. w21986). National Bureau of Economic Research.
Penuel, W., Fishman, B., Yamaguchi, R., & Gallagher, L. (2007). What makes professional
development effective? Strategies that foster curriculum implementation American Education Research Journal, 44(9), 921-958.
Peterson, S. M. (2013). Readiness to change: Effective implementation processes for meeting
people where they are. In T. Halle, A.Metz,& I. Martinez-Beck (Eds.), Applying implementation science in early childhood programs and systems (pp. 43–64). Baltimore: Paul H. Brookes Publishing Co.

177
Power, T. J., Blom-Hoffman, J., Clarke, A. T., Riley-Tillman, T., Kelleher, C., & Manz, P. H. (2005). Reconceptualizing intervention integrity: A partnership-based framework for linking research with practice. Psychology in the Schools, 42, 495–507.
Putnam, R. T., & Borko, H. (2000). What do new views of knowledge and thinking have to say
about research on teacher learning?. Educational researcher, 29(1), 4-15. Reinke, W. M., Herman, K. C., Stormont, M., Newcomer, L., & David, K. (2013). Illustrating the
multiple facets and levels of fidelity of implementation to a teacher classroom management intervention. Administration and Policy in Mental Health and Mental Health Services Research, 40(6), 494-506.
Ronfeldt, M., & Campbell, S. L. (2016). Evaluating Teacher Preparation Using Graduates’
Observational Ratings. Educational Evaluation and Policy Analysis, 38(4), 603-625. Ronfeldt, M., & McQueen, K. (2017). Does New Teacher Induction Really Improve
Retention? Journal of Teacher Education, 68(4), 394-410.
Ronfeldt, M., Reininger, M., & Kwok, A. (2013). Recruitment or preparation? Investigating the effects of teacher characteristics and student teaching. Journal of Teacher Education, 64(4), 319-337.
Sailors, M., & Price, L. R. (2010). Professional development that supports the teaching of
cognitive reading strategy instruction. The elementary school Journal, 110(3), 301-322. Sanford, K., & Hopper, T. (2000). Mentoring, not monitoring: Mediating a whole-school model in
supervising preservice teachers. Alberta journal of educational research, 46(2), 149
Scher, L., & O'Reilly, F. (2009). Professional development for K–12 math and science teachers: What do we really know? Journal of Research on Educational Effectiveness, 2(3), 209-249.
Schon, D. (1983). The reflective practitioner: How professionals think in action. New York: Basic Books.
Seligman, M. E., & Csikszentmihalyi, M. (2014). Positive psychology: An introduction. In Flow
and the foundations of positive psychology (pp. 279-298). Springer Netherlands. Stanulis, R. N., & Floden, R. E. (2009). Intensive mentoring as a way to help beginning teachers
develop balanced instruction. Journal of Teacher Education, 60(2), 112-122. Stitcher, J. P., Lewis, T. J., Richter, M., Johnson, N. W., & Bradley, L. (2006). Assessing
antecedent variables: The effects of instructional variables on student outcomes through in-service and peer coaching professional development models. Education and Treatment of Children, 29, 665-692.

178
Stuhlman, M., Hamre, B., Downer, J., & Pianta, R. C. (2014). How Classroom Observations Can Support Systematic Improvement in Teacher Effectiveness. Retrieved from http://curry.virginia.edu/uploads/resourceLibrary/CASTL_practioner_Part5_single.pdf
Sweller, J. (1988). Cognitive load during problem solving: Effects on learning. Cognitive science, 12(2), 257-285.
Unlu, F., Bozzi, L., Layzer, C., Smith, A., Price, C., & Hurtig, R. (2013). Linking implementation
fidelity to impacts in an RCT. Paper presented at the annual meeting of Society for Research on Educational Effectiveness, Washington, DC.
Vásquez, C., & Reppen, R. (2007). Transforming practice: Changing patterns of participation in
post-observation meetings. Language Awareness, 16(3), 153-172. Wanless, S. B., Rimm-Kaufman, S. E., Abry, T., Larsen, R. A., & Patton, C. L. (2015).
Engagement in training as a mechanism to understanding fidelity of implementation of the Responsive Classroom Approach. Prevention Science, 16(8), 1107-1116.
Wayne, A. J., Yoon, K. S., Zhu, P., Cronen, S., & Garet, M. S. (2008). Experimenting with
teacher professional development: Motives and methods. Educational Researcher, 37(8), 469–479
Weiss, M., Bloom, H., and Brock, T. (2014). A conceptual framework for studying the sources of
variation in program effects. Journal of Policy Analysis and Management, 33(3), 778-808. Wenz-Gross, M., & Upshur, C. (2012). Implementing a primary prevention social skills
intervention in urban preschools: Factors associated with quality and fidelity. Early Education & Development, 23(4), 427-450.
What Works Clearinghouse (2014). Procedures and standards handbook (Version 3.0).
Washington DC: Institute of Education Sciences. Chicago. Retrieved from: https://ies.ed.gov/ncee/wwc/Docs/refereceresources/wwc_procedures_v3_0_standards_handbook.pdf
What Works Clearinghouse (2015). WWC Standards Brief. Retrieved from:
https://ies.ed.gov/ncee/wwc/Docs/referenceresources/wwc_brief_attrition_080715.pdf Wiggins, G. (2016). Seven keys to effective feedback. On Formative Assessment: Readings from
Educational Leadership (EL Essentials), 24. Wong, V., Ruble, L. A., McGrew, J. H., & Yu, Y. (2017). An Empirical Study of Multidimensional
Fidelity of COMPASS Consultation. School psychology quarterly: the official journal of the Division of School Psychology, American Psychological Association.
Wood, R.E. (1986). Task complexity. Definition of the construct. Organizational behavior and human
decision processes, 37(1), 60-82.