Embed Size (px)
Citation preview

1
Promoting Independence Advisory Committee
Department Activity Report
Department Name: DATE:
Department of Aging and Disability Services June 2016
Legislation/Rider Update:
84th Legislature, Appropriations for 2016-17 Biennium
Promoting Independence ($22.5M GR / $53.1M AF)
500 Home and Community-based Services (HCS) waiver slots for large and medium Intermediate
Care Facilities for Individuals with an Intellectual Disability or Related Condition (ICFs/IID)
o People in large ICFs/IID – As of August 31, 2016, 43 HCS offers have been released and 12
people have been enrolled.
o People in small/medium ICFs/IID – As of August 31, 2016, 62 HCS offers have been released and
26 people have been enrolled.
o Residents of state supported living centers – As of August 31, 2016, 147 HCS offers have been
released and 102 people have been enrolled.
680 HCS waiver slots for adults transitioning from nursing facilities – As of August 31, 16, 1,128 HCS
offers have been released and 192 people have been enrolled.
20 HCS waiver slots for people 21 and younger who reside in nursing facilities – As of August 31,
2016 13 HCS offers have been released and 9 people have been enrolled.
400 HCS waiver slots for people at risk of ICF/IID institutionalization – As of
August 31, 2016, 252 HCS offers have been released and 185 people have been enrolled.
600 HCS waiver slots for adults at risk of nursing facility institutionalization – As of August 31, 2016,
205 HCS offers have been released and 124 people have been enrolled.
216 HCS waiver slots for children aging-out of the Department of Family and Protective Services
(DFPS) foster care – As of August 31, 2016, 143 HCS offers have been released and 90 people have
been enrolled.
25 HCS waiver slots for children transitioning from DFPS General Residential Operation – As of
August 31, 2016, 16 HCS offers have been released and 10 people have been enrolled.
120 HCS waiver slots for people moving out of state hospitals – As of
August 31, 2016, 108 HCS offers have been released and 65 people have been enrolled.
Riders
Rider 34 (previously Rider 29) services under a 1915(c) waiver:
o Children 21 years and younger, and residing in nursing facilities, may by-pass the HCS interest list
to receive HCS.
Between September 1, 2009, and August 31, 2016, 84 people received an HCS offer through
this rider.
Rider 35 (previously Rider 30)
o Services under HCS waiver program:
As of August 31, 2016, there has been one instance where a person referred for HCS services
from community ICFs/IID was determined ineligible for HCS .

2
General Revenue (GR) funds pursuant to the 2016-17 General Appropriations Act (Article II, Special
Provisions, Section 42, House Bill 1, 84th Legislature, Regular Session, 2015)
o Waiver Program Cost Limits
Use of GR Funds for Services:
o Five people are receiving waiver services above the individual waiver cost limit with the difference
being funded by GR.
Three people receive GR funds due to settlement agreements; and
Two people receive GR funds in compliance with Special Provision, Section 42.
o DADS completed two clinical assessments under Special Provisions, Section 42.
Use of Utilization Management and Utilization Review Practices. Utilization review continues for
waiver program areas as authorized under this section.
Promoting Independence Plan Directives:
If directed and/or funded by the Legislature, HHSC will work with DADS, the Department of State Health
Services (DSHS), and the Department of Assistive and Rehabilitative Services (DARS) to reduce
community-based interest lists (IL).
Interest List Releases Summary
Fiscal Years 2016 - 2017 CLASS DBMD HCS MDCP TxHmL Total
Number of individuals on IL –
September 1, 2015 54,083 221 73,004 20,540 50,680 198,528
Total Released/Removed from IL 1 3,408 493 2,070 7,024 1,998 14,4993
Enrolled 493 51 1395 856 807 3,602
Denied/Declined/Withdrawn 1,641 215 573 5,316 1,164 8,909
In the Pipeline 1,272 228 102 838 27 2,467
Current IL – August 30, 2016 56,912 150 80,189 19,221 58,997 215,469 2
1 Released/Removed counts include individuals already in the pipeline as of August 31, 2015, excluding MFP. 2 The total of Current IL counts in the above table is a duplicated count. The unduplicated count across all four Interest Lists is: 110,630.
3
Relocation Contractor Services
Statewide Service Areas
DADS relocation services are available statewide:
Region 1 (Lubbock)
Region 2 (Abilene)
Region 3 (Dallas)
Region 4 (Tyler and Longview)
Region 5 (Beaumont)
Region 6 (Houston)
Region 7 (Austin)
Region 8 (San Antonio)
Regions 9 and 10 (Midland and El Paso)
Region 11(Rio Grande Valley)
Contracts
DADS has nine contracts with the following entities for relocation services effective
September 1, 2015:
Lifetime Independence for Everyone, Inc. (LIFE/RUN) – Regions 1 and 2
North Central Texas Council of Governments (NCTCOG) – Region 3
ARCIL, Inc. – Region 4
ARCIL, Inc. – Region 5
Houston Center for Independent Living (HCIL) – Region 6
ARCIL, Inc. – Region 7
The Center on Independent Living, Inc. (COIL) – Region 8
Lifetime Independence for Everyone, Inc. (LIFE/RUN) – Regions 9 and 10
Coastal Bend Center for Independent Living – Region 11
Relocation Activity
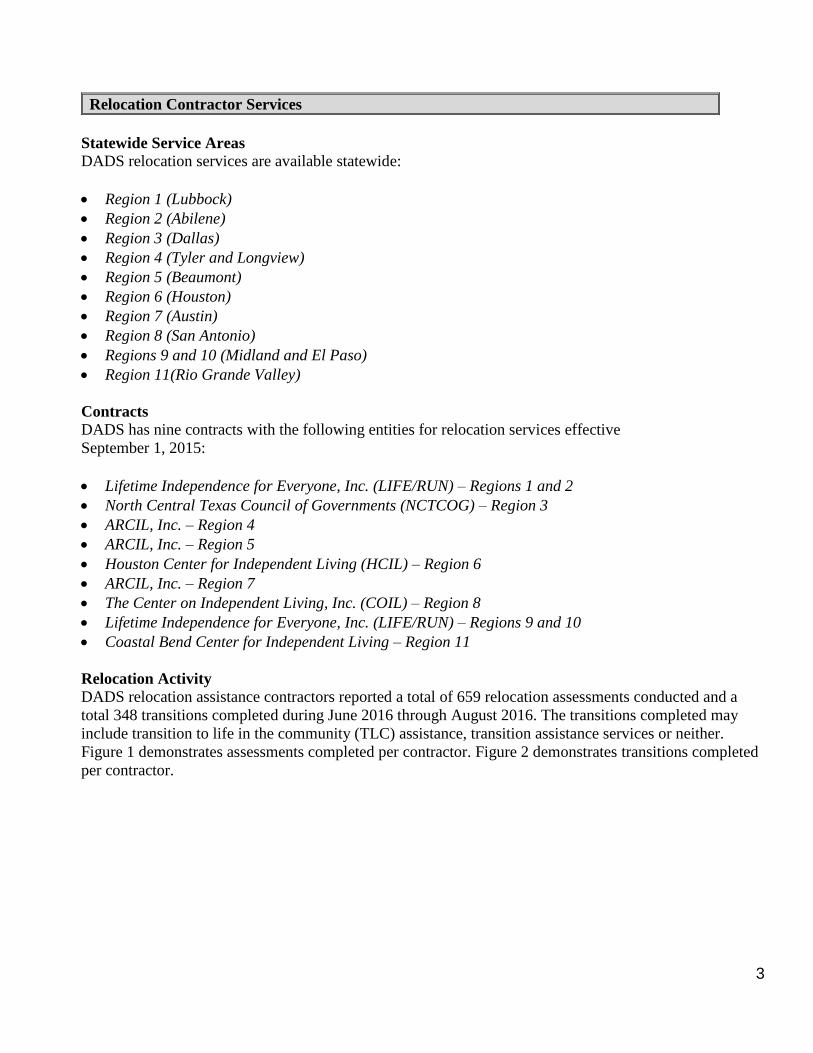
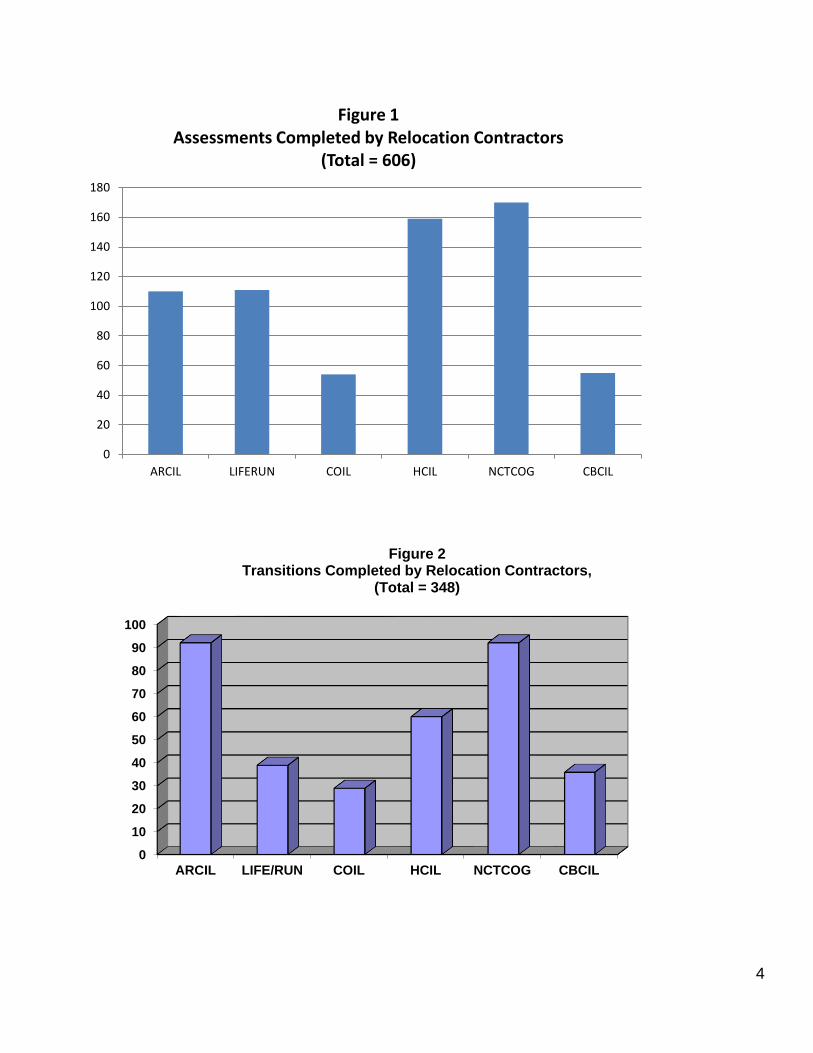
DADS relocation assistance contractors reported a total of 659 relocation assessments conducted and a
total 348 transitions completed during June 2016 through August 2016. The transitions completed may
include transition to life in the community (TLC) assistance, transition assistance services or neither.
Figure 1 demonstrates assessments completed per contractor. Figure 2 demonstrates transitions completed
per contractor.
4
0
20
40
60
80
100
120
140
160
180
ARCIL LIFERUN COIL HCIL NCTCOG CBCIL
Figure 1Assessments Completed by Relocation Contractors
(Total = 606)
0
10
20
30
40
50
60
70
80
90
100
ARCIL LIFE/RUN COIL HCIL NCTCOG CBCIL
Figure 2Transitions Completed by Relocation Contractors,
(Total = 348)
5
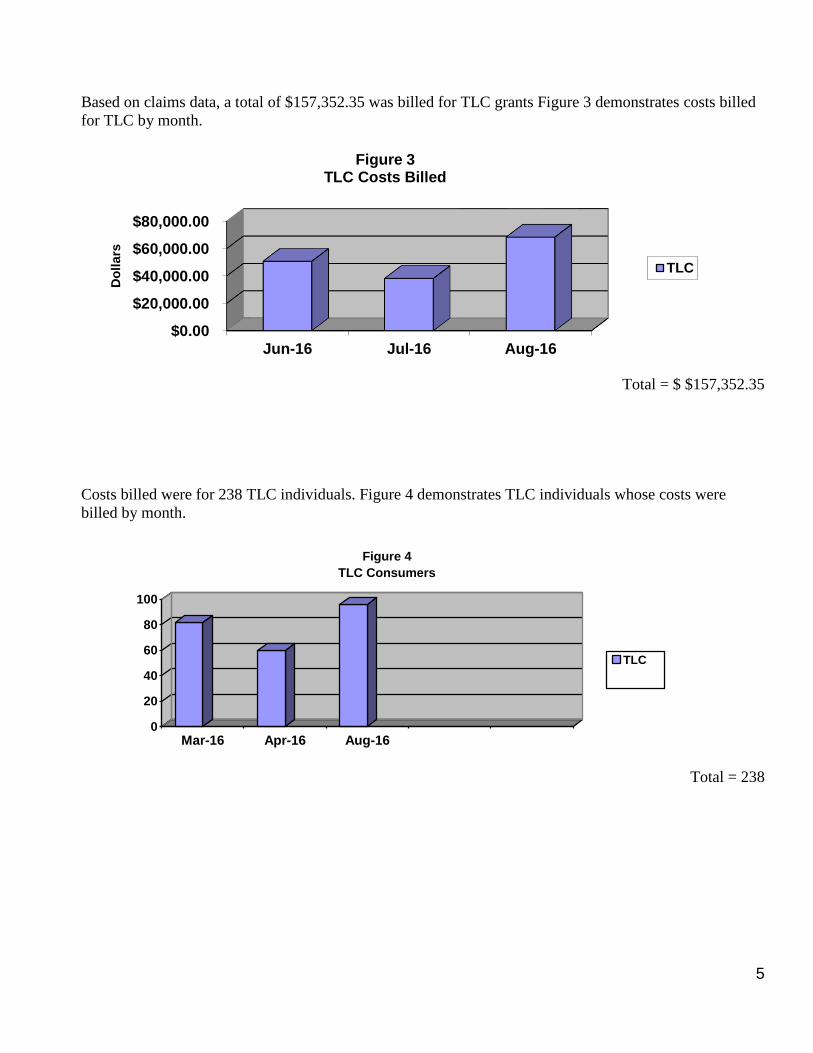
Based on claims data, a total of $157,352.35 was billed for TLC grants Figure 3 demonstrates costs billed
for TLC by month.
Total = $ $157,352.35
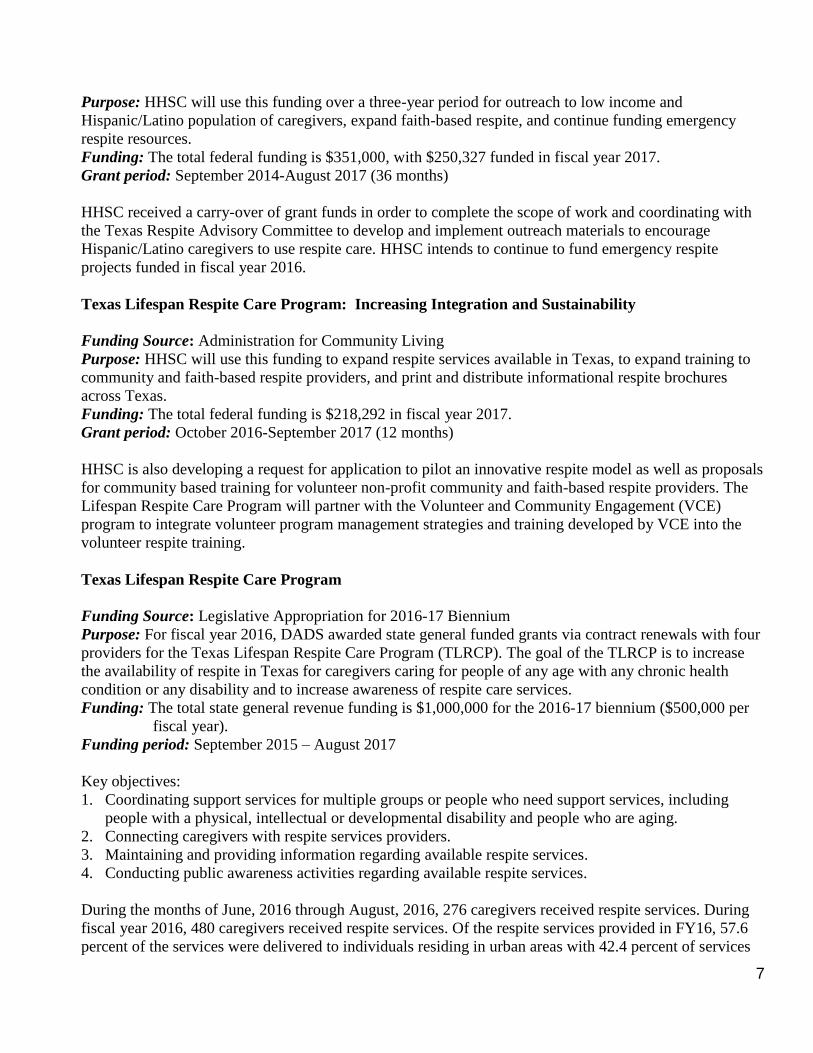
Costs billed were for 238 TLC individuals. Figure 4 demonstrates TLC individuals whose costs were
billed by month.
0
20
40
60
80
100
Mar-16 Apr-16 Aug-16
Figure 4
TLC Consumers
TLC
3-D
Colum
n 2
Total = 238
$0.00
$20,000.00
$40,000.00
$60,000.00
$80,000.00
Jun-16 Jul-16 Aug-16
Do
lla
rs
Figure 3TLC Costs Billed
TLC

6
Data from the relocation contractors indicate 119 people transitioned back into their own or family home,
110 into assisted living facilities (ALF), 63 into rentals, 2 into an independent living center (ILC), 1 into
senior retirement center, 20 into shared residence and 33 into other. Figure 5 demonstrates living
arrangements for TLC individuals who transitioned.
Figure 5
Living Arrangement – For Those Who Transitioned
June 2016 through August 2016
(Total = 348)
There were 35 applications submitted for public housing.
Topics of Interest (ongoing issues/projects)
Program of All-Inclusive Care for the Elderly (PACE) - Expansion Request for Proposal
The 2012-13 General Appropriations Act (Article II, Department of Aging and Disability Services, Rider
48, Senate Bill 1, 83rd Legislature, Regular Session, 2013) allocated DADS funding to establish up to three
additional PACE sites in Texas. DADS staff developed a request for proposal (RFP) in collaboration with
staff at HHSC in 2014 but the RFP was closed in April 2016 due to vendors concerns with the proposed
PACE reimbursement rates for the 2016-2017 biennium. The Health and Human Services Commission is
developing new rate methodology rules for release in November 2016. On September 13, 2016 a new RFP
was posted to the Electronic State Business Daily website to solicit bids for up to three additional PACE
sites in Texas.
Grant-Funded Projects
2014 Lifespan Respite Care Program: Developing a Sustainable System of Respite Care
Funding Source: Administration for Community Living
0
20
40
60
80
100
120
Living ArrangementHome
ALF
Rental
ILC/Retirement
Senior Retirement Center
Shared Residence
Other
7
Purpose: HHSC will use this funding over a three-year period for outreach to low income and
Hispanic/Latino population of caregivers, expand faith-based respite, and continue funding emergency
respite resources.
Funding: The total federal funding is $351,000, with $250,327 funded in fiscal year 2017.
Grant period: September 2014-August 2017 (36 months)
HHSC received a carry-over of grant funds in order to complete the scope of work and coordinating with
the Texas Respite Advisory Committee to develop and implement outreach materials to encourage
Hispanic/Latino caregivers to use respite care. HHSC intends to continue to fund emergency respite
projects funded in fiscal year 2016.
Texas Lifespan Respite Care Program: Increasing Integration and Sustainability
Funding Source: Administration for Community Living
Purpose: HHSC will use this funding to expand respite services available in Texas, to expand training to
community and faith-based respite providers, and print and distribute informational respite brochures
across Texas.
Funding: The total federal funding is $218,292 in fiscal year 2017.
Grant period: October 2016-September 2017 (12 months)
HHSC is also developing a request for application to pilot an innovative respite model as well as proposals
for community based training for volunteer non-profit community and faith-based respite providers. The
Lifespan Respite Care Program will partner with the Volunteer and Community Engagement (VCE)
program to integrate volunteer program management strategies and training developed by VCE into the
volunteer respite training.
Texas Lifespan Respite Care Program
Funding Source: Legislative Appropriation for 2016-17 Biennium
Purpose: For fiscal year 2016, DADS awarded state general funded grants via contract renewals with four
providers for the Texas Lifespan Respite Care Program (TLRCP). The goal of the TLRCP is to increase
the availability of respite in Texas for caregivers caring for people of any age with any chronic health
condition or any disability and to increase awareness of respite care services.
Funding: The total state general revenue funding is $1,000,000 for the 2016-17 biennium ($500,000 per
fiscal year).
Funding period: September 2015 – August 2017
Key objectives:
1. Coordinating support services for multiple groups or people who need support services, including
people with a physical, intellectual or developmental disability and people who are aging.
2. Connecting caregivers with respite services providers.
3. Maintaining and providing information regarding available respite services.
4. Conducting public awareness activities regarding available respite services.
During the months of June, 2016 through August, 2016, 276 caregivers received respite services. During
fiscal year 2016, 480 caregivers received respite services. Of the respite services provided in FY16, 57.6
percent of the services were delivered to individuals residing in urban areas with 42.4 percent of services

8
delivered to rural areas. Caregivers primarily received respite services through a government agency
(44.64 percent) or vouchers to purchase consumer-directed respite services (23.61 percent). The most
common types of respite services used were both personal care services to help with daily living activities
(56.65 percent) and caregiver support coordination (37.55 percent). Caregivers received, on average, 52
hours of respite services per caregiver. The majority of caregivers (92.71 percent) ranged in age from 21-
59 (66 percent) and 66-79 (26 percent). Caregivers were predominantly female (80%). The majority of the
care recipient’s caregivers were age 60 or older (40 percent).
State Supported Living Centers:
Department of Justice Settlement Agreement: Efforts are ongoing to ensure all required activities
are addressed. The eleventh round of compliance visits began in July 2016. The most recent
compliance report for each facility is posted at
http://www.dads.state.tx.us/monitors/reports/index.html.
State Supported Living Center (SSLC) Census Management: Data relevant to movement of people
to and from each of the centers is evaluated on an ongoing basis. Overall census at the centers
continues to decline as noted in the table below:
SSLC Sept 2011 Sept 2012 Sept 2013 Sept 2014 Sept 2015 June 2016
Abilene 439 413 386 356 321 298
Austin 353 326 288 266 191 184
Brenham 312 297 288 283 279 267
Corpus Christi 272 258 242 224 221 222
Denton 517 493 484 460 458 455
El Paso 130 124 116 110 106 106
Lubbock 225 211 209 203 201 196
Lufkin 376 361 342 322 308 294
Mexia 391 366 331 288 256 264
Richmond 377 350 339 335 330 326
Rio Grande 71 70 62 67 71 63
San Angelo 239 231 210 208 214 215
San Antonio 280 274 250 240 229 232
All Facilities 3982 3774 3547 3362 3186 3122
Community Transition Specialist positions at the SSLCs: In December 2011, DADS received
notice from CMS that 100 percent Money Follows the Person Demonstration administrative funding
project had been approved. The request was for 26 positions (24 community transition specialists, 1
community transition specialist coordinator and 1 administrative assistant). One to two transition
specialists have been assigned to each of the twelve SSLCs and one State Center. The transition
specialists’ duties are to provide education and support to help people make successful transitions
from an SSLC into a community setting. They serve as a resource to the residents, legally authorized
representatives, families and interdisciplinary teams (IDTs). They assist not only with education but
facilitation of the transition process.
9
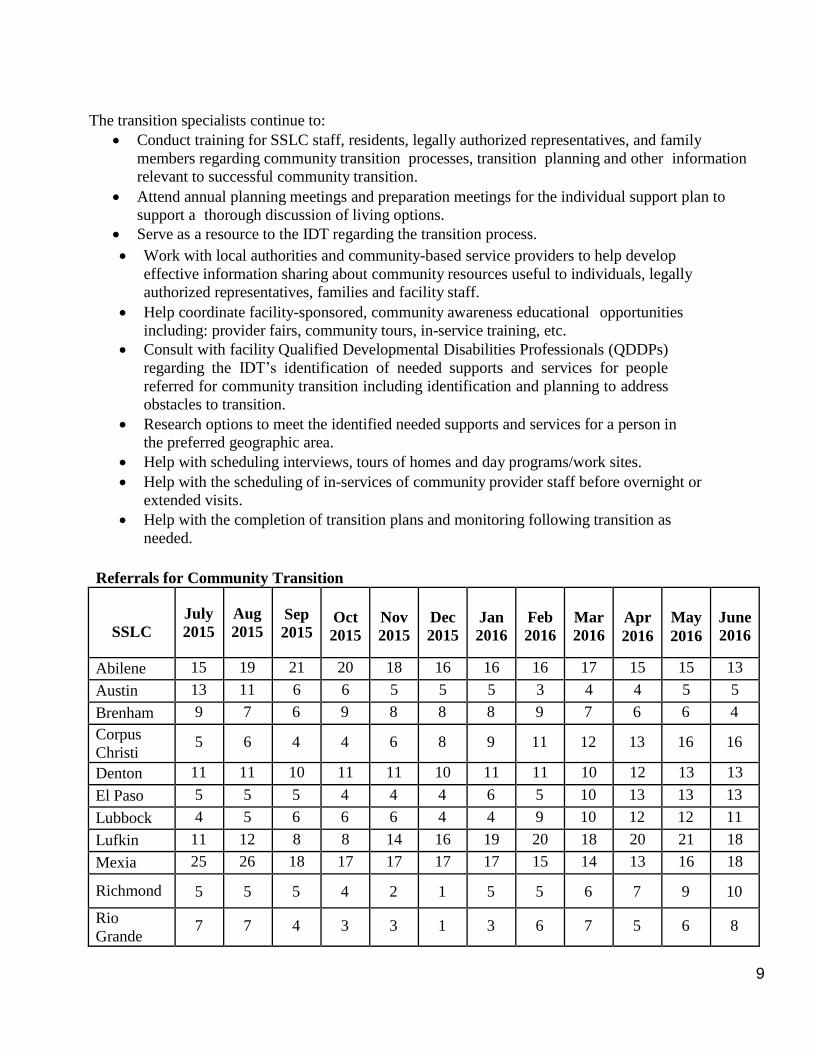
The transition specialists continue to:
Conduct training for SSLC staff, residents, legally authorized representatives, and family
members regarding community transition processes, transition planning and other information
relevant to successful community transition.
Attend annual planning meetings and preparation meetings for the individual support plan to
support a thorough discussion of living options.
Serve as a resource to the IDT regarding the transition process.
Work with local authorities and community-based service providers to help develop
effective information sharing about community resources useful to individuals, legally
authorized representatives, families and facility staff.
Help coordinate facility-sponsored, community awareness educational opportunities
including: provider fairs, community tours, in-service training, etc.
Consult with facility Qualified Developmental Disabilities Professionals (QDDPs)
regarding the IDT’s identification of needed supports and services for people
referred for community transition including identification and planning to address
obstacles to transition.
Research options to meet the identified needed supports and services for a person in
the preferred geographic area.
Help with scheduling interviews, tours of homes and day programs/work sites.
Help with the scheduling of in-services of community provider staff before overnight or
extended visits.
Help with the completion of transition plans and monitoring following transition as
needed.
Referrals for Community Transition
SSLC
July
2015
Aug
2015
Sep
2015
Oct
2015
Nov
2015
Dec
2015
Jan
2016
Feb
2016
Mar
2016
Apr
2016
May
2016
June
2016
Abilene 15 19 21 20 18 16 16 16 17 15 15 13
Austin 13 11 6 6 5 5 5 3 4 4 5 5
Brenham 9 7 6 9 8 8 8 9 7 6 6 4
Corpus
Christi 5 6 4 4 6 8 9 11 12 13 16 16
Denton 11 11 10 11 11 10 11 11 10 12 13 13
El Paso 5 5 5 4 4 4 6 5 10 13 13 13
Lubbock 4 5 6 6 6 4 4 9 10 12 12 11
Lufkin 11 12 8 8 14 16 19 20 18 20 21 18
Mexia 25 26 18 17 17 17 17 15 14 13 16 18
Richmond 5 5 5 4 2 1 5 5 6 7 9 10
Rio
Grande 7 7 4 3 3 1 3 6 7 5 6 8
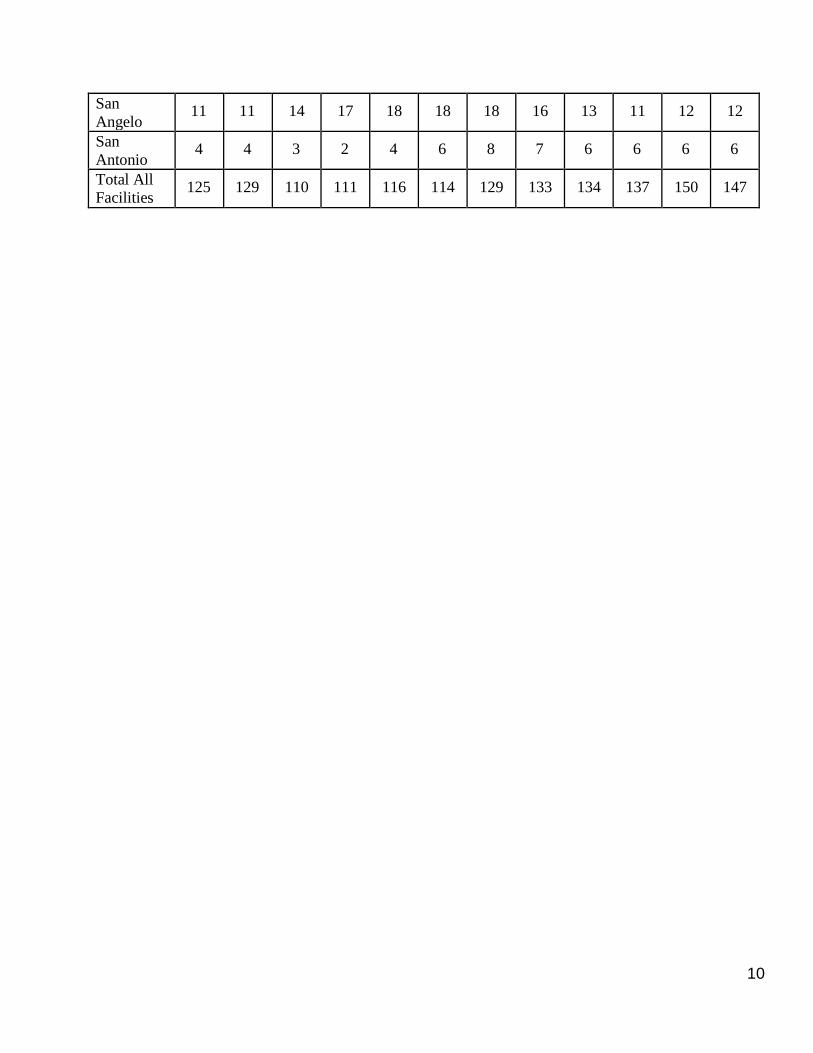
10
San
Angelo 11 11 14 17 18 18 18 16 13 11 12 12
San
Antonio 4 4 3 2 4 6 8 7 6 6 6 6
Total All
Facilities 125 129 110 111 116 114 129 133 134 137 150 147
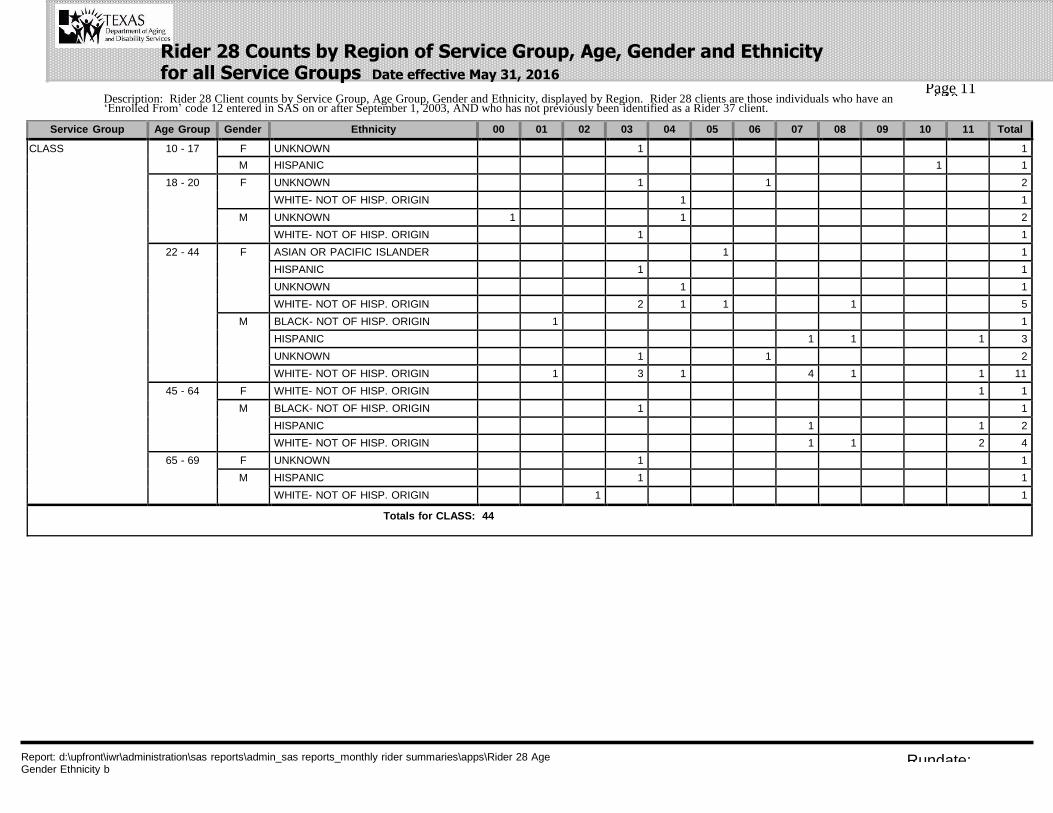
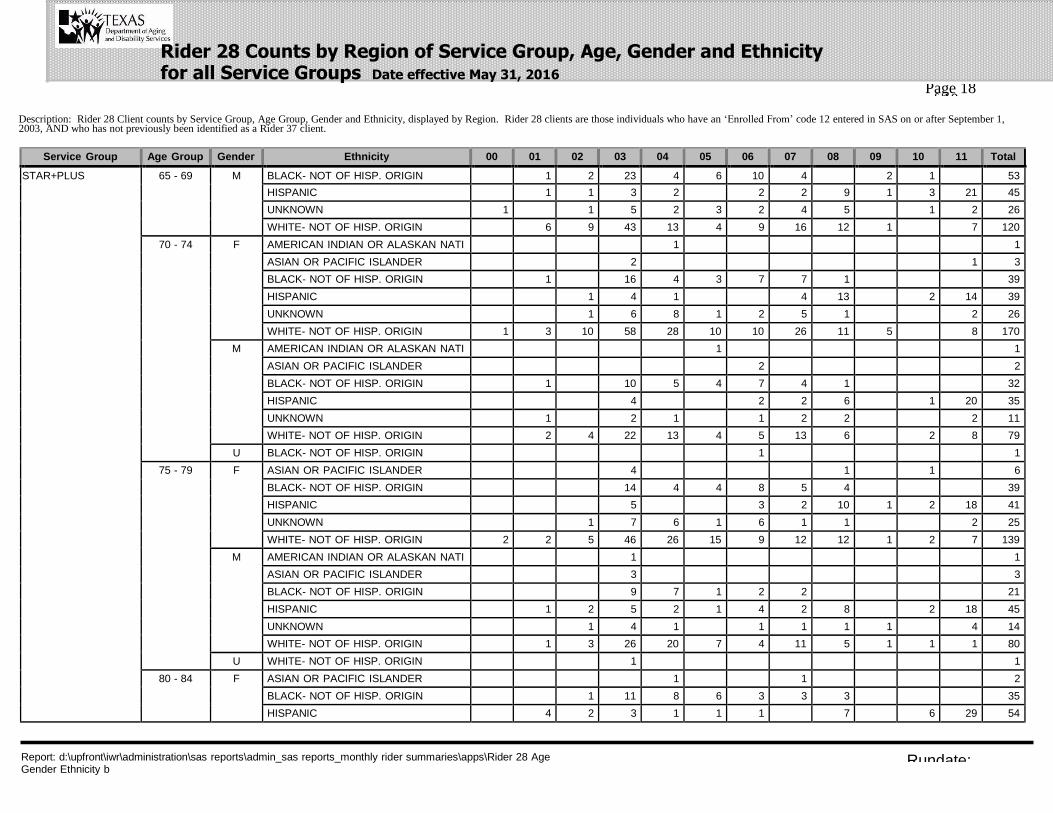
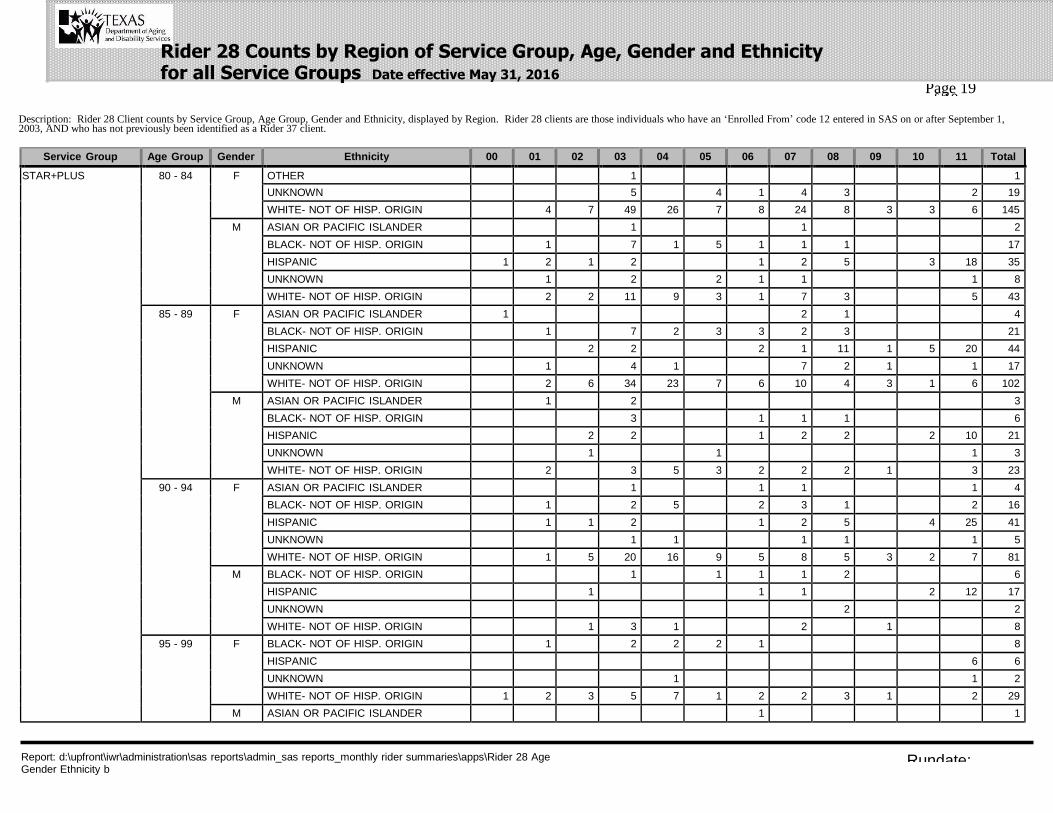
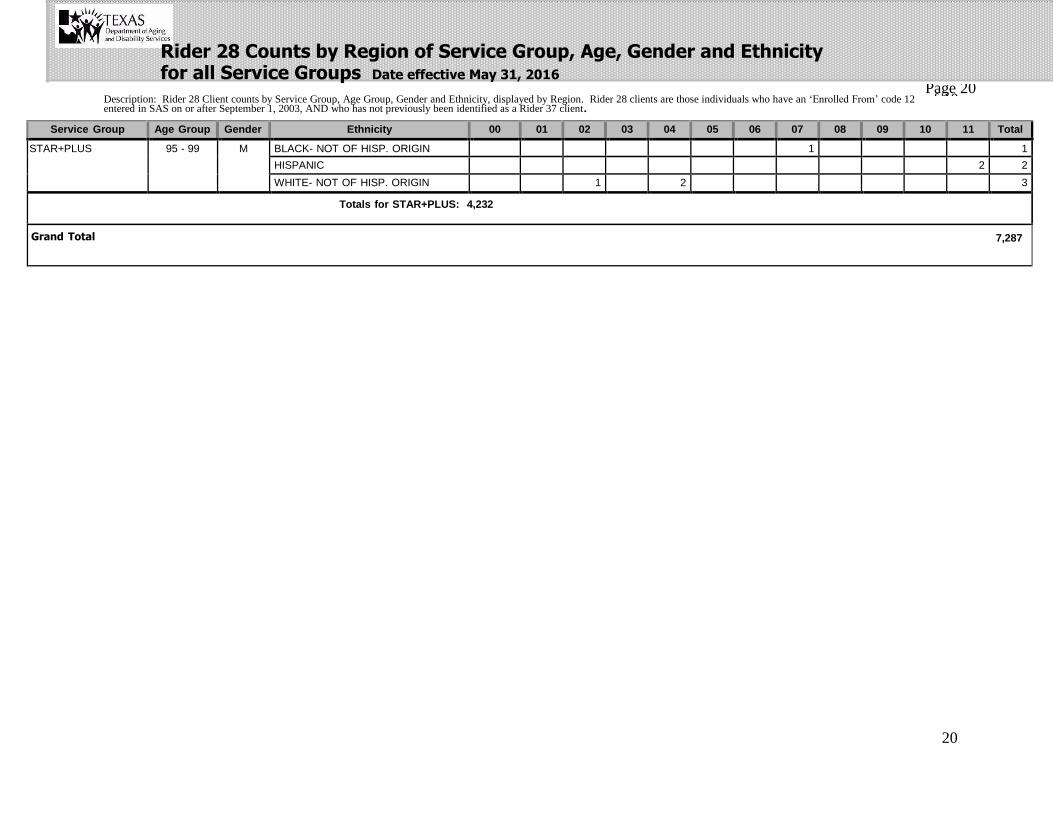
Rider 28 Counts by Region of Service Group, Age, Gender and Ethnicity for all Service Groups Date effective May 31, 2016
Page 11 of 10
Report: d:\upfront\iwr\administration\sas reports\admin_sas reports_monthly rider summaries\apps\Rider 28 Age Gender Ethnicity b
Detail Filter: Rider 28 Flag C = 'Y'
Rundate: 6/6/2016
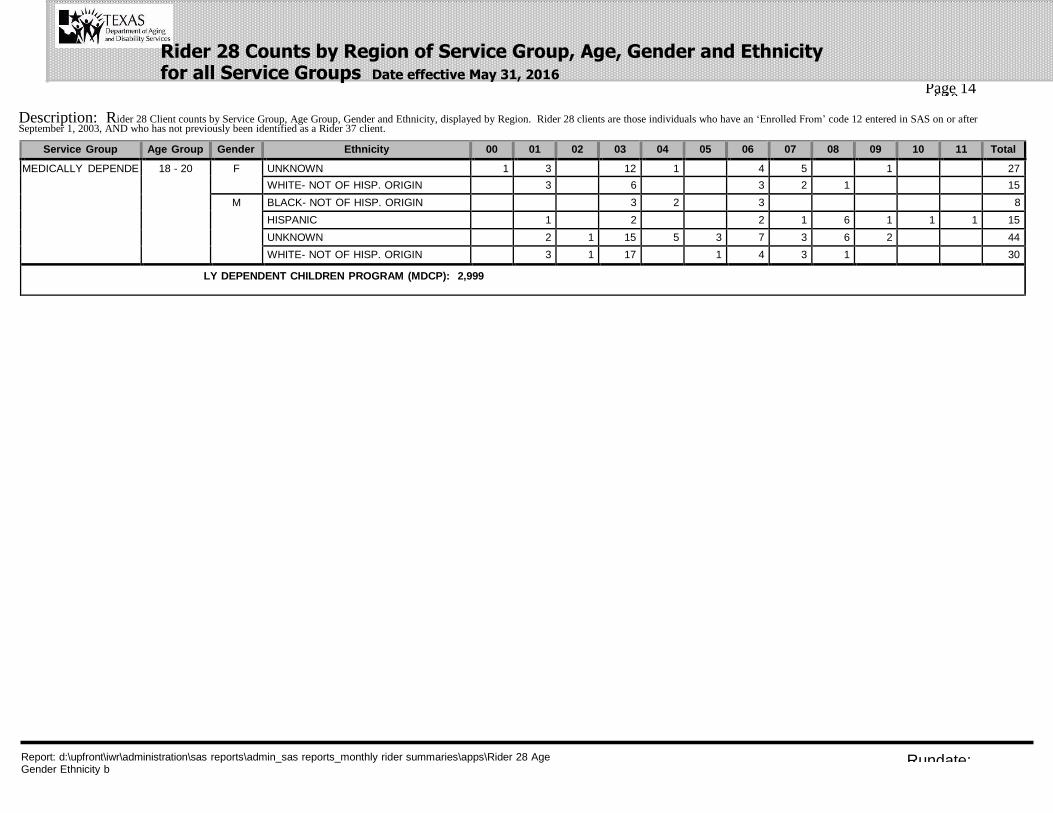
Description: Rider 28 Client counts by Service Group, Age Group, Gender and Ethnicity, displayed by Region. Rider 28 clients are those individuals who have an ‘Enrolled From’ code 12 entered in SAS on or after September 1, 2003, AND who has not previously been identified as a Rider 37 client.
Service Group Age Group Gender Ethnicity 00 01 02 03 04 05 06 07 08 09 10 11 Total
CLASS 10 - 17 F UNKNOWN 1 1
M HISPANIC 1 1
18 - 20 F UNKNOWN 1 1 2
WHITE- NOT OF HISP. ORIGIN 1 1
M UNKNOWN 1 1 2
WHITE- NOT OF HISP. ORIGIN 1 1
22 - 44 F ASIAN OR PACIFIC ISLANDER 1 1
HISPANIC 1 1
UNKNOWN 1 1
WHITE- NOT OF HISP. ORIGIN 2 1 1 1 5
M BLACK- NOT OF HISP. ORIGIN 1 1
HISPANIC 1 1 1 3
UNKNOWN 1 1 2
WHITE- NOT OF HISP. ORIGIN 1 3 1 4 1 1 11
45 - 64 F WHITE- NOT OF HISP. ORIGIN 1 1
M BLACK- NOT OF HISP. ORIGIN 1 1
HISPANIC 1 1 2
WHITE- NOT OF HISP. ORIGIN 1 1 2 4
65 - 69 F UNKNOWN 1 1
M HISPANIC 1 1
WHITE- NOT OF HISP. ORIGIN 1 1
Totals for CLASS: 44

Rider 28 Counts by Region of Service Group, Age, Gender and Ethnicity for all Service Groups Date effective May 31, 2016
Page 12 of 10
Report: d:\upfront\iwr\administration\sas reports\admin_sas reports_monthly rider summaries\apps\Rider 28 Age Gender Ethnicity b
Detail Filter: Rider 28 Flag C = 'Y'
Rundate: 6/6/2016
Description: Rider 28 Client counts by Service Group, Age Group, Gender and Ethnicity, displayed by Region. Rider 28 clients are those individuals who have an ‘Enrolled From’ code 12 entered in SAS on or after September 1, 2003, AND who has not previously been identified as a Rider 37 client.
Service Group Age Group Gender Ethnicity 00 01 02 03 04 05 06 07 08 09 10 11 Total
COMMUNITY CARE 70 - 74 M BLACK- NOT OF HISP. ORIGIN 1 1
75 - 79 F WHITE- NOT OF HISP. ORIGIN 1 1
Totals for COMMUNITY CARE: 2
Rider 28 Counts by Region of Service Group, Age, Gender and Ethnicity for all Service Groups Date effective May 31, 2016
Page 13 of 10
Report: d:\upfront\iwr\administration\sas reports\admin_sas reports_monthly rider summaries\apps\Rider 28 Age Gender Ethnicity b
Detail Filter: Rider 28 Flag C = 'Y'
Rundate: 6/6/2016
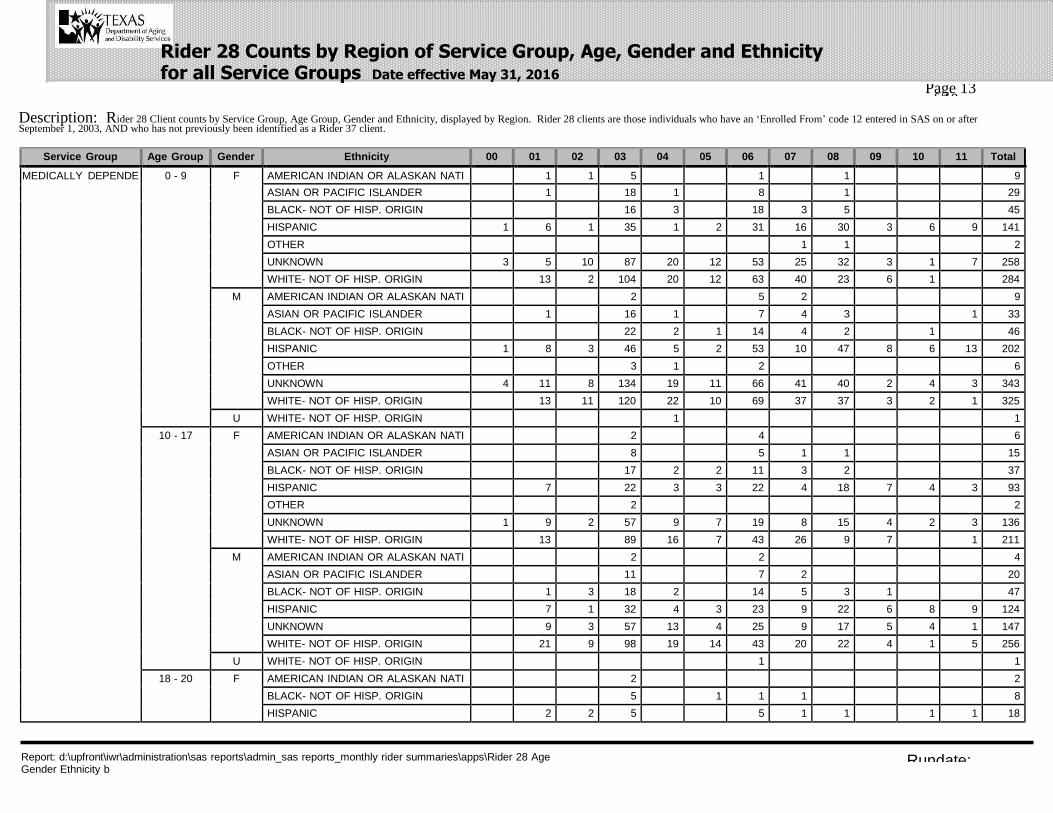
Description: Rider 28 Client counts by Service Group, Age Group, Gender and Ethnicity, displayed by Region. Rider 28 clients are those individuals who have an ‘Enrolled From’ code 12 entered in SAS on or after September 1, 2003, AND who has not previously been identified as a Rider 37 client.
Service Group Age Group Gender Ethnicity 00 01 02 03 04 05 06 07 08 09 10 11 Total
MEDICALLY DEPENDE 0 - 9 F AMERICAN INDIAN OR ALASKAN NATI 1 1 5 1 1 9
ASIAN OR PACIFIC ISLANDER 1 18 1 8 1 29
BLACK- NOT OF HISP. ORIGIN 16 3 18 3 5 45
HISPANIC 1 6 1 35 1 2 31 16 30 3 6 9 141
OTHER 1 1 2
UNKNOWN 3 5 10 87 20 12 53 25 32 3 1 7 258
WHITE- NOT OF HISP. ORIGIN 13 2 104 20 12 63 40 23 6 1 284
M AMERICAN INDIAN OR ALASKAN NATI 2 5 2 9
ASIAN OR PACIFIC ISLANDER 1 16 1 7 4 3 1 33
BLACK- NOT OF HISP. ORIGIN 22 2 1 14 4 2 1 46
HISPANIC 1 8 3 46 5 2 53 10 47 8 6 13 202
OTHER 3 1 2 6
UNKNOWN 4 11 8 134 19 11 66 41 40 2 4 3 343
WHITE- NOT OF HISP. ORIGIN 13 11 120 22 10 69 37 37 3 2 1 325
U WHITE- NOT OF HISP. ORIGIN 1 1
10 - 17 F AMERICAN INDIAN OR ALASKAN NATI 2 4 6
ASIAN OR PACIFIC ISLANDER 8 5 1 1 15
BLACK- NOT OF HISP. ORIGIN 17 2 2 11 3 2 37
HISPANIC 7 22 3 3 22 4 18 7 4 3 93
OTHER 2 2
UNKNOWN 1 9 2 57 9 7 19 8 15 4 2 3 136
WHITE- NOT OF HISP. ORIGIN 13 89 16 7 43 26 9 7 1 211
M AMERICAN INDIAN OR ALASKAN NATI 2 2 4
ASIAN OR PACIFIC ISLANDER 11 7 2 20
BLACK- NOT OF HISP. ORIGIN 1 3 18 2 14 5 3 1 47
HISPANIC 7 1 32 4 3 23 9 22 6 8 9 124
UNKNOWN 9 3 57 13 4 25 9 17 5 4 1 147
WHITE- NOT OF HISP. ORIGIN 21 9 98 19 14 43 20 22 4 1 5 256
U WHITE- NOT OF HISP. ORIGIN 1 1
18 - 20 F AMERICAN INDIAN OR ALASKAN NATI 2 2
BLACK- NOT OF HISP. ORIGIN 5 1 1 1 8
HISPANIC 2 2 5 5 1 1 1 1 18
Rider 28 Counts by Region of Service Group, Age, Gender and Ethnicity for all Service Groups Date effective May 31, 2016
Page 14 of 10
Report: d:\upfront\iwr\administration\sas reports\admin_sas reports_monthly rider summaries\apps\Rider 28 Age Gender Ethnicity b
Detail Filter: Rider 28 Flag C = 'Y'
Rundate: 6/6/2016
Description: Rider 28 Client counts by Service Group, Age Group, Gender and Ethnicity, displayed by Region. Rider 28 clients are those individuals who have an ‘Enrolled From’ code 12 entered in SAS on or after September 1, 2003, AND who has not previously been identified as a Rider 37 client.
Service Group Age Group Gender Ethnicity 00 01 02 03 04 05 06 07 08 09 10 11 Total
MEDICALLY DEPENDE 18 - 20 F UNKNOWN 1 3 12 1 4 5 1 27
WHITE- NOT OF HISP. ORIGIN 3 6 3 2 1 15
M BLACK- NOT OF HISP. ORIGIN 3 2 3 8
HISPANIC 1 2 2 1 6 1 1 1 15
UNKNOWN 2 1 15 5 3 7 3 6 2 44
WHITE- NOT OF HISP. ORIGIN 3 1 17 1 4 3 1 30
LY DEPENDENT CHILDREN PROGRAM (MDCP): 2,999
Rider 28 Counts by Region of Service Group, Age, Gender and Ethnicity for all Service Groups Date effective May 31, 2016
Page 15 of 10
Report: d:\upfront\iwr\administration\sas reports\admin_sas reports_monthly rider summaries\apps\Rider 28 Age Gender Ethnicity b
Detail Filter: Rider 28 Flag C = 'Y'
Rundate: 6/6/2016
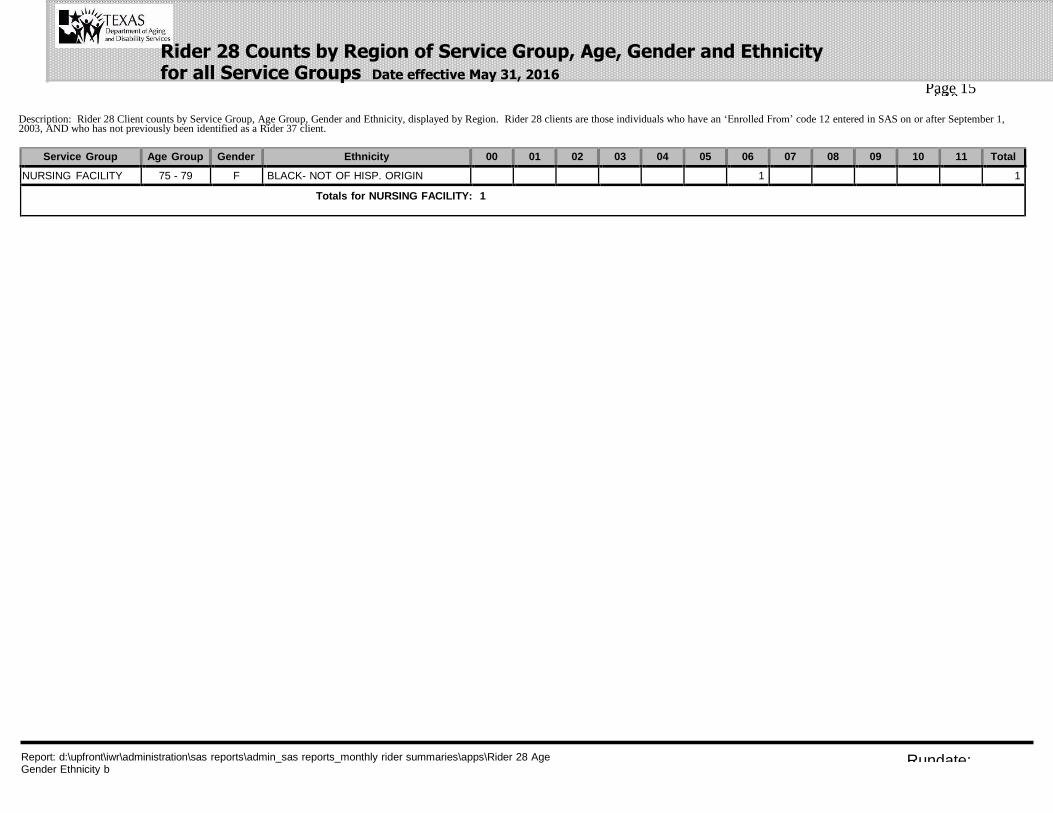
Description: Rider 28 Client counts by Service Group, Age Group, Gender and Ethnicity, displayed by Region. Rider 28 clients are those individuals who have an ‘Enrolled From’ code 12 entered in SAS on or after September 1, 2003, AND who has not previously been identified as a Rider 37 client.
Service Group Age Group Gender Ethnicity 00 01 02 03 04 05 06 07 08 09 10 11 Total
NURSING FACILITY 75 - 79 F BLACK- NOT OF HISP. ORIGIN 1 1
Totals for NURSING FACILITY: 1
Rider 28 Counts by Region of Service Group, Age, Gender and Ethnicity for all Service Groups Date effective May 31, 2016
Page 16 of 10
Report: d:\upfront\iwr\administration\sas reports\admin_sas reports_monthly rider summaries\apps\Rider 28 Age Gender Ethnicity b
Detail Filter: Rider 28 Flag C = 'Y'
Rundate: 6/6/2016
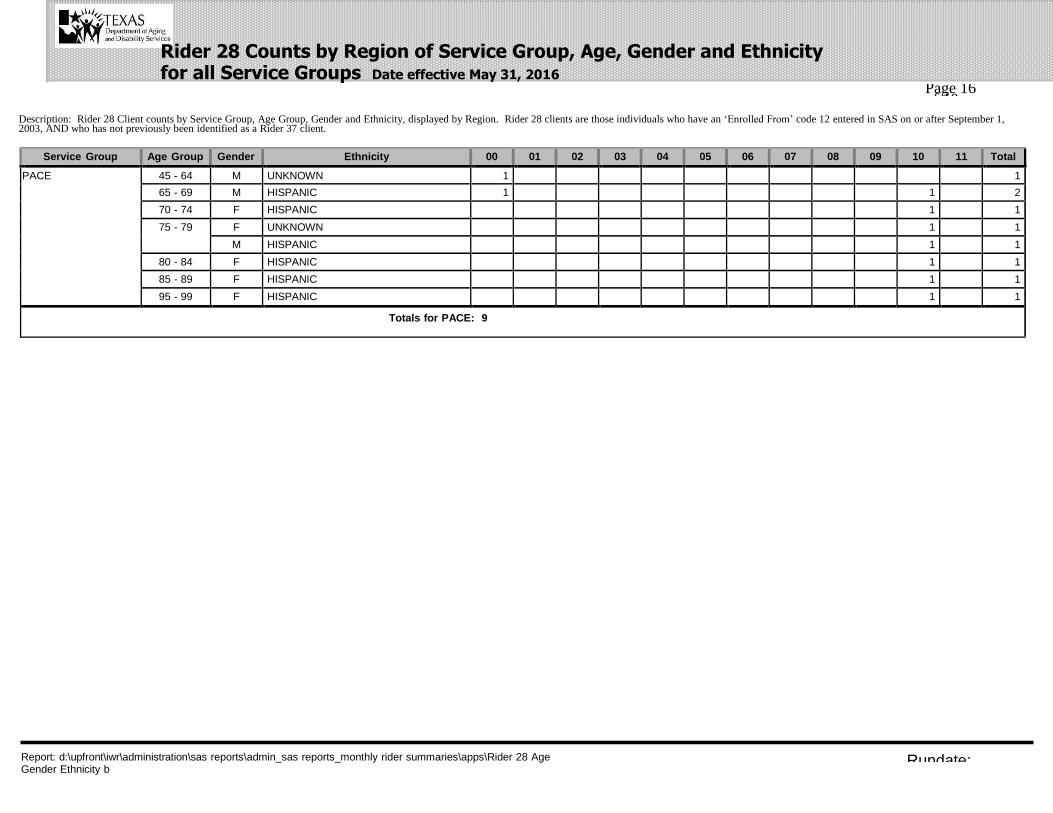
Description: Rider 28 Client counts by Service Group, Age Group, Gender and Ethnicity, displayed by Region. Rider 28 clients are those individuals who have an ‘Enrolled From’ code 12 entered in SAS on or after September 1, 2003, AND who has not previously been identified as a Rider 37 client.
Service Group Age Group Gender Ethnicity 00 01 02 03 04 05 06 07 08 09 10 11 Total
PACE 45 - 64 M UNKNOWN 1 1
65 - 69 M HISPANIC 1 1 2
70 - 74 F HISPANIC 1 1
75 - 79 F UNKNOWN 1 1
M HISPANIC 1 1
80 - 84 F HISPANIC 1 1
85 - 89 F HISPANIC 1 1
95 - 99 F HISPANIC 1 1
Totals for PACE: 9
Rider 28 Counts by Region of Service Group, Age, Gender and Ethnicity for all Service Groups Date effective May 31, 2016
Page 17 of 10
Report: d:\upfront\iwr\administration\sas reports\admin_sas reports_monthly rider summaries\apps\Rider 28 Age Gender Ethnicity b
Detail Filter: Rider 28 Flag C = 'Y'
Rundate: 6/6/2016
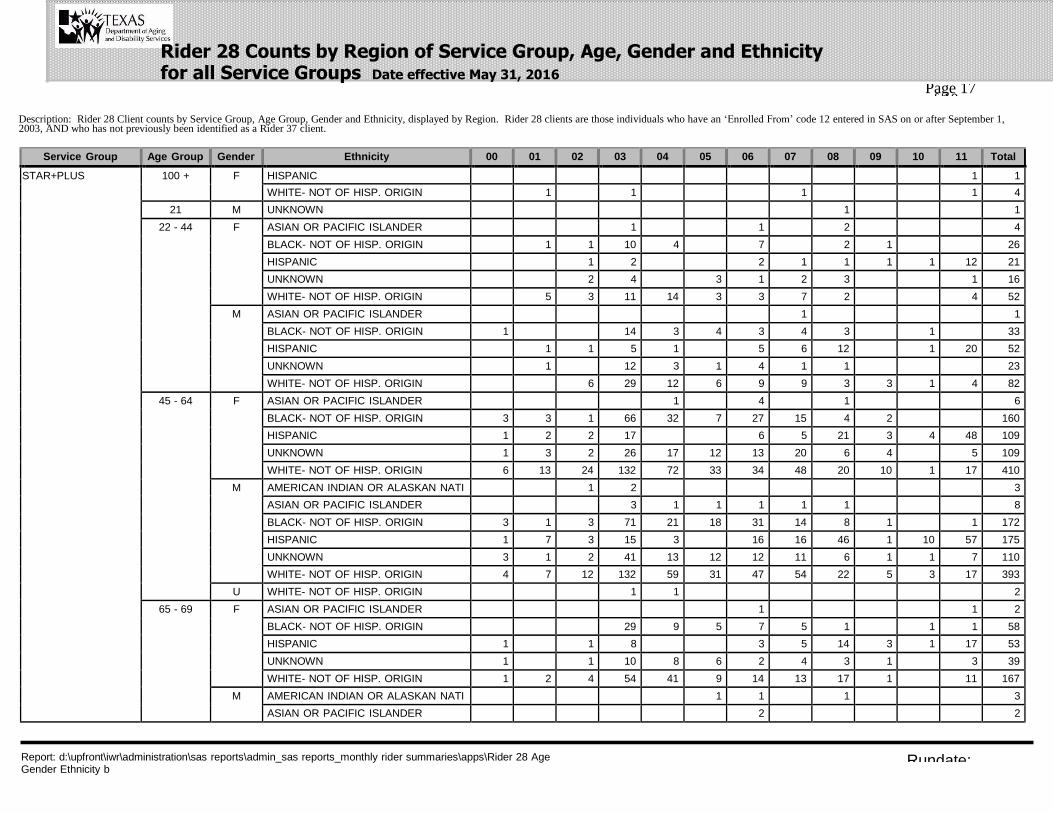
Description: Rider 28 Client counts by Service Group, Age Group, Gender and Ethnicity, displayed by Region. Rider 28 clients are those individuals who have an ‘Enrolled From’ code 12 entered in SAS on or after September 1, 2003, AND who has not previously been identified as a Rider 37 client.
Service Group Age Group Gender Ethnicity 00 01 02 03 04 05 06 07 08 09 10 11 Total
STAR+PLUS 100 + F HISPANIC 1 1
WHITE- NOT OF HISP. ORIGIN 1 1 1 1 4
21 M UNKNOWN 1 1
22 - 44 F ASIAN OR PACIFIC ISLANDER 1 1 2 4
BLACK- NOT OF HISP. ORIGIN 1 1 10 4 7 2 1 26
HISPANIC 1 2 2 1 1 1 1 12 21
UNKNOWN 2 4 3 1 2 3 1 16
WHITE- NOT OF HISP. ORIGIN 5 3 11 14 3 3 7 2 4 52
M ASIAN OR PACIFIC ISLANDER 1 1
BLACK- NOT OF HISP. ORIGIN 1 14 3 4 3 4 3 1 33
HISPANIC 1 1 5 1 5 6 12 1 20 52
UNKNOWN 1 12 3 1 4 1 1 23
WHITE- NOT OF HISP. ORIGIN 6 29 12 6 9 9 3 3 1 4 82
45 - 64 F ASIAN OR PACIFIC ISLANDER 1 4 1 6
BLACK- NOT OF HISP. ORIGIN 3 3 1 66 32 7 27 15 4 2 160
HISPANIC 1 2 2 17 6 5 21 3 4 48 109
UNKNOWN 1 3 2 26 17 12 13 20 6 4 5 109
WHITE- NOT OF HISP. ORIGIN 6 13 24 132 72 33 34 48 20 10 1 17 410
M AMERICAN INDIAN OR ALASKAN NATI 1 2 3
ASIAN OR PACIFIC ISLANDER 3 1 1 1 1 1 8
BLACK- NOT OF HISP. ORIGIN 3 1 3 71 21 18 31 14 8 1 1 172
HISPANIC 1 7 3 15 3 16 16 46 1 10 57 175
UNKNOWN 3 1 2 41 13 12 12 11 6 1 1 7 110
WHITE- NOT OF HISP. ORIGIN 4 7 12 132 59 31 47 54 22 5 3 17 393
U WHITE- NOT OF HISP. ORIGIN 1 1 2
65 - 69 F ASIAN OR PACIFIC ISLANDER 1 1 2
BLACK- NOT OF HISP. ORIGIN 29 9 5 7 5 1 1 1 58
HISPANIC 1 1 8 3 5 14 3 1 17 53
UNKNOWN 1 1 10 8 6 2 4 3 1 3 39
WHITE- NOT OF HISP. ORIGIN 1 2 4 54 41 9 14 13 17 1 11 167
M AMERICAN INDIAN OR ALASKAN NATI 1 1 1 3
ASIAN OR PACIFIC ISLANDER 2 2
Rider 28 Counts by Region of Service Group, Age, Gender and Ethnicity for all Service Groups Date effective May 31, 2016
Page 18 of 10
Report: d:\upfront\iwr\administration\sas reports\admin_sas reports_monthly rider summaries\apps\Rider 28 Age Gender Ethnicity b
Detail Filter: Rider 28 Flag C = 'Y'
Rundate: 6/6/2016
Description: Rider 28 Client counts by Service Group, Age Group, Gender and Ethnicity, displayed by Region. Rider 28 clients are those individuals who have an ‘Enrolled From’ code 12 entered in SAS on or after September 1, 2003, AND who has not previously been identified as a Rider 37 client.
Service Group Age Group Gender Ethnicity 00 01 02 03 04 05 06 07 08 09 10 11 Total
STAR+PLUS 65 - 69 M BLACK- NOT OF HISP. ORIGIN 1 2 23 4 6 10 4 2 1 53
HISPANIC 1 1 3 2 2 2 9 1 3 21 45
UNKNOWN 1 1 5 2 3 2 4 5 1 2 26
WHITE- NOT OF HISP. ORIGIN 6 9 43 13 4 9 16 12 1 7 120
70 - 74 F AMERICAN INDIAN OR ALASKAN NATI 1 1
ASIAN OR PACIFIC ISLANDER 2 1 3
BLACK- NOT OF HISP. ORIGIN 1 16 4 3 7 7 1 39
HISPANIC 1 4 1 4 13 2 14 39
UNKNOWN 1 6 8 1 2 5 1 2 26
WHITE- NOT OF HISP. ORIGIN 1 3 10 58 28 10 10 26 11 5 8 170
M AMERICAN INDIAN OR ALASKAN NATI 1 1
ASIAN OR PACIFIC ISLANDER 2 2
BLACK- NOT OF HISP. ORIGIN 1 10 5 4 7 4 1 32
HISPANIC 4 2 2 6 1 20 35
UNKNOWN 1 2 1 1 2 2 2 11
WHITE- NOT OF HISP. ORIGIN 2 4 22 13 4 5 13 6 2 8 79
U BLACK- NOT OF HISP. ORIGIN 1 1
75 - 79 F ASIAN OR PACIFIC ISLANDER 4 1 1 6
BLACK- NOT OF HISP. ORIGIN 14 4 4 8 5 4 39
HISPANIC 5 3 2 10 1 2 18 41
UNKNOWN 1 7 6 1 6 1 1 2 25
WHITE- NOT OF HISP. ORIGIN 2 2 5 46 26 15 9 12 12 1 2 7 139
M AMERICAN INDIAN OR ALASKAN NATI 1 1
ASIAN OR PACIFIC ISLANDER 3 3
BLACK- NOT OF HISP. ORIGIN 9 7 1 2 2 21
HISPANIC 1 2 5 2 1 4 2 8 2 18 45
UNKNOWN 1 4 1 1 1 1 1 4 14
WHITE- NOT OF HISP. ORIGIN 1 3 26 20 7 4 11 5 1 1 1 80
U WHITE- NOT OF HISP. ORIGIN 1 1
80 - 84 F ASIAN OR PACIFIC ISLANDER 1 1 2
BLACK- NOT OF HISP. ORIGIN 1 11 8 6 3 3 3 35
HISPANIC 4 2 3 1 1 1 7 6 29 54
Rider 28 Counts by Region of Service Group, Age, Gender and Ethnicity for all Service Groups Date effective May 31, 2016
Page 19 of 10
Report: d:\upfront\iwr\administration\sas reports\admin_sas reports_monthly rider summaries\apps\Rider 28 Age Gender Ethnicity b
Detail Filter: Rider 28 Flag C = 'Y'
Rundate: 6/6/2016
Description: Rider 28 Client counts by Service Group, Age Group, Gender and Ethnicity, displayed by Region. Rider 28 clients are those individuals who have an ‘Enrolled From’ code 12 entered in SAS on or after September 1, 2003, AND who has not previously been identified as a Rider 37 client.
Service Group Age Group Gender Ethnicity 00 01 02 03 04 05 06 07 08 09 10 11 Total
STAR+PLUS 80 - 84 F OTHER 1 1
UNKNOWN 5 4 1 4 3 2 19
WHITE- NOT OF HISP. ORIGIN 4 7 49 26 7 8 24 8 3 3 6 145
M ASIAN OR PACIFIC ISLANDER 1 1 2
BLACK- NOT OF HISP. ORIGIN 1 7 1 5 1 1 1 17
HISPANIC 1 2 1 2 1 2 5 3 18 35
UNKNOWN 1 2 2 1 1 1 8
WHITE- NOT OF HISP. ORIGIN 2 2 11 9 3 1 7 3 5 43
85 - 89 F ASIAN OR PACIFIC ISLANDER 1 2 1 4
BLACK- NOT OF HISP. ORIGIN 1 7 2 3 3 2 3 21
HISPANIC 2 2 2 1 11 1 5 20 44
UNKNOWN 1 4 1 7 2 1 1 17
WHITE- NOT OF HISP. ORIGIN 2 6 34 23 7 6 10 4 3 1 6 102
M ASIAN OR PACIFIC ISLANDER 1 2 3
BLACK- NOT OF HISP. ORIGIN 3 1 1 1 6
HISPANIC 2 2 1 2 2 2 10 21
UNKNOWN 1 1 1 3
WHITE- NOT OF HISP. ORIGIN 2 3 5 3 2 2 2 1 3 23
90 - 94 F ASIAN OR PACIFIC ISLANDER 1 1 1 1 4
BLACK- NOT OF HISP. ORIGIN 1 2 5 2 3 1 2 16
HISPANIC 1 1 2 1 2 5 4 25 41
UNKNOWN 1 1 1 1 1 5
WHITE- NOT OF HISP. ORIGIN 1 5 20 16 9 5 8 5 3 2 7 81
M BLACK- NOT OF HISP. ORIGIN 1 1 1 1 2 6
HISPANIC 1 1 1 2 12 17
UNKNOWN 2 2
WHITE- NOT OF HISP. ORIGIN 1 3 1 2 1 8
95 - 99 F BLACK- NOT OF HISP. ORIGIN 1 2 2 2 1 8
HISPANIC 6 6
UNKNOWN 1 1 2
WHITE- NOT OF HISP. ORIGIN 1 2 3 5 7 1 2 2 3 1 2 29
M ASIAN OR PACIFIC ISLANDER 1 1
Rider 28 Counts by Region of Service Group, Age, Gender and Ethnicity for all Service Groups Date effective May 31, 2016
Page 20 of 10
20
Description: Rider 28 Client counts by Service Group, Age Group, Gender and Ethnicity, displayed by Region. Rider 28 clients are those individuals who have an ‘Enrolled From’ code 12 entered in SAS on or after September 1, 2003, AND who has not previously been identified as a Rider 37 client.
Service Group Age Group Gender Ethnicity 00 01 02 03 04 05 06 07 08 09 10 11 Total
STAR+PLUS 95 - 99 M BLACK- NOT OF HISP. ORIGIN 1 1
HISPANIC 2 2
WHITE- NOT OF HISP. ORIGIN 1 2 3
Totals for STAR+PLUS: 4,232
Grand Total 7,287
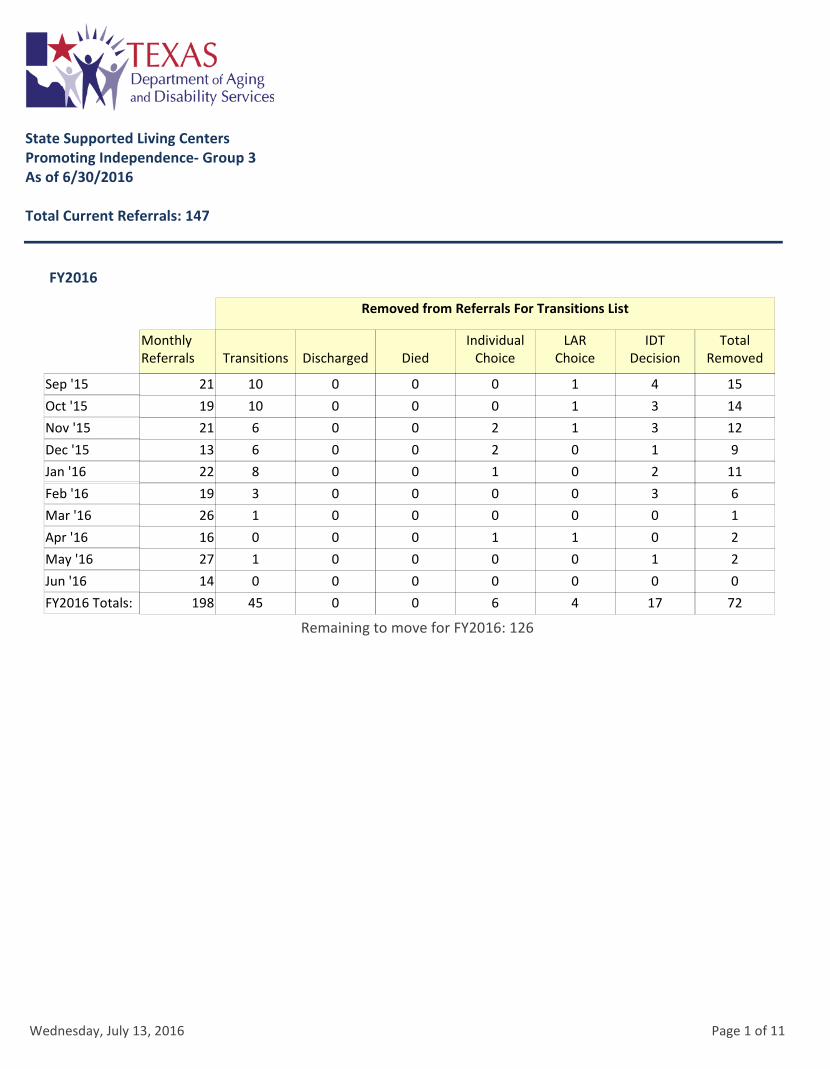
FY2016
MonthlyReferrals DischargedTransitions Died
IndividualChoice
LARChoice
IDTDecision
TotalRemoved
Removed from Referrals For Transitions List
State Supported Living CentersPromoting Independence- Group 3As of 6/30/2016
Total Current Referrals: 147
21 10 0 0 0 1 4 15Sep '15
19 10 0 0 0 1 3 14Oct '15
21 6 0 0 2 1 3 12Nov '15
13 6 0 0 2 0 1 9Dec '15
22 8 0 0 1 0 2 11Jan '16
19 3 0 0 0 0 3 6Feb '16
26 1 0 0 0 0 0 1Mar '16
16 0 0 0 1 1 0 2Apr '16
27 1 0 0 0 0 1 2May '16
14 0 0 0 0 0 0 0Jun '16
198 45 0 0 6 4 17 72FY2016 Totals:
Remaining to move for FY2016: 126
Wednesday, July 13, 2016 Page 1 of 11
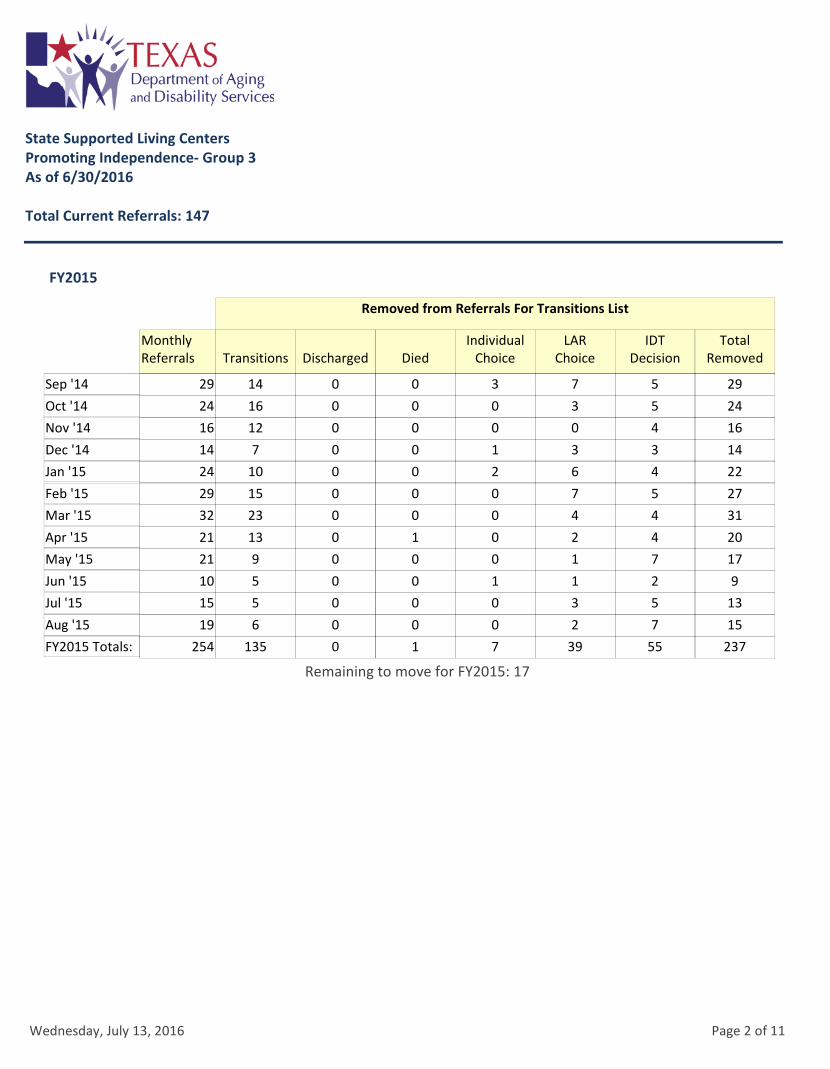
FY2015
MonthlyReferrals DischargedTransitions Died
IndividualChoice
LARChoice
IDTDecision
TotalRemoved
Removed from Referrals For Transitions List
State Supported Living CentersPromoting Independence- Group 3As of 6/30/2016
Total Current Referrals: 147
29 14 0 0 3 7 5 29Sep '14
24 16 0 0 0 3 5 24Oct '14
16 12 0 0 0 0 4 16Nov '14
14 7 0 0 1 3 3 14Dec '14
24 10 0 0 2 6 4 22Jan '15
29 15 0 0 0 7 5 27Feb '15
32 23 0 0 0 4 4 31Mar '15
21 13 0 1 0 2 4 20Apr '15
21 9 0 0 0 1 7 17May '15
10 5 0 0 1 1 2 9Jun '15
15 5 0 0 0 3 5 13Jul '15
19 6 0 0 0 2 7 15Aug '15
254 135 0 1 7 39 55 237FY2015 Totals:
Remaining to move for FY2015: 17
Wednesday, July 13, 2016 Page 2 of 11

FY2014
MonthlyReferrals DischargedTransitions Died
IndividualChoice
LARChoice
IDTDecision
TotalRemoved
Removed from Referrals For Transitions List
State Supported Living CentersPromoting Independence- Group 3As of 6/30/2016
Total Current Referrals: 147
33 20 0 0 0 3 10 33Sep '13
36 24 0 0 1 4 7 36Oct '13
33 22 0 0 1 0 10 33Nov '13
40 28 0 0 1 2 8 39Dec '13
49 31 0 0 0 4 13 48Jan '14
30 19 0 0 1 4 6 30Feb '14
30 19 0 0 1 3 7 30Mar '14
34 22 0 0 1 6 5 34Apr '14
22 15 0 0 0 2 4 21May '14
34 22 0 0 2 4 6 34Jun '14
36 27 0 0 0 7 2 36Jul '14
20 14 0 0 0 4 2 20Aug '14
397 263 0 0 8 43 80 394FY2014 Totals:
Remaining to move for FY2014: 3
Wednesday, July 13, 2016 Page 3 of 11
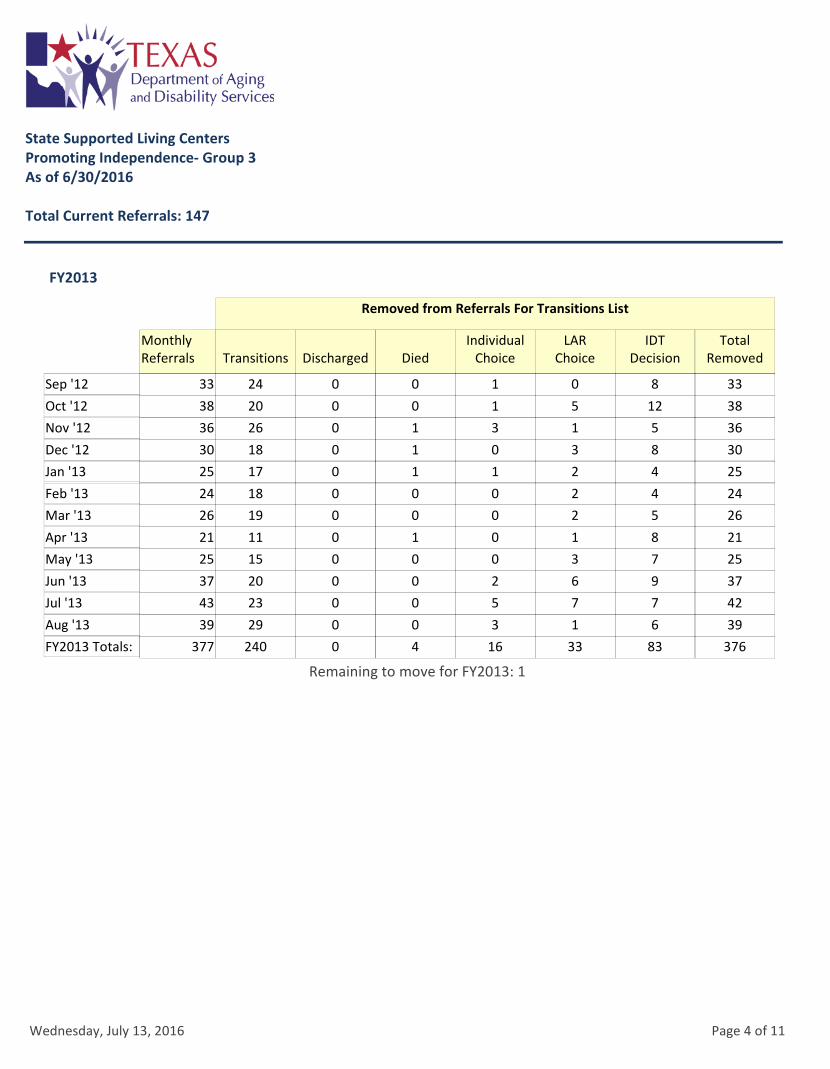
FY2013
MonthlyReferrals DischargedTransitions Died
IndividualChoice
LARChoice
IDTDecision
TotalRemoved
Removed from Referrals For Transitions List
State Supported Living CentersPromoting Independence- Group 3As of 6/30/2016
Total Current Referrals: 147
33 24 0 0 1 0 8 33Sep '12
38 20 0 0 1 5 12 38Oct '12
36 26 0 1 3 1 5 36Nov '12
30 18 0 1 0 3 8 30Dec '12
25 17 0 1 1 2 4 25Jan '13
24 18 0 0 0 2 4 24Feb '13
26 19 0 0 0 2 5 26Mar '13
21 11 0 1 0 1 8 21Apr '13
25 15 0 0 0 3 7 25May '13
37 20 0 0 2 6 9 37Jun '13
43 23 0 0 5 7 7 42Jul '13
39 29 0 0 3 1 6 39Aug '13
377 240 0 4 16 33 83 376FY2013 Totals:
Remaining to move for FY2013: 1
Wednesday, July 13, 2016 Page 4 of 11

FY2012
MonthlyReferrals DischargedTransitions Died
IndividualChoice
LARChoice
IDTDecision
TotalRemoved
Removed from Referrals For Transitions List
State Supported Living CentersPromoting Independence- Group 3As of 6/30/2016
Total Current Referrals: 147
35 23 0 0 1 4 7 35Sep '11
27 18 0 1 1 3 4 27Oct '11
25 22 0 0 1 1 1 25Nov '11
11 8 0 0 1 2 0 11Dec '11
15 12 0 0 0 1 2 15Jan '12
28 24 0 0 2 1 1 28Feb '12
14 7 0 0 1 2 4 14Mar '12
26 18 0 0 0 2 6 26Apr '12
37 29 0 1 0 6 1 37May '12
28 20 0 0 0 3 4 28Jun '12
32 18 0 0 2 4 8 32Jul '12
41 35 0 0 0 3 3 41Aug '12
319 234 0 2 9 32 41 319FY2012 Totals:
Remaining to move for FY2012: 0
Wednesday, July 13, 2016 Page 5 of 11

FY2011
MonthlyReferrals DischargedTransitions Died
IndividualChoice
LARChoice
IDTDecision
TotalRemoved
Removed from Referrals For Transitions List
State Supported Living CentersPromoting Independence- Group 3As of 6/30/2016
Total Current Referrals: 147
24 21 0 0 2 1 0 24Sep '10
20 17 0 0 1 1 1 20Oct '10
28 21 0 0 2 2 3 28Nov '10
16 11 0 0 1 1 3 16Dec '10
19 13 0 1 2 1 2 19Jan '11
13 8 0 0 1 1 3 13Feb '11
22 16 0 1 0 4 1 22Mar '11
25 18 0 0 1 2 4 25Apr '11
26 19 0 0 1 2 4 26May '11
23 18 0 1 0 2 2 23Jun '11
37 29 0 0 4 0 4 37Jul '11
39 31 0 0 0 3 5 39Aug '11
292 222 0 3 15 20 32 292FY2011 Totals:
Remaining to move for FY2011: 0
Wednesday, July 13, 2016 Page 6 of 11
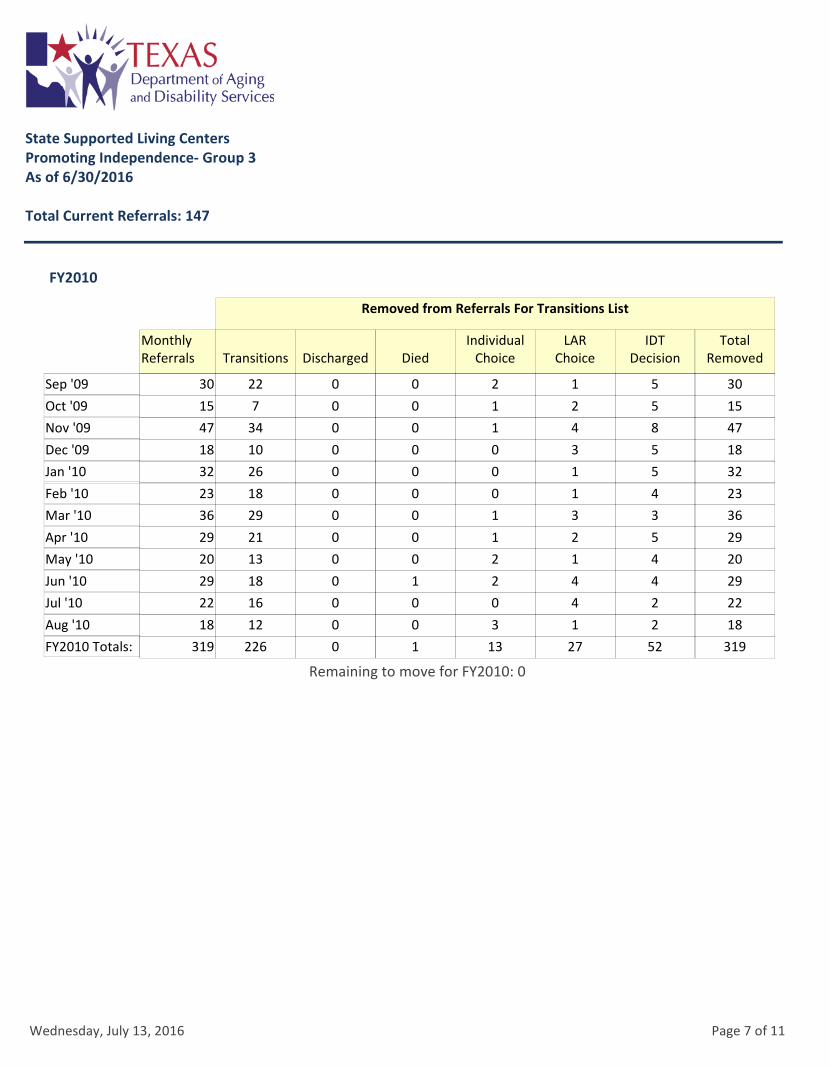
FY2010
MonthlyReferrals DischargedTransitions Died
IndividualChoice
LARChoice
IDTDecision
TotalRemoved
Removed from Referrals For Transitions List
State Supported Living CentersPromoting Independence- Group 3As of 6/30/2016
Total Current Referrals: 147
30 22 0 0 2 1 5 30Sep '09
15 7 0 0 1 2 5 15Oct '09
47 34 0 0 1 4 8 47Nov '09
18 10 0 0 0 3 5 18Dec '09
32 26 0 0 0 1 5 32Jan '10
23 18 0 0 0 1 4 23Feb '10
36 29 0 0 1 3 3 36Mar '10
29 21 0 0 1 2 5 29Apr '10
20 13 0 0 2 1 4 20May '10
29 18 0 1 2 4 4 29Jun '10
22 16 0 0 0 4 2 22Jul '10
18 12 0 0 3 1 2 18Aug '10
319 226 0 1 13 27 52 319FY2010 Totals:
Remaining to move for FY2010: 0
Wednesday, July 13, 2016 Page 7 of 11

FY2009
MonthlyReferrals DischargedTransitions Died
IndividualChoice
LARChoice
IDTDecision
TotalRemoved
Removed from Referrals For Transitions List
State Supported Living CentersPromoting Independence- Group 3As of 6/30/2016
Total Current Referrals: 147
40 34 0 0 2 1 3 40Sep '08
45 37 0 0 0 2 6 45Oct '08
27 24 0 0 1 0 2 27Nov '08
23 20 0 0 1 1 1 23Dec '08
39 35 0 0 0 2 2 39Jan '09
48 40 0 0 0 2 6 48Feb '09
45 40 0 0 1 2 2 45Mar '09
40 34 0 0 1 1 4 40Apr '09
39 28 0 0 0 2 9 39May '09
42 33 0 0 3 3 3 42Jun '09
47 41 0 0 1 2 3 47Jul '09
34 26 0 0 0 5 3 34Aug '09
469 392 0 0 10 23 44 469FY2009 Totals:
Remaining to move for FY2009: 0
Wednesday, July 13, 2016 Page 8 of 11
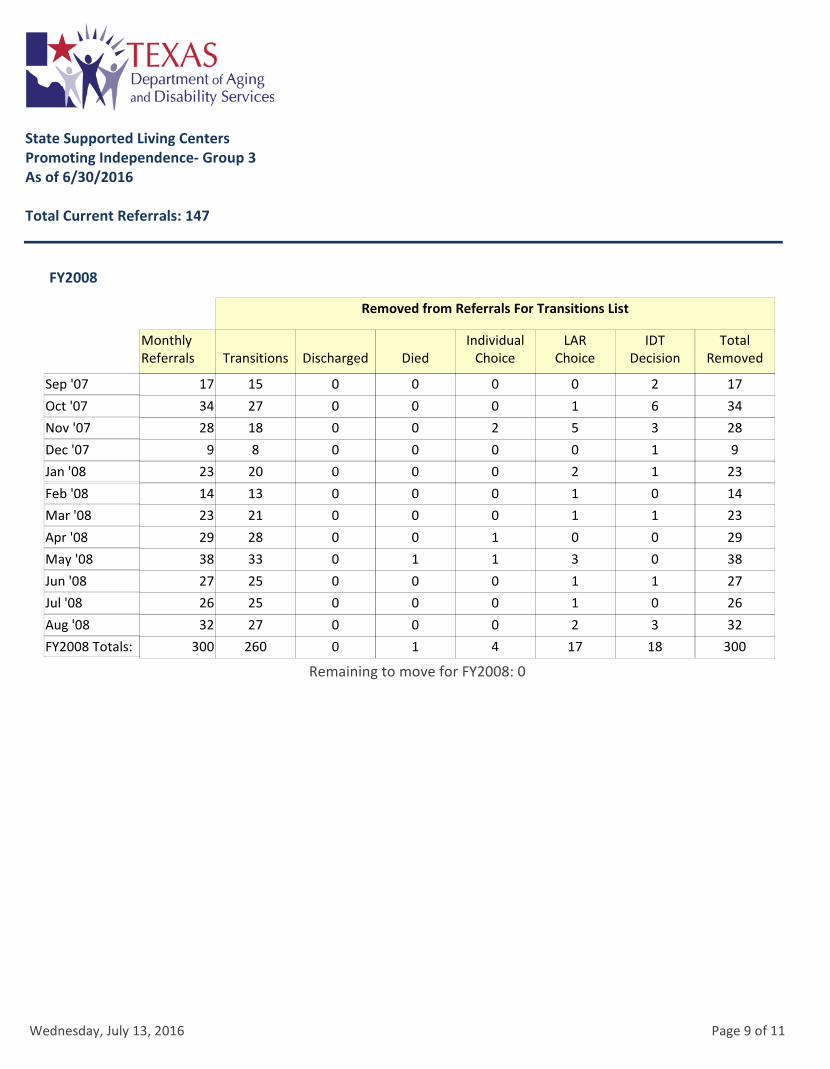
FY2008
MonthlyReferrals DischargedTransitions Died
IndividualChoice
LARChoice
IDTDecision
TotalRemoved
Removed from Referrals For Transitions List
State Supported Living CentersPromoting Independence- Group 3As of 6/30/2016
Total Current Referrals: 147
17 15 0 0 0 0 2 17Sep '07
34 27 0 0 0 1 6 34Oct '07
28 18 0 0 2 5 3 28Nov '07
9 8 0 0 0 0 1 9Dec '07
23 20 0 0 0 2 1 23Jan '08
14 13 0 0 0 1 0 14Feb '08
23 21 0 0 0 1 1 23Mar '08
29 28 0 0 1 0 0 29Apr '08
38 33 0 1 1 3 0 38May '08
27 25 0 0 0 1 1 27Jun '08
26 25 0 0 0 1 0 26Jul '08
32 27 0 0 0 2 3 32Aug '08
300 260 0 1 4 17 18 300FY2008 Totals:
Remaining to move for FY2008: 0
Wednesday, July 13, 2016 Page 9 of 11
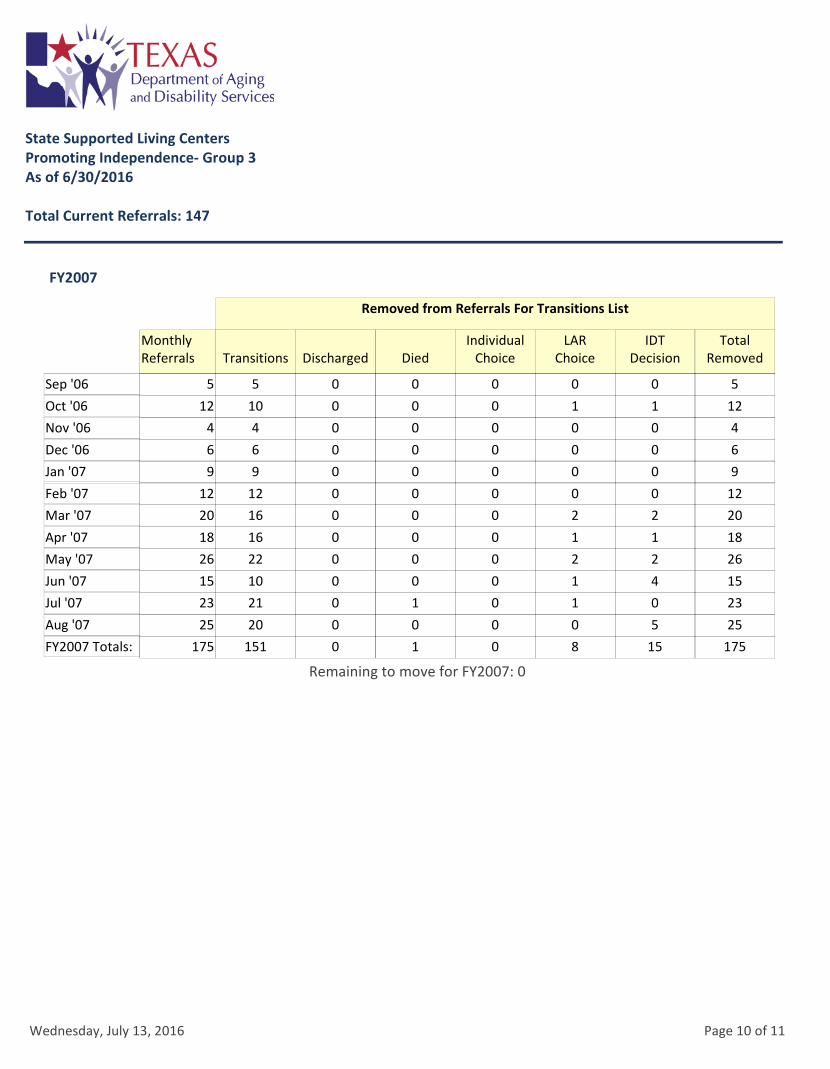
FY2007
MonthlyReferrals DischargedTransitions Died
IndividualChoice
LARChoice
IDTDecision
TotalRemoved
Removed from Referrals For Transitions List
State Supported Living CentersPromoting Independence- Group 3As of 6/30/2016
Total Current Referrals: 147
5 5 0 0 0 0 0 5Sep '06
12 10 0 0 0 1 1 12Oct '06
4 4 0 0 0 0 0 4Nov '06
6 6 0 0 0 0 0 6Dec '06
9 9 0 0 0 0 0 9Jan '07
12 12 0 0 0 0 0 12Feb '07
20 16 0 0 0 2 2 20Mar '07
18 16 0 0 0 1 1 18Apr '07
26 22 0 0 0 2 2 26May '07
15 10 0 0 0 1 4 15Jun '07
23 21 0 1 0 1 0 23Jul '07
25 20 0 0 0 0 5 25Aug '07
175 151 0 1 0 8 15 175FY2007 Totals:
Remaining to move for FY2007: 0
Wednesday, July 13, 2016 Page 10 of 11
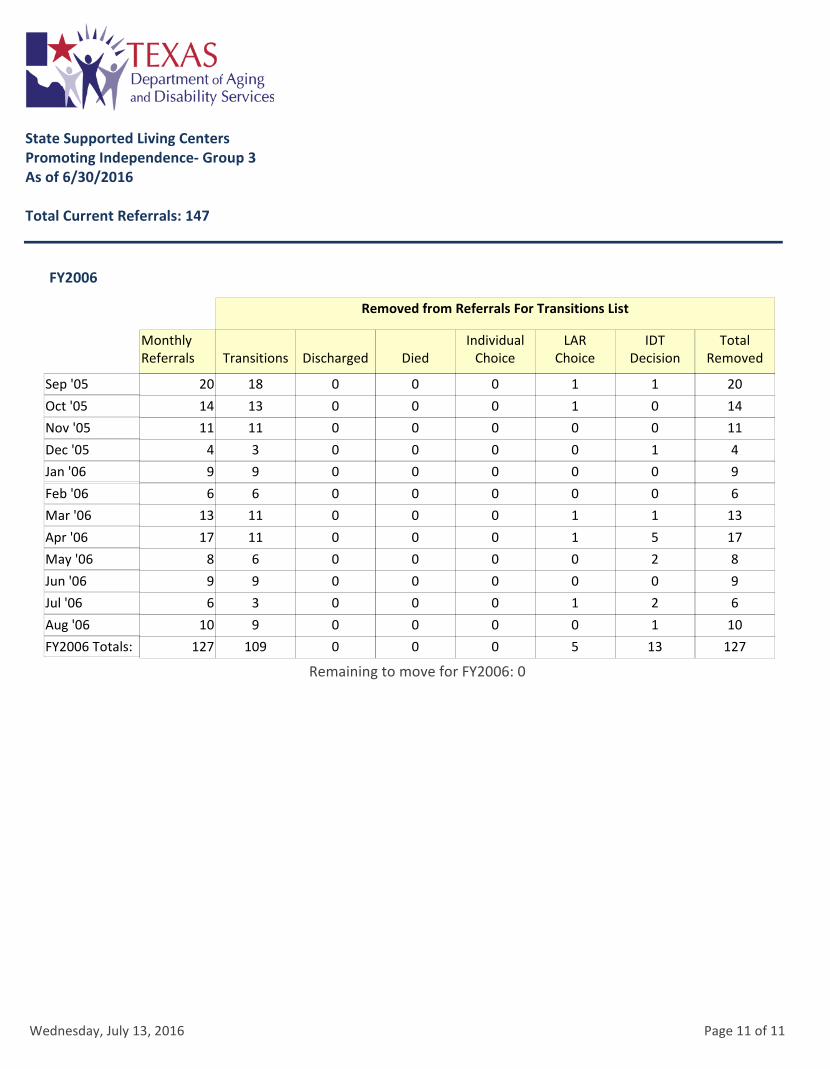
FY2006
MonthlyReferrals DischargedTransitions Died
IndividualChoice
LARChoice
IDTDecision
TotalRemoved
Removed from Referrals For Transitions List
State Supported Living CentersPromoting Independence- Group 3As of 6/30/2016
Total Current Referrals: 147
20 18 0 0 0 1 1 20Sep '05
14 13 0 0 0 1 0 14Oct '05
11 11 0 0 0 0 0 11Nov '05
4 3 0 0 0 0 1 4Dec '05
9 9 0 0 0 0 0 9Jan '06
6 6 0 0 0 0 0 6Feb '06
13 11 0 0 0 1 1 13Mar '06
17 11 0 0 0 1 5 17Apr '06
8 6 0 0 0 0 2 8May '06
9 9 0 0 0 0 0 9Jun '06
6 3 0 0 0 1 2 6Jul '06
10 9 0 0 0 0 1 10Aug '06
127 109 0 0 0 5 13 127FY2006 Totals:
Remaining to move for FY2006: 0
Wednesday, July 13, 2016 Page 11 of 11

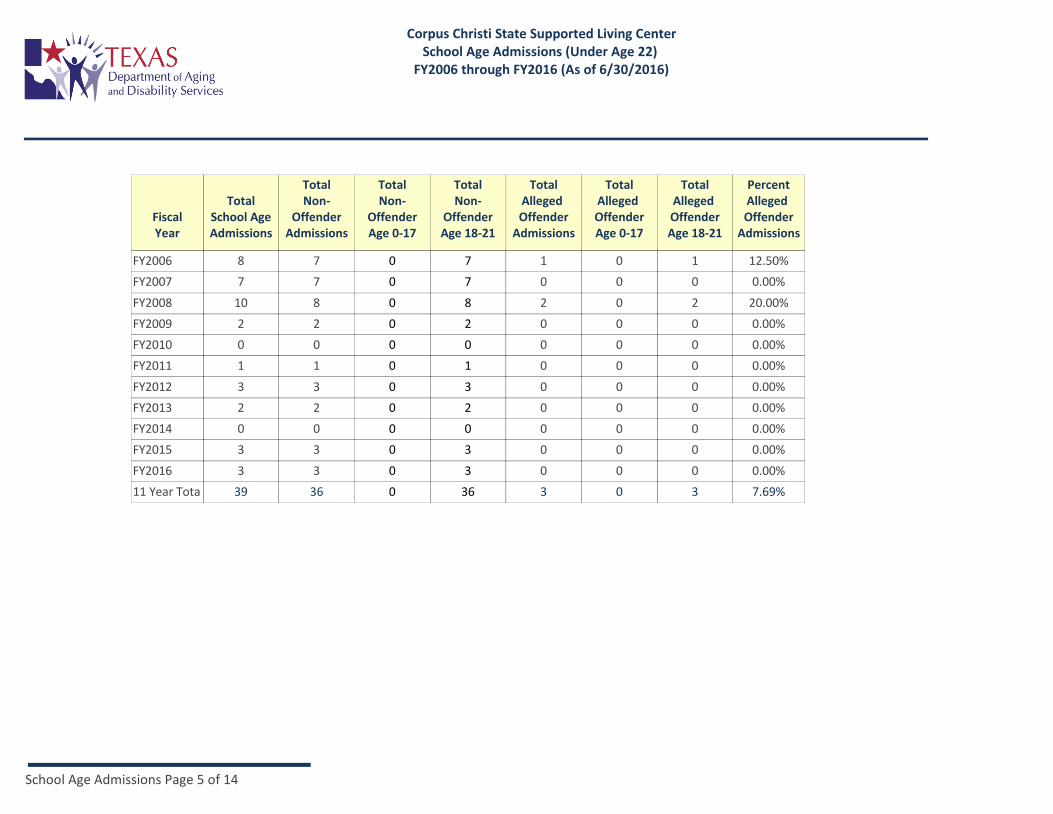
State Supported Living CentersSchool Age Admissions (Under Age 22)
FY2006 through FY2016 (As of 6/30/2016)
TotalSchool AgeAdmissions
TotalNon-
OffenderAdmissions
TotalAlleged Offender
Admissions
TotalAlleged OffenderAge 0-17
TotalAlleged OffenderAge 18-21
PercentAlleged Offender
AdmissionsFiscalYear
TotalNon-
OffenderAge 0-17
TotalNon-
OffenderAge 18-21
FY2006 125 90 35 32 3 28.00%45 45
FY2007 151 107 44 43 1 29.14%68 39
FY2008 149 94 55 46 9 36.91%52 42
FY2009 85 40 45 40 5 52.94%25 15
FY2010 90 41 49 39 10 54.44%24 17
FY2011 64 27 37 36 1 57.81%10 17
FY2012 66 25 41 32 9 62.12%9 16
FY2013 76 30 46 33 13 60.53%16 14
FY2014 88 47 41 37 4 46.59%25 22
FY2015 75 45 30 29 1 40.00%17 28
FY2016 63 40 23 21 2 36.51%16 24
11 Year Total 1032 586 446 388 58 43.22%307 279
School Age Admissions Page 1 of 14

TotalSchool AgeAdmissions
TotalNon-
OffenderAdmissions
TotalAlleged Offender
Admissions
TotalAlleged OffenderAge 0-17
TotalAlleged OffenderAge 18-21
PercentAlleged Offender
Admissions
Abilene State Supported Living CenterSchool Age Admissions (Under Age 22)
FY2006 through FY2016 (As of 6/30/2016)
FiscalYear
TotalNon-
OffenderAge 0-17
TotalNon-
OffenderAge 18-21
FY2006 6 0 006 0.00%3 3
FY2007 13 0 0013 0.00%10 3
FY2008 14 0 0014 0.00%7 7
FY2009 4 0 004 0.00%2 2
FY2010 5 0 005 0.00%2 3
FY2011 4 0 004 0.00%2 2
FY2012 1 0 001 0.00%0 1
FY2013 2 0 002 0.00%2 0
FY2014 5 0 005 0.00%5 0
FY2015 3 0 003 0.00%1 2
FY2016 1 0 001 0.00%1 0
58 0 0058 0.00%11 Year Tota 35 23
School Age Admissions Page 2 of 14
TotalSchool AgeAdmissions
TotalNon-
OffenderAdmissions
TotalAlleged Offender
Admissions
TotalAlleged OffenderAge 0-17
TotalAlleged OffenderAge 18-21
PercentAlleged Offender
Admissions
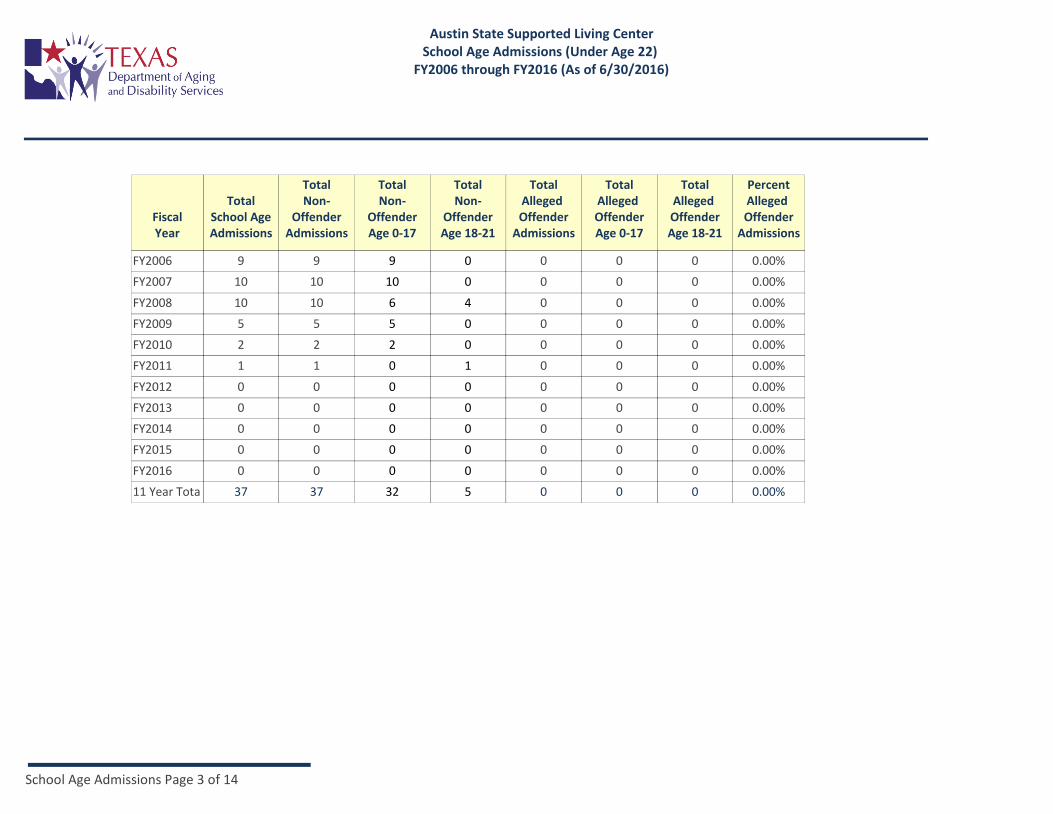
Austin State Supported Living CenterSchool Age Admissions (Under Age 22)
FY2006 through FY2016 (As of 6/30/2016)
FiscalYear
TotalNon-
OffenderAge 0-17
TotalNon-
OffenderAge 18-21
FY2006 9 0 009 0.00%9 0
FY2007 10 0 0010 0.00%10 0
FY2008 10 0 0010 0.00%6 4
FY2009 5 0 005 0.00%5 0
FY2010 2 0 002 0.00%2 0
FY2011 1 0 001 0.00%0 1
FY2012 0 0 000 0.00%0 0
FY2013 0 0 000 0.00%0 0
FY2014 0 0 000 0.00%0 0
FY2015 0 0 000 0.00%0 0
FY2016 0 0 000 0.00%0 0
37 0 0037 0.00%11 Year Tota 32 5
School Age Admissions Page 3 of 14
TotalSchool AgeAdmissions
TotalNon-
OffenderAdmissions
TotalAlleged Offender
Admissions
TotalAlleged OffenderAge 0-17
TotalAlleged OffenderAge 18-21
PercentAlleged Offender
Admissions
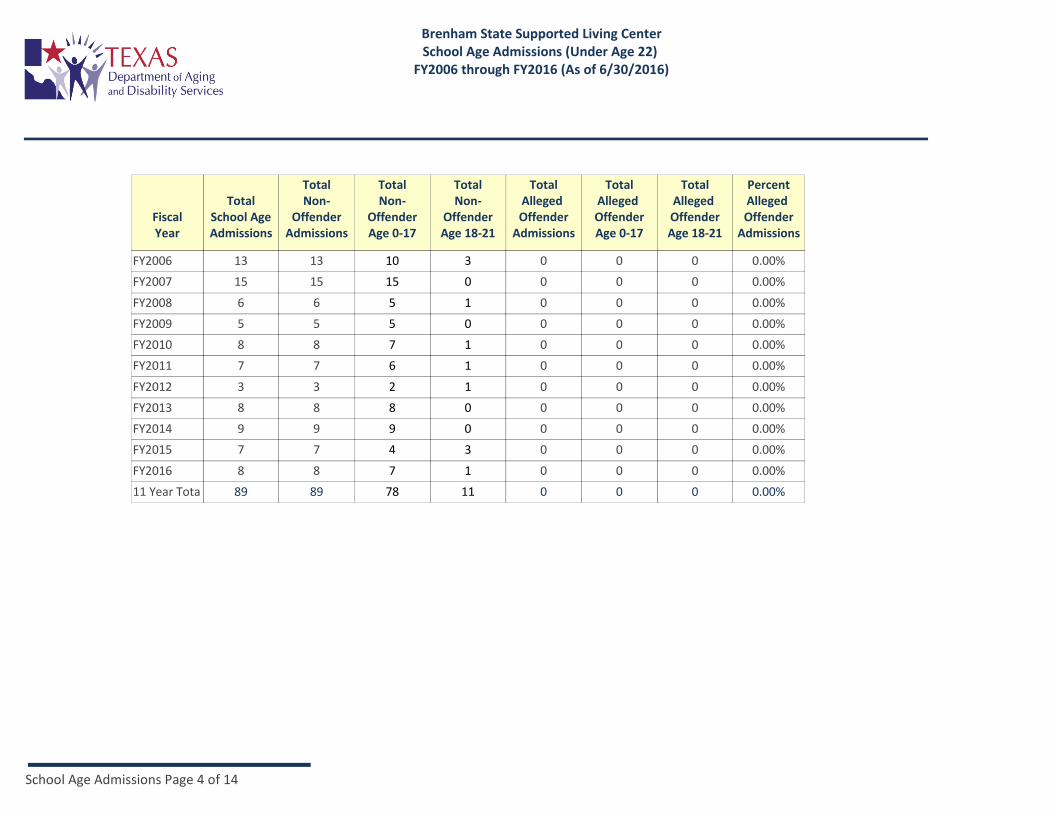
Brenham State Supported Living CenterSchool Age Admissions (Under Age 22)
FY2006 through FY2016 (As of 6/30/2016)
FiscalYear
TotalNon-
OffenderAge 0-17
TotalNon-
OffenderAge 18-21
FY2006 13 0 0013 0.00%10 3
FY2007 15 0 0015 0.00%15 0
FY2008 6 0 006 0.00%5 1
FY2009 5 0 005 0.00%5 0
FY2010 8 0 008 0.00%7 1
FY2011 7 0 007 0.00%6 1
FY2012 3 0 003 0.00%2 1
FY2013 8 0 008 0.00%8 0
FY2014 9 0 009 0.00%9 0
FY2015 7 0 007 0.00%4 3
FY2016 8 0 008 0.00%7 1
89 0 0089 0.00%11 Year Tota 78 11
School Age Admissions Page 4 of 14
TotalSchool AgeAdmissions
TotalNon-
OffenderAdmissions
TotalAlleged Offender
Admissions
TotalAlleged OffenderAge 0-17
TotalAlleged OffenderAge 18-21
PercentAlleged Offender
Admissions
Corpus Christi State Supported Living CenterSchool Age Admissions (Under Age 22)
FY2006 through FY2016 (As of 6/30/2016)
FiscalYear
TotalNon-
OffenderAge 0-17
TotalNon-
OffenderAge 18-21
FY2006 8 0 117 12.50%0 7
FY2007 7 0 007 0.00%0 7
FY2008 10 0 228 20.00%0 8
FY2009 2 0 002 0.00%0 2
FY2010 0 0 000 0.00%0 0
FY2011 1 0 001 0.00%0 1
FY2012 3 0 003 0.00%0 3
FY2013 2 0 002 0.00%0 2
FY2014 0 0 000 0.00%0 0
FY2015 3 0 003 0.00%0 3
FY2016 3 0 003 0.00%0 3
39 0 3336 7.69%11 Year Tota 0 36
School Age Admissions Page 5 of 14

TotalSchool AgeAdmissions
TotalNon-
OffenderAdmissions
TotalAlleged Offender
Admissions
TotalAlleged OffenderAge 0-17
TotalAlleged OffenderAge 18-21
PercentAlleged Offender
Admissions
Denton State Supported Living CenterSchool Age Admissions (Under Age 22)
FY2006 through FY2016 (As of 6/30/2016)
FiscalYear
TotalNon-
OffenderAge 0-17
TotalNon-
OffenderAge 18-21
FY2006 0 0 000 0.00%0 0
FY2007 4 0 004 0.00%2 2
FY2008 2 0 002 0.00%1 1
FY2009 0 0 000 0.00%0 0
FY2010 2 0 002 0.00%2 0
FY2011 3 0 003 0.00%0 3
FY2012 0 0 000 0.00%0 0
FY2013 1 0 001 0.00%0 1
FY2014 6 0 006 0.00%1 5
FY2015 3 0 003 0.00%0 3
FY2016 2 0 002 0.00%0 2
23 0 0023 0.00%11 Year Tota 6 17
School Age Admissions Page 6 of 14

TotalSchool AgeAdmissions
TotalNon-
OffenderAdmissions
TotalAlleged Offender
Admissions
TotalAlleged OffenderAge 0-17
TotalAlleged OffenderAge 18-21
PercentAlleged Offender
Admissions
El Paso State Supported Living CenterSchool Age Admissions (Under Age 22)
FY2006 through FY2016 (As of 6/30/2016)
FiscalYear
TotalNon-
OffenderAge 0-17
TotalNon-
OffenderAge 18-21
FY2006 3 0 003 0.00%1 2
FY2007 3 0 003 0.00%2 1
FY2008 0 0 000 0.00%0 0
FY2009 1 0 001 0.00%1 0
FY2010 0 0 000 0.00%0 0
FY2011 0 0 000 0.00%0 0
FY2012 1 0 001 0.00%0 1
FY2013 0 0 000 0.00%0 0
FY2014 1 0 001 0.00%0 1
FY2015 1 0 001 0.00%0 1
FY2016 1 0 001 0.00%0 1
11 0 0011 0.00%11 Year Tota 4 7
School Age Admissions Page 7 of 14

TotalSchool AgeAdmissions
TotalNon-
OffenderAdmissions
TotalAlleged Offender
Admissions
TotalAlleged OffenderAge 0-17
TotalAlleged OffenderAge 18-21
PercentAlleged Offender
Admissions
Lubbock State Supported Living CenterSchool Age Admissions (Under Age 22)
FY2006 through FY2016 (As of 6/30/2016)
FiscalYear
TotalNon-
OffenderAge 0-17
TotalNon-
OffenderAge 18-21
FY2006 1 0 001 0.00%0 1
FY2007 4 0 004 0.00%1 3
FY2008 2 0 002 0.00%1 1
FY2009 1 0 001 0.00%1 0
FY2010 4 0 004 0.00%1 3
FY2011 3 0 003 0.00%0 3
FY2012 3 0 003 0.00%0 3
FY2013 3 0 003 0.00%0 3
FY2014 2 0 002 0.00%0 2
FY2015 2 0 002 0.00%0 2
FY2016 1 0 001 0.00%0 1
26 0 0026 0.00%11 Year Tota 4 22
School Age Admissions Page 8 of 14

TotalSchool AgeAdmissions
TotalNon-
OffenderAdmissions
TotalAlleged Offender
Admissions
TotalAlleged OffenderAge 0-17
TotalAlleged OffenderAge 18-21
PercentAlleged Offender
Admissions
Lufkin State Supported Living CenterSchool Age Admissions (Under Age 22)
FY2006 through FY2016 (As of 6/30/2016)
FiscalYear
TotalNon-
OffenderAge 0-17
TotalNon-
OffenderAge 18-21
FY2006 7 0 007 0.00%4 3
FY2007 13 0 0013 0.00%12 1
FY2008 13 0 0013 0.00%12 1
FY2009 7 0 007 0.00%6 1
FY2010 5 0 005 0.00%5 0
FY2011 2 0 002 0.00%2 0
FY2012 5 0 005 0.00%4 1
FY2013 8 0 008 0.00%6 2
FY2014 5 0 005 0.00%3 2
FY2015 9 0 009 0.00%8 1
FY2016 9 0 009 0.00%5 4
83 0 0083 0.00%11 Year Tota 67 16
School Age Admissions Page 9 of 14
TotalSchool AgeAdmissions
TotalNon-
OffenderAdmissions
TotalAlleged Offender
Admissions
TotalAlleged OffenderAge 0-17
TotalAlleged OffenderAge 18-21
PercentAlleged Offender
Admissions
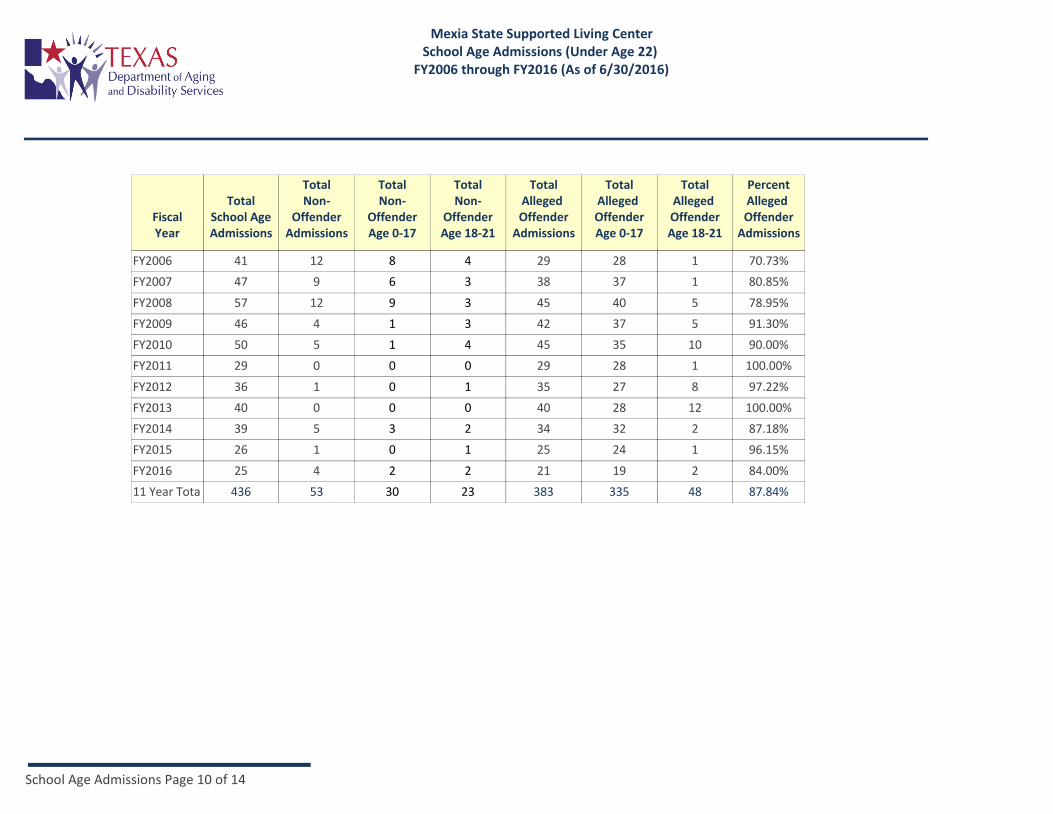
Mexia State Supported Living CenterSchool Age Admissions (Under Age 22)
FY2006 through FY2016 (As of 6/30/2016)
FiscalYear
TotalNon-
OffenderAge 0-17
TotalNon-
OffenderAge 18-21
FY2006 41 28 12912 70.73%8 4
FY2007 47 37 1389 80.85%6 3
FY2008 57 40 54512 78.95%9 3
FY2009 46 37 5424 91.30%1 3
FY2010 50 35 10455 90.00%1 4
FY2011 29 28 1290 100.00%0 0
FY2012 36 27 8351 97.22%0 1
FY2013 40 28 12400 100.00%0 0
FY2014 39 32 2345 87.18%3 2
FY2015 26 24 1251 96.15%0 1
FY2016 25 19 2214 84.00%2 2
436 335 4838353 87.84%11 Year Tota 30 23
School Age Admissions Page 10 of 14

TotalSchool AgeAdmissions
TotalNon-
OffenderAdmissions
TotalAlleged Offender
Admissions
TotalAlleged OffenderAge 0-17
TotalAlleged OffenderAge 18-21
PercentAlleged Offender
Admissions
Richmond State Supported Living CenterSchool Age Admissions (Under Age 22)
FY2006 through FY2016 (As of 6/30/2016)
FiscalYear
TotalNon-
OffenderAge 0-17
TotalNon-
OffenderAge 18-21
FY2006 13 0 0013 0.00%0 13
FY2007 12 0 0012 0.00%1 11
FY2008 8 0 008 0.00%0 8
FY2009 3 0 003 0.00%0 3
FY2010 3 0 003 0.00%0 3
FY2011 2 0 002 0.00%0 2
FY2012 0 0 000 0.00%0 0
FY2013 4 0 004 0.00%0 4
FY2014 3 0 003 0.00%0 3
FY2015 2 0 002 0.00%0 2
FY2016 1 0 001 0.00%0 1
51 0 0051 0.00%11 Year Tota 1 50
School Age Admissions Page 11 of 14
TotalSchool AgeAdmissions
TotalNon-
OffenderAdmissions
TotalAlleged Offender
Admissions
TotalAlleged OffenderAge 0-17
TotalAlleged OffenderAge 18-21
PercentAlleged Offender
Admissions
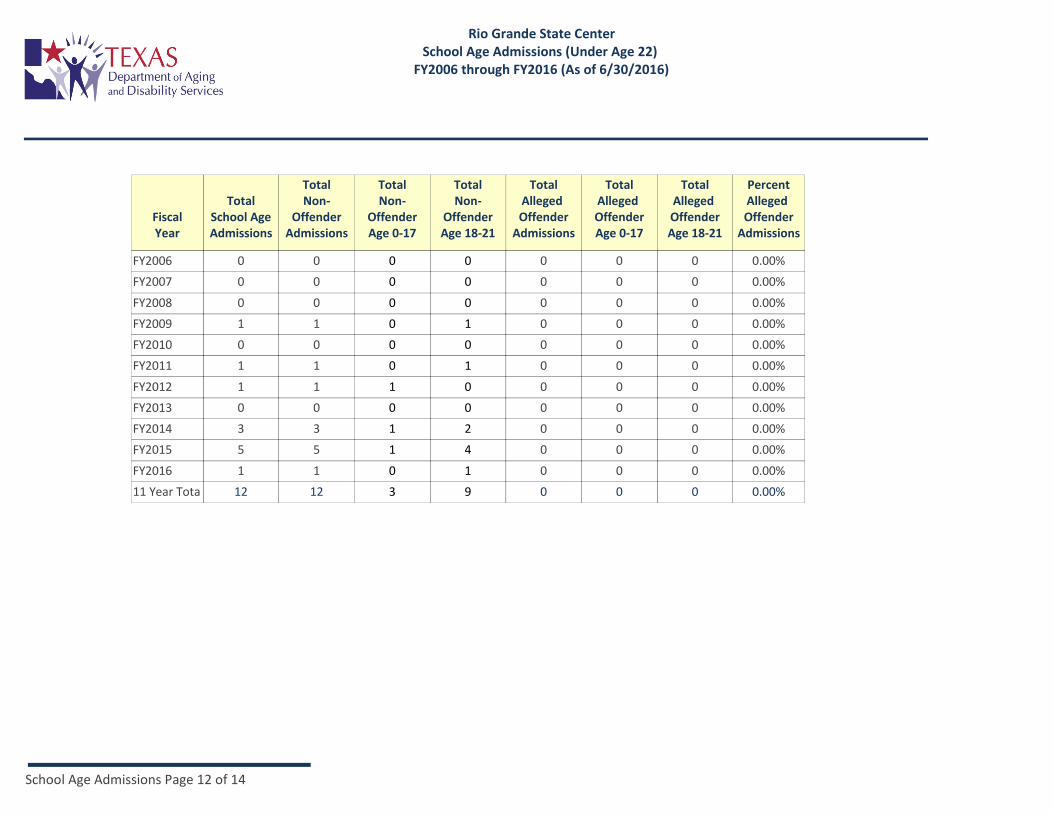
Rio Grande State CenterSchool Age Admissions (Under Age 22)
FY2006 through FY2016 (As of 6/30/2016)
FiscalYear
TotalNon-
OffenderAge 0-17
TotalNon-
OffenderAge 18-21
FY2006 0 0 000 0.00%0 0
FY2007 0 0 000 0.00%0 0
FY2008 0 0 000 0.00%0 0
FY2009 1 0 001 0.00%0 1
FY2010 0 0 000 0.00%0 0
FY2011 1 0 001 0.00%0 1
FY2012 1 0 001 0.00%1 0
FY2013 0 0 000 0.00%0 0
FY2014 3 0 003 0.00%1 2
FY2015 5 0 005 0.00%1 4
FY2016 1 0 001 0.00%0 1
12 0 0012 0.00%11 Year Tota 3 9
School Age Admissions Page 12 of 14
TotalSchool AgeAdmissions
TotalNon-
OffenderAdmissions
TotalAlleged Offender
Admissions
TotalAlleged OffenderAge 0-17
TotalAlleged OffenderAge 18-21
PercentAlleged Offender
Admissions
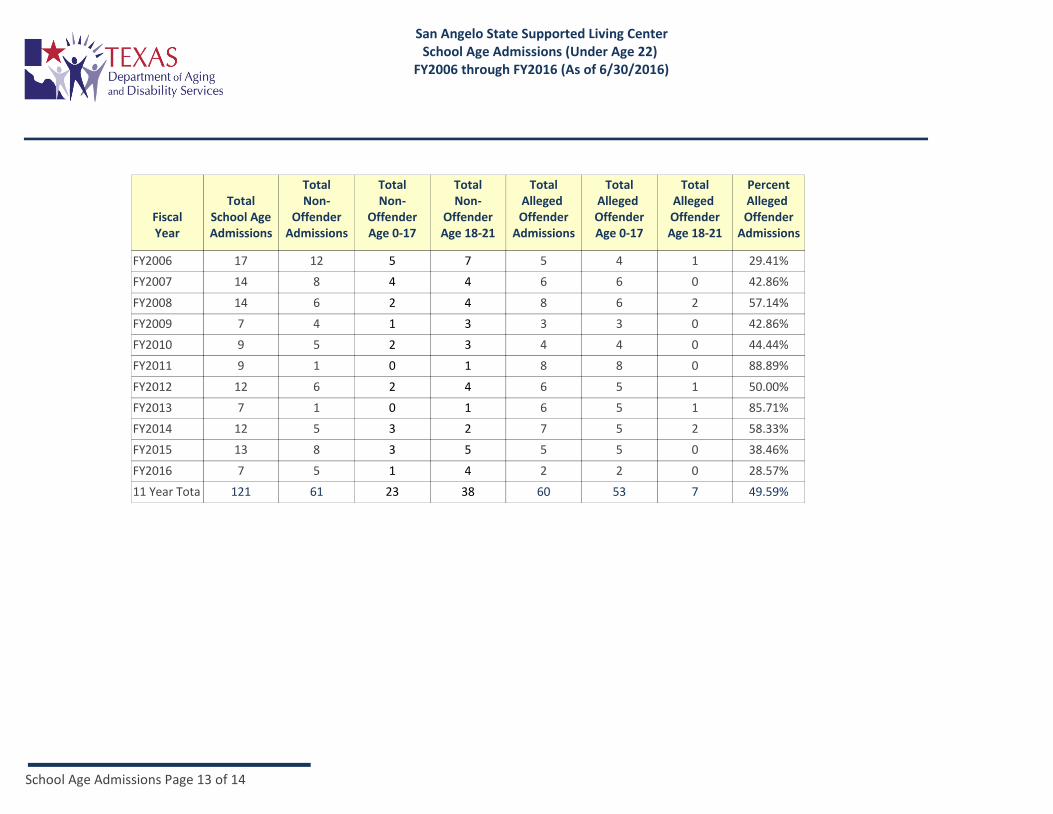
San Angelo State Supported Living CenterSchool Age Admissions (Under Age 22)
FY2006 through FY2016 (As of 6/30/2016)
FiscalYear
TotalNon-
OffenderAge 0-17
TotalNon-
OffenderAge 18-21
FY2006 17 4 1512 29.41%5 7
FY2007 14 6 068 42.86%4 4
FY2008 14 6 286 57.14%2 4
FY2009 7 3 034 42.86%1 3
FY2010 9 4 045 44.44%2 3
FY2011 9 8 081 88.89%0 1
FY2012 12 5 166 50.00%2 4
FY2013 7 5 161 85.71%0 1
FY2014 12 5 275 58.33%3 2
FY2015 13 5 058 38.46%3 5
FY2016 7 2 025 28.57%1 4
121 53 76061 49.59%11 Year Tota 23 38
School Age Admissions Page 13 of 14

TotalSchool AgeAdmissions
TotalNon-
OffenderAdmissions
TotalAlleged Offender
Admissions
TotalAlleged OffenderAge 0-17
TotalAlleged OffenderAge 18-21
PercentAlleged Offender
Admissions
San Antonio State Supported Living CenterSchool Age Admissions (Under Age 22)
FY2006 through FY2016 (As of 6/30/2016)
FiscalYear
TotalNon-
OffenderAge 0-17
TotalNon-
OffenderAge 18-21
FY2006 7 0 007 0.00%5 2
FY2007 9 0 009 0.00%5 4
FY2008 13 0 0013 0.00%9 4
FY2009 3 0 003 0.00%3 0
FY2010 2 0 002 0.00%2 0
FY2011 2 0 002 0.00%0 2
FY2012 1 0 001 0.00%0 1
FY2013 1 0 001 0.00%0 1
FY2014 3 0 003 0.00%0 3
FY2015 1 0 001 0.00%0 1
FY2016 4 0 004 0.00%0 4
46 0 0046 0.00%11 Year Tota 24 22
School Age Admissions Page 14 of 14
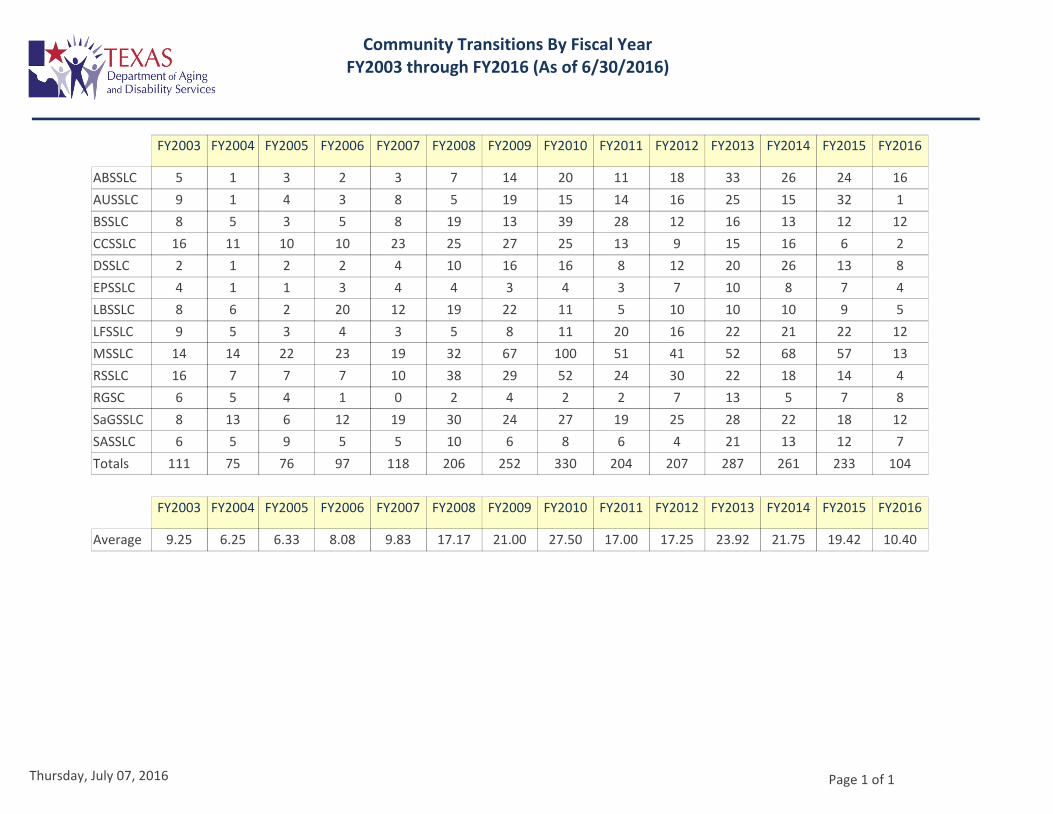
Community Transitions By Fiscal YearFY2003 through FY2016 (As of 6/30/2016)
FY2003 FY2004 FY2005 FY2006 FY2007 FY2008 FY2009 FY2010 FY2011 FY2012 FY2013 FY2014 FY2015 FY2016
ABSSLC 5 1 3 2 3 7 14 20 11 18 33 26 24 16
AUSSLC 9 1 4 3 8 5 19 15 14 16 25 15 32 1
BSSLC 8 5 3 5 8 19 13 39 28 12 16 13 12 12
CCSSLC 16 11 10 10 23 25 27 25 13 9 15 16 6 2
DSSLC 2 1 2 2 4 10 16 16 8 12 20 26 13 8
EPSSLC 4 1 1 3 4 4 3 4 3 7 10 8 7 4
LBSSLC 8 6 2 20 12 19 22 11 5 10 10 10 9 5
LFSSLC 9 5 3 4 3 5 8 11 20 16 22 21 22 12
MSSLC 14 14 22 23 19 32 67 100 51 41 52 68 57 13
RSSLC 16 7 7 7 10 38 29 52 24 30 22 18 14 4
RGSC 6 5 4 1 0 2 4 2 2 7 13 5 7 8
SaGSSLC 8 13 6 12 19 30 24 27 19 25 28 22 18 12
SASSLC 6 5 9 5 5 10 6 8 6 4 21 13 12 7
Totals 111 75 76 97 118 206 252 330 204 207 287 261 233 104
FY2003 FY2004 FY2005 FY2006 FY2007 FY2008 FY2009 FY2010 FY2011 FY2012 FY2013 FY2014 FY2015 FY2016
Average 9.25 6.25 6.33 8.08 9.83 17.17 21.00 27.50 17.00 17.25 23.92 21.75 19.42 10.40
Thursday, July 07, 2016 Page 1 of 1
1
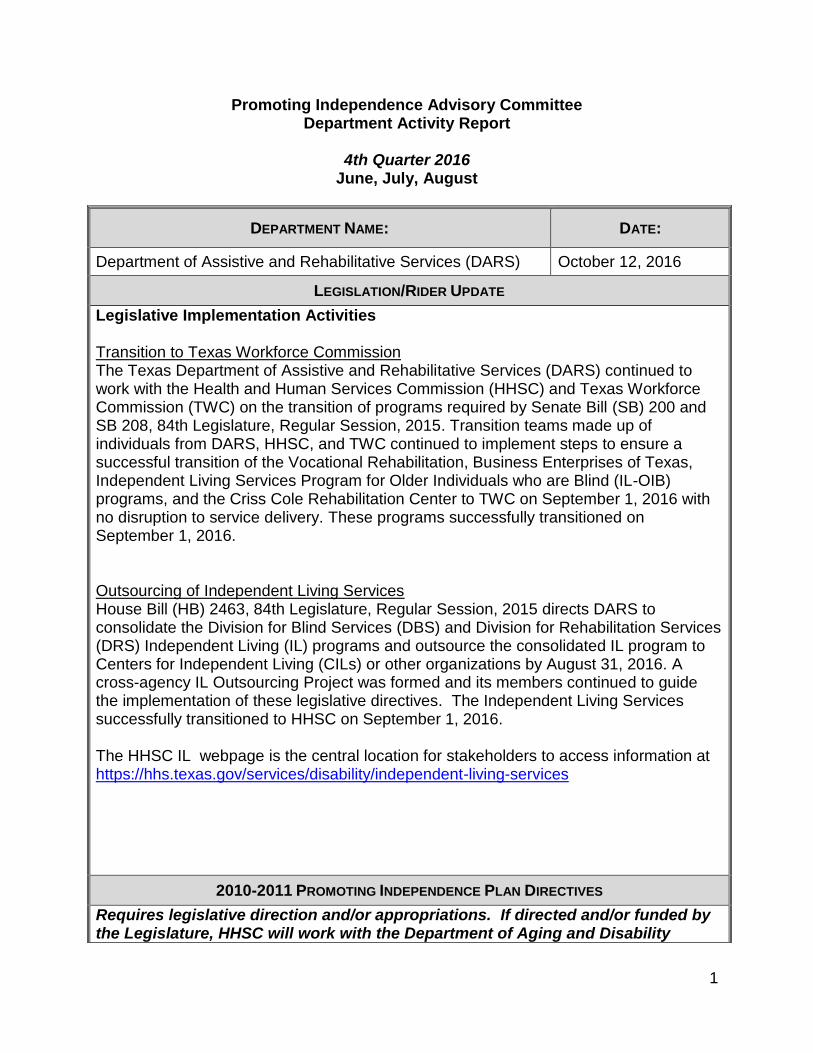
Promoting Independence Advisory Committee Department Activity Report
4th Quarter 2016
June, July, August
DEPARTMENT NAME: DATE:
Department of Assistive and Rehabilitative Services (DARS) October 12, 2016
LEGISLATION/RIDER UPDATE
Legislative Implementation Activities Transition to Texas Workforce Commission The Texas Department of Assistive and Rehabilitative Services (DARS) continued to work with the Health and Human Services Commission (HHSC) and Texas Workforce Commission (TWC) on the transition of programs required by Senate Bill (SB) 200 and SB 208, 84th Legislature, Regular Session, 2015. Transition teams made up of individuals from DARS, HHSC, and TWC continued to implement steps to ensure a successful transition of the Vocational Rehabilitation, Business Enterprises of Texas, Independent Living Services Program for Older Individuals who are Blind (IL-OIB) programs, and the Criss Cole Rehabilitation Center to TWC on September 1, 2016 with no disruption to service delivery. These programs successfully transitioned on September 1, 2016. Outsourcing of Independent Living Services House Bill (HB) 2463, 84th Legislature, Regular Session, 2015 directs DARS to consolidate the Division for Blind Services (DBS) and Division for Rehabilitation Services (DRS) Independent Living (IL) programs and outsource the consolidated IL program to Centers for Independent Living (CILs) or other organizations by August 31, 2016. A cross-agency IL Outsourcing Project was formed and its members continued to guide the implementation of these legislative directives. The Independent Living Services successfully transitioned to HHSC on September 1, 2016. The HHSC IL webpage is the central location for stakeholders to access information at https://hhs.texas.gov/services/disability/independent-living-services
2010-2011 PROMOTING INDEPENDENCE PLAN DIRECTIVES
Requires legislative direction and/or appropriations. If directed and/or funded by the Legislature, HHSC will work with the Department of Aging and Disability

2
Services (DADS), the Department of State Health Services (DSHS), and the Department of Assistive and Rehabilitative Services (DARS) to reduce community-based interest/waiting lists. DARS DRS Comprehensive Rehabilitation Services Program The DARS Division for Rehabilitation Services (DRS) Comprehensive Rehabilitation Services (CRS) program successfully transitioned to HHSC on September 1, 2016. The HHSC CRS webpage is the central location for stakeholders to access information at https://hhs.texas.gov/services/disability/comprehensive-rehabilitation-services
TOPICS OF INTEREST (ONGOING ISSUES/PROJECTS)
Other TWC Initiatives DARS Division for Rehabilitative Services Vocational Rehabilitation Transition Services The DARS Division for Rehabilitation Services (DRS) Vocational Rehabilitation (VR) program provides Transition Services. Eligible youth and students with disabilities can receive transition planning services to prepare them to move from receiving education services to receiving VR services. Transition planning services help minimize potential delays in service delivery during the transition from school to competitive employment or independence. As of September 9, 2016, the VR program has:
served 29,499 eligible transition-age consumers; and
closed 3,368 transition-age consumers’ cases successfully. DARS DRS has approximately:
102 transition vocational rehabilitation counselors (TVRCs) located in offices across the state; and
235 VR counselors who work with transition consumers and serve as liaisons to high schools.
DARS DRS is currently working to implement changes to transition policies and procedures, as required by the Workforce Innovation and Opportunity Act (WIOA). These changes will lead to increased collaboration with schools and community partners and will require working with students earlier and providing them with greater preparation for work and independence. DRS developed and is in the process of providing training to all school counselors in the state to increase consistency in service delivery.

3
The DARS Division for Rehabilitation Services successfully transitioned to the Texas Workforce Commission on September 1, 2016. The TWC webpage is the central location for stakeholders to access information at http://www.twc.state.tx.us/jobseekers/vocational-rehabilitation-services DARS Division for Blind Services Transition Services As of August 31, 2016, the Division for Blind Services (DBS) Transition Services has 28 counselors located in offices across the state. DARS and the Texas School for the Blind and Visually Impaired have a long-standing Interagency Agreement to coordinate services for youth who are blind or visually impaired. As of August 31, 2016, DBS Transition Services has:
transferred 156 consumers successfully to the adult VR program;
staffed 26 of the 28 transition counselor positions; and served 2,417 transition-age consumers.
The DARS Division for Blind Services successfully transitioned to the Texas Workforce Commission on September 1, 2016. The TWC webpage is the central location for stakeholders to access information at http://www.twc.state.tx.us/jobseekers/vocational-rehabilitation-services DARS Autism Program The DARS Autism Program successfully transitioned to the Health and Human Services Commission on September 1, 2016. The HHSC Autism webpage is the central location for stakeholders to access information at https://hhs.texas.gov/services/disability/autism DARS Early Childhood Intervention Program The DARS ECI Program successfully transitioned to the Health and Human Services Commission on September 1, 2016. The HHSC ECI webpage is the central location for stakeholders to access information at https://hhs.texas.gov/services/disability/early-childhood-intervention-services
RELEVANT MEETING NOTICES
4
Rehabilitation Council of Texas (RCT) November3-4, 2016 Criss Cole Rehabilitation Center 4800 N Lamar Austin TX 78756
Report Completed By: Jonas Schwartz
Telephone/Contact Number: (512) 424-4211
1 | P a g e
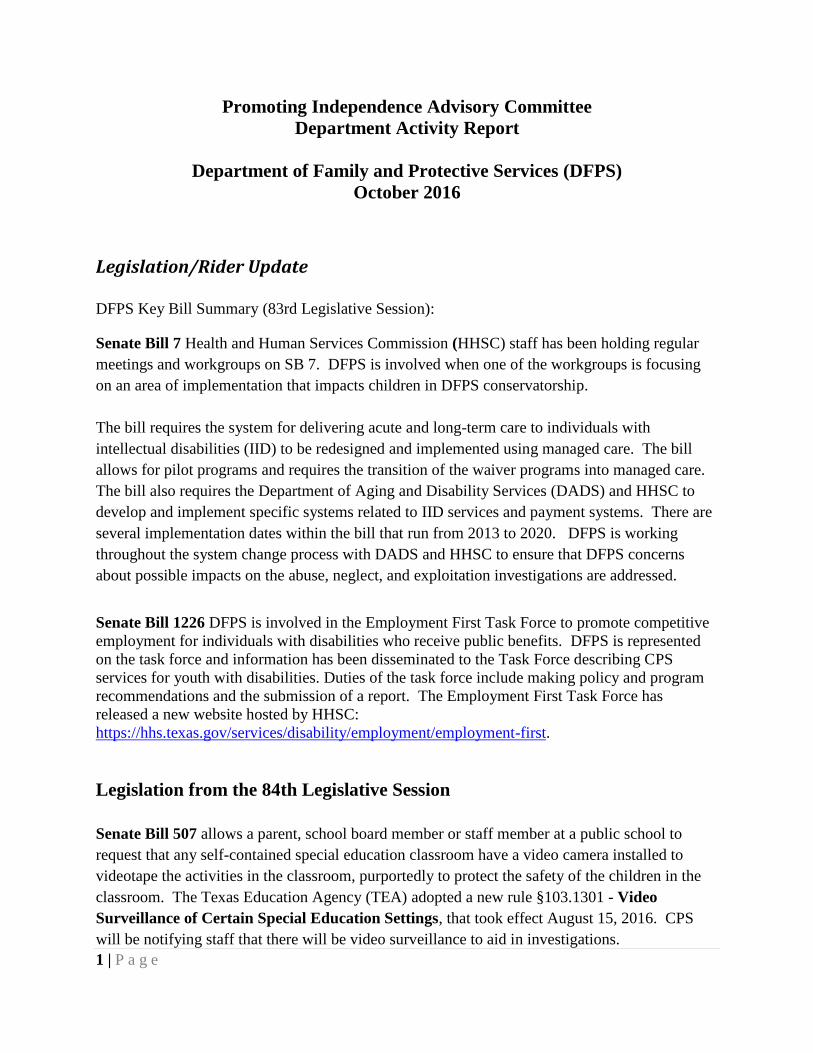
Promoting Independence Advisory Committee
Department Activity Report
Department of Family and Protective Services (DFPS)
October 2016
Legislation/Rider Update
DFPS Key Bill Summary (83rd Legislative Session):
Senate Bill 7 Health and Human Services Commission (HHSC) staff has been holding regular
meetings and workgroups on SB 7. DFPS is involved when one of the workgroups is focusing
on an area of implementation that impacts children in DFPS conservatorship.
The bill requires the system for delivering acute and long-term care to individuals with
intellectual disabilities (IID) to be redesigned and implemented using managed care. The bill
allows for pilot programs and requires the transition of the waiver programs into managed care.
The bill also requires the Department of Aging and Disability Services (DADS) and HHSC to
develop and implement specific systems related to IID services and payment systems. There are
several implementation dates within the bill that run from 2013 to 2020. DFPS is working
throughout the system change process with DADS and HHSC to ensure that DFPS concerns
about possible impacts on the abuse, neglect, and exploitation investigations are addressed.
Senate Bill 1226 DFPS is involved in the Employment First Task Force to promote competitive
employment for individuals with disabilities who receive public benefits. DFPS is represented
on the task force and information has been disseminated to the Task Force describing CPS
services for youth with disabilities. Duties of the task force include making policy and program
recommendations and the submission of a report. The Employment First Task Force has
released a new website hosted by HHSC:
https://hhs.texas.gov/services/disability/employment/employment-first.
Legislation from the 84th Legislative Session
Senate Bill 507 allows a parent, school board member or staff member at a public school to
request that any self-contained special education classroom have a video camera installed to
videotape the activities in the classroom, purportedly to protect the safety of the children in the
classroom. The Texas Education Agency (TEA) adopted a new rule §103.1301 - Video
Surveillance of Certain Special Education Settings, that took effect August 15, 2016. CPS
will be notifying staff that there will be video surveillance to aid in investigations.
2 | P a g e
Senate Bill 1880/Senate Bill 760 ensure continued State of Texas compliance with CMS
requirements for the health and welfare of recipients of Home and Community-based Services
(HCBS), particularly requirements related to abuse, neglect, and exploitation. The bills expand
authority for the APS Provider Investigations program to investigate all HCBS providers whether
the services are provided in a traditional or managed care delivery model. The bill also clarifies
and addresses the gaps and inconsistencies that have resulted from the evolving service delivery
changes and changes in contracting arrangements. DFPS worked with HHSC, DADS and DSHS
to implement the bills and will continue to work with those agencies and external stakeholders to
improve investigation processes.
Senate Bill 1889 attempts to make it easier for families to receive mental health services for their
child in DFPS conservatorship without having a finding of abuse or neglect, and to encourage
joint managing conservatorship (JMC) in certain cases. The bill adds an exemption to the
definition of "neglect" in the Family Code; prohibits DFPS from making a finding of abuse or
neglect against a parent(s) in a case in which DFPS is named managing conservator of the child
solely because the family is unable to obtain mental health services for the child; and requires
DFPS to develop a process for removing from the registry names of families for which DFPS
was made managing conservator of a child only because of the child's mental health needs. This
bill requires biennial reporting to the legislature, and repeals Senate Bill 44 (83rd Legislature)
language regarding a study and report. CPS published Policy 2390 in December 2015 which
explains the changes to JMC being offered to the parents who wish for CPS to take custody of
their child solely to obtain mental health services.
For the first three quarters of FY16, 129 children have come into care who met these criteria. In
addition, to date the dispositions in 73 cases have been overturned and removed from the
registry. Currently an additional 28 cases have been sent to the resolution specialist to be
reviewed and overturned.
Promoting Independence Plan Directives
12. Requires legislative direction and/or appropriations.
If directed and/or funded by the Legislature, HHSC will work with the Department of Family and
Protective Services (DFPS) to expand the Promoting Independence (PI) population to include
children in DFPS conservatorship who have disabilities and are residing in select institutions
licensed by DFPS.
Senate Bill 49 relates to transitional living assistance for children who have disabilities who
also reside in General Residential Operations (GRO). GROs are 24 hour residential facilities
for children with intellectual and developmental disabilities who are in Child Protective
Services (CPS) custody. The bill codifies the current policy by adding GROs to the current
3 | P a g e
definition in government code and requires that a child that lives in the GRO who has a
disability would qualify for home and community based services through the Department of
Aging and Disability Services (DADS). The bill includes this population in the Promoting
Independence plan, giving them timely access to Home and Community based Services
waivers similar to children in State Supported Living Centers, large Intermediate Care
Facilities for Individuals with Intellectual Disabilities (ICF/IID) and nursing facilities. This
bill codifies current practice by DADS to include this population.
CPS and Every Child Inc. staffs continue to work together to find Home and Community-
based Services (HCS) homes for the children in General Residential Operations who received
HCS waivers. DADS allocated 25 HCS slots in General Residential Operations for children
in DFPS Conservatorship who have intellectual and developmental disabilities for FY 2016-
2017. As of September 2016, 15 HCS slots have been released for children with disabilities
who are currently residing in DFPS licensed institutions.
DADS allocated 216 HCS slots for CPS youth aging out of care for FY 2016-2017. As of
September 2016, 122 HCS slots have been released for youth aging out of care.
14. Requires legislative direction and/or appropriations.
If directed and/or funded by the Legislature, HHSC will work with DADS and DFPS to develop
adequate behavioral services to support children (0-21 years of age) coming out of institutions
and to help provide them with community options in order to support individual choice.
Funding in Other Agency Budgets that Impact Children in DFPS Conservatorship:
Department of State Health Services (DSHS)
Thirty beds in private residential treatment centers for children/youth that are at risk for
parental relinquishment of custody to DFPS. There are 36 children currently placed.
Department of Aging and Disability Services (DADS)
Additional HCS capacity for 216 children aging-out of foster care.
Additional HCS capacity for 25 children with IDD who are now receiving services in a
DFPS residential facility
Topics of Interest (ongoing issues/projects)
DFPS and DSHS have established a referral process for children to access the thirty
Residential Treatment Center beds funded through DSHS. At this time there are 36
children placed in Residential Treatment Center beds and 14 children on a waiting list for
placement.
4 | P a g e
The Texas Workforce Commission (TWC) partnered with DFPS Child Care Licensing
(CCL) to enhance inclusion opportunities for infants, toddlers, preschool, and school-age
children with special care needs receiving daycare services. The project was funded by
Child Care Development Block Grant (CCDBG) funds.
The outcome of the initiative is to provide free and reduced cost training resources that
will educate and support caregivers in learning that inclusive child care can be beneficial,
both for the child with a special need and for the other children in the classroom. Eight
2-hour online courses are now available for providers serving preschool and school-age
children. Topics include helping typical children in the classroom understand and
interact with children with special care needs, adapting classroom routines and activities
to meet the developmental needs of children with and without special needs, strategies for
dealing with children with difficult behaviors, and partnering with families of children
with special needs. The online courses are free of charge, offered in English and Spanish,
and can be accessed at http://childcare.tamu.edu.
From February 2016 to date, more than 32,633 courses have been taken online for a total
of 65,266 training hours. The pre-test average score for training participants was 64
percent while the post-test average scores was 90 percent.
Additionally, 24 instructor-led trainings on inclusive care for pre-school and school-age
children with special needs were conducted statewide through August 2016, with 1,520
participants in attendance. Ninety-six percent of participants reported an intent to take
action or make changes based on the information from this training.
SafePlace Texas has published Promoting Justice: An Essential Resource Guide for
Responding to Abuse Against Children with Disabilities. You can access the manual
online at www.safeplace.org/promotingjustice.
DFPS and the Texas Department of Housing and Community Affairs (TDHCA) are
collaborating on conducting a needs assessment and count on homeless and unstably-
housed youth per requirements of HB 679.
Texas Department of Housing and Community Affairs (TDHCA) along with DFPS,
DADS, and DSHS have begun the launch of the 811 Project Rental Assistance program.
The Section 811 Project Rental Assistance (PRA) program provides project-based rental
assistance for extremely low-income persons with disabilities linked with long term
services. The program is limited to individuals who are part of the Target Population and
receiving services through one of the HHSC Agencies participating in the program. Each
eligible household must have a qualified member of the Target Population that will be at
least 18 years of age and under the age of 62 at the time of admission and receiving SSI
5 | P a g e
and Medicaid. All three target populations are eligible for community-based, long-term
care services as provided through Medicaid waivers, Medicaid state plan options, or state
funded services and have been referred to TDHCA through their service provider. The
target population includes youth with disabilities exiting foster care, people with
disabilities living in institutions, and people with serious mental illness.
https://www.tdhca.state.tx.us/section-811-pra/
Relevant Meeting Notices
The Health and Human Services Executive Council (which has replaced the DFPS
Council) held their inaugural meeting on September 23, 2016 at 10:00am in the Public
Hearing Room of the Brown-Heatly Building, located at 4900 North Lamar Boulevard
Austin, TX 78751. The HHS Executive Council is scheduled to meet next on November
17, 2016.
The next Texas Governor's Committee on People with Disabilities will take place over
two days October 26 and 27, 2016, in connection with the Annual Lex Frieden
Employment Awards. The location will be the Crowne Plaza, 8686 Kirby Street,
Houston Texas 77054.
Report Compiled By: Peter Hajmasy as submitted by CPS, APS, and CCL Programs
Telephone Number: 512/438-4124
Promoting Independence Advisory Committee
Department Activity Report
Department Name: Date:
Department of State Health Services (DSHS) July 5, 2016
Legislation/Rider Update:
HHSC Special Provisions for all Agencies, Sec. 52. of the 81st Legislative Session (Waiting List for Children’s
Community Mental Health Services)
Rider 65 of the 81st Legislative Session (Transitional and On-Going Community Mental Health Services)
2013-2014 Promoting Independence Plan Directives:
1. Requires legislative direction and/or appropriations.
If directed and/or funded by the Legislature, HHSC will work with the Department of Aging and Disability
Services (DADS), the Department of State Health Services (DSHS), and the Department of Assistive and
Rehabilitative Services (DARS) to reduce community-based interest/waiting lists
DSHS (via HHSC) received exceptional item funding (Sec. 52) to reduce the waiting list for children needing
community-based mental health services at community mental health centers. Both child and adult waiting lists
will be reported.
o Number of adults waiting for community-based mental health services = 969 as of May 31, 2016.
o Number of children waiting for community-based mental health services = 122 as of May 31, 2016.
DSHS (via HHSC) received exceptional item funding (Sec. 52) for Children with Special Health Care Needs
(CSHCN) to reduce waiting lists.
Number of CSHCN waiting for community-based services:
As of May 31, 2016 there were 47 children on the CSHCN Services Program waiting list for health care
benefits. During the third quarter of FY 2016, 176 clients were removed from the waiting list as of May 31, 2016 to
receive comprehensive health care benefits.
2. Requires legislative direction and/or appropriations.
If directed and/or funded by the Legislature, HHSC will work with DSHS to implement a fully funded Assertive
Community Treatment (ACT) service package as part of the Resiliency and Disease Management (RDM)
program.
DSHS received exceptional item funding (Rider 65) in enhance the capacity of the community-based mental
health service system by increasing the number of persons receiving intensive community-based mental health
service packages at community mental health centers, including Assertive Community Treatment (ACT).
o Number of people receiving ACT = 2,284 in May 2016 (including NorthSTAR).
3. Requires legislative direction and/or appropriations
If directed and/or funded by the Legislature, HHSC will work with DSHS to provide services and supports for
individuals leaving the state mental health facility (state hospital) system.
DSHS received exceptional item funding (Rider 65) to extend the post crisis/hospital benefit at community
mental health centers from 30 to 90 days.
o Number of people receiving service package 5 (crisis follow up) = 2,039 in May 2016 (including
NorthSTAR).
Topics of Interest (ongoing issues/projects):
Reports attached
o Patients Admitted Three or More Times in 180 days
o Discharge Destination from State Hospitals
o Adults Readmitted to a State or Community Psychiatric Hospital Three or More Times in 180 Days Since
FY 2001; Where are They Now?
o Children Readmitted to a State of Community Psychiatric Hospital Three or More Times in 180 Days Since
FY 2001; Where are They Now?
o Hospitalized Patients Discharged After One Year (New Report added Q1 2016)
Follow-Up From Previous PIAC Request:
Youth Empowerment Services (YES) Waiver
As of May 2016 YES Waiver enrolled 1,361 active participants. Comprehensive waiver providers are contracted
through an open enrollment process. DSHS continues to grow its YES Waiver provider base and has executed a
contract with Covenant Kids to serve as a comprehensive waiver provider in North Texas. The Local Mental Health
Authority (LMHA) serves as the waiver administrator as well as the comprehensive waiver provider to afford
additional choice across the state among providers.
The YES Waiver has submitted Amendment 9 – Inclusion of Children in Department of Family and Protective
Services Conservatorship. CMS approval of this amendment is expected in July 2016. DSHS has proposed an
update to the Texas Administrative Code (TAC) to YES relating to management of the Inquiry List and the
establishment of a reserve capacity for children at imminent risk of relinquishment.
DSHS partnered with the Texas Institute for Excellence in Mental Health (TIEMH) on May 9, 2016 to host a
statewide organizational leadership meeting to provide an update to LMHAs/LBHAs on the standards used to
measure fidelity to wraparound and share strategies to improve client outcomes.
Home and Community-Based Services—Adult Mental Health: 1915 (i) State Plan Amendment
DSHS received exceptional item funding during the 83rd Legislature, Regular Session, 2013 to develop a Home and
Community-Based Services (HCBS) program for adults with complex needs and extended or repeated state
inpatient psychiatric stays as defined by the Department. The Department was authorized to seek federal approval
for a Medicaid 1915(i) state plan amendment to enable federal financial participation, to the extent possible, in the
HCBS program in collaboration with the Health and Human Services Commission (HHSC).
Texas received federal approval of the Home and Community-Based Services-Adult Mental Health (HCBS-AMH)
SPA from the Center for Medicare and Medicaid Services (CMS) on October 13, 2015.

The 84th Legislature, Regular Session, 2015 directed DSHS to expand home and community based services to divert
jail and emergency room populations to community based treatment. HHSC formally submitted the amendment to
the HCBS-AMH SPA to CMS on May 20, 2016. DSHS will operate the expansion using general revenue until CMS
approves the SPA amendment.
DSHS has executed contracts with Texoma Community Center to provide both HCBS-AMH comprehensive service
array and recovery management in Sherman. DSHS enrolled the first two HCBS-AMH participants on June 15,
2016. In addition, DSHS has two executed contracts, one in Harris County for provider agency and one in Wichita
Falls for recovery management. There are seven additional contracts with anticipated execution including a
recovery management entity in Harris County and a provider agency in Wichita Falls. Once executed, HCBS-AMH
referrals will open in Harris County and Wichita Falls.
Money Follows the Person Behavioral Health Pilot and Related Efforts
The Money Follows the Person Behavioral Health Pilot in Bexar, Atascosa, Wilson, Guadalupe, Williamson, Hays,
and Travis Counties (San Antonio and Austin) helps people with co-occurring physical and mental health and
substance abuse conditions leave nursing facilities and live independently in the community. Two pilot services,
Cognitive Adaptation Training (CAT) and substance abuse counseling, are currently provided by the Center for
Health Care Services, San Antonio’s local mental health authority (LMHA), the University of Texas Health Science
Center at San Antonio, and Austin Travis County Integral Care. CAT is an evidence-based rehabilitative service
that helps improve adaptive functioning by helping people establish daily routines, organize their homes, and hone
their community living skills. Examples of increased independence include getting a paid job at competitive wages,
driving to work, volunteering, getting a GED, teaching art classes, leading peer support groups, and working toward
a college degree.
Significant updates since the last report include the following:
The total number of people who have received at least one day of pilot services in the community since the
start of the pilot in 2008 is 424. Of these, 240 have successfully completed one year of pilot services in the
community. In addition, pilot participants have shown statistically significant improvements in functioning
independently. Participants show increased functional status and quality of life across time, and gains
achieved during the intervention persist for at least a year after the end of services.
CAT services have reached maximum capacity in the Austin and San Antonio service delivery areas because
of robust outreach and recruitment efforts. New participants are enrolled as others transition off services.
The pilot is currently serving 32 clients in the community and 48 in nursing facilities (pre-transition).
The cognitive challenges faced by pilot participants are similar to those faced by some long term residents of
state psychiatric facilities. DSHS has been working with the Center for Health Care Services to provide pilot
services to people at the San Antonio State Hospital. This effort is funded with Mental Health Block Grant
dollars. To date, 42 people have moved from the state hospital into the community.
The University of Texas Health Science Center at San Antonio has continued to reach out to LMHA staff
and has provided training in Illness Management and Recovery (IMR) and CAT, funded under an Money
Follows the Person (MFP) administrative grant award. To date, 5,062 supervisors and direct care staff
members have been trained in the IMR psychosocial rehabilitative curriculum. In addition, 345 direct care
staff members have received CAT certification.
Staff continued planning activities to develop a center of excellence to provide training and technical
assistance to managed care organizations and their networks which would enable them to deliver evidence-
based rehabilitative services (CAT). In addition, the center of excellence would create a learning community
with resources to help MCOs understand the implications of substance abuse disorders for institutionalized

populations and provide them with strategies to deliver substance abuse treatment to people moving from
institutions.
DSHS continues to work with the University of Texas' School of Social Work’s Addiction Research Institute
(UTARI) to evaluate the pilot. This quarter, UTARI will continue its analysis to examine whether
information in the pilot datasets, such as participant physical, psychological, and psychosocial functioning
measures, diagnoses, medical assessments etc., can help predict (1) characteristics of participants who
successfully returned to the community and (2) which participants remained in the community over time.
DSHS staff will continue to use evaluation results to inform policy recommendations, facilitate
programmatic improvement, and promote and disseminate effective practices relating to community
transition for adult nursing facility residents with behavioral health conditions.
In April, DSHS staff facilitated a session called, “On the Move: Meeting the Transition Needs of Individuals
with Behavioral Health Conditions,” at the Texas State Independent Living Conference in San Antonio.
Mental Health Best Practices, Promising Practices and Evidence-based Practices (formerly Mental Health
Transformation Initiatives)
Mental Health Transformation initiatives were activities designed to bring the latest evidence based and promising
practices into the public mental health system for the benefit of consumers and family members. The focus of these
practices is to promote recovery and build resilience for the people we serve. Mental Health Transformation
activities and initiatives have been integrated into programming within the Mental Health and Substance Abuse
Division. Programming within DSHS is informed by the division’s overall mission:
To improve health and well-being in Texas by providing leadership and services that promote hope, build
resilience, and foster recovery.
Veteran Peer Services and Training
Through third quarter of fiscal year 2016, certified Peer Service Coordinators, working in 37 communities
served by the state’s Local Mental Health Authorities (LMHAs), served 3,380 incarcerated veterans, and,
statewide provided an additional 29,384 peer-to-peer services to an estimated 14,000 additional (non-
incarcerated) service members, veterans, and family members.
Licensed mental health professionals (field clinicians) provided 83 case management clinical services to
incarcerated veterans in special Texas Department of Criminal Justice (TDCJ) veteran dormitory units in
Austin and Gatesville. Additionally, these field clinicians provided 1,082 clinical services to 355 service
members, veterans, and family members in Dallas/Fort Worth, Waco, Killeen, Austin, and San Antonio.
To date, 105 Texas Veterans Commission (TVC) certified trainers, employed at LMHAs, trained 973
people in peer-to-peer counseling skills.
Other Recovery Initiatives
DSHS contracts with Via Hope to provide mental health, family partner peer certification and training,
expand the practice of recovery oriented person-centered planning and further peer integration into the
behavioral health service array. The total number of people trained as certified peer specialists to date is
now 846, of which 790 were certified and 528 currently have an active certification. The total number of
certified family partners is now 183, of whom 127 currently have an active certification.
The University of Texas Center for Social Work Research, Institute for Excellence in Mental Health, has
initiated projects at the Austin State Hospital to research the experiences of client’s perception of recovery
when working with peers compared to a control group which is not working with peers. A similar study has
been initiated at Bluebonnet MHMR crisis units.
The General Appropriations Act, 84th Legislature, Regular Session, 2015 (Article II, Department of State
Health Services (DSHS), Rider 73) requires DSHS to implement a mental health peer support re-entry
program. DSHS is required to partner with Local Mental Health Authorities (LMHAs) and county sheriffs to
establish a pilot program that uses certified peer specialists to ensure inmates with a mental illness
successfully transition from the county jail into clinically appropriate community-based care. Three LMHAS
were awarded contracts based on a needs and capacity assessment: MHMR of Tarrant County, Harris Center
for MHMR and Tropical of Texas Behavioral Health. These LMHAs are in the process of hiring and
training peers, enrolling clients, and strengthening relationships/working in the jails. In addition, DSHS is
collaborating with the Hogg Foundation for a process evaluation.
Centralized Training Infrastructure for Evidence-based Practices
The Centralized Training Infrastructure for Evidence Based Practices (CTI-EBP) is designed to aid the development
of a training infrastructure to support the delivery of mental health services in Texas for the adult and youth
populations. DSHS Mental Health and Substance Abuse Division developed this project as a mechanism to ensure
providers contracted by the department and delivering mental health services did so using evidence-based practices.
The infrastructure promotes and supports the utilization of evidence-based and promising practices to facilitate
resiliency and recovery, and increase positive outcomes for people utilizing behavioral health services in the Texas
mental health system. DSHS has contracted with the University of Texas Health Science Center, Department of
Psychiatry to coordinate and implement this project.
The training infrastructure includes many evidence-based practices, including, but not limited to Illness
Management & Recovery (IMR), Cognitive Adaptation Training (CAT), Cognitive Processing Training (CPT),
Social Skills and Aggression Replacement, Nurturing Parent, Motivational Interviewing and Person Centered
Recovery Planning. To date approximately 16,655 providers have completed online or face-to-face training
modules within the infrastructure:
The CTI-EBP is free to those with DSHS funded contracts and
through partnerships with other state agencies. The CTI-EBP E-
Commerce will be fully promoted September 1, 2016 to charge
non-DSHS contracted providers for web-based training that
offers continuing education units (CEUs).
DSHS continues to work with other community and enterprise
partners to identify training gaps with an eye toward helping the
development of a competent workforce by offering appropriate
training opportunities. The system continues to partner with the
Department of Aging and Disability Services. DADS is
releasing Mental Health Wellness Intellectual Developmental
Disabilities training modules for fiscal year 2017 (September 1,
2016).
For more information regarding the training infrastructure,
please use the following link
https://tango.uthscsa.edu/cttesting/.
Training
Number
Completed Individual Placement and
Support – Supported
Employment (IPS-SE)
882
Co-Occurring Psychiatric and
Substance Disorders (COPSD) 5,494
Illness Management Recovery
(IMR) 5,797
IMR Recertification 1,890
Cognitive Adaptation Training
(CAT) 415
TOTAL Web based 14,478
TOTAL In Person 2,177
TOTAL Training 16,655
Relevant Meeting Notices:
Note: Please note that because of grace periods in the submission of encounter data by funded community mental
health centers to DSHS, the values listed in this report do not freeze until 37 days after the last day of FY 2016
Quarter 3.
Also note that this report is completed and compiled in collaboration with DSHS Children with Special Health Care
Needs (CSHCN) Services Program, DSHS Mental Health and Substance Abuse (MHSA) Division Decision
Support staff, DSHS MHSA Special Projects Unit staff, DSHS MHSA Adult Program Services Staff, DSHS MHSA
Senior Policy Analyst Office and DSHS Hospitals Section staff.
Report Completed By: Carissa Dougherty
Telephone/Contact Number: (512) 206-5347
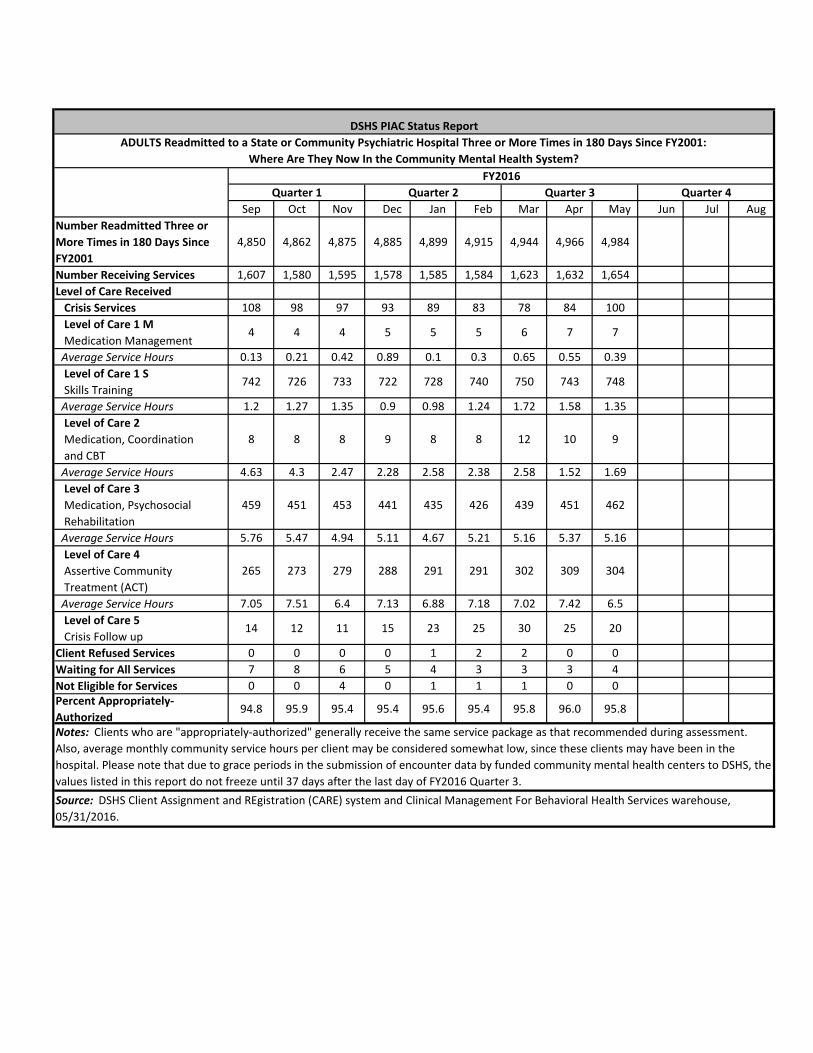
Sep Oct Nov Dec Jan Feb Mar Apr May Jun Jul Aug
Number Readmitted Three or
More Times in 180 Days Since
FY2001
4,850 4,862 4,875 4,885 4,899 4,915 4,944 4,966 4,984
Number Receiving Services 1,607 1,580 1,595 1,578 1,585 1,584 1,623 1,632 1,654
Level of Care Received
Crisis Services 108 98 97 93 89 83 78 84 100
Level of Care 1 M
Medication Management4 4 4 5 5 5 6 7 7
Average Service Hours 0.13 0.21 0.42 0.89 0.1 0.3 0.65 0.55 0.39
Level of Care 1 S
Skills Training742 726 733 722 728 740 750 743 748
Average Service Hours 1.2 1.27 1.35 0.9 0.98 1.24 1.72 1.58 1.35
Level of Care 2
Medication, Coordination
and CBT
8 8 8 9 8 8 12 10 9
Average Service Hours 4.63 4.3 2.47 2.28 2.58 2.38 2.58 1.52 1.69
Level of Care 3
Medication, Psychosocial
Rehabilitation
459 451 453 441 435 426 439 451 462
Average Service Hours 5.76 5.47 4.94 5.11 4.67 5.21 5.16 5.37 5.16
Level of Care 4
Assertive Community
Treatment (ACT)
265 273 279 288 291 291 302 309 304
Average Service Hours 7.05 7.51 6.4 7.13 6.88 7.18 7.02 7.42 6.5
Level of Care 5
Crisis Follow up14 12 11 15 23 25 30 25 20
Client Refused Services 0 0 0 0 1 2 2 0 0
Waiting for All Services 7 8 6 5 4 3 3 3 4
Not Eligible for Services 0 0 4 0 1 1 1 0 0Percent Appropriately-
Authorized94.8 95.9 95.4 95.4 95.6 95.4 95.8 96.0 95.8
Source: DSHS Client Assignment and REgistration (CARE) system and Clinical Management For Behavioral Health Services warehouse,
05/31/2016.
Notes: Clients who are "appropriately-authorized" generally receive the same service package as that recommended during assessment.
Also, average monthly community service hours per client may be considered somewhat low, since these clients may have been in the
hospital. Please note that due to grace periods in the submission of encounter data by funded community mental health centers to DSHS, the
values listed in this report do not freeze until 37 days after the last day of FY2016 Quarter 3.
DSHS PIAC Status Report
ADULTS Readmitted to a State or Community Psychiatric Hospital Three or More Times in 180 Days Since FY2001:
Where Are They Now In the Community Mental Health System?
FY2016
Quarter 4Quarter 3Quarter 2Quarter 1
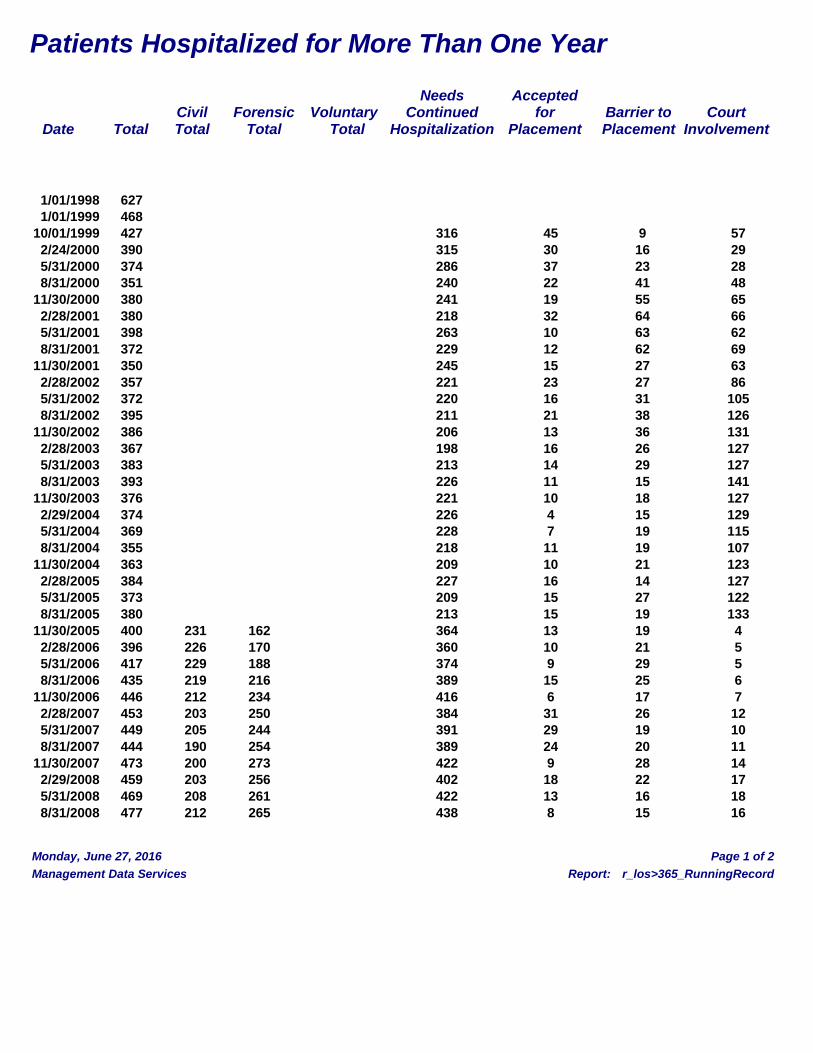
Patients Hospitalized for More Than One Year
Needs Accepted Civil Forensic Voluntary Continued for Barrier to Court Date Total Total Total Total Hospitalization Placement Placement Involvement
1/01/1998 627 1/01/1999 468 10/01/1999 427 316 45 9 57 2/24/2000 390 315 30 16 29 5/31/2000 374 286 37 23 28 8/31/2000 351 240 22 41 48 11/30/2000 380 241 19 55 65 2/28/2001 380 218 32 64 66 5/31/2001 398 263 10 63 62 8/31/2001 372 229 12 62 69 11/30/2001 350 245 15 27 63 2/28/2002 357 221 23 27 86 5/31/2002 372 220 16 31 105 8/31/2002 395 211 21 38 126 11/30/2002 386 206 13 36 131 2/28/2003 367 198 16 26 127 5/31/2003 383 213 14 29 127 8/31/2003 393 226 11 15 141 11/30/2003 376 221 10 18 127 2/29/2004 374 226 4 15 129 5/31/2004 369 228 7 19 115 8/31/2004 355 218 11 19 107 11/30/2004 363 209 10 21 123 2/28/2005 384 227 16 14 127 5/31/2005 373 209 15 27 122 8/31/2005 380 213 15 19 133 11/30/2005 400 231 162 364 13 19 4 2/28/2006 396 226 170 360 10 21 5 5/31/2006 417 229 188 374 9 29 5 8/31/2006 435 219 216 389 15 25 6 11/30/2006 446 212 234 416 6 17 7 2/28/2007 453 203 250 384 31 26 12 5/31/2007 449 205 244 391 29 19 10 8/31/2007 444 190 254 389 24 20 11 11/30/2007 473 200 273 422 9 28 14 2/29/2008 459 203 256 402 18 22 17 5/31/2008 469 208 261 422 13 16 18 8/31/2008 477 212 265 438 8 15 16
Monday, June 27, 2016 Page 1 of 2
Management Data Services Report: r_los>365_RunningRecord
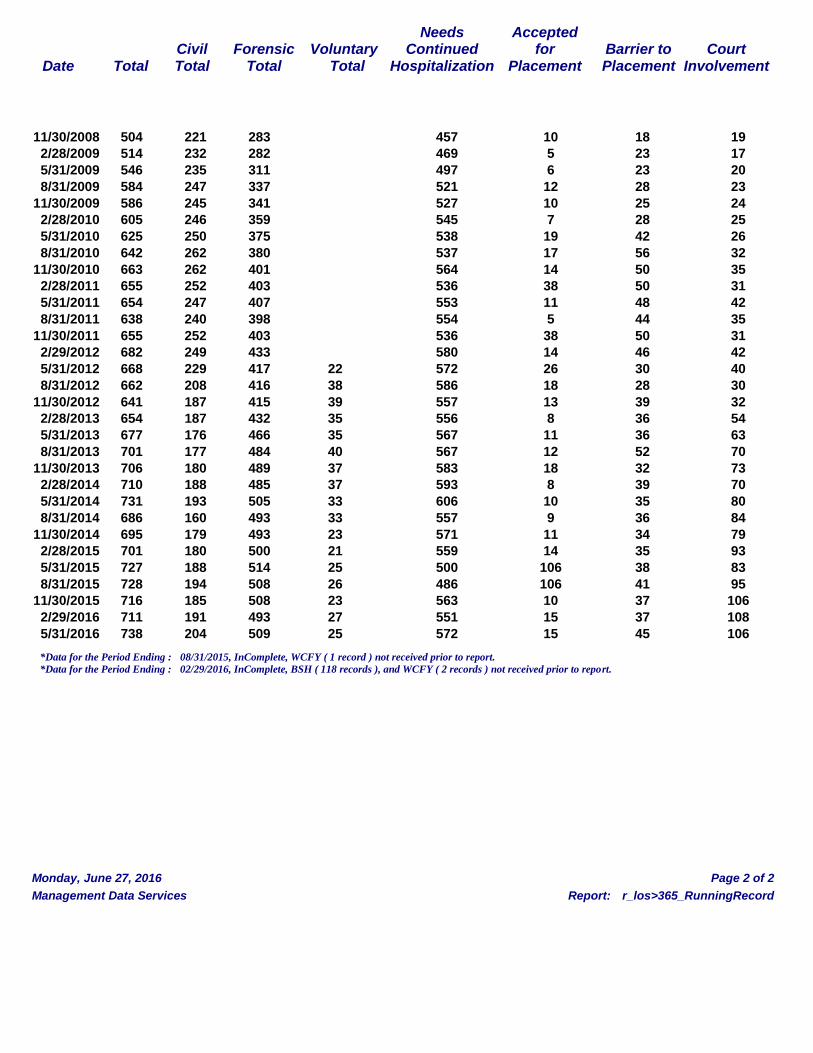
Needs Accepted Civil Forensic Voluntary Continued for Barrier to Court Date Total Total Total Total Hospitalization Placement Placement Involvement
11/30/2008 504 221 283 457 10 18 19 2/28/2009 514 232 282 469 5 23 17 5/31/2009 546 235 311 497 6 23 20 8/31/2009 584 247 337 521 12 28 23 11/30/2009 586 245 341 527 10 25 24 2/28/2010 605 246 359 545 7 28 25 5/31/2010 625 250 375 538 19 42 26 8/31/2010 642 262 380 537 17 56 32 11/30/2010 663 262 401 564 14 50 35 2/28/2011 655 252 403 536 38 50 31 5/31/2011 654 247 407 553 11 48 42 8/31/2011 638 240 398 554 5 44 35 11/30/2011 655 252 403 536 38 50 31 2/29/2012 682 249 433 580 14 46 42 5/31/2012 668 229 417 22 572 26 30 40 8/31/2012 662 208 416 38 586 18 28 30 11/30/2012 641 187 415 39 557 13 39 32 2/28/2013 654 187 432 35 556 8 36 54 5/31/2013 677 176 466 35 567 11 36 63 8/31/2013 701 177 484 40 567 12 52 70 11/30/2013 706 180 489 37 583 18 32 73 2/28/2014 710 188 485 37 593 8 39 70 5/31/2014 731 193 505 33 606 10 35 80 8/31/2014 686 160 493 33 557 9 36 84 11/30/2014 695 179 493 23 571 11 34 79 2/28/2015 701 180 500 21 559 14 35 93 5/31/2015 727 188 514 25 500 106 38 83 8/31/2015 728 194 508 26 486 106 41 95 11/30/2015 716 185 508 23 563 10 37 106 2/29/2016 711 191 493 27 551 15 37 108 5/31/2016 738 204 509 25 572 15 45 106
*Data for the Period Ending : 08/31/2015, InComplete, WCFY ( 1 record ) not received prior to report. *Data for the Period Ending : 02/29/2016, InComplete, BSH ( 118 records ), and WCFY ( 2 records ) not received prior to report.
Monday, June 27, 2016 Page 2 of 2
Management Data Services Report: r_los>365_RunningRecord
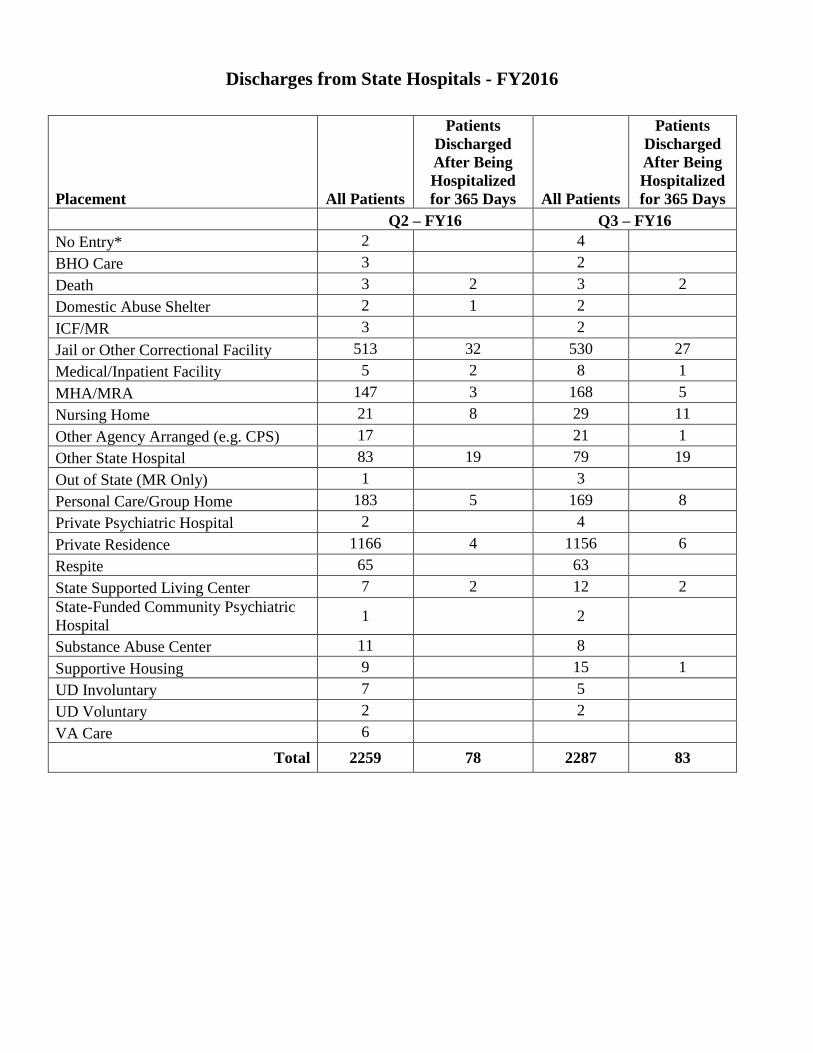
Discharges from State Hospitals - FY2016
Placement All Patients
Patients
Discharged
After Being
Hospitalized
for 365 Days All Patients
Patients
Discharged
After Being
Hospitalized
for 365 Days
Q2 – FY16 Q3 – FY16
No Entry* 2 4
BHO Care 3 2
Death 3 2 3 2
Domestic Abuse Shelter 2 1 2
ICF/MR 3 2
Jail or Other Correctional Facility 513 32 530 27
Medical/Inpatient Facility 5 2 8 1
MHA/MRA 147 3 168 5
Nursing Home 21 8 29 11
Other Agency Arranged (e.g. CPS) 17 21 1
Other State Hospital 83 19 79 19
Out of State (MR Only) 1 3
Personal Care/Group Home 183 5 169 8
Private Psychiatric Hospital 2 4
Private Residence 1166 4 1156 6
Respite 65 63
State Supported Living Center 7 2 12 2
State-Funded Community Psychiatric
Hospital 1 2
Substance Abuse Center 11 8
Supportive Housing 9 15 1
UD Involuntary 7 5
UD Voluntary 2 2
VA Care 6
Total 2259 78 2287 83
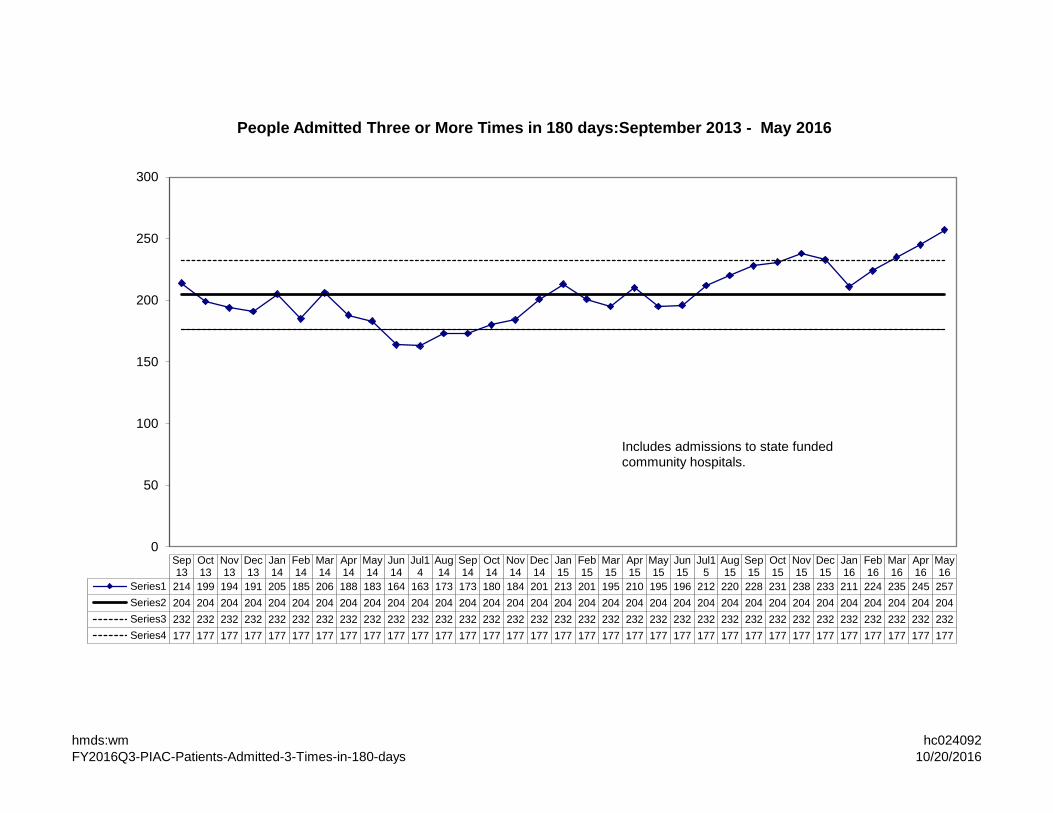
hmds:wm
FY2016Q3-PIAC-Patients-Admitted-3-Times-in-180-days
hc024092
10/20/2016
0
50
100
150
200
250
300
Sep13
Oct13
Nov13
Dec13
Jan14
Feb14
Mar14
Apr14
May14
Jun14
Jul14
Aug14
Sep14
Oct14
Nov14
Dec14
Jan15
Feb15
Mar15
Apr15
May15
Jun15
Jul15
Aug15
Sep15
Oct15
Nov15
Dec15
Jan16
Feb16
Mar16
Apr16
May16
Series1 214 199 194 191 205 185 206 188 183 164 163 173 173 180 184 201 213 201 195 210 195 196 212 220 228 231 238 233 211 224 235 245 257
Series2 204 204 204 204 204 204 204 204 204 204 204 204 204 204 204 204 204 204 204 204 204 204 204 204 204 204 204 204 204 204 204 204 204
Series3 232 232 232 232 232 232 232 232 232 232 232 232 232 232 232 232 232 232 232 232 232 232 232 232 232 232 232 232 232 232 232 232 232
Series4 177 177 177 177 177 177 177 177 177 177 177 177 177 177 177 177 177 177 177 177 177 177 177 177 177 177 177 177 177 177 177 177 177
People Admitted Three or More Times in 180 days:September 2013 - May 2016
Includes admissions to state funded community hospitals.
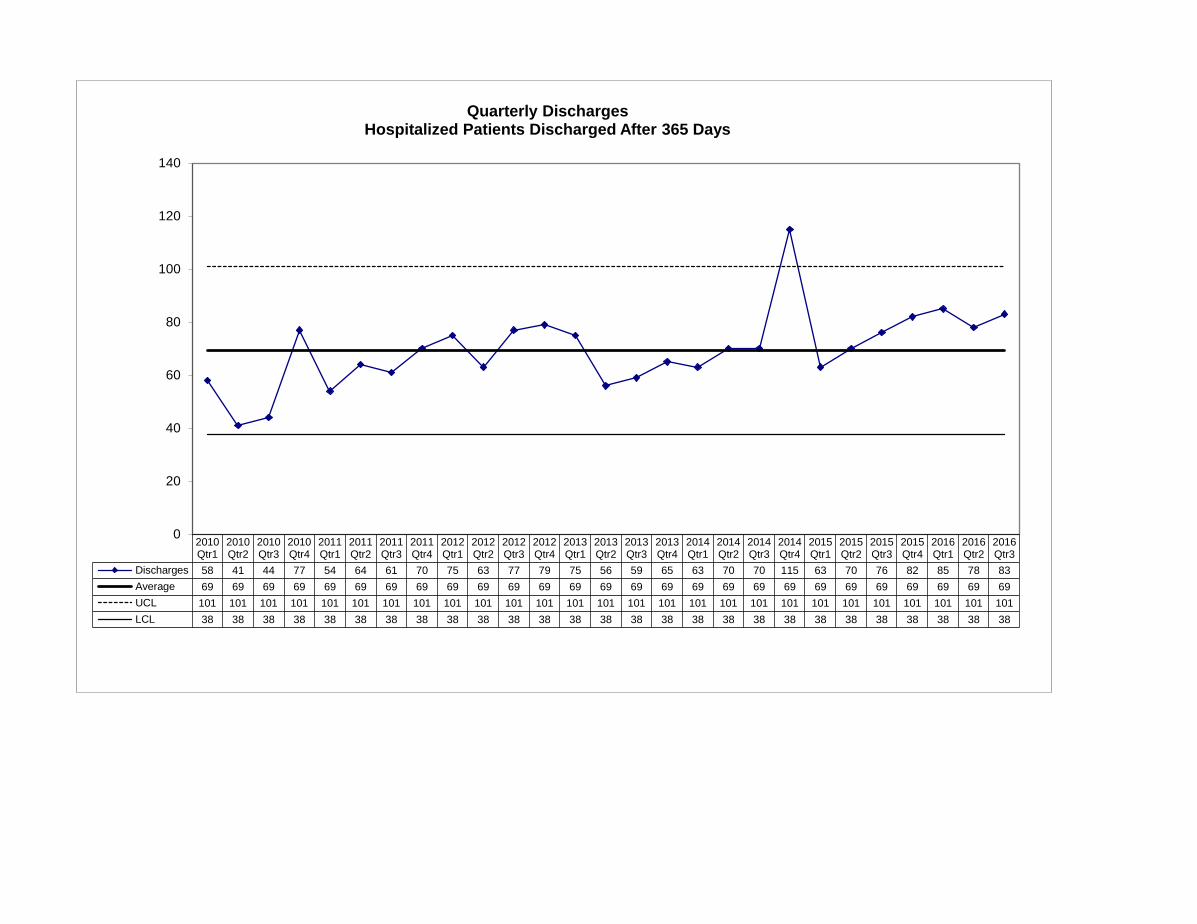
2010Qtr1
2010Qtr2
2010Qtr3
2010Qtr4
2011Qtr1
2011Qtr2
2011Qtr3
2011Qtr4
2012Qtr1
2012Qtr2
2012Qtr3
2012Qtr4
2013Qtr1
2013Qtr2
2013Qtr3
2013Qtr4
2014Qtr1
2014Qtr2
2014Qtr3
2014Qtr4
2015Qtr1
2015Qtr2
2015Qtr3
2015Qtr4
2016Qtr1
2016Qtr2
2016Qtr3
Discharges 58 41 44 77 54 64 61 70 75 63 77 79 75 56 59 65 63 70 70 115 63 70 76 82 85 78 83
Average 69 69 69 69 69 69 69 69 69 69 69 69 69 69 69 69 69 69 69 69 69 69 69 69 69 69 69
UCL 101 101 101 101 101 101 101 101 101 101 101 101 101 101 101 101 101 101 101 101 101 101 101 101 101 101 101
LCL 38 38 38 38 38 38 38 38 38 38 38 38 38 38 38 38 38 38 38 38 38 38 38 38 38 38 38
0
20
40
60
80
100
120
140
Quarterly DischargesHospitalized Patients Discharged After 365 Days
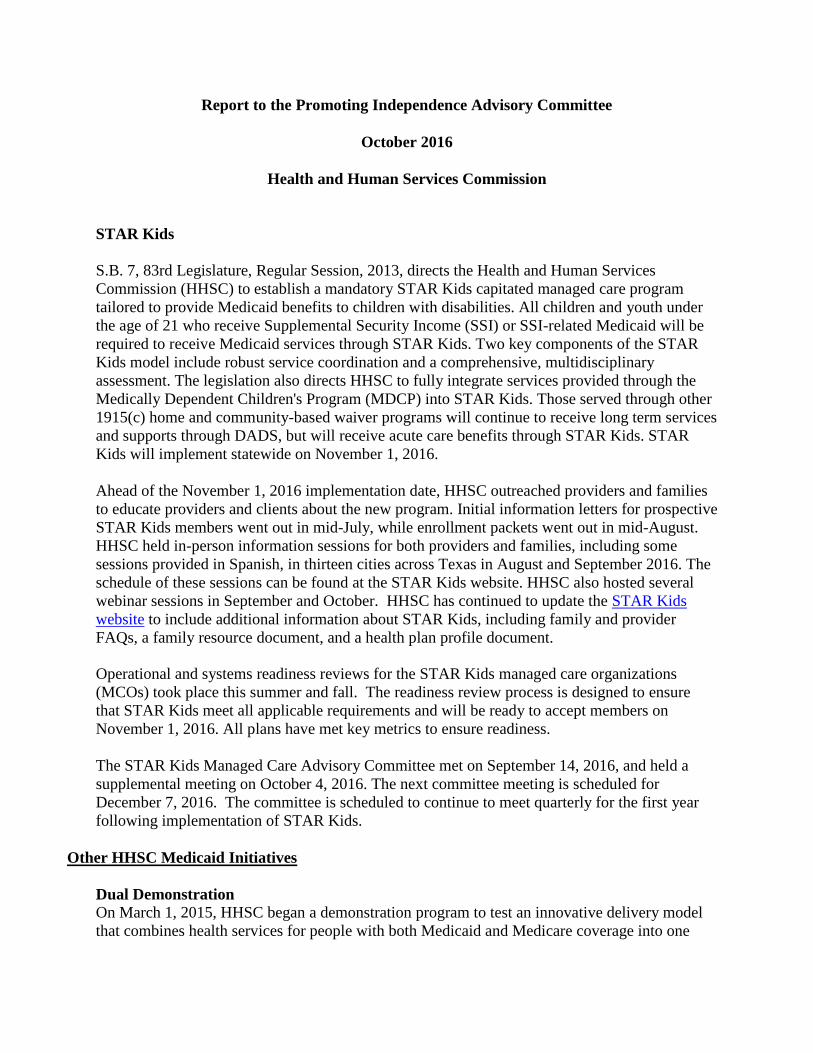
Report to the Promoting Independence Advisory Committee
October 2016
Health and Human Services Commission
STAR Kids
S.B. 7, 83rd Legislature, Regular Session, 2013, directs the Health and Human Services
Commission (HHSC) to establish a mandatory STAR Kids capitated managed care program
tailored to provide Medicaid benefits to children with disabilities. All children and youth under
the age of 21 who receive Supplemental Security Income (SSI) or SSI-related Medicaid will be
required to receive Medicaid services through STAR Kids. Two key components of the STAR
Kids model include robust service coordination and a comprehensive, multidisciplinary
assessment. The legislation also directs HHSC to fully integrate services provided through the
Medically Dependent Children's Program (MDCP) into STAR Kids. Those served through other
1915(c) home and community-based waiver programs will continue to receive long term services
and supports through DADS, but will receive acute care benefits through STAR Kids. STAR
Kids will implement statewide on November 1, 2016.
Ahead of the November 1, 2016 implementation date, HHSC outreached providers and families
to educate providers and clients about the new program. Initial information letters for prospective
STAR Kids members went out in mid-July, while enrollment packets went out in mid-August.
HHSC held in-person information sessions for both providers and families, including some
sessions provided in Spanish, in thirteen cities across Texas in August and September 2016. The
schedule of these sessions can be found at the STAR Kids website. HHSC also hosted several
webinar sessions in September and October. HHSC has continued to update the STAR Kids
website to include additional information about STAR Kids, including family and provider
FAQs, a family resource document, and a health plan profile document.
Operational and systems readiness reviews for the STAR Kids managed care organizations
(MCOs) took place this summer and fall. The readiness review process is designed to ensure
that STAR Kids meet all applicable requirements and will be ready to accept members on
November 1, 2016. All plans have met key metrics to ensure readiness.
The STAR Kids Managed Care Advisory Committee met on September 14, 2016, and held a
supplemental meeting on October 4, 2016. The next committee meeting is scheduled for
December 7, 2016. The committee is scheduled to continue to meet quarterly for the first year
following implementation of STAR Kids.
Other HHSC Medicaid Initiatives
Dual Demonstration
On March 1, 2015, HHSC began a demonstration program to test an innovative delivery model
that combines health services for people with both Medicaid and Medicare coverage into one
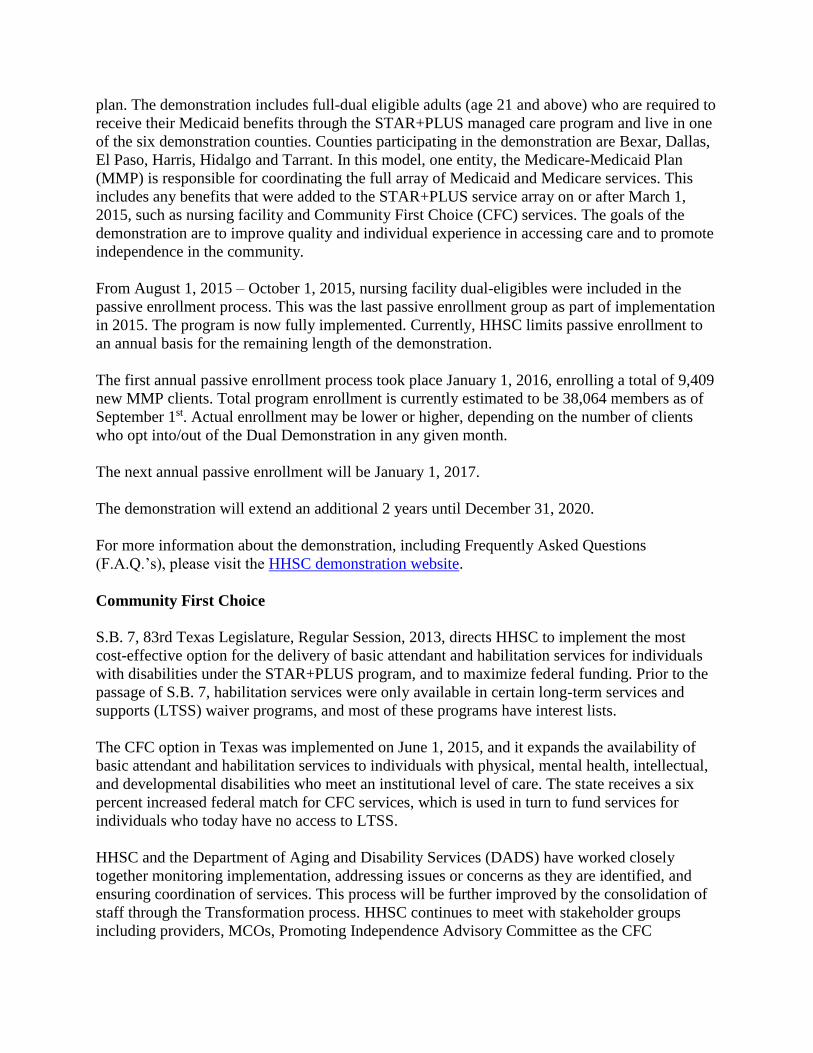
plan. The demonstration includes full-dual eligible adults (age 21 and above) who are required to
receive their Medicaid benefits through the STAR+PLUS managed care program and live in one
of the six demonstration counties. Counties participating in the demonstration are Bexar, Dallas,
El Paso, Harris, Hidalgo and Tarrant. In this model, one entity, the Medicare-Medicaid Plan
(MMP) is responsible for coordinating the full array of Medicaid and Medicare services. This
includes any benefits that were added to the STAR+PLUS service array on or after March 1,
2015, such as nursing facility and Community First Choice (CFC) services. The goals of the
demonstration are to improve quality and individual experience in accessing care and to promote
independence in the community.
From August 1, 2015 – October 1, 2015, nursing facility dual-eligibles were included in the
passive enrollment process. This was the last passive enrollment group as part of implementation
in 2015. The program is now fully implemented. Currently, HHSC limits passive enrollment to
an annual basis for the remaining length of the demonstration.
The first annual passive enrollment process took place January 1, 2016, enrolling a total of 9,409
new MMP clients. Total program enrollment is currently estimated to be 38,064 members as of
September 1st. Actual enrollment may be lower or higher, depending on the number of clients
who opt into/out of the Dual Demonstration in any given month.
The next annual passive enrollment will be January 1, 2017.
The demonstration will extend an additional 2 years until December 31, 2020.
For more information about the demonstration, including Frequently Asked Questions
(F.A.Q.’s), please visit the HHSC demonstration website.
Community First Choice
S.B. 7, 83rd Texas Legislature, Regular Session, 2013, directs HHSC to implement the most
cost-effective option for the delivery of basic attendant and habilitation services for individuals
with disabilities under the STAR+PLUS program, and to maximize federal funding. Prior to the
passage of S.B. 7, habilitation services were only available in certain long-term services and
supports (LTSS) waiver programs, and most of these programs have interest lists.
The CFC option in Texas was implemented on June 1, 2015, and it expands the availability of
basic attendant and habilitation services to individuals with physical, mental health, intellectual,
and developmental disabilities who meet an institutional level of care. The state receives a six
percent increased federal match for CFC services, which is used in turn to fund services for
individuals who today have no access to LTSS.
HHSC and the Department of Aging and Disability Services (DADS) have worked closely
together monitoring implementation, addressing issues or concerns as they are identified, and
ensuring coordination of services. This process will be further improved by the consolidation of
staff through the Transformation process. HHSC continues to meet with stakeholder groups
including providers, MCOs, Promoting Independence Advisory Committee as the CFC

Development and Implementation Council, local intellectual and developmental disability
authorities (LIDDAs), and Texas Council of Community Centers to gather feedback regarding
CFC.
In July 2016, HHSC posted on its website the legislatively mandated CFC report required by
S.B. 7. In September 2016, HHSC distributed the "Local Intellectual and Developmental
Disability Authority and STAR Kids Managed Care Organization Procedures for Community
First Choice" to stakeholders.
HHSC continues to work to review, develop and evaluate person-centered planning training
proposals, curricula, and related materials, to ensure compliance with the federal regulations and
quality and consistency across systems. A person-centered planning webpage with a mailbox,
along with a set of minimum criteria, a list of approved trainings, an introductory web-based
training developed by DADS and HHSC, and other resources will be deployed in the next
several weeks. Alerts will go out to providers, stakeholders, and MCOs when the website goes
live. A new committee, to include external stakeholders, will expand beyond the training focus to
begin designing the ways in which person-centered planning will be implemented more
systemically, including changes to forms, processes, and policies.
Employment Initiatives
The Employment First Task Force (Task Force) is an interagency task force authorized by S.B.
1226, 83rd Legislature, Regular Session, 2013. The Task Force began meeting in April 2014. A
report was sent to the Governor, the Legislature, and the HHSC Executive Commissioner in
October 2014.
The Texas Education Agency (TEA), the Texas Workforce Commission (TWC), and HHSC
have adopted the Employment First policy as prescribed in S.B. 1226. The Employment First
policies of each agency may be found at the following links: TEA Employment First policy,
TWC Employment First policy, and HHSC Employment First policy. Task Force members
completed their second report to the Legislature in September. Recommendations include the
formation of an Employment First Division at HHSC, increased employment data collection, and
improved benefits counseling. The next meeting of the Task Force will be held in January 2017.
In an effort to increase coordination and information sharing, state agency members of the Task
Force continue to meet quarterly to discuss employment related projects and initiatives. Visit the
Employment First website for more information on the Employment First Task Force and its
members.
New Federal Home and Community-based Services Rules
In March 2014, a new rule became effective governing Home and Community-based Services
(HCBS) setting requirements, including individuals’ right to privacy, dignity, respect,
community integration, access to competitive employment and optimization of individual
choices concerning daily activities, physical environment and social interaction. The new rule
also includes expectations governing how states implement person directed planning.
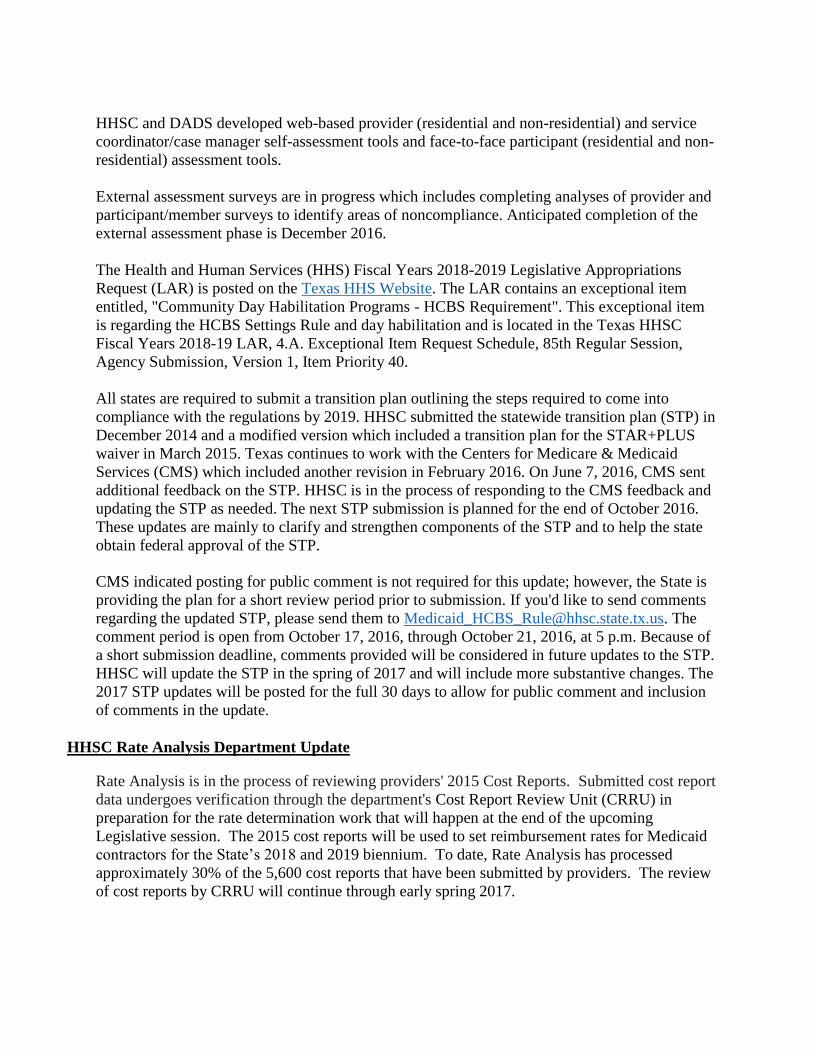
HHSC and DADS developed web-based provider (residential and non-residential) and service
coordinator/case manager self-assessment tools and face-to-face participant (residential and non-
residential) assessment tools.
External assessment surveys are in progress which includes completing analyses of provider and
participant/member surveys to identify areas of noncompliance. Anticipated completion of the
external assessment phase is December 2016.
The Health and Human Services (HHS) Fiscal Years 2018-2019 Legislative Appropriations
Request (LAR) is posted on the Texas HHS Website. The LAR contains an exceptional item
entitled, "Community Day Habilitation Programs - HCBS Requirement". This exceptional item
is regarding the HCBS Settings Rule and day habilitation and is located in the Texas HHSC
Fiscal Years 2018-19 LAR, 4.A. Exceptional Item Request Schedule, 85th Regular Session,
Agency Submission, Version 1, Item Priority 40.
All states are required to submit a transition plan outlining the steps required to come into
compliance with the regulations by 2019. HHSC submitted the statewide transition plan (STP) in
December 2014 and a modified version which included a transition plan for the STAR+PLUS
waiver in March 2015. Texas continues to work with the Centers for Medicare & Medicaid
Services (CMS) which included another revision in February 2016. On June 7, 2016, CMS sent
additional feedback on the STP. HHSC is in the process of responding to the CMS feedback and
updating the STP as needed. The next STP submission is planned for the end of October 2016. These updates are mainly to clarify and strengthen components of the STP and to help the state
obtain federal approval of the STP.
CMS indicated posting for public comment is not required for this update; however, the State is
providing the plan for a short review period prior to submission. If you'd like to send comments
regarding the updated STP, please send them to [email protected]. The
comment period is open from October 17, 2016, through October 21, 2016, at 5 p.m. Because of
a short submission deadline, comments provided will be considered in future updates to the STP.
HHSC will update the STP in the spring of 2017 and will include more substantive changes. The
2017 STP updates will be posted for the full 30 days to allow for public comment and inclusion
of comments in the update.
HHSC Rate Analysis Department Update
Rate Analysis is in the process of reviewing providers' 2015 Cost Reports. Submitted cost report
data undergoes verification through the department's Cost Report Review Unit (CRRU) in
preparation for the rate determination work that will happen at the end of the upcoming
Legislative session. The 2015 cost reports will be used to set reimbursement rates for Medicaid
contractors for the State’s 2018 and 2019 biennium. To date, Rate Analysis has processed
approximately 30% of the 5,600 cost reports that have been submitted by providers. The review
of cost reports by CRRU will continue through early spring 2017.
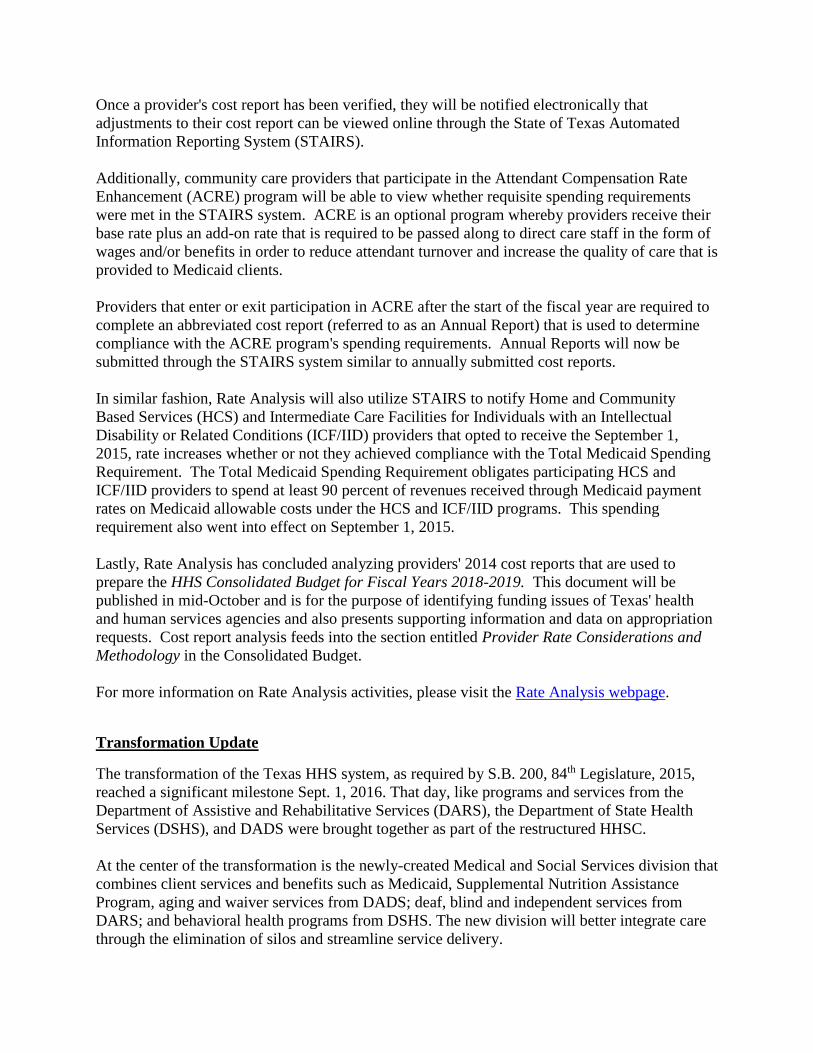
Once a provider's cost report has been verified, they will be notified electronically that
adjustments to their cost report can be viewed online through the State of Texas Automated
Information Reporting System (STAIRS).
Additionally, community care providers that participate in the Attendant Compensation Rate
Enhancement (ACRE) program will be able to view whether requisite spending requirements
were met in the STAIRS system. ACRE is an optional program whereby providers receive their
base rate plus an add-on rate that is required to be passed along to direct care staff in the form of
wages and/or benefits in order to reduce attendant turnover and increase the quality of care that is
provided to Medicaid clients.
Providers that enter or exit participation in ACRE after the start of the fiscal year are required to
complete an abbreviated cost report (referred to as an Annual Report) that is used to determine
compliance with the ACRE program's spending requirements. Annual Reports will now be
submitted through the STAIRS system similar to annually submitted cost reports.
In similar fashion, Rate Analysis will also utilize STAIRS to notify Home and Community
Based Services (HCS) and Intermediate Care Facilities for Individuals with an Intellectual
Disability or Related Conditions (ICF/IID) providers that opted to receive the September 1,
2015, rate increases whether or not they achieved compliance with the Total Medicaid Spending
Requirement. The Total Medicaid Spending Requirement obligates participating HCS and
ICF/IID providers to spend at least 90 percent of revenues received through Medicaid payment
rates on Medicaid allowable costs under the HCS and ICF/IID programs. This spending
requirement also went into effect on September 1, 2015.
Lastly, Rate Analysis has concluded analyzing providers' 2014 cost reports that are used to
prepare the HHS Consolidated Budget for Fiscal Years 2018-2019. This document will be
published in mid-October and is for the purpose of identifying funding issues of Texas' health
and human services agencies and also presents supporting information and data on appropriation
requests. Cost report analysis feeds into the section entitled Provider Rate Considerations and
Methodology in the Consolidated Budget.
For more information on Rate Analysis activities, please visit the Rate Analysis webpage.
Transformation Update
The transformation of the Texas HHS system, as required by S.B. 200, 84th Legislature, 2015,
reached a significant milestone Sept. 1, 2016. That day, like programs and services from the
Department of Assistive and Rehabilitative Services (DARS), the Department of State Health
Services (DSHS), and DADS were brought together as part of the restructured HHSC.
At the center of the transformation is the newly-created Medical and Social Services division that
combines client services and benefits such as Medicaid, Supplemental Nutrition Assistance
Program, aging and waiver services from DADS; deaf, blind and independent services from
DARS; and behavioral health programs from DSHS. The new division will better integrate care
through the elimination of silos and streamline service delivery.
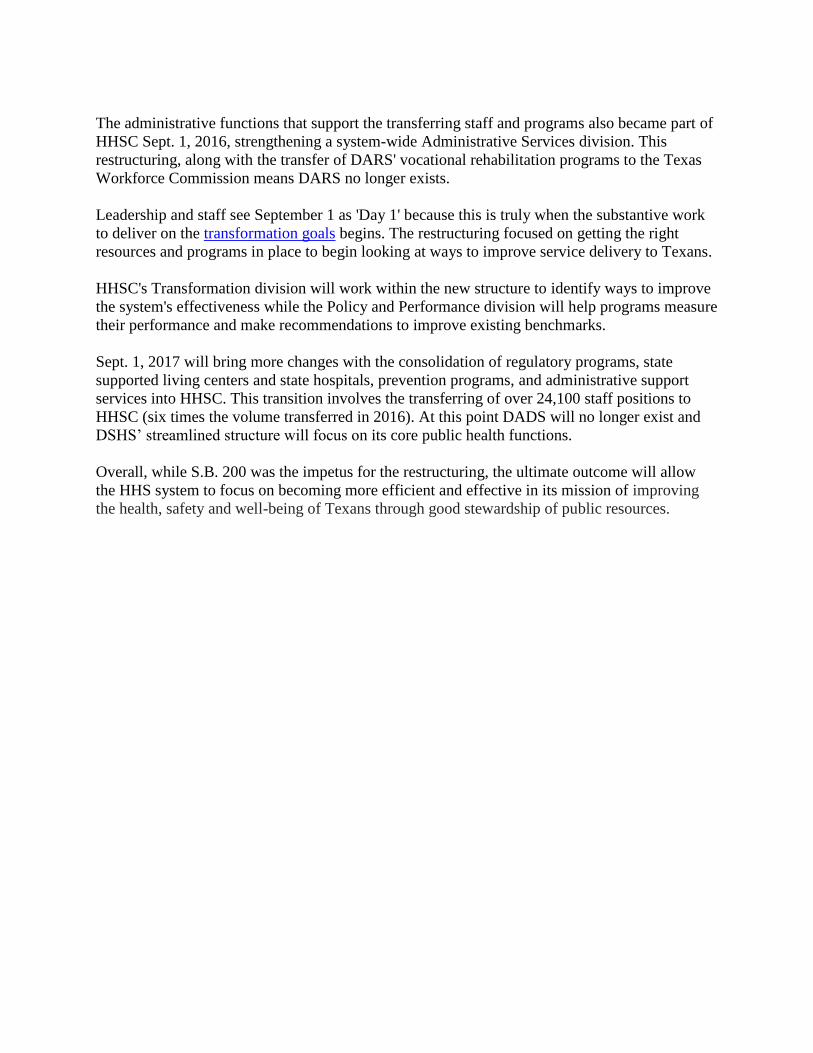
The administrative functions that support the transferring staff and programs also became part of
HHSC Sept. 1, 2016, strengthening a system-wide Administrative Services division. This
restructuring, along with the transfer of DARS' vocational rehabilitation programs to the Texas
Workforce Commission means DARS no longer exists.
Leadership and staff see September 1 as 'Day 1' because this is truly when the substantive work
to deliver on the transformation goals begins. The restructuring focused on getting the right
resources and programs in place to begin looking at ways to improve service delivery to Texans.
HHSC's Transformation division will work within the new structure to identify ways to improve
the system's effectiveness while the Policy and Performance division will help programs measure
their performance and make recommendations to improve existing benchmarks.
Sept. 1, 2017 will bring more changes with the consolidation of regulatory programs, state
supported living centers and state hospitals, prevention programs, and administrative support
services into HHSC. This transition involves the transferring of over 24,100 staff positions to
HHSC (six times the volume transferred in 2016). At this point DADS will no longer exist and
DSHS’ streamlined structure will focus on its core public health functions.
Overall, while S.B. 200 was the impetus for the restructuring, the ultimate outcome will allow
the HHS system to focus on becoming more efficient and effective in its mission of improving
the health, safety and well-being of Texans through good stewardship of public resources.