Embed Size (px)
Citation preview
ARTICLE
Promoting CO2 methanation via ligand-stabilizedmetal oxide clusters as hydrogen-donating motifsYuhang Li 1,2,6, Aoni Xu1,6, Yanwei Lum 1,6, Xue Wang 1, Sung-Fu Hung1, Bin Chen1, Ziyun Wang 1,
Yi Xu 3, Fengwang Li 1, Jehad Abed 1,4, Jianan Erick Huang1, Armin Sedighian Rasouli1, Joshua Wicks 1,
Laxmi Kishore Sagar1, Tao Peng 1, Alexander H. Ip1, David Sinton 3, Hao Jiang 2,5, Chunzhong Li 2,5✉ &
Edward H. Sargent 1✉
Electroreduction uses renewable energy to upgrade carbon dioxide to value-added chemicals
and fuels. Renewable methane synthesized using such a route stands to be readily deployed
using existing infrastructure for the distribution and utilization of natural gas. Here we design
a suite of ligand-stabilized metal oxide clusters and find that these modulate carbon dioxide
reduction pathways on a copper catalyst, enabling thereby a record activity for methane
electroproduction. Density functional theory calculations show adsorbed hydrogen donation
from clusters to copper active sites for the *CO hydrogenation pathway towards *CHO. We
promote this effect via control over cluster size and composition and demonstrate the effect
on metal oxides including cobalt(II), molybdenum(VI), tungsten(VI), nickel(II) and palladium
(II) oxides. We report a carbon dioxide-to-methane faradaic efficiency of 60% at a partial
current density to methane of 135 milliampere per square centimetre. We showcase
operation over 18 h that retains a faradaic efficiency exceeding 55%.
https://doi.org/10.1038/s41467-020-20004-7 OPEN
1 Department of Electrical and Computer Engineering, University of Toronto, Toronto, ON M5S 1A4, Canada. 2 Key Laboratory for Ultrafine Materials ofMinistry of Education, Shanghai Engineering Research Center of Hierarchical Nanomaterials, School of Materials Science and Engineering, East ChinaUniversity of Science and Technology, Shanghai 200237, China. 3 Department of Mechanical and Industrial Engineering, University of Toronto, Toronto, ONM5S 3G8, Canada. 4Department of Materials Science and Engineering, University of Toronto, Toronto, ON M5S 3E4, Canada. 5 School of ChemicalEngineering, East China University of Science and Technology, Shanghai 200237, China. 6These authors contributed equally: Yuhang Li, Aoni Xu, Yanwei Lum.✉email: [email protected]; [email protected]
NATURE COMMUNICATIONS | (2020) 11:6190 | https://doi.org/10.1038/s41467-020-20004-7 | www.nature.com/naturecommunications 1
1234
5678
90():,;
The electrochemical reduction of carbon dioxide (CO2)enables the storage of intermittent renewable energy in theform of chemical bonds1,2. CO2 emissions then become a
valuable feedstock in the production of chemical fuels, enablingclosing of the carbon cycle3–5. Methane (CH4) especially benefitsfrom an existing widely-deployed infrastructure for its storage,distribution and utilization6–8.
This motivates the need for practical electrolyzers which con-vert CO2 to CH4 at high rates and energy efficiency9,10. Along theway to this goal, further progress is required in the electro-catalysts which facilitate the conversion chemistry11–20. By judi-cious adjustment of CO2 partial pressure, copper (Cu) catalystshave attained a 48% faradaic efficiency (FE) to CH4 (ref. 14).Fivefold twinned Cu nanowires have achieved a CH4 FE of 55%due to a high-density of edge sites available on twin boundaries15.
Until now, such systems have operated with good FEs of >50%only at modest current densities of <50 milliampere per squarecentimetre (mA cm−2), below the level needed according to tech-noeconomic analyses21. Electrolysis in systems where CO2 is fed inthe gas phase overcomes mass transport limitations and as a resultis operational at impressive current densities (>100mA cm−2);however, this produces high local pH conditions, promoting theformation of C2+ products instead of CH4 (refs. 22–24).
With the goal of seeking the rational design of more efficientCH4 electrocatalysts, we began by examining the factors thatinfluence the CO2 methanation pathway. We reasoned that, inflow cell systems, a high local pH results in a lowered drivingforce for pH-dependent water reduction, and reduces the avail-ability of adsorbed hydrogen (*H) to Cu. Specifically, this mili-tates against the protonation (transfer of *H) of *CO to generate*CHO25,26.
To remedy this, we sought to enhance the kinetics of theproton-transfer step: we would strive to increase H2O reductionto provide the necessary *H, but without significantly alteringthe binding energy of intermediates interacting with Cu activesites.
In this work, we design and synthesize a suite of ligand-stabilized cobalt oxide (CoO) nanoclusters. We show that judi-cious selection of CoO nanocluster size enables control oversurface *H coverage for tuneable modulation of CO2 methana-tion. Optimization of CoO nanocluster size (2.5 nm) enables thecooperative system to achieve a methane FE of 60% at an oper-ating current density of 225 mA cm−2 and continuous operationfor over 18 h in a flow cell system, without significant loss inperformance.
ResultsDensity functional theory calculations. We began by exploringCO2 methanation pathways using computational investigations.Recent studies27–29 of CO2 reduction pathways on Cu surfaceshow that the *CO intermediate undergoes either a hydrogena-tion step (Eq. (1)) toward CH4, or a dimerization step (Eq. (2))toward C2+ products.
*COþ *H ! *CHO ð1Þ
*COþ *CO ! *OCCO ð2ÞSteering the CO2 reduction pathway toward CH4 requires
enhancing the local *H availability to promote hydrogenation ofthe *CO intermediate over the dimerization (C–C coupling) step.
Coupling the Cu surface with *H generating motifs wouldprovide a means to tune *H availability and thereby direct thereaction toward CH4. These motifs reduce H2O to produce *H,which will hydrogenate *CO on neighbouring Cu atoms to*CHO. We also compared the *CO hydrogenate energies on pureCu via the H2O-assisting Heyrovsky mechanism vs. the *Htransfer mechanism30,31 (0.63 vs. 0.43 eV, Supplementary Fig. 1):the *H transfer mechanism is more likely from a thermodynamicanalysis.
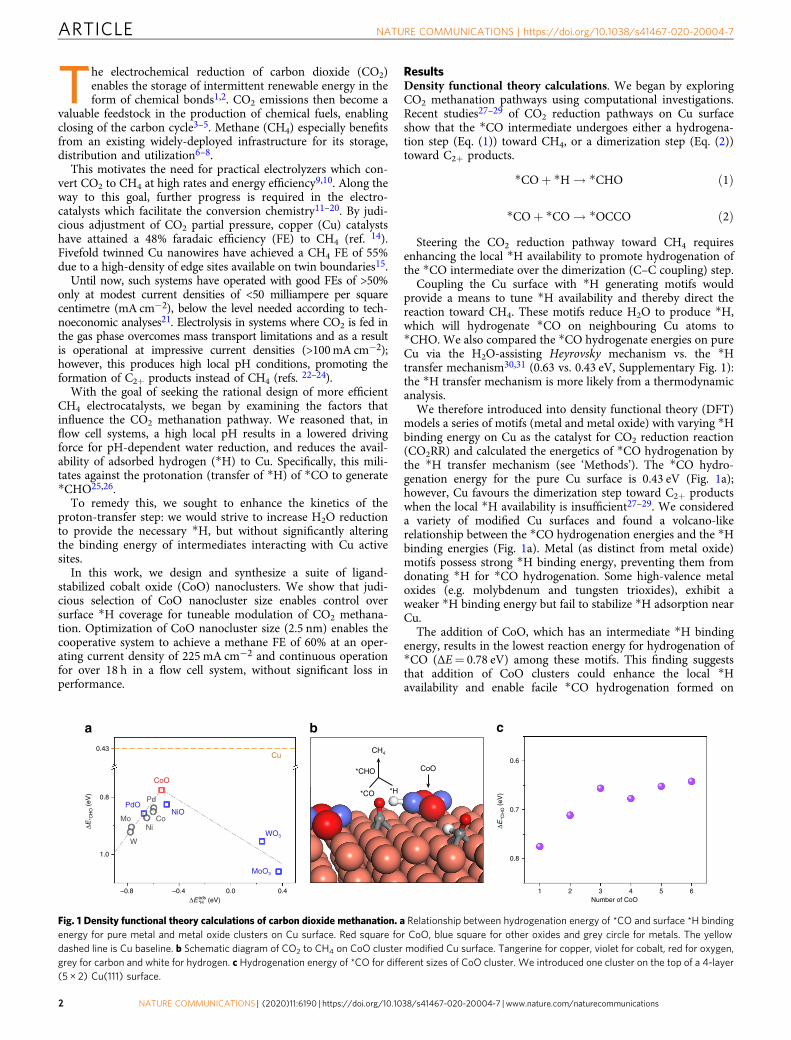
We therefore introduced into density functional theory (DFT)models a series of motifs (metal and metal oxide) with varying *Hbinding energy on Cu as the catalyst for CO2 reduction reaction(CO2RR) and calculated the energetics of *CO hydrogenation bythe *H transfer mechanism (see ‘Methods’). The *CO hydro-genation energy for the pure Cu surface is 0.43 eV (Fig. 1a);however, Cu favours the dimerization step toward C2+ productswhen the local *H availability is insufficient27–29. We considereda variety of modified Cu surfaces and found a volcano-likerelationship between the *CO hydrogenation energies and the *Hbinding energies (Fig. 1a). Metal (as distinct from metal oxide)motifs possess strong *H binding energy, preventing them fromdonating *H for *CO hydrogenation. Some high-valence metaloxides (e.g. molybdenum and tungsten trioxides), exhibit aweaker *H binding energy but fail to stabilize *H adsorption nearCu.
The addition of CoO, which has an intermediate *H bindingenergy, results in the lowest reaction energy for hydrogenation of*CO (ΔE= 0.78 eV) among these motifs. This finding suggeststhat addition of CoO clusters could enhance the local *Havailability and enable facile *CO hydrogenation formed on
a0.43
0.8
1.0
–0.8 –0.4 0.0 0.4
CoO
PdONiO
WO3
MoO3
Pd
CoNi
Mo
W
Cu
*CO *H
CH4
*CHO CoO
b c
0.6
0.7
0.8
1 2 3 4 5 6Number of CoO
ΔE*C
HO (
eV)
ΔE*C
HO (
eV)
ΔEads (eV)*H
Fig. 1 Density functional theory calculations of carbon dioxide methanation. a Relationship between hydrogenation energy of *CO and surface *H bindingenergy for pure metal and metal oxide clusters on Cu surface. Red square for CoO, blue square for other oxides and grey circle for metals. The yellowdashed line is Cu baseline. b Schematic diagram of CO2 to CH4 on CoO cluster modified Cu surface. Tangerine for copper, violet for cobalt, red for oxygen,grey for carbon and white for hydrogen. c Hydrogenation energy of *CO for different sizes of CoO cluster. We introduced one cluster on the top of a 4-layer(5 × 2) Cu(111) surface.
ARTICLE NATURE COMMUNICATIONS | https://doi.org/10.1038/s41467-020-20004-7
2 NATURE COMMUNICATIONS | (2020) 11:6190 | https://doi.org/10.1038/s41467-020-20004-7 | www.nature.com/naturecommunications
neighbouring Cu atoms and increase the FE toward CH4
(Fig. 1b).We further investigated the influence of the CoO-cluster sizes
on CH4 selectivity (Fig. 1c). The results show that a larger CoO-cluster size increases *CO hydrogenation activity; however, toolarge CoO clusters also enhance hydrogen evolution reaction(HER) activity which competes with CO2RR: indeed, calculationspoint to the need to optimize the cluster diameter.
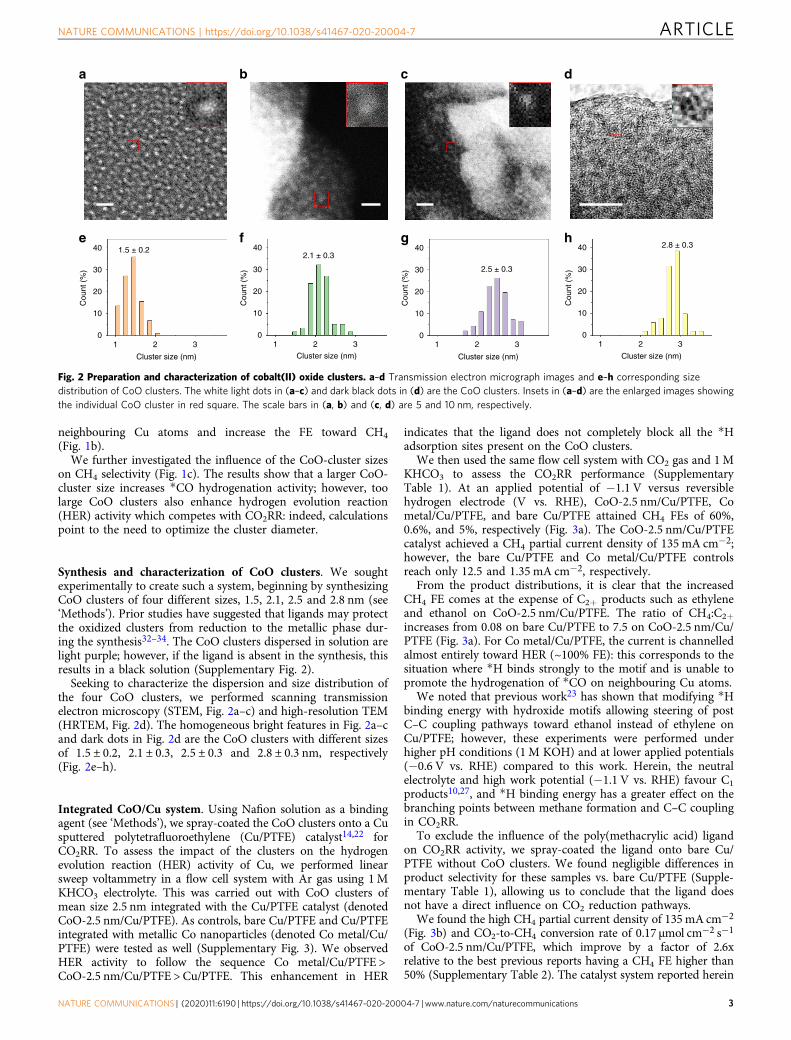
Synthesis and characterization of CoO clusters. We soughtexperimentally to create such a system, beginning by synthesizingCoO clusters of four different sizes, 1.5, 2.1, 2.5 and 2.8 nm (see‘Methods’). Prior studies have suggested that ligands may protectthe oxidized clusters from reduction to the metallic phase dur-ing the synthesis32–34. The CoO clusters dispersed in solution arelight purple; however, if the ligand is absent in the synthesis, thisresults in a black solution (Supplementary Fig. 2).
Seeking to characterize the dispersion and size distribution ofthe four CoO clusters, we performed scanning transmissionelectron microscopy (STEM, Fig. 2a–c) and high-resolution TEM(HRTEM, Fig. 2d). The homogeneous bright features in Fig. 2a–cand dark dots in Fig. 2d are the CoO clusters with different sizesof 1.5 ± 0.2, 2.1 ± 0.3, 2.5 ± 0.3 and 2.8 ± 0.3 nm, respectively(Fig. 2e–h).
Integrated CoO/Cu system. Using Nafion solution as a bindingagent (see ‘Methods’), we spray-coated the CoO clusters onto a Cusputtered polytetrafluoroethylene (Cu/PTFE) catalyst14,22 forCO2RR. To assess the impact of the clusters on the hydrogenevolution reaction (HER) activity of Cu, we performed linearsweep voltammetry in a flow cell system with Ar gas using 1MKHCO3 electrolyte. This was carried out with CoO clusters ofmean size 2.5 nm integrated with the Cu/PTFE catalyst (denotedCoO-2.5 nm/Cu/PTFE). As controls, bare Cu/PTFE and Cu/PTFEintegrated with metallic Co nanoparticles (denoted Co metal/Cu/PTFE) were tested as well (Supplementary Fig. 3). We observedHER activity to follow the sequence Co metal/Cu/PTFE >CoO-2.5 nm/Cu/PTFE > Cu/PTFE. This enhancement in HER
indicates that the ligand does not completely block all the *Hadsorption sites present on the CoO clusters.
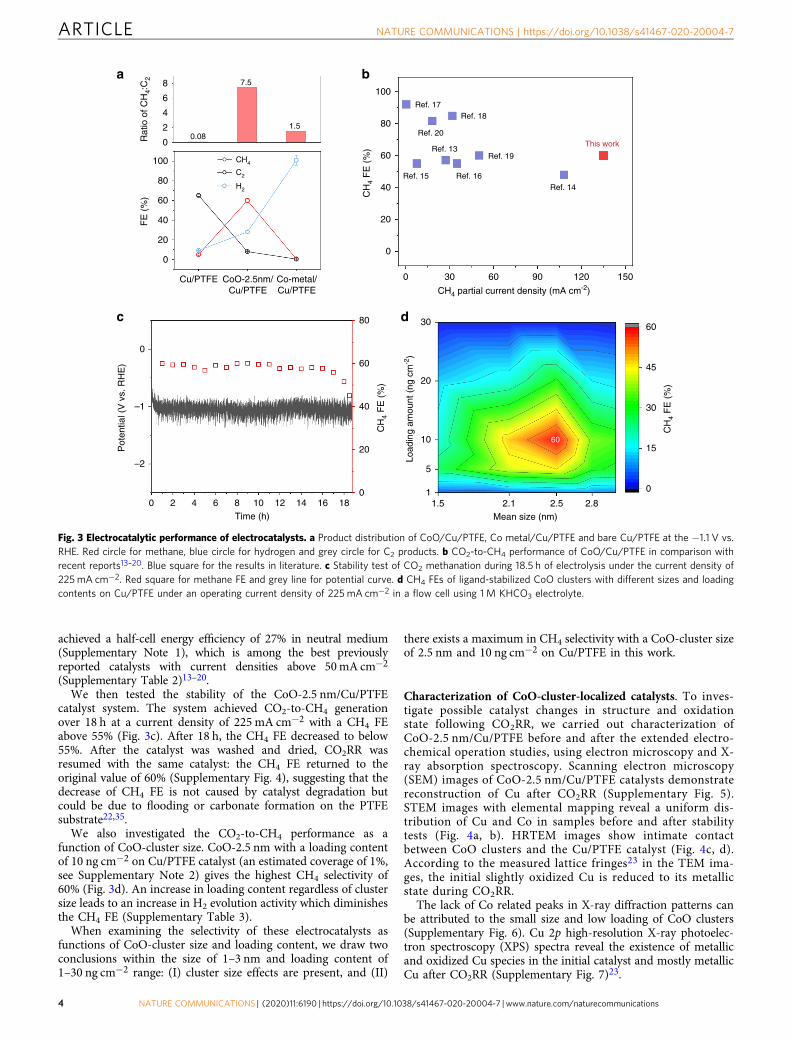
We then used the same flow cell system with CO2 gas and 1MKHCO3 to assess the CO2RR performance (SupplementaryTable 1). At an applied potential of −1.1 V versus reversiblehydrogen electrode (V vs. RHE), CoO-2.5 nm/Cu/PTFE, Cometal/Cu/PTFE, and bare Cu/PTFE attained CH4 FEs of 60%,0.6%, and 5%, respectively (Fig. 3a). The CoO-2.5 nm/Cu/PTFEcatalyst achieved a CH4 partial current density of 135 mA cm−2;however, the bare Cu/PTFE and Co metal/Cu/PTFE controlsreach only 12.5 and 1.35 mA cm−2, respectively.
From the product distributions, it is clear that the increasedCH4 FE comes at the expense of C2+ products such as ethyleneand ethanol on CoO-2.5 nm/Cu/PTFE. The ratio of CH4:C2+increases from 0.08 on bare Cu/PTFE to 7.5 on CoO-2.5 nm/Cu/PTFE (Fig. 3a). For Co metal/Cu/PTFE, the current is channelledalmost entirely toward HER (~100% FE): this corresponds to thesituation where *H binds strongly to the motif and is unable topromote the hydrogenation of *CO on neighbouring Cu atoms.
We noted that previous work23 has shown that modifying *Hbinding energy with hydroxide motifs allowing steering of postC–C coupling pathways toward ethanol instead of ethylene onCu/PTFE; however, these experiments were performed underhigher pH conditions (1M KOH) and at lower applied potentials(−0.6 V vs. RHE) compared to this work. Herein, the neutralelectrolyte and high work potential (−1.1 V vs. RHE) favour C1
products10,27, and *H binding energy has a greater effect on thebranching points between methane formation and C–C couplingin CO2RR.
To exclude the influence of the poly(methacrylic acid) ligandon CO2RR activity, we spray-coated the ligand onto bare Cu/PTFE without CoO clusters. We found negligible differences inproduct selectivity for these samples vs. bare Cu/PTFE (Supple-mentary Table 1), allowing us to conclude that the ligand doesnot have a direct influence on CO2 reduction pathways.
We found the high CH4 partial current density of 135mA cm−2
(Fig. 3b) and CO2-to-CH4 conversion rate of 0.17 μmol cm−2 s−1
of CoO-2.5 nm/Cu/PTFE, which improve by a factor of 2.6xrelative to the best previous reports having a CH4 FE higher than50% (Supplementary Table 2). The catalyst system reported herein
c da b
40
30
20
10
01 2 3
Cou
nt (
%)
Cluster size (nm)
1 2 3
Cluster size (nm)1 2 3
Cluster size (nm)
1 2 3
Cluster size (nm)
40
30
20
10
0
Cou
nt (
%)
40
30
20
10
0
Cou
nt (
%)
40
30
20
10
0
Cou
nt (
%)
g he f1.5 ± 0.2
2.1 ± 0.3
2.5 ± 0.3
2.8 ± 0.3
Fig. 2 Preparation and characterization of cobalt(II) oxide clusters. a–d Transmission electron micrograph images and e–h corresponding sizedistribution of CoO clusters. The white light dots in (a–c) and dark black dots in (d) are the CoO clusters. Insets in (a–d) are the enlarged images showingthe individual CoO cluster in red square. The scale bars in (a, b) and (c, d) are 5 and 10 nm, respectively.
NATURE COMMUNICATIONS | https://doi.org/10.1038/s41467-020-20004-7 ARTICLE
NATURE COMMUNICATIONS | (2020) 11:6190 | https://doi.org/10.1038/s41467-020-20004-7 | www.nature.com/naturecommunications 3
achieved a half-cell energy efficiency of 27% in neutral medium(Supplementary Note 1), which is among the best previouslyreported catalysts with current densities above 50mA cm−2
(Supplementary Table 2)13–20.We then tested the stability of the CoO-2.5 nm/Cu/PTFE
catalyst system. The system achieved CO2-to-CH4 generationover 18 h at a current density of 225 mA cm−2 with a CH4 FEabove 55% (Fig. 3c). After 18 h, the CH4 FE decreased to below55%. After the catalyst was washed and dried, CO2RR wasresumed with the same catalyst: the CH4 FE returned to theoriginal value of 60% (Supplementary Fig. 4), suggesting that thedecrease of CH4 FE is not caused by catalyst degradation butcould be due to flooding or carbonate formation on the PTFEsubstrate22,35.
We also investigated the CO2-to-CH4 performance as afunction of CoO-cluster size. CoO-2.5 nm with a loading contentof 10 ng cm−2 on Cu/PTFE catalyst (an estimated coverage of 1%,see Supplementary Note 2) gives the highest CH4 selectivity of60% (Fig. 3d). An increase in loading content regardless of clustersize leads to an increase in H2 evolution activity which diminishesthe CH4 FE (Supplementary Table 3).
When examining the selectivity of these electrocatalysts asfunctions of CoO-cluster size and loading content, we draw twoconclusions within the size of 1–3 nm and loading content of1–30 ng cm−2 range: (I) cluster size effects are present, and (II)
there exists a maximum in CH4 selectivity with a CoO-cluster sizeof 2.5 nm and 10 ng cm−2 on Cu/PTFE in this work.
Characterization of CoO-cluster-localized catalysts. To inves-tigate possible catalyst changes in structure and oxidationstate following CO2RR, we carried out characterization ofCoO-2.5 nm/Cu/PTFE before and after the extended electro-chemical operation studies, using electron microscopy and X-ray absorption spectroscopy. Scanning electron microscopy(SEM) images of CoO-2.5 nm/Cu/PTFE catalysts demonstratereconstruction of Cu after CO2RR (Supplementary Fig. 5).STEM images with elemental mapping reveal a uniform dis-tribution of Cu and Co in samples before and after stabilitytests (Fig. 4a, b). HRTEM images show intimate contactbetween CoO clusters and the Cu/PTFE catalyst (Fig. 4c, d).According to the measured lattice fringes23 in the TEM ima-ges, the initial slightly oxidized Cu is reduced to its metallicstate during CO2RR.
The lack of Co related peaks in X-ray diffraction patterns canbe attributed to the small size and low loading of CoO clusters(Supplementary Fig. 6). Cu 2p high-resolution X-ray photoelec-tron spectroscopy (XPS) spectra reveal the existence of metallicand oxidized Cu species in the initial catalyst and mostly metallicCu after CO2RR (Supplementary Fig. 7)23.
8
6
4
2
0Rat
io o
f CH
4:C
2
0.08
7.5
1.5
FE
(%
)
100
80
60
40
20
0
CH4
C2
H2
Cu/PTFE CoO-2.5nm/Cu/PTFE
Co-metal/Cu/PTFE
a100
80
60
40
20
0
b
0 30 60 90 120 150
CH4 partial current density (mA cm-2)
Ref. 17
Ref. 13
Ref. 14Ref. 15 Ref. 16
Ref. 18
Ref. 19
Ref. 20This work
Pot
entia
l (V
vs.
RH
E)
0
–1
–2
CH
4 F
E (
%)
CH
4 F
E (
%)
80
60
40
20
00 4 8 10 14 18
Time (h)12 162 6
Mean size (nm)1.5 2.1 2.5 2.8
Load
ing
amou
nt (
ng c
m-2
)
30
20
10
5
1
60
45
30
15
0
CH
4 F
E (
%)
c d
60
Fig. 3 Electrocatalytic performance of electrocatalysts. a Product distribution of CoO/Cu/PTFE, Co metal/Cu/PTFE and bare Cu/PTFE at the −1.1 V vs.RHE. Red circle for methane, blue circle for hydrogen and grey circle for C2 products. b CO2-to-CH4 performance of CoO/Cu/PTFE in comparison withrecent reports13–20. Blue square for the results in literature. c Stability test of CO2 methanation during 18.5 h of electrolysis under the current density of225mA cm−2. Red square for methane FE and grey line for potential curve. d CH4 FEs of ligand-stabilized CoO clusters with different sizes and loadingcontents on Cu/PTFE under an operating current density of 225 mA cm−2 in a flow cell using 1M KHCO3 electrolyte.
ARTICLE NATURE COMMUNICATIONS | https://doi.org/10.1038/s41467-020-20004-7
4 NATURE COMMUNICATIONS | (2020) 11:6190 | https://doi.org/10.1038/s41467-020-20004-7 | www.nature.com/naturecommunications
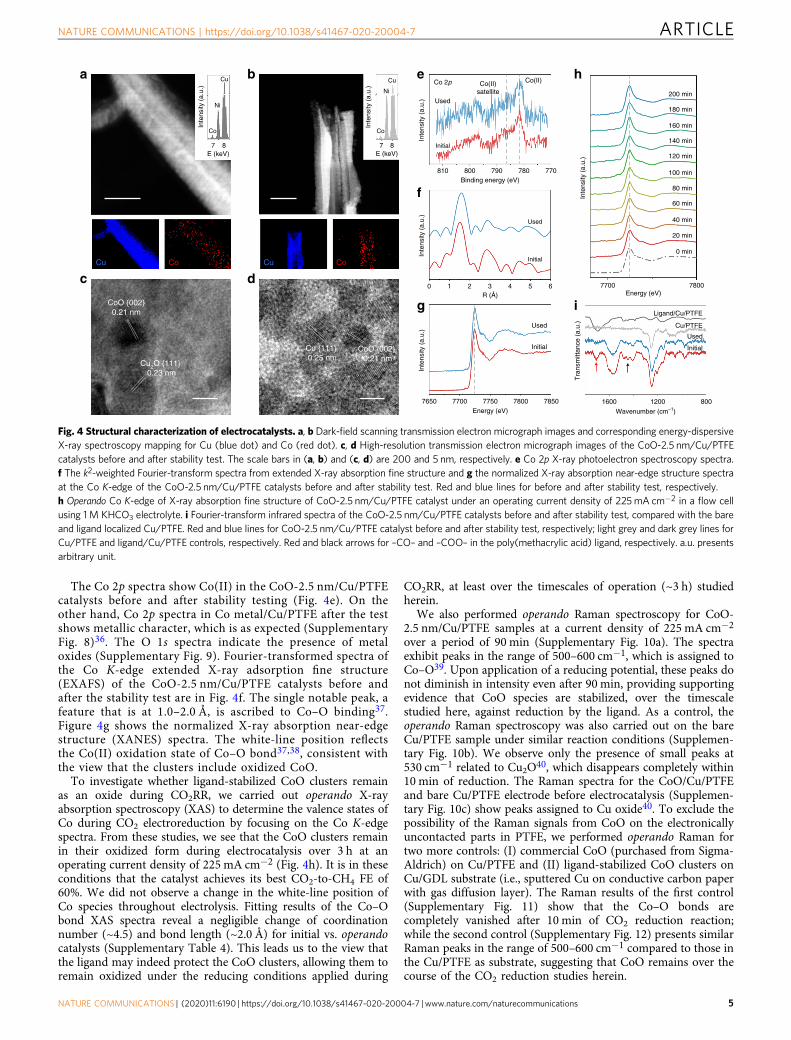
The Co 2p spectra show Co(II) in the CoO-2.5 nm/Cu/PTFEcatalysts before and after stability testing (Fig. 4e). On theother hand, Co 2p spectra in Co metal/Cu/PTFE after the testshows metallic character, which is as expected (SupplementaryFig. 8)36. The O 1s spectra indicate the presence of metaloxides (Supplementary Fig. 9). Fourier-transformed spectra ofthe Co K-edge extended X-ray adsorption fine structure(EXAFS) of the CoO-2.5 nm/Cu/PTFE catalysts before andafter the stability test are in Fig. 4f. The single notable peak, afeature that is at 1.0–2.0 Å, is ascribed to Co–O binding37.Figure 4g shows the normalized X-ray absorption near-edgestructure (XANES) spectra. The white-line position reflectsthe Co(II) oxidation state of Co–O bond37,38, consistent withthe view that the clusters include oxidized CoO.
To investigate whether ligand-stabilized CoO clusters remainas an oxide during CO2RR, we carried out operando X-rayabsorption spectroscopy (XAS) to determine the valence states ofCo during CO2 electroreduction by focusing on the Co K-edgespectra. From these studies, we see that the CoO clusters remainin their oxidized form during electrocatalysis over 3 h at anoperating current density of 225 mA cm−2 (Fig. 4h). It is in theseconditions that the catalyst achieves its best CO2-to-CH4 FE of60%. We did not observe a change in the white-line position ofCo species throughout electrolysis. Fitting results of the Co–Obond XAS spectra reveal a negligible change of coordinationnumber (~4.5) and bond length (~2.0 Å) for initial vs. operandocatalysts (Supplementary Table 4). This leads us to the view thatthe ligand may indeed protect the CoO clusters, allowing them toremain oxidized under the reducing conditions applied during
CO2RR, at least over the timescales of operation (~3 h) studiedherein.
We also performed operando Raman spectroscopy for CoO-2.5 nm/Cu/PTFE samples at a current density of 225 mA cm−2
over a period of 90 min (Supplementary Fig. 10a). The spectraexhibit peaks in the range of 500–600 cm−1, which is assigned toCo–O39. Upon application of a reducing potential, these peaks donot diminish in intensity even after 90 min, providing supportingevidence that CoO species are stabilized, over the timescalestudied here, against reduction by the ligand. As a control, theoperando Raman spectroscopy was also carried out on the bareCu/PTFE sample under similar reaction conditions (Supplemen-tary Fig. 10b). We observe only the presence of small peaks at530 cm−1 related to Cu2O40, which disappears completely within10 min of reduction. The Raman spectra for the CoO/Cu/PTFEand bare Cu/PTFE electrode before electrocatalysis (Supplemen-tary Fig. 10c) show peaks assigned to Cu oxide40. To exclude thepossibility of the Raman signals from CoO on the electronicallyuncontacted parts in PTFE, we performed operando Raman fortwo more controls: (I) commercial CoO (purchased from Sigma-Aldrich) on Cu/PTFE and (II) ligand-stabilized CoO clusters onCu/GDL substrate (i.e., sputtered Cu on conductive carbon paperwith gas diffusion layer). The Raman results of the first control(Supplementary Fig. 11) show that the Co–O bonds arecompletely vanished after 10 min of CO2 reduction reaction;while the second control (Supplementary Fig. 12) presents similarRaman peaks in the range of 500–600 cm−1 compared to those inthe Cu/PTFE as substrate, suggesting that CoO remains over thecourse of the CO2 reduction studies herein.
Inte
nsity
(a.
u.)
Co
Ni
Cu
7 8E (keV)
Inte
nsity
(a.
u.)
Cu
Ni
Co
E (keV)7 8
Co CoCu Cu
CoO {002}0.21 nm
Cu2O {111} 0.23 nm
Cu {111} 0.25 nm
CoO {002} 0.21 nm
a b
c d
Inte
nsity
(a.
u.)
810 800 790 780 770Binding energy (eV)
Co 2p
Used
Initial
Co(II)satellite
Co(II)
Inte
nsity
(a.
u.)
0 1 2 3 4R (Å)
5 6
Used
Initial
Inte
nsity
(a.
u.)
7650 7700 7750 7800 7850Energy (eV)
e
f
gEnergy (eV)
7700 7800
Inte
nsity
(a.
u.)
0 min
20 min
40 min
60 min
80 min
100 min
120 min
140 min
160 min
180 min
200 min
Initial
Used
h
1600 1200 800
Wavenumber (cm–1)
Tra
nsm
ittan
ce (
a.u.
)
i
Used
Cu/PTFE
Ligand/Cu/PTFE
Initial
Fig. 4 Structural characterization of electrocatalysts. a, b Dark-field scanning transmission electron micrograph images and corresponding energy-dispersiveX-ray spectroscopy mapping for Cu (blue dot) and Co (red dot). c, d High-resolution transmission electron micrograph images of the CoO-2.5 nm/Cu/PTFEcatalysts before and after stability test. The scale bars in (a, b) and (c, d) are 200 and 5 nm, respectively. e Co 2p X-ray photoelectron spectroscopy spectra.f The k2-weighted Fourier-transform spectra from extended X-ray absorption fine structure and g the normalized X-ray absorption near-edge structure spectraat the Co K-edge of the CoO-2.5 nm/Cu/PTFE catalysts before and after stability test. Red and blue lines for before and after stability test, respectively.h Operando Co K-edge of X-ray absorption fine structure of CoO-2.5 nm/Cu/PTFE catalyst under an operating current density of 225mA cm−2 in a flow cellusing 1M KHCO3 electrolyte. i Fourier-transform infrared spectra of the CoO-2.5 nm/Cu/PTFE catalysts before and after stability test, compared with the bareand ligand localized Cu/PTFE. Red and blue lines for CoO-2.5 nm/Cu/PTFE catalyst before and after stability test, respectively; light grey and dark grey lines forCu/PTFE and ligand/Cu/PTFE controls, respectively. Red and black arrows for –CO– and –COO– in the poly(methacrylic acid) ligand, respectively. a.u. presentsarbitrary unit.
NATURE COMMUNICATIONS | https://doi.org/10.1038/s41467-020-20004-7 ARTICLE
NATURE COMMUNICATIONS | (2020) 11:6190 | https://doi.org/10.1038/s41467-020-20004-7 | www.nature.com/naturecommunications 5
The presence of the ligand in catalysts before and after CO2RRis indicated by Fourier-transform infrared spectroscopy analysis,showing that poly(methacrylic acid) ligand is retained during theCO2RR (Fig. 4i). In addition, the peak at 1550 cm−1 is attributedto the carboxylate groups in the ligand associated with metal ions(here is Co) in a bridging mode41.
We noted that stronger-binding organic ligands on Co(II) didnot prevent Co metal formation under negative cathodicpotentials in prior literature reports42; however, in these priorstudies, the electrolyte was acidic phosphate buffer (pH 2.2), andthe cathodic reaction was hydrogen evolution, compared to the 1M KHCO3 solution (pH 8.9) studied in CO2 reduction herein.The local pH is higher during electrochemical CO2 reduction,particularly so at high current density (such as 225 mA cm−2
when we obtained the best CH4 FE)43. The stability of Coδ+
based catalysts, including Coδ+ complexes44 and ultra-small/thincobalt oxides45,46, under negative potentials for electrocatalyticCO2 reduction, has previously been reported. In a broadercontext, there are other examples in which metal oxide surfaceremain during electrochemical CO2 reduction, even though thePourbaix diagram suggests that the metallic phase is thermo-dynamically stable47,48. We propose that the CoO clusters areligand-stabilized CoO to the point that, under the conditions ofpH and applied potential discussed here, the oxidation state andcatalytic enhancement can be maintained under the conditions ofcurrent and experimental duration reported herein.
We also prepared the molybdenum(VI), tungsten(VI), nickel(II) and palladium(II) oxides clusters as controls (SupplementaryFig. 13), with the ligand stabilization and similarly spray-coatedon Cu/PTFE. The microscopy and spectroscopy analyses showthat these clusters are oxidized49–52 and these catalysts exhibitsimilar structures to CoO/Cu/PTFE (Supplementary Figs. 14–17).Similar catalytic trends are obtained using these catalysts withtheir different respective ligand concentrations and clusterloading contents (Supplementary Figs. 18–20 and Tables 5–8).Of the catalysts, CoO-2.5 nm/Cu/PTFE exhibits the highest CH4
selectivity.
DiscussionWe developed a cooperative system designed on the principle thatlocal *H availability can provide enhanced CO2 methanation at acatalyst/electrolyte interface, with size effects playing a role inlocalized CoO clusters. The CoO-cluster size is controlled from1.5 to 2.8 nm and the clusters are reduction-resistant under acathodic potential, a finding we attribute to stabilization using apoly(methacrylic acid) ligand. These clusters serve to modulatethe CO2 reduction pathways toward CH4 formation. On theCoO/Cu/PTFE catalyst, the reaction energetics are altered tofavour CO hydrogenation. The catalysts exhibit a CH4 FE of 60%at a current density of 225 mA cm−2; these operate over 18 hwhile retaining initial performance to within 91%.
MethodsCatalyst preparation. For CoO clusters, 8.8 mg of cobalt(II) chloride (99.9%,Sigma-Aldrich) and 20 mg of poly(methacrylic acid) ligand32–34 were added into ascrew-neck glass bottle containing 5 ml of methanol. After the solution becominguniform by sonication, 0.5 ml of freshly prepared NaBH4 solution (5 mgml−1 inmethanol) was injected into the solution under vigorous stirring (2000 r.p.m.). Thestirring speed of the solution was kept at the same for another 10 min. In thewashing process, the precipitate was sonicated to ensure all clusters dispersinguniformly in methanol, and then separated by centrifuge. The precipitate waswashed for two times and stored in methanol for further use. For different sizes ofCoO clusters, the ligand concentrations are 2, 4, 8 and 16 mgml−1 for synthesizecluster with mean size of 2.8, 2.5, 2.1 and 1.5 nm, respectively. The metal Conanoparticles were synthesized using the similar process without adding the ligand.For different clusters, we only changed the corresponding chloride salts (tungsten(VI) chloride, 99.9%, Sigma-Aldrich; molybdenum(V) chloride, 99.99%, Sigma-Aldrich; nickel(II) chloride, 99.99%, Sigma-Aldrich; palladium(II) chloride, 99.9%,
Sigma-Aldrich) as the precursor and the concentration is the same 0.8 mgml−1
(metal-based). Cu/PTFE electrodes were prepared by sputtering a Cu layer of200 nm in thickness onto a PTFE membrane (average pore size of 450 nm) using aCu target (99.99%) at a rate of 1 Å s−1. Then, 10 μl of 5% Nafion was dispersed in1 ml the cluster suspension (0.2 mg ml−1 in methanol) and the mixture was underultrasonication for 30 min. The suspension was deposited on a Cu/PTFE electrodeusing spray-coating.
Materials characterization. The morphology of the electrodes was characterizedusing scanning electron microscopy (SEM, Hitachi S-5200) with a 5-kV beamvoltage. Transmission electron microscopy (TEM) and elemental mapping imageswere collected using a Hitachi HF-3300, at an acceleration voltage of 300 kV,equipped with a Bruker energy-dispersive X-ray spectroscopy (EDX) detector. Theacquisition time in the EDX studies was 3 min. The samples for TEM measure-ments are dip-coated on the carbon-coated nickel grids. Fourier-transform infraredspectroscopy (FTIR) was performed using a Nicolet 6700 FTIR spectrometer.Measurements were carried out using the attenuated total reflection (ATR) modeusing the iS50-ATR-FTIR system. Spectra were obtained using 16 scans with aresolution of 4 cm−1. Powder X-ray diffraction (XRD) patterns were recordedusing a Bruker D8 using Cu-Kα radiation (λ= 0.15406 nm). X-ray photoelectronspectroscopy (XPS) was conducted on a PHI 5700 ESCA System using Al Kα X-rayradiation (1486.6 eV) for excitation. Some exposure to air during cell disassemblyand the transfer to XPS equipment is expected. Operando Raman spectroscopymeasurements were carried out using a Renishaw inVia Raman microscope in amodified flow cell (Supplementary Fig. 10d) using a water immersion objectivewith a 785-nm laser.
XAS measurements were carried out at 9-BM beamline at the advanced photonsource (APS) light source (IL, USA). An in-house custom-made electrochemicalcell with a three-electrode configuration was used to perform operando XAS. Aplatinum mesh and Ag/AgCl electrode were used as the counter electrode andreference electrode, respectively. The catalyst was prepared on the front side ofPTFE and connected electrically by Cu tape while the back side was stuck to a thinKapton tape. The sample was then mounted on the window of the electrochemicalcell so that the back side (PTFE gas diffusion layer) faced the beam and the catalyst(front side) is in direct contact with the electrolyte. The ex situ XAS experiments,including XANES and EXAFS, were conducted on the front side of the samples.Data was collected in fluorescence mode on a passivated implanted planar silicon(PIPS)/Lytle detector placed at an angle of 45°. Several spectra were collected andaveraged at each condition to improve the quality of the data and increase thesignal to noise ratio. Data post-processing and fitting was performed using theDemeter software package.
Electrochemical measurements. We used an electrochemical flow cell containinga gas chamber, a cathodic chamber, an anodic chamber and an anion exchangemembrane (separating the anodic and cathodic chambers) to study the electro-chemical CO2 reduction performance. We fixed the working electrode (such asCoO/Cu/PTFE) with a geometric active surface area of 1 cm2 and place it betweenthe gas and cathodic chambers. We made the catalysts layer side of the workingelectrode face to the cathodic chamber. We chose 1M KHCO3 solution as theelectrolyte, and used peristaltic pumps to circulate the electrolyte through thecathodic and anodic chambers with a rate of 10 ml min−1. We controlled the CO2
gas flow rate through the gas chamber as 50 sccm by a gas flow controller. Weoperated the electrochemical tests on an Autolab PGSTAT204, with a reference Ag/AgCl electrode and a counter Ni foam electrode. We calibrated the potentials tothose vs. RHE after iR-compensation. We collected the gas products from the endof the gas chamber and analysed them by a gas chromatography (PerkinElmerClarus 600) with a flame ionization detector (FID) and a thermal conductivitydetector (TCD). We evaluated the hydrogen evolution activities of the electrodes inthe same flow cell using argon as the only flow gas.
DFT calculations. We performed density functional theory calculations with theVienna Ab Initio Simulation Package (VASP) code53,54. The exchange-correlationenergy was described by Perdew–Burke–Ernzerhof (PBE) functional within thegeneralized gradient approximation (GGA)55. The ionic cores were simplified usingthe projector augmented wave (PAW) pseudo-potentials56. After a series of tests,we set up the cutoff energy of 450 eV. In all calculations, the Hellmann–Feynmanforces criteria between atoms were set as 0.02 eV A−1 and the electronic iterationsconvergence was 10−5 eV using the Normal algorithm. A 4-layer (5 × 2) Cu (111)supercell was built to simulate the most stable exposed surface of copper accom-panied with a sufficient vacuum gap of 15 Å. Pure metal (Co, Ni, Pd, W and Mo)and metal oxide (CoO, NiO, PdO, WO3 and MoO3) clusters were added on thefixed positions of Cu (111) surface. Structural optimizations were then performedon all modified slab models. *CO, *CHO and *(CO+H) were considered as keyintermediates to simulate the CO2-to-methane reaction on catalyst surfaces.During all adsorption calculations, the top two layers were fully relaxed while theother layers were fixed at the tested lattice position. After comparing the hydro-genation activity of Co atom and O atom (Supplementary Fig. 21), we consider Cosites in clusters as the active sites for *CO hydrogenation. The adsorption energiesand hydrogenation energies were calculated according to Supplementary Note 3.
ARTICLE NATURE COMMUNICATIONS | https://doi.org/10.1038/s41467-020-20004-7
6 NATURE COMMUNICATIONS | (2020) 11:6190 | https://doi.org/10.1038/s41467-020-20004-7 | www.nature.com/naturecommunications
Data availabilityThe data that support the findings of this study are available from the correspondingauthor upon reasonable request.
Received: 14 May 2020; Accepted: 22 October 2020;
References1. Qiao, J., Liu, Y., Hong, F. & Zhang, J. A review of catalysts for the
electroreduction of carbon dioxide to produce low-carbon fuels. Chem. Soc.Rev. 43, 631–675 (2014).
2. Kim, D., Kley, C. S., Li, Y. & Yang, P. Copper nanoparticle ensembles forselective electroreduction of CO2 to C2–C3 products. Proc. Natl Acad. Sci. USA114, 10560–10565 (2017).
3. Yang, D. et al. Selective electroreduction of carbon dioxide to methanol oncopper selenide nanocatalysts. Nat. Commun. 10, 677 (2019).
4. Mistry, H. et al. Highly selective plasma-activated copper catalysts for carbondioxide reduction to ethylene. Nat. Commun. 7, 12123 (2016).
5. Liu, Y., Chen, S., Quan, X. & Yu, H. Efficient electrochemical reduction ofcarbon dioxide to acetate on nitrogen-doped nanodiamond. J. Am. Chem. Soc.137, 11631–11636 (2015).
6. Howarth, R. W., Ingraffea, A. & Engelder, T. Should fracking stop? Nature477, 271–275 (2011).
7. Connolly, B. M. et al. Tuning porosity in macroscopic monolithic metal-organic frameworks for exceptional natural gas storage. Nat. Commun. 10,2345 (2019).
8. Gan, Y. et al. Carbon footprint of global natural gas supplies to China. Nat.Commun. 11, 824 (2020).
9. García de Arquer, F. P. et al. CO2 electrolysis to multicarbon products atactivities greater than 1 A cm−2. Science 367, 661–666 (2020).
10. Liu, X. et al. Understanding trends in electrochemical carbon dioxidereduction rates. Nat. Commun. 8, 15438 (2017).
11. Zhou, Y. et al. Dopant-induced electron localization drives CO2 reduction toC2 hydrocarbons. Nat. Chem. 10, 974–980 (2018).
12. Zhang, S. et al. Polymer-supported CuPd nanoalloy as a synergistic catalyst forelectrocatalytic reduction of carbon dioxide to methane. Proc. Natl Acad. Sci.USA 112, 15809–15814 (2015).
13. Reske, R., Mistry, H., Behafarid, F., Cuenya, B. R. & Strasser, P. Particle sizeeffects in the catalytic electroreduction of CO2 on Cu nanoparticles. J. Am.Chem. Soc. 136, 6978–6986 (2014).
14. Wang, X. et al. Efficient methane electrosynthesis enabled by tuning local CO2
availability. J. Am. Chem. Soc. 142, 3525–3531 (2020).15. Li, Y. et al. Structure-sensitive CO2 electroreduction to hydrocarbons
on ultrathin 5-fold twinned copper nanowires. Nano Lett. 17, 1312–1317(2017).
16. Wang, Y. et al. Single-atomic Cu with multiple oxygen vacancies on ceria forelectrocatalytic CO2 reduction to CH4. ACS Catal. 8, 7113–7119 (2018).
17. Wang, Y., Chen, J., Wang, G., Li, Y. & Wen, Z. Perfluorinated covalent triazineframework derived hybrids for the highly selective electroconversion of carbondioxide into methane. Angew. Chem. Int. Ed. 57, 13120–13124 (2018).
18. Han, L. et al. Stable and efficient single-atom Zn catalyst for CO2 reduction toCH4. J. Am. Chem. Soc. 142, 12563–12567 (2020).
19. Chang, C.-J. et al. Dynamic reoxidation/reduction-driven atomicinterdiffusion for highly selective CO2 reduction toward methane. J. Am.Chem. Soc. 142, 12119–12132 (2020).
20. Hu, Q. et al. Facile synthesis of sub‐nanometric copper clusters by doubleconfinement enables selective reduction of carbon dioxide to methane. Angew.Chem. Int. Ed. 59, 19054–19059 (2020).
21. Jouny, M., Luc, W. & Jiao, F. General techno-economic analysis of CO2
electrolysis systems. Ind. Eng. Chem. Res. 57, 2165–2177 (2018).22. Dinh, C.-T. et al. CO2 electroreduction to ethylene via hydroxide-mediated
copper catalysis at an abrupt interface. Science 360, 783–787 (2018).23. Luo, M. et al. Hydroxide promotes carbon dioxide electroreduction to ethanol
on copper via tuning of adsorbed hydrogen. Nat. Commun. 10, 5814 (2019).24. Li, J. et al. Enhanced multi-carbon alcohol electroproduction from CO via
modulated hydrogen adsorption. Nat. Commun. 11, 3685 (2020).25. Cheng, T., Xiao, H. & Goddard, W. A. Full atomistic reaction mechanism with
kinetics for CO reduction on Cu(100) from ab initio molecular dynamics free-energy calculations at 298 K. Proc. Natl Acad. Sci. USA 114, 1795–1800(2017).
26. Cheng, T., Xiao, H. & Goddard, W. A. Free-energy barriers and reactionmechanisms for the electrochemical reduction of CO on the Cu(100) surface,including multiple layers of explicit solvent at pH 0. J. Phys. Chem. Lett. 6,4767–4773 (2015).
27. Peterson, A. A. & Nørskov, J. K. Activity descriptors for CO2 electroreductionto methane on transition-metal catalysts. J. Phys. Chem. Lett. 3, 251–258(2012).
28. Liu, X. et al. pH effects on the electrochemical reduction of CO(2) towards C2
products on stepped copper. Nat. Commun. 10, 32 (2019).29. Kortlever, R., Shen, J., Schouten, K. J. P., Calle-Vallejo, F. & Koper, M. T.
Catalysts and reaction pathways for the electrochemical reduction of carbondioxide. J. Phys. Chem. Lett. 6, 4073–4082 (2015).
30. Nie, X., Esopi, M. R., Janik, M. J. & Asthagiri, A. Selectivity of CO2 reductionon copper electrodes: the role of the kinetics of elementary steps. Angew.Chem. Int. Ed. 52, 2459–2462 (2013).
31. Feng, Y. et al. Electrochemical CO2 reduction reaction on M@Cu(211)bimetallic single-atom surface alloys: mechanism, kinetics, and catalystscreening. ACS Sustain. Chem. Eng. 8, 210–222 (2020).
32. Li, Y. H. et al. Unidirectional suppression of hydrogen oxidation on oxidizedplatinum clusters. Nat. Commun. 4, 2500 (2013).
33. Majeed, M. I., Guo, J., Yan, W. & Tan, B. Preparation of magnetic iron oxidenanoparticles (MIONs) with improved saturation magnetization usingmultifunctional polymer ligand. Polymers 8, 392 (2016).
34. Wen, L. et al. Ultrasmall biocompatible WO3−x nanodots for multi‐modalityimaging and combined therapy of cancers. Adv. Mater. 28, 5072–5079 (2016).
35. Nwabara, U. O., Cofell, E. R., Verma, S., Negro, E. & Kenis, P. J. A. Durablecathodes and electrolyzers for the efficient aqueous electrochemical reductionof CO2. ChemSusChem 13, 855–875 (2020).
36. Lukashuk, L. et al. Operando insights into CO oxidation on cobalt oxidecatalysts by NAP-XPS, FTIR, and XRD. ACS Catal. 8, 8630–8641 (2018).
37. Li, X., Clatworthy, E. B., Bartlett, S., Masters, A. F. & Maschmeyer, T.Structural investigation of cobalt oxide clusters derived from molecular cobaltcubane, trimer, and dimer oligomers in a phosphate electrolyte. J. Phys. Chem.C. 121, 11021–11026 (2017).
38. Jacobs, G. et al. Fischer-Tropsch synthesis: study of the promotion of Pt on thereduction property of Co/Al2O3 catalysts by in situ EXAFS of Co K and Pt LIIIedges and XPS. J. Synchrotron Rad. 11, 414–422 (2004).
39. Ravindra, A. V., Behera, B. C. & Padhan, P. Laser induced structural phasetransformation of cobalt oxides nanostructures. J. Nanosci. Nanotechnol. 14,5591–5595 (2014).
40. Deng, Y., Handoko, A. D., Du, Y., Xi, S. & Yeo, B. S. In situ Ramanspectroscopy of copper and copper oxide surfaces during electrochemicaloxygen evolution reaction: identification of CuIII oxides as catalytically activespecies. ACS Catal. 6, 2473–2481 (2016).
41. Lu, Y. & Miller, J. D. Carboxyl stretching vibrations of spontaneouslyadsorbed and LB-transferred calcium carboxylates as determined by FTIRinternal reflection spectroscopy. J. Colloid Interface Sci. 256, 41–52 (2002).
42. Kaeffer, N. et al. The dark side of molecular catalysis: diimine–dioxime cobaltcomplexes are not the actual hydrogen evolution electrocatalyst in acidicaqueous solutions. ACS Catal. 6, 3727–3737 (2016).
43. Zhang, Z. et al. pH matters when reducing CO2 in an electrochemical flow cell.ACS Energy Lett. 5, 3101–3107 (2020).
44. Wang, M. et al. CO2 electrochemical catalytic reduction with a highly activecobalt phthalocyanine. Nat. Commun. 10, 3602 (2019).
45. Gao, S. et al. Partially oxidized atomic cobalt layers for carbon dioxideelectroreduction to liquid fuel. Nature 529, 68–71 (2016).
46. Sekar, P. et al. Cobalt spinel nanocubes on N-doped graphene: a synergistichybrid electrocatalyst for the highly selective reduction of carbon dioxide toformic acid. ACS Catal. 7, 7695–7703 (2017).
47. Luc, W. et al. Ag–Sn bimetallic catalyst with a core–shell structure for CO2
reduction. J. Am. Chem. Soc. 139, 1885–1893 (2017).48. Deng, P. et al. Bismuth oxides with enhanced bismuth–oxygen structure for
efficient electrochemical reduction of carbon dioxide to formate. ACS Catal.10, 743–750 (2020).
49. Kröger, M. et al. Role of the deep-lying electronic states of MoO3 in theenhancement of hole-injection in organic thin films. Appl. Phys. Lett. 95,123301 (2009).
50. Kwon, Y. T., Song, K. Y., Lee, W. I., Choi, G. J. & Do, Y. R. Photocatalyticbehavior of WO3-loaded TiO2 in an oxidation reaction. J. Catal. 191, 192–199(2000).
51. Grosvenor, A. P., Biesinger, M. C., Smart, R. S. C. & Mclntyre, N. S. Newinterpretations of XPS spectra of nickel metal and oxides. Surf. Sci. 600,1771–1779 (2006).
52. Brun, M., Berthet, A. & Bertolini, J. C. XPS, AES and auger parameter of Pdand PdO. J. Electron. Spectrosc. Relat. Phenom. 104, 55–60 (1999).
53. Kresse, G. & Hafner, J. Ab initio molecular dynamics for liquid metals. Phys.Rev. B 47, 558–561 (1993).
54. Kresse, G. & Furthmüller, J. Efficiency of ab-initio total energy calculations formetals and semiconductors using a plane-wave basis set. Computat. Mater.Sci. 6, 15–50 (1996).
55. Perdew, J. P., Burke, K. & Ernzerhof, M. Generalized gradient approximationmade simple. Phys. Rev. Lett. 77, 3865–3868 (1996).
NATURE COMMUNICATIONS | https://doi.org/10.1038/s41467-020-20004-7 ARTICLE
NATURE COMMUNICATIONS | (2020) 11:6190 | https://doi.org/10.1038/s41467-020-20004-7 | www.nature.com/naturecommunications 7
56. Payne, M. C., Teter, M. P., Allan, D. C., Arias, T. A. & Joannopoulos, J. D.Iterative minimization techniques for ab initio total-energy calculations:molecular dynamics and conjugate gradients. Rev. Mod. Phys. 64, 1045–1097(1992).
AcknowledgementsThis work was supported by the Natural Gas Innovation Fund, the Natural Sciences andEngineering Research Council (NSERC) of Canada, the Natural Resources Canada - CleanGrowth Program, and the Ontario Research Fund—Research Excellence program. AllDFT computations were performed on the Niagara supercomputer at the SciNet HPCConsortium. SciNet is funded by the Canada Foundation for Innovation, the Governmentof Ontario, Ontario Research Fund Research Excellence Program, and the University ofToronto. This research used synchrotron resources of the Advanced Photon Source(APS), an Office of Science User Facility operated for the U.S. Department of Energy(DOE) Office of Science by Argonne National Laboratory, and was supported by the U.S.DOE under Contract No. DE-AC02-06CH11357, and the Canadian Light Source and itsfunding partners. The authors thank T. P. Wu, Y. Z. Finfrock and L. Ma for technicalsupport at 9-BM beamline of APS. Y.L. acknowledges the financial support from theprogram of China Scholarships Council (201906745001).
Author contributionsC.L. and E.H.S. jointly supervised this work. Yu.L. designed and carried out theexperiments. A.X. carried out the DFT calculations. B.C. collected the STEM and TEMimages and did the EDX mapping. J.A., S.F.H., F.L. and Yu.L. performed and analysedthe XAS measurements. A.S.R., J.W. and A.X. performed the XPS and XRD measure-ments. J.E.H. performed the Raman spectroscopy measurements. L.K.S. performed theFTIR measurements. T.P. collected the SEM images. X.W., Z.W., Y.X., D.S., A.H.I. andH.J. contributed to data analysis and manuscript editing. Yu.L., Ya.L., C.L. and E.H.S. co-wrote the paper. All authors discussed the results and assisted during manuscriptpreparation.
Competing interestsThe authors declare no competing interests.
Additional informationSupplementary information is available for this paper at https://doi.org/10.1038/s41467-020-20004-7.
Correspondence and requests for materials should be addressed to C.L. or E.H.S.
Peer review information Nature Communications thanks Wei An, Feng Jiao and theother, anonymous, reviewer(s) for their contribution to the peer review of this work.
Reprints and permission information is available at http://www.nature.com/reprints
Publisher’s note Springer Nature remains neutral with regard to jurisdictional claims inpublished maps and institutional affiliations.
Open Access This article is licensed under a Creative CommonsAttribution 4.0 International License, which permits use, sharing,
adaptation, distribution and reproduction in any medium or format, as long as you giveappropriate credit to the original author(s) and the source, provide a link to the CreativeCommons license, and indicate if changes were made. The images or other third partymaterial in this article are included in the article’s Creative Commons license, unlessindicated otherwise in a credit line to the material. If material is not included in thearticle’s Creative Commons license and your intended use is not permitted by statutoryregulation or exceeds the permitted use, you will need to obtain permission directly fromthe copyright holder. To view a copy of this license, visit http://creativecommons.org/licenses/by/4.0/.
© The Author(s) 2020
ARTICLE NATURE COMMUNICATIONS | https://doi.org/10.1038/s41467-020-20004-7
8 NATURE COMMUNICATIONS | (2020) 11:6190 | https://doi.org/10.1038/s41467-020-20004-7 | www.nature.com/naturecommunications