Embed Size (px)
Citation preview
January 3, 2011
Mr. Robert E. Feldman Executive Secretary Attention: Comments Federal Deposit Insurance Corporation 550 17th Street, NW Washington, DC 20429
Re: Federal Deposit Insurance Corporation Notice of Proposed Rulemaking, RIN 3064-AD66, Assessments, Large Bank Pricing; Assessments, Assessment Base and Rates
Dear Mr. Feldman: Promontory Interfinancial Network, LLC (“Promontory Interfinancial”) is submitting this comment letter in response to the Notice of Proposed Rulemaking by the Federal Deposit Insurance Corporation (the “FDIC”) with respect to Assessments, Large Bank Pricing, RIN 3064-AD66 (the “Notice”). Our comments focus on the proposed treatment of “brokered deposits” under the Notice and the related FDIC Notice of Proposed Rulemaking, Assessments, Assessment Base and Rates. Promontory Interfinancial provides services to its depository institution customers to enable them to attract stable deposits at cost-effective rates. Although Promontory Interfinancial does not broker deposits, its services to financial institutions facilitate the placement of deposits, resulting in the characterization of these deposits as “brokered deposits” for purposes of the Notice.1
Promontory Interfinancial is not a typical deposit broker that markets bank certificates of deposit to its customers, often on a nationwide basis. Rather, Promontory Interfinancial offers services such as CDARS®, a deposit allocation service which permits banks to market their deposits primarily to local customers at local market interest rates, and IND®, a deposit sweep service which permits broker-dealers to place stable customer funds at unaffiliated as well as affiliated banks. As described below, Promontory Interfinancial believes that the Notice raises significant concerns that should be addressed by the FDIC as a predicate to the adoption of a new large bank deposit assessment rule: 1This is based on the FDIC’s definition of “brokered deposits” at 12 C.F.R. 337.6(a)(2)(1992).
Promontory Interfinancial Network, LLC 1515 North Courthouse Road Suite 800 Arlington, Virginia 22201 T 703-292-3400 F 703-528-5700 www.promnetwork.com
Mr. Robert E. Feldman January 3, 2011 Page 2
• The rule will make the banking system less safe, not safer, and will put a drag on the economy at the worst possible time, depressing economic activity and job growth.
(1) The rule creates the risk that banks will defund by forcing the movement of hundreds of billions of dollars in stable broker-dealer sweep balances from large banks to destinations outside the banking system, such as money market funds. This would impair bank funding and pose risks to the recovery of credit markets.
(2) The rule creates the risk of destabilizing banks by forcing them to replace funding from highly stable reciprocal deposits, merely because such deposits are labeled “brokered,” with funding from highly volatile rate board deposits, merely because such deposits are labeled “core.” This would increase the volatility of bank funding and exacerbate attendant failure risks.
• As discussed below, banks with reciprocal deposits placed through Promontory’s CDARS Reciprocal service (“CDARS Reciprocal Deposits”) have performed better during the financial crisis than banks without CDARS Reciprocal Deposits.
• There is a fundamental absence of analytical support for the proposed rule’s imposition of severe penalties on all of the diverse deposit products that are labeled “brokered” – including reciprocal deposits for which the FDIC has without explanation reversed its previous safe harbor for “Risk Category I” banks.
• The lack of analytical support demonstrating a necessary positive correlation between the risks of bank failure and the use of “brokered” deposit products does not satisfy administrative rulemaking requirements and undermines the FDIC efforts to formulate a truly risk-based assessment system.
Mr. Robert E. Feldman January 3, 2011 Page 3
These concerns take on important significance in the context of a provision of the recently enacted Dodd-Frank Wall Street Reform and Consumer Protection Act (“Dodd-Frank”) mandating an FDIC study of the definitions of core deposits and brokered deposits, including with respect to calculating deposit insurance premiums. Section 1506 of Dodd-Frank requires the FDIC to conduct a study to evaluate –
(1) the definition of core deposits for the purpose of calculating the insurance premiums of banks;
(2) the potential impact on the Deposit Insurance Fund of revising the definitions of brokered deposits and core deposits to better distinguish between them;
(3) an assessment of the differences between core deposits and brokered deposits and their role in the economy and banking sector of the United States;
(4) the potential stimulative effect on local economies of redefining core deposits; and
(5) the competitive parity between large institutions and community banks that could result from redefining core deposits.
The FDIC is required to report the results of this study to Congress no later than a year after
Dodd-Frank’s enactment, including recommendations, if any, to address concerns arising in connection with the definitions of “core” deposits and “brokered” deposits. Because the results of this study are not yet available, the proposed rule is not informed by this Congressionally-mandated thorough evaluation. Treatment of “Brokered Deposits” under the Notice Poses Risks for the Recovery of Credit Markets. The Notice proposes changes in the current deposit insurance assessment system, including the elimination of “risk categories” for large institutions. These risk categories would be replaced by a “scorecard” method for determining a large bank’s initial assessment rate. This scorecard method would determine a “Performance Score,” which includes the calculation of a ratio of “core” deposits to total liabilities. All deposit products deemed to be “brokered deposits” are excluded from core deposits in this calculation. The Notice would also require the determination of a “Loss Severity Score,” which includes the calculation of a ratio of “noncore funding” to total liabilities. “Brokered deposits” are treated as noncore funding for purposes of this calculation.
One important change under the proposed rule based on the elimination of risk categories would be to subject all large banks, regardless of risk category, to a “brokered deposit adjustment,” which would impose a 25 basis point surcharge on all “brokered deposits” in excess of 10% of a

Mr. Robert E. Feldman January 3, 2011 Page 4 large bank’s domestic deposits.2
But in fact, the true penalty that the proposed rule would impose on “brokered deposits” exceeding the 10% threshold would be far greater than 25 basis points. Consider the following example:
Bank X has total liabilities of $100 billion. These liabilities include deposits of $80 billion, comprised of $8 billion in brokered deposits, representing 10% of total deposits, and $72 billion in core deposits. Bank Y also has total liabilities of $100 billion and deposits of $80 billion. The only difference is that Bank Y’s deposits include brokered deposits of $16 billion, representing 20% of total deposits, and $64 billion in core deposits. Using total liabilities as a proxy for the assessment base, and keeping static all other values provided by the FDIC for its hypothetical “Bank A” example in the Notice except the ratio of noncore liabilities to total liabilities, the resulting base assessment rates would be as follows: Bank X: 20.04 basis points Bank Y: 22.58 basis points
The nominal value of the penalty added to Bank Y’s base assessment rate is therefore 1.64 basis points.3
This higher base assessment rate applies, however, not merely to the $8 billion by which Bank Y’s brokered deposits exceed Bank X’s brokered deposits, but to Bank Y’s entire assessment base of $100 billion. Accordingly, Bank Y’s base assessment exceeds Bank X’s base assessment by $16.4 million. This is equivalent to a 20.5 basis point penalty on the “excess” $8 billion in brokered deposits.
In addition, because Bank Y’s brokered deposits represent more than 10% of its domestic deposits, Bank Y also must pay a brokered deposit adjustment equal to $8 billion multiplied by 25 basis points, or $20 million. Therefore, the total penalty imposed by the rule on Bank Y merely because its brokered deposits are $8 billion greater than Bank X’s brokered deposits is $36.4 million, for an effective penalty rate of 45.5 basis points. At current low interest rates, a 45.5 basis point penalty will in some cases actually double the cost of the brokered deposits, more than enough to force banks to change their funding strategies by
2 See FDIC Notice of Proposed Rulemaking, RIN 3064-AD66, Assessments, Assessment Base and Rates. As described in the attached study by Mark J. Flannery, Ph.D., discussed below, the proposed rule would treat large banks differently from Risk Category I small banks, which would not be subject to the brokered deposit adjustment; yet the Notice provides no justification for this difference (including no evidence that the effects of brokered deposits differ between large and small banks). 322.58-20.94=1.64.
Mr. Robert E. Feldman January 3, 2011 Page 5 running off “brokered deposits” and turn instead to alternatives that could increase risks to the Deposit Insurance Fund. In addition, the proposed scorecard method includes “brokered deposits” in calculating both the Performance Score and the Loss Severity Score. Promontory Interfinancial is attaching a study authored by Mark J. Flannery, Ph.D., discussed below. In this study, Dr. Flannery notes that because the product of these two scores determines a banking institution’s initial base assessment rate, this rate rises with the square of noncore liabilities. Dr. Flannery notes that this nonlinear dependence is not addressed at all in the statistical evidence, yet this effect could be quite large. Because even a small change in brokered deposits (for example) raises the assessment fee due on the entire assessment base, this feature of the proposed rule can easily make the marginal cost of brokered deposits extremely large. The cumulative effect of the measures in the proposed rule penalizing “brokered deposits” thus will impact large banks far beyond the 25 basis point surcharge mentioned in the Notice. The economic impact of this penalty is predictable and is explained in the comment letter by Joseph R. Mason, Ph.D., Department of Finance, E.J. Ourso School of Business, Louisiana State University.4
As Dr. Mason notes
The FDIC is proposing to substantially increase the incremental cost of brokered funding by 25% or more in today’s rate environment. Unfortunately, that increase is occurring at a crucial time in the economic recovery when banks are in dire need of funding to make investments in firms and industries that can create the economic value that is the basis for growth. Moreover, the effects hit squarely upon the sector of the deposit funding industry that can most effectively distinguish those banks in today’s marketplace that can efficiently intermediate lending in recovering markets from those that continue to lag. Hence, the FDIC’s brokered deposit assessment will place unnecessary constraints on U.S. economic growth at a crucial juncture in the recovery with potentially debilitating effects.
4 Among other things, Dr. Mason was a Visiting Scholar at the FDIC from 2005-2007 and at the Federal Reserve Bank of Philadelphia from 2002-2005. He has held the Hermann Moyse, Jr./Louisiana Bankers Association Endowed Chair of Banking at Louisiana State University since 2008 and is also a Senior Fellow at the Wharton School.
Mr. Robert E. Feldman January 3, 2011 Page 6
Dr. Mason further notes that brokered deposit services, particularly reciprocal deposits and sweep deposits, increase market efficiency that is “crucial” to economic recovery by “bring[ing] depositors together with banks that can best use the funds, socially, systemically, and economically.” He concludes
While brokered deposit policy can be part of [bank regulatory] policy a blanket assessment surcharge will almost certainly cut the wrong way, impeding recovery and growth at precisely the time when we need funds most efficiently motivated in the U.S. economy.
The Notice proposes changes that produce precisely the opposite effects from those which Dr. Mason finds so central to economic recovery:
• faced with the cost consequences of the proposed rule, banks are likely to turn away from products deemed to be brokered deposits in favor of sourcing deposits that are not penalized as brokered deposits, even at higher rates, including the use of Internet rate boards that compete on the basis of price and direct advertising on the Internet or elsewhere;
• banks that raise funds through deposit sweeps from unaffiliated broker-dealers also may turn to alternative deposit-raising, including by attracting deposits through local branches, increasing deposit competition and raising the cost of funds for all in-market banks, including smaller community banks, and/or by aggressively raising deposits at high rates on a national basis via the Internet, potentially affecting the cost of funds nationwide; and
• funds previously swept from broker-dealer accounts to bank deposit accounts will return to being swept into money market mutual funds or other fixed income investments – according to Dr. Mason, industry estimates indicate that broker-dealer customer funds in deposit accounts at banks through sweep services represent hundreds of billions of dollars of important bank funding that will be removed from the banking system and swept into money market mutual funds.
These consequences are troubling, particularly for efforts to achieve economic recovery, which Dr. Mason observes may still be a long way off. Increasing the cost of funds for banks will increase the cost of credit for borrowers. Draining liquidity from the banking system will contract rather than expand credit, as fewer dollars will be available at reasonable prices to make and refinance loans. The changes in bank liability structures and the disintermediation of funds from
Mr. Robert E. Feldman January 3, 2011 Page 7 bank deposits will constrain lending to meet the needs of people and businesses looking to banks for relief in struggling credit markets.
The Notice does not address or analyze these issues that are central to the foundation for
reasoned decisionmaking,5
creating the risk of a significant mistake at the worst possible time – when the national economy remains fragile and recovery is far from certain after a long and deep slump in bank lending. Before taking such a momentous step, the FDIC should carefully analyze the implications of the proposed rule both on the banks affected and on macroeconomic concerns for bank liquidity and credit markets.
The Absence of Analytical Support to Evaluate the Risk Characteristics of Diverse Deposit Products May Result in Diverting Banks from Lower-Cost and Stable Deposits to Higher-Cost, Volatile Deposits. Because the Notice relies on an outdated definition of “brokered deposits” crafted for a very different purpose, the Notice would treat a broad category of deposit products as “brokered deposits” and subject them all to being penalized under the proposed rule. However, the Notice does not analyze or quantify the risk or absence of risk associated with diverse deposit products. As a result, deposits that pose higher risks to the Deposit Insurance Fund escape assessment scrutiny and lower risk products are penalized. This incongruous result and the absence of analysis raises the prospect that the rule proposed under the Notice would lack a rational basis. A key case in point is the treatment of “reciprocal deposits” under the proposed rule. As one example, through CDARS®, the Certificate of Deposit Account Registry Service®, Promontory Interfinancial offers a reciprocal deposit allocation service that facilitates the exchange of customer funds among participating banks, with the originating bank setting the rate in its local deposit market. Through the exchange, an institution can retain the benefit of large, local customer deposit relationships, while providing the customer with access to insurance on large deposit amounts.
CDARS Reciprocal Deposits are cost-effective, even when compared to “core” deposits. The majority of the “large” institutions that have utilized the CDARS service since January 2009, on average, have priced their CDARS Reciprocal Deposits at rates that do not exceed their standard posted rates for similar maturity certificates of deposit.6
5Under the Administrative Procedure Act (“APA”), any agency action, including informal rulemaking, must be the product of “reasoned decisionmaking.” Int’l Bhd. of Teamsters v. U.S., 735 F. 2d 1525, 1531 (D.C. Cir. 1984) (vacating in part a rule promulgated by the Federal Highway Administration changing certain record-keeping requirements for truck drivers based on a lack of adequate explanation for the agency’s conclusion). 6Based on a comparison of each bank’s CDARS reciprocal rates and their posted CD rates from 1/1/09 through 12/23/10, as reported by RateWatch (a division of Bankers Financial Products Corporation), for the same week and deposit maturity. 12/23/10 is the last date of 2010 for which RateWatch has received and published rate data.
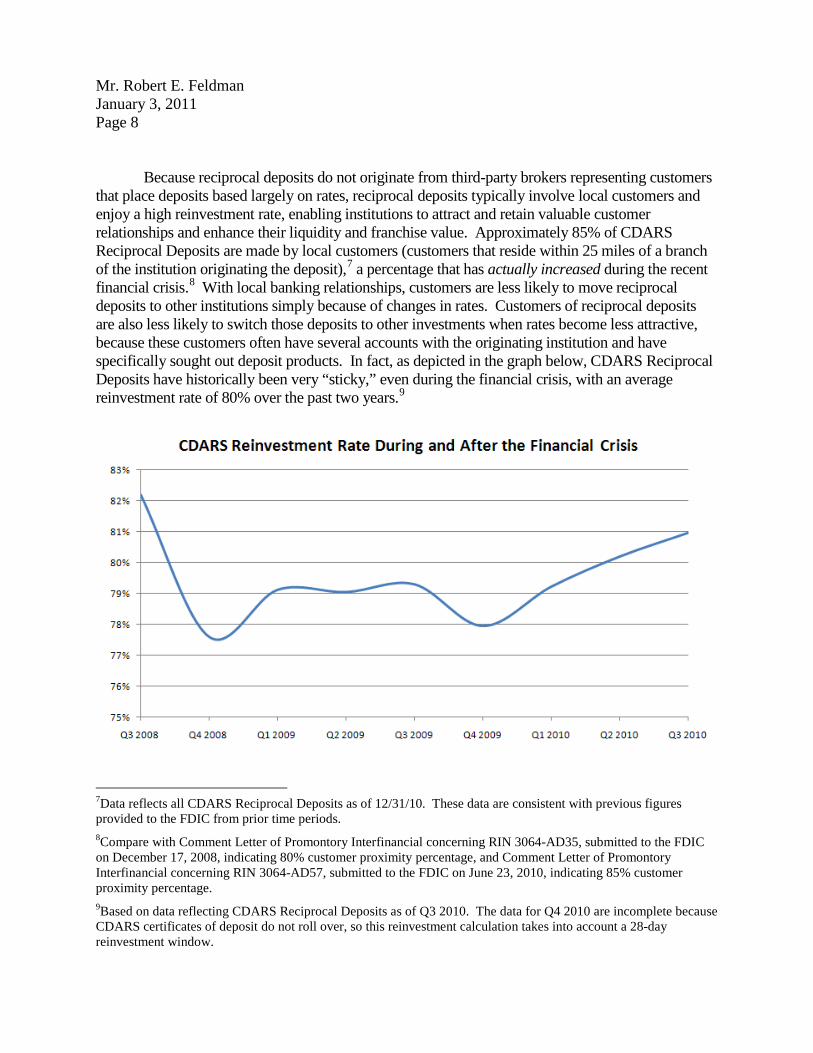
Mr. Robert E. Feldman January 3, 2011 Page 8 Because reciprocal deposits do not originate from third-party brokers representing customers that place deposits based largely on rates, reciprocal deposits typically involve local customers and enjoy a high reinvestment rate, enabling institutions to attract and retain valuable customer relationships and enhance their liquidity and franchise value. Approximately 85% of CDARS Reciprocal Deposits are made by local customers (customers that reside within 25 miles of a branch of the institution originating the deposit),7 a percentage that has actually increased during the recent financial crisis.8 With local banking relationships, customers are less likely to move reciprocal deposits to other institutions simply because of changes in rates. Customers of reciprocal deposits are also less likely to switch those deposits to other investments when rates become less attractive, because these customers often have several accounts with the originating institution and have specifically sought out deposit products. In fact, as depicted in the graph below, CDARS Reciprocal Deposits have historically been very “sticky,” even during the financial crisis, with an average reinvestment rate of 80% over the past two years.9
7Data reflects all CDARS Reciprocal Deposits as of 12/31/10. These data are consistent with previous figures provided to the FDIC from prior time periods. 8Compare with Comment Letter of Promontory Interfinancial concerning RIN 3064-AD35, submitted to the FDIC on December 17, 2008, indicating 80% customer proximity percentage, and Comment Letter of Promontory Interfinancial concerning RIN 3064-AD57, submitted to the FDIC on June 23, 2010, indicating 85% customer proximity percentage. 9Based on data reflecting CDARS Reciprocal Deposits as of Q3 2010. The data for Q4 2010 are incomplete because CDARS certificates of deposit do not roll over, so this reinvestment calculation takes into account a 28-day reinvestment window.
Mr. Robert E. Feldman January 3, 2011 Page 9 The FDIC has recognized these positive attributes. The FDIC excluded reciprocal deposits from the calculation of the adjusted brokered deposit financial measure for Risk Category I institutions under the 2009 assessment rule, noting that:
The FDIC is persuaded that reciprocal deposits like those described in the comment letters should not be included in the adjusted brokered deposit ratio applicable to institutions in Risk Category I. (However, as discussed below, reciprocal deposits will be included in the brokered deposits adjustment applicable to institutions in Risk Categories II, III and IV.) The FDIC recognizes that reciprocal deposits may be a more stable source of funding for healthy banks than other types of brokered deposits and that they may not be as readily used to fund rapid asset growth.10
Consistent with this recognition, FDIC examiners are asked “to look at the underlying relationships and franchise value of reciprocal CDARS deposits to determine whether they are, in fact, core deposits.”
11
That approach involves assessing the characteristics of funding sources in terms of stability (“stickiness”), reliability and so forth. Such an evaluation is in sharp contrast to the FDIC’s proposed new assessment regime. This contrast is particularly troubling because Congress has identified these issues in Dodd-Frank and mandated a study and recommendations, which have not yet been done and which may lead to a very different approach.
The FDIC has not offered any reason, much less supporting analysis, for reversing its course with respect to reciprocal deposits,12
and we believe the data discussed in this letter demonstrate that there is no support for any such analysis.
Promontory Interfinancial also offers IND®, a deposit “sweep” service that enables registered broker-dealers to sweep cash balances from the customer’s brokerage account to deposit accounts
10See 74 FR 9532 (March 4, 2009). 11 Minutes of the Meeting of the Advisory Committee on Community Banking of the Federal Deposit Insurance Corporation, January 28, 2010, available at http://www.fdic.gov/communitybanking/meetingminsJan2810.pdf . 12See Teamsters, 735 F.2d at 1531 (“[W]hen an agency seeks to change a settled policy, the record must at least indicate what led it to make the change.”); see also Motor Vehicle Mfrs. Ass’n v. State Farm Mut. Auto. Ins. Co., 463 U.S. 29, 41-42 (U.S. 1983) (vacating the National Highway Traffic Safety Administration’s rescission of a rule requiring automatic seatbelts or airbags in all automobiles because the agency was “too quick to dismiss” the safety considerations that were the agency’s statutory mandate); Atchison, Topeka & Santa Fe Railway Co. v. Wichita Bd. of Trade, 412 U.S. 800, 808 (U.S. 1973) (remanding an order by the Interstate Commerce Commission imposing new rates for in-transit inspections of grain because the agency had not sufficiently explained its departure from prior policies, finding that “[w]hatever the ground for the departure from prior norms,…it must be clearly set forth so that the reviewing court may understand the basis of the agency’s action and so may judge the consistency of that action with the agency’s mandate”).
Mr. Robert E. Feldman January 3, 2011 Page 10 with one or more affiliated or unaffiliated receiving banks in amounts within FDIC insurance limits. These and similar deposit sweep arrangements are governed by contractual provisions with terms in most cases of a year or more that automatically renew unless terminated by notice (generally requiring at least 180 days advance notice of nonrenewal). These contracts typically set an “all-in” cost of funds for receiving banks at rates tied to a spread over a designated index. A receiving bank thus achieves a negotiated cost of funds for amounts swept into its deposit accounts. Because such sweep programs involve millions of brokerage accounts, relative fluctuations in a bank’s deposit balances are typically very small. As a result, the receiving banks achieve generally very stable deposit balances.
Thus, reciprocal deposits and broker-dealer sweep deposits have important and recognizable
characteristics that distinguish them from the risks of traditional brokered deposits. They permit cost-effective pricing for banks and they are stable. As Dr. Mason notes in his comment letter, both reciprocal deposits and sweep deposits help banks intermediate funds, which is important for economic recovery. Yet, reciprocal deposits and sweep deposits would be subject to the same measures under the proposed rule as very different “brokered” deposits. Among the effects, as described by Dr. Mason, would be to force medium-sized banks to compete in national funding markets directly with large firms, perpetuating the “barbell” in bank size distribution and performance. Moreover, Internet-based deposit products such as “rate board” deposits are not subject to being treated as brokered deposits under the proposed assessment rule, even though they result in highly volatile deposits. Such rate boards list CD rates for numerous institutions on a nationwide basis. Customers can (and do) shop for high rates of interest. There is no local customer relationship, and rate-sensitive customers can (and do) move their deposits to follow better rates. Banks seeking to attract such deposits pay more. But despite being much more volatile, these deposits are treated under the rule as “core.” Separately, the FDIC has determined that certain sweep arrangements between a bank and an affiliated broker-dealer will not be treated as “brokered deposits.” This determination is based on the “primary purpose” of the broker-dealer. For example, an affiliated broker-dealer whose primary purpose is not to provide a deposit-placement service, but rather to facilitate the purchase and sale of securities by its customers, was not treated as a “deposit broker,” and the swept deposits were not characterized as “brokered deposits,” where certain criteria – unrelated to the stability, cost or other product characteristics of the deposits – were satisfied.13
13See FDIC Advisory Opinion 05-02 (February 3, 2005).
Exempting sweep deposits at affiliated banks is quite reasonable, for the reasons stated. But denying the same exemption to sweep deposits at unaffiliated banks ignores important facts. For example, sweep programs involving unaffiliated broker-dealers and governed by contracts of significant duration with locked-in rate structures are likely to provide at least as much stability as relationships with affiliated banks that are not so constrained. This is particularly true for affiliate relationships in which the broker-dealer’s economic

Mr. Robert E. Feldman January 3, 2011 Page 11 interests dominate within the affiliated group. In addition, receiving banks accepting deposits from a diverse group of broker-dealers, as in IND, have a lower risk of depositor withdrawals relative to a single broker-dealer affiliate sweep arrangement in which any perceived risk of the broker-dealer’s instability may trigger customer defections. Finally, the treatment of affiliate sweep programs ironically affords banks affiliated with broker-dealers a significant funding advantage relative to banks without such an affiliation, a result for which the proposed rule offers no analysis. The Notice fails to analyze the impact of the polar opposite risks posed by the very different characteristics and performance of stable, but “brokered,” reciprocal deposits and broker-dealer sweep deposits, on one hand, and volatile, but “core,” deposits such as rate board deposits on the other hand. As a result, and considering the serious issues identified by Professor Flannery with the statistical model, the proposed assessment rule lacks a rational basis to support this element of what is required to be a risk-based system. Placing diverse deposit products under the “brokered deposit” umbrella and then treating them all the same under the proposed rule with no consideration or analysis of risk does not support reasoned decisionmaking. A risk-based system, by definition, must evaluate differential product risks, rather than relying on a common undifferentiated label.
In this context, the use of the “brokered deposit” label in the Notice precludes a transparent analysis of risk. Important product characteristics – such as volatility, high rate features, local depositor relationships, maturity and franchise value – have not been considered or analyzed. The implications of these omissions for assessing the FDIC’s risk are fundamental. Faced with economic disincentives to accept deposits labeled as “brokered,” including reciprocal deposits and sweep deposits, banks are likely to turn to other deposit sources with greater volatility and higher cost, and funds previously swept to bank deposit accounts will leave the banking system for money market or other fixed-income products:
Effects of the Proposed Rule on the U.S. Banking System
Deposits
Destination Effect on the Banking System
Broker-Dealer Sweeps Stable
Money Market Funds Not Bank Deposits
Defund the Banking System
Reciprocal Deposits Stable
Rate Board Deposits Volatile
Destabilize the Banking System
Mr. Robert E. Feldman January 3, 2011 Page 12 A Lack of Analysis Demonstrating a Positive Correlation between the Risk of Bank Failure and the Use of Certain “Non-Core” Deposit Products Undermines the FDIC’s Efforts to Formulate a Risk-Based Assessment System. The FDIC Act requires the deposit insurance system to be risk-based, and in the first instance to be based on an institution’s probability of causing a loss to the Deposit Insurance Fund. Yet the FDIC has not provided any analysis that links the risk of bank failure to the use of various deposit products included in the broadly defined category “brokered deposits.” In addition, an analysis of the use of one category of deposits that are considered “brokered” – reciprocal deposits – indicates the absence of such a connection to the facts.14
Promontory Interfinancial has attached to this comment letter a study authored by Mark J. Flannery, Ph.D., Department of Finance, Graduate School of Business Administration, University of Florida, entitled “The Effect of Brokered (Non-Core) Liabilities on FDIC Insurance Payouts.”15
Dr. Flannery’s study reviews the underlying statistical analysis in the Notice, of which the most relevant is presented in Tables 1.3 and 1.5. As shown in Dr. Flannery’s study, Table 1.3 is a model of the FDIC’s Expert Judgment Rankings, in which larger numbers connote riskier banks. In this table, once other variables are controlled for (including the CAMELS rating), both core earnings (relative to assets) and, more important, core deposits (relative to liabilities) show positive coefficients, with core deposits showing significantly positive coefficients. This suggests, counterintuitively, that heavy reliance on core deposits is a source of risk. Table 1.5 is a similar model of bank failure, using the same list of variables, although this model also counts banks that received government aid as “failures.” Once again, core deposits show a positive coefficient, suggesting that banks with more core deposits fail more often.
Dr. Flannery also considered the relationship between the FDIC’s losses in bank failures on the one hand and core or non-core liabilities on the other hand. Dr. Flannery’s preliminary analysis suggests that the FDIC’s loss given default from failing banks may not depend on the composition of their liabilities.
14See, e.g., Am. Min. Congress v. U.S. Env’t Prot. Agency, 907 F.2d 1179, 1187 (D.C. Cir. 1990) (remanding part of an agency’s informal rulemaking listing certain wastes as hazardous because the agency did not establish that it had “made a reasoned decision based on ‘reasonable extrapolations from some reliable evidence’ to ensure that the agency has examined ‘the relevant data and articulate[d] a satisfactory explanation for its action including a rational connection between the facts found and the choice made.’”) (internal citations omitted). 15Among other things, Dr. Flannery served as “Resident Scholar” in the New York Federal Reserve Bank Research Department, 2009-2010, and has been the BankAmerica Eminent Scholar in Finance since 1989. He also was Co-Director, FDIC Center for Financial Research (2003-2007), and Senior Fellow, FDIC Center for Financial Research (2007).
Mr. Robert E. Feldman January 3, 2011 Page 13
Based on the significant inconsistencies in the FDIC’s asserted support in the Notice for the treatment of brokered deposits, Dr. Flannery finds that the statistical models offered in the Notice are potentially “very misleading.” Dr. Flannery states the following conclusions:
My main conclusion from examining the FDIC’s Proposed Rule for Assessments and Large Bank Pricing is that the underlying statistical analysis cannot justify the proposed policy changes. Among other things, none of the reported statistical results supports the proposed treatment of brokered deposits. Moreover, the NPR fails to provide any evidence related to some important changes in the treatment of brokered deposits for large, Risk Category I IDIs. Assessment changes of the proposed magnitude should be supported with more careful – and more fully-described – statistical analysis.
Similarly, in the attached study, “Estimated Effects of CDARS Reciprocal Deposits on the Likelihood of Bank Failure, by Alan Blinder and Arun Shastri, Promontory Interfinancial has analyzed data with respect to the utilization of CDARS Reciprocal Deposits , which are included as “brokered” under the proposed rule. This analysis shows that the use of CDARS Reciprocal Deposits is associated with, if anything, a lower risk of bank failure .
Blinder and Shastri studied statistically the differences between banks that use CDARS Reciprocal Deposits and banks that do not, as well as banks that use CDARS Reciprocal Deposits more and banks that use them less, in all cases focusing on the likelihood of failure. The analysis focused on nine quarters from the third quarter of 2008 through the third quarter of 2010 (excluding earlier periods in which bank failures were minimal or non-existent). The data analyzed were derived from bank call reports, supplemented with Promontory Interfinancial data. The major findings include:
1. Banks that use CDARS Reciprocal Deposits may look weaker on some of the characteristics that previous studies have shown to predict bank failures – although the statistical ability to predict failure is quite modest. For example, CDARS banks have less equity relative to assets, lower ROEs, and use brokered deposits more. However, CDARS banks also look stronger on some other characteristics, such as having lower operating expenses.
2. Despite these seemingly “weaker” characteristics, CDARS banks fail slightly less often than non-CDARS banks. In the overall sample, 0.41% of non-CDARS banks failed versus only 0.37% of CDARS banks.
3. When the authors analyzed the relationship between CDARS usage and bank failure quantitatively – as opposed to just qualitatively as in 2. above – they find that heavier use of CDARS Reciprocal Deposits (as a share of deposits) is associated with a lower
Mr. Robert E. Feldman January 3, 2011 Page 14
probability of failure. The effect is both statistically significant and economically meaningful.
4. The negative relationship between CDARS usage and failure is reasonably robust. It continues to hold, though often not statistically significantly, in more complicated multivariate models that include a large number of other bank characteristics as statistical controls (examples: bank size, capital, charge-offs, non-current loans, etc.) It does not hold in every single quarter, however.
Overall, a very conservative summary of these conclusions might be that the use of CDARS Reciprocal Deposits has either no effect or a salutary effect on the probability of bank failure.
***
In conclusion, we believe the treatment of “brokered deposits” under the proposed rule poses significant economic risks that should be carefully analyzed before the proposed rulemaking proceeds in this respect. Dodd-Frank reflects the importance that Congress attached to this issue, mandating an FDIC study of the definitions of core deposits and brokered deposits, including with respect to calculating deposit insurance premiums. We believe the FDIC should in deference to this Congressional mandate let the study run its course in order to inform this aspect of the rulemaking under the Notice. Finally, we respectfully submit that the proposed rule also is unsupported by the critical analysis necessary to satisfy the requirements for an administrative rulemaking. The models offered by the FDIC are not offered as a rationale for proposed changes relating specifically to brokered deposits, do not even purport to justify the treatment of brokered deposits, and could not provide such a justification because the models show just the opposite of what such a rationale would need to show.

Mr. Robert E. Feldman January 3, 2011 Page 15 Thank you for your consideration of our comments. Please let us know if you would like additional information.
Sincerely, Eugene A. Ludwig Chairman Alan Blinder Vice Chairman Mark Jacobsen President and Chief Executive Officer
Attachments
January 3, 2011
The Effect of Brokered (Non-Core) Liabilities on FDIC Insurance Payouts
Mark J. Flannery, Ph.D. University of Florida
[email protected] 352-392-3184
This note evaluates the statistical model underlying the FDIC’s November 24, 2010
Notice of Proposed Rulemaking (Federal Register pages 72612 – 72651), which proposes new
assessment procedures intended to make FDIC insurance assessments conform more accurately
to the amount of risk taken by large (assets > $10 billion) insured depository institutions (IDIs).
This is an economically legitimate goal, and the desire to “take a more forward-looking view of
risk” is especially appropriate. While the proposed rules contain a number of positive
innovations, their treatment of brokered deposits is not supported by the statistical evidence
accompanying the NPR. In fact, the “evidence” in the Appendix to this NPR is potentially very
misleading and should not be used as the basis for government policy-making.
I. Background
The FDIC has been collecting higher insurance assessments from IDIs that rely more
extensively on brokered deposits for their funding. This goal appears to reflect two distinct
considerations.
2
1) The FDIC has stated its belief that brokered deposits tend to increase the FDIC’s cost
of resolving a failed bank because a bank with fewer Core Deposits has less franchise
value:
The FDIC believes that heavy reliance on secured liabilities or other types of noncore funding reduces an IDI’s potential franchise value, thereby increasing the FDIC’s potential loss in the event of failure. Under the proposal, the FDIC includes a ratio of noncore funding to total liabilities as a risk measure in the loss severity scorecard. (2010 Federal Register page 72618)
In other words, brokered deposits tend to increase the FDIC’s loss given default
(LGD).
2) The FDIC has also stated its belief that rapid fapid growth funded with brokered
deposits raises the bank’s risk and hence its probability of default (PD). This belief
led the FDIC in 2009 to add a new risk measure to its formula for computing an IDI’s
initial base assessment rate (IBAR):
A number of costly institution failures, including some recent failures, involved rapid asset growth funded through brokered deposits. Moreover, statistical analysis reveals a significant correlation between rapid asset growth funded by brokered deposits and the probability of an institution’s being downgraded from a CAMELS composite 1 or 2 rating to a CAMELS composite 3, 4 or 5 rating within a year. A significant correlation is the standard the FDIC used when it adopted the financial ratios method in the 2006 assessments rule. (2009 Federal Register, page 9531)
The proposed assessment rules for large IDIs consider the level of an institution’s brokered
deposit funding, but not its growth rate. Accordingly, the proposed change for large IDIs
assessment rates addresses only one of these two stated concerns. In addition, the proposed
approach removes an existing provision that has permitted large, Risk Category I institutions to
use reciprocal brokered deposits without incurring an assessment increase.
The proposed formula for a large IDI’s IBAR derives from a “Score” that is the product
of two indices: 1
1 The exact formula linking the combined score to IBAR is given on page 72631:
3
a) a “Performance Score” that “measures an IDI’s financial performance and its ability
to withstand stress.” (2010 Federal Register, page 72614); and
b) a “Loss Severity Score” that “measures the relative magnitude of potential losses to
the FDIC in the event of an IDI’s failure. It is based on two measures that are most
relevant to assessing an IDI’s potential losses—a loss severity measure and a ratio of
noncore funding to total liabilities.” (2010 Federal Register, page 72618)
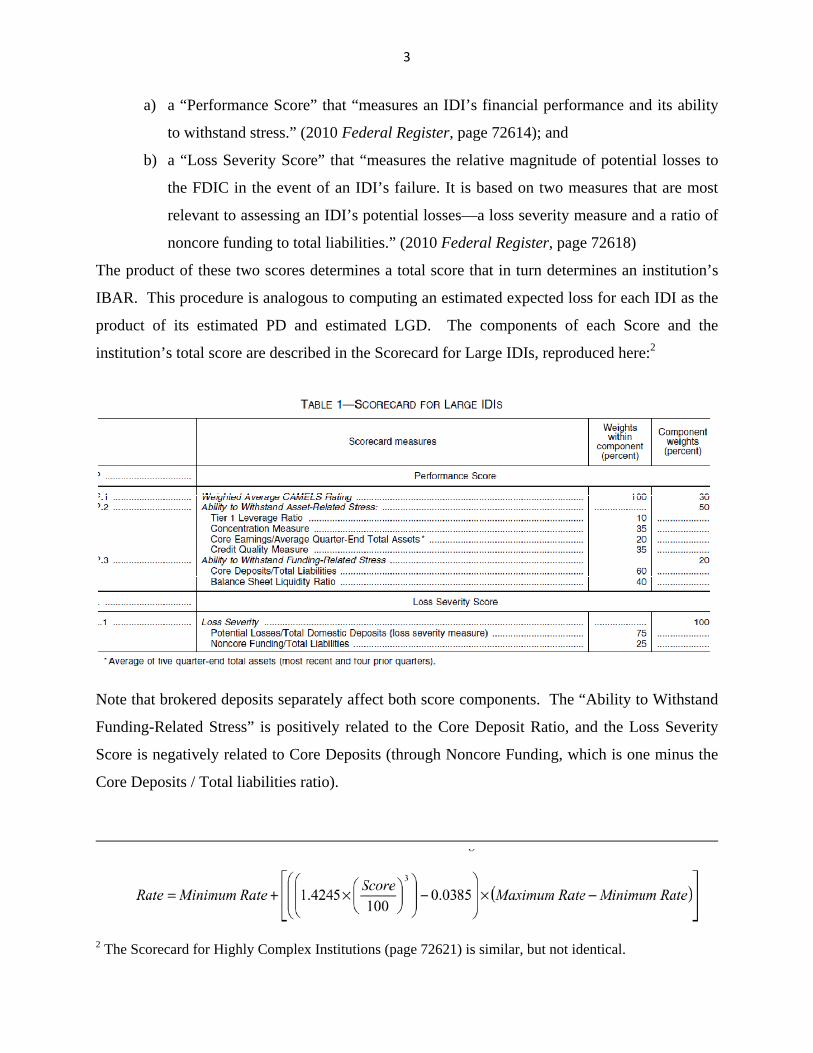
The product of these two scores determines a total score that in turn determines an institution’s
IBAR. This procedure is analogous to computing an estimated expected loss for each IDI as the
product of its estimated PD and estimated LGD. The components of each Score and the
institution’s total score are described in the Scorecard for Large IDIs, reproduced here:2
Note that brokered deposits separately affect both score components. The “Ability to Withstand
Funding-Related Stress” is positively related to the Core Deposit Ratio, and the Loss Severity
Score is negatively related to Core Deposits (through Noncore Funding, which is one minus the
Core Deposits / Total liabilities ratio).
2 The Scorecard for Highly Complex Institutions (page 72621) is similar, but not identical.
4
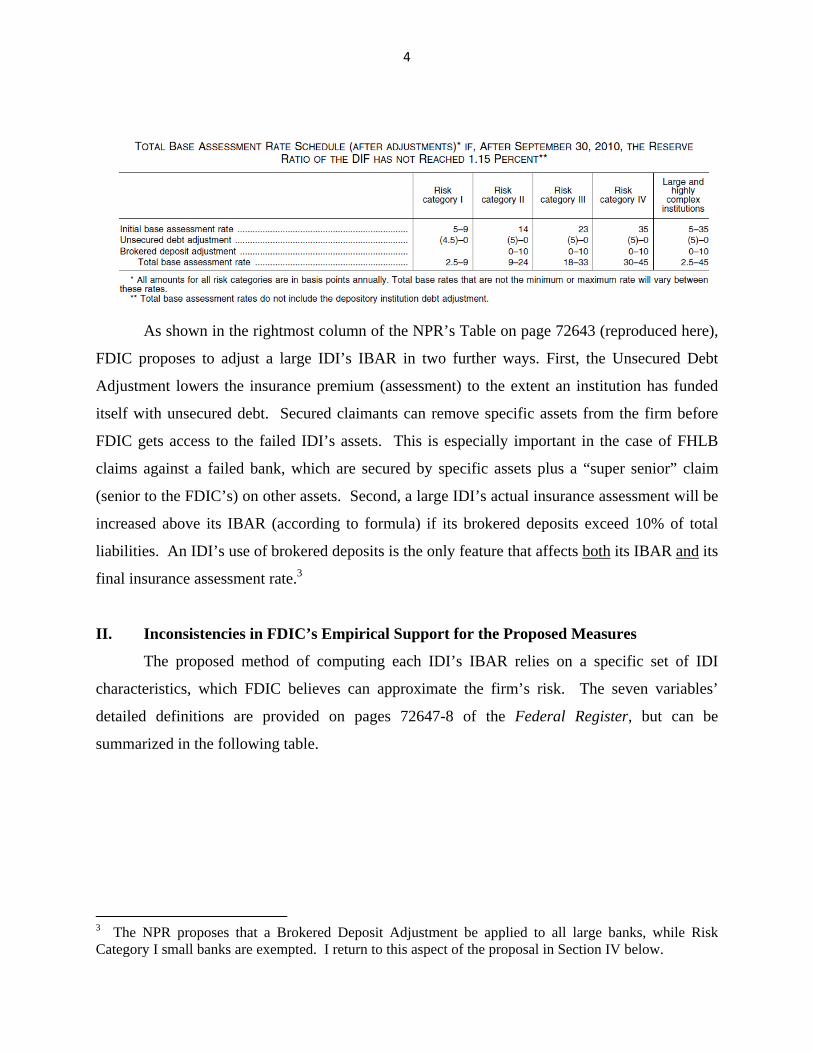
As shown in the rightmost column of the NPR’s Table on page 72643 (reproduced here),
FDIC proposes to adjust a large IDI’s IBAR in two further ways. First, the Unsecured Debt
Adjustment lowers the insurance premium (assessment) to the extent an institution has funded
itself with unsecured debt. Secured claimants can remove specific assets from the firm before
FDIC gets access to the failed IDI’s assets. This is especially important in the case of FHLB
claims against a failed bank, which are secured by specific assets plus a “super senior” claim
(senior to the FDIC’s) on other assets. Second, a large IDI’s actual insurance assessment will be
increased above its IBAR (according to formula) if its brokered deposits exceed 10% of total
liabilities. An IDI’s use of brokered deposits is the only feature that affects both its IBAR and its
final insurance assessment rate.3
II. Inconsistencies in FDIC’s Empirical Support for the Proposed Measures
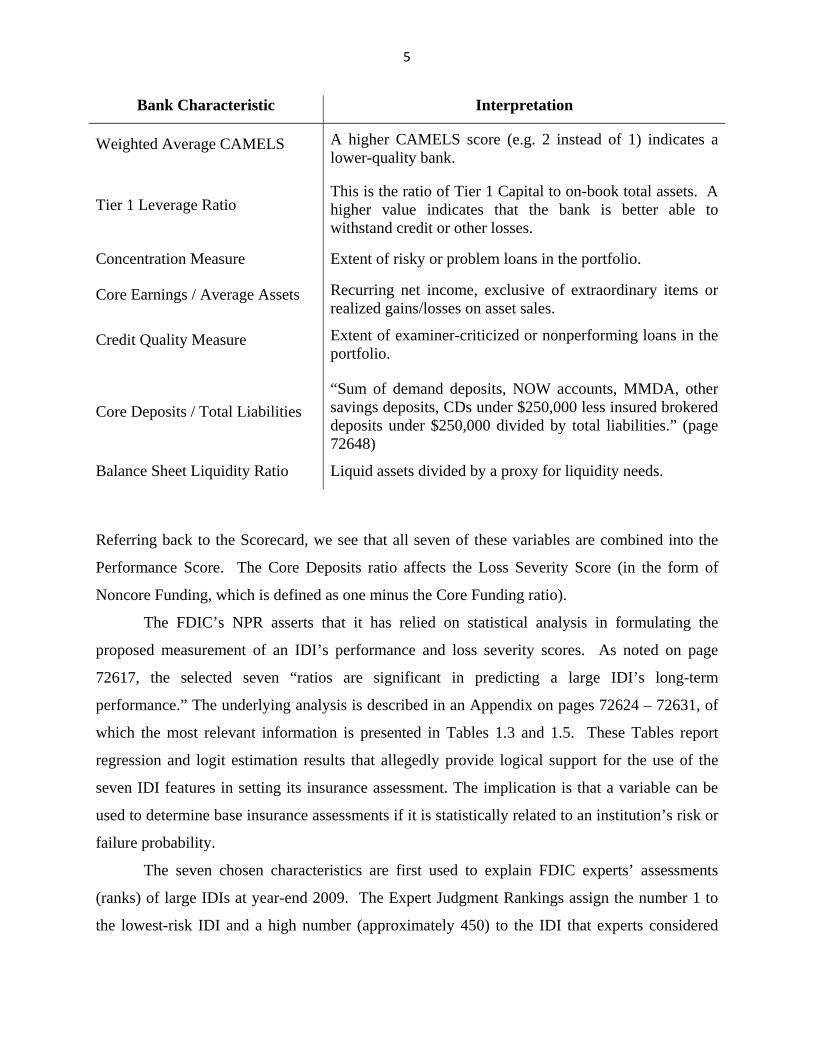
The proposed method of computing each IDI’s IBAR relies on a specific set of IDI
characteristics, which FDIC believes can approximate the firm’s risk. The seven variables’
detailed definitions are provided on pages 72647-8 of the Federal Register, but can be
summarized in the following table.
3 The NPR proposes that a Brokered Deposit Adjustment be applied to all large banks, while Risk Category I small banks are exempted. I return to this aspect of the proposal in Section IV below.
5
Bank Characteristic Interpretation
Weighted Average CAMELS A higher CAMELS score (e.g. 2 instead of 1) indicates a lower-quality bank.
Tier 1 Leverage Ratio This is the ratio of Tier 1 Capital to on-book total assets. A higher value indicates that the bank is better able to withstand credit or other losses.
Concentration Measure Extent of risky or problem loans in the portfolio.
Core Earnings / Average Assets Recurring net income, exclusive of extraordinary items or realized gains/losses on asset sales.
Credit Quality Measure Extent of examiner-criticized or nonperforming loans in the portfolio.
Core Deposits / Total Liabilities
“Sum of demand deposits, NOW accounts, MMDA, other savings deposits, CDs under $250,000 less insured brokered deposits under $250,000 divided by total liabilities.” (page 72648)
Balance Sheet Liquidity Ratio Liquid assets divided by a proxy for liquidity needs.
Referring back to the Scorecard, we see that all seven of these variables are combined into the
Performance Score. The Core Deposits ratio affects the Loss Severity Score (in the form of
Noncore Funding, which is defined as one minus the Core Funding ratio).
The FDIC’s NPR asserts that it has relied on statistical analysis in formulating the
proposed measurement of an IDI’s performance and loss severity scores. As noted on page
72617, the selected seven “ratios are significant in predicting a large IDI’s long-term
performance.” The underlying analysis is described in an Appendix on pages 72624 – 72631, of
which the most relevant information is presented in Tables 1.3 and 1.5. These Tables report
regression and logit estimation results that allegedly provide logical support for the use of the
seven IDI features in setting its insurance assessment. The implication is that a variable can be
used to determine base insurance assessments if it is statistically related to an institution’s risk or
failure probability.
The seven chosen characteristics are first used to explain FDIC experts’ assessments
(ranks) of large IDIs at year-end 2009. The Expert Judgment Rankings assign the number 1 to
the lowest-risk IDI and a high number (approximately 450) to the IDI that experts considered
6
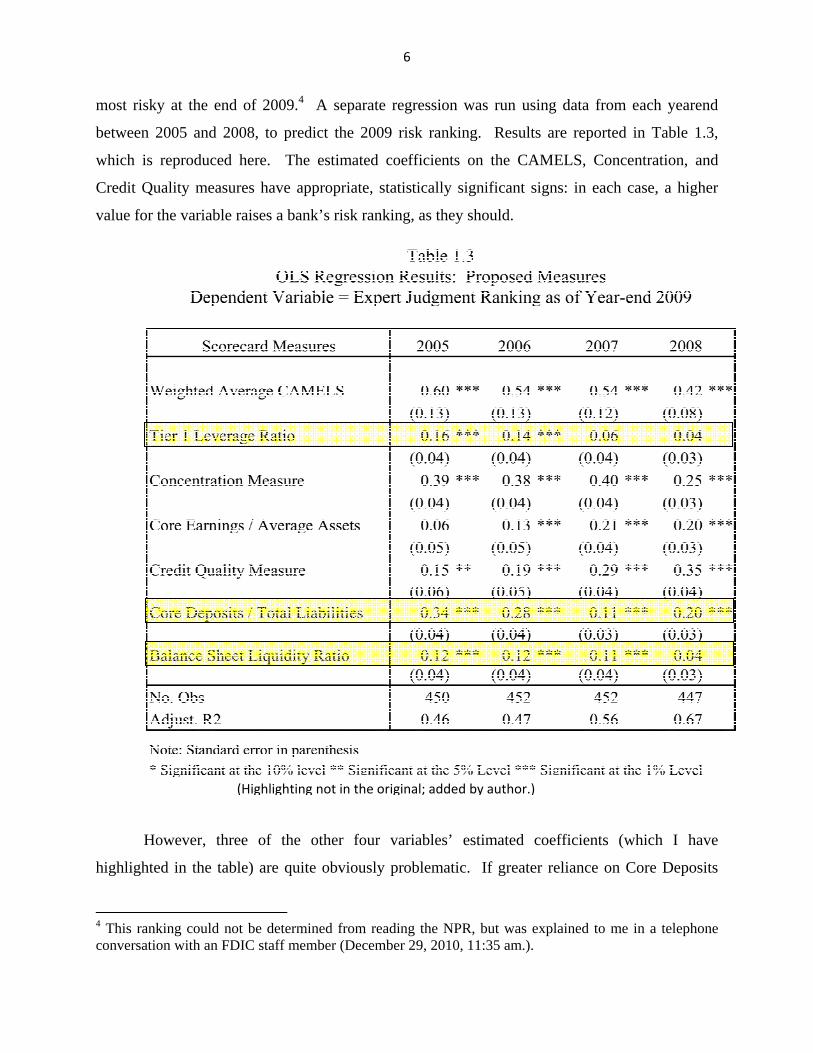
most risky at the end of 2009.4 A separate regression was run using data from each yearend
between 2005 and 2008, to predict the 2009 risk ranking. Results are reported in Table 1.3,
which is reproduced here. The estimated coefficients on the CAMELS, Concentration, and
Credit Quality measures have appropriate, statistically significant signs: in each case, a higher
value for the variable raises a bank’s risk ranking, as they should.
However, three of the other four variables’ estimated coefficients (which I have
highlighted in the table) are quite obviously problematic. If greater reliance on Core Deposits
4 This ranking could not be determined from reading the NPR, but was explained to me in a telephone conversation with an FDIC staff member (December 29, 2010, 11:35 am.).
(Highlighting not in the original; added by author.)
7
tends to make a bank safer, as FDIC asserts, the coefficient on Core Deposits should be negative.
Yet this coefficient is significantly positive in all four years, implying that a greater reliance on
NON-core liability sources (brokered deposits, secured liabilities, uninsured deposits, etc.)
makes the bank safer. This result completely contradicts the use to which the Core Deposits
ratio has been put in the NPR. Instead of raising a bank’s assessment if it has low Core
Deposits, this result suggests lowering its assessment. This result may indicate that the
underlying regression is mis-specified. Further evidence of possible mis-specification is
provided by the incorrectly signed coefficients on Tier I Leverage and the Balance Sheet
Liquidity Ratio. According to Table 1.3, each of these variables tends to increase bank risk. But
higher capital and liquidity are uniformly considered good for bank stability!5 When a regression
model yields so many “wrong” coefficient signs, it indicates that some important variable has
probably been omitted from the regression. The resulting estimated coefficients are very likely
unreliable and should not be used in making important public policy decisions. I provide some
examples of this sensitivity in the following Section.
In summary, the evidence in Table 1.3 is very likely to be misleading and should not be
used to set new policies.
The other statistical results in the NPR’s Appendix are presented in Table 1.5, which
reports coefficients for a logit model predicting which IDIs will encounter serious problems.
This logit model clearly corresponds to the “PD” component of FDIC’s loss exposure, and
therefore seems relevant to the Scorecard’s Performance Score.
5 The appropriate sign for Core Earnings is theoretically ambiguous: higher earnings could indicate a more profitable – and therefore safer – bank, or one that is earning higher profits because it is taking higher risks.
8
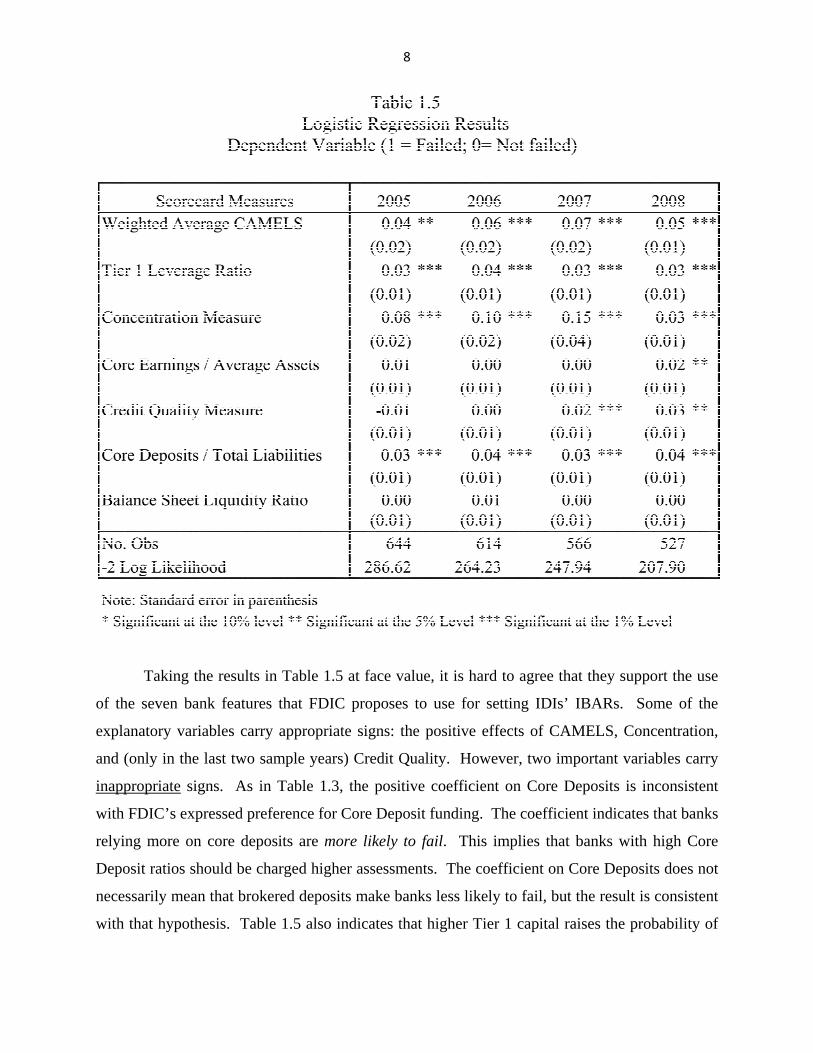
Taking the results in Table 1.5 at face value, it is hard to agree that they support the use
of the seven bank features that FDIC proposes to use for setting IDIs’ IBARs. Some of the
explanatory variables carry appropriate signs: the positive effects of CAMELS, Concentration,
and (only in the last two sample years) Credit Quality. However, two important variables carry
inappropriate signs. As in Table 1.3, the positive coefficient on Core Deposits is inconsistent
with FDIC’s expressed preference for Core Deposit funding. The coefficient indicates that banks
relying more on core deposits are more likely to fail. This implies that banks with high Core
Deposit ratios should be charged higher assessments. The coefficient on Core Deposits does not
necessarily mean that brokered deposits make banks less likely to fail, but the result is consistent
with that hypothesis. Table 1.5 also indicates that higher Tier 1 capital raises the probability of
9
failure. If this Tier 1 variable measures real, economic capital, it must logically be inversely
related to an IDI’s probability of failure. 6
As for Table 1.3, the statistical results in Table 1.5 may reflect a mis-specified regression.
They surely do not support the role of Core Deposits proposed for computing large IDIs’
insurance assessments. 7, 8
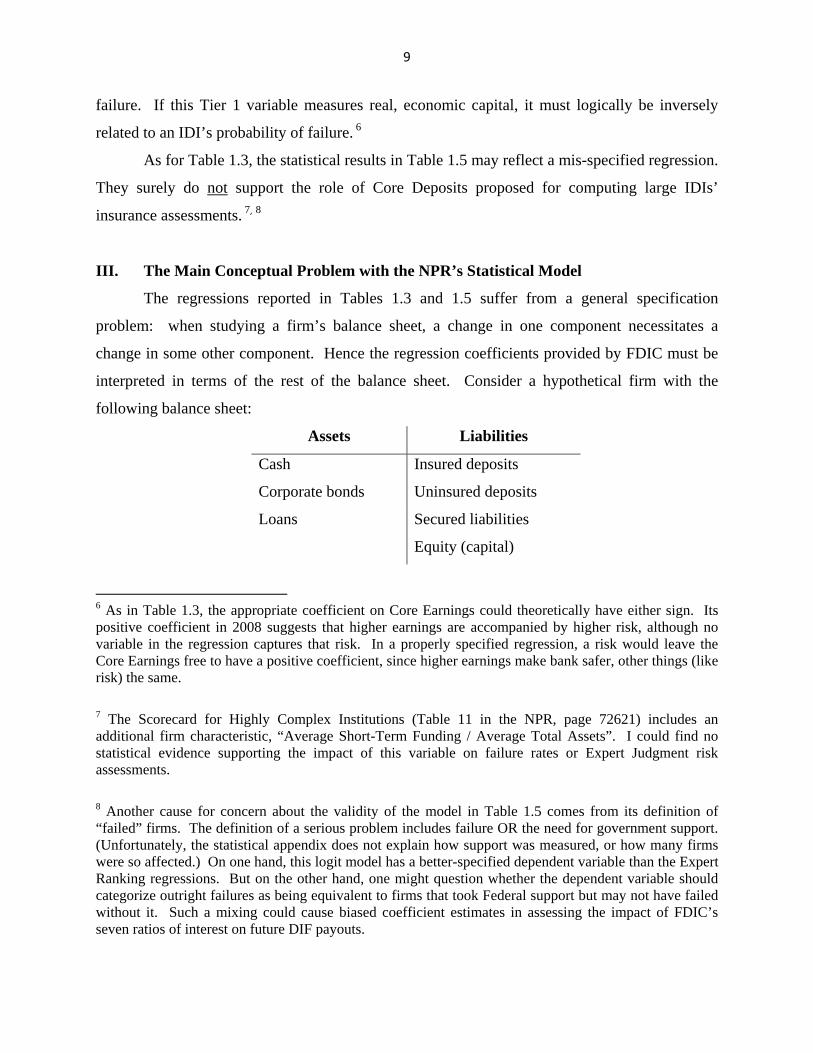
III. The Main Conceptual Problem with the NPR’s Statistical Model
The regressions reported in Tables 1.3 and 1.5 suffer from a general specification
problem: when studying a firm’s balance sheet, a change in one component necessitates a
change in some other component. Hence the regression coefficients provided by FDIC must be
interpreted in terms of the rest of the balance sheet. Consider a hypothetical firm with the
following balance sheet:
Assets Liabilities
Cash Insured deposits
Corporate bonds Uninsured deposits
Loans Secured liabilities
Equity (capital)
6 As in Table 1.3, the appropriate coefficient on Core Earnings could theoretically have either sign. Its positive coefficient in 2008 suggests that higher earnings are accompanied by higher risk, although no variable in the regression captures that risk. In a properly specified regression, a risk would leave the Core Earnings free to have a positive coefficient, since higher earnings make bank safer, other things (like risk) the same.
7 The Scorecard for Highly Complex Institutions (Table 11 in the NPR, page 72621) includes an additional firm characteristic, “Average Short-Term Funding / Average Total Assets”. I could find no statistical evidence supporting the impact of this variable on failure rates or Expert Judgment risk assessments.
8 Another cause for concern about the validity of the model in Table 1.5 comes from its definition of “failed” firms. The definition of a serious problem includes failure OR the need for government support. (Unfortunately, the statistical appendix does not explain how support was measured, or how many firms were so affected.) On one hand, this logit model has a better-specified dependent variable than the Expert Ranking regressions. But on the other hand, one might question whether the dependent variable should categorize outright failures as being equivalent to firms that took Federal support but may not have failed without it. Such a mixing could cause biased coefficient estimates in assessing the impact of FDIC’s seven ratios of interest on future DIF payouts.
10
Suppose we wish to determine the impact of Secured liabilities on this firm’s risk by regressing
an Expert Risk Rank on secured liabilities alone. The resulting coefficient cannot be clearly
interpreted. The impact of higher Secured liabilities depends on what other component of the
balance sheet adjusts in response to this change. Is the change in Secured liabilities reflected in
an offsetting change in insured deposits? In Uninsured deposits? Does equity fall? Do assets
rise, and if so which one(s)? Without including all the other balance sheet components in a
regression of the sort presented in Table 1.3 or 1.5, we cannot get a statistical answer to the
question how an increase in the included variable affects the firm’s overall profits or risk. In
short, the regressions in Tables 1.3 and 1.5 are incomplete and cannot provide evidence on the
questions FDIC wishes to address in its proposed rule.
It would be ideal to demonstrate the relevance of this statistical issue in the context of the
NPR’s Table 1.3 or Table 1.5, but this is infeasible. Table 1.3 is based on FDIC Expert Risk
Rankings, which are (presumably) confidential. The probit results in Table 1.5 utilize a “failure”
definition that includes Federal assistance and I cannot re-create that variable with any
confidence. Therefore, I have constructed a data set based on 325 commercial bank and thrift
failures since the start of 2007, as identified on the FDIC’s web site. I linked the estimated
losses on these failures to balance sheet data from the Call Reports and Thrift Financial Reports.
The results are presented in Table 1.
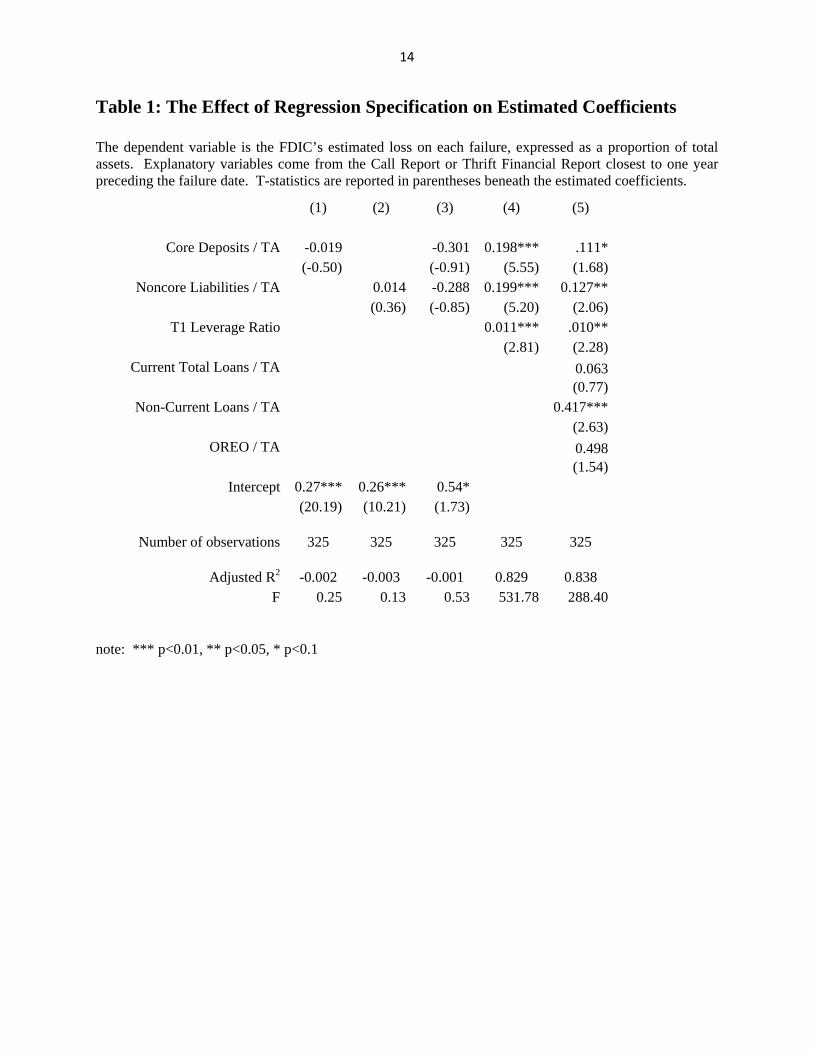
The first column of Table 1 regresses estimated insurance losses on Core Deposits alone,
yielding an insignificantly negative coefficient and a negative Adjusted R2 statistic. The second
column’s sole explanatory variable is Noncore Liabilities, and similarly yields completely
insignificant results. Combining the two liability components into the same regression
substantially changes the coefficient estimates, while leaving the overall relationship statistically
insignificant. These three regressions are incomplete, in that they omit relevant variables. Only
when we incorporate the entire liability structure, in column (4), do the estimated results become
economically more reasonable. The difference between the regression in Column (4) and those
in Columns (1) – (3) is that (4) includes in the regression all liability components. Because the
regression in (4) controls for other liabilities, a change in (say) Core Deposits implies an equal
change in one or more asset categories. While the regressions in column (1) – (3) permit a bank
to get bigger or to reduce other liability items when one liability increases, there is no clear effect
of a change in one liability category.
11
The final column adds three asset categories into the regression, current loans, noncurrent
loans, and OREO. I have excluded one balance sheet category (all other assets, including cash
and securities) in order to avoid perfect collinearity among the explanatory variables’ sums. The
interpretation of each coefficient is now the impact on FDIC losses of a shift from the associated
asset or liability into the omitted category. For example, the estimated coefficient on Core
Deposits now measures the effect of adding a similar proportion of total assets to Core Deposits
and to “All Other Assets.” This effect is smaller than in column (4), where the proper
interpretation of the coefficient on Core Deposits is the effect of losses on an increase in Core
Deposits that is used to fund higher assets of an unspecified sort. Since the “All Other Assets”
category appears to be safer than the typical asset, the impact of an increase in Core Deposits is
smaller in column (5) than in column (4).
Note that the coefficients on Core Deposits and Noncore Liabilities in Table 1 are very
similar to one another. Taken literally, this would indicate that FDIC’s LGD does not depend on
the composition of liabilities. However, I do not offer these regressions as the best basis for
setting IDI assessments, but only to illustrate the impact of mis-specified regressions on the
policy implications one might draw.
IV. Other Questions about the Logic of the Proposed Rule:
In addition to the quality of statistical support for the assignment of higher assessments to
IDIs using more brokered deposits, the logic of the proposed assessment calculations is based on
other questionable or unjustified assumptions.
Use of Risk Rankings. It is not clear what can be inferred from regressions explaining
these Expert Risk Rankings with variables that are commonly believed (within the FDIC) to
proxy for risk. For example, if the Expert Rankings are based exclusively on the seven
explanatory variables, a good statistical fit would demonstrate only that FDIC staff have a
consistent view of what constitutes a risky IDIs. Second, the explained variable is a risk ranking,
not the firm’s risk level. Although risk levels and risk Rankings are likely to be correlated, the
firm’s PD depends on level. A regression that explains the risk ranking will not necessarily
explain the IDIs’ risk levels. Accordingly, it is questionable whether a correlation between IDI

12
features and the Expert Judgment Rankings can support the use of these features in setting
insurance assessments.
Differential Treatment of Brokered Deposits for Large, Risk Category 1 IDI. In contrast
with existing assessment procedures, the NPR treats large Risk Category I institutions differently
from small ones:
(8) Brokered Deposit Adjustment. All small institutions in Risk Categories II, III, and IV, all large institutions, and all highly complex institutions shall be subject to an assessment rate adjustment for brokered deposits. (2010 Federal Register, page 72642).
Likewise, the NPR would treat brokered deposit balances differently at large and small IDIs.
Yet the NPR provides no justification for either change. Is there evidence that the effects of
brokered deposits differ betweenlarge and small Category I IDIs? Changed Treatment of Certain
Reciprocal Deposits. A further change for the large, Risk Category I IDIs concerns certain types
of reciprocal deposits that are presently excluded from the definition of brokered deposits:
The brokered deposit adjustment includes all brokered deposits as defined in Section 29 of the Federal Deposit Insurance Act (12 U.S.C. 1831f), and 12 CFR 337.6, including reciprocal deposits as defined in § 327.8(p) (2010 Federal Register, page 72642, emphasis added).
This treatment reverses the FDIC’s reasoning when it set the existing assessment rules in early
2009. At that time, the FDIC agreed that certain types of reciprocal deposits differed
qualitatively from other brokered deposits:
The FDIC is persuaded that reciprocal deposits like those described in the comment letters should not be included in the adjusted brokered deposit ratio applicable to institutions in Risk Category I. (However, as discussed below, reciprocal deposits will be included in the brokered deposits adjustment applicable to institutions in Risk Categories II, III and IV.) The FDIC recognizes that reciprocal deposits may be a more stable source of funding for healthy banks than other types of brokered deposits and that they may not be as readily used to fund rapid asset growth. (2009 Federal Register, page 9532).
It seems incumbent upon FDIC to explain their rationale for this changed treatment, along with
relevant evidence.
Source of the “Component Weights” in Performance and Loss Severity Scores. The NPR
carefully connects the Scorecard “Weights within component” (Table 1) to empirical results
from their regression models. However, the “Component weights”, which might be equally
13
important in assessing IDIs, are not supported with any statistical evidence. Neither are the
weights in the final column of Table 4 derived from any statistical evidence.
Multiplicative Effect of Brokered Deposits on IBAR. I noted above that the Large Bank
Scorecard includes brokered deposits in both its Performance Score and its Loss Severity Score.
Since the product of these two scores determines an IDI’s IBAR, IBAR rises with the square of
Noncore Liabilities. This nonlinear dependence is not addressed at all in the statistical evidence,
yet this effect could be quite large. Because even a small change in brokered deposits (for
example) raises the assessment fee due on the entire assessment base, this feature of the proposal
can easily make the marginal cost of brokered deposits extremely large.
V. Conclusions My main conclusion from examining the FDIC’s Proposed Rule for Assessments and
Large Bank Pricing is that the underlying statistical analysis cannot justify the proposed policy
changes. Among other things, none of the reported statistical results supports the proposed
treatment of brokered deposits. Moreover, the NPR fails to provide any evidence related to some
important changes in the treatment of brokered deposits for large, Risk Category I IDIs.
Assessment changes of the proposed magnitude should be supported with more careful – and
more fully-described -- statistical analysis.
14
Table 1: The Effect of Regression Specification on Estimated Coefficients The dependent variable is the FDIC’s estimated loss on each failure, expressed as a proportion of total assets. Explanatory variables come from the Call Report or Thrift Financial Report closest to one year preceding the failure date. T-statistics are reported in parentheses beneath the estimated coefficients.
(1) (2) (3) (4) (5)
Core Deposits / TA -0.019 -0.301 0.198*** .111* (-0.50) (-0.91) (5.55) (1.68)
Noncore Liabilities / TA 0.014 -0.288 0.199*** 0.127** (0.36) (-0.85) (5.20) (2.06)
T1 Leverage Ratio 0.011*** .010** (2.81) (2.28)
Current Total Loans / TA 0.063 (0.77)
Non-Current Loans / TA 0.417*** (2.63)
OREO / TA 0.498 (1.54)
Intercept 0.27*** 0.26*** 0.54*(20.19) (10.21) (1.73)
Number of observations
325 325 325 325 325
Adjusted R2 -0.002 -0.003 -0.001 0.829 0.838 F 0.25 0.13 0.53 531.78 288.40
note: *** p<0.01, ** p<0.05, * p<0.1
April 2010
Mark J. Flannery Curriculum Vitae
Department of Finance Graduate School of Business Administration
P. O. Box 117168 University of Florida
Gainesville, Florida 32611-7168 Tel: (352) 392-3184 Fax: (352) 392-0301
Email: [email protected] Current Position University of Florida
BankAmerica Eminent Scholar in Finance (since 1989) Prior Academic Experience
University of North Carolina at Chapel Hill Associate Professor of Finance (1984-87) Full Professor of Finance (1987-89) The University of Pennsylvania Assistant Professor of Finance (1976-1984) London Business School Visiting Professor of Finance (Autumn 1987) University of New South Wales Visiting Professor (May-June 1996) New York University Finance Department Visiting Professor (Fall 2006)
Education A.B., Princeton University, 1972, Summa cum Laude M.A. in Economics, Yale University, 1973 M. Phil. in Economics, Yale University, 1974 Ph.D. in Economics, Yale University, 1978
Other Professional Experience Resident Scholar, New York Federal Reserve Bank Research Department, 2009-10 (on leave of absence
from the University of Florida).
Advisory Committee member, Federal Reserve Bank of Atlanta’s Center for Financial Innovation and Financial Stability (2009 - )
Financial Advisory Roundtable, Federal Reserve Bank of New York (2006 - )
Co-Director, FDIC Center for Financial Research (2003 - 07)
Senior Fellow, FDIC Center for Financial Research (2007)

2
Chairman, Board of Trustees (2005-2008) Financial Management Association International (FMA); President (2003-4)
Editor, Journal of Money, Credit and Banking, (December 2000 – June 2005)
President, Financial Intermediation Research Society (www.finirs.org), 2008-2010; Founding Director, 2003.
Visiting Scholar, Federal Reserve Bank of New York, Fall 2006 (one day per week).
Associate Editor: Journal of Banking and Finance (1985 - 2007), Journal of Financial Services Research, The Financial Review, Journal of Financial Intermediation, Review of Quantitative Finance and Accounting.
Editorial Advisory Boards: Federal Reserve Bank of New York Quarterly Review, Journal of Financial Stability, International Journal of Managerial Finance, Journal of Money, Credit and Banking.
Special Issue co-editor (JFI), conference proceedings “Accounting, Transparency and Bank Stability” (2004).
Special Issue editor (JFSR) and conference organizer, “Market Discipline in Banking” (November 2001).
Ph.D. seminars (1-week) in Financial Intermediation: Aarhus Business School, 2000, 2004, 2008.
“Master Class” lectures on financial intermediation, Melbourne, Australia (July 2008).
American Finance Association Board of Directors (1999-2002)
Credit Research Center (Georgetown University), Research Committee and Board of Governors, 2000-2003.
Barnett Bank of Alachua County Board of Directors (1989-1998).
University of Pennsylvania Credit Union Board of Directors, January 1982 - March 1984.
Consultant to University of Pennsylvania Federal Credit Union (September 1978 - 1981).
Research Adviser, Federal Reserve Bank of Philadelphia, January 1981-July 1984.
Senior Economist, Federal Reserve Bank of Philadelphia, January - December 1980 (on leave from Wharton).
Summer Research Associate, Federal Reserve Bank of Boston (1973, 1974), and Federal Reserve Board of Governors (1975).
Consultant on EFTS and Credit Unions, 1974-1975.
Co-Author of “Flannery and Flood's ProBanker: A Financial Services Simulation” (Web-based simulation program: www.probanker.com ).
Working Papers “What to do about TBTF” (April 2010)
"Credit lines and the substitutability of cash and debt", (with Brandon Lockhart), November 2009 (Invited re-submission in preparation, JFQA)
"Institutional Determinants of Capital Structure Adjustment Speeds" (with Ozde Oztekin), November 2009 (Invited re-submission in preparation, JFE).
“Estimating Dynamic Panel Models in Corporate Finance” (with Kristine Hankins), February 2010.
3
“Stabilizing Large Financial Institutions with Contingent Capital Certificates” (October 2009)
“Do Credit Spreads Reflect Mean-Reverting Leverage?” (with Stanislava Nikolova and Ozde Oztekin), October 2009. (Invited re-submission to JFQA)
“Transaction Costs and Capital Structure Adjustments” (with Michael Faulkender, Kristine Hankins, and Jason Smith), January 2008.
“Major Investments, Firm Financing Decisions, and Long-run Performance” (with Ralf Elsas and Jon Garfinkel), March 2009.
“Scale Economies at Payday Loan Stores,” (with Katherine Samolyk), FDIC Center for Financial Research Working Paper, July 2007.
“New Estimates of the Jumbo-Conforming Spread” (with Alan Blinder and Brandon Lockhart), January 2006.
Work in Progress
“Disciplining Financial Institutions with Market vs. Supervisory Forces” (with Kevin Stiroh), in
preparation for the Journal of Economic Literature.
“The Current Financial Crisis and Bank Opaqueness” with Simon Kwan and M. Nimalendran
“Macroeconomic News and the DM/$ Exchange Rate, 1980-1998” (with Aris Protopapadakis), March 2010.
“Impact of Macroeconomic Announcements on Index Options’ Implied Volatility Measures” (with Elvan Aktase and Aris Protopapadakis), in progress.
“Improved Measures of Target Capital Structures” (with R. Burt Porter), in progress.
Refereed Publications
“Frequent Issuers’ Influence on Long-Run Post-Issuance Returns” (with Matthew Billett and Jon Garfinkel), forthcoming Journal of Financial Economics.
“Why Do Large Banking Organizations Hold So Much Capital?” (with Allen Berger, Robert DeYoung, Ozde Oztekin, and David Lee), Journal of Financial Services Research, (2008) 34(2/3), 123-150.
“Fiduciary Standards and Institutions’ Preference for Dividend-Paying Stocks” (with Kristine Watson Hankins and M. Nimalendran), Financial Management, (2008) 37(4), 647-672.
“What Caused the Bank Capital Build-up of the 1990s?” (with Kasturi Rangan), Review of Finance (2008) 12: 391-429.
“Are Bank Loans Special? Evidence on the Post-Announcement Performance of Bank Borrowers” (with Matthew T. Billett and Jon A. Garfinkel), Journal of Financial and Quantitative Analysis, 2006, 41(4), 733-752. (Lead article)
“Partial Adjustment toward Target Capital Structures” (with Kasturi Rangan), Journal of Financial Economics, 79(3), 2006, pp. 469–506. (Lead article)
“Market Evidence on the Opaqueness of Banking Firms’ Assets” (with S. Kwan and M. Nimalendran), Journal of Financial Economics, 71(3), 2004, pp. 419-460. (Lead article)
“Market Discipline in the Governance of U.S. Bank Holding Companies: Monitoring versus Influencing,” (with Robert R. Bliss) European Finance Review, vol. 6(3), 2002, pp. 361-395.
4
“Macroeconomic Factors Do Influence Aggregate Stock Returns” (with Aris Protopapadakis) Review of Financial Studies, (Summer 2002), pp. 751-782.
“The Faces of Market Discipline” Journal of Financial Services Research, (October/December 2001), pp. 107-119.
“The Informational Content of Bank Exam Ratings and Subordinated Debt Prices” (with Robert DeYoung, William Lang, and Sorin Sorescu) Journal of Money, Credit and Banking, (November 2001), pp. 900-925.
“Comparing Market and Regulatory Assessments of Bank Performance: Who Knows What When?” (with A. Berger and S. Davies) Journal of Money, Credit and Banking (August 2000, Part 2), pp. 641-667.
“Modernizing Financial Regulation: The Relation Between Interbank Transactions and Supervisory Reform”, Journal of Financial Services Research (September/ December 1999), pp.101-116.
“The Value of a Government Monitor for Firms with Hard-to-Value Assets” (with Joel F. Houston) Journal of Money, Credit and Banking (February 1999), pp. 14-34.
“Using Market Information in Prudential Bank Supervision: A Review of the U.S. Empirical Evidence” Journal of Money, Credit and Banking (August 1998, Part I), pp. 273-305.
“Asset Pricing with Time-Varying Factor Volatilities” (with A. Hameed and R. Harjes), Journal of Banking and Finance (March 1997), pp. 315-335.
“Financial Crises, Payment System Problems, and Discount Window Lending” Journal of Money, Credit and Banking (November 1996, Part II), pp. 804-824.
Reprinted in Financial Crises, Contagion, and the Lender of Last Resort, Charles Goodhart and Gerhard Illing (eds.) (Oxford: Oxford University Press, 2002).
“Evidence of Bank Market Discipline In Subordinated Debenture Yields: 1983-1991” (with Sorin M. Sorescu) Journal of Finance (September 1996), pp. 1347-1377.
Reprinted in The Regulation and Supervision of Banks (a 4-volume set), Maximilian J.B. Hall (ed.) (Cheltenham: Edward Elgar Publishing, Ltd., 2002).
“The Effect of Lender Identity on a Borrowing Firm’s Equity Return” (with M. Billett and J. Garfinkel), Journal of Finance (June 1995), pp. 699-718.
“Debt Maturity Structure and the Deadweight Cost of Leverage: Optimally Financing Banking Firms” American Economic Review (March 1994), pp. 320-331.
“Financing Multiple Investment Projects” (with Joel F. Houston and S. Venkataraman), Financial Management Corporate Investments Special Issue (Summer 1993), pp. 161-172.
“Does the Debt Market Assess Large Banks’ Risk?” (with David M. Ellis) Journal of MonetaryEconomics (December 1992), pp. 481-502.
Reprinted in The Regulation and Supervision of Banks (a 4-volume set), Maximilian J.B. Hall (ed.) (Cheltenham: Edward Elgar Publishing, Ltd., 2002).
“Pricing Deposit Insurance When the Insurer Measures Bank Risk with Error” Journal of Banking and Finance (September 1991), pp.975-998.
Reprinted in The Regulation and Supervision of Banks (a 4-volume set), Maximilian J.B. Hall (ed.) (Cheltenham: Edward Elgar Publishing, Ltd., 2002).
“Capital Regulation and Insured Banks’ Choice of Individual Loan Default Risk” Journal of Monetary Economics (September 1989), pp. 235-258.
5
Reprinted in The Regulation and Supervision of Banks (a 4-volume set), Maximilian J.B. Hall (ed.) (Cheltenham: Edward Elgar Publishing, Ltd., 2002).
“From T-bills to Common Stocks: Investigating the Generality of Intra-Week Return Seasonality” Journal of Finance (June 1988), pp. 431-450 (with Aris A. Protopapadakis).
“The Bank-Customer Relationship” Geld, Banken und Versicherungen (1987, Number 2), pp. 801-812 (with Timothy M. Devinney).
“Asymmetric Information and Risky Debt Maturity Choice” Journal of Finance (March 1986), pp. 19-37.
“The Effect of Interest Rate Changes on the Common Stock of Financial Institutions” Journal of Finance, (September 1984), pp. 1141-1154 (with Christopher James).
“Market Evidence on the Effective Maturity of Bank Assets and Liabilities” Journal of Money, Credit and Banking, (November 1984), pp. 435-445 (with Christopher James).
“The Social Cost of Unit Banking Restrictions” Journal of Monetary Economics (March 1984), pp. 237-249
“Interest Rates and Bank Profitability: Additional Evidence” Journal of Money, Credit and Banking (August 1983), pp. 355-362
“Correspondent Services and Cost Economies in Commercial Banking” Journal of Banking and Finance (March 1983), pp. 83-100.
“Retail Bank Deposits as Quasi-fixed Factors of Production” American Economic Review (June 1983), pp. 527-536.
“Market Interest Rates and Commercial Bank Profitability: An Empirical Investigation” Journal of Finance (December 1981), pp. 1085-1101.
“Can State Bank Examination Data Replace FDIC Examination Visits?” Journal of Bank Research (Winter 1983), pp. 312-316.
“Indexing the U.S. Economy: Simulation Results with the MPS Model” Journal of Econometrics (Annals of Applied Econometrics Supplement) (January 1981), pp. 93-114 (with Lewis Johnson).
“Risk-Efficient Monopoly Pricing for the Multiproduct Firm: Comment” Quarterly Journal of Economics (November 1979), pp.737-740.
Other Academic Publications
“Credit Default Swap Spreads Are Viable Substitutes for Credit Ratings” (with Frank Partnoy and Joel Houston), forthcoming University of Pennsylvania Law Review.
“Financial system instability: Threats, prevention, management, and resolution,” Journal of Financial Stability, v5(3), 221-223.
"Market discipline in financial regulation", in Vesala, J. (ed.), Effective Risk Based Supervision: How to develop good supervision, The Marketing & Management Collection, Henry Stewart Talks Ltd, London (online at http://www.hstalks.com/?t=MM0842243-Flannery)
“The Subprime Crisis: Lessons about Market Discipline,” in The Credit Market Turmoil of 2007-2008: Implications for Public Policy, Douglas D. Evanoff, Philipp Hartmann and George G. Kaufman (eds.). World Scientific Publishing Co. Pte. Ltd, New Jersey, forthcoming.
“Market Discipline in Bank Supervision,” in the Oxford Handbook of Banking, A. Berger, P. Molyneux, and J. Wilson (eds.), 2010.
6
“The Role of Hedge Funds in World Capital Markets,” in Paolo Savona (ed.) Money and Derivatives, Innovation and Growth (Florence: Associazione Guido Carli, 2007).
“Supervising Bank Safety and Soundness: Some Open Issues“, Federal Reserve Bank of Atlanta Economic Review First and Second Quarters 2007, pp. 83-100.
“The Federal Home Loan Bank System: The ‘Other’ Housing GSE” (with W. Scott Frame), Federal Reserve Bank of Atlanta Economic Review, 91(3) Third Quarter 2006, 33-54.
“Commentary” on “Market Indicators, Bank Fragility, and Indirect Market Discipline” by Reint Gropp, Jukka Vesala, and Giuseppe Vulpes, New York Federal Reserve Bank Economic Policy Review, (2004).
“Market Discipline of U.S. Financial Firms: Recent Evidence and Research Issues” (with Stanislava Nikolova), in William C. Hunter, George G. Kaufman, Claudio Borio, and Kostas Tsatsaronis (eds.), Market Discipline across Countries and Industries (Cambridge: MIT Press, 2004), pp. 87-100.
“No Pain, No Gain? Effecting Market Discipline via ‘Reverse Convertible Debentures’”, in Hal S. Scott (ed.), Capital Adequacy beyond Basel: Banking, Securities, and Insurance (Oxford: Oxford University Press, 2005).
“Discussion” of three papers on credit rating agencies, in (Ratings, Rating Agencies, and the Global Financial System (eds: Richard M. Levich, Carmen Reinhart and Giovanni Majnoni), to be published by Kluwer Academic Publishers (2002), pp. 89-95.
“Market Discipline in the Governance of U.S. Bank Holding Companies: Monitoring versus Influencing,” in Frederic S. Mishkin (ed.) Prudential Supervision: What Works and What Doesn’t (Chicago: The University of Chicago Press, 2001), pp. 107-143 (with Robert R. Bliss).
“Discussion” of “Megamergers and Expanded Scope: Theories of Bank Size and Activity Diversity”, by Todd Millbourn, Arnoud Boot, and Anjan Thakor, Journal of Banking and Finance, v. 23 (#2-4) (February 1999), pp. 215-220.
“Discussion” of “Who Benefits from Secondary Market Price Stabilization of IPOs?”, by L.M. Benveniste, S.M. Erdal, and W.J. Wilhelm Jr., Journal of Banking and Finance, v22(#6-8) (August 1998), pp. 768-772.
“Market Evidence on the Opaqueness of Bank Assets”, Proceedings of the 1997 Conference on Bank Structure and Competition, Federal Reserve Bank of Chicago, pages 470-485 (with Simon Kwan and M. Nimalendran).
“Off-Site Surveillance Systems”, in History of the Eighties: Lessons for the Future, Symposium Proceedings (FDIC Conference, January 1997), pp. 31-40.
“Technology and Payments: Deja Vu All Over Again?”, panel discussion (“Innovations in Money and Payments”) in a Conference Proceedings published in the Journal of Money, Credit and Banking (November 1996).
“Discussion of the Historical and Foreign Experience with Universal Banking”, in Anthony Saunders and Ingo Walter (eds.), Universal Banking (Chicago: Irwin Professional Publishing, 1996), pp. 101-108.
“Pricing Bank Default Risk in Subordinated Debenture Yields”, Proceedings of the 1995 Conference on Bank Structure and Competition, Federal Reserve Bank of Chicago, pages 459-482 (with Sorin M. Sorescu).
7
“Regulatory Responses to the Potential for Systemic Risk in the Financial Sector”, George Kaufman (ed.), Research in Financial Services, Private and Public Policy (Volume 7) (Greenwich: JAI Press, 1995), pp. 323-336.
“Prudential Regulation in Banking”, in Kuniho Sawamoto, Zenta Nakajima and Hiroo Taguchi (eds.) Financial Stability in a Changing Environment (New York: St. Martin’s Press, Inc., 1995), pp. 281-318.
“Panel Discussion on The Implications of ‘Banking’s Decline’ for Safety and Soundness Regulation”, Proceedings of the 1994 Conference on Bank Structure and Competition, Federal Reserve Bank of Chicago, pp. 69-72.
“Corporate Finance, Market Discipline, and Bank Supervision”, Proceedings of the 1994 Conference on Bank Structure and Competition, Federal Reserve Bank of Chicago, pp. 313-330.
“The Future of the Financial Services Industry”, Journal of Banking and Finance (April 1993), pp. 559-561.
“Comment” on “Deposit Insurance Reform: A Functional Approach” by Robert Merton and Zvi Bodie, Journal of Monetary Economics (Proceedings of the 1992 Carnegie-Rochester Conference), (June 1993), pp. 35-40.
Reprinted in The Regulation and Supervision of Banks (a 4-volume set), Maximilian J.B. Hall (ed.) (Cheltenham: Edward Elgar Publishing, Ltd., 2002).
“Government Risk-Bearing in the Financial Sector of a Capitalist Economy”, in Mark S. Sniderman (ed.), Proceedings of a Conference on Government Risk-Bearing, 1993, pp. 71-100.
Book Review: The Future of Banking (by James L. Pierce), Journal of Finance (March 1992), pp. 417-420.
Book Review: The S&L Debacle (by Lawrence White), Journal of Economic Literature (March 1992), pp. 205-207.
“Comment on Payments System Risk”, in Governing Banking’s Future: Markets vs. Regulations, Catherine England (ed.) (Norwell, MA: Kluwer Academic Publishers, 1991), pages 181-187.
“Discussion” of “Off Balance Sheet Activities: Banking and Monetary Policy”, in Journal of Accounting, Auditing, and Finance (Spring 1989), pp. 161-168.
“Payments System Risk and Public Policy” in William S. Haraf (ed.) Restructuring the Financial System, (Washington: The American Enterprise Institute, 1988), pp. 261-287.
“Contagious Bank Runs, Financial Structure, and Corporate Separateness within a Bank Holding Company”, Proceedings of the 1986 Conference on Bank Structure and Regulation, Federal Reserve Bank of Chicago, pp. 213-230.
“Recapitalizing the Thrift Industry”, in Federal Home Loan Bank of San Francisco, Financial Stability of the Thrift Industry (1986), pp. 91-114.
“Comment” on “The Role of Interstate Banking in the Diffusion of Electronic Payments Technology” and “Technology and Financial Intermediation in a Multiproduct Banking Firm” in C. Lawrence and R. P. Shay (eds.), Technological Innovation, Regulation and the Monetary Economy (Boston: Ballinger Press, 1986).
“Discussion” of “Can Supervision and Regulation Ensure Financial Stability?”, in The Search for Financial Stability: The Last 50 Years (Federal Reserve Bank of San Francisco, (1985), pp. 147-151.
8
“An Economic Evaluation of Bank Securities Activities before 1933,” in Ingo Walter (ed.), Deregulating Investment Banking (New York: John Wiley and Sons, 1985), pp. 67-87.
“A Portfolio View of Loan Selection and Pricing”, in Robert A. Eisenbeis and Richard C. Aspinwall (eds.), Handbook for Banking Strategy (New York: John Wiley and Sons, 1985), pp. 457-472.
“Discussion” of Fischer Black’s “The Future of Financial Services”, in Robert P. Inman (ed.), Managing the Service Economy: Prospects and Problems, (Cambridge: Cambridge University Press, 1985), pp. 234-38.
“Policy Issues in Federal Deposit Insurance,” Proceedings of the 1983 Conference on Bank Structure and Competition, Federal Reserve Bank of Chicago, pp. 295-298.
“The Impact of Market Interest Rates on Intermediary Stock Prices,” Proceedings of the 1982 Conference on Bank Structure and Competition, Federal Reserve Bank of Chicago, pp. 520-538 (with Christopher James).
Book Review: Risk and Capital Adequacy in Commercial Banks (by Sherman J. Maisel), Journal of Finance (June 1982), pp. 891-895
“Discussion of: ‘An Economic Theory of a Credit Union’”, Journal of Finance (May 1981), pp. 554-556.
“A Method for Empirically Assessing the Impact of Market Interest Rates on Intermediary Profitability”, Proceedings of the 1980 Conference on Bank Structure and Regulation, Federal Reserve Bank of Chicago, pp.1-15.
Book Review: Implications of Regulation on Bank Expansion: A Simulation Analysis (by George S. Oldfield), Journal of Finance (December 1980), pp. 1286-88.
“Identifying Problem Banks”, Proceedings of the 1979 Conference on Bank Structure and Regulation, Federal Reserve Bank of Chicago, pp. 1-32 (with Jack M. Guttentag).
“Thrift Institutions and Small Banks in the EFTS”, in The Economics of a National Electronic Funds Transfer System, Federal Reserve Bank of Boston, 1975.
An Economic Evaluation of Credit Unions in the United States, Research Report # 54, Federal Reserve Bank of Boston, 1974.
Economic Implications of an Electronic Monetary Transfer System (Lexington: D.C. Health and Company, 1973), (with Dwight M. Jaffee).
Other Publications
“Banking and Finance”, chapter in The Economy of Florida (1995: University of Florida Bureau of
Business and Economic Research), pages 171-188 (with Joel F. Houston).
“Deposit Insurance”, New Palgrave Dictionary of Money and Finance, Volume 1 (1992).
“More Capital is Needed: External Sources are Best”, Outlook of the Federal Home Loan Bank System, (March/April 1986), pp. 12-15.
“Risk-Sensitive Deposit Insurance Premia: Some Practical Issues”, Federal Reserve Bank of Philadelphia Business Review (September/October 1984), pp. 3-10 (with Aris A. Protopapadakis).
“Removing Deposit Rate Ceilings: How Will Bank Profits Fare?”, Federal Reserve Bank of Philadelphia Business Review, (March/April 1983), pp. 13-21.
“Deposit Insurance Creates a Need for Bank Regulation”, Federal Reserve Bank of Philadelphia Business Review, January/February 1982), pp. 17-27.
9
“How Do Changes in Market Interest Rates Affect Bank Profits?”, Federal Reserve Bank of Philadelphia Business Review (September/October 1980), pp. 13-22.
“Credit Unions as Consumer Lenders in the United States”, New England Economic Review, July/August 1974.
“Comparability of State and FDIC Examination Results”, in Leonard Lapidus (and others), State and Federal Regulation of Commercial Banks, Federal Deposit Insurance Corporation, 1980.
“Problem Banks: Examination, Identification, and Supervision”, in Leonard Lapidus (and other), State and Federal Regulation of Commercial Banks, Federal Deposit Insurance Corporation, 1980 (with Jack M. Guttentag).
Fellowships, Honors and Awards
University of Florida Research Foundation Professorship, 2006-8
MBA Teaching Award - Outstanding Faculty Award for Core Courses (2006, 2009)
Keynote Addresses:
2003 Financial Management Association European meeting (Dublin, Ireland).
2005 Australian Banking and Finance Conference (Sydney, Australia)
2006 Infiniti Conference (Trinity College, Dublin)
2006 Asian Finance Association – FMA Conference (Auckland, NZ)
2007 Conference on “Information in bank asset prices: theory and empirics” Ghent University, Belgium
2007 Southern Finance Association
2008 Mid-Atlantic Research Conference in Finance
2010 BIS-CEPR-JFI Conference on “Systemic risk and financial regulation – causes and lessons from the financial crisis”.
Inducted as FMA Fellow, 2005
1997 Journal of Money, Credit and Banking Lecture at the Ohio State University Department of Economics (by invitation).
1995 FMA Competitive Paper Award, best paper in Financial Institutions
Institute for Quantitative Research in Finance Research Award, 1987, 1994
Prochnow Educational Foundation Research Award, 1987
North Carolina Business Foundation Summer Research Grant, 1984-88
University of Pennsylvania Summer Research Grant, 1977-79, 1982-83
FDIC Dissertation Support Fellowship, 1975-1976
Conferences Organized
Workshop on Contingent Capital Instruments (with Hamid Mehran), Federal Reserve Bank of New York, April 2010.

10
FIRS Annual Conference, May 2009 (Prague)
Frontiers of Finance, January 2005, 2006, 2007
“Identifying and Resolving Financial Crises” (with Joe Haubrich), FDIC and Federal Reserve Bank of
Cleveland, April 2008
“Market Discipline in Banking” (November 2001)
Financial Management Association North American Meeting, October 2001.
1
ESTIMATED EFFECTS OF CDARS RECIPROCAL DEPOSITS ON
THE LIKELIHOOD OF BANK FAILURE
Alan Blinder and Arun Shastri1
Promontory Interfinancial Network
January 3, 2011
INTRODUCTION AND SUMMARY OF FINDINGS The purpose of this paper is to describe the findings of a statistical analysis of the effect of reciprocal deposits placed through the CDARS Reciprocal service (“CDARS Reciprocal Deposits”) on the likelihood of bank failure. Now that there is some historical experience with bank failures in an environment in which CDARS Reciprocal Deposits exist, this is possible for the first time.2
We study the relationship between CDARS Reciprocal Deposits and standard measures of bank performance. We also construct models to predict failure of a bank based on a number of commonly-used financial measures plus the use of CDARS Reciprocal Deposits. Our analysis shows that while greater use of certain kinds of brokered deposits appears to increase the risk of failure, greater use of CDARS Reciprocal Deposits probably decreases it. I. DATA In this study, we used data from several sources, including the FDIC's website, as well as Promontory data. Use of the FDIC's Statistics on Depository Institutions database allowed for the collection of quarterly, bank-specific data points dating from the March 31, 2005 call report (henceforth, 2005:Q1) through the September 30, 2010 call report (2010:Q3). But our primary focus is on data from 2008:Q3 forward, since there were so few bank failures prior to that. Banks chartered after January 1, 2005 were excluded on the grounds that de novo banks are a special case. We identified quarter-end outstanding balances of CDARS Reciprocal Deposits during the same time periods. The FDIC's list of failed institutions identified the population of failed banks each quarter over this period. Its press releases on specific bank failures provided all bank statistics as of the time of failure--the lone exception being outstanding CDARS Reciprocal Deposits. In addition to failure of an institution, the study considered several financial measures as being important in understanding bank risks. These include rates of return on both assets and equity, several different capital ratios, measures of loan quality (charge-offs and non-current loans), ratios of loans to assets (both in total and for specific lending categories), and operating expenses, among others. In “cleaning” the dataset, any observations with non-positive or completely illogical values (e.g., loans greater than assets) were excluded. 1 We are deeply indebted to Thomas Zuzelo for superb research assistance. 2 CDARS Reciprocal Deposits began in January 2003. The FDIC reports one bank failure in 2003, four in 2004, none in either 2005 or 2006, and three in 2007.

2
A list of all the variables used in our analyses can be found in Appendix B. But many of these variables do not appear in the body of the paper. They were used, instead, in numerous variants of the analysis that are not reported here. In general, the qualitative results about CDARS Reciprocal Deposits and bank failure were robust to dozens of different choices of which variables to include and which to exclude. The statistical reason is simple: Apart from some obvious exceptions (e.g., different ways to measure bank capital), the variables have very little correlation with one another. II. CHARACTERISTICS OF BANKS THAT USE CDARS RECIPROCAL DEPOSITS The analyses proceeded in stages. First we compared the mean values of key ratios across banks that use CDARS Reciprocal Deposits versus banks that do not, without regard for the amount of CDARS deposits used. Then we treated the ratio of CDARS Reciprocal Deposits to total deposits (where it was not zero) as a continuous quantitative variable. Simple Comparisons of Means: In Table 1 below, “No CDARS Reciprocal Deposits” banks are those with no outstanding CDARS Reciprocal deposits as of the date of the call report. Thus, this group includes both inactive members of the Promontory Network and banks that do not belong to the Network. Since the precise numbers differ by quarters, we show data for the third quarter of each year. Table 1
Mean Values 3Q 2008 3Q 2009 3Q 2010
CDARS Reciprocal Deposits
No CDARS Reciprocal Deposits
CDARS Reciprocal Deposits
No CDARS Reciprocal Deposits
CDARS Reciprocal Deposits
No CDARS Reciprocal Deposits
pctFailed 0.07% 0.12% 0.49% 0.52% 0.27% 0.36% pctCDARS 3.90% 4.09% 3.45% pctBrokered 6.64% 3.82% 5.52% 3.28% 3.85% 2.62% pctFHLB 10.67% 8.38% 9.00% 6.94% 7.53% 5.71% EquityAssets 9.79% 11.71% 9.68% 11.70% 9.94% 11.77% Tier1Cap 11.86% 19.38% 11.90% 22.10% 12.80% 24.81% Chargeoffs 3.58% 3.30% 8.48% 6.33% 8.40% 4.98% ROA 0.40% 0.72% -0.11% 0.37% 0.26% 0.60% ROE 4.72% 5.74% -2.03% 1.18% 0.46% 3.98% OpExpAssets 2.30% 2.67% 2.40% 2.77% 2.33% 2.71% LA 74.62% 65.85% 72.04% 63.44% 69.19% 61.44% CommTotal 15.05% 13.18% 14.47% 12.39% 14.12% 12.20% Insider 2.03% 2.01% 1.95% 1.98% 1.87% 1.99% CRELoans 28.52% 20.27% 30.16% 20.67% 31.25% 21.68% Noncurrent 1.99% 1.84% 3.49% 2.74% 3.67% 2.89% Leverage 9.27 11.39 8.94 11.13 9.13 11.14 lnAssets 19.66 18.78 19.74 18.75 19.80 18.78

3
A brief summary of the differences is: Bank failures: In each period, failure rates were lower for banks holding CDARS Reciprocal Deposits. (On average, banks with non-zero CDARS balances held 3-4% of their deposits in CDARS.) Averaged over all nine quarters, the difference in quarterly failure rates was 0.41% for non-CDARS banks versus 0.37 for CDARS banks. Brokered deposits and FHLB advances: Banks with CDARS Reciprocal Balances also held more of other deposits classified as “brokered” and more FHLB advances.3
Capital: Banks with CDARS Reciprocal Deposits had both a lower ratio of total equity to assets and a lower ratio of Tier 1 capital to risk-weighted assets than banks that did not. Net Charge-offs to Loans: During this stressful period, banks with CDARS Reciprocal Deposits experienced greater ratios of Net Charge-offs to Loans than banks without. Return on Assets (ROA) and Return on Equity (ROE): Banks that had CDARS Reciprocal Deposits experienced lower returns on assets and equity. Operating expenses to Total Assets: Banks with CDARS Reciprocal Deposits had lower operating expenses to total assets ratio. Loans to Assets: Banks with CDARS Reciprocal Deposits had higher ratios of loans to assets than banks that did not. Types of loans: Banks with CDARS Reciprocal Deposits made relatively more commercial loans and commercial real estate loans. Insider loans were roughly equal across the two types of banks. CDARS banks had somewhat higher non-current loans. Leverage: CDARS banks had substantially lower leverage ratios, as defined in the call reports. Size: CDARS banks were, on average, somewhat larger than non-CDARS banks in this sample.4
III. ESTIMATING THE EFFECT OF CDARS RECIPROCAL DEPOSITS ON THE LIKELIHOOD OF FAILURE
We estimate how the likelihood of an institution’s failure depends on its usage of CDARS Reciprocal Deposits in several ways. Each method tells approximately the same story, though with different levels of statistical sophistication. Raw data: The bar chart in Figure 1 breaks down all the observations over all nine quarters into groups. The two leftmost bars divide banks into two groups, as in Table 1. The average quarterly failure rate within the non-CDARS group was 0.41%, versus only 0.37% within the CDARS group—as just noted. The 3 For purposes of this study, we define “brokered deposits” by subtracting CDARS Reciprocal Balances from call report data on brokered deposits. 4 Historically, the relative sizes of CDARS banks versus non-CDARS banks has varied from period to period.
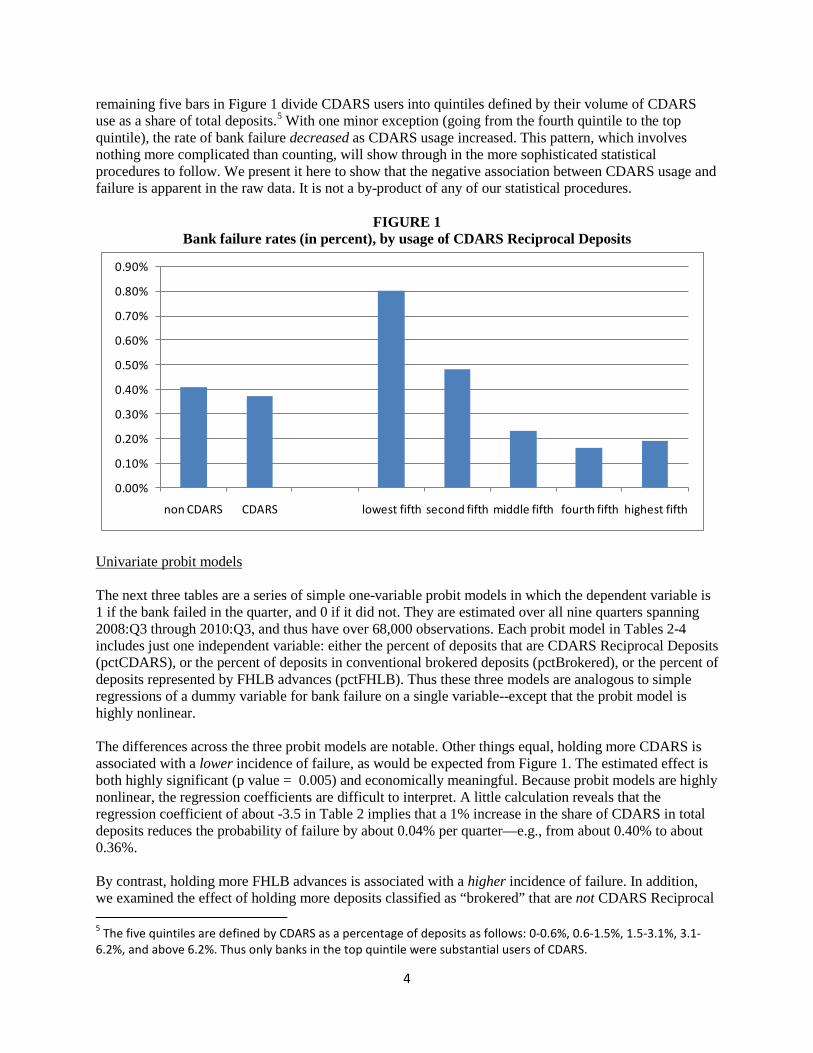
4
remaining five bars in Figure 1 divide CDARS users into quintiles defined by their volume of CDARS use as a share of total deposits.5
With one minor exception (going from the fourth quintile to the top quintile), the rate of bank failure decreased as CDARS usage increased. This pattern, which involves nothing more complicated than counting, will show through in the more sophisticated statistical procedures to follow. We present it here to show that the negative association between CDARS usage and failure is apparent in the raw data. It is not a by-product of any of our statistical procedures.
FIGURE 1 Bank failure rates (in percent), by usage of CDARS Reciprocal Deposits
0.00%
0.10%
0.20%
0.30%
0.40%
0.50%
0.60%
0.70%
0.80%
0.90%
non CDARS CDARS lowest fifth second fifth middle fifth fourth fifth highest fifth
Univariate probit models The next three tables are a series of simple one-variable probit models in which the dependent variable is 1 if the bank failed in the quarter, and 0 if it did not. They are estimated over all nine quarters spanning 2008:Q3 through 2010:Q3, and thus have over 68,000 observations. Each probit model in Tables 2-4 includes just one independent variable: either the percent of deposits that are CDARS Reciprocal Deposits (pctCDARS), or the percent of deposits in conventional brokered deposits (pctBrokered), or the percent of deposits represented by FHLB advances (pctFHLB). Thus these three models are analogous to simple regressions of a dummy variable for bank failure on a single variable--except that the probit model is highly nonlinear. The differences across the three probit models are notable. Other things equal, holding more CDARS is associated with a lower incidence of failure, as would be expected from Figure 1. The estimated effect is both highly significant (p value = 0.005) and economically meaningful. Because probit models are highly nonlinear, the regression coefficients are difficult to interpret. A little calculation reveals that the regression coefficient of about -3.5 in Table 2 implies that a 1% increase in the share of CDARS in total deposits reduces the probability of failure by about 0.04% per quarter—e.g., from about 0.40% to about 0.36%. By contrast, holding more FHLB advances is associated with a higher incidence of failure. In addition, we examined the effect of holding more deposits classified as “brokered” that are not CDARS Reciprocal 5 The five quintiles are defined by CDARS as a percentage of deposits as follows: 0-0.6%, 0.6-1.5%, 1.5-3.1%, 3.1-6.2%, and above 6.2%. Thus only banks in the top quintile were substantial users of CDARS.
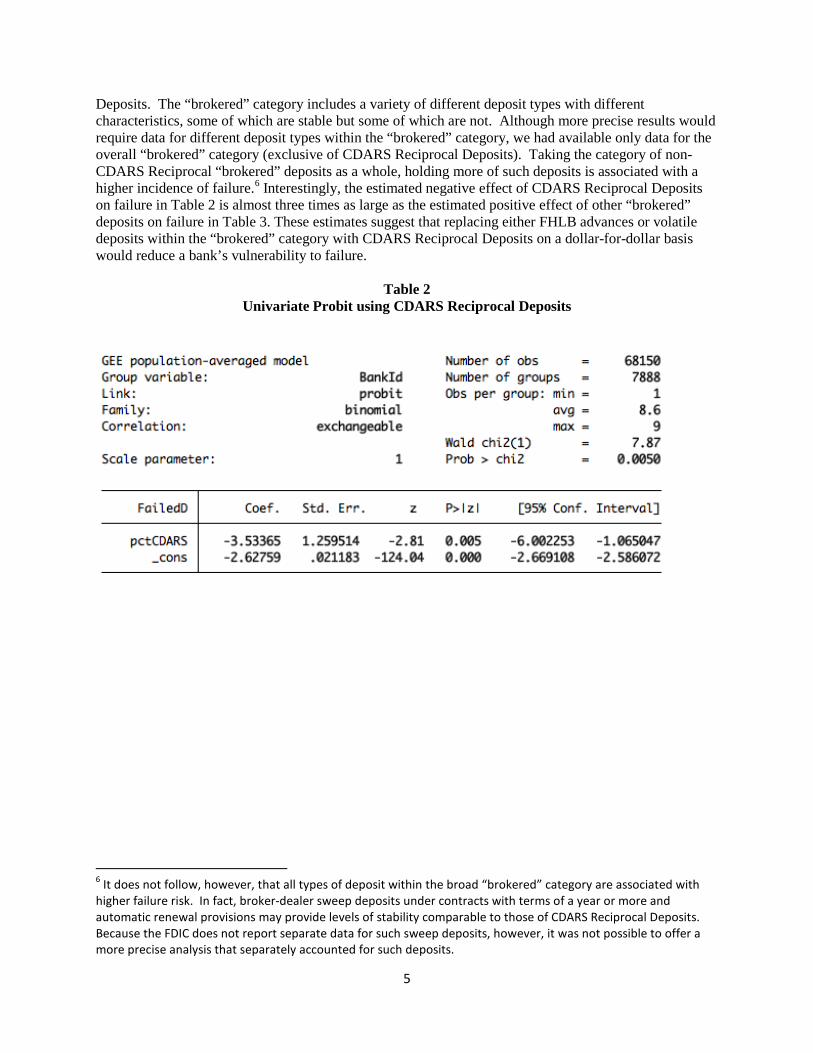
5
Deposits. The “brokered” category includes a variety of different deposit types with different characteristics, some of which are stable but some of which are not. Although more precise results would require data for different deposit types within the “brokered” category, we had available only data for the overall “brokered” category (exclusive of CDARS Reciprocal Deposits). Taking the category of non-CDARS Reciprocal “brokered” deposits as a whole, holding more of such deposits is associated with a higher incidence of failure.6
Interestingly, the estimated negative effect of CDARS Reciprocal Deposits on failure in Table 2 is almost three times as large as the estimated positive effect of other “brokered” deposits on failure in Table 3. These estimates suggest that replacing either FHLB advances or volatile deposits within the “brokered” category with CDARS Reciprocal Deposits on a dollar-for-dollar basis would reduce a bank’s vulnerability to failure.
Table 2 Univariate Probit using CDARS Reciprocal Deposits
6 It does not follow, however, that all types of deposit within the broad “brokered” category are associated with higher failure risk. In fact, broker-dealer sweep deposits under contracts with terms of a year or more and automatic renewal provisions may provide levels of stability comparable to those of CDARS Reciprocal Deposits. Because the FDIC does not report separate data for such sweep deposits, however, it was not possible to offer a more precise analysis that separately accounted for such deposits.
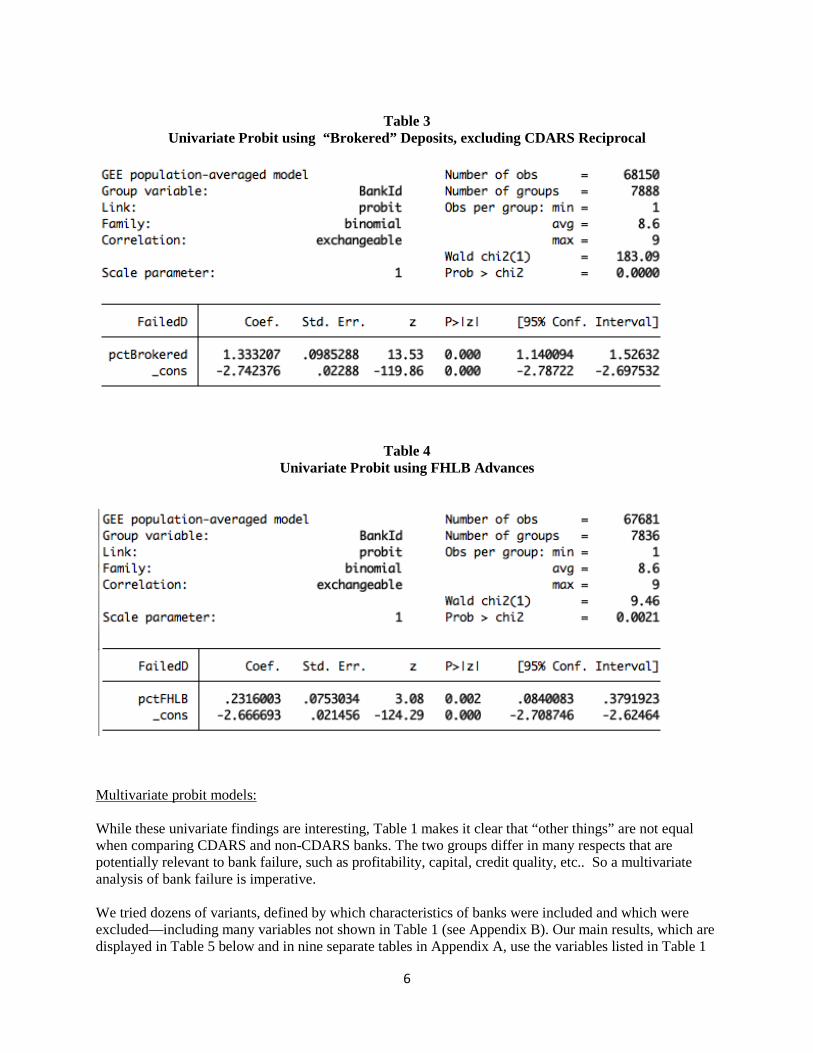
6
Table 3
Univariate Probit using “Brokered” Deposits, excluding CDARS Reciprocal
Table 4 Univariate Probit using FHLB Advances
Multivariate probit models: While these univariate findings are interesting, Table 1 makes it clear that “other things” are not equal when comparing CDARS and non-CDARS banks. The two groups differ in many respects that are potentially relevant to bank failure, such as profitability, capital, credit quality, etc.. So a multivariate analysis of bank failure is imperative. We tried dozens of variants, defined by which characteristics of banks were included and which were excluded—including many variables not shown in Table 1 (see Appendix B). Our main results, which are displayed in Table 5 below and in nine separate tables in Appendix A, use the variables listed in Table 1
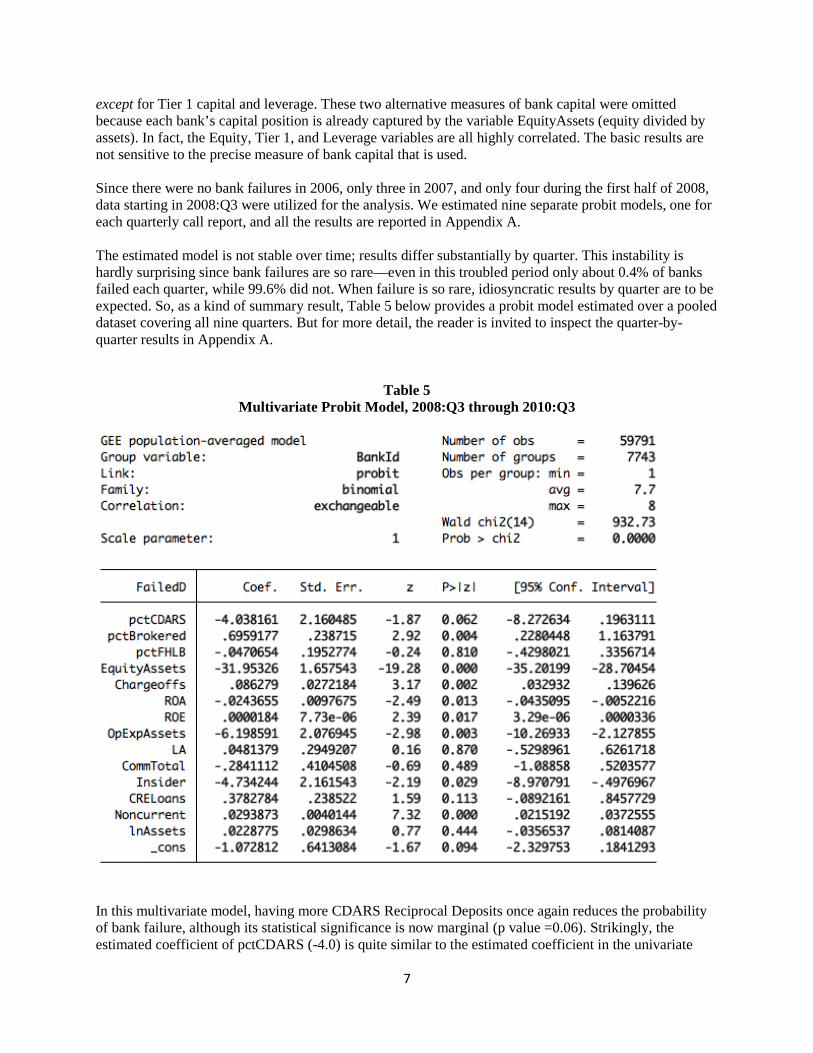
7
except for Tier 1 capital and leverage. These two alternative measures of bank capital were omitted because each bank’s capital position is already captured by the variable EquityAssets (equity divided by assets). In fact, the Equity, Tier 1, and Leverage variables are all highly correlated. The basic results are not sensitive to the precise measure of bank capital that is used. Since there were no bank failures in 2006, only three in 2007, and only four during the first half of 2008, data starting in 2008:Q3 were utilized for the analysis. We estimated nine separate probit models, one for each quarterly call report, and all the results are reported in Appendix A. The estimated model is not stable over time; results differ substantially by quarter. This instability is hardly surprising since bank failures are so rare—even in this troubled period only about 0.4% of banks failed each quarter, while 99.6% did not. When failure is so rare, idiosyncratic results by quarter are to be expected. So, as a kind of summary result, Table 5 below provides a probit model estimated over a pooled dataset covering all nine quarters. But for more detail, the reader is invited to inspect the quarter-by-quarter results in Appendix A.
Table 5 Multivariate Probit Model, 2008:Q3 through 2010:Q3
In this multivariate model, having more CDARS Reciprocal Deposits once again reduces the probability of bank failure, although its statistical significance is now marginal (p value =0.06). Strikingly, the estimated coefficient of pctCDARS (-4.0) is quite similar to the estimated coefficient in the univariate
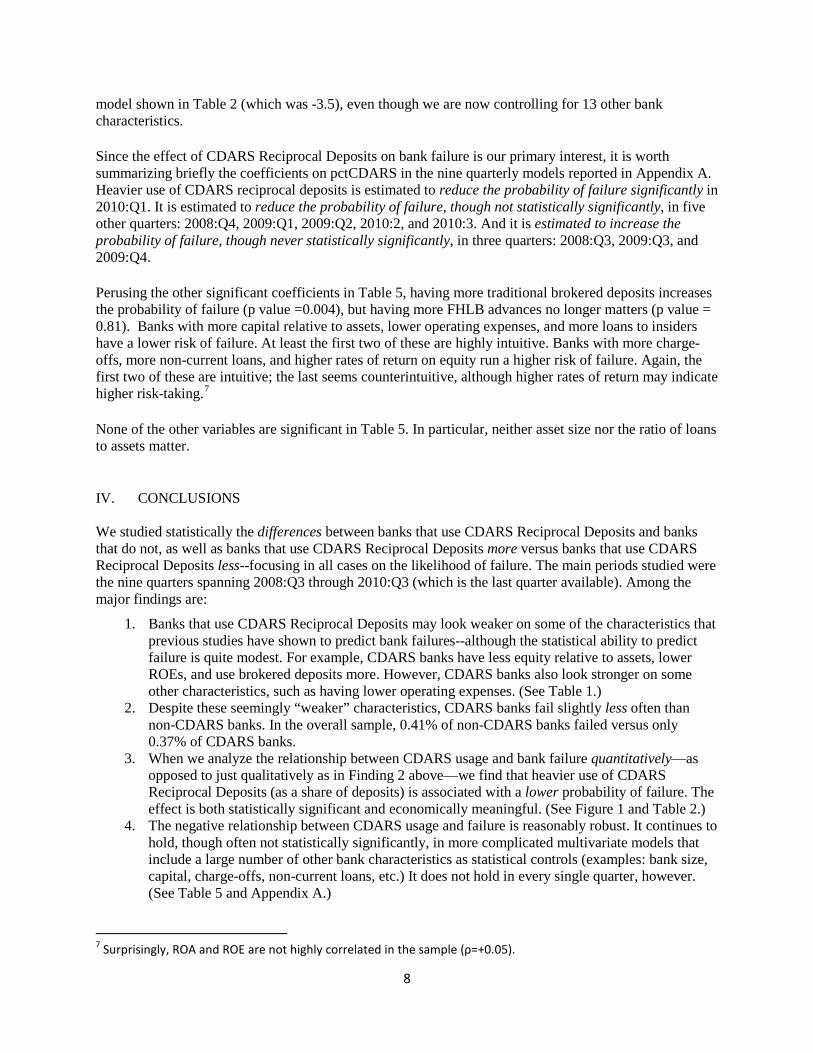
8
model shown in Table 2 (which was -3.5), even though we are now controlling for 13 other bank characteristics.
Since the effect of CDARS Reciprocal Deposits on bank failure is our primary interest, it is worth summarizing briefly the coefficients on pctCDARS in the nine quarterly models reported in Appendix A. Heavier use of CDARS reciprocal deposits is estimated to reduce the probability of failure significantly in 2010:Q1. It is estimated to reduce the probability of failure, though not statistically significantly, in five other quarters: 2008:Q4, 2009:Q1, 2009:Q2, 2010:2, and 2010:3. And it is estimated to increase the probability of failure, though never statistically significantly, in three quarters: 2008:Q3, 2009:Q3, and 2009:Q4.
Perusing the other significant coefficients in Table 5, having more traditional brokered deposits increases the probability of failure (p value =0.004), but having more FHLB advances no longer matters (p value = 0.81). Banks with more capital relative to assets, lower operating expenses, and more loans to insiders have a lower risk of failure. At least the first two of these are highly intuitive. Banks with more charge-offs, more non-current loans, and higher rates of return on equity run a higher risk of failure. Again, the first two of these are intuitive; the last seems counterintuitive, although higher rates of return may indicate higher risk-taking.7
None of the other variables are significant in Table 5. In particular, neither asset size nor the ratio of loans to assets matter.
IV. CONCLUSIONS
We studied statistically the differences between banks that use CDARS Reciprocal Deposits and banks that do not, as well as banks that use CDARS Reciprocal Deposits more versus banks that use CDARS Reciprocal Deposits less--focusing in all cases on the likelihood of failure. The main periods studied were the nine quarters spanning 2008:Q3 through 2010:Q3 (which is the last quarter available). Among the major findings are:
1. Banks that use CDARS Reciprocal Deposits may look weaker on some of the characteristics that previous studies have shown to predict bank failures--although the statistical ability to predict failure is quite modest. For example, CDARS banks have less equity relative to assets, lower ROEs, and use brokered deposits more. However, CDARS banks also look stronger on some other characteristics, such as having lower operating expenses. (See Table 1.)
2. Despite these seemingly “weaker” characteristics, CDARS banks fail slightly less often than non-CDARS banks. In the overall sample, 0.41% of non-CDARS banks failed versus only 0.37% of CDARS banks.
3. When we analyze the relationship between CDARS usage and bank failure quantitatively—as opposed to just qualitatively as in Finding 2 above—we find that heavier use of CDARS Reciprocal Deposits (as a share of deposits) is associated with a lower probability of failure. The effect is both statistically significant and economically meaningful. (See Figure 1 and Table 2.)
4. The negative relationship between CDARS usage and failure is reasonably robust. It continues to hold, though often not statistically significantly, in more complicated multivariate models that include a large number of other bank characteristics as statistical controls (examples: bank size, capital, charge-offs, non-current loans, etc.) It does not hold in every single quarter, however. (See Table 5 and Appendix A.)
7 Surprisingly, ROA and ROE are not highly correlated in the sample (ρ=+0.05).
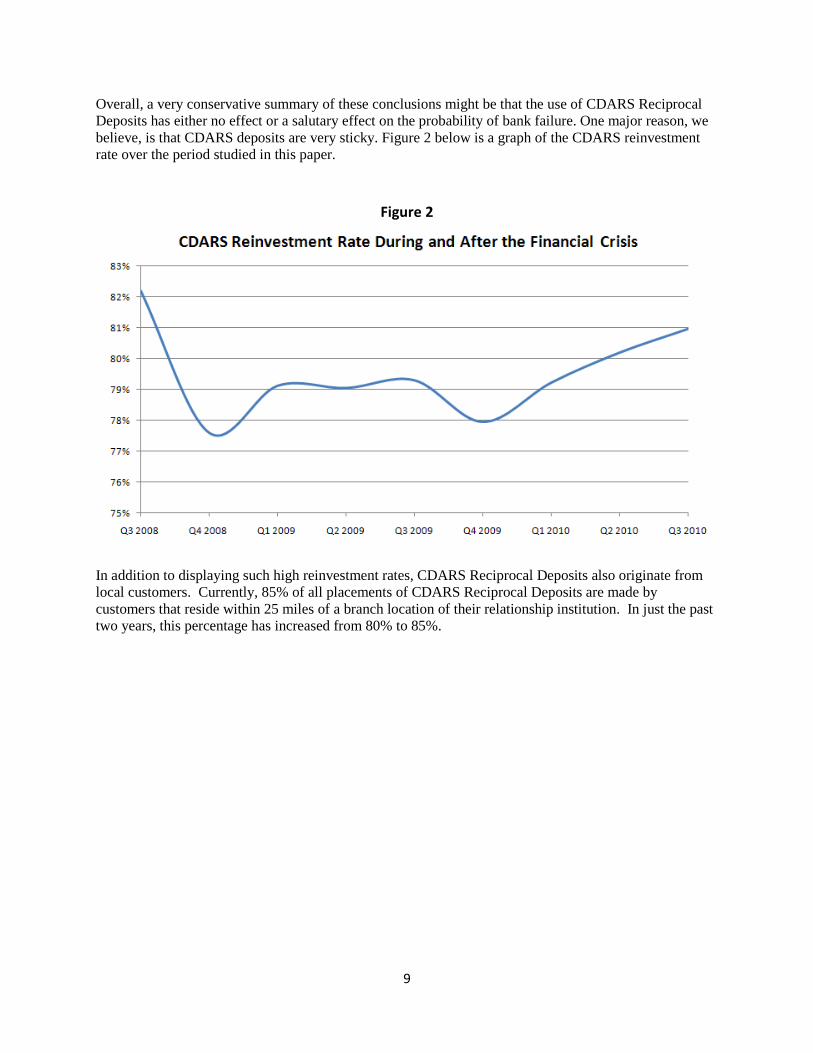
9
Overall, a very conservative summary of these conclusions might be that the use of CDARS Reciprocal Deposits has either no effect or a salutary effect on the probability of bank failure. One major reason, we believe, is that CDARS deposits are very sticky. Figure 2 below is a graph of the CDARS reinvestment rate over the period studied in this paper.
Figure 2
In addition to displaying such high reinvestment rates, CDARS Reciprocal Deposits also originate from local customers. Currently, 85% of all placements of CDARS Reciprocal Deposits are made by customers that reside within 25 miles of a branch location of their relationship institution. In just the past two years, this percentage has increased from 80% to 85%.
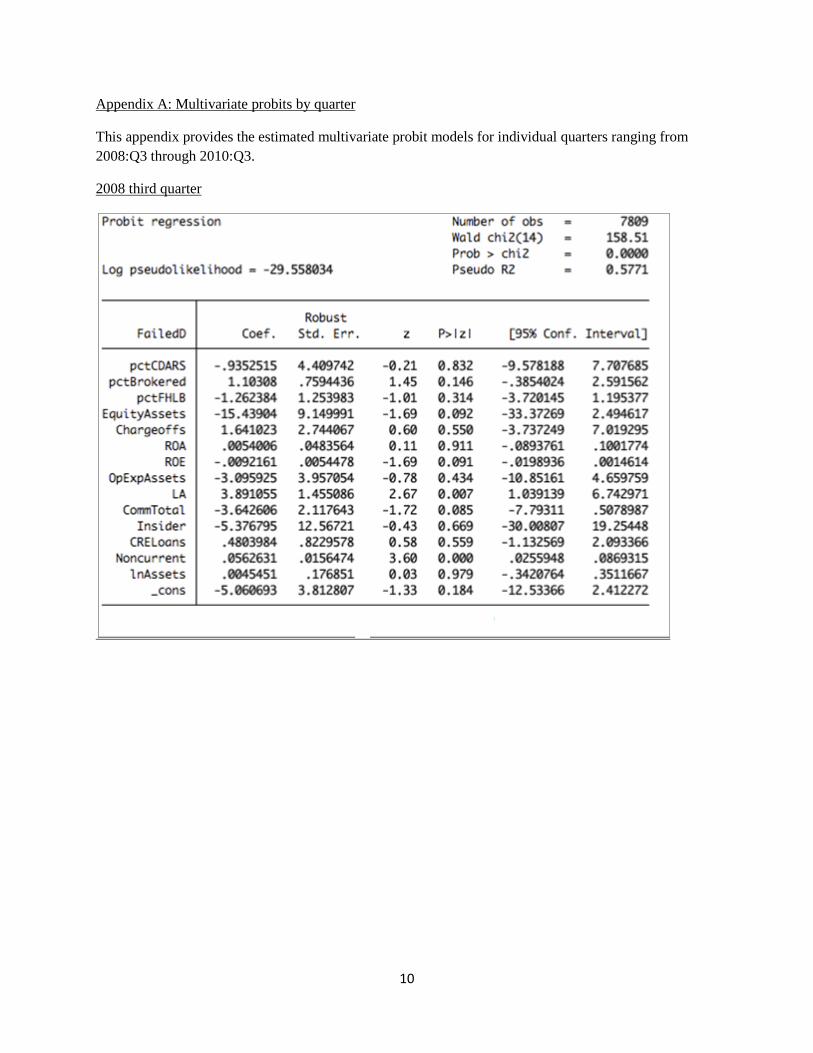
10
Appendix A: Multivariate probits by quarter
This appendix provides the estimated multivariate probit models for individual quarters ranging from 2008:Q3 through 2010:Q3.
2008 third quarter
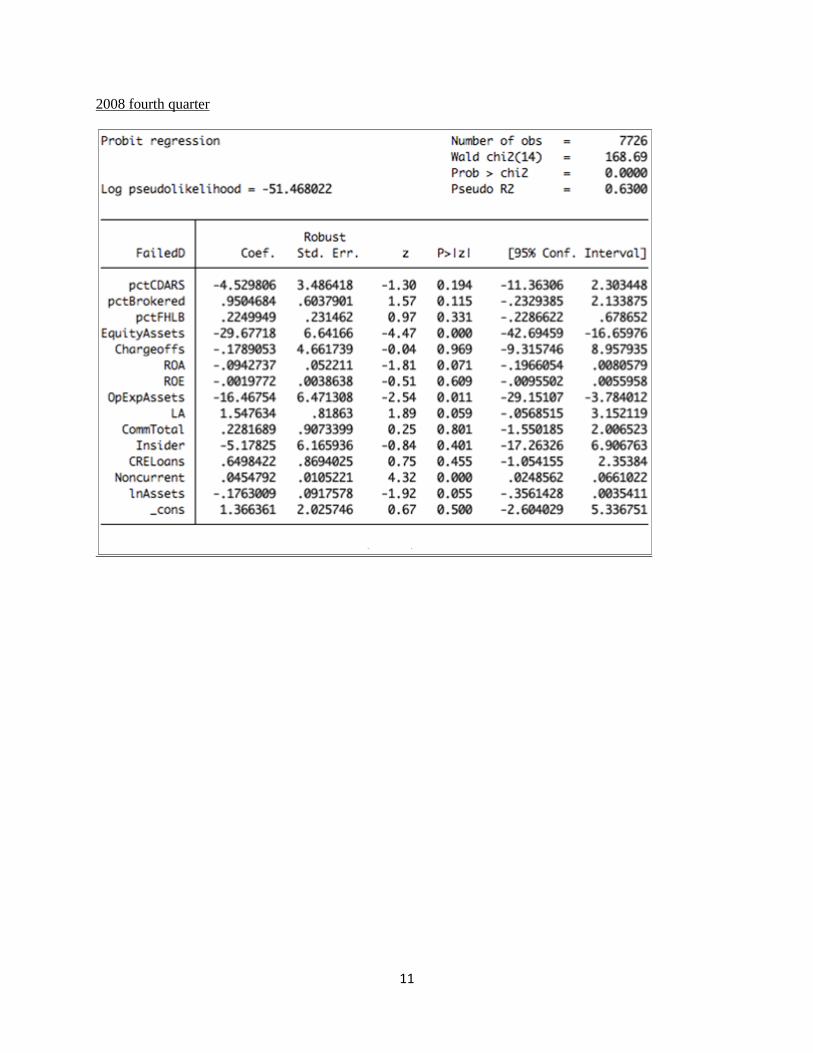
11
2008 fourth quarter
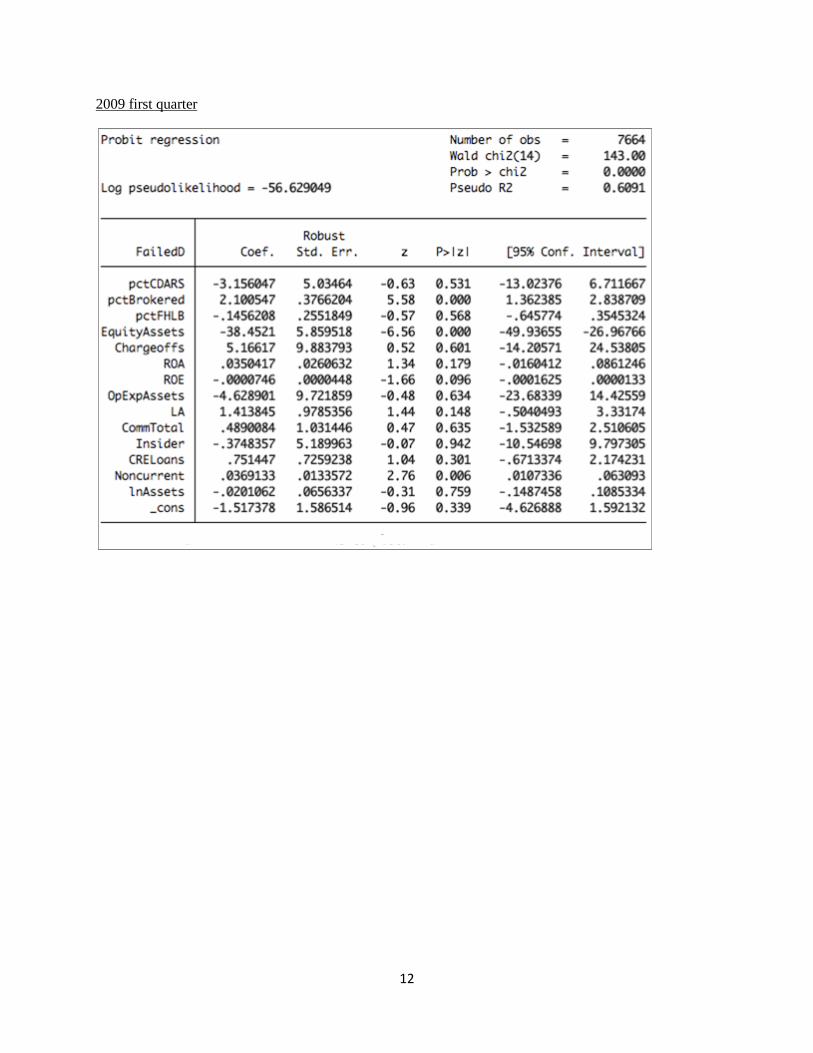
12
2009 first quarter
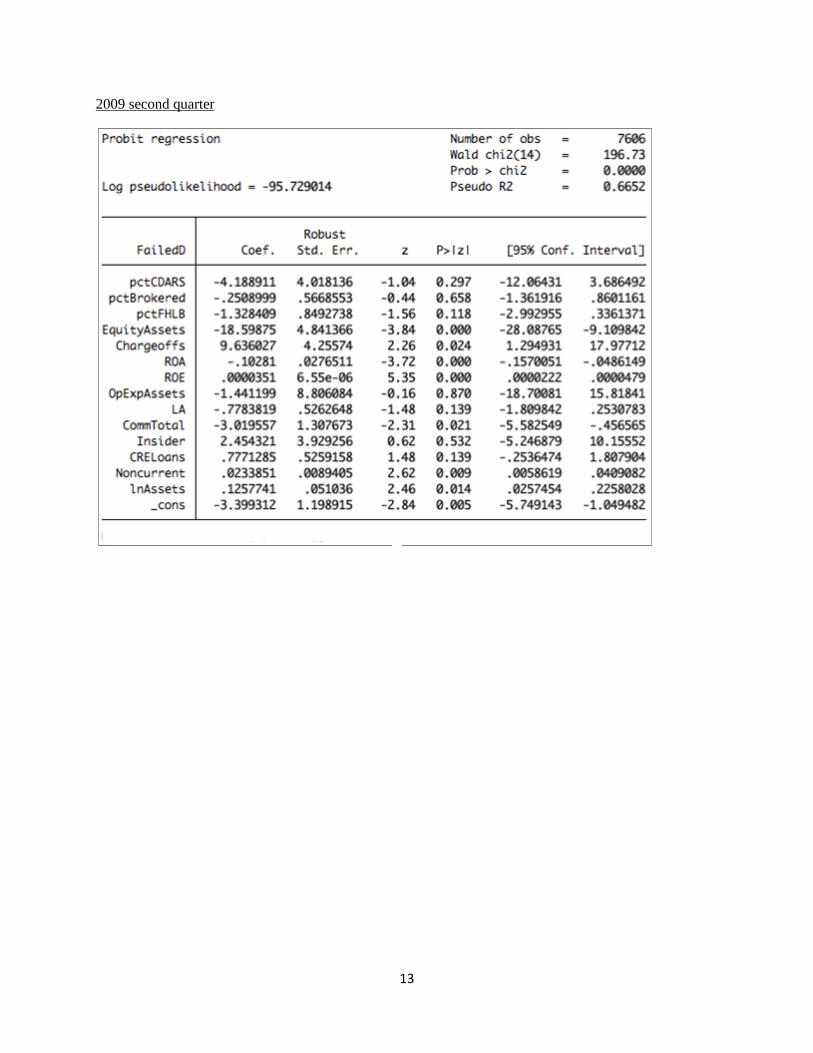
13
2009 second quarter
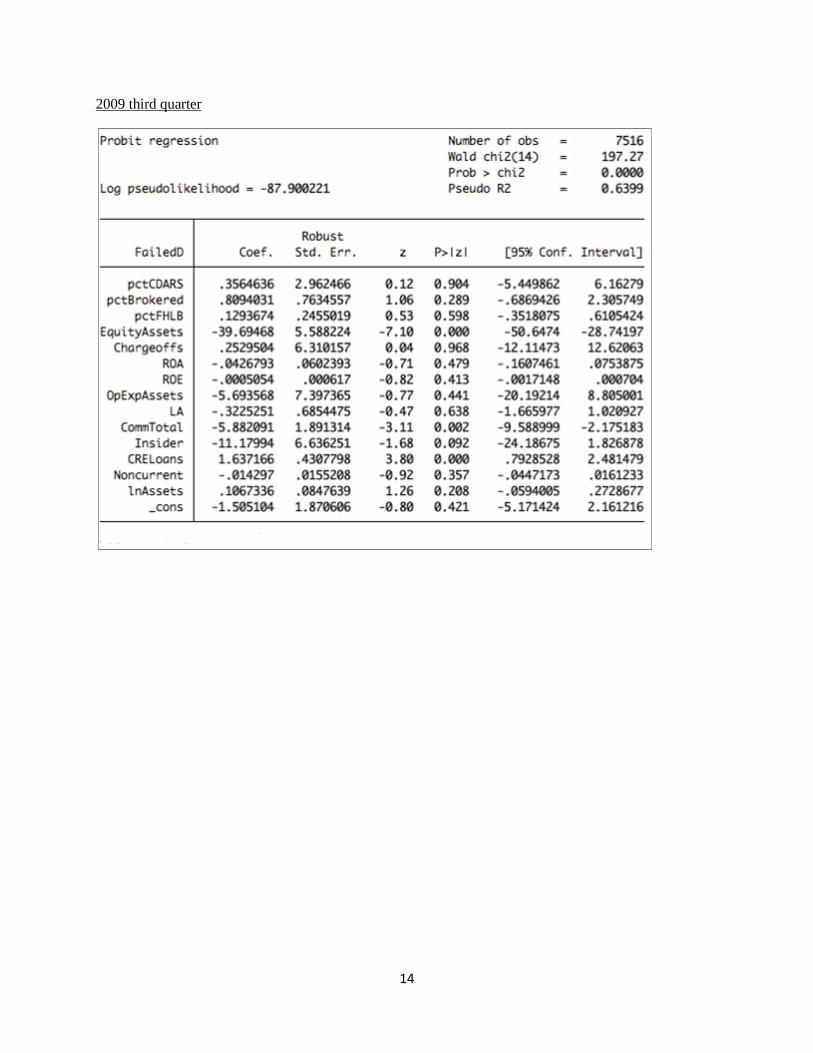
14
2009 third quarter
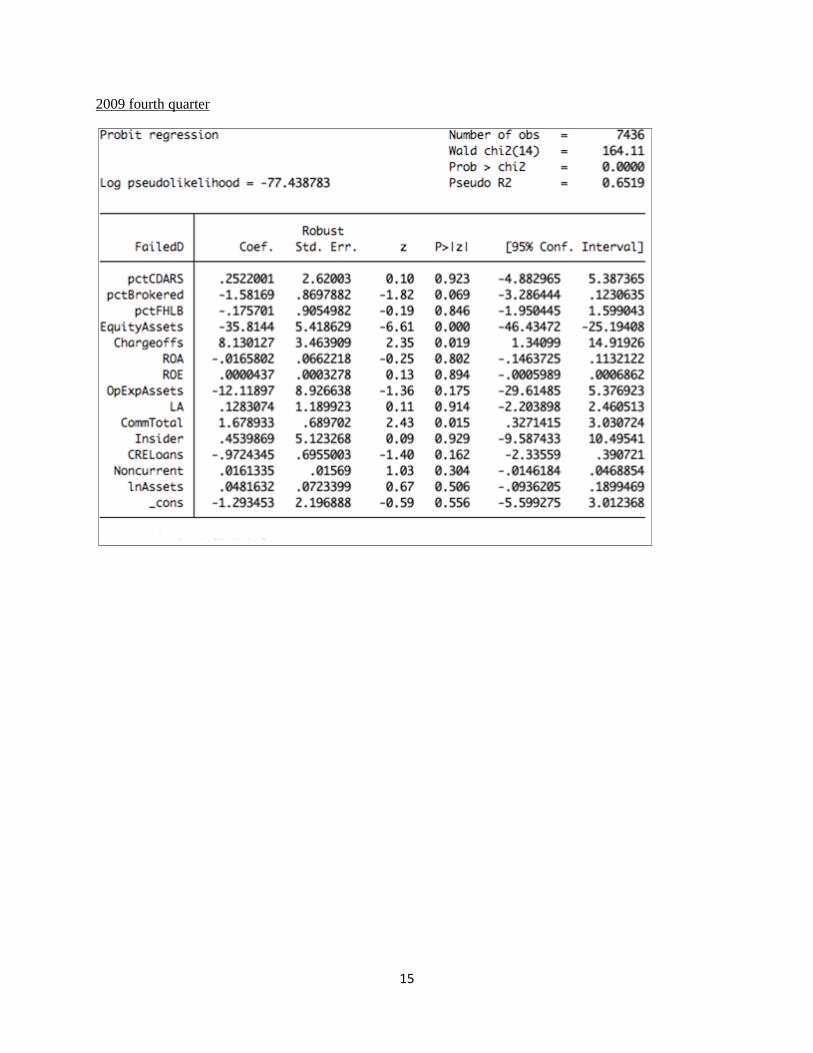
15
2009 fourth quarter
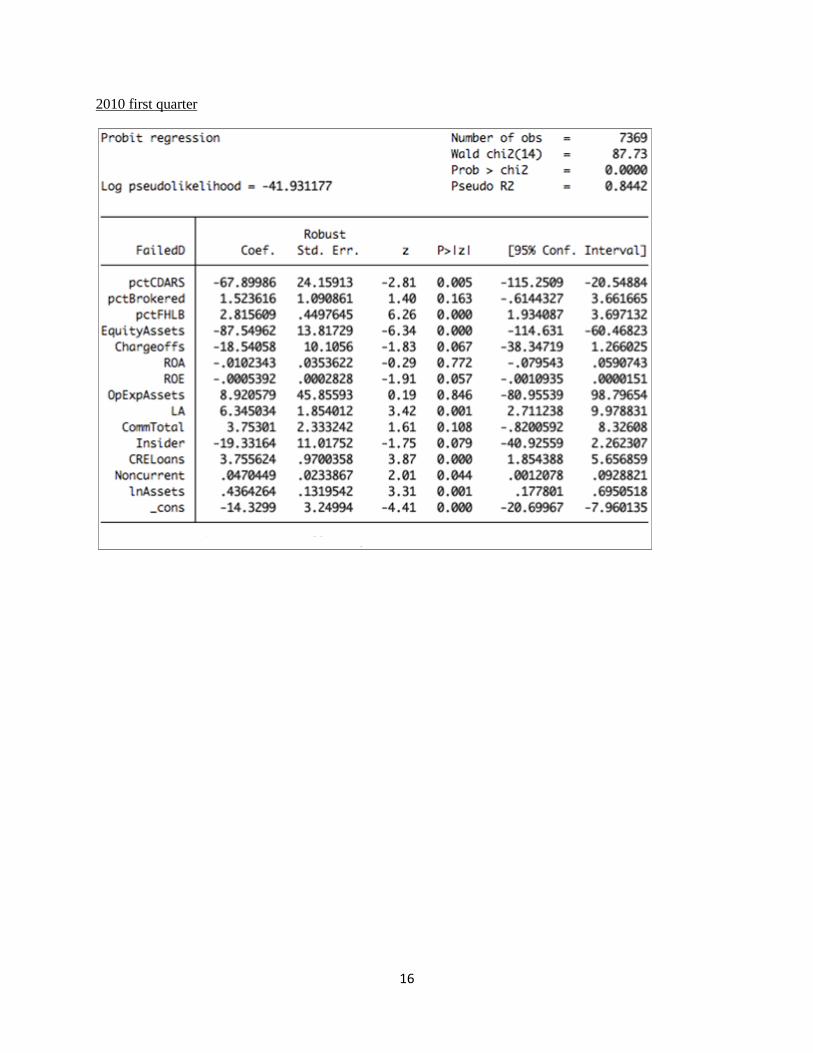
16
2010 first quarter
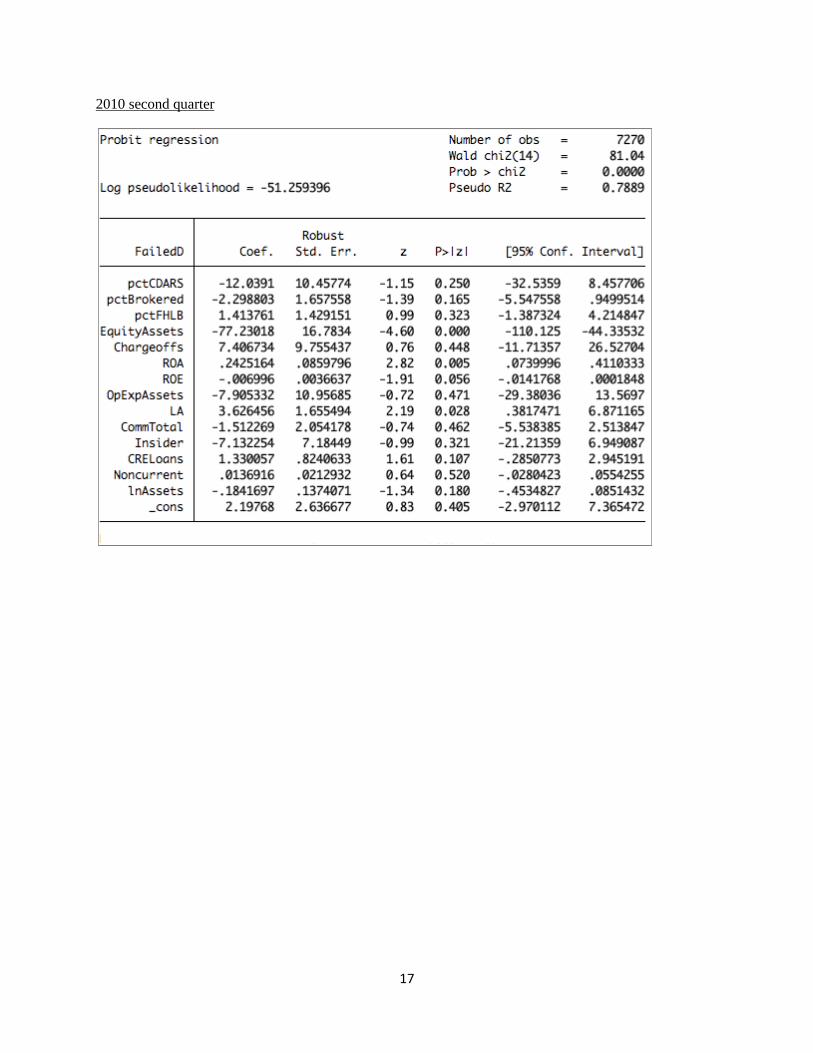
17
2010 second quarter

18
2010 third quarter
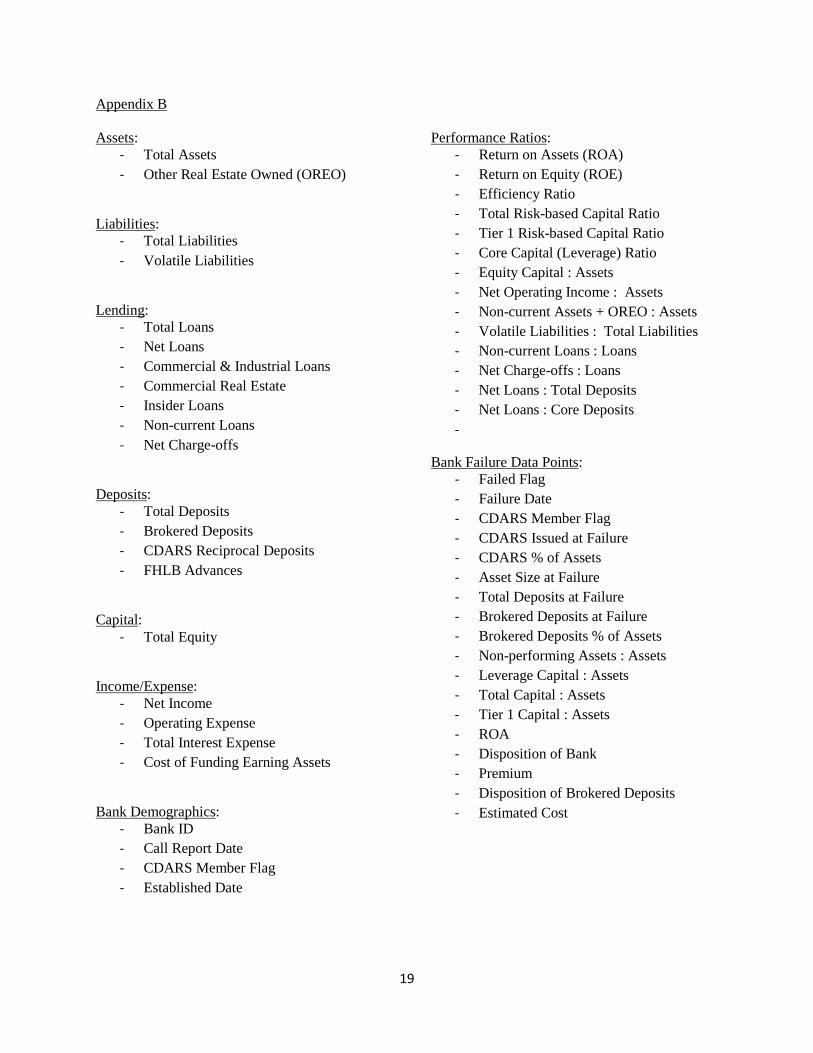
19
Appendix B Assets:
- Total Assets - Other Real Estate Owned (OREO)
Liabilities:
- Total Liabilities - Volatile Liabilities
Lending:
- Total Loans - Net Loans - Commercial & Industrial Loans - Commercial Real Estate - Insider Loans - Non-current Loans - Net Charge-offs
Deposits:
- Total Deposits - Brokered Deposits - CDARS Reciprocal Deposits - FHLB Advances
Capital:
- Total Equity
Income/Expense:
- Net Income - Operating Expense - Total Interest Expense - Cost of Funding Earning Assets
Bank Demographics:
- Bank ID - Call Report Date - CDARS Member Flag - Established Date
Performance Ratios: - Return on Assets (ROA) - Return on Equity (ROE) - Efficiency Ratio - Total Risk-based Capital Ratio - Tier 1 Risk-based Capital Ratio - Core Capital (Leverage) Ratio - Equity Capital : Assets - Net Operating Income : Assets - Non-current Assets + OREO : Assets - Volatile Liabilities : Total Liabilities - Non-current Loans : Loans - Net Charge-offs : Loans - Net Loans : Total Deposits - Net Loans : Core Deposits -
Bank Failure Data Points: - Failed Flag - Failure Date - CDARS Member Flag - CDARS Issued at Failure - CDARS % of Assets - Asset Size at Failure - Total Deposits at Failure - Brokered Deposits at Failure - Brokered Deposits % of Assets - Non-performing Assets : Assets - Leverage Capital : Assets - Total Capital : Assets - Tier 1 Capital : Assets - ROA - Disposition of Bank - Premium - Disposition of Brokered Deposits - Estimated Cost