Embed Size (px)
Citation preview

PROMISINGPRACTICEPATHWAYS™
COLLEGE OF AMERICAN PATHOLOGISTS

College of American Pathologists
Promising Practice Pathways
TABLE OF CONTENTS
HIGH-PERFORMANCE PATHOLOGY FOR HIGH-VALUE ONCOLOGY .......................................................... 18
HIGH-PERFORMANCE DIAGNOSTIC SERVICES .......................... 46
COORDINATED POPULATION CARE SERVICES .......................... 80
PATIENT DIAGNOSTIC SERVICES CENTER ................................. 127
ABOUT THE AUTHOR .................................................................. 174

Promising Practice Pathways
College of American Pathologists4
So … Promising Practice Pathways – What are we talking about? Promising how? For what practices? And Path-ways to where?
In a NutshellThe Promising Practice Pathways de-scribe new pathologist-driven services and programs that add clinical value outside of the laboratory by improving downstream clinical quality and out-comes, and generating downstream clinical cost savings. They span a broad range of clinical conditions and procedures, with some of the most interesting opportunities in oncology and infectious disease.
The Pathways draw upon our current capabilities as well as emerging ex-pertise in genomics and informatics technologies. But fear not. We have numerous opportunities for deliver-ing clinical value even without these advanced technologies. Pathology and laboratory information impact so much of clinical medicine, they are estimated to comprise 70 percent of the data in an EMR.1
The Pathways can be used by all of us, regardless of setting or roles. The pay-ers, providers, institutions, and increas-ingly the patients with whom we all interact are moving steadily toward a value-based “currency.” In other
words, what is measured and com-pensated is quality improvement and cost savings. This has important impli-cations for us professionally. We need to move toward delivering this form of clinical value in order to be players in this market. If not, we will become vendors, sitting on the sidelines.
These Pathways provide a number of entries into this value-based mar-ketplace, all of which give us control of our own economic destinies in this rapidly changing marketplace.
What’s So Promising?Let’s start with “Promising...” We don’t intend to make “promises” per se, except to say we promise you will get something valuable from read-ing these chapters. By promising, we mean that the future of pathology practice can be very promising, but we need to pursue a different course to realize it.
It might seem strange in the midst of economic downturns, relentless reim-bursement cuts, regulatory uncertain-ties, and market turbulence to make such an optimistic pronouncement, but we have the wind at our backs, as you’ll see in the chapters ahead. Our promising future is not, however, our traditional business as usual; rather, it will take on new forms and leverage
INTRODUCTION: PROMISING PRACTICE PATHWAYS™
1L Pantanowitz et al. “Medical laboratory informatics.” Clin Lab Med 2007; 27:823-43
College of American Pathologists
Promising Practice Pathways
5
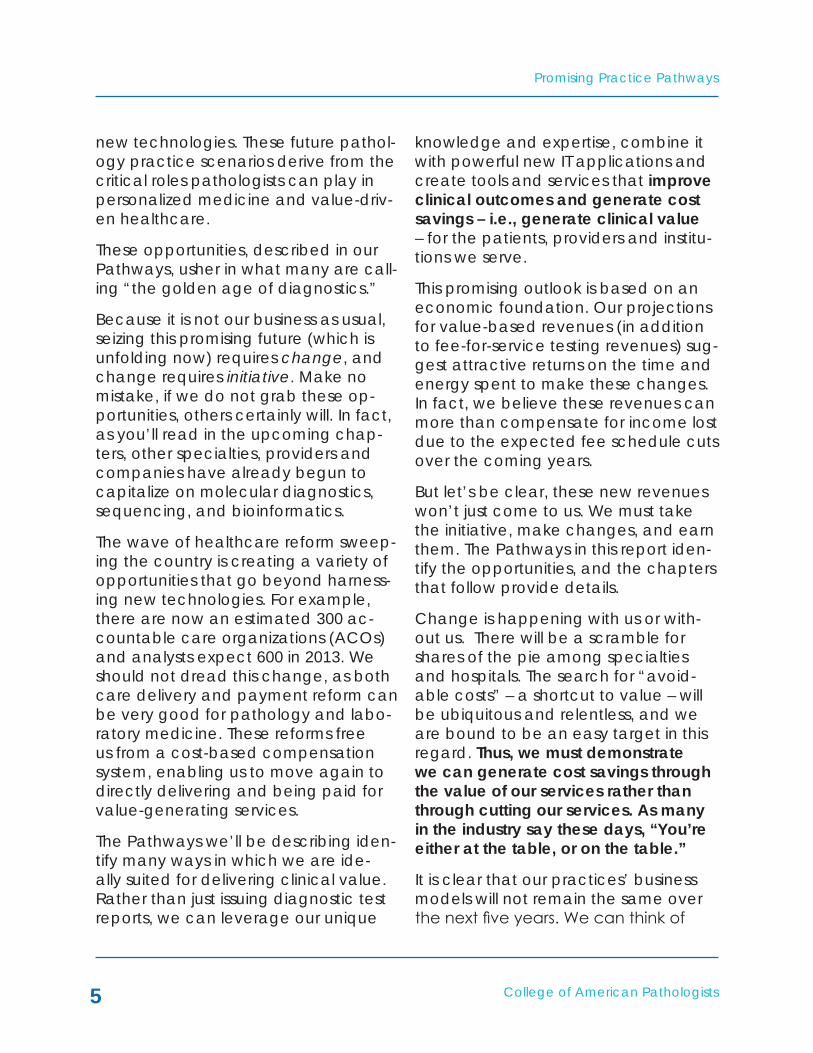
new technologies. These future pathol-ogy practice scenarios derive from the critical roles pathologists can play in personalized medicine and value-driv-en healthcare.
These opportunities, described in our Pathways, usher in what many are call-ing “the golden age of diagnostics.”
Because it is not our business as usual, seizing this promising future (which is unfolding now) requires change, and change requires initiative. Make no mistake, if we do not grab these op-portunities, others certainly will. In fact, as you’ll read in the upcoming chap-ters, other specialties, providers and companies have already begun to capitalize on molecular diagnostics, sequencing, and bioinformatics.
The wave of healthcare reform sweep-ing the country is creating a variety of opportunities that go beyond harness-ing new technologies. For example, there are now an estimated 300 ac-countable care organizations (ACOs) and analysts expect 600 in 2013. We should not dread this change, as both care delivery and payment reform can be very good for pathology and labo-ratory medicine. These reforms free us from a cost-based compensation system, enabling us to move again to directly delivering and being paid for value-generating services.
The Pathways we’ll be describing iden-tify many ways in which we are ide-ally suited for delivering clinical value. Rather than just issuing diagnostic test reports, we can leverage our unique
knowledge and expertise, combine it with powerful new IT applications and create tools and services that improve clinical outcomes and generate cost savings – i.e., generate clinical value – for the patients, providers and institu-tions we serve.
This promising outlook is based on an economic foundation. Our projections for value-based revenues (in addition to fee-for-service testing revenues) sug-gest attractive returns on the time and energy spent to make these changes. In fact, we believe these revenues can more than compensate for income lost due to the expected fee schedule cuts over the coming years.
But let’s be clear, these new revenues won’t just come to us. We must take the initiative, make changes, and earn them. The Pathways in this report iden-tify the opportunities, and the chapters that follow provide details.
Change is happening with us or with-out us. There will be a scramble for shares of the pie among specialties and hospitals. The search for “avoid-able costs” – a shortcut to value – will be ubiquitous and relentless, and we are bound to be an easy target in this regard. Thus, we must demonstrate we can generate cost savings through the value of our services rather than through cutting our services. As many in the industry say these days, “You’re either at the table, or on the table.”
It is clear that our practices’ business models will not remain the same over the next five years. We can think of

Promising Practice Pathways
College of American Pathologists6
pathology, and many other special-ties, as being on a down escalator. If we exert ourselves and move up to the top, there are many promising oppor-tunities to provide value and derive our share of new revenues. If we don’t move, we will be carried down the escalator. What will be the result of in-action? Being treated as a cost center to be marginalized by other special-ties, seeing our services commoditized, suffering substantial income losses, having difficulty maintaining indepen-dent practices, and losing professional stature are likely outcomes.
Up or down. Fortunately, it is our choice and we have the Pathways to guide us.
Promising for Whom?The Promising Practice Pathways are relevant to all pathologists, in all types of practices, and in all types of set-tings. When changes as sweeping as healthcare market reform and person-alized medicine occur, they impact all stakeholders, so potential opportunities apply broadly, although not always uniformly.
The Pathways speak to how patholo-gists can begin offering value-generat-ing services in order to truly participate as a peer in the value-based market. These Pathways create opportuni-ties not just for community pathology practices, but also academic groups, hospital and healthcare system pathol-ogy employees, commercial reference labs, and specialty pathology groups of all sorts.
Three points make the universal appli-cability of these Pathways clear:
1. The value “food chain” will touch all of us eventually, wherever we are.
Our imperative is to begin generat-ing value before we get eaten. “Food chain” economics are at play here. The payers are shifting financial risk to providers and patients, and, in turn, providers and patients are behaving like consumers looking for high-value services.
For example, in our practice pathway on oncology we’ll describe how bun-dling payment is growing. This means oncologists receive a flat fee for a bundle of services per cancer patient and determine how to allocate the money across service providers. We can see how pathologists, radiologists and anesthesiologists, in particular, become vulnerable as the food chain plays out in this value-based market. Those of us providing oncology diag-nostic services will be impacted by this within the next few years, especially if Medicare adopts oncology bundling, which Medicare is pursuing, according to many experts in the field.
Whether we’re chairs of pathology de-partments or employees of those de-partments, we can use these Pathways to identify value-generating services that address the needs of our institu-tions’ providers, and then propose pro-grams based on those initiatives. Dem-onstrating our ability to deliver clinical value moves us up the food chain.

College of American Pathologists
Promising Practice Pathways
7
This might result in our department averting a budget cut, pathology and lab medicine being included in ACO discussions should the institution move in that direction, or, as an employee, earning a performance bonus and the opportunity for a new position.
2. “Reform” is about value, and it is coming soon to a town near you.
It would be a mistake to think that if you do not see local ACOs or new payment models, then reform is not a concern in your market. These new delivery and payment programs are spreading quickly and reform, such as movement to a value-based market, is occurring in numerous ways that may not be visible.
Most industry leaders agree that the healthcare system is fundamentally unsustainable in its current fee-for-ser-vice, fragmented form. Thus, it is a very good bet that “value” – quality im-provement and decreasing avoidable costs – will continue to take over the healthcare market and impact virtually all providers in the next several years, regardless of political drivers, because the private market momentum is too strong to stop. The changes may arrive through Medicare, Medicaid, com-mercial insurers, or a practice being purchased by provider organizations or health plans.
We need to be ready when value reform arrives at our practice. We must have our business case for value gen-eration prepared in advance to seize these opportunities. We cannot wait to
plan our strategy until our hospital be-comes an ACO or Medicare launches bundling programs that affect us.
These Practice Pathways offer a num-ber of different entry points for devel-oping a value-generating program and building a business case for it.
3. There’s only a short window.
The old cliché “window of opportu-nity” applies to our promising future and the Pathways that lead us there. Here is yet another source of urgency, because while we are currently well positioned for a coordinated-care, population management + personal-ized medicine health care system, there are others who have begun to provide similar services, and they are working to diminish our competitive advantages.
When technologies such as molecular diagnostics, next generation sequenc-ing, informatics, and cloud comput-ing advance with exponential speed and impact broad swaths of clinical care, disruptive innovators and even business sectors often spawn from the market turbulence created.
For example, a new business sector called “genetic benefit managers,” comprised of companies such as DNA Direct (now part of Medco/Express Scripts) and Generation Health (now part of CVS Caremark) emerged to provide payers a range of services related to molecular diagnostics test-ing, including utilization management, patient counseling, and physician
Promising Practice Pathways
College of American Pathologists8
education. Medco/Express Scripts and CVS Caremark (Pharmacy Ben-efit Managers, or PBMs) also employ a disruptive, innovative business model in which they proactively encourage pharmacogenetic testing for millions of patients being prescribed drugs with potentially beneficial alternatives, based on testing, and according to value-based economics.
These giant PBMs control prescription channels to a significant share of the U.S. population, with Express Scripts/Medco now covering 155 million lives and CVS Caremark 85 million. They could end up controlling pharmaco-genetic testing in this country. Many others are beginning to take the initia-tive in the “golden age of diagnostics,” drawn by the truly historic opportunities presented by applications of personal-ized medicine testing.
Our Pathways are designed to capital-ize on the promising prospects avail-able during this window and to do so quickly.
Here are a few concrete examples of how these Pathways apply even in the following situations:
“Small cog in a wheel” – A pa-thologist who is an employee in a large department in a hospital that is part of a larger health care system can benefit by devising a way to deliver clinical value that helps the department avert a budget cut. For example, he or she could initiate a molecular an-tibiogram and pathogen surveil-
lance program to tackle resistant infections. This proactive effort could earn the employee a per-formance bonus or an opportunity for a new position in the organiza-tion.
“Department leader” – A patholo-gist whose responsibilities include managing institutional budgets and negotiating with administra-tion can communicate the de-partment’s ability to generate value in new ways and secure a seat at the table when the institu-tion makes key decisions, such as whether or not to move in the di-rection of becoming an ACO. For example, the department could launch a program to improve clinician diagnostic accuracy through test ordering, interpreta-tion and follow-up interventions. Aversion of these diagnostic errors can be shown to generate cost savings.
“No signs of reform” – A patholo-gist in an area without ACO activ-ity or other visible signs of major re-form can, by becoming informed by these Pathways, recognize the tell-tale signs that reform is coming to the local area and prepare an intelligent business plan for value-generation in response. The Path-ways are also relevant for those of us beginning to look toward the next phase of our careers be-cause they are meant as a guide to the near-term future.
“Still in training” – Pathology resi-
College of American Pathologists
Promising Practice Pathways
9
dents and fellows now focused on finishing training and finding a job may realize that the market’s move to value and personalized medicine offers tremendous op-portunities, but that those oppor-tunities will be the most secure in a practice, department or specialty lab that is implementing the types of services described in the Path-ways.
“Commercial executive” – A pathologist whose reference lab is healthy and who sees no near-term threats can recognize that many of the market forces driv-ing current growth at reference labs, for instance, may decline or shift in the next few years, due to reform and disruptive innovation. For example, hospitals are acquir-ing physician practices at a rapid rate. Accenture’s report, titled, “Clinical Transformation: Dramatic Changes as Physician Employ-ment Grows,” predicted that less than one-third of physicians would remain independent by 2013, down from 43 percent in 2009.2 He or she can use the Pathways to identify new growth opportunities for the business based on value-based clients.
We cannot assume that financial health now will continue in the future when such market shifts are occur-ring. On the contrary, business strate-gists typically advise companies to
seek innovative market openings as industries begin to undergo these rear-rangements. Those of us in reference or specialty labs will find the Pathways valuable in identifying novel growth directions for our businesses.
And Finally, the Pathways … Promising Practice Pathways describe new pathologist-driven services and programs that add clinical value out-side of the laboratory by improving downstream clinical quality and out-comes, and generating downstream clinical cost savings. As we’ve been discussing, these value-generating Pathways offer a promising future for our profession, indeed, a “golden age.”
To better understand what the Path-ways are and are not, let’s look at a True and False list:
• True or False? The Pathways are business models for practices.
– False – They offer business cases and market analytics for a set of practice offerings, along with implementation guides (forthcoming in the full report later this fall). The Pathways do not recommend a wholesale transformation of our practices’ business models, rather a “ser-vice model” that can be initially adjunctive to our practices, and then more fully implemented over time. The Pathway does not contain all of the elements
2“Clinical Transformation: Dramatic Changes as Physician Employment Grows,” Accenture, March 28, 2011
Promising Practice Pathways
College of American Pathologists10
of a business model, but rather presents the strategic rationale, market economics, descrip-tion of the service model, and implementation planning guide. The College of American Pa-thologists plans to provide a wide range of resources to sup-port us in implementing these Pathways over the next few years.
• True or False? The Pathways can be customized according to prac-tice type, setting and resources.
– True – The Pathways are mod-els that have built-in variables to tailoring them to specific practices depending on market conditions, strategic focus, and capabilities. We have devel-oped them to be broadly appli-cable.
• TrueorFalse? Pursuing any Path-way will require a major financial investment.
– False – Not all Pathway variations require significant financial invest-ments; several require minimal, or even none, at least to start. The level of investment, whether in time or money, depends on what Pathway opportunity we want to pursue and how quickly we want to pursue it.
• TrueorFalse? If I don’t know mo-lecular diagnostics or informatics, the Pathways have nothing to of-fer me.
– False – First, there are offerings within the Pathways that do not involve either molecular diag-nostics or informatics technolo-gies. Second, because we rec-ognize that these technologies are critical to our future, the Pathways provide implementa-tion options that allow us to pro-ceed with the Pathway while acquiring these capabilities. For example, we can partner with a molecular diagnostics spe-cialty lab initially while we de-velop our services. Further, it is not necessary for each of us to learn these skills, but rather for our group or practice to have these capabilities.
The next four chapters describe the four Pathways we have identified as most “Promising.” In this abridged report, these chapters do not include details about implementing the Path-ways, but rather focus on the business rationale for the Pathway, market analysis, and Pathway description.
These are brief descriptions and fig-ures for each Pathway as a preview of what’s to come.
Practice Pathway 1: High Performance Pathology for High-Value OncologyThis Pathway represents the epitome of personalized medicine and one of our flagship “golden era of diagnostics” opportunities. It entails providing not just diagnostic reports put true know-ledge services to enable oncologists to improve their outcomes and lower

College of American Pathologists
Promising Practice Pathways
11
spending, i.e., to achieve “high-value oncology.” For example, we can of-fer technologies and services for high accuracy initial diagnostic evaluations, tumor test panels that direct oncology care decisions along the care con-tinuum, informatics and algorithms for predicting risk and monitoring patients to avoid complications, as well as tools for clinical trial decisions. Together, these and other sources of patho-logy “tumor intelligence,” when linked to the patient’s clinical context, can significantly impact the oncologist’s results, and earn us value-based com-pensation in the alternative-payment programs that are beginning to prolif-erate in oncology.
This Pathway details the tumultuous oncology market changes creating demand for our Pathway services, the market opportunity size, the Pathway services and technologies, and initial implementation considerations.
Practice Pathway 2: High-Performance Diagnostic ServicesMany clinical diagnostic errors relate directly to clinicians’ knowledge and management of diagnostic testing. This puts pathologists in the critical position to provide a range of inter-ventions that decrease these errors, thereby improving outcomes and decreasing costs – i.e., adding clinical value. These errors are a clinically and financially significant issue. “Medical diagnoses that are wrong, missed, or delayed make up a large fraction of all medical errors and cause substan-tial suffering and injury,” writes Mark
Graber, Professor of Medicine at State University of New York Stony Brook.
This Pathway explains how pathologist services and IT tools can improve test selection, communications of results, interpretation of results, and follow-up/management of results, thereby gener-ating clinical value worthy of compen-sation.
Practice Pathway 3: Coordinated Population Care ServicesACOs and other coordinated care healthcare systems deliver care using a new population health manage-ment model that holds the ACO ac-countable for both the health and costs of an assigned patient popula-tion. This model requires both a system-atization of care with guidelines and an individualized medicine approach to ensure the use of optimal treatments and services.
This Pathway describes the multiple competitive advantages patholo-gists have in advancing population health management for these orga-nizations. For example, we can marry “top down” population lab informatics applications that support systematizing care with “bottom up,” patient-spe-cific, molecular testing tools that can individualize those guidelines in a way that preserves the art and complexity of medicine. We also bring expertise in other areas critical to population health management, such as test analytics, instrumentation, and quality control.
The population health management

Promising Practice Pathways
College of American Pathologists12
model also demands novel approach-es to risk management and preven-tion. Because pathologists deliver the most potent of predictive tools in health care – in the form of individual-ized diagnostics and biomarkers – and because lab testing is performed fre-quently, pathologists are uniquely po-sitioned to provide a steady supply of temporal predictive data to keep risk assessments fresh.
This Pathway includes a framework and numerous examples of services, tools and programs for us to use in generating value in an ACO setting.
Practice Pathway 4: Patient Diagnostic Services CenterThe value-based health care market is patient-centered, meaning high qual-ity patient experiences are rewarded. Furthermore, a true health care con-sumer market has arrived, and con-sumers who are paying for their care are demanding high levels of service.
Diagnostic testing as structured today offers few to no patient conveniences – patients who need multiple tests must travel to different locations, juggle schedules, and take time off of work for each test, for example. Further, radiology and laboratory medicine/pathology are segregated, which can negatively impact the accuracy of the final diagnosis.
In short, there are a number of market factors that provide the opportunity for a disruptive diagnostic testing center model that combines excellent patient services; integration of pathology, lab and imaging testing to improve effi-ciency and accuracy; and LEAN op-erations and an ambulatory setting for cost savings.
This Pathway describes the market needs for a new diagnostic testing center, the market opportunity, exam-ples of integrated diagnostic testing centers, and a potential workflow plan.

College of American Pathologists
Promising Practice Pathways
13
Figure for Practice Pathway 1: “High-Performance Pathology for High-Value Oncology”
Oncologist Treatment Continuum
High PerformancePathology Pathway
2014-2016
Monitoring forefficacy/patientadherence
Digitally reviewedfor high accuracy+ comprehensivereport
Testing algorithmsfor risk-benefit ofstimulation factors
Monitoring fortoxicity, anemia,clotting, etc.
Analysis of testresults -recommendwhen to switchto palliativecare
Re-profiling ofrecurrent tumor+ Test Panels forRx selection
Evidence-baseddiagnostictesting pathway
Test panelsfor Rxselection
Clinical trialrecruiting - tumorprofiling matching(2016)
Diagnosis
Onc work up -staging
Evaluateresponse
Patientcomplication
> Hospitalization
Progression
Progression
Progression
1st linetherapydecision
2nd linetherapydecision
3rd linetherapydecision
Clinical trialoptions
Clinical trialoptions
UseGranulocyte
growth factors orErythroStims?
Palliativecare
Clinical trialoptions
Palliativecare

Promising Practice Pathways
College of American Pathologists14
Figure for Practice Pathway 2: “High-Performance Diagnostic Services”
Sources ofDx error
Ordered wrongtests
Test results notinterpreted
correctly
Test resultsdelayed/”handoff”problems
Next steps indiagnostic work-
up incorrect
Pathwayinterventions
Test orderingguidance – tool
or service
Comprehensive,interpretive
reports, services
Abnormal testresults
communicationsystem + leverage
patient
Targetedfollow-up
monitoring
Figure A for Practice Pathway 3: “Coordinated Population Care Services”
LabInformatics
PathologyExpertise
Guidelines,Algorithms,
EMR Tools, RiskPredictions
MolecularTesting

College of American Pathologists
Promising Practice Pathways
15
Figure B for Practice Pathway 3: “Coordinated Population Care Services” – Our Competitive Advantage – The Dual Approach
Population-Based:Lab Informatics• Patterns for identifying risk• Algorithms inform guidelines• Statistics for performance management
Individualized:Molecular or Biomarker Testing• Results and algorithms identify risk• Results individualized guidelines/interventions
Guidelinessystematize
care
Molecularindividualizes
care

Promising Practice Pathways
College of American Pathologists16
Figure A for Practice Pathway 4: “Patient Diagnostic Services Center” – How the Center’s Design Addresses Market Needs
ClinicalQuality
CostSavings
Health CareConsumers
PatientExperience
• Integrated Dx service modalities• Interpretive reporting• Six Sigma
• Co-location and scheduling conveniences• Patient-centered• Rapid results
• Community setting• Retail-level services• Low prices and financing• High quality
• Ambulatory setting• LEAN operations• Algorithmic optimization• Economies of scale

College of American Pathologists
Promising Practice Pathways
17
Figure B for Practice Pathway 4: “Patient Diagnostic Services Center”
Scheduling andReception −
“Retail” LevelServices
Phase 1: ApplyDiagnostic Testing
Algorithm andDevelop Testing
Plan
Phase 2: PatientTesting FlowIntegration
Phase 4: ReportIntegration
Phase 3: Evaluation,Cross Review,
Interpretation andIntegration of
Results
HIGH-PERFORMANCE PATHOLOGY FOR HIGH- VALUE ONCOLOGY
PROMISING PRACTICEPATHWAYS™:
COLLEGE OF AMERICAN PATHOLOGISTS

College of American Pathologists
Promising Practice Pathways
19
SUMMARY
As the pioneering clinical specialty in personalized or “precision” medicine, oncology may offer pathologists more high value and high growth opportuni-ties than any other specialty or market area. Because genomic, proteomic, and other profiling techniques will, in combination with traditional pathol-ogy diagnostics, be directing clinical cancer decisions in highly prescriptive ways, we have the prospect of part-nering with oncologists to manage care in a manner warranting signifi-cant compensation. Many industry analysts and investors reflecting on this next decade of personalized oncology care have opined that a power shift is occurring, from therapeutics to di-agnostics, and that we are entering a “golden age of diagnostics.”
This oncology diagnostic services op-portunity is ours to lose, as there are others who are already entering what they see as a sentinel new, long-term market. Driven both by science and value-based market reforms, oncolo-gists have an increasingly long list of new molecular and diagnostic testing service needs. If we can help them translate this information into achieving better outcomes more cost efficiently, we can be compensated on value rather than as a vendor.
Pathology groups that deliver knowl-edge services enabling “high-value oncology” – i.e., improvements in
quality and decreased spending – will likely have tremendous long-term growth and control of their financial futures. Other groups who offer only basic diagnostic testing to oncologists will likely see shrinking, low-cost testing revenues.
The “High Performance Pathology for High-value Oncology” practice path-way is designed to capture this op-portunity. The pathway comprises, for example, technologies and services for high accuracy initial diagnostic evaluations, tumor test panels that direct oncology care decisions along the care continuum, informatics and algorithms for predicting risk and moni-toring patients to avoid complications, and tools for clinical trial decisions. Together, these and other sources of pathology “tumor intelligence,” when linked to the patient’s clinical context, can significantly impact the oncolo-gist’s results and hence compensation in value-based payment programs.
Fortunately, there are a number of re-lated roads to becoming a high perfor-mance pathology practice pathway for oncology. Hospital, academic, and community pathology practices can all pursue this pathway and can either build the molecular test panels and informatics systems themselves, partner with their institutions, partner with spe-cialty/reference labs, or outsource/buy them.

Promising Practice Pathways
College of American Pathologists20
Hopefully this abridged guide gives a sense of (1) the attractiveness of this practice model both professionally and financially, (2) a clear picture of what this practice model entails, and (3) the attainability of this opportunity.

College of American Pathologists
Promising Practice Pathways
21
Oncologists Consider Costs Oncology leaders have begun to call for changes in management that are driven by value concerns, such as evaluating palliative end-of-life can-cer care and considering the cost as well as the benefit of a new therapeu-tic before adopting it.
As an example, Dendreon's prostate cancer therapeutic, Provenge, has seen slow adoption, which is being attributed by many to push back from oncologists and urologists to the poor cost–benefit offered by the drug. Provenge offers a median sur-vival benefit of 4.1 months and costs $93,000. Based on an online survey of oncologists and urologists conducted by Sermo, most oncologists and urolo-gists thought that such drugs should have a survival benefit of at least sev-en months, and 30 percent said the benefit should be at least one year.
Furthermore, 86 percent of these doc-tors believe that Provenge and similar therapeutics should not cost more than $60,000.1
Like the rest of the healthcare market, oncology is being subjected to pay-ment and delivery model reforms by private and government payers. Hav-ing already experienced substantial financial pressures over the past few years, oncologists are reacting to these recent developments as a “last straw” requiring new types of business arrangements.
Oncology Business Review wrote in January 2011, “Before Health Reform was enacted in March 2010, commu-nity oncology was already faced with significant economic challenges, with declining payment rates and rising costs of care, coupled with a serious re-examination of potential overutiliza-tion of oncology treatment, particu-larly near end of life. Health Reform compounds these problems and pres-ents new opportunities by mandating profound changes to our healthcare payment and delivery systems. It marks the beginning of a transforma-tion in the way that cancer care ser-vices will be paid and delivered in the future.”
CONTExT: HOW THE PRACTICE OF ONCOLOGY IS CHANGING
1Ed Silverman, “Why Docs Are Skittish About Prescribing Provenge,” Pharma Blog, August 30, 2011
Promising Practice Pathways
College of American Pathologists22
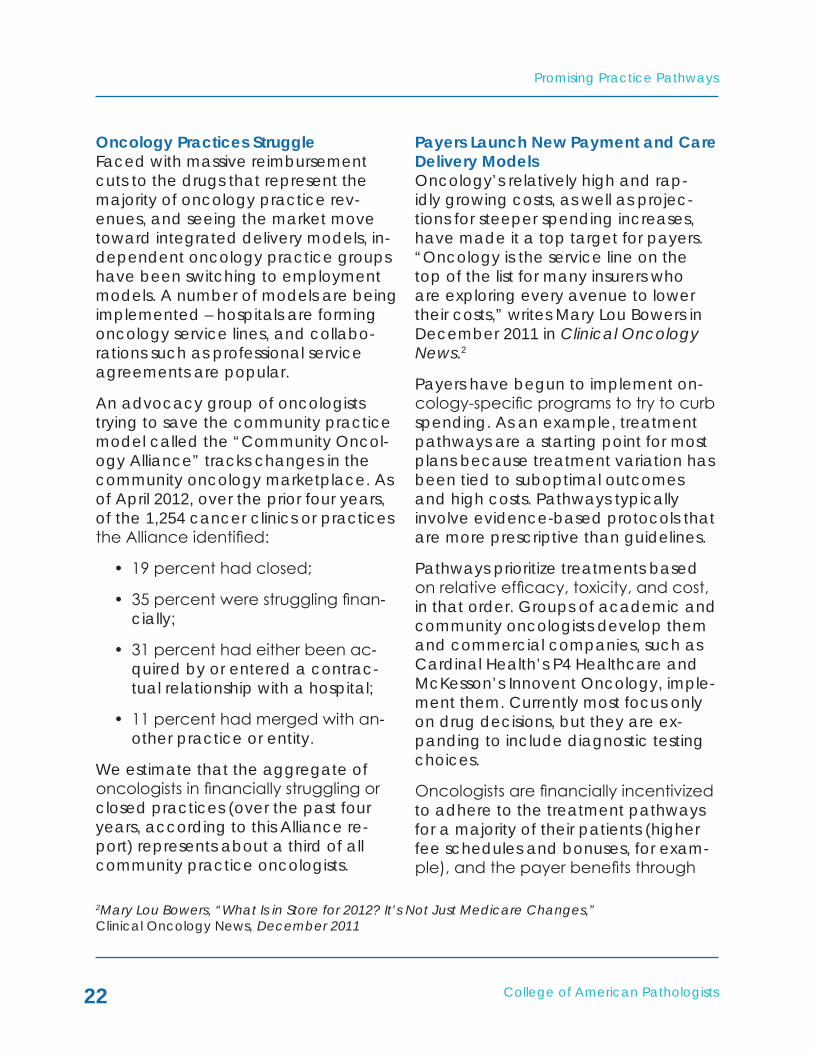
Oncology Practices Struggle Faced with massive reimbursement cuts to the drugs that represent the majority of oncology practice rev-enues, and seeing the market move toward integrated delivery models, in-dependent oncology practice groups have been switching to employment models. A number of models are being implemented – hospitals are forming oncology service lines, and collabo-rations such as professional service agreements are popular.
An advocacy group of oncologists trying to save the community practice model called the “Community Oncol-ogy Alliance” tracks changes in the community oncology marketplace. As of April 2012, over the prior four years, of the 1,254 cancer clinics or practices the Alliance identified:
• 19 percent had closed;
• 35 percent were struggling finan-cially;
• 31 percent had either been ac-quired by or entered a contrac-tual relationship with a hospital;
• 11 percent had merged with an-other practice or entity.
We estimate that the aggregate of oncologists in financially struggling or closed practices (over the past four years, according to this Alliance re-port) represents about a third of all community practice oncologists.
Payers Launch New Payment and Care Delivery ModelsOncology’s relatively high and rap-idly growing costs, as well as projec-tions for steeper spending increases, have made it a top target for payers. “Oncology is the service line on the top of the list for many insurers who are exploring every avenue to lower their costs,” writes Mary Lou Bowers in December 2011 in Clinical Oncology News.2
Payers have begun to implement on-cology-specific programs to try to curb spending. As an example, treatment pathways are a starting point for most plans because treatment variation has been tied to suboptimal outcomes and high costs. Pathways typically involve evidence-based protocols that are more prescriptive than guidelines.
Pathways prioritize treatments based on relative efficacy, toxicity, and cost, in that order. Groups of academic and community oncologists develop them and commercial companies, such as Cardinal Health’s P4 Healthcare and McKesson’s Innovent Oncology, imple-ment them. Currently most focus only on drug decisions, but they are ex-panding to include diagnostic testing choices.
Oncologists are financially incentivized to adhere to the treatment pathways for a majority of their patients (higher fee schedules and bonuses, for exam-ple), and the payer benefits through
2Mary Lou Bowers, “What Is in Store for 2012? It’s Not Just Medicare Changes,” Clinical Oncology News, December 2011

College of American Pathologists
Promising Practice Pathways
23
cost savings from usage of less expen-sive drugs and more frequent end-of-life palliative care decisions. To date Aetna, UnitedHealth Group, and a number of state Blues are implement-ing oncology pathway programs.
Oncology Bundling Looks Here to StayAnother popular value-based model, bundling or episode of care payments, can be implemented with or without pathways. Many industry experts pre-dict that bundling models will be one of the long-term reform winners, as early results have shown them to be quite effective in both cost reduction and maintaining quality.
Here’s how a bundled model works:
“... a “bundled payment” or an “episode payment,” reimburses participating medical oncolo-gists upfront for an entire cancer treatment program, rather than using the current “fee-for-service” approach that rewards volume regardless of health outcomes.”3
According to Jay Sultan, Assoc. Vice President and General Manager for Payment Reform at The TriZetto Group, bundled or “global case rate” pay-ments per patient for cancer drugs are now extremely common.4 For example, an oncologist might receive a flat fee
of $15,000 for all drug infusions for a patient over the course of two years. Sultan also reports that he is beginning to hear of complete oncology bun-dling programs, which include all costs – medical, surgery, pathology, etc. – in the global payment fee.
As an example of a cancer bundled payment program designed to pro-vide value and quality to patients and oncologists at the diagnostic phase of care, Cancer Treatment Centers of America (CTCA), an employee model, integrated oncology provider network, recently launched the diagnostic ser-vices bundled offering directly to pa-tients. Called CareEdge, the program offers a comprehensive set of pathol-ogy and radiology testing with a guar-anteed five day turn-around time, set package price and personalized care plan with suggested next steps.
CareEdge is priced at $12,200 for a breast cancer patient, $11,400 for colorectal cancer, $14,500 for lung can-cer, and $10,000 for prostate cancer.5 CTCA has obtained reimbursement from smaller health plans and is pursu-ing coverage from national carriers.
The speed with which payers are mov-ing along this reform continuum varies with the payer and the geographic
3“UnitedHealthcare Report Recommends Adopting New Cancer Care Payment Model to Reward Physicians for Health Outcomes,” UnitedHealthcare press release, April 16, 20124Jay Sultan, Assoc. Vice President and General Manager for Payment Reform at The TriZetto Group, interview with Eleanor Herriman, MD, MBA, G2 Intelligence, on July 3, 20125Lola Butcher, “Flat Fee for Cancer Treatment Plan Introduced,” Oncology Times, Volume 33, Issue 23, December 10, 2011
Promising Practice Pathways
College of American Pathologists24
region. UnitedHealthcare is at the fore-front of payers, having rolled out on-cology bundling programs that include oncology services, drugs, hospitaliza-tions and other costs – diagnostics are planned for later. In California, for example, reform is relatively far ahead of other states.
ACOsThe final phase that many payers are targeting for oncologists is a variant of an Accountable Care Organization, with value-based payment, coordi-nated care, and financial risk shifted to the oncologist. For example:
• The oncologist may receive some sort of “global payment” that cov-ers managing a cancer patient over an episode of care, perhaps 1-2 years;
• The oncologist decides how to al-locate that payment amongst the various services needed to care for the patient, including drugs, surgeries, radiation, labs, imaging, hospitalizations, etc.;
• The oncologist may also receive a “patient management fee” for coordinating services (this is the medical home model), such as extra office hours, round-the-clock nursing support, etc.;
• The oncologist may be rewarded or penalized according to adher-ence to care pathways, which would likely direct both options for therapies and testing;
• The oncologist would share in or retain all of the savings achieved if spending for the patient was lower than the fixed payment.
Payers Versus HospitalsAetna and several other payers are backing the oncology medical home model, in collaboration with the Com-munity Oncology Alliance, as they see it as a means to save the com-munity oncology practice model. In the medical home model, oncologists employ intensive care management and coordination services with the goal of reducing the use of hospitals and emergency departments. Payers’ motivation for supporting the viability of the independent oncology practice relates to curbing the tide of hospital acquisitions and avoiding expensive hospital-based oncology services.
So the payers and hospitals are in an interesting battle regarding the future of oncology practice models. Payers are hoping to safeguard private com-munity practices through a medical home model and gain sharing, and hospitals are aiming to manage and integrate oncology through acquisition and contracting.
Medicare – The Determining FactorThe most important predictor of the timeline for new oncology payment models is Medicare. Jay Sultan pre-dicts that by 2016 Medicare will be implementing bundled payments for oncology. This timeline begins with the Center for Medicare and Medicaid In-

College of American Pathologists
Promising Practice Pathways
25
novation’s (CMMI) “Bundled Payments for Care Improvement” initiative, which begins piloting bundled programs, in-cluding one in oncology, in 2013.
CMMI has enormous powers to rapidly enact new Medicare payment reform programs without the need for Con-gressional approval or any type of ad-visory review. Assuming CMMI endures, it is quite likely Medicare will be rolling out some form of oncology bundled payment program in a few years.
Memorial Sloan Kettering has proposed a bundling model to Medicare that delivers a set reimbursement to provid-ers for a period of care for a particular patient with a defined condition.
“As an example of our model, consider the case of non–small-cell lung cancer (NSCLC). There are currently eight combinations of chemotherapeutics that are recommended as first-line treat-ment for this disease, according to the National Comprehensive Cancer Network (NCCN) and a number of other practice guide-lines. The costs of these regimens … vary quite substantially, how-ever, from approximately $1,292 to $7,092 per month. If these regi-mens are largely interchangeable and of similar efficacy, an epi-sode-based payment framework could result in savings without harming quality.
"For instance, imagine if the rate of reimbursement for a 1-month episode of treatment of NSCLC were set at $4,000 per month, … This would create an incentive for oncologists to choose lower priced regimens.”6
Bottom Line – and Caveats – for PathologyBoth the variety of new oncology practice models being explored and the stakeholder dynamics present us as pathologists contemplating this oncol-ogy pathway with interesting opportu-nities and multiple “client” possibilities.
There is, however, also a cautionary side to this situation. Oncology prac-tices under bundling contracts have another alternative – to insource the pathology and laboratory testing. This would allow them to manage the costs as well as generate revenues. The more oncologists view our diagnos-tic and lab testing as simply reporting results, and basically a commodity, the more likely this is to happen. However, with a high performance pathology practice oncology model that pro-vides knowledge that directly influ-ences decisions that save money and improve outcomes, the pathology lab is in an entirely different category.
6J Luke et al. “Improving Quality and Addressing the Rising Costs of Cancer Care: Two Birds, One Stone,” Journal of Onc Practice, November 2011 vol. 7 no. 6 402-404

Promising Practice Pathways
College of American Pathologists26
Although this market landscape may seem a bit complicated by stakehold-er power struggles, practice model variations, and evolution in payment programs, it can be distilled to a few fundamentals. Namely, whoever is be-ing paid under these new, risk-based models, be they oncologists or hospi-tals/health systems, will have compen-sation tied to clinical outcomes and costs.
The implications are relevant for pa-thologists as risk-based compensation depends, directly or indirectly, upon:
• Having the highest accuracy and most precise and timely diagnosis possible;
• Utilizing the optimal (selected for efficacy, toxicity and costs) com-bination of therapeutics (including clinical trial drugs) at each point in the tumor’s progression; this may include the development of one’s own treatment pathway, based on evidence and experience;
• Applying the best possible infor-mation to prevent complications and hospitalizations;
• Assessing patients’ adherence to medication regimens in order to ensure therapeutic efficacy and avert complications;
• Transitioning to palliative, end-of-life care in an evidence-based manner and according to patient preferences.
Oncologists Can’t Go It AloneFor community oncologists and com-munity hospital oncology service lines, possessing these “Oncology Manage-ment Capabilities” in the context of the ever-accelerating fields of cancer science and technology will be very challenging. Workforce studies are projecting shortages of oncologists, so it seems impractical to assume that an overloaded community oncologist will have sufficient time to keep current with all the necessary therapeutic and diagnostic literature needed to inform best practice management. Technol-ogy and knowledge accumulation offer only a partial solution. The combi-nation of the spread of clinical IT and the availability of actionable oncology knowledge repositories mean that an infrastructure exists to bring academic-type oncology to community oncol-ogy practice. There are now websites that log cancer genetic variants, com-parative treatment effectiveness re-sults, and clinical trial information.
Still, because so much of cancer is driven by molecular medicine, one of the most critical pieces to equipping
STRATEGY: HIGH-VALUE ONCOLOGY SERVICES

College of American Pathologists
Promising Practice Pathways
27
community oncology for value-based payment programs is a pathology lab designed to translate testing informa-tion into clinical management deci-sions.
Market Opportunity for PathologistsThese market changes open up an opportunity for pathologists to provide knowledge services to enable oncolo-gists to improve their outcomes and lower spending, i.e., to achieve “high value oncology.”
The pathology practice’s objectives for this pathway model include:
• Ownership – Put a stake in the ground to begin owning this opportunity
– other, non-pathology/lab mar-ket entities have already begun to move into this market with various offerings;
• Competitive differentiation – Create a competitively superior solution to generate value for on-cology practices
– comprehensive, integrated test-ing – integrating all information for interpretation adds diag-nostic power; plus it is critical to have all testing done at one lab, due to differences in refer-ence ranges, methods, assays, etc.;
– disease expertise – only pathol-ogists can integrate the histo-pathology with the molecular genetics and understanding of disease processes;
– informatics and IT systems – ac-cess to LIS and oncology clinical data for data mining, algorithm development and bioinformat-ics analysis;
• Diagnostics in pathways – Work at the local level with your oncolo-gists to integrate testing into treat-ment pathways
– treatment pathways are a key tool of payers for managing on-cology costs and will likely con-tinue to be used in bundling;
– diagnostics should be increas-ingly driving cancer treatment decisions, so pathology groups have an opportunity to both codify this with oncologists and payers and tie it to value-based payment by integrating testing into pathways.
• Business case – Develop an evi-dence-supported business case quantifying the value delivered by the pathology care management services;
– this is especially critical for gain-sharing and bundled payment contracts that become more prevalent after 2016;
– for those practices that want to aggressively expand in this mar-ket, and/or contract early with payers, investing early in such a business case will provide pow-erful ammunition.

Promising Practice Pathways
College of American Pathologists28
• Perceptions – Reframe the oncologists’ view of the patholo-gist from a provider of diagnoses to a knowledge partner who is critical to care decisions.
Importantly, this pathway enables us to be compensated fairly as oncology moves away from fee-for-service to-wards value-based payments. Without a set of services that demonstrate we can participate directly in improving quality outcomes and generating sav-ings, we will be a cost line item that will become part of those savings.
The practice model we are proposing, then, is a new one. It involves pursuing revenue services that come from new payment models tied to value, and thus often based on bundling, shared-savings, global payments/capitation, and the like. Our compensation will be determined by a business case built on evidence that the services we provide result in improved quality and lower costs.
Sizing the opportunity: initial target market and clientsThe likely, initial target market will be community oncology groups and community hospitals, given that they will have the greatest need for help. An additional, and immediate, market opportunity is contracting with payers to offer these oncology service solu-tions.
The size of this market opportunity can be estimated in several ways:
• It may represent the majority of the available community oncol-ogy market within 6–10 years.
• We control how big an opportuni-ty this is for pathologists, because if we don’t pursue this course, others will, including oncologists themselves by insourcing labora-tories.
• The opportunity size will vary geo-graphically, due to differences in the adoption rates of payment reform in oncology.
• We need to compare this oppor-tunity to projections for our fee-for-service (FFS) oncology testing market.
In Figure 1 we take a macro level, national view of the potential pathol-ogy markets in oncology in both the traditional, FFS model, and the emerg-ing, value-based model. For an expla-nation of the market revenue defini-tions and the methodology used, see “Methodology” under the Figure.
What comes out of this model exercise is that the potential value-based on-cology market for pathologists based only on a proportion of cost savings is substantial – about 23 percent of the entire FFS revenue market (this as-sumes testing including molecular, Flow, FISH). This does not include com-pensation for the testing itself. When that is included, the total value-based estimate is about 13 percent higher than the FFS market.
College of American Pathologists
Promising Practice Pathways
29
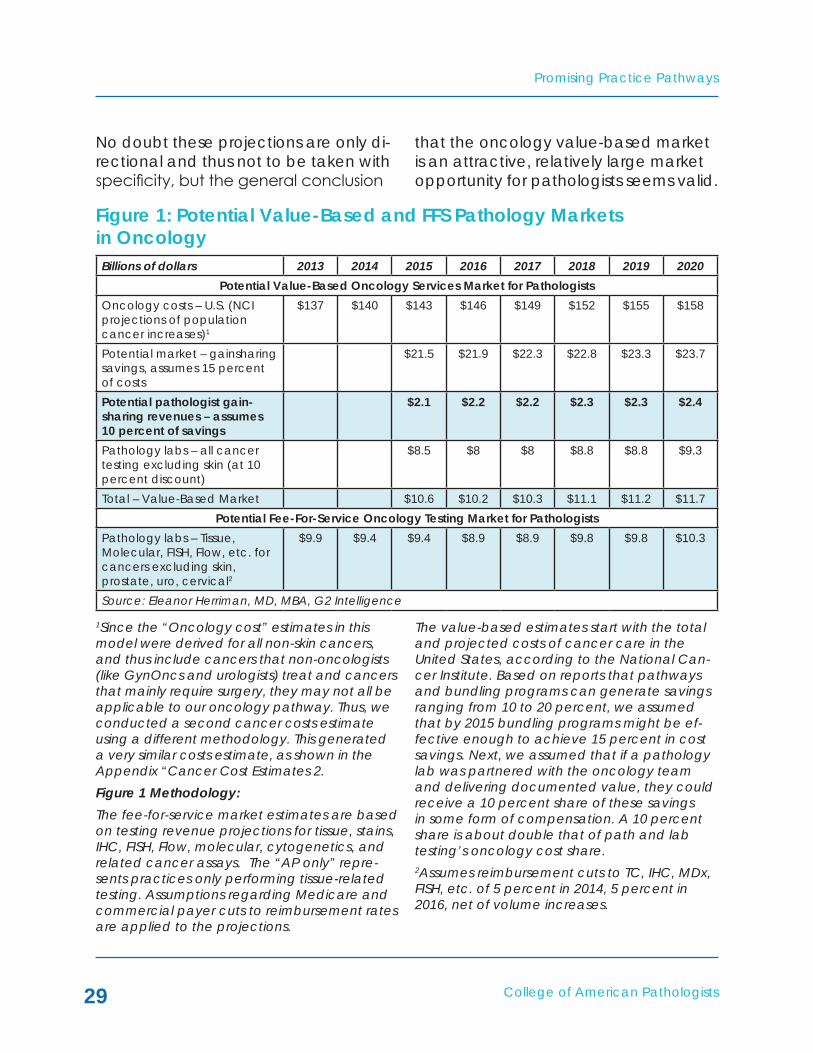
No doubt these projections are only di-rectional and thus not to be taken with specificity, but the general conclusion
that the oncology value-based market is an attractive, relatively large market opportunity for pathologists seems valid.
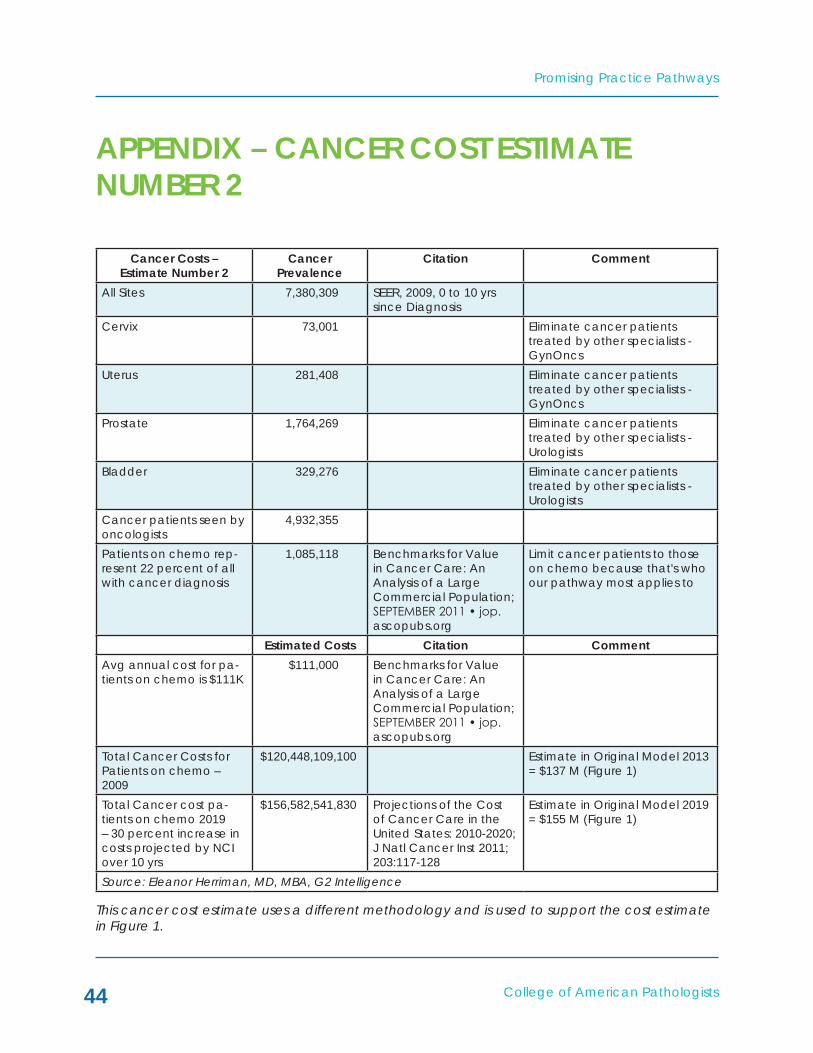
1Since the “Oncology cost” estimates in this model were derived for all non-skin cancers, and thus include cancers that non-oncologists (like GynOncs and urologists) treat and cancers that mainly require surgery, they may not all be applicable to our oncology pathway. Thus, we conducted a second cancer costs estimate using a different methodology. This generated a very similar costs estimate, as shown in the Appendix “Cancer Cost Estimates 2.Figure 1 Methodology:The fee-for-service market estimates are based on testing revenue projections for tissue, stains, IHC, FISH, Flow, molecular, cytogenetics, and related cancer assays. The “AP only” repre-sents practices only performing tissue-related testing. Assumptions regarding Medicare and commercial payer cuts to reimbursement rates are applied to the projections.
The value-based estimates start with the total and projected costs of cancer care in the United States, according to the National Can-cer Institute. Based on reports that pathways and bundling programs can generate savings ranging from 10 to 20 percent, we assumed that by 2015 bundling programs might be ef-fective enough to achieve 15 percent in cost savings. Next, we assumed that if a pathology lab was partnered with the oncology team and delivering documented value, they could receive a 10 percent share of these savings in some form of compensation. A 10 percent share is about double that of path and lab testing’s oncology cost share. 2Assumes reimbursement cuts to TC, IHC, MDx, FISH, etc. of 5 percent in 2014, 5 percent in 2016, net of volume increases.
Figure 1: Potential Value-Based and FFS Pathology Markets in Oncology Billions of dollars 2013 2014 2015 2016 2017 2018 2019 2020
Potential Value-Based Oncology Services Market for PathologistsOncology costs – U.S. (NCI projections of population cancer increases)1
$137 $140 $143 $146 $149 $152 $155 $158
Potential market – gainsharing savings, assumes 15 percent of costs
$21.5 $21.9 $22.3 $22.8 $23.3 $23.7
Potential pathologist gain-sharing revenues – assumes 10 percent of savings
$2.1 $2.2 $2.2 $2.3 $2.3 $2.4
Pathology labs – all cancer testing excluding skin (at 10 percent discount)
$8.5 $8 $8 $8.8 $8.8 $9.3
Total – Value-Based Market $10.6 $10.2 $10.3 $11.1 $11.2 $11.7Potential Fee-For-Service Oncology Testing Market for Pathologists
Pathology labs – Tissue, Molecular, FISH, Flow, etc. for cancers excluding skin, prostate, uro, cervical2
$9.9 $9.4 $9.4 $8.9 $8.9 $9.8 $9.8 $10.3
Source: Eleanor Herriman, MD, MBA, G2 Intelligence
Promising Practice Pathways
College of American Pathologists30
Challenges and Tremendous Opportunity AheadWhile there will be many phases in the evolution of this pathway, the launch phase, which spans approximately 2014 through 2016, is perhaps both the most challenging and the most critical. It involves risk taking, initiating cultural and governance shifts, financial invest-ments, and learning curves.
But it also offers tremendous oppor-tunities to control our futures. This pa-thology pathway is an opportunity to provide knowledge services, driven by diagnostic testing and informatics + algorithms, that enable oncologists to improve their outcomes and lower spending, i.e., to achieve “high value oncology.”
College of American Pathologists
Promising Practice Pathways
31
The high-value oncology practice model has the following characteris-tics:
• Services are knowledge-based, not test reports, and address clini-cal decisions throughout the care continuum
• Superior clinical decision-making is enabled by:
– Expertise and evidence-review – continuous development of test panels and protocols;
– Pathologists integrating infor-mation across multiple types of tests – tissue, molecular, Flow, etc.;
– Advanced tumor profiling using sequencing;
– Risk analysis to mitigate com-plications – e.g., pharmacoge-netic testing;
– Informatics, mining of lab data, and algorithms; and
– Digital pathology for expert re-view and quantitative analysis.
• Clients include community oncol-ogy groups, hospital oncology services lines and cancer centers, payers, ACOs, and companies developing pathways or manag-ing oncology care.
• Payment models may initially be fee-for-service but will transition to some component of service contract, gain-sharing through bundled payments or global pay-ments.
Applying the Model: High-Value Oncology Services in ActionKnowledge services in a high-perfor-mance pathology practice support oncology decision making and im-prove performance along the care continuum (See Figure 2).
A MODEL FOR HIGH-VALUE ONCOLOGY SERVICES

Promising Practice Pathways
College of American Pathologists32
Figure 2: High Performance Pathology for High-Value Oncology Practice Pathway
Oncologist Treatment Continuum
High PerformancePathology Pathway
2014-2016
Monitoring forefficacy/patientadherence
Digitally reviewedfor high accuracy+ comprehensivereport
Testing algorithmsfor risk-benefit ofstimulation factors
Monitoring fortoxicity, anemia,clotting, etc.
Analysis of testresults -recommendwhen to switchto palliativecare
Re-profiling ofrecurrent tumor+ Test Panels forRx selection
Evidence-baseddiagnostictesting pathway
Test panelsfor Rxselection
Clinical trialrecruiting - tumorprofiling matching(2016)
Diagnosis
Onc work up -staging
Evaluateresponse
Patientcomplication
> Hospitalization
Progression
Progression
Progression
1st linetherapydecision
2nd linetherapydecision
3rd linetherapydecision
Clinical trialoptions
Clinical trialoptions
UseGranulocyte
growth factors orErythroStims?
Palliativecare
Clinical trialoptions
Palliativecare
Source: Eleanor Herriman, MD, MBA, G2 Intelligence

College of American Pathologists
Promising Practice Pathways
33
Core Service Offerings of High Performance Pathology for High-Value Oncology PathwayIn addition to a complete menu of oncology pathology and laboratory testing (not all of which needs to be in-house, though rapid turn-around is important), testing services will include:
• High accuracy and timely, high-precision diagnostic testing services
This need is driven by the fact that medical diagnostic errors from all causes are believed to occur at a rate of 15-23 percent. Cancer diag-nostic accuracy can be suboptimal in terms of delays, misinterpretations, pre- or post- analytic errors, or clini-cian cognitive or system errors. Fur-ther, pathologist interpretation error has also been found to be important: “In a CAP multi-institutional study of a variety of secondary review prac-tices, the self-reported mean and median discrepancy frequency of 74 laboratories was 6.7 percent and 5.1 percent, respectively. Forty-eight per-cent of all discrepancies were due to a change within the same category of interpretation (e.g., one tumor type was changed to another tumor type). This change in diagnosis has a major impact on the clinical management ofpatientsinmanyfieldsofoncology,such as lung cancer."7
There are multiple ways to increase diagnostic accuracy:
– Conducting multiple, digital reviews of cancer cases;
– Integrating all testing into a single, interpretive case report;
– Providing services to direct test ordering;
– Utilizing “high precision” molec-ular testing to sub-classify and ensure diagnosis; and
– Implementing more intensive systems for tracking report fol-low-up.
• Test panels for clinical decisions and pathways
The heart of our high performance practice is the test panels and related services. These are what can drive care decisions toward better out-comes and lower spending, as we can leverage the rapid advancements in molecular and "-omics" sciences in cancer.
In our high performance practice con-text:
• A “test panel” is loosely defined as a suite of tests that can be comprised of different assay types (e.g., molecular, IHC, Flow, FISH, tissue, clinical lab) and are se-lected to address a specific clini-cal question for a specific cancer type.
• A test panel is dynamic – it is rou-tinely reviewed by the pathologist and the test selection updated as the science and evidence evolve.
• A test panel may have an ac-companying algorithm that quan-
7http://onlinelibrary.wiley.com/doi/10.3322/caac.20068/full
Promising Practice Pathways
College of American Pathologists34
tifies risk, prognosis or treatment efficacy probability. A risk esti-mate algorithm, for example, may also include clinical factors. Panels may also involve a “mini path-way” with further testing.
• A test panel results in an integrat-ed report with an interpretation and decision recommendation. It will likely frequently entail a call with the oncologist – hence the “knowledge service” moniker.
Example test panel applications:
• Deciding between treatment regi-mens for 1st, 2nd or 3rd course of therapy;
• Predicting prognoses;
• Determining level of risk for toxicity or complication – direct interven-tions;
• Evaluating treatment response or tumor resistance;
• Deciding whether to use stimulat-ing factors (e.g., Erythropoietin, Granulocyte colony stimulating factor(G-CSF)) or other supportive therapies;
• Identifying options for clinical trial agents;
• Deciding whether to enter pallia-tive care, based on marker profil-ing indicating lack of effective therapies/poor prognosis; and
• Tumor profiling to support patient consulting for palliative care deci-sions.
End-of-life care is an area that the American Society of Clinical Oncolo-gists, among others, has targeted for improvement in care. Oncology lead-ership is communicating that chemo-therapy is being administered far after it should be in terms of benefits versus harms. Moreover, patients’ wishes are not being considered in the treat-ment decisions. Finally, a significant proportion of cancer costs occur in the last year of life, so these therapeutic courses mostly represent unnecessary spending.
This presents an opportunity for pathol-ogists to provide a valuable service. By mapping the evolution of the tumor’s molecular profile across a panel of markers as it develops resistance to various therapies, we can provide an objective means of assessing when further therapeutic interventions may no longer be effective. This data can be used by the oncologist for palliative care/end-of-life discussions with pa-tients.
A key technology platform needed for tumor profiling throughout the course of treatment is next-generation se-quencing (NGS). NGS of cancer mark-ers is already being used routinely for clinical care of some cancers at many major academic medical centers, and many predict that by 2016 it will be routinely used for at least one major cancer throughout the community.
We will likely need NGS of marker pan-els for our high performance testing services in particular applications, such as evaluating recurrent tumor’s pro-
College of American Pathologists
Promising Practice Pathways
35
files, and by a particular time period – about 2016-2017. Although adopting NGS seems daunting, the technology is maturing very quickly, so bench-top instruments, sample prep and bioinfor-matics software are becoming more accessible every month. Our practice
pathway goal should be to have either built, or arranged through a reference lab or partnership for NGS tumor profil-ing services with less than a two week turn-around time and the ability to sequence ~200 markers by ~2016-2017.
Promising Practice Pathways
College of American Pathologists36
A pathology practice need not think that this pathway requires a complete practice conversion to oncology, or a sudden transition to a new business model. First, the pathway envisions a gradual transition in business revenues switching to the new model, so the practice would likely have a mix of business for a few years. Second, a high performance pathology pathway for oncology can operate within a more general practice group if it is of sufficient size.
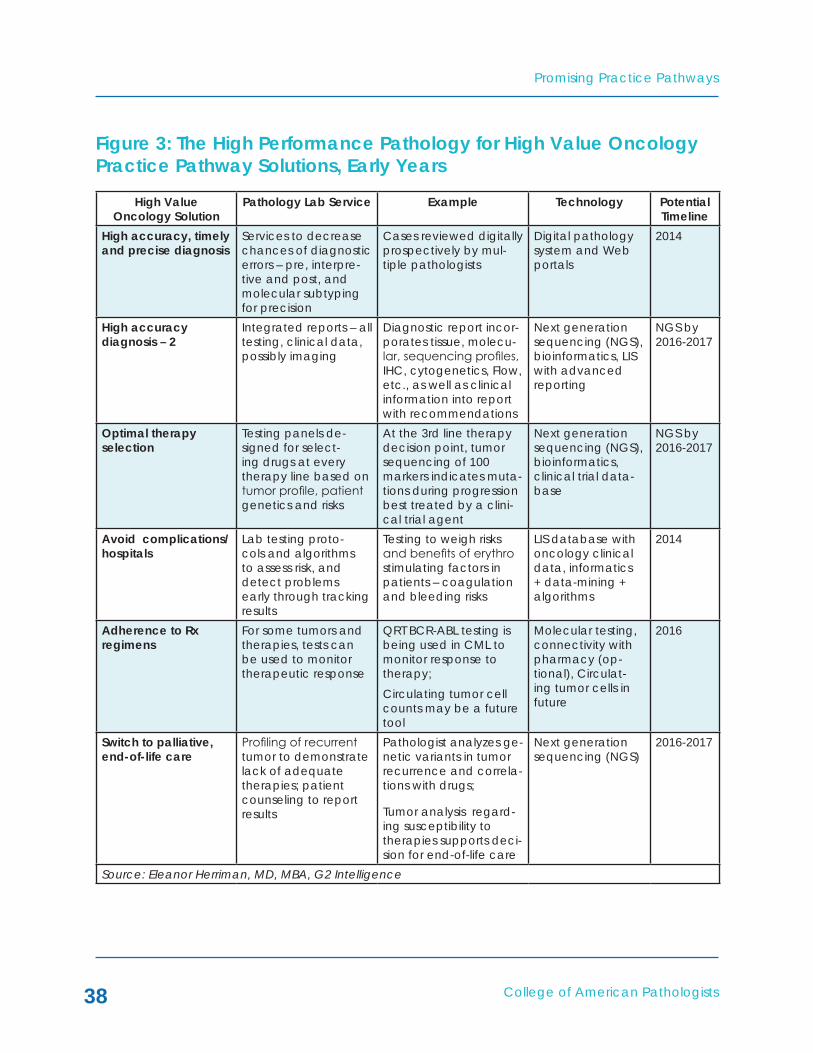
Figure 3, “The High Performance Pa-thology for High Value Oncology Prac-tice Pathway Solutions, Early Years,” provides an overview of the type of knowledge services our practice path-way model might use to support “high value” oncology in the beginning years. Keep in mind that these services may be developed through buying, building or partnering.
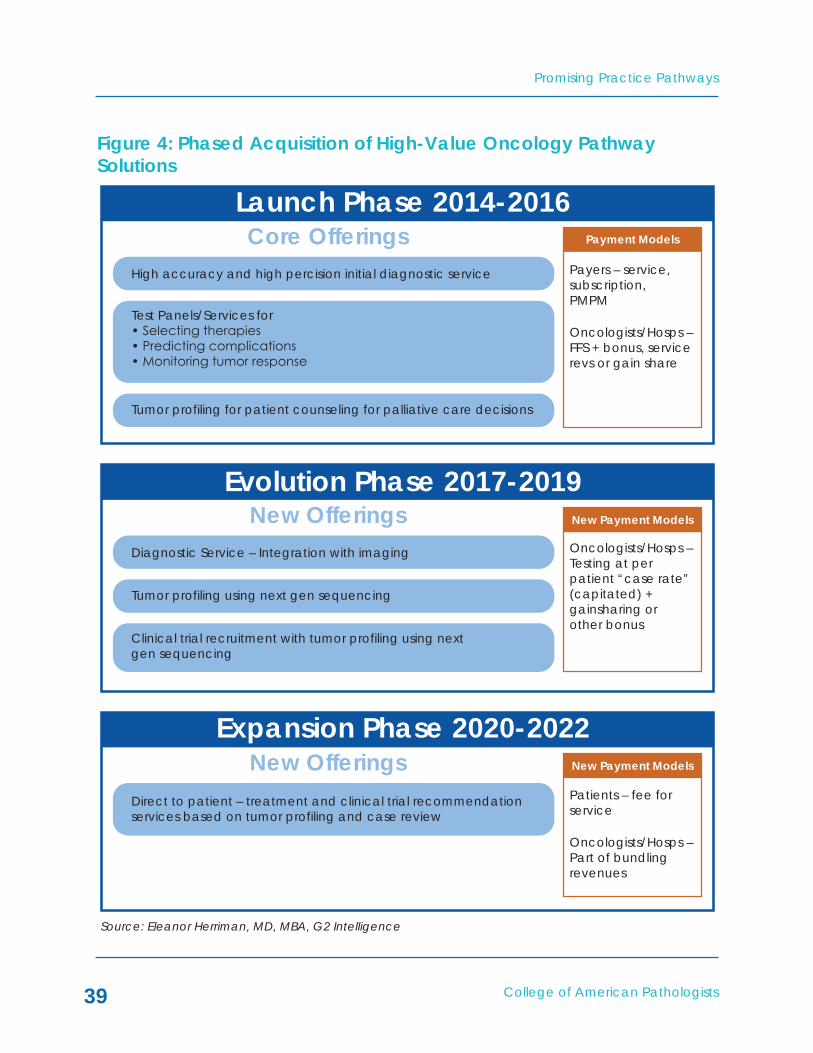
In addition, our pathway guide an-ticipates a phased acquisition of the technologies and offerings (see Figure 4, “Phased Acquisition of High Value Oncology Pathway Solutions”).
One pathway requirement that needs highlighting concerns accessing clini-cal oncology data. This is essential in order to formulate our clinical decision applications. In addition, it would be
helpful to have access to claims data for cost analysis purposes, although in a bundled payment setting this will be automatically calculated by the payer.
Laboratory access to clinical data can be challenging, depending on the practice setting. However, with care delivery reform integrating providers, and our new practice pathway model involving us more directly in care man-agement, we have an excellent case for accessing this data. Further, as part of our business proposal to the oncol-ogy group, hospital, ACO, academic medical center, or payer, we simply make it clear that without this data we cannot execute the program.
There are a number of ways we can access the data. In an ACO, for ex-ample, they likely have already inte-grated lab, clinical and other data, so it is a matter of accessing that network or database. In the case of a hospital cancer center, it may also be straight forward, as the data is likely concen-trated in an EHR. For community on-cology groups, we either analyze their EMRs, if they contain all the pathology and lab data we need, or build suf-ficient interfaces to enable two-way data exchange and work with our LIS systems.
MAkING THE TRANSITION TO HIGH PERFORMANCE PATHWAY SERVICES
College of American Pathologists
Promising Practice Pathways
37
Choosing a Path ForwardThe path forward will vary depending on many factors including timing, size, resources and geography. It is possible even for small pathology practices in regions early along in reformation to begin implementing this model. Fig-ure 5, “Spectra of Practice Pathway Service Offerings,” shows variations of some of the key pathway services along three dimensions:
• Time – 2014 to 2022: all groups will be developing the offerings to some extent incrementally;
• Size and resources: from small (e.g., five pathologists) on the left side to large or well capitalized with assets/CLIA lab on the right side.
• Geography: from regions early in reform (not many ACOs, for exam-ple, and no oncology pathway programs) on the left side to re-gions far along in oncology reform on the right.
The left side of the graphic shows each core service offering as a more basic version compared to the right side. “Version A” service offerings might then reflect either being early in development (2014-2015), or a small group’s offering for a number of years, or where a region without much reform would start. On the other hand, a large reference lab targeting a payer with an oncology bundling program might start developing a mix of “Versions B and C” offerings as early as 2014.
Promising Practice Pathways
College of American Pathologists38
Figure 3: The High Performance Pathology for High Value Oncology Practice Pathway Solutions, Early Years
High Value Oncology Solution
Pathology Lab Service Example Technology Potential Timeline
High accuracy, timely and precise diagnosis
Services to decrease chances of diagnostic errors – pre, interpre-tive and post, and molecular subtyping for precision
Cases reviewed digitally prospectively by mul-tiple pathologists
Digital pathology system and Web portals
2014
High accuracy diagnosis – 2
Integrated reports – all testing, clinical data, possibly imaging
Diagnostic report incor-porates tissue, molecu-lar, sequencing profiles, IHC, cytogenetics, Flow, etc., as well as clinical information into report with recommendations
Next generation sequencing (NGS), bioinformatics, LIS with advanced reporting
NGS by 2016-2017
Optimal therapy selection
Testing panels de-signed for select-ing drugs at every therapy line based on tumor profile, patient genetics and risks
At the 3rd line therapy decision point, tumor sequencing of 100 markers indicates muta-tions during progression best treated by a clini-cal trial agent
Next generation sequencing (NGS), bioinformatics, clinical trial data-base
NGS by 2016-2017
Avoid complications/ hospitals
Lab testing proto-cols and algorithms to assess risk, and detect problems early through tracking results
Testing to weigh risks and benefits of erythro stimulating factors in patients – coagulation and bleeding risks
LIS database with oncology clinical data, informatics + data-mining + algorithms
2014
Adherence to Rx regimens
For some tumors and therapies, tests can be used to monitor therapeutic response
QRT BCR-ABL testing is being used in CML to monitor response to therapy;Circulating tumor cell counts may be a future tool
Molecular testing, connectivity with pharmacy (op-tional), Circulat-ing tumor cells in future
2016
Switch to palliative, end-of-life care
Profiling of recurrent tumor to demonstrate lack of adequate therapies; patient counseling to report results
Pathologist analyzes ge-netic variants in tumor recurrence and correla-tions with drugs;
Tumor analysis regard-ing susceptibility to therapies supports deci-sion for end-of-life care
Next generation sequencing (NGS)
2016-2017
Source: Eleanor Herriman, MD, MBA, G2 Intelligence
College of American Pathologists
Promising Practice Pathways
39
Figure 4: Phased Acquisition of High-Value Oncology Pathway Solutions
Payers – service,subscription,PMPM
Oncologists/Hosps –FFS + bonus, servicerevs or gain share
Payment Models
Launch Phase 2014-2016
High accuracy and high percision initial diagnostic service
Core Offerings
Tumor profiling for patient counseling for palliative care decisions
Test Panels/Services for• Selecting therapies• Predicting complications• Monitoring tumor response
New OfferingsEvolution Phase 2017-2019
Diagnostic Service – Integration with imaging
Tumor profiling using next gen sequencing
Clinical trial recruitment with tumor profiling using nextgen sequencing
Oncologists/Hosps –Testing at perpatient “case rate”(capitated) +gainsharing orother bonus
New Payment Models
New Payment ModelsNew OfferingsExpansion Phase 2020-2022
Direct to patient – treatment and clinical trial recommendationservices based on tumor profiling and case review
Patients – fee forservice
Oncologists/Hosps –Part of bundlingrevenues
Source: Eleanor Herriman, MD, MBA, G2 Intelligence

Promising Practice Pathways
College of American Pathologists40
Figure 5: Spectra of Practice Pathway Service Offerings
2014 ... 2022
and/or
Smaller Path Groups ... Larger/Better Capitalized
and/or
Regions Early in Reform ... Deeper into Reform
InitialDiagnosis
Test Panelsfor Rx
Selection
Testing toAvoid
Complications
TumorResponse and
End of Life
Clinical TrialRecruitment
Version A Version B Version C
2nd pathologistread + “standard”
markers forsubclassification
Digital pathology-enabled review by
multiple pathologists +subclassification +
integration with imaging
Digital pathology-enabledreview + imaging integration
+ assessment with allcurrent, clinical evidence-
based markers
MDx test panel ofcancer markers
Next gen sequencing(NGS) marker profiling+ diagnostic pathways
Next gen sequencingprofiling for treatment +panels for decisions on
blood stimulants
Monitoring labdata + alerts
Protocols targeted forspecific complications +integration with nursing
Risk algorithms withpharmacogenetics, MDx
and protocols with point ofcare decision support and
nursing integration
Use MDx panels toassess tumor
mutations and likelyresponse to Rx
NGS profiling of recurrencesto compare mutations and
predict resistance + teststhat allow Rx monitoring -
e.g., CTCs
NGS profiling of recurrences+ test to monitor tumor
response + patient counselingre palliative care decisions
Use MDx panels andclinical data to
assess candidacy forclinical trial
NGS profiling for clinicaltrial markers + interfaceto clinical trial database
Partner with CRO or offerrecruitment services topharmas - pre-profiled
cancer patients
Source: Eleanor Herriman, MD, MBA, G2 Intelligence

College of American Pathologists
Promising Practice Pathways
41
Variations in Developing the OfferingsThere are three options for developing the portfolio of test panels needed for this high performance pathology prac-tice, and they can be used in combi-nation with one another for different individual services and will likely evolve over time.
• “Build” – the build approach involves the pathology group developing the test panels within its lab; this does not necessarily mean each test is a “laboratory developed test” (LDT). The panels may be comprised of In Vitro Di-agnostic (IVD) kits or LDTs. But the pathologist will be designing the selection, conducting the valida-tion, and developing any algo-rithms and systematic interpreta-tions for the panel.
• “Buy” – this option entails utilizing a reference lab for individual tests, or perhaps test panels. A relevant example is next-generation se-quencing for tumor profiling. Giv-en the level of expertise required to perform this testing, most com-munity pathology groups will likely want to outsource this in the early years until the technology ma-tures. Another example of “buy” for a larger pathology group might be acquiring a molecular lab with special expertise in tumor markers and profiling.
• “Borrow” – in the borrow ap-proach the pathology group partners with another entity, such as a reference lab, for access to its technology, capabilities and tests. This might take a number of forms – a joint venture, a licensing arrangement, a service contract – but the general objective would be to enable a pathology group to rapidly launch into the market with a full program of services. A borrow strategy would most likely be designed to phase into the pa-thology practice building its own testing capabilities over time.
A Variety of Ways to Fund the PathwayThe issue of managing capital needs is as much a strategic as a financial one. There are several ways to plan the development of the pathway and the client-selling strategy that will increase the capital requirement's flexibility. We have options to partner to access test-ing and even capabilities and services initially.
For instance, pathology labs already engaged in a contract or partnership with a hospital can partner with a hos-pital to provide high value oncology services. In fact, hospitals and aca-demic medical centers may be excel-lent funding sources as they are look-ing for ways to diversify their revenue streams as services move to outpatient settings in efforts to lower spending.
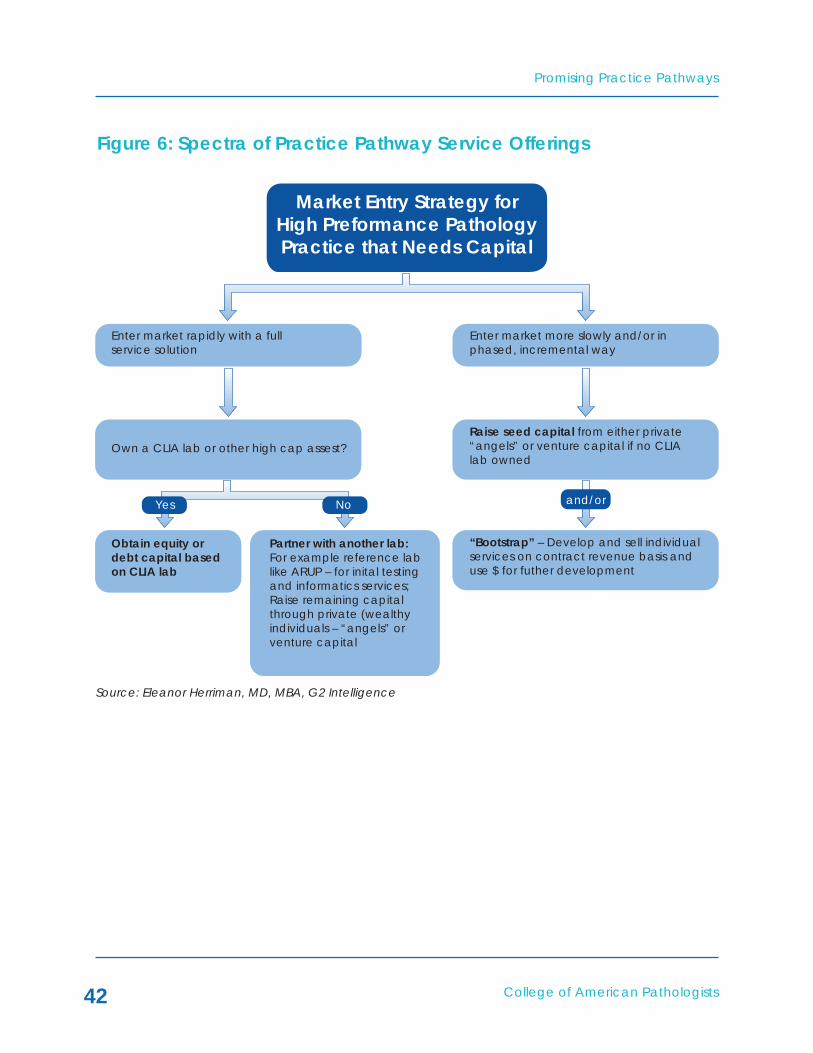
Figure 6 illustrates some of these options.
Promising Practice Pathways
College of American Pathologists42
Figure 6: Spectra of Practice Pathway Service Offerings
Market Entry Strategy forHigh Preformance PathologyPractice that Needs Capital
Enter market rapidly with a fullservice solution
Own a CLIA lab or other high cap assest?Raise seed capital from either private“angels” or venture capital if no CLIAlab owned
“Bootstrap” – Develop and sell individualservices on contract revenue basis anduse $ for futher development
Partner with another lab:For example reference lablike ARUP – for inital testingand informatics services;Raise remaining capitalthrough private (wealthyindividuals – “angels” orventure capital
Obtain equity ordebt capital basedon CLIA lab
Enter market more slowly and/or inphased, incremental way
Yes No and/or
Source: Eleanor Herriman, MD, MBA, G2 Intelligence

College of American Pathologists
Promising Practice Pathways
43
Seldom are there opportunities in business in which multiple forces align needs and capabilities as well as the high value oncology diagnostic ser-vices opportunity presents for patholo-gists. The convergence of oncologists’ financial pressures, their needs for new approaches to improve clinical out-comes and achieve cost savings, the switch to episode-based and global payment programs and the advent of personalized oncology treatment management, create an unprec-edented entry point for personalized medicine testing services.
At the same time, pathology faces its own challenges. We are also soon go-ing to be struggling with the transition from fee-for-service to value-based payment. As well, we are in danger of being relinquished to a cost center to be managed like a vendor, squeezed and commoditized by our provider colleagues who are soon to be allo-cating fixed fee payments for episodes of care.
The answer seems obvious, but it will not be simple to execute. Our “High Performance Pathology for High Value Oncology” practice pathway offers us a roadmap for seizing this unpre-cedented market opportunity.
By providing evidence regarding how our tools and services generate value for oncology care by improving di-agnostic accuracy, improving treat-ment selection decisions, helping to avoid complications and admissions, supporting end-of-life decisions, and advancing entry into clinical trials, we can participate in the emerging, next generation of payment models.
Although we do need molecular test-ing and informatics capabilities, as well as access to clinical data, this path-way can be navigated from a number of starting points, with variable speeds and using either buy, build or borrow resourcing.
We believe that, in the medium to long term, many of us have little choice but to move to a value-generating oncol-ogy service model such as this prac-tice pathway. The value generation re-quires in expanding beyond our offices and laboratories, beyond reporting test results, and moving into the clinics with decision support services for on-cologists.
The stars are aligned for us, though, and this future is a very bright one.
CONCLUSIONS
Promising Practice Pathways
College of American Pathologists44
APPENDIx – CANCER COST ESTIMATE NUMBER 2
Cancer Costs – Estimate Number 2
Cancer Prevalence
Citation Comment
All Sites 7,380,309 SEER, 2009, 0 to 10 yrs since Diagnosis
Cervix 73,001 Eliminate cancer patients treated by other specialists - GynOncs
Uterus 281,408 Eliminate cancer patients treated by other specialists - GynOncs
Prostate 1,764,269 Eliminate cancer patients treated by other specialists - Urologists
Bladder 329,276 Eliminate cancer patients treated by other specialists - Urologists
Cancer patients seen by oncologists
4,932,355
Patients on chemo rep-resent 22 percent of all with cancer diagnosis
1,085,118 Benchmarks for Value in Cancer Care: An Analysis of a Large Commercial Population; SEPTEMBER 2011 • jop.ascopubs.org
Limit cancer patients to those on chemo because that's who our pathway most applies to
Estimated Costs Citation CommentAvg annual cost for pa-tients on chemo is $111K
$111,000 Benchmarks for Value in Cancer Care: An Analysis of a Large Commercial Population; SEPTEMBER 2011 • jop.ascopubs.org
Total Cancer Costs for Patients on chemo – 2009
$120,448,109,100 Estimate in Original Model 2013 = $137 M (Figure 1)
Total Cancer cost pa-tients on chemo 2019 – 30 percent increase in costs projected by NCI over 10 yrs
$156,582,541,830 Projections of the Cost of Cancer Care in the United States: 2010-2020; J Natl Cancer Inst 2011; 203:117-128
Estimate in Original Model 2019 = $155 M (Figure 1)
Source: Eleanor Herriman, MD, MBA, G2 Intelligence
This cancer cost estimate uses a different methodology and is used to support the cost estimate in Figure 1.

COLLEGE OF AMERICAN PATHOLOGISTS
HIGH-PREFORMANCE DIAGNOSTIC SERVICES
PROMISING PRACTICEPATHWAYS™:
Promising Practice Pathways
College of American Pathologists46
An under-appreciated “epidemic” of clinical diagnostic errors is creating a need for new approaches to el-evating clinical diagnostic accuracy, opening up an opportunity for pa-thologists to deliver high-performance pre- and post- laboratory testing ser-vices. Clinical diagnostic error rates average 15 percent, three-fold higher than pathology, laboratory or radiol-ogy mistakes. Estimates suggest these errors contribute to 15–20 percent of all “adverse events.” While industry experts agree that these errors have received relatively less public or scien-tific attention, compared with other types of adverse events, this is starting to change.
At the same time, these errors do not appear to be declining. Increasing clinical complexity and rising clini-cian pressure may be increasing the likelihood of clinical diagnostic errors, and strengthening the case that it is pathologists who are best able to provide an answer. Aggravating fac-tors include a wave of aging Baby Boomers with multiple chronic condi-tions that are challenging to diagnose, a significant shortage of primary care physicians and an exponentially rising number of diagnostic tests. Clinicians who provide direct patient care need expert diagnostic services to meet these challenges.
A significant number of clinical diag-nostic errors are due to physicians’ knowledge, communication, synthesis, interpretation and management of diagnostic testing. If pathologists can help clinicians order, interpret and follow up on the right results in an ac-curate and timely manner, they will improve not just diagnostic accuracy, but also outcomes that translate into value warranting compensation.
This Practice Pathway, “High-Perfor-mance Diagnostic Services,” describes a promising opportunity for entering the value-based marketplace by addressing clinically and financially significant issues. The practice model entails deploying pathologist services and IT tools that improve test selec-tion, result communications, result interpretations and result follow-up/management.
We’re offering this pathway guide because we believe that these errors are receiving increasing attention and that there is a rising interest in services aimed at reducing clinical diagnostic errors. Pathology groups that deliver high-performance diagnostic services that improve quality and decrease spending will likely have more robust growth opportunities compared with groups who offer fee-for-service test-ing alone.
SUMMARY
College of American Pathologists
Promising Practice Pathways
47
There is a cautionary note to add here, too. Although we are the logical profession to seize this opportunity for value generation – particularly given our long-standing expertise with qual-ity control and assurance programs and analytics of all kinds, including the College’s Q-PROBES program – if we do not take action others may usurp us. Others in health care, particularly in the quality and safety areas, have expertise in Six Sigma and can acquire other capabilities needed to design interventions to address the problems we’ll be describing.
While pathologists hold the strong competitive advantage of being able to apply much of our successful intra-lab quality work to the pre- and post-clinician testing phases, as well as holding a unique understanding of laboratory and pathology testing, we should not count on this giving us more than a great head start.
This pathway is accessible to patholo-gists across practice types, settings, resource levels and capability portfoli-os. The guide does not present a “how to” for every practice, but it does offer models applicable to several types of practices. Hopefully it gives you a sense of (1) the market demand for this practice model, (2) the attractiveness of this practice pathway both profes-sionally and financially, and (3) the attainability of this opportunity.
The guide is structured as follows:
• Introduction: The Under-Appreci-ated Epidemic
• The Market Opportunity: How Improved Diagnostic Accuracy Generates Value
• Defining the High-Performance Diagnostic Services Pathway

Promising Practice Pathways
College of American Pathologists48
The high-performance diagnostic ser-vices practice pathway uses the pa-thologist’s expertise and laboratory information to tackle a serious “epidem-ic” – that of clinical diagnostic errors.
As defined here, clinical diagnostic errors are cases in which the clinician misdiagnoses, misses making a diag-nosis or experiences a clinically signifi-cant delay in making a diagnosis. The majority of these cases are not due to pathology, laboratory or radiology mistakes, where error rates are typically about 5 percent, but to diagnostic er-rors by clinicians, where the error rates average 15 percent.1
“Medical diagnoses that are wrong, missed or delayed make up a large fraction of all medical errors and cause substantial suffering and injury,” writes Mark Graber, Professor of Medicine at State University of New York Stony Brook.2 The inpatient mortality burden
alone is alarming: “Diagnostic errors probably cause 40,000-80,000 prevent-able deaths annually in U.S. hospitals alone, and these estimates fail to ac-count for mortality from ambulatory misdiagnosis and non-lethal morbidity due to diagnostic error.”3
These errors are “under-appreciated” because other than in the malprac-tice arena, where diagnostic errors have represented the leading cause of medical malpractice for the past decade,4 they have received relatively less attention versus other sources of medical errors.
Wachter, Professor of Medicine at University of California San Francisco, writes in Health Affairs, “The topic of diagnostic errors has been strangely absent from the flurry of patient safety activity over the past decade. This ab-sence is particularly noteworthy given the frequency of these errors.”5
INTRODUCTION – THE UNDER-APPRECIATED EPIDEMIC
1Mario Plebani, Clinica Chimica Acta 404 (2009) 16–232M Graber, “Diagnostic Errors in Medicine: A Case of Neglect.” Joint Commission Journal on Quality and Patient Safety, February 2005 Volume 31, Number 23AS Tehrani et al. “20-Year Summary of US Malpractice Claims for Diagnostic Errors from 1985-2005.” Diagnostic Error in Medicine, 4th International Conference, October 25, 2011, Chicago, IL4Mario Plebani, Clinica Chimica Acta 404 (2009) 16–235Robert Wachter, “Why Diagnostic Errors Don’t Get Any Respect – And What Can Be Done About Them.” Health Affairs 29, NO. 9 (2010): 1605–1610 http://hospitalmedicine.ucsf.edu/ downloads/why_diagnostic_errors_dont_get_respect_wachter.pdf
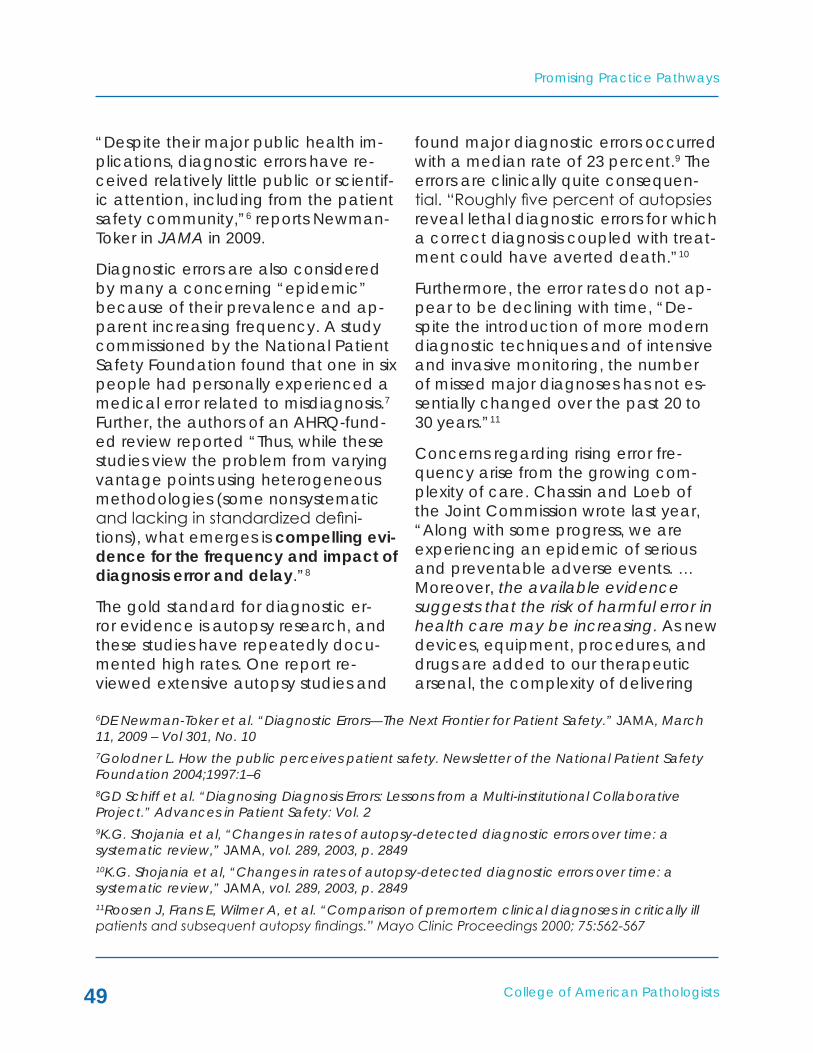
College of American Pathologists
Promising Practice Pathways
49
“Despite their major public health im-plications, diagnostic errors have re-ceived relatively little public or scientif-ic attention, including from the patient safety community,”6 reports Newman-Toker in JAMA in 2009.
Diagnostic errors are also considered by many a concerning “epidemic” because of their prevalence and ap-parent increasing frequency. A study commissioned by the National Patient Safety Foundation found that one in six people had personally experienced a medical error related to misdiagnosis.7 Further, the authors of an AHRQ-fund-ed review reported “Thus, while these studies view the problem from varying vantage points using heterogeneous methodologies (some nonsystematic and lacking in standardized defini-tions), what emerges is compelling evi-dence for the frequency and impact of diagnosis error and delay.”8
The gold standard for diagnostic er-ror evidence is autopsy research, and these studies have repeatedly docu-mented high rates. One report re-viewed extensive autopsy studies and
found major diagnostic errors occurred with a median rate of 23 percent.9 The errors are clinically quite consequen-tial. “Roughly five percent of autopsies reveal lethal diagnostic errors for which a correct diagnosis coupled with treat-ment could have averted death.”10
Furthermore, the error rates do not ap-pear to be declining with time, “De-spite the introduction of more modern diagnostic techniques and of intensive and invasive monitoring, the number of missed major diagnoses has not es-sentially changed over the past 20 to 30 years.”11
Concerns regarding rising error fre-quency arise from the growing com-plexity of care. Chassin and Loeb of the Joint Commission wrote last year, “Along with some progress, we are experiencing an epidemic of serious and preventable adverse events. … Moreover, the available evidence suggests that the risk of harmful error in health care may be increasing. As new devices, equipment, procedures, and drugs are added to our therapeutic arsenal, the complexity of delivering
6DE Newman-Toker et al. “Diagnostic Errors—The Next Frontier for Patient Safety.” JAMA, March 11, 2009 – Vol 301, No. 107Golodner L. How the public perceives patient safety. Newsletter of the National Patient Safety Foundation 2004;1997:1–68GD Schiff et al. “Diagnosing Diagnosis Errors: Lessons from a Multi-institutional Collaborative Project.” Advances in Patient Safety: Vol. 29K.G. Shojania et al, “Changes in rates of autopsy-detected diagnostic errors over time: a systematic review,” JAMA, vol. 289, 2003, p. 284910K.G. Shojania et al, “Changes in rates of autopsy-detected diagnostic errors over time: a systematic review,” JAMA, vol. 289, 2003, p. 284911Roosen J, Frans E, Wilmer A, et al. “Comparison of premortem clinical diagnoses in critically ill patients and subsequent autopsy findings.” Mayo Clinic Proceedings 2000; 75:562-567

Promising Practice Pathways
College of American Pathologists50
12Mark R. Chassin and Jerod M. Loeb, “The Ongoing Quality Improvement Journey: Next Stop, High Reliability.” Health Affairs 30, NO. 4 (2011): 559–56813LL Leape et al. “The nature of adverse events in hospitalized patients: results of the Harvard Medical Practice Study II.” N Engl J Med. 1991; 324(6):377–8414“Adverse events” can be defined as “unintended patient harm caused by medical management rather than by a disease process, which results in a prolonged hospital stay, morbidity, or mortality.” Annu. Rev. Med. 2012. 63:447–6315L Zwaan et al. “Patient Record Review of the Incidence, Consequences, and Causes of Diagnostic Adverse Events.” Arch Intern Med. 2010;170(12):1015-102116JC Pham et al. “Reducing Medical Errors and Adverse Events.” Annu. Rev. Med. 2012. 63:447–6317Paul Epner, MBA, MEd, and Michael Astion, MD, PhD, “Focusing on Test Ordering Practices to Cut Diagnostic Errors.” Clinical Laboratory News: Reducing Diagnostic Errors, July 2012
effective care increases. Complexity greatly increases the likelihood of error, especially in systems that perform at low levels of reliability.”12
Multiple studies indicate that a signifi-cant share, from 15-20 percent13, of the “adverse events”14 referred to by Chassin and Loeb can be attributed to diagnostic errors. And other investi-gations point to diagnostic errors be-ing relatively more dangerous among these adverse events. For example, a study that examined adverse events among inpatients that resulted in some type of patient harm found that diag-nostic errors were significantly more dangerous, with a mortality rate of 29.1 percent versus 7.4 percent for non-diagnostic error adverse events.15
Research has indicated that the major-ity of diagnostic errors contain a com-ponent of clinical decision making – so-called “cognitive errors.” “Three-fourths of all diagnostic errors (74 percent) involve some cognitive deficiencies.”16
Enter Pathology and Lab MedicineWhat does all of this have to do with
us? Simply put, a significant number of these errors are attributable to clinician problems selecting, tracking, under-standing, synthesizing and following up on pathology and laboratory test-ing. Epner and Astion have dissected the root causes of clinician diagnostic errors as they relate to pathology and laboratory medicine, and developed the following taxonomy to categorize the sources of errors17:
1. Inappropriate test is ordered.2. Appropriate test is not ordered.3. Appropriate test result is not used
properly. • Knowledge deficit – Clinician
doesn’t know the meaning of the result.
• Failure of synthesis – Clinician inappropriately integrates the result with other findings.
• Misleading result – Clinician is misled by normal test limitations.
4. Appropriate test result is delayed.5. Appropriate test result is wrong.

College of American Pathologists
Promising Practice Pathways
51
Category 5, “Appropriate test result is wrong,” relates to laboratory errors, which while certainly contributory to clinical diagnostic errors and address-able by pathologists, is not the subject of this pathway, so will not be included in our subsequent analyses.
For the purposes of our pathway guide, we have translated Epner and Astion’s framework into a testing chain of “Pre- and Post-Laboratory Diagnos-tic Errors,” shown in Figure 1, as follows:
• Step 1: Ordered wrong tests – cor-responds to “Inappropriate test is ordered” and “Appropriate test is not ordered” in Epner and Astion;
• Step 2: Test results not interpreted correctly – corresponds to “Ap-propriate test result is not used properly” – Knowledge deficit, Failure of synthesis and Misleading result;
• Step 3: Test results delayed/ "handoffs" problems – corresponds to “Appropriate test result is de-layed;”
• Step 4: Next steps in diagnostic work-up incorrect – corresponds to combinations of the above.
Again, these pre- and post- laboratory
testing errors are clinically significant. Michael Laposata, Pathologist-in-Chief, Vanderbilt University Hospital, entitled a presentation last year, “Errors in Test Selection and Result Interpretation: A Major Source of Poor Patient Out-come.”18 His abstract states “It has long been thought that errors in laboratory test selection largely result in the perfor-mance of additional, inexpensive, and automated laboratory tests. Similarly, errors in test result interpretation have been widely regarded as relatively harmless, and primarily related to a de-lay in achieving the correct diagnosis. However, recent information has dem-onstrated that the consequences of errors in test selection and results inter-pretation can produce outcomes with significant morbidity and mortality.”
A review of results from the College of American Pathologists’ (CAP) Q-PROBES studies shows that inaccuracies in test ordering are another common source of errors. One large study in 660 institutions looked at errors in computer entry of outpatient test orders. Novis reports that “Half the participants re-ported the occurrence of one or more test-ordering errors on 6 percent of req-uisitions, and 10 percent of participants reported the occurrence of errors on at least 18 percent of requisitions.”19
18Michael Laposata, MD, PhD, Edward and Nancy Fody Professor. Executive Vice Chair of Pathology,Dept of Pathology. Pathologist-in-Chief, Vanderbilt University Hospital, Nashville, TN, “Errors in Test Selection and Result Interpretation: A Major Source of Poor Patient Outcome.” Diagnostic Error in Medicine, 4th International Conference, October 23, 2011, Chicago, IL19David A. Novis, MD, “Detecting and preventing the occurrence of errors in the practices of laboratory medicine and anatomic pathology: 15 years’ experience with the College of American Pathologists’ Q-PROBES and Q-TRACKS programs.” Clin Lab Med 24 (2004) 965–978

Promising Practice Pathways
College of American Pathologists52
The other major contributor to diagnos-tic errors pertains to missed test results, potentially resulting in delays in diag-nosis, treatment or complete failure to diagnose the condition. These missed cases can result from failures in com-municating, transmitting or attending to the results.
The frequency and magnitude of the problem are surprising. One review of the frequency of missed testing found:20
• 6.8 percent (79/1163) of missed abnormal laboratory results dis-played as alerts through a com-puterized provider order entry sys-tem were not followed-up within 30 days;
• 62 percent (125/202) of abnormal glucose tests not followed-up;
• 11 percent (131/1196) of critical radiology imaging alerts were not followed up;
• Inpatient abnormal test follow-up failures ranged from 20 percent to 62 percent.
A CAP Q-PROBES’ study supports the missed test results problem from a dif-ferent standpoint – that of laboratories trying to convey critical lab values.21
The study of 623 institutions found that 5.4 percent of approximately 13,000 critical calls had to be abandoned due to failure to reach a responsible provid-er to receive the results. This was de-spite the fact that laboratorians spent, on average 46 minutes trying to reach outpatient providers, and from 9 to 25 minute averages (depending on the shift) trying to reach inpatient providers. The critical value calls in this study were also found to be clinically important, with more than 45 percent reportedly unexpected by the clinicians, and 65 percent resulting in a change in therapy. This suggests that the cases in which the critical value results were not communicated might have resulted in errors.
Wahls et al. reviewed the clinical bur-den from missed test results, writing, “The investigators found that clinically important missed results occurred in 0.9 percent of patient discharges [14]. In another study, this one of primary care ambulatory practices, clinicians' documented test results were missing, often causing clinical delay, for one out of ten patients in clinic [15]. Also serial surveys of primary care providers, documented nearly [half] of the clini-cians had encountered patients hav-ing clinically significant missed results in
20JL Callen et al. “Failure to Follow-Up Test Results for Ambulatory Patients: A Systematic Review.” J Gen Intern Med, Dec 20, 2011, published online21PJ Howanitz et al. “Laboratory Critical Values Policies and Procedures A College of American Pathologists Q-Probes Study in 623 Institutions.” Arch Pathol Lab Med 2002;126:663–669
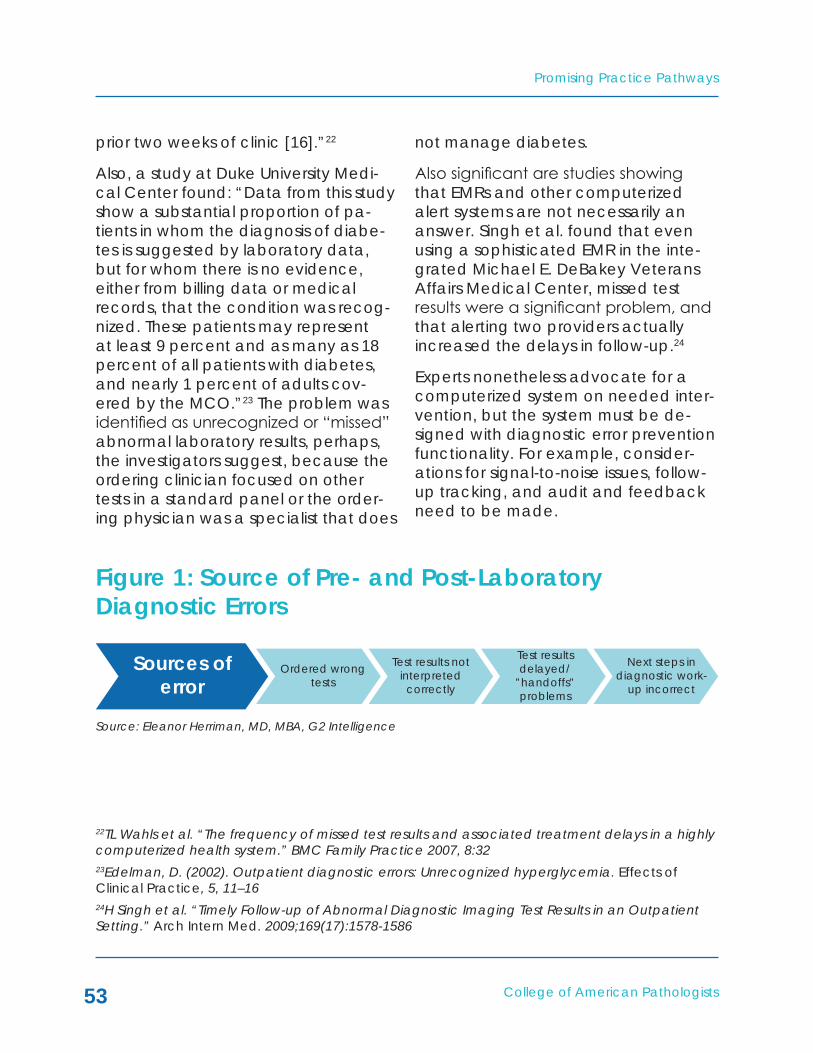
College of American Pathologists
Promising Practice Pathways
53
Figure 1: Source of Pre- and Post-Laboratory Diagnostic Errors
22TL Wahls et al. “The frequency of missed test results and associated treatment delays in a highly computerized health system.” BMC Family Practice 2007, 8:32 23Edelman, D. (2002). Outpatient diagnostic errors: Unrecognized hyperglycemia. Effects of Clinical Practice, 5, 11–1624H Singh et al. “Timely Follow-up of Abnormal Diagnostic Imaging Test Results in an Outpatient Setting.” Arch Intern Med. 2009;169(17):1578-1586
Source: Eleanor Herriman, MD, MBA, G2 Intelligence
prior two weeks of clinic [16].”22
Also, a study at Duke University Medi-cal Center found: “Data from this study show a substantial proportion of pa-tients in whom the diagnosis of diabe-tes is suggested by laboratory data, but for whom there is no evidence, either from billing data or medical records, that the condition was recog-nized. These patients may represent at least 9 percent and as many as 18 percent of all patients with diabetes, and nearly 1 percent of adults cov-ered by the MCO.”23 The problem was identified as unrecognized or “missed” abnormal laboratory results, perhaps, the investigators suggest, because the ordering clinician focused on other tests in a standard panel or the order-ing physician was a specialist that does
not manage diabetes.
Also significant are studies showing that EMRs and other computerized alert systems are not necessarily an answer. Singh et al. found that even using a sophisticated EMR in the inte-grated Michael E. DeBakey Veterans Affairs Medical Center, missed test results were a significant problem, and that alerting two providers actually increased the delays in follow-up.24
Experts nonetheless advocate for a computerized system on needed inter-vention, but the system must be de-signed with diagnostic error prevention functionality. For example, consider-ations for signal-to-noise issues, follow-up tracking, and audit and feedback need to be made.
Sources oferror
Ordered wrongtests
Test results notinterpreted
correctly
Test resultsdelayed/
”handoffs”problems
Next steps indiagnostic work-
up incorrect
Promising Practice Pathways
College of American Pathologists54
Source: Eleanor Herriman, MD, MBA, G2 Intelligence
The Market Need Grows StrongerThere is an additional, compounding set of factors impacting health care that both increase the need for a di-agnostic error solution and strengthen the case for pathologists as the an-swer. These dynamics include a wave of aging Baby Boomers with multiple chronic conditions, a significant short-age of primary care physicians, and an exponentially rising number of diag-nostic tests. Paul Epner has discussed the impact of these factors on diag-nostic errors and the opportunities for pathologists and laboratorians to offer solutions.25
Figure 2 shows how these aggravating factors apply to the chain of diagnos-tic errors. This combination is a recipe for complexity, clinician pressure and, therefore, likely also for increased diag-nostic errors.
Above age 65, almost two-thirds of Americans have multiple chronic con-ditions.26 Patients with multiple chronic conditions can be more challenging to diagnose and present more oppor-tunities for errors in a number of ways. Illnesses interact with one another in complex ways, and the process of ag-ing adds a further dimension that can distort the typical clinical presentation with which a physician is familiar.
Furthermore, although health care delivery reform is moving toward coor-dinated care and medical homes, hos-pitals and other provider organizations are often organized around therapeu-tic or condition area service lines, such as cardiac and cancer. This inevitably leads to specialists focusing on one of the patient’s conditions or cluster of conditions, and “locking in” on these areas, which can lead to errors.
25Paul Epner, “Impact of Laboratory Services on Diagnostic Errors.” Clinical Laboratory Management Association, ThinkLab, May 24, 201126CA DuBard, “Moving Forward with the Medical Home: Evidence, Expectations, and Insights from CCNC.” NC Med J May/June 2009, Volume 70, Number 3
Figure 2: Health Care Trends Potentially Driving Increases in Diagnostic Errors
Ordering wrongtests
Test resultsmisinterpreted
Test results delayed/“handoffs” problems
Next steps in work-upincorrect
• Enormous bank of lab tests beyond clinicians’ ablity to navigate• Aging population with multiple chronic conditions
• Interacting nature of multiple conditions• Complexity of tests – exp. MDx• Clinicians rushed, knowledge can’t be current
• Multiple providers and transitions• PCP shortages – clinicians overwhelmed with test results
• Incomplete knowledge re testing workup – e.g. coagulation• Unaware of availability of key test

College of American Pathologists
Promising Practice Pathways
55
Rouse has aptly described health care as a “'complex adaptive system' that includes many different players and forces, and therefore cannot be thought of as a hierarchical function. This observation is vividly true in the arena of geriatric care and chronic illness, where focusing on single condi-tions can neglect others, where focus-ing only on known conditions can lead to missed diagnoses. …”27
The other risk that accompanies an aging population with multiple chronic conditions is the increase in clinical “handoffs” between providers. Given that these patients will need to see a number of different specialists, and may experience periodic hospital ad-missions, these handoffs, also known as “care transitions,” are inevitable and known to be a major source of medi-cal and diagnostic errors. This factor is particularly likely to exacerbate the problem of missed test results.
Aggravating the diagnostic challenges associated with an aging, chronically ill population is the primary care physi-cian shortage crisis. The Association of American Medical Colleges estimates
that the country will be short 29,800 primary care physicians in 2015, grow-ing to 65,800 by 2025.28 If a wave of tens of millions of formerly uninsured Americans also enters the system as a result of the Affordable Care Act, primary care will be stretched beyond the break point.
Finally, as we know, genomics and molecular medicine are producing a variety of new laboratory tests at an unprecedented rate. Clinicians, especially primary care physicians, cannot be expected to keep current with these ever-growing test menus, to know what tests might be optimal in a given situation, and to understand how to interpret results from these new tests. Without addressing this knowledge gap, diagnostic accuracy will likely decline further.
Taken together, these trends suggest an increase in clinical diagnostic error rates. When considered in the context of providers being increasingly com-pensated based on clinical outcomes and costs, the market demand for solutions to diagnostic inaccuracies is bound to rise.
27C.K. Cassel et al. “Aging: Adding complexity, requiring skills.” Information Knowledge Systems Management 8 (2009) 47–69 28S Kliff, “Success of health reform hinges on hiring 30,000 primary care doctors by 2015.” Washington Post, Feb 10, 2012; and AP Carnevale et al. “Healthcare.” Georgetown University Center on Education and the Work Force, June 2012

Promising Practice Pathways
College of American Pathologists56
In a value-driven marketplace, services that can improve quality, e.g. by raising clinical diagnostic accuracy, and lower health care costs, e.g. by avoiding the spending associated with diagnostic errors and adverse events, can translate directly into financial compensation. As payers advance toward “alternative payment mod-els,” – i.e., value-based or non-Fee For Service (FFS) – providers are becoming increasingly focused on quality mea-sures, avoidable complications and meeting spending benchmarks.
Our opportunity, then, is to generate value by elevating clinical diagnostic accuracy through “high performance” pre- and post- laboratory testing ser-vices.
The “High-Performance Diagnostic Ser-vices Pathway” that embodies this op-portunity entails pathology lab services and tools that improve test selection, result communications, result interpre-tations and result follow-up/manage-ment. Many of the interventions have reported evidence of effectiveness.
Pathway Overview and Value PropositionThe overarching principle upon which
the High-Performance Diagnostic Services Pathway operates is patholo-gist involvement in the pre- and post-laboratory clinical testing processes to decrease errors and introduce ad-vancements that improve diagnostic accuracy.
Example services that we might pro-vide as part of this pathway, as shown in Figure 3, include:
• Service line/condition targeted test ordering guidance29 – guide-lines/clinical pathways, algorithms, computer decision support, col-laborative services.
• Pathologist as diagnostic specialist – integrates diagnos-tic testing (radiology, pathology and laboratory) with clinical data and creates narrative report with recommendations; can include collaborative teams with specialty physicians and regular meetings.
• Specially designed abnormal test result communication systems to mitigate handoff and missed result problems – computerized, or multimedia, also can include engaging patient given new ruling
THE MARkET OPPORTUNITY – IMPROVED DIAGNOSTIC ACCURACY GENERATES VALUE
29Paul Epner, “Impact of Laboratory Services on Diagnostic Errors.” Clinical Laboratory Management Association, ThinkLab, May 24, 2011

College of American Pathologists
Promising Practice Pathways
57
Figure 3: High-Performance Diagnostic Services Pathway – Example Interventions
regarding patient access to test results.
• Pathologist monitoring for missed or erroneous cases - lab test track-ing by the pathologist using infor-matics.
• Collaboration, measurement, feedback, iteration – pathology, radiology and clinical specialists meet regularly to review reports, results and outcomes; outcomes and costs are measured and evi-dence collected; continuous pro-cess improvement is employed.
Because pathologists have the diag-nostic testing expertise that can inform many diagnostic missteps, as well as ownership of the pathology and labo-ratory data that are critical to clinical decisions, as evidenced by estimates that these data comprise 70 percent of EMR content,30 developing such a program is not as challenging as it may seem. In fact, because it can be implemented in a targeted, modular way, the pathway should be accessi-ble to most pathology groups with ac-cess to basic informatics capabilities, as well as clinical pathology expertise.
30L Pantanowitz et al. “Medical laboratory informatics.” Clin Lab Med 2007;27:823-43
Sources ofDx error
Ordered wrongtests
Test results notinterpreted
correctly
Test resultsdelayed/”handoff”problems
Next steps indiagnostic work-
up incorrect
Pathwayinterventions
Test orderingguidance – tool
or service
Comprehensive,interpretive
reports, services
Abnormal testresults
communicationsystem + leverage
patient
Targetedfollow-up
monitoring
Source: Eleanor Herriman, MD, MBA, G2 Intelligence
Promising Practice Pathways
College of American Pathologists58
Providers, ACOs and payers would de-rive value from this practice pathway in direct and indirect ways, to wit:
• Lowering diagnostic errors could help improve a wide variety of quality performance measures such as readmission, complica-tions and mortality rates. Scoring high on quality measures is impor-tant to variable compensation payment programs being rolled out by Medicare and others.
• Higher clinical diagnostic accu-racy translates into cost savings from, for example, shorter length of stay, avoidance of unneces-sary treatments and services, and averted malpractice expenses. Di-agnostic errors are, indeed, costly – one study found them to be in the top three most expensive of all medical adverse events.31
• Improving patient confidence and satisfaction: Patient experi-ence measures are a key compo-nent of many value-based pay-ment programs, and surveys show patients believe diagnostic errors are common and concerning.32 Furthermore, health care is now a consumer market, and “hospi-tal leaders have overwhelmingly agreed that patient experience will drive referrals and volume as much as clinical quality.”33
Pathologists Are an Excellent FitWhy are we ideally suited to address this issue?
• Diagnostic specialist – First and foremost, a major cause of the di-agnostic errors made by clinicians has to do with ordering, identifying and interpreting tests. Although some of these tests are radiol-ogy tests, pathologists may be in a better position to coordinate the integration of testing across modalities given our knowledge of the disease processes. Further-more, digitization is driving a con-vergence between radiology and pathology, and as clinical labo-ratory informatics and molecular informatics become increasingly important the pathologist seems the natural integrator and inter-preter of information, in collabora-tion with radiologists.
• Information nexus point – More than any other service, we can serve as a clinical information nexus point within a provider network, hospital system, medical home, ACO or similar setting. This value has not yet been tapped at all. Leveraging our lab data in conjunction with clinical data, we can connect, track and monitor patient health status throughout provider and facility settings, and
31EJ Thomas et al. “Costs of medical injuries in Utah and Colorado,” Inquiry. 1999 Fall;36(3):255-6432Mario Plebani, Clinica Chimica Acta 404 (2009) 16–2333BA Liang et al. “Quality and Safety in Medical Care,” Arch Pathol Lab Med, Vol 135, November 2011 http://www.archivesofpathology.org/doi/pdf/10.5858/arpa.2011-0154-OA

College of American Pathologists
Promising Practice Pathways
59
in a time frame that enables clini-cal action. Services based on this knowledge could improve the diagnostic accuracy of care tran-sitions and help ensure providers in acute care settings like the emer-gency room do not miss a poten-tially critical diagnosis.
Pathologists Louis et al. recently advo-cated for a new vision for “next gener-ation pathology and laboratory medi-cine” that encompasses many of the above points regarding our role in im-proving diagnostic accuracy through comprehensive test integration, sup-porting test ordering and analysis, and clinician collaboration. They write:
“In a value-oriented health care system, the pathologist will then become the integrator of large, complex data sets to continue to fulfill the classic central role of determining diagnosis, prognosis, and appropriate therapy. Further-more, with this increase in clinical data, pathologists can extend their traditional roles in the appro-priate use and integration of labo-ratory information. … A greater need for pathologist involvement has thus arisen at the interface of the laboratory with the clinic. The pathologist can no longer be solely within the laboratory, but must be positioned at the door, able to look both into and out of the laboratory.
For instance, the growing number of different laboratory tests cre-ates a challenge for the typical physician to remain appropriately informed. … Given that "shotgun" approaches to laboratory test ordering lead to wasteful over-ordering and affect quality out-comes adversely through delays in diagnosis and pursuit of false-positives, the laboratory diagnosti-cian will need to define ordering practices … and integrate infor-mation from different platforms.
In such a model, pathology reports would become comprehensive, integrating the results of imaging, biochemical, histologic, molecular genetics, cytogenetic, genomic and epigenetic analyses into a cohesive, clinically relevant and valuable di-agnostic, predictive and prognostic document.”34
To sum up, pathology groups have the ingredients for an attractive business venture, as illustrated in Figure 4:
• A substantial, unmet market need with few competitive solutions be-ing proposed.
• A client base that needs and would pay for a solution to this problem.
• A practice pathway model that holds great promise as a value-generating answer.
34DN Louis et al. “Next-Generation'' Pathology and Laboratory Medicine.” Arch Pathol Lab Med-Vol 135, December 2011

Promising Practice Pathways
College of American Pathologists60
Market Demand and Size EstimatesAlthough diagnostic errors have been “under-appreciated” relative to other patient safety issues, in the past few years they have been receiving in-creasing national attention. First, there have been a number of papers in prominent medical journals such as JAMA, for example, “Diagnostic Errors – The Next Frontier for Patient Safety,”35 drawing attention to the problem.
Secondly, in 2007 the Agency for Healthcare Research and Quality (AHRQ) focused on diagnostic errors as an issue for special emphasis, based
on its conclusion that these errors con-stituted a substantial and expensive share of all medical errors. They have also sponsored research through the Diagnostic Error Evaluation and Re-search (DEER) project. Furthermore, the “Diagnostic Error in Medicine” confer-ence series is now in its fifth year, sup-ported in part by a grant from AHRQ. Other organizations endorsing this con-ference include the Institute for Health-care Improvement, National Patient Safety Foundation, National Center for Patient Safety, Veterans Affairs Admin-istration and the Society of Medical Decision Making.
Figure 4: High-Performance Diagnostic Services Pathway – Business Case
35DE Newman-Toker et al. “Diagnostic Errors – The Next Frontier for Patient Safety.” JAMA, March 11, 2009 – Vol 301, No. 10
Unmet Need - Clinical Diagnostic Problem• Preventable clinical diagnostic errors – delayed, missed or misdiagnosed• Trends point to worsening of problem• No current solutions
Important to Value-Based Market• Higher accuracy/faster Dx and Rx = $ for better outcomes, quality cost avoidance• Hospitals, ACOs, Providers, Medical Homes, payers
Practice Pathway Answer• Testing integration, link with clinical information, interpretive and ordering support, clinician collaboration• Establish nexus point of diagnostic support using informatics
Source: Eleanor Herriman, MD, MBA, G2 Intelligence

College of American Pathologists
Promising Practice Pathways
61
The diagnostic errors agenda is also being driven at the national level through a number of initiatives, namely36:
• Clinical Laboratory Integration Into Healthcare Collaborative – CLIHCTM; “Seeking to break down the barriers between care provid-ers and laboratory professionals.” Sponsored by the CDC.
• Improvements In Test Selection And Results Interpretation (ITSRI) – seeks to experimentally determine the effectiveness of laboratory interventions on diagnostic error reduction.
• National conferences –
– Society to Improve Diagnosis in Medicine (SIDM) – launched 2011.
– Diagnostic Error in Medicine – 5th year.
Also, there was attention drawn to diagnostic errors due to an issue with a Centers for Medicare and Medicaid Services (CMS) and Joint Commission quality measure regarding community acquired pneumonia (CAP) and time to first antibiotic dose (TMAD). Initially the quality measure was an eight-hour
target, but based on retrospective studies CMS made the measure a four-hour TFAD in 2002 for public reporting purposes, and in 2006 CMS pay for per-formance programs included this mea-sure in their calculations.37 After imple-mentation, the emergency medicine community began issuing complaints and publishing studies indicating that the measure was having perverse con-sequences, including increasing the rate of misdiagnoses of pneumonia, without producing offsetting outcome improvements.
For example, a prospective study by Welker et al. in Arch Intern Med found a significantly high diagnostic error rate: “… [D]epending on the rigor with which one assigns the diagnosis of CAP, nearly one-third to two-thirds of patients who were admitted and empirically treated for CAP seem not to have had that diagnosis at dis-charge.”38
Not only did this episode spotlight clini-cal diagnostic difficulties, but also their clinical and cost outcomes. Welker et al. wrote, “The potential morbidity and mortality resulting from an increased number of incorrect diagnoses, in-appropriate antibiotic therapy, and delays in establishing the correct diag-nosis in patients who do not have CAP
36Paul Epner, “Impact of Laboratory Services on Diagnostic Errors.” Clinical Laboratory Management Association, ThinkLab, May 24, 201137RM Wachter et al. “Public Reporting of Antibiotic Timing in Patients with Pneumonia: Lessons from a Flawed Performance Measure.” Ann Intern Med. 2008;149:29-3238JA Welker et al. “Antibiotic Timing and Errors in Diagnosing Pneumonia.” Arch Intern Med Vol 168 (No. 4), Feb 25, 2008

Promising Practice Pathways
College of American Pathologists62
must be considered if a TFAD of less than four hours is considered to be a core quality measure.39
Within months of these critical publica-tions, in 2006, CMS revised the mea-sure.
Employers are showing interest in com-panies that offer second opinions or other diagnostic accuracy services. “More employers and health plans are offering second opinions as a benefit to workers or their member companies for review of diagnoses and treatment plans. The idea is to reduce diagnostic error rates, and to save money,” re-ports a journalist in The Tennessean.40 One example company is Best Doc-tors, Inc., which provides its client cor-porations’ employees expert second opinions through in-depth reviews of diagnoses and treatment plans by opinion-leading medical physicians.41
Another is called Premerus,42 a unit within radiology benefits manager MedSolutions. Premerus claims im-proved outcomes and decreased costs through subspecialist radiologist digital reviews of CT and MRI scans.
Regardless of the market’s awareness
of the problem of diagnostic errors, the size of the opportunity and financial actualization of that business depends on the business case we can bring to the table and the results we can de-liver.
Laposata’s team at Vanderbilt Univer-sity has begun to build such a business case, in quantifying the impact of their coagulation diagnostic management team (DMT).43 RL Van Horn, PhD, MPH, MBA, Assoc. Prof. of Economics and Management at Vanderbilt, conduct-ed an analysis in which “differences in total charges and Length of Stay, pre/post implementation of DMT pilot” were calculated. He concluded that “There is evidence that in coagulation sensitive DRGs an initiative is related to an observed change in LOS [length of stay].” For example, for pulmonary em-bolism cases, the LOS dropped from three to two days, on average.
Getting Paid Based on Value In the context of our Pathway oppor-tunity, we are defining market size as (1) the value, in dollars, of the improve-ment in diagnostic accuracy that our pathway might deliver, and (2) the proportion of that amount that we might retain.
39JA Welker et al. “Antibiotic Timing and Errors in Diagnosing Pneumonia.” Arch Intern Med Vol 168 (No. 4), Feb 25, 200840Getahn Ward “TennCare to initiate financial sanctions.” The Tennessean, Oct 31, 201141Getahn Ward “TennCare to initiate financial sanctions.” The Tennessean, Oct 31, 201142http://www.medsolutions.com/services/expert_interp/premerus_radiology/index.html 43Michael Laposata, MD, PhD, “Advising Treating Physicians on Laboratory Test Selection and Interpretation.” Presentation at Massachusetts Society of Pathologists Annual Dinner Meeting and CME Seminar, May 10, 2012

College of American Pathologists
Promising Practice Pathways
63
Before we proceed with the macro market estimates, we need to briefly review the value-based purchasing market in terms of provider payments. This is far too dynamic and varied a topic to adequately cover here, so we aim to just provide sufficient funda-mentals to enable an understanding of this pathway opportunity. The Col-lege has a series of resources and tools planned to support members in navi-gating the business aspects of these new payment schemes.
At a basic/simplistic level, most value payment models assign providers a risk-adjusted (for their patient popula-tion) “benchmark” payment of some sort – it could be for a population, per patient (as for an ACO), or for an episode of care, such as for a pros-tate surgery, in which case it would include all physician, hospital, inpatient and outpatient, and ancillary services before and after the surgery (called a “bundled payment”). In addition, pro-viders will be assessed based on some group of quality metrics for that period of care.
There are a number of ways that pay-ers calculate how much money gets retained by which party, but in simple terms the result is a “gain share.” If the providers are able to deliver care for less money than the benchmarked fee, while still hitting the quality met-ric targets, then the providers “gain,” i.e. retain some share of the cost sav-ings achieved (the savings being the difference between the benchmark fee and the actual spending). On
the other hand, with many of these models, if their spending exceeds the benchmark fee, and the contract has them at financial risk, then they can lose income.
Currently, in most parts of the country, most providers are still being paid on a fee-for-service basis, with an increas-ingly large proportion of their income being transferred over to these types of “alternative payment models” – ei-ther bundling or some type of gain sharing arrangements.
How would our pathway model fit into these value payment models? First, we will need to demonstrate through an evidence-based business case, that we have a program or set of services that can impact quality outcomes and/or costs. The most commonly used study to generate this type of evidence is a pre- and post-observa-tional model. We can take a targeted service line, such as diabetes, collect data regarding costs and quality met-rics for a six-month period, for example, then compare these data to a similar six months during which we imple-ment our high-performance diagnostic services pathway. With evidence such as this as a starting point, we are ready to negotiate with a provider organiza-tion such as an ACO or Medical Home network.
Our revenues will be directly tied to the quantificationoftheclinicalvaluewegenerate. The improvement in clinical quality outcomes is clearly more chal-lenging to translate into dollars, un-less those outcomes are aligned with
Promising Practice Pathways
College of American Pathologists64
measures on a payment scorecard, in which case they will be quantifiable to provider executives.
In most cases, we will want to assess the value and negotiate a contract separately for each “program” in our pathway. A program would likely, then, roughly correspond to either a clini-cal service line or some other business delineation, such as the emergency room.
Fundamentally, then, if our pathway delivers services that decrease down-stream clinical costs, and increase quality measures, then we will be able to negotiate with providers or payers involved in gain sharing payment con-tracts. We can be paid based on the value, in terms of savings and quality improvement, we generate. For ex-ample, we might have a contract with an ACO that states that we receive 10 percent of the gain share savings from a program we lead to reduce ER avoidable admissions for viral meningi-tis. At the end of the year, if the num-ber of viral meningitis ER admissions has
been reduced, and the target sav-ings achieved, than our program was successful, and we would receive 10 percent of those savings, in addition to our regular laboratory testing fees.
We now turn to estimating the overall, macro opportunity.
Estimating the Market Size Given the relative immaturity of the field of diagnostic errors, there are few economic studies that directly quantify the downstream costs related to di-agnostic inaccuracies. It is a complex value proposition to quantify, given the multiple aspects of inpatient and out-patient cost savings opportunities, as well as the variety of quality outcomes improvements.
We can, however, make estimates by applying findings from diagnostic error research with other studies in the field of adverse events and patient safety to create simple economic impact models. These estimates provide a picture of the high level, or “macro,” market opportunity.
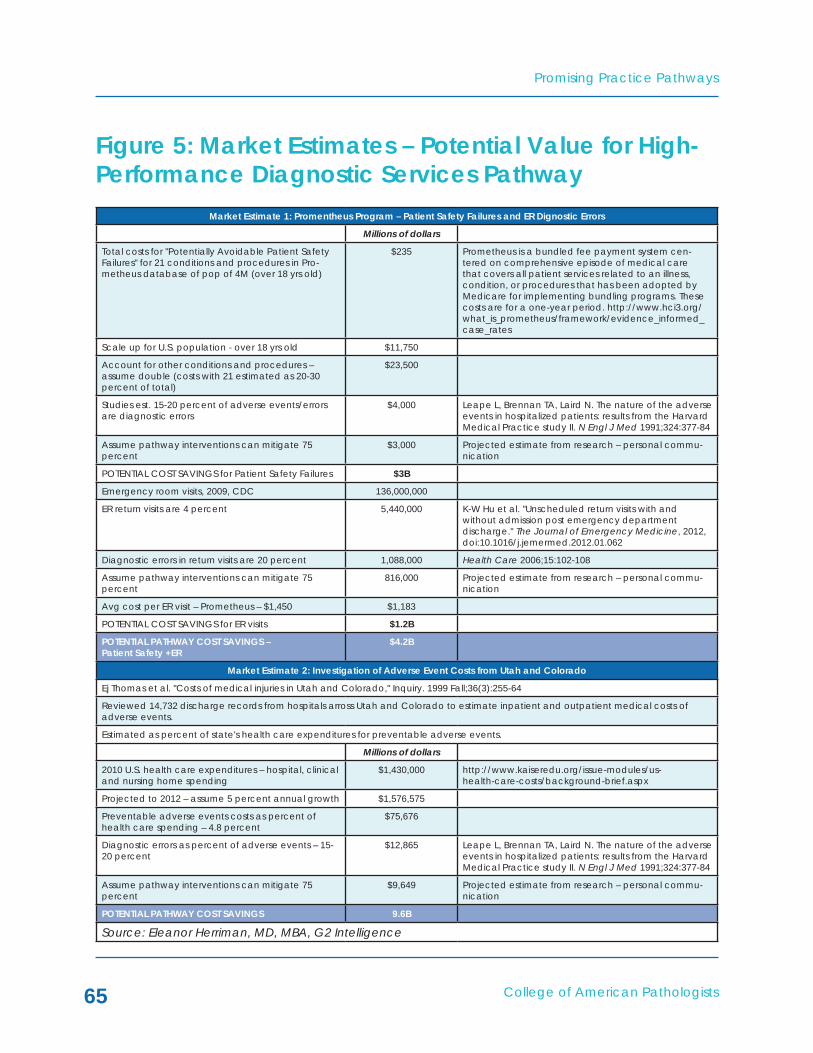
College of American Pathologists
Promising Practice Pathways
65
Figure 5: Market Estimates – Potential Value for High- Performance Diagnostic Services Pathway
Market Estimate 1: Promentheus Program – Patient Safety Failures and ER Dignostic Errors
Millions of dollars
Total costs for "Potentially Avoidable Patient Safety Failures" for 21 conditions and procedures in Pro-metheus database of pop of 4M (over 18 yrs old)
$235 Prometheus is a bundled fee payment system cen-tered on comprehensive episode of medical care that covers all patient services related to an illness, condition, or procedures that has been adopted by Medicare for implementing bundling programs. These costs are for a one-year period. http://www.hci3.org/what_is_prometheus/framework/evidence_informed_case_rates
Scale up for U.S. population - over 18 yrs old $11,750
Account for other conditions and procedures – assume double (costs with 21 estimated as 20-30 percent of total)
$23,500
Studies est. 15-20 percent of adverse events/errors are diagnostic errors
$4,000 Leape L, Brennan TA, Laird N. The nature of the adverse events in hospitalized patients: results from the Harvard Medical Practice study II. N Engl J Med 1991;324:377-84
Assume pathway interventions can mitigate 75 percent
$3,000 Projected estimate from research – personal commu-nication
POTENTIAL COST SAVINGS for Patient Safety Failures $3B
Emergency room visits, 2009, CDC 136,000,000
ER return visits are 4 percent 5,440,000 K-W Hu et al. "Unscheduled return visits with and without admission post emergency department discharge." The Journal of Emergency Medicine, 2012, doi:10.1016/j.jemermed.2012.01.062
Diagnostic errors in return visits are 20 percent 1,088,000 Health Care 2006;15:102-108
Assume pathway interventions can mitigate 75 percent
816,000 Projected estimate from research – personal commu-nication
Avg cost per ER visit – Prometheus – $1,450 $1,183
POTENTIAL COST SAVINGS for ER visits $1.2B
POTENTIAL PATHWAY COST SAVINGS – Patient Safety +ER
$4.2B
Market Estimate 2: Investigation of Adverse Event Costs from Utah and Colorado
Ej Thomas et al. "Costs of medical injuries in Utah and Colorado," Inquiry. 1999 Fall;36(3):255-64
Reviewed 14,732 discharge records from hospitals arross Utah and Colorado to estimate inpatient and outpatient medical costs of adverse events.
Estimated as percent of state's health care expenditures for preventable adverse events.
Millions of dollars
2010 U.S. health care expenditures – hospital, clinical and nursing home spending
$1,430,000 http://www.kaiseredu.org/issue-modules/us- health-care-costs/background-brief.aspx
Projected to 2012 – assume 5 percent annual growth $1,576,575
Preventable adverse events costs as percent of health care spending – 4.8 percent
$75,676
Diagnostic errors as percent of adverse events – 15-20 percent
$12,865 Leape L, Brennan TA, Laird N. The nature of the adverse events in hospitalized patients: results from the Harvard Medical Practice study II. N Engl J Med 1991;324:377-84
Assume pathway interventions can mitigate 75 percent
$9,649 Projected estimate from research – personal commu-nication
POTENTIAL PATHWAY COST SAVINGS 9.6B
Source: Eleanor Herriman, MD, MBA, G2 Intelligence

Promising Practice Pathways
College of American Pathologists66
Market Estimate 3: Milliman Economic Assessment of Medical Errors
J Shreve et al. "The Economic Measurement of Medical Errors." Society of Acturaries' Health Section, Milliman, June 2010
Used medical claim data for large insured population to estimate medical errors and costs related to those errors.
Millions of dollars
Total cost of medical errors – extrapolated to U.S., for 2008
$19,500
Projected to 2012, using Milliman Medical Index $25,935
Assume percent that are diagnostic errors is 30 percent $7,781
Assume pathway interventions can mitigate 75 percent $5,835
POTENTIAL PATHWAY COST SAVINGS $5.8B
FINAL TRIANGULATED MARkET ESTIMATE – POTENTIAL VALUE FOR HIGH-PERFORMANCE DIAGNOSTIC SERVICES PATHWAY
Average of Three Estimates $6.5B
Share Retained by Pathologists – assume 5-20 percent
$330M - $1.3B These revenues are supplemental to any payment for diagnostic testing.
Source: Eleanor Herriman, MD, MBA, G2 Intelligence
As displayed in Figure 5, we used three different research methodologies to generate model estimates for the costs associated with diagnostic errors, and thus the potential value that might be generated through interventions de-signed to improve accuracy.
The resulting, triangulated or averaged estimate of these three estimates was an annual, U.S. market of $6.5 billion in value that might be generated by our diagnostic pathway as it relates to diagnostic errors. This would represent anywhere from ~$330 million to $1.3 billion in revenues for pathologists in value-based payments, depending on the share of savings we received. This compensation would be in addition to any fee-for-service payments for diag-nostic testing.
There are a number of caveats regard-ing this estimate. First, it should be tak-en as “directional” only, as it rests upon many assumptions and estimates, by
necessity. This means it is best used as an indicator of the relative size of the opportunity, rather than for specific business planning purposes.
There are aspects of these market estimates that likely overestimate the market size, but others that exclude opportunities, and numerous variables that impact both, so focusing on the details of the analysis is not likely to be fruitful.
The business opportunity for an individ-ual pathology practice will vary, de-pending on, for example, the clinical setting, the focus of the services and intervention, and the degree of the provider’s need.
One interesting target market oppor-tunity worth noting is the emergency room (ER). The largest source of ER errors that caused patient harm ac-cording to one report was diagnostic errors.44 Furthermore, multiple studies
44TW Brown et al. “An Epidemiologic Study of Closed Emergency Department Malpractice Claims in a National Database of Physician Malpractice Insurers.” Academic Emergency Medicine 2010; 17:553–560
College of American Pathologists
Promising Practice Pathways
67
found that 20 percent of return ER visits were caused by diagnostic errors.45 Our market estimation of potential value generated by targeting this area was $1.2 billion. Given that return ER visits also drive potentially avoidable admissions, the cost escalation might be significant. Especially for hospital-based pathology practices, designing specific diagnostic accuracy improve-ment services for the ER could be an attractive starting point.
Radiology Business “Proof of Concept”?As mentioned previously in this chap-ter, radiology services company Med-Solutions, which serves 30 million lives through commercial, Medicare Ad-vantage and Medicaid payers, is suc-cessfully operating a diagnostic accu-racy unit called “Premerus.” Premerus uses “definitive imaging diagnoses” and focused subspecialty interpreta-tions by subspecialist radiologists, who they describe as local to health plan members, to improve outcomes and reduce costs for payers.46
Support for the Premerus concept emanates from prestigious sources nationwide, including Edward Coleman, MD, professor and vice chairman of the department of radiol-ogy, Duke University Medical Center47:
“Premerus is founded upon the fundamental fact that for specific medical problems, experienced specialists provide more accurate diagnoses and better outcomes than do generalists. In the past three decades, there has been a great deal of research demon-strating the relationship between volume and patient outcome for a variety of medical conditions and procedures.”
He concludes that an accurate diag-nosis mitigates downstream expendi-tures and minimizes emotional distress for patients that result from an inac-curate diagnosis, adding, "An early, accurate diagnosis provides the best prognosis for the patient."
There are two points that are perhaps relevant for our practice pathway business model considerations – first, the way they are positioning their busi-ness to payers and other clients, and, secondly, the clinical and value results they are claiming.
First, Premerus is certainly making the case for diagnostic accuracy being the key to value generation. Consider their website content48:
45S Nunez et al. “Unscheduled returns to the emergency department: an outcome of medical errors?” Qual Saf Health Care 2006;15:102–10846http://www.scanhealthplan.com/documents/arizona/providers/radiology/Premerus%20SCAN%20AZ.pdf 47http://www.premerus.com/news/Misdiagnosis_in_America.pdf 48http://www.medsolutions.com/services/expert_interp/premerus_radiology/index.html
Promising Practice Pathways
College of American Pathologists68
“Premerus is founded on the prin-ciple that diagnostic accuracy can improve patient outcomes and reduce costs. This is because once the diagnosis is made, a cascade of costly treatments - including high-tech therapies, specialist visits, medications, biop-sies and additional testing – are often set into motion. Premerus focuses on the diagnosis because it impacts all subsequent medical decisions, expenditures and out-comes.”
Secondly, the cost savings and value results they are reporting from particu-lar health plans are impressive. “Using MedSolutions' Premerus® Diagnostic Accuracy, a proven solution to the
problem of diagnostic error, one major health plan reduced ER use of services by over 50 percent, shortened hos-pital length of stay by 1.4 days, and decreased unnecessary biopsies and surgeries by 35 percent. … The health plan using Premerus also reduced total health care claims by 7.6 percent, saving more than $5 per member, per month (PMPM) while improving out-comes.”49
There is no way of evaluating the valid-ity of these results, as details have not been published. However, even if the data are only directionally correct, they strongly support interventions that improve diagnostic accuracy as po-tent drivers of clinical cost savings.
49MedSolutions Press release, Franklin, TN, May 10, 2011: “MedSolutions Shares Savings Data from Premerus Diagnostic Accuracy Program.” http://www.thefreelibrary.com/New+Data+Shows+ Reduced+ER+Use+and+Hospital+Length+of+Stay.-a0255982141

College of American Pathologists
Promising Practice Pathways
69
THE HIGH-PERFORMANCE DIAGNOSTIC SERVICES PRACTICE PATHWAY
In this section, we’ll provide an over-view of the practice model and inter-ventions. The pathway model descrip-tion comprises the services and tools that would be used to implement the pathway, with consideration given to key variables such as the target step in the testing chain, target condition and/or target clinical setting.
Overview – High Performance Diagnostic Services Pathway ModelThe multifaceted nature of the clini-cal diagnostic accuracy opportunity means that there is no, one “best prac-tices” model. This makes this pathway very accessible to a wide variety of
us, across practice types, settings, resource levels and capability port-folios, because we can each design an intervention program from a matrix of potential target opportunities and services.
The first determination in defining the model concerns what the clinical focus, or target, of the pathway inter-ventions will be. There are two primary dimensions we can use to frame this choice – clinical conditions/clinical area or the chain of diagnostic steps we’ve described earlier (previously denoted as the source of errors), as shown in Figure 6.
Figure 6: Practice Pathway Design – Diagnostic Step Chain and Potential Target Conditions
DiagnosticChain
Test Selection
Diabetes
Infectous disease
Coagulation
Cancer
Myocardial infarctions
Drug reactions
Pulmonary emboli
Pathwayexample 1
Pathwayexample 2
Test ResultsInterpretation
Test ResultCommunication
Follow-up andTracking
Source: Eleanor Herriman, MD, MBA, G2 Intelligence

Promising Practice Pathways
College of American Pathologists70
50Michael Laposata and Anand Dighe, “Pre-pre” and “post-post” analytical error: high-incidence patient safety hazards involving the clinical laboratory.” Clinical Chemical Laboratory Medicine. Volume 45, Issue 6, Pages 712–719
Thus, our pathology group could choose to initially focus our high-per-formance diagnostics pathway pro-gram on interventions to improve test result communications (i.e., address the “missed test results” and handoffs problem) across multiple conditions (example 1 in Figure 6), or improve di-agnostic accuracy across all steps for coagulation conditions (example 2 in Figure 6), as Laposata has done first at Massachusetts General Hospital, and currently at Vanderbilt.50
There are a number of considerations that should inform our choice, includ-ing strategic (e.g., the goals for your practice, and other business initiatives you’re pursuing), our practice’s re-sources and expertise, and your target client’s most critical needs in terms of diagnostic accuracy and value.
If we decide to focus on a target con-dition rather than a model where we design a solution for a single error step across diseases, then we next consider which disease area to select. Figure 7
Figure 7: Considerations in Selecting Target Conditions
High rate ofDx errors
Highavoidable
costs
Accessibility –intervention
that fitspractice
Optimal area for selectingtarget condition for pathway isintersection of all three
Source: Eleanor Herriman, MD, MBA, G2 Intelligence
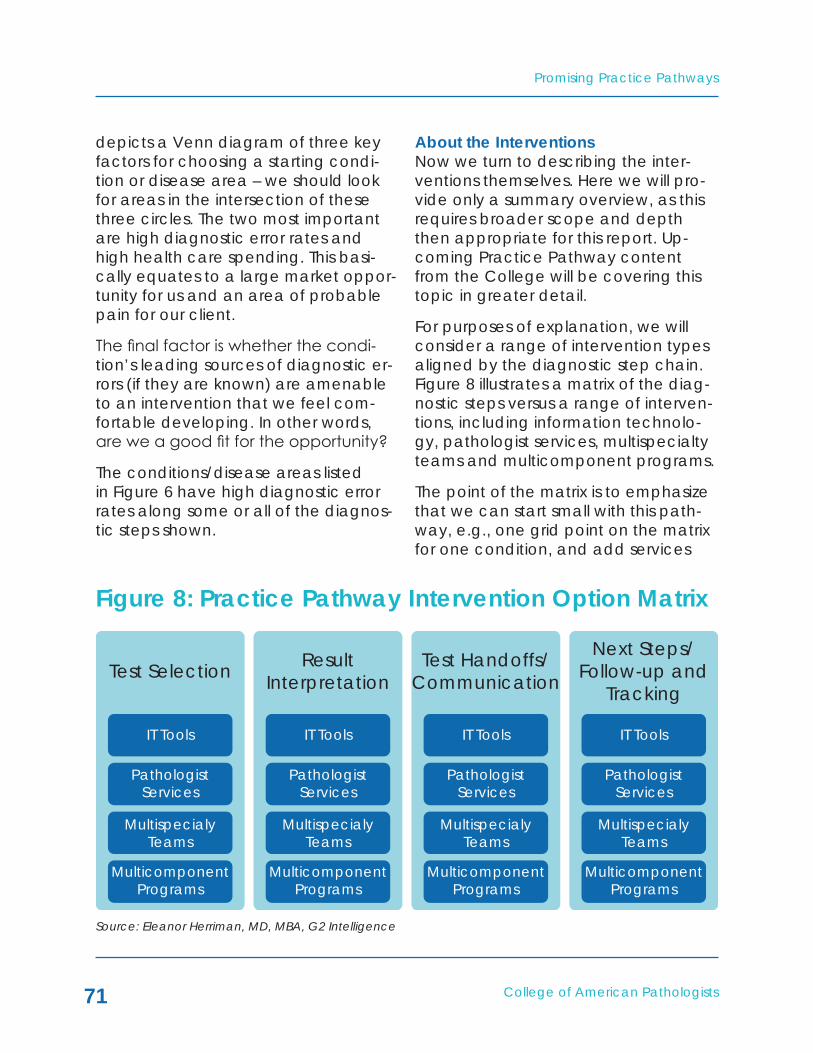
College of American Pathologists
Promising Practice Pathways
71
depicts a Venn diagram of three key factors for choosing a starting condi-tion or disease area – we should look for areas in the intersection of these three circles. The two most important are high diagnostic error rates and high health care spending. This basi-cally equates to a large market oppor-tunity for us and an area of probable pain for our client.
The final factor is whether the condi-tion’s leading sources of diagnostic er-rors (if they are known) are amenable to an intervention that we feel com-fortable developing. In other words, are we a good fit for the opportunity?
The conditions/disease areas listed in Figure 6 have high diagnostic error rates along some or all of the diagnos-tic steps shown.
About the InterventionsNow we turn to describing the inter-ventions themselves. Here we will pro-vide only a summary overview, as this requires broader scope and depth then appropriate for this report. Up-coming Practice Pathway content from the College will be covering this topic in greater detail.
For purposes of explanation, we will consider a range of intervention types aligned by the diagnostic step chain. Figure 8 illustrates a matrix of the diag-nostic steps versus a range of interven-tions, including information technolo-gy, pathologist services, multispecialty teams and multicomponent programs.
The point of the matrix is to emphasize that we can start small with this path-way, e.g., one grid point on the matrix for one condition, and add services
Figure 8: Practice Pathway Intervention Option Matrix
Test Selection
IT Tools
PathologistServices
MultispecialyTeams
MulticomponentPrograms
IT Tools
PathologistServices
MultispecialyTeams
MulticomponentPrograms
IT Tools
PathologistServices
MultispecialyTeams
MulticomponentPrograms
IT Tools
PathologistServices
MultispecialyTeams
MulticomponentPrograms
ResultInterpretation
Test Handoffs/Communication
Next Steps/Follow-up and
Tracking
Source: Eleanor Herriman, MD, MBA, G2 Intelligence

Promising Practice Pathways
College of American Pathologists72
and tools to our interventions vertically, as well as extend horizontally to ad-dress other error steps.
An individual pathology group custom-izes their pathway program by select-ing from this type of matrix, based on the needs of their providers and pay-ers, and what they are best equipped to provide.
For example, a pathology group could decide to start pursuing this pathway by implementing a diabetes program that uses IT tools and pathologist follow-up to identify patients with ab-normal glucose and HA1c values that may have been missed.
The intervention types range from single component offerings, such as IT applications and pathologist services, to the more advanced multispecialty teams and multicomponent programs which incorporate pathologists, IT sys-tems, and other elements.
IT tools and applications span a range from, for example, testing panels with algorithms, order entry with decision support, LIS data mining for disease management, and more complex clinical decision support systems. Many of us already use forms of these tools in our laboratories. By expand-ing their functionality and considering evidence-based design principles, these types of tools can be effective in improving diagnostic accuracy for par-
ticular applications. One review found that “The availability of automated in-formation management systems at the point of care may significantly improve the appropriateness of test requesting. …”51
There is evidence from various sources that different IT tools can have an impact on improving diagnostic per-formance. For example, a JAMA 2005 review evaluating the performance of the then very primitive computer-ized clinical decision support systems (CDSS) found “The CDSS improved practitioner performance in 62 (64 percent) of the 97 studies assessing this outcome, including 4 (40 percent) of 10 diagnostic systems, 16 (76 percent) of 21 reminder systems, 23 (62 percent) of 37 disease management systems, and 19 (66 percent) of 29 drug-dosing or prescribing systems.”52
Pathologist services go beyond the phone call for an abnormal result. They might comprise a spectrum form more structured telephone consulta-tions, regular meetings with clinicians, collaborations with clinicians including hospital rounding, generating patient-specific expert narrative interpretive reports and establishing new roles for pathologists as diagnostic specialists at the point of care in high risk settings such as the emergency room.
Multispecialty teams are exempli-fied by the “diagnostic manage-
51Mario Plebani, Clinica Chimica Acta 404 (2009) 16–2352AX Garg et al. “Effects of Computerized Clinical Decision Support Systems on Practitioner Performance and Patient Outcomes.” JAMA. 2005;293(10):1223-1238

College of American Pathologists
Promising Practice Pathways
73
53Michael Laposata and Anand Dighe, “Pre-pre” and “post-post” analytical error: high-incidence patient safety hazards involving the clinical laboratory.” Clinical Chemical Laboratory Medicine. Volume 45, Issue 6, Pages 712–71954J.Y. Kim et al. “The Use of Decision Analysis Tools for the Selection of Clinical Laboratory Tests.” A.M. Marchevsky and M.R. Wick (eds.), Evidence Based Pathology and Laboratory Medicine, 305 © Springer Science Business Media, LLC 201155Pennsylvania Patient Safety Advisory: “Diagnostic Error in Acute Care.” Pa Patient Saf Advis 2010 Sep;7[3]:76-8656J.Y. Kim et al. “The Use of Decision Analysis Tools for the Selection of Clinical Laboratory Tests.” A.M. Marchevsky and M.R. Wick (eds.), Evidence Based Pathology and Laboratory Medicine, 305 © Springer Science Business Media, LLC 201157Pennsylvania Patient Safety Advisory: “Diagnostic Error in Acute Care.” Pa Patient Saf Advis 2010 Sep;7[3]:76-86.c
ment teams” innovated over the past several years by Michael Laposata, MD, PhD, now at Vanderbilt Univer-sity Medical Center. These teams are comprised of multiple pathologists, including an attending, and often a specialist clinician, depending on the disease area (e.g., microbiology has an infectious disease specialist on the team). The team meets daily to inter-pret individual patient cases, consider-ing clinical data as well as all pertinent laboratory, pathology and radiology results, and generates a patient-spe-cific, expert-driven interpretation that “improves both the time to diagnosis and the accuracy of the diagnosis.”53
Multicomponent Programs combine one or more of these services and tools into a broader “program” that might be employed by a hospital or ACO to tackle a broad problem area, major condition (e.g., diabetes) or particular care setting (e.g. the ER).
Let’s look at selected examples of these interventions along the diagnos-tic testing chain.
1) Test Selection – IT Tools Example
Examples include:
• Disease-specific, reflex testing algorithms – e.g., celiac disease at Massachusetts General Hos-pital (MGH).54
• Clinical guidelines, algorithms – have been found useful for diagnostic errors when well designed.55 These can be incor-porated in order entry systems, and can be part of automated order sets. MGH has imple-mented a “rule-out acute myo-cardial infarction” as part of an admission order set.56
• Diagnostic checklists oriented around high risk conditions or care settings57 can be imple-mented through EMRs or hospi-tal IT systems.
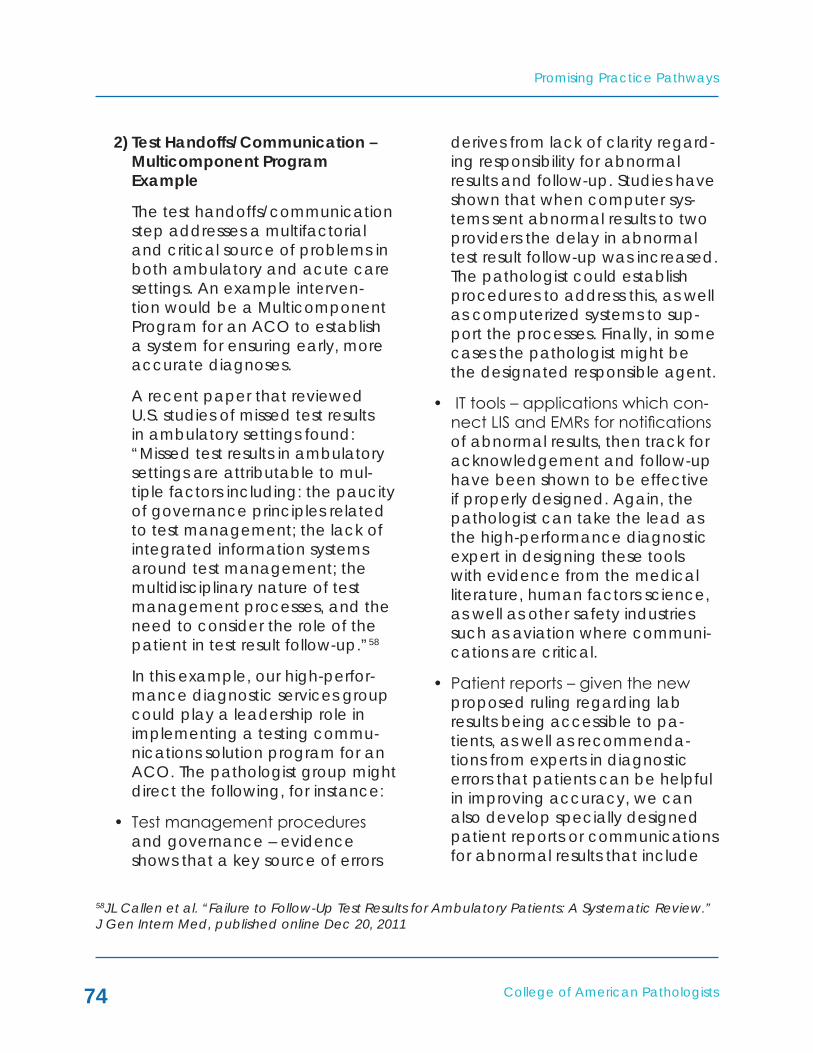
Promising Practice Pathways
College of American Pathologists74
2) Test Handoffs/Communication – Multicomponent Program Example
The test handoffs/communication step addresses a multifactorial and critical source of problems in both ambulatory and acute care settings. An example interven-tion would be a Multicomponent Program for an ACO to establish a system for ensuring early, more accurate diagnoses.
A recent paper that reviewed U.S. studies of missed test results in ambulatory settings found: “Missed test results in ambulatory settings are attributable to mul-tiple factors including: the paucity of governance principles related to test management; the lack of integrated information systems around test management; the multidisciplinary nature of test management processes, and the need to consider the role of the patient in test result follow-up.”58
In this example, our high-perfor-mance diagnostic services group could play a leadership role in implementing a testing commu-nications solution program for an ACO. The pathologist group might direct the following, for instance:
• Test management procedures and governance – evidence shows that a key source of errors
derives from lack of clarity regard-ing responsibility for abnormal results and follow-up. Studies have shown that when computer sys-tems sent abnormal results to two providers the delay in abnormal test result follow-up was increased. The pathologist could establish procedures to address this, as well as computerized systems to sup-port the processes. Finally, in some cases the pathologist might be the designated responsible agent.
• IT tools – applications which con-nect LIS and EMRs for notifications of abnormal results, then track for acknowledgement and follow-up have been shown to be effective if properly designed. Again, the pathologist can take the lead as the high-performance diagnostic expert in designing these tools with evidence from the medical literature, human factors science, as well as other safety industries such as aviation where communi-cations are critical.
• Patient reports – given the new proposed ruling regarding lab results being accessible to pa-tients, as well as recommenda-tions from experts in diagnostic errors that patients can be helpful in improving accuracy, we can also develop specially designed patient reports or communications for abnormal results that include
58JL Callen et al. “Failure to Follow-Up Test Results for Ambulatory Patients: A Systematic Review.” J Gen Intern Med, published online Dec 20, 2011

College of American Pathologists
Promising Practice Pathways
75
patients as a safety net. This in-tervention is exactly in line with the Institute of Medicine’s call for “patient-centered care.”
3) Test Result Interpretation – Pathol-ogist Services and Multispecialty Teams Example
As described above, a prototypical example of a test result interpretation intervention is Laposata’s “diagnostic management teams (DMTs).” These teams provide diagnostic services for coagulation, hematopathology and microbiology disorders. They have plans in the next couple of years to add teams for endocrinology, toxicol-ogy, autoimmunity, anemia, renal and some cancers.59
Geisinger has also implemented pa-thologist interpretative services along the lines of Laposata’s DMTs. They report:
“At Geisinger, the Department of Laboratory Medicine provides a coagulation consultation service, including 24-hour availability by one of four pathologists between two hospitals with reports gener-ated on the same AMEDx system used by Dr. Laposata. The labo-ratory has supported (as part of its point-of-care testing role) the installation of six thromboelasto-
graph analyzers for the operating rooms and intensive care units in two hospitals. The same patholo-gists provide consultative interpre-tation of the thromboelastograph histograms that have been net-worked and can be seen from remote sites or home. Pathologists have developed a standard inter-pretive algorithm for evaluation of microvascular bleeding and use it to advise clinicians on the ap-propriate blood components in complex cases. This approach is a significant step in the rationaliza-tion of blood component usage in difficult operative bleeding cases.”
Laposata reported that 72 percent of physicians at MGH indicated that his coagulation services helped them avoid a misdiagnosis – an impressive indicator of effectiveness. Also, 59 per-cent said that the services shortened the time to diagnosis.61
In terms of the accessibility of this in-tervention to community pathology groups, it is important to note that there is evidence that patient-specific narrative interpretations that incorpo-rate clinical data can be potent ac-curacy boosters even for less complex conditions than coagulation or hema-tologic conditions. Laposata has stat-
59Michael Laposata, MD, PhD, Professor of Pathology, Vanderbilt University Medical Center, presentation, “Advising Treating Physicians on Laboratory Test Selection and Interpretation,” 201260C Schuerch and M Selna “Laboratory Clinical Effectiveness: Pathologists Improving Clinical Outcomes.” Clin Lab Med 28 (2008) 223–24461M Laposata et al. Arch Pathol Lab Med 2004. 128:1424-1427
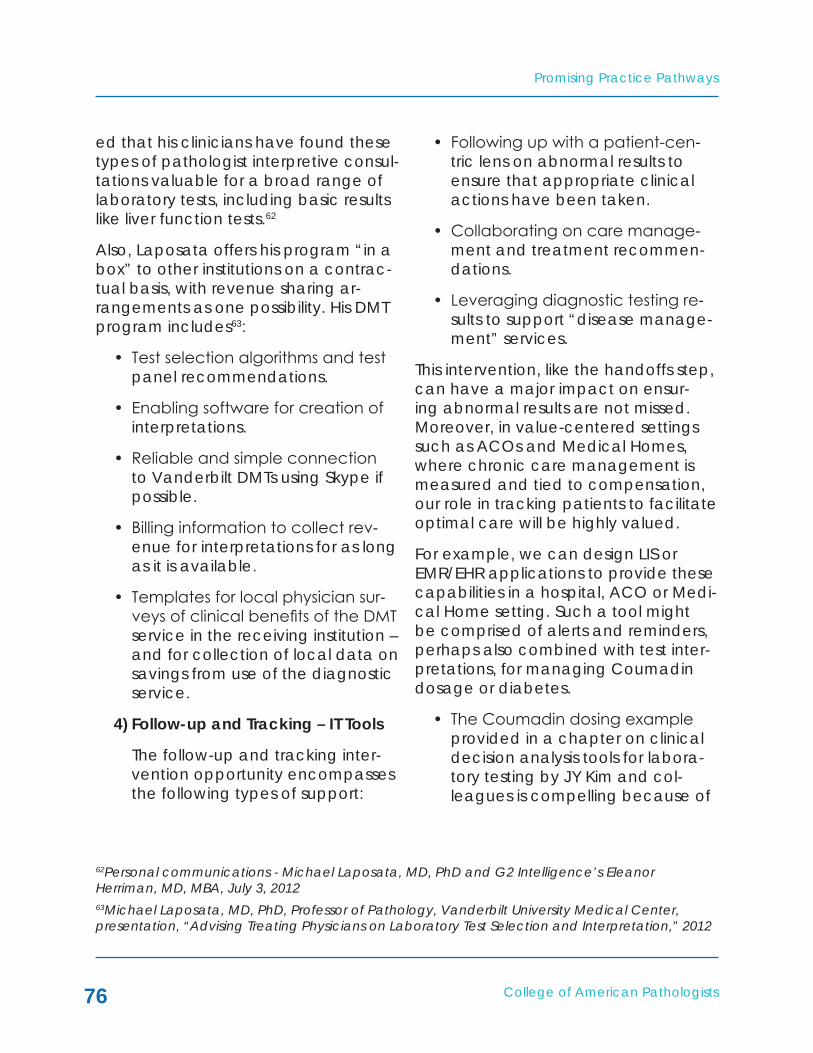
Promising Practice Pathways
College of American Pathologists76
ed that his clinicians have found these types of pathologist interpretive consul-tations valuable for a broad range of laboratory tests, including basic results like liver function tests.62
Also, Laposata offers his program “in a box” to other institutions on a contrac-tual basis, with revenue sharing ar-rangements as one possibility. His DMT program includes63:
• Test selection algorithms and test panel recommendations.
• Enabling software for creation of interpretations.
• Reliable and simple connection to Vanderbilt DMTs using Skype if possible.
• Billing information to collect rev-enue for interpretations for as long as it is available.
• Templates for local physician sur-veys of clinical benefits of the DMT service in the receiving institution – and for collection of local data on savings from use of the diagnostic service.
4) Follow-up and Tracking – IT Tools
The follow-up and tracking inter-vention opportunity encompasses the following types of support:
• Following up with a patient-cen-tric lens on abnormal results to ensure that appropriate clinical actions have been taken.
• Collaborating on care manage-ment and treatment recommen-dations.
• Leveraging diagnostic testing re-sults to support “disease manage-ment” services.
This intervention, like the handoffs step, can have a major impact on ensur-ing abnormal results are not missed. Moreover, in value-centered settings such as ACOs and Medical Homes, where chronic care management is measured and tied to compensation, our role in tracking patients to facilitate optimal care will be highly valued.
For example, we can design LIS or EMR/EHR applications to provide these capabilities in a hospital, ACO or Medi-cal Home setting. Such a tool might be comprised of alerts and reminders, perhaps also combined with test inter-pretations, for managing Coumadin dosage or diabetes.
• The Coumadin dosing example provided in a chapter on clinical decision analysis tools for labora-tory testing by JY Kim and col-leagues is compelling because of
62Personal communications - Michael Laposata, MD, PhD and G2 Intelligence’s Eleanor Herriman, MD, MBA, July 3, 201263Michael Laposata, MD, PhD, Professor of Pathology, Vanderbilt University Medical Center, presentation, “Advising Treating Physicians on Laboratory Test Selection and Interpretation,” 2012

College of American Pathologists
Promising Practice Pathways
77
the serious impact of this common problem. They write64: “[P]atients receiving long-term anticoagula-tion therapy with Coumadin must be monitored at regular intervals using a PT-INR test to ensure ad-equate anticoagulation therapy. If the patient’s PT-INR becomes subtherapeutic, the patient may develop a fatal clot or embolism. Excessive anticoagulation may result in bleeding or hemorrhage. Usually the physician schedules office visits for these patients at various intervals and provides a prescription for outpatient PT-INR testing at more frequent intervals. Once the patient has left the of-fice, the physician has no way to be certain that the patient actu-ally went to the laboratory for the regular PT-INR testing, unless the office staff periodically reviews the patient’s records to check for the
results of recent testing. Noncom-pliance on the part of the patient can have potentially catastrophic consequences. On the other hand, if the test orders for PT-INR have been recorded in an order entry system, it is possible to imple-ment an alert system such that the physician is made aware if the patient did not show up for testing within an appropriate time inter-val. Furthermore, the system could alert the physician of nonthera-peutic PT-INR values, thus permit-ting more timely adjustments to therapy.”
A final example is a diabetes manage-ment system that monitors hemoglobin A1c, urinary microalbumin, lipids and other parameters. The system could issue reminders to clinicians when pa-tients have not received recommend-ed testing or abnormal results have not been followed up.65
64J.Y. Kim et al. “The Use of Decision Analysis Tools for the Selection of Clinical Laboratory Tests.” A.M. Marchevsky and M.R. Wick (eds.), Evidence Based Pathology and Laboratory Medicine, 305 © Springer Science Business Media, LLC 201165J.Y. Kim et al. “The Use of Decision Analysis Tools for the Selection of Clinical Laboratory Tests.” A.M. Marchevsky and M.R. Wick (eds.), Evidence Based Pathology and Laboratory Medicine, 305 © Springer Science Business Media, LLC 2011

Promising Practice Pathways
College of American Pathologists78
CONCLUSIONS
Clinical diagnostic errors are not only significant, causing unnecessary harms for patients and value destruction for the health care system, but they are also increasingly being recognized as such. Many clinical diagnostic errors relate directly to clinicians’ knowledge and management of diagnostic test-ing, putting pathologists in a central, ideal position to provide a range of interventions that can help decrease errors and add value to providers and payers.
“In general, focusing on decreasing diagnostic errors is a good strategy for clinical laboratorians, because it de-emphasizes lab tests as a commodity and focuses on the value we add. In other words, it changes our mission from providing accurate, timely, low-cost test results to rapidly and efficient-ly enabling accurate diagnosis, selec-tion of appropriate treatments and effective monitoring of health status. In addition, because many diagnostic errors related to laboratory services involve physician behavior, it motivates us to collaborate beyond our walls and show our value to our colleagues who provide direct patient care,” wrote Paul Epner, MBA, MEd, and Michael Astion, MD, PhD66.
Because there are multiple sources of errors, there are many opportunities for different types of interventions, making this a pathway that is accessible to a wide variety of pathology practices, regardless of practice type, setting, re-source levels and capability portfolios. Potential interventions range widely in scope, making it possible for any group to start small and expand over time.
The pathway is also likely to be attrac-tive to any client compensated based on value/clinical costs. Examples of market applications include:
• High-performance diagnostic services in an academic medical center may help improve out-comes in a cancer center and/or may lower costs, thus improving the AMC’s margins when under cancer bundling contracts.
• For a reference lab, the value proposition may lie in the de-sign, development and offering of computer tools for diagnostic decision support for specific con-ditions.
• A pathology group with a hospi-tal contract or within a provider institution might begin by offering
66Paul Epner, MBA, MEd, and Michael Astion, MD, PhD, “Focusing on Test Ordering Practices to Cut Diagnostic Errors.” Clinical Laboratory News: Reducing Diagnostic Errors, July 2012
College of American Pathologists
Promising Practice Pathways
79
diagnostic testing interpretive ser-vices that target a particular “out of control,” high-cost DRG area.
• In an ACO setting, the high-per-forming diagnostic specialty team might be the “command center” in charge of ensuring delivery and follow-up of abnormal test results, perhaps initially targeting only high-risk areas, such as the emer-gency room, critical care units, and discharge hand-offs. With such a high profile, high responsi-bility program, the pathway busi-ness plan would include require-ments for additional resources, IT systems and authority from the ACO.
• For a payer, a high-performance diagnostic service can implement a diagnostic accuracy improve-ment program for a population or a service line and contract for revenue based on performance targets or shared savings.
The possibilities are many and, overall, this pathway represents an excellent opportunity for pathologists to expand the reach of their diagnostic expertise outside of the laboratory. We can participate in a visible way, clinically with our physician colleagues, and add clinical value in this new market, enabling us to participate financially, as well.
COORDINATED POPULATION CARE SERVICES
PROMISING PRACTICEPATHWAYS™:
COLLEGE OF AMERICAN PATHOLOGISTS
College of American Pathologists
Promising Practice Pathways
81
The new performance-based de-mands of healthcare delivery reform will ultimately shift compensation to “alternative,” value-based purchas-ing arrangements such as shared savings, bundled or global payment. These changes are driving healthcare systems and physician groups, such as Accountable Care Organizations (ACOs), toward a new paradigm called population health manage-ment, a model that holds the ACO accountable for both the health and costs of an assigned patient popula-tion.
This new care delivery model de-mands that ACOs perform compre-hensive performance measurements, including process of care, outcomes, and patient experience metrics. To im-prove quality and reduce costs, ACOs need to both systematize care with pathways and embed “individualized medicine” into routine care. They also need to segment their populations and predict risks to direct interven-tions, improve health and avoid pre-ventable illnesses and complications.
Population health management (PHM) is challenging because it spans three dimensions of care. As shown in Figure 1, PHM requires 1) managing populations that range from the com-munity down to a physician’s prac-tice, 2) managing care along the time continuum form prevention through
end of life, and 3) managing across all conditions and procedures.
Pathology and laboratory medicine are competitively advantaged in hav-ing expertise and services that add value across all three of these dimen-sions, arguably uniquely so in medi-cine.
Furthermore, information technology systems and robust, thorough clinical data are critical components in this new model. But beyond IT solutions, ACOs are looking for guidelines, order sets, and other electronic medical record (EMR) applications for which pathology knowledge is a necessity. These ACO PHM needs provide an opportunity for pathology and labora-tory medicine to develop services and EMR/EHR applications that go beyond supplying laboratory results.
The key to meeting these needs intel-ligently involves a dual approach that is unique to pathology. Pathologists can marry “top down” population lab informatics applications that sup-port systematizing care with “bottom up,” patient-specific, molecular test-ing tools that can individualize those guidelines in a way that accounts for the art and variability of medicine. This is our second, critical competitive advantage in delivering PHM value to ACOs. See Figure 2.
SUMMARY
Promising Practice Pathways
College of American Pathologists82
ACOs and other providers engaged in PHM need not only our data, but our expertise and services to generate the value they need to be success-ful under these new payment models. But the move to ACOs has significant momentum and the models and roles supporting their needs are becom-ing established rapidly. Without taking action to develop these services and applications that extend beyond test results, ACOs will sideline us as provid-ers of data.
ACOs are now estimated to number 3001 and are projected by some ana-lysts to double to 600 in 2013.2 That implies that we will all be exposed in some manner to ACOs of some type in the near term. “You’re either at the table or on the table” is a favorite phrase among the healthcare market stakeholders immersed in reform these days.
We have tremendous value to bring to the ACO table in terms of PHM ser-vices, but we need to take action to do so. We do not need to have infor-matics capabilities to start this journey, for we will have resources and guides along the way to build them, and there are many services we can offer that do not require informatics.
The “Coordinated Population Care Ser-vices Practice Pathway” we introduce
includes “entry options” for pathology practices without informatics expertise, which can begin by adding value in their hospitals, for example, through population health applications and services we’ll describe. Many of these are collaborative programs in which the pathologist’s expertise adds a vital component that can greatly improve the initiative’s impact.
For example, one of the leading op-portunities for cost avoidance for ACOs is infectious diseases, particularly given the ubiquity of resistant patho-gens, both inpatient and in community settings. Pathologists can play a signifi-cant population health, value generat-ing role in teaming with infectious and pharmacy colleagues to develop high powered surveillance and stewardship programs, including the targeted use of molecular testing to guide antibiotic use.
There are a number of other opportu-nities for pathology groups who have not yet acquired informatics capabili-ties that rely solely on our expertise. For example, controlling glycemia in inpa-tients is very challenging, and subopti-mal management drives high rates of avoidable costs and adverse events. One problem that contributes to this situation is that some of the hand-held glucometers widely used in hospitals have clinically significant accuracy
1Susan Dentzer, Editor of Health Affairs, remarks at the Third National Accountable Care Organization Summit in June 20122Jim Bloedau, “ACO Market Will More Than Double in 2013 by Jim Bloedau,” Information Advantage Group, August 9, 2012
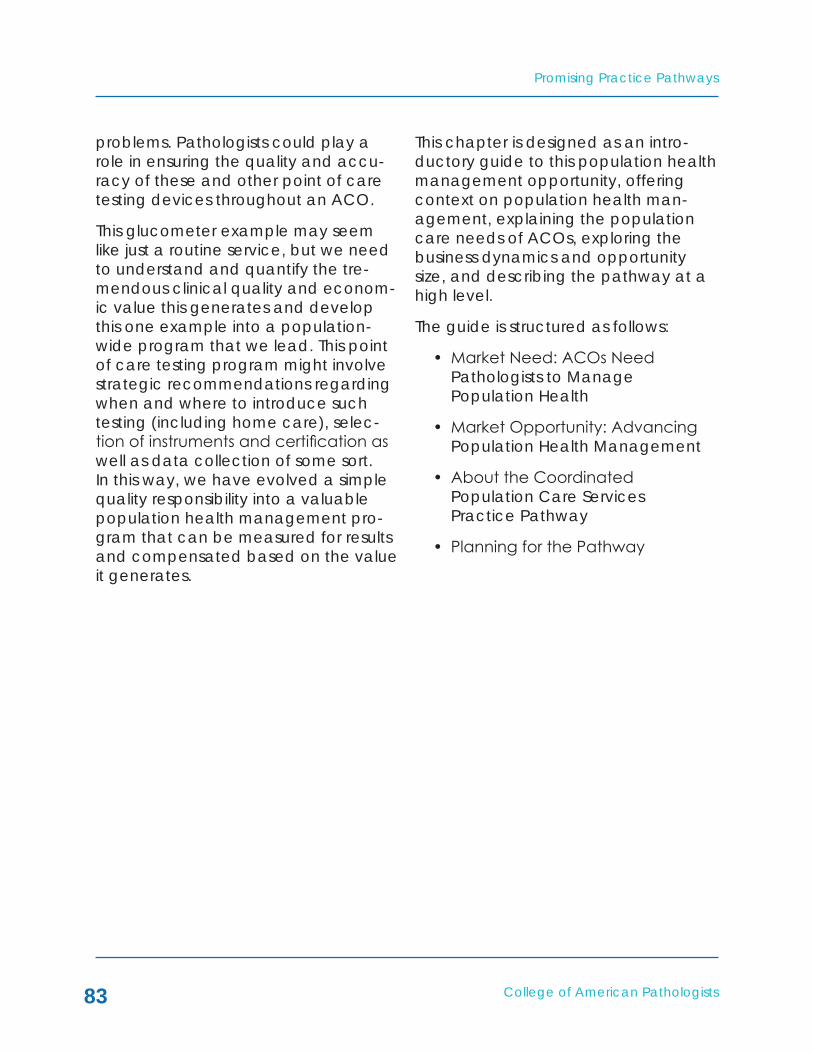
College of American Pathologists
Promising Practice Pathways
83
problems. Pathologists could play a role in ensuring the quality and accu-racy of these and other point of care testing devices throughout an ACO.
This glucometer example may seem like just a routine service, but we need to understand and quantify the tre-mendous clinical quality and econom-ic value this generates and develop this one example into a population-wide program that we lead. This point of care testing program might involve strategic recommendations regarding when and where to introduce such testing (including home care), selec-tion of instruments and certification as well as data collection of some sort. In this way, we have evolved a simple quality responsibility into a valuable population health management pro-gram that can be measured for results and compensated based on the value it generates.
This chapter is designed as an intro-ductory guide to this population health management opportunity, offering context on population health man-agement, explaining the population care needs of ACOs, exploring the business dynamics and opportunity size, and describing the pathway at a high level.
The guide is structured as follows:
• Market Need: ACOs Need Pathologists to Manage Population Health
• Market Opportunity: Advancing Population Health Management
• About the Coordinated Population Care Services Practice Pathway
• Planning for the Pathway

Promising Practice Pathways
College of American Pathologists84
Figure 1: Population Health Management Spans Three Dimensions of Care
Populations:Communityto Practice
Conditions andProcedures:Diabetes toCABG
Time:Preventionto End ofLife
PopulationHealth
Management

College of American Pathologists
Promising Practice Pathways
85
MARkET NEEDS – ACOS NEED PATHOLOGISTS TO MANAGE POPULATION HEALTH Population Health Management: A Paradigm Shift in Care DeliveryA major component of the current U.S. healthcare market reinvention is care delivery reform, and one of the primary new paradigms in care delivery is pop-ulation health management (PHM).Providers being compensated under “alternative payment” programs such as ACOs need PHM by definition; they are responsible for both the health and costs of an assigned patient popula-tion.
“To cope with these new de-mands, healthcare systems and physician groups are moving toward an approach known as ‘population health management.’ The goal of population health management (PHM) is to keep a patient population as healthy as possible, minimizing the need for expensive interventions such as emergency department visits, hospitalizations, imaging tests, and procedures.”3
To manage population care and suc-cessfully operate this business model, an ACO must be able to perform comprehensive performance mea-
surements, including process of care, outcomes, and patient experience metrics. In order to qualify for Medi-care shared savings payments, ACOs are required to meet specified thresh-olds on a set of 33 such quality perfor-mance measures. They also, of course, need to measure and project their costs.
When we look at the span of condi-tions, providers and settings that need to be measured in order to be man-aged by ACOs, or indeed by any pro-vider organization that is being com-pensated based on an “alternative” or value-based purchasing arrangement (e.g., bundled or global payment), it is quite evident that potent informa-tion technology systems and robust, abundant clinical data are critical to success.
Information Technology: Essential for Population Health ManagementA variety of electronic health record (EHR) tools and informatics database applications have become important for ACOs and Medical Homes and, so far, these applications have helped enable PHM:
3“Population Health Management – A Roadmap for Provider-Based Automation in a New Era of Healthcare Institute for Health Technology Transformation,” Institute for Health Technology Transformation, 2012

Promising Practice Pathways
College of American Pathologists86
• Describing his experience with a partnership ACO with Norton Healthcare, launched in 2010, Dr. Tom James, Humana’s corporate medical director, said “ACOs are really changing our work from (health) utilization management to more data and information sharing. It is more extensive than we have ever seen before.”4
• The Institute for Health Technology Transformation puts it very suc-cinctly: “Automation makes popu-lation health management fea-sible, scalable and sustainable.”5
The majority of ACOs using IT tools in a PHM setting recognize that pathology and laboratory testing results are an important component of these data-bases and tools. Yet without involving pathologists in the analysis and utiliza-tion of this information, these organiza-tions are working below full potential.
What ACOs really need are standard-ized and coordinated applications for implementing the insights generated by the laboratory test informatics. Par-ticularly they need to imbed “individu-alized medicine” into routine care. This translates into guidelines, order sets, and other EMR applications for which pathology knowledge is a necessity.
Systematization with IntelligenceSuch systematization, however, may not be immediately embraced by physicians, especially if they perceive that standardized guidelines and co-ordinated IT applications equate to “managed care” medicine. Yet the re-ality is that physicians cannot care for individuals without the collective intelli-gence of the entire healthcare system, from appointment management to pharmacy to laboratory and beyond. Further, ACOs cannot manage quality and costs without controlling variations in provider care.
Pathologists have a unique opportunity to contribute intelligence that trans-forms “managed care” medicine into astute care. The key to this transforma-tion is a dual approach that is unique to pathology. Pathologists marry “top down” population lab informatics ap-plications that systematize care with “bottom up,” patient-specific, mo-lecular testing tools that individualize guidelines in a way that allows for the art and variability of medicine.
Our data, tests and knowledge enable both population-level analytics, and individualized patient-level applica-tions. Using this dual approach (see Figure 2), we can employ informatics and molecular testing to utilize both population-based and individualized care management.
4Steve Ivey, “Humana, Norton use information to keep employees healthier under ACO,” Business First, December 2, 20115“Population Health Management: A Roadmap for Provider-Based Automation in a New Era of Healthcare,” Institute for Health Technology Transformation, 2012

College of American Pathologists
Promising Practice Pathways
87
For example, on the population level, informatics analysis of serial antibio-grams taken from locations throughout the community, as well as other near-by locations, can be used to formulate guidelines for antibiotics based on predicted pathogens and resistance patterns. At the same time, we can of-fer individualization of those guidelines for particularly high-risk patients using point of care molecular testing to iden-tify the pathogens and immediately direct antibiotic treatment. A patient with COPD and heart failure, for in-stance, presenting with a recurrence of a pneumonia, would be a good candidate for such testing.
Another illustration of our dual popula-tion and individualization approach might be in the area of venous throm-boembolism (VTE) prevention. Based on statistical data mining of an ACO database containing both lab and clinical data, we might identify par-ticular patterns of lab test values that would inform the complex risk stratifica-tion involved in current VTE prevention guidelines. Turning to the individualized level, we might provide a personal-ized coagulation profiling service for challenging patients. This service might include pharmacogenetic testing to ensure proper dosing of warfarin, as well as for the hereditary thrombophil-ias, for example.
In this way, our expertise and testing information are applied both to ad-vancing guidelines at the population level and to individualizing care at the
patient management level – a dual approach that represents a strong competitive advantage.
Any provider organization that is man-aging patient populations under alter-native, non-fee-for-service payment programs needs a population care focused pathology group to optimize its performance. We are needed to develop applications and services directed at population health care – via informatics, molecular technologies and programs that impact care at the community, hospital or practice popu-lation level.
Risk Management and Prevention: Central to PHMIn addition to applications to support clinical decision making, information sharing and reporting, PHM requires a different way of looking at patients. For instance, one of the core functions that determines how effectively an or-ganization can manage a population is population segmentation, such as risk stratification.
For example, population segmenta-tion can be performed according to a patient or cohort’s clinical risks, testing results, demographics, lifestyle factors, and/or claims history. Since this seg-mentation is typically used for deci-sions regarding resource allocation, care management services, and pro-vider interventions, the “accuracy” of the segmentation in terms of predict-ing risks and optimally matching needs with resources impacts the ACO’s quality and cost results.
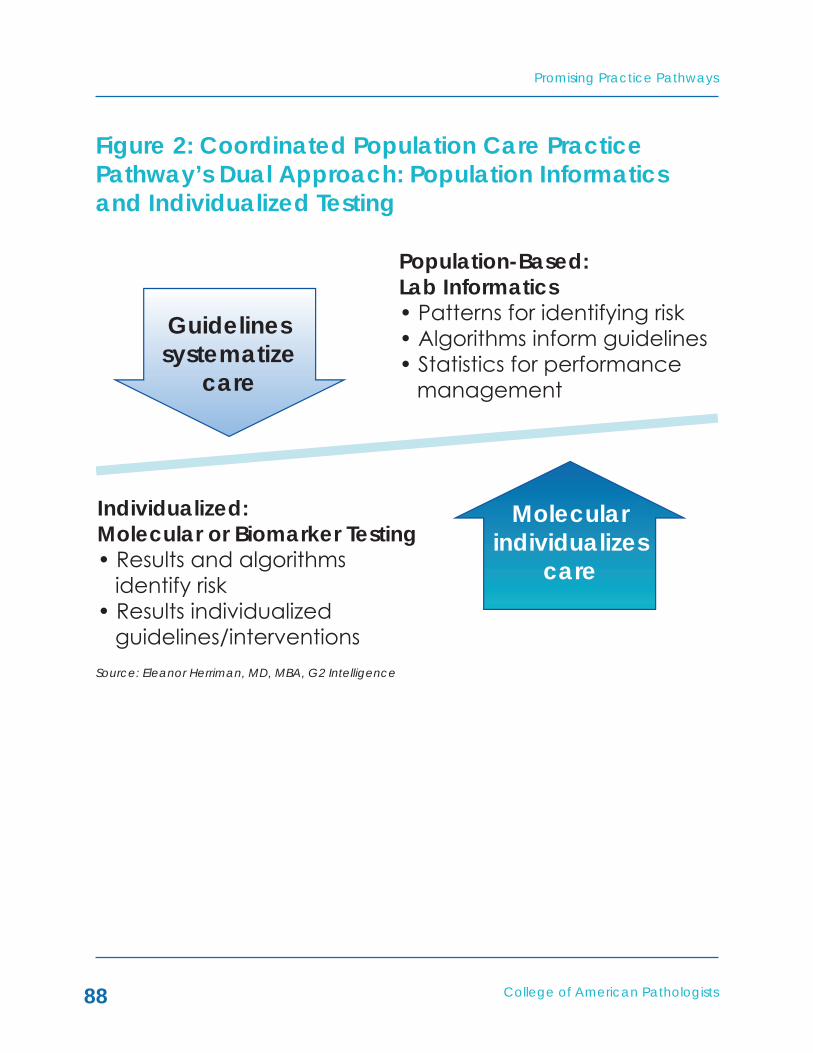
Promising Practice Pathways
College of American Pathologists88
Figure 2: Coordinated Population Care Practice Pathway’s Dual Approach: Population Informatics and Individualized Testing
Population-Based:Lab Informatics• Patterns for identifying risk• Algorithms inform guidelines• Statistics for performance management
Individualized:Molecular or Biomarker Testing• Results and algorithms identify risk• Results individualized guidelines/interventions
Guidelinessystematize
care
Molecularindividualizes
care
Source: Eleanor Herriman, MD, MBA, G2 Intelligence

College of American Pathologists
Promising Practice Pathways
89
Health risk stratification is the most criti-cal type of segmentation, as it is mostly closely linked to value – i.e., costs and outcomes. It is also used in population health management to direct care management – which patients are at high-risk and need ongoing support, which have serious chronic conditions warranting an active intervention plan to prevent complications, and which are fairly healthy and just need pre-vention and education.
The tricky part of risk stratification is that a patient’s risk status is quite dynamic, so ACOs need recent data to continu-ously refresh risk stratifications. In fact, the true power comes with being able to use risk assessment to predict future healthcare spending.
Studies show that more than 70 per-cent of patients in the high cost cat-egory in a given year were in a lower cost category the prior year.6 In other words, who will be the highest cost pa-tient mostly changes year to year.
While payers have developed predic-tive algorithms for risk assessment, they do not completely meet the needs of ACOs. “Health insurers use predictive modeling algorithms that can help forecast which patients are likely to have significant health costs. Some
health plans are giving provider or-ganizations these kinds of tools, which can be valuable in identifying patients who may be hospitalized or suffer complications in coming months. But, since these programs are not designed for providers and have limited utility in clinical settings, organizations must define and develop more appropriate tools.”7
For example, Robert Fortini, Vice Presi-dent and Chief Clinical Officer Bon Secours Medical Group, Richmond, Va., described his organization’s IT needs for population health manage-ment: “In the future, we’d like to be able to predict which patients are most likely to get sick and incur major treatment costs.”8
The critical capability of population segmentation and risk prediction needed for successful ACO financial management requires pathology and lab testing more than most any other part of medicine. Why? Because we deliver the most potent of predic-tive tools in health care – molecular diagnostics and lab biomarkers. Fur-thermore, because lab testing is per-formed frequently, it provides a steady supply of temporal data with which to refresh risk assessments.
6Ian Duncan, Healthcare Risk Adjustment and Predictive Modeling (Winstead, CT: ACTEX Publications, 2011)7“Population Health Management: A Roadmap for Provider-Based Automation in a New Era of Healthcare,” Institute for Health Technology Transformation, 20128“Population Health Management: A Roadmap for Provider-Based Automation in a New Era of Healthcare,” Institute for Health Technology Transformation, 2012

Promising Practice Pathways
College of American Pathologists90
Pathology and Laboratory Medicine: At the Core of PHMIn fact, pathology and laboratory medicine are at the core of popula-tion health management, and there-fore inexorably linked to its success.
Pathologists are critical to success be-cause pathology and laboratory test data are critical to PHM:
• These data go beyond being just a component in the ACO’s EHRs and integrated databases. Lab and pathology results are one of the leading sources of information powering the IT systems so vital to population care: lab and pathol-ogy data are estimated to com-prise 70 percent of EMR content.9
• Population health management requires tools that span a wide clinical breadth – few healthcare applications can rival the “impact range” of pathology and lab testing. They are performed in the diagnosis and/or management of almost all major clinical condi-tions.
• Population health management requires tools that cover both the population and patient care continua – again, pathology and lab medicine are among the only clinical implements with significant roles across these care continuum ranges:
– Prevention and wellness – e.g., cervical cancer screening and HPV, hepatitis screening, lipid profiles.
– Diagnosis – e.g., histopathology, coagulation testing, microbiol-ogy.
– Therapeutic guidance – e.g., pharmacogenetics, molecular testing for HCV, oncology markers.
– Chronic care management – e.g., HA1c, warfarin INR, lipid profile.
– Acute care – e.g., microbe identification with molecular tests, perioperative glucose control.
• Care coordination is integral to population health management. Because pathology and lab testing span clinical conditions and care settings/continua (as described above), the informa-tion can be used as a coordina-tion glue to track and manage patients, services and providers. However, this requires recognition of this resource and development of the asset into a coordination system that is managed by an expert in pathology/lab medicine. For example, because lab tests are ordered during the majority of provider visits, lab test records can be used as a proxy for clinician interactions.
9L Pantanowitz et al. “Medical laboratory informatics,” Clin Lab Med 2007;27:823-43

College of American Pathologists
Promising Practice Pathways
91
• We deliver the most potent of predictive, risk assessment tools in health care: individualized medi-cine diagnostics and biomarkers. Furthermore, lab testing is per-formed frequently, so it provides a steady supply of temporal data with which to refresh risk assess-ments.
Not by Data Alone: Expertise NeededACOs and other providers engaged in PHM need not only our data, but our expertise and services to generate the value they need to be success-ful under these new payment models. Moreover, we bring the ability to infuse individualized medicine into guideline-driven care, and to merge the two – population informatics with person-alized medicine testing, as shown in Figure 2.
In addition to pathology and labora-tory test data, pathologists are needed to:
• Interpret this data for ACOs
Given the complexities gener-ated by the increasing numbers of molecular and “omics” diag-nostic tests, the complexities of pathophysiology, and the com-plexities of the aging population with multiple chronic conditions and polypharmacy, providers and payers need pathology experts to interpret and disentangle the interrelationship of test results. This is essential when conducting data mining and developing predictive algorithms. For example, without
knowing a patient’s albumin lev-els, one cannot properly interpret calcium levels.
• Select the correct diagnostic data to analyze
Pathologists are needed to iden-tify the new evidence regarding tests with predictive power that can serve as clinical biomarkers.
• Assure that data is used correctly
Pathologists’ expertise in labora-tory analytics can identify issues that can influence the degree of validity of informatics analyses. For example, a little-appreciated problem with potentially signifi-cant consequences on a popula-tion management level is that of mixing test results from different labs, as they often use different reference ranges for the same tests. Thus, problems can occur when trying to interpret test results for one patient from a variety of labs.
• Assure that diagnostic data is lev-eraged optimally
Pathologists can have a tremen-dous impact on the effectiveness of PHM because there are many opportunities to utilize pathology and laboratory testing in the re-duction of downstream clinical costs and improvement of out-comes, but they necessitate pa-thology/laboratory expertise. For example, by applying informatics-determined cohort-specific test

Promising Practice Pathways
College of American Pathologists92
reference ranges, we can often detect early signs of pathology in what would otherwise be consid-ered “normal” lab results. Labora-tories have used data repositories to set analyte-specific reference ranges based on gender, age groups, and pediatric Tanner de-velopment stages.
Population Health Management: A Clear Opportunity for Pathology and Laboratory MedicineTaken together, the superior value of pathology and lab medicine for popu-lation health value seems clear. Yet this value cannot be fully realized unless pathologists are engaged in applying the information to population health management.
In the “Coordinated Population Care Services Practice Pathway” our pa-thology group plays a key leadership role by applying laboratory informat-ics, molecular testing and pathologist expertise to produce applications and services for optimally managing care that are used by the ACO providers, hospitals, and community.
But we need to move quickly to secure our role and prove our value in these ACOs. They have significant adoption momentum behind them, with an es-timated 300 ACOs in existence today, so the models and roles are becom-ing established rapidly. Without taking action to develop these services and applications that extend beyond test results, and to present a business case, ACOs will sideline us as providers of data.
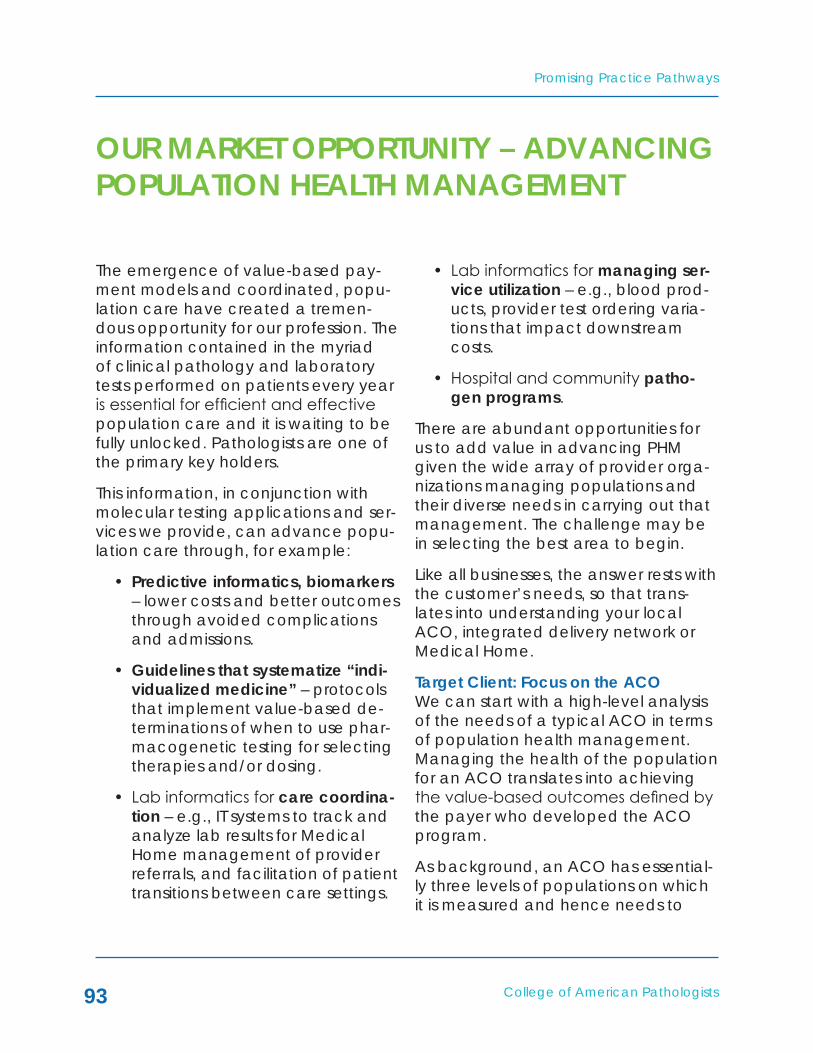
College of American Pathologists
Promising Practice Pathways
93
OUR MARkET OPPORTUNITY – ADVANCING POPULATION HEALTH MANAGEMENT
The emergence of value-based pay-ment models and coordinated, popu-lation care have created a tremen-dous opportunity for our profession. The information contained in the myriad of clinical pathology and laboratory tests performed on patients every year is essential for efficient and effective population care and it is waiting to be fully unlocked. Pathologists are one of the primary key holders.
This information, in conjunction with molecular testing applications and ser-vices we provide, can advance popu-lation care through, for example:
• Predictive informatics, biomarkers – lower costs and better outcomes through avoided complications and admissions.
• Guidelines that systematize “indi-vidualized medicine” – protocols that implement value-based de-terminations of when to use phar-macogenetic testing for selecting therapies and/or dosing.
• Lab informatics for care coordina-tion – e.g., IT systems to track and analyze lab results for Medical Home management of provider referrals, and facilitation of patient transitions between care settings.
• Lab informatics for managing ser-vice utilization – e.g., blood prod-ucts, provider test ordering varia-tions that impact downstream costs.
• Hospital and community patho-gen programs.
There are abundant opportunities for us to add value in advancing PHM given the wide array of provider orga-nizations managing populations and their diverse needs in carrying out that management. The challenge may be in selecting the best area to begin.
Like all businesses, the answer rests with the customer’s needs, so that trans-lates into understanding your local ACO, integrated delivery network or Medical Home.
Target Client: Focus on the ACOWe can start with a high-level analysis of the needs of a typical ACO in terms of population health management. Managing the health of the population for an ACO translates into achieving the value-based outcomes defined by the payer who developed the ACO program.
As background, an ACO has essential-ly three levels of populations on which it is measured and hence needs to
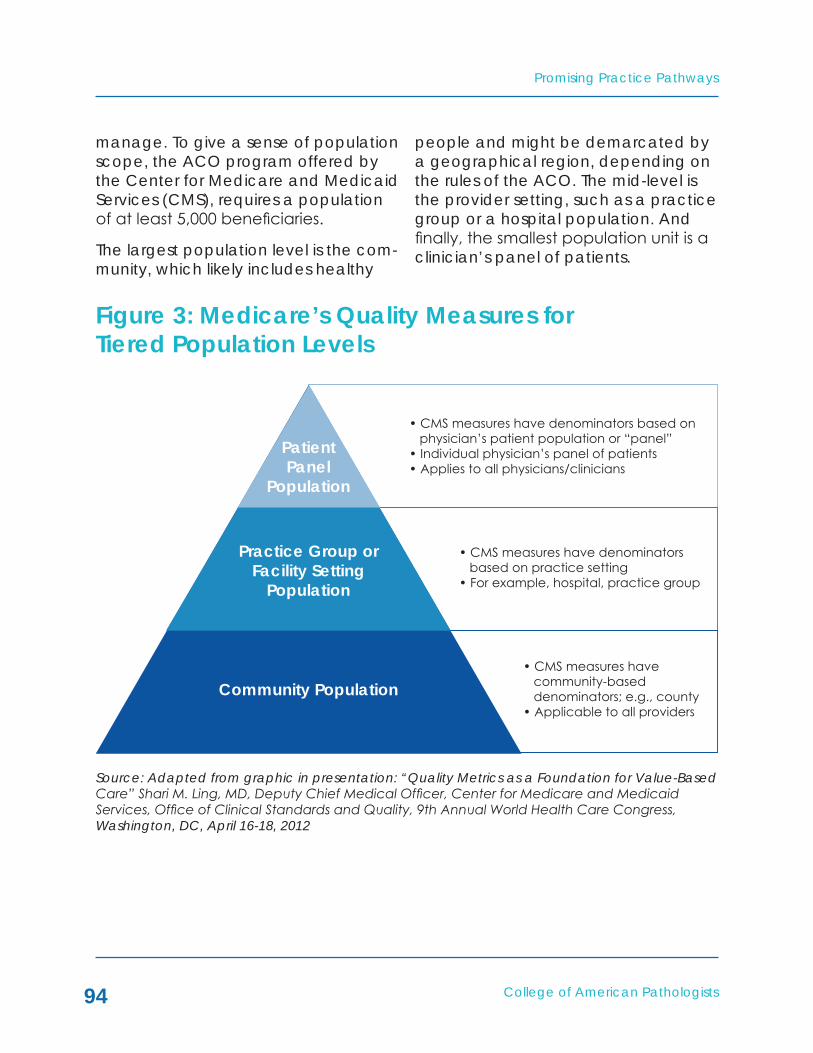
Promising Practice Pathways
College of American Pathologists94
manage. To give a sense of population scope, the ACO program offered by the Center for Medicare and Medicaid Services (CMS), requires a population of at least 5,000 beneficiaries.
The largest population level is the com-munity, which likely includes healthy
people and might be demarcated by a geographical region, depending on the rules of the ACO. The mid-level is the provider setting, such as a practice group or a hospital population. And finally, the smallest population unit is a clinician’s panel of patients.
Figure 3: Medicare’s Quality Measures for Tiered Population Levels
Source: Adapted from graphic in presentation: “Quality Metrics as a Foundation for Value-Based Care” Shari M. Ling, MD, Deputy Chief Medical Officer, Center for Medicare and Medicaid Services, Office of Clinical Standards and Quality, 9th Annual World Health Care Congress, Washington, DC, April 16-18, 2012
• CMS measures have denominators based on physician’s patient population or “panel”• Individual physician’s panel of patients• Applies to all physicians/clinicians
• CMS measures have denominators based on practice setting• For example, hospital, practice group
• CMS measures have community-based denominators; e.g., county• Applicable to all providers
PatientPanel
Population
Practice Group orFacility Setting
Population
Community Population
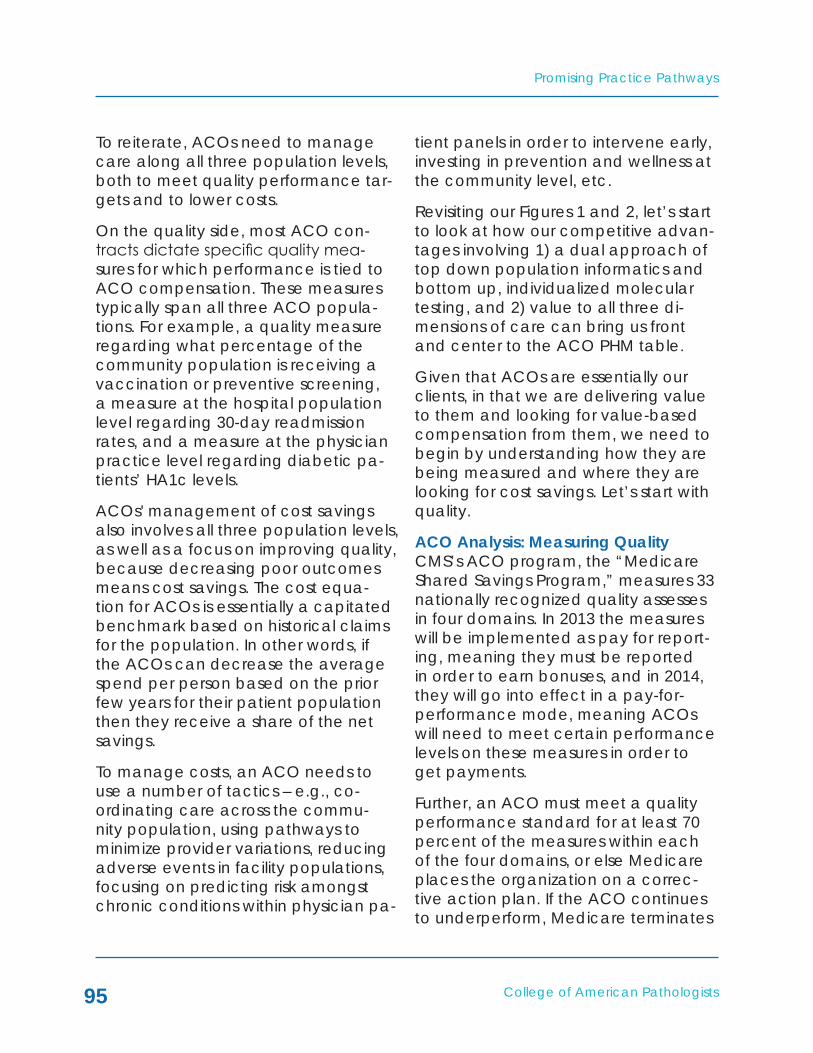
College of American Pathologists
Promising Practice Pathways
95
To reiterate, ACOs need to manage care along all three population levels, both to meet quality performance tar-gets and to lower costs.
On the quality side, most ACO con-tracts dictate specific quality mea-sures for which performance is tied to ACO compensation. These measures typically span all three ACO popula-tions. For example, a quality measure regarding what percentage of the community population is receiving a vaccination or preventive screening, a measure at the hospital population level regarding 30-day readmission rates, and a measure at the physician practice level regarding diabetic pa-tients’ HA1c levels.
ACOs' management of cost savings also involves all three population levels, as well as a focus on improving quality, because decreasing poor outcomes means cost savings. The cost equa-tion for ACOs is essentially a capitated benchmark based on historical claims for the population. In other words, if the ACOs can decrease the average spend per person based on the prior few years for their patient population then they receive a share of the net savings.
To manage costs, an ACO needs to use a number of tactics – e.g., co-ordinating care across the commu-nity population, using pathways to minimize provider variations, reducing adverse events in facility populations, focusing on predicting risk amongst chronic conditions within physician pa-
tient panels in order to intervene early, investing in prevention and wellness at the community level, etc.
Revisiting our Figures 1 and 2, let’s start to look at how our competitive advan-tages involving 1) a dual approach of top down population informatics and bottom up, individualized molecular testing, and 2) value to all three di-mensions of care can bring us front and center to the ACO PHM table.
Given that ACOs are essentially our clients, in that we are delivering value to them and looking for value-based compensation from them, we need to begin by understanding how they are being measured and where they are looking for cost savings. Let’s start with quality.
ACO Analysis: Measuring QualityCMS’s ACO program, the “Medicare Shared Savings Program,” measures 33 nationally recognized quality assesses in four domains. In 2013 the measures will be implemented as pay for report-ing, meaning they must be reported in order to earn bonuses, and in 2014, they will go into effect in a pay-for-performance mode, meaning ACOs will need to meet certain performance levels on these measures in order to get payments.
Further, an ACO must meet a quality performance standard for at least 70 percent of the measures within each of the four domains, or else Medicare places the organization on a correc-tive action plan. If the ACO continues to underperform, Medicare terminates
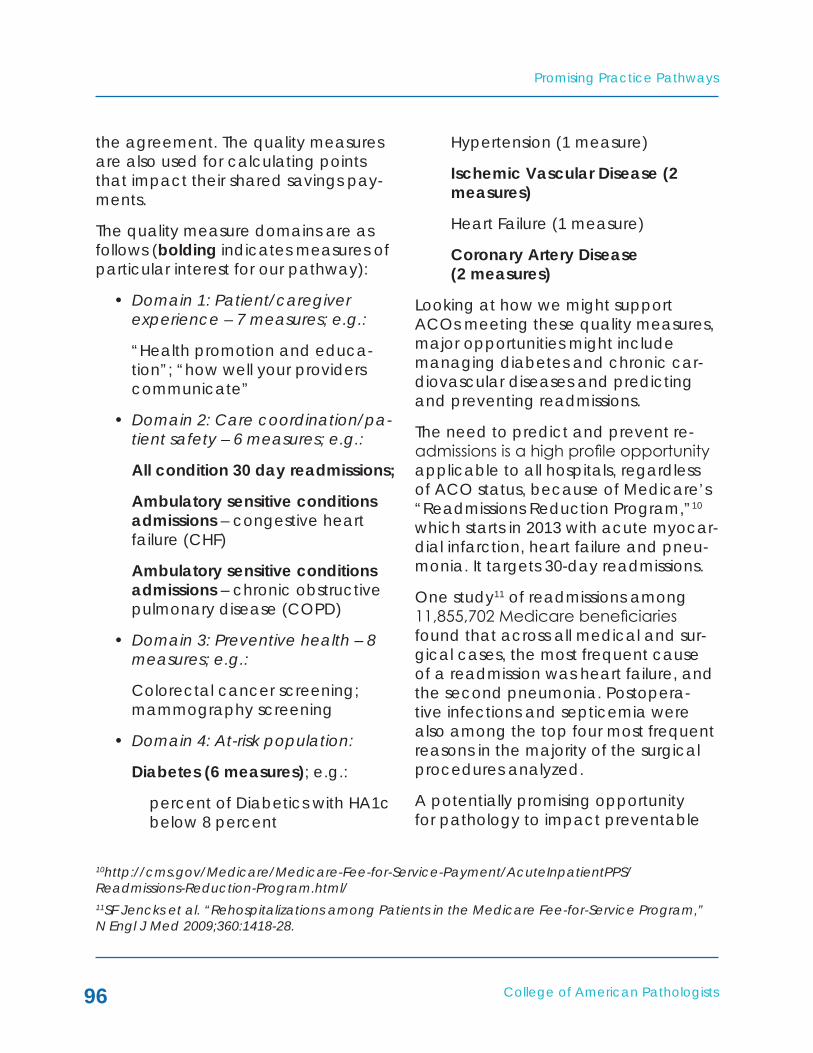
Promising Practice Pathways
College of American Pathologists96
the agreement. The quality measures are also used for calculating points that impact their shared savings pay-ments.
The quality measure domains are as follows (bolding indicates measures of particular interest for our pathway):
• Domain 1: Patient/caregiver experience – 7 measures; e.g.:
“Health promotion and educa-tion”; “how well your providers communicate”
• Domain 2: Care coordination/pa-tient safety – 6 measures; e.g.:
All condition 30 day readmissions;
Ambulatory sensitive conditions admissions – congestive heart failure (CHF)
Ambulatory sensitive conditions admissions – chronic obstructive pulmonary disease (COPD)
• Domain 3: Preventive health – 8 measures; e.g.:
Colorectal cancer screening; mammography screening
• Domain 4: At-risk population:
Diabetes (6 measures); e.g.:
percent of Diabetics with HA1c below 8 percent
Hypertension (1 measure)
Ischemic Vascular Disease (2 measures)
Heart Failure (1 measure)
Coronary Artery Disease (2 measures)
Looking at how we might support ACOs meeting these quality measures, major opportunities might include managing diabetes and chronic car-diovascular diseases and predicting and preventing readmissions.
The need to predict and prevent re-admissions is a high profile opportunity applicable to all hospitals, regardless of ACO status, because of Medicare’s “Readmissions Reduction Program,”10 which starts in 2013 with acute myocar-dial infarction, heart failure and pneu-monia. It targets 30-day readmissions.
One study11 of readmissions among 11,855,702 Medicare beneficiaries found that across all medical and sur-gical cases, the most frequent cause of a readmission was heart failure, and the second pneumonia. Postopera-tive infections and septicemia were also among the top four most frequent reasons in the majority of the surgical procedures analyzed.
A potentially promising opportunity for pathology to impact preventable
10http://cms.gov/Medicare/Medicare-Fee-for-Service-Payment/AcuteInpatientPPS/ Readmissions-Reduction-Program.html/ 11SF Jencks et al. “Rehospitalizations among Patients in the Medicare Fee-for-Service Program,” N Engl J Med 2009;360:1418-28.

College of American Pathologists
Promising Practice Pathways
97
30-day readmissions is to tackle the resistant pathogen problem. With the emerging maturity of rapid molecular testing for identifying microbes, and powerful informatics for integrating surveillance data across laboratories, microbial surveillance programs are advancing to the point where they might be able to help meaningfully reduce resistant pathogen levels and hospital acquired infections.
ACO Analysis: Reducing CostsTo understand how an ACO might ap-proach reducing costs, we can refer-ence an influential and vetted source, the Prometheus Payment model,12
which was recently adopted by CMS as the engine behind its bundling pro-grams. The Prometheus model bundles all care services for specific conditions and procedures, called “evidence-informed case rates (ECRs),” into base payments with severity adjustments (what should be done) and “poten-tially avoidable complications (PACs)” (what should not happen).
The developers write, “We separated the costs attributable to patient-relat-ed factors from those attributable to providers’ actions. These latter costs are critically important in terms of accountability. In Prometheus, these potentially avoidable costs are called PACs and are recognized as the result of “care defects” – problems neces-sitating technical care that are under
the professionals’ control and that, with the best professional standards, could have been avoided. PACs might include the cost of hospitalization of a patient with uncontrolled diabetes or the readmission for a wound infection of a patient who had recently been discharged after cardiac bypass sur-gery.”13
The Prometheus model has been de-veloped for 21 ECRs, together com-prising about 30-35 percent of total spending. These 21 do not include any oncology related conditions, other than colonoscopy and colon resection procedures. HCI3 is currently develop-ing ECRs for the majority of major con-ditions and procedures, and for the Medicare population.
Because PACs represent the costs that are in providers’ control and have been deemed “potentially avoid-able” by groups of expert physicians who advised on the development of the program, these dollars and areas should be good targets for ACO cost reduction, and therefore for our PHM services.
HCI3 has made available the results of an analysis of a privately insured popu-lation of 4.7 million adult beneficiaries for the starting set of 21 conditions and procedure ECRs and their associated PACs. Using these data, we have ana-lyzed the share of PAC dollar opportu-
12Developed by the Healthcare Incentives Improvement Institute (HCI3) – see http://www.hci3.org/what_is_prometheus 13F de Brantes et al. “Building a Bridge from Fragmentation to Accountability – The Prometheus Payment Model.” N Engl J Med 361;11

Promising Practice Pathways
College of American Pathologists98
nity by ECR condition/procedure and service setting and type in Figure 4.
The following summarizes the share of PAC dollars for this commercial popu-lation – in other words, what percent of cost reduction opportunity does each area have:
By conditions and procedures: percent of PAC dollarsChronic Medical = 61 percent of PAC dollarsOutpatient procedural = 21 percentInpatient procedural = 12 percentAcute medical = 6 percent
By setting/charge area: percent of PAC dollars
Inpatient = 57 percent of PAC dollarsOutpatient = 27 percent Professional = 15 percent
The top 10 conditions or proce-dures (in order of highest share): percent of PAC dollarsGERD (gastroespohageal reflux) = 17 percent of PAC dollarsDiabetes = 15 percentCOPD = 9 percentHypertension = 6 percentPCI (Percutaneous Coronary Intervention) = 6 percentAsthma = 5 percentColonoscopy = 5 percentCHF = 5 percent
Prometheus also provides a detailed analysis of the types of PACs that drive these costs. Some of the most costly PAC areas as a percent of all PAC dollars include:
Emergency room visits = 15 percent of PAC dollarsGastritis, Ulcer, GI Hemorrhage = 7 percentPneumonia = 7 percentSepsis, meningitis, hepatitis = 5 percentFluid and electrolyte disorders = 5 percentDVT and pulmonary embolism = 4 percentStroke = 4 percentDiabetic emergencies – hypo- and hyper- glycemia = 4 percentUrinary tract infections = 3 percent
What can we take from these data to inform a starting roadmap for our PHM applications and services? A few ob-servations:
• Inpatient and chronic conditions areas dominate the opportunities for savings.
– This is driven in part by admis-sions for chronic conditions that are deemed avoidable.
• Diabetes also offers an oversized share of avoidable costs.
• Infections and coagulation dis-orders comprise a large share of PAC dollars.
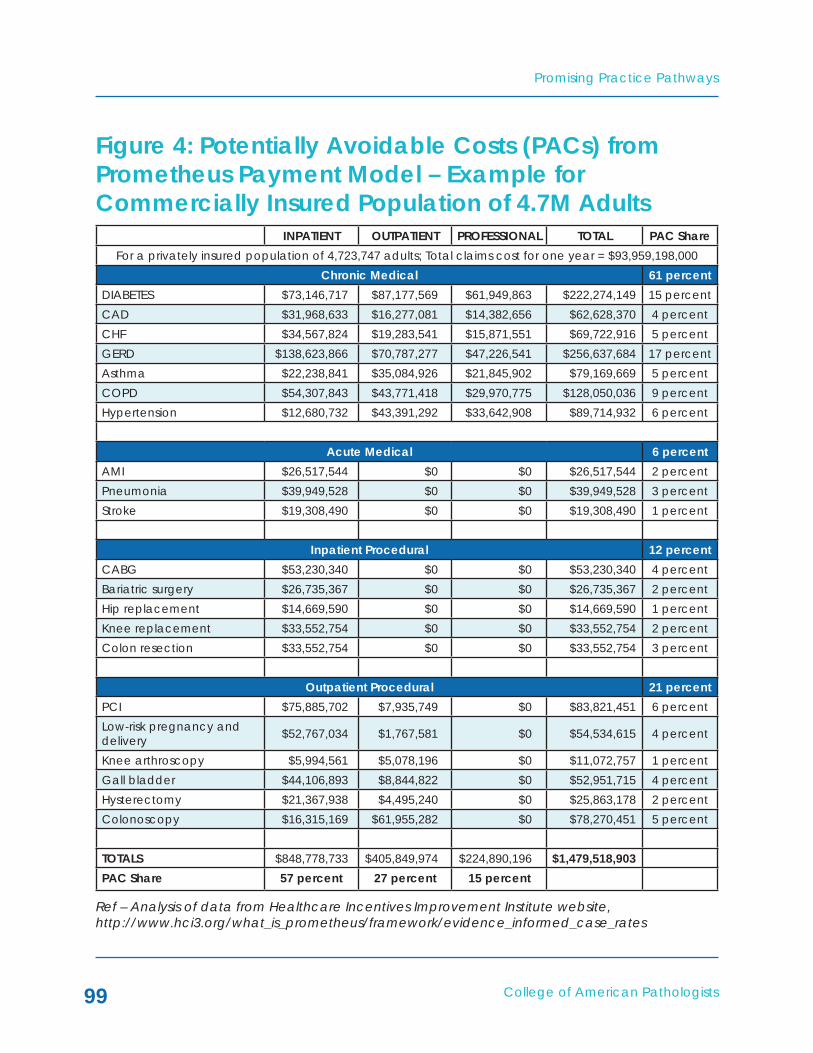
College of American Pathologists
Promising Practice Pathways
99
Figure 4: Potentially Avoidable Costs (PACs) from Prometheus Payment Model – Example for Commercially Insured Population of 4.7M Adults
Ref – Analysis of data from Healthcare Incentives Improvement Institute website, http://www.hci3.org/what_is_prometheus/framework/evidence_informed_case_rates
INPATIENT OUTPATIENT PROFESSIONAL TOTAL PAC ShareFor a privately insured population of 4,723,747 adults; Total claims cost for one year = $93,959,198,000
Chronic Medical 61 percentDIABETES $73,146,717 $87,177,569 $61,949,863 $222,274,149 15 percentCAD $31,968,633 $16,277,081 $14,382,656 $62,628,370 4 percentCHF $34,567,824 $19,283,541 $15,871,551 $69,722,916 5 percentGERD $138,623,866 $70,787,277 $47,226,541 $256,637,684 17 percentAsthma $22,238,841 $35,084,926 $21,845,902 $79,169,669 5 percentCOPD $54,307,843 $43,771,418 $29,970,775 $128,050,036 9 percentHypertension $12,680,732 $43,391,292 $33,642,908 $89,714,932 6 percent
Acute Medical 6 percentAMI $26,517,544 $0 $0 $26,517,544 2 percentPneumonia $39,949,528 $0 $0 $39,949,528 3 percentStroke $19,308,490 $0 $0 $19,308,490 1 percent
Inpatient Procedural 12 percentCABG $53,230,340 $0 $0 $53,230,340 4 percentBariatric surgery $26,735,367 $0 $0 $26,735,367 2 percentHip replacement $14,669,590 $0 $0 $14,669,590 1 percentKnee replacement $33,552,754 $0 $0 $33,552,754 2 percentColon resection $33,552,754 $0 $0 $33,552,754 3 percent
Outpatient Procedural 21 percentPCI $75,885,702 $7,935,749 $0 $83,821,451 6 percentLow-risk pregnancy and delivery $52,767,034 $1,767,581 $0 $54,534,615 4 percent
Knee arthroscopy $5,994,561 $5,078,196 $0 $11,072,757 1 percentGall bladder $44,106,893 $8,844,822 $0 $52,951,715 4 percentHysterectomy $21,367,938 $4,495,240 $0 $25,863,178 2 percentColonoscopy $16,315,169 $61,955,282 $0 $78,270,451 5 percent
TOTALS $848,778,733 $405,849,974 $224,890,196 $1,479,518,903PAC Share 57 percent 27 percent 15 percent
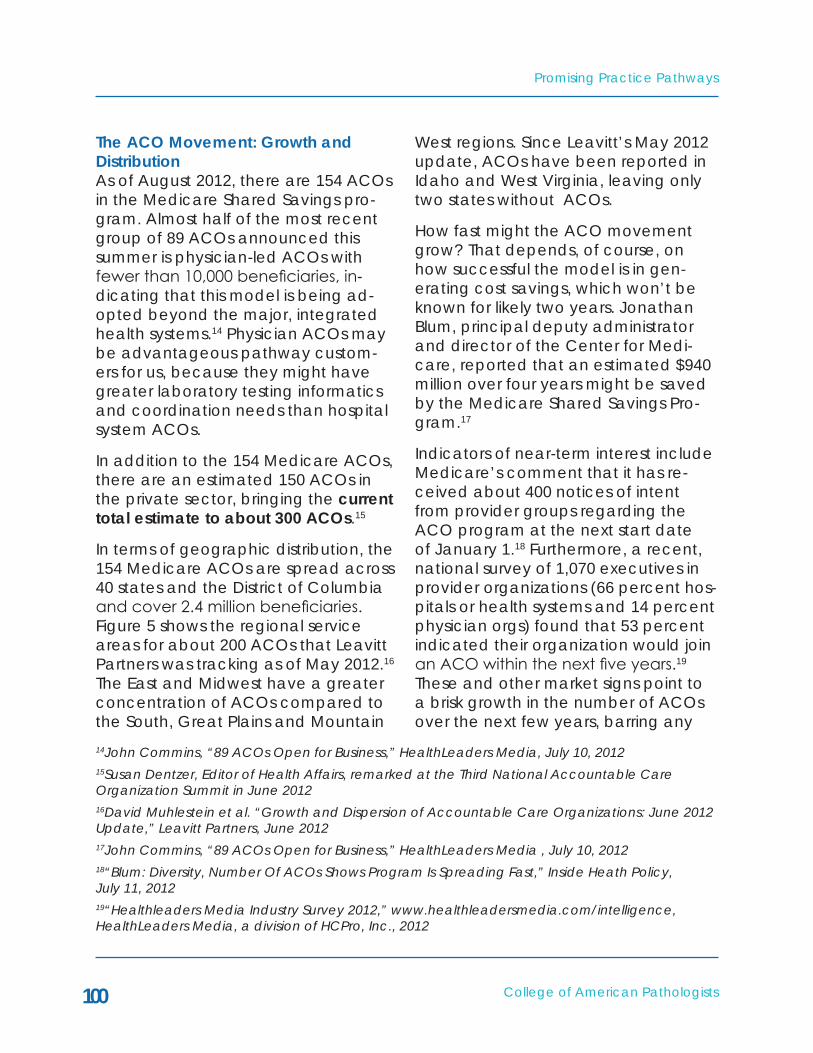
Promising Practice Pathways
College of American Pathologists100
The ACO Movement: Growth and DistributionAs of August 2012, there are 154 ACOs in the Medicare Shared Savings pro-gram. Almost half of the most recent group of 89 ACOs announced this summer is physician-led ACOs with fewer than 10,000 beneficiaries, in-dicating that this model is being ad-opted beyond the major, integrated health systems.14 Physician ACOs may be advantageous pathway custom-ers for us, because they might have greater laboratory testing informatics and coordination needs than hospital system ACOs.
In addition to the 154 Medicare ACOs, there are an estimated 150 ACOs in the private sector, bringing the current total estimate to about 300 ACOs.15
In terms of geographic distribution, the 154 Medicare ACOs are spread across 40 states and the District of Columbia and cover 2.4 million beneficiaries. Figure 5 shows the regional service areas for about 200 ACOs that Leavitt Partners was tracking as of May 2012.16 The East and Midwest have a greater concentration of ACOs compared to the South, Great Plains and Mountain
West regions. Since Leavitt’s May 2012 update, ACOs have been reported in Idaho and West Virginia, leaving only two states without ACOs.
How fast might the ACO movement grow? That depends, of course, on how successful the model is in gen-erating cost savings, which won’t be known for likely two years. Jonathan Blum, principal deputy administrator and director of the Center for Medi-care, reported that an estimated $940 million over four years might be saved by the Medicare Shared Savings Pro-gram.17
Indicators of near-term interest include Medicare’s comment that it has re-ceived about 400 notices of intent from provider groups regarding the ACO program at the next start date of January 1.18 Furthermore, a recent, national survey of 1,070 executives in provider organizations (66 percent hos-pitals or health systems and 14 percent physician orgs) found that 53 percent indicated their organization would join an ACO within the next five years.19 These and other market signs point to a brisk growth in the number of ACOs over the next few years, barring any
14John Commins, “89 ACOs Open for Business,” HealthLeaders Media, July 10, 201215Susan Dentzer, Editor of Health Affairs, remarked at the Third National Accountable Care Organization Summit in June 201216David Muhlestein et al. “Growth and Dispersion of Accountable Care Organizations: June 2012 Update,” Leavitt Partners, June 2012 17John Commins, “89 ACOs Open for Business,” HealthLeaders Media , July 10, 201218“Blum: Diversity, Number Of ACOs Shows Program Is Spreading Fast,” Inside Heath Policy, July 11, 201219“Healthleaders Media Industry Survey 2012,” www.healthleadersmedia.com/intelligence, HealthLeaders Media, a division of HCPro, Inc., 2012
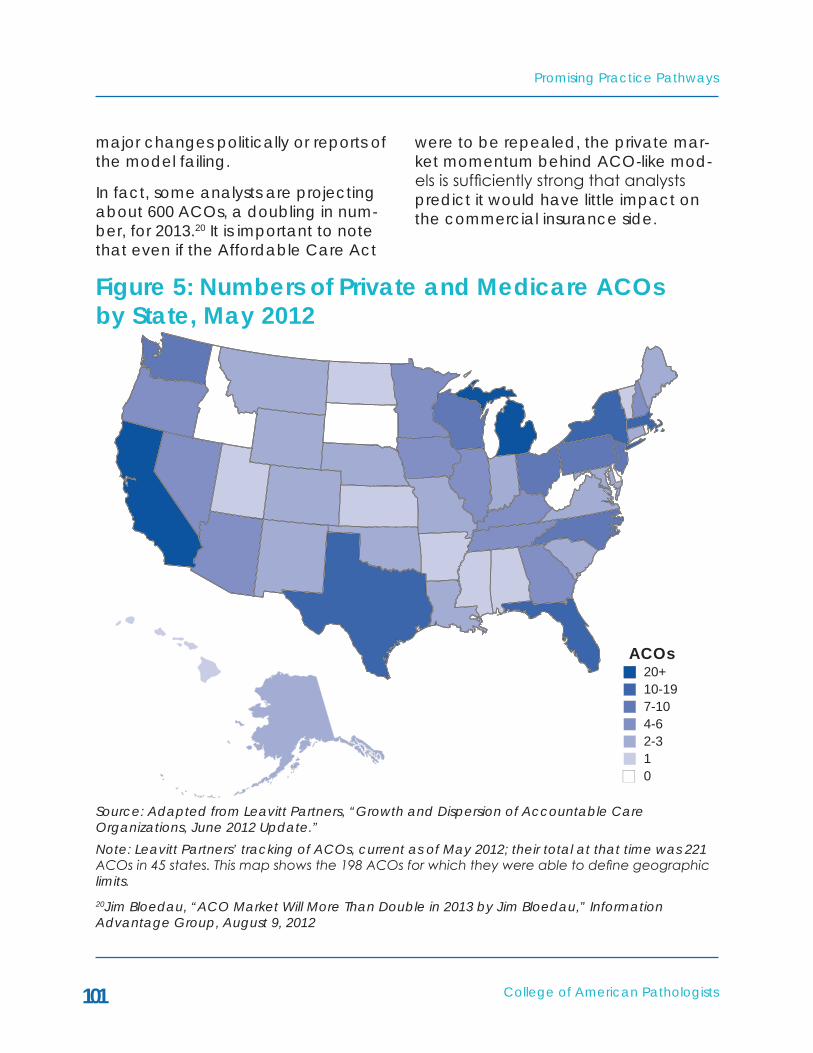
College of American Pathologists
Promising Practice Pathways
101
major changes politically or reports of the model failing.
In fact, some analysts are projecting about 600 ACOs, a doubling in num-ber, for 2013.20 It is important to note that even if the Affordable Care Act
were to be repealed, the private mar-ket momentum behind ACO-like mod-els is sufficiently strong that analysts predict it would have little impact on the commercial insurance side.
20Jim Bloedau, “ACO Market Will More Than Double in 2013 by Jim Bloedau,” Information Advantage Group, August 9, 2012
Figure 5: Numbers of Private and Medicare ACOs by State, May 2012
Source: Adapted from Leavitt Partners, “Growth and Dispersion of Accountable Care Organizations, June 2012 Update.” Note: Leavitt Partners’ tracking of ACOs, current as of May 2012; their total at that time was 221 ACOs in 45 states. This map shows the 198 ACOs for which they were able to define geographic limits.
ACOs20+10-197-104-62-310

Promising Practice Pathways
College of American Pathologists102
Fitting Into the ACO Market There are a multitude of business fla-vors among ACOs, as many are imple-mented in the private payer market. Even within the Medicare Shared Sav-ings program, there are ACOs that are run and owned by physician organiza-tions, others by hospitals, and others by payers partnered with either physi-cian groups or hospitals. It is beyond the scope of this chapter to review the contractual options available to
pathology groups across various ACO models. In most circumstances, a pa-thology group that was already con-tractually tied to either an ACO hospi-tal or ACO physician organization for diagnostic testing services will be the best candidate for this pathway.
Figure 6 illustrates how the Medicare Shared Savings “one-sided” program works in terms of payment flows, in a simplified depiction.
Figure 6: Medicare ACO Shared Savings Payment Mechanism–SimplifiedIllustration
0%
10%
20%
30%
40%
50%
60%
70%
80%
90%
100%Savings
15%
ActualSpend
85%
Benchmark spending for ACO basedon prior 3 years CMS claims data
Share of Savings for Medicare’sTrack 1 Upside Only Program
Medicare
ACO
Perc
ent o
f Dol
lars
ACOSource: Eleanor Herriman, MD, MBA, G2 Intelligence

College of American Pathologists
Promising Practice Pathways
103
No matter how it is contractually con-figured, the business arrangement we seek with ACOs is compensation based on value payments – e.g., ACO shared savings bonuses. We will dem-onstrate the value of our Coordinated Population Care Pathway to the ACO in terms of a business case that docu-ments opportunities for cost savings and for achieving quality measures. Based on this business case, our goal will be to negotiate a share of the ACO’s net savings.
According to Milliman, the savings pool is generally allocated between three provider pools, primary care, specialty and hospital (when a hospi-tal is part of the ACO). As an example methodology, the report provides the table in Figure 7 as a starting point that shows how an ACO might divide the providers’ pools first against service line dollars, according to that pool’s level of responsibility for that service line. Thus, in their example, hospital has no responsibility for PCP service costs.
The exact share can be determined using one of several other methods it details. For example, for hospitals, it describes incorporating important cost savings measures into the determina-tion of the hospital’s allocation, includ-ing:
• Length of stay
• Readmission rates
• Infection rates
• Preventable events
• Admissions through the emergen-cy room
• Intensive care unit days
• ER visits (top five diagnoses)
• Utilization of high-cost or frequent-ly overutilized interventions – e.g., MRI, CT, PET and endoscopy
In a scenario in which the hospital’s allocation of the savings pool is being determined based on the cost savings measures listed above, we may have another negotiating approach: Some of our pathway interventions can im-prove measures such as readmission rates, infection rates, length of stay or intensive care unit days. If our pathol-ogy group is already aligned or part of the hospital, we can build a case that by using our new services and applica-tions we can position the hospital to capture a greater share of the ACO bonus pool, and that we therefore de-serve a share for our group.
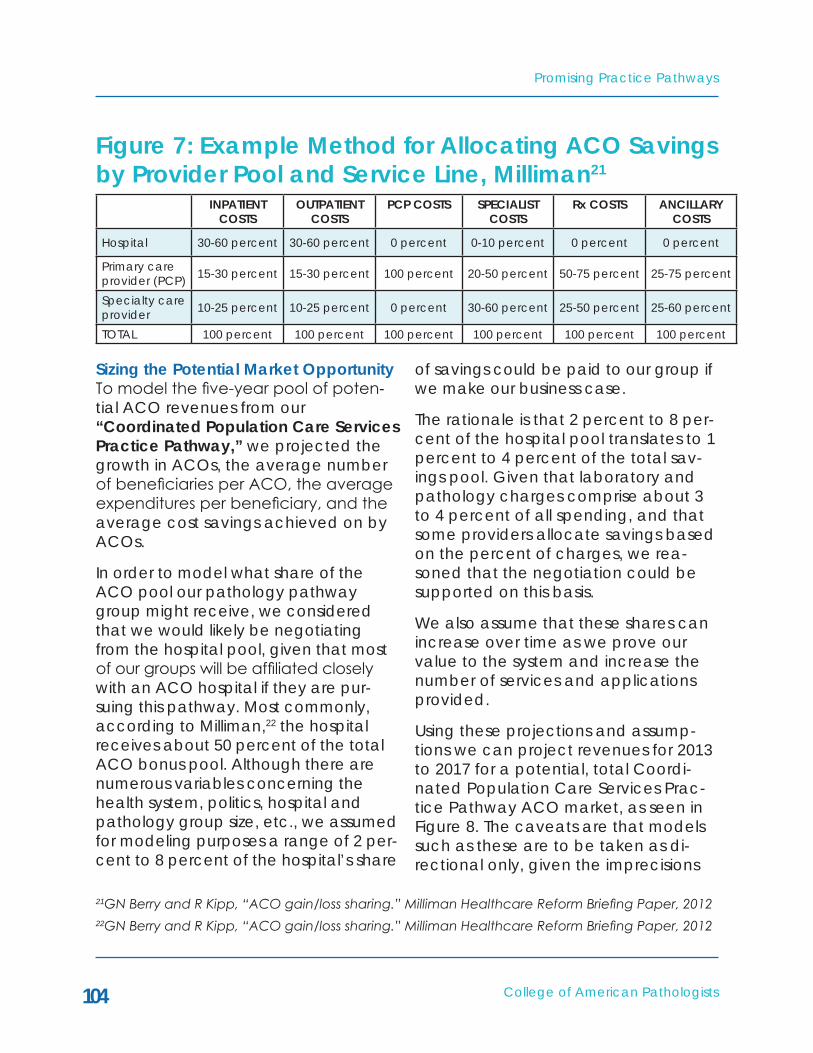
Promising Practice Pathways
College of American Pathologists104
Figure 7: Example Method for Allocating ACO Savings by Provider Pool and Service Line, Milliman21
INPATIENT COSTS
OUTPATIENT COSTS
PCP COSTS SPECIALIST COSTS
Rx COSTS ANCILLARY COSTS
Hospital 30-60 percent 30-60 percent 0 percent 0-10 percent 0 percent 0 percent
Primary care provider (PCP) 15-30 percent 15-30 percent 100 percent 20-50 percent 50-75 percent 25-75 percent
Specialty care provider 10-25 percent 10-25 percent 0 percent 30-60 percent 25-50 percent 25-60 percent
TOTAL 100 percent 100 percent 100 percent 100 percent 100 percent 100 percent
Sizing the Potential Market OpportunityTo model the five-year pool of poten-tial ACO revenues from our “Coordinated Population Care Services Practice Pathway,” we projected the growth in ACOs, the average number of beneficiaries per ACO, the average expenditures per beneficiary, and the average cost savings achieved on by ACOs.
In order to model what share of the ACO pool our pathology pathway group might receive, we considered that we would likely be negotiating from the hospital pool, given that most of our groups will be affiliated closely with an ACO hospital if they are pur-suing this pathway. Most commonly, according to Milliman,22 the hospital receives about 50 percent of the total ACO bonus pool. Although there are numerous variables concerning the health system, politics, hospital and pathology group size, etc., we assumed for modeling purposes a range of 2 per-cent to 8 percent of the hospital’s share
of savings could be paid to our group if we make our business case.
The rationale is that 2 percent to 8 per-cent of the hospital pool translates to 1 percent to 4 percent of the total sav-ings pool. Given that laboratory and pathology charges comprise about 3 to 4 percent of all spending, and that some providers allocate savings based on the percent of charges, we rea-soned that the negotiation could be supported on this basis.
We also assume that these shares can increase over time as we prove our value to the system and increase the number of services and applications provided.
Using these projections and assump-tions we can project revenues for 2013 to 2017 for a potential, total Coordi-nated Population Care Services Prac-tice Pathway ACO market, as seen in Figure 8. The caveats are that models such as these are to be taken as di-rectional only, given the imprecisions
21GN Berry and R Kipp, “ACO gain/loss sharing.” Milliman Healthcare Reform Briefing Paper, 201222GN Berry and R Kipp, “ACO gain/loss sharing.” Milliman Healthcare Reform Briefing Paper, 2012

College of American Pathologists
Promising Practice Pathways
105
inherent in dealing with such complex and highly uncertain systems.
Our model estimates that in 2014, for example:
• The average payment per pathol-ogy group from a CMS ACO cov-ering 15,000 lives is ~$472,000.
• The average payment per pathol-ogy group from a private ACO covering 30,000 lives is ~$416,000.
• This is due to the fact that Medi-care patients have double the per cap expenditures versus private populations.
• The total, potential ACO market opportunity in 2014 is estimated at $332 million.
In 2017 the model estimates the poten-tial total market for pathology groups to be $739 million.
Again, these payments are in addi-tion to diagnostic testing service pay-ments and Medicare Part A revenues. It is also true, however, that many are predicting that our fee-for-service test-ing revenues will be declining over this time period, especially hospital lab test volume.
The model directionally supports an attractive opportunity from a financial perspective.
More importantly, however, if we do not pursue demonstrating our value with ACOs, the risk of our becoming a commodity vendor is real and possibly permanent.

Promising Practice Pathways
College of American Pathologists106
MARkET ESTIMATES 2013 2014 2015 2016 2017Medicare ACOs
Estimated number of CMS ACOs 154 350 450 500 550
Estimated number of covered lives per ACO
15,000 15,000 15,000 15,000 15,000
Estimated per capita medical expen-ditures for Medicare beneficiaries in 2013
$11,000 $11,440 $12,012 $12,613 $13,243
Conservative ScenarioAssumed percent cost savings retained by ACO (assumes Medi-care gets 50 percent under Track 1 program)
5 percent 5 percent 5 percent 5 percent 5 percent
Assumed shared of net cost savings earned by pathology group
1 percent 2 percent 3 percent 3 percent 3 percent
Total potential Medicare ACO mar-ket for pathology pathway – conser-vative scenario
$12,705,000 $60,060,000 $121,621,500 $141,891,750 $163,884,971
Estimated potential Medicare market per ACO – conservative
$82,500 $171,600 $270,270 $283,784 $297,973
Aggressive ScenarioAssumed percent cost savings retained by ACO (assumes Medi-care gets 50 percent under Track 1 program)
9 percent 9 percent 9 percent 9 percent 9 percent
Assumed share of net cost savings earned by pathology group
4 percent 5 percent 6 percent 6 percent 6 percent
Total potential Medicare ACO mar-ket for pathology pathway – aggres-sive scenario
$91,476,000 $270,270,000 $437,837,400 $510,810,300 $589,985,897
Estimated potential Medicare market per ACO – agressive
$594,000 $772,200 $972,972 $1,021,621 $1,021,702
Total potential Medicare ACO market for pathology pathway – average
$52,090,500 $165,165,00 $279,729450 $326,351,025 $376,935,434
Potential Medicare ACO market for pathology pathway per ACO – average
$338,250 $471,900 $621,621 $652,702 $685,337
Source: Eleanor Herriman, MD, MBA, G2 Intelligence
Figure 8: Market Estimates for Medicare ACOs

College of American Pathologists
Promising Practice Pathways
107
2013 2014 2015 2016 2017Private Market ACOs
Estimated number of private market ACOs
300 400 500 550 600
Estimated number of covered lives per ACO
30,000 30,000 30,000 30,000 30,000
Estimated per capita medical expen-ditures for commercial beneficiaries
$4,800 $5,040 $5,292 $5,557 $5,834
Conservative ScenarioAssumed percent cost savings re-tained by ACO (assumes payer gets 50 percent)
5 percent 5 percent 5 percent 5 percent 5 percent
Assumed share of net cost savings earned by pathology group
1 percent 2 percent 3 percent 3 percent 3 percent
Total potential private ACO market for pathology pathway – conserva-tive scenario
$21,600,000 $60,480,000 $119,070,000 $137,525,850 $157,529,610
Estimated potential commercial mar-ket per ACO – conservative
$72,000 $151,200 $238,140 $250,047 $262,549
Aggressive ScenarioAssumed percent of cost savings retained by ACO (assumes payer gets 50 percent)
9 percent 9 percent 9 percent 9 percent 9 percent
Assumed share of net cost savings earned by pathology group
4 percent 5 percent 6 percent 6 percent 6 percent
Total potential private ACO market for pathology pathway – aggressive scenario
$155,520,000 $272,160,000 $428,652,000 $495,093,060 $567,106,596
Estimated potential commercial market per ACO – aggressive
$518,400 $680,400 $857,304 $900,169 $945,178
Total potential private ACO market for pathology pathway – average
$88,560,000 $166,320,000 $273,861,000 $316,309,455 $362,318,103
Potential private ACO market for pathology pathway per ACO – average
$295,200 $415,800 $547,722 $575,108 $603,864
Total, estimated, potential ACO mar-ket for pathology pathway
$140,650,500 $331,485,000 $553,590,450 $642,660,480 $739,253,537
Estimated, potential pathology path-way payment per ACO – average
$316,725 $443,850 $584,672 $613,905 $644,600
Source: Eleanor Herriman, MD, MBA, G2 Intelligence
Figure 9: Market Estimates for Private Market ACOs
Promising Practice Pathways
College of American Pathologists108
ABOUT THE COORDINATED POPULATION CARE SERVICES PRACTICE PATHWAY
The Coordinated Population Care Services Practice Pathway offers one model for becoming an ACO popu-lation care management center. As we’ve been describing, there are a number of dimensions along which we can generate value, including:
• The population level – either com-munity, hospital or provider’s pa-tient population.
• The application areas – includ-ing population informatics for risk prediction, individualized medi-cine guidance, utilization man-agement, quality programs, and coordination programs.
• The provider group users – primary care providers, hospitalists and ER clinicians, surgeons/proceduralists and ACO executive leadership who manages the population.
The primary inputs for our practice are our pathology expertise, lab informat-ics, and molecular testing. The “out-puts” – i.e. our pathway’s offerings – take the form of guidelines, algorithms, EMR applications, and risk prediction reports, for example (See Figure 10).
In pursuing this pathway, we can choose to target only a particular pop-ulation level or provider user group, especially to start out and prove our ability to generate value. For that reason, we will describe the pathway applications, services and programs in a matrix fashion across “provider user groups” and “application areas,” as shown in Figure 11, “Pathway Offerings Matrix.”
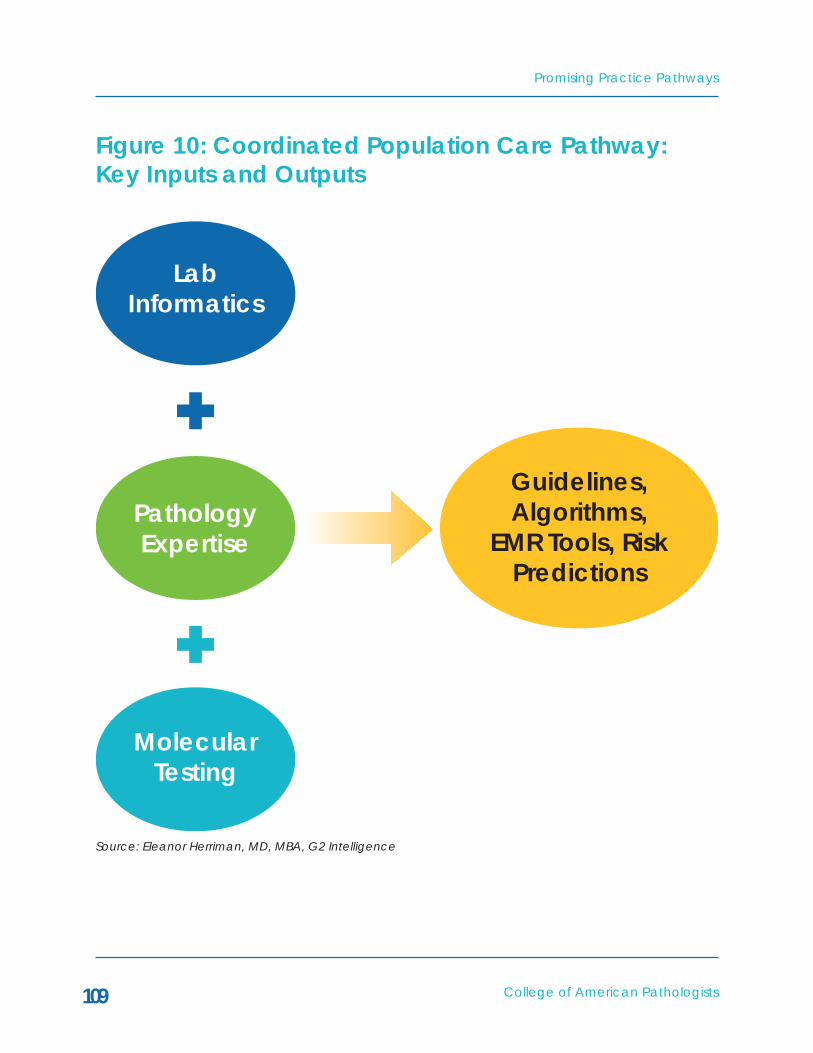
College of American Pathologists
Promising Practice Pathways
109
Figure 10: Coordinated Population Care Pathway: key Inputs and Outputs
LabInformatics
PathologyExpertise
Guidelines,Algorithms,
EMR Tools, RiskPredictions
MolecularTesting
Source: Eleanor Herriman, MD, MBA, G2 Intelligence

Promising Practice Pathways
College of American Pathologists110
Figure 11: Coordinated Population Care Practice Pathway Offerings Matrix
INFORMATICS-BASED RISk PREDICTION
INDIVIDUALIzED MEDICINE GUIDANCE
UTILIzATION MANAGEMENT
QUALITY AND COORDINATION PROGRAMS
Primary Care Providers
• Reports on patients at high risk
• Tests to order based on elevated risk
• Tools – MDx for rapid, targeted antibiotic selection
• Tools – PGx for statins, anticoags, SSRIs, – Rx selection and adherence …
• PCP test order-ing variations for tests with high downstream costs
• EMR apps – changing Rx, ordering Rx levels, ordering LFTs, protocols for referrals to specialists
• High risk patient reports – triage care manage-ment services
Hospitalists and ER • Reports on in-patients at high risk – e.g., daily; protocols with re-flex testing based on risk
• Early detection based on labs - alerts
• Suggested meds and tests based on risk in certain settings
• Tools - MDx for rapid, targeted antibiotic selec-tion
• Programs for preventing ER admissions using MDx – e.g. en-terovirus
• Specialist test ordering varia-tions for tests with high downstream costs
• Glycemia control and glucometer accuracy prob-lems
Specialists – Medical Specialties, Surgeons, Proceduralists
• Reports and protocols for patients at high risk – anticoagu-lation, fluids and electrolytes, …
• Tools - MDx for rapid, targeted antibiotic selec-tion
• PGx tools – e.g. Clopidogrel
• Oncology – see Oncology path-way
• Blood products/ transfusions
• Specialist test ordering varia-tions for tests with high downstream costs
• Lab testing proto-cols for referrals between provid-ers
Population-wide Management/ACO Leadership
• Subpopulation reference ranges for more precise disease detec-tion
• Prediction of next year’s high cost patients
• Identification of high adverse event areas
• Development of guidelines for PGx and MDx testing by risk status and cost-effectiveness modeling
• Blood products utilization pro-gram
• Lab-Pharmacy – decision free for antibiotics based on cost-effectiveness + antibiograms
• Pathogen surveil-lance
• POC testing vali-dation and data networking
• Home testing – glucometers, etc.
• Lab phlebotomy network
• Digital pathology
Source: Eleanor Herriman, MD, MBA, G2 Intelligence
College of American Pathologists
Promising Practice Pathways
111
PGx = pharmacogenetic testing; MDx = molecular (e.g. DNA) testing
This Matrix is not an exhaustive ac-counting of the potential solutions we can offer for ACO population health management, but provides a range of examples that illustrate the model and its value.
Belowwedescribespecificapplicationexamples and, for some, their poten-tial value generation in terms of ei-ther quality or cost reduction for each practice category.
Offerings for Primary Care Providers (PCPs):Informatics-Based Risk Prediction for PCPs – Reports on patients at high risk and recommended tests to order.
Example: EMR report on high risk diabetics. Based on trends in glucose, HA1c, and levels of biomarkers such as CRP, lipid profiles, etc. We produce an EMR report that identifies particular diabetes patients in a PCP’s practice as very high risk for thromboembolic events. If we have a program linking us to pharmacy data, we can check on statin or other anticoagulation prescriptions and apply protocols that consider adherence and resistance questions. Test recommendations could include both other biomarkers, such as hs-CRP, and perhaps phar-macogenetic tests for aspirin or Plavix resistance, for example.
• Value generation potential: when the Prometheus model’s PAC costs for diabetic stroke, AMI, DVT
and pulmonary embolisms are scaled up from the commercial population to the nation, they represent $1.2 billion in potentially avoidable costs. Each avoided myocardial infarction admission is estimated to be worth ~$13,600. If, using our lab data/biomarker al-gorithm informatics we can iden-tify high risk diabetics, and thereby direct more intensive interventions and therapeutics, we might help prevent some of these adverse events.
Example: Reports alerting PCP of pa-tients with even low levels of hypona-tremia, as these have been associated with risks of falls, hip fractures and osteoporosis. This is especially risky in patients' CHF, cirrhosis and renal fail-ure, as it portends a worse prognosis. Also, thiazide diuretics and SSRIs can worsen the condition.
• Value generation potential: by intervening, hospital admissions, adverse events like falls or frac-tures while in the hospital, and poor outcomes might be averted.
Individualized Medicine Guidance for PCPs 1 – MDx tools for rapid, targeted antibiotic selection. EMR guidelines or decision support for using point of care or near care molecular testing to identify resistant pathogen strains and select targeted antibiotics. Guidelines will be based on informatics indicat-ing patient risk and antibiograms de-termining local resistance patterns. The resistance problem is impacting
Promising Practice Pathways
College of American Pathologists112
the empirical treatment of all types of infections, and significant proportions of patients are not effectively treated based on empirically directed antibio-tics. Molecular testing for rapid identifi-cation of the pathogen and thus more specific antibiotic selection has been shown to significantly improve treat-ment – i.e., more rapid recovery for more patients, and thus cost savings and better outcomes.
Example: an EMR application or guide-line for using rapid molecular infectious testing to guide antibiotic selection for pneumonia. This might be cost effec-tive, for example, in populations at high risk for adverse events with pneu-monia, such as patients with multiple chronic conditions. In addition, in the ER, this might allow for avoided ad-missions if molecular testing confirms a viral versus bacterial etiology (an estimated 20 percent to 30 percent of community-acquired pneumonias).
• Value generation potential: mul-tiple studies23 show that delays in effective treatment of resistant pathogens in pneumonia increase hospital lengths of stay for several days, typically five to seven, rep-resenting a difference of at least $20,000 per patient in costs.
Individualized Medicine Guidance for PCPs 2 – PGx tools for anticoags, statins, SSRIs, adverse reactions, etc. – pharmacogenetics (PGx) is beginning to gain both clinical and payer trac-tion, and our ACO population practice center should take the lead in answer-ing all the major questions regarding how these tests are implemented for population care in an ACO setting. An important data point here is that the two leading pharmacy benefit man-agers (PBMs), Medco and CVS Care-mark, are currently operating major PGx testing programs for millions of their client payers’ beneficiaries. The PBMs have publicly stated that these programs are economically attractive for their clients. Thus, PGx testing should have a value generating role to play in an ACO population. For a list of drugs with PGx tests included on their FDA drug labels see http://www.fda.gov/drugs/scienceresearch/researchareas/pharmacogenetics/ucm083378.htm
Example: Program (EMR applications, testing and customized patient report) to increase patient adherence to statin therapy using data on their KIF6 carrier status as a motivator.
• Medco reports 50-90 percent of patients stop taking their pre-scribed therapies at end of first
23For example, SE Cosgrove, “The Relationship between Antimicrobial Resistance and Patient Outcomes: Mortality, Length of Hospital Stay, and Health Care Costs,” Clinical Infectious Diseases 2006; 42:S82–9
College of American Pathologists
Promising Practice Pathways
113
year –this includes depression, diabetes, cholesterol, and hyper-tension. For statins, at one year the difference between high and low adherence translates into almost a 10 percent difference in patient survival rates.24
Medco trial with Celera just pub-lished – “The AKROBATS trial dem-onstrated that 6-month statin therapy adherence and persis-tence are significantly improved by providing the patient with KIF6 genetic information. This study provides the first prospective evidence that pharmacogenetic testing has utility in modifying pa-tient adherence.”25
Utilization Management for PCPs – Identification of lab tests that have high PCP ordering variations and also high downstream cost consequences, using data-mining of LIS systems. Pro-vide feedback to PCPs of their test ordering relative to peers, along with explanation of optimal use of test, and test menu decision support for EMR/CPOE as available.
Example – A program to reduce varia-tions in ordering of CA 125 testing. This testing has a high false positive rate and generates high downstream costs
due to imaging testing.26
Quality and Coordination Programs for PCPs – There are a number of applica-tions that we can deliver for supporting chronic care management based on analysis of an individual’s lab testing re-sults, especially if we link our data with the pharmacy database. Needless to say, we also need access to the ACO’s clinical database/EMRs and EHRs.
Example – guidelines implemented into the EMR for when to either refer diabetics to an endocrinologist or start them on insulin based on lab values.
• Value generation potential – stu-dies show improvements in HA1c levels and complication rates when diabetics are started on insulin early, yet many PCPs are reluctant to do so.
Example – reminders to PCPs or directly to patients about testing for drug levels like warfarin, digoxin, etc.
• Value generation potential – stud-ies show keeping patients with the target INR zone significantly de-creases the rate of hemorrhages and thromboembolic adverse events. This may reduce ER visits and admissions.
24Rasmussen, J. N. et al. JAMA 2007;297:177-18625SL Charland et al. “Patient Knowledge of Pharmacogenetic Information Improves Adherence to Statin Therapy: Results of hte Additional KIF6 Risk Offers Better Adherence to Statins (AKROBATS) Trial,” JACC March 27, 2012 Volume 59, Issue 1326G2 Intelligence interview with Philip Chen, M.D., Ph.D., director of informatics for the Department of Pathology at the University of Miami, June 15, 2011, in “Creating a Value-Driven Laboratory: Opportunities in the New Marketplace,” G2 Intelligence©, 2011 Kennedy Information, LLC.
Promising Practice Pathways
College of American Pathologists114
Offerings for Hospitalists and ER (Hosp and ER):Informatics-based risk prediction for Hosp and ER – Our practice pathway mines our lab testing data and clinical data to identify inpatients who are at particularly high risk for a complication or adverse event (beyond what would be evident to a clinician), and to alert clinicians to tests that might be indi-cated based on lab results that point to early signs of a particular problem. For hospitalists, the reports on patients at high risk for an adverse event, com-plication or mortality are needed on a frequent reporting period, for example daily. For patients in critical units, it may be necessary to access point of care test results, as well, if a particularly challenging clinical situation requires an intensive solution.
Example – EHR applications for fluid and electrolyte problems. Our applica-tion could first alert the clinician to a low sodium upon admission; next, if the sodium declined during hospitalization, further alerts with suggestions for test-ing such as serum and urine osmolality could be sent; finally, based on results of tests, decision support algorithms for etiology of the disorder could be of-fered (e.g., is this hypovolemic, hyper-volemic, normovolemic, etc.).
Fluid and electrolyte disturbances, hy-ponatremia being the most common, are a major hospital problem with sig-nificant quality and cost consequen-ces. One study found that 11 percent of surgical ICU patients had hypona-termia at admission to the ICU and 31 percent acquired hyponatermia while in the ICU.27 The inpatient costs of patients with hyponatermia are more than twice those with normal sodium. When hyponatremia is corrected, the heightened mortality associated with it decreases to levels associated with normonaterima.28
There are a number of studies that report that clinician management of fluid and electrolyte disorders is quite problematic, and thus is playing a causal role. Diagnosing the patho-physiology underlying the electrolyte disorder is complex and important to the treatment. Furthermore, laboratory testing plays a significant role in unrav-eling the etiology of the disorder. Im-portantly, one investigation found that “the adequacy of laboratory assess-ments during hospitalization directly relates to patient outcomes in hypona-tremia.”29
• Value generation potential – Based on the Prometheus data,
27Y Sakr “Fluctuations in serum sodium level are associated with an increased risk of death in surgical ICU patients.” Critical Care 2012, 16(Suppl 1):P14528SS Waikar et al. “Mortality after hospitalization with mild, moderate, and severe hyponatremia.” Am J Med. 2009 Sep;122(9):857-65.29M Whyte et al. “Lack of laboratory assessment of severe hyponatremia is associated with detrimental clinical outcomes in hospitalized patients.” Int J Clin Pract. 2009;63(10):1451-1455.

College of American Pathologists
Promising Practice Pathways
115
Fluid and Electrolyte Disorders rep-resent 1.5 percent of all PAC costs. When scaled to the national level and expanded beyond the com-mercial population based on our modeling, this represents potential avoidable costs of $1.14 billion nationally.
Individualized medicine guidance for Hospital and ER – Molecular testing to guide targeted antibiotic therapy for hospitalized patients presents a major opportunity to improve outcomes and generate cost savings. According to the Prometheus Payment Model, the leading infections (pneumonia, sepsis, meningitis, and urinary tract infections) comprise at least 10 percent of all avoidable costs, and most of these are inpatient costs.
One recent study estimated that the cost of an antimicrobial-resistant infec-tion is $18,588 to $29,069 per patient, with an excess duration of hospital stay of 6.4 to 12.7 days and attributable mortality of 6.5 percent.30
Also, a growing evidence base sup-ports the ability of antibiotic therapy based on molecular testing to improve outcomes and shorten lengths of stay – in other words, generate cost savings. In the next few years these tests will increasingly be available for routine, in-patient use for guiding antibiotic ther-apy, and we can bring the needed expertise of assessing which tests to use
and interpreting results. Likely we will collaborate with pharmacy and infec-tion control in these programs.
Example – an EMR application with guidelines specifying who is at suffi-ciently high risk to warrant molecular infectious testing for antibiotic selec-tion for UTIs and pneumonia.
Quality and Coordination Programs for Hospital and ER – One area for our pathology practice pathway to ad-dress in hospital and emergency room settings is glucose control – including diabetics with hypoglycemic episodes due to illness, operative procedures or iatrogenic insulin therapy, and other patients undergoing procedures and having their glucose managed. Dia-betic episodes of hypo and hypergly-cemia are identified by Prometheus to constitute 3 percent of all PAC costs, a substantial opportunity for savings. Further, hypoglycemia problems in hospitalized patients during attempts to manage their glucose are common, dangerous and costly.
The National Quality Forum prioritized inpatient glycemic control as one of the 34 Safe Practices it recommends to optimize hospital care of patients, admonishing hospitals to “Take actions to improve glycemic control by imple-menting evidence-based intervention practices that prevent hypoglycemia and optimize the care of patients with hyperglycemia and diabetes.”
30Roberts RR, Hota B, Ahmad I, et al. Hospital and societal costs of antimicrobial-resistant infections in a Chicago teaching hospital: implications for antibiotic stewardship. Clin Infect Dis. 2009;49(8):1175-1184.
Promising Practice Pathways
College of American Pathologists116
Example – quality control and valida-tion of bedside glucometers. Many studies have produced evidence that some of the hand-held glucometers used commonly in hospitals are not reliable in detecting clinically impor-tant hypoglycemia.31 When clinicians are trying to calibrate critically ill pa-tients’ glucose levels using insulin, very precise glucose measurements are needed. Our practice can ensure this is the case through a quality program, with instrumentation replacements as needed.
Offerings for Specialists – Medical Specialties, Surgeons, ProceduralistsIndividualized medicine guidance for Specialists – There are a number of areas where MDx and PGx will begin playing major roles in improving qual-ity and generating cost savings across specialty areas. We’ve discussed in-fectious disease and how MDx can begin to move therapy from empiric to targeted. Oncology is another signifi-cant opportunity, but that is covered in another Practice Pathway, “High-Performance Pathology for High-Value Oncology.” PGx is a bit behind in the adoption curve, but as described above, the fact that the national PBMs are rolling out PGx testing for many tests and therapeutics indicates there is an economic rationale there. PGx
tests are being developed rapidly and can have impact in selecting therapies that are most effective, driving dos-ing decisions, avoiding adverse events and bad outcomes in general, and saving pharmaceutical costs.
Example – Program for clopidogrel PGx testing – CYP2C19 for high risk patients. Evidence is accumulating rapidly that patients with loss of function CYP2C19 alleles do not get benefit from clopido-grel and thus have much higher rates (53 percent in one study) of mortal-ity from cardiovascular events and a three-fold increase in stent thrombosis. A recent presentation by The Mayo Clinic commented about clopidogrel PGx testing, “Some would argue that there is sufficient evidence to provide this testing for certain groups of pa-tients, such as those undergoing coro-nary stenting.”32
• Our practice application could be programmed that enables clopidogrel PGx testing for stent-ing patients – guidelines, a testing solution, interpretation of results with recommendations on chang-ing therapies, and a means of tracking results/registry. This would all be developed in conjunction with interventional cardiologists/radiologists.
31C Voulgari et al. “Accuracy and Precision of Glucose Monitoring Are Relevant to Treatment Decision-Making and Clinical Outcome in Hospitalized Patients with Diabetes,” Diabetes Technology & Therapeutics. July 2011, 13(7): 723-730.32Linnea Baudhuin, PhD, “The Use of Genetics in Guiding Therapy,” Mayo Medical Laboratories Hot Topics, 2012.

College of American Pathologists
Promising Practice Pathways
117
Pharmacogenomic guidelines, reference databases, and elec-tronic platforms to integrate per-sonal pharmacogenomic data into the clinical workflow would all be helpful in overcoming these barriers. Innovative strategies are needed to promote the wide-spread adoption of pharmacoge-nomic clinical applications by cardiovascular providers.
• A National Heart, Lung, and Blood Institute Working Group recently described how IT systems could integrate PGx into workflow. “One such strategy would be the use of information technology to inte-grate pharmacogenomics into the clinical workflow, which would follow a “learning by doing” mod-el. For example, a provider using a computerized provider order entry system to prescribe clopidogrel for a patient would be asked wheth-er the patient is known to have reduced-function CYP2C19 alleles and, if not, would be prompted to consider ordering a genotyp-ing test. Extending this model, if the computerized provider order entry were linked to the patient's
medical record and found that the patient was known to have reduced-function CYP2C19 al-leles, the system would prompt the provider to consider using an alternative antiplatelet medica-tion. Thus, preemptive genotyping – placing data in computerized provider order entry – enabled electronic medical records – is an-other strategy that needs further evaluation.”33
Utilization Management for Specialists Blood product and transfusion man-agement – There is a large body of evidence indicating that blood utiliza-tion is suboptimal and that managing utilization would result in substantial savings – in the hundreds of millions of dollars, according to Barry Portugal, President of Health Care Development Services, Inc. (HCDS).
• One study found that over 70 percent of transfusion orders were deemed inappropriate among medical staff at an academic hospital.34 Studies also show that utilization management programs can lower usage rates by 15-25 percent.
33K Musunuru et al. “Cardiovascular Pharmacogenomics: Current Status and Future Directions – Report of a National Heart, Lung, and Blood Institute Working Group,” Journal of the American Heart Association. 201234Rothschild et al., Transfusion 2007; 47 cited in “How Should the Blood Center-Hospital Relationship Evolve?," presentation by Timothy Hannon, MD, MBA, Medical Director, Blood Management Program, St. Vincent Hospital Indianapolis, CEO, Strategic Healthcare Group LLC, http://www.aabb.org/programs/nbf/Documents/lf11hannon.pdf

Promising Practice Pathways
College of American Pathologists118
Portugal stated that most hospitals have no effective blood manage-ment program and that laborato-ries are in an excellent position to apply testing algorithms to reduce unnecessary transfusions and save hospitals significant money as well as reduce adverse events.35
Example – our practice pathway blood transfusion utilization management program would have multiple com-ponents, perhaps including an assess-ment of suppliers, protocols for when to transfuse, coagulation consultative services to help evaluate complex operative cases with microvascular bleeding, etc.
Quality and Coordination Programs for Specialists – Lab testing protocols for referrals between providers – our practice can contribute to ACO care coordination by developing auto-mated, protocol recommendations, based on lab and clinical data, for referring between specialists and PCPs. These protocols would be developed in conjunction with the specialists, and might also incorporate pharmacy data, which has the advantage of tak-ing into account patient adherence to therapies. Philip Chen, MD, PhD, Direc-tor of Informatics for the Department of Pathology at the University of Miami, is developing protocols such as these
and implementing them as EMR appli-cations.36
• The protocols could be devel-oped as a hybrid between “stan-dardization” to mitigate care variations and improve quality – this is critical for ACOs to achieve their quality measures – and in-dividualized care, based on risk assessment from lab and clinical data.
• These protocols might also in-clude indications for procedures, although obtaining physician buy-in for this will be more dif-ficult. However, if the protocols are created and positioned as evidence-based, individualized medicine algorithms, rather than ACO rules, they may be adopted. These could be very powerful cost savings programs, as unnecessary procedures are a huge driver of spending.
Example – our practice pathway, in collaboration with cardiologists and PCPs, could develop an evidence-based, individualized algorithm and protocol for referrals to cardiologists based on risk for cardiovascular/thromboembolic events. The algorithm might take into account not only ba-sic cardiovascular lab tests, and more esoteric biomarkers if the patient has
35G2 Intelligence interview with Barry Portugal, President of Health Care Development Services, Inc., June 2, 2011, in “Creating a Value-Driven Laboratory: Opportunities in the New Market-place,” G2 Intelligence, 2011 Kennedy Information, LLC.36G2 Intelligence interview with Philip Chen, MD, PhD, on May 25, 2012

College of American Pathologists
Promising Practice Pathways
119
other risk factors, but also effectiveness of therapeutics and adherence data if known. A further protocol might make recommendations for stenting versus medical therapy based on patient risk factors, likely outcomes, etc.
Offerings for Population-wide Management/ACO LeadershipInformatics-based risk prediction for Population/Leadership – depending on the scope and depth of laboratory and clinical data we have available to us for informatics and data-mining, there may be many opportunities to produce very valuable applications for ACO population management.
• Subpopulation reference ranges for more precise disease detec-tion – With sufficient population data, we can use statistical tech-niques to derive more “individu-alized” reference ranges for lab tests. Applying these more per-sonalized ranges equates to more clinically powerful testing, includ-ing earlier disease detection and more potent risk assessment.
Prediction of next year’s high cost patients. A minority of patients comprise the majority of health-care spending. A typical split is 20 percent of patients representing 80 percent of costs.
In Chen’s research he observed that 3 percent of the population each year went from the low spending groups to the highest spending group. In other words, the 5 percent highest spend-ing patients are not all chronically high spenders. This presents an opportunity for a laboratory to develop analytics to help identify these 3 percent, high-risk, “time bombs.” He commented that patients typically in this 3 percent were diabetics who are not well managed and are first time myocardial infarction patients.37
With an understanding of how to read changes in lab results in the context of various combinations of disorders, combined with statistical, or perhaps artificial intelligence programs (avail-able off-the-shelf), we may be able to find algorithms that identify patients at high risk of becoming the 5 percent highest cost patients in the coming year. This would enable interventions that might mitigate that risk.
• Identification of high adverse event areas – Applying our ex-pertise in statistical quality control to unusual laboratory test results may allow us to develop applica-tions that alert ACO leadership to potential problems in particular provider areas.
37G2 Intelligence interview with Philip Chen, MD, PhD, director of informatics for the Department of Pathology at the University of Miami, June 15, 2011, in “Creating a Value-Driven Laboratory: Opportunities in the New Marketplace,” G2 Intelligence, 2011 Kennedy Information, LLC

Promising Practice Pathways
College of American Pathologists120
Example: An early warning surveillance application to identify care units ex-periencing/about to experience high rates of adverse events. Using labora-tory QC process control charting tech-niques and critical value test reporting frequency “spikes,” a researcher at Ohio State University Medical Center developed an application that pre-dicted units with 2.5 times higher rates of adverse events in the two weeks fol-lowing the critical value spikes.
A patient adverse event was defined as cardiac injury, cerebrovascular adverse events, major bleeding epi-sode, prolongation of hospital stay, or death. With the lead time provided by the early warning, the care unit can be assessed for operational, qual-ity and resource problems. Also, ad-ditional care management services and interventions can be directed at particularly high-risk patients. Although this application likely needs validation, it appears quite promising and would have significant value from both a cost and quality perspective.
Individualized Medicine Guidance for Population/Leadership – Development of guidelines for PGx and MDx testing by risk status and cost-effectiveness modeling.
• A component of our practice pathway’s leadership for the ACO is developing a type of molecular testing “formulary,” with associ-ated guidelines or decision trees. Again, the guidelines/protocols for when to test and which tests to use should be individualized
based on a patient’s risk status, determined in part by lab results. A major driver will, of course, be the level of clinical evidence sup-porting a particular indication. Also, our analytic assessment of the various assay platforms will be important in selecting and validat-ing testing systems.
• A new role in this regard for many of us involves an economic assess-ment of these tests, not from the perspective of the test cost versus its revenues, but from a population health care perspective. This es-sentially entails conducting value-based economic modeling where-by the test’s impact on subsequent spending and outcomes is com-pared to not performing the test in various population cohorts with different risk and clinical profiles.
• By working with economic spe-cialists or the ACO, we can help develop these economic analy-ses and use them to inform deci-sions regarding when to introduce new MDx and PGx tests into ACO guidelines.
Quality and Coordination Programs for Population/Leadership – Pathogen surveillance and/or antibiotic steward-ship programs – the opportunity for a tremendous value impact is simply too large to not take a leadership role in advancing whatever infection con-trol/antibiotic stewardship might be in place at the ACO’s facilities at the start. There are a number of ways we might take these programs to a new
College of American Pathologists
Promising Practice Pathways
121
level of effectiveness.
As we’ve reiterated, resistant organ-isms are a major problem, both in com-munity and hospital settings. Although MRSA rates seem to be declining na-tionally, gram-negative organisms are showing disturbingly accelerating rates of resistance. With the advent of mo-lecular testing for pathogen identifica-tion we have a truly effective answer in hand, and we need to utilize our expertise to bring this into routine care in the next couple of years.
A recent study used rigorous analytic techniques and a robust database to estimate the differences in costs between resistant and susceptible pathogen infections in community and healthcare-acquired infections. They found, “Consistent with previ-ous findings, our results from all mod-els indicate that resistant infections lead to generally higher charges and length of stay for both healthcare- and community-acquired infections.” The differences in hospital charges were significantly higher, with an average of $15,626 higher for resistant healthcare-associated infections and $25,573 for community-associated infections. The infections studied included pneumo-nia, blood-stream and urinary tract.38
Antimicrobial stewardship programs reportedly generate form $200,000 to $900,000 in annual savings from drug costs alone.39
Example – components of a steward-ship or surveillance program we could lead include:
• MDx testing protocols integrated into antibiotic pre-prescription guidelines.
• Using MDx testing to direct antibi-otic de-escalation.
• Conducting, analyzing and dis-seminating frequent antibiograms throughout the inpatient and out-patient ACO network, and work-ing with the pharmacy to continu-ously update and correlate drug usage data.
• Methicillin Resistant Staph Aureus (MRSA) and C difficile screening programs.
• Frederick L. Kiechle, MD, PhD, FCAP, medical director of clinical pathology at Memorial Health-care System, Hollywood, FL., esti-mates that his institution’s MRSA has generated $8.8 million in cost savings.40
38MJ Neidell et al. “Costs of Healthcare- and Community-Associated Infections With Antimicrobial-Resistant versus Susceptible Organisms,” Clinical Infectious Diseases Advance Access published June 14, 201239Shira Doron, MD, and Lisa E. Davidson, MD, “Antimicrobial Stewardship,” Mayo Clin Proc. 2011;86(11):1113-112340Frederick L. Kiechle, MD, PhD, FCAP, medical director of Clinical Pathology at Memorial Healthcare System, Hollywood, FL, “How to Build and Fund a Financially Viable Molecular Lab,” College of American Pathologists webinar, 2010.
Promising Practice Pathways
College of American Pathologists122
PLANNING FOR THE PATHWAY
The plethora of potential applications, services and programs we might de-liver to an ACO for population care management may seem onerous at the outset, but we need only select a subset for our initial practice. This focus should be determined by the priorities of our client ACO and our capabilities and resources.
By targeting the ACO leadership’s highest priorities and needs with a practice pathway program designed to specifically address them, we are significantly improving our negotiating power. For example, are they priori-tizing inpatient adverse events, PCP chronic care management, or infec-tions most highly? Perhaps between provider coordination is a concern, or clinician guideline adoption.
The pathway also allows for flexibility in terms of offering multiple axes along which to define our practice focus, as shown in Figure 10. For example, we can start by implementing a practice serving mainly ACO PCPs, or one fo-cused on diabetes, or on infections, etc.
Finally, we need to consider the rela-tive strengths and weaknesses of our group in molecular testing and infor-matics in determining which focus to pursue. We will eventually need to bring in expertise and resources to ensure both of these capabilities are strong, given they are key engines for this opportunity.
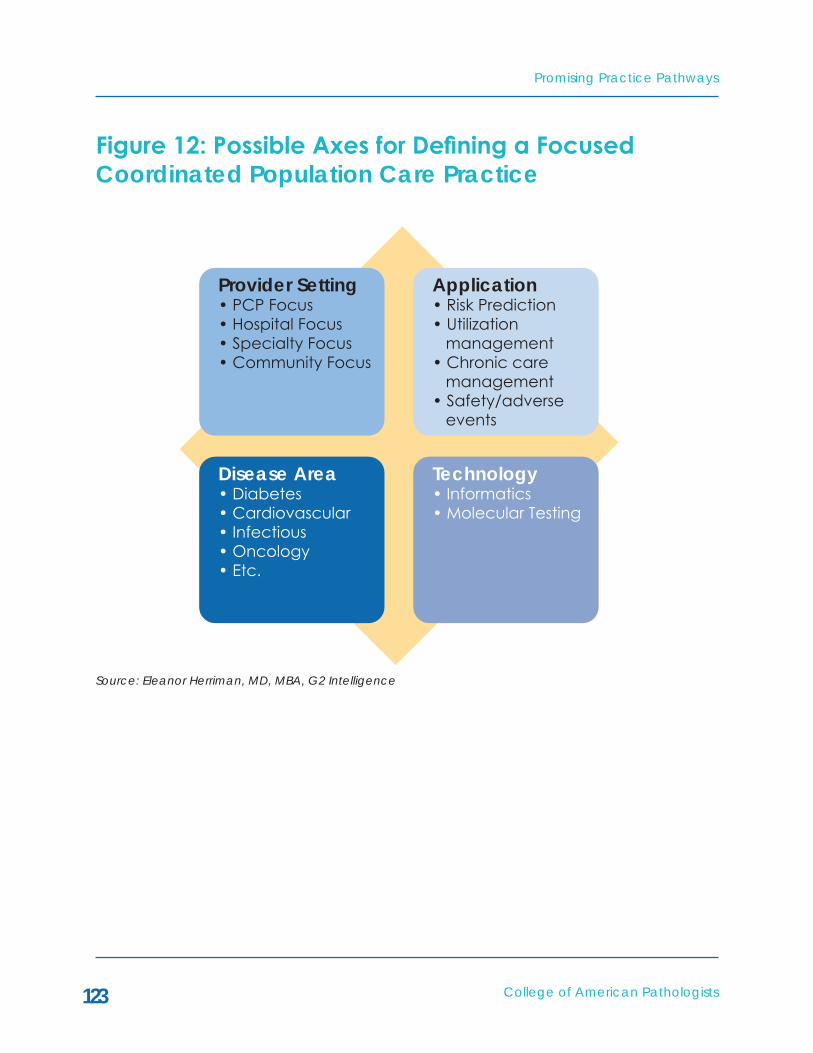
College of American Pathologists
Promising Practice Pathways
123
Figure12:PossibleAxesforDefiningaFocused Coordinated Population Care Practice
Provider Setting• PCP Focus• Hospital Focus• Specialty Focus• Community Focus
Application• Risk Prediction• Utilization management• Chronic care management• Safety/adverse events
Disease Area• Diabetes• Cardiovascular• Infectious• Oncology• Etc.
Technology• Informatics• Molecular Testing
Source: Eleanor Herriman, MD, MBA, G2 Intelligence
Promising Practice Pathways
College of American Pathologists124
Getting a Seat at the ACO TableOur first hurdle is getting “a seat at the ACO table” by establishing to the ex-ecutive leadership that our pathology laboratory group has a value proposi-tion of significance. This requires some type of evidence showing that our pathway interventions can produce cost savings in whatever targeted areas we have chosen. This evidence can be a combination of peer-re-viewed studies and pre- and post-ob-servational data.
For some services and applications that require development resources, there is a chicken and egg problem here, in that we cannot generate the evidence until we have developed the pathway interventions. In this case, we need to create a business proposal focused on an investment case for resourcing these interventions, with the return investment projections based on the literature or pilot studies.
After convincing the ACO that we have significant economic value to add, we move to negotiations regard-ing compensation. As there are no market precedents yet to draw upon, we have the opportunity to determine our own financial destiny here. First, we need to clarify that ACOs continue to be paid by Medicare on a fee-for-service basis, so our testing revenues
continue, although they may decline due to utilization management by the ACO.
If our pathway interventions allow for discrete measurement, we have the option of using the first year to prove our case and ask for an attractive share of bonus payments, contingent on hitting target savings metrics. An-other possibility is that the ACO is cau-tious and wants to evaluate our per-formance the first year, in which case we might negotiate a service contract with a small, performance-based bo-nus.
In terms of what percentage of the ACO’s shared savings bonus we might negotiate, we can start by looking at what approaches are being used by ACOs currently. Each ACO determines its own payment allocation method-ology, and these are not generally made public. In a recent report41 on ACO payment allocation by the ac-tuarial firm Milliman, a variety of meth-odologies were described, including divisions based on volume of services, RVU counts, cost per episode targets, and responsibility by service line.
The complete report on all of the Prac-tice Pathways to be published later this year will describe implementation plans for this Pathway, as well as further details on the Pathway itself.
41GN Berry and R Kipp, “ACO gain/loss sharing.” Milliman Healthcare Reform Briefing Paper, 2012

College of American Pathologists
Promising Practice Pathways
125
CONCLUSIONS
For ACOs, integrated delivery networks and Medical Homes to implement population health management, there is a clear need for both a population-based view of care delivery as well as individualized, patient-centric care. Pathologists alone have the dual ap-proach that marries “top-down” popu-lation lab informatics applications that systematize care with “bottom-up” patient-specific, molecular testing tools that individualize treatment guide-lines. We also have particular expertise in other areas critical to population health management, such as test ana-lytics, instrumentation, and infectious disease.
The population health management model also demands novel approach-es to risk management and preven-tion. Because pathologists deliver the most potent of predictive tools in health care – in the form of individual-ized diagnostics and biomarkers – and because lab testing is performed fre-quently, pathologists are uniquely able to provide a steady supply of temporal predictive data to keep risk assess-ments fresh. Pathologists also have the expertise to utilize this data in powerful predictive applications that can pre-vent adverse events.
In most circumstances, a pathology
group that was already contractually tied to either an ACO hospital or ACO physician organization (one in which a physician organization rather than a hospital-led organization contracts with the payer) for diagnostic testing services will be the best candidate for this pathway. Because there are many different types of ACOs, there will be significant variability in how a pathol-ogy group approaches implementing this pathway.
The way forward will vary from practice to practice depending on the highest priorities of the ACO. Step one for any practice will involve working with its local ACOs or the groups with which they already have contracts to identify the highest priority needs and then re-sponding with services based on core capabilities that deliver clear value. Most practices will need to start with targeted offerings and then expand over time to add new capabilities, such as molecular testing expertise, and to develop additional services.
Compensation for these services will likely be based on value payments, such as ACO shared savings bonuses. To demonstrate the value of the Coor-dinated Population Care Pathway to the ACO, we will need to develop a business case that documents oppor-
Promising Practice Pathways
College of American Pathologists126
tunities for cost savings and increased quality and allows us to negotiate a share of the ACO’s net savings.
The number of ACOs is growing and the ACO model is maturing, so ACOs are rapidly developing the solutions
they need to implement population health management. If pathologists want to play a larger role than data suppliers in this new business land-scape, they must act now and apply their skills and expertise to design the valuable services ACOs need.

COLLEGE OF AMERICAN PATHOLOGISTS
PATIENT DIAGNOSTIC SERVICES CENTER
PROMISING PRACTICEPATHWAYS™:
Promising Practice Pathways
College of American Pathologists128
As the health care system transitions to value-based purchasing and coor-dinated-care, health care delivery is becoming more patient-centric. Not only are hospitals and providers using patient satisfaction measures as key quality indicators, but new approach-es to health insurance are shifting costs to patients and turning them into health care consumers.
These shifting market dynamics are raising the bar for health care provid-ers. In addition to providing quality clinical care, they must now cater to their patients as true consumers who shop around for affordable and convenient services with quick turn-around-times and low error rates.
At the same time, ACOs, hospitals and other providers are looking for ways to improve clinical quality and decrease costs. One way to improve quality is to reduce diagnostic errors both in the laboratory and in the clinic, where overburdened clinicians are often called upon to interpret fragmented and asynchronous results. Yet much of our health care system’s current model for performing diagnostic test-ing on patients – be it laboratory, pa-thology or imaging testing – is a poor fit with these new needs. Diagnostic testing offers few to no conveniences, in terms of co-location, coordination and scheduling, to patients who need to have multiple types of tests per-
formed. Also radiology and laboratory medicine/pathology operate primarily as silos, which can negatively impact the accuracy of the final diagnosis.
Our “Patient Diagnostic Services Cen-ter” Pathway opportunity involves developing new models for diagnostic testing services. The keys to address-ing these market needs are integrat-ing across types of testing, centering services on the patient, and focusing onoperationalefficiencyandquality.A patient testing facility with integrat-ed, quality-focused and coordinated diagnostic services could meet this growing need for increased accuracy, efficiencyandconvenience.
To be successful in this emerging mar-ketplace with such a model, pathol-ogy and imaging services must realign themselves. There are historic turf con-flicts between radiologists and pathol-ogists to be overcome, for example. However, given that the value-based market is realigning provider incen-tives, and given the strong business case for our collaboration, we see these obstacles as surmountable.
We’re offering this pathway guide because we believe that the mar-ket is ready for innovative ventures in diagnostic testing. Pathology groups that provide forward-looking Patient Diagnostic Services are likely to grow with this new consumer-oriented mar-ketplace.
SUMMARY
College of American Pathologists
Promising Practice Pathways
129
In its most enterprising forms, this path-way can be a risky endeavor. But by leveraging partnerships and existing provider relationships, this pathway can be accessible across several prac-tice types, settings, resource levels and capability portfolios.
Because this pathway is truly novel in the U.S. market, this guide does not present a “how to” for every practice, but it does offer examples of possible approaches in multiple types of prac-tices. Hopefully our guide gives you a sense of (1) the attractiveness of this practice model both professionally and financially, (2) the opportunities to improve health care quality and at the same time embrace what could other-
wise be a daunting shift to health care consumerism, and (3) the attainability of this opportunity.
The guide is structured as follows:
• Market Need: A New Way to Perform Diagnostic Testing Services
• Market Opportunity
• Practice Pathway: Into the Patient Diagnostic Services Center
• Examples of Patient Diagnostic Services Centers
• Implementation Plans: The Way Forward
Promising Practice Pathways
College of American Pathologists130
Hospitals and providers increasingly have their compensation tied to qual-ity measures and their health care spending rates, and patients have now become true health care consumers. As a result, diagnostic testing services’ suboptimal performance in the areas of patient experience, costs and accu-racy may begin to have negative im-pacts financially on any provider group being compensated under alternative payment programs – i.e., non-fee-for-service (NFFS).
Providers have four major types of needs that might be addressed by an improved system for patient diagnostic testing services:
• Providing a high quality patient experience,
• Attracting health care consumers.
• Lowering health care spending.
• Improving health care quality/ avoiding errors and adverse events.
These needs present an opportunity for us to better engage these value-driven clients and consumers by designing
next generation diagnostic service models. Indeed, in a health care mar-ket system transitioning to value-based purchasing, coordinated-care and consumerism, the current antiquated model for delivering pathology and laboratory diagnostics has deleterious consequences. To be successful, this new model must be patient-centered, efficient/LEAN, coordinated and inte-grated across testing services.
Patients Matter: A High Quality ExperienceProviders need all aspects of patients’ health care experiences, including the diagnostic testing process, to be convenient, pleasant, understandable, streamlined, timely and error-free be-cause they are now being measured on how well their patients judge the quality of their experience. These met-rics are being used in both inpatient and ambulatory value-based payment programs, and in many cases are be-ing published by payers to drive con-sumer comparative shopping.
For example, of Medicare’s ACO shared savings program’s 33 quality measures used to determine payment, seven are tied to patient experience.1
MARkET NEED: A NEW WAY TO PERFORM DIAGNOSTIC TESTING SERVICES
1http://www.cms.gov/Medicare/Medicare-Fee-for-Service-Payment/sharedsavingsprogram/Downloads/ACO_QualityMeasures.pdf
College of American Pathologists
Promising Practice Pathways
131
According to the “Clinician and Group Consumer Assessment of Health Care Providers and Systems” (CAHPS) pa-tient satisfaction surveys, topics in-clude:
• Getting Timely Care, Appoint-ments, and Information.
• How Well Your Doctors Communi-cate.
• Patient Rating of Doctor.
• Access to Specialist.
Under Medicare’s "Value Based Pur-chasing (VBP)” program, patient ex-perience scores have been proposed that represent up to 30 percent of hospital incentive payments.2 This puts patient experience at the top of hos-pital executives’ agendas in the near future. Beginning in FY13, the program will start to reward hospitals for improv-ing and maintaining high levels of measurable quality:
“Although the differences in payment for the identified groups may not seem significant, facilities receiving a [total performance score] TPS of 0 will have a 1.0 percent reduction in revenue. Similarly, hospitals achieving a TPS grade of 100 will receive a 1.6 percent
bonus. In future years, these extremes will double. Further, hospitals will need to be prepared to explain their quality measurements to all public interests, such as patients, physicians, and insur-ers. Hospitals that are most successful in achieving high levels of quality will also have the opportunity to promote their accomplishments to public in-terests. VBP is a program under which "average" hospitals do not fare well.”3
This trend affects diagnostic testing centers directly. Those that do not pro-vide patients with timely, convenient, high-quality services might hurt the patient experience and result in value destruction, so there is a need and opportunity to propose new patient-pleasing diagnostic testing centers to our hospitals, medical centers or ACOs.
Diagnostic testing is of great interest to patients, so solutions designed to im-prove patient engagement are likely to have outsized positive impacts. For example, a recent survey by Mayo Clinic found that of 1,972 patients, 70 percent were very interested and 20 percent somewhat interested in using a Mayo Clinic website to view their laboratory test results.4
Overall there are sufficient market
2Presentation: “National Provider Call: Hospital Value-Based Purchasing,” Centers for Medicare & Medicaid Services, July 11, 20123Ed Klein and Paul Shoemaker, “Value-based purchasing: a preview of quality scoring and incentive payments: findings of a recent study suggest that some types of hospitals participating in CMS's Value-Based Purchasing (VBP) program can expect to perform much better than other types,” Health Care Financial Management, January 1, 20124Patrice Wendling, “Patients want online access to test results Stat,” Skin and Allergy News, May 1, 2012

Promising Practice Pathways
College of American Pathologists132
drivers to make a business case that positions us as value generators rather than as cost centers. Conveniences in scheduling, parking, childcare, pay-ment, instructions, receiving reports and aftercare can create loyal pa-tients. Similarly, a streamlined opera-tional flow and coordinated approach to developing a diagnostic testing plan is likely to instill a sense of security and confidence in the patients regard-ing the medical care they are receiving.
Consumers Are the New MarketNot only must hospitals and provider groups please their patients, they must also compete for their patients’ busi-ness. Patients have become savvy consumers of health care services out of necessity, because they are bearing more of the burden of health costs.
“According to our modeling of the 2010 flow of health care funds, con-sumers now pay more in health care costs than do employers. This cost is split among direct payment of non-covered services, out-of-pocket ex-penses after insurance, and the con-sumers’ share of premium expenses,”5 writes McKinsey.
A trend towards high-deductible insur-ance is driving this shift:
• One survey found that 70 percent of large companies indicated they will offer high-deductible insurance by 2013.6 Nearly a fifth of the firms that responded indi-cated that this high-deductible coverage would be the only op-tion by 2013.
• In the Kaiser Family Foundation’s 2011 employer survey, 17 percent of the covered workers were en-rolled in a high-deductible plan, up from 4 percent in 2006.7
• A RAND researcher believes these “consumer-directed plans” could reach the 50 percent enrollment level over the coming decade.8
High deductibles are forcing patients to shop around to reduce their out-of-pocket costs and to be more selective about the health care they pursue. According to a RAND study, “Families in consumer-directed plans used fewer brand-name drugs, had fewer visits to specialists and had fewer elective hos-pital admissions than families in tradi-tional plans.”
5Thomas Pellathy and Shubham Singhal “The next wave of change for US health care payments,” McKinsey Quarterly, May 20106Towers Watson, “Performance in an Era of Uncertainty,” 17th Annual Towers Watson/National Business Group on Health Employer Survey on Purchasing Value in Health Care, 2012. http://www.towerswatson.com/assets/pdf/6556/Towers-Watson-NBGH-2012.pdf7Jay Hancock, “The New Normal In Health Insurance: High Deductibles,” Kaiser Health News, Jun 03, 20128“Expanding Consumer-Directed Health Plans Could Help Cut Overall Health Care Spending,” May 7, 2012, http://www.rand.org/news/press/2012/05/07/index1.html.

College of American Pathologists
Promising Practice Pathways
133
This new dynamic, where patients don’t just follow doctor’s orders and let their insurance take care of the costs, is putting the onus on health care providers to meet – on top of demands for their expert medical services – the demands of consumers who want con-venience, quality and affordability.
For example, for diagnostic services, patients are shopping around for “re-tail” level customer services. "We are seeing that patients are willing to go to other locations if they can be seen sooner," says Jennifer Nichols, director of patient access at Spectrum Health in Grand Rapids, MI, where same-day scheduling is now offered to radiology patients. "They will often call multiple hospital or service providers."
Since hospitals and doctors are also vying for their patients’ business, they are also attracted to same-day diag-nostic service. “Provider offices prefer this option," she says. "They are eager to have the diagnostic results back in order to proceed with patient care."9
Patients also want to know up-front what their tests and procedures are going to cost them so that they can make informed choices. But the costs of diagnostic tests and procedures vary widely. A hernia repair might cost between $4,026 and $7,498, and a colonoscopy could cost from $1,450 to $2,973.10 Consumers are realizing that higher prices don’t always mean bet-
ter service or higher quality. So they are shopping around and sharing infor-mation with one another on the Web.
Some providers are offering “bundled,” flat-rate pricing to address this consum-er market, while others are developing alternative solutions. Cancer Treatment Centers of America (CTCA) recently launched an example of a flat-rate di-agnostic testing bundle for consumers, as described in the “High-Performance Pathology for High Value Oncology” Practice Pathway chapter. Their offer-ings include a comprehensive set of pathology and radiology testing with a guaranteed five-day turn-around time, set package price and personalized care plan with suggested next steps, and are priced at $12,200 for a breast cancer patient, $11,400 for colorectal cancer, $14,500 for lung cancer, and $10,000 for prostate cancer.
Meanwhile, insurers are giving patients cash incentives to select lower-cost care: “Some Anthem Blue Cross and Blue Shield members in New Hamp-shire, Connecticut and Indiana can receive $50 to $200 if they get a diag-nostic test or elective procedure at a less expensive facility than the one their doctor recommended. The offer covers nearly 40 services, from standard radiol-ogy tests such as mammograms and MRIs to such surgical procedures as hip and knee replacements, hernia repair, bariatric surgery and tonsillectomies.”11
9“Patients will expect same-day scheduling,” Hospital Access Management, July 1, 201210“Consumers offered cash to pick cheaper care,” The Washington Post, March 27, 2012.11“Consumers offered cash to pick cheaper care,” The Washington Post, March 27, 2012.

Promising Practice Pathways
College of American Pathologists134
The need to satisfy patients as con-sumers making choices about care based on quality, comfort and price represents a completely new dynamic in diagnostic testing. Patients need “retail” level customer services, clearly labeled price tags, one-stop shopping, and timely results.
Lowering Health Care SpendingThe denominator in the value equa-tion is spending, or rather lowering spending through cost savings. Value-based payments are all about the bottom line. So most providers are very focused on lowering their costs these days using means that go beyond the typical chase to stay ahead of reim-bursement cuts.
“According to [the November 2011 HealthLeaders Intelligence Report], 55 percent of leaders said that even with annual cost sav-ings from initiatives over the past three years, they need to pull an additional 4 percent-10 percent out of their operating budgets, and 23 percent said they need to pull an additional 11 percent or more. To achieve this magni-tude of savings – and maintain it – requires organizations to shed reactive, tactical approaches in favor of deliberate, well-planned
approaches. Several health care systems have achieved financial and clinical rewards through dif-ferent approaches--using a value management methodology, shar-ing costs with partners, redesign-ing inpatient care, and leaning on Lean process techniques.”12
In this context, the estimated 8 percent of costs that laboratory, pathology and radiology testing services together comprise13 can be financially mate-rial to a provider organization. If the diagnostic testing service processes or facilities are wasteful, inefficient or oth-erwise driving avoidable costs, leader-ship will be interested in pursuing rem-edies. We can respond by reducing inefficiencies by implementing Lean-programs and integrating services.
Another approach provider organiza-tions are taking to lower their costs and simultaneously respond to the consum-er health care market is to transition services to outpatient care:
“In the early 1990s, outpatient care accounted for only 10 per-cent to 15 percent of hospital revenue, says Guy David, associ-ate professor of health care man-agement at the Wharton School of Business at the University of Pennsylvania. Today, that figure
12Shaping sustainable cost control: HealthLeaders magazine, Health Care Leadership Review, September 1, 201213This estimate is based on IMS Institute for Health Care Informatics’ commercially insured database for outpatient claims, and is discussed in the context of all of spending because outpatient expenditures are almost three times as much as inpatient – 56 percent vs. 20 percent of total costs. Reference – “Health Care Spending Among Privately Insured Individuals Under Age 65,” IMS Institute for Health Care Informatics, February 2012

College of American Pathologists
Promising Practice Pathways
135
14Outpatient care takes the inside track; Ambulatory services continue to account for growing share of systems' revenue, as they work to bring care closer to the customer, Modern Health Care August 6, 2012 15Outpatient care takes the inside track; Ambulatory services continue to account for growing share of systems' revenue, as they work to bring care closer to the customer, Modern Health Care August 6, 2012 16S Snyder and D Stampfli, “Ambulatory care offers significant opportunities for lenders: the rise of outpatient services and other health care trends will strengthen this sector,” The RMA Journal, June 1, 201117Outpatient care takes the inside track; Ambulatory services continue to account for growing share of systems' revenue, as they work to bring care closer to the customer, Modern Health Care August 6, 2012
is closer to 60 percent. It's also a shift that's been happening across the board – sweeping along aca-demic medical centers, commu-nity hospitals, for-profit chains and not-for-profit providers alike.”14
A number of factors are driving this trend. For example, less invasive tech-nologies allow procedures to be per-formed with less need for long-term observation. An estimated 60-70 per-cent of all surgeries are done on an outpatient basis.15
The primary forces moving care to the ambulatory settings are financial, though. Estimates suggest that outpa-tient services provide nearly two-thirds of a hospital’s margin.
“Significant growth in outpatient volumes for imaging, rehabilitation, endoscopy, and other services has created a wave of ambulatory care development by hospitals and other providers (primarily single-service cen-ters such as ambulatory surgery cen-ters, diagnostic imaging centers, and physical therapy satellites).”16
Hospitals and health systems are even developing new health care “malls” that provide patients with the ambu-latory services they need. These malls deliver a retail-quality customer experi-ence and, at the same time, they are reducing the costs of care by focusing specifically on outpatient services.
As an example: “WellStar Health Sys-tem envisions a health care mall, of sorts, where mom can get a mam-mogram, dad can refill his choles-terol medication and junior can get his sports physical, all in the same place.”17
There are a multitude of initiatives pro-viders are pursuing to lower their spend-ing base. What we can take away per-taining to our diagnostic patient testing services is potential opportunities for adding value through reducing costs. These might include moving services from inpatient to ambulatory settings and removing inefficiencies and wastes from our services through integration and Lean programs.
Promising Practice Pathways
College of American Pathologists136
Improving QualityThe numerator in value is quality. Pro-viders in value-based payment pro-grams must manage and improve a range of quality metrics. We have already discussed their need for excel-lence in patient quality measures, so we now turn to the remaining clinical quality issues.
Providers in reform settings get a high return on investing in clinical quality im-provement, whether those investments target particular metrics or reduce avoidable and costly complications. Simply put, relentlessly pursuing high quality is a new priority for value-com-pensated providers.
This need for improved clinical quality also relates to diagnostic testing servic-es. Radiology, pathology, laboratory medicine and other diagnostic testing modalities are typically ordered sepa-rately, performed in different areas, interpreted without the benefit of other patient test results, and reported inde-pendently of each other. In short, the legacy model for diagnostic testing services is a siloed system. This system’s lack of integration can contribute to diagnostic errors that lower quality.
Fragmented Testing and Clinical Errors There are two primary sources of inac-curacies that reduce clinical quality.
The first derives from diagnostic errors when the clinician receives, aggre-gates and interprets patient results. The second comes from diagnostic errors made by the pathologists or radiolo-gists during evaluation and reporting of the test results.
The clinicians’ diagnostic errors are a more frequent and significant problem. As discussed in the “High-Performance Diagnostic Services Practice Pathway,” clinical diagnostic errors include cases in which the clinician misdiagnoses, misses making a diagnosis or experi-ences a clinically significant delay in making a diagnosis.
These errors are common, serious and financially significant. Diagnostic error experts Paul Epner, MBA, MEd, and Mi-chael Astion, MD, PhD write, “A variety of studies, including comparison of au-topsy results with physician diagnoses, suggest that such errors occur in an astounding 10–15 percent of diagnos-tic encounters.”18
Clinical diagnostic errors can have a significant impact on clinical quality:
• They “make up a large fraction of all medical errors and cause sub-stantial suffering and injury,”19
• They “probably cause 40,000-80,000 preventable deaths an-
18Paul Epner, MBA, MEd, and Michael Astion, MD, PhD, “Focusing on Test Ordering Practices to Cut Diagnostic Errors.” Clinical Laboratory News: Reducing Diagnostic Errors, July 201219M Graber, “Diagnostic Errors in Medicine: A Case of Neglect.” Joint Commission Journal on Quality and Patient Safety, February 2005 Volume 31, Number 2
College of American Pathologists
Promising Practice Pathways
137
nually in U.S. hospitals alone, and these estimates fail to account for mortality from ambulatory misdi-agnosis and non-lethal morbidity due to diagnostic error.”20
• They hit the bottom line, sitting in the top three most expensive of all medically adverse events, ac-cording to one investigation.21
• Failure to order appropriate diag-nostic or laboratory tests was a contributing factor in 55 percent of cases.
• Incorrect interpretation [by clini-cians] of diagnostic or laboratory tests contributed to 37 percent of cases.
• Failure to retrieve diagnostic or laboratory test results was a factor in 13 percent of cases.
Furthermore, in a study of diagnostic errors by internists:23
• Cognitive errors were identified as the cause in 92 percent of the wrong diagnosis errors.
• The most common cognitive error was faulty synthesis or processing
of data, comprising 83 percent of identified mistakes.
• A common “faulty data gather-ing” error was clinicians having problems with test coordination.
At the same time, testing is becoming more complex, multimodal and volu-minous as medical science advances our molecular understanding of pa-thology. In turn, diagnosis is becoming more challenging. The task of synthesiz-ing test results is needlessly made more complex when data arrives asynchro-nously and without an integrated inter-pretation.
One example supporting the idea that integrating diagnostic information can lower clinician errors comes from Mi-chael Laposata, MD, PhD. Laposata ran a coagulation interpretive service while at Massachusetts General Hospi-tal that operated as follows: “Informa-tion regarding the patient’s past clinical conditions and other related test results are integrated into the interpretation to provide a clinically relevant, patient specific interpretation of the patient’s laboratory test results.” He reported that 72 percent of the physician users
20AS Tehrani et al. “20-Year Summary of US Malpractice Claims for Diagnostic Errors from 1985-2005,” Diagnostic Error in Medicine, 4th International Conference, October 25, 2011, Chicago, IL21EJ Thomas et al. “Costs of medical injuries in Utah and Colorado,” Inquiry, 1999 Fall;36(3):255-64.22Paul Epner, MBA, MEd, and Michael Astion, MD, PhD, “Focusing on Test Ordering Practices to Cut Diagnostic Errors,” Clinical Laboratory News: Reducing Diagnostic Errors, July 201223M.L. Graber, N. Franklin, and R. Gordon, “Diagnostic error in internal medicine,” Archives of internal medicine, vol. 165, Jul. 2005, pp. 1493-9
Promising Practice Pathways
College of American Pathologists138
he surveyed “felt that the interpretation helped avoid a misdiagnosis.”24
Cancer diagnostics are also moving towards test integration. As multiple test modalities beyond histopathol-ogy began driving the diagnosis and treatment decisions of hematologic cancers, the need for a new approach to integrating findings grew stronger. Diagnostic reporting quickly moved to patient-centered, integrative, interpre-tive summaries that incorporated lymph node and bone marrow evaluations, flow cytometry, cytogenetics, molecu-lar testing, FISH, etc. Once hem-oncs were aware of this alternative service, they responded with a tremendous de-mand for these integrated reports.
Fragmented Testing and Diagnostic ErrorsHematologic malignancies also pro-vide an illustration of the second source of errors deriving from testing services fragmentation: errors made by either pathologists or radiologists in evaluating test results. Given the diversity of tests involved in diagnos-ing hematologic malignancies, an integrated approach to analyzing and interpreting the findings and preparing a comprehensive report is critical.
A report by a Health and Human Ser-vices department panel25 asserted that, “Improvements to the collabora-tive workflow processes between ra-diologists and pathologists are critical in cancer diagnoses. Implementing a system or process that allows optimal communication exchange between radiology and pathology will provide immediate benefits for practitioners and patients.”26
The United Kingdom has linked its diag-nostic error problems in hematologic malignancies to fragmented diagnos-tic testing and launched an initiative to create integrated hematopathology testing centers about ten years ago.27
This theme of diagnostic integration will only accelerate as digital pathol-ogy and information technology/cloud computing disseminate widely. Not only will we have digital imaging, but informatics will merge and integrate sequencing data, laboratory data, and clinical data.
Further, image-guided biopsies are driving radiology and pathology to-gether. These biopsies have become increasingly popular, usurping surgical biopsies in recent years. According
24M Laposata et al. Arch Pathol Lab Med 2004. 128:1424-142725The ASPE (Assistant Secretary for Planning and Evaluation) Technical Expert Panel on Improving Cancer Policy Research through Information Technology26“The Importance of Radiology and Pathology Communication in the Diagnosis and Staging of Cancer: Mammography as a Case Study,” The ASPE Technical Expert Panel on Improving Cancer Policy Research through Information Technology, November 201027Robin Ireland, “Haematological malignancies: the rationale for integrated haematopathology services, key elements of organization and wider contribution to patient care,” Histopathology 2011, 58, 145–154

College of American Pathologists
Promising Practice Pathways
139
to the Radiological Society of North America, even in 2008 radiologists were performing about 55 percent of all biopsies.28
The International Society for Strategic
Studies in Radiology puts the need suc-cinctly: “What is required is a new con-cept of “integrated diagnostics”: the convergence of imaging, pathology, and laboratory tests with advanced information technology (IT).”29
28SW Kwan et al. “Effect of Advanced Imaging Technology on How Biopsies Are Done and Who Does Them,” June 29, 2010, doi: 10.1148/radiol.1009213029GP Krestin et al. “Integrated diagnostics: proceedings from the 9th biennial symposium of the International Society for Strategic Studies in Radiology,” Eur Radiol, published online June 2012
Promising Practice Pathways
College of American Pathologists140
MARkET OPPORTUNITY
We have the opportunity to launch a new model of diagnostic testing cen-ter, in collaboration with our radiologist colleagues. This patient-centered, inte-grated diagnostics service center is a powerful business opportunity because it answers multiple market needs, such as improving quality, decreasing costs and increasing consumer business, for multiple stakeholder groups.
Although traditionally pathology and radiology have had challenges col-laborating professionally, given the move away from fee-for-service and toward a value-based market many turf battles between specialties may be minimized as incentives realign. Par-ticularly in ACO settings, the incentives are no longer to perform as many tests as possible or increase patient referrals, as the top line is not what drives com-pensation.
We believe that as the business incen-tives drive both specialties toward col-laboration, legacy competitive issues can be overcome.
The value-based purchasing market is not well served by a fragmented, in-convenient, inefficient diagnostic test-ing patient services model. The market
needs a testing service model that:
1) Provides a high quality patient experience, given the importance of these measures in the value marketplace.
2) Can attract health care consum-ers with “retail-like” services at relatively lower price points and high quality.
3) Can help lower health care spending, perhaps with efficien-cies or by moving services to am-bulatory settings.
4) Can help improve diagnostic ac-curacy and overall clinical quality.
Meanwhile, as science and technol-ogy push diagnostic testing modali-ties together, we are on the brink of integrating diagnostic interpretation through information technology. Also, we appear interested in collaborations with radiologists. According to a 2009 CAP survey, 88 percent of responding pathologists indicated that they would like to review radiologic images.30
This is evidenced through a collab-orative effort between radiology and pathology at the University of Kan-
30College of American Pathologists , Diagnostic Intelligence and Health Information Technology (DIHIT), June 2009 survey
College of American Pathologists
Promising Practice Pathways
141
sas, described in a later section in this document. In this example radiologists and pathologists have crossed their re-spective borders and recognized that they are not competing practices but rather complements of one another with congruent goals.
So the pieces seem to be coming to-gether for us to take action and de-velop a new, integrated patient testing model that addresses these market needs and takes advantage of the technology winds that are blowing.
Synthesizing all of these market dynam-ics, one clear picture for our market opportunity emerges – an ambulatory, integrated patient diagnostic services center (IPDSC, or “The Center”). In this model, pathologists and radiologists would collaboratively operate free-standing centers that offer convenient, high quality, efficient, “one-stop” diag-nostic testing for a particular disease area or diagnostic question.
Our “Patient Diagnostic Services Cen-ter” Practice Pathway provides the rationale and, ultimately, a guide for developing these IPDSCs.
In this section we’ll look at:
• The Center as a disruptive idea whose time has come.
• Design elements for The Center.
• Market segments and types of Centers.
• Business considerations and mar-ket estimates.
The Center – A Disruptive Innovation for a Ready MarketTo our knowledge, there are not yet any examples in the United States of integrated (e.g., pathology and im-aging) patient testing centers that address the market needs we’ve de-scribed. This likely reflects the timing of market demand.
It is only recently that 1) a critical mass of consumers with high-deductible health plans paying first dollar for im-aging tests (except preventive screen-ing) has emerged, and 2) a critical mass of provider organizations such as ACOs paid based on value and look-ing to move to patient-friendly, ambu-latory services has become a reality. Without the economic demand for higher quality, lower costs, and/or retail services, sufficient financial impetus for re-engineering patient testing services probably would not be available.
But given the market dynamics, there is financial impetus. Further, there is a need for a disruptive innovation in the diagnostic services arena that will help shape and strengthen this new value-based market by acknowledging that there is a new set of consumers to cater to. In fact, there is a need for disruption across the entire health care services arena:
“With a rapidly aging population increasing demand for services and highlighting system inad-equacies, traditional approaches to cost containment, such as provider discounts and cost shift-ing, will not suffice,” writes David
Promising Practice Pathways
College of American Pathologists142
Gruber, MD, director of the health care industry group of global professional services firm Alvarez & Marsal, and author of the report, “Getting Much Closer to the Cost Precipice,” which provides a de-tailed look at why the options on the table will not accomplish what they are supposed to.
"While the Affordable Care Act is often held up as the solution to the country’s health care costs problem, Gruber said, the real solutions will come from business leaders in local communities find-ing business models that will dis-rupt the system.
“The question is, given where we are today and given where the marketplace is going, who will be best positioned to take advan-tage of those changes that are inevitably going to come,” he said. “What you need is the inno-vator.”31
An Innovative Center Example: Before Its TimeA case-in-point was made back in 2008 by the then founder and chair of a rapid diagnostic testing center for breast and prostate cancer: Ronald S. Weinstein, MD, Chairman of UltraClinics Inc. Using digital pathology, based on an award-winning technology from the
University of Arizona for digitizing slides called “DMetrix,” and microwave-based rapid tissue processing, these clinics provide answers on biopsies within 24 hours of the biopsies being taken, alleviating the agony of waiting and anxiety for the majority of patients. The model incorporates integration of imaging and pathology, as well as a laser focus on what the founder had identified as the most important pa-tient issue in mammography biopsies: waiting for results.
Three years post the 2005 launch, although UltraClinics’ model was oper-ating well from the patient, technical and clinical standpoints, it was not yet generating the volume they anticipat-ed. A journalist who explored the Ultra-Clinics story concluded, “UltraClinics, for now, is an example of the inertia that can strike medical advances – not because the core ideas don’t work, but because the health care delivery apparatus isn’t designed or prepared to support them. The irony is that while UltraClinics sits more or less motionless, its founder is almost certainly correct when he says that what the company offers is a model for how medicine will be practiced, perhaps in the near future.”32
In fact, Weinstein was quite prescient in his identification that consumer demand was the missing ingredient
31Bouchard, Stephanie, “Disruptive innovation needed to rein in care costs, change system.” Health Care Finance News, June 7 2012.32George Wiley, “UltraClinics: Same-day Cancer Diagnosis in Search of a Market,” ImagingBiz, January 15, 2008

College of American Pathologists
Promising Practice Pathways
143
for the business model: “UltraClinics is dependent on patient-driven health care and patients having a health care account. That is the carrot for us, and we’re trying to design a business model that will thrive in that environ-ment. … The people behind UltraClin-ics like to believe – and probably pray for – the day when consumer-driven health care is available on a wide ba-sis. That’s necessary if we’re going to bundle these services.”33
Currently, UltraClinics does not appear to be in commercial operations, at least as can be determined by public websites. While other, isolated, same-day, integrated imaging and biopsy services may exist in the United States, commercial centers are not prominent or widespread.
However, rapid assessment breast clinics, relying mostly on a triple assess-ment of clinical examination, mam-mography and fine needle aspiration, are relatively common in parts of Eu-rope, for example. In fact, developed regions outside of the United States commonly employ comprehensive pa-tient testing centers that include imag-ing, pathology and laboratory testing, according to experts in the area, such as Karim E. Sirgi, MD, President, UniPath P.C.34
Design for a New ModelAs depicted in Figure 1, our integrated
patient diagnostic services center would address the four market needs as follows:
1. High quality patient experience:
• Rapid results – some centers might focus on being same-day or “rapid” clinics, such as rapid breast clinics in Europe, where patients can get mammograms and preliminary biopsy results if indicated within one-two days. Regardless, generating test re-sults as soon as possible will be a top priority.
• High quality – the clinical quality of the testing center’s services will be important to patients and consumers and evident in the sophistication of technology and testing used, staff creden-tials, ubiquity of Lean and Six Sigma throughout operations (and transparent in patient service flow), and use of digital pathology and radiology for quality control consultations.
2. Attracting health care consumers:
• Conveniences – e.g., commu-nity and ambulatory setting, same-day scheduling, coor-dination of all types of testing, onsite daycare, free and ample parking, extensive patient edu-
33George Wiley, “UltraClinics: Same-day Cancer Diagnosis in Search of a Market,” ImagingBiz, January 15, 200834G2 Intelligence interview with Karim E. Sirgi, M.D., President, UniPath P.C., May 24, 2012
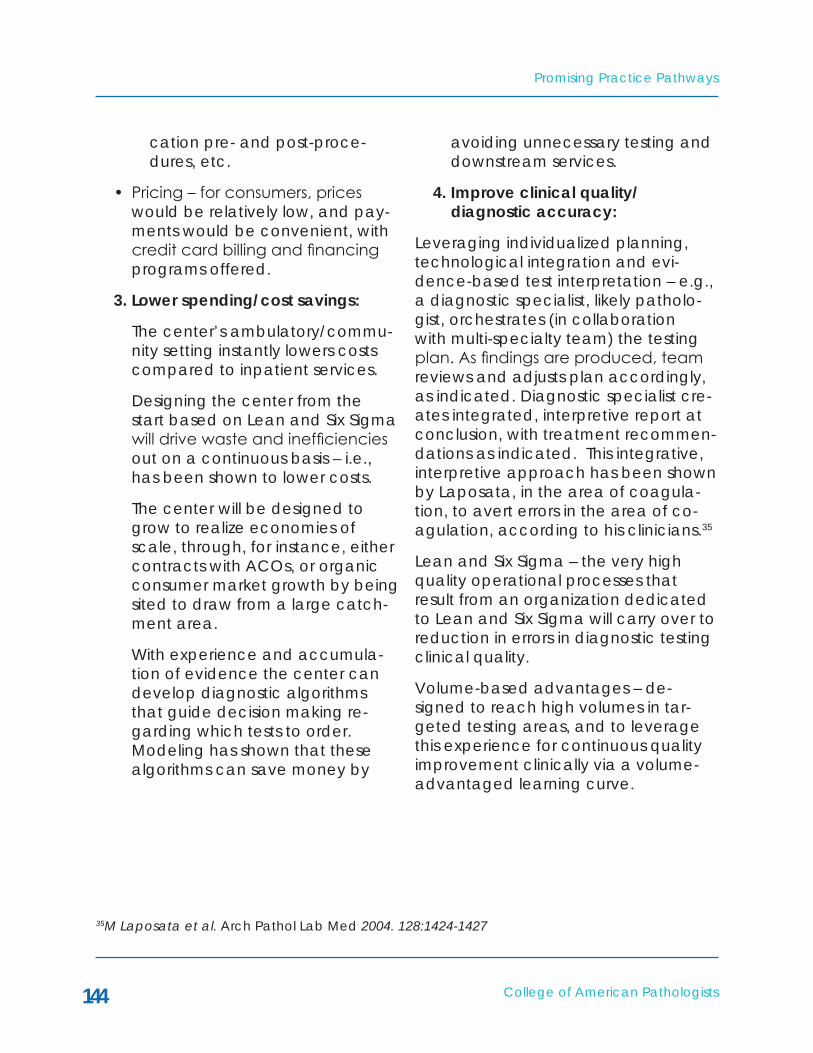
Promising Practice Pathways
College of American Pathologists144
cation pre- and post-proce-dures, etc.
• Pricing – for consumers, prices would be relatively low, and pay-ments would be convenient, with credit card billing and financing programs offered.
3. Lower spending/cost savings:
The center’s ambulatory/commu-nity setting instantly lowers costs compared to inpatient services.
Designing the center from the start based on Lean and Six Sigma will drive waste and inefficiencies out on a continuous basis – i.e., has been shown to lower costs.
The center will be designed to grow to realize economies of scale, through, for instance, either contracts with ACOs, or organic consumer market growth by being sited to draw from a large catch-ment area.
With experience and accumula-tion of evidence the center can develop diagnostic algorithms that guide decision making re-garding which tests to order. Modeling has shown that these algorithms can save money by
avoiding unnecessary testing and downstream services.
4. Improve clinical quality/ diagnostic accuracy:
Leveraging individualized planning, technological integration and evi-dence-based test interpretation – e.g., a diagnostic specialist, likely patholo-gist, orchestrates (in collaboration with multi-specialty team) the testing plan. As findings are produced, team reviews and adjusts plan accordingly, as indicated. Diagnostic specialist cre-ates integrated, interpretive report at conclusion, with treatment recommen-dations as indicated. This integrative, interpretive approach has been shown by Laposata, in the area of coagula-tion, to avert errors in the area of co-agulation, according to his clinicians.35
Lean and Six Sigma – the very high quality operational processes that result from an organization dedicated to Lean and Six Sigma will carry over to reduction in errors in diagnostic testing clinical quality.
Volume-based advantages – de-signed to reach high volumes in tar-geted testing areas, and to leverage this experience for continuous quality improvement clinically via a volume-advantaged learning curve.
35M Laposata et al. Arch Pathol Lab Med 2004. 128:1424-1427
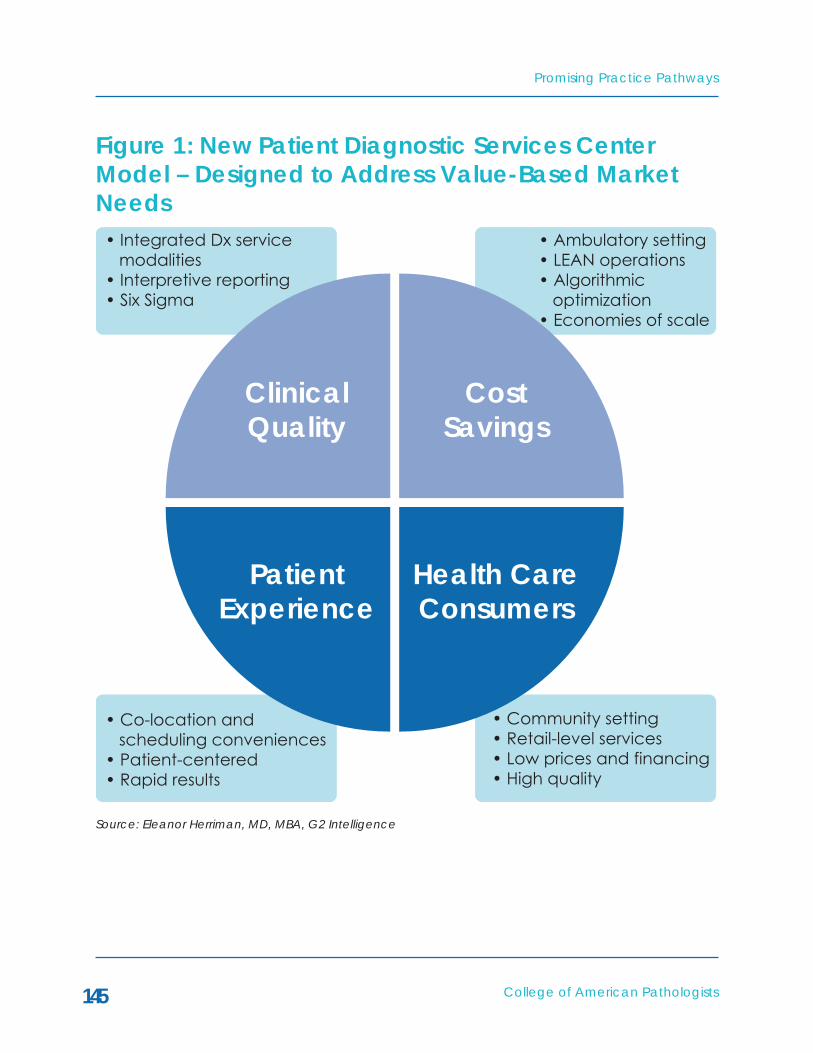
College of American Pathologists
Promising Practice Pathways
145
Figure 1: New Patient Diagnostic Services Center Model – Designed to Address Value-Based Market Needs
ClinicalQuality
CostSavings
Health CareConsumers
PatientExperience
• Integrated Dx service modalities• Interpretive reporting• Six Sigma
• Co-location and scheduling conveniences• Patient-centered• Rapid results
• Community setting• Retail-level services• Low prices and financing• High quality
• Ambulatory setting• LEAN operations• Algorithmic optimization• Economies of scale
Source: Eleanor Herriman, MD, MBA, G2 Intelligence
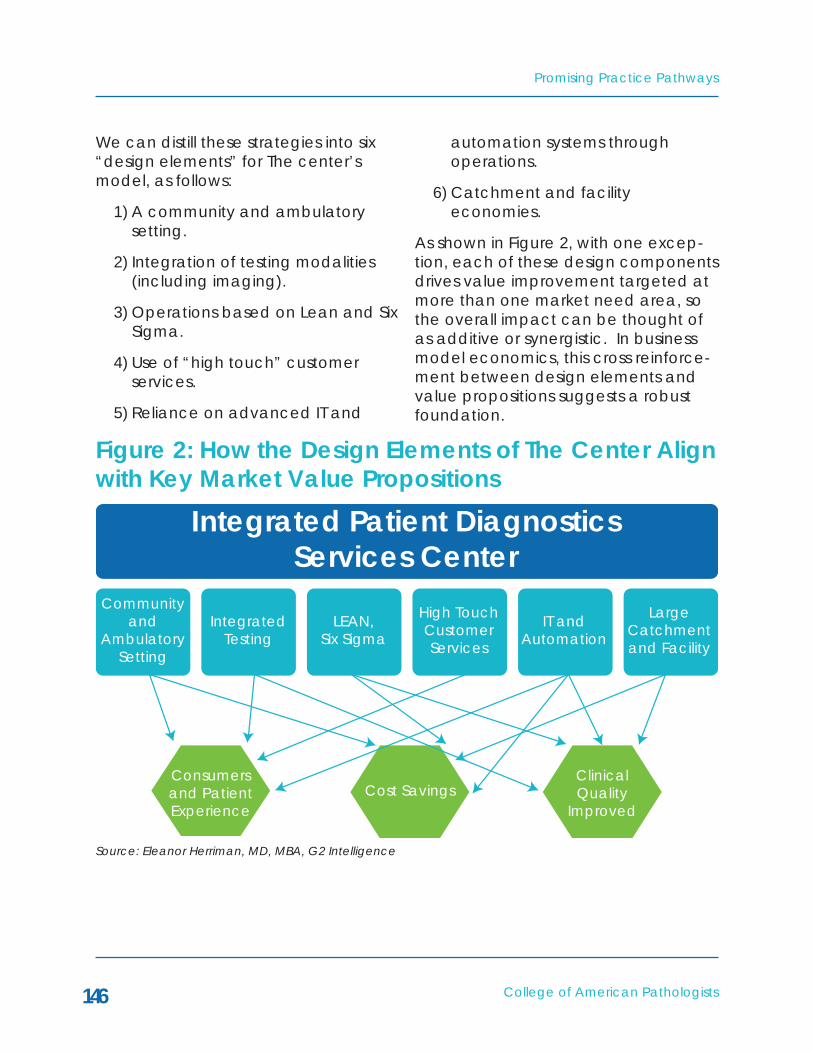
Promising Practice Pathways
College of American Pathologists146
Figure 2: How the Design Elements of The Center Align with key Market Value Propositions
We can distill these strategies into six “design elements” for The center’s model, as follows:
1) A community and ambulatory setting.
2) Integration of testing modalities (including imaging).
3) Operations based on Lean and Six Sigma.
4) Use of “high touch” customer services.
5) Reliance on advanced IT and
automation systems through operations.
6) Catchment and facility economies.
As shown in Figure 2, with one excep-tion, each of these design components drives value improvement targeted at more than one market need area, so the overall impact can be thought of as additive or synergistic. In business model economics, this cross reinforce-ment between design elements and value propositions suggests a robust foundation.
Integrated Patient DiagnosticsServices Center
Communityand
AmbulatorySetting
IntegratedTesting
LEAN,Six Sigma
High TouchCustomerServices
IT andAutomation
LargeCatchmentand Facility
Consumersand PatientExperience
Cost SavingsClinicalQuality
Improved
Source: Eleanor Herriman, MD, MBA, G2 Intelligence

College of American Pathologists
Promising Practice Pathways
147
Market Analysis: Market Segments and Types of Testing Centers Given the multiple value propositions offered by our vision for a patient diagnostics center, there are several stakeholder groups who might be clients, partners or investors. Our po-tential markets include ACOs, hospitals and health care systems, academic medical centers, health plans, physi-cian organizations, consumers, private investors, and radiology imaging com-panies.
We can also analyze our patient diag-nostics services center market in terms of the types of centers, as there can be a spectrum of “flavors” along two dimensions (see Figure 3):
• The “conditions or therapeutic ar-eas” dimension – the center might be a breast clinic with mammog-
raphy and biopsies and rapid results, or a broader therapeutic specialty area such as gastro-enterology or hematologic ma-lignancies, or a “one-stop shop” evaluation for newly discovered masses.
• The “value proposition” dimension – the testing center might focus more toward the clinical accu-racy, cost savings and streamlined testing operations or toward con-sumer services and low pricing for test bundles.
As the purpose of the pathways is to ensure our participation in the value marketplace, we want to advance our patient testing services model toward delivering and documenting improve-ments in quality and decreases in costs.
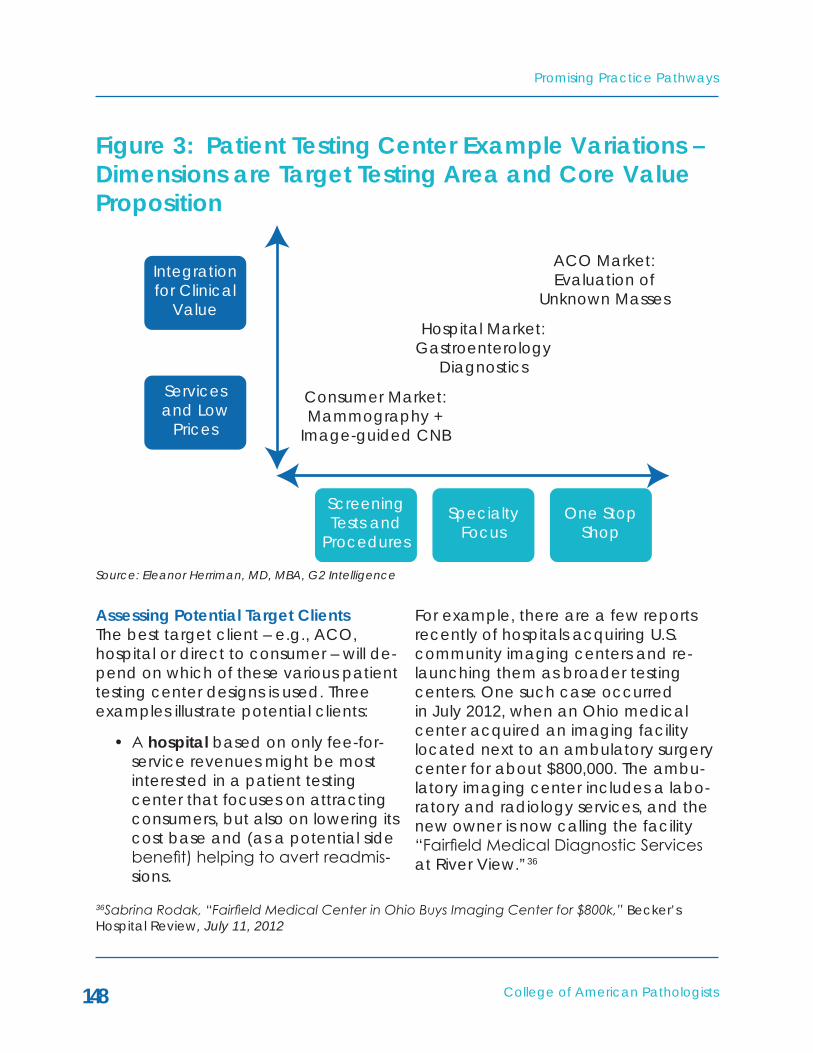
Promising Practice Pathways
College of American Pathologists148
Figure 3: Patient Testing Center Example Variations – Dimensions are Target Testing Area and Core Value Proposition
Assessing Potential Target ClientsThe best target client – e.g., ACO, hospital or direct to consumer – will de-pend on which of these various patient testing center designs is used. Three examples illustrate potential clients:
• A hospital based on only fee-for-service revenues might be most interested in a patient testing center that focuses on attracting consumers, but also on lowering its cost base and (as a potential side benefit) helping to avert readmis-sions.
For example, there are a few reports recently of hospitals acquiring U.S. community imaging centers and re-launching them as broader testing centers. One such case occurred in July 2012, when an Ohio medical center acquired an imaging facility located next to an ambulatory surgery center for about $800,000. The ambu-latory imaging center includes a labo-ratory and radiology services, and the new owner is now calling the facility “Fairfield Medical Diagnostic Services at River View.”36
ScreeningTests and
Procedures
Servicesand Low
Prices
Integrationfor Clinical
Value
Consumer Market:Mammography +
Image-guided CNB
Hospital Market:Gastroenterology
Diagnostics
ACO Market:Evaluation of
Unknown Masses
SpecialtyFocus
One StopShop
Source: Eleanor Herriman, MD, MBA, G2 Intelligence
36Sabrina Rodak, “Fairfield Medical Center in Ohio Buys Imaging Center for $800k,” Becker’s Hospital Review, July 11, 2012
College of American Pathologists
Promising Practice Pathways
149
• An ACO might be most interested in a patient testing center that offers value in the form of cost savings and improved outcomes through better diagnostic accu-racy.
• The new health care consum-ers with high-deductible plans, numbering about 13.5 million as of May 2012,37 will be interested in value, too, in the form of low test-ing prices and high quality, along with conveniences and good service.
The ACO and hospital market seg-ments are likely the most interesting in the near term, with consumers being a close third. Let’s briefly review the ACO sector, although we have covered this topic in other pathway chapters, par-ticularly in the “Coordination Popula-tion Care Services” practice pathway chapter.
The ACO market is substantial, growing quickly, and dominated by the private sector. Many analysts estimate there are now more than 300 operating ACOs in the country. Susan Dentzer, editor of Health Affairs, remarked at the Third National Accountable Care Organization Summit in June 2012, “300
ACOS are now up and running, they are no longer unicorns.”38
Furthermore, given that “ACO news releases show increased activity by payers in the expansion of their ACO partnering with providers and providers showing growth in the number of phy-sicians joining an established ACO,” and that “more than 400 organizations have submitted notices to apply for the CMS 2013 ACO program,” some analysts expect there to be up to 600 ACOs in 2013.39
According to Leavitt Partners’ track-ing of 221 ACOs as of May 2012, these ACOs were sponsored by hospitals (53 percent), physician groups (31 percent), payers (13 percent) and community-based organizations (2 percent).40
ACOs sponsored by physician groups may be particularly interested in our patient testing centers, because they are particularly focused on provid-ing as many services as possible in an ambulatory setting, and do not have legacy inpatient imaging units to navi-gate in this regard.
As we discussed earlier in the chapter, the hospital market is also an attrac-
37Press Release: “Health Savings Account Enrollment Reaches 13.5 Million,” America’s Health Insurance Plans, May 30, 201238Patricia Salber, “I Think I Saw a Unicorn – An Update on ACOs,” The Doctor Weighs In, June 10, 201239Jim Bloedau, “ACO Market Will More Than Double in 2013 by Jim Bloedau,” Information Advantage Group, August 9, 201240David Muhlestein et al. “Growth and Dispersion of Accountable Care Organizations: June 2012 Update,” Leavitt Partners, June 2012
Promising Practice Pathways
College of American Pathologists150
tive opportunity, because hospitals are pursuing new sources of ambulatory service revenues, especially those that might attract consumers. This may be an ideal opportunity for those of us in community pathology groups con-tracted with hospitals, as we could propose the development of a com-munity patient testing facility designed to best meet the needs of our hospital.
Business Considerations and Market Estimates This practice pathway is different from the others in that it is based primarily on testing services, although integrat-ed with imaging and in some cases endoscopic procedures. In fact, in its “complete form,” it comprises a pa-tient testing services facility. As such, its revenues will be based on some mix of “fee for service” and value-based or global payment structures, depending on the clientele.
The revenue model for a particular testing center will depend entirely on the type of center and client. There are many, many permutations that might be negotiated given the many potential configurations, market seg-ments and payment models. For ex-ample:
• For an ACO, the model may be a mix of fee for service testing rev-enues, as well as shared savings if performance targets are met.
• Or, an ACO agreement might involve a capitated contract for diagnostic testing services for some range of conditions, or for all
image-guided diagnostic testing, for example, with a bonus compo-nent of shared savings.
• For a hospital-owned patient test-ing center, the revenue model might be performance-based. For example, employees of the cen-ter might receive bonuses based on the center’s revenue or value performance targets.
As a result, estimating the size of this market opportunity is not easy. As with all market estimates, we need to cave-at that these rely on multiple assump-tions, by necessity, and this should be taken as only high-level indicators of the potential revenues available.
We analyzed the market using both a “top down” and “bottom up” meth-odology, as a means to increase the estimates’ accuracy. Given that the estimates employ very different ap-proaches, the fact that their market revenue totals are close to each other, $17B vs. $19B, supports the analysis.
We focused both analyses on the market for cancer diagnostics based on the following assumptions, which suggest lower cost diagnostic testing centers will be a growth market over the next 10 years:
• The demographics of aging Baby Boomers is driving increases in cancer.
• The trend towards high-deductible insurance is shifting consumers towards paying more of their own health bills.
College of American Pathologists
Promising Practice Pathways
151
The patient integrated diagnostic test-ing center market estimates that we provide here are restricted to centers offering services for diagnosing major cancers, such as breast, lung, colon, hematologic cancers, and other solid tumors diagnosed by fine needle biop-sies. Note, however, that these markets do not include all cancers (such as prostate), nor do they include com-plete work-ups of cancers, gastroen-terology, or other complex diagnostic conditions, such as coagulation dis-orders, stroke, neurologic diseases, or developmental disorders.
Top Down Market AnalysisOur “top down” method estimates di-
agnostic testing services using a series of assumptions to estimate the share of outpatient, per capita expenditures in ACOs for radiology, pathology and laboratory that might comprise these services. As this method does not ac-count for colonoscopies, it is lower than it should be.
The benefit of starting with the ACO market is we also have a size estimate for this target market segment. In 2013, we estimate that patient diagnostic testing services for these cancers might represent about $820,000. We then scale up for the entire country, to get an estimate of $17 billion for adults (See Figure 4).

Promising Practice Pathways
College of American Pathologists152
Figure 4: Patient Testing Center Market Estimate #1: Top Down ACO Methodology
Patient Testing Center Top Down Market Estimate 2013 2014 2015 2016 2017
Medicare ACOsEstimated number of CMS ACOs
154 350 450 500 550
Estimated number of covered lives per ACO
15,000 15,000 15,000 15,000 15,000
Estimated per capita medical expenditures for Medicare beneficiaries in 2013
$11,000 $11,400 $12,012 $12,613 $13,243
Radiology – 4 percent of spend (IMS outpatient date)
$440 $458 $480 $505 $530
Assume ~40 percent is relevant to cancers (about 50 percent of radiology costs are for chronic conditions in outpatient
$176 $183 $192 $202 $212
Imaging for major cancers per person per yr Lab and Path – 4 percent of spend (IMS outpatient data)
$440 $458 $480 $505 $530
40 percent is esoteric, AP $176 $183 $192 $202 $212Assume 50 percent is relevant to major cancers
$88 $92 $96 $101 $106
Lab and path for major cancers per person per yr
$88 $92 $96 $101 $106
Imaging + lab and path for major cancers pppy
$264 $275 $288 $303 $318
Assume ~50 percent of path/lab + imaging for new work-ups/diagnostic questions
$132 $137 $144 $151 $159
CMS ACOs revenue opportunity
$304,920,000 $720,720,000 $972,972,000 $1,135,134,000 $1,311,079,770
Source: Eleanor Herriman, MD, MBA, G2 Intelligence

College of American Pathologists
Promising Practice Pathways
153
2013 2014 2015 2016 2017Private Market ACOs
Estimated number of private market ACOs
300 400 500 550 600
Estimated number of covered lives per ACO
30,000 30,000 30,000 30,000 30,000
Estimated per capita medical expenditures for commercial beneficiaries
$4,800 $5,040 $5,292 $5,557 $5,834
Radiology – 4 percent of spend (IMS outpatient data)
$192 $202 $212 $222 $233
Assume ~40 percent is relevant to cancers (about 50 percent of radiology costs are for chronic conditions in outpatient)
$77 $81 $85 $89 $93
Imaging for major cancers per person per yr Lab and Path – 4 percent of spend (IMS outpatient data)
$192 $202 $212 $222 $233
40 percent is esoteric, AP $77 $81 $85 $89 $93Assume 50 percent is relevant to major cancers
$38 $40 $42 $44 $47
Lab and path for major cancers per person per yr
$38 $40 $42 $44 $47
Imaging + lab and path for major cancers pppy
$115 $121 $127 $133 $140
Assume ~50 percent of path/lab + imaging for new work-ups/diagnostic questions
$58 $60 $64 $67 $70
Private ACOs revenue opportunity
$518,400,000 $725,760,000 $952,560,000 $1,100,260,800 $1,260,236,880
Total ACOs revenue opportunity
$823,320,000 $1,446,480,000 $1,925,532,000 $2,235,340,800 $2,571,316,650
Total ACO patients 11,310,000 17,250,000 21,750,000 24,000,000 26,250,000Population over 18 yrs old (US Census 2010)
234,000,000 234,000,000 234,000,000 234,000,000 234,000,000
Patient: testing center revenues (major cancers) for entire U.S. population
$17,034,206,897 $19,621,815,652 $20,716,068,414 $21,794,572,800 $22,921,451,280
Source: Eleanor Herriman, MD, MBA, G2 Intelligence

Promising Practice Pathways
College of American Pathologists154
Bottom Up Market AnalysisOur “bottom up” method uses statistics regarding the number of procedures, biopsies and other tests regarding these cancers, along with average re-imbursement fees, to sum a total reve-nue opportunity by volume of patients.
Using this methodology, see Figure 5, we obtain a total revenue estimate for 2013 of $19 billion for potential patient integrated diagnostic testing centers, about 6 percent different from our first estimate.
Figure 5: Patient Testing Center Market Estimate #6: Bottom Up MethodologyPatient Testing Center Bottom Up Market Estimate 2013
Imaging or Procedures
Est. Price of Test/ Procedure
Diagnostic Biopsies
Est. Price of Test
Est. Revenue
Breast 22,000,000 $400 1,000,000 $150 $8,950,000,000Chest 30,000,000 $35 530,901 $150 $1,129,635,216Colon 3,700,000 $2,000 6,000,000 $150 $8,060,000,000RNA 1,021,985 $150 $153,297,791
Hematologic CancersBone marrow evals – path 1,400,000 $150 $211,000,000Bone marrows – outpatient procedures 2010
950,000 $150 $145,500,000
Lymph node evals – path 1,200,000 $150 $180,000,000Lymph node biopsies – outpatient procedures 2010
96,373 $300 $28,911,900
Leukemias and lymphomas (new work-ups except nodes and marrows; assumes 149,230 at ~1,000 each)
$1,000 $149,230,000
Patient testing center revenues (select and major cancers) for entire U.S. population
$19,004,574,907
Source: Eleanor Herriman, MD, MBA, G2 Intelligence
College of American Pathologists
Promising Practice Pathways
155
Applying the EstimatesAs challenging as it is to develop mar-ket estimates for a diverse and emerg-ing marketplace, so it is for applying them to the business considerations of our innovative practice pathway. But disruptive and innovative ideas have succeeded before and, over time, patterns have emerged as to how to size their market share before they come to fruition.
One rule of thumb from venture busi-ness investing is that targeting a 1 percent share of a market with a dis-ruptive idea such as this, if well mar-keted, is not unreasonable. Taking an average of our two market estimates, that would be 1 percent of $18 billion, or $180 million in annual revenues that might be generated through a sub-stantially resourced patient integrated diagnostic testing center business.

Promising Practice Pathways
College of American Pathologists156
PRACTICE PATHWAY: INTO THE PATIENT DIAGNOSTIC SERVICES CENTER
Our “Patient Diagnostic Services Cen-ter” Practice Pathway offers us an en-try into the future of diagnostic services both clinically and commercially. All indicators point to imaging, pathology, and molecular diagnostics converg-ing through computing in some way, perhaps to start with cross-commu-nications between pathologists and radiologists. Given that image-guided biopsies are becoming the standard approach, having close collaborations between pathologists and radiologists is essential. While there is little justifica-tion for keeping pathology and radiol-ogy patient testing services so discon-nected, there are many reasons for integrating them.
This is a sentinel opportunity for us to take the initiative in identifying a mar-ket need, a technology trend, and an evidence-based, pathology-led solution that can generate value for
our employers, institutional leaders, or owners.
Pathway Operations: How the Patient Diagnostic Service Pathway WorksThe operational aspects of the diag-nostic center are not complex from a business standpoint. They involve assembling an experienced manage-ment team with expertise in functions that are well established, such as deliv-ering excellence in customer services and Lean and Six Sigma operations. Alternatively, consultants and training courses can be employed to trans-fer these skills to the staff involved in launching the facility.
The more challenging components of the center involve optimizing the plan-ning, integration and reporting of the various types of testing. Figure 6 shows a simple schematic of the patient ser-vice center workflow:

College of American Pathologists
Promising Practice Pathways
157
Figure 6: Schematic of Patient Diagnostic Testing Center Operational Flow
Scheduling andReception −
“Retail” LevelServices
Phase 1: ApplyDiagnostic Testing
Algorithm andDevelop Testing
Plan
Phase 2: PatientTesting FlowIntegration
Phase 4: ReportIntegration
Phase 3: Evaluation,Cross Review,
Interpretation andIntegration of
Results
Source: Eleanor Herriman, MD, MBA, G2 Intelligence

Promising Practice Pathways
College of American Pathologists158
This workflow follows four key phases.
Phase 1: Apply Diagnostic Testing Algorithm and Develop Testing Plan
The first phase in the process marks an important area of advancement in terms of employing evidence-based medicine and informatics to generat-ing value. This step is led by the as-signed “Senior” diagnostic specialist, presumably a specialist pathologist, depending on the case, and entails re-viewing the patient’s history and prior clinical testing, then applying devel-oped diagnostic algorithms that guide test plans based on a number of case variables.
The sophistication of such algorithms can vary widely, but one can envision that these computerized algorithms can become the codified, intellectual property representation of the experi-ence the patient services center gen-erates in diagnosing cases over time. As the center learns which tests are more or less helpful, for which patients, and in which order, based on which risk factors, these algorithms become one of the foundations for improved quality and cost avoidance.
The International Society for Strategic Studies in Radiology proceedings ad-vocate for these algorithms:
“To date, there is too little coor-dination between the medical specialties responsible for ordering
and performing these tests, nor is there enough consideration as to the optimal order of tests. This will change in a world of integrated diagnostics, where, instead of relying on individual provider bias in the selection of tests, data from diverse sources will be used to determine the most efficient di-agnostic algorithms. … Algorithms should start with the least expen-sive tests that will narrow down the possibilities and effectively increase the positive predictive value of subsequent tests. Each test in a diagnostic algorithm should break the tested popula-tion into smaller subpopulations with specific phenotypes, or sets of observable traits, for which the associated risks of disease are better defined. … Determining the optimal use of diagnostic tests will require heavy use of IT to calcu-late the probabilities and discern linkages between data and dis-ease, because the complexity of the data precludes depending solely on intuition and experi-ence.”41
Bruce Friedman, MD, Emeritus Profes-sor of Pathology at University of Michi-gan Medical School, and longtime proponent of integrated diagnostic centers, which he terms “IDCs,” wrote in a recent presentation describing an IDC: “Assume that sequencing of tests/procedures will be managed by IDC
41GP Krestin et al. “Integrated diagnostics: proceedings from the 9th biennial symposium of the International Society for Strategic Studies in Radiology,” Eur Radiol, published online June 2012

College of American Pathologists
Promising Practice Pathways
159
computer algorithms based on proto-cols and positive results.”42
Phase 2: Patient Testing Flow Integration
Phase 2 follows the test plan devel-oped in the first phase by the diagnos-tic specialist and computer algorithm. The key value points here are to have operations be as efficient and error-free as possible (Lean) and as pleasant as possible from a patient experience perspective. In terms of efficiency, it can be built in and it can evolve through continuous improvement as the group applies the lessons it learns from experience to make small, posi-tive changes that add up to a large value.
Phase 3: Evaluation, Cross Review, Interpretation and Integration of Results
Phase 3 is the heart of the pathologist and radiologist integration phase, so this phase involves close communica-tion and coordination between the two as they evaluate what may be multiple tests from the same patient. There are a number of ways this inte-gration might occur, especially given the flexibility offered by digital com-munications. Indeed the integration and communication can be virtual, as digital pathology can now be easily implemented.
As we’ll describe in the next section, there are groups such as University of
California Los Angeles (UCLA) working on technology platforms and work-flows that explicitly map the back and forth of imaging and pathology evalu-ations, cross reviews of the other’s re-ports, and reinterpretations as needed due to discordances.
This integrative evaluation phase in-volves three key functions for an indi-vidual patient case:
• The pathologist and radiologist review each other’s interpreta-tions before they are completed to check for discordance and ensure accurate specimen sam-pling in the case of image-guided biopsies.
• Based on test results, and the cen-ter’s algorithm, the team makes decisions regarding what other tests to order.
• Upon completion of all testing, the diagnostic team reviews all test results and the clinical data and generates a diagnostic interpreta-tion.
Phase 4: Report Integration
Phase 4 is comprehensive, integrated reporting, which we have also dis-cussed. One issue to emphasize here is the importance to patients in cancer settings of getting results back as soon as possible. As an example, in Fried-man’s description of his model IDC, he
42Bruce Friedman, MD, Presentation, “Integrated Diagnostics and Its Relationship to Digital Pathology: A Strategic Analysis,” April 27, 2012

Promising Practice Pathways
College of American Pathologists160
states that the “goal is to establish a final tissue diagnosis in 48-72 hours.”43 Some clinics in Europe use microwave tissue processing to facilitate same-day reporting of tissue biopsies.
43Bruce Friedman, MD, Presentation, “Integrated Diagnostics and Its Relationship to Digital Pathology: A Strategic Analysis.” April 27, 2012
College of American Pathologists
Promising Practice Pathways
161
ExAMPLES OF PATIENT DIAGNOSTIC SERVICES CENTERS
44“UCLA Pathology and Laboratory Medicine Annual Report.” http://pathology.ucla.edu/workfiles/Publications/2012-annual-report.pdf 45MD Kuo et al. “Next Generation Radiologic-Pathologic Correlation in Oncology: Rad-Path 2.0,” AJR 2011; 197:990–997
There are no “full featured” patient diagnostic service centers in the U.S. market today, to our knowledge, espe-cially in commercial markets. However, there are examples in the academic medical center arena that are instruc-tive.
The two leaders in this regard are UCLA and Kansas University Medical Center. Each has demonstrated the feasibil-ity and value of integrating pathology and radiology workflow for cancer diagnostics.
Example: UCLA’s Rad-Path DepartmentUCLA’s integrated diagnostic services model focuses primarily on one of our four market needs: improving clinical quality. Although they do not explicitly address cost savings as an objective, they would also likely result from the workflow integration and decrease in diagnostic errors.
The model is not designed to be an ambulatory facility that caters to the patient’s diagnostic testing experi-ence, so those aspects of our market needs are not addressed.
The academic medical center at
UCLA’s initiative for integrating imag-ing and pathology is described in the pathology department’s 2012 annual report as follows:
“The development of the UCLA Radiology Pathology Center (Rad-Path) is a joint venture between the UCLA Departments of Radiol-ogy and Pathology that is bringing together industry-leading experts in radiologic imaging and tissue diagnosis for enhanced diagnos-tic reporting and research devel-opment. In this new era of person-alized medicine, the center seeks to develop a single, integrated report encompassing both radio-logical and pathological diagnos-tic modalities for better evaluation of a disease process.”44
AnIntegratedWorkflowThe primary focus of Rad-Path is devel-oping both the human and computer workflow integration of “diagnostic pathology,” “diagnostic radiology,” “molecular pathology,” and “interven-tional radiology” in the field of cancer diagnosis.45 The UCLA Rad-Path team, including Michael D. Kuo, MD, Associ-

Promising Practice Pathways
College of American Pathologists162
46MD Kuo et al. “Next Generation Radiologic-Pathologic Correlation in Oncology: Rad-Path 2.0,” AJR 2011; 197:990–997
ate Professor of Radiological and Diag-nostic Sciences, W. Dean Wallace, MD, Chief of Pulmonary Pathology, and Fe-reidoun Abtin, MD, Assistant Professor of Radiology, proposes an “integrative diagnostic model,” which they term “Rad-Path 2.0.”46
Figure 7 shows one idealized workflow model developed by the ASPE Tech-nical Expert Panel, including Wallace from UCLA, which exemplifies this inte-grated cancer diagnostic process.
This model programmatically inte-grates the four pathology and radiol-ogy units so that (1) each radiologist and pathologist has the opportunity to review and revise his/her findings based on comparison with the other tests and discussions with the other physicians before reports are issued, and (2) the oncologist receives an integrated electronic report with Web links that track the status of each test component.
Figure7:IntegratedDiagnosticWorkflowModelforCancer Diagnostics
Reproduced from the “The Importance of Radiology and Pathology Communication in the Diagnosis and Staging of Cancer: Mammography as a Case Study.” The Health and Human Services’ ASPE Technical Expert Panel on Improving Cancer Policy Research through Information Technology, November 2010 http://aspe.hhs.gov/sp/reports/2010/PathRad/index.pdf
Order DxImaging
ReviewRad.
Report
PerformAncillaryStudies
InterpretResults
PerformImaging
CreateRad.
Report
OrderBiopsy
CollectSpeci-men(s)
InterpretImages
CreateRad.
Report
ProcessSpeci-men(s)
InterpretSlides
CompleteReqs
AccessionSpeci-men(s)
Prim
ary
Car
eRa
dio
logy
Path
olog
yRe
gist
rar
Radiologycommunicatesclinical info,and context toPathology.
Radiology andPathology wantto discussfindings andaddress anydiscordances,producing anintegrated report.
ReviseRad.
Report
HoldConcord
Conf.
CreatePath.
Report
Add toCancerRegistry
ReviewIntegratedReport(s)
CreateTreatment
Plan
Source: Eleanor Herriman, MD, MBA, G2 Intelligence

College of American Pathologists
Promising Practice Pathways
163
Integrated Reviews and ReportsThe group reported on its clinical Rad-Path experience with lung cancer in March of 2012.47 The group implement-ed a “single access report through creation of a system that integrates the radiographic, pathologic, and molecular characterization of cancer.” It found two parts of the process to be most important clinically: the review of diagnostic and procedural imaging to ensure the tissue was representative; and the reassessment of discordant cases. In addition, the system’s capac-ity for creating a database of well- characterized lung cancer patients is allowing for development of important decision support and quality control tools.
One of the challenges group members noted in their initial experience was lack of automated reminders for com-munication between radiologists and pathologists. They solved this “through email, paging and powerpath remind-ers.”
A Glimpse at the Future of IntegrationOn the cutting-edge research side, UCLA envisions as part of its Rad-Path 2.0 model a major role for “radioge-nomics.” Radiogenomics involves identifying imaging phenotypes that are statistical surrogates for unique molecular tumor expression profiles. Radiologists would be able to “con-
tinue to provide structural and ana-tomic information at an organ, tissue, or cellular level for both disease detec-tion and cell type diagnosis but could also add high-level molecular detail that could potentially be used for mo-lecular characterization and targeted therapy selection. Thus, imaging could be leveraged across multiple scales of biology.”
The scientific thesis for radiogenomics is that there is sufficiently dense, struc-tured and extractable information in conventional imaging to enable iden-tification of these molecular-imaging associations.
Sound like science fiction? This work is undoubtedly far from clinical imple-mentation, at least in the community. Nonetheless, early evidence has been generated. Kuo and colleagues con-clude, “Thus, although early and still requiring additional validation, the ini-tial data suggest that a radiogenomic approach appears both robust and scalable, capable of integrating data from the molecular to the microscopic and macroscopic levels, and supports the overall feasibility of the Rad-Path 2.0 concept.”48
How might this relate to our integrated patient testing center model? The UCLA team proposes radiogenomics as a Rad-Path 2.0 diagnostic platform,
47Fereidoun Abtin, MD, Assistant Professor of Radiology, David Geffen School of Medicine at UCLA. “Rad Path Report: Initial Experience with Combined Radiology and Pathology Reporting for Lung Cancer.” Presentation at STR, March 13 201248MD Kuo et al. “Next Generation Radiologic-Pathologic Correlation in Oncology: Rad-Path 2.0.” AJR 2011; 197:990–997
Promising Practice Pathways
College of American Pathologists164
in the spirit of integrating radiology and pathology. Radiogenomics is pro-posed as a bridge across the multiple tumor biology levels, from molecules to organ systems, all contributing im-portant information in the diagnosis of cancer. However, the UCLA team also posits that a multi-specialty, integrated pathology and radiology team, work-ing collaboratively in a Rad-Path 2.0 type model, can bridge these biologic levels and bring the same value as this technology platform.49
If the UCLA Rad-Path improvements in clinical quality are substantiated, they provide a strong endorsement for this new, integrated cancer diagnostics testing.
A Second Example: The kansas University Medical CenterAnother academic medical center that has pioneered an integrating pathology and imaging service is The University of Kansas School of Medi-cine/Kansas University Medical Center (KUMC), led by Ossama Tawfik, MD, PhD, Professor and Director of Anatom-ic and Surgical Pathology, and Mark Redick, MD, PhD, Assistant Professor of Radiology.
The KUMC integrated diagnostic ser-vices model targets two of our market
needs: improving clinical quality and generating cost savings. Like the UCLA program, it does not address the pa-tient experience or consumer market needs.
The work at KUMC has centered on correlating breast cancer core needle biopsies with imaging to ensure diag-nostic accuracy. The problem they have been addressing is the high rates of radiologic-pathologic discordance of core needle biopsy analysis, ranging from 1 percent to 6 percent. Further, many of these discordant cases are malignant when microcalcifications are present.50
The team has, over the past three or so years, utilized two types of innovations to improve the diagnostic breast core biopsy process.
First, team members implemented an integrated cross-review and col-laboration process between the pa-thologists and radiologists using Aperio telepathology and teleradiology. Each case’s images and findings were re-viewed via weekly teleconference by both specialists, and any discordances were resolved before issuing final re-ports.
A KUMC study51 of the impact of this
49MD Kuo et al. “Next Generation Radiologic-Pathologic Correlation in Oncology: Rad-Path 2.0,” AJR 2011; 197:990–99750R Gallagher et al. “Microcalcifications of the breast: a mammographic-histologic correlation study using a newly designed Path/Rad Tissue Tray.” Annals of Diagnostic Pathology 16 (2012) 196–20151Tawfik O, Redick M. “Integrated radiology/pathology service for breast cancer,” Crit Values 2009:3-26.

College of American Pathologists
Promising Practice Pathways
165
process found that treatment decisions were altered in more than one-third of the 106 patient cases included in the investigation. Details of their integrated diagnostic model and the study were profiled by Agency for Health Care Research and Quality (AHRQ) on their website as a “Service Delivery Innova-tion” entitled “Joint Radiologist–Pa-thologist Review of Diagnostic Find-ings Improves Care of Patients Being Screened for Breast Cancer,” at http://www.innovations.ahrq.gov/content.aspx?id=2714.
Second, they developed a “Path/Rad Tissue Tray” to address residual discordances they were experiencing relating to locating difficult microcalci-fications.52 These trays contain slots that allow for the core needle biopsy speci-mens to be separated, and for their integrity and orientation to be main-tained throughout processing. The tray is placed in a slide cassette such that the gross specimens and microscopic slides have identical orientation, al-lowing for alignment and localization of microcalcifications on the original images, on imaging of the tissue trays and finally on the slides.
In a study of 440 core breast biopsy cases, the KUMC group found a signifi-cantly higher concordance between pathology and radiology using the Path/Rad Trays compared with not us-ing them: 95.8 percent concordance with the tray versus 79.1 percent con-cordance without. The group wrote, “It improved diagnostic reliability, encouraged communication between pathologists and radiologists, and mini-mized false diagnoses and/or delays in cancer diagnosis.”53
Furthermore, the KUMC team argued that its integrative approach can generate cost savings: “Reducing the number of false and delayed diagno-ses will effectively lower health care costs by increasing the number of prompt, accurate breast cancer diag-noses by CNB.”54
Collectively, these AMC initiatives pro-vide evidence, guidance and innova-tive technologies to support our inte-grated patient testing center model.
An Example: Groupo Fleury – “The Lexus of Laboratories”The best example model for our “Pa-tient Diagnostic Services Center”
52R Gallagher et al. “Microcalcifications of the breast: a mammographic-histologic correlation study using a newly designed Path/Rad Tissue Tray,” Annals of Diagnostic Pathology 16 (2012) 196–20153R Gallagher et al. “Microcalcifications of the breast: a mammographic-histologic correlation study using a newly designed Path/Rad Tissue Tray,” Annals of Diagnostic Pathology 16 (2012) 196–20154R Gallagher et al. “Microcalcifications of the breast: a mammographic-histologic correlation study using a newly designed Path/Rad Tissue Tray,” Annals of Diagnostic Pathology 16 (2012) 196–201
Promising Practice Pathways
College of American Pathologists166
Practice Pathway is a large, national, publicly traded, commercial Brazilian laboratory company called “Groupo Fleury.” Fleury’s patient testing centers combine all the design elements we described and address all four market needs: improved clinical quality, cost savings (in their case through Lean operations), excellent patient experi-ence, and services for the health care consumer market.
Although a company with an 86-year-old history, Fleury is growing quickly. Its 2011 gross revenues were ~$600M, a 31 percent increase over 2010. Its operat-ing statistics for 2011, according to the company it performed: “3500 tests in 37 different diagnostic areas, roughly covering 40 million tests per year and 7 million clients serviced. To this end the company has more than 8000 employ-ees and 1300 physicians.”55 Fleury’s tests include a broad range of assays and procedures from clinical lab, ana-tomic pathology, molecular patholo-gy, diagnostic radiology, interventional radiology and clinical specialty areas such as gastroenterology.
Fleury’s lines of business include 200 patient service centers (83 percent of sales), diagnostic operations in hospi-tals, and a reference laboratory and preventive medicine. The company
reports a 2011 gross margin of 35 per-cent.56
Fleury’s business model is very innova-tive and successful and serves as a proof of concept for our pathway, with the caveat that Brazil is not the United States. However, the majority of Fleu-ry’s revenues come from health plans, and another 14 percent directly from patients. Thus, from a client market perspective, Fleury may be more rep-resentative than we’d have thought, especially given the United States’s growing consumer market.57
Fleury’s model combines “Lexus” like patient services, academic-level physi-cian services, economies of scale and efficiency and a focus on clinical qual-ity.
In short, Fleury’s service model formula appears to answer the core market needs we’ve been describing. Criti-cally, the company’s strategic position-ing statement communicates a con-ceptual leap we need to make: “From clinical laboratory to health services provider, solutions provider.”58
Fleury’s strategy also entails delivering value to all key stakeholder groups, including patients, health plans, phy-sicians and employers, as shown in Figure 8. The Brazilian diagnostic mar-
55Groupo Fleury “Management Report 2011” 56Groupo Fleury “Management Report 2011” 57Groupo Fleury “Fleury Investor’s Day 2011” http://ri.fleury.com.br/fleury/web/arquivos/ Investors-Day-Tradu%E7%E3o.pdf

College of American Pathologists
Promising Practice Pathways
167
ket’s interconnecting stakeholder rec-ommendations regarding diagnostic service providers, as well as substantial
consumer segment, may foreshadow that of the United States.
58Rogerio Rabelo, MD, PhD, MBA, Executive Director, Operations, Fleury Group, presentation: “How Quality, Continuous Improvement, and Customer Service Built the “Lexus” of Laboratories.”
Figure 8: Fleury’s Multi-Stakeholder Strategy
70%
8% 5% 3%6%
85%908070605040302010
0
Competitive Advantages for all Stakeholders
Health Plan ProvidersOffer several coverage options
72 percent of Fleury revenues
Offers preventive medicine solutions to improve employee wellness
EmployersChoose health plan
and services provider: for them Fleury is
a must-have
PhysiciansRecommend health
service provider
Integrated SolutionsKnowledge GenerationConsultancyInnovation
Best and most trusted center for diagnostic medicine for 85 percent of physicians
PatientsChoose service provider based on
health plan coverage, personal preference and physician’s
indication
Client satisfaction index above 90 percent
Our brands portfolio covers the entire health plan coverage segmentation
20082010
Source: 2008 – IBOPE; 2010 – Ipsos
Fleury competitor A competitor B
Source: Groupo Fleury “Fleury Investor’s Day 2011,” http://ri.fleury.com.br/fleury/web/arquivos/ Investors-Day-Tradu%E7%E3o.pdf
Promising Practice Pathways
College of American Pathologists168
Examples of Fleury’s accomplishments in 2011 include publication of 54 scien-tific papers with Groupo Fleury listed as a research institute, and the delivery of more than 10,000 integrated diagnos-tic reports for complex cases. It also launched a “Center of Imaging-Guid-ed Procedures” with multi-disciplinary services.
The company describes the extension of its model’s value to the patients as providing “the benefit of a more pre-cise and safe diagnosis, in one place, and out of the hospital environment, reinforcing the strategic positioning of intimacy with the client, with focus on his/her needs and the solving of his/her problems.”59
Fleury sees the following elements as key to the success of its innovative ser-vice formula:
• Focus on the primary client: the patient – excellence in customer service, “one-stop shop experi-ence,” and obtaining recommen-dations of physicians and health plans.
– Designing services to meet pa-tient needs along every step of process.
– Measure, track, continuously im-prove performance; track and manage average wait times, complaint indices, time to de-livery of results; also track social networking communications
and try to intervene to correct problems.
– Offer special services – kids’ activities, cafes, valets, etc.
– Use of CRM technology.
– Focus on interior space design.
– Allow patients to choose service provider, e.g., lab, based on health plan coverage, personal preference and physician’s indi-cation.
– Maintain Fleury’s client satisfac-tion index above 90 percent.
• knowledge and innovation – the company sees this as a key com-petitive advantage and fuels it by encouraging idea generation from all levels; new innovations (and academic papers) are gen-erated on two sides:
– Integrated reports, for example, artificial intelligence and infor-matics tools to analyze and inte-grate test results.
– New diagnostic product innova-tions.
• Lean and Six Sigma – this is core to the company’s operations strat-egy, enabling high quality, and efficient, rapid results.
• Comprehensive, integrated re-ports – solution for physician and patient.
59Groupo Fleury “Management Report 2011”
College of American Pathologists
Promising Practice Pathways
169
– “Core information at a glance; Each report represents the result of the medical expertise ac-cumulated at Fleury; Diagnos-tic conclusion and eventually treatment recommendation.”60
• Not just integrated reports, but integrated centers –
– Tests performed in a rapid, se-quential and prioritized way.
– New centers: 2010/2011:
• Integrated Neurology Center & Center for Sleep Disorders.
• Advanced Gastroenterology & Endoscopy Center.
• Lymphoma Center.
• Center for Investigation & Rehabilitation of Urology Disorders.
• Fetal Medicine Center.
• Center of Complex Diagnostics Procedures.
The success of the Fleury service model serves as a partial proof of principle for our practice pathway. We say par-tial only because of the difference in geographic markets. Nonetheless, the company’s decided commercial and clinical success using a combination of excellent customer service, integrated and comprehensive diagnostic servic-es, Lean operations, and academic-style innovation is a strong endorse-ment and blueprint for one version of our practice pathway.
60Rogerio Rabelo, MD, PhD, MBA, Executive Director, Operations, Fleury Group, presentation: “How Quality, Continuous Improvement, and Customer Service Built the “Lexus” of Laboratories.”

Promising Practice Pathways
College of American Pathologists170
IMPLEMENTATION PLANS: THE WAY FORWARD
61Vince Galloro, “Growth strategies; Chains look beyond inpatient side,” Modern Health Care, August 29, 2011
Whether we are at a community practice working with a hospital, at a hospital or medical center working as an employee, at an independent practice group, or at a reference lab, there are opportunities for pursuing the establishment of a patient diagnostic services center of some type.
Although there are certainly daunting aspects to developing a new service center, we are not suggesting that practices should all be launching start-up patient diagnostic service facilities. We are not in this alone. This is not a solo venture.
This pathway envisions these centers being developed through a variety of means, primarily in conjunction with health care institutions, investors and other types of partners.
At a minimum, our pathway involves collaborating with our colleague radi-ologists. Many of them can be helpful by leveraging their experience operat-ing patient imaging centers. At a maxi-mum, our pathway may involve secur-ing venture capital and other partners to support building a new facility to house a new kind of business.
One sign of potential investment inter-est in this type of diagnostic testing center is the robust acquisition activity in imaging centers by both national and regional health systems over the past two years. For example: “Dallas-based Tenet Health Care Corp., in par-ticular, has cited outpatient services as an integral part of its strategy for boost-ing its operating margins to match or exceed its peers' margins. Tenet told investors in January that it spent $65 million acquiring 24 outpatient centers in 2010 and expected to spend up to $100 million acquiring 15 to 25 centers this year [2011].”
These outpatient centers included ur-gent care, ambulatory surgery centers, and imaging centers. Vice President of outpatient services for Tenet Kyle Burtnett commented, "I think the pay-ers really like the idea of an expanded footprint: urgent care, ambulatory sur-gery centers, imaging centers—good quality care at a quality price."61
In all cases, the patient testing center pathway represents a business venture that requires a strategic planning pro-cess and investment plan. Consider-ations about which potential pathway
College of American Pathologists
Promising Practice Pathways
171
“flavor” best suits you will include:
• Identifying the appropriate target client in your local market,
• Identifying your core strengths and technical expertise.
• Balancing your desire to be an in-novator with your comfort with risk.
In the upcoming, final report this path-way chapter will include a more de-tailed implementation section.
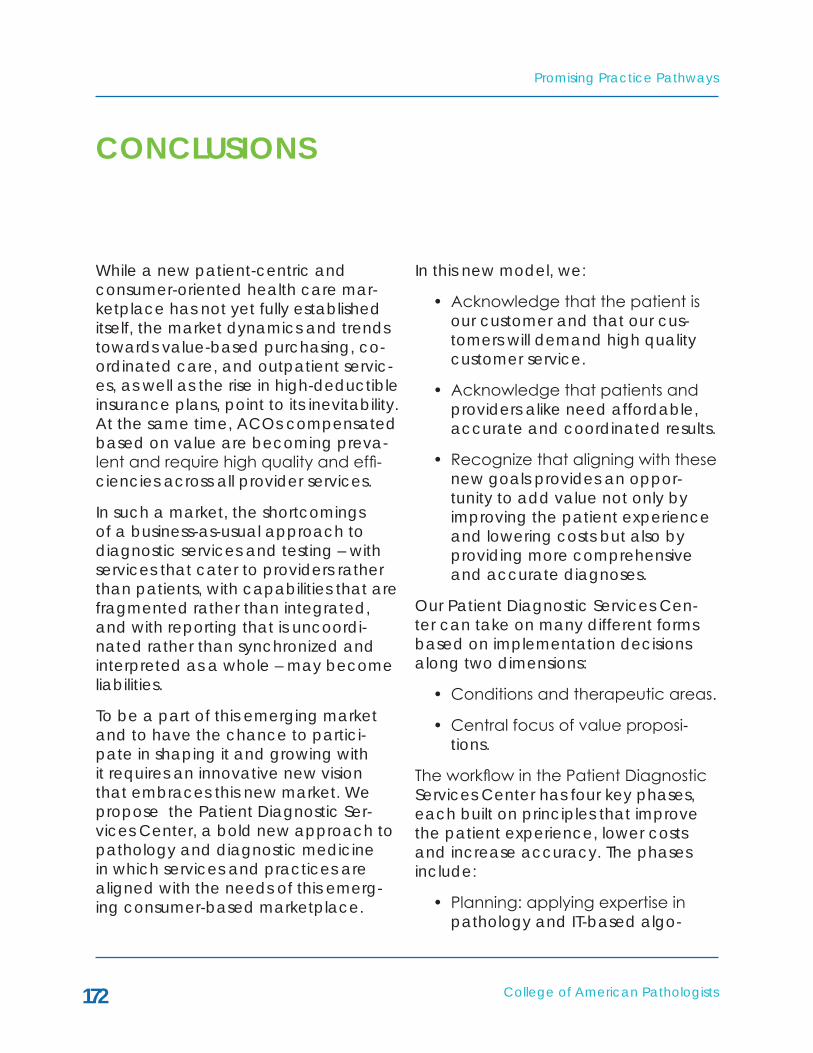
Promising Practice Pathways
College of American Pathologists172
CONCLUSIONS
While a new patient-centric and consumer-oriented health care mar-ketplace has not yet fully established itself, the market dynamics and trends towards value-based purchasing, co-ordinated care, and outpatient servic-es, as well as the rise in high-deductible insurance plans, point to its inevitability. At the same time, ACOs compensated based on value are becoming preva-lent and require high quality and effi-ciencies across all provider services.
In such a market, the shortcomings of a business-as-usual approach to diagnostic services and testing – with services that cater to providers rather than patients, with capabilities that are fragmented rather than integrated, and with reporting that is uncoordi-nated rather than synchronized and interpreted as a whole – may become liabilities.
To be a part of this emerging market and to have the chance to partici-pate in shaping it and growing with it requires an innovative new vision that embraces this new market. We propose the Patient Diagnostic Ser-vices Center, a bold new approach to pathology and diagnostic medicine in which services and practices are aligned with the needs of this emerg-ing consumer-based marketplace.
In this new model, we:
• Acknowledge that the patient is our customer and that our cus-tomers will demand high quality customer service.
• Acknowledge that patients and providers alike need affordable, accurate and coordinated results.
• Recognize that aligning with these new goals provides an oppor-tunity to add value not only by improving the patient experience and lowering costs but also by providing more comprehensive and accurate diagnoses.
Our Patient Diagnostic Services Cen-ter can take on many different forms based on implementation decisions along two dimensions:
• Conditions and therapeutic areas.
• Central focus of value proposi-tions.
The workflow in the Patient Diagnostic Services Center has four key phases, each built on principles that improve the patient experience, lower costs and increase accuracy. The phases include:
• Planning: applying expertise in pathology and IT-based algo-

College of American Pathologists
Promising Practice Pathways
173
rithms to create an integrated and individualized testing plan for a patient.
• Integrated testing: applying evi-dence and experience to provide a streamlined, efficient and effec-tive testing experience for pa-tients.
• Integrated evaluation: employ-ing IT-based platforms to interpret, collaborate with other diagnostic specialists, reconcile differences, and interpret integrated findings.
• Reporting: delivering a timely, comprehensive, integrated and patient-friendly report.
The Patient Diagnostic Services Center is accessible across several practice types, settings, resource levels and ca-pability portfolios. In almost every case, launching a Patient Diagnostic Ser-vices Center will not be a solo venture. It will involve collaboration and part-nerships with other institutions, inves-tors and colleagues in pathology and imaging. The options range widely, but perhaps most importantly, the Patient Diagnostic Center is an opportunity to be a part of shaping the future of health care.

Promising Practice Pathways
College of American Pathologists174
L. Eleanor J. Herriman, MD, MBA is a pathologist executive with 15+ years experi-ence in the medical technology indus-try. She has worked across sectors with
both small ventures and corporations. Her market experience spans the clinical laboratory, in vitro diagnostics, e-health, biotech, and strategy con-sulting for Bain & Company. Other key accomplishments include growing a venture with a CLIA lab and FDA PMA approved computer-assisted cytology instrument from start-up to publicly traded company (IPO raised $100 million).
She is the leader of G2 Intelligence’s advisory services, which provides stra-
tegic consulting and custom market research and assessments for a range of clients, including pathology groups, clinical labs, health systems, hospitals, medical centers, diagnostic technol-ogy companies, and investors.
She is the author of three G2 reports: Health Care Market Reforms: Implica-tions and Prescriptions for Laboratories; How to Build a Molecular Testing Labo-ratory: Key Strategic & Operational Considerations; and Creating a Value-Driven Laboratory: Opportunities in the New Marketplace.
She earned her MD at Baylor College of Medicine, completed pathology residency at University of California San Francisco, and received an MBA from Harvard Business School with highest honors (Baker Scholar).
ABOUT THE AUTHOR