Embed Size (px)
Citation preview
Scott T. Clarke1, Jolene A. Bradford1, Shayne Boucher2, Lucas G. Chase3, and Mohan Vemuri2 , 1 Molecular Probes® Division – Life Technologies, 29851 Willow Creek Rd • Eugene, Oregon • USA 2Primary & Stem Cells Systems – Life Technologies • 7305 Executive Way • Frederick, MD • USA 3Cellular Systems Division – Life Technologies • 501 Charmany Drive • Madison, Wisconsin • USA
RESULTS INTRODUCTIONAdult human mesenchymal stem cells (hMSC) are rare fibroblast-like cells capable of differentiating into a variety of cell types including bone, cartilage, and fat cells. They have been shown to promote tumorigenesis and progression of cancer. Conventional surface markers used to define hMSCsare CD73, CD90, and CD105 positive and CD14, CD19, CD34, CD45 and HLA-DR negative.1 Shifts in phenotypic and proliferation profiles of hMSCthrough multiple passaging reveal changes that are characteristic of gradual lineage restriction.2 To characterize these cells at a single cell level, we performed multi-parametric flow cytometry combining eight surface marker panel analysis with DNA content and cell proliferation on two hMSC sources over multiple passages.
MATERIALS AND METHODSFrozen seed stock from adipose derived stem cells (ADSC) (Invitrogen) and bone marrow derived hMSC (BMSC) (Lonza -four patient pool) were plated into serum free medium at an initial density of 1500 cells/cm2 (assuming >95% viability). Cultures were grown and expanded in T75 flasks (Greiner) pre-coated with CELLStart™ (Invitrogen) in the serum free media, StemPro®
MSC SFM (Invitrogen) supplemented with L-glutamine (2 mM). Half of the flasks were also supplemented with a human derived lipoprotein supplement. Cells were serially passaged using TrypLE™ Express (Invitrogen) upon reaching near confluency, and reseeded to a density of 3000 cells/cm2. Passage number was defined by the growth in the medium used in the study. During passages 3 and 7, cultures were treated twice daily for 4 hours with 60 μM 5-ethynyl-2′-deoxyuridine (EdU) immediately prior to harvesting. Similarly, for the other passages, replicate flasks were treated with EdU just prior to the time of passaging.3,4 After harvesting, the cells were paraformaldehyde fixed and stored at 4° C in 1% BSA/DPBS until labeling. The labeling procedure requires permeabilizing the fixed cells with 0.1% Triton® X-100 in phosphate buffered saline (DPBS), followed by labeling with Click-iT® EdU Alexa Fluor® 647 azide (Invitrogen).3,4 The cells were washed, and labeled with antibody dye conjugates (table 1). Following a final wash, FxCycle™ Violet stain (Invitrogen) was added. Data acquisition and analysis was performed using the 405 nm, 488 nm, and 633 nm laser lines on a BD™LSR II flow cytometer with BD FACSDiva™ 6.1 software. Spectral compensation was adjusted using a combination of hMSC and the AbC™anti-mouse bead kit (Invitrogen) for labeling of single-color controls.5,6 Gating for immunophenotypic analysis was determined using Fluorescence Minus One (FMO) controls in dual parameter plots to define positive and negative populations.5,6 Percent proliferating cells was determined in single parameter Click-iT® EdU measurement and by combining Click-iT® EdU measurement with the DNA content measurement obtained with FxCycle™ Violet stain for dual parameter analysis. Cell cycle was modeled using ModFit LT™ (Verity Software) to determine fitted S-phase fraction (% proliferation) and compared to the percent proliferating cells determined by Click-iT® EdU analysis (data not shown).
Proliferative and phenotypic characterization of human mesenchymalstem cells by flow cytometry and imaging
Life Technologies • 5791 Van Allen Way • Carlsbad, CA 92008 • www.lifetechnologies.com
Table 1. Immunophenotype Panel
450/50405FxCycle™ Violet stainDNA content
660/20633Click-iT® EdU Alexa Fluor® 647 azideCell proliferation
780/60488Qdot® 800CD34
HLA-DR
CD45
CD19575/26488R-PE
CD14
730/30633Alexa Fluor® 700CD105
530/30488FITCCD90
675/20488PerCPCD73
Emission Bandpass
Excitation Laser (nm)FluorophoreMarker
Figure 1. Flow Cytometric Analysis
Immunophenotype as measured by flow cytometry is among the criteria for identifying hMSC proposed by an ISCT position paper in 2006, which states that ≥95% of the hMSC population must express CD105, CD73, and CD90 and the same cells must lack (≤ 2% positive) expression of CD45, CD34, CD14 or CD11b, CD79a or CD19, and HLA-DR.1 Recent studies have shown that CD34 may have positive expression in early passages.2 Flow cytometry is one of the most powerful technologies that is routinely used to measure multiple parameters in a single sample.5-7 For this study, a flow cytometric panel was developed which combines immunophenotypic and functional testing in a ten-marker, seven-color panel (table 1) to test for antigen expression as well as measure proliferation and DNA content, providing more information with a minimum of sample. The markers which are expected to be negative (CD14, CD19, CD45, HLA-DR) are measured within the same fluorescent channel while the other markers and functional tests are measured in a separate channels (CD90, CD73, CD105, CD34, proliferation and DNA content). In multicolor flow cytometry, spectral overlap between the fluorophores needs to be eliminated using a mathematical process knows as compensation, but which may result in unexpected distribution (spread) of data and an inability to bring the extent of compensated data down to the autofluorescence level of unlabeled cells. The use of staining controls which include all reagents except for the one of interest, Fluorescence Minus One (FMO) controls, allows a precise definition for cut-off of positive and negative populations.5-7 The proliferative state of the cells can be measured using Click-iT® EdU, which in dual parameter testing with DNA content can very accurately measure the percentage of cells that are proliferating.4 No percent change to either positive or negative markers was observed for any of the samples and conditions tested from passage 1 through passage 7.
Figure 1A: (left) Demonstrates the use of FMO controls to determine gating of immunophenotypic parameters. Columns A and B shows dual parameter plots with FMO controls used for defining gating. Column C shows dual parameter plots with hMSC labeled with the full panel demonstrating that immunophenotype falls within defining criteria. Column D shows individual marker histograms of the full hMSC panel testing.
Figure 1B: (below) Demonstrates proliferation and DNA content measurements E. Initial gating on singlet cells to eliminate cell aggregates from the analysis, based on signal width vs signal area (called pulse processing); all subsequent plots are gated on this singlet gate F. Histogram of the proliferation measurement as labeled with the Click-iT® EdU azide G.Histogram of DNA content as measured with FxCycle™ Violet stain H. Dual parameter plot combining DNA content and proliferation measurements with region defining the dual positive region, the proliferating cells.
FMO-No FITC
CD90-FITCNeg
ativ
e co
ckta
il-rP
E
99.9%
FMO-No PE
CD90-FITCNeg
ativ
e co
ckta
il-rP
E
100%
Full panel
CD90-FITC
Neg
ativ
e co
ckta
il-rP
E
100%
Full panel
CD90-FITCC
D34
-Qdo
t®80
0
100%
FMO-No PerCP
CD90-FITC
CD
73-P
erC
P
99.7%
FMO-No FITC
CD90-FITC
CD
34-Q
dot®
800
100%
FMO-No Alexa Fluor® 700
CD90-FITCCD
105-
Ale
xaFl
uor®
700
99.1%
0.9%
FMO-No FITC
CD90-FITCCD
105-
Ale
xaFl
uor®
700 99.7% 0.1%
0.2%
Full panel
CD90-FITCCD
105-
Ale
xaFl
uor®
700 99.6%
0.4%
FMO-No FITC
CD90-FITC
CD
73-P
erC
P
99.7%
0.3%
CD90-FITC
CD
73-P
erC
P
Full panel
99.5%
0.5%
0.3%
CD90-FITC
CD
34-Q
dot®
800
100%
FMO-No Qdot® 800
CD90-FITC
CD73-PerCP
CD34-Qdot® 800
Negatives-rPE
CD105-Alexa Fluor® 700
FxCycle™ Violet DNA content
FxCycle™ Violet Width Signal
FxC
ycle
™V
iole
t Are
a S
igna
lClick-iT® EdU
Alexa Fluor® 647 azide
21.3%
Clic
k-iT
®E
dU A
lexa
Flu
or®
647
azid
e
FxCycle™ Violet DNA content
21.5%
E F G H
Figure 2: The relation between proliferation rate, cell origin, passage number, and confluency was examined. Images taken with phase contrast microscopy (10X objective) to estimate degree of confluency were compared to proliferation rates determined by Click-iT®
EdU labeling (insert of dual parameter plot of DNA content vs. EdU signal showing gated region defining % proliferation). 2A: Low passage cultures with low confluency have high % proliferation. 2B: Percent proliferation drops dramatically as cell density approaches confluency independent of passage number. 2C: Low passage confluent cultures with near zero % proliferation achieve very high proliferation rates after 24 hours from expansion. 2D: Late passage low confluencycultures have reduced % proliferation reflective of nearing their limited proliferative potential.
2A
Figure 2. Proliferation Measurements
2C
ADSC P7 day 4 ADSC P7 day 5
28.4 % 3.4 %
ADSC P3 day 2 ADSC P3 day3
26.6 % 34.2 %
BMSC P7 day4 BMSC P7 day5
16.7 % 12.6 %
2B
2D
ADSC + lipoprotein P2 day 4
0.9 %
ADSC + lipoprotein P3 day 2
56.7 %
Figure 3. Cell Proliferation: Click-iT® EdU labeling
Figure 3: Proliferation rate measured by Click-iT® EdU labeling during the course of a passages 3 and 7. 3A: Image shows EdU incorporated proliferating cells are detected with click chemistry. Nuclei of proliferating cells are labeled pink with Alexa Fluor® 594 azide. DNA content labeled with Hoechst 33342 in blue. Overlay with DIC phase contrast shows spindle shape cellular morphology typical of hMSCs at low passage number. By imaging, proliferative index is determined by the ratio of % positive EdU cells to total cell. Image acquired on DeltaVision® Core (API Issaquah, WA). 3B: Schematic of click chemistry labeling to determine % proliferation. EdU, when added to complete medium is incorporated into proliferating cells. After fixation and permeabilization, incorporated EdU is detected by click reaction of a fluorescently modified azide dye. 3C-3D: Percent proliferation as measured by EdU signal in passages 3and 7 of ADSC and BMSC. Cultures from passage 3 with higher % proliferation rates reach confluency before P7 cultures. Medium replacement stimulates proliferation especially during cultures at low passage.
Figure 4: Characterization of differentiated tissue derived from hMSC. Using medium specifically formulated to differentiate hMSC (StemPro® osteogenesis, adipogenesis, or chrondrogenesis differentiation medium) , confirmation of terminal differentiation is made by staining for characteristic markers. Traditional methods use colorimetric stains like Oil Red O for adipocytes, Alcian Blue for chondrocytes, and alkaline phosphatase or AlazarinRed S for osteoblasts (fig. 4A-4D, respectively). Growth in adipogenesis differentiation medium (Invitrogen) differentiates hMSC to adipocytes which form lipid vesicles detected after staining with LipidTOX™ Green neutral lipid stain (Invitrogen). Nuclear counterstainwith Hoechst 33342 (blue) (fig. 4E). DIC image shows adipocyte lipid droplets appear as refractile bodies within the cell (fig. 4F).
% proliferation ADSC
0
5
10
15
20
25
30
35
40
45
50
55
60
65
0 20 40 60 80 100 120time (hrs)
P3P7
% proliferation BM SC
05
101520253035404550556065
0 20 40 60 80 100 120
time (hrs)
P3
P7
Cu (I)
DNA= Alexa Fluor® dye
Incorporation into DNA
4A
4B
Medium replacement
EdU added to culture medium
4A 4C
4E4D 4F
3A
EdUHoechst
3B
Medium replacement
3C
3D
Figure 4. Terminal differentiation of hMSC
Labeling with click chemistry
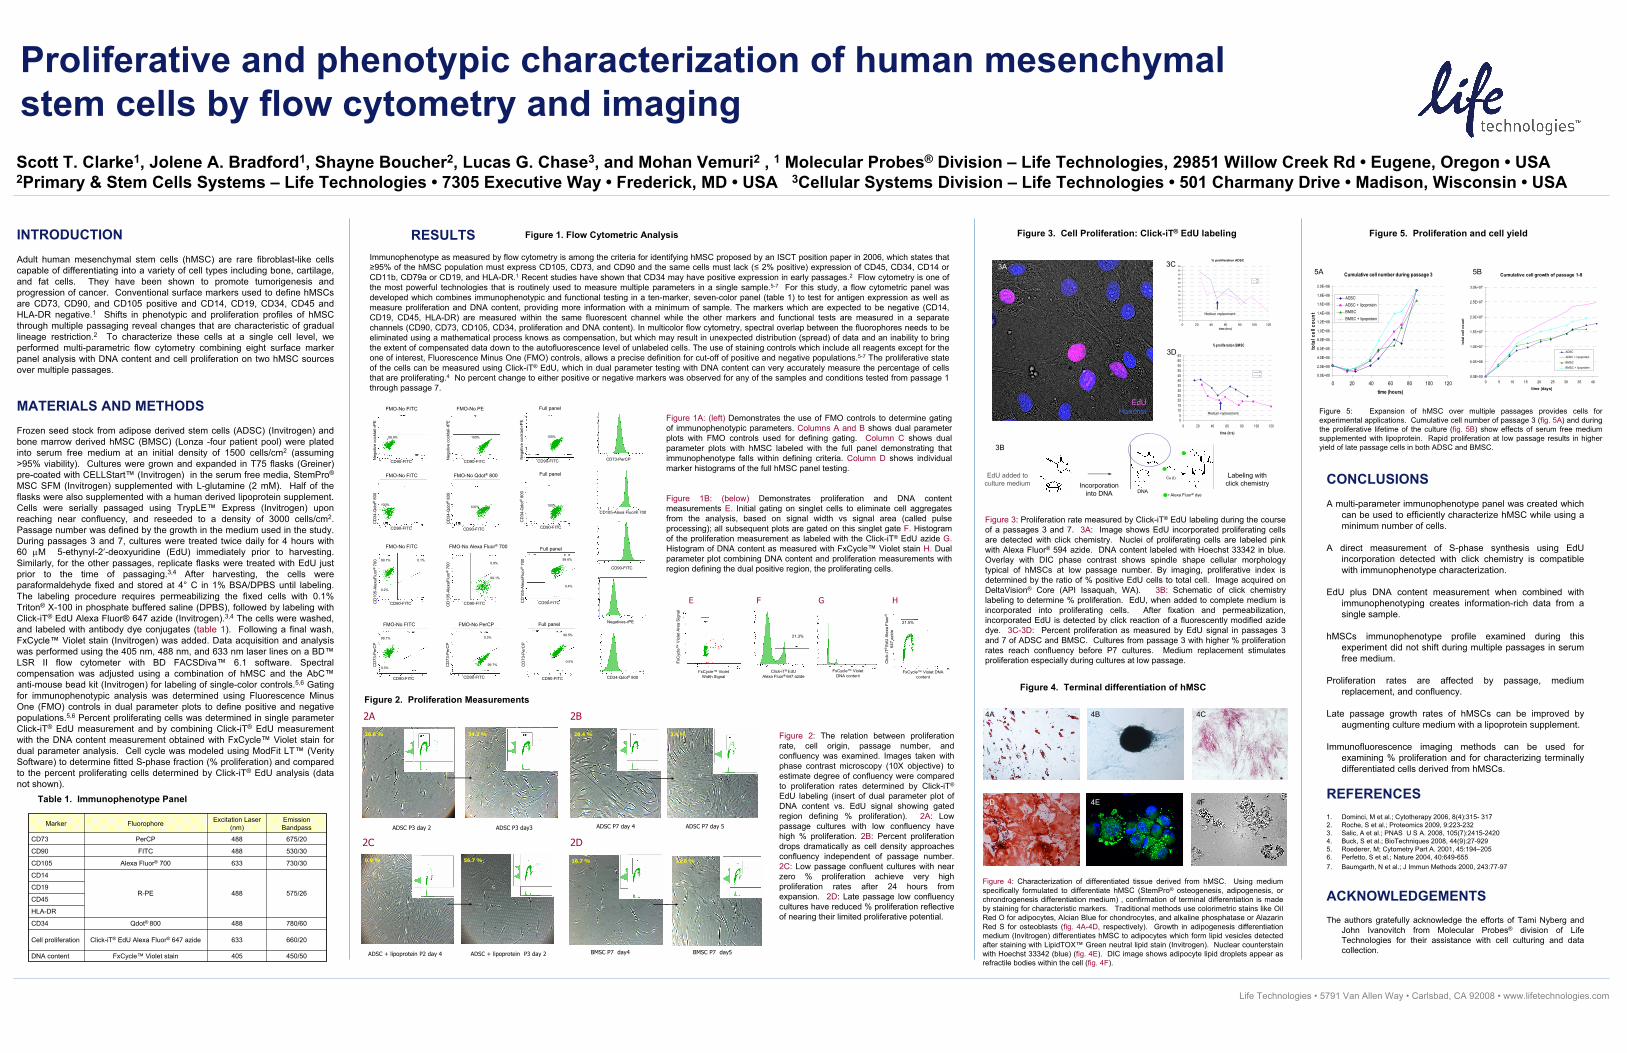
Figure 5: Expansion of hMSC over multiple passages provides cells for experimental applications. Cumulative cell number of passage 3 (fig. 5A) and during the proliferative lifetime of the culture (fig. 5B) show effects of serum free medium supplemented with lipoprotein. Rapid proliferation at low passage results in higher yield of late passage cells in both ADSC and BMSC.
Figure 5. Proliferation and cell yield
CONCLUSIONSA multi-parameter immunophenotype panel was created which
can be used to efficiently characterize hMSC while using a minimum number of cells.
A direct measurement of S-phase synthesis using EdU incorporation detected with click chemistry is compatible with immunophenotype characterization.
EdU plus DNA content measurement when combined with immunophenotyping creates information-rich data from a single sample.
hMSCs immunophenotype profile examined during this experiment did not shift during multiple passages in serum free medium.
Proliferation rates are affected by passage, medium replacement, and confluency.
Late passage growth rates of hMSCs can be improved by augmenting culture medium with a lipoprotein supplement.
Immunofluorescence imaging methods can be used for examining % proliferation and for characterizing terminally differentiated cells derived from hMSCs.
REFERENCES1. Dominci, M et al.; Cytotherapy 2006, 8(4):315- 3172. Roche, S et al.; Proteomics 2009, 9:223-2323. Salic, A et al.; PNAS U S A. 2008, 105(7):2415-24204. Buck, S et al.; BioTechniques 2008, 44(9):27-9295. Roederer, M; Cytometry Part A. 2001, 45:194–205 6. Perfetto, S et al.; Nature 2004, 40:649-6557. Baumgarth, N et al.; J Immun Methods 2000, 243:77-97
ACKNOWLEDGEMENTSThe authors gratefully acknowledge the efforts of Tami Nyberg and
John Ivanovitch from Molecular Probes® division of Life Technologies for their assistance with cell culturing and data collection.
Cumulative cell growth of passage 1-8
0.0E+00
5.0E+06
1.0E+07
1.5E+07
2.0E+07
2.5E+07
3.0E+07
0 5 10 15 20 25 30 35 40
time (days)
tota
l cel
l cou
nt
ADSC
ADSC + lipoprotein
BMSC
BMSC + lipoprotein
5BCumulative cell number during passage 3
0.0E+00
2.0E+05
4.0E+05
6.0E+05
8.0E+05
1.0E+06
1.2E+06
1.4E+06
1.6E+06
1.8E+06
2.0E+06
0 20 40 60 80 100 120time (hours)
tota
l cel
l cou
nt
ADSCADSC + lipoproteinBMSCBMSC + lipoprotein
5A