Embed Size (px)
Citation preview
Projections of sea level change
Jonathan GregoryNCAS-Climate, University of Reading
Met Office Hadley Centre, Exeter
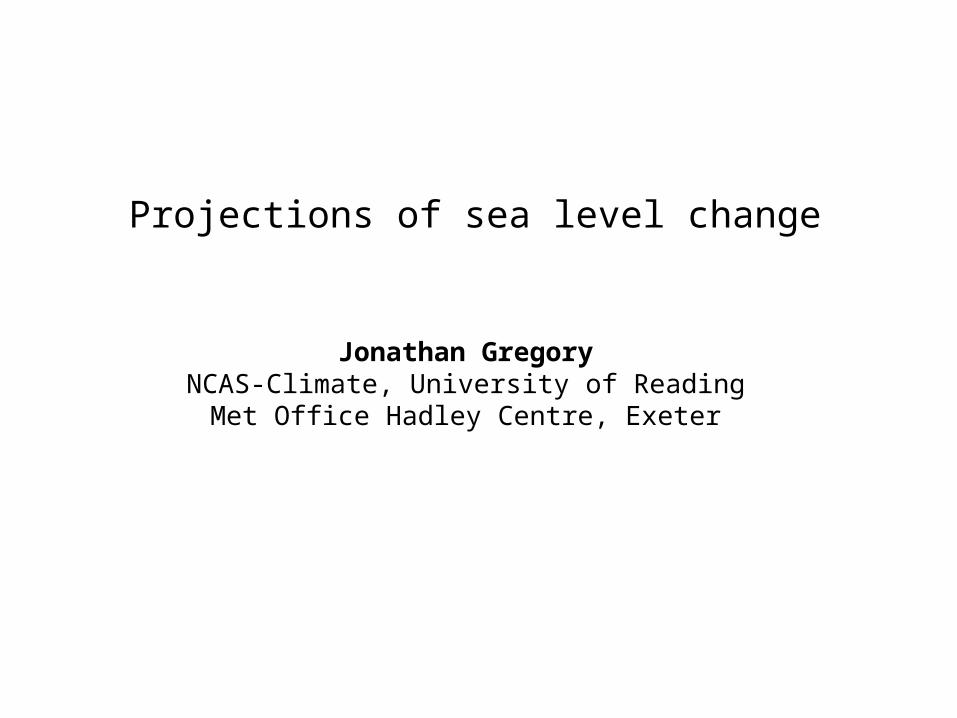
It is very likely that there will be a significant increase in the occurrence of sea level extremes in the 21st century
Multiplication factor for the frequency of a given sea level extremefor a uniform mean sea level rise of 0.5 m
IPCC WG1 AR5 Fig 13.25a
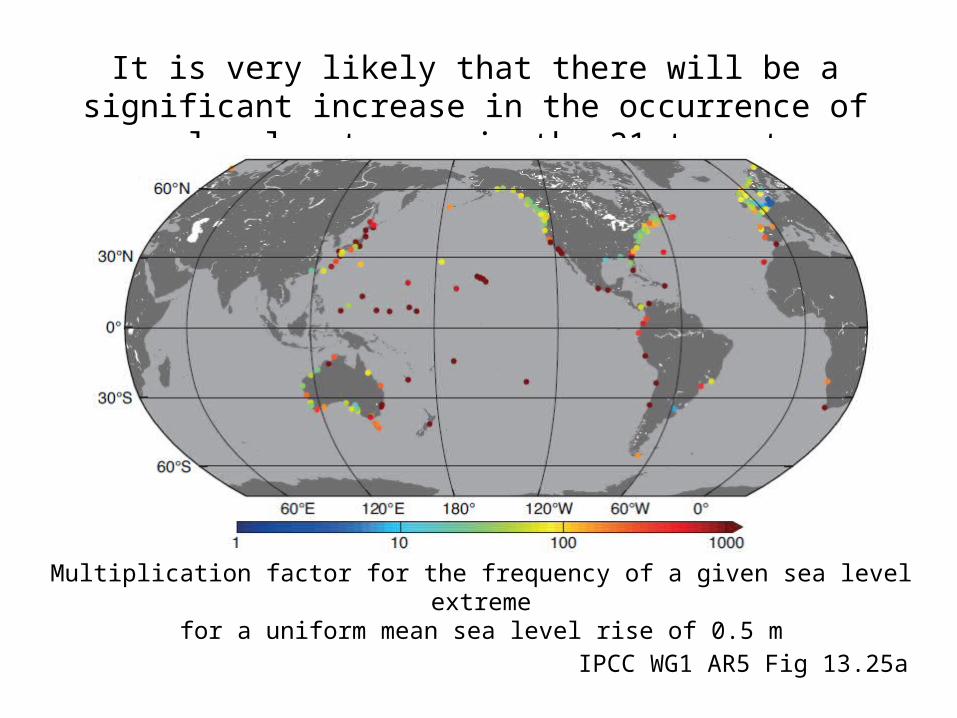
Continued emissions of greenhouse gases will cause further warming and changes in all components of the climate system
Glo
bal s
urfa
ce t
empe
ratu
re c
hang
e (°
C)
Limiting climate change will require substantial and sustained reductions of greenhouse gas emissions.
IPCC WG1 AR5 Fig SPM 7a
Likely ranges
wrt
198
6-20
05
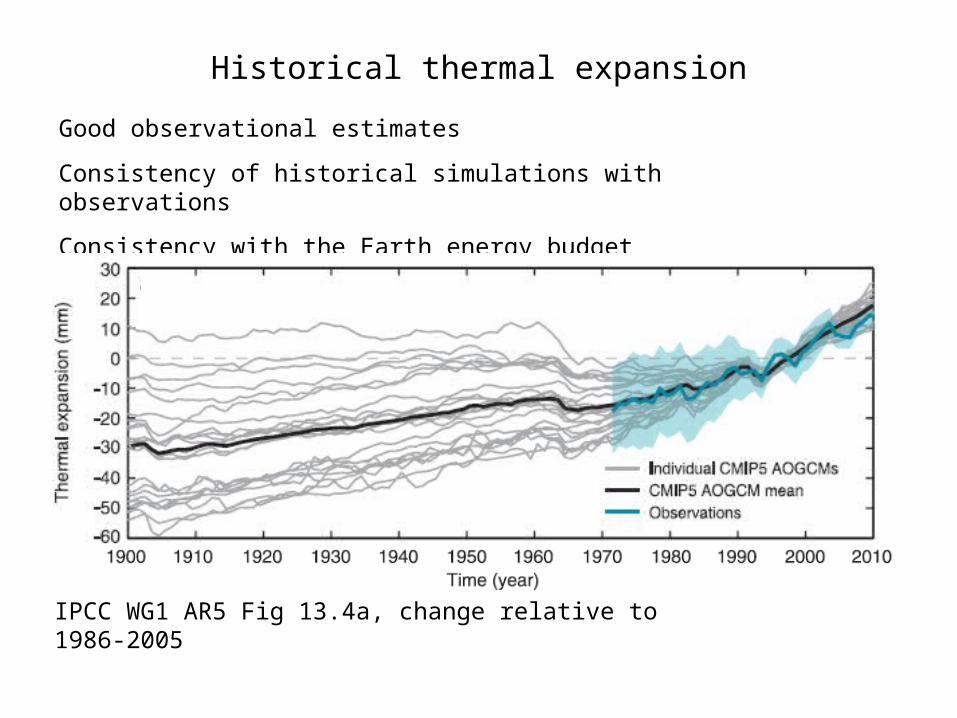
Historical thermal expansion
Consistency of historical simulations with observations
Consistency with the Earth energy budget
Good observational estimates
IPCC WG1 AR5 Fig 13.4a, change relative to 1986-2005
Dep
th (
m)
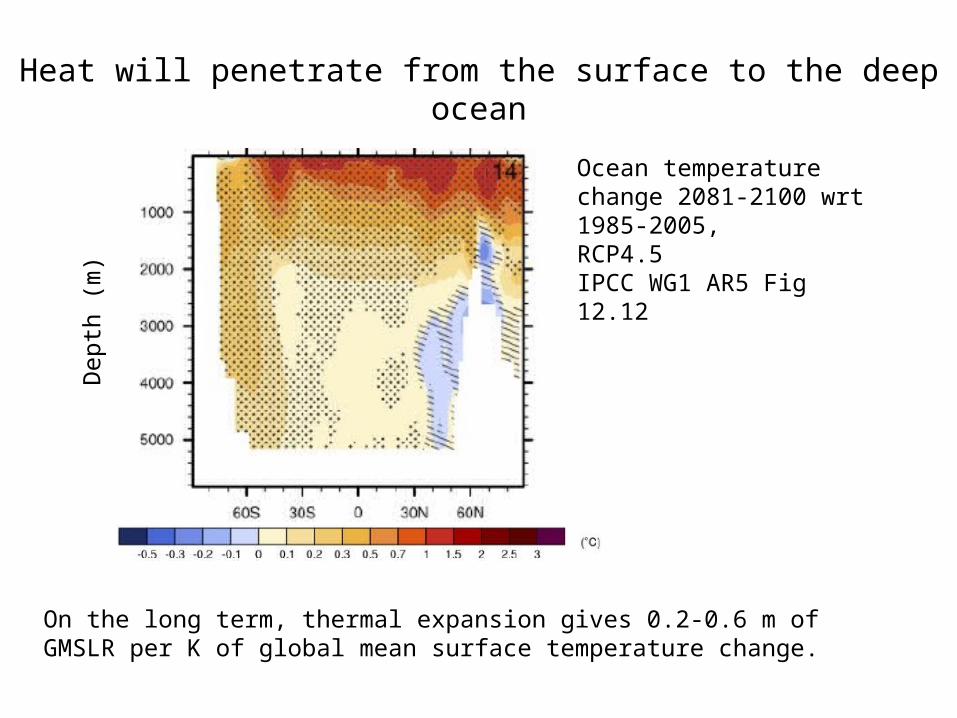
Ocean temperature change 2081-2100 wrt 1985-2005,RCP4.5IPCC WG1 AR5 Fig 12.12
Heat will penetrate from the surface to the deep ocean
On the long term, thermal expansion gives 0.2-0.6 m of GMSLR per K of global mean surface temperature change.
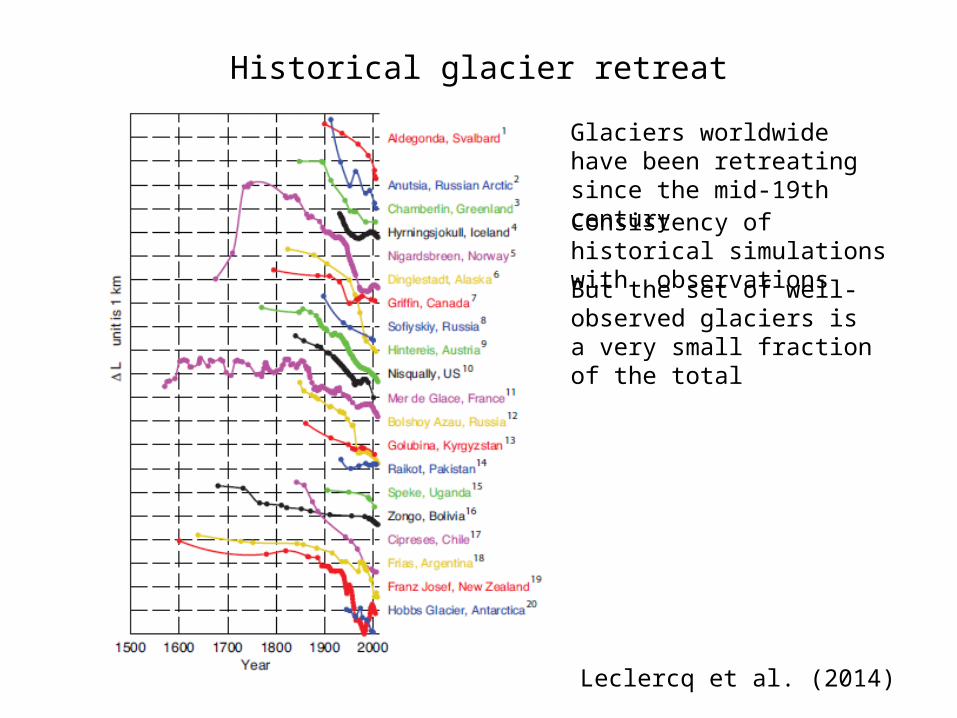
Historical glacier retreat
Glaciers worldwide have been retreating since the mid-19th century
Leclercq et al. (2014)
Consistency of historical simulations with observations
But the set of well-observed glaciers is a very small fraction of the total
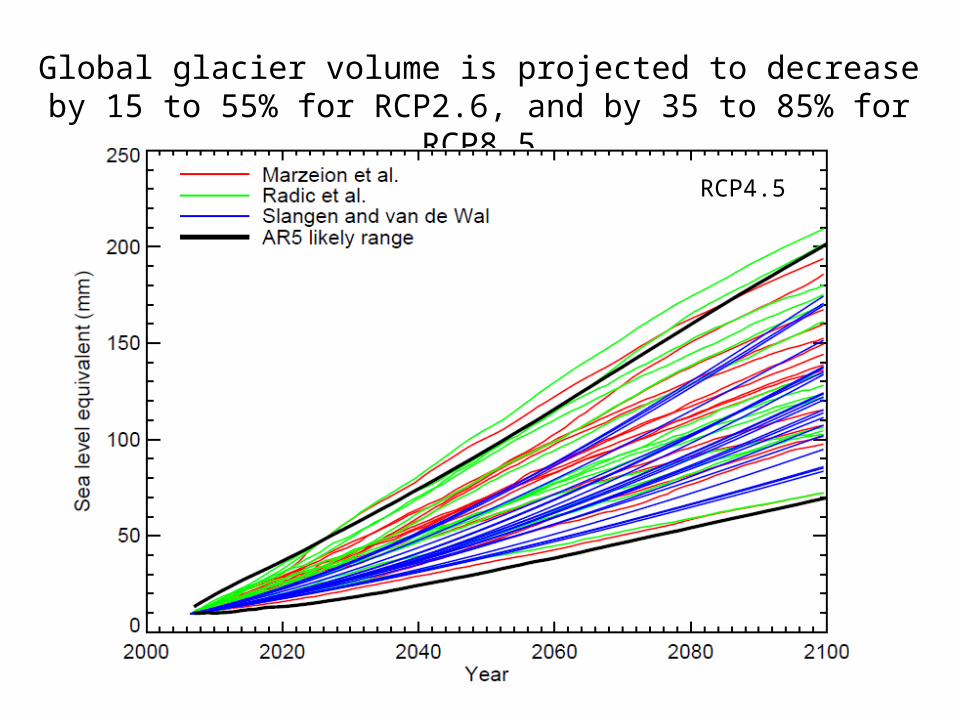
Global glacier volume is projected to decrease by 15 to 55% for RCP2.6, and by 35 to 85% for RCP8.5
RCP4.5
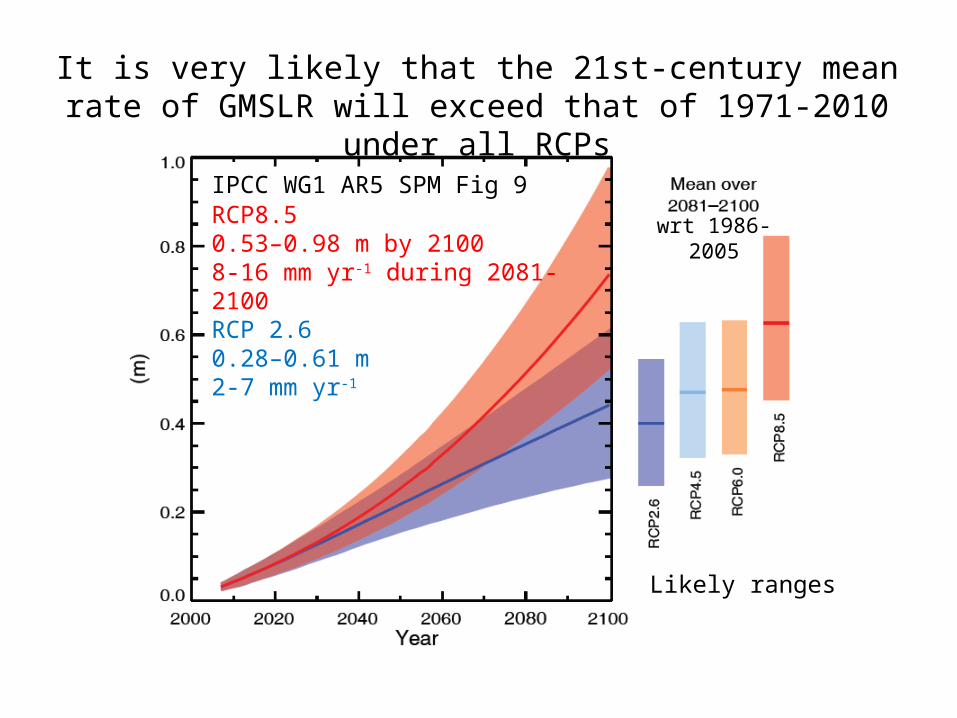
RCP8.5 0.53–0.98 m by 21008-16 mm yr-1 during 2081-2100RCP 2.60.28–0.61 m2-7 mm yr-1
IPCC WG1 AR5 SPM Fig 9
It is very likely that the 21st-century mean rate of GMSLR will exceed that of 1971-2010 under all RCPs
wrt 1986-2005
Likely ranges
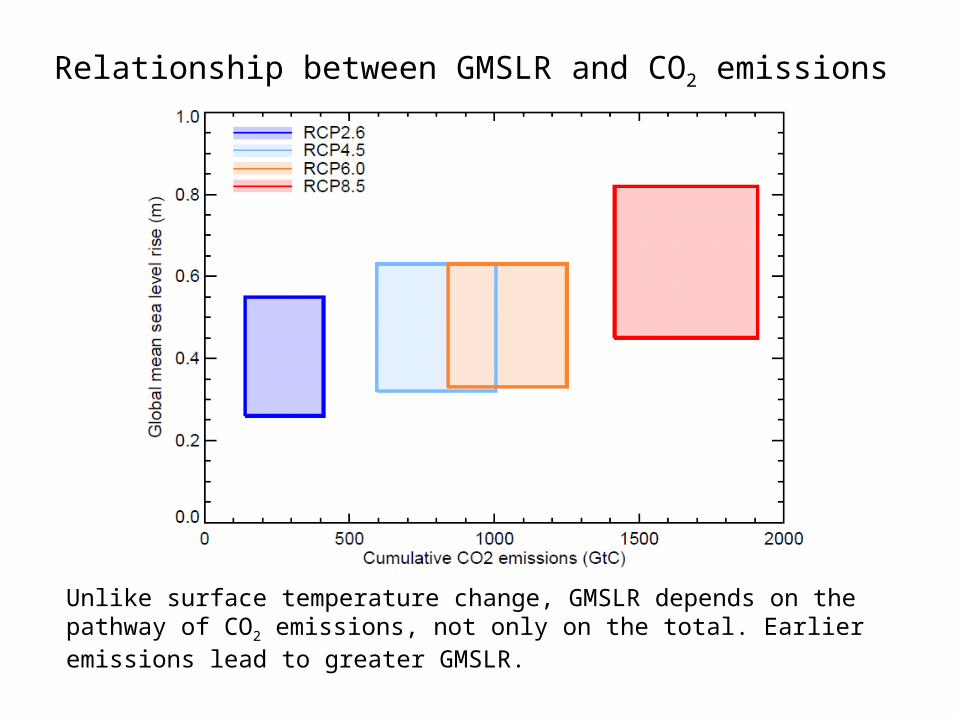
Relationship between GMSLR and CO2 emissions
Data from SPM
Unlike surface temperature change, GMSLR depends on the pathway of CO2 emissions, not only on the total. Earlier emissions lead to greater GMSLR.
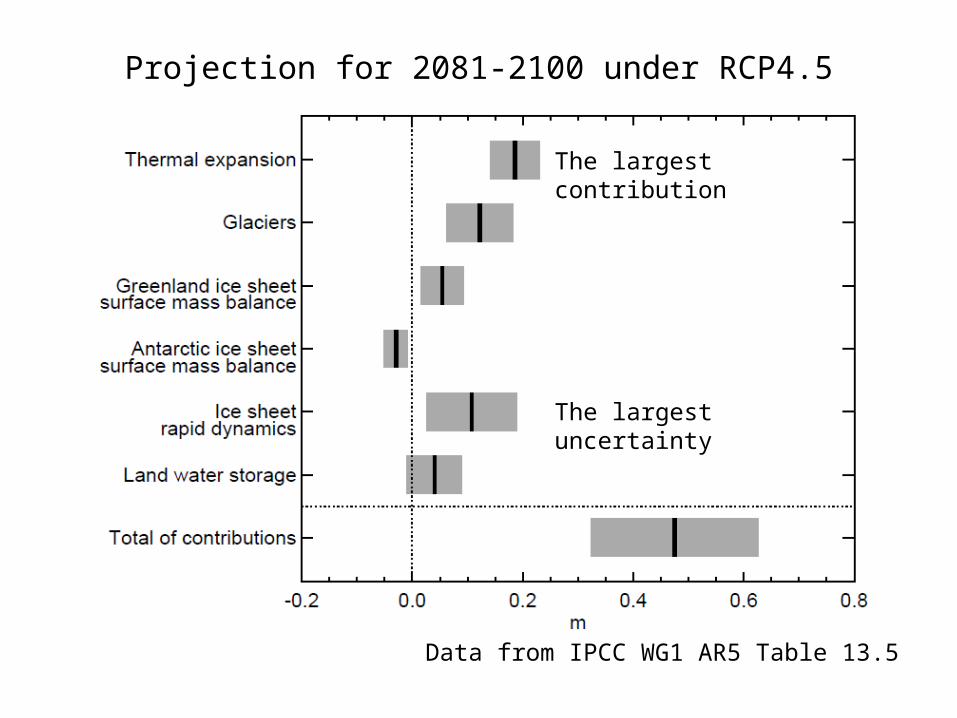
Projection for 2081-2100 under RCP4.5
The largest uncertainty
Data from IPCC WG1 AR5 Table 13.5
The largest contribution
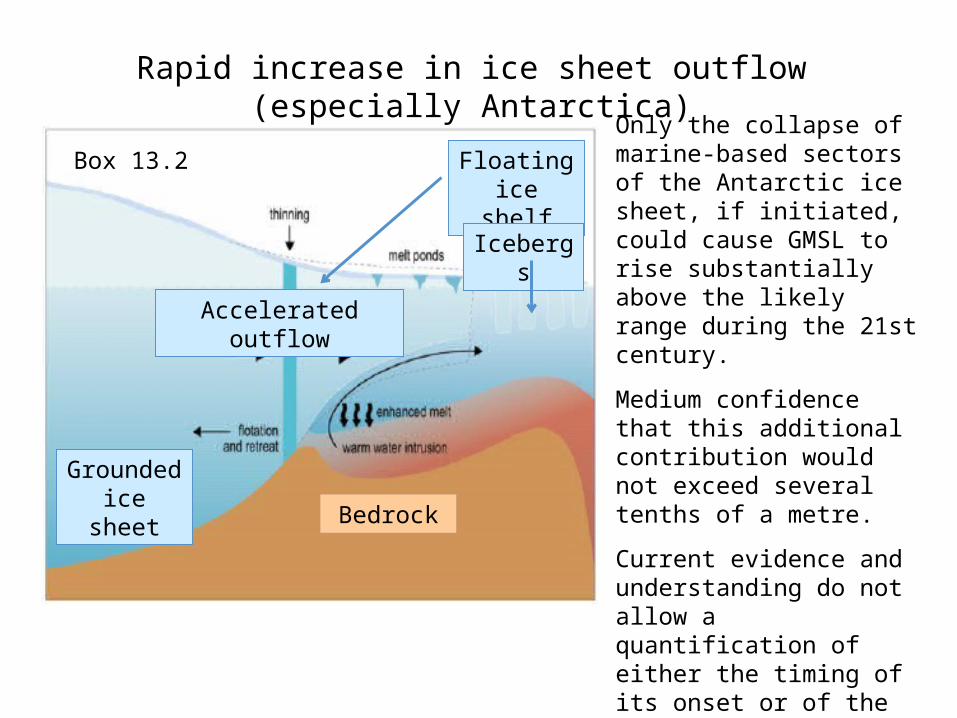
Rapid increase in ice sheet outflow (especially Antarctica)
Accelerated outflow
Only the collapse of marine-based sectors of the Antarctic ice sheet, if initiated, could cause GMSL to rise substantially above the likely range during the 21st century.
Medium confidence that this additional contribution would not exceed several tenths of a metre.
Current evidence and understanding do not allow a quantification of either the timing of its onset or of the magnitude of its multi-century contribution.
Grounded ice sheet
Floating ice shelf
Box 13.2
Bedrock
Icebergs
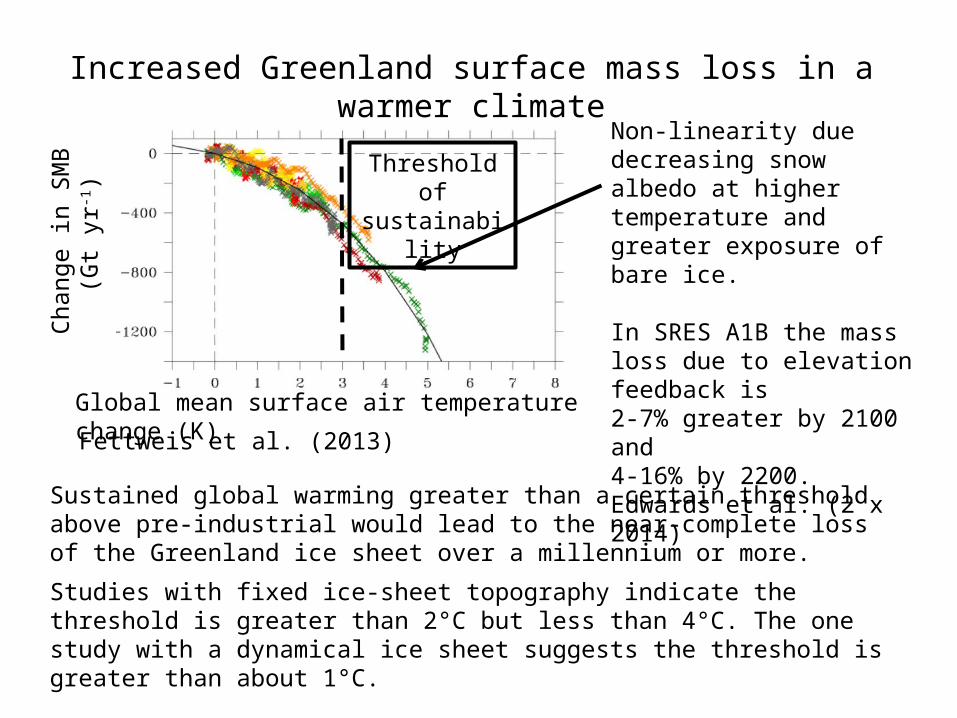
Studies with fixed ice-sheet topography indicate the threshold is greater than 2°C but less than 4°C. The one study with a dynamical ice sheet suggests the threshold is greater than about 1°C.
Sustained global warming greater than a certain threshold above pre-industrial would lead to the near-complete loss of the Greenland ice sheet over a millennium or more.
Increased Greenland surface mass loss in a warmer climateC
hang
e in
SM
B (
Gt
yr-1)
Global mean surface air temperature change (K)
Non-linearity due decreasing snow albedo at higher temperature and greater exposure of bare ice.
Threshold of sustainability
In SRES A1B the mass loss due to elevation feedback is2-7% greater by 2100 and4-16% by 2200.Edwards et al. (2 x 2014)Fettweis et al. (2013)
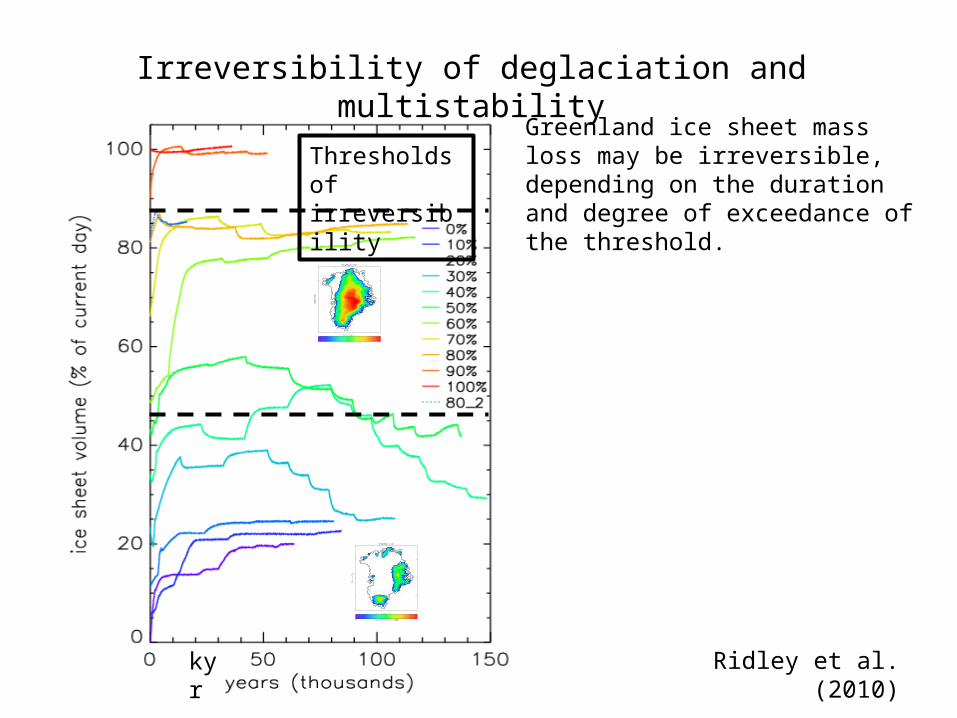
Ridley et al. (2010)kyr
Thresholds of irreversibility
Irreversibility of deglaciation and multistability
Greenland ice sheet mass loss may be irreversible, depending on the duration and degree of exceedance of the threshold.
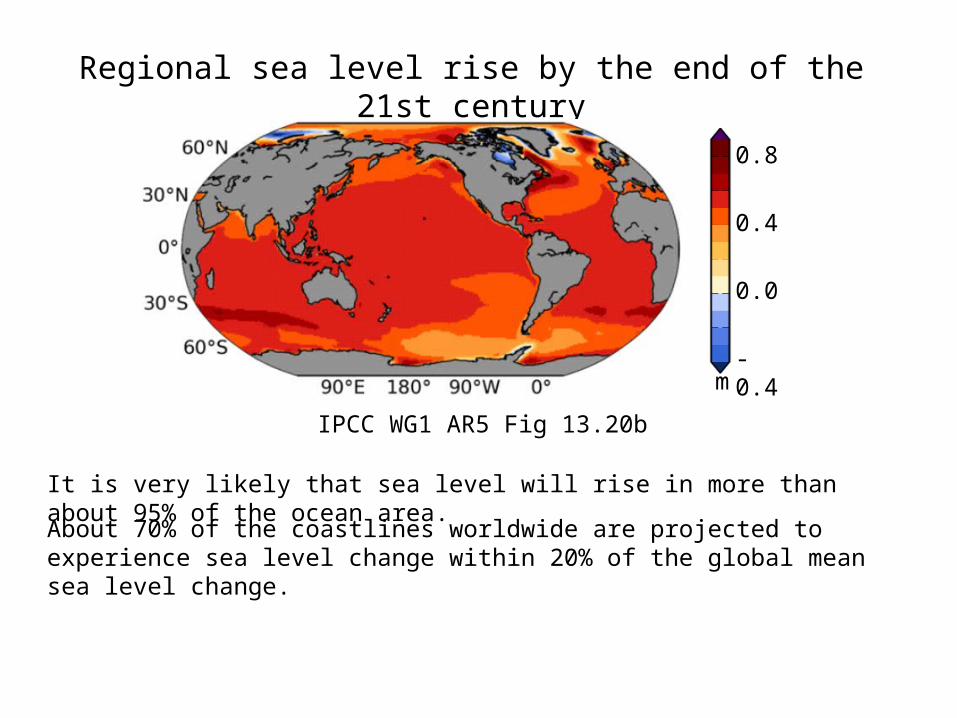
Regional sea level rise by the end of the 21st century
0.0
-0.4
0.4
m
0.8
Fig 13.20b
It is very likely that sea level will rise in more than about 95% of the ocean area.
About 70% of the coastlines worldwide are projected to experience sea level change within 20% of the global mean sea level change.
IPCC WG1 AR5 Fig 13.20b
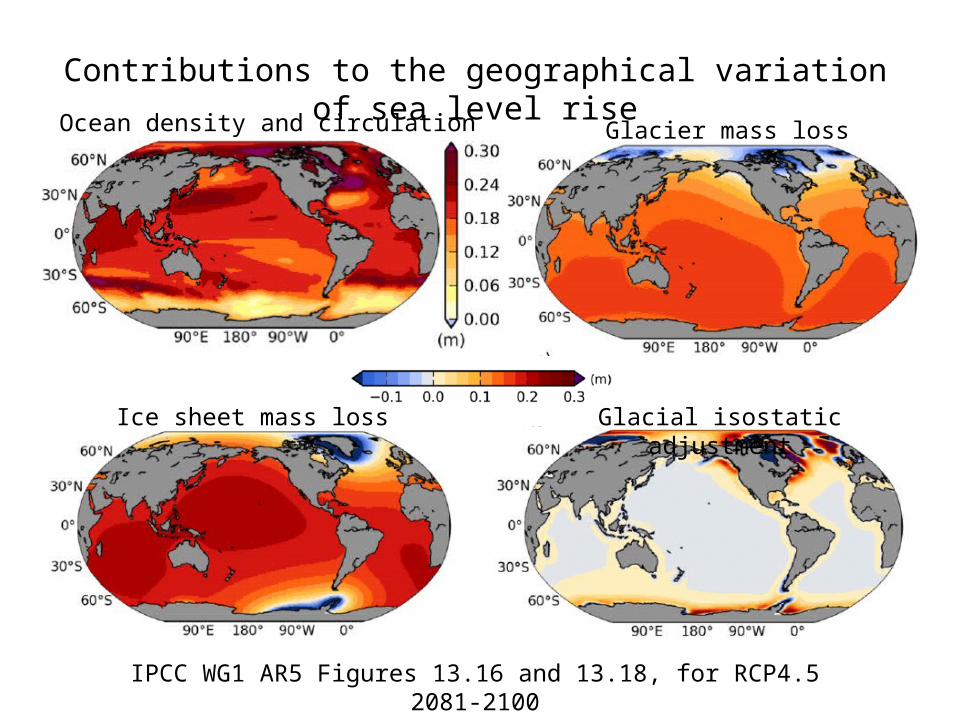
Contributions to the geographical variation of sea level rise
Ocean density and circulation Glacier mass loss
Ice sheet mass loss Glacial isostatic adjustment
IPCC WG1 AR5 Figures 13.16 and 13.18, for RCP4.5 2081-2100
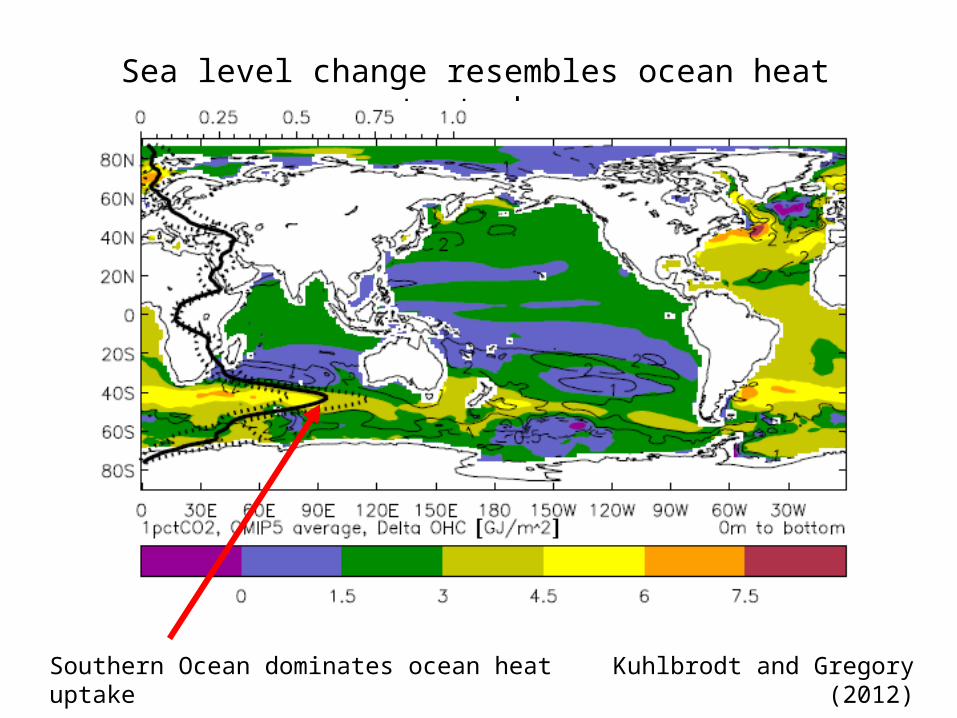
Sea level change resembles ocean heat content change
Kuhlbrodt and Gregory (2012)Southern Ocean dominates ocean heat uptake
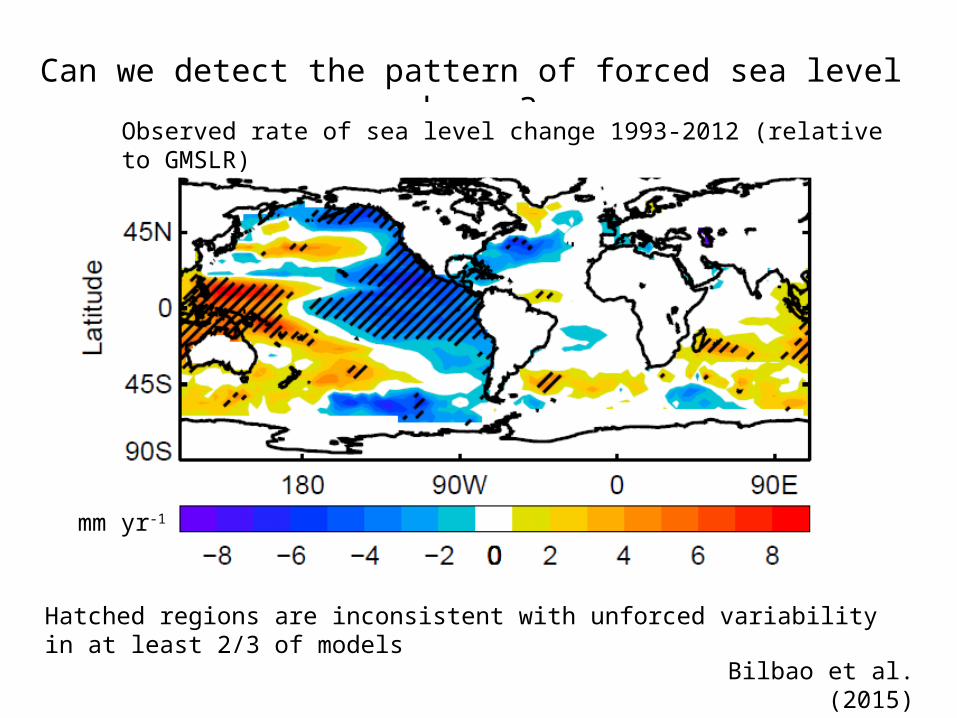
Hatched regions are inconsistent with unforced variability in at least 2/3 of models
Can we detect the pattern of forced sea level change?
Bilbao et al. (2015)
mm yr-1
Observed rate of sea level change 1993-2012 (relative to GMSLR)
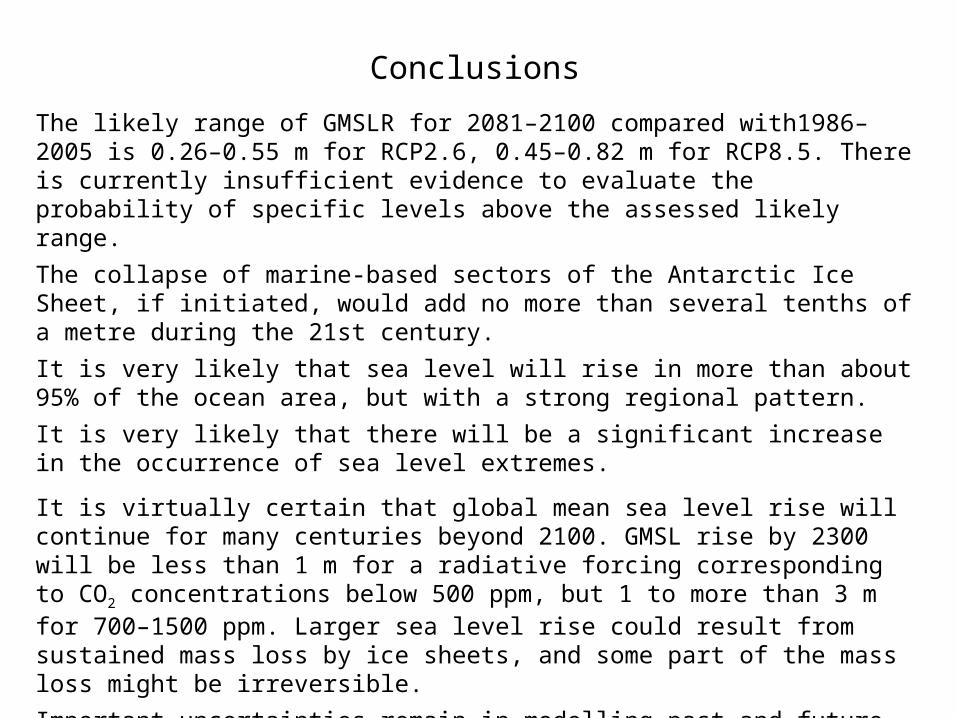
The likely range of GMSLR for 2081–2100 compared with1986–2005 is 0.26–0.55 m for RCP2.6, 0.45–0.82 m for RCP8.5. There is currently insufficient evidence to evaluate the probability of specific levels above the assessed likely range.
The collapse of marine-based sectors of the Antarctic Ice Sheet, if initiated, would add no more than several tenths of a metre during the 21st century.
It is very likely that sea level will rise in more than about 95% of the ocean area, but with a strong regional pattern.
It is very likely that there will be a significant increase in the occurrence of sea level extremes.
It is virtually certain that global mean sea level rise will continue for many centuries beyond 2100. GMSL rise by 2300 will be less than 1 m for a radiative forcing corresponding to CO2 concentrations below 500 ppm, but 1 to more than 3 m for 700–1500 ppm. Larger sea level rise could result from sustained mass loss by ice sheets, and some part of the mass loss might be irreversible.
Important uncertainties remain in modelling past and future changes in ocean heat uptake, regional sea level rise and ice sheets. They imply a need to keep open a range of adaptation options and to be able to change the approach as predictions become more robust.
Conclusions

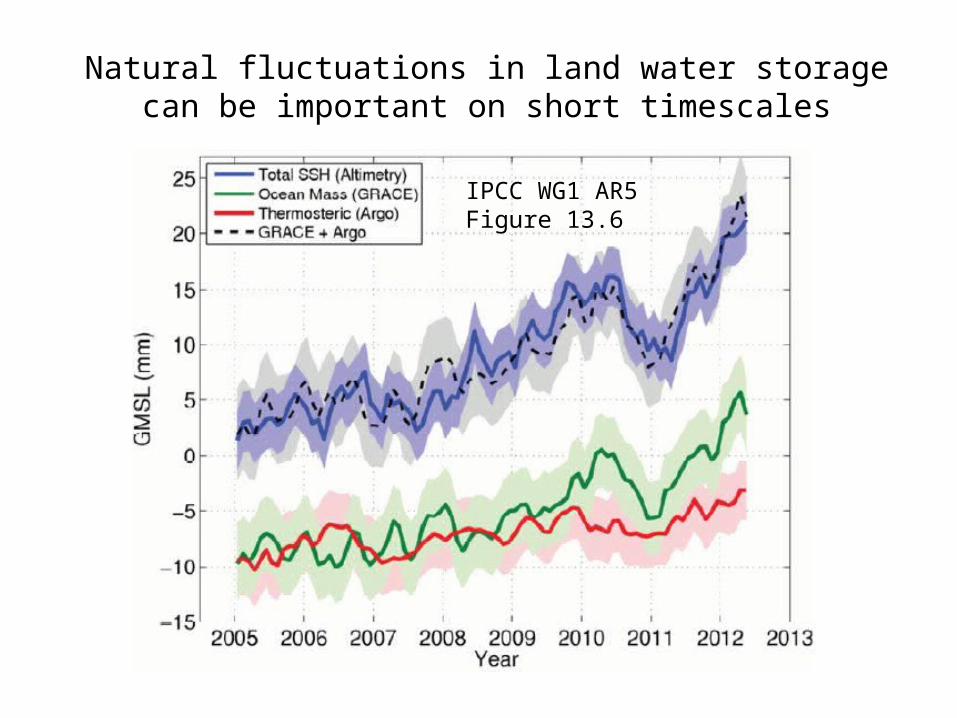
Natural fluctuations in land water storage can be important on short timescales
IPCC WG1 AR5 Figure 13.6
CM
IP5
FAM
OU
S+
win
dstr
ess
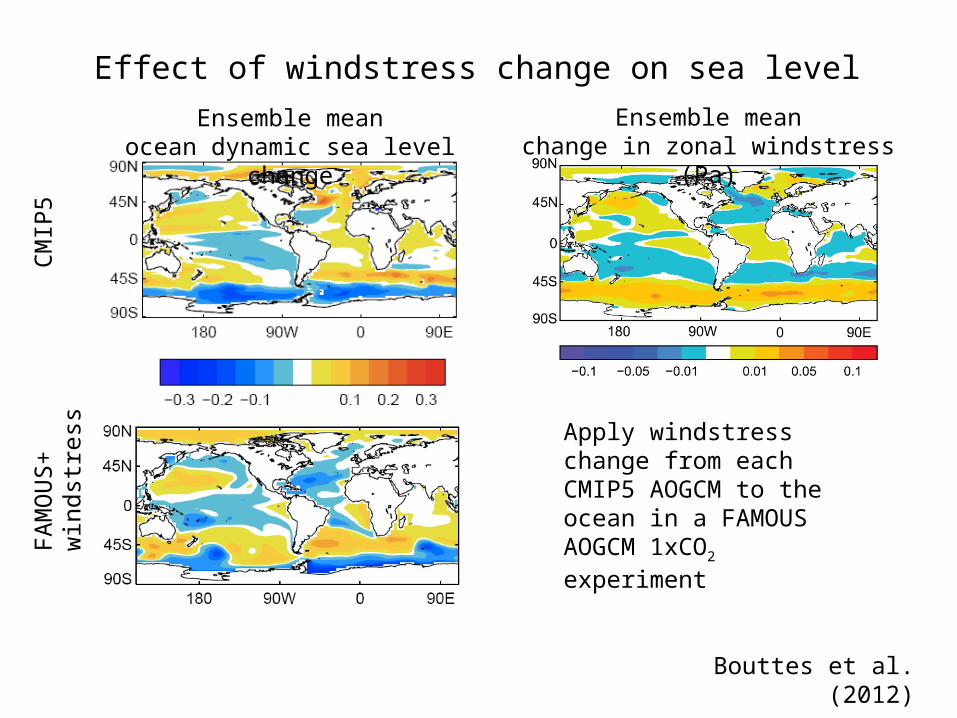
Effect of windstress change on sea level
Apply windstress change from each CMIP5 AOGCM to the ocean in a FAMOUS AOGCM 1xCO2 experiment
Ensemble meanocean dynamic sea level change
Ensemble meanchange in zonal windstress (Pa)
Bouttes et al. (2012)
CM
IP5
FAM
OU
S+
Hea
t flu
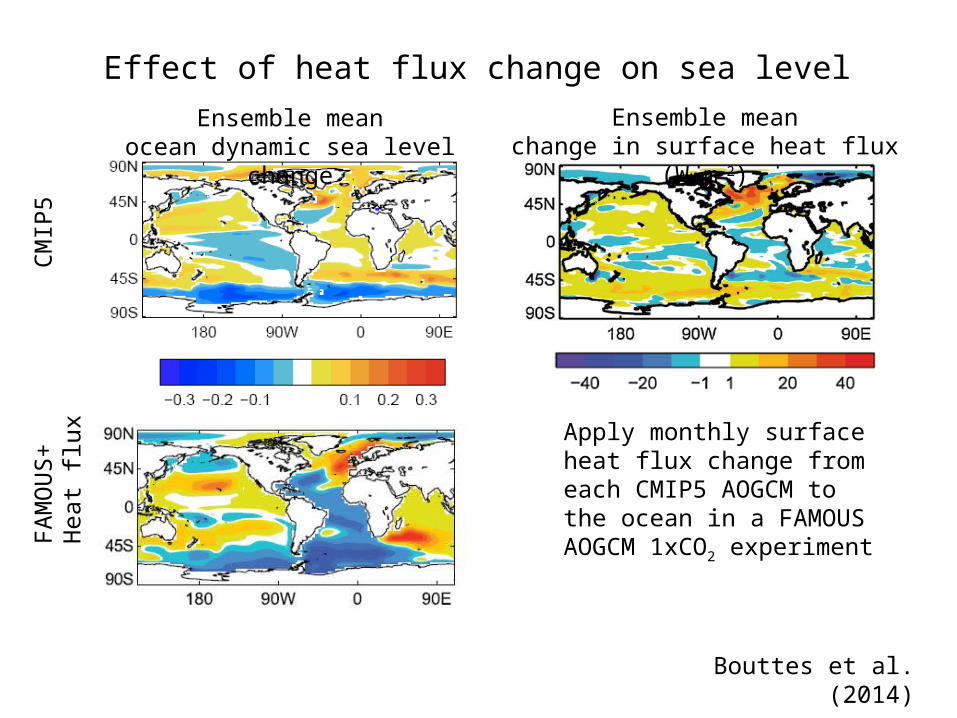
xEffect of heat flux change on sea level
Apply monthly surface heat flux change from each CMIP5 AOGCM to the ocean in a FAMOUS AOGCM 1xCO2 experiment
Bouttes et al. (2014)
Ensemble meanchange in surface heat flux (W m-2)
Ensemble meanocean dynamic sea level change
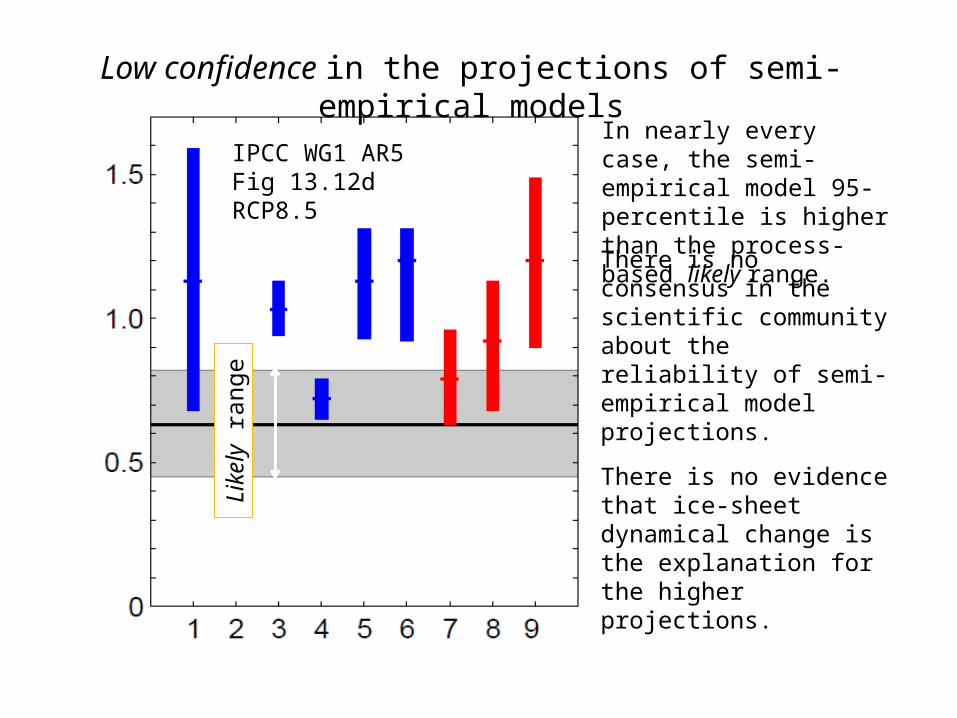
Low confidence in the projections of semi-empirical models
Like
ly r
ange
GM
SL
rise
(m)
in 2
081-
2100
rela
tive
to 1
986-
2005
IPCC WG1 AR5 Fig 13.12dRCP8.5
In nearly every case, the semi-empirical model 95-percentile is higher than the process-based likely range.
There is no consensus in the scientific community about the reliability of semi-empirical model projections.
There is no evidence that ice-sheet dynamical change is the explanation for the higher projections.
The colours indicate different types of RCP-derived input data
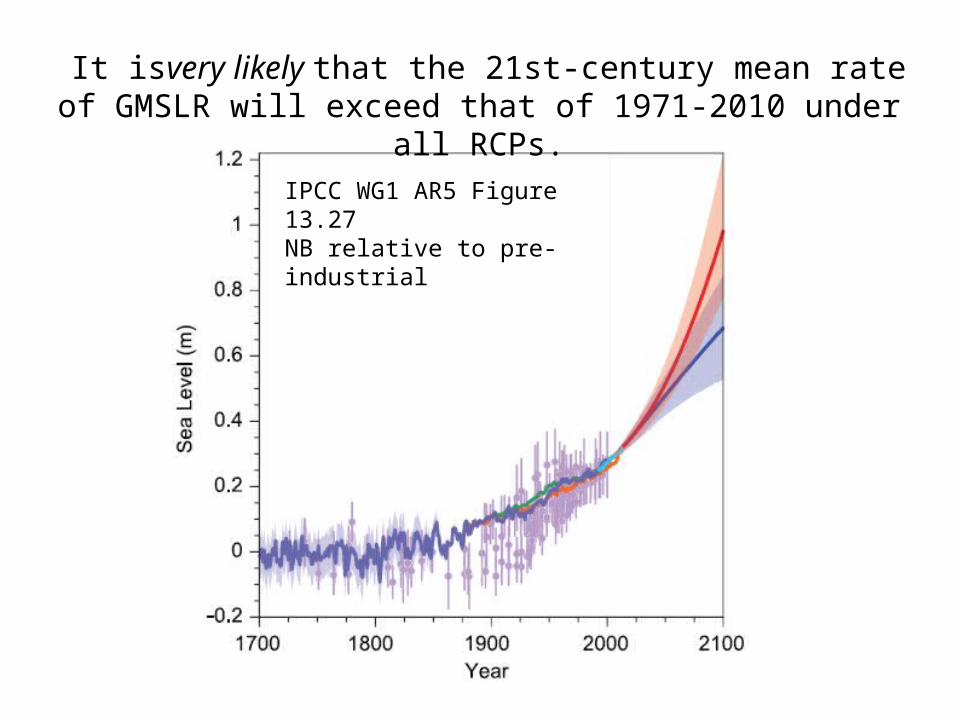
It isvery likely that the 21st-century mean rate of GMSLR will exceed that of 1971-2010 under all RCPs.
IPCC WG1 AR5 Figure 13.27NB relative to pre-industrial
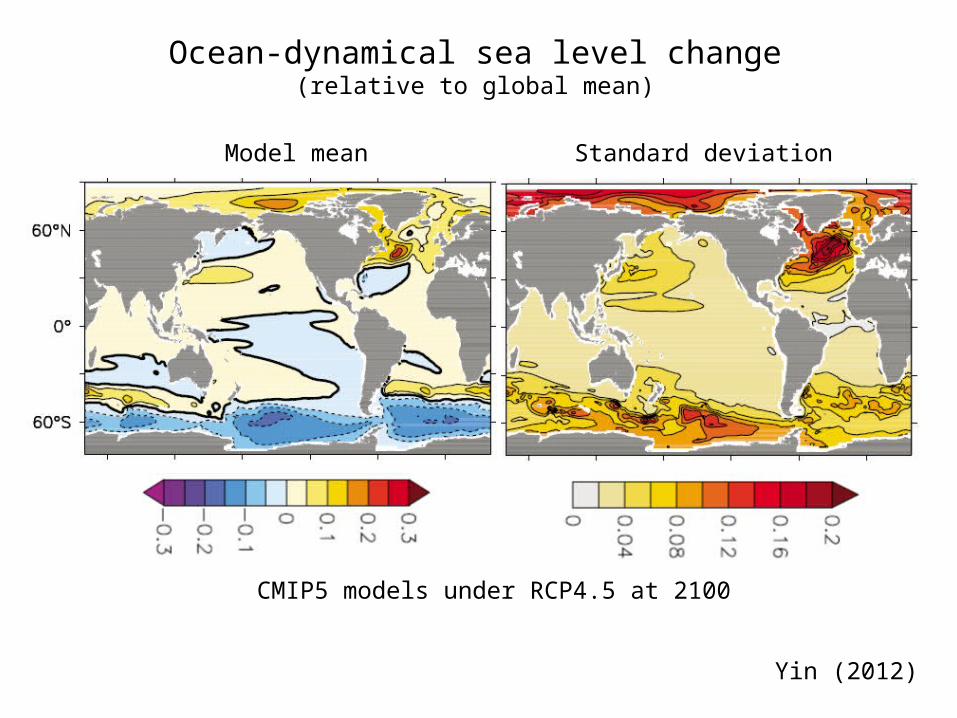
Ocean-dynamical sea level change(relative to global mean)
Yin (2012)
CMIP5 models under RCP4.5 at 2100
Model mean Standard deviation
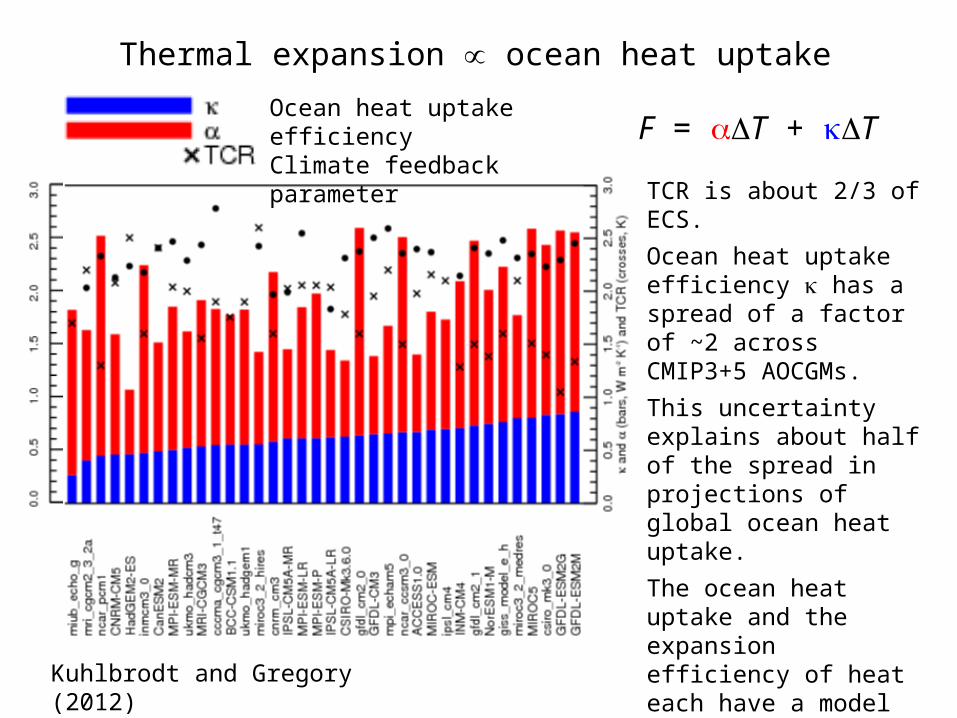
Thermal expansion ocean heat uptake
Kuhlbrodt and Gregory (2012)
F = T + T
TCR is about 2/3 of ECS.
Ocean heat uptake efficiency has a spread of a factor of ~2 across CMIP3+5 AOCGMs.
This uncertainty explains about half of the spread in projections of global ocean heat uptake.
The ocean heat uptake and the expansion efficiency of heat each have a model SD of about 10%.
Ocean heat uptake efficiencyClimate feedback parameter
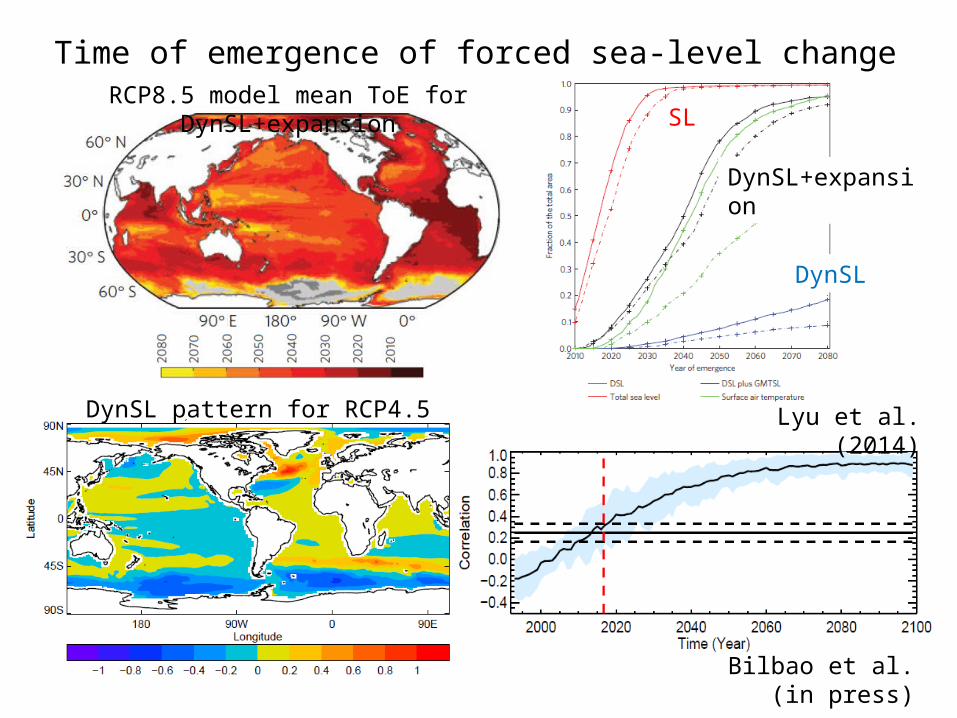
Time of emergence of forced sea-level change
Bilbao et al. (in press)
Lyu et al. (2014)
SL
DynSL+expansion
DynSL
RCP8.5 model mean ToE for DynSL+expansion
DynSL pattern for RCP4.5
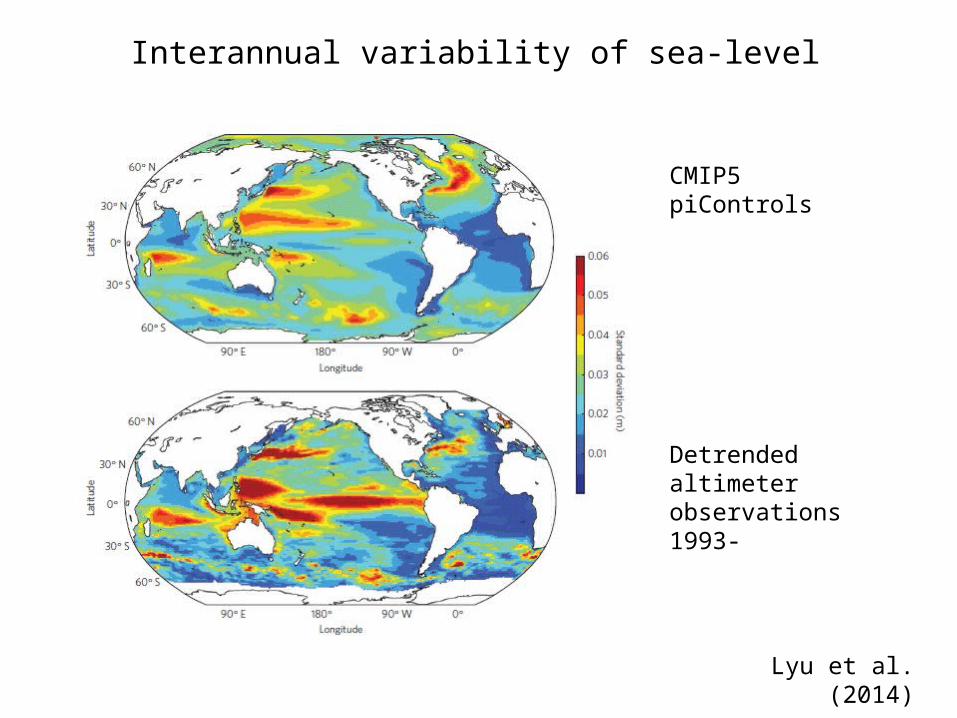
Interannual variability of sea-level
CMIP5 piControls
Detrended altimeter observations 1993-
Lyu et al. (2014)
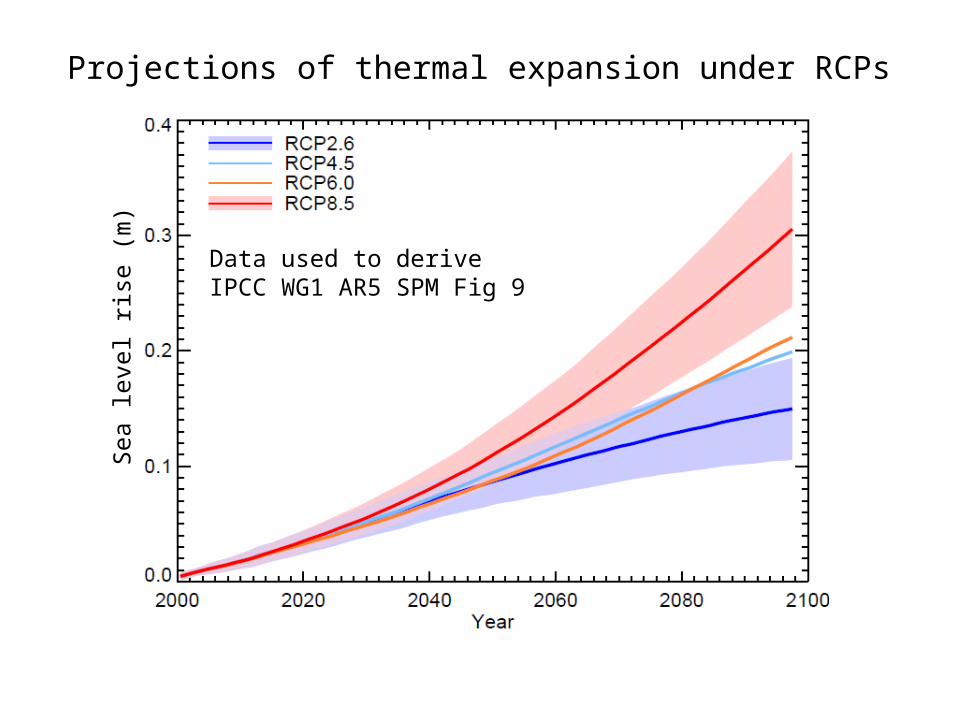
Projections of thermal expansion under RCPs
Sea
leve
l ris
e (m
)
Data used to deriveIPCC WG1 AR5 SPM Fig 9
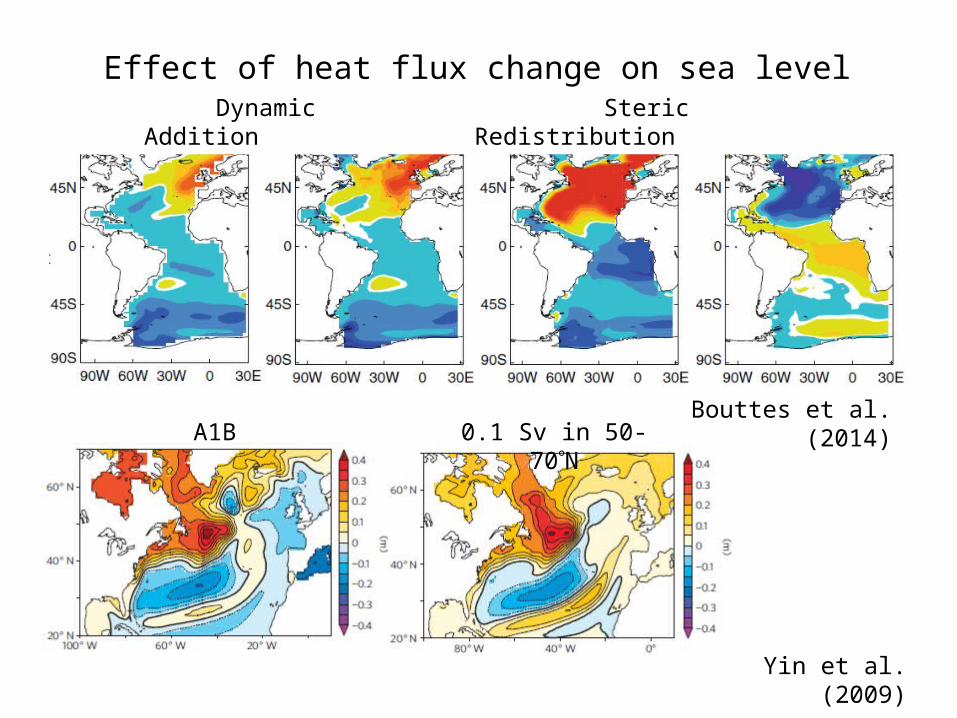
Dynamic Steric Addition Redistribution
Bouttes et al. (2014)
Effect of heat flux change on sea level
Yin et al. (2009)
A1B 0.1 Sv in 50-70N
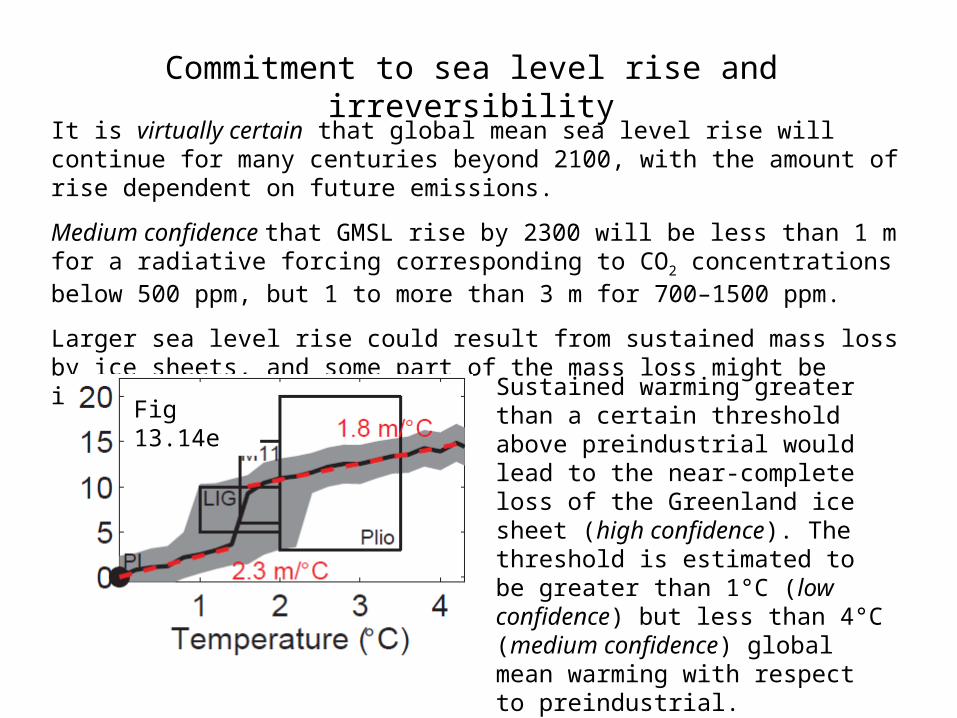
Commitment to sea level rise and irreversibility
It is virtually certain that global mean sea level rise will continue for many centuries beyond 2100, with the amount of rise dependent on future emissions.
Medium confidence that GMSL rise by 2300 will be less than 1 m for a radiative forcing corresponding to CO2 concentrations below 500 ppm, but 1 to more than 3 m for 700–1500 ppm.
Larger sea level rise could result from sustained mass loss by ice sheets, and some part of the mass loss might be irreversible.
Sustained warming greater than a certain threshold above preindustrial would lead to the near-complete loss of the Greenland ice sheet (high confidence). The threshold is estimated to be greater than 1°C (low confidence) but less than 4°C (medium confidence) global mean warming with respect to preindustrial.
Fig 13.14e
GM
SLR
(m
)
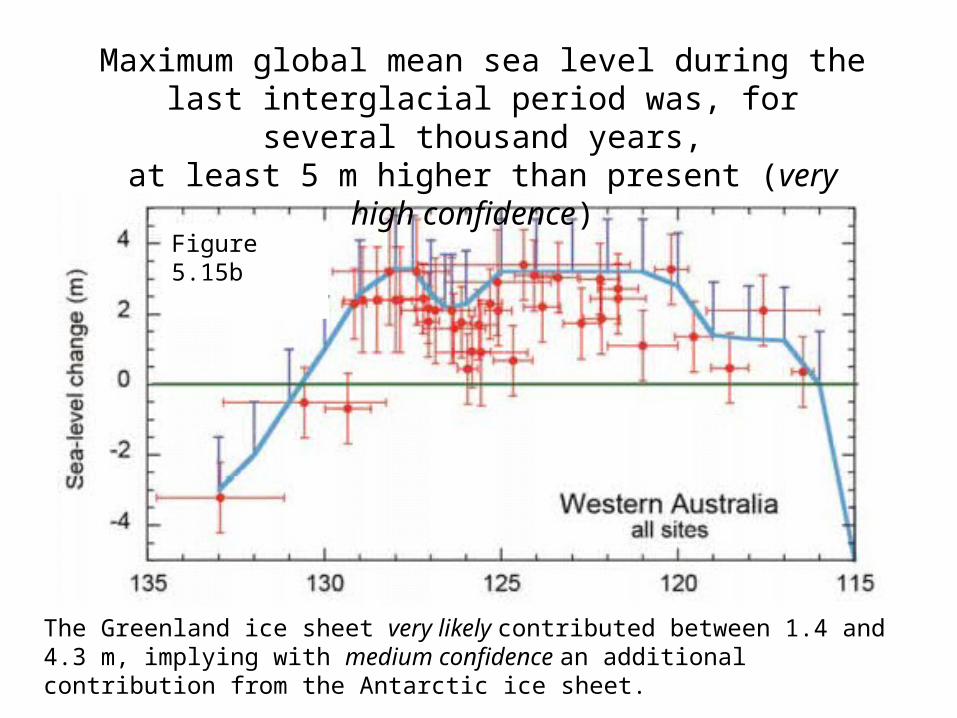
Figure 5.15b
Maximum global mean sea level during the last interglacial period was, for several thousand years,
at least 5 m higher than present (very high confidence)
The Greenland ice sheet very likely contributed between 1.4 and 4.3 m, implying with medium confidence an additional contribution from the Antarctic ice sheet.
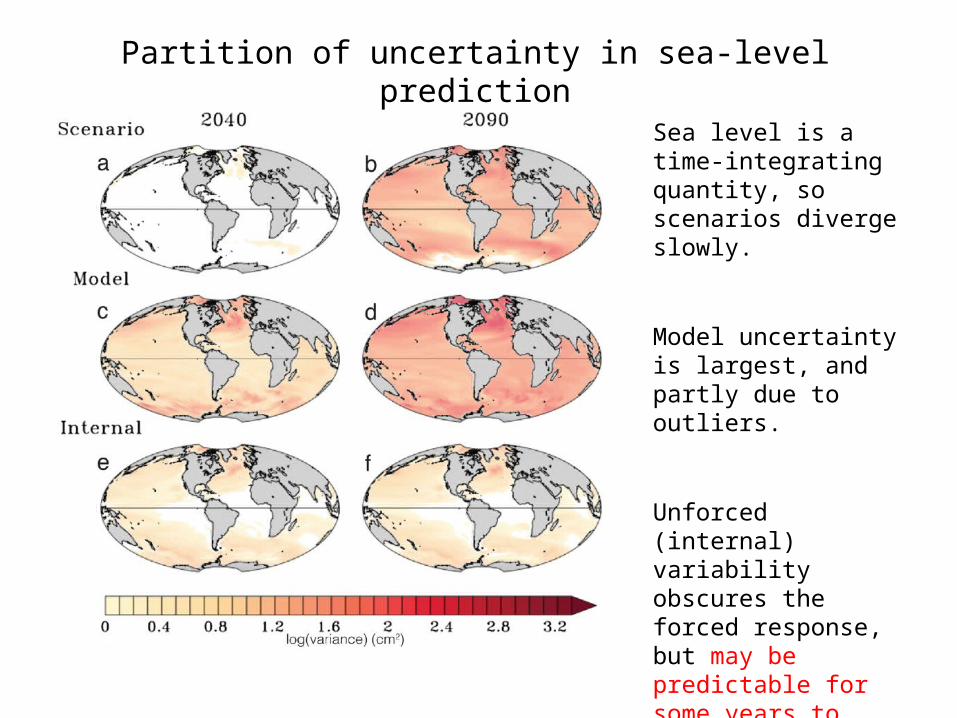
Sea level is a time-integrating quantity, so scenarios diverge slowly.
Model uncertainty is largest, and partly due to outliers.
Unforced (internal) variability obscures the forced response, but may be predictable for some years to decades
Little et al., 2015
Partition of uncertainty in sea-level prediction