Embed Size (px)
Citation preview
PROJECTIONS OF DEMAND FOR FULL TIME THIRD
LEVEL EDUCATION, 2015 - 2029
NOVEMBER 2015
This report and others in the series may be accessed at:
www.education.ie and go to Statistics/Projections of Enrolment
For further information please contact:
Diarmuid Reidy at 01 – 889 6588 or by e-mail at
________________________________________________________________
Statistics Section, Department of Education and Skills.
2
Table of Contents
1. Introduction 4
2. Overview of Methodology 5
3. Scenarios 5
4. Projected Demand for Full Time Aided Places at Third Level 2015-2029 5
5. Components of Demand for Third Level 8
5.1. Projection of Entrants 8
5.2 Rate of Undergraduate Turnover 11
5.3 Postgraduate Enrolments 11
Appendix A: Comparison with previous projections 12
________________________________________________________________
Statistics Section, Department of Education and Skills.
3
List of Tables
Table 1: Projections of Full Time Demand for Education in DES-Aided Third
Level Institutions 2015-2029 6
Table 2: Projections of New Entrants to Third Level 2015-2029 10
Table 3: Comparison with 2014 projections 11
List of Graphs
Figure A: Projected Demand for Full Time DES-Aided Third Level Education,
2015-2029 7
Figure B: Projected Entrants to Third Level, 2015-2029 10

________________________________________________________________
Statistics Section, Department of Education and Skills.
4
1. Introduction
This document provides the latest set of projections of demand for full time third level
education for the period 2015-2029. It should be noted that these are projections of
likely demand for Department of Education and Skills aided institutions only. Actual
enrolments in each year do not always equate with projected demand, as demand is
constantly fluctuating in response to the changing economic situation and resulting
shifts in prospective students’ options and preferences. A separate release on first and
second level projections was released in July 2015. This release discusses third level
full time projections only.
The numbers enrolled in higher education have been steadily increasing in recent
years. Full time enrolments in particular have grown substantially, by over 25% in the
past 10 years alone. A number of continuing pressures on demand for higher
education will arise from
-Underlying demographic pressure following on from increases in numbers at primary
and post primary level in recent years
-The continued increase in attractiveness of third level education as Ireland and other
EU and OECD economies seek to move up the value chain in terms of the skills
profile of their workforce
-Policy initiatives that aim to increase participation in higher education from under-
represented socio-economic groups, mature students, and further education graduates.
Entrants into third level education fall into three main groups, transfers from the
second level system before reaching the “mature” cut-off age of 23, international
entrants, and mature students. In response to feedback from users of the third level
projections, in this iteration of the projections model the emphasis is shifted onto the
possible impact of changes to these entry cohort groups on demand for third level
education, rather than the impact of changes in migration patterns at first and second
level.
The Department’s baseline scenario (called S1), assumes that the transfer rate of
pupils from second level, the number of mature students and the number of
international students will all remain at 2014/15 levels for the period of these
projections. A number of alternative scenarios (S0, S2 and S3) are also presented to
demonstrate how variations in the components of entry to third level education could
affect the projected numbers, when compared to the baseline scenario.
This assumption suggests that demand for third level full time education under
scenario S1 is expected to continue to rise every year over the period 2015-2029,
reaching 207,544 by 2029, an increase of over 38,000 on 2014 enrolment levels.
________________________________________________________________
Statistics Section, Department of Education and Skills.
5
2. Overview of Methodology
The majority of entrants to third level education each year come directly from the
second level system, with a further significant proportion entering third level within a
few years of leaving second level education. A data matching exercise is carried out
using data from the Department’s Post-Primary Pupil database and the HEA Student
Record System, to arrive at an accurate transfer rate from second to third level
education for non-mature students (i.e. those that have progressed to third level
education in the five years immediately after leaving second level)
Separately, numbers of mature and international entrants are projected based on
current numbers in the system, and these are combined with the entrants from second
level to arrive at an overall figure for new fulltime entrants to third level for each year.
Adjustments are also made for the relatively small numbers of entrants to non-HEA
institutions and for entrants from the private second level sector.
The projected numbers of undergraduate new entrants are combined with the
estimated numbers of continuing students each year, using a statistic known as the
Rate of Undergraduate Turnover (see page 11 for further details) in order to arrive at a
total figure for undergraduate enrolments. Postgraduate enrolments are calculated as a
proportion of undergraduate enrolments based on recent trend data available from the
Higher Education Authority.
Section 4 from page 8 on below provides a more detailed description of the
methodology employed in the projections model.
3. Scenarios
The transfer rate from second to third level has remained fairly stable in recent years,
and the most recent exercise shows a transfer rate from second level of 63.8%. This
transfer rate is carried through in the baseline scenario (S1). For scenario S1, mature
and international new entrants are also maintained around their current levels
(approximately 5300 and 1700 respectively).
While it is considered unlikely that the transfer rate to third level will fall significantly
in the future given policy targets to further increase participation, and the continued
attractiveness of third level education, a scenario was considered (S0) where the
transfer rate to third level would fall to 60% in the coming years due to continued
recovery in the labour market and possible growth in the further education sector.
Two “growth” scenarios (S2 and S3) are also considered in this report. A low growth
scenario (S2) evaluates the impact of increases in mature and international new
entrants by 25% on current levels of demand over the period of the projections. A
higher growth scenario (S3) considers the impact of the same levels of increase in
mature and international new entrants combined with a gradual increase in the transfer
rate to third level to 70% over the period of the projections.
More “growth” scenarios are included in this publication to facilitate consideration of
possible impacts of current policy objectives in the higher education sector. These
include increasing internationalisation of the student population, increasing
participation in lifelong learning, and increasing transfer to higher education of those
from lower socio-economic groups.
________________________________________________________________
Statistics Section, Department of Education and Skills.
6
4. Projected Demand for Full Time DES Aided Places at Third Level,
2015-2029
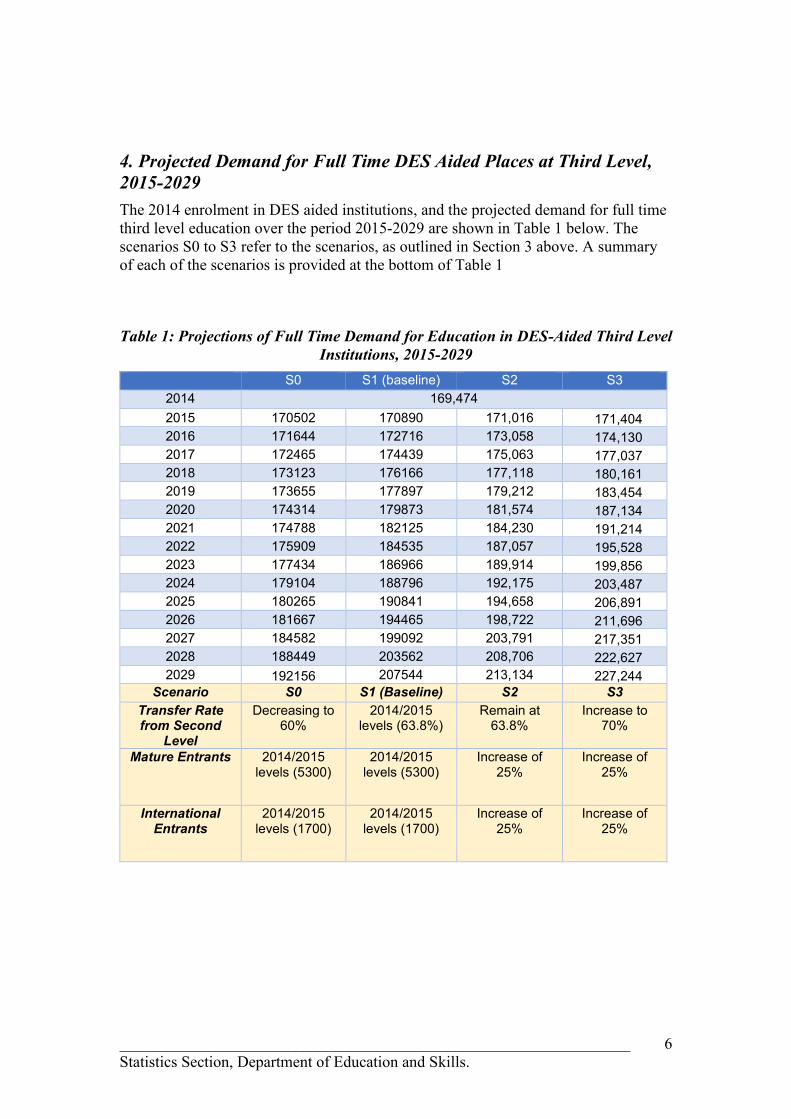
The 2014 enrolment in DES aided institutions, and the projected demand for full time
third level education over the period 2015-2029 are shown in Table 1 below. The
scenarios S0 to S3 refer to the scenarios, as outlined in Section 3 above. A summary
of each of the scenarios is provided at the bottom of Table 1
Table 1: Projections of Full Time Demand for Education in DES-Aided Third Level
Institutions, 2015-2029
S0 S1 (baseline) S2 S3
2014 169,474
2015 170502 170890 171,016 171,404
2016 171644 172716 173,058 174,130
2017 172465 174439 175,063 177,037
2018 173123 176166 177,118 180,161
2019 173655 177897 179,212 183,454
2020 174314 179873 181,574 187,134
2021 174788 182125 184,230 191,214
2022 175909 184535 187,057 195,528
2023 177434 186966 189,914 199,856
2024 179104 188796 192,175 203,487
2025 180265 190841 194,658 206,891
2026 181667 194465 198,722 211,696
2027 184582 199092 203,791 217,351
2028 188449 203562 208,706 222,627
2029 192156 207544 213,134 227,244
Scenario S0 S1 (Baseline) S2 S3
Transfer Rate from Second
Level
Decreasing to 60%
2014/2015 levels (63.8%)
Remain at 63.8%
Increase to 70%
Mature Entrants 2014/2015 levels (5300)
2014/2015 levels (5300)
Increase of 25%
Increase of 25%
International Entrants
2014/2015 levels (1700)
2014/2015 levels (1700)
Increase of 25%
Increase of 25%
________________________________________________________________
Statistics Section, Department of Education and Skills.
7
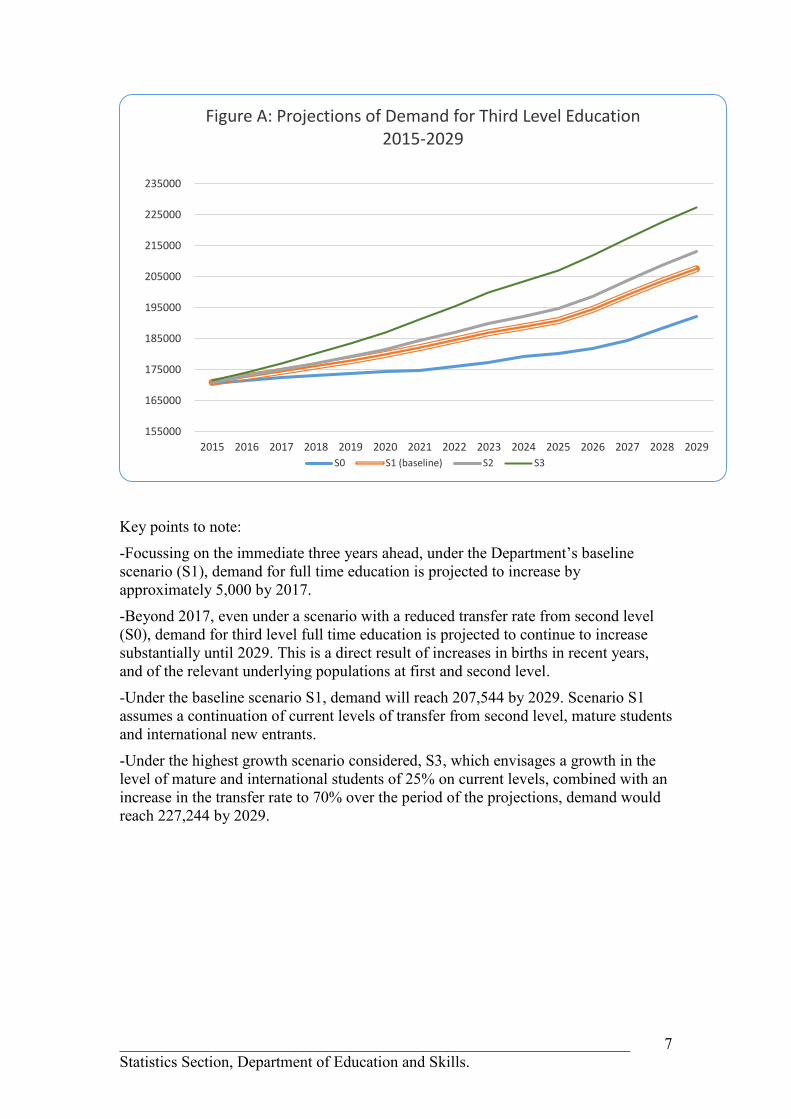
Key points to note:
-Focussing on the immediate three years ahead, under the Department’s baseline
scenario (S1), demand for full time education is projected to increase by
approximately 5,000 by 2017.
-Beyond 2017, even under a scenario with a reduced transfer rate from second level
(S0), demand for third level full time education is projected to continue to increase
substantially until 2029. This is a direct result of increases in births in recent years,
and of the relevant underlying populations at first and second level.
-Under the baseline scenario S1, demand will reach 207,544 by 2029. Scenario S1
assumes a continuation of current levels of transfer from second level, mature students
and international new entrants.
-Under the highest growth scenario considered, S3, which envisages a growth in the
level of mature and international students of 25% on current levels, combined with an
increase in the transfer rate to 70% over the period of the projections, demand would
reach 227,244 by 2029.
155000
165000
175000
185000
195000
205000
215000
225000
235000
2015 2016 2017 2018 2019 2020 2021 2022 2023 2024 2025 2026 2027 2028 2029
Figure A: Projections of Demand for Third Level Education 2015-2029
S0 S1 (baseline) S2 S3
________________________________________________________________
Statistics Section, Department of Education and Skills.
8
5. Components of Demand at Third Level
5.1 Projection of Entrants to Third Level Education
The projection of entrants to third level education involves three separate components:
1) Calculation of a transfer rate from second to third level education.
2) Projection of numbers of mature entrants.
3) Projection of numbers of international students.
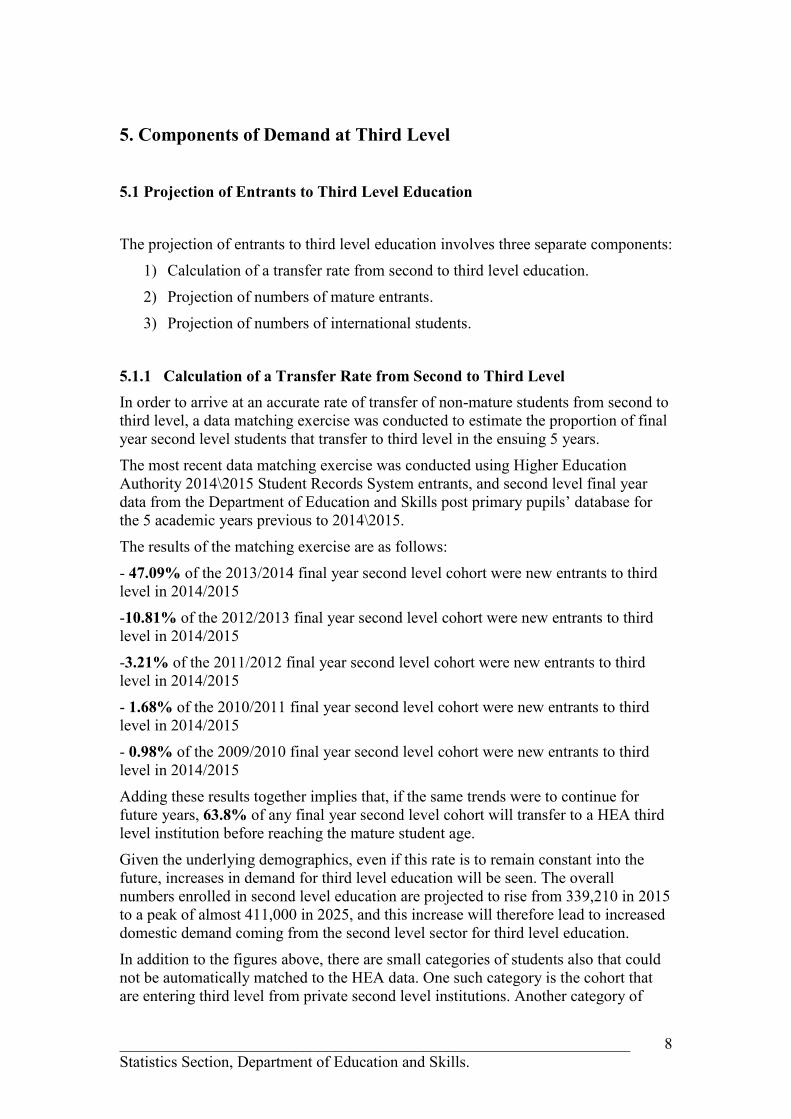
5.1.1 Calculation of a Transfer Rate from Second to Third Level
In order to arrive at an accurate rate of transfer of non-mature students from second to
third level, a data matching exercise was conducted to estimate the proportion of final
year second level students that transfer to third level in the ensuing 5 years.
The most recent data matching exercise was conducted using Higher Education
Authority 2014\2015 Student Records System entrants, and second level final year
data from the Department of Education and Skills post primary pupils’ database for
the 5 academic years previous to 2014\2015.
The results of the matching exercise are as follows:
- 47.09% of the 2013/2014 final year second level cohort were new entrants to third
level in 2014/2015
-10.81% of the 2012/2013 final year second level cohort were new entrants to third
level in 2014/2015
-3.21% of the 2011/2012 final year second level cohort were new entrants to third
level in 2014/2015
- 1.68% of the 2010/2011 final year second level cohort were new entrants to third
level in 2014/2015
- 0.98% of the 2009/2010 final year second level cohort were new entrants to third
level in 2014/2015
Adding these results together implies that, if the same trends were to continue for
future years, 63.8% of any final year second level cohort will transfer to a HEA third
level institution before reaching the mature student age.
Given the underlying demographics, even if this rate is to remain constant into the
future, increases in demand for third level education will be seen. The overall
numbers enrolled in second level education are projected to rise from 339,210 in 2015
to a peak of almost 411,000 in 2025, and this increase will therefore lead to increased
domestic demand coming from the second level sector for third level education.
In addition to the figures above, there are small categories of students also that could
not be automatically matched to the HEA data. One such category is the cohort that
are entering third level from private second level institutions. Another category of
________________________________________________________________
Statistics Section, Department of Education and Skills.
9
students are the small numbers that did not have a PPS number available for linking.
There is also a small cohort of entrants to DES-aided institutions that do not provide
data to the HEA Student Record system. In total, an adjustment is made of the order
of 3.1 percentage points to the transfer rate above to take account of these categories
of pupils, which gives a total estimated transfer rate of students from the second level
sector to third level of approximately 66.9% in 2014/2015. In other words, in total
66.9% of final year second level students (public and private) in any given academic
year are estimated to make the transfer to publicly-aided third level institutions before
reaching the mature student age of 23.
For the purposes of the projections, the path taken to third level education is irrelevant
when calculating the transfer rate from second to third level. Students who do not
make the transfer directly to third level may repeat the Leaving Certificate to get more
points, pursue a Post-Leaving Certificate course, enter employment, be unemployed
for a period of time, or travel abroad for a “gap year” before entering the third level
system. Whichever path is taken to third level, this data matching exercise ensures
that students who enter third level before the age of 23 after a period of other activity,
are included in the transfer rate for projections purposes.
5.1.2 Mature Entrants and International Students
A significant proportion of undergraduate new entrants into the third level sector are
mature entrants. These are first time entrants to third level education which are aged
23 or over. Applicants aged 23 or over are entitled to be assessed for financial
supports independently of their parents. The age profile breakdown of undergraduate
new entrants shows a surge in entrants to third level at the age of 23 and 24, with a
gradual levelling off after those ages.
Trends in international student entrants, particularly those from non-EU countries are,
in general, not dictated by Ireland’s economic or demographic profile of the moment,
but rather by events and policies in their home countries.
Given that many third level Irish institutions are aiming to attract a larger number of
international students to their campuses, and have stated policy objectives in relation
to strengthening lifelong learning, some scenarios shown on page 6 above assume
numbers of international and mature students will increase over time (see section
“Scenarios” on page 2 for more information).
It should be noted that there is some overlap between mature and international
entrants (i.e. there are some international entrants that are also aged over 23). For the
purposes of this model international entrants are therefore counted as those aged
under 23 only, in order to avoid double counting.
________________________________________________________________
Statistics Section, Department of Education and Skills.
10
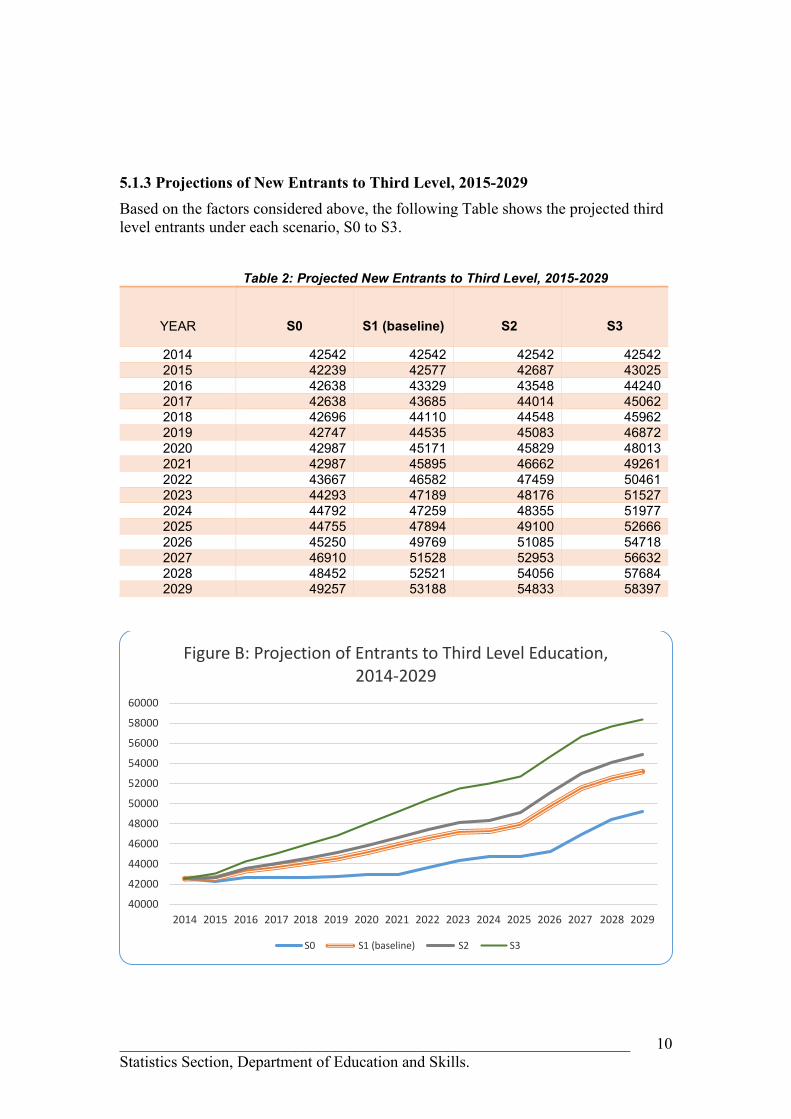
5.1.3 Projections of New Entrants to Third Level, 2015-2029
Based on the factors considered above, the following Table shows the projected third
level entrants under each scenario, S0 to S3.
Table 2: Projected New Entrants to Third Level, 2015-2029
YEAR
S0
S1 (baseline)
S2
S3
2014 42542 42542 42542 42542
2015 42239 42577 42687 43025
2016 42638 43329 43548 44240
2017 42638 43685 44014 45062 2018 42696 44110 44548 45962
2019 42747 44535 45083 46872
2020 42987 45171 45829 48013
2021 42987 45895 46662 49261
2022 43667 46582 47459 50461
2023 44293 47189 48176 51527
2024 44792 47259 48355 51977
2025 44755 47894 49100 52666
2026 45250 49769 51085 54718
2027 46910 51528 52953 56632
2028 48452 52521 54056 57684 2029 49257 53188 54833 58397
40000
42000
44000
46000
48000
50000
52000
54000
56000
58000
60000
2014 2015 2016 2017 2018 2019 2020 2021 2022 2023 2024 2025 2026 2027 2028 2029
Figure B: Projection of Entrants to Third Level Education, 2014-2029
S0 S1 (baseline) S2 S3
________________________________________________________________
Statistics Section, Department of Education and Skills.
11
Under all scenarios, the numbers entering third level are projected to rise continuously
between 2015 and 2029. This is a direct result of the underlying demographic profile
of the population.
5.2 Rate of Undergraduate Turnover (ROUT)
In addition to projecting the number of entrants, a projection needs to be made of the
likely level of continuing enrolments. The rate of undergraduate turnover is the
proportion of total Higher Education undergraduate enrolment which is “turned over”
into the following academic year. It is calculated as follows:
Rate of Undergraduate Turnover = ROUT = (Stock t+1 – Entrants t+1) / Stock t
Where
Stock t = total enrolment in full time undergraduate courses at Higher Education in
year T
Stock t+1 = total enrolment in full time undergraduate courses at Higher Education in
year T+1
And Entrants t+1 = total intake to full time undergraduate courses at Higher Education
in year T+1
This measure gives an indication of those who continue each year in higher education.
If one takes the total stock enrolment in one year, then those remaining the following
year are those that have not either graduated, or dropped out of college. Although no
analysis is made of the proportion of graduates and dropouts each year, the ROUT
gives an implied figure for combined turnover in the sector year-on-year due to both
graduation and dropout.
As an example, from 2013/2014 to 2014/2015 academic year, the ROUT is calculated
as follows:
Stock 2014: 147,765
Entrants 2014: 42,542
Stock 2013: 144,269
ROUT = (147,765 – 42,542) / 144,269
This gives a rate for the sector as a whole of just over 72.9%. As the ROUT can show
some volatility year on year, an average ROUT figure of 71.98% based on the
previous two years data is carried throughout the model.
5.3 Postgraduate Enrolments
The final component in the third level projections model is a projection of
postgraduate enrolments as a proportion of total full time enrolment.
________________________________________________________________
Statistics Section, Department of Education and Skills.
12
In recent years there has been a gradual decrease in the proportion of postgraduate
enrolments from a peak of 14.5% in 2009. The most recent data available from the
HEA shows that for 2014/2015, postgraduate enrolments represented just under 13%
of all full time third level enrolments. This figure of 13.0% is carried throughout the
model.
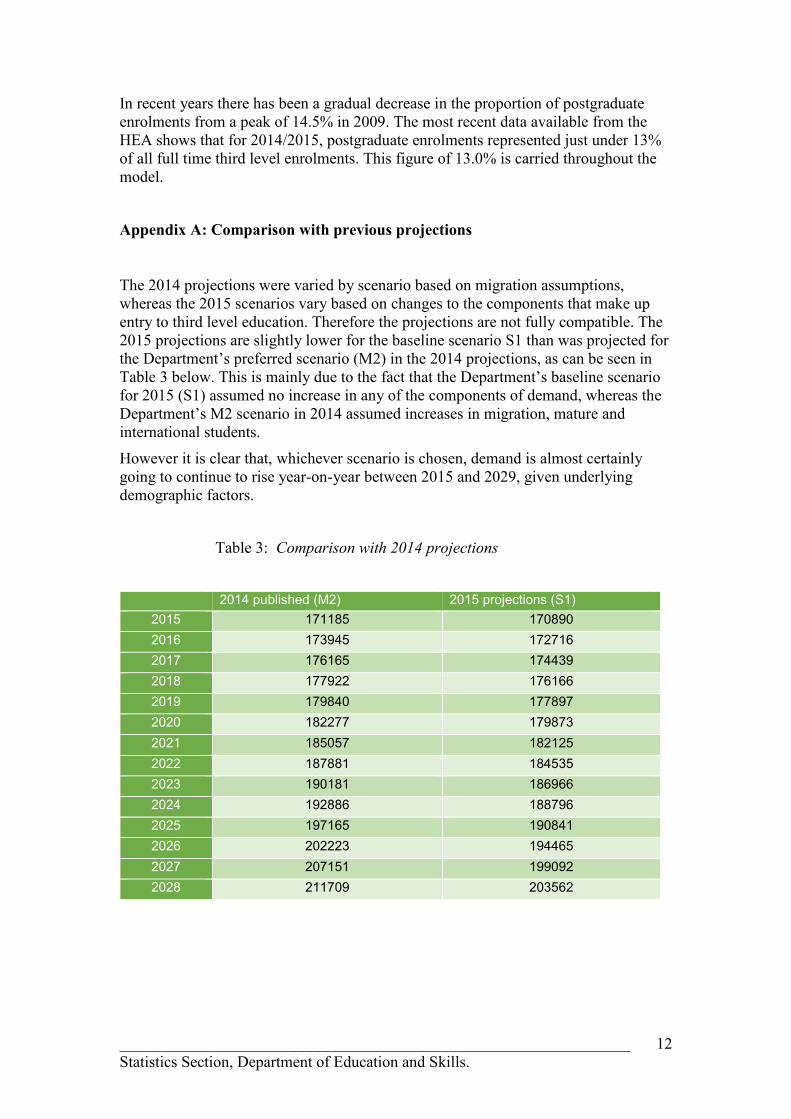
Appendix A: Comparison with previous projections
The 2014 projections were varied by scenario based on migration assumptions,
whereas the 2015 scenarios vary based on changes to the components that make up
entry to third level education. Therefore the projections are not fully compatible. The
2015 projections are slightly lower for the baseline scenario S1 than was projected for
the Department’s preferred scenario (M2) in the 2014 projections, as can be seen in
Table 3 below. This is mainly due to the fact that the Department’s baseline scenario
for 2015 (S1) assumed no increase in any of the components of demand, whereas the
Department’s M2 scenario in 2014 assumed increases in migration, mature and
international students.
However it is clear that, whichever scenario is chosen, demand is almost certainly
going to continue to rise year-on-year between 2015 and 2029, given underlying
demographic factors.
Table 3: Comparison with 2014 projections
2014 published (M2) 2015 projections (S1)
2015 171185 170890
2016 173945 172716
2017 176165 174439
2018 177922 176166
2019 179840 177897
2020 182277 179873
2021 185057 182125
2022 187881 184535
2023 190181 186966
2024 192886 188796
2025 197165 190841
2026 202223 194465
2027 207151 199092
2028 211709 203562