Embed Size (px)
Citation preview

Projecting Mathematical Curves with Laser Light
Merrill Lessley*
Department of Theatre and Dance • University of Colorado Boulder [email protected]
Paul Beale Department of Physics • University of Colorado Boulder
Abstract
This paper describes the math and technology required to project a variety of mathematical curves with an innovative laser light control system. The focus is upon creating large-scale animated laser projections of spirograph shapes, such as those found among the epitrochoid, hypotrochoid, epicycloid, and hypocycloid curves. The process described utilizes an unusual math approach that was first presented by the Greek or Egyptian mathematician/astronomer Ptolemy. Instead of using the traditional spirograph techniques of rotating one wheel outside or inside of another wheel, the Laser Light Math system is structured around Ptolemy’s idea of epicycles where one circle's center moves on the circumference of another circle. Traditional equations are modified to consider fully the elements of frequency, rotational direction, diameter, and offset.
Introduction When graphed, many mathematical curves are beautiful to view. These curves are often brought into graphic form by incorporating such devices as a plotter, printer, video screen, or mechanical spirograph tool. While these techniques work, and can produce interesting results, the images are normally small and not animated. To create large-scale animated images, such as those encountered in the entertainment industry, light shows, or art installations, one must use some unusual graphing strategies. This desire to create large and animated images of certain mathematical curves led to our design and implementation of the Laser Light Math projection system. In our interdisciplinary efforts to create new ways to graph certain mathematical curves with laser light, Professor Lessley designed the hardware and software and Professor Beale constructed a simplified set of harmonic equations.
The issue of graphing a family of mathematical curves in the roulette or spirograph domain with laser light is of special interest in this project. Consistent with common techniques of making roulette patterns, images created by the Laser Light Math system are constructed by mixing sine and cosine functions together at various frequencies, shapes, and amplitudes. Images created in this fashion find birth in the mathematical process of making “roulette” or “spirograph” curves. Consider, for example, the workings of a traditional spirograph toy where a pen is inserted into a small geared wheel that is rotated within the circumference of another larger geared wheel: Insert the pen, rotate the smaller gear within (or outside of) the circumference of the larger gear, and a graphed representation emerges of a certain mathematical curve in the roulette family (such as the epitrochoid, hypotrochoid, epicycloid, hypocycloid, or rose). The spirograph, of course, is simply a clever mechanical plotting device. Performing this same artistry with a laser beam and its tiny dot of light is, however, a much more demanding process.
The Problem: Moving from the Spirograph to the Laser Herein lies the problem: the spirograph, as a graphing device, utilizes a geared wheel running inside or outside of another larger geared wheel. The larger wheel does not rotate. Having the larger wheel remain
Bridges 2011: Mathematics, Music, Art, Architecture, Culture
557
stationary will not work for laser projection devices. Forming a complete projected pattern(s) of any mathematical curve with a small laser “dot” requires a modified and dynamic approach. To do this, a laser dot must be “scanned” rapidly through a complete image path at least sixteen times a second before the image will appear solid. Because of our "persistence of vision," a moving dot can appear as a solid line.”
For a better understanding of this idea, move a hand-held laser pointer back and forth rapidly. This action creates the appearance of a horizontal line. Similarly, moving the pointer quickly in a circular pattern creates the appearance of a solid circle in light. In reality, thanks to the persistence of vision effect, moving a dot of laser light quickly creates the “illusion” of a solid line or pattern. And, by using the laser pointer to draw a series of smaller circles that follow the path of a larger circle (a roulette shape), we discover that the trace and the base circles rotate simultaneously and can possess individual frequency and diameter factors as well as differing rotational directions.
Unlike the common spirograph method for graphing such curves, where the trace circle rotates within or outside of the base circle, our approach has the trace circle center point rotating “on the circumference” of the base circle. This graphing methodology, which ironically harkens back to Ptolemy's ancient theory of "epicycles," is quite elegant when dealing with how electrical summing circuits and certain computer programming strategies must work harmoniously to convert digital curve data into actual electrical signals in a laser projection system.
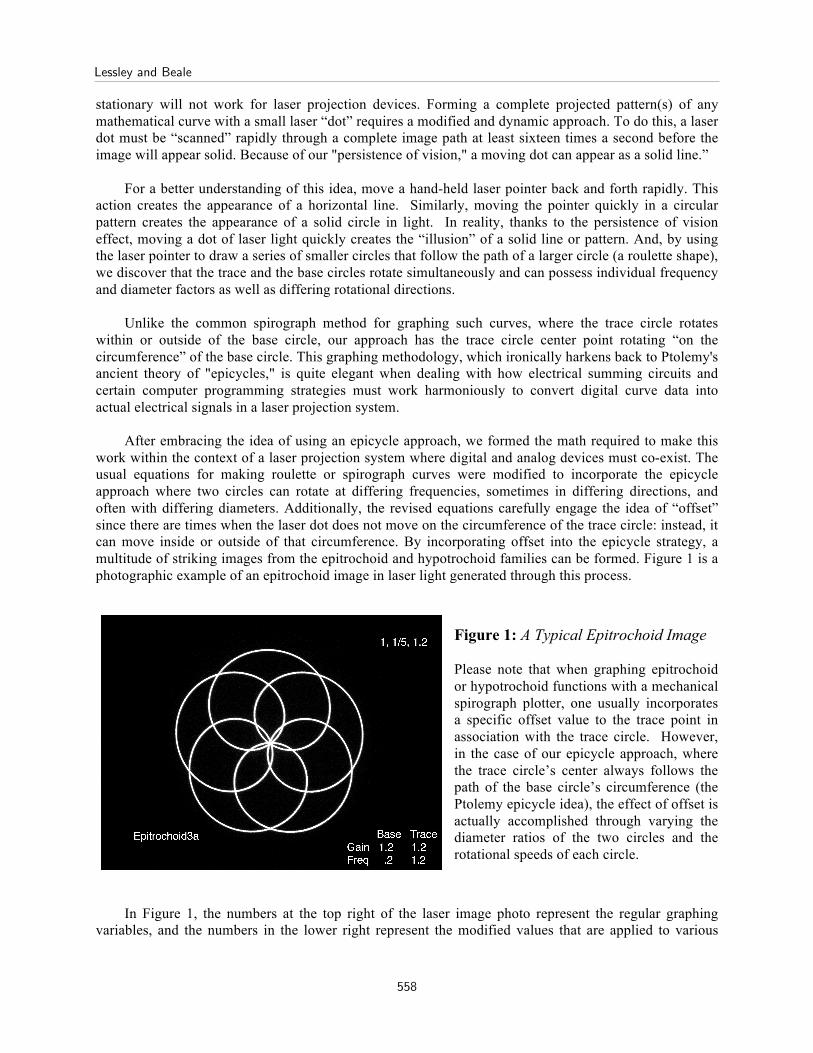
After embracing the idea of using an epicycle approach, we formed the math required to make this work within the context of a laser projection system where digital and analog devices must co-exist. The usual equations for making roulette or spirograph curves were modified to incorporate the epicycle approach where two circles can rotate at differing frequencies, sometimes in differing directions, and often with differing diameters. Additionally, the revised equations carefully engage the idea of “offset” since there are times when the laser dot does not move on the circumference of the trace circle: instead, it can move inside or outside of that circumference. By incorporating offset into the epicycle strategy, a multitude of striking images from the epitrochoid and hypotrochoid families can be formed. Figure 1 is a photographic example of an epitrochoid image in laser light generated through this process.
Figure 1: A Typical Epitrochoid Image Please note that when graphing epitrochoid or hypotrochoid functions with a mechanical spirograph plotter, one usually incorporates a specific offset value to the trace point in association with the trace circle. However, in the case of our epicycle approach, where the trace circle’s center always follows the path of the base circle’s circumference (the Ptolemy epicycle idea), the effect of offset is actually accomplished through varying the diameter ratios of the two circles and the rotational speeds of each circle.
In Figure 1, the numbers at the top right of the laser image photo represent the regular graphing
variables, and the numbers in the lower right represent the modified values that are applied to various
Lessley and Beale
558

control faders within our projection system. Translating the traditional values into revised values requires only simple addition or subtraction.
The parametric equations on the left, in Figure 2, represent the traditional math required to graph an
epitrochoid curve. But since we use base and trace oscillators to form images (instead of common spirograph methods), the equations on the right are used to create the epitrochoid image in Figure 1. In the modified equations,
€
ω0 = 2πfbase , and the
€
fbase (base frequency) is the number of times per second that the base oscillator completes a cycle.
€
x = (a + b)cos(t) − hcos (ab
+1)t⎛
⎝ ⎜
⎞
⎠ ⎟
y = (a + b)sin(t) − h sin (ab
+1)t⎛
⎝ ⎜
⎞
⎠ ⎟
€
x = (a + b)cos ω0t( ) − hcos a + bb
ω0t⎛
⎝ ⎜
⎞
⎠ ⎟
y = (a + b)sin ω0t( ) − h sin a + bb
ω0t⎛
⎝ ⎜
⎞
⎠ ⎟
Figure 2: Traditional and Modified Equations for the Epitrochoid Image
While Laser Light Math generates images within the frame of just epitrochoid and hypotrochoid functions, this practice does not necessarily limit the range of images since a number of “special mathematical cases” exist that can be generated within this same basic framework. The special cases are:
hypotrochoid: hypocycloid: h=b ellipse: a=2*b rose: a=(2n)*h/(n+1), b=(n-1)/(n+1)*h where “n” is the number of petals epitrochoid: epicycloid: h=b limacon: a=b circle: a=0
In terms of comprehending how our technique works within the Laser Light Math system, it is important to understand an essential idea in relationship to sine and cosine math: in a sine/cosine relationship, in which two waves are both sinusoidal in shape, you can create a circle when the x and y waveforms have the same frequency and are exactly ninety degrees out of phase. In electronics, this is referred to as a “quadrature” relationship. Oscillations are in quadrature relationship when they are separated in phase by 90° (π/ 2 radians, or ¼ of a period). The wave shapes produced in Laser Light Math are dependent upon maintaining this relationship. Of course, it is also possible to mix other waveforms in quadrature (saw, triangle, square, saw tooth for example) inside of sinusoidal waves, since Fourier analysis shows that any periodic function can be constructed by a sum of sines and cosines.
The Engineering Issues: Hardware and Software The major engineering challenge in Laser Light Math is this: Creating an accurate visual representation of any waveform(s) requires the precise and rapid movement of a laser dot in a fashion that represents the selected mathematical curve(s) to be projected. In this project, the technique for generating visual representations of chosen waveforms (sine, square, triangle, or saw tooth) requires a mathematical lookup table for each waveform. Every table must hold enough data points (graphing points) to create or graph
Projecting Mathematical Curves with Laser Light
559

the selected laser image. Data points are forwarded to a digital-to-analog converter (DAC). This circuit converts each data point or element into an “electrical” signal that is proportional to the data point’s numerical value (for example, a 255 might produce a 3 volt signal while a value of 128 would create a 1.5 volt signal). These low level signals are input into a series of powerful direct current (DC) amplifiers where the low level signals can be translated into high current output signals.
DC amplifier signal outputs are then fed into a series of “galvanometers” (or “galvos” as they are referred to in the industry). Galvos are precision electro-mechanical devices that rotate a small shaft with a first-surface mirror attached to it. Rotation direction is determined by the polarity of the input signal.
The appearance of a straight line is created by sending a sine wave signal into a galvo through a DC amplifier, and to simultaneously reflect a laser beam off of that galvanometer’s moving mirror (assuming a movement of 16 or more times per second). Similarly, sending a sine wave signal into one “X” direction galvo and a cosine wave into its partner “Y” direction galvo produces a circular laser pattern (assuming both signals are the same frequency and amplitude). Waveforms created in this manner can be very precise. In Laser Light Math, one complete cycle of a sine wave image contains 512 points of mathematical data extracted from a lookup table. Thus, to create an actual waveform image, the system must rapidly “look up” (or clock through lookup tables) and send binary data to a digital-to-analog converter circuit. Creating waveforms in this manner is called “digital synthesis.”
For Laser Light Math, a laptop computer serves as the control console by using an original piece of software written in Visual Basic. This software, detailed in the software section of the Laser Light Math Internet site http://spot.colorado.edu/~lessley/, allows the laser artist to extract primary images of selected mathematical curves from a library. The artist can also create customized images and store them in the library. By arranging and linking these stored images, the laser artist can build his/her own show.
The process of transferring program images from the laptop computer to the laser projection system is completed in the following way: Laser show data are transmitted to a master control device via a high-speed serial interface signal. The serial signal transfers its digital data to a control board that includes a powerful "state-of-the-art" Field Programmable Gate Array (FPGA) integrated circuit. This circuit does the hard work. The FPGA device converts the serial data into waveform information, precise clocking frequencies (using 32 bit numerically controlled oscillators), and appropriate digital-to-analog output signals for selected wave shapes. Four primary synthesizer sections reside in the FPGA, three to combine and mix waveforms, and one to chop the final output image. Every synthesizer unit contains appropriate wave lookup tables, digital-to-analog data conversion sections, and high speed clocking circuits. Additionally, each synthesizer module possesses three X/Y control paths, allowing for the creation of remarkably complex images (completed by mixing numerous waveforms into a single X/Y output).
Numerous full color photographs and video clips created with the Laser Light Math system can be seen on the Laser Light Math Internet site at http://spot.colorado.edu/~lessley/.
References
[1] Xah Lee. A Visual Dictionary of Special Plane Curves. http://xahlee.org/SpecialPlane Curves_dir/specialPlanCurves.html (as of April 12, 2012)
[2] Roulette Plotter Device. http://demonstrations.wolfram.com/RoulettePlotterDevice/ (April 4, 2012) [3] Rose. http://mathworld.wolfram.com/Rose.html (as of April 6, 2012) [4] Merrill Lessley, Laser Light Math. http://spot.colorado.edu/~lessley/ (as of April 9, 2012) [5] Cundy, H. and Rollett, A. Mathematical Models, 3rd ed. Stradbroke, England: Tarquin Pub., 1989. [6] Lockwood, E. H. A Book of Curves. Cambridge, England: Cambridge University Press, 1961. [7] Thomas Kallard, Laser Art and Optical Transforms, Optosonic Press, 1979.
Lessley and Beale
560