Embed Size (px)
Citation preview
Projected Impacts of Climate Change for the Province of Newfoundland & Labrador
Submitted to: The Office of Climate Change, Energy Efficiency
& Emissions Trading
Submitted on: March 22nd, 2013
Submitted by: Dr. Joel Finnis, Department of Geography
Memorial University of Newfoundland
2
Table of Contents
EXECUTIVE SUMMARY OF REGIONAL CLIMATE CHANGE PROJECTIONS ....................................3
INTRODUCTION .....................................................................................................................9
DATA SETS ........................................................................................................................... 10
MODEL PERFORMANCE AND WEIGHTS ................................................................................. 13 A) TEMPERATURE BIAS & DIVERGENCE OF ANNUAL TEMPERATURE: ...................................................... 14 B) EXTREME PRECIPITATION STATISTICS ............................................................................................. 15 C) SEA LEVEL PRESSURE SYNOPTIC CLIMATOLOGY ............................................................................... 15 ENSEMBLE AVERAGING AND UNCERTAINTY: REA APPROACH ................................................................ 16
PROJECTED CHANGE IN KEY CLIMATE VARIABLES .................................................................. 16 DAILY MEAN TEMPERATURE (OC) ..................................................................................................... 20 DAILY MINIMUM TEMPERATURE (OC) ............................................................................................... 25 DAILY MAXIMUM TEMPERATURE (OC) ............................................................................................... 30 COOLING DEGREE DAYS .................................................................................................................. 35 HEATING DEGREE DAYS .................................................................................................................. 40 GROWING DEGREE DAYS ................................................................................................................ 45 NUMBER OF DAYS WITH FROST ....................................................................................................... 50 MAXIMUM HEAT WAVE DURATION (DAYS) ....................................................................................... 55 MEAN DAILY PRECIPITATION (MM) ................................................................................................... 60 MEAN INTENSITY OF PRECIPITATION EVENTS (MM/DAY) ...................................................................... 65 MAXIMUM 3-DAY PRECIPITATION (MM)............................................................................................ 70 MAXIMUM 5-DAY PRECIPITATION (MM)............................................................................................ 75 MAXIMUM 10-DAY PRECIPITATION (MM) ......................................................................................... 80 NUMBER OF DAYS WITH 10MM OR MORE PRECIPITATION .................................................................... 85 90TH
PERCENTILE OF PRECIPITATION EVENTS (MM).............................................................................. 89 MAXIMUM NUMBER OF CONSECUTIVE DRY DAYS (DAYS) ..................................................................... 94 MEAN DRY SPELL LENGTH (DAYS)..................................................................................................... 99 MEDIAN DRY SPELL LENGTH (DAYS) ................................................................................................ 104 STANDARD DEVIATION OF DRY SPELL LENGTH (DAYS) ........................................................................ 109
EXTREME PRECIPITATION: RETURN PERIODS ..................................................................... 114 IDF-DERIVED RESULTS ................................................................................................................. 120
24 Hour Duration ................................................................................................................................................ 120 12 Hour Duration ................................................................................................................................................ 122 6 Hour Duration .................................................................................................................................................. 124
AHCCD-DERIVED RESULTS ........................................................................................................... 126 24-hour Duration ................................................................................................................................................ 126
APPENDIX A: ABBREVIATIONS USED ................................................................................... 129
APPENDIX B: GLOSSARY .................................................................................................... 130
BIBLIOGRAPHY ................................................................................................................... 133
3
Executive Summary of Regional Climate Change Projections Through the integration of available observations and a collection of state-of-the-art regional climate model projections of the 21st century (2038-2070), a summary of the expected impacts of climate change has been compiled for the province of Newfoundland and Labrador. Projected changes in 19 key climate indices are presented, ranging from simple descriptions of temperature to indicators of energy expenditure, agricultural potential, heavy precipitation, and drought severity. Additional site-specific details on the current climatology, projected change, and uncertainty are presented for locations where suitable observations are available. Additional work presents estimates of changes in extreme precipitation (‘return period’ events); these were calculated in a manner that accounts for errors in climate model output. Results are intended to assist the Province and it’s citizens in identifying vulnerabilities and opportunities associated with climate change, and provide guidance for adaptation efforts. Key findings are summarized below. In terms of robustness, spatial extent, and seasonal consistency, the clearest impacts of climate change are related to temperature. Daily mean, minimum, and maximum temperatures all demonstrate statistically significant increases at every model grid cell and in every season. However, the degree of expected change differs between locations and seasons:
a. Temperature shifts are most pronounced in winter (+2-3oC for the Island of Newfoundland; +3-4oC for most of Labrador), and generally smaller (by ~1oC) in summer and autumn.
b. Seasonal differences in projected changes are generally smaller in Newfoundland than Labrador. This reflects the moderating influence of the ocean on Newfoundland. Ocean areas respond relatively slowly to temperature changes (either seasonal or long-term climate trends), keeping maritime climates like Newfoundland locked within a limited temperature range. The Labrador interior lacks this moderating influence, and temperatures consequently see a greater response to climate change.
c. Temperature changes vary strongly with latitude, increasing to 4-6oC in
northern Labrador. As a result, some of the coldest places see the greatest warming.
d. Minimum temperatures generally change more than the mean or maximum;
this is due to reduced nighttime cooling under an enhanced greenhouse effect. In practical terms, this suggests a greater decrease in morning frost events than might be expected from mean daily temperatures alone.
4
These changes closely mirror projected patterns of global climate change. In some locations and seasons, small temperature changes may have a greater impact on day-to-day activities than in others. Temperature shifts of a few degrees will have the greatest direct impact on locations where:
a. Seasonal mean temperatures are close to zero degrees, e.g. the Avalon Peninsula during winter and spring. The expected increases in temperature imply precipitation will fall more often as rain than snow. This does not mean there will no longer be snow in these seasons; changes are not large enough to eliminate these events entirely. The transition from snow to rain has economic impacts (e.g. related to snow clearing budgets, winter flooding events, winter recreation etc.), but also strongly impacts the perception of climate change; as rain replaces snow, inhabitants often become acutely aware of cold season climate change1.
b. The onset of freezing conditions impacts daily life/economic pursuits. For
example, parts of Labrador that rely on frozen ground or stable sea ice for winter transportation may be negatively impacted by delayed freeze-up, early melt, or (particularly in southerly and coastal locations) increased mid-winter thaws.
The shoulder (or transition) seasons of spring and autumn tend to become less like winter and more like summer. This is particularly clear as a dramatic decrease in the number of frost days, suggesting later freeze-up, earlier melt, and a decrease in perceived winter length. With a projected 10-15 fewer frost days in one or both shoulder season, winter may effectively become shorter by several weeks. The three degree day measures included in the analysis are intended to address specific economic concerns around heating costs (heating degree day), cooling costs (cooling degree day), and agricultural/forestry potential (growing degree day). All show widespread, statistically significant changes in one or more seasons; however, in practical terms they are not all economically significant.
a. Heating degree days (HDD) decrease by 12-19% of the annual total across the entire province. Typical annual totals for Newfoundland are ~4000-5000 HDD; decreases projected for 2038-2070 are on the order of 700-850 HDD, or the value expected in a typical autumn. Labrador’s climatological values of ~6000-7000 HDD decrease by 850-950; roughly half the typical spring total.
b. Cooling degree days (CDD) increase slightly in the province (~50 CDD for the island, and 30 CDD for Labrador). Although statistically significant, these
1 Hamilton & Keim, 2009.
5
small changes will not carry a significant economic cost; summers will remain mild enough to keep cooling costs low.
c. Most locations on the island see an additional 150-200 growing degree days (GDD), for a 30-45% increase in total GDD. A measure of heat accumulated for plant growth, an increase in GDD implies a more productive growing season. If other limiting factors (such as high winds or a lack of soil) are not present, this increase will lead to i) a more reliable growing season, ii) northwards migration of the tree line, and iii) potential for the introduction of new plant species to the province. This may also translate into increased spread or activity of pest species, as the maturity and reproductive cycle of insects can also be related to GDD heat accumulation; as such, span worm, spruce budworm, or other insect infestations may offset agricultural/forestry growth due to increased heat.
Results do not suggest any noticeable change in heat wave frequency or duration in the province. Classically defined heat waves are so rare in the province that an accurate climatology cannot be established; neither observations nor model projections show more than one or two events at any location in the period of record, and most models show none. The only season that sees any significant change is winter, when heat waves have no obvious health or safety implications. Observations suggest frequent droughts (an extended period without rain) are not currently a concern anywhere in the province, with dry spells (period between precipitation events) typically lasting less than five days at any location. Dry spells long enough to be of concern (10-14 days or more) are rare. The frequency and intensity of dry spells and/or drought is not expected to change in a significant way; if anything, the data examined suggests dry spells may decrease slightly under a warmer climate. This suggests that issues around drought-driven water shortages and water-stress on vegetation are not a growing concern for the province. Projected changes in the mean length of dry spells are typically too small to be noticeable. If anything, the length of dry spells is expected to decrease very slightly. The impact of climate change on precipitation is most apparent in consideration of intense or multi-day events (maximum 3, 5, or 10 day precipitation). Modest increases in mean precipitation are observed over the island in winter and spring, and through most of Labrador year round, but values are not as large as projected for other parts of Eastern Canada. There is, however, a relatively large increase in the mean intensity of events (0.5-1mm/day) on the island. The Labrador interior also experiences intensity increases (0.2-0.5mm/day) in summer, while southern Labrador sees similar increases from spring through autumn. Other changes related to increased intensity or heavy precipitation events include:
6
a. Winter increases in the number of days with substantial precipitation (more than 10mm) for most of the island, and summer increases in the Labrador interior.
b. Widespread increases in the maximum precipitation over consecutive 3, 5,
and 10 day periods. On the island, these changes are strongest in winter, when precipitation is driven by the passage of low pressure systems and associated fronts; peaks are also apparent near the Burin and Avalon peninsulas in autumn, likely related to warmer early-season lows tracking to the southeast. In Labrador, the biggest changes are observed in summer, likely related to increased diurnal heating and resulting warm season precipitation.
c. Cold season temperature increases suggest precipitation will increasingly
favor rain over snow in regions and seasons that currently experience both. However, snow is expected to remain a relatively common event. Because mean event intensity is expected to increase, the snow events that do occur will be heavier on average. The economic impact of fewer, heavier snow events may be as high (or higher) than that of frequent lighter events.
d. The majority of the models examined predict an increase in extreme
precipitation, as represented by higher precipitation for return period events. The best estimate of expected change shows increases in extreme precipitation (20 year return period or more) at all locations. In some places the probability of exceeding the current 100 year event is approximately doubled; that is, the current 100 year event becomes the future 50 year event. For 24 hour duration events, the projected 50 year event is greater than or equal to the current 100 year event in 10 of the 19 communities examined. Should these projections occur, building structures to withstand the 100 year flood based on the current climate would leave those structures highly vulnerable to climate change. However, it is important to note that the uncertainty associated with return period projections are very high, and these results in particular must be interpreted with caution.
Major Impacts By Region Eastern Newfoundland: This region experiences the smallest increases in temperatures (1.5-2.5 oC). However, because temperatures in this region are close to 0oC between September and May, these small changes will have a large impact on winter perception and weather hazards. This is particularly true of the southeast. The result is a) a large decrease in frost days throughout winter, autumn, and spring, and b) a movement away from snow towards rain. Agricultural potential also increases considerably, both during summer and autumn. Precipitation intensity increases are relatively large along the
7
south coast. Increases are particularly pronounced in the southeast, where substantial changes in intensity are expected in winter, summer, and fall. This represents the most persistent (cross-season) changes in intensity projected for the province. Similar patterns for the southeast (Avalon & Burin Peninsulas) are found in 90th percentile and maximum 3, 5, and 10 day precipitation, pointing to increasing hazards associated with heavy precipitation through much of year. Western Newfoundland: The west coast experiences greater increases in temperature than eastern NL in all seasons, gaining an additional 0.25-0.6 oC relative to the southeast (e.g. St. John’s). However, winters remain colder than eastern Newfoundland, while summers typically remain warmer. The largest increases in agricultural/forestry potential for the province are expected in the west/southwest (e.g. Stephenville, Deer Lake, Corner Brook), and the region also sees some of the greatest reductions in heating costs on the island. Changes in the number of frost days decrease rapidly away from the coast, and are generally less pronounced than in the east. Precipitation intensities increase primarily during winter, with the highest values concentrated along the west/southwest coasts. Great Northern Peninsula: As with the west coast, temperature increases are larger than those projected for eastern NL. However, generally colder temperatures mean the winter temperature increase has little impact on frost free days during winter, pushing the decrease into spring and summer instead. Increases in agricultural potential are much lower than the rest of the island, suggesting limited change to the sparsely vegetated landscape. Changes in intense & multi-day precipitation are generally smaller than regions further south and east, and concentrated in winter; because mean temperatures in this season remain well below freezing, the majority of this increase will be delivered as snow. Northern Labrador: Northern Labrador is expected to see the largest increases in winter temperatures, reaching 5-6 oC at the northernmost point. However, summer temperature increases are lower than the rest of Labrador. Because temperatures remain cold during summer, there is no change in agricultural potential; the region will remain above the tree line and sparsely vegetated. Frost-free days change very little in winter and spring, but decrease sharply in summer (2-3 weeks) and autumn (about 10 days), suggesting an earlier thaw and later freeze-up. Although not explicitly examined in the current study, warmer temperatures and fewer frost days will likely promote permafrost retreat. Significant changes in precipitation intensity are limited to the summer. Southern Labrador: Winter temperature changes are smaller in southern Labrador than the rest of the region, but still higher than most of Newfoundland (3-4oC). The only significant increase in agricultural potential in Labrador is seen here, suggesting faster plant growth, a northwards migration of the tree line, and a possible increase in insect pests. Winters remain cold, but decreases in frost days during spring and autumn
8
suggest an earlier thaw and later freeze (1-2 weeks on either side). Changes in precipitation intensity occur from summer through the end of winter. The greatest changes occur in winter; given the low temperatures, this implies heavier snow events. Labrador Interior vs. Labrador Coast: Coastal Labrador typically sees less warming than the interior at any given latitude, although the impact is generally small (less than 1oC difference in most seasons). Increases in precipitation intensity and long duration precipitation totals are also generally stronger in the interior than the coast; this contrast is clearest in winter and autumn, when the majority of the coast sees no significant change but the southern interior sees large increases.
9
Introduction The following work summarizes climate projections for the province of Newfoundland and Labrador, in order to assist the provincial government, communities, and industry in the assessment of their climate vulnerabilities and related adaptation options. Projections were derived from an ensemble of seven regional climate model (RCM) simulations produced for the North American Regional Climate Change Assessment Project (NARCCAP)2. Projected change from the modern era (1968-2000) to the mid-21st century (2038-2070) is described. Whenever possible, projected changes are interpreted in the context of reliable climate observation data sets, including the Environment Canada (EC) Adjusted Homogenized Canadian Climate Data archive (AHCCD)34, yearly maximum precipitation data used for EC’s Intensity/Duration/ Frequency (IDF) curves, and temperature data from the North American Regional Reanalysis (NARR)5. The bulk of results focus on spatial patterns of change in key climate variables identified as being of interest by the Provincial Government’s Office of Climate Change, Energy Efficiency, and Emissions Trading (CCEEET). These variables are largely drawn from the suite of climate indices used in the Statistical and Regional Dynamical Downscaling of Extremes for European Regions (STARDEX) project. Additional analysis was performed to estimate bias-corrected precipitation return periods for select communities. Results represent a current ‘best-guess’ at the climate Newfoundland can expect by mid-century. As with any forecasting product, there is considerable uncertainty in these projections; however, they provide reasonable guidance for short-term adaptation planning. Users interested in longer-term change can expect the trends outlined here to continue beyond the 21st century, with the magnitude of the continued response strongly dependent on the international response to the problem of human-induced climate change. The results of this report should be re-evaluated when a new multi-model regional climate change assessment for North America becomes available. Based on the timeline of the original NARCCAP project, results from such a project are unlikely to become available prior to 2019. A technical description of data sets, pre-processing, and the ensemble averaging scheme follows; these have been provided for completeness, but are not necessary for most readers. Users interested in examining and applying results can skip to the Projected Change in Climate Variables (pg. 16) and Extreme Precipitation (pg. 114) sections.
2 Mearns, et al., 2009. 3 Mekis & Vincent, 2011.
4 Vincent et al., 2011.
5 Mesinger et al., 2006.
10
Data Sets The primary data source for the current project are regional climate model (RCM) simulations provided by the North American Regional Climate Change Assessment Project, or NARCCAP. NARCCAP provides a useful complement to the General Circulation Model (GCM) projections that have traditionally been used to assess long-term climate change. While GCMs provide global data with limited spatial and temporal resolution, NARCCAP provides a more detailed description of North America; a typical GCM will represent Newfoundland with 1-5 spatial data points and daily data output, while the NARCCAP RCMs cover it with a few dozen points at 3-hourly intervals. This allows for improved treatment of weather systems, topographic effects, and local processes, making RCMs more suitable for regional planning than coarse GCMs; many climatologists feel that RCMs are currently the best available source of information for regional adaptation planning. However, RCMs remain an imperfect planning tool. As with GCMs, NARCCAP simulations contain various biases and overly simplify many important weather processes. They are also partially driven by GCM simulations, and problems with GCMs can therefore be passed on to the RCMs. For these reasons, NARCCAP projections must be interpreted with caution. Although they can provide some context for climate adaptation planning, they should not be interpreted as a certainty; the true climate response may be stronger or weaker than NARCCAP simulations suggest. Table 1: List of NARCCAP ensemble members used in the current study6
Short Name Regional Climate Model Global Climate Model Used for Boundaries
CRCM_ccsm Canadian Regional Climate Model (Canada)
Community Climate System Model (USA)
CRCM_cgcm3 Canadian Regional Climate Model (Canada)
Coupled Global Climate Model, version 3 (Canada)
HRM3_gfdl Hadley Regional Model 3 (UK) Geophysical Fluid Dynamics Laboratory GCM (USA)
HRM3_hadcm3 Hadley Regional Model 3 (UK) Hadley Centre Coupled Model, version 3 (UK)
RCM3_cgcm3 Regional Climate Model version 3 (USA)
Coupled Global Climate Model, version 3 (Canada)
RCM3_gfdl Regional Climate Model version 3 (USA)
Geophysical Fluid Dynamics Laboratory GCM (USA)
WRFG_ccsm Weather Research and Forecasting Model (USA)
Community Climate System Model (USA)
At the time this report was being prepared, seven complete NARCCAP simulations suitable for analysis of Newfoundland & Labrador were available (Table 1). Each
6 Details on the models are available from the NARCCAP website (http://www.narccap.ucar.edu/)
11
projection in this 7-member ensemble was produced through a unique combination of a specific GCM (to provide boundary forcing) and RCM (for dynamical downscaling), and includes a 20th century simulation (1968-2000) and mid-21st century projection (2038-2070). Although all data was provided at a spatial resolution of ~50km, the specific latitude/longitude grids used by individual RCMs varies. In order to compare models, all projections were interpolated to a common grid. Spatially smooth variables (e.g. temperature and sea level pressure) were interpolated using the Cressman scheme, which is commonly used in meteorology. The Cressman algorithm calculates values as an inverse-distance weighted average of points within a critical radius (R) of the destination grid point:
Vnew
wi
i
Vold
wi
i
;
wi R2 di
2
R2 di
2
where di is the distance of the ith point on the original grid to the destination point on the new grid. For the current work, a critical radius of 200km was used. This approach is less suitable for interpolation of spatial inhomogeneous data such as precipitation, due to excessive smoothing of the field. For this reason, nearest-neighbour interpolation was used for precipitation data. Model projections have been compared against observations collected by Environment Canada (EC) climate stations and the North American Regional Reanalysis (NARR). Two EC data sources have been used:
a) the Adjusted Homogenized Canadian Climate Data (AHCCD) archive, which provided daily mean, maximum, and minimum temperatures along with 24 hour precipitation totals for select stations. b) the annual precipitation maxima data used in for the official EC Intensity-Duration-Frequency (IDF) curves.
AHCCD is particularly useful, as the data provided has been rigorously examined and corrections have been made for biases associated with equipment updates, failure, or station relocation. The IDF data provides greater detail on precipitation, and allows short duration precipitation extremes to be examined in addition to the 24 hour AHCCD-based analyses. As a complement to station data, NARR presents high-resolution (25km) gridded meteorological data for the North American region, saved at 3 hour intervals. As an atmospheric reanalysis, this product represents an integration of direct observations of the earth system (e.g. from station data, satellites, radiosondes, and observations-of-
12
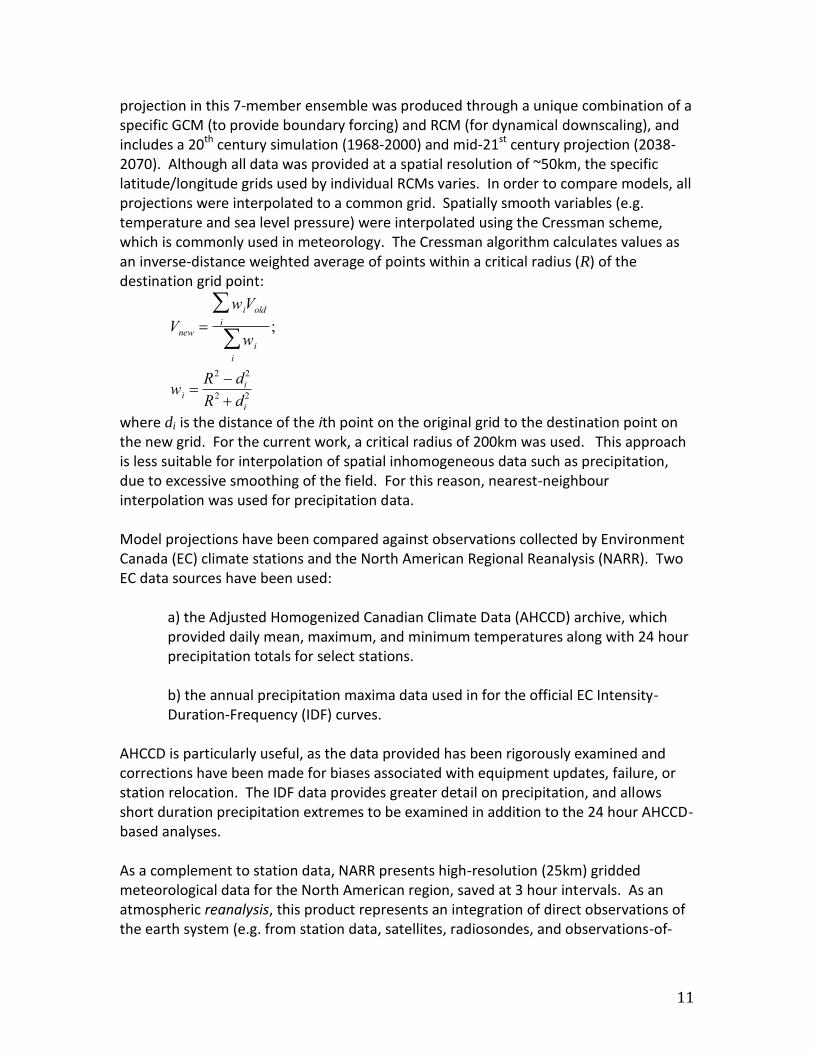
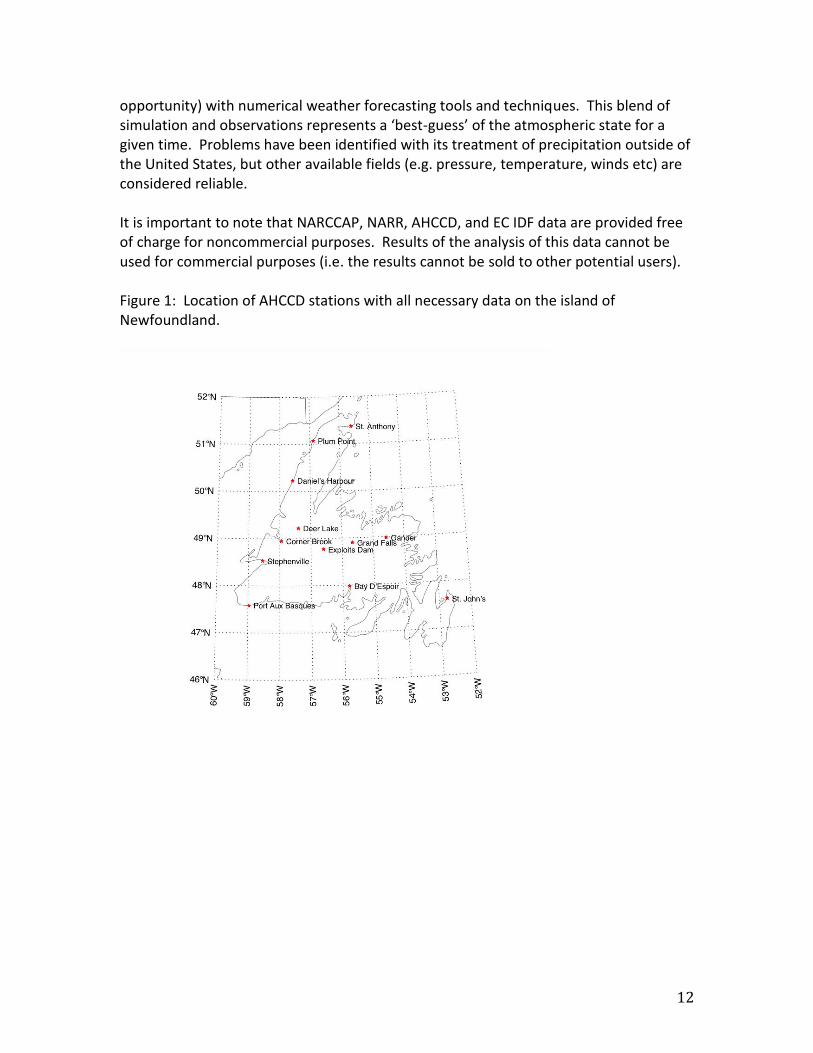
opportunity) with numerical weather forecasting tools and techniques. This blend of simulation and observations represents a ‘best-guess’ of the atmospheric state for a given time. Problems have been identified with its treatment of precipitation outside of the United States, but other available fields (e.g. pressure, temperature, winds etc) are considered reliable. It is important to note that NARCCAP, NARR, AHCCD, and EC IDF data are provided free of charge for noncommercial purposes. Results of the analysis of this data cannot be used for commercial purposes (i.e. the results cannot be sold to other potential users). Figure 1: Location of AHCCD stations with all necessary data on the island of Newfoundland.
13
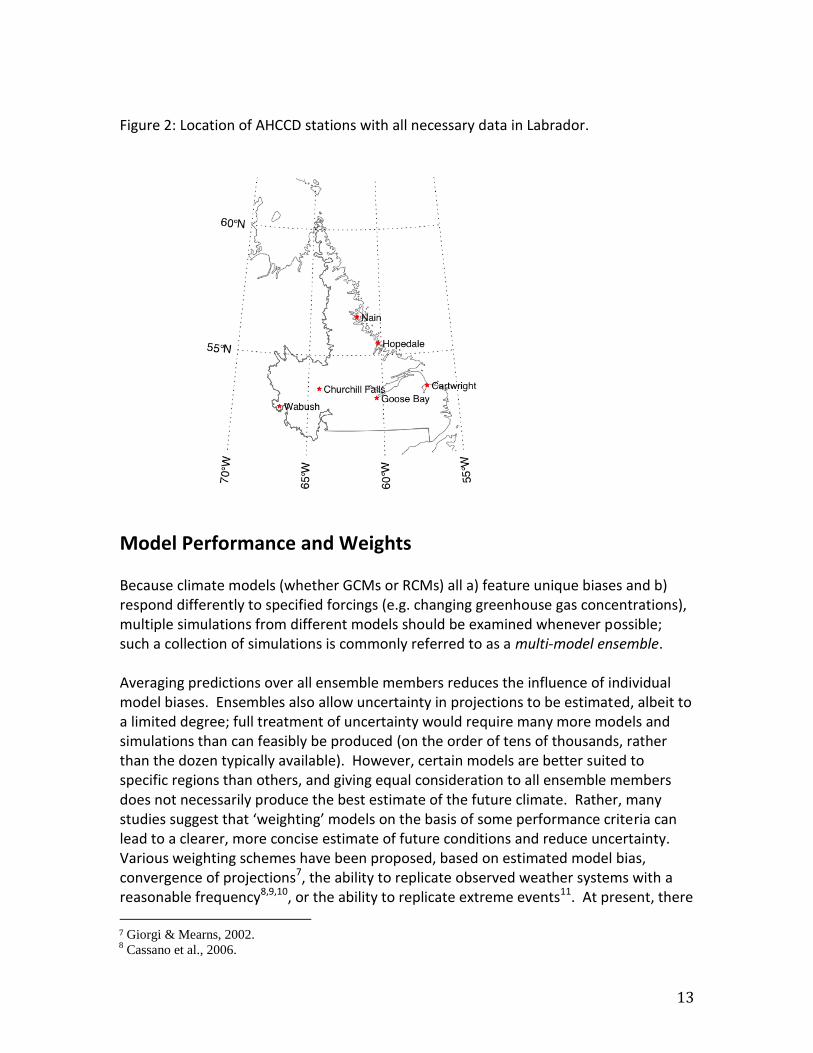
Figure 2: Location of AHCCD stations with all necessary data in Labrador.
Model Performance and Weights Because climate models (whether GCMs or RCMs) all a) feature unique biases and b) respond differently to specified forcings (e.g. changing greenhouse gas concentrations), multiple simulations from different models should be examined whenever possible; such a collection of simulations is commonly referred to as a multi-model ensemble. Averaging predictions over all ensemble members reduces the influence of individual model biases. Ensembles also allow uncertainty in projections to be estimated, albeit to a limited degree; full treatment of uncertainty would require many more models and simulations than can feasibly be produced (on the order of tens of thousands, rather than the dozen typically available). However, certain models are better suited to specific regions than others, and giving equal consideration to all ensemble members does not necessarily produce the best estimate of the future climate. Rather, many studies suggest that ‘weighting’ models on the basis of some performance criteria can lead to a clearer, more concise estimate of future conditions and reduce uncertainty. Various weighting schemes have been proposed, based on estimated model bias, convergence of projections7, the ability to replicate observed weather systems with a reasonable frequency8,9,10, or the ability to replicate extreme events11. At present, there
7 Giorgi & Mearns, 2002. 8 Cassano et al., 2006.
14
is no single, universally accepted weighting criteria or calculation scheme, but applying a weighting scheme does appear to improve forecasts relative to an unweighted ensemble average12 13. For the current study, the ensemble has been weighted following a simplified adaptation of the scheme presented by Christensen et al. (2010). For the current study, the ‘best-guess’ estimates of climate change were based on a weighting scheme with four criteria: a) Bias in mean annual temperatures in Newfoundland and Labrador (NL), b) divergence in projected NL annual temperature change, b) the ability to replicate the extreme precipitation statistics at three long-term climate stations, and c) representation of sea level pressure synoptic climatology. This is essentially a simplified subset of the multi-weight scheme proposed by Christensen et al. 2010. Weights for these individual criteria were calculated for each ensemble member, then normalized to give a value between zero and one. Individual criteria were then multiplied to give a single weight for each ensemble member.
WWBWDWLWSLP
Calculation of the four criteria was as follows: a) Temperature Bias & Divergence of Annual Temperature:
Bias and projection divergence are merged in the Reliability Ensemble Averaging (REA) scheme proposed by Giorgi & Mearns (2002); we use this approach in the current work. Models are scored on the basis of regional mean temperature biases (BT) estimated from 20th century climate simulations, and divergence (DT) from the ensemble-mean temperature change predicted for the 20th century:
BT T Model T reanalysis
DT TModel T
where T is the average annual temperature for the NL region, DT is the
predicted change under the future climate (here, the change from 1968-2000 to
2038-2070), and T is the ensemble mean predicted change. Bias (Wbias) and
divergence (Wdiverge) were calculated as:
WB T
abs(BT )
WD T
abs(DT )
9 Sanchez et al., 2004.
10 van Ulden et al, 2007.
11 Lenderink, 2010.
12 Christensen, 2010.
13 Knutti et al., 2010.
15
where abs( ) is the absolute value and T is standard deviation of mean annual NL temperature, smoothed with a 15 year running mean. Weights greater than
one (i.e. where BT or DT is smaller than natural variability, T) were reset to one.
b) Extreme Precipitation Statistics For each model, time series of maximum annual 24 hour precipitation at grid cells closest to St. John’s, Gander, and Goose Bay were calculated. These time series were then compared to the probability distributions used to generate Environment Canada’s official 24 hour return period events. A multi-site negative log likelihood (L)14 score was calculated for each model :
L log{fm
t1
N
m1
3
[xm(t)]}
where m is the climate station location, t is the year (1968-2000), and fm is the probability density function; in this case, fm is a Gumbel distribution fit to the official EC Intensity-Duration-Frequency (IDF) data provided by Environment Canada (see discussion of precipitation return periods for details). Weights were calculated as:
WL (LM odelmin(L))
min(L)
where LModel is a given model likelihood, and min(L) is the minimum likelihood score over all models (i.e. the best match to observations).
c) Sea Level Pressure Synoptic Climatology
A synoptic climatology of 3-hr sea level pressure (SLP) data was created for a domain covering Eastern Canada and the Labrador Sea, using the method of Self-Organizing Maps15,16. Essentially, this approach condenses the full range of SLP data into a set of archetypal patterns of pre-determined size (99 for the current study). The occurrence frequency (fi) of each pattern was then calculated by comparing 3-hr data from NARR to the archetypal patterns, and identifying the best match. Following Cassano et al. (2006), model performance was calculated as the correlation of model simulated occurrence frequency (fi,Model) to the NARR value (fi,NARR); scores were normalized relative to the highest performing model:
WS LPcorrelat ion( fNARR, fM o d e l)
max(correlat ion( fNARR, fM o d e l))
Perfect correlation implies the model replicates the pattern frequencies found in
NARR exactly; that is, the model recreates key weather patterns with the correct
14 Cannon, 2008. 15 Cassano, et al, 2006. 16
Hewitson & Crane, 2002.
16
frequency. Lower correlations imply less agreement, or a model that emphasizes
certain weather events at the expense of others.
Ensemble Averaging and Uncertainty: REA Approach The spatial patterns of climate change presented in the following section are based on a weighted ensemble average of model projections similar to the REA proposed by Giorgi & Mearns (2002):
V
WiVi
i
Wi
i
where i indicates individual ensemble members, and V is the variable being averaged. Similarly, uncertainty was calculated following the REA scheme as:
V V T
V V T
T
W i
i
(Vi V )2
W i
i
1/ 2
These calculations were performed at every grid cell. Results are presented as a series of maps, with color indicating the ensemble average projected change and cross-
hatching applied to grid cells with a statistically significant change (i.e. [V-, V+] does not contain zero). It is important to note that the REA approach may not be ideally suited to variables that are not normally distributed; several of the climate variables discussed below fall into this category to some degree or another. However, addressing uncertainty in non-normally distributed variables is beyond the scope of the current work, and the REA scheme has consequently been applied to all presented variables. For this reason, the uncertainty presented should be considered a low estimate.
Projected Change in Key Climate Variables Change is presented for Labrador and the island of Newfoundland on a seasonal basis, with separate plots for winter (December/January/February, or DJF), spring (MAM), summer (JJA), and autumn (SON). Colour shading indicates the weighted mean value projected by the multi-model NARCCAP ensemble (i.e. the ‘best guess’ value for future change), and cross-hatching was used to mark grid cells that undergo a statistically significant change (i.e. a change that the model ensemble agrees is very likely).
17
Tabulated data for locations associated with reliable, long-running bias-corrected Environment Canada climate stations (AHCCD stations) within the province are also provided as a complement to the plots, giving the mean climatological value recorded at the station and REA estimates of change and uncertainty. Users interested in incorporating projections into adaptation planning can use the images together with the nearest station(s) to best interpret their projected future climate state. Values examined are listed in Table 2. Changes in annual values were not included in the plots or tables, but can be inferred from the tables provided as follows:
i) Seasonal values based on an average can simply be averaged to get an annual value. ii) Annual change for variables based on maximum occurrences can be estimated by taking the highest of the seasonal values. iii) Annual change for values based on a summation over a season can be calculated by adding the seasonal numbers together.
The variables reported here are all derived from some combination of the following time series: daily mean temperature at 2m above the ground, daily maximum temperature (2m; Tmax), daily minimum temperature (2m; Tmin), and daily total precipitation. Daily mean temperatures and total precipitation were calculated from NARCCAP data reported at 3 hour intervals (i.e. 8x daily); daily maximum and minimum temperatures were reported directly by models for each day. In all cases, the day was measured from midnight-to-midnight, Coordinated Universal Time (UTC; essentially Greenwich Mean Time).
As an example of how this information might be used, consider the case of Bishop’s Falls. Located on the Exploits River, this community may be interested in the potential impacts of climate change on river flow. Suppose the community identifies ice jam flooding events as a particular concern, and recognizes that increases in daily minimum temperatures, daily maximum temperatures, and the number of frost days could trigger river ice break-up. Using the maps, planners can quickly determine that all three variables change significantly in the region near Bishop’s Falls, and that these changes are significant in winter and spring (the seasons of concern for ice jams). The tables could then be used to estimate the magnitude of changes with greater accuracy, using data for the nearest AHCCD location (here, Grand Falls). A future projection with an uncertainty range can be estimated by:
1. Calculating the range of expected change as [Projected Change – Uncertainty, Projected Change + Uncertainty]. That is, the range will fall between these two values.
2. Adding the resulting change range to the current climate value, to give [Lower projection bound, upper projection bound].
18
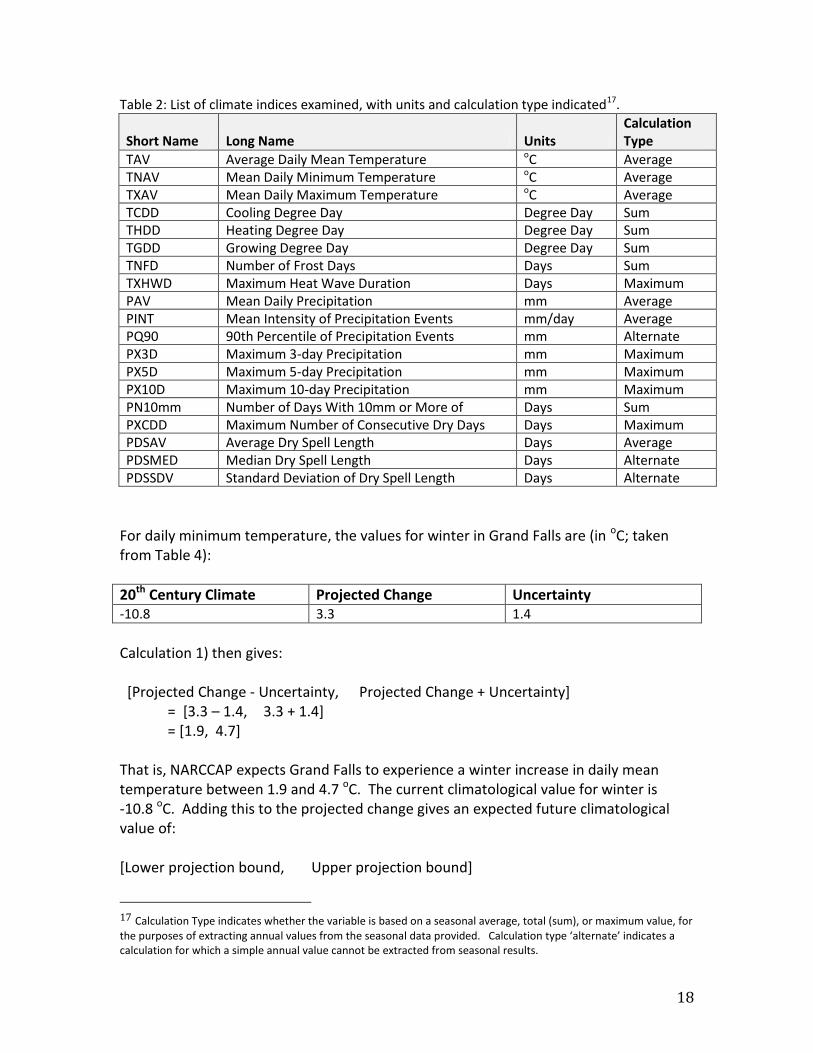
Table 2: List of climate indices examined, with units and calculation type indicated17.
Short Name Long Name Units Calculation Type
TAV Average Daily Mean Temperature oC Average TNAV Mean Daily Minimum Temperature oC Average TXAV Mean Daily Maximum Temperature oC Average TCDD Cooling Degree Day Degree Day Sum THDD Heating Degree Day Degree Day Sum TGDD Growing Degree Day Degree Day Sum TNFD Number of Frost Days Days Sum TXHWD Maximum Heat Wave Duration Days Maximum PAV Mean Daily Precipitation mm Average PINT Mean Intensity of Precipitation Events mm/day Average PQ90 90th Percentile of Precipitation Events mm Alternate PX3D Maximum 3-day Precipitation mm Maximum PX5D Maximum 5-day Precipitation mm Maximum PX10D Maximum 10-day Precipitation mm Maximum PN10mm Number of Days With 10mm or More of
Precipitation Days Sum
PXCDD Maximum Number of Consecutive Dry Days Days Maximum PDSAV Average Dry Spell Length Days Average PDSMED Median Dry Spell Length Days Alternate PDSSDV Standard Deviation of Dry Spell Length Days Alternate
For daily minimum temperature, the values for winter in Grand Falls are (in oC; taken from Table 4):
20th Century Climate Projected Change Uncertainty -10.8 3.3 1.4
Calculation 1) then gives: [Projected Change - Uncertainty, Projected Change + Uncertainty]
= [3.3 – 1.4, 3.3 + 1.4] = [1.9, 4.7]
That is, NARCCAP expects Grand Falls to experience a winter increase in daily mean temperature between 1.9 and 4.7 oC. The current climatological value for winter is -10.8 oC. Adding this to the projected change gives an expected future climatological value of: [Lower projection bound, Upper projection bound]
17 Calculation Type indicates whether the variable is based on a seasonal average, total (sum), or maximum value, for the purposes of extracting annual values from the seasonal data provided. Calculation type ‘alternate’ indicates a calculation for which a simple annual value cannot be extracted from seasonal results.

19
= -10.8 oC + [1.9, 4.7] = [-8.9, -6.1]
That is, the future climatological value is expected to fall between -8.9 to -6.1 oC.
20
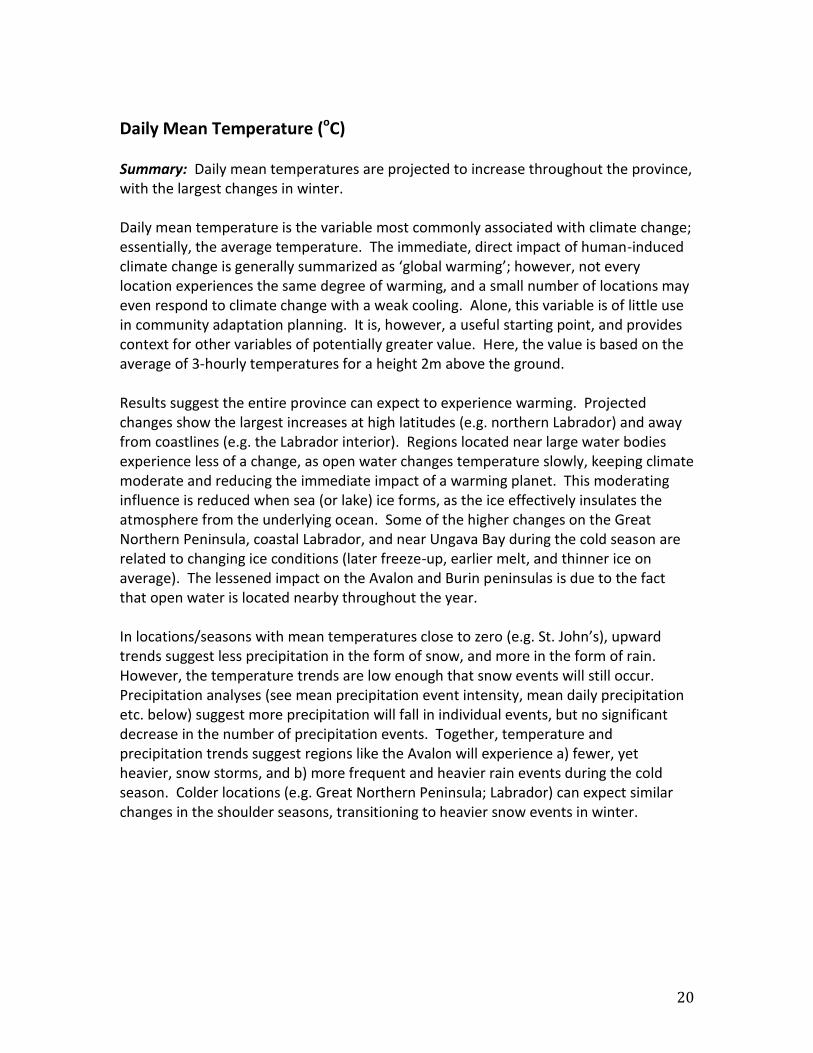
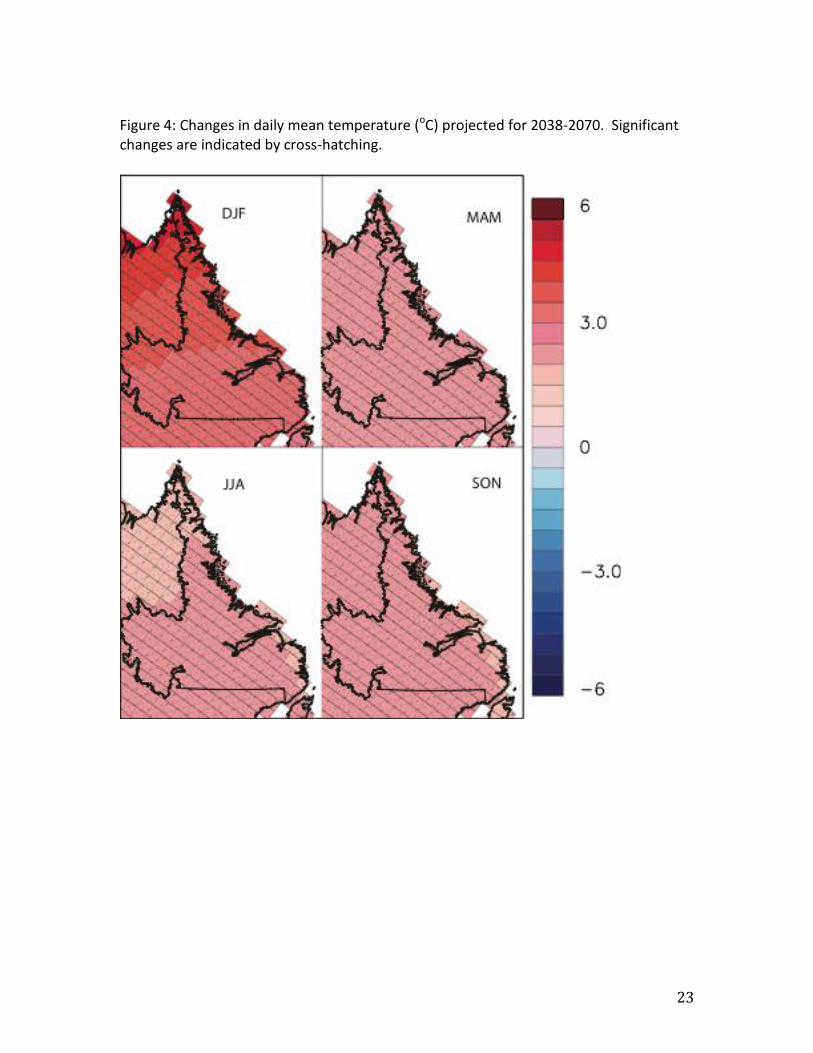
Daily Mean Temperature (oC) Summary: Daily mean temperatures are projected to increase throughout the province, with the largest changes in winter. Daily mean temperature is the variable most commonly associated with climate change; essentially, the average temperature. The immediate, direct impact of human-induced climate change is generally summarized as ‘global warming’; however, not every location experiences the same degree of warming, and a small number of locations may even respond to climate change with a weak cooling. Alone, this variable is of little use in community adaptation planning. It is, however, a useful starting point, and provides context for other variables of potentially greater value. Here, the value is based on the average of 3-hourly temperatures for a height 2m above the ground. Results suggest the entire province can expect to experience warming. Projected changes show the largest increases at high latitudes (e.g. northern Labrador) and away from coastlines (e.g. the Labrador interior). Regions located near large water bodies experience less of a change, as open water changes temperature slowly, keeping climate moderate and reducing the immediate impact of a warming planet. This moderating influence is reduced when sea (or lake) ice forms, as the ice effectively insulates the atmosphere from the underlying ocean. Some of the higher changes on the Great Northern Peninsula, coastal Labrador, and near Ungava Bay during the cold season are related to changing ice conditions (later freeze-up, earlier melt, and thinner ice on average). The lessened impact on the Avalon and Burin peninsulas is due to the fact that open water is located nearby throughout the year. In locations/seasons with mean temperatures close to zero (e.g. St. John’s), upward trends suggest less precipitation in the form of snow, and more in the form of rain. However, the temperature trends are low enough that snow events will still occur. Precipitation analyses (see mean precipitation event intensity, mean daily precipitation etc. below) suggest more precipitation will fall in individual events, but no significant decrease in the number of precipitation events. Together, temperature and precipitation trends suggest regions like the Avalon will experience a) fewer, yet heavier, snow storms, and b) more frequent and heavier rain events during the cold season. Colder locations (e.g. Great Northern Peninsula; Labrador) can expect similar changes in the shoulder seasons, transitioning to heavier snow events in winter.
21
Figure 3: Changes in daily mean temperature (oC) projected for 2038-2070. Significant changes are indicated by cross-hatching.
22
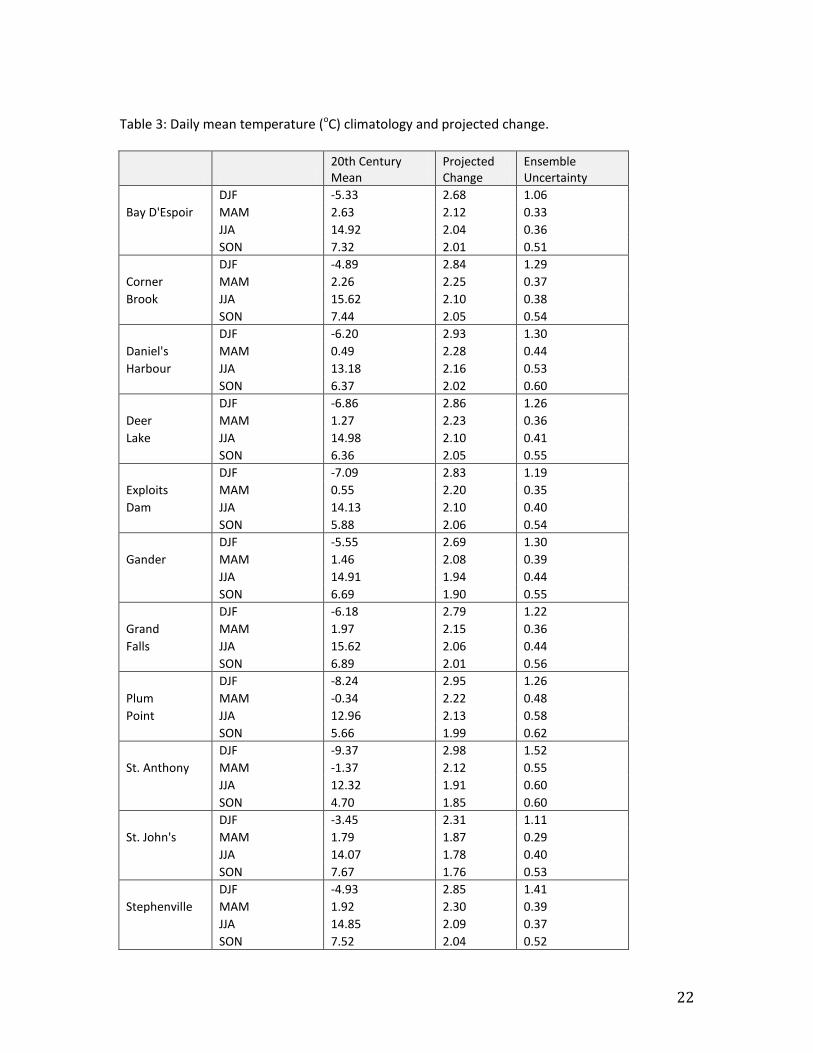
Table 3: Daily mean temperature (oC) climatology and projected change.
20th Century Mean
Projected Change
Ensemble Uncertainty
DJF -5.33 2.68 1.06
Bay D'Espoir MAM 2.63 2.12 0.33
JJA 14.92 2.04 0.36
SON 7.32 2.01 0.51
DJF -4.89 2.84 1.29
Corner MAM 2.26 2.25 0.37
Brook JJA 15.62 2.10 0.38
SON 7.44 2.05 0.54
DJF -6.20 2.93 1.30
Daniel's MAM 0.49 2.28 0.44
Harbour JJA 13.18 2.16 0.53
SON 6.37 2.02 0.60
DJF -6.86 2.86 1.26
Deer MAM 1.27 2.23 0.36
Lake JJA 14.98 2.10 0.41
SON 6.36 2.05 0.55
DJF -7.09 2.83 1.19
Exploits MAM 0.55 2.20 0.35
Dam JJA 14.13 2.10 0.40
SON 5.88 2.06 0.54
DJF -5.55 2.69 1.30
Gander MAM 1.46 2.08 0.39
JJA 14.91 1.94 0.44
SON 6.69 1.90 0.55
DJF -6.18 2.79 1.22
Grand MAM 1.97 2.15 0.36
Falls JJA 15.62 2.06 0.44
SON 6.89 2.01 0.56
DJF -8.24 2.95 1.26
Plum MAM -0.34 2.22 0.48
Point JJA 12.96 2.13 0.58
SON 5.66 1.99 0.62
DJF -9.37 2.98 1.52
St. Anthony MAM -1.37 2.12 0.55
JJA 12.32 1.91 0.60
SON 4.70 1.85 0.60
DJF -3.45 2.31 1.11
St. John's MAM 1.79 1.87 0.29
JJA 14.07 1.78 0.40
SON 7.67 1.76 0.53
DJF -4.93 2.85 1.41
Stephenville MAM 1.92 2.30 0.39
JJA 14.85 2.09 0.37
SON 7.52 2.04 0.52
23
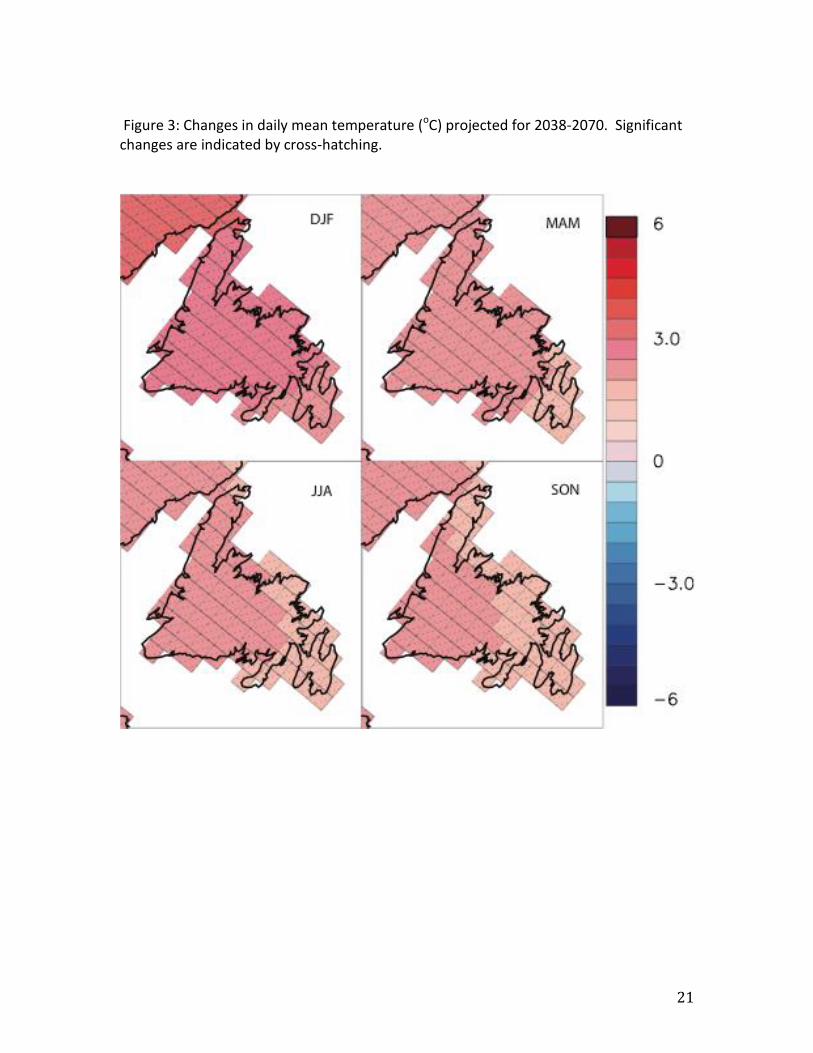
Figure 4: Changes in daily mean temperature (oC) projected for 2038-2070. Significant changes are indicated by cross-hatching.
24
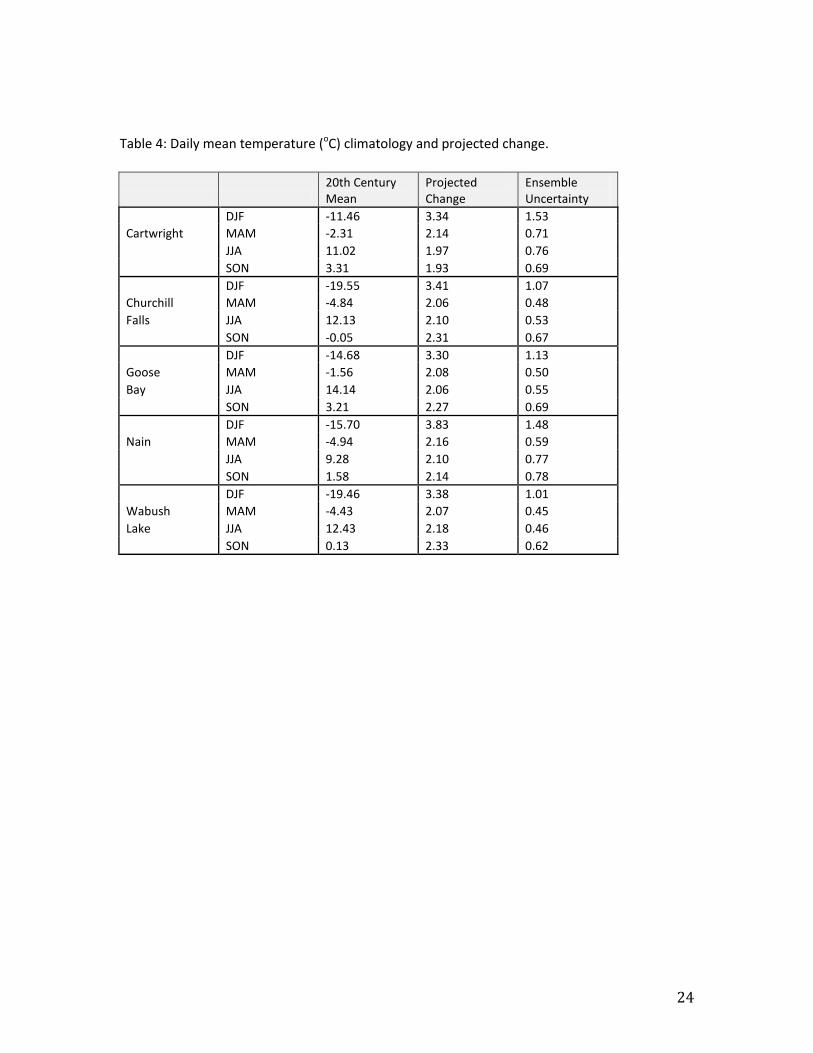
Table 4: Daily mean temperature (oC) climatology and projected change.
20th Century Mean
Projected Change
Ensemble Uncertainty
DJF -11.46 3.34 1.53
Cartwright MAM -2.31 2.14 0.71
JJA 11.02 1.97 0.76
SON 3.31 1.93 0.69
DJF -19.55 3.41 1.07
Churchill MAM -4.84 2.06 0.48
Falls JJA 12.13 2.10 0.53
SON -0.05 2.31 0.67
DJF -14.68 3.30 1.13
Goose MAM -1.56 2.08 0.50
Bay JJA 14.14 2.06 0.55
SON 3.21 2.27 0.69
DJF -15.70 3.83 1.48
Nain MAM -4.94 2.16 0.59
JJA 9.28 2.10 0.77
SON 1.58 2.14 0.78
DJF -19.46 3.38 1.01
Wabush MAM -4.43 2.07 0.45
Lake JJA 12.43 2.18 0.46
SON 0.13 2.33 0.62
25
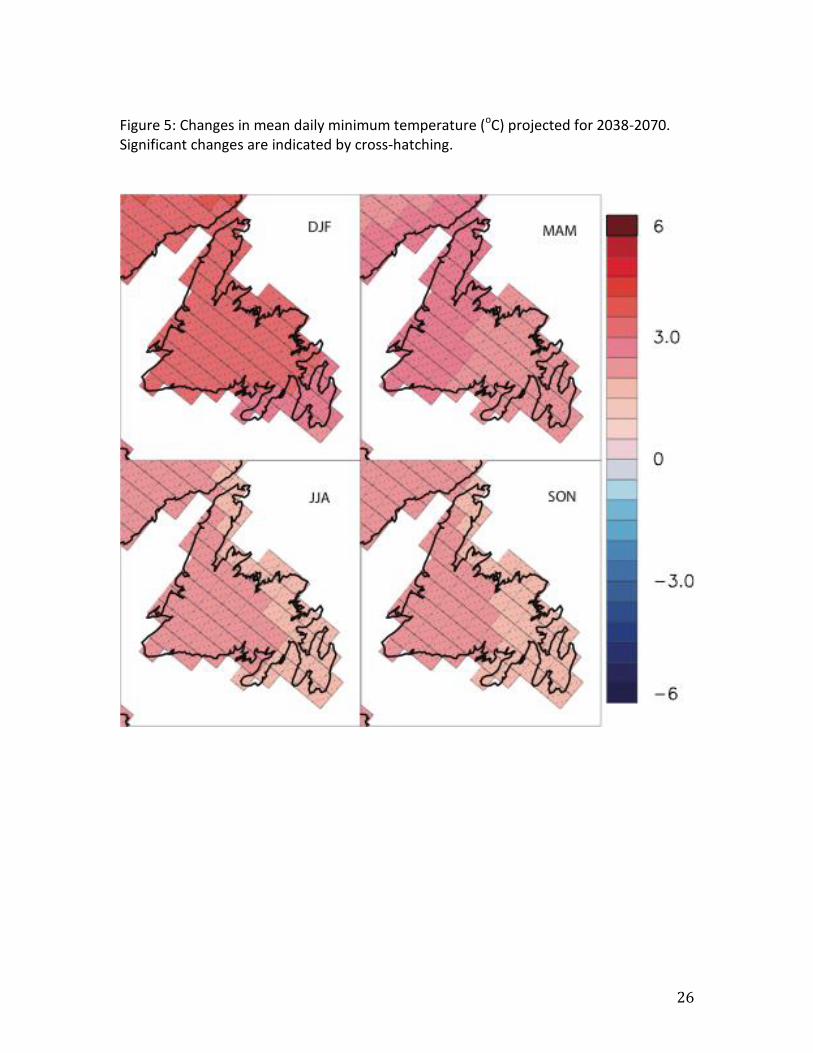
Daily Minimum Temperature (oC) Summary: Daily minimum temperatures are projected to increase throughout the province, with the greatest changes expected in winter. Changes are greater than those of the daily mean or maximum temperatures (3-4 oC in NL; 3-6 oC in Labrador). Mean daily minimum temperature is calculated by averaging the minimum temperature recorded for each day in a given season. Under typical conditions, and in the absence of passing weather systems, the timing of the daily minimum is determined by the timing of sunshine, occurring at dawn when the rising sun interrupts nighttime cooling. The mean daily minima has value as an indicator of frost events during the growing season and thaws during the cold season: regions with daily minima close to 0oC in a relevant season can expect more of these events. Because rising greenhouse gases limit nighttime cooling, daily minima often change more than either mean temperatures or daily maximum temperature in response to human-induced climate change. This results in a smaller mean temperature range (maxima warm a little; minima warm a lot) in many locations. Spatial patterns of minima change projected for Newfoundland & Labrador closely follow daily averages, although the magnitude is typically a little larger.
26
Figure 5: Changes in mean daily minimum temperature (oC) projected for 2038-2070. Significant changes are indicated by cross-hatching.
27
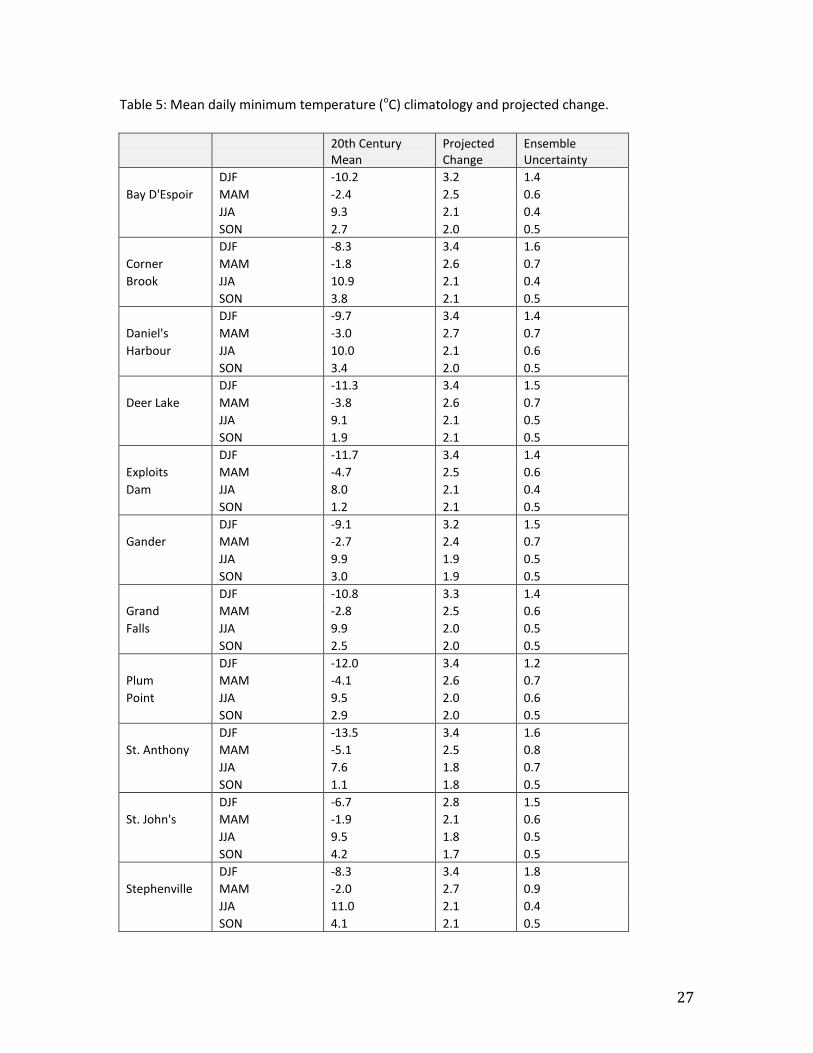
Table 5: Mean daily minimum temperature (oC) climatology and projected change.
20th Century Mean
Projected Change
Ensemble Uncertainty
DJF -10.2 3.2 1.4
Bay D'Espoir MAM -2.4 2.5 0.6
JJA 9.3 2.1 0.4
SON 2.7 2.0 0.5
DJF -8.3 3.4 1.6
Corner MAM -1.8 2.6 0.7
Brook JJA 10.9 2.1 0.4
SON 3.8 2.1 0.5
DJF -9.7 3.4 1.4
Daniel's MAM -3.0 2.7 0.7
Harbour JJA 10.0 2.1 0.6
SON 3.4 2.0 0.5
DJF -11.3 3.4 1.5
Deer Lake MAM -3.8 2.6 0.7
JJA 9.1 2.1 0.5
SON 1.9 2.1 0.5
DJF -11.7 3.4 1.4
Exploits MAM -4.7 2.5 0.6
Dam JJA 8.0 2.1 0.4
SON 1.2 2.1 0.5
DJF -9.1 3.2 1.5
Gander MAM -2.7 2.4 0.7
JJA 9.9 1.9 0.5
SON 3.0 1.9 0.5
DJF -10.8 3.3 1.4
Grand MAM -2.8 2.5 0.6
Falls JJA 9.9 2.0 0.5
SON 2.5 2.0 0.5
DJF -12.0 3.4 1.2
Plum MAM -4.1 2.6 0.7
Point JJA 9.5 2.0 0.6
SON 2.9 2.0 0.5
DJF -13.5 3.4 1.6
St. Anthony MAM -5.1 2.5 0.8
JJA 7.6 1.8 0.7
SON 1.1 1.8 0.5
DJF -6.7 2.8 1.5
St. John's MAM -1.9 2.1 0.6
JJA 9.5 1.8 0.5
SON 4.2 1.7 0.5
DJF -8.3 3.4 1.8
Stephenville MAM -2.0 2.7 0.9
JJA 11.0 2.1 0.4
SON 4.1 2.1 0.5

28
Figure 6: Changes in mean daily minimum temperature (oC) projected for 2038-2070. Significant changes are indicated by cross-hatching.
29
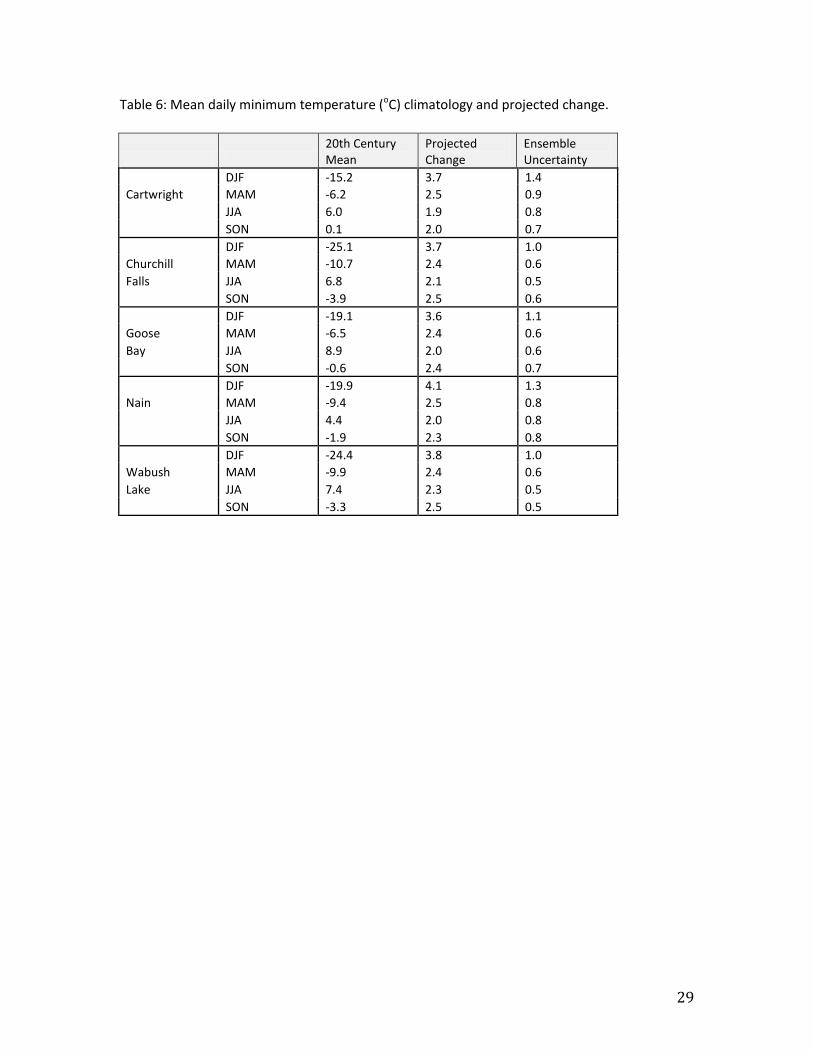
Table 6: Mean daily minimum temperature (oC) climatology and projected change.
20th Century Mean
Projected Change
Ensemble Uncertainty
DJF -15.2 3.7 1.4
Cartwright MAM -6.2 2.5 0.9
JJA 6.0 1.9 0.8
SON 0.1 2.0 0.7
DJF -25.1 3.7 1.0
Churchill MAM -10.7 2.4 0.6
Falls JJA 6.8 2.1 0.5
SON -3.9 2.5 0.6
DJF -19.1 3.6 1.1
Goose MAM -6.5 2.4 0.6
Bay JJA 8.9 2.0 0.6
SON -0.6 2.4 0.7
DJF -19.9 4.1 1.3
Nain MAM -9.4 2.5 0.8
JJA 4.4 2.0 0.8
SON -1.9 2.3 0.8
DJF -24.4 3.8 1.0
Wabush MAM -9.9 2.4 0.6
Lake JJA 7.4 2.3 0.5
SON -3.3 2.5 0.5
30
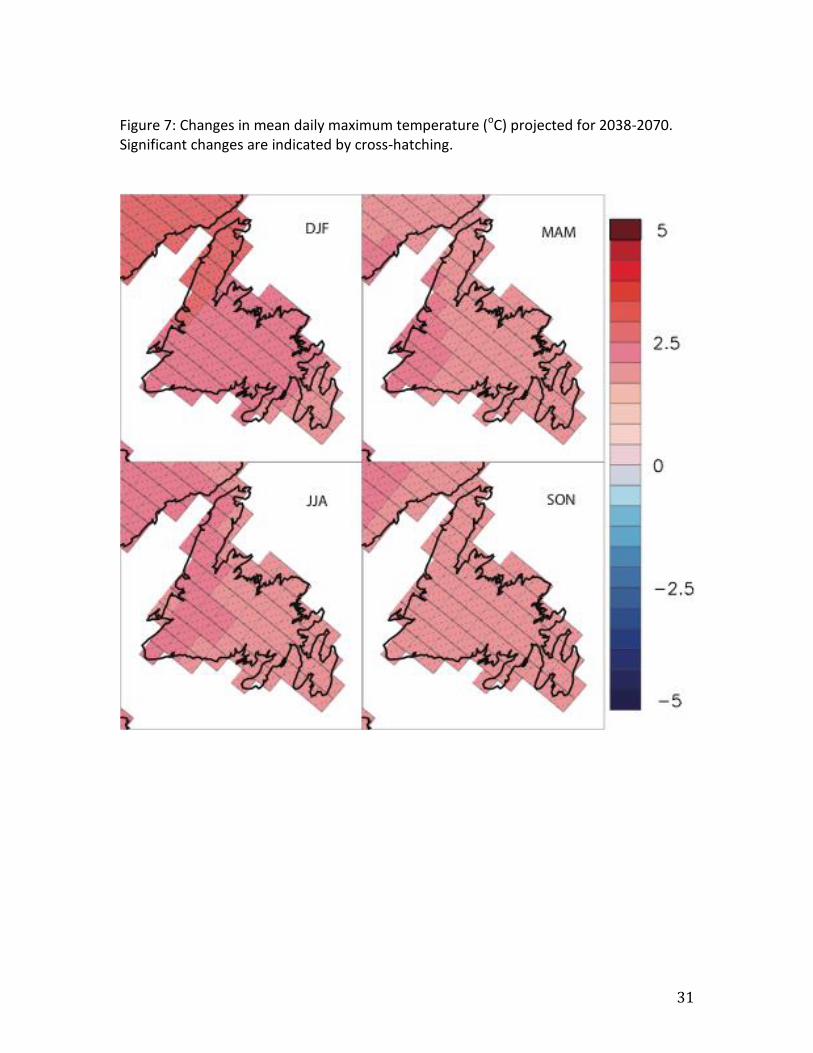
Daily Maximum Temperature (oC) Summary: Increases in daily maximum temperature are projected throughout the province, with the greatest change expected in winter. Changes are smaller than those of the minimum (1-3oC in NL; 2-5 oC in Labrador). Mean daily maximum temperature is calculated by averaging the maximum temperature recorded for each day in a given season. As with daily minima, the timing of the maxima is strongly related to the diurnal cycle in solar heating; daily maximums are expected mid-to-late afternoon, several hours after solar intensity begins to decrease. Seasons/locations with daily maxima close to zero and minima considerably below freezing will see a larger number of daily freeze/thaw cycles associated with the daily temperature cycle. These become less common as both maxima and minima increase. Spatial patterns of projected change closely follow those of the daily average and minima.
31
Figure 7: Changes in mean daily maximum temperature (oC) projected for 2038-2070. Significant changes are indicated by cross-hatching.
32
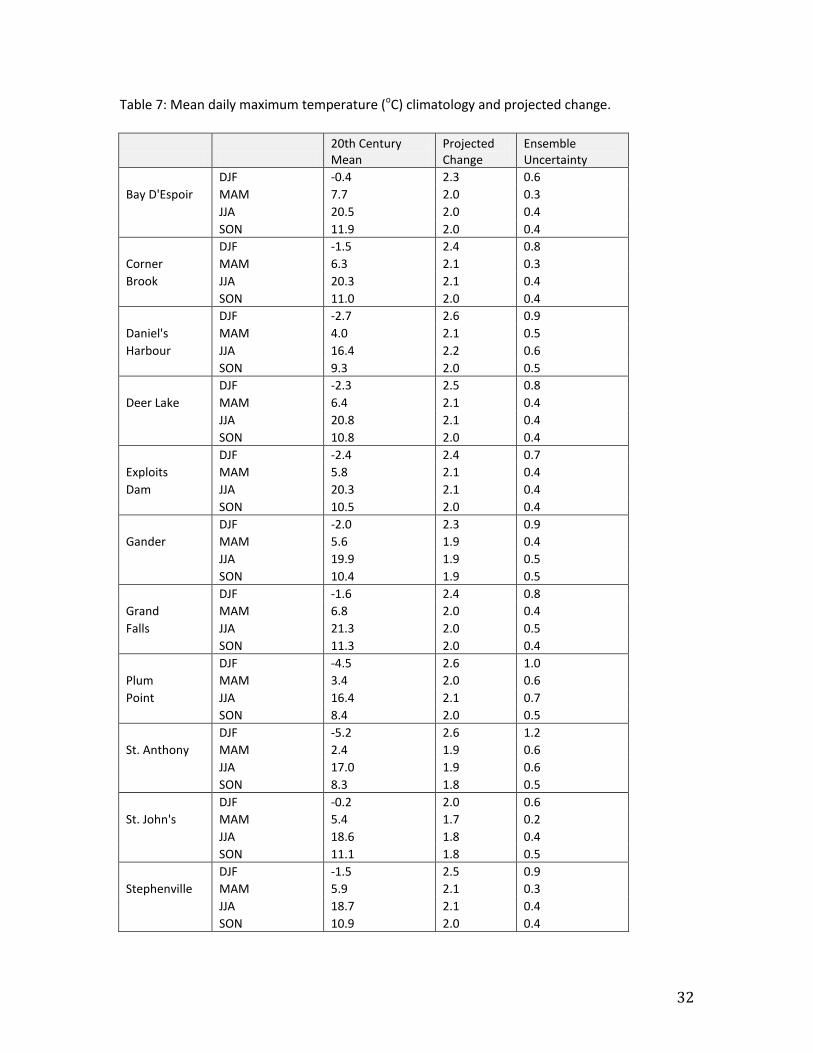
Table 7: Mean daily maximum temperature (oC) climatology and projected change.
20th Century Mean
Projected Change
Ensemble Uncertainty
DJF -0.4 2.3 0.6
Bay D'Espoir MAM 7.7 2.0 0.3
JJA 20.5 2.0 0.4
SON 11.9 2.0 0.4
DJF -1.5 2.4 0.8
Corner MAM 6.3 2.1 0.3
Brook JJA 20.3 2.1 0.4
SON 11.0 2.0 0.4
DJF -2.7 2.6 0.9
Daniel's MAM 4.0 2.1 0.5
Harbour JJA 16.4 2.2 0.6
SON 9.3 2.0 0.5
DJF -2.3 2.5 0.8
Deer Lake MAM 6.4 2.1 0.4
JJA 20.8 2.1 0.4
SON 10.8 2.0 0.4
DJF -2.4 2.4 0.7
Exploits MAM 5.8 2.1 0.4
Dam JJA 20.3 2.1 0.4
SON 10.5 2.0 0.4
DJF -2.0 2.3 0.9
Gander MAM 5.6 1.9 0.4
JJA 19.9 1.9 0.5
SON 10.4 1.9 0.5
DJF -1.6 2.4 0.8
Grand MAM 6.8 2.0 0.4
Falls JJA 21.3 2.0 0.5
SON 11.3 2.0 0.4
DJF -4.5 2.6 1.0
Plum MAM 3.4 2.0 0.6
Point JJA 16.4 2.1 0.7
SON 8.4 2.0 0.5
DJF -5.2 2.6 1.2
St. Anthony MAM 2.4 1.9 0.6
JJA 17.0 1.9 0.6
SON 8.3 1.8 0.5
DJF -0.2 2.0 0.6
St. John's MAM 5.4 1.7 0.2
JJA 18.6 1.8 0.4
SON 11.1 1.8 0.5
DJF -1.5 2.5 0.9
Stephenville MAM 5.9 2.1 0.3
JJA 18.7 2.1 0.4
SON 10.9 2.0 0.4

33
Figure 8: Changes in mean daily maximum temperature (oC) projected for 2038-2070. Significant changes are indicated by cross-hatching.

34
Table 8: Mean daily maximum temperature (oC) climatology and projected change.
20th Century Mean
Projected Change
Ensemble Uncertainty
DJF -7.7 3.0 1.2
Cartwright MAM 1.6 1.9 0.7
JJA 16.0 1.9 0.8
SON 6.5 1.9 0.6
DJF -13.9 3.1 0.7
Churchill MAM 1.1 1.9 0.5
Falls JJA 17.4 2.1 0.6
SON 3.8 2.1 0.5
DJF -10.2 3.0 0.8
Goose MAM 3.4 1.9 0.6
Bay JJA 19.3 2.0 0.6
SON 7.0 2.1 0.5
DJF -11.5 3.6 1.2
Nain MAM -0.4 1.9 0.5
JJA 14.1 2.0 0.8
SON 5.0 2.0 0.6
DJF -14.4 3.1 0.7
Wabush MAM 1.0 1.9 0.5
Lake JJA 17.4 2.1 0.5
SON 3.6 2.2 0.5
35
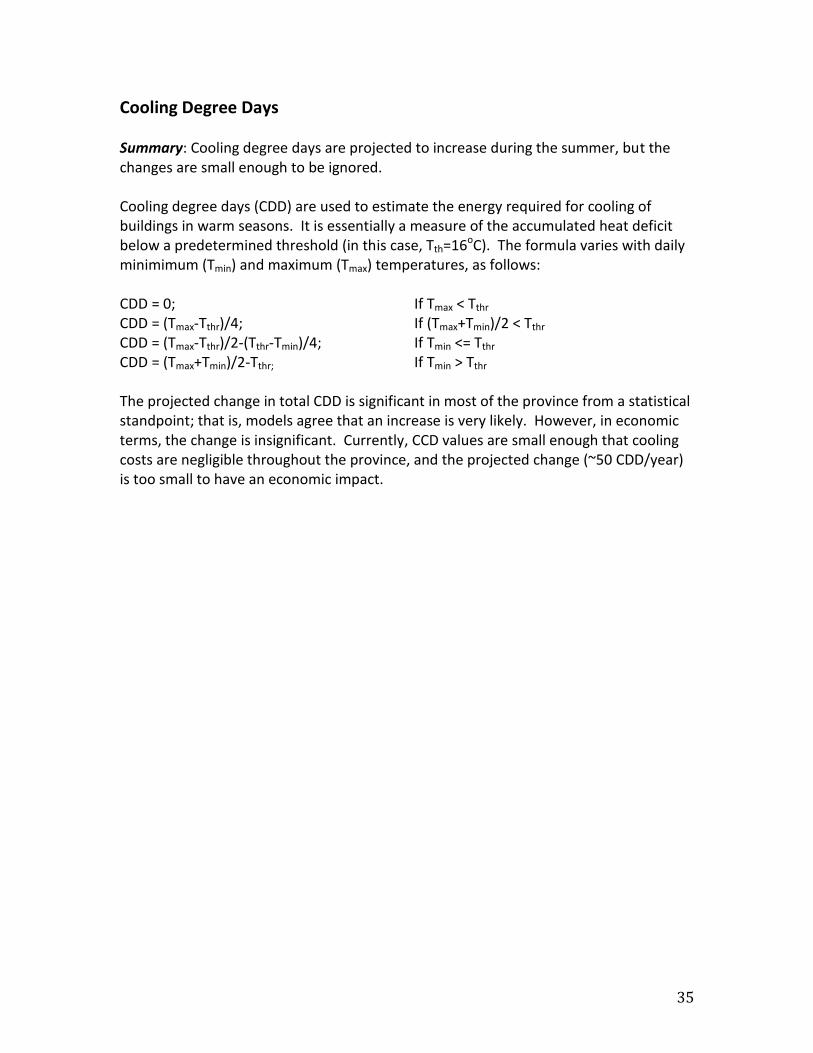
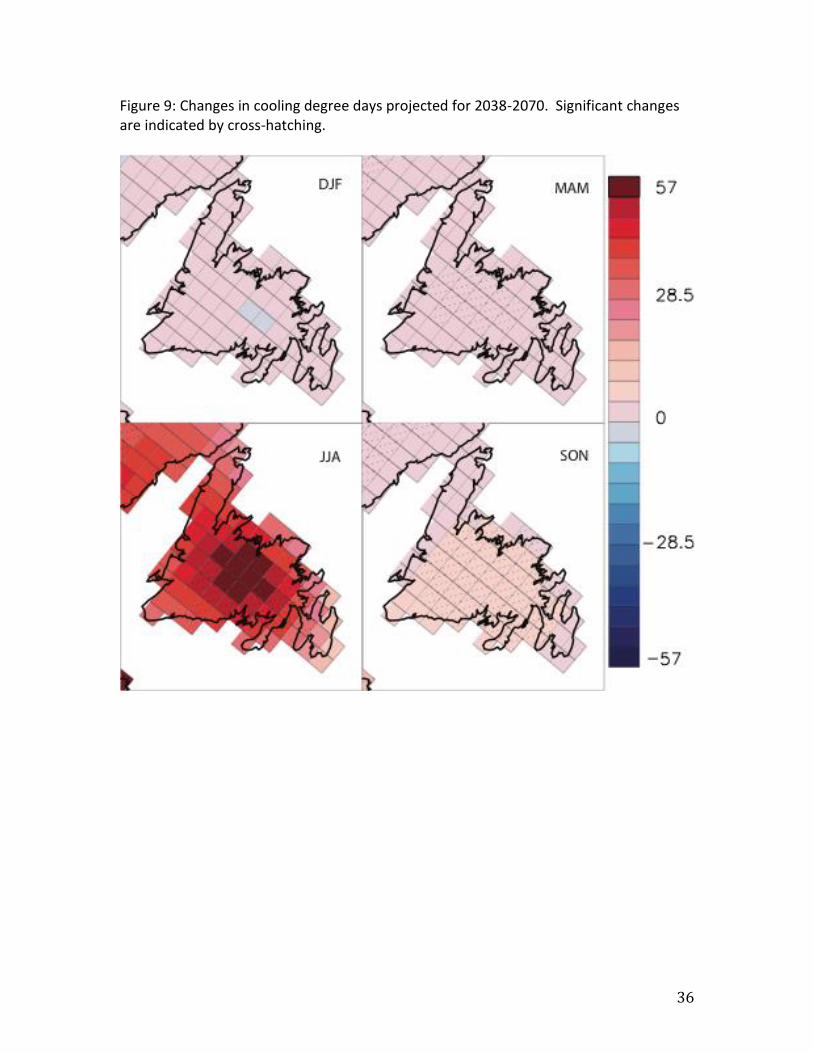
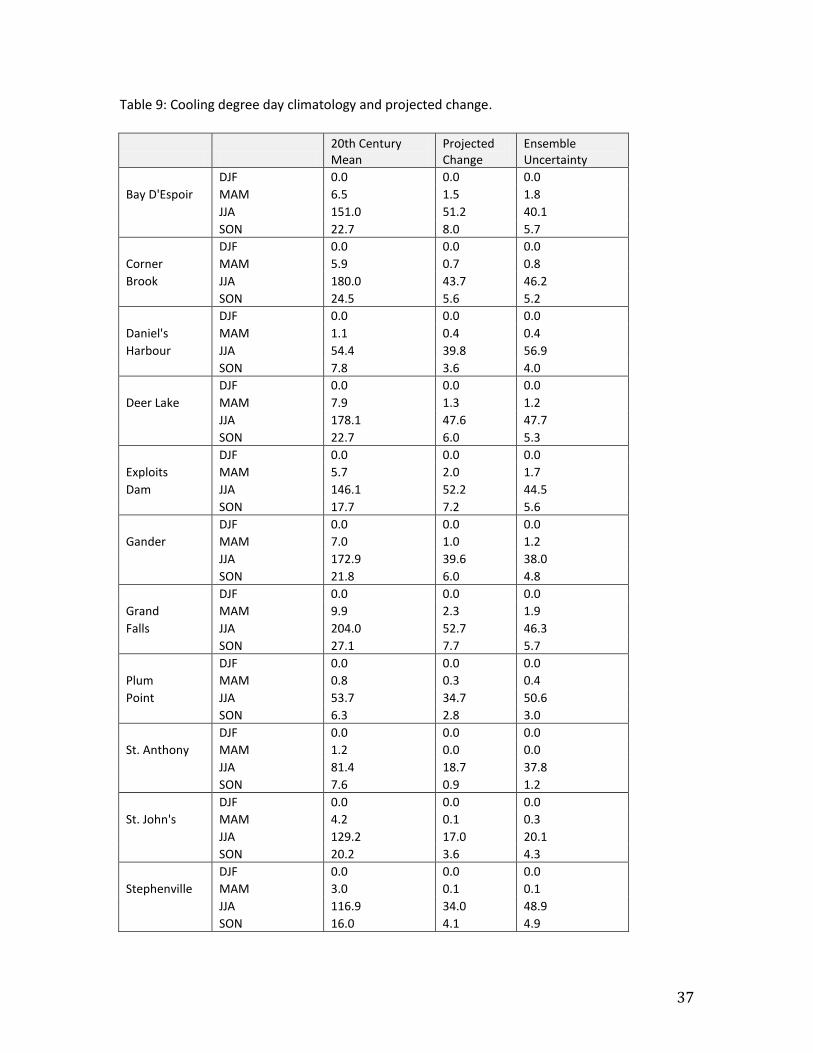
Cooling Degree Days Summary: Cooling degree days are projected to increase during the summer, but the changes are small enough to be ignored. Cooling degree days (CDD) are used to estimate the energy required for cooling of buildings in warm seasons. It is essentially a measure of the accumulated heat deficit below a predetermined threshold (in this case, Tth=16oC). The formula varies with daily minimimum (Tmin) and maximum (Tmax) temperatures, as follows: CDD = 0; If Tmax < Tthr CDD = (Tmax-Tthr)/4; If (Tmax+Tmin)/2 < Tthr CDD = (Tmax-Tthr)/2-(Tthr-Tmin)/4; If Tmin <= Tthr CDD = (Tmax+Tmin)/2-Tthr; If Tmin > Tthr The projected change in total CDD is significant in most of the province from a statistical standpoint; that is, models agree that an increase is very likely. However, in economic terms, the change is insignificant. Currently, CCD values are small enough that cooling costs are negligible throughout the province, and the projected change (~50 CDD/year) is too small to have an economic impact.
36
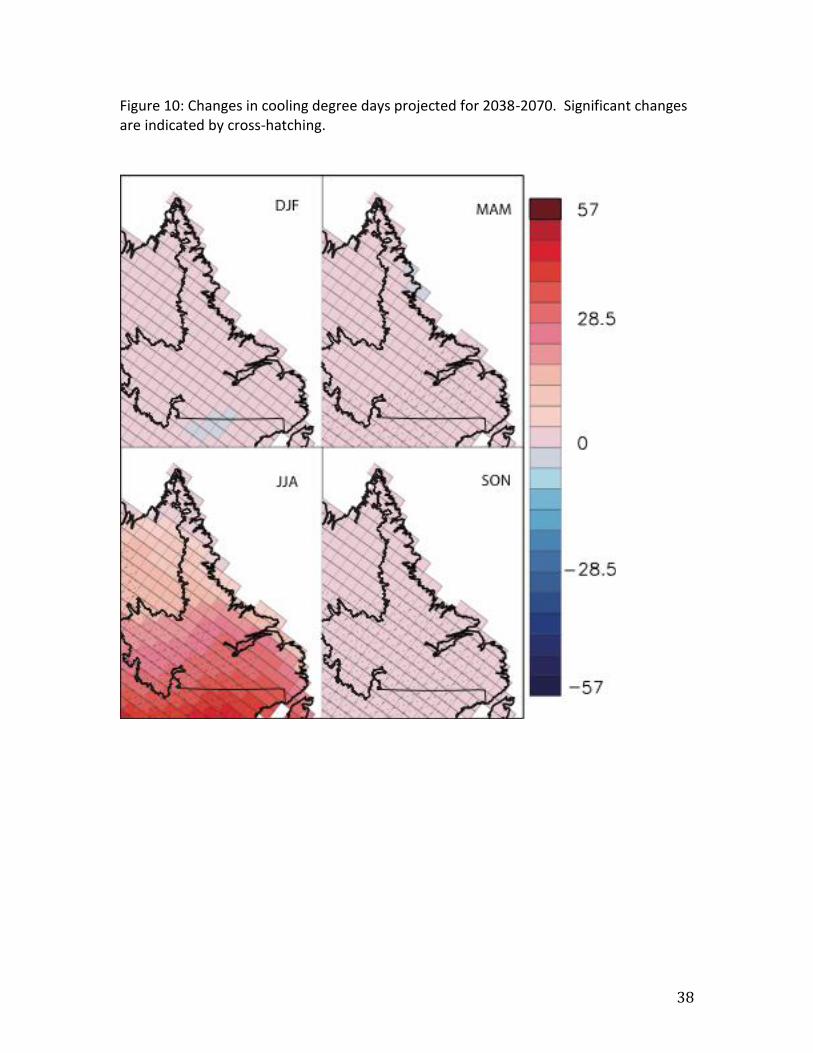
Figure 9: Changes in cooling degree days projected for 2038-2070. Significant changes are indicated by cross-hatching.
37
Table 9: Cooling degree day climatology and projected change.
20th Century Mean
Projected Change
Ensemble Uncertainty
DJF 0.0 0.0 0.0
Bay D'Espoir MAM 6.5 1.5 1.8
JJA 151.0 51.2 40.1
SON 22.7 8.0 5.7
DJF 0.0 0.0 0.0
Corner MAM 5.9 0.7 0.8
Brook JJA 180.0 43.7 46.2
SON 24.5 5.6 5.2
DJF 0.0 0.0 0.0
Daniel's MAM 1.1 0.4 0.4
Harbour JJA 54.4 39.8 56.9
SON 7.8 3.6 4.0
DJF 0.0 0.0 0.0
Deer Lake MAM 7.9 1.3 1.2
JJA 178.1 47.6 47.7
SON 22.7 6.0 5.3
DJF 0.0 0.0 0.0
Exploits MAM 5.7 2.0 1.7
Dam JJA 146.1 52.2 44.5
SON 17.7 7.2 5.6
DJF 0.0 0.0 0.0
Gander MAM 7.0 1.0 1.2
JJA 172.9 39.6 38.0
SON 21.8 6.0 4.8
DJF 0.0 0.0 0.0
Grand MAM 9.9 2.3 1.9
Falls JJA 204.0 52.7 46.3
SON 27.1 7.7 5.7
DJF 0.0 0.0 0.0
Plum MAM 0.8 0.3 0.4
Point JJA 53.7 34.7 50.6
SON 6.3 2.8 3.0
DJF 0.0 0.0 0.0
St. Anthony MAM 1.2 0.0 0.0
JJA 81.4 18.7 37.8
SON 7.6 0.9 1.2
DJF 0.0 0.0 0.0
St. John's MAM 4.2 0.1 0.3
JJA 129.2 17.0 20.1
SON 20.2 3.6 4.3
DJF 0.0 0.0 0.0
Stephenville MAM 3.0 0.1 0.1
JJA 116.9 34.0 48.9
SON 16.0 4.1 4.9
38
Figure 10: Changes in cooling degree days projected for 2038-2070. Significant changes are indicated by cross-hatching.
39
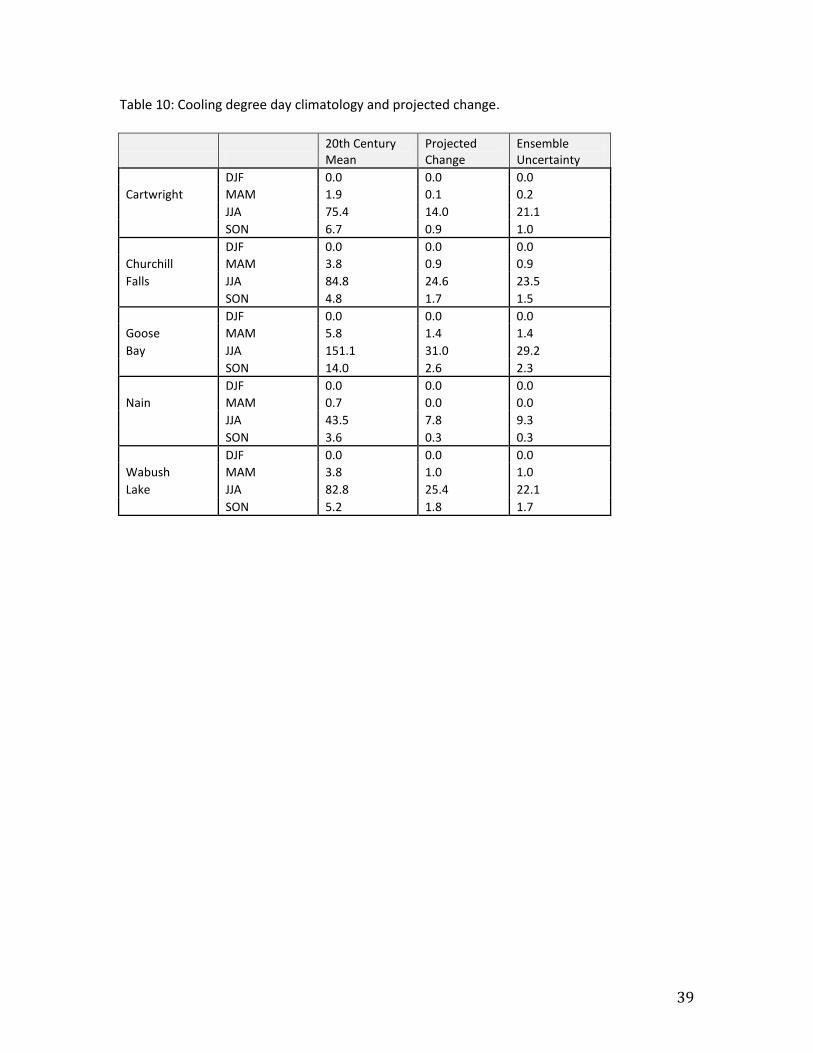
Table 10: Cooling degree day climatology and projected change.
20th Century Mean
Projected Change
Ensemble Uncertainty
DJF 0.0 0.0 0.0
Cartwright MAM 1.9 0.1 0.2
JJA 75.4 14.0 21.1
SON 6.7 0.9 1.0
DJF 0.0 0.0 0.0
Churchill MAM 3.8 0.9 0.9
Falls JJA 84.8 24.6 23.5
SON 4.8 1.7 1.5
DJF 0.0 0.0 0.0
Goose MAM 5.8 1.4 1.4
Bay JJA 151.1 31.0 29.2
SON 14.0 2.6 2.3
DJF 0.0 0.0 0.0
Nain MAM 0.7 0.0 0.0
JJA 43.5 7.8 9.3
SON 3.6 0.3 0.3
DJF 0.0 0.0 0.0
Wabush MAM 3.8 1.0 1.0
Lake JJA 82.8 25.4 22.1
SON 5.2 1.8 1.7
40
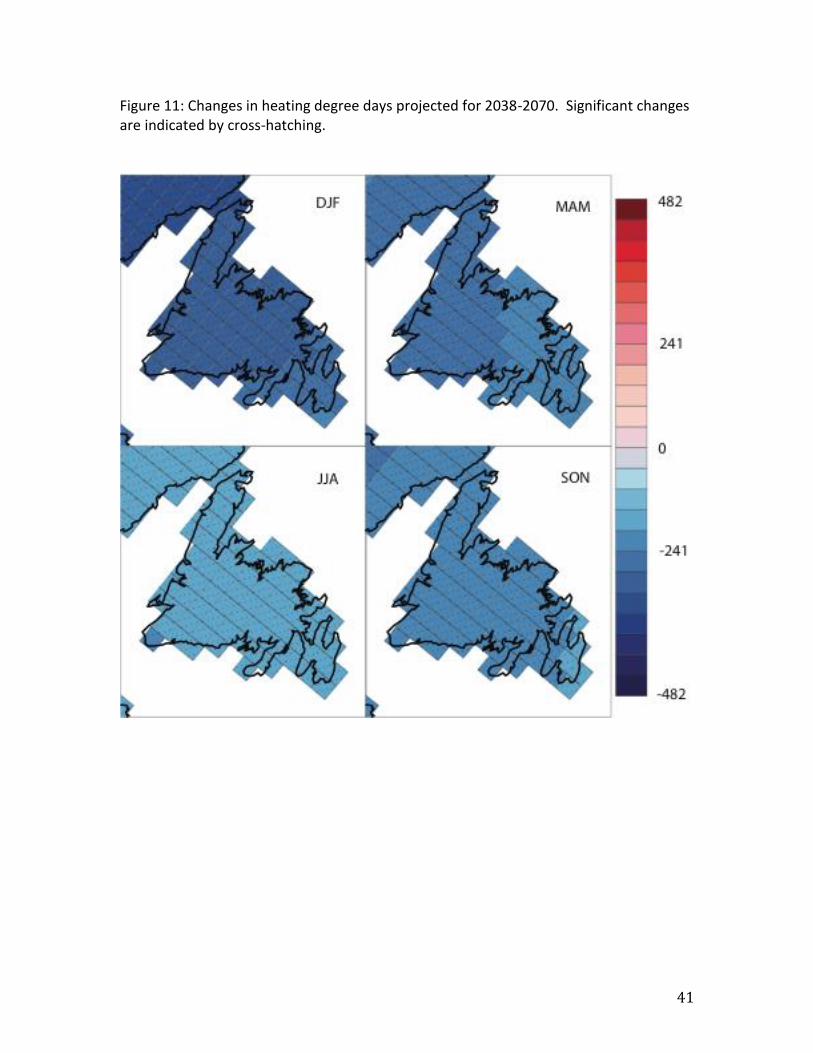
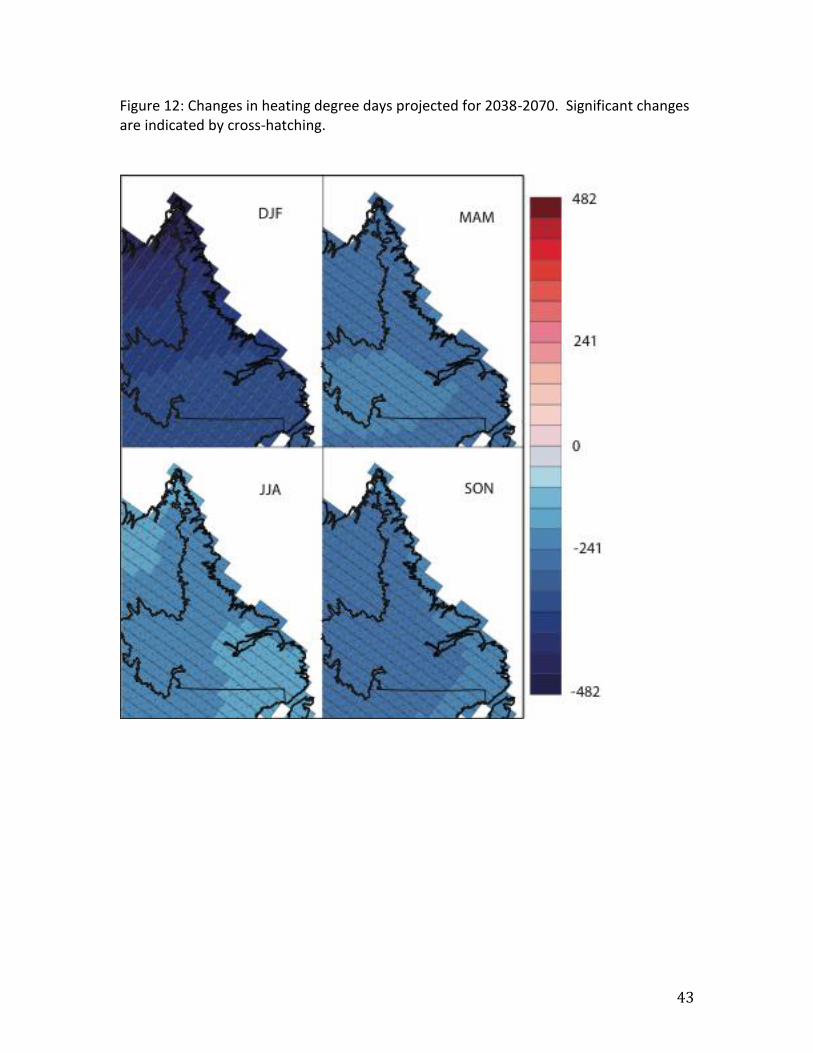
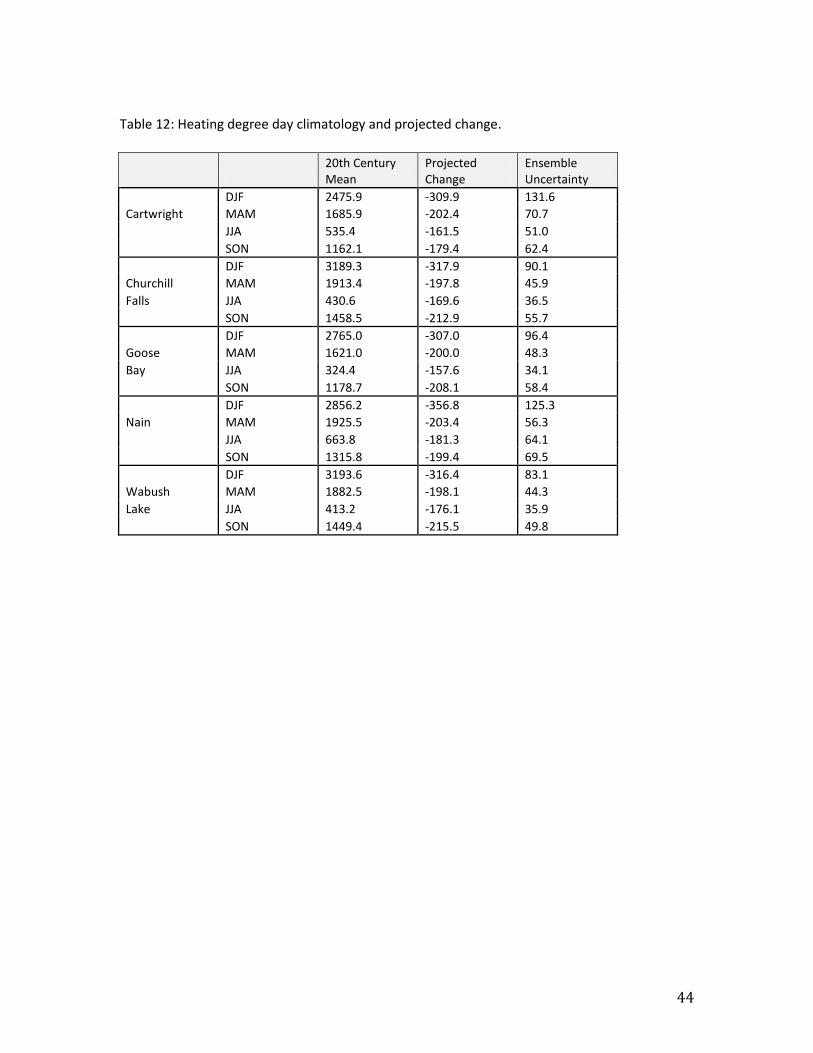
Heating Degree Days Summary: Heating degree days are projected to decrease considerably on an annual basis, with the greatest change expected in winter. Annual decreases are economically significant, implying a substantial decrease in heating costs. Heating degree days (HDD) are similar to cooling degree days, but measure energy requirements for heating homes to comfortable temperatures. It is defined relative to a selected threshold temperature (Tth=16oC was used here). The calculations use daily minimum (Tmin) and daily maximum (Tmax) temperatures, following: HDD = 0; if Tmin > Tthr HDD = (Tthr-Tmin)/4; if (Tmax+Tmin)/2 > Tthr HDD = (Tthr-Tmin)/2-(Tmax-Tthr)/4; if Tmax >= Tthr HDD = Tthr-(Tmax+Tmin)/2; if Tmax < Tthr Under the current climate, total HDD is relatively large, and becomes greater as temperatures drop in given seasons/locations. The models universally predict large, statistically significant decreases in HDD across the complete province during all seasons. The distribution in space and seasons closely follows daily mean, minimum, and maximum temperatures, with the largest decreases in Northern Labrador during winter, and the smallest changes over coastal Newfoundland during summer. Regardless of the location, annual decreases in HDD are economically significant. For Newfoundland, the annual decrease is roughly equivalent to the current HDD for Autumn; in Labrador, the decrease is roughly half the spring values. This points to substantial savings on heating costs arising from climate change.
41
Figure 11: Changes in heating degree days projected for 2038-2070. Significant changes are indicated by cross-hatching.

42
Table 11: Heating degree day climatology and projected change.
20th Century Mean
Projected Change
Ensemble Uncertainty
DJF 1889.3 -251.5 97.7
Bay D'Espoir MAM 1217.2 -201.4 39.9
JJA 251.8 -136.8 13.9
SON 800.2 -175.9 38.9
DJF 1878.3 -266.1 116.4
Corner MAM 1267.6 -214.7 44.8
Brook JJA 217.7 -147.3 17.0
SON 800.7 -184.0 41.1
DJF 1988.7 -275.2 113.8
Daniel's MAM 1414.1 -216.6 51.9
Harbour JJA 313.4 -154.2 28.3
SON 875.0 -184.0 48.2
DJF 2058.2 -267.8 113.5
Deer Lake MAM 1362.4 -212.1 43.4
JJA 274.1 -143.5 16.9
SON 900.5 -183.9 42.5
DJF 2057.3 -265.1 107.7
Exploits MAM 1418.3 -208.2 40.6
Dam JJA 319.0 -139.4 15.5
SON 934.4 -183.1 41.9
DJF 1943.6 -252.7 117.0
Gander MAM 1345.2 -196.5 44.6
JJA 275.8 -136.0 11.7
SON 870.5 -168.5 45.0
DJF 1985.2 -262.1 109.5
Grand MAM 1292.5 -202.0 41.0
Falls JJA 243.9 -134.0 14.1
SON 854.7 -177.8 43.9
DJF 2185.5 -276.1 110.2
Plum MAM 1501.1 -210.4 53.0
Point JJA 335.3 -155.6 28.4
SON 948.2 -182.4 52.5
DJF 2285.7 -275.6 135.2
St. Anthony MAM 1596.9 -201.3 57.2
JJA 420.4 -152.3 30.8
SON 1032.5 -169.5 54.4
DJF 1752.3 -217.4 103.8
St. John's MAM 1312.6 -176.5 36.2
JJA 310.0 -146.1 20.4
SON 772.8 -157.4 44.5
DJF 1883.5 -266.9 127.7
Stephenville MAM 1295.1 -220.4 49.5
JJA 224.5 -156.0 20.2
SON 786.1 -184.1 39.9
43
Figure 12: Changes in heating degree days projected for 2038-2070. Significant changes are indicated by cross-hatching.
44
Table 12: Heating degree day climatology and projected change.
20th Century Mean
Projected Change
Ensemble Uncertainty
DJF 2475.9 -309.9 131.6
Cartwright MAM 1685.9 -202.4 70.7
JJA 535.4 -161.5 51.0
SON 1162.1 -179.4 62.4
DJF 3189.3 -317.9 90.1
Churchill MAM 1913.4 -197.8 45.9
Falls JJA 430.6 -169.6 36.5
SON 1458.5 -212.9 55.7
DJF 2765.0 -307.0 96.4
Goose MAM 1621.0 -200.0 48.3
Bay JJA 324.4 -157.6 34.1
SON 1178.7 -208.1 58.4
DJF 2856.2 -356.8 125.3
Nain MAM 1925.5 -203.4 56.3
JJA 663.8 -181.3 64.1
SON 1315.8 -199.4 69.5
DJF 3193.6 -316.4 83.1
Wabush MAM 1882.5 -198.1 44.3
Lake JJA 413.2 -176.1 35.9
SON 1449.4 -215.5 49.8
45
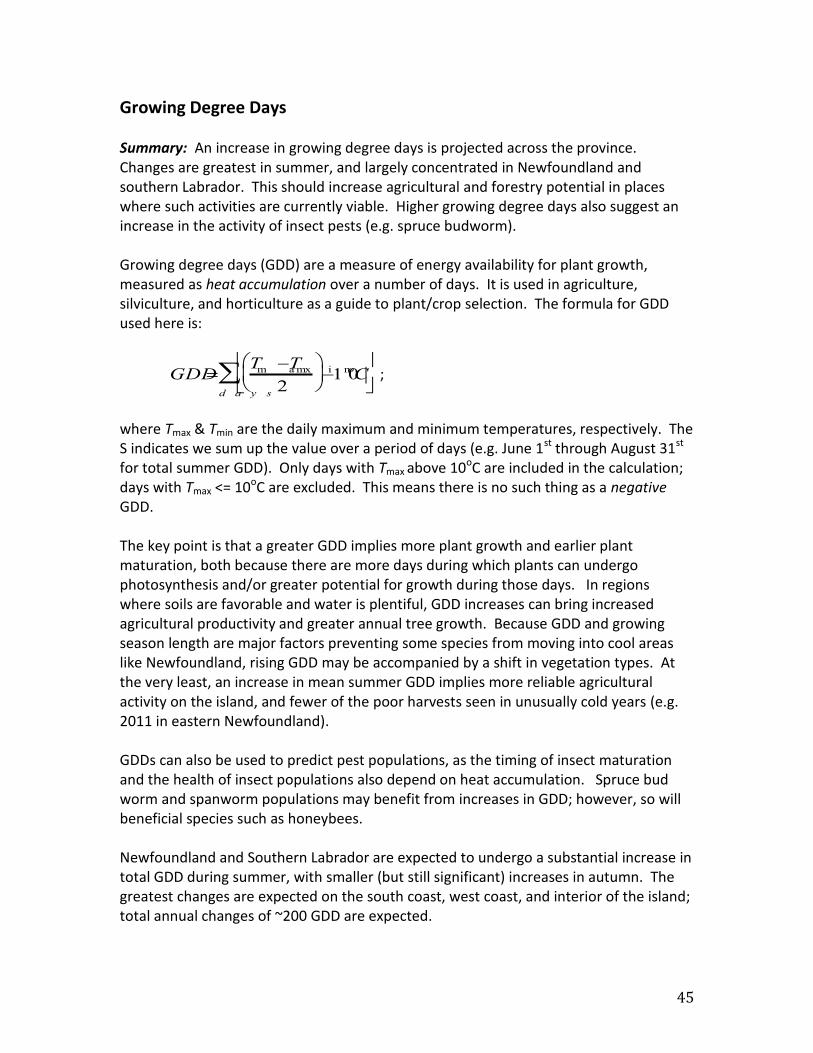
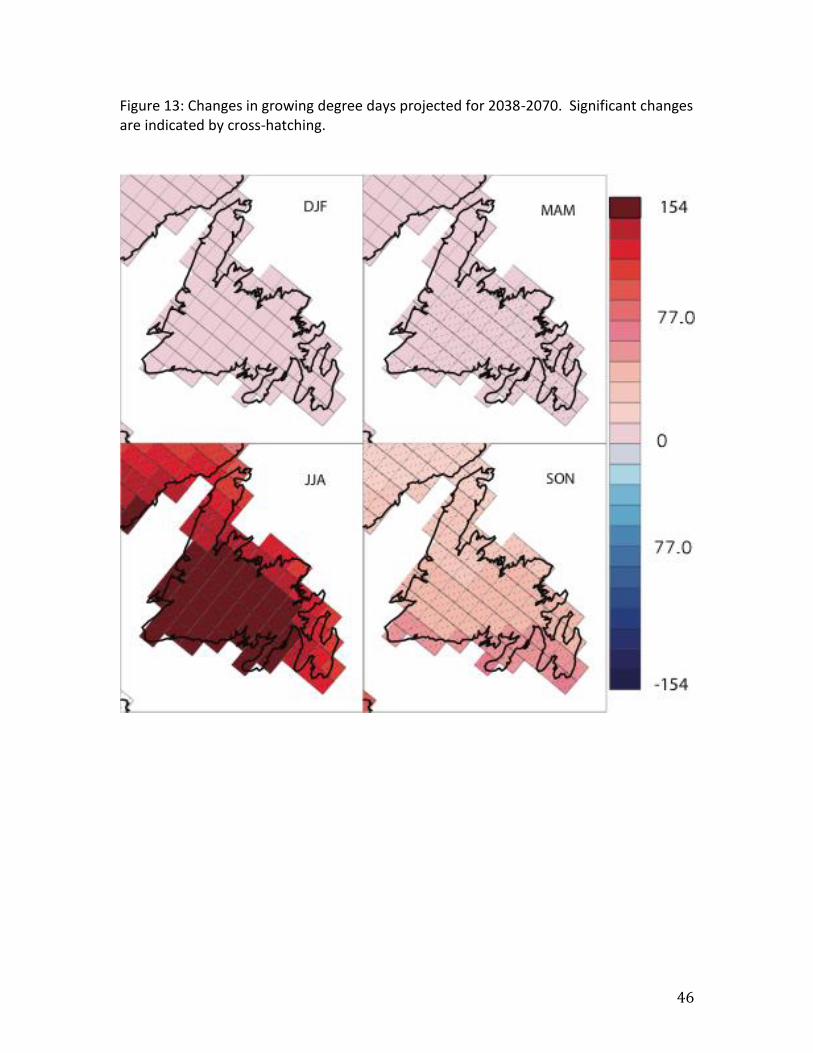
Growing Degree Days Summary: An increase in growing degree days is projected across the province. Changes are greatest in summer, and largely concentrated in Newfoundland and southern Labrador. This should increase agricultural and forestry potential in places where such activities are currently viable. Higher growing degree days also suggest an increase in the activity of insect pests (e.g. spruce budworm). Growing degree days (GDD) are a measure of energy availability for plant growth, measured as heat accumulation over a number of days. It is used in agriculture, silviculture, and horticulture as a guide to plant/crop selection. The formula for GDD used here is:
GDDTm a xTm i n
2
1 0
oC
d a y s
;
where Tmax & Tmin are the daily maximum and minimum temperatures, respectively. The S indicates we sum up the value over a period of days (e.g. June 1st through August 31st for total summer GDD). Only days with Tmax above 10oC are included in the calculation; days with Tmax <= 10oC are excluded. This means there is no such thing as a negative GDD. The key point is that a greater GDD implies more plant growth and earlier plant maturation, both because there are more days during which plants can undergo photosynthesis and/or greater potential for growth during those days. In regions where soils are favorable and water is plentiful, GDD increases can bring increased agricultural productivity and greater annual tree growth. Because GDD and growing season length are major factors preventing some species from moving into cool areas like Newfoundland, rising GDD may be accompanied by a shift in vegetation types. At the very least, an increase in mean summer GDD implies more reliable agricultural activity on the island, and fewer of the poor harvests seen in unusually cold years (e.g. 2011 in eastern Newfoundland). GDDs can also be used to predict pest populations, as the timing of insect maturation and the health of insect populations also depend on heat accumulation. Spruce bud worm and spanworm populations may benefit from increases in GDD; however, so will beneficial species such as honeybees. Newfoundland and Southern Labrador are expected to undergo a substantial increase in total GDD during summer, with smaller (but still significant) increases in autumn. The greatest changes are expected on the south coast, west coast, and interior of the island; total annual changes of ~200 GDD are expected.
46
Figure 13: Changes in growing degree days projected for 2038-2070. Significant changes are indicated by cross-hatching.
47
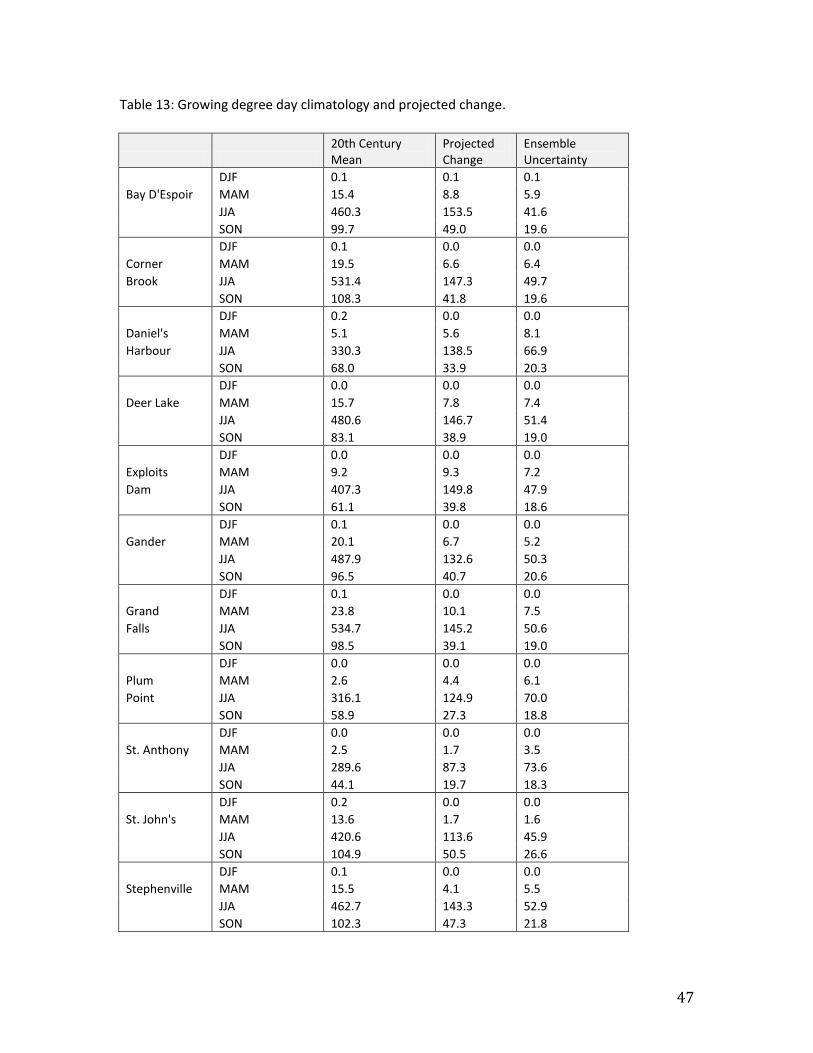
Table 13: Growing degree day climatology and projected change.
20th Century Mean
Projected Change
Ensemble Uncertainty
DJF 0.1 0.1 0.1
Bay D'Espoir MAM 15.4 8.8 5.9
JJA 460.3 153.5 41.6
SON 99.7 49.0 19.6
DJF 0.1 0.0 0.0
Corner MAM 19.5 6.6 6.4
Brook JJA 531.4 147.3 49.7
SON 108.3 41.8 19.6
DJF 0.2 0.0 0.0
Daniel's MAM 5.1 5.6 8.1
Harbour JJA 330.3 138.5 66.9
SON 68.0 33.9 20.3
DJF 0.0 0.0 0.0
Deer Lake MAM 15.7 7.8 7.4
JJA 480.6 146.7 51.4
SON 83.1 38.9 19.0
DJF 0.0 0.0 0.0
Exploits MAM 9.2 9.3 7.2
Dam JJA 407.3 149.8 47.9
SON 61.1 39.8 18.6
DJF 0.1 0.0 0.0
Gander MAM 20.1 6.7 5.2
JJA 487.9 132.6 50.3
SON 96.5 40.7 20.6
DJF 0.1 0.0 0.0
Grand MAM 23.8 10.1 7.5
Falls JJA 534.7 145.2 50.6
SON 98.5 39.1 19.0
DJF 0.0 0.0 0.0
Plum MAM 2.6 4.4 6.1
Point JJA 316.1 124.9 70.0
SON 58.9 27.3 18.8
DJF 0.0 0.0 0.0
St. Anthony MAM 2.5 1.7 3.5
JJA 289.6 87.3 73.6
SON 44.1 19.7 18.3
DJF 0.2 0.0 0.0
St. John's MAM 13.6 1.7 1.6
JJA 420.6 113.6 45.9
SON 104.9 50.5 26.6
DJF 0.1 0.0 0.0
Stephenville MAM 15.5 4.1 5.5
JJA 462.7 143.3 52.9
SON 102.3 47.3 21.8
48
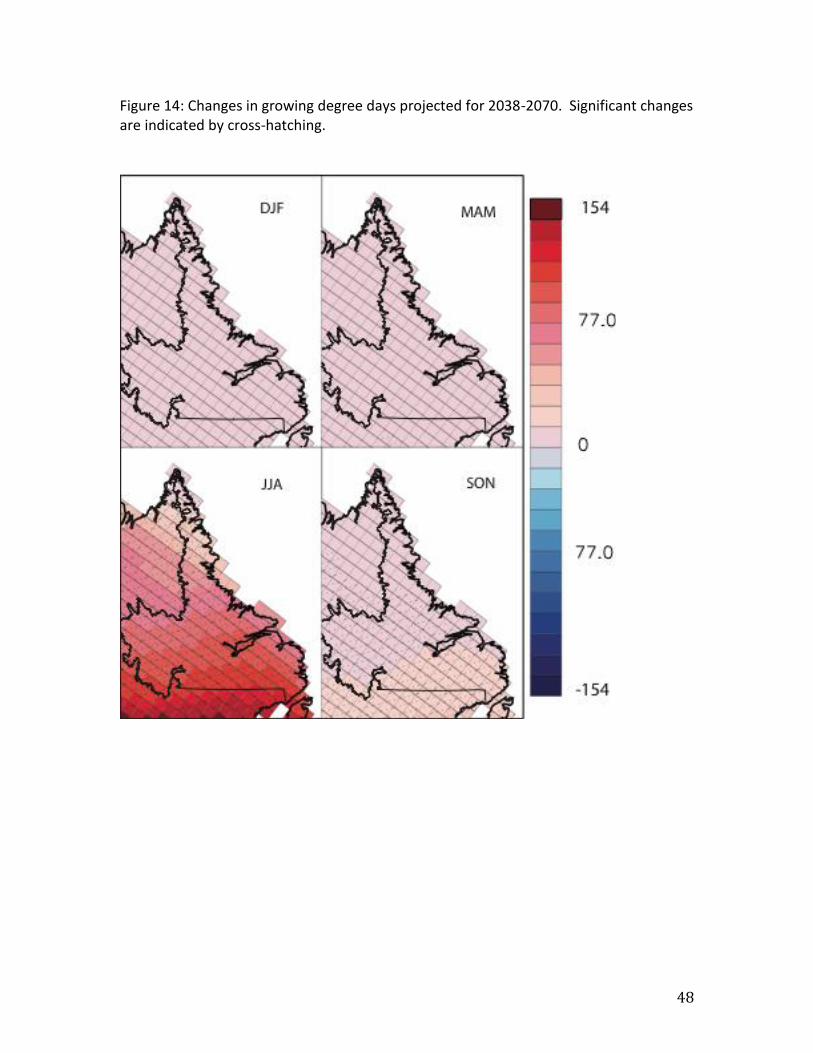
Figure 14: Changes in growing degree days projected for 2038-2070. Significant changes are indicated by cross-hatching.
49
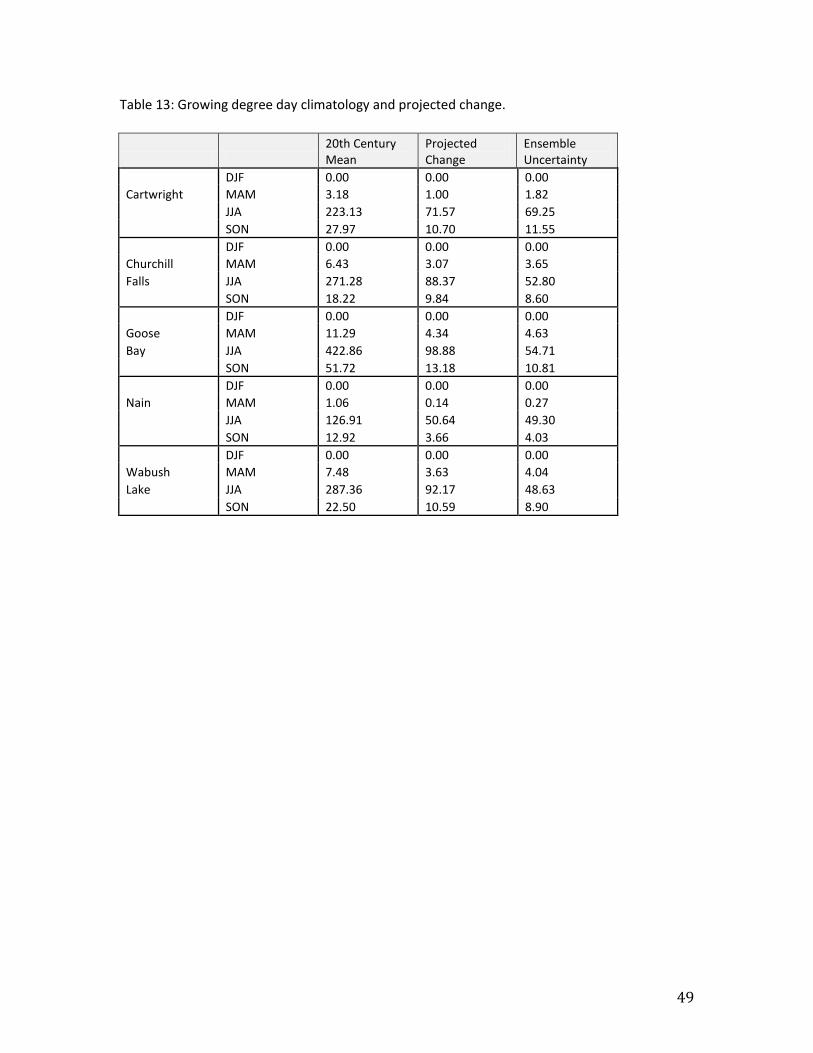
Table 13: Growing degree day climatology and projected change.
20th Century Mean
Projected Change
Ensemble Uncertainty
DJF 0.00 0.00 0.00
Cartwright MAM 3.18 1.00 1.82
JJA 223.13 71.57 69.25
SON 27.97 10.70 11.55
DJF 0.00 0.00 0.00
Churchill MAM 6.43 3.07 3.65
Falls JJA 271.28 88.37 52.80
SON 18.22 9.84 8.60
DJF 0.00 0.00 0.00
Goose MAM 11.29 4.34 4.63
Bay JJA 422.86 98.88 54.71
SON 51.72 13.18 10.81
DJF 0.00 0.00 0.00
Nain MAM 1.06 0.14 0.27
JJA 126.91 50.64 49.30
SON 12.92 3.66 4.03
DJF 0.00 0.00 0.00
Wabush MAM 7.48 3.63 4.04
Lake JJA 287.36 92.17 48.63
SON 22.50 10.59 8.90
50
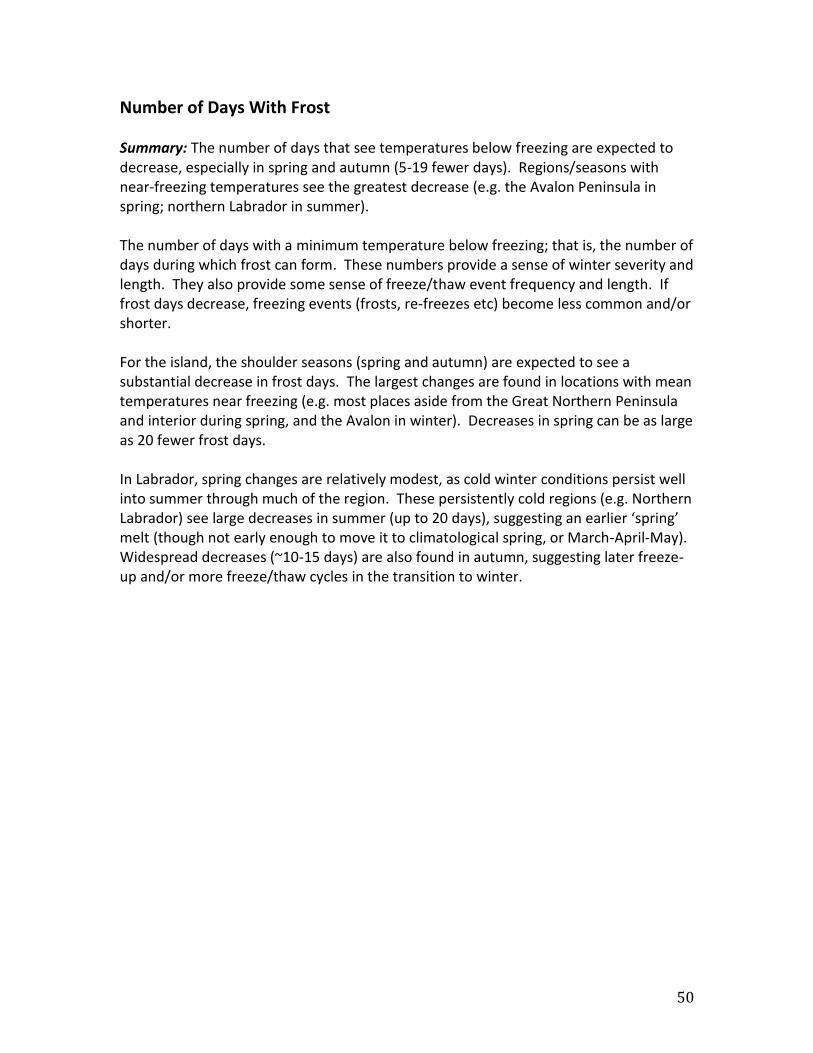
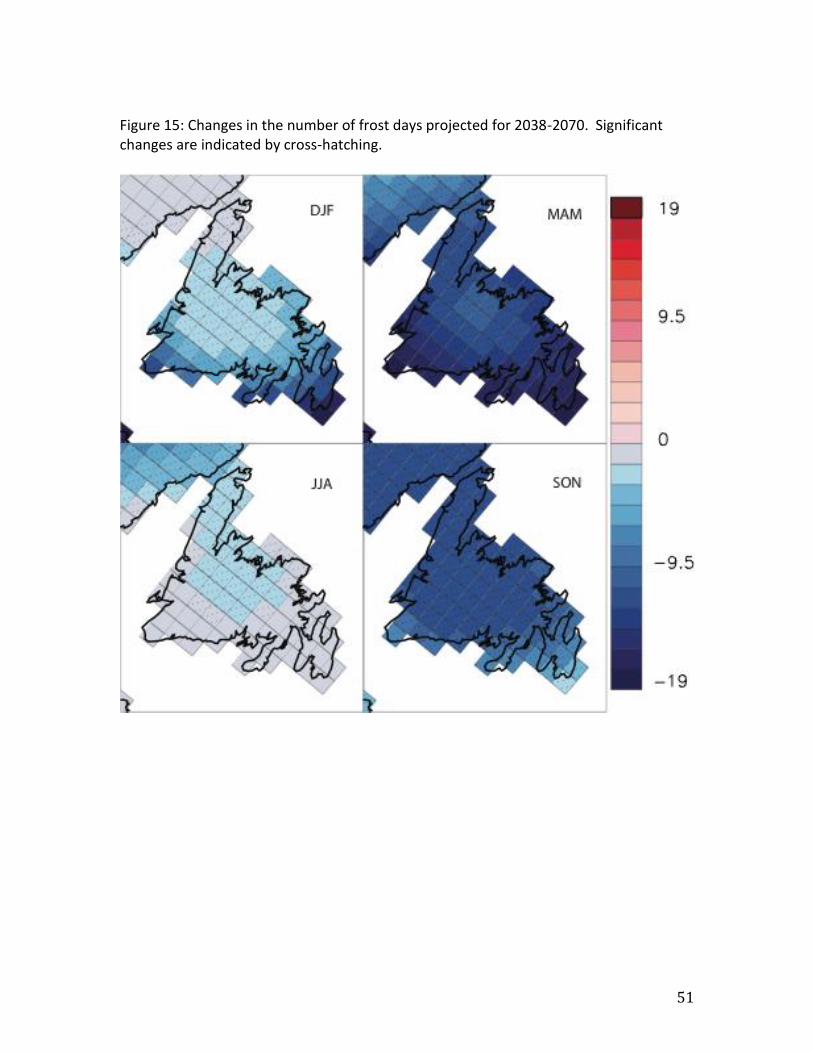
Number of Days With Frost Summary: The number of days that see temperatures below freezing are expected to decrease, especially in spring and autumn (5-19 fewer days). Regions/seasons with near-freezing temperatures see the greatest decrease (e.g. the Avalon Peninsula in spring; northern Labrador in summer). The number of days with a minimum temperature below freezing; that is, the number of days during which frost can form. These numbers provide a sense of winter severity and length. They also provide some sense of freeze/thaw event frequency and length. If frost days decrease, freezing events (frosts, re-freezes etc) become less common and/or shorter. For the island, the shoulder seasons (spring and autumn) are expected to see a substantial decrease in frost days. The largest changes are found in locations with mean temperatures near freezing (e.g. most places aside from the Great Northern Peninsula and interior during spring, and the Avalon in winter). Decreases in spring can be as large as 20 fewer frost days. In Labrador, spring changes are relatively modest, as cold winter conditions persist well into summer through much of the region. These persistently cold regions (e.g. Northern Labrador) see large decreases in summer (up to 20 days), suggesting an earlier ‘spring’ melt (though not early enough to move it to climatological spring, or March-April-May). Widespread decreases (~10-15 days) are also found in autumn, suggesting later freeze-up and/or more freeze/thaw cycles in the transition to winter.
51
Figure 15: Changes in the number of frost days projected for 2038-2070. Significant changes are indicated by cross-hatching.

52
Table 15: Number of frost days climatology and projected change.
20th Century Mean
Projected Change
Ensemble Uncertainty
DJF 81.3 -3.4 2.0
Bay D'Espoir MAM 51.9 -13.6 1.9
JJA 1.6 -1.1 1.2
SON 29.4 -11.5 2.7
DJF 81.8 -3.0 1.6
Corner MAM 48.5 -13.5 1.9
Brook JJA 0.2 -1.1 1.1
SON 19.3 -12.2 2.5
DJF 84.4 -1.9 1.0
Daniel's MAM 57.8 -12.6 2.1
Harbour JJA 0.3 -1.3 1.4
SON 23.4 -11.4 2.0
DJF 86.5 -2.2 1.3
Deer Lake MAM 62.6 -12.0 1.8
JJA 1.9 -1.7 1.4
SON 33.5 -12.3 2.6
DJF 85.6 -1.9 1.3
Exploits MAM 66.0 -11.2 2.0
Dam JJA 3.2 -2.2 1.9
SON 35.4 -12.4 2.6
DJF 85.3 -3.2 2.5
Gander MAM 61.1 -12.8 3.3
JJA 0.7 -1.4 1.3
SON 26.0 -11.5 2.7
DJF 83.8 -1.8 1.4
Grand MAM 54.7 -10.8 2.7
Falls JJA 0.7 -2.3 2.0
SON 28.0 -12.4 2.5
DJF 86.6 -1.2 0.8
Plum MAM 60.1 -11.3 3.1
Point JJA 0.4 -2.2 2.1
SON 25.8 -11.9 2.6
DJF 88.8 -1.8 1.2
St. Anthony MAM 74.1 -11.9 4.5
JJA 1.8 -2.3 2.1
SON 36.0 -11.4 2.6
DJF 81.5 -11.6 5.2
St. John's MAM 57.9 -16.5 2.0
JJA 0.5 -0.3 0.4
SON 17.2 -6.7 3.2
DJF 83.2 -6.1 2.0
Stephenville MAM 51.6 -16.0 1.6
JJA 0.2 -0.2 0.3
SON 18.8 -10.4 2.2
53
Figure 16: Changes in the number of frost days projected for 2038-2070. Significant changes are indicated by cross-hatching.
54
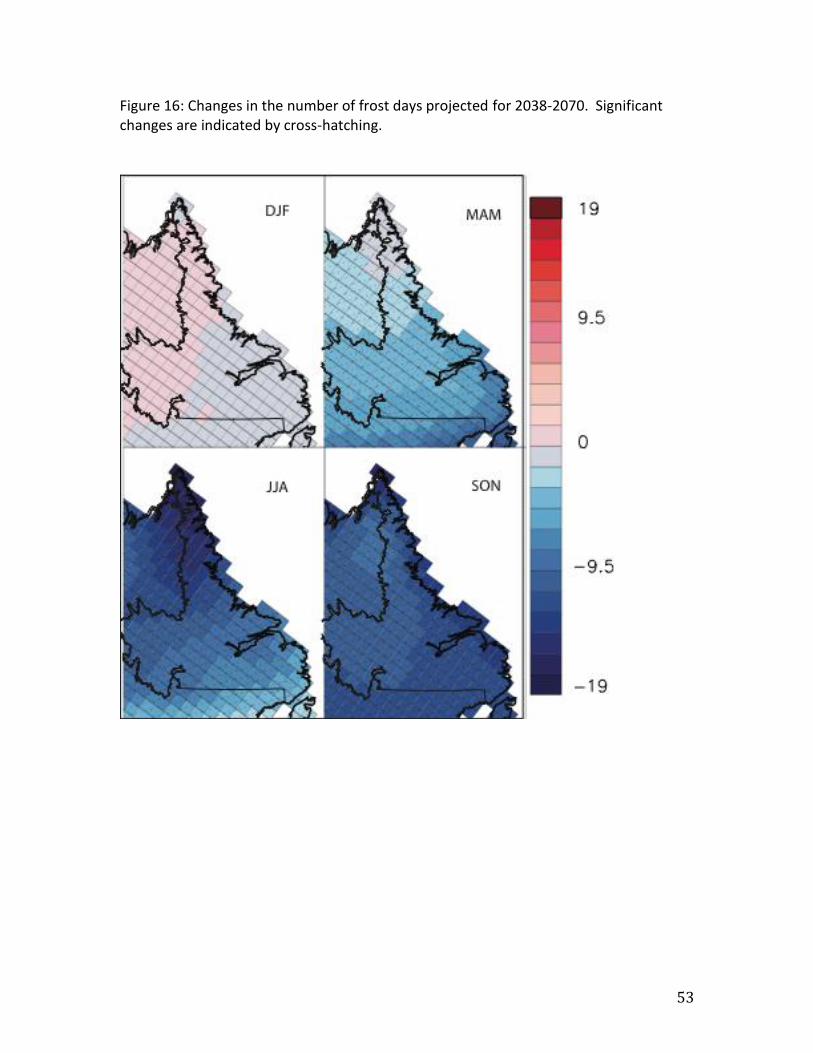
Table 16: Number of frost days climatology and projected change.
20th Century Mean
Projected Change
Ensemble Uncertainty
DJF 87.24 -0.69 1.13
Cartwright MAM 73.58 -7.16 6.27
JJA 4.80 -6.64 3.68
SON 40.37 -13.21 3.56
DJF 89.68 0.02 0.24
Churchill MAM 78.76 -4.30 2.17
Falls JJA 3.88 -9.53 6.15
SON 58.68 -10.44 2.51
DJF 88.67 -0.05 0.41
Goose MAM 67.53 -4.65 2.46
Bay JJA 1.17 -7.99 5.32
SON 43.60 -11.23 2.99
DJF 89.34 0.04 0.29
Nain MAM 82.00 -2.72 2.16
JJA 7.09 -12.53 6.36
SON 50.42 -12.29 4.31
DJF 89.69 0.05 0.23
Wabush MAM 76.90 -4.59 2.16
Lake JJA 3.34 -9.94 5.64
SON 56.84 -10.69 1.78
55
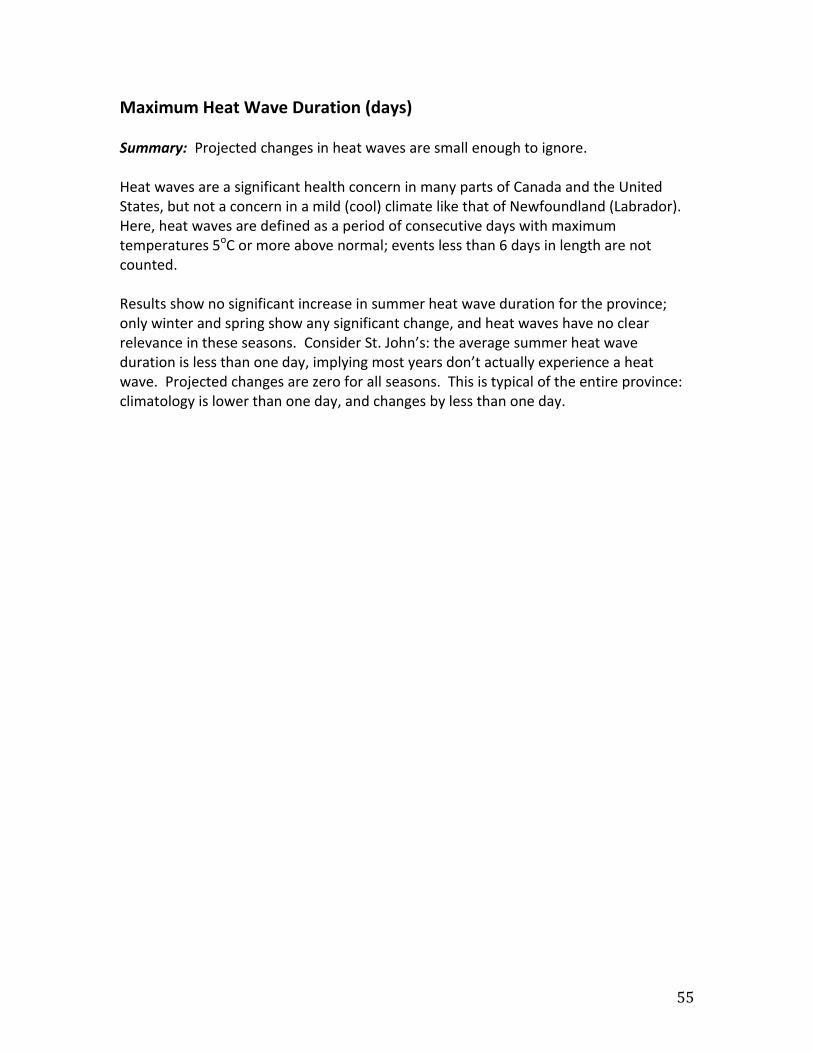
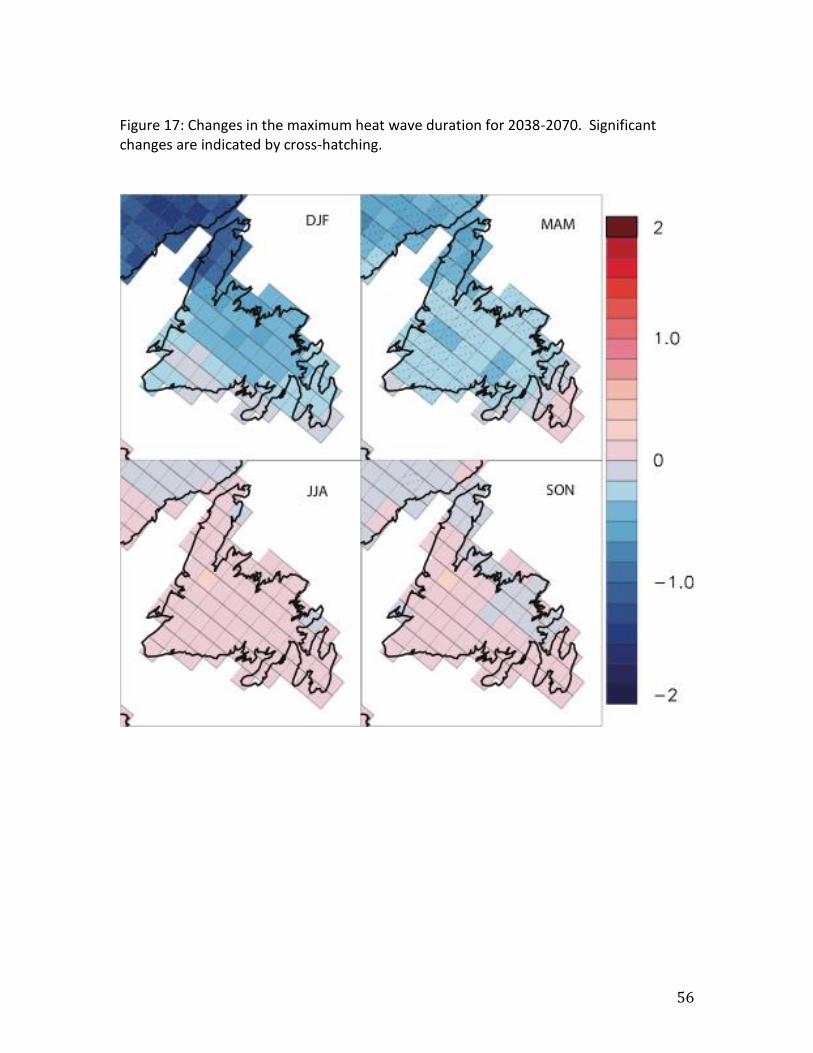
Maximum Heat Wave Duration (days) Summary: Projected changes in heat waves are small enough to ignore. Heat waves are a significant health concern in many parts of Canada and the United States, but not a concern in a mild (cool) climate like that of Newfoundland (Labrador). Here, heat waves are defined as a period of consecutive days with maximum temperatures 5oC or more above normal; events less than 6 days in length are not counted. Results show no significant increase in summer heat wave duration for the province; only winter and spring show any significant change, and heat waves have no clear relevance in these seasons. Consider St. John’s: the average summer heat wave duration is less than one day, implying most years don’t actually experience a heat wave. Projected changes are zero for all seasons. This is typical of the entire province: climatology is lower than one day, and changes by less than one day.
56
Figure 17: Changes in the maximum heat wave duration for 2038-2070. Significant changes are indicated by cross-hatching.
57
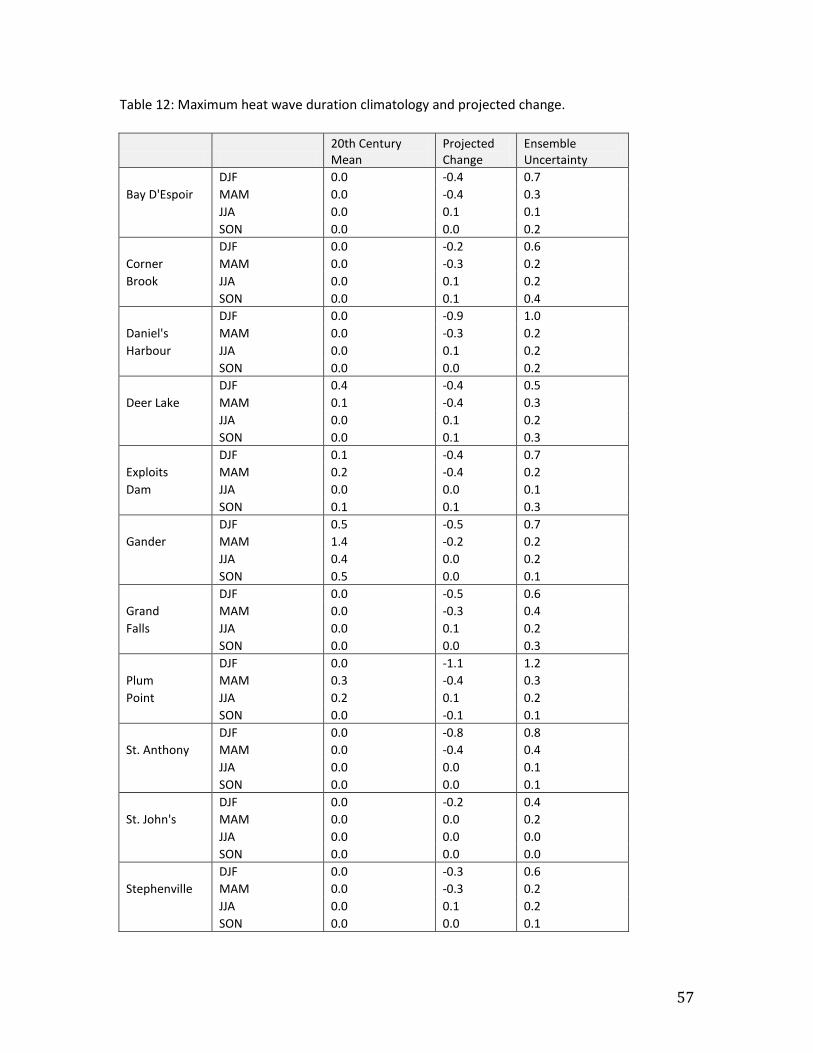
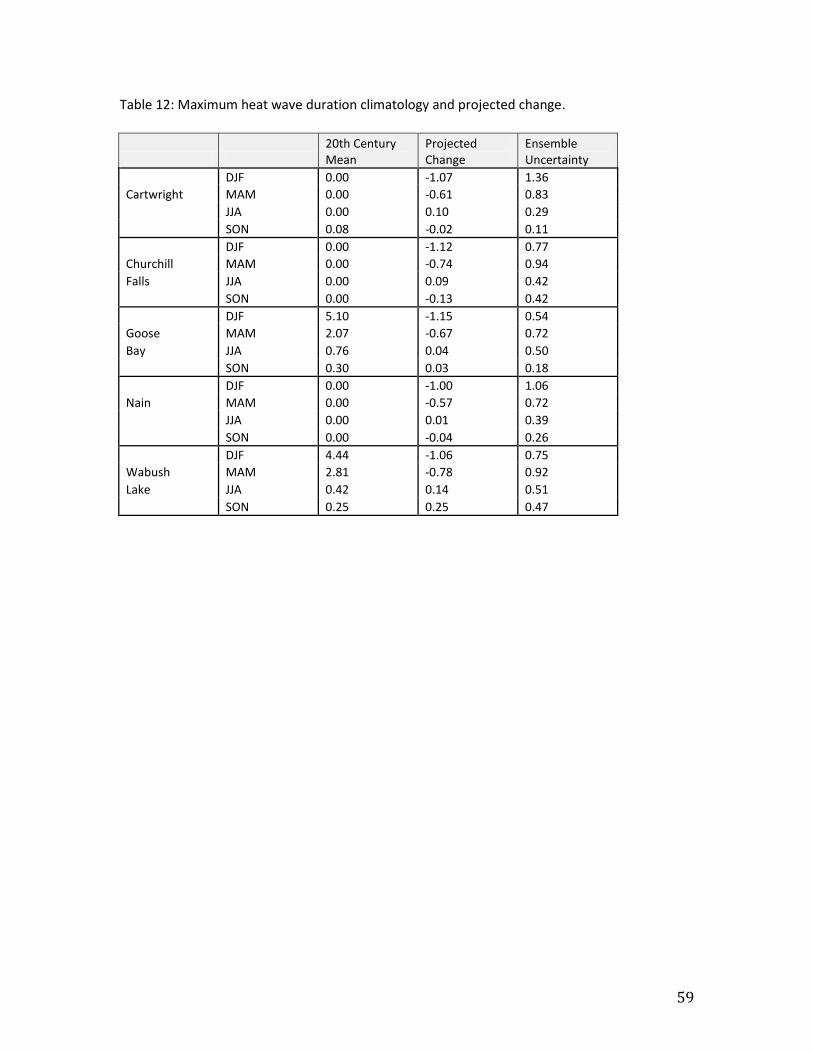
Table 12: Maximum heat wave duration climatology and projected change.
20th Century Mean
Projected Change
Ensemble Uncertainty
DJF 0.0 -0.4 0.7
Bay D'Espoir MAM 0.0 -0.4 0.3
JJA 0.0 0.1 0.1
SON 0.0 0.0 0.2
DJF 0.0 -0.2 0.6
Corner MAM 0.0 -0.3 0.2
Brook JJA 0.0 0.1 0.2
SON 0.0 0.1 0.4
DJF 0.0 -0.9 1.0
Daniel's MAM 0.0 -0.3 0.2
Harbour JJA 0.0 0.1 0.2
SON 0.0 0.0 0.2
DJF 0.4 -0.4 0.5
Deer Lake MAM 0.1 -0.4 0.3
JJA 0.0 0.1 0.2
SON 0.0 0.1 0.3
DJF 0.1 -0.4 0.7
Exploits MAM 0.2 -0.4 0.2
Dam JJA 0.0 0.0 0.1
SON 0.1 0.1 0.3
DJF 0.5 -0.5 0.7
Gander MAM 1.4 -0.2 0.2
JJA 0.4 0.0 0.2
SON 0.5 0.0 0.1
DJF 0.0 -0.5 0.6
Grand MAM 0.0 -0.3 0.4
Falls JJA 0.0 0.1 0.2
SON 0.0 0.0 0.3
DJF 0.0 -1.1 1.2
Plum MAM 0.3 -0.4 0.3
Point JJA 0.2 0.1 0.2
SON 0.0 -0.1 0.1
DJF 0.0 -0.8 0.8
St. Anthony MAM 0.0 -0.4 0.4
JJA 0.0 0.0 0.1
SON 0.0 0.0 0.1
DJF 0.0 -0.2 0.4
St. John's MAM 0.0 0.0 0.2
JJA 0.0 0.0 0.0
SON 0.0 0.0 0.0
DJF 0.0 -0.3 0.6
Stephenville MAM 0.0 -0.3 0.2
JJA 0.0 0.1 0.2
SON 0.0 0.0 0.1
58
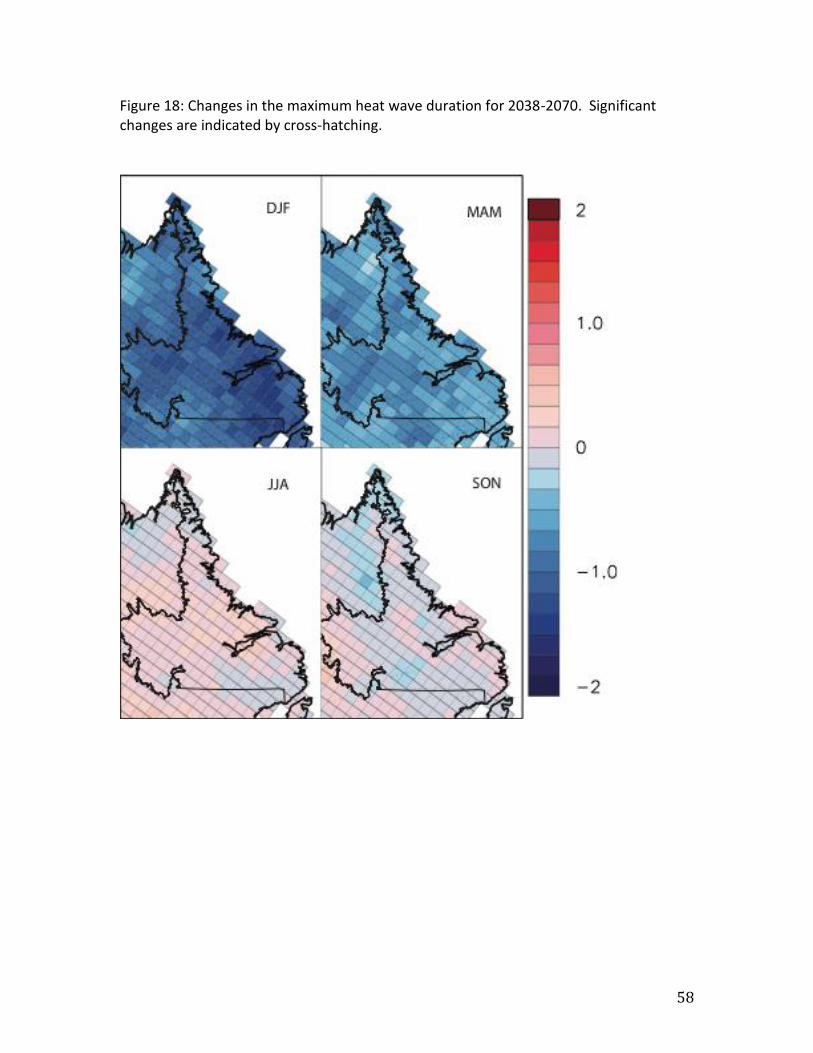
Figure 18: Changes in the maximum heat wave duration for 2038-2070. Significant changes are indicated by cross-hatching.
59
Table 12: Maximum heat wave duration climatology and projected change.
20th Century Mean
Projected Change
Ensemble Uncertainty
DJF 0.00 -1.07 1.36
Cartwright MAM 0.00 -0.61 0.83
JJA 0.00 0.10 0.29
SON 0.08 -0.02 0.11
DJF 0.00 -1.12 0.77
Churchill MAM 0.00 -0.74 0.94
Falls JJA 0.00 0.09 0.42
SON 0.00 -0.13 0.42
DJF 5.10 -1.15 0.54
Goose MAM 2.07 -0.67 0.72
Bay JJA 0.76 0.04 0.50
SON 0.30 0.03 0.18
DJF 0.00 -1.00 1.06
Nain MAM 0.00 -0.57 0.72
JJA 0.00 0.01 0.39
SON 0.00 -0.04 0.26
DJF 4.44 -1.06 0.75
Wabush MAM 2.81 -0.78 0.92
Lake JJA 0.42 0.14 0.51
SON 0.25 0.25 0.47
60
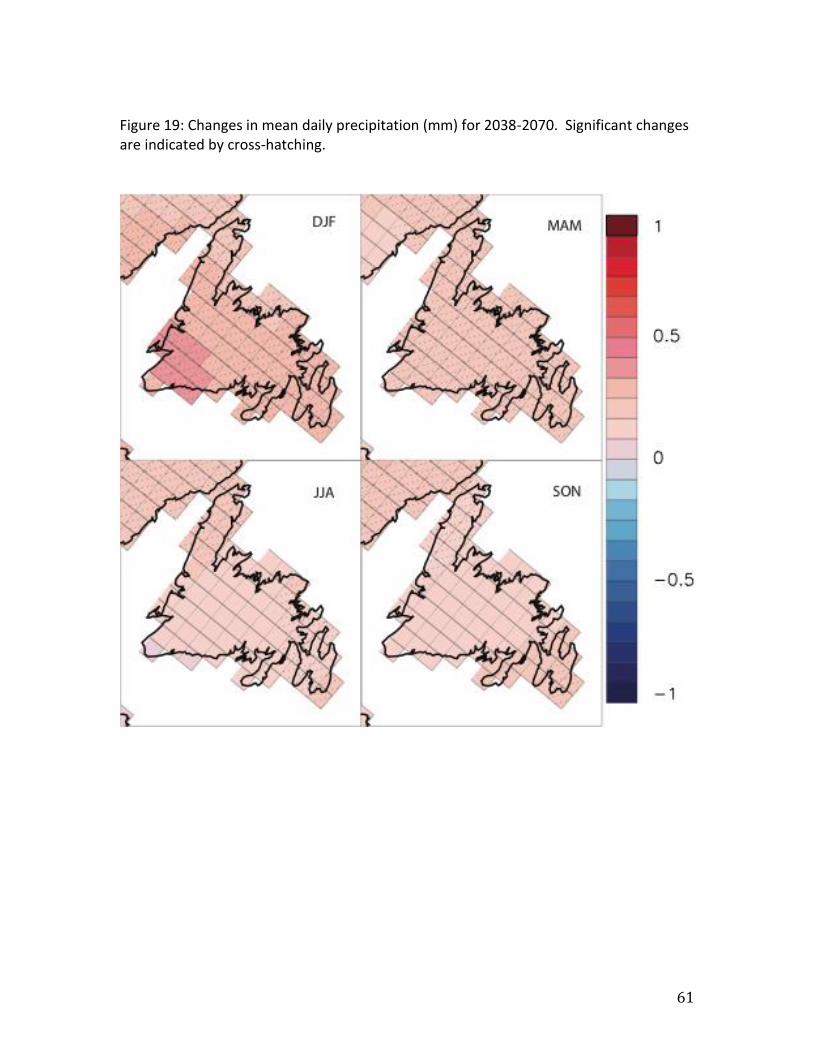
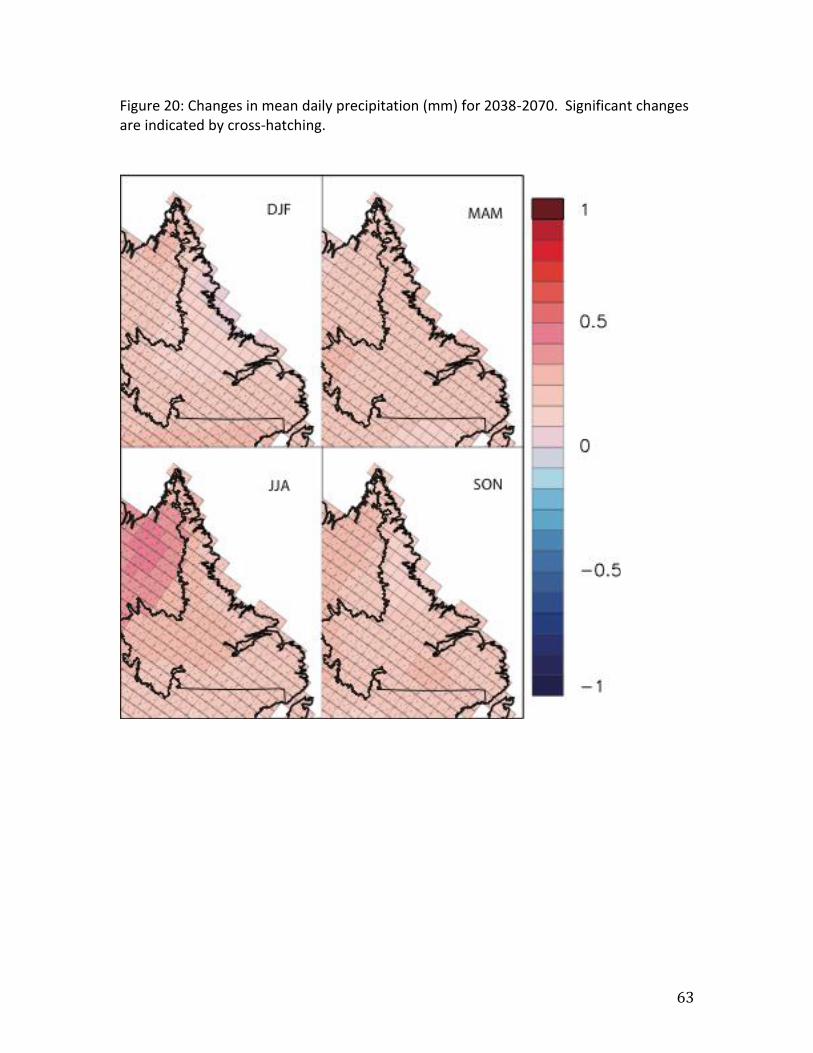
Mean Daily Precipitation (mm) Summary: Mean daily precipitation is expected to increase throughout the province by (on average) 0.1 to 0.3 mm per day. This is the mean precipitation falling in a 24 hr period (12AM – 12 AM, UTC). Because most days experience no precipitation, values of mean daily precipitation are typically small. Consequently, changes in this field are also small. However, these changes are often significant when taken over a full season; for example, a 0.5mm/day change for a 90 day season amounts to 45mm, or a roughly 10% change in total seasonal precipitation for a location like St. John’s. In Newfoundland, widespread significant increase is expected for winter and spring (about 0.1-0.3mm per day). Significant changes are expected year-round on the Avalon Peninsula and Great Northern Peninsula. In Labrador, significant increases are expected in most locations year-round, but are strongest in the north during summer.
61
Figure 19: Changes in mean daily precipitation (mm) for 2038-2070. Significant changes are indicated by cross-hatching.

62
Table 19: Mean daily precipitation (mm) climatology and projected change.
20th Century Mean
Projected Change
Ensemble Uncertainty
DJF 6.2 0.3 0.1
Bay D'Espoir MAM 4.1 0.2 0.1
JJA 3.8 0.1 0.2
SON 5.1 0.1 0.2
DJF 4.9 0.3 0.1
Corner MAM 2.8 0.2 0.1
Brook JJA 3.0 0.1 0.2
SON 4.0 0.1 0.1
DJF 4.1 0.3 0.1
Daniel's MAM 2.8 0.2 0.1
Harbour JJA 3.5 0.2 0.2
SON 3.5 0.1 0.1
DJF 4.0 0.3 0.1
Deer Lake MAM 2.6 0.2 0.1
JJA 3.0 0.1 0.2
SON 3.4 0.1 0.1
DJF 3.9 0.3 0.1
Exploits MAM 2.9 0.2 0.1
Dam JJA 3.2 0.1 0.2
SON 3.6 0.1 0.1
DJF 5.0 0.3 0.1
Gander MAM 3.7 0.2 0.1
JJA 3.1 0.2 0.2
SON 3.9 0.1 0.2
DJF 3.5 0.3 0.1
Grand MAM 2.8 0.2 0.1
Falls JJA 3.1 0.1 0.2
SON 3.4 0.1 0.1
DJF 4.5 0.2 0.1
Plum MAM 3.2 0.2 0.1
Point JJA 3.6 0.2 0.1
SON 3.8 0.2 0.1
DJF 4.6 0.2 0.1
St. Anthony MAM 3.3 0.2 0.1
JJA 3.3 0.2 0.1
SON 3.7 0.2 0.1
DJF 7.0 0.3 0.1
St. John's MAM 4.6 0.2 0.1
JJA 3.3 0.2 0.1
SON 5.0 0.2 0.2
DJF 5.1 0.4 0.1
Stephenville MAM 3.1 0.2 0.1
JJA 3.6 0.1 0.2
SON 4.3 0.1 0.2
63
Figure 20: Changes in mean daily precipitation (mm) for 2038-2070. Significant changes are indicated by cross-hatching.
64
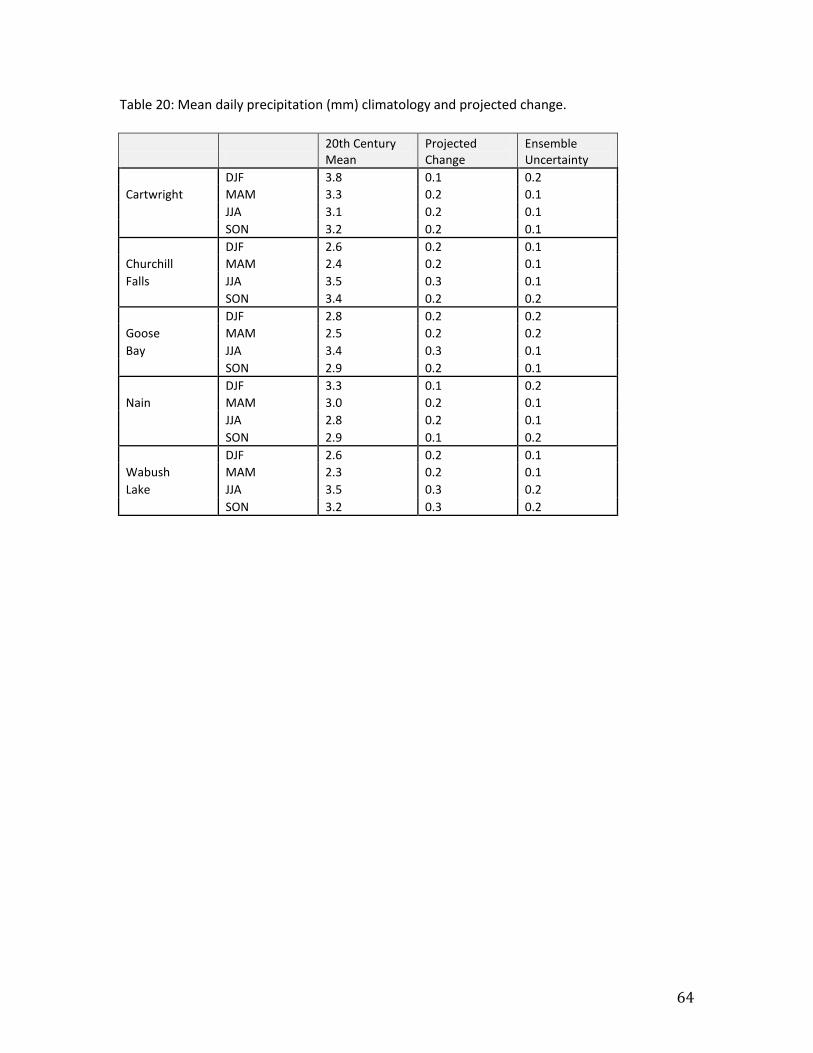
Table 20: Mean daily precipitation (mm) climatology and projected change.
20th Century Mean
Projected Change
Ensemble Uncertainty
DJF 3.8 0.1 0.2
Cartwright MAM 3.3 0.2 0.1
JJA 3.1 0.2 0.1
SON 3.2 0.2 0.1
DJF 2.6 0.2 0.1
Churchill MAM 2.4 0.2 0.1
Falls JJA 3.5 0.3 0.1
SON 3.4 0.2 0.2
DJF 2.8 0.2 0.2
Goose MAM 2.5 0.2 0.2
Bay JJA 3.4 0.3 0.1
SON 2.9 0.2 0.1
DJF 3.3 0.1 0.2
Nain MAM 3.0 0.2 0.1
JJA 2.8 0.2 0.1
SON 2.9 0.1 0.2
DJF 2.6 0.2 0.1
Wabush MAM 2.3 0.2 0.1
Lake JJA 3.5 0.3 0.2
SON 3.2 0.3 0.2
65
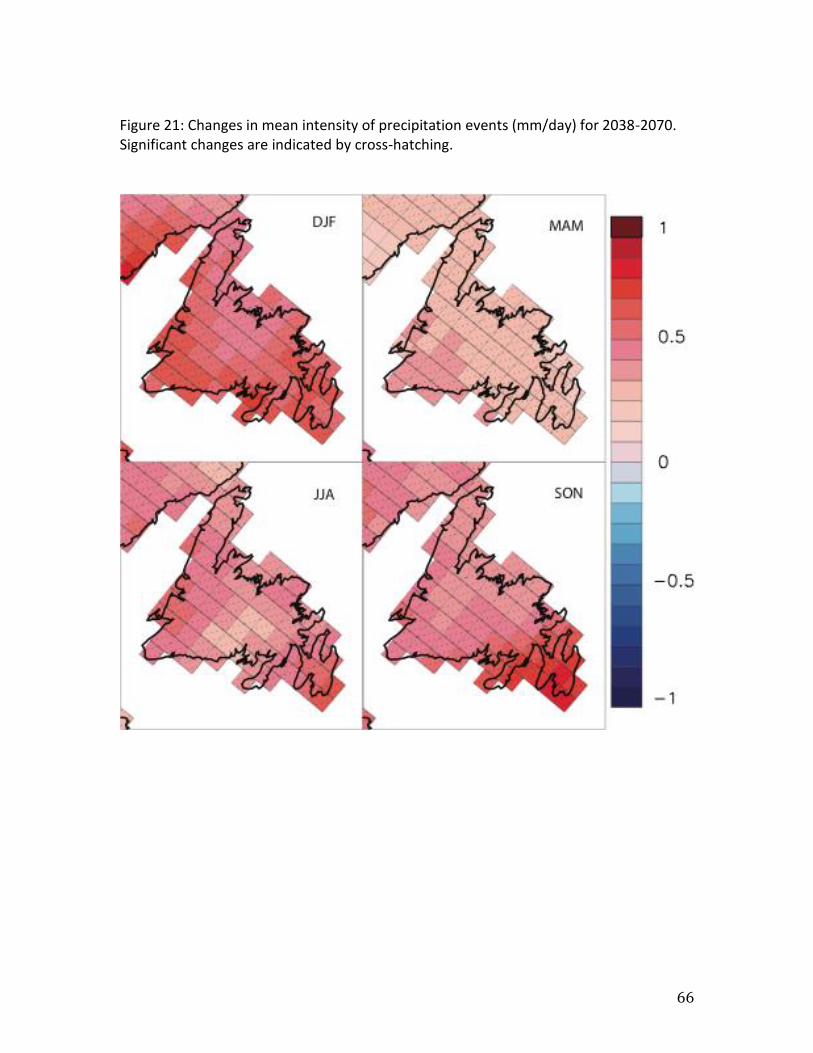
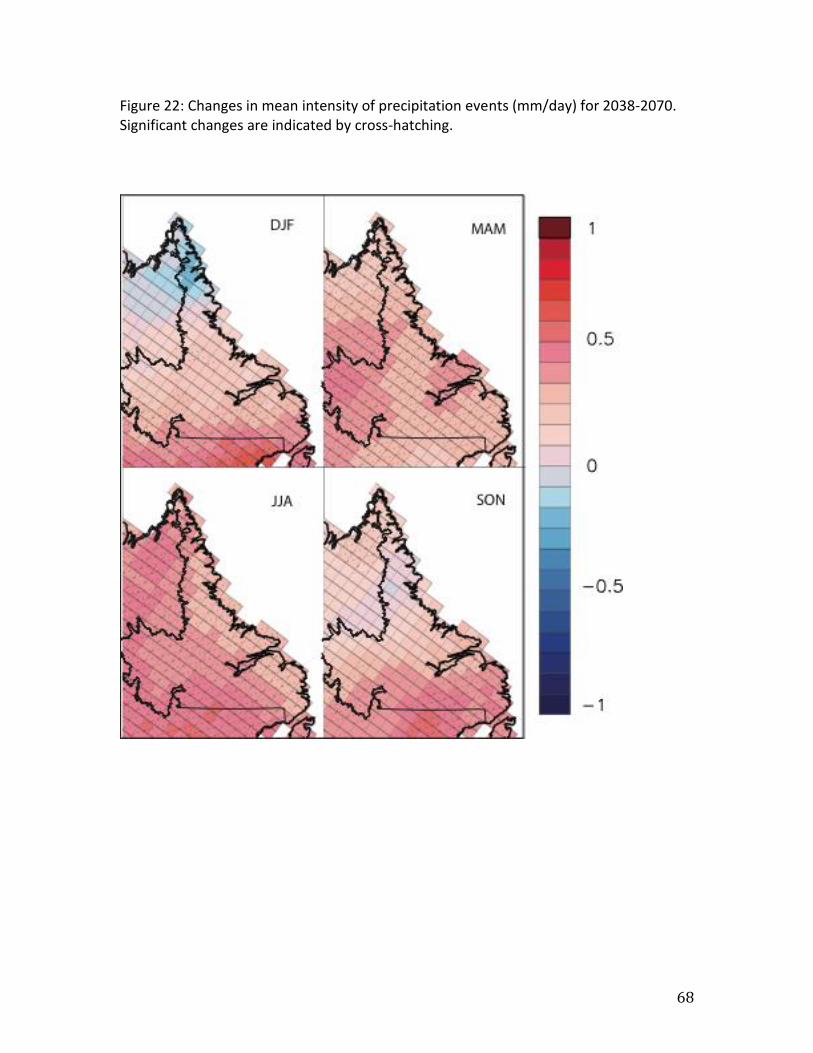
Mean Intensity of Precipitation Events (mm/day) Summary: The typical precipitation event is expected to become more intense under a warming climate. Changes are greatest during winter on the island (0.5-0.7 mm/day). Most of Labrador sees the greatest change in summer (0.3-0.5 mm/day). The 24hr mean precipitation intensity, calculated over all days with measurable precipitation (more than 1mm). While mean daily precipitation gives a sense of how total precipitation changes, mean intensity describes changes in the typical event; an increase in mean daily precipitation can be produced by fewer rain events, if mean intensity increases to a sufficient degree. Basically, fewer stronger events can have the same impact on total precipitation as a higher number of normal events. The model ensemble predicts mean intensity increases for all of Newfoundland in all seasons, with the Avalon and Burin seeing the greatest increases (autumn; ~ 0.7-0.8 mm/day). The island as a whole sees the greatest change in winter. Changes are less pronounced in Labrador, with only southern Labrador seeing year-round shifts. In the north and interior, winter and autumn changes are negligible.
66
Figure 21: Changes in mean intensity of precipitation events (mm/day) for 2038-2070. Significant changes are indicated by cross-hatching.
67
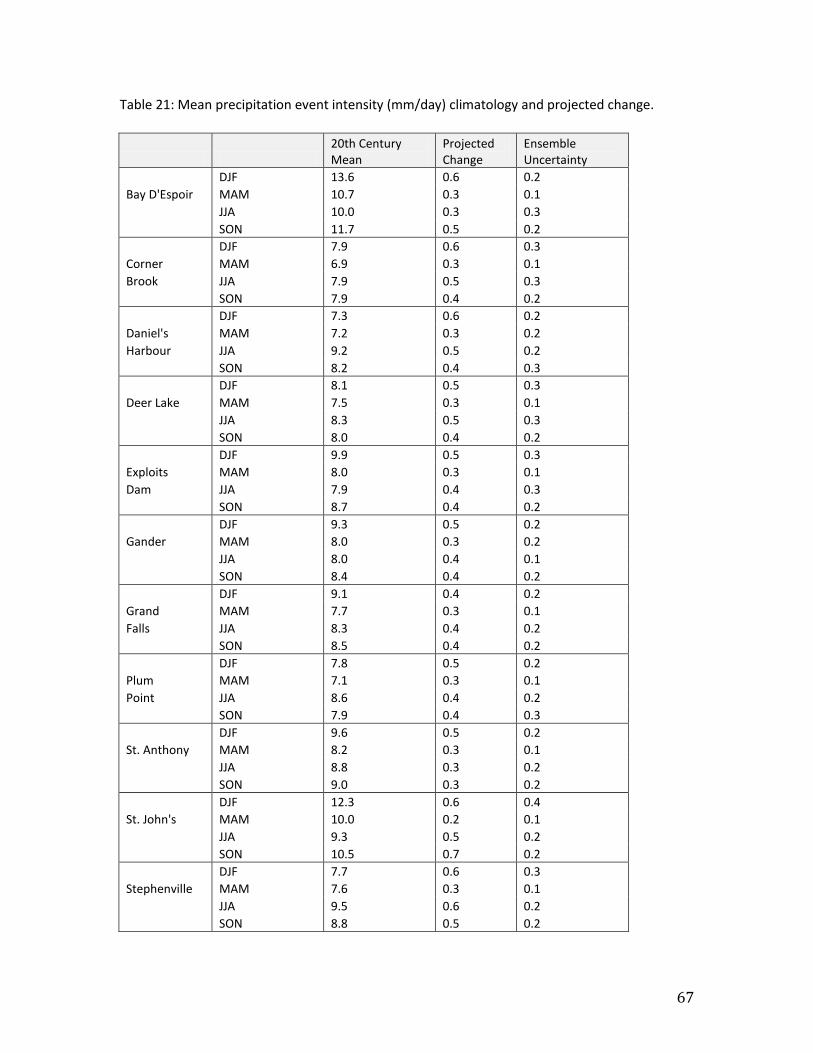
Table 21: Mean precipitation event intensity (mm/day) climatology and projected change.
20th Century Mean
Projected Change
Ensemble Uncertainty
DJF 13.6 0.6 0.2
Bay D'Espoir MAM 10.7 0.3 0.1
JJA 10.0 0.3 0.3
SON 11.7 0.5 0.2
DJF 7.9 0.6 0.3
Corner MAM 6.9 0.3 0.1
Brook JJA 7.9 0.5 0.3
SON 7.9 0.4 0.2
DJF 7.3 0.6 0.2
Daniel's MAM 7.2 0.3 0.2
Harbour JJA 9.2 0.5 0.2
SON 8.2 0.4 0.3
DJF 8.1 0.5 0.3
Deer Lake MAM 7.5 0.3 0.1
JJA 8.3 0.5 0.3
SON 8.0 0.4 0.2
DJF 9.9 0.5 0.3
Exploits MAM 8.0 0.3 0.1
Dam JJA 7.9 0.4 0.3
SON 8.7 0.4 0.2
DJF 9.3 0.5 0.2
Gander MAM 8.0 0.3 0.2
JJA 8.0 0.4 0.1
SON 8.4 0.4 0.2
DJF 9.1 0.4 0.2
Grand MAM 7.7 0.3 0.1
Falls JJA 8.3 0.4 0.2
SON 8.5 0.4 0.2
DJF 7.8 0.5 0.2
Plum MAM 7.1 0.3 0.1
Point JJA 8.6 0.4 0.2
SON 7.9 0.4 0.3
DJF 9.6 0.5 0.2
St. Anthony MAM 8.2 0.3 0.1
JJA 8.8 0.3 0.2
SON 9.0 0.3 0.2
DJF 12.3 0.6 0.4
St. John's MAM 10.0 0.2 0.1
JJA 9.3 0.5 0.2
SON 10.5 0.7 0.2
DJF 7.7 0.6 0.3
Stephenville MAM 7.6 0.3 0.1
JJA 9.5 0.6 0.2
SON 8.8 0.5 0.2
68
Figure 22: Changes in mean intensity of precipitation events (mm/day) for 2038-2070. Significant changes are indicated by cross-hatching.
69
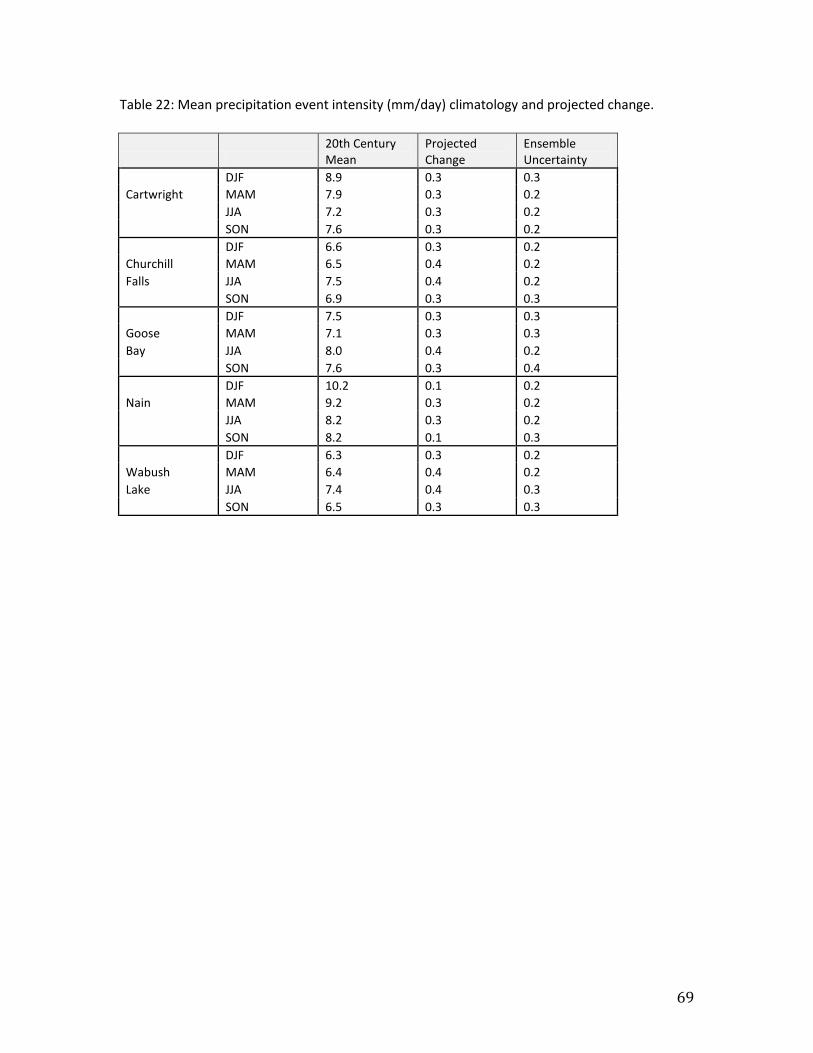
Table 22: Mean precipitation event intensity (mm/day) climatology and projected change.
20th Century Mean
Projected Change
Ensemble Uncertainty
DJF 8.9 0.3 0.3
Cartwright MAM 7.9 0.3 0.2
JJA 7.2 0.3 0.2
SON 7.6 0.3 0.2
DJF 6.6 0.3 0.2
Churchill MAM 6.5 0.4 0.2
Falls JJA 7.5 0.4 0.2
SON 6.9 0.3 0.3
DJF 7.5 0.3 0.3
Goose MAM 7.1 0.3 0.3
Bay JJA 8.0 0.4 0.2
SON 7.6 0.3 0.4
DJF 10.2 0.1 0.2
Nain MAM 9.2 0.3 0.2
JJA 8.2 0.3 0.2
SON 8.2 0.1 0.3
DJF 6.3 0.3 0.2
Wabush MAM 6.4 0.4 0.2
Lake JJA 7.4 0.4 0.3
SON 6.5 0.3 0.3
70
Maximum 3-day Precipitation (mm) Summary: Maximum precipitation falling over three consecutive days increases by 1-6mm. The greatest increases occur on the island in winter. Increases are generally smaller in Labrador. Hazardous precipitation events often occur over several days, during which reservoirs, soil moisture capacity, and water bodies gradually become overwhelmed, leading to flooding even if precipitation intensity remains low. This index is much more variable than the other precipitation indices discussed, due to variations in the length, intensity, and procession of individual precipitation systems occurring over consecutive 3-day periods. However, in many cases it can provide a better estimate of increased flooding potential, as it covers heavy precipitation events occurring over multiple days and slow-building flooding events. In addition to the three day maximum, maximum 5 and 10 day precipitation are presented. Projected changes in maximum 3, 5, and 10-day precipitation all follow spatial patterns similar to those described for mean precipitation intensity, particularly in Newfoundland; the greatest changes on the island occur in winter, and are concentrated along the south coast, west coast, and Avalon Pensinsula, with the Avalon and Burin also demonstrating a pronounced change in autumn. Changes in Labrador are concentrated to the north in summer, with the interior and parts of the coast seeing increases in spring as well.
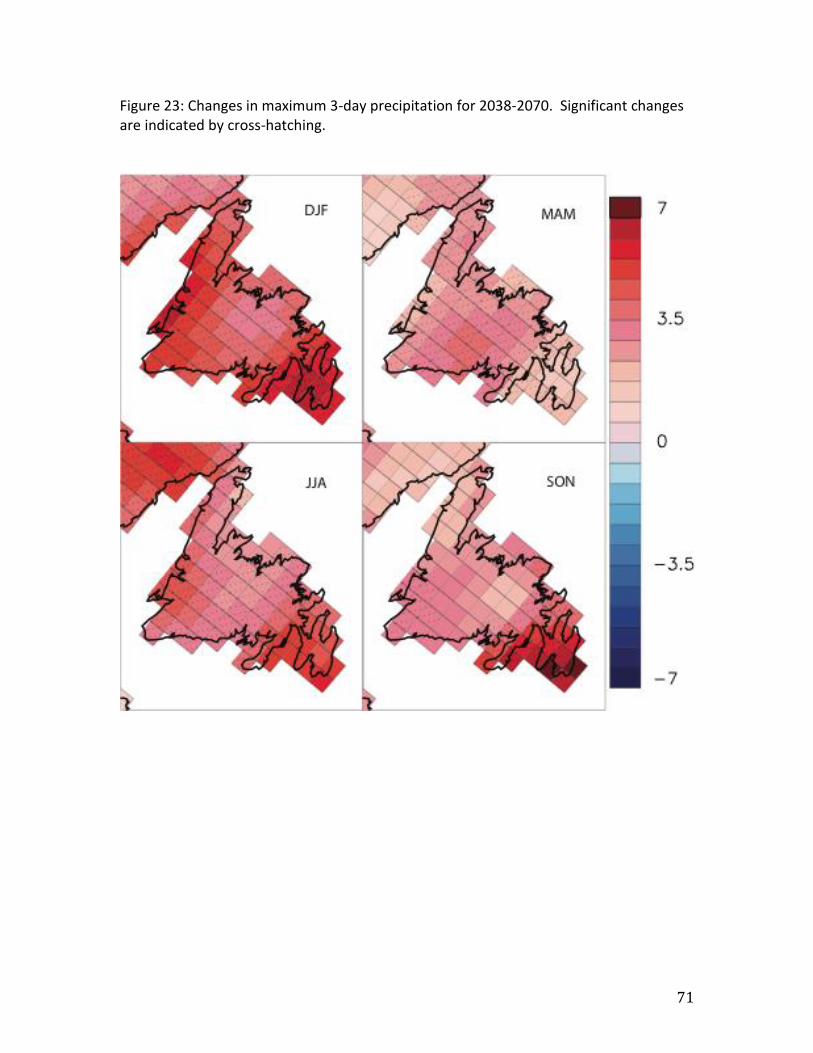
71
Figure 23: Changes in maximum 3-day precipitation for 2038-2070. Significant changes are indicated by cross-hatching.

72
Table 23: Maximum 3-day precipitation (mm) climatology and projected change.
20th Century Mean
Projected Change
Ensemble Uncertainty
DJF 92.5 3.8 3.7
Bay D'Espoir MAM 69.5 3.4 2.6
JJA 64.5 3.3 2.8
SON 77.8 2.7 2.6
DJF 56.3 5.2 2.9
Corner MAM 42.8 2.6 1.9
Brook JJA 50.7 4.2 2.6
SON 55.6 3.4 3.4
DJF 55.7 5.3 2.9
Daniel's MAM 45.9 2.4 2.1
Harbour JJA 64.3 3.7 2.3
SON 55.0 2.1 4.0
DJF 51.4 5.2 3.0
Deer Lake MAM 47.0 2.5 1.9
JJA 49.6 3.8 2.7
SON 49.1 3.2 4.0
DJF 54.7 4.3 2.7
Exploits MAM 51.6 3.0 1.9
Dam JJA 52.8 3.5 2.4
SON 57.3 3.2 4.0
DJF 66.5 3.5 3.2
Gander MAM 60.9 2.7 1.7
JJA 50.7 3.2 1.8
SON 60.3 2.8 3.1
DJF 55.8 3.5 3.1
Grand MAM 47.4 2.6 1.9
Falls JJA 53.4 2.6 2.5
SON 54.2 2.6 3.7
DJF 51.6 4.2 2.3
Plum MAM 47.3 2.8 1.4
Point JJA 60.1 3.4 1.5
SON 53.3 2.1 4.4
DJF 60.4 3.8 2.6
St. Anthony MAM 53.8 2.7 1.6
JJA 54.6 2.1 1.8
SON 57.6 2.8 4.7
DJF 86.8 5.8 4.3
St. John's MAM 76.2 1.6 1.7
JJA 58.9 4.5 6.2
SON 75.0 5.8 3.9
DJF 59.2 5.8 3.0
Stephenville MAM 49.3 2.3 2.1
JJA 59.7 4.4 2.5
SON 59.6 2.9 2.5
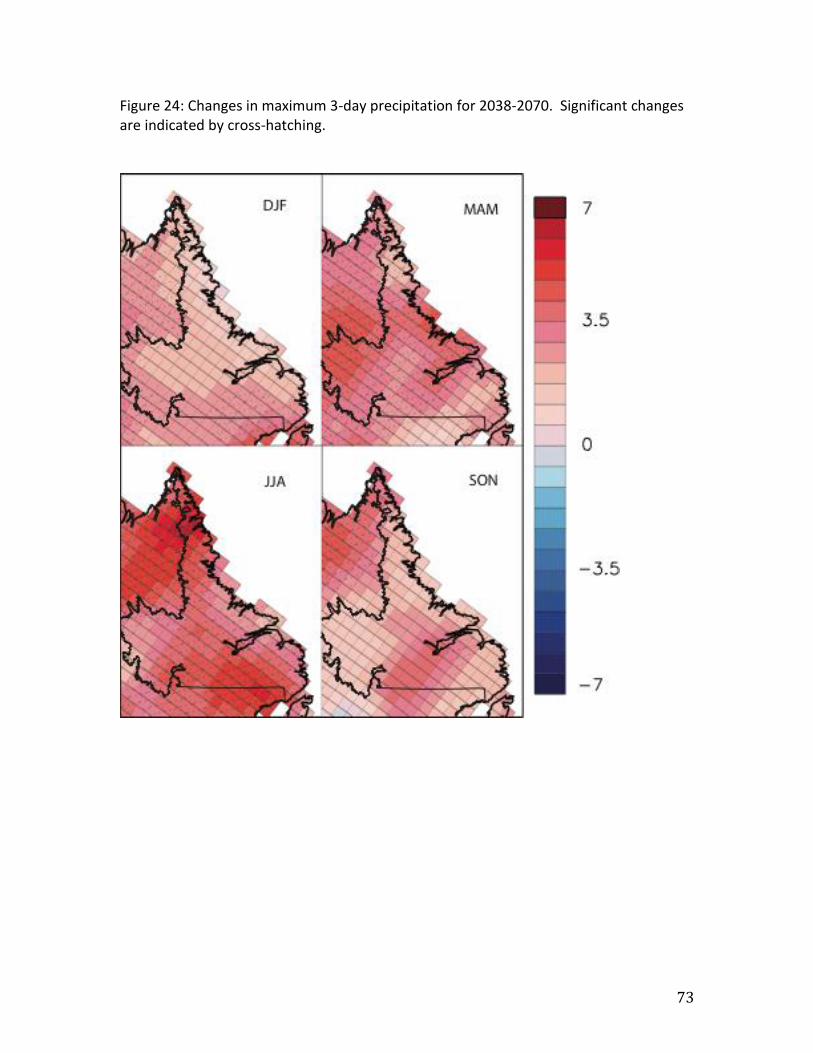
73
Figure 24: Changes in maximum 3-day precipitation for 2038-2070. Significant changes are indicated by cross-hatching.

74
Table 24: Maximum 3-day precipitation (mm) climatology and projected change.
20th Century Mean
Projected Change
Ensemble Uncertainty
DJF 67.4 1.6 1.9
Cartwright MAM 61.2 2.5 2.1
JJA 49.2 2.8 2.0
SON 54.9 1.6 2.0
DJF 41.8 1.9 3.0
Churchill MAM 42.0 3.3 1.9
Falls JJA 48.5 3.7 3.2
SON 46.0 1.6 3.4
DJF 46.4 2.1 3.1
Goose MAM 44.0 3.7 3.4
Bay JJA 53.4 4.2 2.2
SON 48.1 3.7 4.9
DJF 75.3 0.9 2.9
Nain MAM 64.2 3.4 1.2
JJA 54.2 3.4 3.2
SON 53.1 1.4 2.7
DJF 40.8 2.5 2.1
Wabush MAM 39.9 3.8 1.1
Lake JJA 47.6 2.3 3.4
SON 40.1 1.4 4.4
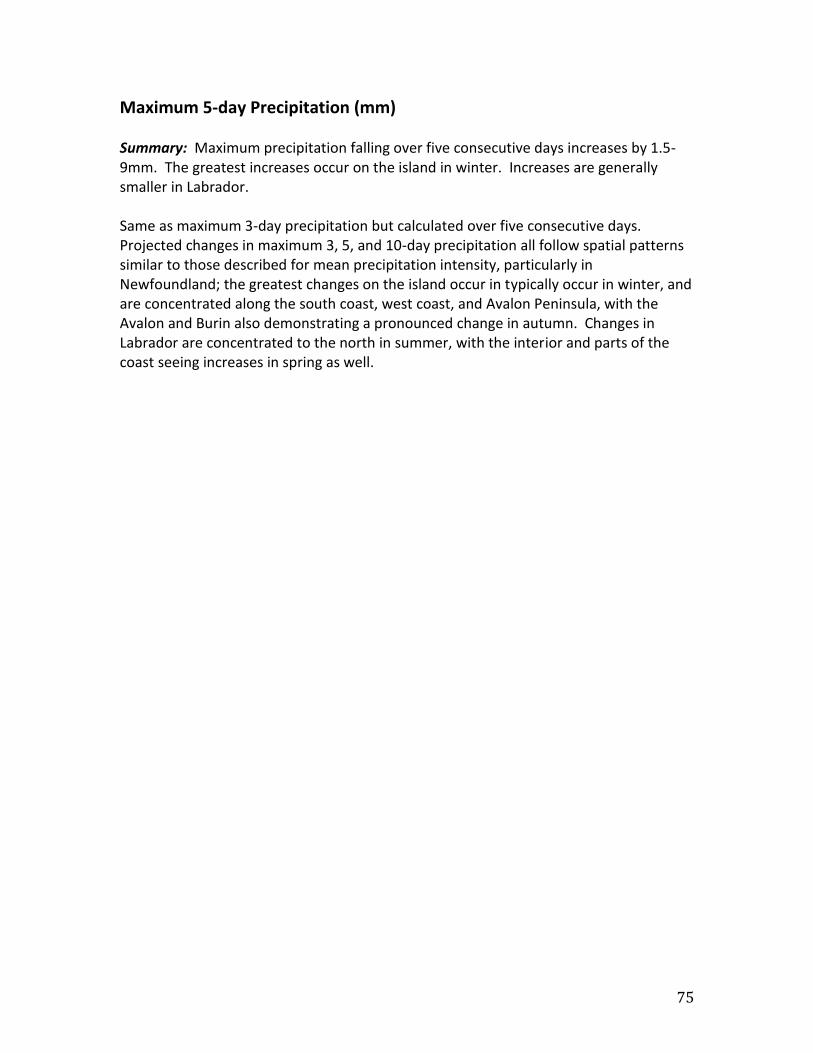
75
Maximum 5-day Precipitation (mm) Summary: Maximum precipitation falling over five consecutive days increases by 1.5-9mm. The greatest increases occur on the island in winter. Increases are generally smaller in Labrador. Same as maximum 3-day precipitation but calculated over five consecutive days. Projected changes in maximum 3, 5, and 10-day precipitation all follow spatial patterns similar to those described for mean precipitation intensity, particularly in Newfoundland; the greatest changes on the island occur in typically occur in winter, and are concentrated along the south coast, west coast, and Avalon Peninsula, with the Avalon and Burin also demonstrating a pronounced change in autumn. Changes in Labrador are concentrated to the north in summer, with the interior and parts of the coast seeing increases in spring as well.
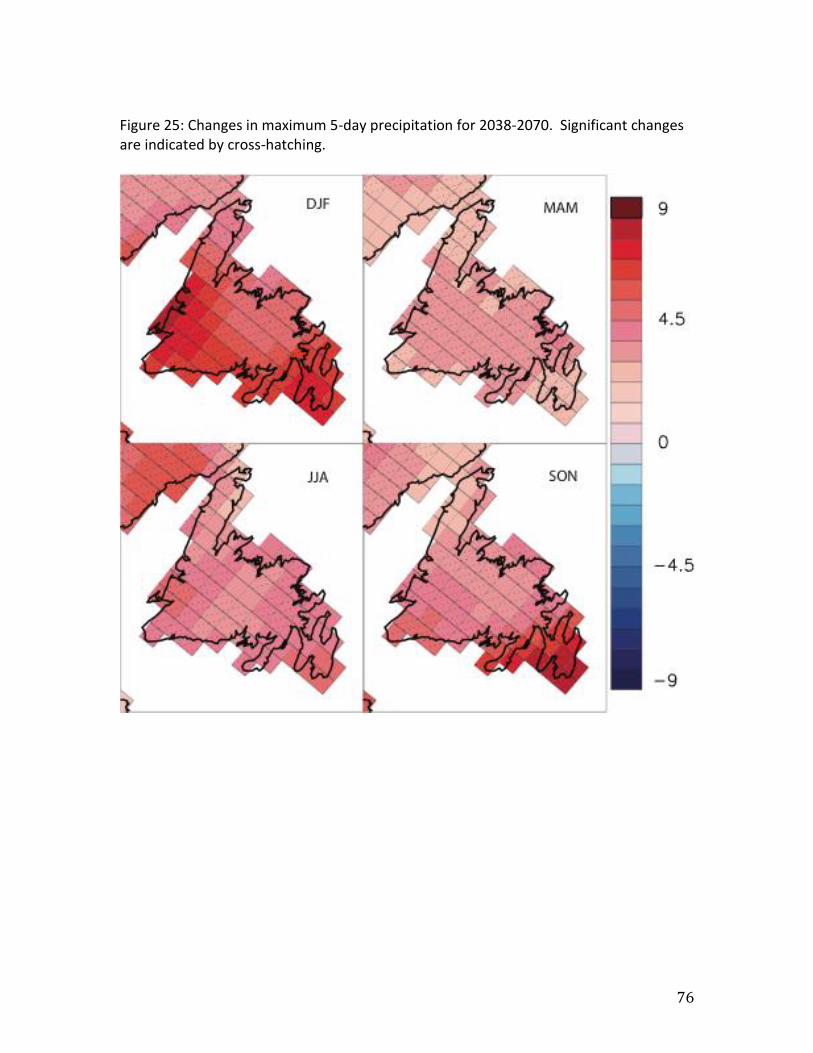
76
Figure 25: Changes in maximum 5-day precipitation for 2038-2070. Significant changes are indicated by cross-hatching.
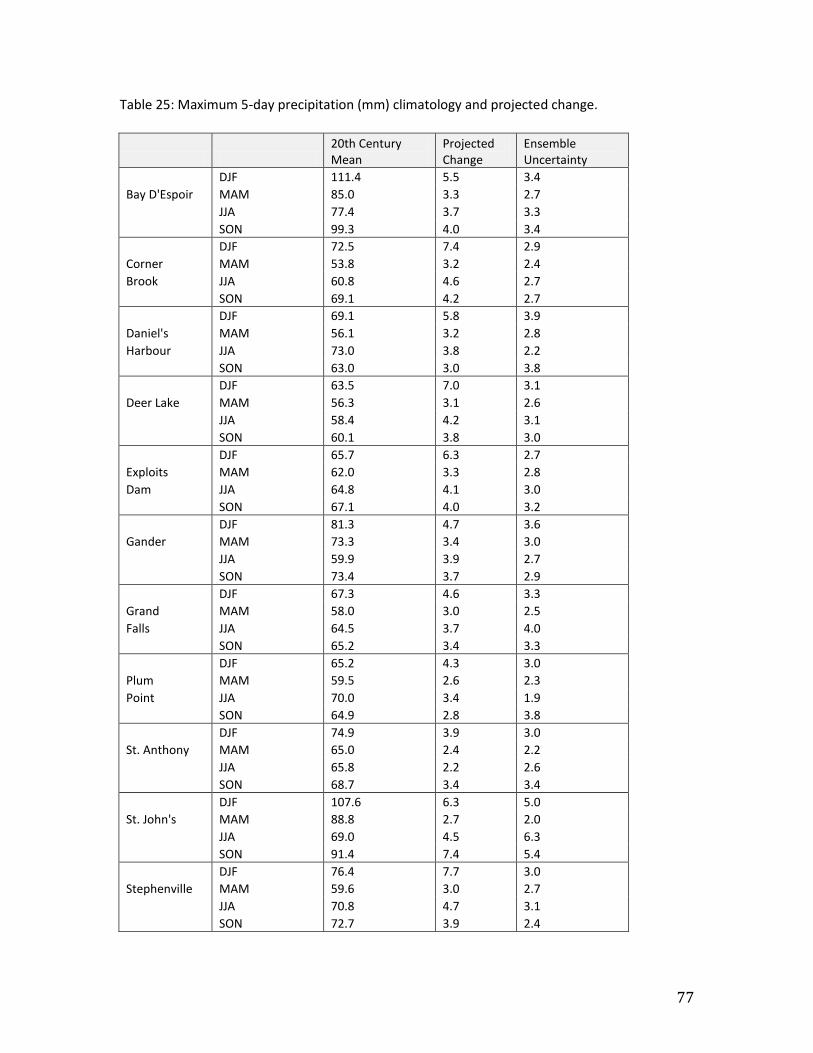
77
Table 25: Maximum 5-day precipitation (mm) climatology and projected change.
20th Century Mean
Projected Change
Ensemble Uncertainty
DJF 111.4 5.5 3.4
Bay D'Espoir MAM 85.0 3.3 2.7
JJA 77.4 3.7 3.3
SON 99.3 4.0 3.4
DJF 72.5 7.4 2.9
Corner MAM 53.8 3.2 2.4
Brook JJA 60.8 4.6 2.7
SON 69.1 4.2 2.7
DJF 69.1 5.8 3.9
Daniel's MAM 56.1 3.2 2.8
Harbour JJA 73.0 3.8 2.2
SON 63.0 3.0 3.8
DJF 63.5 7.0 3.1
Deer Lake MAM 56.3 3.1 2.6
JJA 58.4 4.2 3.1
SON 60.1 3.8 3.0
DJF 65.7 6.3 2.7
Exploits MAM 62.0 3.3 2.8
Dam JJA 64.8 4.1 3.0
SON 67.1 4.0 3.2
DJF 81.3 4.7 3.6
Gander MAM 73.3 3.4 3.0
JJA 59.9 3.9 2.7
SON 73.4 3.7 2.9
DJF 67.3 4.6 3.3
Grand MAM 58.0 3.0 2.5
Falls JJA 64.5 3.7 4.0
SON 65.2 3.4 3.3
DJF 65.2 4.3 3.0
Plum MAM 59.5 2.6 2.3
Point JJA 70.0 3.4 1.9
SON 64.9 2.8 3.8
DJF 74.9 3.9 3.0
St. Anthony MAM 65.0 2.4 2.2
JJA 65.8 2.2 2.6
SON 68.7 3.4 3.4
DJF 107.6 6.3 5.0
St. John's MAM 88.8 2.7 2.0
JJA 69.0 4.5 6.3
SON 91.4 7.4 5.4
DJF 76.4 7.7 3.0
Stephenville MAM 59.6 3.0 2.7
JJA 70.8 4.7 3.1
SON 72.7 3.9 2.4

78
Figure 26: Changes in maximum 5-day precipitation for 2038-2070. Significant changes are indicated by cross-hatching.

79
Table 26: Maximum 3-day precipitation (mm) climatology and projected change.
20th Century Mean
Projected Change
Ensemble Uncertainty
DJF 82.7 2.4 2.0
Cartwright MAM 75.7 3.4 2.7
JJA 59.6 2.9 2.8
SON 67.1 2.7 2.0
DJF 48.8 3.0 4.3
Churchill MAM 50.8 3.5 2.5
Falls JJA 60.1 4.4 3.9
SON 54.4 3.1 2.9
DJF 55.6 2.7 3.8
Goose MAM 52.9 4.1 3.0
Bay JJA 62.9 4.4 2.4
SON 57.4 4.4 5.1
DJF 85.5 1.5 3.8
Nain MAM 76.7 3.6 1.8
JJA 63.5 3.4 3.6
SON 64.3 1.3 2.7
DJF 47.6 3.4 3.3
Wabush MAM 47.9 5.0 1.6
Lake JJA 59.2 3.2 4.7
SON 50.1 2.6 4.1
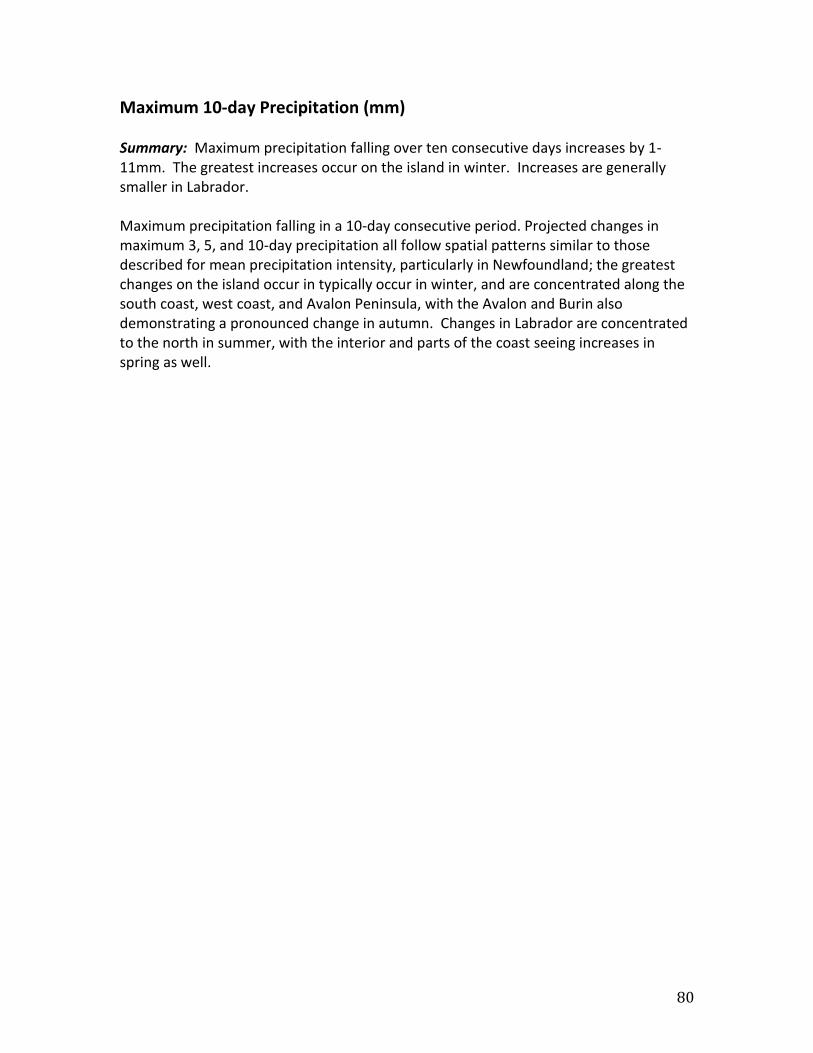
80
Maximum 10-day Precipitation (mm) Summary: Maximum precipitation falling over ten consecutive days increases by 1-11mm. The greatest increases occur on the island in winter. Increases are generally smaller in Labrador. Maximum precipitation falling in a 10-day consecutive period. Projected changes in maximum 3, 5, and 10-day precipitation all follow spatial patterns similar to those described for mean precipitation intensity, particularly in Newfoundland; the greatest changes on the island occur in typically occur in winter, and are concentrated along the south coast, west coast, and Avalon Peninsula, with the Avalon and Burin also demonstrating a pronounced change in autumn. Changes in Labrador are concentrated to the north in summer, with the interior and parts of the coast seeing increases in spring as well.
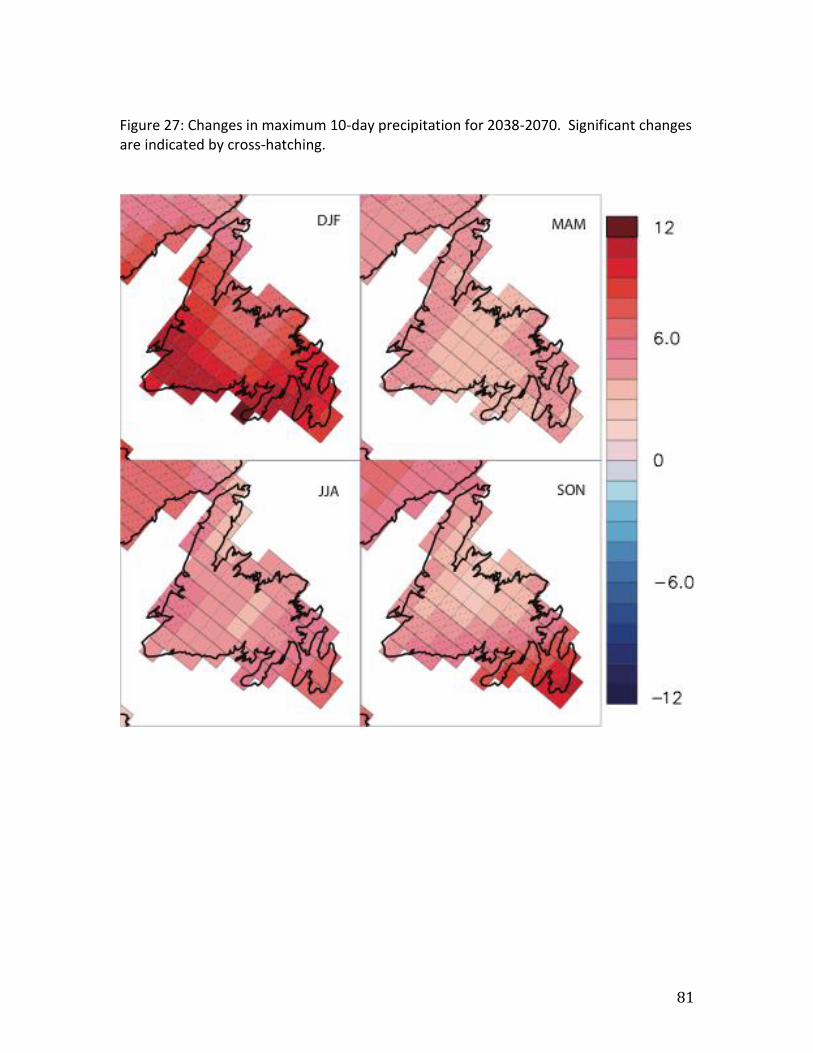
81
Figure 27: Changes in maximum 10-day precipitation for 2038-2070. Significant changes are indicated by cross-hatching.
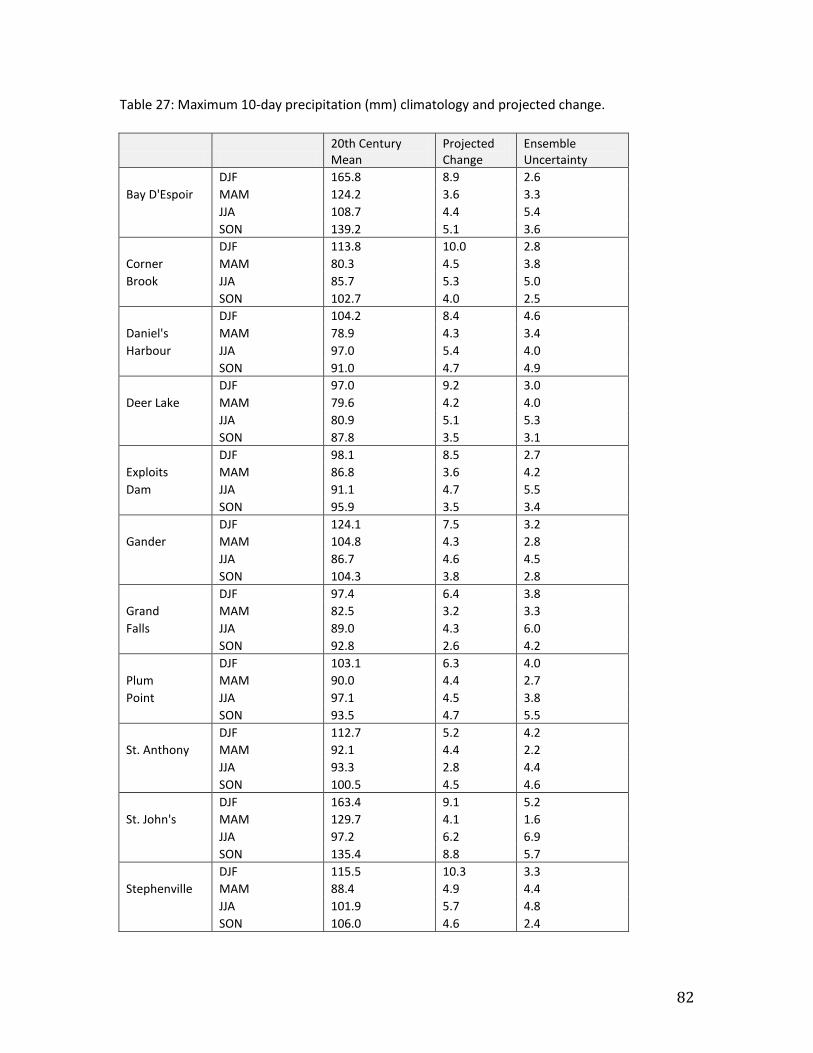
82
Table 27: Maximum 10-day precipitation (mm) climatology and projected change.
20th Century Mean
Projected Change
Ensemble Uncertainty
DJF 165.8 8.9 2.6
Bay D'Espoir MAM 124.2 3.6 3.3
JJA 108.7 4.4 5.4
SON 139.2 5.1 3.6
DJF 113.8 10.0 2.8
Corner MAM 80.3 4.5 3.8
Brook JJA 85.7 5.3 5.0
SON 102.7 4.0 2.5
DJF 104.2 8.4 4.6
Daniel's MAM 78.9 4.3 3.4
Harbour JJA 97.0 5.4 4.0
SON 91.0 4.7 4.9
DJF 97.0 9.2 3.0
Deer Lake MAM 79.6 4.2 4.0
JJA 80.9 5.1 5.3
SON 87.8 3.5 3.1
DJF 98.1 8.5 2.7
Exploits MAM 86.8 3.6 4.2
Dam JJA 91.1 4.7 5.5
SON 95.9 3.5 3.4
DJF 124.1 7.5 3.2
Gander MAM 104.8 4.3 2.8
JJA 86.7 4.6 4.5
SON 104.3 3.8 2.8
DJF 97.4 6.4 3.8
Grand MAM 82.5 3.2 3.3
Falls JJA 89.0 4.3 6.0
SON 92.8 2.6 4.2
DJF 103.1 6.3 4.0
Plum MAM 90.0 4.4 2.7
Point JJA 97.1 4.5 3.8
SON 93.5 4.7 5.5
DJF 112.7 5.2 4.2
St. Anthony MAM 92.1 4.4 2.2
JJA 93.3 2.8 4.4
SON 100.5 4.5 4.6
DJF 163.4 9.1 5.2
St. John's MAM 129.7 4.1 1.6
JJA 97.2 6.2 6.9
SON 135.4 8.8 5.7
DJF 115.5 10.3 3.3
Stephenville MAM 88.4 4.9 4.4
JJA 101.9 5.7 4.8
SON 106.0 4.6 2.4
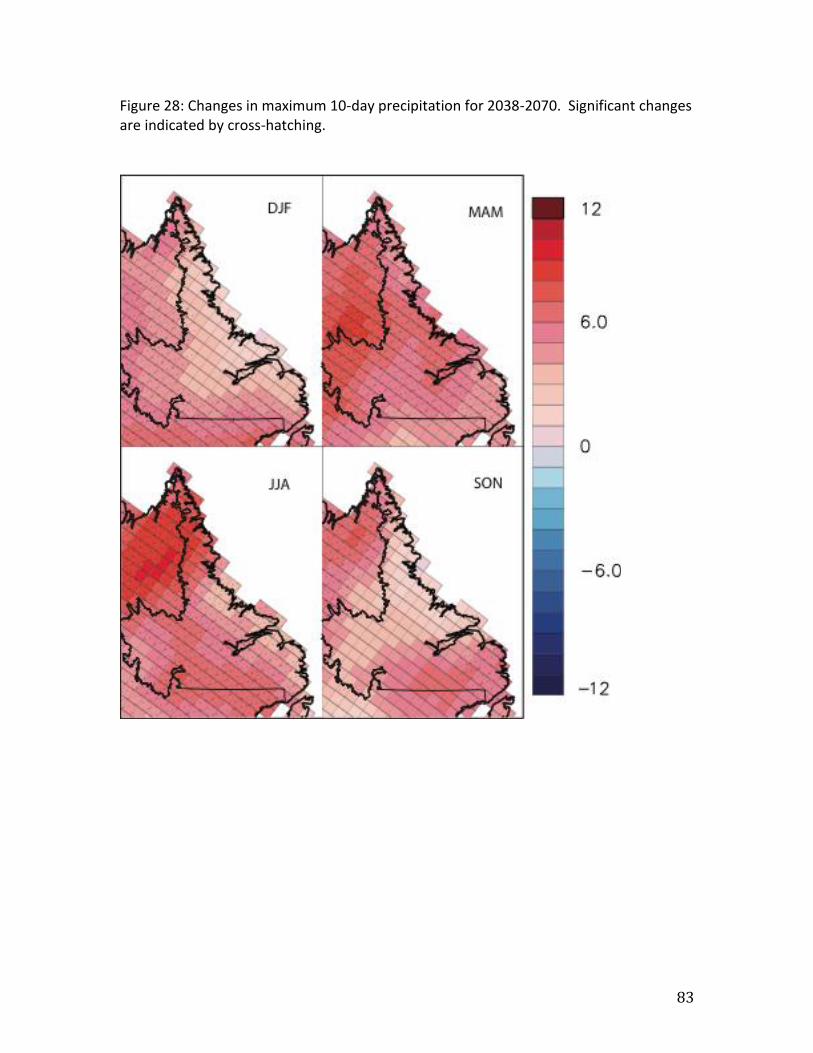
83
Figure 28: Changes in maximum 10-day precipitation for 2038-2070. Significant changes are indicated by cross-hatching.
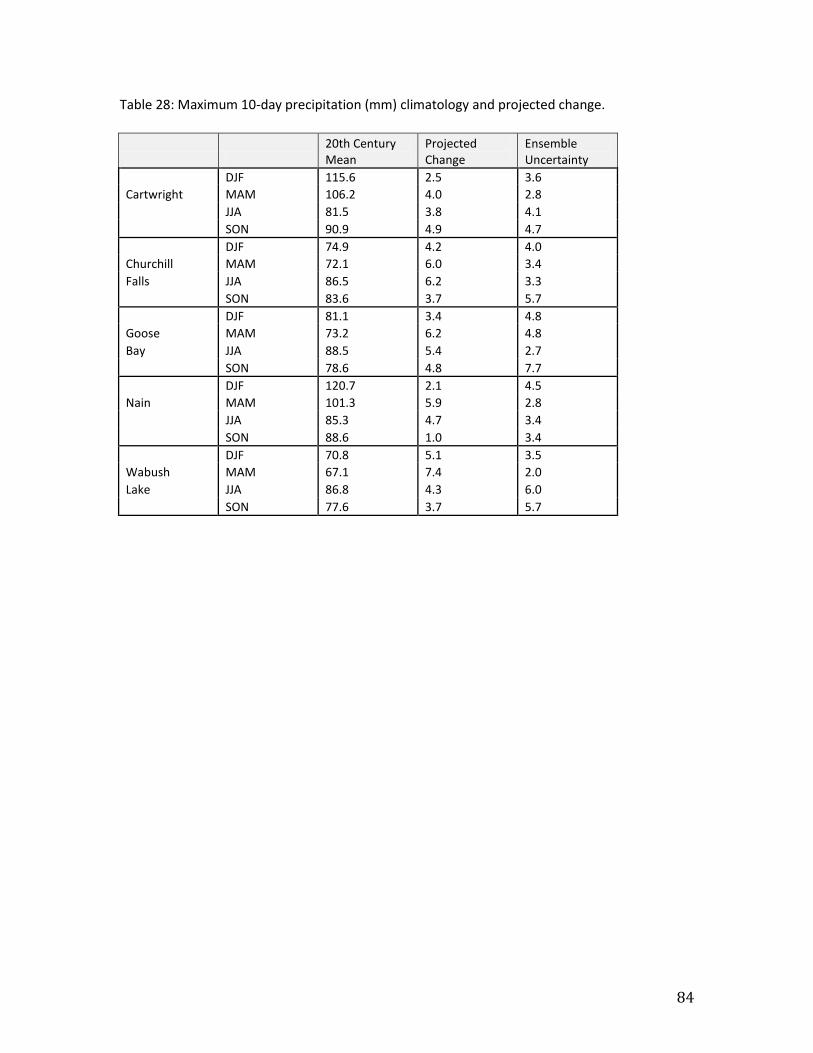
84
Table 28: Maximum 10-day precipitation (mm) climatology and projected change.
20th Century Mean
Projected Change
Ensemble Uncertainty
DJF 115.6 2.5 3.6
Cartwright MAM 106.2 4.0 2.8
JJA 81.5 3.8 4.1
SON 90.9 4.9 4.7
DJF 74.9 4.2 4.0
Churchill MAM 72.1 6.0 3.4
Falls JJA 86.5 6.2 3.3
SON 83.6 3.7 5.7
DJF 81.1 3.4 4.8
Goose MAM 73.2 6.2 4.8
Bay JJA 88.5 5.4 2.7
SON 78.6 4.8 7.7
DJF 120.7 2.1 4.5
Nain MAM 101.3 5.9 2.8
JJA 85.3 4.7 3.4
SON 88.6 1.0 3.4
DJF 70.8 5.1 3.5
Wabush MAM 67.1 7.4 2.0
Lake JJA 86.8 4.3 6.0
SON 77.6 3.7 5.7
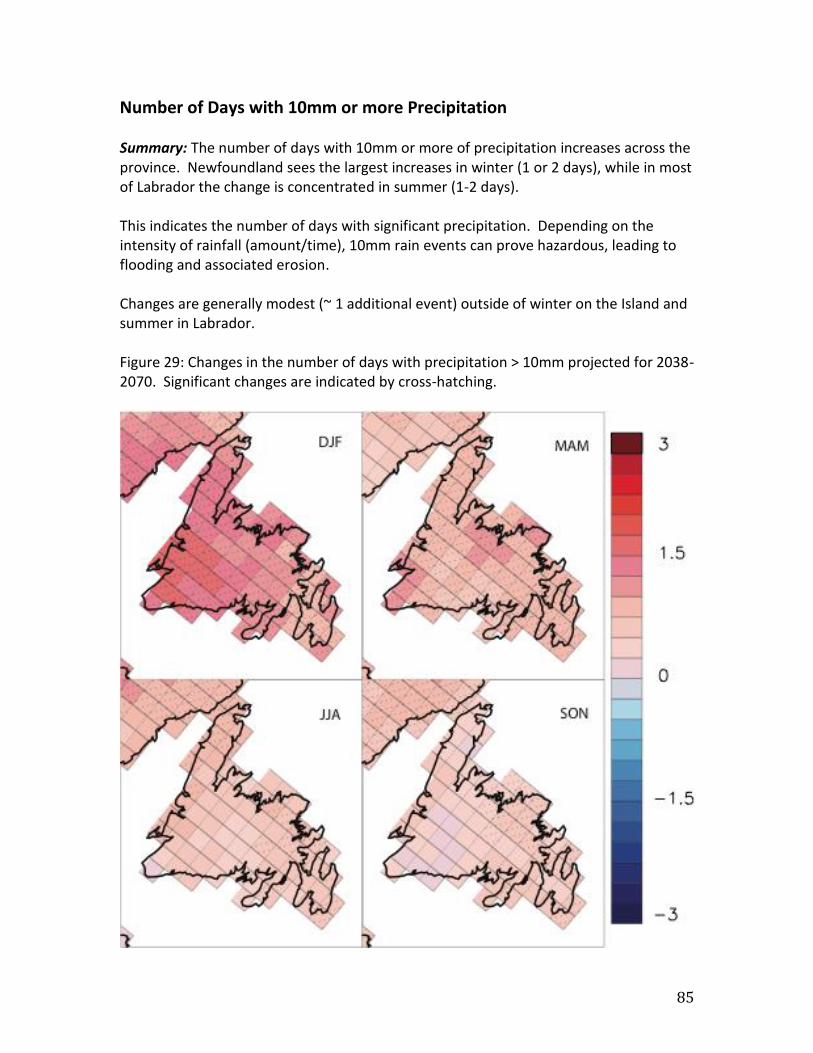
85
Number of Days with 10mm or more Precipitation Summary: The number of days with 10mm or more of precipitation increases across the province. Newfoundland sees the largest increases in winter (1 or 2 days), while in most of Labrador the change is concentrated in summer (1-2 days). This indicates the number of days with significant precipitation. Depending on the intensity of rainfall (amount/time), 10mm rain events can prove hazardous, leading to flooding and associated erosion. Changes are generally modest (~ 1 additional event) outside of winter on the Island and summer in Labrador. Figure 29: Changes in the number of days with precipitation > 10mm projected for 2038-2070. Significant changes are indicated by cross-hatching.
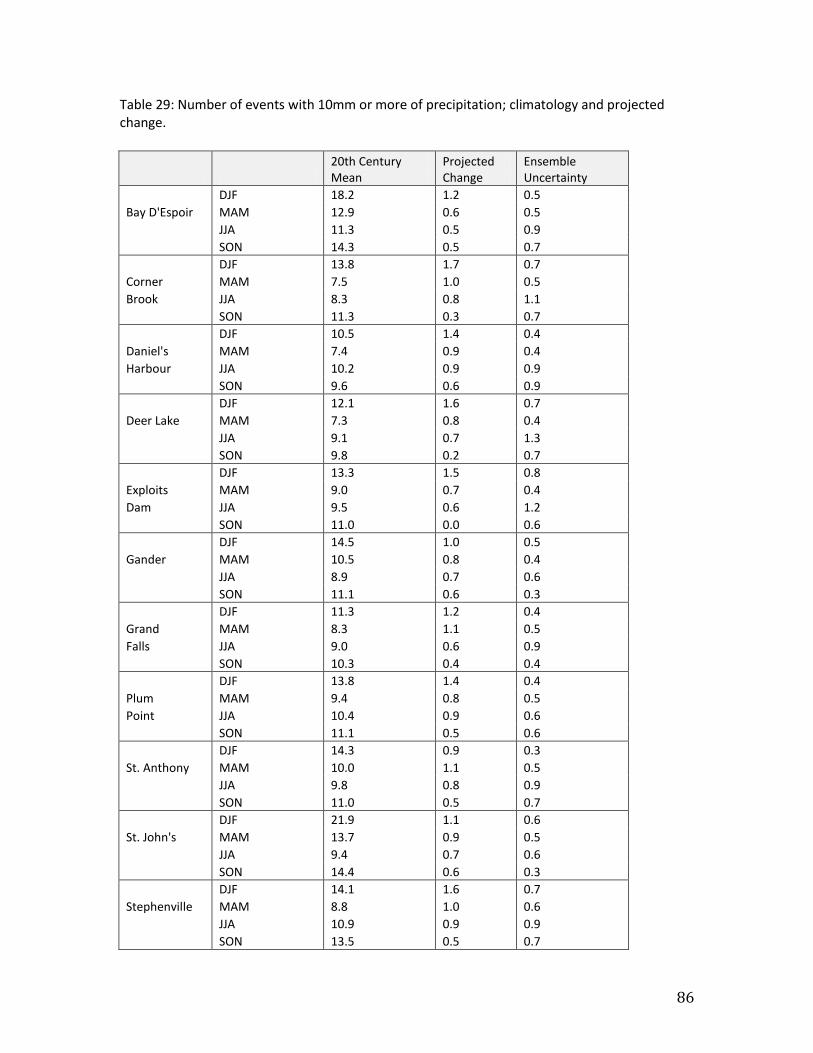
86
Table 29: Number of events with 10mm or more of precipitation; climatology and projected change.
20th Century Mean
Projected Change
Ensemble Uncertainty
DJF 18.2 1.2 0.5
Bay D'Espoir MAM 12.9 0.6 0.5
JJA 11.3 0.5 0.9
SON 14.3 0.5 0.7
DJF 13.8 1.7 0.7
Corner MAM 7.5 1.0 0.5
Brook JJA 8.3 0.8 1.1
SON 11.3 0.3 0.7
DJF 10.5 1.4 0.4
Daniel's MAM 7.4 0.9 0.4
Harbour JJA 10.2 0.9 0.9
SON 9.6 0.6 0.9
DJF 12.1 1.6 0.7
Deer Lake MAM 7.3 0.8 0.4
JJA 9.1 0.7 1.3
SON 9.8 0.2 0.7
DJF 13.3 1.5 0.8
Exploits MAM 9.0 0.7 0.4
Dam JJA 9.5 0.6 1.2
SON 11.0 0.0 0.6
DJF 14.5 1.0 0.5
Gander MAM 10.5 0.8 0.4
JJA 8.9 0.7 0.6
SON 11.1 0.6 0.3
DJF 11.3 1.2 0.4
Grand MAM 8.3 1.1 0.5
Falls JJA 9.0 0.6 0.9
SON 10.3 0.4 0.4
DJF 13.8 1.4 0.4
Plum MAM 9.4 0.8 0.5
Point JJA 10.4 0.9 0.6
SON 11.1 0.5 0.6
DJF 14.3 0.9 0.3
St. Anthony MAM 10.0 1.1 0.5
JJA 9.8 0.8 0.9
SON 11.0 0.5 0.7
DJF 21.9 1.1 0.6
St. John's MAM 13.7 0.9 0.5
JJA 9.4 0.7 0.6
SON 14.4 0.6 0.3
DJF 14.1 1.6 0.7
Stephenville MAM 8.8 1.0 0.6
JJA 10.9 0.9 0.9
SON 13.5 0.5 0.7
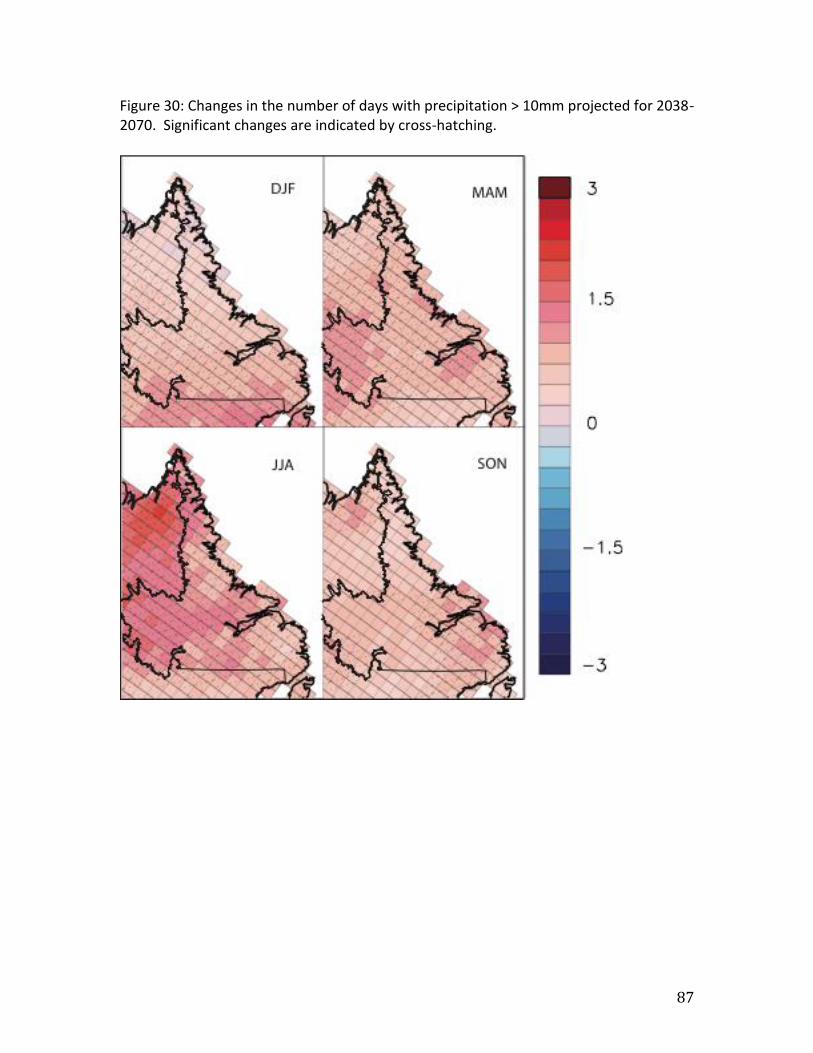
87
Figure 30: Changes in the number of days with precipitation > 10mm projected for 2038-2070. Significant changes are indicated by cross-hatching.

88
Table 30: Number of events with 10mm or more of precipitation; climatology and projected change.
20th Century Mean
Projected Change
Ensemble Uncertainty
DJF 11.4 0.9 0.8
Cartwright MAM 9.1 0.9 0.7
JJA 8.6 0.5 0.3
SON 8.9 1.1 0.5
DJF 6.5 0.7 0.5
Churchill MAM 6.1 1.0 0.6
Falls JJA 10.0 1.4 0.6
SON 9.0 0.9 1.0
DJF 7.9 0.8 0.5
Goose MAM 7.1 0.9 0.8
Bay JJA 10.0 1.0 0.3
SON 8.2 0.9 0.7
DJF 9.8 0.4 0.6
Nain MAM 8.3 0.9 0.2
JJA 8.3 0.6 0.4
SON 8.0 0.5 0.9
DJF 5.8 0.9 0.5
Wabush MAM 5.9 1.2 0.5
Lake JJA 10.0 1.6 0.8
SON 8.1 0.9 0.8
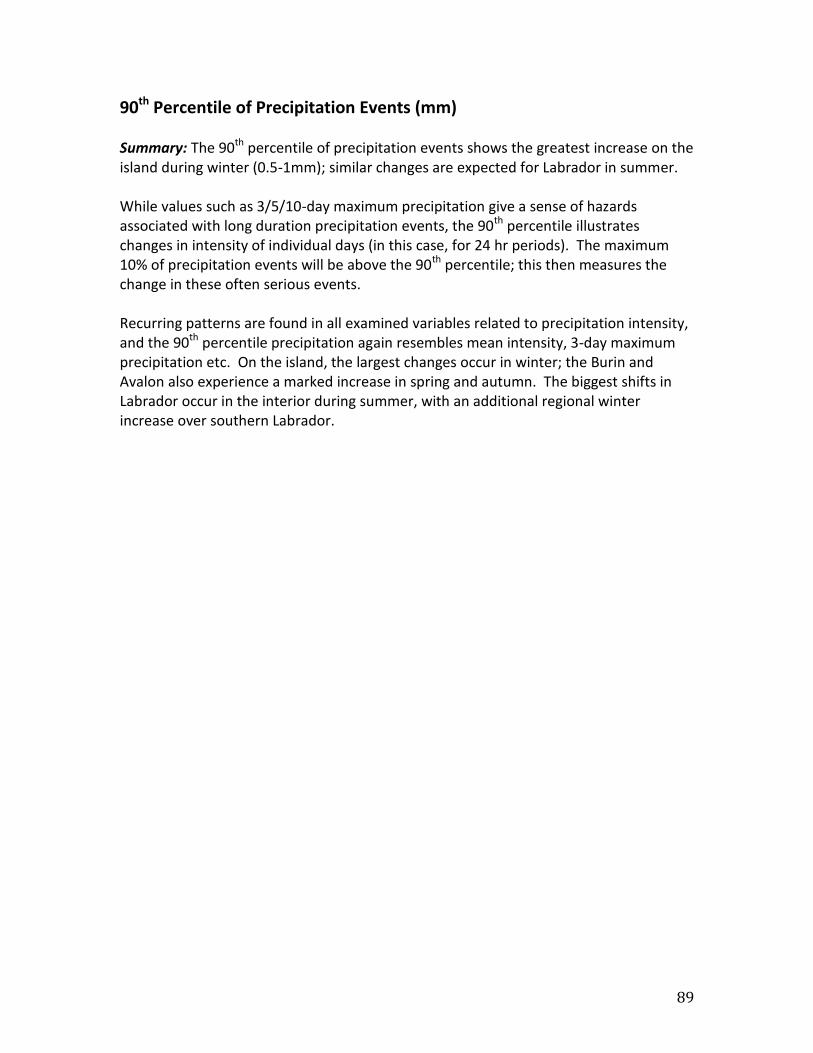
89
90th Percentile of Precipitation Events (mm) Summary: The 90th percentile of precipitation events shows the greatest increase on the island during winter (0.5-1mm); similar changes are expected for Labrador in summer. While values such as 3/5/10-day maximum precipitation give a sense of hazards associated with long duration precipitation events, the 90th percentile illustrates changes in intensity of individual days (in this case, for 24 hr periods). The maximum 10% of precipitation events will be above the 90th percentile; this then measures the change in these often serious events. Recurring patterns are found in all examined variables related to precipitation intensity, and the 90th percentile precipitation again resembles mean intensity, 3-day maximum precipitation etc. On the island, the largest changes occur in winter; the Burin and Avalon also experience a marked increase in spring and autumn. The biggest shifts in Labrador occur in the interior during summer, with an additional regional winter increase over southern Labrador.
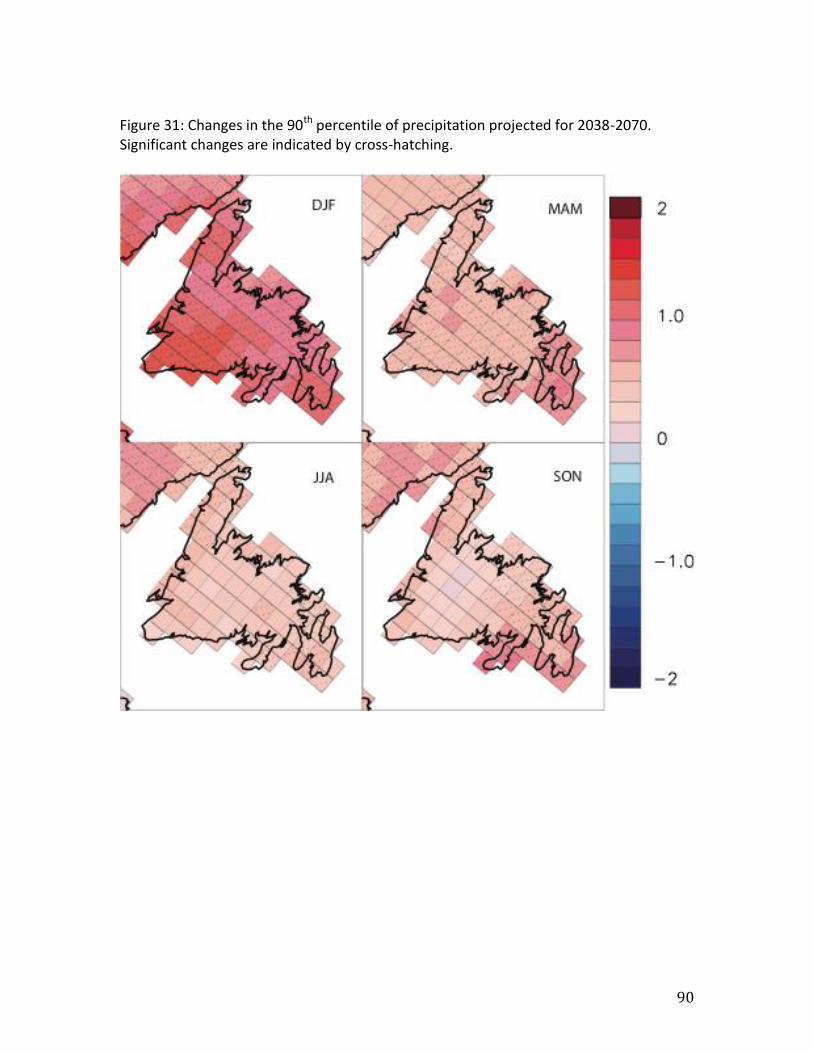
90
Figure 31: Changes in the 90th percentile of precipitation projected for 2038-2070. Significant changes are indicated by cross-hatching.

91
Table 31: 90th percentile of precipitation events (mm); climatology and projected change.
20th Century Mean
Projected Change
Ensemble Uncertainty
DJF 18.9 1.0 0.4
Bay D'Espoir MAM 12.9 0.6 0.2
JJA 11.1 0.4 0.5
SON 14.8 0.5 0.5
DJF 12.8 1.2 0.4
Corner MAM 8.1 0.6 0.3
Brook JJA 8.5 0.4 0.8
SON 10.9 0.3 0.6
DJF 10.9 1.1 0.3
Daniel's MAM 7.9 0.5 0.3
Harbour JJA 9.5 0.6 0.5
SON 9.8 0.7 0.5
DJF 11.4 1.1 0.4
Deer Lake MAM 7.5 0.6 0.4
JJA 8.7 0.4 0.9
SON 9.4 0.2 0.6
DJF 12.8 1.1 0.4
Exploits MAM 8.9 0.7 0.3
Dam JJA 9.4 0.3 0.8
SON 10.6 0.0 0.7
DJF 14.4 1.0 0.2
Gander MAM 10.3 0.6 0.2
JJA 8.9 0.4 0.5
SON 10.6 0.4 0.3
DJF 11.4 0.9 0.2
Grand MAM 8.0 0.5 0.3
Falls JJA 9.1 0.4 0.7
SON 10.0 0.3 0.4
DJF 12.3 1.1 0.2
Plum MAM 9.3 0.5 0.4
Point JJA 10.2 0.5 0.4
SON 10.6 0.6 0.4
DJF 13.6 0.8 0.3
St. Anthony MAM 9.5 0.6 0.4
JJA 9.4 0.5 0.6
SON 11.1 0.5 0.4
DJF 20.0 1.0 0.4
St. John's MAM 13.0 0.7 0.2
JJA 8.9 0.4 0.3
SON 13.9 0.7 0.4
DJF 12.8 1.2 0.4
Stephenville MAM 8.6 0.7 0.4
JJA 10.6 0.5 0.8
SON 12.0 0.6 0.6

92
Figure 32: Changes in the 90th percentile of precipitation projected for 2038-2070. Significant changes are indicated by cross-hatching.

93
Table 32: 90th percentile of precipitation events (mm); climatology and projected change.
20th Century Mean
Projected Change
Ensemble Uncertainty
DJF 11.3 0.4 0.8
Cartwright MAM 9.3 0.7 0.4
JJA 8.6 0.5 0.3
SON 8.6 0.9 0.2
DJF 7.3 0.4 0.5
Churchill MAM 7.0 0.5 0.2
Falls JJA 9.8 0.9 0.3
SON 9.2 0.6 0.8
DJF 8.3 0.5 0.4
Goose MAM 7.4 0.6 0.5
Bay JJA 9.6 0.8 0.3
SON 8.0 0.6 0.7
DJF 10.0 0.1 0.5
Nain MAM 8.3 0.6 0.4
JJA 8.1 0.5 0.3
SON 8.4 0.2 0.7
DJF 7.0 0.5 0.4
Wabush MAM 6.5 0.7 0.2
Lake JJA 9.7 0.9 0.4
SON 8.6 0.7 0.7

94
Maximum Number of Consecutive Dry Days (days) Summary: Results show few noticeable changes in maximum number of consecutive dry days. The only exception is northern Labrador in winter, which sees a decrease of about 2-4 days. Calculated as the longest stretch of days without precipitation in a given year, this is the first of several indices intended to examine potential issues around drought. For each year, the maximum dry spell is identified; the average is then calculated over all years. This is useful as an indicator of changing drought severity (droughts defined as an extended period without precipitation). Results suggest droughts are not a growing concern for the province; significant changes are rare, and typically show a decrease in the maximum stretch of dry days (i.e. shorter ‘drought’). The only exception is northern Labrador in winter, which sees a decrease of about 2-4 days.
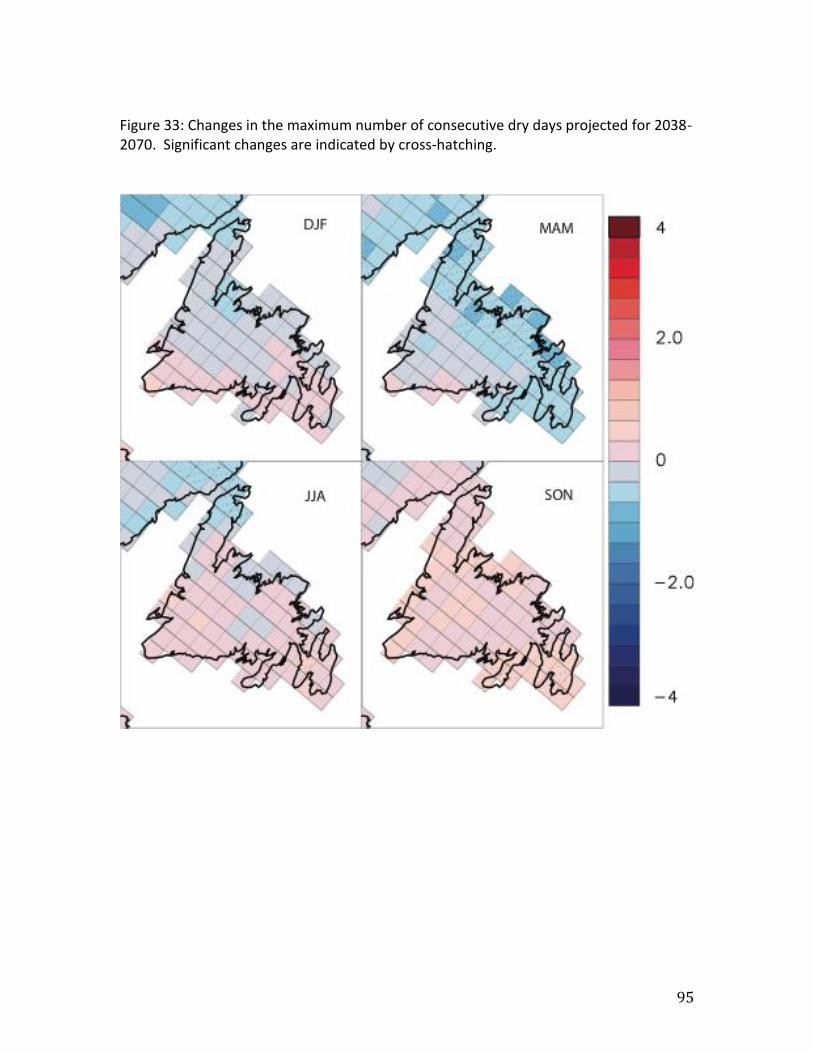
95
Figure 33: Changes in the maximum number of consecutive dry days projected for 2038-2070. Significant changes are indicated by cross-hatching.
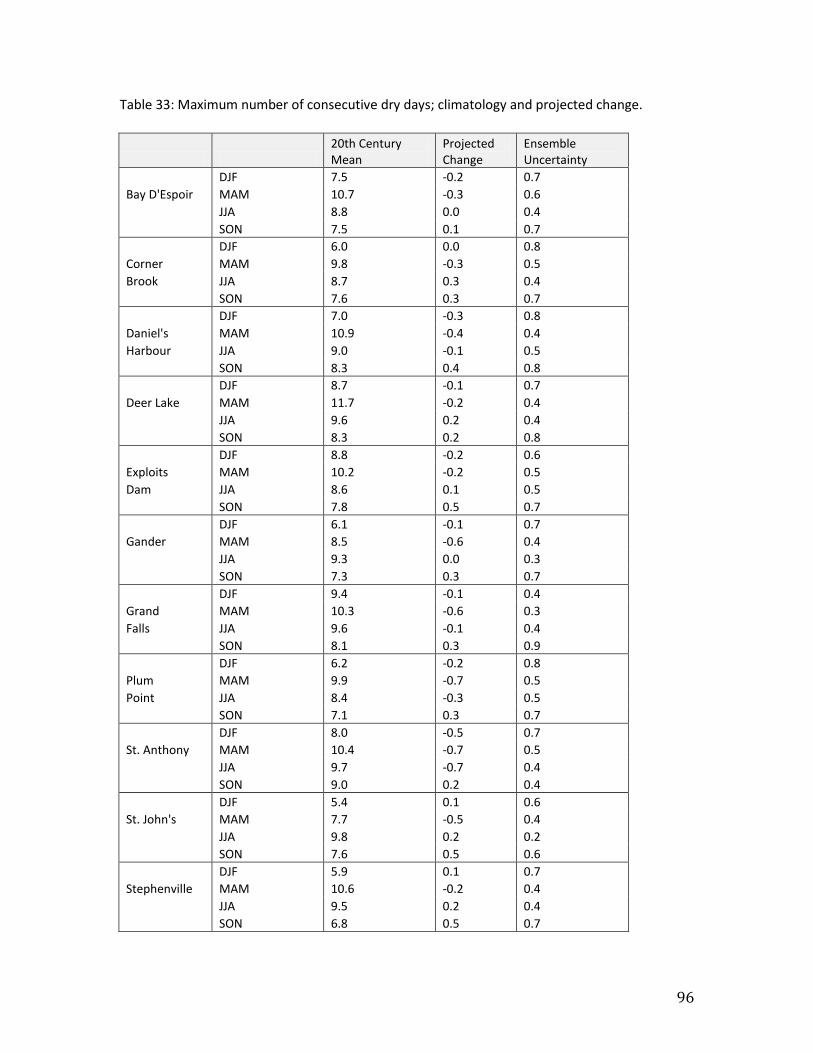
96
Table 33: Maximum number of consecutive dry days; climatology and projected change.
20th Century Mean
Projected Change
Ensemble Uncertainty
DJF 7.5 -0.2 0.7
Bay D'Espoir MAM 10.7 -0.3 0.6
JJA 8.8 0.0 0.4
SON 7.5 0.1 0.7
DJF 6.0 0.0 0.8
Corner MAM 9.8 -0.3 0.5
Brook JJA 8.7 0.3 0.4
SON 7.6 0.3 0.7
DJF 7.0 -0.3 0.8
Daniel's MAM 10.9 -0.4 0.4
Harbour JJA 9.0 -0.1 0.5
SON 8.3 0.4 0.8
DJF 8.7 -0.1 0.7
Deer Lake MAM 11.7 -0.2 0.4
JJA 9.6 0.2 0.4
SON 8.3 0.2 0.8
DJF 8.8 -0.2 0.6
Exploits MAM 10.2 -0.2 0.5
Dam JJA 8.6 0.1 0.5
SON 7.8 0.5 0.7
DJF 6.1 -0.1 0.7
Gander MAM 8.5 -0.6 0.4
JJA 9.3 0.0 0.3
SON 7.3 0.3 0.7
DJF 9.4 -0.1 0.4
Grand MAM 10.3 -0.6 0.3
Falls JJA 9.6 -0.1 0.4
SON 8.1 0.3 0.9
DJF 6.2 -0.2 0.8
Plum MAM 9.9 -0.7 0.5
Point JJA 8.4 -0.3 0.5
SON 7.1 0.3 0.7
DJF 8.0 -0.5 0.7
St. Anthony MAM 10.4 -0.7 0.5
JJA 9.7 -0.7 0.4
SON 9.0 0.2 0.4
DJF 5.4 0.1 0.6
St. John's MAM 7.7 -0.5 0.4
JJA 9.8 0.2 0.2
SON 7.6 0.5 0.6
DJF 5.9 0.1 0.7
Stephenville MAM 10.6 -0.2 0.4
JJA 9.5 0.2 0.4
SON 6.8 0.5 0.7
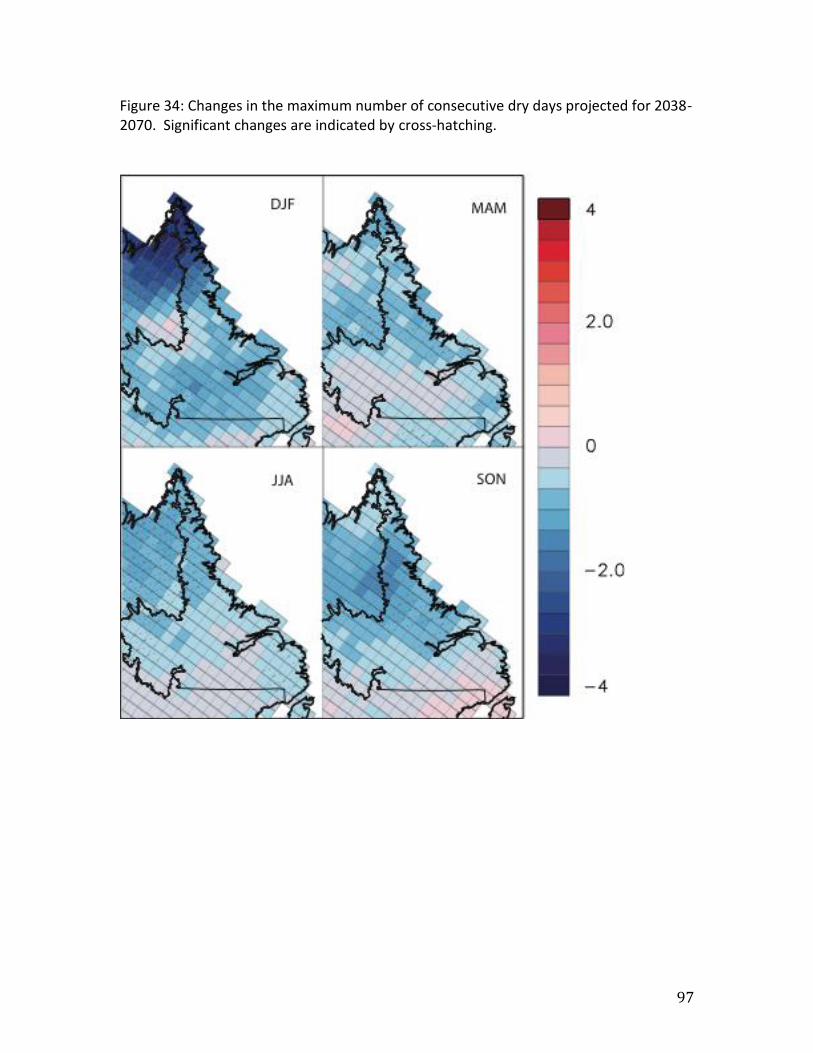
97
Figure 34: Changes in the maximum number of consecutive dry days projected for 2038-2070. Significant changes are indicated by cross-hatching.
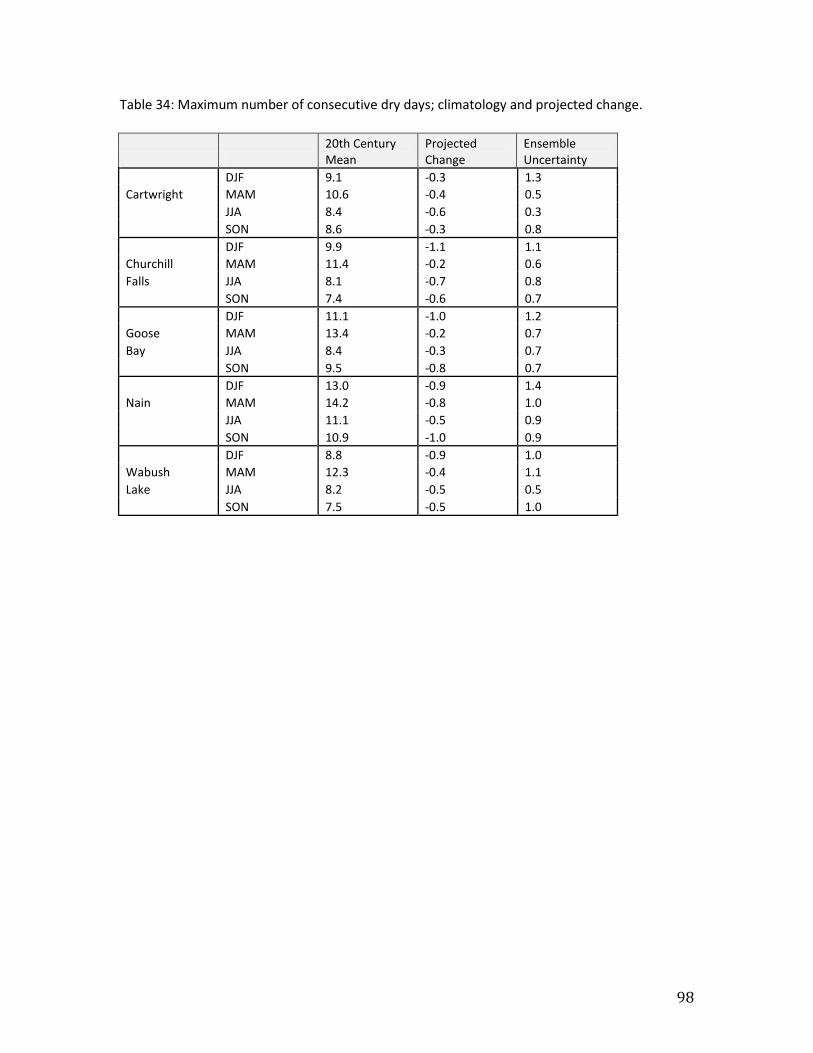
98
Table 34: Maximum number of consecutive dry days; climatology and projected change.
20th Century Mean
Projected Change
Ensemble Uncertainty
DJF 9.1 -0.3 1.3
Cartwright MAM 10.6 -0.4 0.5
JJA 8.4 -0.6 0.3
SON 8.6 -0.3 0.8
DJF 9.9 -1.1 1.1
Churchill MAM 11.4 -0.2 0.6
Falls JJA 8.1 -0.7 0.8
SON 7.4 -0.6 0.7
DJF 11.1 -1.0 1.2
Goose MAM 13.4 -0.2 0.7
Bay JJA 8.4 -0.3 0.7
SON 9.5 -0.8 0.7
DJF 13.0 -0.9 1.4
Nain MAM 14.2 -0.8 1.0
JJA 11.1 -0.5 0.9
SON 10.9 -1.0 0.9
DJF 8.8 -0.9 1.0
Wabush MAM 12.3 -0.4 1.1
Lake JJA 8.2 -0.5 0.5
SON 7.5 -0.5 1.0
99
Mean Dry Spell Length (days) Summary: Results show few noticeable changes in the length of dry spells. The only exception is northern Labrador in winter, which sees more frequent precipitation (typical dry spell length decreases by about 1-2 days). The average number of days between precipitation events. Dry spell length gives an indication of:
1) Water stress on vegetation, as longer spells mean a greater chance of dehydration/heat stress
2) Potential flood frequency, as smaller spells mean less time for water courses to route precipitation from one event out of a region before the next event occurs.
The current report also examines the median (i.e. value that has a 50% chance of being exceeded) and standard deviation (i.e. typical range) of dry spells. None of these values show a large response to climate change in the models examined; there are some statistically significant shifts (notably in northern Labrador in winter, with decreases of 1-2 days), but generally projected changes are considerably less than a day. There is a weak indication that dry spells will become slightly shorter in the future, but the changes are both statistically insignificant in most locations and small enough that no serious impact is likely. In short, the frequency of precipitation is unlikely to change in a dramatic fashion, unlike the intensity of the events that do occur.
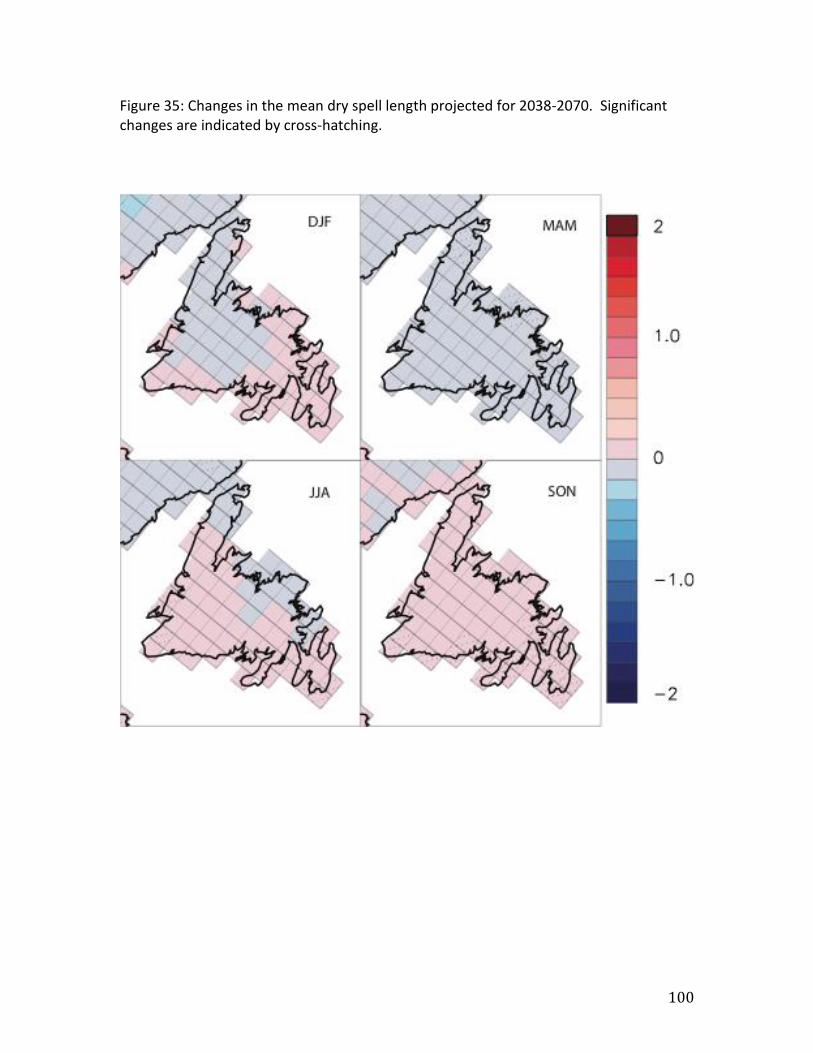
100
Figure 35: Changes in the mean dry spell length projected for 2038-2070. Significant changes are indicated by cross-hatching.
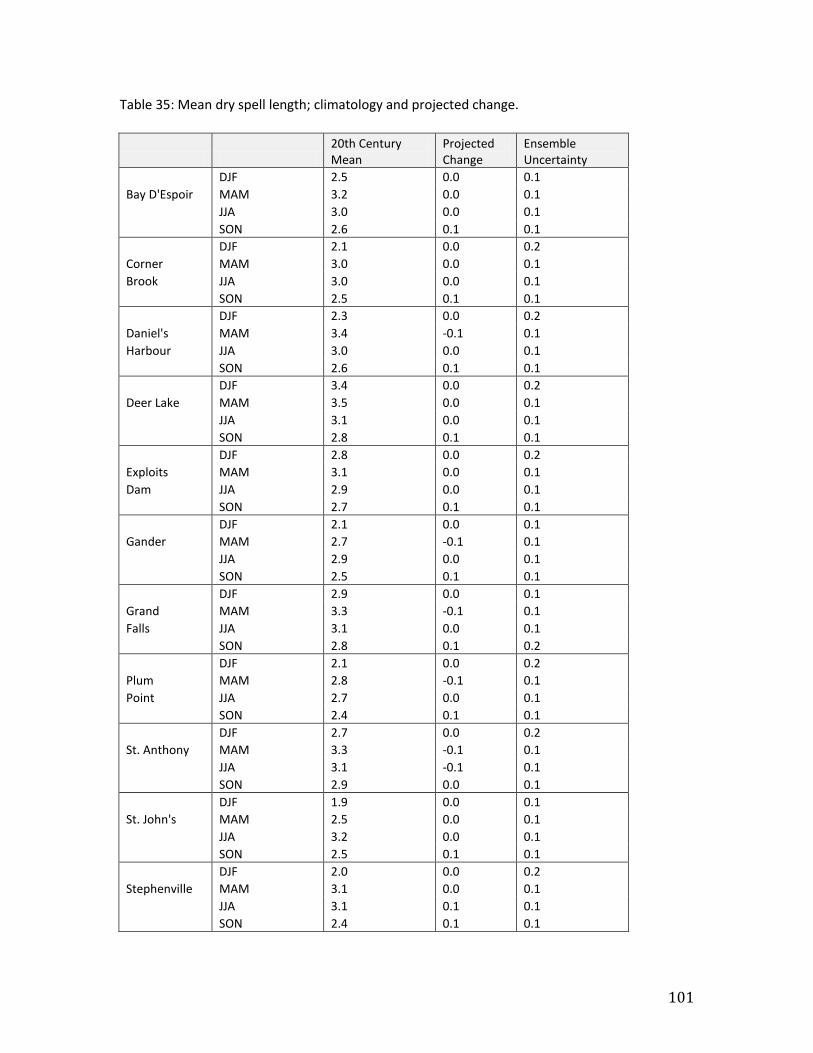
101
Table 35: Mean dry spell length; climatology and projected change.
20th Century Mean
Projected Change
Ensemble Uncertainty
DJF 2.5 0.0 0.1
Bay D'Espoir MAM 3.2 0.0 0.1
JJA 3.0 0.0 0.1
SON 2.6 0.1 0.1
DJF 2.1 0.0 0.2
Corner MAM 3.0 0.0 0.1
Brook JJA 3.0 0.0 0.1
SON 2.5 0.1 0.1
DJF 2.3 0.0 0.2
Daniel's MAM 3.4 -0.1 0.1
Harbour JJA 3.0 0.0 0.1
SON 2.6 0.1 0.1
DJF 3.4 0.0 0.2
Deer Lake MAM 3.5 0.0 0.1
JJA 3.1 0.0 0.1
SON 2.8 0.1 0.1
DJF 2.8 0.0 0.2
Exploits MAM 3.1 0.0 0.1
Dam JJA 2.9 0.0 0.1
SON 2.7 0.1 0.1
DJF 2.1 0.0 0.1
Gander MAM 2.7 -0.1 0.1
JJA 2.9 0.0 0.1
SON 2.5 0.1 0.1
DJF 2.9 0.0 0.1
Grand MAM 3.3 -0.1 0.1
Falls JJA 3.1 0.0 0.1
SON 2.8 0.1 0.2
DJF 2.1 0.0 0.2
Plum MAM 2.8 -0.1 0.1
Point JJA 2.7 0.0 0.1
SON 2.4 0.1 0.1
DJF 2.7 0.0 0.2
St. Anthony MAM 3.3 -0.1 0.1
JJA 3.1 -0.1 0.1
SON 2.9 0.0 0.1
DJF 1.9 0.0 0.1
St. John's MAM 2.5 0.0 0.1
JJA 3.2 0.0 0.1
SON 2.5 0.1 0.1
DJF 2.0 0.0 0.2
Stephenville MAM 3.1 0.0 0.1
JJA 3.1 0.1 0.1
SON 2.4 0.1 0.1

102
Figure 36: Changes in the mean dry spell length projected for 2038-2070. Significant changes are indicated by cross-hatching.
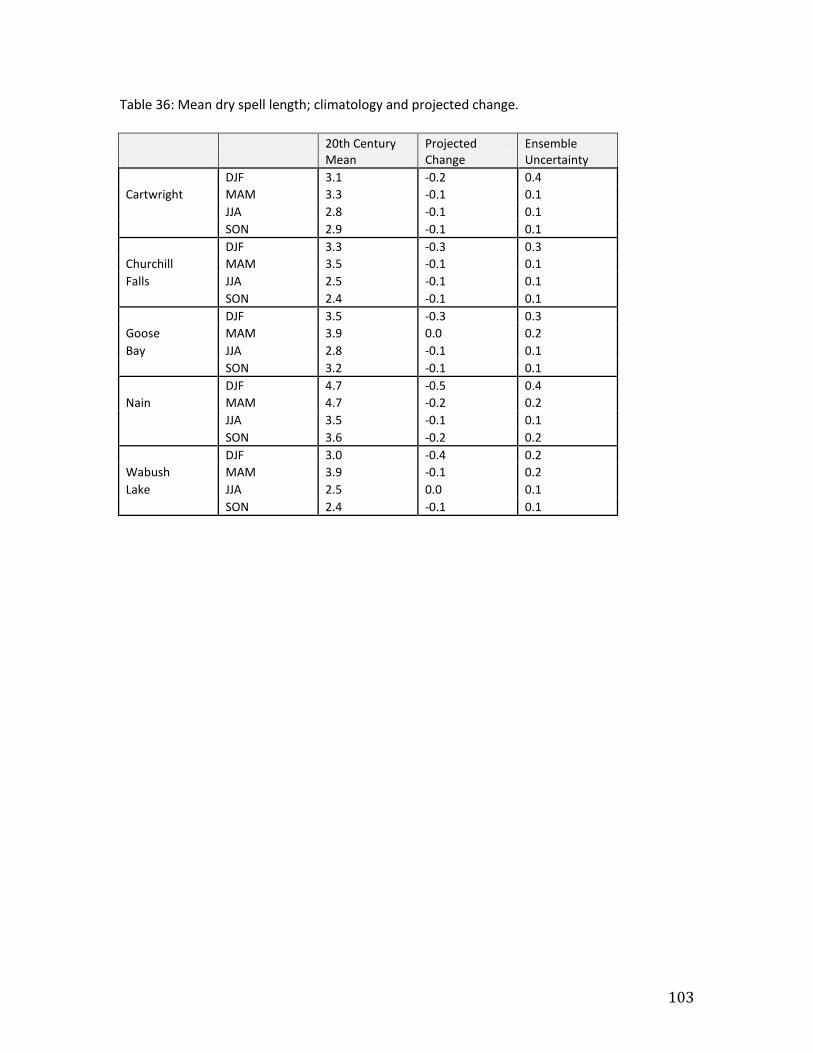
103
Table 36: Mean dry spell length; climatology and projected change.
20th Century Mean
Projected Change
Ensemble Uncertainty
DJF 3.1 -0.2 0.4
Cartwright MAM 3.3 -0.1 0.1
JJA 2.8 -0.1 0.1
SON 2.9 -0.1 0.1
DJF 3.3 -0.3 0.3
Churchill MAM 3.5 -0.1 0.1
Falls JJA 2.5 -0.1 0.1
SON 2.4 -0.1 0.1
DJF 3.5 -0.3 0.3
Goose MAM 3.9 0.0 0.2
Bay JJA 2.8 -0.1 0.1
SON 3.2 -0.1 0.1
DJF 4.7 -0.5 0.4
Nain MAM 4.7 -0.2 0.2
JJA 3.5 -0.1 0.1
SON 3.6 -0.2 0.2
DJF 3.0 -0.4 0.2
Wabush MAM 3.9 -0.1 0.2
Lake JJA 2.5 0.0 0.1
SON 2.4 -0.1 0.1
104
Median Dry Spell Length (days) Summary: Results show few noticeable changes in the length of dry spells under a warming climate. The only exception is northern Labrador in winter, which sees more frequent precipitation (typical dry spell length decreases by about 1-2 days). Similar to the mean dry spell length, but giving the median (rather than mean) number of days between precipitation events. Changes are inconsequential, with only northern Labrador experiencing any statistically significant change (a decrease of 1-2 days in winter).
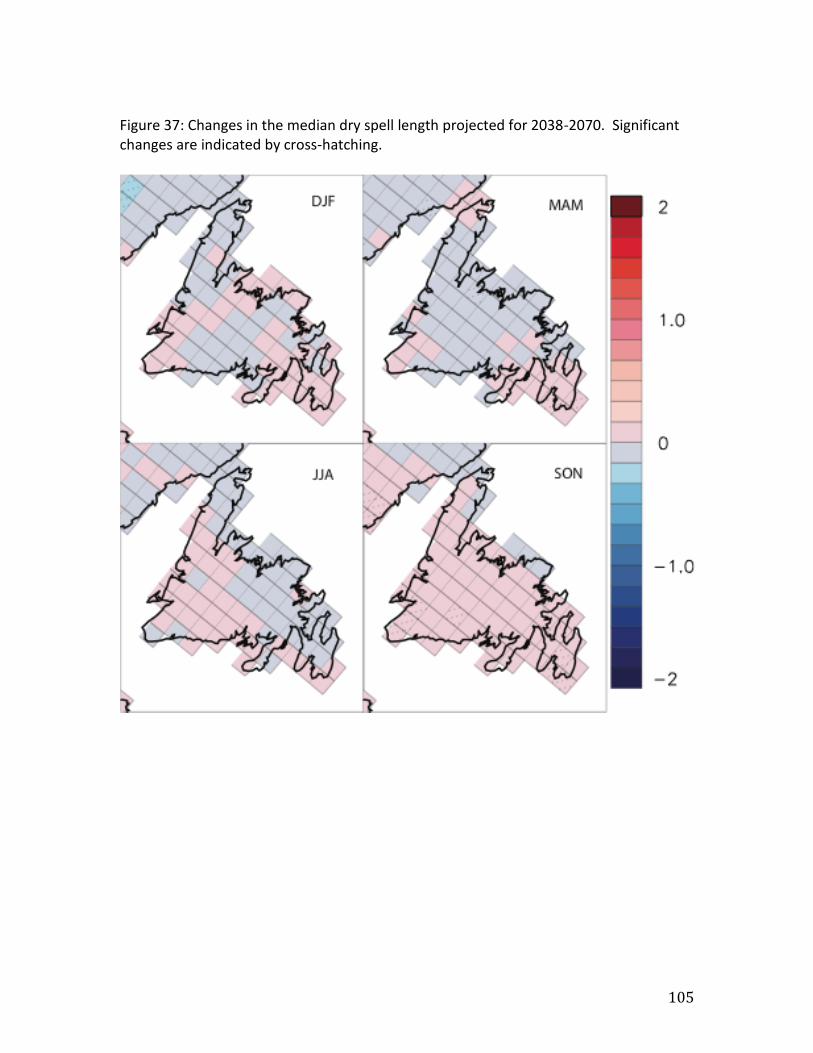
105
Figure 37: Changes in the median dry spell length projected for 2038-2070. Significant changes are indicated by cross-hatching.
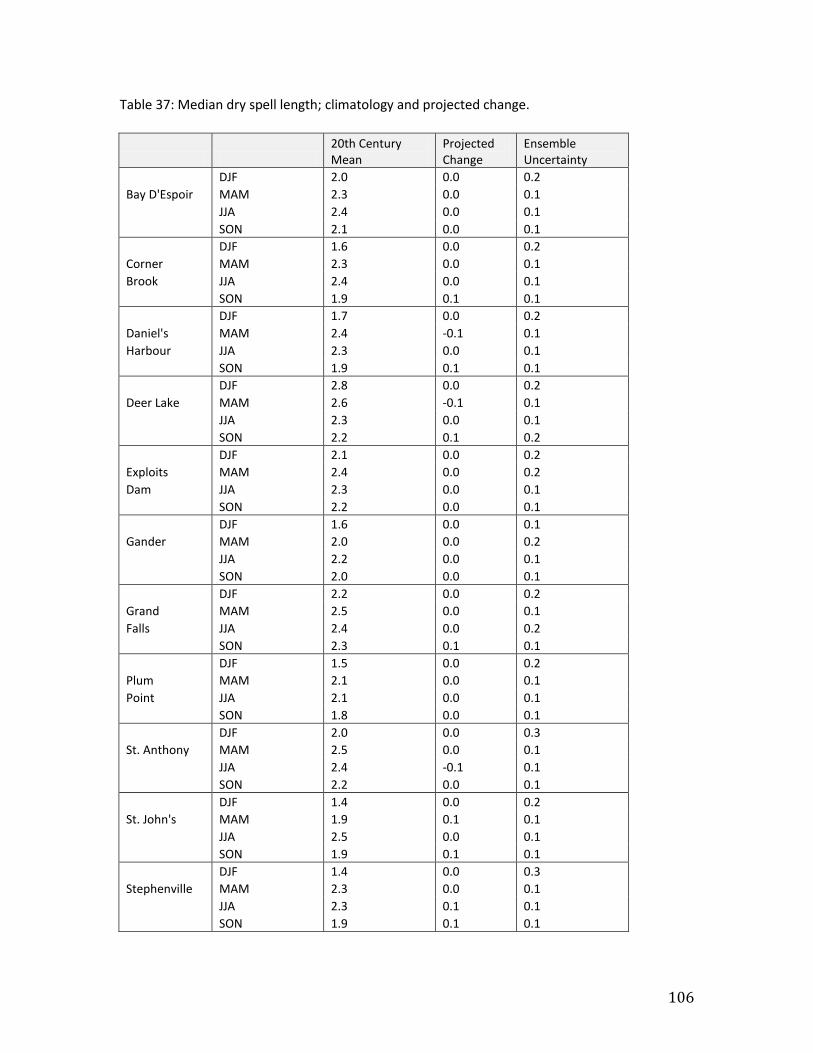
106
Table 37: Median dry spell length; climatology and projected change.
20th Century Mean
Projected Change
Ensemble Uncertainty
DJF 2.0 0.0 0.2
Bay D'Espoir MAM 2.3 0.0 0.1
JJA 2.4 0.0 0.1
SON 2.1 0.0 0.1
DJF 1.6 0.0 0.2
Corner MAM 2.3 0.0 0.1
Brook JJA 2.4 0.0 0.1
SON 1.9 0.1 0.1
DJF 1.7 0.0 0.2
Daniel's MAM 2.4 -0.1 0.1
Harbour JJA 2.3 0.0 0.1
SON 1.9 0.1 0.1
DJF 2.8 0.0 0.2
Deer Lake MAM 2.6 -0.1 0.1
JJA 2.3 0.0 0.1
SON 2.2 0.1 0.2
DJF 2.1 0.0 0.2
Exploits MAM 2.4 0.0 0.2
Dam JJA 2.3 0.0 0.1
SON 2.2 0.0 0.1
DJF 1.6 0.0 0.1
Gander MAM 2.0 0.0 0.2
JJA 2.2 0.0 0.1
SON 2.0 0.0 0.1
DJF 2.2 0.0 0.2
Grand MAM 2.5 0.0 0.1
Falls JJA 2.4 0.0 0.2
SON 2.3 0.1 0.1
DJF 1.5 0.0 0.2
Plum MAM 2.1 0.0 0.1
Point JJA 2.1 0.0 0.1
SON 1.8 0.0 0.1
DJF 2.0 0.0 0.3
St. Anthony MAM 2.5 0.0 0.1
JJA 2.4 -0.1 0.1
SON 2.2 0.0 0.1
DJF 1.4 0.0 0.2
St. John's MAM 1.9 0.1 0.1
JJA 2.5 0.0 0.1
SON 1.9 0.1 0.1
DJF 1.4 0.0 0.3
Stephenville MAM 2.3 0.0 0.1
JJA 2.3 0.1 0.1
SON 1.9 0.1 0.1
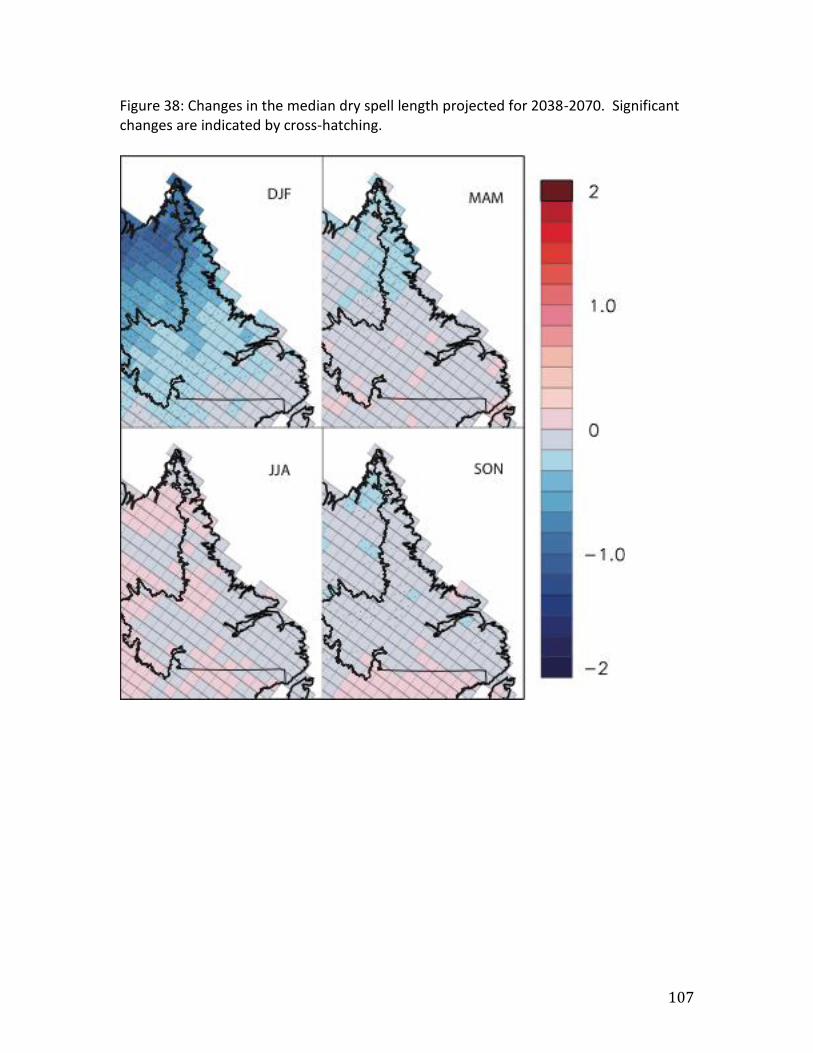
107
Figure 38: Changes in the median dry spell length projected for 2038-2070. Significant changes are indicated by cross-hatching.
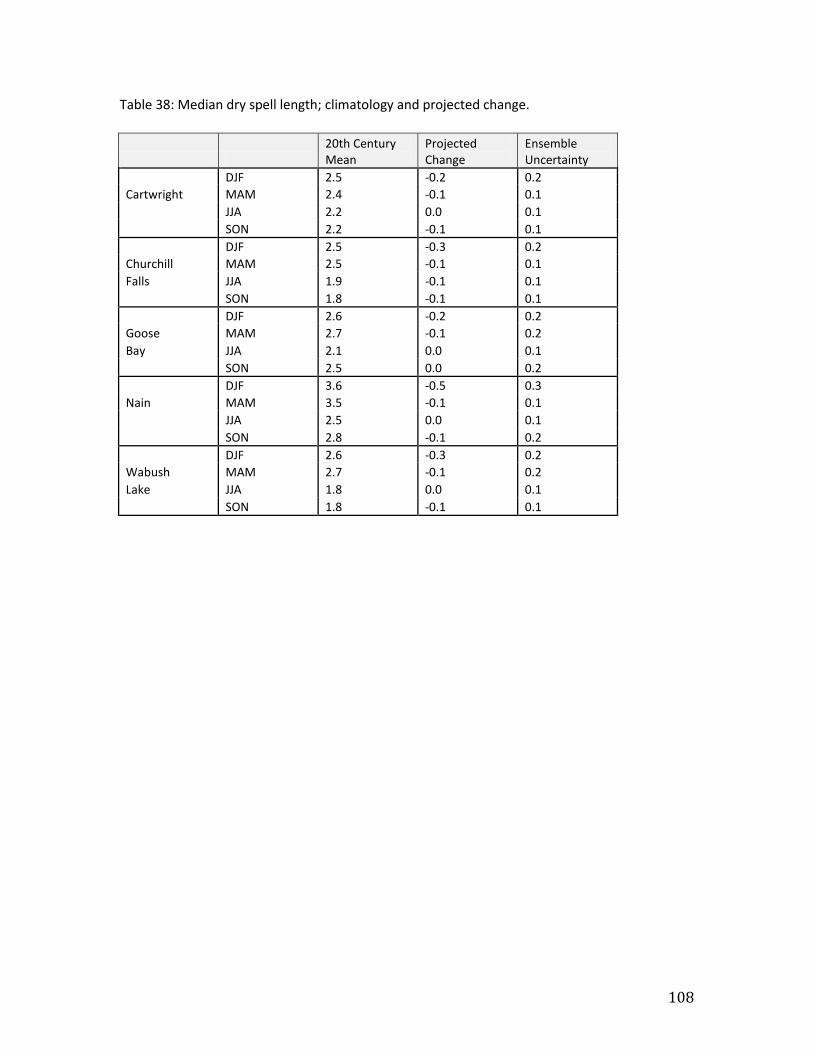
108
Table 38: Median dry spell length; climatology and projected change.
20th Century Mean
Projected Change
Ensemble Uncertainty
DJF 2.5 -0.2 0.2
Cartwright MAM 2.4 -0.1 0.1
JJA 2.2 0.0 0.1
SON 2.2 -0.1 0.1
DJF 2.5 -0.3 0.2
Churchill MAM 2.5 -0.1 0.1
Falls JJA 1.9 -0.1 0.1
SON 1.8 -0.1 0.1
DJF 2.6 -0.2 0.2
Goose MAM 2.7 -0.1 0.2
Bay JJA 2.1 0.0 0.1
SON 2.5 0.0 0.2
DJF 3.6 -0.5 0.3
Nain MAM 3.5 -0.1 0.1
JJA 2.5 0.0 0.1
SON 2.8 -0.1 0.2
DJF 2.6 -0.3 0.2
Wabush MAM 2.7 -0.1 0.2
Lake JJA 1.8 0.0 0.1
SON 1.8 -0.1 0.1
109
Standard Deviation of Dry Spell Length (days) Summary: Results show no noticeable change in range of expected dry spell lengths (variability in length) under a warming climate. Expected change is approximately 0 to 0.1 days. Included to give context to the mean and median dry spell length; the standard deviation is a measure of variability (spread) around the mean. Higher values imply a wider range of dry spell length. Changes are inconsequential, with only northern Labrador experiencing any statistically significant change (a decrease of 1-2 days in winter; i.e. dry spells stay closer to the mean length in a warmer climate).
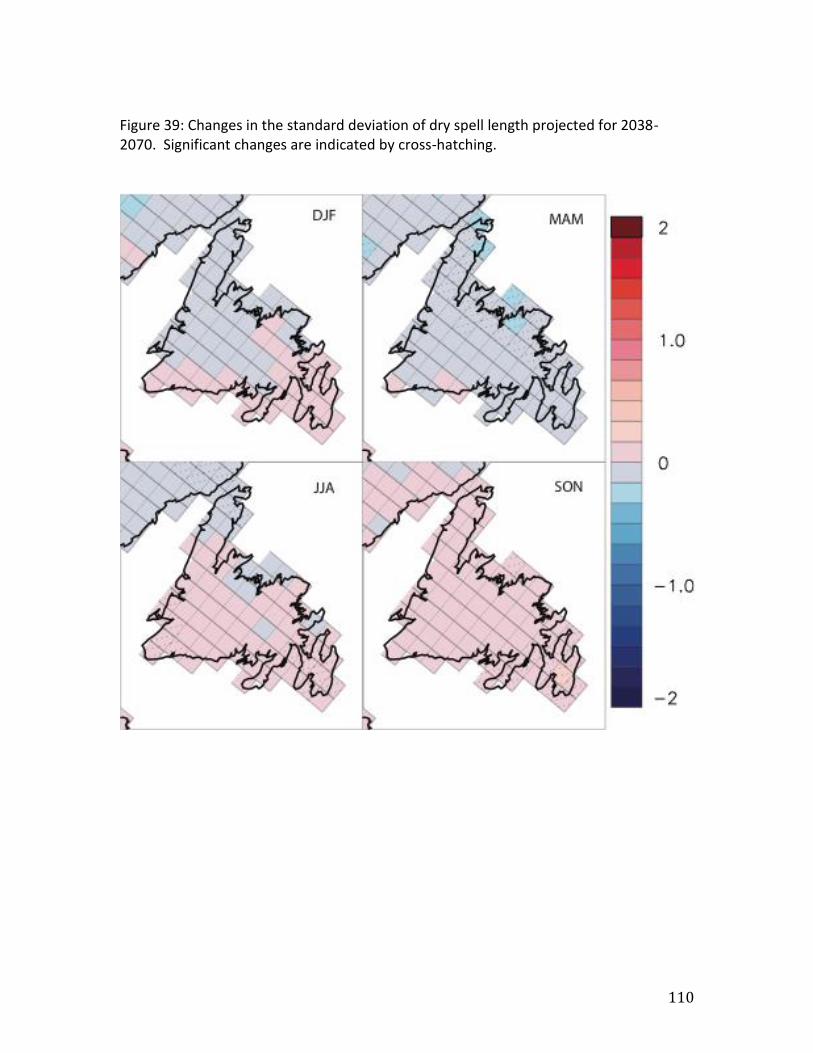
110
Figure 39: Changes in the standard deviation of dry spell length projected for 2038-2070. Significant changes are indicated by cross-hatching.
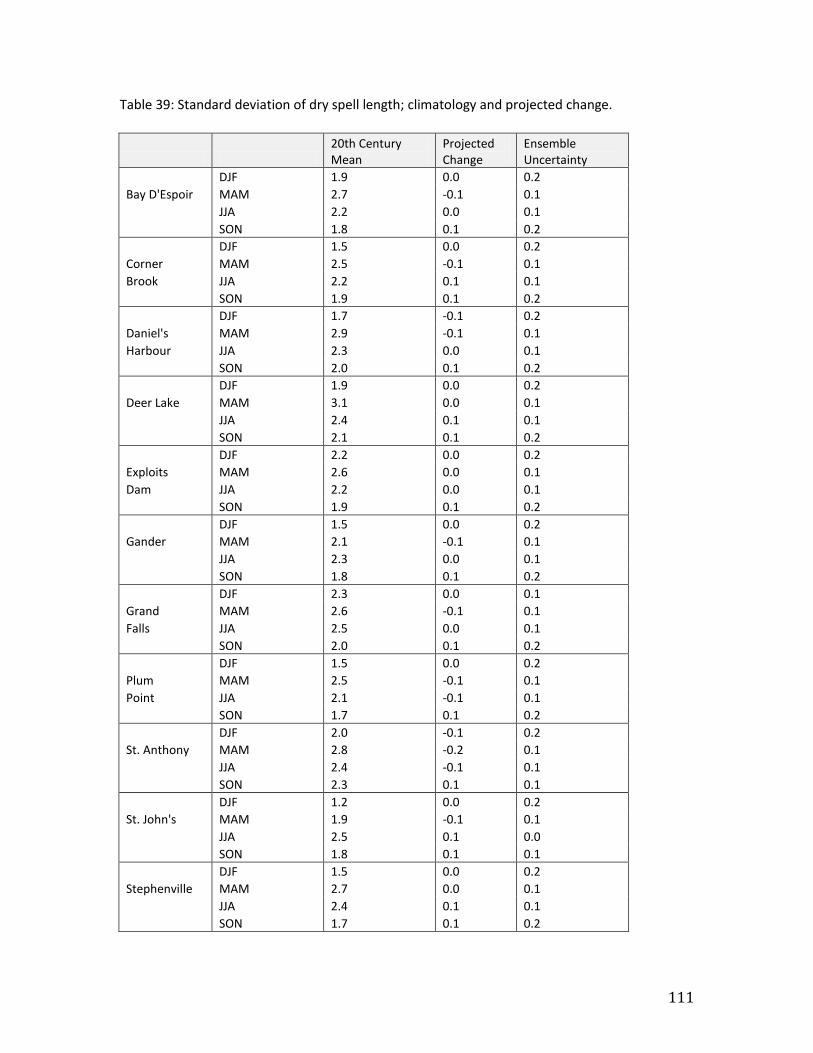
111
Table 39: Standard deviation of dry spell length; climatology and projected change.
20th Century Mean
Projected Change
Ensemble Uncertainty
DJF 1.9 0.0 0.2
Bay D'Espoir MAM 2.7 -0.1 0.1
JJA 2.2 0.0 0.1
SON 1.8 0.1 0.2
DJF 1.5 0.0 0.2
Corner MAM 2.5 -0.1 0.1
Brook JJA 2.2 0.1 0.1
SON 1.9 0.1 0.2
DJF 1.7 -0.1 0.2
Daniel's MAM 2.9 -0.1 0.1
Harbour JJA 2.3 0.0 0.1
SON 2.0 0.1 0.2
DJF 1.9 0.0 0.2
Deer Lake MAM 3.1 0.0 0.1
JJA 2.4 0.1 0.1
SON 2.1 0.1 0.2
DJF 2.2 0.0 0.2
Exploits MAM 2.6 0.0 0.1
Dam JJA 2.2 0.0 0.1
SON 1.9 0.1 0.2
DJF 1.5 0.0 0.2
Gander MAM 2.1 -0.1 0.1
JJA 2.3 0.0 0.1
SON 1.8 0.1 0.2
DJF 2.3 0.0 0.1
Grand MAM 2.6 -0.1 0.1
Falls JJA 2.5 0.0 0.1
SON 2.0 0.1 0.2
DJF 1.5 0.0 0.2
Plum MAM 2.5 -0.1 0.1
Point JJA 2.1 -0.1 0.1
SON 1.7 0.1 0.2
DJF 2.0 -0.1 0.2
St. Anthony MAM 2.8 -0.2 0.1
JJA 2.4 -0.1 0.1
SON 2.3 0.1 0.1
DJF 1.2 0.0 0.2
St. John's MAM 1.9 -0.1 0.1
JJA 2.5 0.1 0.0
SON 1.8 0.1 0.1
DJF 1.5 0.0 0.2
Stephenville MAM 2.7 0.0 0.1
JJA 2.4 0.1 0.1
SON 1.7 0.1 0.2

112
Figure 40: Changes in the standard deviation of dry spell length projected for 2038-2070. Significant changes are indicated by cross-hatching.

113
Table 40: Standard deviation of dry spell length; climatology and projected change.
20th Century Mean
Projected Change
Ensemble Uncertainty
DJF 2.3 -0.2 0.4
Cartwright MAM 2.8 -0.1 0.1
JJA 2.1 -0.2 0.1
SON 2.3 -0.1 0.2
DJF 2.6 -0.4 0.4
Churchill MAM 3.0 0.0 0.2
Falls JJA 2.0 -0.2 0.2
SON 1.8 -0.1 0.2
DJF 2.9 -0.4 0.3
Goose MAM 3.6 0.0 0.2
Bay JJA 2.1 -0.1 0.1
SON 2.5 -0.2 0.2
DJF 3.8 -0.4 0.5
Nain MAM 4.2 -0.3 0.3
JJA 2.9 -0.1 0.2
SON 2.9 -0.3 0.3
DJF 2.3 -0.3 0.3
Wabush MAM 3.5 -0.1 0.2
Lake JJA 2.0 -0.1 0.1
SON 1.8 -0.1 0.2
114
Extreme Precipitation: Return periods
The frequency and intensity of natural hazards are often reported as return periods, or recurrence intervals, which provide an estimate of the time between events of a given magnitude. For example, events meeting or exceeding a 100 year event can be expected roughly once a century. It is important to note, however, that the specified interval is rarely met in the real world. For example, it is possible, though unlikely, to see the 100 year event exceeded twice in two consecutive years. A better interpretation of the return period is as a probability; a 10 year return period has a 1 in 10 chance of occurring in a given year, a 20 year has a 1 in 20 chance, and so on. This emphasizes the fact that, in the absence of some change in the probability distribution, every year has the same chance of seeing a 100 year event. Return periods are used to describe extreme precipitation by engineers and planners, who often design structures, drainage systems, and transportation networks to withstand events with a specific return period. Design criteria derived from return period events are typically based on historical observations. This approach assumes that the precipitation probabilities will not change significantly during the lifetime of the structure or infrastructure being designed. Climate change violates this assumption, leading to potential under-design problems. However, although engineering guidelines may need to be re-evaluated in the context of climate change, estimating future return periods is a much more difficult problem than estimating changes in mean temperature or precipitation. Regional models can provide guidance in this regard, but it is necessary to interpret results with caution. This is particularly true for longer return period estimates, as uncertainty increases as the probability of an event decreases. Similarly, uncertainty increases as the period of record decreases; e.g. estimating the 100 year event from ~30 years is problematic, yet often done. For example, many IDF curves for Canadian locations are based on 10-15 years (e.g. La Scie, St. Albans, and Nain, among other Newfoundland & Labrador examples). The following numbers were extrapolated from available observations (Environment Canada IDF curves and the AHCCD) and climate simulations from NARCCAP, using the same approach employed by Environment Canada (EC) for their official IDF curves. In this approach, return periods are given by a Gumbel probability distribution, or type I extreme value distribution. This distribution is commonly used in hydrology and
precipitation analysis, and depends on two parameters: location () and scale (). Following EC practices, these were estimated using the method of moments, where:
~
s 6
~
X 0.5772~
115
where ~ denotes an estimate of the true value, s is the sample standard deviation, and
X is the sample mean. Other methods have been proposed for estimating these
parameters, and some appear to give improved results18; however, to maximize compatibility with the official EC curves familiar to most users, the method of moments will be used. Distributions are fit to time series of annual maximum precipitation within a specified duration; distributions are fit individually to each duration examined (6, 12, and 24 hour durations for the current study). Once fit, the resulting cumulative density function is then used to find events associated with selected probabilities; i.e., the 100 year event would have a 1/100 probability of being exceeded, the 50 year event a 1/50 year probability, etc. It is important to note that extreme precipitation changes in response to climate change should not be interpreted directly from GCM or RCM output, without first examining the output for biases and considering means of correcting these biases. Models have a tendency to underestimate extreme events, due to a) an inability to accurately replicate small-scale physics responsible for the most intense precipitation events and b) the need to distribute precipitation evenly over a grid cell. Cursory comparison of NARCCAP members with available observations indicate the models do not replicate observed statistics NL well under a modern climate; however, as a group they suggest events should become more extreme under a warming climate. The results presented below represent an estimate of bias-corrected IDF values for the 2038-2070 projection period, based on the assumption that the models capture changes in Gumbel distribution parameters reasonably well, even if the estimates of the true value of these parameters under the current climate are flawed. For each model, Gumbel distributions were fit to the 1968-2000 simulation and 2048-2070 projection at grid cells collocated with operational climate stations. The change in location and scale parameters between these periods was calculated, and this change was then applied to scale and shape parameters estimated from the climate station observations. Return period events were then extracted from this ‘climate perturbed’ distribution. The approach removes the 20th century bias in the model, to focus entirely on simulated changes. Uncertainty in the results remains high, however, and these numbers should only be considered a rough guideline. Results are provided for a) 6, 12, and 24 hour durations for stations with an IDF curve provided by EC, and b) 24 hour durations for precipitation-reporting stations from the AHCCD archive.
18 Martins & Stedinger, 2000.
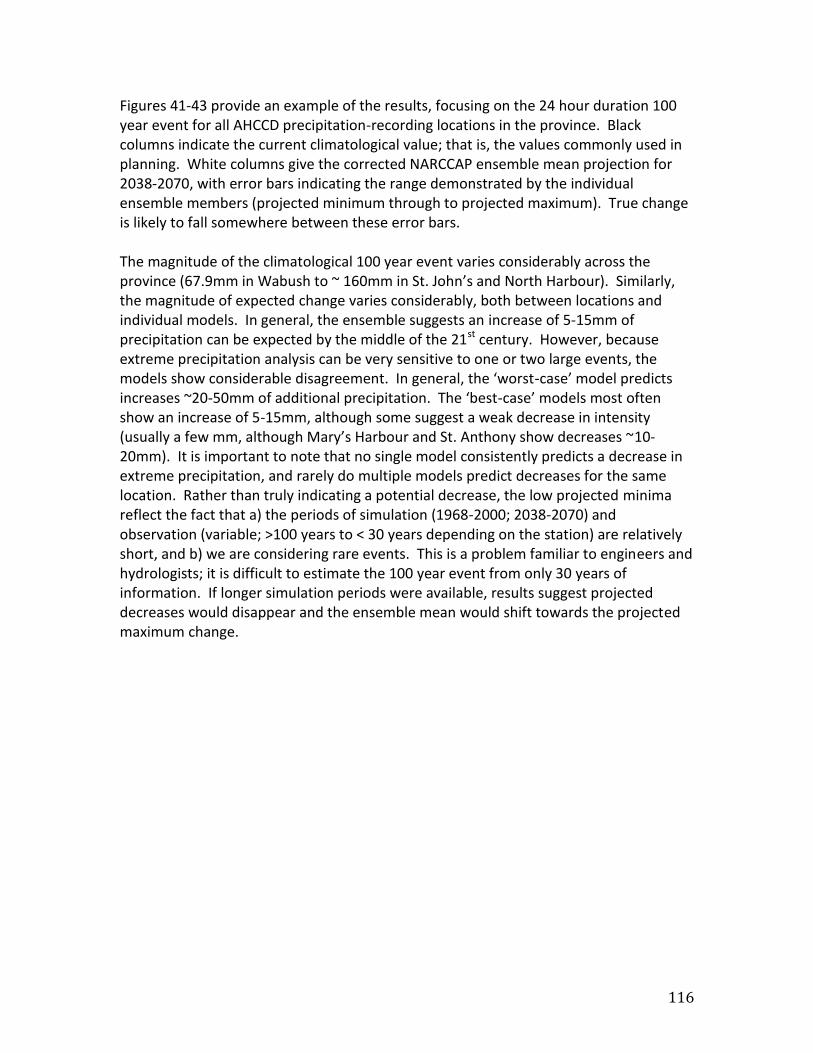
116
Figures 41-43 provide an example of the results, focusing on the 24 hour duration 100 year event for all AHCCD precipitation-recording locations in the province. Black columns indicate the current climatological value; that is, the values commonly used in planning. White columns give the corrected NARCCAP ensemble mean projection for 2038-2070, with error bars indicating the range demonstrated by the individual ensemble members (projected minimum through to projected maximum). True change is likely to fall somewhere between these error bars. The magnitude of the climatological 100 year event varies considerably across the province (67.9mm in Wabush to ~ 160mm in St. John’s and North Harbour). Similarly, the magnitude of expected change varies considerably, both between locations and individual models. In general, the ensemble suggests an increase of 5-15mm of precipitation can be expected by the middle of the 21st century. However, because extreme precipitation analysis can be very sensitive to one or two large events, the models show considerable disagreement. In general, the ‘worst-case’ model predicts increases ~20-50mm of additional precipitation. The ‘best-case’ models most often show an increase of 5-15mm, although some suggest a weak decrease in intensity (usually a few mm, although Mary’s Harbour and St. Anthony show decreases ~10-20mm). It is important to note that no single model consistently predicts a decrease in extreme precipitation, and rarely do multiple models predict decreases for the same location. Rather than truly indicating a potential decrease, the low projected minima reflect the fact that a) the periods of simulation (1968-2000; 2038-2070) and observation (variable; >100 years to < 30 years depending on the station) are relatively short, and b) we are considering rare events. This is a problem familiar to engineers and hydrologists; it is difficult to estimate the 100 year event from only 30 years of information. If longer simulation periods were available, results suggest projected decreases would disappear and the ensemble mean would shift towards the projected maximum change.
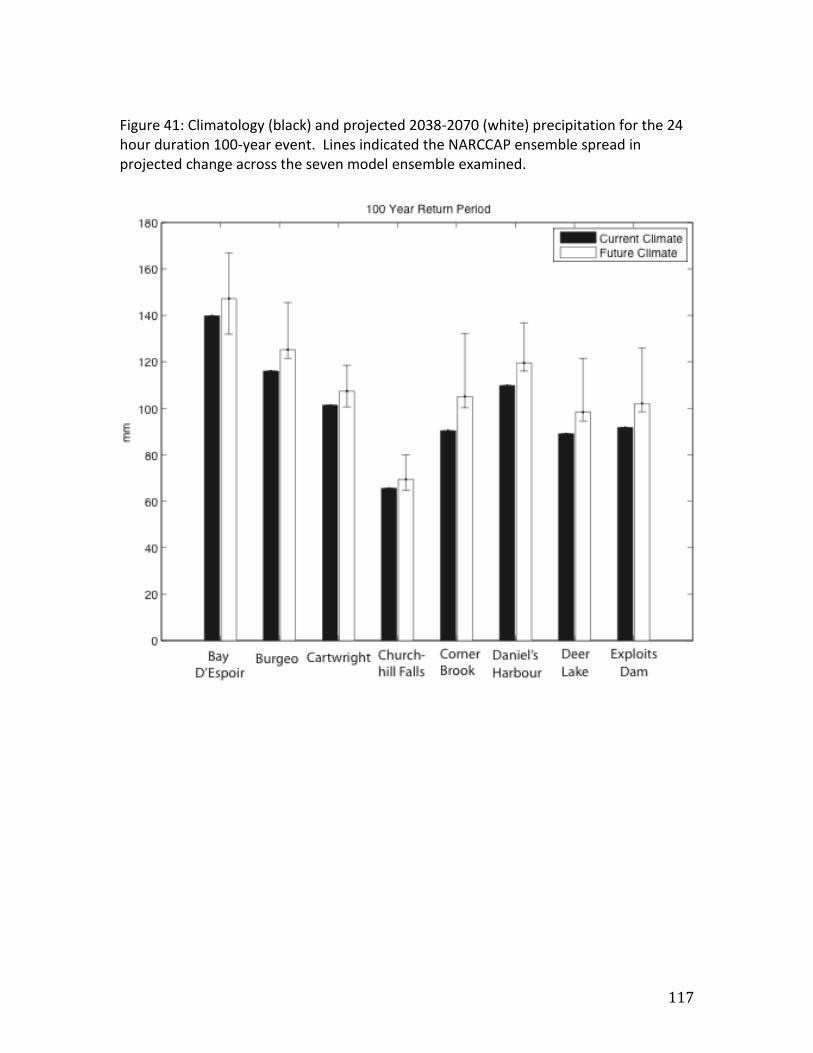
117
Figure 41: Climatology (black) and projected 2038-2070 (white) precipitation for the 24 hour duration 100-year event. Lines indicated the NARCCAP ensemble spread in projected change across the seven model ensemble examined.
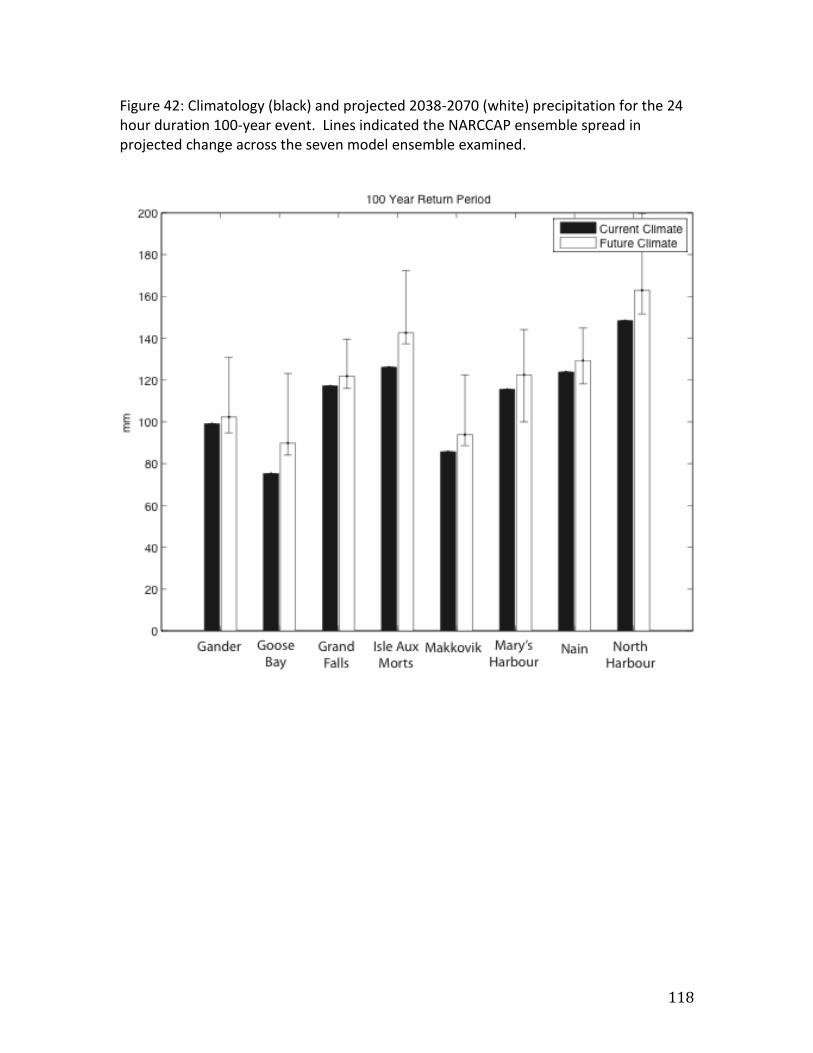
118
Figure 42: Climatology (black) and projected 2038-2070 (white) precipitation for the 24 hour duration 100-year event. Lines indicated the NARCCAP ensemble spread in projected change across the seven model ensemble examined.
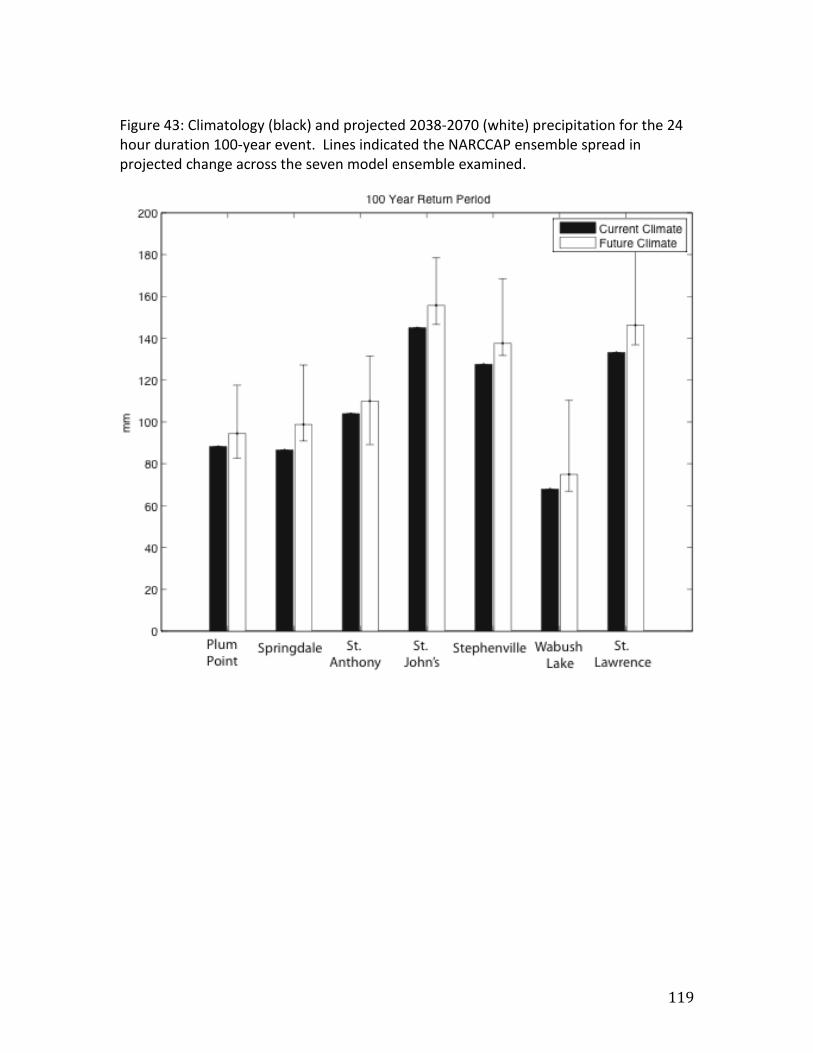
119
Figure 43: Climatology (black) and projected 2038-2070 (white) precipitation for the 24 hour duration 100-year event. Lines indicated the NARCCAP ensemble spread in projected change across the seven model ensemble examined.
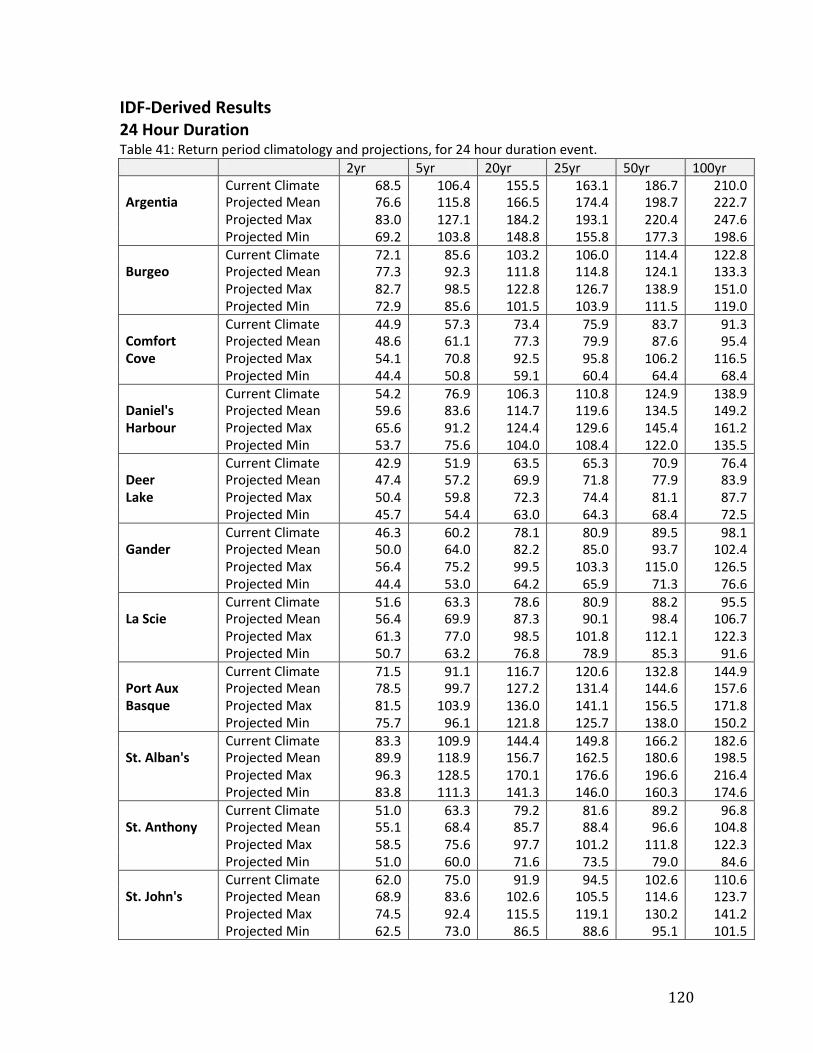
120
IDF-Derived Results 24 Hour Duration Table 41: Return period climatology and projections, for 24 hour duration event.
2yr 5yr 20yr 25yr 50yr 100yr Current Climate 68.5 106.4 155.5 163.1 186.7 210.0 Argentia Projected Mean 76.6 115.8 166.5 174.4 198.7 222.7 Projected Max 83.0 127.1 184.2 193.1 220.4 247.6 Projected Min 69.2 103.8 148.8 155.8 177.3 198.6 Current Climate 72.1 85.6 103.2 106.0 114.4 122.8 Burgeo Projected Mean 77.3 92.3 111.8 114.8 124.1 133.3 Projected Max 82.7 98.5 122.8 126.7 138.9 151.0 Projected Min 72.9 85.6 101.5 103.9 111.5 119.0 Current Climate 44.9 57.3 73.4 75.9 83.7 91.3 Comfort Projected Mean 48.6 61.1 77.3 79.9 87.6 95.4 Cove Projected Max 54.1 70.8 92.5 95.8 106.2 116.5 Projected Min 44.4 50.8 59.1 60.4 64.4 68.4 Current Climate 54.2 76.9 106.3 110.8 124.9 138.9 Daniel's Projected Mean 59.6 83.6 114.7 119.6 134.5 149.2 Harbour Projected Max 65.6 91.2 124.4 129.6 145.4 161.2 Projected Min 53.7 75.6 104.0 108.4 122.0 135.5 Current Climate 42.9 51.9 63.5 65.3 70.9 76.4 Deer Projected Mean 47.4 57.2 69.9 71.8 77.9 83.9 Lake Projected Max 50.4 59.8 72.3 74.4 81.1 87.7 Projected Min 45.7 54.4 63.0 64.3 68.4 72.5 Current Climate 46.3 60.2 78.1 80.9 89.5 98.1 Gander Projected Mean 50.0 64.0 82.2 85.0 93.7 102.4 Projected Max 56.4 75.2 99.5 103.3 115.0 126.5 Projected Min 44.4 53.0 64.2 65.9 71.3 76.6 Current Climate 51.6 63.3 78.6 80.9 88.2 95.5 La Scie Projected Mean 56.4 69.9 87.3 90.1 98.4 106.7 Projected Max 61.3 77.0 98.5 101.8 112.1 122.3 Projected Min 50.7 63.2 76.8 78.9 85.3 91.6 Current Climate 71.5 91.1 116.7 120.6 132.8 144.9 Port Aux Projected Mean 78.5 99.7 127.2 131.4 144.6 157.6 Basque Projected Max 81.5 103.9 136.0 141.1 156.5 171.8 Projected Min 75.7 96.1 121.8 125.7 138.0 150.2 Current Climate 83.3 109.9 144.4 149.8 166.2 182.6 St. Alban's Projected Mean 89.9 118.9 156.7 162.5 180.6 198.5 Projected Max 96.3 128.5 170.1 176.6 196.6 216.4 Projected Min 83.8 111.3 141.3 146.0 160.3 174.6 Current Climate 51.0 63.3 79.2 81.6 89.2 96.8 St. Anthony Projected Mean 55.1 68.4 85.7 88.4 96.6 104.8 Projected Max 58.5 75.6 97.7 101.2 111.8 122.3 Projected Min 51.0 60.0 71.6 73.5 79.0 84.6 Current Climate 62.0 75.0 91.9 94.5 102.6 110.6 St. John's Projected Mean 68.9 83.6 102.6 105.5 114.6 123.7 Projected Max 74.5 92.4 115.5 119.1 130.2 141.2 Projected Min 62.5 73.0 86.5 88.6 95.1 101.5
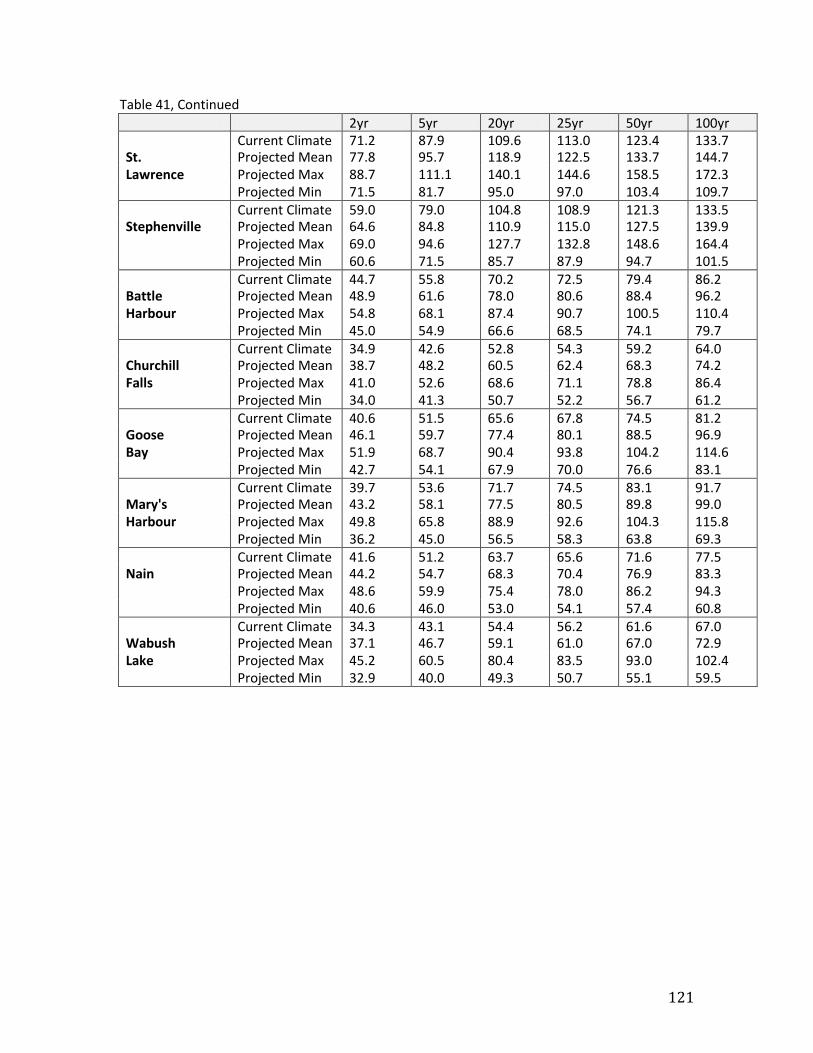
121
Table 41, Continued
2yr 5yr 20yr 25yr 50yr 100yr Current Climate 71.2 87.9 109.6 113.0 123.4 133.7 St. Projected Mean 77.8 95.7 118.9 122.5 133.7 144.7 Lawrence Projected Max 88.7 111.1 140.1 144.6 158.5 172.3 Projected Min 71.5 81.7 95.0 97.0 103.4 109.7 Current Climate 59.0 79.0 104.8 108.9 121.3 133.5 Stephenville Projected Mean 64.6 84.8 110.9 115.0 127.5 139.9 Projected Max 69.0 94.6 127.7 132.8 148.6 164.4 Projected Min 60.6 71.5 85.7 87.9 94.7 101.5 Current Climate 44.7 55.8 70.2 72.5 79.4 86.2 Battle Projected Mean 48.9 61.6 78.0 80.6 88.4 96.2 Harbour Projected Max 54.8 68.1 87.4 90.7 100.5 110.4 Projected Min 45.0 54.9 66.6 68.5 74.1 79.7 Current Climate 34.9 42.6 52.8 54.3 59.2 64.0 Churchill Projected Mean 38.7 48.2 60.5 62.4 68.3 74.2 Falls Projected Max 41.0 52.6 68.6 71.1 78.8 86.4 Projected Min 34.0 41.3 50.7 52.2 56.7 61.2 Current Climate 40.6 51.5 65.6 67.8 74.5 81.2 Goose Projected Mean 46.1 59.7 77.4 80.1 88.5 96.9 Bay Projected Max 51.9 68.7 90.4 93.8 104.2 114.6 Projected Min 42.7 54.1 67.9 70.0 76.6 83.1 Current Climate 39.7 53.6 71.7 74.5 83.1 91.7 Mary's Projected Mean 43.2 58.1 77.5 80.5 89.8 99.0 Harbour Projected Max 49.8 65.8 88.9 92.6 104.3 115.8 Projected Min 36.2 45.0 56.5 58.3 63.8 69.3 Current Climate 41.6 51.2 63.7 65.6 71.6 77.5 Nain Projected Mean 44.2 54.7 68.3 70.4 76.9 83.3 Projected Max 48.6 59.9 75.4 78.0 86.2 94.3 Projected Min 40.6 46.0 53.0 54.1 57.4 60.8 Current Climate 34.3 43.1 54.4 56.2 61.6 67.0 Wabush Projected Mean 37.1 46.7 59.1 61.0 67.0 72.9 Lake Projected Max 45.2 60.5 80.4 83.5 93.0 102.4 Projected Min 32.9 40.0 49.3 50.7 55.1 59.5
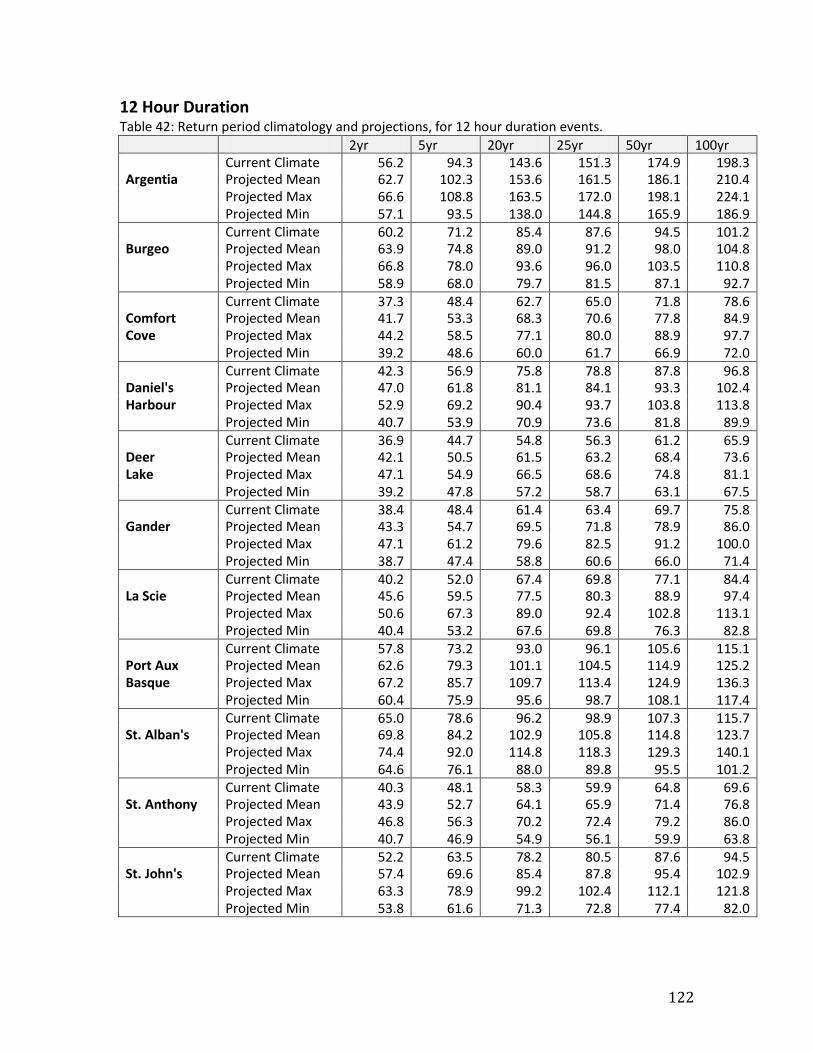
122
12 Hour Duration Table 42: Return period climatology and projections, for 12 hour duration events. 2yr 5yr 20yr 25yr 50yr 100yr Current Climate 56.2 94.3 143.6 151.3 174.9 198.3 Argentia Projected Mean 62.7 102.3 153.6 161.5 186.1 210.4 Projected Max 66.6 108.8 163.5 172.0 198.1 224.1 Projected Min 57.1 93.5 138.0 144.8 165.9 186.9 Current Climate 60.2 71.2 85.4 87.6 94.5 101.2 Burgeo Projected Mean 63.9 74.8 89.0 91.2 98.0 104.8 Projected Max 66.8 78.0 93.6 96.0 103.5 110.8 Projected Min 58.9 68.0 79.7 81.5 87.1 92.7 Current Climate 37.3 48.4 62.7 65.0 71.8 78.6 Comfort Projected Mean 41.7 53.3 68.3 70.6 77.8 84.9 Cove Projected Max 44.2 58.5 77.1 80.0 88.9 97.7 Projected Min 39.2 48.6 60.0 61.7 66.9 72.0 Current Climate 42.3 56.9 75.8 78.8 87.8 96.8 Daniel's Projected Mean 47.0 61.8 81.1 84.1 93.3 102.4 Harbour Projected Max 52.9 69.2 90.4 93.7 103.8 113.8 Projected Min 40.7 53.9 70.9 73.6 81.8 89.9 Current Climate 36.9 44.7 54.8 56.3 61.2 65.9 Deer Projected Mean 42.1 50.5 61.5 63.2 68.4 73.6 Lake Projected Max 47.1 54.9 66.5 68.6 74.8 81.1 Projected Min 39.2 47.8 57.2 58.7 63.1 67.5 Current Climate 38.4 48.4 61.4 63.4 69.7 75.8 Gander Projected Mean 43.3 54.7 69.5 71.8 78.9 86.0 Projected Max 47.1 61.2 79.6 82.5 91.2 100.0 Projected Min 38.7 47.4 58.8 60.6 66.0 71.4 Current Climate 40.2 52.0 67.4 69.8 77.1 84.4 La Scie Projected Mean 45.6 59.5 77.5 80.3 88.9 97.4 Projected Max 50.6 67.3 89.0 92.4 102.8 113.1 Projected Min 40.4 53.2 67.6 69.8 76.3 82.8 Current Climate 57.8 73.2 93.0 96.1 105.6 115.1 Port Aux Projected Mean 62.6 79.3 101.1 104.5 114.9 125.2 Basque Projected Max 67.2 85.7 109.7 113.4 124.9 136.3 Projected Min 60.4 75.9 95.6 98.7 108.1 117.4 Current Climate 65.0 78.6 96.2 98.9 107.3 115.7 St. Alban's Projected Mean 69.8 84.2 102.9 105.8 114.8 123.7 Projected Max 74.4 92.0 114.8 118.3 129.3 140.1 Projected Min 64.6 76.1 88.0 89.8 95.5 101.2 Current Climate 40.3 48.1 58.3 59.9 64.8 69.6 St. Anthony Projected Mean 43.9 52.7 64.1 65.9 71.4 76.8 Projected Max 46.8 56.3 70.2 72.4 79.2 86.0 Projected Min 40.7 46.9 54.9 56.1 59.9 63.8 Current Climate 52.2 63.5 78.2 80.5 87.6 94.5 St. John's Projected Mean 57.4 69.6 85.4 87.8 95.4 102.9 Projected Max 63.3 78.9 99.2 102.4 112.1 121.8 Projected Min 53.8 61.6 71.3 72.8 77.4 82.0
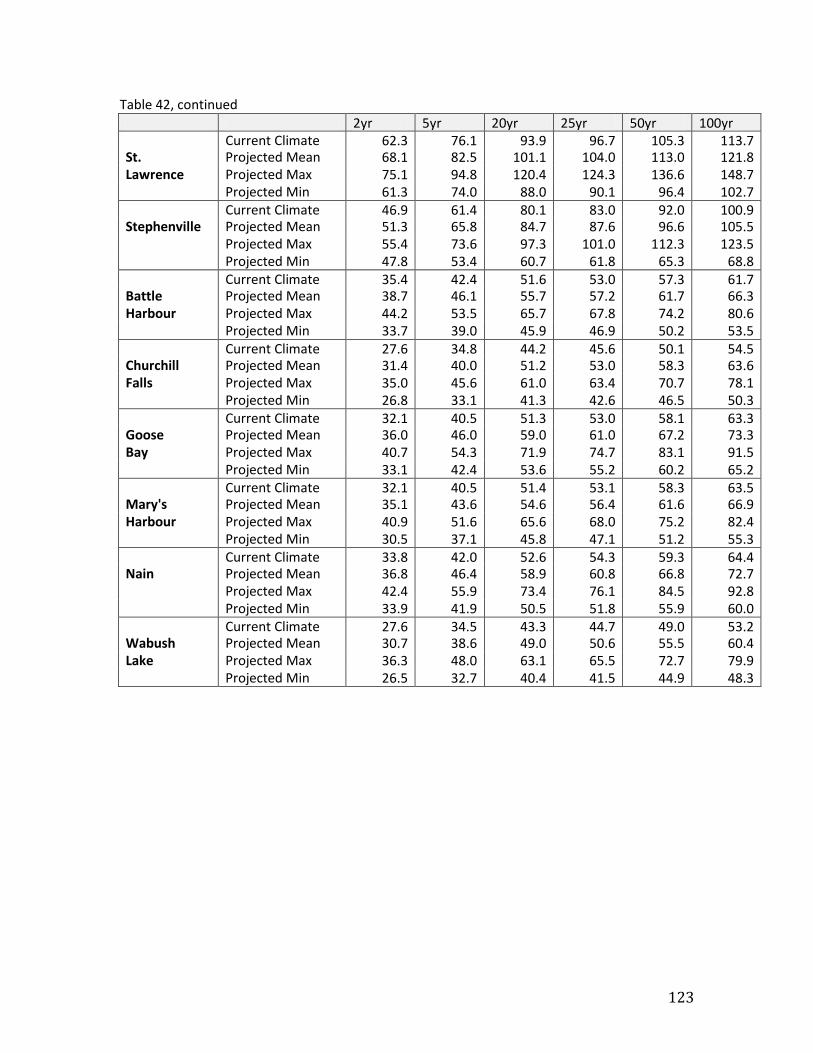
123
Table 42, continued 2yr 5yr 20yr 25yr 50yr 100yr Current Climate 62.3 76.1 93.9 96.7 105.3 113.7 St. Projected Mean 68.1 82.5 101.1 104.0 113.0 121.8 Lawrence Projected Max 75.1 94.8 120.4 124.3 136.6 148.7 Projected Min 61.3 74.0 88.0 90.1 96.4 102.7 Current Climate 46.9 61.4 80.1 83.0 92.0 100.9 Stephenville Projected Mean 51.3 65.8 84.7 87.6 96.6 105.5 Projected Max 55.4 73.6 97.3 101.0 112.3 123.5 Projected Min 47.8 53.4 60.7 61.8 65.3 68.8 Current Climate 35.4 42.4 51.6 53.0 57.3 61.7 Battle Projected Mean 38.7 46.1 55.7 57.2 61.7 66.3 Harbour Projected Max 44.2 53.5 65.7 67.8 74.2 80.6 Projected Min 33.7 39.0 45.9 46.9 50.2 53.5 Current Climate 27.6 34.8 44.2 45.6 50.1 54.5 Churchill Projected Mean 31.4 40.0 51.2 53.0 58.3 63.6 Falls Projected Max 35.0 45.6 61.0 63.4 70.7 78.1 Projected Min 26.8 33.1 41.3 42.6 46.5 50.3 Current Climate 32.1 40.5 51.3 53.0 58.1 63.3 Goose Projected Mean 36.0 46.0 59.0 61.0 67.2 73.3 Bay Projected Max 40.7 54.3 71.9 74.7 83.1 91.5 Projected Min 33.1 42.4 53.6 55.2 60.2 65.2 Current Climate 32.1 40.5 51.4 53.1 58.3 63.5 Mary's Projected Mean 35.1 43.6 54.6 56.4 61.6 66.9 Harbour Projected Max 40.9 51.6 65.6 68.0 75.2 82.4 Projected Min 30.5 37.1 45.8 47.1 51.2 55.3 Current Climate 33.8 42.0 52.6 54.3 59.3 64.4 Nain Projected Mean 36.8 46.4 58.9 60.8 66.8 72.7 Projected Max 42.4 55.9 73.4 76.1 84.5 92.8 Projected Min 33.9 41.9 50.5 51.8 55.9 60.0 Current Climate 27.6 34.5 43.3 44.7 49.0 53.2 Wabush Projected Mean 30.7 38.6 49.0 50.6 55.5 60.4 Lake Projected Max 36.3 48.0 63.1 65.5 72.7 79.9 Projected Min 26.5 32.7 40.4 41.5 44.9 48.3
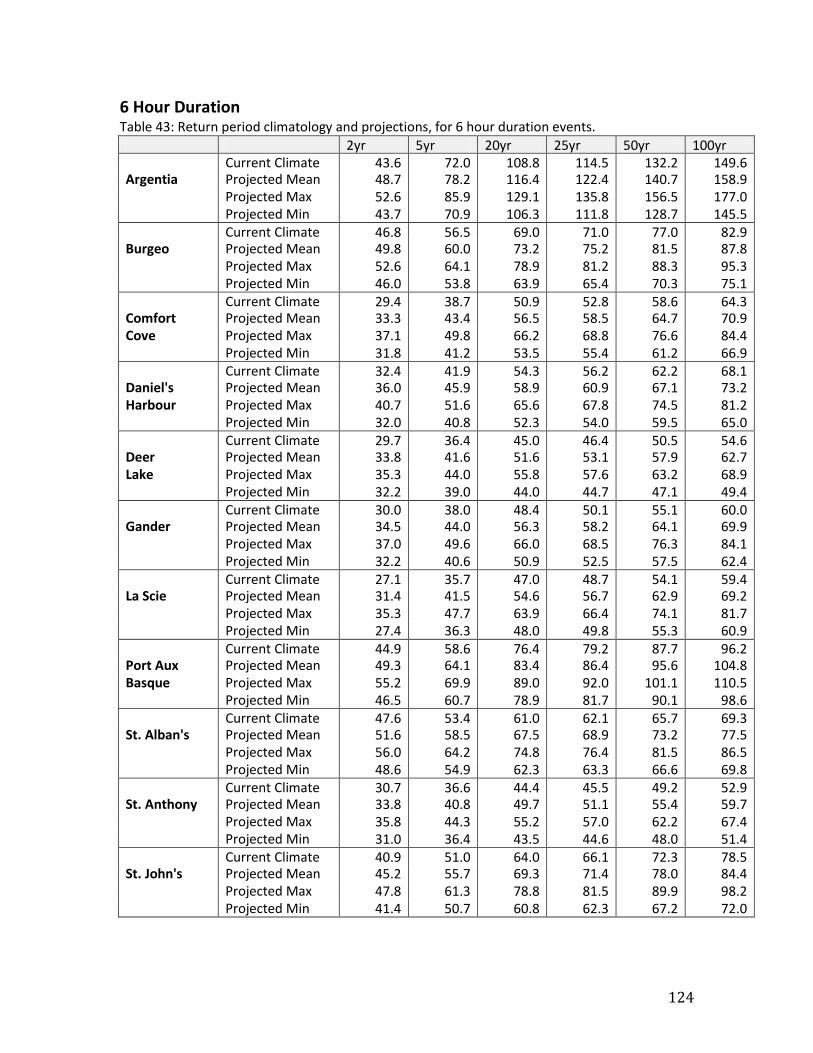
124
6 Hour Duration Table 43: Return period climatology and projections, for 6 hour duration events. 2yr 5yr 20yr 25yr 50yr 100yr Current Climate 43.6 72.0 108.8 114.5 132.2 149.6 Argentia Projected Mean 48.7 78.2 116.4 122.4 140.7 158.9 Projected Max 52.6 85.9 129.1 135.8 156.5 177.0 Projected Min 43.7 70.9 106.3 111.8 128.7 145.5 Current Climate 46.8 56.5 69.0 71.0 77.0 82.9 Burgeo Projected Mean 49.8 60.0 73.2 75.2 81.5 87.8 Projected Max 52.6 64.1 78.9 81.2 88.3 95.3 Projected Min 46.0 53.8 63.9 65.4 70.3 75.1 Current Climate 29.4 38.7 50.9 52.8 58.6 64.3 Comfort Projected Mean 33.3 43.4 56.5 58.5 64.7 70.9 Cove Projected Max 37.1 49.8 66.2 68.8 76.6 84.4 Projected Min 31.8 41.2 53.5 55.4 61.2 66.9 Current Climate 32.4 41.9 54.3 56.2 62.2 68.1 Daniel's Projected Mean 36.0 45.9 58.9 60.9 67.1 73.2 Harbour Projected Max 40.7 51.6 65.6 67.8 74.5 81.2 Projected Min 32.0 40.8 52.3 54.0 59.5 65.0 Current Climate 29.7 36.4 45.0 46.4 50.5 54.6 Deer Projected Mean 33.8 41.6 51.6 53.1 57.9 62.7 Lake Projected Max 35.3 44.0 55.8 57.6 63.2 68.9 Projected Min 32.2 39.0 44.0 44.7 47.1 49.4 Current Climate 30.0 38.0 48.4 50.1 55.1 60.0 Gander Projected Mean 34.5 44.0 56.3 58.2 64.1 69.9 Projected Max 37.0 49.6 66.0 68.5 76.3 84.1 Projected Min 32.2 40.6 50.9 52.5 57.5 62.4 Current Climate 27.1 35.7 47.0 48.7 54.1 59.4 La Scie Projected Mean 31.4 41.5 54.6 56.7 62.9 69.2 Projected Max 35.3 47.7 63.9 66.4 74.1 81.7 Projected Min 27.4 36.3 48.0 49.8 55.3 60.9 Current Climate 44.9 58.6 76.4 79.2 87.7 96.2 Port Aux Projected Mean 49.3 64.1 83.4 86.4 95.6 104.8 Basque Projected Max 55.2 69.9 89.0 92.0 101.1 110.5 Projected Min 46.5 60.7 78.9 81.7 90.1 98.6 Current Climate 47.6 53.4 61.0 62.1 65.7 69.3 St. Alban's Projected Mean 51.6 58.5 67.5 68.9 73.2 77.5 Projected Max 56.0 64.2 74.8 76.4 81.5 86.5 Projected Min 48.6 54.9 62.3 63.3 66.6 69.8 Current Climate 30.7 36.6 44.4 45.5 49.2 52.9 St. Anthony Projected Mean 33.8 40.8 49.7 51.1 55.4 59.7 Projected Max 35.8 44.3 55.2 57.0 62.2 67.4 Projected Min 31.0 36.4 43.5 44.6 48.0 51.4 Current Climate 40.9 51.0 64.0 66.1 72.3 78.5 St. John's Projected Mean 45.2 55.7 69.3 71.4 78.0 84.4 Projected Max 47.8 61.3 78.8 81.5 89.9 98.2 Projected Min 41.4 50.7 60.8 62.3 67.2 72.0
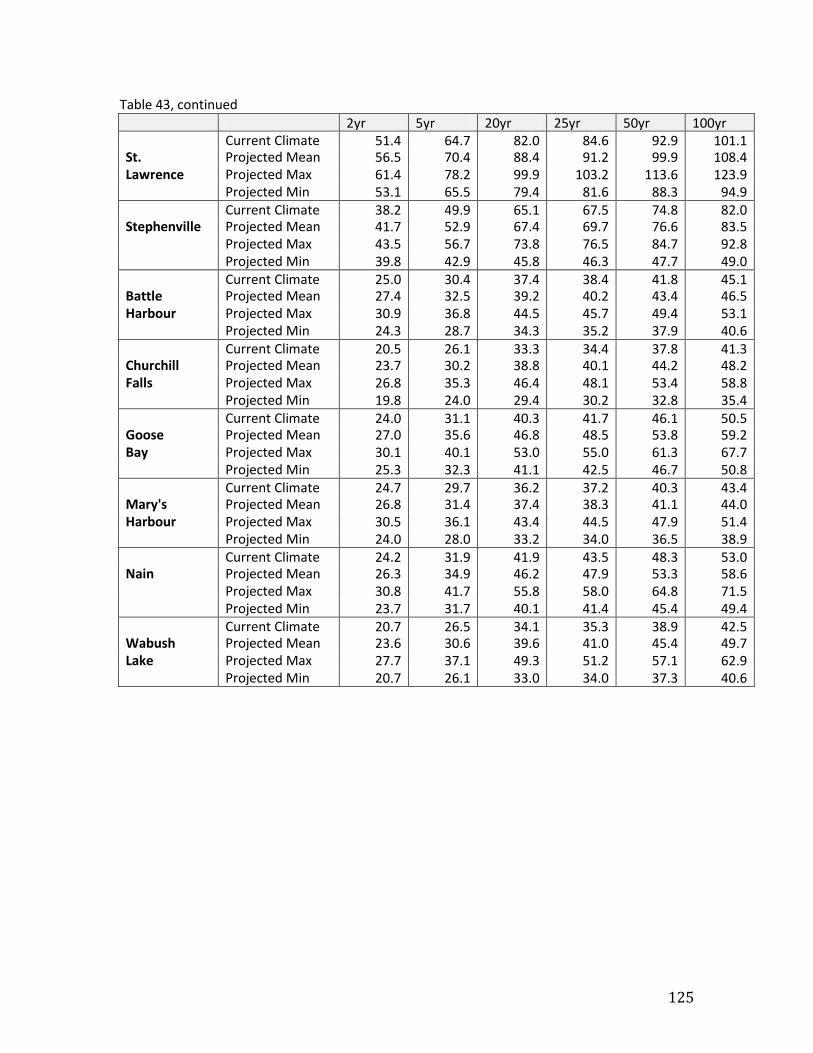
125
Table 43, continued 2yr 5yr 20yr 25yr 50yr 100yr Current Climate 51.4 64.7 82.0 84.6 92.9 101.1 St. Projected Mean 56.5 70.4 88.4 91.2 99.9 108.4 Lawrence Projected Max 61.4 78.2 99.9 103.2 113.6 123.9 Projected Min 53.1 65.5 79.4 81.6 88.3 94.9 Current Climate 38.2 49.9 65.1 67.5 74.8 82.0 Stephenville Projected Mean 41.7 52.9 67.4 69.7 76.6 83.5 Projected Max 43.5 56.7 73.8 76.5 84.7 92.8 Projected Min 39.8 42.9 45.8 46.3 47.7 49.0 Current Climate 25.0 30.4 37.4 38.4 41.8 45.1 Battle Projected Mean 27.4 32.5 39.2 40.2 43.4 46.5 Harbour Projected Max 30.9 36.8 44.5 45.7 49.4 53.1 Projected Min 24.3 28.7 34.3 35.2 37.9 40.6 Current Climate 20.5 26.1 33.3 34.4 37.8 41.3 Churchill Projected Mean 23.7 30.2 38.8 40.1 44.2 48.2 Falls Projected Max 26.8 35.3 46.4 48.1 53.4 58.8 Projected Min 19.8 24.0 29.4 30.2 32.8 35.4 Current Climate 24.0 31.1 40.3 41.7 46.1 50.5 Goose Projected Mean 27.0 35.6 46.8 48.5 53.8 59.2 Bay Projected Max 30.1 40.1 53.0 55.0 61.3 67.7 Projected Min 25.3 32.3 41.1 42.5 46.7 50.8 Current Climate 24.7 29.7 36.2 37.2 40.3 43.4 Mary's Projected Mean 26.8 31.4 37.4 38.3 41.1 44.0 Harbour Projected Max 30.5 36.1 43.4 44.5 47.9 51.4 Projected Min 24.0 28.0 33.2 34.0 36.5 38.9 Current Climate 24.2 31.9 41.9 43.5 48.3 53.0 Nain Projected Mean 26.3 34.9 46.2 47.9 53.3 58.6 Projected Max 30.8 41.7 55.8 58.0 64.8 71.5 Projected Min 23.7 31.7 40.1 41.4 45.4 49.4 Current Climate 20.7 26.5 34.1 35.3 38.9 42.5 Wabush Projected Mean 23.6 30.6 39.6 41.0 45.4 49.7 Lake Projected Max 27.7 37.1 49.3 51.2 57.1 62.9 Projected Min 20.7 26.1 33.0 34.0 37.3 40.6
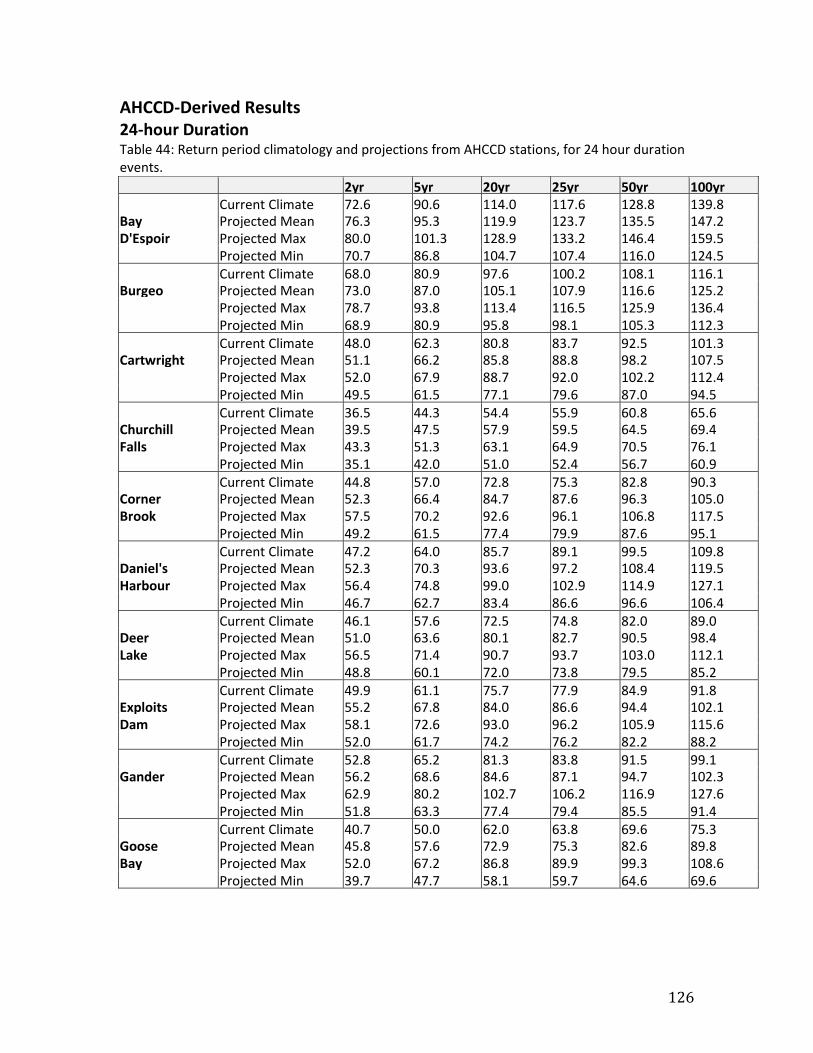
126
AHCCD-Derived Results 24-hour Duration Table 44: Return period climatology and projections from AHCCD stations, for 24 hour duration events. 2yr 5yr 20yr 25yr 50yr 100yr Current Climate 72.6 90.6 114.0 117.6 128.8 139.8 Bay Projected Mean 76.3 95.3 119.9 123.7 135.5 147.2 D'Espoir Projected Max 80.0 101.3 128.9 133.2 146.4 159.5 Projected Min 70.7 86.8 104.7 107.4 116.0 124.5 Current Climate 68.0 80.9 97.6 100.2 108.1 116.1 Burgeo Projected Mean 73.0 87.0 105.1 107.9 116.6 125.2 Projected Max 78.7 93.8 113.4 116.5 125.9 136.4 Projected Min 68.9 80.9 95.8 98.1 105.3 112.3 Current Climate 48.0 62.3 80.8 83.7 92.5 101.3 Cartwright Projected Mean 51.1 66.2 85.8 88.8 98.2 107.5 Projected Max 52.0 67.9 88.7 92.0 102.2 112.4 Projected Min 49.5 61.5 77.1 79.6 87.0 94.5 Current Climate 36.5 44.3 54.4 55.9 60.8 65.6 Churchill Projected Mean 39.5 47.5 57.9 59.5 64.5 69.4 Falls Projected Max 43.3 51.3 63.1 64.9 70.5 76.1 Projected Min 35.1 42.0 51.0 52.4 56.7 60.9 Current Climate 44.8 57.0 72.8 75.3 82.8 90.3 Corner Projected Mean 52.3 66.4 84.7 87.6 96.3 105.0 Brook Projected Max 57.5 70.2 92.6 96.1 106.8 117.5 Projected Min 49.2 61.5 77.4 79.9 87.6 95.1 Current Climate 47.2 64.0 85.7 89.1 99.5 109.8 Daniel's Projected Mean 52.3 70.3 93.6 97.2 108.4 119.5 Harbour Projected Max 56.4 74.8 99.0 102.9 114.9 127.1 Projected Min 46.7 62.7 83.4 86.6 96.6 106.4 Current Climate 46.1 57.6 72.5 74.8 82.0 89.0 Deer Projected Mean 51.0 63.6 80.1 82.7 90.5 98.4 Lake Projected Max 56.5 71.4 90.7 93.7 103.0 112.1 Projected Min 48.8 60.1 72.0 73.8 79.5 85.2 Current Climate 49.9 61.1 75.7 77.9 84.9 91.8 Exploits Projected Mean 55.2 67.8 84.0 86.6 94.4 102.1 Dam Projected Max 58.1 72.6 93.0 96.2 105.9 115.6 Projected Min 52.0 61.7 74.2 76.2 82.2 88.2 Current Climate 52.8 65.2 81.3 83.8 91.5 99.1 Gander Projected Mean 56.2 68.6 84.6 87.1 94.7 102.3 Projected Max 62.9 80.2 102.7 106.2 116.9 127.6 Projected Min 51.8 63.3 77.4 79.4 85.5 91.4 Current Climate 40.7 50.0 62.0 63.8 69.6 75.3 Goose Projected Mean 45.8 57.6 72.9 75.3 82.6 89.8 Bay Projected Max 52.0 67.2 86.8 89.9 99.3 108.6 Projected Min 39.7 47.7 58.1 59.7 64.6 69.6
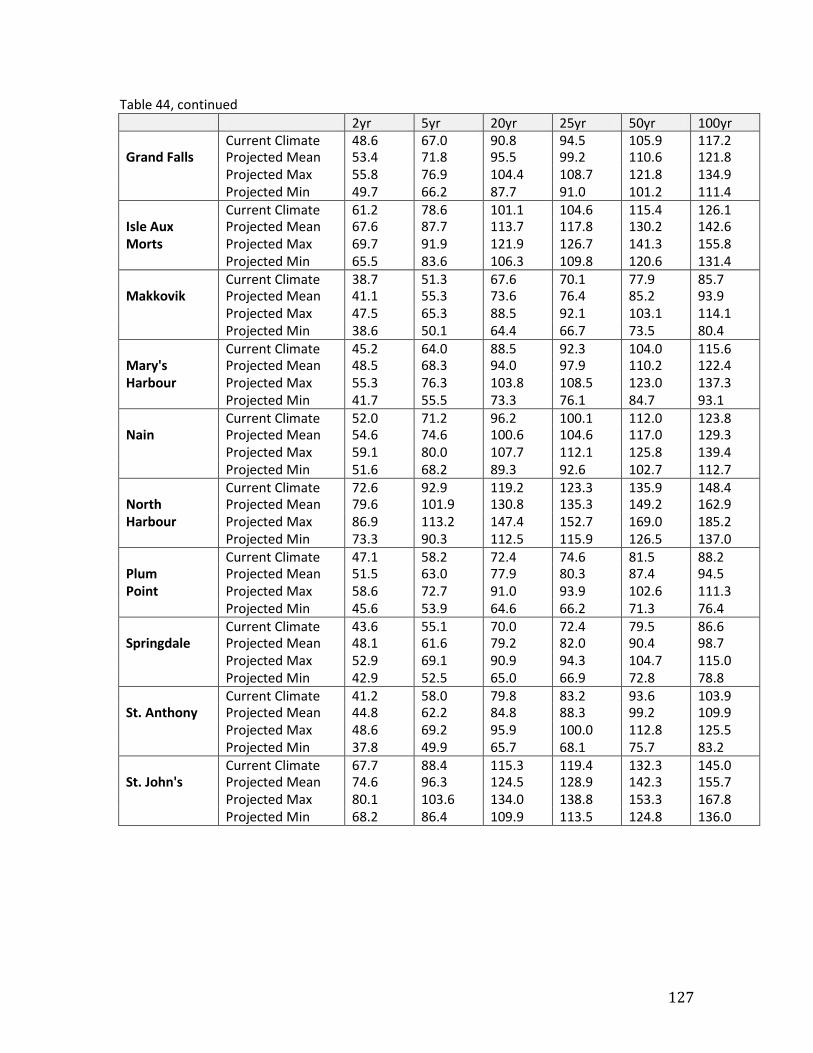
127
Table 44, continued 2yr 5yr 20yr 25yr 50yr 100yr Current Climate 48.6 67.0 90.8 94.5 105.9 117.2 Grand Falls Projected Mean 53.4 71.8 95.5 99.2 110.6 121.8 Projected Max 55.8 76.9 104.4 108.7 121.8 134.9 Projected Min 49.7 66.2 87.7 91.0 101.2 111.4 Current Climate 61.2 78.6 101.1 104.6 115.4 126.1 Isle Aux Projected Mean 67.6 87.7 113.7 117.8 130.2 142.6 Morts Projected Max 69.7 91.9 121.9 126.7 141.3 155.8 Projected Min 65.5 83.6 106.3 109.8 120.6 131.4 Current Climate 38.7 51.3 67.6 70.1 77.9 85.7 Makkovik Projected Mean 41.1 55.3 73.6 76.4 85.2 93.9 Projected Max 47.5 65.3 88.5 92.1 103.1 114.1 Projected Min 38.6 50.1 64.4 66.7 73.5 80.4 Current Climate 45.2 64.0 88.5 92.3 104.0 115.6 Mary's Projected Mean 48.5 68.3 94.0 97.9 110.2 122.4 Harbour Projected Max 55.3 76.3 103.8 108.5 123.0 137.3 Projected Min 41.7 55.5 73.3 76.1 84.7 93.1 Current Climate 52.0 71.2 96.2 100.1 112.0 123.8 Nain Projected Mean 54.6 74.6 100.6 104.6 117.0 129.3 Projected Max 59.1 80.0 107.7 112.1 125.8 139.4 Projected Min 51.6 68.2 89.3 92.6 102.7 112.7 Current Climate 72.6 92.9 119.2 123.3 135.9 148.4 North Projected Mean 79.6 101.9 130.8 135.3 149.2 162.9 Harbour Projected Max 86.9 113.2 147.4 152.7 169.0 185.2 Projected Min 73.3 90.3 112.5 115.9 126.5 137.0 Current Climate 47.1 58.2 72.4 74.6 81.5 88.2 Plum Projected Mean 51.5 63.0 77.9 80.3 87.4 94.5 Point Projected Max 58.6 72.7 91.0 93.9 102.6 111.3 Projected Min 45.6 53.9 64.6 66.2 71.3 76.4 Current Climate 43.6 55.1 70.0 72.4 79.5 86.6 Springdale Projected Mean 48.1 61.6 79.2 82.0 90.4 98.7 Projected Max 52.9 69.1 90.9 94.3 104.7 115.0 Projected Min 42.9 52.5 65.0 66.9 72.8 78.8 Current Climate 41.2 58.0 79.8 83.2 93.6 103.9 St. Anthony Projected Mean 44.8 62.2 84.8 88.3 99.2 109.9 Projected Max 48.6 69.2 95.9 100.0 112.8 125.5 Projected Min 37.8 49.9 65.7 68.1 75.7 83.2 Current Climate 67.7 88.4 115.3 119.4 132.3 145.0 St. John's Projected Mean 74.6 96.3 124.5 128.9 142.3 155.7 Projected Max 80.1 103.6 134.0 138.8 153.3 167.8 Projected Min 68.2 86.4 109.9 113.5 124.8 136.0
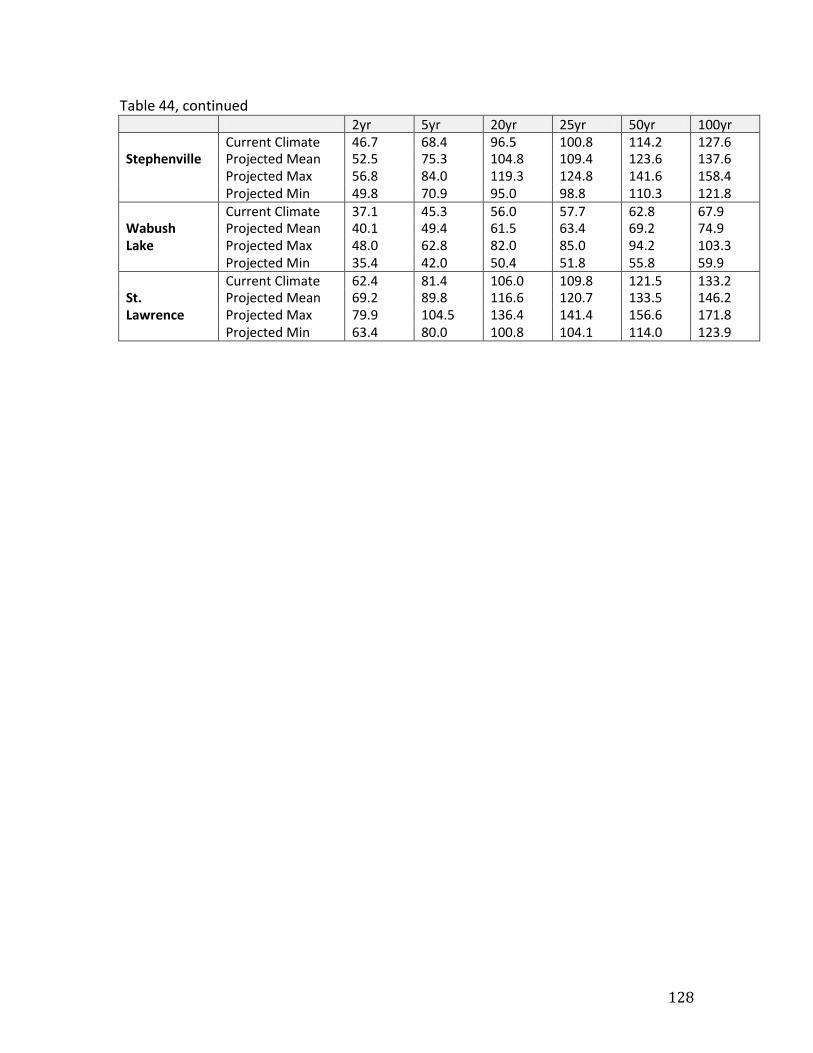
128
Table 44, continued 2yr 5yr 20yr 25yr 50yr 100yr Current Climate 46.7 68.4 96.5 100.8 114.2 127.6 Stephenville Projected Mean 52.5 75.3 104.8 109.4 123.6 137.6 Projected Max 56.8 84.0 119.3 124.8 141.6 158.4 Projected Min 49.8 70.9 95.0 98.8 110.3 121.8 Current Climate 37.1 45.3 56.0 57.7 62.8 67.9 Wabush Projected Mean 40.1 49.4 61.5 63.4 69.2 74.9 Lake Projected Max 48.0 62.8 82.0 85.0 94.2 103.3 Projected Min 35.4 42.0 50.4 51.8 55.8 59.9 Current Climate 62.4 81.4 106.0 109.8 121.5 133.2 St. Projected Mean 69.2 89.8 116.6 120.7 133.5 146.2 Lawrence Projected Max 79.9 104.5 136.4 141.4 156.6 171.8 Projected Min 63.4 80.0 100.8 104.1 114.0 123.9

129
Appendix A: Abbreviations Used Abbreviation Full term
AHCCD Adjusted & Homogenized Canadian Climate Data
CCEEET Office of Climate Change, Energy Efficiency, and Emissions Trading
EC Environment Canada
GCM General Circulation Model
IDF Intensity-Duration-Frequency
Background NARCCAP North American Regional Climate Change Assesment Project
NARR North American Regional Reanalysis
NL Newfoundland & Labrador
RCM Regional Circulation Model
REA Reliability Ensemble Average
STARDEX
Statistical and Regional Dynamical Downscaling of Extremes for European Regions
DJF Winter (December-January-February)
Study MAM Spring (March-April-May)
Periods JJA Summer (June-July-August)
SON Autumn (September-October-November)
ANN Annual
130
Appendix B: Glossary Bias: Disagreement between a model and the system it is intended to represent. For example, a climate model with a ‘warm bias’ tends to overestimate temperatures relative to observed climatology. Boundary forcing: Regional climate models mathematically represent weather within specific region of the Earth. In order to run, they require information about the edges (boundaries) of this region; this ‘boundary forcing’ information is typically supplied by general circulation model with global coverage at lower resolutions. Cooling degree day (CDD): A measure of energy required to cool a building to comfortable levels. The actual energy needed will vary with building standards, energy source, and other factors. However, an increases in CDD translates into some increase in energy spending. Downscaling: The process of extracting information relevant at small spatial scales (high resolution) from information available at large spatial scales (low resolution). Dry Spell: A period without measurable precipitation. Dynamical downscaling: The process of extracting high resolution information from low resolution forecasts through the use of high resolution model; usually a regional climate model. Ensemble: A collection of model forecasts for a single period. By including multiple model runs, an ensemble provides a sense of forecast uncertainty: if the runs agree with one another, the ensemble average forecast is considered reliable; if they diverge, the forecast is less reliable. A multi-model ensemble is generated using runs from different models. Frost day: A day in which the minimum daily temperature drops below the freezing point; i.e. a day when freezing occurs at some point. General Circulation Model (GCM): A model that approximates circulation of the atmosphere and/or ocean, with global coverage. These are typically low resolution models (100s of km between grid points). Greenhouse Effect: An increase in surface temperatures due to the presence of specific gases in the atmosphere. The addition of these ‘greenhouse gases’ to the atmosphere by human activity is the driver of human-induced climate change.
131
Growing degree day (GDD): A measure of heat accumulation, used to determine whether a given plant or insect species will thrive in a region. The energy needed for plants/insects to mature can be estimated in GDD; regions with lower GDD cannot support these species. Heating degree day (HDD): A measure of energy required to heat a building to comfortable levels. The actual energy needed will vary with building standards, heat source, and other factors. However, an increases in HDD translates into some increase in heating costs. Heat Wave: A period of prolonged temperatures well above normal. The definition used here is a period of at least six days, in which mean temperatures are consistently 5 oC above normal. Intensity-duration-frequency curve: A tool used to estimate extreme precipitation events, based on how much precipitation falls (intensity) in a given period of time (duration), and how often events of a given magnitude occur (frequency). Likelihood function: A measure of how probable a series of events are, given a probability distribution. Higher likelihood implies a better match to the probability distribution. For computational purposes, the negative log likelihood (NLL) function in used in place of the standard likelihood (L) function; minimizing NLL is equivalent to maximizing L. Median: The value in a probability distribution that has a 50% chance of being exceeded. Percentile: A probability distribution or a series of observations can be broken into percentiles, by identifying events that are exceeded with a specific frequency. For example, the 90th percentile marks the highest number of lowest 90% of events; it has a 10% of being exceeded. The 70th percentile marks the top of the lowest 75% of events; it has a 25% chance of being exceed. Probability distribution: A description of the frequency with which different potential outcomes occur. Radiosonde: A tool used for the measurement of temperature, moisture, and winds through the depth of the atmosphere, using an instrument package attached to a weather balloon. Reanalysis: An atmospheric reanalysis is a ‘best guess’ estimate of the state of the atmosphere at a given point in time, generated by blending direct weather observations with weather forecast model output. It can be considered weather model output, corrected to match available observations.
132
Regional Climate Model (RCM): A model used provide a detailed representation of the atmosphere or ocean within s specific region of the planet. Typically run at much higher resolution than general circulation models (1-50km, typically). Topographic: Relating to the topography, or shape of the Earth’s surface. The slope, orientation, and altitude of the surface can have a strong influence on the climate of a given location. Self-organizing map: A method of clustering (organizing) a large data set into a set of general patterns (or ‘archetypal’ patterns). The map organizes these patterns in ways that facilitate visual interpretation, and has become popular in climatology and meteorology applications. Standard Deviation: A measure of the ‘spread’ in a probability distribution. In climatology, a greater standard deviation implies a more variable climate. Synoptic: Relates to specific spatial (~1000km) and temporal (~a week) time scales in meteorology. Examples of synoptic weather systems include warm fronts, cold fronts, and the low pressure systems responsible for winter storms in Newfoundland and Labrador. Synoptic climatology: A description of climate in terms of synoptic weather events. For example, a description of the typical number of low pressure systems that occur in a year. Weather system: An interaction between air masses, winds, and/or pressure features. The passage of weather systems (such as low pressure systems) is responsible for the day-to-day fluctuations in weather at a location.
133
Bibliography Cannon, A. J. "Probabilistic Multisite Precipitation Downscaling by an Expanded
Bernoulli-Gamma Density Network." Journal of Hydrometeorology 9, no. 6 (2008): 1284-300.
Cassano, J. J., P. Uotila, and A. Lynch. "Changes in Synoptic Weather Patterns in the Polar Regions in the Twentieth and Twenty-First Centuries, Part 1: Arctic." International Journal of Climatology 26, no. 8 (2006): 1027-49.
Christensen, J. H., E. Kjellstrom, F. Giorgi, G. Lenderink, and M. Rummukainen. "Weight Assignment in Regional Climate Models." Climate Research 44, no. 2-3 (2010): 179-94.
Giorgi, F., and L. O. Mearns. "Calculation of Average, Uncertainty Range, and Reliability of Regional Climate Changes from Aogcm Simulations Via the "Reliability Ensemble Averaging'' (Rea) Method." Journal of Climate 15, no. 10 (2002): 1141-58.
Hamilton, Lawrence C., and Barry D. Keim. "Regional Variation in Perceptions About Climate Change." International Journal of Climatology 29, no. 15 (2009): 2348-52.
Hewitson, B. C., and R. G. Crane. "Self-Organizing Maps: Applications to Synoptic Climatology." Climate Research 22, no. 1 (2002): 13-26.
Knutti, R., R. Furrer, C. Tebaldi, J. Cermak, and G. A. Meehl. "Challenges in Combining Projections from Multiple Climate Models." Journal of Climate 23, no. 10 (2010): 2739-58.
Lenderink, G. "Exploring Metrics of Extreme Daily Precipitation in a Large Ensemble of Regional Climate Model Simulations." Climate Research 44, no. 2-3 (2010): 151-66.
Martins, E. S., and J. R. Stedinger. "Generalized Maximum-Likelihood Generalized Extreme-Value Quantile Estimators for Hydrologic Data." Water Resources Research 36, no. 3 (2000): 737-44.
Mearns, L.O., W.J. Gutowski, R. Jones, L.-Y. Leung, S. McGinnis, A.M.B. Nunes, and Y. Qian. "A Regional Climate Model Assesment Program for North America." EOS 90, no. 36 (2009): 311-12.
Mekis, E., and L. A. Vincent. "An Overview of the Second Generation Adjusted Daily Precipitation Dataset for Trend Analysis in Canada." Atmosphere-Ocean 49, no. 2 (2011): 163-77.
Mesinger, F., G. DiMego, E. Kalnay, K. Mitchell, P. C. Shafran, W. Ebisuzaki, D. Jovic, J. Woollen, E. Rogers, E. H. Berbery, M. B. Ek, Y. Fan, R. Grumbine, W. Higgins, H. Li, Y. Lin, G. Manikin, D. Parrish, and W. Shi. "North American Regional Reanalysis." Bulletin of the American Meteorological Society 87, no. 3 (2006): 343-+.
Sanchez, E., C. Gallardo, M. A. Gaertner, A. Arribas, and M. Castro. "Future Climate Extreme Events in the Mediterranean Simulated by a Regional Climate Model: A First Approach." Global and Planetary Change 44, no. 1-4 (2004): 163-80.
134
van Ulden, A., G. Lenderink, B. van den Hurk, and E. van Meijgaard. "Circulation Statistics and Climate Change in Central Europe: Prudence Simulations and Observations." Climatic Change 81 (2007): 179-92.
Vincent, L. A., X. L. L. Wang, E. J. Milewska, H. Wan, F. Yang, and V. Swail. "A Second Generation of Homogenized Canadian Monthly Surface Air Temperature for Climate Trend Analysis." Journal of Geophysical Research-Atmospheres 117 (2012).


![Polar Climate Change as Manifest in Atmospheric …...tainty in projected climate change [ 4]. This review forms part of a Topical Collection on Climate Change and Atmospheric Circulation](https://img.pdfslide.us/doc/110x75/5f47ba734b9e0419c1183f85/polar-climate-change-as-manifest-in-atmospheric-tainty-in-projected-climate.jpg)