Embed Size (px)
Citation preview
Projected Demand for HIV Diagnostic Tests
John Stover, Yu Teng, Adebiyi Adesina, Eline Korenromp
On behalf of the Diagnostics Forecasting Technical Working Group
(CDC, CHAI, GFATM, PfSCM, UNAIDS, UNICEF, USAID, WHO)
GLOBAL FORECASTS OF DIAGNOSTIC DEMAND FOR 2014-2018, WHO MEETING WITH DIAGNOSTIC MANUFACTURERS AND STAKEHOLDERS
Geneva, 9-10 April 2015
Purpose
• Project future demand for HIV diagnostic tests.
• These projections are intended to: • Support advocacy for the scale-up of access to HIV-related
diagnostics; • Inform producers so that they can plan for adequate supply.

Data Sources
• WHO Survey: Data about actual test utilization, provided by countries in response to an annual survey conducted by WHO.
• CHAI: Utilization data from 25 countries supported by CHAI.
• PfSCM: Procurements for 2011-2013 for countries covered by the PfSCM project.
• Procurement: Procurement data reported to WHO through the Global Price Reporting Mechanism (GPRM), including by Global Fund.
• GARPR: Country reports on number of tests performed as provided to the Global AIDS Response Progress Reporting system.
• Projected ART and PMTCT patients: Projections to 2018 of the number of ART and PMTCT patients by country prepared by Avenir Health based on UNAIDS estimates.

Seven Projection Scenarios
• Extrapolation: Linear extrapolation of past trends of actual use, reported through the WHO surveys.
• 90-90-90: Achievement of UNAIDS treatment targets for 2020.
• Guidelines: All countries implement WHO testing guidelines.
• Country Targets: Achievement of country-defined targets, stated by countries in the WHO surveys.
• CHAI: Country-specific forecasts for 25 key countries, scaled up to global level.
• PfSCM: Linear extrapolation of past procurement trends by PfSCM.
• Procurement: Linear extrapolation of procurement trends reported to GPRM.
• GARPR: Linear extrapolation of country reports through GARPR.

Methods: Extrapolate past trends, based on WHO Survey
• For countries reporting data for 2 or 3 years, use linear extrapolation.
• For countries with data for one year, apply the ratio of tests to ART patients in that year. For EID apply the ratio to HIV+ women receiving PMTCT.
• For countries with no data, apply the average ratio of tests to ART or PMTCT patients from countries with data.
• Constrain the EID forecast by the total need for PMTCT (95% of HIV-infected pregnant women) in each country, plus 10% to account for re-tests.
0
20
40
60
80
CD4 VL EID
Number of Countries Responding
2011 2012 2013

Methods: 90-90-90 Targets / Projections
By 2020: • 90% of HIV+ people know their status • 90% of those diagnosed are sustained on antiretroviral therapy • 90% on treatment with durable viral suppression. • Achieving these goals would mean 60% more people on treatment
in 2018 than 2015 • CD4 tests: 14% higher than a linear extrapolation of past trends. • VL: WHO guidelines achieved by 2018 • EID: 95% PMTCT coverage, + 10% re-tests for infants HIV-positive.
Ambitious Treatment Targets: Writing the Final Chapter of the AIDS Epidemic UNAIDS | Reference | Discussion Paper

Methods: Other scenarios (I)
• Guidelines scenario: This scenario characterizes the need for diagnostic tests. It uses a linear extrapolation of the number of people on ART by country, and assumes that all countries will fully implement WHO guidelines which call for:
• 2 CD4 tests at treatment initiation, and one annually while on ART; • 2 VL tests in the first year of treatment, and one annually after the first year; • One EID test for each child born to an HIV+ mother, plus confirmatory tests
for those (~10%) found HIV+.
• Country Targets scenario: This scenario uses targets for 2017, submitted by national programs, as part of the 2014 WHO survey:
• CD4 tests: Average 29% increase from 2013 to 2017. • EID: 184% increase from 2013 to 2017 (Kenya).
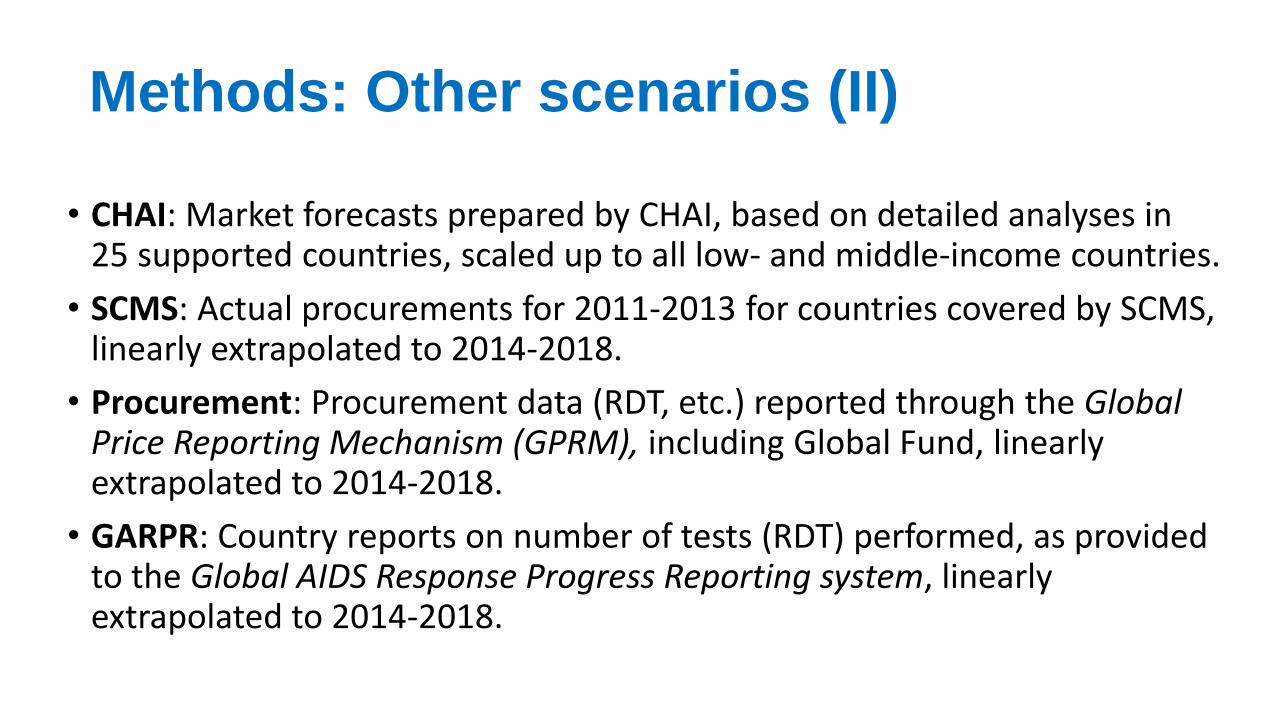
• CHAI: Market forecasts prepared by CHAI, based on detailed analyses in 25 supported countries, scaled up to all low- and middle-income countries.
• SCMS: Actual procurements for 2011-2013 for countries covered by SCMS, linearly extrapolated to 2014-2018.
• Procurement: Procurement data (RDT, etc.) reported through the Global Price Reporting Mechanism (GPRM), including Global Fund, linearly extrapolated to 2014-2018.
• GARPR: Country reports on number of tests (RDT) performed, as provided to the Global AIDS Response Progress Reporting system, linearly extrapolated to 2014-2018.
Methods: Other scenarios (II)
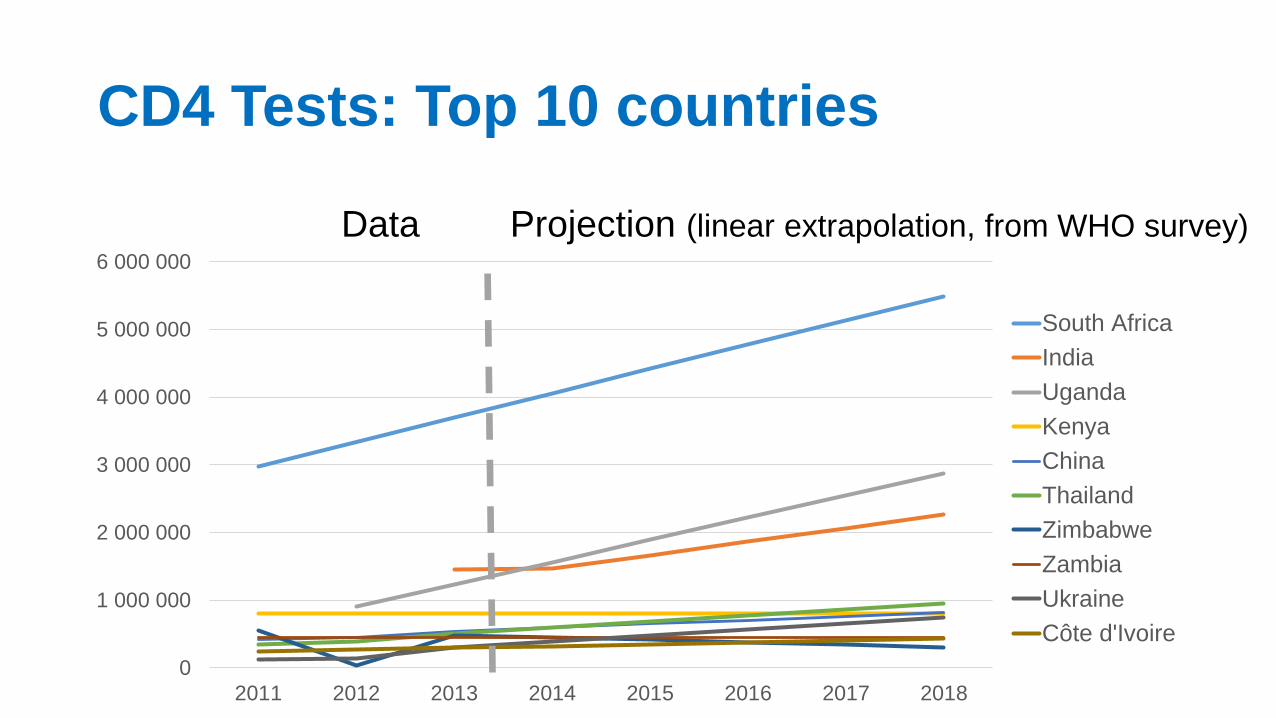
CD4 Tests: Top 10 countries
0
1 000 000
2 000 000
3 000 000
4 000 000
5 000 000
6 000 000
2011 2012 2013 2014 2015 2016 2017 2018
South Africa
India
Uganda
Kenya
China
Thailand
Zimbabwe
Zambia
Ukraine
Côte d'Ivoire
Data Projection (linear extrapolation, from WHO survey)

Demand for CD4 Tests: all LMIC
0
5 000 000
10 000 000
15 000 000
20 000 000
25 000 000
30 000 000
35 000 000
40 000 000
2011 2012 2013 2014 2015 2016 2017 2018
Linear Extrapolation90/90/90 goalCountry targetsCHAI HighCHAI LowPFSCMGuidelines
Note that the PfSCM forecast is for a limited number of countries.
Data Projection

Indexes of Total Demand for CD4 Tests (2013=1.0)
Note: PfSCM forecast is for a limited number of countries.
1.6
1.9
2.2
1.6
1.4
1.8
1.7
1.0
1.2
1.4
1.6
1.8
2.0
2.2
2.4
2013 2014 2015 2016 2017 2018
Linear Extrapolation
90/90/90 goal
Country targets
CHAI High
CHAI Low
PFSCM
Guidelines

CD4 Tests by Region
0
4 000 000
8 000 000
12 000 000
16 000 000
20 000 000
2011 2012 2013 2014 2015 2016 2017 2018
Africa
Asia & EE
LAC
Data Projection (linear extrapolation, from WHO survey)
Africa includes both SSA and North Africa; Asia and EE includes all of Asia and Eastern Europe; LAC includes all of Latin America and the Caribbean
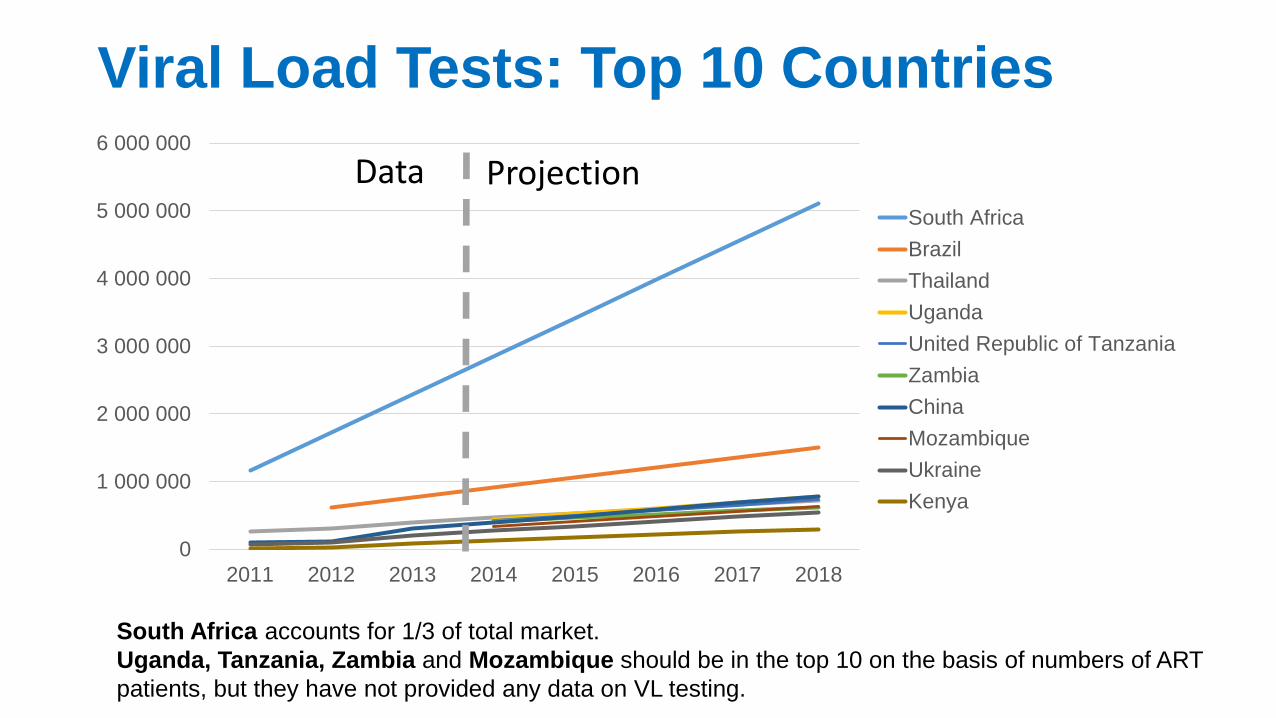
Viral Load Tests: Top 10 Countries
0
1 000 000
2 000 000
3 000 000
4 000 000
5 000 000
6 000 000
2011 2012 2013 2014 2015 2016 2017 2018
South Africa
Brazil
Thailand
Uganda
United Republic of Tanzania
Zambia
China
Mozambique
Ukraine
Kenya
Data Projection
South Africa accounts for 1/3 of total market.
Uganda, Tanzania, Zambia and Mozambique should be in the top 10 on the basis of numbers of ART
patients, but they have not provided any data on VL testing.

Demand for Viral Load Tests
0
5 000 000
10 000 000
15 000 000
20 000 000
25 000 000
30 000 000
35 000 000
2011 2012 2013 2014 2015 2016 2017 2018
Linear Extrapolation90/90/90 goalCountry targetsCHAIGuideline
Data Projection

Indexes of Demand for Viral Load Tests (2013=1.0)
2.08
4.00
4.40 4.35
1.71
1.0
1.5
2.0
2.5
3.0
3.5
4.0
4.5
2013 2014 2015 2016 2017 2018
Linear Extrapolation
90-90-90 Goal
Country targets
CHAI
Guideline

Demand for Viral Load Tests by Region
0
2 000 000
4 000 000
6 000 000
8 000 000
10 000 000
12 000 000
2011 2012 2013 2014 2015 2016 2017 2018
Africa
Asia & EE
LAC
Africa includes both SSA and North Africa; Asia and EE includes all of Asia and Eastern Europe; LAC includes all of Latin America and the Caribbean
Data Projection (linear extrapolation, from WHO survey)

Early Infant Diagnosis: Top 10 Countries
0
50 000
100 000
150 000
200 000
250 000
300 000
350 000
2011 2012 2013 2014 2015 2016 2017 2018
South Africa
Uganda
Botswana
Zimbabwe
Kenya
Nigeria
Zambia
United Republic of Tanzania
Mozambique
India
Data Projection (linear extrapolation, from WHO survey)

Demand for EID Tests
0
500 000
1 000 000
1 500 000
2 000 000
2 500 000
3 000 000
3 500 000
2011 2012 2013 2014 2015 2016 2017 2018
Extrapolation
90/90/90
Country targets
CHAI
SCMS
Procurement
Guidelines
Note: SCMS forecast is for a limited number of countries.
Data Projection

Index of Demand for EID Tests (2013=1.0)
Note: SCMS forecast is for a limited number of countries.
0.95
1.25
3.26
1.95
0.89
1.71
0.5
1.0
1.5
2.0
2.5
3.0
3.5
2013 2014 2015 2016 2017 2018
Extrapolation
90/90/90
Country targets
CHAI
SCMS
Guidelines

Demand for EID by Region
0
200 000
400 000
600 000
800 000
2011 2012 2013 2014 2015 2016 2017 2018
Africa
Asia & EE
LAC
Africa includes both SSA and North Africa; Asia and EE includes all of Asia and Eastern Europe; LAC includes all of Latin America and the Caribbean
Projection (linear extrapolation, from WHO survey) Data

Demand for Rapid HIV Tests
162 million
81 million
0
20 000 000
40 000 000
60 000 000
80 000 000
100 000 000
120 000 000
140 000 000
160 000 000
180 000 000
2008 2009 2010 2011 2012 2013 2014 2015 2016 2017 2018
GARPR
Procurement
Data Projection

Indexes of Demand for Rapid HIV Tests (2013=1.0)
1.45
1.35
1.0
1.1
1.2
1.3
1.4
1.5
2013 2014 2015 2016 2017 2018
Procurement
GARPR

$-
$2,000,000
$4,000,000
$6,000,000
Re
so
urc
e n
ee
d, to
re
ac
h
targ
ete
d c
ove
rag
e (
US
$)
Family Planning
ANC attendants / Pregnant women
Out- & in-patients w. AIDS symptoms
TB patients
Partners of PLWH newly identified
STI patients
Other outpatients & in-patients
FSW
MSM
IDU
Other women 15-49 years
Other men 15-49 years
$-
$3,000,000
$6,000,000
$9,000,000
$12,000,000
Re
so
urc
e n
ee
d, to
re
ac
h
targ
ete
d c
ove
rag
e (
US
$) Family Planning
ANC attendants / Pregnant women
Out- & in-patients w. AIDS symptoms
TB patients
Partners of PLWH newly identified
STI patients
Other outpatients & in-patients
FSW
MSM
IDU
Other women 15-49 years
Other men 15-49 years
Need for HIV testing: country projections Mozambique Nigeria
Increase in test & budget needed,
from 2015 to 2016-2020:
•Mozambique: 35% ↑
•Nigeria: 267% ↑
•Senegal: 169% ↑
Avenir Health projection for UNAIDS
HCT consultation, March 2015
Senegal
$-
$20,000,000
$40,000,000
$60,000,000
$80,000,000
$100,000,000
Re
so
urc
e n
ee
d, to
re
ac
h
targ
ete
d c
ove
rag
e (
US
$)
Family Planning
ANC attendants / Pregnant women
Out- & in-patients w. AIDS symptoms
TB patients
Partners of PLWH newly identified
STI patients
Other outpatients & in-patients
FSW
MSM
IDU
Other women 15-49 years
Other men 15-49 years
Summary
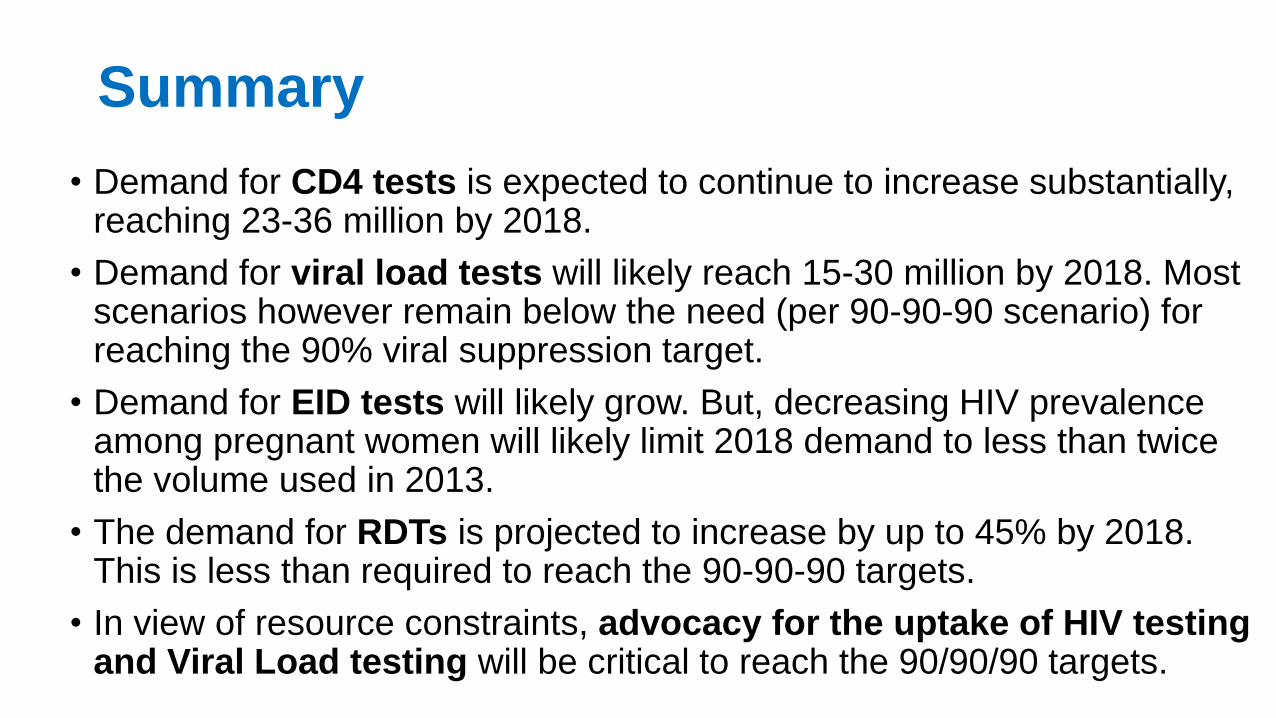
• Demand for CD4 tests is expected to continue to increase substantially, reaching 23-36 million by 2018.
• Demand for viral load tests will likely reach 15-30 million by 2018. Most scenarios however remain below the need (per 90-90-90 scenario) for reaching the 90% viral suppression target.
• Demand for EID tests will likely grow. But, decreasing HIV prevalence among pregnant women will likely limit 2018 demand to less than twice the volume used in 2013.
• The demand for RDTs is projected to increase by up to 45% by 2018. This is less than required to reach the 90-90-90 targets.
• In view of resource constraints, advocacy for the uptake of HIV testing and Viral Load testing will be critical to reach the 90/90/90 targets.
![Scaled Functional Principal Component Analysis for Human ... · still pose challenges to data-driven motion synthesis [Min and Chai 2012;Wang and Neff 2015]. In order to reuse existing](https://img.pdfslide.us/doc/110x75/5f8bdaaf6fd2cb33d142ebcd/scaled-functional-principal-component-analysis-for-human-still-pose-challenges.jpg)