Embed Size (px)
DESCRIPTION
Teleconference 29 March 2011 Mike Davies, Ph.D., P.Eng . Coldwater Consulting Ltd. Project Update: Upper Great Lakes Study Shore Protection. Outline. Shore Protection Performance Indicators - PowerPoint PPT Presentation
Citation preview

Project Update: Upper Great Lakes StudyShore Protection
Teleconference29 March 2011
Mike Davies, Ph.D., P.Eng.Coldwater Consulting Ltd.
OutlineShore Protection Performance Indicators - Review and discussion of model operation and results by
Coldwater Consulting Ltd. (conference call) - Application in the Shared Vision Model and interpretation of
metrics for
o Regulation plan evaluation o Water level “restoration” o Multi-lake regulation and AM
- Performance indicator fact sheet
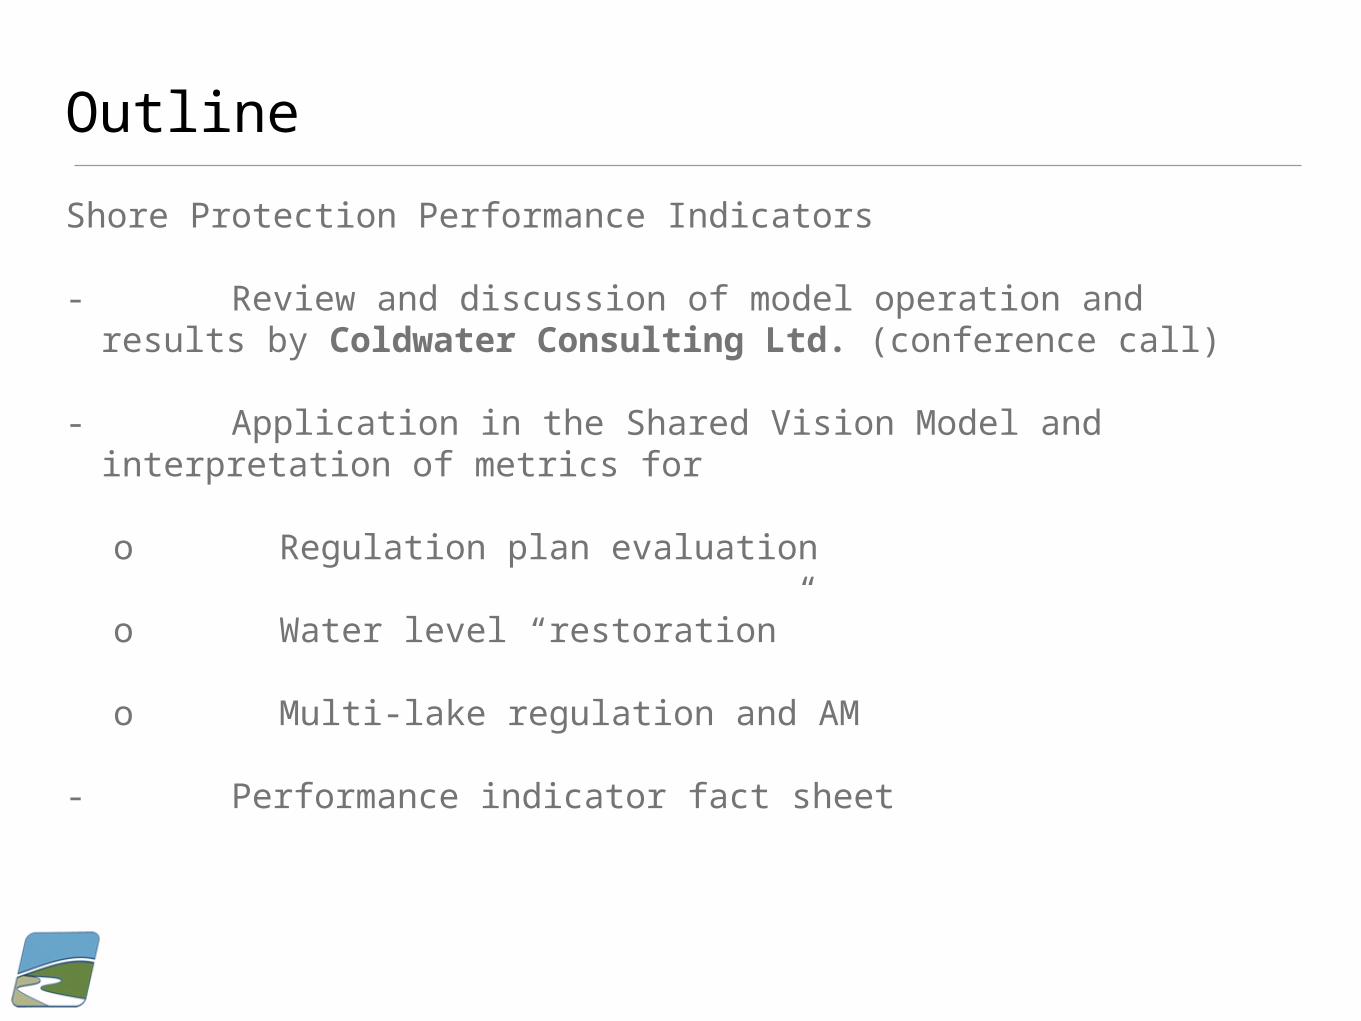
Draft report - updateVersion 0.11 transmitted last week.Subsequent changes:
We have moved Sections 5.6 and 5.7 to Chapter 7 (“Interpretation”).
Chapter 6 has become a part of Chapter 5.
Working on data gaps / future needs and Conclusions.
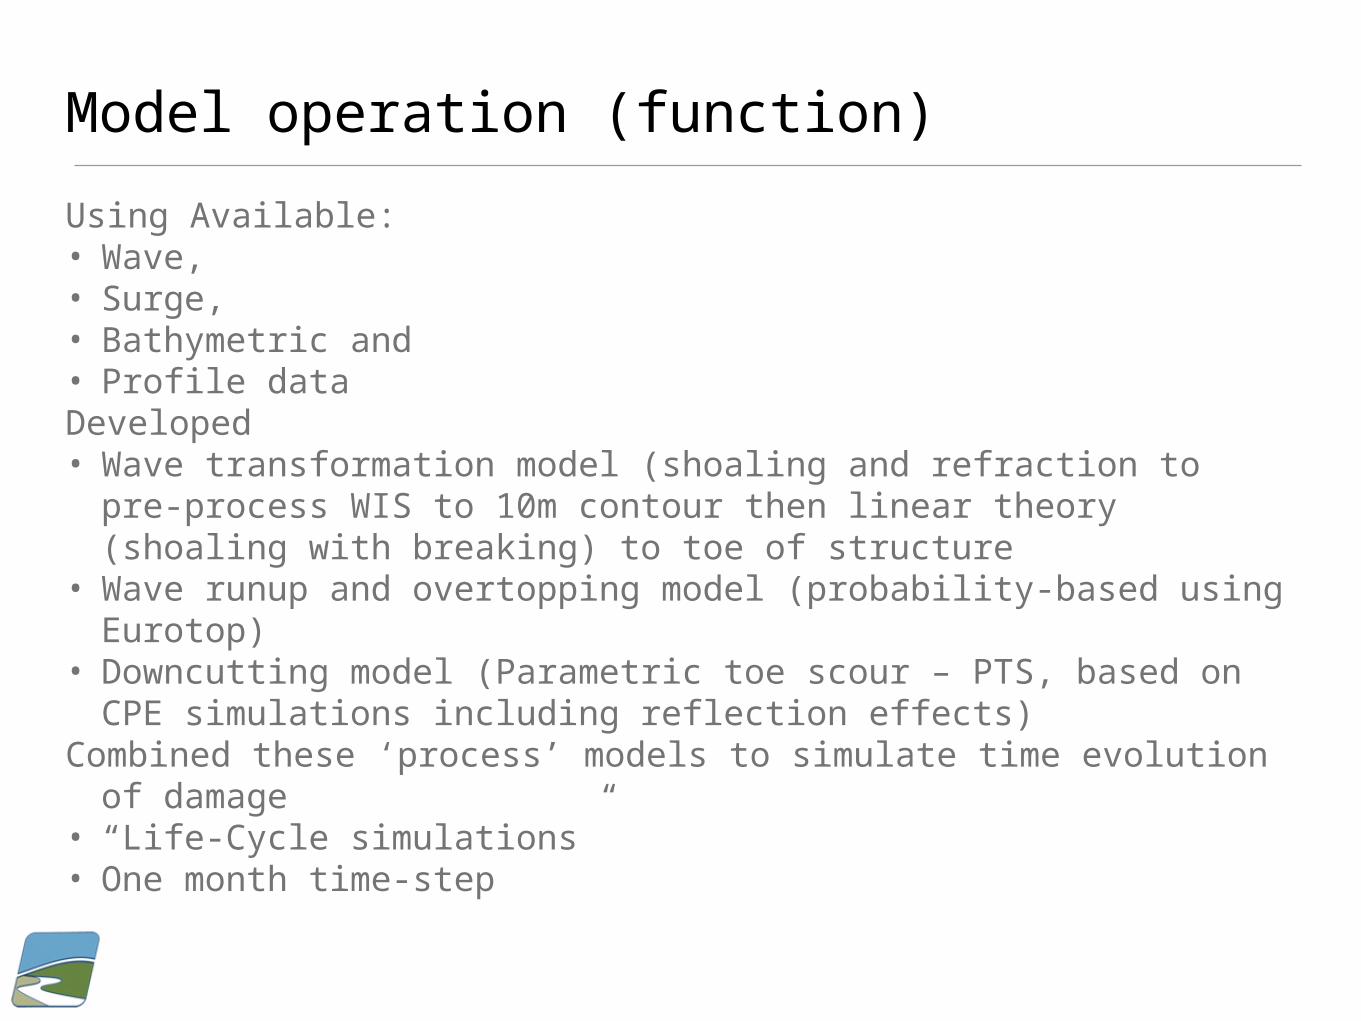
Model operation (function)Using Available:• Wave, • Surge, • Bathymetric and • Profile dataDeveloped• Wave transformation model (shoaling and refraction to pre-process
WIS to 10m contour then linear theory (shoaling with breaking) to toe of structure
• Wave runup and overtopping model (probability-based using Eurotop)
• Downcutting model (Parametric toe scour – PTS, based on CPE simulations including reflection effects)
Combined these ‘process’ models to simulate time evolution of damage
• “Life-Cycle simulations”• One month time-step

Model operation (mechanics)UGLSP – Stand-alone model for prediction of life-cycle performance
and cost of ownership of coastal structuresSAT - .dll version of UGLSP suitable for operation from within Excel
(integrated into SVM).
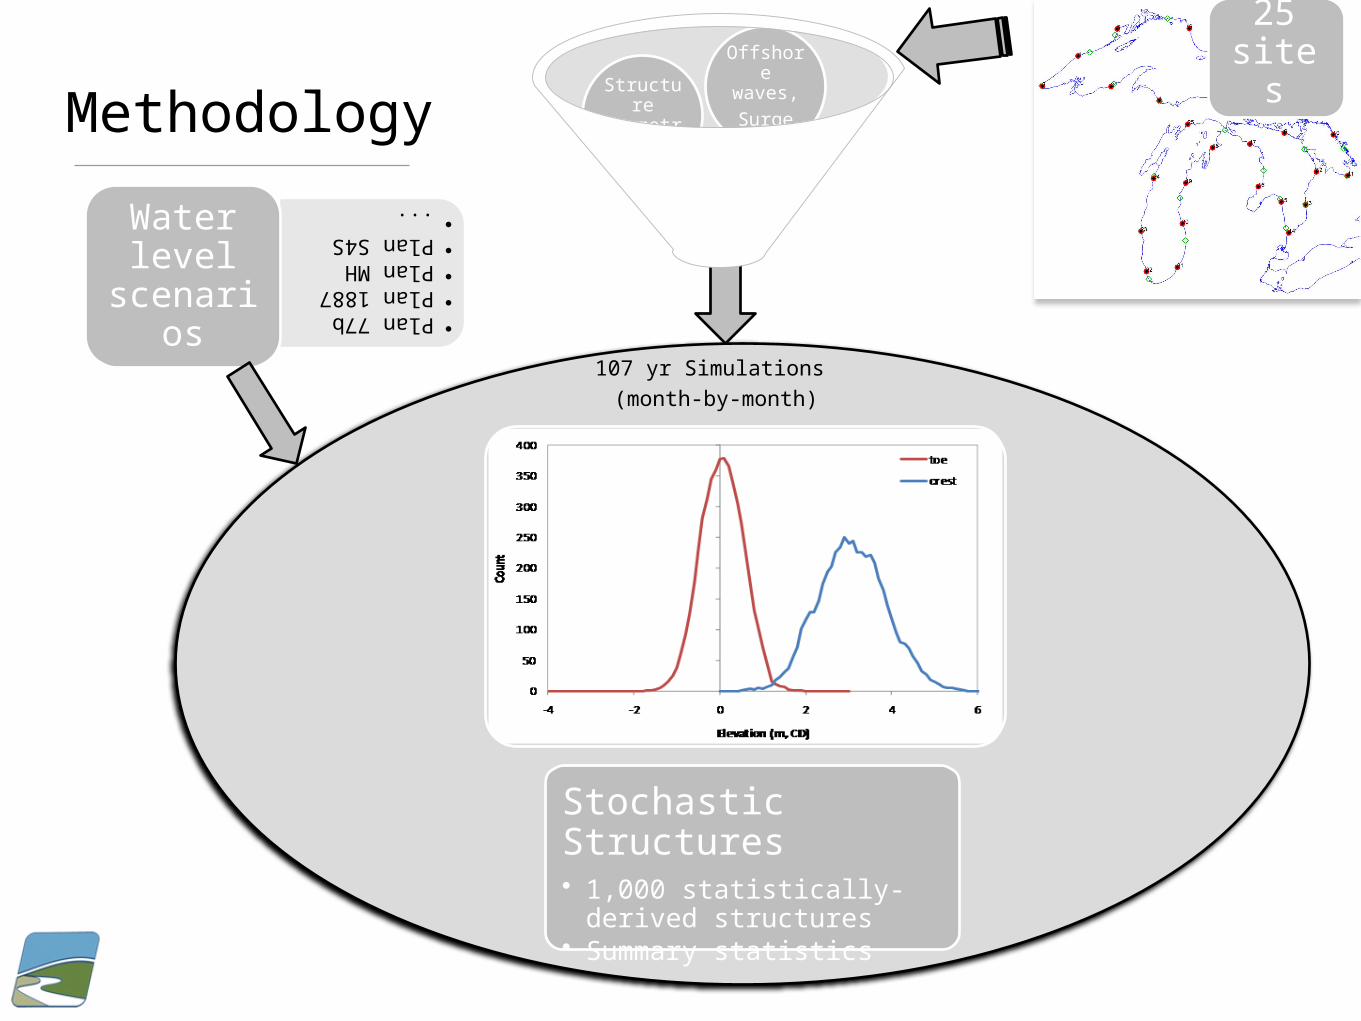
Methodology
107 yr Simulations (month-by-month)
Erodibility Index
Structure
geometry
Offshore waves,Surge
Stochastic Structures• 1,000 statistically-derived
structures• Summary statistics
•Plan 77b•Plan 1887•Plan MH•Plan S4S•...Water
level scenario
s
25 sites

The ‘Stochastic Structure’Probability-based representation of coastal structuresUses the observed statistical distribution of structure characteristicsExtended throughout Upper Great Lakes domain using design water
level scalingA 1,000 structure sample is generated that matches the target
statistical distributionSplit between Class 1 and Class 2 structures is 65/35%Crest elevations are defined relative to the 100-yr design water levelToe elevations are defined relative to chart datum
Type Class 1 Class 2Revetment 82% 29% 71%Wall 18% 90% 10%
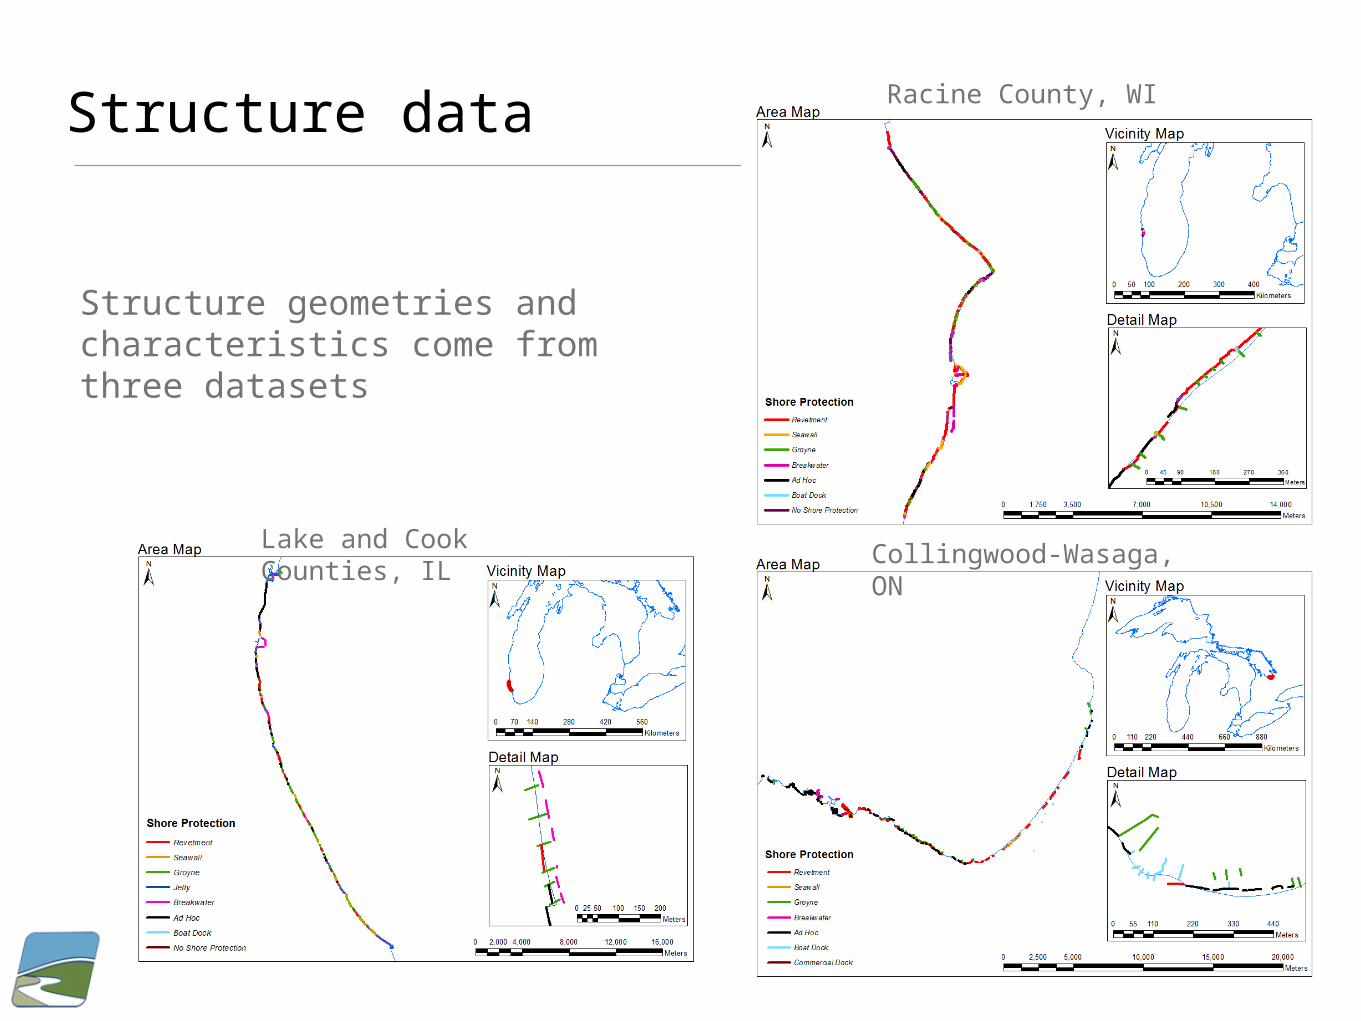
Structure data
Structure geometries and characteristics come from three datasets
Lake and Cook Counties, IL
Racine County, WI
Collingwood-Wasaga, ON
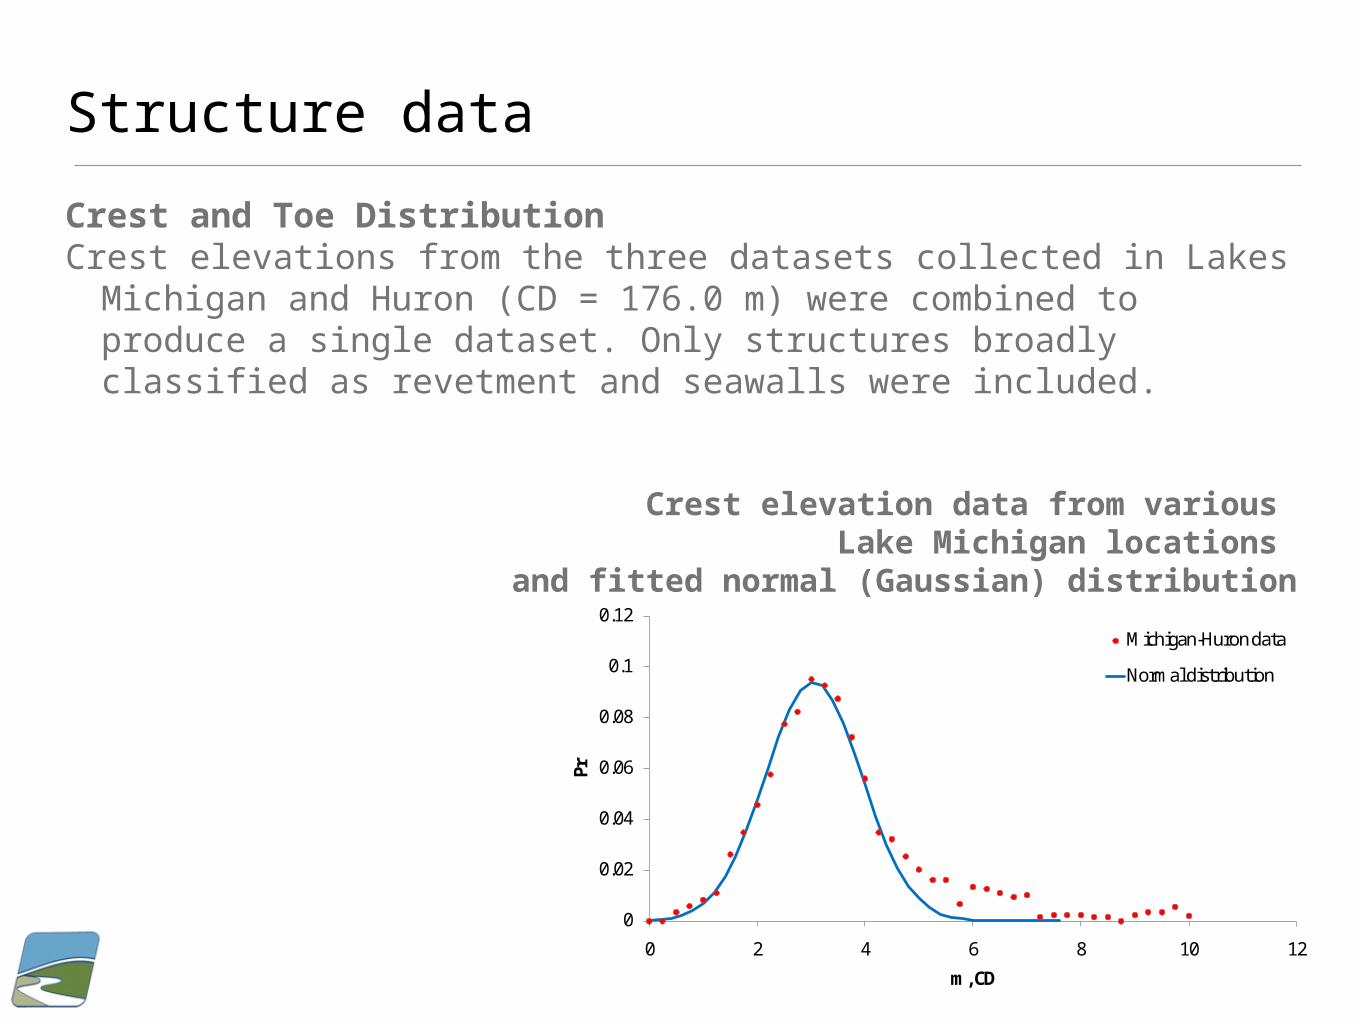
Structure dataCrest and Toe DistributionCrest elevations from the three datasets collected in Lakes Michigan
and Huron (CD = 176.0 m) were combined to produce a single dataset. Only structures broadly classified as revetment and seawalls were included.
Crest elevation data from various Lake Michigan locations
and fitted normal (Gaussian) distribution
0
0.02
0.04
0.06
0.08
0.1
0.12
0 2 4 6 8 10 12
Pr
m, CD
Michigan-Huron data
Normal distribution
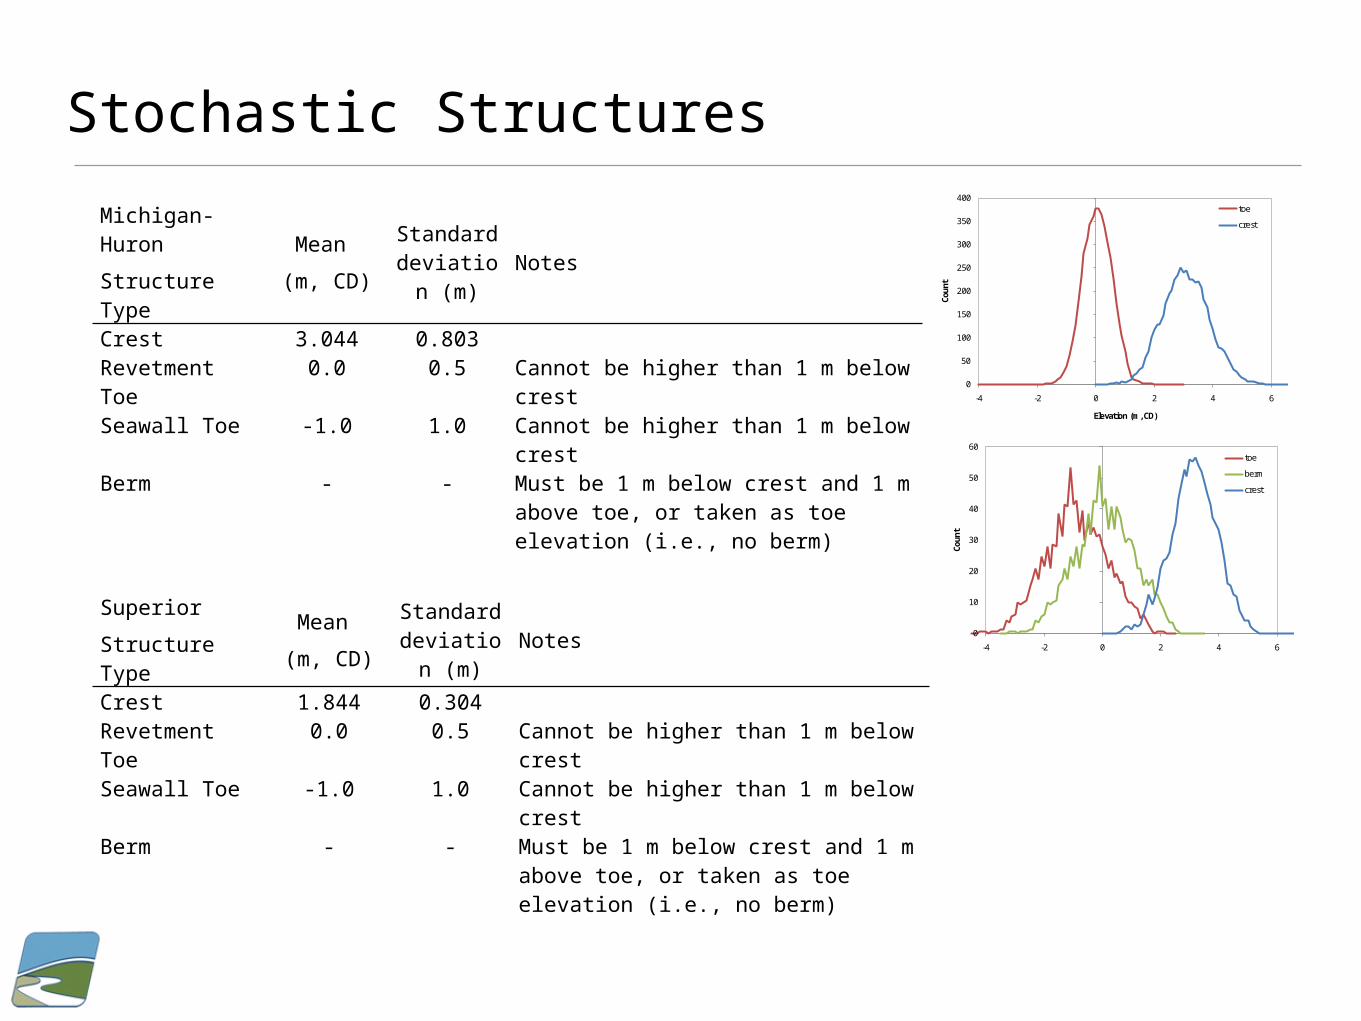
Stochastic StructuresMichigan-HuronStructure Type
Mean (m, CD)
Standard deviation
(m)Notes
Crest 3.044 0.803Revetment Toe 0.0 0.5 Cannot be higher than 1 m below crestSeawall Toe -1.0 1.0 Cannot be higher than 1 m below crestBerm - - Must be 1 m below crest and 1 m above toe,
or taken as toe elevation (i.e., no berm)
0
10
20
30
40
50
60
-4 -2 0 2 4 6
Coun
t
Elevation (m, CD)
toe
berm
crest
0
50
100
150
200
250
300
350
400
-4 -2 0 2 4 6
Coun
t
Elevation (m, CD)
toe
crest
SuperiorStructure Type
Mean (m, CD)
Standard deviation
(m)Notes
Crest 1.844 0.304Revetment Toe 0.0 0.5 Cannot be higher than 1 m below crestSeawall Toe -1.0 1.0 Cannot be higher than 1 m below crestBerm - - Must be 1 m below crest and 1 m above toe,
or taken as toe elevation (i.e., no berm)
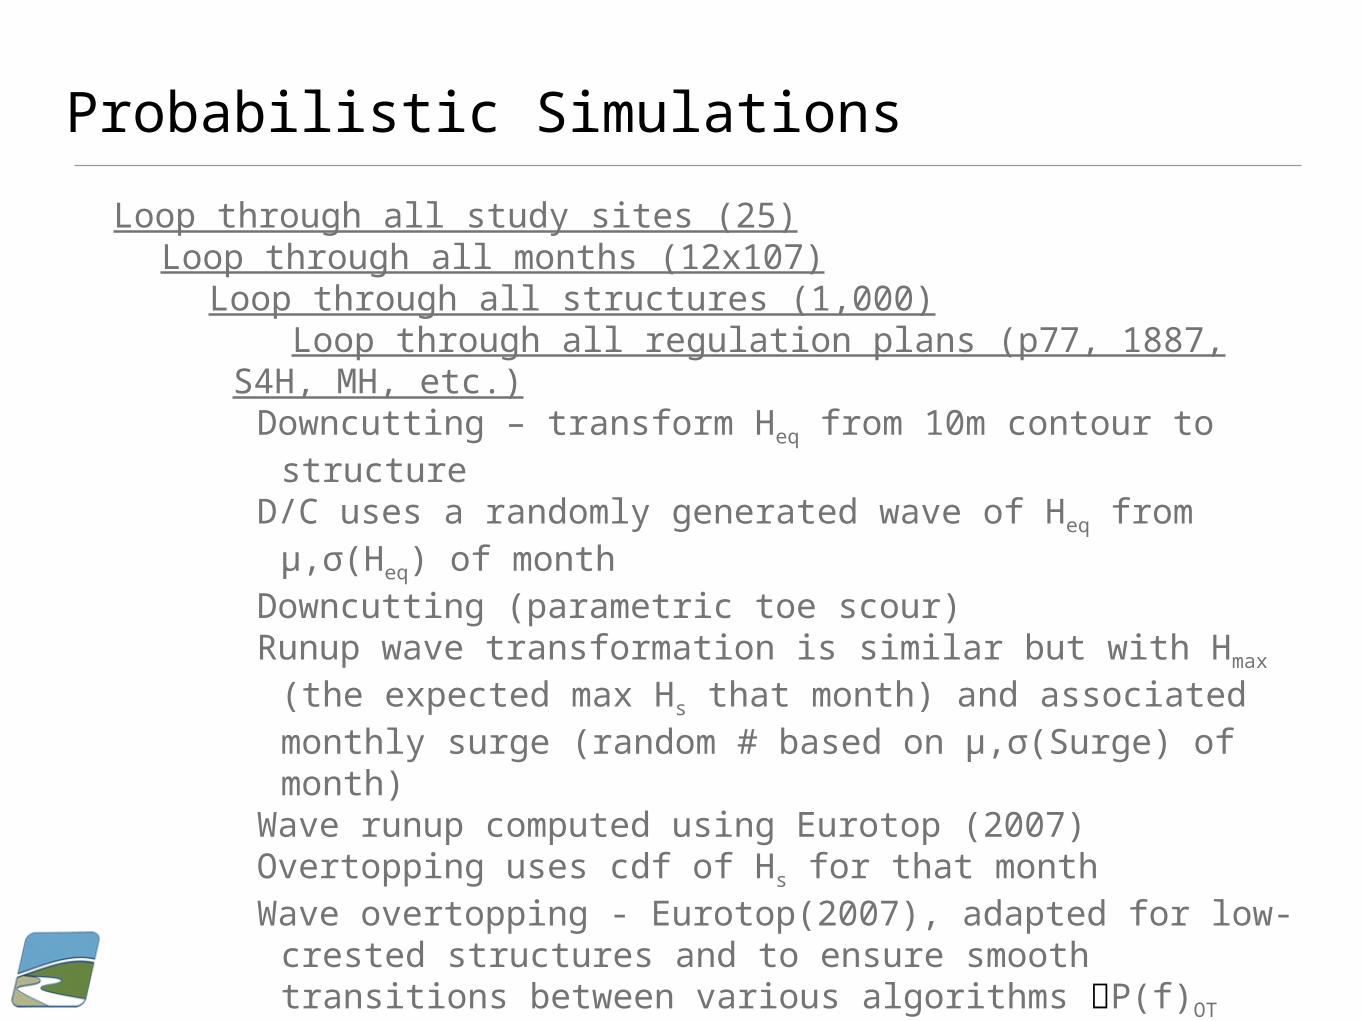
Probabilistic SimulationsLoop through all study sites (25)
Loop through all months (12x107)Loop through all structures (1,000) Loop through all regulation plans (p77, 1887, S4H, MH,
etc.)Downcutting – transform Heq from 10m contour to structureD/C uses a randomly generated wave of Heq from µ,σ(Heq) of
monthDowncutting (parametric toe scour)Runup wave transformation is similar but with Hmax (the
expected max Hs that month) and associated monthly surge (random # based on µ,σ(Surge) of month)
Wave runup computed using Eurotop (2007)Overtopping uses cdf of Hs for that monthWave overtopping - Eurotop(2007), adapted for low-crested
structures and to ensure smooth transitions between various algorithms P(f)OTStructure maintenance costs
Rebuild costOvertopping cost = P(f)OT x rebuild cost

Structure costsCosts are based on the monthly cost of ownership.
Overtopping cost = P(f) OT x rebuild costRebuild cost is computed each month based on structure type & height.Degradation cost = linear depreciation (50yrs for Class 1, 25 yrs for Class 2-)Cost for month = max(Overtopping, Degradation)
Overtopping failure occurs when P(f) OT>0.5; Flag to output, triggers re-buildStructure is rebuilt with crest 25% higher; structure has 12 month rebuild window. During rebuild window, structure cannot fail a second time.
Downcutting cost increases cost of ownership by virtue of increased depth, taller structure being required.
Downcutting allows large waves to reach the structure; increasing likelihood of failure due to overtopping.
Growth algorithm: If downcutting deepens the toe, the crest height grows at a rate of 0.2
(Class 1) or 0.3 (Class 2) x the downcutting. This is based on Eurotop algorithms to maintain constant OT performance.
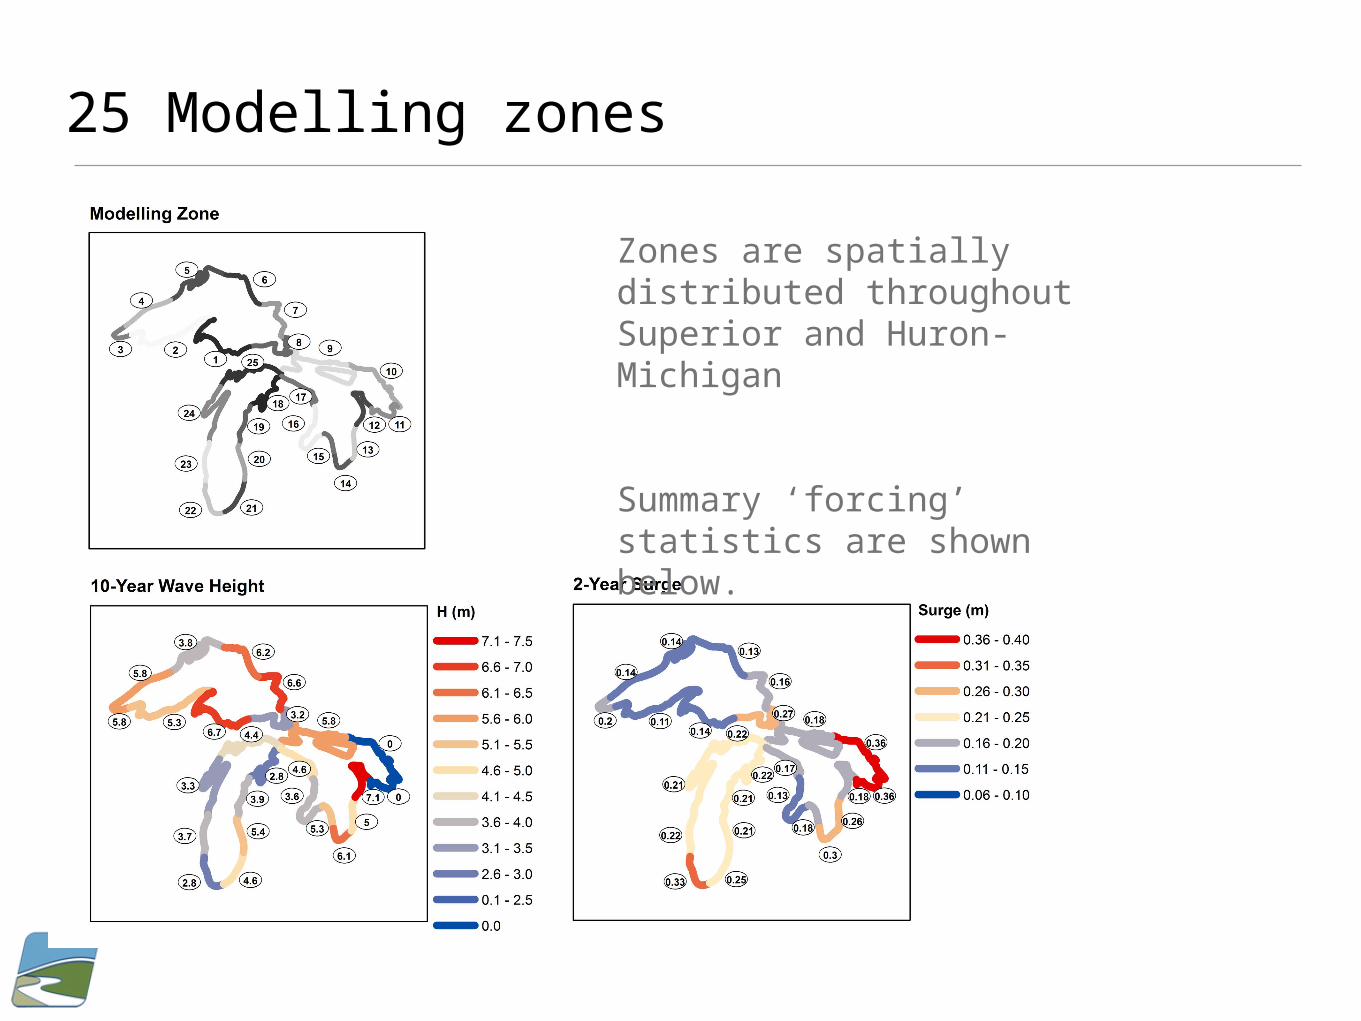
25 Modelling zones
Zones are spatially distributed throughout Superior and Huron-Michigan
Summary ‘forcing’ statistics are shown below.

25 Modelling zonesShore classification database used
to identify substrates susceptible to downcutting
Erodibility index was developed to guide calculation of downcutting – a major factor for shore protection in areas of erodible beds.
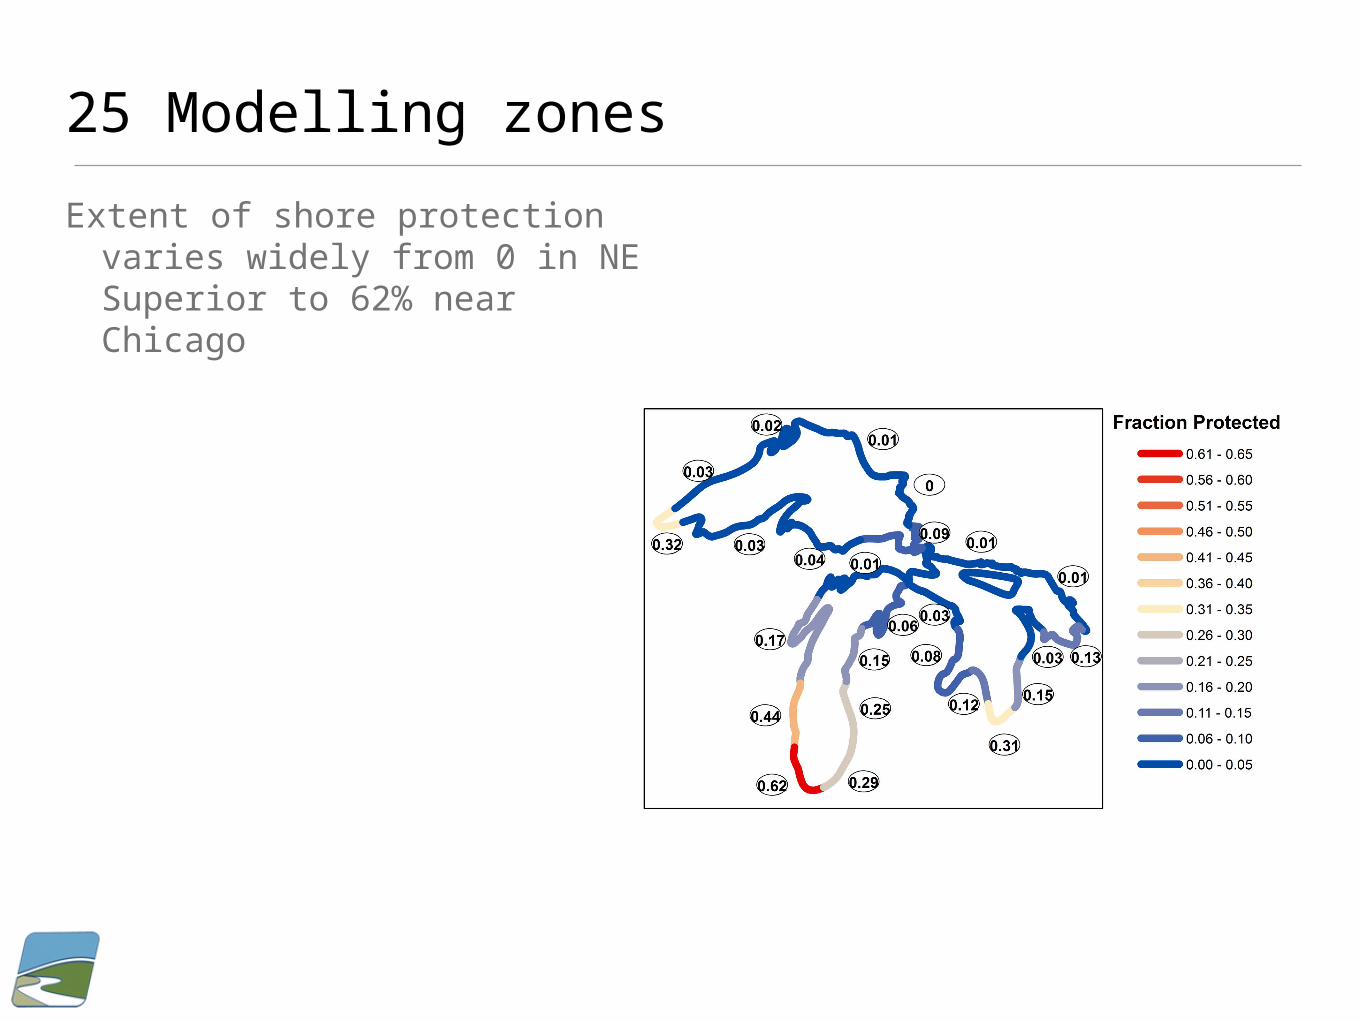
25 Modelling zonesExtent of shore protection varies
widely from 0 in NE Superior to 62% near Chicago
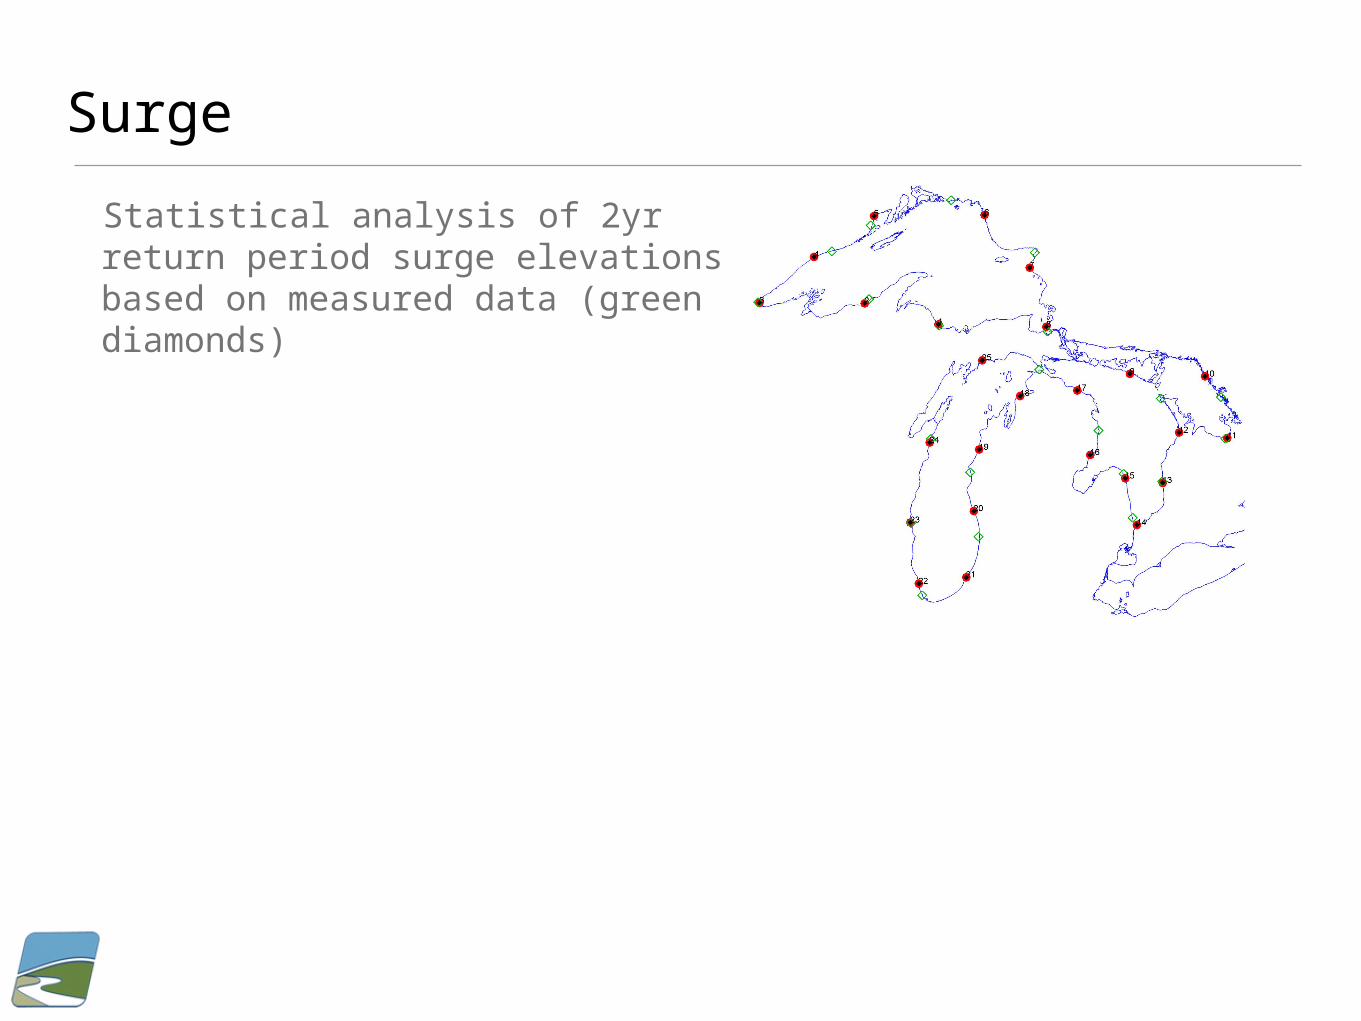
SurgeStatistical analysis of 2yr return period surge elevations based on measured data (green diamonds)
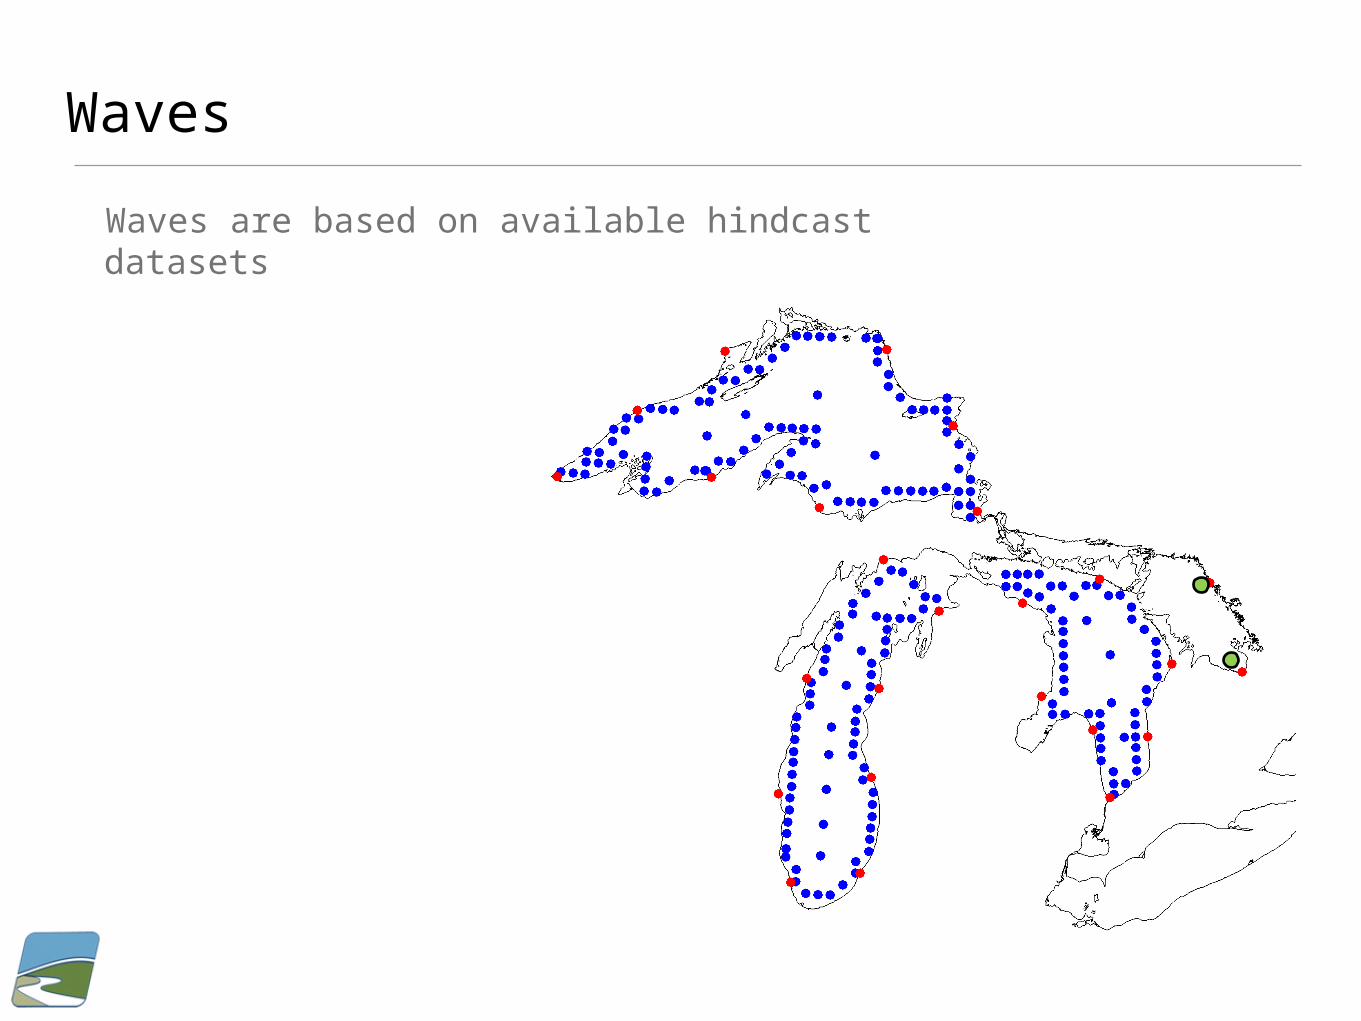
WavesWaves are based on available hindcast datasets

Results
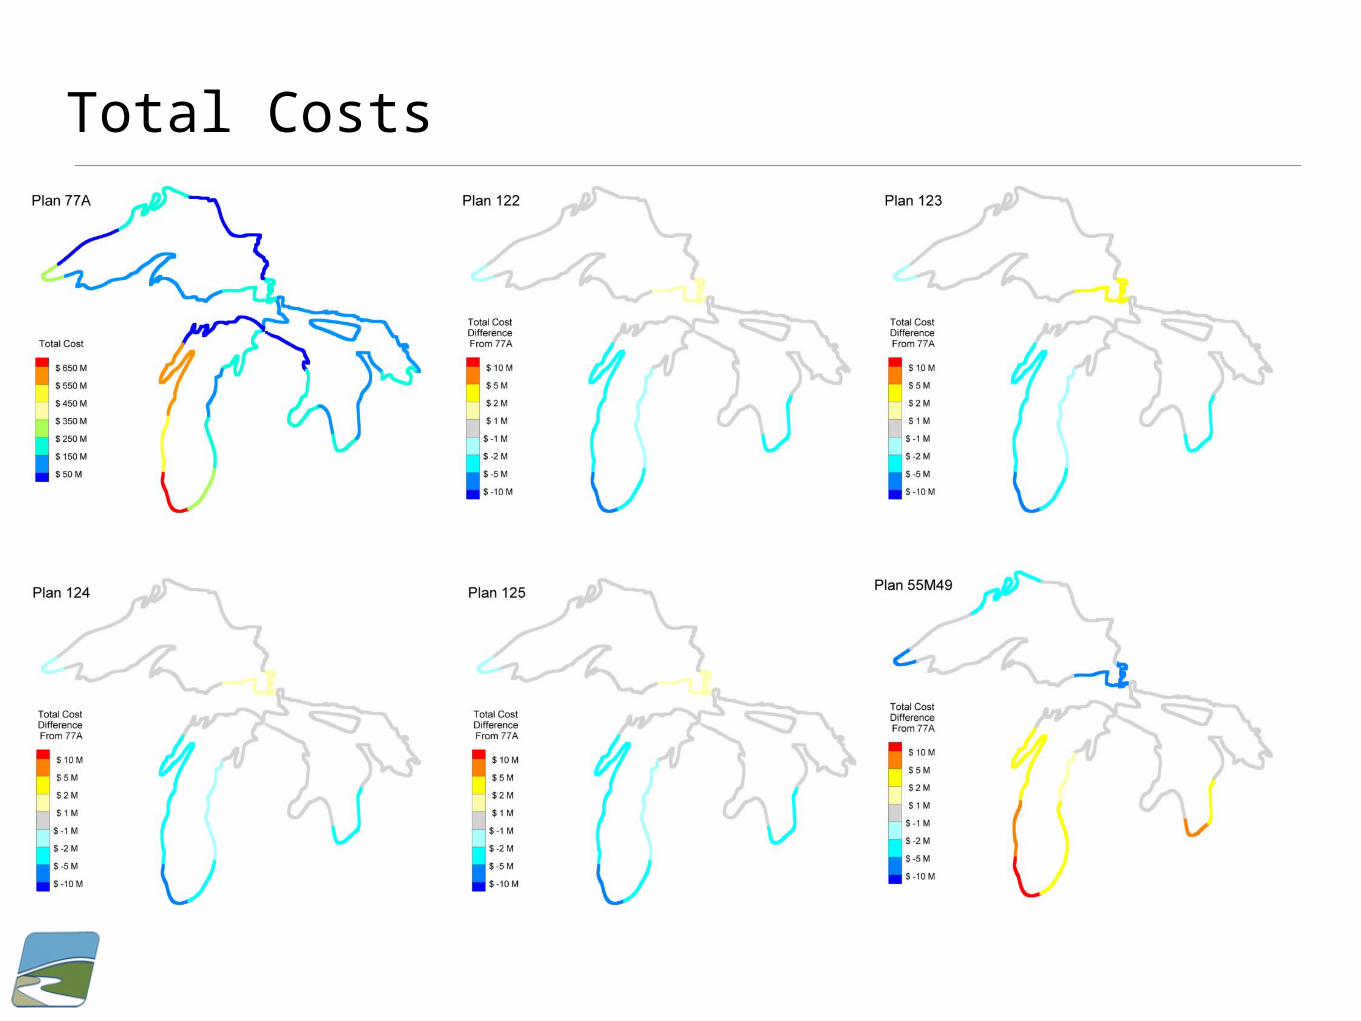
Total Costs
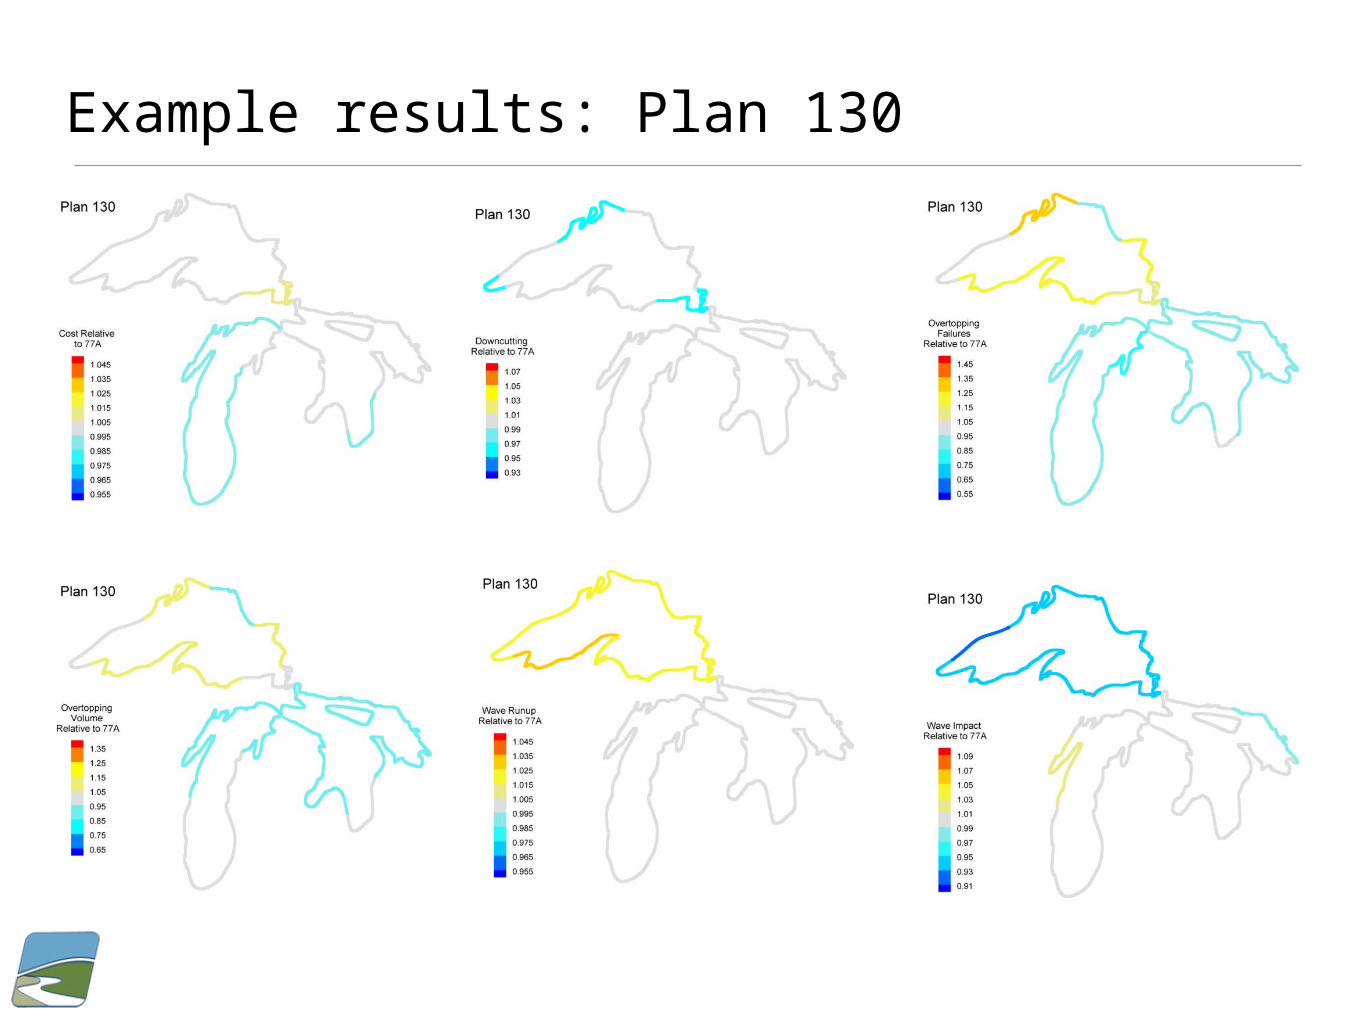
Example results: Plan 130
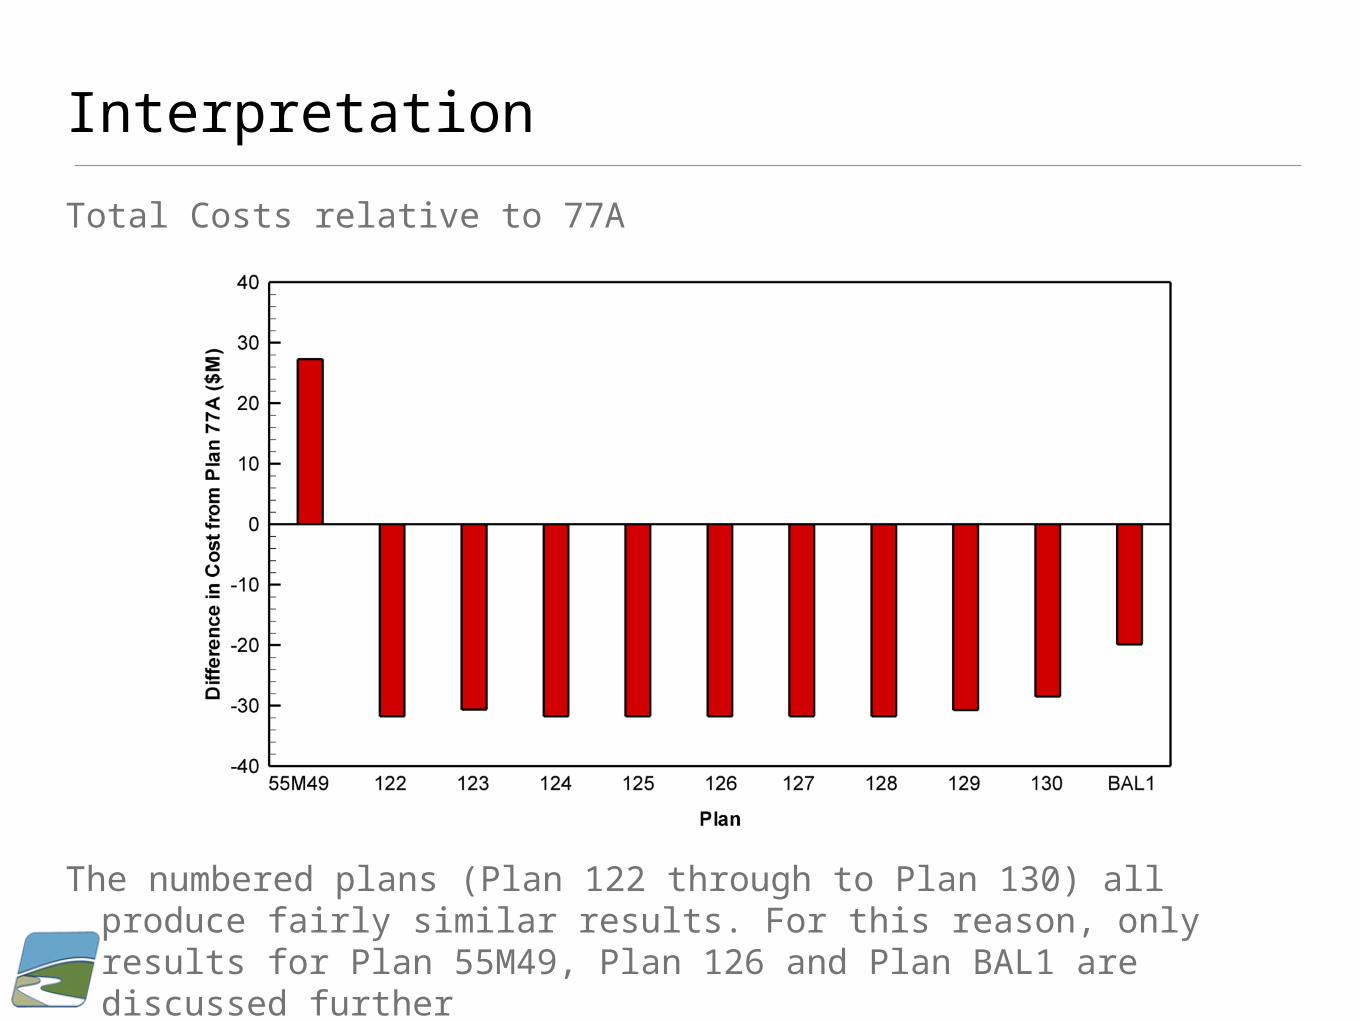
InterpretationTotal Costs relative to 77A
The numbered plans (Plan 122 through to Plan 130) all produce fairly similar results. For this reason, only results for Plan 55M49, Plan 126 and Plan BAL1 are discussed further
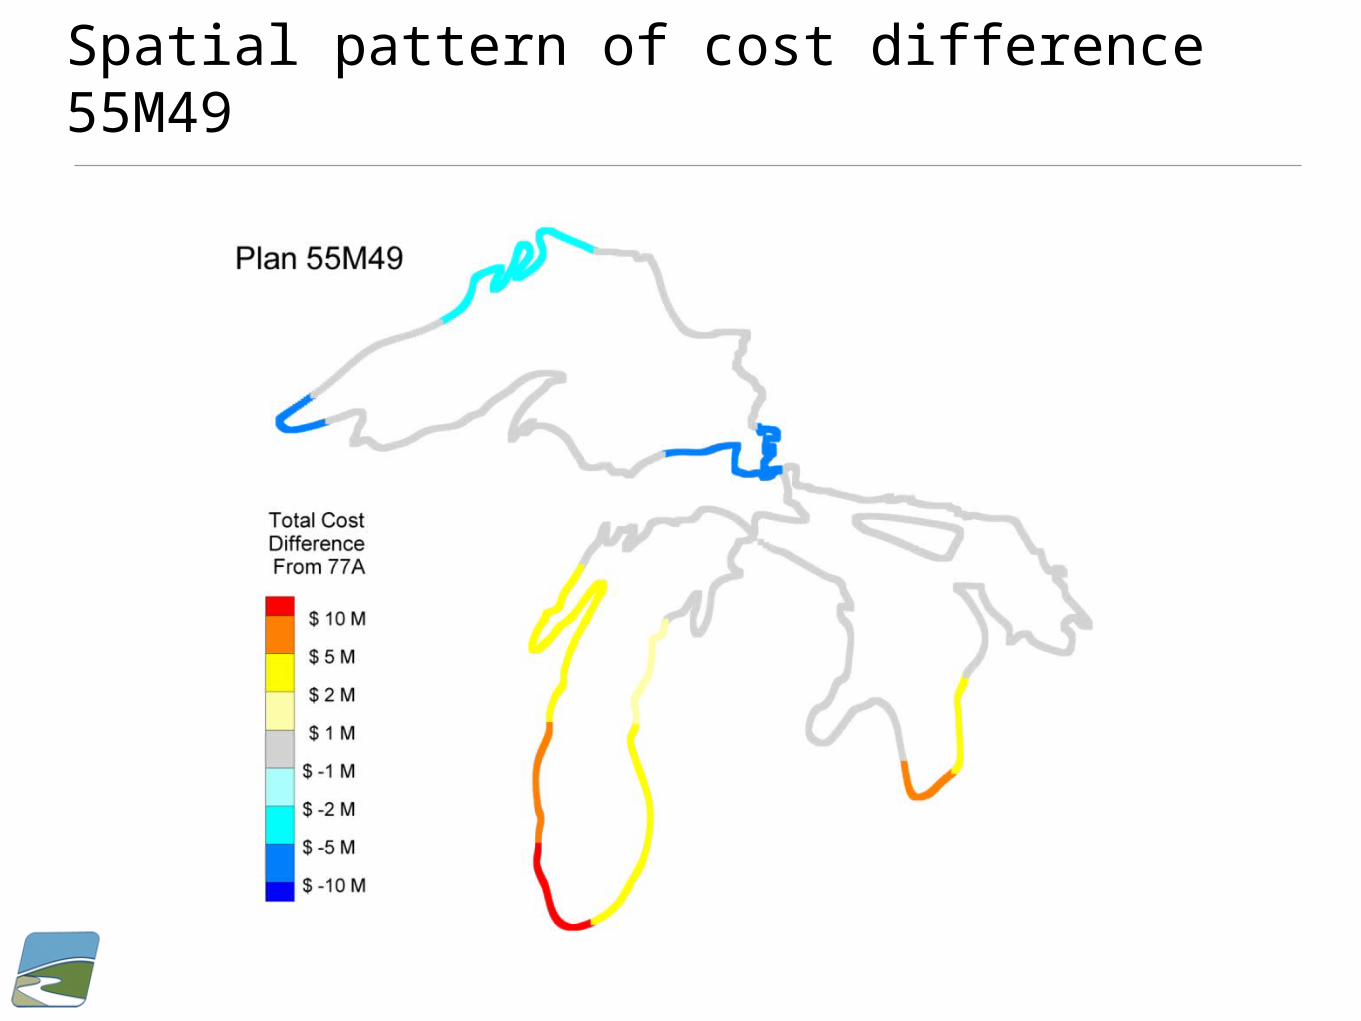
Spatial pattern of cost difference 55M49
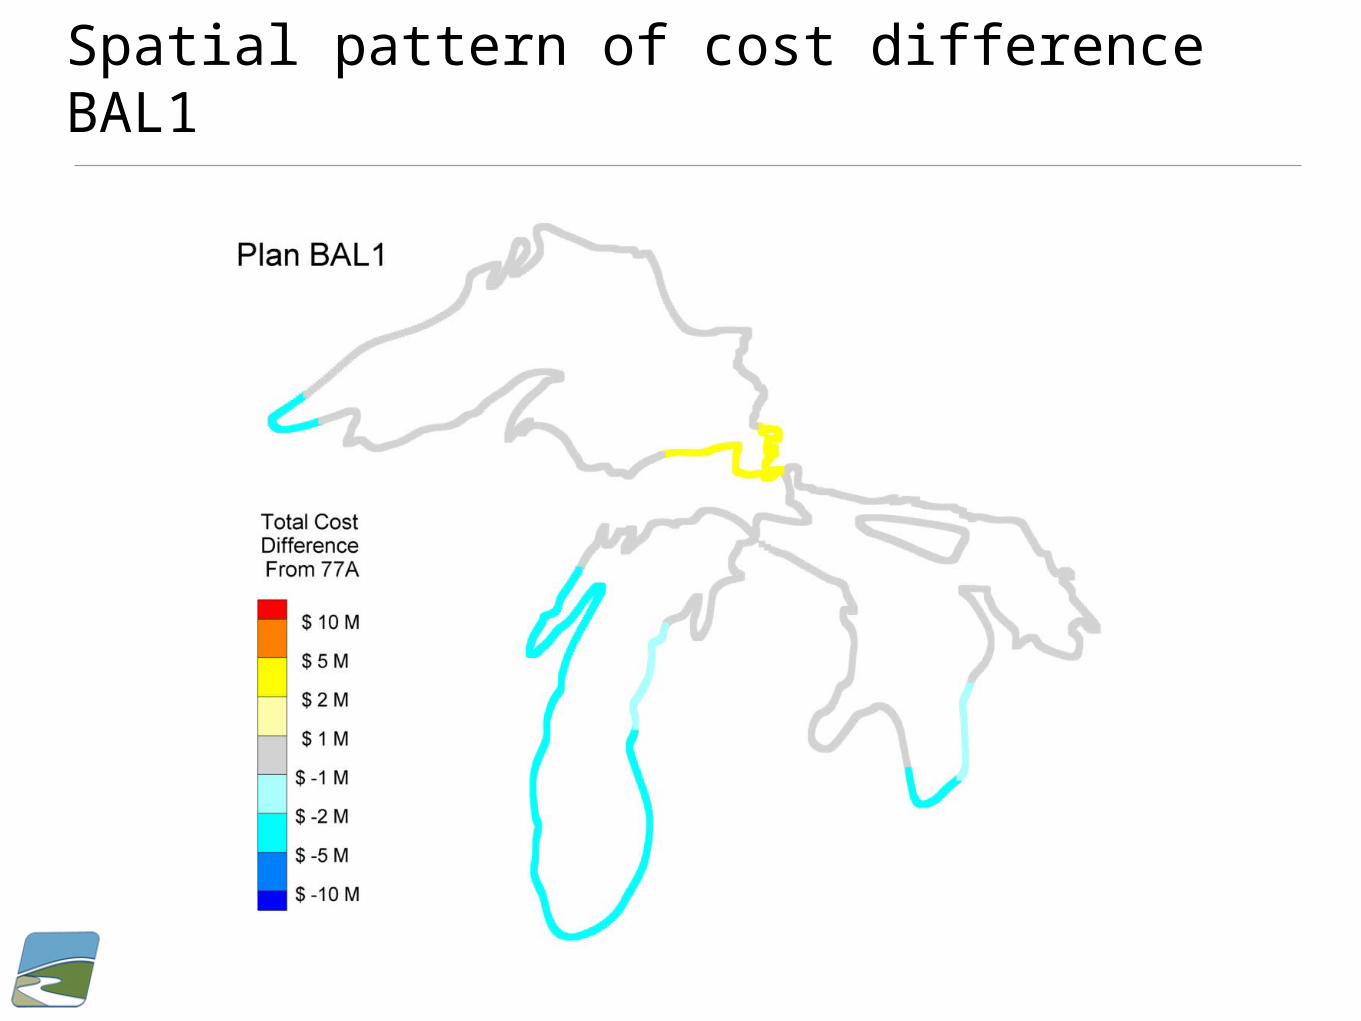
Spatial pattern of cost difference BAL1
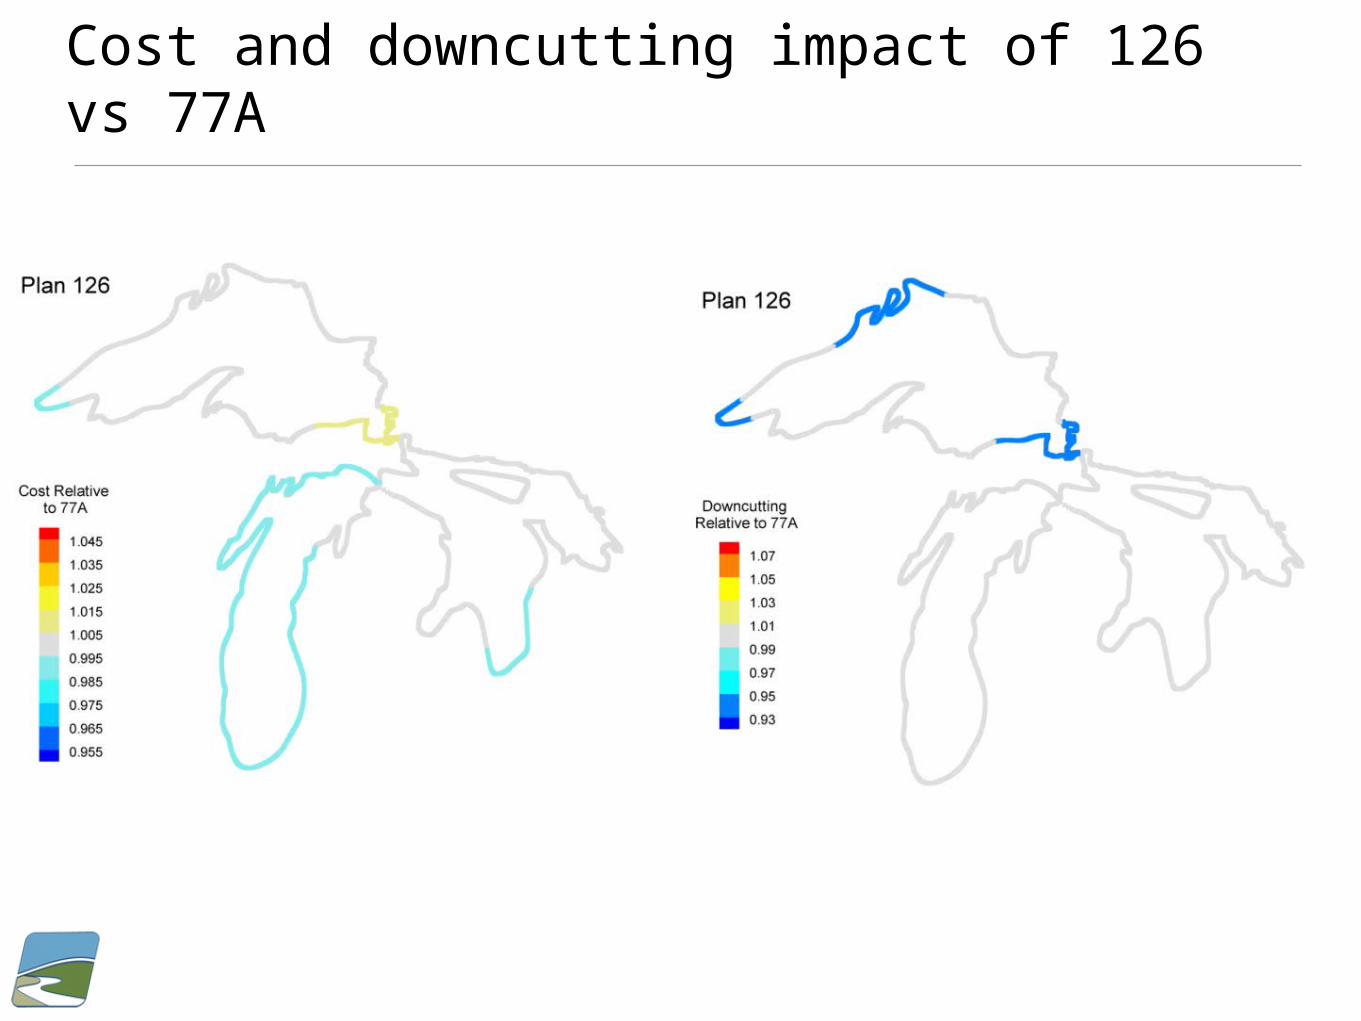
Cost and downcutting impact of 126 vs 77A

Overtopping 126 vs 77A
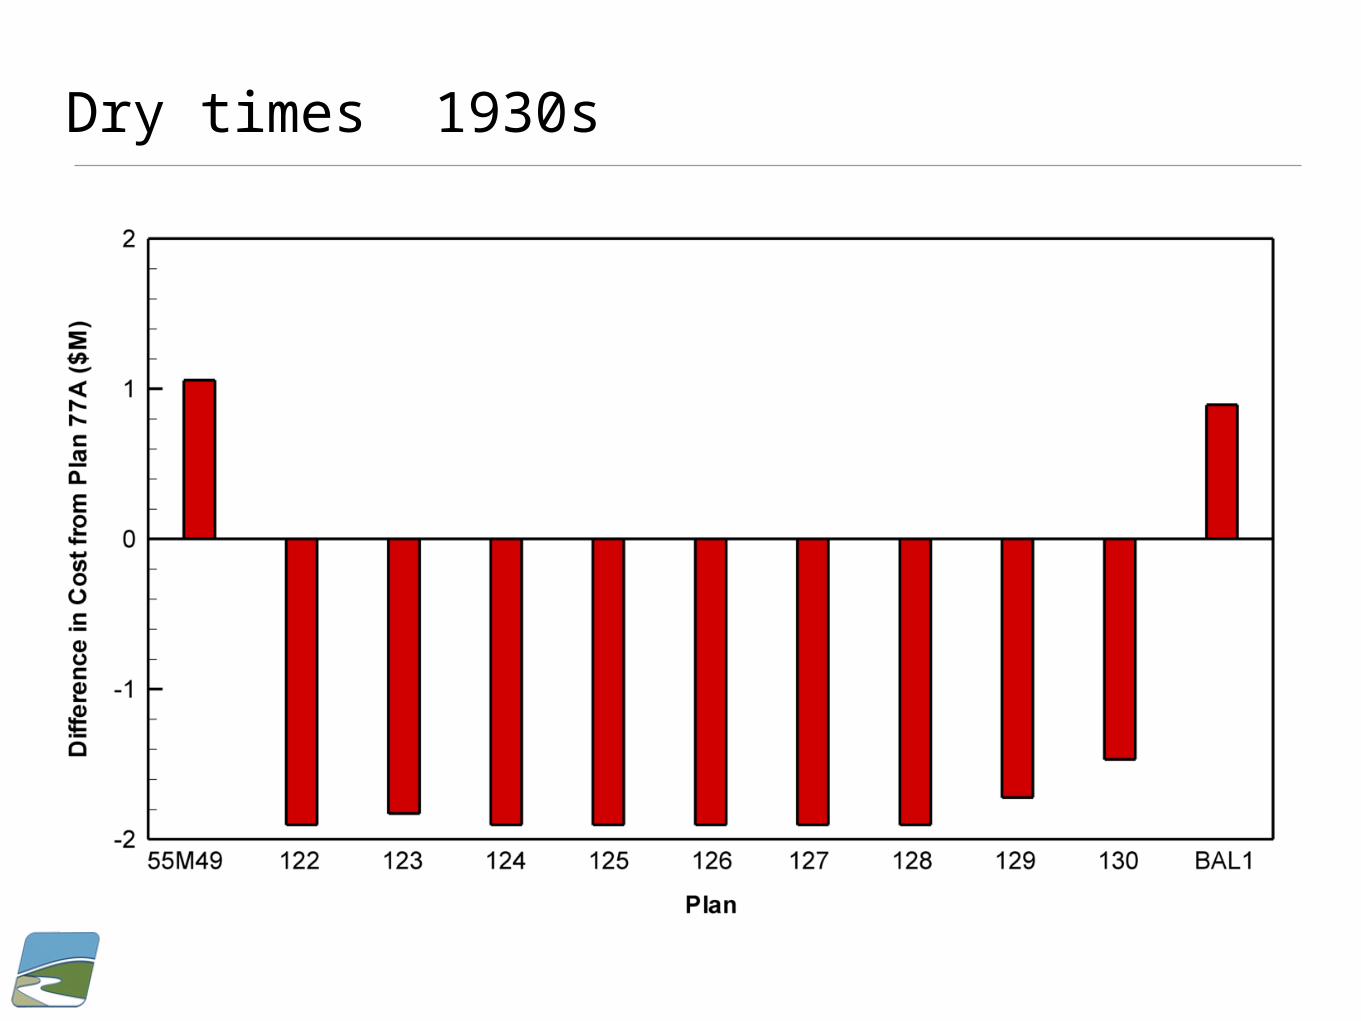
Dry times 1930s
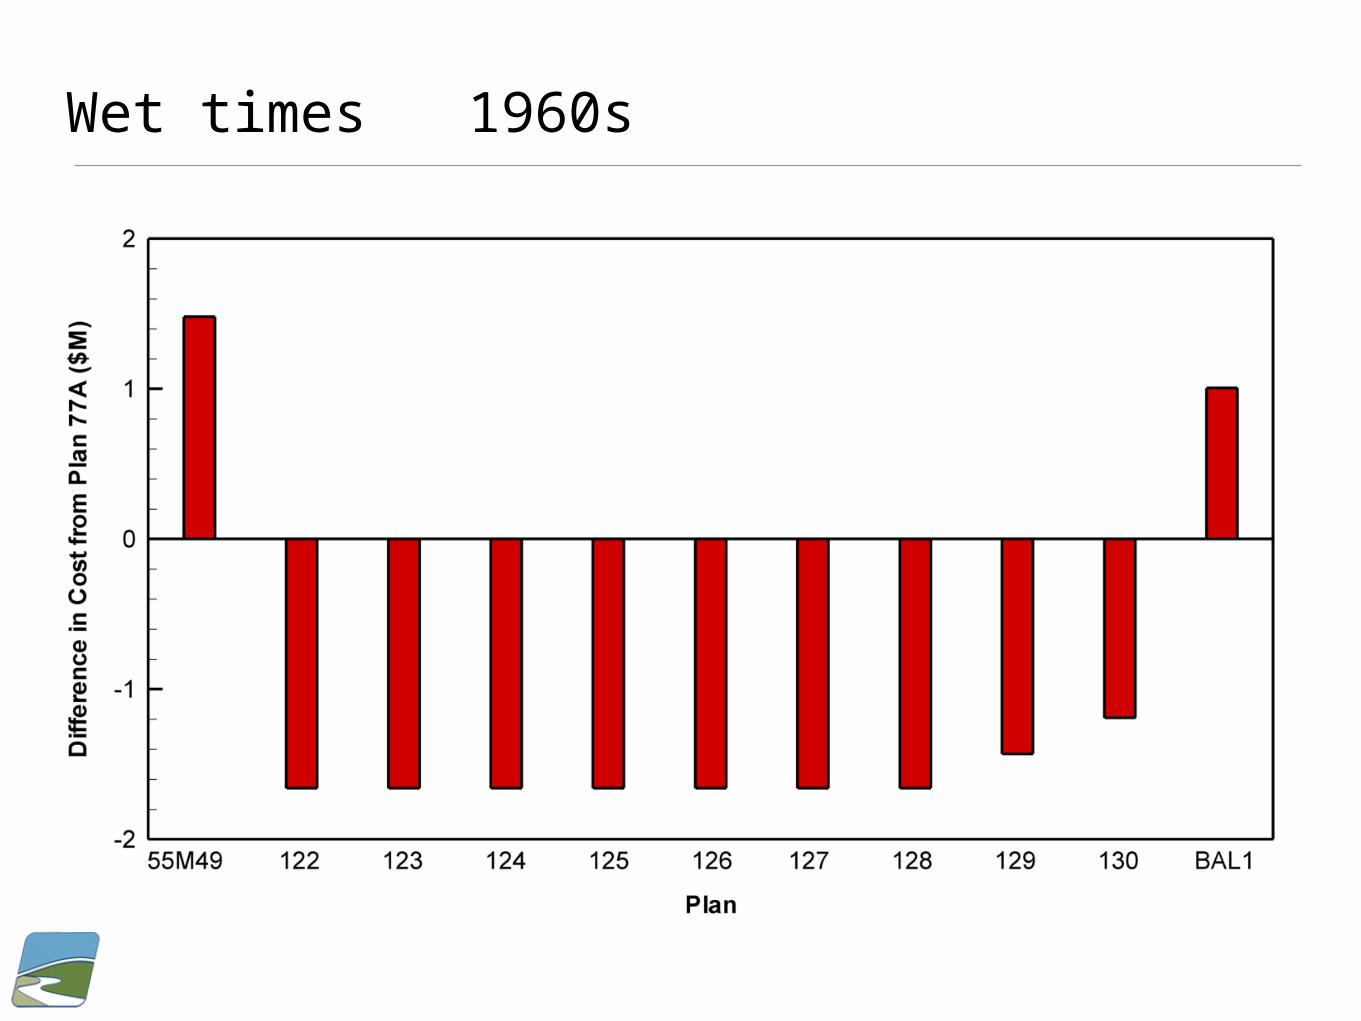
Wet times 1960s

End