Embed Size (px)
Citation preview

Agriculture and Horticulture Development Board 2017. All rights reserved
Project title: Nutrient management in Hardy Nursery Stock
(NutrHONS project)
Project number: HNS 193
Project leader: D J Adlam, Dove Associates
N Bragg, Bulrush Horticulture Ltd
Report: Annual report, February 2016
Previous report:
Key staff: Veronica Monteiro Dias
Teresa Maquire
Ann McCann
Location of project: PCS, Gent, Belgium
Greenmount Campus, Antrim, N. Ireland
Bulrush Horticulture Ltd, N Ireland
s
Industry Representative: Chris Bowman, Osberton Nurseries
Dale Swash, Frank P. Matthews
Date project commenced: 01 May 2015
Date project completed 31 December 2017 (Expected)

Agriculture and Horticulture Development Board 2017. All rights reserved
DISCLAIMER
While the Agriculture and Horticulture Development Board seeks to ensure that the
information contained within this document is accurate at the time of printing, no warranty is
given in respect thereof and, to the maximum extent permitted by law the Agriculture and
Horticulture Development Board accepts no liability for loss, damage or injury howsoever
caused (including that caused by negligence) or suffered directly or indirectly in relation to
information and opinions contained in or omitted from this document.
© Agriculture and Horticulture Development Board 2016 No part of this publication may be
reproduced in any material form (including by photocopy or storage in any medium by
electronic mean) or any copy or adaptation stored, published or distributed (by physical,
electronic or other means) without prior permission in writing of the Agriculture and
Horticulture Development Board, other than by reproduction in an unmodified form for the
sole purpose of use as an information resource when the Agriculture and Horticulture
Development Board or AHDB Horticulture is clearly acknowledged as the source, or in
accordance with the provisions of the Copyright, Designs and Patents Act 1988. All rights
reserved.
All other trademarks, logos and brand names contained in this publication are the trademarks
of their respective holders. No rights are granted without the prior written permission of the
relevant owners.
[The results and conclusions in this report are based on an investigation conducted over a
one-year period. The conditions under which the experiments were carried out and the results
have been reported in detail and with accuracy. However, because of the biological nature of
the work it must be borne in mind that different circumstances and conditions could produce
different results. Therefore, care must be taken with interpretation of the results, especially if
they are used as the basis for commercial product recommendations.]

Agriculture and Horticulture Development Board 2017. All rights reserved
AUTHENTICATION
We declare that this work was done under our supervision according to the procedures described herein and that the report represents a true and accurate record of the results obtained.
D J Adlam
[Position]
Dove Associates, Norfolk, England
Signature ............................................................ Date ............................................
Veronica Monteiro Dias
[Position]
PCS, Gent, Belgium
Signature ............................................................ Date ............................................
Teresa Maguire
[Position] Senior Horticultural Technologist
CAFRE, Greenmount College, N Ireland
Signature ............................................................ Date ............................................
Ann McCann
Assistant PD Manager]
Bulrush Horticulture Ltd, N Ireland
Signature ............................................................ Date ............................................
Report authorised by:
D J Adlam
[Position] Senior Partner
Dove Associates, Norfolk, England
Signature ............................................................ Date ............................................
Dr B Gobin
Director
PCS, Gent, Belgium
Signature ............................................................ Date ............................................

Agriculture and Horticulture Development Board 2017. All rights reserved
Dr Eric Long
Head of Horticultural Development
CAFRE, Greenmount College, N Ireland
Signature ............................................................ Date ............................................
N Bragg
Product Development Director
Bulrush Horticulture Ltd, Bellaghy, N Ireland
Signature ............................................................ Date ............................................

Agriculture and Horticulture Development Board 2017. All rights reserved
CONTENTS
Headline .................................................................................................................... 1
Background................................................................................................................ 1
Equipment ..................................................................................................................... 1
Nitrogen in plant sap...................................................................................................... 1
Merck Nitrate test strip ................................................................................................... 1
Optical sensing methods ............................................................................................... 2
Summary ................................................................................................................... 3
Financial Benefits ...................................................................................................... 6
Action Points .............................................................................................................. 6
Introduction ................................................................................................................ 8
Materials and methods .............................................................................................. 8
‘Pour-thru’ devices ......................................................................................................... 9
Weather station ........................................................................................................... 10
Substrate mixes used and Product Specification ......................................................... 12
Main ingredients .......................................................................................................... 12
‘Pour-thru’ collection and analysis: .............................................................................. 12
Nitrogen in plant sap.................................................................................................... 12
Equipment ................................................................................................................... 13
1 Merck Nitrate test strip .............................................................................................. 13
2 Horiba Laquatwin Nitrate kit ...................................................................................... 14
‘Procheck’ and GS3 sensor probe ............................................................................... 15
4. Optical sensing methods ......................................................................................... 15
5. ‘Fieldscout’ Green Index App ................................................................................... 17
Statistical methods applied ...................................................................................... 19
Results ..................................................................................................................... 19
Equipment results .................................................................................................... 19

Agriculture and Horticulture Development Board 2017. All rights reserved
atLEAF+ and Green Index chlorophyll measurements ................................................. 19
Greenindex App .......................................................................................................... 22
Horiba ‘LAQUAtwin’ NO3 N measurements ................................................................. 22
Decagon ‘Procheck’ with GS3 conductivity .................................................................. 22
Nitrogen leaching ........................................................................................................ 23
Nitrogen balance in containers .................................................................................... 25
Plant height ................................................................................................................. 28
Discussion ............................................................................................................... 29
Conclusions ............................................................................................................. 29
Knowledge and Technology Transfer ...................................................................... 30
References .............................................................................................................. 30
Appendices ................................................................................................................. 31
Appendix 1 - Weather data – Figure 32 – 35 ............................................................... 31
Appendix 2 – Tissue Data – Greenmount Figure 36 - 38 ............................................. 33
Appendix 3 – Tissue Data - PCS Figure 39 – 41 ......................................................... 33
Appendix 4 – Water Data - Greenmount Figure 42 – 44 .............................................. 34
Appendix 5 – Water Data – PCS Figure 45 - 47 .......................................................... 34
Appendix 6 – Substrate Data - Greenmount Figure 48 - 50 ......................................... 35
Appendix 7 – Substrate Data – PCS Figure 51 – 53 .................................................... 35
Appendix 8 – Tissue atLEAF+ Figure 54 - 57 ............................................................... 36
Appendix 9 - Tissue ‘Greenindex’ Figure 58 - 61 ......................................................... 38
Appendix 10 - Sap tissue ‘Horiba LAQUAtwin’ Figure 62 – 67 ..................................... 40
Appendix 11 – Statistical Analysis of Results - graphs ................................................. 43
Appendix 12 – Statistical Analysis of Results .............................................................. 46

Agriculture and Horticulture Development Board 2017. All rights reserved 1
GROWER SUMMARY
Headline
The trial aims to establish a protocol for collecting and monitoring the nutritional inputs and
outputs of container hardy nursery stock growing systems. Several on-nursery hand-held
pieces of equipment have been tested across a range of ornamental species and the readings
compared to traditional laboratory techniques. So far the biggest problem has been obtaining
on-nursery tissue or sap extracts to use with the hand-held meters.
Background
Equipment
Monitoring plant nutrient status has traditionally been done through soil nutrient and/or tissue
analysis. Tissue analysis methods have been widely applied to plants due to their reliability
in organic nitrogen determination, but they are time-consuming and destructive. Therefore,
the focus of these studies is to test easy to use and non-destructive new tools designed for
plant nitrogen (N) status estimation.
This project is initially testing five different pieces of equipment that were affordable and easy
to use. The methods for sensing plant N used in this first year trial are as follows:
Nitrogen in plant sap
The extraction of plant sap is a destructive method that includes the detachment of the main
petiole of the leaves, cutting it into small pieces and press it using a garlic press. As petioles
in ornamental plants are mostly very small, in this trial leaf samples, including the petiole,
were used and leaf sap was analysed.
Two pieces of equipment were used to measure the concentration of nitrate in leaf sap.
Merck Nitrate test strip
Nitrate test strips change colour when exposed to nitrate contained in the sample of plant
sap. The colour can then be compared to a colour chart (subjective method) or be measured
by a hand-held reflectometer. The Merck test strips used during this project were those for
the detection of nitrate the Merckoquant NO3. This test strip measures from 0 ppm to a
maximum of 500 ppm NO3. Merck test strips are quick, easy to use and very cheap (£30.00
per 100 pieces). Quant strip tests measure in nitrates instead of nitrate-N, therefore readings
must be divided by 4.43 to find the nitrate-N value.
Horiba Laquatwin Nitrate kit

Agriculture and Horticulture Development Board 2017. All rights reserved 2
For this piece of equipment, nitrate levels in plant sap are measured using a nitrate sensitive
electrode. This compact nitrate sensor has an operational range from 23 to 2,300 mg/L and
only needs a few drops of plant sap to generate a reading (enough to cover both electrodes).
However, this technology does have some disadvantages:
(1) It does not measure total N in plant tissue but only NO3-N,
(2) The presence of other ions such as chloride, bicarbonate or nitrite can affect
measurements (b).1
(3) Frequent calibration is also needed to maintain the accuracy of the sensor (every 5
samples)
(4) Readings should be make in the shade since direct sunlight can affect the meter.
Optical sensing methods
The greenness of the leaves represents the amount of chlorophyll found in the chloroplasts.
Leaf chlorophyll content can be used as an N status indicator, because this is an essential
element in photosynthetic protein synthesis. Leaf chlorophyll content increases with N supply
and decreases when N is limiting.
atLEAF+
The atLEAF+ is a sensor that measures leaf Chlorophyll content in a similar way as a SPAD
meter, but has the advantage of being cheaper. It is a non-destructive, hand-held, lightweight
and easy-to-use sensor.
The device works by inserting the leaf into the aperture in the front of the sensor and clicking
on the measure button. There are two LED emitters in the upper part of the aperture at two
wavelengths, red at 660 nm and near infra-red (NIR) at 940 nm. Light filtered through the leaf
is captured by a sensor below it which measures the absorbance of the leaf. The difference
in transmission of the filtered wavelengths gives a measure of chlorophyll content in atLEAF+
units. The sensor continues to sample the scanned area as long as the measure button is
being pressed. An average value of the measurements will appear when the measure button
is released. The device can measure leaves that are up to 0.1 in (2.5 mm) in thickness.
Measurements can be stored and easily uploaded to a computer.
According to literature this sensor is not very effective at collecting readings on leaves with
small widths like conifers. Unlike SPAD that makes the measurements in a closed chamber
which clamps over the leaf, and has a filter to clear other wavelengths in the light spectrum,
1 This has always been a problem with ion specific electrodes

Agriculture and Horticulture Development Board 2017. All rights reserved 3
the atLEAF+ sensor takes measurements in an open aperture and has no filters. This is likely
to affect the readings because: (1) the position of the leaf can vary (closer to the top part of
the aperture or to the lower part) and (2) this aperture allows for light to reach the sensor
diode and interfere with the reading.
Fieldscout Green Index App
This App was developed to capture differences in ‘greenness’ between maize leaves. The
app captures images using the iPhone digital camera and determines the DGCI (Dark Green
Colour Index) of plant leaves (between 0 and 1). When purchasing this App, growers should
also purchase a reference board which is used as a background when taking pictures of the
leaves. The green and yellow discs present on this board are known colours (standards) used
by the software to calibrate differences in light conditions; the pink background increases
contrast and reduces noise, and the grey colour calibrates the white balance.
Because N status is not the only factor that affects the greenness of the leaves (water stress,
temperature, and cultivar also do), the DGCI readings taken in a field must be compared with
readings taken in a high-N reference area. Recent studies show that DGCI is closely related
to the N content in leaves as well as with SPAD readings.
Electrical conductivity (EC) in substrate
Monitoring the N present in the growing media through substrate analysis, is a method widely
applied in the hardy nursery stock industry. However, sampling growing media is labour-
intensive, expensive, and growers have to wait for the results in order to be able to adjust
fertilisation regimes.
“Procheck” and “GS3” sensor probe
The sensor GS3 from Decagon measures soil moisture, temperature, and electrical
conductivity (EC) of the substrate. The probe has three steel needles that improve sensor
contact in porous substrates such as peat or perlite. By measuring EC in the substrate
solution, the sensor measures the total amount of salts dissolved in pore water. It does not
give information on the amount of a specific nutrient. However since the majority of salts in
the substrate are macronutrients, EC can be used as an indicator of the presence of
macronutrients in the growing medium.
Summary
This report covers the first 12 months of the three-year project. The aim of the project is to try
to relate crop performance measured using various hand-held instruments, to traditional
sampling and laboratory analysis results. Additionally, by monitoring rainfall and irrigation

Agriculture and Horticulture Development Board 2017. All rights reserved 4
inputs, we look at the nutrient balance between the inputs, uptake by plants, and outputs
through leaching.
In this first year two main trial sites were established, Greenmount College in Northern Ireland
and PCS Research Station at Destelbergen, Ghent, Belgium. It was anticipated that their
geographic positions would give some different inputs, such as hours of sunshine,
temperature and rainfall. The trials were established using the same base substrate, plant
species and increasing rates of CRF fertiliser. Four commonly grown hardy nursery stock
subjects were selected based on criteria such as, colour reaction to fertilisers, vigour of growth
in relation to fertiliser rates, and growth habit. These subjects were Viburnum tinus,
Chamaecyparis pisifera, Skimmia japonica and Buddleja davidii.
At each of the sites the rainfall, irrigation and other climate data was collected. At pre-
determined growth stages, samples of plant tissue, substrate mix and runoff from specific trial
plants were collected and sent for full analysis. In addition to the traditional sampling, the site
operators measured parameters such as sap ‘N’ content, leaf chlorophyll reflectance,
moisture and EC levels in the substrate using a range of hand-held instruments, and a novel
mobile phone app for measuring the health of leaf tissue, all with varying levels of success.
Agriculture and Horticulture Development Board 2017. All rights reserved 5
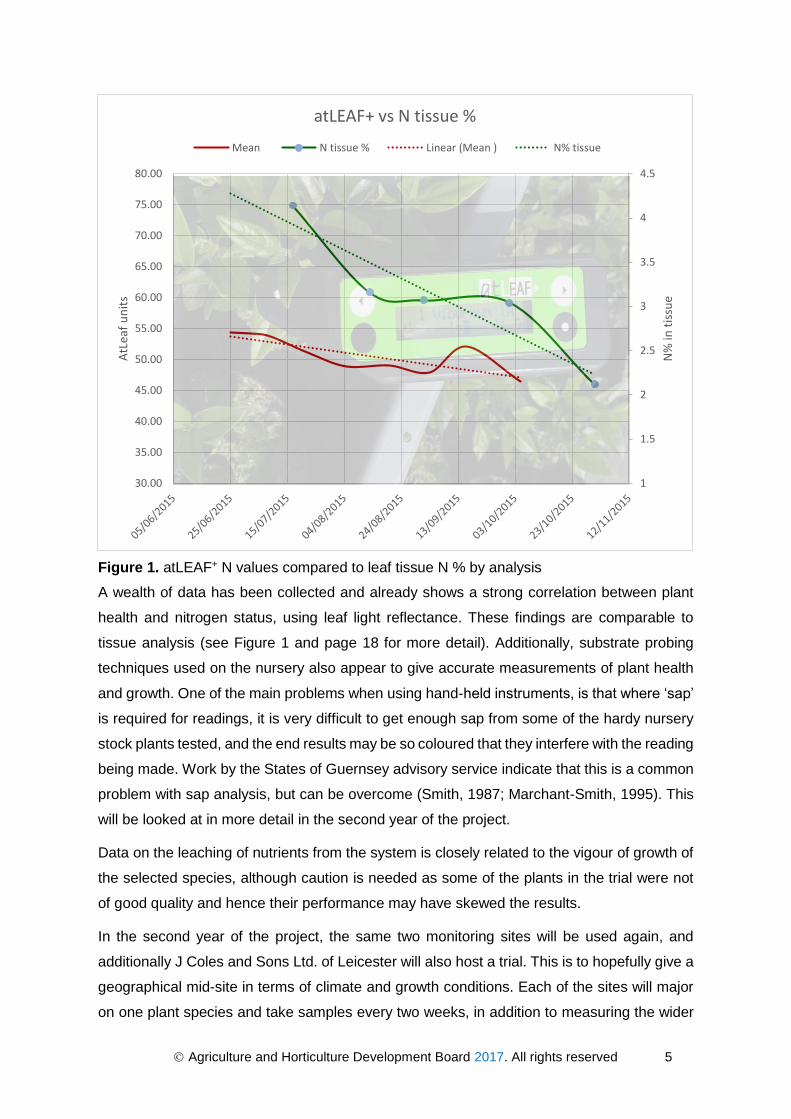
Figure 1. atLEAF+ N values compared to leaf tissue N % by analysis
A wealth of data has been collected and already shows a strong correlation between plant
health and nitrogen status, using leaf light reflectance. These findings are comparable to
tissue analysis (see Figure 1 and page 18 for more detail). Additionally, substrate probing
techniques used on the nursery also appear to give accurate measurements of plant health
and growth. One of the main problems when using hand-held instruments, is that where ‘sap’
is required for readings, it is very difficult to get enough sap from some of the hardy nursery
stock plants tested, and the end results may be so coloured that they interfere with the reading
being made. Work by the States of Guernsey advisory service indicate that this is a common
problem with sap analysis, but can be overcome (Smith, 1987; Marchant-Smith, 1995). This
will be looked at in more detail in the second year of the project.
Data on the leaching of nutrients from the system is closely related to the vigour of growth of
the selected species, although caution is needed as some of the plants in the trial were not
of good quality and hence their performance may have skewed the results.
In the second year of the project, the same two monitoring sites will be used again, and
additionally J Coles and Sons Ltd. of Leicester will also host a trial. This is to hopefully give a
geographical mid-site in terms of climate and growth conditions. Each of the sites will major
on one plant species and take samples every two weeks, in addition to measuring the wider
1
1.5
2
2.5
3
3.5
4
4.5
30.00
35.00
40.00
45.00
50.00
55.00
60.00
65.00
70.00
75.00
80.00
N%
in t
issu
e
AtL
eaf
un
its
atLEAF+ vs N tissue %
Mean N tissue % Linear (Mean ) N% tissue

Agriculture and Horticulture Development Board 2017. All rights reserved 6
range of plants. Two other growers, Osberton Grange and Frank. P. Matthews have agreed
to trial specific hand-held pieces of equipment to establish whether they are easy to use.
There are also planned open days and visits to the trial sites through the autumn of 2016,
and a series of hands-on workshops will be held across the winter period 2016-17.
Financial Benefits
Annual UK sales of CRF fertilisers are currently £4m (across all manufacturers) with a farm
gate market value of £1b for all hardy ornamental plants. The cost of fertiliser is quite a small
percentage of sales but the effect on a grower’s sales when they have a nutrition problem
can be a very high. We asked a group of seven nursery stock growers what the crop losses
were from nutritional problems. No one was able to quantify these losses. The below is from
Table 1 from the science section showing the price of the equipment assessed during the
project:
Equipment Measurement Price
‘Merck’ Nitrate test strip Nitrate – NO3 £30.00 per 100 tests
Horiba ‘LAQUAtwin’ Nitrate kit
Nitrate – NO3 £380.00
‘Procheck’ and GS3 sensor probe
volumetric water content, temperature and electrical conductivity
£730.00
atLEAF+ meter chlorophyll concentration £210.00
‘Fieldscout’ Green Index App
DGCI (Dark Green Colour Index) & SPAD (chlorophyll concentration)
£100.00 (excluding smart phone)
‘Pour-thru’ devices Pour-thru water collection £24.00 each
Davis ‘Vantage PRO2’ Weather data £980.00
Action Points
Growers must decide whether they are introducing an on-nursery monitoring system and they
must then engage and train a suitable member of staff to make the measurements and
develop the trends for a range of subjects.
For growers the current messages are:
1) Various instruments are sold for on-nursery testing but currently there is little guidance on
how to achieve a data set which can be interpreted easily for hardy nursery stock,
2) Both substrate conductivity and leaf colour offer promising data to determine leaf N
content,

Agriculture and Horticulture Development Board 2017. All rights reserved 7
3) The extraction of sap and leaf samples from nursery stock subjects is at best difficult and
may require additional treatment before testing,
4) If the monitoring is to be meaningful, the time of day of sampling, the frequency of sampling
and the consistency of the operator need to be taken into account.

Agriculture and Horticulture Development Board 2017. All rights reserved 8
SCIENCE SECTION
Introduction
Annual UK sales of CRF fertilisers are currently £4m for all manufacturers with a farm gate
market sales value of £1b for all ornamental plants. The cost of fertiliser is quite a small
percentage of sales but the effect on the sales of a grower’s crop when they have a nutrition
problem can be extensive. This project seeks to address and quantify nutritional deviations
before they become a foliar disorder and allow the grower to rectify it in time.
In the past the nutrient status of crops has relied on ‘reactive’ analyses of substrate and tissue
often at a point where correction is difficult. The literature review included here indicates that
various hand-held pieces of equipment are now available which purport to be able to give
field measures of ‘N’ content of growing plants. The protocols being examined in this work
aim to test each hand-held instrument and the values they produce in relation to laboratory
analysis, and to look for trends and similarities in results, such that these simple devices can
predict trends and therefore make additional fertiliser applications ‘proactive’ over time.
This project aims to provide nurserymen with practical methods to monitor plant nutrients and
measure plant uptake so nutrient applications can be adjusted accordingly. This is being
carried out by regularly taking a series of measurements with various pieces of equipment
(outlined later in this report) and comparing them with the analysis of plant tissue, growing
media and pour-thru water. Weather data (air temperature, rainfall and humidity) were
collected at each site.
Materials and methods
The trials were carried out in two locations with different environments in order to expand the
knowledge of crop responses. The two trial sites were at PCS in Ghent, Belgium and
Greenmount College, Northern Ireland. Tissue samples, substrate samples and pour-thru
water samples were all analysed for major nutritional elements when a plant growth extension
of 2 cm was achieved, in addition to the hand-held equipment measurements.
We asked a group of seven nursery stock growers what the crop losses were from nutritional
problems and their responses have helped to clarify what areas we should target to provide
the best adoption of the results found. None of the growers were able to quantify the losses
due to nutritional problems, but suspected that they had high fertiliser release from CRF
fertilisers when used under protection in hot summer periods. As a result of this, their CRF
rates were either reduced or in one case excluded. One grower stopped growing a difficult
plant. All the growers were using the plant condition as a guide to the health of the crop, but
generally this was dealing with the issue after the problem had emerged. This demonstrated

Agriculture and Horticulture Development Board 2017. All rights reserved 9
to us that a method of assessing nutrient availability and uptake prior to any visual symptoms
manifesting themselves would have financial benefits to the grower. Ornamental crops
require blemish-free foliage and any deviation from a strong and healthy plant can render it
totally unsaleable.
The same base growing medium was mixed with an 8-9 months CRF at the rates of 2, 4, 6
and 8 g/L and shipped to the two sites. In the beginning of May, 2015, young plants were
potted into 1.5-litre pots and placed in groups of 20 plants in a growing bed. Six plants were
placed in the pour-thru containers and the remaining plants were placed around them (see
Figure 7).
‘Pour-thru’ devices
Low cost ‘pour-thru’ systems were developed using two grey and opaque plastic containers:
(1) a smaller perforated container where plants were grown (60 x 40 x 21.5 cm) and (2) a
bigger container underneath used to collect the drained water from the container above (60
x 40 x 32 cm). The top box had an even pattern of holes drilled in the bottom in which to
allow water to pass through. Capillary matting was then added to the base of the top box
and the MARA (ART NR 6015 B) plant tray of six 1.5 litre pots set into the box (see Figures
2 and 3).
Figures 2 and 3. Pour-thru units at PCS Belgium (left) and Greenmount College N Ireland (right)

Agriculture and Horticulture Development Board 2017. All rights reserved 10
Weather station
At Greenmount a wireless Davis Vantage Pro Weather station complete with solar panel attachment and wireless console was installed in the project nursery stock area. Data was downloaded using the software and USB connection suitable for Windows application.www.davisweather.co.uk
Figures 4 and 5. Wireless Davis Vantage Pro Weather station: in the field (left), and in detail (right).
Four hardy nursery stock species were used in the trial:
Viburnum tinus: frequently used in HNS trials, compact and visually sensitive to nutrient levels
Chamaecyparis pisifera ‘Boulevard’: because its foliage colour is a good indicator for its N status (important for optical sensing methods).
Skimmia japonica ‘Rubella’: because it is an easy to assess shrub that produces plenty of succulent foliage (important for plant sap methods).
Buddleja davidii: is a vigorous growing shrub and very responsive to fertilizing levels (growth and colour)
The plants in the trial were all irrigated at the same time with overhead sprinklers (Figure 6). In Belgium the irrigation was trigged by a maximum radiation sum. The radiation sum was adapted throughout the season (low value in the summer and high value in the spring and fall). The species and rates of CRF were combined in a 4 x 4 factorial design with three replications (Figure 7).

Agriculture and Horticulture Development Board 2017. All rights reserved 11
Figure 6. shows the overall view of the plant trial at PCS, Belgium
The growth of the Buddleja plants naturally became excessive and to correspond to commercial practice they were trimmed back on both sites. This is reflected in the plant height data.
Figure 7. Schematic of the plant trial at Greenmount College, N. Ireland. The green spots represent the plants in the ‘pour-thru’ devices, the blue spots are the surrounding plants.

Agriculture and Horticulture Development Board 2017. All rights reserved 12
Substrate mixes used and Product Specification
Main ingredients
3 parts Dark peat 18 MM
6 parts Light peat 18 MM
1 part Sod peat 18 MM
FOREST GOLD® -------------
Nutrients added per m³:
1 KG BASE 15-10-20+TE
0.1 KG NITROCHALK
3 KG LIME/DOLODUST
0.4 LITRE WETTING AGENT
CRF additions:
2, 4, 6 & 8 kg/m3 of 8-9 month Osmocote (standard release product)
‘Pour-thru’ collection and analysis:
Every four weeks, the volume of drained water in the lower container of the pour-thru was measured, sampled for water analysis and emptied. At the same time substrate samples were taken and sent to the laboratory. Samples from each site were sent to the same laboratory to avoid differences in procedures. Temperature and rainfall were measured by weather stations present at each site, and the amount of water received by the plants (rainfall plus irrigation) was measured by rainfall gauges. Run-off and nutrient leaching could therefore be monitored to give us an accurate idea of the amount of nutrients being used by the plants and lost through leaching. Plant height was measured every two weeks. Each time a plant species grew more than 2 cm, a leaf sample was taken for tissue analysis. At each site, five different hand-held pieces of equipment were used every two weeks to obtain measurements of the nutritional status of the crop. These results have then been used to compare trends of the results with the full laboratory data sets. The hand-held devices used are set out in detail below.
Nitrogen in plant sap
Leaf sampling and leaf sap extraction occurred differently at each site. In Northern Ireland
leaves were sampled from mid-way on the plant and fresh sap was used, while in Belgium
the first fully expanded leaves from the top were sampled and leaf material was frozen to
increase the volume of extractable sap. Leaf samples in both sites were taken from the guard
plants surrounding the pour-thru devices.
Statistical analysis of all data was carried out by the statistics department of CAFRE at
Greenmount. There were 153 variables, of which 62 are listed of particular relevance and
80% of the mix
20% of the mix

Agriculture and Horticulture Development Board 2017. All rights reserved 13
detailed in Appendix 12. Each variable is tabulated to show the significance level, where “NS”
is no significance, “*” shows significance where P<0.10, “**” shows high significance P< 0.05
and “***” showing very highly significant results where P<0.01. The tables are shown for each
plant variety, each replicate and both sites combined. All the graphs relate to the various
datasets referenced in Appendix 12 and show the degree of significance of the various data
sets when plotted together. The graphs are tabulated in plant groups. (See Figures 21 – 27)
Equipment
1 Merck Nitrate test strip
Merck test strips are quick, easy to use test strips suitable for the semi quantitative detection of ions, and organic and inorganic substances. They give a quick summary of substance concentrations present in the sample.
The Merck test strips used during this project detect nitrate (the Merckoquant NO3N). This test strip measures from 0 ppm to a maximum of 500 ppm NO3.
The test strips use the Azo dye method for testing nitrates. Nitrate is reduced to nitrite by a reducing agent. In the presence of an acidic buffer the nitrite is converted to nitrous acid which diazotizes an aromatic amine compound with N-(1-naphthyl)-ethylenediamine to form a red-violet azo dye (see Figure 8).
Figure 8. Merck test strips being compared to colour standards for the detection of nitrate
Greenmount
A random leaf sample (including the petiole) from mid-way on the plant, was picked early morning. The end of the petiole was then placed into a pair of wide end pliers along with one of the test strips with the test end alongside the petiole. The pliers were then squeezed releasing a small amount of sap which stained the test strip test end. After 1 minute the colour formed was then read against the colour chart supplied on the storage container. One sample was taken from each treatment and plant species, and replicated at fortnightly intervals from the six plants within the pour-thru devices.

Agriculture and Horticulture Development Board 2017. All rights reserved 14
PCS
In Belgium five to eight leaves (depending on the species) were taken from each replicate, placed in a syringe and frozen (one syringe per plant species and per treatment). Every month syringes were left two hours to thaw. After a two-way calibration, plant sap was squeezed from the syringes into the cavity of the Laquatwin NO3 sensor and nitrate was measured. Immediately after, a nitrate test strip was dipped in the same leaf sap sample (and after one minute the colour was red as already referred above). Two-way calibration was performed after every four samples and demineralized water and absorbing paper were used to clean the sensor cavity between measurements.
2 Horiba Laquatwin Nitrate kit
Horiba scientific provides a range of bench top and portable meters suitable for use in the lab or field. The Laquatwin is a hand-held, self-contained, waterproof, compact meter available with a selection of seven parameters such as pH, conductivity and various ions (see http://www.horiba.com/uk/).
Figure 9. Laquatwin NO3 sensor used for the nitrate measurement of plant sap
Greenmount & PCS
A minimum of 15 leaf samples (including the petioles) were collected in the early morning from mid-way on the plant. One collective sample was taken from each treatment and for plant species and replicated at fortnightly intervals from the six plants within the “pour-thru” devices.
All samples were stored on ice for up to eight hours before processing. Each collective sample was placed in a syringe and squeezed to form a liquid sap sample.
Following calibration of the LAQUtwin NO3 meter the squeezed liquid sap sample was placed on the flat sensor and the reading taken. At Greenmount the sampling sheet (known as sampling sheet B part No. 3200053858) was used to counteract the influence of particles within the sample.
For the PCS the same sap sample was also used for the Merck nitrate test strip reading.

Agriculture and Horticulture Development Board 2017. All rights reserved 15
‘Procheck’ and GS3 sensor probe
Decagon Devices Inc. designs, manufactures and markets scientific instruments with a focus on measuring water, light and temperature within the soil-plant atmosphere. (see www.decagon.com).
Figure 10. (left) shows the Procheck which provides a digital reading for volumetric water content, temperature and electrical conductivity.
Figure 11. (right) shows the GS3 probe used to take the readings.
Before starting, the probe (Figure 11) needs to be given time to acclimatise to the outside temperature especially if coming from storage.
Prior to measuring the GS3 sensor has to be conFigured according to the type of growing media: (1) ‘mineral’ for soil and (2) ‘soilless’ for substrate. At PCS, the probe was inserted at the top of the substrate while at Greenmount it was inserted at the side after removing the plastic pot. A reading is then processed within seconds. Measurements can be saved and names can be given on site. This is better than the atLEAF+ device where names have to be processed by a computer program and uploaded into the sensor before taking it to the field.
All six plants were sampled within a “pour-thru” thus a total of 18 plants were sampled per plant species and treatment. Electrical conductivity, volumetric water content and temperature were also automatically registered.
Following completion of all the readings for the day the data was downloaded using the “Procheck” software and USB connection suitable for Windows application.
4. Optical sensing methods
‘atLEAF+’ meter
Optical sensing equipment was always used early in the morning, sampling one leaf per plant from the six plants within the “pour-thru”. It was found that depending on the species the number of leaf measurements needed to obtain a realistic and steady mean value varied. The sampled leaves were not removed from the plant during the measurements (non-destructive method).

Agriculture and Horticulture Development Board 2017. All rights reserved 16
The atLEAF+ meter is an easy to use, hand-held meter, measuring the relative chlorophyll content of green leaf plants (Figure 12). It measures the optical density difference at two wavelengths, 660 nm and 940 nm (http://www.atLEAF+.com/SPAD.aspx). The device works by inserting the leaf into the aperture in the front of the sensor and clicking on the measure button. Measurements were taken in the middle of the leaf ensuring always that the leaf was correctly positioned under the sensor’s window. The sensor continues to sample the scanned area as long as the measure button is being pressed. An average value of the measurements will appear when the measure button is released. The device can measure leaves that are up to 0.1 in (2.5 mm) in thickness.
Figure 12. atLEAF+ meter measuring the relative chlorophyll content of green leaf plants.
Greenmount & PCS
In the early morning one leaf was selected from one plant within the “pour thru” devices and measured using the atLEAF+ meter. The leaf was not removed and any water / moisture on the leaf surface flicked off before measuring. One sample was taken from each treatment and plant species and replicated at fortnightly intervals.
By inserting the names of the different plant species, treatments and replicates, the data is saved in a clear way and the user can easily view and compare previous measurements. Following completion of all the readings for the day the data was downloaded using the software and USB connection suitable for Windows application.

Agriculture and Horticulture Development Board 2017. All rights reserved 17
5. ‘Fieldscout’ Green Index App
The Fieldscout Green Index App is a smart phone application designed for use on iOS
devices such as an iPhone. The app uses the power of the smart phone to capture the
difference in the greenness of the plant leaf. This app is only available for iPhone and captures
images using the camera and determines the DGCI (Dark Green Colour Index) of plant
leaves. A specific reference board has to be separately purchased and acts as a known
background to the App. The green and yellow discs on the board are known colours
(standards), and are used by the software to calibrate differences in light conditions; the pink
background increases contrast and reduces noise (see Figure 13), and the grey colour
calibrates the white balance. Before starting the measurements, the user has to calibrate the
white balance over the grey area (on the reference board) and lock the camera’s white
balance features. The DGCI has been correlated to SPAD readings for chlorophyll
concentrations. (www.specmeters.com).
Figure 13. The reference board which acts as a known background to the App used.

Agriculture and Horticulture Development Board 2017. All rights reserved 18
Figure 14. The comparison between the ‘Fieldscout’ measurements (the mean, shown in red) and the N tissue % from analytical data.
Greenmount & PCS
After downloading and configuring the app, one leaf was selected early morning and removed
from one of the six plants within the pour-thru devices and laid on the target board. The image
was captured and the readings were taken. One sample was taken from each treatment and
plant species and replicated at fortnightly intervals. As each image is captured it can be
shared with an email account providing logged data which can be imported into Windows
Excel.
Table 1. Equipment used and assessed during the project
Equipment Measurement Price
‘Merck’ Nitrate test strip Nitrate – NO3 £30.00 per 100 tests
Horiba ‘LAQUAtwin’ Nitrate kit
Nitrate – NO3 £380.00
‘Procheck’ and GS3 sensor probe
volumetric water content, temperature and electrical conductivity
£730.00
atLEAF+ meter chlorophyll concentration £210.00
‘Fieldscout’ Green Index App
DGCI (Dark Green Colour Index) & SPAD (chlorophyll concentration)
£100.00 (excluding smart phone)
‘Pour-thru’ devices Pour-thru water collection £24.00 each
Davis ‘Vantage PRO2’ Weather data £980.00
0
0.5
1
1.5
2
2.5
3
3.5
4
4.5
5
0.000
0.100
0.200
0.300
0.400
0.500
0.600
0.700
0.800
0.900
1.000
N%
in t
issu
e
DG
LC
Greenindex : N tissue
Mean N tissue % Linear (Mean ) N% tissue

Agriculture and Horticulture Development Board 2017. All rights reserved 19
Statistical methods applied
In 2015 the experiment (four species x four compost treatments x two sites (Greenmount &
PCS)) was arranged as a block design with each block containing each of the four species
and four compost treatments. Statistical analysis was carried out using statistical software by
Biometrics & Information Systems, Agri-Food & Biosciences Institute (AFBI), Northern
Ireland.
Data was analysed using ANOVA. A general ANOVA test between the four compost
treatments with 3 degrees of freedom was carried out. Three specific tests were done: linear,
quadratic and deviation with 1 degree of freedom. Any significant correlative relationships for
individual residuals and between residuals for two variables are also listed. Some of the data
is tabulated in Figure 21-23 for Viburnum and Figure 24-27 for Buddleja. The main effects of
commercial interest are presented as line graphs within the results section.
Results
The equipment data output and data analysis clearly indicate that specific equipment showed
(good) positive relationships to traditional lab analysis. However more work is needed as
obtaining a sufficient sap sample from the shrub species was hard to achieve and the sample
was also stained green with the plant chlorophyll making it difficult to decipher colour readings
The LAQUtwin NO3 meter was found to be simple to use, however due to the preparation
required for the plant tissue sap samples, all readings were carried out under laboratory
conditions, ie. away from the nursery beds. Usage of the “Procheck” and GS3 sensor probe
to measure substrate properties was found to be simple and suitable for use in the nursery.
The atLEAF+ meter was found to be easy to use and suitable for use on the nursery as long
as attention to the leaf position in the ‘jaws’ of the meter were attended to. Whilst using the
Fieldscout Green Index App, the methodology was very simple but required some finger
agility and precision when tapping on the App screen. While less practical than the atLEAF+
meter, the Fieldscout Green Index App was found to be easy to use and suitable for use
within the nursery, although the results do not immediately appear to correlate well with the
laboratory analysis.
Equipment results
atLEAF+ and Green Index chlorophyll measurements
The ‘greenness’ of the leaves represents the amount of chlorophyll found in the chloroplasts. Leaf chlorophyll content can be used as an N status indicator, because this is an essential element in photosynthetic protein synthesis. Leaf chlorophyll content increases with N supply and decreases when N is limiting. Recent studies (see literature review for this project) have tested optical sensors to estimate N status in a variety of crops. The use of optical sensors

Agriculture and Horticulture Development Board 2017. All rights reserved 20
allows the assessment of a large number of plants in a short time period, and the results are immediately available.
The producers of the atLEAF+ device claim that the readings are as accurate as SPAD readings. On their website, there is an atLEAF+ to SPAD conversion application. The atLEAF+ sensor measures chlorophyll content in a small part of a leaf and not the whole plant and it is difficult to collect readings on small leaves from plants such as conifers. It was found that an average reading could be taken by holding down the reading button and passing a whole leaf/needle area through the aperture. The device’s aperture is approximately 4 mm wide and that can cause a variation of readings of +/- 5 units, depending on the position of the leaf
(closer to the top part of the aperture or to the lower part). Secondly, this space allows light to reach the sensor diode and interfere with the reading. The atLEAF+ sensor has an open space and no filters, which makes readings sensitive to high light exposure.
In this first year of trials we have focused on the responses of the equipment and have not established a direct relationship between N tissue levels and the equipment readings. In the case of buddleja, an atLEAF+ unit of 55 equated to tissue N levels of 3-5 %. Tissue N levels were consistent across the different CRF levels and the two sites. In the Buddleja and Chamaecyparis subjects, the N levels started high and fell during the growing season. In the case of Viburnum and Skimmia this was reversed, with N rising in the tissue over the season.
The calibration of the two chlorophyll detection devices to give a direct N level was not possible in this first year. Both pieces of equipment have recommendations as to N application rates for specific crops. It should be noted that in the case of the atLEAF+ system, an increasing reading relates to a rising N application level. In the case of the Green Index system, an increasing number indicates lower N application rates.
Data output was related to the tissue analysis of N. The data from the Greenmount site is shown in Appendix 8 Figures 54-57. The atLEAF+ data used were a mean of the three replicates. In Figure 15, the atLEAF+ + results are shown as atLEAF+ units and the leaf tissue as percentage N. There was a significant correlation (P < 0.05) found between the atLEAF+ readings and the leaf tissue N in species Chamaecyparis and Buddleja. In regard to all four species, a very highly significant correlation (P < 0.001) was found between the atLEAF+ readings and the Greenindex app readings. In the species Chamaecyparis and Buddleja, the atLEAF+ readings and Horiba nitrate meter readings were also found to significantly correlate to analysis results (P < 0.001).
The tissue levels of N followed a similar pattern to the atLEAF+ readings as shown in Figure 15. This was true for the Buddleja and Viburnum at Greenmount, but less so at PCS. The lower 2 kg/m³ and 4 kg/m³ CRF levels gave more consistent readings than the upper levels of 6 kg/m³ and 8 kg/m³. The atLEAF+ data for PCS were less consistent than the Greenmount data and shows that we need to record the levels of light at the time we take the readings. When all readings and species are put together, the trend of the atLEAF+ results has a similar slope to the tissue analysis.

Agriculture and Horticulture Development Board 2017. All rights reserved 21
Figure 15. Illustration of atLEAF+ N values compared to leaf tissue N% by analysis
atLEAF+ chlorophyll measurements continued
The growing conditions in Belgium produced an entirely different set of data to Northern Ireland. Whilst the trend in Northern Ireland was for the N levels in the tissue to fall and then increase towards the end of the season, in Belgium they continued to fall throughout the period of the trial. Leaf colour however did not always follow these trends; a colour increase did not occur with the lower rates of CRF, but did with higher rates.
Buddleja
As expected, in Buddleja, as the CRF rates increased there was an improved correlation between the increasing levels of tissue N and the atLEAF+ readings (chlorophyll response). The greater the CRF application, the more N was utilised by the Buddleja plants.
Chamaecyparis
The technique for measuring the chlorophyll content of a coniferous subject required a series of readings to be taken as the needles passed under the sensor. This ensured a more representative sample of leaf was obtained. All readings from Chamaecyparis were taken this way. The conifer readings in Northern Ireland were inaccurate due to a wrong default setting on the equipment and have been discarded. The other crops at that site and at PCS gave useable data.
Skimmia
The Skimmia plants, whilst not in good condition did manage to grow in Northern Ireland and data were taken from the tissue and atLEAF+ device. No data was available from the plants at PCS due to death after potting. It was too late in the season to purchase replacement plants. We did however manage to obtain some early data sets from them, but the results were somewhat erratic, and are therefore not reported here.
Viburnum
Viburnum showed some correlation between the atLEAF+ and lab analysis data (see Figures 38 and 41 in Appendix 2 and 3), however it was again somewhat erratic between the four CRF treatment levels.
1
1.5
2
2.5
3
3.5
4
4.5
30.00
35.00
40.00
45.00
50.00
55.00
60.00
65.00
70.00
75.00
80.00
N%
in t
issu
e
AtL
eaf
un
its
atLEAF+ vs N tissue
Mean N tissue % Linear (Mean ) N% tissue

Agriculture and Horticulture Development Board 2017. All rights reserved 22
Greenindex App
The Greenindex app was delayed at PCS due to the late delivery of an iPhone so only three sets of readings were possible. The condition of the Skimmia did not allow many tissue samples to be taken.
Horiba ‘LAQUAtwin’ NO3 N measurements
In this case, sap extraction from ornamentals is much harder than for the food crops this system is normally used on, demonstrated by the variable results in Figure 16. Quite large volumes of foliage material are needed. Freezing the foliage prior to squeezing improved the ease of sap collection. Results can be seen in more detail in Figures 62 - 67, in Appendix 10.
Figure 16. The relationship between N tissue measurements and the Laquatwin readings – actual vs mean readings.
Decagon ‘Procheck’ with GS3 conductivity
This device gives an immediate display of substrate conductivity.
Figure 17 shows that substrate N level trends and Procheck data trends follow each other closely over the first year period of the trial.
1.5
2
2.5
3
3.5
4
4.5
0
200
400
600
800
1000
1200
1400
1600
1800
2000
Ho
rib
a u
nit
s
Laqua Twin NO3 : N tissue
Mean N tissue % Linear (Mean ) Linear (N tissue %)

Agriculture and Horticulture Development Board 2017. All rights reserved 23
Figure 17. The relationship between the Procheck and the substrate analysis results over time.
Nitrogen leaching
Analysis of the rainfall and irrigation water collected by the ‘pour-thru’ devices provided data on the fate of the N applied to the substrate.
When we look at the total amount of nutrients leached from the Buddleja pots (per m²) we can see that plants treated with 8 kg/m³ Osmocote took up 4 times more N than plants treated with 2 kg/m³ Osmocote. The atLEAF+ and Greenindex both detected this difference but results were not clear.
The irrigation applications and rainfall at PCS are shown in the following chart, Figure 18
N%EC
µS
EC comparison Procheck:Substrate:Tissue N%
Substrate data Procheck data N tissue %
Linear (Substrate data) Linear (Procheck data) Linear (N tissue %)

Agriculture and Horticulture Development Board 2017. All rights reserved 24
Figure 18. N levels in the ‘pour-thru’ water for the PCS Buddleja across time.
Figure 19. showing N leaching over time, and for each level of CRF in Buddleja.
The initially high levels of leached N seen in Figure 19 above are from the base fertiliser, CAN (calcium ammonium nitrate), used in Forest Gold® and some initial CRF release. We will have some real data on this in year two report.
0.0
5.0
10.0
15.0
20.0
25.0
0
50
100
150
200
250
29 34 38 42
Tem
pera
ture
(°C
)
Wate
r (m
m/m
²)
Week number
PCS 2015
Rainfall Irrigation Temperature
0
500
1000
1500
2000
2500
29 34 38 42
mg
NO
3-N
per
m²
Week no
N leaching - Buddleja PCSOsmocote 2Kg/m3 Osmocote 4Kg/m3 Osmocote 6Kg/m3 Osmocote 8Kg/m3

Agriculture and Horticulture Development Board 2017. All rights reserved 25
Nitrogen balance in containers
Figure 20. A limited amount of leaching loss and the apparent high capture of the N at all fertiliser input levels.
0
10,000
20,000
30,000
40,000
50,000
60,000
70,000
2 kg/m3 4 kg/m3 6 kg/m3 8 kg/m3
mg/
m²
tota
l N
Buddleja total nitrogen allocation (mg/m2) at 4 different CRF rates
N used by the plants
N in pot
Leached N
Input N

Agriculture and Horticulture Development Board 2017. All rights reserved 26
The data, graphically shown below demonstrates the statistical significance of equipment, and plant tissue analysis. Those of particular interest for specific plant subjects is shown below by way of example to the highly significant data sets in Appendix 11. The table in Appendix 12 shows the results of 62 of the 1531 variates that have a degree of significance.
Viburnum
Figures 21, 22 and 23. Comparisons for Viburnum

Agriculture and Horticulture Development Board 2017. All rights reserved 27
Buddleja
Figures 24, 25, 26 and 27. Comparisons for Buddleja

Agriculture and Horticulture Development Board 2017. All rights reserved 28
Plant height
Figures 28, 29, 30 and 31. Illustrate height measurements made through the season.
10.00
30.00
50.00
16-Jun 09-Jul 22-Jul 05-Aug 21-Aug 02-Sep 14-Sep 05-Oct
Pla
nt
he
igh
t (c
m)
Buddleja
2kg 4kg 6kg 8kg
10.00
15.00
20.00
25.00
16-Jun 09-Jul 22-Jul 05-Aug 21-Aug 02-Sep 14-Sep 05-Oct
Pla
nt
he
igh
t (c
m)
Chamaecyparis
2kg 4kg 6kg 8kg

Agriculture and Horticulture Development Board 2017. All rights reserved 29
Note the Skimmia results relate to very poor plants and therefore may not be a true reflection of growth. This relates to plant quality from the start of the trial. The peaks and troughs in the Buddleja relate to the trimming back incidences referred to in Materials and Methods section P 6. The Viburnum and Chamaecyparis gave the most consistent results, and illustrate a good relationship between height and CRF fertiliser application rates.
Discussion
The aim of this project is to examine the possibility for growers to make use of on-nursery tools/equipment to gauge the nutritional status of plants, without having to resort to destructive sampling and sending of samples to laboratories for analysis. The latter is seen as relatively expensive and is generally only done if there appears to be a problem with the growth of plants, by which time the results may show that recovery is almost impossible in any one growing season. For some years now growers have wanted the ability to constantly monitor crops and be able to make any nutritional adjustments to avoid the quality of the plants deteriorating beyond recovery.
Our tests include very simple ‘dip stick’ type assessment tool, through to the more sophisticated chlorophyll meters which assess the fluorescence of chlorophyll. Growers can use optical sensors to monitor plant N levels using sensor readings to make real-time decisions on the need for additional fertilisation. Growers can then produce a higher quality product, saving money on fertilisers and reduce pollution in the environment.
Challenges in this type of work include samples from the ‘marker’ crops on the nursery having to be collected at similar times of the day and from a similar age of plant material. In order to achieve this it is necessary to have someone on the nursery who is responsible for sampling and brings together all the results so that any emerging trends can be assessed.
Eventually it should be possible to see if the nursery results can be used ahead of visual symptoms appearing, in order to correct any nutrient shortfalls.
Collecting both rainfall and irrigation inputs and run-off outputs will allow some simple estimates of the nutrient use efficiency savings that could be made, and particularly the potential for reducing diffuse pollution from the fertiliser combinations used. In addition to the work described in this report, a ‘bench scale’ leaching trial is being run with a view to assessing which fertiliser components are major contributors to potential nutrient losses from the system. Work at RHS Wisley will also complement our ongoing work and broaden our information by looking at a wider range of substrate mixes.
Conclusions
In spite of the teething problems with plant material and learning to use the equipment some worthwhile results have emerged from the mass of data collected, however these results from the first year of the project should not be seen as definitive.
1. Equipment can be used to measure the nutritional status of a small range of ornamental crops, however these crops represent a range of leaf size and nutritional requirements, highlighting the breadth of what can be monitored.
2. The Green Index app needs further testing to confidently establish a link between N and app readings.
3. Horiba LAQUA twin is difficult to use on the nursery. A better sap extraction method needs to be established and will be explored further during the second year of work.

Agriculture and Horticulture Development Board 2017. All rights reserved 30
4. The atLEAF+ device is very promising, with readings showing a good relationship to N tissue levels.
5. Procheck & GS3 show a good correlation between N tissue levels and substrate EC.
6. The highest N leaching rate takes place in the first 4 weeks of cultivation (this is normal), and after week 34 there is almost no N leaching out from the pots. Leached quantities for 8 kg/m³ CRF is higher in Buddleja than the other treatments, suggesting that 8 kg/m³ might be more than needed to sustain the growth of Buddleja.
7. Plant trimming increased nutrient pour-thru, with higher N levels in the pour-thru water.
Actions from the results and conclusions from the year one work, to be included in year two are:
1. We need to monitor the ambient light levels for 4 hours prior to taking the chlorophyll readings, to ensure that the results are not adversely skewed due to large variations in the incident light levels.
2. We have identified some research that looks at Refractometer readings of plant sap as means of measuring N levels. We will be using a new piece of equipment to investigate this.
3. Due to the difficulties with sap extraction we will be using a new published method of sap extraction.
We also need to look again at the sap testing in relation to cleaning the solution by the use of active charcoal. This will achieve a cleaner sap sample that is free from plant tissue colouring which make readings difficult in the Merck strips and LAQUAtwin Nitrate device.
Knowledge and Technology Transfer
Over the coming season three open days are planned at the three trial sites. The PCS site will be a two-day event on 6-7th July 2016 and will include visits to Belgian ornamental nurseries.
One article has been written for the AHDB Grower magazine and another article is planned in the autumn of 2016. Two presentations have been made to growers during year one.
Two nutrition workshops are planned in December. The first on the 7th at the HTA offices in Oxford and the second on the 8th at STC in York.
References
Smith D.L. (1987). Plant sap analysis as a monitoring technique for tomatoes in Rockwool. Stats of Guernsey Annual report 1986
Le Marchant-Smith D. (1995). Monitoring the nutrition of clematis using plant sap anaylsis. Acta Hort 401 Growing Media & Plant nutrition. P 389-392.

Agriculture and Horticulture Development Board 2017. All rights reserved 31
Appendices
Appendix 1 - Weather data – Figure 32 – 35
The two sites each collect weather data on a half hourly basis. The data recorded for the trial
purposes are average daily air temperature, rainfall and W/m². The comparisons between the
two sites is shown in the following four charts.
Figure 32. Average rainfall comparison between PCS and Greenmount
Figure 33. Average daily air temperature comparison between PCS and Greenmount
0
5
10
15
20
25
30
35
12
/06
/15
17
/06
/15
22
/06
/15
27
/06
/15
02
/07
/15
07
/07
/15
12
/07
/15
17
/07
/15
22
/07
/15
27
/07
/15
01
/08
/15
06
/08
/15
11
/08
/15
16
/08
/15
21
/08
/15
26
/08
/15
31
/08
/15
05
/09
/15
10
/09
/15
15
/09
/15
20
/09
/15
25
/09
/15
30
/09
/15
05
/10
/15
10
/10
/15
15
/10
/15
20
/10
/15
25
/10
/15
mm
Rainfall mm
Greenmount PCS
-
5.00
10.00
15.00
20.00
25.00
30.00
°C
Average daily air temperature °CGreenmount PCS

Agriculture and Horticulture Development Board 2017. All rights reserved 32
Figure 34. Average maximum W/m2 comparison between PCS and Greenmount
Figure 35. Cumulative rain and irrigation comparison between PCS and Greenmount
0
10
20
30
40
50
60
70
80
12
/06
/15
17
/06
/15
22
/06
/15
27
/06
/15
02
/07
/15
07
/07
/15
12
/07
/15
17
/07
/15
22
/07
/15
27
/07
/15
01
/08
/15
06
/08
/15
11
/08
/15
16
/08
/15
21
/08
/15
26
/08
/15
31
/08
/15
05
/09
/15
10
/09
/15
15
/09
/15
20
/09
/15
25
/09
/15
30
/09
/15
05
/10
/15
10
/10
/15
15
/10
/15
20
/10
/15
25
/10
/15
W/m
²
Max W/m²
Greenmount PCS
0
100
200
300
400
500
600
700
03
/07
/20
15
10
/07
/20
15
17
/07
/20
15
24
/07
/20
15
31
/07
/20
15
07
/08
/20
15
14
/08
/20
15
21
/08
/20
15
28
/08
/20
15
04
/09
/20
15
11
/09
/20
15
18
/09
/20
15
25
/09
/20
15
02
/10
/20
15
09
/10
/20
15
16
/10
/20
15
mm
Cumulative rain + irrigation mm
Greenmount PCS

Agriculture and Horticulture Development Board 2017. All rights reserved 33
Appendix 2 – Tissue Data – Greenmount Figure 36 - 38
Appendix 3 – Tissue Data - PCS Figure 39 – 41
01234567
% n
utr
ien
t
Tissue Buddleja Greenmount
N 8kg N 6kg N 4kg N 2kg
0
2
4
6
8
10
% n
utr
ien
t
Tissue Chamaecyparis Greenmount
N 8kg N 6kg N 4kg N 2kg
0
1
2
3
4
5
% n
utr
ien
t
Tissue Viburnum Greenmount
N 8kg N 6kg N 4kg N 2kg
01234567
% n
utr
ien
t
Tissue Buddleja PCS
N 8kg N 6kg N 4kg N 2kg
0
2
4
6
8
10
% n
utr
ien
t
Tissue Chamaecyparis PCS
N 8kg N 6kg N 4kg N 2kg
0
1
2
3
4
5
31/08/2015 30/09/2015 31/10/2015
% n
utr
ien
t
Tissue ViburnumPCS
N 8kg N 6kg N 4kg N 2kg
There were insufficient readings for 6kg and 8kg to produce a line for the graph

Agriculture and Horticulture Development Board 2017. All rights reserved 34
Appendix 4 – Water Data - Greenmount Figure 42 – 44
Appendix 5 – Water Data – PCS Figure 45 - 47
0
20
40
60
80
mg/
l
Water Buddleja Greenmount
NO3-N 8kg NO3-N 6 kg
NO3-N 4kg NO3-N 2kg
0
50
100
150
200
mg/
l
Water Chamaecyparis Greenmount
NO3-N 8kg NO3-N6kg
NO3-N 4lg NO3-N 8kg
0
50
100
150
mg/
l
Water Viburnum Greenmount
NO3-N 8kg NO3-N 6kg
NO3-N 4kg NO3-N 2kg
0
20
40
60
80
mg/
l
Water Buddleja PCS
NO3-N 8kg NO3-N 6kg
NO3-N 4kg NO3-N 2kg
0
50
100
150
200
mg/
l
Water Chamaecyparis PCS
Nitrate-N 8kg Nitrate-N 6kg
Nitrate-N 4kg Nitrate-N 2kg
0
50
100
150
mg/
l
Water Virburnum PCS
Nitrate-N 8kg Nitrate-N 6kg
Nitrate-N 4kg Nitrate-N 2kg

Agriculture and Horticulture Development Board 2017. All rights reserved 35
Appendix 6 – Substrate Data - Greenmount Figure 48 - 50
Appendix 7 – Substrate Data – PCS Figure 51 – 53
0
100
200
300
400
mg/
l
Substrate Total N Buddleja Greenmount
TON 8kg TON 6kg
TON 4kg TON 2kg
0
100
200
300
400
mg/
l
Substrate Total N Chamaecyparis Greenmount
TON 8kg TON 6kg
TON 4kg TON 2kg
0100200300400500
mg/
l
Substrate Total N Viburnum Greenmount
TON 8kg TON 6kg
TON 4kg TON 2kg
0
100
200
300
400
mg/
l
Substrate Total N Buddleja PCS
TON 8kg TON 6kg
TON 4kg TON 2kg
0100200300400
mg/
l
Substrate Total N Chamaecyparis
PCS
TON 8kg TON 6kg
TON 4kg TON 2kg
0
100
200
300
400
500
mg/
l
Substrate Total N VirburnumPCS
TON 8kg TON 6kg
TON 4kg TON 2kg

Agriculture and Horticulture Development Board 2017. All rights reserved 36
Appendix 8 – Tissue atLEAF+ Figure 54 - 57
Figure 54
Figure 55
AtL
eaf
un
its
% N
Tissue:AtLeaf comparison Greenmount all treatments Buddleja
Tissue % N AtLeaf+
AtL
eaf
un
its
% N
Tissue:AtLeaf comparison Greenmount all treatments Viburnum
Tissue % N AtLeaf+

Agriculture and Horticulture Development Board 2017. All rights reserved 37
Figure 56
Figure 57
AtL
eaf
un
its
% N
Tissue:AtLeaf comparison PCS all treatments Buddleja
AtLeaf+ Tissue % N
AtL
eaf
un
its
% N
Tissue:AtLeaf comparison PCS all treatments Chamaecyparis
AtLeaf+ Tissue % N

Agriculture and Horticulture Development Board 2017. All rights reserved 38
Appendix 9 - Tissue ‘Greenindex’ Figure 58 - 61
Figure 58
Figure 59
Gre
enin
dex
un
its
% N
Tissue:Greenindex comparison Greenmount all treatments Chamaecyparis
Greenindex Tissue % N
Gre
enin
dex
un
its
% N
Tissue:Greenindex comparison Greenmount all treatments Viburnum
Greenindex Tissue % N

Agriculture and Horticulture Development Board 2017. All rights reserved 39
Figure 60
Figure 61
Gre
enin
dex
un
its
% N
Tissue:GreenIndex comparison PCS all treatments Chamaecyparis
Greenindex Tissue % N
Gre
enin
dex
un
its
% N
Tissue:GreenIndex comparison PCS all treatments Buddleja
Greenindex Tissue % N

Agriculture and Horticulture Development Board 2017. All rights reserved 40
Appendix 10 - Sap tissue ‘Horiba LAQUAtwin’ Figure 62 – 67
Figure 62
Figure 63
LAQ
UA
twin
un
its
% N
Tissue:LAQUAtwin Greenmount all treatments Viburnum
Linear (LAQUAtwin) Linear (Tissue % N)
LAQ
UA
twin
un
its
% N
Tissue:LAQUAtwin Greenmount all treatments Chamaecyparis
Linear (LAQUAtwin) Linear (Tissue % N)

Agriculture and Horticulture Development Board 2017. All rights reserved 41
Figure 64
Figure 65
LAQ
UA
twin
un
its
% N
Tissue:LAQUAtwin Greenmount all treatments Buddleja
Linear (LAQUAtwin) Linear (Tissue % N)
LAQ
UA
twin
un
its
% N
Tissue:LAQUAtwin PCS all treatments Buddleja
Linear (LAQUAtwin) Linear (Tissue % N)

Agriculture and Horticulture Development Board 2017. All rights reserved 42
Figure 66
Figure 67
LAQ
UA
twin
un
its
% N
Tissue:LAQUAtwin PCS all treatments Chamaecyparis
Linear (LAQUAtwin) Linear (Tissue % N)
LAQ
UA
twin
un
its
% N
Tissue:LAQUAtwin PCS all treatments Viburnum
Linear (LAQUAtwin) Linear (Tissue % N)

Agriculture and Horticulture Development Board 2017. All rights reserved 43
Appendix 11 – Statistical Analysis of Results - graphs
Viburnum
AT Leaf Chlorophyll & Heights (Figure 68)
Correlation was found between the AT leaf chlorophyll meter and the height of plants mid season. As
expected as the plants produced new growth chlorophyll levels were found to correspond with growth.
DGCI & Heights (Figure 69)
As found with the AT leaf chlorophyll meter in Figure 68 the Green index app DGCI was found to
correlate with plant height in mid season. The DGCI and measure of dark green colour index was found
to correspond with plant growth.
DGCI & AT Leaf Chlorophyll (Figures 70-72)
The Green index app, DGCI measure of dark green colour index and the chlorophyll measure from the
AT Leaf chlorophyll meter was found to correlate for the Viburnum plant during both the early and mid
season growth period.
Figures 68 – 72 show comparisons for Viburnum
0
20
40
0 20 40 60
Pla
nt
he
igh
t cm
s
aTLEAF units
aTLEAF chlorophyll & heights cm
heights cm 25/09/2015
0
5
10
15
20
25
0.0 0.2 0.4 0.6 0.8
Pla
nt
he
igh
t cm
s
DGCI reading
DGCI & heights cm
heights cm 25/09/2015
0
20
40
60
80
0.0 0.2 0.4 0.6 0.8
aTLE
AF
un
its
DGCI units
DGCI & at leaf Chlorophyll
Chlorophyll - At Leaf 02/07/2015
0
20
40
60
80
0.0 0.2 0.4 0.6 0.8
aTLE
AF
un
its
DGCI units
DGCI & at leaf Chlorophyll
Chlorophyll - At Leaf 20/08/2015
0
10
20
30
40
50
60
0.0 0.2 0.4 0.6 0.8
aTLE
AF
un
its
DGCI units
DGCI & at leaf Chlorophyll
Chlorophyll - At Leaf 16/09/15

Agriculture and Horticulture Development Board 2017. All rights reserved 44
Skimmia
DGCI & AT Leaf Chlorophyll (Figure 73 & 75)
As found in the plant species Viburnum, the Green index app DGCI measure of dark green colour
index and the chlorophyll measure from the AT Leaf chlorophyll meter was found to correlate also for
the plant Skimma during both the mid season growth period.
Figures 73 – 75 show comparisons for Skimmia
Chamaecyparis
AT Leaf Chlorophyll & SAP No3 meter (Figure 76 & 77)
Correlation was found between the AT leaf chlorophyll meter and the SAP meter during the late
growth season. A correlation was found, the nitrogen level dropped (the SAP meter measure) with
the chlorophyll measure following the same.
Figures 76 – 77 show comparisons for Chamaecyparis
0
50
100
0.0 0.5 1.0
aTLe
af u
nit
s
DGCI units
DGCI & at leaf Chlorophyll
Chlorophyll - At Leaf20/08/2015
0
50
100
0.0 0.5 1.0
aTLe
af u
nit
s
DGCI units
DGCI & at leaf Chlorophyll
Chlorophyll - At Leaf03/09/2015
0
100
0.0 0.5 1.0
aTLe
af u
nit
s
DGCI units
DGCI & at leaf Chlorophyll
Chlorophyll - At Leaf 16/09/2015
Chlorophyll - At Leaf 03/09/2015
0
200
400
600
0 20 40 60
Sap
un
its
aTLeaf units
at leaf chlorophyll & SAP -NO3-meter
SAP - NO3 meter 16/09/2015
0
200
400
600
0 20 40 60
Sap
un
its
aTLeaf units
at leaf chloropyll & SAP -NO3 meter
SAP - NO3 meter 01/10/2015

Agriculture and Horticulture Development Board 2017. All rights reserved 45
Buddleja
AT Leaf Chlorophyll & SAP No3 meter (Figure 78)
As seen above with the Chamaecyparis in late growth season a correlation was found between the AT
leaf chlorophyll meter and the SAP meter during the mid-growth season. A correlation was found, the
nitrogen level dropped (the SAP meter measure) with the chlorophyll measure following the same.
DGCI & AT Leaf Chlorophyll (Figures 79-81)
As found in the plant species Viburnum and Skimma the Green index app DGCI measure of dark green
colour index and the chlorophyll measure from the AT Leaf chlorophyll meter was found to correlate
during both the mid and late season growth period.
Figures 78 – 81 show comparisons for Buddleja
0
500
1000
1500
0 50 100
SAP
un
its
aTLeaf units
at leaf chlorophyll & SAP -NO3 meter
SAP - NO3 meter 03/09/15
0
20
40
60
80
0.0 0.5 1.0
aTLe
af u
nit
s
DGCI units
DGCI & at leaf Chlorophyll
Chlorophyll - At Leaf 05/08/15
0
20
40
60
80
0.0 0.5 1.0
aTLe
af u
nit
s
DGCI units
DGCI & at leaf Chlorophyll
Chlorophyll - At Leaf 03/09/15
45
50
55
60
65
0.0 0.5 1.0
aTLe
af u
nit
s
DGCI units
DGCI & at leaf Chlorophyll
Chlorophyll - At Leaf 16/09/15

Agriculture and Horticulture Development Board 2017. All rights reserved 46
Appendix 12 – Statistical Analysis of Results
1. As expected highly significant differences were found between plant heights in different compost
treatments, especially in the plant species Buddleja, and to a lesser extent in Viburnum later in the
growing season. No significant difference was found in plant height for the species Chamaecyparis
however observations found visual effects.
2. In regard to compost EC highly significant differences were found between compost treatments in
mainly the Skimma species especially in the early growth season. None was found in the plants
species Viburnum.
3. SAP NO3 meter nitrogen measurement was found to differ highly significantly between compost
treatments in the plant species Skimma in the mid- to late growth season. No significance in the
other plant species and the early growth season for Skimma.
4. Highly significant differences were found between compost treatments in the atLEAF+ Chlorophyll
meter results in the plant species Skimma in the mid growth season and in the late growth season
for the Buddleja plant species.
5. Compost conductivity and compost total nitrogen was found to be highly significantly different
between compost treatments in the three species Viburnum, Skimma and Chamaecyparis. Not as
significant in the plants species Buddleja.
6. Tissue % nitrogen was found to be highly significantly different between compost treatments in
species Chamaecyparis and Buddleja.
7. Drain water conductivity and total nitrogen was found to have a highly significant differences
between compost treatments in all four plant species in the early growth and late growth season.
Less significance was found in the mid growth season.

Agriculture and Horticulture Development Board 2017. All rights reserved 47
The table below shows the level of significance across all four varieties and each replicate for both PCS and Greenmount combined. The numbers relate to the specific dates on which the readings were taken.
ns – not significant * - significant ** - highly significant *** - v. highly significant
Variate Number Variate Name
Plant Species
Variate Number Variate Name
Plant Species
Viburnum Skimmia Chamaecyparis Buddleja Viburnum Skimmia
Chamaecyparis Buddleja
11 heights cm 1 ns ns ns ns 82 G Index DGCI 1 * ns ns **
12 heights cm 2 ns ns ns ** 83 G Index DGCI 2 ns * ns ns
13 heights cm 3 ns * ns * 84 G Index DGCI 3 ns *** ns ***
14 heights cm 4 ns ns ns *** 85 G Index DGCI 4 ** ns * ns
15 heights cm 5 * ns ns *** 86 G Index DGCI 5 ** ns ** ns
16 heights cm 6 ** ns ns ** 87 G Index DGCI 6 *** ns ns *
17 heights cm 7 ** ns ns *** 94 Compost COND us/cm 1 *** ** ** **
18 heights cm 8 ns * ns *** 95 Compost NH4 - N mg/l 1 * * ns *
19 heights cm 9 * * ** *** 96 Compost NO3 - N mg/l 1 *** *** ** **
51 EC ds/m 1 ns ** ** ns 97 Compost TON mg/l 1 *** ** * **
52 EC ds/m 2 ns *** * * 101 Compost COND us/cm 2 ** *** *** *
53 EC ds/m 3 ns ** ns ns 102 Compost NH4 - N mg/l 2 ns ns ns ns
54 EC ds/m 4 ns ** ns ** 103 Compost NO3 - N mg/l 2 ** *** ** **
55 EC ds/m 5 ns ns ns ns 104 Compost TON mg/l 2 ** *** ** *
56 EC ds/m 6 ns * ns ns 108 Compost COND us/cm 3 ** ** ** ns
57 average EC ds/m * ** * * 109 Compost NH4 - N mg/l 3 ns ns ns ns
66 SAP NO3 meter 1 ** ns ns ns 110 Compost NO3 - N mg/l 3 *** ** *** ns
67 SAP NO3 meter 2 ns ns * ns 111 Compost TON mg/l 3 *** ** ** ns
68 SAP NO3 meter 3 * ns ns ns 115 Compost COND us/cm 4 *** *** * ***
69 SAP NO3 meter 4 ns *** ns ns 116 Compost NH4 - N mg/l 4 * ns ** **
70 SAP NO3 meter 5 ns *** ns ns 117 Compost NO3 - N mg/l 4 ** *** ns ***
71 SAP NO3 meter 6 ns ns ns ** 118 Compost TON mg/l 4 *** *** * ***
72 SAP NO3 meter 7 ns *** ** ns 135 Water COND us/cm 1 * *** ** ***
73 SAP NO3 meter 8 ns ns * ns 136 Water NO3-N mg/l 1 ** *** ** ***
74 Chlorophyll At leaf 1 ns ** ns ns 140 Water COND us/cm 2 ** * * ns
75 Chlorophyll At leaf 2 ns ns ns ns 141 Water NO3-N mg/l 2 ** * * ns
76 Chlorophyll At leaf 3 ns ** ns ** 145 Water COND us/cm 3 ** ns * **
77 Chlorophyll At leaf 4 ns ** ns ns 146 Water NO3-N mg/l 3 ns ns * *
78 Chlorophyll At leaf 5 ns ** ns *** 150 Water COND us/cm 4 ** ** *** **
79 Chlorophyll At leaf 6 ns ns ns *** 151 Water NO3-N mg/l 4 ** ** *** *
80 Chlorophyll At leaf 7 ns ns ns **
81 Chlorophyll At leaf 8 ns ns ns ***